Natixis International Funds (Lux) I
240
Natixis International Funds (Lux) I SICAV Unaudited Semi-Annual Report As at June 30, 2021 No subscriptions should be made on the basis of the financial report alone. Subscriptions should only be made on the basis of the current Prospectus supplemented by the latest Annual Report and the latest Semi-Annual Report, if published thereafter. Performance data shown represents past performance and is not a guarantee of future results. More recent performance may be lower or higher. Principal value and returns fluctuate over time (including as a result of currency fluctuations) so that Shares, when redeemed, will be worth more or less than their original cost. Performance shown is net of all Fund expenses, but does not include the effect of sales charges or correspondent bank charges, and assumes reinvestment of distributions. If such charges were included, returns would have been lower. Performance for other Share classes will be more or less depending on differences in fees and sales charges. For periods when certain Share classes were unsubscribed or not yet created (the "inactive Share classes"), performance is imputed using the actual performance of the Fund's active Share class which has been determined by the management company as having the closest characteristics to such inactive Share class and adjusting it based on the difference in TERs and, where applicable, converting the net asset value of the active Share class into the currency of quotation of the inactive Share class. The quoted performance for such inactive Share class is the result of an indicative calculation. Unless otherwise indicated, all defined terms used herein shall have the same meaning as set out in the Prospectus of the Umbrella Fund. R.C.S. Luxembourg B 53023
-
Upload
khangminh22 -
Category
Documents
-
view
0 -
download
0
Transcript of Natixis International Funds (Lux) I

Natixis International Funds (Lux) I
SICAV
Unaudited Semi-Annual Report
As at June 30, 2021
No subscriptions should be made on the basis of the financial report alone. Subscriptions should only be made on
the basis of the current Prospectus supplemented by the latest Annual Report and the latest Semi-Annual Report,
if published thereafter.
Performance data shown represents past performance and is not a guarantee of future results. More recent
performance may be lower or higher. Principal value and returns fluctuate over time (including as a result of
currency fluctuations) so that Shares, when redeemed, will be worth more or less than their original cost.
Performance shown is net of all Fund expenses, but does not include the effect of sales charges or
correspondent bank charges, and assumes reinvestment of distributions. If such charges were included,
returns would have been lower. Performance for other Share classes will be more or less depending on
differences in fees and sales charges. For periods when certain Share classes were unsubscribed or not yet
created (the "inactive Share classes"), performance is imputed using the actual performance of the Fund's
active Share class which has been determined by the management company as having the closest
characteristics to such inactive Share class and adjusting it based on the difference in TERs and, where
applicable, converting the net asset value of the active Share class into the currency of quotation of the inactive
Share class. The quoted performance for such inactive Share class is the result of an indicative calculation.
Unless otherwise indicated, all defined terms used herein shall have the same meaning as set out in the
Prospectus of the Umbrella Fund.
R.C.S. Luxembourg B 53023

Natixis International Funds (Lux) I
Table of contents
Management and Administration 5
Statement of Net Assets 8
Natixis Asia Equity Fund
Statistics 15 Statement of Investments 16 DNCA Emerging Europe Equity Fund Statistics 18 Statement of Investments 19 Natixis Pacific Rim Equity Fund Statistics 21
Statement of Investments 22 Harris Associates Concentrated U.S. Equity Fund (liquidated on April 9, 2021) Statistics 24 Harris Associates Global Equity Fund Statistics 25 Statement of Investments 27 Harris Associates U.S. Equity Fund
Statistics 29 Statement of Investments 30 Loomis Sayles Global Emerging Markets Equity Fund Statistics 32 Statement of Investments 33 Loomis Sayles Global Growth Equity Fund
Statistics 35 Statement of Investments 36
Loomis Sayles U.S. Growth Equity Fund Statistics 38 Statement of Investments 40 DNCA Europe Smaller Companies Fund Statistics 42
Statement of Investments 43 Seeyond Asia MinVol Equity Income Fund (liquidated on May 28, 2021)
Statistics 46 Thematics AI and Robotics Fund Statistics 47 Statement of Investments 48 Thematics Meta Fund Statistics 50 Statement of Investments 51
Thematics Safety Fund
Statistics 56 Statement of Investments 58 Thematics Subscription Economy Fund Statistics 60 Statement of Investments 61 Thematics Water Fund
Statistics 63 Statement of Investments 64 Thematics Wellness Fund (launched on April 16, 2021) Statistics 66 Statement of Investments 67 Vaughan Nelson Global Smid Cap Equity Fund
Statistics 69 Statement of Investments 70 Vaughan Nelson U.S. Select Equity Fund
Statistics 73 Statement of Investments 74

Natixis International Funds (Lux) I
Table of contents (continued)
WCM Global Emerging Markets Equity Fund
Statistics 75 Statement of Investments 76 WCM Select Global Growth Equity Fund (launched on April 27, 2021) Statistics 79 Statement of Investments 80 Loomis Sayles Global Credit Fund Statistics 82
Statement of Investments 83 Loomis Sayles Disciplined Alpha U.S. Corporate Bond Fund Statistics 94 Statement of Investments 95 Loomis Sayles Sustainable Global Corporate Bond Fund (formerly Loomis Sayles
Institutional Global Corporate Bond Fund, change of name on April 26,2021) Statistics 105
Statement of Investments 106 Loomis Sayles Institutional High Income Fund (liquidated on January 13, 2021) Statistics 119 Loomis Sayles Short Term Emerging Markets Bond Fund Statistics 120 Statement of Investments 122
Loomis Sayles Strategic Alpha Bond Fund Statistics 130 Statement of Investments 131 Loomis Sayles U.S. Core Plus Bond Fund Statistics 144 Statement of Investments 145 Loomis Sayles Asia Bond Plus Fund
Statistics 159 Statement of Investments 160 Ostrum Euro High Income Fund Statistics 166 Statement of Investments 167 Ostrum Global Inflation Fund Statistics 171
Statement of Investments 172 Ostrum Short Term Global High Income Fund Statistics 176 Statement of Investments 177 ASG Managed Futures Fund
Statistics 181 Statement of Investments 182 Dorval Lux Convictions Fund (liquidated on April 6, 2021)
Statistics 184
Loomis Sayles Global Multi Asset Income Fund
Statistics 185
Statement of Investments 186 Natixis Multi Alpha Fund Statistics 202 Statement of Investments 203 Natixis ESG Conservative Fund Statistics 204
Statement of Investments 205 Natixis ESG Dynamic Fund Statistics 206 Statement of Investments 207 Natixis ESG Moderate Fund Statistics 208
Statement of Investments 209
3

Natixis International Funds (Lux) I
Table of contents (continued)
Notes to the Financial Statements 210
Appendix I - Additional Information 239
4

Natixis International Funds (Lux) I
Management and Administration
Chairman
Jason TRÉPANIER
Executive Vice President, Chief Operating Officer
Natixis Investment Managers International
Paris (France)
Directors
Patricia HORSFALL
Executive Vice President, Chief Compliance Officer
Natixis Investment Managers UK Limited
London (United Kingdom)
Florian du Port de PONCHARRA
Head of Financial Planning & Analysis
Natixis Investment Managers International
Paris (France)
Registered Office
80, route d’Esch
L-1470 Luxembourg
(Grand Duchy of Luxembourg)
Management Company, Distributor and Promoter
Natixis Investment Managers S.A.
2, rue Jean Monnet
L-2180 Luxembourg
(Grand Duchy of Luxembourg)
Depositary, Domiciliary and Corporate Agent, Administrative Agent, Paying Agent
and Registrar and Transfer Agent
Brown Brothers Harriman (Luxembourg) S.C.A.
80, route d’Esch
L-1470 Luxembourg
(Grand Duchy of Luxembourg)
Investment Managers
AlphaSimplex Group, LLC
255 Main Street
Cambridge, Massachusetts 02142
(USA)
DNCA Finance
19, Place Vendôme
75001 Paris
(France)
Dorval Asset Management (until April 9, 2021)
1, rue de Gramont
75002 Paris
(France)
5

Natixis International Funds (Lux) I
Management and Administration (continued)
Investment Managers (continued)
Harris Associates L.P.
111 S. Wacker Drive, Suite 4600
Chicago, Illinois 60606
(USA)
Loomis, Sayles & Company, L.P.
One Financial Center
Boston, Massachusetts 02111
(USA)
Natixis Investment Managers International
43 Avenue Pierre Mendès-France
75013 Paris
(France)
Ostrum Asset Management
43 Avenue Pierre Mendès-France
75013 Paris
(France)
Natixis Investment Managers Singapore Limited
5 Shenton Way
#22-06 UIC Building
Singapore 068808
(Singapore)
Seeyond
43 Avenue Pierre Mendès-France
75013 Paris
(France)
Thematics Asset Management
20 rue des Capucines
75002 Paris
(France)
Vaughan Nelson Investment Management, L.P.
600 Travis, Suite 6300
Houston, Texas 77002-3071
(USA)
WCM Investment Management, LLC
281, Brooks Street
92651, Laguna Beach, California
(USA)
Auditor
PricewaterhouseCoopers, Société Coopérative
2, rue Gerhard Mercator
B.P. 1443
L-1014 Luxembourg
(Grand Duchy of Luxembourg)
6

Natixis International Funds (Lux) I
Management and Administration (continued)
Investment Managers (continued)
Legal Adviser
Arendt & Medernach
41A, avenue J.F. Kennedy
L-2082 Luxembourg
(Grand Duchy of Luxembourg)
Hong Kong Representative
RBC Investor Services Trust Hong Kong Limited
51st floor, Central Plaza
18 Harbour Road
Wanchai
Hong Kong
7

Natixis International Funds (Lux) I
Statement of Net Assets
As at June 30, 2021
The accompanying notes form an integral part of these financial statements.
Notes
Natixis Asia
Equity Fund
USD
DNCA Emerging
Europe Equity
Fund
USD
Natixis Pacific
Rim Equity
Fund
USD
Harris Associates
Global Equity Fund
USD
ASSETS
Portfolio at cost 131,693,313 33,868,474 153,429,785 1,642,103,516
Investments portfolio at market value (2) 196,302,128 42,574,058 207,974,945 1,976,902,339
Cash at bank 5,239,589 901,032 9,301,837 37,231,436
Amounts receivable on sale of investments 9,602,334 0 0 33,649,640
Amounts receivable on subscriptions 3,049,059 5,085 79,240 4,720,985
Amounts receivable on financial futures
contracts (2,10) 0 0 0 0
Receivable due from the swap counterparty (2,11) 0 0 0 0
Interest and dividends receivable, net 200,146 117,581 505,399 1,361,940
Net unrealised appreciation on financial
futures contracts (2,10) 0 0 0 0
Net unrealised appreciation on swaps (2,11) 0 0 0 0
Net unrealised appreciation on forward
foreign exchange contracts (2,9) 0 0 1,195 0
Other receivable (2) 0 0 0 0
Other assets (2,8) 0 0 0 0
TOTAL ASSETS 214,393,256 43,597,756 217,862,616 2,053,866,340
LIABILITIES
Amounts payable on purchase of
investments 0 0 0 32,677,975
Amounts payable on redemptions 15,092,788 16,620 3,729,713 6,158,422
Payable due to the swap counterparty (2,11) 0 0 0 0
Net unrealised depreciation on financial
futures contracts (2,10) 0 0 0 0
Net unrealised depreciation on forward
foreign exchange contracts (2,9) 0 0 0 202,511
Net unrealised depreciation on swaps (2,11) 0 0 0 0
Amounts payable on financial futures
contracts (2,10) 0 0 0 0
Management commission payable (3) 159,404 30,405 183,457 1,569,156
Taxes and expenses payable (7) 1,319,419 69,579 77,381 1,615,492
Other payable (2) 0 0 0 0
Other liabilities (2,8) 0 0 0 0
TOTAL LIABILITIES 16,571,611 116,604 3,990,551 42,223,556
TOTAL NET ASSETS 197,821,645 43,481,152 213,872,065 2,011,642,784
8

Natixis International Funds (Lux) I
Statement of Net Assets (continued)
As at June 30, 2021
The accompanying notes form an integral part of these financial statements.
Harris Associates
U.S. Equity Fund
USD
Loomis Sayles
Global Emerging
Markets Equity
Fund
USD
Loomis Sayles
Global Growth
Equity Fund
USD
Loomis Sayles
U.S. Growth
Equity Fund
USD
DNCA Europe
Smaller Companies
Fund
EUR
Thematics AI and
Robotics Fund
USD
Thematics Meta
Fund
USD
861,161,258 10,900,181 707,607,908 2,190,695,456 122,638,822 322,327,810 561,171,163
998,604,756 14,871,211 882,300,894 3,474,953,865 164,673,803 472,273,894 734,405,583
23,764,658 695,266 11,340,134 49,468,927 2,202,973 11,818,342 10,062,523
24,782,570 379,804 1,225,733 12,130,510 4,068,232 1,004,104 2,354,375
4,456,996 0 1,479,633 9,343,889 115,531 1,578,048 3,501,091
0 0 0 0 0 0 0
0 9,621 0 0 0 0 0
444,609 7,671 351,451 1,645,603 424,559 134,217 1,443,982
0 0 0 0 0 0 0
0 236,292 0 0 0 0 0
0 0 0 0 9,884 0 0
1,141,257 0 0 0 0 0 0
0 4,789 0 0 0 0 0
1,053,194,846 16,204,654 896,697,845 3,547,542,794 171,494,982 486,808,605 751,767,554
24,605,136 641,525 2,829,938 9,833,532 3,115,594 1,014,667 2,116,274
3,312,336 0 1,315,087 7,327,514 131,755 272,414 2,462,839
0 0 0 0 0 0 0
0 0 0 0 0 0 0
1,081,441 0 95,713 3,735,908 0 1,694,397 1,775,258
0 0 0 0 0 0 0
0 0 0 0 0 0 0
840,746 4,907 262,212 2,339,184 152,020 544,635 1,055,618
186,655 149,904 44,403 1,220,056 68,210 153,350 21,397
0 0 0 0 0 1,225,174 0
0 0 107,027 0 0 0 0
30,026,314 796,336 4,654,380 24,456,194 3,467,579 4,904,637 7,431,386
1,023,168,532 15,408,318 892,043,465 3,523,086,600 168,027,403 481,903,968 744,336,168
9

Natixis International Funds (Lux) I
Statement of Net Assets (continued)
As at June 30, 2021
The accompanying notes form an integral part of these financial statements.
Notes
Thematics Safety
Fund
USD
Thematics
Subscription
Economy Fund
USD
Thematics Water
Fund
USD
Thematics
Wellness Fund(1)
USD
ASSETS
Portfolio at cost 634,262,073 202,253,171 250,579,420 5,947,341
Investments portfolio at market value (2) 842,177,640 241,785,178 320,013,364 6,140,913
Cash at bank 7,529,285 651,501 5,976,090 12,514
Amounts receivable on sale of investments 6,847,300 607,219 0 0
Amounts receivable on subscriptions 2,312,465 89,951 1,508,099 0
Amounts receivable on financial futures
contracts (2,10) 0 0 0 0
Receivable due from the swap counterparty (2,11) 0 0 0 0
Interest and dividends receivable, net 514,906 130 4,772,923 5,005
Net unrealised appreciation on financial
futures contracts (2,10) 0 0 0 0
Net unrealised appreciation on swaps (2,11) 0 0 0 0
Net unrealised appreciation on forward
foreign exchange contracts (2,9) 0 0 0 0
Other receivable (2) 0 0 0 0
Other assets (2,8) 0 0 0 24,004
TOTAL ASSETS 859,381,596 243,133,979 332,270,476 6,182,436
LIABILITIES
Amounts payable on purchase of investments 2,701,491 482,204 1,342,849 0
Amounts payable on redemptions 1,675,004 234,294 435,645 0
Payable due to the swap counterparty (2,11) 0 0 0 0
Net unrealised depreciation on financial futures contracts (2,10) 0 0 0 0
Net unrealised depreciation on forward foreign exchange contracts (2,9) 1,252,411 1,074,031 1,015,839 42,782
Net unrealised depreciation on swaps (2,11) 0 0 0 0
Amounts payable on financial futures contracts (2,10) 0 0 0 0
Management commission payable (3) 920,364 239,447 329,060 0
Taxes and expenses payable (7) 49,685 46,968 136,904 48,912
Other payable (2) 3,627,472 328,717 0 0
Other liabilities (2,8) 0 0 0 0
TOTAL LIABILITIES 10,226,427 2,405,661 3,260,297 91,694
TOTAL NET ASSETS 849,155,169 240,728,318 329,010,179 6,090,742
(1) See Note 1.
10

Natixis International Funds (Lux) I
Statement of Net Assets (continued)
As at June 30, 2021
The accompanying notes form an integral part of these financial statements.
Vaughan Nelson
Global Smid Cap
Equity Fund
USD
Vaughan Nelson
U.S. Select Equity
Fund
USD
WCM Global
Emerging Markets
Equity Fund
USD
WCM Select
Global Growth
Equity Fund(1)
USD
Loomis Sayles
Global Credit Fund
USD
Loomis Sayles
Disciplined Alpha
U.S. Corporate
Bond Fund
USD
Loomis Sayles
Sustainable
Global Corporate
Bond Fund(1)
USD
5,805,279 112,470,528 103,788,216 82,696,734 178,532,611 141,333,224 264,442,310
7,697,401 140,479,530 116,984,702 87,398,237 182,964,444 145,982,449 268,268,000
272,509 972,663 2,000,679 4,195,117 9,474,596 9,468,387 8,445,246
32,960 0 0 0 4,602,663 8,423,756 1,350,972
0 229,768 573,285 900,000 0 0 0
0 0 0 0 0 0 0
0 0 0 0 0 0 0
5,707 67,019 66,201 4,854 1,124,212 858,607 1,777,120
0 0 0 0 125,073 0 191,258
0 0 0 0 0 0 0
0 0 0 0 0 0 0
0 0 433,489 0 0 0 4,281,735
5,900 0 9,667 4,014 0 0 0
8,014,477 141,748,980 120,068,023 92,502,222 198,290,988 164,733,199 284,314,331
0 0 9,101 2,787,499 7,212,162 16,700,756 7,545,761
0 1,700,284 5,904 0 3,015,219 0 2,396,131
0 0 0 0 0 0 0
0 0 0 0 0 91,767 0
0 177,369 441,765 0 275,834 0 2,949,147
0 0 0 0 0 0 0
0 0 0 0 49 1,959 17,040
10 136,137 72,363 46,314 58,151 30,919 47,648
6,407 81,862 215,823 24,426 1,239,690 39,610 319,750
0 0 0 0 0 0 0
0 0 0 0 0 0 11,866
6,417 2,095,652 744,956 2,858,239 11,801,105 16,865,011 13,287,343
8,008,060 139,653,328 119,323,067 89,643,983 186,489,883 147,868,188 271,026,988
(1) See Note 1.
11

Natixis International Funds (Lux) I
Statement of Net Assets (continued)
As at June 30, 2021
The accompanying notes form an integral part of these financial statements.
Notes
Loomis Sayles
Short Term
Emerging Markets
Bond Fund
USD
Loomis Sayles
Strategic Alpha
Bond Fund
USD
Loomis Sayles U.S.
Core Plus Bond
Fund
USD
Loomis Sayles
Asia Bond Plus
Fund
USD
ASSETS
Portfolio at cost 1,317,007,523 32,848,391 199,017,053 50,902,482
Investments portfolio at market value (2) 1,345,312,975 27,751,731 202,582,728 49,782,866
Cash at bank 41,404,980 1,388,054 3,655,974 3,172,536
Amounts receivable on sale of investments 0 4,125,582 10,073,056 0
Amounts receivable on subscriptions 13,910,525 410,851 619,203 625,194
Amounts receivable on financial futures
contracts (2,10) 0 2,745 0 0
Receivable due from the swap counterparty (2,11) 0 1,228 0 0
Interest and dividends receivable, net 15,099,352 248,074 1,108,103 946,206
Net unrealised appreciation on financial
futures contracts (2,10) 0 0 0 0
Net unrealised appreciation on swaps (2,11) 0 0 0 0
Net unrealised appreciation on forward
foreign exchange contracts (2,9) 0 0 0 0
Other receivable (2) 0 0 0 0
Other assets (2,8) 0 0 0 0
TOTAL ASSETS 1,415,727,832 33,928,265 218,039,064 54,526,802
LIABILITIES
Amounts payable on purchase of
investments 19,131,138 4,414,574 31,453,148 2,931,793
Amounts payable on redemptions 19,318,908 426,982 432,626 790
Payable due to the swap counterparty (2,11) 0 0 0 0
Net unrealised depreciation on financial
futures contracts (2,10) 0 66,147 0 0
Net unrealised depreciation on forward
foreign exchange contracts (2,9) 4,546,986 2,719 3,464 3,508
Net unrealised depreciation on swaps (2,11) 0 2,144 0 0
Amounts payable on financial futures
contracts (2,10) 0 0 0 0
Management commission payable (3) 767,553 17,725 142,595 1,257
Taxes and expenses payable (7) 662,953 91,641 30,101 94,853
Other payable (2) 0 0 0 0
Other liabilities (2,8) 17 0 0 22,102
TOTAL LIABILITIES 44,427,555 5,021,932 32,061,934 3,054,303
TOTAL NET ASSETS 1,371,300,277 28,906,333 185,977,130 51,472,499
12
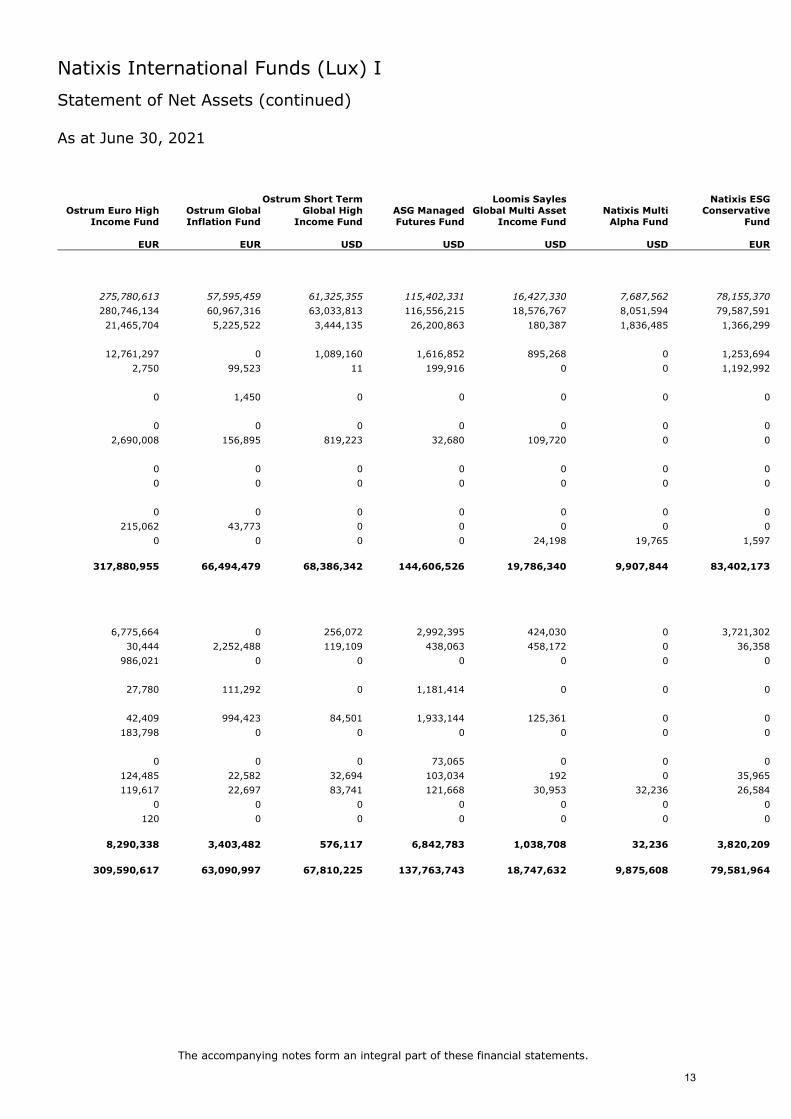
Natixis International Funds (Lux) I
Statement of Net Assets (continued)
As at June 30, 2021
The accompanying notes form an integral part of these financial statements.
Ostrum Euro High
Income Fund
EUR
Ostrum Global
Inflation Fund
EUR
Ostrum Short Term
Global High
Income Fund
USD
ASG Managed
Futures Fund
USD
Loomis Sayles
Global Multi Asset
Income Fund
USD
Natixis Multi
Alpha Fund
USD
Natixis ESG
Conservative
Fund
EUR
275,780,613 57,595,459 61,325,355 115,402,331 16,427,330 7,687,562 78,155,370
280,746,134 60,967,316 63,033,813 116,556,215 18,576,767 8,051,594 79,587,591
21,465,704 5,225,522 3,444,135 26,200,863 180,387 1,836,485 1,366,299
12,761,297 0 1,089,160 1,616,852 895,268 0 1,253,694
2,750 99,523 11 199,916 0 0 1,192,992
0 1,450 0 0 0 0 0
0 0 0 0 0 0 0
2,690,008 156,895 819,223 32,680 109,720 0 0
0 0 0 0 0 0 0
0 0 0 0 0 0 0
0 0 0 0 0 0 0
215,062 43,773 0 0 0 0 0
0 0 0 0 24,198 19,765 1,597
317,880,955 66,494,479 68,386,342 144,606,526 19,786,340 9,907,844 83,402,173
6,775,664 0 256,072 2,992,395 424,030 0 3,721,302
30,444 2,252,488 119,109 438,063 458,172 0 36,358
986,021 0 0 0 0 0 0
27,780 111,292 0 1,181,414 0 0 0
42,409 994,423 84,501 1,933,144 125,361 0 0
183,798 0 0 0 0 0 0
0 0 0 73,065 0 0 0
124,485 22,582 32,694 103,034 192 0 35,965
119,617 22,697 83,741 121,668 30,953 32,236 26,584
0 0 0 0 0 0 0
120 0 0 0 0 0 0
8,290,338 3,403,482 576,117 6,842,783 1,038,708 32,236 3,820,209
309,590,617 63,090,997 67,810,225 137,763,743 18,747,632 9,875,608 79,581,964
13

Natixis International Funds (Lux) I
Statement of Net Assets (continued)
As at June 30, 2021
The accompanying notes form an integral part of these financial statements.
Notes
Natixis ESG
Dynamic Fund
EUR
Natixis ESG
Moderate Fund
EUR
Combined
EUR
ASSETS
Portfolio at cost 109,335,313 37,473,396 9,448,402,678
Investments portfolio at market value (2) 118,026,802 39,207,166 11,867,386,214
Cash at bank 1,208,347 542,908 276,620,483
Amounts receivable on sale of investments 0 0 123,314,573
Amounts receivable on subscriptions 1,410,692 715,190 45,355,626
Amounts receivable on financial futures
contracts (2,10) 0 0 3,765
Receivable due from the swap counterparty (2,11) 0 0 9,148
Interest and dividends receivable, net 0 0 31,748,839
Net unrealised appreciation on financial
futures contracts (2,10) 0 0 266,743
Net unrealised appreciation on swaps (2,11) 0 0 199,251
Net unrealised appreciation on forward
foreign exchange contracts (2,9) 0 0 10,890
Other receivable (2) 0 0 5,197,262
Other assets (2,8) 13 6,339 85,811
TOTAL ASSETS 120,645,854 40,471,603 12,350,198,605
LIABILITIES
Amounts payable on purchase of
investments 2,238,542 941,418 163,604,241
Amounts payable on redemptions 1,131 0 61,761,680
Payable due to the swap counterparty (2,11) 0 0 986,021
Net unrealised depreciation on financial
futures contracts (2,10) 0 0 1,268,449
Net unrealised depreciation on forward
foreign exchange contracts (2,9) 0 0 20,021,644
Net unrealised depreciation on swaps (2,11) 0 0 185,605
Amounts payable on financial futures
contracts (2,10) 0 0 77,673
Management commission payable (3) 66,062 14,626 8,793,098
Taxes and expenses payable (7) 32,724 15,595 7,213,176
Other payable (2) 0 0 4,369,140
Other liabilities (2,8) 0 0 119,028
TOTAL LIABILITIES 2,338,459 971,639 268,399,755
TOTAL NET ASSETS 118,307,395 39,499,964 12,081,798,850
14

Natixis International Funds (Lux) I
Natixis Asia Equity Fund
Statistics
As at June 30, 2021
Net asset value per share
I/A (USD) 173.31
I/A (EUR) 146.46
N/A (EUR) 125.18
R/A (USD) 147.00
R/A (EUR) 123.99
R/D (USD) 282.09
RE/A (EUR) 198.45
Number of shares outstanding
I/A (USD) 147.043
I/A (EUR) 1,039,346.616
N/A (EUR) 645.000
R/A (USD) 31,909.052
R/A (EUR) 77,495.140
R/D (USD) 190.896
RE/A (EUR) 4,420.574
15

Natixis International Funds (Lux) I
The accompanying notes form an integral part of these financial statements.
Natixis Asia Equity Fund Statement of Investments
As at June 30, 2021 (expressed in USD)
Description Quantity Currency Cost Evaluation % of Net
Assets
Transferable securities admitted to an official stock exchange listing Shares
China
Aier Eye Hospital Group Co Ltd 196,997 CNH 1,644,885 2,164,243 1.09
Alibaba Group Holding Ltd 311,600 HKD 6,666,169 8,827,366 4.46
Alibaba Group Holding Ltd ADR 21,700 USD 3,430,556 4,921,126 2.49
Angel Yeast Co Ltd 375,000 CNH 2,636,046 3,156,318 1.60
Bilibili Inc ADR 20,000 USD 2,204,646 2,436,800 1.23
China Animal Healthcare Ltd 1,949,000 HKD 0 0 0.00
ENN Energy Holdings Ltd 165,000 HKD 1,289,890 3,140,287 1.59
Haier Smart Home Co Ltd 934,000 HKD 4,069,121 3,259,321 1.65
Hundsun Technologies Inc 244,978 CNH 3,868,535 3,535,788 1.79
Inner Mongolia Yili Industrial Group Co Ltd 549,012 CNH 2,006,236 3,129,637 1.58
Jiangsu Hengrui Medicine Co Ltd 319,200 CNH 3,541,263 3,358,076 1.70
Kingdee International Software Group Co Ltd 964,000 HKD 2,473,240 3,270,911 1.65
Kweichow Moutai Co Ltd 13,000 CNH 2,319,231 4,138,325 2.09
Li Ning Co Ltd 277,000 HKD 1,918,419 3,381,420 1.71
Meituan 144A(2) 157,000 HKD 3,883,223 6,477,437 3.27
Niu Technologies ADR 74,000 USD 2,775,439 2,416,100 1.22
Ping An Insurance Group Co of China Ltd 341,000 HKD 3,006,217 3,339,370 1.69
Shenzhou International Group Holdings Ltd 130,000 HKD 933,489 3,282,706 1.66
Tencent Holdings Ltd 213,500 HKD 6,879,300 16,055,422 8.12
WuXi AppTec Co Ltd 236,800 CNH 2,426,797 5,739,262 2.90
Wuxi Biologics Cayman Inc 144A(2) 156,000 HKD 921,162 2,858,515 1.45
Yonyou Network Technology Co Ltd 439,922 CNH 2,737,681 2,264,687 1.14
Yum China Holdings Inc 43,300 USD 1,550,731 2,868,625 1.45
63,182,276 94,021,742 47.53 Hong Kong
AIA Group Ltd 662,000 HKD 5,600,669 8,226,144 4.16
Hong Kong Exchanges & Clearing Ltd 75,000 HKD 2,521,347 4,469,569 2.26
8,122,016 12,695,713 6.42 India
Apollo Hospitals Enterprise Ltd 78,000 INR 1,696,816 3,798,578 1.92
Bajaj Finance Ltd 57,700 INR 4,427,252 4,669,912 2.36
Eicher Motors Ltd 100,000 INR 3,687,545 3,593,637 1.82
Havells India Ltd 247,000 INR 3,878,833 3,257,223 1.65
Housing Development Finance Corp Ltd 166,000 INR 4,210,583 5,527,936 2.79
SBI Cards & Payment Services Ltd 332,998 INR 4,129,630 4,347,387 2.20
Tata Consultancy Services Ltd 127,282 INR 3,551,666 5,729,231 2.89
Torrent Pharmaceuticals Ltd 105,000 INR 3,678,684 4,098,856 2.07
Varun Beverages Ltd 108,890 INR 649,256 1,068,830 0.54
29,910,265 36,091,590 18.24 Indonesia
Bank Central Asia Tbk PT 1,860,000 IDR 2,590,335 3,864,310 1.95
2,590,335 3,864,310 1.95 Singapore
Sea Ltd ADR 12,600 USD 1,936,303 3,459,960 1.75
1,936,303 3,459,960 1.75 South Korea
Douzone Bizon Co Ltd 29,600 KRW 1,975,662 2,181,592 1.10
(2) See Note 13.
16

Natixis International Funds (Lux) I
The accompanying notes form an integral part of these financial statements.
Natixis Asia Equity Fund Statement of Investments (continued)
As at June 30, 2021 (expressed in USD)
Description Quantity Currency Cost Evaluation % of Net
Assets
Kakao Corp 30,300 KRW 1,535,583 4,385,650 2.22
LG Chem Ltd 5,700 KRW 2,130,290 4,302,269 2.18
NAVER Corp 13,200 KRW 4,576,924 4,893,665 2.47
NCSoft Corp 4,830 KRW 1,974,632 3,516,938 1.78
12,193,091 19,280,114 9.75 Taiwan
MediaTek Inc 158,000 TWD 4,705,141 5,455,218 2.76
Taiwan Semiconductor Manufacturing Co Ltd 823,000 TWD 5,389,536 17,575,056 8.88
10,094,677 23,030,274 11.64
Total - Shares 128,028,963 192,443,703 97.28
Investment Funds
Luxembourg
DNCA Invest - Sustainable China Equity 30,000 EUR 3,664,350 3,858,425 1.95
3,664,350 3,858,425 1.95
Total - Investment Funds 3,664,350 3,858,425 1.95
Total - Transferable securities admitted to an official stock exchange listing 131,693,313 196,302,128 99.23
TOTAL INVESTMENT PORTFOLIO 131,693,313 196,302,128 99.23
A detailed schedule of portfolio movements for the period from January 1, 2021 to
June 30, 2021 is available free of charge upon request at the registered office of the SICAV.
17

Natixis International Funds (Lux) I
DNCA Emerging Europe Equity Fund
Statistics
As at June 30, 2021
Net asset value per share
I/A (USD) 93.23
I/A (EUR) 78.62
R/A (USD) 76.71
R/A (EUR) 64.77
R/A (SGD) 144.78
R/D (USD) 62.35
RE/A (USD) 90.16
Number of shares outstanding
I/A (USD) 816.000
I/A (EUR) 423,602.970
R/A (USD) 25,899.994
R/A (EUR) 17,292.908
R/A (SGD) 314.694
R/D (USD) 4,922.942
RE/A (USD) 2,802.137
18

Natixis International Funds (Lux) I
The accompanying notes form an integral part of these financial statements.
DNCA Emerging Europe Equity Fund Statement of Investments
As at June 30, 2021 (expressed in USD)
Description Quantity Currency Cost Evaluation % of Net
Assets
Transferable securities admitted to an official stock exchange listing Shares
Czech Republic
Komercni banka AS 19,000 CZK 722,495 668,711 1.54
722,495 668,711 1.54 Germany
Delivery Hero SE 144A(2) 5,500 EUR 707,668 726,601 1.67
707,668 726,601 1.67 Great Britain
Endava PLC ADR 3,000 USD 250,895 340,140 0.78
250,895 340,140 0.78 Greece
JUMBO SA 26,000 EUR 393,889 437,526 1.01
OPAP SA 96,350 EUR 1,061,363 1,452,263 3.34
1,455,252 1,889,789 4.35 Hungary
MOL Hungarian Oil & Gas PLC 67,500 HUF 690,281 537,714 1.24
OTP Bank Nyrt 44,850 HUF 1,731,568 2,417,481 5.56
Richter Gedeon Nyrt 54,500 HUF 1,088,171 1,452,705 3.34
3,510,020 4,407,900 10.14 Poland
CD Projekt SA 10,000 PLN 472,779 485,999 1.12
Dino Polska SA 144A(2) 33,000 PLN 397,525 2,426,241 5.58
Powszechny Zaklad Ubezpieczen SA 106,000 PLN 1,158,726 1,021,854 2.35
Warsaw Stock Exchange 88,000 PLN 965,629 1,101,214 2.53
2,994,659 5,035,308 11.58 Portugal
Jeronimo Martins SGPS SA 54,000 EUR 883,371 984,914 2.26
883,371 984,914 2.26 Russia
Credit Bank of Moscow PJSC 5,630,000 USD 429,348 499,313 1.15
Detsky Mir PJSC 421,000 USD 678,923 871,348 2.00
Globaltrans Investment PLC GDR 100,000 USD 762,925 717,000 1.65
Lukoil PJSC ADR 34,000 USD 2,244,858 3,149,080 7.24
PhosAgro PJSC GDR 57,833 USD 781,111 1,170,540 2.69
Tatneft PJSC Preferred 253,000 USD 696,707 1,734,026 3.99
X5 Retail Group NV GDR 23,000 USD 891,383 806,380 1.86
Yandex NV 38,000 USD 1,440,195 2,688,500 6.18
7,925,450 11,636,187 26.76 Switzerland
Coca-Cola HBC AG 42,000 GBP 1,396,097 1,516,666 3.49
1,396,097 1,516,666 3.49 Turkey
BIM Birlesik Magazalar AS 124,000 TRY 1,007,200 887,091 2.04
Coca-Cola Icecek AS 115,000 TRY 625,683 1,029,209 2.37
Haci Omer Sabanci Holding AS 405,000 TRY 684,846 414,440 0.95
Mavi Giyim Sanayi Ve Ticaret AS 144A(2) 50,000 TRY 427,826 324,317 0.75
Turkcell Iletisim Hizmetleri AS 322,000 TRY 928,341 596,742 1.37
Ulker Biskuvi Sanayi AS 122,000 TRY 404,667 291,255 0.67
4,078,563 3,543,054 8.15
(2) See Note 13.
19

Natixis International Funds (Lux) I
The accompanying notes form an integral part of these financial statements.
DNCA Emerging Europe Equity Fund Statement of Investments (continued)
As at June 30, 2021 (expressed in USD)
Description Quantity Currency Cost Evaluation % of Net
Assets
United States
EPAM Systems Inc 4,000 USD 1,276,217 2,043,840 4.70
1,276,217 2,043,840 4.70
Total - Shares 25,200,687 32,793,110 75.42
Total - Transferable securities admitted to an official stock exchange listing 25,200,687 32,793,110 75.42
Transferable securities dealt in on another regulated market Shares
Russia
Gazprom Neft PJSC ADR 49,000 USD 849,656 1,450,890 3.34
Gazprom PJSC ADR 236,000 USD 2,071,313 1,803,040 4.14
Lukoil PJSC ADR 11,000 USD 984,703 1,012,000 2.33
Mail.Ru Group Ltd GDR 65,000 USD 1,947,870 1,472,900 3.39
Sberbank of Russia PJSC ADR 242,188 USD 2,814,245 4,042,118 9.29
8,667,787 9,780,948 22.49
Total - Shares 8,667,787 9,780,948 22.49
Total - Transferable securities dealt in on another regulated market 8,667,787 9,780,948 22.49
TOTAL INVESTMENT PORTFOLIO 33,868,474 42,574,058 97.91
A detailed schedule of portfolio movements for the period from January 1, 2021 to June 30, 2021 is available free of charge upon request at the registered office of the SICAV.
20

Natixis International Funds (Lux) I
Natixis Pacific Rim Equity Fund
Statistics
As at June 30, 2021
Net asset value per share
H-I/A (EUR) 127.64
I/A (USD) 131.13
I/A (EUR) 110.62
R/A (USD) 117.60
R/A (EUR) 99.09
R/D (USD) 126.53
S/A (EUR) 164.31
Number of shares outstanding
H-I/A (EUR) 3,001.000
I/A (USD) 28,527.903
I/A (EUR) 354,274.630
R/A (USD) 22,103.886
R/A (EUR) 14,722.569
R/D (USD) 10.127
S/A (EUR) 812,565.250
21

Natixis International Funds (Lux) I
The accompanying notes form an integral part of these financial statements.
Natixis Pacific Rim Equity Fund Statement of Investments
As at June 30, 2021 (expressed in USD)
Description Quantity Currency Cost Evaluation % of Net
Assets
Transferable securities admitted to an official stock exchange listing Shares
Australia
Aristocrat Leisure Ltd 227,000 AUD 4,055,683 7,341,452 3.43
BHP Group Ltd 375,163 AUD 12,085,698 13,676,272 6.39
Cochlear Ltd 26,090 AUD 3,533,612 4,928,164 2.30
Commonwealth Bank of Australia 170,000 AUD 9,242,186 12,742,762 5.96
Computershare Ltd 254,500 AUD 3,315,909 3,228,153 1.51
CSL Ltd 58,359 AUD 5,025,279 12,491,706 5.84
Macquarie Group Ltd 65,347 AUD 4,045,808 7,672,295 3.59
National Australia Bank Ltd 226,449 AUD 5,434,187 4,456,385 2.08
Pro Medicus Ltd 76,000 AUD 2,226,749 3,349,494 1.57
Qantas Airways Ltd 896,000 AUD 3,516,742 3,133,816 1.47
Rio Tinto Ltd 100,491 AUD 6,643,244 9,551,634 4.47
Santos Ltd 1,062,000 AUD 4,630,209 5,651,326 2.64
Seek Ltd 213,138 AUD 3,393,165 5,301,430 2.48
Sydney Airport 604,983 AUD 2,170,502 2,629,065 1.23
Transurban Group 437,800 AUD 4,246,921 4,675,847 2.19
Treasury Wine Estates Ltd 290,000 AUD 3,423,256 2,542,263 1.19
Wesfarmers Ltd 157,402 AUD 4,603,597 6,981,960 3.26
Westpac Banking Corp 412,300 AUD 8,825,923 7,986,950 3.73
90,418,670 118,340,974 55.33 China
Alibaba Group Holding Ltd 129,000 HKD 3,772,572 3,654,297 1.71
Tencent Holdings Ltd 50,600 HKD 1,270,651 3,805,001 1.78
5,043,223 7,459,298 3.49 Hong Kong
AIA Group Ltd 1,316,800 HKD 8,313,435 16,362,082 7.65
BOC Hong Kong Holdings Ltd 1,484,000 HKD 5,037,814 5,035,075 2.36
Hong Kong Exchanges & Clearing Ltd 198,870 HKD 4,506,499 11,850,974 5.54
Sun Hung Kai Properties Ltd 394,413 HKD 5,620,543 5,875,922 2.75
Techtronic Industries Co Ltd 442,500 HKD 2,692,349 7,726,172 3.61
26,170,640 46,850,225 21.91 Singapore
DBS Group Holdings Ltd 426,670 SGD 5,106,346 9,461,102 4.42
Sea Ltd ADR 12,000 USD 2,413,088 3,446,280 1.61
UOL Group Ltd 638,097 SGD 3,295,694 3,464,952 1.62
10,815,128 16,372,334 7.65
Total - Shares 132,447,661 189,022,831 88.38
Investment Funds
Australia
Mirvac Group REIT 1,762,000 AUD 3,077,003 3,861,610 1.81
Scentre Group REIT 916,219 AUD 3,286,211 1,884,211 0.88
6,363,214 5,745,821 2.69 Hong Kong
Link REIT 612,000 HKD 7,306,491 5,929,927 2.77
7,306,491 5,929,927 2.77
22

Natixis International Funds (Lux) I
The accompanying notes form an integral part of these financial statements.
Natixis Pacific Rim Equity Fund Statement of Investments (continued)
As at June 30, 2021 (expressed in USD)
Description Quantity Currency Cost Evaluation % of Net
Assets
Luxembourg
DNCA Invest - Sustainable China Equity 30,000 EUR 3,658,051 3,868,511 1.81
3,658,051 3,868,511 1.81 Singapore
Ascendas Real Estate Investment Trust REIT 1,553,000 SGD 3,654,368 3,407,855 1.59
3,654,368 3,407,855 1.59
Total - Investment Funds 20,982,124 18,952,114 8.86
Total - Transferable securities admitted to an official stock exchange listing 153,429,785 207,974,945 97.24
TOTAL INVESTMENT PORTFOLIO 153,429,785 207,974,945 97.24
A detailed schedule of portfolio movements for the period from January 1, 2021 to June 30, 2021 is available free of charge upon request at the registered office of the SICAV.
23
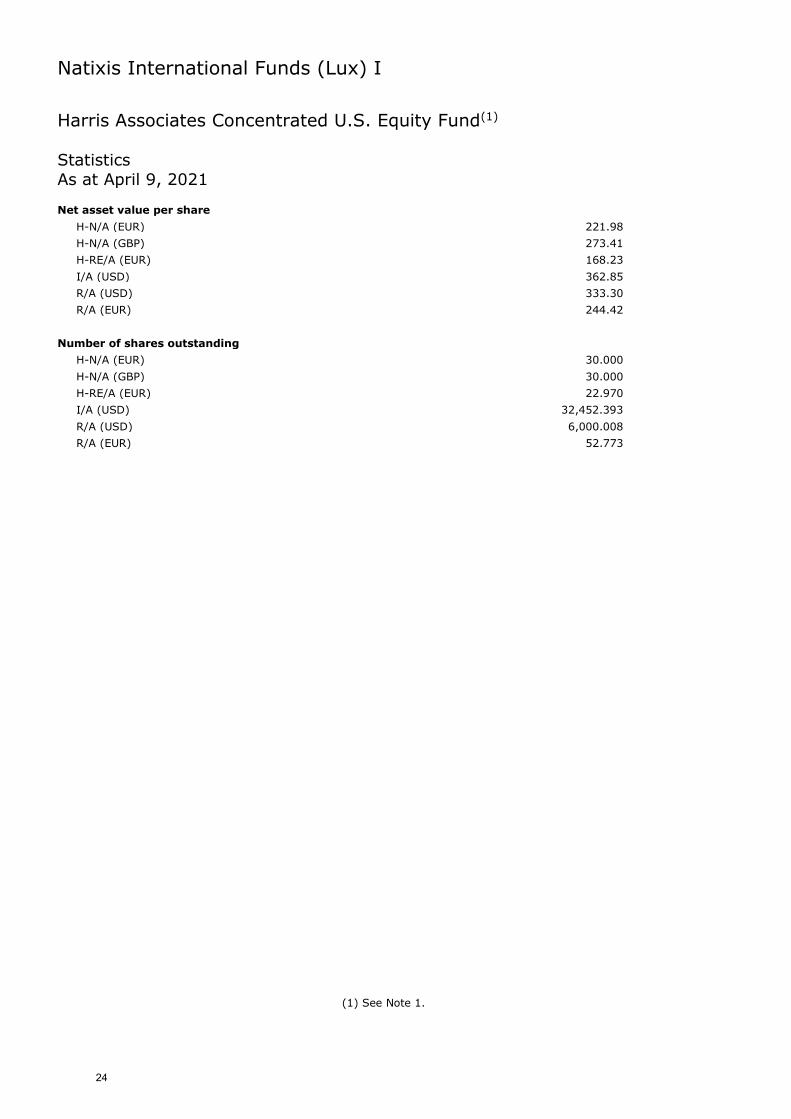
Natixis International Funds (Lux) I
Harris Associates Concentrated U.S. Equity Fund(1)
Statistics
As at April 9, 2021
Net asset value per share
H-N/A (EUR) 221.98
H-N/A (GBP) 273.41
H-RE/A (EUR) 168.23
I/A (USD) 362.85
R/A (USD) 333.30
R/A (EUR) 244.42
Number of shares outstanding
H-N/A (EUR) 30.000
H-N/A (GBP) 30.000
H-RE/A (EUR) 22.970
I/A (USD) 32,452.393
R/A (USD) 6,000.008
R/A (EUR) 52.773
(1) See Note 1.
24

Natixis International Funds (Lux) I
Harris Associates Global Equity Fund
Statistics
As at June 30, 2021
Net asset value per share
C/A (USD) 340.47
F/A (USD) 177.75
H-I/A (EUR) 203.43
H-N/A (EUR) 147.56
H-N/A (GBP) 151.48
H-N1/A (EUR) 102.28
H-R/A (EUR) 98.04
H-RE/A (EUR) 164.01
I/A (USD) 509.85
I/A (EUR) 430.05
I/A (GBP) 136.81
I/D (USD) 152.81
N/A (USD) 169.22
N/A (EUR) 140.08
N1/A (USD) 106.86
N1/A (EUR) 134.70
P/A (SGD) 154.77
R/A (USD) 427.09
R/A (EUR) 361.53
R/A (GBP) 187.36
R/A (SGD) 205.83
R/D (USD) 381.21
R/D (GBP) 175.01
RE/A (USD) 232.54
RE/A (EUR) 222.54
S/A (USD) 275.94
S/A (EUR) 280.79
S/A (GBP) 213.83
S/D (USD) 196.87
S1/A (EUR) 167.58
S1/A (GBP) 140.73
S1/D (GBP) 131.02
Number of shares outstanding
C/A (USD) 8,600.245
F/A (USD) 495.000
H-I/A (EUR) 30,997.769
H-N/A (EUR) 2,066.301
H-N/A (GBP) 382.000
H-N1/A (EUR) 122,152.868
H-R/A (EUR) 4,852.890
H-RE/A (EUR) 25,775.525
I/A (USD) 151,963.030
I/A (EUR) 309,860.523
I/A (GBP) 8,220.622
I/D (USD) 30.000
N/A (USD) 35,825.421
N/A (EUR) 377,052.335
N1/A (USD) 28,885.261
25

Natixis International Funds (Lux) I
Harris Associates Global Equity Fund
Statistics (continued)
As at June 30, 2021
Number of shares outstanding
N1/A (EUR) 444,808.551
P/A (SGD) 44,362.131
R/A (USD) 87,344.508
R/A (EUR) 270,179.848
R/A (GBP) 2,290.301
R/A (SGD) 6,565.793
R/D (USD) 2,635.448
R/D (GBP) 32.085
RE/A (USD) 153,576.997
RE/A (EUR) 105.620
S/A (USD) 2,716,293.637
S/A (EUR) 94,667.486
S/A (GBP) 117,547.023
S/D (USD) 11,878.000
S1/A (EUR) 28,511.437
S1/A (GBP) 2,459,184.151
S1/D (GBP) 563,084.510
26

Natixis International Funds (Lux) I
The accompanying notes form an integral part of these financial statements.
Harris Associates Global Equity Fund Statement of Investments
As at June 30, 2021 (expressed in USD)
Description Quantity / Face value
Currency Cost Evaluation % of Net Assets
Transferable securities admitted to an official stock exchange listing
Shares
Australia
Incitec Pivot Ltd 22,368,475 AUD 47,689,273 39,967,654 1.99
47,689,273 39,967,654 1.99 Belgium
Anheuser-Busch InBev SA/NV 296,200 EUR 18,240,647 21,360,338 1.06
18,240,647 21,360,338 1.06 China
Alibaba Group Holding Ltd 932,700 HKD 26,354,833 26,422,607 1.31
Alibaba Group Holding Ltd ADR 117,100 USD 27,004,864 26,555,938 1.32
53,359,697 52,978,545 2.63 France
Capgemini SE 104,800 EUR 17,433,879 20,133,736 1.00
17,433,879 20,133,736 1.00 Germany
Allianz SE 275,224 EUR 59,960,225 68,639,426 3.41
Bayer AG 1,399,142 EUR 92,734,216 84,969,808 4.22
Continental AG 428,600 EUR 64,867,397 63,016,150 3.13
Daimler AG 798,400 EUR 55,987,009 71,295,738 3.55
SAP SE 282,600 EUR 35,875,869 39,827,483 1.98
309,424,716 327,748,605 16.29 Great Britain
CNH Industrial NV 3,015,735 EUR 29,221,380 49,800,815 2.48
Compass Group PLC 520,100 GBP 7,926,414 10,935,450 0.54
Liberty Global PLC 1,556,500 USD 42,501,322 42,274,540 2.10
Lloyds Banking Group PLC 148,287,420 GBP 82,456,845 95,645,235 4.75
Prudential PLC 1,057,100 GBP 14,828,873 20,057,643 1.00
Travis Perkins PLC 1,021,632 GBP 18,758,775 23,837,422 1.18
Wickes Group PLC 97,367 GBP 364,493 330,889 0.02
196,058,102 242,881,994 12.07 India
Axis Bank Ltd 2,382,100 INR 16,176,443 23,981,238 1.19
16,176,443 23,981,238 1.19 Ireland
Ryanair Holdings PLC 62,700 EUR 839,565 1,186,721 0.06
Ryanair Holdings PLC ADR 167,122 USD 14,589,810 18,084,271 0.90
15,429,375 19,270,992 0.96 Japan
Toyota Motor Corp 270,300 JPY 17,120,392 23,647,293 1.18
17,120,392 23,647,293 1.18 Mexico
Grupo Televisa SAB ADR 1,995,200 USD 48,510,345 28,491,456 1.42
48,510,345 28,491,456 1.42 South Africa
Naspers Ltd 308,090 ZAR 59,681,738 64,691,402 3.22
59,681,738 64,691,402 3.22 Switzerland
Cie Financiere Richemont SA 34,396 CHF 2,545,925 4,165,773 0.21
Credit Suisse Group AG 7,924,418 CHF 106,840,361 83,089,154 4.13
Julius Baer Group Ltd 777,860 CHF 37,932,099 50,811,042 2.53
Novartis AG 365,700 CHF 32,637,006 33,359,467 1.66
27

Natixis International Funds (Lux) I
The accompanying notes form an integral part of these financial statements.
Harris Associates Global Equity Fund Statement of Investments (continued)
As at June 30, 2021 (expressed in USD)
Description Quantity / Face
value Currency Cost Evaluation % of Net
Assets
TE Connectivity Ltd 624,100 USD 45,936,489 84,384,561 4.19
225,891,880 255,809,997 12.72 United States
Alphabet Inc - Class A 45,085 USD 110,217,950 110,088,102 5.47
Alphabet Inc - Class C 7,557 USD 7,745,973 18,940,260 0.94
Arconic Corp 418,800 USD 8,159,648 14,917,656 0.74
Bank of America Corp 1,977,600 USD 44,572,547 81,536,448 4.05
Booking Holdings Inc 8,455 USD 15,554,111 18,500,301 0.92
Charter Communications Inc 84,315 USD 35,186,254 60,829,057 3.02
Citigroup Inc 302,600 USD 17,211,620 21,408,950 1.06
Envista Holdings Corp 613,500 USD 15,591,359 26,509,335 1.32
Fiserv Inc 191,800 USD 20,692,574 20,501,502 1.02
Flowserve Corp 777,300 USD 24,448,305 31,340,736 1.56
General Dynamics Corp 116,700 USD 17,872,150 21,969,942 1.09
General Motors Co 1,593,200 USD 58,830,113 94,269,644 4.69
Howmet Aerospace Inc 977,800 USD 19,691,048 33,704,766 1.67
Humana Inc 89,600 USD 36,889,711 39,667,712 1.97
Interpublic Group of Cos Inc/The 1,207,000 USD 25,962,674 39,215,430 1.95
Johnson Controls International PLC 403,400 USD 17,354,595 27,685,342 1.38
Keurig Dr Pepper Inc 649,400 USD 19,464,325 22,884,856 1.14
Mastercard Inc 92,975 USD 8,036,547 33,944,243 1.69
NOV Inc 1,676,100 USD 48,800,897 25,677,852 1.28
Oracle Corp 571,400 USD 25,446,058 44,477,776 2.21
Tenet Healthcare Corp 921,058 USD 34,023,334 61,701,675 3.07
611,751,793 849,771,585 42.24
Total - Shares 1,636,768,280 1,970,734,835 97.97
Fixed rate bonds
Guernsey
Credit Suisse Group Guernsey VII Ltd 3.000% 12/11/2021 4,870,000 CHF 5,335,236 5,903,232 0.29
5,335,236 5,903,232 0.29
Total - Fixed rate bonds 5,335,236 5,903,232 0.29
Warrants
Switzerland
Cie Financiere Richemont SA 394,000 CHF 0 264,272 0.01
0 264,272 0.01
Total - Warrants 0 264,272 0.01
Total - Transferable securities admitted to an official stock exchange listing 1,642,103,516 1,976,902,339 98.27
TOTAL INVESTMENT PORTFOLIO 1,642,103,516 1,976,902,339 98.27
A detailed schedule of portfolio movements for the period from January 1, 2021 to June 30, 2021 is available free of charge upon request at the registered office of the SICAV.
28

Natixis International Funds (Lux) I
Harris Associates U.S. Equity Fund
Statistics
As at June 30, 2021
Net asset value per share
C/A (USD) 183.17
H-I/A (EUR) 300.55
H-N/A (EUR) 233.41
H-P/A (SGD) 191.42
H-R/A (EUR) 152.18
H-R/A (SGD) 188.21
H-S/A (GBP) 100.41
I/A (USD) 500.88
I/A (EUR) 422.66
I/A (SGD) 155.44
I/D (USD) 181.35
N/A (USD) 198.65
N/A (EUR) 169.29
N1/A (USD) 155.77
R/A (USD) 430.20
R/A (EUR) 362.88
R/A (GBP) 561.18
R/A (SGD) 254.39
R/D (USD) 300.09
R/D (GBP) 147.81
RE/A (USD) 213.09
S/A (USD) 217.80
S/A (EUR) 138.67
Number of shares outstanding
C/A (USD) 6,178.032
H-I/A (EUR) 94,125.317
H-N/A (EUR) 18,842.288
H-P/A (SGD) 282,360.382
H-R/A (EUR) 264,298.826
H-R/A (SGD) 40,415.984
H-S/A (GBP) 370,844.116
I/A (USD) 296,270.331
I/A (EUR) 10,410.905
I/A (SGD) 174,317.817
I/D (USD) 7,072.380
N/A (USD) 39,485.669
N/A (EUR) 5,281.071
N1/A (USD) 534.000
R/A (USD) 130,550.157
R/A (EUR) 49,398.803
R/A (GBP) 40.434
R/A (SGD) 49,896.562
R/D (USD) 5,436.692
R/D (GBP) 44.683
RE/A (USD) 33,453.396
S/A (USD) 2,227,669.342
S/A (EUR) 446,244.662
29
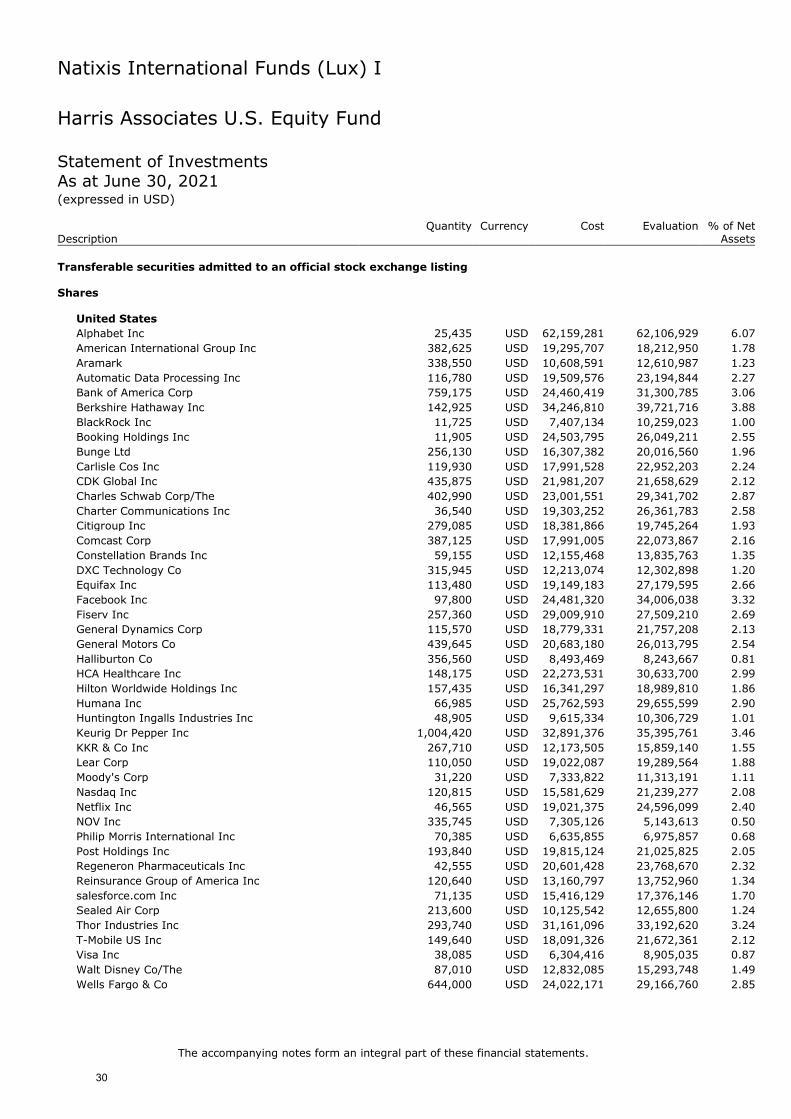
Natixis International Funds (Lux) I
The accompanying notes form an integral part of these financial statements.
Harris Associates U.S. Equity Fund Statement of Investments
As at June 30, 2021 (expressed in USD)
Description Quantity Currency Cost Evaluation % of Net
Assets
Transferable securities admitted to an official stock exchange listing Shares
United States
Alphabet Inc 25,435 USD 62,159,281 62,106,929 6.07
American International Group Inc 382,625 USD 19,295,707 18,212,950 1.78
Aramark 338,550 USD 10,608,591 12,610,987 1.23
Automatic Data Processing Inc 116,780 USD 19,509,576 23,194,844 2.27
Bank of America Corp 759,175 USD 24,460,419 31,300,785 3.06
Berkshire Hathaway Inc 142,925 USD 34,246,810 39,721,716 3.88
BlackRock Inc 11,725 USD 7,407,134 10,259,023 1.00
Booking Holdings Inc 11,905 USD 24,503,795 26,049,211 2.55
Bunge Ltd 256,130 USD 16,307,382 20,016,560 1.96
Carlisle Cos Inc 119,930 USD 17,991,528 22,952,203 2.24
CDK Global Inc 435,875 USD 21,981,207 21,658,629 2.12
Charles Schwab Corp/The 402,990 USD 23,001,551 29,341,702 2.87
Charter Communications Inc 36,540 USD 19,303,252 26,361,783 2.58
Citigroup Inc 279,085 USD 18,381,866 19,745,264 1.93
Comcast Corp 387,125 USD 17,991,005 22,073,867 2.16
Constellation Brands Inc 59,155 USD 12,155,468 13,835,763 1.35
DXC Technology Co 315,945 USD 12,213,074 12,302,898 1.20
Equifax Inc 113,480 USD 19,149,183 27,179,595 2.66
Facebook Inc 97,800 USD 24,481,320 34,006,038 3.32
Fiserv Inc 257,360 USD 29,009,910 27,509,210 2.69
General Dynamics Corp 115,570 USD 18,779,331 21,757,208 2.13
General Motors Co 439,645 USD 20,683,180 26,013,795 2.54
Halliburton Co 356,560 USD 8,493,469 8,243,667 0.81
HCA Healthcare Inc 148,175 USD 22,273,531 30,633,700 2.99
Hilton Worldwide Holdings Inc 157,435 USD 16,341,297 18,989,810 1.86
Humana Inc 66,985 USD 25,762,593 29,655,599 2.90
Huntington Ingalls Industries Inc 48,905 USD 9,615,334 10,306,729 1.01
Keurig Dr Pepper Inc 1,004,420 USD 32,891,376 35,395,761 3.46
KKR & Co Inc 267,710 USD 12,173,505 15,859,140 1.55
Lear Corp 110,050 USD 19,022,087 19,289,564 1.88
Moody's Corp 31,220 USD 7,333,822 11,313,191 1.11
Nasdaq Inc 120,815 USD 15,581,629 21,239,277 2.08
Netflix Inc 46,565 USD 19,021,375 24,596,099 2.40
NOV Inc 335,745 USD 7,305,126 5,143,613 0.50
Philip Morris International Inc 70,385 USD 6,635,855 6,975,857 0.68
Post Holdings Inc 193,840 USD 19,815,124 21,025,825 2.05
Regeneron Pharmaceuticals Inc 42,555 USD 20,601,428 23,768,670 2.32
Reinsurance Group of America Inc 120,640 USD 13,160,797 13,752,960 1.34
salesforce.com Inc 71,135 USD 15,416,129 17,376,146 1.70
Sealed Air Corp 213,600 USD 10,125,542 12,655,800 1.24
Thor Industries Inc 293,740 USD 31,161,096 33,192,620 3.24
T-Mobile US Inc 149,640 USD 18,091,326 21,672,361 2.12
Visa Inc 38,085 USD 6,304,416 8,905,035 0.87
Walt Disney Co/The 87,010 USD 12,832,085 15,293,748 1.49
Wells Fargo & Co 644,000 USD 24,022,171 29,166,760 2.85
30

Natixis International Funds (Lux) I
The accompanying notes form an integral part of these financial statements.
Harris Associates U.S. Equity Fund Statement of Investments (continued)
As at June 30, 2021 (expressed in USD)
Description Quantity Currency Cost Evaluation % of Net
Assets
Workday Inc 66,775 USD 13,559,575 15,941,864 1.56
861,161,258 998,604,756 97.60
Total - Shares 861,161,258 998,604,756 97.60
Total - Transferable securities admitted to an official stock exchange listing 861,161,258 998,604,756 97.60
TOTAL INVESTMENT PORTFOLIO 861,161,258 998,604,756 97.60
A detailed schedule of portfolio movements for the period from January 1, 2021 to
June 30, 2021 is available free of charge upon request at the registered office of the SICAV.
31

Natixis International Funds (Lux) I
Loomis Sayles Global Emerging Markets Equity Fund
Statistics
As at June 30, 2021
Net asset value per share
I/A (USD) 179.28
Q/A (USD) 181.62
R/A (USD) 176.88
S/A (USD) 161.71
Number of shares outstanding
I/A (USD) 53,967.000
Q/A (USD) 31,510.075
R/A (USD) 30.000
S/A (USD) 30.000
32

Natixis International Funds (Lux) I
The accompanying notes form an integral part of these financial statements.
Loomis Sayles Global Emerging Markets Equity Fund Statement of Investments
As at June 30, 2021 (expressed in USD)
Description Quantity Currency Cost Evaluation % of Net
Assets
Transferable securities admitted to an official stock exchange listing Shares
Argentina
Despegar.com Corp 41,990 USD 412,761 554,688 3.60
MercadoLibre Inc 549 USD 505,625 855,227 5.55
918,386 1,409,915 9.15 Brazil
Localiza Rent a Car SA 15,825 BRL 166,345 201,840 1.31
Rumo SA 75,800 BRL 332,015 289,281 1.88
TOTVS SA 99,000 BRL 515,984 742,818 4.82
1,014,344 1,233,939 8.01 China
21Vianet Group Inc ADR 23,507 USD 456,874 539,486 3.50
Baozun Inc ADR 10,250 USD 367,372 363,260 2.36
GDS Holdings Ltd ADR 9,972 USD 566,943 782,702 5.08
Kuaishou Technology 144A(2) 21,300 HKD 635,985 534,293 3.47
Kweichow Moutai Co Ltd 1,500 CNH 274,515 477,499 3.10
Shenzhou International Group Holdings Ltd 18,300 HKD 326,817 462,104 3.00
Wuxi Biologics Cayman Inc 144A(2) 27,128 HKD 271,880 497,089 3.22
Yum China Holdings Inc 868 USD 40,289 57,505 0.37
2,940,675 3,713,938 24.10 Cyprus
TCS Group Holding PLC GDR 13,257 USD 313,180 1,159,987 7.53
313,180 1,159,987 7.53 France
LVMH Moet Hennessy Louis Vuitton SE 303 EUR 128,004 237,623 1.54
128,004 237,623 1.54 Hong Kong
AIA Group Ltd 25,800 HKD 327,938 320,596 2.08
China Mengniu Dairy Co Ltd 99,000 HKD 468,886 598,524 3.88
796,824 919,120 5.96 India
Bajaj Finserv Ltd 3,991 INR 364,300 650,171 4.22
Cholamandalam Investment & Finance Co Ltd 55,363 INR 203,462 382,282 2.48
HDFC Bank Ltd 14,620 INR 283,122 294,623 1.91
HDFC Bank Ltd ADR 772 USD 49,286 56,449 0.37
Maruti Suzuki India Ltd 3,654 INR 353,061 369,475 2.40
Titan Co Ltd 8,720 INR 158,661 203,248 1.32
1,411,892 1,956,248 12.70 Indonesia
Bank Central Asia Tbk PT 149,800 IDR 327,672 311,222 2.02
327,672 311,222 2.02 Japan
Shiseido Co Ltd 2,400 JPY 186,242 176,686 1.15
186,242 176,686 1.15 Kenya
Safaricom PLC 772,800 KES 223,568 300,812 1.95
223,568 300,812 1.95 Peru
Credicorp Ltd 1,334 USD 200,287 161,561 1.05
(2) See Note 13.
33

Natixis International Funds (Lux) I
The accompanying notes form an integral part of these financial statements.
Loomis Sayles Global Emerging Markets Equity Fund Statement of Investments (continued)
As at June 30, 2021 (expressed in USD)
Description Quantity Currency Cost Evaluation % of Net
Assets
InRetail Peru Corp 144A(2) 3,429 USD 124,295 120,015 0.78
324,582 281,576 1.83
Russia
Sberbank of Russia PJSC Preferred 77,220 USD 255,483 297,607 1.93
Yandex NV 6,595 USD 314,703 466,596 3.03
570,186 764,203 4.96 South Africa
Capitec Bank Holdings Ltd 3,447 ZAR 290,043 407,129 2.64
290,043 407,129 2.64 South Korea
Yuhan Corp 4,007 KRW 151,742 224,519 1.46
151,742 224,519 1.46 Taiwan
Taiwan Semiconductor Manufacturing Co Ltd 35,000 TWD 422,946 747,420 4.85
422,946 747,420 4.85 United States
Estee Lauder Cos Inc/The 801 USD 164,033 254,782 1.65
MSCI Inc 294 USD 155,600 156,726 1.01
S&P Global Inc 382 USD 157,110 156,792 1.02
Starbucks Corp 1,404 USD 158,401 156,981 1.02
Unity Software Inc 2,746 USD 244,751 301,593 1.96
879,895 1,026,874 6.66
Total - Shares 10,900,181 14,871,211 96.51
Total - Transferable securities admitted to an official stock exchange listing 10,900,181 14,871,211 96.51
TOTAL INVESTMENT PORTFOLIO 10,900,181 14,871,211 96.51
(2) See Note 13.
A detailed schedule of portfolio movements for the period from January 1, 2021 to
June 30, 2021 is available free of charge upon request at the registered office of the SICAV.
34

Natixis International Funds (Lux) I
Loomis Sayles Global Growth Equity Fund
Statistics
As at June 30, 2021
Net asset value per share
H-I/A (EUR) 178.09
H-R/A (EUR) 199.38
I/A (USD) 237.77
I/A (EUR) 174.20
I/A (GBP) 168.62
N/A (USD) 106.58
N/A (GBP) 106.25
N1/A (USD) 159.61
N1/A (GBP) 161.69
Q/A (USD) 246.81
Q/A (GBP) 156.08
R/A (USD) 228.31
R/A (EUR) 179.10
R/D (USD) 142.10
RE/A (USD) 150.54
S/A (GBP) 108.44
S/D (GBP) 163.51
S2/A (USD) 159.42
S2/A (GBP) 144.04
Number of shares outstanding
H-I/A (EUR) 54,697.000
H-R/A (EUR) 8,626.147
I/A (USD) 5,820.154
I/A (EUR) 300.000
I/A (GBP) 30.000
N/A (USD) 133.166
N/A (GBP) 179.163
N1/A (USD) 30.000
N1/A (GBP) 13,453.051
Q/A (USD) 432,308.373
Q/A (GBP) 4,048.450
R/A (USD) 7,896.734
R/A (EUR) 346.302
R/D (USD) 387.568
RE/A (USD) 4,343.270
S/A (GBP) 137,452.000
S/D (GBP) 121,754.251
S2/A (USD) 213,548.184
S2/A (GBP) 3,425,610.981
35

Natixis International Funds (Lux) I
The accompanying notes form an integral part of these financial statements.
Loomis Sayles Global Growth Equity Fund Statement of Investments
As at June 30, 2021 (expressed in USD)
Description Quantity Currency Cost Evaluation % of Net
Assets
Transferable securities admitted to an official stock exchange listing Shares
Argentina
MercadoLibre Inc 34,235 USD 38,118,325 53,330,941 5.98
38,118,325 53,330,941 5.98 Brazil
Ambev SA ADR 4,742,845 USD 15,180,825 16,315,387 1.83
15,180,825 16,315,387 1.83 China
Alibaba Group Holding Ltd ADR 144,314 USD 31,653,381 32,727,529 3.67
Baidu Inc ADR 96,170 USD 20,067,317 19,609,063 2.20
Tencent Holdings Ltd 375,900 HKD 25,924,677 28,268,071 3.17
Trip.com Group Ltd ADR 403,901 USD 13,073,935 14,322,329 1.60
Yum China Holdings Inc 254,135 USD 13,194,196 16,836,444 1.89
103,913,506 111,763,436 12.53 Denmark
Novo Nordisk A/S 112,813 DKK 7,134,394 9,452,432 1.06
7,134,394 9,452,432 1.06 France
Sodexo SA 76,596 EUR 7,690,553 7,148,730 0.80
7,690,553 7,148,730 0.80 Great Britain
Reckitt Benckiser Group PLC 82,887 GBP 6,987,064 7,324,836 0.82
Unilever PLC 209,372 EUR 11,826,348 12,257,046 1.38
18,813,412 19,581,882 2.20 Hong Kong
Budweiser Brewing Co. APAC Ltd 144A(2) 1,077,667 HKD 3,567,213 3,399,865 0.38
3,567,213 3,399,865 0.38 Ireland
Experian PLC 492,400 GBP 15,901,416 18,951,095 2.12
15,901,416 18,951,095 2.12 Japan
FANUC Corp 74,000 JPY 14,433,825 17,864,943 2.00
14,433,825 17,864,943 2.00 Netherlands
Adyen NV 144A(2) 14,797 EUR 23,159,783 36,157,164 4.06
Core Laboratories NV 25,461 USD 1,218,108 991,706 0.11
NXP Semiconductors NV 95,096 USD 12,751,574 19,563,149 2.19
37,129,465 56,712,019 6.36 Switzerland
CRISPR Therapeutics AG 127,888 USD 16,123,420 20,703,789 2.32
Nestle SA 117,971 CHF 12,441,339 14,705,056 1.65
Novartis AG 400,832 CHF 35,504,448 36,564,239 4.10
Roche Holding AG 76,353 CHF 23,790,187 28,790,867 3.23
87,859,394 100,763,951 11.30 United States
Alnylam Pharmaceuticals Inc 122,693 USD 20,739,049 20,798,917 2.33
Alphabet Inc 19,085 USD 31,442,197 46,601,562 5.22
Amazon.com Inc 17,489 USD 44,024,815 60,164,958 6.74
Autodesk Inc 48,185 USD 10,858,967 14,065,201 1.58
(2) See Note 13.
36

Natixis International Funds (Lux) I
The accompanying notes form an integral part of these financial statements.
Loomis Sayles Global Growth Equity Fund Statement of Investments (continued)
As at June 30, 2021 (expressed in USD)
Description Quantity Currency Cost Evaluation % of Net
Assets
Boeing Co/The 159,822 USD 30,481,410 38,286,958 4.29
Colgate-Palmolive Co 133,053 USD 10,065,271 10,823,862 1.21
Deere & Co 84,621 USD 20,131,887 29,846,673 3.35
Expeditors International of Washington Inc 70,444 USD 6,020,301 8,918,210 1.00
Facebook Inc 135,183 USD 30,988,114 47,004,481 5.27
Microsoft Corp 122,865 USD 22,785,075 33,284,129 3.73
Oracle Corp 459,844 USD 27,099,864 35,794,257 4.01
QUALCOMM Inc 113,968 USD 12,988,968 16,289,446 1.83
salesforce.com Inc 107,396 USD 20,796,802 26,233,621 2.94
Schlumberger NV 313,804 USD 10,440,746 10,044,866 1.13
SEI Investments Co 140,299 USD 8,101,944 8,694,329 0.97
Under Armour Inc 691,190 USD 13,770,422 14,618,669 1.64
Vertex Pharmaceuticals Inc 17,554 USD 3,420,862 3,539,413 0.40
Visa Inc 151,682 USD 27,905,339 35,466,285 3.98
Yum! Brands Inc 56,858 USD 5,803,547 6,540,376 0.73
357,865,580 467,016,213 52.35
Total - Shares 707,607,908 882,300,894 98.91
Total - Transferable securities admitted to an official stock exchange listing 707,607,908 882,300,894 98.91
TOTAL INVESTMENT PORTFOLIO 707,607,908 882,300,894 98.91
A detailed schedule of portfolio movements for the period from January 1, 2021 to June 30, 2021 is available free of charge upon request at the registered office of the SICAV.
37

Natixis International Funds (Lux) I
Loomis Sayles U.S. Growth Equity Fund
Statistics
As at June 30, 2021
Net asset value per share
C/A (USD) 177.65
F/A (USD) 244.10
H-I/A (EUR) 169.91
H-N/A (EUR) 179.86
H-N/D (GBP) 154.18
H-R/A (CHF) 218.96
H-R/A (EUR) 213.87
H-R/A (SGD) 195.81
H-S/A (EUR) 148.00
H-S/A (GBP) 161.33
H-S/A (SGD) 182.68
H-S1/A (EUR) 178.06
H-S1/A (GBP) 220.76
H-SN1/D (GBP) 180.75
I/A (USD) 251.00
I/A (EUR) 200.72
I/A (GBP) 229.61
I/D (USD) 126.53
N/A (USD) 227.89
N/A (EUR) 221.77
N/A (GBP) 122.50
N/D (USD) 185.40
N1/A (USD) 173.48
R/A (USD) 241.13
R/A (EUR) 180.36
R/D (USD) 243.15
RE/A (USD) 222.28
S/A (USD) 242.73
S/A (EUR) 200.62
S/A (GBP) 194.96
S/D (USD) 152.25
S1/A (USD) 260.61
S1/A (EUR) 227.85
S1/A (GBP) 273.58
SN1/A (USD) 172.38
SN1/D (USD) 182.39
SN1/D (GBP) 169.48
Number of shares outstanding
C/A (USD) 5,319.109
F/A (USD) 20,633.582
H-I/A (EUR) 33,359.310
H-N/A (EUR) 89,547.028
H-N/D (GBP) 1,900.000
H-R/A (CHF) 1,075.000
H-R/A (EUR) 412,578.469
H-R/A (SGD) 27,684.648
H-S/A (EUR) 538,839.318
H-S/A (GBP) 526,524.779
38

Natixis International Funds (Lux) I
Loomis Sayles U.S. Growth Equity Fund
Statistics (continued)
As at June 30, 2021
Number of shares outstanding
H-S/A (SGD) 2,269,755.169
H-S1/A (EUR) 68,639.967
H-S1/A (GBP) 244,366.916
H-SN1/D (GBP) 14,836.842
I/A (USD) 1,124,576.937
I/A (EUR) 63,921.345
I/A (GBP) 12,396.576
I/D (USD) 30.000
N/A (USD) 285,574.196
N/A (EUR) 21,494.000
N/A (GBP) 7,977.630
N/D (USD) 51,273.566
N1/A (USD) 21,228.067
R/A (USD) 831,754.630
R/A (EUR) 1,591.149
R/D (USD) 41,809.030
RE/A (USD) 43,663.693
S/A (USD) 2,762,819.605
S/A (EUR) 335,997.610
S/A (GBP) 424,972.551
S/D (USD) 73,497.813
S1/A (USD) 647,223.823
S1/A (EUR) 665,822.910
S1/A (GBP) 275,129.293
SN1/A (USD) 10,630.997
SN1/D (USD) 690,036.688
SN1/D (GBP) 3,010,884.903
39

Natixis International Funds (Lux) I
The accompanying notes form an integral part of these financial statements.
Loomis Sayles U.S. Growth Equity Fund Statement of Investments
As at June 30, 2021 (expressed in USD)
Description Quantity Currency Cost Evaluation % of Net
Assets
Transferable securities admitted to an official stock exchange listing Shares
China
Alibaba Group Holding Ltd ADR 618,911 USD 117,788,775 140,356,637 3.98
Yum China Holdings Inc 422,653 USD 17,641,742 28,000,761 0.80
135,430,517 168,357,398 4.78 Denmark
Novo Nordisk A/S ADR 341,671 USD 18,123,324 28,621,780 0.81
18,123,324 28,621,780 0.81 Switzerland
Novartis AG ADR 1,143,548 USD 97,613,712 104,337,320 2.96
97,613,712 104,337,320 2.96 United States
Alphabet Inc - Class A 48,176 USD 59,094,951 117,635,675 3.34
Alphabet Inc - Class C 48,319 USD 58,996,423 121,102,876 3.44
Amazon.com Inc 69,516 USD 125,611,097 239,146,163 6.79
Autodesk Inc 531,786 USD 83,794,324 155,228,333 4.41
Automatic Data Processing Inc 122,358 USD 16,338,066 24,302,746 0.69
Boeing Co/The 641,226 USD 108,375,121 153,612,101 4.36
Cerner Corp 564,951 USD 37,392,711 44,156,570 1.25
Cisco Systems Inc/Delaware 1,131,529 USD 48,024,149 59,971,037 1.70
Colgate-Palmolive Co 533,613 USD 38,043,626 43,409,418 1.23
Deere & Co 390,388 USD 61,983,229 137,693,751 3.91
Expeditors International of Washington Inc 705,509 USD 50,184,293 89,317,439 2.54
Facebook Inc 638,211 USD 124,282,928 221,912,347 6.30
FactSet Research Systems Inc 129,814 USD 31,240,225 43,566,877 1.24
Illumina Inc 192,280 USD 58,937,385 90,988,819 2.58
Intuitive Surgical Inc 49,480 USD 26,161,885 45,503,787 1.29
Microsoft Corp 559,429 USD 71,974,749 151,549,316 4.30
Monster Beverage Corp 1,186,239 USD 75,371,990 108,362,933 3.08
NVIDIA Corp 273,461 USD 64,286,734 218,796,146 6.21
Oracle Corp 1,804,308 USD 92,572,042 140,447,335 3.99
QUALCOMM Inc 478,140 USD 35,569,612 68,340,550 1.94
Regeneron Pharmaceuticals Inc 151,640 USD 61,647,520 84,697,006 2.40
salesforce.com Inc 498,967 USD 80,405,590 121,882,669 3.46
Schlumberger NV 1,796,345 USD 68,013,508 57,501,003 1.63
SEI Investments Co 768,930 USD 46,470,982 47,650,592 1.35
Starbucks Corp 781,166 USD 57,495,746 87,342,170 2.48
Vertex Pharmaceuticals Inc 120,467 USD 23,476,233 24,289,761 0.69
Visa Inc 806,731 USD 118,130,593 188,629,842 5.35
Walt Disney Co/The 647,426 USD 83,382,150 113,798,068 3.23
Workday Inc 187,975 USD 28,043,233 44,877,152 1.27
Yum! Brands Inc 344,943 USD 29,649,384 39,678,793 1.13
1,864,950,479 3,085,391,275 87.58
Total - Shares 2,116,118,032 3,386,707,773 96.13
Total - Transferable securities admitted to an official stock exchange listing 2,116,118,032 3,386,707,773 96.13
40

Natixis International Funds (Lux) I
The accompanying notes form an integral part of these financial statements.
Loomis Sayles U.S. Growth Equity Fund Statement of Investments (continued)
As at June 30, 2021 (expressed in USD)
Description Quantity Currency Cost Evaluation % of Net
Assets
Transferable securities dealt in on another regulated market Shares
Switzerland
Roche Holding AG ADR 1,877,976 USD 74,577,424 88,246,092 2.50
74,577,424 88,246,092 2.50
Total - Shares 74,577,424 88,246,092 2.50
Total - Transferable securities dealt in on another regulated market 74,577,424 88,246,092 2.50
TOTAL INVESTMENT PORTFOLIO 2,190,695,456 3,474,953,865 98.63
A detailed schedule of portfolio movements for the period from January 1, 2021 to June 30, 2021 is available free of charge upon request at the registered office of the SICAV.
41

Natixis International Funds (Lux) I
DNCA Europe Smaller Companies Fund
Statistics
As at June 30, 2021
Net asset value per share
H-I/A (USD) 162.89
H-R/A (USD) 166.33
I/A (USD) 150.96
I/A (EUR) 245.47
N/A (EUR) 139.51
N1/A (EUR) 140.06
R/A (USD) 143.97
R/A (EUR) 201.56
R/A (SGD) 182.37
R/D (EUR) 85.49
Number of shares outstanding
H-I/A (USD) 2,135.000
H-R/A (USD) 7,956.636
I/A (USD) 2,781.937
I/A (EUR) 93,931.891
N/A (EUR) 90.709
N1/A (EUR) 891,939.691
R/A (USD) 2,821.040
R/A (EUR) 86,294.373
R/A (SGD) 3,371.506
R/D (EUR) 1,762.976
42

Natixis International Funds (Lux) I
The accompanying notes form an integral part of these financial statements.
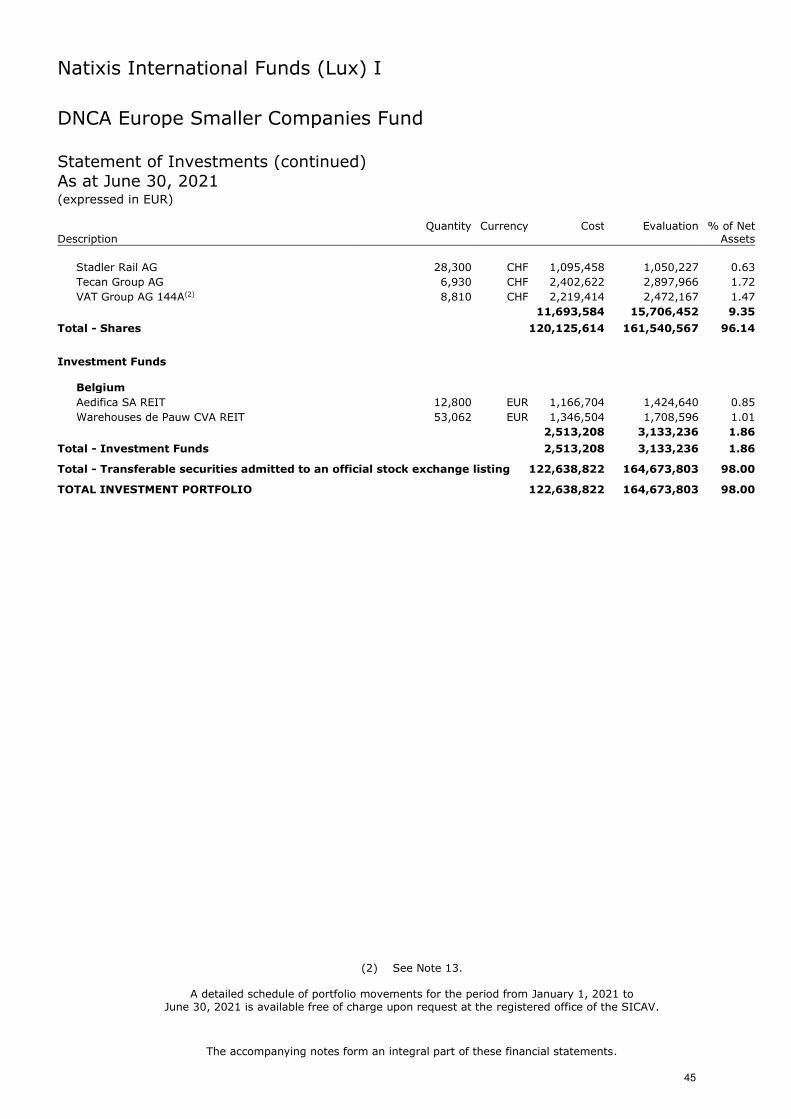
DNCA Europe Smaller Companies Fund Statement of Investments
As at June 30, 2021 (expressed in EUR)
Description Quantity Currency Cost Evaluation % of Net
Assets
Transferable securities admitted to an official stock exchange listing
Shares
Austria
Wienerberger AG 94,100 EUR 2,090,952 3,058,250 1.82
2,090,952 3,058,250 1.82 Denmark
GN Store Nord A/S 19,500 DKK 700,529 1,436,491 0.85
Netcompany Group A/S 144A(2) 32,800 DKK 1,450,355 3,142,715 1.87
Royal Unibrew A/S 23,200 DKK 1,366,437 2,492,140 1.48
SimCorp A/S 15,500 DKK 1,373,026 1,640,828 0.98
4,890,347 8,712,174 5.18 Finland
Kesko Oyj 48,800 EUR 783,831 1,520,120 0.90
Konecranes Oyj 71,700 EUR 2,668,288 2,546,784 1.52
Metso Outotec Oyj 346,000 EUR 2,321,654 3,389,416 2.02
Valmet Oyj 100,400 EUR 2,059,422 3,692,712 2.20
7,833,195 11,149,032 6.64 France
Alten SA 13,500 EUR 900,058 1,509,300 0.90
Elis SA 117,700 EUR 1,769,191 1,870,253 1.11
Faurecia SE 42,300 EUR 1,946,496 1,749,951 1.04
IPSOS 53,000 EUR 1,566,281 1,884,150 1.12
Orpea SA 13,900 EUR 1,226,834 1,490,775 0.89
SOITEC 16,700 EUR 1,837,900 3,104,530 1.85
Sopra Steria Group SACA 17,300 EUR 2,221,094 2,806,060 1.67
SPIE SA 115,900 EUR 1,955,030 2,248,460 1.34
13,422,884 16,663,479 9.92 Germany
CANCOM SE 43,700 EUR 2,069,750 2,228,700 1.32
Dermapharm Holding SE 37,200 EUR 1,373,253 2,501,700 1.49
Evotec SE 28,000 EUR 679,530 1,070,440 0.64
flatexDEGIRO AG 19,500 EUR 2,172,027 2,213,250 1.32
HelloFresh SE 27,500 EUR 915,571 2,254,450 1.34
Norma Group SE 58,400 EUR 1,762,106 2,521,712 1.50
ProSiebenSat.1 Media SE 116,900 EUR 2,099,058 1,960,997 1.17
Stroeer SE & Co KGaA 27,300 EUR 1,510,509 1,844,115 1.10
TAG Immobilien AG 57,300 EUR 1,194,458 1,533,348 0.91
13,776,262 18,128,712 10.79 Great Britain
B&M European Value Retail SA 489,400 GBP 2,500,092 3,267,813 1.95
Bellway PLC 78,100 GBP 2,549,710 2,947,699 1.76
Diploma PLC 87,400 GBP 1,868,339 2,956,618 1.76
Dr. Martens PLC 322,000 GBP 1,417,244 1,669,179 0.99
Future PLC 86,200 GBP 1,361,429 3,144,967 1.87
GB Group PLC 220,900 GBP 1,696,832 2,124,222 1.26
HomeServe PLC 154,000 GBP 1,772,392 1,714,109 1.02
Howden Joinery Group PLC 262,000 GBP 2,435,366 2,492,285 1.48
IMI PLC 100,000 GBP 2,027,400 2,003,621 1.19
Morgan Advanced Materials PLC 504,000 GBP 1,623,477 2,072,490 1.23
Rightmove PLC 247,000 GBP 1,446,600 1,868,514 1.11
(2) See Note 13.
43
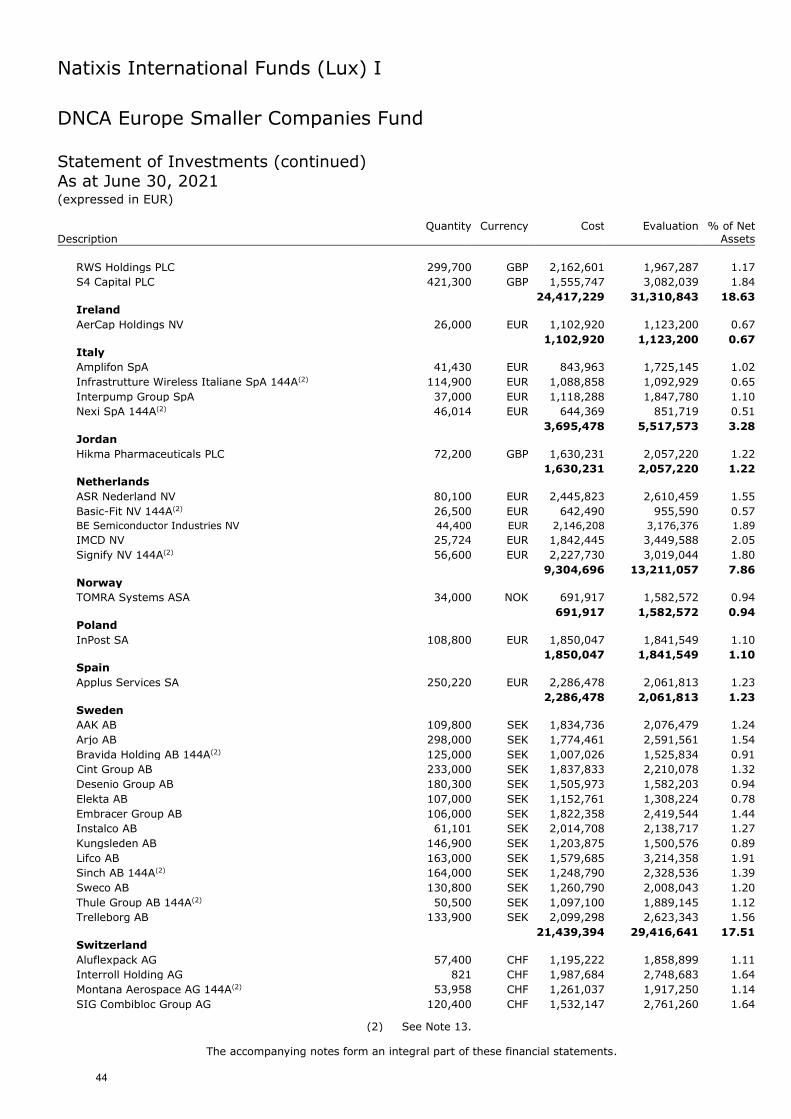
Natixis International Funds (Lux) I
The accompanying notes form an integral part of these financial statements.
DNCA Europe Smaller Companies Fund Statement of Investments (continued)
As at June 30, 2021 (expressed in EUR)
Description Quantity Currency Cost Evaluation % of Net
Assets
RWS Holdings PLC 299,700 GBP 2,162,601 1,967,287 1.17
S4 Capital PLC 421,300 GBP 1,555,747 3,082,039 1.84
24,417,229 31,310,843 18.63 Ireland
AerCap Holdings NV 26,000 EUR 1,102,920 1,123,200 0.67
1,102,920 1,123,200 0.67 Italy
Amplifon SpA 41,430 EUR 843,963 1,725,145 1.02
Infrastrutture Wireless Italiane SpA 144A(2) 114,900 EUR 1,088,858 1,092,929 0.65
Interpump Group SpA 37,000 EUR 1,118,288 1,847,780 1.10
Nexi SpA 144A(2) 46,014 EUR 644,369 851,719 0.51
3,695,478 5,517,573 3.28 Jordan
Hikma Pharmaceuticals PLC 72,200 GBP 1,630,231 2,057,220 1.22
1,630,231 2,057,220 1.22 Netherlands
ASR Nederland NV 80,100 EUR 2,445,823 2,610,459 1.55
Basic-Fit NV 144A(2) 26,500 EUR 642,490 955,590 0.57
BE Semiconductor Industries NV 44,400 EUR 2,146,208 3,176,376 1.89
IMCD NV 25,724 EUR 1,842,445 3,449,588 2.05
Signify NV 144A(2) 56,600 EUR 2,227,730 3,019,044 1.80
9,304,696 13,211,057 7.86 Norway
TOMRA Systems ASA 34,000 NOK 691,917 1,582,572 0.94
691,917 1,582,572 0.94 Poland
InPost SA 108,800 EUR 1,850,047 1,841,549 1.10
1,850,047 1,841,549 1.10 Spain
Applus Services SA 250,220 EUR 2,286,478 2,061,813 1.23
2,286,478 2,061,813 1.23 Sweden
AAK AB 109,800 SEK 1,834,736 2,076,479 1.24
Arjo AB 298,000 SEK 1,774,461 2,591,561 1.54
Bravida Holding AB 144A(2) 125,000 SEK 1,007,026 1,525,834 0.91
Cint Group AB 233,000 SEK 1,837,833 2,210,078 1.32
Desenio Group AB 180,300 SEK 1,505,973 1,582,203 0.94
Elekta AB 107,000 SEK 1,152,761 1,308,224 0.78
Embracer Group AB 106,000 SEK 1,822,358 2,419,544 1.44
Instalco AB 61,101 SEK 2,014,708 2,138,717 1.27
Kungsleden AB 146,900 SEK 1,203,875 1,500,576 0.89
Lifco AB 163,000 SEK 1,579,685 3,214,358 1.91
Sinch AB 144A(2) 164,000 SEK 1,248,790 2,328,536 1.39
Sweco AB 130,800 SEK 1,260,790 2,008,043 1.20
Thule Group AB 144A(2) 50,500 SEK 1,097,100 1,889,145 1.12
Trelleborg AB 133,900 SEK 2,099,298 2,623,343 1.56
21,439,394 29,416,641 17.51 Switzerland
Aluflexpack AG 57,400 CHF 1,195,222 1,858,899 1.11
Interroll Holding AG 821 CHF 1,987,684 2,748,683 1.64
Montana Aerospace AG 144A(2) 53,958 CHF 1,261,037 1,917,250 1.14
SIG Combibloc Group AG 120,400 CHF 1,532,147 2,761,260 1.64
(2) See Note 13.
44
Natixis International Funds (Lux) I
The accompanying notes form an integral part of these financial statements.
DNCA Europe Smaller Companies Fund Statement of Investments (continued)
As at June 30, 2021 (expressed in EUR)
Description Quantity Currency Cost Evaluation % of Net
Assets
Stadler Rail AG 28,300 CHF 1,095,458 1,050,227 0.63
Tecan Group AG 6,930 CHF 2,402,622 2,897,966 1.72
VAT Group AG 144A(2) 8,810 CHF 2,219,414 2,472,167 1.47
11,693,584 15,706,452 9.35
Total - Shares 120,125,614 161,540,567 96.14
Investment Funds
Belgium
Aedifica SA REIT 12,800 EUR 1,166,704 1,424,640 0.85
Warehouses de Pauw CVA REIT 53,062 EUR 1,346,504 1,708,596 1.01
2,513,208 3,133,236 1.86
Total - Investment Funds 2,513,208 3,133,236 1.86
Total - Transferable securities admitted to an official stock exchange listing 122,638,822 164,673,803 98.00
TOTAL INVESTMENT PORTFOLIO 122,638,822 164,673,803 98.00
(2) See Note 13.
A detailed schedule of portfolio movements for the period from January 1, 2021 to June 30, 2021 is available free of charge upon request at the registered office of the SICAV.
45

Natixis International Funds (Lux) I
Seeyond Asia MinVol Equity Income Fund(1)
Statistics
As at May 28, 2021
Net asset value per share
H-R/DIVM (SGD) 80.25
I/A (USD) 96.53
N1/A (SGD) 98.03
Q/A (USD) 98.12
R/DIVM (USD) 82.42
Number of shares outstanding
H-R/DIVM (SGD) 34.244
I/A (USD) 30.000
N1/A (SGD) 30.000
Q/A (USD) 112,463.465
R/DIVM (USD) 34.247
(1) See Note 1.
46

Natixis International Funds (Lux) I
Thematics AI and Robotics Fund
Statistics
As at June 30, 2021
Net asset value per share
H-I/A (EUR) 148.19
H-N/A (CHF) 155.09
H-N/A (EUR) 168.99
H-R/A (EUR) 146.23
H-R/A (SGD) 163.38
H-RE/A (EUR) 208.81
H-S/A (EUR) 152.49
I/A (USD) 218.87
I/A (EUR) 160.44
N/A (USD) 160.35
N/A (EUR) 162.40
N1/A (USD) 219.15
N1/A (EUR) 151.95
N1/A (GBP) 161.51
R/A (USD) 214.19
R/A (EUR) 168.88
R/A (SGD) 150.18
RE/A (USD) 163.01
RE/A (EUR) 139.46
S/A (USD) 220.00
S1/A (EUR) 112.97
Number of shares outstanding
H-I/A (EUR) 434,562.431
H-N/A (CHF) 5,219.000
H-N/A (EUR) 23,008.023
H-R/A (EUR) 278,428.964
H-R/A (SGD) 2,180.352
H-RE/A (EUR) 1,426.991
H-S/A (EUR) 612,333.998
I/A (USD) 20,251.411
I/A (EUR) 123,959.045
N/A (USD) 1,284.569
N/A (EUR) 155,691.213
N1/A (USD) 30.000
N1/A (EUR) 24,912.678
N1/A (GBP) 31,382.081
R/A (USD) 122,791.531
R/A (EUR) 532,165.202
R/A (SGD) 1,012.569
RE/A (USD) 3,633.700
RE/A (EUR) 2,215.822
S/A (USD) 46,500.000
S1/A (EUR) 197,964.110
47
Natixis International Funds (Lux) I
The accompanying notes form an integral part of these financial statements.
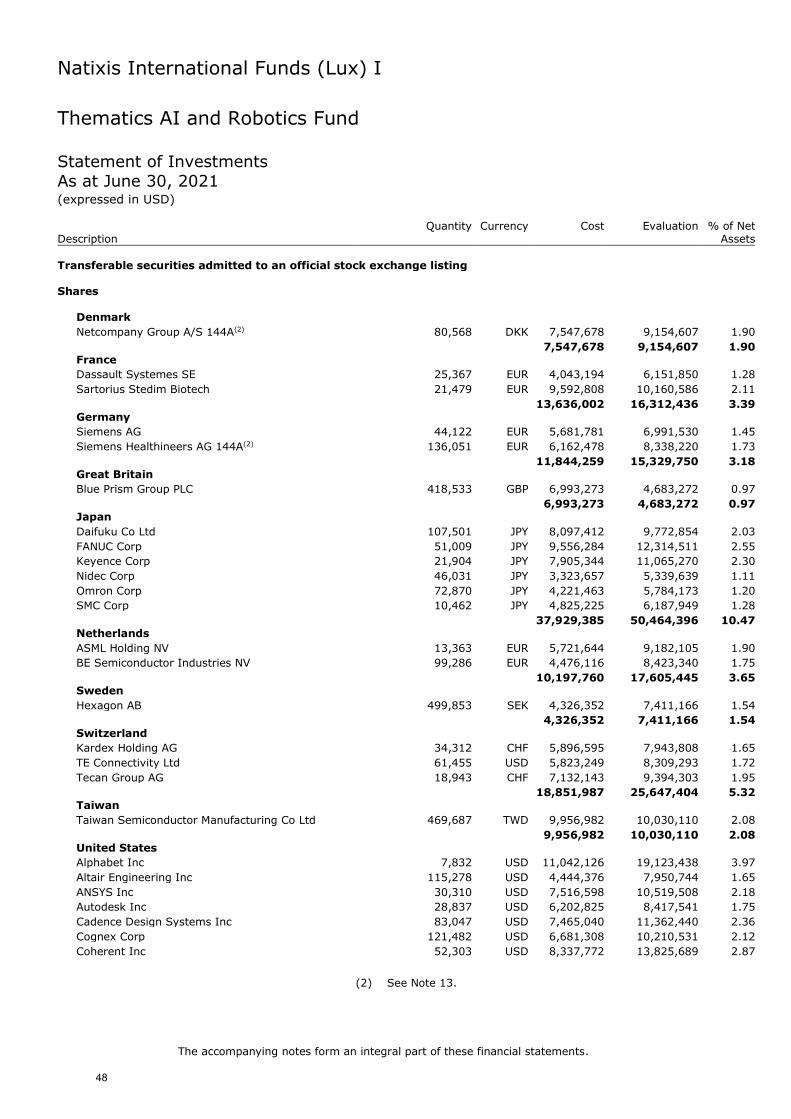
Thematics AI and Robotics Fund Statement of Investments
As at June 30, 2021 (expressed in USD)
Description Quantity Currency Cost Evaluation % of Net
Assets
Transferable securities admitted to an official stock exchange listing Shares
Denmark
Netcompany Group A/S 144A(2) 80,568 DKK 7,547,678 9,154,607 1.90
7,547,678 9,154,607 1.90 France
Dassault Systemes SE 25,367 EUR 4,043,194 6,151,850 1.28
Sartorius Stedim Biotech 21,479 EUR 9,592,808 10,160,586 2.11
13,636,002 16,312,436 3.39 Germany
Siemens AG 44,122 EUR 5,681,781 6,991,530 1.45
Siemens Healthineers AG 144A(2) 136,051 EUR 6,162,478 8,338,220 1.73
11,844,259 15,329,750 3.18 Great Britain
Blue Prism Group PLC 418,533 GBP 6,993,273 4,683,272 0.97
6,993,273 4,683,272 0.97 Japan
Daifuku Co Ltd 107,501 JPY 8,097,412 9,772,854 2.03
FANUC Corp 51,009 JPY 9,556,284 12,314,511 2.55
Keyence Corp 21,904 JPY 7,905,344 11,065,270 2.30
Nidec Corp 46,031 JPY 3,323,657 5,339,639 1.11
Omron Corp 72,870 JPY 4,221,463 5,784,173 1.20
SMC Corp 10,462 JPY 4,825,225 6,187,949 1.28
37,929,385 50,464,396 10.47 Netherlands
ASML Holding NV 13,363 EUR 5,721,644 9,182,105 1.90
BE Semiconductor Industries NV 99,286 EUR 4,476,116 8,423,340 1.75
10,197,760 17,605,445 3.65 Sweden
Hexagon AB 499,853 SEK 4,326,352 7,411,166 1.54
4,326,352 7,411,166 1.54
Switzerland
Kardex Holding AG 34,312 CHF 5,896,595 7,943,808 1.65
TE Connectivity Ltd 61,455 USD 5,823,249 8,309,293 1.72
Tecan Group AG 18,943 CHF 7,132,143 9,394,303 1.95
18,851,987 25,647,404 5.32 Taiwan
Taiwan Semiconductor Manufacturing Co Ltd 469,687 TWD 9,956,982 10,030,110 2.08
9,956,982 10,030,110 2.08 United States
Alphabet Inc 7,832 USD 11,042,126 19,123,438 3.97
Altair Engineering Inc 115,278 USD 4,444,376 7,950,744 1.65
ANSYS Inc 30,310 USD 7,516,598 10,519,508 2.18
Autodesk Inc 28,837 USD 6,202,825 8,417,541 1.75
Cadence Design Systems Inc 83,047 USD 7,465,040 11,362,440 2.36
Cognex Corp 121,482 USD 6,681,308 10,210,531 2.12
Coherent Inc 52,303 USD 8,337,772 13,825,689 2.87
(2) See Note 13.
48

Natixis International Funds (Lux) I
The accompanying notes form an integral part of these financial statements.
Thematics AI and Robotics Fund Statement of Investments (continued)
As at June 30, 2021 (expressed in USD)
Description Quantity Currency Cost Evaluation % of Net
Assets
Emerson Electric Co 63,540 USD 4,223,062 6,115,072 1.27
Hologic Inc 105,440 USD 5,742,198 7,034,964 1.46
Intuitive Surgical Inc 14,444 USD 8,016,584 13,283,416 2.76
iRobot Corp 75,822 USD 5,862,180 7,080,986 1.47
John Bean Technologies Corp 61,768 USD 5,813,614 8,809,331 1.83
KLA Corp 23,948 USD 4,501,785 7,764,272 1.61
Mettler-Toledo International Inc 5,079 USD 4,369,680 7,035,503 1.46
Nuance Communications Inc 279,338 USD 6,987,383 15,207,183 3.16
NVIDIA Corp 34,354 USD 11,951,190 27,486,276 5.70
Omnicell Inc 62,956 USD 4,737,349 9,534,707 1.98
ON Semiconductor Corp 229,743 USD 5,359,690 8,794,580 1.82
PTC Inc 74,201 USD 7,004,308 10,481,664 2.17
Rockwell Automation Inc 29,947 USD 5,912,950 8,565,566 1.78
Roper Technologies Inc 17,488 USD 6,441,138 8,222,903 1.71
salesforce.com Inc 60,528 USD 11,547,175 14,785,081 3.07
ServiceNow Inc 27,146 USD 10,518,162 14,918,033 3.09
Splunk Inc 49,920 USD 7,229,647 7,217,481 1.50
SPS Commerce Inc 82,138 USD 5,777,196 8,201,507 1.70
Synopsys Inc 44,034 USD 6,593,242 12,144,260 2.52
Teradyne Inc 89,868 USD 6,459,008 12,038,658 2.50
Tyler Technologies Inc 16,663 USD 4,769,383 7,537,713 1.56
Xilinx Inc 82,731 USD 9,537,163 11,966,261 2.48
201,044,132 315,635,308 65.50
Total - Shares 322,327,810 472,273,894 98.00
Total - Transferable securities admitted to an official stock exchange listing 322,327,810 472,273,894 98.00
TOTAL INVESTMENT PORTFOLIO 322,327,810 472,273,894 98.00
A detailed schedule of portfolio movements for the period from January 1, 2021 to June 30, 2021 is available free of charge upon request at the registered office of the SICAV.
49

Natixis International Funds (Lux) I
Thematics Meta Fund
Statistics
As at June 30, 2021
Net asset value per share
H-I/A (CHF) 155.11
H-I/A (EUR) 155.47
H-N/A (CHF) 132.68
H-N/A (EUR) 112.09
H-R/A (CHF) 154.11
H-R/A (EUR) 154.55
H-R/A (SGD) 126.59
H-RE/A (EUR) 141.24
H-S/A (EUR) 125.18
I/A (USD) 206.42
I/A (EUR) 161.54
N/A (USD) 138.97
N/A (EUR) 152.45
N1/A (USD) 206.62
N1/A (EUR) 152.09
N1/A (GBP) 152.77
R/A (USD) 201.95
R/A (EUR) 163.48
R/A (SGD) 124.91
RE/A (USD) 151.74
RE/A (EUR) 132.91
S/A (USD) 207.52
S/A (EUR) 134.88
Number of shares outstanding
H-I/A (CHF) 30,843.251
H-I/A (EUR) 101,235.357
H-N/A (CHF) 2,241.000
H-N/A (EUR) 651.000
H-R/A (CHF) 2,812.000
H-R/A (EUR) 1,218,961.560
H-R/A (SGD) 773.227
H-RE/A (EUR) 234.790
H-S/A (EUR) 4,750.000
I/A (USD) 88,668.810
I/A (EUR) 248,785.799
N/A (USD) 650.000
N/A (EUR) 89,333.274
N1/A (USD) 15,794.832
N1/A (EUR) 16,199.800
N1/A (GBP) 31,754.224
R/A (USD) 84,022.179
R/A (EUR) 1,640,368.150
R/A (SGD) 1,057.926
RE/A (USD) 22,217.022
RE/A (EUR) 1,699.405
S/A (USD) 150,930.000
S/A (EUR) 189,130.646
50

Natixis International Funds (Lux) I
The accompanying notes form an integral part of these financial statements.
Thematics Meta Fund Statement of Investments
As at June 30, 2021 (expressed in USD)
Description Quantity Currency Cost Evaluation % of Net
Assets
Transferable securities admitted to an official stock exchange listing Shares
Brazil
Cia de Saneamento Basico do Estado de Sao Paulo 327,365 BRL 2,921,852 2,386,483 0.32
2,921,852 2,386,483 0.32 Canada
Stantec Inc 115,527 CAD 3,446,726 5,160,122 0.69
3,446,726 5,160,122 0.69 China
Tencent Music Entertainment Group ADR 217,391 USD 3,785,285 3,365,206 0.45
3,785,285 3,365,206 0.45 Denmark
Netcompany Group A/S 144A(2) 31,101 DKK 2,913,119 3,533,939 0.48
2,913,119 3,533,939 0.48 France
Dassault Systemes SE 9,792 EUR 1,567,197 2,374,789 0.32
Elis SA 153,838 EUR 2,543,495 2,898,919 0.39
Sartorius Stedim Biotech 8,291 EUR 3,703,766 3,922,276 0.53
Ubisoft Entertainment SA 34,386 EUR 2,917,423 2,407,575 0.32
Veolia Environnement SA 193,241 EUR 4,757,130 5,836,819 0.78
Worldline SA/France 144A(2) 54,787 EUR 4,820,607 5,128,895 0.69
20,309,618 22,569,273 3.03 Germany
HelloFresh SE 30,036 EUR 1,621,705 2,920,111 0.39
Knorr-Bremse AG 18,502 EUR 2,270,464 2,128,314 0.29
Scout24 AG 144A(2) 63,141 EUR 5,076,420 5,325,420 0.72
Siemens AG 17,032 EUR 2,183,434 2,698,930 0.36
Siemens Healthineers AG 144A(2) 52,520 EUR 2,367,516 3,218,790 0.43
13,519,539 16,291,565 2.19 Great Britain
Alphawave IP Group PLC 269,445 GBP 1,537,997 1,340,009 0.18
Auto Trader Group PLC 144A(2) 328,834 GBP 2,380,570 2,877,332 0.39
Blue Prism Group PLC 161,565 GBP 2,688,674 1,807,876 0.24
Clarivate PLC 148,667 USD 3,810,824 4,092,806 0.55
Ferguson PLC 34,859 GBP 3,091,797 4,839,725 0.65
Halma PLC 216,766 GBP 5,733,800 8,061,219 1.08
HomeServe PLC 473,215 GBP 6,973,685 6,246,323 0.84
London Stock Exchange Group PLC 28,489 GBP 3,089,149 3,136,717 0.42
Pennon Group PLC 306,054 GBP 3,692,569 4,800,868 0.65
Pentair PLC 61,078 USD 2,354,342 4,122,160 0.55
Rentokil Initial PLC 679,720 GBP 4,164,543 4,648,044 0.62
Severn Trent PLC 128,586 GBP 3,851,230 4,442,638 0.60
Spirax-Sarco Engineering PLC 14,604 GBP 1,570,675 2,746,741 0.37
Travis Perkins PLC 117,518 GBP 2,774,991 2,741,999 0.37
47,714,846 55,904,457 7.51 Hong Kong
China Everbright Environment Group Ltd 3,550,037 HKD 2,371,819 2,011,391 0.27
Guangdong Investment Ltd 1,431,425 HKD 2,564,559 2,057,046 0.28
4,936,378 4,068,437 0.55 Ireland
Aptiv PLC 35,567 USD 3,393,044 5,595,714 0.75
(2) See Note 13.
51

Natixis International Funds (Lux) I
The accompanying notes form an integral part of these financial statements.
Thematics Meta Fund Statement of Investments (continued)
As at June 30, 2021 (expressed in USD)
Description Quantity Currency Cost Evaluation % of Net
Assets
Experian PLC 114,424 GBP 3,874,350 4,403,869 0.59
7,267,394 9,999,583 1.34 Israel
Wix.com Ltd 9,755 USD 2,151,046 2,831,753 0.38
2,151,046 2,831,753 0.38 Italy
Nexi SpA 144A(2) 199,389 EUR 3,255,137 4,376,795 0.59
3,255,137 4,376,795 0.59 Japan
Daifuku Co Ltd 41,499 JPY 3,109,120 3,772,600 0.50
FANUC Corp 19,691 JPY 3,683,565 4,753,752 0.64
Keyence Corp 8,455 JPY 3,040,842 4,271,510 0.57
Kurita Water Industries Ltd 74,204 JPY 2,217,362 3,563,464 0.48
Menicon Co Ltd 31,797 JPY 2,044,281 2,234,576 0.30
Nidec Corp 17,769 JPY 1,285,430 2,061,253 0.28
Omron Corp 28,130 JPY 1,625,038 2,232,856 0.30
Shimadzu Corp 87,887 JPY 2,375,881 3,400,972 0.46
SMC Corp 4,038 JPY 1,856,662 2,388,725 0.32
Sony Group Corp 38,235 JPY 3,351,472 3,725,620 0.50
24,589,653 32,405,328 4.35 Luxembourg
Eurofins Scientific SE 46,213 EUR 2,899,688 5,283,065 0.71
2,899,688 5,283,065 0.71 Netherlands
Aalberts NV 76,513 EUR 2,713,553 4,112,187 0.55
ASML Holding NV 5,159 EUR 2,203,975 3,544,555 0.48
Basic-Fit NV 144A(2) 84,870 EUR 2,589,265 3,629,335 0.49
BE Semiconductor Industries NV 38,327 EUR 1,727,158 3,251,649 0.44
Signify NV 144A(2) 57,409 EUR 1,896,843 3,631,473 0.49
Wolters Kluwer NV 55,045 EUR 4,355,527 5,530,310 0.74
15,486,321 23,699,509 3.19 South Korea
Coway Co Ltd 74,947 KRW 4,711,138 5,237,599 0.70
4,711,138 5,237,599 0.70 Spain
Fluidra SA 82,797 EUR 1,183,039 3,284,412 0.44
1,183,039 3,284,412 0.44 Sweden
Alfa Laval AB 130,925 SEK 2,861,851 4,627,901 0.62
Hexagon AB 192,958 SEK 1,651,209 2,860,921 0.39
4,513,060 7,488,822 1.01 Switzerland
Geberit AG 2,565 CHF 1,280,258 1,925,747 0.26
Kardex Holding AG 13,246 CHF 2,263,096 3,066,537 0.41
TE Connectivity Ltd 23,723 USD 2,247,940 3,207,624 0.43
Tecan Group AG 7,313 CHF 2,738,952 3,626,469 0.49
8,530,246 11,826,377 1.59 Taiwan
Taiwan Semiconductor Manufacturing Co Ltd 181,313 TWD 3,843,333 3,871,909 0.52
3,843,333 3,871,909 0.52 United States
1Life Healthcare Inc 63,097 USD 2,315,880 2,085,987 0.28
(2) See Note 13.
52

Natixis International Funds (Lux) I
The accompanying notes form an integral part of these financial statements.
Thematics Meta Fund Statement of Investments (continued) As at June 30, 2021 (expressed in USD)
Description Quantity Currency Cost Evaluation % of Net
Assets
Activision Blizzard Inc 43,209 USD 3,610,467 4,123,821 0.55
Adobe Inc 10,871 USD 4,666,428 6,366,726 0.86
Agilent Technologies Inc 12,638 USD 1,101,202 1,867,954 0.25
Alarm.com Holdings Inc 28,855 USD 1,775,980 2,443,992 0.33
Alphabet Inc 3,023 USD 4,262,575 7,382,192 0.99
Altair Engineering Inc 44,501 USD 1,715,656 3,069,214 0.41
American Water Works Co Inc 28,249 USD 3,597,850 4,354,023 0.59
Anaplan Inc 39,537 USD 2,253,446 2,107,338 0.28
ANSYS Inc 11,701 USD 2,901,621 4,060,830 0.55
API Group Corp 144A(2) 235,854 USD 3,553,272 4,926,993 0.66
Applied Industrial Technologies Inc 43,667 USD 2,934,926 3,976,272 0.53
Autodesk Inc 24,525 USD 6,273,024 7,158,818 0.96
Avantor Inc 72,930 USD 2,184,868 2,589,736 0.35
BrightView Holdings Inc 173,747 USD 3,081,157 2,800,795 0.38
Brooks Automation Inc 30,537 USD 2,649,888 2,909,574 0.39
Cadence Design Systems Inc 32,058 USD 2,881,718 4,386,226 0.59
California Water Service Group 56,276 USD 2,870,159 3,125,558 0.42
Charter Communications Inc 7,376 USD 4,201,903 5,321,670 0.72
Chegg Inc 45,139 USD 3,378,830 3,751,498 0.50
Cintas Corp 10,598 USD 2,923,026 4,048,500 0.54
Clean Harbors Inc 41,726 USD 2,818,317 3,886,357 0.52
Clorox Co/The 16,397 USD 3,220,834 2,950,045 0.40
Cognex Corp 46,895 USD 2,579,176 3,941,556 0.53
Coherent Inc 20,190 USD 3,218,618 5,337,110 0.72
CoStar Group Inc 82,315 USD 6,929,357 6,817,344 0.92
Costco Wholesale Corp 15,665 USD 5,231,763 6,198,113 0.83
Crowdstrike Holdings Inc 13,293 USD 2,713,669 3,340,567 0.45
CryoPort Inc 91,072 USD 2,892,462 5,746,668 0.77
Danaher Corp 23,729 USD 3,698,404 6,367,839 0.86
Dexcom Inc 9,786 USD 3,509,138 4,178,492 0.56
Ecolab Inc 26,981 USD 5,250,452 5,557,243 0.75
Emerson Electric Co 24,528 USD 1,630,222 2,360,592 0.32
Essential Utilities Inc 178,894 USD 7,769,763 8,175,473 1.10
Everbridge Inc 39,159 USD 4,190,777 5,328,802 0.72
Evoqua Water Technologies Corp 128,500 USD 3,219,106 4,340,733 0.58
Exponent Inc 35,111 USD 2,797,824 3,132,279 0.42
FactSet Research Systems Inc 9,951 USD 3,074,730 3,339,650 0.45
Fiserv Inc 53,530 USD 5,680,654 5,721,792 0.77
frontdoor Inc 46,829 USD 2,590,379 2,333,013 0.31
Generac Holdings Inc 17,424 USD 2,201,605 7,233,617 0.97
Global Payments Inc 26,585 USD 4,657,669 4,985,795 0.67
GoDaddy Inc 54,658 USD 4,201,787 4,753,022 0.64
HealthEquity Inc 60,372 USD 3,969,648 4,858,763 0.65
Helios Technologies Inc 43,799 USD 2,323,482 3,418,483 0.46
Hologic Inc 40,703 USD 2,216,652 2,715,697 0.36
HubSpot Inc 11,049 USD 3,614,715 6,438,651 0.87
IDEX Corp 16,706 USD 2,651,898 3,676,257 0.49
Intuit Inc 14,774 USD 4,675,509 7,241,994 0.97
Intuitive Surgical Inc 5,576 USD 3,094,630 5,127,777 0.69
iRobot Corp 29,269 USD 2,262,968 2,733,462 0.37
Jack Henry & Associates Inc 23,352 USD 3,760,350 3,818,268 0.51
(2) See Note 13.
53

Natixis International Funds (Lux) I
The accompanying notes form an integral part of these financial statements.
Thematics Meta Fund Statement of Investments (continued) As at June 30, 2021 (expressed in USD)
Description Quantity Currency Cost Evaluation % of Net
Assets
John Bean Technologies Corp 23,844 USD 2,244,221 3,400,653 0.46
KLA Corp 9,245 USD 1,737,818 2,997,230 0.40
Littelfuse Inc 12,394 USD 2,646,644 3,157,986 0.42
Masco Corp 75,296 USD 3,758,494 4,435,708 0.60
Match Group Inc 32,891 USD 3,859,686 5,303,719 0.71
Mettler-Toledo International Inc 1,960 USD 1,686,821 2,715,905 0.37
Microsoft Corp 16,899 USD 3,407,223 4,577,908 0.62
MSA Safety Inc 22,454 USD 2,926,293 3,717,891 0.50
MSCI Inc 12,469 USD 4,468,780 6,647,013 0.89
Nasdaq Inc 34,376 USD 4,355,507 6,043,276 0.81
Netflix Inc 6,180 USD 2,970,848 3,264,195 0.44
New York Times Co/The 91,761 USD 3,852,304 3,996,180 0.54
Nuance Communications Inc 107,833 USD 2,697,329 5,870,406 0.79
NVIDIA Corp 19,369 USD 7,156,345 15,497,031 2.08
Omnicell Inc 24,303 USD 1,828,752 3,680,669 0.49
ON Semiconductor Corp 88,688 USD 2,068,993 3,394,959 0.46
Palo Alto Networks Inc 8,443 USD 1,977,934 3,132,630 0.42
PayPal Holdings Inc 22,364 USD 3,382,362 6,518,638 0.88
Peloton Interactive Inc 20,790 USD 1,982,913 2,578,400 0.35
Planet Fitness Inc 74,623 USD 4,950,165 5,615,384 0.75
Pool Corp 7,104 USD 1,650,400 3,258,516 0.44
Primo Water Corp 173,907 USD 2,371,412 2,909,464 0.39
PTC Inc 28,644 USD 2,703,862 4,046,221 0.54
Q2 Holdings Inc 32,513 USD 2,920,500 3,335,186 0.45
Rapid7 Inc 44,907 USD 2,443,865 4,249,596 0.57
Rexnord Corp 61,535 USD 2,910,193 3,079,224 0.41
RingCentral Inc 10,926 USD 2,987,914 3,174,937 0.43
Rockwell Automation Inc 11,561 USD 2,282,567 3,306,553 0.44
Rollins Inc 81,911 USD 2,462,666 2,801,365 0.38
Roper Technologies Inc 11,775 USD 4,310,267 5,536,471 0.74
salesforce.com Inc 23,365 USD 4,457,539 5,707,463 0.77
ServiceNow Inc 18,383 USD 7,151,780 10,102,274 1.36
Shift4 Payments Inc 46,345 USD 4,350,794 4,343,409 0.58
SJW Group 48,955 USD 3,125,045 3,098,869 0.42
Sotera Health Co 142,626 USD 3,783,347 3,455,832 0.46
Splunk Inc 51,604 USD 7,014,222 7,460,915 1.00
SPS Commerce Inc 31,708 USD 2,230,162 3,166,016 0.43
Stanley Black & Decker Inc 17,783 USD 2,919,617 3,645,412 0.49
STERIS PLC 17,783 USD 2,821,165 3,668,708 0.49
Stitch Fix Inc 35,007 USD 1,399,734 2,110,896 0.28
Synopsys Inc 29,752 USD 4,919,704 8,205,381 1.10
Teladoc Health Inc 12,659 USD 2,471,983 2,105,091 0.28
Teradyne Inc 34,691 USD 2,493,361 4,647,265 0.62
Tetra Tech Inc 26,786 USD 2,671,541 3,268,956 0.44
Thermo Fisher Scientific Inc 23,294 USD 8,525,329 11,751,020 1.58
T-Mobile US Inc 44,054 USD 4,771,961 6,380,294 0.86
Toro Co/The 33,654 USD 2,444,985 3,697,861 0.50
TransUnion 42,213 USD 3,365,281 4,635,414 0.62
Tyler Technologies Inc 6,432 USD 1,841,118 2,909,772 0.39
US Ecology Inc 57,841 USD 2,311,397 2,170,188 0.29
Vail Resorts Inc 12,075 USD 3,544,069 3,821,836 0.51
Varonis Systems Inc 106,521 USD 3,249,043 6,137,715 0.82
54
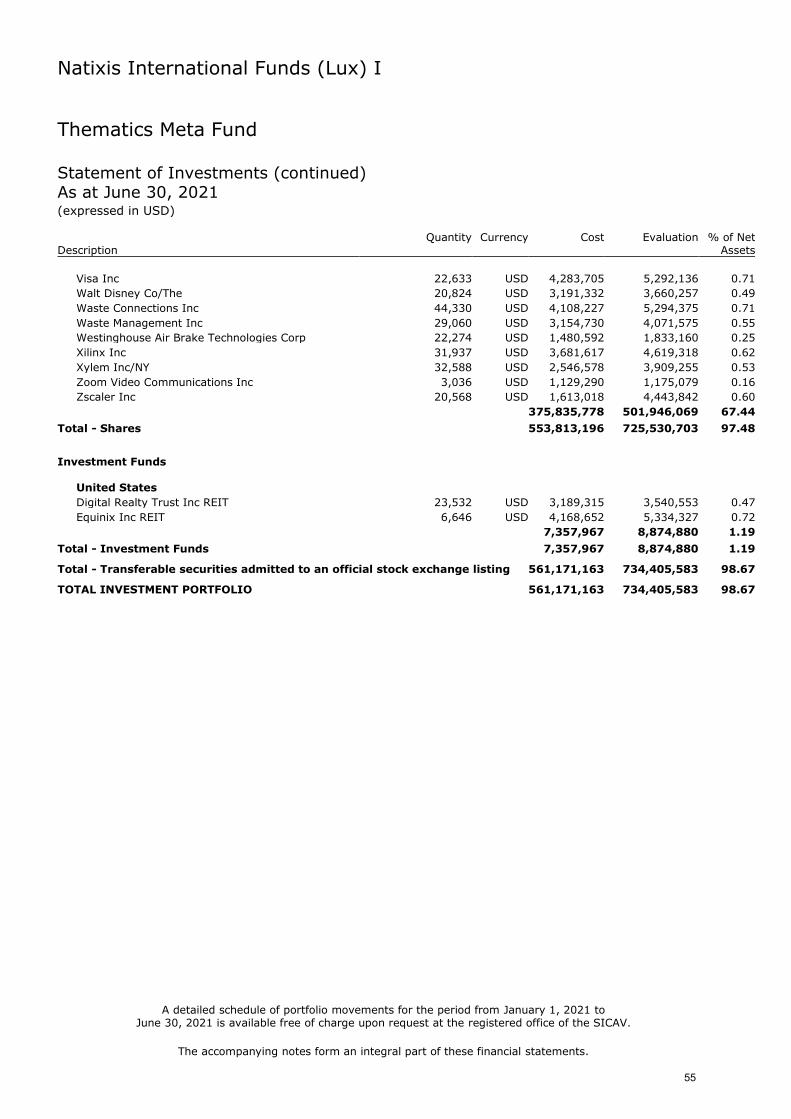
Natixis International Funds (Lux) I
The accompanying notes form an integral part of these financial statements.
Thematics Meta Fund Statement of Investments (continued) As at June 30, 2021 (expressed in USD)
Description Quantity Currency Cost Evaluation % of Net
Assets
Visa Inc 22,633 USD 4,283,705 5,292,136 0.71
Walt Disney Co/The 20,824 USD 3,191,332 3,660,257 0.49
Waste Connections Inc 44,330 USD 4,108,227 5,294,375 0.71
Waste Management Inc 29,060 USD 3,154,730 4,071,575 0.55
Westinghouse Air Brake Technologies Corp 22,274 USD 1,480,592 1,833,160 0.25
Xilinx Inc 31,937 USD 3,681,617 4,619,318 0.62
Xylem Inc/NY 32,588 USD 2,546,578 3,909,255 0.53
Zoom Video Communications Inc 3,036 USD 1,129,290 1,175,079 0.16
Zscaler Inc 20,568 USD 1,613,018 4,443,842 0.60
375,835,778 501,946,069 67.44
Total - Shares 553,813,196 725,530,703 97.48
Investment Funds
United States
Digital Realty Trust Inc REIT 23,532 USD 3,189,315 3,540,553 0.47
Equinix Inc REIT 6,646 USD 4,168,652 5,334,327 0.72
7,357,967 8,874,880 1.19
Total - Investment Funds 7,357,967 8,874,880 1.19
Total - Transferable securities admitted to an official stock exchange listing 561,171,163 734,405,583 98.67
TOTAL INVESTMENT PORTFOLIO 561,171,163 734,405,583 98.67
A detailed schedule of portfolio movements for the period from January 1, 2021 to June 30, 2021 is available free of charge upon request at the registered office of the SICAV.
55

Natixis International Funds (Lux) I
Thematics Safety Fund
Statistics
As at June 30, 2021
Net asset value per share
H-I/A (CHF) 198.75
H-I/A (EUR) 143.33
H-N/A (CHF) 153.20
H-N/A (EUR) 159.04
H-N/A (GBP) 104.32
H-N1/A (CHF) 120.04
H-N1/A (EUR) 139.75
H-R/A (CHF) 138.66
H-R/A (EUR) 141.30
H-R/A (GBP) 140.57
H-R/A (SGD) 126.80
H-S/A (CHF) 129.48
H-S1/A (CHF) 129.56
I/A (USD) 219.20
I/A (EUR) 141.13
N/A (USD) 156.59
N/A (EUR) 148.36
N1/A (USD) 219.46
N1/A (EUR) 155.02
N1/A (GBP) 148.10
R/A (USD) 214.52
R/A (EUR) 171.11
R/A (SGD) 125.11
RE/A (USD) 155.81
RE/A (EUR) 145.19
S/A (USD) 220.36
S/A (EUR) 121.72
S/A (GBP) 114.98
S1/A (USD) 122.59
S1/A (EUR) 154.09
Number of shares outstanding
H-I/A (CHF) 4,949.000
H-I/A (EUR) 415,396.558
H-N/A (CHF) 5,613.416
H-N/A (EUR) 34,147.219
H-N/A (GBP) 1,195.000
H-N1/A (CHF) 14,575.268
H-N1/A (EUR) 189,679.606
H-R/A (CHF) 14,290.033
H-R/A (EUR) 360,346.925
H-R/A (GBP) 750.000
H-R/A (SGD) 405.414
H-S/A (CHF) 30.000
H-S1/A (CHF) 30.000
I/A (USD) 128,156.386
I/A (EUR) 389,183.264
N/A (USD) 40,267.930
N/A (EUR) 89,285.108
N1/A (USD) 112,898.835
56

Natixis International Funds (Lux) I
Thematics Safety Fund
Statistics (continued)
As at June 30, 2021
Number of shares outstanding
N1/A (EUR) 97,661.630
N1/A (GBP) 126,088.746
R/A (USD) 198,382.094
R/A (EUR) 973,076.439
R/A (SGD) 31.718
RE/A (USD) 5,987.086
RE/A (EUR) 3,820.752
S/A (USD) 70,838.602
S/A (EUR) 181,353.076
S/A (GBP) 48,778.019
S1/A (USD) 486,503.619
S1/A (EUR) 762,523.312
57

Natixis International Funds (Lux) I
The accompanying notes form an integral part of these financial statements
Thematics Safety Fund Statement of Investments
As at June 30, 2021 (expressed in USD)
Description Quantity Currency Cost Evaluation % of Net
Assets
Transferable securities admitted to an official stock exchange listing Shares
France
Worldline SA/France 144A(2) 250,213 EUR 21,962,556 23,423,664 2.76
21,962,556 23,423,664 2.76 Germany
Knorr-Bremse AG 84,498 EUR 10,377,216 9,720,012 1.15
10,377,216 9,720,012 1.15 Great Britain
Alphawave IP Group PLC 1,230,555 GBP 7,023,869 6,119,821 0.72
Halma PLC 528,318 GBP 14,040,494 19,647,435 2.31
Rentokil Initial PLC 3,104,280 GBP 19,030,381 21,227,619 2.50
40,094,744 46,994,875 5.53 Ireland
Aptiv PLC 162,433 USD 15,496,033 25,555,626 3.01
Experian PLC 522,576 GBP 17,641,729 20,112,474 2.37
33,137,762 45,668,100 5.38 Italy
Nexi SpA 144A(2) 910,611 EUR 14,790,210 19,988,825 2.35
14,790,210 19,988,825 2.35 Luxembourg
Eurofins Scientific SE 74,654 EUR 4,586,020 8,534,465 1.01
4,586,020 8,534,465 1.01 United States
API Group Corp 144A(2) 1,077,146 USD 16,227,794 22,501,577 2.65
Avantor Inc 333,070 USD 9,978,295 11,827,324 1.39
Brooks Automation Inc 139,463 USD 12,102,037 13,288,026 1.56
Cintas Corp 48,402 USD 13,349,459 18,489,500 2.18
Crowdstrike Holdings Inc 60,707 USD 12,393,329 15,256,373 1.80
CryoPort Inc 415,928 USD 13,209,876 26,245,032 3.09
Ecolab Inc 43,480 USD 8,396,682 8,955,496 1.05
Everbridge Inc 178,841 USD 19,139,278 24,336,638 2.87
Fiserv Inc 244,470 USD 25,943,547 26,131,428 3.08
Generac Holdings Inc 79,576 USD 10,054,729 33,035,933 3.89
Global Payments Inc 121,415 USD 21,271,576 22,770,125 2.68
Jack Henry & Associates Inc 106,648 USD 17,173,519 17,438,032 2.05
Littelfuse Inc 56,606 USD 12,087,224 14,422,524 1.70
MSA Safety Inc 102,546 USD 13,364,383 16,979,609 2.00
NVIDIA Corp 27,893 USD 11,613,176 22,316,855 2.63
Palo Alto Networks Inc 38,557 USD 9,033,226 14,306,720 1.68
PayPal Holdings Inc 102,136 USD 15,447,247 29,770,622 3.51
Q2 Holdings Inc 148,487 USD 13,337,923 15,231,794 1.79
Rapid7 Inc 205,093 USD 11,161,133 19,407,904 2.28
Rollins Inc 374,089 USD 11,246,997 12,793,835 1.51
ServiceNow Inc 36,096 USD 14,118,743 19,836,712 2.34
Shift4 Payments Inc 211,655 USD 19,870,076 19,836,351 2.34
Sotera Health Co 651,374 USD 17,278,545 15,782,788 1.86
Splunk Inc 147,667 USD 19,288,141 21,349,638 2.51
Stanley Black & Decker Inc 81,217 USD 13,333,890 16,648,598 1.96
STERIS PLC 81,217 USD 12,884,261 16,754,992 1.97
(2) See Note 13.
58

Natixis International Funds (Lux) I
The accompanying notes form an integral part of these financial statements
Thematics Safety Fund Statement of Investments (continued)
As at June 30, 2021 (expressed in USD)
Description Quantity Currency Cost Evaluation % of Net
Assets
Synopsys Inc 58,246 USD 10,844,453 16,063,740 1.89
Thermo Fisher Scientific Inc 46,761 USD 17,104,221 23,589,568 2.78
TransUnion 192,787 USD 15,369,240 21,169,936 2.49
US Ecology Inc 264,159 USD 10,556,149 9,911,252 1.17
Varonis Systems Inc 486,479 USD 14,838,380 28,030,945 3.30
Visa Inc 103,367 USD 19,563,683 24,169,184 2.85
Westinghouse Air Brake Technologies Corp 101,726 USD 6,761,863 8,372,040 0.99
Zscaler Inc 93,932 USD 7,366,653 20,295,028 2.39
475,709,728 647,316,119 76.23
Total - Shares 600,658,236 801,646,060 94.41
Investment Funds
United States
Digital Realty Trust Inc REIT 107,468 USD 14,565,603 16,169,707 1.90
Equinix Inc REIT 30,354 USD 19,038,234 24,361,873 2.87
33,603,837 40,531,580 4.77
Total - Investment Funds 33,603,837 40,531,580 4.77
Total - Transferable securities admitted to an official stock exchange listing 634,262,073 842,177,640 99.18
TOTAL INVESTMENT PORTFOLIO 634,262,073 842,177,640 99.18
A detailed schedule of portfolio movements for the period from January 1, 2021 to
June 30, 2021 is available free of charge upon request at the registered office of the SICAV.
59

Natixis International Funds (Lux) I
Thematics Subscription Economy Fund
Statistics
As at June 30, 2021
Net asset value per share
H-I/A (EUR) 172.98
H-N/A (EUR) 103.24
H-N1/A (EUR) 122.02
H-R/A (EUR) 150.57
H-R/A (SGD) 109.98
H-RE/A (EUR) 101.19
I/A (USD) 156.97
I/A (EUR) 146.76
N/A (USD) 156.62
N/A (EUR) 146.43
N1/A (USD) 116.96
N1/A (EUR) 126.24
N1/A (GBP) 118.72
R/A (USD) 154.95
R/A (EUR) 144.88
R/A (SGD) 110.52
RE/A (USD) 153.58
RE/A (EUR) 143.60
S/A (USD) 98.33
Number of shares outstanding
H-I/A (EUR) 586,273.979
H-N/A (EUR) 3,429.780
H-N1/A (EUR) 194,408.684
H-R/A (EUR) 15,611.440
H-R/A (SGD) 99.059
H-RE/A (EUR) 265.041
I/A (USD) 65,920.468
I/A (EUR) 134,784.157
N/A (USD) 3,879.663
N/A (EUR) 31,505.241
N1/A (USD) 5,473.769
N1/A (EUR) 1,162.000
N1/A (GBP) 281.698
R/A (USD) 60,231.047
R/A (EUR) 110,451.791
R/A (SGD) 277.483
RE/A (USD) 6,895.356
RE/A (EUR) 763.577
S/A (USD) 191,415.000
60

Natixis International Funds (Lux) I
The accompanying notes form an integral part of these financial statements.
Thematics Subscription Economy Fund Statement of Investments
As at June 30, 2021 (expressed in USD)
Description Quantity Currency Cost Evaluation % of Net
Assets
Transferable securities admitted to an official stock exchange listing Shares
China
Tencent Music Entertainment Group ADR 282,383 USD 4,916,964 4,371,295 1.81
4,916,964 4,371,295 1.81 France
Ubisoft Entertainment SA 44,667 EUR 3,798,955 3,127,363 1.30
3,798,955 3,127,363 1.30 Germany
HelloFresh SE 39,016 EUR 2,077,423 3,793,131 1.58
Scout24 AG 144A(2) 82,019 EUR 6,594,947 6,917,550 2.87
8,672,370 10,710,681 4.45 Great Britain
Auto Trader Group PLC 144A(2) 427,145 GBP 3,103,252 3,737,563 1.55
Clarivate PLC 193,114 USD 4,950,138 5,316,424 2.21
HomeServe PLC 236,350 GBP 3,575,753 3,119,761 1.30
London Stock Exchange Group PLC 37,007 GBP 4,014,516 4,074,495 1.69
15,643,659 16,248,243 6.75 Israel
Wix.com Ltd 12,672 USD 2,794,140 3,678,357 1.53
2,794,140 3,678,357 1.53 Japan
Menicon Co Ltd 41,303 JPY 2,655,487 2,902,643 1.21
Sony Group Corp 49,665 JPY 4,351,554 4,839,462 2.01
7,007,041 7,742,105 3.22 Netherlands
Basic-Fit NV 144A(2) 110,243 EUR 3,391,480 4,714,390 1.96
Signify NV 144A(2) 74,573 EUR 2,455,779 4,717,168 1.96
Wolters Kluwer NV 71,501 EUR 5,669,189 7,183,697 2.98
11,516,448 16,615,255 6.90 South Korea
Coway Co Ltd 36,611 KRW 2,307,714 2,558,540 1.06
2,307,714 2,558,540 1.06 United States
1Life Healthcare Inc 81,961 USD 3,008,254 2,709,631 1.13
Activision Blizzard Inc 56,126 USD 4,689,882 5,356,712 2.23
Adobe Inc 14,122 USD 6,061,541 8,270,174 3.44
Alarm.com Holdings Inc 37,481 USD 2,306,942 3,174,667 1.32
Anaplan Inc 51,358 USD 2,927,154 2,737,365 1.14
Charter Communications Inc 9,582 USD 5,458,138 6,912,679 2.87
Chegg Inc 58,634 USD 4,388,992 4,873,076 2.02
CoStar Group Inc 106,925 USD 8,471,458 8,855,513 3.68
Costco Wholesale Corp 20,348 USD 6,795,893 8,051,151 3.34
Dexcom Inc 12,711 USD 4,558,259 5,427,727 2.25
Essential Utilities Inc 92,155 USD 4,091,495 4,211,489 1.75
FactSet Research Systems Inc 12,926 USD 3,993,977 4,338,100 1.80
frontdoor Inc 60,829 USD 3,364,819 3,030,509 1.26
GoDaddy Inc 70,998 USD 5,457,987 6,174,024 2.57
HealthEquity Inc 78,422 USD 5,156,446 6,311,378 2.62
HubSpot Inc 14,353 USD 4,695,400 8,363,602 3.47
Intuit Inc 19,192 USD 6,073,337 9,407,120 3.91
(2) See Note 13.
61

Natixis International Funds (Lux) I
The accompanying notes form an integral part of these financial statements.
Thematics Subscription Economy Fund Statement of Investments (continued) As at June 30, 2021 (expressed in USD)
Description Quantity Currency Cost Evaluation % of Net
Assets
Match Group Inc 42,725 USD 5,013,609 6,889,361 2.86
Microsoft Corp 21,951 USD 4,425,874 5,946,557 2.47
MSCI Inc 16,197 USD 5,804,802 8,634,258 3.59
Nasdaq Inc 44,653 USD 5,657,665 7,850,022 3.26
Netflix Inc 8,027 USD 3,859,037 4,240,085 1.76
New York Times Co/The 119,194 USD 5,004,020 5,190,910 2.16
Peloton Interactive Inc 27,006 USD 2,575,741 3,349,260 1.39
Planet Fitness Inc 96,933 USD 6,430,107 7,294,205 3.03
RingCentral Inc 14,193 USD 3,881,206 4,124,142 1.71
Stitch Fix Inc 45,472 USD 1,818,210 2,741,987 1.14
Teladoc Health Inc 16,444 USD 3,211,028 2,734,447 1.14
T-Mobile US Inc 57,224 USD 6,198,625 8,287,799 3.44
Vail Resorts Inc 15,684 USD 4,603,633 4,964,443 2.06
Walt Disney Co/The 27,050 USD 4,145,438 4,754,556 1.98
Zoom Video Communications Inc 3,944 USD 1,466,911 1,526,390 0.63
145,595,880 176,733,339 73.42
Total - Shares 202,253,171 241,785,178 100.44
Total - Transferable securities admitted to an official stock exchange listing 202,253,171 241,785,178 100.44
TOTAL INVESTMENT PORTFOLIO 202,253,171 241,785,178 100.44
A detailed schedule of portfolio movements for the period from January 1, 2021 to June 30, 2021 is available free of charge upon request at the registered office of the SICAV.
62

Natixis International Funds (Lux) I
Thematics Water Fund
Statistics
As at June 30, 2021
Net asset value per share
H-I/A (EUR) 123.34
H-N/A (CHF) 128.31
H-N/A (EUR) 123.22
H-R/A (EUR) 124.06
H-R/A (SGD) 124.87
H-RE/A (EUR) 112.26
H-S/A (EUR) 138.20
I/A (USD) 175.17
I/A (EUR) 140.75
N/A (USD) 135.22
N/A (EUR) 135.91
N1/A (USD) 175.41
N1/A (GBP) 125.98
R/A (USD) 171.42
R/A (EUR) 144.90
R/A (SGD) 124.74
RE/A (USD) 133.32
RE/A (EUR) 116.00
S/A (USD) 176.04
S/A (EUR) 161.47
Number of shares outstanding
H-I/A (EUR) 252,796.172
H-N/A (CHF) 5,733.000
H-N/A (EUR) 4,901.742
H-R/A (EUR) 214,310.030
H-R/A (SGD) 903.300
H-RE/A (EUR) 651.504
H-S/A (EUR) 446,196.000
I/A (USD) 24,659.500
I/A (EUR) 76,796.578
N/A (USD) 1,359.000
N/A (EUR) 48,115.037
N1/A (USD) 5,930.288
N1/A (GBP) 92,675.997
R/A (USD) 17,478.870
R/A (EUR) 267,485.740
R/A (SGD) 230.425
RE/A (USD) 5,105.742
RE/A (EUR) 1,381.414
S/A (USD) 123,000.000
S/A (EUR) 375,697.115
63

Natixis International Funds (Lux) I
The accompanying notes form an integral part of these financial statements.
Thematics Water Fund Statement of Investments
As at June 30, 2021 (expressed in USD)
Description Quantity Currency Cost Evaluation % of Net
Assets
Transferable securities admitted to an official stock exchange listing Shares
Brazil
Cia de Saneamento Basico do Estado de Sao Paulo 577,028 BRL 5,250,600 4,206,519 1.28
5,250,600 4,206,519 1.28 Canada
Stantec Inc 203,632 CAD 6,097,374 9,095,457 2.77
6,097,374 9,095,457 2.77 France
Elis SA 271,162 EUR 4,483,029 5,109,761 1.55
Veolia Environnement SA 340,615 EUR 8,446,806 10,288,233 3.13
12,929,835 15,397,994 4.68 Great Britain
Ferguson PLC 61,445 GBP 5,544,576 8,530,711 2.59
Halma PLC 178,175 GBP 4,709,805 6,626,086 2.02
HomeServe PLC 513,393 GBP 7,490,418 6,776,661 2.06
Pennon Group PLC 539,463 GBP 6,549,994 8,462,220 2.57
Pentair PLC 107,659 USD 4,149,867 7,265,900 2.21
Severn Trent PLC 226,650 GBP 6,803,507 7,830,788 2.38
Spirax-Sarco Engineering PLC 25,741 GBP 2,765,394 4,841,525 1.47
Travis Perkins PLC 207,141 GBP 4,890,205 4,833,168 1.47
42,903,766 55,167,059 16.77 Hong Kong
China Everbright Environment Group Ltd 6,257,451 HKD 4,176,777 3,545,366 1.08
Guangdong Investment Ltd 2,523,093 HKD 4,515,257 3,625,838 1.10
8,692,034 7,171,204 2.18 Japan
Kurita Water Industries Ltd 130,796 JPY 3,906,094 6,281,117 1.91
Shimadzu Corp 154,913 JPY 4,177,397 5,994,703 1.82
8,083,491 12,275,820 3.73 Luxembourg
Eurofins Scientific SE 52,644 EUR 3,346,855 6,018,266 1.83
3,346,855 6,018,266 1.83 Netherlands
Aalberts NV 134,865 EUR 4,819,838 7,248,321 2.20
4,819,838 7,248,321 2.20 South Korea
Coway Co Ltd 82,425 KRW 5,227,735 5,760,192 1.75
5,227,735 5,760,192 1.75 Spain
Fluidra SA 145,941 EUR 2,106,263 5,789,248 1.76
2,106,263 5,789,248 1.76 Sweden
Alfa Laval AB 230,773 SEK 5,098,996 8,157,341 2.48
5,098,996 8,157,341 2.48 Switzerland
Geberit AG 4,521 CHF 2,241,785 3,394,406 1.03
2,241,785 3,394,406 1.03 United States
Agilent Technologies Inc 22,275 USD 1,941,026 3,292,537 1.00
American Water Works Co Inc 49,793 USD 6,341,727 7,674,591 2.33
Applied Industrial Technologies Inc 76,968 USD 5,173,229 7,008,751 2.13
64

Natixis International Funds (Lux) I
The accompanying notes form an integral part of these financial statements.
Thematics Water Fund Statement of Investments (continued) As at June 30, 2021 (expressed in USD)
Description Quantity Currency Cost Evaluation % of Net
Assets
Autodesk Inc 23,607 USD 6,836,514 6,890,893 2.09
BrightView Holdings Inc 306,253 USD 5,430,983 4,936,805 1.50
California Water Service Group 99,194 USD 5,059,068 5,509,246 1.67
Clean Harbors Inc 73,548 USD 4,967,689 6,850,263 2.08
Clorox Co/The 28,903 USD 5,677,183 5,199,878 1.58
Danaher Corp 41,825 USD 6,518,969 11,224,232 3.41
Ecolab Inc 30,777 USD 6,013,958 6,339,046 1.93
Essential Utilities Inc 190,277 USD 8,143,341 8,695,636 2.64
Evoqua Water Technologies Corp 226,500 USD 5,674,137 7,651,167 2.33
Exponent Inc 61,889 USD 4,931,567 5,521,091 1.68
Helios Technologies Inc 77,201 USD 4,095,470 6,025,567 1.83
IDEX Corp 29,448 USD 4,674,352 6,479,931 1.97
Masco Corp 132,721 USD 6,624,886 7,818,573 2.38
Pool Corp 12,523 USD 2,909,068 5,743,603 1.75
Primo Water Corp 306,536 USD 4,179,955 5,128,348 1.56
Rexnord Corp 108,465 USD 5,129,633 5,427,576 1.65
Roper Technologies Inc 8,855 USD 3,214,717 4,163,710 1.27
SJW Group 86,291 USD 5,508,342 5,462,203 1.66
Tetra Tech Inc 47,214 USD 4,708,975 5,762,004 1.75
Thermo Fisher Scientific Inc 23,011 USD 8,425,706 11,608,417 3.53
Toro Co/The 59,319 USD 4,309,637 6,518,012 1.98
Waste Connections Inc 78,139 USD 7,241,341 9,332,097 2.84
Waste Management Inc 51,222 USD 5,560,665 7,176,736 2.18
Xylem Inc/NY 57,441 USD 4,488,710 6,890,624 2.09
143,780,848 180,331,537 54.81
Total - Shares 250,579,420 320,013,364 97.27
Total - Transferable securities admitted to an official stock exchange listing 250,579,420 320,013,364 97.27
TOTAL INVESTMENT PORTFOLIO 250,579,420 320,013,364 97.27
A detailed schedule of portfolio movements for the period from January 1, 2021 to June 30, 2021 is available free of charge upon request at the registered office of the SICAV.
65

Natixis International Funds (Lux) I
Thematics Wellness Fund(1)
Statistics
As at June 30, 2021
Net asset value per share
H-R/A (EUR) 101.99
H-S/A (EUR) 102.20
I/A (USD) 102.40
I/A (EUR) 103.35
N/A (USD) 102.37
N/A (EUR) 103.32
R/A (USD) 102.22
R/A (EUR) 103.17
RE/A (USD) 102.09
RE/A (EUR) 103.04
Number of shares outstanding
H-R/A (EUR) 30.000
H-S/A (EUR) 49,999.999
I/A (USD) 30.000
I/A (EUR) 30.000
N/A (USD) 30.000
N/A (EUR) 30.000
R/A (USD) 30.000
R/A (EUR) 30.000
RE/A (USD) 30.000
RE/A (EUR) 30.000
(1) See Note 1.
66

Natixis International Funds (Lux) I
The accompanying notes form an integral part of these financial statements.
Thematics Wellness Fund(1)
Statement of Investments
As at June 30, 2021 (expressed in USD)
Description Quantity Currency Cost Evaluation % of Net
Assets
Transferable securities admitted to an official stock exchange listing Shares
Canada
Lululemon Athletica Inc 470 USD 153,969 171,536 2.82
153,969 171,536 2.82 China
ANTA Sports Products Ltd 4,000 HKD 73,718 94,156 1.55
73,718 94,156 1.55 France
Believe SAS 4,900 EUR 116,432 84,781 1.39
L'Oreal SA 504 EUR 207,490 224,613 3.69
Orpea SA 936 EUR 120,502 119,048 1.95
444,424 428,442 7.03 Germany
HelloFresh SE 908 EUR 77,518 88,276 1.45
Puma SE 1,100 EUR 121,910 131,166 2.15
199,428 219,442 3.60 Great Britain
Nomad Foods Ltd 4,070 USD 118,188 115,059 1.89
Pets at Home Group PLC 25,000 GBP 155,995 157,485 2.59
Reckitt Benckiser Group PLC 993 GBP 91,441 87,753 1.44
THG PLC 10,000 GBP 91,934 84,269 1.38
457,558 444,566 7.30 Ireland
Kerry Group PLC 1,144 EUR 151,838 159,816 2.62
Medtronic PLC 735 USD 92,487 91,235 1.50
244,325 251,051 4.12 Italy
Amplifon SpA 2,572 EUR 109,343 127,008 2.08
Technogym SpA 144A(2) 7,302 EUR 94,104 93,175 1.53
203,447 220,183 3.61 Japan
Shimano Inc 500 JPY 123,802 118,705 1.95
123,802 118,705 1.95 Luxembourg
L'Occitane International SA 36,000 HKD 110,576 131,653 2.16
110,576 131,653 2.16 Netherlands
Accell Group NV 1,690 EUR 86,138 90,789 1.49
Basic-Fit NV 144A(2) 2,877 EUR 121,326 123,031 2.02
Koninklijke DSM NV 550 EUR 98,058 102,663 1.69
305,522 316,483 5.20 Spain
Fluidra SA 3,715 EUR 129,737 147,368 2.42
129,737 147,368 2.42 Sweden
Oatly Group AB ADR 5,368 USD 140,107 131,301 2.16
140,107 131,301 2.16 Switzerland
Alcon Inc 1,641 USD 121,684 115,297 1.89
(1) See Note 1.
(2) See Note 13.
67

Natixis International Funds (Lux) I
The accompanying notes form an integral part of these financial statements.
Thematics Wellness Fund Statement of Investments (continued) As at June 30, 2021 (expressed in USD)
Description Quantity Currency Cost Evaluation % of Net
Assets
Garmin Ltd 656 USD 90,916 94,884 1.56
Givaudan SA 40 CHF 166,592 186,206 3.06
Nestle SA 736 CHF 92,870 91,742 1.50
472,062 488,129 8.01 United States
Align Technology Inc 202 USD 122,495 123,422 2.03
Callaway Golf Co 2,731 USD 78,950 92,117 1.51
Chegg Inc 1,350 USD 123,940 112,198 1.84
Chipotle Mexican Grill Inc 92 USD 139,710 142,631 2.34
Dexcom Inc 231 USD 92,310 98,637 1.62
Estee Lauder Cos Inc/The 593 USD 180,996 188,621 3.10
Exact Sciences Corp 946 USD 123,509 117,597 1.93
Freshpet Inc 353 USD 60,353 57,525 0.94
Hain Celestial Group Inc/The 2,105 USD 89,679 84,453 1.39
Hologic Inc 1,603 USD 121,848 106,952 1.76
IDEXX Laboratories Inc 234 USD 123,697 147,783 2.43
Laboratory Corp of America Holdings 356 USD 92,378 98,203 1.61
Match Group Inc 914 USD 133,430 147,382 2.42
NIKE Inc 1,900 USD 254,049 293,531 4.82
Peloton Interactive Inc 1,276 USD 153,038 158,250 2.60
Planet Fitness Inc 1,611 USD 137,580 121,228 1.99
Procter & Gamble Co/The 695 USD 92,516 93,776 1.54
Sleep Number Corp 911 USD 97,958 100,164 1.64
Teladoc Health Inc 398 USD 63,956 66,183 1.09
Ulta Beauty Inc 366 USD 119,469 126,552 2.08
Vail Resorts Inc 384 USD 122,156 121,544 1.99
Walgreens Boots Alliance Inc 2,760 USD 148,312 145,204 2.38
YETI Holdings Inc 1,050 USD 94,198 96,411 1.58
Zoetis Inc 738 USD 122,139 137,534 2.26
2,888,666 2,977,898 48.89
Total - Shares 5,947,341 6,140,913 100.82
Total - Transferable securities admitted to an official stock exchange listing 5,947,341 6,140,913 100.82
TOTAL INVESTMENT PORTFOLIO 5,947,341 6,140,913 100.82
(1) See Note 1. (2) See Note 13.
A detailed schedule of portfolio movements for the period from April 16, 2021 to June 30, 2021 is available free of charge upon request at the registered office of the SICAV.
68

Natixis International Funds (Lux) I
Vaughan Nelson Global Smid Cap Equity Fund
Statistics
As at June 30, 2021
Net asset value per share
I/A (USD) 158.68
Q/A (USD) 159.88
R/A (USD) 157.29
S/A (USD) 159.00
Number of shares outstanding
I/A (USD) 30.000
Q/A (USD) 50,000.000
R/A (USD) 30.000
S/A (USD) 30.000
69

Natixis International Funds (Lux) I
The accompanying notes form an integral part of these financial statements.
Vaughan Nelson Global Smid Cap Equity Fund Statement of Investments
As at June 30, 2021 (expressed in USD)
Description Quantity Currency Cost Evaluation % of Net
Assets
Transferable securities admitted to an official stock exchange listing Shares
Australia
Steadfast Group Ltd 46,007 AUD 107,792 151,975 1.90
107,792 151,975 1.90 Austria
S&T AG 5,230 EUR 139,831 119,704 1.49
139,831 119,704 1.49 Belgium
Mithra Pharmaceuticals SA 2,770 EUR 81,641 78,017 0.97
81,641 78,017 0.97 Canada
Ritchie Bros Auctioneers Inc 1,575 USD 88,692 93,366 1.17
88,692 93,366 1.17 China
China Yongda Automobiles Services Holdings Ltd 42,103 HKD 51,075 75,360 0.94
Haier Smart Home Co Ltd 15,175 HKD 48,395 52,955 0.66
99,470 128,315 1.60 France
Alten SA 663 EUR 57,665 87,903 1.10
Vetoquinol SA 769 EUR 50,945 94,479 1.18
108,610 182,382 2.28 Germany
PATRIZIA AG 3,341 EUR 89,490 87,166 1.09
TAG Immobilien AG 2,520 EUR 64,083 79,971 1.00
153,573 167,137 2.09 Great Britain
Alliance Pharma PLC 70,521 GBP 87,839 96,642 1.21
Beazley PLC 16,478 GBP 84,908 75,666 0.94
Capri Holdings Ltd 2,095 USD 71,698 119,813 1.50
Close Brothers Group PLC 3,025 GBP 41,575 63,310 0.79
Inchcape PLC 12,787 GBP 96,307 135,752 1.69
Marlowe PLC 19,210 GBP 126,803 233,531 2.92
National Express Group PLC 27,249 GBP 78,729 100,357 1.25
587,859 825,071 10.30 Israel
Tower Semiconductor Ltd 4,045 USD 81,788 119,044 1.49
81,788 119,044 1.49 Japan
Daiseki Co Ltd 2,015 JPY 52,074 90,593 1.13
FULLCAST Holdings Co Ltd 4,050 JPY 60,976 84,364 1.05
Noritsu Koki Co Ltd 3,567 JPY 57,268 76,360 0.96
Poletowin Pitcrew Holdings Inc 7,285 JPY 66,206 71,544 0.89
Ship Healthcare Holdings Inc 3,700 JPY 79,755 86,441 1.08
Stella Chemifa Corp 3,030 JPY 99,759 78,678 0.98
Takeuchi Manufacturing Co Ltd 3,952 JPY 67,310 98,524 1.23
Zenkoku Hosho Co Ltd 2,190 JPY 89,127 94,218 1.18
572,475 680,722 8.50
70

Natixis International Funds (Lux) I
The accompanying notes form an integral part of these financial statements.
Vaughan Nelson Global Smid Cap Equity Fund Statement of Investments (continued) As at June 30, 2021 (expressed in USD)
Description Quantity Currency Cost Evaluation % of Net
Assets
Jersey
Sanne Group PLC 13,582 GBP 105,356 156,107 1.95
105,356 156,107 1.95 Luxembourg
Befesa SA 144A(2) 1,512 EUR 56,397 116,192 1.45
Shurgard Self Storage SA 2,531 EUR 97,517 122,161 1.53
153,914 238,353 2.98
Mexico
GMexico Transportes SAB de CV 144A(2) 33,153 MXN 37,057 56,297 0.70
37,057 56,297 0.70 Netherlands
Koninklijke DSM NV 434 EUR 64,231 81,011 1.01
64,231 81,011 1.01 Norway
Aker ASA 1,240 NOK 100,403 91,503 1.14
Atea ASA 9,689 NOK 100,899 188,483 2.35
Leroy Seafood Group ASA 9,990 NOK 56,267 87,627 1.10
257,569 367,613 4.59 Philippines
Puregold Price Club Inc 60,633 PHP 55,855 50,305 0.63
55,855 50,305 0.63 South Korea
Osstem Implant Co Ltd 1,169 KRW 42,710 118,026 1.47
42,710 118,026 1.47 Sweden
Dometic Group AB 144A(2) 4,631 SEK 40,141 78,924 0.98
40,141 78,924 0.98 Switzerland
Bucher Industries AG 139 CHF 42,819 72,752 0.91
42,819 72,752 0.91 Thailand
Fabrinet 1,145 USD 77,223 109,771 1.37
77,223 109,771 1.37 United States
Alamo Group Inc 500 USD 48,156 76,340 0.95
ASGN Inc 785 USD 57,924 76,090 0.95
Avantor Inc 5,725 USD 165,878 203,295 2.54
Axalta Coating Systems Ltd 3,880 USD 94,356 118,301 1.48
Brown & Brown Inc 4,545 USD 201,809 241,521 3.02
Builders FirstSource Inc 1,780 USD 39,425 75,935 0.95
CACI International Inc 525 USD 126,262 133,938 1.67
CMC Materials Inc 495 USD 67,263 74,616 0.93
DXC Technology Co 2,485 USD 49,710 96,766 1.21
Elanco Animal Health Inc 5,455 USD 181,410 189,234 2.36
Element Solutions Inc 6,735 USD 78,173 157,464 1.97
ExlService Holdings Inc 1,505 USD 150,044 159,921 2.00
FMC Corp 1,350 USD 139,016 146,070 1.82
Group 1 Automotive Inc 675 USD 55,789 104,240 1.30
II-VI Inc 1,830 USD 124,294 132,840 1.66
(2) See Note 13.
71

Natixis International Funds (Lux) I
The accompanying notes form an integral part of these financial statements.
Vaughan Nelson Global Smid Cap Equity Fund Statement of Investments (continued) As at June 30, 2021 (expressed in USD)
Description Quantity Currency Cost Evaluation % of Net
Assets
Insight Enterprises Inc 2,300 USD 110,619 230,023 2.87
Installed Building Products Inc 600 USD 69,290 73,416 0.92
International Game Technology PLC 4,963 USD 84,463 118,914 1.48
Jack Henry & Associates Inc 970 USD 160,994 158,605 1.98
LPL Financial Holdings Inc 1,205 USD 93,085 162,651 2.03
MKS Instruments Inc 620 USD 72,390 110,329 1.38
Performance Food Group Co 1,425 USD 45,009 69,098 0.86
Pioneer Natural Resources Co 798 USD 89,601 129,691 1.62
Rush Enterprises Inc 1,235 USD 31,357 53,401 0.67
Saia Inc 265 USD 30,189 55,515 0.69
Selective Insurance Group Inc 1,725 USD 90,584 139,984 1.75
Sinclair Broadcast Group Inc 2,525 USD 47,145 83,881 1.05
Skechers USA Inc 1,680 USD 73,951 83,714 1.05
Syneos Health Inc 1,905 USD 158,301 170,478 2.13
Univar Solutions Inc 4,775 USD 90,112 116,415 1.45
2,826,599 3,742,686 46.74
Total - Shares 5,725,205 7,617,578 95.12
Investment Funds
Belgium
Xior Student Housing NV REIT 1,325 EUR 80,074 79,823 1.00
80,074 79,823 1.00
Total - Investment Funds 80,074 79,823 1.00
Total - Transferable securities admitted to an official stock exchange listing 5,805,279 7,697,401 96.12
TOTAL INVESTMENT PORTFOLIO 5,805,279 7,697,401 96.12
A detailed schedule of portfolio movements for the period from January 1, 2021 to June 30, 2021 is available free of charge upon request at the registered office of the SICAV.
72

Natixis International Funds (Lux) I
Vaughan Nelson U.S. Select Equity Fund
Statistics
As at June 30, 2021
Net asset value per share
C/A (USD) 495.57
H-I/A (EUR) 253.43
I/A (USD) 608.86
I/A (EUR) 391.24
N1/A (USD) 162.56
R/A (USD) 531.82
Number of shares outstanding
C/A (USD) 2,725.000
H-I/A (EUR) 83,943.263
I/A (USD) 84,371.623
I/A (EUR) 90,875.942
N1/A (USD) 97,000.000
R/A (USD) 7,093.446
73

Natixis International Funds (Lux) I
The accompanying notes form an integral part of these financial statements.
Vaughan Nelson U.S. Select Equity Fund Statement of Investments
As at June 30, 2021 (expressed in USD)
Description Quantity Currency Cost Evaluation % of Net
Assets
Transferable securities admitted to an official stock exchange listing Shares
Canada
Nutrien Ltd 46,985 USD 2,055,522 2,847,761 2.04
2,055,522 2,847,761 2.04 Great Britain
TechnipFMC PLC 302,655 USD 3,034,565 2,739,028 1.96
3,034,565 2,739,028 1.96 Ireland
Accenture PLC 13,835 USD 3,216,020 4,078,420 2.92
3,216,020 4,078,420 2.92 Puerto Rico
Popular Inc 22,060 USD 1,280,246 1,655,603 1.19
1,280,246 1,655,603 1.19 United States
Alphabet Inc 2,874 USD 6,075,688 7,017,704 5.02
Amazon.com Inc 2,039 USD 4,880,436 7,014,486 5.02
Aon PLC 26,890 USD 5,653,492 6,420,256 4.60
Apple Inc 31,720 USD 4,157,089 4,344,371 3.11
Cogent Communications Holdings Inc 53,840 USD 3,883,671 4,139,758 2.96
Entegris Inc 27,965 USD 2,223,073 3,438,856 2.46
Facebook Inc 24,265 USD 5,323,053 8,437,183 6.04
Jack Henry & Associates Inc 29,870 USD 4,848,746 4,884,044 3.50
Kosmos Energy Ltd 879,758 USD 4,202,517 3,043,963 2.18
Lamb Weston Holdings Inc 70,000 USD 5,017,725 5,646,200 4.04
Luminar Technologies Inc 35,955 USD 821,763 789,212 0.57
Masimo Corp 24,210 USD 5,065,403 5,869,714 4.20
Mastercard Inc 18,840 USD 5,181,010 6,878,296 4.93
Microsoft Corp 27,070 USD 4,026,089 7,333,263 5.25
Moderna Inc 29,930 USD 5,316,886 7,032,951 5.04
Motorola Solutions Inc 24,925 USD 3,897,547 5,404,986 3.87
NextEra Energy Inc 55,985 USD 4,170,887 4,102,581 2.94
NVIDIA Corp 9,300 USD 5,332,625 7,440,930 5.33
Saia Inc 22,655 USD 4,133,785 4,745,996 3.40
Sherwin-Williams Co/The 9,420 USD 1,623,821 2,566,479 1.84
Texas Instruments Inc 34,165 USD 4,284,357 6,569,930 4.70
Union Pacific Corp 30,885 USD 5,502,144 6,792,538 4.86
UnitedHealth Group Inc 14,845 USD 4,116,626 5,944,532 4.26
Universal Display Corp 14,845 USD 3,145,742 3,300,489 2.36
102,884,175 129,158,718 92.48
Total - Shares 112,470,528 140,479,530 100.59
Total - Transferable securities admitted to an official stock exchange listing 112,470,528 140,479,530 100.59
TOTAL INVESTMENT PORTFOLIO 112,470,528 140,479,530 100.59
A detailed schedule of portfolio movements for the period from January 1, 2021 to
June 30, 2021 is available free of charge upon request at the registered office of the SICAV.
74

Natixis International Funds (Lux) I
WCM Global Emerging Markets Equity Fund
Statistics
As at June 30, 2021
Net asset value per share
H-I/A (EUR) 98.79
H-R/A (EUR) 137.52
H-R/A (SGD) 104.48
I/A (USD) 159.32
N/A (EUR) 101.71
N1/A (USD) 168.10
N1/A (GBP) 149.57
Q/A (USD) 161.74
R/A (USD) 157.23
RE/A (USD) 145.68
S/A (USD) 100.55
S1/A (USD) 98.36
Number of shares outstanding
H-I/A (EUR) 528,064.000
H-R/A (EUR) 1,811.285
H-R/A (SGD) 131.364
I/A (USD) 38,864.480
N/A (EUR) 106.757
N1/A (USD) 45,582.360
N1/A (GBP) 30.000
Q/A (USD) 71,130.634
R/A (USD) 58,200.240
RE/A (USD) 3,954.907
S/A (USD) 20,000.000
S1/A (USD) 203,692.213
75

Natixis International Funds (Lux) I
The accompanying notes form an integral part of these financial statements.
WCM Global Emerging Markets Equity Fund Statement of Investments
As at June 30, 2021 (expressed in USD)
Description Quantity Currency Cost Evaluation % of Net
Assets
Transferable securities admitted to an official stock exchange listing Shares
Argentina
MercadoLibre Inc 1,237 USD 1,543,685 1,926,986 1.61
1,543,685 1,926,986 1.61 Brazil
Hapvida Participacoes e Investimentos SA 144A(2) 460,000 BRL 1,266,132 1,412,677 1.18
Lojas Renner SA 113,600 BRL 1,018,440 1,001,331 0.84
Magazine Luiza SA 393,200 BRL 1,667,434 1,657,319 1.39
Notre Dame Intermedica Participacoes SA 93,400 BRL 1,406,450 1,580,849 1.33
XP Inc 34,837 USD 1,432,027 1,517,151 1.27
6,790,483 7,169,327 6.01 China
Airtac International Group 46,000 TWD 1,337,056 1,774,787 1.49
Alibaba Group Holding Ltd ADR 22,978 USD 5,041,788 5,210,951 4.37
Guangzhou GRG Metrology & Test Co Ltd 210,448 CNH 1,222,861 1,426,689 1.20
Hundsun Technologies Inc 83,358 CNH 1,188,365 1,203,113 1.01
Kingdee International Software Group Co Ltd 461,000 HKD 1,546,408 1,564,201 1.31
Li Ning Co Ltd 292,500 HKD 2,009,692 3,570,633 2.99
Linklogis Inc 144A(2) 448,000 HKD 1,093,270 1,006,087 0.84
Meituan 144A(2) 47,900 HKD 1,760,784 1,976,237 1.66
Offcn Education Technology Co Ltd 254,103 CNH 1,273,716 821,596 0.69
Shandong Pharmaceutical Glass Co Ltd 165,879 CNH 1,080,933 871,649 0.73
Shenzhou International Group Holdings Ltd 155,200 HKD 2,970,213 3,919,045 3.28
Silergy Corp 25,000 TWD 2,042,821 3,400,628 2.85
Tencent Holdings Ltd 72,700 HKD 5,070,283 5,467,116 4.58
TravelSky Technology Ltd 561,000 HKD 1,288,706 1,210,732 1.01
Wuliangye Yibin Co Ltd 38,494 CNH 1,372,538 1,774,840 1.49
WuXi AppTec Co Ltd 144A(2) 120,300 HKD 1,795,639 2,808,500 2.35
32,095,073 38,006,804 31.85 Germany
Delivery Hero SE 144A(2) 8,252 EUR 1,101,061 1,090,166 0.91
1,101,061 1,090,166 0.91 Hong Kong
AIA Group Ltd 315,800 HKD 3,701,126 3,924,194 3.29
China Mengniu Dairy Co Ltd 506,000 HKD 2,701,034 3,059,124 2.56
Techtronic Industries Co Ltd 218,500 HKD 3,096,882 3,815,242 3.20
9,499,042 10,798,560 9.05 India
Asian Paints Ltd 26,732 INR 865,258 1,076,293 0.90
Avenue Supermarts Ltd 144A(2) 26,206 INR 964,656 1,179,006 0.99
Divi's Laboratories Ltd 44,974 INR 1,981,980 2,667,249 2.23
HDFC Bank Ltd ADR 37,995 USD 2,671,465 2,778,194 2.33
Kotak Mahindra Bank Ltd 85,961 INR 1,964,912 1,972,778 1.65
WNS Holdings Ltd ADR 34,594 USD 2,396,661 2,763,023 2.32
10,844,932 12,436,543 10.42
Indonesia
Bank Central Asia Tbk PT 702,700 IDR 1,542,805 1,459,920 1.22
1,542,805 1,459,920 1.22
(2) See Note 13.
76

Natixis International Funds (Lux) I
The accompanying notes form an integral part of these financial statements.
WCM Global Emerging Markets Equity Fund Statement of Investments (continued) As at June 30, 2021 (expressed in USD)
Description Quantity Currency Cost Evaluation % of Net
Assets
Mexico
Grupo Aeroportuario del Centro Norte SAB de CV 244,573 MXN 1,545,238 1,603,995 1.34
Grupo Aeroportuario del Sureste SAB de CV ADR 8,822 USD 1,508,704 1,631,188 1.37
Wal-Mart de Mexico SAB de CV 403,000 MXN 1,231,925 1,317,864 1.11
4,285,867 4,553,047 3.82 Netherlands
BE Semiconductor Industries NV 18,742 EUR 1,459,715 1,590,058 1.33
1,459,715 1,590,058 1.33 Peru
Credicorp Ltd 7,770 USD 1,170,688 941,025 0.79
1,170,688 941,025 0.79 Poland
Dino Polska SA 144A(2) 16,249 PLN 1,033,960 1,194,666 1.00
1,033,960 1,194,666 1.00 Russia
Moscow Exchange MICEX-RTS PJSC 671,750 USD 1,305,556 1,569,543 1.32
Yandex NV 63,099 USD 3,527,250 4,464,254 3.74
4,832,806 6,033,797 5.06 South Africa
Capitec Bank Holdings Ltd 14,300 ZAR 1,378,156 1,688,990 1.42
Clicks Group Ltd 60,602 ZAR 1,012,697 1,042,760 0.87
2,390,853 2,731,750 2.29 South Korea
Douzone Bizon Co Ltd 19,163 KRW 1,585,732 1,412,360 1.18
LG Household & Health Care Ltd 914 KRW 1,214,883 1,430,065 1.20
NAVER Corp 5,665 KRW 1,899,332 2,100,198 1.76
4,699,947 4,942,623 4.14 Switzerland
Wizz Air Holdings PLC 144A(2) 34,936 GBP 2,134,558 2,253,368 1.89
2,134,558 2,253,368 1.89 Taiwan
Taiwan Semiconductor Manufacturing Co Ltd 441,000 TWD 9,896,555 9,417,497 7.89
9,896,555 9,417,497 7.89 Thailand
Airports of Thailand PCL 404,300 THB 788,382 782,109 0.66
Bangkok Dusit Medical Services PCL 1,291,400 THB 936,237 926,746 0.78
CP ALL PCL 527,300 THB 1,129,169 983,032 0.82
2,853,788 2,691,887 2.26
United States
EPAM Systems Inc 7,325 USD 2,575,942 3,742,782 3.14
2,575,942 3,742,782 3.14 Uruguay
Globant SA 6,235 USD 1,124,746 1,366,587 1.15
1,124,746 1,366,587 1.15 Vietnam
Vietnam Dairy Products JSC 38 VND 161 149 0.00
161 149 0.00
Total - Shares 101,876,667 114,347,542 95.83
(2) See Note 13.
77

Natixis International Funds (Lux) I
The accompanying notes form an integral part of these financial statements.
WCM Global Emerging Markets Equity Fund Statement of Investments (continued) As at June 30, 2021 (expressed in USD)
Description Quantity Currency Cost Evaluation % of Net
Assets
Warrants
Ireland
Beijing Huafeng Test & Control Technology Co Ltd 23/02/2022 36,000 USD 1,911,549 2,637,160 2.21
1,911,549 2,637,160 2.21
Total - Warrants 1,911,549 2,637,160 2.21
Total - Transferable securities admitted to an official stock exchange listing 103,788,216 116,984,702 98.04
TOTAL INVESTMENT PORTFOLIO 103,788,216 116,984,702 98.04
A detailed schedule of portfolio movements for the period from January 1, 2021 to June 30, 2021 is available free of charge upon request at the registered office of the SICAV.
78

Natixis International Funds (Lux) I
WCM Select Global Growth Equity Fund(1)
Statistics
As at June 30, 2021
Net asset value per share
F/A (USD) 102.37
I/A (USD) 104.53
N1/A (USD) 106.40
Q/A (USD) 104.70
R/A (USD) 104.38
RE/A (USD) 106.17
Number of shares outstanding
F/A (USD) 69,819.072
I/A (USD) 538,117.427
N1/A (USD) 30.000
Q/A (USD) 250,000.000
R/A (USD) 30.000
RE/A (USD) 649.315
(1) See Note 1.
79

Natixis International Funds (Lux) I
The accompanying notes form an integral part of these financial statements.
WCM Select Global Growth Equity Fund(1)
Statement of Investments
As at June 30, 2021 (expressed in USD)
Description Quantity Currency Cost Evaluation % of Net
Assets
Transferable securities admitted to an official stock exchange listing Shares
Argentina
MercadoLibre Inc 2,181 USD 3,140,737 3,397,540 3.79
3,140,737 3,397,540 3.79 Canada
Descartes Systems Group Inc/The 27,600 CAD 1,681,475 1,910,804 2.13
Shopify Inc 2,181 USD 2,705,634 3,186,397 3.56
4,387,109 5,097,201 5.69 China
NetEase Inc ADR 25,550 USD 2,939,433 2,944,637 3.28
2,939,433 2,944,637 3.28 Denmark
Novozymes A/S 25,706 DKK 1,848,325 1,937,825 2.16
1,848,325 1,937,825 2.16
France
Sartorius Stedim Biotech 10,282 EUR 4,586,214 4,863,957 5.43
4,586,214 4,863,957 5.43 Great Britain
Halma PLC 47,673 GBP 1,769,060 1,772,894 1.98
Spirax-Sarco Engineering PLC 16,514 GBP 2,958,111 3,106,026 3.46
4,727,171 4,878,920 5.44 Italy
Moncler SpA 46,115 EUR 3,143,866 3,120,485 3.48
3,143,866 3,120,485 3.48 Japan
Freee KK 18,200 JPY 1,449,259 1,674,223 1.87
Keyence Corp 3,300 JPY 1,611,100 1,667,096 1.86
3,060,359 3,341,319 3.73 Netherlands
Adyen NV 144A(2) 1,091 EUR 2,609,739 2,665,910 2.97
IMCD NV 11,996 EUR 1,903,696 1,907,714 2.13
4,513,435 4,573,624 5.10 Russia
Yandex NV 19,007 USD 1,259,643 1,344,745 1.50
1,259,643 1,344,745 1.50 Spain
Amadeus IT Group SA 44,401 EUR 3,313,912 3,123,503 3.48
3,313,912 3,123,503 3.48 Sweden
Nibe Industrier AB 183,835 SEK 1,881,801 1,935,049 2.16
1,881,801 1,935,049 2.16 Switzerland
VAT Group AG 144A(2) 7,790 CHF 2,360,390 2,592,312 2.89
2,360,390 2,592,312 2.89 United States
Amphenol Corp 39,883 USD 2,712,246 2,728,396 3.04
Bill.com Holdings Inc 12,463 USD 1,947,188 2,282,972 2.55
Brooks Automation Inc 34,430 USD 3,538,798 3,280,491 3.66
Dexcom Inc 4,206 USD 1,632,671 1,795,962 2.00
(1) See Note 1.
(2) See Note 13.
80

Natixis International Funds (Lux) I
The accompanying notes form an integral part of these financial statements.
WCM Select Global Growth Equity Fund(1) Statement of Investments (continued) As at June 30, 2021 (expressed in USD)
Description Quantity Currency Cost Evaluation % of Net
Assets
Elastic NV 37,546 USD 4,659,386 5,472,705 6.11
Entegris Inc 21,499 USD 2,475,951 2,643,732 2.95
First Republic Bank/CA 11,996 USD 2,257,874 2,245,291 2.50
HEICO Corp 18,384 USD 2,584,998 2,563,097 2.86
Maravai LifeSciences Holdings Inc 45,180 USD 1,725,749 1,885,362 2.10
Mettler-Toledo International Inc 1,714 USD 2,257,854 2,374,473 2.65
Novanta Inc 11,840 USD 1,637,653 1,595,558 1.78
Procore Technologies Inc 38,013 USD 3,051,806 3,609,334 4.03
Repligen Corp 17,916 USD 3,524,307 3,576,392 3.99
Snap Inc 38,948 USD 2,316,519 2,653,917 2.96
Square Inc 8,724 USD 1,966,543 2,126,911 2.37
West Pharmaceutical Services Inc 9,503 USD 3,244,796 3,412,527 3.81
41,534,339 44,247,120 49.36
Total - Shares 82,696,734 87,398,237 97.49
Total - Transferable securities admitted to an official stock exchange listing 82,696,734 87,398,237 97.49
TOTAL INVESTMENT PORTFOLIO 82,696,734 87,398,237 97.49
(1) See Note 1.
A detailed schedule of portfolio movements for the period from April 27, 2021 to June 30, 2021 is available free of charge upon request at the registered office of the SICAV
81

Natixis International Funds (Lux) I
Loomis Sayles Global Credit Fund
Statistics
As at June 30, 2021
Net asset value per share
H-I/A (EUR) 139.88
H-N/D (EUR) 105.06
H-R/A (EUR) 99.53
H-S/A (USD) 208.01
H-S/A (EUR) 195.20
H-S/A (JPY) 11,598.60
H-S/A (NOK) 99.35
H-S/D (USD) 112.22
I/A (USD) 188.37
R/A (USD) 160.78
R/A (EUR) 136.72
R/D (USD) 82.58
R/D (SGD) 110.75
S/A (USD) 172.62
Number of shares outstanding
H-I/A (EUR) 175,685.867
H-N/D (EUR) 33.909
H-R/A (EUR) 1,143.000
H-S/A (USD) 151,782.459
H-S/A (EUR) 77,532.078
H-S/A (JPY) 756,010.019
H-S/A (NOK) 157,568.999
H-S/D (USD) 63,074.365
I/A (USD) 44,326.592
R/A (USD) 2,611.168
R/A (EUR) 1,004.394
R/D (USD) 8,399.065
R/D (SGD) 50.810
S/A (USD) 58,832.309
82

Natixis International Funds (Lux) I
The accompanying notes form an integral part of these financial statements.
Loomis Sayles Global Credit Fund Statement of Investments
As at June 30, 2021 (expressed in USD)
Description Face value Currency Cost Evaluation % of Net
Assets
Transferable securities admitted to an official stock exchange listing Fixed rate bonds
Australia
AusNet Services Holdings Pty Ltd 0.625% 25/08/2030 EMTN 805,000 EUR 901,654 961,207 0.52
SGSP Australia Assets Pty Ltd 3.250% 29/07/2026 EMTN 230,000 USD 229,360 248,229 0.13
1,131,014 1,209,436 0.65 Austria
Suzano Austria GmbH 3.750% 15/01/2031 745,000 USD 769,585 781,319 0.42
769,585 781,319 0.42 Belgium
Solvay SA 0.500% 06/09/2029 400,000 EUR 451,124 479,736 0.26
451,124 479,736 0.26 Canada
Canadian Government Bond 0.250% 01/11/2022 845,000 CAD 682,930 681,466 0.37
Canadian Government Bond 1.250% 01/06/2030 2,635,000 CAD 2,068,549 2,112,192 1.13
Province of Ontario Canada 4.650% 02/06/2041 290,000 CAD 288,920 313,514 0.17
3,040,399 3,107,172 1.67 Cayman Islands
DP World Crescent Ltd 4.848% 26/09/2028 EMTN 240,000 USD 245,000 276,105 0.15
245,000 276,105 0.15 Chile
Chile Government International Bond 2.550% 27/01/2032 665,000 USD 694,675 679,630 0.36
Chile Government International Bond 3.240% 06/02/2028 200,000 USD 207,356 218,002 0.12
902,031 897,632 0.48 Finland
Nokia Oyj 4.375% 12/06/2027 360,000 USD 367,582 397,660 0.21
367,582 397,660 0.21 France
Aeroports de Paris 1.500% 02/07/2032 400,000 EUR 458,889 512,849 0.27
Coentreprise de Transport d'Electricite SA 1.500% 29/07/2028 300,000 EUR 385,628 383,078 0.21
Societe Generale SA 1.250% 07/12/2027 EMTN 800,000 GBP 1,075,322 1,075,513 0.58
1,919,839 1,971,440 1.06 Germany
Bundesrepublik Deutschland Bundesanleihe 0.000% 15/08/2030 3,040,000 EUR 3,782,718 3,704,227 1.98
Bundesrepublik Deutschland Bundesanleihe 0.000% 15/08/2050 1,230,000 EUR 1,369,693 1,340,802 0.72
Bundesrepublik Deutschland Bundesanleihe 0.250% 15/08/2028 2,035,000 EUR 2,576,961 2,535,721 1.36
Deutsche Telekom AG 1.750% 09/12/2049 EMTN 390,000 EUR 409,608 478,195 0.26
E.ON SE 0.600% 01/10/2032 EMTN 920,000 EUR 1,089,743 1,080,541 0.58
Fraport AG Frankfurt Airport Services Worldwide 1.875% 31/03/2028 870,000 EUR 1,103,697 1,079,605 0.58
Vantage Towers AG 0.750% 31/03/2030 EMTN 700,000 EUR 830,711 828,105 0.44
Volkswagen Financial Services AG 3.375% 06/04/2028 EMTN 25,000 EUR 31,067 35,272 0.02
11,194,198 11,082,468 5.94
83

Natixis International Funds (Lux) I
The accompanying notes form an integral part of these financial statements.
Loomis Sayles Global Credit Fund Statement of Investments (continued) As at June 30, 2021 (expressed in USD)
Description Face value Currency Cost Evaluation % of Net
Assets
Great Britain
Anglian Water Osprey Financing PLC 2.000% 31/07/2028 EMTN 1,105,000 GBP 1,538,204 1,527,928 0.82
Barclays PLC 4.375% 11/09/2024 825,000 USD 858,333 900,393 0.48
British Telecommunications PLC 1.125% 12/09/2029 EMTN 100,000 EUR 116,680 122,052 0.07
British Telecommunications PLC 3.250% 08/11/2029 144A(2) 1,300,000 USD 1,367,756 1,380,229 0.74
Cadent Finance PLC 0.750% 11/03/2032 EMTN 560,000 EUR 631,001 659,864 0.35
Coca-Cola Europacific Partners PLC 0.700% 12/09/2031 610,000 EUR 732,571 721,488 0.39
National Grid Electricity Transmission PLC 1.125% 07/07/2028 EMTN 100,000 GBP 134,404 134,731 0.07
National Grid Electricity Transmission PLC 2.000% 16/09/2038 EMTN 580,000 GBP 806,329 789,843 0.42
National Grid Electricity Transmission PLC 2.750% 06/02/2035 EMTN 100,000 GBP 146,887 149,737 0.08
National Grid PLC 0.163% 20/01/2028 EMTN 200,000 EUR 234,432 233,287 0.13
National Grid PLC 0.553% 18/09/2029 EMTN 645,000 EUR 775,981 762,900 0.41
Standard Chartered PLC 3.625% 23/11/2022 EMTN 195,000 EUR 221,706 242,975 0.13
United Kingdom Gilt 4.750% 07/12/2030 150,000 GBP 283,668 283,247 0.15
7,847,952 7,908,674 4.24 India
Adani Ports & Special Economic Zone Ltd 3.100% 02/02/2031 440,000 USD 440,000 419,399 0.23
440,000 419,399 0.23 Indonesia
Indonesia Government International Bond 5.125% 15/01/2045 EMTN 260,000 USD 257,691 321,550 0.17
Perusahaan Perseroan Persero PT Perusahaan Listrik Negara 3.375% 05/02/2030 EMTN 240,000 USD 231,230 246,000 0.13
488,921 567,550 0.30 Ireland
Cyrusone Europe Finance DAC 1.125% 26/05/2028 665,000 EUR 792,484 783,608 0.42
792,484 783,608 0.42 Israel
Israel Government International Bond 2.750% 03/07/2030 1,370,000 USD 1,477,219 1,462,352 0.78
1,477,219 1,462,352 0.78 Italy
Intesa Sanpaolo SpA 0.750% 04/12/2024 EMTN 230,000 EUR 240,677 279,589 0.15
Intesa Sanpaolo SpA 1.000% 19/11/2026 EMTN 470,000 EUR 533,991 574,167 0.31
UniCredit SpA 0.850% 19/01/2031 EMTN 930,000 EUR 1,123,558 1,083,959 0.58
1,898,226 1,937,715 1.04 Jersey
Hastings Group Finance PLC 3.000% 24/05/2025 315,000 GBP 447,557 461,487 0.25
Heathrow Funding Ltd 1.125% 08/10/2030 EMTN 635,000 EUR 742,654 745,150 0.40
Heathrow Funding Ltd 1.875% 14/03/2034 EMTN 655,000 EUR 754,419 810,869 0.43
Heathrow Funding Ltd 2.750% 13/10/2029 EMTN 100,000 GBP 128,741 143,702 0.08
2,073,371 2,161,208 1.16 Luxembourg
Acef Holding SCA 0.750% 14/06/2028 800,000 EUR 975,825 947,122 0.51
HeidelbergCement Finance Luxembourg SA 0.500% 09/08/2022 EMTN 170,000 EUR 198,051 202,962 0.11
(2) See Note 13.
84

Natixis International Funds (Lux) I
The accompanying notes form an integral part of these financial statements.
Loomis Sayles Global Credit Fund Statement of Investments (continued)
As at June 30, 2021 (expressed in USD)
Description Face value Currency Cost Evaluation % of Net
Assets
Prologis International Funding II SA 1.625% 17/06/2032 EMTN 125,000 EUR 139,777 160,469 0.09
SELP Finance Sarl 0.875% 27/05/2029 135,000 EUR 163,959 160,369 0.08
SELP Finance Sarl 1.500% 20/11/2025 1,445,000 EUR 1,724,406 1,800,869 0.96
3,202,018 3,271,791 1.75 Mexico
America Movil SAB de CV 2.875% 07/05/2030 1,390,000 USD 1,408,237 1,465,055 0.78
America Movil SAB de CV 3.625% 22/04/2029 640,000 USD 659,363 705,773 0.38
Mexico Government International Bond 4.280% 14/08/2041 655,000 USD 655,543 687,514 0.37
Orbia Advance Corp SAB de CV 5.875% 17/09/2044 605,000 USD 658,169 733,569 0.39
Sigma Alimentos SA de CV 4.125% 02/05/2026 955,000 USD 984,352 1,040,950 0.56
4,365,664 4,632,861 2.48 Netherlands
Cooperatieve Rabobank UA 1.250% 14/01/2025 EMTN 300,000 GBP 393,155 418,564 0.23
Cooperatieve Rabobank UA 4.625% 23/05/2029 EMTN 100,000 GBP 167,738 164,475 0.09
CRH Funding BV 1.625% 05/05/2030 135,000 EUR 145,625 175,890 0.10
Digital Intrepid Holding BV 0.625% 15/07/2031 910,000 EUR 1,098,220 1,042,580 0.56
EDP Finance BV 0.375% 16/09/2026 EMTN 100,000 EUR 110,114 119,749 0.06
Enel Finance International NV 1.000% 20/10/2027 EMTN 115,000 GBP 149,001 155,964 0.08
LeasePlan Corp NV 0.750% 03/10/2022 EMTN 640,000 EUR 735,034 768,220 0.41
Madrilena Red de Gas Finance BV 2.250% 11/04/2029 EMTN 220,000 EUR 263,105 284,644 0.15
MDGH - GMTN BV 3.700% 07/11/2049 EMTN 305,000 USD 305,000 332,985 0.18
MDGH - GMTN BV 3.950% 21/05/2050 EMTN 200,000 USD 200,000 228,277 0.12
Prosus NV 2.031% 03/08/2032 EMTN 600,000 EUR 703,710 732,689 0.39
Prosus NV 4.027% 03/08/2050 144A(2) 285,000 USD 285,000 274,017 0.15
Prosus NV 4.850% 06/07/2027 144A(2) 415,000 USD 427,968 472,648 0.25
Redexis Gas Finance BV 1.875% 28/05/2025 EMTN 1,400,000 EUR 1,732,817 1,758,929 0.94
Upjohn Finance BV 1.908% 23/06/2032 170,000 EUR 201,203 214,661 0.12
Volkswagen International Finance NV 4.125% 17/11/2031 100,000 GBP 143,407 167,024 0.09
7,061,097 7,311,316 3.92 Philippines
Philippine Government International Bond 2.457% 05/05/2030 930,000 USD 989,635 968,388 0.52
989,635 968,388 0.52 Poland
Republic of Poland Government International Bond 1.000% 07/03/2029 EMTN 785,000 EUR 1,013,741 1,000,735 0.54
1,013,741 1,000,735 0.54 Portugal
EDP - Energias de Portugal SA 1.625% 15/04/2027 EMTN 700,000 EUR 801,418 892,041 0.48
801,418 892,041 0.48 Qatar
Qatar Government International Bond 3.750% 16/04/2030 315,000 USD 354,626 356,407 0.19
Qatar Government International Bond 4.817% 14/03/2049 200,000 USD 228,280 257,250 0.14
582,906 613,657 0.33
(2) See Note 13.
85

Natixis International Funds (Lux) I
The accompanying notes form an integral part of these financial statements.
Loomis Sayles Global Credit Fund Statement of Investments (continued) As at June 30, 2021 (expressed in USD)
Description Face value Currency Cost Evaluation % of Net
Assets
Romania
Romanian Government International Bond 2.000% 14/04/2033 EMTN 225,000 EUR 264,888 264,599 0.14
UniCredit Leasing Corp. IFN SA 0.502% 18/10/2022 200,000 EUR 220,750 238,717 0.13
485,638 503,316 0.27 Singapore
BOC Aviation Ltd 2.625% 17/01/2025 EMTN 620,000 USD 619,528 637,389 0.34
619,528 637,389 0.34 South Korea
Korea Gas Corp 2.875% 16/07/2029 370,000 USD 367,370 398,079 0.21
367,370 398,079 0.21 Spain
Banco Bilbao Vizcaya Argentaria SA 1.125% 18/09/2025 800,000 USD 794,286 792,989 0.42
Banco de Sabadell SA 1.125% 27/03/2025 EMTN 600,000 EUR 732,718 725,048 0.39
Banco de Sabadell SA 1.750% 10/05/2024 EMTN 300,000 EUR 372,758 368,933 0.20
Banco Santander SA 2.749% 03/12/2030 800,000 USD 793,772 792,494 0.42
Cellnex Telecom SA 1.750% 23/10/2030 EMTN 800,000 EUR 939,684 944,024 0.51
Telefonica Emisiones SA 4.103% 08/03/2027 840,000 USD 946,449 945,465 0.51
4,579,667 4,568,953 2.45 Supranational Organisations
International Bank for Reconstruction &
Development 2.200% 27/02/2024 210,000 AUD 147,055 164,966 0.09
147,055 164,966 0.09 Switzerland
Credit Suisse Group AG 0.625% 18/01/2033 EMTN 260,000 EUR 291,162 289,718 0.16
291,162 289,718 0.16 United Arab Emirates
Abu Dhabi Government International Bond 1.700% 02/03/2031 EMTN 295,000 USD 294,170 284,402 0.15
Abu Dhabi Government International Bond 2.500% 30/09/2029 935,000 USD 990,380 976,271 0.52
DP World PLC 5.625% 25/09/2048 EMTN 200,000 USD 201,681 249,740 0.14
MDGH GMTN RSC Ltd 2.500% 03/06/2031 EMTN 940,000 USD 937,379 950,575 0.51
2,423,610 2,460,988 1.32 United States
Air Products & Chemicals Inc 0.800% 05/05/2032 EMTN 100,000 EUR 107,779 120,878 0.06
Ally Financial Inc 3.875% 21/05/2024 55,000 USD 50,735 59,265 0.03
Ally Financial Inc 4.625% 30/03/2025 390,000 USD 424,207 436,666 0.23
Ally Financial Inc 5.800% 01/05/2025 1,165,000 USD 1,313,937 1,353,825 0.73
American International Group Inc 1.875% 21/06/2027 130,000 EUR 145,394 166,470 0.09
American International Group Inc 3.400% 30/06/2030 1,335,000 USD 1,453,039 1,463,964 0.78
American International Group Inc 3.875% 15/01/2035 75,000 USD 74,581 84,818 0.05
American International Group Inc 4.700% 10/07/2035 25,000 USD 26,062 30,451 0.02
American Tower Corp 0.500% 15/01/2028 765,000 EUR 916,670 899,003 0.48
AmerisourceBergen Corp 0.737% 15/03/2023 2,105,000 USD 2,106,139 2,108,818 1.13
Anheuser-Busch InBev Worldwide Inc 3.500% 01/06/2030 275,000 USD 305,305 305,906 0.16
Anheuser-Busch InBev Worldwide Inc 4.000% 13/04/2028 510,000 USD 563,549 580,693 0.31
86

Natixis International Funds (Lux) I
The accompanying notes form an integral part of these financial statements.
Loomis Sayles Global Credit Fund Statement of Investments (continued) As at June 30, 2021 (expressed in USD)
Description Face value Currency Cost Evaluation % of Net
Assets
Anheuser-Busch InBev Worldwide Inc 4.750% 15/04/2058 945,000 USD 1,086,248 1,184,873 0.64
AT&T Inc 2.250% 01/02/2032 240,000 USD 228,343 235,550 0.13
AT&T Inc 3.650% 01/06/2051 335,000 USD 341,444 347,781 0.19
Bank of America Corp 4.183% 25/11/2027 265,000 USD 269,138 296,905 0.16
Bank of America Corp 4.450% 03/03/2026 895,000 USD 943,326 1,016,536 0.55
Centene Corp 2.500% 01/03/2031 440,000 USD 432,702 433,950 0.23
Centene Corp 3.000% 15/10/2030 1,365,000 USD 1,363,820 1,402,237 0.75
Chubb INA Holdings Inc 0.875% 15/12/2029 530,000 EUR 608,894 646,387 0.35
Chubb INA Holdings Inc 1.550% 15/03/2028 100,000 EUR 121,570 127,663 0.07
Chubb INA Holdings Inc 2.500% 15/03/2038 100,000 EUR 121,784 142,533 0.08
Citigroup Inc 4.090% 09/06/2025 275,000 CAD 219,217 241,543 0.13
Citigroup Inc 4.400% 10/06/2025 270,000 USD 274,616 301,541 0.16
CNH Industrial Capital LLC 4.200% 15/01/2024 370,000 USD 369,483 400,371 0.21
Consolidated Edison Co of New York Inc 3.000% 01/12/2060 650,000 USD 631,655 600,722 0.32
Consolidated Edison Co of New York Inc 3.950% 01/04/2050 190,000 USD 228,079 215,722 0.12
Continental Resources Inc 4.375% 15/01/2028 1,020,000 USD 1,124,018 1,128,375 0.61
Crown Castle International Corp 3.150% 15/07/2023 1,230,000 USD 1,294,002 1,291,283 0.69
Crown Castle International Corp 4.000%
01/03/2027 315,000 USD 323,618 352,512 0.19
Crown Castle International Corp 4.450% 15/02/2026 255,000 USD 263,628 288,130 0.15
CVS Health Corp 1.750% 21/08/2030 1,250,000 USD 1,214,302 1,204,823 0.65
CVS Health Corp 3.250% 15/08/2029 550,000 USD 570,686 596,773 0.32
CVS Health Corp 3.750% 01/04/2030 190,000 USD 218,513 212,623 0.11
CVS Health Corp 3.875% 20/07/2025 345,000 USD 379,024 380,912 0.20
Dominion Energy Inc 3.375% 01/04/2030 200,000 USD 198,240 217,782 0.12
Enterprise Products Operating LLC 2.800% 31/01/2030 15,000 USD 13,575 15,846 0.01
Enterprise Products Operating LLC 3.700% 31/01/2051 10,000 USD 7,291 10,724 0.01
Enterprise Products Operating LLC 3.950% 31/01/2060 150,000 USD 149,077 167,203 0.09
Enterprise Products Operating LLC 4.800% 01/02/2049 85,000 USD 98,200 104,609 0.06
Enterprise Products Operating LLC 5.100% 15/02/2045 90,000 USD 105,716 113,668 0.06
Fidelity National Financial Inc 2.450% 15/03/2031 925,000 USD 918,916 921,051 0.49
General Electric Co 4.875% 18/09/2037 EMTN 240,000 GBP 377,782 406,481 0.22
General Motors Financial Co Inc 1.250% 08/01/2026 1,915,000 USD 1,889,215 1,902,238 1.02
General Motors Financial Co Inc 1.500% 10/06/2026 135,000 USD 134,757 134,119 0.07
General Motors Financial Co Inc 2.400% 10/04/2028 425,000 USD 424,552 431,458 0.23
HCA Inc 4.125% 15/06/2029 2,065,000 USD 2,343,808 2,325,348 1.25
Healthpeak Properties Inc 2.875% 15/01/2031 285,000 USD 282,749 298,180 0.16
John Deere Capital Corp 0.450% 17/01/2024 1,610,000 USD 1,609,248 1,608,202 0.86
Keurig Dr Pepper Inc 0.750% 15/03/2024 1,045,000 USD 1,044,987 1,046,140 0.56
Kinder Morgan Energy Partners LP 5.000% 01/03/2043 165,000 USD 156,683 198,969 0.11
87

Natixis International Funds (Lux) I
The accompanying notes form an integral part of these financial statements.
Loomis Sayles Global Credit Fund Statement of Investments (continued) As at June 30, 2021 (expressed in USD)
Description Face value Currency Cost Evaluation % of Net
Assets
Kinder Morgan Inc 5.050% 15/02/2046 5,000 USD 4,761 6,067 0.00
Kinder Morgan Inc 5.550% 01/06/2045 360,000 USD 416,432 466,063 0.25
Lennar Corp 4.750% 30/05/2025 10,000 USD 10,876 11,213 0.01
LYB International Finance III LLC 3.625% 01/04/2051 740,000 USD 754,571 781,184 0.42
McDonald's Corp 3.625% 01/09/2049 740,000 USD 733,535 820,022 0.44
Oracle Corp 2.875% 25/03/2031 1,025,000 USD 1,034,333 1,066,080 0.57
Oracle Corp 3.950% 25/03/2051 310,000 USD 309,462 338,362 0.18
Owl Rock Capital Corp 2.875% 11/06/2028 760,000 USD 752,490 754,298 0.40
Prologis Euro Finance LLC 0.250% 10/09/2027 205,000 EUR 227,253 243,459 0.13
Prologis Euro Finance LLC 0.375% 06/02/2028 480,000 EUR 507,346 573,520 0.31
Prologis Euro Finance LLC 1.875% 05/01/2029 190,000 EUR 229,107 249,244 0.13
Prologis LP 3.000% 02/06/2026 760,000 EUR 988,811 1,027,666 0.55
PulteGroup Inc 5.000% 15/01/2027 177,000 USD 202,481 206,998 0.11
Raytheon Technologies Corp 4.125% 16/11/2028 145,000 USD 160,632 166,831 0.09
Santander Holdings USA Inc 3.450% 02/06/2025 115,000 USD 114,822 123,582 0.07
T-Mobile USA Inc 2.550% 15/02/2031 1,725,000 USD 1,740,302 1,744,320 0.94
T-Mobile USA Inc 3.875% 15/04/2030 305,000 USD 303,067 340,935 0.18
U.S. Treasury Bond 1.375% 15/11/2040 1,125,000 USD 984,111 1,010,566 0.54
U.S. Treasury Bond 1.375% 15/08/2050 150,000 USD 141,294 126,451 0.07
U.S. Treasury Bond 1.875% 15/02/2051 1,160,000 USD 1,053,665 1,107,075 0.59
U.S. Treasury Bond 2.875% 15/05/2043 375,000 USD 356,290 431,279 0.23
U.S. Treasury Note 0.875% 30/06/2026 4,010,000 USD 4,002,642 4,008,120 2.15
UnitedHealth Group Inc 2.300% 15/05/2031 875,000 USD 891,943 896,075 0.48
Verizon Communications Inc 2.550% 21/03/2031 370,000 USD 368,522 378,186 0.20
Verizon Communications Inc 2.987% 30/10/2056 185,000 USD 141,839 173,907 0.09
Verizon Communications Inc 3.400% 22/03/2041 240,000 USD 239,863 253,882 0.14
Vulcan Materials Co 4.500% 15/06/2047 220,000 USD 217,229 266,010 0.14
Williams Cos Inc/The 3.750% 15/06/2027 65,000 USD 66,696 72,213 0.04
46,824,678 48,206,128 25.85
Total - Fixed rate bonds 108,794,132 111,363,800 59.72
Variable rate bonds
Cayman Islands
XLIT Ltd 3.250% 29/06/2047 435,000 EUR 530,997 578,028 0.31
530,997 578,028 0.31 Finland
Sampo Oyj 2.500% 03/09/2052 EMTN 435,000 EUR 522,262 547,347 0.29
Sampo Oyj 3.375% 23/05/2049 145,000 EUR 178,536 195,482 0.11
700,798 742,829 0.40 France
AXA SA 3.250% 28/05/2049 EMTN 800,000 EUR 1,044,741 1,085,889 0.58
AXA SA 3.375% 06/07/2047 EMTN 125,000 EUR 142,919 169,702 0.09
Mutuelle Assurance Des Commercants et Industriels de France et Des Cadres et Sal 2.125% 21/06/2052 200,000 EUR 240,755 239,130 0.13
1,428,415 1,494,721 0.80 Germany
Deutsche Bank AG 1.750% 19/11/2030 EMTN 700,000 EUR 859,667 876,680 0.47
859,667 876,680 0.47 Great Britain
Aviva PLC 4.000% 03/06/2055 710,000 GBP 1,083,307 1,091,600 0.59
Barclays PLC 2.645% 24/06/2031 275,000 USD 275,000 278,332 0.15
88

Natixis International Funds (Lux) I
The accompanying notes form an integral part of these financial statements.
Loomis Sayles Global Credit Fund Statement of Investments (continued)
As at June 30, 2021 (expressed in USD)
Description Face value Currency Cost Evaluation % of Net
Assets
Barclays PLC 3.564% 23/09/2035 200,000 USD 200,000 208,368 0.11
Channel Link Enterprises Finance PLC 1.761% 30/06/2050 735,000 EUR 831,264 869,732 0.47
Channel Link Enterprises Finance PLC 2.706% 30/06/2050 255,000 EUR 288,903 308,628 0.17
HSBC Bank PLC 5.375% 04/11/2030 EMTN 256,000 GBP 371,053 413,883 0.22
HSBC Holdings PLC 4.292% 12/09/2026 1,370,000 USD 1,466,265 1,524,648 0.82
Legal & General Group PLC 3.750% 26/11/2049 EMTN 100,000 GBP 145,820 150,305 0.08
Legal & General Group PLC 4.500% 01/11/2050 485,000 GBP 754,815 770,809 0.41
Lloyds Banking Group PLC 2.707% 03/12/2035 700,000 GBP 975,835 988,686 0.53
Natwest Group PLC 2.359% 22/05/2024 295,000 USD 304,419 303,954 0.16
Natwest Group PLC 3.032% 28/11/2035 360,000 USD 360,000 360,162 0.19
Natwest Group PLC 4.445% 08/05/2030 210,000 USD 210,000 240,390 0.13
Silverstone Master Issuer PLC 0.799% 21/01/2070 135,300 GBP 177,446 188,415 0.10
Standard Chartered PLC 2.500% 09/09/2030 105,000 EUR 120,271 132,149 0.07
7,564,398 7,830,061 4.20 Ireland
AIB Group PLC 2.875% 30/05/2031 EMTN 1,115,000 EUR 1,366,128 1,413,894 0.76
Cloverie PLC for Zurich Insurance Co Ltd 5.625% 24/06/2046 EMTN 200,000 USD 230,389 231,504 0.12
Willow No 2 Ireland PLC for Zurich Insurance Co Ltd 4.250% 01/10/2045 EMTN 310,000 USD 316,961 335,963 0.18
Zurich Finance Ireland Designated Activity Co 3.000% 19/04/2051 EMTN 555,000 USD 548,523 549,252 0.30
2,462,001 2,530,613 1.36 Italy
Assicurazioni Generali SpA 5.500% 27/10/2047 EMTN 300,000 EUR 422,548 438,166 0.23
422,548 438,166 0.23 Spain
Banco Bilbao Vizcaya Argentaria SA 1.000% 16/01/2030 400,000 EUR 434,932 476,873 0.25
Banco de Sabadell SA 0.875% 16/06/2028 EMTN 300,000 EUR 363,992 350,572 0.19
CaixaBank SA 2.250% 17/04/2030 EMTN 1,100,000 EUR 1,386,654 1,366,268 0.73
2,185,578 2,193,713 1.17 United States
Morgan Stanley 1.794% 13/02/2032 1,065,000 USD 1,048,576 1,023,265 0.55
1,048,576 1,023,265 0.55
Total - Variable rate bonds 17,202,978 17,708,076 9.49
Total - Transferable securities admitted to an official stock exchange listing 125,997,110 129,071,876 69.21
Transferable securities dealt in on another regulated market Fixed rate bonds
Austria
Suzano Austria GmbH 3.125% 15/01/2032 90,000 USD 88,764 89,133 0.05
Suzano Austria GmbH 7.000% 16/03/2047 200,000 USD 247,721 270,460 0.14
336,485 359,593 0.19 British Virgin Islands
Sinopec Group Overseas Development 2017 Ltd 3.625% 12/04/2027 144A(2) 1,000,000 USD 1,020,758 1,098,988 0.59
1,020,758 1,098,988 0.59
(2) See Note 13.
89

Natixis International Funds (Lux) I
The accompanying notes form an integral part of these financial statements.
Loomis Sayles Global Credit Fund Statement of Investments (continued) As at June 30, 2021 (expressed in USD)
Description Face value Currency Cost Evaluation % of Net
Assets
France
Credit Agricole SA 2.811% 11/01/2041 144A(2) 790,000 USD 768,288 749,556 0.40
Societe Generale SA 3.875% 28/03/2024 144A(2) 930,000 USD 1,004,173 999,579 0.54
1,772,461 1,749,135 0.94 Great Britain
Coca-Cola Europacific Partners PLC 0.800% 03/05/2024 144A(2) 980,000 USD 979,626 977,033 0.52
Ferguson Finance PLC 3.250% 02/06/2030 144A(2) 200,000 USD 199,202 215,851 0.12
Vodafone Group PLC 4.250% 17/09/2050 150,000 USD 178,567 175,201 0.09
Vodafone Group PLC 5.250% 30/05/2048 220,000 USD 228,684 289,886 0.16
1,586,079 1,657,971 0.89 Italy
Intesa Sanpaolo SpA 5.710% 15/01/2026 144A(2) 200,000 USD 188,986 226,227 0.12
188,986 226,227 0.12 Mexico
Orbia Advance Corp SAB de CV 1.875% 11/05/2026 640,000 USD 639,322 644,241 0.35
639,322 644,241 0.35 Multinational
Delta Air Lines Inc/SkyMiles IP Ltd 4.500% 20/10/2025 144A(2) 1,520,000 USD 1,597,995 1,633,423 0.87
Delta Air Lines Inc/SkyMiles IP Ltd 4.750% 20/10/2028 144A(2) 330,000 USD 361,483 366,880 0.20
NXP BV/NXP Funding LLC/NXP USA Inc 3.400% 01/05/2030 144A(2) 745,000 USD 802,952 813,472 0.44
2,762,430 2,813,775 1.51 Netherlands
EDP Finance BV 1.710% 24/01/2028 144A(2) 2,410,000 USD 2,393,529 2,381,591 1.28
Embraer Netherlands Finance BV 5.050% 15/06/2025 255,000 USD 252,932 269,318 0.14
Embraer Netherlands Finance BV 5.400% 01/02/2027 55,000 USD 56,008 58,610 0.03
Enel Finance International NV 2.650% 10/09/2024 144A(2) 1,090,000 USD 1,150,630 1,145,747 0.61
Enel Finance International NV 4.750% 25/05/2047 144A(2) 430,000 USD 488,137 527,934 0.28
Enel Finance International NV 6.000% 07/10/2039 144A(2) 180,000 USD 160,920 251,741 0.14
LeasePlan Corp NV 2.875% 24/10/2024 144A(2) 1,005,000 USD 1,017,785 1,055,468 0.57
Siemens Financieringsmaatschappij NV 0.650% 11/03/2024 144A(2) 1,290,000 USD 1,290,265 1,291,375 0.69
6,810,206 6,981,784 3.74 Norway
Aker BP ASA 3.750% 15/01/2030 144A(2) 650,000 USD 657,986 701,406 0.38
Aker BP ASA 4.000% 15/01/2031 144A(2) 180,000 USD 177,158 197,709 0.10
835,144 899,115 0.48 United States
Amazon.com Inc 0.450% 12/05/2024 1,860,000 USD 1,857,408 1,855,880 0.99
American Credit Acceptance Receivables Trust 2.190% 13/03/2026 144A(2) 630,000 USD 629,970 639,870 0.34
Apple Inc 3.750% 12/09/2047 60,000 USD 58,017 70,744 0.04
Ares Capital Corp 2.875% 15/06/2028 530,000 USD 527,550 537,961 0.29
Ares Capital Corp 3.875% 15/01/2026 313,000 USD 329,619 335,299 0.18
Astrazeneca Finance LLC 0.700% 28/05/2024 970,000 USD 969,915 968,116 0.52
(2) See Note 13.
90

Natixis International Funds (Lux) I
The accompanying notes form an integral part of these financial statements.
Loomis Sayles Global Credit Fund Statement of Investments (continued) As at June 30, 2021 (expressed in USD)
Description Face value Currency Cost Evaluation % of Net
Assets
AT&T Inc 3.500% 15/09/2053 144A(2) 256,000 USD 217,643 257,196 0.14
AT&T Inc 3.550% 15/09/2055 144A(2) 60,000 USD 48,215 60,201 0.03
AT&T Inc 3.800% 01/12/2057 144A(2) 749,000 USD 674,442 780,370 0.42
Broadcom Inc 2.450% 15/02/2031 144A(2) 305,000 USD 291,633 299,722 0.16
Broadcom Inc 3.150% 15/11/2025 121,000 USD 130,498 129,685 0.07
Broadcom Inc 3.419% 15/04/2033 144A(2) 399,000 USD 398,911 419,016 0.22
Broadcom Inc 3.469% 15/04/2034 144A(2) 329,000 USD 305,624 348,001 0.19
Broadcom Inc 4.150% 15/11/2030 65,000 USD 72,981 72,892 0.04
Centene Corp 3.375% 15/02/2030 590,000 USD 610,184 616,739 0.33
Centene Corp 4.625% 15/12/2029 410,000 USD 425,800 450,906 0.24
Charter Communications Operating LLC/Charter Communications Operating Capital 2.800% 01/04/2031 2,515,000 USD 2,597,968 2,571,113 1.38
Charter Communications Operating LLC/Charter Communications Operating Capital 4.800% 01/03/2050 300,000 USD 290,603 344,565 0.18
Cigna Corp 3.875% 15/10/2047 565,000 USD 643,101 631,067 0.34
Comcast Corp 3.969% 01/11/2047 60,000 USD 64,321 69,854 0.04
Comcast Corp 4.000% 15/08/2047 165,000 USD 177,663 192,595 0.10
CRH America Inc 3.875% 18/05/2025 144A(2) 985,000 USD 1,087,708 1,079,452 0.58
Delta Air Lines 4.250% 30/07/2023 208,744 USD 209,136 212,880 0.11
Diamond Resorts Owner Trust 3.700% 21/01/2031
144A(2) 30,454 USD 30,454 31,726 0.02
Diamondback Energy Inc 0.900% 24/03/2023 220,000 USD 219,981 220,047 0.12
Diamondback Energy Inc 3.125% 24/03/2031 235,000 USD 235,101 243,544 0.13
Empower Finance 2020 LP 3.075% 17/09/2051 144A(2) 480,000 USD 473,508 485,733 0.26
ERAC USA Finance LLC 3.300% 01/12/2026 144A(2) 171,000 USD 167,487 186,378 0.10
ERAC USA Finance LLC 4.200% 01/11/2046 144A(2) 50,000 USD 45,720 59,374 0.03
GE Capital Funding LLC 4.400% 15/05/2030 560,000 USD 645,213 652,586 0.35
GE Capital Funding LLC 4.550% 15/05/2032 220,000 USD 220,000 262,618 0.14
Guardian Life Global Funding 1.250% 13/05/2026 144A(2) 405,000 USD 405,000 404,044 0.22
Kraft Heinz Foods Co 3.750% 01/04/2030 165,000 USD 166,064 181,041 0.10
Kraft Heinz Foods Co 4.375% 01/06/2046 195,000 USD 185,257 220,997 0.12
Lennar Corp 5.000% 15/06/2027 75,000 USD 86,463 87,032 0.05
Massachusetts Mutual Life Insurance Co 3.375% 15/04/2050 144A(2) 45,000 USD 44,822 46,973 0.03
Microchip Technology Inc 0.983% 01/09/2024 144A(2) 355,000 USD 355,000 353,279 0.19
Microsoft Corp 3.700% 08/08/2046 135,000 USD 152,572 162,104 0.09
National Rural Utilities Cooperative Finance Corp 0.350% 08/02/2024 1,205,000 USD 1,203,288 1,200,385 0.64
New York Life Global Funding 0.550% 26/04/2024 144A(2) 1,245,000 USD 1,244,223 1,245,426 0.67
Owens Corning 4.400% 30/01/2048 150,000 USD 142,801 177,116 0.09
Santander Holdings USA Inc 3.244% 05/10/2026 385,000 USD 394,947 411,226 0.22
Slam Ltd 2.434% 15/06/2046 144A(2) 565,000 USD 564,982 565,764 0.30
United Airlines 3.650% 07/10/2025 101,534 USD 101,534 100,988 0.05
United Airlines 3.650% 07/01/2026 85,451 USD 85,451 84,847 0.05
United Airlines 3.700% 01/03/2030 715,604 USD 632,065 728,818 0.39
United Airlines 4.625% 03/09/2022 36,742 USD 36,834 37,568 0.02
(2) See Note 13.
91

Natixis International Funds (Lux) I
The accompanying notes form an integral part of these financial statements.
Loomis Sayles Global Credit Fund Statement of Investments (continued) As at June 30, 2021 (expressed in USD)
Description Face value Currency Cost Evaluation % of Net
Assets
United Airlines 5.375% 15/08/2021 136,861 USD 136,967 137,316 0.07
USAA Capital Corp 0.500% 01/05/2024 144A(2) 465,000 USD 464,204 463,671 0.25
Viatris Inc 2.700% 22/06/2030 144A(2) 1,070,000 USD 1,058,794 1,081,965 0.58
Viatris Inc 4.000% 22/06/2050 144A(2) 50,000 USD 54,651 52,876 0.03
Volkswagen Group of America Finance LLC 4.750% 13/11/2028 144A(2) 340,000 USD 372,363 402,603 0.22
WEA Finance LLC 2.875% 15/01/2027 144A(2) 245,000 USD 244,023 252,878 0.14
WEA Finance LLC 3.500% 15/06/2029 144A(2) 95,000 USD 97,695 98,691 0.05
WEA Finance LLC 4.125% 20/09/2028 144A(2) 40,000 USD 41,742 43,259 0.02
22,928,116 23,626,997 12.67
Total - Fixed rate bonds 38,879,987 40,057,826 21.48
Variable rate bonds
Australia
Macquarie Group Ltd 3.189% 28/11/2023 144A(2) 345,000 USD 357,495 357,320 0.19
357,495 357,320 0.19 France
BNP Paribas SA 2.588% 12/08/2035 144A(2) 1,040,000 USD 996,780 1,014,420 0.55
BNP Paribas SA 4.705% 10/01/2025 144A(2) 705,000 USD 773,836 769,152 0.41
1,770,616 1,783,572 0.96 Germany
Deutsche Bank AG/New York NY 3.547% 18/09/2031 1,230,000 USD 1,265,505 1,309,295 0.70
1,265,505 1,309,295 0.70 Great Britain
Gosforth Funding PLC 0.597% 25/08/2060 144A(2) 57,955 USD 57,955 58,005 0.03
Lanark Master Issuer PLC 2.277% 22/12/2069 144A(2) 200,000 USD 200,000 204,480 0.11
257,955 262,485 0.14 Italy
UniCredit SpA 2.569% 22/09/2026 144A(2) 350,000 USD 350,000 354,846 0.19
UniCredit SpA 5.861% 19/06/2032 144A(2) 315,000 USD 312,057 348,621 0.19
662,057 703,467 0.38 Switzerland
Credit Suisse Group AG 3.091% 14/05/2032 144A(2) 800,000 USD 806,043 824,290 0.44
806,043 824,290 0.44 United States
Bank of America Corp 2.592% 29/04/2031 1,460,000 USD 1,471,969 1,505,168 0.81
Bank of America Corp 2.676% 19/06/2041 445,000 USD 445,000 431,872 0.23
Citigroup Inc 2.561% 01/05/2032 770,000 USD 770,000 783,823 0.42
Citigroup Inc 2.572% 03/06/2031 1,755,000 USD 1,764,325 1,804,179 0.97
Citigroup Inc 4.412% 31/03/2031 217,000 USD 256,164 253,384 0.14
Citigroup Mortgage Loan Trust 4.000% 25/01/2068 144A(2) 110,187 USD 109,461 110,288 0.06
JPMorgan Chase & Co 2.301% 15/10/2025 260,000 USD 270,237 270,795 0.15
JPMorgan Chase & Co 2.522% 22/04/2031 360,000 USD 378,867 370,438 0.20
JPMorgan Chase & Co 2.739% 15/10/2030 1,090,000 USD 1,148,365 1,140,808 0.61
JPMorgan Chase & Co 3.157% 22/04/2042 240,000 USD 241,430 249,823 0.13
MPLX LP 1.223% 09/09/2022 745,000 USD 745,079 745,475 0.40
Wells Fargo & Co 2.572% 11/02/2031 640,000 USD 664,977 662,313 0.35
(2) See Note 13.
92

Natixis International Funds (Lux) I
The accompanying notes form an integral part of these financial statements.
Loomis Sayles Global Credit Fund Statement of Investments (continued) As at June 30, 2021 (expressed in USD)
Description Face value Currency Cost Evaluation % of Net
Assets
Wells Fargo & Co 4.478% 04/04/2031 225,000 USD 269,969 265,947 0.14
8,535,843 8,594,313 4.61
Total - Variable rate bonds 13,655,514 13,834,742 7.42
Total - Transferable securities dealt in on another regulated market 52,535,501 53,892,568 28.90
TOTAL INVESTMENT PORTFOLIO 178,532,611 182,964,444 98.11
A detailed schedule of portfolio movements for the period from January 1, 2021 to June 30, 2021 is available free of charge upon request at the registered office of the SICAV.
93

Natixis International Funds (Lux) I
Loomis Sayles Disciplined Alpha U.S. Corporate Bond Fund
Statistics
As at June 30, 2021
Net asset value per share
I/A (USD) 123.07
R/A (USD) 120.54
S/A (USD) 123.22
Number of shares outstanding
I/A (USD) 30.000
R/A (USD) 30.000
S/A (USD) 1,200,000.000
94

Natixis International Funds (Lux) I
The accompanying notes form an integral part of these financial statements.
Loomis Sayles Disciplined Alpha U.S. Corporate Bond Fund
Statement of Investments As at June 30, 2021 (expressed in USD)
Description Face value Currency Cost Evaluation % of Net
Assets
Transferable securities admitted to an official stock exchange listing Fixed rate bonds
Brazil
Vale SA 5.625% 11/09/2042 135,000 USD 144,839 168,887 0.12
144,839 168,887 0.12 Canada
Cenovus Energy Inc 5.375% 15/07/2025 662,000 USD 753,087 757,350 0.51
Cenovus Energy Inc 5.400% 15/06/2047 268,000 USD 312,136 331,629 0.23
Suncor Energy Inc 3.750% 04/03/2051 232,000 USD 228,084 250,958 0.17
1,293,307 1,339,937 0.91 Cayman Islands
CK Hutchison International 21 Ltd 3.125% 15/04/2041 144A(2) 349,000 USD 343,288 357,409 0.24
QNB Finance Ltd 2.750% 12/02/2027 EMTN 400,000 USD 399,373 418,454 0.28
SA Global Sukuk Ltd 0.946% 17/06/2024 144A(2) 118,000 USD 118,000 117,849 0.08
SA Global Sukuk Ltd 1.602% 17/06/2026 144A(2) 665,000 USD 665,048 664,534 0.45
SA Global Sukuk Ltd 2.694% 17/06/2031 144A(2) 200,000 USD 200,000 202,480 0.14
Vale Overseas Ltd 6.250% 10/08/2026 477,000 USD 569,738 573,831 0.39
2,295,447 2,334,557 1.58 Great Britain
Anglo American Capital PLC 2.875% 17/03/2031
144A(2) 419,000 USD 420,161 428,331 0.29
HSBC Holdings PLC 6.500% 15/09/2037 206,000 USD 261,521 286,552 0.19
681,682 714,883 0.48 Indonesia
Indonesia Asahan Aluminium Persero PT 4.750% 15/05/2025 144A(2) 316,000 USD 315,033 348,217 0.24
Indonesia Asahan Aluminium Persero PT 6.757% 15/11/2048 144A(2) 80,000 USD 101,458 103,704 0.07
Perusahaan Perseroan Persero PT Perusahaan Listrik Negara 4.125% 15/05/2027 144A(2) 182,000 USD 197,122 197,379 0.13
Perusahaan Perseroan Persero PT Perusahaan Listrik Negara 4.875% 17/07/2049 144A(2) 139,000 USD 154,701 151,343 0.10
Perusahaan Perseroan Persero PT Perusahaan Listrik Negara 5.500% 22/11/2021 144A(2) 171,000 USD 172,842 173,685 0.12
941,156 974,328 0.66 Ireland
GE Capital International Funding Co Unlimited Co 4.418% 15/11/2035 1,002,000 USD 1,076,360 1,200,878 0.81
1,076,360 1,200,878 0.81 Israel
Israel Electric Corp Ltd 4.250% 14/08/2028 144A(2) 626,000 USD 710,216 700,819 0.47
Israel Electric Corp Ltd 5.000% 12/11/2024 144A(2) 200,000 USD 214,086 223,502 0.15
Israel Electric Corp Ltd 6.875% 21/06/2023 144A(2) 245,000 USD 263,939 273,309 0.19
1,188,241 1,197,630 0.81 Mexico
America Movil SAB de CV 3.625% 22/04/2029 821,000 USD 877,335 905,374 0.61
America Movil SAB de CV 6.125% 15/11/2037 124,000 USD 172,855 171,434 0.12
Mexico Government International Bond 4.280% 14/08/2041 195,000 USD 194,880 204,680 0.14
1,245,070 1,281,488 0.87
(2) See Note 13.
95

Natixis International Funds (Lux) I
The accompanying notes form an integral part of these financial statements.
Loomis Sayles Disciplined Alpha U.S. Corporate Bond Fund
Statement of Investments (continued) As at June 30, 2021 (expressed in USD)
Description Face value Currency Cost Evaluation % of Net
Assets
Philippines
Philippine Government International Bond 3.200% 06/07/2046 138,000 USD 136,826 138,423 0.09
136,826 138,423 0.09 Qatar
Qatar Government International Bond 4.400% 16/04/2050 144A(2) 223,000 USD 264,324 271,424 0.18
264,324 271,424 0.18 Saudi Arabia
Saudi Arabian Oil Co 3.250% 24/11/2050 144A(2) 202,000 USD 200,122 195,940 0.13
Saudi Government International Bond 3.450% 02/02/2061 144A(2) 216,000 USD 215,596 215,499 0.15
415,718 411,439 0.28 United Arab Emirates
Abu Dhabi Crude Oil Pipeline LLC 4.600% 02/11/2047 144A(2) 403,000 USD 434,982 475,016 0.32
434,982 475,016 0.32 United States
AbbVie Inc 4.875% 14/11/2048 479,000 USD 507,931 621,103 0.42
Alexandria Real Estate Equities Inc 3.000% 18/05/2051 361,000 USD 352,798 353,158 0.24
Altria Group Inc 4.500% 02/05/2043 239,000 USD 260,777 256,869 0.17
Ameren Corp 2.500% 15/09/2024 507,000 USD 506,971 533,140 0.36
Ameren Illinois Co 3.250% 15/03/2050 48,000 USD 47,775 51,887 0.04
American Electric Power Co Inc 0.750% 01/11/2023 161,000 USD 160,893 161,084 0.11
American International Group Inc 4.500% 16/07/2044 588,000 USD 663,593 713,680 0.48
Anheuser-Busch Cos LLC/Anheuser-Busch InBev Worldwide Inc 4.700% 01/02/2036 779,000 USD 911,257 956,101 0.65
Anheuser-Busch Cos LLC/Anheuser-Busch InBev Worldwide Inc 4.900% 01/02/2046 318,000 USD 374,610 402,508 0.27
Anheuser-Busch InBev Worldwide Inc 4.375% 15/04/2038 92,000 USD 90,897 109,992 0.07
Anheuser-Busch InBev Worldwide Inc 4.600% 15/04/2048 175,000 USD 183,976 213,648 0.14
Anthem Inc 3.600% 15/03/2051 185,000 USD 184,333 203,344 0.14
Aon Corp 2.800% 15/05/2030 564,000 USD 565,344 592,098 0.40
AT&T Inc 2.300% 01/06/2027 759,000 USD 796,138 785,036 0.53
BAT Capital Corp 3.215% 06/09/2026 1,058,000 USD 1,093,728 1,122,569 0.76
Becton Dickinson & Co 4.669% 06/06/2047 308,000 USD 372,716 383,707 0.26
Berkshire Hathaway Finance Corp 2.850% 15/10/2050 589,000 USD 596,955 587,940 0.40
Boeing Co/The 5.150% 01/05/2030 1,171,000 USD 1,304,394 1,386,645 0.94
Boeing Co/The 5.805% 01/05/2050 327,000 USD 423,705 440,348 0.30
BP Capital Markets America Inc 3.060% 17/06/2041 771,000 USD 771,000 776,831 0.53
Bristol-Myers Squibb Co 0.537% 13/11/2023 795,000 USD 795,000 795,952 0.54
Bristol-Myers Squibb Co 2.350% 13/11/2040 460,000 USD 432,269 442,998 0.30
Burlington Northern Santa Fe LLC 3.300% 15/09/2051 579,000 USD 590,985 632,293 0.43
Capital One Financial Corp 3.900% 29/01/2024 581,000 USD 621,185 627,027 0.42
Centene Corp 2.500% 01/03/2031 139,000 USD 137,814 137,089 0.09
Cigna Corp 4.900% 15/12/2048 119,000 USD 119,003 153,253 0.10
Citigroup Inc 4.300% 20/11/2026 356,000 USD 373,013 401,873 0.27
(2) See Note 13.
96

Natixis International Funds (Lux) I
The accompanying notes form an integral part of these financial statements.
Loomis Sayles Disciplined Alpha U.S. Corporate Bond Fund Statement of Investments (continued) As at June 30, 2021 (expressed in USD)
Description Face value Currency Cost Evaluation % of Net
Assets
Citigroup Inc 4.450% 29/09/2027 419,000 USD 439,960 478,706 0.32
CNH Industrial Capital LLC 1.450% 15/07/2026 735,000 USD 729,448 730,198 0.49
Conagra Brands Inc 5.400% 01/11/2048 169,000 USD 221,641 226,865 0.15
Consolidated Edison Co of New York Inc 3.000% 01/12/2060 353,000 USD 350,909 326,238 0.22
Consolidated Edison Inc 0.650% 01/12/2023 530,000 USD 529,924 530,073 0.36
Continental Resources Inc 4.375% 15/01/2028 411,000 USD 453,401 454,669 0.31
Continental Resources Inc 4.500% 15/04/2023 277,000 USD 288,757 288,241 0.20
Crown Castle International Corp 2.500% 15/07/2031 607,000 USD 605,910 611,321 0.41
CVS Health Corp 4.780% 25/03/2038 810,000 USD 959,798 996,499 0.67
CVS Health Corp 5.050% 25/03/2048 183,000 USD 247,377 237,694 0.16
DCP Midstream Operating LP 5.600% 01/04/2044 122,000 USD 129,311 134,201 0.09
Devon Energy Corp 4.750% 15/05/2042 69,000 USD 75,862 77,857 0.05
Devon Energy Corp 5.600% 15/07/2041 166,000 USD 177,373 205,255 0.14
Dominion Energy Inc 3.300% 15/04/2041 457,000 USD 458,609 479,810 0.32
Dominion Energy Inc 3.375% 01/04/2030 238,000 USD 253,827 259,161 0.18
DPL Inc 4.125% 01/07/2025 1,134,000 USD 1,210,195 1,216,215 0.82
DTE Electric Co 3.250% 01/04/2051 216,000 USD 214,211 233,885 0.16
DTE Energy Co 1.050% 01/06/2025 416,000 USD 416,007 415,885 0.28
Duke Energy Carolinas LLC 3.700% 01/12/2047 86,000 USD 102,908 96,948 0.07
Duke Energy Corp 3.950% 15/08/2047 190,000 USD 198,343 208,663 0.14
Edison International 3.125% 15/11/2022 188,000 USD 193,427 193,636 0.13
Edison International 5.750% 15/06/2027 821,000 USD 931,175 934,160 0.63
Energy Transfer LP 3.600% 01/02/2023 66,000 USD 68,490 68,485 0.05
Energy Transfer LP 6.050% 01/06/2041 207,000 USD 201,798 262,484 0.18
Energy Transfer LP 6.250% 15/04/2049 399,000 USD 465,198 523,586 0.35
Energy Transfer LP 6.500% 01/02/2042 6,000 USD 6,618 7,790 0.01
Enterprise Products Operating LLC 5.100% 15/02/2045 154,000 USD 173,032 194,498 0.13
Essex Portfolio LP 1.700% 01/03/2028 777,000 USD 770,919 762,976 0.52
Exxon Mobil Corp 3.452% 15/04/2051 560,000 USD 594,712 609,484 0.41
FirstEnergy Corp 4.750% 15/03/2023 480,000 USD 493,253 506,665 0.34
Florida Power & Light Co 3.700% 01/12/2047 484,000 USD 527,336 569,261 0.39
Ford Motor Credit Co LLC 3.625% 17/06/2031 377,000 USD 377,000 384,306 0.26
General Electric Co 6.750% 15/03/2032 98,000 USD 106,717 135,841 0.09
General Motors Co 5.950% 01/04/2049 259,000 USD 319,950 352,573 0.24
General Motors Co 6.250% 02/10/2043 130,000 USD 140,398 179,464 0.12
General Motors Financial Co Inc 1.500% 10/06/2026 155,000 USD 154,721 153,989 0.10
General Motors Financial Co Inc 2.700% 20/08/2027 100,000 USD 104,274 103,912 0.07
General Motors Financial Co Inc 3.150% 30/06/2022 68,000 USD 66,666 69,629 0.05
General Motors Financial Co Inc 4.000% 15/01/2025 89,000 USD 96,613 96,959 0.07
Goldman Sachs Group Inc/The 3.500% 16/11/2026 1,763,000 USD 1,826,784 1,917,089 1.30
Healthpeak Properties Inc 1.350% 01/02/2027 224,000 USD 223,724 223,724 0.15
Hess Corp 5.800% 01/04/2047 312,000 USD 372,071 406,545 0.28
Home Depot Inc/The 2.375% 15/03/2051 430,000 USD 407,988 397,714 0.27
Hormel Foods Corp 3.050% 03/06/2051 217,000 USD 224,203 224,992 0.15
ITC Holdings Corp 2.700% 15/11/2022 835,000 USD 837,301 858,400 0.58
97

Natixis International Funds (Lux) I
The accompanying notes form an integral part of these financial statements.
Loomis Sayles Disciplined Alpha U.S. Corporate Bond Fund Statement of Investments (continued) As at June 30, 2021 (expressed in USD)
Description Face value Currency Cost Evaluation % of Net
Assets
Kinder Morgan Inc 3.600% 15/02/2051 268,000 USD 265,204 272,776 0.18
Lincoln National Corp 7.000% 15/06/2040 66,000 USD 88,823 100,842 0.07
Lowe's Cos Inc 2.625% 01/04/2031 1,208,000 USD 1,216,781 1,248,195 0.84
Lowe's Cos Inc 3.000% 15/10/2050 194,000 USD 200,524 191,270 0.13
LYB International Finance III LLC 4.200% 01/05/2050 459,000 USD 476,945 528,132 0.36
Marathon Petroleum Corp 4.700% 01/05/2025 460,000 USD 514,672 518,779 0.35
Marathon Petroleum Corp 4.750% 15/09/2044 116,000 USD 105,495 137,058 0.09
Mastercard Inc 3.850% 26/03/2050 89,000 USD 101,338 107,480 0.07
McDonald's Corp 3.700% 15/02/2042 84,000 USD 92,006 93,975 0.06
McDonald's Corp 4.450% 01/09/2048 43,000 USD 56,684 53,508 0.04
MDC Holdings Inc 6.000% 15/01/2043 143,000 USD 186,102 184,284 0.12
MetLife Inc 6.400% 15/12/2036 438,000 USD 489,959 562,533 0.38
Morgan Stanley 3.875% 29/04/2024 706,000 USD 721,015 767,862 0.52
MPLX LP 5.500% 15/02/2049 295,000 USD 307,843 381,830 0.26
NextEra Energy Capital Holdings Inc 0.650% 01/03/2023 556,000 USD 556,134 558,269 0.38
NextEra Energy Capital Holdings Inc 2.800% 15/01/2023 372,000 USD 375,495 384,464 0.26
Norfolk Southern Corp 3.050% 15/05/2050 187,000 USD 188,345 186,920 0.13
Norfolk Southern Corp 4.100% 15/05/2121 175,000 USD 177,280 191,792 0.13
ONEOK Inc 2.750% 01/09/2024 146,000 USD 153,666 153,701 0.10
ONEOK Inc 7.150% 15/01/2051 148,000 USD 163,907 217,572 0.15
Oracle Corp 3.600% 01/04/2040 199,000 USD 201,309 209,897 0.14
Oracle Corp 3.600% 01/04/2050 765,000 USD 792,882 785,542 0.53
Oracle Corp 3.950% 25/03/2051 113,000 USD 116,570 123,338 0.08
Pacific Gas & Electric Co 1.750% 16/06/2022 283,000 USD 282,991 282,844 0.19
Pacific Gas & Electric Co 3.750% 15/02/2024 90,000 USD 94,897 94,344 0.06
Pacific Gas & Electric Co 4.000% 01/12/2046 219,000 USD 227,818 204,967 0.14
PacifiCorp 3.300% 15/03/2051 385,000 USD 394,235 407,754 0.28
Pfizer Inc 4.400% 15/05/2044 200,000 USD 217,584 257,877 0.17
Pioneer Natural Resources Co 2.150% 15/01/2031 462,000 USD 453,578 452,699 0.31
Raytheon Technologies Corp 3.125% 01/07/2050 69,000 USD 67,823 70,841 0.05
Reynolds American Inc 5.700% 15/08/2035 31,000 USD 35,929 37,428 0.03
San Diego Gas & Electric Co 3.750% 01/06/2047 281,000 USD 303,557 320,654 0.22
Santander Holdings USA Inc 3.450% 02/06/2025 353,000 USD 378,484 379,342 0.26
Sempra Energy 6.000% 15/10/2039 226,000 USD 278,204 312,777 0.21
Southern California Edison Co 4.125% 01/03/2048 107,000 USD 112,507 114,028 0.08
Southern Power Co 4.950% 15/12/2046 368,000 USD 417,711 441,803 0.30
Sysco Corp 6.600% 01/04/2050 162,000 USD 243,048 251,645 0.17
T-Mobile USA Inc 3.500% 15/04/2025 187,000 USD 202,154 202,679 0.14
T-Mobile USA Inc 3.750% 15/04/2027 371,000 USD 408,813 409,955 0.28
T-Mobile USA Inc 4.500% 15/04/2050 171,000 USD 201,950 203,615 0.14
Toll Brothers Finance Corp 4.875% 15/11/2025 131,000 USD 146,213 147,030 0.10
U.S. Treasury Bond 1.875% 15/02/2051 1,931,000 USD 1,803,527 1,842,898 1.25
U.S. Treasury Bond 2.250% 15/05/2041 1,128,000 USD 1,165,748 1,173,649 0.79
U.S. Treasury Note 0.125% 31/05/2023 872,000 USD 871,571 870,127 0.59
U.S. Treasury Note 0.125% 30/06/2023 1,955,000 USD 1,949,814 1,950,342 1.32
U.S. Treasury Note 0.250% 15/06/2024 4,090,000 USD 4,079,067 4,065,077 2.75
U.S. Treasury Note 0.750% 31/05/2026 2,990,000 USD 2,975,186 2,972,948 2.01
U.S. Treasury Note 0.875% 30/06/2026 2,609,000 USD 2,605,960 2,607,777 1.76
98

Natixis International Funds (Lux) I
The accompanying notes form an integral part of these financial statements.
Loomis Sayles Disciplined Alpha U.S. Corporate Bond Fund Statement of Investments (continued) As at June 30, 2021 (expressed in USD)
Description Face value Currency Cost Evaluation % of Net
Assets
U.S. Treasury Note 1.250% 30/06/2028 706,000 USD 706,257 707,103 0.48
U.S. Treasury Note 1.625% 15/05/2031 3,160,000 USD 3,199,886 3,208,387 2.17
Union Pacific Corp 3.200% 20/05/2041 240,000 USD 240,319 254,049 0.17
UnitedHealth Group Inc 2.300% 15/05/2031 624,000 USD 625,354 639,029 0.43
UnitedHealth Group Inc 2.750% 15/05/2040 150,000 USD 146,146 151,906 0.10
UnitedHealth Group Inc 3.250% 15/05/2051 238,000 USD 238,688 253,891 0.17
UnitedHealth Group Inc 3.500% 15/08/2039 552,000 USD 582,935 616,910 0.42
Valero Energy Corp 6.625% 15/06/2037 120,000 USD 142,645 164,506 0.11
Ventas Realty LP 4.875% 15/04/2049 154,000 USD 154,748 190,020 0.13
Verizon Communications Inc 3.550% 22/03/2051 209,000 USD 205,314 223,289 0.15
Verizon Communications Inc 3.700% 22/03/2061 376,000 USD 371,328 402,718 0.27
Verizon Communications Inc 4.272% 15/01/2036 1,250,000 USD 1,318,498 1,487,281 1.01
Walt Disney Co/The 3.600% 13/01/2051 291,000 USD 310,423 329,851 0.22
Waste Management Inc 2.950% 01/06/2041 318,000 USD 316,383 327,598 0.22
Wells Fargo & Co 4.900% 17/11/2045 531,000 USD 605,434 681,024 0.46
Williams Cos Inc/The 4.850% 01/03/2048 28,000 USD 33,121 34,029 0.02
67,652,026 69,895,429 47.27
Total - Fixed rate bonds 77,769,978 80,404,319 54.38
Variable rate bonds
Great Britain
Barclays PLC 3.811% 10/03/2042 360,000 USD 358,474 379,794 0.26
Barclays PLC 4.338% 16/05/2024 239,000 USD 239,000 254,819 0.17
HSBC Holdings PLC 2.804% 24/05/2032 467,000 USD 467,000 479,258 0.32
HSBC Holdings PLC 3.803% 11/03/2025 891,000 USD 949,674 958,078 0.65
Standard Chartered PLC 1.214% 23/03/2025 144A(2) 200,000 USD 200,000 200,714 0.13
2,214,148 2,272,663 1.53 Switzerland
Credit Suisse Group AG 2.593% 11/09/2025 144A(2) 1,488,000 USD 1,494,584 1,548,557 1.05
1,494,584 1,548,557 1.05
Total - Variable rate bonds 3,708,732 3,821,220 2.58
Total - Transferable securities admitted to an official stock exchange listing 81,478,710 84,225,539 56.96
Transferable securities dealt in on another regulated market
Fixed rate bonds
Canada
Canadian Imperial Bank of Commerce 1.250% 22/06/2026 1,433,000 USD 1,431,004 1,426,041 0.96
1,431,004 1,426,041 0.96 Cayman Islands
Tencent Holdings Ltd 3.840% 22/04/2051 144A(2) 188,000 USD 187,935 202,405 0.14
187,935 202,405 0.14 Chile
Empresa de Transporte de Pasajeros Metro SA 4.700% 07/05/2050 144A(2) 86,000 USD 92,992 97,180 0.07
92,992 97,180 0.07
(2) See Note 13.
99

Natixis International Funds (Lux) I
The accompanying notes form an integral part of these financial statements.
Loomis Sayles Disciplined Alpha U.S. Corporate Bond Fund Statement of Investments (continued) As at June 30, 2021 (expressed in USD)
Description Face value Currency Cost Evaluation % of Net
Assets
France
Banque Federative du Credit Mutuel SA 0.650% 27/02/2024 144A(2) 380,000 USD 379,562 378,936 0.26
Societe Generale SA 2.625% 22/01/2025 144A(2) 972,000 USD 971,771 1,014,006 0.68
1,351,333 1,392,942 0.94 Germany
Deutsche Bank AG/New York NY 0.898% 28/05/2024 173,000 USD 173,000 172,212 0.12
173,000 172,212 0.12 Great Britain
Vodafone Group PLC 4.875% 19/06/2049 217,000 USD 224,791 273,692 0.19
Weir Group PLC/The 2.200% 13/05/2026 144A(2) 472,000 USD 472,080 473,929 0.32
696,871 747,621 0.51 Multinational
NXP BV/NXP Funding LLC/NXP USA Inc 3.250% 11/05/2041 144A(2) 618,000 USD 617,406 635,409 0.43
617,406 635,409 0.43 Netherlands
Cooperatieve Rabobank UA 4.625% 01/12/2023 204,000 USD 209,628 223,070 0.15
JAB Holdings BV 3.750% 28/05/2051 144A(2) 157,000 USD 156,915 167,705 0.11
366,543 390,775 0.26 United States
AbbVie Inc 2.600% 21/11/2024 877,000 USD 905,784 924,750 0.63
AbbVie Inc 4.050% 21/11/2039 349,000 USD 393,109 405,338 0.27
Amazon.com Inc 2.500% 03/06/2050 252,000 USD 254,145 238,115 0.16
Amazon.com Inc 3.100% 12/05/2051 177,000 USD 182,916 185,927 0.13
Amazon.com Inc 3.250% 12/05/2061 573,000 USD 575,014 603,856 0.41
American Credit Acceptance Receivables Trust 1.650% 13/12/2023 144A(2) 13,345 USD 13,345 13,380 0.01
Americredit Automobile Receivables Trust 3.450% 18/06/2024 121,000 USD 120,995 122,402 0.08
Amgen Inc 3.150% 21/02/2040 324,000 USD 321,916 337,609 0.23
Apple Inc 2.650% 11/05/2050 939,000 USD 951,476 921,944 0.62
Apple Inc 2.800% 08/02/2061 107,000 USD 101,182 104,214 0.07
AT&T Inc 2.550% 01/12/2033 144A(2) 1,650,000 USD 1,596,611 1,634,559 1.11
AT&T Inc 3.500% 15/09/2053 144A(2) 897,000 USD 753,285 901,189 0.61
Athene Global Funding 1.608% 29/06/2026 144A(2) 548,000 USD 548,000 548,061 0.37
Athene Global Funding 2.673% 07/06/2031 144A(2) 493,000 USD 495,294 499,334 0.34
Bimbo Bakeries USA Inc 4.000% 17/05/2051 144A(2) 190,000 USD 186,815 204,023 0.14
Brighthouse Financial Inc 4.700% 22/06/2047 47,000 USD 47,744 52,199 0.04
Bristol-Myers Squibb Co 4.125% 15/06/2039 329,000 USD 367,809 397,036 0.27
Broadcom Inc 3.500% 15/02/2041 144A(2) 219,000 USD 212,459 224,043 0.15
Broadcom Inc 4.150% 15/11/2030 821,000 USD 879,496 920,682 0.62
Capital One Prime Auto Receivables Trust 1.920% 15/05/2024 25,927 USD 25,925 26,227 0.02
CarMax Auto Owner Trust 3.160% 17/07/2023 19,000 USD 19,000 19,350 0.01
Centene Corp 2.450% 15/07/2028 378,000 USD 378,000 383,103 0.26
Charter Communications Operating LLC/Charter Communications Operating Capital 3.850% 01/04/2061 101,000 USD 90,298 99,131 0.07
(2) See Note 13.
100

Natixis International Funds (Lux) I
The accompanying notes form an integral part of these financial statements.
Loomis Sayles Disciplined Alpha U.S. Corporate Bond Fund Statement of Investments (continued) As at June 30, 2021 (expressed in USD)
Description Face value Currency Cost Evaluation % of Net
Assets
Charter Communications Operating LLC/Charter Communications Operating Capital 4.908% 23/07/2025 650,000 USD 706,241 736,392 0.50
Charter Communications Operating LLC/Charter Communications Operating Capital 5.050% 30/03/2029 627,000 USD 697,099 740,607 0.50
Charter Communications Operating LLC/Charter Communications Operating Capital 5.375% 01/05/2047 129,000 USD 136,520 158,078 0.11
Charter Communications Operating LLC/Charter Communications Operating Capital 5.750% 01/04/2048 170,000 USD 220,483 216,366 0.15
Citigroup Commercial Mortgage Trust 3.154% 15/11/2049 82,000 USD 82,337 88,948 0.06
Citigroup Commercial Mortgage Trust 3.778% 10/09/2058 18,000 USD 18,360 19,781 0.01
Comcast Corp 4.600% 15/10/2038 527,000 USD 556,321 653,165 0.44
Comcast Corp 4.650% 15/07/2042 353,000 USD 390,617 443,081 0.30
Commercial Mortgage Trust 3.213% 10/03/2046 15,270 USD 15,281 15,843 0.01
Commercial Mortgage Trust 3.765% 10/10/2046 78,067 USD 78,856 81,896 0.06
Commercial Mortgage Trust 3.774% 10/10/2048 109,000 USD 110,415 119,927 0.08
CommonSpirit Health 4.187% 01/10/2049 88,000 USD 98,185 101,149 0.07
Cottage Health Obligated Group 3.304% 01/11/2049 280,000 USD 282,963 302,314 0.20
CSAIL Commercial Mortgage Trust 3.502% 15/11/2049 57,000 USD 57,488 62,157 0.04
Dell International LLC/EMC Corp 4.900% 01/10/2026 343,000 USD 393,016 395,851 0.27
Dell International LLC/EMC Corp 8.350% 15/07/2046 304,000 USD 436,364 497,223 0.34
Diamondback Energy Inc 4.400% 24/03/2051 139,000 USD 151,278 156,500 0.11
Dominion Energy Inc 2.450% 15/01/2023 144A(2) 586,000 USD 585,591 603,347 0.41
Drive Auto Receivables Trust 1.020% 15/06/2027 54,000 USD 53,992 54,232 0.04
Drive Auto Receivables Trust 1.420% 17/03/2025 94,000 USD 93,996 95,038 0.06
Drive Auto Receivables Trust 2.020% 15/11/2023 199,153 USD 199,642 199,482 0.13
Drive Auto Receivables Trust 2.230% 16/01/2024 45,454 USD 45,451 45,591 0.03
Drive Auto Receivables Trust 2.280% 17/08/2026 147,000 USD 146,996 150,280 0.10
DTE Energy Co 2.529% 01/10/2024 941,000 USD 942,051 990,557 0.67
Duke Energy Florida LLC 4.200% 15/07/2048 389,000 USD 465,101 477,649 0.32
Exelon Corp 4.050% 15/04/2030 400,000 USD 449,298 455,575 0.31
Exelon Corp 4.700% 15/04/2050 322,000 USD 397,401 406,723 0.27
FirstEnergy Transmission LLC 2.866% 15/09/2028 144A(2) 50,000 USD 50,667 51,756 0.03
FirstEnergy Transmission LLC 4.350% 15/01/2025 144A(2) 159,000 USD 171,563 174,442 0.12
FirstEnergy Transmission LLC 5.450% 15/07/2044 144A(2) 202,000 USD 234,198 252,047 0.17
Flagship Credit Auto Trust 2.830% 16/10/2023 144A(2) 13,069 USD 13,069 13,153 0.01
Ford Foundation/The 2.815% 01/06/2070 385,000 USD 387,424 386,286 0.26
Freddie Mac Multifamily Structured Pass Through Certificates 3.243% 25/04/2027 43,000 USD 43,508 47,702 0.03
(2) See Note 13.
101

Natixis International Funds (Lux) I
The accompanying notes form an integral part of these financial statements.
Loomis Sayles Disciplined Alpha U.S. Corporate Bond Fund Statement of Investments (continued) As at June 30, 2021 (expressed in USD)
Description Face value Currency Cost Evaluation % of Net
Assets
Freddie Mac Multifamily Structured Pass Through Certificates 3.244% 25/08/2027 52,000 USD 51,288 57,884 0.04
Fresenius Medical Care US Finance III Inc 3.000% 01/12/2031 144A(2) 239,000 USD 237,098 243,803 0.16
GE Capital Funding LLC 4.400% 15/05/2030 272,000 USD 294,015 316,970 0.21
Gilead Sciences Inc 0.750% 29/09/2023 455,000 USD 454,881 455,225 0.31
Gilead Sciences Inc 2.600% 01/10/2040 592,000 USD 590,500 569,910 0.39
Gilead Sciences Inc 4.750% 01/03/2046 87,000 USD 95,792 110,329 0.07
Glencore Funding LLC 3.875% 27/04/2051 144A(2) 169,000 USD 168,941 176,977 0.12
GS Mortgage Securities Trust 3.135% 10/06/2046 25,000 USD 24,814 26,001 0.02
GS Mortgage Securities Trust 4.074% 10/01/2047 28,000 USD 28,411 29,970 0.02
Hyundai Capital America 1.150% 10/11/2022 144A(2) 217,000 USD 216,992 218,358 0.15
Hyundai Capital America 1.500% 15/06/2026 144A(2) 1,521,000 USD 1,518,392 1,509,085 1.02
Jersey Central Power & Light Co 2.750% 01/03/2032 144A(2) 144,000 USD 144,214 146,173 0.10
Liberty Mutual Group Inc 3.950% 15/05/2060 144A(2) 209,000 USD 190,923 229,637 0.15
Marathon Petroleum Corp 4.750% 15/12/2023 313,000 USD 316,733 341,536 0.23
Marathon Petroleum Corp 5.125% 15/12/2026 504,000 USD 563,709 592,618 0.40
Microchip Technology Inc 0.972% 15/02/2024 144A(2) 1,635,000 USD 1,635,412 1,634,195 1.10
Microsoft Corp 2.525% 01/06/2050 660,000 USD 673,390 648,437 0.44
Morgan Stanley Bank of America Merrill Lynch Trust 3.249% 15/02/2048 79,000 USD 79,403 84,443 0.06
Morgan Stanley Bank of America Merrill Lynch Trust 3.732% 15/05/2048 164,000 USD 165,900 179,450 0.12
NVIDIA Corp 1.550% 15/06/2028 1,154,000 USD 1,150,155 1,149,296 0.78
NVIDIA Corp 2.000% 15/06/2031 816,000 USD 812,416 816,870 0.55
NYU Langone Hospitals 3.380% 01/07/2055 147,000 USD 147,000 155,707 0.11
Pacific Gas & Electric Co 4.250% 01/08/2023 362,000 USD 379,677 383,523 0.26
Pacific Gas & Electric Co 4.500% 01/07/2040 89,000 USD 96,190 89,043 0.06
Pacific Gas & Electric Co 4.950% 01/07/2050 131,000 USD 137,681 134,742 0.09
Plains All American Pipeline LP/PAA Finance Corp 4.700% 15/06/2044 165,000 USD 173,656 174,801 0.12
Plains All American Pipeline LP/PAA Finance Corp 6.650% 15/01/2037 149,000 USD 170,669 195,110 0.13
Principal Life Global Funding II 2.250% 21/11/2024 144A(2) 990,000 USD 989,114 1,031,402 0.70
salesforce.com Inc 2.700% 15/07/2041 455,000 USD 452,488 456,881 0.31
salesforce.com Inc 2.900% 15/07/2051 179,000 USD 178,501 180,745 0.12
Santander Drive Auto Receivables Trust 0.670% 15/04/2024 41,000 USD 40,999 41,068 0.03
Santander Drive Auto Receivables Trust 0.900% 15/06/2026 54,000 USD 53,988 54,087 0.04
Santander Drive Auto Receivables Trust 0.960% 15/11/2024 66,000 USD 65,994 66,386 0.04
Santander Drive Auto Receivables Trust 1.010% 15/01/2026 141,000 USD 140,971 141,818 0.10
Santander Drive Auto Receivables Trust 2.030% 15/02/2024 232,814 USD 234,001 234,011 0.16
(2) See Note 13.
102

Natixis International Funds (Lux) I
The accompanying notes form an integral part of these financial statements.
Loomis Sayles Disciplined Alpha U.S. Corporate Bond Fund Statement of Investments (continued) As at June 30, 2021 (expressed in USD)
Description Face value Currency Cost Evaluation % of Net
Assets
Seattle Children's Hospital 2.719% 01/10/2050 245,000 USD 245,000 240,421 0.16
Stanford Health Care 3.027% 15/08/2051 234,000 USD 234,000 242,181 0.16
Starbucks Corp 4.450% 15/08/2049 103,000 USD 129,524 127,758 0.09
Time Warner Cable LLC 7.300% 01/07/2038 343,000 USD 414,578 500,927 0.34
Toyota Auto Receivables Owner Trust 0.530% 15/10/2026 36,000 USD 35,998 35,821 0.02
Union Pacific Corp 2.973% 16/09/2062 475,000 USD 428,247 456,124 0.31
ViacomCBS Inc 4.375% 15/03/2043 221,000 USD 200,038 255,710 0.17
Walt Disney Co/The 6.400% 15/12/2035 391,000 USD 503,631 572,316 0.39
WEA Finance LLC 3.150% 05/04/2022 144A(2) 106,000 USD 105,919 107,569 0.07
Wells Fargo Commercial Mortgage Trust 3.096% 15/06/2049 101,000 USD 99,853 106,202 0.07
Wells Fargo Commercial Mortgage Trust 3.695% 15/11/2048 76,000 USD 76,619 83,471 0.06
Wells Fargo Commercial Mortgage Trust 3.809% 15/12/2048 51,000 USD 51,383 56,329 0.04
Wells Fargo Commercial Mortgage Trust 4.442% 15/09/2061 26,000 USD 27,583 30,398 0.02
WFRBS Commercial Mortgage Trust 3.631% 15/11/2047 83,000 USD 84,005 89,802 0.06
World Omni Auto Receivables Trust 3.330% 15/04/2024 78,598 USD 78,592 79,746 0.05
Xcel Energy Inc 6.500% 01/07/2036 218,000 USD 288,564 315,266 0.21
33,810,232 35,136,142 23.76
Total - Fixed rate bonds 38,727,316 40,200,727 27.19
Variable rate bonds
France
Credit Agricole SA 1.247% 26/01/2027 144A(2) 1,102,000 USD 1,101,265 1,084,956 0.73
1,101,265 1,084,956 0.73 Germany
Deutsche Bank AG/New York NY 3.035% 28/05/2032 214,000 USD 214,000 217,606 0.15
214,000 217,606 0.15 Japan
Mitsubishi UFJ Financial Group Inc 0.848% 15/09/2024 1,002,000 USD 1,002,948 1,007,303 0.68
1,002,948 1,007,303 0.68 Sweden
Svenska Handelsbanken AB 1.418% 11/06/2027 144A(2) 1,358,000 USD 1,357,984 1,353,384 0.91
1,357,984 1,353,384 0.91 United States
Bank of America Corp 2.592% 29/04/2031 2,042,000 USD 2,066,217 2,105,174 1.42
Bank of America Corp 2.676% 19/06/2041 828,000 USD 828,000 803,573 0.54
Bank of America Corp 3.559% 23/04/2027 443,000 USD 447,138 485,184 0.33
Citigroup Commercial Mortgage Trust 3.720% 10/12/2049 100,000 USD 102,488 111,367 0.07
Citigroup Inc 2.572% 03/06/2031 494,000 USD 494,000 507,843 0.34
Citigroup Inc 2.976% 05/11/2030 518,000 USD 522,523 548,656 0.37
Citigroup Inc 3.887% 10/01/2028 807,000 USD 910,145 898,147 0.61
(2) See Note 13.
103

Natixis International Funds (Lux) I
The accompanying notes form an integral part of these financial statements.
Loomis Sayles Disciplined Alpha U.S. Corporate Bond Fund
Statement of Investments (continued) As at June 30, 2021 (expressed in USD)
Description Face value Currency Cost Evaluation % of Net
Assets
Fannie Mae 30-year TBA 2.500% 01/07/2051 2,180,000 USD 2,251,531 2,254,767 1.52
Freddie Mac Multifamily Structured Pass Through Certificates 3.303% 25/11/2027 200,000 USD 204,150 223,773 0.15
Goldman Sachs Group Inc/The 0.855% 12/02/2026 248,000 USD 248,000 246,180 0.17
Goldman Sachs Group Inc/The 2.876% 31/10/2022 324,000 USD 324,969 326,550 0.22
Goldman Sachs Group Inc/The 4.411% 23/04/2039 494,000 USD 508,227 601,463 0.41
GS Mortgage Securities Trust 3.442% 10/11/2049 68,000 USD 68,929 74,508 0.05
JPMorgan Chase & Co 0.969% 23/06/2025 795,000 USD 795,000 795,940 0.54
JPMorgan Chase & Co 1.953% 04/02/2032 896,000 USD 860,964 870,194 0.59
JPMorgan Chase & Co 2.069% 01/06/2029 963,000 USD 963,000 970,570 0.66
JPMorgan Chase & Co 2.182% 01/06/2028 612,000 USD 617,513 626,677 0.42
JPMorgan Chase & Co 3.109% 22/04/2051 281,000 USD 294,425 289,909 0.20
JPMorgan Chase & Co 3.702% 06/05/2030 537,000 USD 551,817 599,658 0.41
JPMorgan Chase & Co 3.964% 15/11/2048 304,000 USD 311,964 356,739 0.24
Morgan Stanley 1.593% 04/05/2027 1,026,000 USD 1,032,287 1,033,259 0.70
Morgan Stanley 1.928% 28/04/2032 475,000 USD 461,909 461,714 0.31
Wells Fargo & Co 3.068% 30/04/2041 299,000 USD 313,410 306,679 0.21
Wells Fargo & Co 3.584% 22/05/2028 155,000 USD 172,542 170,762 0.12
15,351,148 15,669,286 10.60
Total - Variable rate bonds 19,027,345 19,332,535 13.07
Total - Transferable securities dealt in on another regulated market 57,754,661 59,533,262 40.26
Other transferable securities
Fixed rate bonds
United States
Idaho Energy Resources Authority 2.861% 01/09/2046 215,000 USD 215,000 221,494 0.15
New Jersey Transportation Trust Fund Authority 5.754% 15/12/2028 250,000 USD 250,000 297,877 0.20
New York State Dormitory Authority 2.202% 15/03/2034 330,000 USD 330,000 333,262 0.22
New York State Dormitory Authority 3.190% 15/02/2043 160,000 USD 161,323 175,008 0.12
State of California 7.300% 01/10/2039 165,000 USD 265,018 264,067 0.18
State of Illinois 5.100% 01/06/2033 580,000 USD 628,620 681,995 0.46
1,849,961 1,973,703 1.33
Total - Fixed rate bonds 1,849,961 1,973,703 1.33
Treasury Bills
United States
United States Treasury Bill 0.000% 02/12/2021 250,000 USD 249,892 249,945 0.17
249,892 249,945 0.17
Total - Treasury Bills 249,892 249,945 0.17
Total - Other transferable securities 2,099,853 2,223,648 1.50
TOTAL INVESTMENT PORTFOLIO 141,333,224 145,982,449 98.72
A detailed schedule of portfolio movements for the period from January 1, 2021 to June 30, 2021 is available free of charge upon request at the registered office of the SICAV.
104

Natixis International Funds (Lux) I
Loomis Sayles Sustainable Global Corporate Bond Fund(1)
Statistics
As at June 30, 2021
Net asset value per share
H-I/A (EUR) 101.88
H-I/A (SEK) 102.11
H-S/A (GBP) 175.02
H-S/A (NOK) 102.58
I/A (USD) 102.72
Q/A (USD) 138.36
Number of shares outstanding
H-I/A (EUR) 61,012.620
H-I/A (SEK) 2,603,988.062
H-S/A (GBP) 238,221.436
H-S/A (NOK) 11,999,333.773
I/A (USD) 43.783
Q/A (USD) 230,769.602
(1) See Note 1.
105

Natixis International Funds (Lux) I
The accompanying notes form an integral part of these financial statements.
Loomis Sayles Sustainable Global Corporate Bond Fund(1)
Statement of Investments
As at June 30, 2021 (expressed in USD)
Description Face value Currency Cost Evaluation % of Net
Assets
Transferable securities admitted to an official stock exchange listing Fixed rate bonds
Australia
AusNet Services Holdings Pty Ltd 0.625% 25/08/2030 EMTN 490,000 EUR 590,403 585,083 0.22
590,403 585,083 0.22 Austria
Suzano Austria GmbH 3.750% 15/01/2031 885,000 USD 941,204 928,144 0.34
941,204 928,144 0.34 Belgium
Solvay SA 0.500% 06/09/2029 200,000 EUR 231,039 239,868 0.09
231,039 239,868 0.09 Canada
Bank of Nova Scotia/The 1.050% 02/03/2026 1,310,000 USD 1,308,569 1,296,068 0.48
Canadian Government Bond 1.500% 01/06/2026 5,585,000 CAD 4,626,331 4,621,663 1.70
5,934,900 5,917,731 2.18 Cayman Islands
CK Hutchison International 19 Ltd 3.625% 11/04/2029 200,000 USD 198,960 221,648 0.08
DP World Crescent Ltd 4.848% 26/09/2028 EMTN 400,000 USD 428,560 460,175 0.17
627,520 681,823 0.25 Finland
Nokia Oyj 4.375% 12/06/2027 500,000 USD 530,137 552,305 0.20
530,137 552,305 0.20 France
Aeroports de Paris 1.500% 02/07/2032 700,000 EUR 816,401 897,485 0.33
Coentreprise de Transport d'Electricite SA 1.500% 29/07/2028 200,000 EUR 259,611 255,386 0.09
Societe Generale SA 1.250% 07/12/2027 EMTN 1,200,000 GBP 1,620,215 1,613,269 0.60
Societe Generale SA 4.750% 24/11/2025 144A(2) 365,000 USD 358,983 406,994 0.15
3,055,210 3,173,134 1.17
Germany
ADLER Real Estate AG 1.500% 17/04/2022 100,000 EUR 112,295 118,005 0.04
Bundesrepublik Deutschland Bundesanleihe 0.000% 15/08/2030 795,000 EUR 994,335 968,704 0.36
Bundesrepublik Deutschland Bundesanleihe 1.000% 15/08/2025 1,040,000 EUR 1,325,667 1,318,113 0.49
Deutsche Telekom AG 1.750% 09/12/2049 EMTN 265,000 EUR 329,842 324,927 0.12
E.ON SE 0.600% 01/10/2032 EMTN 735,000 EUR 860,269 863,258 0.32
Fraport AG Frankfurt Airport Services Worldwide 1.875% 31/03/2028 1,265,000 EUR 1,605,509 1,569,771 0.58
Vantage Towers AG 0.750% 31/03/2030 EMTN 1,000,000 EUR 1,193,327 1,183,007 0.44
Volkswagen Financial Services AG 3.375% 06/04/2028 EMTN 275,000 EUR 350,467 387,990 0.14
6,771,711 6,733,775 2.49 Great Britain
Anglian Water Osprey Financing PLC 2.000% 31/07/2028 EMTN 165,000 GBP 229,156 228,152 0.08
Barclays PLC 4.337% 10/01/2028 400,000 USD 414,830 447,251 0.16
(1) See Note 1.
(2) See Note 13.
106

Natixis International Funds (Lux) I
The accompanying notes form an integral part of these financial statements.
Loomis Sayles Sustainable Global Corporate Bond Fund(1) Statement of Investments (continued) As at June 30, 2021 (expressed in USD)
Description Face value Currency Cost Evaluation % of Net
Assets
British Telecommunications PLC 1.125% 12/09/2029 EMTN 100,000 EUR 116,680 122,052 0.05
British Telecommunications PLC 3.250% 08/11/2029 144A(2) 1,660,000 USD 1,788,910 1,762,447 0.65
HSBC Holdings PLC 4.950% 31/03/2030 1,010,000 USD 1,184,268 1,218,879 0.45
HSBC Holdings PLC 6.500% 15/09/2037 100,000 USD 137,614 139,103 0.05
Lloyds Banking Group PLC 4.050% 16/08/2023 585,000 USD 628,429 627,174 0.23
National Grid Electricity Transmission PLC 1.125% 07/07/2028 EMTN 200,000 GBP 272,429 269,463 0.10
National Grid Electricity Transmission PLC 2.000% 16/09/2038 EMTN 1,070,000 GBP 1,474,090 1,457,125 0.54
National Grid Electricity Transmission PLC 2.750% 06/02/2035 EMTN 160,000 GBP 235,019 239,579 0.09
National Grid PLC 0.163% 20/01/2028 EMTN 305,000 EUR 357,434 355,763 0.13
National Grid PLC 0.553% 18/09/2029 EMTN 105,000 EUR 124,450 124,193 0.05
Sky Ltd 3.750% 16/09/2024 144A(2) 200,000 USD 220,069 218,593 0.08
7,183,378 7,209,774 2.66 India
Adani Ports & Special Economic Zone Ltd 3.100% 02/02/2031 945,000 USD 884,893 900,755 0.33
884,893 900,755 0.33 Indonesia
Perusahaan Gas Negara Tbk PT 5.125% 16/05/2024 200,000 USD 218,641 221,519 0.08
218,641 221,519 0.08 Ireland
CCEP Finance Ireland DAC 0.875% 06/05/2033 1,085,000 EUR 1,297,375 1,283,758 0.48
Cyrusone Europe Finance DAC 1.125% 26/05/2028 1,455,000 EUR 1,740,437 1,714,510 0.63
GE Capital International Funding Co Unlimited Co 3.373% 15/11/2025 775,000 USD 814,188 845,624 0.31
GE Capital International Funding Co Unlimited Co 4.418% 15/11/2035 300,000 USD 314,537 359,545 0.13
4,166,537 4,203,437 1.55 Italy
Atlantia SpA 1.625% 03/02/2025 EMTN 110,000 EUR 124,014 133,710 0.05
Atlantia SpA 1.875% 13/07/2027 EMTN 555,000 EUR 627,912 680,885 0.25
Atlantia SpA 1.875% 12/02/2028 605,000 EUR 736,734 737,027 0.27
Autostrade per l'Italia SpA 2.000% 04/12/2028 230,000 EUR 273,701 283,804 0.10
Autostrade per l'Italia SpA 2.000% 15/01/2030 710,000 EUR 864,104 869,903 0.32
Intesa Sanpaolo SpA 0.750% 04/12/2024 EMTN 100,000 EUR 104,642 121,560 0.05
Intesa Sanpaolo SpA 1.000% 19/11/2026 EMTN 155,000 EUR 184,284 189,353 0.07
Intesa Sanpaolo SpA 5.148% 10/06/2030 EMTN 570,000 GBP 842,925 896,706 0.33
3,758,316 3,912,948 1.44 Jersey
Hastings Group Finance PLC 3.000% 24/05/2025 565,000 GBP 802,164 827,746 0.31
Heathrow Funding Ltd 1.875% 12/07/2032 EMTN 1,000,000 EUR 1,283,679 1,255,700 0.46
Heathrow Funding Ltd 1.875% 14/03/2034 EMTN 700,000 EUR 770,457 866,578 0.32
Heathrow Funding Ltd 2.750% 13/10/2029 EMTN 365,000 GBP 510,299 524,513 0.19
3,366,599 3,474,537 1.28 Luxembourg
Acef Holding SCA 0.750% 14/06/2028 1,205,000 EUR 1,472,615 1,426,603 0.53
DH Europe Finance II Sarl 0.750% 18/09/2031 765,000 EUR 903,277 907,444 0.33
(1) See Note 1.
(2) See Note 13.
107

Natixis International Funds (Lux) I
The accompanying notes form an integral part of these financial statements.
Loomis Sayles Sustainable Global Corporate Bond Fund(1) Statement of Investments (continued) As at June 30, 2021 (expressed in USD)
Description Face value Currency Cost Evaluation % of Net
Assets
DH Europe Finance II Sarl 1.350% 18/09/2039 135,000 EUR 158,348 162,663 0.06
DH Europe Finance II Sarl 2.600% 15/11/2029 500,000 USD 540,185 522,755 0.19
SELP Finance Sarl 0.875% 27/05/2029 320,000 EUR 388,644 380,133 0.14
SELP Finance Sarl 1.500% 20/11/2025 1,705,000 EUR 2,047,534 2,124,901 0.78
SELP Finance Sarl 1.500% 20/12/2026 250,000 EUR 280,214 312,025 0.12
Ultrapar International SA 5.250% 06/06/2029 745,000 USD 770,843 800,875 0.30
6,561,660 6,637,399 2.45 Mexico
America Movil SAB de CV 2.875% 07/05/2030 1,095,000 USD 1,173,248 1,154,126 0.43
America Movil SAB de CV 3.625% 22/04/2029 1,000,000 USD 1,077,925 1,102,770 0.41
Fomento Economico Mexicano SAB de CV 3.500% 16/01/2050 862,000 USD 913,420 906,617 0.33
Grupo Bimbo SAB de CV 3.875% 27/06/2024 590,000 USD 625,255 635,954 0.24
Orbia Advance Corp SAB de CV 5.875% 17/09/2044 600,000 USD 661,830 727,506 0.27
Sigma Alimentos SA de CV 4.125% 02/05/2026 144A(2) 1,080,000 USD 1,150,684 1,177,200 0.43
5,602,362 5,704,173 2.11 Netherlands
Cooperatieve Rabobank UA 1.250% 14/01/2025 EMTN 300,000 GBP 402,904 418,564 0.16
Cooperatieve Rabobank UA 4.625% 23/05/2029 EMTN 250,000 GBP 408,544 411,187 0.15
CRH Funding BV 1.625% 05/05/2030 215,000 EUR 254,038 280,121 0.10
Digital Intrepid Holding BV 0.625% 15/07/2031 1,080,000 EUR 1,319,711 1,237,347 0.46
Embraer Netherlands Finance BV 6.950% 17/01/2028 520,000 USD 518,745 594,750 0.22
Enel Finance International NV 1.000% 20/10/2027 EMTN 255,000 GBP 330,393 345,832 0.13
Madrilena Red de Gas Finance BV 2.250% 11/04/2029 EMTN 325,000 EUR 400,403 420,497 0.16
MDGH - GMTN BV 3.700% 07/11/2049 EMTN 425,000 USD 452,499 463,996 0.17
MDGH - GMTN BV 3.950% 21/05/2050 EMTN 200,000 USD 233,690 228,277 0.08
Prosus NV 4.027% 03/08/2050 144A(2) 510,000 USD 524,900 490,347 0.18
Redexis Gas Finance BV 1.875% 28/05/2025 EMTN 800,000 EUR 958,345 1,005,102 0.37
Sigma Finance Netherlands BV 4.875% 27/03/2028 640,000 USD 691,879 724,800 0.27
Teva Pharmaceutical Finance Netherlands II BV 1.125% 15/10/2024 375,000 EUR 424,330 416,918 0.15
Teva Pharmaceutical Finance Netherlands III BV
3.150% 01/10/2026 670,000 USD 636,171 637,338 0.24
Upjohn Finance BV 1.908% 23/06/2032 395,000 EUR 473,543 498,771 0.18
Volkswagen International Finance NV 4.125% 17/11/2031 100,000 GBP 153,922 167,024 0.06
8,184,017 8,340,871 3.08 Portugal
EDP - Energias de Portugal SA 1.625% 15/04/2027 EMTN 100,000 EUR 126,376 127,434 0.05
126,376 127,434 0.05 Singapore
BOC Aviation Ltd 2.625% 17/01/2025 EMTN 530,000 USD 540,411 544,865 0.20
540,411 544,865 0.20
(1) See Note 1.
(2) See Note 13.
108

Natixis International Funds (Lux) I
The accompanying notes form an integral part of these financial statements.
Loomis Sayles Sustainable Global Corporate Bond Fund(1) Statement of Investments (continued) As at June 30, 2021 (expressed in USD)
Description Face value Currency Cost Evaluation % of Net
Assets
Spain
Banco Santander SA 2.958% 25/03/2031 800,000 USD 804,583 824,296 0.31
Banco Santander SA 3.490% 28/05/2030 400,000 USD 409,421 431,925 0.16
Banco Santander SA 4.250% 11/04/2027 400,000 USD 433,053 451,360 0.17
Banco Santander SA 5.179% 19/11/2025 600,000 USD 671,244 686,410 0.25
Cellnex Finance Co SA 2.000% 15/02/2033 EMTN 300,000 EUR 356,193 352,197 0.13
Cellnex Telecom SA 1.750% 23/10/2030 EMTN 900,000 EUR 1,051,222 1,062,027 0.39
Telefonica Emisiones SA 4.103% 08/03/2027 725,000 USD 815,688 816,026 0.30
Telefonica Emisiones SA 5.520% 01/03/2049 170,000 USD 170,000 220,924 0.08
4,711,404 4,845,165 1.79 Supranational Organisations
Corp Andina de Fomento 4.375% 15/06/2022 200,000 USD 200,253 207,184 0.08
200,253 207,184 0.08 Switzerland
Credit Suisse Group AG 0.625% 18/01/2033 EMTN 1,045,000 EUR 1,258,234 1,164,444 0.43
1,258,234 1,164,444 0.43 United Arab Emirates
Abu Dhabi Crude Oil Pipeline LLC 4.600% 02/11/2047 250,000 USD 306,659 294,675 0.11
DP World PLC 5.625% 25/09/2048 EMTN 390,000 USD 449,874 486,993 0.18
MDGH GMTN RSC Ltd 2.500% 03/06/2031 EMTN 1,140,000 USD 1,136,821 1,152,825 0.42
1,893,354 1,934,493 0.71 United States
Ally Financial Inc 4.625% 30/03/2025 560,000 USD 612,252 627,008 0.23
Ally Financial Inc 5.750% 20/11/2025 955,000 USD 1,074,304 1,096,491 0.40
Ally Financial Inc 5.800% 01/05/2025 1,510,000 USD 1,696,945 1,754,743 0.65
American International Group Inc 1.875% 21/06/2027 100,000 EUR 111,843 128,054 0.05
American International Group Inc 3.400% 30/06/2030 835,000 USD 899,483 915,663 0.34
American International Group Inc 3.875% 15/01/2035 905,000 USD 1,021,954 1,023,470 0.38
American International Group Inc 4.700% 10/07/2035 55,000 USD 58,703 66,993 0.02
American Tower Corp 1.950% 22/05/2026 550,000 EUR 684,991 703,541 0.26
American Tower Corp 2.750% 15/01/2027 870,000 USD 894,157 920,362 0.34
American Tower Corp 3.375% 15/05/2024 625,000 USD 670,569 668,445 0.25
American Tower Corp 3.375% 15/10/2026 15,000 USD 14,896 16,340 0.01
American Tower Corp 3.800% 15/08/2029 250,000 USD 284,965 278,555 0.10
Anheuser-Busch Cos LLC/Anheuser-Busch InBev Worldwide Inc 4.700% 01/02/2036 130,000 USD 143,537 159,555 0.06
Anheuser-Busch InBev Finance Inc 4.900% 01/02/2046 395,000 USD 482,482 488,989 0.18
Anheuser-Busch InBev Worldwide Inc 3.500% 01/06/2030 1,295,000 USD 1,470,775 1,440,539 0.53
Anheuser-Busch InBev Worldwide Inc 4.375% 15/04/2038 115,000 USD 131,730 137,491 0.05
Anheuser-Busch InBev Worldwide Inc 4.500% 01/06/2050 220,000 USD 261,261 267,738 0.10
Anheuser-Busch InBev Worldwide Inc 4.750% 23/01/2029 235,000 USD 281,439 279,947 0.10
(1) See Note 1.
109

Natixis International Funds (Lux) I
The accompanying notes form an integral part of these financial statements.
Loomis Sayles Sustainable Global Corporate Bond Fund(1) Statement of Investments (continued) As at June 30, 2021 (expressed in USD)
Description Face value Currency Cost Evaluation % of Net
Assets
Anheuser-Busch InBev Worldwide Inc 4.750% 15/04/2058 465,000 USD 515,330 583,033 0.22
Anheuser-Busch InBev Worldwide Inc 5.450% 23/01/2039 185,000 USD 233,685 243,991 0.09
AT&T Inc 2.750% 01/06/2031 2,550,000 USD 2,559,578 2,650,696 0.98
AT&T Inc 3.650% 01/06/2051 1,050,000 USD 1,070,232 1,090,059 0.40
Bunge Ltd Finance Corp 1.630% 17/08/2025 445,000 USD 446,262 450,241 0.17
Centene Corp 2.500% 01/03/2031 855,000 USD 846,996 843,244 0.31
Centene Corp 3.000% 15/10/2030 1,720,000 USD 1,719,420 1,766,922 0.65
Chubb INA Holdings Inc 0.875% 15/12/2029 1,270,000 EUR 1,542,849 1,548,890 0.57
Chubb INA Holdings Inc 1.550% 15/03/2028 230,000 EUR 290,881 293,625 0.11
CNH Industrial Capital LLC 4.200% 15/01/2024 315,000 USD 317,189 340,856 0.13
Continental Resources Inc/OK 4.375% 15/01/2028 1,500,000 USD 1,652,968 1,659,375 0.61
Crown Castle International Corp 3.800% 15/02/2028 15,000 USD 16,860 16,666 0.01
Crown Castle International Corp 4.000% 01/03/2027 1,160,000 USD 1,284,982 1,298,140 0.48
Crown Castle International Corp 4.300% 15/02/2029 30,000 USD 34,876 34,503 0.01
Crown Castle International Corp 4.450% 15/02/2026 425,000 USD 482,564 480,216 0.18
Crown Castle International Corp 4.750% 15/05/2047 85,000 USD 88,675 103,706 0.04
CVS Health Corp 1.750% 21/08/2030 2,325,000 USD 2,307,496 2,240,970 0.83
CVS Health Corp 1.875% 28/02/2031 1,050,000 USD 996,914 1,018,455 0.38
CVS Health Corp 3.250% 15/08/2029 535,000 USD 582,628 580,497 0.21
CVS Health Corp 3.750% 01/04/2030 215,000 USD 242,563 240,600 0.09
Enterprise Products Operating LLC 2.800% 31/01/2030 195,000 USD 200,626 206,001 0.08
Enterprise Products Operating LLC 3.125% 31/07/2029 25,000 USD 27,227 26,974 0.01
Enterprise Products Operating LLC 3.700% 31/01/2051 25,000 USD 22,641 26,810 0.01
Enterprise Products Operating LLC 3.950% 31/01/2060 150,000 USD 150,866 167,203 0.06
Enterprise Products Operating LLC 4.150% 16/10/2028 25,000 USD 28,845 28,734 0.01
Enterprise Products Operating LLC 4.800% 01/02/2049 190,000 USD 219,457 233,832 0.09
Enterprise Products Operating LLC 5.100% 15/02/2045 125,000 USD 148,982 157,871 0.06
EQT Corp 3.900% 01/10/2027 1,270,000 USD 1,319,551 1,360,488 0.50
EQT Corp 5.000% 15/01/2029 205,000 USD 205,000 228,569 0.08
Fidelity National Financial Inc 2.450% 15/03/2031 1,010,000 USD 1,006,656 1,005,689 0.37
General Electric Co 3.625% 01/05/2030 1,115,000 USD 1,210,017 1,243,313 0.46
General Electric Co 4.875% 18/09/2037 EMTN 130,000 GBP 171,413 220,177 0.08
General Electric Co 6.875% 10/01/2039 23,000 USD 28,770 34,409 0.01
General Motors Financial Co Inc 2.350% 08/01/2031 1,055,000 USD 1,019,466 1,040,969 0.38
General Motors Financial Co Inc 2.400% 10/04/2028 1,060,000 USD 1,058,882 1,076,106 0.40
(1) See Note 1.
110

Natixis International Funds (Lux) I
The accompanying notes form an integral part of these financial statements.
Loomis Sayles Sustainable Global Corporate Bond Fund(1) Statement of Investments (continued) As at June 30, 2021 (expressed in USD)
Description Face value Currency Cost Evaluation % of Net
Assets
General Motors Financial Co Inc 3.550% 08/07/2022 875,000 USD 886,804 903,118 0.33
Goldman Sachs Group Inc/The 3.125% 25/07/2029 EMTN 205,000 GBP 290,428 314,236 0.12
Goldman Sachs Group Inc/The 3.800% 15/03/2030 480,000 USD 549,933 539,469 0.20
HCA Inc 3.500% 01/09/2030 1,930,000 USD 1,984,752 2,056,164 0.76
Healthpeak Properties Inc 2.875% 15/01/2031 500,000 USD 519,154 523,123 0.19
Huntsman International LLC 2.950% 15/06/2031 1,775,000 USD 1,773,770 1,800,345 0.66
John Deere Capital Corp 0.450% 17/01/2024 1,515,000 USD 1,514,047 1,513,308 0.56
John Deere Capital Corp 3.450% 07/03/2029 70,000 USD 80,460 78,622 0.03
Kinder Morgan Energy Partners LP 5.000% 01/03/2043 45,000 USD 48,725 54,264 0.02
Kinder Morgan Inc 5.300% 01/12/2034 95,000 USD 113,971 117,341 0.04
Kinder Morgan Inc 5.550% 01/06/2045 750,000 USD 910,281 970,965 0.36
Lennar Corp 4.750% 30/05/2025 15,000 USD 16,313 16,819 0.01
LYB International Finance III LLC 3.625% 01/04/2051 1,115,000 USD 1,137,617 1,177,055 0.43
McDonald's Corp 3.625% 01/09/2049 610,000 USD 680,500 675,964 0.25
NiSource Inc 2.950% 01/09/2029 1,375,000 USD 1,484,903 1,456,460 0.54
NiSource Inc 3.490% 15/05/2027 240,000 USD 266,417 263,976 0.10
Oracle Corp 2.875% 25/03/2031 1,250,000 USD 1,258,917 1,300,098 0.48
Oracle Corp 3.950% 25/03/2051 725,000 USD 723,743 791,329 0.29
Owens Corning 3.875% 01/06/2030 385,000 USD 428,363 429,635 0.16
Owens Corning 4.300% 15/07/2047 140,000 USD 153,389 162,800 0.06
Owl Rock Capital Corp 2.875% 11/06/2028 1,155,000 USD 1,143,586 1,146,334 0.42
Prologis Euro Finance LLC 0.250% 10/09/2027 970,000 EUR 1,087,140 1,151,974 0.43
Prologis Euro Finance LLC 0.375% 06/02/2028 295,000 EUR 350,186 352,476 0.13
Prologis Euro Finance LLC 1.000% 06/02/2035 305,000 EUR 348,791 359,901 0.13
PulteGroup Inc 5.000% 15/01/2027 266,000 USD 304,330 311,082 0.11
Quest Diagnostics Inc 2.800% 30/06/2031 680,000 USD 734,546 709,805 0.26
Quest Diagnostics Inc 2.950% 30/06/2030 515,000 USD 560,021 546,439 0.20
Raytheon Technologies Corp 4.125% 16/11/2028 160,000 USD 187,393 184,090 0.07
Santander Holdings USA Inc 3.400% 18/01/2023 95,000 USD 97,927 98,907 0.04
Santander Holdings USA Inc 3.500% 07/06/2024 580,000 USD 621,481 620,433 0.23
Santander Holdings USA Inc 4.500% 17/07/2025 175,000 USD 181,809 194,265 0.07
T-Mobile USA Inc 2.550% 15/02/2031 1,410,000 USD 1,451,828 1,425,792 0.53
T-Mobile USA Inc 3.750% 15/04/2027 305,000 USD 327,073 337,025 0.12
T-Mobile USA Inc 3.875% 15/04/2030 1,080,000 USD 1,189,757 1,207,246 0.45
U.S. Treasury Bond 1.375% 15/11/2040 435,000 USD 393,368 390,752 0.14
U.S. Treasury Bond 1.625% 15/11/2050 2,070,000 USD 1,979,111 1,859,119 0.69
U.S. Treasury Bond 1.875% 15/02/2051 1,675,000 USD 1,495,076 1,598,578 0.59
U.S. Treasury Bond 2.875% 15/05/2043 170,000 USD 197,041 195,513 0.07
U.S. Treasury Note 0.125% 30/06/2023 5,525,000 USD 5,511,619 5,511,835 2.03
U.S. Treasury Note 0.750% 31/05/2026 2,790,000 USD 2,775,561 2,774,088 1.02
U.S. Treasury Note 1.625% 15/05/2031 1,345,000 USD 1,362,648 1,365,595 0.50
UnitedHealth Group Inc 2.000% 15/05/2030 2,945,000 USD 3,078,842 2,966,918 1.09
Verizon Communications Inc 2.550% 21/03/2031 1,175,000 USD 1,170,304 1,200,997 0.44
Verizon Communications Inc 3.400% 22/03/2041 780,000 USD 779,554 825,117 0.30
Verizon Communications Inc 4.272% 15/01/2036 340,000 USD 389,738 404,541 0.15
Vulcan Materials Co 3.500% 01/06/2030 975,000 USD 1,089,839 1,074,743 0.40
Vulcan Materials Co 4.500% 15/06/2047 140,000 USD 148,012 169,279 0.06
(1) See Note 1.
111

Natixis International Funds (Lux) I
The accompanying notes form an integral part of these financial statements.
Loomis Sayles Sustainable Global Corporate Bond Fund(1) Statement of Investments (continued) As at June 30, 2021 (expressed in USD)
Description Face value Currency Cost Evaluation % of Net
Assets
Williams Cos Inc/The 3.750% 15/06/2027 135,000 USD 142,203 149,980 0.06
78,768,904 79,793,669 29.44
Total - Fixed rate bonds 146,107,463 148,034,530 54.62
Variable rate bonds
Cayman Islands
XLIT Ltd 3.250% 29/06/2047 765,000 EUR 980,417 1,016,533 0.37
980,417 1,016,533 0.37 Finland
Sampo Oyj 2.500% 03/09/2052 EMTN 810,000 EUR 988,426 1,019,197 0.38
988,426 1,019,197 0.38 France
AXA SA 3.250% 28/05/2049 EMTN 950,000 EUR 1,220,108 1,289,493 0.47
AXA SA 5.125% 17/01/2047 EMTN 300,000 USD 336,599 341,449 0.13
Mutuelle Assurance Des Commercants et Industriels de France et Des Cadres et Sal 2.125% 21/06/2052 200,000 EUR 240,755 239,130 0.09
1,797,462 1,870,072 0.69
Germany
Deutsche Bank AG 5.625% 19/05/2031 EMTN 2,100,000 EUR 2,832,029 2,946,131 1.09
2,832,029 2,946,131 1.09 Great Britain
Aviva PLC 4.000% 03/06/2055 705,000 GBP 1,038,098 1,083,913 0.40
Aviva PLC 4.375% 12/09/2049 EMTN 125,000 GBP 195,418 195,660 0.07
Aviva PLC 5.125% 04/06/2050 EMTN 306,000 GBP 444,419 504,521 0.19
Barclays PLC 1.125% 22/03/2031 EMTN 510,000 EUR 621,689 607,816 0.22
Barclays PLC 2.645% 24/06/2031 260,000 USD 260,000 263,151 0.10
Barclays PLC 3.564% 23/09/2035 245,000 USD 245,000 255,251 0.09
Channel Link Enterprises Finance PLC 1.761% 30/06/2050 495,000 EUR 572,561 585,738 0.22
Channel Link Enterprises Finance PLC 2.706% 30/06/2050 405,000 EUR 482,167 490,173 0.18
HSBC Bank PLC 5.375% 04/11/2030 EMTN 45,000 GBP 65,109 72,753 0.03
HSBC Holdings PLC 4.292% 12/09/2026 900,000 USD 992,716 1,001,594 0.37
Legal & General Group PLC 4.500% 01/11/2050 875,000 GBP 1,371,295 1,390,634 0.51
Lloyds Banking Group PLC 2.707% 03/12/2035 1,125,000 GBP 1,562,989 1,588,959 0.59
Natwest Group PLC 2.105% 28/11/2031 EMTN 425,000 GBP 602,895 589,938 0.22
Natwest Group PLC 4.445% 08/05/2030 400,000 USD 430,974 457,886 0.17
Natwest Group PLC 4.519% 25/06/2024 1,445,000 USD 1,551,466 1,551,325 0.57
Silverstone Master Issuer PLC 0.799% 21/01/2070 89,100 GBP 118,392 124,078 0.04
Standard Chartered PLC 0.991% 12/01/2025 144A(2) 1,045,000 USD 1,046,845 1,041,712 0.38
Standard Chartered PLC 2.500% 09/09/2030 215,000 EUR 262,163 270,590 0.10
11,864,196 12,075,692 4.45 Ireland
AIB Group PLC 2.875% 30/05/2031 EMTN 1,030,000 EUR 1,220,885 1,306,108 0.48
Zurich Finance Ireland Designated Activity Co 3.000% 19/04/2051 EMTN 895,000 USD 876,370 885,732 0.33
2,097,255 2,191,840 0.81
(1) See Note 1.
(2) See Note 13.
112

Natixis International Funds (Lux) I
The accompanying notes form an integral part of these financial statements.
Loomis Sayles Sustainable Global Corporate Bond Fund(1) Statement of Investments (continued) As at June 30, 2021 (expressed in USD)
Description Face value Currency Cost Evaluation % of Net
Assets
Italy
Assicurazioni Generali SpA 5.500% 27/10/2047 EMTN 200,000 EUR 274,599 292,111 0.11
UniCredit SpA 2.000% 23/09/2029 EMTN 205,000 EUR 233,440 244,815 0.09
UniCredit SpA 5.861% 19/06/2032 200,000 USD 210,959 220,838 0.08
718,998 757,764 0.28 Portugal
EDP - Energias de Portugal SA 4.496% 30/04/2079 600,000 EUR 716,677 774,689 0.29
716,677 774,689 0.29 Spain
Banco Bilbao Vizcaya Argentaria SA 1.000% 16/01/2030 900,000 EUR 1,058,623 1,072,964 0.40
Banco de Sabadell SA 2.500% 15/04/2031 EMTN 800,000 EUR 965,083 954,033 0.35
2,023,706 2,026,997 0.75 Switzerland
Credit Suisse Group AG 0.650% 14/01/2028 EMTN 475,000 EUR 561,658 563,032 0.21
561,658 563,032 0.21 United States
Morgan Stanley 1.342% 23/10/2026 EMTN 1,165,000 EUR 1,404,910 1,451,081 0.53
1,404,910 1,451,081 0.53
Total - Variable rate bonds 25,985,734 26,693,028 9.85
Total - Transferable securities admitted to an official stock exchange listing 172,093,197 174,727,558 64.47
Transferable securities dealt in on another regulated market Fixed rate bonds
Austria
Suzano Austria GmbH 3.125% 15/01/2032 210,000 USD 207,117 207,978 0.08
Suzano Austria GmbH 7.000% 16/03/2047 305,000 USD 377,742 412,451 0.15
584,859 620,429 0.23 Brazil
Banco Bradesco SA/Cayman Islands 2.850% 27/01/2023 EMTN 255,000 USD 255,000 260,214 0.10
255,000 260,214 0.10 Canada
Videotron Ltd 3.625% 15/06/2029 144A(2) 545,000 USD 545,000 555,742 0.21
545,000 555,742 0.21 France
Credit Agricole SA/London 3.250% 04/10/2024 144A(2) 1,055,000 USD 1,137,006 1,130,371 0.42
Societe Generale SA 2.625% 16/10/2024 144A(2) 565,000 USD 593,356 589,933 0.22
1,730,362 1,720,304 0.64 Germany
Deutsche Telekom AG 3.625% 21/01/2050 144A(2) 705,000 USD 786,511 744,250 0.27
786,511 744,250 0.27 Great Britain
Coca-Cola Europacific Partners PLC 0.800% 03/05/2024 144A(2) 1,315,000 USD 1,314,489 1,311,019 0.48
Ferguson Finance PLC 3.250% 02/06/2030 144A(2) 200,000 USD 212,771 215,851 0.08
Vodafone Group PLC 4.250% 17/09/2050 150,000 USD 174,137 175,201 0.06
Vodafone Group PLC 4.875% 19/06/2049 270,000 USD 337,413 340,538 0.13
(1) See Note 1.
(2) See Note 13.
113

Natixis International Funds (Lux) I
The accompanying notes form an integral part of these financial statements.
Loomis Sayles Sustainable Global Corporate Bond Fund(1) Statement of Investments (continued) As at June 30, 2021 (expressed in USD)
Description Face value Currency Cost Evaluation % of Net
Assets
Vodafone Group PLC 5.250% 30/05/2048 350,000 USD 422,332 461,183 0.17
2,461,142 2,503,792 0.92 India
Bharti Airtel Ltd 4.375% 10/06/2025 144A(2) 1,110,000 USD 1,184,806 1,210,930 0.45
1,184,806 1,210,930 0.45 Italy
Intesa Sanpaolo SpA 4.198% 01/06/2032 144A(2) 230,000 USD 230,000 236,184 0.09
230,000 236,184 0.09 Mexico
Cemex SAB de CV 3.875% 11/07/2031 530,000 USD 529,354 538,745 0.20
Cemex SAB de CV 5.200% 17/09/2030 630,000 USD 630,000 692,748 0.26
Cemex SAB de CV 5.450% 19/11/2029 480,000 USD 487,453 527,760 0.19
Grupo Bimbo SAB de CV 4.000% 06/09/2049 400,000 USD 432,565 425,923 0.16
Kimberly-Clark de Mexico SAB de CV 2.431% 01/07/2031 945,000 USD 952,621 935,635 0.34
Orbia Advance Corp SAB de CV 1.875% 11/05/2026 1,185,000 USD 1,183,744 1,192,853 0.44
4,215,737 4,313,664 1.59 Mulitnational
NXP BV/NXP Funding LLC 5.350% 01/03/2026 144A(2) 180,000 USD 210,044 210,031 0.08
NXP BV/NXP Funding LLC 5.550% 01/12/2028 144A(2) 210,000 USD 256,549 257,883 0.09
466,593 467,914 0.17 Multinational
Broadcom Corp./Broadcom Cayman Finance Ltd 3.875% 15/01/2027 400,000 USD 439,020 441,991 0.16
Delta Air Lines Inc/SkyMiles IP Ltd 4.500% 20/10/2025 144A(2) 2,670,000 USD 2,814,091 2,869,237 1.06
Delta Air Lines Inc/SkyMiles IP Ltd 4.750% 20/10/2028 144A(2) 355,000 USD 386,017 394,674 0.14
NXP BV/NXP Funding LLC/NXP USA Inc 2.500% 11/05/2031 144A(2) 875,000 USD 878,577 883,655 0.33
NXP BV/NXP Funding LLC/NXP USA Inc 3.150% 01/05/2027 144A(2) 145,000 USD 158,643 155,110 0.06
NXP BV/NXP Funding LLC/NXP USA Inc 3.400% 01/05/2030 144A(2) 515,000 USD 559,988 562,333 0.21
5,236,336 5,307,000 1.96 Netherlands
EDP Finance BV 1.710% 24/01/2028 144A(2) 1,140,000 USD 1,139,591 1,126,561 0.42
EDP Finance BV 3.625% 15/07/2024 144A(2) 200,000 USD 200,061 215,013 0.08
Embraer Netherlands Finance BV 5.050% 15/06/2025 185,000 USD 182,564 195,388 0.07
Embraer Netherlands Finance BV 5.400% 01/02/2027 220,000 USD 208,728 234,441 0.09
Enel Finance International NV 2.650% 10/09/2024 144A(2) 890,000 USD 930,046 935,518 0.34
Enel Finance International NV 4.750% 25/05/2047 144A(2) 605,000 USD 751,713 742,790 0.27
Enel Finance International NV 6.000% 07/10/2039 144A(2) 160,000 USD 143,039 223,770 0.08
LeasePlan Corp NV 2.875% 24/10/2024 144A(2) 1,055,000 USD 1,094,155 1,107,979 0.41
4,649,897 4,781,460 1.76
(1) See Note 1.
(2) See Note 13.
114

Natixis International Funds (Lux) I
The accompanying notes form an integral part of these financial statements.
Loomis Sayles Sustainable Global Corporate Bond Fund(1) Statement of Investments (continued) As at June 30, 2021 (expressed in USD)
Description Face value Currency Cost Evaluation % of Net
Assets
New Zealand
Bank of New Zealand 1.000% 03/03/2026 144A(2) 1,075,000 USD 1,068,964 1,060,430 0.39
1,068,964 1,060,430 0.39 Norway
Aker BP ASA 3.750% 15/01/2030 144A(2) 150,000 USD 152,589 161,863 0.06
Aker BP ASA 4.000% 15/01/2031 144A(2) 735,000 USD 727,574 807,312 0.30
880,163 969,175 0.36
United States
Amazon.com Inc 0.450% 12/05/2024 2,685,000 USD 2,681,259 2,679,052 0.99
American Credit Acceptance Receivables Trust 2.190% 13/03/2026 144A(2) 845,000 USD 849,990 858,239 0.32
Apple Inc 1.800% 11/09/2024 1,940,000 USD 2,023,785 2,019,158 0.74
Apple Inc 3.750% 12/09/2047 45,000 USD 54,608 53,058 0.02
Ares Capital Corp 2.875% 15/06/2028 865,000 USD 861,002 877,992 0.32
Ares Capital Corp 3.875% 15/01/2026 557,000 USD 587,250 596,681 0.22
Astrazeneca Finance LLC 0.700% 28/05/2024 1,535,000 USD 1,534,866 1,532,018 0.56
AT&T Inc 3.500% 15/09/2053 144A(2) 361,000 USD 356,685 362,686 0.13
AT&T Inc 3.550% 15/09/2055 144A(2) 54,000 USD 43,392 54,181 0.02
AT&T Inc 3.800% 01/12/2057 144A(2) 751,000 USD 717,352 782,454 0.29
Broadcom Inc 2.450% 15/02/2031 144A(2) 815,000 USD 781,463 800,896 0.30
Broadcom Inc 3.459% 15/09/2026 315,000 USD 331,676 343,034 0.13
Broadcom Inc 3.469% 15/04/2034 144A(2) 880,000 USD 883,994 930,824 0.34
CCO Holdings LLC/CCO Holdings Capital Corp 4.500% 15/08/2030 144A(2) 1,290,000 USD 1,361,596 1,343,166 0.50
CCO Holdings LLC/CCO Holdings Capital Corp 4.500% 01/05/2032 15,000 USD 15,354 15,544 0.01
Centene Corp 2.450% 15/07/2028 235,000 USD 235,000 238,172 0.09
Centene Corp 3.375% 15/02/2030 955,000 USD 980,250 998,281 0.37
Centene Corp 4.625% 15/12/2029 185,000 USD 198,822 203,457 0.07
Charter Communications Operating LLC/Charter Communications Operating Capital 2.800% 01/04/2031 1,645,000 USD 1,717,114 1,681,702 0.62
Charter Communications Operating LLC/Charter Communications Operating Capital 3.500% 01/06/2041 290,000 USD 288,699 291,963 0.11
Charter Communications Operating LLC/Charter Communications Operating Capital 3.700% 01/04/2051 160,000 USD 156,325 158,251 0.06
Charter Communications Operating LLC/Charter Communications Operating Capital 4.800% 01/03/2050 120,000 USD 124,523 137,826 0.05
Charter Communications Operating LLC/Charter Communications Operating Capital 5.050% 30/03/2029 325,000 USD 386,904 383,887 0.14
Charter Communications Operating LLC/Charter Communications Operating Capital 5.125% 01/07/2049 80,000 USD 84,794 95,272 0.03
Comcast Corp 1.500% 15/02/2031 1,240,000 USD 1,229,407 1,174,871 0.43
Comcast Corp 3.969% 01/11/2047 45,000 USD 53,992 52,391 0.02
Comcast Corp 3.999% 01/11/2049 405,000 USD 463,433 476,928 0.18
Comcast Corp 4.000% 15/08/2047 55,000 USD 66,590 64,198 0.02
(1) See Note 1.
(2) See Note 13.
115

Natixis International Funds (Lux) I
The accompanying notes form an integral part of these financial statements.
Loomis Sayles Sustainable Global Corporate Bond Fund(1) Statement of Investments (continued) As at June 30, 2021 (expressed in USD)
Description Face value Currency Cost Evaluation % of Net
Assets
Comcast Corp 4.000% 01/03/2048 60,000 USD 72,251 70,252 0.03
Comcast Corp 4.600% 15/10/2038 200,000 USD 253,820 247,880 0.09
Cox Communications Inc 2.950% 01/10/2050 144A(2) 920,000 USD 912,743 871,495 0.32
CRH America Inc 3.875% 18/05/2025 144A(2) 1,145,000 USD 1,268,670 1,254,795 0.46
Delta Air Lines 4.250% 30/07/2023 123,349 USD 120,726 125,793 0.05
Diamond Resorts Owner Trust 3.700% 21/01/2031 144A(2) 59,386 USD 59,385 61,866 0.02
Diamondback Energy Inc 0.900% 24/03/2023 380,000 USD 379,967 380,082 0.14
Diamondback Energy Inc 3.125% 24/03/2031 280,000 USD 279,071 290,180 0.11
Empower Finance 2020 LP 3.075% 17/09/2051 144A(2) 605,000 USD 616,563 612,227 0.23
Enterprise Fleet Financing LLC 3.140% 20/02/2024 144A(2) 3,987 USD 3,987 3,997 0.00
EQT Corp 3.125% 15/05/2026 144A(2) 195,000 USD 195,000 199,818 0.07
ERAC USA Finance LLC 3.300% 01/12/2026 144A(2) 700,000 USD 721,930 762,951 0.28
ERAC USA Finance LLC 3.800% 01/11/2025 144A(2) 145,000 USD 156,869 160,057 0.06
ERAC USA Finance LLC 3.850% 15/11/2024 144A(2) 56,000 USD 56,485 61,046 0.02
ERAC USA Finance LLC 4.200% 01/11/2046 144A(2) 125,000 USD 132,458 148,436 0.05
GE Capital Funding LLC 3.450% 15/05/2025 202,000 USD 219,788 219,830 0.08
GE Capital Funding LLC 4.400% 15/05/2030 920,000 USD 1,059,992 1,072,106 0.40
GE Capital Funding LLC 4.550% 15/05/2032 315,000 USD 345,908 376,021 0.14
Great-West Lifeco Finance LP 4.581% 17/05/2048 144A(2) 215,000 USD 263,574 270,686 0.10
Guardian Life Global Funding 1.250% 13/05/2026 144A(2) 585,000 USD 585,000 583,620 0.22
Kraft Heinz Foods Co 3.750% 01/04/2030 870,000 USD 921,402 954,581 0.35
Kraft Heinz Foods Co 3.875% 15/05/2027 1,070,000 USD 1,171,425 1,175,688 0.43
Kraft Heinz Foods Co 4.375% 01/06/2046 60,000 USD 57,003 67,999 0.02
Lennar Corp 5.000% 15/06/2027 115,000 USD 131,498 133,449 0.05
Leonardo US Holdings Inc 6.250% 15/01/2040 144A(2) 100,000 USD 95,210 118,913 0.04
Massachusetts Mutual Life Insurance Co 3.375% 15/04/2050 144A(2) 715,000 USD 719,554 746,343 0.28
Microchip Technology Inc 0.983% 01/09/2024 144A(2) 555,000 USD 555,000 552,309 0.20
Microsoft Corp 3.700% 08/08/2046 225,000 USD 281,801 270,173 0.10
National Rural Utilities Cooperative Finance Corp 0.350% 08/02/2024 1,420,000 USD 1,419,148 1,414,561 0.52
New York Life Global Funding 0.550% 26/04/2024 144A(2) 1,655,000 USD 1,654,081 1,655,567 0.61
Owens Corning 4.400% 30/01/2048 220,000 USD 212,912 259,770 0.10
Quicken Loans LLC 5.250% 15/01/2028 144A(2) 410,000 USD 424,070 430,500 0.16
Quicken Loans LLC/Quicken Loans Co-Issuer Inc 3.625% 01/03/2029 144A(2) 135,000 USD 132,987 133,313 0.05
Quicken Loans LLC/Quicken Loans Co-Issuer Inc 3.875% 01/03/2031 144A(2) 1,265,000 USD 1,258,788 1,274,475 0.47
Raytheon Technologies Corp 3.500% 15/03/2027 5,000 USD 5,557 5,515 0.00
Regency Centers LP 3.700% 15/06/2030 450,000 USD 481,615 497,791 0.18
Retail Opportunity Investments Partnership LP 4.000% 15/12/2024 125,000 USD 123,857 134,955 0.05
(1) See Note 1.
(2) See Note 13.
116

Natixis International Funds (Lux) I
The accompanying notes form an integral part of these financial statements.
Loomis Sayles Sustainable Global Corporate Bond Fund(1) Statement of Investments (continued) As at June 30, 2021 (expressed in USD)
Description Face value Currency Cost Evaluation % of Net
Assets
Santander Holdings USA Inc 3.244% 05/10/2026 970,000 USD 1,012,657 1,036,077 0.38
Slam Ltd 2.434% 15/06/2046 144A(2) 890,000 USD 889,971 891,204 0.33
United Airlines 3.650% 07/10/2025 189,063 USD 163,997 188,047 0.07
United Airlines 3.650% 07/01/2026 260,069 USD 233,385 258,229 0.10
United Airlines 3.700% 01/03/2030 1,099,909 USD 971,509 1,120,220 0.41
United Airlines Inc 4.375% 15/04/2026 144A(2) 130,000 USD 130,000 134,573 0.05
USAA Capital Corp 0.500% 01/05/2024 144A(2) 675,000 USD 673,844 673,071 0.25
Viatris Inc 2.700% 22/06/2030 144A(2) 1,410,000 USD 1,393,955 1,425,766 0.53
Volkswagen Group of America Finance LLC 4.750% 13/11/2028 144A(2) 315,000 USD 374,385 373,000 0.14
Walt Disney Co/The 1.750% 30/08/2024 1,955,000 USD 2,027,978 2,021,424 0.75
WEA Finance LLC 2.875% 15/01/2027 144A(2) 335,000 USD 334,773 345,772 0.13
WEA Finance LLC 3.500% 15/06/2029 144A(2) 835,000 USD 840,294 867,446 0.32
45,466,968 46,140,051 17.02
Total - Fixed rate bonds 69,762,338 70,891,539 26.16
Variable rate bonds
Australia
Macquarie Group Ltd 3.189% 28/11/2023 144A(2) 625,000 USD 647,636 647,319 0.24
647,636 647,319 0.24 France
BNP Paribas SA 2.588% 12/08/2035 144A(2) 630,000 USD 603,629 614,505 0.23
BNP Paribas SA 4.375% 01/03/2033 144A(2) 850,000 USD 929,552 939,250 0.35
Credit Agricole SA 4.000% 10/01/2033 144A(2) 1,030,000 USD 1,120,993 1,119,790 0.41
2,654,174 2,673,545 0.99 Germany
Deutsche Bank AG/New York NY 2.129% 24/11/2026 450,000 USD 450,000 456,618 0.17
Deutsche Bank AG/New York NY 4.875% 01/12/2032 400,000 USD 428,768 431,368 0.16
878,768 887,986 0.33 Great Britain
Gosforth Funding PLC 0.597% 25/08/2060 144A(2) 64,694 USD 64,593 64,750 0.02
Lanark Master Issuer PLC 2.277% 22/12/2069 144A(2) 200,000 USD 202,351 204,480 0.08
266,944 269,230 0.10 Italy
UniCredit SpA 5.459% 30/06/2035 144A(2) 725,000 USD 754,577 790,498 0.29
UniCredit SpA 5.861% 19/06/2032 144A(2) 265,000 USD 255,825 293,284 0.11
UniCredit SpA 7.296% 02/04/2034 144A(2) 200,000 USD 224,359 240,464 0.09
1,234,761 1,324,246 0.49 Switzerland
Credit Suisse Group AG 4.194% 01/04/2031 144A(2) 310,000 USD 355,585 348,387 0.13
Credit Suisse Group AG 4.207% 12/06/2024 144A(2) 425,000 USD 453,757 452,649 0.16
809,342 801,036 0.29 United States
Bank of America Corp 2.592% 29/04/2031 2,730,000 USD 2,789,749 2,814,458 1.04
Bank of America Corp 2.676% 19/06/2041 790,000 USD 800,606 766,694 0.28
Citigroup Inc 2.561% 01/05/2032 950,000 USD 950,000 967,054 0.36
(1) See Note 1.
(2) See Note 13.
117

Natixis International Funds (Lux) I
The accompanying notes form an integral part of these financial statements.
Loomis Sayles Sustainable Global Corporate Bond Fund(1) Statement of Investments (continued) As at June 30, 2021 (expressed in USD)
Description Face value Currency Cost Evaluation % of Net
Assets
Citigroup Inc 2.572% 03/06/2031 1,805,000 USD 1,873,280 1,855,580 0.68
Citigroup Inc 4.412% 31/03/2031 380,000 USD 448,548 443,714 0.16
Citigroup Mortgage Loan Trust 4.000% 25/01/2068 144A(2) 236,697 USD 235,138 236,915 0.09
Goldman Sachs Group Inc/The 3.691% 05/06/2028 195,000 USD 218,346 215,301 0.08
JPMorgan Chase & Co 0.824% 01/06/2025 495,000 USD 495,000 494,051 0.18
JPMorgan Chase & Co 2.301% 15/10/2025 355,000 USD 368,978 369,740 0.14
JPMorgan Chase & Co 2.522% 22/04/2031 1,350,000 USD 1,432,248 1,389,140 0.51
JPMorgan Chase & Co 2.580% 22/04/2032 215,000 USD 215,000 220,663 0.08
JPMorgan Chase & Co 3.157% 22/04/2042 950,000 USD 955,555 988,884 0.37
Morgan Stanley 2.699% 22/01/2031 235,000 USD 244,594 245,999 0.09
Morgan Stanley 3.622% 01/04/2031 715,000 USD 820,356 798,122 0.29
Wells Fargo & Co 2.572% 11/02/2031 895,000 USD 941,156 926,203 0.34
Wells Fargo & Co 4.478% 04/04/2031 430,000 USD 515,435 508,254 0.19
13,303,989 13,240,772 4.88
Total - Variable rate bonds 19,795,614 19,844,134 7.32
Total - Transferable securities dealt in on another regulated market 89,557,952 90,735,673 33.48
Other transferable securities Fixed rate bonds
Canada
Bell Telephone Co of Canada or Bell Canada/The 2.500% 14/05/2030 3,510,000 CAD 2,791,161 2,804,769 1.03
2,791,161 2,804,769 1.03
Total - Fixed rate bonds 2,791,161 2,804,769 1.03
Total - Other transferable securities 2,791,161 2,804,769 1.03
TOTAL INVESTMENT PORTFOLIO 264,442,310 268,268,000 98.98
(1) See Note 1.
A detailed schedule of portfolio movements for the period from January 1, 2021 to
June 30, 2021 is available free of charge upon request at the registered office of the SICAV.
118

Natixis International Funds (Lux) I
Loomis Sayles Institutional High Income Fund(1)
Statistics
As at January 13, 2021
Net asset value per share
H-S/A (SGD) 130.14
S/A (USD) 178.70
Number of shares outstanding
H-S/A (SGD) 54,813.087
S/A (USD) 16.375
(1) See Note 1.
119

Natixis International Funds (Lux) I
Loomis Sayles Short Term Emerging Markets Bond Fund
Statistics
As at June 30, 2021
Net asset value per share
H-I/A (CHF) 106.88
H-I/A (EUR) 108.11
H-I/D (EUR) 91.06
H-N/A (EUR) 102.09
H-N/D (EUR) 98.46
H-N/D (GBP) 98.07
H-R/A (CHF) 102.48
H-R/A (EUR) 106.41
H-R/D (EUR) 91.54
H-RE/A (EUR) 102.09
H-S/A (EUR) 110.11
H-S/A (GBP) 113.19
H-S/A (JPY) 10,873.10
H-S/D (EUR) 92.75
I/A (USD) 129.19
I/D (USD) 100.44
N/A (USD) 107.05
N/D (USD) 101.49
N1/A (USD) 113.97
N1/D (USD) 101.33
Q/A (USD) 135.07
R/A (USD) 118.63
R/D (USD) 102.18
RE/A (USD) 115.20
S/A (USD) 125.97
S/D (USD) 101.81
Number of shares outstanding
H-I/A (CHF) 2,358.000
H-I/A (EUR) 902,675.809
H-I/D (EUR) 95,356.844
H-N/A (EUR) 426.957
H-N/D (EUR) 500.000
H-N/D (GBP) 1.556
H-R/A (CHF) 1,430.000
H-R/A (EUR) 92,987.496
H-R/D (EUR) 86,592.539
H-RE/A (EUR) 7,878.871
H-S/A (EUR) 3,279,216.518
H-S/A (GBP) 2,521.476
H-S/A (JPY) 499,768.161
H-S/D (EUR) 372,617.304
I/A (USD) 1,716,722.592
I/D (USD) 505,659.299
N/A (USD) 30.000
N/D (USD) 55,687.000
N1/A (USD) 10,667.664
N1/D (USD) 14,300.000
Q/A (USD) 203.192
R/A (USD) 1,539,392.461
120

Natixis International Funds (Lux) I
Loomis Sayles Short Term Emerging Markets Bond Fund
Statistics (continued)
As at June 30, 2021
Number of shares outstanding
R/D (USD) 360,270.067
RE/A (USD) 73,518.812
S/A (USD) 1,545,141.829
S/D (USD) 6,430.000
121

Natixis International Funds (Lux) I
The accompanying notes form an integral part of these financial statements.
Loomis Sayles Short Term Emerging Markets Bond Fund Statement of Investments
As at June 30, 2021 (expressed in USD)
Description Face value Currency Cost Evaluation % of Net
Assets
Transferable securities admitted to an official stock exchange listing Fixed rate bonds
Bermuda Islands
Concord New Energy Group Ltd 10.750% 24/09/2023 7,215,000 USD 7,084,724 7,532,480 0.55
Geopark Ltd 6.500% 21/09/2024 9,125,000 USD 9,234,628 9,410,573 0.68
Li & Fung Ltd 4.375% 04/10/2024 EMTN 9,750,000 USD 9,737,478 9,973,088 0.73
Ooredoo International Finance Ltd 3.250% 21/02/2023 EMTN 5,525,000 USD 5,504,339 5,755,116 0.42
31,561,169 32,671,257 2.38 Brazil
Banco do Brasil SA/Cayman 4.625% 15/01/2025 11,580,000 USD 12,125,444 12,355,860 0.90
12,125,444 12,355,860 0.90 British Virgin Islands
Beijing Gas Singapore Capital Corp 2.750% 31/05/2022 5,560,000 USD 5,548,669 5,641,399 0.41
China Cinda 2020 I Management Ltd 1.250% 20/01/2024 EMTN 4,200,000 USD 4,186,365 4,046,402 0.29
ENN Clean Energy International Investment Ltd 3.375% 12/05/2026
14,295,000 USD 14,247,450 14,572,466 1.06
Gold Fields Orogen Holdings BVI Ltd 5.125% 15/05/2024 12,180,000 USD 12,655,656 13,266,334 0.97
Voyage Bonds Ltd 3.375% 28/09/2022 3,400,000 USD 3,401,516 3,467,764 0.25
Wanda Properties Overseas Ltd 6.875% 23/07/2023 7,005,000 USD 6,990,531 6,932,842 0.51
Yili Holding Investment Ltd 1.625% 19/11/2025 10,660,000 USD 10,623,364 10,617,267 0.77
57,653,551 58,544,474 4.26 Canada
MEGlobal Canada ULC 5.000% 18/05/2025 EMTN 12,325,000 USD 12,658,432 13,817,558 1.01
12,658,432 13,817,558 1.01 Cayman Islands
AAC Technologies Holdings Inc 2.625% 02/06/2026 8,955,000 USD 8,985,972 9,064,061 0.66
ADCB Finance Cayman Ltd 4.000% 29/03/2023 EMTN 6,935,000 USD 6,942,367 7,318,617 0.53
Aldar Sukuk Ltd 4.750% 29/09/2025 12,675,000 USD 14,211,888 14,142,258 1.03
Almarai Sukuk Ltd 4.311% 05/03/2024 6,245,000 USD 6,421,428 6,739,242 0.49
China Hongqiao Group Ltd 7.125% 22/07/2022 5,895,000 USD 5,901,258 6,039,416 0.44
CK Hutchison International 21 Ltd 1.500% 15/04/2026 7,600,000 USD 7,586,023 7,643,124 0.56
Dar Al-Arkan Sukuk Co Ltd 6.875% 21/03/2023 5,830,000 USD 5,919,816 6,059,527 0.44
DP World Crescent Ltd 3.908% 31/05/2023 144A(2) 9,750,000 USD 10,056,026 10,261,875 0.75
eHi Car Services Ltd 7.750% 14/11/2024 5,670,000 USD 5,750,620 5,868,450 0.43
EMG SUKUK Ltd 4.564% 18/06/2024 7,190,000 USD 7,426,055 7,671,356 0.56
Golden Eagle Retail Group Ltd 4.625% 21/05/2023 9,220,000 USD 9,000,878 9,323,725 0.68
Goodman HK Finance 4.375% 19/06/2024 EMTN 7,775,000 USD 8,283,069 8,424,010 0.61
HPHT Finance 19 Ltd 2.875% 05/11/2024 8,085,000 USD 8,110,431 8,464,025 0.62
Kaisa Group Holdings Ltd 11.250% 16/04/2025 560,000 USD 545,197 531,740 0.04
Kaisa Group Holdings Ltd 11.500% 30/01/2023 4,515,000 USD 4,506,575 4,573,486 0.33
Kaisa Group Holdings Ltd 11.950% 22/10/2022 3,440,000 USD 3,545,627 3,527,720 0.26
(2) See Note 13.
122

Natixis International Funds (Lux) I
The accompanying notes form an integral part of these financial statements.
Loomis Sayles Short Term Emerging Markets Bond Fund Statement of Investments (continued)
As at June 30, 2021 (expressed in USD)
Description Face value Currency Cost Evaluation % of Net
Assets
Longfor Group Holdings Ltd 3.875% 13/07/2022 8,035,000 USD 8,054,120 8,225,196 0.60 MAF Global Securities Ltd 4.750% 07/05/2024 8,805,000 USD 9,234,917 9,593,400 0.70
MAF Sukuk Ltd 4.500% 03/11/2025 4,995,000 USD 5,353,722 5,525,020 0.40
NagaCorp Ltd 7.950% 06/07/2024 7,665,000 USD 7,960,380 7,868,142 0.57
QNB Finance Ltd 1.625% 22/09/2025 EMTN 14,165,000 USD 14,164,121 14,256,789 1.04
QNB Finance Ltd 3.500% 28/03/2024 EMTN 2,665,000 USD 2,717,536 2,841,316 0.21
Samba Funding Ltd 2.750% 02/10/2024 13,480,000 USD 13,667,752 14,069,750 1.03
Sands China Ltd 4.600% 08/08/2023 7,580,000 USD 7,643,537 8,050,718 0.59
Sands China Ltd 5.125% 08/08/2025 7,192,000 USD 7,961,715 8,035,837 0.58
Saudi Electricity Global Sukuk Co 5 1.740% 17/09/2025 6,060,000 USD 6,060,000 6,135,992 0.45
Shimao Group Holdings Ltd 6.125% 21/02/2024 9,285,000 USD 9,586,370 9,588,372 0.70
Sunac China Holdings Ltd 7.250% 14/06/2022 2,015,000 USD 2,015,840 2,057,780 0.15
Sunac China Holdings Ltd 7.950% 11/10/2023 5,060,000 USD 5,073,549 5,218,603 0.38
Sunny Optical Technology Group Co Ltd 3.750% 23/01/2023 4,897,000 USD 4,863,233 5,070,169 0.37
Tingyi Cayman Islands Holding Corp 1.625% 24/09/2025 11,855,000 USD 11,815,761 11,785,535 0.86
229,365,783 233,975,251 17.06 Chile
Banco del Estado de Chile 2.704% 09/01/2025 9,535,000 USD 9,559,526 9,916,495 0.72
Enel Generacion Chile SA 4.250% 15/04/2024 4,490,000 USD 4,667,149 4,803,058 0.35
Falabella SA 3.750% 30/04/2023 1,825,000 USD 1,869,926 1,899,278 0.14
Sociedad Quimica y Minera de Chile SA 3.625% 03/04/2023 6,149,000 USD 6,226,763 6,418,019 0.47
22,323,364 23,036,850 1.68 Colombia
Bancolombia SA 3.000% 29/01/2025 8,190,000 USD 8,148,544 8,411,130 0.61
Ecopetrol SA 4.125% 16/01/2025 1,765,000 USD 1,883,941 1,859,798 0.14
Ecopetrol SA 5.875% 18/09/2023 7,240,000 USD 7,607,096 7,828,685 0.57
17,639,581 18,099,613 1.32
Costa Rica
Instituto Costarricense de Electricidad 6.950% 10/11/2021 5,275,000 USD 5,301,113 5,294,781 0.39
5,301,113 5,294,781 0.39 Cyprus
MHP SE 7.750% 10/05/2024 8,128,000 USD 8,468,005 8,822,975 0.64
8,468,005 8,822,975 0.64 Egypt
Egypt Government International Bond 5.250% 06/10/2025 2,875,000 USD 2,876,278 3,029,675 0.22
Egypt Government International Bond 5.750% 29/05/2024 3,880,000 USD 3,932,075 4,129,484 0.30
6,808,353 7,159,159 0.52 Georgia
Georgia Global Utilities JSC 7.750% 30/07/2025 144A(2) 6,395,000 USD 6,498,318 6,805,363 0.50
Republic of Georgia 2.750% 22/04/2026 6,630,000 USD 6,627,976 6,759,680 0.49
Silknet JSC 11.000% 02/04/2024 11,225,000 USD 11,834,381 12,288,717 0.90
24,960,675 25,853,760 1.89
(2) See Note 13.
123

Natixis International Funds (Lux) I
The accompanying notes form an integral part of these financial statements.
Loomis Sayles Short Term Emerging Markets Bond Fund Statement of Investments (continued)
As at June 30, 2021 (expressed in USD)
Description Face value Currency Cost Evaluation % of Net
Assets
Great Britain Liquid Telecommunications Financing PLC 8.500% 13/07/2022 8,010,000 USD 8,013,193 8,041,129 0.59 Vedanta Resources Finance II PLC 8.950% 11/03/2025 10,850,000 USD 10,816,896 10,638,425 0.77 18,830,089 18,679,554 1.36
Hong Kong
GLP China Holdings Ltd 4.974% 26/02/2024 EMTN 9,120,000 USD 9,590,759 9,811,834 0.71
Hero Asia Investment Ltd 1.500% 18/11/2023 8,290,000 USD 8,278,100 8,283,218 0.60
Yanlord Land HK Co Ltd 5.125% 20/05/2026 4,275,000 USD 4,275,000 4,361,765 0.32
Yanlord Land HK Co Ltd 6.800% 27/02/2024 1,395,000 USD 1,459,749 1,467,514 0.11
23,603,608 23,924,331 1.74 India
Adani Green Energy UP Ltd/Prayatna Developers Pvt Ltd/Parampujya Solar Energ 6.250% 10/12/2024 9,370,000 USD 10,356,927 10,374,097 0.76
GMR Hyderabad International Airport Ltd 5.375% 10/04/2024 6,495,000 USD 6,495,000 6,722,819 0.49
JSW Steel Ltd 5.250% 13/04/2022 5,275,000 USD 5,279,449 5,393,563 0.39
REC Ltd 5.250% 13/11/2023 EMTN 8,660,000 USD 8,813,365 9,350,896 0.68
ReNew Power Synthetic 6.670% 12/03/2024 7,170,000 USD 7,163,135 7,549,156 0.55
Shriram Transport Finance Co Ltd 4.400% 13/03/2024 EMTN 8,270,000 USD 8,261,854 8,282,405 0.61
Shriram Transport Finance Co Ltd 5.100% 16/07/2023 EMTN 7,050,000 USD 7,082,394 7,156,012 0.52
53,452,124 54,828,948 4.00 Indonesia
Bank Rakyat Indonesia Persero Tbk PT 3.950% 28/03/2024 6,000,000 USD 6,066,845 6,408,251 0.47
Bank Rakyat Indonesia Persero Tbk PT 4.625% 20/07/2023 3,774,000 USD 3,914,471 4,034,554 0.29
Indonesia Asahan Aluminium Persero PT 4.750% 15/05/2025 8,765,000 USD 9,064,798 9,658,606 0.70
Tower Bersama Infrastructure Tbk PT 4.250% 21/01/2025 14,670,000 USD 15,395,764 15,476,906 1.13
34,441,878 35,578,317 2.59 Ireland
MMK International Capital DAC 4.375% 13/06/2024 5,010,000 USD 5,161,991 5,368,957 0.39
Phosagro OAO Via Phosagro Bond Funding DAC 3.050% 23/01/2025 9,885,000 USD 9,955,591 10,297,164 0.75
Uralkali OJSC Via Uralkali Finance DAC 4.000% 22/10/2024 2,625,000 USD 2,625,000 2,741,549 0.20
17,742,582 18,407,670 1.34 Israel
Energean Israel Finance Ltd 4.500% 30/03/2024 144A(2) 10,700,000 USD 10,750,099 10,937,265 0.80
Israel Electric Corp Ltd 5.000% 12/11/2024 144A(2) 5,238,000 USD 5,665,587 5,853,517 0.42
Leviathan Bond Ltd 5.750% 30/06/2023 144A(2) 2,225,000 USD 2,227,354 2,327,629 0.17
18,643,040 19,118,411 1.39 Jersey
Oriflame Investment Holding PLC 5.125% 04/05/2026 144A(2) 6,615,000 USD 6,623,975 6,796,962 0.50
6,623,975 6,796,962 0.50
(2) See Note 13.
124

Natixis International Funds (Lux) I
The accompanying notes form an integral part of these financial statements.
Loomis Sayles Short Term Emerging Markets Bond Fund Statement of Investments (continued) As at June 30, 2021 (expressed in USD)
Description Face value Currency Cost Evaluation % of Net
Assets
Jordan Jordan Government International Bond 4.950% 07/07/2025 5,225,000 USD 5,226,428 5,421,983 0.40 5,226,428 5,421,983 0.40 Luxembourg
Gazprom PJSC Via Gaz Capital SA 4.950% 19/07/2022 3,000,000 USD 3,076,108 3,120,000 0.23
Kernel Holding SA 6.500% 17/10/2024 6,000,000 USD 6,395,949 6,415,800 0.47
Kernel Holding SA 8.750% 31/01/2022 5,185,000 USD 5,231,554 5,371,360 0.39
14,703,611 14,907,160 1.09 Mauritius
Greenko Mauritius Ltd 6.250% 21/02/2023 8,220,000 USD 8,220,000 8,476,298 0.62
HTA Group Ltd/Mauritius 7.000% 18/12/2025 13,495,000 USD 13,853,091 14,355,711 1.04
22,073,091 22,832,009 1.66 Mexico
America Movil SAB de CV 3.125% 16/07/2022 2,320,000 USD 2,307,857 2,383,385 0.17
Banco Inbursa SA Institucion de Banca Multiple Grupo Financiero Inbursa 4.125% 06/06/2024 6,175,000 USD 6,356,197 6,625,775 0.48
Banco Santander Mexico SA Institucion de Banca Multiple Grupo Financiero Santand 4.125% 09/11/2022 4,500,000 USD 4,580,988 4,674,375 0.34
BBVA Bancomer SA/Texas 1.875% 18/09/2025 8,105,000 USD 8,101,162 8,196,992 0.60
BBVA Bancomer SA/Texas 6.750% 30/09/2022 4,020,000 USD 4,157,664 4,268,436 0.31
Sigma Alimentos SA de CV 4.125% 02/05/2026 7,545,000 USD 8,187,509 8,224,050 0.60
Unifin Financiera SAB de CV 7.000% 15/01/2025 6,270,000 USD 6,192,975 5,964,337 0.44
Unifin Financiera SAB de CV 7.250% 27/09/2023 4,525,000 USD 4,406,733 4,462,788 0.33
44,291,085 44,800,138 3.27 Morocco
OCP SA 4.500% 22/10/2025 520,000 USD 537,642 562,139 0.04
537,642 562,139 0.04 Multinational
CANPACK SA/Eastern PA Land Investment Holding LLC 3.125% 01/11/2025 144A(2) 8,865,000 USD 8,939,401 9,020,137 0.66
8,939,401 9,020,137 0.66 Netherlands
Bharti Airtel International Netherlands BV 5.125% 11/03/2023 9,035,000 USD 9,108,384 9,572,583 0.70
Bharti Airtel International Netherlands BV 5.350%
20/05/2024 4,725,000 USD 4,997,223 5,201,283 0.38
IHS Netherlands Holdco BV 7.125% 18/03/2025 11,030,000 USD 11,293,234 11,510,664 0.84
MDGH - GMTN BV 2.500% 07/11/2024 EMTN 13,070,000 USD 13,458,030 13,723,500 1.00
SABIC Capital II BV 4.000% 10/10/2023 7,365,000 USD 7,388,702 7,898,962 0.57
Teva Pharmaceutical Finance Netherlands III BV 2.200% 21/07/2021 2,975,000 USD 2,971,136 2,973,810 0.22
Teva Pharmaceutical Finance Netherlands III BV 6.000% 15/04/2024 9,585,000 USD 9,907,210 10,160,100 0.74
VEON Holdings BV 4.950% 16/06/2024 11,540,000 USD 12,180,373 12,434,350 0.91
71,304,292 73,475,252 5.36 Nigeria
SEPLAT Energy PLC 7.750% 01/04/2026 9,210,000 USD 9,330,044 9,603,820 0.70
United Bank for Africa PLC 7.750% 08/06/2022 144A(2) 7,630,000 USD 7,792,086 7,877,975 0.57
17,122,130 17,481,795 1.27
(2) See Note 13.
125

Natixis International Funds (Lux) I
The accompanying notes form an integral part of these financial statements.
Loomis Sayles Short Term Emerging Markets Bond Fund Statement of Investments (continued) As at June 30, 2021 (expressed in USD)
Description Face value Currency Cost Evaluation % of Net
Assets
Peru Nexa Resources Peru SAA 4.625% 28/03/2023 5,781,000 USD 5,787,029 5,918,357 0.43 Volcan Cia Minera SAA 4.375% 11/02/2026 5,600,000 USD 5,673,481 5,544,000 0.41 11,460,510 11,462,357 0.84
Philippines
BDO Unibank Inc 2.950% 06/03/2023 EMTN 6,010,000 USD 5,962,336 6,207,128 0.45
5,962,336 6,207,128 0.45
Saudi Arabia
Saudi Arabian Oil Co 1.250% 24/11/2023 860,000 USD 858,506 868,670 0.06
Saudi Arabian Oil Co 2.875% 16/04/2024 EMTN 11,065,000 USD 11,444,961 11,649,674 0.85
12,303,467 12,518,344 0.91 Singapore
ABJA Investment Co. Pte Ltd 5.950% 31/07/2024 7,565,000 USD 7,900,296 8,170,200 0.60
BOC Aviation Ltd 2.375% 15/09/2021 EMTN 4,400,000 USD 4,396,931 4,406,435 0.32
GLP Pte Ltd 3.875% 04/06/2025 EMTN 6,490,000 USD 6,744,831 6,862,129 0.50
LMIRT Capital Pte Ltd 7.250% 19/06/2024 9,190,000 USD 9,351,418 9,596,822 0.70
28,393,476 29,035,586 2.12 South Africa
Transnet SOC Ltd 4.000% 26/07/2022 5,560,000 USD 5,541,173 5,663,928 0.41
5,541,173 5,663,928 0.41 South Korea
Kookmin Bank 1.375% 06/05/2026 EMTN 15,240,000 USD 15,217,989 15,257,172 1.11
KT Corp 2.625% 07/08/2022 5,985,000 USD 5,972,998 6,105,358 0.44
NAVER Corp 1.500% 29/03/2026 9,695,000 USD 9,698,255 9,675,771 0.71
POSCO 2.500% 17/01/2025 3,550,000 USD 3,535,345 3,674,001 0.27
POSCO 4.000% 01/08/2023 3,570,000 USD 3,592,595 3,801,649 0.28
Shinhan Financial Group Co Ltd 1.350% 10/01/2026 EMTN 9,195,000 USD 9,180,780 9,180,472 0.67
SK Hynix Inc 1.000% 19/01/2024 9,000,000 USD 8,985,139 8,949,240 0.65
SK Hynix Inc 3.000% 17/09/2024 2,480,000 USD 2,468,511 2,618,442 0.19
SK Telecom Co Ltd 3.750% 16/04/2023 6,470,000 USD 6,521,117 6,812,716 0.50
65,172,729 66,074,821 4.82 Supranational Organisations
Africa Finance Corp 3.125% 16/06/2025 13,010,000 USD 13,203,472 13,517,622 0.99
African Export-Import Bank/The 2.634% 17/05/2026 5,600,000 USD 5,600,000 5,668,365 0.41
African Export-Import Bank/The 4.125% 20/06/2024 EMTN 7,545,000 USD 8,083,046 8,056,219 0.59
26,886,518 27,242,206 1.99 Sweden
Powszechna Kasa Oszczednosci Bank Polski SA Via PKO Finance AB 4.630% 26/09/2022 9,930,000 USD 10,140,904 10,373,315 0.76
10,140,904 10,373,315 0.76 Thailand
Bangkok Bank PCL/Hong Kong 4.050% 19/03/2024 EMTN 8,424,000 USD 8,743,101 9,113,505 0.66
GC Treasury Center Co Ltd 4.250% 19/09/2022 5,985,000 USD 6,028,799 6,211,626 0.45
PTT Global Chemical PCL 4.250% 19/09/2022 4,355,000 USD 4,447,175 4,515,344 0.33
Siam Commercial Bank PCL/Cayman Islands 3.900% 11/02/2024 EMTN 600,000 USD 634,495 644,007 0.05
19,853,570 20,484,482 1.49 Togo
Ecobank Transnational Inc 9.500% 18/04/2024 10,270,000 USD 10,572,567 11,024,331 0.80
10,572,567 11,024,331 0.80
126

Natixis International Funds (Lux) I
The accompanying notes form an integral part of these financial statements.
Loomis Sayles Short Term Emerging Markets Bond Fund Statement of Investments (continued) As at June 30, 2021 (expressed in USD)
Description Face value Currency Cost Evaluation % of Net
Assets
Turkey Akbank T.A.S. 5.125% 31/03/2025 EMTN 8,795,000 USD 8,720,543 8,838,975 0.65 KOC Holding AS 5.250% 15/03/2023 7,070,000 USD 7,178,706 7,311,245 0.53 KOC Holding AS 6.500% 11/03/2025 2,345,000 USD 2,391,656 2,526,737 0.18
QNB Finansbank AS 4.875% 19/05/2022 EMTN 6,010,000 USD 6,048,387 6,135,777 0.45
TC Ziraat Bankasi AS 5.375% 02/03/2026 10,055,000 USD 10,003,680 9,879,038 0.72
Turk Telekomunikasyon AS 4.875% 19/06/2024 10,755,000 USD 10,620,106 11,212,088 0.82
Turkiye Sinai Kalkinma Bankasi AS 6.000% 23/01/2025 7,250,000 USD 7,217,613 7,380,220 0.54
Ulker Biskuvi Sanayi AS 6.950% 30/10/2025 7,830,000 USD 7,930,447 8,497,825 0.62
60,111,138 61,781,905 4.51 Ukraine
VF Ukraine PAT via VFU Funding PLC 6.200% 11/02/2025 4,715,000 USD 4,779,282 4,915,388 0.36
4,779,282 4,915,388 0.36 United Arab Emirates
Burgan Senior SPC Ltd 3.125% 14/09/2021 EMTN 8,280,000 USD 8,276,012 8,310,056 0.61
Kuwait Projects Co. SPC Ltd 5.000% 15/03/2023 7,265,000 USD 7,331,812 7,529,074 0.55
NBK SPC Ltd 2.750% 30/05/2022 10,365,000 USD 10,406,961 10,551,726 0.77
Oztel Holdings SPC Ltd 5.625% 24/10/2023 10,885,000 USD 11,082,726 11,578,919 0.84
37,097,511 37,969,775 2.77 United States
HCL America Inc 1.375% 10/03/2026 13,280,000 USD 13,175,465 13,175,126 0.96
Hikma Finance USA LLC 3.250% 09/07/2025 11,180,000 USD 11,239,367 11,647,659 0.85
Sasol Financing USA LLC 5.875% 27/03/2024 5,625,000 USD 5,769,857 6,007,500 0.44
SK Battery America Inc 1.625% 26/01/2024 6,555,000 USD 6,544,681 6,562,550 0.48
SK Battery America Inc 2.125% 26/01/2026 3,445,000 USD 3,419,145 3,415,229 0.25
Stillwater Mining Co 6.125% 27/06/2022 8,045,000 USD 8,045,000 8,064,925 0.59
Stillwater Mining Co 7.125% 27/06/2025 144A(2) 3,295,000 USD 3,411,741 3,414,246 0.25
51,605,256 52,287,235 3.82
Total - Fixed rate bonds 1,136,280,883 1,162,507,145 84.77
Variable rate bonds
Hong Kong
ICBCIL Finance Co Ltd 1.205% 20/11/2024 EMTN 7,195,000 USD 7,195,000 7,159,931 0.52
7,195,000 7,159,931 0.52
Total - Variable rate bonds 7,195,000 7,159,931 0.52
Total - Transferable securities admitted to an official stock exchange listing 1,143,475,883 1,169,667,076 85.29
Transferable securities dealt in on another regulated market Fixed rate bonds
Bermuda Islands
Credicorp Ltd 2.750% 17/06/2025 9,915,000 USD 9,985,521 10,060,949 0.74
Tengizchevroil Finance Co. International Ltd 2.625% 15/08/2025 8,590,000 USD 8,716,901 8,811,725 0.64
18,702,422 18,872,674 1.38
(2) See Note 13.
127

Natixis International Funds (Lux) I
The accompanying notes form an integral part of these financial statements.
Loomis Sayles Short Term Emerging Markets Bond Fund Statement of Investments (continued) As at June 30, 2021 (expressed in USD)
Description Face value Currency Cost Evaluation % of Net
Assets
Brazil Centrais Eletricas Brasileiras SA 3.625% 04/02/2025 7,480,000 USD 7,477,858 7,695,050 0.56 Itau Unibanco Holding SA/Cayman Island 3.250% 24/01/2025 9,840,000 USD 10,093,053 10,120,440 0.74 17,570,911 17,815,490 1.30
British Virgin Islands
Grupo Unicomer Co Ltd 7.875% 01/04/2024 8,170,000 USD 8,434,607 8,501,356 0.62
Yingde Gases Investment Ltd 6.250% 19/01/2023 6,725,000 USD 6,803,317 6,894,920 0.50
15,237,924 15,396,276 1.12 Canada
First Quantum Minerals Ltd 6.875% 01/03/2026 144A(2) 6,345,000 USD 6,657,166 6,637,568 0.48
6,657,166 6,637,568 0.48 Cayman Islands
Arabian Centres Sukuk Ltd 5.375% 26/11/2024 2,570,000 USD 2,575,628 2,688,220 0.20
Braskem Finance Ltd 6.450% 03/02/2024 1,400,000 USD 1,476,788 1,582,000 0.12
XP Inc 3.250% 01/07/2026 10,610,000 USD 10,489,258 10,490,637 0.76
14,541,674 14,760,857 1.08 Chile
Banco de Credito e Inversiones SA 4.000% 11/02/2023 144A(2) 5,200,000 USD 5,248,861 5,447,000 0.40
Banco Santander Chile 3.875% 20/09/2022 3,280,000 USD 3,271,996 3,414,316 0.25
Falabella SA 4.375% 27/01/2025 7,045,000 USD 7,578,290 7,573,375 0.55
Falabella SA 4.375% 27/01/2025 144A(2) 3,270,000 USD 3,407,018 3,515,250 0.26
Telefonica Chile SA 3.875% 12/10/2022 6,125,000 USD 6,105,656 6,308,811 0.46
25,611,821 26,258,752 1.92 Mexico
Axtel SAB de CV 6.375% 14/11/2024 4,063,000 USD 4,216,640 4,205,205 0.31
El Puerto de Liverpool SAB de CV 3.950% 02/10/2024 3,800,000 USD 3,943,369 4,061,250 0.29
8,160,009 8,266,455 0.60 Multinational
ATP Tower Holdings LLC/Andean Tower Partners Colombia SAS/Andean Telecom Par 4.050% 27/04/2026 9,475,000 USD 9,405,525 9,733,837 0.71
9,405,525 9,733,837 0.71 Netherlands
Teva Pharmaceutical Finance Netherlands III BV 7.125% 31/01/2025 5,725,000 USD 6,277,385 6,311,813 0.46
VEON Holdings BV 4.000% 09/04/2025 3,020,000 USD 3,200,230 3,182,325 0.23
9,477,615 9,494,138 0.69 Singapore
BOC Aviation Ltd 2.750% 18/09/2022 EMTN 6,675,000 USD 6,763,494 6,794,237 0.50
6,763,494 6,794,237 0.50 Supranational Organisations
Arab Petroleum Investments Corp 1.460% 30/06/2025 EMTN 4,815,000 USD 4,815,000 4,856,776 0.35
4,815,000 4,856,776 0.35 United Arab Emirates
Dolphin Energy Ltd LLC 5.500% 15/12/2021 5,000,000 USD 5,067,195 5,106,300 0.37
5,067,195 5,106,300 0.37
(2) See Note 13.
128
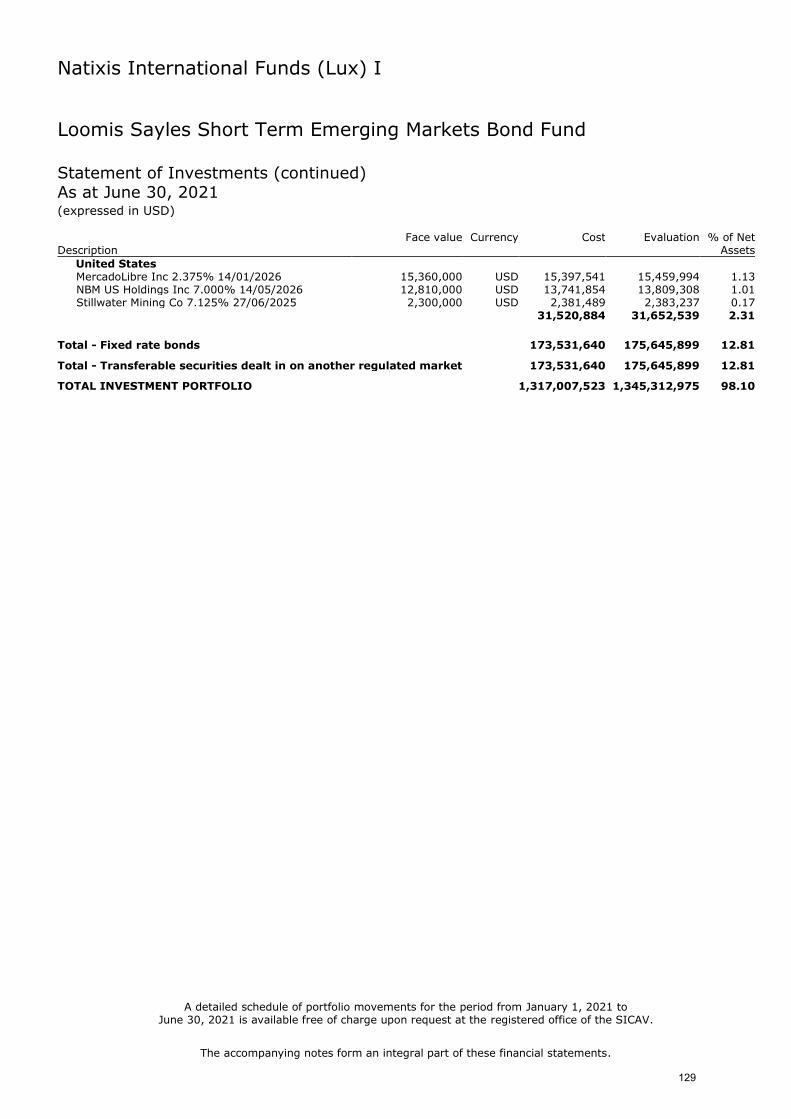
Natixis International Funds (Lux) I
The accompanying notes form an integral part of these financial statements.
Loomis Sayles Short Term Emerging Markets Bond Fund Statement of Investments (continued) As at June 30, 2021 (expressed in USD)
Description Face value Currency Cost Evaluation % of Net
Assets
United States MercadoLibre Inc 2.375% 14/01/2026 15,360,000 USD 15,397,541 15,459,994 1.13 NBM US Holdings Inc 7.000% 14/05/2026 12,810,000 USD 13,741,854 13,809,308 1.01 Stillwater Mining Co 7.125% 27/06/2025 2,300,000 USD 2,381,489 2,383,237 0.17 31,520,884 31,652,539 2.31
Total - Fixed rate bonds 173,531,640 175,645,899 12.81
Total - Transferable securities dealt in on another regulated market 173,531,640 175,645,899 12.81
TOTAL INVESTMENT PORTFOLIO 1,317,007,523 1,345,312,975 98.10
A detailed schedule of portfolio movements for the period from January 1, 2021 to June 30, 2021 is available free of charge upon request at the registered office of the SICAV.
129

Natixis International Funds (Lux) I
Loomis Sayles Strategic Alpha Bond Fund
Statistics
As at June 30, 2021
Net asset value per share
C/A (USD) 112.85
C/D (USD) 102.16
H-I/A (EUR) 100.80
H-N/D (GBP) 96.21
H-R/A (EUR) 115.27
I/A (USD) 141.28
I/A (EUR) 118.33
R/A (USD) 131.97
R/D (USD) 105.28
RE/A (USD) 110.64
S/A (USD) 127.37
Number of shares outstanding
C/A (USD) 200.000
C/D (USD) 2,192.593
H-I/A (EUR) 3,750.000
H-N/D (GBP) 35.936
H-R/A (EUR) 3,186.215
I/A (USD) 36,010.433
I/A (EUR) 30.000
R/A (USD) 42,391.664
R/D (USD) 31.744
RE/A (USD) 30.000
S/A (USD) 134,082.494
130

Natixis International Funds (Lux) I
The accompanying notes form an integral part of these financial statements.
Loomis Sayles Strategic Alpha Bond Fund
Statement of Investments As at June 30, 2021 (expressed in USD)
Description Quantity / Face
value Currency Cost Evaluation % of Net
Assets
Transferable securities admitted to an official stock exchange listing Shares
Canada
Bellatrix Exploration Ltd 67,699 CAD 0 0 0.00
0 0 0.00 France
LVMH Moet Hennessy Louis Vuitton SE 32 EUR 14,449 25,096 0.09
14,449 25,096 0.09 Ireland
Accenture PLC 38 USD 8,848 11,202 0.04
8,848 11,202 0.04 Jersey
Clarivate PLC 5.250% 01/06/2024 Preferred Convertible 625 USD 62,500 65,125 0.22
62,500 65,125 0.22 Mexico
Cemex SAB de CV ADR 9,567 USD 63,628 80,363 0.28
63,628 80,363 0.28 Netherlands
NXP Semiconductors NV 53 USD 10,641 10,903 0.04
10,641 10,903 0.04 United States
Abbott Laboratories 62 USD 6,798 7,188 0.02
Activision Blizzard Inc 107 USD 7,898 10,212 0.03
AES Corp/The 411 USD 11,671 10,715 0.04
Allstate Corp/The 84 USD 10,490 10,957 0.04
Anthem Inc 29 USD 8,691 11,072 0.04
Apple Inc 331 USD 33,055 45,334 0.16
Applied Materials Inc 85 USD 6,359 12,104 0.04
Artisan Partners Asset Management Inc 30 USD 1,465 1,525 0.00
Bank of America Corp 7.250% Preferred Convertible 99 USD 138,299 140,184 0.48
Blackstone Group Inc/The 109 USD 8,638 10,588 0.04
Booking Holdings Inc 8 USD 15,249 17,505 0.06
Boston Scientific Corp 5.500% 01/06/2023 Preferred Convertible 373 USD 39,178 43,290 0.15
Bristol-Myers Squibb Co 162 USD 9,424 10,825 0.04
Caterpillar Inc 51 USD 11,789 11,099 0.04
Chevron Corp 106 USD 9,317 11,102 0.04
Cisco Systems Inc/Delaware 218 USD 9,808 11,554 0.04
Citigroup Inc 157 USD 8,465 11,108 0.04
Citizens Financial Group Inc 62 USD 2,766 2,844 0.01
Coca-Cola Co/The 194 USD 10,433 10,497 0.03
Comcast Corp 201 USD 9,392 11,461 0.04
ConocoPhillips 166 USD 8,547 10,109 0.03
Costco Wholesale Corp 26 USD 9,901 10,287 0.03
Cummins Inc 45 USD 11,491 10,971 0.04
Deere & Co 33 USD 9,302 11,639 0.04
El Paso Energy Capital Trust I 4.750% 31/03/2028 Preferred Convertible 86 USD 3,850 4,321 0.01
Estee Lauder Cos Inc/The 70 USD 14,716 22,266 0.08
Expeditors International of Washington Inc 172 USD 12,626 21,775 0.07
Exxon Mobil Corp 186 USD 9,852 11,733 0.04
Fidelity National Financial Inc 235 USD 10,429 10,213 0.03
131

Natixis International Funds (Lux) I
The accompanying notes form an integral part of these financial statements.
Loomis Sayles Strategic Alpha Bond Fund
Statement of Investments (continued) As at June 30, 2021 (expressed in USD)
Description Quantity / Face
value Currency Cost Evaluation % of Net
Assets
Fox Corp 282 USD 10,244 10,471 0.03
Home Depot Inc/The 36 USD 8,170 11,480 0.04
HP Inc 373 USD 12,419 11,261 0.04
iHeartMedia Inc 2,133 USD 29,602 57,442 0.20
Interpublic Group of Cos Inc/The 328 USD 9,742 10,657 0.04
Intuit Inc 19 USD 9,005 9,313 0.03
Johnson & Johnson 273 USD 40,475 44,974 0.15
JPMorgan Chase & Co 70 USD 10,632 10,888 0.04
KLA Corp 33 USD 6,972 10,699 0.04
Lam Research Corp 17 USD 6,566 11,062 0.04
Lowe's Cos Inc 58 USD 8,247 11,250 0.04
LyondellBasell Industries NV 104 USD 10,550 10,698 0.04
Mastercard Inc 76 USD 23,770 27,747 0.09
Microsoft Corp 42 USD 6,118 11,378 0.04
Morgan Stanley 130 USD 7,683 11,920 0.04
Newmont Corp 170 USD 9,882 10,775 0.04
Nexstar Media Group Inc 32 USD 3,271 4,732 0.02
NIKE Inc 75 USD 9,895 11,587 0.04
Norfolk Southern Corp 40 USD 10,517 10,616 0.04
NVIDIA Corp 14 USD 5,880 11,201 0.04
OneMain Holdings Inc 182 USD 10,458 10,904 0.04
Oracle Corp 137 USD 7,726 10,664 0.04
Parker-Hannifin Corp 33 USD 9,173 10,135 0.03
Pfizer Inc 281 USD 9,705 11,004 0.04
Philip Morris International Inc 110 USD 8,843 10,902 0.04
Procter & Gamble Co/The 185 USD 25,237 24,962 0.09
QUALCOMM Inc 75 USD 8,023 10,720 0.04
Reliance Steel & Aluminum Co 27 USD 4,220 4,074 0.01
Ross Stores Inc 91 USD 10,629 11,284 0.04
Ryder System Inc 137 USD 9,222 10,183 0.03
Starbucks Corp 265 USD 24,476 29,630 0.10
Target Corp 46 USD 8,764 11,120 0.04
Texas Instruments Inc 55 USD 8,218 10,576 0.04
Thermo Fisher Scientific Inc 22 USD 10,122 11,098 0.04
TJX Cos Inc/The 166 USD 11,510 11,192 0.04
T-Mobile US Inc 1,493 USD 201,678 216,231 0.75
Truist Financial Corp 192 USD 10,977 10,656 0.04
Tyson Foods Inc 136 USD 10,725 10,031 0.03
Umpqua Holdings Corp 317 USD 5,653 5,849 0.02
United Parcel Service Inc 54 USD 8,798 11,230 0.04
UnitedHealth Group Inc 27 USD 7,461 10,812 0.04
Verizon Communications Inc 190 USD 11,157 10,646 0.04
Visa Inc 74 USD 15,802 17,303 0.06
Walmart Inc 76 USD 10,689 10,718 0.04
Wells Fargo & Co 7.500% Preferred Convertible 100 USD 138,749 152,621 0.53
1,277,554 1,469,174 5.08
Total - Shares 1,437,620 1,661,863 5.75
Fixed rate bonds
Argentina
Banco Macro SA 17.500% 08/05/2022 144A(2) 4,575,000 ARS 298,100 25,583 0.09
(2) See Note 13.
132

Natixis International Funds (Lux) I
The accompanying notes form an integral part of these financial statements.
Loomis Sayles Strategic Alpha Bond Fund
Statement of Investments (continued) As at June 30, 2021 (expressed in USD)
Description Quantity / Face
value Currency Cost Evaluation % of Net
Assets
Provincia de Buenos Aires/Government Bonds 37.854% 12/04/2025 144A(2) 23,055,000 ARS 1,143,108 114,999 0.40
Provincia de Buenos Aires/Government Bonds 37.954% 31/05/2022 42,215,000 ARS 2,641,049 235,971 0.81
YPF SA 6.950% 21/07/2027 144A(2) 85,000 USD 85,498 59,874 0.21
4,167,755 436,427 1.51 Austria
Suzano Austria GmbH 3.750% 15/01/2031 55,000 USD 57,847 57,681 0.20
57,847 57,681 0.20 Bermuda Islands
Athene Holding Ltd 3.500% 15/01/2031 40,000 USD 39,457 42,646 0.15
39,457 42,646 0.15 Brazil
Brazil Notas do Tesouro Nacional Serie F 10.000% 01/01/2025 760,000 BRL 146,619 159,768 0.55
146,619 159,768 0.55 Colombia
Financiera de Desarrollo Territorial SA Findeter 7.875% 12/08/2024 144A(2) 327,000,000 COP 171,284 88,922 0.31
171,284 88,922 0.31 Finland
Nokia Oyj 2.000% 11/03/2026 EMTN 100,000 EUR 101,994 125,077 0.43
101,994 125,077 0.43 Ireland
AerCap Ireland Capital DAC/AerCap Global Aviation Trust 3.875% 23/01/2028 150,000 USD 120,385 160,555 0.55
120,385 160,555 0.55 Israel
Energean Israel Finance Ltd 5.375% 30/03/2028 144A(2) 35,000 USD 35,099 35,953 0.13
Energean Israel Finance Ltd 5.875% 30/03/2031 144A(2) 45,000 USD 44,786 46,330 0.16
Leviathan Bond Ltd 6.125% 30/06/2025 144A(2) 65,000 USD 65,000 71,358 0.25
Leviathan Bond Ltd 6.500% 30/06/2027 144A(2) 40,000 USD 40,000 44,540 0.15
184,885 198,181 0.69 Mexico
Mexican Bonos 6.750% 09/03/2023 2,965,000 MXN 149,046 151,579 0.52
Mexico Government International Bond 3.771% 24/05/2061 200,000 USD 200,000 186,363 0.65
Petroleos Mexicanos 5.950% 28/01/2031 310,000 USD 214,521 301,165 1.04
563,567 639,107 2.21 Netherlands
Teva Pharmaceutical Finance Netherlands II BV 6.000% 31/01/2025 140,000 EUR 149,278 178,734 0.62
Teva Pharmaceutical Finance Netherlands III BV 4.100% 01/10/2046 225,000 USD 155,412 197,156 0.68
304,690 375,890 1.30 Peru
Volcan Cia Minera SAA 4.375% 11/02/2026 144A(2) 10,000 USD 10,000 9,900 0.03
10,000 9,900 0.03 South Korea
Export-Import Bank of Korea 6.750% 09/08/2022 EMTN 2,300,000 INR 32,013 31,451 0.11
32,013 31,451 0.11
(2) See Note 13.
133
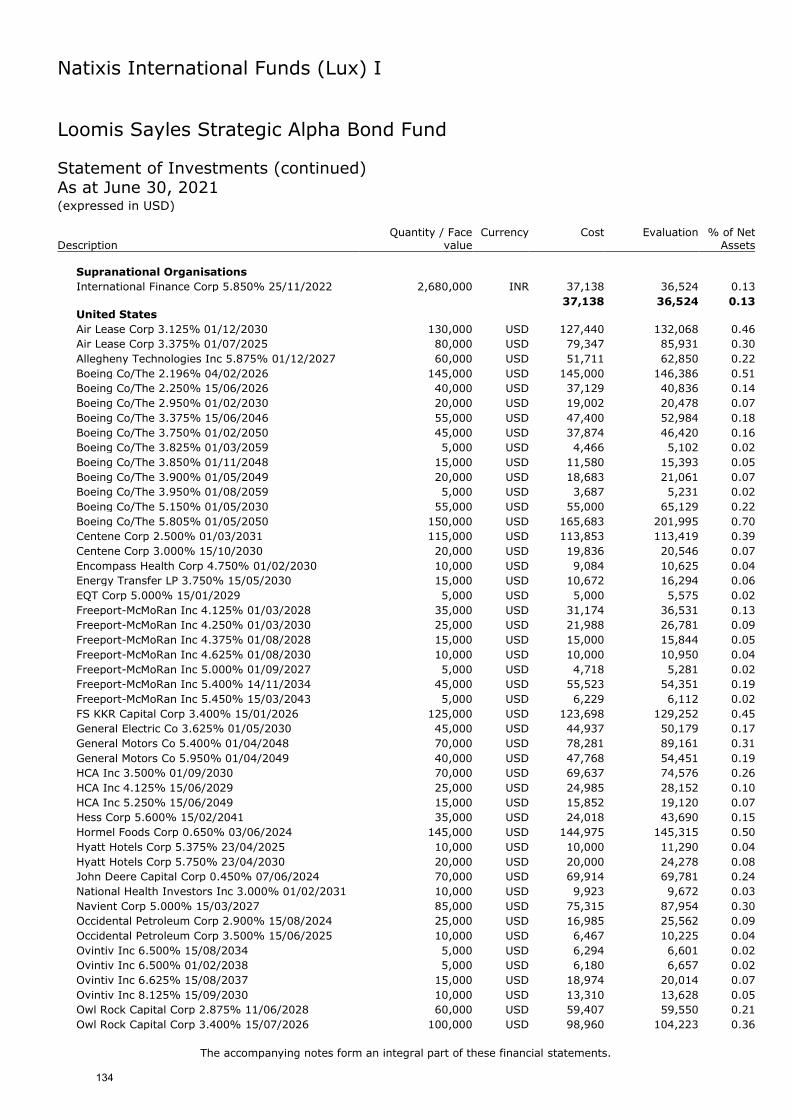
Natixis International Funds (Lux) I
The accompanying notes form an integral part of these financial statements.
Loomis Sayles Strategic Alpha Bond Fund
Statement of Investments (continued) As at June 30, 2021 (expressed in USD)
Description Quantity / Face
value Currency Cost Evaluation % of Net
Assets
Supranational Organisations
International Finance Corp 5.850% 25/11/2022 2,680,000 INR 37,138 36,524 0.13
37,138 36,524 0.13 United States
Air Lease Corp 3.125% 01/12/2030 130,000 USD 127,440 132,068 0.46
Air Lease Corp 3.375% 01/07/2025 80,000 USD 79,347 85,931 0.30
Allegheny Technologies Inc 5.875% 01/12/2027 60,000 USD 51,711 62,850 0.22
Boeing Co/The 2.196% 04/02/2026 145,000 USD 145,000 146,386 0.51
Boeing Co/The 2.250% 15/06/2026 40,000 USD 37,129 40,836 0.14
Boeing Co/The 2.950% 01/02/2030 20,000 USD 19,002 20,478 0.07
Boeing Co/The 3.375% 15/06/2046 55,000 USD 47,400 52,984 0.18
Boeing Co/The 3.750% 01/02/2050 45,000 USD 37,874 46,420 0.16
Boeing Co/The 3.825% 01/03/2059 5,000 USD 4,466 5,102 0.02
Boeing Co/The 3.850% 01/11/2048 15,000 USD 11,580 15,393 0.05
Boeing Co/The 3.900% 01/05/2049 20,000 USD 18,683 21,061 0.07
Boeing Co/The 3.950% 01/08/2059 5,000 USD 3,687 5,231 0.02
Boeing Co/The 5.150% 01/05/2030 55,000 USD 55,000 65,129 0.22
Boeing Co/The 5.805% 01/05/2050 150,000 USD 165,683 201,995 0.70
Centene Corp 2.500% 01/03/2031 115,000 USD 113,853 113,419 0.39
Centene Corp 3.000% 15/10/2030 20,000 USD 19,836 20,546 0.07
Encompass Health Corp 4.750% 01/02/2030 10,000 USD 9,084 10,625 0.04
Energy Transfer LP 3.750% 15/05/2030 15,000 USD 10,672 16,294 0.06
EQT Corp 5.000% 15/01/2029 5,000 USD 5,000 5,575 0.02
Freeport-McMoRan Inc 4.125% 01/03/2028 35,000 USD 31,174 36,531 0.13
Freeport-McMoRan Inc 4.250% 01/03/2030 25,000 USD 21,988 26,781 0.09
Freeport-McMoRan Inc 4.375% 01/08/2028 15,000 USD 15,000 15,844 0.05
Freeport-McMoRan Inc 4.625% 01/08/2030 10,000 USD 10,000 10,950 0.04
Freeport-McMoRan Inc 5.000% 01/09/2027 5,000 USD 4,718 5,281 0.02
Freeport-McMoRan Inc 5.400% 14/11/2034 45,000 USD 55,523 54,351 0.19
Freeport-McMoRan Inc 5.450% 15/03/2043 5,000 USD 6,229 6,112 0.02
FS KKR Capital Corp 3.400% 15/01/2026 125,000 USD 123,698 129,252 0.45
General Electric Co 3.625% 01/05/2030 45,000 USD 44,937 50,179 0.17
General Motors Co 5.400% 01/04/2048 70,000 USD 78,281 89,161 0.31
General Motors Co 5.950% 01/04/2049 40,000 USD 47,768 54,451 0.19
HCA Inc 3.500% 01/09/2030 70,000 USD 69,637 74,576 0.26
HCA Inc 4.125% 15/06/2029 25,000 USD 24,985 28,152 0.10
HCA Inc 5.250% 15/06/2049 15,000 USD 15,852 19,120 0.07
Hess Corp 5.600% 15/02/2041 35,000 USD 24,018 43,690 0.15
Hormel Foods Corp 0.650% 03/06/2024 145,000 USD 144,975 145,315 0.50
Hyatt Hotels Corp 5.375% 23/04/2025 10,000 USD 10,000 11,290 0.04
Hyatt Hotels Corp 5.750% 23/04/2030 20,000 USD 20,000 24,278 0.08
John Deere Capital Corp 0.450% 07/06/2024 70,000 USD 69,914 69,781 0.24
National Health Investors Inc 3.000% 01/02/2031 10,000 USD 9,923 9,672 0.03
Navient Corp 5.000% 15/03/2027 85,000 USD 75,315 87,954 0.30
Occidental Petroleum Corp 2.900% 15/08/2024 25,000 USD 16,985 25,562 0.09
Occidental Petroleum Corp 3.500% 15/06/2025 10,000 USD 6,467 10,225 0.04
Ovintiv Inc 6.500% 15/08/2034 5,000 USD 6,294 6,601 0.02
Ovintiv Inc 6.500% 01/02/2038 5,000 USD 6,180 6,657 0.02
Ovintiv Inc 6.625% 15/08/2037 15,000 USD 18,974 20,014 0.07
Ovintiv Inc 8.125% 15/09/2030 10,000 USD 13,310 13,628 0.05
Owl Rock Capital Corp 2.875% 11/06/2028 60,000 USD 59,407 59,550 0.21
Owl Rock Capital Corp 3.400% 15/07/2026 100,000 USD 98,960 104,223 0.36
134

Natixis International Funds (Lux) I
The accompanying notes form an integral part of these financial statements.
Loomis Sayles Strategic Alpha Bond Fund
Statement of Investments (continued) As at June 30, 2021 (expressed in USD)
Description Quantity / Face
value Currency Cost Evaluation % of Net
Assets
Pacific Gas & Electric Co 3.500% 01/08/2050 50,000 USD 49,696 44,563 0.15
Pacific Gas & Electric Co 4.300% 15/03/2045 55,000 USD 53,834 52,778 0.18
Southern California Edison Co 3.650% 01/02/2050 15,000 USD 15,700 15,001 0.05
Southern California Edison Co 4.000% 01/04/2047 5,000 USD 5,392 5,259 0.02
Southern California Edison Co 4.125% 01/03/2048 5,000 USD 5,478 5,328 0.02
Teladoc Health Inc 1.250% 01/06/2027 95,000 USD 109,473 106,343 0.37
T-Mobile USA Inc 3.875% 15/04/2030 200,000 USD 198,732 223,564 0.77
United Rentals North America Inc 4.000% 15/07/2030 75,000 USD 75,000 77,250 0.27
UnitedHealth Group Inc 0.550% 15/05/2024 145,000 USD 144,855 144,792 0.50
Yum! Brands Inc 3.625% 15/03/2031 55,000 USD 55,000 54,725 0.19
Yum! Brands Inc 4.625% 31/01/2032 30,000 USD 30,000 31,500 0.11
2,836,119 3,068,607 10.62
Total - Fixed rate bonds 8,773,753 5,430,736 18.79
Variable rate bonds
Argentina
Banco Hipotecario SA 38.125% 07/11/2022 144A(2) 8,485,000 ARS 480,222 53,016 0.18
480,222 53,016 0.18
Total - Variable rate bonds 480,222 53,016 0.18
Investment Funds
United States
American Tower Corp REIT 43 USD 10,352 11,616 0.04
Energy Transfer LP REIT 971 USD 10,306 10,322 0.04
Iron Mountain Inc REIT 235 USD 10,494 9,945 0.03
Omega Healthcare Investors Inc REIT 294 USD 10,745 10,669 0.04
41,897 42,552 0.15
Total - Investment Funds 41,897 42,552 0.15
Treasury Bills
United States
United States Treasury Bill 0.000% 24/02/2022 280,000 USD 279,861 279,898 0.97
279,861 279,898 0.97
Total - Treasury Bills 279,861 279,898 0.97
Total - Transferable securities admitted to an official stock exchange listing 11,013,353 7,468,065 25.84
Transferable securities dealt in on another regulated market Shares
Bermuda Islands
Bunge Ltd 4.875% Preferred Convertible 632 USD 60,482 73,350 0.26
60,482 73,350 0.26 United States
Hexion Holdings Corp 3,644 USD 64,969 67,414 0.23
64,969 67,414 0.23
Total - Shares 125,451 140,764 0.49
(2) See Note 13.
135

Natixis International Funds (Lux) I
The accompanying notes form an integral part of these financial statements.
Loomis Sayles Strategic Alpha Bond Fund
Statement of Investments (continued)
As at June 30, 2021 (expressed in USD)
Description Quantity / Face
value Currency Cost Evaluation % of Net
Assets
Fixed rate bonds
Australia
FMG Resources August 2006 Pty Ltd 4.375% 01/04/2031 144A(2) 50,000 USD 50,000 53,492 0.19
50,000 53,492 0.19 Austria
OGX Austria GmbH defaulted 8.375% 01/04/2022 200,000 USD 200,000 20 0.00
OGX Austria GmbH defaulted 8.375% 01/04/2022 144A(2) 400,000 USD 389,748 40 0.00
589,748 60 0.00 Bermuda Islands
Aircastle Ltd 4.250% 15/06/2026 165,000 USD 164,432 179,178 0.62
NCL Corp Ltd 5.875% 15/03/2026 144A(2) 35,000 USD 35,000 36,663 0.13
NCL Finance Ltd 6.125% 15/03/2028 144A(2) 15,000 USD 15,000 15,719 0.05
214,432 231,560 0.80 Canada
1011778 BC ULC/New Red Finance Inc 3.875% 15/01/2028 144A(2) 15,000 USD 14,401 15,188 0.05
1011778 BC ULC/New Red Finance Inc 4.375% 15/01/2028 144A(2) 100,000 USD 98,459 101,375 0.35
Bank of Nova Scotia/The 0.700% 15/04/2024 140,000 USD 139,969 140,158 0.49
Bellatrix Exploration Ltd 8.500% 11/09/2023 168,000 USD 476,605 0 0.00
Bellatrix Exploration Ltd 12.500% 15/12/2023 184,000 USD 0 0 0.00
First Quantum Minerals Ltd 6.875% 15/10/2027 144A(2) 200,000 USD 200,000 217,940 0.76
Open Text Corp 3.875% 15/02/2028 144A(2) 15,000 USD 14,052 15,242 0.05
Toronto-Dominion Bank/The 0.300% 02/06/2023 145,000 USD 144,925 145,043 0.50
1,088,411 634,946 2.20 Cayman Islands
Sprite Ltd 5.750% 15/12/2037 144A(2) 200,448 USD 198,716 176,682 0.61
198,716 176,682 0.61 Liberia
Royal Caribbean Cruises Ltd 4.250% 01/07/2026 144A(2) 5,000 USD 5,000 4,994 0.02
Royal Caribbean Cruises Ltd 5.500% 01/04/2028 144A(2) 65,000 USD 65,000 68,074 0.23
70,000 73,068 0.25 Mexico
Petroleos Mexicanos 6.625% 15/06/2035 150,000 USD 101,686 144,863 0.50
101,686 144,863 0.50 Multinational
American Airlines Inc/AAdvantage Loyalty IP Ltd 5.500% 20/04/2026 144A(2) 15,000 USD 15,000 15,881 0.05
American Airlines Inc/AAdvantage Loyalty IP Ltd 5.750% 20/04/2029 144A(2) 15,000 USD 15,000 16,219 0.06
JBS USA LUX SA/JBS USA Food Co/JBS USA Finance Inc 3.750% 01/12/2031 144A(2) 25,000 USD 25,000 25,581 0.09
55,000 57,681 0.20 Netherlands
Embraer Netherlands Finance BV 5.050% 15/06/2025 35,000 USD 30,387 36,965 0.13
Embraer Netherlands Finance BV 5.400% 01/02/2027 25,000 USD 21,470 26,641 0.09
51,857 63,606 0.22
(2) See Note 13.
136

Natixis International Funds (Lux) I
The accompanying notes form an integral part of these financial statements.
Loomis Sayles Strategic Alpha Bond Fund
Statement of Investments (continued)
As at June 30, 2021 (expressed in USD)
Description Quantity / Face
value Currency Cost Evaluation % of Net
Assets
Norway
Aker BP ASA 4.000% 15/01/2031 144A(2) 150,000 USD 149,125 164,758 0.57
149,125 164,758 0.57 Panama
Carnival Corp 5.750% 01/03/2027 144A(2) 60,000 USD 59,976 62,850 0.22
59,976 62,850 0.22 United States
Accelerated Assets LLC 3.870% 02/12/2033 144A(2) 172,968 USD 172,632 180,485 0.62
Accelerated Assets LLC 4.510% 02/12/2033 144A(2) 104,292 USD 104,273 107,801 0.37
Adams Outdoor Advertising LP 5.653% 15/11/2048 144A(2) 165,000 USD 165,491 171,097 0.59
Allison Transmission Inc 3.750% 30/01/2031 144A(2) 45,000 USD 45,000 44,229 0.15
Alternative Loan Trust 5.500% 25/02/2025 11,182 USD 11,321 11,304 0.04
Alternative Loan Trust 5.500% 25/07/2034 31,460 USD 31,784 32,281 0.11
Alternative Loan Trust 5.500% 25/08/2034 35,478 USD 35,842 36,427 0.13
Alternative Loan Trust 5.750% 25/12/2033 62,455 USD 63,022 64,500 0.22
Alternative Loan Trust 6.000% 25/12/2033 184,491 USD 185,424 191,881 0.66
AMC Networks Inc 4.250% 15/02/2029 30,000 USD 30,000 30,262 0.10
American Homes 4 Rent Trust 6.231% 17/10/2036 144A(2) 235,000 USD 245,023 258,032 0.89
American Homes 4 Rent Trust 6.418% 17/12/2036 144A(2) 100,000 USD 102,574 109,470 0.38
Ares Capital Corp 2.875% 15/06/2028 110,000 USD 109,492 111,652 0.39
Ascentium Equipment Receivables Trust 2.870% 10/08/2022 144A(2) 70,000 USD 69,998 70,502 0.24
Astrazeneca Finance LLC 0.700% 28/05/2024 145,000 USD 144,987 144,718 0.50
Aviation Capital Group LLC 1.950% 30/01/2026 144A(2) 20,000 USD 19,825 20,005 0.07
Aviation Capital Group LLC 5.500% 15/12/2024 144A(2) 45,000 USD 44,664 50,865 0.18
Avis Budget Rental Car Funding AESOP LLC 2.130% 20/08/2027 144A(2) 100,000 USD 99,993 100,081 0.35
Banc of America Alternative Loan Trust 5.500% 25/10/2033 11,929 USD 12,164 12,270 0.04
Banc of America Funding Trust 5.500% 25/11/2034 6,231 USD 6,177 6,198 0.02
Banc of America Funding Trust 5.750% 25/11/2035 12,314 USD 12,413 13,293 0.05
BioMarin Pharmaceutical Inc 0.599% 01/08/2024 30,000 USD 29,532 31,089 0.11
BioMarin Pharmaceutical Inc 1.250% 15/05/2027 175,000 USD 172,374 175,337 0.61
Block Communications Inc 4.875% 01/03/2028 144A(2) 25,000 USD 23,350 25,500 0.09
Boeing Co/The 3.625% 01/03/2048 40,000 USD 35,293 39,967 0.14
Broadcom Inc 4.300% 15/11/2032 130,000 USD 129,851 148,034 0.51
Calpine Corp 3.750% 01/03/2031 144A(2) 100,000 USD 100,000 95,235 0.33
Calpine Corp 4.500% 15/02/2028 144A(2) 25,000 USD 24,769 25,500 0.09
Calpine Corp 5.125% 15/03/2028 144A(2) 35,000 USD 35,350 35,612 0.12
Carvana Co 5.625% 01/10/2025 144A(2) 35,000 USD 35,000 36,388 0.13
Carvana Co 5.875% 01/10/2028 144A(2) 35,000 USD 35,000 36,817 0.13
Catalent Pharma Solutions Inc 3.125% 15/02/2029 144A(2) 15,000 USD 15,000 14,526 0.05
CCO Holdings LLC/CCO Holdings Capital Corp 4.250% 01/02/2031 144A(2) 95,000 USD 96,367 96,824 0.33
CCO Holdings LLC/CCO Holdings Capital Corp 4.500% 15/08/2030 144A(2) 85,000 USD 79,482 88,503 0.31
(2) See Note 13.
137

Natixis International Funds (Lux) I
The accompanying notes form an integral part of these financial statements.
Loomis Sayles Strategic Alpha Bond Fund
Statement of Investments (continued) As at June 30, 2021 (expressed in USD)
Description Quantity / Face
value Currency Cost Evaluation % of Net
Assets
CCO Holdings LLC/CCO Holdings Capital Corp 4.500% 01/05/2032 5,000 USD 4,420 5,181 0.02
CCO Holdings LLC/CCO Holdings Capital Corp 5.375% 01/06/2029 144A(2) 10,000 USD 9,094 10,931 0.04
Charles River Laboratories International Inc 3.750% 15/03/2029 144A(2) 10,000 USD 10,000 10,137 0.03
Charter Communications Operating LLC/Charter Communications Operating Capital 4.400% 01/12/2061 285,000 USD 284,733 306,228 1.06
Cheniere Corpus Christi Holdings LLC 3.700% 15/11/2029 140,000 USD 139,913 152,919 0.53
Clear Channel Worldwide Holdings Inc 5.125% 15/08/2027 144A(2) 75,000 USD 71,313 76,891 0.27
CommScope Inc 7.125% 01/07/2028 144A(2) 110,000 USD 110,243 119,212 0.41
CommScope Technologies LLC 5.000% 15/03/2027 144A(2) 45,000 USD 42,628 46,069 0.16
Continental Resources Inc/OK 5.750% 15/01/2031 144A(2) 60,000 USD 68,892 71,850 0.25
CSC Holdings LLC 4.625% 01/12/2030 144A(2) 200,000 USD 199,549 196,222 0.68
CSFB Mortgage-Backed Pass-Through Certificates 5.750% 25/11/2033 24,193 USD 25,018 25,802 0.09
CSMC OA LLC 4.373% 15/09/2037 144A(2) 625,000 USD 569,707 566,009 1.96
Diamond Resorts Owner Trust 4.530% 21/01/2031 144A(2) 161,408 USD 161,387 166,403 0.58
Diamond Resorts Owner Trust 6.070% 22/10/2029 144A(2) 43,505 USD 43,500 44,373 0.15
DISH DBS Corp 5.125% 01/06/2029 144A(2) 45,000 USD 45,000 44,434 0.15
DISH Network Corp 0.000% 15/12/2025 144A(2) 5,000 USD 5,000 5,822 0.02
DISH Network Corp 2.375% 15/03/2024 110,000 USD 107,377 106,631 0.37
DISH Network Corp 3.375% 15/08/2026 200,000 USD 188,028 204,100 0.71
Domino's Pizza Master Issuer LLC 4.118% 25/07/2047 144A(2) 149,963 USD 160,477 161,816 0.56
EQT Corp 3.125% 15/05/2026 144A(2) 5,000 USD 5,000 5,124 0.02
EQT Corp 3.625% 15/05/2031 144A(2) 10,000 USD 10,000 10,425 0.04
Equinix Inc 1.450% 15/05/2026 140,000 USD 139,803 140,671 0.49
Everi Holdings Inc 5.000% 15/07/2029 144A(2) 5,000 USD 5,000 5,000 0.02
Expedia Group Inc 0.000% 15/02/2026 144A(2) 30,000 USD 30,000 32,400 0.11
Expedia Group Inc 2.950% 15/03/2031 25,000 USD 24,777 25,333 0.09
Expedia Group Inc 3.250% 15/02/2030 170,000 USD 153,536 177,573 0.61
Expedia Group Inc 3.800% 15/02/2028 15,000 USD 15,938 16,314 0.06
First Investors Auto Owner Trust 4.280% 15/01/2025 144A(2) 400,000 USD 399,965 413,173 1.43
Gartner Inc 3.750% 01/10/2030 144A(2) 35,000 USD 35,000 35,809 0.12
GE Capital Funding LLC 4.400% 15/05/2030 200,000 USD 200,000 233,066 0.81
Glencore Funding LLC 2.850% 27/04/2031 144A(2) 120,000 USD 119,868 122,032 0.42
Global Atlantic Finance Co 4.400% 15/10/2029 144A(2) 35,000 USD 36,396 38,624 0.13
Go Daddy Operating Co LLC/GD Finance Co Inc 3.500% 01/03/2029 144A(2) 55,000 USD 55,000 54,642 0.19
Gray Oak Pipeline LLC 3.450% 15/10/2027 144A(2) 10,000 USD 10,000 10,510 0.04
Guardant Health Inc 0.000% 15/11/2027 144A(2) 20,000 USD 20,000 22,762 0.08
Hilton Domestic Operating Co Inc 3.625% 15/02/2032 144A(2) 10,000 USD 10,000 9,875 0.03
(2) See Note 13.
138

Natixis International Funds (Lux) I
The accompanying notes form an integral part of these financial statements.
Loomis Sayles Strategic Alpha Bond Fund
Statement of Investments (continued) As at June 30, 2021 (expressed in USD)
Description Quantity / Face
value Currency Cost Evaluation % of Net
Assets
Hilton Domestic Operating Co Inc 4.000% 01/05/2031 144A(2) 50,000 USD 50,000 50,494 0.17
Hilton Grand Vacations Borrower Escrow LLC/Hilton Grand Vacations Borrower Esc 4.875% 01/07/2031 144A(2) 10,000 USD 10,000 9,974 0.03
Hilton Grand Vacations Borrower Escrow LLC/Hilton Grand Vacations Borrower Esc 5.000% 01/06/2029 144A(2) 30,000 USD 30,000 30,675 0.11
Icahn Enterprises LP/Icahn Enterprises Finance Corp 5.250% 15/05/2027 110,000 USD 96,391 113,574 0.39
Icahn Enterprises LP/Icahn Enterprises Finance Corp 6.250% 15/05/2026 35,000 USD 31,874 37,135 0.13
iHeartCommunications Inc 4.750% 15/01/2028 144A(2) 65,000 USD 65,000 66,869 0.23
iHeartCommunications Inc 5.250% 15/08/2027 144A(2) 70,000 USD 65,649 73,178 0.25
iHeartCommunications Inc 6.375% 01/05/2026 20,000 USD 19,235 21,275 0.07
iHeartCommunications Inc 8.375% 01/05/2027 80,000 USD 74,303 85,700 0.30
Ionis Pharmaceuticals Inc 0.000% 01/04/2026 144A(2) 25,000 USD 25,000 24,492 0.08
Iron Mountain Inc 5.000% 15/07/2028 144A(2) 40,000 USD 40,000 41,518 0.14
Iron Mountain Inc 5.250% 15/07/2030 144A(2) 40,000 USD 40,000 42,343 0.15
JetBlue Airways Corp 0.500% 01/04/2026 144A(2) 20,000 USD 20,000 19,930 0.07
Kraft Heinz Foods Co 4.375% 01/06/2046 35,000 USD 32,502 39,666 0.14
Kraft Heinz Foods Co 4.875% 01/10/2049 130,000 USD 118,620 157,814 0.55
Kraft Heinz Foods Co 5.000% 04/06/2042 20,000 USD 20,449 24,391 0.08
Kraft Heinz Foods Co 5.200% 15/07/2045 45,000 USD 42,044 55,865 0.19
Ladder Capital Finance Holdings LLLP/Ladder Capital Finance Corp 4.250% 01/02/2027 144A(2) 40,000 USD 36,220 39,943 0.14
Ladder Capital Finance Holdings LLLP/Ladder Capital Finance Corp 5.250% 01/10/2025 144A(2) 5,000 USD 4,256 5,087 0.02
Lamar Media Corp 3.750% 15/02/2028 10,000 USD 8,908 10,175 0.03
Lamar Media Corp 4.000% 15/02/2030 20,000 USD 18,079 20,242 0.07
Liberty Media Corp 0.500% 01/12/2050 144A(2) 25,000 USD 25,000 28,874 0.10
Lithia Motors Inc 3.875% 01/06/2029 144A(2) 20,000 USD 20,000 20,715 0.07
Lithia Motors Inc 4.375% 15/01/2031 144A(2) 10,000 USD 10,000 10,711 0.04
Livongo Health Inc 0.875% 01/06/2025 5,000 USD 7,987 7,943 0.03
Marriott International Inc/MD 4.625% 15/06/2030 20,000 USD 19,888 23,034 0.08
Marriott International Inc/MD 5.750% 01/05/2025 25,000 USD 24,999 28,857 0.10
Marriott Ownership Resorts Inc 4.500% 15/06/2029 144A(2) 25,000 USD 25,000 25,344 0.09
Marvell Technology Inc 2.950% 15/04/2031 144A(2) 30,000 USD 29,945 31,091 0.11
MASTR Alternative Loan Trust 5.250% 25/11/2033 6,788 USD 6,890 6,953 0.02
MASTR Alternative Loan Trust 5.500% 25/06/2034 6,691 USD 6,790 6,858 0.02
MASTR Alternative Loan Trust 6.000% 25/06/2034 7,110 USD 7,288 7,335 0.03
MASTR Alternative Loan Trust 6.000% 25/09/2034 120,215 USD 123,908 123,435 0.43
Metropolitan Life Global Funding I 0.550% 07/06/2024 144A(2) 150,000 USD 149,847 149,518 0.52
MGM Growth Properties Operating Partnership LP/MGP Finance Co-Issuer Inc 3.875% 15/02/2029 144A(2) 65,000 USD 65,000 66,012 0.23
Microchip Technology Inc 0.983% 01/09/2024 144A(2) 25,000 USD 25,000 24,879 0.09
Micron Technology Inc 4.663% 15/02/2030 180,000 USD 208,486 209,223 0.72
(2) See Note 13.
139

Natixis International Funds (Lux) I
The accompanying notes form an integral part of these financial statements.
Loomis Sayles Strategic Alpha Bond Fund
Statement of Investments (continued) As at June 30, 2021 (expressed in USD)
Description Quantity / Face
value Currency Cost Evaluation % of Net
Assets
Murphy Oil USA Inc 3.750% 15/02/2031 144A(2) 15,000 USD 15,000 14,827 0.05
Navient Corp 6.750% 15/06/2026 5,000 USD 4,480 5,581 0.02
Netflix Inc 4.875% 15/04/2028 25,000 USD 27,448 29,063 0.10
Netflix Inc 4.875% 15/06/2030 144A(2) 70,000 USD 71,941 83,251 0.29
Netflix Inc 5.375% 15/11/2029 144A(2) 15,000 USD 15,508 18,219 0.06
Netflix Inc 5.875% 15/11/2028 40,000 USD 40,340 49,097 0.17
Netflix Inc 6.375% 15/05/2029 5,000 USD 6,525 6,386 0.02
Neurocrine Biosciences Inc 2.250% 15/05/2024 15,000 USD 19,165 20,054 0.07
Novelis Corp 4.750% 30/01/2030 144A(2) 20,000 USD 20,160 21,000 0.07
NRG Energy Inc 4.450% 15/06/2029 144A(2) 30,000 USD 29,864 33,113 0.11
NRG Energy Inc 5.250% 15/06/2029 144A(2) 30,000 USD 27,478 31,913 0.11
Oaktree Specialty Lending Corp 2.700% 15/01/2027 15,000 USD 14,959 15,006 0.05
Occidental Petroleum Corp 5.550% 15/03/2026 5,000 USD 3,203 5,525 0.02
OneMain Finance Corp 7.125% 15/03/2026 15,000 USD 12,874 17,471 0.06
OneMain Financial Issuance Trust 4.160% 20/11/2028 144A(2) 430,000 USD 429,991 430,434 1.49
Open Text Holdings Inc 4.125% 15/02/2030 144A(2) 15,000 USD 13,562 15,297 0.05
Outfront Media Capital LLC/Outfront Media Capital Corp 4.625% 15/03/2030 144A(2) 35,000 USD 35,000 35,525 0.12
Owl Rock Technology Finance Corp 2.500% 15/01/2027 10,000 USD 9,901 9,873 0.03
Pacific Gas & Electric Co 4.950% 01/07/2050 5,000 USD 5,351 5,143 0.02
Palo Alto Networks Inc 0.375% 01/06/2025 90,000 USD 113,973 122,400 0.42
Peloton Interactive Inc 0.000% 15/02/2026 144A(2) 30,000 USD 29,278 29,006 0.10
Penn National Gaming Inc 4.125% 01/07/2029 144A(2) 20,000 USD 20,000 19,975 0.07
Planet Fitness Master Issuer LLC 4.262% 05/09/2048 144A(2) 150,738 USD 150,398 151,295 0.52
Playtika Holding Corp 4.250% 15/03/2029 144A(2) 15,000 USD 15,000 14,990 0.05
Progress Residential Trust 4.656% 17/08/2035 144A(2) 100,000 USD 100,805 100,557 0.35
Quicken Loans LLC 5.250% 15/01/2028 144A(2) 160,000 USD 152,136 168,000 0.58
Quicken Loans LLC/Quicken Loans Co-Issuer Inc 3.625% 01/03/2029 144A(2) 50,000 USD 49,797 49,375 0.17
Quicken Loans LLC/Quicken Loans Co-Issuer Inc 3.875% 01/03/2031 144A(2) 95,000 USD 95,025 95,712 0.33
Sabine Pass Liquefaction LLC 4.500% 15/05/2030 110,000 USD 109,752 126,946 0.44
Sabre GLBL Inc 9.250% 15/04/2025 144A(2) 5,000 USD 5,000 5,944 0.02
salesforce.com Inc 0.625% 15/07/2024 95,000 USD 94,952 95,039 0.33
SBA Communications Corp 3.125% 01/02/2029 144A(2) 85,000 USD 85,000 81,946 0.28
Scientific Games International Inc 7.000% 15/05/2028 144A(2) 65,000 USD 69,439 70,993 0.25
Scientific Games International Inc 7.250% 15/11/2029 144A(2) 25,000 USD 27,501 28,200 0.10
Sirius XM Radio Inc 5.500% 01/07/2029 144A(2) 5,000 USD 4,558 5,449 0.02
Skyworks Solutions Inc 1.800% 01/06/2026 5,000 USD 4,998 5,063 0.02
Smithfield Foods Inc 3.000% 15/10/2030 144A(2) 10,000 USD 9,892 10,082 0.03
Southwest Airlines Co 1.250% 01/05/2025 30,000 USD 41,879 45,431 0.16
Spirit AeroSystems Inc 4.600% 15/06/2028 10,000 USD 10,208 9,800 0.03
Spirit AeroSystems Inc 7.500% 15/04/2025 144A(2) 75,000 USD 75,167 80,063 0.28
Splunk Inc 1.125% 15/06/2027 10,000 USD 9,617 9,744 0.03
Square Inc 3.500% 01/06/2031 144A(2) 30,000 USD 30,000 30,263 0.10
(2) See Note 13.
140

Natixis International Funds (Lux) I
The accompanying notes form an integral part of these financial statements.
Loomis Sayles Strategic Alpha Bond Fund
Statement of Investments (continued) As at June 30, 2021 (expressed in USD)
Description Quantity / Face
value Currency Cost Evaluation % of Net
Assets
Targa Resources Partners LP/Targa Resources Partners Finance Corp 4.000% 15/01/2032 144A(2) 15,000 USD 15,000 15,430 0.05
Tenet Healthcare Corp 6.125% 01/10/2028 144A(2) 15,000 USD 14,695 15,985 0.06
T-Mobile USA Inc 3.375% 15/04/2029 150,000 USD 150,000 154,799 0.54
T-Mobile USA Inc 3.500% 15/04/2031 75,000 USD 75,000 77,591 0.27
Travel + Leisure Co 4.625% 01/03/2030 144A(2) 30,000 USD 31,137 30,921 0.11
Travel + Leisure Co 6.000% 01/04/2027 5,000 USD 5,551 5,493 0.02
Travel + Leisure Co 6.625% 31/07/2026 144A(2) 25,000 USD 25,615 28,325 0.10
TriNet Group Inc 3.500% 01/03/2029 144A(2) 50,000 USD 50,000 49,300 0.17
Twitter Inc 0.000% 15/03/2026 144A(2) 45,000 USD 45,000 42,919 0.15
Uber Technologies Inc 0.000% 15/12/2025 144A(2) 40,000 USD 40,000 40,560 0.14
Uber Technologies Inc 7.500% 15/09/2027 144A(2) 160,000 USD 166,915 175,837 0.61
Uber Technologies Inc 8.000% 01/11/2026 144A(2) 155,000 USD 143,140 167,013 0.58
United Airlines Inc 4.375% 15/04/2026 144A(2) 10,000 USD 10,000 10,352 0.04
United Airlines Inc 4.625% 15/04/2029 144A(2) 15,000 USD 15,000 15,525 0.05
Viatris Inc 4.000% 22/06/2050 144A(2) 35,000 USD 34,913 37,014 0.13
Vistra Operations Co LLC 3.700% 30/01/2027 144A(2) 170,000 USD 169,509 181,630 0.63
WAVE Trust 3.844% 15/11/2042 144A(2) 313,094 USD 310,211 306,872 1.06
Wendy's Funding LLC 3.884% 15/03/2048 144A(2) 139,925 USD 149,450 148,803 0.51
WFRBS Commercial Mortgage Trust 4.378% 15/05/2047 100,000 USD 105,294 104,954 0.36
Yum! Brands Inc 4.750% 15/01/2030 144A(2) 50,000 USD 45,857 54,126 0.19
11,353,999 11,898,670 41.16
Total - Fixed rate bonds 13,982,950 13,562,236 46.92
Variable rate bonds
Bermuda Islands
Aircastle Ltd 5.250% Perpetual 144A(2) 20,000 USD 20,000 20,200 0.07
20,000 20,200 0.07 Cayman Islands
KKR CLO Ltd 8.038% 20/10/2031 144A(2) 250,000 USD 220,137 231,027 0.80
Madison Park Funding XXVI Ltd 3.177% 29/07/2030 144A(2) 250,000 USD 242,930 247,180 0.86
OCP CLO Ltd 5.140% 18/10/2028 144A(2) 250,000 USD 224,296 247,109 0.85
687,363 725,316 2.51 Spain
Banco Santander SA 0.701% 30/06/2024 200,000 USD 200,000 200,399 0.69
200,000 200,399 0.69 United States
Air Lease Corp 4.650% Perpetual 45,000 USD 44,881 46,631 0.16
Ally Financial Inc 4.700% Perpetual 115,000 USD 115,000 118,075 0.41
Bank of America Corp 0.523% 14/06/2024 145,000 USD 145,000 144,970 0.50
Citigroup Mortgage Loan Trust 4.000% 25/01/2068 144A(2) 183,645 USD 182,435 183,813 0.64
DSLA Mortgage Loan Trust 0.423% 19/09/2045 141,445 USD 108,338 106,830 0.37
Edison International 5.375% Perpetual 115,000 USD 115,000 115,839 0.40
General Motors Financial Co Inc 5.700% Perpetual 10,000 USD 11,316 11,200 0.04
General Motors Financial Co Inc 5.750% Perpetual 30,000 USD 31,840 32,652 0.11
General Motors Financial Co Inc 6.500% Perpetual 30,000 USD 33,180 33,600 0.12
Goldman Sachs Group Inc/The 0.657% 10/09/2024 145,000 USD 145,000 144,742 0.50
(2) See Note 13.
141

Natixis International Funds (Lux) I
The accompanying notes form an integral part of these financial statements.
Loomis Sayles Strategic Alpha Bond Fund
Statement of Investments (continued) As at June 30, 2021 (expressed in USD)
Description Quantity / Face
value Currency Cost Evaluation % of Net
Assets
IndyMac INDX Mortgage Loan Trust 0.512% 25/02/2046 375,964 USD 311,908 301,175 1.04
IndyMac INDX Mortgage Loan Trust 2.986% 25/08/2035 179,083 USD 161,135 164,420 0.57
Invitation Homes Trust 1.732% 17/01/2038 144A(2) 219,764 USD 219,764 220,175 0.76
JPMorgan Chase & Co 1.578% 22/04/2027 55,000 USD 55,000 55,285 0.19
KeyBank NA/Cleveland OH 0.433% 14/06/2024 250,000 USD 250,000 250,189 0.87
Lehman XS Trust 0.612% 25/02/2046 63,214 USD 49,315 58,126 0.20
Morgan Stanley Capital I Trust 5.420% 15/06/2044
144A(2) 445,000 USD 445,000 338,114 1.17
Motel 6 Trust 7.000% 15/08/2024 144A(2) 244,224 USD 244,224 236,129 0.82
SLM Private Credit Student Loan Trust 0.000% 15/06/2032 85,000 USD 84,965 84,982 0.29
SLM Private Credit Student Loan Trust 0.000% 15/03/2033 490,000 USD 489,784 489,811 1.70
Starwood Retail Property Trust 2.823% 15/11/2027 144A(2) 165,000 USD 164,120 77,956 0.27
Starwood Retail Property Trust 4.473% 15/11/2027 144A(2) 620,000 USD 609,494 59,118 0.21
Structured Adjustable Rate Mortgage Loan Trust 0.402% 25/07/2035 424,433 USD 344,995 313,451 1.08
Towd Point Mortgage Trust 3.250% 25/07/2058 144A(2) 100,000 USD 104,928 104,331 0.36
UBS-Barclays Commercial Mortgage Trust 5.044% 10/05/2063 144A(2) 235,000 USD 217,633 35,250 0.12
WFRBS Commercial Mortgage Trust 4.957% 15/06/2045 80,000 USD 80,242 61,671 0.21
WFRBS Commercial Mortgage Trust 4.957% 15/06/2045 144A(2) 185,000 USD 154,676 75,467 0.26
WFRBS Commercial Mortgage Trust 5.520% 15/03/2044 144A(2) 290,533 USD 290,533 141,548 0.49
WFRBS Commercial Mortgage Trust 5.850% 15/04/2045 144A(2) 325,000 USD 325,633 330,033 1.14
5,535,339 4,335,583 15.00
Total - Variable rate bonds 6,442,702 5,281,498 18.27
Total - Transferable securities dealt in on another regulated market 20,551,103 18,984,498 65.68
Other transferable securities Variable rate bonds
Cayman Islands
ArrowMark Colorado Holdings 2.884% 15/07/2029 144A(2) 250,000 USD 234,285 249,459 0.86
234,285 249,459 0.86
Total - Variable rate bonds 234,285 249,459 0.86
Treasury Bills
United States
United States Treasury Bill 0.000% 15/07/2021 300,000 USD 299,991 299,991 1.04
United States Treasury Bill 0.000% 07/10/2021 310,000 USD 309,921 309,958 1.07
United States Treasury Bill 0.000% 04/11/2021 150,000 USD 149,938 149,972 0.52
(2) See Note 13.
142

Natixis International Funds (Lux) I
The accompanying notes form an integral part of these financial statements.
Loomis Sayles Strategic Alpha Bond Fund Statement of Investments (continued) As at June 30, 2021 (expressed in USD)
Description Quantity / Face
value Currency Cost Evaluation % of Net
Assets
United States Treasury Bill 0.000% 16/06/2022 290,000 USD 289,800 289,788 1.00
1,049,650 1,049,709 3.63
Total - Treasury Bills 1,049,650 1,049,709 3.63
Total - Other transferable securities 1,283,935 1,299,168 4.49
TOTAL INVESTMENT PORTFOLIO 32,848,391 27,751,731 96.01
A detailed schedule of portfolio movements for the period from January 1, 2021 to June 30, 2021 is available free of charge upon request at the registered office of the SICAV.
143

Natixis International Funds (Lux) I
Loomis Sayles U.S. Core Plus Bond Fund
Statistics
As at June 30, 2021
Net asset value per share
H-R/A (EUR) 99.37
I/A (USD) 125.78
I/D (USD) 108.56
N/D (USD) 100.21
N1/A (USD) 100.85
R/A (USD) 121.57
R/D (USD) 108.24
RE/A (USD) 119.73
RE/D (USD) 105.72
S1/A (USD) 129.45
Number of shares outstanding
H-R/A (EUR) 4,229.000
I/A (USD) 906,110.373
I/D (USD) 115,852.731
N/D (USD) 1,291.125
N1/A (USD) 18,045.908
R/A (USD) 349,537.662
R/D (USD) 70,894.189
RE/A (USD) 525.172
RE/D (USD) 990.099
S1/A (USD) 51,376.392
144

Natixis International Funds (Lux) I
The accompanying notes form an integral part of these financial statements.
Loomis Sayles U.S. Core Plus Bond Fund Statement of Investments
As at June 30, 2021 (expressed in USD)
Description Face value Currency Cost Evaluation % of Net
Assets
Transferable securities admitted to an official stock exchange listing Fixed rate bonds
Argentina
Pan American Energy LLC/Argentina 9.125% 30/04/2027 144A(2) 185,000 USD 185,000 203,594 0.11
185,000 203,594 0.11 Austria
Klabin Austria GmbH 7.000% 03/04/2049 144A(2) 200,000 USD 200,635 254,500 0.14
Suzano Austria GmbH 3.750% 15/01/2031 185,000 USD 191,874 194,019 0.10
392,509 448,519 0.24 Bermuda Islands
Ooredoo International Finance Ltd 2.625% 08/04/2031 144A(2) 310,000 USD 306,735 313,633 0.17
Ooredoo International Finance Ltd 3.250% 21/02/2023 144A(2) 200,000 USD 199,061 208,330 0.11
505,796 521,963 0.28 Brazil
BRF SA 5.750% 21/09/2050 144A(2) 405,000 USD 398,063 416,717 0.23
398,063 416,717 0.23 Cayman Islands
Alibaba Group Holding Ltd 3.250% 09/02/2061 370,000 USD 369,920 358,231 0.19
CK Hutchison International 20 Ltd 2.500% 08/05/2030 144A(2) 200,000 USD 199,203 204,296 0.11
SA Global Sukuk Ltd 0.946% 17/06/2024 144A(2) 200,000 USD 200,000 199,744 0.11
Vale Overseas Ltd 3.750% 08/07/2030 235,000 USD 239,016 250,204 0.14
1,008,139 1,012,475 0.55 Chile
Enel Americas SA 4.000% 25/10/2026 20,000 USD 19,827 21,780 0.01
Falabella SA 3.750% 30/04/2023 144A(2) 200,000 USD 199,148 208,140 0.11
218,975 229,920 0.12 Colombia
Colombia Government International Bond 4.125% 15/05/2051 400,000 USD 399,183 378,936 0.20
399,183 378,936 0.20 Dominican Republic
Dominican Republic International Bond 4.875% 23/09/2032 144A(2) 565,000 USD 575,265 581,950 0.31
Dominican Republic International Bond 5.300% 21/01/2041 144A(2) 280,000 USD 280,000 279,303 0.15
855,265 861,253 0.46 Egypt
Egypt Government International Bond 5.875% 16/02/2031 144A(2) 385,000 USD 385,000 373,835 0.20
385,000 373,835 0.20 Germany
Deutsche Bank AG/New York NY 1.686%
19/03/2026 220,000 USD 220,000 222,087 0.12
220,000 222,087 0.12 Great Britain
Anglo American Capital PLC 2.625% 10/09/2030 144A(2) 200,000 USD 200,080 200,756 0.11
(2) See Note 13.
145

Natixis International Funds (Lux) I
The accompanying notes form an integral part of these financial statements.
Loomis Sayles U.S. Core Plus Bond Fund Statement of Investments (continued) As at June 30, 2021 (expressed in USD)
Description Face value Currency Cost Evaluation % of Net
Assets
Anglo American Capital PLC 5.625% 01/04/2030 144A(2) 200,000 USD 199,009 244,705 0.13
Barclays PLC 3.200% 10/08/2021 600,000 USD 600,210 601,859 0.32
Lloyds Banking Group PLC 3.000% 11/01/2022 200,000 USD 200,769 202,916 0.11
Santander UK Group Holdings PLC 5.625% 15/09/2045 144A(2) 200,000 USD 255,201 258,841 0.14
1,455,269 1,509,077 0.81
Indonesia
Indonesia Government International Bond 3.700% 08/01/2022 144A(2) 200,000 USD 200,203 203,406 0.11
200,203 203,406 0.11 Ireland
AerCap Ireland Capital DAC/AerCap Global Aviation Trust 3.300% 23/01/2023 300,000 USD 299,943 311,146 0.17
299,943 311,146 0.17 Israel
Energean Israel Finance Ltd 4.500% 30/03/2024 144A(2) 315,000 USD 315,000 321,985 0.17
Leviathan Bond Ltd 6.125% 30/06/2025 144A(2) 165,000 USD 165,000 181,140 0.10
480,000 503,125 0.27 Japan
Sumitomo Mitsui Financial Group Inc 1.474% 08/07/2025 255,000 USD 255,000 257,506 0.14
Sumitomo Mitsui Financial Group Inc 2.696% 16/07/2024 200,000 USD 202,981 211,425 0.11
Sumitomo Mitsui Financial Group Inc 3.040% 16/07/2029 400,000 USD 419,517 429,276 0.23
Toyota Motor Corp 2.358% 02/07/2024 125,000 USD 125,351 131,670 0.07
1,002,849 1,029,877 0.55 Kenya
Kenya Government International Bond 6.300% 23/01/2034 144A(2) 200,000 USD 199,982 200,299 0.11
199,982 200,299 0.11 Mexico
America Movil SAB de CV 2.875% 07/05/2030 425,000 USD 439,925 447,948 0.24
El Puerto de Liverpool SAB de CV 3.875% 06/10/2026 144A(2) 600,000 USD 610,271 643,506 0.35
Fomento Economico Mexicano SAB de CV 3.500%
16/01/2050 684,000 USD 712,774 719,404 0.39
Mexican Bonos 5.750% 05/03/2026 15,778,000 MXN 775,340 770,448 0.41
Mexican Bonos 8.500% 31/05/2029 58,221,500 MXN 3,250,449 3,216,869 1.73
Mexico Government International Bond 3.771% 24/05/2061 410,000 USD 410,000 382,044 0.20
Orbia Advance Corp SAB de CV 5.875% 17/09/2044 144A(2) 400,000 USD 415,373 485,004 0.26
6,614,132 6,665,223 3.58 Morocco
Morocco Government International Bond 4.000% 15/12/2050 144A(2) 400,000 USD 400,890 370,000 0.20
OCP SA 3.750% 23/06/2031 144A(2) 200,000 USD 198,733 201,900 0.11
OCP SA 5.625% 25/04/2024 144A(2) 400,000 USD 418,880 439,240 0.23
1,018,503 1,011,140 0.54 Netherlands
Prosus NV 3.832% 08/02/2051 144A(2) 355,000 USD 354,971 330,357 0.18
(2) See Note 13.
146
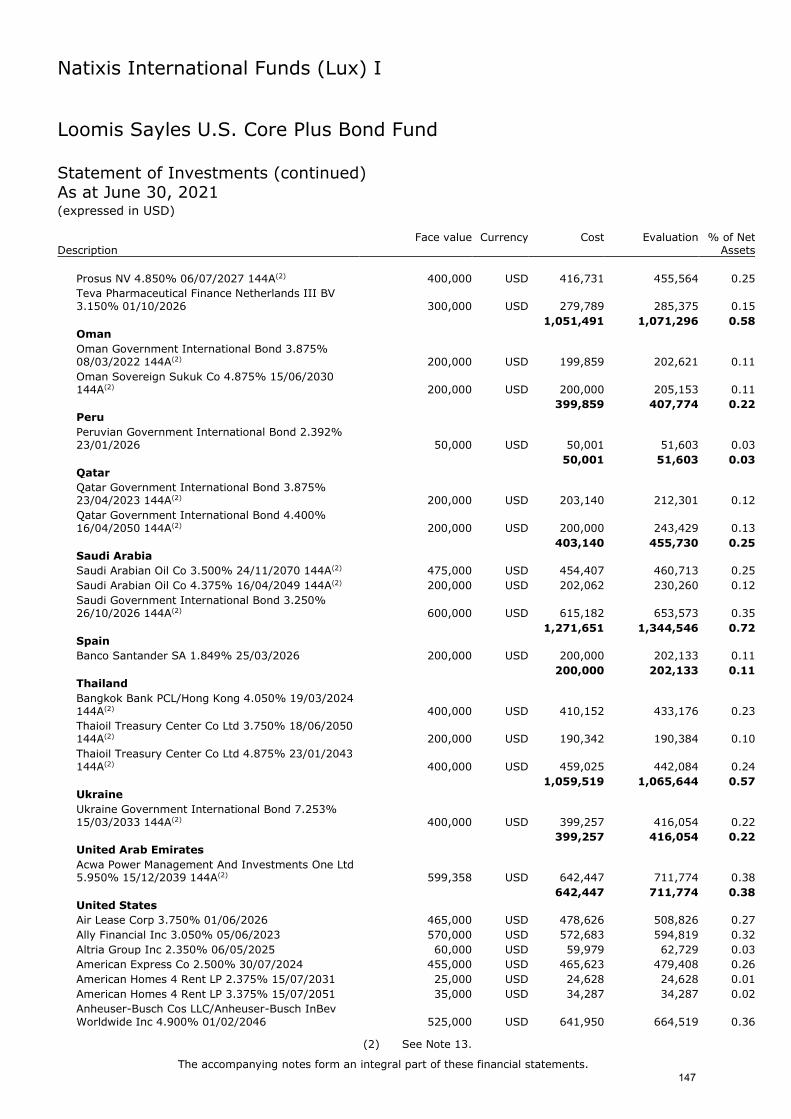
Natixis International Funds (Lux) I
The accompanying notes form an integral part of these financial statements.
Loomis Sayles U.S. Core Plus Bond Fund Statement of Investments (continued) As at June 30, 2021 (expressed in USD)
Description Face value Currency Cost Evaluation % of Net
Assets
Prosus NV 4.850% 06/07/2027 144A(2) 400,000 USD 416,731 455,564 0.25
Teva Pharmaceutical Finance Netherlands III BV 3.150% 01/10/2026 300,000 USD 279,789 285,375 0.15
1,051,491 1,071,296 0.58 Oman
Oman Government International Bond 3.875% 08/03/2022 144A(2) 200,000 USD 199,859 202,621 0.11
Oman Sovereign Sukuk Co 4.875% 15/06/2030 144A(2) 200,000 USD 200,000 205,153 0.11
399,859 407,774 0.22 Peru
Peruvian Government International Bond 2.392% 23/01/2026 50,000 USD 50,001 51,603 0.03
50,001 51,603 0.03 Qatar
Qatar Government International Bond 3.875% 23/04/2023 144A(2) 200,000 USD 203,140 212,301 0.12
Qatar Government International Bond 4.400% 16/04/2050 144A(2) 200,000 USD 200,000 243,429 0.13
403,140 455,730 0.25 Saudi Arabia
Saudi Arabian Oil Co 3.500% 24/11/2070 144A(2) 475,000 USD 454,407 460,713 0.25
Saudi Arabian Oil Co 4.375% 16/04/2049 144A(2) 200,000 USD 202,062 230,260 0.12
Saudi Government International Bond 3.250% 26/10/2026 144A(2) 600,000 USD 615,182 653,573 0.35
1,271,651 1,344,546 0.72 Spain
Banco Santander SA 1.849% 25/03/2026 200,000 USD 200,000 202,133 0.11
200,000 202,133 0.11 Thailand
Bangkok Bank PCL/Hong Kong 4.050% 19/03/2024 144A(2) 400,000 USD 410,152 433,176 0.23
Thaioil Treasury Center Co Ltd 3.750% 18/06/2050 144A(2) 200,000 USD 190,342 190,384 0.10
Thaioil Treasury Center Co Ltd 4.875% 23/01/2043 144A(2) 400,000 USD 459,025 442,084 0.24
1,059,519 1,065,644 0.57 Ukraine
Ukraine Government International Bond 7.253% 15/03/2033 144A(2) 400,000 USD 399,257 416,054 0.22
399,257 416,054 0.22 United Arab Emirates
Acwa Power Management And Investments One Ltd 5.950% 15/12/2039 144A(2) 599,358 USD 642,447 711,774 0.38
642,447 711,774 0.38 United States
Air Lease Corp 3.750% 01/06/2026 465,000 USD 478,626 508,826 0.27
Ally Financial Inc 3.050% 05/06/2023 570,000 USD 572,683 594,819 0.32
Altria Group Inc 2.350% 06/05/2025 60,000 USD 59,979 62,729 0.03
American Express Co 2.500% 30/07/2024 455,000 USD 465,623 479,408 0.26
American Homes 4 Rent LP 2.375% 15/07/2031 25,000 USD 24,628 24,628 0.01
American Homes 4 Rent LP 3.375% 15/07/2051 35,000 USD 34,287 34,287 0.02
Anheuser-Busch Cos LLC/Anheuser-Busch InBev
Worldwide Inc 4.900% 01/02/2046 525,000 USD 641,950 664,519 0.36
(2) See Note 13.
147

Natixis International Funds (Lux) I
The accompanying notes form an integral part of these financial statements.
Loomis Sayles U.S. Core Plus Bond Fund Statement of Investments (continued) As at June 30, 2021 (expressed in USD)
Description Face value Currency Cost Evaluation % of Net
Assets
Anheuser-Busch InBev Worldwide Inc 4.350% 01/06/2040 230,000 USD 232,099 273,755 0.15
Anheuser-Busch InBev Worldwide Inc 4.600% 01/06/2060SS 295,000 USD 327,789 363,136 0.19
AT&T Inc 1.700% 25/03/2026 580,000 USD 579,084 586,129 0.31
AT&T Inc 3.650% 01/06/2051 150,000 USD 151,183 155,723 0.08
Atmos Energy Corp 0.625% 09/03/2023 325,000 USD 324,989 325,100 0.17
BAT Capital Corp 2.789% 06/09/2024 840,000 USD 856,637 882,390 0.47
BOC Aviation USA Corp 1.625% 29/04/2024 144A(2) 455,000 USD 454,650 458,580 0.25
Boeing Co/The 1.433% 04/02/2024 495,000 USD 495,000 496,310 0.27
Boeing Co/The 5.705% 01/05/2040 385,000 USD 405,192 495,835 0.27
Boeing Co/The 5.805% 01/05/2050 460,000 USD 504,735 619,450 0.33
Brixmor Operating Partnership LP 4.050% 01/07/2030 35,000 USD 34,929 39,160 0.02
Caterpillar Financial Services Corp 2.150% 08/11/2024 105,000 USD 105,570 110,090 0.06
Centene Corp 2.500% 01/03/2031 350,000 USD 350,000 345,187 0.19
Citigroup Inc 4.000% 05/08/2024 360,000 USD 381,577 392,107 0.21
CNH Industrial Capital LLC 1.950% 02/07/2023 105,000 USD 104,558 107,637 0.06
Corning Inc 5.450% 15/11/2079 385,000 USD 435,849 539,017 0.29
Crown Castle International Corp 4.150% 01/07/2050 15,000 USD 14,841 17,120 0.01
CVS Health Corp 5.050% 25/03/2048 375,000 USD 437,284 487,078 0.26
Dana Inc 4.250% 01/09/2030 155,000 USD 155,000 159,456 0.09
DPL Inc 4.125% 01/07/2025 65,000 USD 65,000 69,712 0.04
DXC Technology Co 4.125% 15/04/2025 230,000 USD 243,528 252,780 0.14
Edison International 4.950% 15/04/2025 15,000 USD 14,974 16,607 0.01
Energy Transfer LP 5.400% 01/10/2047 335,000 USD 347,951 396,890 0.21
Energy Transfer LP 6.500% 01/02/2042 95,000 USD 104,603 123,341 0.07
Energy Transfer LP/Regency Energy Finance Corp 5.000% 01/10/2022 100,000 USD 103,274 104,246 0.06
Energy Transfer LP/Regency Energy Finance Corp 5.875% 01/03/2022 270,000 USD 272,992 275,776 0.15
Entergy Corp 2.800% 15/06/2030 150,000 USD 151,940 156,113 0.08
EQM Midstream Partners LP 4.750% 15/07/2023 20,000 USD 20,945 20,875 0.01
EQT Corp 5.000% 15/01/2029 30,000 USD 30,000 33,449 0.02
Equifax Inc 2.600% 15/12/2025 55,000 USD 54,951 57,883 0.03
Expedia Group Inc 3.600% 15/12/2023 135,000 USD 134,924 143,473 0.08
Federal National Mortgage Association 6.625% 15/11/2030 475,000 USD 620,045 687,234 0.37
Ford Motor Credit Co LLC 2.900% 16/02/2028 385,000 USD 385,000 383,175 0.21
Ford Motor Credit Co LLC 4.250% 20/09/2022 200,000 USD 205,198 206,514 0.11
Freeport-McMoRan Inc 3.875% 15/03/2023 80,000 USD 79,412 83,413 0.04
FS KKR Capital Corp 3.400% 15/01/2026 450,000 USD 445,889 465,308 0.25
GATX Corp 4.000% 30/06/2030 110,000 USD 116,817 123,971 0.07
General Electric Co 4.250% 01/05/2040 330,000 USD 331,787 385,638 0.21
General Electric Co 4.350% 01/05/2050 90,000 USD 95,358 108,836 0.06
General Motors Co 5.000% 01/04/2035 470,000 USD 494,987 567,699 0.30
Goldman Sachs Group Inc/The 3.625% 22/01/2023 450,000 USD 456,665 472,414 0.25
Goldman Sachs Group Inc/The 6.750% 01/10/2037 330,000 USD 445,030 480,537 0.26
HCL America Inc 1.375% 10/03/2026 144A(2) 385,000 USD 383,230 381,960 0.21
Hewlett Packard Enterprise Co 4.450% 02/10/2023 190,000 USD 193,842 205,475 0.11
(2) See Note 13.
148

Natixis International Funds (Lux) I
The accompanying notes form an integral part of these financial statements.
Loomis Sayles U.S. Core Plus Bond Fund Statement of Investments (continued) As at June 30, 2021 (expressed in USD)
Description Face value Currency Cost Evaluation % of Net
Assets
Hewlett Packard Enterprise Co 6.200% 15/10/2035 365,000 USD 423,309 495,039 0.27
International Lease Finance Corp 5.875% 15/08/2022 105,000 USD 107,655 111,114 0.06
iStar Inc 4.250% 01/08/2025 365,000 USD 362,605 375,494 0.20
iStar Inc 4.750% 01/10/2024 20,000 USD 20,261 21,050 0.01
Jabil Inc 3.000% 15/01/2031 150,000 USD 150,919 154,402 0.08
John Deere Capital Corp 2.600% 07/03/2024 70,000 USD 70,848 73,790 0.04
JPMorgan Chase & Co 3.200% 25/01/2023 245,000 USD 246,958 255,917 0.14
Kinder Morgan Energy Partners LP 4.150% 01/02/2024 720,000 USD 750,932 777,434 0.42
Lear Corp 5.250% 15/05/2049 385,000 USD 418,236 485,665 0.26
Lennar Corp 4.500% 30/04/2024 5,000 USD 4,922 5,469 0.00
Lennar Corp 4.750% 15/11/2022 20,000 USD 19,817 20,925 0.01
Mohawk Industries Inc 3.625% 15/05/2030 420,000 USD 428,160 461,262 0.25
Morgan Stanley 3.700% 23/10/2024 445,000 USD 466,615 485,495 0.26
Morgan Stanley 3.875% 29/04/2024 130,000 USD 141,426 141,391 0.08
Morgan Stanley 5.500% 28/07/2021 215,000 USD 215,434 215,824 0.12
Navient Corp 5.000% 15/03/2027 460,000 USD 447,999 475,985 0.26
NVR Inc 3.000% 15/05/2030 270,000 USD 278,358 286,258 0.15
Occidental Petroleum Corp 5.875% 01/09/2025 385,000 USD 398,627 428,312 0.23
Occidental Petroleum Corp 8.000% 15/07/2025 50,000 USD 56,412 59,875 0.03
OneMain Finance Corp 5.375% 15/11/2029 125,000 USD 125,000 135,967 0.07
ONEOK Inc 5.850% 15/01/2026 65,000 USD 67,879 76,847 0.04
Oracle Corp 4.100% 25/03/2061 365,000 USD 364,289 404,673 0.22
Owens Corning 4.200% 01/12/2024 190,000 USD 198,119 208,156 0.11
Owl Rock Capital Corp 2.625% 15/01/2027 95,000 USD 94,344 95,245 0.05
Owl Rock Capital Corp 3.400% 15/07/2026 350,000 USD 348,408 364,780 0.20
PG&E Corp 5.000% 01/07/2028 290,000 USD 306,266 293,225 0.16
PG&E Corp 5.250% 01/07/2030 165,000 USD 174,258 166,567 0.09
Range Resources Corp 4.875% 15/05/2025 165,000 USD 151,469 170,775 0.09
Range Resources Corp 5.000% 15/03/2023 19,000 USD 18,751 19,665 0.01
Ryder System Inc 2.500% 01/09/2024 235,000 USD 238,987 245,975 0.13
Southwest Airlines Co 5.125% 15/06/2027 360,000 USD 384,485 423,530 0.23
Tennessee Valley Authority 4.250% 15/09/2065 1,240,000 USD 1,696,842 1,739,256 0.93
Tennessee Valley Authority 4.625% 15/09/2060 235,000 USD 328,449 345,430 0.19
T-Mobile USA Inc 3.875% 15/04/2030 480,000 USD 500,342 536,554 0.29
Toyota Motor Credit Corp 1.800% 13/02/2025 325,000 USD 328,236 335,523 0.18
U.S. Treasury Bond 1.125% 15/05/2040 30,000 USD 28,985 25,898 0.01
U.S. Treasury Bond 1.875% 15/02/2041 30,000 USD 28,887 29,367 0.02
U.S. Treasury Bond 2.375% 15/05/2051 1,045,000 USD 1,079,856 1,115,701 0.60
U.S. Treasury Note 0.125% 15/09/2023 5,240,000 USD 5,219,858 5,220,759 2.81
U.S. Treasury Note 0.375% 31/03/2022 2,835,000 USD 2,840,923 2,841,201 1.53
U.S. Treasury Note 0.500% 15/03/2023 350,000 USD 350,233 351,777 0.19
U.S. Treasury Note 0.750% 31/05/2026 495,000 USD 494,694 492,177 0.26
U.S. Treasury Note 0.875% 30/06/2026 2,400,000 USD 2,396,607 2,398,875 1.29
U.S. Treasury Note 1.625% 31/10/2023 3,775,000 USD 3,888,817 3,889,725 2.09
U.S. Treasury Note 1.625% 15/05/2031 410,000 USD 414,505 416,278 0.22
U.S. Treasury Note 1.750% 30/06/2024 205,000 USD 206,184 212,896 0.11
U.S. Treasury Note 1.750% 31/12/2024 155,000 USD 156,214 161,297 0.09
Welltower Inc 2.750% 15/01/2031 155,000 USD 157,045 159,725 0.09
Whirlpool Corp 3.700% 01/03/2023 70,000 USD 70,696 73,636 0.04
149
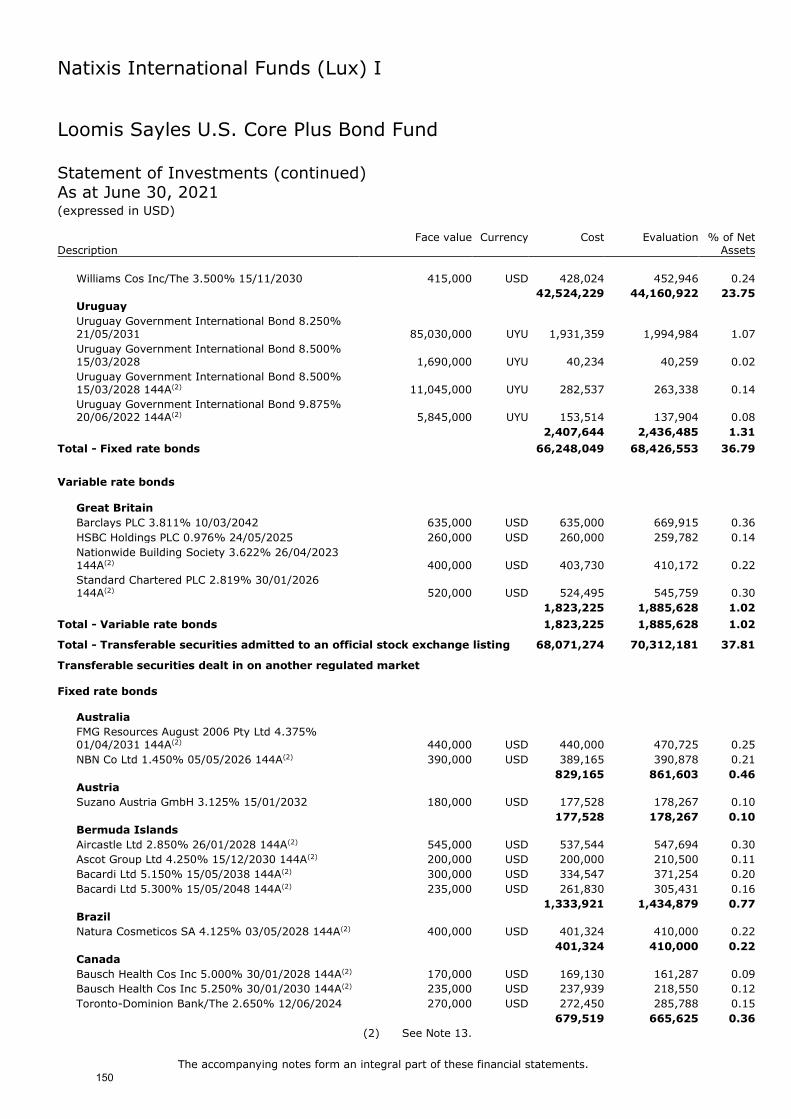
Natixis International Funds (Lux) I
The accompanying notes form an integral part of these financial statements.
Loomis Sayles U.S. Core Plus Bond Fund Statement of Investments (continued) As at June 30, 2021 (expressed in USD)
Description Face value Currency Cost Evaluation % of Net
Assets
Williams Cos Inc/The 3.500% 15/11/2030 415,000 USD 428,024 452,946 0.24
42,524,229 44,160,922 23.75 Uruguay
Uruguay Government International Bond 8.250% 21/05/2031 85,030,000 UYU 1,931,359 1,994,984 1.07
Uruguay Government International Bond 8.500% 15/03/2028 1,690,000 UYU 40,234 40,259 0.02
Uruguay Government International Bond 8.500% 15/03/2028 144A(2) 11,045,000 UYU 282,537 263,338 0.14
Uruguay Government International Bond 9.875% 20/06/2022 144A(2) 5,845,000 UYU 153,514 137,904 0.08
2,407,644 2,436,485 1.31
Total - Fixed rate bonds 66,248,049 68,426,553 36.79
Variable rate bonds
Great Britain
Barclays PLC 3.811% 10/03/2042 635,000 USD 635,000 669,915 0.36
HSBC Holdings PLC 0.976% 24/05/2025 260,000 USD 260,000 259,782 0.14
Nationwide Building Society 3.622% 26/04/2023 144A(2) 400,000 USD 403,730 410,172 0.22
Standard Chartered PLC 2.819% 30/01/2026 144A(2) 520,000 USD 524,495 545,759 0.30
1,823,225 1,885,628 1.02
Total - Variable rate bonds 1,823,225 1,885,628 1.02
Total - Transferable securities admitted to an official stock exchange listing 68,071,274 70,312,181 37.81
Transferable securities dealt in on another regulated market Fixed rate bonds
Australia
FMG Resources August 2006 Pty Ltd 4.375% 01/04/2031 144A(2) 440,000 USD 440,000 470,725 0.25
NBN Co Ltd 1.450% 05/05/2026 144A(2) 390,000 USD 389,165 390,878 0.21
829,165 861,603 0.46 Austria
Suzano Austria GmbH 3.125% 15/01/2032 180,000 USD 177,528 178,267 0.10
177,528 178,267 0.10 Bermuda Islands
Aircastle Ltd 2.850% 26/01/2028 144A(2) 545,000 USD 537,544 547,694 0.30
Ascot Group Ltd 4.250% 15/12/2030 144A(2) 200,000 USD 200,000 210,500 0.11
Bacardi Ltd 5.150% 15/05/2038 144A(2) 300,000 USD 334,547 371,254 0.20
Bacardi Ltd 5.300% 15/05/2048 144A(2) 235,000 USD 261,830 305,431 0.16
1,333,921 1,434,879 0.77 Brazil
Natura Cosmeticos SA 4.125% 03/05/2028 144A(2) 400,000 USD 401,324 410,000 0.22
401,324 410,000 0.22 Canada
Bausch Health Cos Inc 5.000% 30/01/2028 144A(2) 170,000 USD 169,130 161,287 0.09
Bausch Health Cos Inc 5.250% 30/01/2030 144A(2) 235,000 USD 237,939 218,550 0.12
Toronto-Dominion Bank/The 2.650% 12/06/2024 270,000 USD 272,450 285,788 0.15
679,519 665,625 0.36
(2) See Note 13.
150
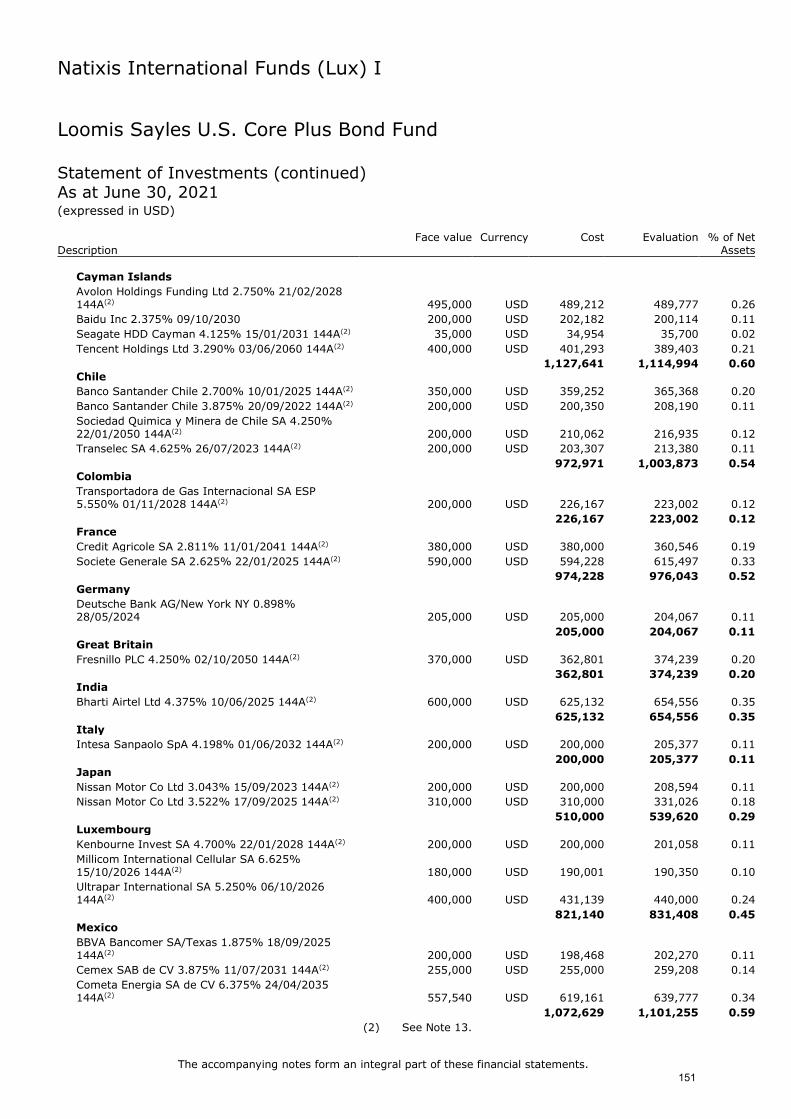
Natixis International Funds (Lux) I
The accompanying notes form an integral part of these financial statements.
Loomis Sayles U.S. Core Plus Bond Fund Statement of Investments (continued) As at June 30, 2021 (expressed in USD)
Description Face value Currency Cost Evaluation % of Net
Assets
Cayman Islands
Avolon Holdings Funding Ltd 2.750% 21/02/2028 144A(2) 495,000 USD 489,212 489,777 0.26
Baidu Inc 2.375% 09/10/2030 200,000 USD 202,182 200,114 0.11
Seagate HDD Cayman 4.125% 15/01/2031 144A(2) 35,000 USD 34,954 35,700 0.02
Tencent Holdings Ltd 3.290% 03/06/2060 144A(2) 400,000 USD 401,293 389,403 0.21
1,127,641 1,114,994 0.60
Chile
Banco Santander Chile 2.700% 10/01/2025 144A(2) 350,000 USD 359,252 365,368 0.20
Banco Santander Chile 3.875% 20/09/2022 144A(2) 200,000 USD 200,350 208,190 0.11
Sociedad Quimica y Minera de Chile SA 4.250% 22/01/2050 144A(2) 200,000 USD 210,062 216,935 0.12
Transelec SA 4.625% 26/07/2023 144A(2) 200,000 USD 203,307 213,380 0.11
972,971 1,003,873 0.54 Colombia
Transportadora de Gas Internacional SA ESP 5.550% 01/11/2028 144A(2) 200,000 USD 226,167 223,002 0.12
226,167 223,002 0.12 France
Credit Agricole SA 2.811% 11/01/2041 144A(2) 380,000 USD 380,000 360,546 0.19
Societe Generale SA 2.625% 22/01/2025 144A(2) 590,000 USD 594,228 615,497 0.33
974,228 976,043 0.52
Germany
Deutsche Bank AG/New York NY 0.898% 28/05/2024 205,000 USD 205,000 204,067 0.11
205,000 204,067 0.11 Great Britain
Fresnillo PLC 4.250% 02/10/2050 144A(2) 370,000 USD 362,801 374,239 0.20
362,801 374,239 0.20 India
Bharti Airtel Ltd 4.375% 10/06/2025 144A(2) 600,000 USD 625,132 654,556 0.35
625,132 654,556 0.35 Italy
Intesa Sanpaolo SpA 4.198% 01/06/2032 144A(2) 200,000 USD 200,000 205,377 0.11
200,000 205,377 0.11 Japan
Nissan Motor Co Ltd 3.043% 15/09/2023 144A(2) 200,000 USD 200,000 208,594 0.11
Nissan Motor Co Ltd 3.522% 17/09/2025 144A(2) 310,000 USD 310,000 331,026 0.18
510,000 539,620 0.29 Luxembourg
Kenbourne Invest SA 4.700% 22/01/2028 144A(2) 200,000 USD 200,000 201,058 0.11
Millicom International Cellular SA 6.625% 15/10/2026 144A(2) 180,000 USD 190,001 190,350 0.10
Ultrapar International SA 5.250% 06/10/2026 144A(2) 400,000 USD 431,139 440,000 0.24
821,140 831,408 0.45 Mexico
BBVA Bancomer SA/Texas 1.875% 18/09/2025 144A(2) 200,000 USD 198,468 202,270 0.11
Cemex SAB de CV 3.875% 11/07/2031 144A(2) 255,000 USD 255,000 259,208 0.14
Cometa Energia SA de CV 6.375% 24/04/2035 144A(2) 557,540 USD 619,161 639,777 0.34
1,072,629 1,101,255 0.59
(2) See Note 13.
151

Natixis International Funds (Lux) I
The accompanying notes form an integral part of these financial statements.
Loomis Sayles U.S. Core Plus Bond Fund Statement of Investments (continued) As at June 30, 2021 (expressed in USD)
Description Face value Currency Cost Evaluation % of Net
Assets
Multinational
American Airlines Inc/AAdvantage Loyalty IP Ltd 5.500% 20/04/2026 144A(2) 180,000 USD 180,000 190,575 0.10
American Airlines Inc/AAdvantage Loyalty IP Ltd 5.750% 20/04/2029 144A(2) 200,000 USD 200,000 216,250 0.12
Delta Air Lines Inc/SkyMiles IP Ltd 4.750% 20/10/2028 144A(2) 365,000 USD 369,142 405,792 0.22
749,142 812,617 0.44 Netherlands
Embraer Netherlands Finance BV 5.050% 15/06/2025 345,000 USD 360,789 364,372 0.20
Prosus NV 3.680% 21/01/2030 144A(2) 200,000 USD 200,000 213,582 0.11
Sensata Technologies BV 4.000% 15/04/2029 144A(2) 200,000 USD 200,000 203,016 0.11
Teva Pharmaceutical Finance Netherlands III BV 7.125% 31/01/2025 200,000 USD 200,000 220,500 0.12
960,789 1,001,470 0.54 Norway
DNB Bank ASA 2.150% 02/12/2022 144A(2) 430,000 USD 429,836 441,221 0.24
429,836 441,221 0.24 United Arab Emirates
Dolphin Energy Ltd LLC 5.500% 15/12/2021 144A(2) 200,000 USD 201,946 204,252 0.11
201,946 204,252 0.11 United States
AES Corp/The 3.300% 15/07/2025 144A(2) 65,000 USD 64,986 69,361 0.04
AES Corp/The 3.950% 15/07/2030 144A(2) 140,000 USD 152,078 153,090 0.08
Albertsons Cos Inc/Safeway Inc/New Albertsons LP/Albertsons LLC 3.250% 15/03/2026 144A(2) 310,000 USD 310,354 314,417 0.17
Albertsons Cos Inc/Safeway Inc/New Albertsons LP/Albertsons LLC 3.500% 15/03/2029 144A(2) 265,000 USD 261,986 262,019 0.14
AMC Networks Inc 4.250% 15/02/2029 410,000 USD 409,813 413,587 0.22
American Builders & Contractors Supply Co Inc 3.875% 15/11/2029 144A(2) 330,000 USD 330,000 327,859 0.18
Americredit Automobile Receivables Trust 3.740% 18/10/2024 730,000 USD 760,454 756,579 0.41
Antares Holdings LP 3.950% 15/07/2026 144A(2) 250,000 USD 247,226 260,156 0.14
Ares Capital Corp 2.150% 15/07/2026 645,000 USD 642,596 641,403 0.34
Asbury Automotive Group Inc 4.500% 01/03/2028 40,000 USD 40,328 41,100 0.02
Asbury Automotive Group Inc 4.750% 01/03/2030 40,000 USD 40,625 41,800 0.02
AT&T Inc 3.500% 15/09/2053 144A(2) 60,000 USD 46,843 60,280 0.03
AT&T Inc 3.550% 15/09/2055 144A(2) 8,000 USD 6,553 8,027 0.00
AT&T Inc 3.650% 15/09/2059 144A(2) 397,000 USD 355,777 402,597 0.22
AT&T Inc 3.800% 01/12/2057 144A(2) 117,000 USD 114,019 121,900 0.07
Athene Global Funding 2.450% 20/08/2027 144A(2) 590,000 USD 593,206 608,785 0.33
Avis Budget Rental Car Funding AESOP LLC 3.070% 20/09/2023 144A(2) 395,000 USD 395,667 405,965 0.22
BBCMS Mortgage Trust 3.674% 15/02/2050 300,000 USD 331,137 333,065 0.18
Boston Gas Co 3.001% 01/08/2029 144A(2) 30,000 USD 30,000 31,572 0.02
Braskem America Finance Co 7.125% 22/07/2041 144A(2) 600,000 USD 674,622 746,106 0.40
Brighthouse Financial Inc 5.625% 15/05/2030 365,000 USD 389,823 444,109 0.24
Broadcom Inc 3.150% 15/11/2025 149,000 USD 154,719 159,695 0.09
Broadcom Inc 3.419% 15/04/2033 144A(2) 571,000 USD 534,315 599,644 0.32
(2) See Note 13.
152

Natixis International Funds (Lux) I
The accompanying notes form an integral part of these financial statements.
Loomis Sayles U.S. Core Plus Bond Fund Statement of Investments (continued) As at June 30, 2021 (expressed in USD)
Description Face value Currency Cost Evaluation % of Net
Assets
Broadcom Inc 3.750% 15/02/2051 144A(2) 340,000 USD 338,553 354,929 0.19
Calpine Corp 3.750% 01/03/2031 144A(2) 300,000 USD 299,428 285,705 0.15
Calpine Corp 5.000% 01/02/2031 144A(2) 275,000 USD 275,000 273,625 0.15
CarMax Auto Owner Trust 2.980% 17/01/2023 67,035 USD 67,222 67,334 0.04
CCO Holdings LLC/CCO Holdings Capital Corp 4.250% 01/02/2031 144A(2) 515,000 USD 521,912 524,885 0.28
Centene Corp 3.375% 15/02/2030 250,000 USD 255,054 261,330 0.14
Chesapeake Energy Corp 5.875% 01/02/2029 144A(2) 60,000 USD 60,000 64,947 0.03
Clark Equipment Co 5.875% 01/06/2025 144A(2) 50,000 USD 50,000 52,875 0.03
Clearway Energy Operating LLC 3.750% 15/02/2031 144A(2) 495,000 USD 495,000 492,525 0.26
CNH Industrial Capital LLC 4.375% 05/04/2022 145,000 USD 146,554 149,161 0.08
COMM Mortgage Trust 3.694% 10/08/2047 50,000 USD 50,689 53,819 0.03
Continental Airlines 4.000% 29/10/2024 40,652 USD 41,141 42,985 0.02
CSMC OA LLC 3.953% 15/09/2037 144A(2) 200,000 USD 195,157 215,473 0.12
DaVita Inc 4.625% 01/06/2030 144A(2) 365,000 USD 370,680 375,300 0.20
Devon Energy Corp 4.500% 15/01/2030 144A(2) 269,000 USD 271,518 295,738 0.16
Diamondback Energy Inc 4.750% 31/05/2025 210,000 USD 218,572 236,448 0.13
EQM Midstream Partners LP 4.500% 15/01/2029 144A(2) 295,000 USD 294,321 300,126 0.16
EQM Midstream Partners LP 6.500% 01/07/2027
144A(2) 125,000 USD 126,664 139,375 0.07
EQT Corp 3.125% 15/05/2026 144A(2) 30,000 USD 30,000 30,741 0.02
Expedia Group Inc 4.625% 01/08/2027 250,000 USD 262,372 282,536 0.15
Expedia Group Inc 6.250% 01/05/2025 144A(2) 31,000 USD 31,000 36,061 0.02
Fannie Mae Pool 2.500% 01/04/2045 14,047 USD 13,479 14,594 0.01
Fannie Mae Pool 3.000% 01/07/2046 26,676 USD 26,789 28,460 0.02
Fannie Mae Pool 3.000% 01/11/2046 29,349 USD 29,413 30,852 0.02
Fannie Mae Pool 3.000% 01/04/2048 30,668 USD 29,627 31,493 0.02
Fannie Mae Pool 3.000% 01/10/2049 31,466 USD 31,918 32,862 0.02
Fannie Mae Pool 3.000% 01/11/2049 506,824 USD 514,447 529,727 0.28
Fannie Mae Pool 3.500% 01/03/2046 15,961 USD 16,422 16,989 0.01
Fannie Mae Pool 3.500% 01/06/2046 12,106 USD 12,456 12,859 0.01
Fannie Mae Pool 3.500% 01/07/2046 22,127 USD 22,818 23,550 0.01
Fannie Mae Pool 3.500% 01/10/2046 33,184 USD 34,255 35,577 0.02
Fannie Mae Pool 3.500% 01/06/2047 16,980 USD 17,448 18,341 0.01
Fannie Mae Pool 3.500% 01/09/2047 17,556 USD 18,120 18,799 0.01
Fannie Mae Pool 3.500% 01/01/2048 56,239 USD 57,162 58,781 0.03
Fannie Mae Pool 3.500% 01/10/2048 82,752 USD 84,944 87,251 0.05
Fannie Mae Pool 3.500% 01/03/2049 190,061 USD 195,101 200,063 0.11
Fannie Mae Pool 3.500% 01/11/2049 231,827 USD 235,674 239,808 0.13
Fannie Mae Pool 4.000% 01/12/2045 301,146 USD 314,790 330,768 0.18
Fannie Mae Pool 4.000% 01/04/2046 23,974 USD 24,979 25,623 0.01
Fannie Mae Pool 4.000% 01/02/2047 93,961 USD 96,174 101,709 0.05
Fannie Mae Pool 4.000% 01/09/2048 4,419,877 USD 4,726,312 4,707,368 2.53
Fannie Mae Pool 4.000% 01/03/2049 1,059,303 USD 1,125,697 1,126,183 0.61
Fannie Mae Pool 4.000% 01/04/2049 126,141 USD 130,014 134,346 0.07
Fannie Mae Pool 4.500% 01/10/2043 23,376 USD 25,178 25,826 0.01
Fannie Mae Pool 4.500% 01/02/2044 17,111 USD 18,575 19,014 0.01
Fannie Mae Pool 4.500% 01/05/2044 127,008 USD 135,351 141,437 0.08
Fannie Mae Pool 4.500% 01/05/2047 24,289 USD 25,832 26,338 0.01
(2) See Note 13.
153

Natixis International Funds (Lux) I
The accompanying notes form an integral part of these financial statements.
Loomis Sayles U.S. Core Plus Bond Fund Statement of Investments (continued) As at June 30, 2021 (expressed in USD)
Description Face value Currency Cost Evaluation % of Net
Assets
Fannie Mae Pool 4.500% 01/06/2048 1,645,604 USD 1,773,837 1,771,194 0.95
Fannie Mae Pool 4.500% 01/07/2048 313,468 USD 338,665 337,274 0.18
Fannie Mae Pool 4.500% 01/09/2048 1,508,830 USD 1,645,437 1,625,933 0.87
Fannie Mae Pool 4.500% 01/12/2048 117,019 USD 122,868 125,984 0.07
Fannie Mae Pool 4.500% 01/01/2049 110,883 USD 117,276 119,205 0.06
Fannie Mae Pool 4.500% 01/02/2050 3,674,898 USD 4,013,192 3,943,065 2.12
Fannie Mae Pool 5.000% 01/07/2048 49,912 USD 53,253 54,849 0.03
Fannie Mae Pool 5.000% 01/08/2048 21,482 USD 23,014 23,578 0.01
Fannie Mae Pool 5.000% 01/09/2049 49,272 USD 52,548 54,117 0.03
Fannie Mae Pool 5.000% 01/11/2049 186,609 USD 199,071 204,306 0.11
Federal National Mortgage Association 5.625% 15/07/2037 225,000 USD 294,475 342,114 0.18
Forestar Group Inc 3.850% 15/05/2026 144A(2) 150,000 USD 150,000 151,357 0.08
Freddie Mac Gold Pool 3.000% 01/01/2047 21,275 USD 20,664 22,386 0.01
Freddie Mac Gold Pool 3.500% 01/01/2046 73,403 USD 75,601 79,443 0.04
Freddie Mac Gold Pool 3.500% 01/03/2047 18,583 USD 19,172 19,985 0.01
Freddie Mac Gold Pool 3.500% 01/07/2047 16,060 USD 16,531 17,191 0.01
Freddie Mac Gold Pool 3.500% 01/11/2047 22,370 USD 22,997 24,229 0.01
Freddie Mac Gold Pool 4.000% 01/11/2048 129,236 USD 133,500 137,648 0.07
Freddie Mac Gold Pool 4.500% 01/04/2044 39,163 USD 41,627 43,694 0.02
Freddie Mac Pool 3.000% 01/10/2049 97,754 USD 98,768 102,068 0.05
Freddie Mac Pool 4.500% 01/09/2048 2,433,478 USD 2,656,441 2,611,055 1.40
Freddie Mac Pool 4.500% 01/10/2048 68,398 USD 71,756 73,759 0.04
Freddie Mac Pool 4.500% 01/01/2049 314,478 USD 332,738 337,887 0.18
Freddie Mac Pool 5.000% 01/07/2048 147,774 USD 157,486 162,098 0.09
Freddie Mac Pool 5.000% 01/10/2048 78,769 USD 84,324 86,403 0.05
Freddie Mac Pool 5.000% 01/10/2049 5,523,820 USD 6,088,814 6,063,738 3.26
Georgetown University/The 5.215% 01/10/2118 20,000 USD 20,000 30,052 0.02
Glencore Funding LLC 2.500% 01/09/2030 144A(2) 670,000 USD 667,839 667,489 0.36
Goodyear Tire & Rubber Co/The 5.625% 30/04/2033 525,000 USD 525,000 553,717 0.30
Gray Oak Pipeline LLC 2.600% 15/10/2025 144A(2) 40,000 USD 39,951 41,090 0.02
Gray Oak Pipeline LLC 3.450% 15/10/2027 144A(2) 20,000 USD 19,999 21,021 0.01
Group 1 Automotive Inc 4.000% 15/08/2028 144A(2) 105,000 USD 105,277 106,837 0.06
GS Mortgage Securities Trust 3.764% 10/07/2048 305,000 USD 321,490 334,756 0.18
Hanesbrands Inc 4.625% 15/05/2024 144A(2) 15,000 USD 14,684 15,900 0.01
Hanesbrands Inc 4.875% 15/05/2026 144A(2) 190,000 USD 198,251 205,200 0.11
Hanesbrands Inc 5.375% 15/05/2025 144A(2) 55,000 USD 55,000 58,231 0.03
Hasbro Inc 3.550% 19/11/2026 90,000 USD 91,886 98,650 0.05
Hasbro Inc 3.900% 19/11/2029 10,000 USD 9,982 11,119 0.01
Hewlett Packard Enterprise Co 4.650% 01/10/2024 155,000 USD 172,411 172,326 0.09
Hilton Domestic Operating Co Inc 3.625% 15/02/2032 144A(2) 365,000 USD 364,748 360,438 0.19
Huntington Bancshares Inc/OH 2.625% 06/08/2024 420,000 USD 428,765 443,238 0.24
Hyundai Capital America 2.375% 15/10/2027 144A(2) 75,000 USD 74,983 76,676 0.04
Hyundai Capital America 2.650% 10/02/2025 144A(2) 160,000 USD 159,783 167,356 0.09
Hyundai Capital America 3.000% 10/02/2027 144A(2) 450,000 USD 454,294 476,732 0.26
(2) See Note 13.
154

Natixis International Funds (Lux) I
The accompanying notes form an integral part of these financial statements.
Loomis Sayles U.S. Core Plus Bond Fund Statement of Investments (continued) As at June 30, 2021 (expressed in USD)
Description Face value Currency Cost Evaluation % of Net
Assets
Icahn Enterprises LP/Icahn Enterprises Finance Corp 4.375% 01/02/2029 144A(2) 205,000 USD 205,000 203,975 0.11
Icahn Enterprises LP/Icahn Enterprises Finance Corp 5.250% 15/05/2027 175,000 USD 177,729 180,687 0.10
Iron Mountain Inc 4.500% 15/02/2031 144A(2) 380,000 USD 380,843 384,750 0.21
J2 Global Inc 4.625% 15/10/2030 144A(2) 470,000 USD 472,437 486,591 0.26
JPMBB Commercial Mortgage Securities Trust
3.775% 15/08/2047 425,000 USD 441,566 459,272 0.25
Ken Garff Automotive LLC 4.875% 15/09/2028 144A(2) 80,000 USD 80,000 81,600 0.04
Kinder Morgan Inc 5.625% 15/11/2023 144A(2) 85,000 USD 85,329 93,636 0.05
Koppers Inc 6.000% 15/02/2025 144A(2) 180,000 USD 181,039 185,760 0.10
Kraft Heinz Foods Co 3.875% 15/05/2027 235,000 USD 241,874 258,212 0.14
Lamar Media Corp 3.625% 15/01/2031 144A(2) 105,000 USD 104,861 102,638 0.06
Lamar Media Corp 4.000% 15/02/2030 160,000 USD 161,164 161,938 0.09
Liberty Mutual Group Inc 3.950% 15/05/2060 144A(2) 155,000 USD 165,966 170,305 0.09
Lithia Motors Inc 3.875% 01/06/2029 144A(2) 60,000 USD 60,000 62,145 0.03
Lithia Motors Inc 4.375% 15/01/2031 144A(2) 245,000 USD 247,206 262,422 0.14
Marriott International Inc/MD 3.500% 15/10/2032 430,000 USD 432,431 456,790 0.25
MercadoLibre Inc 2.375% 14/01/2026 200,000 USD 200,000 201,302 0.11
MercadoLibre Inc 3.125% 14/01/2031 200,000 USD 200,000 196,008 0.11
Microchip Technology Inc 2.670% 01/09/2023 350,000 USD 355,982 364,532 0.20
Microchip Technology Inc 4.333% 01/06/2023 115,000 USD 117,002 122,636 0.07
Micron Technology Inc 2.497% 24/04/2023 305,000 USD 308,203 315,254 0.17
Molex Electronic Technologies LLC 3.900% 15/04/2025 144A(2) 25,000 USD 24,827 25,653 0.01
Morgan Stanley Bank of America Merrill Lynch Trust 3.306% 15/04/2048 430,000 USD 443,297 461,131 0.25
MSBAM Commercial Mortgage Securities Trust 3.277% 15/10/2030 144A(2) 120,000 USD 120,120 119,326 0.06
Navient Corp 5.875% 25/10/2024 15,000 USD 12,921 16,181 0.01
Navient Corp 6.125% 25/03/2024 105,000 USD 104,656 113,322 0.06
Navient Corp 6.750% 15/06/2026 15,000 USD 12,909 16,744 0.01
New Fortress Energy Inc 6.500% 30/09/2026 144A(2) 45,000 USD 45,000 45,981 0.02
New Fortress Energy Inc 6.750% 15/09/2025 144A(2) 435,000 USD 454,338 445,331 0.24
Newell Brands Inc 4.875% 01/06/2025 90,000 USD 93,810 99,563 0.05
OneAmerica Financial Partners Inc 4.250% 15/10/2050 144A(2) 65,000 USD 64,562 67,891 0.04
OneMain Financial Issuance Trust 3.630% 20/11/2028 144A(2) 28,454 USD 28,459 28,511 0.02
Outfront Media Capital LLC/Outfront Media Capital Corp 4.250% 15/01/2029 144A(2) 330,000 USD 328,090 332,063 0.18
Owl Rock Technology Finance Corp 3.750% 17/06/2026 144A(2) 330,000 USD 329,811 346,996 0.19
Pattern Energy Operations LP/Pattern Energy Operations Inc 4.500% 15/08/2028 144A(2) 230,000 USD 233,192 238,096 0.13
Planet Fitness Master Issuer LLC 4.262% 05/09/2048 144A(2) 97,250 USD 97,250 97,610 0.05
Post Holdings Inc 4.500% 15/09/2031 144A(2) 405,000 USD 405,000 404,332 0.22
Post Holdings Inc 4.625% 15/04/2030 144A(2) 415,000 USD 420,295 421,984 0.23
(2) See Note 13.
155

Natixis International Funds (Lux) I
The accompanying notes form an integral part of these financial statements.
Loomis Sayles U.S. Core Plus Bond Fund Statement of Investments (continued)
As at June 30, 2021 (expressed in USD)
Description Face value Currency Cost Evaluation % of Net
Assets
Quicken Loans LLC/Quicken Loans Co-Issuer Inc 3.625% 01/03/2029 144A(2) 85,000 USD 84,617 83,938 0.04
Quicken Loans LLC/Quicken Loans Co-Issuer Inc 3.875% 01/03/2031 144A(2) 240,000 USD 240,107 241,798 0.13
Rattler Midstream LP 5.625% 15/07/2025 144A(2) 155,000 USD 156,355 162,944 0.09
Sabre GLBL Inc 7.375% 01/09/2025 144A(2) 165,000 USD 170,208 179,438 0.10
Sabre GLBL Inc 9.250% 15/04/2025 144A(2) 25,000 USD 25,000 29,721 0.02
Santander Drive Auto Receivables Trust 0.900% 15/06/2026 175,000 USD 174,961 175,282 0.09
Santander Drive Auto Receivables Trust 3.350% 17/07/2023 12,637 USD 12,688 12,653 0.01
SBA Communications Corp 3.125% 01/02/2029 144A(2) 415,000 USD 415,000 400,087 0.21
Science Applications International Corp 4.875% 01/04/2028 144A(2) 25,000 USD 25,000 26,219 0.01
Sensata Technologies Inc 3.750% 15/02/2031 144A(2) 180,000 USD 180,190 177,989 0.10
Sirius XM Radio Inc 4.000% 15/07/2028 144A(2) 260,000 USD 260,000 267,800 0.14
Smithfield Foods Inc 3.000% 15/10/2030 144A(2) 35,000 USD 34,625 35,288 0.02
Southern Natural Gas Co LLC 0.625% 28/04/2023 144A(2) 125,000 USD 124,982 125,118 0.07
Sprint Corp 7.250% 15/09/2021 65,000 USD 65,792 65,961 0.04
Summit Materials LLC/Summit Materials Finance Corp 5.250% 15/01/2029 144A(2) 20,000 USD 20,000 21,249 0.01
SunCoke Energy Inc 4.875% 30/06/2029 144A(2) 130,000 USD 130,000 129,838 0.07
Targa Resources Partners LP/Targa Resources Partners Finance Corp 6.500% 15/07/2027 60,000 USD 65,188 65,023 0.03
Time Warner Cable LLC 4.500% 15/09/2042 235,000 USD 249,310 261,213 0.14
Time Warner Cable LLC 5.500% 01/09/2041 160,000 USD 161,688 198,317 0.11
UBS-Citigroup Commercial Mortgage Trust 5.154%
10/01/2045 144A(2) 15,000 USD 15,115 15,151 0.01
United Airlines Inc 4.375% 15/04/2026 144A(2) 80,000 USD 80,000 82,814 0.04
United Airlines Inc 4.625% 15/04/2029 144A(2) 125,000 USD 125,000 129,375 0.07
Univar Solutions USA Inc/Washington 5.125% 01/12/2027 144A(2) 170,000 USD 175,224 178,713 0.10
University of Virginia 3.227% 01/09/2119 220,000 USD 222,863 212,098 0.11
Valvoline Inc 3.625% 15/06/2031 144A(2) 200,000 USD 200,000 200,000 0.11
Valvoline Inc 4.250% 15/02/2030 144A(2) 95,000 USD 95,699 98,086 0.05
Viatris Inc 4.000% 22/06/2050 144A(2) 55,000 USD 54,861 58,164 0.03
WFRBS Commercial Mortgage Trust 4.176% 15/05/2047 125,000 USD 133,717 133,709 0.07
53,114,696 53,932,194 29.00
Total - Fixed rate bonds 65,975,575 67,170,562 36.12
Variable rate bonds
Canada
Canadian Imperial Bank of Commerce 0.850% 17/03/2023 250,000 USD 250,000 252,475 0.14
250,000 252,475 0.14 France
BNP Paribas SA 1.323% 13/01/2027 144A(2) 430,000 USD 430,000 424,791 0.23
BNP Paribas SA 2.819% 19/11/2025 144A(2) 570,000 USD 579,678 599,720 0.32
1,009,678 1,024,511 0.55
(2) See Note 13.
156

Natixis International Funds (Lux) I
The accompanying notes form an integral part of these financial statements.
Loomis Sayles U.S. Core Plus Bond Fund Statement of Investments (continued) As at June 30, 2021 (expressed in USD)
Description Face value Currency Cost Evaluation % of Net
Assets
Germany
Deutsche Bank AG/New York NY 2.129% 24/11/2026 275,000 USD 275,000 279,045 0.15
Deutsche Bank AG/New York NY 3.729% 14/01/2032 265,000 USD 265,000 269,672 0.14
540,000 548,717 0.29 Italy
UniCredit SpA 1.982% 03/06/2027 144A(2) 330,000 USD 330,000 328,766 0.18
330,000 328,766 0.18 United States
Bank of America Corp 0.976% 22/04/2025 695,000 USD 695,000 697,227 0.37
Bank of America Corp 3.004% 20/12/2023 221,000 USD 221,330 229,033 0.12
Bank of America Corp 3.559% 23/04/2027 795,000 USD 849,114 870,703 0.47
Bayview Opportunity Master Fund IVa Trust 3.500% 28/05/2069 144A(2) 45,098 USD 46,059 46,065 0.02
CenterPoint Energy Inc 0.684% 13/05/2024 215,000 USD 215,000 215,897 0.12
Citigroup Inc 0.981% 01/05/2025 185,000 USD 185,000 185,440 0.10
Citigroup Inc 4.412% 31/03/2031 455,000 USD 530,487 531,289 0.29
Federal National Mortgage Association 2.000% 01/09/2051 18,791,000 USD 18,876,521 18,897,434 10.16
Federal National Mortgage Association 2.500% 01/09/2051 3,149,000 USD 3,242,921 3,243,839 1.74
Ginnie Mae II Pool 4.216% 20/03/2063 2,661 USD 2,800 2,885 0.00
Ginnie Mae II Pool 4.657% 20/05/2064 67,721 USD 72,242 72,982 0.04
Government National Mortgage Association 0.507% 20/04/2065 132,950 USD 133,227 133,287 0.07
Government National Mortgage Association 0.640% 20/03/2060 111,239 USD 110,784 111,842 0.06
GS Mortgage Securities Trust 4.885% 10/01/2047 50,000 USD 49,125 49,007 0.03
Invitation Homes Trust 0.973% 17/06/2037 144A(2) 277,516 USD 277,516 278,156 0.15
JPMorgan Chase & Co 2.739% 15/10/2030 330,000 USD 335,940 345,380 0.19
JPMorgan Chase & Co 2.956% 13/05/2031 450,000 USD 467,670 472,728 0.25
JPMorgan Chase & Co 3.797% 23/07/2024 435,000 USD 449,540 463,505 0.25
Morgan Stanley 0.731% 05/04/2024 435,000 USD 435,000 435,911 0.23
Morgan Stanley 3.591% 22/07/2028 120,000 USD 134,300 132,930 0.07
National Rural Utilities Cooperative Finance Corp 4.750% 30/04/2043 270,000 USD 271,673 282,634 0.15
OBX Trust 4.000% 25/04/2048 144A(2) 26,076 USD 26,020 26,598 0.01
PNC Bank NA 2.028% 09/12/2022 250,000 USD 250,000 251,808 0.14
Sequoia Mortgage Trust 4.000% 25/08/2048 144A(2) 93,812 USD 94,910 95,704 0.05
Towd Point Mortgage Trust 2.750% 25/08/2055 144A(2) 14,223 USD 14,223 14,348 0.01
Towd Point Mortgage Trust 3.241% 25/10/2053 144A(2) 100,000 USD 102,347 105,344 0.06
Towd Point Mortgage Trust 3.750% 25/05/2058 144A(2) 134,101 USD 138,919 141,350 0.08
28,227,668 28,333,326 15.23
Total - Variable rate bonds 30,357,346 30,487,795 16.39
Total - Transferable securities dealt in on another regulated market 96,332,921 97,658,357 52.51
(2) See Note 13.
157

Natixis International Funds (Lux) I
The accompanying notes form an integral part of these financial statements.
Loomis Sayles U.S. Core Plus Bond Fund Statement of Investments (continued) As at June 30, 2021 (expressed in USD)
Description Face value Currency Cost Evaluation % of Net
Assets
Other transferable securities Treasury Bills
United States
United States Treasury Bill 0.000% 06/07/2021 2,025,000 USD 2,024,997 2,024,997 1.09
United States Treasury Bill 0.000% 13/07/2021 1,440,000 USD 1,439,990 1,439,990 0.77
United States Treasury Bill 0.000% 15/07/2021 1,845,000 USD 1,844,988 1,844,989 0.99
United States Treasury Bill 0.000% 29/07/2021 19,360,000 USD 19,359,412 19,359,412 10.41
United States Treasury Bill 0.000% 21/10/2021 1,195,000 USD 1,194,913 1,194,824 0.64
United States Treasury Bill 0.000% 09/12/2021 8,750,000 USD 8,748,558 8,747,978 4.71
34,612,858 34,612,190 18.61
Total - Treasury Bills 34,612,858 34,612,190 18.61
Total - Other transferable securities 34,612,858 34,612,190 18.61
TOTAL INVESTMENT PORTFOLIOS 199,017,053 202,582,728 108.93
A detailed schedule of portfolio movements for the period from January 1, 2021 to June 30, 2021 is available free of charge upon request at the registered office of the SICAV.
158

Natixis International Funds (Lux) I
Loomis Sayles Asia Bond Plus Fund
Statistics
As at June 30, 2021
Net asset value per share
H-R/DIVM (SGD) 94.31
I/A (USD) 101.03
I/DIVM (USD) 97.13
Q/DIVM (USD) 98.30
R/DIVM (USD) 95.34
R/DIVM (HKD) 94.22
R/DIVM (SGD) 95.71
Number of shares outstanding
H-R/DIVM (SGD) 27,054.802
I/A (USD) 7,604.365
I/DIVM (USD) 34.355
Q/DIVM (USD) 493,963.004
R/DIVM (USD) 822.770
R/DIVM (HKD) 343.546
R/DIVM (SGD) 2,287.418
159

Natixis International Funds (Lux) I
The accompanying notes form an integral part of these financial statements.
Loomis Sayles Asia Bond Plus Fund
Statement of Investments
As at June 30, 2021
(expressed in USD)
Description
Face value Currency Cost Evaluation % of Net
Assets
Transferable securities admitted to an official stock exchange listing Fixed rate bonds
Bermuda Islands
China Oil & Gas Group Ltd 4.700% 30/06/2026 750,000 USD 750,000 761,405 1.48
Concord New Energy Group Ltd 10.750% 24/09/2023 207,000 USD 203,456 216,109 0.42
Li & Fung Ltd 4.375% 04/10/2024 EMTN 700,000 USD 686,784 716,017 1.39
Star Energy Geothermal Darajat II/Star Energy Geothermal Salak 4.850% 14/10/2038 320,000 USD 338,916 351,360 0.68
1,979,156 2,044,891 3.97 British Virgin Islands
Champion Path Holdings Ltd 4.500% 27/01/2026 235,000 USD 245,509 244,064 0.47
Easy Tactic Ltd 8.125% 27/02/2023 890,000 USD 845,026 831,037 1.61
ENN Clean Energy International Investment Ltd 3.375% 12/05/2026 980,000 USD 976,740 999,022 1.94
Greenland Global Investment Ltd 6.250% 16/12/2022 EMTN 200,000 USD 192,500 190,998 0.37
Greenland Global Investment Ltd 7.250% 22/01/2025 EMTN 800,000 USD 794,052 627,672 1.22
Hejun Shunze Investment Co Ltd 11.000% 04/06/2022 400,000 USD 398,386 103,988 0.20
Huarong Finance 2019 Co Ltd 3.375% 29/05/2022 EMTN 420,000 USD 365,139 348,600 0.68
Huarong Finance II Co Ltd 5.500% 16/01/2025 EMTN 320,000 USD 239,964 236,800 0.46
New Metro Global Ltd 6.800% 05/08/2023 200,000 USD 198,721 207,773 0.40
Scenery Journey Ltd 13.000% 06/11/2022 640,000 USD 626,036 524,073 1.02
Scenery Journey Ltd 13.750% 06/11/2023 305,000 USD 308,648 242,862 0.47
Sino-Ocean Land Treasure IV Ltd 3.250% 05/05/2026 830,000 USD 823,254 827,689 1.61
Tongfang Aqua Ltd 6.800% 10/01/2022 500,000 USD 499,523 486,242 0.95
Tsinghua Unic Ltd defaulted 4.750% 31/01/2021 240,000 USD 240,000 101,139 0.20
Tsinghua Unic Ltd defaulted 5.375% 31/01/2023 210,000 USD 207,027 88,999 0.17
Wanda Properties Overseas Ltd 7.250% 28/04/2022 470,000 USD 470,000 471,410 0.92
7,430,525 6,532,368 12.69 Cayman Islands
AAC Technologies Holdings Inc 2.625% 02/06/2026 250,000 USD 249,680 253,045 0.49
CAR Inc 8.875% 10/05/2022 200,000 USD 198,124 206,449 0.40
Central China Real Estate Ltd 7.250% 13/08/2024 200,000 USD 183,267 172,051 0.33
Central China Real Estate Ltd 7.900% 07/11/2023 200,000 USD 200,000 187,727 0.36
CFLD Cayman Investment Ltd 8.050% 13/01/2025 910,000 USD 413,184 319,797 0.62
CFLD Cayman Investment Ltd 8.600% 08/04/2024 600,000 USD 600,501 212,219 0.41
CFLD Cayman Investment Ltd defaulted 8.625%
28/02/2021 200,000 USD 160,904 70,341 0.14
China Aoyuan Group Ltd 5.375% 13/09/2022 220,000 USD 217,491 212,411 0.41
China Aoyuan Group Ltd 5.980% 18/08/2025 200,000 USD 190,280 178,286 0.35
China Evergrande Group 7.500% 28/06/2023 265,000 USD 211,164 188,288 0.37
China Evergrande Group 8.750% 28/06/2025 600,000 USD 502,787 400,125 0.78
China Evergrande Group 9.500% 29/03/2024 200,000 USD 144,875 140,102 0.27
China Evergrande Group 10.000% 11/04/2023 935,000 USD 913,199 720,200 1.40
China Hongqiao Group Ltd 7.125% 22/07/2022 440,000 USD 440,000 450,779 0.88
China SCE Group Holdings Ltd 5.875% 10/03/2022 440,000 USD 437,766 444,079 0.86
160

Natixis International Funds (Lux) I
The accompanying notes form an integral part of these financial statements.
Loomis Sayles Asia Bond Plus Fund Statement of Investments (continued) As at June 30, 2021 (expressed in USD)
Description Face value Currency Cost Evaluation % of Net
Assets
Country Garden Holdings Co Ltd 5.125% 14/01/2027 440,000 USD 440,000 469,812 0.91
Dar Al-Arkan Sukuk Co Ltd 6.750% 15/02/2025 325,000 USD 322,439 335,089 0.65
eHi Car Services Ltd 7.750% 14/11/2024 500,000 USD 506,520 517,500 1.01
Fantasia Holdings Group Co Ltd 9.250% 28/07/2023 200,000 USD 199,292 162,885 0.32
Fantasia Holdings Group Co Ltd 11.875% 01/06/2023 200,000 USD 199,295 175,798 0.34
Fantasia Holdings Group Co Ltd 12.250% 18/10/2022 215,000 USD 212,125 194,684 0.38
Golden Eagle Retail Group Ltd 4.625% 21/05/2023 225,000 USD 217,545 227,531 0.44
Kaisa Group Holdings Ltd 6.500% 07/12/2021 355,000 USD 356,357 355,394 0.69
Kaisa Group Holdings Ltd 9.375% 30/06/2024 660,000 USD 582,151 623,041 1.21
Kaisa Group Holdings Ltd 11.250% 16/04/2025 500,000 USD 500,298 474,768 0.92
Kaisa Group Holdings Ltd 11.650% 01/06/2026 245,000 USD 245,000 229,249 0.44
KWG Group Holdings Ltd 7.400% 05/03/2024 EMTN 200,000 USD 203,262 209,103 0.41
Melco Resorts Finance Ltd 5.250% 26/04/2026 570,000 USD 594,204 590,235 1.15
NagaCorp Ltd 7.950% 06/07/2024 685,000 USD 709,361 703,154 1.37
Sunac China Holdings Ltd 5.950% 26/04/2024 200,000 USD 199,944 196,953 0.38
Sunac China Holdings Ltd 8.350% 19/04/2023 210,000 USD 210,943 217,461 0.42
Times China Holdings Ltd 6.750% 16/07/2023 200,000 USD 205,250 205,000 0.40
Yuzhou Group Holdings Co Ltd 6.350% 13/01/2027 215,000 USD 162,175 165,952 0.32
Yuzhou Group Holdings Co Ltd 7.850% 12/08/2026 500,000 USD 500,000 395,907 0.77
Yuzhou Group Holdings Co Ltd 8.300% 27/05/2025 205,000 USD 203,272 174,231 0.34
Zhenro Properties Group Ltd 7.875% 14/04/2024 200,000 USD 199,927 199,755 0.39
Zhenro Properties Group Ltd 8.300% 15/09/2023 200,000 USD 204,200 204,106 0.40
12,236,782 11,183,507 21.73 China
China Grand Automotive Services Ltd 8.625% 08/04/2022 661,000 USD 624,247 637,865 1.24
624,247 637,865 1.24 Georgia
Georgia Global Utilities JSC 7.750% 30/07/2025 144A(2) 325,000 USD 325,000 345,855 0.67
Silknet JSC 11.000% 02/04/2024 450,000 USD 475,541 492,644 0.96
800,541 838,499 1.63 Great Britain
Liquid Telecommunications Financing PLC 5.500% 04/09/2026 400,000 USD 400,000 409,835 0.80
Vedanta Resources Ltd 6.125% 09/08/2024 1,050,000 USD 771,350 880,529 1.71
Vedanta Resources Ltd 6.375% 30/07/2022 290,000 USD 258,037 285,795 0.55
1,429,387 1,576,159 3.06 Hong Kong
Wanda Group Overseas Ltd 8.875% 21/03/2023 465,000 USD 464,122 441,609 0.86
Yanlord Land HK Co Ltd 5.125% 20/05/2026 325,000 USD 325,000 331,596 0.64
789,122 773,205 1.50 India
Adani Transmission Ltd 4.250% 21/05/2036 247,775 USD 253,474 253,163 0.49
Indiabulls Housing Finance Ltd 6.375% 28/05/2022 EMTN 255,000 USD 245,878 242,632 0.47
JSW Hydro Energy Ltd 4.125% 18/05/2031 400,000 USD 400,000 405,200 0.79
Power Finance Corp Ltd 3.950% 23/04/2030 EMTN 200,000 USD 205,796 205,751 0.40
ReNew Wind Energy AP2/ReNew Power Pvt Ltd other 9 Subsidiaries 4.500% 14/07/2028 700,000 USD 699,879 711,631 1.38
(2) See Note 13.
161

Natixis International Funds (Lux) I
The accompanying notes form an integral part of these financial statements.
Loomis Sayles Asia Bond Plus Fund Statement of Investments (continued) As at June 30, 2021 (expressed in USD)
Description Face value Currency Cost Evaluation % of Net
Assets
Shriram Transport Finance Co Ltd 4.400% 13/03/2024 EMTN 460,000 USD 459,961 460,690 0.90
Shriram Transport Finance Co Ltd 5.100% 16/07/2023 EMTN 230,000 USD 217,108 233,459 0.45
2,482,096 2,512,526 4.88 Indonesia
Japfa Comfeed Indonesia Tbk PT 5.375% 23/03/2026 465,000 USD 462,626 491,966 0.96
Pakuwon Jati Tbk PT 4.875% 29/04/2028 200,000 USD 200,000 208,392 0.40
Tower Bersama Infrastructure Tbk PT 4.250% 21/01/2025 460,000 USD 460,000 485,302 0.94
1,122,626 1,185,660 2.30 Isle of Man
Gohl Capital Ltd 4.250% 24/01/2027 450,000 USD 451,131 473,341 0.92
451,131 473,341 0.92 Jersey
Oriflame Investment Holding PLC 5.125% 04/05/2026 144A(2) 280,000 USD 280,000 287,702 0.56
280,000 287,702 0.56 Kenya
Kenya Government International Bond 6.300% 23/01/2034 585,000 USD 584,948 585,876 1.14
584,948 585,876 1.14 Luxembourg
Kernel Holding SA 6.750% 27/10/2027 400,000 USD 417,360 434,115 0.84
MHP Lux SA 6.950% 03/04/2026 280,000 USD 268,652 297,371 0.58
686,012 731,486 1.42 Mauritius
Clean Renewable Power Mauritius Pte Ltd 4.250% 25/03/2027 475,000 USD 475,000 482,838 0.94
Cliffton Ltd 6.250% 25/10/2025 480,000 USD 479,960 472,320 0.92
Greenko Mauritius Ltd 6.250% 21/02/2023 425,000 USD 425,000 438,251 0.85
HTA Group Ltd/Mauritius 7.000% 18/12/2025 450,000 USD 447,952 478,701 0.93
1,827,912 1,872,110 3.64 Mongolia
Mongolia Government International Bond 4.450% 07/07/2031 200,000 USD 196,046 195,918 0.38
Mongolian Mortgage Corp Hfc LLC 8.850% 08/02/2024 480,000 USD 477,045 468,033 0.91
673,091 663,951 1.29 Netherlands
First Bank of Nigeria Ltd Via FBN Finance Co BV 8.625% 27/10/2025 250,000 USD 247,856 265,685 0.52
IHS Netherlands Holdco BV 8.000% 18/09/2027 355,000 USD 355,000 386,234 0.75
Mong Duong Finance Holdings BV 5.125% 07/05/2029 340,000 USD 342,420 340,850 0.66
Teva Pharmaceutical Finance Netherlands III BV 3.150% 01/10/2026 125,000 USD 116,071 118,906 0.23
1,061,347 1,111,675 2.16 Nigeria
SEPLAT Energy PLC 7.750% 01/04/2026 360,000 USD 360,000 375,394 0.73
United Bank for Africa PLC 7.750% 08/06/2022 290,000 USD 291,764 299,425 0.58
651,764 674,819 1.31
(2) See Note 13.
162

Natixis International Funds (Lux) I
The accompanying notes form an integral part of these financial statements.
Loomis Sayles Asia Bond Plus Fund Statement of Investments (continued) As at June 30, 2021 (expressed in USD)
Description Face value Currency Cost Evaluation % of Net
Assets
Pakistan
Islamic Republic of Pakistan 7.375% 08/04/2031 200,000 USD 206,000 205,750 0.40
Pakistan Government International Bond 6.000% 08/04/2026 EMTN 365,000 USD 370,429 369,563 0.72
576,429 575,313 1.12 Singapore
ABJA Investment Co. Pte Ltd 5.450% 24/01/2028 345,000 USD 357,684 370,582 0.72
ABJA Investment Co. Pte Ltd 5.950% 31/07/2024 200,000 USD 202,314 216,000 0.42
APL Realty Holdings Pte Ltd 5.950% 02/06/2024 795,000 USD 627,221 580,393 1.13
LLPL Capital Pte Ltd 6.875% 04/02/2039 182,400 USD 185,392 212,450 0.41
LMIRT Capital Pte Ltd 7.250% 19/06/2024 285,000 USD 275,531 297,616 0.58
LMIRT Capital Pte Ltd 7.500% 09/02/2026 480,000 USD 475,484 497,253 0.97
Medco Bell Pte Ltd 6.375% 30/01/2027 144A(2) 345,000 USD 359,430 355,091 0.69
Singapore Airlines Ltd 3.000% 20/07/2026 EMTN 480,000 USD 478,116 484,390 0.94
Theta Capital Pte Ltd 8.125% 22/01/2025 370,000 USD 370,000 382,872 0.74
3,331,172 3,396,647 6.60 South Korea
Export-Import Bank of Korea 6.750% 09/08/2022 EMTN 69,100,000 INR 961,513 944,888 1.84
961,513 944,888 1.84 Sri Lanka
Sri Lanka Government International Bond 6.825% 18/07/2026 2,195,000 USD 1,444,214 1,393,825 2.71
1,444,214 1,393,825 2.71 Turkey
Turk Telekomunikasyon AS 6.875% 28/02/2025 144A(2) 200,000 USD 196,195 220,632 0.43
Turkey Government International Bond 5.950% 15/01/2031 460,000 USD 458,316 450,351 0.88
Ulker Biskuvi Sanayi AS 6.950% 30/10/2025 400,000 USD 400,000 434,116 0.84
1,054,511 1,105,099 2.15 Ukraine
Ukraine Government International Bond 6.876% 21/05/2029 300,000 USD 300,000 311,304 0.60
VF Ukraine PAT via VFU Funding PLC 6.200% 11/02/2025 400,000 USD 400,000 417,000 0.81
700,000 728,304 1.41 United Arab Emirates
Oztel Holdings SPC Ltd 6.625% 24/04/2028 490,000 USD 535,466 543,091 1.06
535,466 543,091 1.06 United States
Kosmos Energy Ltd 7.500% 01/03/2028 360,000 USD 360,000 357,751 0.70
360,000 357,751 0.70
Total - Fixed rate bonds 44,073,992 42,730,558 83.02
Variable rate bonds
Cayman Islands
Agile Group Holdings Ltd 6.875% Perpetual 360,000 USD 367,970 363,788 0.71
DP World Salaam 6.000% Perpetual 460,000 USD 457,368 505,374 0.98
Yuzhou Group Holdings Co Ltd 5.375% Perpetual 225,000 USD 209,207 191,364 0.37
1,034,545 1,060,526 2.06
(2) See Note 13.
163

Natixis International Funds (Lux) I
The accompanying notes form an integral part of these financial statements.
Loomis Sayles Asia Bond Plus Fund Statement of Investments (continued) As at June 30, 2021 (expressed in USD)
Description Face value Currency Cost Evaluation % of Net
Assets
Hong Kong
Chalieco Hong Kong Corp Ltd 5.000% Perpetual 370,000 USD 374,980 372,631 0.72
374,980 372,631 0.72 Mauritius
Network i2i Ltd 3.975% Perpetual 960,000 USD 958,927 960,480 1.86
UPL Corp Ltd 5.250% Perpetual 835,000 USD 821,269 852,084 1.66
1,780,196 1,812,564 3.52 Togo
Ecobank Transnational Inc 8.750% 17/06/2031 400,000 USD 396,844 407,800 0.79
396,844 407,800 0.79
Total - Variable rate bonds 3,586,565 3,653,521 7.10
Total - Transferable securities admitted to an official stock exchange listing 47,660,557 46,384,079 90.12
Transferable securities dealt in on another regulated market Fixed rate bonds
Bahrain
Oil & Gas Holding Co BSCC/The 7.500% 25/10/2027 215,000 USD 224,990 240,005 0.47
224,990 240,005 0.47 British Virgin Islands
Studio City Finance Ltd 5.000% 15/01/2029 144A(2) 360,000 USD 360,000 363,247 0.70
360,000 363,247 0.70 Canada
First Quantum Minerals Ltd 6.875% 15/10/2027 144A(2) 500,000 USD 500,000 544,850 1.06
500,000 544,850 1.06 Cayman Islands
Wynn Macau Ltd 5.125% 15/12/2029 144A(2) 220,000 USD 206,523 226,600 0.44
206,523 226,600 0.44 China
China Development Bank 3.450% 20/09/2029 6,000,000 CNY 889,016 923,446 1.79
889,016 923,446 1.79 Netherlands
Teva Pharmaceutical Finance Netherlands III BV 7.125% 31/01/2025 200,000 USD 200,000 220,500 0.43
200,000 220,500 0.43 Turkey
Akbank T.A.S. 6.800% 06/02/2026 360,000 USD 359,971 380,221 0.74
359,971 380,221 0.74
Total - Fixed rate bonds 2,740,500 2,898,869 5.63
Total - Transferable securities dealt in on another regulated market 2,740,500 2,898,869 5.63
Other transferable securities Money Market Instruments Treasury Bills
Egypt
Egypt Treasury Bills 0.000% 04/01/2022 4,200,000 EGP 251,728 250,550 0.49
Egypt Treasury Bills 0.000% 29/03/2022 4,300,000 EGP 249,697 249,368 0.48
501,425 499,918 0.97
(2) See Note 13.
164

Natixis International Funds (Lux) I
The accompanying notes form an integral part of these financial statements.
Loomis Sayles Asia Bond Plus Fund Statement of Investments (continued) As at June 30, 2021 (expressed in USD)
Cost Evaluation % of Net
Assets
Total - Treasury Bills 501,425 499,918 0.97
Total - Money Market Instruments 501,425 499,918 0.97
Total - Other transferable securities 501,425 499,918 0.97
TOTAL INVESTMENT PORTFOLIO 50,902,482 49,782,866 96.72
A detailed schedule of portfolio movements for the period from January 1, 2021 to
June 30, 2021 is available free of charge upon request at the registered office of the SICAV.
165

Natixis International Funds (Lux) I
Ostrum Euro High Income Fund
Statistics
As at June 30, 2021
Net asset value per share
H-I/A (USD) 152.75
H-I/D (USD) 124.03
H-R/A (USD) 132.40
H-R/D (SGD) 56.55
H-RE/A (USD) 132.51
I/A (USD) 130.36
I/A (EUR) 175.30
I/D (USD) 105.78
I/D (EUR) 100.91
N/A (EUR) 111.26
N/D (EUR) 104.33
N1/A (EUR) 112.25
Q/A (EUR) 182.59
R/A (USD) 112.65
R/A (EUR) 160.18
R/D (USD) 105.67
R/D (EUR) 96.34
RE/A (EUR) 151.80
S/A (EUR) 177.29
S/D (EUR) 106.56
Number of shares outstanding
H-I/A (USD) 8,070.205
H-I/D (USD) 1,022.933
H-R/A (USD) 350.278
H-R/D (SGD) 1,325.429
H-RE/A (USD) 507.666
I/A (USD) 26.434
I/A (EUR) 411,953.653
I/D (USD) 32.574
I/D (EUR) 231,339.951
N/A (EUR) 20,353.458
N/D (EUR) 17,950.000
N1/A (EUR) 229,437.029
Q/A (EUR) 642.000
R/A (USD) 30.862
R/A (EUR) 10,950.138
R/D (USD) 32.672
R/D (EUR) 1,379.157
RE/A (EUR) 1,042.392
S/A (EUR) 367,499.206
S/D (EUR) 1,084,117.086
166

Natixis International Funds (Lux) I
The accompanying notes form an integral part of these financial statements.
Ostrum Euro High Income Fund Statement of Investments
As at June 30, 2021 (expressed in EUR)
Description Quantity / Face
value Currency Cost Evaluation % of Net
Assets
Transferable securities admitted to an official stock exchange listing Fixed rate bonds
Austria
Sappi Papier Holding GmbH 3.625% 15/03/2028 1,200,000 EUR 1,200,000 1,200,807 0.39
1,200,000 1,200,807 0.39 France
Altice France SA/France 4.125% 15/01/2029 3,000,000 EUR 3,047,540 3,003,750 0.97
Altice France SA/France 5.875% 01/02/2027 2,000,000 EUR 2,117,853 2,119,584 0.69
Altice France SA/France 7.375% 01/05/2026 1,333,000 USD 1,247,784 1,168,454 0.38
CAB SELAS 3.375% 01/02/2028 1,900,000 EUR 1,900,000 1,890,500 0.61
Casino Guichard Perrachon SA 4.561% 25/01/2023 EMTN 3,600,000 EUR 3,562,223 3,729,240 1.20
Faurecia SE 3.125% 15/06/2026 3,000,000 EUR 3,089,056 3,101,250 1.00
Laboratoire Eimer Selas 5.000% 01/02/2029 2,000,000 EUR 2,028,310 2,036,532 0.66
Loxam SAS 3.250% 14/01/2025 1,000,000 EUR 1,016,289 1,006,800 0.33
Loxam SAS 4.250% 15/04/2024 900,000 EUR 906,663 907,744 0.29
Loxam SAS 5.750% 15/07/2027 2,000,000 EUR 2,067,477 2,080,000 0.67
Mobilux Finance SAS 4.250% 15/07/2028 3,300,000 EUR 3,300,000 3,301,898 1.07
Orano SA 2.750% 08/03/2028 EMTN 2,000,000 EUR 2,025,453 2,088,000 0.67
Paprec Holding SA 3.500% 01/07/2028 2,900,000 EUR 2,900,000 2,892,363 0.93
Parts Europe SA 6.500% 16/07/2025 3,000,000 EUR 3,045,916 3,143,100 1.02
Quatrim SASU 5.875% 15/01/2024 1,000,000 EUR 1,042,071 1,038,870 0.34
Renault SA 2.000% 28/09/2026 EMTN 2,000,000 EUR 1,820,877 1,989,328 0.64
SPCM SA 2.625% 01/02/2029 5,500,000 EUR 5,603,554 5,644,375 1.82
40,721,066 41,141,788 13.29 Germany
Cheplapharm Arzneimittel GmbH 3.500% 11/02/2027 1,800,000 EUR 1,800,000 1,817,798 0.59
Deutsche Lufthansa AG 2.875% 11/02/2025 2,000,000 EUR 2,002,004 2,035,360 0.66
Deutsche Lufthansa AG 3.750% 11/02/2028 EMTN 1,000,000 EUR 992,873 1,030,100 0.33
IHO Verwaltungs GmbH 3.625% 15/05/2025 1,100,000 EUR 1,100,000 1,117,072 0.36
Mahle GmbH 2.375% 14/05/2028 EMTN 4,300,000 EUR 4,300,000 4,283,875 1.38
Nidda Healthcare Holding GmbH 3.500% 30/09/2024 2,000,000 EUR 2,011,380 1,994,516 0.65
Schaeffler AG 2.750% 12/10/2025 EMTN 2,100,000 EUR 2,100,000 2,241,750 0.72
Schaeffler AG 3.375% 12/10/2028 EMTN 1,800,000 EUR 1,800,000 1,984,234 0.64
ZF Finance GmbH 3.000% 21/09/2025 EMTN 2,000,000 EUR 1,990,366 2,119,640 0.69
ZF Finance GmbH 3.750% 21/09/2028 EMTN 4,500,000 EUR 4,894,796 4,924,800 1.59
22,991,419 23,549,145 7.61 Great Britain
INEOS Finance PLC 3.375% 31/03/2026 2,400,000 EUR 2,400,000 2,482,147 0.80
International Game Technology PLC 3.500% 15/06/2026 2,000,000 EUR 2,068,593 2,048,000 0.66
Virgin Media Secured Finance PLC 5.250% 15/05/2029 4,000,000 GBP 4,924,144 4,913,577 1.59
9,392,737 9,443,724 3.05 Ireland
eircom Finance DAC 3.500% 15/05/2026 2,000,000 EUR 2,061,593 2,046,904 0.66
2,061,593 2,046,904 0.66 Isle of Man
Playtech PLC 3.750% 12/10/2023 2,000,000 EUR 2,024,049 2,027,000 0.66
2,024,049 2,027,000 0.66
167

Natixis International Funds (Lux) I
The accompanying notes form an integral part of these financial statements.
Ostrum Euro High Income Fund Statement of Investments (continued) As at June 30, 2021 (expressed in EUR)
Description Quantity / Face
value Currency Cost Evaluation % of Net
Assets
Italy
Autostrade per l'Italia SpA 1.875% 04/11/2025 EMTN 7,000,000 EUR 7,102,101 7,277,592 2.35
Autostrade per l'Italia SpA 6.250% 09/06/2022 EMTN 2,000,000 GBP 2,408,044 2,437,078 0.79
Nexi SpA 1.625% 30/04/2026 3,000,000 EUR 2,991,842 2,984,760 0.96
Nexi SpA 2.125% 30/04/2029 3,000,000 EUR 2,986,975 2,968,800 0.96
Telecom Italia SpA/Milano 1.125% 26/03/2022 2,000,000 EUR 1,994,971 2,006,318 0.65
17,483,933 17,674,548 5.71 Luxembourg
ADLER Group SA 1.500% 26/07/2024 1,000,000 EUR 984,591 979,916 0.32
ADLER Group SA 1.875% 14/01/2026 3,500,000 EUR 3,438,863 3,425,954 1.11
ADLER Group SA 2.250% 27/04/2027 2,100,000 EUR 2,071,941 2,067,438 0.67
ADLER Group SA 2.250% 14/01/2029 2,000,000 EUR 1,912,553 1,937,500 0.62
ARD Finance SA 5.000% 30/06/2027 3,000,000 EUR 3,013,841 3,076,260 0.99
Flamingo Lux II SCA 5.000% 31/03/2029 3,000,000 EUR 2,997,734 2,978,370 0.96
Garfunkelux Holdco 3 SA 6.750% 01/11/2025 1,400,000 EUR 1,400,000 1,458,111 0.47
Kleopatra Finco Sarl 4.250% 01/03/2026 1,500,000 EUR 1,509,078 1,505,775 0.49
Kleopatra Holdings 2 SCA 6.500% 01/09/2026 3,000,000 EUR 2,931,228 2,918,670 0.94
Telecom Italia Finance SA 7.750% 24/01/2033 EMTN 2,600,000 EUR 3,548,530 3,807,929 1.23
23,808,359 24,155,923 7.80 Mexico
Petroleos Mexicanos 2.750% 21/04/2027 EMTN 5,500,000 EUR 4,536,222 5,127,100 1.66
4,536,222 5,127,100 1.66 Multinational
Ardagh Packaging Finance PLC/Ardagh Holdings USA Inc 2.125% 15/08/2026 3,500,000 EUR 3,464,125 3,500,000 1.13
3,464,125 3,500,000 1.13 Netherlands
Ashland Services BV 2.000% 30/01/2028 2,000,000 EUR 2,000,000 2,026,068 0.65
Dufry One BV 3.375% 15/04/2028 6,000,000 EUR 5,954,607 5,955,000 1.92
Energizer Gamma Acquisition BV 3.500% 30/06/2029 3,200,000 EUR 3,200,000 3,192,369 1.03
Intertrust Group BV 3.375% 15/11/2025 4,000,000 EUR 4,012,402 4,080,000 1.32
Louis Dreyfus Co BV 1.625% 28/04/2028 3,000,000 EUR 2,978,435 3,029,430 0.98
OI European Group BV 2.875% 15/02/2025 4,000,000 EUR 3,968,964 4,056,928 1.31
Phoenix PIB Dutch Finance BV 2.375% 05/08/2025 3,000,000 EUR 3,090,858 3,100,002 1.00
Teva Pharmaceutical Finance Netherlands II BV 4.500% 01/03/2025 2,000,000 EUR 2,059,335 2,065,000 0.67
Teva Pharmaceutical Finance Netherlands II BV 6.000% 31/01/2025 1,500,000 EUR 1,500,000 1,614,810 0.52
Ziggo BV 2.875% 15/01/2030 2,500,000 EUR 2,506,409 2,500,000 0.81
31,271,010 31,619,607 10.21 Poland
Synthos SA 2.500% 07/06/2028 3,500,000 EUR 3,500,000 3,479,304 1.12
3,500,000 3,479,304 1.12 Spain
International Consolidated Airlines Group SA 2.750% 25/03/2025 5,000,000 EUR 4,998,323 5,000,046 1.62
International Consolidated Airlines Group SA 3.750% 25/03/2029 1,000,000 EUR 997,551 1,002,500 0.32
Lorca Telecom Bondco SA 4.000% 18/09/2027 4,000,000 EUR 4,077,525 4,070,000 1.31
10,073,399 10,072,546 3.25
168
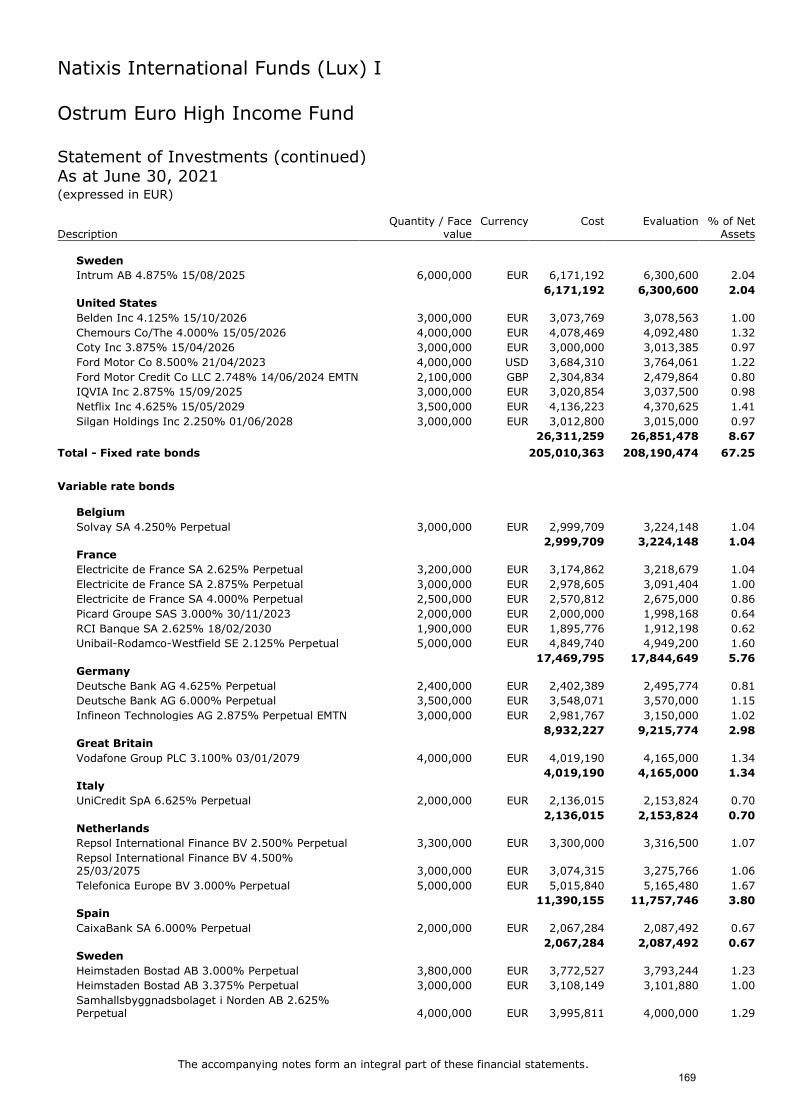
Natixis International Funds (Lux) I
The accompanying notes form an integral part of these financial statements.
Ostrum Euro High Income Fund Statement of Investments (continued) As at June 30, 2021 (expressed in EUR)
Description Quantity / Face
value Currency Cost Evaluation % of Net
Assets
Sweden
Intrum AB 4.875% 15/08/2025 6,000,000 EUR 6,171,192 6,300,600 2.04
6,171,192 6,300,600 2.04 United States
Belden Inc 4.125% 15/10/2026 3,000,000 EUR 3,073,769 3,078,563 1.00
Chemours Co/The 4.000% 15/05/2026 4,000,000 EUR 4,078,469 4,092,480 1.32
Coty Inc 3.875% 15/04/2026 3,000,000 EUR 3,000,000 3,013,385 0.97
Ford Motor Co 8.500% 21/04/2023 4,000,000 USD 3,684,310 3,764,061 1.22
Ford Motor Credit Co LLC 2.748% 14/06/2024 EMTN 2,100,000 GBP 2,304,834 2,479,864 0.80
IQVIA Inc 2.875% 15/09/2025 3,000,000 EUR 3,020,854 3,037,500 0.98
Netflix Inc 4.625% 15/05/2029 3,500,000 EUR 4,136,223 4,370,625 1.41
Silgan Holdings Inc 2.250% 01/06/2028 3,000,000 EUR 3,012,800 3,015,000 0.97
26,311,259 26,851,478 8.67
Total - Fixed rate bonds 205,010,363 208,190,474 67.25
Variable rate bonds
Belgium
Solvay SA 4.250% Perpetual 3,000,000 EUR 2,999,709 3,224,148 1.04
2,999,709 3,224,148 1.04 France
Electricite de France SA 2.625% Perpetual 3,200,000 EUR 3,174,862 3,218,679 1.04
Electricite de France SA 2.875% Perpetual 3,000,000 EUR 2,978,605 3,091,404 1.00
Electricite de France SA 4.000% Perpetual 2,500,000 EUR 2,570,812 2,675,000 0.86
Picard Groupe SAS 3.000% 30/11/2023 2,000,000 EUR 2,000,000 1,998,168 0.64
RCI Banque SA 2.625% 18/02/2030 1,900,000 EUR 1,895,776 1,912,198 0.62
Unibail-Rodamco-Westfield SE 2.125% Perpetual 5,000,000 EUR 4,849,740 4,949,200 1.60
17,469,795 17,844,649 5.76 Germany
Deutsche Bank AG 4.625% Perpetual 2,400,000 EUR 2,402,389 2,495,774 0.81
Deutsche Bank AG 6.000% Perpetual 3,500,000 EUR 3,548,071 3,570,000 1.15
Infineon Technologies AG 2.875% Perpetual EMTN 3,000,000 EUR 2,981,767 3,150,000 1.02
8,932,227 9,215,774 2.98 Great Britain
Vodafone Group PLC 3.100% 03/01/2079 4,000,000 EUR 4,019,190 4,165,000 1.34
4,019,190 4,165,000 1.34 Italy
UniCredit SpA 6.625% Perpetual 2,000,000 EUR 2,136,015 2,153,824 0.70
2,136,015 2,153,824 0.70 Netherlands
Repsol International Finance BV 2.500% Perpetual 3,300,000 EUR 3,300,000 3,316,500 1.07
Repsol International Finance BV 4.500% 25/03/2075 3,000,000 EUR 3,074,315 3,275,766 1.06
Telefonica Europe BV 3.000% Perpetual 5,000,000 EUR 5,015,840 5,165,480 1.67
11,390,155 11,757,746 3.80 Spain
CaixaBank SA 6.000% Perpetual 2,000,000 EUR 2,067,284 2,087,492 0.67
2,067,284 2,087,492 0.67 Sweden
Heimstaden Bostad AB 3.000% Perpetual 3,800,000 EUR 3,772,527 3,793,244 1.23
Heimstaden Bostad AB 3.375% Perpetual 3,000,000 EUR 3,108,149 3,101,880 1.00
Samhallsbyggnadsbolaget i Norden AB 2.625% Perpetual 4,000,000 EUR 3,995,811 4,000,000 1.29
169

Natixis International Funds (Lux) I
The accompanying notes form an integral part of these financial statements.
Ostrum Euro High Income Fund Statement of Investments (continued) As at June 30, 2021 (expressed in EUR)
Description Quantity / Face
value Currency Cost Evaluation % of Net
Assets
Samhallsbyggnadsbolaget i Norden AB 2.875% Perpetual 3,900,000 EUR 3,875,664 3,869,808 1.25
14,752,151 14,764,932 4.77
Total - Variable rate bonds 63,766,526 65,213,565 21.06
Investment Funds
Luxembourg
Natixis International Funds (Lux) I - Ostrum Short Term Global High Income Fund 63,739 EUR 7,003,724 7,342,095 2.37
7,003,724 7,342,095 2.37
Total - Investment Funds 7,003,724 7,342,095 2.37
Total - Transferable securities admitted to an official stock exchange listing 275,780,613 280,746,134 90.68
TOTAL INVESTMENT PORTFOLIO 275,780,613 280,746,134 90.68
A detailed schedule of portfolio movements for the period from January 1, 2021 to June 30, 2021 is available free of charge upon request at the registered office of the SICAV.
170

Natixis International Funds (Lux) I
Ostrum Global Inflation Fund
Statistics
As at June 30, 2021
Net asset value per share
DH-I/A (EUR) 81.03
I/A (EUR) 165.26
I/D (EUR) 89.87
N/A (EUR) 110.05
R/A (EUR) 153.72
R/D (EUR) 82.86
Number of shares outstanding
DH-I/A (EUR) 66,851.205
I/A (EUR) 200,020.274
I/D (EUR) 106,000.000
N/A (EUR) 9,832.447
R/A (EUR) 81,993.964
R/D (EUR) 16,972.101
171

Natixis International Funds (Lux) I
The accompanying notes form an integral part of these financial statements.
Ostrum Global Inflation Fund Statement of Investments As at June 30, 2021 (expressed in EUR)
Description Face value Currency Cost Evaluation % of Net
Assets
Transferable securities admitted to an official stock exchange listing Fixed rate bonds
Australia
Australia Government Bond 0.750% 21/11/2027 150,000 AUD 102,823 112,189 0.18
Australia Government Bond 1.000% 21/02/2050 50,000 AUD 39,467 40,942 0.06
Australia Government Bond 1.250% 21/08/2040 50,000 AUD 39,991 43,191 0.07
Australia Government Bond 2.000% 21/08/2035 475,000 AUD 444,306 455,791 0.72
Australia Government Bond 2.500% 20/09/2030 425,000 AUD 361,523 429,820 0.68
Australia Government Bond 3.000% 20/09/2025 85,000 AUD 72,618 80,790 0.13
1,060,728 1,162,723 1.84 Canada
Canadian Government Real Return Bond 1.250% 01/12/2047 208,247 CAD 169,585 183,003 0.29
Canadian Government Real Return Bond 4.000% 01/12/2031 230,297 CAD 220,357 230,238 0.36
Canadian Government Real Return Bond 4.250% 01/12/2026 535,156 CAD 458,040 470,467 0.75
847,982 883,708 1.40
France
French Republic Government Bond OAT 0.100% 25/07/2036 144A(2) 303,732 EUR 360,219 362,891 0.58
French Republic Government Bond OAT 0.100% 25/07/2047 144A(2) 276,320 EUR 330,517 350,115 0.55
French Republic Government Bond OAT 0.250% 25/07/2024 670,660 EUR 718,152 716,802 1.14
French Republic Government Bond OAT 0.700% 25/07/2030 144A(2) 309,665 EUR 370,152 374,317 0.59
French Republic Government Bond OAT 1.800% 25/07/2040 144A(2) 81,762 EUR 112,463 129,935 0.21
French Republic Government Bond OAT 1.850% 25/07/2027 660,226 EUR 809,420 810,333 1.28
French Republic Government Bond OAT 3.150% 25/07/2032 138,237 EUR 190,325 212,550 0.34
2,891,248 2,956,943 4.69 Germany
Deutsche Bundesrepublik Inflation Linked Bond 0.100% 15/04/2026 482,909 EUR 530,767 528,560 0.84
Deutsche Bundesrepublik Inflation Linked Bond 0.100% 15/04/2046 178,398 EUR 224,292 254,613 0.40
755,059 783,173 1.24 Great Britain
United Kingdom Inflation-Linked Gilt 0.125% 22/03/2026 956,087 GBP 1,286,219 1,287,665 2.04
United Kingdom Inflation-Linked Gilt 0.125% 10/08/2031 358,936 GBP 551,591 552,737 0.88
United Kingdom Inflation-Linked Gilt 0.125% 22/11/2036 225,808 GBP 372,055 387,199 0.61
United Kingdom Inflation-Linked Gilt 0.125% 10/08/2041 166,648 GBP 308,574 311,630 0.49
United Kingdom Inflation-Linked Gilt 0.125% 22/03/2044 288,156 GBP 448,348 561,238 0.89
United Kingdom Inflation-Linked Gilt 0.125% 22/03/2046 228,928 GBP 389,589 461,514 0.73
(2) See Note 13.
172

Natixis International Funds (Lux) I
The accompanying notes form an integral part of these financial statements.
Ostrum Global Inflation Fund Statement of Investments (continued)
As at June 30, 2021 (expressed in EUR)
Description Face value Currency Cost Evaluation % of Net
Assets
United Kingdom Inflation-Linked Gilt 0.125% 10/08/2048 219,146 GBP 439,067 465,009 0.74
United Kingdom Inflation-Linked Gilt 0.125% 22/11/2056 545,630 GBP 1,304,228 1,346,148 2.13
United Kingdom Inflation-Linked Gilt 0.125% 22/03/2058 522,450 GBP 1,228,662 1,329,461 2.11
United Kingdom Inflation-Linked Gilt 0.125% 22/11/2065 168,796 GBP 448,133 505,818 0.80
United Kingdom Inflation-Linked Gilt 0.125% 22/03/2068 288,198 GBP 794,517 932,130 1.48
United Kingdom Inflation-Linked Gilt 0.250% 22/03/2052 323,430 GBP 689,552 751,718 1.19
United Kingdom Inflation-Linked Gilt 0.375% 22/03/2062 287,273 GBP 753,315 842,412 1.34
United Kingdom Inflation-Linked Gilt 0.500% 22/03/2050 313,235 GBP 549,277 737,530 1.17
United Kingdom Inflation-Linked Gilt 0.625% 22/03/2040 319,843 GBP 523,594 626,150 0.99
United Kingdom Inflation-Linked Gilt 0.750% 22/03/2034 401,934 GBP 668,158 694,549 1.10
United Kingdom Inflation-Linked Gilt 0.750% 22/11/2047 231,875 GBP 508,204 545,931 0.87
United Kingdom Inflation-Linked Gilt 1.125% 22/11/2037 305,204 GBP 478,396 607,420 0.96
United Kingdom Inflation-Linked Gilt 1.250% 22/11/2027 597,339 GBP 849,299 899,346 1.43
United Kingdom Inflation-Linked Gilt 1.250% 22/11/2032 395,212 GBP 637,201 695,804 1.10
United Kingdom Inflation-Linked Gilt 1.250% 22/11/2055 248,306 GBP 693,981 766,278 1.21
United Kingdom Inflation-Linked Gilt 1.875% 22/11/2022 702,758 GBP 858,288 883,891 1.40
United Kingdom Inflation-Linked Gilt 2.000% 26/01/2035 120,000 GBP 322,362 409,474 0.65
United Kingdom Inflation-Linked Gilt 4.125% 22/07/2030 274,000 GBP 1,081,482 1,189,344 1.89
16,184,092 17,790,396 28.20 Italy
Italy Buoni Poliennali Del Tesoro 0.150% 15/05/2051 144A(2) 122,525 EUR 114,933 114,092 0.18
Italy Buoni Poliennali Del Tesoro 1.250% 15/09/2032 144A(2) 702,035 EUR 792,719 830,629 1.32
Italy Buoni Poliennali Del Tesoro 1.300% 15/05/2028 144A(2) 1,071,937 EUR 1,170,801 1,221,500 1.93
Italy Buoni Poliennali Del Tesoro 2.350% 15/09/2024 144A(2) 267,530 EUR 288,627 299,783 0.47
Italy Buoni Poliennali Del Tesoro 2.350%
15/09/2035 144A(2) 417,531 EUR 538,553 565,630 0.90
Italy Buoni Poliennali Del Tesoro 2.550% 15/09/2041 144A(2) 202,465 EUR 256,449 300,813 0.48
Italy Buoni Poliennali Del Tesoro 3.100% 15/09/2026 144A(2) 1,321,246 EUR 1,583,379 1,616,628 2.56
4,745,461 4,949,075 7.84 New Zealand
New Zealand Government Inflation Linked Bond 2.000% 20/09/2025 100,000 NZD 62,307 73,401 0.12
(2) See Note 13.
173

Natixis International Funds (Lux) I
The accompanying notes form an integral part of these financial statements.
Ostrum Global Inflation Fund Statement of Investments (continued)
As at June 30, 2021 (expressed in EUR)
Description Face value Currency Cost Evaluation % of Net
Assets
New Zealand Government Inflation Linked Bond 2.500% 20/09/2035 583,000 NZD 485,517 467,298 0.74
New Zealand Government Inflation Linked Bond 3.000% 20/09/2030 65,000 NZD 50,710 53,658 0.08
598,534 594,357 0.94 Spain
Spain Government Inflation Linked Bond 0.650% 30/11/2027 144A(2) 254,714 EUR 274,235 288,853 0.46
Spain Government Inflation Linked Bond 0.700% 30/11/2033 144A(2) 209,144 EUR 243,309 248,665 0.39
Spain Government Inflation Linked Bond 1.000% 30/11/2030 144A(2) 850,688 EUR 989,008 1,020,597 1.62
Spain Government Inflation Linked Bond 1.800% 30/11/2024 144A(2) 469,163 EUR 526,307 527,514 0.84
2,032,859 2,085,629 3.31 United States
U.S. Treasury Inflation Indexed Bonds 0.125% 15/02/2051 184,633 USD 158,716 171,506 0.27
U.S. Treasury Inflation Indexed Bonds 0.250% 15/02/2050 727,118 USD 655,577 695,766 1.10
U.S. Treasury Inflation Indexed Bonds 0.625% 15/02/2043 406,543 USD 367,131 410,228 0.65
U.S. Treasury Inflation Indexed Bonds 0.750% 15/02/2042 481,963 USD 470,229 496,037 0.79
U.S. Treasury Inflation Indexed Bonds 0.750% 15/02/2045 446,828 USD 424,251 465,632 0.74
U.S. Treasury Inflation Indexed Bonds 0.875% 15/02/2047 604,267 USD 604,387 656,892 1.04
U.S. Treasury Inflation Indexed Bonds 1.000% 15/02/2046 358,296 USD 360,768 395,908 0.63
U.S. Treasury Inflation Indexed Bonds 1.000% 15/02/2048 322,830 USD 330,663 363,746 0.58
U.S. Treasury Inflation Indexed Bonds 1.000% 15/02/2049 249,398 USD 261,846 283,875 0.45
U.S. Treasury Inflation Indexed Bonds 1.375% 15/02/2044 400,134 USD 408,144 466,643 0.74
U.S. Treasury Inflation Indexed Bonds 2.000% 15/01/2026 1,762,618 USD 1,694,969 1,749,221 2.77
U.S. Treasury Inflation Indexed Bonds 2.125% 15/02/2040 264,410 USD 259,403 332,847 0.53
U.S. Treasury Inflation Indexed Bonds 2.125% 15/02/2041 481,691 USD 481,105 613,178 0.97
U.S. Treasury Inflation Indexed Bonds 2.500% 15/01/2029 565,952 USD 557,850 615,138 0.98
U.S. Treasury Inflation Indexed Bonds 3.375% 15/04/2032 120,362 USD 147,549 149,852 0.24
U.S. Treasury Inflation Indexed Bonds 3.625%
15/04/2028 1,155,791 USD 1,225,195 1,315,270 2.08
U.S. Treasury Inflation Indexed Bonds 3.875% 15/04/2029 763,506 USD 801,970 906,213 1.44
U.S. Treasury Inflation Indexed Note 0.125% 15/01/2023 347,091 USD 300,846 305,736 0.48
U.S. Treasury Inflation Indexed Note 0.125% 15/07/2026 1,448,343 USD 1,311,921 1,337,601 2.12
U.S. Treasury Inflation Indexed Note 0.125% 15/01/2030 2,441,305 USD 2,215,484 2,260,757 3.58
(2) See Note 13.
174

Natixis International Funds (Lux) I
The accompanying notes form an integral part of these financial statements.
Ostrum Global Inflation Fund Statement of Investments (continued) As at June 30, 2021 (expressed in EUR)
Description Face value Currency Cost Evaluation % of Net
Assets
U.S. Treasury Inflation Indexed Note 0.125% 15/01/2031 307,764 USD 277,810 285,687 0.45
U.S. Treasury Inflation Indexed Note 0.250% 15/01/2025 3,754,575 USD 3,373,414 3,426,739 5.43
U.S. Treasury Inflation Indexed Note 0.250% 15/07/2029 1,044,020 USD 953,486 979,751 1.55
U.S. Treasury Inflation Indexed Note 0.375% 15/07/2023 4,360,652 USD 3,837,394 3,910,601 6.20
U.S. Treasury Inflation Indexed Note 0.375% 15/01/2027 1,790,975 USD 1,606,593 1,672,153 2.65
U.S. Treasury Inflation Indexed Note 0.500% 15/01/2028 1,028,527 USD 954,724 973,015 1.54
U.S. Treasury Inflation Indexed Note 0.625% 15/04/2023 1,773,965 USD 1,579,241 1,582,038 2.51
U.S. Treasury Inflation Indexed Note 0.625% 15/01/2024 2,060,154 USD 1,840,698 1,870,993 2.97
U.S. Treasury Inflation Indexed Note 0.750% 15/07/2028 537,264 USD 502,885 520,146 0.82
27,964,249 29,213,169 46.30
Total - Fixed rate bonds 57,080,212 60,419,173 95.76
Total - Transferable securities admitted to an official stock exchange listing 57,080,212 60,419,173 95.76
Other transferable securities Fixed rate bonds
Canada
Canadian Government Real Return Bond 0.500% 01/12/2050 53,976 CAD 38,719 40,872 0.06
Canadian Government Real Return Bond 1.500% 01/12/2044 63,111 CAD 54,089 56,480 0.09
Canadian Government Real Return Bond 2.000% 01/12/2041 251,035 CAD 227,062 238,922 0.38
Canadian Government Real Return Bond 3.000% 01/12/2036 173,006 CAD 158,636 175,459 0.28
478,506 511,733 0.81 New Zealand
New Zealand Government Inflation Linked Bond 2.500% 20/09/2040 46,000 NZD 36,741 36,410 0.06
36,741 36,410 0.06
Total - Fixed rate bonds 515,247 548,143 0.87
Total - Other transferable securities 515,247 548,143 0.87
TOTAL INVESTMENT PORTFOLIO 57,595,459 60,967,316 96.63
A detailed schedule of portfolio movements for the period from January 1, 2021 to
June 30, 2021 is available free of charge upon request at the registered office of the SICAV.
175
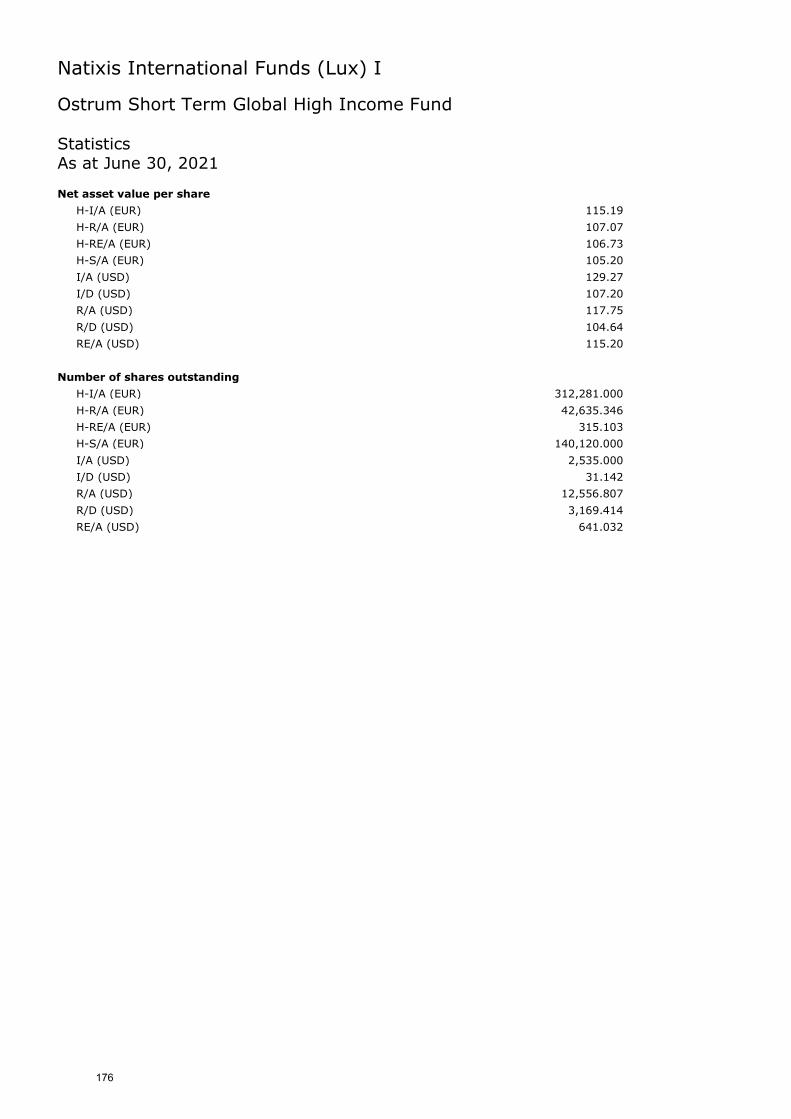
Natixis International Funds (Lux) I
Ostrum Short Term Global High Income Fund
Statistics
As at June 30, 2021
Net asset value per share
H-I/A (EUR) 115.19
H-R/A (EUR) 107.07
H-RE/A (EUR) 106.73
H-S/A (EUR) 105.20
I/A (USD) 129.27
I/D (USD) 107.20
R/A (USD) 117.75
R/D (USD) 104.64
RE/A (USD) 115.20
Number of shares outstanding
H-I/A (EUR) 312,281.000
H-R/A (EUR) 42,635.346
H-RE/A (EUR) 315.103
H-S/A (EUR) 140,120.000
I/A (USD) 2,535.000
I/D (USD) 31.142
R/A (USD) 12,556.807
R/D (USD) 3,169.414
RE/A (USD) 641.032
176

Natixis International Funds (Lux) I
The accompanying notes form an integral part of these financial statements.
Ostrum Short Term Global High Income Fund Statement of Investments
As at June 30, 2021 (expressed in USD)
Description Quantity/Face
value Currency Cost Evaluation % of Net
Assets
Transferable securities admitted to an official stock exchange listing Fixed rate bonds
France
Altice France SA/France 7.375% 01/05/2026 578,000 USD 598,128 600,838 0.89
Casino Guichard Perrachon SA 1.865% 13/06/2022 EMTN 400,000 EUR 455,569 473,444 0.70
Casino Guichard Perrachon SA 4.561% 25/01/2023 EMTN 400,000 EUR 506,101 491,389 0.72
Crown European Holdings SA 2.250% 01/02/2023 1,100,000 EUR 1,293,450 1,333,841 1.97
Elis SA 1.000% 03/04/2025 EMTN 1,300,000 EUR 1,411,987 1,532,220 2.26
Fnac Darty SA 1.875% 30/05/2024 300,000 EUR 334,320 358,207 0.53
Loxam SAS 3.500% 15/04/2022 800,000 EUR 860,000 948,720 1.40
Loxam SAS 4.250% 15/04/2024 200,000 EUR 240,260 239,221 0.35
Nexans SA 3.750% 08/08/2023 400,000 EUR 502,066 503,415 0.74
Orano SA 4.875% 23/09/2024 EMTN 400,000 EUR 520,797 536,638 0.79
Parts Europe SA 6.500% 16/07/2025 600,000 EUR 722,401 745,480 1.10
SPCM SA 2.000% 01/02/2026 1,000,000 EUR 1,196,039 1,207,839 1.78
SPCM SA 4.875% 15/09/2025 500,000 USD 511,654 512,177 0.76
9,152,772 9,483,429 13.99 Germany
ADLER Real Estate AG 1.875% 27/04/2023 500,000 EUR 598,585 595,091 0.87
Deutsche Lufthansa AG 2.875% 11/02/2025 600,000 EUR 715,689 724,120 1.07
IHO Verwaltungs GmbH 3.625% 15/05/2025 500,000 EUR 557,878 602,153 0.89
Nidda Healthcare Holding GmbH 3.500% 30/09/2024 1,100,000 EUR 1,221,705 1,300,913 1.92
Schaeffler AG 1.125% 26/03/2022 EMTN 700,000 EUR 786,816 834,953 1.23
Techem Verwaltungsgesellschaft 675 mbH 2.000% 15/07/2025 600,000 EUR 678,981 704,211 1.04
thyssenkrupp AG 1.375% 03/03/2022 600,000 EUR 738,206 711,896 1.05
ZF Finance GmbH 3.000% 21/09/2025 EMTN 800,000 EUR 954,045 1,005,472 1.48
6,251,905 6,478,809 9.55 Great Britain
FCE Bank PLC 0.869% 13/09/2021 EMTN 500,000 EUR 552,816 593,314 0.88
International Game Technology PLC 3.500% 15/07/2024 300,000 EUR 348,852 373,092 0.55
Virgin Media Secured Finance PLC 5.000% 15/04/2027 900,000 GBP 1,308,821 1,290,600 1.90
2,210,489 2,257,006 3.33 Ireland
Bank of Ireland 10.000% 19/12/2022 EMTN 500,000 EUR 624,619 677,102 1.00
eircom Finance DAC 3.500% 15/05/2026 800,000 EUR 992,789 970,969 1.43
1,617,408 1,648,071 2.43 Isle of Man
Playtech PLC 3.750% 12/10/2023 800,000 EUR 919,054 961,528 1.42
919,054 961,528 1.42 Italy
Autostrade per l'Italia SpA 1.875% 04/11/2025 EMTN 400,000 EUR 498,281 493,171 0.73
Autostrade per l'Italia SpA 6.250% 09/06/2022 EMTN 400,000 GBP 558,768 578,026 0.85
Intesa Sanpaolo SpA 6.625% 13/09/2023 EMTN 1,000,000 EUR 1,235,599 1,341,893 1.98
Leonardo SpA 5.250% 21/01/2022 200,000 EUR 226,273 243,797 0.36
177

Natixis International Funds (Lux) I
The accompanying notes form an integral part of these financial statements.
Ostrum Short Term Global High Income Fund Statement of Investments (continued) As at June 30, 2021 (expressed in USD)
Description Quantity / Face
value Currency Cost Evaluation % of Net
Assets
Nexi SpA 1.625% 30/04/2026 600,000 EUR 718,258 707,926 1.04
Nexi SpA 1.750% 31/10/2024 200,000 EUR 245,100 241,873 0.36
Telecom Italia SpA/Milano 4.000% 11/04/2024 EMTN 400,000 EUR 452,626 511,702 0.76
Telecom Italia SpA/Milano 5.250% 10/02/2022 EMTN 300,000 EUR 332,893 367,037 0.54
UniCredit SpA 6.950% 31/10/2022 EMTN 800,000 EUR 944,063 1,033,631 1.52
5,211,861 5,519,056 8.14 Japan
SoftBank Group Corp 3.125% 19/09/2025 600,000 EUR 751,530 732,886 1.08
751,530 732,886 1.08 Luxembourg
ADLER Group SA 1.500% 26/07/2024 800,000 EUR 950,634 929,666 1.37
ADLER Group SA 1.875% 14/01/2026 300,000 EUR 363,858 348,243 0.51
ARD Finance SA 5.000% 30/06/2027 300,000 EUR 363,708 364,814 0.54
Garfunkelux Holdco 3 SA 6.750% 01/11/2025 300,000 EUR 355,065 370,537 0.55
INEOS Group Holdings SA 5.375% 01/08/2024 300,000 EUR 336,811 356,595 0.53
Kleopatra Finco Sarl 4.250% 01/03/2026 600,000 EUR 712,357 714,279 1.05
3,082,433 3,084,134 4.55 Multinational
Ardagh Packaging Finance PLC/Ardagh Holdings USA Inc 2.125% 15/08/2026 200,000 EUR 242,585 237,180 0.35
242,585 237,180 0.35 Netherlands
Dufry One BV 2.500% 15/10/2024 1,100,000 EUR 1,317,948 1,298,236 1.92
Dufry One BV 3.625% 15/04/2026 300,000 CHF 327,405 326,506 0.48
Energizer Gamma Acquisition BV 4.625% 15/07/2026 900,000 EUR 1,107,700 1,091,965 1.61
Louis Dreyfus Co BV 2.375% 27/11/2025 500,000 EUR 642,318 628,304 0.93
OI European Group BV 2.875% 15/02/2025 500,000 EUR 561,929 601,389 0.89
OI European Group BV 3.125% 15/11/2024 400,000 EUR 469,099 490,423 0.72
Phoenix PIB Dutch Finance BV 2.375% 05/08/2025 500,000 EUR 625,866 612,715 0.90
PPF Telecom Group BV 2.125% 31/01/2025 EMTN 500,000 EUR 622,284 608,568 0.90
Summer BidCo BV 9.000% 15/11/2025 209,750 EUR 266,509 253,449 0.37
Teva Pharmaceutical Finance Netherlands II BV
1.250% 31/03/2023 300,000 EUR 337,345 347,765 0.51
United Group BV 4.875% 01/07/2024 200,000 EUR 226,034 239,730 0.35
Ziggo Bond Co BV 6.000% 15/01/2027 144A(2) 700,000 USD 730,506 731,500 1.08
7,234,943 7,230,550 10.66 Romania
RCS & RDS SA 2.500% 05/02/2025 700,000 EUR 769,523 829,873 1.22
769,523 829,873 1.22 Spain
El Corte Ingles SA 3.000% 15/03/2024 700,000 EUR 816,017 840,091 1.24
International Consolidated Airlines Group SA 0.500% 04/07/2023 300,000 EUR 351,858 345,097 0.51
International Consolidated Airlines Group SA 2.750% 25/03/2025 600,000 EUR 722,805 711,547 1.05
Lorca Telecom Bondco SA 4.000% 18/09/2027 600,000 EUR 744,715 723,992 1.06
2,635,395 2,620,727 3.86 Sweden
Intrum AB 4.875% 15/08/2025 600,000 EUR 741,326 747,188 1.10
(2) See Note 13.
178

Natixis International Funds (Lux) I
The accompanying notes form an integral part of these financial statements.
Ostrum Short Term Global High Income Fund Statement of Investments (continued) As at June 30, 2021 (expressed in USD)
Description Quantity / Face
value Currency Cost Evaluation % of Net
Assets
Verisure Holding AB 3.500% 15/05/2023 300,000 EUR 365,022 358,616 0.53
Verisure Holding AB 3.875% 15/07/2026 500,000 EUR 617,467 605,882 0.89
Volvo Car AB 2.125% 02/04/2024 EMTN 300,000 EUR 340,993 371,335 0.55
2,064,808 2,083,021 3.07
United States
Ball Corp 4.375% 15/12/2023 700,000 EUR 893,699 911,156 1.34
Belden Inc 4.125% 15/10/2026 600,000 EUR 749,813 730,174 1.08
Chemours Co 4.000% 15/05/2026 800,000 EUR 983,464 970,654 1.43
Coty Inc 3.875% 15/04/2026 700,000 EUR 852,985 833,834 1.23
Ford Motor Co 8.500% 21/04/2023 400,000 USD 429,249 446,380 0.66
Ford Motor Credit Co LLC 2.748% 14/06/2024 EMTN 300,000 GBP 399,510 420,124 0.62
HCA Inc 5.375% 01/02/2025 300,000 USD 334,652 338,400 0.50
IQVIA Inc 2.875% 15/09/2025 500,000 EUR 569,682 600,362 0.89
Lennar Corp 4.125% 15/01/2022 600,000 USD 601,296 606,010 0.89
Lennar Corp 4.750% 15/11/2022 600,000 USD 614,229 627,750 0.93
Level 3 Financing Inc 5.250% 15/03/2026 700,000 USD 716,563 721,357 1.06
Lumen Technologies Inc 5.800% 15/03/2022 700,000 USD 709,079 720,363 1.06
MGM Resorts International 6.000% 15/03/2023 800,000 USD 841,559 855,760 1.26
Netflix Inc 3.000% 15/06/2025 200,000 EUR 266,024 258,092 0.38
Sealed Air Corp 4.500% 15/09/2023 EMTN 700,000 EUR 814,404 895,672 1.32
Tenet Healthcare Corp 4.625% 15/07/2024 400,000 USD 402,499 405,880 0.60
Toll Brothers Finance Corp 5.875% 15/02/2022 1,000,000 USD 1,007,036 1,020,110 1.51
11,185,743 11,362,078 16.76
Total - Fixed rate bonds 53,330,449 54,528,348 80.41
Variable rate bonds
France
Goldstory SASU 5.500% 01/03/2026 200,000 EUR 242,450 239,274 0.35
Picard Groupe SAS 3.000% 30/11/2023 800,000 EUR 949,963 947,851 1.40
1,192,413 1,187,125 1.75
Luxembourg
Garfunkelux Holdco 3 SA 6.250% 01/05/2026 200,000 EUR 233,590 240,738 0.36
233,590 240,738 0.36 Netherlands
Trivium Packaging Finance BV 3.750% 15/08/2026 600,000 EUR 665,730 710,584 1.05
665,730 710,584 1.05
Total - Variable rate bonds 2,091,733 2,138,447 3.16
Investment Funds
France
Natixis Investment Managers International - Ostrum
Global Subordinated Debt 92 USD 943,244 1,290,784 1.90
943,244 1,290,784 1.90
Total - Investment Funds 943,244 1,290,784 1.90
Total - Transferable securities admitted to an official stock exchange listing 56,365,426 57,957,579 85.47
179

Natixis International Funds (Lux) I
The accompanying notes form an integral part of these financial statements.
Ostrum Short Term Global High Income Fund Statement of Investments (continued) As at June 30, 2021 (expressed in USD)
Description Quantity / Face
value Currency Cost Evaluation % of Net
Assets
Transferable securities dealt in on another regulated market Fixed rate bonds
France
Altice France SA/France 8.125% 01/02/2027 144A(2) 300,000 USD 327,021 326,850 0.48
327,021 326,850 0.48 Multinational
Ardagh Packaging Finance PLC/Ardagh Holdings USA Inc 5.250% 30/04/2025 144A(2) 900,000 USD 942,956 946,125 1.40
942,956 946,125 1.40 Netherlands
OI European Group BV 4.000% 15/03/2023 144A(2) 700,000 USD 701,134 723,044 1.07
701,134 723,044 1.07 United States
CCO Holdings LLC/CCO Holdings Capital Corp 5.750% 15/02/2026 458,000 USD 469,532 473,391 0.70
Sprint Corp 7.250% 15/09/2021 1,500,000 USD 1,511,975 1,522,170 2.24
1,981,507 1,995,561 2.94
Total - Fixed rate bonds 3,952,618 3,991,580 5.89
Total - Transferable securities dealt in on another regulated market 3,952,618 3,991,580 5.89
Other transferable securities Fixed rate bonds
United States
Newell Brands Inc 3.750% 01/10/2021 900,000 EUR 1,007,311 1,084,654 1.60
1,007,311 1,084,654 1.60
Total - Fixed rate bonds 1,007,311 1,084,654 1.60
Total - Other transferable securities 1,007,311 1,084,654 1.60
TOTAL INVESTMENT PORTFOLIO 61,325,355 63,033,813 92.96
A detailed schedule of portfolio movements for the period from January 1, 2021 to June 30, 2021 is available free of charge upon request at the registered office of the SICAV.
180

Natixis International Funds (Lux) I
ASG Managed Futures Fund
Statistics
As at June 30, 2021
Net asset value per share
H-I/A (GBP) 109.58
H-N1/A (GBP) 125.50
H-R/A (EUR) 105.08
H-S1/A (EUR) 109.69
H-S1/A (GBP) 114.48
I/A (USD) 115.92
R/A (USD) 111.92
S/A (USD) 117.24
Number of shares outstanding
H-I/A (GBP) 179.741
H-N1/A (GBP) 30.000
H-R/A (EUR) 5,055.390
H-S1/A (EUR) 742,130.000
H-S1/A (GBP) 6,366.955
I/A (USD) 19,390.570
R/A (USD) 36,493.652
S/A (USD) 283,366.050
181

Natixis International Funds (Lux) I
The accompanying notes form an integral part of these financial statements.
ASG Managed Futures Fund Statement of Investments As at June 30, 2021 (expressed in USD)
Description Quantity / Face
value Currency Cost Evaluation % of Net
Assets
Transferable securities admitted to an official stock exchange listing Investment Funds
Jersey
WisdomTree Aluminium 338,771 USD 1,085,602 1,197,894 0.87
WisdomTree Brent Crude Oil 82,471 USD 2,569,323 2,556,189 1.86
WisdomTree Copper 48,962 USD 1,706,123 1,858,842 1.35
WisdomTree Gasoline 64,858 USD 1,602,510 1,804,674 1.31
WisdomTree Heating Oil 168,606 USD 1,585,136 1,848,765 1.34
WisdomTree Nickel 24,535 USD 423,072 416,482 0.30
WisdomTree Silver 24,559 USD 542,042 574,619 0.42
WisdomTree WTI Crude Oil 503,020 USD 2,889,247 3,297,296 2.39
12,403,055 13,554,761 9.84
Total - Investment Funds 12,403,055 13,554,761 9.84
Total - Transferable securities admitted to an official stock exchange listing 12,403,055 13,554,761 9.84
Transferable securities dealt in on another regulated market Money Market Instruments Certificates of Deposits
Germany DG Bank/NY 0.060% 03/09/2021 7,000,000 USD 7,000,000 6,999,659 5.08
7,000,000 6,999,659 5.08
Norway DNB Bank ASA 0.135% 27/10/2021 8,000,000 USD 8,000,000 8,000,687 5.81
8,000,000 8,000,687 5.81
United States Bank of Montreal 0.200% 23/06/2022 6,500,000 USD 6,500,000 6,498,903 4.72
Bank of Nova Scotia 0.220% 08/04/2022 5,000,000 USD 4,999,999 5,001,756 3.63
Canadian Imperial Bank of Commerce 0.150%
24/08/2021 5,000,000 USD 5,000,000 5,000,000 3.63
Canadian Imperial Bank of Commerce 0.210% 26/01/2022 1,000,000 USD 1,000,000 1,000,390 0.73
Commonwealth Bank of Australia/NY 0.140% 29/07/2021 5,000,000 USD 5,000,000 5,000,000 3.63
Mitsubishi UFJ Trust and Banking Corp 0.080% 07/09/2021 7,000,000 USD 7,000,000 6,999,865 5.08
Mizuho Bank Ltd 0.160% 16/11/2021 7,000,000 USD 7,000,000 7,000,999 5.08
Nordea Bank ABP NY 0.190% 14/07/2021 5,500,000 USD 5,500,060 5,500,060 3.99
Oversea Chinese Bank 0.150% 16/08/2021 5,500,000 USD 5,500,000 5,500,000 3.99
Royal Bank of Canada 0.140% 11/08/2021 5,500,000 USD 5,500,000 5,500,000 3.99
Royal Bank of Canada/New York NY 0.100% 08/02/2022 1,000,000 USD 1,000,000 999,727 0.73
Skandinaviska Enskilda Banken AB 0.130% 02/12/2021 6,500,000 USD 6,500,000 6,500,191 4.72
Sumitomo Mitsui Banking Corp 0.180% 17/08/2021 5,500,000 USD 5,500,000 5,500,000 3.99
Sumitomo Mitsui Trust Bank 0.150% 20/08/2021 6,000,000 USD 6,000,000 6,000,000 4.36
Svenska Handelsbanken/New York NY 0.150% 17/08/2021 5,500,000 USD 5,500,036 5,500,036 3.99
182

Natixis International Funds (Lux) I
The accompanying notes form an integral part of these financial statements.
ASG Managed Futures Fund Statement of Investments (continued) As at June 30, 2021 (expressed in USD)
Description Quantity / Face
value Currency Cost Evaluation % of Net
Assets
Toronto-Dominion Bank/NY 0.150% 22/07/2021 5,000,000 USD 5,000,015 5,000,015 3.63
82,500,110 82,501,942 59.89
Total - Certificates of Deposits 97,500,110 97,502,288 70.78
Commercial Papers
United States
Cooperatieve Centrale Raiffesen-Boerenleenbank BA 0.000% 09/08/2021 5,500,000 USD 5,499,166 5,499,166 3.99
5,499,166 5,499,166 3.99
Total - Commercial Papers 5,499,166 5,499,166 3.99
Total - Money Market Instruments 102,999,276 103,001,454 74.77
Total - Transferable securities dealt in on another regulated market 102,999,276 103,001,454 74.77
TOTAL INVESTMENT PORTFOLIO 115,402,331 116,556,215 84.61
A detailed schedule of portfolio movements for the period from January 1, 2021 to June 30, 2021 is available free of charge upon request at the registered office of the SICAV.
183

Natixis International Funds (Lux) I
Dorval Lux Convictions Fund(1)
Statistics
As at April 6, 2021
Net asset value per share
F/A (EUR) 108.04
I/A (EUR) 105.10
N/A (EUR) 108.15
R/A (EUR) 101.29
RE/A (EUR) 99.70
Number of shares outstanding
F/A (EUR) 30.000
I/A (EUR) 2,320.000
N/A (EUR) 30.000
R/A (EUR) 10,069.882
RE/A (EUR) 11,388.123
(1) See Note 1.
184

Natixis International Funds (Lux) I
Loomis Sayles Global Multi Asset Income Fund
Statistics
As at June 30, 2021
Net asset value per share
H-N/A (EUR) 124.09
H-R/A (EUR) 125.95
H-R/D (EUR) 112.13
H-R/DIV (EUR) 106.73
H-R/DIVM (EUR) 105.68
H-R/DM (EUR) 111.89
H-S/A (EUR) 128.35
I/A (USD) 153.72
I/D (USD) 123.37
I/DIVM (USD) 118.88
N/A (USD) 152.47
R/A (USD) 147.11
R/D (USD) 130.95
R/DM (USD) 143.33
RE/A (USD) 126.58
RE/D (USD) 123.41
RE/DM (USD) 143.25
Number of shares outstanding
H-N/A (EUR) 30.000
H-R/A (EUR) 54.526
H-R/D (EUR) 32.827
H-R/DIV (EUR) 112.865
H-R/DIVM (EUR) 264.224
H-R/DM (EUR) 32.895
H-S/A (EUR) 120,000.000
I/A (USD) 1,008.454
I/D (USD) 33.841
I/DIVM (USD) 33.953
N/A (USD) 30.000
R/A (USD) 678.796
R/D (USD) 985.425
R/DM (USD) 30.700
RE/A (USD) 30.000
RE/D (USD) 30.772
RE/DM (USD) 30.577
185

Natixis International Funds (Lux) I
The accompanying notes form an integral part of these financial statements.
Loomis Sayles Global Multi Asset Income Fund
Statement of Investments
As at June 30, 2021
(expressed in USD)
Description
Quantity / Face
value
Currency Cost Evaluation % of Net
Assets
Transferable securities admitted to an official stock exchange listing
Shares
Argentina
MercadoLibre Inc 16 USD 19,055 24,925 0.13
19,055 24,925 0.13
Australia
BHP Group PLC 1,301 GBP 37,293 38,282 0.20
37,293 38,282 0.20
Belgium
Anheuser-Busch InBev SA/NV 208 EUR 13,634 15,000 0.08
13,634 15,000 0.08
Canada
Lululemon Athletica Inc 47 USD 16,746 17,154 0.09
16,746 17,154 0.09
Denmark
AP Moller - Maersk A/S 5 DKK 11,696 14,373 0.08
Danske Bank A/S 823 DKK 14,492 14,483 0.08
DSV PANALPINA A/S 80 DKK 15,127 18,659 0.10
Genmab A/S 37 DKK 13,217 15,141 0.08
Novo Nordisk A/S 442 DKK 30,870 37,034 0.20
Vestas Wind Systems A/S 455 DKK 16,867 17,763 0.09
102,269 117,453 0.63
Finland
Kone Oyj 128 EUR 10,816 10,444 0.06
Nokia Oyj 4,570 EUR 20,613 24,472 0.13
Sampo Oyj 261 EUR 11,789 11,997 0.06
43,218 46,913 0.25
France
Air Liquide SA 125 EUR 21,128 21,889 0.12
Airbus SE 157 EUR 16,994 20,190 0.11
AXA SA 1,337 EUR 35,038 33,907 0.18
BNP Paribas SA 741 EUR 44,355 46,460 0.25
Bouygues SA 317 EUR 13,035 11,725 0.06
Capgemini SE 197 EUR 33,249 37,847 0.20
Cie de Saint-Gobain 357 EUR 21,769 23,514 0.13
Cie Generale des Etablissements Michelin SCA 199 EUR 28,586 31,741 0.17
Danone SA 201 EUR 14,006 14,152 0.08
Dassault Systemes SE 65 EUR 13,567 15,764 0.08
Engie SA 1,736 EUR 25,553 23,786 0.13
186
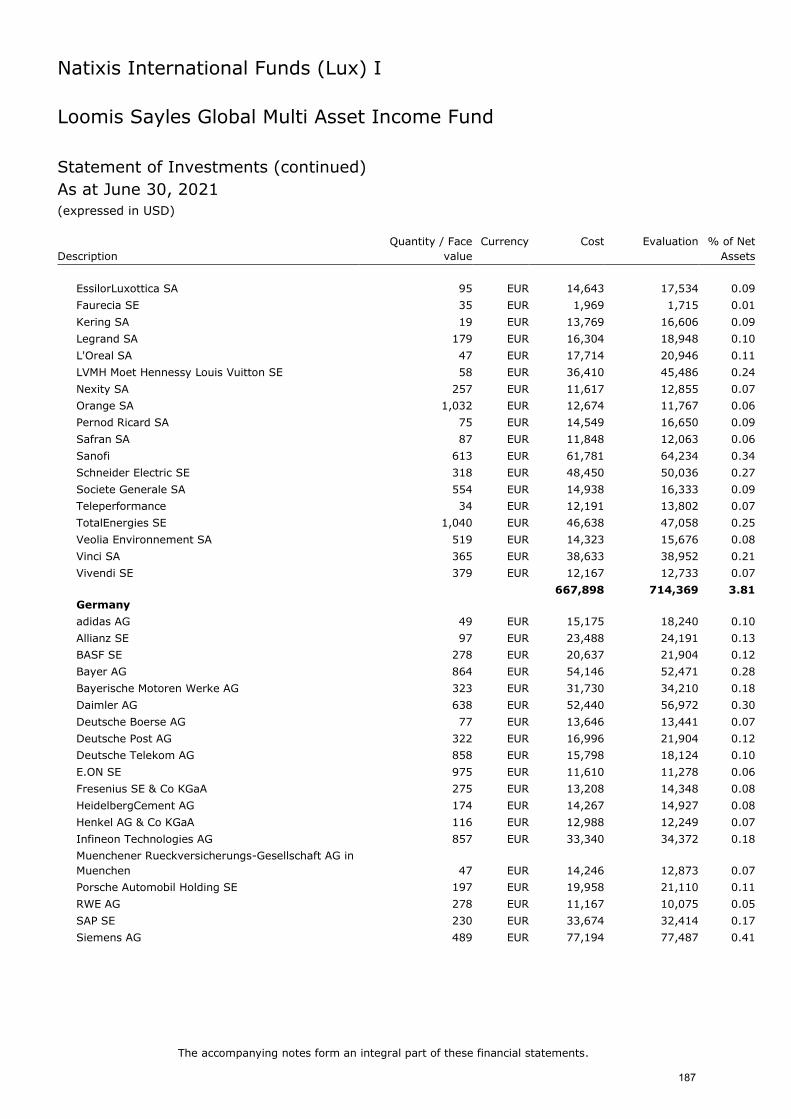
Natixis International Funds (Lux) I
The accompanying notes form an integral part of these financial statements.
Loomis Sayles Global Multi Asset Income Fund
Statement of Investments (continued)
As at June 30, 2021
(expressed in USD)
Description
Quantity / Face
value
Currency Cost Evaluation % of Net
Assets
EssilorLuxottica SA 95 EUR 14,643 17,534 0.09
Faurecia SE 35 EUR 1,969 1,715 0.01
Kering SA 19 EUR 13,769 16,606 0.09
Legrand SA 179 EUR 16,304 18,948 0.10
L'Oreal SA 47 EUR 17,714 20,946 0.11
LVMH Moet Hennessy Louis Vuitton SE 58 EUR 36,410 45,486 0.24
Nexity SA 257 EUR 11,617 12,855 0.07
Orange SA 1,032 EUR 12,674 11,767 0.06
Pernod Ricard SA 75 EUR 14,549 16,650 0.09
Safran SA 87 EUR 11,848 12,063 0.06
Sanofi 613 EUR 61,781 64,234 0.34
Schneider Electric SE 318 EUR 48,450 50,036 0.27
Societe Generale SA 554 EUR 14,938 16,333 0.09
Teleperformance 34 EUR 12,191 13,802 0.07
TotalEnergies SE 1,040 EUR 46,638 47,058 0.25
Veolia Environnement SA 519 EUR 14,323 15,676 0.08
Vinci SA 365 EUR 38,633 38,952 0.21
Vivendi SE 379 EUR 12,167 12,733 0.07
667,898 714,369 3.81
Germany
adidas AG 49 EUR 15,175 18,240 0.10
Allianz SE 97 EUR 23,488 24,191 0.13
BASF SE 278 EUR 20,637 21,904 0.12
Bayer AG 864 EUR 54,146 52,471 0.28
Bayerische Motoren Werke AG 323 EUR 31,730 34,210 0.18
Daimler AG 638 EUR 52,440 56,972 0.30
Deutsche Boerse AG 77 EUR 13,646 13,441 0.07
Deutsche Post AG 322 EUR 16,996 21,904 0.12
Deutsche Telekom AG 858 EUR 15,798 18,124 0.10
E.ON SE 975 EUR 11,610 11,278 0.06
Fresenius SE & Co KGaA 275 EUR 13,208 14,348 0.08
HeidelbergCement AG 174 EUR 14,267 14,927 0.08
Henkel AG & Co KGaA 116 EUR 12,988 12,249 0.07
Infineon Technologies AG 857 EUR 33,340 34,372 0.18
Muenchener Rueckversicherungs-Gesellschaft AG in
Muenchen 47 EUR 14,246 12,873 0.07
Porsche Automobil Holding SE 197 EUR 19,958 21,110 0.11
RWE AG 278 EUR 11,167 10,075 0.05
SAP SE 230 EUR 33,674 32,414 0.17
Siemens AG 489 EUR 77,194 77,487 0.41
187

Natixis International Funds (Lux) I
The accompanying notes form an integral part of these financial statements.
Loomis Sayles Global Multi Asset Income Fund
Statement of Investments (continued)
As at June 30, 2021
(expressed in USD)
Description
Quantity / Face
value
Currency Cost Evaluation % of Net
Assets
Siemens Energy AG 90 EUR 2,769 2,713 0.01
Sirius Real Estate Ltd 7,550 GBP 9,796 11,536 0.06
Volkswagen AG Preferred 161 EUR 40,020 40,324 0.22
Vonovia SE 194 EUR 13,226 12,543 0.07
551,519 569,706 3.04
Great Britain
Anglo American PLC 989 GBP 38,584 39,246 0.21
AstraZeneca PLC 319 GBP 34,157 38,264 0.20
Barclays PLC 17,097 GBP 39,937 40,416 0.22
Berkeley Group Holdings PLC 200 GBP 12,809 12,696 0.07
BP PLC 10,371 GBP 42,165 45,130 0.24
British American Tobacco PLC 2,114 GBP 79,791 81,771 0.44
Compass Group PLC 735 GBP 14,736 15,454 0.08
Diageo PLC 657 GBP 27,177 31,412 0.17
Ferguson PLC 124 GBP 14,314 17,216 0.09
GlaxoSmithKline PLC 1,331 GBP 25,722 26,099 0.14
HSBC Holdings PLC 4,919 GBP 26,273 28,357 0.15
Imperial Brands PLC 994 GBP 21,148 21,380 0.11
Linde PLC 103 USD 20,934 29,777 0.16
Lloyds Banking Group PLC 36,863 GBP 18,830 23,777 0.13
London Stock Exchange Group PLC 112 GBP 12,357 12,331 0.07
National Grid PLC 1,250 GBP 15,166 15,900 0.09
Ocado Group PLC 199 GBP 6,152 5,506 0.03
Prudential PLC 810 GBP 15,452 15,369 0.08
Reckitt Benckiser Group PLC 201 GBP 19,188 17,763 0.09
RELX PLC 618 GBP 15,662 16,383 0.09
Rio Tinto PLC 754 GBP 59,776 61,966 0.33
Smith & Nephew PLC 644 GBP 13,070 13,901 0.07
Tesco PLC 4,291 GBP 14,484 13,216 0.07
Unilever PLC 683 GBP 40,144 39,953 0.21
Vodafone Group PLC 19,243 GBP 34,033 32,256 0.17
WPP PLC 1,479 GBP 16,935 19,904 0.11
678,996 715,443 3.82
Hong Kong
CK Asset Holdings Ltd 3,000 HKD 18,774 20,706 0.11
Sun Hung Kai Properties Ltd 1,500 HKD 22,168 22,348 0.12
40,942 43,054 0.23
Ireland
CRH PLC 312 EUR 13,718 15,725 0.08
Experian PLC 366 GBP 13,774 14,086 0.08
188

Natixis International Funds (Lux) I
The accompanying notes form an integral part of these financial statements.
Loomis Sayles Global Multi Asset Income Fund
Statement of Investments (continued)
As at June 30, 2021
(expressed in USD)
Description
Quantity / Face
value
Currency Cost Evaluation % of Net
Assets
Flutter Entertainment PLC 56 EUR 10,704 10,141 0.05
38,196 39,952 0.21
Italy
Enel SpA 4,930 EUR 49,066 45,790 0.25
ENI SpA 1,431 EUR 15,784 17,428 0.09
Intesa Sanpaolo SpA 6,052 EUR 15,046 16,719 0.09
Snam SpA 2,100 EUR 11,506 12,141 0.07
UniCredit SpA 2,595 EUR 27,861 30,620 0.16
119,263 122,698 0.66
Japan
Hulic Co Ltd 1,300 JPY 14,468 14,641 0.08
Mitsubishi Estate Co Ltd 1,200 JPY 19,971 19,423 0.10
34,439 34,064 0.18
Jersey
Aptiv PLC 5.500% 15/06/2023 Preferred Convertible 100 USD 15,568 17,882 0.09
Clarivate PLC 5.250% 01/06/2024 Preferred
Convertible 500 USD 50,000 52,100 0.28
65,568 69,982 0.37
Luxembourg
Grand City Properties SA 361 EUR 9,083 9,752 0.05
9,083 9,752 0.05
Netherlands
Adyen NV 144A(2) 10 EUR 20,438 24,435 0.13
ASML Holding NV 99 EUR 52,526 68,024 0.36
ING Groep NV 3,116 EUR 36,598 41,165 0.22
Koninklijke Ahold Delhaize NV 1,589 EUR 44,893 47,242 0.25
Koninklijke DSM NV 84 EUR 14,451 15,679 0.08
Koninklijke Philips NV 384 EUR 21,743 19,031 0.10
NN Group NV 413 EUR 20,019 19,483 0.10
Prosus NV 130 EUR 14,106 12,714 0.07
Royal Dutch Shell PLC 729 GBP 12,208 14,089 0.08
Royal Dutch Shell PLC 2,333 GBP 44,267 46,629 0.25
Stellantis NV 1,559 EUR 27,800 30,593 0.16
Wolters Kluwer NV 159 EUR 13,934 15,975 0.09
322,983 355,059 1.89
Norway
Entra ASA 144A(2) 58 NOK 1,018 1,326 0.01
Mowi ASA 596 NOK 13,367 15,168 0.08
14,385 16,494 0.09
(2) See Note 13.
189

Natixis International Funds (Lux) I
The accompanying notes form an integral part of these financial statements.
Loomis Sayles Global Multi Asset Income Fund
Statement of Investments (continued)
As at June 30, 2021
(expressed in USD)
Description
Quantity / Face
value
Currency Cost Evaluation % of Net
Assets
South Africa
Thungela Resources Ltd 98 GBP 180 269 0.00
180 269 0.00
Spain
Amadeus IT Group SA 159 EUR 10,526 11,185 0.06
Banco Bilbao Vizcaya Argentaria SA 6,966 EUR 35,987 43,188 0.23
Banco Santander SA 12,846 EUR 44,021 49,046 0.26
Iberdrola SA 1,397 EUR 18,853 17,031 0.09
Industria de Diseno Textil SA 338 EUR 10,860 11,909 0.07
Telefonica SA 6,411 EUR 28,795 29,963 0.16
149,042 162,322 0.87
Sweden
Assa Abloy AB 508 SEK 13,786 15,314 0.08
Atlas Copco AB 273 SEK 15,467 16,727 0.09
Atrium Ljungberg AB 427 SEK 9,132 9,731 0.05
Castellum AB 439 SEK 9,577 11,180 0.06
Dios Fastigheter AB 1,407 SEK 13,543 14,585 0.08
Electrolux AB 526 SEK 13,796 14,595 0.08
Epiroc AB 751 SEK 15,244 17,124 0.09
Industrivarden AB 415 SEK 13,854 15,198 0.08
Sandvik AB 553 SEK 13,589 14,135 0.07
Swedish Match AB 1,600 SEK 13,024 13,654 0.07
Telefonaktiebolaget LM Ericsson 983 SEK 12,674 12,363 0.07
Volvo AB 1,134 SEK 28,283 27,302 0.15
171,969 181,908 0.97
Switzerland
ABB Ltd 611 CHF 18,375 20,749 0.11
Adecco Group AG 232 CHF 15,765 15,777 0.09
Alcon Inc 224 CHF 15,162 15,698 0.08
Chubb Ltd 136 USD 19,330 21,616 0.12
Cie Financiere Richemont SA 207 CHF 18,246 25,070 0.13
Credit Suisse Group AG 2,255 CHF 26,000 23,644 0.13
Givaudan SA 6 CHF 25,112 27,931 0.15
Holcim Ltd 664 CHF 38,722 39,868 0.21
Logitech International SA 145 CHF 13,996 17,585 0.09
Lonza Group AG 32 CHF 19,707 22,703 0.12
Nestle SA 597 CHF 70,653 74,416 0.40
Novartis AG 945 CHF 82,543 86,204 0.46
PSP Swiss Property AG 112 CHF 14,636 14,237 0.08
Roche Holding AG 151 CHF 51,676 56,939 0.30
Sika AG 63 CHF 17,139 20,617 0.11
190

Natixis International Funds (Lux) I
The accompanying notes form an integral part of these financial statements.
Loomis Sayles Global Multi Asset Income Fund
Statement of Investments (continued)
As at June 30, 2021
(expressed in USD)
Description
Quantity / Face
value
Currency Cost Evaluation % of Net
Assets
Swiss Re AG 132 CHF 12,040 11,921 0.06
UBS Group AG 1,168 CHF 16,779 17,893 0.10
Zurich Insurance Group AG 42 CHF 16,766 16,866 0.09
492,647 529,734 2.83
United States
3M Co 119 USD 21,247 23,637 0.13
Abbott Laboratories 323 USD 27,588 37,445 0.20
AbbVie Inc 317 USD 27,460 35,707 0.19
Activision Blizzard Inc 250 USD 22,498 23,860 0.13
Adobe Inc 98 USD 48,874 57,393 0.31
Advanced Micro Devices Inc 263 USD 21,763 24,704 0.13
Air Products & Chemicals Inc 83 USD 21,540 23,877 0.13
Alphabet Inc 101 USD 166,695 249,783 1.33
Amazon.com Inc 72 USD 233,019 247,692 1.32
American Electric Power Co Inc 385 USD 32,036 32,567 0.17
Amgen Inc 113 USD 22,963 27,544 0.15
Amphenol Corp 445 USD 26,055 30,442 0.16
Analog Devices Inc 152 USD 18,277 26,168 0.14
Anthem Inc 81 USD 22,823 30,926 0.16
Apple Inc 2,716 USD 219,022 371,983 1.98
AT&T Inc 1,103 USD 35,684 31,744 0.17
Autodesk Inc 80 USD 20,304 23,352 0.12
Bank of America Corp 3,251 USD 124,374 134,039 0.72
Baxter International Inc 260 USD 21,651 20,930 0.11
Becton Dickinson & Co 78 USD 19,155 18,969 0.10
Berkshire Hathaway Inc 153 USD 35,417 42,522 0.23
BlackRock Inc 36 USD 19,372 31,499 0.17
Boeing Co/The 105 USD 19,458 25,154 0.13
Booking Holdings Inc 13 USD 26,145 28,445 0.15
Boston Scientific Corp 536 USD 22,195 22,919 0.12
Broadcom Inc 67 USD 19,762 31,948 0.17
Broadcom Inc 8.000% 30/09/2022 Preferred
Convertible 5 USD 7,336 7,599 0.04
Cadence Design Systems Inc 212 USD 24,188 29,006 0.15
CarMax Inc 196 USD 21,658 25,313 0.14
Caterpillar Inc 117 USD 16,167 25,463 0.14
Charles Schwab Corp/The 318 USD 18,465 23,154 0.12
Charter Communications Inc 50 USD 30,752 36,072 0.19
Chevron Corp 310 USD 33,017 32,469 0.17
Chipotle Mexican Grill Inc 25 USD 33,926 38,758 0.21
191

Natixis International Funds (Lux) I
The accompanying notes form an integral part of these financial statements.
Loomis Sayles Global Multi Asset Income Fund
Statement of Investments (continued)
As at June 30, 2021
(expressed in USD)
Description
Quantity / Face
value
Currency Cost Evaluation % of Net
Assets
Cigna Corp 113 USD 22,546 26,789 0.14
Cisco Systems Inc/Delaware 832 USD 38,705 44,096 0.24
Citigroup Inc 310 USD 20,809 21,932 0.12
Citizens Financial Group Inc 601 USD 21,067 27,568 0.15
CMS Energy Corp Class REIT 490 USD 29,806 28,949 0.15
Coca-Cola Co/The 1,004 USD 51,960 54,326 0.29
Comcast Corp 808 USD 34,266 46,072 0.25
Costco Wholesale Corp 99 USD 30,793 39,171 0.21
CSX Corp 711 USD 17,573 22,809 0.12
CVS Health Corp 326 USD 22,177 27,201 0.15
Danaher Corp 153 USD 32,007 41,059 0.22
Danaher Corp 5.000% 15/04/2023 Preferred
Convertible 6 USD 8,240 8,852 0.05
DocuSign Inc 85 USD 19,866 23,763 0.13
Eaton Corp PLC 196 USD 19,539 29,043 0.15
Elanco Animal Health Inc 5.000% 01/02/2023
Preferred Convertible 201 USD 9,343 10,786 0.06
Eli Lilly & Co 169 USD 21,827 38,789 0.21
Emerson Electric Co 326 USD 22,244 31,374 0.17
Entergy Corp 299 USD 30,413 29,810 0.16
Eversource Energy 289 USD 24,768 23,189 0.12
Exxon Mobil Corp 731 USD 40,511 46,111 0.25
Facebook Inc 398 USD 108,968 138,389 0.74
FedEx Corp 67 USD 13,815 19,988 0.11
Fidelity National Information Services Inc 177 USD 23,405 25,076 0.13
Fiserv Inc 203 USD 21,242 21,699 0.12
General Electric Co 1,875 USD 14,217 25,237 0.13
General Mills Inc 442 USD 26,222 26,931 0.14
General Motors Co 373 USD 18,548 22,070 0.12
Gilead Sciences Inc 302 USD 23,022 20,796 0.11
Global Payments Inc 105 USD 19,309 19,692 0.11
Goldman Sachs Group Inc/The 75 USD 19,288 28,465 0.15
Halliburton Co 656 USD 13,756 15,167 0.08
HCA Healthcare Inc 98 USD 14,243 20,261 0.11
Home Depot Inc/The 137 USD 31,502 43,688 0.23
Honeywell International Inc 140 USD 24,256 30,709 0.16
Huntington Bancshares Inc/OH 1,747 USD 18,808 24,930 0.13
Illinois Tool Works Inc 151 USD 27,765 33,758 0.18
Illumina Inc 40 USD 15,259 18,928 0.10
Intel Corp 619 USD 32,049 34,751 0.19
192

Natixis International Funds (Lux) I
The accompanying notes form an integral part of these financial statements.
Loomis Sayles Global Multi Asset Income Fund
Statement of Investments (continued)
As at June 30, 2021
(expressed in USD)
Description
Quantity / Face
value
Currency Cost Evaluation % of Net
Assets
Intercontinental Exchange Inc 227 USD 22,554 26,945 0.14
International Paper Co 390 USD 15,861 23,911 0.13
Intuit Inc 60 USD 17,310 29,410 0.16
Intuitive Surgical Inc 31 USD 23,051 28,509 0.15
Johnson & Johnson 385 USD 54,359 63,425 0.34
Johnson Controls International PLC 557 USD 24,183 38,227 0.20
JPMorgan Chase & Co 980 USD 140,099 152,429 0.81
KeyCorp 1,295 USD 17,440 26,742 0.14
Kimberly-Clark Corp 224 USD 31,053 29,967 0.16
KKR & Co Inc 6.000% 15/09/2023 Preferred
Convertible 101 USD 7,250 7,783 0.04
KLA Corp 87 USD 16,993 28,206 0.15
Lam Research Corp 62 USD 22,383 40,343 0.22
Lincoln National Corp 400 USD 21,901 25,136 0.13
Loews Corp 465 USD 19,798 25,412 0.14
Lowe's Cos Inc 147 USD 18,131 28,514 0.15
Mastercard Inc 141 USD 37,434 51,478 0.27
McCormick & Co Inc/MD 244 USD 21,708 21,550 0.11
Merck & Co Inc 386 USD 28,940 30,019 0.16
Micron Technology Inc 247 USD 19,889 20,990 0.11
Microsoft Corp 1,123 USD 213,280 304,221 1.62
Moody's Corp 89 USD 23,476 32,251 0.17
Morgan Stanley 1,373 USD 116,553 125,890 0.67
Netflix Inc 84 USD 43,776 44,370 0.24
Newmont Corp 318 USD 16,316 20,155 0.11
NIKE Inc 226 USD 20,787 34,915 0.19
NiSource Inc 1,206 USD 28,505 29,547 0.16
Norfolk Southern Corp 89 USD 17,694 23,621 0.13
NVIDIA Corp 107 USD 37,310 85,611 0.46
Okta Inc 70 USD 17,033 17,128 0.09
Oracle Corp 357 USD 19,594 27,789 0.15
O'Reilly Automotive Inc 45 USD 21,536 25,479 0.14
Organon & Co 38 USD 1,350 1,150 0.01
Parker-Hannifin Corp 100 USD 20,914 30,711 0.16
Paychex Inc 333 USD 27,295 35,731 0.19
PayPal Holdings Inc 211 USD 43,845 61,502 0.33
PepsiCo Inc 330 USD 44,544 48,896 0.26
Pfizer Inc 981 USD 33,747 38,416 0.20
Phillips 66 356 USD 24,021 30,552 0.16
Pioneer Natural Resources Co 134 USD 14,698 21,778 0.12
193

Natixis International Funds (Lux) I
The accompanying notes form an integral part of these financial statements.
Loomis Sayles Global Multi Asset Income Fund
Statement of Investments (continued)
As at June 30, 2021
(expressed in USD)
Description
Quantity / Face
value
Currency Cost Evaluation % of Net
Assets
Procter & Gamble Co/The 352 USD 42,383 47,495 0.25
Prudential Financial Inc 338 USD 26,637 34,635 0.18
PulteGroup Inc 549 USD 25,327 29,959 0.16
QUALCOMM Inc 204 USD 17,912 29,158 0.16
Raytheon Technologies Corp 369 USD 26,507 31,479 0.17
Regeneron Pharmaceuticals Inc 37 USD 21,124 20,666 0.11
Regions Financial Corp 1,172 USD 18,566 23,651 0.13
Ross Stores Inc 207 USD 20,683 25,668 0.14
S&P Global Inc 78 USD 22,943 32,015 0.17
salesforce.com Inc 167 USD 42,659 40,793 0.22
ServiceNow Inc 51 USD 24,378 28,027 0.15
Sherwin-Williams Co/The 99 USD 20,029 26,973 0.14
Square Inc 95 USD 22,291 23,161 0.12
Stryker Corp 123 USD 26,014 31,947 0.17
Synopsys Inc 124 USD 27,535 34,198 0.18
Target Corp 107 USD 20,393 25,866 0.14
Tesla Inc 118 USD 88,882 80,205 0.43
Thermo Fisher Scientific Inc 83 USD 29,312 41,871 0.22
TransDigm Group Inc 34 USD 17,517 22,008 0.12
Travelers Cos Inc/The 193 USD 24,757 28,894 0.15
Union Pacific Corp 112 USD 18,973 24,632 0.13
United Parcel Service Inc 130 USD 15,457 27,036 0.14
UnitedHealth Group Inc 129 USD 35,901 51,657 0.28
Verizon Communications Inc 633 USD 35,036 35,467 0.19
Vertex Pharmaceuticals Inc 112 USD 29,212 22,583 0.12
Visa Inc 262 USD 46,253 61,261 0.33
Walmart Inc 221 USD 26,038 31,165 0.17
Walt Disney Co/The 324 USD 44,505 56,949 0.30
Waste Management Inc 287 USD 32,768 40,212 0.21
Wells Fargo & Co 2,623 USD 112,868 118,796 0.63
Yum! Brands Inc 294 USD 29,721 33,819 0.18
Zimmer Biomet Holdings Inc 136 USD 19,912 21,872 0.12
Zoetis Inc 147 USD 22,455 27,395 0.15
Zoom Video Communications Inc 45 USD 16,606 17,416 0.09
4,863,185 6,032,945 32.18
Total - Shares 8,452,510 9,857,478 52.58
194

Natixis International Funds (Lux) I
The accompanying notes form an integral part of these financial statements.
Loomis Sayles Global Multi Asset Income Fund
Statement of Investments (continued)
As at June 30, 2021
(expressed in USD)
Description
Quantity / Face
value
Currency Cost Evaluation % of Net
Assets
Fixed rate bonds
British Virgin Islands
Gold Fields Orogen Holdings BVI Ltd 6.125%
15/05/2029 144A(2) 200,000 USD 203,596 236,760 1.26
203,596 236,760 1.26
Canada
Enbridge Inc 3.400% 01/08/2051 40,000 USD 39,902 40,083 0.21
39,902 40,083 0.21
Cayman Islands
DP World Crescent Ltd 4.848% 26/09/2028 144A(2) 200,000 USD 207,628 230,088 1.23
207,628 230,088 1.23
Egypt
Egypt Government Bond 14.605% 08/09/2025 930,000 EGP 59,444 59,385 0.32
Egypt Government Bond 16.500% 02/04/2026 2,040,000 EGP 137,893 138,282 0.74
197,337 197,667 1.06
Ghana
Ghana Government International Bond 7.750%
07/04/2029 144A(2) 200,000 USD 202,435 204,250 1.09
202,435 204,250 1.09
Israel
Leviathan Bond Ltd 6.125% 30/06/2025 144A(2) 65,000 USD 65,000 71,358 0.38
Leviathan Bond Ltd 6.500% 30/06/2027 144A(2) 60,000 USD 60,000 66,810 0.36
125,000 138,168 0.74
Ivory Coast
Ivory Coast Government International Bond 5.750%
31/12/2032 173,896 USD 177,321 173,993 0.93
177,321 173,993 0.93
Mexico
Petroleos Mexicanos 6.875% 16/10/2025 144A(2) 80,000 USD 79,786 88,560 0.47
79,786 88,560 0.47
Multinational
GEMS MENASA Cayman Ltd/GEMS Education
Delaware LLC 7.125% 31/07/2026 144A(2) 200,000 USD 206,889 207,000 1.10
206,889 207,000 1.10
Netherlands
IHS Netherlands Holdco BV 7.125% 18/03/2025
144A(2) 200,000 USD 202,010 208,716 1.11
Petrobras Global Finance BV 5.600% 03/01/2031 215,000 USD 225,852 240,800 1.29
427,862 449,516 2.40
(2) See Note 13.
195
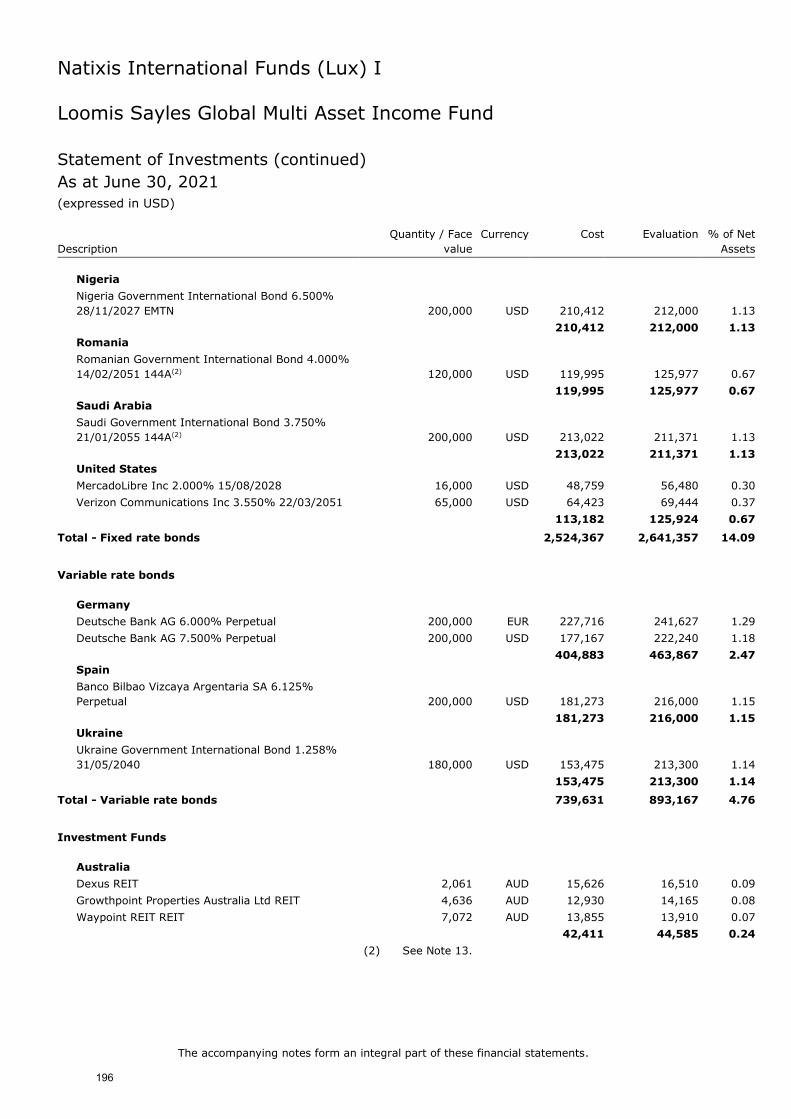
Natixis International Funds (Lux) I
The accompanying notes form an integral part of these financial statements.
Loomis Sayles Global Multi Asset Income Fund
Statement of Investments (continued)
As at June 30, 2021
(expressed in USD)
Description
Quantity / Face
value
Currency Cost Evaluation % of Net
Assets
Nigeria
Nigeria Government International Bond 6.500%
28/11/2027 EMTN 200,000 USD 210,412 212,000 1.13
210,412 212,000 1.13
Romania
Romanian Government International Bond 4.000%
14/02/2051 144A(2) 120,000 USD 119,995 125,977 0.67
119,995 125,977 0.67
Saudi Arabia
Saudi Government International Bond 3.750%
21/01/2055 144A(2) 200,000 USD 213,022 211,371 1.13
213,022 211,371 1.13
United States
MercadoLibre Inc 2.000% 15/08/2028 16,000 USD 48,759 56,480 0.30
Verizon Communications Inc 3.550% 22/03/2051 65,000 USD 64,423 69,444 0.37
113,182 125,924 0.67
Total - Fixed rate bonds 2,524,367 2,641,357 14.09
Variable rate bonds
Germany
Deutsche Bank AG 6.000% Perpetual 200,000 EUR 227,716 241,627 1.29
Deutsche Bank AG 7.500% Perpetual 200,000 USD 177,167 222,240 1.18
404,883 463,867 2.47
Spain
Banco Bilbao Vizcaya Argentaria SA 6.125%
Perpetual 200,000 USD 181,273 216,000 1.15
181,273 216,000 1.15
Ukraine
Ukraine Government International Bond 1.258%
31/05/2040 180,000 USD 153,475 213,300 1.14
153,475 213,300 1.14
Total - Variable rate bonds 739,631 893,167 4.76
Investment Funds
Australia
Dexus REIT 2,061 AUD 15,626 16,510 0.09
Growthpoint Properties Australia Ltd REIT 4,636 AUD 12,930 14,165 0.08
Waypoint REIT REIT 7,072 AUD 13,855 13,910 0.07
42,411 44,585 0.24
(2) See Note 13.
196

Natixis International Funds (Lux) I
The accompanying notes form an integral part of these financial statements.
Loomis Sayles Global Multi Asset Income Fund
Statement of Investments (continued)
As at June 30, 2021
(expressed in USD)
Description
Quantity / Face
value
Currency Cost Evaluation % of Net
Assets
Belgium
Warehouses de Pauw CVA REIT 419 EUR 14,857 16,000 0.09
14,857 16,000 0.09
France
Mercialys SA REIT 884 EUR 9,578 10,703 0.06
9,578 10,703 0.06
Germany
alstria office REIT-AG 417 EUR 6,999 7,710 0.04
6,999 7,710 0.04
Great Britain
British Land Co PLC/The REIT 2,166 GBP 15,120 14,808 0.08
Safestore Holdings PLC REIT 971 GBP 10,572 12,703 0.07
Segro PLC REIT 1,642 GBP 22,245 24,827 0.13
47,937 52,338 0.28
Ireland
Vanguard FTSE Developed Asia Pacific ex Japan
UCITS ETF 3,457 USD 88,179 110,559 0.59
Vanguard FTSE Japan UCITS ETF 13,164 USD 444,425 469,445 2.50
532,604 580,004 3.09
Japan
AEON REIT Investment Corp REIT 10 JPY 13,496 14,821 0.08
Japan Excellent Inc REIT 10 JPY 14,040 14,308 0.07
Japan Logistics Fund Inc REIT 3 JPY 8,749 9,028 0.05
36,285 38,157 0.20
Singapore
Ascendas India Trust REIT 1,700 SGD 1,834 1,758 0.01
1,834 1,758 0.01
United States
Alexander's Inc REIT 32 USD 8,990 8,574 0.05
American Homes 4 Rent REIT 361 USD 11,124 14,025 0.07
Apple Hospitality REIT Inc 709 USD 11,507 10,819 0.06
Brandywine Realty Trust REIT 808 USD 9,590 11,078 0.06
CareTrust REIT Inc 574 USD 12,640 13,334 0.07
Centerspace REIT 157 USD 11,070 12,387 0.07
Crown Castle International Corp REIT 140 USD 22,802 27,314 0.15
CubeSmart REIT 25 USD 960 1,158 0.01
CyrusOne Inc REIT 120 USD 8,637 8,582 0.05
Duke Realty Corp REIT 334 USD 14,094 15,815 0.08
Easterly Government Properties Inc REIT 155 USD 3,327 3,267 0.02
Equinix Inc REIT 47 USD 32,246 37,722 0.20
Extra Space Storage Inc REIT 134 USD 17,926 21,952 0.12
197
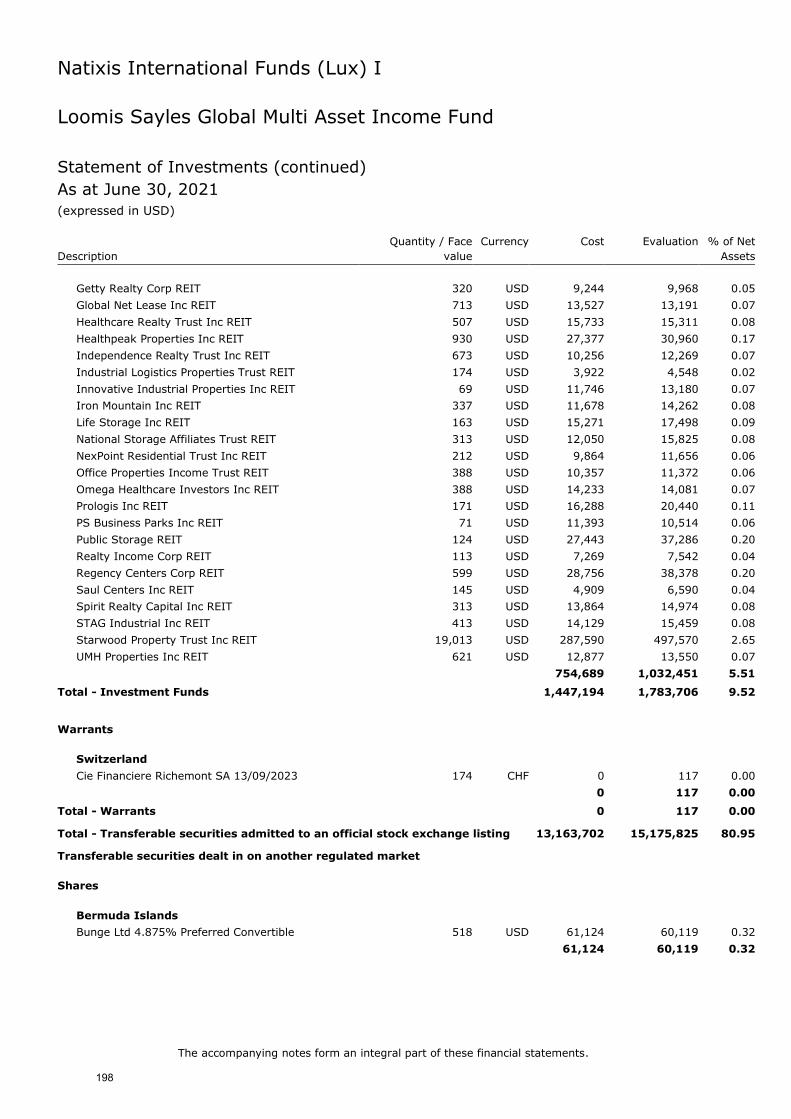
Natixis International Funds (Lux) I
The accompanying notes form an integral part of these financial statements.
Loomis Sayles Global Multi Asset Income Fund
Statement of Investments (continued)
As at June 30, 2021
(expressed in USD)
Description
Quantity / Face
value
Currency Cost Evaluation % of Net
Assets
Getty Realty Corp REIT 320 USD 9,244 9,968 0.05
Global Net Lease Inc REIT 713 USD 13,527 13,191 0.07
Healthcare Realty Trust Inc REIT 507 USD 15,733 15,311 0.08
Healthpeak Properties Inc REIT 930 USD 27,377 30,960 0.17
Independence Realty Trust Inc REIT 673 USD 10,256 12,269 0.07
Industrial Logistics Properties Trust REIT 174 USD 3,922 4,548 0.02
Innovative Industrial Properties Inc REIT 69 USD 11,746 13,180 0.07
Iron Mountain Inc REIT 337 USD 11,678 14,262 0.08
Life Storage Inc REIT 163 USD 15,271 17,498 0.09
National Storage Affiliates Trust REIT 313 USD 12,050 15,825 0.08
NexPoint Residential Trust Inc REIT 212 USD 9,864 11,656 0.06
Office Properties Income Trust REIT 388 USD 10,357 11,372 0.06
Omega Healthcare Investors Inc REIT 388 USD 14,233 14,081 0.07
Prologis Inc REIT 171 USD 16,288 20,440 0.11
PS Business Parks Inc REIT 71 USD 11,393 10,514 0.06
Public Storage REIT 124 USD 27,443 37,286 0.20
Realty Income Corp REIT 113 USD 7,269 7,542 0.04
Regency Centers Corp REIT 599 USD 28,756 38,378 0.20
Saul Centers Inc REIT 145 USD 4,909 6,590 0.04
Spirit Realty Capital Inc REIT 313 USD 13,864 14,974 0.08
STAG Industrial Inc REIT 413 USD 14,129 15,459 0.08
Starwood Property Trust Inc REIT 19,013 USD 287,590 497,570 2.65
UMH Properties Inc REIT 621 USD 12,877 13,550 0.07
754,689 1,032,451 5.51
Total - Investment Funds 1,447,194 1,783,706 9.52
Warrants
Switzerland
Cie Financiere Richemont SA 13/09/2023 174 CHF 0 117 0.00
0 117 0.00
Total - Warrants 0 117 0.00
Total - Transferable securities admitted to an official stock exchange listing 13,163,702 15,175,825 80.95
Transferable securities dealt in on another regulated market
Shares
Bermuda Islands
Bunge Ltd 4.875% Preferred Convertible 518 USD 61,124 60,119 0.32
61,124 60,119 0.32
198

Natixis International Funds (Lux) I
The accompanying notes form an integral part of these financial statements.
Loomis Sayles Global Multi Asset Income Fund
Statement of Investments (continued)
As at June 30, 2021
(expressed in USD)
Description
Quantity / Face
value
Currency Cost Evaluation % of Net
Assets
Switzerland
STMicroelectronics NV 434 EUR 16,261 15,752 0.08
16,261 15,752 0.08
Total - Shares 77,385 75,871 0.40
Fixed rate bonds
Canada
Shopify Inc 0.125% 01/11/2025 5,000 USD 5,740 6,510 0.03
5,740 6,510 0.03
Cayman Islands
Sea Ltd 2.375% 01/12/2025 5,000 USD 12,981 15,425 0.08
12,981 15,425 0.08
Italy
Intesa Sanpaolo SpA 4.950% 01/06/2042 144A(2) 200,000 USD 200,000 207,260 1.11
200,000 207,260 1.11
Luxembourg
Trinseo Materials Operating SCA/Trinseo Materials
Finance Inc 5.125% 01/04/2029 144A(2) 130,000 USD 130,000 132,925 0.71
130,000 132,925 0.71
Mexico
Unifin Financiera SAB de CV 8.375% 27/01/2028
144A(2) 200,000 USD 198,839 187,000 1.00
198,839 187,000 1.00
United States
Aerie Pharmaceuticals Inc 1.500% 01/10/2024 75,000 USD 76,611 73,878 0.39
American Airlines Inc 11.750% 15/07/2025 144A(2) 60,000 USD 59,520 75,300 0.40
American Eagle Outfitters Inc 3.750% 15/04/2025 2,000 USD 7,736 8,728 0.05
Avnet Inc 3.000% 15/05/2031 45,000 USD 44,655 44,836 0.24
Bill.com Holdings Inc 0.000% 01/12/2025 144A(2) 5,000 USD 6,081 6,675 0.04
BioMarin Pharmaceutical Inc 1.250% 15/05/2027 49,000 USD 49,230 49,094 0.26
Broadcom Inc 3.750% 15/02/2051 144A(2) 45,000 USD 44,809 46,976 0.25
Burlington Stores Inc 2.250% 15/04/2025 5,000 USD 7,675 7,944 0.04
Charter Communications Operating LLC/Charter
Communications Operating Capital 3.900%
01/06/2052 95,000 USD 90,810 96,730 0.52
Datadog Inc 0.125% 15/06/2025 38,000 USD 46,518 50,611 0.27
Dell International LLC/EMC Corp 8.350%
15/07/2046 40,000 USD 42,946 65,424 0.35
DocuSign Inc 0.000% 15/01/2024 144A(2) 5,000 USD 4,933 5,150 0.03
Enphase Energy Inc 0.000% 01/03/2028 144A(2) 10,000 USD 9,018 9,691 0.05
(2) See Note 13.
199

Natixis International Funds (Lux) I
The accompanying notes form an integral part of these financial statements.
Loomis Sayles Global Multi Asset Income Fund
Statement of Investments (continued)
As at June 30, 2021
(expressed in USD)
Description
Quantity / Face
value
Currency Cost Evaluation % of Net
Assets
Envista Holdings Corp 2.375% 01/06/2025 5,000 USD 10,296 10,650 0.06
Etsy Inc 0.250% 15/06/2028 144A(2) 30,000 USD 30,000 33,060 0.18
Euronet Worldwide Inc 0.750% 15/03/2049 5,000 USD 5,814 5,694 0.03
Expedia Group Inc 0.000% 15/02/2026 144A(2) 7,000 USD 7,671 7,560 0.04
Ford Motor Co 0.000% 15/03/2026 144A(2) 4,000 USD 3,999 4,422 0.02
Halozyme Therapeutics Inc 0.250% 01/03/2027
144A(2) 5,000 USD 4,753 4,641 0.02
HubSpot Inc 0.375% 01/06/2025 5,000 USD 9,222 10,582 0.06
Icahn Enterprises LP/Icahn Enterprises Finance Corp
4.375% 01/02/2029 144A(2) 75,000 USD 75,000 74,625 0.40
Liberty Mutual Group Inc 4.300% 01/02/2061
144A(2) 90,000 USD 90,000 82,198 0.44
Livongo Health Inc 0.875% 01/06/2025 15,000 USD 21,461 23,829 0.13
Microchip Technology Inc 0.125% 15/11/2024 5,000 USD 5,779 5,625 0.03
Middleby Corp/The 1.000% 01/09/2025 144A(2) 5,000 USD 7,003 7,197 0.04
MongoDB Inc 0.250% 15/01/2026 5,000 USD 7,787 9,022 0.05
Nordstrom Inc 4.250% 01/08/2031 144A(2) 40,000 USD 39,970 41,660 0.22
NortonLifeLock Inc 2.000% 15/08/2022 144A(2) 5,000 USD 5,735 6,860 0.04
Nutanix Inc 0.000% 15/01/2023 5,000 USD 4,908 5,281 0.03
ON Semiconductor Corp 0.000% 01/05/2027
144A(2) 5,000 USD 5,021 5,203 0.03
Pegasystems Inc 0.750% 01/03/2025 5,000 USD 5,701 5,956 0.03
Penn National Gaming Inc 4.125% 01/07/2029
144A(2) 10,000 USD 10,000 9,987 0.05
Pioneer Natural Resources Co 0.250% 15/05/2025 5,000 USD 7,196 7,977 0.04
Rapid7 Inc 0.250% 15/03/2027 144A(2) 50,000 USD 50,000 55,470 0.30
SM Energy Co 10.000% 15/01/2025 144A(2) 54,000 USD 69,718 61,155 0.33
Square Inc 0.125% 01/03/2025 5,000 USD 8,915 10,297 0.05
Starwood Property Trust Inc 3.625% 15/07/2026
144A(2) 25,000 USD 25,000 25,188 0.13
Sunrun Inc 0.000% 01/02/2026 144A(2) 35,000 USD 29,249 31,304 0.17
Teradyne Inc 1.250% 15/12/2023 2,000 USD 7,700 8,473 0.04
Twitter Inc 0.250% 15/06/2024 6,000 USD 8,161 8,231 0.04
Uber Technologies Inc 0.000% 15/12/2025 144A(2) 15,000 USD 15,000 15,210 0.08
Vail Resorts Inc 0.000% 01/01/2026 144A(2) 9,000 USD 9,463 9,338 0.05
Vishay Intertechnology Inc 2.250% 15/06/2025 5,000 USD 5,545 5,257 0.03
Zendesk Inc 0.625% 15/06/2025 5,000 USD 7,355 7,282 0.04
Zillow Group Inc 2.750% 15/05/2025 4,000 USD 8,196 7,888 0.04
Zscaler Inc 0.125% 01/07/2025 144A(2) 5,000 USD 7,057 7,935 0.04
(2) See Note 13.
200

Natixis International Funds (Lux) I
The accompanying notes form an integral part of these financial statements.
Loomis Sayles Global Multi Asset Income Fund
Statement of Investments (continued)
As at June 30, 2021
(expressed in USD)
Description
Quantity / Face
value
Currency Cost Evaluation % of Net
Assets
Zynga Inc 0.000% 15/12/2026 144A(2) 9,000 USD 9,688 9,596 0.05
1,108,905 1,165,690 6.22
Total - Fixed rate bonds 1,656,465 1,714,810 9.15
Variable rate bonds
Cayman Islands
Fillmore Park CLO Ltd 5.584% 15/07/2030 144A(2) 250,000 USD 244,710 241,347 1.29
Neuberger Berman Loan Advisers CLO 27 Ltd
5.384% 15/01/2030 144A(2) 250,000 USD 244,109 243,690 1.30
488,819 485,037 2.59
Germany
Deutsche Bank AG 4.789% Perpetual 200,000 USD 161,181 200,250 1.07
161,181 200,250 1.07
Switzerland
Credit Suisse Group AG 7.250% Perpetual 144A(2) 200,000 USD 200,898 226,100 1.20
200,898 226,100 1.20
United States
General Electric Co 3.449% Perpetual 110,000 USD 92,819 107,800 0.58
General Motors Financial Co Inc 5.750% Perpetual 95,000 USD 94,501 103,397 0.55
187,320 211,197 1.13
Total - Variable rate bonds 1,038,218 1,122,584 5.99
Total - Transferable securities dealt in on another regulated market 2,772,068 2,913,265 15.54
Other transferable securities
Money Market Instruments
Treasury Bills
Egypt
Egypt Treasury Bills 0.000% 04/01/2022 8,175,000 EGP 491,560 487,677 2.60
491,560 487,677 2.60
Total - Treasury Bills 491,560 487,677 2.60
Total - Money Market Instruments 491,560 487,677 2.60
Total - Other transferable securities 491,560 487,677 2.60
TOTAL INVESTMENT PORTFOLIO 16,427,330 18,576,767 99.09
(2) See Note 13
A detailed schedule of portfolio movements for the period from January 1, 2021 to
June 30, 2021 is available free of charge upon request at the registered office of the SICAV.
201

Natixis International Funds (Lux) I
Natixis Multi Alpha Fund
Statistics
As at June 30, 2021
Net asset value per share
Q/A (USD) 98.76
Number of shares outstanding
Q/A (USD) 100,000.000
202
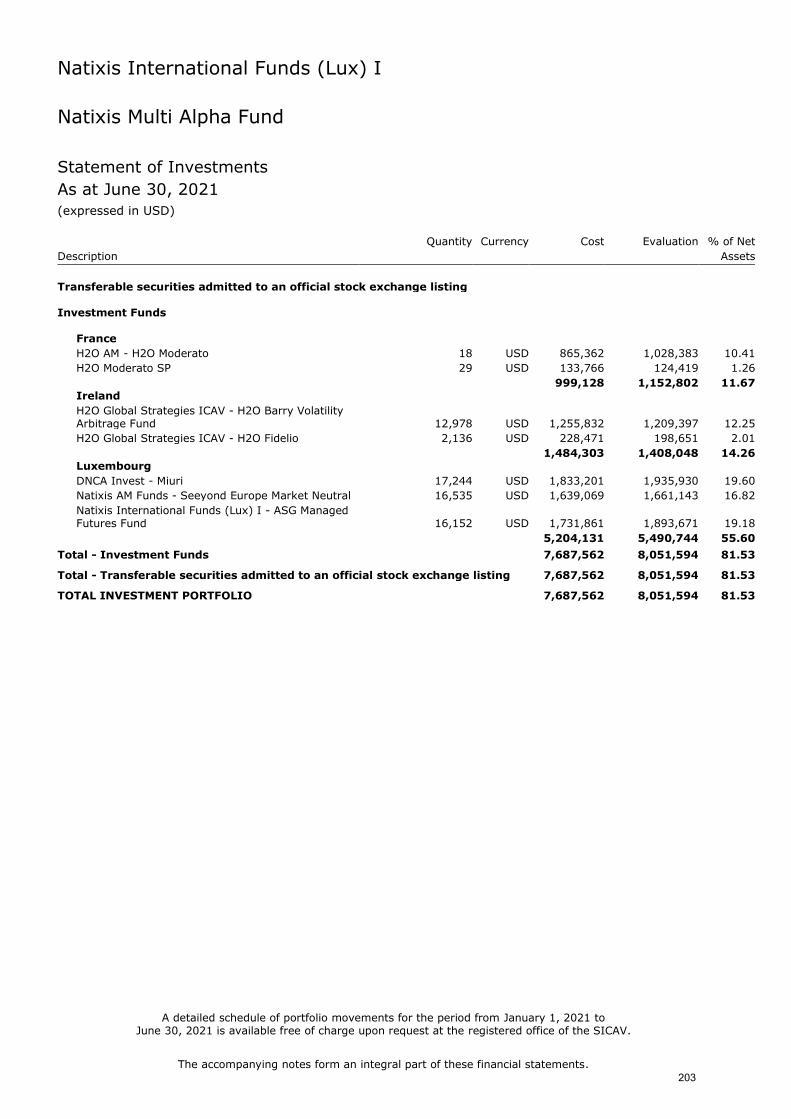
Natixis International Funds (Lux) I
The accompanying notes form an integral part of these financial statements.
Natixis Multi Alpha Fund
Statement of Investments
As at June 30, 2021
(expressed in USD)
Description
Quantity Currency Cost Evaluation % of Net
Assets
Transferable securities admitted to an official stock exchange listing Investment Funds
France
H2O AM - H2O Moderato 18 USD 865,362 1,028,383 10.41
H2O Moderato SP 29 USD 133,766 124,419 1.26
999,128 1,152,802 11.67 Ireland
H2O Global Strategies ICAV - H2O Barry Volatility Arbitrage Fund 12,978 USD 1,255,832 1,209,397 12.25
H2O Global Strategies ICAV - H2O Fidelio 2,136 USD 228,471 198,651 2.01
1,484,303 1,408,048 14.26 Luxembourg
DNCA Invest - Miuri 17,244 USD 1,833,201 1,935,930 19.60
Natixis AM Funds - Seeyond Europe Market Neutral 16,535 USD 1,639,069 1,661,143 16.82
Natixis International Funds (Lux) I - ASG Managed Futures Fund 16,152 USD 1,731,861 1,893,671 19.18
5,204,131 5,490,744 55.60
Total - Investment Funds 7,687,562 8,051,594 81.53
Total - Transferable securities admitted to an official stock exchange listing 7,687,562 8,051,594 81.53
TOTAL INVESTMENT PORTFOLIO 7,687,562 8,051,594 81.53
A detailed schedule of portfolio movements for the period from January 1, 2021 to June 30, 2021 is available free of charge upon request at the registered office of the SICAV.
203

Natixis International Funds (Lux) I
Natixis ESG Conservative Fund
Statistics
As at June 30, 2021
Net asset value per share
I/A (EUR) 108.78
N/A (EUR) 108.71
R/A (EUR) 108.20
S/A (EUR) 109.01
Number of shares outstanding
I/A (EUR) 30.000
N/A (EUR) 30.000
R/A (EUR) 735,405.252
S/A (EUR) 30.000
204

Natixis International Funds (Lux) I
The accompanying notes form an integral part of these financial statements.
Natixis ESG Conservative Fund Statement of Investments As at June 30, 2021 (expressed in EUR) Quantity Currency Cost Evaluation % of Net
Description Assets
Transferable securities admitted to an official stock exchange listing Investment Funds
France
DNCA Invest - Beyond Engage 18,000 EUR 1,923,974 2,035,260 2.56
Natixis Investment Managers International - DNCA Actions Euro 32 EUR 3,068,035 3,213,104 4.04
Natixis Investment Managers International - Insertion Emplois Dynamique 13,000 EUR 1,434,042 1,517,490 1.91
Natixis Investment Managers International - Ostrum Sustainable Euro Sovereign 1 1,021 EUR 3,195,043 3,187,296 4.00
Natixis Investment Managers International - Ostrum Sustainable Tresorerie 992 EUR 12,297,567 12,281,337 15.43
21,918,661 22,234,487 27.94 Ireland
Ossiam ESG Low Carbon Shiller Barclays Cape US Sector UCITS ETF 18,700 EUR 1,692,992 1,801,371 2.26
1,692,992 1,801,371 2.26 Luxembourg
DNCA Invest - Beyond Semperosa 7,600 EUR 796,804 850,212 1.07
DNCA Invest - Global New World 14,700 EUR 1,520,820 1,684,179 2.12
Mirova Funds - Mirova Euro Green and Sustainable Bond Fund 121,900 EUR 13,662,608 13,610,135 17.10
Mirova Funds - Mirova Euro Green and Sustainable Corporate Bond Fund 141,800 EUR 14,533,267 14,545,844 18.28
Mirova Funds - Mirova Global Green Bond Fund 1,129 EUR 12,592,152 12,524,731 15.74
Mirova Funds - Mirova Global Sustainable Equity 22,800 EUR 3,978,394 4,438,476 5.58
Mirova Women Leaders Equity Fund 7,800 EUR 1,211,823 1,255,488 1.58
Natixis International Funds (Lux) I - Loomis Sayles Institutional Global Corporate Bond Fund 30,650 EUR 3,092,273 3,122,622 3.92
Natixis International Funds (Lux) I - Thematics Water Fund 21,800 EUR 3,155,576 3,520,046 4.42
54,543,717 55,551,733 69.81
Total - Investment Funds 78,155,370 79,587,591 100.01
Total - Transferable securities admitted to an official stock exchange listing 78,155,370 79,587,591 100.01
TOTAL INVESTMENT PORTFOLIO 78,155,370 79,587,591 100.01
A detailed schedule of portfolio movements for the period from January 1, 2021 to June 30, 2021 is available free of charge upon request at the registered office of the SICAV.
205

Natixis International Funds (Lux) I
Natixis ESG Dynamic Fund
Statistics
As at June 30, 2021
Net asset value per share
I/A (EUR) 126.52
N/A (EUR) 126.40
R/A (EUR) 125.71
S/A (EUR) 126.79
Number of shares outstanding
I/A (EUR) 30.000
N/A (EUR) 30.000
R/A (EUR) 941,018.216
S/A (EUR) 30.000
206

Natixis International Funds (Lux) I
The accompanying notes form an integral part of these financial statements.
Natixis ESG Dynamic Fund
Statement of Investments As at June 30, 2021 (expressed in EUR) Quantity Currency Cost Evaluation % of Net
Description Assets
Transferable securities admitted to an official stock exchange listing Investment Funds
France
DNCA Invest - Beyond Engage 116,700 EUR 12,311,870 13,195,269 11.15
Natixis Investment Managers International - DNCA Actions Euro 147 EUR 13,621,768 14,896,193 12.59
Natixis Investment Managers International - Insertion Emplois Dynamique 79,600 EUR 8,653,444 9,291,708 7.85
Natixis Investment Managers International - Ostrum Sustainable Euro Sovereign 1 284 EUR 890,242 886,574 0.75
Natixis Investment Managers International - Ostrum Sustainable Tresorerie 80 EUR 990,893 990,426 0.84
36,468,217 39,260,170 33.18 Ireland
Ossiam ESG Low Carbon Shiller Barclays Cape US Sector UCITS ETF 106,200 EUR 9,593,799 10,230,246 8.65
9,593,799 10,230,246 8.65 Luxembourg
DNCA Invest - Beyond Semperosa 72,400 EUR 7,578,505 8,099,388 6.85
DNCA Invest - Global New World 77,100 EUR 8,006,364 8,833,347 7.47
Mirova Funds - Mirova Euro Green and Sustainable Bond Fund 32,200 EUR 3,614,579 3,595,130 3.04
Mirova Funds - Mirova Euro Green and Sustainable Corporate Bond Fund 37,300 EUR 3,819,221 3,826,234 3.23
Mirova Funds - Mirova Europe Environmental Equity Fund 15,000 EUR 1,911,188 2,231,700 1.89
Mirova Funds - Mirova Global Green Bond Fund 222 EUR 2,488,225 2,462,790 2.08
Mirova Funds - Mirova Global Sustainable Equity 81,300 EUR 14,247,258 15,826,671 13.38
Mirova Women Leaders Equity Fund 60,300 EUR 9,047,307 9,705,888 8.20
Natixis International Funds (Lux) I - Loomis Sayles Institutional Global Corporate Bond Fund 8,600 EUR 870,310 876,168 0.74
Natixis International Funds (Lux) I - Thematics Water Fund 81,000 EUR 11,690,340 13,079,070 11.05
63,273,297 68,536,386 57.93
Total - Investment Funds 109,335,313 118,026,802 99.76
Total - Transferable securities admitted to an official stock exchange listing 109,335,313 118,026,802 99.76
TOTAL INVESTMENT PORTFOLIO 109,335,313 118,026,802 99.76
A detailed schedule of portfolio movements for the period from January 1, 2021 to June 30, 2021 is available free of charge upon request at the registered office of the SICAV.
207

Natixis International Funds (Lux) I
Natixis ESG Moderate Fund
Statistics
As at June 30, 2021
Net asset value per share
I/A (EUR) 117.30
N/A (EUR) 117.20
Q/A (EUR) 117.53
R/A (EUR) 116.62
S/A (EUR) 117.54
Number of shares outstanding
I/A (EUR) 30.000
N/A (EUR) 30.000
Q/A (EUR) 32,742.619
R/A (EUR) 305,606.057
S/A (EUR) 30.000
208

Natixis International Funds (Lux) I
The accompanying notes form an integral part of these financial statements.
Natixis ESG Moderate Fund Statement of Investments As at June 30, 2021 (expressed in EUR) Quantity Currency Cost Evaluation % of Net Description Assets
Transferable securities admitted to an official stock exchange listing Investment Funds
France
DNCA Invest - Beyond Engage 24,000 EUR 2,570,571 2,713,680 6.87
Natixis Investment Managers International - DNCA Actions Euro 39 EUR 3,712,606 3,955,371 10.01
Natixis Investment Managers International - Insertion Emplois Dynamique 14,100 EUR 1,532,946 1,645,893 4.17
Natixis Investment Managers International - Ostrum Sustainable Euro Sovereign 1 339 EUR 1,060,584 1,058,270 2.68
Natixis Investment Managers International - Ostrum Sustainable Tresorerie 183 EUR 2,267,311 2,265,599 5.73
11,144,018 11,638,813 29.46 Ireland
Ossiam ESG Low Carbon Shiller Barclays Cape US Sector UCITS ETF 21,100 EUR 1,917,325 2,032,563 5.15
1,917,325 2,032,563 5.15 Luxembourg
DNCA Invest - Beyond Semperosa 14,100 EUR 1,510,061 1,577,367 3.99
DNCA Invest - Global New World 16,800 EUR 1,753,609 1,924,776 4.87
Mirova Funds - Mirova Euro Green & Sustainable Corporate Bond Fund 48,700 EUR 4,983,823 4,995,646 12.65
Mirova Funds - Mirova Euro Green and Sustainable Bond Fund 38,900 EUR 4,330,772 4,343,185 11.00
Mirova Funds - Mirova Europe Environmental Equity Fund 2,100 EUR 242,769 312,438 0.79
Mirova Funds - Mirova Global Green Bond Fund 266 EUR 2,952,325 2,950,911 7.47
Mirova Funds - Mirova Global Sustainable Equity 20,500 EUR 3,602,022 3,990,735 10.10
Mirova Women Leaders Equity Fund 9,500 EUR 1,428,461 1,529,120 3.87
Natixis International Funds (Lux) I - Loomis Sayles Institutional Global Corporate Bond Fund 10,500 EUR 1,053,840 1,069,740 2.71
Natixis International Funds (Lux) I - Thematics Water Fund 17,600 EUR 2,554,371 2,841,872 7.20
24,412,053 25,535,790 64.65
Total - Investment Funds 37,473,396 39,207,166 99.26
Total - Transferable securities admitted to an official stock exchange listing 37,473,396 39,207,166 99.26
TOTAL INVESTMENT PORTFOLIO 37,473,396 39,207,166 99.26
A detailed schedule of portfolio movements for the period from January 1, 2021 to June 30, 2021 is available free of charge upon request at the registered office of the SICAV.
209

Natixis International Funds (Lux) I
Notes to the Financial Statements
As at June 30, 2021
Note 1 – GENERAL
Natixis International Funds (Lux) I (the “Umbrella Fund”) is a Société d’Investissement à Capital Variable
incorporated under the laws of the Grand Duchy of Luxembourg on December 1, 1995 and is currently
governed by Part I of the Luxembourg Law of December 17, 2010 on Undertakings for Collective Investment,
as amended, implementing the Directive 2009/65/EC of the European Parliament and of the Council of July
13, 2009 (“UCITS Directive”), as amended.
The registered office of the Umbrella Fund is located at 80, route d’Esch, L-1470 Luxembourg. The Umbrella
Fund is recorded in the Luxembourg Registre de Commerce under number B.53023.
Natixis International Funds (Lux) I is an umbrella fund and as such provides investors access to a diversified
management expertise through a range of several separate sub-funds each having its own objective and
policy.
As at June 30, 2021 shares are offered in thirty-five sub-funds (each, a “Fund”):
- Natixis Asia Equity Fund(1), - DNCA Emerging Europe Equity Fund(2), - Natixis Pacific Rim Equity Fund(1), - Harris Associates Global Equity Fund(2), - Harris Associates U.S. Equity Fund(2), - Loomis Sayles Global Emerging Markets Equity Fund(1),
- Loomis Sayles Global Growth Equity Fund(1),
- Loomis Sayles U.S. Growth Equity Fund(1), - DNCA Europe Smaller Companies Fund(2), - Thematics AI and Robotics Fund(1), - Thematics Meta Fund(1), - Thematics Safety Fund(1), - Thematics Subscription Economy Fund(1),
- Thematics Water Fund(1), - Thematics Wellness Fund (launched on April 16, 2021) (1), - Vaughan Nelson Global Smid Cap Equity Fund(1), - Vaughan Nelson U.S. Select Equity Fund(1), - WCM Global Emerging Markets Equity Fund(1), - WCM Select Global Growth Equity Fund (launched on April 27, 2021) (1), - Loomis Sayles Global Credit Fund(1),
- Loomis Sayles Disciplined Alpha U.S. Corporate Bond Fund(1),
- Loomis Sayles Sustainable Global Corporate Bond Fund (formerly Loomis Sayles Institutional Global Corporate Bond Fund, change of name on April 26, 2021) (1),
- Loomis Sayles Short Term Emerging Markets Bond Fund(1), - Loomis Sayles Strategic Alpha Bond Fund(1), - Loomis Sayles U.S. Core Plus Bond Fund(1),
- Loomis Sayles Asia Bond Plus Fund(1), - Ostrum Euro High Income Fund(2), - Ostrum Global Inflation Fund(1), - Ostrum Short Term Global High Income Fund(2), - ASG Managed Futures Fund(1), - Loomis Sayles Global Multi Asset Income Fund(1), - Natixis Multi Alpha Fund(1),
- Natixis ESG Conservative Fund(1), - Natixis ESG Dynamic Fund(1), - Natixis ESG Moderate Fund(1).
(1) Not Authorised and not available to the public in Hong Kong. (2) Authorised for public distribution in Hong Kong.
On January 13, 2021, the Loomis Sayles Institutional High Income Fund was liquidated.
210

Natixis International Funds (Lux) I
Notes to the Financial Statements
As at June 30, 2021 (continued)
Note 1 – GENERAL (continued)
On April 6, 2021, the Dorval Lux Convictions Fund was liquidated.
On April 9, 2021, the Harris Associates Concentrated U.S. Equity Fund was liquidated. On May 28, 2021, the Seeyond Asia MinVol Equity Income Fund was liquidated. Dorval Lux Convictions Fund was a feeder fund (the “Feeder”) of Dorval Convictions, a French domiciled fonds commun de placement, organized in accordance with the Directive 2009/65/EC (as amended),
registered with the Autorités des Marchés Financiers, which has appointed Dorval Asset Management as its
management company and which qualifies as a master fund (the “Master”). The Feeder intended to meet its investment objective by investing a substantial portion of its assets into the M units of the Master. The investment objective of the Master is to outperform the benchmark (50% EONIA Capitalization Index 7-
Day and 50% EURO STOXX 50 Index NR (EUR)) (the “Composite Benchmark”) over an investment period of a minimum of 3 years, via a flexible allocation between equity and fixed-income securities. The Master is managed on a fully discretionary basis.
The Umbrella Fund has appointed Natixis Investment Managers S.A. (the “Management Company”) as its management company and delegated to the Management Company all powers related to the investment management, administration and distribution of the Umbrella Fund with effect on April 30, 2006.
Natixis Investment Managers S.A. is a Société Anonyme incorporated under Luxembourg law on April 25,
2006 for an unlimited period of time and licensed as a management company under Chapter 15 of the Luxembourg Law of December 17, 2010 on Undertakings for Collective Investment, as amended. Since July 22, 2014 Natixis Investment Managers S.A. is also authorised by the CSSF to act as an alternative investment fund manager under Chapter 2 of the law of July 12, 2013 on alternative investment fund managers.
Investors have the flexibility to convert between Funds.
The Umbrella Fund has been established for an unlimited period of time.
Note 2 – SUMMARY OF SIGNIFICANT ACCOUNTING POLICIES
a) Presentation of financial statements
The financial statements are prepared in accordance with Luxembourg regulations relating to Undertakings for Collective Investment.
Cross-Funds investments were not eliminated from the combined figures. At June 30, 2021, the total of cross-Funds investments amounts to EUR 33,448,434 and therefore the total combined NAV at period-end without cross-investments would amount to EUR 12,048,350,416.
b) Method of calculation The value of each Fund’s assets shall be determined as follows:
a. Securities and money market instruments traded on exchanges and Regulated Markets – last market price, unless the Umbrella Fund believes that an occurrence after the publication of the last market price and before any Fund next calculates its net asset value will materially affect the security’s value.
In that case, the security may be fair valued at the time the Administrative Agent determines its net
asset value by or pursuant to procedures approved by the Umbrella Fund. The value of Indian securities shall be determined by using the closing price (defined as the weighted average price of all trades executed during the last 30 minutes of a trading session).
211

Natixis International Funds (Lux) I
Notes to the Financial Statements
As at June 30, 2021 (continued)
Note 2 – SUMMARY OF SIGNIFICANT ACCOUNTING POLICIES (continued)
b) Method of calculation (continued)
b. Securities and money market instruments not traded on a Regulated Market (other than short-term money market instruments) – based upon valuations provided by pricing vendors, which valuations
are determined based on normal, institutional-size trading of such securities using market information, transactions for comparable securities and various relationships between securities which are generally recognized by institutional traders.
c. Short-term money market instruments (with remaining maturities of 60 days or less) – amortized cost (which approximates market value under normal conditions).
d. Futures, options and forwards – unrealised gain or loss on the contract using current settlement price. When a settlement price is not used, future and forward Short contracts will be valued at their fair
value as determined pursuant to procedures approved by the Umbrella Fund, as used on a consistent basis.
e. Shares of open-ended funds – last published net asset value.
f. Cash on hand or deposit, bills, demand notes, accounts receivable, prepaid expenses, cash dividends and interest declared or accrued and not yet received – full amount, unless in any case such amount is unlikely to be paid or received in full, in which case the value thereof is arrived at after the Umbrella Fund or its agent makes such discount as it may consider appropriate in such case to reflect the true value thereof.
g. Credit Default Swaps (CDS), Interest Rate Swaps (IRS) and Total Return Rate Swaps (TRRS) – Swaps
are marked to market based upon daily prices obtained from third party pricing agents and verified against the value from the counterparty. Realised appreciation/(depreciation) and change in unrealised appreciation/ (depreciation) resulting there from are included in the statement of changes in net assets respectively under the heading “Net realised appreciation/(depreciation) on swaps” and “Change in net unrealised appreciation/(depreciation) on swaps”.
h. Swaptions – when the Fund writes a swaption, an amount equal to the premium received by the Fund is recorded as a liability and is subsequently adjusted to the current fair value of the swaption written. Premiums received from the written swaptions which expire unexercised are treated by the Fund on the expiration dates as realised gains.
When the Fund purchases a swaption, an amount equal to the premium paid by the Fund is recorded as an asset and is subsequently adjusted to the current fair value of the swaption purchased. Premiums
paid for the purchase of swaptions which expire unexercised are treated on the expiration date as realised losses.
i. To Be Announced securities - the Fund may purchase or sell debt securities in a “To Be Announced” TBA transactions, which delivery or payment to occur at a later date beyond the normal settlement period. TBA securities resulting from these transactions are included in the Statement of Investments. At the time that the Fund enters into a commitment to purchase or sell a security, the transaction is recorded and the value of the security is reflected in the Fund’s net asset value. The price of such security and the date that the security will be delivered and paid for are fixed at the time the transaction is negotiated. The value of the security may vary with market fluctuations.
j. Repurchase agreements – the Fund may enter into repurchase agreement transactions and may act either as purchaser or seller in repurchase agreement transactions or a series of continuing repurchase transactions under restrictions described in Prospectus. Securities that are the subject of repurchase agreement are included in the Statement of Investments. Changes in unrealised appreciation / (depreciation) as a result thereof are included in the statement of changes in net assets respectively
under “Net realised appreciation / (depreciation) on sales of investments” and “Change in net unrealised appreciation / (depreciation) on repurchase agreement”.
k. Time deposit – the Fund may invest in time deposit with credit institutions. Such deposits may be
withdrawn at any time and must have maturity of less than twelve (12) months. The value of time deposits shall be determined by using amortized cost.
212

Natixis International Funds (Lux) I
Notes to the Financial Statements
As at June 30, 2021 (continued)
Note 2 – SUMMARY OF SIGNIFICANT ACCOUNTING POLICIES (continued)
b) Method of calculation (continued)
l. All other assets – fair market value as determined pursuant to procedures approved by the Umbrella Fund’s Board of Directors.
c) Foreign exchange translation
The value of all assets and liabilities not expressed in the Reference Currency of a Fund will be converted
into the Reference Currency of such Fund at rates last quoted by any major bank. The exchange rate used as at June 30, 2021: 1 EUR = 1.185900 USD
d) Swing Pricing Adjustment
The price at which Shares may be subscribed for or redeemed at is the net asset value per Share. Shares are “single priced” such that the same Share price applies whether investors are subscribing or redeeming
on any full bank business day (unswung NAV). However, large subscriptions, redemptions and/or conversions in and/or out of a Fund on a same full bank business day, may cause the Fund to buy and/or sell underlying investments and the value of these investments may be affected by bid/offer spreads, trading costs and related expenses including transaction charges, brokerage fees, and taxes. This investment activity may
have a negative impact on net asset value per Share called “dilution”. In such circumstances, for certain Funds, the Management Company will, on an automatic and systematic basis, apply a “swing pricing” mechanism as part of its daily valuation policy in order to take into account the dilution impacts and to
protect the Shareholders’ interests. This means that, if on any full bank business day, the aggregate transactions in Shares of a Fund exceed a threshold determined by the Management Company (the “Swing Threshold”), the net asset value of the Fund may be adjusted by an amount, not exceeding 2% of the relevant net asset value (the “Swing Factor”), in order to reflect both the estimated fiscal charges and dealing costs that may be incurred by the Fund and the estimated dealing spread of the assets in which the Fund invests/disinvests.
The Swing Factor will have the following effect on subscriptions or redemptions: 1) on a Fund experiencing levels of net subscriptions on a full bank business day (i.e. subscriptions are greater in value than redemptions) (in excess of the Swing Threshold) the net asset value per Share will be adjusted upwards by the Swing Factor; and
2) on a Fund experiencing levels of net redemptions on a full bank business day (i.e. redemptions are greater in value than subscriptions) (in excess of the Swing Threshold) the net asset value per Share will be adjusted downwards by the Swing Factor. In such event, the official net asset value per Share, as published, will have been adjusted to take account of the swing price mechanism (swung NAV). Net asset values and the net asset values per share in the Statement of Net Assets are unswung.
During the period ended June 30, 2021, Natixis Asia Equity Fund and DNCA Europe Smaller Companies Fund applied swing pricing adjustments. As of June 30, 2021, none of the Funds net asset values per share were swung.
Additional information about the swing pricing mechanism and the Funds concerned may be obtained at
im.natixis.com or at the registered office of the Management Company.
213

Natixis International Funds (Lux) I
Notes to the Financial Statements
As at June 30, 2021 (continued)
Note 3 – FEES PAID TO THE MANAGEMENT COMPANY
The Management Company is entitled to receive from the Funds a Management Fee calculated and payable monthly in arrears. The Management Fee due to each Share class and for each month shall be calculated as follows:
Where:
“Value” means the average daily net asset value of all Shares issued in each Fund during the relevant month;
“Rate of Management Fee” shall be calculated according to the following formula: Rate of Management Fee Share class = TER Share class – Administration Expenses Share class
Rate of Management Fee Share class means the applicable Rate of Management Fee for the relevant Share class; expressed as an annualized percentage;
TER Share class means the Total Expense Ratio of the relevant Share class as disclosed in the current Prospectus; expressed as an annualized percentage; and
Administration Expenses Share class means the total operating expenses owed, and forecasted to be owed, by the relevant Fund to service providers, government regulators and agencies for services and benefits rendered to the relevant Share class; expressed as an annualized percentage.
The Rate of Management Fee accrued to a Share class can never be greater than its Total Expense Ratio, as disclosed in the current Prospectus;
D month shall be the number of calendar days during such month; and D year shall be the number of calendar days during the applicable calendar year.
Note 4 – PERFORMANCE FEES For the Dorval Lux Convictions Fund: The Performance Fee is based on a comparison between the performance of the Fund and the Composite Benchmark over the financial year:
· If the performance of the Fund over the financial year is greater than that of the Composite Benchmark and is greater than zero, then the performance Fee will be 20% of the difference between the Fund’s performance and that of the benchmark.
· If, during the year, the Fund’s performance since the beginning of the financial year is greater than that of the Composite Benchmark calculated over the same period and greater than zero, then this outperformance is subject to a provision for variable management fees at the time of each net asset value calculation.
· If over the financial year, the Fund’s performance is below that of the Composite Benchmark,
the Performance Fee is zero. · If the Fund underperforms in comparison to the Composite Benchmark between two net asset
value calculations, any previously accrued provision will be reversed accordingly. The new provisions must not exceed the previous allocations.
· This Performance Fee is only definitively charged at the end of each financial year n, in respect
of the financial year n, if during this period, the Fund's performance is greater than that of the Composite Benchmark and is greater than zero. In all other cases, no Performance Fee is levied at the end of the financial year.
The Performance Fees are accrued for on a daily basis and levied annually. The following formula sets out how performance fees are calculated in respect of the financial year starting
at 0 and ending in n: · If NAV(n) <= NAV(0), then TotalFGV(n) = 0 · Calculation of the provision between two consecutive NAVs:
For all i varying between 1 and n: if NAV(i) > NAV(0) then: TotalFGV(i) = Max(0, 0.20 * [N(i)*NAV(i) - Bench(i)/Bench(0)*N(i)*NAV(0)])
(Value x Rate of Management Fee) x D month
D year
Management Fee =
214

Natixis International Funds (Lux) I
Notes to the Financial Statements
As at June 30, 2021 (continued)
Note 4 – PERFORMANCE FEES (continued)
Where:
· NAV(n) is the net asset value at the end of the financial year after TER, with no performance fee,
· NAV(0) is the net asset value at the end of the previous financial year. This net asset value
serves as a benchmark for the current financial year, · TotalFGV(n) is the amount of the outperformance fee levied over the financial year, · N(i) is the total number of Fund shares on the NAV calculation date (i), · NAV(i) is the share net asset value on day (i) after fixed management fees, with no
Performance fee, · Bench(i) is the value of the index on the same date:
Benchi=Benchi-1 x (50% x EONIA Capitalization Index 7 Di
EONIA Capitalization Index 7 Di-1+ 50% x
Euro Stoxx 50 NR (EUR)iEuro Stoxx 50 NR (EUR)i-1
)
· N(i)*NAV(i) represents pure assets, after fixed costs, · N(i)*NAV(0) represents the equivalent assets since the beginning of the year,
· Bench(i)/Bench(0)*N(i)*NAV(0) represents the benchmark equivalent assets. The daily provision is thus expressed as: ProvisionFGV(i) = TotalFGV(i)-TotalFGV(i-1)
Where:
· ProvisionFGV(i) is the amount of variable management fees (“frais de gestion variables”), provisioned or reversed, at the net asset value calculation on i.
Note 5 – DISTRIBUTION FEES
The fees paid out of the Fund’s assets to cover marketing and selling fund shares may cover advertising
costs, compensating brokers and others who sell the Fund’s shares, payments for printing and mailing prospectuses to new investors, and providing sales literature to prospective investors.
Note 6 – OTHER CHARGES
Other Charges mainly composed of Broker fees, Soulte to Management Company and Legal Expenses.
Note 7 – TAXATION
The Umbrella Fund is not subject to any Luxembourg tax on interest or dividends received by any Fund, any realised or unrealised capital appreciation of Fund assets or any distribution paid by any Fund to Shareholders. The Umbrella Fund is not subject to any Luxembourg stamp tax or other duty payable on the issuance of Shares. The Umbrella Fund is subject to the Luxembourg taxe d’abonnement of 0.01% per year of each Fund’s net asset value with respect to class “I” Shares, class “S” Shares, class “S1” Shares and class “S2” Shares and of 0.05% per year of each Fund’s net asset value with respect to class “R” Shares, class
“RE” Shares, class "RET" Shares, class “C” Shares, class “CW” Shares, class "CT" Shares, class “F” Shares, class “N” Shares, class “N1” Shares, class “SN1” Shares and class “P” Shares. These taxes are payable quarterly on the basis of the value of the aggregate net assets of the Funds at the end of the relevant calendar quarter. No tax is due on the assets held by the Umbrella Fund in other UCITS that are already subject to subscription tax in Luxembourg.
215
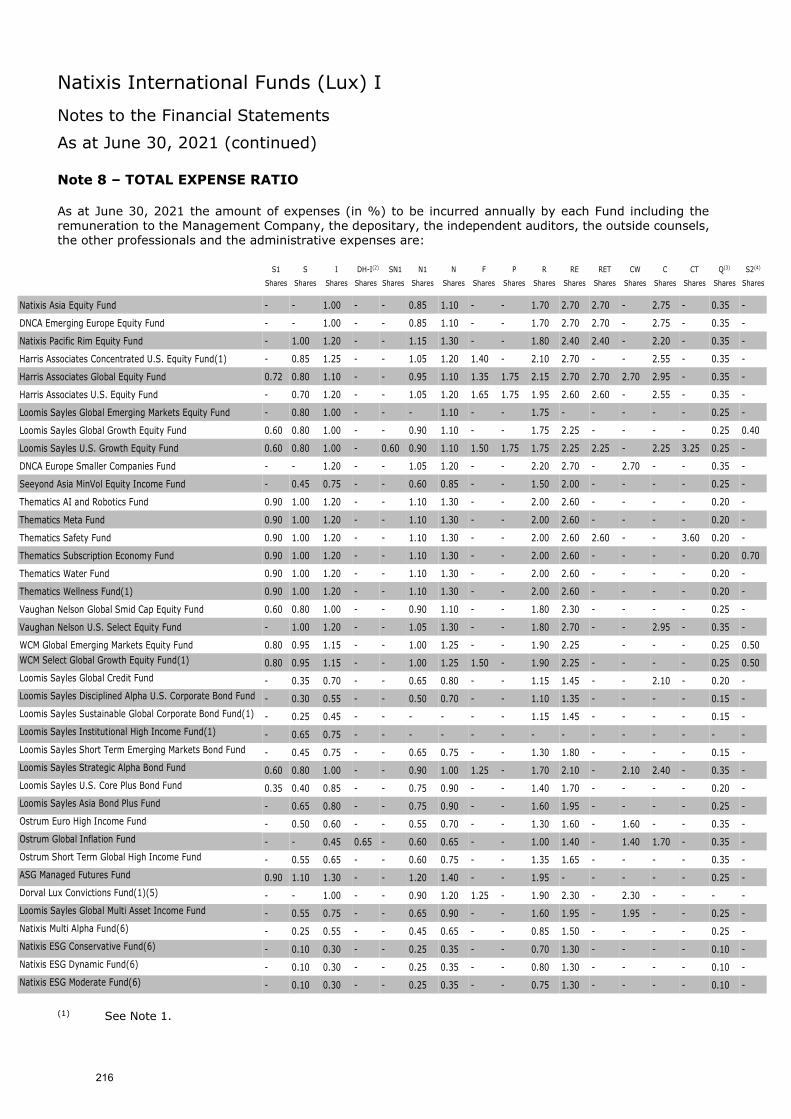
Natixis International Funds (Lux) I
Notes to the Financial Statements
As at June 30, 2021 (continued)
Note 8 – TOTAL EXPENSE RATIO
As at June 30, 2021 the amount of expenses (in %) to be incurred annually by each Fund including the remuneration to the Management Company, the depositary, the independent auditors, the outside counsels, the other professionals and the administrative expenses are:
S1 S I DH-I(2) SN1 N1 N F P R RE RET CW C CT Q(3) S2(4)
Shares Shares Shares Shares Shares Shares Shares Shares Shares Shares Shares Shares Shares Shares Shares Shares Shares
Natixis Asia Equity Fund - - 1.00 - - 0.85 1.10 - - 1.70 2.70 2.70 - 2.75 - 0.35 -
DNCA Emerging Europe Equity Fund - - 1.00 - - 0.85 1.10 - - 1.70 2.70 2.70 - 2.75 - 0.35 -
Natixis Pacific Rim Equity Fund - 1.00 1.20 - - 1.15 1.30 - - 1.80 2.40 2.40 - 2.20 - 0.35 -
Harris Associates Concentrated U.S. Equity Fund(1) - 0.85 1.25 - - 1.05 1.20 1.40 - 2.10 2.70 - - 2.55 - 0.35 -
Harris Associates Global Equity Fund 0.72 0.80 1.10 - - 0.95 1.10 1.35 1.75 2.15 2.70 2.70 2.70 2.95 - 0.35 -
Harris Associates U.S. Equity Fund - 0.70 1.20 - - 1.05 1.20 1.65 1.75 1.95 2.60 2.60 - 2.55 - 0.35 -
Loomis Sayles Global Emerging Markets Equity Fund - 0.80 1.00 - - - 1.10 - - 1.75 - - - - - 0.25 -
Loomis Sayles Global Growth Equity Fund 0.60 0.80 1.00 - - 0.90 1.10 - - 1.75 2.25 - - - - 0.25 0.40
Loomis Sayles U.S. Growth Equity Fund 0.60 0.80 1.00 - 0.60 0.90 1.10 1.50 1.75 1.75 2.25 2.25 - 2.25 3.25 0.25 -
DNCA Europe Smaller Companies Fund - - 1.20 - - 1.05 1.20 - - 2.20 2.70 - 2.70 - - 0.35 -
Seeyond Asia MinVol Equity Income Fund - 0.45 0.75 - - 0.60 0.85 - - 1.50 2.00 - - - - 0.25 -
Thematics AI and Robotics Fund 0.90 1.00 1.20 - - 1.10 1.30 - - 2.00 2.60 - - - - 0.20 -
Thematics Meta Fund 0.90 1.00 1.20 - - 1.10 1.30 - - 2.00 2.60 - - - - 0.20 -
Thematics Safety Fund 0.90 1.00 1.20 - - 1.10 1.30 - - 2.00 2.60 2.60 - - 3.60 0.20 -
Thematics Subscription Economy Fund 0.90 1.00 1.20 - - 1.10 1.30 - - 2.00 2.60 - - - - 0.20 0.70
Thematics Water Fund 0.90 1.00 1.20 - - 1.10 1.30 - - 2.00 2.60 - - - - 0.20 -
Thematics Wellness Fund(1) 0.90 1.00 1.20 - - 1.10 1.30 - - 2.00 2.60 - - - - 0.20 -
Vaughan Nelson Global Smid Cap Equity Fund 0.60 0.80 1.00 - - 0.90 1.10 - - 1.80 2.30 - - - - 0.25 -
Vaughan Nelson U.S. Select Equity Fund - 1.00 1.20 - - 1.05 1.30 - - 1.80 2.70 - - 2.95 - 0.35 -
WCM Global Emerging Markets Equity Fund 0.80 0.95 1.15 - - 1.00 1.25 - - 1.90 2.25 - - - 0.25 0.50
WCM Select Global Growth Equity Fund(1) 0.80 0.95 1.15 - - 1.00 1.25 1.50 - 1.90 2.25 - - - - 0.25 0.50
Loomis Sayles Global Credit Fund - 0.35 0.70 - - 0.65 0.80 - - 1.15 1.45 - - 2.10 - 0.20 -
Loomis Sayles Disciplined Alpha U.S. Corporate Bond Fund - 0.30 0.55 - - 0.50 0.70 - - 1.10 1.35 - - - - 0.15 -
Loomis Sayles Sustainable Global Corporate Bond Fund(1) - 0.25 0.45 - - - - - - 1.15 1.45 - - - - 0.15 -
Loomis Sayles Institutional High Income Fund(1) - 0.65 0.75 - - - - - - - - - - - - - -
Loomis Sayles Short Term Emerging Markets Bond Fund - 0.45 0.75 - - 0.65 0.75 - - 1.30 1.80 - - - - 0.15 -
Loomis Sayles Strategic Alpha Bond Fund 0.60 0.80 1.00 - - 0.90 1.00 1.25 - 1.70 2.10 - 2.10 2.40 - 0.35 -
Loomis Sayles U.S. Core Plus Bond Fund 0.35 0.40 0.85 - - 0.75 0.90 - - 1.40 1.70 - - - - 0.20 -
Loomis Sayles Asia Bond Plus Fund - 0.65 0.80 - - 0.75 0.90 - - 1.60 1.95 - - - - 0.25 -
Ostrum Euro High Income Fund - 0.50 0.60 - - 0.55 0.70 - - 1.30 1.60 - 1.60 - - 0.35 -
Ostrum Global Inflation Fund - - 0.45 0.65 - 0.60 0.65 - - 1.00 1.40 - 1.40 1.70 - 0.35 -
Ostrum Short Term Global High Income Fund - 0.55 0.65 - - 0.60 0.75 - - 1.35 1.65 - - - - 0.35 -
ASG Managed Futures Fund 0.90 1.10 1.30 - - 1.20 1.40 - - 1.95 - - - - - 0.25 -
Dorval Lux Convictions Fund(1)(5) - - 1.00 - - 0.90 1.20 1.25 - 1.90 2.30 - 2.30 - - - -
Loomis Sayles Global Multi Asset Income Fund - 0.55 0.75 - - 0.65 0.90 - - 1.60 1.95 - 1.95 - - 0.25 -
Natixis Multi Alpha Fund(6) - 0.25 0.55 - - 0.45 0.65 - - 0.85 1.50 - - - - 0.25 -
Natixis ESG Conservative Fund(6) - 0.10 0.30 - - 0.25 0.35 - - 0.70 1.30 - - - - 0.10 -
Natixis ESG Dynamic Fund(6) - 0.10 0.30 - - 0.25 0.35 - - 0.80 1.30 - - - - 0.10 -
Natixis ESG Moderate Fund(6) - 0.10 0.30 - - 0.25 0.35 - - 0.75 1.30 - - - - 0.10 -
(1) See Note 1.
216

Natixis International Funds (Lux) I
Notes to the Financial Statements
As at June 30, 2021 (continued)
Note 8 – TOTAL EXPENSE RATIO (continued)
(2) DH Share class types are duration hedged Share classes. Further details regarding duration hedging
methodology are in Prospectus. Please note that on January 30, 2017 ESMA published an Opinion (ESMA Opinion n°34-43-296) on Share Classes of UCITS which will impact duration hedged Share classes. In compliance with ESMA’s opinion, the available duration hedged Share classes in the Ostrum Global Inflation Fund is closed to new investors after Cut-Off Time on this last subscription date July 30, 2017 and is closed to additional investment(s) from existing shareholders after Cut-Off Time on the last subscription date July 30, 2018.
(3) No investment management fee is charged by the Management Company on this Share class. However,
this Share class will pay other expenses such as administrative fees and depositary fees. Q Share class of Natixis Multi Alpha Fund, Natixis ESG Conservative Fund, Natixis ESG Dynamic Fund and Natixis ESG Moderate Fund will also pay management fees up to the Maximum Indirect Management Fee that may be charged to the Fund when investing in other UCITS and/or other UCIs.
(4) This Share class closes permanently to new subscriptions and switches upon satisfying or certain level of
subscription in the Share class determined by the Management Company. (5) Maximum Indirect Management Fee is 0.10% per annum for all Share classes. Maximum Indirect
Management Fee is defined as the maximum percentage of the fees payable by the Feeder (at the level of the Master) by virtue of its investment in the Master and corresponds to the maximum percentage of fees that would have been payable by an investor investing directly in the relevant Share class of the Master.
(6) Maximum Indirect Management Fee is 1.00% per annum for all Share classes. Maximum Indirect
Management Fee is defined as the maximum level of management fees, excluding performance fees, that may be charged to the Fund when investing in other UCITS and/or UCIs.
The Total Expense Ratio by Share class, as indicated in each Fund’s description, does not necessarily include all the expenses linked to the Fund’s investments (such as brokerage fees, Luxembourg taxe d’abonnement,
expenses linked to withholding tax reclaims) that are paid by such fund.
If the total real expenses paid by each Fund exceed the Total Expense Ratio, the Management Company will support the difference and the corresponding income will be presented under the “Other income” and the corresponding “Other assets” caption; if the total real expenses paid by each Fund are lower than the Total Expense Ratio, the difference will be paid to the Management Company and the corresponding charge will be presented under the “Other charges” caption and the corresponding “Other liabilities” caption. At June 30, 2021, total real expenses were lower than total expenses ratio for 6 funds for an amount of EUR 120,614; at June 30, 2021, total real expenses exceeded the Total Expense Ratio for 11 funds for an
amount of EUR 89,813.
Note 9 – NET UNREALISED APPRECIATION/(DEPRECIATION) ON FORWARD FOREIGN
EXCHANGE CONTRACTS
As at June 30, 2021, Natixis Pacific Rim Equity Fund had the following Forward Foreign Exchange Contracts outstanding: Hedged Share Class Forward Foreign Exchange Contracts Unrealised appreciation/ Purchases Sales Class Maturity Date (depreciation) (*)
EUR 114,429 HKD 1,061,322 H-I/A (EUR) 29/07/2021 (535) EUR 17,180 USD 20,531 H-I/A (EUR) 29/07/2021 (93) EUR 29,646 SGD 47,533 H-I/A (EUR) 29/07/2021 (87) EUR 218,187 AUD 343,249 H-I/A (EUR) 29/07/2021 1,910
USD 1,195 All Hedged Share Class Forward Foreign Exchange Contracts are held with BBH&Co.
(*) The net unrealised appreciation/(depreciation) is included in the Statement of Net Assets.
217

Natixis International Funds (Lux) I
Notes to the Financial Statements
As at June 30, 2021 (continued)
Note 9 – NET UNREALISED APPRECIATION/(DEPRECIATION) ON FORWARD FOREIGN
EXCHANGE CONTRACTS (continued)
As at June 30, 2021, Harris Associates Global Equity Fund had the following Forward Foreign Exchange Contracts outstanding: Hedged Share Class Forward Foreign Exchange Contracts Unrealised
appreciation/ Purchases Sales Class Maturity Date (depreciation) (*)
EUR 6,412,088 USD 7,662,369 H-I/A (EUR) 29/07/2021 (53,920) EUR 307,714 USD 367,718 H-N/A (EUR) 29/07/2021 (2,591) GBP 58,399 USD 81,273 H-N/A (GBP) 29/07/2021 (592) EUR 12,542,086 USD 14,987,811 H-N1/A (EUR) 29/07/2021 (105,637) EUR 478,039 USD 571,121 H-R/A (EUR) 29/07/2021 (3,890) EUR 4,410,199 USD 5,270,166 H-RE/A (EUR) 29/07/2021 (37,117) USD 170,995 EUR 143,066 H-RE/A (EUR) 29/07/2021 1,236
USD (202,511) All Hedged Share Class Forward Foreign Exchange Contracts are held with BBH&Co.
As at June 30, 2021, Harris Associates U.S. Equity Fund had the following Forward Foreign Exchange Contracts outstanding: Hedged Share Class Forward Foreign Exchange Contracts Unrealised appreciation/
Purchases Sales Class Maturity Date (depreciation) (*)
EUR 28,247,970 USD 33,756,322 H-I/A (EUR) 29/07/2021 (237,878) EUR 4,387,509 USD 5,243,067 H-N/A (EUR) 29/07/2021 (36,941) SGD 54,231,762 USD 40,424,482 H-P/A (SGD) 29/07/2021 (82,173) EUR 40,285,884 USD 48,139,503 H-R/A (EUR) 29/07/2021 (337,125) SGD 7,629,226 USD 5,686,868 H-R/A (SGD) 29/07/2021 (11,585) GBP 37,082,931 USD 51,607,993 H-S/A (GBP) 29/07/2021 (375,739)
USD (1,081,441) All Hedged Share Class Forward Foreign Exchange Contracts are held with BBH&Co.
As at June 30, 2021, Loomis Sayles Global Growth Equity Fund had the following Forward Foreign Exchange Contracts outstanding: Hedged Share Class Forward Foreign Exchange Contracts Unrealised appreciation/ Purchases Sales Class Maturity Date (depreciation) (*)
EUR 9,652,009 USD 11,534,103 H-I/A (EUR) 29/07/2021 (81,233) EUR 1,763,059 USD 2,106,847 H-R/A (EUR) 29/07/2021 (14,838) USD 53,696 EUR 44,951 H-R/A (EUR) 29/07/2021 358
USD (95,713) All Hedged Share Class Forward Foreign Exchange Contracts are held with BBH&Co.
(*) The net unrealised appreciation/(depreciation) is included in the Statement of Net Assets.
218

Natixis International Funds (Lux) I
Notes to the Financial Statements
As at June 30, 2021 (continued)
Note 9 – NET UNREALISED APPRECIATION/(DEPRECIATION) ON FORWARD FOREIGN
EXCHANGE CONTRACTS (continued)
As at June 30, 2021, Loomis Sayles U.S. Growth Equity Fund had the following Forward Foreign Exchange Contracts outstanding: Hedged Share Class Forward Foreign Exchange Contracts Unrealised appreciation/ Purchases Sales Class Maturity Date (depreciation) (*)
EUR 5,683,192 USD 6,790,988 H-I/A (EUR) 29/07/2021 (47,432) EUR 16,025,265 USD 19,150,186 H-N/A (EUR) 29/07/2021 (134,946) GBP 288,810 USD 401,941 H-N/D (GBP) 29/07/2021 (2,934) CHF 231,706 USD 253,190 H-R/A (CHF) 29/07/2021 (2,337) EUR 87,104,978 USD 104,090,014 H-R/A (EUR) 29/07/2021 (733,089) SGD 5,352,067 USD 3,989,495 H-R/A (SGD) 29/07/2021 (8,161)
EUR 78,785,133 USD 94,147,840 H-S/A (EUR) 29/07/2021 (663,068) GBP 85,166,539 USD 118,514,198 H-S/A (GBP) 29/07/2021 (851,604) SGD 407,997,089 USD 304,125,922 H-S/A (SGD) 29/07/2021 (622,147) EUR 12,254,634 USD 14,643,294 H-S1/A (EUR) 29/07/2021 (102,205) GBP 54,087,210 USD 75,265,789 H-S1/A (GBP) 29/07/2021 (541,121) GBP 2,688,787 USD 3,741,582 H-SN1/D (GBP) 29/07/2021 (26,864)
USD (3,735,908) All Hedged Share Class Forward Foreign Exchange Contracts are held with BBH&Co.
As at June 30, 2021, DNCA Europe Smaller Companies Fund had the following Forward Foreign Exchange Contracts outstanding: Hedged Share Class Forward Foreign Exchange Contracts Unrealised appreciation/
Purchases Sales Class Maturity Date (depreciation) (*)
USD 347,964 EUR 291,186 H-I/A (USD) 29/07/2021 2,063 USD 1,323,913 EUR 1,107,919 H-R/A (USD) 29/07/2021 7,821
EUR 9,884 All Hedged Share Class Forward Foreign Exchange Contracts are held with BBH&Co.
As at June 30, 2021, Thematics AI and Robotics Fund had the following Forward Foreign Exchange Contracts outstanding: Hedged Share Class Forward Foreign Exchange Contracts Unrealised appreciation/ Purchases Sales Class Maturity Date (depreciation) (*)
EUR 77,958,370 USD 93,159,862 H-I/A (EUR) 29/07/2021 (656,110) USD 17,061,427 EUR 14,274,716 H-I/A (EUR) 29/07/2021 123,350 CHF 800,821 USD 875,036 H-N/A (CHF) 29/07/2021 (8,038) EUR 3,841,162 USD 4,590,187 H-N/A (EUR) 29/07/2021 (32,345) EUR 40,475,697 USD 48,367,865 H-R/A (EUR) 29/07/2021 (340,259) SGD 349,714 USD 260,681 H-R/A (SGD) 29/07/2021 (533) EUR 295,594 USD 353,231 H-RE/A (EUR) 29/07/2021 (2,485) EUR 92,379,279 USD 110,393,274 H-S/A (EUR) 29/07/2021 (777,977)
USD (1,694,397) All Hedged Share Class Forward Foreign Exchange Contracts are held with BBH&Co.
(*) The net unrealised appreciation/(depreciation) is included in the Statement of Net Assets.
219
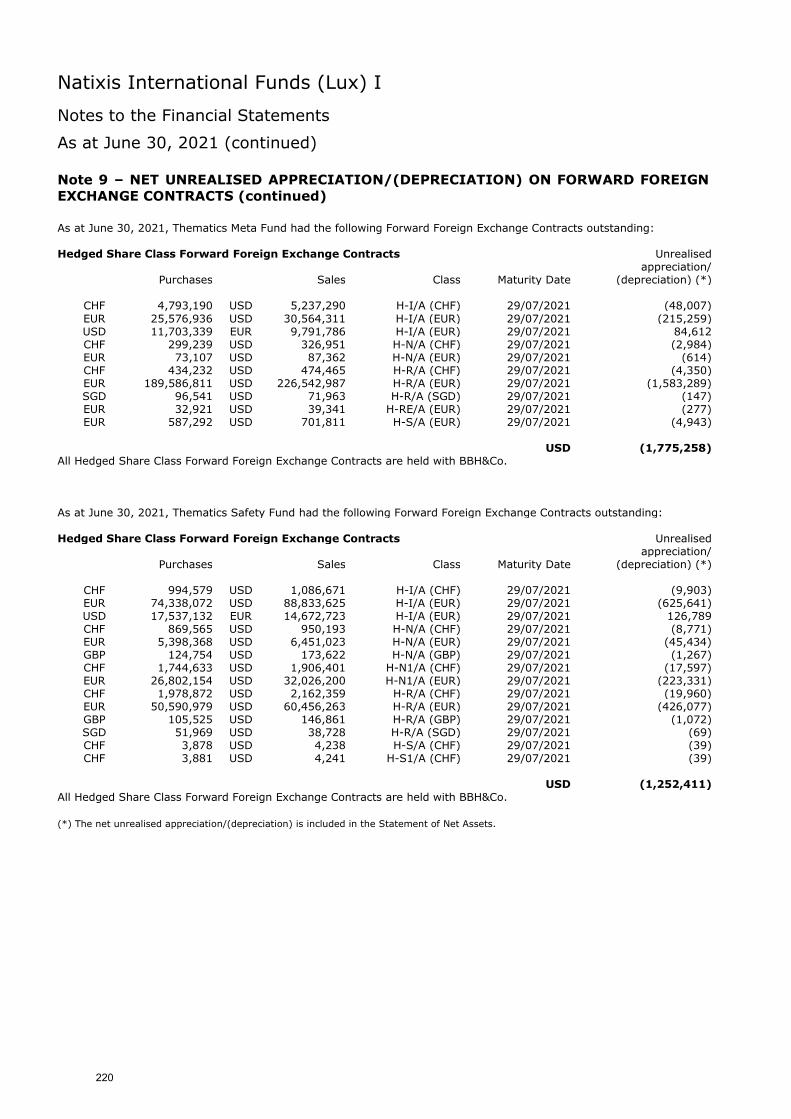
Natixis International Funds (Lux) I
Notes to the Financial Statements
As at June 30, 2021 (continued)
Note 9 – NET UNREALISED APPRECIATION/(DEPRECIATION) ON FORWARD FOREIGN
EXCHANGE CONTRACTS (continued)
As at June 30, 2021, Thematics Meta Fund had the following Forward Foreign Exchange Contracts outstanding: Hedged Share Class Forward Foreign Exchange Contracts Unrealised appreciation/ Purchases Sales Class Maturity Date (depreciation) (*)
CHF 4,793,190 USD 5,237,290 H-I/A (CHF) 29/07/2021 (48,007)
EUR 25,576,936 USD 30,564,311 H-I/A (EUR) 29/07/2021 (215,259) USD 11,703,339 EUR 9,791,786 H-I/A (EUR) 29/07/2021 84,612 CHF 299,239 USD 326,951 H-N/A (CHF) 29/07/2021 (2,984) EUR 73,107 USD 87,362 H-N/A (EUR) 29/07/2021 (614) CHF 434,232 USD 474,465 H-R/A (CHF) 29/07/2021 (4,350) EUR 189,586,811 USD 226,542,987 H-R/A (EUR) 29/07/2021 (1,583,289) SGD 96,541 USD 71,963 H-R/A (SGD) 29/07/2021 (147) EUR 32,921 USD 39,341 H-RE/A (EUR) 29/07/2021 (277) EUR 587,292 USD 701,811 H-S/A (EUR) 29/07/2021 (4,943)
USD (1,775,258) All Hedged Share Class Forward Foreign Exchange Contracts are held with BBH&Co.
As at June 30, 2021, Thematics Safety Fund had the following Forward Foreign Exchange Contracts outstanding: Hedged Share Class Forward Foreign Exchange Contracts Unrealised appreciation/ Purchases Sales Class Maturity Date (depreciation) (*)
CHF 994,579 USD 1,086,671 H-I/A (CHF) 29/07/2021 (9,903) EUR 74,338,072 USD 88,833,625 H-I/A (EUR) 29/07/2021 (625,641) USD 17,537,132 EUR 14,672,723 H-I/A (EUR) 29/07/2021 126,789 CHF 869,565 USD 950,193 H-N/A (CHF) 29/07/2021 (8,771) EUR 5,398,368 USD 6,451,023 H-N/A (EUR) 29/07/2021 (45,434) GBP 124,754 USD 173,622 H-N/A (GBP) 29/07/2021 (1,267) CHF 1,744,633 USD 1,906,401 H-N1/A (CHF) 29/07/2021 (17,597) EUR 26,802,154 USD 32,026,200 H-N1/A (EUR) 29/07/2021 (223,331) CHF 1,978,872 USD 2,162,359 H-R/A (CHF) 29/07/2021 (19,960) EUR 50,590,979 USD 60,456,263 H-R/A (EUR) 29/07/2021 (426,077) GBP 105,525 USD 146,861 H-R/A (GBP) 29/07/2021 (1,072) SGD 51,969 USD 38,728 H-R/A (SGD) 29/07/2021 (69) CHF 3,878 USD 4,238 H-S/A (CHF) 29/07/2021 (39) CHF 3,881 USD 4,241 H-S1/A (CHF) 29/07/2021 (39)
USD (1,252,411) All Hedged Share Class Forward Foreign Exchange Contracts are held with BBH&Co.
(*) The net unrealised appreciation/(depreciation) is included in the Statement of Net Assets.
220

Natixis International Funds (Lux) I
Notes to the Financial Statements
As at June 30, 2021 (continued)
Note 9 – NET UNREALISED APPRECIATION/(DEPRECIATION) ON FORWARD FOREIGN
EXCHANGE CONTRACTS (continued)
As at June 30, 2021, Thematics Subscription Economy Fund had the following Forward Foreign Exchange Contracts outstanding: Hedged Share Class Forward Foreign Exchange Contracts Unrealised appreciation/ Purchases Sales Class Maturity Date (depreciation) (*)
EUR 101,217,730 USD 120,954,681 H-I/A (EUR) 29/07/2021 (851,864) EUR 353,422 USD 422,337 H-N/A (EUR) 29/07/2021 (2,974) EUR 23,673,686 USD 28,289,937 H-N1/A (EUR) 29/07/2021 (199,241) EUR 2,341,637 USD 2,798,244 H-R/A (EUR) 29/07/2021 (19,708) SGD 10,989 USD 8,191 H-R/A (SGD) 29/07/2021 (17) EUR 26,952 USD 32,207 H-RE/A (EUR) 29/07/2021 (227)
USD (1,074,031) All Hedged Share Class Forward Foreign Exchange Contracts are held with BBH&Co.
As at June 30, 2021, Thematics Water Fund had the following Forward Foreign Exchange Contracts outstanding: Hedged Share Class Forward Foreign Exchange Contracts Unrealised appreciation/ Purchases Sales Class Maturity Date (depreciation) (*)
EUR 31,047,833 USD 37,102,005 H-I/A (EUR) 29/07/2021 (261,304) CHF 732,960 USD 800,923 H-N/A (CHF) 29/07/2021 (7,393) EUR 601,850 USD 719,207 H-N/A (EUR) 29/07/2021 (5,065) EUR 26,733,453 USD 31,945,897 H-R/A (EUR) 29/07/2021 (224,547) SGD 112,414 USD 83,793 H-R/A (SGD) 29/07/2021 (170) EUR 73,050 USD 87,295 H-RE/A (EUR) 29/07/2021 (615) EUR 61,399,181 USD 73,371,715 H-S/A (EUR) 29/07/2021 (516,745)
USD (1,015,839) All Hedged Share Class Forward Foreign Exchange Contracts are held with BBH&Co.
As at June 30, 2021, Thematics Wellness Fund had the following Forward Foreign Exchange Contracts outstanding:
Hedged Share Class Forward Foreign Exchange Contracts Unrealised appreciation/ Purchases Sales Class Maturity Date (depreciation) (*)
EUR 3,041 USD 3,634 H-R/A (EUR) 29/07/2021 (25) EUR 5,077,484 USD 6,067,592 H-S/A (EUR) 29/07/2021 (42,757)
USD (42,782) All Hedged Share Class Forward Foreign Exchange Contracts are held with BBH&Co.
(*) The net unrealised appreciation/(depreciation) is included in the Statement of Net Assets.
221

Natixis International Funds (Lux) I
Notes to the Financial Statements
As at June 30, 2021 (continued)
Note 9 – NET UNREALISED APPRECIATION/(DEPRECIATION) ON FORWARD FOREIGN
EXCHANGE CONTRACTS (continued)
As at June 30, 2021, Vaughan Nelson U.S. Select Equity Fund had the following Forward Foreign Exchange Contracts outstanding: Hedged Share Class Forward Foreign Exchange Contracts Unrealised appreciation/ Purchases Sales Class Maturity Date (depreciation) (*)
EUR 21,074,765 USD 25,184,238 H-I/A (EUR) 29/07/2021 (177,369) USD (177,369) All Hedged Share Class Forward Foreign Exchange Contracts are held with BBH&Co.
As at June 30, 2021, WCM Global Emerging Markets Equity Fund had the following Forward Foreign Exchange Contracts outstanding: Hedged Share Class Forward Foreign Exchange Contracts Unrealised appreciation/ Purchases Sales Class Maturity Date (depreciation) (*)
EUR 52,317,448 USD 62,518,437 H-I/A (EUR) 29/07/2021 (439,660) EUR 247,382 USD 295,626 H-R/A (EUR) 29/07/2021 (2,088) SGD 13,785 USD 10,272 H-R/A (SGD) 29/07/2021 (17)
USD (441,765) All Hedged Share Class Forward Foreign Exchange Contracts are held with BBH&Co.
(*) The net unrealised appreciation/(depreciation) is included in the Statement of Net Assets.
222
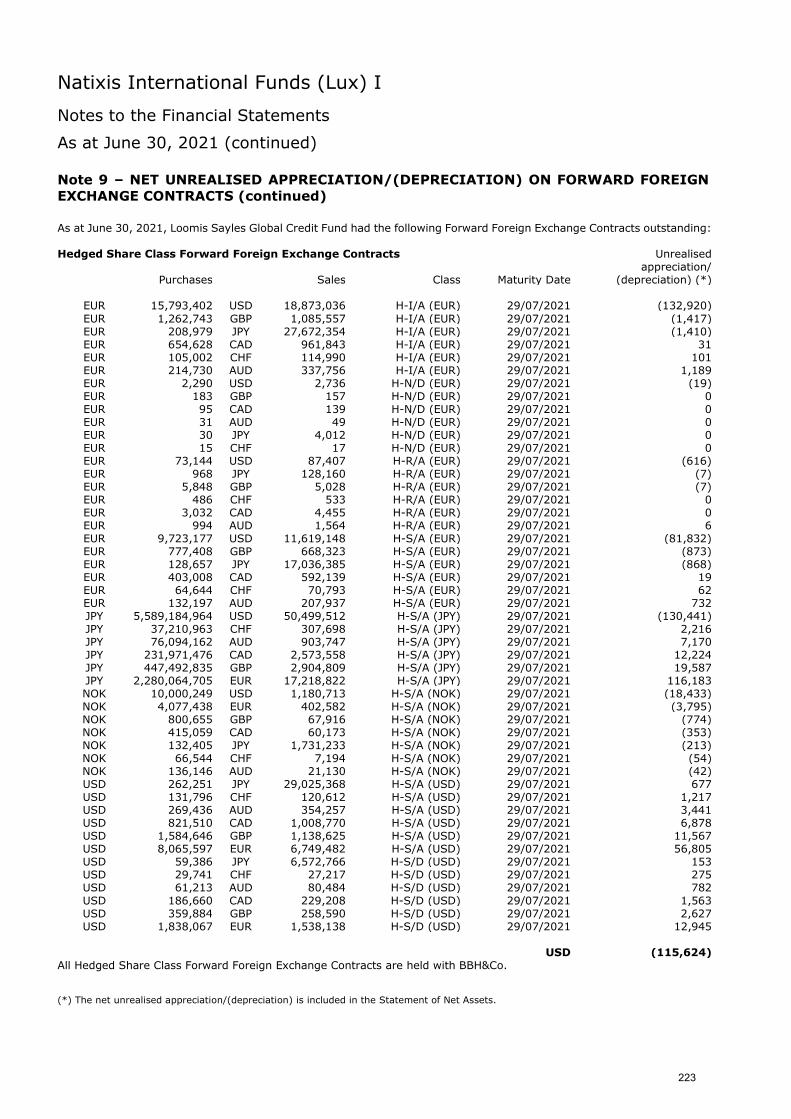
Natixis International Funds (Lux) I
Notes to the Financial Statements
As at June 30, 2021 (continued)
Note 9 – NET UNREALISED APPRECIATION/(DEPRECIATION) ON FORWARD FOREIGN
EXCHANGE CONTRACTS (continued)
As at June 30, 2021, Loomis Sayles Global Credit Fund had the following Forward Foreign Exchange Contracts outstanding: Hedged Share Class Forward Foreign Exchange Contracts Unrealised appreciation/ Purchases Sales Class Maturity Date (depreciation) (*)
EUR 15,793,402 USD 18,873,036 H-I/A (EUR) 29/07/2021 (132,920)
EUR 1,262,743 GBP 1,085,557 H-I/A (EUR) 29/07/2021 (1,417) EUR 208,979 JPY 27,672,354 H-I/A (EUR) 29/07/2021 (1,410) EUR 654,628 CAD 961,843 H-I/A (EUR) 29/07/2021 31 EUR 105,002 CHF 114,990 H-I/A (EUR) 29/07/2021 101 EUR 214,730 AUD 337,756 H-I/A (EUR) 29/07/2021 1,189 EUR 2,290 USD 2,736 H-N/D (EUR) 29/07/2021 (19) EUR 183 GBP 157 H-N/D (EUR) 29/07/2021 0 EUR 95 CAD 139 H-N/D (EUR) 29/07/2021 0 EUR 31 AUD 49 H-N/D (EUR) 29/07/2021 0 EUR 30 JPY 4,012 H-N/D (EUR) 29/07/2021 0 EUR 15 CHF 17 H-N/D (EUR) 29/07/2021 0 EUR 73,144 USD 87,407 H-R/A (EUR) 29/07/2021 (616) EUR 968 JPY 128,160 H-R/A (EUR) 29/07/2021 (7) EUR 5,848 GBP 5,028 H-R/A (EUR) 29/07/2021 (7) EUR 486 CHF 533 H-R/A (EUR) 29/07/2021 0 EUR 3,032 CAD 4,455 H-R/A (EUR) 29/07/2021 0 EUR 994 AUD 1,564 H-R/A (EUR) 29/07/2021 6 EUR 9,723,177 USD 11,619,148 H-S/A (EUR) 29/07/2021 (81,832) EUR 777,408 GBP 668,323 H-S/A (EUR) 29/07/2021 (873) EUR 128,657 JPY 17,036,385 H-S/A (EUR) 29/07/2021 (868) EUR 403,008 CAD 592,139 H-S/A (EUR) 29/07/2021 19 EUR 64,644 CHF 70,793 H-S/A (EUR) 29/07/2021 62 EUR 132,197 AUD 207,937 H-S/A (EUR) 29/07/2021 732 JPY 5,589,184,964 USD 50,499,512 H-S/A (JPY) 29/07/2021 (130,441) JPY 37,210,963 CHF 307,698 H-S/A (JPY) 29/07/2021 2,216 JPY 76,094,162 AUD 903,747 H-S/A (JPY) 29/07/2021 7,170 JPY 231,971,476 CAD 2,573,558 H-S/A (JPY) 29/07/2021 12,224 JPY 447,492,835 GBP 2,904,809 H-S/A (JPY) 29/07/2021 19,587 JPY 2,280,064,705 EUR 17,218,822 H-S/A (JPY) 29/07/2021 116,183 NOK 10,000,249 USD 1,180,713 H-S/A (NOK) 29/07/2021 (18,433) NOK 4,077,438 EUR 402,582 H-S/A (NOK) 29/07/2021 (3,795) NOK 800,655 GBP 67,916 H-S/A (NOK) 29/07/2021 (774) NOK 415,059 CAD 60,173 H-S/A (NOK) 29/07/2021 (353) NOK 132,405 JPY 1,731,233 H-S/A (NOK) 29/07/2021 (213) NOK 66,544 CHF 7,194 H-S/A (NOK) 29/07/2021 (54) NOK 136,146 AUD 21,130 H-S/A (NOK) 29/07/2021 (42) USD 262,251 JPY 29,025,368 H-S/A (USD) 29/07/2021 677 USD 131,796 CHF 120,612 H-S/A (USD) 29/07/2021 1,217 USD 269,436 AUD 354,257 H-S/A (USD) 29/07/2021 3,441 USD 821,510 CAD 1,008,770 H-S/A (USD) 29/07/2021 6,878 USD 1,584,646 GBP 1,138,625 H-S/A (USD) 29/07/2021 11,567 USD 8,065,597 EUR 6,749,482 H-S/A (USD) 29/07/2021 56,805 USD 59,386 JPY 6,572,766 H-S/D (USD) 29/07/2021 153 USD 29,741 CHF 27,217 H-S/D (USD) 29/07/2021 275 USD 61,213 AUD 80,484 H-S/D (USD) 29/07/2021 782
USD 186,660 CAD 229,208 H-S/D (USD) 29/07/2021 1,563 USD 359,884 GBP 258,590 H-S/D (USD) 29/07/2021 2,627 USD 1,838,067 EUR 1,538,138 H-S/D (USD) 29/07/2021 12,945
USD (115,624) All Hedged Share Class Forward Foreign Exchange Contracts are held with BBH&Co.
(*) The net unrealised appreciation/(depreciation) is included in the Statement of Net Assets.
223

Natixis International Funds (Lux) I
Notes to the Financial Statements
As at June 30, 2021 (continued)
Note 9 – NET UNREALISED APPRECIATION/(DEPRECIATION) ON FORWARD FOREIGN
EXCHANGE CONTRACTS (continued) As at June 30, 2021, Loomis Sayles Global Credit Fund had the following Forward Foreign Exchange Contracts outstanding (continued): Forwards Unrealised appreciation/ Purchases Sales Counterparty Maturity Date (depreciation) (*)
AUD 1,300,000 USD 1,006,792 HSBC 15/09/2021 (30,501) CAD 2,357,000 USD 1,947,929 HSBC 15/09/2021 (44,556) CHF 723,000 USD 803,636 UBS 15/09/2021 (19,865) EUR 1,509,000 USD 1,843,447 BNP Paribas 15/09/2021 (51,094) JPY 167,928,000 USD 1,538,824 Credit Suisse 15/09/2021 (24,827) SEK 1,285,000 USD 155,595 Citibank 15/09/2021 (5,234) USD 767,728 EUR 633,000 BNP Paribas 15/09/2021 15,867
USD (160,210) As at June 30, 2021, the net unrealised depreciation on Forward Foreign Exchange Contracts amounted to USD (275,834).
As at June 30, 2021, Loomis Sayles Sustainable Global Corporate Bond Fund had the following Forward Foreign Exchange Contracts outstanding: Hedged Share Class Forward Foreign Exchange Contracts Unrealised appreciation/ Purchases Sales Class Maturity Date (depreciation) (*)
EUR 3,956,696 USD 4,728,232 H-I/A (EUR) 29/07/2021 (33,300) EUR 61,537 JPY 8,148,547 H-I/A (EUR) 29/07/2021 (415) EUR 305,949 GBP 263,019 H-I/A (EUR) 29/07/2021 (343) EUR 206,420 CAD 303,293 H-I/A (EUR) 29/07/2021 10 EUR 22,795 CHF 24,963 H-I/A (EUR) 29/07/2021 22 EUR 24,744 AUD 38,920 H-I/A (EUR) 29/07/2021 137 SEK 169,557,070 USD 20,041,330 H-I/A (SEK) 29/07/2021 (209,897) SEK 64,715,800 EUR 6,394,449 H-I/A (SEK) 29/07/2021 (18,344) SEK 13,055,745 GBP 1,108,694 H-I/A (SEK) 29/07/2021 (4,724) SEK 2,618,840 JPY 34,257,252 H-I/A (SEK) 29/07/2021 (2,422) SEK 8,829,635 CAD 1,281,500 H-I/A (SEK) 29/07/2021 (2,159) SEK 966,994 CHF 104,626 H-I/A (SEK) 29/07/2021 (172) SEK 1,053,066 AUD 163,618 H-I/A (SEK) 29/07/2021 314 GBP 26,516,709 USD 36,903,782 H-S/A (GBP) 29/07/2021 (269,385) GBP 412,362 JPY 63,525,355 H-S/A (GBP) 29/07/2021 (2,781) GBP 152,905 CHF 194,764 H-S/A (GBP) 29/07/2021 389 GBP 165,892 AUD 303,585 H-S/A (GBP) 29/07/2021 1,242 GBP 1,386,198 CAD 2,368,814 H-S/A (GBP) 29/07/2021 2,179
GBP 10,199,572 EUR 11,864,354 H-S/A (GBP) 29/07/2021 13,318 NOK 790,394,563 USD 93,320,586 H-S/A (NOK) 29/07/2021 (1,456,936) NOK 310,798,497 EUR 30,686,419 H-S/A (NOK) 29/07/2021 (289,284) NOK 62,213,398 GBP 5,277,298 H-S/A (NOK) 29/07/2021 (60,142) NOK 42,108,674 CAD 6,104,718 H-S/A (NOK) 29/07/2021 (35,780) NOK 12,375,052 JPY 161,807,345 H-S/A (NOK) 29/07/2021 (19,897) NOK 4,629,744 CHF 500,516 H-S/A (NOK) 29/07/2021 (3,785) NOK 5,055,692 AUD 784,645 H-S/A (NOK) 29/07/2021 (1,556)
USD (2,393,711) All Hedged Share Class Forward Foreign Exchange Contracts are held with BBH&Co. (*) The net unrealised appreciation/(depreciation) is included in the Statement of Net Assets.
224
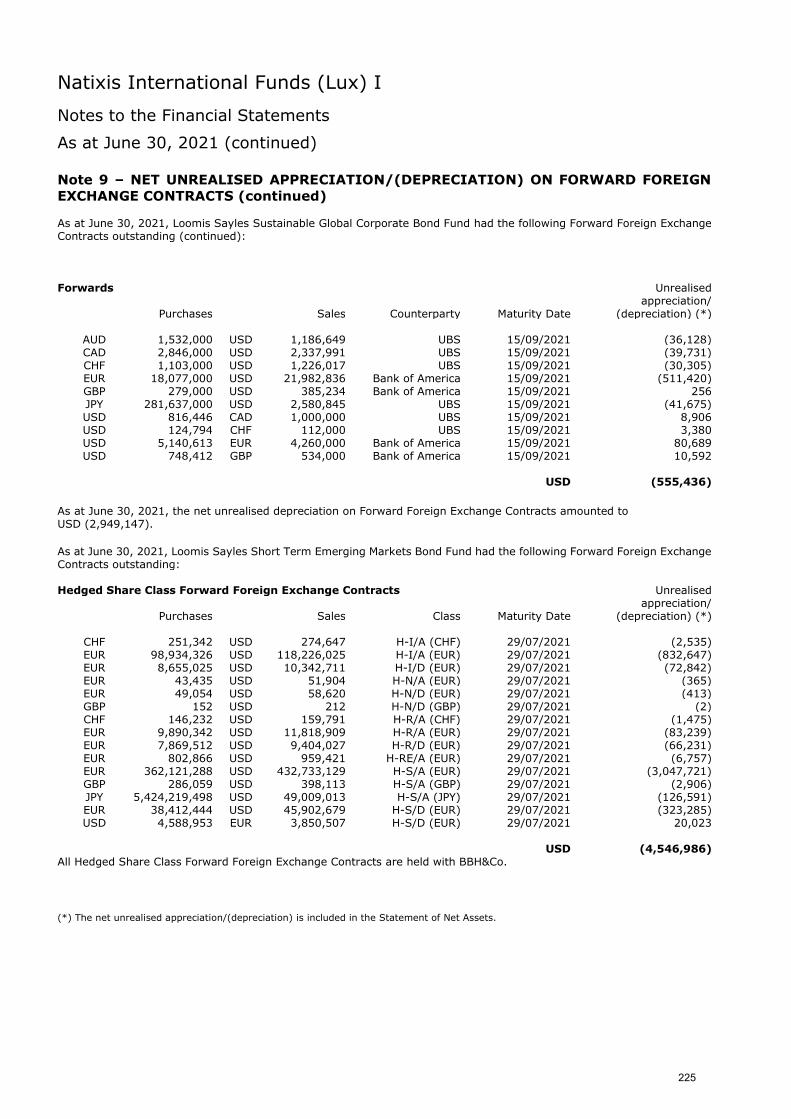
Natixis International Funds (Lux) I
Notes to the Financial Statements
As at June 30, 2021 (continued)
Note 9 – NET UNREALISED APPRECIATION/(DEPRECIATION) ON FORWARD FOREIGN
EXCHANGE CONTRACTS (continued) As at June 30, 2021, Loomis Sayles Sustainable Global Corporate Bond Fund had the following Forward Foreign Exchange Contracts outstanding (continued): Forwards Unrealised appreciation/ Purchases Sales Counterparty Maturity Date (depreciation) (*)
AUD 1,532,000 USD 1,186,649 UBS 15/09/2021 (36,128) CAD 2,846,000 USD 2,337,991 UBS 15/09/2021 (39,731) CHF 1,103,000 USD 1,226,017 UBS 15/09/2021 (30,305) EUR 18,077,000 USD 21,982,836 Bank of America 15/09/2021 (511,420) GBP 279,000 USD 385,234 Bank of America 15/09/2021 256 JPY 281,637,000 USD 2,580,845 UBS 15/09/2021 (41,675) USD 816,446 CAD 1,000,000 UBS 15/09/2021 8,906 USD 124,794 CHF 112,000 UBS 15/09/2021 3,380 USD 5,140,613 EUR 4,260,000 Bank of America 15/09/2021 80,689 USD 748,412 GBP 534,000 Bank of America 15/09/2021 10,592
USD (555,436)
As at June 30, 2021, the net unrealised depreciation on Forward Foreign Exchange Contracts amounted to USD (2,949,147).
As at June 30, 2021, Loomis Sayles Short Term Emerging Markets Bond Fund had the following Forward Foreign Exchange Contracts outstanding: Hedged Share Class Forward Foreign Exchange Contracts Unrealised appreciation/ Purchases Sales Class Maturity Date (depreciation) (*)
CHF 251,342 USD 274,647 H-I/A (CHF) 29/07/2021 (2,535) EUR 98,934,326 USD 118,226,025 H-I/A (EUR) 29/07/2021 (832,647) EUR 8,655,025 USD 10,342,711 H-I/D (EUR) 29/07/2021 (72,842) EUR 43,435 USD 51,904 H-N/A (EUR) 29/07/2021 (365) EUR 49,054 USD 58,620 H-N/D (EUR) 29/07/2021 (413) GBP 152 USD 212 H-N/D (GBP) 29/07/2021 (2) CHF 146,232 USD 159,791 H-R/A (CHF) 29/07/2021 (1,475) EUR 9,890,342 USD 11,818,909 H-R/A (EUR) 29/07/2021 (83,239) EUR 7,869,512 USD 9,404,027 H-R/D (EUR) 29/07/2021 (66,231) EUR 802,866 USD 959,421 H-RE/A (EUR) 29/07/2021 (6,757) EUR 362,121,288 USD 432,733,129 H-S/A (EUR) 29/07/2021 (3,047,721) GBP 286,059 USD 398,113 H-S/A (GBP) 29/07/2021 (2,906) JPY 5,424,219,498 USD 49,009,013 H-S/A (JPY) 29/07/2021 (126,591) EUR 38,412,444 USD 45,902,679 H-S/D (EUR) 29/07/2021 (323,285) USD 4,588,953 EUR 3,850,507 H-S/D (EUR) 29/07/2021 20,023
USD (4,546,986) All Hedged Share Class Forward Foreign Exchange Contracts are held with BBH&Co.
(*) The net unrealised appreciation/(depreciation) is included in the Statement of Net Assets.
225

Natixis International Funds (Lux) I
Notes to the Financial Statements
As at June 30, 2021 (continued)
Note 9 – NET UNREALISED APPRECIATION/(DEPRECIATION) ON FORWARD FOREIGN
EXCHANGE CONTRACTS (continued)
As at June 30, 2021, Loomis Sayles Strategic Alpha Bond Fund had the following Forward Foreign Exchange Contracts outstanding: Hedged Share Class Forward Foreign Exchange Contracts Unrealised appreciation/ Purchases Sales Class Maturity Date (depreciation) (*)
EUR 377,911 USD 451,586 H-I A (EUR) 29/07/2021 (3,164) GBP 3,439 USD 4,786 H-N/D (GBP) 29/07/2021 (35) EUR 364,728 USD 435,848 H-R/A (EUR) 29/07/2021 (3,070)
USD (6,269) All Hedged Share Class Forward Foreign Exchange Contracts are held with BBH&Co.
Forwards Unrealised appreciation/ Purchases Sales Counterparty Maturity Date (depreciation) (*)
USD 72,565 BRL 389,000 Bank of America 02/09/2021 (4,377) USD 97,103 COP 354,347,000 Morgan Stanley 08/07/2021 2,235 USD 188,020 EUR 156,000 Bank of America 26/07/2021 2,925 USD 129,375 EUR 107,000 Morgan Stanley 30/07/2021 2,408 USD 18,165 EUR 15,000 HSBC 17/08/2021 359
USD 3,550 As at June 30, 2021, the net unrealised depreciation on Forward Foreign Exchange Contracts amounted to USD (2,719).
As at June 30, 2021, Loomis Sayles U.S. Core Plus Bond Fund had the following Forward Foreign Exchange Contracts outstanding: Hedged Share Class Forward Foreign Exchange Contracts Unrealised
appreciation/ Purchases Sales Class Maturity Date (depreciation) (*)
EUR 411,536 USD 491,784 H-R/A (EUR) 29/07/2021 (3,464) USD (3,464) All Hedged Share Class Forward Foreign Exchange Contracts are held with BBH&Co.
As at June 30, 2021, Loomis Sayles Asia Bond Plus Fund had the following Forward Foreign Exchange Contracts outstanding: Hedged Share Class Forward Foreign Exchange Contracts Unrealised appreciation/ Purchases Sales Class Maturity Date (depreciation) (*)
SGD 2,516,686 USD 1,875,638 H-R/DIVM (SGD) 29/07/2021 (3,508) USD (3,508) All Hedged Share Class Forward Foreign Exchange Contracts are held with BBH&Co.
(*) The net unrealised appreciation/(depreciation) is included in the Statement of Net Assets.
226

Natixis International Funds (Lux) I
Notes to the Financial Statements
As at June 30, 2021 (continued)
Note 9 – NET UNREALISED APPRECIATION/(DEPRECIATION) ON FORWARD FOREIGN
EXCHANGE CONTRACTS (continued)
As at June 30, 2021, Ostrum Euro High Income Fund had the following Forward Foreign Exchange Contracts outstanding: Hedged Share Class Forward Foreign Exchange Contracts Unrealised appreciation/ Purchases Sales Class Maturity Date (depreciation) (*)
USD 1,246,247 EUR 1,042,889 H-I/A (USD) 29/07/2021 7,397
USD 127,574 EUR 106,757 H-I/D (USD) 29/07/2021 757 USD 46,957 EUR 39,295 H-R/A (USD) 29/07/2021 279 EUR 23,117 SGD 37,081 H-R/D (SGD) 29/07/2021 (130) SGD 112,054 EUR 69,803 H-R/D (SGD) 29/07/2021 446 USD 68,154 EUR 57,032 H-RE/A (USD) 29/07/2021 404
EUR 9,153 All Hedged Share Class Forward Foreign Exchange Contracts are held with BBH&Co. Forwards Unrealised appreciation/ Purchases Sales Counterparty Maturity Date (depreciation) (*)
EUR 9,894,363 GBP 8,500,000 Societe Generale 29/07/2021 (2,362) EUR 6,861,422 USD 8,200,000 JP Morgan 29/07/2021 (49,200)
EUR (51,562) As at June 30, 2021, the net unrealised depreciation on Forward Foreign Exchange Contracts amounted to USD (42,409).
As at June 30, 2021, Ostrum Global Inflation Fund had the following Forward Foreign Exchange Contracts outstanding: Forwards Unrealised appreciation/ Purchases Sales Counterparty Maturity Date (depreciation) (*)
AUD 1,000,000 EUR 632,387 State Street 09/07/2021 604 EUR 1,203,891 AUD 1,900,000 State Street 09/07/2021 1,208 EUR 1,316,455 CAD 1,950,000 State Street 09/07/2021 (11,223) EUR 17,051,579 GBP 14,730,000 JP Morgan 09/07/2021 (105,175) EUR 165,095 GBP 142,000 State Street 09/07/2021 (300) EUR 725,687 GBP 625,000 Barclays 09/07/2021 (2,282) EUR 757,581 GBP 650,000 Societe Generale 09/07/2021 494 EUR 24,306,412 USD 29,720,000 JP Morgan 09/07/2021 (751,026) EUR 3,320,119 USD 4,050,000 Credit Agricole 09/07/2021 (94,506) EUR 989,890 USD 1,200,000 State Street 09/07/2021 (21,850) EUR 311,882 USD 380,000 Barclays 09/07/2021 (8,502) EUR 534,245 NZD 910,000 State Street 09/07/2021 (1,865)
EUR (994,423)
(*) The net unrealised appreciation/(depreciation) is included in the Statement of Net Assets.
227

Natixis International Funds (Lux) I
Notes to the Financial Statements
As at June 30, 2021 (continued)
Note 9 – NET UNREALISED APPRECIATION/(DEPRECIATION) ON FORWARD FOREIGN
EXCHANGE CONTRACTS (continued)
As at June 30, 2021, Ostrum Short Term Global High Income Fund had the following Forward Foreign Exchange Contracts outstanding: Hedged Share Class Forward Foreign Exchange Contracts Unrealised appreciation/ Purchases Sales Class Maturity Date (depreciation) (*)
EUR 35,384,862 USD 42,284,733 H-I/A (EUR) 29/07/2021 (297,804) EUR 4,553,351 USD 5,441,232 H-R/A (EUR) 29/07/2021 (38,322) EUR 33,113 USD 39,570 H-RE/A (EUR) 29/07/2021 (279) EUR 14,484,010 USD 17,308,319 H-S/A (EUR) 29/07/2021 (121,899)
USD (458,304) All Hedged Share Class Forward Foreign Exchange Contracts are held with BBH&Co. Forwards Unrealised appreciation/ Purchases Sales Counterparty Maturity Date (depreciation) (*)
USD 338,044 CHF 310,000 State Street 29/07/2021 2,427 USD 49,277,210 EUR 41,230,000 Morgan Stanley 29/07/2021 354,564 USD 2,324,016 GBP 1,670,000 Barclays 29/07/2021 16,812
USD 373,803 As at June 30, 2021, the net unrealised depreciation on Forward Foreign Exchange Contracts amounted to USD (84,501).
As at June 30, 2021, ASG Managed Futures Fund had the following Forward Foreign Exchange Contracts outstanding: Hedged Share Class Forward Foreign Exchange Contracts Unrealised appreciation/ Purchases Sales Class Maturity Date (depreciation) (*)
GBP 19,736 USD 27,467 H-I/A (GBP) 29/07/2021 (200) GBP 3,773 USD 5,251 H-N1/A (GBP) 29/07/2021 (38) EUR 530,901 USD 634,423 H-R/A (EUR) 29/07/2021 (4,468) EUR 81,248,378 USD 97,091,406 H-S1/A (EUR) 29/07/2021 (683,799) GBP 730,348 USD 1,016,439 H-S1/A (GBP) 29/07/2021 (7,420)
USD (695,925) All Hedged Share Class Forward Foreign Exchange Contracts are held with BBH&Co. (*) The net unrealised appreciation/(depreciation) is included in the Statement of Net Assets.
228

Natixis International Funds (Lux) I
Notes to the Financial Statements
As at June 30, 2021 (continued)
Note 9 – NET UNREALISED APPRECIATION/(DEPRECIATION) ON FORWARD FOREIGN
EXCHANGE CONTRACTS (continued) As at June 30, 2021, ASG Managed Futures Fund had the following Forward Foreign Exchange Contracts outstanding (continued): Forwards Unrealised appreciation/ Purchases Sales Counterparty Maturity Date (depreciation) (*)
CNH 58,000,000 USD 9,011,749 UBS 15/09/2021 (83,652) NOK 34,000,000 USD 4,113,971 UBS 15/09/2021 (161,663) PLN 23,500,000 USD 6,408,036 UBS 15/09/2021 (233,758) SEK 44,000,000 USD 5,329,405 UBS 15/09/2021 (180,836) SGD 24,500,000 USD 18,507,221 UBS 15/09/2021 (284,224) USD 2,311,895 NOK 20,000,000 UBS 15/09/2021 (12,992) USD 4,337,087 PLN 16,500,000 UBS 15/09/2021 1,957 USD 3,981,254 SEK 34,000,000 UBS 15/09/2021 2,815 USD 13,399,112 SGD 18,000,000 UBS 15/09/2021 10,789 USD 132,564 TRY 1,200,000 UBS 15/09/2021 (314) USD 1,080,993 ZAR 15,500,000 UBS 15/09/2021 6,054 ZAR 83,000,000 USD 6,057,522 UBS 15/09/2021 (301,395)
USD (1,237,219) As at June 30, 2021, the net unrealised depreciation on Forward Foreign Exchange Contracts amounted to USD (1,933,144).
As at June 30, 2021, Loomis Sayles Global Multi Asset Income Fund had the following Forward Foreign Exchange Contracts outstanding: Hedged Share Class Forward Foreign Exchange Contracts Unrealised appreciation/ Purchases Sales Class Maturity Date (depreciation) (*)
EUR 3,671 USD 4,387 H-N/A (EUR) 29/07/2021 (31) EUR 6,831 USD 8,163 H-R/A (EUR) 29/07/2021 (57) EUR 3,632 USD 4,341 H-R/D (EUR) 29/07/2021 (31) EUR 11,889 USD 14,207 H-R/DIV (EUR) 29/07/2021 (100) EUR 27,611 USD 32,995 H-R/DIVM (EUR) 29/07/2021 (232) EUR 3,632 USD 4,341 H-R/DM (EUR) 29/07/2021 (30) EUR 15,597,107 USD 18,638,464 H-S/A (EUR) 29/07/2021 (131,268)
USD (131,749) All Hedged Share Class Forward Foreign Exchange Contracts are held with BBH&Co. Forwards Unrealised appreciation/ Purchases Sales Counterparty Maturity Date (depreciation) (*)
USD 234,139 EUR 192,000 Barclays 14/07/2021 6,388
USD 6,388 As at June 30, 2021, the net unrealised depreciation on Forward Foreign Exchange Contracts amounted to USD (125,361).
(*) The net unrealised appreciation/(depreciation) is included in the Statement of Net Assets.
229

Natixis International Funds (Lux) I
Notes to the Financial Statements
As at June 30, 2021 (continued)
Note 10 – NET UNREALISED APPRECIATION/(DEPRECIATION) ON FINANCIAL
FUTURES CONTRACTS
As at June 30, 2021, Loomis Sayles Global Credit Fund had the following Financial Futures Contracts outstanding:
Financial Futures Contracts
Number of contracts Maturity Unrealised
appreciation/ purchased/(sold) Index Date Currency Commitments (depreciation) (*)
(42) EURO-BUND FUTURE 08/09/2021 EUR 115,083,347 (45,467)
4 EURO BUXL 30Y BND 08/09/2021 EUR 3,013 15,180 13 LONG GILT FUTURE 28/09/2021 GBP 11,206 24,244
(28) US 10YR NOTE (CBT) 21/09/2021 USD 30,884 (12,175) (177) US 10YR ULTRA FUTURE 21/09/2021 USD 363,204 (360,892)
39 US 2YR NOTE (CBT) 30/09/2021 USD 52,806 (16,149) 86 US LONG BOND (CBT) 21/09/2021 USD 94,858 340,668 28 US ULTRA BOND (CBT) 21/09/2021 USD 34,496 179,664
USD 125,073
As at June 30, 2021, Loomis Sayles Disciplined Alpha U.S. Corporate Bond Fund had the following Financial Futures Contracts outstanding:
Financial Futures Contracts
Number of contracts Maturity Unrealised
appreciation/ purchased/(sold) Index Date Currency Commitments (depreciation) (*)
(7) US 10YR ULTRA FUTURE 21/09/2021 USD 14,364 (13,509) 14 US 2YR NOTE (CBT) 30/09/2021 USD 18,956 (3,406) 10 US 5YR NOTE (CBT) 30/09/2021 USD 7,830 (4,669)
(11) US ULTRA BOND (CBT) 21/09/2021 USD 13,552 (70,183) USD (91,767)
As at June 30, 2021, Loomis Sayles Sustainable Global Corporate Bond Fund had the following Financial Futures Contracts outstanding:
Financial Futures Contracts
Number of contracts Maturity Unrealised
appreciation/ purchased/(sold) Index Date Currency Commitments (depreciation) (*)
38 EURO-BOBL FUTURE 08/09/2021 EUR 8,972 (10,887)
(14) EURO-BUND FUTURE 08/09/2021 EUR 38,361,116 486 3 LONG GILT FUTURE 28/09/2021 GBP 2,586 5,595
(28) US 10YR NOTE (CBT) 21/09/2021 USD 30,884 (14,834) (240) US 10YR ULTRA FUTURE 21/09/2021 USD 492,480 (448,527) (42) US 5YR NOTE (CBT) 30/09/2021 USD 32,886 18,703 66 US LONG BOND (CBT) 21/09/2021 USD 72,798 227,425 63 US ULTRA BOND (CBT) 21/09/2021 USD 77,616 413,297
USD 191,258
(*) The net unrealised appreciation/(depreciation) is included in the Statement of Net Assets.
230

Natixis International Funds (Lux) I
Notes to the Financial Statements
As at June 30, 2021 (continued)
Note 10 – NET UNREALISED APPRECIATION/(DEPRECIATION) ON FINANCIAL FUTURES
CONTRACTS (continued)
As at June 30, 2021, Loomis Sayles Strategic Alpha Bond Fund had the following Financial Futures Contracts outstanding:
Financial Futures Contracts
Number of contracts Maturity Unrealised
appreciation/ purchased/(sold) Index Date Currency Commitments (depreciation) (*)
(9) US 10YR ULTRA FUTURE 21/09/2021 USD 18,468 (3,026) (12) US LONG BOND (CBT) 21/09/2021 USD 13,236 (46,222) (6) US ULTRA BOND (CBT) 21/09/2021 USD 7,392 (16,899)
USD (66,147)
As at June 30, 2021, Ostrum Euro High Income Fund had the following Financial Futures Contracts outstanding:
Financial Futures Contracts
Number of contracts Maturity Unrealised
appreciation/ purchased/(sold) Index Date Currency Commitments (depreciation) (*)
(80) EURO-BUND FUTURE 08/09/2021 EUR 219,206,375 (27,780)
EUR (27,780)
As at June 30, 2021, Ostrum Global Inflation Fund had the following Financial Futures Contracts outstanding:
Hedged Share Class Financial Futures Contracts
Number of contracts Maturity Unrealised
appreciation/ purchased/(sold) Index Date Currency Commitments (depreciation) (*)
(1) EURO-BUND FUTURE 08/09/2021 EUR 2,740,080 (1,060) (1) EURO BUXL 30Y BND 08/09/2021 EUR 753 (3,460) (32) LONG GILT FUTURE 28/09/2021 GBP 27,585 (38,395) (3) US 10YR NOTE (CBT) 21/09/2021 USD 3,309 (1,917) (1) US 2YR NOTE (CBT) 30/09/2021 USD 1,354 323 (2) US 5YR NOTE (CBT) 30/09/2021 USD 1,566 553 (8) US LONG BOND (CBT) 21/09/2021 USD 8,824 (30,778)
EUR (74,734) Financial Futures Contracts
Number of contracts Maturity Unrealised
appreciation/ purchased/(sold) Index Date Currency Commitments (depreciation) (*)
(10) CAN 10YR BOND FUTURE 21/09/2021 CAD 5,798 (4,781) (5) LONG GILT FUTURE 28/09/2021 GBP 4,310 (5,999) (13) US 10YR NOTE (CBT) 21/09/2021 USD 14,339 (5,501) (3) US ULTRA BOND (CBT) 21/09/2021 USD 3,696 (20,277)
EUR (36,558)
As at June 30, 2021, the net unrealised (depreciation) on futures contracts amounted to USD (111,292).
(*) The net unrealised appreciation/(depreciation) is included in the Statement of Net Assets.
231

Natixis International Funds (Lux) I
Notes to the Financial Statements
As at June 30, 2021 (continued)
Note 10 – NET UNREALISED APPRECIATION/(DEPRECIATION) ON FINANCIAL FUTURES
CONTRACTS (continued)
As at June 30, 2021, ASG Managed Futures Fund had the following Financial Futures Contracts outstanding:
Financial Futures Contracts
Number of contracts Maturity Unrealised
appreciation/ purchased/(sold) Index Date Currency Commitments (depreciation) (*)
44 3MO EURO EURIBOR FUTURE 13/09/2021 EUR 13,114,690 1,112 10 3MO SOFR FUTURE 15/03/2022 USD 2,498,750 125 372 90DAY EURO$ FUTURE 13/09/2021 USD 504,060 (14,013)
(212) 90DAY STERLING FUTURE 15/09/2021 GBP 615,022 (397) 11 AMSTERDAM INDEX FUTURE 16/07/2021 EUR 1,903,303 (4,001) (5) AUST 10Y BOND FUTURE 15/09/2021 AUD 405 (1,528) 81 AUST 3Y BOND FUTURE 15/09/2021 AUD 44,362,657 (25,877) 89 BP CURRENCY FUTURE 13/09/2021 USD 76,843 (205,728) 42 BRAZIL REAL FUTURE 30/07/2021 USD 840,420 (4,735) 182 C$ CURRENCY FUTURE 14/09/2021 USD 146,976 (395,665) 47 CAC40 10 EURO FUTURE 16/07/2021 EUR 3,627,289 (62,982)
(32) CAN 10YR BOND FUTURE 21/09/2021 CAD 18,554 (43,439) (38) CHF CURRENCY FUTURE 13/09/2021 USD 51,348 27,675
4 DAX INDEX FUTURE 17/09/2021 EUR 834,574 (26,327) 23 DJIA MINI E-CBOT FUTURE 17/09/2021 USD 3,967,789 4,870 22 E-MINI RUSS 2000 FUTURE 17/09/2021 USD 4,727,250 (19,775)
(11) EURO BUXL 30Y BND 08/09/2021 EUR 8,286 (42,052) (35) EURO FX CURRENCY FUTURE 13/09/2021 USD 5,188,312 25,681 61 EURO STOXX 50 FUTURE 17/09/2021 EUR 2,940,111 (57,368)
(45) EURO-BOBL FUTURE 08/09/2021 EUR 10,625 (8,064) 17 EURO-BTP FUTURE 08/09/2021 EUR 13,487 (7,827)
(27) EURO-BUND FUTURE 08/09/2021 EUR 73,982,151 (34,901) (43) EURO-OAT FUTURE 08/09/2021 EUR 18,766 (38,755) (600) EURO-SCHATZ FUTURE 08/09/2021 EUR 238,366 (973)
33 FTSE 100 INDEX FUTURE 17/09/2021 GBP 3,208,231 (42,853) 64 FTSE CHINA A50 FUTURE 29/07/2021 USD 1,117,343 13,925 20 FTSE TAIWAN INDEX FUTURE 29/07/2021 USD 1,231,864 9,900 6 FTSE/JSE TOP 40 FUTURE 16/09/2021 ZAR 9,510 (5,526) 14 FTSE/MIB INDEX FUTURE 17/09/2021 EUR 732,274 (44,335) 7 HANG SENG INDEX FUTURE 29/07/2021 HKD 1,299,250 (12,800) 9 HSCEI INDEX FUTURE 29/07/2021 HKD 617,901 (2,962) 15 IBEX 35 INDEX FUTURE 16/07/2021 EUR 1,569,159 (59,188) (2) ICE 3MO SONIA FUTURE 15/03/2022 GBP 690,172 0 45 INR/USD FUTURE 28/07/2021 USD 12,101 (586)
(225) JPN YEN CURRENCY FUTURE 13/09/2021 USD 2,534 249,130 (46) LONG GILT FUTURE 28/09/2021 GBP 39,653 (69,459) 177 MEXICAN PESO FUTURE 13/09/2021 USD 1,720,059,450 (36,520) 46 MSCI EAFE FUTURE 17/09/2021 USD 3,161,672 (121,555) 36 MSCI EMGMKT FUTURE 17/09/2021 USD 11,714,094 (6,235) 36 MSCI SING IX ETS FUTURE 29/07/2021 SGD 952,840 467 21 NASDAQ 100 E-MINI FUTURE 17/09/2021 USD 6,113,017 142,450 54 NEW ZEALAND $ FUTURE 13/09/2021 USD 37,708 (110,525) 5 NIKKEI 225 (OSE) FUTURE 09/09/2021 JPY 898 (9,857) 60 OMXS30 INDEX FUTURE 16/07/2021 SEK 17,611,038 (13,623) 10 S&P MID 400 EMINI FUTURE 17/09/2021 USD 15,531,040 (53,390) 45 S&P/TSX 60 INDEX FUTURE 16/09/2021 CAD 8,788,137 55,260 29 S&P500 EMINI FUTURE 17/09/2021 USD 84 107,050 38 SHORT EURO-BTP FUTURE 08/09/2021 EUR 87,585,427 1,969 36 SPI 200 FUTURE 16/09/2021 AUD 4,941,211 (37,669) 49 STOXX EUROPE 600 FUTURE 17/09/2021 EUR 1,315,706 (10,976) 9 TOPIX INDEX FUTURE 09/09/2021 JPY 14,183 (12,055)
(26) US 10YR NOTE (CBT) 21/09/2021 USD 28,678 (19,703) (16) US 10YR ULTRA FUTURE 21/09/2021 USD 32,832 (45,625) (353) US 2YR NOTE (CBT) 30/09/2021 USD 477,962 (18,859) (44) US 5YR NOTE (CBT) 30/09/2021 USD 34,452 (4,773) (8) US LONG BOND (CBT) 21/09/2021 USD 8,824 (40,594) (5) US ULTRA BOND (CBT) 21/09/2021 USD 6,160 (46,953)
USD (1,181,414) (*) The net unrealised appreciation/(depreciation) is included in the Statement of Net Assets.
232

Natixis International Funds (Lux) I
Notes to the Financial Statements
As at June 30, 2021 (continued)
Note 11 – CREDIT DEFAULT INDEX SWAPS, CREDIT DEFAULT SWAPTIONS, CREDIT
DEFAULT SWAPS AND TOTAL RETURN RATE SWAPS
As at June 30, 2021, Ostrum Euro High Income Fund had the following Credit Default Index Swaps: Unrealised appreciation/
Position Counterparty Underlying Index Rate Maturity Date Currency Nominal (depreciation) (*)
BUY BNP Paribas iTraxx Europe
Crossover 5.00% 20/06/2026 EUR 10,000,000 (161,906) EUR (161,906)
As at June 30, 2021, Ostrum Euro High Income Fund had the following Credit Default Swaptions:
Pay/Receive Fixed Rate Counterparty
Floating Rate Index Fixed Rate Maturity Date Currency Nominal
Unrealised appreciation/
(depreciation) (*)
Pay J.P. Morgan AG iTraxx Europe
Series 35 1.00% 15/09/2021 EUR 100,000,000 (21,892) EUR (21,892)
As at June 30, 2021, the net unrealised depreciation on Swaps amounted to EUR (183,798).
As at June 30, 2021, Loomis Sayles Strategic Alpha Bond Fund had the following Credit Default Swaps: Unrealised appreciation/
Position Counterparty Underlying Security Rate Maturity Date Currency Nominal (depreciation) (*)
BUY Barclays
Mexico Government Bond 4.150%
28/03/27 1.00% 20/06/2026 USD 305,000 (2,144) USD (2,144)
As at June 30, 2021, Loomis Sayles Global Emerging Markets Equity Fund had the following Total Return Rate Swaps:
Unrealised appreciation/
Position Counterparty Underlying Security Rate Maturity Date Currency Nominal (depreciation) (*) SELL Goldman Sachs HDFC Bank Ltd 0.83% 11/10/2021 USD 222,311 40,290 SELL Goldman Sachs Titan Co Ltd 0.83% 11/10/2021 USD 212,067 76,512 SELL Goldman Sachs Maruti Suzuki India Ltd 0.83% 11/10/2021 USD 464,909 7,187 SELL Goldman Sachs Localiza Rent a Car SA 0.38% 19/12/2022 USD 103,634 (3,902) SELL Goldman Sachs HDFC Bank Ltd 0.38% 19/01/2023 USD 382,832 (28,755) SELL Goldman Sachs Sea Ltd 0.38% 23/02/2023 USD 213,906 18,954 SELL Morgan Stanley Wuxi Biologics Cayman Inc 0.59% 01/03/2023 HKD 1,197,804 74,782
SELL Goldman Sachs China Mengniu Dairy
Co Ltd 0.29% 10/03/2023 HKD 799,425 17,959 SELL Goldman Sachs Kweichow Moutai Co Ltd 0.00% 10/03/2023 USD 89,942 5,549 SELL Goldman Sachs Unity Software Inc 0.38% 26/05/2023 USD 118,640 18,538 SELL Goldman Sachs Capitec Bank Holdings Ltd 4.27% 29/05/2023 ZAR 1,147,273 322 SELL Goldman Sachs MercadoLibre Inc 2.37% 15/06/2023 USD 87,182 7,843 SELL Goldman Sachs Estee Lauder Inc 2.37% 28/06/2023 USD 208,711 2,176 SELL Goldman Sachs Credicorp Ltd 2.37% 30/06/2023 USD 80,611 (1,163)
USD 236,292
(*) The net unrealised appreciation/(depreciation) is included in the Statement of Net Assets.
233

Natixis International Funds (Lux) I
Notes to the Financial Statements
As at June 30, 2021 (continued)
Note 12 – CO-MANAGEMENT OF ASSETS
For the purpose of effective management, the Investment Manager may choose, subject to the Management Company’s prior approval, that the assets of certain Funds (the “Participating Funds”) within the Umbrella Fund be co-managed. In such cases, the assets (or a portion thereof) of the Participating Funds will be managed in common. Co-managed assets are referred to as a “pool”, notwithstanding the fact that such
pools are used solely for internal management purposes. The pools do not constitute separate entities and are not directly accessible to investors. Each of the Participating Funds shall have its own assets (or a portion thereof) allocated to the relevant pool(s). Each Participating Fund will remain entitled to its specific assets. Where the assets of a Participating Fund are managed using this technique, the assets attributable to each
Participating Fund will initially be determined by reference to its initial allocation of assets to such a pool and will change in the event of additional allocations or withdrawals.
The entitlement of each Participating Fund to the co-managed assets applies to each and every line of investments of such pool. Additional investments made on behalf of the Participating Funds shall be allotted to such funds in accordance with their respective entitlements whereas assets sold shall be levied similarly on the assets attributable to each Participating Fund. As of June 30, 2021, the Umbrella Fund co-manages the assets of certain Funds within the Umbrella Fund utilizing the following pools:
Asset Pool Participating Funds
Thematics AI and Robotics Pool…........................................................ Thematics AI and Robotics Fund
Thematics Meta Fund
Thematics Safety Pool….....................................................................
Thematics Safety Fund
Thematics Meta Fund
Thematics Water Pool….....................................................................
Thematics Water Fund
Thematics Meta Fund
Thematics Subscription Economy Pool...........……………………………………………. Thematics Subscription Economy Fund
Thematics Meta Fund
Thematics Wellness Pool……………………………………………………………………… Thematics Wellness Fund
Note 13 – 144A RULE
144A is an SEC rule that modifies the two year lock up requirement on private placement securities that are without SEC registration. 144A allows debt or equity private placements to trade to and from qualified
institutional investors. 144A securities are often called “restricted securities”.
Note 14 – GERMAN REPRESENTATIVE
LBBW Landesbank Baden-Württemberg Depotbankkoordination / Fondskontrolle Große Bleiche 54-56
55098 Mainz Germany
A copy of the list of changes in the portfolio during the reference period may be obtained free of charge at the depositary or paying agents and at the paying and information agent in Germany.
234

Natixis International Funds (Lux) I
Notes to the Financial Statements
As at June 30, 2021 (continued)
Note 15 – DIVIDEND DISTRIBUTION During the period ended June 30, 2021, the following dividends were declared: Income Dividend
Sub-Fund Share Class Ex-date Share class
currency
Dividend per Share
(share class currency)
DNCA Emerging Europe Equity Fund R/D (USD) January 4, 2021 USD 1.091
Natixis Pacific Rim Equity Fund R/D (USD) January 4, 2021 USD 0.862
Harris Associates Global Equity Fund S/D (USD) January 4, 2021 USD 0.362
Harris Associates Global Equity Fund S1/D (GBP) January 4, 2021 GBP 0.309
Seeyond Asia MinVol Equity Income Fund(1) H-R/DIVM (SGD) January 4, 2021 SGD 0.229
Seeyond Asia MinVol Equity Income Fund(1) H-R/DIVM (SGD) February 1, 2021 SGD 0.220
Seeyond Asia MinVol Equity Income Fund(1) H-R/DIVM (SGD) March 1, 2021 SGD 0.224 Seeyond Asia MinVol Equity Income Fund(1) H-R/DIVM (SGD) April 1, 2021 SGD 0.229
Seeyond Asia MinVol Equity Income Fund(1) H-R/DIVM (SGD) May 3, 2021 SGD 0.232
Seeyond Asia MinVol Equity Income Fund(1) R/DIVM (USD) January 4, 2021 USD 0.235
Seeyond Asia MinVol Equity Income Fund(1) R/DIVM (USD) February 1, 2021 USD 0.226
Seeyond Asia MinVol Equity Income Fund(1) R/DIVM (USD) March 1, 2021 USD 0.230
Seeyond Asia MinVol Equity Income Fund(1) R/DIVM (USD) April 1, 2021 USD 0.235
Seeyond Asia MinVol Equity Income Fund(1) R/DIVM (USD) May 3, 2021 USD 0.238
Loomis Sayles Global Credit Fund H-S/D (USD) January 4, 2021 USD 0.554
Loomis Sayles Global Credit Fund H-S/D (USD) April 1, 2021 USD 0.508
Loomis Sayles Global Credit Fund R/D (USD) January 4, 2021 USD 0.231 Loomis Sayles Global Credit Fund R/D (USD) April 1, 2021 USD 0.204
Loomis Sayles Global Credit Fund R/D (SGD) January 4, 2021 SGD 0.157
Loomis Sayles Global Credit Fund R/D (SGD) April 1, 2021 SGD 0.097
Loomis Sayles Short Term Emerging Markets Bond Fund H-I/D (EUR) January 4, 2021 EUR 0.754
Loomis Sayles Short Term Emerging Markets Bond Fund H-I/D (EUR) April 1, 2021 EUR 0.765
Loomis Sayles Short Term Emerging Markets Bond Fund H-N/D (EUR) January 4, 2021 EUR 0.805
Loomis Sayles Short Term Emerging Markets Bond Fund H-N/D (EUR) April 1, 2021 EUR 0.815
Loomis Sayles Short Term Emerging Markets Bond Fund H-N/D (GBP) January 4, 2021 GBP 0.724
Loomis Sayles Short Term Emerging Markets Bond Fund H-R/D (EUR) January 4, 2021 EUR 0.626 Loomis Sayles Short Term Emerging Markets Bond Fund H-R/D (EUR) April 1, 2021 EUR 0.632
Loomis Sayles Short Term Emerging Markets Bond Fund H-S/D (EUR) January 4, 2021 EUR 0.836
Loomis Sayles Short Term Emerging Markets Bond Fund H-S/D (EUR) April 1, 2021 EUR 0.849
Loomis Sayles Short Term Emerging Markets Bond Fund I/D (USD) January 4, 2021 USD 0.849
Loomis Sayles Short Term Emerging Markets Bond Fund I/D (USD) April 1, 2021 USD 0.818
Loomis Sayles Short Term Emerging Markets Bond Fund N/D (USD) January 4, 2021 USD 0.847
Loomis Sayles Short Term Emerging Markets Bond Fund N/D (USD) April 1, 2021 USD 0.816
Loomis Sayles Short Term Emerging Markets Bond Fund N1/D (USD) January 4, 2021 USD 0.872
Loomis Sayles Short Term Emerging Markets Bond Fund N1/D (USD) April 1, 2021 USD 0.840
Loomis Sayles Short Term Emerging Markets Bond Fund R/D (USD) January 4, 2021 USD 0.714 Loomis Sayles Short Term Emerging Markets Bond Fund R/D (USD) April 1, 2021 USD 0.684
Loomis Sayles Short Term Emerging Markets Bond Fund S/D (USD) January 4, 2021 USD 0.936
Loomis Sayles Short Term Emerging Markets Bond Fund S/D (USD) April 1, 2021 USD 0.905
Loomis Sayles Strategic Alpha Bond Fund C/D (USD) January 4, 2021 USD 0.778
Loomis Sayles Strategic Alpha Bond Fund C/D (USD) April 1, 2021 USD 0.791
Loomis Sayles Strategic Alpha Bond Fund H-N/D (GBP) January 4, 2021 GBP 0.617
Loomis Sayles Strategic Alpha Bond Fund H-N/D (GBP) April 1, 2021 GBP 0.722
Loomis Sayles Strategic Alpha Bond Fund R/D (USD) January 4, 2021 USD 0.495
Loomis Sayles Strategic Alpha Bond Fund R/D (USD) April 1, 2021 USD 0.531 Loomis Sayles U.S. Core Plus Bond Fund I/D (USD) January 4, 2021 USD 0.369
Loomis Sayles U.S. Core Plus Bond Fund I/D (USD) April 1, 2021 USD 0.404
Loomis Sayles U.S. Core Plus Bond Fund R/D (USD) January 4, 2021 USD 0.206
Loomis Sayles U.S. Core Plus Bond Fund R/D (USD) April 1, 2021 USD 0.244
Loomis Sayles U.S. Core Plus Bond Fund RE/D (USD) January 4, 2021 USD 0.121
Loomis Sayles U.S. Core Plus Bond Fund RE/D (USD) April 1, 2021 USD 0.160
Loomis Sayles Asia Bond Plus Fund H-R/DIVM (SGD) January 4, 2021 SGD 0.581
Loomis Sayles Asia Bond Plus Fund H-R/DIVM (SGD) February 1, 2021 SGD 0.539
Loomis Sayles Asia Bond Plus Fund H-R/DIVM (SGD) March 1, 2021 SGD 0.518 Loomis Sayles Asia Bond Plus Fund H-R/DIVM (SGD) April 1, 2021 SGD 0.604
Loomis Sayles Asia Bond Plus Fund H-R/DIVM (SGD) May 3, 2021 SGD 0.552
Loomis Sayles Asia Bond Plus Fund H-R/DIVM (SGD) June 1, 2021 SGD 0.571
Loomis Sayles Asia Bond Plus Fund I/DIVM (USD) January 4, 2021 USD 0.596
Loomis Sayles Asia Bond Plus Fund I/DIVM (USD) February 1, 2021 USD 0.553
Loomis Sayles Asia Bond Plus Fund I/DIVM (USD) March 1, 2021 USD 0.532
Loomis Sayles Asia Bond Plus Fund I/DIVM (USD) April 1, 2021 USD 0.620
Loomis Sayles Asia Bond Plus Fund I/DIVM (USD) May 3, 2021 USD 0.567
Loomis Sayles Asia Bond Plus Fund I/DIVM (USD) June 1, 2021 USD 0.588
(1) See Note 1.
235

Natixis International Funds (Lux) I
Notes to the Financial Statements
As at June 30, 2021 (continued)
Note 15 – DIVIDEND DISTRIBUTION (continued) During the period ended June 30, 2021, the following dividends were declared: Income Dividend (continued)
Sub-Fund Share Class Ex-date Share class
currency
Dividend per Share
(share class currency)
Loomis Sayles Asia Bond Plus Fund Q/DIVM (USD) January 4, 2021 USD 0.601
Loomis Sayles Asia Bond Plus Fund Q/DIVM (USD) February 1, 2021 USD 0.558
Loomis Sayles Asia Bond Plus Fund Q/DIVM (USD) March 1, 2021 USD 0.538
Loomis Sayles Asia Bond Plus Fund Q/DIVM (USD) April 1, 2021 USD 0.627
Loomis Sayles Asia Bond Plus Fund Q/DIVM (USD) May 3, 2021 USD 0.574
Loomis Sayles Asia Bond Plus Fund Q/DIVM (USD) June 1, 2021 USD 0.595
Loomis Sayles Asia Bond Plus Fund R/DIVM (USD) January 4, 2021 USD 0.587 Loomis Sayles Asia Bond Plus Fund R/DIVM (USD) February 1, 2021 USD 0.545
Loomis Sayles Asia Bond Plus Fund R/DIVM (USD) March 1, 2021 USD 0.524
Loomis Sayles Asia Bond Plus Fund R/DIVM (USD) April 1, 2021 USD 0.610
Loomis Sayles Asia Bond Plus Fund R/DIVM (USD) May 3, 2021 USD 0.558
Loomis Sayles Asia Bond Plus Fund R/DIVM (USD) June 1, 2021 USD 0.577
Loomis Sayles Asia Bond Plus Fund R/DIVM (HKD) January 4, 2021 HKD 0.580
Loomis Sayles Asia Bond Plus Fund R/DIVM (HKD) February 1, 2021 HKD 0.537
Loomis Sayles Asia Bond Plus Fund R/DIVM (HKD) March 1, 2021 HKD 0.517
Loomis Sayles Asia Bond Plus Fund R/DIVM (HKD) April 1, 2021 HKD 0.604
Loomis Sayles Asia Bond Plus Fund R/DIVM (HKD) May 3, 2021 HKD 0.551 Loomis Sayles Asia Bond Plus Fund R/DIVM (HKD) June 1, 2021 HKD 0.570
Loomis Sayles Asia Bond Plus Fund R/DIVM (SGD) January 4, 2021 SGD 0.580
Loomis Sayles Asia Bond Plus Fund R/DIVM (SGD) February 1, 2021 SGD 0.540
Loomis Sayles Asia Bond Plus Fund R/DIVM (SGD) March 1, 2021 SGD 0.520
Loomis Sayles Asia Bond Plus Fund R/DIVM (SGD) April 1, 2021 SGD 0.612
Loomis Sayles Asia Bond Plus Fund R/DIVM (SGD) May 3, 2021 SGD 0.554
Loomis Sayles Asia Bond Plus Fund R/DIVM (SGD) June 1, 2021 SGD 0.570
Ostrum Euro High Income Fund H-I/D (USD) January 4, 2021 USD 0.845
Ostrum Euro High Income Fund H-I/D (USD) April 1, 2021 USD 0.771 Ostrum Euro High Income Fund H-R/D (SGD) January 4, 2021 SGD 0.323
Ostrum Euro High Income Fund H-R/D (SGD) April 1, 2021 SGD 0.270
Ostrum Euro High Income Fund I/D (USD) January 4, 2021 USD 0.548
Ostrum Euro High Income Fund I/D (USD) April 1, 2021 USD 0.383
Ostrum Euro High Income Fund I/D (EUR) January 4, 2021 EUR 0.777
Ostrum Euro High Income Fund I/D (EUR) April 1, 2021 EUR 0.646
Ostrum Euro High Income Fund N/D (EUR) January 4, 2021 EUR 0.767
Ostrum Euro High Income Fund N/D (EUR) April 1, 2021 EUR 0.631
Ostrum Euro High Income Fund R/D (USD) January 4, 2021 USD 0.360
Ostrum Euro High Income Fund R/D (USD) April 1, 2021 USD 0.200 Ostrum Euro High Income Fund R/D (EUR) January 4, 2021 EUR 0.569
Ostrum Euro High Income Fund R/D (EUR) April 1, 2021 EUR 0.443
Ostrum Euro High Income Fund S/D (EUR) January 4, 2021 EUR 0.847
Ostrum Euro High Income Fund S/D (EUR) April 1, 2021 EUR 0.708
Ostrum Global Inflation Fund I/D (EUR) April 1, 2021 EUR 0.028
Ostrum Short Term Global High Income Fund I/D (USD) January 4, 2021 USD 0.437
Ostrum Short Term Global High Income Fund I/D (USD) April 1, 2021 USD 0.337
Ostrum Short Term Global High Income Fund R/D (USD) January 4, 2021 USD 0.436
Ostrum Short Term Global High Income Fund R/D (USD) April 1, 2021 USD 0.339 Loomis Sayles Global Multi Asset Income Fund H-R/D (EUR) January 4, 2021 EUR 0.495
Loomis Sayles Global Multi Asset Income Fund H-R/D (EUR) April 1, 2021 EUR 0.429
Loomis Sayles Global Multi Asset Income Fund H-R/DIV (EUR) January 4, 2021 EUR 1.142
Loomis Sayles Global Multi Asset Income Fund H-R/DIV (EUR) April 1, 2021 EUR 1.013
Loomis Sayles Global Multi Asset Income Fund H-R/DIVM (EUR) January 4, 2021 EUR 0.381
Loomis Sayles Global Multi Asset Income Fund H-R/DIVM (EUR) February 1, 2021 EUR 0.313
Loomis Sayles Global Multi Asset Income Fund H-R/DIVM (EUR) March 1, 2021 EUR 0.307
Loomis Sayles Global Multi Asset Income Fund H-R/DIVM (EUR) April 1, 2021 EUR 0.368
Loomis Sayles Global Multi Asset Income Fund H-R/DIVM (EUR) May 3, 2021 EUR 0.343 Loomis Sayles Global Multi Asset Income Fund H-R/DIVM (EUR) June 1, 2021 EUR 0.357
Loomis Sayles Global Multi Asset Income Fund H-R/DM (EUR) January 4, 2021 EUR 0.205
Loomis Sayles Global Multi Asset Income Fund H-R/DM (EUR) February 1, 2021 EUR 0.075
Loomis Sayles Global Multi Asset Income Fund H-R/DM (EUR) March 1, 2021 EUR 0.155
Loomis Sayles Global Multi Asset Income Fund H-R/DM (EUR) April 1, 2021 EUR 0.193
Loomis Sayles Global Multi Asset Income Fund H-R/DM (EUR) May 3, 2021 EUR 0.146
Loomis Sayles Global Multi Asset Income Fund H-R/DM (EUR) June 1, 2021 EUR 0.192
Loomis Sayles Global Multi Asset Income Fund I/D (USD) January 4, 2021 USD 0.792
Loomis Sayles Global Multi Asset Income Fund I/D (USD) April 1, 2021 USD 0.710
Loomis Sayles Global Multi Asset Income Fund I/DIVM (USD) January 4, 2021 USD 0.424
236

Natixis International Funds (Lux) I
Notes to the Financial Statements
As at June 30, 2021 (continued)
Note 15 – DIVIDEND DISTRIBUTION (continued) During the period ended June 30, 2021, the following dividends were declared: Income Dividend (continued)
Sub-Fund Share Class Ex-date Share class
currency
Dividend per Share
(share class currency)
Loomis Sayles Global Multi Asset Income Fund I/DIVM (USD) February 1, 2021 USD 0.350
Loomis Sayles Global Multi Asset Income Fund I/DIVM (USD) March 1, 2021 USD 0.344
Loomis Sayles Global Multi Asset Income Fund I/DIVM (USD) April 1, 2021 USD 0.412
Loomis Sayles Global Multi Asset Income Fund I/DIVM (USD) May 3, 2021 USD 0.385
Loomis Sayles Global Multi Asset Income Fund I/DIVM (USD) June 1, 2021 USD 0.401
Loomis Sayles Global Multi Asset Income Fund R/D (USD) January 4, 2021 USD 0.541 Loomis Sayles Global Multi Asset Income Fund R/D (USD) April 1, 2021 USD 0.490
Loomis Sayles Global Multi Asset Income Fund R/DM (USD) January 4, 2021 USD 0.267
Loomis Sayles Global Multi Asset Income Fund R/DM (USD) February 1, 2021 USD 0.093
Loomis Sayles Global Multi Asset Income Fund R/DM (USD) March 1, 2021 USD 0.198
Loomis Sayles Global Multi Asset Income Fund R/DM (USD) April 1, 2021 USD 0.238
Loomis Sayles Global Multi Asset Income Fund R/DM (USD) May 3, 2021 USD 0.190
Loomis Sayles Global Multi Asset Income Fund R/DM (USD) June 1, 2021 USD 0.247
Loomis Sayles Global Multi Asset Income Fund RE/D (USD) January 4, 2021 USD 0.441
Loomis Sayles Global Multi Asset Income Fund RE/D (USD) April 1, 2021 USD 0.355
Loomis Sayles Global Multi Asset Income Fund RE/DM (USD) January 4, 2021 USD 0.226 Loomis Sayles Global Multi Asset Income Fund RE/DM (USD) February 1, 2021 USD 0.053
Loomis Sayles Global Multi Asset Income Fund RE/DM (USD) March 1, 2021 USD 0.158
Loomis Sayles Global Multi Asset Income Fund RE/DM (USD) April 1, 2021 USD 0.199
Loomis Sayles Global Multi Asset Income Fund RE/DM (USD) May 3, 2021 USD 0.150
Loomis Sayles Global Multi Asset Income Fund RE/DM (USD) June 1, 2021 USD 0.204
Note 16 – LIQUIDATED SUB-FUNDS
Dorval Lux Convictions Fund liquidated on April 6, 2021. The liquidated Sub- Fund retained cash to pay post liquidation invoices to miscellaneous service providers. As at June 30, 2021, Dorval Lux Convictions Fund held EUR 37,704.
Harris Associates Concentrated U.S. Equity Fund liquidated on April 9, 2021. The liquidated Sub- Fund retained cash to pay post liquidation invoices to miscellaneous service providers. As at June 30, 2021, Harris Associates Concentrated U.S. Equity Fund held USD 59,726. Seeyond Asia MinVol Equity Income Fund liquidated on May 28, 2021. The liquidated Sub- Fund retained cash to pay post liquidation invoices to miscellaneous service providers. As at June 30, 2021, Seeyond Asia
MinVol Equity Income Fund held USD 9,568.
Note 17 – SIGNIFICANT EVENTS DURING THE PERIOD
A new prospectus entered into force in March 2021. The main changes implemented in this prospectus may
be summarized as follows: o Addition of new Funds: the Thematics Wellness Fund and the WCM Select Global Growth Equity Fund; o Inclusion of additional disclosures applicable to all sub-funds to ensure compliance with SFDR
(Level I); o Creation of R and RE share classes in the Loomis Sayles Sustainable Global Corporate Bond Fund; o The change of name from Loomis Sayles Institutional Global Corporate Bond Fund into Loomis Sayles
Sustainable Global Corporate Bond Fund became effective April 26, 2021;
o Removing Dorval Asset Management from Investment Managers (following to the liquidation of the Dorval Lux Convictions Fund managed by Dorval Asset Management);
o Removal of the Fund profile for the Harris Associates Concentrated U.S. Equity Fund (liquidated on
April 9, 2021), the Loomis Sayles Institutional High Income Fund (liquidated on January 13, 2021) and the Dorval Lux Convictions Fund (liquidated on April 6, 2021).
237

Natixis International Funds (Lux) I
Notes to the Financial Statements
As at June 30, 2021 (continued)
Note 17 – SIGNIFICANT EVENTS DURING THE PERIOD (continued)
The Covid-19 pandemic has seen an increase in the volatility of all financial markets. The Management Company is currently monitoring the situation and, with the support of the Delegate Investment Managers, continues to manage the Umbrella Fund’s assets within investment and risk parameters that have been established. The Management Company will continue to review the situation in order to navigate the Umbrella
Fund through this period of additional uncertainty. There have been no other significant events affecting the Umbrella Fund during the period ended June 30, 2021.
Note 18 – SUBSEQUENT EVENTS The liquidation process of the Natixis Multi Alpha Fund started on July 22, 2021. There are no other subsequent events to be disclosed as at June 30, 2021.
238

Natixis International Funds (Lux) I
Appendix I
Additional Information Securities Financing Transaction Regulation (“SFTR”) introduces reporting requirements for securities
financing transactions (“SFTs”) and Total Return Rate Swaps.
A Securities Financing Transaction (SFT) is defined as per Article 3(11) of the SFTR as:
• a repurchase/reverse repurchase agreement
• securities or commodities lending and securities or commodities borrowing
• a buy-sell back transaction or sell-buy back transaction, or
• a margin lending transaction
As at June 30, 2021 the Funds held Total Return Rate Swaps as type of instruments under the scope of the
SFTR.
a. Global Data The amount of assets across all SFTs as at June 30, 2021 is as follows:
Loomis Sayles Global Emerging Markets Equity Fund
Type of Asset Amount % of NAV
Total Return Rate Swaps $ 236,292 1.53%
b. Data on reuse of collateral
There was no collateral reuse during the period ended June 30, 2021.
There was no cash collateral reinvestment during the period ended June 30, 2021. c. Concentration Data As at June 30, 2021 there are no collateral securities and commodities received in respect of Total Return Rate Swaps.
The ten largest counterparties across all SFTs and Total Return Rate Swaps as at June 30, 2021 are as follows: Loomis Sayles Global Emerging Markets Equity Fund
Security type Counterparty Amount
Total Return Rate Swaps Goldman Sachs $ 161,510
Morgan Stanley $ 74,782
d. Safekeeping of collateral received
There were no security and cash collaterals received for Total Return Rate Swaps as at June 30, 2021. e. Safekeeping of collateral granted
The following cash collateral was granted for Total Return Rate Swaps as at June 30, 2021: Loomis Sayles Global Emerging Markets Equity Fund
Collateral type Counterparty Amount
Cash Goldman Sachs $ 330,000
239
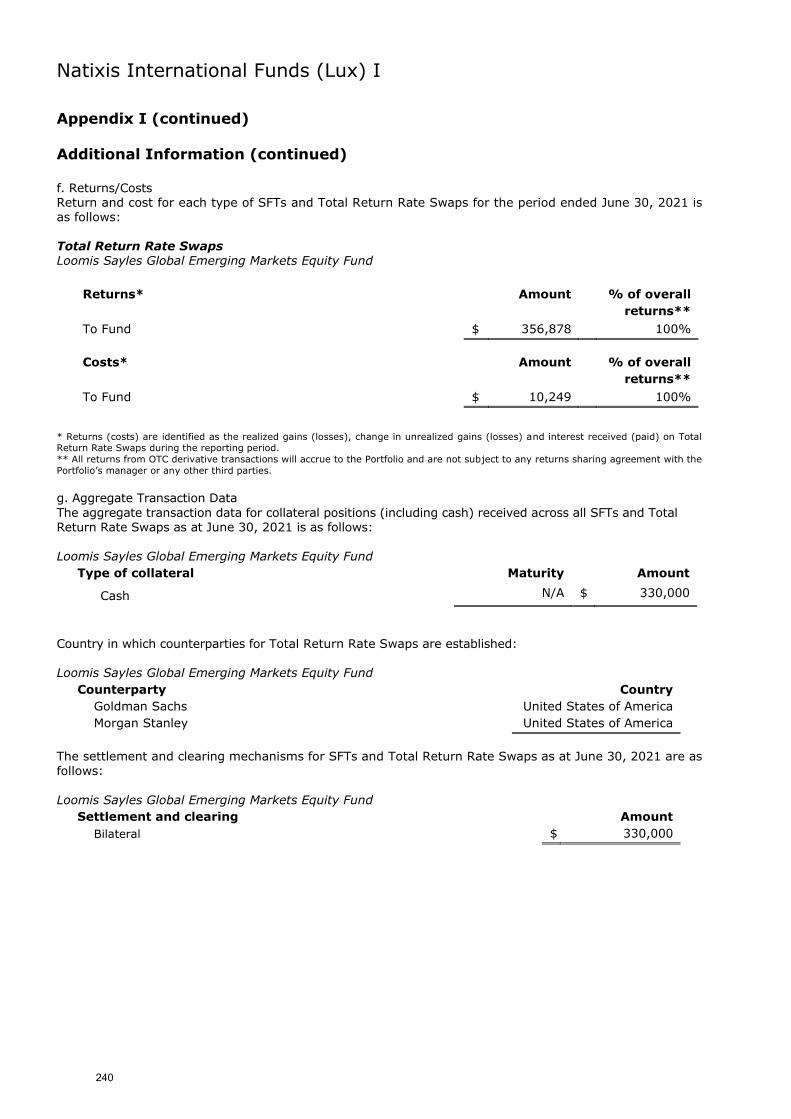
Natixis International Funds (Lux) I
Appendix I (continued)
Additional Information (continued) f. Returns/Costs Return and cost for each type of SFTs and Total Return Rate Swaps for the period ended June 30, 2021 is as follows: Total Return Rate Swaps Loomis Sayles Global Emerging Markets Equity Fund
Returns* Amount % of overall
returns**
To Fund $ 356,878 100%
Costs* Amount % of overall
returns**
To Fund $ 10,249 100%
* Returns (costs) are identified as the realized gains (losses), change in unrealized gains (losses) and interest received (paid) on Total Return Rate Swaps during the reporting period.
** All returns from OTC derivative transactions will accrue to the Portfolio and are not subject to any returns sharing agreement with the
Portfolio’s manager or any other third parties.
g. Aggregate Transaction Data
The aggregate transaction data for collateral positions (including cash) received across all SFTs and Total Return Rate Swaps as at June 30, 2021 is as follows:
Loomis Sayles Global Emerging Markets Equity Fund
Type of collateral Maturity Amount
Cash N/A $ 330,000
Country in which counterparties for Total Return Rate Swaps are established: Loomis Sayles Global Emerging Markets Equity Fund
Counterparty
Country
Goldman Sachs United States of America
Morgan Stanley United States of America
The settlement and clearing mechanisms for SFTs and Total Return Rate Swaps as at June 30, 2021 are as follows:
Loomis Sayles Global Emerging Markets Equity Fund
Settlement and clearing Amount
Bilateral $ 330,000
240