natixis international funds (dublin) i plc
175
NATIXIS INTERNATIONAL FUNDS (DUBLIN) I PLC (an umbrella investment company with variable capital having segregated liability between its Funds incorporated with limited liability in Ireland under registration number 267219) UNAUDITED CONDENSED FINANCIAL STATEMENTS For the half year ended 30 June 2021 No subscriptions should be made on the basis of the financial report alone. Subscriptions should only be made on the basis of the current Prospectus supplemented by the latest Annual Report and the latest Semi-Annual Report, if published thereafter. Performance data shown represents past performance and is not a guarantee of future results. More recent performance may be lower or higher. Principal value and returns fluctuate over time (including as a result of currency fluctuations) so that shares, when redeemed, will be worth more or less than their original cost. Performance shown is net of all Fund expenses, but does not include the effect of sales charges or correspondent bank charges, and assumes reinvestment of distributions. If such charges were included, returns would have been lower. Performance for other share classes will be more or less depending on differences in fees and sales charges. Unless otherwise indicated, all defined terms used herein shall have the same meaning as set out in the Prospectus of the Company.
-
Upload
khangminh22 -
Category
Documents
-
view
0 -
download
0
Transcript of natixis international funds (dublin) i plc

NATIXIS INTERNATIONAL FUNDS (DUBLIN) I PLC
(an umbrella investment company with variable capital having segregated liability between its Funds incorporated with limited liability in Ireland under registration number 267219)
UNAUDITED CONDENSED FINANCIAL STATEMENTS
For the half year ended 30 June 2021
No subscriptions should be made on the basis of the financial report alone. Subscriptions should only be made on the basis of the current Prospectus supplemented by the latest Annual Report and the latest Semi-Annual Report, if published thereafter. Performance data shown represents past performance and is not a guarantee of future results. More recent performance may be lower or higher. Principal value and returns fluctuate over time (including as a result of currency fluctuations) so that shares, when redeemed, will be worth more or less than their original cost. Performance shown is net of all Fund expenses, but does not include the effect of sales charges or correspondent bank charges, and assumes reinvestment of distributions. If such charges were included, returns would have been lower. Performance for other share classes will be more or less depending on differences in fees and sales charges. Unless otherwise indicated, all defined terms used herein shall have the same meaning as set out in the Prospectus of the Company.

NATIXIS INTERNATIONAL FUNDS (DUBLIN) I PLC
Table of Contents Page
Organisation 1
Background to the Company 2
Delegate Investment Manager’s Reports 14
Condensed Statement of Financial Position 21
Condensed Statement of Comprehensive Income
23
Condensed Statement of Changes in Net Assets Attributable to Redeemable Participating Shareholders
25
Condensed Statement of Cash Flows 27
Notes to the Condensed Financial Statements as at 30 June 2021 29
Schedule of Investments
Natixis International Funds (Dublin) I - Loomis Sayles Multisector Income Fund 52
Natixis International Funds (Dublin) I - Loomis Sayles High Income Fund 68
Natixis International Funds (Dublin) I - Loomis Sayles Global Opportunistic Bond Fund 85
Natixis International Funds (Dublin) I - Loomis Sayles Alternative Risk Premia Fund 100
Natixis International Funds (Dublin) I - Loomis Sayles Euro Credit Fund 130
Natixis International Funds (Dublin) I - Loomis Sayles Euro High Yield Fund 138
Natixis International Funds (Dublin) I - Loomis Sayles Sustainable Euro Credit Fund 144
Schedule of Portfolio Changes
Natixis International Funds (Dublin) I - Loomis Sayles Multisector Income Fund 151
Natixis International Funds (Dublin) I - Loomis Sayles High Income Fund 153
Natixis International Funds (Dublin) I - Loomis Sayles Global Opportunistic Bond Fund 155
Natixis International Funds (Dublin) I - Loomis Sayles Alternative Risk Premia Fund 157
Natixis International Funds (Dublin) I - Loomis Sayles Euro Credit Fund 159
Natixis International Funds (Dublin) I - Loomis Sayles Euro High Yield Fund 161
Natixis International Funds (Dublin) I - Loomis Sayles Sustainable Euro Credit Fund 163
Appendix I – Performance Disclosure 165
Appendix II - Securities Financing Transaction Regulation Disclosure 172

NATIXIS INTERNATIONAL FUNDS (DUBLIN) I PLC
Organisation
Board of Directors (all non-executive)* Investment Manager and Promoter
Daniel Morrissey (Irish)** Natixis Investment Managers S.A.
Jason Trepanier (US)**+ 2 rue Jean Monnet
Lynda Wood (Schweitzer) (US)*** L- 2180 Luxembourg
John Nolan (Irish)** Grand Duchy of Luxembourg
Christine Kenny (Irish)****
* See Directors’ Report in the audited financial statements for the year ended 31 December 2020 – Corporate Governance Statement
and Composition of the Board of Directors Distributor
** Director Independent of the Delegate Investment Manager Natixis Investment Managers S.A.
*** Executive of the Delegate Investment Manager 2 rue Jean Monnet
**** Executive of Loomis Sayles Investments Limited, UK (a wholly L- 2180 Luxembourg
owned subsidiary of the Delegate Investment Manager) Grand Duchy of Luxembourg
+ Executive Director of the Investment Manager and
Promoter and Distributor
Registered Office Delegate Investment Manager
6th Floor Loomis, Sayles & Company, L.P. 2 Grand Canal Square One Financial Center
Dublin Boston
D02 A342 Massachusetts 02111
Ireland USA
Administrator, Registrar and Transfer Agent Legal Adviser to the Company
Brown Brothers Harriman Fund Administration William Fry LLP
Services (Ireland) Limited 2 Grand Canal Square
30 Herbert Street Dublin
Dublin D02 A342
D02 W329 Ireland
Ireland
Depositary Independent Auditors
Brown Brothers Harriman Trustee Services PricewaterhouseCoopers
(Ireland) Limited Chartered Accountants & Registered Auditors
30 Herbert Street One Spencer Dock
Dublin International Financial Services Centre
D02 W329 Dublin
Ireland D01 X9R7
Ireland
Secretary Hong Kong Representative
Wilton Secretarial Limited Brown Brothers Harriman (Hong Kong) Limited
6th Floor Level 13, Man Yee Building,
2 Grand Canal Square 68 Des Voeux Road,
Dublin Central
D02 A342 Hong Kong
Ireland
1

NATIXIS INTERNATIONAL FUNDS (DUBLIN) I PLC
Background to the Company The following information is derived from and should be read in conjunction with the full texts and definitions section of the Prospectus.
Natixis International Funds (Dublin) I plc (the “Company”) is structured as an open-ended umbrella investment company with variable capital and segregated liability between its funds, incorporated under the laws of Ireland on 26 June 1997 as a public limited company pursuant to the Companies Act 2014. The Company has been authorised by the Central Bank of Ireland (the “Central Bank”) as an investment company pursuant to the provisions of the European Communities (Undertakings for Collective Investment in Transferable Securities) Regulations 2011 (as amended) (the “UCITS Regulations”). The Company commenced operations on 30 June 1997.
Key Investor Information Documents (“KIID”) were submitted to the Central Bank on the following dates:
Loomis Sayles Multisector Income Fund - 18 February 2021 Loomis Sayles High Income Fund - 18 February 2021 Loomis Sayles Global Opportunistic Bond Fund - 18 February 2021 Loomis Sayles Alternative Risk Premia Fund - 18 February 2021 Loomis Sayles Euro Credit Fund - 3 March 2021 Loomis Sayles Euro High Yield Fund - 3 March 2021 Loomis Sayles Sustainable Euro Credit Fund - 3 March 2021
These KIID are structured by share class type focusing on the representative share for a given class. There are currently Redeemable Participating Shares of seven Funds (the “Funds”) in issue, Natixis International Funds (Dublin) I - Loomis Sayles Multisector Income Fund* (hereafter “Loomis Sayles Multisector Income Fund”), Natixis International Funds (Dublin) I - Loomis Sayles High Income Fund** (hereafter “Loomis Sayles High Income Fund”), Natixis International Funds (Dublin) I - Loomis Sayles Global Opportunistic Bond Fund** (hereafter “Loomis Sayles Global Opportunistic Bond Fund”), Natixis International Funds (Dublin) I - Loomis Sayles Alternative Risk Premia Fund** (hereafter “Loomis Sayles Alternative Risk Premia Fund”), Natixis International Funds (Dublin) I - Loomis Sayles Euro Credit Fund** (hereafter “Loomis Sayles Euro Credit Fund”), Natixis International Funds (Dublin) I - Loomis Sayles Euro High Yield Fund** (hereafter “Loomis Sayles Euro High Yield Fund”) and Natixis International Funds (Dublin) I - Loomis Sayles Sustainable Euro Credit Fund** (hereafter “Loomis Sayles Sustainable Euro Credit Fund”).
* Authorized in Hong Kong and available to the public in Hong Kong. ** Not authorized in Hong Kong and not available to the public in Hong Kong.
2

NATIXIS INTERNATIONAL FUNDS (DUBLIN) I PLC
Background to the Company (Continued) At 30 June 2021, the Company offered the following share classes for subscription in each of the Funds:
Loomis Sayles Multisector Income Fund
Loomis Sayles High Income Fund
Loomis Sayles Global Opportunistic Bond Fund
Loomis Sayles Alternative Risk Premia Fund
Loomis Sayles Euro Credit Fund
Loomis Sayles Euro High Yield Fund
Loomis Sayles Sustainable Euro Credit Fund
Class C/A(USD) Shares Class C/A(USD) Shares Class C/A(USD) Shares Class H-R/D(EUR) Shares Class I/A(EUR) Shares Class I/A(EUR) Shares Class I/A(EUR) Shares
Class C/D(USD) Shares Class C/D(USD) Shares Class C/D(USD) Shares Class H-RE/A(EUR) Shares Class I/D(EUR) Shares Class I/D(EUR) Shares Class I/D(EUR) Shares
Class CT/A(USD) Shares Class CT/DM(USD) Shares Class F/D(USD) Shares Class H-RE/D(EUR) Shares Class H-I/A(GBP) Shares Class H-I/A(GBP) Shares Class H-I/A(GBP) Shares
Class CT/DM(USD) Shares Class F/A(USD) Shares Class I/A(EUR) Shares Class I/A(USD) Shares Class H-I/D(GBP) Shares Class H-I/D(GBP) Shares Class H-I/D(GBP) Shares
Class CW/A(EUR) Shares Class I/A(EUR) Shares Class I/A(USD) Shares Class I/A(GBP) Shares Class H-I/A(CHF) Shares Class H-I/A(CHF) Shares Class H-I/A(CHF) Shares
Class H-CW/A(EUR) Shares Class I/A(USD) Shares Class I/A(SGD) Shares Class I/D(USD) Shares Class N/A(EUR) Shares Class N/A(EUR) Shares Class N/A(EUR) Shares
Class F/A(USD) Shares Class I/A(SGD) Shares Class I/D(GBP) Shares Class N/A(USD) Shares Class N/D(EUR) Shares Class N/D(EUR) Shares Class N/D(EUR) Shares
Class F/DM(USD) Shares Class I/D(GBP) Shares Class I/D(USD) Shares Class N/A(EUR) Shares Class H-N/A(GBP) Shares Class H-N/A(GBP) Shares Class H-N/A(GBP) Shares
Class I/A(EUR) Shares Class I/D(USD) Shares Class I/D(SGD) Shares Class R/A(USD) Shares Class H-N/D(GBP) Shares Class H-N/D(GBP) Shares Class H-N/D(GBP) Shares
Class I/A(USD) Shares Class I/D(JPY) Shares Class H-I/A(EUR) Shares Class S/A(EUR) Shares Class H-N/A(CHF) Shares Class H-N/A(CHF) Shares Class H-N/A(CHF) Shares
Class I/A(SGD) Shares Class I/D(SGD) Shares Class H-I/A(USD) Shares Class S/A(USD) Shares Class R/A(EUR) Shares Class R/A(EUR) Shares Class R/A(EUR) Shares
Class I/D(GBP) Shares Class H-I/A(EUR) Shares Class H-I/A(SGD) Shares Class S/A(GBP) Shares Class R/D(EUR) Shares Class R/D(EUR) Shares Class R/D(EUR) Shares
Class I/D(USD) Shares Class H-I/A(CHF) Shares Class H-I/A(AUD) Shares Class S/D(USD) Shares Class H-R/A(CHF) Shares Class H-R/A(CHF) Shares Class H-R/A(CHF) Shares
Class I/D(SGD) Shares Class H-I/A(SGD) Shares Class H-I/A(SEK) Shares Class H-Q/A(EUR) Shares Class RE/A(EUR) Shares Class RE/A(EUR) Shares Class RE/A(EUR) Shares
Class H-I/A(EUR) Shares Class H-I/D(EUR) Shares Class H-I/D(EUR) Shares Class H-I/A(EUR) Shares Class RE/D(EUR) Shares Class RE/D(EUR) Shares Class RE/D(EUR) Shares
Class H-I/A(SGD) Shares Class H-I/D(GBP) Shares Class H-I/D(GBP) Shares Class H-R/A(EUR) Shares Class H-RE/A(CHF) Shares Class H-RE/A(CHF) Shares Class H-RE/A(CHF) Shares
Class H-I/A(SEK) Shares Class H-I/D(SGD) Shares Class H-I/D(SGD) Shares Class S/A(EUR) Shares Class S/A(EUR) Shares Class S/A(EUR) Shares
Class H-I/D(EUR) Shares Class N/A(USD) Shares Class N/A(USD) Shares Class S/D(EUR) Shares Class S/D(EUR) Shares Class S/D(EUR) Shares
Class H-I/D(GBP) Shares Class N/A(EUR) Shares Class N/A(EUR) Shares Class H-S/A(GBP) Shares Class H-S/A(GBP) Shares Class H-S/A(GBP) Shares
Class H-I/D(SGD) Shares Class N/DM(USD) Shares Class N/DM(USD) Shares Class H-S/D(GBP) Shares Class H-S/D(GBP) Shares Class H-S/D(GBP) Shares
Class H-I/D(SEK) Shares Class H-N/A(EUR) Shares Class H-N/A(EUR) Shares Class H-S/A(CHF) Shares Class H-S/A(CHF) Shares Class H-S/A(CHF) Shares
Class J/DM(USD) Shares Class H-N/A(GBP) Shares Class H-N/A(GBP) Shares Class S2/A(EUR) Shares Class S2/A(EUR) Shares Class S2/A(EUR) Shares
Class N/A(USD) Shares Class H-N/A(CHF) Shares Class H-N/A(CHF) Shares Class S2/D(EUR) Shares Class S2/D(EUR) Shares Class S2/D(EUR) Shares
Class N/A(EUR) Shares Class H-N/D(EUR) Shares Class H-N/D(EUR) Shares Class H-S2/A(GBP) Shares Class H-S2/A(GBP) Shares Class H-S2/A(GBP) Shares
Class N/DM(USD) Shares Class H-N/D(GBP) Shares Class H-N/D(GBP) Shares Class H-S2/D(GBP) Shares Class H-S2/D(GBP) Shares Class H-S2/D(GBP) Shares
Class H-N/A(EUR) Shares Class H-N/D(CHF) Shares Class H-N/D(CHF) Shares Class H-S2/A(CHF) Shares Class H-S2/A(CHF) Shares Class H-S2/A(CHF) Shares
Class H-N/A(CHF) Shares Class H-N/DM(GBP) Shares Class H-N/DM(GBP) Shares Class Q/A(EUR) Shares Class Q/A(EUR) Shares Class Q/A(EUR) Shares
Class H-N/A(GBP) Shares Class N1/A(USD) Shares Class N1/A(USD) Shares
3

NATIXIS INTERNATIONAL FUNDS (DUBLIN) I PLC
Background to the Company (Continued)
Loomis Sayles Multisector Income Fund
Loomis Sayles High Income Fund
Loomis Sayles Global Opportunistic Bond Fund
Loomis Sayles Alternative Risk Premia Fund
Loomis Sayles Euro Credit Fund
Loomis Sayles Euro High Yield Fund
Loomis Sayles Sustainable Euro Credit Fund
Class H-N/D(EUR) Shares Class H-N1/A(EUR) Shares Class N1/A(EUR) Shares
Class H-N/D(GBP) Shares Class H-N1/A(CHF) Shares Class R/A(EUR) Shares
Class H-N/D(CHF) Shares Class R/A(EUR) Shares Class R/A(USD) Shares
Class H-N/DM(GBP) Shares Class R/A(USD) Shares Class R/A(SGD) Shares
Class N1/A(USD) Shares Class R/A(SGD) Shares Class R/D(EUR) Shares
Class N1/A(EUR) Shares Class R/D(EUR) Shares Class R/D(GBP) Shares
Class N1/D(USD) Shares Class R/D(GBP) Shares Class R/D(USD) Shares
Class H-N1/A(EUR) Shares Class R/D(USD) Shares Class R/D(SGD) Shares
Class R/A(EUR) Shares Class R/D(SGD) Shares Class H-R/A(EUR) Shares
Class R/A(USD) Shares Class R/DM(USD) Shares Class H-R/A(SGD) Shares
Class R/A(SGD) Shares Class H-R/A(EUR) Shares Class H-R/A(SEK) Shares
Class R/D(EUR) Shares Class H-R/A(SGD) Shares Class H-R/D(EUR) Shares
Class R/D(GBP) Shares Class H-R/D(EUR) Shares Class H-R/D(SGD) Shares
Class R/D(USD) Shares Class H-R/D(SGD) Shares Class RE/A(EUR) Shares
Class R/D(SGD) Shares Class RE/A(EUR) Shares Class RE/A(USD) Shares
Class R/DM(USD) Shares Class RE/A(USD) Shares Class RE/D(EUR) Shares
Class H-R/A(EUR) Shares Class RE/D(EUR) Shares Class RE/D(USD) Shares
Class H-R/A(SGD) Shares Class RE/D(USD) Shares Class RE/DM(USD) Shares
Class H-R/A(SEK) Shares Class H-RE/A(EUR) Shares Class H-RE/A(EUR) Shares
Class H-R/D(EUR) Shares Class H-RE/D(EUR) Shares Class H-RE/D(EUR) Shares
Class H-R/D(SGD) Shares Class S/A(EUR) Shares Class S/A(EUR) Shares
Class H-R/D(SEK) Shares Class S/A(USD) Shares Class S/A(USD) Shares
Class H-R/DM(AUD) Shares Class S/A(SGD) Shares Class S/A(SGD) Shares
Class H-R/DM(SGD) Shares Class S/D(GBP) Shares Class S/D(GBP) Shares
Class RE/A(EUR) Shares Class S/D(USD) Shares Class S/D(USD) Shares
Class RE/A(USD) Shares Class S/D(JPY) Shares Class S/D(SGD) Shares
Class RE/D(EUR) Shares Class S/D(SGD) Shares Class H-S/A(EUR) Shares
Class RE/D(USD) Shares Class H-S/A(EUR) Shares Class H-S/A(USD) Shares
Class RE/DM(USD) Shares Class H-S/A(CHF) Shares Class H-S/A(SGD) Shares
4

NATIXIS INTERNATIONAL FUNDS (DUBLIN) I PLC
Background to the Company (Continued)
Loomis Sayles Multisector Income Fund
Loomis Sayles High Income Fund
Loomis Sayles Global Opportunistic Bond Fund
Loomis Sayles Alternative Risk Premia Fund
Loomis Sayles Euro Credit Fund
Loomis Sayles Euro High Yield Fund
Loomis Sayles Sustainable Euro Credit Fund
Class H-RE/A(EUR) Shares Class H-S/A(SGD) Shares Class H-S/A(NOK) Shares
Class H-RE/D(EUR) Shares Class H-S/D(EUR) Shares Class H-S/A(AUD) Shares
Class H-RE/DM(AUD) Shares Class H-S/D(GBP) Shares Class H-S/A(SEK) Shares
Class S/A(EUR) Shares Class H-S/D(EUR) Shares
Class S/A(USD) Shares Class H-S/D(GBP) Shares
Class S/A(SGD) Shares Class H-S/D(SGD) Shares
Class S/D(GBP) Shares
Class S/D(USD) Shares
Class S/D(SGD) Shares
Class H-S/A(EUR) Shares
Class H-S/A(SGD) Shares
Class H-S/A(SEK) Shares
Class H-S/D(EUR) Shares
Class H-S/D(GBP) Shares
Class H-S/D(SEK) Shares
5

NATIXIS INTERNATIONAL FUNDS (DUBLIN) I PLC
Background to the Company (Continued)
Each share class is being offered to specific targeted investors:
Targeted Investors Share Class Offered
Retail Investors Class C, Class CT, Class CW, Class F, Class N, Class N1, Class R and Class RE
Institutional Investors Class I, Class J, Class S, Class S2 and Class Q
The functional currency of Loomis Sayles Multisector Income Fund, Loomis Sayles High Income Fund, Loomis Sayles Global Opportunistic Bond Fund and Loomis Sayles Alternative Risk Premia Fund is currently U.S. Dollar (USD).
The functional currency of Loomis Sayles Euro Credit Fund, Loomis Sayles Euro High Yield Fund and Loomis Sayles Sustainable Euro Credit Fund is currently Euro (EUR).
The share classes of each Fund were denominated as at 30 June 2021:
Currency Share Class
U.S. Dollar (USD) Class C, Class CT, Class F, Class H-I, Class H-S, Class I, Class J, Class N, Class N1, Class R, Class RE and Class S
Euro (EUR) Class CW, Class H-CW, Class H-I, Class H-N, Class H-N1, Class H-Q, Class H-R, Class H-RE, Class H-S, Class I, Class N, Class N1, Class Q, Class R, Class RE, Class S and Class S2
Sterling (GBP) Class H-I, Class H-N, Class H-S, Class H-S2, Class I, Class R and Class S
Norwegian Krone (NOK) Class H-S
Swedish Krona (SEK) Class H-I, Class H-R and Class H-S
Singapore Dollar (SGD) Class H-I, Class H-R, Class H-S, Class I, Class R and Class S
Japanese Yen (JPY) Class I and Class S
Swiss Franc (CHF) Class H-I, Class H-N, Class H-N1, Class H-R, Class H-RE, Class H-S and Class H-S2
Australian Dollar (AUD) Class H-I, Class H-S, Class H-R and Class H-RE
As at 30 June 2021, there were no CW and no J share classes in issue.
Investment Objectives and Policies
Loomis Sayles Multisector Income Fund
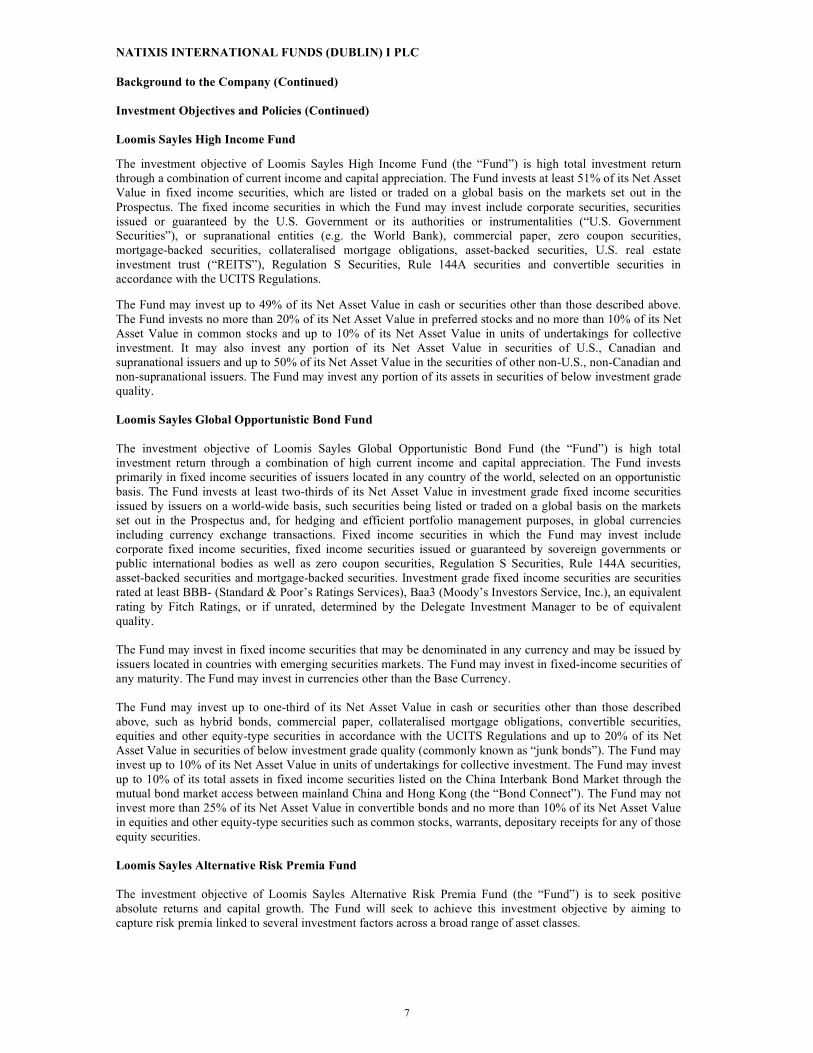
The investment objective of Loomis Sayles Multisector Income Fund (the “Fund”) is high total investment return through a combination of current income and capital appreciation. The Fund invests at least 80% of its Net Asset Value in bonds and other related fixed income securities issued or guaranteed by the U.S. Government or its authorities or instrumentalities or fixed income securities issued by supranational entities (e.g. the World Bank) as well as commercial paper, zero coupon securities, asset-backed securities, mortgage-backed securities (including collateralised mortgage obligations), when-issued securities, Regulation S Securities, Rule 144A securities, structured notes and convertible securities in accordance with the UCITS Regulations.
The Fund may invest up to 20% of its Net Asset Value in securities other than those described above, such as common stocks, preferred stocks, and closed-ended U.S. real estate investment trusts (“REITS”). The Fund may invest up to 10% of its Net Asset Value in units of undertakings for collective investment. The Fund may invest any amount of its assets in securities of U.S. and Canadian issuers (such securities being listed or traded on a global basis on the markets set out in the Prospectus) and up to 30% of its Net Asset Value in securities of other non-U.S. or non-Canadian issuers including issuers in emerging markets. The Fund may invest any amount of its Net Asset Value in securities issued by supranational issuers. The Fund may invest in securities denominated in any currency including currencies of emerging markets countries. The Fund may invest in securities of any maturity. The Fund may also invest up to 35% of its Net Asset Value in securities of below investment grade quality. Securities of below investment grade quality are securities rated less than BBB- (Standard & Poor’s Rating Services), Baa3 (Moody’s Investor Service, Inc.), an equivalent rating by Fitch Ratings or, if unrated, determined by the Investment Manager to be comparable. The Fund does not impose limits on the amount of its assets invested in cash or money market instruments.
6
NATIXIS INTERNATIONAL FUNDS (DUBLIN) I PLC
Background to the Company (Continued) Investment Objectives and Policies (Continued) Loomis Sayles High Income Fund
The investment objective of Loomis Sayles High Income Fund (the “Fund”) is high total investment return through a combination of current income and capital appreciation. The Fund invests at least 51% of its Net Asset Value in fixed income securities, which are listed or traded on a global basis on the markets set out in the Prospectus. The fixed income securities in which the Fund may invest include corporate securities, securities issued or guaranteed by the U.S. Government or its authorities or instrumentalities (“U.S. Government Securities”), or supranational entities (e.g. the World Bank), commercial paper, zero coupon securities, mortgage-backed securities, collateralised mortgage obligations, asset-backed securities, U.S. real estate investment trust (“REITS”), Regulation S Securities, Rule 144A securities and convertible securities in accordance with the UCITS Regulations. The Fund may invest up to 49% of its Net Asset Value in cash or securities other than those described above. The Fund invests no more than 20% of its Net Asset Value in preferred stocks and no more than 10% of its Net Asset Value in common stocks and up to 10% of its Net Asset Value in units of undertakings for collective investment. It may also invest any portion of its Net Asset Value in securities of U.S., Canadian and supranational issuers and up to 50% of its Net Asset Value in the securities of other non-U.S., non-Canadian and non-supranational issuers. The Fund may invest any portion of its assets in securities of below investment grade quality. Loomis Sayles Global Opportunistic Bond Fund The investment objective of Loomis Sayles Global Opportunistic Bond Fund (the “Fund”) is high total investment return through a combination of high current income and capital appreciation. The Fund invests primarily in fixed income securities of issuers located in any country of the world, selected on an opportunistic basis. The Fund invests at least two-thirds of its Net Asset Value in investment grade fixed income securities issued by issuers on a world-wide basis, such securities being listed or traded on a global basis on the markets set out in the Prospectus and, for hedging and efficient portfolio management purposes, in global currencies including currency exchange transactions. Fixed income securities in which the Fund may invest include corporate fixed income securities, fixed income securities issued or guaranteed by sovereign governments or public international bodies as well as zero coupon securities, Regulation S Securities, Rule 144A securities, asset-backed securities and mortgage-backed securities. Investment grade fixed income securities are securities rated at least BBB- (Standard & Poor’s Ratings Services), Baa3 (Moody’s Investors Service, Inc.), an equivalent rating by Fitch Ratings, or if unrated, determined by the Delegate Investment Manager to be of equivalent quality. The Fund may invest in fixed income securities that may be denominated in any currency and may be issued by issuers located in countries with emerging securities markets. The Fund may invest in fixed-income securities of any maturity. The Fund may invest in currencies other than the Base Currency. The Fund may invest up to one-third of its Net Asset Value in cash or securities other than those described above, such as hybrid bonds, commercial paper, collateralised mortgage obligations, convertible securities, equities and other equity-type securities in accordance with the UCITS Regulations and up to 20% of its Net Asset Value in securities of below investment grade quality (commonly known as “junk bonds”). The Fund may invest up to 10% of its Net Asset Value in units of undertakings for collective investment. The Fund may invest up to 10% of its total assets in fixed income securities listed on the China Interbank Bond Market through the mutual bond market access between mainland China and Hong Kong (the “Bond Connect”). The Fund may not invest more than 25% of its Net Asset Value in convertible bonds and no more than 10% of its Net Asset Value in equities and other equity-type securities such as common stocks, warrants, depositary receipts for any of those equity securities. Loomis Sayles Alternative Risk Premia Fund The investment objective of Loomis Sayles Alternative Risk Premia Fund (the “Fund”) is to seek positive absolute returns and capital growth. The Fund will seek to achieve this investment objective by aiming to capture risk premia linked to several investment factors across a broad range of asset classes.
7

NATIXIS INTERNATIONAL FUNDS (DUBLIN) I PLC
Background to the Company (Continued) Investment Objectives and Policies (Continued) The Fund will seek to invest globally in the full spectrum of permitted investments namely debt securities, equity securities, shares or units of undertakings for collective investment (including exchange traded funds), derivatives, cash and near cash instruments. The Fund may make significant use of derivative instruments. The Fund may also have exposure to commodities through eligible exchange traded notes (ETNs) that qualify as transferable securities within the meaning of Regulation 3(1) of the Regulations and through Total Return Swaps (TRS) on commodity indices. The debt securities in which the Fund may invest include public debt obligations (for example government bonds) or private debt obligations (for example corporate bonds). They are issued or guaranteed by issuers anywhere in the world, including but not limited to corporations, governments (including their agencies, instrumentalities and sponsored entities) and supranational entities (e.g. the World Bank). The Fund may invest in floating-rate securities, commercial paper, Regulation S Securities, Rule 144A securities and convertible securities issued by corporate issuers. The Fund may invest any portion of its Net Asset Value in investment grade and below investment grade securities. Investment grade securities are securities rated greater than BBB- (Standard & Poor's Ratings Services), Baa3 (Moody's Investors Service, Inc.) or an equivalent rating by Fitch Ratings, or if unrated, determined by the Delegate Investment Manager to be of equivalent quality. Below investment grade securities are securities rated less than BBB- (Standard & Poor's Ratings Services), Baa3 (Moody's Investors Service, Inc.) or an equivalent rating by Fitch Ratings, or if unrated, determined by the Delegate Investment Manager to be of equivalent quality. The equity securities in which the Fund may invest are common stocks, preferred stocks, equity-related instruments on an ancillary basis such as warrants and equity-linked notes whose value is derived from the value of any of those equity securities, and depositary receipts for any of those equity investments. The Fund may invest up to 10% of its Net Asset Value in undertakings for collective investment, including but not limited to, exchange traded funds that qualify as UCITS. For investment and efficient portfolio management purposes, the Fund may:
enter into futures contracts and options on financial indices, equities, debt securities and interest rates in order to gain exposure globally across the full range of permitted assets including equity and debt securities;
enter into futures contracts and options on currencies and currency forwards allowing the Fund to gain exposure to various currencies;
enter into TRS on financial indices in order to gain exposure to commodities or assets that may otherwise be inefficient or costly to access through traditional investments in physical securities;
engage in the credit derivatives market by entering into credit default swaps and obtaining exposures to credit-based indices through futures and options on such indices in order to sell and buy protection;
enter into interest rate swaps in order to adequately extract rate premium from global markets by swapping fixed-rate interest payments (in a bull market) for floating-rate interest payments (in a bear market) or vice versa (as market movements dictate); and
invest in ETNs in order to gain indirect exposure to commodities. To support the Fund's use of derivative instruments, the Fund may invest in money market instruments, short-term debt securities and hold cash. Money market instruments, short-term debt securities, cash and cash equivalents may include, among others, certificates of deposit, commercial paper, U.S. treasury bills, corporate debt securities (such as corporate bonds) and short-term bonds issued or guaranteed by sovereign governments, public international bodies or other public issuers and time deposits.
8

NATIXIS INTERNATIONAL FUNDS (DUBLIN) I PLC
Background to the Company (Continued) Investment Objectives and Policies (Continued) In addition to taking long positions in respect of each of the asset classes named above, the Fund may take synthetic short positions through derivatives in any asset class. The Fund is not permitted to enter into “physical short sales”. The Fund will generally invest in a portfolio of up to 250% of its Net Asset Value in long positions, and up to 250% of its Net Asset Value in short positions. The Delegate Investment Manager may aim to generate positive returns from both long and short positions, although short positions may also be used to hedge out certain risk exposures in the portfolio (for example, currency or interest rate risk). Loomis Sayles Euro Credit Fund The investment objective of Loomis Sayles Euro Credit Fund (the “Fund”) is to seek return through a combination of income and capital appreciation. The Fund may invest any portion of its Net Asset Value in investment grade, debt securities issued by companies (such as corporate bonds) denominated in Euro. The debt securities in which the Fund invests may be issued by companies anywhere in the world, which are also listed or traded on Regulated Markets. Investment grade debt securities are securities rated greater than or equal to BBB- (Standard & Poor's Ratings Services), Baa3 (Moody's Investors Service, Inc.) or an equivalent rating by Fitch Ratings, or if unrated, determined by the Delegate Investment Manager to be of equivalent quality. In the instance of a split-rated issue, the lower of the ratings will apply. The Fund may also invest any portion of its Net Asset Value in investment grade public debt securities (such as government bonds) issued by governments (including their agencies, instrumentalities and sponsored entities) and supranational entities (e.g. the World Bank). The Fund may invest up to 10% of its assets in securities rated below investment grade; however such securities must be rated no lower than BB- (Standard & Poor’s Ratings Services), Ba3 (Moody’s Investors Services, Inc.), or an equivalent rating by Fitch Ratings at the time of purchase. The Fund may invest up to 10% of its Net Asset Value, at time of purchase, in debt securities denominated in currencies other than Euro. The Fund may not invest in asset backed securities and will not invest in any equity securities. The Fund may invest up to 10% of its Net Asset Value in units of undertakings for collective investment. The Fund may not invest in debt securities rated at or below B+ (Standard & Poor’s Ratings Services), B1 (Moody’s Investors Services, Inc.), or an equivalent rating by Fitch Ratings. If the credit ratings of any debt securities are downgraded below BB- (standard & Poor’s Ratings Services), Ba3 (Moody’s Investors Services, Inc.), or an equivalent rating by Fitch Ratings, the Fund may continue to hold the affected debt securities. Subject to state of the markets at the relevant time and provided it is in the best interests of investors, the affected security shall be sold within six months from the downgrade unless a subsequent upgrade restores the credit rating to a level meeting the relevant limit as set out above during this same period. For investment purposes and for the purposes of efficient portfolio management, the Fund may:
use futures, swaps, currency options and forward contracts in order to expose its assets to, or hedge its assets against, risks linked to interest rates, exchange rates or credit, within the limits described in Appendix II of the Prospectus, under the Section entitled "Investment in Financial Derivative Instruments ("FDIs") – Efficient Portfolio Management/Direct Investment";
enter into interest rate swaps in order to adequately extract rate premium from global markets by swapping fixed-rate interest payments (in a bull market) for floating-rate interest payments (in a bear market) or vice versa (as market movements dictate);
access the credit derivatives market by entering into, among other things, credit default swaps in order to sell and buy protection. The Fund may use credit derivatives in order to hedge the specific credit risks of certain issuers in its portfolio by buying protection. In addition, the Fund may, provided it is in its best interest, buy protection using credit derivatives without holding the underlying assets. Provided it is in its best interest, the Fund may also sell protection using credit derivatives in order to acquire a specific credit exposure; and
on an ancillary basis, invest in financial derivative instruments linked to one or more credit indices such as, but not limited to, Markit iTraxx® Europe Main Index and Markit iTraxx® Crossover Index. Information related to these indices may be obtained from the Markit website (www.markit.com). The constituents of such indices are generally rebalanced on a semi-annual basis. The costs associated with the rebalancing of such indices are generally expected to be negligible.
9

NATIXIS INTERNATIONAL FUNDS (DUBLIN) I PLC
Background to the Company (Continued) Investment Objectives and Policies (Continued) To support the Fund's use of derivative instruments, the Fund may invest in money market instruments, short-term debt securities and hold cash. Financial derivative instruments may be used for investment purposes and for efficient portfolio management subject to compliance with the conditions and limits set out in Appendix II of the Prospectus. Please see the section on the “Use of Financial Derivative Instruments” of the Prospectus for further details. The Fund may be leveraged up to 100% of its Net Asset Value using the Commitment Approach. The maximum proportion of the Fund’s Net Asset Value that will be subject to TRS is 0%. The maximum proportion of the Fund's Net Asset Value that can be subject to SFTs is 100%. The expected proportion of the Fund's Net Asset Value that will be subject to SFTs is 0%. Please refer to the Section entitled Appendix II of the Prospectus, under the Section entitled "Investment in Financial Derivative Instruments ("FDIs") – Efficient Portfolio Management/Direct Investment" for additional information on TRSs and SFTs. If the investment limit percentages set forth above are exceeded for reasons beyond the control of the Fund or as a result of the exercise of subscription rights, the Fund will adopt as a priority objective for its sales transactions the remedying of that situation, taking due account of the interests of Shareholders. Loomis Sayles Euro High Yield Fund The investment objective of Loomis Sayles Euro High Yield Fund (the “Fund”) is to seek return through a combination of income and capital appreciation. The Fund may invest any portion of its Net Asset Value in below investment grade, debt securities issued by companies (such as corporate bonds) denominated in Euro. The debt securities in which the Fund invests may be issued by companies anywhere in the world, which are also listed or traded on Regulated Markets. Below investment grade debt securities are securities rated less than BBB- (Standard & Poor's Ratings Services), Baa3 (Moody's Investors Service, Inc.) or an equivalent rating by Fitch Ratings, or if unrated, determined by the Delegate Investment Manager to be of equivalent quality. No more than 10% of the Fund’s Net Asset Value may be invested in below investment grade debt securities of a highly speculative nature, being securities rated either B+, B or B- (Standard & Poor's Ratings Services), B1, B2 or B3 (Moody's Investors Service, Inc.) or an equivalent rating by Fitch Ratings, or if unrated, determined by the Delegate Investment Manager to be of equivalent quality. The Fund may invest up to 30% of its Net Asset Value in investment grade debt securities; being securities rated greater than or equal to BBB- (Standard & Poor's Ratings Services), Baa3 (Moody's Investors Service, Inc.) or an equivalent rating by Fitch Ratings, or if unrated, determined by the Delegate Investment Manager to be of equivalent quality. In the instance of a split-rated issue, the average of the ratings will apply. The Fund may invest no more than 20% of its Net Asset Value in investment grade and/or below investment grade public debt securities (such as government bonds). They are issued or guaranteed by issuers anywhere in the world, including but not limited to governments (including their agencies, instrumentalities and sponsored entities) and supranational entities (e.g. the World Bank). The Fund may invest up to 10% of its Net Asset Value, at time of purchase, in debt securities denominated in currencies other than Euro. The Fund may not invest in asset backed securities and will not invest in any equity securities. The Fund may invest up to 10% of its Net Asset Value in units of undertakings for collective investment. The Fund may not invest in debt securities rated at or below CCC+ (Standard & Poor’s Ratings Services), Caa1 (Moody’s Investors Service, Inc.), an equivalent rating by Fitch Ratings or if unrated, determined by the Delegate Investment Manager to be equivalent. If the credit ratings of any debt securities are downgraded below B- (Standard & Poor’s Ratings Services), B3 (Moody’s Investors Services, Inc.), or an equivalent rating by Fitch Ratings, the Fund may continue to hold the affected debt securities. Subject to state of the markets at the relevant time and provided it is in the best interests of investors, the affected security shall be sold within six months from the downgrade unless a subsequent upgrade restores the credit rating to a level meeting the relevant limit as set out above during this same period.
10

NATIXIS INTERNATIONAL FUNDS (DUBLIN) I PLC
Background to the Company (Continued) Investment Objectives and Policies (Continued) For investment purposes and for the purposes of efficient portfolio management, the Fund may:
use futures, swaps, currency options and forward contracts in order to expose its assets to, or hedge its assets against, risks linked to interest rates, exchange rates or credit, within the limits described in Appendix II of the Prospectus, under the Section entitled "Investment in Financial Derivative Instruments ("FDIs") – Efficient Portfolio Management/Direct Investment";
enter into interest rate swaps in order to adequately extract rate premium from global markets by swapping fixed-rate interest payments (in a bull market) for floating-rate interest payments (in a bear market) or vice versa (as market movements dictate);
access the credit derivatives market by entering into, among other things, credit default swaps in order to sell and buy protection. The Fund may use credit derivatives in order to hedge the specific credit risks of certain issuers in its portfolio by buying protection. In addition, the Fund may, provided it is in its best interest, buy protection using credit derivatives without holding the underlying assets. Provided it is in its best interest, the Fund may also sell protection using credit derivatives in order to acquire a specific credit exposure; and
on an ancillary basis, invest in financial derivative instruments linked to one or more credit indices such as, but not limited to, Markit iTraxx® Europe Main Index and Markit iTraxx® Crossover Index. Information related to these indices may be obtained from the Markit website (www.markit.com). The constituents of such indices are generally rebalanced on a semi-annual basis. The costs associated with the rebalancing of such indices are generally expected to be negligible.
To support the Fund's use of derivative instruments, the Fund may invest in money market instruments, short-term debt securities and hold cash. Financial derivative instruments may be used for investment purposes and for efficient portfolio management subject to compliance with the conditions and limits set out in Appendix II of the Prospectus. Please see the section on the “Use of Financial Derivative Instruments” of the Prospectus for further details. The Fund may be leveraged up to 100% of its Net Asset Value using the Commitment Approach. The maximum proportion of the Fund’s Net Asset Value that can be subject to TRS is 100%. The expected proportion of the Fund’s Net Asset Value that will be subject to TRS is 0%. The maximum proportion of the Fund's Net Asset Value that can be subject to SFTs is 100%. The expected proportion of the Fund's Net Asset Value that will be subject to SFTs is 0%. Please refer to the Section entitled Appendix II of the Prospectus, under the Section entitled "Investment in Financial Derivative Instruments ("FDIs") – Efficient Portfolio Management/Direct Investment" for additional information on TRSs and SFTs. If the investment limit percentages set forth above are exceeded for reasons beyond the control of the Fund or as a result of the exercise of subscription rights, the Fund will adopt as a priority objective for its sales transactions the remedying of that situation, taking due account of the interests of Shareholders. Loomis Sayles Sustainable Euro Credit Fund The investment objective of Loomis Sayles Sustainable Euro Credit Fund (the “Fund”) is to seek to create investment return in the form of capital appreciation and income, through an investment process that includes Environmental, Social and Governance (‘ESG’) considerations.
The Fund may invest any portion of its Net Asset Value in investment grade, debt securities issued by companies (i.e. corporate bonds) denominated in Euro. The debt securities in which the Fund invests may be issued by companies anywhere in the world, which are also listed or traded on Regulated Markets. The debt securities in which the Fund invests may also be Green Bonds, subject to the Principal Investment Strategy described above and the specifications set out in this Investment Policy. Investment grade debt securities are securities rated greater than or equal to BBB- (Standard & Poor's Ratings Services), Baa3 (Moody's Investors Service, Inc.) or an equivalent rating by Fitch Ratings, or if unrated, determined by the Delegate Investment Manager to be of equivalent quality. In the instance of a split-rated issue, the lower of the ratings will apply. The Fund may also invest any portion of its Net Asset Value in investment grade public debt securities (such as government bonds) issued by governments (including their agencies, instrumentalities and sponsored entities) and supranational entities (e.g. the World Bank).
11

NATIXIS INTERNATIONAL FUNDS (DUBLIN) I PLC
Background to the Company (Continued) Investment Objectives and Policies (Continued) The Fund may invest up to 10% of its assets in securities rated below investment grade; however such securities must be rated no lower than BB- (Standard & Poor’s Ratings Services), Ba3 (Moody’s Investors Services, Inc.), or an equivalent rating by Fitch Ratings at the time of purchase. The Fund may invest up to 10% of its Net Asset Value, at time of purchase, in debt securities denominated in currencies other than Euro. The Fund may not invest in asset backed securities and will not invest in any equity securities. The Fund may invest up to 10% of its Net Asset Value in units of undertakings for collective investment. The Fund may not invest in debt securities rated at or below B+ (Standard & Poor’s Ratings Services), B1 (Moody’s Investors Services, Inc.), or an equivalent rating by Fitch Ratings. If the credit ratings of any debt securities are downgraded below BB- (standard & Poor’s Ratings Services), Ba3 (Moody’s Investors Services, Inc.), or an equivalent rating by Fitch Ratings, the Fund may continue to hold the affected debt securities. Subject to state of the markets at the relevant time and provided it is in the best interests of investors, the affected security shall be sold within six months from the downgrade unless a subsequent upgrade restores the credit rating to a level meeting the relevant limit as set out above during this same period. For investment purposes and for the purposes of efficient portfolio management, the Fund may:
use futures, swaps, currency options and forward contracts in order to expose its assets to, or hedge its assets against, risks linked to interest rates, exchange rates or credit, within the limits described in Appendix II of the Prospectus, under the Section entitled "Investment in Financial Derivative Instruments ("FDIs") – Efficient Portfolio Management/Direct Investment";
enter into interest rate swaps in order to adequately extract rate premium from global markets by swapping fixed-rate interest payments (in a bull market) for floating-rate interest payments (in a bear market) or vice versa (as market movements dictate);
access the credit derivatives market by entering into credit default swaps in order to sell and buy protection. The Fund may use credit default swaps in order to hedge the specific credit risks of certain issuers in its portfolio by buying protection. In addition, the Fund may, provided it is in its best interest, buy protection using credit default swaps without holding the underlying assets. Provided it is in its best interest, the Fund may also sell protection using credit default swaps in order to acquire a specific credit exposure; and
on an ancillary basis, invest in financial derivative instruments linked to one or more credit indices such as, but not limited to, Markit iTraxx® Europe Main Index and Markit iTraxx® Crossover Index. Information related to these indices may be obtained from the Markit website (www.markit.com). The constituents of such indices are generally rebalanced on a semi-annual basis. The costs associated with the rebalancing of such indices are generally expected to be negligible.
To support the Fund's use of derivative instruments, the Fund may invest in money market instruments, short-term debt securities and hold cash. Financial derivative instruments may be used for investment purposes and for efficient portfolio management subject to compliance with the conditions and limits set out in Appendix II of the Prospectus. Please see the section on the “Use of Financial Derivative Instruments” of the Prospectus for further details. The Fund may be leveraged up to 100% of its Net Asset Value using the Commitment Approach. The maximum proportion of the Fund’s Net Asset Value that can be subject to TRS is 100%. The expected proportion of the Fund’s Net Asset Value that will be subject to TRS is 0%. The maximum proportion of the Fund's Net Asset Value that can be subject to SFTs is 100%. The expected proportion of the Fund's Net Asset Value that will be subject to SFTs is 0%. Please refer to the Section entitled Appendix II of the Prospectus, under the Section entitled "Investment in Financial Derivative Instruments ("FDIs") – Efficient Portfolio Management/Direct Investment" for additional information on TRSs and SFTs. If the investment limit percentages set forth above are exceeded for reasons beyond the control of the Fund or as a result of the exercise of subscription rights, the Fund will adopt as a priority objective for its sales transactions the remedying of that situation, taking due account of the interests of Shareholders.
12

NATIXIS INTERNATIONAL FUNDS (DUBLIN) I PLC
Efficient Portfolio Management Each Fund may engage in financial derivative instruments for the purposes of efficient portfolio management. Loomis Sayles Multisector Income Fund may also engage in repurchase agreements for the above purpose. Other Relevant Information Audited annual reports and unaudited half-yearly reports are available from Brown Brothers Harriman Fund Administration Services (Ireland) Limited (the “Administrator”) at the address listed under "Organisation" on page 1 and are sent to shareholders upon request at their registered address. The latest version of the Prospectus is also available from the Administrator at the address listed on page 1.
13

NATIXIS INTERNATIONAL FUNDS (DUBLIN) I PLC
Delegate Investment Manager’s Reports Loomis Sayles Multisector Income Fund
6 Months Performance Loomis Sayles Multisector Income Fund (Class I/D (USD))* 1.28 % Bloomberg Barclays U.S. Government/Credit Bond Index (Total Return) (1.96) %
For indicative purposes, the Fund's performance is compared to the Bloomberg Barclays U.S. Government/ Credit Bond Index (Total Return) (the "Reference Index"). The Fund outperformed its Reference Index in the six months ended 30 June 2021.
The Fund outperformed its Reference Index primarily due to security selection. High yield credit was the largest contributor to relative returns, largely driven by consumer non-
cyclical, transportation and energy names. Within investment grade credit, selected communications and finance company holdings were
beneficial for performance. An allocation to equities was positive, particularly within the consumer non-cyclical and technology
sectors. Duration positioning within the U.S. Treasury sector, particularly early in the period, was a detractor
from relative returns.
* Performance data shown represents past performance and is not a guarantee of future results. More recent performance may be lower or higher. Principal value and returns fluctuate over time (including as a result of currency fluctuations) so that shares, when redeemed, will be worth more or less than their original cost. Performance shown is net of all Fund expenses, but does not include the effect of sales charges or correspondent bank charges, and assumes reinvestment of distributions. If such charges were included, returns would have been lower. Performance for other share classes will be more or less depending on differences in fees and sales charges. Unless otherwise indicated, all defined terms used herein shall have the same meaning as set out in the Prospectus of the Company. Loomis, Sayles & Company, L.P. 19 August 2021
14

NATIXIS INTERNATIONAL FUNDS (DUBLIN) I PLC
Delegate Investment Manager’s Reports (Continued) Loomis Sayles High Income Fund
6 Months Performance Loomis Sayles High Income Fund (Class I/D (USD))* 3.46 % Bloomberg Barclays U.S. Corporate High-Yield Bond Index (Total Return) 3.62 %
For indicative purposes, the Fund's performance is compared to the Bloomberg Barclays U.S. Corporate High-Yield Bond Index (Total Return) (the "Reference Index"). The Fund underperformed its Reference Index in the six months ended 30 June 2021.
The Fund underperformed its Reference Index. Within high yield corporate credit, selected communications, energy and consumer cyclical holdings
were helpful for performance. Equity securities were positive, particularly within the utility sector. A small allocation to preferred
stock was also beneficial for returns. Investment grade corporate credit was the largest detractor from relative return as this sector is more
interest-rate sensitive than high yield and U.S. Treasury yields rose in the period. Holdings of defensive, reserve-like positions were a laggard of performance as investors favored riskier
asset classes.
* Performance data shown represents past performance and is not a guarantee of future results. More recent performance may be lower or higher. Principal value and returns fluctuate over time (including as a result of currency fluctuations) so that shares, when redeemed, will be worth more or less than their original cost. Performance shown is net of all Fund expenses, but does not include the effect of sales charges or correspondent bank charges, and assumes reinvestment of distributions. If such charges were included, returns would have been lower. Performance for other share classes will be more or less depending on differences in fees and sales charges. Unless otherwise indicated, all defined terms used herein shall have the same meaning as set out in the Prospectus of the Company. Loomis, Sayles & Company, L.P. 19 August 2021
15

NATIXIS INTERNATIONAL FUNDS (DUBLIN) I PLC
Delegate Investment Manager’s Reports (Continued) Loomis Sayles Global Opportunistic Bond Fund
6 Months Performance Loomis Sayles Global Opportunistic Bond Fund (Class I/D (USD))* (3.07) % Bloomberg Barclays Global Aggregate Index (Total Return) (3.21) %
For indicative purposes, the Fund's performance is compared to the Bloomberg Barclays Global Aggregate Index (Total Return) (the "Reference Index"). The Fund outperformed its Reference Index in the six months ended 30 June 2021.
Selections in the banking sector added value. In particular, favored European banks were among the top credit picks.
Risk-adjusted overweights to the transportation, aerospace, and communications sectors helped given their initial yield advantage and ensuing spread narrowing.
The modest allocation to inflation-linked Japanese government bonds helped as they outperformed nominal government bonds.
However, selections in nominal global treasuries detracted value. In particular, the targeted allocation to local currency government bonds in Latin America dampened results.
Currency allocation also hampered results. The underweight to the euro detracted value as it fared better than most major peers such as the Japanese yen and Swiss franc. Also, overweights to select emerging markets currencies including the Indonesian rupiah and South Korean won resulted in a modest drag on results.
Duration and yield curve positioning was mixed. The contribution to duration underweight in long maturity USD denominated bonds was a moderate drag on performance.
* Performance data shown represents past performance and is not a guarantee of future results. More recent performance may be lower or higher. Principal value and returns fluctuate over time (including as a result of currency fluctuations) so that shares, when redeemed, will be worth more or less than their original cost. Performance shown is net of all Fund expenses, but does not include the effect of sales charges or correspondent bank charges, and assumes reinvestment of distributions. If such charges were included, returns would have been lower. Performance for other share classes will be more or less depending on differences in fees and sales charges. Unless otherwise indicated, all defined terms used herein shall have the same meaning as set out in the Prospectus of the Company. Loomis, Sayles & Company, L.P. 19 August 2021
16

NATIXIS INTERNATIONAL FUNDS (DUBLIN) I PLC
Delegate Investment Manager’s Reports (Continued) Loomis Sayles Alternative Risk Premia Fund
6 Months Performance Loomis Sayles Alternative Risk Premia Fund (Class I/A (USD))* 1.46 % No reference index
All portfolio decisions are systematically implemented based on current conditions and how the model optimizes this data into the most appropriate allocation.
Rates were the worst performing asset class declining 188 bps on a gross basis. The model reduced exposure to rates by ~30% to end the period with approximately 9% exposure.
Equities and Credit were the best performing asset classes during the period, adding 178 bps and 135bps respectively. The model added about 4% to equites to end the quarter at 16% and added 11% to credit to end near 30%.
* Performance data shown represents past performance and is not a guarantee of future results. More recent performance may be lower or higher. Principal value and returns fluctuate over time (including as a result of currency fluctuations) so that shares, when redeemed, will be worth more or less than their original cost. Performance shown is net of all Fund expenses, but does not include the effect of sales charges or correspondent bank charges, and assumes reinvestment of distributions. If such charges were included, returns would have been lower. Performance for other share classes will be more or less depending on differences in fees and sales charges. Unless otherwise indicated, all defined terms used herein shall have the same meaning as set out in the Prospectus of the Company. Loomis, Sayles & Company, L.P. 19 August 2021
17

NATIXIS INTERNATIONAL FUNDS (DUBLIN) I PLC
Delegate Investment Manager’s Reports (Continued) Loomis Sayles Euro Credit Fund
Performance (since inception) Loomis Sayles Euro Credit Fund (Class I/A (EUR))* (0.50) % iBoxx Euro Corporates Overall Index (Total Return) (0.36) %
The Fund launched on 2 February 2021. For indicative purposes, the Fund's performance is compared to the iBoxx Euro Corporates Overall Index (Total Return) (the "Reference Index"). The Fund underperformed its Reference Index since inception till the period ended 30 June 2021.
The Fund outperformed its Reference Index. The Delegate Investment Manager estimates costs related to trading securities on inception date were 0.27%.
During this period, the spread over swap of the Reference Index tightened from 70 to 63 basis points, and from 101 to 96 basis points looking at spreads over government bonds. The Euro Investment Grade credit market exhibited a gradual trend towards lower spreads, with continued spread compression and limited volatility.
Positive contributors were Banks, Infrastructure, Healthcare and Real Estate, whereas Insurance, Travel & Leisure and Technology had a slightly negative attribution.
On a company level, among top contributors were Fraport, Aeroporti di Roma, Mercialys, Traton and SES Global. On the other hand, Daimler, Air Liquide, Assicurazioni Generali, easyJet and Femsa detracted from performance.
* Performance data shown represents past performance and is not a guarantee of future results. More recent performance may be lower or higher. Principal value and returns fluctuate over time (including as a result of currency fluctuations) so that shares, when redeemed, will be worth more or less than their original cost. Performance shown is net of all Fund expenses, but does not include the effect of sales charges or correspondent bank charges, and assumes reinvestment of distributions. If such charges were included, returns would have been lower. Performance for other share classes will be more or less depending on differences in fees and sales charges. Unless otherwise indicated, all defined terms used herein shall have the same meaning as set out in the Prospectus of the Company. Loomis, Sayles & Company, L.P. 19 August 2021
18

NATIXIS INTERNATIONAL FUNDS (DUBLIN) I PLC
Delegate Investment Manager’s Reports (Continued) Loomis Sayles Euro High Yield Fund
Performance (since inception) Loomis Sayles Euro High Yield Fund (Class I/A (EUR))* 1.50 % 85% ICE BofA BB Euro High Yield Non-Financial Constrained Index (Total Return), 15% ICE BofA Euro Subordinated Financial Index (Total Return)
0.98 %
The Fund launched on 9 February 2021, the I/A(EUR) share class displayed launched 16 February 2021. For indicative purposes, the Fund's performance is compared to the 85% ICE BofA BB Euro High Yield Non-Financial Constrained Index and 15% ICE BofA Euro Subordinated Financial Index (the "Reference Index"). The Fund outperformed its Reference Index since inception till the period ended 30 June 2021.
The Fund outperformed its Reference Index. During this period, the spread over swap of the Reference Index tightened from 191 to 184 basis points,
and remained at 223 basis points looking at spreads over government bonds. The Euro High Yield market showed some volatility, with spreads compressing whereby lower-rated bonds outperformed higher-rated ones.
Positive contributors were Utilities, Infrastructure and Real Estate, whereas Oil & Gas, Insurance and Retail had a negative attribution.
On a company level, among top contributors were Electricité de France, TVO, Aeroporti di Roma and Vivion. On the other hand, Petroleos Mexicanos (excluded due to weak ESG profile), Unibail-Rodamco and International Airlines Group detracted from performance.
* Performance data shown represents past performance and is not a guarantee of future results. More recent performance may be lower or higher. Principal value and returns fluctuate over time (including as a result of currency fluctuations) so that shares, when redeemed, will be worth more or less than their original cost. Performance shown is net of all Fund expenses, but does not include the effect of sales charges or correspondent bank charges, and assumes reinvestment of distributions. If such charges were included, returns would have been lower. Performance for other share classes will be more or less depending on differences in fees and sales charges. Unless otherwise indicated, all defined terms used herein shall have the same meaning as set out in the Prospectus of the Company. Loomis, Sayles & Company, L.P. 19 August 2021
19

NATIXIS INTERNATIONAL FUNDS (DUBLIN) I PLC
Delegate Investment Manager’s Reports (Continued) Loomis Sayles Sustainable Euro Credit Fund
Performance (since inception) Loomis Sayles Sustainable Euro Credit Fund (Class I/A (EUR))* 0.60 % iBoxx Euro Corporates Overall Index (Total Return) 0.64 %
The Fund launched on 19 May 2021, the I/A(EUR) share class displayed launched 24 May 2021. For indicative purposes, the Fund's performance is compared to the iBoxx Euro Corporates Overall Index (Total Return) (the "Reference Index"). The Fund underperformed its Reference Index since inception till the period ended 30 June 2021.
* Performance data shown represents past performance and is not a guarantee of future results. More recent performance may be lower or higher. Principal value and returns fluctuate over time (including as a result of currency fluctuations) so that shares, when redeemed, will be worth more or less than their original cost. Performance shown is net of all Fund expenses, but does not include the effect of sales charges or correspondent bank charges, and assumes reinvestment of distributions. If such charges were included, returns would have been lower. Performance for other share classes will be more or less depending on differences in fees and sales charges. Unless otherwise indicated, all defined terms used herein shall have the same meaning as set out in the Prospectus of the Company. Loomis, Sayles & Company, L.P. 19 August 2021
20

NATIXIS INTERNATIONAL FUNDS (DUBLIN) I PLC
Condensed Statement of Financial Position
Notes
TOTAL AS AT
30 JUNE 2021 USD
LOOMIS SAYLES
MULTISECTOR INCOME FUND
AS AT 30 JUNE 2021
USD
LOOMIS SAYLES
HIGH INCOME
FUND AS AT
30 JUNE 2021 USD
LOOMIS SAYLES GLOBAL
OPPORTUNISTIC BOND FUND
AS AT 30 JUNE 2021
USD
LOOMIS SAYLES
ALTERNATIVE RISK PREMIA
FUND AS AT
30 JUNE 2021 USD
LOOMIS SAYLES
EURO CREDIT
FUND* AS AT
30 JUNE 2021 EUR
LOOMIS SAYLES
EURO HIGH YIELD
FUND** AS AT
30 JUNE 2021 EUR
LOOMIS SAYLES
SUSTAINABLE EURO CREDIT
FUND*** AS AT
30 JUNE 2021 EUR
CURRENT ASSETS
Cash at bank 1(b) 21,110,402 11,626,322 538,024 1,712,834 1,924,573 2,646,831 762,248 1,067,394
Deposits with Broker for Derivatives Collateral
4,382,664 1,594,697 – 356,664 2,281,115 74,400 25,758 26,487
Debtors 22,493,175 9,938,116 247,413 6,156,853 3,244,510 1,021,723 808,976 619,999
Investments: Financial assets at fair value through profit or loss 1,237,800,066 876,367,540 15,935,929 74,895,591 26,548,063 115,851,608 29,184,613 60,759,329 Total Assets 1,285,786,307 899,526,675 16,721,366 83,121,942 33,998,261 119,594,562 30,781,595 62,473,209
CURRENT LIABILITIES
Creditors - (Amounts falling due within one financial year) (21,356,004) (7,524,274) (474,148) (8,340,298) (2,372,733) (1,177,570) (524,174) (528,251)
Investments: Financial liabilities at fair value through profit or loss (4,226,928) (2,901,096) (15,955) (481,351) (806,172) (10,450) (5,360) (3,040)
NET ASSETS ATTRIBUTABLE TO REDEEMABLE PARTICIPATING SHAREHOLDERS
1,260,203,375
889,101,305
16,231,263
74,300,293
30,819,356
118,406,542
30,252,061
61,941,918
As at 30 June 2021 1,260,203,375
889,101,305
16,231,263
74,300,293
30,819,356
118,406,542
30,252,061
61,941,918
As at 31 December 2020 1,243,074,340
1,000,775,311
18,692,099
192,280,202
31,326,728
As at 31 December 2019 1,250,596,821
1,022,695,050
36,546,151
191,355,620
* Fund launched on 2 February 2021. ** Fund launched on 9 February 2021. *** Fund launched on 19 May 2021. The notes on pages 29 to 51 are an integral part of these condensed financial statements.
21

NATIXIS INTERNATIONAL FUNDS (DUBLIN) I PLC
Condensed Statement of Financial Position (Continued)
Notes
TOTAL AS AT
31 DECEMBER 2020 USD
LOOMIS SAYLES MULTISECTOR INCOME FUND
AS AT 31 DECEMBER 2020
USD
LOOMIS SAYLES HIGH INCOME FUND
AS AT 31 DECEMBER 2020
USD
LOOMIS SAYLES GLOBAL
OPPORTUNISTIC BOND FUND
AS AT 31 DECEMBER 2020
USD
LOOMIS SAYLES ALTERNATIVE RISK
PREMIA FUND* AS AT
31 DECEMBER 2020 USD
CURRENT ASSETS
Cash at bank 1(b) 38,743,163 21,188,266 449,516 2,305,854 14,799,527
Deposits with Broker for Derivatives Collateral 1,941,642 – – 152,043 1,789,599
Debtors 25,567,124 19,573,265 294,472 5,536,938 162,449
Investments: Financial assets at fair value through profit or loss 1,195,323,640 964,186,653 18,252,334 197,723,785 15,160,868 Total Assets 1,261,575,569 1,004,948,184 18,996,322 205,718,620 31,912,443
CURRENT LIABILITIES
Creditors - (Amounts falling due within one financial year) (17,873,434) (4,170,248) (304,165) (13,144,899) (254,122)
Investments: Financial liabilities at fair value through profit or loss (627,795) (2,625) (58) (293,519) (331,593)
NET ASSETS ATTRIBUTABLE TO REDEEMABLE PARTICIPATING SHAREHOLDERS
1,243,074,340
1,000,775,311
18,692,099
192,280,202
31,326,728
As at 31 December 2020 1,243,074,340
1,000,775,311
18,692,099
192,280,202
31,326,728
As at 31 December 2019 1,250,596,821
1,022,695,050
36,546,151
191,355,620
As at 31 December 2018 1,224,490,578
985,950,656
55,362,176
183,177,746
* Fund launched on 30 October 2020. The notes on pages 29 to 51 are an integral part of these condensed financial statements.
22

NATIXIS INTERNATIONAL FUNDS (DUBLIN) I PLC
Condensed Statement of Comprehensive Income
Notes
TOTAL HALF YEAR
ENDED 30 JUNE 2021
USD
LOOMIS SAYLES
MULTISECTOR INCOME FUND
HALF YEAR ENDED
30 JUNE 2021USD
LOOMIS SAYLES
HIGH INCOME
FUNDHALF YEAR
ENDED30 JUNE 2021
USD
LOOMIS SAYLES GLOBAL
OPPORTUNISTIC BOND FUNDHALF YEAR
ENDED30 JUNE 2021
USD
LOOMIS SAYLES
ALTERNATIVE RISK PREMIA
FUNDHALF YEAR
ENDED30 JUNE 2021
USD
LOOMIS SAYLES
EURO CREDIT
FUND* PERIOD ENDED
30 JUNE 2021 EUR
LOOMIS SAYLES
EURO HIGH YIELD
FUND**PERIODENDED
30 JUNE 2021EUR
LOOMIS SAYLES
SUSTAINABLE EURO CREDIT
FUND***PERIODENDED
30 JUNE 2021EUR
Investment income 20,743,208 17,727,691 479,455 1,821,348 347,533 106,431 181,388 21,803 Net gain/(loss) on Financial Assets and Financial Liabilities at fair value through profit or loss (16,299,324) (8,799,095) 96,490 (6,840,460) (749,255) (469,347) 102,627 360,814 Total Investment Income 4,443,884 8,928,596 575,945 (5,019,112) (401,722) (362,916) 284,015 382,617 Operating Expenses 3 (7,793,330) (6,001,433) (234,492) (892,136) (259,665) (230,066) (73,829) (38,127) Expense Reimbursement 3 1,019,190 187,202 100,231 340,160 192,834 99,464 38,941 29,200 Net Operating Expenses (6,774,140) (5,814,231) (134,261) (551,976) (66,831) (130,602) (34,888) (8,927) Net (Loss)/Income from Operations before Finance Costs (2,330,256) 3,114,365 441,684 (5,571,088) (468,553) (493,518) 249,127 373,690 Finance Costs Distributions to Redeemable Participating Shareholders (4,515,754) (3,149,623) (178,441) (1,187,690) – – – – Total Finance Costs (4,515,754) (3,149,623) (178,441) (1,187,690) – – – – Profit before Tax (6,846,010) (35,258) 263,243 (6,758,778) (468,553) (493,518) 249,127 373,690 Withholding Tax (454,295) (351,555) (6,681) (46,297) (38,819) (4,790) (466) (3,972) Net (decrease)/increase in Net Assets Attributable to Redeemable Participating Shareholders resulting from Operations (7,300,305) (386,813) 256,562 (6,805,075) (507,372) (498,308) 248,661 369,718
There are no gains or losses other than those dealt with in the Condensed Statement of Comprehensive Income. In arriving at the results for the financial period, all amounts above relate to continuing operations. * Fund launched on 2 February 2021. ** Fund launched on 9 February 2021. *** Fund launched on 19 May 2021. The notes on pages 29 to 51 are an integral part of these condensed financial statements.
23

NATIXIS INTERNATIONAL FUNDS (DUBLIN) I PLC
Condensed Statement of Comprehensive Income (Continued)
Notes
TOTAL HALF YEAR ENDED
30 JUNE 2020 USD
LOOMIS SAYLES MULTISECTOR INCOME FUND
HALF YEAR ENDED 30 JUNE 2020
USD
LOOMIS SAYLES HIGH INCOME FUND
HALF YEAR ENDED 30 JUNE 2020
USD
LOOMIS SAYLES GLOBAL
OPPORTUNISTIC BOND FUND
HALF YEAR ENDED 30 JUNE 2020
USD Investment income 23,344,578 20,113,899 933,393 2,297,286 Net gain/(loss) on Financial Assets and Financial Liabilities at fair value through profit or loss (56,860,452) (53,208,926) (6,125,866) 2,474,340 Total Investment Income (33,515,874) (33,095,027) (5,192,473) 4,771,626 Operating Expenses 3 (7,687,695) (6,424,649) (305,778) (957,268) Expense Reimbursement 3 675,268 218,834 89,216 367,218 Net Operating Expenses (7,012,427) (6,205,815) (216,562) (590,050) Net (Loss)/Income from Operations before Finance Costs (40,528,301) (39,300,842) (5,409,035) 4,181,576 Finance Costs Distributions to Redeemable Participating Shareholders (5,944,791) (4,142,989) (402,036) (1,399,766) Total Finance Costs (5,944,791) (4,142,989) (402,036) (1,399,766) Profit before Tax (46,473,092) (43,443,831) (5,811,071) 2,781,810 Withholding Tax (678,437) (642,609) (17,916) (17,912) Net (decrease)/increase in Net Assets Attributable to Redeemable Participating Shareholders resulting from Operations (47,151,529) (44,086,440) (5,828,987) 2,763,898
There are no gains or losses other than those dealt with in the Condensed Statement of Comprehensive Income. In arriving at the results for the financial period, all amounts above relate to continuing operations. The notes on pages 29 to 51 are an integral part of these condensed financial statements.
24

NATIXIS INTERNATIONAL FUNDS (DUBLIN) I PLC
Condensed Statement of Changes in Net Assets Attributable to Redeemable Participating Shareholders
Notes
TOTAL HALF YEAR
ENDED 30 JUNE 2021
USD
LOOMIS SAYLES
MULTISECTOR INCOME FUND
HALF YEAR ENDED
30 JUNE 2021USD
LOOMIS SAYLES
HIGH INCOME
FUNDHALF YEAR
ENDED30 JUNE 2021
USD
LOOMIS SAYLES GLOBAL
OPPORTUNISTIC BOND FUNDHALF YEAR
ENDED30 JUNE 2021
USD
LOOMIS SAYLES
ALTERNATIVE RISK PREMIA
FUND HALF YEAR
ENDED 30 JUNE 2021
USD
LOOMIS SAYLES
EURO CREDIT
FUND*PERIODENDED
30 JUNE 2021EUR
LOOMIS SAYLES
EURO HIGH YIELD
FUND**PERIODENDED
30 JUNE 2021EUR
LOOMIS SAYLES
SUSTAINABLE EURO CREDIT
FUND***PERIODENDED
30 JUNE 2021EUR
Net Assets Attributable to Redeemable Participating Shareholders at 1 January 2021 1,243,074,340 1,000,775,311 18,692,099 192,280,202 31,326,728 – – – Net (decrease)/increase in Net Assets Attributable to Redeemable Participating Shareholders resulting from Operations (7,300,305) (386,813) 256,562 (6,805,075) (507,372) (498,308) 248,661 369,718 Share Transactions Proceeds from Redeemable Participating Shares issued1 2 343,542,508 75,588,506 210,453 17,658,929 – 119,245,751 30,003,400 61,632,560 Redemption proceeds of Redeemable Participating Shares2 2 (319,113,168) (186,875,699) (2,927,851) (128,833,763) – (340,901) – (60,360) Total (decrease)/increase in Net Assets resulting from Share Transactions 24,429,340 (111,287,193) (2,717,398) (111,174,834) – 118,904,850 30,003,400 61,572,200 Total (decrease)/increase in Net Assets Attributable to Redeemable Participating Shareholders 17,129,035 (111,674,006) (2,460,836) (117,979,909) (507,372) 118,406,542 30,252,061 61,941,918 Net Assets Attributable to Redeemable Participating Shareholders at 30 June 2021 1,260,203,375 889,101,305 16,231,263 74,300,293 30,819,356 118,406,542 30,252,061 61,941,918
* Fund launched on 2 February 2021. ** Fund launched on 9 February 2021. *** Fund launched on 19 May 2021. 1 Includes reinvested distributions of USD 605,910 on Loomis Sayles Multisector Income Fund, USD 50,739 on Loomis Sayles High Income Fund, USD 201,473 on Loomis Sayles Global Opportunistic Bond Fund, USD
nil on Loomis Sayles Alternative Risk Premia Fund and EUR nil on Loomis Sayles Euro Credit Fund, Loomis Sayles Euro High Yield Fund, Loomis Sayles Sustainable Euro Credit Fund.
2 Proceeds from Redeemable Participating Shares issued and Redemption proceeds of Redeemable Participating Shares include income equalisation adjustments of USD 19,897 on Loomis Sayles High Income Fund.
The notes on pages 29 to 51 are an integral part of these condensed financial statements.
25

NATIXIS INTERNATIONAL FUNDS (DUBLIN) I PLC
Condensed Statement of Changes in Net Assets Attributable to Redeemable Participating Shareholders (Continued)
Notes
TOTAL HALF YEAR ENDED
30 JUNE 2020 USD
LOOMIS SAYLES MULTISECTOR INCOME FUND
HALF YEAR ENDED 30 JUNE 2020
USD
LOOMIS SAYLES HIGH INCOME FUND
HALF YEAR ENDED 30 JUNE 2020
USD
LOOMIS SAYLES GLOBAL
OPPORTUNISTIC BOND FUND
HALF YEAR ENDED 30 JUNE 2020
USD Net Assets Attributable to Redeemable Participating Shareholders at 1 January 2020 1,250,596,821 1,022,695,050 36,546,151 191,355,620 Net (decrease)/increase in Net Assets Attributable to Redeemable Participating Shareholders resulting from Operations (47,151,529) (44,086,440) (5,828,987) 2,763,898 Share Transactions Proceeds from Redeemable Participating Shares issued1 2 309,875,498 278,739,701 411,085 30,724,712 Redemption proceeds of Redeemable Participating Shares2 2 (292,919,809) (242,350,031) (8,993,804) (41,575,974) Total increase/(decrease) in Net Assets resulting from Share Transactions 16,955,689 36,389,670 (8,582,719) (10,851,262) Total decrease in Net Assets Attributable to Redeemable Participating Shareholders (30,195,840) (7,696,770) (14,411,706) (8,087,364) Net Assets Attributable to Redeemable Participating Shareholders at 30 June 2020 1,220,400,981 1,014,998,280 22,134,445 183,268,256
1 Includes reinvested distributions of USD 626,882 on Loomis Sayles Multisector Income Fund, USD 112,889 on Loomis Sayles High Income Fund and USD 19,485 on Loomis Sayles Global Opportunistic Bond Fund.
2 Proceeds from Redeemable Participating Shares issued and Redemption proceeds of Redeemable Participating Shares include income equalisation adjustment of USD (25,745) on Loomis Sayles High Income Fund. The notes on pages 29 to 51 are an integral part of these condensed financial statements.
26

NATIXIS INTERNATIONAL FUNDS (DUBLIN) I PLC
Condensed Statement of Cash Flows
TOTALHALF YEAR
ENDED30 JUNE 2021
USD
LOOMIS SAYLES
MULTISECTOR INCOME FUND
HALF YEAR ENDED
30 JUNE 2021USD
LOOMIS SAYLES
HIGH INCOME
FUNDHALF YEAR
ENDED30 JUNE 2021
USD
LOOMIS SAYLES GLOBAL
OPPORTUNISTIC BOND FUNDHALF YEAR
ENDED30 JUNE 2021
USD
LOOMIS SAYLES
ALTERNATIVE RISK PREMIA
FUNDHALF YEAR
ENDED30 JUNE 2021
USD
LOOMIS SAYLES
EURO CREDIT
FUND* PERIOD ENDED
30 JUNE 2021 EUR
LOOMIS SAYLES
EURO HIGH YIELD
FUND**PERIOD ENDED
30 JUNE 2021EUR
LOOMIS SAYLES
SUSTAINABLE EURO CREDIT
FUND***PERIOD ENDED
30 JUNE 2021EUR
Cash flows from operating activities
Purchase of financial assets and settlement of financial liabilities (1,225,920,374) (543,669,748) (4,784,482) (242,018,831) (91,387,080) (171,841,187) (48,796,854) (69,487,799) Proceeds from sale of investments at fair value through profit or loss 1,178,556,479 635,132,843 7,367,193 356,109,074 78,840,593 56,241,723 19,716,095 9,299,604 Bond income received 21,793,874 19,111,939 541,416 2,886,939 175,714 (403,055) (126,873) (247,653) Deposit interest income received -22,048 681 (27) 1,198 773 (13,238) (3,512) (4,055) Other income received 1,143,081 1,163,570 (16,409) (37,622) 94,136 (24,739) (1,562) (24,795) Operating expenses paid (7,074,404) (5,960,111) (170,314) (688,713) (107,574) (108,331) (2,588) (13,621) Net cash inflow/(outflow) from operating activities (31,523,392) 105,779,174 2,937,377 116,252,045 (12,383,438) (116,148,827) (29,215,294) (60,478,319)
Cash flows from financing activities
Proceeds from issue of Redeemable Participating Shares 345,633,874 77,359,533 154,566 18,088,437 – 119,200,921 30,003,300 61,632,560 Dividends paid to holders of Redeemable Participating Shares (4,515,754) (3,149,623) (178,441) (1,187,690) – – – – Dividends re-invested 858,122 605,910 50,739 201,473 – – – – Payments on redemptions of Redeemable Participating Shares (325,644,589) (188,562,241) (2,875,733) (133,742,664) – (330,863) – (60,360) Cash inflow/(outflow) from financing activities 16,331,653 (113,746,421) (2,848,869) (116,640,444) – 118,870,058 30,003,300 61,572,200
Net increase/(decrease) in cash and cash equivalents for the period (15,191,739) (7,967,247) 88,508 (388,399) (12,383,438) 2,721,231 788,006 1,093,881
Cash and cash equivalents as at 1 January 2021 40,684,805 21,188,266 449,516 2,457,897 16,589,126 – – –
Cash and cash equivalents as at 30 June 2021 25,493,066 13,221,019 538,024 2,069,498 4,205,688 2,721,231 788,006 1,093,881
* Fund launched on 2 February 2021. ** Fund launched on 9 February 2021. *** Fund launched on 19 May 2021.
The notes on pages 29 to 51 are an integral part of these condensed financial statements.
27

NATIXIS INTERNATIONAL FUNDS (DUBLIN) I PLC
Condensed Statement of Cash Flows (Continued)
TOTAL HALF YEAR ENDED
30 JUNE 2020 USD
LOOMIS SAYLES MULTISECTOR INCOME FUND
HALF YEAR ENDED 30 JUNE 2020
USD
LOOMIS SAYLES HIGH INCOME FUND
HALF YEAR ENDED 30 JUNE 2020
USD
LOOMIS SAYLES GLOBAL
OPPORTUNISTIC BOND FUND
HALF YEAR ENDED 30 JUNE 2020
USD Cash flows from operating activities Purchase of financial assets and settlement of financial liabilities (755,627,020) (476,387,826) (14,604,593) (264,634,601) Proceeds from sale of investments at fair value through profit or loss 712,862,478 419,052,628 23,234,821 270,575,029 Bond income received 20,776,322 17,719,387 983,852 2,073,083 Deposit interest income received 51,383 44,019 1,351 6,013 Other income received 1,798,365 1,716,707 85,216 (3,558) Operating expenses paid (7,642,398) (6,762,033) (248,826) (631,539) Net cash (outflow)/inflow from operating activities (27,780,870) (44,617,118) 9,451,821 7,384,427
Cash flows from financing activities Proceeds from issue of Redeemable Participating Shares 314,540,135 282,495,766 305,545 31,738,824 Dividends paid to holders of Redeemable Participating Shares (5,944,790) (4,142,988) (402,036) (1,399,766) Dividends re-invested 759,256 626,882 112,889 19,485 Payments on redemptions of Redeemable Participating Shares (292,996,289) (242,347,792) (9,116,308) (41,532,189) Cash inflow/(outflow) from financing activities 16,358,312 36,631,868 (9,099,910) (11,173,646) Net (decrease)/increase in cash and cash equivalents for the period (11,422,558) (7,985,250) 351,911 (3,789,219) Cash and cash equivalents as at 1 January 2020 28,706,744 21,700,442 496,785 6,509,517 Cash and cash equivalents as at 30 June 2020 17,284,186 13,715,192 848,696 2,720,298
The notes on pages 29 to 51 are an integral part of these condensed financial statements.
28

NATIXIS INTERNATIONAL FUNDS (DUBLIN) I PLC Notes to the Condensed Financial Statements as at 30 June 2021
1. SIGNIFICANT ACCOUNTING POLICIES The principal accounting policies applied in the preparation of these condensed financial statements are set out below. These policies have been consistently applied to all periods presented, unless otherwise stated in the following text. a) Basis of Presentation The condensed financial statements have been prepared in accordance with IFRS, as adopted by the European Union (EU) and Irish statute comprising the Companies Act 2014 and the UCITS Regulations. The financial statements have been prepared in accordance with the pronouncements on IAS 34 “Interim Financial Reporting” issued by the International Accounting Standards Board. The unaudited condensed financial statements should be read in conjunction with the audited financial statements for the year ended 31 December 2020. The condensed financial statements have been prepared under the historical cost convention as modified by the revaluation of financial assets and financial liabilities held at fair value through profit or loss. The preparation of financial statements in conformity with IFRS requires the use of certain critical accounting estimates. It also requires the Board of Directors to exercise its judgement in the process of applying the Company’s accounting policies. The Delegate Investment Manager is registered with and regulated by the Securities and Exchange Commission (“SEC”) in the United States as an investment adviser. The Company evaluates that there are no material differences between IFRS and U.S. Generally Accepted Accounting Principles (“US GAAP”) equivalent disclosures to be reconciled for the purpose of SEC Custody Rule 206. The Loomis Sayles Multisector Income Fund is authorised under the Section 104 of the Hong Kong Securities and Futures Ordinance (the “SFO”) and the Fund is subject to the requirements of the Code on Unit Trusts and Mutual Funds. The Company evaluates that these condensed financial statements are prepared in accordance with Hong Kong law requirements. b) Cash and Cash Equivalents
Cash and cash equivalents include cash in hand, deposits held on call with banks, other short-term highly liquid investments with original maturities of three months or less and bank overdrafts.
All cash at bank balances are held with Brown Brothers Harriman & Co., or with third party institutions approved by the Company on overnight deposit or directly with a sub-custodian. All deposits held on call with banks are returned to the Depositary the following day.
In response to the CBI publishing the Central Bank (Supervision and Enforcement) Act 2013 (Section 48(1)) Investor Money Regulations 2015 for Fund Service Providers (the “Investor Money Regulations” or “IMR”) in March 2015 (effective from 1st July, 2016), the Investment Manager undertook a review together with the Administrator of the way in which subscription, distribution and redemption monies are channelled to and from the Company. As a result of this review, effective from 1st July, 2016, subscription and redemption monies will be channelled through an umbrella cash collection account in the name of the Company.
29

NATIXIS INTERNATIONAL FUNDS (DUBLIN) I PLC Notes to the Condensed Financial Statements as at 30 June 2021 (Continued)
1. SIGNIFICANT ACCOUNTING POLICIES (Continued)
c) Foreign Currency Exchange Rates
The condensed financial statements are presented in USD. The following exchange rates at 30 June 2021 and 31 December 2020 have been used to translate assets and liabilities held in currencies other than USD: 30 June 2021
31 December
2020
30 June 2021
31 December 2020
USD 1 = ARS N/A 84.0702 INR 74.3300 73.0675 AUD 1.3939 1.2959 JPY 110.9900 103.2450 BRL 5.0179 5.1942 KRW 1,126.1500 1,086.3000 CAD 1.2383 1.2740 MXN 19.9105 19.9255 CHF 0.9244 0.8840 MYR 4.1515 4.0225 CLP 728.1100 710.5000 NOK 8.6052 8.5620 CNH 6.4609 6.4967 NZD 1.4311 1.3889 CNY 6.4615 6.5398 PEN 3.8325 3.6173 COP 3,734.0000 3,420.5000 PHP 48.8150 48.0235 CZK 21.5086 21.4638 PLN 3.8070 3.7260 DKK 6.2706 6.0835 RUB 73.0538 73.9644 EGP 15.6950 15.7300 SEK 8.5522 8.2126 EUR 0.8432 0.8173 SGD 1.3442 1.3217 GBP 0.7239 0.7316 THB 32.0500 29.9600 HKD 7.7659 7.7539 TRY 8.6875 7.4325 HUF N/A 296.4203 TWD 27.8625 28.0980 IDR 14,500.0000 14,050.0000 UYU 43.4950 42.4750 ILS 3.2585 3.2108 ZAR 14.2788 14.6888 d) Distributions Payable to Holders of Redeemable Participating Shares
The distributions to holders of Redeemable Participating Shares are recognised as finance costs in the Condensed Statement of Comprehensive Income.
e) Swing Pricing
The Funds may apply a single swing pricing mechanism in accordance with relevant Supplement to the Prospectus instead of the single price mechanism. During the period ended 30 June 2021 only the Loomis Sayles High Income Fund, Loomis Sayles Euro Credit Fund, Loomis Sayles Euro High Yield Fund and Loomis Sayles Sustainable Euro Credit Fund have the ability to apply a single swing pricing mechanism in accordance with its Supplement to the Prospectus.
During the period ended 30 June 2021, only Loomis Sayles Euro Credit Fund applied swing pricing adjustments.
At the period ended 30 June 2021, there were no swing pricing adjustments applied on the Net Asset Value per Share of any other Funds (during the year ended 30 December 2020: nil).
Swing pricing methodology is an operation for which the Price on a given Dealing Day may be adjusted in order to take into account the dilution impacts and to protect the Shareholders’ interests in the event of large subscriptions, redemptions and/or conversions in and/or out of a Fund on such Dealing Day. This means that, if on any Dealing Day, the aggregate transactions in Shares of a Fund exceed a threshold determined by the Directors, the Net Asset Value may be adjusted by an amount, not exceeding 2% of the relevant Net Asset Value, in order to reflect both the estimated fiscal charges and dealing costs that may be incurred by the Fund and the estimated dealing spread of the assets in which the Fund invests/disinvests. In such event, the official Net Asset Value per Share, as published, is the Net Asset Value for which the swing pricing has been applied. Where such an adjustment is applied, it will typically increase the Net Asset Value per Share when there are large net inflows into the Fund and decrease the Net Asset Value per Share when there are large net outflows.
30

NATIXIS INTERNATIONAL FUNDS (DUBLIN) I PLC Notes to the Condensed Financial Statements as at 30 June 2021 (Continued)
2. SHARE CAPITAL
Authorised
The authorised share capital of the Company is USD 70,000 divided into 70,000 Subscriber Shares of a par value of USD 1 each and 5,000,000,000 shares of no par value designated as unclassified shares. The unclassified shares are available for issue as Redeemable Participating Shares. In order to provide for the minimum share capital on incorporation required under Irish law, the Delegate Investment Manager subscribed for 69,993 Subscriber Shares for cash at par fully paid up and a further seven Subscriber Shares have been issued fully paid up for cash at par to nominees. Subsequently, the issue of the participating shares, the Delegate Investment Manager redeemed its 69,993 shares at par and no further Subscriber Shares will be issued. Number of Shares Issued and Fully Paid
LOOMIS SAYLES MULTISECTOR INCOME FUND
Shares in Issue
at 1 January 2021SharesIssued
SharesReinvested
SharesRedeemed
Shares in Issueat 30 June 2021
Class C/A (USD) Shares 1,193,944 2 – (332,931) 861,015Class C/D (USD) Shares 779,611 – 3,722 (135,878) 647,455Class CT/A (USD) Shares 646,878 – – (131,676) 515,202Class CT/DM (USD) Shares 769,714 – – (202,494) 567,220Class F/A (USD) Shares 129,698 62,972 – (24,455) 168,215Class F/DM (USD) Shares 51,232 – 114 (101) 51,245Class H-I/A (EUR) Shares 762,332 15,191 – (105,376) 672,147Class H-I/D (EUR) Shares 23,330 – – – 23,330Class H-I/D (GBP) Shares 154,667 7,200 – (7,200) 154,667Class H-N/A (CHF) Shares 750 – – – 750Class H-N/A (EUR) Shares 213,190 370 – – 213,560Class H-N/D (EUR) Shares 3,400 – – – 3,400Class H-N1/A (EUR) Shares 874,763 – – (725,016) 149,747Class H-R/A (EUR) Shares 9,334,765 13,390 – (2,688,849) 6,659,306Class H-R/A (SGD) Shares 2,416,234 847,421 – (315,622) 2,948,033Class H-R/D (SGD) Shares 864,743 36,484 1,804 (251,054) 651,977Class H-RE/DM (AUD) Shares 232,469 378 – (74,324) 158,523Class H-S/D (EUR) Shares 249,550 – – (173,000) 76,550Class I/A (EUR) Shares 111,469 – – (10,730) 100,739Class I/A (USD) Shares 5,173,794 1,528,271 – (1,012,390) 5,689,675Class I/D (GBP) Shares 10,537 – – – 10,537Class I/D (USD) Shares 4,209,894 268,601 22,675 (428,022) 4,073,148Class N/A (USD) Shares 7,382 – – (2,500) 4,882Class N1/A (USD) Shares 703,300 219,225 – (25,952) 896,573Class N1/D (USD) Shares 407,511 14,881 347 (9,232) 413,507Class R/A (EUR) Shares 1,289,388 103,487 – (102,327) 1,290,548Class R/A (SGD) Shares 72,429 884 – – 73,313Class R/A (USD) Shares 8,245,755 572,528 – (1,090,313) 7,727,970Class R/D (GBP) Shares 103,601 5,744 21 (12,336) 97,030Class R/D (SGD) Shares 291,651 14,551 247 (26,383) 280,066Class R/D (USD) Shares 5,290,822 178,199 18,058 (885,660) 4,601,419Class R/DM (USD) Shares 2,919,381 574,188 602 (901,628) 2,592,543Class RE/A (EUR) Shares 447,533 938 – (78,070) 370,401Class RE/A (USD) Shares 7,345,898 247,723 – (852,512) 6,741,109Class RE/D (USD) Shares 145 – – (48) 97Class RE/DM (USD) Shares 154 – – (48) 106Class S/A (USD) Shares 5,833,543 39,800 – (1,439,462) 4,433,881Class S/D (GBP) Shares 3,327 – – – 3,327Class S/D (USD) Shares 1,199,159 – – – 1,199,159
31

NATIXIS INTERNATIONAL FUNDS (DUBLIN) I PLC Notes to the Condensed Financial Statements as at 30 June 2021 (Continued)
2. SHARE CAPITAL (Continued)
Number of Shares Issued and Fully Paid (Continued)
LOOMIS SAYLES HIGH INCOME FUND
Shares in Issue
at 1 January 2021SharesIssued
SharesReinvested
SharesRedeemed
Shares in Issueat 30 June 2021
Class CT/DM (USD) Shares 235,975 – – (51,900) 184,075Class H-I/A (CHF) Shares 3,955 – – (3,955) –Class H-I/A (EUR) Shares 80,887 – – (9) 80,878Class H-N/D (EUR) Shares 404 – 5 – 409Class I/A (EUR) Shares 165,384 – – – 165,384Class I/A (USD) Shares 3,506 – – (3,103) 403Class I/D (USD) Shares 391,731 – 7,621 (77,249) 322,103Class N/DM (USD) Shares 434 – – – 434Class R/A (EUR) Shares 125,015 4,591 – (37,788) 91,818Class R/A (USD) Shares 4,280 – – – 4,280Class R/D (SGD) Shares 544 – 3 – 547Class R/D (USD) Shares 430,946 7,773 538 (85,203) 354,054Class R/DM (USD) Shares 204,620 144 – (42,973) 161,791Class S/A (USD) Shares 5,500 – – – 5,500
LOOMIS SAYLES GLOBAL OPPORTUNISTIC BOND FUND
Shares in Issue
at 1 January 2021SharesIssued
SharesReinvested
SharesRedeemed
Shares in Issueat 30 June 2021
Class C/A (USD) Shares 11,926 – – – 11,926Class C/D (USD) Shares 323 – 16 – 339Class F/D (USD) Shares 3,475 1 204 (3,680) –Class H-I/A (SGD) Shares 196,255 73,229 – (80,469) 189,015Class H-N/D (EUR) Shares 329 – 29 – 358Class H-R/A (EUR) Shares – 146,063 – (72,292) 73,771Class H-S/A (EUR) Shares 384,515 – – (183,942) 200,573Class H-S/A (SEK) Shares 7,916,028 530,489 – (8,422,495) 24,022Class H-S/D (GBP) Shares 1,977,489 – 4 – 1,977,493Class I/A (USD) Shares 2,045,718 318,261 – (741,293) 1,622,686Class I/D (USD) Shares 320,800 135,690 13,413 (23,189) 446,714Class N/A (EUR) Shares 352 – – (44) 308Class N1/A (USD) Shares 102,634 29,666 – (5,471) 126,829Class R/A (EUR) Shares 227,312 1,413 – (21,620) 207,105Class R/A (USD) Shares 62,982 16,900 – – 79,882Class R/D (GBP) Shares 12,612 2,061 – (1,365) 13,308Class R/D (USD) Shares 95,966 42,356 607 (9,918) 129,011Class RE/A (USD) Shares 300 – – – 300
LOOMIS SAYLES ALTERNATIVE RISK PREMIA FUND
Shares in Issue
at 1 January 2021SharesIssued
SharesReinvested
SharesRedeemed
Shares in Issueat 30 June 2021
Class H-Q/A (EUR) Shares 2,500,000 – – – 2,500,000Class I/A (USD) Shares 10 – – – 10Class R/A (USD) Shares 10 – – – 10
LOOMIS SAYLES EURO CREDIT FUND
Shares in Issue
at 2 February 2021SharesIssued
SharesReinvested
SharesRedeemed
Shares in Issueat 30 June 2021
Class I/A (EUR) Shares – 25,238 – – 25,238Class N/A (EUR) Shares – 10 – – 10Class Q/A (EUR) Shares – 7,000,000 – – 7,000,000Class R/A (EUR) Shares – 10 – – 10Class RE/A (EUR) Shares – 300 – – 300Class S/A (EUR) Shares – 10 – – 10Class S2/A (EUR) Shares – 4,905,633 – (34,306) 4,871,327
32

NATIXIS INTERNATIONAL FUNDS (DUBLIN) I PLC Notes to the Condensed Financial Statements as at 30 June 2021 (Continued)
2. SHARE CAPITAL (Continued)
Number of Shares Issued and Fully Paid (Continued)
LOOMIS SAYLES EURO HIGH YIELD FUND
Shares in Issue
at 9 February 2021SharesIssued
SharesReinvested
SharesRedeemed
Shares in Issueat 30 June 2021
Class I/A (EUR) Shares – 10 – – 10Class N/A (EUR) Shares – 10 – – 10Class Q/A (EUR) Shares – 3,000,000 – – 3,000,000Class R/A (EUR) Shares – 10 – – 10Class RE/A (EUR) Shares – 300 – – 300Class S/A (EUR) Shares – 10 – – 10
LOOMIS SAYLES SUSTAINABLE EURO CREDIT FUND
Shares in Issueat 19 May 2021
SharesIssued
SharesReinvested
SharesRedeemed
Shares in Issueat 30 June 2021
Class I/A (EUR) Shares – 300 – – 300Class N/A (EUR) Shares – 300 – – 300Class Q/A (EUR) Shares – 6,087,157 – – 6,087,157Class R/A (EUR) Shares – 300 – – 300Class RE/A (EUR) Shares – 299 – – 299Class S/D (EUR) Shares – 74,500 – (6,000) 68,500Class S2/A (EUR) Shares – 300 – – 300
LOOMIS SAYLES MULTISECTOR INCOME FUND
Shares in Issue
at 1 January 2020SharesIssued
SharesReinvested
SharesRedeemed
Shares in Issueat 30 June 2020
Class C/A (USD) Shares 1,259,362 138,868 – (181,695) 1,216,535Class C/D (USD) Shares 988,481 69,885 4,543 (256,819) 806,090Class CT/A (USD) Shares 1,356,663 90,858 – (328,366) 1,119,155Class CT/DM (USD) Shares 1,426,504 73,894 – (444,148) 1,056,250Class F/A (USD) Shares 191,687 – – (55,315) 136,372Class F/DM (USD) Shares 117,192 35 616 (66,081) 51,762Class H-I/A (EUR) Shares 1,367,886 148,372 – (445,039) 1,071,219Class H-I/D (EUR) Shares 34,670 – – – 34,670Class H-I/D (GBP) Shares 130,000 33,467 – (1,600) 161,867Class H-N/A (CHF) Shares 32,000 – – (32,000) –Class H-N/A (EUR) Shares 45,889 209,473 – (875) 254,487Class H-N/D (EUR) Shares 17,100 – – (13,700) 3,400Class H-N1/A (EUR) Shares 1,310,910 707,117 – (929,171) 1,088,856Class H-R/A (EUR) Shares 3,320,392 8,349,641 – (1,202,383) 10,467,650Class H-R/A (SGD) Shares 1,764,569 691,098 – (501,292) 1,954,375Class H-R/D (SGD) Shares 1,610,476 71,447 1,920 (797,939) 885,904Class H-RE/DM (AUD) Shares 689,004 35,313 – (301,295) 423,022Class H-S/D (EUR) Shares 3,156,400 24,200 – (91,600) 3,089,000Class I/A (EUR) Shares 125,187 23,136 – (29,618) 118,705Class I/A (USD) Shares 5,287,517 3,814,543 – (3,436,856) 5,665,204Class I/D (GBP) Shares 8,846 – – – 8,846Class I/D (USD) Shares 3,848,953 402,996 26,913 (653,983) 3,624,879Class N/A (USD) Shares 37,583 – – (21,855) 15,728Class N1/A (USD) Shares 742,397 73,643 – (71,659) 744,381Class N1/D (USD) Shares 378,172 – 351 – 378,523Class R/A (EUR) Shares 2,337,085 183,192 – (687,649) 1,832,628Class R/A (SGD) Shares 113,396 555 – (1,862) 112,089Class R/A (USD) Shares 9,242,956 1,431,214 – (2,146,293) 8,527,877Class R/D (GBP) Shares 170,829 7,539 22 (67,382) 111,008Class R/D (SGD) Shares 367,236 71,936 504 (90,717) 348,959Class R/D (USD) Shares 5,765,340 212,031 17,693 (825,255) 5,169,809Class R/DM (USD) Shares 3,804,006 724,967 409 (1,050,047) 3,479,335Class RE/A (EUR) Shares 569,811 38,088 – (82,927) 524,972Class RE/A (USD) Shares 9,154,135 645,593 – (1,572,827) 8,226,901Class RE/D (USD) Shares 145 – – – 145Class RE/DM (USD) Shares 154 – – – 154Class S/A (USD) Shares 4,404,211 1,878,935 – (305,286) 5,977,860Class S/D (GBP) Shares 36,917 – 17 (31,857) 5,077Class S/D (USD) Shares 1,934,338 – – (22,450) 1,911,888
33

NATIXIS INTERNATIONAL FUNDS (DUBLIN) I PLC Notes to the Condensed Financial Statements as at 30 June 2021 (Continued)
2. SHARE CAPITAL (Continued)
Number of Shares Issued and Fully Paid (Continued)
LOOMIS SAYLES HIGH INCOME FUND
Shares in Issue
at 1 January 2020SharesIssued
SharesReinvested
SharesRedeemed
Shares in Issueat 30 June 2020
Class CT/DM (USD) Shares 464,398 – – (144,490) 319,908Class H-I/A (CHF) Shares 8,800 – – (2,445) 6,355Class H-I/A (EUR) Shares 112,743 – – (7,046) 105,697Class H-N/D (EUR) Shares 385 – 12 – 397Class H-R/A (EUR) Shares 794 42 – – 836Class I/A (EUR) Shares 208,534 1,094 – (44,070) 165,558Class I/A (USD) Shares 32,155 – – (28,644) 3,511Class I/D (USD) Shares 622,652 – 17,620 (3,533) 636,739Class N/DM (USD) Shares 434 – – – 434Class R/A (EUR) Shares 218,362 6,289 – (47,360) 177,291Class R/A (USD) Shares 63,717 – – (42,114) 21,603Class R/D (SGD) Shares 525 – 13 – 538Class R/D (USD) Shares 810,385 20,726 2,112 (251,072) 582,151Class R/DM (USD) Shares 484,865 144 – (206,484) 278,525Class S/A (USD) Shares 6,600 – – – 6,600Class S/D (USD) Shares 123,457 – – (123,457) –
LOOMIS SAYLES GLOBAL OPPORTUNISTIC BOND FUND
Shares in Issue
at 1 January 2020SharesIssued
SharesReinvested
SharesRedeemed
Shares in Issueat 30 June 2020
Class C/A (USD) Shares 11,926 – – – 11,926Class C/D (USD) Shares 323 – – – 323Class F/D (USD) Shares 3,435 18 17 (17) 3,453Class H-I/A (EUR) Shares 527,638 – – (527,638) –Class H-I/A (SGD) Shares 152,676 373,303 – (126,163) 399,816Class H-N/D (EUR) Shares 328 – 1 – 329Class H-S/A (EUR) Shares 169,837 – – – 169,837Class H-S/A (SEK) Shares 7,859,397 1,512,630 – (2,293,455) 7,078,572Class H-S/A (USD) Shares 2,437,436 34,746 – (234,400) 2,237,782Class H-S/D (GBP) Shares 1,980,108 – 135 (2,756) 1,977,487Class I/A (USD) Shares 1,484,524 571,658 – (375,583) 1,680,599Class I/D (USD) Shares 318,446 34,154 1,282 (85,765) 268,117Class N/A (EUR) Shares 352 – – – 352Class N1/A (USD) Shares – 169,094 – (3,019) 166,075Class R/A (EUR) Shares 246,350 12,273 – (26,473) 232,150Class R/A (USD) Shares 18,905 6,363 – – 25,268Class R/D (GBP) Shares 14,879 1,920 – (4,645) 12,154Class R/D (USD) Shares 112,918 13,300 68 (33,261) 93,025Class RE/A (USD) Shares 300 – – – 300
The 7 Subscriber Shares have been issued and are fully paid up to the value of USD 7 and as they do not form part of the Redeemable Participating Shares of the Company, they do not form part of the Net Asset Value of the Company. They are thus disclosed in the financial statements by way of this note only. Share Rights
The holders of the Subscriber Shares are entitled to one vote per holder on a vote taken on a show of hands and on a poll, to one vote per Subscriber Share. The holders of Subscriber Shares are not entitled to any dividends and, in the event of a winding up or dissolution of the Company, shall be entitled to the return of capital, provided sufficient funds exist. The holders of Redeemable Participating Shares are entitled to one vote per holder on a vote taken on a show of hands and, on a poll, to one vote per Redeemable Participating Share. The holders of Redeemable Participating Shares are entitled to such dividends as the Directors may from time to time declare and in the event of a winding up or dissolution of the Company, shall have the entitlements referred to in the Company’s Prospectus.
Neither the Subscriber Shares nor the Redeemable Participating Shares carry pre-emption rights.
34

NATIXIS INTERNATIONAL FUNDS (DUBLIN) I PLC Notes to the Condensed Financial Statements as at 30 June 2021 (Continued)
3. FEES
The Company pays the Investment Manager a monthly fixed fee at the rates listed below. The Investment Manager received USD 6,173,695 during the half year ended 30 June 2021 (30 June 2020: USD 6,621,401) of which USD 954,317 was outstanding at 30 June 2021 (30 June 2020: USD 1,118,933).
Share Class Loomis Sayles
Multisector Income Fund
Loomis Sayles High
Income Fund
Loomis Sayles Global
Opportunistic Bond Fund
Loomis Sayles Alternative Risk
Premia Fund
Loomis Sayles Euro Credit
Fund
Loomis Sayles Euro High Yield
Fund
Loomis Sayles Sustainable Euro
Credit Fund
Class C 1.95% N/A 1.95% N/A N/A N/A N/A Class CT 1.35% 1.60% N/A N/A N/A N/A N/A Class CW N/A N/A N/A N/A N/A N/A N/A Class F 1.05% N/A 1.05% N/A N/A N/A N/A Class H-CW N/A N/A N/A N/A N/A N/A N/A Class H-I 0.75% 0.75% 0.75% N/A N/A N/A N/A Class H-N 0.50% 0.75% 0.75% N/A N/A N/A N/A Class H-N1 0.75% N/A N/A N/A N/A N/A N/A Class H-R 1.25% N/A N/A N/A N/A N/A N/A Class H-RE 1.60% N/A N/A N/A N/A N/A N/A Class H-S 0.75% N/A 0.75% N/A N/A N/A N/A Class H-Q N/A N/A N/A 0.00% N/A N/A N/A Class I 0.75% 0.75% 0.75% 0.75% 0.75% 0.75% 0.75% Class J N/A N/A N/A N/A N/A N/A N/A Class N 0.75% 0.75% 0.75% N/A 0.75% 0.75% 0.75% Class N1 0.75% N/A 0.75% N/A N/A N/A N/A Class Q N/A N/A N/A N/A 0.00% 0.00% 0.00% Class R 1.25% 1.65% 1.25% 1.35% 1.25% 1.25% 1.25% Class RE 1.60% N/A 1.60% N/A 1.60% 1.60% 1.60% Class S 0.75% 0.75% N/A N/A 0.75% 0.75% 0.75% Class S2 N/A N/A N/A N/A 0.75% 0.75% 0.75%
Distribution fees for Class CT are included in Investment Manager fees and amounted to USD 67,462 and USD 9,412 for the Loomis Sayles Multisector Income Fund and the Loomis Sayles High Income Fund, respectively, for the half year ended 30 June 2021 (30 June 2020: USD 126,112 and USD 16,502, respectively). The Investment Manager reimburses the Funds for all expenses that exceed the respective percentages of the Net Asset Value of each Fund as follows*:
Share Class Loomis Sayles
Multisector Income Fund
Loomis Sayles High
Income Fund
Loomis Sayles Global
Opportunistic Bond Fund
Loomis Sayles Alternative Risk
Premia Fund
Loomis Sayles Euro Credit
Fund
Loomis Sayles Euro High Yield
Fund
Loomis Sayles Sustainable Euro
Credit Fund
Class C 2.25% N/A 2.25% N/A N/A N/A N/A Class CT 2.50% 2.95% N/A N/A N/A N/A N/A Class CW N/A N/A N/A N/A N/A N/A N/A Class F 1.25% N/A 1.25% N/A N/A N/A N/A Class H-CW N/A N/A N/A N/A N/A N/A N/A Class H-I 0.90% 0.90% 0.90% N/A 0.50% 0.65% 0.50% Class H-N 0.90% 0.90% 0.90% N/A 0.60% 0.75% 0.60% Class H-N1 1.80% N/A N/A N/A N/A N/A N/A Class H-R 1.50% N/A N/A N/A 1.00% 1.30% 1.00% Class H-RE 1.80% N/A N/A N/A 1.20% 1.50% 1.20% Class H-S 0.60% N/A 0.55% N/A 0.40% 0.50% 0.40% Class H-S2 N/A N/A N/A N/A 0.35% 0.45% 0.35% Class H-Q N/A N/A N/A 0.25% N/A N/A N/A Class I 0.90% 0.90% 0.90% 1.00% 0.50% 0.65% 0.50% Class J N/A N/A N/A N/A N/A N/A N/A Class N 0.90% 0.90% 0.90% N/A 0.60% 0.75% 0.60% Class N1 0.80% N/A 0.80% N/A N/A N/A N/A Class Q N/A N/A N/A N/A 0.25% 0.25% 0.25% Class R 1.50% 1.95% 1.50% 1.75% 1.00% 1.30% 1.00% Class RE 1.80% N/A 1.80% N/A 1.20% 1.50% 1.20% Class S 0.60% 0.75% N/A N/A 0.40% 0.50% 0.40% Class S2 N/A N/A N/A N/A 0.35% 0.45% 0.35%
* Share classes that do not present any expense cap limit are either not active or unfunded.
35

NATIXIS INTERNATIONAL FUNDS (DUBLIN) I PLC Notes to the Condensed Financial Statements as at 30 June 2021 (Continued)
3. FEES (Continued)
Amounts of USD 187,202, USD 100,231, USD 340,160, USD 192,834, EUR 99,464, EUR 38,941 and EUR 29,200
were reimbursed to the Loomis Sayles Multisector Income Fund, the Loomis Sayles High Income Fund, the Loomis Sayles Global Opportunistic Bond Fund, Loomis Sayles Alternative Risk Premia Fund, the Loomis Sayles Euro Credit Fund, the Loomis Sayles Euro High Yield Fund and the Loomis Sayles Sustainable Euro Credit Fund, respectively, for the half year ended 30 June 2021 (30 June 2020: USD 218,834, USD 89,216, USD 367,218, USD nil, EUR nil, EUR nil and EUR nil respectively). The Company pays the Administrator a monthly fee in arrears of 1/12 of the following percentages of the Net Asset Value of each Fund as at each valuation point: 0.03% on the first USD 75 million; 0.02% on the next USD 75 million; and 0.01% on the balance in excess of USD 150 million (or equivalent), together with VAT (if any). Administration fees accrue daily and are paid monthly in arrears.
The Company pays the Depositary a monthly fee between 0.005% and 0.45% of the Net Asset Value of each Fund for safekeeping fees as at each valuation point, as well as, transaction charges at normal commercial rates. The Company pays a monthly fee in arrears of 1/12 of 0.012% of the Net Asset Value of each Fund for trustee fees.
Brown Brothers Harriman Fund Administration Services (Ireland) Limited earned an administration fee of USD 445,748 for the half year ended 30 June 2021 (30 June 2020: USD 335,819), of which USD 182,913 (30 June 2020: USD 138,913) remained outstanding at the financial period end. Brown Brothers Harriman Trustee Services (Ireland) Limited earned a safekeeping and transaction fee of USD 277,757 for the half year ended 30 June 2021 (30 June 2020: USD 77,452), of which USD 65,482 (30 June 2020: USD 16,114) remained outstanding at the financial period end. Brown Brothers Harriman Trustee Services (Ireland) Limited earned a trustee fee of USD 71,973 for the half year ended 30 June 2021 (30 June 2020: USD 70,753), of which 15,244 (30 June 2020: USD 18,259) remained outstanding at the financial period end. Transaction costs amounted to USD 15,464, USD 162, USD 9,450, USD 17,625, EUR nil, EUR nil, EUR nil (30 June 2020: USD 323, USD 1,340, USD nil, USD nil, EUR nil, EUR nil and EUR nil) for the Loomis Sayles Multisector Income Fund, the Loomis Sayles High Income Fund, the Loomis Sayles Global Opportunistic Bond Fund, the Loomis Sayles Alternative Risk Premia Fund, the Loomis Sayles Euro Credit Fund, the Loomis Sayles Euro High Yield Fund and the Loomis Sayles Sustainable Euro Credit Fund, respectively, for the half year ended 30 June 2021.
36

NATIXIS INTERNATIONAL FUNDS (DUBLIN) I PLC Notes to the Condensed Financial Statements as at 30 June 2021 (Continued)
4. RELATED PARTY DISCLOSURES
Parties are described as related if any one party has the ability to control the other party or exercise significant influence over the other party in making financial or operational decisions.
The Company’s Directors and Natixis Investment Managers S.A., the Company’s Investment Manager and Distributor are disclosed on page 1. Loomis, Sayles & Company, L.P. is the Company's Delegate Investment Manager. The Investment Manager is responsible for paying out of its fees the fees and expenses of the Delegate Investment Manager. Natixis Investment Managers S.A. and Loomis, Sayles & Company, L.P. are both subsidiaries of Natixis Investment Managers, an international asset management group. Headquartered in Paris and Boston, Natixis Investment Managers is wholly-owned by Natixis. Natixis is a subsidiary of BPCE, the second-largest banking group in France.
Mr. Daniel Morrissey, a Director of the Company, is also a partner in William Fry LLP, the Company's legal counsel to whom fees were paid during the half year ended 30 June 2021 amounting to EUR 19,460 (30 June 2020: EUR 61,110). Mr. Jason Trepanier is a Director of the Company and also an executive of Natixis Investment Managers S.A., the Company’s Investment Manager and Promoter and Distributor. Mrs. Lynda Wood (Schweitzer) is a Director of the Company and also an executive of Loomis, Sayles & Company, L.P., the Delegate Investment Manager. Ms. Christine Kenny is a Director of the Company and also an executive of Loomis Sayles Investments Limited, UK (a wholly owned subsidiary of the Delegate Investment Manager).
The ability to direct the financial and operating policy of the Funds, and hence control, rests with the Shareholders in general meeting. As at 30 June 2021, together with comparative figures for 31 December 2020, the entities below had interests in excess of 20% of the issued share capital of the Fund. 30 June 2021 31 December 2020 Redeemable Participating Shares No. of Shares % of Fund No. of Shares % of Fund Loomis Sayles Multisector Income Fund Allfunds Bank 13,683,526 25% 17,341,567 28% 30 June 2021 31 December 2020 Redeemable Participating Shares No. of Shares % of Fund No. of Shares % of Fund Loomis Sayles High Income Fund SGSS SPA - Natixis – – 342,506 21% 30 June 2021 31 December 2020 Redeemable Participating Shares No. of Shares % of Fund No. of Shares % of Fund Loomis Sayles Global Opportunistic Fund FundSettle EOC Nominees 1,660,418 33% 9,534,892 71% The Royal Literary Fund 1,977,352 39% – – 30 June 2021 31 December 2020 Redeemable Participating Shares No. of Shares % of Fund No. of Shares % of Fund Loomis Sayles Alternative Risk Premia Fund Kennedy Fin Lux s.à r.l. -Natixis Dub 2,500,000 100% 2,500,000 100% 30 June 2021 31 December 2020 Redeemable Participating Shares No. of Shares % of Fund No. of Shares % of Fund Loomis Sayles Euro Credit Fund International Fund Services & Asset Management S.A. 2,823,333 24% – – Kennedy Fin Lux s.à r.l. -Natixis Dub 7,000,000 59% – – 30 June 2021 31 December 2020 Redeemable Participating Shares No. of Shares % of Fund No. of Shares % of Fund Loomis Sayles Euro High Yield Fund Kennedy Fin Lux s.à r.l. -Natixis Dub 3,000,000 100% – – 30 June 2021 31 December 2020 Redeemable Participating Shares No. of Shares % of Fund No. of Shares % of Fund Loomis Sayles Sustainable Euro Credit Fund Caceis 2,560,000 42% – – Kennedy Fin Lux s.à r.l. -Natixis Dub 3,000,000 49% – –
37

NATIXIS INTERNATIONAL FUNDS (DUBLIN) I PLC Notes to the Condensed Financial Statements as at 30 June 2021 (Continued)
5. CONNECTED PERSONS The UCITS Regulations states that, inter alia, any transaction carried out with a UCITS by the management company or depositary; and the delegates or sub-delegates of such a management company or depositary (excluding any non-group company sub-custodians appointed by a depositary); and any associated or group company of these (“connected persons”) must be carried out as if negotiated at arm's length. Transactions must be in the best interests of the shareholders of the Company. Additionally, there are also transactions carried out by connected parties on behalf of the Company to which the Directors have no direct access and in respect of which the Directors must rely upon assurances from the Company's delegates that the connected parties carrying out those transactions do carry them out on a similar basis.
Shareholders should have regard to the governance structure of the Company as more particularly described in the corporate governance section of the Directors’ Report included in the Annual Report and Audited Financial Statements for the year ended 31 December 2020 and the roles and responsibilities of the Company's respective delegates subject to the overall supervision of the Board. Further, Shareholders should refer to the Prospectus which identifies many of the connected party transactions and the general nature of the contractual arrangements with the principal connected persons but it is not exhaustive of all connected party transactions. Shareholders should also refer to the provisions of the Prospectus dealing with conflicts of interest. Therefore, having regard to confirmations from the Company's management and its relevant delegates, the Directors of the Company are satisfied that:
(i) there are arrangements (evidenced by written procedures) in place, to ensure that the obligations set out in the UCITS Regulation are applied to all transactions with connected persons; and
(ii) transactions with connected persons entered into during the period complied with the obligations set out in the UCITS Regulation.
6. FINANCIAL RISK MANAGEMENT Fair Value Estimation The Company has classified Financial Instruments measured at fair value using a fair value hierarchy that reflects the significance of the inputs used in making the measurements. The fair value hierarchy has the following levels:
(i) Level 1: Investments, whose values are based on quoted market prices in active markets, and therefore classified within level 1, include active listed equities; U.S. government treasury bills and certain non-U.S. sovereign obligations. Quoted prices for these instruments are not adjusted.
(ii) Level 2: Financial instruments that trade in markets that are not considered to be active but are valued based on quoted market prices, dealer quotations or alternative pricing sources supported by observable inputs are classified within level 2. These include investment-grade corporate bonds and certain non-U.S. sovereign obligations, listed equities and over the counter derivatives. As level 2 investments include positions that are not traded in active markets and/or are subject to transfer restrictions, valuations may be adjusted to reflect illiquidity and/or non-transferability, which are generally based on available market information.
(iii) Level 3: Investments classified within level 3 have significant unobservable inputs, as they trade infrequently. Level 3 instruments include certain corporate debt securities. As observable prices are not available for these securities, the Funds have used valuation techniques to derive the fair value.
The level in the fair value hierarchy within which the fair value measurement is categorised in its entirety is determined on the basis of the lowest level input that is significant to the fair value measurement in its entirety. For this purpose, the significance of an input is assessed against the fair value measurement in its entirety. If a fair value measurement uses observable inputs that require significant adjustment based on unobservable inputs, that measurement is a level 3 measurement. Assessing the significance of a particular input to the fair value measurement in its entirety requires judgement, considering factors specific to the financial asset or liability.
The determination of what constitutes ‘observable’ requires significant judgment by the Directors. The Directors have delegated this task to the Delegate Investment Manager. The Delegate Investment Manager, in consultation with the Administrator, considers observable data to be that market data that is readily available, regularly distributed or updated, reliable and verifiable, not proprietary, and provided by independent sources that are actively involved in the relevant market.
38

NATIXIS INTERNATIONAL FUNDS (DUBLIN) I PLC Notes to the Condensed Financial Statements as at 30 June 2021 (Continued)
6. FINANCIAL RISK MANAGEMENT (Continued) Fair Value Estimation (Continued)
Loomis Sayles Multisector Income Fund The following tables analyse within the fair value hierarchy the Fund’s financial assets and liabilities measured at fair value at 30 June 2021 and 31 December 2020:
At 30 June 2021 Assets Level 1 Level 2 Level 3 Total Financial Assets held for trading:
Bonds – 820,809,438 2,644,106 823,453,544 Equities 36,378,544 808,783 193,563 37,380,890 Preferred Stock 10,604,840 4,928,266 – 15,533,106
Liabilities Financial Liabilities held for trading:
Forwards – (866,122) – (866,122) Futures (2,034,974) – – (2,034,974)
Total Assets 44,948,410 825,680,365 2,837,669 873,466,444
The level 3 positions had been valued either using a broker provided quotation that was thought to be indicative of their respective market prices, but where each had unobservable inputs assumed in their valuations.
At 31 December 2020 Assets Level 1 Level 2 Level 3 TotalFinancial Assets held for trading:
Bonds – 856,643,851 897,039 857,540,890Preferred Stock 5,832,314 463,401 – 6,295,715Equities 98,989,430 726,370 – 99,715,800Forwards – 634,248 – 634,248
Liabilities Financial Liabilities held for trading:
Forwards – (2,625) – (2,625)
Total Assets 104,821,744 858,465,245 897,039 964,184,028
The level 3 positions had been valued either using a broker provided quotation that was thought to be indicative of their respective market prices, but where each had unobservable inputs assumed in their valuations.
39

NATIXIS INTERNATIONAL FUNDS (DUBLIN) I PLC Notes to the Condensed Financial Statements as at 30 June 2021 (Continued)
6. FINANCIAL RISK MANAGEMENT (Continued) Fair Value Estimation (Continued)
Loomis Sayles Multisector Income Fund (Continued) The tables below present the movement in level 3 instruments for the period ended 30 June 2021 and the financial year ended 31 December 2020 by class of financial instrument.
At 30 June 2021 Bonds Equities TotalOpening balance at 1 January 2021 897,039 – 897,039Purchases 104,046 – 104,046Sales – – –Accrued Discounts (Premiums) – – –Transfers into level 3 52,500 161,096 213,596Transfers out of level 3 (155,548) – (155,548)Gains and losses recognised in profit and loss 1,746,069 32,467 1,778,536 Closing balance at 30 June 2021 2,644,106 193,563 2,837,669 Change in unrealised gains or losses for Level 3 assets held at year end and included in other net changes in fair value on financial assets and financial liabilities at fair value through profit or loss 1,746,069 32,467 1,778,536
At 31 December 2020 Bonds Equities Preferred Stocks Total Opening balance at 1 January 2020 2,172,669 123,991 531,406 2,828,066 Purchases 169,523 300,000 – 469,523 Sales – (1,153,249) – (1,153,249) Accrued Discounts (Premiums) – – – – Transfers into level 3 – – 206,640 206,640 Transfers out of level 3 – – – – Gains and losses recognised in profit and loss (1,445,153) 729,258 (738,046) (1,453,941) Closing balance at 31 December 2020 897,039 – – 897,039 Change in unrealised gains or losses for Level 3 assets held at year end and included in other net changes in fair value on financial assets and financial liabilities at fair value through profit or loss 1,220,368 729,258 (738,046) 1,211,580
Loomis Sayles High Income Fund The following tables analyse within the fair value hierarchy the Fund’s financial assets and liabilities measured at fair value at 30 June 2021 and 31 December 2020:
At 30 June 2021 Assets Level 1 Level 2 Level 3 Total Financial Assets held for trading:
Bonds – 15,590,404 7,686 15,598,090 Equities 30,136 – 43,719 73,855 Preferred Stock 61,474 202,510 – 263,984
Liabilities Financial Liabilities held for trading:
Forwards – (15,955) – (15,955)
Total Assets 91,610 15,776,959 51,405 15,919,974
The level 3 positions had been valued using a broker provided quotation that was thought to be indicative of their respective market prices, but where each had unobservable inputs assumed in their valuations.
* Includes securities with Zero fair value.
40

NATIXIS INTERNATIONAL FUNDS (DUBLIN) I PLC Notes to the Condensed Financial Statements as at 30 June 2021 (Continued)
6. FINANCIAL RISK MANAGEMENT (Continued) Fair Value Estimation (Continued) Loomis Sayles High Income Fund (Continued)
At 31 December 2020 Assets Level 1 Level 2 Level 3 TotalFinancial Assets held for trading:
Bonds – 17,049,420 – 17,049,420Preferred Stock 171,699 388,728 – 560,427 Equities 605,902 – 30,647 636,549Forwards – 5,938 – 5,938
Liabilities Financial Liabilities held for trading:
Forwards – (58) – (58)
Total Assets 777,600 17,444,029 30,647 18,252,276
The level 3 positions had been valued using a broker provided quotation that was thought to be indicative of their respective market prices, but where each had unobservable inputs assumed in their valuations. The tables below present the movement in level 3 instruments for the period ended 30 June 2021 and the financial year ended 31 December 2020 by class of financial instrument.
At 30 June 2021 Bonds Equities TotalOpening balance at 1 January 2021 – 30,647 30,647Purchases 1,882 – 1,882Sales – – –Accrued Discounts (Premiums) – – –Transfer into level 3 – – –Transfer out of level 3 – – –Gains and losses recognised in profit and loss 5,804 13,072 18,876 Closing balance at 30 June 2021 7,686 43,719 51,405 Change in unrealised gains or losses for Level 3 assets held at year end and included in other net changes in fair value on financial assets and financial liabilities at fair value through profit or loss 5,804 13,072 18,876
At 31 December 2020 Bonds Equities TotalOpening balance at 1 January 2020 3,600 3,530 7,130Purchases – 115,000 115,000Sales (29,409) (68,164) (97,573)Accrued Discounts (Premiums) – – –Transfers into level 3 – 138,140 138,140Transfers out of level 3 – – –Gains and losses recognised in profit and loss 25,809 (157,859) (132,050) Closing balance at 31 December 2020 – 30,647 30,647 Change in unrealised gains or losses for Level 3 assets held at year end and included in other net changes in fair value on financial assets and financial liabilities at fair value through profit or loss 99,775 1,037,533 1,137,308
41

NATIXIS INTERNATIONAL FUNDS (DUBLIN) I PLC Notes to the Condensed Financial Statements as at 30 June 2021 (Continued)
6. FINANCIAL RISK MANAGEMENT (Continued) Fair Value Estimation (Continued) Loomis Sayles Global Opportunistic Bond Fund The following tables analyse within the fair value hierarchy the Fund’s financial assets and liabilities measured at fair value at 30 June 2021 and 31 December 2020:
At 30 June 2021 Assets Level 1 Level 2 Level 3 Total Financial Assets held for trading:
Bonds – 74,731,394 – 74,731,394 Forwards – 138,179 – 138,179 Futures 26,018 – – 26,018
Liabilities Financial Liabilities held for trading:
Forwards – (400,698) – (400,698) Futures (80,653) – – (80,653)
Total Assets (54,635) 74,468,875 – 74,414,240
* Includes securities with Zero fair value.
At 31 December 2020 Assets Level 1 Level 2 Level 3 TotalFinancial Assets held for trading:
Bonds – 195,716,209 – 195,716,209 Purchased Options – 13,207 – 13,207 Forwards – 1,911,989 – 1,911,989 Futures 82,380 – – 82,380
Liabilities Financial Liabilities held for trading:
Written Options – (20,626) – (20,626)Forwards – (264,666) – (264,666)Futures (8,227) – – (8,227)
74,153 197,356,113 – 197,430,266
At 30 June 2021, for the Loomis Sayles Global Opportunistic Bond Fund, there were no securities within level 3, no transfers between levels and no movements in level 3 (31 December 2020: nil).
42

NATIXIS INTERNATIONAL FUNDS (DUBLIN) I PLC Notes to the Condensed Financial Statements as at 30 June 2021 (Continued)
6. FINANCIAL RISK MANAGEMENT (Continued) Fair Value Estimation (Continued) Loomis Sayles Alternative Risk Premia Fund The following tables analyse within the fair value hierarchy the Fund’s financial assets and liabilities measured at fair value at 30 June 2021 and 31 December 2020:
At 30 June 2021 Assets Level 1 Level 2 Level 3 Total Financial Assets held for trading:
Bonds – 14,712,045 – 14,712,045 Equities 10,802,875 – – 10,802,875 Forwards – 359,985 – 359,985 Futures 165,590 – – 165,590 Total Return Rate Swaps – 25,666 – 25,666 Credit Default Index Swaps – 481,902 – 481,902
Liabilities Financial Liabilities held for trading:
Forwards – (557,144) – (557,144) Futures (175,847) – – (175,847) Total Return Rate Swaps – – (25,369) (25,369) Credit Default Index Swaps – (47,812) – (47,812)
Total Assets 10,792,618 14,974,642 (25,369) 25,741,891
* Includes securities with Zero fair value.
At 31 December 2020 Assets Level 1 Level 2 Level 3 TotalFinancial Assets held for trading:
Bonds – 5,718,979 – 5,718,979 Equities 8,808,130 – – 8,808,130 Forwards – 182,723 – 182,723 Futures 216,650 – – 216,650 Total Return Rate Swaps – 14,779 29,710 44,489 Credit Default Index Swaps – 189,897 – 189,897
Liabilities Financial Liabilities held for trading:
Forwards – (46,106) – (46,106)Futures (155,095) – – (155,095)Total Return Rate Swaps – (79,246) – (79,246)Credit Default Index Swaps – (51,146) – (51,146)
Total Assets 8,869,685 5,929,880 29,710 14,829,275
43

NATIXIS INTERNATIONAL FUNDS (DUBLIN) I PLC Notes to the Condensed Financial Statements as at 30 June 2021 (Continued)
6. FINANCIAL RISK MANAGEMENT (Continued) Fair Value Estimation (Continued) Loomis Sayles Alternative Risk Premia Fund (Continued) The level 3 positions had been valued using a broker provided quotation that was thought to be indicative of their respective market prices, but where each had unobservable inputs assumed in their valuations. The tables below present the movement in level 3 instruments for the period ended 30 June 2021 and the financial year ended 31 December 2020 by class of financial instrument.
At 30 June 2021
Total Return
Rate Swaps TotalOpening balance at 1 January 2021 29,710 29,710Purchases – –Sales – –Accrued Discounts (Premiums) – –Transfer into level 3 – –Transfer out of level 3 – –Gains and losses recognised in profit and loss (55,079) (55,079) Closing balance at 30 June 2021 (25,369) (25,369) Change in unrealised gains or losses for Level 3 assets held at year end and included in other net changes in fair value on financial assets and financial liabilities at fair value through profit or loss (55,079) (55,079)
At 31 December 2020
Total Return
Rate Swaps TotalOpening balance at 30 October 2020 – –Purchases – –Sales – –Accrued Discounts (Premiums) – –Transfers into level 3 – –Transfers out of level 3 – –Gains and losses recognised in profit and loss 29,710 29,710 Closing balance at 31 December 2020 29,710 29,710 Change in unrealised gains or losses for Level 3 assets held at year end and included in other net changes in fair value on financial assets and financial liabilities at fair value through profit or loss 29,710 29,710
44

NATIXIS INTERNATIONAL FUNDS (DUBLIN) I PLC Notes to the Condensed Financial Statements as at 30 June 2021 (Continued)
6. FINANCIAL RISK MANAGEMENT (Continued) Fair Value Estimation (Continued) Loomis Sayles Euro Credit Fund The following tables analyse within the fair value hierarchy the Fund’s financial assets and liabilities measured at fair value at 30 June 2021:
At 30 June 2021 Assets Level 1 Level 2 Level 3 Total Financial Assets held for trading:
Bonds – 115,808,478 – 115,808,478 Futures 43,130 – – 43,130
Liabilities Financial Liabilities held for trading:
Futures (10,450) – – (10,450)
Total Assets 32,680 115,808,478 – 115,841,158
At 30 June 2021, for the Loomis Sayles Euro Credit Fund, there were no securities within level 3, no transfers between levels and no movements in level 3.
Loomis Sayles Euro High Yield Fund The following tables analyse within the fair value hierarchy the Fund’s financial assets and liabilities measured at fair value at 30 June 2021:
At 30 June 2021 Assets Level 1 Level 2 Level 3 Total Financial Assets held for trading:
Bonds – 29,181,523 – 29,181,523 Futures 3,090 – – 3,090
Liabilities Financial Liabilities held for trading:
Futures (5,360) – – (5,360)
Total Assets (2,270) 29,181,523 – 29,179,253
At 30 June 2021, for the Loomis Sayles Euro High Yield Fund, there were no securities within level 3, no transfers between levels and no movements in level 3.
Loomis Sayles Sustainable Euro Credit Fund The following tables analyse within the fair value hierarchy the Fund’s financial assets and liabilities measured at fair value at 30 June 2021:
At 30 June 2021 Assets Level 1 Level 2 Level 3 Total Financial Assets held for trading:
Bonds – 60,750,569 – 60,750,569 Futures 8,760 – – 8,760
Liabilities Financial Liabilities held for trading:
Futures (3,040) – – (3,040)
Total Assets 5,720 60,750,569 – 60,756,289
At 30 June 2021, for the Loomis Sayles Sustainable Euro Credit Fund, there were no securities within level 3, no transfers between levels and no movements in level 3.
45

NATIXIS INTERNATIONAL FUNDS (DUBLIN) I PLC Notes to the Condensed Financial Statements as at 30 June 2021 (Continued)
7. EFFICIENT PORTFOLIO MANAGEMENT The Company may, for the purposes of efficient portfolio management and hedging of currency risks, engage in financial derivative instruments to the extent permitted by the investment objectives and policies of the Funds and subject to the limits set down by the Central Bank of Ireland from time to time and to the provisions of the Prospectus. During the half year ended 30 June 2021, the Company engaged in efficient portfolio management techniques through the use of interest rate futures transactions. The Company entered into forward currency transactions for the purpose of hedging currency risk on investment and cash holdings, to hedge benchmark risk. The Company also entered into forward currency transactions for the purpose of share class hedging. Contracts outstanding at 30 June 2021 are disclosed in the Schedule of Investments. Realised gains and losses on financial instruments used for efficient portfolio management purposes are included in the table below. At 30 June 2021
Fund Futures Commission
Expense Realised Gain / (Loss)
Change in Unrealised Gain / (Loss)
Loomis Sayles Multisector Income Fund
USD 6,056 USD (1,191,613) USD (2,034,974)
Loomis Sayles Opportunistic Bond Fund
USD 10,953 USD 539,843 USD (128,788)
Loomis Sayles Alternative Risk Premia Fund
USD 10,646 USD (983,654) USD (71,811)
Loomis Sayles Euro Credit Fund
EUR 1,047 EUR (55,909) EUR 32,680
Loomis Sayles Euro High Yield Fund
EUR 231 EUR 1,110 EUR (2,270)
Loomis Sayles Sustainable Euro Credit Fund
EUR 89 EUR (800) EUR 5,720
At 31 December 2020
Fund Futures Commission
Expense Realised Gain / (Loss)
Change in Unrealised Gain
Loomis Sayles Global Opportunistic Bond Fund
USD 21,840 USD 948,426 USD 92,080
Loomis Sayles Alternative Risk Premia Fund
USD 2,861 USD (10,277) USD 61,554
8. SOFT COMMISSION ARRANGEMENTS There were no soft commission arrangements entered into by the Investment Manager or the Delegate Investment Manager on any of the Funds for the period 1 January 2021 until 30 June 2021 (31 December 2020: nil).
46

NATIXIS INTERNATIONAL FUNDS (DUBLIN) I PLC Notes to the Condensed Financial Statements as at 30 June 2021 (Continued)
9. NET ASSET VALUE COMPARATIVE
As at 30 June 2021 As at 31 December 2020 As at 30 June 2020
Shares USD Shares USD Shares USD
LOOMIS SAYLES MULTISECTOR INCOME FUND
- Class C/A (USD) Shares 861,015 24.41 1,193,944 24.25 1,216,535 22.25- Class C/D (USD) Shares 647,455 14.09 779,611 14.15 806,090 13.11- Class CT/A (USD) Shares 515,202 11.34 646,878 11.29 1,119,155 10.38- Class CT/DM (USD) Shares 567,220 10.87 769,714 10.90 1,056,250 10.10- Class F/A (USD) Shares 168,215 15.92 129,698 15.74 136,372 14.38- Class F/DM (USD) Shares 51,245 9.48 51,232 9.51 51,762 8.81- Class H-I/A (EUR) Shares 672,147 21.52 762,332 22.01 1,071,219 18.57- Class H-I/D (EUR) Shares 23,330 12.84 23,330 13.35 34,670 11.43- Class H-I/D (GBP) Shares 154,667 16.86 154,667 16.76 161,867 14.10- Class H-N/A (CHF) Shares 750 11.69 750 12.13 – –- Class H-N/A (EUR) Shares 213,560 12.60 213,190 12.89 254,487 10.87- Class H-N/D (EUR) Shares 3,400 9.85 3,400 10.23 3,400 8.76- Class H-N1/A (EUR) Shares 149,747 12.72 874,763 12.99 1,088,856 10.96- Class H-R/A (EUR) Shares 6,659,306 13.52 9,334,765 13.86 10,467,650 11.72- Class H-R/A (SGD) Shares 2,948,033 8.89 2,416,234 8.95 1,954,375 7.77- Class H-R/D (SGD) Shares 651,977 7.03 864,743 7.18 885,904 6.32- Class H-RE/DM (AUD) Shares 158,523 7.82 232,469 8.07 423,022 6.70- Class H-S/D (EUR) Shares 76,550 10.29 249,550 10.68 3,089,000 9.16- Class I/A (EUR) Shares 100,739 38.60 111,469 38.11 118,705 34.76- Class I/A (USD) Shares 5,689,675 20.26 5,173,794 20.01 5,665,204 18.25- Class I/D (GBP) Shares 10,537 16.08 10,537 16.14 8,846 14.94- Class I/D (USD) Shares 4,073,148 13.10 4,209,894 13.15 3,624,879 12.18- Class N/A (USD) Shares 4,882 11.51 7,382 11.36 15,728 10.37- Class N1/A (USD) Shares 896,573 11.61 703,300 11.46 744,381 10.45- Class N1/D (USD) Shares 413,507 10.24 407,511 10.28 378,523 9.52- Class R/A (EUR) Shares 1,290,548 26.65 1,289,388 26.38 1,832,628 24.12- Class R/A (SGD) Shares 73,313 9.67 72,429 9.57 112,089 8.75- Class R/A (USD) Shares 7,727,970 18.27 8,245,755 18.08 8,527,877 16.53- Class R/D (GBP) Shares 97,030 21.35 103,601 21.43 111,008 19.85- Class R/D (SGD) Shares 280,066 7.38 291,651 7.40 348,959 6.86- Class R/D (USD) Shares 4,601,419 13.10 5,290,822 13.16 5,169,809 12.19- Class R/DM (USD) Shares 2,592,543 15.14 2,919,381 15.18 3,479,335 14.07- Class RE/A (EUR) Shares 370,401 23.91 447,533 23.71 524,972 21.72- Class RE/A (USD) Shares 6,741,109 16.92 7,345,898 16.78 8,226,901 15.37- Class RE/D (USD) Shares 97 11.62 145 11.51 145 10.54- Class RE/DM (USD) Shares 106 11.60 154 11.50 154 10.53- Class S/A (USD) Shares 4,433,881 20.20 5,833,543 19.92 5,977,860 18.14- Class S/D (GBP) Shares 3,327 16.01 3,327 16.06 5,077 14.88- Class S/D (USD) Shares 1,199,159 15.92 1,199,159 15.98 1,911,888 14.81
47

NATIXIS INTERNATIONAL FUNDS (DUBLIN) I PLC Notes to the Condensed Financial Statements as at 30 June 2021 (Continued)
9. NET ASSET VALUE COMPARATIVE (Continued)
As at 30 June 2021 As at 31 December 2020 As at 30 June 2020
Shares USD Shares USD Shares USD
LOOMIS SAYLES HIGH INCOME FUND
- Class CT/DM (USD) Shares 184,075 9.25 235,975 9.15 319,908 8.29- Class H-I/A (CHF) Shares – – 3,955 14.73 6,355 12.22- Class H-I/A (EUR) Shares 80,878 28.56 80,887 28.57 105,697 23.33- Class H-N/D (EUR) Shares 409 9.57 404 9.69 397 8.06- Class H-R/A (EUR) Shares – – – – 836 10.01- Class I/A (EUR) Shares 165,384 22.50 165,384 21.74 165,558 19.19- Class I/A (USD) Shares 403 26.58 3,506 25.68 3,511 22.67- Class I/D (USD) Shares 322,103 6.24 391,731 6.18 636,739 5.60- Class N/DM (USD) Shares 434 8.91 434 8.72 434 7.80- Class R/A (EUR) Shares 91,818 21.41 125,015 20.79 177,291 18.45- Class R/A (USD) Shares 4,280 11.53 4,280 11.20 21,603 9.93- Class R/D (SGD) Shares 547 6.22 544 6.08 538 5.46- Class R/D (USD) Shares 354,054 8.10 430,946 8.02 582,151 7.27- Class R/DM (USD) Shares 161,791 9.03 204,620 8.93 278,525 8.09- Class S/A (USD) Shares 5,500 22.34 5,500 21.57 6,600 19.02
As at 30 June 2021 As at 31 December 2020 As at 30 June 2020
Shares USD Shares USD Shares USD
LOOMIS SAYLES GLOBAL OPPORTUNISTIC BOND FUND
- Class C/A (USD) Shares 11,926 15.73 11,926 16.33 11,926 15.08- Class C/D (USD) Shares 339 10.05 323 10.97 323 10.13- Class F/D (USD) Shares – – 3,475 10.67 3,453 9.87- Class H-I/A (SGD) Shares 189,015 7.98 196,255 8.23 399,816 7.47- Class H-N/D (EUR) Shares 358 11.55 329 13.21 329 11.70- Class H-R/A (EUR) Shares 73,771 11.69 – – – –- Class H-S/A (EUR) Shares 200,573 16.69 384,515 17.48 169,837 15.39- Class H-S/A (SEK) Shares 24,022 12.92 7,916,028 13.70 7,078,572 11.60- Class H-S/A (USD) Shares – – – – 2,237,782 14.89- Class H-S/D (GBP) Shares 1,977,493 13.88 1,977,489 14.38 1,977,487 12.59- Class I/A (USD) Shares 1,622,686 15.78 2,045,718 16.28 1,680,599 14.94- Class I/D (USD) Shares 446,714 13.74 320,800 14.82 268,117 13.72- Class N/A (EUR) Shares 308 13.45 352 13.88 352 12.73- Class N1/A (USD) Shares 126,829 11.00 102,634 11.34 166,075 10.40- Class R/A (EUR) Shares 207,105 21.66 227,312 22.42 232,150 20.63- Class R/A (USD) Shares 79,882 11.54 62,982 11.94 25,268 10.99- Class R/D (GBP) Shares 13,308 23.01 12,612 24.45 12,154 22.63- Class R/D (USD) Shares 129,011 13.67 95,966 14.75 93,025 13.65- Class RE/A (USD) Shares 300 10.96 300 11.35 300 10.46
As at 30 June 2021 As at 31 December 2020
Shares USD Shares USD
LOOMIS SAYLES ALTERNATIVE RISK PREMIA FUND
- Class H-Q/A (EUR) Shares 2,500,000 12.33 2,500,000 12.53- Class I/A (USD) Shares 10 10.41 10 10.26- Class R/A (USD) Shares 10 10.41 10 10.26
48

NATIXIS INTERNATIONAL FUNDS (DUBLIN) I PLC Notes to the Condensed Financial Statements as at 30 June 2021 (Continued)
9. NET ASSET VALUE COMPARATIVE (Continued)
As at 30 June 2021
Shares EUR
LOOMIS SAYLES EURO CREDIT FUND
- Class I/A (EUR) Shares 25,238 9.95- Class N/A (EUR) Shares 10 10.01- Class Q/A (EUR) Shares 7,000,000 9.95- Class R/A (EUR) Shares 10 9.95- Class RE/A (EUR) Shares 300 9.98- Class S/A (EUR) Shares 10 9.95- Class S2/A (EUR) Shares 4,871,327 9.95
As at 30 June 2021
Shares EUR
LOOMIS SAYLES EURO HIGH YIELD FUND
- Class I/A (EUR) Shares 10 10.15- Class N/A (EUR) Shares 10 10.00- Class Q/A (EUR) Shares 3,000,000 10.08- Class R/A (EUR) Shares 10 10.15- Class RE/A (EUR) Shares 300 10.06- Class S/A (EUR) Shares 10 10.15
As at 30 June 2021
Shares EUR
LOOMIS SAYLES SUSTAINABLE EURO CREDIT FUND
- Class I/A (EUR) Shares 300 10.06- Class N/A (EUR) Shares 300 10.06- Class Q/A (EUR) Shares 6,087,157 10.06- Class R/A (EUR) Shares 300 10.06- Class RE/A (EUR) Shares 299 10.06- Class S/D (EUR) Shares 68,500 10.07- Class S2/A (EUR) Shares 300 10.06
10. MATERIAL EVENTS AFFECTING THE COMPANY DURING THE HALF YEAR The Covid-19 pandemic has seen an increase in the volatility of all financial markets which has continued during the semi-annual reporting period. Natixis and the Delegate Investment Manager are currently monitoring the situation and continue to manage the Company’s assets within investment and risk parameters that have been established. Natixis and the Delegate Investment Manager will continue to review the situation in order to navigate the Company through this period of additional uncertainty. Loomis Sayles Euro Credit Fund launched on 2 February 2021. Loomis Sayles Euro High Yield Fund launched on 9 February 2021. Loomis Sayles Sustainable Euro Credit Fund launched on 19 May 2021. There were no other material events affecting the Company during the half year.
49

NATIXIS INTERNATIONAL FUNDS (DUBLIN) I PLC Notes to the Condensed Financial Statements as at 30 June 2021 (Continued)
11. FINANCE COSTS During the half year ended 30 June 2021 and for the year ended 31 December 2020, the Company declared and paid the following dividends:
Loomis Sayles Multisector Income Fund
Date
Income DistributionAmount
USD
Capital DistributionAmount
USD
TotalAmount
USD30 June 2021 (1,648,898) (1,500,725) (3,149,623)
Date
Income DistributionAmount
USD
Capital DistributionAmount
USD
TotalAmount
USD31 December 2020 (5,681,876) (1,857,202) (7,539,078)
Loomis Sayles High Income Fund
Date
Income DistributionAmount
USD
Capital DistributionAmount
USD
TotalAmount
USD30 June 2021 (105,006) (73,435) (178,441)
Date
Income DistributionAmount
USD
Capital DistributionAmount
USD
TotalAmount
USD31 December 2020 (538,341) (134,972) (673,313)
Loomis Sayles Global Opportunistic Bond Fund
Date
Income DistributionAmount
USD
Capital DistributionAmount
USD
TotalAmount
USD30 June 2021 (299,980) (887,710) (1,187,690)
Date
Income DistributionAmount
USD
Capital DistributionAmount
USD
TotalAmount
USD31 December 2020 (433,356) (1,273,038) (1,706,394)
50
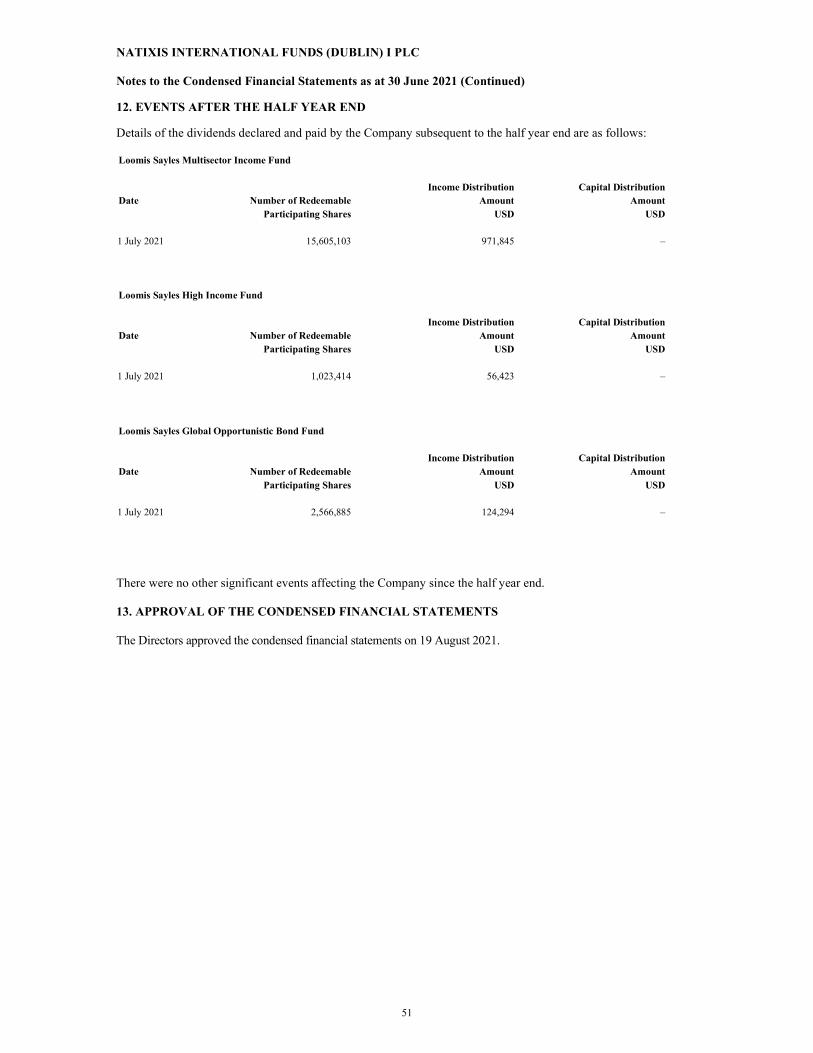
NATIXIS INTERNATIONAL FUNDS (DUBLIN) I PLC Notes to the Condensed Financial Statements as at 30 June 2021 (Continued)
12. EVENTS AFTER THE HALF YEAR END Details of the dividends declared and paid by the Company subsequent to the half year end are as follows: Loomis Sayles Multisector Income Fund Income Distribution Capital Distribution Date Number of Redeemable Amount Amount
Participating Shares USD USD 1 July 2021 15,605,103 971,845 – Loomis Sayles High Income Fund Income Distribution Capital Distribution Date Number of Redeemable Amount Amount Participating Shares USD USD 1 July 2021 1,023,414 56,423 –
Loomis Sayles Global Opportunistic Bond Fund Income Distribution Capital Distribution Date Number of Redeemable Amount Amount Participating Shares USD USD 1 July 2021 2,566,885 124,294 –
There were no other significant events affecting the Company since the half year end. :
13. APPROVAL OF THE CONDENSED FINANCIAL STATEMENTS The Directors approved the condensed financial statements on 19 August 2021.
51

NATIXIS INTERNATIONAL FUNDS (DUBLIN) I PLC LOOMIS SAYLES MULTISECTOR INCOME FUND Schedule of Investments As at 30 June 2021
Face Fair Value % of
Amount USD Net Assets
BONDS AND NOTES - 92.62% OF NET ASSETS (31 December 2020: 85.69%)
NON-CONVERTIBLE BONDS - 86.64% OF NET ASSETS (31 December 2020: 80.84%)
Aerospace/Defense - 2.90% (31 December 2020: 1.51%) Boeing Co, 2.196%, 2/04/26 USD 4,725,000 4,770,163 0.54
Boeing Co, 3.100%, 5/01/26 USD 320,000 338,291 0.04
Boeing Co, 3.625%, 3/01/48 USD 55,000 54,954 0.01
Boeing Co, 3.750%, 2/01/50 USD 1,320,000 1,361,649 0.15
Boeing Co, 3.825%, 3/01/59 USD 3,615,000 3,688,708 0.41
Boeing Co, 3.850%, 11/01/48 USD 1,470,000 1,508,500 0.17
Boeing Co, 3.900%, 5/01/49 USD 5,180,000 5,454,783 0.61
Boeing Co, 3.950%, 8/01/59 USD 1,445,000 1,511,809 0.17
Boeing Co, 5.805%, 5/01/50 USD 1,955,000 2,632,664 0.29
Embraer Netherlands Finance BV, 5.400%, 2/01/27 (i) USD 1,195,000 1,273,440 0.14
Leonardo US Holdings Inc, 6.250%, 1/15/40 144A (ii) USD 1,264,000 1,503,062 0.17
Leonardo US Holdings Inc, 7.375%, 7/15/39 USD 115,000 148,520 0.02
TransDigm Inc, 5.500%, 11/15/27 USD 1,505,000 1,568,962 0.18
25,815,505 2.90
Airlines - 3.15% (31 December 2020: 2.72%) American Airlines, 3.700%, 10/15/25 USD 1,097,273 1,064,031 0.12
American Airlines, 3.750%, 10/15/25 USD 3,025,081 2,905,765 0.33
American Airlines, 4.950%, 2/15/25 USD 1,361,113 1,340,609 0.15
American Airlines Inc, 11.750%, 7/15/25 144A (ii) USD 5,070,000 6,362,850 0.72
American Airlines Group Inc, 3.750%, 3/01/25 144A (ii) USD 35,000 32,244 0.00
American Airlines Group Inc, 5.000%, 6/01/22 144A (ii) USD 5,425,000 5,431,890 0.61American Airlines Inc/AAdvantage Loyalty IP Ltd, 5.500%, 4/20/26 144A (i) (ii) USD 445,000 471,144 0.05American Airlines Inc/AAdvantage Loyalty IP Ltd, 5.750%, 4/20/29 144A (i) (ii) USD 515,000 556,844 0.06Mileage Plus Holdings LLC/Mileage Plus Intellectual Property Assets Ltd, 6.500%, 6/20/27 144A (ii) USD 5,780,000 6,363,780 0.72
United Airlines, 3.650%, 10/07/25 USD 896,296 891,480 0.10
United Airlines, 4.000%, 4/11/26 USD 1,459,606 1,538,789 0.17
United Airlines Inc, 4.375%, 4/15/26 144A (ii) USD 370,000 383,016 0.04
United Airlines Inc, 4.625%, 4/15/29 144A (ii) USD 555,000 574,425 0.06
US Airways Inc, 5.375%, 11/15/21 USD 132,826 133,203 0.02
28,050,070 3.15
Automobile ABS - 0.50% (31 December 2020: 0.00%) Avis Budget Rental Car Funding AESOP LLC, 2.360%, 3/20/26 144A (ii) USD 2,230,000 2,333,204 0.26Avis Budget Rental Car Funding AESOP LLC, 2.680%, 8/20/26 144A (ii) USD 290,000 301,285 0.03Avis Budget Rental Car Funding AESOP LLC, 4.000%, 9/20/24 144A (ii) USD 1,305,000 1,380,668 0.16Avis Budget Rental Car Funding AESOP LLC, 4.250%, 2/20/27 144A (ii) USD 430,000 468,637 0.05
4,483,794 0.50
52

NATIXIS INTERNATIONAL FUNDS (DUBLIN) I PLC LOOMIS SAYLES MULTISECTOR INCOME FUND (Continued) Schedule of Investments As at 30 June 2021
Face Fair Value % of
Amount USD Net Assets
BONDS AND NOTES (Continued)
NON-CONVERTIBLE BONDS (Continued)
Automotive - 2.15% (31 December 2020: 4.54%) Ford Motor Co, 4.750%, 1/15/43 USD 2,840,000 3,017,500 0.34
General Motors Co, 5.200%, 4/01/45 USD 3,215,000 3,973,641 0.45
General Motors Co, 6.250%, 10/02/43 USD 940,000 1,297,664 0.14
General Motors Financial Co Inc, 3.600%, 6/21/30 USD 1,210,000 1,310,129 0.15
General Motors Financial Co Inc, 5.700% (iii) (iv) USD 145,000 162,400 0.02
General Motors Financial Co Inc, 5.750% (iii) (iv) USD 90,000 97,955 0.01
Goodyear Tire & Rubber Co, 7.000%, 3/15/28 USD 390,000 447,280 0.05
Toyota Motor Credit Corp, 0.500%, 6/18/24 USD 8,845,000 8,806,070 0.99
19,112,639 2.15
Banking - 6.41% (31 December 2020: 4.81%) Banco Santander SA, 0.701%, 6/30/24 (i) (iii) USD 3,600,000 3,607,189 0.41
Bank of America Corp, 0.523%, 6/14/24 (iii) USD 4,510,000 4,509,053 0.51
Bank of America Corp, 4.183%, 11/25/27 USD 500,000 560,199 0.06
Bank of America Corp, 4.250%, 10/22/26 USD 210,000 237,124 0.03
BNP Paribas SA, 1.675%, 6/30/27 144A (i) (ii) (iii) USD 3,095,000 3,092,133 0.35
BNP Paribas SA, 7.195% 144A (i) (ii) (iii) (iv) USD 1,200,000 1,281,000 0.14
Credit Agricole SA, 3.250%, 1/14/30 144A (i) (ii) USD 805,000 847,468 0.09
Credit Agricole SA, 4.000%, 1/10/33 EMTN (i) (iii) USD 940,000 1,020,606 0.11
Deutsche Bank AG, 3.035%, 5/28/32 (i) (iii) USD 1,165,000 1,184,628 0.13
Deutsche Bank AG, 4.875%, 12/01/32 (i) (iii) USD 1,235,000 1,331,849 0.15
Goldman Sachs Group Inc, 0.657%, 9/10/24 (iii) USD 4,505,000 4,496,976 0.51
JPMorgan Chase & Co, 1.578%, 4/22/27 (iii) USD 1,730,000 1,738,963 0.20
JPMorgan Chase & Co, 1.953%, 2/04/32 (iii) USD 7,775,000 7,551,070 0.85
KeyBank NA, 0.433%, 6/14/24 (iii) USD 4,505,000 4,508,407 0.51
Morgan Stanley, 4.350%, 9/08/26 USD 10,955,000 12,403,976 1.39
Natwest Group PLC, 1.642%, 6/14/27 (i) (iii) USD 2,220,000 2,219,722 0.25
Svenska Handelsbanken AB, 0.550%, 6/11/24 144A (i) (ii) USD 4,515,000 4,498,550 0.51
UniCredit SpA, 5.459%, 6/30/35 144A (i) (ii) (iii) USD 1,725,000 1,880,839 0.21
56,969,752 6.41
Building Materials - 1.43% (31 December 2020: 0.96%) Cemex SAB de CV, 3.875%, 7/11/31 144A (i) (ii) USD 8,335,000 8,472,527 0.95
Cemex SAB de CV, 5.125% 144A (i) (ii) (iii) (iv) USD 1,020,000 1,052,844 0.12
JELD-WEN Inc, 4.875%, 12/15/27 144A (ii) USD 2,285,000 2,374,618 0.27
Masco Corp, 6.500%, 8/15/32 USD 112,000 148,983 0.02
Masco Corp, 7.750%, 8/01/29 USD 464,000 636,426 0.07
12,685,398 1.43
Chemicals - 0.75% (31 December 2020: 0.23%) Alpek SAB de CV, 3.250%, 2/25/31 144A (i) (ii) USD 775,000 784,308 0.09Braskem Netherlands Finance BV, 4.500%, 1/31/30 144A (i) (ii) USD 220,000 229,222 0.03
53

NATIXIS INTERNATIONAL FUNDS (DUBLIN) I PLC LOOMIS SAYLES MULTISECTOR INCOME FUND (Continued) Schedule of Investments As at 30 June 2021
Face Fair Value % of
Amount USD Net Assets
BONDS AND NOTES (Continued)
NON-CONVERTIBLE BONDS (Continued)
Chemicals - 0.75% (31 December 2020: 0.23%) (Continued) Braskem Netherlands Finance BV, 5.875%, 1/31/50 144A (i) (ii) USD 1,260,000 1,379,713 0.15
INEOS Quattro Finance 2 PLC, 3.375%, 1/15/26 144A (i) (ii) USD 205,000 207,712 0.02
Minerals Technologies Inc, 5.000%, 7/01/28 144A (ii) USD 2,200,000 2,288,739 0.26
Orbia Advance Corp SAB de CV, 2.875%, 5/11/31 144A (i) (ii) USD 1,773,000 1,784,079 0.20
6,673,773 0.75
Commercial MBS - 0.48% (31 December 2020: 0.00%) GS Mortgage Securities Corp Trust, 3.668%, 3/05/33 144A (ii) (iii) USD 405,000 422,606 0.05
GS Mortgage Securities Trust, 4.885%, 1/10/47 (iii) USD 355,000 347,947 0.04JP Morgan Chase Commercial Mortgage Securities Trust, 4.566%, 12/15/47 144A (ii) (iii) USD 845,000 862,168 0.10MSBAM Commercial Mortgage Securities Trust, 3.277%, 10/15/30 144A (ii) USD 160,000 159,102 0.02RBS Commercial Funding Inc Trust, 3.961%, 1/15/32 144A (ii) (iii) USD 855,000 906,250 0.10UBS-Barclays Commercial Mortgage Trust, 4.972%, 5/10/63 144A (ii) (iii) USD 150,000 141,018 0.01
WFRBS Commercial Mortgage Trust, 4.090%, 6/15/45 (iii) USD 685,000 693,550 0.08
WFRBS Commercial Mortgage Trust, 4.378%, 5/15/47 USD 665,000 697,942 0.08
4,230,583 0.48
Commercial Services - 1.14% (31 December 2020: 0.76%) Element Fleet Management Corp, 1.600%, 4/06/24 144A (ii) USD 420,000 426,833 0.05
Equifax Inc, 7.000%, 7/01/37 USD 1,073,000 1,513,394 0.17
Square Inc, 3.500%, 6/01/31 144A (ii) USD 960,000 968,400 0.11
Terminix Co LLC, 7.450%, 8/15/27 USD 4,795,000 5,610,150 0.63
TriNet Group Inc, 3.500%, 3/01/29 144A (ii) USD 1,625,000 1,602,250 0.18
10,121,027 1.14
Computers - 1.11% (31 December 2020: 1.13%) Dell International LLC/EMC Corp, 6.020%, 6/15/26 USD 2,145,000 2,575,129 0.29
Dell International LLC/EMC Corp, 8.100%, 7/15/36 USD 2,705,000 4,122,760 0.46
Dell International LLC/EMC Corp, 8.350%, 7/15/46 USD 1,960,000 3,205,783 0.36
9,903,672 1.11
Cosmetics/Personal Care - 0.11% (31 December 2020: 0.00%) Natura Cosmeticos SA, 4.125%, 5/03/28 144A (i) (ii) USD 995,000 1,019,875 0.11
1,019,875 0.11
Electric - 0.54% (31 December 2020: 0.22%) Edison International, 4.950%, 4/15/25 USD 345,000 381,961 0.04
Enel Finance International NV, 6.000%, 10/07/39 (i) USD 1,300,000 1,818,131 0.21
Pacific Gas & Electric Co, 3.250%, 6/01/31 USD 2,600,000 2,556,643 0.29
4,756,735 0.54
54

NATIXIS INTERNATIONAL FUNDS (DUBLIN) I PLC LOOMIS SAYLES MULTISECTOR INCOME FUND (Continued) Schedule of Investments As at 30 June 2021
Face Fair Value % of
Amount USD Net Assets
BONDS AND NOTES (Continued)
NON-CONVERTIBLE BONDS (Continued)
Electronics - 0.24% (31 December 2020: 0.00%) Jabil Inc, 1.700%, 4/15/26 USD 1,290,000 1,299,556 0.14
Sensata Technologies BV, 4.000%, 4/15/29 144A (i) (ii) USD 855,000 867,896 0.10
2,167,452 0.24
Engineering & Construction - 0.02% (31 December 2020: 0.00%) GMR Hyderabad International Airport Ltd, 4.250%, 10/27/27 144A (i) (ii) USD 205,000 199,203 0.02
199,203 0.02
Entertainment - 0.57% (31 December 2020: 0.28%) Genm Capital Labuan Ltd, 3.882%, 4/19/31 144A (i) (ii) USD 2,160,000 2,150,194 0.24
Penn National Gaming Inc, 4.125%, 7/01/29 144A (ii) USD 535,000 534,331 0.06
Scientific Games International Inc, 7.000%, 5/15/28 144A (ii) USD 2,130,000 2,326,386 0.26
Scientific Games International Inc, 7.250%, 11/15/29 144A (ii) USD 45,000 50,760 0.01
5,061,671 0.57
Financial - 6.83% (31 December 2020: 6.94%) AerCap Ireland Capital DAC/AerCap Global Aviation Trust, 3.650%, 7/21/27 (i) USD 150,000 160,242 0.02
AGFC Capital Trust I, 1.934%, 1/15/67 (iii) USD 400,000 257,072 0.03
AIG Global Funding, 0.650%, 6/17/24 144A (ii) USD 2,245,000 2,238,604 0.25
Air Lease Corp, 3.000%, 2/01/30 USD 520,000 527,449 0.06
Air Lease Corp, 3.125%, 12/01/30 USD 455,000 462,237 0.05
Air Lease Corp, 4.625%, 10/01/28 USD 847,000 954,237 0.11
Air Lease Corp, 4.650% (iii) (iv) USD 1,890,000 1,958,513 0.22
Ally Financial Inc, 4.700% (iii) (iv) USD 2,200,000 2,278,540 0.25
Ally Financial Inc, 4.700% (iii) (iv) USD 1,865,000 1,888,872 0.21
Antares Holdings LP, 6.000%, 8/15/23 144A (ii) USD 3,155,000 3,417,365 0.38
Aviation Capital Group LLC, 1.950%, 1/30/26 144A (ii) USD 890,000 890,240 0.10
GE Capital Funding LLC, 4.550%, 5/15/32 USD 16,225,000 19,368,074 2.18GE Capital International Funding Co Unlimited Co, 4.418%, 11/15/35 (i) USD 1,680,000 2,013,449 0.23
Jefferies Group Inc, 6.250%, 1/15/36 USD 1,970,000 2,632,816 0.29
Nationstar Mortgage Holdings Inc, 5.500%, 8/15/28 144A (ii) USD 1,930,000 1,945,691 0.22
Navient Corp, 5.000%, 3/15/27 USD 2,210,000 2,286,798 0.26
Navient Corp, 5.625%, 8/01/33 USD 5,315,000 5,138,489 0.58
Navient Corp, 6.750%, 6/15/26 USD 320,000 357,200 0.04
OneMain Finance Corp, 6.875%, 3/15/25 USD 2,840,000 3,205,224 0.36
Quicken Loans LLC, 5.250%, 1/15/28 144A (ii) USD 3,300,000 3,465,000 0.39Quicken Loans LLC/Quicken Loans Co-Issuer Inc, 3.625%, 3/01/29 144A (ii) USD 1,350,000 1,333,125 0.15Quicken Loans LLC/Quicken Loans Co-Issuer Inc, 3.875%, 3/01/31 144A (ii) USD 3,945,000 3,974,548 0.45
60,753,785 6.83
55

NATIXIS INTERNATIONAL FUNDS (DUBLIN) I PLC LOOMIS SAYLES MULTISECTOR INCOME FUND (Continued) Schedule of Investments As at 30 June 2021
Face Fair Value % of
Amount USD Net Assets
BONDS AND NOTES (Continued)
NON-CONVERTIBLE BONDS (Continued)
Food - 0.55% (31 December 2020: 1.29%) JBS USA LUX SA/JBS USA Food Co/JBS USA Finance Inc, 3.750%, 12/01/31 144A (i) (ii) USD 720,000 736,740 0.08
Kraft Heinz Foods Co, 4.375%, 6/01/46 USD 3,680,000 4,170,603 0.47
4,907,343 0.55
Forest Products & Paper - 0.64% (31 December 2020: 0.58%) Georgia-Pacific LLC, 7.375%, 12/01/25 USD 1,650,000 2,087,966 0.24
Georgia-Pacific LLC, 7.750%, 11/15/29 USD 2,470,000 3,560,095 0.40
5,648,061 0.64
Healthcare - 1.35% (31 December 2020: 4.29%) Centene Corp, 2.500%, 3/01/31 USD 3,570,000 3,520,912 0.40
Centene Corp, 3.000%, 10/15/30 USD 730,000 749,914 0.08
HCA Inc, 5.250%, 6/15/49 USD 2,705,000 3,448,042 0.39
HCA Inc, 5.375%, 9/01/26 USD 1,390,000 1,600,336 0.18
Tenet Healthcare Corp, 6.875%, 11/15/31 USD 2,330,000 2,644,550 0.30
11,963,754 1.35
Home Builders - 1.02% (31 December 2020: 0.96%) Beazer Homes USA Inc, 7.250%, 10/15/29 USD 1,555,000 1,726,548 0.19
PulteGroup Inc, 6.000%, 2/15/35 USD 1,605,000 2,106,450 0.24
PulteGroup Inc, 6.375%, 5/15/33 USD 3,970,000 5,243,417 0.59
9,076,415 1.02
Home Furnishings - 0.46% (31 December 2020: 0.42%) Whirlpool Corp, 4.600%, 5/15/50 USD 3,280,000 4,071,360 0.46
4,071,360 0.46
Insurance - 2.08% (31 December 2020: 4.94%) Athene Global Funding, 1.608%, 6/29/26 144A (ii) USD 1,625,000 1,625,180 0.18
Brighthouse Financial Inc, 4.700%, 6/22/47 USD 745,000 827,417 0.09
Brighthouse Financial Inc, 5.625%, 5/15/30 USD 4,390,000 5,341,477 0.60
Liberty Mutual Group Inc, 3.951%, 10/15/50 USD 2,735,000 3,032,409 0.34
MBIA Insurance Corp, 11.444%, 1/15/33 USD 150,000 44,063 0.01
Penn Mutual Life Insurance Co, 7.625%, 6/15/40 * USD 4,225,000 6,208,534 0.70
Radian Group Inc, 6.625%, 3/15/25 USD 1,215,000 1,371,115 0.16
18,450,195 2.08
Internet - 2.26% (31 December 2020: 0.00%) Expedia Group Inc, 2.950%, 3/15/31 USD 6,680,000 6,768,937 0.76Go Daddy Operating Co LLC/GD Finance Co Inc, 3.500%, 3/01/29 144A (ii) USD 1,785,000 1,773,397 0.20
Netflix Inc, 4.875%, 4/15/28 USD 200,000 232,500 0.03
Netflix Inc, 4.875%, 6/15/30 144A (ii) USD 1,935,000 2,301,296 0.26
Netflix Inc, 5.375%, 11/15/29 144A (ii) USD 215,000 261,138 0.03
Netflix Inc, 5.875%, 11/15/28 USD 1,100,000 1,350,173 0.15
Netflix Inc, 6.375%, 5/15/29 USD 1,280,000 1,634,880 0.18
56

NATIXIS INTERNATIONAL FUNDS (DUBLIN) I PLC LOOMIS SAYLES MULTISECTOR INCOME FUND (Continued) Schedule of Investments As at 30 June 2021
Face Fair Value % of
Amount USD Net Assets
BONDS AND NOTES (Continued)
NON-CONVERTIBLE BONDS (Continued)
Internet - 2.26% (31 December 2020: 0.00%) (Continued) Uber Technologies Inc, 6.250%, 1/15/28 144A (ii) USD 830,000 893,254 0.10
Uber Technologies Inc, 7.500%, 9/15/27 144A (ii) USD 4,445,000 4,884,966 0.55
20,100,541 2.26
Investment Companies - 2.42% (31 December 2020: 1.06%) FS KKR Capital Corp, 3.400%, 1/15/26 USD 1,175,000 1,214,972 0.14Icahn Enterprises LP/Icahn Enterprises Finance Corp, 4.375%, 2/01/29 144A (ii) USD 4,960,000 4,935,200 0.55
Owl Rock Capital Corp, 4.250%, 1/15/26 USD 10,090,000 10,900,703 1.23Owl Rock Technology Finance Corp, 4.750%, 12/15/25 144A (ii) USD 4,075,000 4,480,098 0.50
21,530,973 2.42
Iron/Steel - 0.09% (31 December 2020: 0.23%) ArcelorMittal SA, 7.000%, 3/01/41 (i) USD 590,000 819,476 0.09
819,476 0.09
Leisure Time - 0.66% (31 December 2020: 0.00%) Carnival Corp, 5.750%, 3/01/27 144A (i) (ii) USD 1,980,000 2,074,050 0.23
NCL Corp Ltd, 5.875%, 3/15/26 144A (i) (ii) USD 1,115,000 1,167,962 0.13
NCL Finance Ltd, 6.125%, 3/15/28 144A (i) (ii) USD 410,000 429,660 0.05
Royal Caribbean Cruises Ltd, 4.250%, 7/01/26 144A (i) (ii) USD 65,000 64,919 0.01
Royal Caribbean Cruises Ltd, 5.500%, 4/01/28 144A (i) (ii) USD 2,010,000 2,105,073 0.24
5,841,664 0.66
Lodging - 0.69% (31 December 2020: 0.00%) Hilton Domestic Operating Co, Inc., 3.625%, 2/15/32 144A (ii) USD 1,280,000 1,264,000 0.14Hilton Grand Vacations Borrower Escrow LLC/Hilton Grand Vacations Borrower Esc, 4.875%, 7/01/31 144A (ii) USD 270,000 269,293 0.03Hilton Grand Vacations Borrower Escrow LLC/Hilton Grand Vacations Borrower Esc, 5.000%, 6/01/29 144A (ii) USD 900,000 920,250 0.10
Marriott International Inc, 2.850%, 4/15/31 USD 1,255,000 1,274,441 0.14
Marriott Ownership Resorts Inc, 4.500%, 6/15/29 144A (ii) USD 695,000 704,556 0.08
Travel + Leisure Co, 4.625%, 3/01/30 144A (ii) USD 1,290,000 1,329,603 0.15
Travel + Leisure Co, 6.000%, 4/01/27 USD 165,000 181,264 0.02
Travel + Leisure Co, 6.625%, 7/31/26 144A (ii) USD 190,000 215,270 0.03
6,158,677 0.69
Machinery-Diversified - 0.68% (31 December 2020: 0.12%) John Deere Capital Corp, 0.450%, 6/07/24 USD 2,185,000 2,178,156 0.24
John Deere Capital Corp, 2.000%, 6/17/31 USD 2,605,000 2,633,109 0.30
Toro Co, 6.625%, 5/01/37 USD 930,000 1,263,761 0.14
6,075,026 0.68
Media - 2.92% (31 December 2020: 1.66%) AMC Networks Inc, 4.250%, 2/15/29 USD 925,000 933,094 0.10Charter Communications Operating LLC/Charter Communications Operating Capital, 3.700%, 4/01/51 USD 2,410,000 2,383,650 0.27
57

NATIXIS INTERNATIONAL FUNDS (DUBLIN) I PLC LOOMIS SAYLES MULTISECTOR INCOME FUND (Continued) Schedule of Investments As at 30 June 2021
Face Fair Value % of
Amount USD Net Assets
BONDS AND NOTES (Continued)
NON-CONVERTIBLE BONDS (Continued)
Media - 2.92% (31 December 2020: 1.66%) (Continued) Charter Communications Operating LLC/Charter Communications Operating Capital, 3.850%, 4/01/61 USD 4,235,000 4,156,638 0.47Charter Communications Operating LLC/Charter Communications Operating Capital, 3.900%, 6/01/52 USD 2,185,000 2,224,781 0.25Charter Communications Operating LLC/Charter Communications Operating Capital, 4.400%, 12/01/61 USD 4,625,000 4,969,495 0.56
CSC Holdings LLC, 5.375%, 2/01/28 144A (ii) USD 2,595,000 2,745,380 0.31
DISH DBS Corp, 5.125%, 6/01/29 144A (ii) USD 1,350,000 1,333,031 0.15
DISH DBS Corp, 5.875%, 11/15/24 USD 610,000 654,987 0.07
DISH DBS Corp, 7.750%, 7/01/26 USD 1,515,000 1,715,738 0.19
Grupo Televisa SAB, 7.250%, 5/14/43 EMTN (i) MXN 24,000,000 879,067 0.10
iHeartCommunications Inc, 8.375%, 5/01/27 USD 2,900,000 3,106,625 0.35
Time Warner Cable LLC, 4.500%, 9/15/42 USD 535,000 594,677 0.07
Time Warner Cable LLC, 5.875%, 11/15/40 USD 85,000 109,952 0.01
ViacomCBS Inc, 4.375%, 3/15/43 USD 135,000 156,203 0.02
25,963,318 2.92
Mining - 3.64% (31 December 2020: 1.31%) Anglo American Capital PLC, 2.875%, 3/17/31 144A (i) (ii) USD 2,645,000 2,703,902 0.30
Barrick Gold Corp, 5.800%, 11/15/34 USD 610,000 766,750 0.09
Barrick North America Finance LLC, 5.750%, 5/01/43 USD 3,285,000 4,631,205 0.52
First Quantum Minerals Ltd, 6.875%, 10/15/27 144A (ii) USD 4,310,000 4,696,607 0.53
First Quantum Minerals Ltd, 7.500%, 4/01/25 144A (ii) USD 200,000 207,500 0.02FMG Resources August 2006 Pty Ltd, 4.375%, 4/01/31 144A (i) (ii) USD 1,575,000 1,684,982 0.19
Freeport-McMoRan Inc, 5.400%, 11/14/34 USD 3,845,000 4,644,010 0.52
Glencore Funding LLC, 2.850%, 4/27/31 144A (ii) USD 6,945,000 7,062,612 0.79
Newmont Corp, 4.875%, 3/15/42 USD 4,485,000 5,680,326 0.64
Volcan Cia Minera SAA, 4.375%, 2/11/26 144A (i) (ii) USD 320,000 316,800 0.04
32,394,694 3.64
Municipal - 0.13% (31 December 2020: 0.32%) Tobacco Settlement Financing Corp/VA, 6.706%, 6/01/46 * USD 1,130,000 1,187,043 0.13
1,187,043 0.13
Oil & Gas - 3.18% (31 December 2020: 4.30%) Aker BP ASA, 3.750%, 1/15/30 144A (i) (ii) USD 2,090,000 2,255,288 0.25
Aker BP ASA, 4.000%, 1/15/31 144A (i) (ii) USD 2,355,000 2,586,696 0.29
Bellatrix Exploration Ltd, 12.500%, 12/15/23 USD 110,000 0 0.00
Bellatrix Exploration Ltd, 8.500%, 9/11/23 USD 101,000 0 0.00
Continental Resources Inc, 5.750%, 1/15/31 144A (ii) USD 1,550,000 1,856,125 0.21
Devon Energy Corp, 4.500%, 1/15/30 144A (ii) USD 416,000 457,349 0.05
Diamondback Energy Inc, 3.125%, 3/24/31 USD 590,000 611,450 0.07
Diamondback Energy Inc, 3.500%, 12/01/29 USD 365,000 390,750 0.04
Energean Israel Finance Ltd, 5.375%, 3/30/28 144A (i) (ii) USD 1,045,000 1,073,447 0.12
58

NATIXIS INTERNATIONAL FUNDS (DUBLIN) I PLC LOOMIS SAYLES MULTISECTOR INCOME FUND (Continued) Schedule of Investments As at 30 June 2021
Face Fair Value % of
Amount USD Net Assets
BONDS AND NOTES (Continued)
NON-CONVERTIBLE BONDS (Continued)
Oil & Gas - 3.18% (31 December 2020: 4.30%) (Continued) Energean Israel Finance Ltd, 5.875%, 3/30/31 144A (i) (ii) USD 1,375,000 1,415,636 0.16
EQT Corp, 3.125%, 5/15/26 144A (ii) USD 135,000 138,336 0.02
EQT Corp, 3.625%, 5/15/31 144A (ii) USD 290,000 302,325 0.03
Lundin Energy Finance BV, 2.000%, 7/15/26 144A (i) (ii) USD 1,410,000 1,412,257 0.16
Lundin Energy Finance BV, 3.100%, 7/15/31 144A (i) (ii) USD 1,020,000 1,030,339 0.12
Mesquite Energy Inc, 6.125%, 1/15/23 USD 3,105,000 56,821 0.01
Mesquite Energy Inc, 7.750%, 6/15/21 * USD 1,365,000 24,979 0.00
Occidental Petroleum Corp, 6.625%, 9/01/30 USD 2,020,000 2,424,000 0.27
Occidental Petroleum Corp, 8.875%, 7/15/30 USD 3,395,000 4,540,439 0.51
Ovintiv Inc, 6.500%, 8/15/34 USD 205,000 270,624 0.03
Ovintiv Inc, 6.625%, 8/15/37 USD 440,000 587,083 0.07
Ovintiv Inc, 6.500%, 2/01/38 USD 90,000 119,822 0.01
Ovintiv Inc, 7.200%, 11/01/31 USD 60,000 78,952 0.01
Ovintiv Inc, 7.375%, 11/01/31 USD 50,000 66,385 0.01
Ovintiv Inc, 8.125%, 9/15/30 USD 240,000 327,070 0.04
Pertamina Persero PT, 6.450%, 5/30/44 144A (i) (ii) USD 2,150,000 2,801,090 0.32
Petroleos Mexicanos, 7.650%, 11/24/21 144A (i) (ii) MXN 15,000,000 751,171 0.08
Range Resources Corp, 4.875%, 5/15/25 USD 2,595,000 2,685,825 0.30
28,264,259 3.18
Other ABS - 0.68% (31 December 2020: 0.13%) Domino's Pizza Master Issuer LLC, 4.118%, 7/25/47 144A (ii) USD 77,400 83,518 0.01GCA2014 Holdings Ltd, Zero Coupon Bond, 1/05/30 144A (i) (ii)* USD 2,775,000 138,750 0.02
GCA2014 Holdings Ltd, 6.000%, 1/05/30 144A (i) (ii)* USD 1,916,848 1,725,163 0.20
GCA2014 Holdings Ltd, 7.500%, 1/05/30 144A (i) (ii)* USD 872,439 654,330 0.07
Global Container Assets Ltd, 4.500%, 2/05/30 144A (i) (ii) USD 522,222 523,695 0.06
Merlin Aviation Holdings DAC, 4.500%, 12/15/32 144A (ii) (v) USD 292,118 280,608 0.03
OneMain Financial Issuance Trust, 3.570%, 3/14/33 144A (ii) USD 360,000 379,218 0.04
S-Jets Ltd, 3.967%, 8/15/42 144A (i) (ii) USD 1,831,277 1,811,109 0.20
Wendy's Funding LLC, 3.884%, 3/15/48 144A (ii) USD 381,175 405,360 0.05
6,001,751 0.68
Packaging - 0.18% (31 December 2020: 0.16%) Owens-Brockway Glass Container Inc, 6.625%, 5/13/27 144A (ii) USD 1,390,000 1,511,625 0.17
Sealed Air Corp, 6.875%, 7/15/33 144A (ii) USD 65,000 82,220 0.01
1,593,845 0.18
Pharmaceuticals - 0.23% (31 December 2020: 0.00%) Jazz Securities DAC, 4.375%, 1/15/29 144A (i) (ii) USD 325,000 336,960 0.04
Viatris Inc, 4.000%, 6/22/50 144A (ii) USD 1,605,000 1,697,334 0.19
2,034,294 0.23
59

NATIXIS INTERNATIONAL FUNDS (DUBLIN) I PLC LOOMIS SAYLES MULTISECTOR INCOME FUND (Continued) Schedule of Investments As at 30 June 2021
Face Fair Value % of
Amount USD Net Assets
BONDS AND NOTES (Continued)
NON-CONVERTIBLE BONDS (Continued)
Pipelines - 0.38% (31 December 2020: 0.82%) DCP Midstream Operating LP, 6.450%, 11/03/36 144A (ii) USD 125,000 146,250 0.01
Galaxy Pipeline Assets Bidco Ltd, 2.940%, 9/30/40 144A (i) (ii) USD 2,485,000 2,466,639 0.28
ONEOK Partners LP, 6.200%, 9/15/43 USD 145,000 190,236 0.02Targa Resources Partners LP/Targa Resources Partners Finance Corp, 4.000%, 1/15/32 144A (ii) USD 590,000 606,903 0.07
3,410,028 0.38
Real Estate Investment Trusts - 2.29% (31 December 2020: 2.19%) American Homes 4 Rent LP, 2.375%, 7/15/31 USD 305,000 300,465 0.03
Brixmor Operating Partnership LP, 2.250%, 4/01/28 USD 270,000 269,677 0.03
Corporate Office Properties LP, 2.750%, 4/15/31 USD 320,000 322,415 0.04
Crown Castle International Corp, 2.500%, 7/15/31 USD 2,755,000 2,774,612 0.31
Iron Mountain Inc, 4.875%, 9/15/29 144A (ii) USD 2,255,000 2,327,611 0.26
SBA Communications Corp, 3.125%, 2/01/29 144A (ii) USD 2,790,000 2,689,744 0.30
Weyerhaeuser Co, 6.875%, 12/15/33 USD 340,000 469,752 0.05
Weyerhaeuser Co, 6.950%, 10/01/27 USD 825,000 1,066,029 0.12
Weyerhaeuser Co, 7.375%, 3/15/32 USD 7,050,000 10,173,407 1.15
20,393,712 2.29
Retailers - 0.76% (31 December 2020: 0.07%) Carvana Co, 5.500%, 4/15/27 144A (ii) USD 605,000 624,802 0.07
Carvana Co, 5.625%, 10/01/25 144A (ii) USD 500,000 519,831 0.06
Carvana Co, 5.875%, 10/01/28 144A (ii) USD 1,035,000 1,088,739 0.12
Dillard's Inc, 7.000%, 12/01/28 USD 200,000 238,196 0.03
Dillard's Inc, 7.750%, 7/15/26 USD 130,000 156,589 0.02
Marks & Spencer PLC, 7.125%, 12/01/37 144A (i) (ii) USD 325,000 384,134 0.04
Murphy Oil USA Inc, 3.750%, 2/15/31 144A (ii) USD 430,000 425,038 0.05
Yum! Brands Inc, 4.625%, 1/31/32 USD 3,150,000 3,307,500 0.37
6,744,829 0.76
Semiconductors - 2.03% (31 December 2020: 0.81%) Broadcom Inc, 2.600%, 2/15/33 144A (ii) USD 6,165,000 6,028,561 0.68
KLA Corp, 5.650%, 11/01/34 USD 2,970,000 3,788,352 0.43
Marvell Technology Inc, 2.450%, 4/15/28 144A (ii) USD 1,080,000 1,100,747 0.12
Marvell Technology Inc, 2.950%, 4/15/31 144A (ii) USD 920,000 953,461 0.11Microchip Technology Inc, 0.983%, 9/01/24 144A (ii) USD 1,635,000 1,627,073 0.18
Micron Technology Inc, 4.975%, 2/06/26 USD 455,000 522,970 0.06
NVIDIA Corp, 0.584%, 6/14/24 USD 3,985,000 3,985,903 0.45
18,007,067 2.03
Software - 0.51% (31 December 2020: 0.00%) salesforce.com Inc, 0.625%, 7/15/24 USD 4,495,000 4,496,841 0.51
4,496,841 0.51
Sovereign - 24.20% (31 December 2020: 26.72%) Export-Import Bank of Korea, 6.750%, 8/09/22 EMTN (i) INR 77,000,000 1,052,915 0.12
60

NATIXIS INTERNATIONAL FUNDS (DUBLIN) I PLC LOOMIS SAYLES MULTISECTOR INCOME FUND (Continued) Schedule of Investments As at 30 June 2021
Face Fair Value % of
Amount USD Net Assets
BONDS AND NOTES (Continued)
NON-CONVERTIBLE BONDS (Continued)
Sovereign - 24.20% (31 December 2020: 26.72%) (Continued) Mexican Bonos, 8.000%, 12/07/23 (i) MXN 81,151,100 4,269,883 0.48
Mexico Government International Bond, 4.280%, 8/14/41 (i) USD 3,390,000 3,558,280 0.40
Republic of Brazil, 10.250%, 1/10/28 (i) BRL 21,875,000 4,555,393 0.51
Republic of Brazil, 8.500%, 1/05/24 (i) BRL 2,100,000 425,888 0.05
United States Treasury Note/Bond, 0.125%, 12/31/22 USD 9,940,000 9,931,458 1.12
United States Treasury Note/Bond, 0.125%, 1/31/23 USD 27,000,000 26,973,633 3.03
United States Treasury Note/Bond, 0.125%, 2/28/23 USD 36,105,000 36,059,869 4.05
United States Treasury Note/Bond, 0.125%, 3/31/23 USD 49,655,000 49,579,353 5.58
United States Treasury Note/Bond, 0.125%, 4/30/23 USD 44,415,000 44,331,722 4.99
United States Treasury Note/Bond, 1.250%, 5/15/50 USD 14,680,000 11,986,564 1.35
United States Treasury Note/Bond, 1.500%, 9/30/21 USD 22,330,000 22,410,204 2.52
215,135,162 24.20
Supranational - 0.14% (31 December 2020: 0.00%) International Finance Corp, 5.850%, 11/25/22 (i) INR 88,680,000 1,208,568 0.14
1,208,568 0.14
Telecommunications - 3.93% (31 December 2020: 2.52%) America Movil SAB de CV, 6.450%, 12/05/22 (i) MXN 50,370,000 2,527,038 0.28
AT&T Inc, 3.500%, 9/15/53 144A (ii) USD 4,660,000 4,681,765 0.53
Bharti Airtel Ltd, 3.250%, 6/03/31 144A (i) (ii) USD 1,065,000 1,056,507 0.12
Cincinnati Bell Inc, 8.000%, 10/15/25 144A (ii) USD 255,000 268,069 0.03
Cincinnati Bell Telephone Co LLC, 6.300%, 12/01/28 USD 40,000 44,194 0.00
Lumen Technologies Inc, 5.625%, 4/01/25 USD 360,000 390,600 0.04
Telecom Italia Capital SA, 6.375%, 11/15/33 (i) USD 8,927,000 10,645,448 1.20
T-Mobile USA Inc, 3.375%, 4/15/29 USD 4,530,000 4,674,931 0.53
T-Mobile USA Inc, 3.500%, 4/15/31 USD 2,240,000 2,317,392 0.26
T-Mobile USA Inc, 3.875%, 4/15/30 USD 4,105,000 4,588,651 0.52
Verizon Communications Inc, 2.875%, 11/20/50 USD 540,000 512,955 0.06
Verizon Communications Inc, 3.000%, 11/20/60 USD 1,975,000 1,843,443 0.21
Verizon Communications Inc, 3.550%, 3/22/51 USD 1,290,000 1,378,193 0.15
34,929,186 3.93
Transportation Services - 0.21% (31 December 2020: 0.02%) Fenix Marine Service Holdings Ltd, 8.000%, 1/15/24 USD 35,000 38,500 0.00
Indian Railway Finance Corp Ltd, 2.800%, 2/10/31 144A (i) (ii) USD 1,890,000 1,836,202 0.21
1,874,702 0.21
TOTAL NON-CONVERTIBLE BONDS 770,287,718 86.64
CONVERTIBLE BONDS - 5.98% OF NET ASSETS (31 December 2020: 4.85%)
Airlines - 0.29% (31 December 2020: 0.05%) JetBlue Airways Corp, 0.500%, 4/01/26 144A (ii) USD 605,000 602,882 0.07
61

NATIXIS INTERNATIONAL FUNDS (DUBLIN) I PLC LOOMIS SAYLES MULTISECTOR INCOME FUND (Continued) Schedule of Investments As at 30 June 2021
Face Fair Value % of
Amount USD Net Assets
BONDS AND NOTES (Continued)
CONVERTIBLE BONDS (Continued)
Airlines - 0.29% (31 December 2020: 0.05%) (Continued) Southwest Airlines Co, 1.250%, 5/01/25 USD 1,275,000 1,930,828 0.22
2,533,710 0.29
Biotechnology - 0.67% (31 December 2020: 0.14%) BioMarin Pharmaceutical Inc, 0.599%, 8/01/24 USD 1,190,000 1,233,197 0.14
BioMarin Pharmaceutical Inc, 1.250%, 5/15/27 USD 3,280,000 3,286,321 0.37Ionis Pharmaceuticals Inc, Zero Coupon Bond, 4/01/26 144A (ii) USD 815,000 798,456 0.09
Livongo Health Inc, 0.875%, 6/01/25 USD 430,000 683,086 0.07
6,001,060 0.67
Computers - 0.13% (31 December 2020: 0.20%) Western Digital Corp, 1.500%, 2/01/24 USD 1,110,000 1,185,619 0.13
1,185,619 0.13
Healthcare - 0.36% (31 December 2020: 0.00%) Teladoc Health Inc, 1.250%, 6/01/27 USD 2,885,000 3,229,469 0.36
3,229,469 0.36
Internet - 0.99% (31 December 2020: 0.69%) Expedia Group Inc, Zero Coupon Bond, 2/15/26 144A (ii) USD 905,000 977,400 0.11
Palo Alto Networks Inc, 0.375%, 6/01/25 USD 175,000 238,000 0.02
Palo Alto Networks Inc, 0.375%, 6/01/25 144A (ii) USD 3,675,000 4,961,581 0.56
Twitter Inc, Zero Coupon Bond, 3/15/26 144A (ii) USD 1,400,000 1,335,250 0.15
Uber Technologies Inc, Zero Coupon Bond, 12/15/25 144A (ii) USD 1,295,000 1,313,130 0.15
8,825,361 0.99
Leisure Time - 0.11% (31 December 2020: 0.00%) Peloton Interactive Inc, Zero Coupon Bond, 2/15/26 144A (ii) USD 985,000 952,372 0.11
952,372 0.11
Media - 3.39% (31 December 2020: 2.86%) DISH Network Corp, 2.375%, 3/15/24 USD 17,860,000 17,313,037 1.95
DISH Network Corp, 3.375%, 8/15/26 USD 12,556,000 12,813,398 1.44
30,126,435 3.39
Software - 0.04% (31 December 2020: 0.57%) Splunk Inc, 1.125%, 6/15/27 USD 320,000 311,800 0.04
311,800 0.04
TOTAL CONVERTIBLE BONDS 53,165,826 5.98
TOTAL BONDS AND NOTES 823,453,544 92.62
62
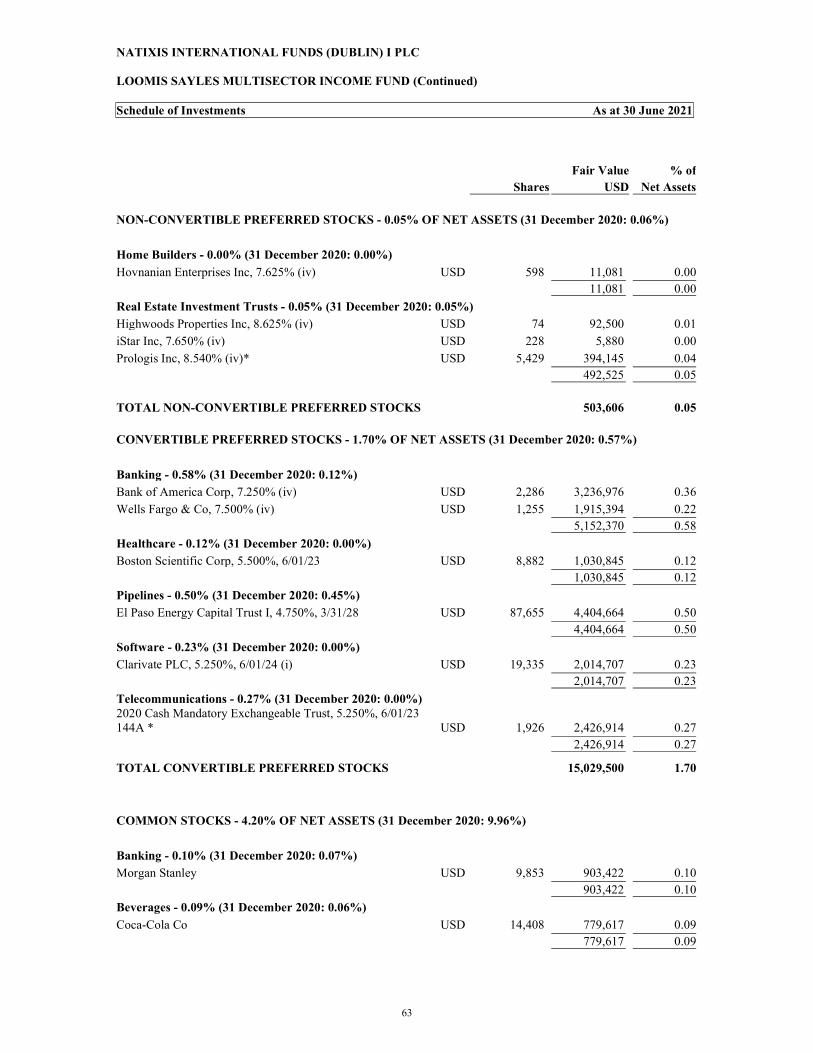
NATIXIS INTERNATIONAL FUNDS (DUBLIN) I PLC LOOMIS SAYLES MULTISECTOR INCOME FUND (Continued) Schedule of Investments As at 30 June 2021
Fair Value % of
Shares USD Net Assets
NON-CONVERTIBLE PREFERRED STOCKS - 0.05% OF NET ASSETS (31 December 2020: 0.06%)
Home Builders - 0.00% (31 December 2020: 0.00%) Hovnanian Enterprises Inc, 7.625% (iv) USD 598 11,081 0.00
11,081 0.00
Real Estate Investment Trusts - 0.05% (31 December 2020: 0.05%) Highwoods Properties Inc, 8.625% (iv) USD 74 92,500 0.01
iStar Inc, 7.650% (iv) USD 228 5,880 0.00
Prologis Inc, 8.540% (iv)* USD 5,429 394,145 0.04
492,525 0.05
TOTAL NON-CONVERTIBLE PREFERRED STOCKS 503,606 0.05
CONVERTIBLE PREFERRED STOCKS - 1.70% OF NET ASSETS (31 December 2020: 0.57%)
Banking - 0.58% (31 December 2020: 0.12%) Bank of America Corp, 7.250% (iv) USD 2,286 3,236,976 0.36
Wells Fargo & Co, 7.500% (iv) USD 1,255 1,915,394 0.22
5,152,370 0.58
Healthcare - 0.12% (31 December 2020: 0.00%) Boston Scientific Corp, 5.500%, 6/01/23 USD 8,882 1,030,845 0.12
1,030,845 0.12
Pipelines - 0.50% (31 December 2020: 0.45%) El Paso Energy Capital Trust I, 4.750%, 3/31/28 USD 87,655 4,404,664 0.50
4,404,664 0.50
Software - 0.23% (31 December 2020: 0.00%) Clarivate PLC, 5.250%, 6/01/24 (i) USD 19,335 2,014,707 0.23
2,014,707 0.23
Telecommunications - 0.27% (31 December 2020: 0.00%) 2020 Cash Mandatory Exchangeable Trust, 5.250%, 6/01/23 144A * USD 1,926 2,426,914 0.27
2,426,914 0.27
TOTAL CONVERTIBLE PREFERRED STOCKS 15,029,500 1.70
COMMON STOCKS - 4.20% OF NET ASSETS (31 December 2020: 9.96%)
Banking - 0.10% (31 December 2020: 0.07%) Morgan Stanley USD 9,853 903,422 0.10
903,422 0.10
Beverages - 0.09% (31 December 2020: 0.06%) Coca-Cola Co USD 14,408 779,617 0.09
779,617 0.09
63

NATIXIS INTERNATIONAL FUNDS (DUBLIN) I PLC LOOMIS SAYLES MULTISECTOR INCOME FUND (Continued) Schedule of Investments As at 30 June 2021
Fair Value % of
Shares USD Net Assets
COMMON STOCKS (Continued)
Chemicals - 0.09% (31 December 2020: 0.06%) Hexion Holdings Corp* USD 43,718 808,783 0.09
808,783 0.09
Commercial Services - 0.09% (31 December 2020: 0.06%) Automatic Data Processing Inc USD 4,020 798,452 0.09
798,452 0.09
Computers - 0.18% (31 December 2020: 0.12%) Accenture PLC (i) USD 2,696 794,754 0.09
Apple Inc USD 5,774 790,807 0.09
1,585,561 0.18
Cosmetics/Personal Care - 0.09% (31 December 2020: 0.06%) Procter & Gamble Co USD 5,650 762,354 0.09
762,354 0.09
Electric - 0.16% (31 December 2020: 0.12%) Duke Energy Corp USD 7,700 760,144 0.08
NextEra Energy Inc USD 9,591 702,828 0.08
1,462,972 0.16
Financial - 0.09% (31 December 2020: 0.06%) BlackRock Inc USD 955 835,596 0.09
835,596 0.09
Healthcare - 0.26% (31 December 2020: 0.19%) Abbott Laboratories USD 6,210 719,925 0.08
Anthem Inc USD 2,063 787,654 0.09
UnitedHealth Group Inc USD 1,982 793,672 0.09
2,301,251 0.26
Insurance - 0.09% (31 December 2020: 0.06%) Progressive Corp USD 7,850 770,949 0.09
770,949 0.09
Machinery-Diversified - 0.08% (31 December 2020: 0.06%) Deere & Co USD 2,016 711,063 0.08
711,063 0.08
Media - 0.09% (31 December 2020: 0.06%) Comcast Corp USD 14,044 800,789 0.09
800,789 0.09
Mining - 0.09% (31 December 2020: 0.06%) Newmont Corp USD 11,873 752,511 0.09
752,511 0.09
Oil & Gas - 0.12% (31 December 2020: 0.08%) Battalion Oil Corp USD 8,641 115,789 0.01
Bellatrix Exploration Ltd CAD 40,757 0 0.00
Chevron Corp USD 7,528 788,483 0.09
Hercules Offshore Inc* USD 302,952 0 0.00
Paragon Offshore PLC Class A Litigation Trust Interests* USD 16,523 0 0.00
64

NATIXIS INTERNATIONAL FUNDS (DUBLIN) I PLC LOOMIS SAYLES MULTISECTOR INCOME FUND (Continued) Schedule of Investments As at 30 June 2021
Fair Value % of
Shares USD Net Assets
COMMON STOCKS (Continued)
Oil & Gas - 0.12% (31 December 2020: 0.08%) (Continued) Paragon Offshore PLC Class B Litigation Trust Interests* USD 24,784 193,563 0.02
1,097,835 0.12
Oil & Gas Services - 0.00% (31 December 2020: 0.00%) Pioneer Energy Services Corp USD 989 0 0.00
0 0.00
Pharmaceuticals - 0.98% (31 December 2020: 4.15%) Bristol-Myers Squibb Co USD 106,795 7,136,042 0.80
Johnson & Johnson USD 4,776 786,798 0.09
Merck & Co Inc USD 10,004 778,011 0.09
Organon & Co USD 1,000 30,260 0.00
8,731,111 0.98
Pipelines - 0.10% (31 December 2020: 0.06%) Williams Cos Inc USD 32,822 871,424 0.10
871,424 0.10
Real Estate Investment Trusts - 0.09% (31 December 2020: 0.06%) American Tower Corp USD 3,105 838,785 0.09
838,785 0.09
Retailers - 0.25% (31 December 2020: 0.18%) Home Depot Inc USD 2,363 753,537 0.08
Starbucks Corp USD 6,548 732,132 0.08
Walmart Inc USD 5,517 778,007 0.09
2,263,676 0.25
Software - 0.09% (31 December 2020: 0.06%) Microsoft Corp USD 2,974 805,657 0.09
805,657 0.09
Telecommunications - 0.88% (31 December 2020: 4.21%) Cisco Systems Inc USD 14,590 773,270 0.09
Corning Inc USD 59,011 2,413,549 0.27
T-Mobile US Inc USD 32,096 4,648,464 0.52
7,835,283 0.88
Transportation Services - 0.19% (31 December 2020: 0.12%) Union Pacific Corp USD 3,481 765,576 0.09
United Parcel Service Inc USD 4,319 898,223 0.10
1,663,799 0.19
TOTAL COMMON STOCKS 37,380,890 4.20
TOTAL FINANCIAL ASSETS AT FAIR VALUE THROUGH PROFIT OR LOSS EXCLUDING FINANCIAL DERIVATIVE INSTRUMENTS (Cost: USD 860,608,079) 876,367,540 98.57
65

NATIXIS INTERNATIONAL FUNDS (DUBLIN) I PLC LOOMIS SAYLES MULTISECTOR INCOME FUND (Continued) Schedule of Investments As at 30 June 2021
FINANCIAL DERIVATIVE INSTRUMENTS – (0.33%) (31 December 2020: 0.06%)
Open Forward Foreign Currency Exchange Contracts - (0.10%) (31 December 2020: 0.06%)
Unrealised Maturity Gain/ Loss % of Date Amount Bought Amount Sold Counterparty USD Net Assets 7/29/21 77,114,651 EUR 92,143,217 USD Brown Brothers Harriman (640,602) (0.07%) 7/29/21 12,299,518 EUR 14,696,521 USD Brown Brothers Harriman (102,174) (0.01%) 7/29/21 34,215,123 SGD 25,496,760 USD Brown Brothers Harriman (44,572) (0.01%) 7/29/21 2,240,920 EUR 2,677,644 USD Brown Brothers Harriman (18,616) (0.01%) 7/29/21 1,869,948 GBP 2,600,088 USD Brown Brothers Harriman (16,645) (0.00%) 7/29/21 1,680,665 AUD 1,275,585 USD Brown Brothers Harriman (13,651) (0.00%) 7/29/21 1,585,802 EUR 1,894,853 USD Brown Brothers Harriman (13,174) (0.00%) 7/29/21 6,134,284 SGD 4,571,206 USD Brown Brothers Harriman (7,991) (0.00%) 7/29/21 655,888 EUR 783,712 USD Brown Brothers Harriman (5,449) (0.00%) 7/29/21 249,451 EUR 298,066 USD Brown Brothers Harriman (2,072) (0.00%) 7/29/21 828,914 SGD 617,491 USD Brown Brothers Harriman (872) (0.00%) 7/29/21 27,884 EUR 33,318 USD Brown Brothers Harriman (232) (0.00%) 7/29/21 8,020 CHF 8,755 USD Brown Brothers Harriman (72) (0.00%) Unrealised loss on Open Forward Foreign Currency Exchange Contracts (866,122) (0.10%) Net unrealised loss on Open Forward Foreign Currency Exchange Contracts (866,122) (0.10%)
Futures - (0.23)% (31 December 2020: 0.00%)
Number of Unrealised % of Contracts Description Counterparty Commitment Gain/(Loss) Net Assets
(34) US Ultra Bond September 2021 Futures JP Morgan 6,310,102 (241,273) (0.03%)
(830) US 10 Year Ultra September 2021 Futures JP Morgan 120,384,892 (1,793,701) (0.20%)
Unrealised loss on Futures (2,034,974) (0.23%) Net unrealised loss on Futures (2,034,974) (0.23%)
Fair Value % of USD Net Assets Total Financial Assets Designated at Fair Value Through Profit or Loss 876,367,540 98.57Total Financial Liabilities Designated at Fair Value Through Profit or Loss (2,901,096) (0.33)
66

NATIXIS INTERNATIONAL FUNDS (DUBLIN) I PLC LOOMIS SAYLES MULTISECTOR INCOME FUND (Continued) Schedule of Investments As at 30 June 2021
Fair Value % of USD Net Assets TOTAL FINANCIAL ASSETS AT FAIR VALUE THROUGH PROFIT OR LOSS AND FINANCIAL DERIVATIVES 873,466,444 98.24 Net Cash at Bank 13,221,019 1.49Other Assets 9,938,116 1.12Less Other Liabilities (7,524,274) (0.85) NET ASSETS ATTRIBUTABLE TO REDEEMABLE PARTICIPATING SHAREHOLDERS 889,101,305 100.00
(i) Securities issued by Non-U.S. or Non-Canadian users. (ii) Securities exempt from registration under Rule 144A (i) of the U.S. Securities Act of 1933. These
securities may be resold in transactions exempt from registration, normally to qualified institutional buyers. (iii) Indicates a variable rate security. The interest rate shown reflects the rate in effect at 30 June 2021. (iv) Perpetual bonds. (v) Indicates a multi-step coupon security. The interest rate shown reflects the rate in effect at 30 June 2021. * Unlisted Securities. Other Information:
All of the above long term securities are traded on regulated markets unless otherwise stated.
Key to Abbreviations AUD: Australian Dollar BRL: Brazilian Real CAD: Canadian Dollar CHF: Swiss Franc EUR: Euro GBP: British Pound INR: Indian Rupee MXN: Mexican Peso SGD: Singapore Dollar USD: United States Dollar
% ofAnalysis of total assets Total Assets Transferable securities and money market instruments admitted to an official stock exchange 51.90Transferable securities and money market instruments traded on a regulated market 44.00Transferable securities and money market instruments other than those admitted to an official exchange listing or traded on another regulated market 1.53Current assets 2.57 100.00
67

NATIXIS INTERNATIONAL FUNDS (DUBLIN) I PLC
LOOMIS SAYLES HIGH INCOME FUND
Schedule of Investments As at 30 June 2021
Face Fair Value % of
Amount USD Net Assets
BONDS AND NOTES - 96.10% OF NET ASSETS (31 December 2020: 91.21%)
NON-CONVERTIBLE BONDS - 90.26% OF NET ASSETS (31 December 2020: 86.38%)
Advertising - 0.74% (31 December 2020: 0.36%) Clear Channel Outdoor Holdings Inc, 7.500%, 6/01/29 144A (i) USD 30,000 31,060 0.19
Clear Channel Outdoor Holdings Inc, 7.750%, 4/15/28 144A (i) USD 20,000 20,951 0.13
Lamar Media Corp, 4.000%, 2/15/30 USD 30,000 30,363 0.19Outfront Media Capital LLC/Outfront Media Capital Corp, 6.250%, 6/15/25 144A (i) USD 35,000 36,996 0.23
119,370 0.74
Aerospace/Defense - 2.20% (31 December 2020: 5.27%) Boeing Co, 3.250%, 2/01/35 USD 10,000 10,111 0.06
Boeing Co, 3.375%, 6/15/46 USD 40,000 38,534 0.24
Boeing Co, 3.500%, 3/01/39 USD 10,000 10,021 0.06
Boeing Co, 3.550%, 3/01/38 USD 5,000 5,135 0.03
Boeing Co, 5.705%, 5/01/40 USD 5,000 6,440 0.04
Embraer Netherlands Finance BV, 5.050%, 6/15/25 (ii) USD 15,000 15,842 0.10
Embraer Netherlands Finance BV, 5.400%, 2/01/27 (ii) USD 80,000 85,251 0.53
Spirit AeroSystems Inc, 4.600%, 6/15/28 USD 50,000 49,000 0.30
Spirit AeroSystems Inc, 7.500%, 4/15/25 144A (i) USD 90,000 96,075 0.59
TransDigm Inc, 5.500%, 11/15/27 USD 25,000 26,063 0.16
Triumph Group Inc, 6.250%, 9/15/24 144A (i) USD 15,000 15,225 0.09
357,697 2.20
Airlines - 1.65% (31 December 2020: 0.57%) American Airlines Group Inc, 5.000%, 6/01/22 144A (i) USD 10,000 10,013 0.06
American Airlines Inc, 11.750%, 7/15/25 144A (i) USD 40,000 50,200 0.31American Airlines Inc/AAdvantage Loyalty IP Ltd, 5.500%, 4/20/26 144A (i) (ii) USD 35,000 37,056 0.23American Airlines Inc/AAdvantage Loyalty IP Ltd, 5.750%, 4/20/29 144A (i) (ii) USD 40,000 43,250 0.27
Delta Air Lines Inc, 7.375%, 1/15/26 USD 45,000 52,800 0.32Hawaiian Brand Intellectual Property Ltd/HawaiianMiles Loyalty Ltd, 5.750%, 1/20/26 144A (i) (ii) USD 35,000 37,576 0.23
United Airlines Inc, 4.375%, 4/15/26 144A (i) USD 15,000 15,528 0.10
United Airlines Inc, 4.625%, 4/15/29 144A (i) USD 20,000 20,700 0.13
267,123 1.65
Automotive - 3.29% (31 December 2020: 4.36%) Clarios Global LP/Clarios US Finance Co, 8.500%, 5/15/27 144A (i) (ii) USD 15,000 16,353 0.10
Dana Inc, 4.250%, 9/01/30 USD 10,000 10,287 0.06
Ford Motor Credit Co LLC, 4.389%, 1/08/26 USD 275,000 297,000 1.83
General Motors Financial Co Inc, 5.700% (iii) (iv) USD 15,000 16,800 0.10
General Motors Financial Co Inc, 5.750% (iii) (iv) USD 35,000 38,094 0.24
General Motors Financial Co, Inc., 6.500% (iii) (iv) USD 35,000 39,200 0.24
Goodyear Tire & Rubber Co, 4.875%, 3/15/27 USD 50,000 52,983 0.33
68

NATIXIS INTERNATIONAL FUNDS (DUBLIN) I PLC
LOOMIS SAYLES HIGH INCOME FUND (Continued)
Schedule of Investments As at 30 June 2021
Face Fair Value % of
Amount USD Net Assets
BONDS AND NOTES (Continued)
NON-CONVERTIBLE BONDS (Continued)
Automotive - 3.29% (31 December 2020: 4.36%) (Continued) Meritor Inc, 4.500%, 12/15/28 144A (i) USD 10,000 10,137 0.06
Real Hero Merger Sub 2 Inc, 6.250%, 2/01/29 144A (i) USD 10,000 10,372 0.07
Tenneco Inc, 7.875%, 1/15/29 144A (i) USD 10,000 11,294 0.07
Titan International Inc, 7.000%, 4/30/28 144A (i) USD 20,000 20,925 0.13
Wheel Pros Inc, 6.500%, 5/15/29 144A (i) USD 10,000 10,113 0.06
533,558 3.29
Banking - 0.32% (31 December 2020: 0.48%) Freedom Mortgage Corp, 7.625%, 5/01/26 144A (i) USD 50,000 52,050 0.32
52,050 0.32
Beverages - 0.12% (31 December 2020: 0.00%) Triton Water Holdings Inc, 6.250%, 4/01/29 144A (i) USD 20,000 20,050 0.12
20,050 0.12
Building Materials - 1.91% (31 December 2020: 3.20%) Builders FirstSource Inc, 5.000%, 3/01/30 144A (i) USD 35,000 36,801 0.23
Builders FirstSource Inc, 6.750%, 6/01/27 144A (i) USD 23,000 24,639 0.15
Cornerstone Building Brands Inc, 6.125%, 1/15/29 144A (i) USD 45,000 48,262 0.30
CP Atlas Buyer Inc, 7.000%, 12/01/28 144A (i) USD 10,000 10,362 0.06
JELD-WEN Inc, 4.625%, 12/15/25 144A (i) USD 95,000 96,782 0.60
Patrick Industries Inc, 4.750%, 5/01/29 144A (i) USD 20,000 19,875 0.12Summit Materials LLC/Summit Materials Finance Corp, 5.250%, 1/15/29 144A (i) USD 10,000 10,624 0.06
US Concrete Inc, 5.125%, 3/01/29 144A (i) USD 35,000 38,238 0.24
Victors Merger Corp, 6.375%, 5/15/29 144A (i) USD 25,000 25,188 0.15
310,771 1.91
Chemicals - 0.72% (31 December 2020: 0.63%) Chemours Co, 5.375%, 5/15/27 USD 15,000 16,269 0.10CVR Partners LP/CVR Nitrogen Finance Corp, 6.125%, 6/15/28 144A (i) USD 10,000 10,250 0.06
Hexion Inc, 7.875%, 7/15/27 144A (i) USD 10,000 10,787 0.07
Methanex Corp, 5.125%, 10/15/27 USD 20,000 21,600 0.13
Methanex Corp, 5.250%, 12/15/29 USD 5,000 5,387 0.03
Olin Corp, 5.000%, 2/01/30 USD 35,000 37,319 0.23
Olin Corp, 5.125%, 9/15/27 USD 15,000 15,600 0.10
117,212 0.72
Coal - 0.03% (31 December 2020: 0.00%) SunCoke Energy Inc, 4.875%, 6/30/29 144A (i) USD 5,000 4,994 0.03
4,994 0.03
Commercial Services - 2.39% (31 December 2020: 2.01%) Avis Budget Car Rental LLC/Avis Budget Finance Inc, 5.750%, 7/15/27 144A (i) USD 35,000 36,508 0.22
Deluxe Corp, 8.000%, 6/01/29 144A (i) USD 15,000 16,275 0.10
69

NATIXIS INTERNATIONAL FUNDS (DUBLIN) I PLC
LOOMIS SAYLES HIGH INCOME FUND (Continued)
Schedule of Investments As at 30 June 2021
Face Fair Value % of
Amount USD Net Assets
BONDS AND NOTES (Continued)
NON-CONVERTIBLE BONDS (Continued)
Commercial Services - 2.39% (31 December 2020: 2.01%) (Continued) Jaguar Holding Co II/PPD Development LP, 5.000%, 6/15/28 144A (i) USD 35,000 37,937 0.23
MPH Acquisition Holdings LLC, 5.750%, 11/01/28 144A (i) USD 40,000 40,196 0.25Nielsen Finance LLC/Nielsen Finance Co, 5.625%, 10/01/28 144A (i) USD 45,000 47,524 0.29Nielsen Finance LLC/Nielsen Finance Co, 5.875%, 10/01/30 144A (i) USD 40,000 43,559 0.27Prime Security Services Borrower LLC/Prime Finance Inc, 6.250%, 1/15/28 144A (i) USD 25,000 26,594 0.16
Sabre GLBL Inc, 7.375%, 9/01/25 144A (i) USD 15,000 16,312 0.10
Sabre GLBL Inc, 9.250%, 4/15/25 144A (i) USD 20,000 23,777 0.15Shift4 Payments LLC/Shift4 Payments Finance Sub Inc, 4.625%, 11/01/26 144A (i) USD 15,000 15,656 0.10
Square Inc, 2.750%, 6/01/26 144A (i) USD 25,000 25,438 0.16
Terminix Co LLC, 7.450%, 8/15/27 USD 50,000 58,500 0.36
388,276 2.39
Computers - 0.22% (31 December 2020: 0.50%) NCR Corp, 5.000%, 10/01/28 144A (i) USD 15,000 15,511 0.09
NCR Corp, 5.250%, 10/01/30 144A (i) USD 20,000 20,750 0.13
36,261 0.22
Distribution/Wholesale - 0.28% (31 December 2020: 0.25%) Performance Food Group Inc, 5.500%, 10/15/27 144A (i) USD 30,000 31,529 0.19
Wolverine Escrow LLC, 9.000%, 11/15/26 144A (i) USD 15,000 14,625 0.09
46,154 0.28
Electric - 1.08% (31 December 2020: 1.47%) Calpine Corp, 5.125%, 3/15/28 144A (i) USD 95,000 96,662 0.60
NRG Energy Inc, 5.750%, 1/15/28 USD 20,000 21,300 0.13Pattern Energy Operations LP/Pattern Energy Operations Inc, 4.500%, 8/15/28 144A (i) USD 10,000 10,352 0.06
PG&E Corp, 5.000%, 7/01/28 USD 25,000 25,278 0.16
Talen Energy Supply LLC, 10.500%, 1/15/26 144A (i) USD 30,000 21,694 0.13
175,286 1.08
Electrical Compo&Equip - 0.69% (31 December 2020: 0.61%) Energizer Holdings Inc, 4.375%, 3/31/29 144A (i) USD 35,000 35,036 0.22
WESCO Distribution Inc, 7.125%, 6/15/25 144A (i) USD 30,000 32,421 0.20
WESCO Distribution Inc, 7.250%, 6/15/28 144A (i) USD 40,000 44,554 0.27
112,011 0.69
Engineering&Construction - 0.13% (31 December 2020: 0.00%) Brundage-Bone Concrete Pumping Holdings Inc, 6.000%, 2/01/26 144A (i) USD 20,000 21,054 0.13
21,054 0.13
Entertainment - 2.85% (31 December 2020: 3.04%) AMC Entertainment Holdings Inc, 10.500%, 4/15/25 144A (i) USD 10,000 10,850 0.07
70

NATIXIS INTERNATIONAL FUNDS (DUBLIN) I PLC
LOOMIS SAYLES HIGH INCOME FUND (Continued)
Schedule of Investments As at 30 June 2021
Face Fair Value % of
Amount USD Net Assets
BONDS AND NOTES (Continued)
NON-CONVERTIBLE BONDS (Continued)
Entertainment - 2.85% (31 December 2020: 3.04%) (Continued) Boyne USA Inc, 4.750%, 5/15/29 144A (i) USD 10,000 10,317 0.06
Caesars Entertainment Inc, 6.250%, 7/01/25 144A (i) USD 45,000 47,700 0.30
Caesars Entertainment Inc, 8.125%, 7/01/27 144A (i) USD 45,000 50,049 0.31Caesars Resort Collection LLC/CRC Finco Inc, 5.250%, 10/15/25 144A (i) USD 55,000 55,688 0.34Caesars Resort Collection LLC/CRC Finco Inc, 5.750%, 7/01/25 144A (i) USD 20,000 21,075 0.13Cedar Fair LP/Canada's Wonderland Co./Magnum Management Corp/Millennium Op, 6.500%, 10/01/28 144A (i) USD 30,000 32,325 0.20
Cinemark USA Inc, 5.250%, 7/15/28 144A (i) USD 15,000 15,375 0.10
Everi Holdings Inc, 5.000%, 7/15/29 144A (i) USD 10,000 10,000 0.06
Lions Gate Capital Holdings LLC, 5.500%, 4/15/29 144A (i) USD 25,000 26,281 0.16
Live Nation Entertainment Inc, 3.750%, 1/15/28 144A (i) USD 20,000 20,088 0.12
Live Nation Entertainment Inc, 4.750%, 10/15/27 144A (i) USD 35,000 36,269 0.22
Scientific Games International Inc, 7.000%, 5/15/28 144A (i) USD 70,000 76,454 0.47
Scientific Games International Inc, 7.250%, 11/15/29 144A (i) USD 45,000 50,760 0.31
463,231 2.85
Environmental Control - 0.34% (31 December 2020: 0.22%) GFL Environmental Inc, 4.000%, 8/01/28 144A (i) USD 40,000 39,514 0.24
Madison IAQ LLC, 5.875%, 6/30/29 144A (i) USD 15,000 15,263 0.10
54,777 0.34
Financial - 3.65% (31 December 2020: 3.27%) Aircastle Ltd, 5.250% 144A (i) (ii) (iii) (iv) USD 10,000 10,100 0.06
Global Aircraft Leasing Co Ltd., 6.500%, 9/15/24 144A (i) (ii) USD 20,000 20,100 0.12
Midcap Financial Issuer Trust, 6.500%, 5/01/28 144A (i) USD 25,000 26,163 0.16
Nationstar Mortgage Holdings Inc, 5.125%, 12/15/30 144A (i) USD 35,000 34,825 0.22
Nationstar Mortgage Holdings Inc, 6.000%, 1/15/27 144A (i) USD 10,000 10,363 0.07
Navient Corp, 4.875%, 3/15/28 USD 20,000 20,100 0.12
Navient Corp, 5.625%, 8/01/33 USD 165,000 159,520 0.98
OneMain Finance Corp, 6.875%, 3/15/25 USD 40,000 45,144 0.28Provident Funding Associates LP/PFG Finance Corp, 6.375%, 6/15/25 144A (i) USD 35,000 35,438 0.22
Quicken Loans LLC, 5.250%, 1/15/28 144A (i) USD 220,000 231,000 1.42
592,753 3.65
Food - 1.91% (31 December 2020: 3.38%) Kraft Heinz Foods Co, 3.000%, 6/01/26 USD 42,000 44,727 0.28
Pilgrim's Pride Corp, 5.875%, 9/30/27 144A (i) USD 55,000 58,575 0.36
Post Holdings Inc, 4.625%, 4/15/30 144A (i) USD 85,000 86,431 0.53
Post Holdings Inc, 5.500%, 12/15/29 144A (i) USD 15,000 16,069 0.10
Safeway Inc, 7.250%, 2/01/31 USD 20,000 23,350 0.14Simmons Foods Inc/Simmons Prepared Foods Inc/Simmons Pet Food Inc/Simmons Feed, 4.625%, 3/01/29 144A (i) USD 25,000 25,217 0.16
TreeHouse Foods Inc, 4.000%, 9/01/28 USD 30,000 29,775 0.18
71

NATIXIS INTERNATIONAL FUNDS (DUBLIN) I PLC
LOOMIS SAYLES HIGH INCOME FUND (Continued)
Schedule of Investments As at 30 June 2021
Face Fair Value % of
Amount USD Net Assets
BONDS AND NOTES (Continued)
NON-CONVERTIBLE BONDS (Continued)
Food - 1.91% (31 December 2020: 3.38%) (Continued) US Foods Inc, 4.750%, 2/15/29 144A (i) USD 25,000 25,500 0.16
309,644 1.91
Food Service - 0.49% (31 December 2020: 0.43%) Aramark Services Inc, 5.000%, 2/01/28 144A (i) USD 15,000 15,708 0.10
Aramark Services Inc, 6.375%, 5/01/25 144A (i) USD 50,000 53,125 0.33
TKC Holdings Inc, 10.500%, 5/15/29 144A (i) USD 10,000 10,825 0.06
79,658 0.49
Healthcare - 5.15% (31 December 2020: 5.70%) AHP Health Partners Inc, 5.750%, 7/15/29 144A (i) USD 15,000 15,206 0.09Avantor Funding Inc, 4.625%, 7/15/28 144A (i) USD 55,000 58,067 0.36
CHS/Community Health Systems Inc, 5.625%, 3/15/27 144A (i) USD 75,000 80,063 0.49
CHS/Community Health Systems Inc, 6.125%, 4/01/30 144A (i) USD 35,000 35,525 0.22
CHS/Community Health Systems Inc, 6.875%, 4/15/29 144A (i) USD 30,000 31,394 0.19
DaVita Inc, 3.750%, 2/15/31 144A (i) USD 50,000 48,000 0.30
Encompass Health Corp, 4.750%, 2/01/30 USD 105,000 111,563 0.69
HCA Inc, 3.500%, 9/01/30 USD 70,000 74,576 0.46
LifePoint Health Inc, 5.375%, 1/15/29 144A (i) USD 50,000 48,750 0.30
ModivCare Inc, 5.875%, 11/15/25 144A (i) USD 10,000 10,700 0.07
RP Escrow Issuer LLC, 5.250%, 12/15/25 144A (i) USD 15,000 15,656 0.10
Select Medical Corp, 6.250%, 8/15/26 144A (i) USD 20,000 21,300 0.13
Surgery Center Holdings Inc, 6.750%, 7/01/25 144A (i) USD 25,000 25,500 0.16
Tenet Healthcare Corp, 6.875%, 11/15/31 USD 215,000 244,025 1.50
US Acute Care Solutions LLC, 6.375%, 3/01/26 144A (i) USD 15,000 15,500 0.09
835,825 5.15
Home Builders - 0.42% (31 December 2020: 0.44%) Brookfield Residential Properties Inc/Brookfield Residential US LLC, 6.250%, 9/15/27 144A (i) USD 40,000 42,250 0.26
Empire Communities Corp, 7.000%, 12/15/25 144A (i) USD 20,000 21,000 0.13
Forestar Group Inc, 3.850%, 5/15/26 144A (i) USD 5,000 5,045 0.03
68,295 0.42
Insurance - 0.31% (31 December 2020: 0.17%) AmWINS Group Inc, 7.750%, 7/01/26 144A (i) USD 10,000 10,607 0.06
AssuredPartners Inc, 5.625%, 1/15/29 144A (i) USD 20,000 20,000 0.12
BroadStreet Partners Inc, 5.875%, 4/15/29 144A (i) USD 20,000 20,400 0.13
51,007 0.31
Internet - 4.72% (31 December 2020: 4.03%) ANGI Group LLC, 3.875%, 8/15/28 144A (i) USD 20,000 19,875 0.12
Arches Buyer Inc, 6.125%, 12/01/28 144A (i) USD 10,000 10,300 0.06
Endure Digital Inc, 6.000%, 2/15/29 144A (i) USD 55,000 54,450 0.34
Netflix Inc, 4.875%, 6/15/30 144A (i) USD 45,000 53,518 0.33
72

NATIXIS INTERNATIONAL FUNDS (DUBLIN) I PLC
LOOMIS SAYLES HIGH INCOME FUND (Continued)
Schedule of Investments As at 30 June 2021
Face Fair Value % of
Amount USD Net Assets
BONDS AND NOTES (Continued)
NON-CONVERTIBLE BONDS (Continued)
Internet - 4.72% (31 December 2020: 4.03%) (Continued) Netflix Inc, 5.375%, 11/15/29 144A (i) USD 5,000 6,073 0.04
Netflix Inc, 5.875%, 11/15/28 USD 30,000 36,823 0.23
Netflix Inc, 6.375%, 5/15/29 USD 40,000 51,090 0.31
Uber Technologies Inc, 6.250%, 1/15/28 144A (i) USD 15,000 16,143 0.10
Uber Technologies Inc, 7.500%, 9/15/27 144A (i) USD 20,000 21,980 0.14
Uber Technologies Inc, 8.000%, 11/01/26 144A (i) USD 460,000 495,650 3.05
765,902 4.72
Investment Companies - 1.37% (31 December 2020: 0.99%) Icahn Enterprises LP/Icahn Enterprises Finance Corp, 4.375%, 2/01/29 144A (i) USD 40,000 39,800 0.25Icahn Enterprises LP/Icahn Enterprises Finance Corp, 4.750%, 9/15/24 USD 60,000 62,700 0.39Icahn Enterprises LP/Icahn Enterprises Finance Corp, 5.250%, 5/15/27 USD 90,000 92,925 0.57Icahn Enterprises LP/Icahn Enterprises Finance Corp, 6.250%, 5/15/26 USD 25,000 26,525 0.16
221,950 1.37
Iron/Steel - 1.45% (31 December 2020: 1.99%) Carpenter Technology Corp, 6.375%, 7/15/28 USD 5,000 5,489 0.03
Cleveland-Cliffs Inc, 4.625%, 3/01/29 144A (i) USD 35,000 36,829 0.23
Cleveland-Cliffs Inc, 4.875%, 3/01/31 144A (i) USD 30,000 31,500 0.19
Cleveland-Cliffs Inc, 6.750%, 3/15/26 144A (i) USD 5,000 5,394 0.03
Cleveland-Cliffs Inc, 9.875%, 10/17/25 144A (i) USD 22,000 25,784 0.16
Mineral Resources Ltd, 8.125%, 5/01/27 144A (i) (ii) USD 80,000 87,900 0.54
United States Steel Corp, 6.650%, 6/01/37 USD 30,000 31,955 0.20
United States Steel Corp, 6.875%, 3/01/29 USD 10,000 10,700 0.07
235,551 1.45
Leisure Time - 2.16% (31 December 2020: 0.52%) Carnival Corp, 5.750%, 3/01/27 144A (i) (ii) USD 110,000 115,225 0.71
NCL Corp Ltd, 5.875%, 3/15/26 144A (i) (ii) USD 50,000 52,375 0.32
NCL Finance Ltd, 6.125%, 3/15/28 144A (i) (ii) USD 10,000 10,479 0.06
Royal Caribbean Cruises Ltd, 3.700%, 3/15/28 (ii) USD 20,000 19,102 0.12
Royal Caribbean Cruises Ltd, 4.250%, 7/01/26 144A (i) (ii) USD 45,000 44,944 0.28
Royal Caribbean Cruises Ltd, 5.500%, 4/01/28 144A (i) (ii) USD 55,000 57,602 0.36
Viking Cruises Ltd, 5.875%, 9/15/27 144A (i) (ii) USD 15,000 14,823 0.09Viking Ocean Cruises Ship VII Ltd, 5.625%, 2/15/29 144A (i) (ii) USD 35,000 35,350 0.22
349,900 2.16
Lodging - 2.44% (31 December 2020: 2.02%) Boyd Gaming Corp, 4.750%, 6/15/31 144A (i) USD 20,000 20,750 0.13Hilton Grand Vacations Borrower Escrow LLC/Hilton Grand Vacations Borrower Esc, 4.875%, 7/01/31 144A (i) USD 15,000 14,961 0.09
73

NATIXIS INTERNATIONAL FUNDS (DUBLIN) I PLC
LOOMIS SAYLES HIGH INCOME FUND (Continued)
Schedule of Investments As at 30 June 2021
Face Fair Value % of
Amount USD Net Assets
BONDS AND NOTES (Continued)
NON-CONVERTIBLE BONDS (Continued)
Lodging - 2.44% (31 December 2020: 2.02%) (Continued) Hilton Grand Vacations Borrower Escrow LLC/Hilton Grand Vacations Borrower Esc, 5.000%, 6/01/29 144A (i) USD 55,000 56,237 0.35
Marriott Ownership Resorts Inc, 4.500%, 6/15/29 144A (i) USD 15,000 15,206 0.09
Marriott Ownership Resorts Inc, 4.750%, 1/15/28 USD 15,000 15,371 0.10
Marriott Ownership Resorts Inc, 6.125%, 9/15/25 144A (i) USD 5,000 5,317 0.03
Marriott Ownership Resorts Inc/ILG LLC, 6.500%, 9/15/26 USD 40,000 41,550 0.26
MGM Resorts International, 5.500%, 4/15/27 USD 70,000 76,825 0.47
Travel + Leisure Co, 3.900%, 3/01/23 USD 5,000 5,156 0.03
Travel + Leisure Co, 4.625%, 3/01/30 144A (i) USD 15,000 15,461 0.10
Travel + Leisure Co, 6.000%, 4/01/27 USD 5,000 5,493 0.03
Travel + Leisure Co, 6.625%, 7/31/26 144A (i) USD 80,000 90,640 0.56Wynn Las Vegas LLC/Wynn Las Vegas Capital Corp, 5.500%, 3/01/25 144A (i) USD 30,000 32,306 0.20
395,273 2.44
Machinery-Diversified - 0.06% (31 December 2020: 0.05%) GrafTech Finance Inc, 4.625%, 12/15/28 144A (i) USD 10,000 10,263 0.06
10,263 0.06
Media - 6.42% (31 December 2020: 7.53%) AMC Networks Inc, 4.250%, 2/15/29 USD 40,000 40,350 0.25
Audacy Capital Corp, 6.750%, 3/31/29 144A (i) USD 20,000 20,752 0.13CCO Holdings LLC/CCO Holdings Capital Corp, 4.250%, 2/01/31 144A (i) USD 95,000 96,824 0.60CCO Holdings LLC/CCO Holdings Capital Corp, 4.500%, 8/15/30 144A (i) USD 230,000 239,479 1.48
CSC Holdings LLC, 4.125%, 12/01/30 144A (i) USD 225,000 223,594 1.38Diamond Sports Group LLC/Diamond Sports Finance Co, 5.375%, 8/15/26 144A (i) USD 35,000 22,662 0.14Diamond Sports Group LLC/Diamond Sports Finance Co, 6.625%, 8/15/27 144A (i) USD 15,000 7,367 0.04
DISH DBS Corp, 5.125%, 6/01/29 144A (i) USD 30,000 29,623 0.18
DISH DBS Corp, 5.875%, 11/15/24 USD 45,000 48,319 0.30
DISH DBS Corp, 7.750%, 7/01/26 USD 65,000 73,612 0.45
Gray Television Inc, 4.750%, 10/15/30 144A (i) USD 55,000 54,809 0.34
iHeartCommunications Inc, 8.375%, 5/01/27 USD 75,000 80,344 0.49Radiate Holdco LLC/Radiate Finance Inc, 6.500%, 9/15/28 144A (i) USD 45,000 47,279 0.29
Sinclair Television Group Inc, 5.125%, 2/15/27 144A (i) USD 25,000 25,094 0.15
Townsquare Media Inc, 6.875%, 2/01/26 144A (i) USD 10,000 10,700 0.07
Univision Communications Inc, 6.625%, 6/01/27 144A (i) USD 20,000 21,671 0.13
1,042,479 6.42
Mining - 2.55% (31 December 2020: 2.59%) First Quantum Minerals Ltd, 7.250%, 4/01/23 144A (i) USD 240,000 244,651 1.51
Freeport-McMoRan Inc, 4.250%, 3/01/30 USD 60,000 64,275 0.39
74

NATIXIS INTERNATIONAL FUNDS (DUBLIN) I PLC
LOOMIS SAYLES HIGH INCOME FUND (Continued)
Schedule of Investments As at 30 June 2021
Face Fair Value % of
Amount USD Net Assets
BONDS AND NOTES (Continued)
NON-CONVERTIBLE BONDS (Continued)
Mining - 2.55% (31 December 2020: 2.59%) (Continued) Freeport-McMoRan Inc, 4.375%, 8/01/28 USD 15,000 15,844 0.10
Freeport-McMoRan Inc, 4.625%, 8/01/30 USD 10,000 10,950 0.07
Novelis Corp, 4.750%, 1/30/30 144A (i) USD 70,000 73,500 0.45
Volcan Cia Minera SAA, 4.375%, 2/11/26 144A (i) (ii) USD 5,000 4,950 0.03
414,170 2.55
Miscellaneous Manufacturer - 1.41% (31 December 2020: 1.25%) Bombardier Inc, 6.000%, 10/15/22 144A (i) USD 120,000 120,150 0.74
Bombardier Inc, 7.125%, 6/15/26 144A (i) USD 85,000 88,995 0.55
General Electric Co, 3.449% (iii) (iv) USD 20,000 19,600 0.12
228,745 1.41
Office/Business Equip - 0.49% (31 December 2020: 0.28%) Pitney Bowes Inc, 6.875%, 3/15/27 144A (i) USD 25,000 26,406 0.17
Xerox Holdings Corp, 5.000%, 8/15/25 144A (i) USD 25,000 26,391 0.16
Xerox Holdings Corp, 5.500%, 8/15/28 144A (i) USD 25,000 25,975 0.16
78,772 0.49
Oil & Gas - 10.66% (31 December 2020: 8.13%) Antero Resources Corp, 7.625%, 2/01/29 144A (i) USD 30,000 33,300 0.21
Antero Resources Corp, 8.375%, 7/15/26 144A (i) USD 5,000 5,687 0.04
Apache Corp, 4.250%, 1/15/30 USD 50,000 52,750 0.33
Apache Corp, 4.375%, 10/15/28 USD 5,000 5,322 0.03Ascent Resources Utica Holdings LLC/ARU Finance Corp, 5.875%, 6/30/29 144A (i) USD 15,000 15,000 0.09Ascent Resources Utica Holdings LLC/ARU Finance Corp, 7.000%, 11/01/26 144A (i) USD 30,000 31,386 0.19
Baytex Energy Corp, 8.750%, 4/01/27 144A (i) USD 25,000 25,187 0.16
Bellatrix Exploration Ltd, 12.500%, 12/15/23 USD 7,000 0 0.00
Bellatrix Exploration Ltd, 8.500%, 9/11/23 USD 6,000 0 0.00
California Resources Corp, 7.125%, 2/01/26 144A (i) USD 5,000 5,262 0.03
Callon Petroleum Co, 6.250%, 4/15/23 USD 10,000 10,012 0.06
Callon Petroleum Co, 8.000%, 8/01/28 144A (i) USD 25,000 25,281 0.16Calumet Specialty Products Partners LP/Calumet Finance Corp, 11.000%, 4/15/25 144A (i) USD 10,000 10,875 0.07
Centennial Resource Production LLC, 5.375%, 1/15/26 144A (i) USD 10,000 9,800 0.06
Centennial Resource Production LLC, 6.875%, 4/01/27 144A (i) USD 20,000 20,452 0.13
Chesapeake Energy Corp, 5.500%, 2/01/26 144A (i) USD 5,000 5,275 0.03
Comstock Resources Inc, 6.750%, 3/01/29 144A (i) USD 15,000 15,978 0.10
CVR Energy Inc, 5.250%, 2/15/25 144A (i) USD 10,000 10,005 0.06Endeavor Energy Resources LP/EER Finance Inc, 5.500%, 1/30/26 144A (i) USD 5,000 5,194 0.03Endeavor Energy Resources LP/EER Finance Inc, 6.625%, 7/15/25 144A (i) USD 10,000 10,700 0.07
Energean Israel Finance Ltd, 4.875%, 3/30/26 144A (i) (ii) USD 25,000 25,616 0.16
75

NATIXIS INTERNATIONAL FUNDS (DUBLIN) I PLC
LOOMIS SAYLES HIGH INCOME FUND (Continued)
Schedule of Investments As at 30 June 2021
Face Fair Value % of
Amount USD Net Assets
BONDS AND NOTES (Continued)
NON-CONVERTIBLE BONDS (Continued)
Oil & Gas - 10.66% (31 December 2020: 8.13%) (Continued) Energean Israel Finance Ltd, 5.375%, 3/30/28 144A (i) (ii) USD 10,000 10,272 0.06Energy Ventures Gom LLC/EnVen Finance Corp, 11.750%, 4/15/26 144A (i) USD 15,000 15,643 0.10
EQT Corp, 3.125%, 5/15/26 144A (i) USD 5,000 5,124 0.03
EQT Corp, 3.625%, 5/15/31 144A (i) USD 5,000 5,212 0.03
EQT Corp, 7.625%, 2/01/25 USD 10,000 11,665 0.07
EQT Corp, 8.500%, 2/01/30 USD 50,000 65,145 0.40Hilcorp Energy I LP/Hilcorp Finance Co, 5.750%, 2/01/29 144A (i) USD 15,000 15,637 0.10Hilcorp Energy I LP/Hilcorp Finance Co, 6.000%, 2/01/31 144A (i) USD 10,000 10,600 0.07
Independence Energy Finance LLC, 7.250%, 5/01/26 144A (i) USD 20,000 21,003 0.13
Indigo Natural Resources LLC, 5.375%, 2/01/29 144A (i) USD 30,000 31,350 0.19
Leviathan Bond Ltd, 6.125%, 6/30/25 144A (i) (ii) USD 15,000 16,467 0.10
Leviathan Bond Ltd, 6.500%, 6/30/27 144A (i) (ii) USD 25,000 27,837 0.17
Matador Resources Co, 5.875%, 9/15/26 USD 20,000 20,600 0.13
MEG Energy Corp, 5.875%, 2/01/29 144A (i) USD 10,000 10,425 0.06
MEG Energy Corp, 7.125%, 2/01/27 144A (i) USD 25,000 26,633 0.16
Mesquite Energy Inc, 6.125%, 1/15/23 (v) USD 420,000 7,686 0.05
Murphy Oil Corp, 6.375%, 7/15/28 USD 15,000 15,815 0.10
Murphy Oil Corp, 6.375%, 12/01/42 USD 25,000 24,759 0.15
Murphy Oil Corp, 6.875%, 8/15/24 USD 15,000 15,337 0.10
Nabors Industries Ltd, 7.250%, 1/15/26 144A (i) (ii) USD 20,000 19,600 0.12
Northern Oil & Gas Inc, 8.125%, 3/01/28 144A (i) USD 20,000 21,550 0.13
Oasis Petroleum Inc, 6.375%, 6/01/26 144A (i) USD 10,000 10,427 0.06
Occidental Petroleum Corp, 2.900%, 8/15/24 USD 60,000 61,350 0.38
Occidental Petroleum Corp, 3.000%, 2/15/27 USD 10,000 9,925 0.06
Occidental Petroleum Corp, 3.200%, 8/15/26 USD 5,000 5,038 0.03
Occidental Petroleum Corp, 3.400%, 4/15/26 USD 5,000 5,113 0.03
Occidental Petroleum Corp, 3.500%, 6/15/25 USD 160,000 163,600 1.01
Occidental Petroleum Corp, 3.500%, 8/15/29 USD 20,000 20,072 0.12
Occidental Petroleum Corp, 4.100%, 2/15/47 USD 30,000 27,934 0.17
Occidental Petroleum Corp, 4.200%, 3/15/48 USD 10,000 9,350 0.06
Occidental Petroleum Corp, 4.400%, 4/15/46 USD 5,000 4,803 0.03
Occidental Petroleum Corp, 5.550%, 3/15/26 USD 40,000 44,200 0.27
Occidental Petroleum Corp, 5.875%, 9/01/25 USD 50,000 55,625 0.34
Occidental Petroleum Corp, 7.500%, 5/01/31 USD 10,000 12,600 0.08
Occidental Petroleum Corp, 7.875%, 9/15/31 USD 5,000 6,425 0.04
Occidental Petroleum Corp, 8.500%, 7/15/27 USD 25,000 31,480 0.19
Occidental Petroleum Corp, 8.875%, 7/15/30 USD 35,000 46,809 0.29
Ovintiv Inc, 6.500%, 8/15/34 USD 40,000 52,805 0.33
Ovintiv Inc, 6.625%, 8/15/37 USD 10,000 13,343 0.08
76

NATIXIS INTERNATIONAL FUNDS (DUBLIN) I PLC
LOOMIS SAYLES HIGH INCOME FUND (Continued)
Schedule of Investments As at 30 June 2021
Face Fair Value % of
Amount USD Net Assets
BONDS AND NOTES (Continued)
NON-CONVERTIBLE BONDS (Continued)
Oil & Gas - 10.66% (31 December 2020: 8.13%) (Continued) Ovintiv Inc, 7.200%, 11/01/31 USD 15,000 19,738 0.12
Ovintiv Inc, 7.375%, 11/01/31 USD 5,000 6,639 0.04
Parkland Corp/Canada, 5.875%, 7/15/27 144A (i) USD 70,000 74,611 0.46
PBF Holding Co LLC/PBF Finance Corp, 6.000%, 2/15/28 USD 15,000 10,275 0.06PBF Holding Co LLC/PBF Finance Corp, 9.250%, 5/15/25 144A (i) USD 20,000 20,148 0.12
Petroleos Mexicanos, 5.950%, 1/28/31 (ii) USD 60,000 58,290 0.36
Petroleos Mexicanos, 6.625%, 6/15/35 (ii) USD 25,000 24,144 0.15
Precision Drilling Corp, 6.875%, 1/15/29 144A (i) USD 15,000 15,450 0.10
Range Resources Corp, 8.250%, 1/15/29 144A (i) USD 20,000 22,550 0.14
Range Resources Corp, 9.250%, 2/01/26 USD 20,000 22,050 0.14
SM Energy Co, 5.625%, 6/01/25 USD 10,000 9,900 0.06
SM Energy Co, 6.500%, 7/15/28 USD 5,000 5,138 0.03
SM Energy Co, 6.750%, 9/15/26 USD 15,000 15,263 0.09
Southwestern Energy Co, 6.450%, 1/23/25 USD 30,000 33,210 0.21
Southwestern Energy Co, 7.500%, 4/01/26 USD 5,000 5,294 0.03
Southwestern Energy Co, 7.750%, 10/01/27 USD 5,000 5,425 0.03
Sunoco LP/Sunoco Finance Corp, 4.500%, 5/15/29 144A (i) USD 30,000 30,525 0.19
Transocean Inc, 11.500%, 1/30/27 144A (i) (ii) USD 10,000 10,687 0.07
Transocean Inc, 8.000%, 2/01/27 144A (i) (ii) USD 20,000 16,839 0.10
Vine Energy Holdings LLC, 6.750%, 4/15/29 144A (i) USD 20,000 21,050 0.13
1,729,567 10.66
Oil & Gas Services - 0.50% (31 December 2020: 0.27%) Transocean Proteus Ltd, 6.250%, 12/01/24 144A (i) (ii) USD 49,500 49,995 0.31
Weatherford International Ltd, 11.000%, 12/01/24 144A (i) (ii) USD 25,000 26,000 0.16
Weatherford International Ltd, 8.750%, 9/01/24 144A (i) (ii) USD 5,000 5,231 0.03
81,226 0.50
Packaging - 2.87% (31 December 2020: 2.55%) ARD Finance SA, 6.500%, 6/30/27 144A (i) (ii) USD 200,000 210,000 1.29Ardagh Packaging Finance PLC/Ardagh Holdings USA Inc, 5.250%, 8/15/27 144A (i) (ii) USD 200,000 204,000 1.26
Graham Packaging Co, Inc., 7.125%, 8/15/28 144A (i) USD 15,000 16,162 0.10Intelligent Packaging Ltd. Finco, Inc./Intelligent Packaging Ltd. Co-Issuer LLC, 6.000%, 9/15/28 144A (i) USD 20,000 20,800 0.13Mauser Packaging Solutions Holding Co, 7.250%, 4/15/25 144A (i) USD 15,000 14,700 0.09
465,662 2.87
Pharmaceuticals - 4.19% (31 December 2020: 3.41%) Bausch Health Cos Inc, 5.250%, 1/30/30 144A (i) USD 65,000 60,450 0.37
Bausch Health Cos Inc, 5.250%, 2/15/31 144A (i) USD 50,000 46,672 0.29
Bausch Health Cos Inc, 6.250%, 2/15/29 144A (i) USD 100,000 98,905 0.61Endo Dac/Endo Finance LLC/Endo Finco Inc, 6.000%, 6/30/28 144A (i) (ii) USD 30,000 20,231 0.13
77

NATIXIS INTERNATIONAL FUNDS (DUBLIN) I PLC
LOOMIS SAYLES HIGH INCOME FUND (Continued)
Schedule of Investments As at 30 June 2021
Face Fair Value % of
Amount USD Net Assets
BONDS AND NOTES (Continued)
NON-CONVERTIBLE BONDS (Continued)
Pharmaceuticals - 4.19% (31 December 2020: 3.41%) (Continued) Endo Luxembourg Finance Co I Sarl/Endo US, Inc., 6.125%, 4/01/29 144A (i) (ii) USD 20,000 19,600 0.12Herbalife Nutrition Ltd/HLF Financing, Inc., 7.875%, 9/01/25 144A (i) (ii) USD 55,000 59,813 0.37
Par Pharmaceutical Inc, 7.500%, 4/01/27 144A (i) USD 15,000 15,335 0.09
Prestige Brands Inc, 5.125%, 1/15/28 144A (i) USD 30,000 31,583 0.20Teva Pharmaceutical Finance Netherlands III BV, 3.150%, 10/01/26 (ii) USD 45,000 42,806 0.26Teva Pharmaceutical Finance Netherlands III BV, 4.100%, 10/01/46 (ii) USD 325,000 284,781 1.75
680,176 4.19
Pipelines - 5.39% (31 December 2020: 5.04%) Blue Racer Midstream LLC/Blue Racer Finance Corp, 7.625%, 12/15/25 144A (i) USD 35,000 37,929 0.23
Buckeye Partners LP, 4.500%, 3/01/28 144A (i) USD 15,000 15,380 0.09
Buckeye Partners LP, 5.600%, 10/15/44 USD 20,000 19,400 0.12
Buckeye Partners LP, 5.850%, 11/15/43 USD 10,000 9,925 0.06Crestwood Midstream Partners LP/Crestwood Midstream Finance Corp, 6.000%, 2/01/29 144A (i) USD 20,000 20,950 0.13
DCP Midstream Operating LP, 5.125%, 5/15/29 USD 10,000 11,050 0.07
DCP Midstream Operating LP, 5.625%, 7/15/27 USD 45,000 51,273 0.32
EnLink Midstream Partners LP, 5.450%, 6/01/47 USD 40,000 35,500 0.22
EQM Midstream Partners LP, 5.500%, 7/15/28 USD 15,000 16,209 0.10
EQM Midstream Partners LP, 6.000%, 7/01/25 144A (i) USD 15,000 16,312 0.10
EQM Midstream Partners LP, 6.500%, 7/01/27 144A (i) USD 40,000 44,600 0.27
EQM Midstream Partners LP, 6.500%, 7/15/48 USD 25,000 26,750 0.17Genesis Energy LP/Genesis Energy Finance Corp, 7.750%, 2/01/28 USD 45,000 46,505 0.29
Harvest Midstream I LP, 7.500%, 9/01/28 144A (i) USD 25,000 27,150 0.17
Hess Midstream Operations LP, 5.625%, 2/15/26 144A (i) USD 130,000 135,590 0.84
New Fortress Energy Inc, 6.500%, 9/30/26 144A (i) USD 15,000 15,327 0.09
New Fortress Energy Inc, 6.750%, 9/15/25 144A (i) USD 70,000 71,662 0.44NGL Energy Partners LP/NGL Energy Finance Corp, 6.125%, 3/01/25 USD 20,000 18,150 0.11
NuStar Logistics LP, 5.750%, 10/01/25 USD 30,000 32,625 0.20Tallgrass Energy Partners LP/Tallgrass Energy Finance Corp, 5.500%, 9/15/24 144A (i) USD 3,000 3,041 0.02Tallgrass Energy Partners LP/Tallgrass Energy Finance Corp, 5.500%, 1/15/28 144A (i) USD 10,000 10,175 0.06Targa Resources Partners LP/Targa Resources Partners Finance Corp, 4.875%, 2/01/31 144A (i) USD 40,000 43,300 0.27Targa Resources Partners LP/Targa Resources Partners Finance Corp, 5.500%, 3/01/30 USD 55,000 60,481 0.37
Western Midstream Operating LP, 5.300%, 2/01/30 USD 30,000 33,600 0.21
Western Midstream Operating LP, 5.300%, 3/01/48 USD 5,000 5,325 0.03
78

NATIXIS INTERNATIONAL FUNDS (DUBLIN) I PLC
LOOMIS SAYLES HIGH INCOME FUND (Continued)
Schedule of Investments As at 30 June 2021
Face Fair Value % of
Amount USD Net Assets
BONDS AND NOTES (Continued)
NON-CONVERTIBLE BONDS (Continued)
Pipelines - 5.39% (31 December 2020: 5.04%) (Continued) Western Midstream Operating LP, 5.450%, 4/01/44 USD 30,000 32,325 0.20
Western Midstream Operating LP, 6.500%, 2/01/50 USD 30,000 34,735 0.21
875,269 5.39
Real Estate - 0.60% (31 December 2020: 0.38%) Realogy Group LLC/Realogy Co.-Issuer Corp, 5.750%, 1/15/29 144A (i) USD 25,000 26,135 0.16Realogy Group LLC/Realogy Co.-Issuer Corp, 7.625%, 6/15/25 144A (i) USD 45,000 48,811 0.30Realogy Group LLC/Realogy Co.-Issuer Corp, 9.375%, 4/01/27 144A (i) USD 20,000 22,223 0.14
97,169 0.60
Real Estate Investment Trusts - 1.49% (31 December 2020: 2.02%) Iron Mountain Inc, 4.875%, 9/15/29 144A (i) USD 80,000 82,576 0.51Ladder Capital Finance Holdings LLLP/Ladder Capital Finance Corp, 4.250%, 2/01/27 144A (i) USD 45,000 44,936 0.28
Service Properties Trust, 7.500%, 9/15/25 USD 65,000 73,593 0.45
Starwood Property Trust Inc, 3.625%, 7/15/26 144A (i) USD 10,000 10,075 0.06Uniti Group LP/Uniti Group Finance Inc/CSL Capital LLC, 4.750%, 4/15/28 144A (i) USD 30,000 29,925 0.19
241,105 1.49
Retailers - 3.84% (31 December 2020: 3.01%) Ambience Merger Sub Inc, 4.875%, 7/15/28 144A (i) USD 10,000 10,025 0.06
Ambience Merger Sub Inc, 7.125%, 7/15/29 144A (i) USD 20,000 20,200 0.13Bloomin' Brands Inc/OSI Restaurant Partners LLC, 5.125%, 4/15/29 144A (i) USD 15,000 15,412 0.10
Carvana Co, 5.500%, 4/15/27 144A (i) USD 65,000 67,127 0.41
Carvana Co, 5.625%, 10/01/25 144A (i) USD 10,000 10,397 0.06
Carvana Co, 5.875%, 10/01/28 144A (i) USD 25,000 26,298 0.16Ferrellgas LP/Ferrellgas Finance Corp, 5.375%, 4/01/26 144A (i) USD 20,000 19,825 0.12
Foundation Building Materials Inc, 6.000%, 3/01/29 144A (i) USD 45,000 44,550 0.28
Group 1 Automotive Inc, 4.000%, 8/15/28 144A (i) USD 5,000 5,087 0.03
Ken Garff Automotive LLC, 4.875%, 9/15/28 144A (i) USD 10,000 10,200 0.06
L Brands Inc, 5.250%, 2/01/28 USD 55,000 61,531 0.38
L Brands Inc, 6.750%, 7/01/36 USD 5,000 6,262 0.04
LBM Acquisition LLC, 6.250%, 1/15/29 144A (i) USD 25,000 25,192 0.16
Lithia Motors Inc, 4.375%, 1/15/31 144A (i) USD 25,000 26,778 0.17NMG Holding Co, Inc./Neiman Marcus Group LLC, 7.125%, 4/01/26 144A (i) USD 20,000 21,350 0.13
Park River Holdings Inc, 5.625%, 2/01/29 144A (i) USD 30,000 29,171 0.18
Park River Holdings Inc, 6.750%, 8/01/29 144A (i) USD 15,000 15,188 0.09
QVC Inc, 4.850%, 4/01/24 USD 5,000 5,425 0.03
Rite Aid Corp, 7.500%, 7/01/25 144A (i) USD 15,000 15,188 0.09
79

NATIXIS INTERNATIONAL FUNDS (DUBLIN) I PLC
LOOMIS SAYLES HIGH INCOME FUND (Continued)
Schedule of Investments As at 30 June 2021
Face Fair Value % of
Amount USD Net Assets
BONDS AND NOTES (Continued)
NON-CONVERTIBLE BONDS (Continued)
Retailers - 3.84% (31 December 2020: 3.01%) (Continued) SRS Distribution Inc, 6.125%, 7/01/29 144A (i) USD 15,000 15,437 0.10
Staples Inc, 7.500%, 4/15/26 144A (i) USD 35,000 36,251 0.22Suburban Propane Partners LP/Suburban Energy Finance Corp, 5.000%, 6/01/31 144A (i) USD 20,000 20,475 0.13
Victoria'S Secret & Co, 4.625%, 7/15/29 144A (i) USD 25,000 25,000 0.15
White Capital Buyer LLC, 6.875%, 10/15/28 144A (i) USD 10,000 10,703 0.07
Yum! Brands Inc, 3.625%, 3/15/31 USD 80,000 79,600 0.49
622,672 3.84
Software - 1.64% (31 December 2020: 0.86%) BY Crown Parent LLC/BY Bond Finance Inc, 4.250%, 1/31/26 144A (i) USD 20,000 20,950 0.13
Camelot Finance SA, 4.500%, 11/01/26 144A (i) (ii) USD 55,000 57,544 0.35
Clarivate Science Holdings Corp, 4.875%, 6/30/29 144A (i) USD 30,000 30,787 0.19
Elastic NV, 4.125%, 7/15/29 144A (i) (ii) USD 30,000 30,000 0.18
J2 Global Inc, 4.625%, 10/15/30 144A (i) USD 20,000 20,706 0.13
Playtika Holding Corp, 4.250%, 3/15/29 144A (i) USD 10,000 9,993 0.06
Rackspace Technology Global Inc, 5.375%, 12/01/28 144A (i) USD 20,000 20,500 0.13
Rocket Software Inc, 6.500%, 2/15/29 144A (i) USD 35,000 34,730 0.21
Veritas US Inc./Veritas Bermuda Ltd, 7.500%, 9/01/25 144A (i) USD 40,000 41,650 0.26
266,860 1.64
Sovereign - 1.01% (31 December 2020: 0.00%) United States Treasury Note/Bond, 0.125%, 12/15/23 USD 165,000 164,130 1.01
164,130 1.01
Telecommunications - 3.94% (31 December 2020: 2.82%) CommScope Inc, 7.125%, 7/01/28 144A (i) USD 5,000 5,419 0.03
CommScope Technologies LLC, 5.000%, 3/15/27 144A (i) USD 305,000 312,244 1.92
Embarq Corp, 7.995%, 6/01/36 USD 20,000 22,673 0.14
Ligado Networks LLC, 15.500%, 11/01/23 144A (i) USD 37,833 37,327 0.23
Ligado Networks LLC, 17.500%, 5/01/24 144A (i) USD 10,913 8,403 0.05
LogMeIn Inc, 5.500%, 9/01/27 144A (i) USD 20,000 20,701 0.13
Lumen Technologies Inc, 5.125%, 12/15/26 144A (i) USD 5,000 5,194 0.03
Lumen Technologies Inc, 5.375%, 6/15/29 144A (i) USD 55,000 55,791 0.35
Telecom Italia Capital SA, 6.000%, 9/30/34 (ii) USD 20,000 23,075 0.14
Telesat Canada/Telesat LLC, 5.625%, 12/06/26 144A (i) USD 20,000 20,075 0.12
T-Mobile USA Inc, 2.625%, 4/15/26 USD 85,000 86,912 0.54
ViaSat Inc, 6.500%, 7/15/28 144A (i) USD 15,000 15,997 0.10Windstream Escrow LLC/Windstream Escrow Finance Corp, 7.750%, 8/15/28 144A (i) USD 25,000 25,750 0.16
639,561 3.94
80

NATIXIS INTERNATIONAL FUNDS (DUBLIN) I PLC
LOOMIS SAYLES HIGH INCOME FUND (Continued)
Schedule of Investments As at 30 June 2021
Face Fair Value % of
Amount USD Net Assets
BONDS AND NOTES (Continued)
NON-CONVERTIBLE BONDS (Continued)
Trucking&Leasing - 0.10% (31 December 2020: 0.00%) Fortress Transportation & Infrastructure Investors LLC, 5.500%, 5/01/28 144A (i) USD 15,000 15,619 0.10
15,619 0.10
Water - 0.07% (31 December 2020: 0.00%) Solaris Midstream Holdings LLC, 7.625%, 4/01/26 144A (i) USD 10,000 10,600 0.07
10,600 0.07
TOTAL NON-CONVERTIBLE BONDS 14,649,678 90.26
CONVERTIBLE BONDS - 5.84% OF NET ASSETS (31 December 2020: 4.83%) Airlines - 0.11% (31 December 2020: 0.04%) JetBlue Airways Corp, 0.500%, 4/01/26 144A (i) USD 10,000 9,965 0.06
Southwest Airlines Co, 1.250%, 5/01/25 USD 5,000 7,572 0.05
17,537 0.11
Biotechnology - 1.45% (31 December 2020: 1.22%) BioMarin Pharmaceutical Inc, 1.250%, 5/15/27 USD 190,000 190,366 1.17
Guardant Health Inc, Zero Coupon Bond, 11/15/27 144A (i) USD 15,000 17,072 0.11
Ionis Pharmaceuticals Inc, Zero Coupon Bond, 4/01/26 144A (i) USD 20,000 19,594 0.12
Livongo Health Inc, 0.875%, 6/01/25 USD 5,000 7,943 0.05
234,975 1.45
Healthcare - 0.55% (31 December 2020: 0.43%) Teladoc Health Inc, 1.250%, 6/01/27 USD 80,000 89,552 0.55
89,552 0.55
Internet - 0.78% (31 December 2020: 0.20%) Expedia Group Inc, Zero Coupon Bond, 2/15/26 144A (i) USD 15,000 16,200 0.10
Palo Alto Networks Inc, 0.375%, 6/01/25 USD 45,000 61,200 0.38
Twitter Inc, Zero Coupon Bond, 3/15/26 144A (i) USD 25,000 23,844 0.15
Uber Technologies Inc, Zero Coupon Bond, 12/15/25 144A (i) USD 25,000 25,350 0.15
126,594 0.78
Leisure Time - 0.12% (31 December 2020: 0.00%) Peloton Interactive Inc, Zero Coupon Bond, 2/15/26 144A (i) USD 20,000 19,337 0.12
19,337 0.12
Media - 2.72% (31 December 2020: 2.32%) DISH Network Corp, 3.375%, 8/15/26 USD 405,000 413,302 2.54
Liberty Media Corp, 0.500%, 12/01/50 144A (i) USD 25,000 28,874 0.18
442,176 2.72
Pharmaceuticals - 0.08% (31 December 2020: 0.15%) Neurocrine Biosciences Inc, 2.250%, 5/15/24 USD 10,000 13,369 0.08
13,369 0.08
81

NATIXIS INTERNATIONAL FUNDS (DUBLIN) I PLC
LOOMIS SAYLES HIGH INCOME FUND (Continued)
Schedule of Investments As at 30 June 2021
Face Fair Value % of
Amount USD Net Assets
BONDS AND NOTES (Continued)
CONVERTIBLE BONDS (Continued) Software - 0.03% (31 December 2020: 0.12%) Splunk Iinc, 1.125% 6/15/27 USD 5,000 4,872 0.03 4,872 0.03
TOTAL CONVERTIBLE BONDS 948,412 5.84
TOTAL BONDS AND NOTES 15,598,090 96.10
NON-CONVERTIBLE PREFERRED STOCKS - 0.57% OF NET ASSETS (31 December 2020: 0.37%)
Home Builders - 0.22% (31 December 2020: 0.08%) Hovnanian Enterprises Inc, 7.625% (iv) USD 1,902 35,244 0.22
35,244 0.22
Real Estate Investment Trusts - 0.35% (31 December 2020: 0.29%) Highwoods Properties Inc, 8.625% (iv) USD 45 56,250 0.35
56,250 0.35
TOTAL NON-CONVERTIBLE PREFERRED STOCKS 91,494 0.57
CONVERTIBLE PREFERRED STOCKS - 1.06% OF NET ASSETS (31 December 2020: 2.63%)
Agriculture - 0.67% (31 December 2020: 1.79%) Bunge Ltd, 4.875% (iv) * USD 937 108,748 0.67
108,748 0.67
Healthcare - 0.16% (31 December 2020: 0.25%) Boston Scientific Corp, 5.500%6/01/23 USD 226 26,230 0.16
26,230 0.16
Software - 0.23% (31 December 2020: 0.00%) Clarivate PLC, 5.250%6/01/24 USD 360 37,512 0.23
37,512 0.23
TOTAL CONVERTIBLE PREFERRED STOCKS 172,490 1.06
COMMON STOCKS - 0.45% OF NET ASSETS (31 December 2020: 3.41%)
Oil & Gas - 0.50% (31 December 2020: 0.43%) Battalion Oil Corp USD 242 3,243 0.02
Bellatrix Exploration Ltd CAD 2,763 0 0.00
Lonestar Resources US Inc * USD 4,416 43,719 0.27
Paragon Offshore PLC Class A Litigation Trust Interests * USD 6,209 0 0.00
82

NATIXIS INTERNATIONAL FUNDS (DUBLIN) I PLC
LOOMIS SAYLES HIGH INCOME FUND (Continued)
Schedule of Investments As at 30 June 2021
Fair Value % of
Shares USD Net Assets
COMMON STOCK (Continued)
Oil & Gas - 0.50% (31 December 2020: 0.43%) (Continued) Whiting Petroleum Corp USD 493 26,893 0.16
73,855 0.45
TOTAL COMMON STOCKS 73,855 0.45
TOTAL FINANCIAL ASSETS AT FAIR VALUE THROUGH PROFIT OR LOSS EXCLUDING FINANCIAL DERIVATIVE INSTRUMENTS (Cost: USD 15,298,751) 15,935,929 98.18
FINANCIAL DERIVATIVE INSTRUMENTS - (0.10%) (31 December 2020: 0.03%) Open Forward Foreign Currency Exchange Contracts - (0.10%) (31 December 2020: 0.03%)
Unrealised Maturity Gain/(Loss) % of Date Amount Bought Amount Sold Counterparty USD Net Assets 7/29/21 1,917,350 EUR 2,291,015 USD Brown Brothers Harriman (15,928) (0.10%) 7/29/21 3,250 EUR 3,884 USD Brown Brothers Harriman (27) (0.00%) Unrealised loss on Open Forward Foreign Currency Exchange Contracts (15,955) (0.10%) Net unrealised loss on Open Forward Foreign Currency Exchange Contracts (15,955) (0.10%)
Fair Value % of USD Net Assets Total Financial Assets Designated at Fair Value Through Profit or Loss 15,935,929 98.18Total Financial Liabilities Designated at Fair Value Through Profit or Loss (15,955) (0.10) TOTAL FINANCIAL ASSETS AT FAIR VALUE THROUGH PROFIT OR LOSS AND FINANCIAL DERIVATIVES 15,919,974 98.08 Net Cash at Bank 538,024 3.32Other Assets 247,413 1.52Less Other Liabilities (474,148) (2.92) NET ASSETS ATTRIBUTABLE TO REDEEMABLE PARTICIPATING SHAREHOLDERS 16,231,263 100.00
83

NATIXIS INTERNATIONAL FUNDS (DUBLIN) I PLC
LOOMIS SAYLES HIGH INCOME FUND (Continued)
Schedule of Investments As at 30 June 2021
(i) Securities exempt from registration under Rule 144A (i) of the U.S. Securities Act of 1933. These securities may be resold in transactions exempt from registration, normally to qualified institutional buyers.
(ii) Securities issued by Non-U.S. or Non-Canadian users. (iii) Indicates a variable rate security. The interest rate shown reflects the rate in effect at 30 June 2021. (iv) Perpetual bonds. (v) Security in default. * Unlisted securities.
Other Information: All of the above long term securities are traded on regulated markets unless otherwise stated.
Key to Abbreviations CAD: Canadian Dollar EUR: Euro USD: United States Dollar
% ofAnalysis of total assets Total Assets Transferable securities and money market instruments admitted to an official stock exchange or traded on a regulated market 94.67Transferable securities and money market instruments other than those admitted to an official exchange listing or traded on another regulated market 0.66OTC financial derivative instruments (0.01)Current assets 4.77 100.00
84

NATIXIS INTERNATIONAL FUNDS (DUBLIN) I PLC
LOOMIS SAYLES GLOBAL OPPORTUNISTIC BOND FUND
Schedule of Investments As at 30 June 2021
Face Fair Value % of Amount USD Net Assets
BONDS AND NOTES - 100.58% OF NET ASSETS (31 December 2020: 101.79%)
NON-CONVERTIBLE BONDS - 100.58% OF NET ASSETS (31 December 2020: 101.79%)
Australia - 2.03% (31 December 2020: 1.83%) Australia Government Bond, 3.250%, 4/21/25 (i) AUD 815,000 674,463 0.91National Australia Bank Ltd, 5.000%, 3/11/24 (i) AUD 500,000 419,007 0.56New South Wales Treasury Corp, 4.000%, 5/20/26 (i) AUD 480,000 412,443 0.56 1,505,913 2.03Austria - 0.26% (31 December 2020: 0.23%) Suzano Austria GmbH, 3.750%, 1/15/31 (i) USD 185,000 194,019 0.26 194,019 0.26Brazil - 2.06% (31 December 2020: 2.90%) Brazil Notas do Tesouro Nacional Serie F, 10.000%, 1/01/27 (i) BRL 5,493,000 1,159,953 1.56Republic of Brazil, 4.625%, 1/13/28 (i) USD 340,000 367,278 0.50 1,527,231 2.06Canada - 2.26% (31 December 2020: 1.92%) Canadian Government, 2.000%, 12/01/51 CAD 680,000 569,184 0.77CPPIB Capital Inc, 0.875%, 2/06/29 EMTN EUR 380,000 479,503 0.65Export Development Canada, 1.800%, 9/01/22 CAD 285,000 234,071 0.31Province of British Columbia Canada, 4.300%, 6/18/42 CAD 145,000 152,318 0.20Province of Ontario Canada, 0.625%, 4/17/25 EMTN EUR 200,000 245,667 0.33 1,680,743 2.26Cayman Islands - 0.77% (31 December 2020: 1.04%) CK Hutchison International 19 Ltd, 3.625%, 4/11/29 (i) USD 385,000 426,672 0.57XLIT Ltd, 3.250%, 6/29/47 (i) (ii) EUR 110,000 146,168 0.20 572,840 0.77China - 7.70% (31 December 2020: 6.66%) China Government Bond, 1.990%, 4/09/25 (i) CNY 32,840,000 4,915,645 6.62China Government Bond, 3.810%, 9/14/50 (i) CNY 5,080,000 806,305 1.08 5,721,950 7.70Colombia - 1.10% (31 December 2020: 0.98%) Colombian TES, 7.500%, 8/26/26 (i) COP 2,888,500,000 819,010 1.10 819,010 1.10Denmark - 0.91% (31 December 2020: 0.84%) Denmark Government Bond, 1.750%, 11/15/25 (i) DKK 3,865,000 675,249 0.91 675,249 0.91France - 1.10% (31 December 2020: 1.85%) AXA SA, 3.250%, 5/28/49 EMTN (i) (ii) EUR 235,000 318,980 0.43French Republic Government Bond OAT, 3.250%, 5/25/45 (i) EUR 195,000 360,071 0.49French Republic Government Bond OAT, Zero Coupon Bond, 11/25/30 (i) EUR 115,000 135,970 0.18 815,021 1.10Germany - 3.62% (31 December 2020: 2.68%) Bundesrepublik Deutschland Bundesanleihe, Zero Coupon Bond, 8/15/30 (i) EUR 885,000 1,078,368 1.45Deutsche Bank AG, 5.625%, 5/19/31 EMTN (i) (ii) EUR 500,000 701,460 0.95Fraport AG Frankfurt Airport Services Worldwide, 1.875%, 3/31/28 (i) EUR 355,000 441,375 0.59Kreditanstalt fuer Wiederaufbau, 1.250%, 8/28/23 EMTN (i) NOK 3,220,000 377,100 0.51Volkswagen Financial Services AG, 3.375%, 4/06/28 EMTN (i) EUR 65,000 91,707 0.12 2,690,010 3.62
85

NATIXIS INTERNATIONAL FUNDS (DUBLIN) I PLC
LOOMIS SAYLES GLOBAL OPPORTUNISTIC BOND FUND (Continued)
Schedule of Investments As at 30 June 2021
Face Fair Value % of Amount USD Net Assets
BONDS AND NOTES (Continued)
NON-CONVERTIBLE BONDS (Continued)
India - 0.57% (31 December 2020: 0.48%) Bharti Airtel Ltd, 4.375%, 6/10/25 144A (i) (iii) USD 390,000 425,462 0.57 425,462 0.57Indonesia - 1.42% (31 December 2020: 1.04%) Indonesia Treasury Bond, 8.250%, 5/15/29 (i) * IDR 13,739,000,000 1,055,079 1.42 1,055,079 1.42Ireland - 1.97% (31 December 2020: 0.93%) AIB Group PLC, 2.875%, 5/30/31 EMTN (i) (ii) EUR 270,000 342,378 0.46Bruegel 2021 DAC, 0.800%, 8/22/26 (i) (ii) EUR 230,000 272,757 0.37GE Capital International Funding Co Unlimited Co, 4.418%, 11/15/35 (i) USD 200,000 239,696 0.32Republic of Ireland, 1.000%, 5/15/26 (i) EUR 395,000 500,354 0.68Republic of Ireland, Zero Coupon Bond, 10/18/31 (i) EUR 90,000 104,937 0.14 1,460,122 1.97Israel - 0.68% (31 December 2020: 0.71%) Israel Government Bonds, 1.000%, 3/31/30 (i) ILS 1,655,000 503,118 0.68 503,118 0.68Italy - 4.92% (31 December 2020: 5.72%) Assicurazioni Generali SpA, 5.500%, 10/27/47 EMTN (i) (ii) EUR 100,000 146,055 0.20Atlantia SpA, 1.625%, 2/03/25 EMTN (i) EUR 140,000 170,177 0.23Atlantia SpA, 1.875%, 7/13/27 EMTN (i) EUR 185,000 226,962 0.30Autostrade per l'Italia SpA, 2.000%, 1/15/30 (i) EUR 260,000 318,355 0.43Intesa Sanpaolo SpA, 5.148%, 6/10/30 EMTN (i) GBP 240,000 377,560 0.51Italy Buoni Poliennali Del Tesoro, 1.350%, 4/01/30 (i) EUR 1,485,000 1,865,225 2.51UniCredit SpA, 2.000%, 9/23/29 EMTN (i) (ii) EUR 200,000 238,844 0.32UniCredit SpA, 5.459%, 6/30/35 144A (i) (ii) (iii) USD 290,000 316,199 0.42 3,659,377 4.92Japan - 13.51% (31 December 2020: 8.62%) Development Bank of Japan Inc, 0.875%, 10/10/25 EMTN (i) EUR 335,000 414,033 0.56Japan Government Five Year Bond, 0.100%, 12/20/25 (i) JPY 266,450,000 2,422,969 3.26Japan Government Ten Year Bond, 0.100%, 3/20/28 (i) JPY 83,700,000 762,840 1.03Japan Government Thirty Year Bond, 0.300%, 6/20/46 (i) JPY 100,450,000 847,422 1.14Japan Government Thirty Year Bond, 1.700%, 12/20/43 (i) JPY 86,450,000 973,655 1.31Japan Government Twenty Year Bond, 1.500%, 6/20/34 (i) JPY 59,500,000 626,093 0.84Japan Government Twenty Year Bond, 2.000%, 9/20/25 (i) JPY 74,650,000 732,705 0.98Japan Government Twenty Year Bond, 2.100%, 12/20/30 (i) JPY 156,750,000 1,686,768 2.27Japanese Government CPI Linked Bond, 0.100%, 3/10/28 (i) * JPY 42,434,274 392,265 0.53Japanese Government CPI Linked Bond, 0.100%, 3/10/29 (i) * JPY 127,526,126 1,180,585 1.59 10,039,335 13.51Jersey, Channel Islands - 0.64% (31 December 2020: 0.43%) Heathrow Funding Ltd, 1.125%, 10/08/30 EMTN (i) EUR 300,000 352,039 0.47Heathrow Funding Ltd, 1.875%, 3/14/34 EMTN (i) EUR 100,000 123,797 0.17 475,836 0.64Luxembourg - 0.38% (31 December 2020: 0.50%) Ultrapar International SA, 5.250%, 6/06/29 (i) USD 265,000 284,875 0.38 284,875 0.38Malaysia - 0.30% (31 December 2020: 0.29%) Malaysia Government Bond, 3.906%, 7/15/26 (i) * MYR 880,000 223,829 0.30 223,829 0.30
86

NATIXIS INTERNATIONAL FUNDS (DUBLIN) I PLC
LOOMIS SAYLES GLOBAL OPPORTUNISTIC BOND FUND (Continued)
Schedule of Investments As at 30 June 2021
Face Fair Value % of Amount USD Net Assets
BONDS AND NOTES (Continued)
NON-CONVERTIBLE BONDS (Continued)
Mexico - 2.89% (31 December 2020: 3.82%) Cemex SAB de CV, 5.200%, 9/17/30 (i) USD 200,000 219,920 0.30Cemex SAB de CV, 5.450%, 11/19/29 (i) USD 200,000 219,900 0.30Mexican Bonos, 8.500%, 5/31/29 (i) MXN 26,671,600 1,473,666 1.98Orbia Advance Corp SAB de CV, 5.500%, 1/15/48 144A (i) (iii) USD 200,000 234,300 0.31 2,147,786 2.89Netherlands - 2.22% (31 December 2020: 2.72%) Cooperatieve Rabobank UA, 1.250%, 5/31/32 EMTN (i) EUR 100,000 132,121 0.18EDP Finance BV, 0.375%, 9/16/26 EMTN (i) EUR 100,000 119,749 0.16Embraer Netherlands Finance BV, 6.950%, 1/17/28 (i) USD 305,000 348,844 0.47Enel Finance International NV, 4.625%, 9/14/25 144A (i) (iii) USD 265,000 300,548 0.40Enel Finance International NV, 5.750%, 9/14/40 EMTN (i) GBP 60,000 124,949 0.17Teva Pharmaceutical Finance Netherlands II BV, 1.125%, 10/15/24 (i) EUR 190,000 211,238 0.28Teva Pharmaceutical Finance Netherlands III BV, 3.150%, 10/01/26 (i) USD 195,000 185,494 0.25Upjohn Finance BV, 1.908%, 6/23/32 (i) EUR 180,000 227,030 0.31 1,649,973 2.22New Zealand - 0.15% (31 December 2020: 0.29%) New Zealand Government Bond, 5.500%, 4/15/23 (i) NZD 145,000 110,288 0.15 110,288 0.15Norway - 0.94% (31 December 2020: 1.80%) Aker BP ASA, 4.000%, 1/15/31 144A (i) (iii) USD 290,000 318,532 0.43Norway Government Bond, 1.750%, 3/13/25 144A (i) (iii) NOK 3,175,000 378,895 0.51 697,427 0.94Qatar - 0.45% (31 December 2020: 0.00%) Qatar Pertoleum, 2.250%, 7/12/31 (i) USD 335,000 331,439 0.45 331,439 0.45Singapore - 0.50% (31 December 2020: 0.31%) Singapore Government Bond, 2.125%, 6/01/26 (i) SGD 475,000 373,537 0.50 373,537 0.50South Africa - 0.15% (31 December 2020: 1.51%) Republic of South Africa Government Bond, 7.000%, 2/28/31 (i) ZAR 1,805,000 108,448 0.15 108,448 0.15South Korea - 1.25% (31 December 2020: 1.25%) Korea Treasury Bond, 1.375%, 6/10/30 (i) KRW 1,107,340,000 926,508 1.25 926,508 1.25Spain - 2.83% (31 December 2020: 3.35%) Banco Santander SA, 2.958%, 3/25/31 (i) USD 200,000 206,074 0.27Spain Government Bond, 1.300%, 10/31/26 144A (i) (iii) EUR 730,000 934,678 1.26Spain Government Bond, 4.200%, 1/31/37 144A (i) (iii) EUR 545,000 964,820 1.30 2,105,572 2.83Supranational - 3.19% (31 December 2020: 2.83%) European Investment Bank, 2.375%, 7/06/23 144A (i) (iii) CAD 1,585,000 1,326,185 1.78Nordic Investment Bank, 0.200%, 1/16/23 EMTN (i) SEK 2,000,000 234,311 0.32Nordic Investment Bank, 1.500%, 3/13/25 EMTN (i) NOK 6,900,000 809,120 1.09 2,369,616 3.19
87

NATIXIS INTERNATIONAL FUNDS (DUBLIN) I PLC
LOOMIS SAYLES GLOBAL OPPORTUNISTIC BOND FUND (Continued)
Schedule of Investments As at 30 June 2021
Face Fair Value % of Amount USD Net Assets
BONDS AND NOTES (Continued)
NON-CONVERTIBLE BONDS (Continued)
Sweden - 0.08% (31 December 2020: 0.10%) Sweden Government Bond, 1.500%, 11/13/23 144A (i) (iii) SEK 515,000 62,711 0.08 62,711 0.08Switzerland - 0.35% (31 December 2020: 0.00%) Credit Suisse Group AG, 0.625%, 1/18/33 EMTN (i) EUR 125,000 139,288 0.19Credit Suisse Group AG, 0.650%, 1/14/28 EMTN (i) (ii) EUR 100,000 118,533 0.16 257,821 0.35Thailand - 0.31% (31 December 2020: 0.30%) Thailand Government Bond, 1.600%, 12/17/29 (i) * THB 7,435,000 232,108 0.31 232,108 0.31United Arab Emirates - 0.34% (31 December 2020: 0.41%) DP World PLC, 5.625%, 9/25/48 EMTN (i) USD 205,000 255,983 0.34 255,983 0.34United Kingdom - 7.57% (31 December 2020: 6.19%) Aviva PLC, 4.000%, 6/03/55 (i) (ii) GBP 210,000 322,868 0.44Aviva PLC, 4.375%, 9/12/49 EMTN (i) (ii) GBP 100,000 156,528 0.21Barclays PLC, 3.564%, 9/23/35 (i) (ii) USD 245,000 255,251 0.34Brass NO 8 PLC, 0.856%, 11/16/66 144A (i) (ii) (iii) USD 352,380 353,676 0.48Channel Link Enterprises Finance PLC, 1.761%, 6/30/50 (i) (ii) EUR 180,000 212,996 0.29Channel Link Enterprises Finance PLC, 2.706%, 6/30/50 (i) (ii) EUR 125,000 151,288 0.20Dukinfield II PLC, 1.331%, 12/20/52 (i) (ii) GBP 81,542 112,770 0.15Gosforth Funding PLC, 0.597%, 8/25/60 144A (i) (ii) (iii) USD 121,300 121,405 0.16Lanark Master Issuer PLC, 0.620%, 12/22/69 (i) (ii) GBP 85,000 118,056 0.16Lanark Master Issuer PLC, 2.277%, 12/22/69 144A (i) (ii) (iii) USD 285,000 291,385 0.39Lanark Master Issuer PLC, 2.710%, 12/22/69 144A (i) (iii) (iv) USD 410,000 418,059 0.56Legal & General Group PLC, 4.500%, 11/01/50 (i) (ii) GBP 195,000 309,563 0.42National Grid Electricity Transmission PLC, 2.000%, 9/16/38 EMTN (i) GBP 200,000 272,360 0.37National Grid PLC, 0.163%, 1/20/28 EMTN (i) EUR 200,000 233,287 0.31National Grid PLC, 0.553%, 9/18/29 EMTN (i) EUR 100,000 118,279 0.16Penarth Master Issuer PLC, 0.623%, 7/18/23 144A (i) (ii) (iii) USD 835,000 835,080 1.12Tower Bridge Funding No 3 PLC, 1.281%, 12/20/61 (i) (ii) GBP 190,559 263,835 0.36United Kingdom Treasury, 4.750%, 12/07/30 (i) GBP 570,000 1,076,338 1.45 5,623,024 7.57United States - 31.16% (31 December 2020: 35.40%) Ally Financial Inc, 3.875%, 5/21/24 USD 70,000 75,428 0.10Ally Financial Inc, 5.800%, 5/01/25 USD 70,000 81,346 0.11Anheuser-Busch Cos LLC/Anheuser-Busch InBev Worldwide Inc, 4.700%, 2/01/36 USD 155,000 190,238 0.26Anheuser-Busch InBev Worldwide Inc, 4.500%, 6/01/50 USD 245,000 298,163 0.40Ares Capital Corp, 2.875%, 6/15/28 USD 75,000 76,126 0.10AT&T Inc, 3.650%, 6/01/51 USD 335,000 347,781 0.47Avis Budget Rental Car Funding AESOP LLC, 2.720%, 11/20/22 144A (iii) USD 737,500 741,483 1.00Bank of America Corp, 2.592%, 4/29/31 (ii) USD 205,000 211,342 0.28Bayview Opportunity Master Fund IVa Trust, 4.000%, 4/28/55 144A (iii) USD 24,406 24,966 0.03Broadcom Inc, 3.469%, 4/15/34 144A (iii) USD 275,000 290,882 0.39Broadcom Inc, 4.300%, 11/15/32 USD 55,000 62,630 0.08
88

NATIXIS INTERNATIONAL FUNDS (DUBLIN) I PLC
LOOMIS SAYLES GLOBAL OPPORTUNISTIC BOND FUND (Continued)
Schedule of Investments As at 30 June 2021
Face Fair Value % of Amount USD Net Assets
BONDS AND NOTES (Continued)
NON-CONVERTIBLE BONDS (Continued)
United States - 31.16% (31 December 2020: 35.40%) (Continued) CCO Holdings LLC/CCO Holdings Capital Corp, 4.500%, 5/01/32 USD 75,000 77,719 0.11Centene Corp, 2.450%, 7/15/28 USD 55,000 55,742 0.08Centene Corp, 2.500%, 3/01/31 USD 130,000 128,212 0.17Centene Corp, 3.000%, 10/15/30 USD 960,000 986,189 1.33Charter Communications Operating LLC/Charter Communications Operating Capital, 2.800%, 4/01/31 USD 95,000 97,120 0.13Charter Communications Operating LLC/Charter Communications Operating Capital, 3.700%, 4/01/51 USD 210,000 207,704 0.28Charter Communications Operating LLC/Charter Communications Operating Capital, 5.050%, 3/30/29 USD 130,000 153,555 0.21Charter Communications Operating LLC/Charter Communications Operating Capital, 5.125%, 7/01/49 USD 100,000 119,090 0.16Citigroup Inc, 2.400%, 10/31/25 JPY 25,000,000 240,067 0.32Citigroup Inc, 4.400%, 6/10/25 USD 130,000 145,186 0.20Citigroup Inc, 4.412%, 3/31/31 (ii) USD 200,000 233,533 0.31Citigroup Mortgage Loan Trust, 4.000%, 1/25/68 144A (ii) (iii) USD 269,345 269,593 0.36Commercial Trust, 3.644%, 12/10/47 USD 109,000 117,752 0.16Commercial Trust, 3.902%, 7/10/50 USD 500,000 549,117 0.74Delta Air Lines Class B Pass Through Trust, 4.250%, 7/30/23 USD 180,279 183,851 0.25Delta Air Lines, Inc./SkyMiles IP Ltd, 4.500%, 10/20/25 144A (iii) USD 595,000 639,399 0.86Diamond Resorts Owner Trust, 3.700%, 1/21/31 144A (iii) USD 70,045 72,970 0.10ERAC USA Finance LLC, 4.500%, 2/15/45 144A (iii) USD 120,000 146,359 0.20Fannie Mae or Freddie Mac, 2.000%, 9/01/51 (v) USD 1,103,000 1,109,247 1.49Fannie Mae or Freddie Mac, 2.500%, 9/01/51 (v) USD 685,000 705,630 0.95Fannie Mae Pool, 3.000%, 4/01/45 USD 58,577 61,931 0.08Fannie Mae Pool, 4.000%, 6/01/47 USD 123,885 134,822 0.18Fannie Mae Pool, 4.500%, 11/01/45 USD 33,507 37,370 0.05Fannie Mae Pool, 4.500%, 7/01/46 USD 13,158 14,479 0.02Fannie Mae Pool, 4.500%, 2/01/47 USD 10,563 11,378 0.02Fannie Mae Pool, 4.500%, 3/01/47 USD 246,215 268,685 0.36Fannie Mae-Aces, 2.964%, 11/25/27 (ii) USD 1,500,000 1,639,135 2.21Fannie Mae-Aces, 3.023%, 9/25/27 (ii) USD 84,131 92,131 0.12Freddie Mac Gold Pool, 3.500%, 12/01/46 USD 41,638 45,048 0.06Freddie Mac Gold Pool, 4.500%, 7/01/39 USD 36,326 40,545 0.05Freddie Mac Gold Pool, 5.000%, 8/01/48 USD 76,228 83,839 0.11Freddie Mac Pool, 5.000%, 9/01/48 USD 508,776 558,101 0.75Freddie Mac Pool, 5.000%, 10/01/48 USD 236,306 259,208 0.35Freddie Mac Pool, 5.000%, 11/01/48 USD 145,549 159,258 0.21Freddie Mac Pool, 5.000%, 10/01/49 USD 288,749 316,972 0.43Ginnie Mae II Pool, 1.877%, 5/20/64 (ii) USD 91,270 95,712 0.13Ginnie Mae II Pool, 2.102%, 11/20/64 (ii) USD 65,927 71,341 0.10Ginnie Mae II Pool, 2.153%, 11/20/64 (ii) USD 64,858 69,835 0.09Ginnie Mae II Pool, 2.417%, 10/20/63 (ii) USD 141,830 150,288 0.20Ginnie Mae II Pool, 3.630%, 1/20/63 (ii) USD 1,501 1,550 0.00Ginnie Mae II Pool, 4.611%, 2/20/65 (ii) USD 82,827 90,089 0.12Ginnie Mae II Pool, 4.630%, 12/20/61 (ii) USD 401 404 0.00Ginnie Mae II Pool, 4.639%, 7/20/64 (ii) USD 101,655 110,311 0.15Ginnie Mae II Pool, 4.653%, 7/20/64 (ii) USD 121,887 131,855 0.18
89

NATIXIS INTERNATIONAL FUNDS (DUBLIN) I PLC
LOOMIS SAYLES GLOBAL OPPORTUNISTIC BOND FUND (Continued)
Schedule of Investments As at 30 June 2021
Face Fair Value % of Amount USD Net Assets
BONDS AND NOTES (Continued)
NON-CONVERTIBLE BONDS (Continued)
United States - 31.16% (31 December 2020: 35.40%) (Continued) Ginnie Mae II Pool, 4.657%, 5/20/64 (ii) USD 145,117 156,390 0.21Ginnie Mae II Pool, 5.310%, 6/20/60 (ii) USD 1,733 1,879 0.00Goldman Sachs Group Inc, 1.000%, 11/24/25 EMTN CHF 335,000 377,863 0.51Kraft Heinz Foods Co, 3.750%, 4/01/30 USD 205,000 224,930 0.30Kraft Heinz Foods Co, 5.000%, 7/15/35 USD 100,000 122,662 0.17Onemain Financial Issuance Trust, 3.300%, 3/14/29 144A (iii) USD 497,503 499,068 0.67Quicken Loans LLC/Quicken Loans Co-Issuer Inc, 3.625%, 3/01/29 144A (iii) USD 220,000 217,250 0.29Quicken Loans LLC/Quicken Loans Co-Issuer Inc, 3.875%, 3/01/31 144A (iii) USD 380,000 382,846 0.52Santander Drive Auto Receivables Trust, 2.900%, 10/15/24 USD 320,000 324,408 0.44T-Mobile USA Inc, 2.550%, 2/15/31 USD 460,000 465,152 0.63T-Mobile USA Inc, 3.875%, 4/15/30 USD 140,000 156,495 0.21Towd Point Mortgage Trust, 2.750%, 10/25/57 144A (ii) (iii) USD 180,171 184,527 0.25United Airlines Inc, 4.375%, 4/15/26 144A (iii) USD 140,000 144,925 0.20United Airlines, 3.650%, 10/07/25 USD 210,069 208,941 0.28United Airlines, 3.650%, 1/07/26 USD 96,597 95,914 0.13United States Treasury Bill, 0.038%, 9/23/21 * USD 1,820,000 1,819,845 2.45United States Treasury Note/Bond, 0.125%, 5/31/23 USD 565,000 563,786 0.76United States Treasury Note/Bond, 1.625%, 5/15/31 USD 390,000 395,972 0.53United States Treasury Note/Bond, 1.875%, 2/15/41 USD 2,370,000 2,320,008 3.12United States Treasury Note/Bond, 2.750%, 11/15/47 (vi) USD 465,000 529,337 0.71United States Treasury Note/Bond, 2.875%, 5/15/49 USD 570,000 667,457 0.90WEA Finance LLC, 3.500%, 6/15/29 144A (iii) USD 200,000 207,772 0.28 23,150,134 31.16
TOTAL NON-CONVERTIBLE BONDS 74,731,394 100.58
TOTAL BONDS AND NOTES 74,731,394 100.58
TOTAL FINANCIAL ASSETS AT FAIR VALUE THROUGH PROFIT OR LOSS EXCLUDING FINANCIAL DERIVATIVE INSTRUMENTS (Cost: USD 72,405,921) 74,731,394 100.58
FINANCIAL DERIVATIVE INSTRUMENTS - (0.43%) (31 December 2020: 0.89%)
Open Forward Foreign Currency Exchange Contracts - (0.35%) (31 December 2020: 0.85%)
Unrealised Maturity Gain/(Loss) % of Date Amount Bought Amount Sold Counterparty USD Net Assets 9/2/21 1,283,041 USD 6,878,000 BRL Bank of America (77,392) (0.11%) 9/2/21 2,800,000 BRL 519,673 USD Bank of America 34,152 0.05%
90

NATIXIS INTERNATIONAL FUNDS (DUBLIN) I PLC
LOOMIS SAYLES GLOBAL OPPORTUNISTIC BOND FUND (Continued)
Schedule of Investments As at 30 June 2021
FINANCIAL DERIVATIVE INSTRUMENTS (Continued) Open Forward Foreign Currency Exchange Contracts - (0.35%) (31 December 2020: 0.85%) (Continued)
Unrealised Maturity Gain/(Loss) % of Date Amount Bought Amount Sold Counterparty USD Net Assets 9/15/21 270,734 USD 30,000,000 JPY Bank of America 261 0.00% 8/23/21 900,000 GBP 1,271,361 USD Barclays Bank Plc (27,905) (0.04%) 9/16/21 315,000 GBP 446,684 USD Barclays Bank Plc (11,452) (0.02%) 9/15/21 144,362 EUR 125,000 GBP Barclays Bank Plc (1,241) (0.00%) 9/15/21 125,000 GBP 145,060 EUR Barclays Bank Plc 412 0.00% 9/16/21 113,221 USD 82,000 GBP Barclays Bank Plc (77) (0.00%) 8/23/21 1,273,034 USD 900,000 GBP Barclays Bank Plc 29,577 0.04% 9/15/21 1,244,000 SEK 123,341 EUR BNP Paribas SA (937) (0.00%) 9/15/21 76,947 USD 500,000 CNH BNP Paribas SA (20) (0.00%) 7/29/21 8,465,557 GBP 11,771,018 USD Brown Brothers Harriman (75,352) (0.10%) 7/29/21 4,889,192 GBP 5,689,990 EUR Brown Brothers Harriman 3,086 0.01% 7/29/21 2,638,206 GBP 406,195,419 JPY Brown Brothers Harriman (15,747) (0.02%) 7/29/21 1,369,869 GBP 12,323,727 CNH Brown Brothers Harriman (11,069) (0.02%) 7/29/21 1,209,168 EUR 1,444,818 USD Brown Brothers Harriman (10,045) (0.01%) 7/29/21 570,019 GBP 975,555 CAD Brown Brothers Harriman (294) (0.00%) 7/29/21 455,776 GBP 850,455 SGD Brown Brothers Harriman (2,961) (0.01%) 7/29/21 2,894,362 SEK 341,830 USD Brown Brothers Harriman (3,305) (0.01%) 7/29/21 376,894 EUR 49,858,039 JPY Brown Brothers Harriman (2,101) (0.00%) 7/29/21 328,625 GBP 602,087 AUD Brown Brothers Harriman 1,936 0.00% 7/29/21 312,368 EUR 373,244 USD Brown Brothers Harriman (2,595) (0.00%) 7/29/21 1,718,326 SEK 169,936 EUR Brown Brothers Harriman (667) (0.00%) 7/29/21 1,052,600 SGD 784,387 USD Brown Brothers Harriman (1,371) (0.00%) 7/29/21 195,658 EUR 1,512,648 CNH Brown Brothers Harriman (1,492) (0.00%) 7/29/21 914,938 SEK 11,963,360 JPY Brown Brothers Harriman (801) (0.00%) 7/29/21 142,454 EUR 122,406 GBP Brown Brothers Harriman (77) (0.00%) 7/29/21 100,246 GBP 127,696 CHF Brown Brothers Harriman 247 0.00%
91

NATIXIS INTERNATIONAL FUNDS (DUBLIN) I PLC
LOOMIS SAYLES GLOBAL OPPORTUNISTIC BOND FUND (Continued)
Schedule of Investments As at 30 June 2021
FINANCIAL DERIVATIVE INSTRUMENTS (Continued) Open Forward Foreign Currency Exchange Contracts - (0.35%) (31 December 2020: 0.85%) (Continued)
Unrealised Maturity Gain/(Loss) % of Date Amount Bought Amount Sold Counterparty USD Net Assets 7/29/21 86,283 GBP 1,015,967 SEK Brown Brothers Harriman 377 0.00% 7/29/21 79,531 EUR 127,529 SGD Brown Brothers Harriman (497) (0.00%) 7/29/21 97,986 EUR 12,962,264 JPY Brown Brothers Harriman (546) (0.00%) 7/29/21 475,022 SEK 362,995 CNH Brown Brothers Harriman (512) (0.00%) 7/29/21 81,415 EUR 119,741 CAD Brown Brothers Harriman (92) (0.00%) 7/29/21 65,101 EUR 104,388 SGD Brown Brothers Harriman (406) (0.00%) 7/29/21 348,558 SEK 29,602 GBP Brown Brothers Harriman (129) (0.00%) 7/29/21 50,720 EUR 392,119 CNH Brown Brothers Harriman (387) (0.00%) 7/29/21 46,952 EUR 73,902 AUD Brown Brothers Harriman 223 0.00% 7/29/21 37,021 EUR 31,811 GBP Brown Brothers Harriman (20) (0.00%) 7/29/21 200,383 SEK 29,130 CAD Brown Brothers Harriman (87) (0.00%) 7/29/21 20,980 EUR 212,618 SEK Brown Brothers Harriman 26 0.00% 7/29/21 158,683 SEK 25,151 SGD Brown Brothers Harriman (150) (0.00%) 7/29/21 628,186 SGD 391,762 EUR Brown Brothers Harriman 2,443 0.00% 7/29/21 13,820 GBP 25,782 SGD Brown Brothers Harriman (86) (0.00%) 7/29/21 21,314 EUR 31,348 CAD Brown Brothers Harriman (24) (0.00%) 7/29/21 115,355 SEK 17,947 AUD Brown Brothers Harriman 17 0.00% 7/29/21 16,900 EUR 27,100 SGD Brown Brothers Harriman (105) (0.00%) 7/29/21 25,692 EUR 260,795 SEK Brown Brothers Harriman (17) (0.00%) 7/29/21 13,948 CAD 15,233 SGD Brown Brothers Harriman (68) (0.00%) 7/29/21 14,319 EUR 15,674 CHF Brown Brothers Harriman 21 0.00% 7/29/21 8,704 AUD 8,870 SGD Brown Brothers Harriman (63) (0.00%) 7/29/21 5,247,130 JPY 63,596 SGD Brown Brothers Harriman (22) (0.00%) 7/29/21 330,649 SGD 27,280,442 JPY Brown Brothers Harriman 118 0.00% 7/29/21 12,257 EUR 19,293 AUD Brown Brothers Harriman 58 0.00% 7/29/21 12,333 EUR 124,704 SEK Brown Brothers Harriman 48 0.00%
92
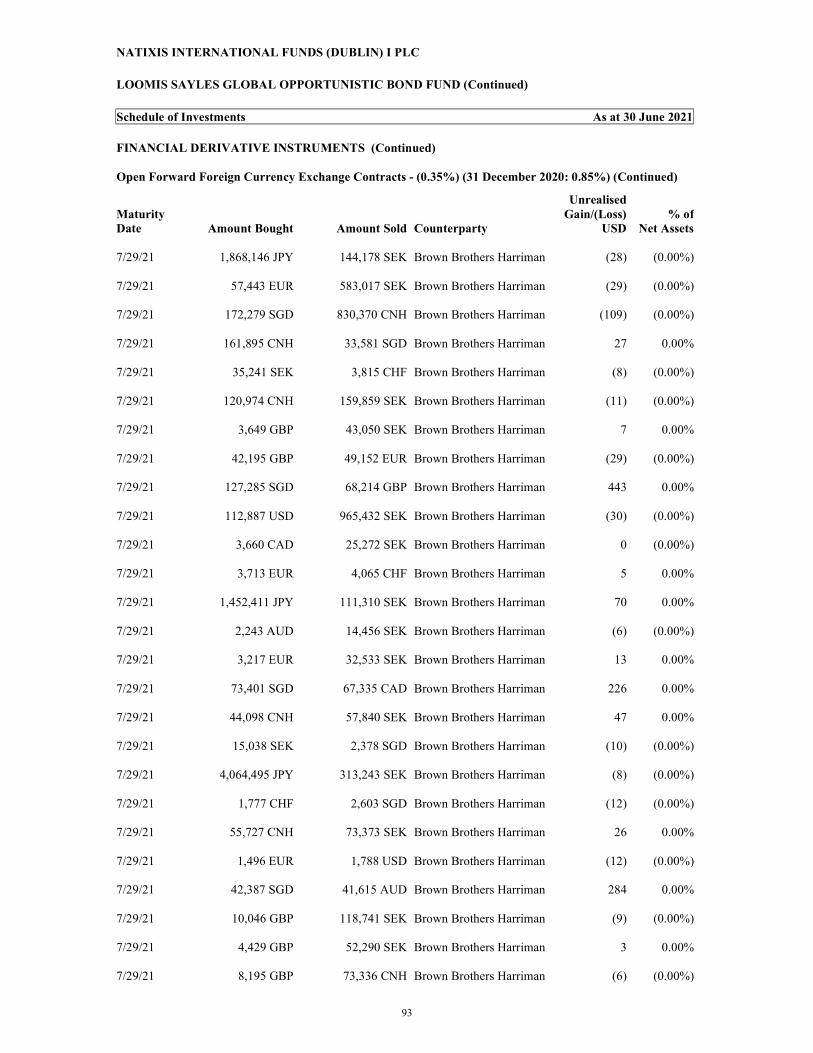
NATIXIS INTERNATIONAL FUNDS (DUBLIN) I PLC
LOOMIS SAYLES GLOBAL OPPORTUNISTIC BOND FUND (Continued)
Schedule of Investments As at 30 June 2021
FINANCIAL DERIVATIVE INSTRUMENTS (Continued) Open Forward Foreign Currency Exchange Contracts - (0.35%) (31 December 2020: 0.85%) (Continued)
Unrealised Maturity Gain/(Loss) % of Date Amount Bought Amount Sold Counterparty USD Net Assets 7/29/21 1,868,146 JPY 144,178 SEK Brown Brothers Harriman (28) (0.00%) 7/29/21 57,443 EUR 583,017 SEK Brown Brothers Harriman (29) (0.00%) 7/29/21 172,279 SGD 830,370 CNH Brown Brothers Harriman (109) (0.00%) 7/29/21 161,895 CNH 33,581 SGD Brown Brothers Harriman 27 0.00% 7/29/21 35,241 SEK 3,815 CHF Brown Brothers Harriman (8) (0.00%) 7/29/21 120,974 CNH 159,859 SEK Brown Brothers Harriman (11) (0.00%) 7/29/21 3,649 GBP 43,050 SEK Brown Brothers Harriman 7 0.00% 7/29/21 42,195 GBP 49,152 EUR Brown Brothers Harriman (29) (0.00%) 7/29/21 127,285 SGD 68,214 GBP Brown Brothers Harriman 443 0.00% 7/29/21 112,887 USD 965,432 SEK Brown Brothers Harriman (30) (0.00%) 7/29/21 3,660 CAD 25,272 SEK Brown Brothers Harriman 0 (0.00%) 7/29/21 3,713 EUR 4,065 CHF Brown Brothers Harriman 5 0.00% 7/29/21 1,452,411 JPY 111,310 SEK Brown Brothers Harriman 70 0.00% 7/29/21 2,243 AUD 14,456 SEK Brown Brothers Harriman (6) (0.00%) 7/29/21 3,217 EUR 32,533 SEK Brown Brothers Harriman 13 0.00% 7/29/21 73,401 SGD 67,335 CAD Brown Brothers Harriman 226 0.00% 7/29/21 44,098 CNH 57,840 SEK Brown Brothers Harriman 47 0.00% 7/29/21 15,038 SEK 2,378 SGD Brown Brothers Harriman (10) (0.00%) 7/29/21 4,064,495 JPY 313,243 SEK Brown Brothers Harriman (8) (0.00%) 7/29/21 1,777 CHF 2,603 SGD Brown Brothers Harriman (12) (0.00%) 7/29/21 55,727 CNH 73,373 SEK Brown Brothers Harriman 26 0.00% 7/29/21 1,496 EUR 1,788 USD Brown Brothers Harriman (12) (0.00%) 7/29/21 42,387 SGD 41,615 AUD Brown Brothers Harriman 284 0.00% 7/29/21 10,046 GBP 118,741 SEK Brown Brothers Harriman (9) (0.00%) 7/29/21 4,429 GBP 52,290 SEK Brown Brothers Harriman 3 0.00% 7/29/21 8,195 GBP 73,336 CNH Brown Brothers Harriman (6) (0.00%)
93

NATIXIS INTERNATIONAL FUNDS (DUBLIN) I PLC
LOOMIS SAYLES GLOBAL OPPORTUNISTIC BOND FUND (Continued)
Schedule of Investments As at 30 June 2021
FINANCIAL DERIVATIVE INSTRUMENTS (Continued) Open Forward Foreign Currency Exchange Contracts - (0.35%) (31 December 2020: 0.85%) (Continued)
Unrealised Maturity Gain/(Loss) % of Date Amount Bought Amount Sold Counterparty USD Net Assets 7/29/21 476 CHF 4,406 SEK Brown Brothers Harriman 0 (0.00%) 7/29/21 7,855 USD 6,623 EUR Brown Brothers Harriman (4) (0.00%) 7/29/21 3,075 SGD 19,444 SEK Brown Brothers Harriman 13 0.00% 7/29/21 466 EUR 61,703 JPY Brown Brothers Harriman (3) (0.00%) 7/29/21 1,140,833 JPY 8,665 EUR Brown Brothers Harriman 0 (0.00%) 7/29/21 6,933,826 JPY 45,221 GBP Brown Brothers Harriman 12 0.00% 7/29/21 11,230 SGD 70,855 SEK Brown Brothers Harriman 67 0.00% 7/29/21 12,856 SGD 8,775 CHF Brown Brothers Harriman 63 0.00% 7/29/21 573 CHF 5,310 SEK Brown Brothers Harriman (1) (0.00%) 7/29/21 242 EUR 1,872 CNH Brown Brothers Harriman (2) (0.00%) 7/29/21 2,604 AUD 16,684 SEK Brown Brothers Harriman 4 0.00% 7/29/21 321 GBP 592 AUD Brown Brothers Harriman (1) (0.00%) 7/29/21 2,225 CNH 290 EUR Brown Brothers Harriman 0 (0.00%) 7/29/21 101 EUR 148 CAD Brown Brothers Harriman 0 (0.00%) 7/29/21 81 EUR 129 SGD Brown Brothers Harriman (1) (0.00%) 7/29/21 176 EUR 151 GBP Brown Brothers Harriman 0 (0.00%) 7/29/21 405,213 JPY 3,078 EUR Brown Brothers Harriman 0 (0.00%) 7/29/21 2,861 USD 2,412 EUR Brown Brothers Harriman (1) (0.00%) 7/29/21 8,583 SGD 54,601 SEK Brown Brothers Harriman (2) (0.00%) 7/29/21 203,130 JPY 2,462 SGD Brown Brothers Harriman (1) (0.00%) 7/29/21 42 SGD 41 AUD Brown Brothers Harriman 0 (0.00%) 7/29/21 365 AUD 231 EUR Brown Brothers Harriman 0 (0.00%) 7/29/21 338 AUD 214 EUR Brown Brothers Harriman 0 (0.00%) 7/29/21 0 AUD 0 EUR Brown Brothers Harriman 0 (0.00%) 7/29/21 58 EUR 91 AUD Brown Brothers Harriman 0 (0.00%) 7/29/21 1,338 CAD 909 EUR Brown Brothers Harriman 1 0.00%
94

NATIXIS INTERNATIONAL FUNDS (DUBLIN) I PLC
LOOMIS SAYLES GLOBAL OPPORTUNISTIC BOND FUND (Continued)
Schedule of Investments As at 30 June 2021
FINANCIAL DERIVATIVE INSTRUMENTS (Continued) Open Forward Foreign Currency Exchange Contracts - (0.35%) (31 December 2020: 0.85%) (Continued)
Unrealised Maturity Gain/(Loss) % of Date Amount Bought Amount Sold Counterparty USD Net Assets 7/29/21 10,068 CAD 69,440 SEK Brown Brothers Harriman 9 0.00% 7/29/21 5,173 CAD 3,019 GBP Brown Brothers Harriman 6 0.00% 7/29/21 830 CAD 564 EUR Brown Brothers Harriman 1 0.00% 7/29/21 331 CAD 359 SGD Brown Brothers Harriman 0 (0.00%) 7/29/21 2 CAD 1 EUR Brown Brothers Harriman 0 (0.00%) 7/29/21 18 EUR 19 CHF Brown Brothers Harriman 0 (0.00%) 7/29/21 57 CHF 52 EUR Brown Brothers Harriman 0 (0.00%) 7/29/21 31 CHF 45 SGD Brown Brothers Harriman 0 (0.00%) 7/29/21 125 CHF 114 EUR Brown Brothers Harriman 0 (0.00%) 7/29/21 0 CHF 0 EUR Brown Brothers Harriman 0 (0.00%) 7/29/21 263 CHF 206 GBP Brown Brothers Harriman 0 (0.00%) 7/29/21 1 EUR 9 CNH Brown Brothers Harriman 0 (0.00%) 7/29/21 0 CNH 0 EUR Brown Brothers Harriman 0 (0.00%) 7/29/21 1,941 SGD 9,347 CNH Brown Brothers Harriman 0 (0.00%) 7/29/21 1,425 JPY 11 EUR Brown Brothers Harriman 0 (0.00%) 7/29/21 12 SEK 1 EUR Brown Brothers Harriman 0 (0.00%) 7/29/21 15 EUR 154 SEK Brown Brothers Harriman 0 (0.00%) 7/29/21 9,564 SEK 942 EUR Brown Brothers Harriman 1 0.00% 7/29/21 618 SGD 387 EUR Brown Brothers Harriman 0 (0.00%) 7/29/21 313 GBP 365 EUR Brown Brothers Harriman 0 (0.00%) 7/29/21 2 SGD 1 EUR Brown Brothers Harriman 0 (0.00%) 7/29/21 341 GBP 397 EUR Brown Brothers Harriman 0 (0.00%) 7/29/21 1,648 SGD 1,033 EUR Brown Brothers Harriman 0 (0.00%) 7/29/21 0 GBP 0 EUR Brown Brothers Harriman 0 (0.00%) 7/29/21 2,491 SGD 1,562 EUR Brown Brothers Harriman 0 (0.00%) 7/29/21 10 USD 9 EUR Brown Brothers Harriman 0 (0.00%)
95

NATIXIS INTERNATIONAL FUNDS (DUBLIN) I PLC
LOOMIS SAYLES GLOBAL OPPORTUNISTIC BOND FUND (Continued)
Schedule of Investments As at 30 June 2021
FINANCIAL DERIVATIVE INSTRUMENTS (Continued) Open Forward Foreign Currency Exchange Contracts - (0.35%) (31 December 2020: 0.85%) (Continued)
Unrealised Maturity Gain/(Loss) % of Date Amount Bought Amount Sold Counterparty USD Net Assets 7/29/21 2,855 SEK 281 EUR Brown Brothers Harriman 0 (0.00%) 7/29/21 585 SGD 315 GBP Brown Brothers Harriman 0 (0.00%) 7/29/21 4,222 SEK 664 SGD Brown Brothers Harriman 0 (0.00%) 7/29/21 6,192 AUD 39,740 SEK Brown Brothers Harriman 1 0.00% 7/29/21 1,306 CHF 12,081 SEK Brown Brothers Harriman 1 0.00% 7/29/21 8,450 SGD 4,549 GBP Brown Brothers Harriman 1 0.00% 7/29/21 17,837 SGD 13,255 USD Brown Brothers Harriman 14 0.00% 7/29/21 153,756 USD 206,407 SGD Brown Brothers Harriman 212 0.00% 7/29/21 52,895 USD 450,759 SEK Brown Brothers Harriman 174 0.00% 7/29/21 4,065 GBP 5,615 USD Brown Brothers Harriman 1 0.00% 7/29/21 41,003 USD 347,982 SEK Brown Brothers Harriman 303 0.00% 7/29/21 3,838 SGD 24,330 SEK Brown Brothers Harriman 9 0.00% 7/29/21 4,288 CAD 29,503 SEK Brown Brothers Harriman 12 0.00% 7/29/21 72,349 SEK 6,121 GBP Brown Brothers Harriman 6 0.00% 9/15/21 5,317,000 SEK 455,730 GBP Citibank NA (7,517) (0.01%) 9/15/21 76,798 USD 1,106,000 ZAR Citibank NA 96 0.00% 9/15/21 143,314 USD 1,975,000 ZAR Citibank NA 6,346 0.01% 9/15/21 582,000 PLN 130,290 EUR Credit Suisse (1,844) (0.00%) 9/15/21 648,081 EUR 6,565,000 NOK HSBC Bank 6,630 0.01% 9/15/21 210,000 SGD 158,583 USD HSBC Bank (2,386) (0.00%) 9/15/21 816,384 USD 2,947,800,000 COP HSBC Bank 30,286 0.04% 9/15/21 3,416,000 EUR 4,173,498 USD UBS Securities LLC (116,057) (0.16%) 9/15/21 539,011 EUR 9,009,000 ZAR UBS Securities LLC 15,442 0.02% 9/15/21 10,650,000 CZK 417,693 EUR UBS Securities LLC (1,253) (0.00%) 9/15/21 508,000 AUD 393,484 USD UBS Securities LLC (11,980) (0.02%) 9/15/21 888,025,000 KRW 795,223 USD UBS Securities LLC (6,901) (0.01%)
96

NATIXIS INTERNATIONAL FUNDS (DUBLIN) I PLC
LOOMIS SAYLES GLOBAL OPPORTUNISTIC BOND FUND (Continued)
Schedule of Investments As at 30 June 2021
FINANCIAL DERIVATIVE INSTRUMENTS (Continued) Open Forward Foreign Currency Exchange Contracts - (0.35%) (31 December 2020: 0.85%) (Continued)
Unrealised Maturity Gain/(Loss) % of Date Amount Bought Amount Sold Counterparty USD Net Assets 9/15/21 67,870 USD 1,000,000,000 IDR UBS Securities LLC (666) (0.00%) 9/15/21 76,806 USD 1,555,000 MXN UBS Securities LLC (544) (0.00%) 9/15/21 377,323 USD 318,000 EUR UBS Securities LLC (390) (0.00%) 9/15/21 75,394 USD 85,284,000 KRW UBS Securities LLC (315) (0.00%) 9/15/21 835,000 CAD 674,600 USD UBS Securities LLC (303) (0.00%) 9/15/21 74,358 USD 1,497,000 MXN UBS Securities LLC (107) (0.00%) 9/15/21 394,180 USD 7,864,000 MXN UBS Securities LLC 3,004 0.01% 9/15/21 232,928 USD 195,000 EUR UBS Securities LLC 1,311 0.00% Unrealised gain on Open Forward Foreign Currency Exchange Contracts 138,179 0.19%Unrealised loss on Open Forward Foreign Currency Exchange Contracts (400,698) (0.54%) Net unrealised loss on Open Forward Foreign Currency Exchange Contracts (262,519) (0.35%)
Futures - (0.08)% (31 December 2020: 0.04%)
Number of Unrealised % of Contracts Description Counterparty Commitment Gain/(Loss) Net Assets
(2) US Ultra Bond September 2021 Futures JP Morgan 382,414 (2,961) (0.01%)
(5) US Long Bond September 2021 Futures JP Morgan 803,813 62 0.00%
(57) US 10 Year Ultra September 2021 Futures JP Morgan 8,322,151 (68,427) (0.09%)
22 US 2 Year Note September 2021 Futures JP Morgan 4,856,156 (9,109) (0.01%)
5 US 10 Year Note September 2021 Futures JP Morgan 662,656 (156) (0.00%)
22 Long Gilt September 2021 Futures JP Morgan 3,869,497 23,706 0.03%
24 US 5 Year Note September 2021 Futures Morgan Stanley Capital 2,960,063 2,250 0.00%
Unrealised gain on Futures 26,018 0.03%)Unrealised loss on Futures (80,653) (0.11%) Net unrealised loss on Futures (54,635) (0.08%)
Fair Value % of USD Net Assets Total Financial Assets Designated at Fair Value Through Profit or Loss 74,895,591 100.80Total Financial Liabilities Designated at Fair Value Through Profit or Loss (481,351) (0.65)
97

NATIXIS INTERNATIONAL FUNDS (DUBLIN) I PLC
LOOMIS SAYLES GLOBAL OPPORTUNISTIC BOND FUND (Continued)
Schedule of Investments As at 30 June 2021
TOTAL FINANCIAL ASSETS AT FAIR VALUE THROUGH PROFIT OR LOSS AND FINANCIAL DERIVATIVES 74,414,240 100.15 Net Cash at Bank 2,069,499 2.79Other Assets 6,156,853 8.29Less Other Liabilities (8,340,299) (11.23) NET ASSETS ATTRIBUTABLE TO REDEEMABLE PARTICIPATING SHAREHOLDERS 74,300,293 100.00
TEN LARGEST SECTOR HOLDINGS AT 30 JUNE 2021 AS A PERCENTAGE OF NET ASSETS
Sovereign 51.97%
Banking 7.06%
UMBS Collateral 4.90% Commercial MBS 3.59%
Supranational 3.19%
WL Collateral CMO 2.62%
Financial 1.99%
Commercial Services 1.99%
Insurance 1.88%
Telecommunications 1.88%
(i) Securities issued by Non-U.S. or Non-Canadian users. (ii) Indicates a variable rate security. The interest rate shown reflects the rate in effect at 30 June 2021.
(iii) Securities exempt from registration under Rule 144A (i) of the U.S. Securities Act of 1933. These securities may be resold in transactions exempt from registration, normally to qualified institutional buyers.
(iv) Indicates a multi-step coupon security. The interest rate shown reflects the rate in effect at 30 June 2021. (v) To-be announced (“TBA”). (vi) 450,000 shares of this security are held as non-cash collateral with JP Morgan for the future contract. * Unlisted securities. Other Information: All of the above long term securities are traded on regulated markets unless otherwise stated.
Key to Abbreviations AUD: Australian Dollar BRL: Brazilian Real CAD: Canadian Dollar CHF: Swiss Franc CNH: China Yuan CNY: China Yuan Renminbi COP: Colombian Peso CZK: Czech Koruna DKK: Danish Krone EUR: Euro GBP: British Pound IDR: Indonesian Rupiah ILS: Israeli New Shekel JPY: Japanese Yen KRW: Korean Won MXN: Mexican Peso MYR: Malaysian Ringgit NOK: Norwegian Krone
98

NATIXIS INTERNATIONAL FUNDS (DUBLIN) I PLC
LOOMIS SAYLES GLOBAL OPPORTUNISTIC BOND FUND (Continued)
Schedule of Investments As at 30 June 2021
NZD: New Zealand Dollar PLN: Polish Zloty SEK: Swedish Krona SGD: Singapore Dollar THB: Thai Baht USD: United States Dollar ZAR: South African Rand
% ofAnalysis of total assets Total Assets Transferable securities and money market instruments admitted to an official stock exchange 65.45Transferable securities and money market instruments traded on a regulated market 19.85Transferable securities and money market instruments other than those admitted to an official exchange listing or traded on another regulated market 4.63OTC financial derivative instruments 0.17Current assets 9.90 100.00
99

NATIXIS INTERNATIONAL FUNDS (DUBLIN) I PLC
LOOMIS SAYLES ALTERNATIVE RISK PREMIA FUND
Schedule of Investments As at 30 June 2021
Face Fair Value % of Amount USD Net Assets
BONDS AND NOTES - 47.74% OF NET ASSETS (31 December 2020: 18.26%)
NON-CONVERTIBLE BONDS - 47.74% OF NET ASSETS (31 December 2020: 18.19%)
Australia - 0.05% (31 December 2020: 0.06%) FMG Resources August Pty Ltd, 4.375%, 4/01/31 144A (i) (ii) USD 15,000 16,047 0.05 16,047 0.05Austria - 0.47% (31 December 2020: 0.00%) Suzano Austria GmbH, 3.125%, 1/15/32 (ii) USD 145,000 143,604 0.47 143,604 0.47Bermuda - 0.13% (31 December 2020: 0.15%) Aircastle Ltd, 4.250%, 6/15/26 (ii) USD 20,000 21,719 0.07Athene Holding Ltd, 6.150%, 4/03/30 (ii) USD 15,000 18,965 0.06 40,684 0.13Brazil - 0.27% (31 December 2020: 0.16%) Brazil Notas do Tesouro Nacional Serie F, 10.000%, 1/01/31 (ii) BRL 390,000 81,880 0.27 81,880 0.27Canada - 1.46% (31 December 2020: 0.42%) Cenovus Energy Inc, 6.800%, 9/15/37 USD 15,000 19,632 0.06CI Financial Corp, 3.200%, 12/17/30 USD 20,000 20,522 0.07Enbridge Inc, 2.500%, 8/01/33 USD 300,000 300,028 0.97Fairfax Financial Holdings Ltd, 4.850%, 4/17/28 USD 15,000 17,255 0.06MDC Partners Inc, 7.500%, 5/01/24 144A (i) (iii) USD 5,000 5,063 0.02Methanex Corp, 5.125%, 10/15/27 USD 4,000 4,320 0.01Methanex Corp, 5.650%, 12/01/44 USD 20,000 20,690 0.07Suncor Energy Inc, 6.800%, 5/15/38 USD 15,000 21,534 0.07Teck Resources Ltd, 6.000%, 8/15/40 USD 18,000 22,997 0.07TransAlta Corp, 6.500%, 3/15/40 USD 15,000 17,175 0.06 449,216 1.46Cayman Islands - 0.12% (31 December 2020: 0.19%) Seagate HDD Cayman, 5.750%, 12/01/34 (ii) USD 20,000 23,000 0.08Spirit Loyalty Cayman Ltd/Spirit IP Cayman Ltd, 8.000%, 9/20/25 144A (i) (ii) USD 11,968 13,536 0.04 36,536 0.12Chile - 0.18% (31 December 2020: 0.00%) Bonos de la Tesoreria de la Republica en pesos, 4.700%, 9/01/30 144A (i) (ii) CLP 40,000,000 55,619 0.18 55,619 0.18China - 5.07% (31 December 2020: 0.00%) China Government International Bond, 1.950%, 12/03/24 (ii) USD 1,500,000 1,563,263 5.07 1,563,263 5.07Colombia - 0.08% (31 December 2020: 0.51%) Colombian TES, 7.750%, 9/18/30 (ii) COP 85,500,000 23,853 0.08 23,853 0.08Egypt - 2.04% (31 December 2020: 0.51%) Egypt Government Bond, 16.500%, 4/02/26 (ii) EGP 2,426,000 164,448 0.54Egypt Treasury Bills, 13.326%, 1/04/22 (ii) * EGP 7,750,000 463,097 1.50 627,545 2.04Finland - 0.06% (31 December 2020: 0.06%) Nokia OYJ, 6.625%, 5/15/39 (ii) USD 15,000 19,425 0.06 19,425 0.06
100

NATIXIS INTERNATIONAL FUNDS (DUBLIN) I PLC
LOOMIS SAYLES ALTERNATIVE RISK PREMIA FUND (Continued)
Schedule of Investments As at 30 June 2021
Face Fair Value % of Amount USD Net Assets
BONDS AND NOTES (Continued)
NON-CONVERTIBLE BONDS (Continued)
France - 0.51% (31 December 2020: 0.00%) Paysafe Finance PLC, 3.000%, 6/15/29 144A (i) (ii) EUR 135,000 157,695 0.51 157,695 0.51Indonesia - 0.28% (31 December 2020: 0.48%) Indonesia Treasury Bond, 7.000%, 9/15/30 (ii) * IDR 1,234,000,000 87,882 0.28 87,882 0.28Liberia - 0.07% (31 December 2020: 0.11%) Royal Caribbean Cruises Ltd, 10.875%, 6/01/23 144A (i) (ii) USD 18,000 20,497 0.07 20,497 0.07Luxembourg - 1.29% (31 December 2020: 0.13%) JBS Finance Luxembourg Sarl, 3.625%, 1/15/32 144A (i) (ii) USD 350,000 349,892 1.14nVent Finance Sarl, 4.550%, 4/15/28 (ii) USD 20,000 21,967 0.07Telecom Italia Capital SA, 7.200%, 7/18/36 (ii) USD 15,000 19,350 0.06Telecom Italia Capital SA, 7.721%, 6/04/38 (ii) USD 5,000 6,816 0.02 398,025 1.29Malaysia - 0.41% (31 December 2020: 0.39%) Federation of Malaysia, 2.632%, 4/15/31 (ii) * MYR 559,000 127,174 0.41 127,174 0.41Mexico - 0.32% (31 December 2020: 0.51%) Mexican Bonos, 7.750%, 5/29/31 (ii) MXN 1,838,700 97,477 0.32 97,477 0.32Netherlands - 1.07% (31 December 2020: 0.07%) Koninklijke KPN NV, 8.375%, 10/01/30 (ii) USD 15,000 21,231 0.07Petrobras Global Finance BV, 5.500%, 6/10/51 (ii) USD 310,000 310,109 1.00 331,340 1.07Russia - 0.04% (31 December 2020: 0.46%) Russian Federal Bond - OFZ, 7.650%, 4/10/30 (ii) RUB 861,000 12,264 0.04 12,264 0.04Senegal - 0.47% (31 December 2020: 0.00%) Senegal Government International Bond, 5.375%, 6/08/37 144A (i) (ii) EUR 125,000 146,179 0.47 146,179 0.47South Africa - 0.34% (31 December 2020: 0.39%) Republic of South Africa Government Bond, 8.000%, 1/31/30 (ii) ZAR 1,563,400 103,828 0.34 103,828 0.34Supranational - 0.05% (31 December 2020: 0.00%) JBS USA LUX SA/JBS USA Food Co/JBS USA Finance, Inc., 6.500%, 4/15/29 144A (i) (ii) USD 13,000 14,609 0.05 14,609 0.05Turkey - 0.82% (31 December 2020: 0.00%) Turkiye Ihracat Kredi Bankasi AS, 5.750%, 7/06/26 144A (i) (ii) USD 255,000 253,215 0.82 253,215 0.82United States - 31.57% (31 December 2020: 12.78%) Abercrombie & Fitch Management Co, 8.750%, 7/15/25 144A (i) USD 3,000 3,326 0.01ACCO Brands Corp, 4.250%, 3/15/29 144A (i) USD 23,000 22,770 0.07Allegheny Technologies Inc, 7.875%, 8/15/23 USD 5,000 5,481 0.02
101

NATIXIS INTERNATIONAL FUNDS (DUBLIN) I PLC
LOOMIS SAYLES ALTERNATIVE RISK PREMIA FUND (Continued)
Schedule of Investments As at 30 June 2021
Face Fair Value % of Amount USD Net Assets
BONDS AND NOTES (Continued)
NON-CONVERTIBLE BONDS (Continued)
United States - 31.57% (31 December 2020: 12.78%) (Continued) Ally Financial Inc, 8.000%, 11/01/31 USD 2,000 2,874 0.01Altria Group Inc, 5.375%, 1/31/44 USD 5,000 5,938 0.02Altria Group Inc, 5.800%, 2/14/39 USD 10,000 12,353 0.04Altria Group Inc, 5.950%, 2/14/49 USD 5,000 6,394 0.02Ambience Merger Sub Inc, 4.875%, 7/15/28 144A (i) USD 60,000 60,150 0.19Ambience Merger Sub Inc, 7.125%, 7/15/29 144A (i) USD 110,000 111,100 0.36Anheuser-Busch InBev Worldwide Inc, 8.200%, 1/15/39 USD 15,000 24,943 0.08Antero Midstream Partners LP/Antero Midstream Finance Corp, 5.750%, 3/01/27 144A (i) USD 5,000 5,200 0.02Antero Resources Corp, 8.375%, 7/15/26 144A (i) USD 3,000 3,412 0.01Avon Products Inc, 8.450%, 3/15/43 USD 18,000 23,343 0.08BAT Capital Corp, 5.282%, 4/02/50 USD 5,000 5,803 0.02BGC Partners Inc, 3.750%, 10/01/24 USD 20,000 21,105 0.07Big River Steel LLC/BRS Finance Corp, 6.625%, 1/31/29 144A (i) USD 5,000 5,506 0.02Bloomin' Brands Inc/OSI Restaurant Partners LLC, 5.125%, 4/15/29 144A (i) USD 3,000 3,082 0.01Boeing Co, 6.875%, 3/15/39 USD 15,000 21,010 0.07Brighthouse Financial Inc, 4.700%, 6/22/47 USD 20,000 22,213 0.07Brinker International Inc, 3.875%, 5/15/23 USD 5,000 5,150 0.02Brundage-Bone Concrete Pumping Holdings Inc, 6.000%, 2/01/26 144A (i) USD 3,000 3,158 0.01Builders FirstSource Inc, 5.000%, 3/01/30 144A (i) USD 5,000 5,257 0.02Calpine Corp, 3.750%, 3/01/31 144A (i) USD 5,000 4,762 0.01Cardinal Health Inc, 4.368%, 6/15/47 USD 20,000 22,395 0.07Carpenter Technology Corp, 6.375%, 7/15/28 USD 3,000 3,294 0.01Carrier Global Corp, 3.377%, 4/05/40 USD 10,000 10,489 0.03Centennial Resource Production LLC, 6.875%, 4/01/27 144A (i) USD 3,000 3,068 0.01Central Garden & Pet Co, 4.125%, 10/15/30 USD 10,000 10,212 0.03Century Communities Inc, 5.875%, 7/15/25 USD 5,000 5,171 0.02Charter Communications Operating LLC/Charter Communications Operating Capital, 5.750%, 4/01/48 USD 15,000 19,091 0.06Chemours Co, 5.375%, 5/15/27 USD 5,000 5,423 0.02Clarivate Science Holdings Corp, 3.875%, 6/30/28 144A (i) USD 300,000 302,733 0.98Clarivate Science Holdings Corp, 4.875%, 6/30/29 144A (i) USD 150,000 153,937 0.50Clearwater Paper Corp, 4.750%, 8/15/28 144A (i) USD 23,000 22,914 0.07CommonSpirit Health, 4.187%, 10/01/49 USD 20,000 22,988 0.07CoreCivic Inc, 4.750%, 10/15/27 USD 25,000 22,805 0.07CoreCivic Inc, 8.250%, 4/15/26 USD 5,000 5,188 0.02Curo Group Holdings Corp, 8.250%, 9/01/25 144A (i) USD 3,000 3,105 0.01Darden Restaurants Inc, 4.550%, 2/15/48 USD 5,000 5,868 0.02Darling Ingredients Inc, 5.250%, 4/15/27 144A (i) USD 5,000 5,250 0.02Dell International LLC/EMC Corp, 8.350%, 7/15/46 USD 15,000 24,534 0.08Delta Air Lines Inc, 4.375%, 4/19/28 USD 20,000 20,950 0.07Dow Chemical Co, 9.400%, 5/15/39 USD 10,000 17,635 0.06DPL Inc, 4.125%, 7/01/25 USD 5,000 5,363 0.02DXC Technology Co, 4.125%, 4/15/25 USD 3,000 3,297 0.01Edgewell Personal Care Co, 5.500%, 6/01/28 144A (i) USD 18,000 19,080 0.06Embarq Corp, 7.995%, 6/01/36 USD 20,000 22,673 0.07
102

NATIXIS INTERNATIONAL FUNDS (DUBLIN) I PLC
LOOMIS SAYLES ALTERNATIVE RISK PREMIA FUND (Continued)
Schedule of Investments As at 30 June 2021
Face Fair Value % of Amount USD Net Assets
BONDS AND NOTES (Continued)
NON-CONVERTIBLE BONDS (Continued)
United States - 31.57% (31 December 2020: 12.78%) (Continued) Enable Midstream Partners LP, 5.000%, 5/15/44 USD 20,000 21,792 0.07Enact Holdings Inc, 6.500%, 8/15/25 144A (i) USD 20,000 22,044 0.07Energy Transfer LP, 6.100%, 2/15/42 USD 5,000 6,216 0.02EnLink Midstream LLC, 5.375%, 6/01/29 USD 23,000 24,003 0.08EnLink Midstream Partners LP, 5.600%, 4/01/44 USD 28,000 25,340 0.08Enova International Inc, 8.500%, 9/15/25 144A (i) USD 5,000 5,142 0.02EPR Properties, 4.950%, 4/15/28 USD 20,000 21,601 0.07Exelon Generation Co LLC, 6.250%, 10/01/39 USD 20,000 24,644 0.08Expedia Group Inc, 4.625%, 8/01/27 USD 20,000 22,603 0.07Flowserve Corp, 3.500%, 10/01/30 USD 20,000 21,095 0.07Fluor Corp, 4.250%, 9/15/28 USD 20,000 20,300 0.07Ford Motor Co, 5.291%, 12/08/46 USD 5,000 5,584 0.02Ford Motor Co, 7.400%, 11/01/46 USD 15,000 19,697 0.06Forterra Finance LLC/FRTA Finance Corp, 6.500%, 7/15/25 144A (i) USD 5,000 5,388 0.02Fortinet Inc, 2.200%, 3/15/31 USD 3,000 2,992 0.01Fortress Transportation & Infrastructure Investors LLC, 9.750%, 8/01/27 144A (i) USD 15,000 17,344 0.06General Electric Co, 6.875%, 1/10/39 USD 2,000 2,992 0.01General Motors Co, 6.600%, 4/01/36 USD 5,000 6,863 0.02G-III Apparel Group Ltd, 7.875%, 8/15/25 144A (i) USD 5,000 5,413 0.02Global Net Lease Inc/Global Net Lease Operating Partnership LP, 3.750%, 12/15/27 144A (i) USD 23,000 22,764 0.07GLP Capital LP/GLP Financing II Inc, 5.300%, 1/15/29 USD 20,000 23,300 0.07Goodyear Tire & Rubber Co, 4.875%, 3/15/27 USD 5,000 5,298 0.02Goodyear Tire & Rubber Co, 5.625%, 4/30/33 USD 22,000 23,203 0.07Halliburton Co, 7.450%, 9/15/39 USD 15,000 22,046 0.07Harley-Davidson Inc, 4.625%, 7/28/45 USD 20,000 21,919 0.07Hasbro Inc, 6.350%, 3/15/40 USD 15,000 20,912 0.07HAT Holdings I LLC/HAT Holdings II LLC, 3.750%, 9/15/30 144A (i) USD 5,000 4,881 0.02Hecla Mining Co, 7.250%, 2/15/28 USD 3,000 3,278 0.01Herc Holdings Inc, 5.500%, 7/15/27 144A (i) USD 5,000 5,271 0.02Hewlett Packard Enterprise Co, 6.350%, 10/15/45 USD 17,000 22,837 0.07HollyFrontier Corp, 4.500%, 10/01/30 USD 20,000 21,394 0.07Howmet Aerospace Inc, 5.950%, 2/01/37 USD 19,000 22,993 0.07HP Inc, 6.000%, 9/15/41 USD 15,000 19,725 0.06Hyatt Hotels Corp, 5.750%, 4/23/30 USD 15,000 18,208 0.06IAA Inc, 5.500%, 6/15/27 144A (i) USD 5,000 5,249 0.02Iron Mountain Inc, 5.625%, 7/15/32 144A (i) USD 20,000 21,406 0.07iStar Inc, 5.500%, 2/15/26 USD 20,000 20,950 0.07Jefferies Group Inc, 6.500%, 1/20/43 USD 15,000 20,689 0.07JELD-WEN Inc, 4.875%, 12/15/27 144A (i) USD 5,000 5,196 0.02Kohl's Corp, 5.550%, 7/17/45 USD 20,000 23,924 0.08Las Vegas Sands Corp, 3.900%, 8/08/29 USD 20,000 21,292 0.07Lear Corp, 5.250%, 5/15/49 USD 15,000 18,922 0.06Madison IAQ LLC, 5.875%, 6/30/29 144A (i) USD 200,000 203,500 0.66MasTec Inc, 4.500%, 8/15/28 144A (i) USD 5,000 5,264 0.02Matador Resources Co, 5.875%, 9/15/26 USD 3,000 3,090 0.01
103

NATIXIS INTERNATIONAL FUNDS (DUBLIN) I PLC
LOOMIS SAYLES ALTERNATIVE RISK PREMIA FUND (Continued)
Schedule of Investments As at 30 June 2021
Face Fair Value % of Amount USD Net Assets
BONDS AND NOTES (Continued)
NON-CONVERTIBLE BONDS (Continued)
United States - 31.57% (31 December 2020: 12.78%) (Continued) Montefiore Obligated Group, 4.287%, 9/01/50 USD 20,000 21,441 0.07Murphy Oil Corp, 6.375%, 12/01/42 USD 25,000 24,759 0.08National Oilwell Varco Inc, 3.950%, 12/01/42 USD 25,000 24,726 0.08Nationstar Mortgage Holdings Inc, 6.000%, 1/15/27 144A (i) USD 5,000 5,181 0.02Navient Corp, 5.625%, 8/01/33 USD 28,000 27,070 0.09NCR Corp, 5.250%, 10/01/30 144A (i) USD 5,000 5,188 0.02NESCO Holdings II Inc, 5.500%, 4/15/29 144A (i) USD 5,000 5,219 0.02Newell Brands Inc, 5.875%, 4/01/36 USD 15,000 18,488 0.06NMI Holdings Inc, 7.375%, 6/01/25 144A (i) USD 20,000 22,919 0.07Nordstrom Inc, 5.000%, 1/15/44 USD 28,000 27,908 0.09Northern Oil & Gas Inc, 8.125%, 3/01/28 144A (i) USD 3,000 3,233 0.01Nuance Communications Inc, 5.625%, 12/15/26 USD 5,000 5,209 0.02Oasis Midstream Partners LP/OMP Finance Corp, 8.000%, 4/01/29 144A (i) USD 3,000 3,189 0.01Occidental Petroleum Corp, 6.200%, 3/15/40 USD 3,000 3,392 0.01Occidental Petroleum Corp, 8.875%, 7/15/30 USD 15,000 20,061 0.06Oceaneering International Inc, 6.000%, 2/01/28 USD 3,000 3,023 0.01Office Properties Income Trust, 4.500%, 2/01/25 USD 20,000 21,717 0.07Olin Corp, 5.625%, 8/01/29 USD 5,000 5,489 0.02ONEOK Partners LP, 6.850%, 10/15/37 USD 15,000 20,413 0.07Owens & Minor Inc, 4.500%, 3/31/29 144A (i) USD 3,000 3,083 0.01Pacific Gas & Electric Co, 4.300%, 3/15/45 USD 3,000 2,879 0.01Pacific Gas & Electric Co, 4.500%, 7/01/40 USD 10,000 10,005 0.03Pacific Gas & Electric Co, 4.750%, 2/15/44 USD 5,000 5,048 0.02Pacific Gas & Electric Co, 4.950%, 7/01/50 USD 5,000 5,143 0.02Park Intermediate Holdings LLC/PK Domestic Property LLC/PK Finance Co-Issuer, 5.875%, 10/01/28 144A (i) USD 5,000 5,324 0.02Patterson-UTI Energy Inc, 5.150%, 11/15/29 USD 23,000 24,050 0.08Paysafe Finance PLC/Paysafe Holdings US Corp, 4.000%, 6/15/29 144A (i) USD 320,000 315,200 1.02PBF Holding Co. LLC/PBF Finance Corp, 7.250%, 6/15/25 USD 4,000 3,040 0.01PBF Holding Co. LLC/PBF Finance Corp, 9.250%, 5/15/25 144A (i) USD 20,000 20,148 0.06Penn National Gaming Inc, 4.125%, 7/01/29 144A (i) USD 20,000 19,975 0.06Performance Food Group Inc, 5.500%, 10/15/27 144A (i) USD 5,000 5,255 0.02Pilgrim's Pride Corp, 4.250%, 4/15/31 144A (i) USD 22,000 22,798 0.07Plains All American Pipeline LP/PAA Finance Corp, 6.650%, 1/15/37 USD 10,000 13,095 0.04Prospect Capital Corp, 3.706%, 1/22/26 USD 20,000 20,546 0.07QVC Inc, 5.450%, 8/15/34 USD 5,000 5,207 0.02QVC Inc, 5.950%, 3/15/43 USD 20,000 20,250 0.06Radian Group Inc, 4.875%, 3/15/27 USD 20,000 21,750 0.07Resolute Forest Products Inc, 4.875%, 3/01/26 144A (i) USD 3,000 3,099 0.01Retail Properties of America Inc, 4.750%, 9/15/30 USD 20,000 22,156 0.07Reynolds American Inc, 6.150%, 9/15/43 USD 10,000 12,521 0.04Reynolds American Inc, 7.250%, 6/15/37 USD 5,000 6,714 0.02Rockies Express Pipeline LLC, 6.875%, 4/15/40 144A (i) USD 10,000 10,575 0.03RR Donnelley & Sons Co, 6.125%, 11/01/26 144A (i) USD 3,000 3,161 0.01Ryder System Inc, 2.900%, 12/01/26 USD 5,000 5,353 0.02
104

NATIXIS INTERNATIONAL FUNDS (DUBLIN) I PLC
LOOMIS SAYLES ALTERNATIVE RISK PREMIA FUND (Continued)
Schedule of Investments As at 30 June 2021
Face Fair Value % of Amount USD Net Assets
BONDS AND NOTES (Continued)
NON-CONVERTIBLE BONDS (Continued)
United States - 31.57% (31 December 2020: 12.78%) (Continued) Select Medical Corp, 6.250%, 8/15/26 144A (i) USD 5,000 5,325 0.02Service Properties Trust, 4.750%, 10/01/26 USD 24,000 23,700 0.08SLM Corp, 4.200%, 10/29/25 USD 3,000 3,225 0.01SM Energy Co, 5.625%, 6/01/25 USD 3,000 2,970 0.01SM Energy Co, 6.500%, 7/15/28 USD 235,000 241,463 0.78Southern Power Co, 4.950%, 12/15/46 USD 20,000 24,011 0.08Southwest Airlines Co, 3.450%, 11/16/27 USD 5,000 5,421 0.02Spanish Broadcasting System Inc, 9.750%, 3/01/26 144A (i) USD 3,000 3,030 0.01Starwood Property Trust Inc, 3.625%, 7/15/26 144A (i) USD 75,000 75,563 0.24StoneX Group Inc, 8.625%, 6/15/25 144A (i) USD 20,000 21,375 0.07SVB Financial Group, 3.125%, 6/05/30 USD 5,000 5,321 0.02Talen Energy Supply LLC, 7.250%, 5/15/27 144A (i) USD 10,000 9,331 0.03Talen Energy Supply LLC, 7.625%, 6/01/28 144A (i) USD 10,000 9,357 0.03Tanger Properties LP, 3.875%, 7/15/27 USD 23,000 24,789 0.08Tenneco Inc, 5.125%, 4/15/29 144A (i) USD 22,000 22,607 0.07Tenneco Inc, 5.375%, 12/15/24 USD 5,000 5,005 0.02Time Warner Cable LLC, 6.750%, 6/15/39 USD 10,000 13,921 0.04Time Warner Cable LLC, 7.300%, 7/01/38 USD 5,000 7,302 0.02Toledo Hospital, 6.015%, 11/15/48 USD 19,000 23,489 0.08Transatlantic Holdings Inc, 8.000%, 11/30/39 USD 15,000 23,255 0.07TripAdvisor Inc, 7.000%, 7/15/25 144A (i) USD 5,000 5,380 0.02United States Cellular Corp, 6.700%, 12/15/33 USD 15,000 18,375 0.06United States Treasury Bill, 0.044%, 2/24/22 * USD 4,515,000 4,513,676 14.65United States Treasury Note/Bond, 0.125%, 3/31/23 USD 1,500,000 1,497,715 4.86Unum Group, 5.750%, 8/15/42 USD 20,000 24,991 0.08Urban One Inc, 7.375%, 2/01/28 144A (i) USD 3,000 3,240 0.01US Concrete Inc, 5.125%, 3/01/29 144A (i) USD 5,000 5,463 0.02Utah Acquisition Sub Inc, 5.250%, 6/15/46 USD 15,000 18,268 0.06Valero Energy Corp, 6.625%, 6/15/37 USD 5,000 6,854 0.02Vector Group Ltd, 5.750%, 2/01/29 144A (i) USD 20,000 20,374 0.07ViacomCBS Inc, 6.875%, 4/30/36 USD 15,000 21,536 0.07Victoria'S Secret & Co, 4.625%, 7/15/29 144A sss(i) USD 95,000 95,000 0.31Vista Outdoor Inc, 4.500%, 3/15/29 144A (i) USD 3,000 3,053 0.01Western Union Co, 6.200%, 11/17/36 USD 20,000 25,190 0.08Williams Scotsman International Inc, 4.625%, 8/15/28 144A (i) USD 5,000 5,164 0.02Xerox Corp, 6.750%, 12/15/39 USD 20,000 22,027 0.07Xerox Holdings Corp, 5.500%, 8/15/28 144A (i) USD 20,000 20,780 0.07XHR LP, 6.375%, 8/15/25 144A (i) USD 5,000 5,319 0.02 9,728,222 31.57Uruguay - 0.57% (31 December 2020: 0.68%) Republic of Uruguay, 8.250%, 5/21/31 (ii) UYU 7,500,000 175,966 0.57 175,966 0.57
TOTAL NON-CONVERTIBLE BONDS 14,712,045 47.74
TOTAL BONDS AND NOTES 14,712,045 47.74
105

NATIXIS INTERNATIONAL FUNDS (DUBLIN) I PLC
LOOMIS SAYLES ALTERNATIVE RISK PREMIA FUND (Continued)
Schedule of Investments As at 30 June 2021
Fair Value % of Shares USD Net Assets
COMMON STOCKS - 35.04% OF NET ASSETS (31 December 2020: 28.11%)
Australia - 0.04% (31 December 2020: 0.12%) BHP Group PLC GBP 401 11,799 0.04 11,799 0.04Austria - 0.23% (31 December 2020: 0.09%) OMV AG EUR 956 54,385 0.17Verbund AG EUR 194 17,864 0.06 72,249 0.23Belgium - 0.48% (31 December 2020: 0.33%) Ageas SA/NV EUR 753 41,792 0.14KBC Group NV EUR 291 22,190 0.07Proximus SADP EUR 1,305 25,210 0.08Solvay SA EUR 151 19,196 0.06UCB SA EUR 130 13,591 0.05Umicore SA EUR 404 24,674 0.08 146,653 0.48Bermuda - 0.04% (31 December 2020: 0.00%) Athene Holding Ltd USD 185 12,488 0.04 12,488 0.04Chile - 0.14% (31 December 2020: 0.06%) Antofagasta PLC GBP 2,214 43,905 0.14 43,905 0.14Denmark - 1.79% (31 December 2020: 1.43%) Ambu A/S DKK 796 30,606 0.10AP Moller-Maersk A/S DKK 12 33,337 0.11AP Moller-Maersk A/S DKK 12 34,495 0.11Carlsberg AS DKK 349 65,063 0.21Chr Hansen Holding A/S DKK 192 17,331 0.06Coloplast A/S DKK 102 16,738 0.05Demant A/S DKK 347 19,534 0.06DSV PANALPINA A/S DKK 160 37,317 0.12Genmab A/S DKK 49 20,051 0.06GN Store Nord AS DKK 408 35,643 0.12Novo Nordisk A/S DKK 728 60,998 0.20Novozymes A/S DKK 591 44,552 0.14Orsted AS144A (i) DKK 232 32,559 0.11Pandora A/S DKK 502 67,488 0.22ROCKWOOL International A/S DKK 39 18,988 0.06Vestas Wind Systems A/S DKK 462 18,036 0.06 552,736 1.79Finland - 0.85% (31 December 2020: 0.60%) Fortum OYJ EUR 947 26,122 0.09Kesko OYJ EUR 1,254 46,324 0.15Neste OYJ EUR 656 40,173 0.13Orion OYJ EUR 790 33,961 0.11Sampo OYJ EUR 322 14,801 0.05Stora Enso OYJ EUR 1,751 31,947 0.10UPM-Kymmene OYJ EUR 495 18,726 0.06Wartsila OYJ Abp EUR 3,409 50,595 0.16 262,649 0.85France - 2.24% (31 December 2020: 1.51%) Airbus SE EUR 151 19,419 0.06Atos SE EUR 458 27,863 0.09
106

NATIXIS INTERNATIONAL FUNDS (DUBLIN) I PLC
LOOMIS SAYLES ALTERNATIVE RISK PREMIA FUND (Continued)
Schedule of Investments As at 30 June 2021
Fair Value % of Shares USD Net Assets
COMMON STOCKS (Continued)
France - 2.24% (31 December 2020: 1.51%) (Continued) AXA SA EUR 809 20,517 0.07BNP Paribas SA EUR 203 12,728 0.04Bouygues SA EUR 660 24,412 0.08Capgemini SE EUR 163 31,315 0.10Cie de Saint-Gobain EUR 264 17,388 0.06Cie Generale des Etablissements Michelin SCA EUR 94 14,993 0.05Danone SA EUR 313 22,037 0.07Eiffage SA EUR 111 11,294 0.04Electricite de France SA EUR 1,069 14,604 0.05Hermes International EUR 14 20,396 0.07Iliad SA EUR 220 32,195 0.10Kering SA EUR 23 20,102 0.07L'Oreal SA EUR 100 44,566 0.15LVMH Moet Hennessy Louis Vuitton SE EUR 48 37,643 0.12Orange SA EUR 2,285 26,055 0.08Orpea SA EUR 119 15,135 0.05Publicis Groupe SA EUR 252 16,120 0.05Sanofi EUR 118 12,365 0.04Sartorius Stedim Biotech EUR 41 19,395 0.06Schneider Electric SE EUR 144 22,658 0.07SCOR SE EUR 399 12,691 0.04Suez SA EUR 1,482 35,238 0.11Teleperformance EUR 100 40,593 0.13Thales SA EUR 116 11,836 0.04TotalEnergies SE EUR 311 14,072 0.05Ubisoft Entertainment SA EUR 190 13,303 0.04Valeo SA EUR 587 17,661 0.06Veolia Environnement SA EUR 546 16,492 0.05Vinci SA EUR 134 14,300 0.05Vivendi SE EUR 432 14,514 0.05Worldline SA144A (i) EUR 172 16,102 0.05 690,002 2.24Germany - 2.68% (31 December 2020: 1.77%) adidas AG EUR 70 26,058 0.08Allianz SE EUR 141 35,165 0.11BASF SE EUR 190 14,970 0.05Bayer AG EUR 230 13,968 0.05Bayerische Motoren Werke AG EUR 299 31,668 0.10Brenntag SE EUR 181 16,833 0.05Carl Zeiss Meditec AG EUR 91 17,585 0.06Continental AG EUR 115 16,908 0.06Covestro AG144A (i) EUR 504 32,550 0.11Daimler AG EUR 321 28,665 0.09Deutsche Bank AG EUR 1,224 15,947 0.05Deutsche Boerse AG EUR 222 38,753 0.13Deutsche Post AG EUR 515 35,032 0.11E.ON SE EUR 1,444 16,703 0.05Fresenius Medical Care AG & Co KGaA EUR 163 13,539 0.04Fresenius SE & Co KGaA EUR 291 15,182 0.05HeidelbergCement AG EUR 175 15,013 0.05HelloFresh SE EUR 417 40,541 0.13
107

NATIXIS INTERNATIONAL FUNDS (DUBLIN) I PLC
LOOMIS SAYLES ALTERNATIVE RISK PREMIA FUND (Continued)
Schedule of Investments As at 30 June 2021
Fair Value % of Shares USD Net Assets
COMMON STOCKS (Continued)
Germany - 2.68% (31 December 2020: 1.77%) (Continued) Infineon Technologies AG EUR 412 16,524 0.05KION Group AG EUR 164 17,480 0.06Knorr-Bremse AG EUR 116 13,344 0.04LANXESS AG EUR 346 23,725 0.08Merck KGaA EUR 125 23,970 0.08Muenchener Rueckversicherungs-Gesellschaft AG in Muenchen EUR 46 12,599 0.04Porsche Automobil Holding SE EUR 422 45,221 0.15Puma SE EUR 392 46,743 0.15SAP SE EUR 176 24,804 0.08Sartorius AG EUR 30 15,618 0.05Scout24 AG144A (i) EUR 185 15,603 0.05Siemens AG EUR 96 15,212 0.05Siemens Energy AG EUR 405 12,209 0.04TeamViewer AG144A (i) EUR 754 28,363 0.09Telefonica Deutschland Holding AG EUR 5,734 15,130 0.05Volkswagen AG EUR 90 29,543 0.10Volkswagen AG EUR 110 27,551 0.09Zalando SE144A (i) EUR 146 17,652 0.06 826,371 2.68Ireland - 0.32% (31 December 2020: 0.44%) CRH PLC EUR 471 23,739 0.08DCC PLC GBP 347 28,369 0.09Experian PLC GBP 447 17,204 0.06Kerry Group PLC EUR 112 15,646 0.05Seagate Technology Holdings PLC USD 142 12,486 0.04 97,444 0.32Isle of Man - 0.06% (31 December 2020: 0.03%) Entain PLC GBP 727 17,530 0.06 17,530 0.06Italy - 1.48% (31 December 2020: 1.01%) Davide Campari-Milano NV EUR 1,259 16,864 0.05DiaSorin SpA EUR 91 17,213 0.06Enel SpA EUR 1,916 17,796 0.06ENI SpA EUR 1,359 16,552 0.05Ferrari NV EUR 150 30,952 0.10FinecoBank Banca Fineco SpA EUR 920 16,038 0.05Infrastrutture Wireless Italiane SpA144A (i) EUR 2,788 31,444 0.10Intesa Sanpaolo SpA EUR 23,715 65,514 0.21Moncler SpA EUR 270 18,270 0.06Nexi SpA144A (i) EUR 833 18,285 0.06Poste Italiane SpA144A (i) EUR 1,315 17,388 0.06Prysmian SpA EUR 448 16,061 0.05Recordati Industria Chimica e Farmaceutica SpA EUR 314 17,948 0.06Snam SpA EUR 7,807 45,134 0.15Telecom Italia SpA EUR 53,100 26,379 0.09Telecom Italia SpA, EUR 78,974 41,845 0.13Terna SpA EUR 2,080 15,501 0.05UniCredit SpA EUR 2,416 28,508 0.09 457,692 1.48
108

NATIXIS INTERNATIONAL FUNDS (DUBLIN) I PLC
LOOMIS SAYLES ALTERNATIVE RISK PREMIA FUND (Continued)
Schedule of Investments As at 30 June 2021
Fair Value % of Shares USD Net Assets
COMMON STOCKS (Continued)
Jordan - 0.04% (31 December 2020: 0.12%) Hikma Pharmaceuticals PLC GBP 373 12,604 0.04 12,604 0.04Luxembourg - 0.06% (31 December 2020: 0.09%) ArcelorMittal SA EUR 602 18,455 0.06 18,455 0.06Netherlands - 1.45% (31 December 2020: 1.42%) ABN AMRO Bank NV144A (i) EUR 1,171 14,153 0.05Adyen NV144A (i) EUR 14 34,210 0.11Akzo Nobel NV EUR 326 40,284 0.13ASM International NV EUR 58 19,053 0.06ASML Holding NV EUR 115 79,018 0.26EXOR NV EUR 170 13,620 0.04ING Groep NV EUR 1,307 17,267 0.06Koninklijke Ahold Delhaize NV EUR 420 12,487 0.04Koninklijke DSM NV EUR 112 20,906 0.07Koninklijke KPN NV EUR 11,155 34,844 0.11Koninklijke Vopak NV EUR 767 34,837 0.11NN Group NV EUR 575 27,126 0.09Prosus NV EUR 123 12,029 0.04QIAGEN NV EUR 287 13,873 0.04Stellantis NV EUR 1,517 29,781 0.10Wolters Kluwer NV EUR 444 44,608 0.14 448,096 1.45Norway - 0.63% (31 December 2020: 0.55%) DNB ASA NOK 1,570 34,227 0.11Equinor ASA NOK 1,872 39,632 0.13Mowi ASA NOK 601 15,295 0.05Norsk Hydro ASA NOK 2,673 17,066 0.06Orkla ASA NOK 3,414 34,794 0.11Telenor ASA NOK 3,135 52,862 0.17 193,876 0.63Panama - 0.05% (31 December 2020: 0.04%) Copa Holdings SA USD 222 16,723 0.05 16,723 0.05Portugal - 0.23% (31 December 2020: 0.18%) EDP - Energias de Portugal SA EUR 3,785 20,064 0.07Galp Energia SGPS SA EUR 4,564 49,535 0.16 69,599 0.23South Africa - –% (31 December 2020: 0.00%) Thungela Resources Ltd GBP 70 193 0.00 193 0.00Spain - 1.50% (31 December 2020: 1.18%) ACS Actividades de Construccion y Servicios SA EUR 1,361 36,460 0.12Aena SME SA144A (i) EUR 89 14,597 0.05Banco Bilbao Vizcaya Argentaria SA EUR 12,647 78,410 0.25Enagas SA EUR 2,022 46,723 0.15Endesa SA EUR 1,166 28,291 0.09Iberdrola SA EUR 2,841 34,635 0.11Industria de Diseno Textil SA EUR 1,616 56,937 0.19Naturgy Energy Group SA EUR 1,432 36,817 0.12Red Electrica Corp SA EUR 3,795 70,455 0.23
109

NATIXIS INTERNATIONAL FUNDS (DUBLIN) I PLC
LOOMIS SAYLES ALTERNATIVE RISK PREMIA FUND (Continued)
Schedule of Investments As at 30 June 2021
Fair Value % of Shares USD Net Assets
COMMON STOCKS (Continued)
Spain - 1.50% (31 December 2020: 1.18%) (Continued) Repsol SA EUR 1,148 14,368 0.05Siemens Gamesa Renewable Energy SA EUR 480 16,030 0.05Telefonica SA EUR 5,993 28,009 0.09 461,732 1.50Sweden - 1.81% (31 December 2020: 1.94%) Alfa Laval AB SEK 456 16,119 0.05Atlas Copco AB SEK 260 15,930 0.05Atlas Copco AB SEK 306 16,101 0.05Boliden AB SEK 442 17,004 0.05Electrolux AB SEK 575 15,955 0.05Epiroc AB SEK 777 17,717 0.06EQT AB SEK 953 34,611 0.11Essity AB SEK 987 32,753 0.11Evolution AB144A (i) SEK 311 49,180 0.16Hexagon AB SEK 1,204 17,851 0.06Husqvarna AB SEK 2,360 31,376 0.10ICA Gruppen AB SEK 390 18,163 0.06Kinnevik AB SEK 530 21,232 0.07Lundin Energy AB SEK 366 12,959 0.04Securitas AB SEK 674 10,647 0.03Skandinaviska Enskilda Banken AB SEK 1,250 16,158 0.05Skanska AB SEK 427 11,334 0.04SKF AB SEK 399 10,166 0.03Svenska Cellulosa AB SCA SEK 1,998 32,766 0.11Svenska Handelsbanken AB SEK 2,909 32,845 0.11Swedbank AB SEK 865 16,106 0.05Tele2 AB SEK 2,801 38,189 0.12Telefonaktiebolaget LM Ericsson SEK 871 10,955 0.04Telia Co AB SEK 8,050 35,750 0.12Volvo AB SEK 1,095 26,363 0.09 558,230 1.81Switzerland - 2.03% (31 December 2020: 2.00%) ABB Ltd CHF 1,023 34,740 0.11Cie Financiere Richemont SA CHF 156 18,893 0.06Coca-Cola HBC AG GBP 694 25,061 0.08Credit Suisse Group AG CHF 862 9,038 0.03EMS-Chemie Holding AG CHF 17 16,718 0.06Geberit AG CHF 25 18,770 0.06Givaudan SA CHF 5 23,276 0.08Glencore PLC GBP 4,158 17,775 0.06Julius Baer Group Ltd CHF 251 16,396 0.05Kuehne + Nagel International AG CHF 126 43,156 0.14Logitech International SA CHF 589 71,431 0.23Lonza Group AG CHF 36 25,541 0.08Nestle SA CHF 140 17,451 0.06Partners Group Holding AG CHF 25 37,905 0.12Roche Holding AG CHF 36 13,575 0.05SGS SA CHF 13 40,138 0.13Sika AG CHF 50 16,363 0.05Sonova Holding AG CHF 56 21,083 0.07Straumann Holding AG CHF 12 19,149 0.06Swiss Re AG CHF 354 31,970 0.10
110

NATIXIS INTERNATIONAL FUNDS (DUBLIN) I PLC
LOOMIS SAYLES ALTERNATIVE RISK PREMIA FUND (Continued)
Schedule of Investments As at 30 June 2021
Fair Value % of Shares USD Net Assets
COMMON STOCKS (Continued)
Switzerland - 2.03% (31 December 2020: 2.00%) (Continued) Swisscom AG CHF 70 40,000 0.13Temenos AG CHF 103 16,558 0.05Vifor Pharma AG CHF 272 35,238 0.12Zurich Insurance Group AG CHF 38 15,260 0.05 625,485 2.03United Kingdom - 5.39% (31 December 2020: 3.85%) 3i Group PLC GBP 717 11,619 0.04Admiral Group PLC GBP 386 16,765 0.05Amcor PLC USD 2,526 28,948 0.09Anglo American PLC GBP 708 28,095 0.09Ashtead Group PLC GBP 510 37,791 0.12Auto Trader Group PLC144A (i) GBP 1,984 17,360 0.06Aviva PLC GBP 5,560 31,177 0.10BAE Systems PLC GBP 4,078 29,407 0.10Barclays PLC GBP 13,377 31,622 0.10Barratt Developments PLC GBP 3,034 29,138 0.09Berkeley Group Holdings PLC GBP 536 34,024 0.11BP PLC GBP 4,110 17,885 0.06British American Tobacco PLC GBP 1,174 45,411 0.15BT Group PLC GBP 5,744 15,394 0.05Bunzl PLC GBP 417 13,762 0.04Burberry Group PLC GBP 837 23,889 0.08CNH Industrial NV EUR 2,451 40,475 0.13Coca-Cola Europacific Partners PLC USD 670 39,744 0.13Croda International PLC GBP 434 44,175 0.14Diageo PLC GBP 486 23,237 0.08Evraz PLC GBP 9,813 80,253 0.26Ferguson PLC GBP 168 23,324 0.08GlaxoSmithKline PLC GBP 2,485 48,727 0.16Hargreaves Lansdown PLC GBP 727 15,959 0.05HSBC Holdings PLC GBP 2,460 14,181 0.05IHS Markit Ltd USD 111 12,505 0.04Imperial Brands PLC GBP 2,126 45,729 0.15InterContinental Hotels Group PLC GBP 206 13,688 0.04Intertek Group PLC GBP 209 15,966 0.05J Sainsbury PLC GBP 6,452 24,226 0.08Johnson Matthey PLC GBP 906 38,461 0.13Kingfisher PLC GBP 8,157 41,074 0.13Legal & General Group PLC GBP 6,995 24,893 0.08London Stock Exchange Group PLC GBP 154 16,956 0.06M&G PLC GBP 20,983 66,351 0.22Melrose Industries PLC GBP 8,160 17,484 0.06Mondi PLC GBP 1,275 33,483 0.11National Grid PLC GBP 2,939 37,385 0.12Natwest Group PLC GBP 6,841 19,203 0.06Next PLC GBP 315 34,186 0.11Pearson PLC GBP 1,665 19,091 0.06Persimmon PLC GBP 654 26,725 0.09Phoenix Group Holdings PLC GBP 1,682 15,717 0.05RELX PLC GBP 1,511 40,057 0.13Rentokil Initial PLC GBP 2,371 16,213 0.05
111

NATIXIS INTERNATIONAL FUNDS (DUBLIN) I PLC
LOOMIS SAYLES ALTERNATIVE RISK PREMIA FUND (Continued)
Schedule of Investments As at 30 June 2021
Fair Value % of Shares USD Net Assets
COMMON STOCKS (Continued)
United Kingdom (31 December 2020: 3.85%) (Continued) Rio Tinto PLC GBP 568 46,680 0.15Sage Group PLC GBP 1,370 12,949 0.04Severn Trent PLC GBP 513 17,724 0.06Spirax-Sarco Engineering PLC GBP 98 18,432 0.06SSE PLC GBP 2,348 48,671 0.16St James's Place PLC GBP 2,725 55,601 0.18Standard Life Aberdeen PLC GBP 3,557 13,316 0.04Taylor Wimpey PLC GBP 10,283 22,580 0.07Tesco PLC GBP 9,805 30,199 0.10Unilever PLC GBP 274 16,013 0.05United Utilities Group PLC GBP 1,137 15,305 0.05Vodafone Group PLC GBP 16,289 27,304 0.09Wm Morrison Supermarkets PLC GBP 4,722 16,093 0.05WPP PLC GBP 1,378 18,545 0.06 1,661,167 5.39United States - 11.50% (31 December 2020: 9.24%) AbbVie Inc USD 265 29,850 0.10Aflac Inc USD 385 20,659 0.07Air Lease Corp USD 189 7,889 0.03Albertsons Cos Inc USD 497 9,771 0.03Alliance Data Systems Corp USD 82 8,544 0.03Allison Transmission Holdings Inc USD 231 9,180 0.03Allstate Corp USD 171 22,305 0.07Alphabet Inc USD 6 15,038 0.05Altria Group Inc USD 346 16,497 0.05Amdocs Ltd USD 111 8,587 0.03American Airlines Group Inc USD 414 8,781 0.03American National Group Inc USD 84 12,478 0.04Ameriprise Financial Inc USD 46 11,448 0.04Amgen Inc USD 43 10,481 0.03Antero Midstream Corp USD 2,095 21,767 0.07Apollo Global Management Inc USD 386 24,009 0.08Apple Inc USD 87 11,916 0.04Arrow Electronics Inc USD 88 10,017 0.03Assurant Inc USD 74 11,557 0.04AT&T Inc USD 609 17,527 0.06AutoZone Inc USD 9 13,430 0.04Bank of America Corp USD 268 11,050 0.04Bank of New York Mellon Corp USD 224 11,476 0.04Berkshire Hathaway Inc USD 42 11,673 0.04Berry Global Group Inc USD 152 9,913 0.03Biogen Inc USD 74 25,624 0.08Booking Holdings Inc USD 5 10,940 0.04Bristol-Myers Squibb Co USD 169 11,293 0.04Bunge Ltd USD 119 9,300 0.03Cabot Oil & Gas Corp USD 493 8,608 0.03CACI International Inc USD 38 9,695 0.03Capital One Financial Corp USD 81 12,530 0.04Cardinal Health Inc USD 155 8,849 0.03Carnival Corp USD 759 20,007 0.06Celanese Corp USD 133 20,163 0.07
112

NATIXIS INTERNATIONAL FUNDS (DUBLIN) I PLC
LOOMIS SAYLES ALTERNATIVE RISK PREMIA FUND (Continued)
Schedule of Investments As at 30 June 2021
Fair Value % of Shares USD Net Assets
COMMON STOCKS (Continued)
United States - 11.50% (31 December 2020: 9.24%) (Continued) Centene Corp USD 165 12,033 0.04Cerner Corp USD 147 11,490 0.04Charter Communications Inc USD 17 12,265 0.04Chemours Co USD 1,045 36,366 0.12Chevron Corp USD 166 17,387 0.06Cigna Corp USD 81 19,203 0.06Cirrus Logic Inc USD 117 9,959 0.03Cisco Systems Inc USD 184 9,752 0.03Citizens Financial Group Inc USD 226 10,367 0.03Citrix Systems Inc USD 81 9,499 0.03CNA Financial Corp USD 413 18,787 0.06Cognizant Technology Solutions Corp USD 137 9,489 0.03Comerica Inc USD 398 28,393 0.09Consolidated Edison Inc USD 249 17,858 0.06CoStar Group Inc USD 5,110 423,210 1.37Coty Inc USD 2,070 19,334 0.06Cummins Inc USD 39 9,509 0.03CVS Health Corp USD 127 10,597 0.03DaVita Inc USD 97 11,682 0.04Dell Technologies Inc USD 108 10,764 0.03Diamondback Energy Inc USD 134 12,581 0.04Discovery Inc USD 168 4,869 0.02DISH Network Corp USD 255 10,659 0.03Dollar General Corp USD 60 12,983 0.04Dominion Energy Inc USD 145 10,668 0.03Domino's Pizza Inc USD 30 13,995 0.05Dow Inc USD 266 16,832 0.05DR Horton Inc USD 106 9,579 0.03Duke Energy Corp USD 193 19,053 0.06Eaton Corp PLC USD 77 11,410 0.04eBay Inc USD 335 23,520 0.08Edison International USD 304 17,577 0.06Entergy Corp USD 187 18,644 0.06Equitrans Midstream Corp USD 3,377 28,738 0.09Etsy Inc USD 49 10,086 0.03Expedia Group Inc USD 58 9,495 0.03Expeditors International of Washington Inc USD 102 12,913 0.04Exxon Mobil Corp USD 324 20,438 0.07FedEx Corp USD 34 10,143 0.03Fidelity National Financial Inc USD 230 9,996 0.03First American Financial Corp USD 166 10,350 0.03FirstEnergy Corp USD 535 19,907 0.06FleetCor Technologies Inc USD 37 9,474 0.03Foot Locker Inc USD 164 10,107 0.03Fortinet Inc USD 60 14,291 0.05Fox Corp USD 242 8,518 0.03Fox Corp USD 245 9,097 0.03Franklin Resources Inc USD 558 17,850 0.06General Dynamics Corp USD 52 9,790 0.03General Motors Co USD 164 9,704 0.03Gilead Sciences Inc USD 281 19,350 0.06Goldman Sachs Group Inc USD 30 11,386 0.04
113

NATIXIS INTERNATIONAL FUNDS (DUBLIN) I PLC
LOOMIS SAYLES ALTERNATIVE RISK PREMIA FUND (Continued)
Schedule of Investments As at 30 June 2021
Fair Value % of Shares USD Net Assets
COMMON STOCKS (Continued)
United States - 11.50% (31 December 2020: 9.24%) (Continued) GrafTech International Ltd USD 803 9,331 0.03Graham Holdings Co USD 16 10,142 0.03H&R Block Inc USD 1,333 31,299 0.10Hanesbrands Inc USD 507 9,466 0.03Henry Schein Inc USD 154 11,425 0.04Herbalife Nutrition Ltd USD 205 10,810 0.04Hilton Worldwide Holdings Inc USD 84 10,132 0.03HollyFrontier Corp USD 486 15,989 0.05Hologic Inc USD 278 18,548 0.06HP Inc USD 655 19,774 0.06Huntington Bancshares Inc USD 1,277 18,223 0.06Huntington Ingalls Industries Inc USD 47 9,905 0.03Intel Corp USD 313 17,572 0.06Intercontinental Exchange Inc USD 95 11,276 0.04International Business Machines Corp USD 209 30,637 0.10International Paper Co USD 338 20,723 0.07Interpublic Group of Cos Inc USD 661 21,476 0.07Jabil Inc USD 187 10,868 0.04Johnson Controls International PLC USD 172 11,804 0.04JPMorgan Chase & Co USD 66 10,266 0.03Juniper Networks Inc USD 417 11,405 0.04Kansas City Southern USD 47 13,318 0.04Kinder Morgan Inc USD 1,035 18,868 0.06KLA Corp USD 36 11,672 0.04Knight-Swift Transportation Holdings Inc USD 202 9,183 0.03Kraft Heinz Co USD 455 18,555 0.06Kroger Co USD 559 21,415 0.07L3Harris Technologies Inc USD 55 11,888 0.04Laboratory Corp of America Holdings USD 38 10,482 0.03Lam Research Corp USD 20 13,014 0.04Las Vegas Sands Corp USD 298 15,702 0.05Lazard Ltd USD 447 20,227 0.07Leidos Holdings Inc USD 96 9,706 0.03Lennar Corp USD 93 9,240 0.03Lennar Corp USD 115 9,367 0.03Loews Corp USD 200 10,930 0.04Lumen Technologies Inc USD 1,386 18,836 0.06LyondellBasell Industries NV USD 173 17,797 0.06M&T Bank Corp USD 67 9,736 0.03Macquarie Infrastructure Corp USD 576 22,044 0.07Marathon Petroleum Corp USD 339 20,482 0.07Masco Corp USD 185 10,898 0.04McKesson Corp USD 56 10,709 0.03Mercury General Corp USD 309 20,070 0.07MetLife Inc USD 154 9,217 0.03Mettler-Toledo International Inc USD 10 13,853 0.04MGIC Investment Corp USD 730 9,928 0.03MGM Resorts International USD 260 11,089 0.04Molson Coors Beverage Co USD 347 18,630 0.06Morgan Stanley USD 124 11,370 0.04MSCI Inc USD 26 13,860 0.05NetApp Inc USD 280 22,910 0.07
114
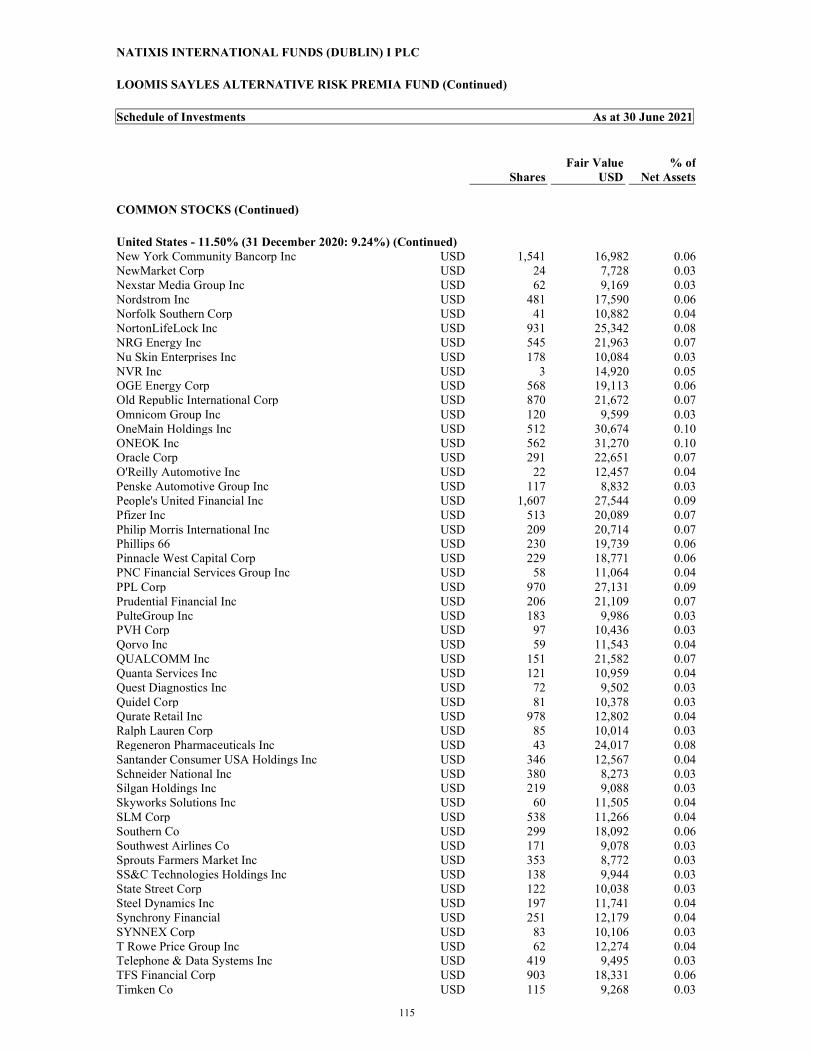
NATIXIS INTERNATIONAL FUNDS (DUBLIN) I PLC
LOOMIS SAYLES ALTERNATIVE RISK PREMIA FUND (Continued)
Schedule of Investments As at 30 June 2021
Fair Value % of Shares USD Net Assets
COMMON STOCKS (Continued)
United States - 11.50% (31 December 2020: 9.24%) (Continued) New York Community Bancorp Inc USD 1,541 16,982 0.06NewMarket Corp USD 24 7,728 0.03Nexstar Media Group Inc USD 62 9,169 0.03Nordstrom Inc USD 481 17,590 0.06Norfolk Southern Corp USD 41 10,882 0.04NortonLifeLock Inc USD 931 25,342 0.08NRG Energy Inc USD 545 21,963 0.07Nu Skin Enterprises Inc USD 178 10,084 0.03NVR Inc USD 3 14,920 0.05OGE Energy Corp USD 568 19,113 0.06Old Republic International Corp USD 870 21,672 0.07Omnicom Group Inc USD 120 9,599 0.03OneMain Holdings Inc USD 512 30,674 0.10ONEOK Inc USD 562 31,270 0.10Oracle Corp USD 291 22,651 0.07O'Reilly Automotive Inc USD 22 12,457 0.04Penske Automotive Group Inc USD 117 8,832 0.03People's United Financial Inc USD 1,607 27,544 0.09Pfizer Inc USD 513 20,089 0.07Philip Morris International Inc USD 209 20,714 0.07Phillips 66 USD 230 19,739 0.06Pinnacle West Capital Corp USD 229 18,771 0.06PNC Financial Services Group Inc USD 58 11,064 0.04PPL Corp USD 970 27,131 0.09Prudential Financial Inc USD 206 21,109 0.07PulteGroup Inc USD 183 9,986 0.03PVH Corp USD 97 10,436 0.03Qorvo Inc USD 59 11,543 0.04QUALCOMM Inc USD 151 21,582 0.07Quanta Services Inc USD 121 10,959 0.04Quest Diagnostics Inc USD 72 9,502 0.03Quidel Corp USD 81 10,378 0.03Qurate Retail Inc USD 978 12,802 0.04Ralph Lauren Corp USD 85 10,014 0.03Regeneron Pharmaceuticals Inc USD 43 24,017 0.08Santander Consumer USA Holdings Inc USD 346 12,567 0.04Schneider National Inc USD 380 8,273 0.03Silgan Holdings Inc USD 219 9,088 0.03Skyworks Solutions Inc USD 60 11,505 0.04SLM Corp USD 538 11,266 0.04Southern Co USD 299 18,092 0.06Southwest Airlines Co USD 171 9,078 0.03Sprouts Farmers Market Inc USD 353 8,772 0.03SS&C Technologies Holdings Inc USD 138 9,944 0.03State Street Corp USD 122 10,038 0.03Steel Dynamics Inc USD 197 11,741 0.04Synchrony Financial USD 251 12,179 0.04SYNNEX Corp USD 83 10,106 0.03T Rowe Price Group Inc USD 62 12,274 0.04Telephone & Data Systems Inc USD 419 9,495 0.03TFS Financial Corp USD 903 18,331 0.06Timken Co USD 115 9,268 0.03
115

NATIXIS INTERNATIONAL FUNDS (DUBLIN) I PLC
LOOMIS SAYLES ALTERNATIVE RISK PREMIA FUND (Continued)
Schedule of Investments As at 30 June 2021
Fair Value % of Shares USD Net Assets
COMMON STOCKS (Continued)
United States - 11.50% (31 December 2020: 9.24%) (Continued) T-Mobile US Inc USD 85 12,311 0.04Toll Brothers Inc USD 162 9,365 0.03Tyson Foods Inc USD 123 9,072 0.03UGI Corp USD 224 10,373 0.03Umpqua Holdings Corp USD 1,035 19,096 0.06Union Pacific Corp USD 49 10,777 0.04United Rentals Inc USD 33 10,527 0.03United Therapeutics Corp USD 47 8,432 0.03Universal Health Services Inc USD 143 20,939 0.07Unum Group USD 1,024 29,082 0.09US Bancorp USD 187 10,653 0.03Valero Energy Corp USD 249 19,442 0.06VeriSign Inc USD 56 12,751 0.04Verizon Communications Inc USD 482 27,006 0.09Virtu Financial Inc USD 312 8,621 0.03Vontier Corp USD 296 9,644 0.03Walgreens Boots Alliance Inc USD 198 10,417 0.03Waters Corp USD 40 13,824 0.04Wells Fargo & Co USD 256 11,594 0.04Western Union Co USD 1,519 34,891 0.11Whirlpool Corp USD 43 9,375 0.03Williams Cos Inc USD 688 18,266 0.06Xerox Holdings Corp USD 1,538 36,128 0.12Zions Bancorp NA USD 180 9,515 0.03 3,543,292 11.50
TOTAL COMMON STOCKS 10,800,970 35.04
RIGHTS - 0.01% OF NET ASSETS (31 December 2020: 0.00%)
Spain - 0.01% (31 December 2020: 0.00%) ACS Actividades de Construccion y Servicios SA, 7/07/21 EUR 1,361 1,905 0.01 1,905 0.01
TOTAL RIGHTS 1,905 0.01
TOTAL FINANCIAL ASSETS AT FAIR VALUE THROUGH PROFIT OR LOSS EXCLUDING FINANCIAL DERIVATIVE INSTRUMENTS (Cost: USD 24,747,509) 25,514,920 82.79
116

NATIXIS INTERNATIONAL FUNDS (DUBLIN) I PLC
LOOMIS SAYLES ALTERNATIVE RISK PREMIA FUND (Continued)
Schedule of Investments As at 30 June 2021
FINANCIAL DERIVATIVE INSTRUMENTS - (0.72%) (31 December 2020: (0.96%)) Open Forward Foreign Currency Exchange Contracts - (0.69%) (31 December 2020: 0.43%)
Unrealised Maturity Gain/(Loss) % of Date Amount Bought Amount Sold Counterparty USD Net Assets 9/15/21 24,315,000 THB 779,002 USD Bank of America (20,581) (0.07%) 9/15/21 1,563,000 SGD 1,180,585 USD Bank of America (18,032) (0.06%) 9/15/21 230,943 USD 918,000 PEN Bank of America (9,394) (0.03%) 9/15/21 316,702 USD 10,211,000 THB Bank of America (1,795) (0.01%) 9/15/21 1,263,000 THB 40,489 USD Bank of America (1,094) (0.00%) 9/15/21 32,349 USD 1,043,000 THB Bank of America (183) (0.00%) 9/15/21 545,063 USD 733,000 SGD Bank of America (139) (0.00%) 9/14/21 111,000 ILS 34,190 USD Bank of America (95) (0.00%) 9/14/21 153,000 ILS 47,090 USD Bank of America (95) (0.00%) 9/15/21 49,383 USD 1,576,000 THB Bank of America 225 0.00% 9/15/21 361,520 USD 11,503,000 THB Bank of America 2,724 0.01% 9/15/21 367,357 USD 11,456,000 THB Bank of America 10,027 0.03% 9/15/21 49,971 USD 67,000 SGD Bank of America 136 0.00% 9/15/21 40,718 USD 54,000 SGD Bank of America 553 0.00% 9/15/21 536,659 USD 712,000 SGD Bank of America 7,077 0.02% 9/15/21 551,579 USD 730,000 SGD Bank of America 8,608 0.03% 9/15/21 369,876 USD 1,412,000 PEN Bank of America 206 0.00% 9/15/21 508,796 USD 4,209,000 NOK Bank of America 19,524 0.06% 9/15/21 495,976 USD 665,000 SGD Bank of America 1,352 0.01% 9/14/21 75,013 USD 244,000 ILS Bank of America 67 0.00% 7/29/21 26,103,725 EUR 31,190,975 USD Brown Brothers Harriman (216,848) (0.70%) 9/15/21 358,000 GBP 505,330 USD Citibank NA (10,687) (0.04%) 9/15/21 125,000 AUD 96,878 USD Citibank NA (3,004) (0.01%) 9/15/21 754,000 ZAR 54,713 USD Citibank NA (2,423) (0.01%)
117
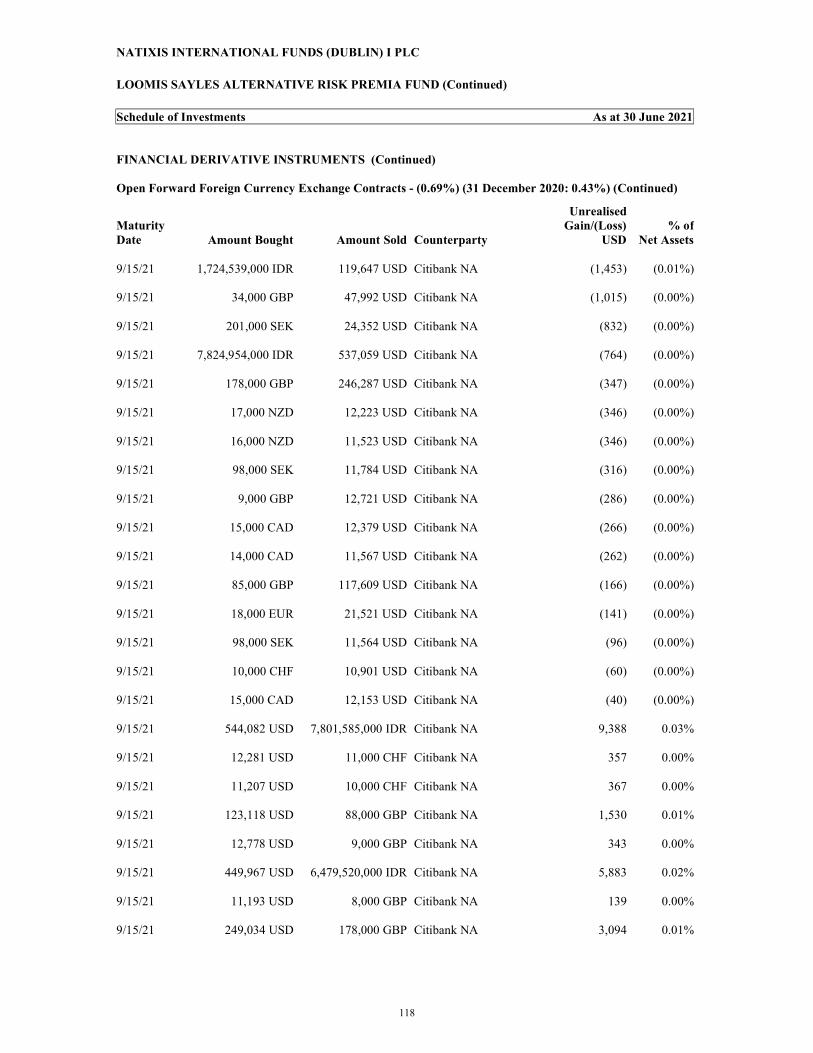
NATIXIS INTERNATIONAL FUNDS (DUBLIN) I PLC
LOOMIS SAYLES ALTERNATIVE RISK PREMIA FUND (Continued)
Schedule of Investments As at 30 June 2021
FINANCIAL DERIVATIVE INSTRUMENTS (Continued) Open Forward Foreign Currency Exchange Contracts - (0.69%) (31 December 2020: 0.43%) (Continued)
Unrealised Maturity Gain/(Loss) % of Date Amount Bought Amount Sold Counterparty USD Net Assets 9/15/21 1,724,539,000 IDR 119,647 USD Citibank NA (1,453) (0.01%) 9/15/21 34,000 GBP 47,992 USD Citibank NA (1,015) (0.00%) 9/15/21 201,000 SEK 24,352 USD Citibank NA (832) (0.00%) 9/15/21 7,824,954,000 IDR 537,059 USD Citibank NA (764) (0.00%) 9/15/21 178,000 GBP 246,287 USD Citibank NA (347) (0.00%) 9/15/21 17,000 NZD 12,223 USD Citibank NA (346) (0.00%) 9/15/21 16,000 NZD 11,523 USD Citibank NA (346) (0.00%) 9/15/21 98,000 SEK 11,784 USD Citibank NA (316) (0.00%) 9/15/21 9,000 GBP 12,721 USD Citibank NA (286) (0.00%) 9/15/21 15,000 CAD 12,379 USD Citibank NA (266) (0.00%) 9/15/21 14,000 CAD 11,567 USD Citibank NA (262) (0.00%) 9/15/21 85,000 GBP 117,609 USD Citibank NA (166) (0.00%) 9/15/21 18,000 EUR 21,521 USD Citibank NA (141) (0.00%) 9/15/21 98,000 SEK 11,564 USD Citibank NA (96) (0.00%) 9/15/21 10,000 CHF 10,901 USD Citibank NA (60) (0.00%) 9/15/21 15,000 CAD 12,153 USD Citibank NA (40) (0.00%) 9/15/21 544,082 USD 7,801,585,000 IDR Citibank NA 9,388 0.03% 9/15/21 12,281 USD 11,000 CHF Citibank NA 357 0.00% 9/15/21 11,207 USD 10,000 CHF Citibank NA 367 0.00% 9/15/21 123,118 USD 88,000 GBP Citibank NA 1,530 0.01% 9/15/21 12,778 USD 9,000 GBP Citibank NA 343 0.00% 9/15/21 449,967 USD 6,479,520,000 IDR Citibank NA 5,883 0.02% 9/15/21 11,193 USD 8,000 GBP Citibank NA 139 0.00% 9/15/21 249,034 USD 178,000 GBP Citibank NA 3,094 0.01%
118

NATIXIS INTERNATIONAL FUNDS (DUBLIN) I PLC
LOOMIS SAYLES ALTERNATIVE RISK PREMIA FUND (Continued)
Schedule of Investments As at 30 June 2021
FINANCIAL DERIVATIVE INSTRUMENTS (Continued) Open Forward Foreign Currency Exchange Contracts - (0.69%) (31 December 2020: 0.43%) (Continued)
Unrealised Maturity Gain/(Loss) % of Date Amount Bought Amount Sold Counterparty USD Net Assets 9/15/21 12,510 USD 9,000 GBP Citibank NA 74 0.00% 9/15/21 11,157 USD 8,000 GBP Citibank NA 103 0.00% 9/15/21 119,760 USD 1,724,539,000 IDR Citibank NA 1,566 0.01% 9/15/21 380,515 USD 270,000 GBP Citibank NA 7,460 0.02% 9/15/21 11,512 USD 16,000 NZD Citibank NA 335 0.00% 9/15/21 11,881 USD 10,000 EUR Citibank NA 3 0.00% 9/15/21 23,883 USD 20,000 EUR Citibank NA 127 0.00% 9/15/21 95,190 USD 78,000 EUR Citibank NA 2,544 0.01% 9/15/21 48,313 USD 399,000 SEK Citibank NA 1,625 0.01% 9/15/21 11,931 USD 99,000 SEK Citibank NA 347 0.00% 9/15/21 35,764 USD 513,000 ZAR Citibank NA 187 0.00% 9/15/21 16,751 USD 241,000 ZAR Citibank NA 37 0.00% 9/15/21 132,775 USD 13,543,000 ARS Citibank NA 86 0.00% 9/15/21 24,458 USD 22,000 CHF Citibank NA 609 0.00% 9/15/21 17,000 NZD 11,862 USD Citibank NA 14 0.00% 9/15/21 11,746 USD 169,000 ZAR Citibank NA 26 0.00% 9/15/21 561,000 NZD 405,774 USD Goldman Sachs (13,865) (0.05%) 9/15/21 379,187 USD 7,899,000 MXN Goldman Sachs (13,729) (0.04%) 9/15/21 626,000 NZD 450,116 USD Goldman Sachs (12,799) (0.04%) 9/15/21 522,000 NZD 368,673 USD Goldman Sachs (4,010) (0.01%) 9/15/21 9,306,000 MXN 466,887 USD Goldman Sachs (3,983) (0.01%) 9/15/21 316,000 PLN 86,161 USD Goldman Sachs (3,137) (0.01%) 9/15/21 695,000 SEK 84,256 USD Goldman Sachs (2,932) (0.01%) 9/15/21 34,742 USD 711,000 MXN Goldman Sachs (625) (0.00%) 9/15/21 34,273 USD 696,000 MXN Goldman Sachs (347) (0.00%)
119

NATIXIS INTERNATIONAL FUNDS (DUBLIN) I PLC
LOOMIS SAYLES ALTERNATIVE RISK PREMIA FUND (Continued)
Schedule of Investments As at 30 June 2021
FINANCIAL DERIVATIVE INSTRUMENTS (Continued) Open Forward Foreign Currency Exchange Contracts - (0.69%) (31 December 2020: 0.43%) (Continued)
Unrealised Maturity Gain/(Loss) % of Date Amount Bought Amount Sold Counterparty USD Net Assets 9/15/21 50,000 NZD 35,254 USD Goldman Sachs (325) (0.00%) 9/15/21 9,724 USD 199,000 MXN Goldman Sachs (175) (0.00%) 9/15/21 522,000 NZD 364,775 USD Goldman Sachs (111) (0.00%) 9/15/21 102,000 NOK 11,965 USD Goldman Sachs (108) (0.00%) 9/15/21 382,147 USD 535,000 NZD Goldman Sachs 8,402 0.03% 9/15/21 33,604 USD 125,000 PLN Goldman Sachs 762 0.00% 9/15/21 44,102 USD 167,000 PLN Goldman Sachs 225 0.00% 9/15/21 10,175,000 ARS 98,930 USD Goldman Sachs 760 0.00% 9/15/21 11,952 USD 102,000 NOK Goldman Sachs 95 0.00% 9/15/21 75,786 USD 642,000 SEK Goldman Sachs 664 0.00% 9/15/21 145,655,000 ARS 1,414,813 USD Goldman Sachs 12,251 0.04% 9/15/21 5,604 USD 8,000 NZD Goldman Sachs 15 0.00% 9/15/21 376,849 USD 538,000 NZD Goldman Sachs 1,007 0.00% 9/15/21 388,488 USD 556,000 NZD Goldman Sachs 72 0.00% 9/15/21 35,223 USD 49,000 NZD Goldman Sachs 992 0.00% 9/15/21 384,949 USD 535,000 NZD Goldman Sachs 11,204 0.04% 9/15/21 42,826 USD 60,000 NZD Goldman Sachs 911 0.00% 9/15/21 941,000 EUR 1,148,086 USD HSBC Bank (30,389) (0.10%) 9/15/21 596,000 GBP 841,089 USD HSBC Bank (17,605) (0.06%) 9/15/21 79,748,000 INR 1,081,329 USD HSBC Bank (17,508) (0.06%) 9/15/21 673,000 NZD 484,742 USD HSBC Bank (14,591) (0.05%) 9/15/21 380,000 EUR 463,627 USD HSBC Bank (12,272) (0.04%) 9/15/21 459,000 AUD 355,475 USD HSBC Bank (10,769) (0.04%) 9/15/21 286,000 GBP 403,610 USD HSBC Bank (8,448) (0.03%) 9/15/21 344,000 AUD 266,413 USD HSBC Bank (8,071) (0.03%) 9/15/21 485,000 AUD 366,984 USD HSBC Bank (2,752) (0.01%)
120

NATIXIS INTERNATIONAL FUNDS (DUBLIN) I PLC
LOOMIS SAYLES ALTERNATIVE RISK PREMIA FUND (Continued)
Schedule of Investments As at 30 June 2021
FINANCIAL DERIVATIVE INSTRUMENTS (Continued) Open Forward Foreign Currency Exchange Contracts - (0.69%) (31 December 2020: 0.43%) (Continued)
Unrealised Maturity Gain/(Loss) % of Date Amount Bought Amount Sold Counterparty USD Net Assets 9/15/21 132,000 CAD 109,091 USD HSBC Bank (2,495) (0.01%) 9/15/21 296,000 EUR 354,067 USD HSBC Bank (2,486) (0.01%) 9/15/21 478,000 CAD 388,408 USD HSBC Bank (2,404) (0.01%) 9/15/21 27,000 AUD 20,930 USD HSBC Bank (653) (0.00%) 9/15/21 14,000 EUR 17,094 USD HSBC Bank (465) (0.00%) 9/15/21 62,000 AUD 47,014 USD HSBC Bank (452) (0.00%) 9/15/21 453,000 CAD 366,182 USD HSBC Bank (366) (0.00%) 9/15/21 43,000 AUD 32,555 USD HSBC Bank (262) (0.00%) 9/15/21 14,000 NZD 10,002 USD HSBC Bank (222) (0.00%) 9/15/21 136,000 CZK 6,523 USD HSBC Bank (204) (0.00%) 9/15/21 58,000 CAD 47,039 USD HSBC Bank (201) (0.00%) 9/15/21 38,000 CAD 30,878 USD HSBC Bank (191) (0.00%) 9/15/21 24,000 AUD 18,203 USD HSBC Bank (179) (0.00%) 9/15/21 15,000 EUR 17,934 USD HSBC Bank (117) (0.00%) 9/15/21 11,000 GBP 15,310 USD HSBC Bank (112) (0.00%) 9/15/21 9,000 EUR 10,719 USD HSBC Bank (29) (0.00%) 9/15/21 14,239,000 INR 189,955 USD HSBC Bank (9) (0.00%) 9/15/21 42,408 USD 892,000 CZK HSBC Bank 960 0.00% 9/15/21 265,843 USD 344,000 AUD HSBC Bank 7,502 0.03% 9/15/21 395,283 USD 526,000 AUD HSBC Bank 261 0.00% 9/15/21 376,128 USD 271,000 GBP HSBC Bank 1,691 0.01% 9/15/21 407,042 USD 288,000 GBP HSBC Bank 9,116 0.03% 9/15/21 18,330 USD 382,000 CZK HSBC Bank 580 0.00% 9/15/21 123,648 USD 160,000 AUD HSBC Bank 3,489 0.01% 9/15/21 36,673 USD 2,705,000 INR HSBC Bank 589 0.00% 9/15/21 6,526 USD 136,000 CZK HSBC Bank 206 0.00%
121
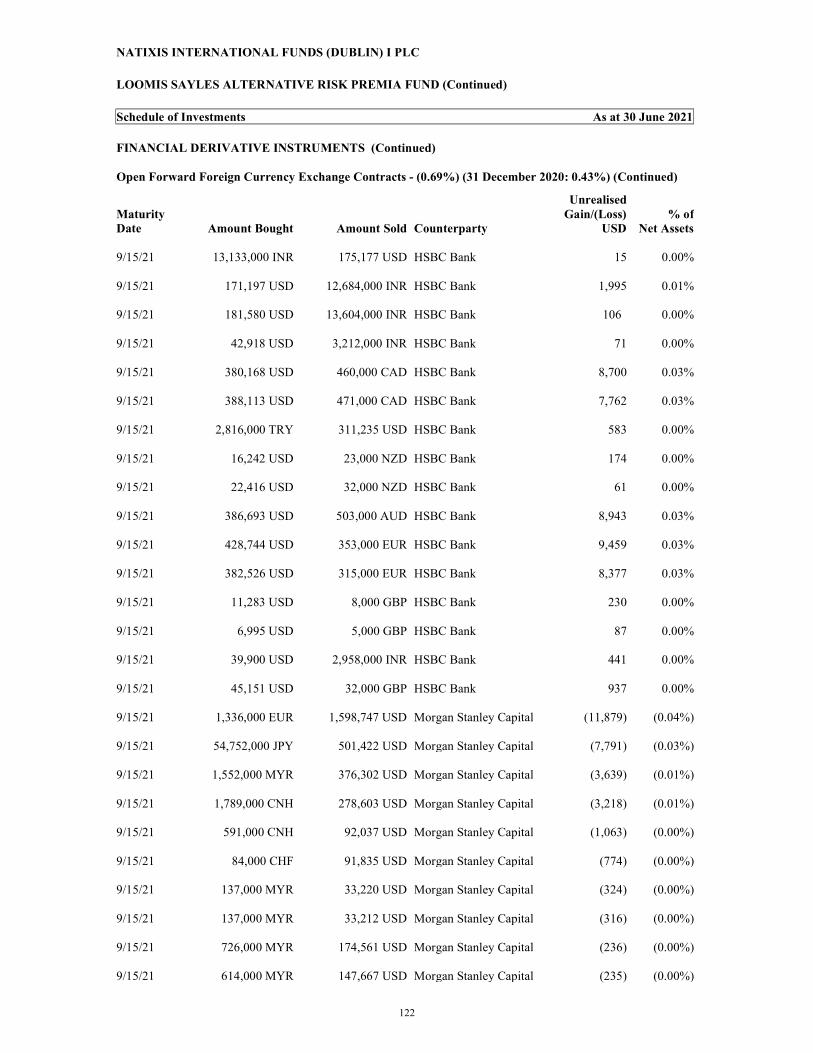
NATIXIS INTERNATIONAL FUNDS (DUBLIN) I PLC
LOOMIS SAYLES ALTERNATIVE RISK PREMIA FUND (Continued)
Schedule of Investments As at 30 June 2021
FINANCIAL DERIVATIVE INSTRUMENTS (Continued) Open Forward Foreign Currency Exchange Contracts - (0.69%) (31 December 2020: 0.43%) (Continued)
Unrealised Maturity Gain/(Loss) % of Date Amount Bought Amount Sold Counterparty USD Net Assets 9/15/21 13,133,000 INR 175,177 USD HSBC Bank 15 0.00% 9/15/21 171,197 USD 12,684,000 INR HSBC Bank 1,995 0.01% 9/15/21 181,580 USD 13,604,000 INR HSBC Bank 106 0.00% 9/15/21 42,918 USD 3,212,000 INR HSBC Bank 71 0.00% 9/15/21 380,168 USD 460,000 CAD HSBC Bank 8,700 0.03% 9/15/21 388,113 USD 471,000 CAD HSBC Bank 7,762 0.03% 9/15/21 2,816,000 TRY 311,235 USD HSBC Bank 583 0.00% 9/15/21 16,242 USD 23,000 NZD HSBC Bank 174 0.00% 9/15/21 22,416 USD 32,000 NZD HSBC Bank 61 0.00% 9/15/21 386,693 USD 503,000 AUD HSBC Bank 8,943 0.03% 9/15/21 428,744 USD 353,000 EUR HSBC Bank 9,459 0.03% 9/15/21 382,526 USD 315,000 EUR HSBC Bank 8,377 0.03% 9/15/21 11,283 USD 8,000 GBP HSBC Bank 230 0.00% 9/15/21 6,995 USD 5,000 GBP HSBC Bank 87 0.00% 9/15/21 39,900 USD 2,958,000 INR HSBC Bank 441 0.00% 9/15/21 45,151 USD 32,000 GBP HSBC Bank 937 0.00% 9/15/21 1,336,000 EUR 1,598,747 USD Morgan Stanley Capital (11,879) (0.04%) 9/15/21 54,752,000 JPY 501,422 USD Morgan Stanley Capital (7,791) (0.03%) 9/15/21 1,552,000 MYR 376,302 USD Morgan Stanley Capital (3,639) (0.01%) 9/15/21 1,789,000 CNH 278,603 USD Morgan Stanley Capital (3,218) (0.01%) 9/15/21 591,000 CNH 92,037 USD Morgan Stanley Capital (1,063) (0.00%) 9/15/21 84,000 CHF 91,835 USD Morgan Stanley Capital (774) (0.00%) 9/15/21 137,000 MYR 33,220 USD Morgan Stanley Capital (324) (0.00%) 9/15/21 137,000 MYR 33,212 USD Morgan Stanley Capital (316) (0.00%) 9/15/21 726,000 MYR 174,561 USD Morgan Stanley Capital (236) (0.00%) 9/15/21 614,000 MYR 147,667 USD Morgan Stanley Capital (235) (0.00%)
122

NATIXIS INTERNATIONAL FUNDS (DUBLIN) I PLC
LOOMIS SAYLES ALTERNATIVE RISK PREMIA FUND (Continued)
Schedule of Investments As at 30 June 2021
FINANCIAL DERIVATIVE INSTRUMENTS (Continued) Open Forward Foreign Currency Exchange Contracts - (0.69%) (31 December 2020: 0.43%) (Continued)
Unrealised Maturity Gain/(Loss) % of Date Amount Bought Amount Sold Counterparty USD Net Assets 9/15/21 37,439 USD 244,000 CNH Morgan Stanley Capital (120) (0.00%) 9/15/21 27,000 EUR 32,166 USD Morgan Stanley Capital (96) (0.00%) 9/15/21 44,365 USD 185,000 MYR Morgan Stanley Capital (57) (0.00%) 9/15/21 17,000 EUR 20,205 USD Morgan Stanley Capital (13) (0.00%) 9/15/21 1,311,000 JPY 11,830 USD Morgan Stanley Capital (10) (0.00%) 9/15/21 1,844,444 USD 1,659,000 CHF Morgan Stanley Capital 45,998 0.15% 9/15/21 183,646 USD 758,000 MYR Morgan Stanley Capital 1,637 0.01% 9/15/21 1,627,441 USD 1,330,000 EUR Morgan Stanley Capital 47,700 0.16% 9/15/21 11,938 USD 1,311,000 JPY Morgan Stanley Capital 119 0.00% 9/15/21 47,875 USD 44,000 CHF Morgan Stanley Capital 177 0.00% 9/15/21 181,950 USD 751,000 MYR Morgan Stanley Capital 1,622 0.01% 9/15/21 53,797 USD 48,000 CHF Morgan Stanley Capital 1,762 0.01% 9/15/21 278,069 USD 1,789,000 CNH Morgan Stanley Capital 2,683 0.01% 9/15/21 91,846 USD 591,000 CNY Morgan Stanley Capital 874 0.00% 9/15/21 34,669 USD 29,000 EUR Morgan Stanley Capital 223 0.00% 9/15/21 25,049 USD 21,000 EUR Morgan Stanley Capital 106 0.00% 9/15/21 45,679 USD 41,000 CHF Morgan Stanley Capital 1,233 0.00% 9/15/21 281,910 USD 1,814,000 CNY Morgan Stanley Capital 2,681 0.01% 9/15/21 36,050,000 PHP 751,504 USD UBS Securities LLC (14,831) (0.05%) 9/15/21 460,272,000 CLP 641,729 USD UBS Securities LLC (10,872) (0.04%) 9/15/21 376,114 USD 1,922,000 BRL UBS Securities LLC (3,416) (0.01%) 9/15/21 955,559 USD 46,915,000 PHP UBS Securities LLC (3,137) (0.01%) 9/15/21 13,926,000 TWD 502,718 USD UBS Securities LLC (2,830) (0.01%) 9/15/21 395,132 USD 2,013,000 BRL UBS Securities LLC (2,368) (0.01%) 9/15/21 13,612,000 TWD 490,844 USD UBS Securities LLC (2,227) (0.01%) 9/15/21 400,141 USD 2,037,000 BRL UBS Securities LLC (2,098) (0.01%)
123
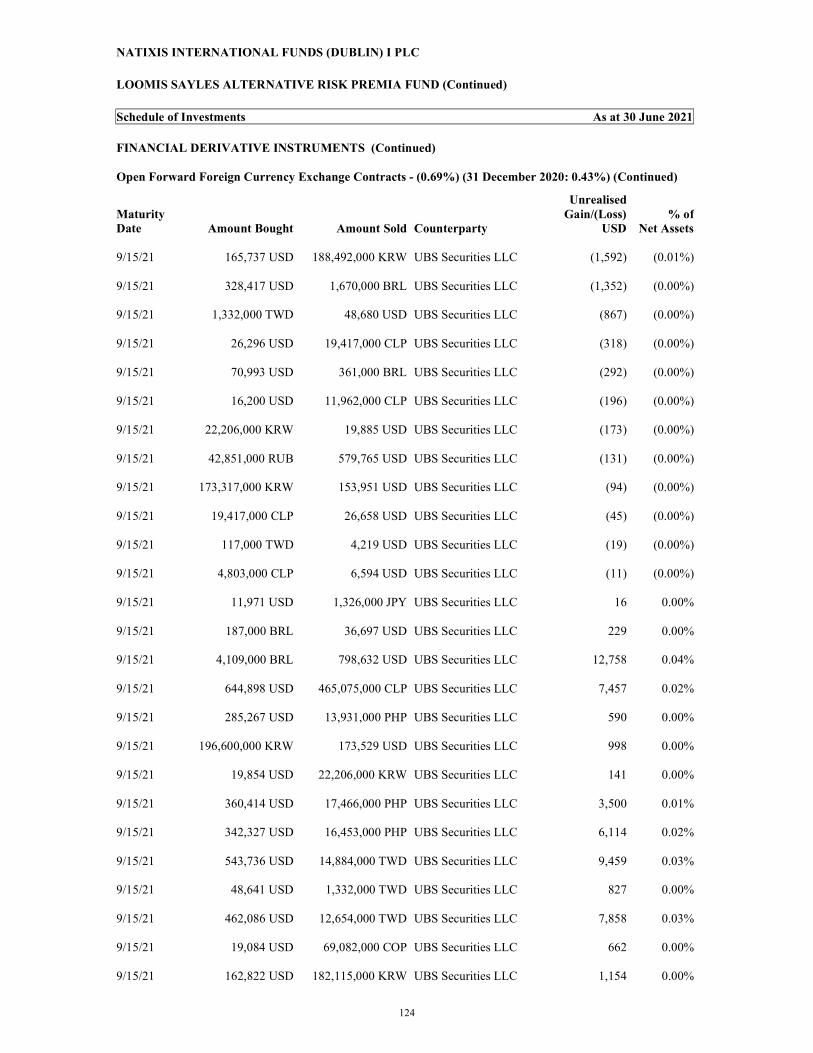
NATIXIS INTERNATIONAL FUNDS (DUBLIN) I PLC
LOOMIS SAYLES ALTERNATIVE RISK PREMIA FUND (Continued)
Schedule of Investments As at 30 June 2021
FINANCIAL DERIVATIVE INSTRUMENTS (Continued) Open Forward Foreign Currency Exchange Contracts - (0.69%) (31 December 2020: 0.43%) (Continued)
Unrealised Maturity Gain/(Loss) % of Date Amount Bought Amount Sold Counterparty USD Net Assets 9/15/21 165,737 USD 188,492,000 KRW UBS Securities LLC (1,592) (0.01%) 9/15/21 328,417 USD 1,670,000 BRL UBS Securities LLC (1,352) (0.00%) 9/15/21 1,332,000 TWD 48,680 USD UBS Securities LLC (867) (0.00%) 9/15/21 26,296 USD 19,417,000 CLP UBS Securities LLC (318) (0.00%) 9/15/21 70,993 USD 361,000 BRL UBS Securities LLC (292) (0.00%) 9/15/21 16,200 USD 11,962,000 CLP UBS Securities LLC (196) (0.00%) 9/15/21 22,206,000 KRW 19,885 USD UBS Securities LLC (173) (0.00%) 9/15/21 42,851,000 RUB 579,765 USD UBS Securities LLC (131) (0.00%) 9/15/21 173,317,000 KRW 153,951 USD UBS Securities LLC (94) (0.00%) 9/15/21 19,417,000 CLP 26,658 USD UBS Securities LLC (45) (0.00%) 9/15/21 117,000 TWD 4,219 USD UBS Securities LLC (19) (0.00%) 9/15/21 4,803,000 CLP 6,594 USD UBS Securities LLC (11) (0.00%) 9/15/21 11,971 USD 1,326,000 JPY UBS Securities LLC 16 0.00% 9/15/21 187,000 BRL 36,697 USD UBS Securities LLC 229 0.00% 9/15/21 4,109,000 BRL 798,632 USD UBS Securities LLC 12,758 0.04% 9/15/21 644,898 USD 465,075,000 CLP UBS Securities LLC 7,457 0.02% 9/15/21 285,267 USD 13,931,000 PHP UBS Securities LLC 590 0.00% 9/15/21 196,600,000 KRW 173,529 USD UBS Securities LLC 998 0.00% 9/15/21 19,854 USD 22,206,000 KRW UBS Securities LLC 141 0.00% 9/15/21 360,414 USD 17,466,000 PHP UBS Securities LLC 3,500 0.01% 9/15/21 342,327 USD 16,453,000 PHP UBS Securities LLC 6,114 0.02% 9/15/21 543,736 USD 14,884,000 TWD UBS Securities LLC 9,459 0.03% 9/15/21 48,641 USD 1,332,000 TWD UBS Securities LLC 827 0.00% 9/15/21 462,086 USD 12,654,000 TWD UBS Securities LLC 7,858 0.03% 9/15/21 19,084 USD 69,082,000 COP UBS Securities LLC 662 0.00% 9/15/21 162,822 USD 182,115,000 KRW UBS Securities LLC 1,154 0.00%
124

NATIXIS INTERNATIONAL FUNDS (DUBLIN) I PLC
LOOMIS SAYLES ALTERNATIVE RISK PREMIA FUND (Continued)
Schedule of Investments As at 30 June 2021
FINANCIAL DERIVATIVE INSTRUMENTS (Continued) Open Forward Foreign Currency Exchange Contracts - (0.69%) (31 December 2020: 0.43%) (Continued) 9/15/21 573,340 USD 42,025,000 RUB UBS Securities LLC 4,879 0.02% 9/15/21 43,637 USD 2,131,000 PHP UBS Securities LLC 90 0.00% Unrealised Gain/(Loss) % of USD Net Assets Unrealised gain on Open Forward Foreign Currency Exchange Contracts 359,985 1.16%Unrealised loss on Open Forward Foreign Currency Exchange Contracts (557,144) (1.81%) Net unrealised loss on Open Forward Foreign Currency Exchange Contracts (197,159) (0.63%)
Futures - (0.03)% (31 December 2020: 0.20%)
Number of Unrealised % of Contracts Description Counterparty Commitment Gain/(Loss) Net Assets
3 WIG20 Index September 2021 Futures JP Morgan 35,177 (631) (0.00%)
(17) US Ultra Bond September 2021 Futures JP Morgan 3,138,804 (136,883) (0.45%)
3 US Long Bond September 2021 Futures JP Morgan 479,625 2,625 0.01%
4 US 5 Year Note September 2021 Futures Morgan Stanley Capital 495,250 (1,531) (0.01%)
(2) US 2 Year Note September 2021 Futures JP Morgan 440,500 (141) (0.00%)
3 US 10 Year Note September 2021 Futures JP Morgan 395,766 1,734 0.01%
1 SPI 200 Index September 2021 Futures JP Morgan 136,167 (601) (0.00%)
3 SGX Nifty 50 July 2021 Futures JP Morgan 94,128 354 0.00%(7) SET50 September 2021 Futures JP Morgan 41,468 79 0.00%
(10) S&P 500 E-Mini September 2021 Futures JP Morgan 2,116,130 (28,120) (0.09%)
3 OMX Stockholm 30 Index July 2021 Futures JP Morgan 80,503 (1,014) (0.00%)
59 Nasdaq 100 Micro E-mini Septermber 2021 Futures JP Morgan 1,650,448 66,334 0.22%
3 MSCI Singapore Index July 2021 Futures JP Morgan 79,010 320 0.00%
3 Mini DAX September 2021 Futures JP Morgan 278,675 (2,455) (0.01%)
(2) Euro-Schatz September 2021 Futures JP Morgan 265,914 (59) (0.00%)
(1) Euro-OAT September 2021 Futures JP Morgan 187,882 (723) (0.00%)
(1) Euro-Bund September 2021 Futures JP Morgan 203,666 (1,032) (0.00%)
3 Euro-BTP September 2021 Futures JP Morgan 536,288 2,384 0.01%
(3) Euro-Bobl September 2021 Futures JP Morgan 476,625 (640) (0.00%)
125

NATIXIS INTERNATIONAL FUNDS (DUBLIN) I PLC
LOOMIS SAYLES ALTERNATIVE RISK PREMIA FUND (Continued)
Schedule of Investments As at 30 June 2021
FINANCIAL DERIVATIVE INSTRUMENTS (Continued) Futures - (0.03)% (31 December 2020: 0.20%) (Continued)
Number of Unrealised % of Contracts Description Counterparty Commitment Gain/(Loss) Net Assets
(109) Euro Stoxx 50 September 2021 Futures JP Morgan 5,323,896 81,631 0.26%
(8) E-mini Russell 2000 Index September 2020 Futures JP Morgan 932,280 9,160 0.03%
5 Canada 10 Year Bond September 2021 Futures JP Morgan 586,611 969 0.00%
24 BIST 30 August 2021 Futures JP Morgan 43,462 (2,017) (0.01%)
1 3 Month Euro Euribor December 2021 Futures JP Morgan 298,046 – (0.00%)
Unrealised gain on Futures 165,590 0.54%Unrealised loss on Futures (175,847) (0.57%)Net unrealised loss on Futures (10,257) (0.03%)
OTC Total Return Rate Swaps - 0.01% (31 December 2020: (0.11)%)
Maturity Unrealised % of
Position Counterparty Underlying Index Rate Date Currency Nominal Gain/(Loss) Net Assets
SELL Citibank NA
Citi Commodities Congestion/Liquidity
Navigator Ex Agriculture &
Livestock
0.22% 30/09/2021 USD
4,350,000 8,121 0.03%
SELL Citibank NA
Citi Commodities Congestion Alpha (DJF0 ex-AgsLvs
Capped)
0.22% 30/09/2021 USD
4,350,000 17,545 0.06%
BUY Morgan Stanley
Capital 3-Month USD LIBOR 0.13% 20/09/2021 USD
100,000 (1,363) (0.00%)
BUY Morgan Stanley
Capital 3-Month USD LIBOR 0.13% 20/09/2021 USD
900,000 (24,006) (0.08%)
Unrealised gain on OTC Total Rate Return Swaps 25,666 0.09%Unrealised loss on OTC Total Rate Return Swaps (25,369) (0.08%)
Net unrealised gain on OTC Total Rate Return Swaps 297 0.01% Centrally Cleared Credit Default Index Swaps - 1.41% (31 December 2020: 0.44%)
Unrealised Maturity appreciation/ % of
Position Counterparty Underlying Index Rate Date Currency Nominal (depreciation) Net Assets
SELL Deutsche Bank
iTraxx Europe Crossover Series 35
Version 1 5.00% 20/06/2026 EUR 600,000 88,239 0.29%
SELL JP Morgan CDX.NA.HY Series
36 Version 1 5.00% 20/06/2026 USD 2,200,000 224,484 0.73%
SELL Morgan Stanley
Capital CDX.NA.HY Series
36 Version 1 5.00% 20/06/2026 USD 100,000 10,204 0.03%
BUY Goldman Sachs CDX.NA.IG Series 36
Version 1 1.00% 20/06/2026 USD 200,000 (5,078) (0.02%)
126

NATIXIS INTERNATIONAL FUNDS (DUBLIN) I PLC
LOOMIS SAYLES ALTERNATIVE RISK PREMIA FUND (Continued)
Schedule of Investments As at 30 June 2021
FINANCIAL DERIVATIVE INSTRUMENTS (Continued) Centrally Cleared Credit Default Index Swaps - 1.41% (31 December 2020: 0.44%) (continued)
Unrealised Maturity appreciation/ % of
Position Counterparty Underlying Index Rate Date Currency Nominal (depreciation) Net Assets
BUY Goldman Sachs
iTraxx Europe Crossover Series 35
Version 1 5.00% 20/06/2026 EUR 100,000 (14,707) (0.05%)
BUY Credit Suisse CDX.NA.HY Series
36 Version 1 5.00% 20/06/2026 USD 200,000 (20,408) (0.07%)
SELL Goldman Sachs iTraxx Europe Series
35 Version 1 1.00% 20/06/2026 EUR 300,000 9,446 0.03%
SELL Goldman Sachs
iTraxx Europe Crossover Series 35
Version 1 5.00% 20/06/2026 EUR 500,000 73,534 0.24%
BUY Morgan Stanley
Capital CDX.EM Series 35
Version 1 1.00% 20/06/2026 USD 100,000 2,618 0.01%
SELL Goldman Sachs iTraxx Europe Series
35 Version 1 1.00% 20/06/2026 EUR 100,000 3,149 0.01%
BUY JP Morgan CDX.NA.IG Series 36
Version 1 1.00% 20/06/2026 USD 300,000 (7,619) (0.02%)
SELL Goldman Sachs
iTraxx Europe Crossover Series 35
Version 1 5.00% 20/06/2026 EUR 200,000 29,413 0.10%
SELL Merrill Lynch CDX.NA.HY Series
36 Version 1 5.00% 20/06/2026 USD 400,000 40,815 0.13%
Unrealised gain on Centrally Cleared Total Credit Default Swaps 481,902 1.53%Unrealised loss on Centrally Cleared Total Credit Default Swaps (47,812) (0.16%)
Net unrealised gain on Centrally Cleared Total Credit Default Swaps 434,090 1.38%
Fair Value % of USD Net Assets Total Financial Assets Designated at Fair Value Through Profit or Loss 26,548,063 86.14Total Financial Liabilities Designated at Fair Value Through Profit or Loss (806,172) (2.62) TOTAL FINANCIAL ASSETS AT FAIR VALUE THROUGH PROFIT OR LOSS AND FINANCIAL DERIVATIVES 25,741,891 83.53 Net Cash at Bank 4,205,688 13.64Other Assets 3,244,510 10.53Less Other Liabilities (2,372,733) (7.70) NET ASSETS ATTRIBUTABLE TO REDEEMABLE PARTICIPATING SHAREHOLDERS 30,819,356 100.00
127

NATIXIS INTERNATIONAL FUNDS (DUBLIN) I PLC
LOOMIS SAYLES ALTERNATIVE RISK PREMIA FUND (Continued)
Schedule of Investments As at 30 June 2021
TEN LARGEST SECTOR HOLDINGS AT 30 JUNE 2021 AS A PERCENTAGE OF NET ASSETS
Sovereign 30.39%
Oil & Gas 3.75%
Commercial Services 3.68% Insurance 2.50%
Food 2.43%
Retailers 2.40%
Electric 2.29%
Banking 2.09%
Telecommunications 2.05%
Software 2.03%
(i) Securities exempt from registration under Rule 144A (i) of the U.S. Securities Act of 1933. These securities may be resold in transactions exempt from registration, normally to qualified institutional buyers.
(ii) Securities issued by Non-U.S. or Non-Canadian users. (iii) Indicates a multi-step coupon security. The interest rate shown reflects the rate in effect at 30
June 2021. * Unlisted securities.
Other Information: All of the above long term securities are traded on regulated markets unless otherwise stated.
Key to Abbreviations AUD: Australian Dollar BRL: Brazilian Real CAD: Canadian Dollar CHF: Swiss Franc CLP: Chilean Peso CNH: China Yuan CNY: China Yuan Renminbi COP: Colombian Peso CZK: Czech Koruna DKK: Danish Krone EGP: Egyptian Pound EUR: Euro GBP: British Pound IDR: Indonesian Rupiah ILS: Israeli New Shekel INR: Indian Rupee JPY: Japanese Yen KRW: Korean Won MXN: Mexican Peso MYR: Malaysian Ringgit NOK: Norwegian Krone NZD: New Zealand Dollar PEN: Peruvian Sol PHP: Philippine Peso PLN: Polish Zloty RUB: Russian Ruble SEK: Swedish Krona SGD: Singapore Dollar
128

NATIXIS INTERNATIONAL FUNDS (DUBLIN) I PLC
LOOMIS SAYLES ALTERNATIVE RISK PREMIA FUND (Continued)
Schedule of Investments As at 30 June 2021
THB: Thai Baht TRY: Turkish Lira TWD: Taiwan New Dollar USD: United States Dollar UYU: Uruguayan Peso ZAR: South African Rand
% ofAnalysis of total assets Total Assets Transferable securities and money market instruments admitted to an official stock exchange or traded on a regulated market 72.05Transferable securities and money market instruments other than those admitted to an official exchange listing or traded on another regulated market 0.46OTC financial derivative instruments 0.81Current assets 26.68 100.00
129

NATIXIS INTERNATIONAL FUNDS (DUBLIN) I PLC
LOOMIS SAYLES EURO CREDIT FUND
Schedule of Investments As at 30 June 2021
Face Fair Value % of Amount EUR Net Assets
BONDS AND NOTES - 97.80% OF NET ASSETS
NON-CONVERTIBLE BONDS - 97.80% OF NET ASSETS
Australia - 1.30% Commonwealth Bank of Australia, 1.936%, 10/03/29 EMTN (i) (ii) EUR 340,000 355,926 0.30Scentre Group Trust 1/Scentre Group Trust 2, 1.750%, 4/11/28 EMTN (ii) EUR 535,000 579,261 0.49Toyota Finance Australia Ltd, 0.250%, 4/09/24 EMTN (ii) EUR 600,000 606,753 0.51 1,541,940 1.30Austria - 1.03% Erste Group Bank AG, 0.100%, 11/16/28 EMTN (i) (ii) EUR 500,000 494,485 0.42OMV AG, 2.875% (i) (ii) (iii) EUR 200,000 208,300 0.18Raiffeisen Bank International AG, 1.000%, 12/04/23 EMTN (ii) EUR 500,000 513,844 0.43 1,216,629 1.03Belgium - 3.15% Anheuser-Busch InBev SA/NV, 2.750%, 3/17/36 EMTN (ii) EUR 550,000 665,555 0.56Anheuser-Busch InBev SA/NV, 2.875%, 9/25/24 EMTN (ii) EUR 305,000 334,675 0.28Argenta Spaarbank NV, 1.000%, 2/06/24 EMTN (ii) EUR 400,000 411,046 0.35Belfius Bank SA, 0.010%, 10/15/25 EMTN (ii) EUR 800,000 800,176 0.68Elia Transmission Belgium SA, 0.875%, 4/28/30 EMTN (ii) EUR 500,000 515,344 0.43KBC Group NV, 0.125%, 9/10/26 EMTN (i) (ii) EUR 600,000 599,064 0.51UCB SA, 1.000%, 3/30/28 EMTN (ii) EUR 400,000 403,371 0.34 3,729,231 3.15Canada - 0.58% Great-West Lifeco Inc, 1.750%, 12/07/26 EUR 250,000 271,015 0.23Great-West Lifeco Inc, 2.500%, 4/18/23 EUR 400,000 418,811 0.35 689,826 0.58Cayman Islands - 0.48% CK Hutchison Finance 16 II Ltd, 0.875%, 10/03/24 (ii) EUR 555,000 570,009 0.48 570,009 0.48Denmark - 0.94% Danske Bank A/S, 1.375%, 2/12/30 EMTN (i) (ii) EUR 400,000 407,596 0.34Danske Bank A/S, 0.750%, 6/09/29 EMTN (i) (ii) EUR 360,000 360,284 0.31Nykredit Realkredit AS, 0.500%, 1/19/22 EMTN (ii) EUR 340,000 341,428 0.29 1,109,308 0.94Finland - 0.72% Kojamo OYJ, 1.625%, 3/07/25 (ii) EUR 815,000 852,327 0.72 852,327 0.72France - 16.56% Banque Federative du Credit Mutuel SA, 0.750%, 6/08/26 EMTN (ii) EUR 500,000 516,354 0.44Banque Federative du Credit Mutuel SA, 2.625%, 3/31/27 EMTN (ii) EUR 200,000 222,179 0.19BNP Paribas SA, 0.250%, 4/13/27 EMTN (i) (ii) EUR 1,400,000 1,390,926 1.17BNP Paribas SA, 1.125%, 1/15/32 EMTN (i) (ii) EUR 400,000 403,254 0.34Carrefour SA, 0.875%, 6/12/23 EMTN (ii) EUR 600,000 610,896 0.52Cie de Saint-Gobain, 1.750%, 4/03/23 EMTN (ii) EUR 300,000 309,747 0.26Coentreprise de Transport d'Electricite SA, 0.875%, 9/29/24 (ii) EUR 900,000 923,717 0.78Credit Agricole Assurances SA, 4.750%, 9/27/48 (i) (ii) EUR 400,000 488,272 0.41Credit Agricole SA, 1.000%, 4/22/26 EMTN (i) (ii) EUR 300,000 309,429 0.26
130

NATIXIS INTERNATIONAL FUNDS (DUBLIN) I PLC
LOOMIS SAYLES EURO CREDIT FUND (Continued)
Schedule of Investments As at 30 June 2021
Face Fair Value % of Amount EUR Net Assets
BONDS AND NOTES (Continued)
NON-CONVERTIBLE BONDS (Continued)
France - 16.56% (Continued) Credit Agricole SA, 1.375%, 5/03/27 EMTN (ii) EUR 600,000 642,798 0.54Credit Agricole SA, 1.625%, 6/05/30 EMTN (i) (ii) EUR 500,000 519,311 0.44Credit Mutuel Arkea SA, 1.250%, 5/31/24 (ii) EUR 400,000 413,920 0.35Credit Mutuel Arkea SA, 1.250%, 6/11/29 EMTN (i) (ii) EUR 600,000 624,986 0.53Crown European Holdings SA, 3.375%, 5/15/25 (ii) EUR 330,000 353,940 0.30Electricite de France SA, 2.000%, 12/09/49 EMTN (ii) EUR 400,000 429,144 0.36Electricite de France SA, 4.625%, 9/11/24 EMTN (ii) EUR 250,000 287,662 0.24ELO SACA, 2.875%, 1/29/26 EMTN (ii) EUR 200,000 222,634 0.19Engie SA, 0.375%, 6/11/27 EMTN (ii) EUR 900,000 912,292 0.77Engie SA, 1.375%, 6/22/28 EMTN (ii) EUR 300,000 322,478 0.27Engie SA, 3.250% (i) (ii) (iii) EUR 500,000 541,250 0.46La Banque Postale SA, 0.875%, 1/26/31 EMTN (i) (ii) EUR 400,000 400,868 0.34La Poste SA, 0.625%, 1/18/36 EMTN (ii) EUR 100,000 95,400 0.08La Poste SA, 1.125%, 6/04/25 EMTN (ii) EUR 500,000 523,474 0.44Orange SA, 1.000%, 9/12/25 EMTN (ii) EUR 500,000 521,950 0.44Orange SA, 3.125%, 1/09/24 EMTN (ii) EUR 500,000 542,536 0.46PSA Banque France SA, 0.750%, 4/19/23 EMTN (ii) EUR 340,000 345,064 0.29PSA Tresorerie GIE, 6.000%, 9/19/33 (ii) EUR 115,000 172,970 0.15RCI Banque SA, 1.625%, 4/11/25 EMTN (ii) EUR 415,000 433,780 0.37RTE Reseau de Transport d'Electricite SADIR, 0.625%, 7/08/32 EMTN (ii) EUR 600,000 601,759 0.51RTE Reseau de Transport d'Electricite SADIR, Zero Coupon Bond, 9/09/27 EMTN (ii) EUR 600,000 592,718 0.50SANEF SA, 1.875%, 3/16/26 (ii) EUR 800,000 856,527 0.72Societe Generale SA, 0.500%, 6/12/29 (i) (ii) EUR 800,000 782,518 0.66Suez SA, Zero Coupon Bond, 6/09/26 EMTN (ii) EUR 400,000 398,720 0.34Thales SA, 0.750%, 1/23/25 EMTN (ii) EUR 500,000 513,201 0.43TotalEnergies Capital International SA, 0.696%, 5/31/28 EMTN (ii) EUR 1,000,000 1,036,302 0.87TotalEnergies SE, 1.625% EMTN (i) (ii) (iii) EUR 540,000 539,981 0.46TotalEnergies SE, 2.000% (i) (ii) (iii) EUR 200,000 201,222 0.17Unibail-Rodamco-Westfield SE, 1.375%, 5/25/33 EMTN (ii) EUR 400,000 405,140 0.34Veolia Environnement SA, 0.800%, 1/15/32 EMTN (ii) EUR 200,000 201,713 0.17 19,611,032 16.56Germany - 7.46% Allianz SE, 2.121%, 7/08/50 EMTN (i) (ii) EUR 100,000 107,111 0.09Bundesrepublik Deutschland Bundesanleihe, 4.000%, 1/04/37 (ii) EUR 1,085,000 1,767,081 1.49Deutsche Bank AG, 1.000%, 11/19/25 EMTN (i) (ii) EUR 900,000 918,524 0.78Deutsche Bank AG, 1.750%, 1/17/28 EMTN (ii) EUR 200,000 211,546 0.18Deutsche Telekom AG, 0.875%, 3/25/26 EMTN (ii) EUR 515,000 536,445 0.45Fraport AG Frankfurt Airport Services Worldwide, 1.875%, 3/31/28 (ii) EUR 585,000 613,320 0.52HeidelbergCement AG, 2.250%, 3/30/23 EMTN (ii) EUR 380,000 393,840 0.33Infineon Technologies AG, 1.625%, 6/24/29 EMTN (ii) EUR 400,000 430,640 0.36LEG Immobilien SE, 1.250%, 1/23/24 EMTN (ii) EUR 300,000 308,862 0.26METRO AG, 1.125%, 3/06/23 EMTN (ii) EUR 400,000 407,648 0.35Santander Consumer Bank AG, 0.250%, 10/15/24 EMTN (ii) EUR 800,000 805,776 0.68Talanx AG, 2.250%, 12/05/47 EMTN (i) (ii) EUR 400,000 428,969 0.36
131

NATIXIS INTERNATIONAL FUNDS (DUBLIN) I PLC
LOOMIS SAYLES EURO CREDIT FUND (Continued)
Schedule of Investments As at 30 June 2021
Face Fair Value % of Amount EUR Net Assets
BONDS AND NOTES (Continued)
NON-CONVERTIBLE BONDS (Continued)
Germany - 7.46% (Continued) Volkswagen Bank GmbH, 0.750%, 6/15/23 EMTN (ii) EUR 535,000 543,668 0.46Volkswagen Leasing GmbH, 0.375%, 7/20/26 EMTN (ii) EUR 600,000 601,739 0.51Volkswagen Leasing GmbH, 1.500%, 6/19/26 EMTN (ii) EUR 240,000 254,491 0.22Vonovia SE, 0.375%, 6/16/27 EMTN (ii) EUR 500,000 500,267 0.42 8,829,927 7.46Ireland - 1.85% Abbott Ireland Financing DAC, 1.500%, 9/27/26 (ii) EUR 400,000 429,063 0.36CCEP Finance Ireland DAC, 0.500%, 9/06/29 (ii) EUR 470,000 469,344 0.40Cloverie PLC for Zurich Insurance Co Ltd., 1.750%, 9/16/24 EMTN (ii) EUR 355,000 377,490 0.32Eaton Capital Unlimited Co, 0.577%, 3/08/30 (ii) EUR 200,000 200,189 0.17Glencore Capital Finance DAC, 1.125%, 3/10/28 EMTN (ii) EUR 700,000 711,581 0.60 2,187,667 1.85Italy - 4.19% Aeroporti di Roma SpA, 1.750%, 7/30/31 EMTN (ii) EUR 200,000 208,225 0.18Amplifon SpA, 1.125%, 2/13/27 (ii) EUR 340,000 341,700 0.29Enel SpA, 5.625%, 6/21/27 EMTN (ii) EUR 520,000 687,581 0.58ENI SpA, 1.250%, 5/18/26 EMTN (ii) EUR 540,000 570,655 0.48FCA Bank SpA, 0.625%, 11/24/22 EMTN (ii) EUR 400,000 404,003 0.34Intesa Sanpaolo SpA, 0.750%, 3/16/28 EMTN (ii) EUR 450,000 452,268 0.38Intesa Sanpaolo SpA, 1.125%, 3/04/22 EMTN (ii) EUR 370,000 373,572 0.32Intesa Sanpaolo SpA, 1.750%, 3/20/28 EMTN (ii) EUR 365,000 389,599 0.33Terna SpA, 0.375%, 9/25/30 EMTN (ii) EUR 360,000 352,724 0.30Terna SpA, 0.875%, 2/02/22 EMTN (ii) EUR 365,000 367,669 0.31UniCredit SpA, 1.250%, 6/25/25 EMTN (i) (ii) EUR 785,000 808,004 0.68 4,956,000 4.19Japan - 1.06% Asahi Group Holdings Ltd, 0.010%, 4/19/24 (ii) EUR 400,000 401,035 0.34Nissan Motor Co Ltd., 2.652%, 3/17/26 (ii) EUR 100,000 108,939 0.09Takeda Pharmaceutical Co Ltd., 1.000%, 7/09/29 (ii) EUR 720,000 743,358 0.63 1,253,332 1.06Luxembourg - 7.67% Bevco Lux Sarl, 1.000%, 1/16/30 (ii) EUR 355,000 351,663 0.30Blackstone Property Partners Europe Holdings Sarl, 1.750%, 3/12/29 EMTN (ii) EUR 540,000 560,477 0.47CNH Industrial Finance Europe SA, 1.750%, 3/25/27 EMTN (ii) EUR 450,000 480,633 0.41DH Europe Finance II Sarl, 0.450%, 3/18/28 (ii) EUR 655,000 659,926 0.56DH Europe Finance Sarl, 1.200%, 6/30/27 (ii) EUR 450,000 473,994 0.40Eurofins Scientific SE, 2.125%, 7/25/24 (ii) EUR 270,000 285,776 0.24Grand City Properties SA, 1.500%, 2/22/27 EMTN (ii) EUR 600,000 636,168 0.54Helvetia Europe SA, 2.750%, 9/30/41 (i) (ii) EUR 300,000 323,570 0.27Holcim Finance Luxembourg SA, 0.500%, 11/29/26 EMTN (ii) EUR 345,000 350,548 0.30Holcim Finance Luxembourg SA, 0.625%, 4/06/30 EMTN (ii) EUR 550,000 549,103 0.46Medtronic Global Holdings SCA, 1.000%, 7/02/31 (ii) EUR 560,000 582,404 0.49Medtronic Global Holdings SCA, 2.250%, 3/07/39 (ii) EUR 470,000 550,742 0.46Novartis Finance SA, Zero Coupon Bond, 9/23/28 (ii) EUR 295,000 291,222 0.25Richemont International Holding SA, 1.000%, 3/26/26 (ii) EUR 700,000 732,840 0.62SES SA, 2.875% (i) (ii) (iii) EUR 225,000 226,597 0.19SES SA, 5.625% (i) (ii) (iii) EUR 355,000 387,394 0.33
132

NATIXIS INTERNATIONAL FUNDS (DUBLIN) I PLC
LOOMIS SAYLES EURO CREDIT FUND (Continued)
Schedule of Investments As at 30 June 2021
Face Fair Value % of Amount EUR Net Assets
BONDS AND NOTES (Continued)
NON-CONVERTIBLE BONDS (Continued)
Luxembourg - 7.67% (Continued) SIG Combibloc PurchaseCo Sarl, 2.125%, 6/18/25 (ii) EUR 410,000 433,706 0.37SIX Finance Luxembourg SA, Zero Coupon Bond, 12/02/25 (ii) EUR 800,000 798,864 0.67Traton Finance Luxembourg SA, 1.250%, 3/24/33 EMTN (ii) EUR 400,000 405,385 0.34 9,081,012 7.67Mexico - 0.39% Fomento Economico Mexicano SAB de CV, 1.000%, 5/28/33 (ii) EUR 470,000 457,667 0.39 457,667 0.39Netherlands - 14.63% ABN AMRO Bank NV, 0.875%, 1/15/24 EMTN (ii) EUR 405,000 416,625 0.35Akelius Residential Property Financing BV, 1.000%, 1/17/28 (ii) EUR 555,000 566,442 0.48Allianz Finance II BV, 0.250%, 6/06/23 EMTN (ii) EUR 600,000 605,904 0.51Argentum Netherlands BV for Givaudan SA, 1.125%, 9/17/25 (ii) EUR 500,000 523,762 0.44BMW Finance NV, Zero Coupon Bond, 3/24/23 EMTN (ii) EUR 760,000 763,998 0.65Citycon Treasury BV, 2.375%, 1/15/27 EMTN (ii) EUR 220,000 230,303 0.19Cooperatieve Rabobank UA, 1.250%, 3/23/26 (ii) EUR 945,000 1,005,775 0.85Daimler International Finance BV, 0.250%, 11/06/23 EMTN (ii) EUR 265,000 267,237 0.23Davide Campari-Milano NV, 1.250%, 10/06/27 (ii) EUR 370,000 377,854 0.32de Volksbank NV, 0.250%, 6/22/26 EMTN (ii) EUR 400,000 397,834 0.34de Volksbank NV, 0.750%, 6/25/23 EMTN (ii) EUR 800,000 815,277 0.69E.ON International Finance BV, 1.000%, 4/13/25 EMTN (ii) EUR 585,000 605,339 0.51ELM BV for Firmenich International SA, 3.750% (i) (ii) (iii) EUR 355,000 382,726 0.32ELM BV for Swiss Life Insurance & Pension Group, 4.500% EMTN (i) (ii) (iii) EUR 155,000 181,931 0.15Enel Finance International NV, Zero Coupon Bond, 6/17/27 EMTN (ii) EUR 735,000 726,174 0.61Enexis Holding NV, 0.875%, 4/28/26 EMTN (ii) EUR 500,000 521,831 0.44EXOR NV, 2.250%, 4/29/30 (ii) EUR 110,000 122,020 0.10Heineken NV, 1.750%, 5/07/40 EMTN (ii) EUR 270,000 288,615 0.24Iberdrola International BV, 2.250% (i) (ii) (iii) EUR 200,000 206,664 0.18ING Groep NV, 0.250%, 2/18/29 (i) (ii) EUR 400,000 391,761 0.33ING Groep NV, 1.000%, 11/13/30 (i) (ii) EUR 200,000 202,619 0.17ING Groep NV, 1.625%, 9/26/29 EMTN (i) (ii) EUR 300,000 311,070 0.26JAB Holdings BV, 2.500%, 4/17/27 (ii) EUR 700,000 778,022 0.66Koninklijke DSM NV, 0.750%, 9/28/26 EMTN (ii) EUR 600,000 622,242 0.53Koninklijke Philips NV, 0.750%, 5/02/24 (ii) EUR 785,000 803,526 0.68LeasePlan Corp NV, 0.750%, 10/03/22 EMTN (ii) EUR 400,000 404,872 0.34Nederlandse Gasunie NV, 0.375%, 10/03/31 EMTN (ii) EUR 460,000 458,068 0.39Repsol International Finance BV, 4.247% (i) (ii) (iii) EUR 155,000 170,486 0.14Shell International Finance BV, 1.250%, 5/12/28 EMTN (ii) EUR 575,000 615,044 0.52Shell International Finance BV, 1.500%, 4/07/28 EMTN (ii) EUR 500,000 543,565 0.46Stellantis NV, 0.750%, 1/18/29 EMTN (ii) EUR 370,000 368,499 0.31Volkswagen International Finance NV, 3.875% (i) (ii) (iii) EUR 700,000 773,445 0.65Vonovia Finance BV, 2.250%, 4/07/30 (ii) EUR 500,000 566,817 0.48Wintershall Dea Finance BV, 1.332%, 9/25/28 (ii) EUR 400,000 410,231 0.35WPC Eurobond BV, 2.125%, 4/15/27 (ii) EUR 325,000 351,436 0.30Wurth Finance International BV, 1.000%, 5/19/22 EMTN (ii) EUR 535,000 539,573 0.46 17,317,587 14.63
133

NATIXIS INTERNATIONAL FUNDS (DUBLIN) I PLC
LOOMIS SAYLES EURO CREDIT FUND (Continued)
Schedule of Investments As at 30 June 2021
Face Fair Value % of Amount EUR Net Assets
BONDS AND NOTES (Continued)
NON-CONVERTIBLE BONDS (Continued)
Norway - 1.22% DNB Bank ASA, 0.250%, 4/09/24 (ii) EUR 640,000 648,678 0.55Statkraft AS, 1.500%, 3/26/30 EMTN (ii) EUR 520,000 569,487 0.48Statnett SF, 0.875%, 3/08/25 EMTN (ii) EUR 225,000 232,313 0.19 1,450,478 1.22Portugal - 0.08% EDP - Energias de Portugal SA, 1.700%, 7/20/80 (i) (ii) EUR 100,000 100,450 0.08 100,450 0.08Spain - 4.65% Abertis Infraestructuras SA, 1.125%, 3/26/28 (ii) EUR 400,000 408,417 0.34Arval Service Lease SA, Zero Coupon Bond, 9/30/24 EMTN (ii) EUR 400,000 400,080 0.34Banco Bilbao Vizcaya Argentaria SA, 0.375%, 11/15/26 EMTN (ii) EUR 400,000 405,160 0.34Banco de Sabadell SA, 0.625%, 11/07/25 (i) (ii) EUR 500,000 503,785 0.43Banco Santander SA, 0.200%, 2/11/28 EMTN (ii) EUR 500,000 495,999 0.42Banco Santander SA, 0.250%, 6/19/24 EMTN (ii) EUR 400,000 404,070 0.34Banco Santander SA, 0.500%, 3/24/27 EMTN (i) (ii) EUR 600,000 602,430 0.51CaixaBank SA, 0.750%, 4/18/23 EMTN (ii) EUR 900,000 914,589 0.77CaixaBank SA, 2.750%, 7/14/28 EMTN (i) (ii) EUR 500,000 521,997 0.44CaixaBank SA, 3.750%, 2/15/29 EMTN (i) (ii) EUR 200,000 215,581 0.18Telefonica Emisiones SA, 1.069%, 5/02/24 EMTN (ii) EUR 400,000 411,475 0.35Telefonica Emisiones SA, 1.930%, 10/17/31 EMTN (ii) EUR 200,000 223,316 0.19 5,506,899 4.65Sweden - 1.08% Atlas Copco AB, 2.500%, 2/28/23 EMTN (ii) EUR 310,000 324,283 0.27Molnlycke Holding AB, 0.875%, 9/05/29 EMTN (ii) EUR 300,000 301,223 0.25Samhallsbyggnadsbolaget i Norden AB, 1.000%, 8/12/27 EMTN (ii) EUR 235,000 237,400 0.20Vattenfall AB, 5.375%, 4/29/24 EMTN (ii) EUR 365,000 421,757 0.36 1,284,663 1.08Switzerland - 1.73% Credit Suisse Group AG, 3.250%, 4/02/26 EMTN (i) (ii) EUR 600,000 661,025 0.56UBS AG, 0.010%, 3/31/26 EMTN (ii) EUR 900,000 898,706 0.76UBS Group AG, 1.500%, 11/30/24 (ii) EUR 470,000 487,729 0.41 2,047,460 1.73United Kingdom - 6.26% Anglo American Capital PLC, 3.250%, 4/03/23 EMTN (ii) EUR 440,000 465,342 0.39Barclays PLC, 2.000%, 2/07/28 EMTN (i) (ii) EUR 400,000 410,078 0.35Barclays PLC, 3.375%, 4/02/25 EMTN (i) (ii) EUR 400,000 435,644 0.37BP Capital Markets PLC, 1.573%, 2/16/27 EMTN (ii) EUR 535,000 574,693 0.49BP Capital Markets PLC, 3.250% (i) (ii) (iii) EUR 170,000 181,560 0.15Chanel Ceres PLC, 0.500%, 7/31/26 (ii) EUR 470,000 473,549 0.40Chanel Ceres PLC, 1.000%, 7/31/31 (ii) EUR 380,000 381,026 0.32GlaxoSmithKline Capital PLC, Zero Coupon Bond, 9/23/23 EMTN (ii) EUR 1,100,000 1,105,654 0.93HSBC Holdings PLC, 0.309%, 11/13/26 (i) (ii) EUR 620,000 621,832 0.53Mondi Finance PLC, 1.625%, 4/27/26 EMTN (ii) EUR 220,000 234,586 0.20Natwest Group PLC, 2.000%, 3/04/25 EMTN (i) (ii) EUR 470,000 494,026 0.42Natwest Group PLC, 2.000%, 3/08/23 EMTN (i) (ii) EUR 370,000 375,434 0.32Phoenix Group Holdings PLC, 4.375%, 1/24/29 EMTN (ii) EUR 155,000 182,009 0.15
134

NATIXIS INTERNATIONAL FUNDS (DUBLIN) I PLC
LOOMIS SAYLES EURO CREDIT FUND (Continued)
Schedule of Investments As at 30 June 2021
Face Fair Value % of Amount EUR Net Assets
BONDS AND NOTES (Continued)
NON-CONVERTIBLE BONDS (Continued)
United Kingdom - 6.26% (Continued) Standard Chartered PLC, 0.750%, 10/03/23 EMTN (i) (ii) EUR 580,000 586,306 0.49Standard Chartered PLC, 2.500%, 9/09/30 (i) (ii) EUR 100,000 106,127 0.09Tesco Corporate Treasury Services PLC, 0.875%, 5/29/26 EMTN (ii) EUR 300,000 308,345 0.26Virgin Money UK PLC, 0.375%, 5/27/24 EMTN (i) (ii) EUR 100,000 100,674 0.08Vodafone Group PLC, 1.625%, 11/24/30 EMTN (ii) EUR 350,000 381,689 0.32 7,418,574 6.26United States - 20.77% American Honda Finance Corp, 1.950%, 10/18/24 EUR 380,000 405,142 0.34Apple Inc, 1.625%, 11/10/26 EUR 1,010,000 1,098,955 0.93AT&T Inc, 1.600%, 5/19/28 EUR 525,000 562,632 0.47AT&T Inc, 2.400%, 3/15/24 EUR 540,000 572,970 0.48AT&T Inc, 2.450%, 3/15/35 EUR 480,000 539,597 0.46Ball Corp, 0.875%, 3/15/24 EUR 425,000 427,766 0.36Bank of America Corp, 0.583%, 8/24/28 EMTN (i) EUR 350,000 352,702 0.30Bank of America Corp, 0.694%, 3/22/31 EMTN (i) EUR 365,000 363,876 0.31Bank of America Corp, 2.375%, 6/19/24 EMTN EUR 410,000 439,918 0.37Berkshire Hathaway Inc, 1.300%, 3/15/24 EUR 1,165,000 1,207,234 1.02Chubb INA Holdings Inc, 1.550%, 3/15/28 EUR 525,000 564,723 0.48Coca-Cola Co, 0.950%, 5/06/36 EUR 175,000 176,308 0.15Digital Euro Finco LLC, 2.500%, 1/16/26 EUR 360,000 395,496 0.33Dow Chemical Co, 1.125%, 3/15/32 EUR 600,000 613,297 0.52Euronet Worldwide Inc, 1.375%, 5/22/26 EUR 175,000 177,248 0.15Exxon Mobil Corp, 1.408%, 6/26/39 EUR 345,000 339,366 0.29Fidelity National Information Services Inc, 1.500%, 5/21/27 EUR 840,000 890,954 0.75Fiserv Inc, 1.625%, 7/01/30 EUR 450,000 483,019 0.41General Electric Co, 1.500%, 5/17/29 EUR 480,000 505,996 0.43General Electric Co, 1.875%, 5/28/27 EUR 595,000 641,499 0.54General Motors Financial Co, Inc., 0.850%, 2/26/26 EUR 100,000 101,755 0.09Goldman Sachs Group Inc, 0.010%, 4/30/24 EMTN (i) EUR 350,000 350,155 0.30Goldman Sachs Group Inc, 2.125%, 9/30/24 EMTN EUR 575,000 613,424 0.52Illinois Tool Works Inc, 0.250%, 12/05/24 EUR 560,000 566,849 0.48International Flavors & Fragrances Inc, 1.750%, 3/14/24 EUR 640,000 668,288 0.56JPMorgan Chase & Co, 0.625%, 1/25/24 EMTN EUR 785,000 799,538 0.67JPMorgan Chase & Co, 1.090%, 3/11/27 EMTN (i) EUR 270,000 280,998 0.24JPMorgan Chase & Co, 1.638%, 5/18/28 EMTN (i) EUR 315,000 338,553 0.29Kellogg Co, 1.000%, 5/17/24 EUR 460,000 474,105 0.40KKR Group Finance Co V LLC, 1.625%, 5/22/29 EUR 210,000 224,672 0.19Merck & Co, Inc., 0.500%, 11/02/24 EUR 1,110,000 1,133,710 0.96Morgan Stanley, 0.406%, 10/29/27 (i) EUR 735,000 737,271 0.62MPT Operating Partnership LP/MPT Finance Corp, 3.325%, 3/24/25 EUR 325,000 350,545 0.30Mylan Inc, 2.125%, 5/23/25 EUR 275,000 293,368 0.25Nasdaq Inc, 1.750%, 3/28/29 EUR 700,000 760,105 0.64PepsiCo Inc, 0.500%, 5/06/28 EMTN EUR 710,000 728,351 0.61Prologis Euro Finance LLC, 1.875%, 1/05/29 EUR 615,000 680,297 0.57Thermo Fisher Scientific Inc, 2.875%, 7/24/37 EUR 410,000 506,625 0.43United Parcel Service Inc, 0.375%, 11/15/23 EUR 460,000 466,449 0.39Utah Acquisition Sub Inc, 3.125%, 11/22/28 EUR 250,000 290,400 0.24
135

NATIXIS INTERNATIONAL FUNDS (DUBLIN) I PLC
LOOMIS SAYLES EURO CREDIT FUND (Continued)
Schedule of Investments As at 30 June 2021
Face Fair Value % of Amount EUR Net Assets
BONDS AND NOTES (Continued)
NON-CONVERTIBLE BONDS (Continued)
United States - 20.77% (Continued) Verizon Communications Inc, 0.750%, 3/22/32 EUR 200,000 197,442 0.17Verizon Communications Inc, 0.875%, 4/08/27 EUR 545,000 563,425 0.48Verizon Communications Inc, 1.300%, 5/18/33 EUR 720,000 741,285 0.63VF Corp, 0.250%, 2/25/28 EUR 400,000 397,056 0.33VF Corp, 0.625%, 9/20/23 EUR 285,000 289,403 0.24Wells Fargo & Co, 1.500%, 5/24/27 EMTN EUR 370,000 392,159 0.33Wells Fargo & Co, 1.625%, 6/02/25 EMTN EUR 435,000 460,554 0.39Wells Fargo & Co, 1.741%, 5/04/30 EMTN (i) EUR 400,000 430,980 0.36 24,596,460 20.77
TOTAL NON-CONVERTIBLE BONDS 115,808,478 97.80
TOTAL BONDS AND NOTES 115,808,478 97.80
TOTAL FINANCIAL ASSETS AT FAIR VALUE THROUGH PROFIT OR LOSS EXCLUDING FINANCIAL DERIVATIVE INSTRUMENTS (Cost: EUR 116,048,792) 115,808,478 97.80
FINANCIAL DERIVATIVE INSTRUMENTS - 0.03%
Futures - 0.03%
Number of Unrealised % of Contracts Description Counterparty Commitment Gain/(Loss) Net Assets
(87) Euro-Bobl September 2021 Futures JP Morgan 11,660,960 (10,090) (0.01%)
51 Euro-Bund September 2021 Futures JP Morgan 8,759,980 43,130 0.04%
18 Euro-Schatz September 2021 Futures JP Morgan 2,018,880 (360) (0.00%)
Unrealised gain on Futures 43,130 0.04%Unrealised loss on Futures (10,450) (0.01%) Net unrealised gain on Futures 32,680 0.03%
136

NATIXIS INTERNATIONAL FUNDS (DUBLIN) I PLC
LOOMIS SAYLES EURO CREDIT FUND (Continued)
Schedule of Investments As at 30 June 2021
Fair Value % of EUR Net Assets Total Financial Assets Designated at Fair Value Through Profit or Loss 115,851,608 97.84Total Financial Liabilities Designated at Fair Value Through Profit or Loss (10,450) (0.01) TOTAL FINANCIAL ASSETS AT FAIR VALUE THROUGH PROFIT OR LOSS AND FINANCIAL DERIVATIVES 115,841,158 97.83 Net Cash at Bank 2,721,231 2.30Other Assets 1,021,723 0.86Less Other Liabilities (1,177,570) (0.99) NET ASSETS ATTRIBUTABLE TO REDEEMABLE PARTICIPATING SHAREHOLDERS 118,406,542 100.00
TEN LARGEST SECTOR HOLDINGS AT 30 JUNE 2021 AS A PERCENTAGE OF NET ASSETS
Banking 28.26%
Electric 8.38%
Telecommunications 5.41%
Automotive 4.90%
Oil & Gas 4.55%
Insurance 4.36%
Pharmaceuticals 3.89%
Healthcare-Products 3.64%
Beverages 3.29%
Real Estate 3.29%
(i) Indicates a variable rate security. The interest rate shown reflects the rate in effect at 30 June 2021.
(ii) Securities issued by Non-U.S. or Non-Canadian users. (iii) Perpetual bonds.
Key to Abbreviations EUR: Euro
% ofAnalysis of total assets Total Assets Transferable securities and money market instruments admitted to an official stock exchange or traded on a regulated market 96.83OTC financial derivative instruments 0.03Current assets 3.14 100.00
137

NATIXIS INTERNATIONAL FUNDS (DUBLIN) I PLC
LOOMIS SAYLES EURO HIGH YIELD FUND
Schedule of Investments As at 30 June 2021
Face Fair Value % of Amount EUR Net Assets
BONDS AND NOTES - 96.46% OF NET ASSETS
NON-CONVERTIBLE BONDS - 96.46% OF NET ASSETS
Australia - 0.69% Commonwealth Bank of Australia, 1.936%, 10/03/29 EMTN (i) (ii) EUR 200,000 209,368 0.69 209,368 0.69Austria - 1.36% ams AG, 6.000%, 7/31/25 (ii) EUR 100,000 107,050 0.35OMV AG, 2.875% (i) (ii) (iii) EUR 100,000 104,150 0.35Sappi Papier Holding GmbH, 3.625%, 3/15/28 (ii) EUR 200,000 200,134 0.66 411,334 1.36Denmark - 0.67% Danske Bank A/S, 1.375%, 2/12/30 EMTN (i) (ii) EUR 200,000 203,798 0.67 203,798 0.67Finland - 1.56% Citycon OYJ, 4.496% (i) (ii) (iii) EUR 100,000 103,981 0.34Nokia OYJ, 2.375%, 5/15/25 EMTN (ii) EUR 130,000 138,125 0.46Teollisuuden Voima OYJ, 2.000%, 5/08/24 EMTN (ii) EUR 220,000 228,171 0.76 470,277 1.56France - 16.67% Accor SA, 3.000%, 2/04/26 (ii) EUR 100,000 106,376 0.35Banque Federative du Credit Mutuel SA, 2.625%, 3/31/27 EMTN (ii) EUR 200,000 222,179 0.73BNP Paribas Cardif SA, 1.000%, 11/29/24 EMTN (ii) EUR 100,000 102,465 0.34BNP Paribas SA, 1.125%, 1/15/32 EMTN (i) (ii) EUR 200,000 201,627 0.67Credit Agricole Assurances SA, 4.750%, 9/27/48 (i) (ii) EUR 200,000 244,136 0.81Credit Agricole SA, 1.625%, 6/05/30 EMTN (i) (ii) EUR 200,000 207,724 0.69Credit Agricole SA, 2.625%, 3/17/27 (ii) EUR 100,000 110,945 0.37Crown European Holdings SA, 0.750%, 2/15/23 (ii) EUR 100,000 100,250 0.33Crown European Holdings SA, 3.375%, 5/15/25 (ii) EUR 300,000 321,764 1.06Electricite de France SA, 5.000% EMTN (i) (ii) (iii) EUR 700,000 785,750 2.60Elis SA, 1.000%, 4/03/25 EMTN (ii) EUR 100,000 99,387 0.33Faurecia SE, 3.125%, 6/15/26 (ii) EUR 215,000 222,256 0.73Faurecia SE, 3.750%, 6/15/28 (ii) EUR 310,000 326,281 1.08La Banque Postale SA, 0.875%, 1/26/31 EMTN (i) (ii) EUR 200,000 200,434 0.66Orano SA, 2.750%, 3/08/28 EMTN (ii) EUR 100,000 104,400 0.35Orano SA, 3.375%, 4/23/26 EMTN (ii) EUR 300,000 324,900 1.07RCI Banque SA, 2.625%, 2/18/30 (i) (ii) EUR 200,000 201,284 0.67Renault SA, 2.375%, 5/25/26 EMTN (ii) EUR 500,000 506,752 1.67Solvay Finance SACA, 5.869% (i) (ii) (iii) EUR 135,000 152,044 0.50Valeo SA, 1.500%, 6/18/25 EMTN (ii) EUR 100,000 102,964 0.34Veolia Environnement SA, 2.500% (i) (ii) (iii) EUR 200,000 201,000 0.66Vilmorin & Cie SA, 1.375%, 3/26/28 (ii) EUR 200,000 199,317 0.66 5,044,235 16.67Germany - 10.22% Allianz SE, 2.121%, 7/08/50 EMTN (i) (ii) EUR 200,000 214,222 0.71DEMIRE Deutsche Mittelstand Real Estate AG, 1.875%, 10/15/24 (ii) EUR 100,000 97,410 0.32Deutsche Lufthansa AG, 3.000%, 5/29/26 EMTN (ii) EUR 400,000 403,467 1.33INEOS Styrolution Group GmbH, 2.250%, 1/16/27 (ii) EUR 100,000 98,700 0.33Infineon Technologies AG, 2.875% EMTN (i) (ii) (iii) EUR 300,000 315,000 1.04Infineon Technologies AG, 3.625% (i) (ii) (iii) EUR 100,000 109,892 0.36
138

NATIXIS INTERNATIONAL FUNDS (DUBLIN) I PLC
LOOMIS SAYLES EURO HIGH YIELD FUND (Continued)
Schedule of Investments As at 30 June 2021
Face Fair Value % of Amount EUR Net Assets
BONDS AND NOTES (Continued)
NON-CONVERTIBLE BONDS (Continued)
Germany - 10.22% (Continued) Mahle GmbH, 2.375%, 5/14/28 EMTN (ii) EUR 300,000 298,875 0.99METRO AG, 1.125%, 3/06/23 EMTN (ii) EUR 200,000 203,824 0.67Schaeffler AG, 2.750%, 10/12/25 EMTN (ii) EUR 400,000 427,000 1.41Schaeffler AG, 2.875%, 3/26/27 EMTN (ii) EUR 200,000 214,700 0.71Talanx AG, 2.250%, 12/05/47 EMTN (i) (ii) EUR 100,000 107,242 0.36thyssenkrupp AG, 1.375%, 3/03/22 (ii) EUR 200,000 200,100 0.66thyssenkrupp AG, 1.875%, 3/06/23 EMTN (ii) EUR 400,000 400,752 1.33 3,091,184 10.22Ireland - 0.69% James Hardie International Finance DAC, 3.625%, 10/01/26 (ii) EUR 100,000 102,259 0.34PartnerRe Ireland Finance DAC, 1.250%, 9/15/26 (ii) EUR 100,000 104,960 0.35 207,219 0.69Italy - 10.54% Aeroporti di Roma SpA, 1.750%, 7/30/31 EMTN (ii) EUR 100,000 104,112 0.34Amplifon SpA, 1.125%, 2/13/27 (ii) EUR 300,000 301,500 1.00Atlantia SpA, 1.875%, 2/12/28 (ii) EUR 235,000 241,406 0.80Autostrade Per l'Italia SpA, 1.875%, 11/04/25 EMTN (ii) EUR 895,000 930,492 3.08Autostrade per l'Italia SpA, 2.000%, 12/04/28 (ii) EUR 120,000 124,860 0.41Immobiliare Grande Distribuzione SIIQ SpA, 2.125%, 11/28/24 (ii) EUR 100,000 99,755 0.33Infrastrutture Wireless Italiane SpA, 1.875%, 7/08/26 (ii) EUR 100,000 104,467 0.35Intesa Sanpaolo SpA, 3.928%, 9/15/26 EMTN (ii) EUR 100,000 112,401 0.37Leonardo SpA, 2.375%, 1/08/26 (ii) EUR 100,000 104,262 0.35Nexi SpA, 1.625%, 4/30/26 (ii) EUR 250,000 248,765 0.82Telecom Italia SpA, 2.750%, 4/15/25 EMTN (ii) EUR 675,000 711,281 2.35Webuild SpA, 3.625%, 1/28/27 (ii) EUR 100,000 103,531 0.34 3,186,832 10.54Luxembourg - 10.00% ADLER Group SA, 1.500%, 7/26/24 (ii) EUR 600,000 587,949 1.94ADLER Group SA, 3.250%, 8/05/25 (ii) EUR 200,000 206,328 0.68Aroundtown SA, 3.375% (i) (ii) (iii) EUR 200,000 207,750 0.69CPI Property Group SA, 4.875% (i) (ii) (iii) EUR 235,000 248,667 0.82Eurofins Scientific SE, 3.250% (i) (ii) (iii) EUR 135,000 142,961 0.47Hanesbrands Finance Luxembourg SCA, 3.500%, 6/15/24 (ii) EUR 100,000 106,047 0.35Helvetia Europe SA, 2.750%, 9/30/41 (i) (ii) EUR 100,000 107,857 0.36Holcim Finance Luxembourg SA, 3.000% (i) (ii) (iii) EUR 295,000 308,654 1.02SES SA, 2.875% (i) (ii) (iii) EUR 100,000 100,710 0.33SES SA, 5.625% (i) (ii) (iii) EUR 255,000 278,269 0.92SIG Combibloc PurchaseCo Sarl, 2.125%, 6/18/25 (ii) EUR 150,000 158,673 0.53Stena International SA, 3.750%, 2/01/25 (ii) EUR 160,000 159,429 0.53Telecom Italia Finance SA, 7.750%, 1/24/33 EMTN (ii) EUR 145,000 212,365 0.70Vivion Investments Sarl, 3.000%, 8/08/24 (ii) EUR 200,000 198,792 0.66 3,024,451 10.00Mexico - 0.68% Cemex SAB de CV, 3.125%, 3/19/26 (ii) EUR 200,000 205,536 0.68 205,536 0.68Netherlands - 16.29% Abertis Infraestructuras Finance BV, 3.248% (i) (ii) (iii) EUR 200,000 206,750 0.68ABN AMRO Bank NV, 2.875%, 1/18/28 EMTN (i) (ii) EUR 100,000 104,214 0.34
139

NATIXIS INTERNATIONAL FUNDS (DUBLIN) I PLC
LOOMIS SAYLES EURO HIGH YIELD FUND (Continued)
Schedule of Investments As at 30 June 2021
Face Fair Value % of Amount EUR Net Assets
BONDS AND NOTES (Continued)
NON-CONVERTIBLE BONDS (Continued)
Netherlands - 16.29% (Continued) Achmea BV, 2.500%, 9/24/39 EMTN (i) (ii) EUR 100,000 102,986 0.34Ashland Services BV, 2.000%, 1/30/28 (ii) EUR 145,000 146,890 0.49ASR Nederland NV, 3.375%, 5/02/49 (i) (ii) EUR 100,000 111,905 0.37Davide Campari-Milano NV, 1.250%, 10/06/27 (ii) EUR 200,000 204,246 0.68ELM BV for Firmenich International SA, 3.750% (i) (ii) (iii) EUR 270,000 291,087 0.96ELM BV for Swiss Life Insurance & Pension Group, 4.500% EMTN (i) (ii) (iii) EUR 100,000 117,375 0.39ING Groep NV, 1.000%, 11/13/30 (i) (ii) EUR 100,000 101,310 0.34ING Groep NV, 1.625%, 9/26/29 EMTN (i) (ii) EUR 100,000 103,690 0.34LKQ European Holdings BV, 4.125%, 4/01/28 (ii) EUR 235,000 252,068 0.83PPF Telecom Group BV, 2.125%, 1/31/25 EMTN (ii) EUR 200,000 205,268 0.68Q-Park Holding I BV, 2.000%, 3/01/27 (ii) EUR 140,000 133,168 0.44Repsol International Finance BV, 4.247% (i) (ii) (iii) EUR 300,000 329,974 1.09Repsol International Finance BV, 4.500%, 3/25/75 (i) (ii) EUR 195,000 212,925 0.70Saipem Finance International BV, 3.375%, 7/15/26 EMTN (ii) EUR 100,000 104,070 0.34Telefonica Europe BV, 3.875% (i) (ii) (iii) EUR 500,000 537,799 1.78Telefonica Europe BV, 4.375% (i) (ii) (iii) EUR 200,000 216,962 0.72TenneT Holding BV, 2.995% (i) (ii) (iii) EUR 295,000 309,679 1.02Teva Pharmaceutical Finance Netherlands II BV, 1.125%, 10/15/24 (ii) EUR 420,000 393,750 1.30Teva Pharmaceutical Finance Netherlands II BV, 1.625%, 10/15/28 (ii) EUR 235,000 207,102 0.69Wintershall Dea Finance 2 BV, 2.499% (i) (ii) (iii) EUR 100,000 99,646 0.33Wintershall Dea Finance BV, 1.823%, 9/25/31 (ii) EUR 100,000 103,567 0.34ZF Europe Finance BV, 2.000%, 2/23/26 (ii) EUR 200,000 202,027 0.67Ziggo BV, 2.875%, 1/15/30 (ii) EUR 130,000 130,000 0.43 4,928,458 16.29Norway - 0.44% Adevinta ASA, 3.000%, 11/15/27 (ii) EUR 130,000 134,388 0.44 134,388 0.44Portugal - 1.66% EDP - Energias de Portugal SA, 1.700%, 7/20/80 (i) (ii) EUR 500,000 502,250 1.66 502,250 1.66Spain - 3.70% CaixaBank SA, 3.750%, 2/15/29 EMTN (i) (ii) EUR 200,000 215,581 0.71Cellnex Telecom SA, 1.875%, 6/26/29 (ii) EUR 600,000 611,873 2.02Grifols SA, 1.625%, 2/15/25 (ii) EUR 100,000 100,800 0.33International Consolidated Airlines Group SA, 1.500%, 7/04/27 (ii) EUR 100,000 90,500 0.30Lorca Telecom Bondco SA, 4.000%, 9/18/27 (ii) EUR 100,000 101,750 0.34 1,120,504 3.70Supranational - 0.66% Ardagh Metal Packaging Finance USA LLC/Ardagh Metal Packaging Finance PLC, 2.000%, 9/01/28 (ii) EUR 200,000 200,665 0.66 200,665 0.66
140

NATIXIS INTERNATIONAL FUNDS (DUBLIN) I PLC
LOOMIS SAYLES EURO HIGH YIELD FUND (Continued)
Schedule of Investments As at 30 June 2021
Face Fair Value % of Amount EUR Net Assets
BONDS AND NOTES (Continued)
NON-CONVERTIBLE BONDS (Continued)
Sweden - 1.26% Heimstaden Bostad AB, 3.375% (i) (ii) (iii) EUR 100,000 103,396 0.34Samhallsbyggnadsbolaget i Norden AB, 2.624% (i) (ii) (iii) EUR 100,000 100,239 0.33Volvo Car AB, 2.000%, 1/24/25 EMTN (ii) EUR 170,000 178,287 0.59 381,922 1.26 United Kingdom - 8.61% Barclays PLC, 2.000%, 2/07/28 EMTN (i) (ii) EUR 200,000 205,039 0.68BP Capital Markets PLC, 3.250% (i) (ii) (iii) EUR 135,000 144,180 0.48INEOS Finance PLC, 2.125%, 11/15/25 (ii) EUR 250,000 250,000 0.82International Game Technology PLC, 2.375%, 4/15/28 (ii) EUR 200,000 195,800 0.65International Game Technology PLC, 3.500%, 7/15/24 (ii) EUR 100,000 104,869 0.35Mondi Finance PLC, 1.500%, 4/15/24 EMTN (ii) EUR 100,000 103,859 0.34Nomad Foods Bondco PLC, 2.500%, 6/24/28 (ii) EUR 160,000 161,689 0.53Phoenix Group Holdings PLC, 4.375%, 1/24/29 EMTN (ii) EUR 100,000 117,426 0.39Rolls-Royce PLC, 1.625%, 5/09/28 EMTN (ii) EUR 100,000 93,125 0.31Standard Chartered PLC, 2.500%, 9/09/30 (i) (ii) EUR 100,000 106,127 0.35Titan Global Finance PLC, 2.375%, 11/16/24 (ii) EUR 300,000 309,945 1.02Vmed O2 UK Financing I PLC, 3.250%, 1/31/31 (ii) EUR 145,000 145,342 0.48Vodafone Group PLC, 3.100%, 1/03/79 (i) (ii) EUR 275,000 286,344 0.95Vodafone Group PLC, 4.200%, 10/03/78 (i) (ii) EUR 340,000 381,650 1.26 2,605,395 8.61United States - 10.76% Avantor Funding Inc, 2.625%, 11/01/25 EUR 145,000 148,373 0.49Ball Corp, 1.500%, 3/15/27 EUR 200,000 202,740 0.67Berry Global Inc, 1.500%, 1/15/27 EUR 210,000 213,675 0.71Chubb INA Holdings Inc, 0.300%, 12/15/24 EUR 100,000 100,872 0.33Euronet Worldwide Inc, 1.375%, 5/22/26 EUR 130,000 131,670 0.44Ford Motor Credit Co LLC, 1.744%, 7/19/24 EMTN EUR 895,000 907,333 3.00IQVIA Inc, 2.250%, 1/15/28 EUR 205,000 206,204 0.68Kraft Heinz Foods Co, 2.250%, 5/25/28 EUR 275,000 299,133 0.99Levi Strauss & Co, 3.375%, 3/15/27 EUR 190,000 195,577 0.65MPT Operating Partnership LP/MPT Finance Corp, 3.325%, 3/24/25 EUR 200,000 215,720 0.71Netflix Inc, 3.625%, 5/15/27 EUR 550,000 632,410 2.09 3,253,707 10.76
TOTAL NON-CONVERTIBLE BONDS 29,181,523 96.46
TOTAL BONDS AND NOTES 29,181,523 96.46
TOTAL FINANCIAL ASSETS AT FAIR VALUE THROUGH PROFIT OR LOSS EXCLUDING FINANCIAL DERIVATIVE INSTRUMENTS (Cost: EUR 29,123,017) 29,181,523 96.46
141

NATIXIS INTERNATIONAL FUNDS (DUBLIN) I PLC
LOOMIS SAYLES EURO HIGH YIELD FUND (Continued)
Schedule of Investments As at 30 June 2021
FINANCIAL DERIVATIVE INSTRUMENTS - (0.01%)
Futures - (0.01)%
Number of Unrealised % of Contracts Description Counterparty Commitment Gain/(Loss) Net Assets
(26) Euro-Bobl September 2021 Futures JP Morgan 3,482,960 (4,940) (0.02%)
3 Euro-Bund September 2021 Futures JP Morgan 514,740 3,090 0.01%
30 Euro-Schatz September 2021 Futures JP Morgan 3,364,620 (420) (0.00%)
Unrealised gain on Futures 3,090 0.01%Unrealised loss on Futures (5,360) (0.02%) Net unrealised loss on Futures (2,270) (0.01%)
Fair Value % of EUR Net Assets Total Financial Assets Designated at Fair Value Through Profit or Loss 29,184,613 96.47Total Financial Liabilities Designated at Fair Value Through Profit or Loss (5,360) (0.02) TOTAL FINANCIAL ASSETS AT FAIR VALUE THROUGH PROFIT OR LOSS AND FINANCIAL DERIVATIVES 29,179,253 96.45 Net Cash at Bank 788,006 2.60Other Assets 808,976 2.67Less Other Liabilities (524,174) (1.72) NET ASSETS ATTRIBUTABLE TO REDEEMABLE PARTICIPATING SHAREHOLDERS 30,252,061 100.00
TEN LARGEST SECTOR HOLDINGS AT 30 JUNE 2021 AS A PERCENTAGE OF NET ASSETS
Automotive 12.69%
Telecommunications 10.96%
Banking 7.62%
Electric 7.45%
Commercial Services 6.31%
Real Estate 6.13%
Insurance 4.73%
Packaging 3.96%
Pharmaceuticals 3.32%
Engineering & Construction 3.74%
(i) Indicates a variable rate security. The interest rate shown reflects the rate in effect at 30 June 2021.
(ii) Securities issued by Non-U.S. or Non-Canadian users. (iii) Perpetual bonds.
142

NATIXIS INTERNATIONAL FUNDS (DUBLIN) I PLC
LOOMIS SAYLES EURO HIGH YIELD FUND (Continued)
Schedule of Investments As at 30 June 2021
Key to Abbreviations EUR: Euro
% ofAnalysis of total assets Total Assets Transferable securities and money market instruments admitted to an official stock exchange or traded on a regulated market 96.68OTC financial derivative instruments (0.01)Current assets 3.33 100.00
143

NATIXIS INTERNATIONAL FUNDS (DUBLIN) I PLC
LOOMIS SAYLES SUSTAINABLE EURO CREDIT FUND
Schedule of Investments As at 30 June 2021
Face Fair Value % of Amount EUR Net Assets
BONDS AND NOTES - 98.08% OF NET ASSETS
NON-CONVERTIBLE BONDS - 98.08% OF NET ASSETS
Australia - 1.48% Commonwealth Bank of Australia, 1.936%, 10/03/29 EMTN (i) (ii) EUR 250,000 261,710 0.42Scentre Group Trust 1/Scentre Group Trust 2, 1.750%, 4/11/28 EMTN (ii) EUR 280,000 303,164 0.49Toyota Finance Australia Ltd, 0.250%, 4/09/24 EMTN (ii) EUR 350,000 353,940 0.57 918,814 1.48Austria - 0.65% Erste Group Bank AG, 0.100%, 11/16/28 EMTN (i) (ii) EUR 200,000 197,794 0.32Raiffeisen Bank International AG, 1.000%, 12/04/23 EMTN (ii) EUR 200,000 205,538 0.33 403,332 0.65Belgium - 2.28% Belfius Bank SA, 0.010%, 10/15/25 EMTN (ii) EUR 400,000 400,088 0.65Elia Transmission Belgium SA, 0.875%, 4/28/30 EMTN (ii) EUR 200,000 206,138 0.33KBC Group NV, 0.125%, 9/10/26 EMTN (i) (ii) EUR 300,000 299,532 0.48Lonza Finance International NV, 1.625%, 4/21/27 (ii) EUR 285,000 307,192 0.50UCB SA, 1.000%, 3/30/28 EMTN (ii) EUR 200,000 201,686 0.32 1,414,636 2.28Canada - 0.61% Great-West Lifeco Inc, 1.750%, 12/07/26 EUR 165,000 178,870 0.29Great-West Lifeco Inc, 2.500%, 4/18/23 EUR 190,000 198,935 0.32 377,805 0.61Denmark - 0.31% Nykredit Realkredit AS, 0.500%, 1/19/22 EMTN (ii) EUR 190,000 190,798 0.31 190,798 0.31Finland - 1.66% Kojamo OYJ, 1.625%, 3/07/25 (ii) EUR 745,000 779,121 1.26UPM-Kymmene OYJ, 0.500%, 3/22/31 EMTN (ii) EUR 250,000 245,768 0.40 1,024,889 1.66France - 16.41% Banque Federative du Credit Mutuel SA, 0.750%, 6/08/26 EMTN (ii) EUR 200,000 206,542 0.33Banque Federative du Credit Mutuel SA, 2.625%, 3/31/27 EMTN (ii) EUR 100,000 111,089 0.18BNP Paribas SA, 0.250%, 4/13/27 EMTN (i) (ii) EUR 800,000 794,815 1.28BNP Paribas SA, 1.125%, 1/15/32 EMTN (i) (ii) EUR 200,000 201,627 0.33Carrefour SA, 0.875%, 6/12/23 EMTN (ii) EUR 300,000 305,448 0.49Cie de Saint-Gobain, 1.750%, 4/03/23 EMTN (ii) EUR 200,000 206,498 0.33Coentreprise de Transport d'Electricite SA, 0.875%, 9/29/24 (ii) EUR 600,000 615,811 0.99Credit Agricole Assurances SA, 4.750%, 9/27/48 (i) (ii) EUR 200,000 244,136 0.39Credit Agricole SA, 1.000%, 4/22/26 EMTN (i) (ii) EUR 200,000 206,286 0.33Credit Agricole SA, 1.375%, 5/03/27 EMTN (ii) EUR 400,000 428,532 0.69Credit Agricole SA, 1.625%, 6/05/30 EMTN (i) (ii) EUR 200,000 207,724 0.34Credit Mutuel Arkea SA, 1.250%, 5/31/24 (ii) EUR 200,000 206,960 0.33Credit Mutuel Arkea SA, 1.250%, 6/11/29 EMTN (i) (ii) EUR 300,000 312,493 0.50Crown European Holdings SA, 3.375%, 5/15/25 (ii) EUR 170,000 182,333 0.29Electricite de France SA, 2.000%, 12/09/49 EMTN (ii) EUR 200,000 214,572 0.35Electricite de France SA, 4.625%, 9/11/24 EMTN (ii) EUR 100,000 115,065 0.19ELO SACA, 2.875%, 1/29/26 EMTN (ii) EUR 200,000 222,634 0.36
144

NATIXIS INTERNATIONAL FUNDS (DUBLIN) I PLC
LOOMIS SAYLES SUSTAINABLE EURO CREDIT FUND (Continued)
Schedule of Investments As at 30 June 2021
Face Fair Value % of Amount EUR Net Assets
BONDS AND NOTES (Continued)
NON-CONVERTIBLE BONDS (Continued)
France - 16.41% (Continued) Engie SA, 1.375%, 6/22/28 EMTN (ii) EUR 800,000 859,941 1.39Engie SA, 1.625% (i) (ii) (iii) EUR 100,000 102,099 0.17La Banque Postale SA, 0.875%, 1/26/31 EMTN (i) (ii) EUR 300,000 300,651 0.49La Poste SA, 0.625%, 1/18/36 EMTN (ii) EUR 100,000 95,400 0.15La Poste SA, 1.125%, 6/04/25 EMTN (ii) EUR 200,000 209,390 0.34Orange SA, 1.000%, 9/12/25 EMTN (ii) EUR 200,000 208,780 0.34Orange SA, 2.375% EMTN (i) (ii) (iii) EUR 200,000 210,000 0.34Orange SA, 5.000% EMTN (i) (ii) (iii) EUR 155,000 185,031 0.30Orange SA, Zero Coupon Bond, 9/04/26 EMTN (ii) EUR 200,000 199,579 0.32PSA Banque France SA, 0.750%, 4/19/23 EMTN (ii) EUR 190,000 192,830 0.31PSA Tresorerie GIE, 6.000%, 9/19/33 (ii) EUR 60,000 90,245 0.15RCI Banque SA, 1.625%, 4/11/25 EMTN (ii) EUR 370,000 386,744 0.62RTE Reseau de Transport d'Electricite SADIR, 0.625%, 7/08/32 EMTN (ii) EUR 300,000 300,880 0.49RTE Reseau de Transport d'Electricite SADIR, Zero Coupon Bond, 9/09/27 EMTN (ii) EUR 400,000 395,146 0.64SANEF SA, 1.875%, 3/16/26 (ii) EUR 500,000 535,329 0.86Societe Fonciere Lyonnaise SA, 1.500%, 6/05/27 (ii) EUR 200,000 213,055 0.34Societe Generale SA, 0.500%, 6/12/29 (i) (ii) EUR 500,000 489,073 0.79Suez SA, 1.000%, 4/03/25 EMTN (ii) EUR 200,000 207,653 0.34Unibail-Rodamco-Westfield SE, 1.375%, 5/25/33 EMTN (ii) EUR 200,000 202,570 0.33 10,166,961 16.41Germany - 10.90% Allianz SE, 2.121%, 7/08/50 EMTN (i) (ii) EUR 100,000 107,111 0.17Bundesrepublik Deutschland Bundesanleihe, 4.000%, 1/04/37 (ii) EUR 985,000 1,604,216 2.59Deutsche Bank AG, 1.000%, 11/19/25 EMTN (i) (ii) EUR 400,000 408,233 0.66Deutsche Bank AG, 1.750%, 1/17/28 EMTN (ii) EUR 100,000 105,773 0.17Deutsche Post AG, 0.375%, 5/20/26 EMTN (ii) EUR 280,000 285,533 0.46Deutsche Telekom AG, 0.875%, 3/25/26 EMTN (ii) EUR 300,000 312,492 0.50Deutsche Wohnen SE, 1.625%, 6/03/31 (ii) EUR 200,000 216,764 0.35Eurogrid GmbH, 1.113%, 5/15/32 EMTN (ii) EUR 200,000 210,523 0.34Fraport AG Frankfurt Airport Services Worldwide, 1.875%, 3/31/28 (ii) EUR 330,000 345,976 0.56Fresenius Medical Care AG & Co KGaA, 1.500%, 5/29/30 EMTN (ii) EUR 285,000 303,066 0.49Fresenius SE & Co KGaA, 0.750%, 1/15/28 EMTN (ii) EUR 245,000 249,715 0.40HeidelbergCement AG, 2.250%, 3/30/23 EMTN (ii) EUR 185,000 191,738 0.31Infineon Technologies AG, 1.625%, 6/24/29 EMTN (ii) EUR 200,000 215,320 0.35LEG Immobilien SE, 1.250%, 1/23/24 EMTN (ii) EUR 200,000 205,908 0.33Merck Financial Services GmbH, 0.005%, 12/15/23 EMTN (ii) EUR 300,000 301,532 0.49Santander Consumer Bank AG, 0.250%, 10/15/24 EMTN (ii) EUR 400,000 402,888 0.65Talanx AG, 2.250%, 12/05/47 EMTN (i) (ii) EUR 200,000 214,485 0.35Volkswagen Bank GmbH, 0.750%, 6/15/23 EMTN (ii) EUR 285,000 289,618 0.47Volkswagen Leasing GmbH, 1.500%, 6/19/26 EMTN (ii) EUR 450,000 477,171 0.77Vonovia SE, 0.375%, 6/16/27 EMTN (ii) EUR 300,000 300,160 0.49 6,748,222 10.90
145

NATIXIS INTERNATIONAL FUNDS (DUBLIN) I PLC
LOOMIS SAYLES SUSTAINABLE EURO CREDIT FUND (Continued)
Schedule of Investments As at 30 June 2021
Face Fair Value % of Amount EUR Net Assets
BONDS AND NOTES (Continued)
NON-CONVERTIBLE BONDS (Continued)
Ireland - 1.68% CCEP Finance Ireland DAC, 0.500%, 9/06/29 (ii) EUR 445,000 444,379 0.72CCEP Finance Ireland DAC, 1.500%, 5/06/41 (ii) EUR 105,000 105,726 0.17Cloverie PLC for Zurich Insurance Co Ltd., 1.750%, 9/16/24 EMTN (ii) EUR 170,000 180,770 0.29Smurfit Kappa Acquisitions ULC, 2.875%, 1/15/26 (ii) EUR 280,000 309,771 0.50 1,040,646 1.68Italy - 4.86% Aeroporti di Roma SpA, 1.750%, 7/30/31 EMTN (ii) EUR 100,000 104,112 0.17Amplifon SpA, 1.125%, 2/13/27 (ii) EUR 270,000 271,350 0.44Assicurazioni Generali SpA, 3.875%, 1/29/29 EMTN (ii) EUR 100,000 117,959 0.19FCA Bank SpA, 0.625%, 11/24/22 EMTN (ii) EUR 210,000 212,102 0.34Intesa Sanpaolo SpA, 0.750%, 3/16/28 EMTN (ii) EUR 200,000 201,008 0.32Intesa Sanpaolo SpA, 0.875%, 6/27/22 EMTN (ii) EUR 250,000 252,732 0.41Intesa Sanpaolo SpA, 1.750%, 3/20/28 EMTN (ii) EUR 255,000 272,186 0.44Nexi SpA, 1.625%, 4/30/26 (ii) EUR 100,000 99,506 0.16Snam SpA, 0.625%, 6/30/31 EMTN (ii) EUR 190,000 188,099 0.30Terna SpA, 0.375%, 9/25/30 EMTN (ii) EUR 190,000 186,160 0.30Terna SpA, 0.875%, 2/02/22 EMTN (ii) EUR 245,000 246,791 0.40Terna SpA, 1.375%, 7/26/27 EMTN (ii) EUR 190,000 202,594 0.33UniCredit SpA, 1.250%, 6/25/25 EMTN (i) (ii) EUR 635,000 653,608 1.06 3,008,207 4.86Japan - 1.00% Takeda Pharmaceutical Co Ltd., 1.000%, 7/09/29 (ii) EUR 600,000 619,465 1.00 619,465 1.00Luxembourg - 6.12% CNH Industrial Finance Europe SA, 1.750%, 3/25/27 EMTN (ii) EUR 375,000 400,528 0.65Eurofins Scientific SE, 0.875%, 5/19/31 (ii) EUR 160,000 158,579 0.26Grand City Properties SA, 1.500% EMTN (i) (ii) (iii) EUR 200,000 195,396 0.32Grand City Properties SA, 1.500%, 2/22/27 EMTN (ii) EUR 300,000 318,084 0.51Helvetia Europe SA, 2.750%, 9/30/41 (i) (ii) EUR 160,000 172,571 0.28Holcim Finance Luxembourg SA, 0.500%, 11/29/26 EMTN (ii) EUR 190,000 193,055 0.31Holcim Finance Luxembourg SA, 0.625%, 4/06/30 EMTN (ii) EUR 285,000 284,535 0.46Novartis Finance SA, Zero Coupon Bond, 9/23/28 (ii) EUR 310,000 306,030 0.49Richemont International Holding SA, 1.000%, 3/26/26 (ii) EUR 455,000 476,346 0.77SELP Finance Sarl, 0.875%, 5/27/29 (ii) EUR 170,000 170,289 0.27SES SA, 2.875% (i) (ii) (iii) EUR 120,000 120,852 0.20SES SA, 5.625% (i) (ii) (iii) EUR 160,000 174,600 0.28SIG Combibloc PurchaseCo Sarl, 2.125%, 6/18/25 (ii) EUR 205,000 216,853 0.35SIX Finance Luxembourg SA, Zero Coupon Bond, 12/02/25 (ii) EUR 400,000 399,432 0.64Traton Finance Luxembourg SA, 1.250%, 3/24/33 EMTN (ii) EUR 200,000 202,692 0.33 3,789,842 6.12Mexico - 0.39% Fomento Economico Mexicano SAB de CV, 1.000%, 5/28/33 (ii) EUR 250,000 243,440 0.39 243,440 0.39Netherlands - 13.48% ABN AMRO Bank NV, 0.875%, 1/15/24 EMTN (ii) EUR 250,000 257,176 0.41Allianz Finance II BV, 0.250%, 6/06/23 EMTN (ii) EUR 300,000 302,952 0.49
146

NATIXIS INTERNATIONAL FUNDS (DUBLIN) I PLC
LOOMIS SAYLES SUSTAINABLE EURO CREDIT FUND (Continued)
Schedule of Investments As at 30 June 2021
Face Fair Value % of Amount EUR Net Assets
BONDS AND NOTES (Continued)
NON-CONVERTIBLE BONDS (Continued)
Netherlands - 13.48% (Continued) Argentum Netherlands BV for Givaudan SA, 1.125%, 9/17/25 (ii) EUR 500,000 523,762 0.85BMW Finance NV, Zero Coupon Bond, 3/24/23 EMTN (ii) EUR 435,000 437,288 0.71Citycon Treasury BV, 2.375%, 1/15/27 EMTN (ii) EUR 120,000 125,620 0.20Cooperatieve Rabobank UA, 1.250%, 3/23/26 (ii) EUR 435,000 462,975 0.75Daimler International Finance BV, 0.250%, 11/06/23 EMTN (ii) EUR 145,000 146,224 0.24de Volksbank NV, 0.250%, 6/22/26 EMTN (ii) EUR 300,000 298,376 0.48de Volksbank NV, 0.750%, 6/25/23 EMTN (ii) EUR 400,000 407,638 0.66E.ON International Finance BV, 1.000%, 4/13/25 EMTN (ii) EUR 545,000 563,948 0.91ELM BV for Firmenich International SA, 3.750% (i) (ii) (iii) EUR 230,000 247,963 0.40ELM BV for Swiss Life Insurance & Pension Group, 4.500% EMTN (i) (ii) (iii) EUR 105,000 123,244 0.20Enexis Holding NV, 0.875%, 4/28/26 EMTN (ii) EUR 300,000 313,099 0.50EXOR NV, 2.250%, 4/29/30 (ii) EUR 105,000 116,473 0.19Iberdrola International BV, 2.250% (i) (ii) (iii) EUR 200,000 206,664 0.33ING Groep NV, 0.250%, 2/18/29 (i) (ii) EUR 200,000 195,880 0.32ING Groep NV, 1.625%, 9/26/29 EMTN (i) (ii) EUR 300,000 311,070 0.50JAB Holdings BV, 2.500%, 4/17/27 (ii) EUR 400,000 444,584 0.72Koninklijke Ahold Delhaize NV, 0.875%, 9/19/24 (ii) EUR 300,000 308,725 0.50Koninklijke DSM NV, 0.750%, 9/28/26 EMTN (ii) EUR 300,000 311,121 0.50LeasePlan Corp NV, 0.750%, 10/03/22 EMTN (ii) EUR 190,000 192,314 0.31Nederlandse Gasunie NV, 0.375%, 10/03/31 EMTN (ii) EUR 310,000 308,698 0.50Stellantis NV, 0.750%, 1/18/29 EMTN (ii) EUR 305,000 303,763 0.49Telefonica Europe BV, 4.375% (i) (ii) (iii) EUR 100,000 108,481 0.17TenneT Holding BV, 2.995% (i) (ii) (iii) EUR 110,000 115,474 0.19Unilever Finance Netherlands BV, 1.250%, 3/25/25 EMTN (ii) EUR 410,000 431,677 0.70Volkswagen International Finance NV, 3.875% (i) (ii) (iii) EUR 400,000 441,969 0.71Vonovia Finance BV, 2.250%, 4/07/30 (ii) EUR 300,000 340,090 0.55 8,347,248 13.48Norway - 1.77% DNB Bank ASA, 0.250%, 4/09/24 (ii) EUR 380,000 385,153 0.62DNB Bank ASA, 0.250%, 2/23/29 EMTN (i) (ii) EUR 250,000 246,474 0.40Statkraft AS, 1.500%, 3/26/30 EMTN (ii) EUR 275,000 301,171 0.48Statnett SF, 0.875%, 3/08/25 EMTN (ii) EUR 160,000 165,200 0.27 1,097,998 1.77Spain - 4.94% Abertis Infraestructuras SA, 1.125%, 3/26/28 (ii) EUR 200,000 204,208 0.33Arval Service Lease SA, Zero Coupon Bond, 9/30/24 EMTN (ii) EUR 300,000 300,060 0.48Banco Bilbao Vizcaya Argentaria SA, 0.375%, 11/15/26 EMTN (ii) EUR 300,000 303,870 0.49Banco de Sabadell SA, 0.625%, 11/07/25 (i) (ii) EUR 300,000 302,271 0.49Banco Santander SA, 0.200%, 2/11/28 EMTN (ii) EUR 300,000 297,599 0.48Banco Santander SA, 0.250%, 6/19/24 EMTN (ii) EUR 200,000 202,035 0.32Banco Santander SA, 0.500%, 3/24/27 EMTN (i) (ii) EUR 300,000 301,215 0.49CaixaBank SA, 0.750%, 4/18/23 EMTN (ii) EUR 400,000 406,484 0.66CaixaBank SA, 3.750%, 2/15/29 EMTN (i) (ii) EUR 300,000 323,372 0.52Telefonica Emisiones SA, 1.069%, 2/05/24 EMTN (ii) EUR 300,000 308,607 0.50Telefonica Emisiones SA, 1.930%, 10/17/31 EMTN (ii) EUR 100,000 111,658 0.18 3,061,379 4.94
147

NATIXIS INTERNATIONAL FUNDS (DUBLIN) I PLC
LOOMIS SAYLES SUSTAINABLE EURO CREDIT FUND (Continued)
Schedule of Investments As at 30 June 2021
Face Fair Value % of Amount EUR Net Assets
BONDS AND NOTES (Continued)
NON-CONVERTIBLE BONDS (Continued)
Sweden - 1.03% Atlas Copco AB, 2.500%, 2/28/23 EMTN (ii) EUR 280,000 292,901 0.47Molnlycke Holding AB, 0.875%, 9/05/29 EMTN (ii) EUR 345,000 346,406 0.56 639,307 1.03Switzerland - 1.97% Credit Suisse Group AG, 3.250%, 4/02/26 EMTN (i) (ii) EUR 380,000 418,649 0.68UBS AG, 0.010%, 3/31/26 EMTN (ii) EUR 475,000 474,317 0.76UBS Group AG, 1.500%, 11/30/24 (ii) EUR 315,000 326,882 0.53 1,219,848 1.97United Kingdom - 5.59% Barclays PLC, 2.000%, 2/07/28 EMTN (i) (ii) EUR 190,000 194,787 0.32Barclays PLC, 3.375%, 4/02/25 EMTN (i) (ii) EUR 250,000 272,277 0.44Chanel Ceres PLC, 0.500%, 7/31/26 (ii) EUR 245,000 246,850 0.40Chanel Ceres PLC, 1.000%, 7/31/31 (ii) EUR 185,000 185,500 0.30GlaxoSmithKline Capital PLC, Zero Coupon Bond, 9/23/23 EMTN (ii) EUR 430,000 432,210 0.70HSBC Holdings PLC, 0.309%, 11/13/26 (i) (ii) EUR 415,000 416,226 0.67Mondi Finance PLC, 1.625%, 4/27/26 EMTN (ii) EUR 125,000 133,288 0.22Natwest Group PLC, 2.000%, 3/08/23 EMTN (i) (ii) EUR 190,000 192,790 0.31Natwest Group PLC, 2.000%, 3/04/25 EMTN (i) (ii) EUR 250,000 262,780 0.42Phoenix Group Holdings PLC, 4.375%, 1/24/29 EMTN (ii) EUR 100,000 117,425 0.19Rentokil Initial PLC, 0.500%, 10/14/28 EMTN (ii) EUR 245,000 245,137 0.40Standard Chartered PLC, 0.750%, 10/03/23 EMTN (i) (ii) EUR 315,000 318,425 0.51Standard Chartered PLC, 2.500%, 9/09/30 (i) (ii) EUR 125,000 132,659 0.21Vodafone Group PLC, 1.625%, 11/24/30 EMTN (ii) EUR 170,000 185,392 0.30Vodafone Group PLC, 3.100%, 1/03/79 (i) (ii) EUR 120,000 124,950 0.20 3,460,696 5.59United States - 20.95% American Honda Finance Corp, 1.950%, 10/18/24 EUR 200,000 213,232 0.34Apple Inc, 1.625%, 11/10/26 EUR 565,000 614,762 0.99AT&T Inc, 1.600%, 5/19/28 EUR 285,000 305,429 0.49AT&T Inc, 2.400%, 3/15/24 EUR 285,000 302,401 0.49AT&T Inc, 2.450%, 3/15/35 EUR 255,000 286,661 0.46Ball Corp, 0.875%, 3/15/24 EUR 210,000 211,367 0.34Bank of America Corp, 0.583%, 8/24/28 EMTN (i) EUR 190,000 191,467 0.31Bank of America Corp, 0.694%, 3/22/31 EMTN (i) EUR 190,000 189,415 0.31Bank of America Corp, 2.375%, 6/19/24 EMTN EUR 250,000 268,242 0.43Berkshire Hathaway Inc, 1.300%, 3/15/24 EUR 665,000 689,108 1.11Bristol-Myers Squibb Co, 1.000%, 5/15/25 EUR 300,000 312,739 0.50Chubb INA Holdings Inc, 1.550%, 3/15/28 EUR 280,000 301,185 0.49Coca-Cola Co, 0.950%, 5/06/36 EUR 105,000 105,785 0.17Coca-Cola Co, 1.000%, 3/09/41 EUR 160,000 156,124 0.25Dover Corp, 0.750%, 11/04/27 EUR 270,000 275,619 0.44Dow Chemical Co, 1.125%, 3/15/32 EUR 300,000 306,649 0.50Equinix Inc, 1.000%, 3/15/33 EUR 160,000 158,419 0.26Fidelity National Information Services Inc, 1.500%, 5/21/27 EUR 480,000 509,117 0.82Fiserv Inc, 1.625%, 7/01/30 EUR 230,000 246,876 0.40Goldman Sachs Group Inc, 0.010%, 4/30/24 EMTN (i) EUR 250,000 250,111 0.40Goldman Sachs Group Inc, 2.125%, 9/30/24 EMTN EUR 315,000 336,050 0.54Illinois Tool Works Inc, 0.625%, 12/05/27 EUR 305,000 313,885 0.51
148

NATIXIS INTERNATIONAL FUNDS (DUBLIN) I PLC
LOOMIS SAYLES SUSTAINABLE EURO CREDIT FUND (Continued)
Schedule of Investments As at 30 June 2021
Face Fair Value % of Amount EUR Net Assets
BONDS AND NOTES (Continued)
NON-CONVERTIBLE BONDS (Continued)
United States - 20.95% (Continued) International Flavors & Fragrances Inc, 1.750%, 3/14/24 EUR 355,000 370,691 0.60JPMorgan Chase & Co, 0.625%, 1/25/24 EMTN EUR 445,000 453,241 0.73JPMorgan Chase & Co, 1.638%, 5/18/28 EMTN (i) EUR 315,000 338,553 0.55Kellogg Co, 1.000%, 5/17/24 EUR 365,000 376,192 0.61Kraft Heinz Foods Co, 2.250%, 5/25/28 EUR 235,000 255,624 0.41Merck & Co, Inc., 0.500%, 11/02/24 EUR 615,000 628,136 1.01Mondelez International Inc, 0.750%, 3/17/33 EUR 200,000 195,796 0.32Morgan Stanley, 0.406%, 10/29/27 (i) EUR 485,000 486,499 0.79Nasdaq Inc, 1.750%, 3/28/29 EUR 450,000 488,639 0.79PepsiCo Inc, 0.500%, 5/06/28 EMTN EUR 410,000 420,597 0.68Prologis Euro Finance LLC, 1.875%, 1/05/29 EUR 560,000 619,457 1.00Thermo Fisher Scientific Inc, 2.875%, 7/24/37 EUR 275,000 339,809 0.55United Parcel Service Inc, 0.375%, 11/15/23 EUR 305,000 309,276 0.50Verizon Communications Inc, 0.750%, 3/22/32 EUR 125,000 123,401 0.20Verizon Communications Inc, 0.875%, 4/08/27 EUR 300,000 310,142 0.50Verizon Communications Inc, 1.300%, 5/18/33 EUR 355,000 365,495 0.59VF Corp, 0.250%, 2/25/28 EUR 200,000 198,528 0.32VF Corp, 0.625%, 9/20/23 EUR 150,000 152,317 0.25 12,977,036 20.95
TOTAL NON-CONVERTIBLE BONDS 60,750,569 98.08
TOTAL BONDS AND NOTES 60,750,569 98.08
TOTAL FINANCIAL ASSETS AT FAIR VALUE THROUGH PROFIT OR LOSS EXCLUDING FINANCIAL DERIVATIVE INSTRUMENTS (Cost: EUR 60,488,882) 60,750,569 98.08
FINANCIAL DERIVATIVE INSTRUMENTS - 0.01%
Futures - 0.01%
Number of Unrealised % of Contracts Description Counterparty Commitment Gain/(Loss) Net Assets
(34) Euro-Bobl September 2021 Futures JP Morgan 4,569,860 8,760 0.01%
19 Euro-Bund September 2021 Futures JP Morgan 3,282,630 (3,040) (0.00%)
Unrealised gain on Futures 8,760 0.01%Unrealised loss on Futures (3,040) (0.00%) Net unrealised gain on Futures 5,720 0.01%
149

NATIXIS INTERNATIONAL FUNDS (DUBLIN) I PLC
LOOMIS SAYLES SUSTAINABLE EURO CREDIT FUND (Continued)
Schedule of Investments As at 30 June 2021
Fair Value % of EUR Net Assets Total Financial Assets Designated at Fair Value Through Profit or Loss 60,759,329 98.09Total Financial Liabilities Designated at Fair Value Through Profit or Loss (3,040) 0.00 TOTAL FINANCIAL ASSETS AT FAIR VALUE THROUGH PROFIT OR LOSS AND FINANCIAL DERIVATIVES 60,756,289 98.09 Net Cash at Bank 1,093,881 1.77Other Assets 619,999 1.00Less Other Liabilities (528,251) (0.86) NET ASSETS ATTRIBUTABLE TO REDEEMABLE PARTICIPATING SHAREHOLDERS 61,941,918 100.00
TEN LARGEST SECTOR HOLDINGS AT 30 JUNE 2021 AS A PERCENTAGE OF NET ASSETS
Banking 28.32%
Electric 8.59%
Telecommunications 6.37%
Automotive 5.40%
Pharmaceuticals 4.96%
Insurance 4.76%
Real Estate 4.01%
Chemicals 2.84%
REITS 2.69%
Food 2.69%
(i) Indicates a variable rate security. The interest rate shown reflects the rate in effect at 30 June 2021.
(ii) Securities issued by Non-U.S. or Non-Canadian users. (iii) Perpetual bonds.
Key to Abbreviations EUR: Euro
% ofAnalysis of total assets Total Assets Transferable securities and money market instruments admitted to an official stock exchange or traded on a regulated market 97.23OTC financial derivative instruments 0.01Current assets 2.76 100.00
150

NATIXIS INTERNATIONAL FUNDS (DUBLIN) I PLC
LOOMIS SAYLES MULTISECTOR INCOME FUND SCHEDULE OF PORTFOLIO CHANGES
Major Purchases Nominal USD Cost USD United States Treasury Note/Bond, 0.125%, 4/30/23 54,135,000 54,108,852 United States Treasury Note/Bond, 0.125%, 3/31/23 49,655,000 49,626,878 United States Treasury Note/Bond, 0.125%, 2/28/23 36,105,000 36,081,740 United States Treasury Note/Bond, 0.125%, 1/31/23 27,000,000 27,001,638 AT&T Inc, 3.500%, 9/15/53 144A 15,115,000 13,365,611 Boeing Co, 5.805%, 5/01/50 8,340,000 11,081,437 Expedia Group Inc, 2.950%, 3/15/31 9,290,000 9,098,370 Toyota Motor Credit Corp, 0.500%, 6/18/24 8,845,000 8,834,474 Cemex SAB de CV, 3.875%, 7/11/31 144A 8,335,000 8,336,781 JPMorgan Chase & Co, 1.953%, 2/04/32 7,775,000 7,775,000 Glencore Funding LLC, 2.850%, 4/27/31 144A 6,945,000 6,924,688 Broadcom Inc, 2.600%, 2/15/33 144A 6,165,000 5,685,980 Boeing Co, 3.900%, 5/01/49 5,180,000 5,366,872 Toronto-Dominion Bank, 0.250%, 1/06/23 5,005,000 5,000,496 Icahn Enterprises LP / Icahn Enterprises Finance Corp, 4.375%, 2/01/29 144A 4,960,000 4,972,201 New York Life Global Funding, 0.850%, 1/15/26 4,960,000 4,955,387 Uber Technologies Inc, 7.500%, 9/15/27 144A 4,445,000 4,900,894 Freeport-McMoRan Inc, 5.400%, 11/14/34 3,845,000 4,777,853 Palo Alto Networks Inc, 0.375%, 6/01/25 3,675,000 4,759,290 Boeing Co, 2.196%, 2/04/26 4,725,000 4,725,000
The CBI requires a schedule of material changes in the composition of the portfolio during the six-month period. These are defined as aggregate purchases of a security exceeding one per cent of the total value of purchases for the six-month period and aggregate disposals greater than one per cent of the total value of sales. At a minimum the largest 20 purchases and 20 sales must be given or all purchases and sales if less than 20. A full listing of the portfolio changes for the six-month period is available, upon request, at no extra cost from the Administrator.
151

NATIXIS INTERNATIONAL FUNDS (DUBLIN) I PLC
LOOMIS SAYLES MULTISECTOR INCOME FUND (Continued) SCHEDULE OF PORTFOLIO CHANGES (Continued)
Major Sales Nominal USD Proceeds USD
United States Treasury Bond, 1.250%, 5/15/50 79,350,000 65,878,891United States Treasury Bond, 1.375%, 8/15/50 49,100,000 40,422,366 Bristol-Myers Squibb Co 542,930 34,614,693 Mexican Bonos, 10.000%, 12/05/24 604,000,000 34,541,906 AT&T Inc 1,008,773 28,909,014 National Australia Bank Ltd, 5.000%, 3/11/24 28,500,000 24,936,945 United States Treasury Note/Bond, 3.000%, 8/15/48 17,295,000 21,794,402 Nationwide Mutual Insurance Co, 4.350%, 4/30/50 11,030,000 11,701,814 Ovintiv Exploration Inc, 5.625%, 7/01/24 10,770,000 11,649,713 Corning Inc 289,795 11,498,288 General Motors Financial Co Inc, 3.600%, 6/21/30 9,735,000 10,496,016 AT&T Inc, 3.500%, 9/15/53 144A 10,455,000 9,791,627 Mexican Bonos, 8.000%, 12/07/23 182,348,900 9,780,850 United States Treasury Note/Bond, 0.125%, 4/30/23 9,720,000 9,713,925 United States Treasury Note/Bond, 1.500%, 11/30/21 9,495,000 9,609,608 Tenet Healthcare Corp, 6.125%, 10/01/28 8,870,000 9,194,800 Fonterra Co-operative Group Ltd, 4.500%, 6/30/21 11,300,000 8,866,193 Boeing Co, 5.805%, 5/01/50 6,385,000 8,178,045 United States Treasury Note/Bond, 1.500%, 9/30/21 7,670,000 7,729,922 Radian Group Inc, 6.625%, 3/15/25 6,835,000 7,615,424 Tenet Healthcare Corp, 6.875%, 11/15/31 6,475,000 7,286,669 Bombardier Inc, 6.000%, 10/15/22 144A 7,095,000 7,018,369 Telecom Italia Capital SA, 6.000%, 9/30/34 5,830,000 6,645,038 Tenet Healthcare Corp, 5.125%, 5/01/25 6,445,000 6,538,453 Boise Cascade Co, 4.875%, 7/01/30 5,895,000 6,283,175 Goodyear Tire & Rubber Co, 4.875%, 3/15/27 5,985,000 6,259,019
The CBI requires a schedule of material changes in the composition of the portfolio during the six-month period. These are defined as aggregate purchases of a security exceeding one per cent of the total value of purchases for the six-month period and aggregate disposals greater than one per cent of the total value of sales. At a minimum the largest 20 purchases and 20 sales must be given or all purchases and sales if less than 20. A full listing of the portfolio changes for the six-month period is available, upon request, at no extra cost from the Administrator.
152

NATIXIS INTERNATIONAL FUNDS (DUBLIN) I PLC
LOOMIS SAYLES HIGH INCOME FUND SCHEDULE OF PORTFOLIO CHANGES
Major Purchases Nominal USD Cost USD United States Treasury Note/Bond, 0.125%, 12/15/23 355,000 353,641 T-Mobile USA Inc, 2.625%, 4/15/26 160,000 160,000 Carnival Corp, 5.750%, 3/01/27 144A 110,000 113,663 Hess Midstream Operations LP, 5.625%, 2/15/26 144A 85,000 87,338 Bombardier Inc, 7.125%, 6/15/26 144A 85,000 85,691 Scientific Games International Inc, 7.000%, 5/15/28 144A 70,000 74,800 DISH DBS Corp, 7.750%, 7/01/26 65,000 71,538 Carvana Co, 5.500%, 4/15/27 144A 65,000 65,000 HCA Inc, 5.375%, 9/01/26 55,000 63,725 Royal Caribbean Cruises Ltd, 5.500%, 4/01/28 144A 60,000 60,000 Palo Alto Networks Inc, 0.375%, 6/01/25 45,000 58,202 Hilton Grand Vacations Borrower Escrow LLC / Hilton Grand Vacations Borrower Esc, 5.000%, 6/01/29 144A
55,000 55,000
Lumen Technologies Inc, 5.375%, 6/15/29 144A 55,000 55,000 Endure Digital Inc, 6.000%, 2/15/29 144A 55,000 54,563 Netflix Inc, 4.875%, 6/15/30 144A 45,000 53,861 Netflix Inc, 6.375%, 5/15/29 40,000 52,506 NCL Corp Ltd, 5.875%, 3/15/26 144A 50,000 50,194 Scientific Games International Inc, 7.250%, 11/15/29 144A 45,000 49,625 Kraft Heinz Foods Co, 3.000%, 6/01/26 45,000 47,813 Foundation Building Materials Inc, 6.000%, 3/01/29 144A 45,000 45,444
The CBI requires a schedule of material changes in the composition of the portfolio during the six-month period. These are defined as aggregate purchases of a security exceeding one per cent of the total value of purchases for the six-month period and aggregate disposals greater than one per cent of the total value of sales. At a minimum the largest 20 purchases and 20 sales must be given or all purchases and sales if less than 20. A full listing of the portfolio changes for the six-month period is available, upon request, at no extra cost from the Administrator.
153

NATIXIS INTERNATIONAL FUNDS (DUBLIN) I PLC
LOOMIS SAYLES HIGH INCOME FUND (Continued) SCHEDULE OF PORTFOLIO CHANGES (Continued)
Major Sales Nominal USD Proceeds USD
AT&T Inc 18,921 549,250 Bunge Ltd, 4.875% 2,140 255,350 iHeartCommunications Inc, 8.375%, 5/01/27 235,000 252,219 International Game Technology PLC, 6.250%, 1/15/27 200,000 225,250 Boeing Co, 5.805%, 5/01/50 165,000 211,778 CHS/Community Health Systems Inc, 6.625%, 2/15/25 144A 195,000 205,113 Kraft Heinz Foods Co, 4.375%, 6/01/46 195,000 204,575 United States Treasury Note/Bond, 0.125%, 12/15/23 190,000 189,570 Masonite International Corp, 5.375%, 2/01/28 165,000 176,316 Ford Motor Co, 9.000%, 4/22/25 140,000 171,402 Expedia Group Inc, 3.250%, 2/15/30 165,000 167,347 TransDigm Inc, 6.250%, 3/15/26 125,000 132,306 Boeing Co, 5.150%, 5/01/30 110,000 128,368 General Motors Co, 6.250%, 10/02/43 95,000 127,417 Marriott Ownership Resorts Inc / ILG LLC 110,000 114,618 American Woodmark Corp, 4.875%, 3/15/26 110,000 112,349 CCO Holdings LLC / CCO Holdings Capital Corp, 4.500%, 8/15/30 144A 85,000 89,916 Cincinnati Bell Inc, 8.000%, 10/15/25 144A 85,000 89,650 Continental Resources Inc, 3.800%, 6/01/24 85,000 88,400 Hess Midstream Operations LP, 5.625%, 2/15/26 144A 80,000 83,300 Carvana Co, 5.625%, 10/01/25 144A 80,000 82,400 United States Steel Corp, 6.650%, 6/01/37 85,000 80,888 T-Mobile USA Inc, 2.625%, 4/15/26 75,000 76,568 Whiting Petroleum Corp 1,896 75,259 Koppers Inc, 6.000%, 2/15/25 70,000 72,149
The CBI requires a schedule of material changes in the composition of the portfolio during the six-month period. These are defined as aggregate purchases of a security exceeding one per cent of the total value of purchases for the six-month period and aggregate disposals greater than one per cent of the total value of sales. At a minimum the largest 20 purchases and 20 sales must be given or all purchases and sales if less than 20. A full listing of the portfolio changes for the six-month period is available, upon request, at no extra cost from the Administrator.
154

NATIXIS INTERNATIONAL FUNDS (DUBLIN) I PLC
LOOMIS SAYLES GLOBAL OPPORTUNISTIC BOND FUND SCHEDULE OF PORTFOLIO CHANGES
Major Purchases Nominal USD Cost USD
United States Treasury Note/Bond, 0.875%, 11/15/30 21,105,000 20,403,616 United States Treasury Note/Bond, 1.125%, 2/15/31 17,620,000 17,114,699 United States Treasury Note/Bond, 0.375%, 1/31/26 15,075,000 15,018,742 United States Treasury Note/Bond, 0.500%, 2/28/26 12,550,000 12,475,393 United States Treasury Note/Bond, 0.750%, 3/31/26 10,250,000 10,199,928 United States Treasury Note/Bond, 1.625%, 5/15/31 10,090,000 10,085,443 United States Treasury Note/Bond, 0.750%, 4/30/26 9,755,000 9,707,821 United States Treasury Note/Bond, 0.750%, 1/31/28 9,145,000 9,139,805 Japan Government Five Year Bond, 0.100%, 12/20/25 832,300,000 7,699,090 United States Treasury Note/Bond, 1.875%, 2/15/51 7,685,000 7,187,809 Bundesrepublik Deutschland Bundesanleihe, 6.250%, 1/04/30 3,235,000 6,343,357 United States Treasury Bond, 1.625%, 11/15/50 5,795,000 5,522,275 United States Treasury Note/Bond, 0.125%, 8/31/22 5,505,000 5,506,581 United States Treasury Note/Bond, 0.750%, 5/31/26 4,760,000 4,751,153 United States Treasury Bill, Zero Coupon Bond, 9/23/21 4,355,000 4,354,179 United States Treasury Note/Bond, 0.875%, 6/30/26 4,220,000 4,214,030 United States Treasury Note/Bond, 1.250%, 3/31/28 3,780,000 3,767,393 United States Treasury Note/Bond, 1.125%, 4/30/28 3,750,000 3,735,996 United States Treasury Note/Bond, 1.875%, 2/15/41 3,215,000 3,121,318 Bundesrepublik Deutschland Bundesanleihe, Zero Coupon Bond, 8/15/30 2,400,000 3,036,714 United States Treasury Note/Bond, 2.375%, 5/15/51 2,965,000 2,979,163 Japan Government Twenty Year Bond, 2.100%, 12/20/30 271,150,000 2,976,687 French Republic Government Bond OAT, Zero Coupon Bond, 11/25/30 1,990,000 2,440,454 China Government Bond, 3.270%, 11/19/30 15,630,000 2,409,167 United States Treasury Note/Bond, 0.125%, 5/31/23 2,355,000 2,351,541
The CBI requires a schedule of material changes in the composition of the portfolio during the six-month period. These are defined as aggregate purchases of a security exceeding one per cent of the total value of purchases for the six-month period and aggregate disposals greater than one per cent of the total value of sales. At a minimum the largest 20 purchases and 20 sales must be given or all purchases and sales if less than 20. A full listing of the portfolio changes for the six-month period is available, upon request, at no extra cost from the Administrator.
155

NATIXIS INTERNATIONAL FUNDS (DUBLIN) I PLC
LOOMIS SAYLES GLOBAL OPPORTUNISTIC BOND FUND (Continued) SCHEDULE OF PORTFOLIO CHANGES (Continued)
Major Sales Nominal USD Proceeds USD
United States Treasury Note/Bond, 0.875%, 11/15/30 21,105,000 20,117,670 United States Treasury Note/Bond, 1.125%, 2/15/31 17,620,000 17,118,516 United States Treasury Note/Bond, 0.375%, 1/31/26 15,075,000 14,976,235 United States Treasury Note/Bond, 0.500%, 2/28/26 12,550,000 12,478,178 United States Treasury Note/Bond, 0.750%, 3/31/26 10,250,000 10,203,924 United States Treasury Note/Bond, 0.750%, 4/30/26 9,755,000 9,708,344 United States Treasury Note/Bond, 1.625%, 5/15/31 9,700,000 9,697,085 United States Treasury Note/Bond, 0.750%, 1/31/28 9,145,000 9,114,007 Bundesrepublik Deutschland Bundesanleihe, 6.250%, 1/04/30 3,855,000 7,377,120 United States Treasury Note/Bond, 1.875%, 2/15/51 7,685,000 7,190,642 United States Treasury Bond, 1.625%, 11/15/50 6,000,000 5,661,798 United States Treasury Note/Bond, 0.125%, 8/31/22 5,505,000 5,506,267 Japan Government Five Year Bond, 0.100%, 12/20/25 565,850,000 5,235,204 United States Treasury Note/Bond, 0.750%, 5/31/26 4,760,000 4,748,503 Italy Buoni Poliennali Del Tesoro, 1.350%, 4/01/30 3,655,000 4,684,898 United States Treasury Note/Bond, 0.875%, 6/30/26 4,220,000 4,214,750 China Government Bond, 1.990%, 4/09/25 25,460,000 3,840,569 United States Treasury Note/Bond, 1.250%, 3/31/28 3,780,000 3,770,541 United States Treasury Note/Bond, 1.125%, 4/30/28 3,750,000 3,732,902 Japanese Government CPI Linked Bond, 0.100%, 3/10/28 383,849,181 3,608,501
The CBI requires a schedule of material changes in the composition of the portfolio during the six-month period. These are defined as aggregate purchases of a security exceeding one per cent of the total value of purchases for the six-month period and aggregate disposals greater than one per cent of the total value of sales. At a minimum the largest 20 purchases and 20 sales must be given or all purchases and sales if less than 20. A full listing of the portfolio changes for the six-month period is available, upon request, at no extra cost from the Administrator.
156

NATIXIS INTERNATIONAL FUNDS (DUBLIN) I PLC
LOOMIS SAYLES ALTERNATIVE RISK PREMIA FUND SCHEDULE OF PORTFOLIO CHANGES
Major Purchases Nominal USD Cost USD United States Treasury Bill, 0.044%, 2/24/22 8,515,000 8,511,227 China Government International Bond, 1.950%, 12/03/24 1,500,000 1,572,765 United States Treasury Note/Bond, 0.125%, 3/31/23 1,500,000 1,498,887 Sinopec Group Overseas Development 2018 Ltd, 3.100%, 1/08/51 470,000 470,000 DISH DBS Corp, 5.125%, 6/01/29 144A 450,000 450,000 Egypt Treasury Bills, 13.326%, 1/04/22 7,750,000 449,691 Uruguay Government International Bond, 9.875%, 6/20/22 18,706,000 446,837 CoStar Group Inc 511 429,941 Realogy Group LLC / Realogy Co-Issuer Corp, 5.750%, 1/15/29 144A 395,000 399,275 Imola Merger Corp, 4.750%, 5/15/29 380,000 380,000 Alibaba Group Holding Ltd, 3.150%, 2/09/51 375,000 374,929 Independence Energy Finance LLC, 3.150%, 2/09/51 144A 355,000 355,000 JBS Finance Luxembourg Sarl, 16.500%, 4/02/26 144A 350,000 346,196 Bonos de la Tesoreria de la Republica en pesos, 3.625%, 1/15/32 144A 220,000,000 339,004 Indonesia Treasury Bond, 7.000%, 9/15/30 4,448,000,000 321,170 Booz Allen Hamilton Inc, 2.632%, 4/15/31 320,000 320,000 Paysafe Finance PLC / Paysafe Holdings US Corp, 4.000%, 6/15/29 144A 320,000 320,000 Crowdstrike Holdings Inc, 3.000%, 2/15/29 310,000 310,000 Macquarie Bank Ltd, 3.052%, 3/3/36 310,000 310,000 Republic of South Africa Government Bond, 8.000%, 1/31/30 4,764,000 309,513
The CBI requires a schedule of material changes in the composition of the portfolio during the six-month period. These are defined as aggregate purchases of a security exceeding one per cent of the total value of purchases for the six-month period and aggregate disposals greater than one per cent of the total value of sales. At a minimum the largest 20 purchases and 20 sales must be given or all purchases and sales if less than 20. A full listing of the portfolio changes for the six-month period is available, upon request, at no extra cost from the Administrator.
157

NATIXIS INTERNATIONAL FUNDS (DUBLIN) I PLC
LOOMIS SAYLES ALTERNATIVE RISK PREMIA FUND (Continued) SCHEDULE OF PORTFOLIO CHANGES (Continued)
Major Sales Nominal USD Proceeds USD
United States Treasury Bill, 0.044%, 2/24/22 4,000,000 3,998,511Uruguay Government International Bond, 9.875%, 6/20/22 27,396,000 648,757 Sinopec Group Overseas Development 2018 Ltd, 3.100%, 1/08/51 470,000 452,552 DISH DBS Corp, 5.125%, 6/01/29 144A 450,000 446,526 Realogy Group LLC / Realogy Co-Issuer Corp, 5.750%, 1/15/29 144A 395,000 402,772 Imola Merger Corp, 4.750%, 5/15/29 380,000 394,896 Indonesia Treasury Bond, 7.000%, 9/15/30 5,174,000,000 379,567 Sherwin-Williams Co 1,299 363,935 Alibaba Group Holding Ltd, 3.150%, 2/09/51 375,000 363,570 Independence Energy Finance LLC, 7.250%, 5/01/26 144A 355,000 358,621 Mexican Bonos, 7.750%, 5/29/31 6,471,500 356,311 Booz Allen Hamilton Inc, 4.000%, 7/01/29 320,000 327,296 Republic of South Africa Government Bond, 8.000%, 1/31/30 5,066,000 326,997 Crowdstrike Holdings Inc, 3.000%, 2/15/29 310,000 316,200 Intesa Sanpaolo SpA, 4.950%, 6/01/42 300,000 311,634 Brighthouse Financial Global Funding, 1.550%, 5/24/26 310,000 311,110 Bank of America Corp, 3.483%, 3/13/52 305,000 310,887 CHS/Community Health Systems Inc, 6.875%, 4/15/29 144A 300,000 307,875 Bank of America Corp, 3.311%, 4/22/42 300,000 307,383 Sammons Financial Group Inc, 3.350%, 4/16/31 300,000 305,385
The CBI requires a schedule of material changes in the composition of the portfolio during the six-month period. These are defined as aggregate purchases of a security exceeding one per cent of the total value of purchases for the six-month period and aggregate disposals greater than one per cent of the total value of sales. At a minimum the largest 20 purchases and 20 sales must be given or all purchases and sales if less than 20. A full listing of the portfolio changes for the six-month period is available, upon request, at no extra cost from the Administrator.
158

NATIXIS INTERNATIONAL FUNDS (DUBLIN) I PLC
LOOMIS SAYLES EURO CREDIT FUND SCHEDULE OF PORTFOLIO CHANGES
Major Purchases Nominal EUR Cost EUR Bundesrepublik Deutschland Bundesanleihe, 4.000%, 1/04/37 1,335,000 2,185,724 Bundesrepublik Deutschland Bundesanleihe, Zero Coupon Bond, 2/15/30 1,790,000 1,877,395 Bundesrepublik Deutschland Bundesanleihe, Zero Coupon Bond, 5/15/35 1,505,000 1,572,289 BNP Paribas SA, 0.250%, 4/13/27 1,400,000 1,391,596 Anheuser-Busch InBev Worldwide Inc,, 2.750%, 3/17/36 1,025,000 1,267,067 Berkshire Hathaway Inc, 1.300%, 3/15/24 1,165,000 1,213,519 Merck & Co Inc, 0.500%, 11/02/24 1,110,000 1,139,492 Apple Inc, 1.625%, 11/10/26 1,010,000 1,112,712 GlaxoSmithKline Capital PLC, Zero Coupon Bond, 9/23/23 1,100,000 1,106,422 PepsiCo Inc, 0.500%, 5/06/28 1,055,000 1,091,653 JAB Holdings BV, 1.750%, 6/25/26 1,000,000 1,077,963 TotalEnergies Capital International SA, 0.696%, 5/31/28 1,000,000 1,047,345 BNP Paribas SA, 1.125%, 6/11/26 970,000 1,016,967 Thermo Fisher Scientific Inc, 1.400%, 1/23/26 950,000 1,014,249 Cooperatieve Rabobank UA, 1.250%, 3/23/26 945,000 1,013,670 Coentreprise de Transport d'Electricite SA, 0.875%, 9/29/24 900,000 929,288 Engie SA, 0.375%, 6/11/27 900,000 918,378 CaixaBank SA, 0.750%, 4/18/23 900,000 916,095 Deutsche Bank AG, 1.000%, 11/19/25 900,000 915,699 Eurofins Scientific SE, 3.750%, 7/17/26 775,000 910,306
The CBI requires a schedule of material changes in the composition of the portfolio during the six-month period. These are defined as aggregate purchases of a security exceeding one per cent of the total value of purchases for the six-month period and aggregate disposals greater than one per cent of the total value of sales. At a minimum the largest 20 purchases and 20 sales must be given or all purchases and sales if less than 20. A full listing of the portfolio changes for the six-month period is available, upon request, at no extra cost from the Administrator.
159

NATIXIS INTERNATIONAL FUNDS (DUBLIN) I PLC
LOOMIS SAYLES EURO CREDIT FUND (Continued) SCHEDULE OF PORTFOLIO CHANGES (Continued)
Major Sales Nominal EUR Proceeds EUR
Bundesrepublik Deutschland Bundesanleihe, Zero Coupon Bond, 2/15/30 1,790,000 1,848,287Bundesrepublik Deutschland Bundesanleihe, Zero Coupon Bond, 5/15/35 1,505,000 1,522,533 JAB Holdings BV, 1.750%, 6/25/26 1,000,000 1,068,330 BNP Paribas SA, 1.125%, 6/11/26 970,000 1,014,814 Thermo Fisher Scientific Inc, 1.400%, 1/23/26 950,000 1,009,220 Eurofins Scientific SE, 3.750%, 7/17/26 775,000 904,307 TotalEnergies SE, 3.369%, 10/06/69 710,000 788,178 Becton Dickinson and Co, 1.900%, 12/15/26 720,000 787,942 Intesa Sanpaolo SpA, 2.125%, 5/26/25 675,000 724,721 RCI Banque SA, 1.375%, 3/08/24 650,000 670,768 Volkswagen Leasing GmbH, 1.500%, 6/19/26 600,000 636,486 Danske Bank A/S, 0.500%, 8/27/25 615,000 622,524 La Banque Postale SA, 0.250%, 7/12/26 600,000 606,120 Kering SA, 0.250%, 5/13/23 600,000 605,928 Covivio, 2.375%, 2/20/28 540,000 598,580 BNP Paribas SA, 2.250%, 1/11/27 540,000 589,651 AT&T Inc, 3.150%, 9/04/36 480,000 586,022 Linde Finance BV, 2.000%, 4/18/23 555,000 579,531 Anheuser-Busch InBev Worldwide Inc,, 2.750%, 3/17/36 475,000 576,954 SES SA, 2.000%, 7/02/28 525,000 564,428 Enel Finance International NV, 1.966%, 1/27/25 520,000 561,345 Nordea Bank Abp, 0.500%, 5/14/27 540,000 557,226 Toyota Finance Australia Ltd, 2.280%, 10/21/27 485,000 552,764
The CBI requires a schedule of material changes in the composition of the portfolio during the six-month period. These are defined as aggregate purchases of a security exceeding one per cent of the total value of purchases for the six-month period and aggregate disposals greater than one per cent of the total value of sales. At a minimum the largest 20 purchases and 20 sales must be given or all purchases and sales if less than 20. A full listing of the portfolio changes for the six-month period is available, upon request, at no extra cost from the Administrator.
160

NATIXIS INTERNATIONAL FUNDS (DUBLIN) I PLC
LOOMIS SAYLES EURO HIGH YIELD FUND SCHEDULE OF PORTFOLIO CHANGES
Major Purchases Nominal EUR Cost EUR Electricite de France SA, 5.000%, 1/22/70 1,500,000 1,696,515 Telecom Italia SpA/Milano, 2.750%, 4/15/25 915,000 967,414 Autostrade per l'Italia SpA, 1.875%, 11/04/25 895,000 921,808 Ford Motor Credit Co LLC, 1.744%, 7/19/24 895,000 909,927 Deutsche Lufthansa AG, 3.000%, 5/29/26 800,000 790,236 Cellnex Finance Co SA, 1.250%, 1/15/29 700,000 688,584 Telefonica Europe BV, 3.875%, 9/22/69 600,000 645,570 Netflix Inc, 3.625%, 5/15/27 550,000 635,085 Renault SA, 2.375%, 5/25/26 600,000 610,520 Cellnex Telecom SA, 1.875%, 6/26/29 600,000 607,222 Electricite de France SA, 2.625%, 6/01/70 600,000 595,534 ADLER Group SA, 1.500%, 7/26/24 600,000 588,050 Autostrade per l'Italia SpA, 1.750%, 6/26/26 510,000 523,974 Kraft Heinz Foods Co, 2.250%, 5/25/28 475,000 520,610 EDP - Energias de Portugal SA, 1.700%, 7/20/80 500,000 499,024 Deutsche Lufthansa AG, 2.875%, 2/11/25 500,000 495,255 Ball Corp, 0.875%, 3/15/24 440,000 444,708 FCE Bank PLC, 1.615%, 5/11/23 435,000 442,747 Crown European Holdings SA, 3.375%, 5/15/25 400,000 433,980 Teollisuuden Voima Oyj, 2.000%, 5/08/24 420,000 433,482
The CBI requires a schedule of material changes in the composition of the portfolio during the six-month period. These are defined as aggregate purchases of a security exceeding one per cent of the total value of purchases for the six-month period and aggregate disposals greater than one per cent of the total value of sales. At a minimum the largest 20 purchases and 20 sales must be given or all purchases and sales if less than 20. A full listing of the portfolio changes for the six-month period is available, upon request, at no extra cost from the Administrator.
161

NATIXIS INTERNATIONAL FUNDS (DUBLIN) I PLC
LOOMIS SAYLES EURO HIGH YIELD FUND (Continued) SCHEDULE OF PORTFOLIO CHANGES (Continued)
Major Sales Nominal EUR Proceeds EUR
Electricite de France SA, 5.000%, 1/22/70 800,000 902,419Cellnex Finance Co SA, 1.250%, 1/15/29 700,000 685,590 Electricite de France SA, 2.625%, 6/01/70 600,000 607,560 Autostrade per l'Italia SpA, 1.750%, 6/26/26 510,000 520,802 Deutsche Lufthansa AG, 2.875%, 2/11/25 500,000 504,750 Ball Corp, 0.875%, 3/15/24 440,000 444,540 FCE Bank PLC, 1.615%, 5/11/23 435,000 440,764 Teva Pharmaceutical Finance Netherlands II BV, 1.875%, 3/31/27 445,000 407,264 thyssenkrupp AG, 2.875%, 2/22/24 395,000 404,675 Telecom Italia SpA, 4.000%, 4/11/24 365,000 395,186 Deutsche Lufthansa AG, 3.000%, 5/29/26 400,000 394,628 Smurfit Kappa Acquisitions ULC, 2.875%, 1/15/26 355,000 394,534 Teva Pharmaceutical Finance Netherlands II BV, 1.250%, 3/31/23 395,000 387,017 Nexi SpA, 1.750%, 10/31/24 375,000 382,804 ADLER Real Estate AG, 2.125%, 2/06/24 340,000 342,244 Teollisuuden Voima Oyj, 1.125%, 3/09/26 335,000 333,442 BNP Paribas SA, 2.250%, 1/11/27 295,000 322,375 Ford Motor Credit Co LLC, 3.021%, 3/06/24 300,000 316,998 ATF Netherlands BV, 3.750%, 1/20/70 300,000 315,030 ADLER Group SA, 2.750%, 11/13/26 300,000 306,096 Telefonica Europe BV, 2.625%, 6/07/69 300,000 305,712 Saipem Finance International BV, 2.625%, 1/07/25 285,000 296,899 Vodafone Group PLC, 3.000%, 8/27/80 280,000 289,030 Telecom Italia SpA, 2.875%, 1/28/26 240,000 256,104 Telecom Italia SpA, 2.750%, 4/15/25 240,000 252,631 Adevinta ASA, 2.625%, 11/15/25 230,000 236,895 Kraft Heinz Foods Co, 2.250%, 5/25/28 200,000 221,520 Standard Chartered PLC, 3.125%, 11/19/24 200,000 220,034 EDP - Energias de Portugal SA, 4.496%, 4/30/79 200,000 219,000 ZF Finance GmbH, 3.750%, 9/21/28 200,000 217,100 Allianz SE, 2.241%, 7/07/45 200,000 215,404 Hornbach Baumarkt AG, 3.250%, 10/25/26 200,000 214,120 Accor SA, 3.630%, 9/17/23 200,000 213,880 Intesa Sanpaolo SpA, 2.855%, 4/23/25 200,000 212,446 Eurofins Scientific SE, 3.250%, 11/13/69 200,000 211,076 ZF Finance GmbH, 3.000%, 9/21/25 200,000 209,900 BAWAG Group AG, 2.375%, 3/26/29 200,000 209,294 Jyske Bank A/S, 2.250%, 4/05/29 200,000 208,938 Saipem Finance International BV, 3.375%, 7/15/26 200,000 208,000 ING Groep NV, 1.625%, 9/26/29 200,000 207,422 Teollisuuden Voima Oyj, 2.000%, 5/08/24 200,000 207,385 Veolia Environnement SA, 2.250%, 4/20/70 200,000 205,520 ArcelorMittal SA, 0.950%, 1/17/23 200,000 202,426 Valeo SA, 0.625%, 1/11/23 200,000 202,094 KBC Group NV, 0.000%, 12/03/29 200,000 199,517 Renault SA, 1.000%, 4/18/24 200,000 198,843 Elis SA, 1.000%, 4/03/25 200,000 198,710
The CBI requires a schedule of material changes in the composition of the portfolio during the six-month period. These are defined as aggregate purchases of a security exceeding one per cent of the total value of purchases for the six-month period and aggregate disposals greater than one per cent of the total value of sales. At a minimum the largest 20 purchases and 20 sales must be given or all purchases and sales if less than 20. A full listing of the portfolio changes for the six-month period is available, upon request, at no extra cost from the Administrator.
162

NATIXIS INTERNATIONAL FUNDS (DUBLIN) I PLC
LOOMIS SAYLES SUSTAINABLE EURO CREDIT FUND SCHEDULE OF PORTFOLIO CHANGES
Major Purchases Nominal EUR Cost EUR Bundesrepublik Deutschland Bundesanleihe, 4.000%, 1/04/37 985,000 1,583,589 Bundesrepublik Deutschland Bundesanleihe, Zero Coupon Bond, 2/15/31 1,295,000 1,311,950 Engie SA, 1.375%, 6/22/28 800,000 862,904 BNP Paribas SA, 0.250%, 4/13/27 800,000 787,816 Kojamo OYJ, 1.625%, 3/07/25 745,000 778,999 Berkshire Hathaway Inc, 1.300%, 3/15/24 665,000 689,492 Cooperatieve Rabobank UA, 1.250%, 3/23/26 635,000 674,307 UniCredit SpA, 1.250%, 6/25/25 635,000 652,456 GlaxoSmithKline Capital PLC, Zero Coupon Bond, 9/23/23 630,000 633,515 Merck & Co, Inc., 0.500%, 11/02/24 615,000 628,696 Takeda Pharmaceutical Co Ltd., 1.000%, 7/09/29 600,000 618,706 Prologis Euro Finance LLC, 1.875%, 1/05/29 560,000 618,218 Coentreprise de Transport d'Electricite SA, 0.875%, 9/29/24 600,000 616,722 PepsiCo Inc, 0.500%, 5/06/28 605,000 615,896 Apple Inc, 1.625%, 11/10/26 565,000 615,274 Iberdrola International BV, 2.250%, 9/15/25 600,000 611,400 CaixaBank SA, 0.750%, 4/18/23 600,000 609,870 RCI Banque SA, 1.625%, 4/11/25 550,000 573,524 E.ON International Finance BV, 1.000%, 4/13/25 545,000 564,130 SANEF SA, 1.875%, 3/16/26 500,000 536,200
The CBI requires a schedule of material changes in the composition of the portfolio during the six-month period. These are defined as aggregate purchases of a security exceeding one per cent of the total value of purchases for the six-month period and aggregate disposals greater than one per cent of the total value of sales. At a minimum the largest 20 purchases and 20 sales must be given or all purchases and sales if less than 20. A full listing of the portfolio changes for the six-month period is available, upon request, at no extra cost from the Administrator.
163

NATIXIS INTERNATIONAL FUNDS (DUBLIN) I PLC
LOOMIS SAYLES SUSTAINABLE EURO CREDIT FUND (Continued) SCHEDULE OF PORTFOLIO CHANGES (Continued)
Major Sales Nominal EUR Proceeds EUR
Bundesrepublik Deutschland Bundesanleihe, Zero Coupon Bond, 2/15/31 1,295,000 1,329,525Iberdrola International BV, 0.375%, 9/15/25 600,000 612,856 Linde Finance BV, 2.000%, 4/18/23 450,000 469,890 JAB Holdings BV, 1.750%, 6/25/26 400,000 426,996 Bundesrepublik Deutschland Bundesanleihe, 2.500%, 7/04/44 275,000 420,750 La Banque Postale SA, 0.250%, 7/12/26 400,000 404,080 Telefonica Emisiones SA, 3.987%, 1/23/23 300,000 320,421 AT&T Inc, 3.150%, 9/04/36 255,000 311,324 Kering SA, 0.250%, 5/13/23 300,000 302,964 Thermo Fisher Scientific Inc, 1.500%, 10/01/39 270,000 271,377 Intesa Sanpaolo SpA, 0.625%, 2/24/26 255,000 255,115 Covivio, 2.375%, 2/20/28 225,000 248,380 Verizon Communications Inc, 2.875%, 1/15/38 200,000 245,444 Inmobiliaria Colonial Socimi SA, 2.500%, 11/28/29 200,000 223,400 Cooperatieve Rabobank UA, 1.250%, 3/23/26 200,000 213,158 Vonovia Finance BV, 0.625%, 7/09/26 200,000 204,766 CaixaBank SA, 0.750%, 4/18/23 200,000 203,372 Commerzbank AG, 0.750%, 3/24/26 200,000 203,294 Takeda Pharmaceutical Co Ltd, 2.000%, 7/09/40 185,000 202,242 GlaxoSmithKline Capital PLC, Zero Coupon Bond, 9/23/23 200,000 201,260 PepsiCo Inc, 0.500%, 5/06/28 195,000 200,021 Snam SpA, 0.875%, 10/25/26 190,000 196,965 Skandinaviska Enskilda Banken AB, 1.375%, 10/31/28 190,000 195,149 RCI Banque SA, 1.625%, 4/11/25 180,000 188,752 HeidelbergCement Finance Luxembourg SA, 5.000%, 8/09/22 185,000 186,301 Mondi Finance PLC, 1.625%, 4/27/26 145,000 154,693 Aeroporti di Roma SpA, 1.750%, 7/30/31 130,000 134,875 Stellantis NV, 4.500%, 7/07/28 105,000 130,832 Goldman Sachs Group Inc, 1.000%, 3/18/33 130,000 130,634 National Grid Electricity Transmission PLC, 0.823%, 7/07/32 125,000 126,544 Assicurazioni Generali SpA, 5.000%, 6/08/48 100,000 121,005 Citigroup Inc, 1.500%, 7/24/26 105,000 110,369 Unibail-Rodamco-Westfield SE, 1.375%, 12/04/31 100,000 102,966 Iberdrola International BV, 2.250% 100,000 102,454
The CBI requires a schedule of material changes in the composition of the portfolio during the six-month period. These are defined as aggregate purchases of a security exceeding one per cent of the total value of purchases for the six-month period and aggregate disposals greater than one per cent of the total value of sales. At a minimum the largest 20 purchases and 20 sales must be given or all purchases and sales if less than 20. A full listing of the portfolio changes for the six-month period is available, upon request, at no extra cost from the Administrator.
164

NATIXIS INTERNATIONAL FUNDS (DUBLIN) I PLC
APPENDIX I Performance Disclosure LOOMIS SAYLES MULTISECTOR INCOME FUND In accordance with Section II, Appendix E, "Performance Table" of the Code on Unit Trusts and Mutual Funds: A performance record over the last 10 financial years; or if the scheme has not been in existence during the whole of that period, over the whole period in which it has been in existence, showing the highest issue price and the lowest redemption price of the units/shares during each of those years.
Share Class Lowest Net Asset Value per Share
Highest Net AssetValue per Share
Class C/A (USD) Shares Year Ended 31 December 2012 16.98 19.12Year Ended 31 December 2013 19.13 20.23Year Ended 31 December 2014 20.11 21.40Year Ended 31 December 2015 18.91 20.89Year Ended 31 December 2016 18.04 21.27Year Ended 31 December 2017 20.77 22.20Year Ended 31 December 2018 20.95 22.41Year Ended 31 December 2019 21.08 23.28Year Ended 31 December 2020 19.79 24.24Period Ended 30 June 2021 23.52 24.41 Class C/D (USD) Shares Year Ended 31 December 2012 13.34 14.62Year Ended 31 December 2013 14.12 14.99Year Ended 31 December 2014 14.32 15.23Year Ended 31 December 2015 12.73 14.27Year Ended 31 December 2016 11.82 13.72Year Ended 31 December 2017 13.18 13.91Year Ended 31 December 2018 12.78 13.90Year Ended 31 December 2019 12.78 13.86Year Ended 31 December 2020 11.73 14.14Period Ended 30 June 2021 13.65 14.10 Class CT/A (USD) Shares Period Ended 31 December 2018 9.83 9.98Year Ended 31 December 2019 9.89 10.88Year Ended 31 December 2020 9.24 11.29Period Ended 30 June 2021 10.94 11.34 Class CT/DM (USD) Shares Period Ended 31 December 2018 9.83 9.98Year Ended 31 December 2019 9.88 10.68Year Ended 31 December 2020 9.03 10.90Period Ended 30 June 2021 10.52 10.91 Class F/A (USD) Shares Year Ended 31 December 2012 10.14 11.55Year Ended 31 December 2013 11.61 12.29Year Ended 31 December 2014 12.27 13.10Year Ended 31 December 2015 11.74 12.89Year Ended 31 December 2016 11.21 13.28Year Ended 31 December 2017 13.01 13.99Year Ended 31 December 2018 13.36 14.17Year Ended 31 December 2019 13.44 14.98Year Ended 31 December 2020 12.76 15.74Period Ended 30 June 2021 15.30 15.92 Class F/DM (USD) Shares Period Ended 31 December 2013 9.73 10.34Year Ended 31 December 2014 9.82 10.44Year Ended 31 December 2015 8.64 9.72Year Ended 31 December 2016 7.96 9.23Year Ended 31 December 2017 8.89 9.36Year Ended 31 December 2018 8.59 9.37Year Ended 31 December 2019 8.62 9.32Year Ended 31 December 2020 7.88 9.51Period Ended 30 June 2021 9.17 9.51
165

NATIXIS INTERNATIONAL FUNDS (DUBLIN) I PLC APPENDIX I (Continued) Performance Disclosure (Continued) LOOMIS SAYLES MULTISECTOR INCOME FUND (Continued)
Share Class Lowest Net Asset Value per Share
Highest Net AssetValue per Share
Class H-I/A (EUR) Shares Year Ended 31 December 2012 16.49 19.43Year Ended 31 December 2013 18.95 21.43Year Ended 31 December 2014 19.45 22.70Year Ended 31 December 2015 16.13 19.31Year Ended 31 December 2016 15.48 18.83Year Ended 31 December 2017 16.92 20.74Year Ended 31 December 2018 18.25 21.66Year Ended 31 December 2019 18.28 19.56Year Ended 31 December 2020 14.75 17.99Period Ended 30 June 2021 17.47 18.14 Class H-I/D (EUR) Shares Year Ended 31 December 2012 16.62 19.31Year Ended 31 December 2013 17.07 19.12Year Ended 31 December 2014 16.07 19.06Year Ended 31 December 2015 12.79 15.80Year Ended 31 December 2016 12.15 14.47Year Ended 31 December 2017 12.61 15.21Year Ended 31 December 2018 11.95 14.54Year Ended 31 December 2019 11.65 12.33Year Ended 31 December 2020 9.16 10.93Period Ended 30 June 2021 10.51 10.85 Class H-I/D (GBP) Shares Year Ended 31 December 2012 19.81 22.88Year Ended 31 December 2013 19.55 22.70Year Ended 31 December 2014 21.14 24.52Year Ended 31 December 2015 18.13 21.61Year Ended 31 December 2016 15.80 19.44Year Ended 31 December 2017 15.64 18.33Year Ended 31 December 2018 14.64 17.61Year Ended 31 December 2019 14.40 16.21Year Ended 31 December 2020 10.28 12.27Period Ended 30 June 2021 11.82 12.20 Class H-N/A (CHF) Shares Period Ended 31 December 2017 9.95 10.92Year Ended 31 December 2018 9.65 11.15Year Ended 31 December 2019 9.70 10.71Year Ended 31 December 2020 8.78 10.73Period Ended 30 June 2021 10.41 10.81 Class H-N/A (EUR) Shares Period Ended 31 December 2017 11.53 12.12Year Ended 31 December 2018 10.67 12.66Year Ended 31 December 2019 10.69 11.44Year Ended 31 December 2020 8.63 10.53Period Ended 30 June 2021 10.23 10.62 Class H-N/D (EUR) Shares Period Ended 31 December 2013 13.13 14.41Year Ended 31 December 2014 12.22 14.50Year Ended 31 December 2015 9.77 12.01Year Ended 31 December 2016 9.27 11.05Year Ended 31 December 2017 9.74 11.74Year Ended 31 December 2018 9.07 11.03Year Ended 31 December 2019 8.93 9.45Year Ended 31 December 2020 7.02 8.38Period Ended 30 June 2021 8.06 8.32 Class H-N1/A (EUR) Shares Period Ended 31 December 2019 10.97 11.53Year Ended 31 December 2020 8.70 10.61Period Ended 30 June 2021 10.32 10.72
166

NATIXIS INTERNATIONAL FUNDS (DUBLIN) I PLC APPENDIX I (Continued) Performance Disclosure (Continued) LOOMIS SAYLES MULTISECTOR INCOME FUND (Continued)
Share Class Lowest Net Asset Value per Share
Highest Net AssetValue per Share
Class H-R/A (EUR) Shares Period Ended 31 December 2013 12.38 13.98Year Ended 31 December 2014 12.62 14.76Year Ended 31 December 2015 10.40 12.53Year Ended 31 December 2016 9.97 12.10Year Ended 31 December 2017 10.85 13.25Year Ended 31 December 2018 11.57 13.80Year Ended 31 December 2019 11.59 12.36Year Ended 31 December 2020 9.32 11.33Period Ended 30 June 2021 10.99 11.40 Class H-R/A (SGD) Shares Period Ended 31 December 2014 7.42 8.24Year Ended 31 December 2015 6.49 7.62Year Ended 31 December 2016 6.11 7.73Year Ended 31 December 2017 7.01 8.09Year Ended 31 December 2018 7.44 8.40Year Ended 31 December 2019 7.53 8.45Year Ended 31 December 2020 9.66 11.83Period Ended 30 June 2021 11.49 11.95 Class H-R/D (SGD) Shares Period Ended 31 December 2014 7.43 8.29Year Ended 31 December 2015 6.28 7.50Year Ended 31 December 2016 5.86 7.28Year Ended 31 December 2017 6.49 7.37Year Ended 31 December 2018 6.33 7.30Year Ended 31 December 2019 6.37 6.97Year Ended 31 December 2020 7.92 9.49Period Ended 30 June 2021 9.15 9.45 Class H-RE/DM (AUD) Shares Period Ended 31 December 2018 6.84 7.29Year Ended 31 December 2019 6.82 7.32Year Ended 31 December 2020 8.76 10.49Period Ended 30 June 2021 10.09 10.47 Class H-S/A (EUR) Shares Period Ended 31 December 2010 12.07 16.08Year Ended 31 December 2011 14.47 17.73Year Ended 31 December 2012 14.81 17.48Year Ended 31 December 2013 17.10 19.39Year Ended 31 December 2014 17.66 20.58Year Ended 31 December 2015 14.66 17.54Year Ended 31 December 2016 14.07 17.14Year Ended 31 December 2017 15.42 18.95Year Ended 31 December 2018 16.75 19.81Period Ended 31 December 2019* 16.78 17.42 Class H-S/D (EUR) Shares Year Ended 31 December 2012 12.12 14.09Year Ended 31 December 2013 12.91 14.46Year Ended 31 December 2014 12.12 14.38Year Ended 31 December 2015 9.70 11.91Year Ended 31 December 2016 9.20 10.97Year Ended 31 December 2017 9.66 11.66Year Ended 31 December 2018 9.50 11.55Year Ended 31 December 2019 9.33 9.89Year Ended 31 December 2020 7.34 9.76Period Ended 30 June 2021 8.40 8.68 * Share class redeemed on 3 April 2019.
167

NATIXIS INTERNATIONAL FUNDS (DUBLIN) I PLC APPENDIX I (Continued) Performance Disclosure (Continued) LOOMIS SAYLES MULTISECTOR INCOME FUND (Continued)
Share Class Lowest Net Asset Value per Share
Highest Net AssetValue per Share
Class I/A (EUR) Shares Period Ended 31 December 2008 14.19 19.99Period Ended 31 December 2013 27.62 29.12Year Ended 31 December 2014 29.08 31.10Year Ended 31 December 2015 27.97 30.66Year Ended 31 December 2016 26.73 31.73Year Ended 31 December 2017 31.11 33.51Year Ended 31 December 2018 32.15 33.99Year Ended 31 December 2019 32.35 36.16Year Ended 31 December 2020 28.65 33.92Period Ended 30 June 2021 30.62 32.55 Class I/A (USD) Shares Year Ended 31 December 2012 12.58 14.33Year Ended 31 December 2013 14.42 15.29Year Ended 31 December 2014 15.27 16.33Year Ended 31 December 2015 14.69 16.10Year Ended 31 December 2016 14.04 16.67Year Ended 31 December 2017 16.34 17.60Year Ended 31 December 2018 16.87 17.85Year Ended 31 December 2019 16.98 18.98Year Ended 31 December 2020 16.18 20.00Period Ended 30 June 2021 19.45 20.26 Class I/D (GBP) Shares Period Ended 31 December 2008 15.67 17.12Period Ended 31 December 2012 16.00 16.46Year Ended 31 December 2013 15.94 16.94Year Ended 31 December 2014 16.22 17.26Year Ended 31 December 2015 14.45 16.19Year Ended 31 December 2016 13.43 15.62Year Ended 31 December 2017 14.98 15.85Year Ended 31 December 2018 14.61 15.81Year Ended 31 December 2019 14.53 15.81Year Ended 31 December 2020 11.18 12.33Period Ended 30 June 2021 11.12 11.78 Class I/D (USD) Shares Year Ended 31 December 2012 12.44 13.67Year Ended 31 December 2013 13.15 13.98Year Ended 31 December 2014 13.36 14.21Year Ended 31 December 2015 11.85 13.28Year Ended 31 December 2016 10.97 12.76Year Ended 31 December 2017 12.23 12.92Year Ended 31 December 2018 11.88 12.89Year Ended 31 December 2019 11.85 12.89Year Ended 31 December 2020 10.90 13.15Period Ended 30 June 2021 12.67 13.10 Class N/A (USD) Shares Period Ended 31 December 2018 9.59 10.05Year Ended 31 December 2019 9.65 10.79Year Ended 31 December 2020 9.19 11.36Period Ended 30 June 2021 11.05 11.51 Class N1/A (USD) Shares Period Ended 31 December 2017 10.00 10.05Year Ended 31 December 2018 9.65 10.20Year Ended 31 December 2019 9.71 10.86Year Ended 31 December 2020 9.26 11.46Period Ended 30 June 2021 11.14 11.61
168

NATIXIS INTERNATIONAL FUNDS (DUBLIN) I PLC APPENDIX I (Continued) Performance Disclosure (Continued) LOOMIS SAYLES MULTISECTOR INCOME FUND (Continued)
Share Class Lowest Net Asset Value per Share
Highest Net AssetValue per Share
Class N1/D (USD) Shares Period Ended 31 December 2018 9.29 10.07Year Ended 31 December 2019 9.26 10.07Year Ended 31 December 2020 8.52 10.28Period Ended 30 June 2021 9.91 10.24 Class R/A (EUR) Shares Year Ended 31 December 2012 17.34 19.67Year Ended 31 December 2013 19.75 20.90Year Ended 31 December 2014 20.85 22.24Year Ended 31 December 2015 19.86 21.84Year Ended 31 December 2016 18.97 22.45Year Ended 31 December 2017 21.98 23.59Year Ended 31 December 2018 22.47 23.88Year Ended 31 December 2019 22.62 25.15Year Ended 31 December 2020 19.90 23.58Period Ended 30 June 2021 21.17 22.47 Class R/A (SGD) Shares Period Ended 31 December 2014 7.69 8.07Year Ended 31 December 2015 7.20 7.92Year Ended 31 December 2016 6.88 8.14Year Ended 31 December 2017 7.97 8.56Year Ended 31 December 2018 8.15 8.66Year Ended 31 December 2019 8.21 9.13Year Ended 31 December 2020 11.34 12.93Period Ended 30 June 2021 12.40 13.00 Class R/A (USD) Shares Year Ended 31 December 2012 11.89 13.48Year Ended 31 December 2013 13.54 14.32Year Ended 31 December 2014 14.29 15.25Year Ended 31 December 2015 13.62 14.97Year Ended 31 December 2016 13.00 15.39Year Ended 31 December 2017 15.06 16.17Year Ended 31 December 2018 15.41 16.37Year Ended 31 December 2019 15.50 17.24Year Ended 31 December 2020 14.68 18.08Period Ended 30 June 2021 17.56 18.27 Class R/D (GBP) Shares Year Ended 31 December 2012 19.72 21.64Year Ended 31 December 2013 20.97 22.28Year Ended 31 December 2014 21.37 22.73Year Ended 31 December 2015 19.12 21.43Year Ended 31 December 2016 17.86 20.76Year Ended 31 December 2017 19.94 21.07Year Ended 31 December 2018 19.41 21.03Year Ended 31 December 2019 19.33 21.00Year Ended 31 December 2020 14.87 16.39Period Ended 30 June 2021 14.77 15.66 Class R/D (SGD) Shares Period Ended 31 December 2013 7.72 8.18Year Ended 31 December 2014 7.79 8.28Year Ended 31 December 2015 6.80 7.63Year Ended 31 December 2016 6.20 7.21Year Ended 31 December 2017 6.90 7.28Year Ended 31 December 2018 6.68 7.27Year Ended 31 December 2019 6.68 7.26Year Ended 31 December 2020 8.96 10.21Period Ended 30 June 2021 9.53 9.92
169

NATIXIS INTERNATIONAL FUNDS (DUBLIN) I PLC APPENDIX I (Continued) Performance Disclosure (Continued) LOOMIS SAYLES MULTISECTOR INCOME FUND (Continued)
Share Class Lowest Net Asset Value per Share
Highest Net AssetValue per Share
Class R/D (USD) Shares Year Ended 31 December 2012 12.45 13.67Year Ended 31 December 2013 13.16 13.98Year Ended 31 December 2014 13.35 14.20Year Ended 31 December 2015 11.85 13.28Year Ended 31 December 2016 10.98 12.76Year Ended 31 December 2017 12.24 12.94Year Ended 31 December 2018 11.89 12.91Year Ended 31 December 2019 11.87 12.90Year Ended 31 December 2020 10.90 13.15Period Ended 30 June 2021 12.68 13.10 Class R/DM (USD) Shares Year Ended 31 December 2012 14.30 15.59Year Ended 31 December 2013 15.10 16.04Year Ended 31 December 2014 15.31 16.28Year Ended 31 December 2015 13.62 15.32Year Ended 31 December 2016 12.69 14.71Year Ended 31 December 2017 14.19 14.95Year Ended 31 December 2018 13.71 14.97Year Ended 31 December 2019 13.76 14.87Year Ended 31 December 2020 12.58 15.18Period Ended 30 June 2021 14.64 15.19 Class RE/A (EUR) Shares Year Ended 31 December 2012 16.05 18.18Year Ended 31 December 2013 18.22 19.27Year Ended 31 December 2014 19.20 20.45Year Ended 31 December 2015 18.17 20.02Year Ended 31 December 2016 17.34 20.49Year Ended 31 December 2017 20.03 21.45Year Ended 31 December 2018 20.34 21.68Year Ended 31 December 2019 20.47 22.68Year Ended 31 December 2020 17.94 21.25Period Ended 30 June 2021 19.02 20.16 Class RE/A (USD) Shares Year Ended 31 December 2012 11.36 12.87Year Ended 31 December 2013 12.90 13.64Year Ended 31 December 2014 13.59 14.48Year Ended 31 December 2015 12.86 14.17Year Ended 31 December 2016 12.28 14.50Year Ended 31 December 2017 14.18 15.19Year Ended 31 December 2018 14.40 15.35Year Ended 31 December 2019 14.49 16.06Year Ended 31 December 2020 13.66 16.78Period Ended 30 June 2021 16.29 16.92 Class RE/D (USD) Shares Period Ended 31 December 2018 9.85 9.99Year Ended 31 December 2019 9.91 11.00Year Ended 31 December 2020 9.37 11.51Period Ended 30 June 2021 11.18 11.62 Class RE/DM (USD) Shares Period Ended 31 December 2018 9.85 9.99Year Ended 31 December 2019 9.91 11.01Year Ended 31 December 2020 9.36 11.50Period Ended 30 June 2021 11.16 11.60
170

NATIXIS INTERNATIONAL FUNDS (DUBLIN) I PLC APPENDIX I (Continued) Performance Disclosure (Continued) LOOMIS SAYLES MULTISECTOR INCOME FUND (Continued)
Share Class Lowest Net Asset Value per Share
Highest Net AssetValue per Share
Class S/A (USD) Shares Year Ended 31 December 2012 12.24 13.97Year Ended 31 December 2013 14.06 14.95Year Ended 31 December 2014 14.93 15.98Year Ended 31 December 2015 14.42 15.79Year Ended 31 December 2016 13.79 16.39Year Ended 31 December 2017 16.09 17.36Year Ended 31 December 2018 16.70 17.63Year Ended 31 December 2019 16.81 18.85Year Ended 31 December 2020 16.08 19.92Period Ended 30 June 2021 19.37 20.20 Class S/D (GBP) Shares Period Ended 31 December 2012 15.85 16.32Year Ended 31 December 2013 15.80 16.80Year Ended 31 December 2014 16.09 17.12Year Ended 31 December 2015 14.33 16.06Year Ended 31 December 2016 13.32 15.49Year Ended 31 December 2017 14.85 15.79Year Ended 31 December 2018 14.56 15.75Year Ended 31 December 2019 14.47 15.75Year Ended 31 December 2020 11.12 12.28Period Ended 30 June 2021 11.07 11.72 Class S/D (USD) Shares Year Ended 31 December 2012 14.92 16.41Year Ended 31 December 2013 15.82 16.81Year Ended 31 December 2014 16.10 17.14Year Ended 31 December 2015 14.34 16.07Year Ended 31 December 2016 13.33 15.50Year Ended 31 December 2017 14.85 15.71Year Ended 31 December 2018 14.44 15.67Year Ended 31 December 2019 14.39 15.67Year Ended 31 December 2020 13.25 15.98Period Ended 30 June 2021 15.40 15.92
171

NATIXIS INTERNATIONAL FUNDS (DUBLIN) I PLC
APPENDIX II Securities Financing Transaction Regulation Securities Financing Transaction Regulation (“SFTR”) introduces reporting requirements for securities financing transactions (“SFTs”) and Total Return Rate Swaps. A Securities Financing Transaction (SFT) is defined as per Article 3(11) of the SFTR as:
a repurchase/reverse repurchase agreement
securities or commodities lending and securities or commodities borrowing
a buy-sell back transaction or sell-buy back transaction, or
a margin lending transaction As at 30 June 2021 the Funds held Total Return Rate Swaps as type of instruments under the scope of the SFTR. a. Global Data The amount of assets across all SFTs as at 30 June 2021 is as follows: Loomis Sayles Alternative Risk Premia Fund
Type of Asset Amount % of NAV Total Return Rate Swaps $ 297 0.01%
b. Data on reuse of collateral There was no collateral reuse during the half year ended 30 June 2021. There was no cash collateral reinvestment during the half year ended 30 June 2021. c. Concentration data As at 30 June 2021 there are no collateral securities and commodities received in respect of Total Return Rate Swaps. The ten largest counterparties across all SFTs and Total Return Rate Swaps as at 30 June 2021 are as follows: Loomis Sayles Alternative Risk Premia Fund
Security type Counterparty Amount Total Return Rate Swaps Citibank NA $ 25,666 Total Return Rate Swaps Morgan Stanley Capital $ (25,369)
$ 297 d. Safekeeping of collateral received There were no security and cash collaterals received for Total Return Rate Swaps as at 30 June 2021. e. Safekeeping of collateral granted The following cash collateral was granted for Total Return Rate Swaps as at 30 June 2021: Loomis Sayles Alternative Risk Premia Fund
Collateral type Counterparty Amount Cash Citibank NA $ 220,000 Cash Morgan Stanley Capital $ 350,000
$ 570,000
172

NATIXIS INTERNATIONAL FUNDS (DUBLIN) I PLC
APPENDIX II (Continued) Securities Financing Transaction Regulation (Continued) f. Returns/Costs Return and cost for each type of SFTs and Total Return Rate Swaps for the year ended 30 June 2021 is as follows: Total return swaps Loomis Sayles Alternative Risk Premia Fund
Returns* Amount % of overall returns**
To Fund $ 160,314 100.00%
Costs* Amount % of overall
returns** To Fund $ (10,854) 100.00%
* Returns (costs) are identified as the realized gains (losses), change in unrealized gains (losses) and interest received (paid) on Total Return Rate Swaps during the reporting period. ** All returns from OTC derivative transactions will accrue to the Portfolio and are not subject to any returns sharing agreement with the Portfolio’s manager or any other third parties. g. Aggregate Transaction Data The aggregate transaction data for collateral positions (including cash) received across all SFTs and Total Return Rate Swaps as at 30 June 2021 is as follows: Loomis Sayles Alternative Risk Premia Fund
Type of collateral Maturity Amount Cash N/A $ 570,000
Country in which counterparties for Total Return Rate Swaps are established: Loomis Sayles Alternative Risk Premia Fund
Counterparty Country Citibank NA United States of America Morgan Stanley Capital United States of America
The settlement and clearing mechanisms for SFTs and Total Return Rate Swaps as at 30 June 2021 are as follows: Loomis Sayles Alternative Risk Premia Fund
Total Return Rate Swaps Amount Bilateral $ 570,000
173