Lux Industries - image
26
Anand Rathi Share and Stock Brokers Limited (hereinafter “ARSSBL”) is a full-service brokerage and equities-research firm and the views expressed therein are solely of ARSSBL and not of the companies which have been covered in the Research Report. This report is intended for the sole use of the Recipient. Disclosures and analyst certifications are present in the Appendix. Anand Rathi Research India Equities India I Equities Key financials (YE Mar) FY19 FY20 FY21e FY22e FY23e Sales (Rsm) 12,070 12,061 13,589 14,768 16,440 Net profit (Rsm) 988 1,225 1,967 1,825 2,167 EPS (Rs) 39.1 48.5 77.9 72.3 85.8 PE (x) 35.2 19.3 21.9 23.7 19.9 EVEBITDA (x) 20.5 13.4 15.8 16.9 14.0 PBV (x) 8.4 4.8 6.9 5.8 4.9 RoE (%) 27.1 27.0 34.9 26.4 26.5 RoCE (%) 17.5 21.1 29.5 24.7 25.5 Dividend yield (%) 0.3 1.3 1.1 1.3 1.5 Net debt/equity (x) 0.4 0.3 -0.0 -0.1 -0.1 Source: Company, Anand Rathi Research Retail Initiating Coverage Vaishnavi Mandhaniya Research Analyst +9122 66266760 [email protected] Kimberly Paes, CFA Research Associate +9122 66266727 [email protected] Rating: Buy Target Price: Rs.2,574 Share Price: Rs.1,710 Relative price performance Source: Bloomberg 20 520 1,020 1,520 2,020 2,520 Feb-20 Mar-20 Apr-20 May-20 Jun-20 Jul-20 Aug-20 Sep-20 Oct-20 Nov-20 Dec-20 Jan-21 Feb-21 Mar-21 LUX Sensex Key data LUX IN / LUXI.BO 52-week high / low Rs1900 / 813 Sensex / Nifty 50364 / 14910 3-m average volume $1.2m Market cap Rs43bn / $595.2m Shares outstanding 25m Shareholding pattern (%) Dec'20 Sep'20 Jun'20 Promoters 69.5 69.5 69.5 - of which, Pledged - - - Free Float 30.5 30.5 30.5 - Foreign Institutions 3.4 3.6 4.0 - Domestic Institutions 4.5 4.5 4.2 - Public 22.6 22.4 22.3 16 March 2021 Lux Industries Branded play, merger to augment potential; initiating, with a Buy With its healthy growth trajectory, we are upbeat on Lux’s long-term growth prospects for its strong brand equity, long-standing operations in innerwear and new launches. Its extension to casual wear and women’s wear via the proposed merger would unlock synergies that would further propel growth. We initiate coverage on Lux Industries with a Buy rating and a TP of Rs2,574, based on 30x FY23e EPS of Rs85.80. Investment in creating strong brands. Through its 16 home-grown brands (incl. GenX and Lyra), Lux has created strong brands in economy and mid- premium innerwear. It has launched several products and sub-brands through the years and effectively marketed them. It spends 7-8% of its revenues on brand-building. Consistent efforts in branding and marketing have helped create strong brand equity, leading to customer stickiness. Increasing focus on premiumisation. Levering its expertise and superior product knowhow and intending to upgrade customers to premium products, it started focusing on increasing the proportion of premium products and launching higher ASP brands and products. Efforts toward growing the premium range led to its economy-range contribution shrinking to ~35% in FY20 (~39% in FY15). Over that period, the mid-premium share in revenue grew from ~42% to ~48%, while the premium share has been ~18%. Unlocking merger synergies. In 2018, Lux approved the merger of group companies—J.M. Hosiery (GenX brand) and Ebell Fashions (Lyra). The integration (expected to be complete by CY21) would add newer categories to Lux’s product range, further raising its growth potential. The proposed merger is expected to be EPS accretive. Financials. We expect ~10%/5% revenue/EBITDA CAGRs over FY21-23, with, by FY23, an 18.3% EBITDA margin and 26.5%/25.5% RoE/RoCE. Valuation. We initiate coverage on Lux Industries with a Buy rating and a TP of Rs2,574, based on 30x FY23e EPS. Risks: Slower growth of its premium range, keen competition and rise in raw material prices.
-
Upload
khangminh22 -
Category
Documents
-
view
1 -
download
0
Transcript of Lux Industries - image

Anand Rathi Share and Stock Brokers Limited (hereinafter “ARSSBL”) is a full-service brokerage and equities-research firm and the views expressed therein are solely of ARSSBL and not of the companies which have been covered in the Research Report. This report is intended for the sole use of the Recipient. Disclosures and analyst certifications are present in the Appendix. Anand Rathi Research India Equities
India I Equities
Key financials (YE Mar) FY19 FY20 FY21e FY22e FY23e
Sales (Rsm) 12,070 12,061 13,589 14,768 16,440
Net profit (Rsm) 988 1,225 1,967 1,825 2,167
EPS (Rs) 39.1 48.5 77.9 72.3 85.8
PE (x) 35.2 19.3 21.9 23.7 19.9
EVEBITDA (x) 20.5 13.4 15.8 16.9 14.0
PBV (x) 8.4 4.8 6.9 5.8 4.9
RoE (%) 27.1 27.0 34.9 26.4 26.5
RoCE (%) 17.5 21.1 29.5 24.7 25.5
Dividend yield (%) 0.3 1.3 1.1 1.3 1.5
Net debt/equity (x) 0.4 0.3 -0.0 -0.1 -0.1
Source: Company, Anand Rathi Research
Retail
Initiating Coverage
Vaishnavi Mandhaniya Research Analyst
+9122 66266760 [email protected]
Kimberly Paes, CFA Research Associate
+9122 66266727 [email protected]
Leading player in val `
Rating: Buy Target Price: Rs.2,574 Share Price: Rs.1,710
Relative price performance
Source: Bloomberg
20
520
1,020
1,520
2,020
2,520
Feb-
20
Mar
-20
Apr-2
0
May
-20
Jun-
20
Jul-2
0
Aug-
20
Sep-
20
Oct
-20
Nov
-20
Dec
-20
Jan-
21
Feb-
21
Mar
-21
LUX Sensex
Key data LUX IN / LUXI.BO
52-week high / low Rs1900 / 813
Sensex / Nifty 50364 / 14910
3-m average volume $1.2m
Market cap Rs43bn / $595.2m
Shares outstanding 25m
Shareholding pattern (%) Dec'20 Sep'20 Jun'20
Promoters 69.5 69.5 69.5 - of which, Pledged - - -Free Float 30.5 30.5 30.5 - Foreign Institutions 3.4 3.6 4.0 - Domestic Institutions 4.5 4.5 4.2 - Public 22.6 22.4 22.3
16 March 2021
Lux Industries
Branded play, merger to augment potential; initiating, with a Buy
With its healthy growth trajectory, we are upbeat on Lux’s long-term growth prospects for its strong brand equity, long-standing operations in innerwear and new launches. Its extension to casual wear and women’s wear via the proposed merger would unlock synergies that would further propel growth. We initiate coverage on Lux Industries with a Buy rating and a TP of Rs2,574, based on 30x FY23e EPS of Rs85.80. Investment in creating strong brands. Through its 16 home-grown brands (incl. GenX and Lyra), Lux has created strong brands in economy and mid-premium innerwear. It has launched several products and sub-brands through the years and effectively marketed them. It spends 7-8% of its revenues on brand-building. Consistent efforts in branding and marketing have helped create strong brand equity, leading to customer stickiness. Increasing focus on premiumisation. Levering its expertise and superior product knowhow and intending to upgrade customers to premium products, it started focusing on increasing the proportion of premium products and launching higher ASP brands and products. Efforts toward growing the premium range led to its economy-range contribution shrinking to ~35% in FY20 (~39% in FY15). Over that period, the mid-premium share in revenue grew from ~42% to ~48%, while the premium share has been ~18%. Unlocking merger synergies. In 2018, Lux approved the merger of group companies—J.M. Hosiery (GenX brand) and Ebell Fashions (Lyra). The integration (expected to be complete by CY21) would add newer categories to Lux’s product range, further raising its growth potential. The proposed merger is expected to be EPS accretive. Financials. We expect ~10%/5% revenue/EBITDA CAGRs over FY21-23, with, by FY23, an 18.3% EBITDA margin and 26.5%/25.5% RoE/RoCE. Valuation. We initiate coverage on Lux Industries with a Buy rating and a TP of Rs2,574, based on 30x FY23e EPS. Risks: Slower growth of its premium range, keen competition and rise in raw material prices.

16 March 2021 Lux Industries – Branded play, merger to augment potential; initiating, with a Buy
Anand Rathi Research 2
Quick Glance – Financials and Valuations
Fig 1 – Income statement (Rs m)
Year-end: Mar FY19 FY20 FY21e FY22e FY23e
Net revenues 12,070 12,061 13,589 14,768 16,440 Growth (%) 12.0 -0.1 12.7 8.7 11.3
Direct costs 5,753 5,268 6,183 6,719 7,480SG&A 4,538 4,931 4,698 5,528 5,956EBITDA 1,779 1,862 2,709 2,520 3,004 EBITDA margins (%) 14.7 15.4 19.9 17.1 18.3Depreciation 112 127 134 152 188Other income 90 38 68 74 82Interest expenses 236 138 41 9 9PBT 1,521 1,634 2,602 2,433 2,889 Effective tax rates (%) 35.1 25.1 24.4 25.0 25.0+ Associates / (Minorities) - - - - -Net income 988 1,225 1,967 1,825 2,167Adjusted income 988 1,225 1,967 1,825 2,167WANS 25 25 25 25 25FDEPS (Rs / sh) 39.1 48.5 77.9 72.3 85.8 FDEPS growth (%) 26.8 24.0 60.7 (7.3) 18.7 Gross margins % 52.3 56.3 54.5 54.5 54.5
Fig 3 – Cash-flow statement (Rs m) Year-end: Mar FY19 FY20 FY21e FY22e FY23e
PBT 1,754 1,765 2,642 2,442 2,898+ Non-cash items 80 149 134 152 188Oper. prof. before WC 1,834 1,914 2,777 2,594 3,086- Incr. / (decr.) in WC -533 492 -372 651 517Others incl. taxes 469 461 634 608 722Operating cash-flow 1,899 961 2,514 1,335 1,847- Capex (tang. + intang.) 124 71 211 250 500Free cash-flow 1,775 890 2,304 1,085 1,347
Acquisitions - Div. (incl. buyback & taxes) 61 411 592 659 782+ Equity raised - - - - -+ Debt raised -1,482 -357 -1,000 -350 -- Fin investments 0 -8 - - -- Misc. (CFI + CFF) 235 136 41 9 9Net cash-flow -3 -6 671 67 556Source: Company, Anand Rathi Research
Fig 5 – Price movement
Source: Bloomberg
Fig 2 – Balance sheet (Rs m) Year-end: Mar FY19 FY20 FY21e FY22e FY23e
Share capital 53 53 53 53 53Net worth 4,115 4,927 6,303 7,469 8,853Total debt 1,777 1,424 452 102 102Minority interest - - - - -DTL / (Assets) 76 178 178 178 178Capital employed 5,968 6,529 6,932 7,748 9,132Net tangible assets 1,319 1,408 1,485 1,582 1,894Net intangible assets 4 2 2 2 2Goodwill - - - - -CWIP (tang. & intang.) 4 8 8 8 8Investments (strategic) - - - - -Investments (financial) 45 44 44 44 44Current assets (ex cash) 6,623 7,002 6,874 7,713 8,496Cash 20 14 685 752 1,308Current liabilities 2,049 1,950 2,165 2,353 2,619Working capital 4,575 5,053 4,709 5,360 5,877Capital deployed 5,968 6,529 6,932 7,748 9,132 Contingent liabilities - - - - -
Fig 4 – Ratio analysis Year-end: Mar FY19 FY20 FY21e FY22e FY23e
P/E (x) 35.2 19.3 21.9 23.7 19.9EV / EBITDA (x) 20.5 13.4 15.8 16.9 14.0EV / Sales (x) 3.0 2.1 3.2 2.9 2.6P/B (x) 8.4 4.8 6.9 5.8 4.9RoE (%) 27.1 27.0 34.9 26.4 26.5RoCE (%) - after tax 17.5 21.1 29.5 24.7 25.5RoIC (%) 13.0 15.8 23.1 20.0 21.3DPS (Rs / sh) 3.5 12.5 19.5 21.7 25.7Dividend yield (%) 0.3 1.3 1.1 1.3 1.5Dividend payout (%) - incl. DDT 8.9 25.8 25.0 30.0 30.0Net debt / equity (x) 0.4 0.3 -0.0 -0.1 -0.1Receivables (days) 111 94 75 83 82Inventory (days) 77 100 92 90 89Payables (days) 49 45 45 45 45CFO : PAT % 192.2 78.5 127.8 73.2 85.3Source: Company, Anand Rathi Research
Fig 6 – 6%/3% revenue / volume CAGRs over FY15-20
Source: Company
0
500
1,000
1,500
2,000
2,500
Feb-
16
Jun-
16
Oct
-16
Feb-
17
Jun-
17
Oct
-17
Feb-
18
Jun-
18
Oct
-18
Feb-
19
Jun-
19
Oct
-19
Feb-
20
Jul-2
0
Nov
-20
Mar
-21
(Rs)
166 163 165
192 200 192
0
50
100
150
200
250
0
2,000
4,000
6,000
8,000
10,000
12,000
14,000
FY15
FY16
FY17
FY18
FY19
FY20
(m)(Rs m)
Revenue No of pieces (RHS)

16 March 2021 Lux Industries – Branded play, merger to augment potential; initiating, with a Buy
Anand Rathi Research 3
Established innerwear manufacturer
~14% market share in organized men’s innerwear market
Initially, in 1957, established as Biswanath Hosiery Mills by the late Girdharilalji Todi, the name was changed in 1995. Lux Industries came out with an IPO in 2003. The Lux Group (Lux Industries, J.M. Hosiery, Ebell Fashions) is the largest mid-segment hosiery company in the country. It enjoys a ~14% market share in the organized men’s innerwear market, primarily catering to economy and mid-premium segments. Its focus on branding and advertising has built a small hosiery company into an innerwear giant. Over time, with the launch of products in different segments, it has transformed itself from merely men’s innerwear to a lifestyle brand.
Improving profitability and cash generation
Powered by its wide product range, innovative launches and relentless brand investments, Lux achieved a 14% revenue CAGR over FY10-20. The CAGR would have been better if not for the Covid-19 impact in Q4 FY20 (sliding 25.3% y/y) as 9M FY20 revenue grew 11% y/y. Its brand investments have helped the share of its mid-premium/premium products to increase, leading to higher average realisation and profitability. Also, the EBITDA has clocked an impressive 10-year ~34% CAGR, with the EBITDA margin expanding 1,251bps to 15.4% in FY20. The margin expansion was aided by the 1,476bp gross-margin expansion (incl. sub-contracting expenses), manufacturing and cost efficiencies. The controlled working capital (steady, averaging ~140-150 days) and greater profitability have led to positive operating cash-flows in four of the last five years. Ahead, as it continues to launch innovative products, increase its share of mid-and premium products, and build its brand, we believe its revenue and profit trajectories would continue.
Fig 7 – Revenue: Rs12bn in FY20, a 14% CAGR over FY10-20
Source: Company, Anand Rathi Research
Fig 8 – EBITDA, a 34% CAGR, margin expanded 1,251bps over FY10-20
Source: Company, Anand Rathi Research
13.1
55.9
5.2
26.4 25.8
4.4 3.5 1.8
12.5 12.0
(0.1)
-10
0
10
20
30
40
50
60
0
2,000
4,000
6,000
8,000
10,000
12,000
14,000
FY10
FY11
FY12
FY13
FY14
FY15
FY16
FY17
FY18
FY19
FY20
(%)(Rs m)
Revenue Revenue growth (RHS)
2.9 4.3
6.0 6.5
8.0 8.9
10.0
12.5
14.3 14.7 15.4
0
2
4
6
8
10
12
14
16
18
0
200
400
600
800
1,000
1,200
1,400
1,600
1,800
2,000
FY10
FY11
FY12
FY13
FY14
FY15
FY16
FY17
FY18
FY19
FY20
(%)(Rs m)
EBITDA EBITDA margin (RHS)

16 March 2021 Lux Industries – Branded play, merger to augment potential; initiating, with a Buy
Anand Rathi Research 4
Branded presence in mass and mid-premium categories
Over time, the company has developed its home-grown brands and launched branded products in the economic, mid and premium innerwear and apparel sub-segments. It has broadened its product range to cater to different ages, regions and seasons. Through its 16 home-grown brands (incl. GenX and Lyra), it has created a strong position in economy and mid-premium innerwear.
Its value proposition and steady expansion have been key growth drivers. However, Lux has been stepping up its margin betterment by increasing its operations in the mid-premium and premium segments.
Lux Cozi and Venus are parent brands. Most of the sub-brands were created 15-16 years prior. Lux Cott’s Wool and Lux Inferno were created for winterwear, Lux Big Shot for underwear, etc. The company is working on consolidating its sub-brands under the mother brands. This would reduce the number of brands and provide synergies in advertising. This, however, will be a 5- to 10-year process.
Fig 11 – Snapshot of Lux’s brands, sub-brands
Source: Company Note: Lyra and GenX are part of group companies
Fig 9 – Steady working-capital cycle (on sales)
Source: Company, Anand Rathi Research
Fig 10 – Improving cash-flow generation
Source: Company, Anand Rathi Research
88
72 67
100 108
134 133
148
169
138 149
0
20
40
60
80
100
120
140
160
180
FY10
FY11
FY12
FY13
FY14
FY15
FY16
FY17
FY18
FY19
FY20
(days)
WC cycle (days)
(243
) (88)
161
(402
)
(98)
(190
)
811
205
(23)
1,89
9
961
(321
)
(177
)
130
(689
)
(231
)
(531
)
573
(4)
(197
)
1,77
5
890
(1,000)
(500)
-
500
1,000
1,500
2,000
FY10
FY11
FY12
FY13
FY14
FY15
FY16
FY17
FY18
FY19
FY20
(Rs m)
OCF FCF
16 March 2021 Lux Industries – Branded play, merger to augment potential; initiating, with a Buy
Anand Rathi Research 5
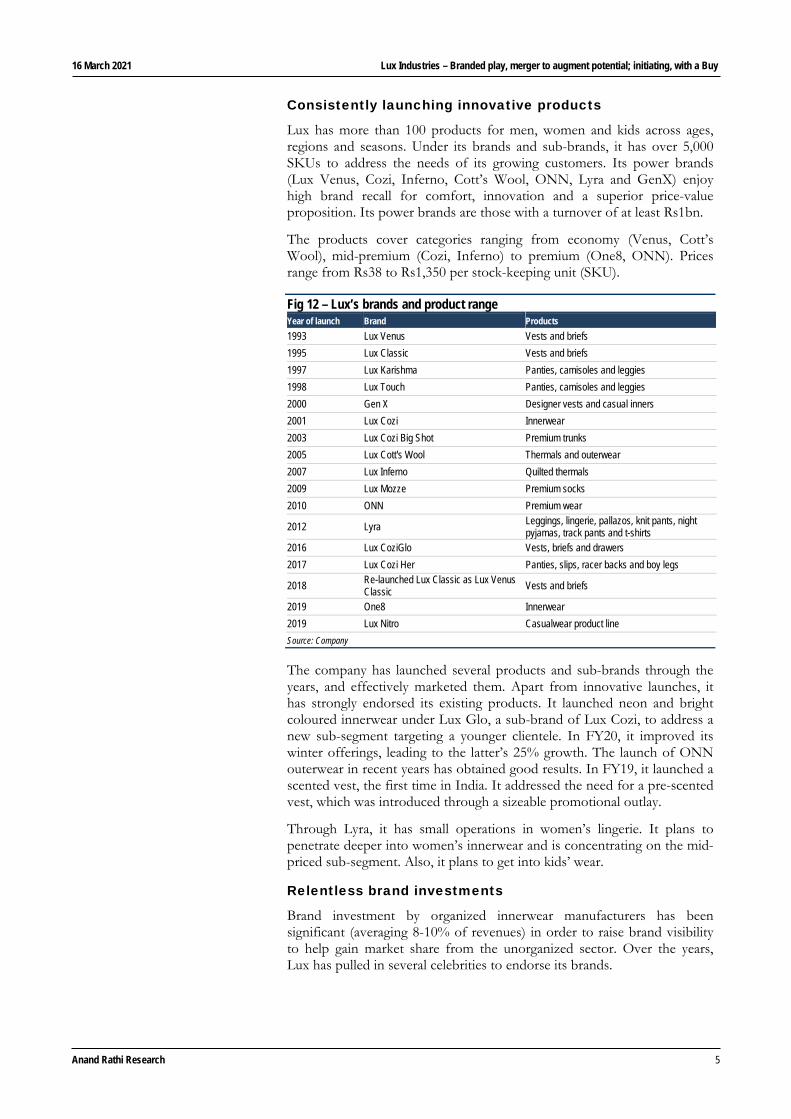
Consistently launching innovative products
Lux has more than 100 products for men, women and kids across ages, regions and seasons. Under its brands and sub-brands, it has over 5,000 SKUs to address the needs of its growing customers. Its power brands (Lux Venus, Cozi, Inferno, Cott’s Wool, ONN, Lyra and GenX) enjoy high brand recall for comfort, innovation and a superior price-value proposition. Its power brands are those with a turnover of at least Rs1bn.
The products cover categories ranging from economy (Venus, Cott’s Wool), mid-premium (Cozi, Inferno) to premium (One8, ONN). Prices range from Rs38 to Rs1,350 per stock-keeping unit (SKU).
Fig 12 – Lux’s brands and product range Year of launch Brand Products
1993 Lux Venus Vests and briefs
1995 Lux Classic Vests and briefs
1997 Lux Karishma Panties, camisoles and leggies
1998 Lux Touch Panties, camisoles and leggies
2000 Gen X Designer vests and casual inners
2001 Lux Cozi Innerwear
2003 Lux Cozi Big Shot Premium trunks
2005 Lux Cott's Wool Thermals and outerwear
2007 Lux Inferno Quilted thermals
2009 Lux Mozze Premium socks
2010 ONN Premium wear
2012 Lyra Leggings, lingerie, pallazos, knit pants, night pyjamas, track pants and t-shirts
2016 Lux CoziGlo Vests, briefs and drawers
2017 Lux Cozi Her Panties, slips, racer backs and boy legs
2018 Re-launched Lux Classic as Lux Venus Classic
Vests and briefs
2019 One8 Innerwear
2019 Lux Nitro Casualwear product line
Source: Company
The company has launched several products and sub-brands through the years, and effectively marketed them. Apart from innovative launches, it has strongly endorsed its existing products. It launched neon and bright coloured innerwear under Lux Glo, a sub-brand of Lux Cozi, to address a new sub-segment targeting a younger clientele. In FY20, it improved its winter offerings, leading to the latter’s 25% growth. The launch of ONN outerwear in recent years has obtained good results. In FY19, it launched a scented vest, the first time in India. It addressed the need for a pre-scented vest, which was introduced through a sizeable promotional outlay.
Through Lyra, it has small operations in women’s lingerie. It plans to penetrate deeper into women’s innerwear and is concentrating on the mid- priced sub-segment. Also, it plans to get into kids’ wear.
Relentless brand investments
Brand investment by organized innerwear manufacturers has been significant (averaging 8-10% of revenues) in order to raise brand visibility to help gain market share from the unorganized sector. Over the years, Lux has pulled in several celebrities to endorse its brands.

16 March 2021 Lux Industries – Branded play, merger to augment potential; initiating, with a Buy
Anand Rathi Research 6
Fig 13 – Celebrities endorsing its various brands Year of Launch Brand Products
2000 Lux Cozi Sunny Deol
2010 ONN Shah Rukh Khan
2017 Lux Cozi brand Varun Dhawan
2017 Lux Venus, Lux Inferno Amitabh Bachchan
2019 Lux Inferno Kartik Aaryan
2019 Lyra Taapsee Pannu
Source: Company
Lux has consistently invested in its brands. It spends 7-8% of its revenues on brand building through celebrity endorsements, extensive publicity and quality-enhancing programmes. This has helped drive a strong brand recall. Its cumulative brand investments from FY11 to FY15 were Rs2bn, more than doubling over FY16-20 to Rs4.2bn – in line with its revenue growth. Given the Covid-19 pandemic and planned cost reductions, management decided to cut FY21 advertising expenditure, expected at 4-5% of revenue (vs. 7-8% in the past). However, given its emphasis on branding, these expenses will return to past levels from FY22.
Fig 14 – Lux’s ad-expenses to sales: averaged ~7% in the past
Source: Company
The company also works on promotional schemes to boost growth. After the slowdown due to the GST, it launched consumer promotions such as ‘Buy any two Lux products and get a pair of socks FREE’ to provide an impetus to growth, which was very successful.
All the initiatives toward branding have helped create strong brand equity leading to customer stickiness. This enables it to pass on raw-material price rises and benefits to consumers without curtailing its margins.
5%6%
8%
10%
8% 7%
0%
2%
4%
6%
8%
10%
12%
0
200
400
600
800
1,000
1,200
FY15
FY16
FY17
FY18
FY19
FY20
(Rs m)
Advertisement expenses Ad expenses (% of sales) (RHS)

16 March 2021 Lux Industries – Branded play, merger to augment potential; initiating, with a Buy
Anand Rathi Research 7
Fig 15 – Lux’s brand investments, in line with peers
Source: Company
Enhancing operations in premium innerwear
Most Indian innerwear brands largely cater to the mid-to-economy sub-segments. For decades, Lux had focused on the mid and economy price categories. Its average realisation was Rs54 a piece in FY15. Its branded operations in the mid-premium category, bridging the gap between the premium and mass ones, resulted in the mid-premium sub-segment growing fastest for it, at a 9% CAGR over FY15-20. The premium and economy categories grew 5% and 4% respectively, leading to the average realisation rising to Rs66 a piece in FY20.
Apart from the increasing share of premium and mid premium products, up-trading has been seen within segments, reflected in improving average realisations across the three sub-segments. The average realisation for the economy segment has risen from Rs45 a piece in FY15 to Rs50 in FY20; similarly, mid-premium realisations grew to Rs79 a piece vs. Rs58. The premium segment (ONN+exports) realisation was Rs80 a piece in FY15 vs. Rs72 in FY20. ONN realisation was a higher Rs138 a piece in FY20 vs Rs90 in FY15.
Fig 16 – Revenue mix shifting toward mid-premium, premium
Source: Company, Anand Rathi Research
5% 6%
8%
10%
8%7%
5%
4%4% 4% 4%
3%
7%
9%10%
9%
10%
8%7% 8%
7% 7% 7%7%
0%
2%
4%
6%
8%
10%
12%
FY15
FY16
FY17
FY18
FY19
FY20
Lux Page Dollar Rupa
Economy, 39%
Mid premium, 42%
Premium, 19%
FY15
Economy, 35%
Mid premium, 48%
Premium, 18%
FY20

16 March 2021 Lux Industries – Branded play, merger to augment potential; initiating, with a Buy
Anand Rathi Research 8
Fig 17 – Mid-premium, premium segments - better margin profile
Segment Revenue
contribution %(FY20)
Five-year CAGR %
Two-year CAGR %
EBITDA margin profile %
Avg realisation(Rs / piece)
(FY20)
Economy
Lux Venus 28 3 -3 8-10 43
Cott's wool 6 9 22 8-10 191
Mid premium
Lux Cozi 37 8 -3 13-15 67
Inferno 10 17 45 13-15 231
Premium
ONN 7 10 10 15-18 138
Exports 11 3 12 15-18 63
Source: Company, Anand Rathi Research
Fig 18 – Realisation rising across segments
Source: Company, Anand Rathi Research
Levering its expertise and superior product knowhow and intending to upgrade customers to premium products, the company started focusing on increasing the proportion of premium products and launching higher ASP brands. Launched in 2010, ONN is its premium innerwear brand. In FY17, under this brand it extended its offerings with the launch of outerwear (in active wear and sportswear). In FY20, it further extended its product range with ONN T-shirts, and launched a promotional campaign. The brand has registered a 10% CAGR over FY15-20.
Further, along its premiumization journey, in FY19 it acquired the manufacturing and marketing rights of Virat Kohli’s brand One8, thus increasing its share of the men’s premium innerwear sub-segment. Artimas Fashions Pvt. Ltd was created as a subsidiary to develop independent, and build dedicated, manufacturing capacities to manufacture all the products sold by the One8 brand. The company worked on a differentiated strategy for One8. In the past, new products were marketed through its existing distribution network. For One8, however, a new distribution channel was created. The product was first online, and then marketed through a select distribution network without much promotional and advertising support. The increasing proportion of repeat orders from trade partners led to growth in offtake. The brand clocked Rs60m revenue in FY20 with 0.2m pieces sold.
Efforts toward growing the premium portfolio led to Lux’s economy range contribution shrinking to 35% in FY20 (from 39% in FY15). Over the same period, the share of revenue of its mid-premium range grew from 42% to 48% while that of the premium range held steady at ~18%.
45
58
72
50
79 80
0
10
20
30
40
50
60
70
80
90
Economy Mid premium Premium
(Rs/ piece)
FY15 FY20

16 March 2021 Lux Industries – Branded play, merger to augment potential; initiating, with a Buy
Anand Rathi Research 9
The proportion of revenue from its premium brands, at ~18%, is more than its peers (Dollar: in single digits, Rupa: ~11%). The average realisation grew to Rs66 a piece in FY20 (Rs54 in FY15). Comparatively, in FY20 Dollar’s average realisation was ~Rs62; Page’s was Rs175.
The rising shares of its mid-premium and premium categories have given a fillip to the company level EBITDA margin, which expanded a significant 650bps from FY15 to FY20. The economy category’s EBITDA margin is 8-10%. The fast-growing mid-premium category has a 13-15% margin and the premium range enjoys 15-18% margins. The company will continue to work on increasing the percentage of revenue of the premium category in the overall mix, thus providing further possibilities of margin expansion
Fig 19 – Premium range enjoys higher EBITDA margins of 15-18%
Source: Company Q3 FY21 presentation
Fig 20 – Peer price comparison (MRP) Rs Product Lux Dollar Rupa Page
Men
Innerwear
Briefs 86-260 70-300 110-360 150-550
Trunks 109-245 60-300 139-410 199-599
Vests 79-319 50-250 76-202 209-319
Outwear bottom
Boxer shorts 375-575 300-450 120-200 399-470
Thermal
Long-sleeves T-shirts 220-500 200-700 337-480 599-899
Long pants 243-825 100-700 337-520 599-650
Women
Camisoles ~198 70-200 115-300 269-399
Leggings 279-700 400-450 NA 899-1499
Source: Page, Rupa – Website, Lux, Dollar - Company
In-house manufacturing capabilities; labour intensive process outsourced
To control quality, Lux focuses on in-house manufacturing. All its high-end work is carried out in-house. It has cumulative capacity of 200m garment pieces a year across its six manufacturing plants, located in Dankuni, Srijan Industrial Logistics Park, Dhulagarh and BT Road (West Bengal), Tirupur (Tamil Nadu) and Ludhiana (Punjab). It purchases its raw material (ie, yarn) and further processes it. Raw-material prices fluctuate often and the mills from which yarn is procured are run exclusively under Lux supervision, thereby, absorbing price fluctuations.
Premium
Revenue contribution: 21%
EBITDA margin: 15-18%
Mid-Premium
Revenue contribution: 46%
EBITDA margin: 13-15%
Economy
Revenue contribution: 33%
EBITDA margin: 8-10%

16 March 2021 Lux Industries – Branded play, merger to augment potential; initiating, with a Buy
Anand Rathi Research 10
In the manufacturing process, knitting of yarn into fabric is done in-house. Fabric colour processing (which is capex driven) is outsourced. 80-90% of job-worker capacity is taken up by Lux, ensuring quality control. Cutting is then done in-house, where costing is controlled. Stitching for premium brands (ie, Lyra, ONN, exports) is done in-house (~10% of total stitching), the others are outsourced. Packing is entirely in-house.
Innerwear producers generally outsource some part of the labour-intensive work required in manufacturing. Rupa procures yarn and carries out dyeing, knitting (partly), designing and cutting in-house while outsourcing, through job work, stitching and knitting, which is labour intensive. Similarly, Dollar outsources some of the processing like dyeing and stitching through job work. Page has a strong manufacturing base with >70% in-house manufacturing, with the balance outsourced (outsourcing in outerwear is greater).
Fig 21 – Lux’s manufacturing process flow Process Manufacturing
Yarn Outsourced
Knitting In-house
Processing (bleaching, dyeing, colouring) Outsourced, but fully controlled
Cutting In-house
Stitching Outsourced, but fully controlled
Packaging In-house
Source: Company
MBO-focused distribution network . . .
Lux’s extensive distribution network is spread across the country, comprising more than 950 distributors and 500,000 retailers. It exports largely under its own brands (~95% of exports) to ~46 countries. Exports accounted for ~10% of revenue in FY20 (11% in FY19). In FY20, MBO/ general trade contributed ~96%, with the balance 3% and 1% from online and modern trade respectively.
Fig 22 – Domestic revenue contribution: 90%
Source: Company
Domestic, 90%
International, 10%

16 March 2021 Lux Industries – Branded play, merger to augment potential; initiating, with a Buy
Anand Rathi Research 11
Fig 23 – MBO / general trade contribution: 96% (FY20)
Source: Company
Peers such as Rupa and Dollar also largely follow a wholesale-driven model with most revenues arising from the MBO channel (>90% of revenue). Page has followed a two-pronged approach with significant EBO operations (more than 810 EBOs) bringing ~16% to revenue.
While there are no exclusive terms, Lux Industries enjoys exclusivity with most distributors (~90%) due to its good relations. Distributors who sell to wholesalers keep 3-7% margins, whereas distributors who sell direct to retailers enjoy a 7-8% margin. Distributors generally carry two months inventory on average. A few years ago, Lux would give cash discounts, ie, ~2% Then, it introduced a 120-day lock-in period, any delay beyond that would lead to restricted supplies. At present, it gives a 2% cash discount for 60 days and 1% for 90 days. In the past couple of years Dollar’s receivables cycle has been stretched. However, it is following a strict 60-day credit policy to improve its working capital cycle. Page follows a strict receivables-day cycle for its distributors. To avail of a cash discount, they have to pay the company within seven days. Without any cash discount/penalty, they can pay within 21 days.
… stepping up its EBO operations
Lux has had small operations in EBOs through its ONN brand. It recently began extending its network under ‘Cozi World’ EBOs, where all its products (manufactured by the Lux Group) would be sold. It aims at 75-80 EBOs by next year. The product mix would differ from city to city. The strategy is to build awareness regarding its entire product range as a fraction of products now make up most of the sales. Hence, products that are not so popular would be given more shelf space.
EBO operations help in brand acceleration, especially with awareness about a company’s premium products, and helps build acceptance. In a bid to focus on premiumisation, Lux and Rupa have also started opening EBOs, and each target more than 100-150 EBOs in the next 1-2 years.
General Trade/MBO, 96%
Online, 3% Modern Trade/LFS, 1%

16 March 2021 Lux Industries – Branded play, merger to augment potential; initiating, with a Buy
Anand Rathi Research 12
Fig 24 – Retail points of Lux’s peers FY16 FY17 FY18 FY19 FY20
Lux
EBOs 9 9 12
LFSs 160 160 160
Distributors 900 950 950 950+
Retailers 450,000 450,000 450,000 450,000 500,000
Dollar (retail reach)
Retail reach 75,000 80,000 95,000 100,000 100,000+
Rupa
Dealers 1,000 1,000 1,000 1,000 1,000
EBOs 6 6 10 10 7
Retail 118,000 118,000 125,000 125,000 125,000
Page
EBOs 270 367 477 626 756
Retail reach 30,000 50,000 50,000 55,000 66,000
Source: Company

16 March 2021 Lux Industries – Branded play, merger to augment potential; initiating, with a Buy
Anand Rathi Research 13
Unlocking synergies via mergers
J.M. Hosiery and Ebell Fashions to merge with Lux Inds.
In 2018, Lux approved the amalgamation of the group companies J.M. Hosiery and Ebell Fashions with Lux Industries. J.M. Hosiery owns the men’s brand, GenX; Ebell Fashions owns the women’s brand, Lyra.
Established in the 1980s as a manufacturing company only, despite being in a similar business as Lux Industries, J.M. Hosiery was set up as a separate entity for accounting purposes as was the practice then. As it was the group’s first foray into womens’ wear, Ebell was created in 2013 as a separate entity so as not to burden Lux Industries with the risk associated with a new category. Now, that both these have a strong hold in their categories, the Board approved their merger with Lux Industries.
Given that these companies operate in a similar line of business as Lux, the proposed merger is synergistic and expected to help in market-share gains. The consideration is in form of issue of shares and does not involve any cash transaction. The post-amalgamation business model will extend the company’s products to include the value-added women’s range and casual wear.
Our assessment indicates that the integration is expected to be completed in CY21, after receiving NCLT approval.
Scheme of merger benefits Lux’s minority shareholders
Ebell Fashions Pvt. Ltd.
1,142 shares of Lux Industries will be issued for every 100 shares of Ebell.
J. M. Hosiery & Company
29 shares of Lux Industries will be issued against every 100 shares of J.M Hosiery.
Based on the proposed merger, Lux Industries would issue 4.8m new equity shares as consideration for the amalgamation. This would result in ~16% equity dilution.
Lux’s men’s outerwear operations to increase via GenX ...
J.M. Hosiery (JMH) manufactures, markets, sells and distributes men’s wear. In 2000, GenX was started as an innovatively designed, affordable innerwear brand to address the youth market. Operations were gradually extended, however, to gym wear in 2005 and casual wear in 2009. Further, in 2019, a wide range of pre-winter products was launched (sweatshirts, hoodies, jackets, track suits) at prices of Rs500 to Rs1,100. Despite being priced higher than competing products (Rs400-700), the off-take was good, given the product positioning and better quality. Ahead, the company plans to introduce five designs a year and invest more on marketing and advertising the brand.
JMH revenue / EBITDA CAGRs, 7% / 11% over FY15-20
The company clocked a ~7% CAGR over FY15-20 led by 4% volume and 3% realisation CAGRs. The gross margin (cost of goods sold) expanded a significant 908bps over FY15-20 to 60.1%. The EBITDA margin expanded 136bps to 7.9%. Excl. the FY20 impact, however, the gross

16 March 2021 Lux Industries – Branded play, merger to augment potential; initiating, with a Buy
Anand Rathi Research 14
margins and EBITDA margins expanded 705bps and 433bps over FY15-FY19 to 51.8% and 10.9% respectively.
The company’s borrowings in FY20 were Rs891m, ie, net debt-to-equity of 0.7x. The working-capital cycle (on sales) lengthened to 209 days in FY20 vs. 173 in FY15, partially due to lower sales in FY20. The average five-year working-capital cycle (FY15-19) was ~196 days.
Ahead, we expect revenue to grow ~10% over FY21-23 driven by higher ASP launches with new designs supported by greater marketing efforts. We expect the margin to expand 216bps to 10.4%, driven by gross margin expansion and operating leverage.
Fig 25 – We expect JMH to clock a ~10% revenue CAGR over FY21-23
Source: Company, Anand Rathi Research
Fig 26 – We expect a 10.4% EBITDA margin for JMH in FY23
Source: Company, Anand Rathi Research
... and women’s wear operations to increase through Lyra
After starting out as a leggings brand in 2012, Lyra has grown into a women’s lifestyle brand, with various products for women and kids such as loungers, palazzos, track pants and T-shirts, along with lingerie. The recent launches include the pocket-leggings range. Leggings is its mainstay product and brings in most of its revenue (~90%). Lyra operates in the mid to premium sub-segments with prices ranging from Rs279 to Rs700 a piece (leggings).
The endorsements (brand ambassadors such as Parineeti Chopra and, more recently, Taapsee Pannu) and better product characteristics have helped transform the brand from a functional leggings product to a lifestyle one.
46.5 46.9 52.1
55.8 61.3
57.2 60.1
63.7 67.5
0
10
20
30
40
50
60
70
80
0
500
1,000
1,500
2,000
2,500
3,000
3,500
4,000
4,500
FY15
FY16
FY17
FY18
FY19
FY20
FY21
e
FY22
e
FY23
e
(m pieces)(Rs m)
Revenue Volume (RHS)
6.5 7.4 7.7
10.8 10.9
7.9 8.2
9.7 10.4
0
2
4
6
8
10
12
0
50
100
150
200
250
300
350
400
450
FY15
FY16
FY17
FY18
FY19
FY20
FY21
e
FY22
e
FY23
e
(%)(Rs m)
EBITDA EBITDA margin (RHS)

16 March 2021 Lux Industries – Branded play, merger to augment potential; initiating, with a Buy
Anand Rathi Research 15
Ebell Fashions revenue/EBITDA CAGRs over FY15-20: 24%/83%
The brand registered a 24% CAGR over FY15-FY20, driven by robust 21% volume and 2% realisation CAGRs. The products have seen strong off-take, driven by endorsements and superior characteristics. The gross margin was 67.9% (41.8% in FY15), driving the EBITDA margin to 21.4% in FY20, vs. 3.1% in FY15.
Ebell Fashions is largely debt-free. The company has a more controlled working-capital cycle of 87 days (FY20).
In CY20, Lyra was struck by the pandemic as women’s wear (especially leggings) was more strongly hit than men’s wear. We expect revenue to grow 22% over FY21-FY23 and margins to expand 726bps to 21.9%. Leggings contribute a significant 90% to revenue and the company aims to gradually increase the share of higher-margin athleisure and lingerie in the revenue pie, thus reducing the contribution of leggings.
Fig 27– We expect Ebell to clock a 22% revenue CAGR over FY21-23
Source: Company, Anand Rathi Research
Fig28 – We expect a 21.9% EBITDA margin for Ebell’s in FY23
Source: Company, Anand Rathi Research
Hence, merger to widen Lux’s products, boost earnings
With the two companies being profitable and the entitlement ratio being in favour of Lux’s minority shareholders, the amalgamation is expected to be EPS accretive. The proposed amalgamation is expected to have synergies, given that the companies operate in similar business lines. The integration will fill gaps in Lux’s range through newer categories such as women’s wear (lingerie, outerwear) and men’s premium outerwear, further bolstering the growth potential ahead. After the proposed merger, the combined
5.9
10.3 10.6 10.8
14.1
15.6
12.5
16.0 17.0
0
2
4
6
8
10
12
14
16
18
0
500
1,000
1,500
2,000
2,500
3,000
3,500
FY15
FY16
FY17
FY18
FY19
FY20
FY21
e
FY22
e
FY23
e
(m pieces)(Rs m)
Revenue Volume (RHS)
3.1
9.7
16.4 17.6 18.3
21.4
14.6
21.2 21.9
0
5
10
15
20
25
0
100
200
300
400
500
600
700
800
FY15
FY16
FY17
FY18
FY19
FY20
FY21
e
FY22
e
FY23
e(%)(Rs m)
EBITDA EBITDA margin (RHS)

16 March 2021 Lux Industries – Branded play, merger to augment potential; initiating, with a Buy
Anand Rathi Research 16
entity will have a broader product range with a higher proportion of value-added products. The amalgamation will also lead to a singular brand image being formed, resulting in greater efficiency from marketing expenditure.
At the group level, the company was net cash at end-Dec’20, aided by the release of cash from working capital and greater profitability. J.M., at 209 days, has a slightly longer working-capital cycle than Lux’s 149 days. Lyra, at 87 days, has a more controlled cycle, leading to a similar to Lux’s working-capital cycle for the proposed amalgamated entity.
Lux’s shares outstanding will increase to 30.1m (on adding 4.8m shares) and the post-merger FY20 consolidated EPS would be Rs58.9, 21% higher than Lux’s standalone EPS, based on fewer shares outstanding.
Factoring in the proposed merger, we expect revenue to register an 11% CAGR over FY21-FY23 and the EBITDA margin to expand 18bps to 17.4%. We expect the post-merger EPS to be Rs99.4 vs. Rs85.8 (pre merger) for FY23, thereby raising the potential.
Fig 29 – We expect post-merger EPS of Rs99.4 in FY23 (merged entity financials) FY15 FY16 FY17 FY18 FY19 FY20 FY21e FY22e FY23e
Revenue (Rs m) 12,193 13,266 13,741 15,670 17,896 17,855 19,247 21,576 23,873
EBITDA (Rs m) 984 1,267 1,661 2,207 2,601 2,683 3,317 3,532 4,158
EBITDA margins (%) 8.1 9.6 12.1 14.1 14.5 15.0 17.2 16.4 17.4
PAT (Rs m) 533 676 850 1,154 1,495 1,773 2,394 2,548 2,993
PAT margins (%) 4.4 5.1 6.2 7.4 8.4 9.9 12.4 11.8 12.5
P/E (x) 97 76 61 45 34 29 22 20 17
EV / EBITDA (x) 56 44 33 25 21 20 16 14 12
EV / Sales (x) 4 4 4 4 3 3 3 2 2
P/B (x) 20 19 15 11 9 7 6 5 4
RoE (%) 21 26 27 28 28 26 29 25 25
RoCE (%) - after tax 11 12 13 16 18 20 23 23 21
RoIC (%) 9 10 11 12 14 15 19 19 20
Net debt / equity (x) 1 1 1 1 0 0 0 (0) (0)
Receivables (days) 101 99 113 131 111 93 82 85 82
Inventory (days) 89 85 94 103 82 102 98 92 89
Payables (days) 55 48 54 65 56 45 50 48 46
Source: Anand Rathi Research

16 March 2021 Lux Industries – Branded play, merger to augment potential; initiating, with a Buy
Anand Rathi Research 17
Financials
~10% revenue CAGR over FY21-23
We model a ~10% revenue CAGR over FY21-23 and expect Lux Industries’ pre-merger revenue to reach Rs16.4bn by end-FY23. We expect overall volume and realisation CAGRs over FY21-23 of respectively ~8% and ~3%, driven by the wide product range, innovative launches and relentless brand investments. We expect 11%, 19% and 8% revenue CAGRs over FY21-23 in the mid-premium, premium (excl. exports) and economy segments respectively.
Lux has achieved a 6% revenue CAGR over FY15-20 with volume and realisation CAGRs of respectively 2% and 4%. The CAGR would have been better if not for the Covid-19 impact in Q4 FY20 (as revenue grew 12% y/y in 9M FY20. For 9M FY21 revenue grew 11% despite the lockdown in H1 FY21. The mid-premium category has grown the fastest, a 9% CAGR over FY15-20, with the premium and economy categories growing 5% and 4% respectively.
Fig 30 – We expect a 10% revenue CAGR over FY21-FY23
Source Company, Anand Rathi Research
Fig 31 – We expect an ~8% volume CAGR over FY21-FY23
Source: Company, AnandRathi Research
4.4 3.5
1.8
12.5 12.0
(0.1)
12.7
8.7
11.3
-2
0
2
4
6
8
10
12
14
16
0
2,000
4,000
6,000
8,000
10,000
12,000
14,000
16,000
18,000
FY15
FY16
FY17
FY18
FY19
FY20
FY21
e
FY22
e
FY23
e
(%)(Rs m)
Revenue Growth (RHS)
166 163 165
192 200 192 200
214 232
0
50
100
150
200
250
FY15
FY16
FY17
FY18
FY19
FY20
FY21
e
FY22
e
FY23
e
(m pieces)
Volume

16 March 2021 Lux Industries – Branded play, merger to augment potential; initiating, with a Buy
Anand Rathi Research 18
Fig 32 – We expect a ~3% realisation CAGR over FY21-FY23
Source: Company, Anand Rathi Research
Impact of Covid-19; FY21, an aberration
Q4 FY20 sales were down ~25% y/y as the bulk of sales (in Mar) were severely curbed and spilled over to Q1 FY21.
Lux then saw strong traction in all its categories and reported 11% growth for 9M FY21. The Covid-19 pandemic hurt unorganized manufacturers, who had already been faced with a cash crunch due to the GST and de-monetization. The lack of brand pull and supply-side constraints struck many small-time players, allowing Lux to gain some market share, especially in tier-2 and -3 markets. Due to curtailed expenses and greater revenue, we expect the EBITDA margin to expand ~450bps y/y to 19.9% in FY21. Operating leverage and lower expenses led to a 375bp y/y expansion in the EBITDA margin to 19% for 9M FY21.
FY21 advertising expenditure was reduced to 4-5% of sales (7-8% in the past). Ahead, though, the company will continue investing in brands in line with previous levels.
Hence, FY21 saw significant growth in its revenue and profitability. We expect them to continue their robust trajectory ahead. However FY21, being an anomaly, will not be a fair comparison for the years ahead.
~5% EBITDA/PAT CAGRs over FY21-23
Over FY15-20 margins have expanded 650bps to 15.4%, mainly driven by the 572bp gross-margin expansion (incl. sub-contracting expenses).
We expect an 18.3% EBITDA margin in FY23 (down 165bps from FY21-FY23) as growth in FY21 has been an anomaly, leading to the highest margins (9M FY21 EBITDA margin: 19%).
However, over FY20-23, we expect the EBITDA margin to expand ~283bps, driven by the gross margin expanding ~206bps over FY20-23 to ~35.5% (incl. sub-contracting expenses). We believe the growing premiumisation will help sustain margins ahead.
Over FY20-23 we expect revenue of the premium (excl. exports) and mid-premium categories to grow 13% and 11.4% respectively, and outpace the economy category’s 10% revenue growth. Hence, we expect the proportion of revenue of the premium category (excl. exports) to rise from 6.9% in FY20 to 7.5% in FY23, driven by launches, growth in points of sales and the company’s greater focus. The percentage of revenue of the premium category would have been higher if not for the slowdown in its
54.6 57.7 58.2 56.2
60.4 62.7 67.9 69.1 71.0
0
10
20
30
40
50
60
70
80
FY15
FY16
FY17
FY18
FY19
FY20
FY21
e
FY22
e
FY23
e
(Rs/piece)
Realization

16 March 2021 Lux Industries – Branded play, merger to augment potential; initiating, with a Buy
Anand Rathi Research 19
growth in FY21 due to Covid-19. The proportion of revenue of the mid-premium category is expected to grow to ~49.2% in FY23 (from 47.7% in FY20) while the share of revenue of the economy category is expected to shrink to 33.9% (from 34.6% in FY20).
Fig 33 – We expect the EBITDA margins to reach 18.3% in FY23
Source: Company, Anand Rathi Research
Fig 34 – Percent of revenue, category-wise (FY15 to FY23)
Source: Company, Anand Rathi Research
We expect a ~5% PAT CAGR over FY21-FY23, driven by healthy revenue growth and an improving margin profile. The PAT CAGR appears lower due to greater profitability in 9M FY21.
Fig 35 – ~5% PAT growth expected over FY21-23
Source: Company, Anand Rathi Research
8.9 10.0
12.5 14.3 14.7
15.4
19.9
17.1 18.3
0
5
10
15
20
25
0
500
1,000
1,500
2,000
2,500
3,000
3,500
FY15
FY16
FY17
FY18
FY19
FY20
FY21
e
FY22
e
FY23
e
(%)(Rs m)
EBITDA EBITDA margin (RHS)
39% 41% 34% 36% 37% 35% 36% 35% 34%
42% 40% 49% 48% 45% 48% 49% 49% 49%
19% 20% 16% 15% 17% 18% 15% 16% 17%
0%
20%
40%
60%
80%
100%
120%
FY15
FY16
FY17
FY18
FY19
FY20
FY21
e
FY22
e
FY23
eEconomy Mid premium Premium
5.0 5.5 6.2
7.2 8.2
10.2
14.5
12.4 13.2
0
2
4
6
8
10
12
14
16
0
500
1,000
1,500
2,000
2,500
FY15
FY16
FY17
FY18
FY19
FY20
FY21
e
FY22
e
FY23
e
(%)(Rs m)
PAT PAT margin (RHS)

16 March 2021 Lux Industries – Branded play, merger to augment potential; initiating, with a Buy
Anand Rathi Research 20
Return ratios to improve
With a healthy EBITDA margin expansion and PAT growth, we expect return ratios to remain steady. Margins and profitability have been at peaks in FY21; hence we expect a 29.5% RoCE and a 34.9% RoE. Post that, we expect a 25.5% RoCE in FY23 (vs. 21.1% in FY20) and a stable, ~27%, RoE.
Fig 36 – Improving return ratios
Source: Company, Anand Rathi Research
Efficient working capital, healthy cash flows
In four of the last five years (exception: FY18), Lux has generated positive operating cash-flows. With improving working capital and increasing profitability, we expect its OCF and FCF to be positive at respectively Rs1.8bn and Rs1.3bn in FY23.
Fig 37 – Higher OCF and FCF generation
Source: Company, Anand Rathi Research
The cash-conversion cycle (on sales) has improved from a peak of 169 days in FY18 to 149 in FY20 (on lower, Covid’19-hit Q4 FY20 sales). Receivables days (on sales) have sharply shortened, from 132 in FY18 to 94 in FY20 on the implementation of a debtor collection policy. The company introduced a 120-day credit period for debtors, which was then cut to ~90 days. It plans to reduce this further to ~80 days.
32.4
27.4 27.6 27.6 27.1 27.0
34.9
26.4 26.5
14.0 12.5
14.6 15.7 17.5
21.1
29.5
24.7 25.5
0
5
10
15
20
25
30
35
40
FY15
FY16
FY17
FY18
FY19
FY20
FY21
e
FY22
e
FY23
e
ROE ROCE
(190
)
811
205
(23)
1,89
9
961
1,33
5
1,84
7
(531
)
573
(4)
(197
)
1,77
5
890 1,
085 1,
347
(1,000)
(500)
-
500
1,000
1,500
2,000
FY15
FY16
FY17
FY18
FY19
FY20
FY21
e
FY22
e
FY23
e
(Rs m)
OCF FCF

16 March 2021 Lux Industries – Branded play, merger to augment potential; initiating, with a Buy
Anand Rathi Research 21
Fig 38 – Improving working-capital cycle
Source: Company, Anand Rathi Research
With cash being released from working capital and with greater profitability, the company turned net cash in Dec’20. Even at the group level (incl. J.M Hosiery and Ebell Fashions), the company is net cash. With all debt being repaid, its cash reserves will be utilised toward expansion (capex) and dividends. The company introduced a dividend policy of a 25% payout in FY20 subject to 1) its need for growth capital and 2) positive cash-flow and other such parameters. Its dividend payout over FY16-19 was 7-9%.
We expect ~Rs750m capex over FY22-23. Over FY18-20 capex was ~Rs370m (Rs788m over FY15-17). We expect Lux’s capex to pick up pace as it spends on raising its manufacturing capacity. It is now utilising ~100% of capacity to manufacture 200m pieces a year, with the ability to increase short-term capacity.
Fig 39 – Lower debt levels, improving net-debt-to-equity
Source: Company, Anand Rathi Research
134 133
148
169
138 149
122 128 126
0
20
40
60
80
100
120
140
160
180
FY15
FY16
FY17
FY18
FY19
FY20
FY21
e
FY22
e
FY23
e
(days)
Working capital cycle
1.31.4
1.21.0
0.40.3
0.0 -0.1 -0.1
-0.4
-0.2
0.0
0.2
0.4
0.6
0.8
1.0
1.2
1.4
1.6
0
500
1,000
1,500
2,000
2,500
3,000
3,500
FY15
FY16
FY17
FY18
FY19
FY20
FY21
e
FY22
e
FY23
e
(x)(Rs m)
Debt Net debt-to-equity (RHS)

16 March 2021 Lux Industries – Branded play, merger to augment potential; initiating, with a Buy
Anand Rathi Research 22
Peer comparison
Fig 40 – Relative peer valuation M. Cap EV / EBITDA (x) P/E (x)
Rs bn FY21e FY22e FY23e FY21e FY22e FY23e
Titan (consolidated) 1,330 82.6 43.5 35.5 143.4 65.2 53.0
Page 317 60.3 41.8 33.5 93.2 61.5 48.1
Relaxo 207 48.4 39.3 31.9 85.3 67.2 52.3
Bata 191 109.9 24.6 20.7 NA 51.3 42.3
ABFRL 179 61.1 18.0 13.5 NA 168.8 48.2
Lux Industries 43 15.8 16.9 14.0 21.9 23.7 19.9
TCNS Clothing 32 112.7 20.4 14.9 NA 82.7 39.5
Rupa 26 12.6 12.0 - 17.9 17.4 -
Arvind Fashions 18 NA 10.1 7.4 NA NA NA
Dollar Industries 15 11.1 9.0 7.4 16.7 14.2 12.1
Source: Company, Bloomberg
For 9M FY21, Lux, Dollar and Rupa have outpaced Page’s performance. While no data are available to corroborate the reason for this, we believe factors contributing to the better performance for the mid ranged players could be (1) earlier and faster rural recovery where these have greater operations than Page and (2) market-share gains from the unorganized segment, especially tier-2 and -3 markets.
Fig 41 – Peer financials
CAGR FY15-FY20 (%) Gross
Margin % EBITDA
margin % RoCE % RoE % Working capital (days)
Revenue EBITDA PAT FY20 FY20 FY18 FY19 FY20 FY18 FY19 FY20 FY18 FY19 FY20
Titan (consolidated) 12.1 16.5 12.8 28.0 11.7 23.3 23.0 22.3 23.6 24.9 23.4 110 110 125
Page 13.8 10.8 11.9 55.5 18.1 41.2 42.9 40.8 45.9 48.6 43.0 83 96 87
Relaxo 10.2 15.3 17.0 56.9 17.0 19.3 16.1 18.5 23.6 18.8 19.0 59 69 66
Bata # 6.0 31.8 10.9 57.6 27.2 12.9 16.3 19.1 15.0 18.9 17.4 38 36 52
ABFRL 12.5 23.8 NA 51.9 14.0 6.3 8.9 10.0 11.5 25.5 (11.5) 12 14 38
Lux Industries 5.8 18.0 22.1 56.3 15.4 15.7 17.5 21.1 27.6 27.1 27.0 169 138 149
TCNS Clothing 30.7 29.5 21.4 65.0 16.2 26.0 23.9 13.7 27.5 25.0 10.9 98 108 122
Rupa (0.6) (1.4) 4.0 60.0 13.2 17.0 14.7 11.3 19.8 17.2 13.3 162 195 212
Arvind Fashions # 9.6 17.3 NA 44.9 6.0 5.4 6.9 (10.4) 1.4 1.8 -41.9 38 65 72
Dollar Industries 6.0 13.3 24.1 53.7 10.8 16.5 14.7 10.4 23.6 19.2 13.1 174 186 205
Source: Company # CAGR from FY16-FY20
Fig 42 – Innerwear peer financials Net sales (Rs m) Growth % EBITDA (Rs m) Growth % EBITDA margins % Growth % PAT (Rs m) Growth %
9M FY21 9M FY20 Y/Y 9M FY21 9M FY20 Y/Y 9M FY21 9M FY20 Y/Y 9M FY21 9M FY20 Y/Y
Page 19,522 24,042 (18.8) 3,568 4,744 (24.8) 18.3 19.7 (146) 2,250 3,122 (27.9)
Lux 10,207 9,200 11.0 1,943 1,406 38.2 19.0 15.3 375 1,345 947 42.0 Dollar 7,292 7,317 (0.3) 1,070 836 28.0 14.7 11.4 324 660 452 46.1
Rupa 8,268 7,649 8.1 1,665 1,125 48.0 20.1 14.7 543 1,147 753 52.3
Source: Company

16 March 2021 Lux Industries – Branded play, merger to augment potential; initiating, with a Buy
Anand Rathi Research 23
Valuation We initiate coverage on Lux Industries, with a Buy rating and a TP of
Rs2,574 based on 30x FY23e EPS of Rs85.80. At 30x FY23e PE, our target multiple is at a ~50% discount to Page Industries.
With its healthy growth trajectory, we are upbeat on Lux’s long-term growth prospects for its strong brand equity, long-standing operations in innerwear and new launches. Its extension to casual wear and women’s wear via the proposed merger would unlock synergies that would further propel growth.
Fig 43 – Valuation parameters FY18 FY19 FY20 FY21e FY22e FY23e
P/E (x) 55.1 35.2 19.3 21.9 23.7 19.9
EV / EBITDA (x) 30.0 20.5 13.4 15.8 16.9 14.0
EV / Sales (x) 4.3 3.0 2.1 3.2 2.9 2.6
RoE (%) 27.6 27.1 27.0 34.9 26.4 26.5
RoCE (%) 15.7 17.5 21.1 29.5 24.7 25.5
Source: Anand Rathi Research
Fig 44 – One-year-forward P/E
Source: Anand Rathi Research
Risks
Macro-economic slowdown: An economic slowdown could cut consumption, leading to sluggish demand.
Slower growth in its premium range: Slower-than-expected growth in higher-value products.
Rise in raw material prices: Any adverse movement in raw material prices could shave margins.
Mean
+1STD
-1STD
0
5
10
15
20
25
30
35
40
45
Jan-
16M
ar-1
6
Jun-
16
Sep-
16
Dec
-16
Mar
-17
Jun-
17
Sep-
17
Dec
-17
Mar
-18
Jun-
18
Sep-
18
Dec
-18
Mar
-19
May
-19
Aug-
19
Nov
-19
Feb-
20
May
-20
Aug-
20
Nov
-20
Feb-
21

16 March 2021 Lux Industries – Branded play, merger to augment potential; initiating, with a Buy
Anand Rathi Research 24
Company Background, Management
About Lux Initially, in 1957, established as Biswanath Hosiery Mills by the late Girdharilalji Todi, the name was changed in 1995, and Lux Industries came out with an IPO in 2003. The Lux Group (Lux Industries, J.M. Hosiery, Ebell Fashions) is the largest mid-segment hosiery company in the country. It has a ~14% market share in men’s organized innerwear, primarily catering to the economy and mid-premium segments. Its focus on branding and advertising has led to a small hosiery company becoming an innerwear giant. Over time, with the launch of products in different segments, it has transformed itself from merely men’s innerwear to a lifestyle brand.
Fig 45 – Company milestones Year Milestones
2019 Engaged Kartik Aaryan to endorse the Lux Inferno winter-wear brand to attract youth. Launched One8, a brand featuring Virat Kohli, India’s cricket captain; new marketing & distribution channel created
2019 Engaged Taapsee Pannu to endorse Lyra, showcasing the product as a relevant choice for the modern and emotionally independent Indian woman. Introduced a scented vest under Lux Cozi, the first time in India. Launched the Lux Nitro range of T-shirts
2018 Conducted the largest ever distributors’ conference in hosiery attended by more than 900 distributors. Re-launched Lux Classic as Lux Venus Classic to create a much larger impact on consumers
2017 Engaged Amitabh Bachchan for two years to endorse winter-wear brands, Lux Venus and Lux Inferno
2017 Launched a ‘Buy any two products, get one pair of socks free’ scheme, the most successful in India’s hosiery sector
2017 Engaged Varun Dhawan as brand ambassador for Lux Cozi
2012 Launched women’s leggings
2010 Launched a premium innerwear brand, ONN, as a retail-driven product
2005 Launched two products in the thermal category
2001 Launched Lux’s flagship, Lux Cozi, brand
2000 Launched GenX, an innerwear brand
1995 Launched Lux Classic as an economy product
1993 Launched Lux Venus as an economy category brand
Source: Company
Fig 46 – Key management personnel Name Designation Background
Ashok Kumar Todi
Chairman Commerce graduate; four decades’ experience in the hosiery business. Strategic head, formulating policies of growth and expansion; looks after marketing and advertising, incl. network and distribution
Pradip Kumar Todi
Managing Director
Commerce graduate; looks after manufacturing and product development. Has technical knowhow of the hosiery sector; his expertise in developing new patterns, yarn combinations, knitting technologies have helped Lux introduce new and innovative products
Navin Todi
Director - JM Hosiery
Has ~20 years’ experience in the hosiery industry. Under his leadership the company has enhanced its product offerings
Saket Todi
President -Marketing
Post-graduate in brand management; associated with the company since 2014
Udit Todi
President -Strategy
Master of Science in Finance from The London School of Economics and Political Science. Associated with the company since 2014
Saurabh Kumar Bhudolia
Chief Financial Officer
Member, Institute of Chartered Accountants of India. Extensive experience of over 15 years. Prior to Lux, was associated with Future Lifestyle Fashions as CFO. Previous experience includes critical roles with Mondelez International and Sula Vineyards Pvt. Ltd. and, in his early career, with Tata Steel
Source: Company

Appendix Analyst Certification The views expressed in this Research Report accurately reflect the personal views of the analyst(s) about the subject securities or issuers and no part of the compensation of the research analyst(s) was, is, or will be directly or indirectly related to the specific recommendations or views expressed by the research analyst(s) in this report. The research analysts are bound by stringent internal regulations and also legal and statutory requirements of the Securities and Exchange Board of India (hereinafter “SEBI”) and the analysts’ compensation are completely delinked from all the other companies and/or entities of Anand Rathi, and have no bearing whatsoever on any recommendation that they have given in the Research Report.
Anand Rathi Ratings Definitions
Analysts’ ratings and the corresponding expected returns take into account our definitions of Large Caps (>US$1bn) and Mid/Small Caps (<US$1bn) as described in the Ratings Table below:
Ratings Guide (12 months) Buy Hold Sell Large Caps (>US$1bn) >15% 5-15% <5% Mid/Small Caps (<US$1bn) >25% 5-25% <5% Research Disclaimer and Disclosure inter-alia as required under Securities and Exchange Board of India (Research Analysts) Regulations, 2014
Anand Rathi Share and Stock Brokers Ltd. (hereinafter refer as ARSSBL) (Research Entity) is a subsidiary of Anand Rathi Financial Services Ltd. ARSSBL is a corporate trading and clearing member of Bombay Stock Exchange Ltd, National Stock Exchange of India Ltd. (NSEIL), Multi Stock Exchange of India Ltd (MCX-SX) and also depository participant with National Securities Depository Ltd (NSDL) and Central Depository Services Ltd. ARSSBL is engaged in the business of Stock Broking, Depository Participant and Mutual Fund distributor.
The research analysts, strategists, or research associates principally responsible for the preparation of Anand Rathi research have received compensation based upon various factors, including quality of research, investor client feedback, stock picking, competitive factors and firm revenues.
General Disclaimer: This Research Report (hereinafter called “Report”) is meant solely for use by the recipient and is not for circulation. This Report does not constitute a personal recommendation or take into account the particular investment objectives, financial situations, or needs of individual clients. The recommendations, if any, made herein are expression of views and/or opinions and should not be deemed or construed to be neither advice for the purpose of purchase or sale of any security, derivatives or any other security through ARSSBL nor any solicitation or offering of any investment /trading opportunity on behalf of the issuer(s) of the respective security (ies) referred to herein. These information / opinions / views are not meant to serve as a professional investment guide for the readers. No action is solicited based upon the information provided herein. Recipients of this Report should rely on information/data arising out of their own investigations. Readers are advised to seek independent professional advice and arrive at an informed trading/investment decision before executing any trades or making any investments. This Report has been prepared on the basis of publicly available information, internally developed data and other sources believed by ARSSBL to be reliable. ARSSBL or its directors, employees, affiliates or representatives do not assume any responsibility for, or warrant the accuracy, completeness, adequacy and reliability of such information / opinions / views. While due care has been taken to ensure that the disclosures and opinions given are fair and reasonable, none of the directors, employees, affiliates or representatives of ARSSBL shall be liable for any direct, indirect, special, incidental, consequential, punitive or exemplary damages, including lost profits arising in any way whatsoever from the information / opinions / views contained in this Report. The price and value of the investments referred to in this Report and the income from them may go down as well as up, and investors may realize losses on any investments. Past performance is not a guide for future performance. ARSSBL does not provide tax advice to its clients, and all investors are strongly advised to consult with their tax advisers regarding taxation aspects of any potential investment.
Opinions expressed are our current opinions as of the date appearing on this Research only. We do not undertake to advise you as to any change of our views expressed in this Report. Research Report may differ between ARSSBL’s RAs and/ or ARSSBL’s associate companies on account of differences in research methodology, personal judgment and difference in time horizons for which recommendations are made. User should keep this risk in mind and not hold ARSSBL, its employees and associates responsible for any losses, damages of any type whatsoever.

ARSSBL and its associates or employees may; (a) from time to time, have long or short positions in, and buy or sell the investments in/ security of company (ies) mentioned herein or (b) be engaged in any other transaction involving such investments/ securities of company (ies) discussed herein or act as advisor or lender / borrower to such company (ies) these and other activities of ARSSBL and its associates or employees may not be construed as potential conflict of interest with respect to any recommendation and related information and opinions. Without limiting any of the foregoing, in no event shall ARSSBL and its associates or employees or any third party involved in, or related to computing or compiling the information have any liability for any damages of any kind.
Details of Associates of ARSSBL and Brief History of Disciplinary action by regulatory authorities & its associates are available on our website i.e. www.rathionline.com
Disclaimers in respect of jurisdiction: This report is not directed to, or intended for distribution to or use by, any person or entity who is a citizen or resident of or located in any locality, state, country or other jurisdiction where such distribution, publication, availability or use would be contrary to law or regulation or which would subject ARSSBL to any registration or licensing requirement within such jurisdiction(s). No action has been or will be taken by ARSSBL in any jurisdiction (other than India), where any action for such purpose(s) is required. Accordingly, this Report shall not be possessed, circulated and/or distributed in any such country or jurisdiction unless such action is in compliance with all applicable laws and regulations of such country or jurisdiction. ARSSBL requires such recipient to inform himself about and to observe any restrictions at his own expense, without any liability to ARSSBL. Any dispute arising out of this Report shall be subject to the exclusive jurisdiction of the Courts in India.
Statements on ownership and material conflicts of interest, compensation - ARSSBL and Associates
Answers to the Best of the knowledge and belief of ARSSBL/ its Associates/ Research Analyst who is preparing this report
Research analyst or research entity or his associate or his relative has any financial interest in the subject company and the nature of such financial interest. No
ARSSBL/its Associates/ Research Analyst/ his Relative have actual/beneficial ownership of one per cent or more securities of the subject company, at the end of the month immediately preceding the date of publication of the research report?
No
ARSSBL/its Associates/ Research Analyst/ his Relative have actual/beneficial ownership of one per cent or more securities of the subject company No
ARSSBL/its Associates/ Research Analyst/ his Relative have any other material conflict of interest at the time of publication of the research report? No
ARSSBL/its Associates/ Research Analyst/ his Relative have received any compensation from the subject company in the past twelve months No
ARSSBL/its Associates/ Research Analyst/ his Relative have managed or co-managed public offering of securities for the subject company in the past twelve months
No
ARSSBL/its Associates/ Research Analyst/ his Relative have received any compensation for investment banking or merchant banking or brokerage services from the subject company in the past twelve months
No
ARSSBL/its Associates/ Research Analyst/ his Relative have received any compensation for products or services other than investment banking or merchant banking or brokerage services from the subject company in the past twelve months
No
ARSSBL/its Associates/ Research Analyst/ his Relative have received any compensation or other benefits from the subject company or third party in connection with the research report
No
ARSSBL/its Associates/ Research Analyst/ his Relative have served as an officer, director or employee of the subject company. No
Other Disclosures pertaining to distribution of research in the United States of America
This research report is a product of ARSSBL, which is the employer of the research analyst(s) who has prepared the research report. The research analyst(s) preparing the research report is/are resident outside the United States (U.S.) and are not associated persons of any U.S. regulated broker-dealer and therefore the analyst(s) is/are not subject to supervision by a U.S. broker-dealer, and is/are not required to satisfy the regulatory licensing requirements of FINRA or required to otherwise comply with U.S. rules or regulations regarding, among other things, communications with a subject company, public appearances and trading securities held by a research analyst account.
This report is intended for distribution by ARSSBL only to "Major Institutional Investors" as defined by Rule 15a-6(b)(4) of the U.S. Securities and Exchange Act, 1934 (the Exchange Act) and interpretations thereof by U.S. Securities and Exchange Commission (SEC) in reliance on Rule 15a 6(a)(2). If the recipient of this report is not a Major Institutional Investor as specified above, then it should not act upon this report and return the same to the sender. Further, this report may not be copied, duplicated and/or transmitted onward to any U.S. person, which is not the Major Institutional Investor.
In reliance on the exemption from registration provided by Rule 15a-6 of the Exchange Act and interpretations thereof by the SEC in order to conduct certain business withMajor Institutional Investors, ARSSBL has entered into an agreement with a U.S. registered broker-dealer, Cabrera Capital Markets. ("Cabrera"). Transactions in securities discussed in this research report should be effected through Cabrera or another U.S. registered broker dealer.
1. ARSSBL or its Affiliates may or may not have been beneficial owners of the securities mentioned in this report.
2. ARSSBL or its affiliates may have or not managed or co-managed a public offering of the securities mentioned in the report in the past 12 months.
3. ARSSBL or its affiliates may have or not received compensation for investment banking services from the issuer of these securities in the past 12 months and do not expect to receive compensation for investment banking services from the issuer of these securities within the next three months.
4. However, one or more of ARSSBL or its Affiliates may, from time to time, have a long or short position in any of the securities mentioned herein and may buy or sell those securities or options thereon, either on their own account or on behalf of their clients.
5. As of the publication of this report, ARSSBL does not make a market in the subject securities.
6. ARSSBL or its Affiliates may or may not, to the extent permitted by law, act upon or use the above material or the conclusions stated above, or the research or analysis on which they are based before the material is published to recipients and from time to time, provide investment banking, investment management or other services for orsolicit to seek to obtain investment banking, or other securities business from, any entity referred to in this report.
© 2021. This report is strictly confidential and is being furnished to you solely for your information. All material presented in this report, unless specifically indicated otherwise, is under copyright to ARSSBL. None of the material, its content, or any copy of such material or content, may be altered in any way, transmitted, copied or reproduced (in whole or in part) or redistributed in any form to any other party, without the prior express written permission of ARSSBL. All trademarks, service marks and logos used in this report are trademarks or service marks or registered trademarks or service marks of ARSSBL or its affiliates, unless specifically mentioned otherwise.
Additional information on recommended securities/instruments is available on request.
ARSSBL registered address: Express Zone, A Wing, 9th Floor, Western Express Highway, Diagonally Opposite Oberoi Mall, Malad (E), Mumbai – 400097. Tel No: +91 22 6281 7000 | Fax No: +91 22 4001 3770 | CIN: U67120MH1991PLC064106.