AR_UBS (Lux) Equity SICAV_EN.indd - Euronext Funds360
246
ab Asset management UBS Funds Annual Report 2017/2018 Investment Company under Luxembourg Law (SICAV) R.C.S. Luxembourg N° B 56 386 Audited annual report as of 31 May 2018 UBS (Lux) Equity SICAV UBS (Lux) Equity SICAV – All China (USD) UBS (Lux) Equity SICAV – Asian Smaller Companies (USD) UBS (Lux) Equity SICAV – Brazil (USD) UBS (Lux) Equity SICAV – Emerging Markets High Dividend (USD) UBS (Lux) Equity SICAV – Emerging Markets Sustainable (USD) UBS (Lux) Equity SICAV – Euro Countries Income (EUR) UBS (Lux) Equity SICAV – European High Dividend (EUR) UBS (Lux) Equity SICAV – European Opportunity Unconstrained (EUR) UBS (Lux) Equity SICAV – German High Dividend (EUR) UBS (Lux) Equity SICAV – Global Emerging Markets Opportunity (USD) UBS (Lux) Equity SICAV – Global High Dividend (USD) UBS (Lux) Equity SICAV – Global Impact (USD) UBS (Lux) Equity SICAV – Global Income (USD) UBS (Lux) Equity SICAV – Global Opportunity Unconstrained (USD) UBS (Lux) Equity SICAV – Global Quantitative (USD) UBS (Lux) Equity SICAV – Long Term Themes (USD) UBS (Lux) Equity SICAV – Russia (USD) UBS (Lux) Equity SICAV – Small Caps Europe (EUR) UBS (Lux) Equity SICAV – Solid Consumer Brands (USD) UBS (Lux) Equity SICAV – Swiss Opportunity (CHF) UBS (Lux) Equity SICAV – US Income (USD) UBS (Lux) Equity SICAV – US Opportunity (USD) UBS (Lux) Equity SICAV – US Systematic Defensive (USD) UBS (Lux) Equity SICAV – US Total Yield (USD) UBS (Lux) Equity SICAV – USA Enhanced (USD) UBS (Lux) Equity SICAV – USA Enhanced Sustainable (USD) UBS (Lux) Equity SICAV – USA Growth (USD)
-
Upload
khangminh22 -
Category
Documents
-
view
0 -
download
0
Transcript of AR_UBS (Lux) Equity SICAV_EN.indd - Euronext Funds360
ab Asset managementUBS Funds
Annual Report 2017/2018
Investment Company under Luxembourg Law (SICAV)
R.C.S. Luxembourg N° B 56 386
Audited annual report as of 31 May 2018
UBS (Lux) Equity SICAVUBS (Lux) Equity SICAV – All China (USD)UBS (Lux) Equity SICAV – Asian Smaller Companies (USD)UBS (Lux) Equity SICAV – Brazil (USD)UBS (Lux) Equity SICAV – Emerging Markets High Dividend (USD)UBS (Lux) Equity SICAV – Emerging Markets Sustainable (USD)UBS (Lux) Equity SICAV – Euro Countries Income (EUR)UBS (Lux) Equity SICAV – European High Dividend (EUR)UBS (Lux) Equity SICAV – European Opportunity Unconstrained (EUR)UBS (Lux) Equity SICAV – German High Dividend (EUR)UBS (Lux) Equity SICAV – Global Emerging Markets Opportunity (USD)UBS (Lux) Equity SICAV – Global High Dividend (USD)UBS (Lux) Equity SICAV – Global Impact (USD)UBS (Lux) Equity SICAV – Global Income (USD)UBS (Lux) Equity SICAV – Global Opportunity Unconstrained (USD)UBS (Lux) Equity SICAV – Global Quantitative (USD)UBS (Lux) Equity SICAV – Long Term Themes (USD)UBS (Lux) Equity SICAV – Russia (USD)UBS (Lux) Equity SICAV – Small Caps Europe (EUR)UBS (Lux) Equity SICAV – Solid Consumer Brands (USD)UBS (Lux) Equity SICAV – Swiss Opportunity (CHF)UBS (Lux) Equity SICAV – US Income (USD)UBS (Lux) Equity SICAV – US Opportunity (USD)UBS (Lux) Equity SICAV – US Systematic Defensive (USD)UBS (Lux) Equity SICAV – US Total Yield (USD)UBS (Lux) Equity SICAV – USA Enhanced (USD)UBS (Lux) Equity SICAV – USA Enhanced Sustainable (USD)UBS (Lux) Equity SICAV – USA Growth (USD)


1
Audited annual report as of 31 May 2018
Table of contents Page ISIN
Management and Administration 6Features of the Company 8Audit report 14
UBS (Lux) Equity SICAV 17UBS (Lux) Equity SICAV – All China (USD) 19 seeding I-A1-acc LU1807303117 P-acc LU1807302812UBS (Lux) Equity SICAV – Asian Smaller Companies (USD) 23 F-acc LU1306439909 K-1-acc LU1036032008 P-acc LU0746413003 Q-acc LU1240781994UBS (Lux) Equity SICAV – Brazil (USD) 29 P-acc LU0286682959 Q-acc LU0399009397UBS (Lux) Equity SICAV – Emerging Markets High Dividend (USD) 33 F-acc LU1081984863 I-B-acc LU1081985753 I-X-dist LU0883523192 (EUR hedged) N-8%-mdist LU1121266271 P-acc LU0625543631 (CHF hedged) P-acc LU1081987023 (EUR hedged) P-acc LU1081987536 (CHF hedged) P-dist LU0669577131 P-mdist LU0625543805 (HKD) P-mdist LU0625544282 Q-acc LU0847991816 (CHF hedged) Q-acc LU1240782026 (EUR hedged) Q-acc LU1081988344 (CHF hedged) Q-dist LU1240782372 U-X-acc LU0630196821UBS (Lux) Equity SICAV – Emerging Markets Sustainable (USD) 40 P-acc LU0346595837 (EUR) P-acc LU0398999499 Q-acc LU0399016178 (EUR) Q-acc LU0979885364UBS (Lux) Equity SICAV – Euro Countries Income (EUR) 46 I-A1-acc LU1432555495 K-1-acc LU1179468605 K-X-acc LU1620846581 (USD hedged) P-8%-mdist LU1216467149 P-acc LU1121265208 (CHF hedged) P-acc LU1121265463 (USD hedged) P-acc LU1121265620 P-dist LU1121265380 (CHF hedged) P-dist LU1121265547 (USD hedged) P-dist LU1121265893 (USD hedged) Q-8%-mdist LU1240783693 Q-acc LU1240784071 (CHF hedged) Q-acc LU1240783347 (USD hedged) Q-acc LU1240783776 Q-dist LU1240784154 (CHF hedged) Q-dist LU1240783420 (USD hedged) Q-dist LU1240783859 U-X-acc LU1230950906 U-X-UKdist-mdist LU1480127684UBS (Lux) Equity SICAV – European High Dividend (EUR) 56 N-8%-mdist LU1121265976 P-acc LU0566497433 (CHF) P-acc LU0571745792 (USD) P-acc LU0571745446 P-dist LU0566497516 (CHF hedged) P-dist LU0826316233 (GBP) P-dist LU0571744555 P-mdist LU1249369007 Q-acc LU0847997854 (CHF) Q-acc LU1240784311 (USD) Q-acc LU1240784584 Q-dist LU1240784741 (CHF hedged) Q-dist LU1240784238 (GBP) Q-dist LU1240784402 U-X-acc LU0566497789

2
UBS (Lux) Equity SICAV – European Opportunity Unconstrained (EUR) 64 I-A1-acc LU0549584471 (USD hedged) I-A1-acc LU1195740300 I-A3-acc LU1246874546 I-B-acc LU0971305403 (USD hedged) I-B-acc LU0979669156 I-X-acc LU1001700605 (CHF hedged) I-X-acc LU1392920226 K-1-acc LU0999556193 (HKD hedged) K-1-acc LU1158420056 (RMB hedged) K-1-acc LU1097914409 (USD hedged) K-1-acc LU1032634336 N-acc LU0815274740 P-acc LU0723564463 (AUD hedged) P-acc LU1017644862 (CAD hedged) P-acc LU1209147823 (CHF hedged) P-acc LU1031038273 (GBP hedged) P-acc LU1185964712 (HKD hedged) P-acc LU1209147237 (RMB hedged) P-acc LU1017648186 (SEK) P-acc LU1036032347 (SGD hedged) P-acc LU0996708193 (USD hedged) P-acc LU0975313742 P-dist LU1392919301 Q-acc LU0848002365 (AUD hedged) Q-acc LU1240784824 (CHF hedged) Q-acc LU1240785128 (GBP hedged) Q-acc LU1059394855 (SEK) Q-acc LU1240785557 (USD hedged) Q-acc LU1059394939 U-X-acc LU0549584711UBS (Lux) Equity SICAV – German High Dividend (EUR) 75 K-1-acc LU0783236630 P-acc LU0775052292 (CHF hedged) P-acc LU0775053266 P-dist LU0775052615 (CHF hedged) P-dist LU0797316337 Q-acc LU1240785987 (CHF hedged) Q-acc LU1240785714 Q-dist LU1240786019 (CHF hedged) Q-dist LU1240785805UBS (Lux) Equity SICAV – Global Emerging Markets Opportunity (USD) 80 I-A1-acc LU0399011708 I-A3-acc LU0399012185 (EUR) I-A3-dist LU1662453890 (EUR) I-B-acc LU1776283878 I-X-acc LU0399012771 P-4%-mdist LU1769817096 (HKD) P-4%-mdist LU1769817179 P-acc LU0328353924 (EUR hedged) P-acc LU1676115329 (SGD hedged) P-acc LU1717043241 Q-acc LU0399011534 (EUR hedged) Q-acc LU1691467994 Q-dist LU0399011450 U-X-acc LU0399012938UBS (Lux) Equity SICAV – Global High Dividend (USD) 87 F-acc LU0946079901 (EUR hedged) F-acc LU0964818024 I-A1-acc LU0804734431 (CHF hedged) I-A1-acc LU0858845737 (EUR hedged) I-A1-acc LU0815048904 I-X-acc LU0745893759 (CHF hedged) I-X-acc LU0678866319 I-X-dist LU0883523606 K-1-acc LU0803748523 (EUR hedged) N-8%-mdist LU1121266198 (EUR hedged) N-dist LU0815274823 P-acc LU0611173427 (EUR hedged) P-acc LU0611173930 (CHF hedged) P-dist LU0626901861 (EUR hedged) P-dist LU1593401398 P-mdist LU1107510957 (AUD hedged) P-mdist LU1115419902 (SGD hedged) P-mdist LU1145061096 Q-acc LU0847993192 (EUR hedged) Q-acc LU0848007240 (CHF hedged) Q-dist LU1240786365 Q-mdist LU1240786951

3
UBS (Lux) Equity SICAV – Global Impact (USD) 97 P-acc LU1679116845 (EUR hedged) P-acc LU1679117579 Q-acc LU1679117140 (EUR hedged) Q-acc LU1679117819 (EUR hedged) Q-dist LU1815428377UBS (Lux) Equity SICAV – Global Income (USD) 103 F-acc LU1289529007 (CHF hedged) F-acc LU1289529189 (EUR hedged) F-acc LU1308715694 I-A1-8%-mdist LU1511577857 I-A1-acc LU1468494312 I-A2-8%-mdist LU1479460237 I-A2-acc LU1045846083 (EUR) I-A2-acc LU1163232496 (EUR hedged) I-A2-acc LU1163232223 I-B-acc LU1131112242 (GBP hedged) I-B-UKdist-mdist LU1059394772 I-X-acc LU1065469329 (EUR hedged) I-X-acc LU1554280666 I-X-UKdist LU1336832164 (EUR hedged) K-1-acc LU1032914704 K-1-dist LU1032914613 (EUR hedged) K-1-dist LU1032914886 K-X-acc LU1525460769 P-8%-mdist LU1076699146 P-acc LU1013383713 (CHF hedged) P-acc LU1013384109 (EUR hedged) P-acc LU1013383986 P-dist LU1013383804 (CHF hedged) P-dist LU1013384281 (EUR hedged) P-dist LU1013384018 (SGD hedged) P-mdist LU1145057144 Q-8%-mdist LU1240787413 Q-acc LU1043174561 (CHF hedged) Q-acc LU1240787090 (EUR hedged) Q-acc LU1086761837 Q-dist LU1240787504 (CHF hedged) Q-dist LU1240787173 (EUR hedged) Q-dist LU1240787256 U-X-acc LU1235143515 U-X-UKdist-mdist LU1435357899UBS (Lux) Equity SICAV – Global Opportunity Unconstrained (USD) 116 I-A1-acc LU1390335310 I-B-acc LU1323608122 (EUR) I-B-acc LU1776281823 K-1-acc LU1314327989 P-4%-mdist LU1278831067 (EUR hedged) P-4%-mdist LU1278831570 P-acc LU1278830929 (HKD) P-acc LU1278831737 (CHF hedged) P-acc LU1278831224 (EUR hedged) P-acc LU1278831497 (SGD hedged) P-acc LU1278831653 Q-acc LU1294558454 (CHF hedged) Q-acc LU1294558611 (EUR hedged) Q-acc LU1294558538 U-X-acc LU1278831141UBS (Lux) Equity SICAV – Global Quantitative (USD) 125 I-B-acc LU1289529346 I-X-acc LU1398086220 U-X-acc LU1289529262UBS (Lux) Equity SICAV – Long Term Themes (USD) 133 (CHF portfolio hedged) F-acc LU1520731438 (EUR portfolio hedged) F-acc LU1520734028 (USD portfolio hedged) F-acc LU1520716801 (CHF portfolio hedged) F-dist LU1722559736 (USD portfolio hedged) F-dist LU1626163403 I-A1-acc LU1599408454 K-1-acc LU1354389790 (CHF hedged) K-1-acc LU1346285536 (EUR hedged) K-1-acc LU1354389956 (EUR hedged) N-acc LU1577364778 P-acc LU1323610961 (CHF hedged) P-acc LU1323611183 (EUR hedged) P-acc LU1323611001 (EUR hedged) P-qdist LU1669356526 Q-acc LU1323611266 (CHF hedged) Q-acc LU1323611423 (EUR hedged) Q-acc LU1323611340 (GBP hedged) Q-acc LU1340049755
4
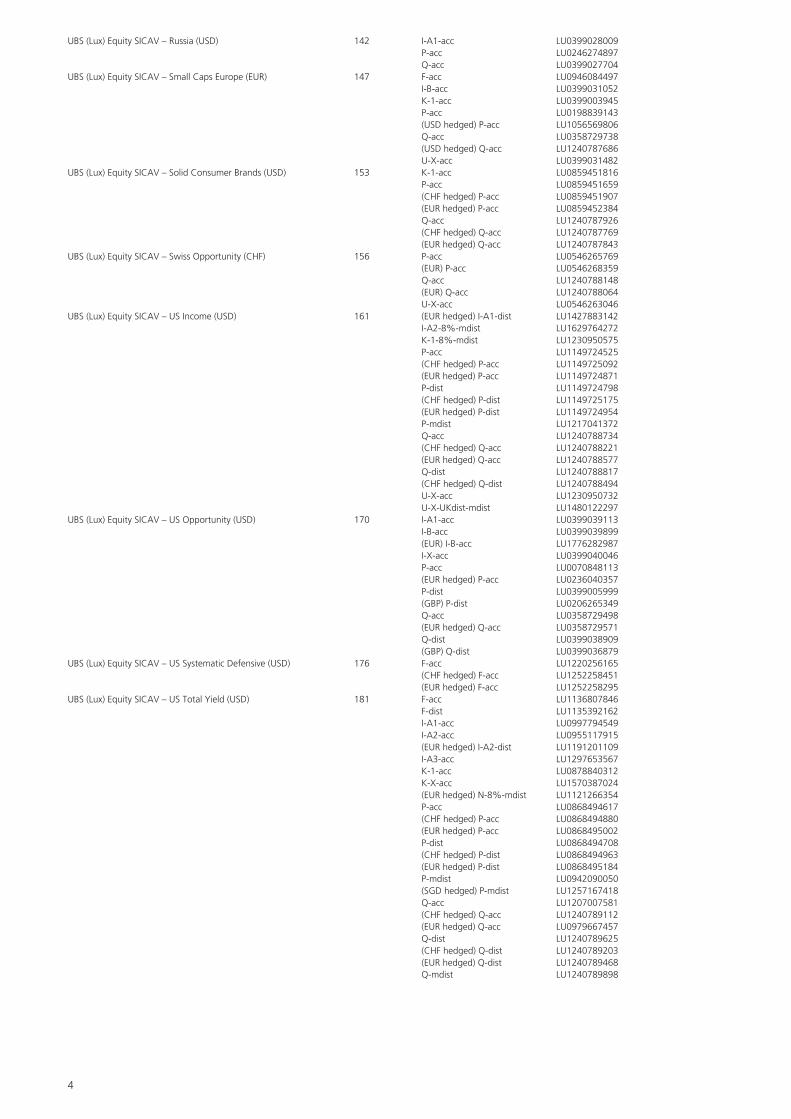
UBS (Lux) Equity SICAV – Russia (USD) 142 I-A1-acc LU0399028009 P-acc LU0246274897 Q-acc LU0399027704UBS (Lux) Equity SICAV – Small Caps Europe (EUR) 147 F-acc LU0946084497 I-B-acc LU0399031052 K-1-acc LU0399003945 P-acc LU0198839143 (USD hedged) P-acc LU1056569806 Q-acc LU0358729738 (USD hedged) Q-acc LU1240787686 U-X-acc LU0399031482UBS (Lux) Equity SICAV – Solid Consumer Brands (USD) 153 K-1-acc LU0859451816 P-acc LU0859451659 (CHF hedged) P-acc LU0859451907 (EUR hedged) P-acc LU0859452384 Q-acc LU1240787926 (CHF hedged) Q-acc LU1240787769 (EUR hedged) Q-acc LU1240787843UBS (Lux) Equity SICAV – Swiss Opportunity (CHF) 156 P-acc LU0546265769 (EUR) P-acc LU0546268359 Q-acc LU1240788148 (EUR) Q-acc LU1240788064 U-X-acc LU0546263046UBS (Lux) Equity SICAV – US Income (USD) 161 (EUR hedged) I-A1-dist LU1427883142 I-A2-8%-mdist LU1629764272 K-1-8%-mdist LU1230950575 P-acc LU1149724525 (CHF hedged) P-acc LU1149725092 (EUR hedged) P-acc LU1149724871 P-dist LU1149724798 (CHF hedged) P-dist LU1149725175 (EUR hedged) P-dist LU1149724954 P-mdist LU1217041372 Q-acc LU1240788734 (CHF hedged) Q-acc LU1240788221 (EUR hedged) Q-acc LU1240788577 Q-dist LU1240788817 (CHF hedged) Q-dist LU1240788494 U-X-acc LU1230950732 U-X-UKdist-mdist LU1480122297UBS (Lux) Equity SICAV – US Opportunity (USD) 170 I-A1-acc LU0399039113 I-B-acc LU0399039899 (EUR) I-B-acc LU1776282987 I-X-acc LU0399040046 P-acc LU0070848113 (EUR hedged) P-acc LU0236040357 P-dist LU0399005999 (GBP) P-dist LU0206265349 Q-acc LU0358729498 (EUR hedged) Q-acc LU0358729571 Q-dist LU0399038909 (GBP) Q-dist LU0399036879UBS (Lux) Equity SICAV – US Systematic Defensive (USD) 176 F-acc LU1220256165 (CHF hedged) F-acc LU1252258451 (EUR hedged) F-acc LU1252258295UBS (Lux) Equity SICAV – US Total Yield (USD) 181 F-acc LU1136807846 F-dist LU1135392162 I-A1-acc LU0997794549 I-A2-acc LU0955117915 (EUR hedged) I-A2-dist LU1191201109 I-A3-acc LU1297653567 K-1-acc LU0878840312 K-X-acc LU1570387024 (EUR hedged) N-8%-mdist LU1121266354 P-acc LU0868494617 (CHF hedged) P-acc LU0868494880 (EUR hedged) P-acc LU0868495002 P-dist LU0868494708 (CHF hedged) P-dist LU0868494963 (EUR hedged) P-dist LU0868495184 P-mdist LU0942090050 (SGD hedged) P-mdist LU1257167418 Q-acc LU1207007581 (CHF hedged) Q-acc LU1240789112 (EUR hedged) Q-acc LU0979667457 Q-dist LU1240789625 (CHF hedged) Q-dist LU1240789203 (EUR hedged) Q-dist LU1240789468 Q-mdist LU1240789898
5
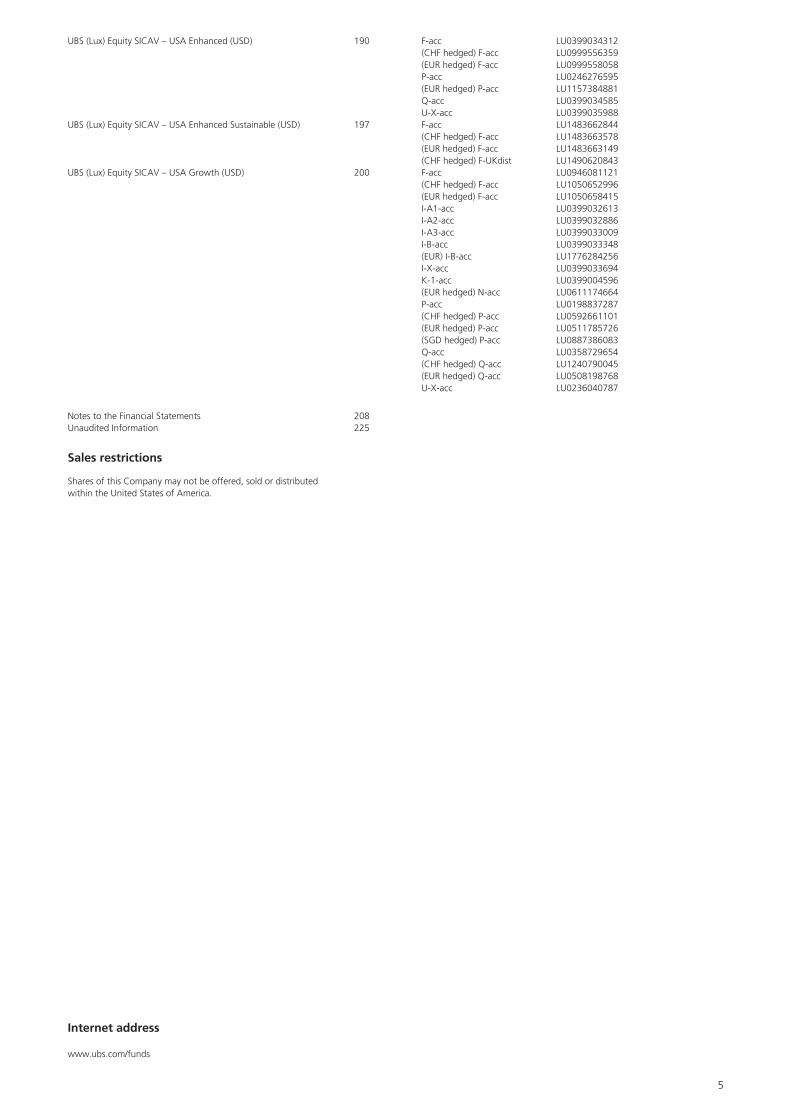
Internet address
www.ubs.com/funds
UBS (Lux) Equity SICAV – USA Enhanced (USD) 190 F-acc LU0399034312 (CHF hedged) F-acc LU0999556359 (EUR hedged) F-acc LU0999558058 P-acc LU0246276595 (EUR hedged) P-acc LU1157384881 Q-acc LU0399034585 U-X-acc LU0399035988UBS (Lux) Equity SICAV – USA Enhanced Sustainable (USD) 197 F-acc LU1483662844 (CHF hedged) F-acc LU1483663578 (EUR hedged) F-acc LU1483663149 (CHF hedged) F-UKdist LU1490620843UBS (Lux) Equity SICAV – USA Growth (USD) 200 F-acc LU0946081121 (CHF hedged) F-acc LU1050652996 (EUR hedged) F-acc LU1050658415 I-A1-acc LU0399032613 I-A2-acc LU0399032886 I-A3-acc LU0399033009 I-B-acc LU0399033348 (EUR) I-B-acc LU1776284256 I-X-acc LU0399033694 K-1-acc LU0399004596 (EUR hedged) N-acc LU0611174664 P-acc LU0198837287 (CHF hedged) P-acc LU0592661101 (EUR hedged) P-acc LU0511785726 (SGD hedged) P-acc LU0887386083 Q-acc LU0358729654 (CHF hedged) Q-acc LU1240790045 (EUR hedged) Q-acc LU0508198768 U-X-acc LU0236040787
Notes to the Financial Statements 208Unaudited Information 225
Sales restrictions
Shares of this Company may not be offered, sold or distributedwithin the United States of America.
6
UBS (Lux) Equity SICAVAnnual Report as of 31 May 2018
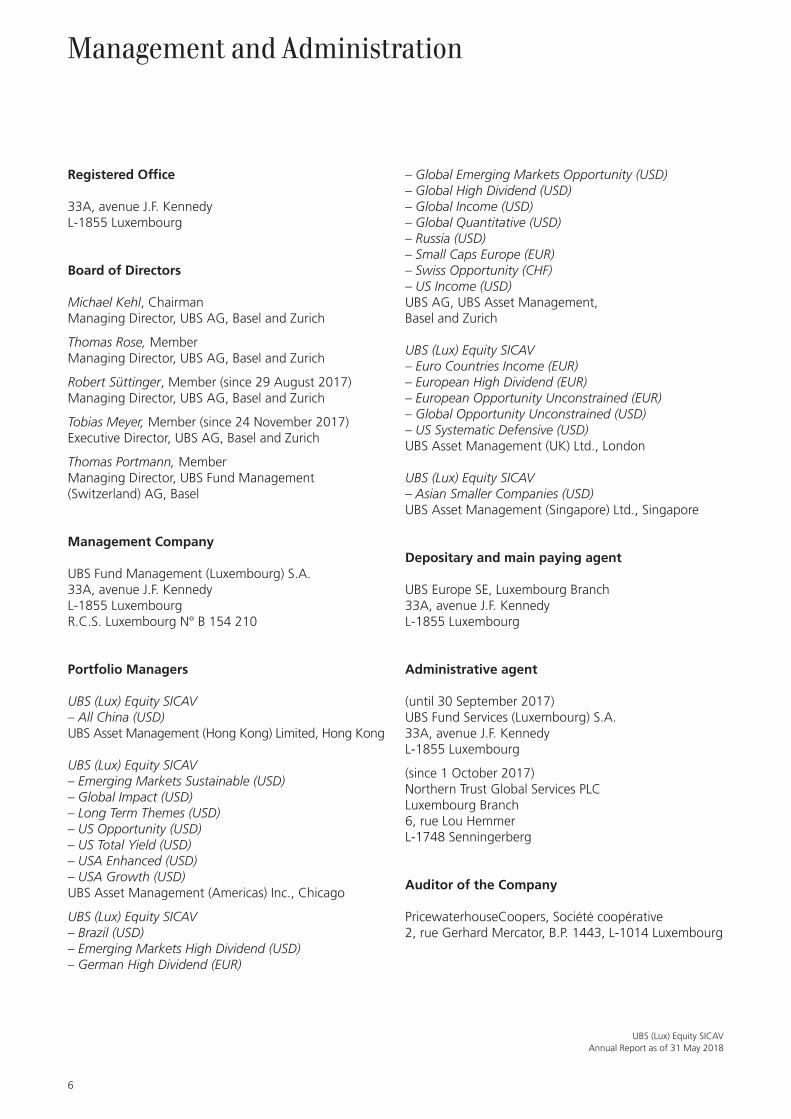
Management and Administration
Registered Office
33A, avenue J.F. KennedyL-1855 Luxembourg
Board of Directors
Michael Kehl, ChairmanManaging Director, UBS AG, Basel and Zurich
Thomas Rose, MemberManaging Director, UBS AG, Basel and Zurich
Robert Süttinger, Member (since 29 August 2017)Managing Director, UBS AG, Basel and Zurich
Tobias Meyer, Member (since 24 November 2017)Executive Director, UBS AG, Basel and Zurich
Thomas Portmann, MemberManaging Director, UBS Fund Management (Switzerland) AG, Basel
Management Company
UBS Fund Management (Luxembourg) S.A.33A, avenue J.F. KennedyL-1855 LuxembourgR.C.S. Luxembourg N° B 154 210
Portfolio Managers
UBS (Lux) Equity SICAV– All China (USD)UBS Asset Management (Hong Kong) Limited, Hong Kong
UBS (Lux) Equity SICAV– Emerging Markets Sustainable (USD)– Global Impact (USD)– Long Term Themes (USD)– US Opportunity (USD)– US Total Yield (USD)– USA Enhanced (USD)– USA Growth (USD)UBS Asset Management (Americas) Inc., Chicago
UBS (Lux) Equity SICAV– Brazil (USD)– Emerging Markets High Dividend (USD)– German High Dividend (EUR)
– Global Emerging Markets Opportunity (USD)– Global High Dividend (USD)– Global Income (USD)– Global Quantitative (USD)– Russia (USD)– Small Caps Europe (EUR)– Swiss Opportunity (CHF)– US Income (USD)UBS AG, UBS Asset Management,Basel and Zurich
UBS (Lux) Equity SICAV– Euro Countries Income (EUR)– European High Dividend (EUR)– European Opportunity Unconstrained (EUR)– Global Opportunity Unconstrained (USD)– US Systematic Defensive (USD)UBS Asset Management (UK) Ltd., London
UBS (Lux) Equity SICAV– Asian Smaller Companies (USD)UBS Asset Management (Singapore) Ltd., Singapore
Depositary and main paying agent
UBS Europe SE, Luxembourg Branch33A, avenue J.F. KennedyL-1855 Luxembourg
Administrative agent
(until 30 September 2017)UBS Fund Services (Luxembourg) S.A.33A, avenue J.F. KennedyL-1855 Luxembourg
(since 1 October 2017)Northern Trust Global Services PLCLuxembourg Branch6, rue Lou HemmerL-1748 Senningerberg
Auditor of the Company
PricewaterhouseCoopers, Société coopérative2, rue Gerhard Mercator, B.P. 1443, L-1014 Luxembourg

7
UBS (Lux) Equity SICAVAnnual Report as of 31 May 2018
Sale in Switzerland
RepresentativeUBS Fund Management (Switzerland) AGAeschenplatz 6, CH-4052 Basel
Paying agentsUBS Switzerland AG, Bahnhofstrasse 45, CH-8001 Zurichand its offices in Switzerland
The sales prospectus, the KIID, the articles of association of the Company, the annual and semi-annual reports as well as the portfolio movements of the Company mentioned in this publication are available free of charge from UBS Switzerland AG, Postfach, CH-8001 Zurich and from UBS Fund Management (Switzerland) AG, P.O. Box, CH-4052 Basel.
Sale in Germany
Paying and information agentUBS Europe SE, Bockenheimer Landstr. 2-4, D-60306 Frankfurt am Main
The sales prospectus, the KIID, the articles of association of theCompany, the annual and semi-annual reports as well as the portfoliomovements of the Company mentioned in this publication are availablefree of charge from UBS Europe SE, Bockenheimer Landstr. 2-4,D-60306 Frankfurt am Main.
Sale in Hongkong
Shares of the following subfunds may not be distributed in Hong Kong:
UBS (Lux) Equity SICAV– All China (USD)– Asian Smaller Companies (USD)– Brazil (USD)– Emerging Markets Sustainable (USD)– Euro Countries Income (EUR) – European High Dividend (EUR) – European Opportunity Unconstrained (EUR) – German High Dividend (EUR) – Global High Dividend (USD) – Global Impact (USD)– Global Income (USD) – Global Opportunity Unconstrained (USD) – Global Quantitative (USD)
– Long Term Themes (USD) – Small Caps Europe (EUR) – Swiss Opportunity (CHF) – US Income (USD) – US Opportunity (USD) – US Systematic Defensive (USD) – USA Enhanced (USD)
Sale in Liechtenstein
Paying agentLiechtensteinische Landesbank AGStädtle 44, FL-9490 Vaduz
Sale in Austria, in Belgium, in Chile, in the CzechRepublic, in Denmark, in Finland, in France, in Greece, in Hungary, in Iceland, in Italy, in Japan, in Macao, in Malta, in the Netherlands, in Norway, in Portugal, in Saudi Arabia, in Singapore, in South Korea, in Spain, in Sweden, in Taiwan and in the United Kingdom
Shares of this Company may be sold in these countries.
The sales prospectus, the KIID, the articles of association of theCompany, the annual and semi-annual reports as well as the portfoliomovements of the Company mentioned in this publication are availablefree of charge at the sales agencies and at the registered office of theCompany.

8
UBS (Lux) Equity SICAVAnnual Report as of 31 May 2018
Features of the Company
UBS (Lux) Equity SICAV (hereinafter called the “company”) offers investors various subfunds (“umbrella structure”) which invest in accordance with the investment policy described in the sales prospectus. The specific details on each subfund are defined in the sales prospectus, which will be updated on the launch of each new subfund.
The Company was established on 7 October 1996 as an open-ended investment fund in the form of a SICAV pursuant to Part I of the Luxembourg Law of 30 March 1988 relating to undertakings for collective investment and was adapted in March 2005 to conform to the provisions of the Law of 2002; it has been subject to the amended Law of 2010 since 1 July 2011.
Effective 15 June 2011, the company has appointed UBS Fund Management (Luxembourg) S.A., R.C.S. Luxembourg 154 210, as its Management Company.
The Articles of Incorporation were published in the “Mémorial, Recueil des Sociétés et Associations”, here-inafter called “Mémorial”, of 8 November 1996. The consolidated version of the Articles of Incorporation of the Company is deposited at the Trade and Compa-nies Register (Registre de Commerce et des Sociétés) in Luxembourg for inspection. Any amendments are shall be published in the “Recueil Electronique des Sociétés et Associations” (“RESA”) by meansway of a notice of deposit in the Mémorial, in a Luxembourg daily news-paper and, if necessary, in the manner described in the official section entitled “Regular reports and publications of the individual distribution countries.” of the sales prospectus. Amendments become legally binding fol-lowing their approval by the general meeting of share-holders.
As at 31 May 2018 the following subfunds are active:
UBS (Lux) Equity SICAV Currency of account
– All China (USD) USD
– Asian Smaller Companies (USD) USD
– Brazil (USD) USD
– Emerging Markets High Dividend (USD) USD
– Emerging Markets Sustainable (USD) USD
– Euro Countries Income (EUR) EUR
– European High Dividend (EUR) EUR
– European Opportunity Unconstrained (EUR) EUR
– German High Dividend (EUR) EUR
– Global Emerging Markets Opportunity (USD) USD
– Global High Dividend (USD) USD
– Global Impact (USD) USD
– Global Income (USD) USD
UBS (Lux) Equity SICAV Currency of account
– Global Opportunity Unconstrained (USD) USD
– Global Quantitative (USD) USD
– Long Term Themes (USD) USD
– Russia (USD) USD
– Small Caps Europe (EUR) EUR
– Swiss Opportunity (CHF) CHF
– US Income (USD) USD
– US Opportunity (USD) USD
– US Systematic Defensive (USD) USD
– US Total Yield (USD) USD
– USA Enhanced (USD) USD
– USA Growth (USD) USD
Currently the following share classes are available:
Various share classes can be offered for the subfunds. Information on which share classes are available for which subfund can be obtained from the Administrative Agent or at www.ubs.com/funds.
Shares are issued as registered shares only.
“P”
Shares in classes with “P” in their name are available to all investors. Their smallest tradable unit is 0.001. Unless the Company decides otherwise, the initial issue price of these shares amounts to AUD 100, BRL 400, CAD 100, CHF 100, CZK 2,000, EUR 100, GBP 100, HKD 1,000, JPY 10,000, NZD 100, PLN 500, RMB 1,000, RUB 3,500, SEK 700, SGD 100, USD 100 or ZAR 1,000.
“N”
Shares in classes with “N” in their name (shares with restrictions on distribution partners or countries) are issued exclusively through distributors authorised by UBS AG and domiciled in Spain, Italy, Portugal and Germany, or in other distribution countries insofar as this has been decided by the Company. Their smallest tradable unit is 0.001. Unless the Company decides otherwise, the initial issue price of these shares amounts to AUD 100, BRL 400, CAD 100, CHF 100, CZK 2,000, EUR 100, GBP 100, HKD 1,000, JPY 10,000, NZD 100, PLN 500, RMB 1,000, RUB 3,500, SEK 700, SGD 100, USD 100 or ZAR 1,000.
“K-1”
Shares in classes with “K-1” in their name are available to all investors. Their smallest tradable unit is 0.1. Unless the Company decides otherwise, the initial issue price of

9
UBS (Lux) Equity SICAVAnnual Report as of 31 May 2018
these shares amounts to AUD 5 million, BRL 20 million, CAD 5 million, CHF 5 million, CZK 100 million, EUR 3 million, GBP 2.5 million, HKD 40 million, JPY 500 million, NZD 5 million, PLN 25 million, RMB 35 million, RUB 175 million, SEK 35 million, SGD 5 million, USD 5 million or ZAR 40 million.
“K-X”
Shares in classes with “K-X” in their name are exclusively reserved for investors who have signed a written agree-ment with UBS AG or UBS Asset Management (a business division of UBS AG) on investing in one or more subfunds of this umbrella fund. The costs for asset management, fund administration (comprising the costs incurred by the Company, administrative agent and the Depositary) and distribution are charged to investors under the aforemen-tioned agreements. Their smallest tradable unit is 0.001. Unless the Company decides otherwise, the initial issueprice of these shares amounts to AUD 100, BRL 400, CAD 100, CHF 100, CZK 2,000, EUR 100, GBP 100, HKD 1,000, JPY 10,000, NZD 100, PLN 500, RMB 1,000, RUB 3,500, SEK 700, SGD 100, USD 100 or ZAR 1,000.
“F”
Shares in classes with “F” in their name are exclusively available to UBS AG and its subsidiaries. These shares may only be acquired by UBS AG or its subsidiaries, either for their own account or as part of discretionary asset management mandates concluded with UBS AG or its subsidiaries. In the latter case, the shares will be returned to the Company upon termination of the mandate at the prevailing net asset value and without being subject to charges. The smallest tradable unit of these shares is 0.001. Unless the Company decides otherwise, the initial issue price of these shares amounts to AUD 100, BRL 400, CAD 100, CHF 100, CZK 2,000, EUR 100, GBP 100, HKD 1,000, JPY 10,000, NZD 100, PLN 500, RMB 1,000, RUB 3,500, SEK 700, SGD 100, USD 100 or ZAR 1,000.
“Q”
Shares in classes with “Q” in their name are only avail-ablea) to investors in an eligible country as defined by
“List A”; orb) to contractual partners of UBS AG acting through
their Asset Management division and other regulated financial service providers duly authorised by their super-visory authority, investing in their own name and
– on their own behalf; or– on behalf of their clients within the framework of
written contracts for pecuniary interest constituting (i) asset management mandates, (ii) advisory agreements, or (iii) similar long-term contracts, provided these spe-cifically allow for investments in share classes without remuneration; or
– on behalf of a collective investment scheme; or– on behalf of another regulated financial service
provider that acts within the above framework on behalf of its clients.
In cases falling under (b), investors are domiciled in one of the eligible countries covered by “List B” if the conditions of (i) above are met, or in one of the eligible countries covered by “List C” if the conditions of (ii) or (iii) are met.
Admission of investors in further distribution countries (changes to lists A, B and C) shall be decided at the sole discretion of the Board of Directors of the Company. Any information in this regard will be disclosed at www.ubs.com/funds.
The smallest tradable unit of these shares is 0.001. Unless the Company decides otherwise, the initial issue price of these shares amounts to AUD 100, BRL 400, CAD 100, CHF 100, CZK 2,000, EUR 100, GBP 100, HKD 1,000, JPY 10,000, NZD 100, PLN 500, RMB 1,000, RUB 3,500, SEK 700, SGD 100, USD 100 or ZAR 1,000.
“A”
Shares in classes with “A” in their name are available to all investors. The maximum flat management fee for this class does not include distribution costs. Their smallest trad-able unit is 0.001. Unless the Company decides otherwise, the initial issue price for these shares amounts to AUD 100, BRL 400, CAD 100, CHF 100, CZK 2,000, EUR 100, GBP 100, HKD 1,000, JPY 10,000, NZD 100, PLN 500, RMB 1,000, RUB 3,500, SEK 700, SGD 100, USD 100 or ZAR 1,000.
“I-A1”
Shares in classes with “I-A1” in their name are exclusively reserved for institutional investors within the meaning of Article 174 (2) (c) of the amended Law of 2010. Their smallest tradable unit is 0.001. Unless the Company decides otherwise, the initial issue price of these shares amounts to AUD 100, BRL 400, CAD 100, CHF 100, CZK 2,000, EUR 100, GBP 100, HKD 1,000, JPY 10,000, NZD 100, PLN 500, RMB 1,000, RUB 3,500, SEK 700, SGD 100, USD 100 or ZAR 1,000.
“I-A2”
Shares in classes with “I-A2” in their name are exclusively reserved for institutional investors within the meaning of Article 174 (2) (c) of the amended Law of 2010. Their smallest tradable unit is 0.001. Unless the Company decides otherwise, the initial issue price of these shares amounts to AUD 100, BRL 400, CAD 100, CHF 100, CZK 2,000, EUR 100, GBP 100, HKD 1,000, JPY 10,000, NZD 100, PLN 500, RMB 1,000, RUB 3,500, SEK 700, SGD 100, USD 100 or ZAR 1,000. The minimum subscription amount for these shares is CHF 10 million (or foreign currency equivalent). Upon subscription(i) a minimum subscription must be made in accordance
with the list above;(ii) based on a written agreement between the institu-
tional investor and UBS AG (or one its authorised contractual partners), the investor’s total assets managed by UBS or its holdings in UBS collective

10
UBS (Lux) Equity SICAVAnnual Report as of 31 May 2018
investment schemes must be more than CHF 30 million (or foreign currency equivalent); or
(iii) the institutional investor must be an institution for occupational retirement provision that is part of UBS Group AG or must be one of its wholly-owned group companies.
“I-A3”
Shares in classes with “I-A3” in their name are exclusively reserved for institutional investors within the meaning of Article 174 (2) (c) of the amended Law of 2010. Their smallest tradable unit is 0.001. Unless the Company decides otherwise, the initial issue price of these shares amounts to AUD 100, BRL 400, CAD 100, CHF 100, CZK 2,000, EUR 100, GBP 100, HKD 1,000, JPY 10,000, NZD 100, PLN 500, RMB 1,000, RUB 3,500, SEK 700, SGD 100, USD 100 or ZAR 1,000. The minimum subscription amount for these shares is CHF 30 million (or foreign currency equivalent). Upon subscription(i) a minimum subscription must be made in accordance
with the list above;(ii) based on a written agreement between the institu-
tional investor and UBS AG (or one its authorised contractual partners), the investor’s total assets man-aged by UBS or its holdings in UBS collective invest-ment schemes must be more than CHF 100 million (or foreign currency equivalent); or
(iii) the institutional investor must be an institution for occupational retirement provision that is part of UBS Group AG or must be one of its wholly-owned group companies.
“I-B”
Shares in classes with “I-B” in their name are exclusively reserved for institutional investors within the meaning of Article 174 (2) (c) of the amended Law of 2010 who have signed a written agreement with UBS AG or one of its authorised contractual partners. A fee covering the costs for fund administration (comprising the costs of the Company, the administrative agent and the Depositary) is charged directly to the subfund. The costs for asset man-agement and distribution are charged to investors under the aforementioned agreements. Their smallest tradable unit is 0.001. Unless the Company decides otherwise, the initial issue price of these shares amounts to AUD 100, BRL 400, CAD 100, CHF 100, CZK 2,000, EUR 100, GBP 100, HKD 1,000, JPY 10,000, NZD 100, PLN 500, RMB 1,000, RUB 3,500, SEK 700, SGD 100, USD 100 or ZAR 1,000.
“I-X”
Shares in classes with “I-X” in their name are exclusively reserved for institutional investors within the meaning of Article 174 (2) (c) of the amended Law of 2010 who have signed a written agreement with UBS AG or one of its authorised contractual partners. The costs for asset management, fund administration (comprising the costs incurred by the Company, administrative agent and the
Depositary) and distribution are charged to investors under the aforementioned agreements. Their smallest tradable unit is 0.001. Unless the Company decides oth-erwise, the initial issue price of these shares amounts to AUD 100, BRL 400, CAD 100, CHF 100, CZK 2,000, EUR 100, GBP 100, HKD 1,000, JPY 10,000, NZD 100, PLN 500, RMB 1,000, RUB 3,500, SEK 700, SGD 100, USD 100 or ZAR 1,000.
“U-X”
Shares in classes with “U-X” in their name are exclusively reserved for institutional investors within the meaning of Article 174 (2) (c) of the amended Law of 2010 who have signed a written agreement with UBS AG or one of its authorised contractual partners. The costs for asset management, fund administration (comprising the costs of the Company, the administrative agent and the Depositary) and distribution are charged to investors under the aforementioned agreements. This share class is exclusively geared towards financial products (i.e. funds of funds or other pooled structures under various legislative frameworks). Their smallest tradable unit is 0.001. Unless the Company decides otherwise, the ini-tial issue price of these shares amounts to AUD 10,000, BRL 40,000, CAD 10,000, CHF 10,000, CZK 200,000, EUR 10,000, GBP 10,000, HKD 100,000, JPY 1 million, NZD 10,000, PLN 50,000, RMB 100,000, RUB 350,000, SEK 70,000, SGD 10,000, USD 10,000 or ZAR 100,000.
Additional characteristics
Currencies
The share classes may be denominated in AUD, BRL, CAD, CHF, CZK, EUR, GBP, HKD, JPY, NZD, PLN, RMB, RUB, SEK, SGD, USD or ZAR. For share classes issued in the currency of account of the subfund, this currency will not be included in the share class name. The currency of account features in the name of the relevant subfund.
“hedged”
For share classes with “hedged” in their name and with reference currencies different to the subfund’s currency of account (“share classes in foreign currencies”), the risk of fluctuations in the value of the reference currency is hedged against the subfund’s currency of account. This hedging shall be between 95% and 105% of the total net assets of the share class in foreign currency. Changes in the market value of the portfolio, as well as subscrip-tions and redemptions of share classes in foreign curren-cies, can result in the hedging temporarily surpassing the aforementioned range. The Company and the Portfolio Manager will take all necessary steps to bring the hedg-ing back within the aforementioned limits.
The hedging described has no effect on possible cur-rency risks resulting from investments denominated in a currency other than the subfund’s currency of account.
11
UBS (Lux) Equity SICAVAnnual Report as of 31 May 2018
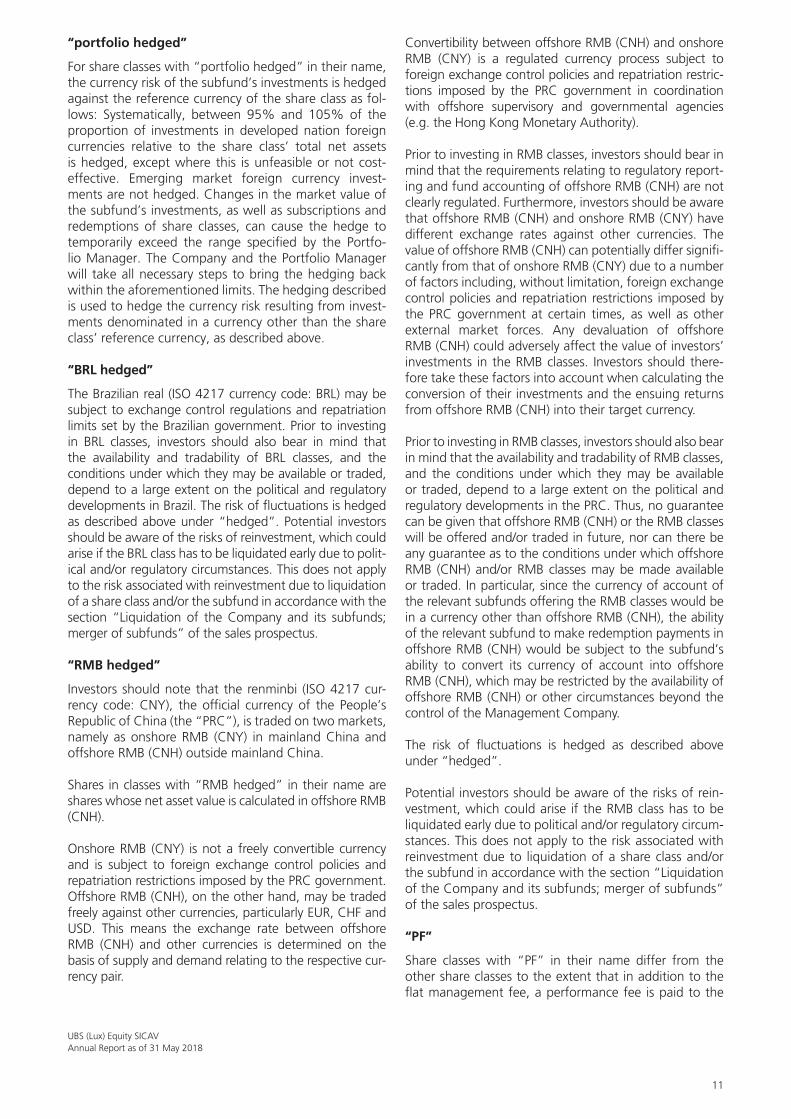
“portfolio hedged”
For share classes with “portfolio hedged” in their name, the currency risk of the subfund’s investments is hedged against the reference currency of the share class as fol-lows: Systematically, between 95% and 105% of the proportion of investments in developed nation foreign currencies relative to the share class’ total net assets is hedged, except where this is unfeasible or not cost-effective. Emerging market foreign currency invest-ments are not hedged. Changes in the market value of the subfund’s investments, as well as subscriptions and redemptions of share classes, can cause the hedge to temporarily exceed the range specified by the Portfo-lio Manager. The Company and the Portfolio Manager will take all necessary steps to bring the hedging back within the aforementioned limits. The hedging described is used to hedge the currency risk resulting from invest-ments denominated in a currency other than the share class’ reference currency, as described above.
“BRL hedged”
The Brazilian real (ISO 4217 currency code: BRL) may be subject to exchange control regulations and repatriation limits set by the Brazilian government. Prior to investing in BRL classes, investors should also bear in mind that the availability and tradability of BRL classes, and the conditions under which they may be available or traded, depend to a large extent on the political and regulatory developments in Brazil. The risk of fluctuations is hedged as described above under “hedged”. Potential investors should be aware of the risks of reinvestment, which could arise if the BRL class has to be liquidated early due to polit-ical and/or regulatory circumstances. This does not apply to the risk associated with reinvestment due to liquidation of a share class and/or the subfund in accordance with the section “Liquidation of the Company and its subfunds; merger of subfunds” of the sales prospectus.
“RMB hedged”
Investors should note that the renminbi (ISO 4217 cur-rency code: CNY), the official currency of the People’s Republic of China (the “PRC”), is traded on two markets, namely as onshore RMB (CNY) in mainland China and offshore RMB (CNH) outside mainland China.
Shares in classes with “RMB hedged” in their name are shares whose net asset value is calculated in offshore RMB (CNH).
Onshore RMB (CNY) is not a freely convertible currency and is subject to foreign exchange control policies and repatriation restrictions imposed by the PRC government. Offshore RMB (CNH), on the other hand, may be traded freely against other currencies, particularly EUR, CHF and USD. This means the exchange rate between offshore RMB (CNH) and other currencies is determined on the basis of supply and demand relating to the respective cur-rency pair.
Convertibility between offshore RMB (CNH) and onshore RMB (CNY) is a regulated currency process subject to foreign exchange control policies and repatriation restric-tions imposed by the PRC government in coordination with offshore supervisory and governmental agencies (e.g. the Hong Kong Monetary Authority).
Prior to investing in RMB classes, investors should bear in mind that the requirements relating to regulatory report-ing and fund accounting of offshore RMB (CNH) are not clearly regulated. Furthermore, investors should be aware that offshore RMB (CNH) and onshore RMB (CNY) have different exchange rates against other currencies. The value of offshore RMB (CNH) can potentially differ signifi-cantly from that of onshore RMB (CNY) due to a number of factors including, without limitation, foreign exchange control policies and repatriation restrictions imposed by the PRC government at certain times, as well as other external market forces. Any devaluation of offshore RMB (CNH) could adversely affect the value of investors’ investments in the RMB classes. Investors should there-fore take these factors into account when calculating the conversion of their investments and the ensuing returns from offshore RMB (CNH) into their target currency.
Prior to investing in RMB classes, investors should also bear in mind that the availability and tradability of RMB classes, and the conditions under which they may be available or traded, depend to a large extent on the political and regulatory developments in the PRC. Thus, no guarantee can be given that offshore RMB (CNH) or the RMB classes will be offered and/or traded in future, nor can there be any guarantee as to the conditions under which offshore RMB (CNH) and/or RMB classes may be made available or traded. In particular, since the currency of account of the relevant subfunds offering the RMB classes would be in a currency other than offshore RMB (CNH), the ability of the relevant subfund to make redemption payments in offshore RMB (CNH) would be subject to the subfund’s ability to convert its currency of account into offshore RMB (CNH), which may be restricted by the availability of offshore RMB (CNH) or other circumstances beyond the control of the Management Company.
The risk of fluctuations is hedged as described above under “hedged”.
Potential investors should be aware of the risks of rein-vestment, which could arise if the RMB class has to be liquidated early due to political and/or regulatory circum-stances. This does not apply to the risk associated with reinvestment due to liquidation of a share class and/or the subfund in accordance with the section “Liquidation of the Company and its subfunds; merger of subfunds” of the sales prospectus.
“PF”
Share classes with “PF” in their name differ from the other share classes to the extent that in addition to the flat management fee, a performance fee is paid to the

12
UBS (Lux) Equity SICAVAnnual Report as of 31 May 2018
Portfolio Manager if the conditions set out in the section “Expenses paid by the Company” are met.
“acc”
The income of share classes with “-acc” in their name is not distributed unless the Company decides otherwise.
“dist”
For share classes with “-dist” in their name, income is distributed unless the Company decides otherwise.
“qdist”
Shares in classes with “-qdist” in their name may make quarterly distributions, gross of fees and expenses. Dis-tributions may also be made out of the capital (this may include, inter alia, realised and unrealised net gains in net asset value) (“capital”). Distributions out of capital result in the reduction of an investor’s original capital invested in the subfund. Furthermore, any distributions from the income and/or involving the capital result in an immediate reduction of the net asset value per share of the subfund. Investors in certain countries may be subject to higher tax rates on distributed capital than on any capital gains from the sale of fund units. Some investors may therefore prefer to subscribe to accumu-lating (-acc) rather than distributing (-dist, -qdist) share classes. Investors may be taxed at a later point in time on income and capital arising on accumulating (-acc) share classes compared with distributing (-dist) share classes. Investors should consult qualified experts for tax advice regarding their individual situation.
“mdist”
Shares in classes with “-mdist” in their name may make monthly distributions, gross of fees and expenses. Distri-butions may also be made out of capital. Distributions out of capital result in the reduction of an investor’s origi-nal capital invested in the subfund. Furthermore, any dis-tributions from the income and/or involving the capital result in an immediate reduction of the net asset value per share of the subfund. Investors in certain countries may be subject to higher tax rates on distributed capital than on any capital gains from the sale of fund units. Some investors may therefore prefer to invest in accumu-lating (-acc) rather than distributing (-dist, -mdist) share classes. Investors may be taxed at a later point in time on income and capital arising on accumulating (-acc) share classes compared with distributing (-dist) share classes. Investors should consult qualified experts for tax advice regarding their individual situation. The maximum issuing commission for shares in classes with “-mdist” in their name is 6%.
“UKdist”
For share classes with “UKdist” in their name that are subject to the reporting fund rules, the Company intends to distribute a sum corresponding to 100% of the reportable income within the meaning of the UK
reporting fund rules. The Company does not intend to make taxable values for these share classes available in other countries, as they are intended for investors whose investment in the share class is liable to tax in the UK.
“2%”, “4%”, “6%”, “8%”
Shares in classes with “2%” / “4%” / “6%” / “8%” in their name may make monthly (-mdist), quarterly (-qdist) or annual (-dist) distributions at the respective afore-mentioned annual percentage rates, gross of fees and expenses. The distribution amount is calculated based on the net asset value of the respective share class at the end of the month (in the case of monthly distributions), financial quarter (in the case of quarterly distributions) or financial year (in the case of annual distributions). These share classes are suitable for investors who wish for more stable distributions, unrelated to past or expected returns or income of the relevant subfund.
Distributions may thus also be made from the capital. Distributions out of capital result in the reduction of an investor’s original capital invested in the subfund. Furthermore, any distributions from the income and/or involving the capital result in an immediate reduction of the net asset value per share of the subfund. Investors in certain countries may be subject to higher tax rates on distributed capital than on any capital gains from the sale of fund units. Some investors may therefore choose to invest in the accumulating (-acc) instead of the distrib-uting (-dist, -qdist, -mdist) share classes. Investors may be taxed at a later point in time on income and capital aris-ing on accumulating (-acc) share classes compared with distributing (-dist, -qdist, -mdist) share classes. Investors should consult qualified experts for tax advice regarding their individual situation.
“seeding”
Shares with “seeding” in their name are only offered for a limited period of time. At the end of this period, no further subscriptions are permitted unless the Company decides otherwise. However, these shares may still be redeemed in accordance with the conditions for the red-emption of shares. Unless the Company decides other-wise, the smallest tradable unit, the initial issue price and the minimum subscription amount are those of the aforementioned asset classes.
The entirety of the subfunds’ net assets forms the total net assets of the company, which at any time correspond to the share capital of the company and consist of fully paid in and non-par-value shares (the “shares“).
At general meetings, shareholders have the right to one vote per share held, irrespective of the difference in value of shares in the respective subfunds. Shares of a particu-lar subfund carry the right of one vote per share held when voting at meetings affecting this subfund.

13
UBS (Lux) Equity SICAVAnnual Report as of 31 May 2018
The company forms a legal entity. With respect to the shareholders, each subfund is regarded as being inde-pendent from the others. The assets of a subfund can be used to offset only the liabilities which the subfund concerned has assumed.
The Board of Directors of the Company is empowered, at all times, to liquidate existing subfunds and/or to estab-lish new subfunds as well as different share classes with specific characteristics within these subfunds. The current sales prospectus shall be updated following the establish-ing of a new subfund or new share class.
The company is unlimited with regard to duration and total assets.
The financial year of the company ends on 31 May.
The ordinary general meeting takes place annually on 24 November at 11.30 a.m. at the registered office of the company. If 24 November happens to be no working day in Luxembourg, the ordinary general meeting takes place on the next following working day.
Only the information contained in the sales prospectus and in one of the documents referred to therein shall be deemed to be valid.
Information on whether a company subfund is listed on the Luxembourg Stock Exchange can be obtained from the Administrative Agent or the Luxembourg Stock Exchange website (www.bourse.lu).
The issue and redemption of shares of UBS (Lux) Equity SICAV are subject to the regulations prevailing in the country concerned.
The annual and semi-annual reports are available free of charge to shareholders at the registered office of the company and the Depositary.
No subscription may be accepted on the basis of the financial reports. Subscriptions are accepted only on the basis of the current prospectus accompanied by the lat-est annual report and the latest semi-annual report if available.
The figures stated in this report are historical and not necessarily indicative of future performance.

14
UBS (Lux) Equity SICAVAnnual Report as of 31 May 2018
Audit report
To the Shareholders of
UBS (Lux) Equity SICAV
Our opinion
In our opinion, the accompanying financial statements give a true and fair view of the financial position of UBS (Lux) Equity SICAV and of each of its subfunds (the “Fund”) as at 31 May 2018, and of the results of their operations and changes in their net assets for the year then ended in accordance with Luxembourg legal and regulatory requirements relating to the preparation and presentation of the financial statements.
What we have audited
The Fund’s financial statements comprise:• the statement of net assets as at 31 May 2018;• the statement of investments in securities and other
net assets as at 31 May 2018;• the statement of operations for the year then ended;• the statement of changes in net assets for the year
then ended; and• the notes to the financial statements, which include a
summary of significant accounting policies.
Basis for opinion
We conducted our audit in accordance with the Law of 23 July 2016 on the audit profession (Law of 23 July 2016) and with International Standards on Auditing (ISAs) as adopted for Luxembourg by the “Commission de Surveillance du Secteur Financier” (CSSF). Our responsibil-ities under those Law and standards are further described in the “Responsibilities of the “Réviseur d’entreprises agréé” for the audit of the financial statements” section of our report.
We believe that the audit evidence we have obtained is sufficient and appropriate to provide a basis for our opinion.
We are independent of the Fund in accordance with the International Ethics Standards Board for Accountants’ Code of Ethics for Professional Accountants (IESBA Code) as adopted for Luxembourg by the CSSF together with the ethical requirements that are relevant to our audit of the financial statements. We have fulfilled our other ethical responsibilities under those ethical requirements.
Other information
The Board of Directors of the Fund is responsible for the other information. The other information comprises the information stated in the annual report but does not include the financial statements and our audit report thereon.
Our opinion on the financial statements does not cover the other information and we do not express any form of assurance conclusion thereon.
In connection with our audit of the financial statements, our responsibility is to read the other information identi-fied above and, in doing so, consider whether the other information is materially inconsistent with the financial statements or our knowledge obtained in the audit, or otherwise appears to be materially misstated. If, based on the work we have performed, we conclude that there is a material misstatement of this other information, we are required to report that fact. We have nothing to report in this regard.
PricewaterhouseCoopers, Société coopérative, 2 rue Gerhard Mercator, B.P. 1443, L-1014 LuxembourgT: +352 494848 1, F: +352 494848 2900, www.pwc.lu
Cabinet de révision agréé. Expert-comptable (autorisation gouvernementale n° 10028256)R.C.S. Luxembourg B 65 477 – TVA LU25482518

15
UBS (Lux) Equity SICAVAnnual Report as of 31 May 2018
Responsibilities of the Board of Directors of the Fund for the financial statements
The Board of Directors of the Fund is responsible for the preparation and fair presentation of the financial statements in accordance with Luxembourg legal and regulatory requirements relating to the preparation and presentation of the financial statements, and for such internal control as the Board of Directors of the Fund determines is necessary to enable the preparation of financial statements that are free from material mis-statement, whether due to fraud or error.
In preparing the financial statements, the Board of Directors of the Fund is responsible for assessing the Fund’s ability to continue as a going concern, disclos-ing, as applicable, matters related to going concern and using the going concern basis of accounting unless the Board of Directors of the Fund either intends to liquidate the Fund or to cease operations, or has no realistic alter-native but to do so.
Responsibilities of the “Réviseur d’entreprises agréé” for the audit of the financial statements
The objectives of our audit are to obtain reasonable assurance about whether the financial statements as a whole are free from material misstatement, whether due to fraud or error, and to issue an audit report that includes our opinion. Reasonable assurance is a high level of assurance, but is not a guarantee that an audit conducted in accordance with the Law of 23 July 2016 and with ISAs as adopted for Luxembourg by the CSSF will always detect a material misstatement when it exists. Misstatements can arise from fraud or error and are con-sidered material if, individually or in the aggregate, they could reasonably be expected to influence the economic decisions of users taken on the basis of these financial statements.
As part of an audit in accordance with the Law of 23 July 2016 and with ISAs as adopted for Luxembourg by the CSSF, we exercise professional judgment and maintain professional scepticism throughout the audit. We also:
• identify and assess the risks of material misstatement of the financial statements, whether due to fraud or error, design and perform audit procedures responsive to those risks, and obtain audit evidence that is sufficient and appropriate to provide a basis for our opinion. The risk of not detecting a material misstatement resulting from fraud is higher than for one resulting from error, as fraud may involve collusion, forgery, intentional omissions, misrepresentations, or the override of internal control;
• obtain an understanding of internal control relevant to the audit in order to design audit procedures that are appropriate in the circumstances, but not for the purpose of expressing an opinion on the effectiveness of the Fund’s internal control;
• evaluate the appropriateness of accounting policies used and the reasonableness of accounting estimates and related disclosures made by the Board of Directors of the Fund;
• conclude on the appropriateness of the Board of Directors of the Fund’s use of the going concern basis of accounting and, based on the audit evidence obtained, whether a material uncertainty exists related to events or conditions that may cast significant doubt on the Fund’s ability to continue as a going concern. If we conclude that a material uncertainty exists, we are required to draw attention in our audit report to the related disclosures in the financial statements or, if such disclosures are inadequate, to modify our opinion. Our conclusions are based on the audit evidence obtained up to the date of our audit report. However, future events or conditions may cause the Fund to cease to continue as a going concern;
• evaluate the overall presentation, structure and content of the financial statements, including the disclosures, and whether the financial statements represent the underlying transactions and events in a manner that achieves fair presentation.

16
UBS (Lux) Equity SICAVAnnual Report as of 31 May 2018
We communicate with those charged with governance regarding, among other matters, the planned scope and timing of the audit and significant audit findings, includ-ing any significant deficiencies in internal control that we identify during our audit.
Luxembourg, 20 August 2018
PricewaterhouseCoopers, Société coopérativeRepresented by
Alain Maechling
Only the German version of the present annual report has been audited by the “Réviseur d’entreprise agréé”. Consequently, the Audit Report refers to the German version of the report; other versions result from a con-scientious translation made under the responsibility of the Board of Directors of the Fund. In case of differences between the German version and the translation, the German version shall be the authentic text.

The notes are an integral part of the fi nancial statements. 17
UBS (Lux) Equity SICAVAnnual Report as of 31 May 2018
Consolidated Statement of Net Assets USDAssets 31.5.2018Investments in securities, cost 12 510 280 613.35Investments in securities, unrealized appreciation (depreciation) 1 473 009 820.04Total investments in securities (Note 1) 13 983 290 433.39Cash at banks, deposits on demand and deposit accounts 276 020 575.49Time deposits and fiduciary deposits 2 635 054.63Other liquid assets (Margins) 176 245.08Receivable on securities sales (Note 1) 49 753 420.55Receivable on subscriptions 36 470 019.05Interest receivable on liquid assets 4 940.96Receivable on dividends 33 356 595.17Other receivables 11 817 452.13Unrealized gain (loss) on financial futures (Note 1) -7 365.66Unrealized gain (loss) on forward foreign exchange contracts (Note 1) 16 773 390.34Unrealized gain (loss) on Synthetic Equity Swaps (Note 1) -364 479.61Total Assets 14 409 926 281.52
LiabilitiesBank overdraft -5 775 395.33Interest payable on bank overdraft -43 534.19Payable on securities purchases (Note 1) -90 133 044.03Payable on redemptions -47 935 169.60Other liabilities -558 898.98Provisions for flat fee (Note 2) -6 379 482.41Provisions for taxe d’abonnement (Note 3) -836 879.38Provisions for other commissions and fees (Note 2) -387 159.36Total provisions -7 603 521.15Total Liabilities -152 049 563.28
Net assets at the end of the financial year 14 257 876 718.24
* As at 31 May 2018, cash amounts serves as collateral for the counterparty Goldman Sachs for an amount of USD 1 610 000.
*
UBS (Lux) Equity SICAV

18 The notes are an integral part of the fi nancial statements.
UBS (Lux) Equity SICAVAnnual Report as of 31 May 2018
Consolidated Statement of Operations USDIncome 1.6.2017-31.5.2018Interest on liquid assets 1 241 825.20Dividends 276 803 194.41Income on Synthetic Equity Swaps (Note 1) 30 905 547.00Income on securities lending (Note 16) 9 658 308.42Other income (Note 4) 5 818 261.42Total income 324 427 136.45
ExpensesInterest paid on Synthetic Equity Swaps (Note 1) -30 007 213.50Flat fee (Note 2) -147 526 109.75Taxe d’abonnement (Note 3) -4 984 160.96Cost on securities lending (Note 16) -3 863 323.13Other commissions and fees (Note 2) -2 734 584.05Interest on cash and bank overdraft -932 423.70Other expenses -2 260.68Total expenses -190 050 075.77
Net income (loss) on investments 134 377 060.68
Realized gain (loss) (Note 1)Realized gain (loss) on market-priced securities without options 1 526 697 413.81Realized gain (loss) on options -31 017 833.27Realized gain (loss) on financial futures 1 171 221.72Realized gain (loss) on forward foreign exchange contracts -136 338 018.80Realized gain (loss) on Synthetic Equity Swaps -11 079 811.07Realized gain (loss) on foreign exchange 158 431.89Total realized gain (loss) 1 349 591 404.28
Net realized gain (loss) of the financial year 1 483 968 464.96
Changes in unrealized appreciation (depreciation) (Note 1)Unrealized appreciation (depreciation) on market-priced securities without options -167 953 911.56Unrealized appreciation (depreciation) on options 3 396 120.96Unrealized appreciation (depreciation) on financial futures -268 893.06Unrealized appreciation (depreciation) on forward foreign exchange contracts 25 866 874.23Unrealized appreciation (depreciation) on Synthetic Equity Swaps -68 834 849.42Total changes in unrealized appreciation (depreciation) -207 794 658.85
Net increase (decrease) in net assets as a result of operations 1 276 173 806.11
The notes are an integral part of the fi nancial statements. 19
UBS (Lux) Equity SICAV – All China (USD)Annual Report as of 31 May 2018
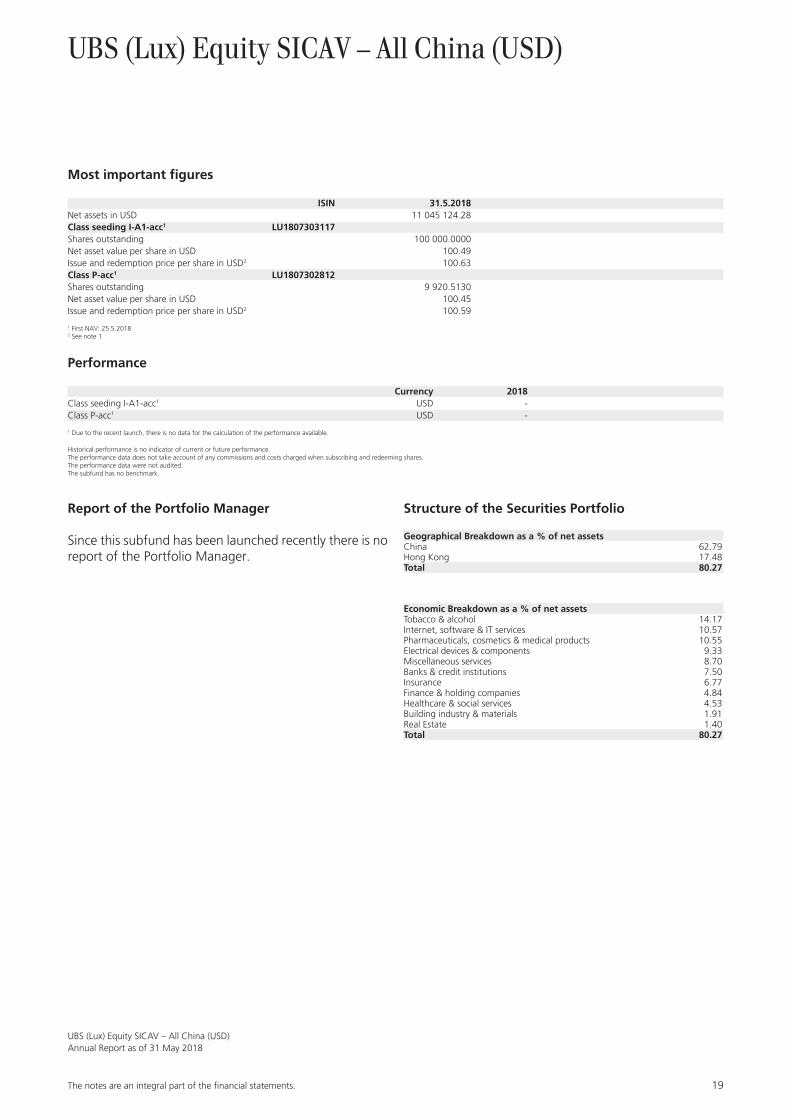
UBS (Lux) Equity SICAV – All China (USD)
Most important figures
ISIN 31.5.2018Net assets in USD 11 045 124.28Class seeding I-A1-acc1 LU1807303117Shares outstanding 100 000.0000Net asset value per share in USD 100.49Issue and redemption price per share in USD2 100.63Class P-acc1 LU1807302812Shares outstanding 9 920.5130Net asset value per share in USD 100.45Issue and redemption price per share in USD2 100.59
1 First NAV: 25.5.20182 See note 1
Performance
Currency 2018Class seeding I-A1-acc1 USD -Class P-acc1 USD -
1 Due to the recent launch, there is no data for the calculation of the performance available.
Historical performance is no indicator of current or future performance.The performance data does not take account of any commissions and costs charged when subscribing and redeeming shares.The performance data were not audited.The subfund has no benchmark.
Report of the Portfolio Manager
Since this subfund has been launched recently there is no report of the Portfolio Manager.
Structure of the Securities Portfolio
Geographical Breakdown as a % of net assetsChina 62.79Hong Kong 17.48Total 80.27
Economic Breakdown as a % of net assetsTobacco & alcohol 14.17Internet, software & IT services 10.57Pharmaceuticals, cosmetics & medical products 10.55Electrical devices & components 9.33Miscellaneous services 8.70Banks & credit institutions 7.50Insurance 6.77Finance & holding companies 4.84Healthcare & social services 4.53Building industry & materials 1.91Real Estate 1.40Total 80.27

20 The notes are an integral part of the fi nancial statements.
UBS (Lux) Equity SICAV – All China (USD)Annual Report as of 31 May 2018
Statement of Net Assets USDAssets 31.5.2018Investments in securities, cost 8 779 071.47Investments in securities, unrealized appreciation (depreciation) 87 111.66Total investments in securities (Note 1) 8 866 183.13Cash at banks, deposits on demand and deposit accounts 5 036 910.60Receivable on subscriptions 339 999.90Receivable on dividends 1 911.87Total Assets 14 245 005.50
LiabilitiesBank overdraft -3 197 371.08Provisions for flat fee (Note 2) -2 254.08Provisions for taxe d’abonnement (Note 3) -251.90Provisions for other commissions and fees (Note 2) -4.16Total provisions -2 510.14Total Liabilities -3 199 881.22
Net assets at the end of the period 11 045 124.28
Statement of Operations USDIncome 25.5.2018-31.5.2018Dividends 1 911.87Other income (Note 4) 478.86Total income 2 390.73
ExpensesFlat fee (Note 2) -2 254.08Taxe d’abonnement (Note 3) -251.90Other commissions and fees (Note 2) -4.13Total expenses -2 510.11
Net income (loss) on investments -119.38
Realized gain (loss) (Note 1)Realized gain (loss) on forward foreign exchange contracts -30 445.77Realized gain (loss) on foreign exchange -943.27Total realized gain (loss) -31 389.04
Net realized gain (loss) of the period -31 508.42
Changes in unrealized appreciation (depreciation) (Note 1)Unrealized appreciation (depreciation) on market-priced securities without options 87 111.66Total changes in unrealized appreciation (depreciation) 87 111.66
Net increase (decrease) in net assets as a result of operations 55 603.24

The notes are an integral part of the fi nancial statements. 21
UBS (Lux) Equity SICAV – All China (USD)Annual Report as of 31 May 2018
Statement of Changes in Net Assets USD 25.5.2018-31.5.2018Net assets at the beginning of the period 0.00Subscriptions 10 989 521.04Total net subscriptions (redemptions) 10 989 521.04Net income (loss) on investments -119.38Total realized gain (loss) -31 389.04Total changes in unrealized appreciation (depreciation) 87 111.66Net increase (decrease) in net assets as a result of operations 55 603.24Net assets at the end of the period 11 045 124.28
Changes in the Number of Shares outstanding
25.5.2018-31.5.2018Class seeding I-A1-accNumber of shares outstanding at the beginning of the period 0.0000Number of shares issued 100 000.0000Number of shares redeemed 0.0000Number of shares outstanding at the end of the period 100 000.0000Class P-accNumber of shares outstanding at the beginning of the period 0.0000Number of shares issued 9 920.5130Number of shares redeemed 0.0000Number of shares outstanding at the end of the period 9 920.5130

22 The notes are an integral part of the fi nancial statements.
UBS (Lux) Equity SICAV – All China (USD)Annual Report as of 31 May 2018
Statement of Investments in Securities and other Net Assets as of 31 May 2018
Description Quantity/ Valuation in USD as a % Nominal Unrealized gain of net (loss) on Futures/ assets Forward Exchange Contracts/ Swaps (Note 1)
Transferable securities and money market instruments listed on an official stock exchange
Bearer shares
China
HKD CHINA MERCHANTS BK ‘H’CNY1 75 000.00 308 661.64 2.79CNY GREE ELEC APPLICAN ‘A’CNY1 51 201.00 379 948.05 3.44CNY HANGZHOU HIKVISION ‘A’CNY1 52 905.00 323 579.25 2.93HKD INDUSTRIAL & COM B ‘H’CNY1 377 000.00 312 229.24 2.83CNY JIANGSU HENGRUI ME ‘A’CNY1 60 634.00 721 147.70 6.53CNY KWEICHOW MOUTAI CO LTD-A 9 020.00 1 058 458.46 9.58CNY MIDEA GROUP CO LTD CNY1 39 500.00 326 502.89 2.96HKD PING AN INSURANCE ‘H’CNY1 37 500.00 367 431.58 3.33HKD TENCENT HLDGS LIMI HKD0.00002 18 500.00 940 981.60 8.52CNY YIBIN WULIANGYE ‘A’CNY1 41 100.00 507 120.45 4.59Total China 5 246 060.86 47.50
Hong Kong
HKD AIA GROUP LTD NPV 41 400.00 379 797.16 3.44HKD CHINA RES LAND HKD0.10 42 000.00 154 120.59 1.40HKD CSPC PHARMACEUTICA HKD0.10 88 000.00 275 266.30 2.49HKD FAR EAST HORIZON L HKD0.01 254 000.00 269 586.16 2.44HKD GALAXY ENTERTAINME HKD0.10 24 000.00 211 151.32 1.91HKD HONG KONG EXCHANGE HKD1 6 400.00 206 961.93 1.87HKD SHN INTL HLDGS HKD1 121 000.00 264 558.38 2.40HKD SINO BIOPHAMACEUTI HKD0.025 67 000.00 169 369.55 1.53Total Hong Kong 1 930 811.39 17.48
Total Bearer shares 7 176 872.25 64.98
Depository receipts
China
USD ALIBABA GROUP HLDG SPON ADS EACH REP ONE ORD-ADR 4 856.00 961 390.88 8.70USD NETEASE INC ADR REP 25 COM USD0.0001 1 000.00 227 010.00 2.06USD TAL EDUCATION GRP ADS EA REPR 2 CL A ORD SHS 11 800.00 500 910.00 4.53Total China 1 689 310.88 15.29
Total Depository receipts 1 689 310.88 15.29
Total Transferable securities and money market instruments listed on an official stock exchange 8 866 183.13 80.27
Total investments in securities 8 866 183.13 80.27
Cash at banks, deposits on demand and deposit accounts and other liquid assets 5 036 910.60 45.60Bank overdraft and other short-term liabilities -3 197 371.08 -28.95Other assets and liabilities 339 401.63 3.08
Total net assets 11 045 124.28 100.00

The notes are an integral part of the fi nancial statements. 23
UBS (Lux) Equity SICAV – Asian Smaller Companies (USD)Annual Report as of 31 May 2018
UBS (Lux) Equity SICAV – Asian Smaller Companies (USD)
Three-year comparison
ISIN 31.5.2018 31.5.2017 31.5.2016Net assets in USD 70 576 771.92 51 195 832.52 58 066 922.87Class F-acc1 LU1306439909Shares outstanding - 652.4230 652.4230Net asset value per share in USD - 119.46 101.05Issue and redemption price per share in USD2 - 119.46 101.05Class K-1-acc3 LU1036032008Shares outstanding - - 0.5000Net asset value per share in USD - - 5 236 936.50Issue and redemption price per share in USD2 - - 5 236 936.50Class P-acc LU0746413003Shares outstanding 330 362.9620 277 697.6530 336 767.7540Net asset value per share in USD 197.05 166.63 142.60Issue and redemption price per share in USD2 197.05 166.63 142.60Class Q-acc LU1240781994Shares outstanding 36 547.4690 38 525.7000 68 982.5090Net asset value per share in USD 149.95 125.74 106.70Issue and redemption price per share in USD2 149.95 125.74 106.70
1 The share class F-acc was in circulation until 27.7.20172 See note 13 The share class K-1-acc was in circulation until 23.12.2016
Performance
Currency 2017/2018 2016/2017 2015/2016Class F-acc1 USD - 18.2% -Class K-1-acc2 USD - - -12.4%Class P-acc USD 18.3% 16.9% -12.6%Class Q-acc USD 19.3% 17.8% -
1 The share class F-acc was in circulation until 27.7.2017. Due to this fact, there is no data for the calculation of the performance available.2 The share class K-1-acc was in circulation until 23.12.2016. Due to this fact, there is no data for the calculation of the performance available.
Historical performance is no indicator of current or future performance.The performance data does not take account of any commissions and costs charged when subscribing and redeeming shares.The performance data were not audited.The subfund has no benchmark.

24 The notes are an integral part of the fi nancial statements.
UBS (Lux) Equity SICAV – Asian Smaller Companies (USD)Annual Report as of 31 May 2018
Report of the Portfolio Manager
Asia ex Japan small and mid-cap equities had strong returns during the financial year, from 1 June 2017 to 31 May 2018, although geopolitical and trade war concerns weighed on last year’s stellar run. China led in positive returns, amid strong fundamentals and positive earnings. Taiwan, Thailand and Korea also rose signifi-cantly. Almost all sectors boosted the index, with Health-care and IT rising most.
The subfund rose in the financial year with China, Taiwan and Korea boosting performance. Sector-wise, Consumer Discretionary, IT and Industrials added most value to the portfolio. Over the financial year we added China A shares through the Stock Connect program. Key contributors included TAL Education, Wonik QnC and Sino Biopharmaceutical while key detractors were Richwave Technology, Hangzhou Robam and Bank Pan Indonesia.
Structure of the Securities Portfolio
Geographical Breakdown as a % of net assetsChina 21.08Hong Kong 19.45South Korea 15.83Taiwan 10.49Singapore 7.19India 7.08Malaysia 5.84Thailand 4.02Indonesia 3.53Philippines 2.69Macau 1.00Total 98.20
Economic Breakdown as a % of net assetsFinance & holding companies 9.22Electronics & semiconductors 8.90Miscellaneous unclassified companies 8.61Mechanical engineering & industrial equipment 7.44Pharmaceuticals, cosmetics & medical products 6.61Electrical devices & components 6.60Healthcare & social services 5.88Lodging, catering & leisure 5.65Real Estate 4.97Traffic & transportation 3.76Chemicals 3.59Textiles, garments & leather goods 3.42Banks & credit institutions 3.25Food & soft drinks 3.01Insurance 2.62Miscellaneous trading companies 2.46Mining, coal & steel 1.90Aerospace industry 1.83Graphic design, publishing & media 1.76Internet, software & IT services 1.25Vehicles 1.07Building industry & materials 1.01Non-ferrous metals 0.98Tobacco & alcohol 0.82Telecommunications 0.73Retail trade, department stores 0.69Petroleum 0.17Total 98.20

The notes are an integral part of the fi nancial statements. 25
UBS (Lux) Equity SICAV – Asian Smaller Companies (USD)Annual Report as of 31 May 2018
Statement of Net Assets USDAssets 31.5.2018Investments in securities, cost 56 653 995.99Investments in securities, unrealized appreciation (depreciation) 12 653 767.33Total investments in securities (Note 1) 69 307 763.32Cash at banks, deposits on demand and deposit accounts 712 763.74Receivable on securities sales (Note 1) 351 686.95Receivable on subscriptions 335 325.69Receivable on dividends 259 789.47Other receivables 50 586.18Total Assets 71 017 915.35
LiabilitiesPayable on securities purchases (Note 1) -316 715.32Payable on redemptions -53 262.75Provisions for flat fee (Note 2) -56 924.60Provisions for taxe d’abonnement (Note 3) -5 914.33Provisions for other commissions and fees (Note 2) -8 326.43Total provisions -71 165.36Total Liabilities -441 143.43
Net assets at the end of the financial year 70 576 771.92
Statement of Operations USDIncome 1.6.2017-31.5.2018Interest on liquid assets 5 756.96Dividends 1 422 986.27Income on securities lending (Note 16) 24 869.57Other income (Note 4) 48 029.98Total income 1 501 642.78
ExpensesFlat fee (Note 2) -1 084 733.10Taxe d’abonnement (Note 3) -31 278.14Cost on securities lending (Note 16) -9 947.83Other commissions and fees (Note 2) -19 008.05Total expenses -1 144 967.12
Net income (loss) on investments 356 675.66
Realized gain (loss) (Note 1)Realized gain (loss) on market-priced securities without options 4 774 829.11Realized gain (loss) on forward foreign exchange contracts -755.59Realized gain (loss) on foreign exchange -79 049.51Total realized gain (loss) 4 695 024.01
Net realized gain (loss) of the financial year 5 051 699.67
Changes in unrealized appreciation (depreciation) (Note 1)Unrealized appreciation (depreciation) on market-priced securities without options 4 060 244.62Total changes in unrealized appreciation (depreciation) 4 060 244.62
Net increase (decrease) in net assets as a result of operations 9 111 944.29

26 The notes are an integral part of the fi nancial statements.
UBS (Lux) Equity SICAV – Asian Smaller Companies (USD)Annual Report as of 31 May 2018
Statement of Changes in Net Assets USD 1.6.2017-31.5.2018Net assets at the beginning of the financial year 51 195 832.52Subscriptions 21 834 891.20Redemptions -11 565 896.09Total net subscriptions (redemptions) 10 268 995.11Net income (loss) on investments 356 675.66Total realized gain (loss) 4 695 024.01Total changes in unrealized appreciation (depreciation) 4 060 244.62Net increase (decrease) in net assets as a result of operations 9 111 944.29Net assets at the end of the financial year 70 576 771.92
Changes in the Number of Shares outstanding
1.6.2017-31.5.2018Class F-accNumber of shares outstanding at the beginning of the financial year 652.4230Number of shares issued 0.0000Number of shares redeemed -652.4230Number of shares outstanding at the end of the financial year 0.0000Class P-accNumber of shares outstanding at the beginning of the financial year 277 697.6530Number of shares issued 107 830.0480Number of shares redeemed -55 164.7390Number of shares outstanding at the end of the financial year 330 362.9620Class Q-accNumber of shares outstanding at the beginning of the financial year 38 525.7000Number of shares issued 5 491.9040Number of shares redeemed -7 470.1350Number of shares outstanding at the end of the financial year 36 547.4690

The notes are an integral part of the fi nancial statements. 27
UBS (Lux) Equity SICAV – Asian Smaller Companies (USD)Annual Report as of 31 May 2018
Statement of Investments in Securities and other Net Assets as of 31 May 2018
Description Quantity/ Valuation in USD as a % Nominal Unrealized gain of net (loss) on Futures/ assets Forward Exchange Contracts/ Swaps (Note 1)
Transferable securities and money market instruments listed on an official stock exchange
Bearer shares
China
HKD ANGANG STEEL ‘H’CNY1 816 000.00 808 888.44 1.15TWD CAYMAN ENGLEY INDU TWD10 129 000.00 695 342.35 0.98USD CHINA BIOLOGIC PR. COM USD0.0001 10 700.00 910 998.00 1.29HKD CHINA MEIDONG AUTO HKD0.1 1 600 000.00 752 255.24 1.07CNY DONG-E-E-JIAO CO ‘A’CNY1 78 000.00 731 379.47 1.04CNY JOINTOWN PHARMACEU ‘A’CNY1 159 400.00 460 942.67 0.65HKD LIVZON PHARMACEUTI ‘H’CNY1 109 920.00 790 604.96 1.12CNY LUZHOU LAO JIAO CO ‘A’CNY1 53 700.00 579 701.61 0.82HKD O-NET COMMUNICATIO HKD0.01 801 000.00 512 336.27 0.73HKD PACIFIC TEXTILES H HKD0.001 1 008 000.00 872 065.64 1.24HKD YIHAI INTERNATIONA USD0.00001 591 000.00 1 090 372.56 1.54CNY ZHEJIANG SUPOR COO ‘A’CNY1 104 398.00 842 882.15 1.19Total China 9 047 769.36 12.82
Hong Kong
HKD CHINA JINMAO HOLDI NPV 1 536 000.00 876 774.88 1.24HKD FAR EAST HORIZON L HKD0.01 1 812 000.00 1 923 189.44 2.72HKD HAITONG INTL SECS HKD0.10 2 170 000.00 1 224 848.38 1.74HKD HOPEWELL HLDGS HKD2.50 263 000.00 904 770.40 1.28HKD JOHNSON ELEC HLDGS COM HKD0.05 (POST REV/SPL) 269 750.00 824 881.50 1.17USD MANDARIN ORIENTAL ORD USD0.05(BERMUDA REG) 316 400.00 822 640.00 1.17HKD PACIFIC BASIN SHIP USD0.01 4 664 000.00 1 242 006.01 1.76HKD REGINA MIRACLE INT USD0.01 604 000.00 515 621.02 0.73HKD SHN INTL HLDGS HKD1 1 073 500.00 2 347 135.72 3.33HKD SINO BIOPHAMACEUTI HKD0.025 384 000.00 970 715.05 1.37HKD TECHTRONIC INDUSTR HKD0.1 211 000.00 1 264 913.87 1.79HKD UNIVERSAL MED FIN NPV 894 000.00 813 307.17 1.15Total Hong Kong 13 730 803.44 19.45
India
INR CITY UNION BANK INR1 362 925.00 1 055 615.45 1.50INR GAYATRI HIGHWAYS L INR2 125 664.00 13 589.13 0.02INR GAYATRI PROJECTS INR2 145 635.00 406 124.03 0.58INR ICICI PRUDENTIAL L INR10 163 280.00 1 021 921.77 1.45INR MARICO LTD INR1 309 269.00 1 474 510.43 2.09INR SRF LIMITED INR10 35 876.00 1 026 866.63 1.44Total India 4 998 627.44 7.08
Indonesia
IDR AKR CORPORINDO TBK IDR100 2 098 500.00 743 045.35 1.05IDR BK PAN INDONESIA IDR100 8 103 800.00 495 734.20 0.70IDR CIPUTRA DEVELOPMNT IDR250 9 841 300.00 715 344.25 1.02IDR PT INDO TAMBANGRAYA MEGAH 287 400.00 534 156.28 0.76Total Indonesia 2 488 280.08 3.53
Macau
HKD MGM CHINA HLDGS LT HKD1 242 400.00 704 184.29 1.00Total Macau 704 184.29 1.00
Malaysia
MYR GENTING MALAYSIA B MYR0.10 1 097 100.00 1 373 443.44 1.95MYR SCIENTEX BERHAD MYR0.50 437 900.00 777 167.92 1.10MYR SIME DARBY BHD MYR0.50 1 716 000.00 1 052 549.02 1.49MYR UNISEM (M) BHD MYR0.50 1 322 500.00 794 563.85 1.13MYR UZMA BHD MYR0.5 520 700.00 121 732.28 0.17Total Malaysia 4 119 456.51 5.84
Philippines
PHP MACROASIA CORP PHP1 2 849 500.00 1 410 227.37 2.00PHP PHILIPPINE SEVEN PHP1 200 685.00 488 958.51 0.69Total Philippines 1 899 185.88 2.69
Singapore
SGD SEMBCORP MARINE SGD0.10 808 700.00 1 294 500.71 1.83SGD SINGAPORE TECH ENG NPV 496 600.00 1 292 668.11 1.83SGD UOL GROUP LIMITED SGD1 166 100.00 1 008 850.33 1.43SGD VENTURE CORP LTD SGD0.25 93 800.00 1 480 424.86 2.10Total Singapore 5 076 444.01 7.19
South Korea
KRW EM TECH CO LTD KRW500 64 107.00 1 061 561.24 1.50KRW FILA KOREA LTD KRW1000 49 131.00 1 328 603.95 1.88KRW HYUNDAI ELEVATOR KRW5000 4 969.00 615 391.71 0.87KRW ING LIFE INSURANCE KRW1000 22 265.00 830 328.85 1.18KRW KOREA ZINC KRW5000 1 843.00 693 294.21 0.98KRW KUMHO PETRO CHEM KRW5000 10 382.00 1 011 280.66 1.43KRW RAYENCE CO LTD KRW500 44 182.00 801 296.99 1.14KRW WONIK QNC CORPORAT KRW500 214 532.00 3 174 345.15 4.50KRW WOOSHIN SYSTEMS KRW500 216 546.00 1 655 307.77 2.35Total South Korea 11 171 410.53 15.83

28 The notes are an integral part of the fi nancial statements.
UBS (Lux) Equity SICAV – Asian Smaller Companies (USD)Annual Report as of 31 May 2018
Taiwan
TWD CHAILEASE HOLDING TWD10 397 000.00 1 417 786.16 2.01TWD CHIPBOND TECHNOLO TWD10 330 000.00 693 890.49 0.98TWD KUNG LONG BATTERIE TWD10 233 000.00 1 147 055.39 1.63TWD NANYA TECHNOLOGY C TWD10 332 000.00 1 103 656.36 1.56TWD QST INTERNATIONAL TWD10 190 000.00 684 878.93 0.97TWD RICHWAVE TECHNOLOG TWD10 174 000.00 412 329.15 0.59TWD SDI CORP TWD10 468 000.00 1 244 917.64 1.76Total Taiwan 6 704 514.12 9.50
Total Bearer shares 59 940 675.66 84.93
Depository receipts
China
USD JUPAI HLDGS LTD ADS EACH REPR 6 SHS 41 100.00 1 012 704.00 1.43USD NEW ORIENTAL ED & TECH GRP INC SPON ADR 15 200.00 1 483 976.00 2.10USD TAL EDUCATION GRP ADS EA REPR 2 CL A ORD SHS 78 576.00 3 335 551.20 4.73Total China 5 832 231.20 8.26
Thailand
THB INTERHIDES PUBLIC THB1(NVDR) 1 996 900.00 561 847.60 0.80THB NETBAY PLC THB1 (NVDR) 704 800.00 881 344.27 1.25THB THAI WAH PUBLIC CO THB1 (NVDR) 2 198 100.00 652 815.95 0.92THB TMB BANK THB0.95(NVDR) 9 561 900.00 741 336.83 1.05Total Thailand 2 837 344.65 4.02
Total Depository receipts 8 669 575.85 12.28
Total Transferable securities and money market instruments listed on an official stock exchange 68 610 251.51 97.21
Transferable securities and money market instruments traded on another regulated market
Bearer shares
Taiwan
TWD TAIWAN SEMICONDUCT TWD10 245 000.00 697 511.81 0.99Total Taiwan 697 511.81 0.99
Total Bearer shares 697 511.81 0.99
Total Transferable securities and money market instruments traded on another regulated market 697 511.81 0.99
Total investments in securities 69 307 763.32 98.20
Cash at banks, deposits on demand and deposit accounts and other liquid assets 712 763.74 1.01Other assets and liabilities 556 244.86 0.79
Total net assets 70 576 771.92 100.00
Description Quantity/ Valuation in USD as a % Nominal Unrealized gain of net (loss) on Futures/ assets Forward Exchange Contracts/ Swaps (Note 1)

The notes are an integral part of the fi nancial statements. 29
UBS (Lux) Equity SICAV – Brazil (USD)Annual Report as of 31 May 2018
UBS (Lux) Equity SICAV – Brazil (USD)
Three-year comparison
ISIN 31.5.2018 31.5.2017 31.5.2016Net assets in USD 87 363 593.48 100 580 499.82 42 411 318.40Class P-acc LU0286682959Shares outstanding 1 351 954.8030 1 576 471.5860 929 611.8700Net asset value per share in USD 58.58 58.97 43.65Issue and redemption price per share in USD1 58.58 58.97 43.59Class Q-acc LU0399009397Shares outstanding 54 149.4910 50 639.4130 16 669.4670Net asset value per share in USD 150.88 150.34 110.02Issue and redemption price per share in USD1 150.88 150.34 109.87
1 See note 1
Performance
Currency 2017/2018 2016/2017 2015/2016Class P-acc USD -1.2% 35.3% -15.2%Class Q-acc USD -0.2% 36.8% -
Historical performance is no indicator of current or future performance.The performance data does not take account of any commissions and costs charged when subscribing and redeeming shares.The performance data were not audited.The subfund has no benchmark.
Report of the Portfolio Manager
The Brazilian market posted a positive return over the financial year, from 1 June 2017 to 31 May 2018. Some of the initial boost from positive economic momentum was offset in 2018 as fiscal discipline and reform worries resurfaced, with non-market-friendly Presidential candi-dates gaining momentum in the polls.
The subfund delivered a negative performance over the financial year. The subfund’s exposure to energy and materials contributed, aided by strong commodity prices and further governance improvement for state-owned enterprises like Vale or Petrobras. However, some of this positive impact was offset by exposure to education-related companies.
Structure of the Securities Portfolio
Geographical Breakdown as a % of net assetsBrazil 97.73Ireland 1.81Total 99.54
Economic Breakdown as a % of net assetsBanks & credit institutions 20.86Finance & holding companies 11.96Mining, coal & steel 11.25Petroleum 7.70Retail trade, department stores 7.15Real Estate 5.74Miscellaneous unclassified companies 5.11Telecommunications 4.72Miscellaneous consumer goods 4.66Traffic & transportation 3.71Miscellaneous services 3.50Internet, software & IT services 3.50Energy & water supply 3.33Insurance 1.94Agriculture & fishery 1.81Investment funds 1.80Chemicals 0.80Total 99.54

30 The notes are an integral part of the fi nancial statements.
UBS (Lux) Equity SICAV – Brazil (USD)Annual Report as of 31 May 2018
Statement of Net Assets USDAssets 31.5.2018Investments in securities, cost 101 198 117.70Investments in securities, unrealized appreciation (depreciation) -14 240 680.30Total investments in securities (Note 1) 86 957 437.40Cash at banks, deposits on demand and deposit accounts 480 619.02Receivable on subscriptions 59 263.42Interest receivable on liquid assets 2 457.80Receivable on dividends 423 805.24Total Assets 87 923 582.88
LiabilitiesPayable on redemptions -477 003.12Provisions for flat fee (Note 2) -74 073.84Provisions for taxe d’abonnement (Note 3) -7 320.31Provisions for other commissions and fees (Note 2) -1 592.13Total provisions -82 986.28Total Liabilities -559 989.40
Net assets at the end of the financial year 87 363 593.48
Statement of Operations USDIncome 1.6.2017-31.5.2018Interest on liquid assets 5 426.47Dividends 2 727 664.97Income on securities lending (Note 16) 5 299.27Other income (Note 4) 330 389.49Total income 3 068 780.20
ExpensesFlat fee (Note 2) -2 304 931.27Taxe d’abonnement (Note 3) -52 235.45Cost on securities lending (Note 16) -2 119.71Other commissions and fees (Note 2) -21 590.62Interest on cash and bank overdraft -1 390.75Total expenses -2 382 267.80
Net income (loss) on investments 686 512.40
Realized gain (loss) (Note 1)Realized gain (loss) on market-priced securities without options 8 378 177.38Realized gain (loss) on forward foreign exchange contracts -94 848.72Realized gain (loss) on foreign exchange -51 718.15Total realized gain (loss) 8 231 610.51
Net realized gain (loss) of the financial year 8 918 122.91
Changes in unrealized appreciation (depreciation) (Note 1)Unrealized appreciation (depreciation) on market-priced securities without options -14 768 232.98Total changes in unrealized appreciation (depreciation) -14 768 232.98
Net increase (decrease) in net assets as a result of operations -5 850 110.07
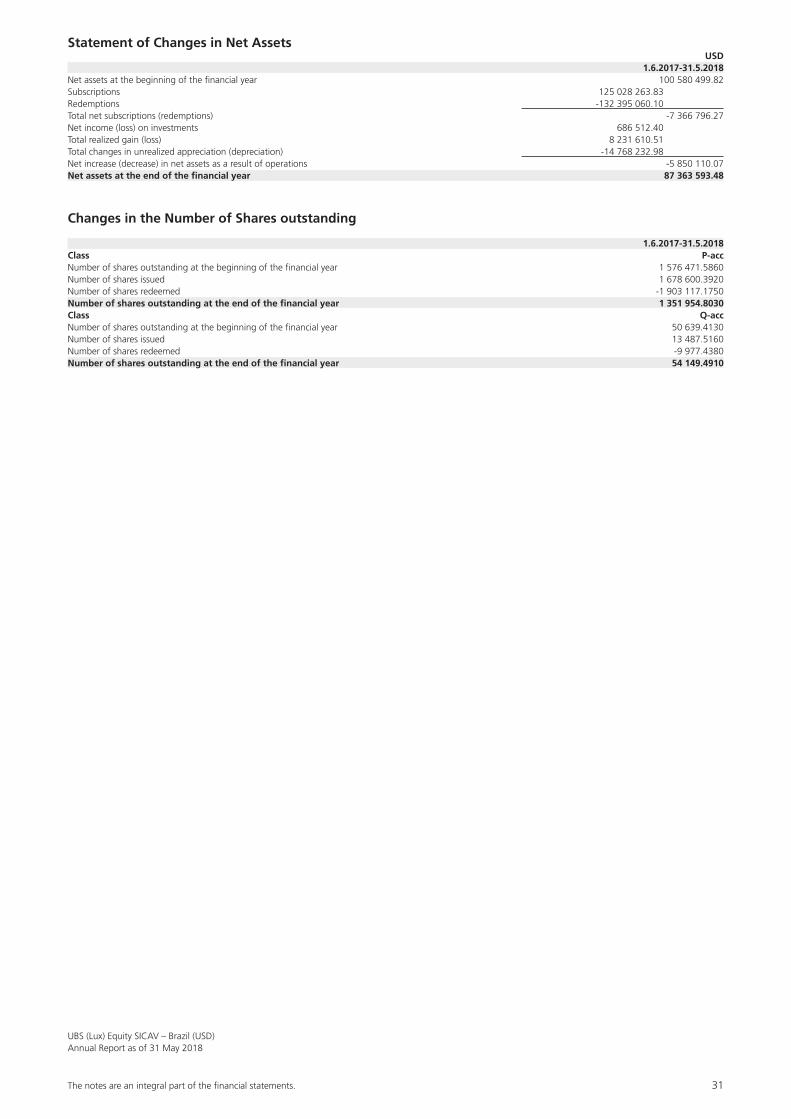
The notes are an integral part of the fi nancial statements. 31
UBS (Lux) Equity SICAV – Brazil (USD)Annual Report as of 31 May 2018
Statement of Changes in Net Assets USD 1.6.2017-31.5.2018Net assets at the beginning of the financial year 100 580 499.82Subscriptions 125 028 263.83Redemptions -132 395 060.10Total net subscriptions (redemptions) -7 366 796.27Net income (loss) on investments 686 512.40Total realized gain (loss) 8 231 610.51Total changes in unrealized appreciation (depreciation) -14 768 232.98Net increase (decrease) in net assets as a result of operations -5 850 110.07Net assets at the end of the financial year 87 363 593.48
Changes in the Number of Shares outstanding
1.6.2017-31.5.2018Class P-accNumber of shares outstanding at the beginning of the financial year 1 576 471.5860Number of shares issued 1 678 600.3920Number of shares redeemed -1 903 117.1750Number of shares outstanding at the end of the financial year 1 351 954.8030Class Q-accNumber of shares outstanding at the beginning of the financial year 50 639.4130Number of shares issued 13 487.5160Number of shares redeemed -9 977.4380Number of shares outstanding at the end of the financial year 54 149.4910

32 The notes are an integral part of the fi nancial statements.
UBS (Lux) Equity SICAV – Brazil (USD)Annual Report as of 31 May 2018
Statement of Investments in Securities and other Net Assets as of 31 May 2018
Description Quantity/ Valuation in USD as a % Nominal Unrealized gain of net (loss) on Futures/ assets Forward Exchange Contracts/ Swaps (Note 1)
Transferable securities and money market instruments listed on an official stock exchange
Bearer shares
Brazil
BRL B3 SA COM NPV 423 767.00 2 477 251.27 2.83BRL BB SEGURIDADE PART COM NPV 241 800.00 1 692 057.84 1.94BRL BCO DO BRASIL SA COM NPV 937 100.00 7 642 144.17 8.75BRL BR MALLS PARTICIPA COM NPV 841 283.00 2 326 825.61 2.66BRL CENTRAIS ELETRICAS BRASILEIRAS SA COM NPV 169 000.00 663 919.66 0.76BRL CIELO SA COM NPV 521 944.00 2 375 626.21 2.72BRL ENERGIAS DO BRASIL COM NPV 218 600.00 776 007.84 0.89BRL EQUATORIAL ENERGIA COM NPV 110 300.00 1 800 495.97 2.06BRL ESTACIO PARTICIPAC COM NPV 394 100.00 2 661 515.02 3.05BRL HYPERA SA COM NPV 507 800.00 3 845 265.24 4.40BRL KROTON EDUCACIONAL COM NPV 1 053 000.00 3 056 599.67 3.50BRL LINX SA COM NPV 598 600.00 3 054 040.63 3.50BRL LOJAS AMERICANAS S COM NPV 1 037 380.00 3 763 376.92 4.31BRL MARISA LOJAS SA COM NPV 176 700.00 223 956.18 0.26BRL MULTIPLAN EMPREEND COM STK NPV 170 400.00 2 684 541.83 3.07BRL PETROL BRASILEIROS COM NPV 545 000.00 3 247 418.80 3.72BRL RUMO SA COM NPV 874 000.00 3 241 078.93 3.71BRL SABESP CIA SANEAME COM NPV 209 600.00 1 471 795.49 1.68BRL ULTRAPAR PARTICIPA COM NPV 52 224.00 701 172.11 0.80BRL VALE SA COM NPV 309 084.00 4 202 124.82 4.81Total Brazil 51 907 214.21 59.42
Total Bearer shares 51 907 214.21 59.42
Preference shares
Brazil
BRL BCO BRADESCO SA PRF NPV 1 047 386.00 8 204 038.51 9.39BRL CIA BRAS DE DISTRI PRF NPV 116 400.00 2 484 875.34 2.84BRL GERDAU SA SIDERURG PRF NPV 1 416 100.00 5 627 819.18 6.44BRL ITAU UNIBANCO HOLDING SA PRF NPV 341 547.00 3 941 861.70 4.51BRL ITAUSA INV ITAU SA PRF NPV 1 337 048.00 4 031 913.92 4.62BRL PETROL BRASILEIROS PRF NPV 683 000.00 3 480 979.04 3.98BRL TELEFONICA BRASIL PRF NPV 337 200.00 4 119 869.50 4.72Total Brazil 31 891 357.19 36.50
Total Preference shares 31 891 357.19 36.50
Depository receipts
Brazil
USD BRF SA SPON ADR EACH REP 1 COM SHS 273 700.00 1 581 986.00 1.81Total Brazil 1 581 986.00 1.81
Total Depository receipts 1 581 986.00 1.81
Total Transferable securities and money market instruments listed on an official stock exchange 85 380 557.40 97.73
UCITS/Other UCIs in accordance with Article 41 (1) e) of the amended Luxembourg law of 17 December 2010
Investment funds, open end
Ireland
USD UBS (IRL) SELECT MONEY MARKET FUND-USD-S-DIST 157.69 1 576 880.00 1.81Total Ireland 1 576 880.00 1.81
Total Investment funds, open end 1 576 880.00 1.81
Total UCITS/Other UCIs in accordance with Article 41 (1) e) of the amended Luxembourg law of 17 December 2010 1 576 880.00 1.81
Total investments in securities 86 957 437.40 99.54
Cash at banks, deposits on demand and deposit accounts and other liquid assets 480 619.02 0.55Other assets and liabilities -74 462.94 -0.09
Total net assets 87 363 593.48 100.00

The notes are an integral part of the fi nancial statements. 33
UBS (Lux) Equity SICAV – Emerging Markets High Dividend (USD)Annual Report as of 31 May 2018
UBS (Lux) Equity SICAV – Emerging Markets High Dividend (USD)
Three-year comparison
ISIN 31.5.2018 31.5.2017 31.5.2016Net assets in USD 294 575 430.59 289 216 208.04 227 136 418.10Class F-acc1 LU1081984863Shares outstanding - 2 115.3710 8 206.7960Net asset value per share in USD - 90.54 72.30Issue and redemption price per share in USD2 - 90.54 72.30Class I-B-acc LU1081985753Shares outstanding 26 846.8610 26 846.8610 28 386.5510Net asset value per share in USD 101.26 92.35 73.23Issue and redemption price per share in USD2 101.26 92.35 73.23Class I-X-dist LU0883523192Shares outstanding 606 269.7390 609 479.3960 353 362.5330Net asset value per share in USD 89.91 84.57 70.03Issue and redemption price per share in USD2 89.91 84.57 70.03Class (EUR hedged) N-8%-mdist3 LU1121266271Shares outstanding - - 8 481.2560Net asset value per share in EUR - - 68.38Issue and redemption price per share in EUR2 - - 68.38Class P-acc LU0625543631Shares outstanding 695 732.4820 868 661.1800 1 219 171.0220Net asset value per share in USD 96.94 90.26 73.07Issue and redemption price per share in USD2 96.94 90.26 73.07Class (CHF hedged) P-acc LU1081987023Shares outstanding 249 273.4630 301 269.1790 247 656.9690Net asset value per share in CHF 86.87 83.27 69.16Issue and redemption price per share in CHF2 86.87 83.27 69.16Class (EUR hedged) P-acc LU1081987536Shares outstanding 296 659.6150 343 486.3150 403 555.1070Net asset value per share in EUR 88.50 84.62 69.96Issue and redemption price per share in EUR2 88.50 84.62 69.96Class (CHF hedged) P-dist LU0669577131Shares outstanding 185 749.2050 248 684.8050 287 375.2620Net asset value per share in CHF 83.92 81.58 69.39Issue and redemption price per share in CHF2 83.92 81.58 69.39Class P-mdist LU0625543805Shares outstanding 43 101.6820 21 198.5550 31 145.9410Net asset value per share in USD 69.52 67.66 57.89Issue and redemption price per share in USD2 69.52 67.66 57.89Class (HKD) P-mdist4 LU0625544282Shares outstanding - - 5 717.6670Net asset value per share in HKD - - 578.02Issue and redemption price per share in HKD2 - - 578.02Class Q-acc LU0847991816Shares outstanding 471 078.7160 311 354.2100 173 822.3060Net asset value per share in USD 97.20 89.60 71.81Issue and redemption price per share in USD2 97.20 89.60 71.81Class (CHF hedged) Q-acc LU1240782026Shares outstanding 190 353.4920 180 655.9330 89 145.2050Net asset value per share in CHF 117.93 111.92 92.02Issue and redemption price per share in CHF2 117.93 111.92 92.02Class (EUR hedged) Q-acc LU1081988344Shares outstanding 101 033.9560 98 263.4880 36 868.6270Net asset value per share in EUR 91.81 86.92 71.15Issue and redemption price per share in EUR2 91.81 86.92 71.15Class (CHF hedged) Q-dist LU1240782372Shares outstanding 163 070.1170 150 199.1010 129 584.2880Net asset value per share in CHF 114.10 110.70 92.02Issue and redemption price per share in CHF2 114.10 110.70 92.02Class U-X-acc5 LU0630196821Shares outstanding - - 461.1930Net asset value per share in USD - - 7 346.98Issue and redemption price per share in USD2 - - 7 346.98
1 The share class F-acc was in circulation until 27.7.20172 See note 13 The share class (EUR hedged) N-8%-mdist was in circulation until 16.9.20164 The share class (HKD) P-mdist was in circulation until 5.9.20165 The share class U-X-acc was in circulation until 8.7.2016

34 The notes are an integral part of the fi nancial statements.
UBS (Lux) Equity SICAV – Emerging Markets High Dividend (USD)Annual Report as of 31 May 2018
Performance
Currency 2017/2018 2016/2017 2015/2016Class F-acc1 USD - 25.2% -20.3%Class I-B-acc USD 9.6% 26.1% -19.7%Class I-X-dist USD 9.8% 26.3% -19.6%Class (EUR hedged) N-8%-mdist2 EUR - - -22.2%Class P-acc USD 7.4% 23.5% -21.4%Class (CHF hedged) P-acc CHF 4.3% 20.4% -22.3%Class (EUR hedged) P-acc EUR 4.6% 21.0% -21.8%Class (CHF hedged) P-dist CHF 4.3% 20.4% -22.3%Class P-mdist USD 7.4% 23.5% -21.4%Class (HKD) P-mdist3 HKD - - -21.1%Class Q-acc USD 8.5% 24.8% -20.6%Class (CHF hedged) Q-acc CHF 5.4% 21.6% -Class (EUR hedged) Q-acc EUR 5.6% 22.2% -21.0%Class (CHF hedged) Q-dist CHF 5.4% 21.6% -Class U-X-acc4 USD - - -19.6%
1 The share class F-acc was in circulation until 27.7.2017. Due to this fact, there is no data for the calculation of the performance available. 2 The share class (EUR hedged) N-8%-mdist was in circulation until 16.9.2016. Due to this fact, there is no data for the calculation of the performance available. 3 The share class (HKD) P-mdist was in circulation until 5.9.2016. Due to this fact, there is no data for the calculation of the performance available.4 The share class U-X-acc was in circulation until 8.7.2016. Due to this fact, there is no data for the calculation of the performance available.
Historical performance is no indicator of current or future performance.The performance data does not take account of any commissions and costs charged when subscribing and redeeming shares.The performance data were not audited.The subfund has no benchmark.
Report of the Portfolio Manager
During the financial year, from 1 June 2017 to 31 May 2018, Emerging Markets equities posted solid gains amid improved fundamentals which in turn led to strong inflows into the asset class. Performance has been more challenging however towards the end of the financial year, amid increasing trade tensions and renewed USD strength creating pressure points for currencies of the weaker EM economies.
The subfund posted solid gains over the financial year. The subfund’s exposure to defensive sectors (high yield-ing sectors) such as consumer staples, telecoms and utili-ties has however continued to lag the broader index in this second year of recovery for EM assets. In contrast, the strongest performance was achieved by IT and healthcare.
Structure of the Securities Portfolio
Geographical Breakdown as a % of net assetsHong Kong 16.51Taiwan 14.95China 10.24South Korea 9.14Brazil 8.61Russian Federation (CIS) 7.73Mexico 5.21Singapore 4.53India 3.68Czech Republic 3.57Indonesia 2.89Thailand 2.84Malaysia 1.84Macau 1.77Hungary 1.31South Africa 1.19Turkey 1.07Philippines 0.94Total 98.02
Economic Breakdown as a % of net assetsBanks & credit institutions 25.20Electronics & semiconductors 13.89Telecommunications 8.82Petroleum 8.20Finance & holding companies 6.76Mining, coal & steel 5.70Tobacco & alcohol 4.12Energy & water supply 3.65Chemicals 3.39Real Estate 2.91Electrical devices & components 2.12Lodging, catering & leisure 1.77Healthcare & social services 1.64Traffic & transportation 1.55Aerospace industry 1.53Building industry & materials 1.47Non-ferrous metals 1.39Retail trade, department stores 1.37Insurance 1.35Food & soft drinks 1.19Total 98.02
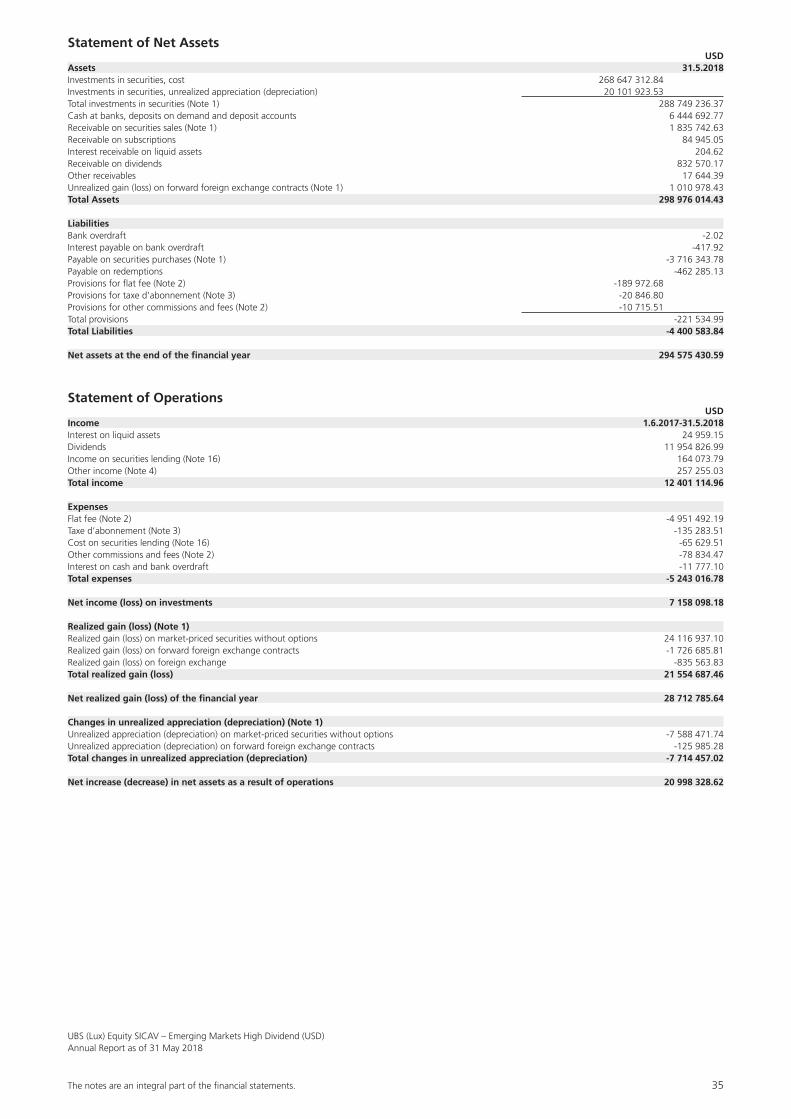
The notes are an integral part of the fi nancial statements. 35
UBS (Lux) Equity SICAV – Emerging Markets High Dividend (USD)Annual Report as of 31 May 2018
Statement of Net Assets USDAssets 31.5.2018Investments in securities, cost 268 647 312.84Investments in securities, unrealized appreciation (depreciation) 20 101 923.53Total investments in securities (Note 1) 288 749 236.37Cash at banks, deposits on demand and deposit accounts 6 444 692.77Receivable on securities sales (Note 1) 1 835 742.63Receivable on subscriptions 84 945.05Interest receivable on liquid assets 204.62Receivable on dividends 832 570.17Other receivables 17 644.39Unrealized gain (loss) on forward foreign exchange contracts (Note 1) 1 010 978.43Total Assets 298 976 014.43
LiabilitiesBank overdraft -2.02Interest payable on bank overdraft -417.92Payable on securities purchases (Note 1) -3 716 343.78Payable on redemptions -462 285.13Provisions for flat fee (Note 2) -189 972.68Provisions for taxe d’abonnement (Note 3) -20 846.80Provisions for other commissions and fees (Note 2) -10 715.51Total provisions -221 534.99Total Liabilities -4 400 583.84
Net assets at the end of the financial year 294 575 430.59
Statement of Operations USDIncome 1.6.2017-31.5.2018Interest on liquid assets 24 959.15Dividends 11 954 826.99Income on securities lending (Note 16) 164 073.79Other income (Note 4) 257 255.03Total income 12 401 114.96
ExpensesFlat fee (Note 2) -4 951 492.19Taxe d’abonnement (Note 3) -135 283.51Cost on securities lending (Note 16) -65 629.51Other commissions and fees (Note 2) -78 834.47Interest on cash and bank overdraft -11 777.10Total expenses -5 243 016.78
Net income (loss) on investments 7 158 098.18
Realized gain (loss) (Note 1)Realized gain (loss) on market-priced securities without options 24 116 937.10Realized gain (loss) on forward foreign exchange contracts -1 726 685.81Realized gain (loss) on foreign exchange -835 563.83Total realized gain (loss) 21 554 687.46
Net realized gain (loss) of the financial year 28 712 785.64
Changes in unrealized appreciation (depreciation) (Note 1)Unrealized appreciation (depreciation) on market-priced securities without options -7 588 471.74Unrealized appreciation (depreciation) on forward foreign exchange contracts -125 985.28Total changes in unrealized appreciation (depreciation) -7 714 457.02
Net increase (decrease) in net assets as a result of operations 20 998 328.62

36 The notes are an integral part of the fi nancial statements.
UBS (Lux) Equity SICAV – Emerging Markets High Dividend (USD)Annual Report as of 31 May 2018
Statement of Changes in Net Assets USD 1.6.2017-31.5.2018Net assets at the beginning of the financial year 289 216 208.04Subscriptions 98 046 139.18Redemptions -111 113 241.28Total net subscriptions (redemptions) -13 067 102.10Dividend paid -2 572 003.97Net income (loss) on investments 7 158 098.18Total realized gain (loss) 21 554 687.46Total changes in unrealized appreciation (depreciation) -7 714 457.02Net increase (decrease) in net assets as a result of operations 20 998 328.62Net assets at the end of the financial year 294 575 430.59
Changes in the Number of Shares outstanding
1.6.2017-31.5.2018Class F-accNumber of shares outstanding at the beginning of the financial year 2 115.3710Number of shares issued 0.0000Number of shares redeemed -2 115.3710Number of shares outstanding at the end of the financial year 0.0000Class I-B-accNumber of shares outstanding at the beginning of the financial year 26 846.8610Number of shares issued 0.0000Number of shares redeemed 0.0000Number of shares outstanding at the end of the financial year 26 846.8610Class I-X-distNumber of shares outstanding at the beginning of the financial year 609 479.3960Number of shares issued 80 945.2150Number of shares redeemed -84 154.8720Number of shares outstanding at the end of the financial year 606 269.7390Class P-accNumber of shares outstanding at the beginning of the financial year 868 661.1800Number of shares issued 46 283.7270Number of shares redeemed -219 212.4250Number of shares outstanding at the end of the financial year 695 732.4820Class (CHF hedged) P-accNumber of shares outstanding at the beginning of the financial year 301 269.1790Number of shares issued 25 056.3560Number of shares redeemed -77 052.0720Number of shares outstanding at the end of the financial year 249 273.4630Class (EUR hedged) P-accNumber of shares outstanding at the beginning of the financial year 343 486.3150Number of shares issued 423 510.9070Number of shares redeemed -470 337.6070Number of shares outstanding at the end of the financial year 296 659.6150Class (CHF hedged) P-distNumber of shares outstanding at the beginning of the financial year 248 684.8050Number of shares issued 11 909.1320Number of shares redeemed -74 844.7320Number of shares outstanding at the end of the financial year 185 749.2050Class P-mdistNumber of shares outstanding at the beginning of the financial year 21 198.5550Number of shares issued 29 413.6520Number of shares redeemed -7 510.5250Number of shares outstanding at the end of the financial year 43 101.6820Class Q-accNumber of shares outstanding at the beginning of the financial year 311 354.2100Number of shares issued 226 935.1460Number of shares redeemed -67 210.6400Number of shares outstanding at the end of the financial year 471 078.7160Class (CHF hedged) Q-accNumber of shares outstanding at the beginning of the financial year 180 655.9330Number of shares issued 32 569.8590Number of shares redeemed -22 872.3000Number of shares outstanding at the end of the financial year 190 353.4920Class (EUR hedged) Q-accNumber of shares outstanding at the beginning of the financial year 98 263.4880Number of shares issued 25 991.2400Number of shares redeemed -23 220.7720Number of shares outstanding at the end of the financial year 101 033.9560Class (CHF hedged) Q-distNumber of shares outstanding at the beginning of the financial year 150 199.1010Number of shares issued 39 507.4260Number of shares redeemed -26 636.4100Number of shares outstanding at the end of the financial year 163 070.1170

The notes are an integral part of the fi nancial statements. 37
UBS (Lux) Equity SICAV – Emerging Markets High Dividend (USD)Annual Report as of 31 May 2018
Annual Distribution
UBS (Lux) Equity SICAV– Emerging Markets High Dividend (USD) Ex-Date Pay-Date Currency Amount per share
I-X-dist 2.8.2017 7.8.2017 USD 2.93(CHF hedged) P-dist 2.8.2017 7.8.2017 CHF 1.21(CHF hedged) Q-dist 2.8.2017 7.8.2017 CHF 2.59
Monthly Distribution
UBS (Lux) Equity SICAV– Emerging Markets High Dividend (USD) Ex-Date Pay-Date Currency Amount per share
P-mdist 15.6.2017 20.6.2017 USD 0.27P-mdist 18.7.2017 21.7.2017 USD 0.27P-mdist 16.8.2017 21.8.2017 USD 0.27P-mdist 15.9.2017 20.9.2017 USD 0.27P-mdist 16.10.2017 19.10.2017 USD 0.27P-mdist 15.11.2017 20.11.2017 USD 0.27P-mdist 15.12.2017 20.12.2017 USD 0.27P-mdist 16.1.2018 19.1.2018 USD 0.27P-mdist 16.2.2018 21.2.2018 USD 0.27P-mdist 15.3.2018 20.3.2018 USD 0.27P-mdist 16.4.2018 19.4.2018 USD 0.27P-mdist 15.5.2018 18.5.2018 USD 0.27

38 The notes are an integral part of the fi nancial statements.
UBS (Lux) Equity SICAV – Emerging Markets High Dividend (USD)Annual Report as of 31 May 2018
Statement of Investments in Securities and other Net Assets as of 31 May 2018
Description Quantity/ Valuation in USD as a % Nominal Unrealized gain of net (loss) on Futures/ assets Forward Exchange Contracts/ Swaps (Note 1)
Transferable securities and money market instruments listed on an official stock exchange
Bearer shares
Brazil
BRL AMBEV SA COM NPV 640 000.00 3 383 842.86 1.15BRL BB SEGURIDADE PART COM NPV 570 000.00 3 988 721.96 1.35BRL VALE SA COM NPV 572 079.00 7 777 650.61 2.64Total Brazil 15 150 215.43 5.14
China
HKD BANK OF CHINA LTD ‘H’HKD1 10 050 000.00 5 291 395.50 1.80HKD CHINA CONST BK ‘H’CNY1 5 983 870.00 6 072 245.58 2.06HKD CHINA MERCHANTS BK ‘H’CNY1 1 508 000.00 6 190 294.68 2.10HKD CHINA VANKE CO ‘H’CNY1 1 011 300.00 3 713 014.16 1.26HKD INDUSTRIAL & COM B ‘H’CNY1 10 740 000.00 8 913 317.57 3.02Total China 30 180 267.49 10.24
Czech Republic
CZK CEZ CZK100 266 214.00 6 650 144.23 2.26CZK KOMERCNI BANKA CZK100 95 555.00 3 866 734.41 1.31Total Czech Republic 10 516 878.64 3.57
Hong Kong
HKD ASM PACIFIC TECH HKD0.10 312 300.00 4 029 086.64 1.37HKD BOC HONG KONG HLDG HKD5 990 000.00 4 922 139.43 1.67HKD CHINA MERCHANTS PO NPV 1 825 211.00 4 146 435.25 1.41HKD CHINA MOBILE LTD NPV 648 000.00 5 828 088.45 1.98HKD CHINA RES LAND HKD0.10 1 288 000.00 4 843 864.53 1.64HKD CHINA RES PWR HLDG HKD1 2 031 938.00 4 092 810.62 1.39HKD CNOOC LTD HKD0.02 3 347 000.00 5 845 617.44 1.98HKD HANG SENG BANK HKD5 224 300.00 5 527 328.01 1.88HKD ORIENT O/SEAS INTL USD0.10 482 500.00 4 564 101.91 1.55HKD UNIVERSAL MED FIN NPV 5 354 500.00 4 826 057.00 1.64Total Hong Kong 48 625 529.28 16.51
Hungary
HUF OTP BANK HUF100 107 895.00 3 860 891.66 1.31Total Hungary 3 860 891.66 1.31
India
INR BHARAT PETROL CORP INR10 1 044 883.00 6 333 633.04 2.15INR ITC INR1 1 123 003.00 4 494 008.97 1.53Total India 10 827 642.01 3.68
Indonesia
IDR BK MANDIRI IDR250 8 345 200.00 4 249 179.14 1.44IDR GUDANG GARAM(PERUS IDR500 870 400.00 4 272 136.34 1.45Total Indonesia 8 521 315.48 2.89
Macau
HKD SANDS CHINA LTD USD0.01 REG’S’ 910 000.00 5 220 450.91 1.77Total Macau 5 220 450.91 1.77
Malaysia
MYR CIMB GROUP HOLDINGS BHD MYR1 3 528 526.00 5 408 042.36 1.84Total Malaysia 5 408 042.36 1.84
Mexico
MXN GPO MEXICO SA SER’B’COM NPV 1 334 258.00 3 301 575.83 1.12MXN GRUPO FINANCIERO BANORTE SAB DE CV COM SER’O’NPV 1 513 000.00 8 029 051.99 2.72MXN WAL-MART DE MEXICO COM NPV 1 609 000.00 4 024 831.60 1.37Total Mexico 15 355 459.42 5.21
Philippines
PHP PLDT INC PHP5 112 060.00 2 762 278.84 0.94Total Philippines 2 762 278.84 0.94
Singapore
SGD SINGAPORE TECH ENG NPV 1 750 000.00 4 501 102.84 1.53SGD SINGAPORE TELECOMM NPV(POST RE-ORG) 1 715 700.00 4 169 146.51 1.42SGD UTD O/S BANK SGD1 221 779.00 4 669 555.23 1.58Total Singapore 13 339 804.58 4.53
South Africa
ZAR TIGER BRANDS ZAR0.10 131 922.00 3 498 823.51 1.19Total South Africa 3 498 823.51 1.19
South Korea
KRW KOREA ZINC KRW5000 10 564.00 4 101 334.88 1.39KRW POSCO KRW5000 18 115.00 5 705 313.25 1.94KRW SHINHAN FIN GROUP KRW5000 98 714.00 4 056 802.39 1.38KRW SK TELECOM KRW500 19 326.00 3 980 121.47 1.35Total South Korea 17 843 571.99 6.06

The notes are an integral part of the fi nancial statements. 39
UBS (Lux) Equity SICAV – Emerging Markets High Dividend (USD)Annual Report as of 31 May 2018
Taiwan
TWD FORMOSA CHEM&FIBRE TWD10 1 324 000.00 5 081 855.05 1.73TWD FORMOSA PLASTIC TWD10 1 345 000.00 4 915 558.30 1.67TWD HON HAI PRECISION TWD10 1 529 400.00 4 420 541.03 1.50TWD NOVATEK MICROELECT TWD10 1 368 000.00 6 255 227.55 2.12TWD TAIWAN SEMICON MAN TWD10 1 219 000.00 9 113 562.41 3.09TWD WPG HOLDINGS TWD10 4 213 260.00 6 046 766.02 2.05Total Taiwan 35 833 510.36 12.16
Thailand
THB BANGKOK BANK THB10(ALIEN MKT) 665 500.00 4 035 854.96 1.37Total Thailand 4 035 854.96 1.37
Turkey
TRY TUPRAS(T PETR RAF) TRY1 135 000.00 3 156 729.00 1.07Total Turkey 3 156 729.00 1.07
Total Bearer shares 234 137 265.92 79.48
Preference shares
Brazil
BRL ITAUSA INV ITAU SA PRF NPV 2 090 118.00 6 302 822.23 2.14Total Brazil 6 302 822.23 2.14
Russian Federation (CIS)
USD SBERBANK PAO 2 740 887.00 8 619 209.79 2.93Total Russian Federation (CIS) 8 619 209.79 2.93
South Korea
KRW SAMSUNG ELECTRONIC PFD KRW100 240 367.00 9 075 501.43 3.08Total South Korea 9 075 501.43 3.08
Total Preference shares 23 997 533.45 8.15
Registered shares
Taiwan
TWD ASE INDL HLDG CO L TWD10 3 242 614.00 8 225 177.78 2.79Total Taiwan 8 225 177.78 2.79
Total Registered shares 8 225 177.78 2.79
Depository receipts
Brazil
USD TELEFONICA BRASIL SPON ADR EA REPR 1 PFD SH 324 200.00 3 906 610.00 1.33Total Brazil 3 906 610.00 1.33
Russian Federation (CIS)
USD MOBILE TELESYSTEMS OJSC SPONSORED ADR 556 900.00 5 335 102.00 1.81USD OIL CO LUKOIL PJSC ADR EACH REPR 1 ORD RUB0.02 132 182.00 8 821 826.68 2.99Total Russian Federation (CIS) 14 156 928.68 4.80
Thailand
THB SIAM CEMENT CO THB1(NVDR) 306 150.00 4 325 720.54 1.47Total Thailand 4 325 720.54 1.47
Total Depository receipts 22 389 259.22 7.60
Total Transferable securities and money market instruments listed on an official stock exchange 288 749 236.37 98.02
Total investments in securities 288 749 236.37 98.02
Forward Foreign Exchange contracts
Forward Foreign Exchange contracts (Purchase/Sale)
CHF 80 122 900.00 USD 80 362 299.29 25.6.2018 1 295 048.70 0.44EUR 37 441 000.00 USD 44 058 509.55 25.6.2018 -280 954.41 -0.10USD 895 828.79 EUR 759 400.00 25.6.2018 7 907.12 0.00USD 198 786.29 EUR 169 600.00 25.6.2018 483.00 0.00USD 1 402 759.24 CHF 1 388 200.00 25.6.2018 -12 026.43 0.00USD 274 277.74 EUR 233 500.00 25.6.2018 1 259.95 0.00USD 117 743.58 EUR 100 700.00 25.6.2018 1.00 0.00SGD 760 000.00 USD 564 402.31 1.6.2018 3 843.23 0.00USD 1 505 476.85 EUR 1 289 600.00 25.6.2018 -2 376.44 0.00USD 1 725 050.13 CHF 1 694 800.00 25.6.2018 -2 207.29 0.00Total Forward Foreign Exchange contracts (Purchase/Sale) 1 010 978.43 0.34
Cash at banks, deposits on demand and deposit accounts and other liquid assets 6 444 692.77 2.19Bank overdraft and other short-term liabilities -2.02 0.00Other assets and liabilities -1 629 474.96 -0.55
Total net assets 294 575 430.59 100.00
Description Quantity/ Valuation in USD as a % Nominal Unrealized gain of net (loss) on Futures/ assets Forward Exchange Contracts/ Swaps (Note 1)

40 The notes are an integral part of the fi nancial statements.
UBS (Lux) Equity SICAV – Emerging Markets Sustainable (USD)Annual Report as of 31 May 2018
UBS (Lux) Equity SICAV – Emerging Markets Sustainable (USD)
Three-year comparison
ISIN 31.5.2018 31.5.2017 31.5.2016Net assets in USD 16 743 262.22 17 921 093.07 15 040 780.72Class P-acc LU0346595837Shares outstanding 102 704.6120 132 887.9100 119 232.1110Net asset value per share in USD 95.43 83.28 71.48Issue and redemption price per share in USD1 95.43 83.28 71.27Class (EUR) P-acc LU0398999499Shares outstanding 32 604.8110 37 578.0990 46 196.7680Net asset value per share in EUR 126.06 114.21 99.01Issue and redemption price per share in EUR1 126.06 114.21 98.71Class Q-acc LU0399016178Shares outstanding 5 153.9430 6 353.0120 3 429.5600Net asset value per share in USD 132.16 114.37 97.34Issue and redemption price per share in USD1 132.16 114.37 97.05Class (EUR) Q-acc LU0979885364Shares outstanding 8 437.6290 8 672.2420 8 554.2380Net asset value per share in EUR 148.54 133.45 114.72Issue and redemption price per share in EUR1 148.54 133.45 114.38
1 See note 1
Performance
Currency 2017/2018 2016/2017 2015/2016Class P-acc USD 14.6% 16.9% -14.5%Class (EUR) P-acc EUR 10.4% 15.7% -15.8%Class Q-acc USD 15.6% 17.8% -13.8%Class (EUR) Q-acc EUR 11.3% 16.7% -15.1%
Historical performance is no indicator of current or future performance.The performance data does not take account of any commissions and costs charged when subscribing and redeeming shares.The performance data were not audited.The subfund has no benchmark.

The notes are an integral part of the fi nancial statements. 41
UBS (Lux) Equity SICAV – Emerging Markets Sustainable (USD)Annual Report as of 31 May 2018
Report of the Portfolio Manager
During the financial year, from 1 June 2017 to 31 May 2018, equity markets in emerging economies rallied led by China. The performance was driven by the weak dol-lar and robust economic growth, which was followed by large equity investor flows into the region. In recent months, the strengthening dollar and tempered eco-nomic outlook provided headwinds.
The subfund posted a positive performance driven by stock selection in Energy and Industrials. Small positions in Telecoms also contributed to the results. On the other side of the spectrum, securities selection in Information Technology and Materials detracted from performance. Within the subfund, we have a preference in Korea and Thailand and we are cautious about Taiwan and Russia.
Structure of the Securities Portfolio
Geographical Breakdown as a % of net assetsChina 28.75South Korea 18.74Taiwan 12.80India 10.05South Africa 8.32Thailand 4.53Brazil 3.91Mexico 3.73Hong Kong 3.29Indonesia 1.79Russian Federation (CIS) 0.90Malaysia 0.84Total 97.65
Economic Breakdown as a % of net assetsBanks & credit institutions 18.82Internet, software & IT services 8.90Electronics & semiconductors 7.84Building industry & materials 7.14Pharmaceuticals, cosmetics & medical products 6.28Graphic design, publishing & media 4.93Computer hardware & network equipment providers 4.79Vehicles 4.77Miscellaneous services 4.57Electrical devices & components 3.51Food & soft drinks 3.26Telecommunications 2.83Energy & water supply 2.74Traffic & transportation 2.65Finance & holding companies 2.37Miscellaneous unclassified companies 2.23Insurance 2.15Mining, coal & steel 2.11Petroleum 1.59Packaging industry 1.38Textiles, garments & leather goods 1.32Lodging, catering & leisure 0.83Tobacco & alcohol 0.64Total 97.65

42 The notes are an integral part of the fi nancial statements.
UBS (Lux) Equity SICAV – Emerging Markets Sustainable (USD)Annual Report as of 31 May 2018
Statement of Net Assets USDAssets 31.5.2018Investments in securities, cost 13 873 340.42Investments in securities, unrealized appreciation (depreciation) 2 476 507.30Total investments in securities (Note 1) 16 349 847.72Cash at banks, deposits on demand and deposit accounts 334 375.34Receivable on securities sales (Note 1) 8 320.84Receivable on subscriptions 754.64Interest receivable on liquid assets 0.84Receivable on dividends 46 368.04Other receivables 21 156.41Total Assets 16 760 823.83
LiabilitiesPayable on redemptions -1 530.92Provisions for flat fee (Note 2) -14 356.44Provisions for taxe d’abonnement (Note 3) -1 402.93Provisions for other commissions and fees (Note 2) -271.32Total provisions -16 030.69Total Liabilities -17 561.61
Net assets at the end of the financial year 16 743 262.22
Statement of Operations USDIncome 1.6.2017-31.5.2018Interest on liquid assets 2 317.81Dividends 439 363.78Income on securities lending (Note 16) 3 778.08Other income (Note 4) 20 312.68Total income 465 772.35
ExpensesFlat fee (Note 2) -336 839.84Taxe d’abonnement (Note 3) -8 546.41Cost on securities lending (Note 16) -1 511.23Other commissions and fees (Note 2) -5 891.75Interest on cash and bank overdraft -251.21Total expenses -353 040.44
Net income (loss) on investments 112 731.91
Realized gain (loss) (Note 1)Realized gain (loss) on market-priced securities without options 1 800 973.14Realized gain (loss) on forward foreign exchange contracts 513.88Realized gain (loss) on foreign exchange -12 582.87Total realized gain (loss) 1 788 904.15
Net realized gain (loss) of the financial year 1 901 636.06
Changes in unrealized appreciation (depreciation) (Note 1)Unrealized appreciation (depreciation) on market-priced securities without options 523 615.51Total changes in unrealized appreciation (depreciation) 523 615.51
Net increase (decrease) in net assets as a result of operations 2 425 251.57

The notes are an integral part of the fi nancial statements. 43
UBS (Lux) Equity SICAV – Emerging Markets Sustainable (USD)Annual Report as of 31 May 2018
Statement of Changes in Net Assets USD 1.6.2017-31.5.2018Net assets at the beginning of the financial year 17 921 093.07Subscriptions 3 355 449.06Redemptions -6 958 531.48Total net subscriptions (redemptions) -3 603 082.42Net income (loss) on investments 112 731.91Total realized gain (loss) 1 788 904.15Total changes in unrealized appreciation (depreciation) 523 615.51Net increase (decrease) in net assets as a result of operations 2 425 251.57Net assets at the end of the financial year 16 743 262.22
Changes in the Number of Shares outstanding
1.6.2017-31.5.2018Class P-accNumber of shares outstanding at the beginning of the financial year 132 887.9100Number of shares issued 26 081.7320Number of shares redeemed -56 265.0300Number of shares outstanding at the end of the financial year 102 704.6120Class (EUR) P-accNumber of shares outstanding at the beginning of the financial year 37 578.0990Number of shares issued 2 028.3740Number of shares redeemed -7 001.6620Number of shares outstanding at the end of the financial year 32 604.8110Class Q-accNumber of shares outstanding at the beginning of the financial year 6 353.0120Number of shares issued 2 220.0000Number of shares redeemed -3 419.0690Number of shares outstanding at the end of the financial year 5 153.9430Class (EUR) Q-accNumber of shares outstanding at the beginning of the financial year 8 672.2420Number of shares issued 2 788.3930Number of shares redeemed -3 023.0060Number of shares outstanding at the end of the financial year 8 437.6290

44 The notes are an integral part of the fi nancial statements.
UBS (Lux) Equity SICAV – Emerging Markets Sustainable (USD)Annual Report as of 31 May 2018
Statement of Investments in Securities and other Net Assets as of 31 May 2018
Description Quantity/ Valuation in USD as a % Nominal Unrealized gain of net (loss) on Futures/ assets Forward Exchange Contracts/ Swaps (Note 1)
Transferable securities and money market instruments listed on an official stock exchange
Bearer shares
Brazil
BRL BCO DO BRASIL SA COM NPV 26 400.00 215 294.64 1.29BRL CIELO SA COM NPV 25 516.00 116 135.98 0.69Total Brazil 331 430.62 1.98
China
HKD CHINA CITIC BK COR ‘H’CNY1 582 000.00 396 203.54 2.37HKD CHINA CONST BK ‘H’CNY1 555 000.00 563 196.78 3.36HKD CHINA SUNTIEN GREEN ENERGY-H 996 000.00 350 447.15 2.09HKD GREATVIEW ASEPTIC HKD0.01 317 000.00 230 350.01 1.38HKD INDUSTRIAL & COM B ‘H’CNY1 735 000.00 609 989.61 3.64HKD LENOVO GROUP LTD HKD0.025 162 000.00 85 913.71 0.51HKD PING AN INSURANCE ‘H’CNY1 36 500.00 359 921.09 2.15HKD TENCENT HLDGS LIMI HKD0.00002 16 700.00 860 105.94 5.14HKD TINGYI(CAYMAN ISL) USD 0.005 96 000.00 218 333.41 1.31Total China 3 674 461.24 21.95
Hong Kong
HKD CHINA MOBILE LTD NPV 29 000.00 260 824.95 1.56HKD SINO BIOPHAMACEUTI HKD0.025 117 000.00 289 958.76 1.73Total Hong Kong 550 783.71 3.29
India
INR AXIS BANK INR2 18 842.00 149 797.84 0.90INR HCL TECHNOLOGIES INR2 12 389.00 167 919.07 1.00INR ICICI BANK INR2 73 840.00 318 032.02 1.90INR INFOSYS LTD INR5 14 149.00 257 054.41 1.54INR MAHINDRA &MAHINDRA INR5 30 858.00 415 204.89 2.48INR NTPC LTD INR10 69 550.00 169 591.41 1.01INR TECH MAHINDRA INR5 19 506.00 204 577.06 1.22Total India 1 682 176.70 10.05
Indonesia
IDR BK MANDIRI IDR250 588 300.00 299 548.49 1.79Total Indonesia 299 548.49 1.79
Malaysia
MYR MISC BERHAD MYR1 90 800.00 141 219.10 0.84Total Malaysia 141 219.10 0.84
Mexico
MXN FOMENTO ECONOMICO UNITS (REP 1’B’& 4’D’ SHS) 13 000.00 107 995.54 0.65MXN GRUPO FINANCIERO BANORTE SAB DE CV COM SER’O’NPV 56 000.00 297 175.75 1.77Total Mexico 405 171.29 2.42
South Africa
ZAR IMPERIAL HLDGS ZAR0.04 18 765.00 302 432.83 1.80ZAR NASPERS ‘N’ ZAR0.02 3 453.00 825 012.08 4.93ZAR SASOL NPV 7 366.00 266 083.30 1.59Total South Africa 1 393 528.21 8.32
South Korea
KRW GS ENGINEERING & C KRW5000 12 661.00 560 844.88 3.35KRW HYUNDAI ENG & CONS KRW5000 6 382.00 415 026.85 2.48KRW HYUNDAI MOBIS KRW5000 972.00 204 237.67 1.22KRW HYUNDAI MOTOR CO KRW5000 1 385.00 179 878.47 1.07KRW LG HOUSEHOLD&HEALT KRW5000 404.00 519 077.87 3.10KRW POSCO KRW5000 1 121.00 353 058.58 2.11KRW SAMSUNG C&T CORPOR KRW100 1 196.00 138 689.18 0.83KRW SAMSUNG ELECTRONIC KRW100 16 120.00 767 156.17 4.58Total South Korea 3 137 969.67 18.74
Taiwan
TWD ASUSTEK COMPUTER TWD10 32 000.00 296 380.35 1.77TWD COMPAL ELECTRONIC TWD10 284 000.00 187 680.86 1.12TWD DELTA ELECTRONIC TWD10 55 000.00 210 186.41 1.25TWD FORMOSA TAFFETA CO TWD10 193 000.00 221 591.04 1.32TWD LITE-ON TECHNOLOGY TWD10 178 112.00 232 140.37 1.39TWD PACIFIC HOSPITAL S TWD10 98 000.00 242 043.96 1.45Total Taiwan 1 390 022.99 8.30
Thailand
THB CHAROEN POK FOODS THB1(ALIEN MKT) 411 500.00 328 016.56 1.96THB KASIKORNBANK PLC THB10 (ALIEN MKT) 69 500.00 430 165.68 2.57Total Thailand 758 182.24 4.53
Total Bearer shares 13 764 494.26 82.21
Other shares
Brazil
BRL AES TIETE ENERGIA UNITS (1 COM & 4 PRF) 40 571.00 108 616.39 0.65Total Brazil 108 616.39 0.65
Total Other shares 108 616.39 0.65

The notes are an integral part of the fi nancial statements. 45
UBS (Lux) Equity SICAV – Emerging Markets Sustainable (USD)Annual Report as of 31 May 2018
Preference shares
Brazil
BRL TELEFONICA BRASIL PRF NPV 17 500.00 213 812.92 1.28Total Brazil 213 812.92 1.28
Total Preference shares 213 812.92 1.28
Depository receipts
China
USD ALIBABA GROUP HLDG SPON ADS EACH REP ONE ORD-ADR 3 868.00 765 902.68 4.57USD NEW ORIENTAL ED & TECH GRP INC SPON ADR 3 750.00 373 012.50 2.23Total China 1 138 915.18 6.80
Mexico
USD CEMEX SAB DE CV SPON ADR 5 ORD 36 784.00 219 232.64 1.31Total Mexico 219 232.64 1.31
Taiwan
USD TAIWAN SEMICON MAN ADS REP 5 ORD TWD10 14 100.00 545 670.00 3.26Total Taiwan 545 670.00 3.26
Total Depository receipts 1 903 817.82 11.37
Total Transferable securities and money market instruments listed on an official stock exchange 15 990 741.39 95.51
Transferable securities and money market instruments traded on another regulated market
Bearer shares
Russian Federation (CIS)
USD SBERBANK PAO 42 308.00 150 938.32 0.90Total Russian Federation (CIS) 150 938.32 0.90
Taiwan
TWD SIMPLO TECHNOLOGY TWD10 33 000.00 208 167.15 1.24Total Taiwan 208 167.15 1.24
Total Bearer shares 359 105.47 2.14
Total Transferable securities and money market instruments traded on another regulated market 359 105.47 2.14
Transferable securities and money market instruments not listed on an official stock exchange and not traded on another regulated market
Bearer shares
Cayman Islands
HKD CHINA METAL RECYCL HKD0.0001 676 800.00 0.86 0.00Total Cayman Islands 0.86 0.00
Total Bearer shares 0.86 0.00
Total Transferable securities and money market instruments not listed on an official stock exchange and not traded on another regulated market 0.86 0.00
Total investments in securities 16 349 847.72 97.65
Cash at banks, deposits on demand and deposit accounts and other liquid assets 334 375.34 2.00Other assets and liabilities 59 039.16 0.35
Total net assets 16 743 262.22 100.00
Description Quantity/ Valuation in USD as a % Nominal Unrealized gain of net (loss) on Futures/ assets Forward Exchange Contracts/ Swaps (Note 1)

46 The notes are an integral part of the fi nancial statements.
UBS (Lux) Equity SICAV – Euro Countries Income (EUR)Annual Report as of 31 May 2018
UBS (Lux) Equity SICAV – Euro Countries Income (EUR)
Three-year comparison
ISIN 31.5.2018 31.5.2017 31.5.2016Net assets in EUR 400 952 866.39 336 023 296.84 225 670 015.70Class I-A1-acc1 LU1432555495Shares outstanding 69 371.7430 46 920.8790 -Net asset value per share in EUR 119.60 118.95 -Issue and redemption price per share in EUR2 119.60 119.24 -Class K-1-acc LU1179468605Shares outstanding 2.6000 2.6000 2.6000Net asset value per share in EUR 3 348 144.76 3 344 960.84 2 905 150.50Issue and redemption price per share in EUR2 3 348 144.76 3 352 988.75 2 905 150.50Class K-X-acc3 LU1620846581Shares outstanding 83 278.4020 - -Net asset value per share in EUR 100.54 - -Issue and redemption price per share in EUR2 100.54 - -Class (USD hedged) P-8%-mdist LU1216467149Shares outstanding 154 061.2220 123 417.6560 173 210.6210Net asset value per share in USD 84.34 89.80 83.43Issue and redemption price per share in USD2 84.34 90.02 83.43Class P-acc LU1121265208Shares outstanding 667 028.3480 769 946.5820 590 606.0320Net asset value per share in EUR 112.97 113.44 99.04Issue and redemption price per share in EUR2 112.97 113.71 99.04Class (CHF hedged) P-acc LU1121265463Shares outstanding 101 067.6900 94 508.6640 103 075.4470Net asset value per share in CHF 110.75 111.69 97.93Issue and redemption price per share in CHF2 110.75 111.96 97.93Class (USD hedged) P-acc LU1121265620Shares outstanding 106 925.1040 103 922.6500 170 949.3720Net asset value per share in USD 117.03 115.08 98.73Issue and redemption price per share in USD2 117.03 115.36 98.73Class P-dist LU1121265380Shares outstanding 111 898.7090 98 521.7460 77 560.9380Net asset value per share in EUR 95.17 101.43 96.43Issue and redemption price per share in EUR2 95.17 101.67 96.43Class (CHF hedged) P-dist LU1121265547Shares outstanding 161 626.3230 129 166.6340 120 341.1070Net asset value per share in CHF 93.26 99.86 95.36Issue and redemption price per share in CHF2 93.26 100.10 95.36Class (USD hedged) P-dist LU1121265893Shares outstanding 41 404.5380 44 480.3200 89 073.5230Net asset value per share in USD 98.73 103.02 96.21Issue and redemption price per share in USD2 98.73 103.27 96.21Class (USD hedged) Q-8%-mdist LU1240783693Shares outstanding 18 548.5380 9 679.9560 18 723.3180Net asset value per share in USD 97.95 103.65 95.71Issue and redemption price per share in USD2 97.95 103.90 95.71Class Q-acc LU1240784071Shares outstanding 484 125.6930 358 996.9380 212 711.9200Net asset value per share in EUR 107.92 107.70 93.43Issue and redemption price per share in EUR2 107.92 107.96 93.43Class (CHF hedged) Q-acc LU1240783347Shares outstanding 533 708.2290 388 760.0050 276 072.2240Net asset value per share in CHF 106.73 106.98 93.22Issue and redemption price per share in CHF2 106.73 107.24 93.22Class (USD hedged) Q-acc LU1240783776Shares outstanding 97 572.4480 97 491.0150 102 027.7680Net asset value per share in USD 112.33 109.78 93.60Issue and redemption price per share in USD2 112.33 110.04 93.60Class Q-dist LU1240784154Shares outstanding 401 045.8060 251 792.5470 80 495.6650Net asset value per share in EUR 94.52 100.68 93.43Issue and redemption price per share in EUR2 94.52 100.92 93.43Class (CHF hedged) Q-dist LU1240783420Shares outstanding 979 496.6480 561 725.9550 306 562.9600Net asset value per share in CHF 93.45 100.00 93.22Issue and redemption price per share in CHF2 93.45 100.24 93.22

The notes are an integral part of the fi nancial statements. 47
UBS (Lux) Equity SICAV – Euro Countries Income (EUR)Annual Report as of 31 May 2018
ISIN 31.5.2018 31.5.2017 31.5.2016
Class (USD hedged) Q-dist LU1240783859Shares outstanding 70 295.5200 75 945.6560 77 515.1470Net asset value per share in USD 98.45 102.70 93.64Issue and redemption price per share in USD2 98.45 102.95 93.64Class U-X-acc4 LU1230950906Shares outstanding - - 383.7850Net asset value per share in EUR - - 9 488.34Issue and redemption price per share in EUR2 - - 9 488.34Class U-X-UKdist-mdist5 LU1480127684Shares outstanding 460.0530 623.2460 -Net asset value per share in EUR 10 653.08 11 338.07 -Issue and redemption price per share in EUR2 10 653.08 11 365.28 -
1 First NAV: 4.7.20162 See note 13 First NAV: 2.6.20174 For the period from 1.6.2015 to 20.9.2016 the share class U-X-acc was in circulation5 First NAV: 16.9.2016
Performance
Currency 2017/2018 2016/2017 2015/2016Class I-A1-acc EUR 0.5% - -Class K-1-acc EUR -0.1% 15.4% -6.2%Class K-X-acc1 EUR - - -Class (USD hedged) P-8%-mdist USD 1.4% 16.8% -6.9%Class P-acc EUR -0.7% 14.8% -6.7%Class (CHF hedged) P-acc CHF -1.1% 14.3% -7.4%Class (USD hedged) P-acc USD 1.4% 16.8% -6.9%Class P-dist EUR -0.6% 14.8% -6.7%Class (CHF hedged) P-dist CHF -1.1% 14.3% -7.4%Class (USD hedged) P-dist USD 1.5% 16.9% -6.8%Class (USD hedged) Q-8%-mdist USD 2.1% 17.6% -Class Q-acc EUR -0.0% 15.6% -Class (CHF hedged) Q-acc CHF -0.5% 15.0% -Class (USD hedged) Q-acc USD 2.1% 17.6% -Class Q-dist EUR -0.0% 15.5% -Class (CHF hedged) Q-dist CHF -0.5% 15.0% -Class (USD hedged) Q-dist USD 2.1% 17.6% -Class U-X-acc2 EUR - - -5.1%Class U-X-UKdist-mdist EUR 1.2% - -
1 Due to the recent launch, there is no data for the calculation of the performance available.2 For the period from 1.6.2015 to 20.9.2016 the share class U-X-acc was in circulation. Due to this fact, there is no data for the calculation of the performance available.
Historical performance is no indicator of current or future performance.The performance data does not take account of any commissions and costs charged when subscribing and redeeming shares.The performance data were not audited.The subfund has no benchmark.

48 The notes are an integral part of the fi nancial statements.
UBS (Lux) Equity SICAV – Euro Countries Income (EUR)Annual Report as of 31 May 2018
Report of the Portfolio Manager
In the financial year, from 1 June 2017 to 31 May 2018, Euro zone equity returns were slightly positive. The markets started off strongly, fueled by solid growth, but February then saw a sell-off led by inflation fears and rising rate expectations. The markets declined further on the back of slowing growth momentum and trade ten-sions, as US import tariffs led to concerns over retaliation measures and uncertainty.
The subfund posted positive returns for the U-X, I-A1-acc and all USD hedged share classes while fees cancelled the return for the others. From a sector perspective, Financials and Information Technology contributed positively while Telecom Services and Utilities detracted. From a stock perspective, Hermes and Dassault added value, while Sodexo and Sanofi detracted most.
Structure of the Securities Portfolio
Geographical Breakdown as a % of net assetsFrance 30.06Germany 23.90Spain 11.84Italy 8.72Finland 8.33Belgium 8.06The Netherlands 6.07Luxembourg 0.59Switzerland -0.04United States -0.06United Kingdom -0.08Total 97.39
Economic Breakdown as a % of net assetsEnergy & water supply 13.53Insurance 10.02Telecommunications 7.26Real Estate 5.88Pharmaceuticals, cosmetics & medical products 5.68Textiles, garments & leather goods 5.46Internet, software & IT services 5.08Banks & credit institutions 4.93Retail trade, department stores 4.34Finance & holding companies 3.66Graphic design, publishing & media 3.24Petroleum 3.22Chemicals 3.20Food & soft drinks 3.11Mechanical engineering & industrial equipment 2.71Tobacco & alcohol 2.53Aerospace industry 2.36Miscellaneous services 1.93Photographic & optics 1.67Miscellaneous consumer goods 1.56Lodging, catering & leisure 1.35Rubber & tyres 1.32Building industry & materials 1.07Traffic & transportation 0.91Electrical devices & components 0.75Non-ferrous metals 0.62Total 97.39
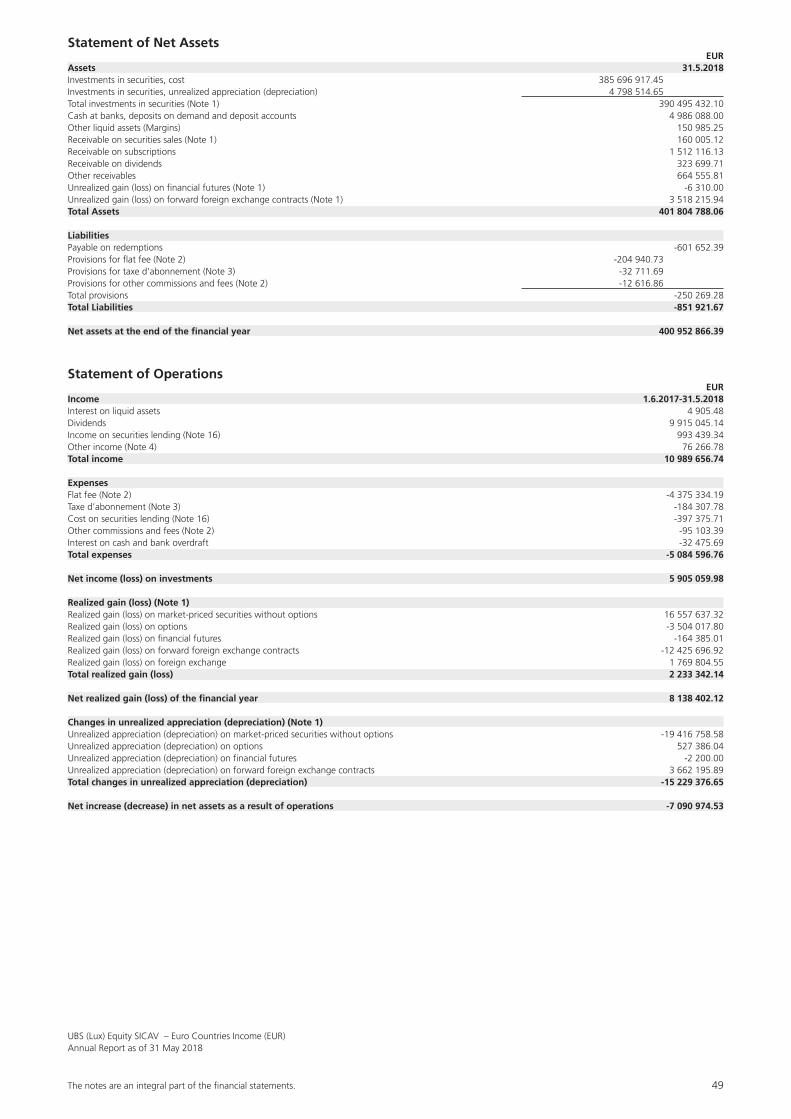
The notes are an integral part of the fi nancial statements. 49
UBS (Lux) Equity SICAV – Euro Countries Income (EUR)Annual Report as of 31 May 2018
Statement of Net Assets EURAssets 31.5.2018Investments in securities, cost 385 696 917.45Investments in securities, unrealized appreciation (depreciation) 4 798 514.65Total investments in securities (Note 1) 390 495 432.10Cash at banks, deposits on demand and deposit accounts 4 986 088.00Other liquid assets (Margins) 150 985.25Receivable on securities sales (Note 1) 160 005.12Receivable on subscriptions 1 512 116.13Receivable on dividends 323 699.71Other receivables 664 555.81Unrealized gain (loss) on financial futures (Note 1) -6 310.00Unrealized gain (loss) on forward foreign exchange contracts (Note 1) 3 518 215.94Total Assets 401 804 788.06
LiabilitiesPayable on redemptions -601 652.39Provisions for flat fee (Note 2) -204 940.73Provisions for taxe d’abonnement (Note 3) -32 711.69Provisions for other commissions and fees (Note 2) -12 616.86Total provisions -250 269.28Total Liabilities -851 921.67
Net assets at the end of the financial year 400 952 866.39
Statement of Operations EURIncome 1.6.2017-31.5.2018Interest on liquid assets 4 905.48Dividends 9 915 045.14Income on securities lending (Note 16) 993 439.34Other income (Note 4) 76 266.78Total income 10 989 656.74
ExpensesFlat fee (Note 2) -4 375 334.19Taxe d’abonnement (Note 3) -184 307.78Cost on securities lending (Note 16) -397 375.71Other commissions and fees (Note 2) -95 103.39Interest on cash and bank overdraft -32 475.69Total expenses -5 084 596.76
Net income (loss) on investments 5 905 059.98
Realized gain (loss) (Note 1)Realized gain (loss) on market-priced securities without options 16 557 637.32Realized gain (loss) on options -3 504 017.80Realized gain (loss) on financial futures -164 385.01Realized gain (loss) on forward foreign exchange contracts -12 425 696.92Realized gain (loss) on foreign exchange 1 769 804.55Total realized gain (loss) 2 233 342.14
Net realized gain (loss) of the financial year 8 138 402.12
Changes in unrealized appreciation (depreciation) (Note 1)Unrealized appreciation (depreciation) on market-priced securities without options -19 416 758.58Unrealized appreciation (depreciation) on options 527 386.04Unrealized appreciation (depreciation) on financial futures -2 200.00Unrealized appreciation (depreciation) on forward foreign exchange contracts 3 662 195.89Total changes in unrealized appreciation (depreciation) -15 229 376.65
Net increase (decrease) in net assets as a result of operations -7 090 974.53

50 The notes are an integral part of the fi nancial statements.
UBS (Lux) Equity SICAV – Euro Countries Income (EUR)Annual Report as of 31 May 2018
Statement of Changes in Net Assets EUR 1.6.2017-31.5.2018Net assets at the beginning of the financial year 336 023 296.84Subscriptions 160 771 498.64Redemptions -79 979 626.69Total net subscriptions (redemptions) 80 791 871.95Dividend paid -8 771 327.87Net income (loss) on investments 5 905 059.98Total realized gain (loss) 2 233 342.14Total changes in unrealized appreciation (depreciation) -15 229 376.65Net increase (decrease) in net assets as a result of operations -7 090 974.53Net assets at the end of the financial year 400 952 866.39
Changes in the Number of Shares outstanding
1.6.2017-31.5.2018Class I-A1-accNumber of shares outstanding at the beginning of the financial year 46 920.8790Number of shares issued 22 450.8640Number of shares redeemed 0.0000Number of shares outstanding at the end of the financial year 69 371.7430Class K-1-accNumber of shares outstanding at the beginning of the financial year 2.6000Number of shares issued 0.4000Number of shares redeemed -0.4000Number of shares outstanding at the end of the financial year 2.6000Class K-X-accNumber of shares outstanding at the beginning of the financial year 0.0000Number of shares issued 96 803.2400Number of shares redeemed -13 524.8380Number of shares outstanding at the end of the financial year 83 278.4020Class (USD hedged) P-8%-mdistNumber of shares outstanding at the beginning of the financial year 123 417.6560Number of shares issued 98 828.3980Number of shares redeemed -68 184.8320Number of shares outstanding at the end of the financial year 154 061.2220Class P-accNumber of shares outstanding at the beginning of the financial year 769 946.5820Number of shares issued 159 353.7060Number of shares redeemed -262 271.9400Number of shares outstanding at the end of the financial year 667 028.3480Class (CHF hedged) P-accNumber of shares outstanding at the beginning of the financial year 94 508.6640Number of shares issued 33 739.5830Number of shares redeemed -27 180.5570Number of shares outstanding at the end of the financial year 101 067.6900Class (USD hedged) P-accNumber of shares outstanding at the beginning of the financial year 103 922.6500Number of shares issued 37 781.6390Number of shares redeemed -34 779.1850Number of shares outstanding at the end of the financial year 106 925.1040Class P-distNumber of shares outstanding at the beginning of the financial year 98 521.7460Number of shares issued 43 785.3200Number of shares redeemed -30 408.3570Number of shares outstanding at the end of the financial year 111 898.7090Class (CHF hedged) P-distNumber of shares outstanding at the beginning of the financial year 129 166.6340Number of shares issued 64 656.6190Number of shares redeemed -32 196.9300Number of shares outstanding at the end of the financial year 161 626.3230Class (USD hedged) P-distNumber of shares outstanding at the beginning of the financial year 44 480.3200Number of shares issued 13 352.8650Number of shares redeemed -16 428.6470Number of shares outstanding at the end of the financial year 41 404.5380Class (USD hedged) Q-8%-mdistNumber of shares outstanding at the beginning of the financial year 9 679.9560Number of shares issued 9 762.3660Number of shares redeemed -893.7840Number of shares outstanding at the end of the financial year 18 548.5380Class Q-accNumber of shares outstanding at the beginning of the financial year 358 996.9380Number of shares issued 195 840.2170Number of shares redeemed -70 711.4620Number of shares outstanding at the end of the financial year 484 125.6930

The notes are an integral part of the fi nancial statements. 51
UBS (Lux) Equity SICAV – Euro Countries Income (EUR)Annual Report as of 31 May 2018
Class (CHF hedged) Q-accNumber of shares outstanding at the beginning of the financial year 388 760.0050Number of shares issued 220 283.3150Number of shares redeemed -75 335.0910Number of shares outstanding at the end of the financial year 533 708.2290Class (USD hedged) Q-accNumber of shares outstanding at the beginning of the financial year 97 491.0150Number of shares issued 53 832.0180Number of shares redeemed -53 750.5850Number of shares outstanding at the end of the financial year 97 572.4480Class Q-distNumber of shares outstanding at the beginning of the financial year 251 792.5470Number of shares issued 192 068.2160Number of shares redeemed -42 814.9570Number of shares outstanding at the end of the financial year 401 045.8060Class (CHF hedged) Q-distNumber of shares outstanding at the beginning of the financial year 561 725.9550Number of shares issued 467 128.6330Number of shares redeemed -49 357.9400Number of shares outstanding at the end of the financial year 979 496.6480Class (USD hedged) Q-distNumber of shares outstanding at the beginning of the financial year 75 945.6560Number of shares issued 4 178.2070Number of shares redeemed -9 828.3430Number of shares outstanding at the end of the financial year 70 295.5200Class U-X-UKdist-mdistNumber of shares outstanding at the beginning of the financial year 623.2460Number of shares issued 44.0930Number of shares redeemed -207.2860Number of shares outstanding at the end of the financial year 460.0530
Annual Distribution
UBS (Lux) Equity SICAV– Euro Countries Income (EUR) Ex-Date Pay-Date Currency Amount per share
P-dist 2.8.2017 7.8.2017 EUR 5.71(CHF hedged) P-dist 2.8.2017 7.8.2017 CHF 5.64(USD hedged) P-dist 2.8.2017 7.8.2017 USD 5.80Q-dist 2.8.2017 7.8.2017 EUR 6.19(CHF hedged) Q-dist 2.8.2017 7.8.2017 CHF 6.17(USD hedged) Q-dist 2.8.2017 7.8.2017 USD 6.34
Monthly Distribution
UBS (Lux) Equity SICAV– Euro Countries Income (EUR) Ex-Date Pay-Date Currency Amount per share
(USD hedged) P-8%-mdist 13.6.2017 16.6.2017 USD 0.60(USD hedged) P-8%-mdist 10.7.2017 13.7.2017 USD 0.57(USD hedged) P-8%-mdist 10.8.2017 16.8.2017 USD 0.57(USD hedged) P-8%-mdist 11.9.2017 14.9.2017 USD 0.57(USD hedged) P-8%-mdist 10.10.2017 13.10.2017 USD 0.57(USD hedged) P-8%-mdist 10.11.2017 15.11.2017 USD 0.58(USD hedged) P-8%-mdist 11.12.2017 14.12.2017 USD 0.57(USD hedged) P-8%-mdist 10.1.2018 16.1.2018 USD 0.57(USD hedged) P-8%-mdist 12.2.2018 15.2.2018 USD 0.57(USD hedged) P-8%-mdist 12.3.2018 15.3.2018 USD 0.55(USD hedged) P-8%-mdist 10.4.2018 13.4.2018 USD 0.55(USD hedged) P-8%-mdist 11.5.2018 16.5.2018 USD 0.57(USD hedged) Q-8%-mdist 13.6.2017 16.6.2017 USD 0.69(USD hedged) Q-8%-mdist 10.7.2017 13.7.2017 USD 0.66(USD hedged) Q-8%-mdist 10.8.2017 16.8.2017 USD 0.66(USD hedged) Q-8%-mdist 11.9.2017 14.9.2017 USD 0.66(USD hedged) Q-8%-mdist 10.10.2017 13.10.2017 USD 0.67(USD hedged) Q-8%-mdist 10.11.2017 15.11.2017 USD 0.67(USD hedged) Q-8%-mdist 11.12.2017 14.12.2017 USD 0.66(USD hedged) Q-8%-mdist 10.1.2018 16.1.2018 USD 0.66(USD hedged) Q-8%-mdist 12.2.2018 15.2.2018 USD 0.66(USD hedged) Q-8%-mdist 12.3.2018 15.3.2018 USD 0.64(USD hedged) Q-8%-mdist 10.4.2018 13.4.2018 USD 0.63(USD hedged) Q-8%-mdist 11.5.2018 16.5.2018 USD 0.66U-X-UKdist-mdist 3.7.2017 6.7.2017 EUR 252.72U-X-UKdist-mdist 18.7.2017 21.7.2017 EUR 71.93

52 The notes are an integral part of the fi nancial statements.
UBS (Lux) Equity SICAV – Euro Countries Income (EUR)Annual Report as of 31 May 2018
UBS (Lux) Equity SICAV– Euro Countries Income (EUR) Ex-Date Pay-Date Currency Amount per share
U-X-UKdist-mdist 16.8.2017 21.8.2017 EUR 47.63U-X-UKdist-mdist 15.9.2017 20.9.2017 EUR 38.95U-X-UKdist-mdist 16.10.2017 19.10.2017 EUR 25.69U-X-UKdist-mdist 15.11.2017 20.11.2017 EUR 45.34U-X-UKdist-mdist 15.12.2017 20.12.2017 EUR 57.66U-X-UKdist-mdist 16.1.2018 19.1.2018 EUR 41.23U-X-UKdist-mdist 15.2.2018 20.2.2018 EUR 38.26U-X-UKdist-mdist 15.3.2018 20.3.2018 EUR 42.48U-X-UKdist-mdist 16.4.2018 19.4.2018 EUR 41.08U-X-UKdist-mdist 15.5.2018 18.5.2018 EUR 105.38

The notes are an integral part of the fi nancial statements. 53
UBS (Lux) Equity SICAV – Euro Countries Income (EUR)Annual Report as of 31 May 2018
Statement of Investments in Securities and other Net Assets as of 31 May 2018
Description Quantity/ Valuation in EUR as a % Nominal Unrealized gain of net (loss) on Futures/ assets Forward Exchange Contracts/ Swaps (Note 1)
Transferable securities and money market instruments listed on an official stock exchange
Bearer shares
Belgium
EUR AGEAS NPV 184 719.00 8 016 804.60 2.00EUR COLRUYT SA NPV 82 651.00 3 758 140.97 0.94EUR GPE BRUXELLES LAM NPV 54 637.00 4 956 668.64 1.23EUR PROXIMUS SA NPV 175 160.00 4 012 915.60 1.00EUR UCB NPV 71 719.00 4 841 032.50 1.21Total Belgium 25 585 562.31 6.38
Finland
EUR ELISA CORPORATION EUR0.50 125 988.00 4 819 041.00 1.20EUR KESKO OYJ EUR2 SER’B’ 67 732.00 3 394 727.84 0.85EUR KONE CORPORATION NPV ORD ‘B’ 155 414.00 6 581 782.90 1.64EUR NOKIAN RENKAAT OYJ NPV 159 884.00 5 309 747.64 1.32EUR SAMPO OYJ SER’A’NPV 214 732.00 9 035 922.56 2.25EUR WARTSILA OYJ ABP SER’B’EUR3.50 236 613.00 4 279 146.11 1.07Total Finland 33 420 368.05 8.33
France
EUR ACCOR EUR3 115 974.00 5 428 742.94 1.35EUR BOUYGUES EUR1 108 121.00 4 275 104.34 1.07EUR CNP ASSURANCES EUR1 112 694.00 2 256 133.88 0.56EUR DANONE EUR0.25 156 339.00 10 223 007.21 2.55EUR DASSAULT SYSTEMES EUR0.50 52 097.00 6 259 454.55 1.56EUR ESSILOR INTL EUR0.18 34 579.00 4 042 285.10 1.01EUR FONCIERE DES REGIO EUR3 45 193.00 4 033 475.25 1.01EUR HERMES INTL NPV 17 054.00 10 382 475.20 2.59EUR L’OREAL EUR0.20 50 069.00 10 294 186.40 2.57EUR ORANGE EUR4 594 026.00 8 747 032.85 2.18EUR PERNOD RICARD EUR1.55 70 722.00 10 162 751.40 2.54EUR PUBLICIS GROUPE SA EUR0.40 134 129.00 7 986 040.66 1.99EUR RUBIS EUR1.25(POST SPLIT) 45 192.00 2 727 337.20 0.68EUR SCOR SE EUR7.876972 (POST CONS) 105 605.00 3 335 005.90 0.83EUR SODEXO EUR4 86 928.00 7 216 762.56 1.80EUR THALES EUR3 67 785.00 7 381 786.50 1.84EUR TOTAL EUR2.5 189 070.00 9 841 093.50 2.45Total France 114 592 675.44 28.58
Germany
EUR AAREAL BANK AG NPV 94 956.00 3 482 986.08 0.87EUR AURUBIS AG 36 049.00 2 503 242.56 0.63EUR BEIERSDORF AG NPV 36 425.00 3 579 120.50 0.89EUR DEUTSCHE WOHNEN AG NPV (BR) 158 144.00 6 346 318.72 1.58EUR INNOGY SE NPV 126 602.00 4 571 598.22 1.14EUR SAP AG ORD NPV 105 431.00 10 157 222.54 2.53EUR TELEFONICA DEUTSCH NPV 499 866.00 1 807 515.46 0.45Total Germany 32 448 004.08 8.09
Italy
EUR BANCA MEDIOLANUM NPV 339 856.00 2 054 429.52 0.51EUR LUXOTTICA GROUP EUR0.06 125 511.00 6 687 226.08 1.67EUR POSTE ITALIANE SPA NPV 481 975.00 3 529 984.90 0.88EUR SALVATORE FERRAGAM EUR0.10 89 164.00 2 201 459.16 0.55EUR SNAM EUR1 2 314 179.00 8 118 139.93 2.03EUR TERNA SPA ORD EUR0.22 2 057 019.00 9 320 353.09 2.32EUR UNIPOLSAI SPA NPV 1 616 573.00 3 042 390.39 0.76Total Italy 34 953 983.07 8.72
Luxembourg
EUR RTL GROUP NPV 36 589.00 2 356 331.60 0.59Total Luxembourg 2 356 331.60 0.59
The Netherlands
EUR AKZO NOBEL NV EUR2 61 715.37 4 634 824.44 1.16EUR KONINKLIJKE AHOLD EUR0.01 521 186.00 10 243 389.64 2.55EUR NN GROUP N.V. EUR0.12 201 758.00 7 416 624.08 1.85Total The Netherlands 22 294 838.16 5.56
Spain
EUR AENA SME S.A. EUR10 22 159.00 3 640 723.70 0.91EUR ENAGAS SA EUR1.50 399 860.00 9 120 806.60 2.27EUR ENDESA SA EUR1.2 444 201.00 8 370 967.85 2.09EUR GAS NATURAL SDG EUR1 93 441.00 1 961 326.59 0.49EUR IBERDROLA SA EUR0.75 (POST SUBDIVISION) 1 126 649.00 6 841 012.73 1.71EUR INTL CONS AIRLINE ORD EUR0.50 268 807.00 2 088 092.78 0.52EUR MERLIN PROPERTIES EUR1 356 751.00 4 204 310.54 1.05EUR RED ELECTRICA CORP EUR0.5 357 865.00 5 958 452.25 1.49EUR SIEMENS GAMESA RENEWABLE ENERGY 230 145.00 3 027 557.48 0.75EUR VISCOFAN SA EUR0.70 39 354.00 2 241 210.30 0.56Total Spain 47 454 460.82 11.84
Total Bearer shares 313 106 223.53 78.09

54 The notes are an integral part of the fi nancial statements.
UBS (Lux) Equity SICAV – Euro Countries Income (EUR)Annual Report as of 31 May 2018
Other shares
The Netherlands
EUR UNILEVER NV CVA EUR0.16 43 117.00 2 058 405.58 0.51Total The Netherlands 2 058 405.58 0.51
Total Other shares 2 058 405.58 0.51
Preference shares
Germany
EUR FUCHS PETROLUB SE NON-VTG PRF NPV 68 190.00 3 059 003.40 0.76EUR HENKEL AG&CO. KGAA NON-VTG PRF NPV 39 880.00 4 213 322.00 1.05Total Germany 7 272 325.40 1.81
Total Preference shares 7 272 325.40 1.81
Registered shares
Belgium
EUR KBC GROUP NV NPV 101 496.00 6 719 035.20 1.68Total Belgium 6 719 035.20 1.68
France
EUR GECINA EUR7.50 25 607.00 3 789 836.00 0.95EUR LAGARDERE SCA EUR6.10(REGD) 94 249.00 2 177 151.90 0.54Total France 5 966 987.90 1.49
Germany
EUR AXEL SPRINGER SE NPV(REGD) 45 329.00 2 814 930.90 0.70EUR BAYER AG NPV (REGD) 25 519.00 2 599 365.34 0.65EUR DEUTSCHE TELEKOM NPV(REGD) 557 265.00 7 367 043.30 1.84EUR EVONIK INDUSTRIES NPV 186 528.00 5 592 109.44 1.39EUR FREENET AG NPV (REGD) 160 632.00 3 943 515.60 0.98EUR HANNOVER RUECKVERS ORD NPV(REGD) 55 505.00 5 994 540.00 1.50EUR HUGO BOSS AG NPV (REGD) 121 054.00 9 306 631.52 2.32EUR LEG IMMOBILIEN AG NPV 44 977.00 4 217 043.52 1.05EUR MUENCHENER RUECKVE NPV(REGD) 51 610.00 9 098 843.00 2.27EUR VONOVIA SE NPV 128 629.00 5 191 466.44 1.30Total Germany 56 125 489.06 14.00
Total Registered shares 68 811 512.16 17.17
Total Transferable securities and money market instruments listed on an official stock exchange 391 248 466.67 97.58
Derivative instruments not listed on an official stock exchange and not traded on another regulated market
Options on shares, classic-styled
EUR
EUR GOLDMAN SACHS/DASSAULT SYSTEMES E CALL 116.92800 21.06.18 -48 180.00 -209 953.50 -0.05EUR GOLDMAN SACHS/EVONIK INDUSTRIES N CALL 31.91350 21.06.18 -172 530.00 -6 964.44 0.00EUR GOLDMAN SACHS/GAS NATURAL SDG CALL 23.12100 21.06.18 -86 430.00 -5 292.05 0.00EUR GOLDMAN SACHS/HENKEL AG&CO. KGAA CALL 112.50750 21.06.18 -36 880.00 -3 785.92 0.00EUR GOLDMAN SACHS/IBERDROLA SA CALL 6.81030 21.06.18 -1 042 150.00 -4 879.12 0.00EUR GOLDMAN SACHS/KESKO OYJ CALL 53.04600 21.06.18 -62 650.00 -12 225.96 0.00EUR GOLDMAN SACHS/LAGARDERE SCA CALL 23.87700 21.06.18 -87 180.00 -15 021.04 -0.01EUR GOLDMAN SACHS/AURUBIS AG CALL 76.81050 21.06.18 -33 340.00 -2 936.92 0.00EUR GOLDMAN SACHS/TELEFONICA DEUTSCH CALL 3.85070 21.06.18 -462 370.00 -11 600.40 0.00EUR GOLDMAN SACHS/L’OREAL CALL 217.14000 21.06.18 -46 310.00 -11 452.83 0.00EUR GOLDMAN SACHS/RED ELECTRICA CORP CALL 18.15450 21.06.18 -331 020.00 -3 712.39 0.00EUR GOLDMAN SACHS/UCB NPV CALL 68.88000 21.06.18 -66 340.00 -38 018.18 -0.01EUR GOLDMAN SACHS/ACCOR CALL 50.42100 21.06.18 -107 270.00 -6 085.05 0.00EUR HSBC/AAREAL BANK AG CALL 40.73640 21.06.18 -87 830.00 -517.50 0.00EUR HSBC/BOUYGUES CALL 43.94200 21.06.18 -100 010.00 -2 583.28 0.00EUR HSBC/UNILEVER NV CVA CALL 50.67300 21.06.18 -39 880.00 -2 017.49 0.00EUR MORGAN STANLEY/PUBLICIS GROUPE SA CALL 61.80080 21.06.18 -124 060.00 -13 632.86 0.00EUR MORGAN STANLEY/KONINKLIJKE AHOLD CALL 20.69760 21.06.18 -482 090.00 -7 023.09 0.00EUR MORGAN STANLEY/AENA SME S.A. CALL 177.92250 21.06.18 -20 490.00 -1 537.00 0.00EUR MORGAN STANLEY/AKZO NOBEL NV CALL 80.57700 21.06.18 -54 280.00 -4 293.51 0.00EUR MORGAN STANLEY/HUGO BOSS AG CALL 80.82900 21.06.18 -73 630.00 -20 727.30 -0.01EUR MORGAN STANLEY/DEUTSCHE WOHNEN AG CALL 39.97670 21.06.18 -146 280.00 -36 387.27 -0.01EUR MORGAN STANLEY/ELISA CORPORATION E CALL 39.53250 21.06.18 -74 000.00 -14 572.01 -0.01EUR MORGAN STANLEY/FREENET AG CALL 26.01900 21.06.18 -148 580.00 -6 964.39 0.00EUR MORGAN STANLEY/FUCHS PETROLUB SE N CALL 48.00600 21.06.18 -34 150.00 -1 193.64 0.00EUR MORGAN STANLEY/INTL CONS AIRLINE CALL 8.21730 21.06.18 -248 640.00 -5 578.74 0.00EUR MORGAN STANLEY/KBC GROUP NV NPV CALL 74.69700 21.06.18 -93 880.00 -1 997.70 0.00EUR MORGAN STANLEY/LUXOTTICA GROUP CALL 56.70000 21.06.18 -114 810.00 -12 095.15 0.00EUR MORGAN STANLEY/HERMES INTL NPV CALL 632.22500 21.06.18 -15 770.00 -52 991.27 -0.01EUR MORGAN STANLEY/SAP AG CALL 101.24100 21.06.18 -97 520.00 -22 050.75 -0.01EUR MORGAN STANLEY/SCOR SE CALL 34.20900 21.06.18 -97 680.00 -1 027.23 0.00EUR MORGAN STANLEY/SIEMENS GAMESA RENE CALL 14.95960 21.06.18 -212 880.00 -752.87 0.00EUR MORGAN STANLEY/AXEL SPRINGER SE NP CALL 67.56750 21.06.18 -33 840.00 -3 395.47 0.00EUR MORGAN STANLEY/UNIPOLSAI SPA NPV CALL 2.02910 21.06.18 -1 495 330.00 -13 662.83 -0.01EUR MORGAN STANLEY/VISCOFAN SA CALL 60.17880 21.06.18 -28 900.00 -240.04 0.00EUR MORGAN STANLEY/WARTSILA OYJ ABP SE CALL 19.60350 21.06.18 -218 860.00 -6 569.96 0.00EUR MORGAN STANLEY/PROXIMUS SA CALL 24.57000 21.06.18 -162 020.00 -1 774.93 0.00EUR SOCIETE GENERALE/DEUTSCHE TELEKOM NP CALL 14.19600 21.06.18 -515 470.00 -3 930.82 0.00EUR SOCIETE GENERALE/TOTAL CALL 54.43270 21.06.18 -174 880.00 -14 278.77 -0.01EUR SOCIETE GENERALE/COLRUYT SA CALL 49.82250 21.06.18 -59 850.00 -1 811.72 0.00EUR SOCIETE GENERALE/POSTE ITALIANE SPA CALL 7.67530 21.06.18 -445 820.00 -8 157.83 0.00EUR UBS/BANCA MEDIOLANUM NP CALL 6.41110 21.06.18 -314 360.00 -10 190.63 0.00
Description Quantity/ Valuation in EUR as a % Nominal Unrealized gain of net (loss) on Futures/ assets Forward Exchange Contracts/ Swaps (Note 1)

The notes are an integral part of the fi nancial statements. 55
UBS (Lux) Equity SICAV – Euro Countries Income (EUR)Annual Report as of 31 May 2018
EUR UBS/MUENCHENER RUECKVE CALL 198.76500 21.06.18 -47 730.00 -1 325.27 0.00EUR UBS/SNAM CALL 3.84430 21.06.18 -2 140 610.00 -1 100.68 0.00EUR UBS/SALVATORE FERRAGAM CALL 26.30250 21.06.18 -82 470.00 -5 628.08 0.00EUR UBS/RUBIS POST CALL 62.26880 21.06.18 -39 760.00 -9 183.41 0.00EUR UBS/ORANGE CALL 15.30370 21.06.18 -549 470.00 -12 086.66 0.00EUR UBS/NOKIAN RENKAAT OYJ CALL 35.15400 21.06.18 -147 890.00 -16 235.69 -0.01EUR UBS/NN GROUP N.V CALL 40.18180 21.06.18 -186 620.00 -1 798.31 0.00EUR UBS/KONE CORPORATION NP CALL 44.66700 21.06.18 -143 750.00 -21 820.39 -0.01EUR UBS/THALES CALL 113.14200 21.06.18 -62 700.00 -31 311.64 -0.01EUR UBS/GPE BRUXELLES LAM N CALL 96.70500 21.06.18 -50 530.00 -2 442.77 0.00EUR UBS/ENDESA SA CALL 20.94750 21.06.18 -375 650.00 -1 313.12 0.00EUR UBS/ESSILOR INTL CALL 124.00500 21.06.18 -31 980.00 -5 383.06 0.00EUR UBS/DANONE CALL 68.86950 21.06.18 -144 610.00 -17 840.02 -0.01EUR UBS/TERNA SPA CALL 4.89060 21.06.18 -1 767 860.00 -1 915.81 0.00EUR UBS/BAYER AG CALL 105.30850 21.06.18 -23 600.00 -18 310.25 -0.01EUR UBS/CNP ASSURANCES CALL 21.65100 21.06.18 -93 040.00 -1 455.56 0.00Total EUR -753 034.57 -0.19
Total Options on shares, classic-styled -753 034.57 -0.19
Total Derivative instruments not listed on an official stock exchange and not traded on anotherregulated market -753 034.57 -0.19
Total investments in securities 390 495 432.10 97.39
Derivative instruments
Derivative instruments listed on an official stock exchange
Financial Future on Indices
EUR EURO STOXX 50 INDEX FUTURE 21.09.18 89.00 -6 310.00 0.00Total Financial Future on Indices -6 310.00 0.00
Total Derivative instruments listed on an official stock exchange -6 310.00 0.00
Total Derivative instruments -6 310.00 0.00
Forward Foreign Exchange contracts
Forward Foreign Exchange contracts (Purchase/Sale)
CHF 172 677 000.00 EUR 147 284 051.29 25.6.2018 3 227 245.83 0.81USD 50 712 900.00 EUR 43 095 912.88 25.6.2018 276 539.10 0.07CHF 684 400.00 EUR 582 720.02 25.6.2018 13 826.90 0.00EUR 654 088.52 USD 768 000.00 25.6.2018 -2 747.18 0.00EUR 315 855.49 USD 371 500.00 25.6.2018 -1 871.67 0.00CHF 716 000.00 EUR 619 558.85 25.6.2018 4 531.73 0.00EUR 568 580.43 USD 664 000.00 25.6.2018 691.23 0.00Total Forward Foreign Exchange contracts (Purchase/Sale) 3 518 215.94 0.88
Cash at banks, deposits on demand and deposit accounts and other liquid assets 5 137 073.25 1.28Other assets and liabilities 1 808 455.10 0.45
Total net assets 400 952 866.39 100.00
Description Quantity/ Valuation in EUR as a % Nominal Unrealized gain of net (loss) on Futures/ assets Forward Exchange Contracts/ Swaps (Note 1)

56 The notes are an integral part of the fi nancial statements.
UBS (Lux) Equity SICAV – European High Dividend (EUR)Annual Report as of 31 May 2018
UBS (Lux) Equity SICAV – European High Dividend (EUR)
Three-year comparison
ISIN 31.5.2018 31.5.2017 31.5.2016Net assets in EUR 347 261 836.79 392 885 283.27 575 190 407.59Class N-8%-mdist LU1121265976Shares outstanding 90 921.4640 46 228.1250 44 016.7750Net asset value per share in EUR 85.12 94.27 94.57Issue and redemption price per share in EUR1 85.12 94.27 94.44Class P-acc LU0566497433Shares outstanding 519 255.8330 591 076.6630 871 449.4880Net asset value per share in EUR 151.89 153.84 141.06Issue and redemption price per share in EUR1 151.89 153.84 140.86Class (CHF) P-acc LU0571745792Shares outstanding 146 257.6880 176 466.1980 226 768.1220Net asset value per share in CHF 136.21 130.83 122.05Issue and redemption price per share in CHF1 136.21 130.83 121.88Class (USD) P-acc LU0571745446Shares outstanding 71 707.3040 83 051.4420 102 150.4180Net asset value per share in USD 133.70 130.47 118.47Issue and redemption price per share in USD1 133.70 130.47 118.30Class P-dist LU0566497516Shares outstanding 182 407.6120 222 441.9240 267 487.8130Net asset value per share in EUR 127.57 131.74 123.81Issue and redemption price per share in EUR1 127.57 131.74 123.64Class (CHF hedged) P-dist LU0826316233Shares outstanding 210 115.3970 228 615.8970 429 000.3080Net asset value per share in CHF 130.14 134.98 127.47Issue and redemption price per share in CHF1 130.14 134.98 127.29Class (GBP) P-dist LU0571744555Shares outstanding 37 628.1310 39 869.0890 46 451.3380Net asset value per share in GBP 131.08 134.34 110.62Issue and redemption price per share in GBP1 131.08 134.34 110.47Class P-mdist LU1249369007Shares outstanding 4 820.6900 4 464.9100 103 777.8110Net asset value per share in EUR 92.75 97.63 92.96Issue and redemption price per share in EUR1 92.75 97.63 92.83Class Q-acc LU0847997854Shares outstanding 283 485.6660 299 452.7270 303 458.0820Net asset value per share in EUR 100.55 101.17 92.16Issue and redemption price per share in EUR1 100.55 101.17 92.03Class (CHF) Q-acc LU1240784311Shares outstanding 97 281.1140 96 372.3480 107 335.1270Net asset value per share in CHF 108.10 103.13 95.56Issue and redemption price per share in CHF1 108.10 103.13 95.43Class (USD) Q-acc LU1240784584Shares outstanding 20 088.8010 32 696.7970 31 288.9850Net asset value per share in USD 107.03 103.74 93.55Issue and redemption price per share in USD1 107.03 103.74 93.42Class Q-dist LU1240784741Shares outstanding 106 103.5590 114 175.5500 111 423.5320Net asset value per share in EUR 95.33 98.41 92.18Issue and redemption price per share in EUR1 95.33 98.41 92.05Class (CHF hedged) Q-dist LU1240784238Shares outstanding 324 375.4680 353 405.5120 351 935.4170Net asset value per share in CHF 93.96 97.43 91.69Issue and redemption price per share in CHF1 93.96 97.43 91.56Class (GBP) Q-dist LU1240784402Shares outstanding 5 937.7740 7 657.6260 8 995.0660Net asset value per share in GBP 119.31 122.21 100.26Issue and redemption price per share in GBP1 119.31 122.21 100.12Class U-X-acc LU0566497789Shares outstanding 8 080.0100 8 963.6180 19 915.2280Net asset value per share in EUR 12 985.42 12 950.39 11 692.51Issue and redemption price per share in EUR1 12 985.42 12 950.39 11 676.14
1 See note 1

The notes are an integral part of the fi nancial statements. 57
UBS (Lux) Equity SICAV – European High Dividend (EUR)Annual Report as of 31 May 2018
Performance
Currency 2017/2018 2016/2017 2015/2016Class N-8%-mdist EUR -2.2% 8.1% -9.5%Class P-acc EUR -1.3% 9.2% -8.6%Class (CHF) P-acc CHF 4.1% 7.3% -2.2%Class (USD) P-acc USD 2.5% 10.3% -7.2%Class P-dist EUR -1.3% 9.2% -8.6%Class (CHF hedged) P-dist CHF -1.7% 8.7% -9.3%Class (GBP) P-dist GBP -0.6% 24.4% -2.7%Class P-mdist EUR -1.3% 9.5% -Class Q-acc EUR -0.6% 9.9% -Class (CHF) Q-acc CHF 4.8% 8.1% -Class (USD) Q-acc USD 3.2% 11.0% -Class Q-dist EUR -0.6% 9.9% -Class (CHF hedged) Q-dist CHF -1.0% 9.5% -Class (GBP) Q-dist GBP 0.1% 25.2% -Class U-X-acc EUR 0.3% 10.8% -6.8%
Historical performance is no indicator of current or future performance.The performance data does not take account of any commissions and costs charged when subscribing and redeeming shares.The performance data were not audited.The subfund has no benchmark.
Report of the Portfolio Manager
In the financial year, from 1 June 2017 to 31 May 2018, European equity returns were slightly positive. The markets started off strongly, fueled by solid growth, but February then saw a sell-off led by inflation fears and rising rate expectations. The markets declined further on the back of slowing growth momentum and trade tensi-ons, as US import tariffs led to concerns over retaliation measures and uncertainty.
The subfund posted positive returns for some share classes (U-X, CHF P-acc, CHF Q-acc, GBP Q-dist, USD P-acc, USD Q-acc) while fees cancelled the return for the others. Exposure in Materials and Financials contributed to performance while exposure in Consumer Discre-tionary and Utilities detracted. From a stock perspective, the largest contributors were Rio Tinto and Neste whe-reas SES, Sodexo and Inditex were the largest detractors.
Structure of the Securities Portfolio
Geographical Breakdown as a % of net assetsUnited Kingdom 33.34France 14.89Germany 10.66Spain 9.05Switzerland 7.75Italy 5.95Sweden 5.83The Netherlands 4.95Denmark 3.16Finland 3.08Norway 3.06Belgium 1.89Portugal 1.08Total 104.69
Economic Breakdown as a % of net assetsInsurance 12.63Energy & water supply 10.14Banks & credit institutions 9.96Pharmaceuticals, cosmetics & medical products 7.22Telecommunications 6.81Building industry & materials 5.97Retail trade, department stores 5.18Real Estate 5.06Petroleum 4.05Traffic & transportation 3.76Internet, software & IT services 3.25Miscellaneous consumer goods 3.00Lodging, catering & leisure 2.97Graphic design, publishing & media 2.96Textiles, garments & leather goods 2.25Tobacco & alcohol 2.22Non-ferrous metals 2.11Chemicals 2.01Miscellaneous services 1.99Food & soft drinks 1.93Mining, coal & steel 1.14Aerospace industry 1.05Mechanical engineering & industrial equipment 1.05Forestry, paper & pulp products 1.04Electrical devices & components 1.03Healthcare & social services 0.99Miscellaneous unclassified companies 0.98Rubber & tyres 0.97Agriculture & fishery 0.97Total 104.69
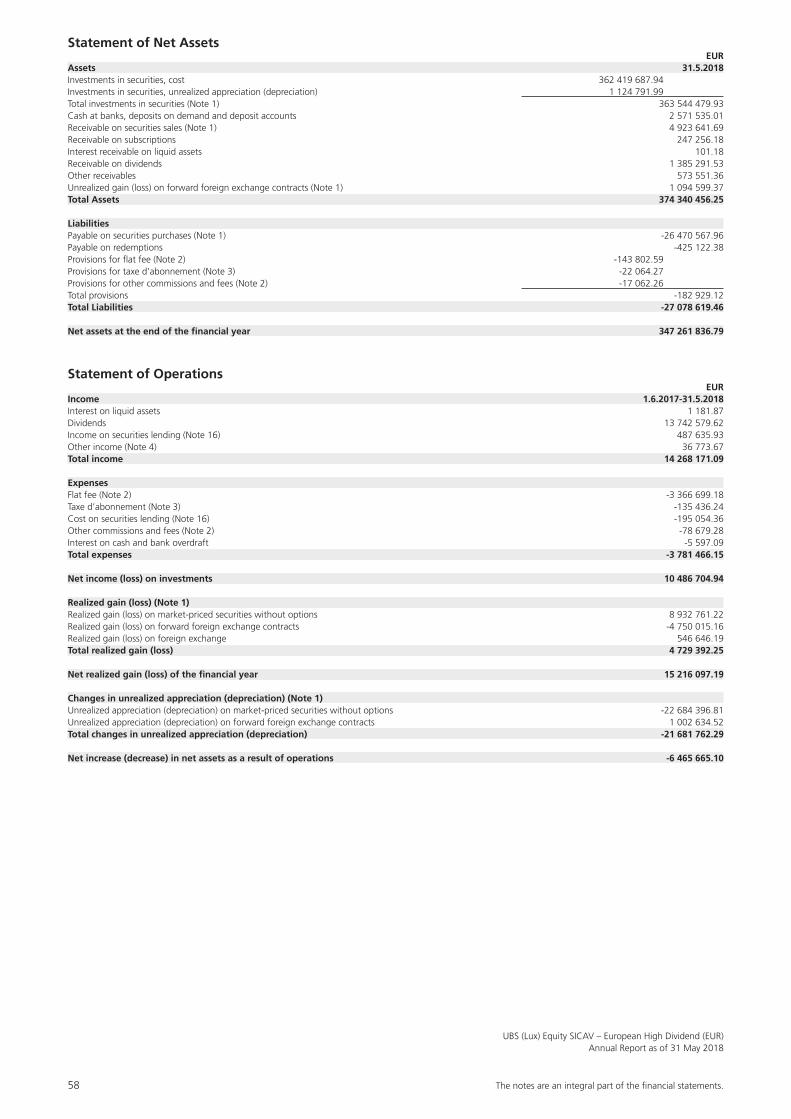
58 The notes are an integral part of the fi nancial statements.
UBS (Lux) Equity SICAV – European High Dividend (EUR)Annual Report as of 31 May 2018
Statement of Net Assets EURAssets 31.5.2018Investments in securities, cost 362 419 687.94Investments in securities, unrealized appreciation (depreciation) 1 124 791.99Total investments in securities (Note 1) 363 544 479.93Cash at banks, deposits on demand and deposit accounts 2 571 535.01Receivable on securities sales (Note 1) 4 923 641.69Receivable on subscriptions 247 256.18Interest receivable on liquid assets 101.18Receivable on dividends 1 385 291.53Other receivables 573 551.36Unrealized gain (loss) on forward foreign exchange contracts (Note 1) 1 094 599.37Total Assets 374 340 456.25
LiabilitiesPayable on securities purchases (Note 1) -26 470 567.96Payable on redemptions -425 122.38Provisions for flat fee (Note 2) -143 802.59Provisions for taxe d’abonnement (Note 3) -22 064.27Provisions for other commissions and fees (Note 2) -17 062.26Total provisions -182 929.12Total Liabilities -27 078 619.46
Net assets at the end of the financial year 347 261 836.79
Statement of Operations EURIncome 1.6.2017-31.5.2018Interest on liquid assets 1 181.87Dividends 13 742 579.62Income on securities lending (Note 16) 487 635.93Other income (Note 4) 36 773.67Total income 14 268 171.09
ExpensesFlat fee (Note 2) -3 366 699.18Taxe d’abonnement (Note 3) -135 436.24Cost on securities lending (Note 16) -195 054.36Other commissions and fees (Note 2) -78 679.28Interest on cash and bank overdraft -5 597.09Total expenses -3 781 466.15
Net income (loss) on investments 10 486 704.94
Realized gain (loss) (Note 1)Realized gain (loss) on market-priced securities without options 8 932 761.22Realized gain (loss) on forward foreign exchange contracts -4 750 015.16Realized gain (loss) on foreign exchange 546 646.19Total realized gain (loss) 4 729 392.25
Net realized gain (loss) of the financial year 15 216 097.19
Changes in unrealized appreciation (depreciation) (Note 1)Unrealized appreciation (depreciation) on market-priced securities without options -22 684 396.81Unrealized appreciation (depreciation) on forward foreign exchange contracts 1 002 634.52Total changes in unrealized appreciation (depreciation) -21 681 762.29
Net increase (decrease) in net assets as a result of operations -6 465 665.10
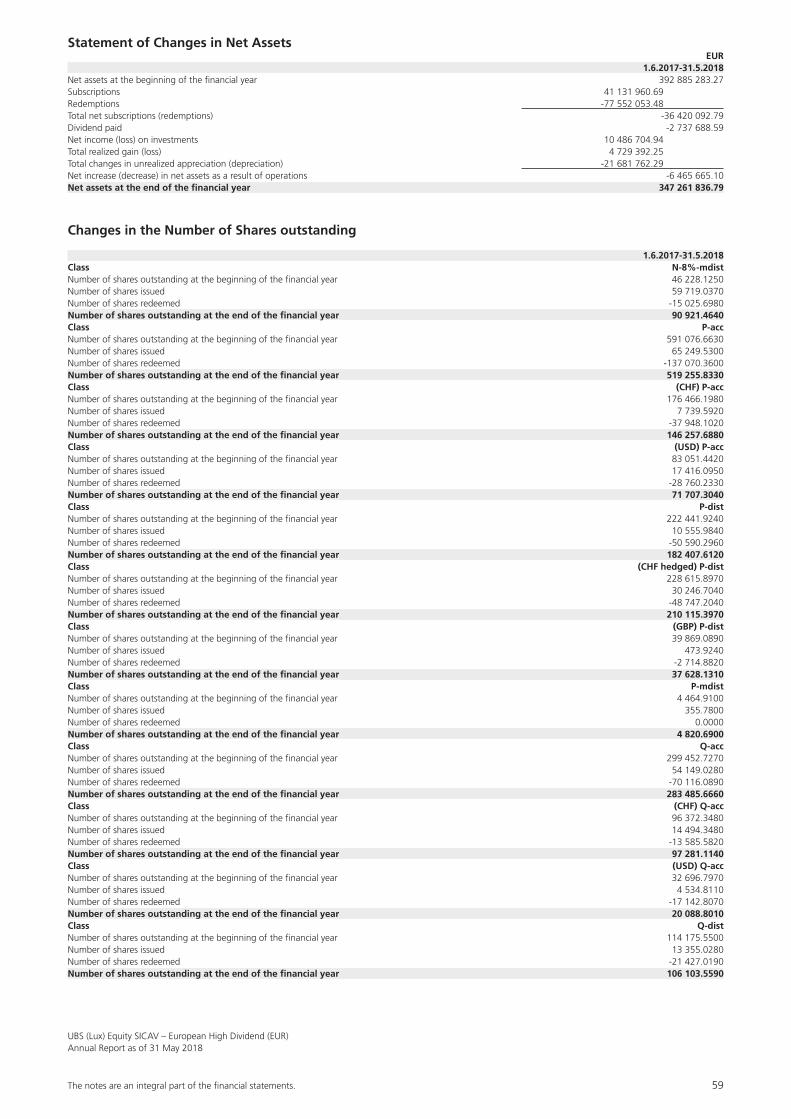
The notes are an integral part of the fi nancial statements. 59
UBS (Lux) Equity SICAV – European High Dividend (EUR)Annual Report as of 31 May 2018
Statement of Changes in Net Assets EUR 1.6.2017-31.5.2018Net assets at the beginning of the financial year 392 885 283.27Subscriptions 41 131 960.69Redemptions -77 552 053.48Total net subscriptions (redemptions) -36 420 092.79Dividend paid -2 737 688.59Net income (loss) on investments 10 486 704.94Total realized gain (loss) 4 729 392.25Total changes in unrealized appreciation (depreciation) -21 681 762.29Net increase (decrease) in net assets as a result of operations -6 465 665.10Net assets at the end of the financial year 347 261 836.79
Changes in the Number of Shares outstanding
1.6.2017-31.5.2018Class N-8%-mdistNumber of shares outstanding at the beginning of the financial year 46 228.1250Number of shares issued 59 719.0370Number of shares redeemed -15 025.6980Number of shares outstanding at the end of the financial year 90 921.4640Class P-accNumber of shares outstanding at the beginning of the financial year 591 076.6630Number of shares issued 65 249.5300Number of shares redeemed -137 070.3600Number of shares outstanding at the end of the financial year 519 255.8330Class (CHF) P-accNumber of shares outstanding at the beginning of the financial year 176 466.1980Number of shares issued 7 739.5920Number of shares redeemed -37 948.1020Number of shares outstanding at the end of the financial year 146 257.6880Class (USD) P-accNumber of shares outstanding at the beginning of the financial year 83 051.4420Number of shares issued 17 416.0950Number of shares redeemed -28 760.2330Number of shares outstanding at the end of the financial year 71 707.3040Class P-distNumber of shares outstanding at the beginning of the financial year 222 441.9240Number of shares issued 10 555.9840Number of shares redeemed -50 590.2960Number of shares outstanding at the end of the financial year 182 407.6120Class (CHF hedged) P-distNumber of shares outstanding at the beginning of the financial year 228 615.8970Number of shares issued 30 246.7040Number of shares redeemed -48 747.2040Number of shares outstanding at the end of the financial year 210 115.3970Class (GBP) P-distNumber of shares outstanding at the beginning of the financial year 39 869.0890Number of shares issued 473.9240Number of shares redeemed -2 714.8820Number of shares outstanding at the end of the financial year 37 628.1310Class P-mdistNumber of shares outstanding at the beginning of the financial year 4 464.9100Number of shares issued 355.7800Number of shares redeemed 0.0000Number of shares outstanding at the end of the financial year 4 820.6900Class Q-accNumber of shares outstanding at the beginning of the financial year 299 452.7270Number of shares issued 54 149.0280Number of shares redeemed -70 116.0890Number of shares outstanding at the end of the financial year 283 485.6660Class (CHF) Q-accNumber of shares outstanding at the beginning of the financial year 96 372.3480Number of shares issued 14 494.3480Number of shares redeemed -13 585.5820Number of shares outstanding at the end of the financial year 97 281.1140Class (USD) Q-accNumber of shares outstanding at the beginning of the financial year 32 696.7970Number of shares issued 4 534.8110Number of shares redeemed -17 142.8070Number of shares outstanding at the end of the financial year 20 088.8010Class Q-distNumber of shares outstanding at the beginning of the financial year 114 175.5500Number of shares issued 13 355.0280Number of shares redeemed -21 427.0190Number of shares outstanding at the end of the financial year 106 103.5590

60 The notes are an integral part of the fi nancial statements.
UBS (Lux) Equity SICAV – European High Dividend (EUR)Annual Report as of 31 May 2018
Class (CHF hedged) Q-distNumber of shares outstanding at the beginning of the financial year 353 405.5120Number of shares issued 29 566.7880Number of shares redeemed -58 596.8320Number of shares outstanding at the end of the financial year 324 375.4680Class (GBP) Q-distNumber of shares outstanding at the beginning of the financial year 7 657.6260Number of shares issued 2 100.0000Number of shares redeemed -3 819.8520Number of shares outstanding at the end of the financial year 5 937.7740Class U-X-accNumber of shares outstanding at the beginning of the financial year 8 963.6180Number of shares issued 549.6820Number of shares redeemed -1 433.2900Number of shares outstanding at the end of the financial year 8 080.0100
Annual Distribution
UBS (Lux) Equity SICAV– European High Dividend (EUR) Ex-Date Pay-Date Currency Amount per share
P-dist 2.8.2017 7.8.2017 EUR 2.45(CHF hedged) P-dist 2.8.2017 7.8.2017 CHF 2.53(GBP) P-dist 2.8.2017 7.8.2017 GBP 2.49Q-dist 2.8.2017 7.8.2017 EUR 2.42(CHF hedged) Q-dist 2.8.2017 7.8.2017 CHF 2.41(GBP) Q-dist 2.8.2017 7.8.2017 GBP 3.01
Monthly Distribution
UBS (Lux) Equity SICAV– European High Dividend (EUR) Ex-Date Pay-Date Currency Amount per share
N-8%-mdist 13.6.2017 16.6.2017 EUR 0.62N-8%-mdist 10.7.2017 13.7.2017 EUR 0.60N-8%-mdist 10.8.2017 16.8.2017 EUR 0.59N-8%-mdist 11.9.2017 14.9.2017 EUR 0.58N-8%-mdist 10.10.2017 13.10.2017 EUR 0.59N-8%-mdist 10.11.2017 15.11.2017 EUR 0.60N-8%-mdist 11.12.2017 14.12.2017 EUR 0.58N-8%-mdist 10.1.2018 15.1.2018 EUR 0.58N-8%-mdist 12.2.2018 15.2.2018 EUR 0.58N-8%-mdist 12.3.2018 15.3.2018 EUR 0.56N-8%-mdist 10.4.2018 13.4.2018 EUR 0.55N-8%-mdist 11.5.2018 16.5.2018 EUR 0.57P-mdist 15.6.2017 20.6.2017 EUR 0.30P-mdist 18.7.2017 21.7.2017 EUR 0.30P-mdist 16.8.2017 21.8.2017 EUR 0.30P-mdist 15.9.2017 20.9.2017 EUR 0.30P-mdist 16.10.2017 19.10.2017 EUR 0.30P-mdist 15.11.2017 20.11.2017 EUR 0.30P-mdist 15.12.2017 20.12.2017 EUR 0.30P-mdist 16.1.2018 19.1.2018 EUR 0.30P-mdist 15.2.2018 20.2.2018 EUR 0.30P-mdist 15.3.2018 20.3.2018 EUR 0.30P-mdist 16.4.2018 19.4.2018 EUR 0.30P-mdist 15.5.2018 18.5.2018 EUR 0.30

The notes are an integral part of the fi nancial statements. 61
UBS (Lux) Equity SICAV – European High Dividend (EUR)Annual Report as of 31 May 2018
Statement of Investments in Securities and other Net Assets as of 31 May 2018
Description Quantity/ Valuation in EUR as a % Nominal Unrealized gain of net (loss) on Futures/ assets Forward Exchange Contracts/ Swaps (Note 1)
Transferable securities and money market instruments listed on an official stock exchange
Bearer shares
Belgium
EUR AGEAS NPV 80 509.00 3 494 090.60 1.01EUR PROXIMUS SA NPV 133 448.00 3 057 293.68 0.88Total Belgium 6 551 384.28 1.89
Denmark
DKK COLOPLAST DKK1 B 47 881.00 3 893 084.92 1.12DKK DANSKE BANK A/S DKK10 124 015.00 3 522 175.13 1.01DKK PANDORA A/S DKK1 53 017.00 3 569 915.67 1.03Total Denmark 10 985 175.72 3.16
Finland
EUR KONE CORPORATION NPV ORD ‘B’ 85 656.00 3 627 531.60 1.04EUR SAMPO OYJ SER’A’NPV 82 217.00 3 459 691.36 1.00EUR UPM-KYMMENE CORP NPV 114 528.00 3 597 324.48 1.04Total Finland 10 684 547.44 3.08
France
EUR ACCOR EUR3 72 810.00 3 408 236.10 0.98EUR BNP PARIBAS EUR2 63 588.00 3 373 979.28 0.97EUR BOUYGUES EUR1 86 833.00 3 433 376.82 0.99EUR DANONE EUR0.25 50 592.00 3 308 210.88 0.95EUR DASSAULT SYSTEMES EUR0.50 30 096.00 3 616 034.40 1.04EUR ESSILOR INTL EUR0.18 28 695.00 3 354 445.50 0.97EUR KLEPIERRE EUR1.40 101 631.00 3 386 344.92 0.98EUR L’OREAL EUR0.20 16 638.00 3 420 772.80 0.98EUR ORANGE EUR4 230 055.00 3 387 559.88 0.98EUR PUBLICIS GROUPE SA EUR0.40 58 213.00 3 466 002.02 1.00EUR SANOFI EUR2 52 657.00 3 455 878.91 0.99EUR SCHNEIDER ELECTRIC EUR8 48 536.00 3 580 986.08 1.03EUR TOTAL EUR2.5 68 580.00 3 569 589.00 1.03EUR UNIBAIL-RODAMCO EUR5 18 515.00 3 565 063.25 1.03Total France 48 326 479.84 13.92
Germany
EUR DEUTSCHE WOHNEN AG NPV (BR) 93 080.00 3 735 300.40 1.08EUR SAP AG ORD NPV 39 772.00 3 831 634.48 1.10Total Germany 7 566 934.88 2.18
Italy
EUR ASSIC GENERALI SPA EUR1 242 547.00 3 529 058.85 1.02EUR ENI SPA EUR1 221 778.00 3 435 341.22 0.99EUR INTESA SANPAOLO EUR0.52 1 368 115.00 3 440 125.17 0.99EUR POSTE ITALIANE SPA NPV 471 951.00 3 456 569.13 1.00EUR SNAM EUR1 964 760.00 3 384 378.08 0.97EUR TERNA SPA ORD EUR0.22 751 420.00 3 404 684.02 0.98Total Italy 20 650 156.47 5.95
The Netherlands
EUR KONINKLIJKE AHOLD EUR0.01 173 991.00 3 419 619.11 0.98EUR NN GROUP N.V. EUR0.12 93 242.00 3 427 575.92 0.99EUR RANDSTAD N.V. EUR0.10 67 341.00 3 438 431.46 0.99GBP ROYAL DUTCH SHELL ‘B’SHS EUR0.07 (UK LIST) 112 293.00 3 426 749.90 0.99Total The Netherlands 13 712 376.39 3.95
Norway
NOK DNB ASA NOK10 244 960.00 3 757 176.91 1.08NOK MARINE HARVEST ASA NOK7.50 196 312.00 3 364 529.75 0.97NOK TELENOR ASA ORD NOK6 199 488.00 3 520 257.07 1.01Total Norway 10 641 963.73 3.06
Spain
EUR AENA SME S.A. EUR10 19 884.00 3 266 941.20 0.94EUR AMADEUS IT GROUP EUR0.01 56 542.00 3 839 201.80 1.11EUR ENAGAS SA EUR1.50 149 245.00 3 404 278.45 0.98EUR ENDESA SA EUR1.2 184 718.00 3 481 010.71 1.00EUR FERROVIAL SA EUR0.2 187 574.00 3 269 414.82 0.94EUR GAS NATURAL SDG EUR1 169 372.00 3 555 118.28 1.02EUR IBERDROLA SA EUR0.75 (POST SUBDIVISION) 574 108.00 3 485 983.78 1.01EUR RED ELECTRICA CORP EUR0.5 205 164.00 3 415 980.60 0.98EUR REPSOL SA EUR1 223 394.00 3 642 439.17 1.05Total Spain 31 360 368.81 9.03
Sweden
SEK ELECTROLUX AB SER’B’NPV (POST SPLIT) 159 794.00 3 372 815.35 0.97SEK NORDEA BANK AB ORD NPV(SEK QUOTE) 416 863.00 3 428 959.92 0.99SEK SKAND ENSKILDA BKN SER’A’NPV 431 582.00 3 325 644.06 0.96SEK SKANSKA AB SER’B’NPV 203 906.00 3 211 112.38 0.92SEK SWEDBANK AB SER’A’NPV 189 956.00 3 377 448.12 0.97SEK TELIA COMPANY AB NPV 883 142.00 3 541 393.76 1.02Total Sweden 20 257 373.59 5.83
Switzerland
CHF SWISS RE AG CHF0.10 44 883.00 3 331 496.27 0.96Total Switzerland 3 331 496.27 0.96

62 The notes are an integral part of the fi nancial statements.
UBS (Lux) Equity SICAV – European High Dividend (EUR)Annual Report as of 31 May 2018
United Kingdom
GBP ANTOFAGASTA ORD GBP0.05 282 955.00 3 401 302.91 0.98GBP ASTRAZENECA ORD USD0.25 63 193.00 3 937 494.44 1.13GBP AVIVA ORD GBP0.25 588 691.00 3 427 832.86 0.99GBP BAE SYSTEMS ORD GBP0.025 500 387.00 3 647 203.56 1.05GBP BARRATT DEVEL ORD GBP0.10 534 487.00 3 324 243.75 0.96GBP BHP BILLITON PLC USD0.50 201 244.00 3 966 425.37 1.14GBP BRITISH LAND CO PLC REIT 461 357.00 3 565 727.59 1.03GBP BURBERRY GROUP ORD GBP0.0005 175 600.00 4 141 582.86 1.19GBP CARNIVAL PLC ORD USD1.66 64 155.00 3 537 430.77 1.02GBP DIAGEO ORD GBP0.28 101/108 122 666.00 3 862 849.99 1.11GBP DIRECT LINE INSURA ORD GBP 0.109090909 819 421.00 3 339 369.60 0.96GBP GLAXOSMITHKLINE ORD GBP0.25 215 162.00 3 737 936.27 1.08GBP HSBC HLDGS ORD USD0.50(UK REG) 432 563.00 3 553 243.58 1.02GBP IMPERIAL BRANDS PL GBP0.10 124 304.00 3 840 040.00 1.11GBP KINGFISHER ORD GBP0.157142857 983 142.00 3 420 441.22 0.97GBP LEGAL & GENERAL GP ORD GBP0.025 1 149 465.00 3 535 241.20 1.02GBP LLOYDS BANKING GP ORD GBP0.1 4 615 664.00 3 325 839.82 0.96GBP MARKS & SPENCER GP ORD GBP0.25 1 083 745.00 3 508 542.97 1.01GBP MORRISON(W)SUPRMKT ORD GBP0.10 1 245 758.00 3 490 574.53 1.01GBP NATIONAL GRID ORD GBP0.12431289 397 182.00 3 772 873.93 1.09GBP PEARSON ORD GBP0.25 387 339.00 3 980 947.79 1.15GBP PERSIMMON ORD GBP0.10 115 041.00 3 713 874.72 1.07GBP PRUDENTIAL ORD GBP0.05 166 151.00 3 430 068.26 0.99GBP RIO TINTO ORD GBP0.10 81 460.00 3 937 237.52 1.13GBP ROYAL MAIL PLC ORD GBP0.01 (WI) 584 523.00 3 391 569.65 0.98GBP SAINSBURY(J) ORD GBP0.28571428 1 147 653.00 4 164 171.31 1.20GBP SMITH & NEPHEW ORD USD0.20 221 129.00 3 449 624.77 0.99GBP SSE PLC ORD GBP0.50 229 561.00 3 578 547.58 1.03GBP TAYLOR WIMPEY ORD GBP0.01 1 512 222.00 3 277 881.39 0.94GBP VODAFONE GROUP ORD USD0.2095238(POST CONS) 1 548 289.00 3 385 534.69 0.97GBP WHITBREAD ORD GBP0.76797385 69 818.00 3 354 643.20 0.97Total United Kingdom 112 000 298.10 32.25
Total Bearer shares 296 068 555.52 85.26
Other shares
The Netherlands
EUR UNILEVER NV CVA EUR0.16 72 820.00 3 476 426.80 1.00Total The Netherlands 3 476 426.80 1.00
United Kingdom
GBP BERKELEY GP HLDGS ORD GBP0.05 78 033.00 3 776 936.18 1.09Total United Kingdom 3 776 936.18 1.09
Total Other shares 7 253 362.98 2.09
Registered shares
France
EUR MICHELIN (CGDE) EUR2 30 421.00 3 367 604.70 0.97Total France 3 367 604.70 0.97
Germany
EUR ALLIANZ SE NPV(REGD)(VINKULIERT) 18 421.00 3 249 095.98 0.94EUR BASF SE NPV 41 639.00 3 508 085.75 1.01EUR BAYER AG NPV (REGD) 34 255.00 3 489 214.30 1.00EUR DEUTSCHE POST AG NPV(REGD) 92 822.00 3 013 930.34 0.87EUR DEUTSCHE TELEKOM NPV(REGD) 248 303.00 3 282 565.66 0.95EUR HUGO BOSS AG NPV (REGD) 47 554.00 3 655 951.52 1.05EUR MUENCHENER RUECKVE NPV(REGD) 17 546.00 3 093 359.80 0.89EUR PROSIEBENSAT1 MED. NPV 112 989.00 2 843 933.13 0.82EUR VONOVIA SE NPV 82 077.00 3 312 627.72 0.95Total Germany 29 448 764.20 8.48
Portugal
EUR EDP ENERGIAS PORTU EUR1(REGD) 1 117 269.00 3 742 851.15 1.08Total Portugal 3 742 851.15 1.08
Switzerland
CHF BALOISE-HLDGS CHF0.1(REGD) 26 244.00 3 306 877.75 0.95CHF KUEHNE&NAGEL INTL CHF1(REGD)(POST-SUBD) 26 521.00 3 434 223.24 0.99CHF NESTLE SA CHF0.10(REGD) 52 517.00 3 403 893.02 0.98CHF NOVARTIS AG CHF0.50(REGD) 51 381.00 3 266 684.53 0.94CHF SWISS LIFE HLDG CHF5.1(REGD) 11 573.00 3 388 480.95 0.97CHF SWISSCOM AG CHF1(REGD) 9 058.00 3 469 842.95 1.00CHF ZURICH INSURANCE GRP CHF0.10 13 097.00 3 334 815.85 0.96Total Switzerland 23 604 818.29 6.79
Total Registered shares 60 164 038.34 17.32
Rights
Spain
EUR FERROVIAL SA (STOCK DIVIDEND) RIGHTS 31.05.18 187 574.00 58 523.09 0.02Total Spain 58 523.09 0.02
Total Rights 58 523.09 0.02
Total Transferable securities and money market instruments listed on an official stock exchange 363 544 479.93 104.69
Total investments in securities 363 544 479.93 104.69
Description Quantity/ Valuation in EUR as a % Nominal Unrealized gain of net (loss) on Futures/ assets Forward Exchange Contracts/ Swaps (Note 1)
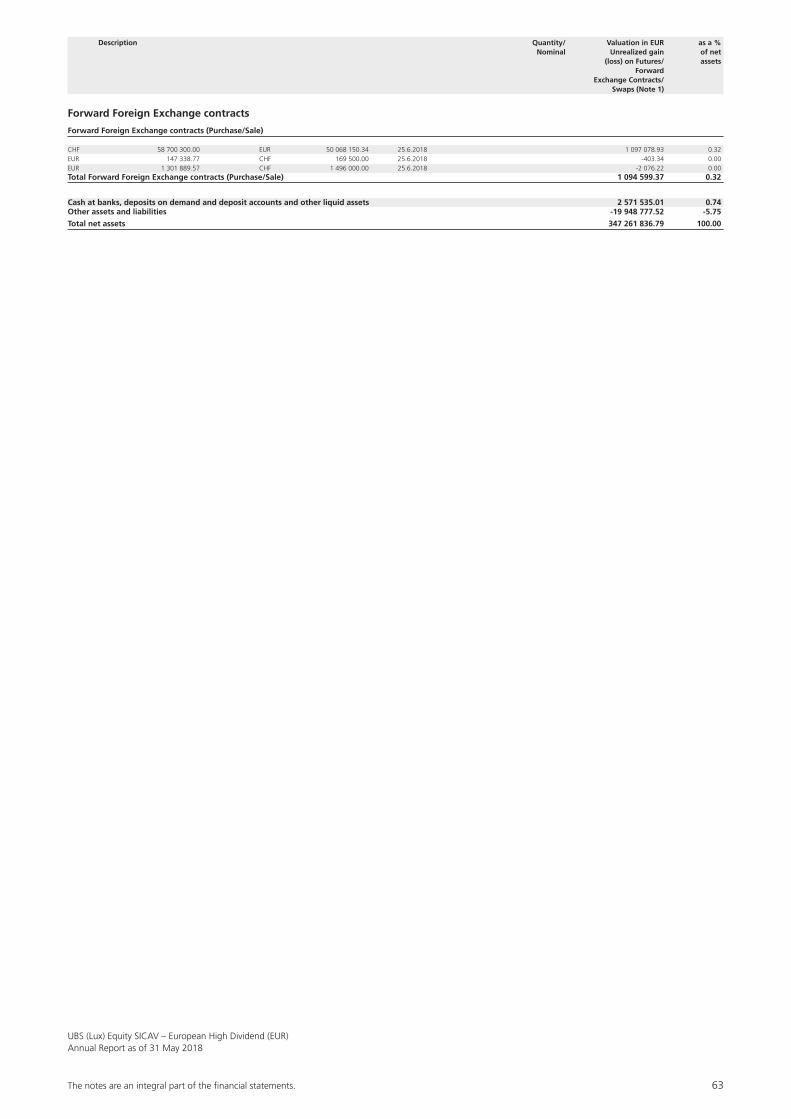
The notes are an integral part of the fi nancial statements. 63
UBS (Lux) Equity SICAV – European High Dividend (EUR)Annual Report as of 31 May 2018
Forward Foreign Exchange contracts
Forward Foreign Exchange contracts (Purchase/Sale)
CHF 58 700 300.00 EUR 50 068 150.34 25.6.2018 1 097 078.93 0.32EUR 147 338.77 CHF 169 500.00 25.6.2018 -403.34 0.00EUR 1 301 889.57 CHF 1 496 000.00 25.6.2018 -2 076.22 0.00Total Forward Foreign Exchange contracts (Purchase/Sale) 1 094 599.37 0.32
Cash at banks, deposits on demand and deposit accounts and other liquid assets 2 571 535.01 0.74Other assets and liabilities -19 948 777.52 -5.75
Total net assets 347 261 836.79 100.00
Description Quantity/ Valuation in EUR as a % Nominal Unrealized gain of net (loss) on Futures/ assets Forward Exchange Contracts/ Swaps (Note 1)
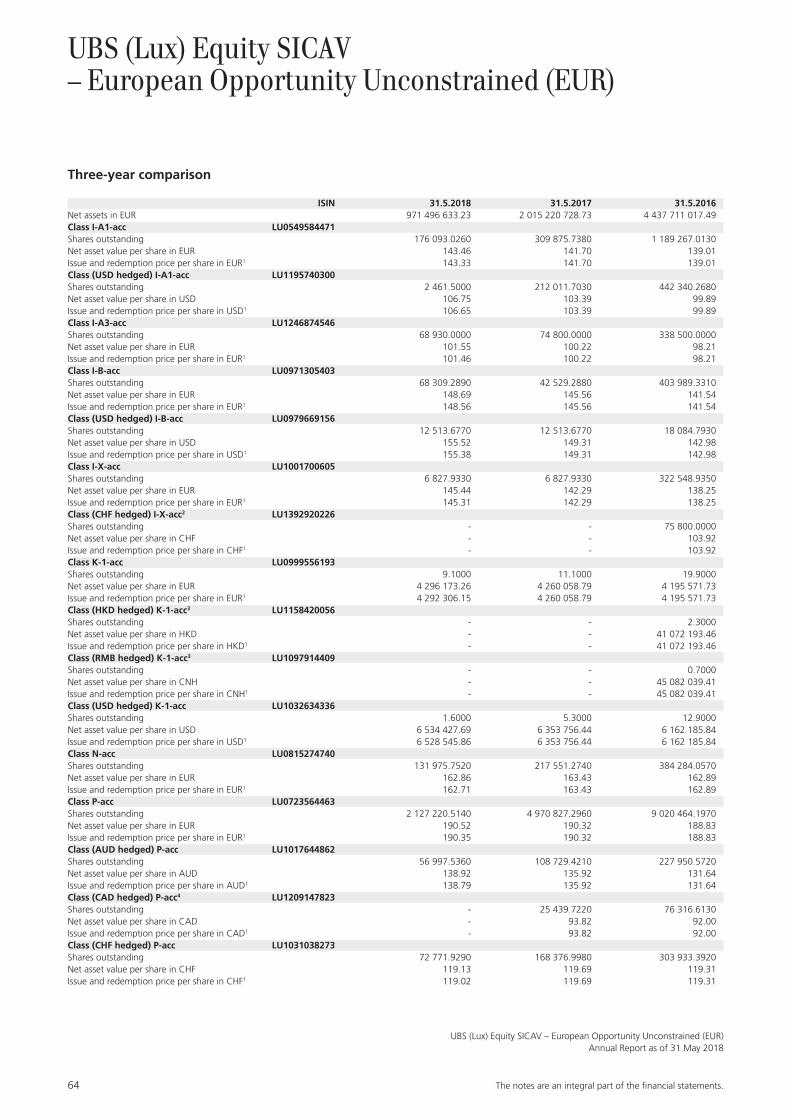
64 The notes are an integral part of the fi nancial statements.
UBS (Lux) Equity SICAV – European Opportunity Unconstrained (EUR)Annual Report as of 31 May 2018
UBS (Lux) Equity SICAV – European Opportunity Unconstrained (EUR)
Three-year comparison
ISIN 31.5.2018 31.5.2017 31.5.2016Net assets in EUR 971 496 633.23 2 015 220 728.73 4 437 711 017.49Class I-A1-acc LU0549584471Shares outstanding 176 093.0260 309 875.7380 1 189 267.0130Net asset value per share in EUR 143.46 141.70 139.01Issue and redemption price per share in EUR1 143.33 141.70 139.01Class (USD hedged) I-A1-acc LU1195740300Shares outstanding 2 461.5000 212 011.7030 442 340.2680Net asset value per share in USD 106.75 103.39 99.89Issue and redemption price per share in USD1 106.65 103.39 99.89Class I-A3-acc LU1246874546Shares outstanding 68 930.0000 74 800.0000 338 500.0000Net asset value per share in EUR 101.55 100.22 98.21Issue and redemption price per share in EUR1 101.46 100.22 98.21Class I-B-acc LU0971305403Shares outstanding 68 309.2890 42 529.2880 403 989.3310Net asset value per share in EUR 148.69 145.56 141.54Issue and redemption price per share in EUR1 148.56 145.56 141.54Class (USD hedged) I-B-acc LU0979669156Shares outstanding 12 513.6770 12 513.6770 18 084.7930Net asset value per share in USD 155.52 149.31 142.98Issue and redemption price per share in USD1 155.38 149.31 142.98Class I-X-acc LU1001700605Shares outstanding 6 827.9330 6 827.9330 322 548.9350Net asset value per share in EUR 145.44 142.29 138.25Issue and redemption price per share in EUR1 145.31 142.29 138.25Class (CHF hedged) I-X-acc2 LU1392920226Shares outstanding - - 75 800.0000Net asset value per share in CHF - - 103.92Issue and redemption price per share in CHF1 - - 103.92Class K-1-acc LU0999556193Shares outstanding 9.1000 11.1000 19.9000Net asset value per share in EUR 4 296 173.26 4 260 058.79 4 195 571.73Issue and redemption price per share in EUR1 4 292 306.15 4 260 058.79 4 195 571.73Class (HKD hedged) K-1-acc3 LU1158420056Shares outstanding - - 2.3000Net asset value per share in HKD - - 41 072 193.46Issue and redemption price per share in HKD1 - - 41 072 193.46Class (RMB hedged) K-1-acc3 LU1097914409Shares outstanding - - 0.7000Net asset value per share in CNH - - 45 082 039.41Issue and redemption price per share in CNH1 - - 45 082 039.41Class (USD hedged) K-1-acc LU1032634336Shares outstanding 1.6000 5.3000 12.9000Net asset value per share in USD 6 534 427.69 6 353 756.44 6 162 185.84Issue and redemption price per share in USD1 6 528 545.86 6 353 756.44 6 162 185.84Class N-acc LU0815274740Shares outstanding 131 975.7520 217 551.2740 384 284.0570Net asset value per share in EUR 162.86 163.43 162.89Issue and redemption price per share in EUR1 162.71 163.43 162.89Class P-acc LU0723564463Shares outstanding 2 127 220.5140 4 970 827.2960 9 020 464.1970Net asset value per share in EUR 190.52 190.32 188.83Issue and redemption price per share in EUR1 190.35 190.32 188.83Class (AUD hedged) P-acc LU1017644862Shares outstanding 56 997.5360 108 729.4210 227 950.5720Net asset value per share in AUD 138.92 135.92 131.64Issue and redemption price per share in AUD1 138.79 135.92 131.64Class (CAD hedged) P-acc4 LU1209147823Shares outstanding - 25 439.7220 76 316.6130Net asset value per share in CAD - 93.82 92.00Issue and redemption price per share in CAD1 - 93.82 92.00Class (CHF hedged) P-acc LU1031038273Shares outstanding 72 771.9290 168 376.9980 303 933.3920Net asset value per share in CHF 119.13 119.69 119.31Issue and redemption price per share in CHF1 119.02 119.69 119.31
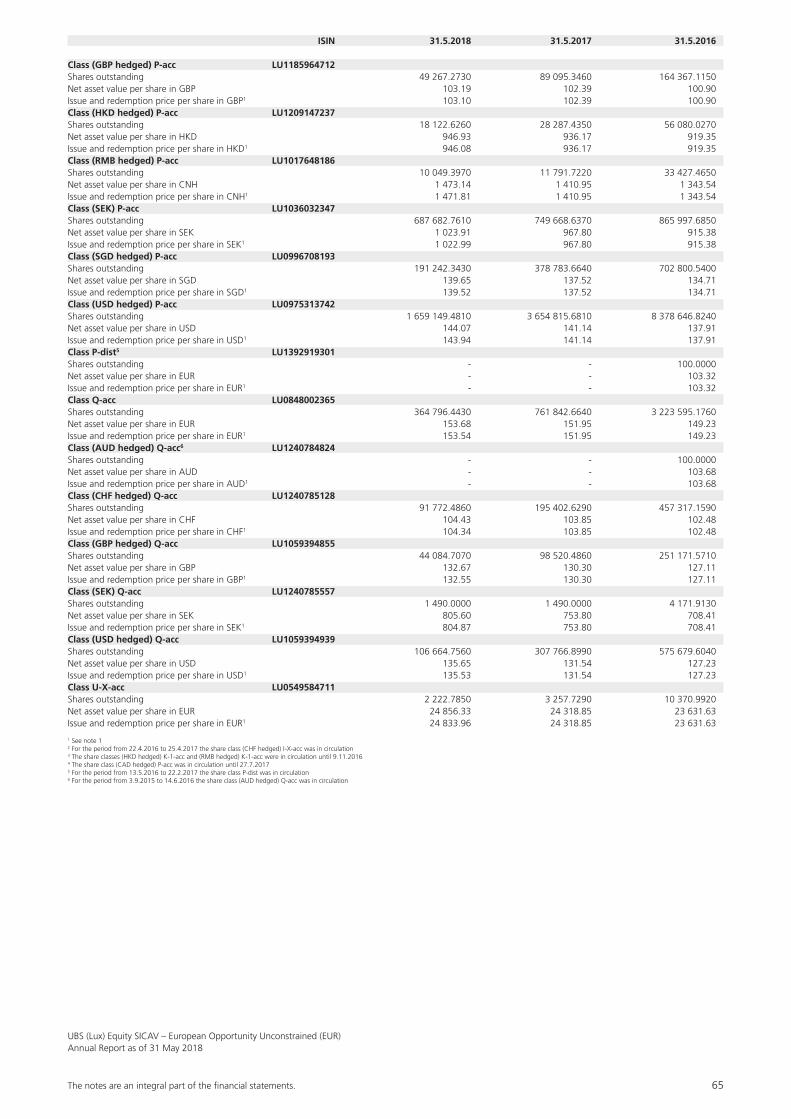
The notes are an integral part of the fi nancial statements. 65
UBS (Lux) Equity SICAV – European Opportunity Unconstrained (EUR)Annual Report as of 31 May 2018
ISIN 31.5.2018 31.5.2017 31.5.2016
Class (GBP hedged) P-acc LU1185964712Shares outstanding 49 267.2730 89 095.3460 164 367.1150Net asset value per share in GBP 103.19 102.39 100.90Issue and redemption price per share in GBP1 103.10 102.39 100.90Class (HKD hedged) P-acc LU1209147237Shares outstanding 18 122.6260 28 287.4350 56 080.0270Net asset value per share in HKD 946.93 936.17 919.35Issue and redemption price per share in HKD1 946.08 936.17 919.35Class (RMB hedged) P-acc LU1017648186Shares outstanding 10 049.3970 11 791.7220 33 427.4650Net asset value per share in CNH 1 473.14 1 410.95 1 343.54Issue and redemption price per share in CNH1 1 471.81 1 410.95 1 343.54Class (SEK) P-acc LU1036032347Shares outstanding 687 682.7610 749 668.6370 865 997.6850Net asset value per share in SEK 1 023.91 967.80 915.38Issue and redemption price per share in SEK1 1 022.99 967.80 915.38Class (SGD hedged) P-acc LU0996708193Shares outstanding 191 242.3430 378 783.6640 702 800.5400Net asset value per share in SGD 139.65 137.52 134.71Issue and redemption price per share in SGD1 139.52 137.52 134.71Class (USD hedged) P-acc LU0975313742Shares outstanding 1 659 149.4810 3 654 815.6810 8 378 646.8240Net asset value per share in USD 144.07 141.14 137.91Issue and redemption price per share in USD1 143.94 141.14 137.91Class P-dist5 LU1392919301Shares outstanding - - 100.0000Net asset value per share in EUR - - 103.32Issue and redemption price per share in EUR1 - - 103.32Class Q-acc LU0848002365Shares outstanding 364 796.4430 761 842.6640 3 223 595.1760Net asset value per share in EUR 153.68 151.95 149.23Issue and redemption price per share in EUR1 153.54 151.95 149.23Class (AUD hedged) Q-acc6 LU1240784824Shares outstanding - - 100.0000Net asset value per share in AUD - - 103.68Issue and redemption price per share in AUD1 - - 103.68Class (CHF hedged) Q-acc LU1240785128Shares outstanding 91 772.4860 195 402.6290 457 317.1590Net asset value per share in CHF 104.43 103.85 102.48Issue and redemption price per share in CHF1 104.34 103.85 102.48Class (GBP hedged) Q-acc LU1059394855Shares outstanding 44 084.7070 98 520.4860 251 171.5710Net asset value per share in GBP 132.67 130.30 127.11Issue and redemption price per share in GBP1 132.55 130.30 127.11Class (SEK) Q-acc LU1240785557Shares outstanding 1 490.0000 1 490.0000 4 171.9130Net asset value per share in SEK 805.60 753.80 708.41Issue and redemption price per share in SEK1 804.87 753.80 708.41Class (USD hedged) Q-acc LU1059394939Shares outstanding 106 664.7560 307 766.8990 575 679.6040Net asset value per share in USD 135.65 131.54 127.23Issue and redemption price per share in USD1 135.53 131.54 127.23Class U-X-acc LU0549584711Shares outstanding 2 222.7850 3 257.7290 10 370.9920Net asset value per share in EUR 24 856.33 24 318.85 23 631.63Issue and redemption price per share in EUR1 24 833.96 24 318.85 23 631.63
1 See note 12 For the period from 22.4.2016 to 25.4.2017 the share class (CHF hedged) I-X-acc was in circulation3 The share classes (HKD hedged) K-1-acc and (RMB hedged) K-1-acc were in circulation until 9.11.20164 The share class (CAD hedged) P-acc was in circulation until 27.7.20175 For the period from 13.5.2016 to 22.2.2017 the share class P-dist was in circulation6 For the period from 3.9.2015 to 14.6.2016 the share class (AUD hedged) Q-acc was in circulation

66 The notes are an integral part of the fi nancial statements.
UBS (Lux) Equity SICAV – European Opportunity Unconstrained (EUR)Annual Report as of 31 May 2018
Performance
Currency 2017/2018 2016/2017 2015/2016Class I-A1-acc EUR 1.2% 1.9% -2.5%Class (USD hedged) I-A1-acc USD 3.2% 3.5% -3.1%Class I-A3-acc EUR 1.3% 2.0% -Class I-B-acc EUR 2.2% 2.8% -1.6%Class (USD hedged) I-B-acc USD 4.2% 4.4% -2.3%Class I-X-acc EUR 2.2% 2.9% -1.6%Class (CHF hedged) I-X-acc1 CHF - - -Class K-1-acc EUR 0.8% 1.5% -2.9%Class (HKD hedged) K-1-acc2 HKD - - -3.6%Class (RMB hedged) K-1-acc2 CNH - - -0.3%Class (USD hedged) K-1-acc USD 2.8% 3.1% -3.5%Class N-acc EUR -0.4% 0.3% -4.1%Class P-acc EUR 0.0% 0.8% -3.6%Class (AUD hedged) P-acc AUD 2.1% 3.3% -3.0%Class (CAD hedged) P-acc3 CAD - 2.0% -4.3%Class (CHF hedged) P-acc CHF -0.6% 0.3% -4.4%Class (GBP hedged) P-acc GBP 0.7% 1.5% -4.1%Class (HKD hedged) P-acc HKD 1.1% 1.8% -4.3%Class (RMB hedged) P-acc CNH 4.3% 5.0% -1.1%Class (SEK) P-acc SEK 5.7% 5.7% -4.3%Class (SGD hedged) P-acc SGD 1.5% 2.1% -3.2%Class (USD hedged) P-acc USD 2.0% 2.3% -4.2%Class P-dist4 EUR - - -Class Q-acc EUR 1.0% 1.8% -2.6%Class (AUD hedged) Q-acc5 AUD - - -Class (CHF hedged) Q-acc CHF 0.5% 1.3% -Class (GBP hedged) Q-acc GBP 1.7% 2.5% -3.2%Class (SEK) Q-acc SEK 6.8% 6.4% -Class (USD hedged) Q-acc USD 3.0% 3.4% -3.2%Class U-X-acc EUR 2.2% 2.9% -1.6%
1 For the period from 22.4.2016 to 25.4.2017 the share class (CHF hedged) I-X-acc was in circulation. Due to this fact, there is no data for the calculation of the performance available.2 The share classes (HKD hedged) K-1-acc and (RMB hedged) K-1-acc were in circulation until 9.11.2016. Due to this fact, there is no data for the calculation of the performance available.3 The share class (CAD hedged) P-acc was in circulation until 27.7.2017. Due to this fact, there is no data for the calculation of the performance available.4 For the period from 13.5.2016 to 22.2.2017 the share class P-dist was in circulation. Due to this fact, there is no data for the calculation of the performance available.5 For the period from 3.9.2015 to 14.6.2016 the share class (AUD hedged) Q-acc was in circulation. Due to this fact, there is no data for the calculation of the performance available.
Historical performance is no indicator of current or future performance.The performance data does not take account of any commissions and costs charged when subscribing and redeeming shares.The performance data were not audited.The subfund has no benchmark.

The notes are an integral part of the fi nancial statements. 67
UBS (Lux) Equity SICAV – European Opportunity Unconstrained (EUR)Annual Report as of 31 May 2018
Report of the Portfolio Manager
In the financial year, from 1 June 2017 to 31 May 2018, Global equity returns were positive. Markets started off strongly, fuelled by solid growth, but February then saw a sell-off led by inflation fears and rising rate expecta-tions. Markets declined further on the back of slowing growth momentum and trade tensions, as US import tar-iffs led to concerns over retaliation measures.
The subfund’s performance was positive over the finan-cial year driven mainly by the long book. IT was the top contributing sector to performance, as we benefited from our sector allocation and our holding in a software company, which reported strong results thanks to its cloud computing business. In the short book, Energy was the largest detractor, weighed down by our holding in an oilfield services provider.
Structure of the Securities Portfolio
Geographical Breakdown as a % of net assetsFrance 17.68The Netherlands 12.35Germany 8.07Italy 7.48United States 7.13Ireland 6.56Switzerland 4.94Spain 3.93Sweden 3.82Finland 3.40Belgium 2.08Austria 2.02Norway 2.01Denmark 1.85Luxembourg 1.76Portugal 1.60China 1.53Canada 0.64Isle of Man 0.57Total 89.42
Economic Breakdown as a % of net assetsBanks & credit institutions 12.64Internet, software & IT services 8.89Investment funds 6.86Textiles, garments & leather goods 6.26Petroleum 6.19Pharmaceuticals, cosmetics & medical products 4.93Insurance 4.20Finance & holding companies 3.70Miscellaneous services 3.52Telecommunications 3.51Chemicals 3.21Graphic design, publishing & media 3.01Electronics & semiconductors 2.79Aerospace industry 2.51Real Estate 2.34Tobacco & alcohol 2.26Building industry & materials 2.14Retail trade, department stores 2.07Electrical devices & components 1.43Vehicles 1.33Forestry, paper & pulp products 1.27Mechanical engineering & industrial equipment 1.20Energy & water supply 0.97Biotechnology 0.64Precious metals & stones 0.64Miscellaneous unclassified companies 0.57Mining, coal & steel 0.34Total 89.42

68 The notes are an integral part of the fi nancial statements.
UBS (Lux) Equity SICAV – European Opportunity Unconstrained (EUR)Annual Report as of 31 May 2018
Statement of Net Assets EURAssets 31.5.2018Investments in securities, cost 773 565 063.61Investments in securities, unrealized appreciation (depreciation) 95 111 114.78Total investments in securities (Note 1) 868 676 178.39Cash at banks, deposits on demand and deposit accounts 102 432 632.92Receivable on securities sales (Note 1) 6 026 606.29Receivable on subscriptions 73 017.20Interest receivable on liquid assets 105.03Receivable on dividends 3 434 931.04Other receivables 5 214 931.99Unrealized gain (loss) on forward foreign exchange contracts (Note 1) 4 757 831.03Unrealized gain (loss) on Synthetic Equity Swaps (Note 1) 1 029 580.57Total Assets 991 645 814.46
LiabilitiesBank overdraft -2 194 710.96Interest payable on bank overdraft -32 902.09Payable on securities purchases (Note 1) -5 683 623.06Payable on redemptions -10 888 073.08Other liabilities -478 796.35Provisions for flat fee (Note 2) -764 621.27Provisions for taxe d’abonnement (Note 3) -74 439.07Provisions for other commissions and fees (Note 2) -32 015.35Total provisions -871 075.69Total Liabilities -20 149 181.23
Net assets at the end of the financial year 971 496 633.23
Statement of Operations EURIncome 1.6.2017-31.5.2018Interest on liquid assets 158 542.89Dividends 20 143 365.91Income on Synthetic Equity Swaps (Note 1) 25 159 109.29Income on securities lending (Note 16) 1 376 288.19Other income (Note 4) 480 635.65Total income 47 317 941.93
ExpensesInterest paid on Synthetic Equity Swaps (Note 1) -24 189 091.31Flat fee (Note 2) -24 564 228.30Taxe d’abonnement (Note 3) -557 549.83Cost on securities lending (Note 16) -550 515.24Other commissions and fees (Note 2) -267 176.64Interest on cash and bank overdraft -547 137.81Total expenses -50 675 699.13
Net income (loss) on investments -3 357 757.20
Realized gain (loss) (Note 1)Realized gain (loss) on market-priced securities without options 152 173 811.12Realized gain (loss) on forward foreign exchange contracts -57 587 103.48Realized gain (loss) on Synthetic Equity Swaps -3 554 661.48Realized gain (loss) on foreign exchange 7 864 961.10Total realized gain (loss) 98 897 007.26
Net realized gain (loss) of the financial year 95 539 250.06
Changes in unrealized appreciation (depreciation) (Note 1)Unrealized appreciation (depreciation) on market-priced securities without options -115 957 262.40Unrealized appreciation (depreciation) on forward foreign exchange contracts 25 396 892.30Unrealized appreciation (depreciation) on Synthetic Equity Swaps -56 433 385.13Total changes in unrealized appreciation (depreciation) -146 993 755.23
Net increase (decrease) in net assets as a result of operations -51 454 505.17

The notes are an integral part of the fi nancial statements. 69
UBS (Lux) Equity SICAV – European Opportunity Unconstrained (EUR)Annual Report as of 31 May 2018
Statement of Changes in Net Assets EUR 1.6.2017-31.5.2018Net assets at the beginning of the financial year 2 015 220 728.73Subscriptions 113 239 708.48Redemptions -1 105 509 298.81Total net subscriptions (redemptions) -992 269 590.33Net income (loss) on investments -3 357 757.20Total realized gain (loss) 98 897 007.26Total changes in unrealized appreciation (depreciation) -146 993 755.23Net increase (decrease) in net assets as a result of operations -51 454 505.17Net assets at the end of the financial year 971 496 633.23
Changes in the Number of Shares outstanding
1.6.2017-31.5.2018Class I-A1-accNumber of shares outstanding at the beginning of the financial year 309 875.7380Number of shares issued 30.0000Number of shares redeemed -133 812.7120Number of shares outstanding at the end of the financial year 176 093.0260Class (USD hedged) I-A1-accNumber of shares outstanding at the beginning of the financial year 212 011.7030Number of shares issued 1 058.0000Number of shares redeemed -210 608.2030Number of shares outstanding at the end of the financial year 2 461.5000Class I-A3-accNumber of shares outstanding at the beginning of the financial year 74 800.0000Number of shares issued 0.0000Number of shares redeemed -5 870.0000Number of shares outstanding at the end of the financial year 68 930.0000Class I-B-accNumber of shares outstanding at the beginning of the financial year 42 529.2880Number of shares issued 25 780.0010Number of shares redeemed 0.0000Number of shares outstanding at the end of the financial year 68 309.2890Class (USD hedged) I-B-accNumber of shares outstanding at the beginning of the financial year 12 513.6770Number of shares issued 0.0000Number of shares redeemed 0.0000Number of shares outstanding at the end of the financial year 12 513.6770Class I-X-accNumber of shares outstanding at the beginning of the financial year 6 827.9330Number of shares issued 0.0000Number of shares redeemed 0.0000Number of shares outstanding at the end of the financial year 6 827.9330Class K-1-accNumber of shares outstanding at the beginning of the financial year 11.1000Number of shares issued 0.6000Number of shares redeemed -2.6000Number of shares outstanding at the end of the financial year 9.1000Class (USD hedged) K-1-accNumber of shares outstanding at the beginning of the financial year 5.3000Number of shares issued 0.0000Number of shares redeemed -3.7000Number of shares outstanding at the end of the financial year 1.6000Class N-accNumber of shares outstanding at the beginning of the financial year 217 551.2740Number of shares issued 5 801.2980Number of shares redeemed -91 376.8200Number of shares outstanding at the end of the financial year 131 975.7520Class P-accNumber of shares outstanding at the beginning of the financial year 4 970 827.2960Number of shares issued 312 483.7690Number of shares redeemed -3 156 090.5510Number of shares outstanding at the end of the financial year 2 127 220.5140Class (AUD hedged) P-accNumber of shares outstanding at the beginning of the financial year 108 729.4210Number of shares issued 323.0720Number of shares redeemed -52 054.9570Number of shares outstanding at the end of the financial year 56 997.5360

70 The notes are an integral part of the fi nancial statements.
UBS (Lux) Equity SICAV – European Opportunity Unconstrained (EUR)Annual Report as of 31 May 2018
Class (CAD hedged) P-accNumber of shares outstanding at the beginning of the financial year 25 439.7220Number of shares issued 0.0000Number of shares redeemed -25 439.7220Number of shares outstanding at the end of the financial year 0.0000Class (CHF hedged) P-accNumber of shares outstanding at the beginning of the financial year 168 376.9980Number of shares issued 4 772.5380Number of shares redeemed -100 377.6070Number of shares outstanding at the end of the financial year 72 771.9290Class (GBP hedged) P-accNumber of shares outstanding at the beginning of the financial year 89 095.3460Number of shares issued 715.8570Number of shares redeemed -40 543.9300Number of shares outstanding at the end of the financial year 49 267.2730Class (HKD hedged) P-accNumber of shares outstanding at the beginning of the financial year 28 287.4350Number of shares issued 0.0000Number of shares redeemed -10 164.8090Number of shares outstanding at the end of the financial year 18 122.6260Class (RMB hedged) P-accNumber of shares outstanding at the beginning of the financial year 11 791.7220Number of shares issued 312.6840Number of shares redeemed -2 055.0090Number of shares outstanding at the end of the financial year 10 049.3970Class (SEK) P-accNumber of shares outstanding at the beginning of the financial year 749 668.6370Number of shares issued 27 282.1160Number of shares redeemed -89 267.9920Number of shares outstanding at the end of the financial year 687 682.7610Class (SGD hedged) P-accNumber of shares outstanding at the beginning of the financial year 378 783.6640Number of shares issued 2 152.1130Number of shares redeemed -189 693.4340Number of shares outstanding at the end of the financial year 191 242.3430Class (USD hedged) P-accNumber of shares outstanding at the beginning of the financial year 3 654 815.6810Number of shares issued 11 456.4880Number of shares redeemed -2 007 122.6880Number of shares outstanding at the end of the financial year 1 659 149.4810Class Q-accNumber of shares outstanding at the beginning of the financial year 761 842.6640Number of shares issued 241 112.4030Number of shares redeemed -638 158.6240Number of shares outstanding at the end of the financial year 364 796.4430Class (CHF hedged) Q-accNumber of shares outstanding at the beginning of the financial year 195 402.6290Number of shares issued 5 249.2060Number of shares redeemed -108 879.3490Number of shares outstanding at the end of the financial year 91 772.4860Class (GBP hedged) Q-accNumber of shares outstanding at the beginning of the financial year 98 520.4860Number of shares issued 496.4880Number of shares redeemed -54 932.2670Number of shares outstanding at the end of the financial year 44 084.7070Class (SEK) Q-accNumber of shares outstanding at the beginning of the financial year 1 490.0000Number of shares issued 0.0000Number of shares redeemed 0.0000Number of shares outstanding at the end of the financial year 1 490.0000Class (USD hedged) Q-accNumber of shares outstanding at the beginning of the financial year 307 766.8990Number of shares issued 6 604.9490Number of shares redeemed -207 707.0920Number of shares outstanding at the end of the financial year 106 664.7560Class U-X-accNumber of shares outstanding at the beginning of the financial year 3 257.7290Number of shares issued 276.3940Number of shares redeemed -1 311.3380Number of shares outstanding at the end of the financial year 2 222.7850

The notes are an integral part of the fi nancial statements. 71
UBS (Lux) Equity SICAV – European Opportunity Unconstrained (EUR)Annual Report as of 31 May 2018
Statement of Investments in Securities and other Net Assets as of 31 May 2018
Description Quantity/ Valuation in EUR as a % Nominal Unrealized gain of net (loss) on Futures/ assets Forward Exchange Contracts/ Swaps (Note 1)
Transferable securities and money market instruments listed on an official stock exchange
Bearer shares
Austria
CHF AMS AG NPV (BR) 76 625.00 5 683 579.26 0.58EUR ERSTE GROUP BK AG NPV 298 785.00 10 660 648.80 1.10EUR VOESTALPINE AG NPV 72 218.00 3 319 139.28 0.34Total Austria 19 663 367.34 2.02
Canada
CAD IVANHOE MINES LTD COM NPV CL’A’ 2 873 055.00 6 204 435.40 0.64Total Canada 6 204 435.40 0.64
Denmark
DKK DANSKE BANK A/S DKK10 449 879.00 12 777 104.57 1.32DKK TRYG A/S DKK5 261 329.00 5 150 500.87 0.53Total Denmark 17 927 605.44 1.85
Finland
EUR SAMPO OYJ SER’A’NPV 490 922.00 20 657 997.76 2.13EUR UPM-KYMMENE CORP NPV 394 434.00 12 389 171.94 1.27Total Finland 33 047 169.70 3.40
France
EUR CGG EUR0.01 1 016 706.00 2 267 254.38 0.23EUR EIFFAGE EUR4 215 887.00 20 811 506.80 2.14EUR FAURECIA EUR7 177 592.00 12 875 420.00 1.33EUR HERMES INTL NPV 22 878.00 13 928 126.40 1.43EUR L’OREAL EUR0.20 99 503.00 20 457 816.80 2.11EUR LEGRAND SA EUR4 215 538.00 13 910 822.52 1.43EUR LVMH MOET HENNESSY EUR0.30 109 559.00 32 544 500.95 3.35EUR PERNOD RICARD EUR1.55 98 903.00 14 212 361.10 1.46EUR SAFRAN EUR0.20 165 388.00 16 894 384.20 1.74EUR THALES EUR3 85 185.00 9 276 646.50 0.96EUR UBISOFT ENTERTAIN EUR0.31 157 113.00 14 551 806.06 1.50Total France 171 730 645.71 17.68
Germany
EUR AUMANN AG NPV 91 810.00 5 545 324.00 0.57EUR BEIERSDORF AG NPV 124 749.00 12 257 836.74 1.26EUR COVESTRO AG NPV 184 841.00 14 406 507.54 1.49EUR DEUTSCHE WOHNEN AG NPV (BR) 566 788.00 22 745 202.44 2.34EUR SIEMENS HEALTHINEE NPV 243 056.00 8 265 119.28 0.85Total Germany 63 219 990.00 6.51
Isle of Man
GBP GVC HLDGS PLC ORD EUR0.01 478 199.00 5 543 843.60 0.57Total Isle of Man 5 543 843.60 0.57
Italy
EUR AMPLIFON EUR0.02 449 297.00 6 928 159.74 0.71EUR ENEL EUR1 2 001 073.00 9 411 046.32 0.97EUR ENI SPA EUR1 822 876.00 12 746 349.24 1.31EUR MEDIOBANCA SPA EUR0.5 1 499 955.00 12 101 636.94 1.24EUR MONCLER SPA NPV 365 371.00 14 348 119.17 1.48EUR TELECOM ITALIA SPA DI RISP EUR0.55 28 682 372.00 17 180 740.83 1.77Total Italy 72 716 052.24 7.48
Luxembourg
EUR EUROFINS SCIENTIFI EUR0.10 32 366.00 14 221 620.40 1.46Total Luxembourg 14 221 620.40 1.46
The Netherlands
EUR ASML HOLDING NV EUR0.09 127 960.00 21 420 504.00 2.20EUR ASR NEDERLAND N.V. EUR0.16 413 268.00 14 960 301.60 1.54EUR HEINEKEN NV EUR1.60 90 259.00 7 729 780.76 0.80EUR IMCD NV EUR0.16 95 592.00 5 071 155.60 0.52EUR KONINKLIJKE DSM NV EUR1.5 193 574.00 16 488 633.32 1.70EUR RELX NV EUR0.07 1 563 005.00 29 196 933.40 3.01EUR SHOP APOTHEKE EURO NPV 186 156.00 7 799 936.40 0.80Total The Netherlands 102 667 245.08 10.57
Norway
NOK EQUINOR ASA NOK2.50 867 837.00 19 561 900.19 2.01Total Norway 19 561 900.19 2.01
Portugal
EUR GALP ENERGIA EUR1-B 976 007.00 15 513 631.27 1.60Total Portugal 15 513 631.27 1.60
Spain
EUR AMADEUS IT GROUP EUR0.01 470 653.00 31 957 338.70 3.29EUR GRIFOLS SA EUR0.25 (CLASS A) POST SUBD 248 362.00 6 258 722.40 0.64Total Spain 38 216 061.10 3.93
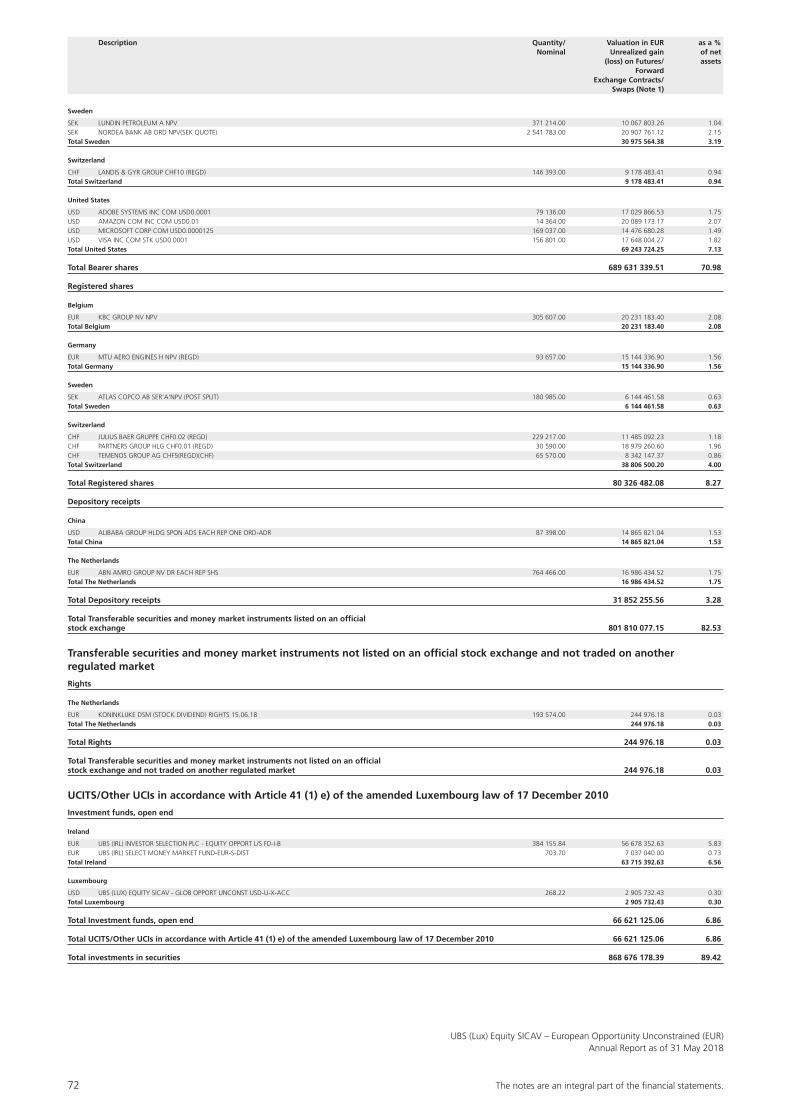
72 The notes are an integral part of the fi nancial statements.
UBS (Lux) Equity SICAV – European Opportunity Unconstrained (EUR)Annual Report as of 31 May 2018
Sweden
SEK LUNDIN PETROLEUM A NPV 371 214.00 10 067 803.26 1.04SEK NORDEA BANK AB ORD NPV(SEK QUOTE) 2 541 783.00 20 907 761.12 2.15Total Sweden 30 975 564.38 3.19
Switzerland
CHF LANDIS & GYR GROUP CHF10 (REGD) 146 393.00 9 178 483.41 0.94Total Switzerland 9 178 483.41 0.94
United States
USD ADOBE SYSTEMS INC COM USD0.0001 79 136.00 17 029 866.53 1.75USD AMAZON COM INC COM USD0.01 14 364.00 20 089 173.17 2.07USD MICROSOFT CORP COM USD0.0000125 169 037.00 14 476 680.28 1.49USD VISA INC COM STK USD0.0001 156 801.00 17 648 004.27 1.82Total United States 69 243 724.25 7.13
Total Bearer shares 689 631 339.51 70.98
Registered shares
Belgium
EUR KBC GROUP NV NPV 305 607.00 20 231 183.40 2.08Total Belgium 20 231 183.40 2.08
Germany
EUR MTU AERO ENGINES H NPV (REGD) 93 657.00 15 144 336.90 1.56Total Germany 15 144 336.90 1.56
Sweden
SEK ATLAS COPCO AB SER’A’NPV (POST SPLIT) 180 985.00 6 144 461.58 0.63Total Sweden 6 144 461.58 0.63
Switzerland
CHF JULIUS BAER GRUPPE CHF0.02 (REGD) 229 217.00 11 485 092.23 1.18CHF PARTNERS GROUP HLG CHF0.01 (REGD) 30 590.00 18 979 260.60 1.96CHF TEMENOS GROUP AG CHF5(REGD)(CHF) 65 570.00 8 342 147.37 0.86Total Switzerland 38 806 500.20 4.00
Total Registered shares 80 326 482.08 8.27
Depository receipts
China
USD ALIBABA GROUP HLDG SPON ADS EACH REP ONE ORD-ADR 87 398.00 14 865 821.04 1.53Total China 14 865 821.04 1.53
The Netherlands
EUR ABN AMRO GROUP NV DR EACH REP SHS 764 466.00 16 986 434.52 1.75Total The Netherlands 16 986 434.52 1.75
Total Depository receipts 31 852 255.56 3.28
Total Transferable securities and money market instruments listed on an official stock exchange 801 810 077.15 82.53
Transferable securities and money market instruments not listed on an official stock exchange and not traded on another regulated market
Rights
The Netherlands
EUR KONINKLIJKE DSM (STOCK DIVIDEND) RIGHTS 15.06.18 193 574.00 244 976.18 0.03Total The Netherlands 244 976.18 0.03
Total Rights 244 976.18 0.03
Total Transferable securities and money market instruments not listed on an official stock exchange and not traded on another regulated market 244 976.18 0.03
UCITS/Other UCIs in accordance with Article 41 (1) e) of the amended Luxembourg law of 17 December 2010
Investment funds, open end
Ireland
EUR UBS (IRL) INVESTOR SELECTION PLC - EQUITY OPPORT L/S FD-I-B 384 155.84 56 678 352.63 5.83EUR UBS (IRL) SELECT MONEY MARKET FUND-EUR-S-DIST 703.70 7 037 040.00 0.73Total Ireland 63 715 392.63 6.56
Luxembourg
USD UBS (LUX) EQUITY SICAV - GLOB OPPORT UNCONST USD-U-X-ACC 268.22 2 905 732.43 0.30Total Luxembourg 2 905 732.43 0.30
Total Investment funds, open end 66 621 125.06 6.86
Total UCITS/Other UCIs in accordance with Article 41 (1) e) of the amended Luxembourg law of 17 December 2010 66 621 125.06 6.86
Total investments in securities 868 676 178.39 89.42
Description Quantity/ Valuation in EUR as a % Nominal Unrealized gain of net (loss) on Futures/ assets Forward Exchange Contracts/ Swaps (Note 1)
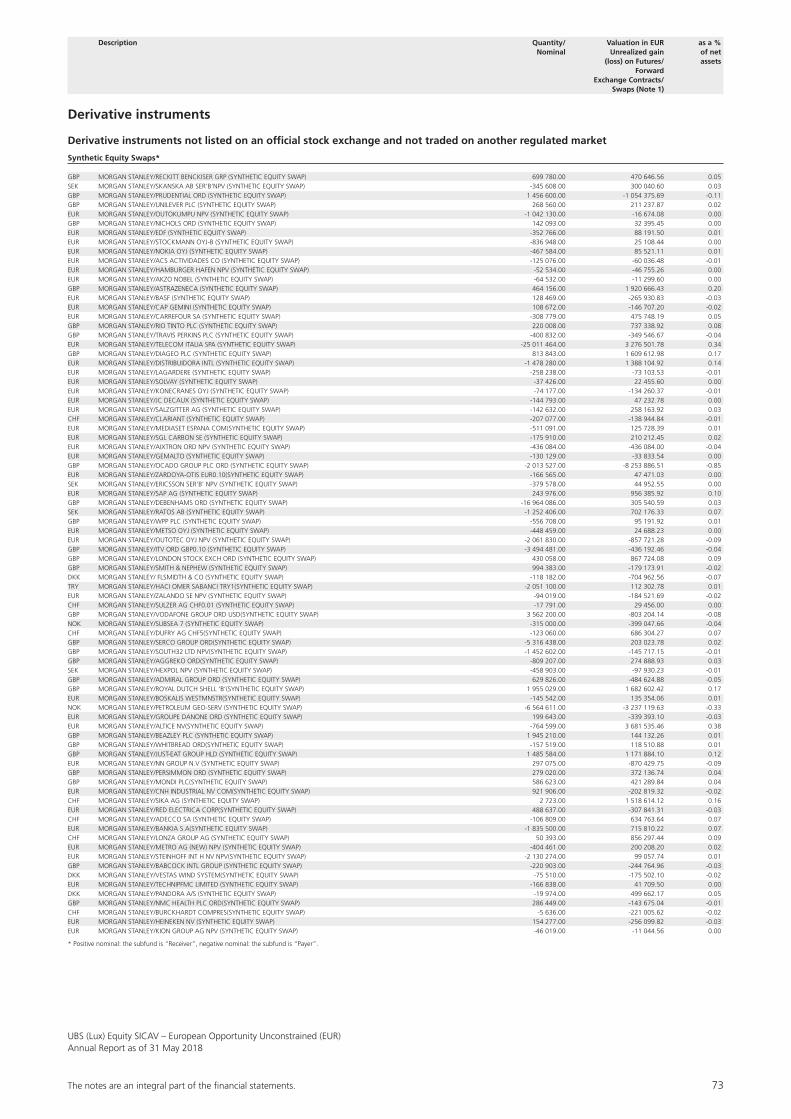
The notes are an integral part of the fi nancial statements. 73
UBS (Lux) Equity SICAV – European Opportunity Unconstrained (EUR)Annual Report as of 31 May 2018
Derivative instruments
Derivative instruments not listed on an official stock exchange and not traded on another regulated market
Synthetic Equity Swaps*
GBP MORGAN STANLEY/RECKITT BENCKISER GRP (SYNTHETIC EQUITY SWAP) 699 780.00 470 646.56 0.05SEK MORGAN STANLEY/SKANSKA AB SER’B’NPV (SYNTHETIC EQUITY SWAP) -345 608.00 300 040.60 0.03GBP MORGAN STANLEY/PRUDENTIAL ORD (SYNTHETIC EQUITY SWAP) 1 456 600.00 -1 054 375.69 -0.11GBP MORGAN STANLEY/UNILEVER PLC (SYNTHETIC EQUITY SWAP) 268 560.00 211 237.87 0.02EUR MORGAN STANLEY/OUTOKUMPU NPV (SYNTHETIC EQUITY SWAP) -1 042 130.00 -16 674.08 0.00GBP MORGAN STANLEY/NICHOLS ORD (SYNTHETIC EQUITY SWAP) 142 093.00 32 395.45 0.00EUR MORGAN STANLEY/EDF (SYNTHETIC EQUITY SWAP) -352 766.00 88 191.50 0.01EUR MORGAN STANLEY/STOCKMANN OYJ-B (SYNTHETIC EQUITY SWAP) -836 948.00 25 108.44 0.00EUR MORGAN STANLEY/NOKIA OYJ (SYNTHETIC EQUITY SWAP) -467 584.00 85 521.11 0.01EUR MORGAN STANLEY/ACS ACTIVIDADES CO (SYNTHETIC EQUITY SWAP) -125 076.00 -60 036.48 -0.01EUR MORGAN STANLEY/HAMBURGER HAFEN NPV (SYNTHETIC EQUITY SWAP) -52 534.00 -46 755.26 0.00EUR MORGAN STANLEY/AKZO NOBEL (SYNTHETIC EQUITY SWAP) -64 532.00 -11 299.60 0.00GBP MORGAN STANLEY/ASTRAZENECA (SYNTHETIC EQUITY SWAP) 464 156.00 1 920 666.43 0.20EUR MORGAN STANLEY/BASF (SYNTHETIC EQUITY SWAP) 128 469.00 -265 930.83 -0.03EUR MORGAN STANLEY/CAP GEMINI (SYNTHETIC EQUITY SWAP) 108 672.00 -146 707.20 -0.02EUR MORGAN STANLEY/CARREFOUR SA (SYNTHETIC EQUITY SWAP) -308 779.00 475 748.19 0.05GBP MORGAN STANLEY/RIO TINTO PLC (SYNTHETIC EQUITY SWAP) 220 008.00 737 338.92 0.08GBP MORGAN STANLEY/TRAVIS PERKINS PLC (SYNTHETIC EQUITY SWAP) -400 832.00 -349 546.67 -0.04EUR MORGAN STANLEY/TELECOM ITALIA SPA (SYNTHETIC EQUITY SWAP) -25 011 464.00 3 276 501.78 0.34GBP MORGAN STANLEY/DIAGEO PLC (SYNTHETIC EQUITY SWAP) 813 843.00 1 609 612.98 0.17EUR MORGAN STANLEY/DISTRIBUIDORA INTL (SYNTHETIC EQUITY SWAP) -1 478 280.00 1 388 104.92 0.14EUR MORGAN STANLEY/LAGARDERE (SYNTHETIC EQUITY SWAP) -258 238.00 -73 103.53 -0.01EUR MORGAN STANLEY/SOLVAY (SYNTHETIC EQUITY SWAP) -37 426.00 22 455.60 0.00EUR MORGAN STANLEY/KONECRANES OYJ (SYNTHETIC EQUITY SWAP) -74 177.00 -134 260.37 -0.01EUR MORGAN STANLEY/JC DECAUX (SYNTHETIC EQUITY SWAP) -144 793.00 47 232.78 0.00EUR MORGAN STANLEY/SALZGITTER AG (SYNTHETIC EQUITY SWAP) -142 632.00 258 163.92 0.03CHF MORGAN STANLEY/CLARIANT (SYNTHETIC EQUITY SWAP) -207 077.00 -138 944.84 -0.01EUR MORGAN STANLEY/MEDIASET ESPANA COM(SYNTHETIC EQUITY SWAP) -511 091.00 125 728.39 0.01EUR MORGAN STANLEY/SGL CARBON SE (SYNTHETIC EQUITY SWAP) -175 910.00 210 212.45 0.02EUR MORGAN STANLEY/AIXTRON ORD NPV (SYNTHETIC EQUITY SWAP) -436 084.00 -436 084.00 -0.04EUR MORGAN STANLEY/GEMALTO (SYNTHETIC EQUITY SWAP) -130 129.00 -33 833.54 0.00GBP MORGAN STANLEY/OCADO GROUP PLC ORD (SYNTHETIC EQUITY SWAP) -2 013 527.00 -8 253 886.51 -0.85EUR MORGAN STANLEY/ZARDOYA-OTIS EUR0.10(SYNTHETIC EQUITY SWAP) -166 565.00 47 471.03 0.00SEK MORGAN STANLEY/ERICSSON SER’B’ NPV (SYNTHETIC EQUITY SWAP) -379 578.00 44 952.55 0.00EUR MORGAN STANLEY/SAP AG (SYNTHETIC EQUITY SWAP) 243 976.00 956 385.92 0.10GBP MORGAN STANLEY/DEBENHAMS ORD (SYNTHETIC EQUITY SWAP) -16 964 086.00 305 540.59 0.03SEK MORGAN STANLEY/RATOS AB (SYNTHETIC EQUITY SWAP) -1 252 406.00 702 176.33 0.07GBP MORGAN STANLEY/WPP PLC (SYNTHETIC EQUITY SWAP) -556 708.00 95 191.92 0.01EUR MORGAN STANLEY/METSO OYJ (SYNTHETIC EQUITY SWAP) -448 459.00 24 688.23 0.00EUR MORGAN STANLEY/OUTOTEC OYJ NPV (SYNTHETIC EQUITY SWAP) -2 061 830.00 -857 721.28 -0.09GBP MORGAN STANLEY/ITV ORD GBP0.10 (SYNTHETIC EQUITY SWAP) -3 494 481.00 -436 192.46 -0.04GBP MORGAN STANLEY/LONDON STOCK EXCH ORD (SYNTHETIC EQUITY SWAP) 430 058.00 867 724.08 0.09GBP MORGAN STANLEY/SMITH & NEPHEW (SYNTHETIC EQUITY SWAP) 994 383.00 -179 173.91 -0.02DKK MORGAN STANLEY/ FLSMIDTH & CO (SYNTHETIC EQUITY SWAP) -118 182.00 -704 962.56 -0.07TRY MORGAN STANLEY/HACI OMER SABANCI TRY1(SYNTHETIC EQUITY SWAP) -2 051 100.00 112 302.78 0.01EUR MORGAN STANLEY/ZALANDO SE NPV (SYNTHETIC EQUITY SWAP) -94 019.00 -184 521.69 -0.02CHF MORGAN STANLEY/SULZER AG CHF0.01 (SYNTHETIC EQUITY SWAP) -17 791.00 29 456.00 0.00GBP MORGAN STANLEY/VODAFONE GROUP ORD USD(SYNTHETIC EQUITY SWAP) 3 562 200.00 -803 204.14 -0.08NOK MORGAN STANLEY/SUBSEA 7 (SYNTHETIC EQUITY SWAP) -315 000.00 -399 047.66 -0.04CHF MORGAN STANLEY/DUFRY AG CHF5(SYNTHETIC EQUITY SWAP) -123 060.00 686 304.27 0.07GBP MORGAN STANLEY/SERCO GROUP ORD(SYNTHETIC EQUITY SWAP) -5 316 438.00 203 023.78 0.02GBP MORGAN STANLEY/SOUTH32 LTD NPV(SYNTHETIC EQUITY SWAP) -1 452 602.00 -145 717.15 -0.01GBP MORGAN STANLEY/AGGREKO ORD(SYNTHETIC EQUITY SWAP) -809 207.00 274 888.93 0.03SEK MORGAN STANLEY/HEXPOL NPV (SYNTHETIC EQUITY SWAP) -458 903.00 -97 930.23 -0.01GBP MORGAN STANLEY/ADMIRAL GROUP ORD (SYNTHETIC EQUITY SWAP) 629 826.00 -484 624.88 -0.05GBP MORGAN STANLEY/ROYAL DUTCH SHELL ‘B’(SYNTHETIC EQUITY SWAP) 1 955 029.00 1 682 602.42 0.17EUR MORGAN STANLEY/BOSKALIS WESTMNSTR(SYNTHETIC EQUITY SWAP) -145 542.00 135 354.06 0.01NOK MORGAN STANLEY/PETROLEUM GEO-SERV (SYNTHETIC EQUITY SWAP) -6 564 611.00 -3 237 119.63 -0.33EUR MORGAN STANLEY/GROUPE DANONE ORD (SYNTHETIC EQUITY SWAP) 199 643.00 -339 393.10 -0.03EUR MORGAN STANLEY/ALTICE NV(SYNTHETIC EQUITY SWAP) -764 599.00 3 681 535.46 0.38GBP MORGAN STANLEY/BEAZLEY PLC (SYNTHETIC EQUITY SWAP) 1 945 210.00 144 132.26 0.01GBP MORGAN STANLEY/WHITBREAD ORD(SYNTHETIC EQUITY SWAP) -157 519.00 118 510.88 0.01GBP MORGAN STANLEY/JUST-EAT GROUP HLD (SYNTHETIC EQUITY SWAP) 1 485 584.00 1 171 884.10 0.12EUR MORGAN STANLEY/NN GROUP N.V (SYNTHETIC EQUITY SWAP) 297 075.00 -870 429.75 -0.09GBP MORGAN STANLEY/PERSIMMON ORD (SYNTHETIC EQUITY SWAP) 279 020.00 372 136.74 0.04GBP MORGAN STANLEY/MONDI PLC(SYNTHETIC EQUITY SWAP) 586 623.00 421 289.84 0.04EUR MORGAN STANLEY/CNH INDUSTRIAL NV COM(SYNTHETIC EQUITY SWAP) 921 906.00 -202 819.32 -0.02CHF MORGAN STANLEY/SIKA AG (SYNTHETIC EQUITY SWAP) 2 723.00 1 518 614.12 0.16EUR MORGAN STANLEY/RED ELECTRICA CORP(SYNTHETIC EQUITY SWAP) 488 637.00 -307 841.31 -0.03CHF MORGAN STANLEY/ADECCO SA (SYNTHETIC EQUITY SWAP) -106 809.00 634 763.64 0.07EUR MORGAN STANLEY/BANKIA S.A(SYNTHETIC EQUITY SWAP) -1 835 500.00 715 810.22 0.07CHF MORGAN STANLEY/LONZA GROUP AG (SYNTHETIC EQUITY SWAP) 50 393.00 856 297.44 0.09EUR MORGAN STANLEY/METRO AG (NEW) NPV (SYNTHETIC EQUITY SWAP) -404 461.00 200 208.20 0.02EUR MORGAN STANLEY/STEINHOFF INT H NV NPV(SYNTHETIC EQUITY SWAP) -2 130 274.00 99 057.74 0.01GBP MORGAN STANLEY/BABCOCK INTL GROUP (SYNTHETIC EQUITY SWAP) -220 903.00 -244 764.96 -0.03DKK MORGAN STANLEY/VESTAS WIND SYSTEM(SYNTHETIC EQUITY SWAP) -75 510.00 -175 502.10 -0.02EUR MORGAN STANLEY/TECHNIPFMC LIMITED (SYNTHETIC EQUITY SWAP) -166 838.00 41 709.50 0.00DKK MORGAN STANLEY/PANDORA A/S (SYNTHETIC EQUITY SWAP) -19 974.00 499 662.17 0.05GBP MORGAN STANLEY/NMC HEALTH PLC ORD(SYNTHETIC EQUITY SWAP) 286 449.00 -143 675.04 -0.01CHF MORGAN STANLEY/BURCKHARDT COMPRES(SYNTHETIC EQUITY SWAP) -5 636.00 -221 005.62 -0.02EUR MORGAN STANLEY/HEINEKEN NV (SYNTHETIC EQUITY SWAP) 154 277.00 -256 099.82 -0.03EUR MORGAN STANLEY/KION GROUP AG NPV (SYNTHETIC EQUITY SWAP) -46 019.00 -11 044.56 0.00
Description Quantity/ Valuation in EUR as a % Nominal Unrealized gain of net (loss) on Futures/ assets Forward Exchange Contracts/ Swaps (Note 1)
* Positive nominal: the subfund is “Receiver”, negative nominal: the subfund is “Payer”.

74 The notes are an integral part of the fi nancial statements.
UBS (Lux) Equity SICAV – European Opportunity Unconstrained (EUR)Annual Report as of 31 May 2018
Description Quantity/ Valuation in EUR as a % Nominal Unrealized gain of net (loss) on Futures/ assets Forward Exchange Contracts/ Swaps (Note 1)
EUR MORGAN STANLEY/CASINO GUICH-PERR (SYNTHETIC EQUITY SWAP) -122 681.00 731 178.76 0.08DKK MORGAN STANLEY/ISS A/S(SYNTHETIC EQUITY SWAP) -203 158.00 -43 670.25 0.00CHF MORGAN STANLEY/NOVARTIS AG (SYNTHETIC EQUITY SWAP) 373 121.00 -1 216 021.11 -0.13GBP MORGAN STANLEY/FOXTONS GROUP PLC ORDS(SYNTHETIC EQUITY SWAP) -717 309.00 52 332.04 0.01EUR MORGAN STANLEY/AIB GROUP PLC(SYNTHETIC EQUITY SWAP) -622 218.00 166 132.21 0.02EUR MORGAN STANLEY/ALTICE NV(SYNTHETIC EQUITY SWAP) -764 599.00 -5 264 724.40 -0.54Total Synthetic Equity Swaps 1 029 580.57 0.11
Total Derivative instruments not listed on an official stock exchange and not traded on anotherregulated market 1 029 580.57 0.11
Total Derivative instruments 1 029 580.57 0.11
Forward Foreign Exchange contracts
Forward Foreign Exchange contracts (Purchase/Sale)
GBP 240 330 000.00 EUR 272 364 104.10 8.6.2018 1 557 112.82 0.16EUR 24 865 915.09 SEK 262 670 000.00 8.6.2018 -613 670.94 -0.06EUR 48 881 398.99 TRY 252 545 000.00 8.6.2018 1 327 450.16 0.14USD 59 220 000.00 EUR 49 395 938.22 8.6.2018 1 317 333.13 0.14SEK 262 670 000.00 EUR 25 443 367.90 8.6.2018 36 218.13 0.00AUD 8 100 500.00 EUR 5 236 405.90 29.6.2018 3 812.72 0.00GBP 10 957 100.00 EUR 12 480 784.07 29.6.2018 399.78 0.00USD 276 542 800.00 EUR 235 582 134.31 29.6.2018 810 067.22 0.08SGD 26 585 600.00 EUR 16 921 776.50 29.6.2018 78 194.43 0.01CHF 18 103 200.00 EUR 15 563 667.10 29.6.2018 216 855.30 0.02CNH 14 691 400.00 EUR 1 956 330.19 29.6.2018 1 907.54 0.00HKD 17 052 500.00 EUR 1 850 723.93 29.6.2018 9 053.62 0.00EUR 1 911 232.81 USD 2 231 500.00 29.6.2018 3 719.04 0.00EUR 153 231.91 AUD 236 800.00 29.6.2018 45.84 0.00USD 1 303 500.00 EUR 1 123 031.14 29.6.2018 -8 783.24 0.00EUR 5 188 618.96 USD 6 048 700.00 29.6.2018 18 115.48 0.00Total Forward Foreign Exchange contracts (Purchase/Sale) 4 757 831.03 0.49
Cash at banks, deposits on demand and deposit accounts and other liquid assets 102 432 632.92 10.54Bank overdraft and other short-term liabilities -2 194 710.96 -0.23Other assets and liabilities -3 204 878.72 -0.33
Total net assets 971 496 633.23 100.00
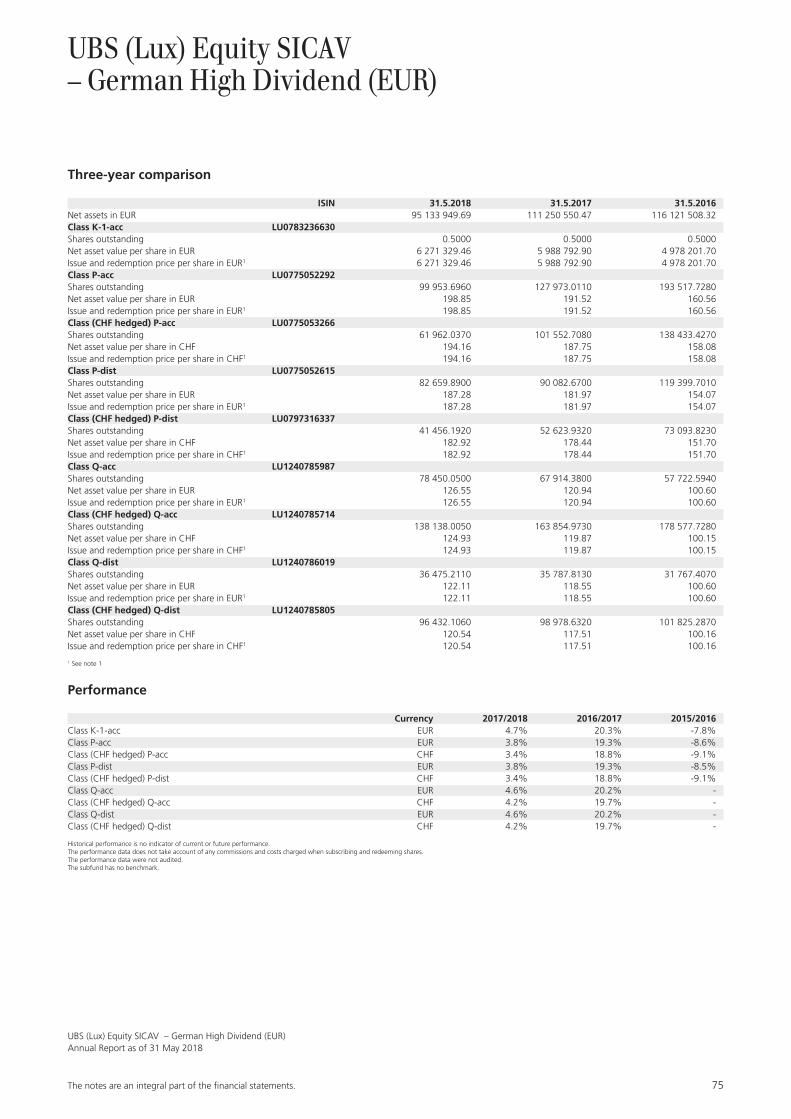
The notes are an integral part of the fi nancial statements. 75
UBS (Lux) Equity SICAV – German High Dividend (EUR)Annual Report as of 31 May 2018
UBS (Lux) Equity SICAV – German High Dividend (EUR)
Three-year comparison
ISIN 31.5.2018 31.5.2017 31.5.2016Net assets in EUR 95 133 949.69 111 250 550.47 116 121 508.32Class K-1-acc LU0783236630Shares outstanding 0.5000 0.5000 0.5000Net asset value per share in EUR 6 271 329.46 5 988 792.90 4 978 201.70Issue and redemption price per share in EUR1 6 271 329.46 5 988 792.90 4 978 201.70Class P-acc LU0775052292Shares outstanding 99 953.6960 127 973.0110 193 517.7280Net asset value per share in EUR 198.85 191.52 160.56Issue and redemption price per share in EUR1 198.85 191.52 160.56Class (CHF hedged) P-acc LU0775053266Shares outstanding 61 962.0370 101 552.7080 138 433.4270Net asset value per share in CHF 194.16 187.75 158.08Issue and redemption price per share in CHF1 194.16 187.75 158.08Class P-dist LU0775052615Shares outstanding 82 659.8900 90 082.6700 119 399.7010Net asset value per share in EUR 187.28 181.97 154.07Issue and redemption price per share in EUR1 187.28 181.97 154.07Class (CHF hedged) P-dist LU0797316337Shares outstanding 41 456.1920 52 623.9320 73 093.8230Net asset value per share in CHF 182.92 178.44 151.70Issue and redemption price per share in CHF1 182.92 178.44 151.70Class Q-acc LU1240785987Shares outstanding 78 450.0500 67 914.3800 57 722.5940Net asset value per share in EUR 126.55 120.94 100.60Issue and redemption price per share in EUR1 126.55 120.94 100.60Class (CHF hedged) Q-acc LU1240785714Shares outstanding 138 138.0050 163 854.9730 178 577.7280Net asset value per share in CHF 124.93 119.87 100.15Issue and redemption price per share in CHF1 124.93 119.87 100.15Class Q-dist LU1240786019Shares outstanding 36 475.2110 35 787.8130 31 767.4070Net asset value per share in EUR 122.11 118.55 100.60Issue and redemption price per share in EUR1 122.11 118.55 100.60Class (CHF hedged) Q-dist LU1240785805Shares outstanding 96 432.1060 98 978.6320 101 825.2870Net asset value per share in CHF 120.54 117.51 100.16Issue and redemption price per share in CHF1 120.54 117.51 100.16
1 See note 1
Performance
Currency 2017/2018 2016/2017 2015/2016Class K-1-acc EUR 4.7% 20.3% -7.8%Class P-acc EUR 3.8% 19.3% -8.6%Class (CHF hedged) P-acc CHF 3.4% 18.8% -9.1%Class P-dist EUR 3.8% 19.3% -8.5%Class (CHF hedged) P-dist CHF 3.4% 18.8% -9.1%Class Q-acc EUR 4.6% 20.2% -Class (CHF hedged) Q-acc CHF 4.2% 19.7% -Class Q-dist EUR 4.6% 20.2% -Class (CHF hedged) Q-dist CHF 4.2% 19.7% -
Historical performance is no indicator of current or future performance.The performance data does not take account of any commissions and costs charged when subscribing and redeeming shares.The performance data were not audited.The subfund has no benchmark.

76 The notes are an integral part of the fi nancial statements.
UBS (Lux) Equity SICAV – German High Dividend (EUR)Annual Report as of 31 May 2018
Report of the Portfolio Manager
In the financial year, from 1 June 2017 to 31 May 2018, the broader German equity market was slightly positive, with an increase in volatility towards the end of the financial year. The markets benefited from continued earnings growth, a sound macro environment, the US tax reform and the ECB’s decision to extend its asset pur-chases. Sources of uncertainty were the Fed’s rate hikes, the strengthening Euro, persistent geopolitical tensions and elections in Italy.
In the financial year, the subfund performed positively with a continued focus on German companies with good quality and attractive dividend yields. Exposure to the Financials sector supported performance, while Telecom-munication Services contributed negatively. The main positive contributors on a stock level were Sixt, Uniper, Tui and 1&1 Drillisch. Negative contribution came from Deutsche Telekom and ProSiebenSat1 Media.
Structure of the Securities Portfolio
Geographical Breakdown as a % of net assetsGermany 90.02France 3.68Luxembourg 1.34Total 95.04
Economic Breakdown as a % of net assetsChemicals 16.43Insurance 11.77Finance & holding companies 9.01Vehicles 8.49Internet, software & IT services 8.00Telecommunications 7.41Traffic & transportation 7.14Energy & water supply 4.61Real Estate 4.22Various capital goods 4.04Lodging, catering & leisure 2.59Graphic design, publishing & media 1.92Pharmaceuticals, cosmetics & medical products 1.84Aerospace industry 1.79Banks & credit institutions 1.78Electronics & semiconductors 1.60Textiles, garments & leather goods 1.36Miscellaneous services 0.54Mechanical engineering & industrial equipment 0.50Total 95.04

The notes are an integral part of the fi nancial statements. 77
UBS (Lux) Equity SICAV – German High Dividend (EUR)Annual Report as of 31 May 2018
Statement of Net Assets EURAssets 31.5.2018Investments in securities, cost 66 665 925.49Investments in securities, unrealized appreciation (depreciation) 23 744 989.56Total investments in securities (Note 1) 90 410 915.05Cash at banks, deposits on demand and deposit accounts 2 873 010.20Receivable on subscriptions 30 812.33Other receivables 1 042 933.82Unrealized gain (loss) on forward foreign exchange contracts (Note 1) 926 510.93Total Assets 95 284 182.33
LiabilitiesPayable on redemptions -78 004.20Provisions for flat fee (Note 2) -62 069.04Provisions for taxe d’abonnement (Note 3) -7 971.41Provisions for other commissions and fees (Note 2) -2 187.99Total provisions -72 228.44Total Liabilities -150 232.64
Net assets at the end of the financial year 95 133 949.69
Statement of Operations EURIncome 1.6.2017-31.5.2018Dividends 2 634 906.40Income on securities lending (Note 16) 109 203.75Other income (Note 4) 12 271.35Total income 2 756 381.50
ExpensesFlat fee (Note 2) -1 542 364.86Taxe d’abonnement (Note 3) -50 508.83Cost on securities lending (Note 16) -43 681.50Other commissions and fees (Note 2) -30 715.44Interest on cash and bank overdraft -10 176.62Total expenses -1 677 447.25
Net income (loss) on investments 1 078 934.25
Realized gain (loss) (Note 1)Realized gain (loss) on market-priced securities without options 10 632 106.85Realized gain (loss) on forward foreign exchange contracts -4 283 436.63Realized gain (loss) on foreign exchange 399 012.69Total realized gain (loss) 6 747 682.91
Net realized gain (loss) of the financial year 7 826 617.16
Changes in unrealized appreciation (depreciation) (Note 1)Unrealized appreciation (depreciation) on market-priced securities without options -7 802 154.47Unrealized appreciation (depreciation) on forward foreign exchange contracts 844 890.25Total changes in unrealized appreciation (depreciation) -6 957 264.22
Net increase (decrease) in net assets as a result of operations 869 352.94

78 The notes are an integral part of the fi nancial statements.
UBS (Lux) Equity SICAV – German High Dividend (EUR)Annual Report as of 31 May 2018
Statement of Changes in Net Assets EUR 1.6.2017-31.5.2018Net assets at the beginning of the financial year 111 250 550.47Subscriptions 9 825 707.20Redemptions -26 384 239.28Total net subscriptions (redemptions) -16 558 532.08Dividend paid -427 421.64Net income (loss) on investments 1 078 934.25Total realized gain (loss) 6 747 682.91Total changes in unrealized appreciation (depreciation) -6 957 264.22Net increase (decrease) in net assets as a result of operations 869 352.94Net assets at the end of the financial year 95 133 949.69
Changes in the Number of Shares outstanding
1.6.2017-31.5.2018Class K-1-accNumber of shares outstanding at the beginning of the financial year 0.5000Number of shares issued 0.0000Number of shares redeemed 0.0000Number of shares outstanding at the end of the financial year 0.5000Class P-accNumber of shares outstanding at the beginning of the financial year 127 973.0110Number of shares issued 9 559.4460Number of shares redeemed -37 578.7610Number of shares outstanding at the end of the financial year 99 953.6960Class (CHF hedged) P-accNumber of shares outstanding at the beginning of the financial year 101 552.7080Number of shares issued 3 737.9000Number of shares redeemed -43 328.5710Number of shares outstanding at the end of the financial year 61 962.0370Class P-distNumber of shares outstanding at the beginning of the financial year 90 082.6700Number of shares issued 4 499.3610Number of shares redeemed -11 922.1410Number of shares outstanding at the end of the financial year 82 659.8900Class (CHF hedged) P-distNumber of shares outstanding at the beginning of the financial year 52 623.9320Number of shares issued 1 424.2050Number of shares redeemed -12 591.9450Number of shares outstanding at the end of the financial year 41 456.1920Class Q-accNumber of shares outstanding at the beginning of the financial year 67 914.3800Number of shares issued 24 453.7580Number of shares redeemed -13 918.0880Number of shares outstanding at the end of the financial year 78 450.0500Class (CHF hedged) Q-accNumber of shares outstanding at the beginning of the financial year 163 854.9730Number of shares issued 11 419.1100Number of shares redeemed -37 136.0780Number of shares outstanding at the end of the financial year 138 138.0050Class Q-distNumber of shares outstanding at the beginning of the financial year 35 787.8130Number of shares issued 4 365.9890Number of shares redeemed -3 678.5910Number of shares outstanding at the end of the financial year 36 475.2110Class (CHF hedged) Q-distNumber of shares outstanding at the beginning of the financial year 98 978.6320Number of shares issued 13 724.7480Number of shares redeemed -16 271.2740Number of shares outstanding at the end of the financial year 96 432.1060
Annual Distribution
UBS (Lux) Equity SICAV – German High Dividend (EUR) Ex-Date Pay-Date Currency Amount per share
P-dist 2.8.2017 7.8.2017 EUR 1.56(CHF hedged) P-dist 2.8.2017 7.8.2017 CHF 1.52Q-dist 2.8.2017 7.8.2017 EUR 1.82(CHF hedged) Q-dist 2.8.2017 7.8.2017 CHF 1.81

The notes are an integral part of the fi nancial statements. 79
UBS (Lux) Equity SICAV – German High Dividend (EUR)Annual Report as of 31 May 2018
Statement of Investments in Securities and other Net Assets as of 31 May 2018
Description Quantity/ Valuation in EUR as a % Nominal Unrealized gain of net (loss) on Futures/ assets Forward Exchange Contracts/ Swaps (Note 1)
Transferable securities and money market instruments listed on an official stock exchange
Bearer shares
France
EUR AIRBUS EUR1 17 463.00 1 699 324.53 1.79EUR ENGIE EUR1 133 081.00 1 801 251.34 1.89Total France 3 500 575.87 3.68
Germany
EUR AAREAL BANK AG NPV 46 112.00 1 691 388.16 1.78EUR AMADEUS FIRE AG NPV 5 422.00 515 090.00 0.54EUR AURELIUS EQUITY OP NPV 24 372.00 1 390 422.60 1.46EUR DEUTSCHE PFAND AG NPV 157 742.00 2 058 533.10 2.16EUR DEUTZ AG NPV 68 010.00 473 349.60 0.50EUR DWS GROUP SE NPV 48 822.00 1 336 502.25 1.41EUR HELLA GMBH & CO.KG NPV 48 153.00 2 590 631.40 2.72EUR MERCK KGAA NPV 19 996.00 1 746 450.64 1.84EUR SAP AG ORD NPV 67 194.00 6 473 469.96 6.80EUR UNIPER SE NPV 57 925.00 1 571 505.25 1.65Total Germany 19 847 342.96 20.86
Luxembourg
EUR CORESTATE CAPHLDG NPV 26 353.00 1 267 579.30 1.34Total Luxembourg 1 267 579.30 1.34
Total Bearer shares 24 615 498.13 25.88
Preference shares
Germany
EUR RWE AG (NEU) NON VTG PRF NPV 64 732.00 1 017 587.04 1.07EUR SIXT SE NON VTG PRF NPV 40 622.00 2 953 219.40 3.10EUR VOLKSWAGEN AG NON VTG PRF NPV 7 660.00 1 232 800.40 1.30Total Germany 5 203 606.84 5.47
Total Preference shares 5 203 606.84 5.47
Registered shares
Germany
EUR ALLIANZ SE NPV(REGD)(VINKULIERT) 46 423.00 8 188 088.74 8.61EUR BASF SE NPV 45 973.00 3 873 225.25 4.07EUR BAYER AG NPV (REGD) 89 615.00 9 128 183.90 9.59EUR DAIMLER AG ORD NPV(REGD) 68 911.00 4 250 430.48 4.47EUR DEUTSCHE BOERSE AG NPV(REGD) 34 154.00 3 907 217.60 4.11EUR DEUTSCHE POST AG NPV(REGD) 118 240.00 3 839 252.80 4.03EUR DEUTSCHE TELEKOM NPV(REGD) 533 606.00 7 054 271.32 7.41EUR EVONIK INDUSTRIES NPV 53 540.00 1 605 129.20 1.69EUR FREENET AG NPV (REGD) 46 400.00 1 139 120.00 1.20EUR HUGO BOSS AG NPV (REGD) 16 804.00 1 291 891.52 1.36EUR INFINEON TECHNOLOG AG NPV (REGD) 64 780.00 1 521 682.20 1.60EUR K&S AG NPV 44 544.00 1 020 057.60 1.07EUR LEG IMMOBILIEN AG NPV 27 990.00 2 624 342.40 2.76EUR MUENCHENER RUECKVE NPV(REGD) 17 083.00 3 011 732.90 3.17EUR PROSIEBENSAT1 MED. NPV 72 468.00 1 824 019.56 1.92EUR SIEMENS AG NPV(REGD) 34 504.00 3 847 196.00 4.04EUR TUI AG NPV (REGD) 124 481.00 2 465 968.61 2.59Total Germany 60 591 810.08 63.69
Total Registered shares 60 591 810.08 63.69
Total Transferable securities and money market instruments listed on an official stock exchange 90 410 915.05 95.04
Total investments in securities 90 410 915.05 95.04
Forward Foreign Exchange contracts
Forward Foreign Exchange contracts (Purchase/Sale)
CHF 49 985 300.00 EUR 42 634 731.25 25.6.2018 934 199.99 0.97EUR 141 086.43 CHF 164 000.00 25.6.2018 -1 861.69 0.00EUR 540 296.85 CHF 624 400.00 25.6.2018 -3 951.97 0.00EUR 1 175 964.82 CHF 1 351 300.00 25.6.2018 -1 875.40 0.00Total Forward Foreign Exchange contracts (Purchase/Sale) 926 510.93 0.97
Cash at banks, deposits on demand and deposit accounts and other liquid assets 2 873 010.20 3.02Other assets and liabilities 923 513.51 0.97
Total net assets 95 133 949.69 100.00

80 The notes are an integral part of the fi nancial statements.
UBS (Lux) Equity SICAV – Global Emerging Markets Opportunity (USD)Annual Report as of 31 May 2018
UBS (Lux) Equity SICAV – Global Emerging Markets Opportunity (USD)
Three-year comparison
ISIN 31.5.2018 31.5.2017 31.5.2016Net assets in USD 630 625 253.64 287 955 823.80 217 480 268.69Class I-A1-acc LU0399011708Shares outstanding 251 919.8450 25 203.7270 59 440.0800Net asset value per share in USD 161.68 134.39 101.35Issue and redemption price per share in USD1 161.99 134.39 101.02Class I-A3-acc2 LU0399012185Shares outstanding 119 704.4650 - -Net asset value per share in USD 99.33 - -Issue and redemption price per share in USD1 99.52 - -Class (EUR) I-A3-dist3 LU1662453890Shares outstanding 540 000.0000 - -Net asset value per share in EUR 105.85 - -Issue and redemption price per share in EUR1 106.05 - -Class (EUR) I-B-acc4 LU1776283878Shares outstanding 619 356.0000 - -Net asset value per share in EUR 100.82 - -Issue and redemption price per share in EUR1 101.01 - -Class I-X-acc5 LU0399012771Shares outstanding - - 2 005.3190Net asset value per share in USD - - 107.20Issue and redemption price per share in USD1 - - 106.85Class P-4%-mdist6 LU1769817096Shares outstanding 1 294.7560 - -Net asset value per share in USD 98.30 - -Issue and redemption price per share in USD1 98.49 - -Class (HKD) P-4%-mdist6 LU1769817179Shares outstanding 5 787.7640 - -Net asset value per share in HKD 985.79 - -Issue and redemption price per share in HKD1 987.66 - -Class P-acc LU0328353924Shares outstanding 822 389.2390 101 865.7870 48 543.5800Net asset value per share in USD 159.55 133.99 102.38Issue and redemption price per share in USD1 159.85 133.99 102.04Class (EUR hedged) P-acc7 LU1676115329Shares outstanding 134 208.3090 - -Net asset value per share in EUR 100.98 - -Issue and redemption price per share in EUR1 101.17 - -Class (SGD hedged) P-acc8 LU1717043241Shares outstanding 92 348.7100 - -Net asset value per share in SGD 100.54 - -Issue and redemption price per share in SGD1 100.73 - -Class Q-acc9 LU0399011534Shares outstanding 13 872.5820 - -Net asset value per share in USD 93.13 - -Issue and redemption price per share in USD1 93.31 - -Class (EUR hedged) Q-acc8 LU1691467994Shares outstanding 96 243.6650 - -Net asset value per share in EUR 99.97 - -Issue and redemption price per share in EUR1 100.16 - -Class Q-dist10 LU0399011450Shares outstanding 858 244.9070 - -Net asset value per share in USD 116.21 - -Issue and redemption price per share in USD1 116.43 - -Class U-X-acc LU0399012938Shares outstanding 5 922.5370 11 375.5370 11 607.0000Net asset value per share in USD 28 924.62 23 815.97 17 771.27Issue and redemption price per share in USD1 28 979.58 23 815.97 17 712.62
1 See note 1 2 First NAV: 22.5.2018 3 First NAV: 19.9.2017 4 First NAV: 22.2.2018 5 The share class I-X-acc was in circulation until 16.9.2016 6 First NAV: 12.2.2018 7 First NAV: 18.9.2017 8 First NAV: 13.11.2017 9 First NAV: 12.3.201810 First NAV: 12.7.2017

The notes are an integral part of the fi nancial statements. 81
UBS (Lux) Equity SICAV – Global Emerging Markets Opportunity (USD)Annual Report as of 31 May 2018
Performance
Currency 2017/2018 2016/2017 2015/2016Class I-A1-acc USD 20.3% 32.6% -17.4%Class I-A3-acc1 USD - - -Class (EUR) I-A3-dist1 EUR - - -Class (EUR) I-B-acc1 EUR - - -Class I-X-acc2 USD - - -16.5%Class P-4%-mdist1 USD - - -Class (HKD) P-4%-mdist1 HKD - - -Class P-acc USD 19.3% 31.3% -18.7%Class (EUR hedged) P-acc1 EUR - - -Class (SGD hedged) P-acc1 SGD - - -Class Q-acc1 USD - - -Class (EUR hedged) Q-acc1 EUR - - -Class Q-dist1 USD - - -Class U-X-acc USD 21.5% 34.0% -16.5%
1 Due to the recent launch, there is no data for the calculation of the performance available.2 The share class I-X-acc was in circulation until 16.9.2016. Due to this fact, there is no data for the calculation of the performance available.
Historical performance is no indicator of current or future performance.The performance data does not take account of any commissions and costs charged when subscribing and redeeming shares.The performance data were not audited.The subfund has no benchmark.
Report of the Portfolio Manager
During the financial year, from 1 June 2017 to 31 May 2018, Emerging Markets equities posted solid gains amid improved fundamentals which in turn led to strong inflows into the asset class. Performance has been more challenging however towards the end of the financial year, amid increasing trade tensions and renewed USD strength creating pressure points for currencies of the weaker EM economies.
The subfund posted strong gains over financial year. This was driven by exposure to internet/e-commerce companies, China’s leading education company as well as exposure to materials and energy companies, buoyed by stronger commodity prices over the financial year. The subfund’s under-exposure to telecoms and industrials also contributed.
Structure of the Securities Portfolio
Geographical Breakdown as a % of net assetsChina 34.94South Korea 19.10India 10.62South Africa 7.67Brazil 5.67Russian Federation (CIS) 5.11Taiwan 5.07Indonesia 3.43Mexico 2.12Hungary 1.99Hong Kong 1.84Ireland 1.46Total 99.02
Economic Breakdown as a % of net assetsBanks & credit institutions 25.69Electronics & semiconductors 15.32Miscellaneous services 6.18Mining, coal & steel 5.75Graphic design, publishing & media 5.45Internet, software & IT services 4.97Petroleum 4.65Vehicles 4.32Healthcare & social services 4.26Pharmaceuticals, cosmetics & medical products 3.82Tobacco & alcohol 3.17Insurance 3.05Electrical devices & components 3.01Forestry, paper & pulp products 2.22Chemicals 2.17Energy & water supply 1.94Real Estate 1.58Investment funds 1.47Total 99.02

82 The notes are an integral part of the fi nancial statements.
UBS (Lux) Equity SICAV – Global Emerging Markets Opportunity (USD)Annual Report as of 31 May 2018
Statement of Net Assets USDAssets 31.5.2018Investments in securities, cost 578 131 327.97Investments in securities, unrealized appreciation (depreciation) 46 340 760.14Total investments in securities (Note 1) 624 472 088.11Cash at banks, deposits on demand and deposit accounts 6 668 153.91Receivable on securities sales (Note 1) 3 069 192.63Receivable on subscriptions 4 781 971.48Interest receivable on liquid assets 34.13Receivable on dividends 439 373.67Other receivables 42.09Unrealized gain (loss) on forward foreign exchange contracts (Note 1) -141 055.73Total Assets 639 289 800.29
LiabilitiesBank overdraft -9.37Payable on securities purchases (Note 1) -6 021 276.70Payable on redemptions -2 381 840.32Provisions for flat fee (Note 2) -227 229.32Provisions for taxe d’abonnement (Note 3) -28 471.82Provisions for other commissions and fees (Note 2) -5 719.12Total provisions -261 420.26Total Liabilities -8 664 546.65
Net assets at the end of the financial year 630 625 253.64
Statement of Operations USDIncome 1.6.2017-31.5.2018Interest on liquid assets 27 381.78Dividends 7 500 754.75Income on securities lending (Note 16) 80 101.25Other income (Note 4) 1 453 381.97Total income 9 061 619.75
ExpensesFlat fee (Note 2) -2 640 660.48Taxe d’abonnement (Note 3) -114 663.77Cost on securities lending (Note 16) -32 040.50Other commissions and fees (Note 2) -75 742.05Interest on cash and bank overdraft -24 018.17Total expenses -2 887 124.97
Net income (loss) on investments 6 174 494.78
Realized gain (loss) (Note 1)Realized gain (loss) on market-priced securities without options 63 513 832.09Realized gain (loss) on forward foreign exchange contracts -1 560 929.97Realized gain (loss) on foreign exchange 821 360.26Total realized gain (loss) 62 774 262.38
Net realized gain (loss) of the financial year 68 948 757.16
Changes in unrealized appreciation (depreciation) (Note 1)Unrealized appreciation (depreciation) on market-priced securities without options -22 419 614.92Unrealized appreciation (depreciation) on forward foreign exchange contracts -141 055.73Total changes in unrealized appreciation (depreciation) -22 560 670.65
Net increase (decrease) in net assets as a result of operations 46 388 086.51

The notes are an integral part of the fi nancial statements. 83
UBS (Lux) Equity SICAV – Global Emerging Markets Opportunity (USD)Annual Report as of 31 May 2018
Statement of Changes in Net Assets USD 1.6.2017-31.5.2018Net assets at the beginning of the financial year 287 955 823.80Subscriptions 729 122 463.90Redemptions -432 834 121.22Total net subscriptions (redemptions) 296 288 342.68Dividend paid -6 999.35Net income (loss) on investments 6 174 494.78Total realized gain (loss) 62 774 262.38Total changes in unrealized appreciation (depreciation) -22 560 670.65Net increase (decrease) in net assets as a result of operations 46 388 086.51Net assets at the end of the financial year 630 625 253.64
Changes in the Number of Shares outstanding
1.6.2017-31.5.2018Class I-A1-accNumber of shares outstanding at the beginning of the financial year 25 203.7270Number of shares issued 253 810.8150Number of shares redeemed -27 094.6970Number of shares outstanding at the end of the financial year 251 919.8450Class I-A3-accNumber of shares outstanding at the beginning of the financial year 0.0000Number of shares issued 119 704.4650Number of shares redeemed 0.0000Number of shares outstanding at the end of the financial year 119 704.4650Class (EUR) I-A3-distNumber of shares outstanding at the beginning of the financial year 0.0000Number of shares issued 540 000.0000Number of shares redeemed 0.0000Number of shares outstanding at the end of the financial year 540 000.0000Class (EUR) I-B-accNumber of shares outstanding at the beginning of the financial year 0.0000Number of shares issued 1 429 713.5520Number of shares redeemed -810 357.5520Number of shares outstanding at the end of the financial year 619 356.0000Class P-4%-mdistNumber of shares outstanding at the beginning of the financial year 0.0000Number of shares issued 1 394.1560Number of shares redeemed -99.4000Number of shares outstanding at the end of the financial year 1 294.7560Class (HKD) P-4%-mdistNumber of shares outstanding at the beginning of the financial year 0.0000Number of shares issued 5 787.7640Number of shares redeemed 0.0000Number of shares outstanding at the end of the financial year 5 787.7640Class P-accNumber of shares outstanding at the beginning of the financial year 101 865.7870Number of shares issued 1 030 087.1260Number of shares redeemed -309 563.6740Number of shares outstanding at the end of the financial year 822 389.2390Class (EUR hedged) P-accNumber of shares outstanding at the beginning of the financial year 0.0000Number of shares issued 147 812.6870Number of shares redeemed -13 604.3780Number of shares outstanding at the end of the financial year 134 208.3090Class (SGD hedged) P-accNumber of shares outstanding at the beginning of the financial year 0.0000Number of shares issued 106 348.7100Number of shares redeemed -14 000.0000Number of shares outstanding at the end of the financial year 92 348.7100Class Q-accNumber of shares outstanding at the beginning of the financial year 0.0000Number of shares issued 13 872.5820Number of shares redeemed 0.0000Number of shares outstanding at the end of the financial year 13 872.5820Class (EUR hedged) Q-accNumber of shares outstanding at the beginning of the financial year 0.0000Number of shares issued 117 355.7340Number of shares redeemed -21 112.0690Number of shares outstanding at the end of the financial year 96 243.6650

84 The notes are an integral part of the fi nancial statements.
UBS (Lux) Equity SICAV – Global Emerging Markets Opportunity (USD)Annual Report as of 31 May 2018
Class Q-distNumber of shares outstanding at the beginning of the financial year 0.0000Number of shares issued 942 422.1460Number of shares redeemed -84 177.2390Number of shares outstanding at the end of the financial year 858 244.9070Class U-X-accNumber of shares outstanding at the beginning of the financial year 11 375.5370Number of shares issued 3 756.0000Number of shares redeemed -9 209.0000Number of shares outstanding at the end of the financial year 5 922.5370
Monthly Distribution
UBS (Lux) Equity SICAV – Global Emerging Markets Opportunity (USD) Ex-Date Pay-Date Currency Amount per shareP-4%-mdist 12.3.2018 15.3.2018 USD 0.19P-4%-mdist 10.4.2018 13.4.2018 USD 0.33P-4%-mdist 11.5.2018 16.5.2018 USD 0.33(HKD) P-4%-mdist 12.3.2018 15.3.2018 HKD 1.99(HKD) P-4%-mdist 10.4.2018 13.4.2018 HKD 3.39(HKD) P-4%-mdist 11.5.2018 16.5.2018 HKD 3.33

The notes are an integral part of the fi nancial statements. 85
UBS (Lux) Equity SICAV – Global Emerging Markets Opportunity (USD)Annual Report as of 31 May 2018
Statement of Investments in Securities and other Net Assets as of 31 May 2018
Description Quantity/ Valuation in USD as a % Nominal Unrealized gain of net (loss) on Futures/ assets Forward Exchange Contracts/ Swaps (Note 1)
Transferable securities and money market instruments listed on an official stock exchange
Bearer shares
China
HKD CHINA CONST BK ‘H’CNY1 32 568 000.00 33 048 995.75 5.24HKD CHINA VANKE CO ‘H’CNY1 2 712 800.00 9 960 115.50 1.58CNY HANGZHOU HIKVISION ‘A’CNY1 3 139 806.00 18 987 953.49 3.01HKD INDUSTRIAL & COM B ‘H’CNY1 26 463 000.00 21 962 115.72 3.48CNY KWEICHOW MOUTAI CO LTD-A 171 598.00 19 974 907.95 3.17HKD PING AN INSURANCE ‘H’CNY1 1 951 000.00 19 238 521.70 3.05HKD TENCENT HLDGS LIMI HKD0.00002 608 700.00 31 350 088.92 4.97Total China 154 522 699.03 24.50
Hong Kong
HKD BRILLIANCE CHINA USD0.01 6 198 000.00 11 599 298.84 1.84Total Hong Kong 11 599 298.84 1.84
Hungary
HUF OTP BANK HUF100 350 053.00 12 526 221.86 1.99Total Hungary 12 526 221.86 1.99
India
INR BHARAT PETROL CORP INR10 2 511 517.00 15 223 739.93 2.41INR HDFC BANK INR2 643 783.00 20 104 117.45 3.19INR MAHINDRA &MAHINDRA INR5 1 162 004.00 15 635 159.23 2.48INR POWER GRID CORP ORD INR10 4 036 030.00 12 245 799.18 1.94Total India 63 208 815.79 10.02
Indonesia
IDR BK MANDIRI IDR250 42 433 100.00 21 605 934.37 3.43Total Indonesia 21 605 934.37 3.43
Mexico
MXN GRUPO FINANCIERO BANORTE SAB DE CV COM SER’O’NPV 2 523 000.00 13 388 828.92 2.12Total Mexico 13 388 828.92 2.12
South Africa
GBP MONDI ORD EUR0.20 503 125.00 13 985 505.75 2.22ZAR NASPERS ‘N’ ZAR0.02 143 940.00 34 391 033.56 5.45Total South Africa 48 376 539.31 7.67
South Korea
KRW LG HOUSEHOLD&HEALT KRW5000 18 775.00 24 122 987.74 3.83KRW LOTTE CHEMICAL CO KRW5000 40 708.00 13 708 431.55 2.17KRW POSCO KRW5000 57 117.00 17 988 980.22 2.85KRW SAMSUNG ELECTRONIC KRW100 866 318.00 41 228 361.97 6.54KRW SK HYNIX INC KRW5000 275 712.00 23 377 778.61 3.71Total South Korea 120 426 540.09 19.10
Taiwan
TWD TAIWAN SEMICON MAN TWD10 4 279 000.00 31 990 921.70 5.07Total Taiwan 31 990 921.70 5.07
Total Bearer shares 477 645 799.91 75.74
Preference shares
Brazil
BRL BCO BRADESCO SA PRF NPV 2 233 222.00 17 492 537.89 2.77Total Brazil 17 492 537.89 2.77
Total Preference shares 17 492 537.89 2.77
Depository receipts
Brazil
USD VALE S.A. SPONS ADR REPR 1 COM NPV 1 344 947.00 18 291 279.20 2.90Total Brazil 18 291 279.20 2.90
China
USD ALIBABA GROUP HLDG SPON ADS EACH REP ONE ORD-ADR 196 775.00 38 963 417.75 6.18USD TAL EDUCATION GRP ADS EA REPR 2 CL A ORD SHS 633 242.00 26 887 455.32 4.26Total China 65 850 873.07 10.44
India
USD HDFC BANK LTD ADR REPS 3 SHS 35 400.00 3 767 268.00 0.60Total India 3 767 268.00 0.60
Russian Federation (CIS)
USD OIL CO LUKOIL PJSC ADR EACH REPR 1 ORD RUB0.02 211 072.00 14 086 945.28 2.24Total Russian Federation (CIS) 14 086 945.28 2.24
Total Depository receipts 101 996 365.55 16.18
Total Transferable securities and money market instruments listed on an official stock exchange 597 134 703.35 94.69

86 The notes are an integral part of the fi nancial statements.
UBS (Lux) Equity SICAV – Global Emerging Markets Opportunity (USD)Annual Report as of 31 May 2018
Transferable securities and money market instruments traded on another regulated market
Bearer shares
Russian Federation (CIS)
USD SBERBANK PAO 5 069 220.00 18 084 984.76 2.87Total Russian Federation (CIS) 18 084 984.76 2.87
Total Bearer shares 18 084 984.76 2.87
Total Transferable securities and money market instruments traded on another regulated market 18 084 984.76 2.87
UCITS/Other UCIs in accordance with Article 41 (1) e) of the amended Luxembourg law of 17 December 2010
Investment funds, open end
Ireland
USD UBS (IRL) SELECT MONEY MARKET FUND-USD-S-DIST 925.24 9 252 400.00 1.46Total Ireland 9 252 400.00 1.46
Total Investment funds, open end 9 252 400.00 1.46
Total UCITS/Other UCIs in accordance with Article 41 (1) e) of the amended Luxembourg law of 17 December 2010 9 252 400.00 1.46
Total investments in securities 624 472 088.11 99.02
Forward Foreign Exchange contracts
Forward Foreign Exchange contracts (Purchase/Sale)
SGD 8 850 500.00 USD 6 581 728.74 25.6.2018 38 116.53 0.01EUR 24 495 800.00 USD 28 825 310.17 25.6.2018 -183 814.61 -0.03USD 500 239.69 EUR 424 000.00 25.6.2018 4 481.47 0.00EUR 100 300.00 USD 117 548.39 25.6.2018 -273.51 0.00USD 227 581.31 EUR 193 700.00 25.6.2018 1 099.31 0.00SGD 182 400.00 USD 136 165.23 25.6.2018 263.20 0.00SGD 48 800.00 USD 36 364.83 25.6.2018 135.76 0.00EUR 103 400.00 USD 119 647.86 25.6.2018 1 251.67 0.00USD 1 492 199.06 EUR 1 278 200.00 25.6.2018 -2 324.88 0.00USD 75 262.22 EUR 64 400.00 25.6.2018 -36.91 0.00SGD 43 900.00 USD 32 789.33 25.6.2018 46.24 0.00Total Forward Foreign Exchange contracts (Purchase/Sale) -141 055.73 -0.02
Cash at banks, deposits on demand and deposit accounts and other liquid assets 6 668 153.91 1.06Bank overdraft and other short-term liabilities -9.37 0.00Other assets and liabilities -373 923.28 -0.06
Total net assets 630 625 253.64 100.00
Description Quantity/ Valuation in USD as a % Nominal Unrealized gain of net (loss) on Futures/ assets Forward Exchange Contracts/ Swaps (Note 1)

The notes are an integral part of the fi nancial statements. 87
UBS (Lux) Equity SICAV – Global High Dividend (USD)Annual Report as of 31 May 2018
UBS (Lux) Equity SICAV – Global High Dividend (USD)
Three-year comparison
ISIN 31.5.2018 31.5.2017 31.5.2016Net assets in USD 650 181 087.88 767 564 969.94 621 656 785.09Class F-acc LU0946079901Shares outstanding 203 418.6610 287 887.9280 251 422.0710Net asset value per share in USD 178.27 168.42 147.30Issue and redemption price per share in USD1 178.27 168.42 147.30Class (EUR hedged) F-acc LU0964818024Shares outstanding 23 040.0000 17 800.0000 10 460.0000Net asset value per share in EUR 162.36 156.94 139.57Issue and redemption price per share in EUR1 162.36 156.94 139.57Class I-A1-acc LU0804734431Shares outstanding 2 653.3210 16 022.1880 12 214.3180Net asset value per share in USD 160.06 151.39 132.58Issue and redemption price per share in USD1 160.06 151.39 132.58Class (CHF hedged) I-A1-acc LU0858845737Shares outstanding 77 969.6910 75 148.0890 62 520.6850Net asset value per share in CHF 156.90 152.34 136.33Issue and redemption price per share in CHF1 156.90 152.34 136.33Class (EUR hedged) I-A1-acc LU0815048904Shares outstanding 1 516.6180 28 987.9760 27 471.3580Net asset value per share in EUR 161.41 156.23 139.12Issue and redemption price per share in EUR1 161.41 156.23 139.12Class I-X-acc LU0745893759Shares outstanding 672 495.4870 670 063.0100 571 257.8000Net asset value per share in USD 186.27 175.07 152.33Issue and redemption price per share in USD1 186.27 175.07 152.33Class (CHF hedged) I-X-acc LU0678866319Shares outstanding 180 424.3110 102 636.4130 54 576.5200Net asset value per share in CHF 186.99 180.39 160.41Issue and redemption price per share in CHF1 186.99 180.39 160.41Class I-X-dist LU0883523606Shares outstanding 71 100.0000 64 218.0000 50 578.0000Net asset value per share in USD 136.60 132.50 118.83Issue and redemption price per share in USD1 136.60 132.50 118.83Class K-1-acc LU0803748523Shares outstanding 0.6000 0.7000 1.0000Net asset value per share in USD 7 527 280.57 7 141 531.86 6 272 691.80Issue and redemption price per share in USD1 7 527 280.57 7 141 531.86 6 272 691.80Class (EUR hedged) N-8%-mdist LU1121266198Shares outstanding 93 416.4980 375 217.5750 39 603.1190Net asset value per share in EUR 87.23 93.14 91.53Issue and redemption price per share in EUR1 87.23 93.14 91.53Class (EUR hedged) N-dist LU0815274823Shares outstanding 5 247.1060 5 620.7660 11 774.2010Net asset value per share in EUR 141.75 140.87 128.61Issue and redemption price per share in EUR1 141.75 140.87 128.61Class P-acc LU0611173427Shares outstanding 605 271.8420 803 545.3840 960 950.6920Net asset value per share in USD 169.59 161.87 143.03Issue and redemption price per share in USD1 169.59 161.87 143.03Class (EUR hedged) P-acc LU0611173930Shares outstanding 438 903.0580 542 632.9850 553 903.7520Net asset value per share in EUR 160.90 157.13 141.18Issue and redemption price per share in EUR1 160.90 157.13 141.18Class (CHF hedged) P-dist LU0626901861Shares outstanding 652 371.8190 769 967.9980 769 229.5480Net asset value per share in CHF 136.25 135.76 124.58Issue and redemption price per share in CHF1 136.25 135.76 124.58Class (EUR hedged) P-dist2 LU1593401398Shares outstanding 1 415.0000 340.0000 -Net asset value per share in EUR 102.42 100.19 -Issue and redemption price per share in EUR1 102.42 100.19 -Class P-mdist LU1107510957Shares outstanding 83 141.1000 112 130.6830 122 151.1070Net asset value per share in USD 108.73 106.89 97.47Issue and redemption price per share in USD1 108.73 106.89 97.47

88 The notes are an integral part of the fi nancial statements.
UBS (Lux) Equity SICAV – Global High Dividend (USD)Annual Report as of 31 May 2018
ISIN 31.5.2018 31.5.2017 31.5.2016
Class (AUD hedged) P-mdist LU1115419902Shares outstanding 39 238.2890 66 260.3990 77 610.4830Net asset value per share in AUD 112.91 111.57 102.40Issue and redemption price per share in AUD1 112.91 111.57 102.40Class (SGD hedged) P-mdist3 LU1145061096Shares outstanding - 67 278.7170 94 628.4230Net asset value per share in SGD - 106.65 98.29Issue and redemption price per share in SGD1 - 106.65 98.29Class Q-acc LU0847993192Shares outstanding 271 968.4510 298 421.4030 204 393.1910Net asset value per share in USD 120.75 114.50 100.51Issue and redemption price per share in USD1 120.75 114.50 100.51Class (EUR hedged) Q-acc LU0848007240Shares outstanding 228 963.0130 356 821.1240 287 634.9220Net asset value per share in EUR 130.84 126.93 113.30Issue and redemption price per share in EUR1 130.84 126.93 113.30Class (CHF hedged) Q-dist LU1240786365Shares outstanding 496 289.1190 565 969.4390 505 130.1460Net asset value per share in CHF 109.69 109.24 99.71Issue and redemption price per share in CHF1 109.69 109.24 99.71Class Q-mdist LU1240786951Shares outstanding 8 659.1170 6 894.1770 19 378.4690Net asset value per share in USD 111.37 108.80 98.80Issue and redemption price per share in USD1 111.37 108.80 98.80
1 See note 12 First NAV: 15.5.20173 The share class (SGD hedged) P-mdist was in circulation until 15.3.2018
Performance
Currency 2017/2018 2016/2017 2015/2016Class F-acc USD 5.8% 14.3% -1.2%Class (EUR hedged) F-acc EUR 3.5% 12.4% -1.3%Class I-A1-acc USD 5.7% 14.2% -1.3%Class (CHF hedged) I-A1-acc CHF 3.0% 11.7% -2.2%Class (EUR hedged) I-A1-acc EUR 3.3% 12.3% -1.4%Class I-X-acc USD 6.4% 14.9% -0.7%Class (CHF hedged) I-X-acc CHF 3.7% 12.5% -1.6%Class I-X-dist USD 6.4% 14.9% -0.7%Class K-1-acc USD 5.4% 13.9% -1.6%Class (EUR hedged) N-8%-mdist EUR 1.4% 10.2% -3.3%Class (EUR hedged) N-dist EUR 1.4% 10.2% -3.3%Class P-acc USD 4.8% 13.2% -2.2%Class (EUR hedged) P-acc EUR 2.4% 11.3% -2.3%Class (CHF hedged) P-dist CHF 2.1% 10.7% -3.1%Class (EUR hedged) P-dist EUR 2.4% - -Class P-mdist USD 4.8% 13.2% -2.2%Class (AUD hedged) P-mdist AUD 4.9% 13.9% -1.2%Class (SGD hedged) P-mdist1 SGD - 12.8% -1.4%Class Q-acc USD 5.5% 13.9% -Class (EUR hedged) Q-acc EUR 3.1% 12.0% -1.7%Class (CHF hedged) Q-dist CHF 2.7% 11.5% -Class Q-mdist USD 5.5% 13.9% -
1 The share class (SGD hedged) P-mdist was in circulation until 15.3.2018. Due to this fact, there is no data for the calculation of the performance available.
Historical performance is no indicator of current or future performance.The performance data does not take account of any commissions and costs charged when subscribing and redeeming shares.The performance data were not audited.The subfund has no benchmark.

The notes are an integral part of the fi nancial statements. 89
UBS (Lux) Equity SICAV – Global High Dividend (USD)Annual Report as of 31 May 2018
Report of the Portfolio Manager
In the financial year, from 1 June 2017 to 31 May 2018, Global equity returns were positive. The markets started off strongly, fueled by solid growth, but February then saw a sell-off led by inflation fears and rising rate expec-tations. The markets declined further on the back of slowing growth momentum and trade tensions, as US import tariffs led to concerns over retaliation measures.
The subfund posted positive returns over the financial year. At the sector level, exposure in Information Tech-nology, Energy and Financials contributed positively, while Utilities and Consumer Staples detracted. From a stock perspective, Valero Energy and Intel added to per-formance, while H&M and Sanofi detracted.
Structure of the Securities Portfolio
Geographical Breakdown as a % of net assetsUnited States 41.00Japan 11.83United Kingdom 5.94France 5.66Canada 4.93China 4.91Germany 4.72Australia 3.97Switzerland 3.82Ireland 2.97Italy 2.94Spain 1.94Norway 1.04Taiwan 0.99The Netherlands 0.96South Korea 0.92Total 98.54
Economic Breakdown as a % of net assetsBanks & credit institutions 13.59Telecommunications 7.89Petroleum 7.25Pharmaceuticals, cosmetics & medical products 6.96Insurance 6.66Energy & water supply 6.00Electronics & semiconductors 5.84Vehicles 4.85Finance & holding companies 4.01Computer hardware & network equipment providers 3.92Real Estate 3.90Retail trade, department stores 3.04Food & soft drinks 3.03Internet, software & IT services 3.02Miscellaneous services 1.99Lodging, catering & leisure 1.98Tobacco & alcohol 1.97Mechanical engineering & industrial equipment 1.96Chemicals 1.94Electrical devices & components 1.92Mining, coal & steel 1.01Non-ferrous metals 1.00Miscellaneous consumer goods 0.99Textiles, garments & leather goods 0.99Miscellaneous trading companies 0.98Aerospace industry 0.95Rubber & tyres 0.90Total 98.54

90 The notes are an integral part of the fi nancial statements.
UBS (Lux) Equity SICAV – Global High Dividend (USD)Annual Report as of 31 May 2018
Statement of Net Assets USDAssets 31.5.2018Investments in securities, cost 623 303 071.43Investments in securities, unrealized appreciation (depreciation) 17 375 046.41Total investments in securities (Note 1) 640 678 117.84Cash at banks, deposits on demand and deposit accounts 23 202 500.72Receivable on securities sales (Note 1) 7 311 152.04Receivable on subscriptions 921 223.27Interest receivable on liquid assets 209.46Receivable on dividends 3 302 570.83Other receivables 422 332.53Unrealized gain (loss) on forward foreign exchange contracts (Note 1) 2 209 945.36Total Assets 678 048 052.05
LiabilitiesInterest payable on bank overdraft -20.69Payable on securities purchases (Note 1) -23 879 418.19Payable on redemptions -3 672 018.71Provisions for flat fee (Note 2) -265 001.27Provisions for taxe d’abonnement (Note 3) -39 525.64Provisions for other commissions and fees (Note 2) -10 979.67Total provisions -315 506.58Total Liabilities -27 866 964.17
Net assets at the end of the financial year 650 181 087.88
Statement of Operations USDIncome 1.6.2017-31.5.2018Interest on liquid assets 27 832.18Dividends 23 859 686.29Income on securities lending (Note 16) 493 243.13Other income (Note 4) 118 851.07Total income 24 499 612.67
ExpensesFlat fee (Note 2) -7 461 766.65Taxe d’abonnement (Note 3) -274 151.13Cost on securities lending (Note 16) -197 297.24Other commissions and fees (Note 2) -155 932.10Interest on cash and bank overdraft -26 999.08Total expenses -8 116 146.20
Net income (loss) on investments 16 383 466.47
Realized gain (loss) (Note 1)Realized gain (loss) on market-priced securities without options 53 796 598.95Realized gain (loss) on forward foreign exchange contracts -10 177 468.10Realized gain (loss) on foreign exchange 2 039 779.50Total realized gain (loss) 45 658 910.35
Net realized gain (loss) of the financial year 62 042 376.82
Changes in unrealized appreciation (depreciation) (Note 1)Unrealized appreciation (depreciation) on market-priced securities without options -23 980 240.43Unrealized appreciation (depreciation) on forward foreign exchange contracts 555 731.64Total changes in unrealized appreciation (depreciation) -23 424 508.79
Net increase (decrease) in net assets as a result of operations 38 617 868.03

The notes are an integral part of the fi nancial statements. 91
UBS (Lux) Equity SICAV – Global High Dividend (USD)Annual Report as of 31 May 2018
Statement of Changes in Net Assets USD 1.6.2017-31.5.2018Net assets at the beginning of the financial year 767 564 969.94Subscriptions 106 614 113.17Redemptions -255 855 583.31Total net subscriptions (redemptions) -149 241 470.14Dividend paid -6 760 279.95Net income (loss) on investments 16 383 466.47Total realized gain (loss) 45 658 910.35Total changes in unrealized appreciation (depreciation) -23 424 508.79Net increase (decrease) in net assets as a result of operations 38 617 868.03Net assets at the end of the financial year 650 181 087.88
Changes in the Number of Shares outstanding
1.6.2017-31.5.2018Class F-accNumber of shares outstanding at the beginning of the financial year 287 887.9280Number of shares issued 23 564.6060Number of shares redeemed -108 033.8730Number of shares outstanding at the end of the financial year 203 418.6610Class (EUR hedged) F-accNumber of shares outstanding at the beginning of the financial year 17 800.0000Number of shares issued 15 970.0000Number of shares redeemed -10 730.0000Number of shares outstanding at the end of the financial year 23 040.0000Class I-A1-accNumber of shares outstanding at the beginning of the financial year 16 022.1880Number of shares issued 10 651.6520Number of shares redeemed -24 020.5190Number of shares outstanding at the end of the financial year 2 653.3210Class (CHF hedged) I-A1-accNumber of shares outstanding at the beginning of the financial year 75 148.0890Number of shares issued 8 456.3700Number of shares redeemed -5 634.7680Number of shares outstanding at the end of the financial year 77 969.6910Class (EUR hedged) I-A1-accNumber of shares outstanding at the beginning of the financial year 28 987.9760Number of shares issued 0.0000Number of shares redeemed -27 471.3580Number of shares outstanding at the end of the financial year 1 516.6180Class I-X-accNumber of shares outstanding at the beginning of the financial year 670 063.0100Number of shares issued 3 276.1310Number of shares redeemed -843.6540Number of shares outstanding at the end of the financial year 672 495.4870Class (CHF hedged) I-X-accNumber of shares outstanding at the beginning of the financial year 102 636.4130Number of shares issued 95 808.5330Number of shares redeemed -18 020.6350Number of shares outstanding at the end of the financial year 180 424.3110Class I-X-distNumber of shares outstanding at the beginning of the financial year 64 218.0000Number of shares issued 15 580.0000Number of shares redeemed -8 698.0000Number of shares outstanding at the end of the financial year 71 100.0000Class K-1-accNumber of shares outstanding at the beginning of the financial year 0.7000Number of shares issued 0.0000Number of shares redeemed -0.1000Number of shares outstanding at the end of the financial year 0.6000Class (EUR hedged) N-8%-mdistNumber of shares outstanding at the beginning of the financial year 375 217.5750Number of shares issued 114 300.2400Number of shares redeemed -396 101.3170Number of shares outstanding at the end of the financial year 93 416.4980Class (EUR hedged) N-distNumber of shares outstanding at the beginning of the financial year 5 620.7660Number of shares issued 488.0190Number of shares redeemed -861.6790Number of shares outstanding at the end of the financial year 5 247.1060Class P-accNumber of shares outstanding at the beginning of the financial year 803 545.3840Number of shares issued 84 908.1440Number of shares redeemed -283 181.6860Number of shares outstanding at the end of the financial year 605 271.8420

92 The notes are an integral part of the fi nancial statements.
UBS (Lux) Equity SICAV – Global High Dividend (USD)Annual Report as of 31 May 2018
Class (EUR hedged) P-accNumber of shares outstanding at the beginning of the financial year 542 632.9850Number of shares issued 64 217.2840Number of shares redeemed -167 947.2110Number of shares outstanding at the end of the financial year 438 903.0580Class (CHF hedged) P-distNumber of shares outstanding at the beginning of the financial year 769 967.9980Number of shares issued 101 973.7050Number of shares redeemed -219 569.8840Number of shares outstanding at the end of the financial year 652 371.8190Class (EUR hedged) P-distNumber of shares outstanding at the beginning of the financial year 340.0000Number of shares issued 1 075.0000Number of shares redeemed 0.0000Number of shares outstanding at the end of the financial year 1 415.0000Class P-mdistNumber of shares outstanding at the beginning of the financial year 112 130.6830Number of shares issued 13 638.6890Number of shares redeemed -42 628.2720Number of shares outstanding at the end of the financial year 83 141.1000Class (AUD hedged) P-mdistNumber of shares outstanding at the beginning of the financial year 66 260.3990Number of shares issued 1 198.8440Number of shares redeemed -28 220.9540Number of shares outstanding at the end of the financial year 39 238.2890Class (SGD hedged) P-mdistNumber of shares outstanding at the beginning of the financial year 67 278.7170Number of shares issued 0.0000Number of shares redeemed -67 278.7170Number of shares outstanding at the end of the financial year 0.0000Class Q-accNumber of shares outstanding at the beginning of the financial year 298 421.4030Number of shares issued 49 066.2120Number of shares redeemed -75 519.1640Number of shares outstanding at the end of the financial year 271 968.4510Class (EUR hedged) Q-accNumber of shares outstanding at the beginning of the financial year 356 821.1240Number of shares issued 41 749.7600Number of shares redeemed -169 607.8710Number of shares outstanding at the end of the financial year 228 963.0130Class (CHF hedged) Q-distNumber of shares outstanding at the beginning of the financial year 565 969.4390Number of shares issued 60 964.6170Number of shares redeemed -130 644.9370Number of shares outstanding at the end of the financial year 496 289.1190Class Q-mdistNumber of shares outstanding at the beginning of the financial year 6 894.1770Number of shares issued 4 952.5560Number of shares redeemed -3 187.6160Number of shares outstanding at the end of the financial year 8 659.1170
Annual Distribution
UBS (Lux) Equity SICAV – Global High Dividend (USD) Ex-Date Pay-Date Currency Amount per shareI-X-dist 2.8.2017 7.8.2017 USD 4.15(EUR hedged) N-dist 2.8.2017 7.8.2017 EUR 1.05(CHF hedged) P-dist 2.8.2017 7.8.2017 CHF 2.27(EUR hedged) P-dist 2.8.2017 7.8.2017 EUR 0.18(CHF hedged) Q-dist 2.8.2017 7.8.2017 CHF 2.49
Monthly Distribution
UBS (Lux) Equity SICAV – Global High Dividend (USD) Ex-Date Pay-Date Currency Amount per share(EUR hedged) N-8%-mdist 13.6.2017 16.6.2017 EUR 0.62(EUR hedged) N-8%-mdist 10.7.2017 13.7.2017 EUR 0.60(EUR hedged) N-8%-mdist 10.8.2017 16.8.2017 EUR 0.61(EUR hedged) N-8%-mdist 11.9.2017 14.9.2017 EUR 0.60(EUR hedged) N-8%-mdist 10.10.2017 13.10.2017 EUR 0.61(EUR hedged) N-8%-mdist 10.11.2017 15.11.2017 EUR 0.62(EUR hedged) N-8%-mdist 11.12.2017 14.12.2017 EUR 0.62(EUR hedged) N-8%-mdist 10.1.2018 15.1.2018 EUR 0.61(EUR hedged) N-8%-mdist 12.2.2018 15.2.2018 EUR 0.62(EUR hedged) N-8%-mdist 12.3.2018 15.3.2018 EUR 0.59(EUR hedged) N-8%-mdist 10.4.2018 13.4.2018 EUR 0.58(EUR hedged) N-8%-mdist 11.5.2018 16.5.2018 EUR 0.58

The notes are an integral part of the fi nancial statements. 93
UBS (Lux) Equity SICAV – Global High Dividend (USD)Annual Report as of 31 May 2018
UBS (Lux) Equity SICAV – Global High Dividend (USD) Ex-Date Pay-Date Currency Amount per shareP-mdist 15.6.2017 20.6.2017 USD 0.27P-mdist 18.7.2017 21.7.2017 USD 0.27P-mdist 16.8.2017 21.8.2017 USD 0.27P-mdist 15.9.2017 20.9.2017 USD 0.27P-mdist 16.10.2017 19.10.2017 USD 0.27P-mdist 15.11.2017 20.11.2017 USD 0.27P-mdist 15.12.2017 20.12.2017 USD 0.27P-mdist 16.1.2018 19.1.2018 USD 0.27P-mdist 15.2.2018 20.2.2018 USD 0.27P-mdist 15.3.2018 20.3.2018 USD 0.27P-mdist 16.4.2018 19.4.2018 USD 0.27P-mdist 15.5.2018 18.5.2018 USD 0.27(AUD hedged) P-mdist 15.6.2017 20.6.2017 AUD 0.37(AUD hedged) P-mdist 18.7.2017 21.7.2017 AUD 0.37(AUD hedged) P-mdist 16.8.2017 21.8.2017 AUD 0.33(AUD hedged) P-mdist 15.9.2017 20.9.2017 AUD 0.33(AUD hedged) P-mdist 16.10.2017 19.10.2017 AUD 0.33(AUD hedged) P-mdist 15.11.2017 20.11.2017 AUD 0.33(AUD hedged) P-mdist 15.12.2017 20.12.2017 AUD 0.33(AUD hedged) P-mdist 16.1.2018 19.1.2018 AUD 0.33(AUD hedged) P-mdist 15.2.2018 20.2.2018 AUD 0.33(AUD hedged) P-mdist 15.3.2018 20.3.2018 AUD 0.33(AUD hedged) P-mdist 16.4.2018 19.4.2018 AUD 0.33(AUD hedged) P-mdist 15.5.2018 18.5.2018 AUD 0.33(SGD hedged) P-mdist 15.6.2017 20.6.2017 SGD 0.27(SGD hedged) P-mdist 18.7.2017 21.7.2017 SGD 0.27(SGD hedged) P-mdist 16.8.2017 21.8.2017 SGD 0.22(SGD hedged) P-mdist 15.9.2017 20.9.2017 SGD 0.22(SGD hedged) P-mdist 16.10.2017 19.10.2017 SGD 0.22(SGD hedged) P-mdist 15.11.2017 20.11.2017 SGD 0.22(SGD hedged) P-mdist 15.12.2017 20.12.2017 SGD 0.22(SGD hedged) P-mdist 16.1.2018 19.1.2018 SGD 0.22(SGD hedged) P-mdist 15.2.2018 20.2.2018 SGD 0.22(SGD hedged) P-mdist 15.3.2018 20.3.2018 SGD 0.22Q-mdist 15.6.2017 20.6.2017 USD 0.27Q-mdist 18.7.2017 21.7.2017 USD 0.28Q-mdist 16.8.2017 21.8.2017 USD 0.28Q-mdist 15.9.2017 20.9.2017 USD 0.28Q-mdist 16.10.2017 19.10.2017 USD 0.28Q-mdist 15.11.2017 20.11.2017 USD 0.28Q-mdist 15.12.2017 20.12.2017 USD 0.28Q-mdist 16.1.2018 19.1.2018 USD 0.28Q-mdist 15.2.2018 20.2.2018 USD 0.28Q-mdist 15.3.2018 20.3.2018 USD 0.28Q-mdist 16.4.2018 19.4.2018 USD 0.28Q-mdist 15.5.2018 18.5.2018 USD 0.28

94 The notes are an integral part of the fi nancial statements.
UBS (Lux) Equity SICAV – Global High Dividend (USD)Annual Report as of 31 May 2018
Statement of Investments in Securities and other Net Assets as of 31 May 2018
Description Quantity/ Valuation in USD as a % Nominal Unrealized gain of net (loss) on Futures/ assets Forward Exchange Contracts/ Swaps (Note 1)
Transferable securities and money market instruments listed on an official stock exchange
Bearer shares
Australia
AUD CMNWLTH BK OF AUST NPV 121 520.00 6 372 003.89 0.98AUD NATL AUSTRALIA BK NPV 320 355.00 6 496 229.17 1.00AUD WESFARMERS LTD NPV 189 243.00 6 523 769.02 1.00AUD WESTPAC BKG CORP NPV 304 501.00 6 416 658.98 0.99Total Australia 25 808 661.06 3.97
Canada
CAD BANK NOVA SCOTIA HALIFAX COM 105 236.00 6 347 259.21 0.98CAD BCE INC COM NEW 155 829.00 6 488 069.91 1.00CAD CDN IMPERIAL BK OF COMMERCE COM 74 166.00 6 472 086.96 0.99CAD MANULIFE FINL CORP COM 341 071.00 6 431 233.93 0.99CAD ROYAL BK OF CANADA COM NPV 83 767.00 6 328 373.42 0.97Total Canada 32 067 023.43 4.93
China
HKD AGRICULTURAL BK CH ‘H’CNY1 11 909 000.00 6 163 897.94 0.95HKD BANK OF CHINA LTD ‘H’HKD1 12 303 000.00 6 430 562.90 0.99HKD CHINA CONST BK ‘H’CNY1 6 260 000.00 6 320 531.86 0.97HKD CHINA PETROLEUM & ‘H’CNY1 6 840 000.00 6 688 143.39 1.03HKD INDUSTRIAL & COM B ‘H’CNY1 7 588 000.00 6 287 743.10 0.96Total China 31 890 879.19 4.90
France
EUR AXA EUR2.29 248 729.00 6 191 529.55 0.95EUR BNP PARIBAS EUR2 92 216.00 5 711 576.67 0.88EUR SCHNEIDER ELECTRIC EUR8 71 443.00 6 152 913.64 0.95EUR TOTAL EUR2.5 109 337.00 6 643 093.62 1.02EUR UNIBAIL-RODAMCO EUR5 27 700.00 6 225 952.13 0.96Total France 30 925 065.61 4.76
Germany
EUR BAYERISCHE MOTOREN WERKE AG EUR1 63 839.00 6 362 454.82 0.98Total Germany 6 362 454.82 0.98
Ireland
USD ACCENTURE PLC SHS CL A ‘NEW’ 41 726.00 6 498 407.24 1.00USD EATON CORP PLC COM USD0.01 84 000.00 6 432 720.00 0.99USD SEAGATE TECH PLC COM USD0.00001 113 401.00 6 390 146.35 0.98Total Ireland 19 321 273.59 2.97
Italy
EUR ASSIC GENERALI SPA EUR1 375 310.00 6 374 345.73 0.98EUR ENI SPA EUR1 362 845.00 6 560 773.52 1.01EUR INTESA SANPAOLO EUR0.52 2 116 276.00 6 211 642.22 0.95Total Italy 19 146 761.47 2.94
Japan
JPY ASTELLAS PHARMA NPV 425 500.00 6 518 889.50 1.00JPY CANON INC NPV 185 600.00 6 344 685.91 0.98JPY KDDI CORP NPV 242 400.00 6 571 763.08 1.01JPY MITSUI & CO NPV 361 600.00 6 380 295.46 0.98JPY MITSUI FUDOSAN CO NPV 248 700.00 6 260 706.89 0.96JPY NIPPON TEL&TEL CP NPV 138 400.00 6 504 398.73 1.00JPY NISSAN MOTOR CO NPV 639 900.00 6 363 955.54 0.98JPY NTT DOCOMO NPV 251 700.00 6 528 515.81 1.01JPY SUBARU CORPORATION NPV 205 700.00 6 304 763.22 0.97JPY TAKEDA PHARMACEUTI NPV 159 200.00 6 523 617.28 1.00JPY TOKIO MARINE HLDG NPV 133 700.00 6 448 414.56 0.99JPY TOKYO ELECTRON NPV 32 800.00 6 158 773.99 0.95Total Japan 76 908 779.97 11.83
The Netherlands
EUR KONINKLIJKE AHOLD EUR0.01 273 293.00 6 269 919.22 0.96Total The Netherlands 6 269 919.22 0.96
Norway
NOK EQUINOR ASA NOK2.50 256 331.00 6 744 604.59 1.04Total Norway 6 744 604.59 1.04
South Korea
KRW SAMSUNG ELECTRONIC KRW100 127 749.00 6 008 510.79 0.92Total South Korea 6 008 510.79 0.92
Spain
EUR IBERDROLA SA EUR0.75 (POST SUBDIVISION) 828 351.00 5 871 223.99 0.90EUR REPSOL SA EUR1 354 234.00 6 742 074.26 1.04Total Spain 12 613 298.25 1.94
Switzerland
CHF SWISS RE AG CHF0.10 71 169.00 6 166 387.36 0.95Total Switzerland 6 166 387.36 0.95
Taiwan
TWD TAIWAN SEMICON MAN TWD10 864 000.00 6 459 489.68 0.99Total Taiwan 6 459 489.68 0.99
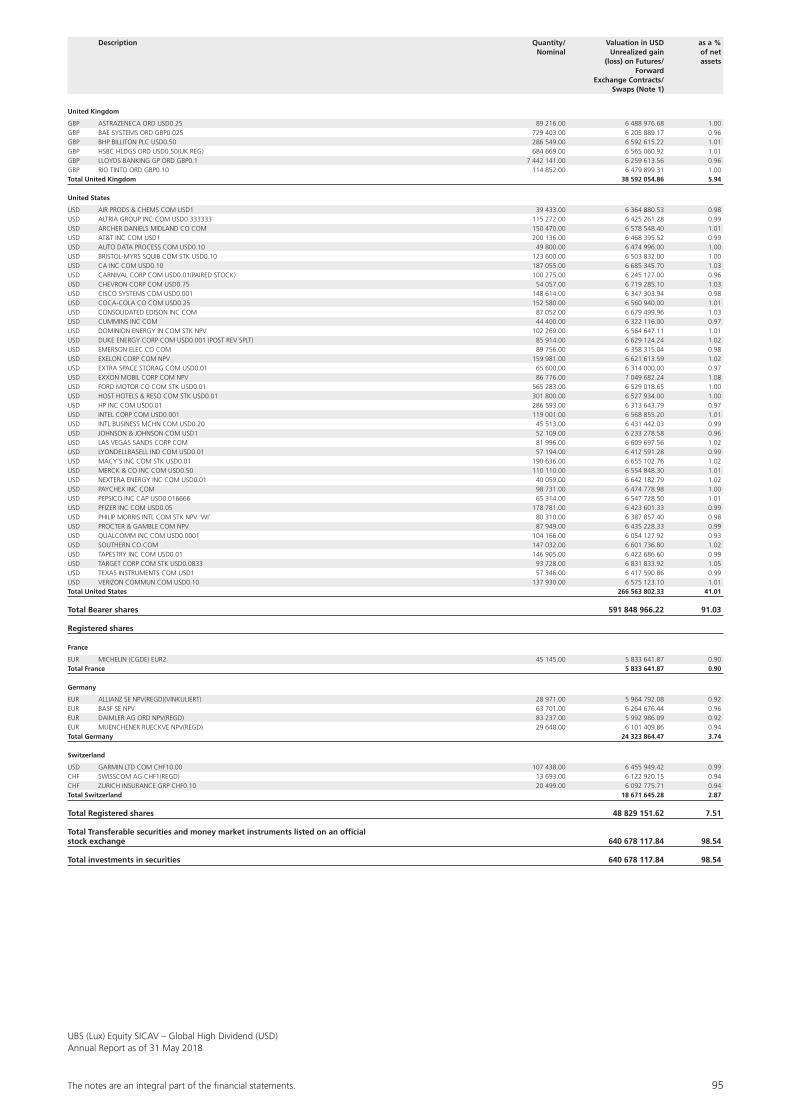
The notes are an integral part of the fi nancial statements. 95
UBS (Lux) Equity SICAV – Global High Dividend (USD)Annual Report as of 31 May 2018
United Kingdom
GBP ASTRAZENECA ORD USD0.25 89 216.00 6 488 976.68 1.00GBP BAE SYSTEMS ORD GBP0.025 729 403.00 6 205 889.17 0.96GBP BHP BILLITON PLC USD0.50 286 549.00 6 592 615.22 1.01GBP HSBC HLDGS ORD USD0.50(UK REG) 684 669.00 6 565 060.92 1.01GBP LLOYDS BANKING GP ORD GBP0.1 7 442 141.00 6 259 613.56 0.96GBP RIO TINTO ORD GBP0.10 114 852.00 6 479 899.31 1.00Total United Kingdom 38 592 054.86 5.94
United States
USD AIR PRODS & CHEMS COM USD1 39 433.00 6 364 880.53 0.98USD ALTRIA GROUP INC COM USD0.333333 115 272.00 6 425 261.28 0.99USD ARCHER DANIELS MIDLAND CO COM 150 470.00 6 578 548.40 1.01USD AT&T INC COM USD1 200 136.00 6 468 395.52 0.99USD AUTO DATA PROCESS COM USD0.10 49 800.00 6 474 996.00 1.00USD BRISTOL-MYRS SQUIB COM STK USD0.10 123 600.00 6 503 832.00 1.00USD CA INC COM USD0.10 187 055.00 6 685 345.70 1.03USD CARNIVAL CORP COM USD0.01(PAIRED STOCK) 100 275.00 6 245 127.00 0.96USD CHEVRON CORP COM USD0.75 54 057.00 6 719 285.10 1.03USD CISCO SYSTEMS COM USD0.001 148 614.00 6 347 303.94 0.98USD COCA-COLA CO COM USD0.25 152 580.00 6 560 940.00 1.01USD CONSOLIDATED EDISON INC COM 87 052.00 6 679 499.96 1.03USD CUMMINS INC COM 44 400.00 6 322 116.00 0.97USD DOMINION ENERGY IN COM STK NPV 102 269.00 6 564 647.11 1.01USD DUKE ENERGY CORP COM USD0.001 (POST REV SPLT) 85 914.00 6 629 124.24 1.02USD EMERSON ELEC CO COM 89 756.00 6 358 315.04 0.98USD EXELON CORP COM NPV 159 981.00 6 621 613.59 1.02USD EXTRA SPACE STORAG COM USD0.01 65 600.00 6 314 000.00 0.97USD EXXON MOBIL CORP COM NPV 86 776.00 7 049 682.24 1.08USD FORD MOTOR CO COM STK USD0.01 565 283.00 6 529 018.65 1.00USD HOST HOTELS & RESO COM STK USD0.01 301 800.00 6 527 934.00 1.00USD HP INC COM USD0.01 286 593.00 6 313 643.79 0.97USD INTEL CORP COM USD0.001 119 001.00 6 568 855.20 1.01USD INTL BUSINESS MCHN COM USD0.20 45 513.00 6 431 442.03 0.99USD JOHNSON & JOHNSON COM USD1 52 109.00 6 233 278.58 0.96USD LAS VEGAS SANDS CORP COM 81 996.00 6 609 697.56 1.02USD LYONDELLBASELL IND COM USD0.01 57 194.00 6 412 591.28 0.99USD MACY’S INC COM STK USD0.01 190 636.00 6 655 102.76 1.02USD MERCK & CO INC COM USD0.50 110 110.00 6 554 848.30 1.01USD NEXTERA ENERGY INC COM USD0.01 40 059.00 6 642 182.79 1.02USD PAYCHEX INC COM 98 731.00 6 474 778.98 1.00USD PEPSICO INC CAP USD0.016666 65 314.00 6 547 728.50 1.01USD PFIZER INC COM USD0.05 178 781.00 6 423 601.33 0.99USD PHILIP MORRIS INTL COM STK NPV ‘WI’ 80 310.00 6 387 857.40 0.98USD PROCTER & GAMBLE COM NPV 87 949.00 6 435 228.33 0.99USD QUALCOMM INC COM USD0.0001 104 166.00 6 054 127.92 0.93USD SOUTHERN CO COM 147 032.00 6 601 736.80 1.02USD TAPESTRY INC COM USD0.01 146 905.00 6 422 686.60 0.99USD TARGET CORP COM STK USD0.0833 93 728.00 6 831 833.92 1.05USD TEXAS INSTRUMENTS COM USD1 57 346.00 6 417 590.86 0.99USD VERIZON COMMUN COM USD0.10 137 930.00 6 575 123.10 1.01Total United States 266 563 802.33 41.01
Total Bearer shares 591 848 966.22 91.03
Registered shares
France
EUR MICHELIN (CGDE) EUR2 45 145.00 5 833 641.87 0.90Total France 5 833 641.87 0.90
Germany
EUR ALLIANZ SE NPV(REGD)(VINKULIERT) 28 971.00 5 964 792.08 0.92EUR BASF SE NPV 63 701.00 6 264 676.44 0.96EUR DAIMLER AG ORD NPV(REGD) 83 237.00 5 992 986.09 0.92EUR MUENCHENER RUECKVE NPV(REGD) 29 648.00 6 101 409.86 0.94Total Germany 24 323 864.47 3.74
Switzerland
USD GARMIN LTD COM CHF10.00 107 438.00 6 455 949.42 0.99CHF SWISSCOM AG CHF1(REGD) 13 693.00 6 122 920.15 0.94CHF ZURICH INSURANCE GRP CHF0.10 20 499.00 6 092 775.71 0.94Total Switzerland 18 671 645.28 2.87
Total Registered shares 48 829 151.62 7.51
Total Transferable securities and money market instruments listed on an official stock exchange 640 678 117.84 98.54
Total investments in securities 640 678 117.84 98.54
Description Quantity/ Valuation in USD as a % Nominal Unrealized gain of net (loss) on Futures/ assets Forward Exchange Contracts/ Swaps (Note 1)
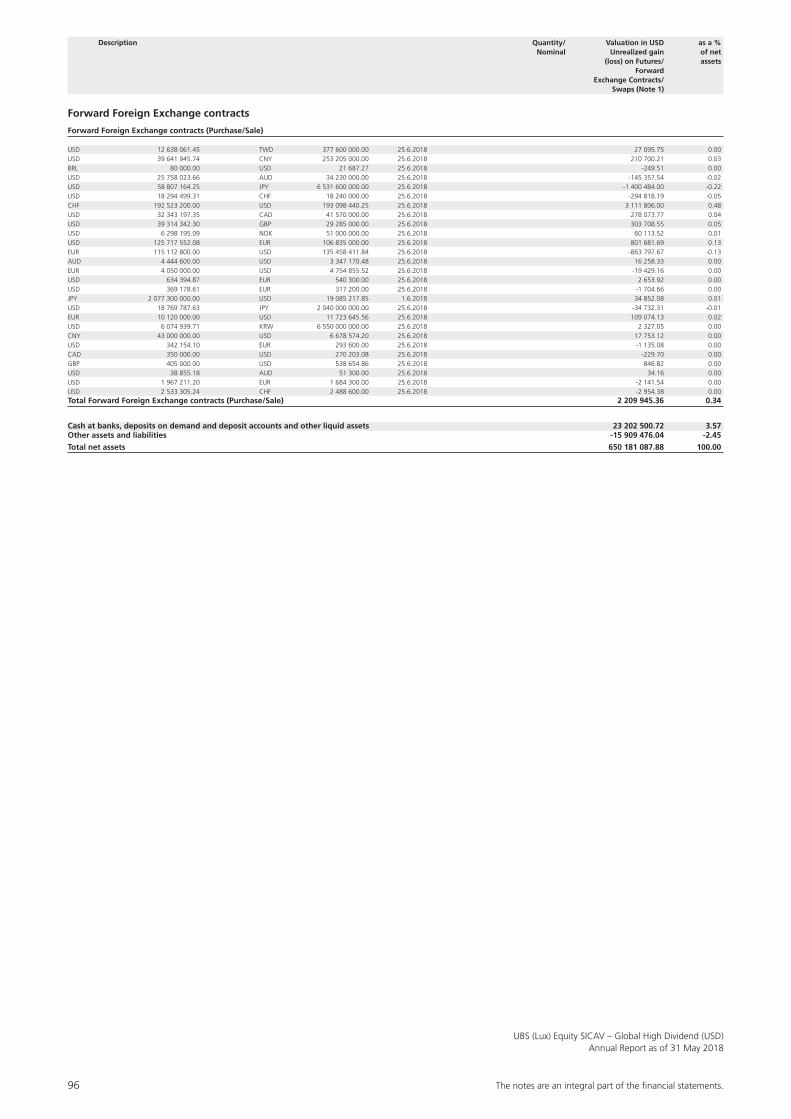
96 The notes are an integral part of the fi nancial statements.
UBS (Lux) Equity SICAV – Global High Dividend (USD)Annual Report as of 31 May 2018
Forward Foreign Exchange contracts
Forward Foreign Exchange contracts (Purchase/Sale)
USD 12 638 061.45 TWD 377 600 000.00 25.6.2018 27 095.75 0.00USD 39 641 945.74 CNY 253 205 000.00 25.6.2018 210 700.21 0.03BRL 80 000.00 USD 21 687.27 25.6.2018 -249.51 0.00USD 25 758 023.66 AUD 34 230 000.00 25.6.2018 -145 357.54 -0.02USD 58 807 164.25 JPY 6 531 600 000.00 25.6.2018 -1 400 484.00 -0.22USD 18 294 499.31 CHF 18 240 000.00 25.6.2018 -294 818.19 -0.05CHF 192 523 200.00 USD 193 098 440.25 25.6.2018 3 111 806.00 0.48USD 32 343 197.35 CAD 41 570 000.00 25.6.2018 278 073.77 0.04USD 39 314 342.30 GBP 29 285 000.00 25.6.2018 303 708.55 0.05USD 6 298 195.09 NOK 51 000 000.00 25.6.2018 60 113.52 0.01USD 125 717 552.08 EUR 106 835 000.00 25.6.2018 801 681.69 0.13EUR 115 112 800.00 USD 135 458 411.84 25.6.2018 -863 797.67 -0.13AUD 4 444 600.00 USD 3 347 170.48 25.6.2018 16 258.33 0.00EUR 4 050 000.00 USD 4 754 855.52 25.6.2018 -19 429.16 0.00USD 634 394.87 EUR 540 300.00 25.6.2018 2 653.92 0.00USD 369 178.61 EUR 317 200.00 25.6.2018 -1 704.66 0.00JPY 2 077 300 000.00 USD 19 085 217.85 1.6.2018 34 852.08 0.01USD 18 769 787.63 JPY 2 040 000 000.00 25.6.2018 -34 732.31 -0.01EUR 10 120 000.00 USD 11 723 645.56 25.6.2018 109 074.13 0.02USD 6 074 939.71 KRW 6 550 000 000.00 25.6.2018 2 327.05 0.00CNY 43 000 000.00 USD 6 678 574.20 25.6.2018 17 753.12 0.00USD 342 154.10 EUR 293 600.00 25.6.2018 -1 135.08 0.00CAD 350 000.00 USD 270 203.08 25.6.2018 -229.70 0.00GBP 405 000.00 USD 538 654.86 25.6.2018 846.82 0.00USD 38 855.18 AUD 51 300.00 25.6.2018 34.16 0.00USD 1 967 211.20 EUR 1 684 300.00 25.6.2018 -2 141.54 0.00USD 2 533 305.24 CHF 2 488 600.00 25.6.2018 -2 954.38 0.00Total Forward Foreign Exchange contracts (Purchase/Sale) 2 209 945.36 0.34
Cash at banks, deposits on demand and deposit accounts and other liquid assets 23 202 500.72 3.57Other assets and liabilities -15 909 476.04 -2.45
Total net assets 650 181 087.88 100.00
Description Quantity/ Valuation in USD as a % Nominal Unrealized gain of net (loss) on Futures/ assets Forward Exchange Contracts/ Swaps (Note 1)

The notes are an integral part of the fi nancial statements. 97
UBS (Lux) Equity SICAV – Global Impact (USD)Annual Report as of 31 May 2018
UBS (Lux) Equity SICAV – Global Impact (USD)
Most important figures
ISIN 31.5.2018Net assets in USD 9 734 574.40Class P-acc1 LU1679116845Shares outstanding 10 270.3620Net asset value per share in USD 102.71Issue and redemption price per share in USD2 102.71Class (EUR hedged) P-acc1 LU1679117579Shares outstanding 18 613.4470Net asset value per share in EUR 100.92Issue and redemption price per share in EUR2 100.92Class Q-acc1 LU1679117140Shares outstanding 10 400.0000Net asset value per share in USD 103.16Issue and redemption price per share in USD2 103.16Class (EUR hedged) Q-acc1 LU1679117819Shares outstanding 12 000.0000Net asset value per share in EUR 101.36Issue and redemption price per share in EUR2 101.36Class (EUR hedged) Q-dist3 LU1815428377Shares outstanding 35 000.0000Net asset value per share in EUR 97.76Issue and redemption price per share in EUR2 97.76
1 First NAV: 16.10.20172 See note 13 First NAV: 15.5.2018
Performance
Currency 2017/2018Class P-acc1 USD -Class (EUR hedged) P-acc1 EUR -Class Q-acc1 USD -Class (EUR hedged) Q-acc1 EUR -Class (EUR hedged) Q-dist1 EUR -
1 Due to the recent launch, there is no data for the calculation of the performance available.
Historical performance is no indicator of current or future performance.The performance data does not take account of any commissions and costs charged when subscribing and redeeming shares.The performance data were not audited.The subfund has no benchmark.

98 The notes are an integral part of the fi nancial statements.
UBS (Lux) Equity SICAV – Global Impact (USD)Annual Report as of 31 May 2018
Report of the Portfolio Manager
During the reporting period, from 16 October 2017 to 31 May 2018, global equity markets rallied whilst volatility increased at the beginning of 2018. All sectors except telecommunication services and consumer staples recorded positive performances as companies globally continued to expand earnings.
Since inception (16 October 2017) the subfund has pos-ted a positive performance. Stock selection in Consumer Staples and Consumer Discretionary contributed to per-formance, while stock selection in Financials and Indust-rials detracted from performance. To navigate the current market environment, we have constructed a diversified portfolio of attractively valued, high-quality companies with high potential to generate a positive impact on soci-ety and the environment.
Structure of the Securities Portfolio
Geographical Breakdown as a % of net assetsUnited States 44.59Japan 8.99Germany 7.76France 4.93The Netherlands 4.53Hong Kong 4.30Italy 3.80Ireland 3.44United Kingdom 3.02China 2.13Norway 2.09Australia 2.02Indonesia 1.96Mexico 1.55South Africa 1.27Switzerland 0.91Thailand 0.89Hungary 0.75Brazil 0.64Total 99.57
Economic Breakdown as a % of net assetsPharmaceuticals, cosmetics & medical products 12.85Mechanical engineering & industrial equipment 11.67Banks & credit institutions 9.19Retail trade, department stores 8.85Electronics & semiconductors 8.66Internet, software & IT services 7.19Chemicals 5.22Building industry & materials 4.06Finance & holding companies 4.00Biotechnology 3.72Real Estate 3.12Petroleum 2.95Vehicles 2.85Environmental services & recycling 2.78Food & soft drinks 2.34Forestry, paper & pulp products 2.20Miscellaneous consumer goods 2.15Miscellaneous unclassified companies 2.13Healthcare & social services 1.73Telecommunications 1.27Energy & water supply 0.64Total 99.57

The notes are an integral part of the fi nancial statements. 99
UBS (Lux) Equity SICAV – Global Impact (USD)Annual Report as of 31 May 2018
Statement of Net Assets USDAssets 31.5.2018Investments in securities, cost 9 682 157.11Investments in securities, unrealized appreciation (depreciation) 10 647.58Total investments in securities (Note 1) 9 692 804.69Cash at banks, deposits on demand and deposit accounts 59 256.06Receivable on subscriptions 48.39Receivable on dividends 10 766.28Other receivables 2 616.51Unrealized gain (loss) on forward foreign exchange contracts (Note 1) -26 268.63Total Assets 9 739 223.30
LiabilitiesProvisions for flat fee (Note 2) -3 804.45Provisions for taxe d’abonnement (Note 3) -815.67Provisions for other commissions and fees (Note 2) -28.78Total provisions -4 648.90Total Liabilities -4 648.90
Net assets at the end of the period 9 734 574.40
Statement of Operations USDIncome 16.10.2017-31.5.2018Interest on liquid assets 505.55Dividends 65 732.01Other income (Note 4) 6 491.95Total income 72 729.51
ExpensesFlat fee (Note 2) -39 281.37Taxe d’abonnement (Note 3) -2 124.22Other commissions and fees (Note 2) -6 715.27Interest on cash and bank overdraft -65.39Total expenses -48 186.25
Net income (loss) on investments 24 543.26
Realized gain (loss) (Note 1)Realized gain (loss) on market-priced securities without options 35 489.24Realized gain (loss) on forward foreign exchange contracts -146 052.42Realized gain (loss) on foreign exchange 19 331.42Total realized gain (loss) -91 231.76
Net realized gain (loss) of the period -66 688.50
Changes in unrealized appreciation (depreciation) (Note 1)Unrealized appreciation (depreciation) on market-priced securities without options 10 647.58Unrealized appreciation (depreciation) on forward foreign exchange contracts -26 268.63Total changes in unrealized appreciation (depreciation) -15 621.05
Net increase (decrease) in net assets as a result of operations -82 309.55

100 The notes are an integral part of the fi nancial statements.
UBS (Lux) Equity SICAV – Global Impact (USD)Annual Report as of 31 May 2018
Statement of Changes in Net Assets USD 16.10.2017-31.5.2018Net assets at the beginning of the period 0.00Subscriptions 9 816 883.95Total net subscriptions (redemptions) 9 816 883.95Net income (loss) on investments 24 543.26Total realized gain (loss) -91 231.76Total changes in unrealized appreciation (depreciation) -15 621.05Net increase (decrease) in net assets as a result of operations -82 309.55Net assets at the end of the period 9 734 574.40
Changes in the Number of Shares outstanding
16.10.2017-31.5.2018Class P-accNumber of shares outstanding at the beginning of the period 0.0000Number of shares issued 10 270.3620Number of shares redeemed 0.0000Number of shares outstanding at the end of the period 10 270.3620Class (EUR hedged) P-accNumber of shares outstanding at the beginning of the period 0.0000Number of shares issued 18 613.4470Number of shares redeemed 0.0000Number of shares outstanding at the end of the period 18 613.4470Class Q-accNumber of shares outstanding at the beginning of the period 0.0000Number of shares issued 10 400.0000Number of shares redeemed 0.0000Number of shares outstanding at the end of the period 10 400.0000Class (EUR hedged) Q-accNumber of shares outstanding at the beginning of the period 0.0000Number of shares issued 12 000.0000Number of shares redeemed 0.0000Number of shares outstanding at the end of the period 12 000.0000Class (EUR hedged) Q-distNumber of shares outstanding at the beginning of the period 0.0000Number of shares issued 35 000.0000Number of shares redeemed 0.0000Number of shares outstanding at the end of the period 35 000.0000

The notes are an integral part of the fi nancial statements. 101
UBS (Lux) Equity SICAV – Global Impact (USD)Annual Report as of 31 May 2018
Statement of Investments in Securities and other Net Assets as of 31 May 2018
Description Quantity/ Valuation in USD as a % Nominal Unrealized gain of net (loss) on Futures/ assets Forward Exchange Contracts/ Swaps (Note 1)
Transferable securities and money market instruments listed on an official stock exchange
Bearer shares
Australia
AUD CALTEX AUSTRALIA NPV 3 789.00 84 345.58 0.87AUD SIMS METAL MANAGEMENT LTD NPV 9 276.00 111 948.03 1.15Total Australia 196 293.61 2.02
France
EUR CREDIT AGRICOLE SA EUR3 16 100.00 220 636.04 2.27EUR SANOFI EUR2 1 903.00 145 788.64 1.50EUR VALEO EUR1 (POST SUBD) 1 783.00 113 055.99 1.16Total France 479 480.67 4.93
Germany
EUR KION GROUP AG NPV 2 023.00 164 215.09 1.69EUR LANXESS AG NPV 1 235.00 97 568.54 1.00EUR SAP AG ORD NPV 2 126.00 239 085.03 2.45Total Germany 500 868.66 5.14
Hong Kong
HKD CHINA EVER INTL HKD0.10 143 000.00 213 657.31 2.20HKD SUN HUNG KAI PROP NPV 6 000.00 96 836.50 0.99HKD SWIRE PROPERTIES LTD HKD1 27 600.00 108 195.28 1.11Total Hong Kong 418 689.09 4.30
Hungary
HUF GEDEON RICHTER PLC HUF100 3 738.00 73 021.93 0.75Total Hungary 73 021.93 0.75
Ireland
EUR KINGSPAN GROUP ORD EUR0.13(DUBLIN LISTING) 2 795.00 129 199.10 1.33GBP SHIRE ORD GBP0.05 3 772.00 205 787.68 2.11Total Ireland 334 986.78 3.44
Italy
EUR INTESA SANPAOLO EUR0.52 83 880.00 246 202.55 2.53EUR PRYSMIAN SPA EUR0.10 4 458.00 123 851.00 1.27Total Italy 370 053.55 3.80
Japan
JPY KUBOTA CORP NPV 5 300.00 89 418.75 0.92JPY MITSUBISHI ESTATE NPV 5 400.00 98 213.45 1.01JPY NABTESCO CORP NPV 5 200.00 170 389.80 1.75JPY SHIONOGI & CO NPV 3 400.00 178 817.25 1.83JPY SUMITOMO MITSUI FG NPV 5 000.00 207 234.57 2.13JPY TAKEDA PHARMACEUTI NPV 3 200.00 131 127.99 1.35Total Japan 875 201.81 8.99
Mexico
MXN GRUPO FINANCIERO BANORTE SAB DE CV COM SER’O’NPV 28 430.00 150 869.76 1.55Total Mexico 150 869.76 1.55
The Netherlands
EUR KONINKLIJKE AHOLD EUR0.01 10 099.00 231 692.42 2.38Total The Netherlands 231 692.42 2.38
Norway
NOK EQUINOR ASA NOK2.50 7 716.00 203 024.09 2.09Total Norway 203 024.09 2.09
South Africa
ZAR TIGER BRANDS ZAR0.10 4 647.00 123 247.32 1.27Total South Africa 123 247.32 1.27
Thailand
THB KASIKORNBANK PLC THB10 (ALIEN MKT) 14 200.00 86 558.30 0.89Total Thailand 86 558.30 0.89
United Kingdom
USD LIVANOVA PLC ORD GBP1.00 (DI) 1 786.00 167 973.30 1.72GBP TESCO ORD GBP0.05 38 579.00 126 130.45 1.30Total United Kingdom 294 103.75 3.02
United States
USD ABBOTT LABS COM 3 789.00 233 137.17 2.39USD AGCO CORP COM USD0.01 2 246.00 142 845.60 1.47USD ALEXION PHARMACEUT COM USD0.0001 429.00 49 819.77 0.51USD ALLERGAN PLC COM USD0.0001 703.00 106 012.40 1.09USD AMAZON COM INC COM USD0.01 206.00 335 701.72 3.45USD CONAGRA BRANDS IN COM USD5 2 829.00 104 842.74 1.08USD DANAHER CORP COM USD0.01 3 121.00 309 852.88 3.18USD ECOLAB INC COM 2 881.00 410 859.41 4.22USD ELI LILLY AND CO COM NPV 2 469.00 209 963.76 2.16USD INCYTE CORPORATION COM USD0.001 1 560.00 106 501.20 1.09USD KROGER CO COM USD1 6 893.00 167 706.69 1.72USD LAB CORP AMER HLDG COM USD0.1 960.00 173 366.40 1.78USD LKQ CORP COM 5 178.00 164 505.06 1.69USD MASCO CORP COM 4 750.00 177 032.50 1.82

102 The notes are an integral part of the fi nancial statements.
UBS (Lux) Equity SICAV – Global Impact (USD)Annual Report as of 31 May 2018
USD MAXIM INTEGRATED COM USD0.001 2 606.00 152 841.90 1.57USD MICRON TECHNOLOGY COM USD0.10 3 429.00 197 476.11 2.03USD MICROSOFT CORP COM USD0.0000125 4 664.00 460 989.76 4.73USD STERICYCLE INC COM 2 503.00 158 940.50 1.63USD TRIMBLE INC COM NPV 4 115.00 136 041.90 1.40USD UNIVERSAL DISPLAY COM USD0.01 1 029.00 101 871.00 1.05USD WABTEC CORP COM 2 658.00 259 181.58 2.66USD ZIMMER BIOMET HOLDINGS INC COM USD0.01 1 629.00 181 649.79 1.87Total United States 4 341 139.84 44.59
Total Bearer shares 8 679 231.58 89.16
Other shares
The Netherlands
EUR UNILEVER NV CVA EUR0.16 3 755.00 209 254.52 2.15Total The Netherlands 209 254.52 2.15
Total Other shares 209 254.52 2.15
Registered shares
Germany
EUR INFINEON TECHNOLOG AG NPV (REGD) 9 293.00 254 812.92 2.62Total Germany 254 812.92 2.62
Switzerland
CHF GEBERIT CHF0.10(REGD) 206.00 89 222.66 0.91Total Switzerland 89 222.66 0.91
Total Registered shares 344 035.58 3.53
Depository receipts
Brazil
USD COMPANHIA DE SANEAMENTO BASICO SPONSORED ADR 9 100.00 62 517.00 0.64Total Brazil 62 517.00 0.64
China
USD NEW ORIENTAL ED & TECH GRP INC SPON ADR 2 083.00 207 196.01 2.13Total China 207 196.01 2.13
Total Depository receipts 269 713.01 2.77
Total Transferable securities and money market instruments listed on an official stock exchange 9 502 234.69 97.61
Transferable securities and money market instruments not listed on an official stock exchange and not traded on another regulated market
Depository receipts
Indonesia
USD BK MANDIRI UNSP ADR EACH REP 10 ORD 19 000.00 190 570.00 1.96Total Indonesia 190 570.00 1.96
Total Depository receipts 190 570.00 1.96
Total Transferable securities and money market instruments not listed on an official stock exchange and not traded on another regulated market 190 570.00 1.96
Total investments in securities 9 692 804.69 99.57
Forward Foreign Exchange contracts
Forward Foreign Exchange contracts (Purchase/Sale)
EUR 4 105 800.00 USD 4 837 465.88 25.6.2018 -36 795.87 -0.38USD 60 268.23 EUR 51 600.00 25.6.2018 -64.61 0.00EUR 2 456 100.00 USD 2 861 069.14 25.6.2018 10 703.87 0.11USD 102 898.12 EUR 88 100.00 25.6.2018 -112.02 0.00Total Forward Foreign Exchange contracts (Purchase/Sale) -26 268.63 -0.27
Cash at banks, deposits on demand and deposit accounts and other liquid assets 59 256.06 0.61Other assets and liabilities 8 782.28 0.09
Total net assets 9 734 574.40 100.00
Description Quantity/ Valuation in USD as a % Nominal Unrealized gain of net (loss) on Futures/ assets Forward Exchange Contracts/ Swaps (Note 1)

The notes are an integral part of the fi nancial statements. 103
UBS (Lux) Equity SICAV – Global Income (USD)Annual Report as of 31 May 2018
UBS (Lux) Equity SICAV – Global Income (USD)
Three-year comparison
ISIN 31.5.2018 31.5.2017 31.5.2016Net assets in USD 1 113 314 407.72 1 093 499 300.47 719 114 024.69Class F-acc LU1289529007Shares outstanding 5 339.0000 12 777.0000 100.0000Net asset value per share in USD 127.81 124.82 109.96Issue and redemption price per share in USD1 127.64 124.82 109.96Class (CHF hedged) F-acc LU1289529189Shares outstanding 31 512.9450 33 956.0980 38 540.1170Net asset value per share in CHF 120.73 121.14 109.05Issue and redemption price per share in CHF1 120.57 121.14 109.05Class (EUR hedged) F-acc LU1308715694Shares outstanding 10 129.9640 24 710.1630 20 961.8150Net asset value per share in EUR 114.68 114.62 102.64Issue and redemption price per share in EUR1 114.53 114.62 102.64Class I-A1-8%-mdist2 LU1511577857Shares outstanding 249 171.7950 - -Net asset value per share in USD 96.22 - -Issue and redemption price per share in USD1 96.09 - -Class I-A1-acc3 LU1468494312Shares outstanding 107 027.7110 95 078.1800 -Net asset value per share in USD 111.69 109.20 -Issue and redemption price per share in USD1 111.54 109.20 -Class I-A2-8%-mdist4 LU1479460237Shares outstanding 915 081.3030 633 368.5240 -Net asset value per share in USD 97.95 103.65 -Issue and redemption price per share in USD1 97.82 103.65 -Class I-A2-acc5 LU1045846083Shares outstanding - 110 015.5150 68 206.0000Net asset value per share in USD - 129.66 114.28Issue and redemption price per share in USD1 - 129.66 114.28Class (EUR) I-A2-acc LU1163232496Shares outstanding 30 747.6990 92 913.7690 88 069.5360Net asset value per share in EUR 116.17 117.84 104.92Issue and redemption price per share in EUR1 116.02 117.84 104.92Class (EUR hedged) I-A2-acc LU1163232223Shares outstanding 301 619.8400 258 026.4210 359 042.9260Net asset value per share in EUR 113.79 113.80 101.96Issue and redemption price per share in EUR1 113.64 113.80 101.96Class I-B-acc LU1131112242Shares outstanding 35 454.6050 52 878.5880 71 087.4100Net asset value per share in USD 124.30 120.68 105.69Issue and redemption price per share in USD1 124.14 120.68 105.69Class (GBP hedged) I-B-UKdist-mdist LU1059394772Shares outstanding 502 233.1220 482 188.4220 231 298.7370Net asset value per share in GBP 90.73 95.73 92.07Issue and redemption price per share in GBP1 90.61 95.73 92.07Class I-X-acc LU1065469329Shares outstanding 50 115.6560 50 115.6560 53 585.1780Net asset value per share in USD 124.16 120.47 105.43Issue and redemption price per share in USD1 124.00 120.47 105.43Class (EUR hedged) I-X-acc6 LU1554280666Shares outstanding 515 834.5980 528 619.0000 -Net asset value per share in EUR 102.83 102.12 -Issue and redemption price per share in EUR1 102.70 102.12 -Class I-X-UKdist LU1336832164Shares outstanding 102 776.3760 102 171.3290 71 444.9010Net asset value per share in USD 107.96 112.06 101.50Issue and redemption price per share in USD1 107.82 112.06 101.50Class (EUR hedged) K-1-acc LU1032914704Shares outstanding 0.7000 0.4000 0.4000Net asset value per share in EUR 3 348 042.19 3 366 435.33 3 032 834.90Issue and redemption price per share in EUR1 3 343 689.74 3 366 435.33 3 032 834.90

104 The notes are an integral part of the fi nancial statements.
UBS (Lux) Equity SICAV – Global Income (USD)Annual Report as of 31 May 2018
ISIN 31.5.2018 31.5.2017 31.5.2016
Class K-1-dist LU1032914613Shares outstanding 0.4000 0.7000 0.7000Net asset value per share in USD 5 178 989.98 5 378 242.84 5 166 460.91Issue and redemption price per share in USD1 5 172 257.29 5 378 242.84 5 166 460.91Class (EUR hedged) K-1-dist LU1032914886Shares outstanding 0.8000 0.8000 0.6000Net asset value per share in EUR 2 875 295.61 3 056 215.28 2 985 391.57Issue and redemption price per share in EUR1 2 871 557.73 3 056 215.28 2 985 391.57Class K-X-acc7 LU1525460769Shares outstanding 100 645.8910 128 010.3970 -Net asset value per share in USD 113.90 110.56 -Issue and redemption price per share in USD1 113.75 110.56 -Class P-8%-mdist LU1076699146Shares outstanding 1 261 922.2900 1 349 078.5650 1 247 745.8840Net asset value per share in USD 85.42 91.45 88.32Issue and redemption price per share in USD1 85.31 91.45 88.32Class P-acc LU1013383713Shares outstanding 717 834.4000 829 111.4920 1 055 311.7210Net asset value per share in USD 125.64 124.18 110.71Issue and redemption price per share in USD1 125.48 124.18 110.71Class (CHF hedged) P-acc LU1013384109Shares outstanding 324 766.3310 384 221.5790 198 297.6410Net asset value per share in CHF 117.79 119.62 108.99Issue and redemption price per share in CHF1 117.64 119.62 108.99Class (EUR hedged) P-acc LU1013383986Shares outstanding 408 759.9430 401 774.8240 269 275.4420Net asset value per share in EUR 120.37 121.77 110.37Issue and redemption price per share in EUR1 120.21 121.77 110.37Class P-dist LU1013383804Shares outstanding 218 245.1890 309 086.9100 393 409.7890Net asset value per share in USD 102.71 106.69 102.72Issue and redemption price per share in USD1 102.58 106.69 102.72Class (CHF hedged) P-dist LU1013384281Shares outstanding 243 109.6390 182 921.7270 152 288.7810Net asset value per share in CHF 96.09 102.59 101.07Issue and redemption price per share in CHF1 95.97 102.59 101.07Class (EUR hedged) P-dist LU1013384018Shares outstanding 288 922.3950 237 144.2560 129 916.2380Net asset value per share in EUR 98.15 104.36 102.21Issue and redemption price per share in EUR1 98.02 104.36 102.21Class (SGD hedged) P-mdist LU1145057144Shares outstanding 175 780.1030 181 194.9820 225 138.4050Net asset value per share in SGD 91.90 97.48 93.64Issue and redemption price per share in SGD1 91.78 97.48 93.64Class Q-8%-mdist LU1240787413Shares outstanding 52 284.3150 82 507.5360 45 954.4470Net asset value per share in USD 95.73 101.75 97.54Issue and redemption price per share in USD1 95.61 101.75 97.54Class Q-acc LU1043174561Shares outstanding 525 710.1010 770 554.9030 565 948.3860Net asset value per share in USD 129.77 127.35 112.73Issue and redemption price per share in USD1 129.60 127.35 112.73Class (CHF hedged) Q-acc LU1240787090Shares outstanding 658 809.8980 565 966.8860 249 517.0080Net asset value per share in CHF 111.10 112.01 101.32Issue and redemption price per share in CHF1 110.96 112.01 101.32Class (EUR hedged) Q-acc LU1086761837Shares outstanding 406 915.6070 214 286.0890 116 359.6920Net asset value per share in EUR 112.66 113.15 101.83Issue and redemption price per share in EUR1 112.51 113.15 101.83Class Q-dist LU1240787504Shares outstanding 441 482.7240 374 608.4510 312 545.8230Net asset value per share in USD 104.04 108.02 102.23Issue and redemption price per share in USD1 103.90 108.02 102.23Class (CHF hedged) Q-dist LU1240787173Shares outstanding 649 559.2290 464 794.2330 249 632.3210Net asset value per share in CHF 98.14 104.73 101.32Issue and redemption price per share in CHF1 98.01 104.73 101.32Class (EUR hedged) Q-dist LU1240787256Shares outstanding 137 142.9910 67 355.6590 24 829.0870Net asset value per share in EUR 99.62 105.86 101.88Issue and redemption price per share in EUR1 99.49 105.86 101.88
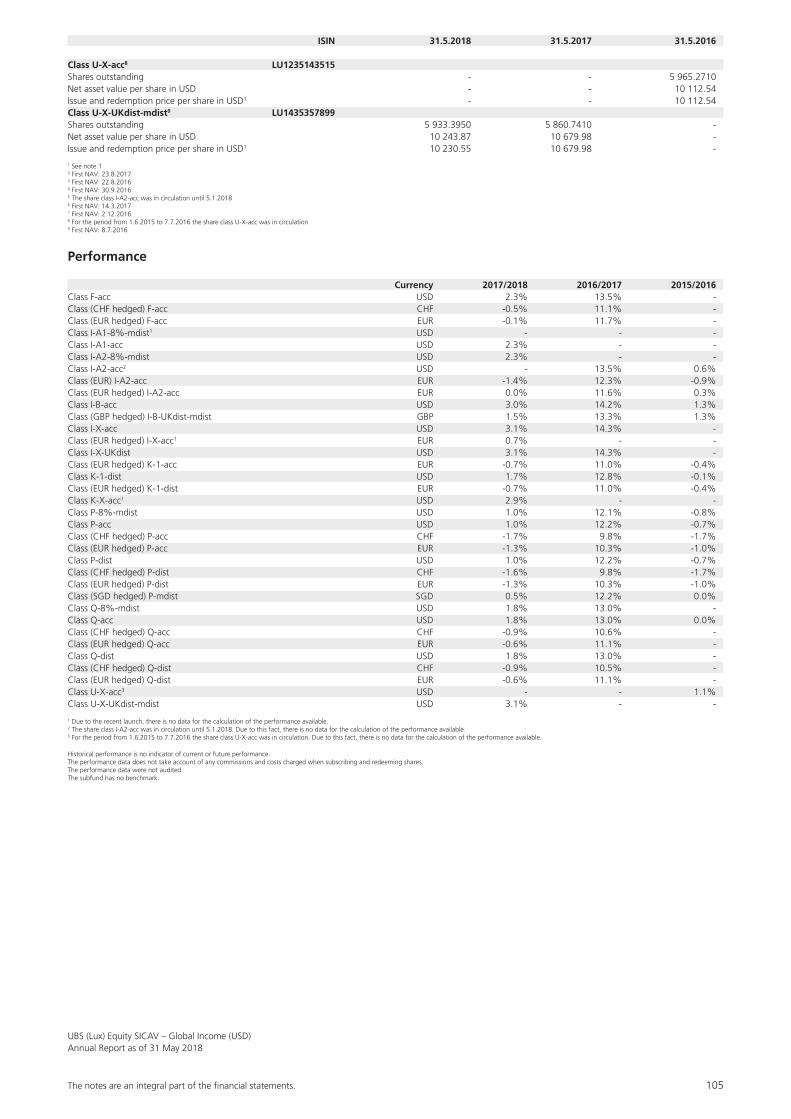
The notes are an integral part of the fi nancial statements. 105
UBS (Lux) Equity SICAV – Global Income (USD)Annual Report as of 31 May 2018
ISIN 31.5.2018 31.5.2017 31.5.2016
Class U-X-acc8 LU1235143515Shares outstanding - - 5 965.2710Net asset value per share in USD - - 10 112.54Issue and redemption price per share in USD1 - - 10 112.54Class U-X-UKdist-mdist9 LU1435357899Shares outstanding 5 933.3950 5 860.7410 -Net asset value per share in USD 10 243.87 10 679.98 -Issue and redemption price per share in USD1 10 230.55 10 679.98 -
1 See note 12 First NAV: 23.8.20173 First NAV: 22.8.20164 First NAV: 30.9.20165 The share class I-A2-acc was in circulation until 5.1.20186 First NAV: 14.3.20177 First NAV: 2.12.20168 For the period from 1.6.2015 to 7.7.2016 the share class U-X-acc was in circulation9 First NAV: 8.7.2016
Performance
Currency 2017/2018 2016/2017 2015/2016Class F-acc USD 2.3% 13.5% -Class (CHF hedged) F-acc CHF -0.5% 11.1% -Class (EUR hedged) F-acc EUR -0.1% 11.7% -Class I-A1-8%-mdist1 USD - - -Class I-A1-acc USD 2.3% - -Class I-A2-8%-mdist USD 2.3% - -Class I-A2-acc2 USD - 13.5% 0.6%Class (EUR) I-A2-acc EUR -1.4% 12.3% -0.9%Class (EUR hedged) I-A2-acc EUR 0.0% 11.6% 0.3%Class I-B-acc USD 3.0% 14.2% 1.3%Class (GBP hedged) I-B-UKdist-mdist GBP 1.5% 13.3% 1.3%Class I-X-acc USD 3.1% 14.3% -Class (EUR hedged) I-X-acc1 EUR 0.7% - -Class I-X-UKdist USD 3.1% 14.3% -Class (EUR hedged) K-1-acc EUR -0.7% 11.0% -0.4%Class K-1-dist USD 1.7% 12.8% -0.1%Class (EUR hedged) K-1-dist EUR -0.7% 11.0% -0.4%Class K-X-acc1 USD 2.9% - -Class P-8%-mdist USD 1.0% 12.1% -0.8%Class P-acc USD 1.0% 12.2% -0.7%Class (CHF hedged) P-acc CHF -1.7% 9.8% -1.7%Class (EUR hedged) P-acc EUR -1.3% 10.3% -1.0%Class P-dist USD 1.0% 12.2% -0.7%Class (CHF hedged) P-dist CHF -1.6% 9.8% -1.7%Class (EUR hedged) P-dist EUR -1.3% 10.3% -1.0%Class (SGD hedged) P-mdist SGD 0.5% 12.2% 0.0%Class Q-8%-mdist USD 1.8% 13.0% -Class Q-acc USD 1.8% 13.0% 0.0%Class (CHF hedged) Q-acc CHF -0.9% 10.6% -Class (EUR hedged) Q-acc EUR -0.6% 11.1% -Class Q-dist USD 1.8% 13.0% -Class (CHF hedged) Q-dist CHF -0.9% 10.5% -Class (EUR hedged) Q-dist EUR -0.6% 11.1% -Class U-X-acc3 USD - - 1.1%Class U-X-UKdist-mdist USD 3.1% - -
1 Due to the recent launch, there is no data for the calculation of the performance available.2 The share class I-A2-acc was in circulation until 5.1.2018. Due to this fact, there is no data for the calculation of the performance available.3 For the period from 1.6.2015 to 7.7.2016 the share class U-X-acc was in circulation. Due to this fact, there is no data for the calculation of the performance available.
Historical performance is no indicator of current or future performance.The performance data does not take account of any commissions and costs charged when subscribing and redeeming shares.The performance data were not audited.The subfund has no benchmark.
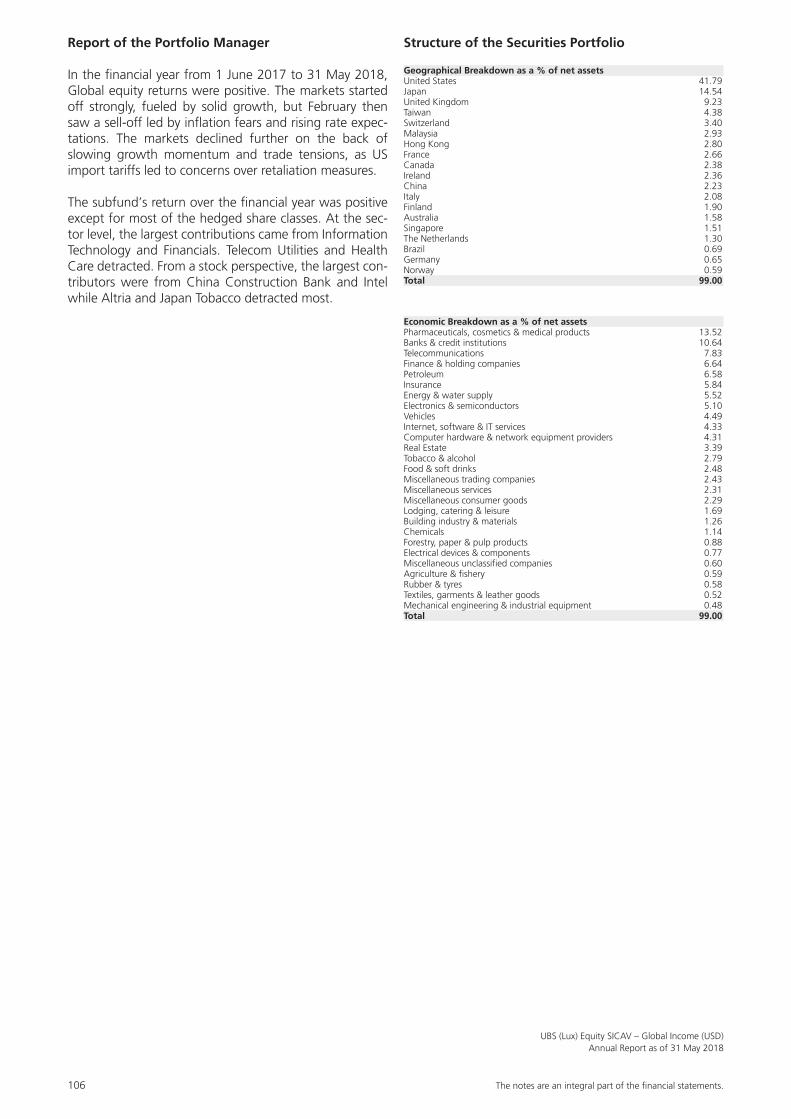
106 The notes are an integral part of the fi nancial statements.
UBS (Lux) Equity SICAV – Global Income (USD)Annual Report as of 31 May 2018
Report of the Portfolio Manager
In the financial year from 1 June 2017 to 31 May 2018, Global equity returns were positive. The markets started off strongly, fueled by solid growth, but February then saw a sell-off led by inflation fears and rising rate expec-tations. The markets declined further on the back of slowing growth momentum and trade tensions, as US import tariffs led to concerns over retaliation measures.
The subfund’s return over the financial year was positive except for most of the hedged share classes. At the sec-tor level, the largest contributions came from Information Technology and Financials. Telecom Utilities and Health Care detracted. From a stock perspective, the largest con-tributors were from China Construction Bank and Intel while Altria and Japan Tobacco detracted most.
Structure of the Securities Portfolio
Geographical Breakdown as a % of net assetsUnited States 41.79Japan 14.54United Kingdom 9.23Taiwan 4.38Switzerland 3.40Malaysia 2.93Hong Kong 2.80France 2.66Canada 2.38Ireland 2.36China 2.23Italy 2.08Finland 1.90Australia 1.58Singapore 1.51The Netherlands 1.30Brazil 0.69Germany 0.65Norway 0.59Total 99.00
Economic Breakdown as a % of net assetsPharmaceuticals, cosmetics & medical products 13.52Banks & credit institutions 10.64Telecommunications 7.83Finance & holding companies 6.64Petroleum 6.58Insurance 5.84Energy & water supply 5.52Electronics & semiconductors 5.10Vehicles 4.49Internet, software & IT services 4.33Computer hardware & network equipment providers 4.31Real Estate 3.39Tobacco & alcohol 2.79Food & soft drinks 2.48Miscellaneous trading companies 2.43Miscellaneous services 2.31Miscellaneous consumer goods 2.29Lodging, catering & leisure 1.69Building industry & materials 1.26Chemicals 1.14Forestry, paper & pulp products 0.88Electrical devices & components 0.77Miscellaneous unclassified companies 0.60Agriculture & fishery 0.59Rubber & tyres 0.58Textiles, garments & leather goods 0.52Mechanical engineering & industrial equipment 0.48Total 99.00
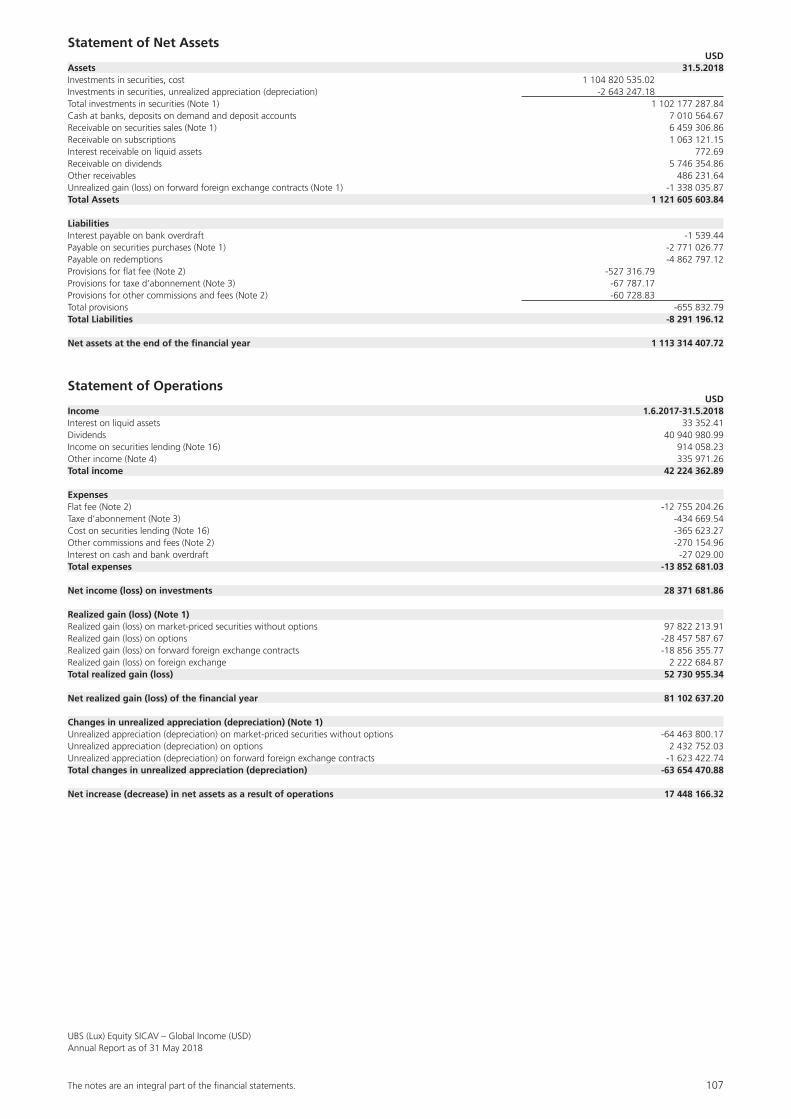
The notes are an integral part of the fi nancial statements. 107
UBS (Lux) Equity SICAV – Global Income (USD)Annual Report as of 31 May 2018
Statement of Net Assets USDAssets 31.5.2018Investments in securities, cost 1 104 820 535.02Investments in securities, unrealized appreciation (depreciation) -2 643 247.18Total investments in securities (Note 1) 1 102 177 287.84Cash at banks, deposits on demand and deposit accounts 7 010 564.67Receivable on securities sales (Note 1) 6 459 306.86Receivable on subscriptions 1 063 121.15Interest receivable on liquid assets 772.69Receivable on dividends 5 746 354.86Other receivables 486 231.64Unrealized gain (loss) on forward foreign exchange contracts (Note 1) -1 338 035.87Total Assets 1 121 605 603.84
LiabilitiesInterest payable on bank overdraft -1 539.44Payable on securities purchases (Note 1) -2 771 026.77Payable on redemptions -4 862 797.12Provisions for flat fee (Note 2) -527 316.79Provisions for taxe d’abonnement (Note 3) -67 787.17Provisions for other commissions and fees (Note 2) -60 728.83Total provisions -655 832.79Total Liabilities -8 291 196.12
Net assets at the end of the financial year 1 113 314 407.72
Statement of Operations USDIncome 1.6.2017-31.5.2018Interest on liquid assets 33 352.41Dividends 40 940 980.99Income on securities lending (Note 16) 914 058.23Other income (Note 4) 335 971.26Total income 42 224 362.89
ExpensesFlat fee (Note 2) -12 755 204.26Taxe d’abonnement (Note 3) -434 669.54Cost on securities lending (Note 16) -365 623.27Other commissions and fees (Note 2) -270 154.96Interest on cash and bank overdraft -27 029.00Total expenses -13 852 681.03
Net income (loss) on investments 28 371 681.86
Realized gain (loss) (Note 1)Realized gain (loss) on market-priced securities without options 97 822 213.91Realized gain (loss) on options -28 457 587.67Realized gain (loss) on forward foreign exchange contracts -18 856 355.77Realized gain (loss) on foreign exchange 2 222 684.87Total realized gain (loss) 52 730 955.34
Net realized gain (loss) of the financial year 81 102 637.20
Changes in unrealized appreciation (depreciation) (Note 1)Unrealized appreciation (depreciation) on market-priced securities without options -64 463 800.17Unrealized appreciation (depreciation) on options 2 432 752.03Unrealized appreciation (depreciation) on forward foreign exchange contracts -1 623 422.74Total changes in unrealized appreciation (depreciation) -63 654 470.88
Net increase (decrease) in net assets as a result of operations 17 448 166.32

108 The notes are an integral part of the fi nancial statements.
UBS (Lux) Equity SICAV – Global Income (USD)Annual Report as of 31 May 2018
Statement of Changes in Net Assets USD 1.6.2017-31.5.2018Net assets at the beginning of the financial year 1 093 499 300.47Subscriptions 419 514 455.08Redemptions -377 860 104.52Total net subscriptions (redemptions) 41 654 350.56Dividend paid -39 287 409.63Net income (loss) on investments 28 371 681.86Total realized gain (loss) 52 730 955.34Total changes in unrealized appreciation (depreciation) -63 654 470.88Net increase (decrease) in net assets as a result of operations 17 448 166.32Net assets at the end of the financial year 1 113 314 407.72
Changes in the Number of Shares outstanding
1.6.2017-31.5.2018Class F-accNumber of shares outstanding at the beginning of the financial year 12 777.0000Number of shares issued 0.0000Number of shares redeemed -7 438.0000Number of shares outstanding at the end of the financial year 5 339.0000Class (CHF hedged) F-accNumber of shares outstanding at the beginning of the financial year 33 956.0980Number of shares issued 249.1480Number of shares redeemed -2 692.3010Number of shares outstanding at the end of the financial year 31 512.9450Class (EUR hedged) F-accNumber of shares outstanding at the beginning of the financial year 24 710.1630Number of shares issued 0.0000Number of shares redeemed -14 580.1990Number of shares outstanding at the end of the financial year 10 129.9640Class I-A1-8%-mdistNumber of shares outstanding at the beginning of the financial year 0.0000Number of shares issued 249 171.7950Number of shares redeemed 0.0000Number of shares outstanding at the end of the financial year 249 171.7950Class I-A1-accNumber of shares outstanding at the beginning of the financial year 95 078.1800Number of shares issued 11 949.5310Number of shares redeemed 0.0000Number of shares outstanding at the end of the financial year 107 027.7110Class I-A2-8%-mdistNumber of shares outstanding at the beginning of the financial year 633 368.5240Number of shares issued 761 712.7790Number of shares redeemed -480 000.0000Number of shares outstanding at the end of the financial year 915 081.3030Class I-A2-accNumber of shares outstanding at the beginning of the financial year 110 015.5150Number of shares issued 0.0000Number of shares redeemed -110 015.5150Number of shares outstanding at the end of the financial year 0.0000Class (EUR) I-A2-accNumber of shares outstanding at the beginning of the financial year 92 913.7690Number of shares issued 0.0000Number of shares redeemed -62 166.0700Number of shares outstanding at the end of the financial year 30 747.6990Class (EUR hedged) I-A2-accNumber of shares outstanding at the beginning of the financial year 258 026.4210Number of shares issued 169 068.3890Number of shares redeemed -125 474.9700Number of shares outstanding at the end of the financial year 301 619.8400Class I-B-accNumber of shares outstanding at the beginning of the financial year 52 878.5880Number of shares issued 2 813.0610Number of shares redeemed -20 237.0440Number of shares outstanding at the end of the financial year 35 454.6050Class (GBP hedged) I-B-UKdist-mdistNumber of shares outstanding at the beginning of the financial year 482 188.4220Number of shares issued 95 960.4370Number of shares redeemed -75 915.7370Number of shares outstanding at the end of the financial year 502 233.1220Class I-X-accNumber of shares outstanding at the beginning of the financial year 50 115.6560Number of shares issued 0.0000Number of shares redeemed 0.0000Number of shares outstanding at the end of the financial year 50 115.6560

The notes are an integral part of the fi nancial statements. 109
UBS (Lux) Equity SICAV – Global Income (USD)Annual Report as of 31 May 2018
Class (EUR hedged) I-X-accNumber of shares outstanding at the beginning of the financial year 528 619.0000Number of shares issued 15 059.3430Number of shares redeemed -27 843.7450Number of shares outstanding at the end of the financial year 515 834.5980Class I-X-UKdistNumber of shares outstanding at the beginning of the financial year 102 171.3290Number of shares issued 2 427.6370Number of shares redeemed -1 822.5900Number of shares outstanding at the end of the financial year 102 776.3760Class (EUR hedged) K-1-accNumber of shares outstanding at the beginning of the financial year 0.4000Number of shares issued 0.3000Number of shares redeemed 0.0000Number of shares outstanding at the end of the financial year 0.7000Class K-1-distNumber of shares outstanding at the beginning of the financial year 0.7000Number of shares issued 0.0000Number of shares redeemed -0.3000Number of shares outstanding at the end of the financial year 0.4000Class (EUR hedged) K-1-distNumber of shares outstanding at the beginning of the financial year 0.8000Number of shares issued 0.3000Number of shares redeemed -0.3000Number of shares outstanding at the end of the financial year 0.8000Class K-X-accNumber of shares outstanding at the beginning of the financial year 128 010.3970Number of shares issued 0.0000Number of shares redeemed -27 364.5060Number of shares outstanding at the end of the financial year 100 645.8910Class P-8%-mdistNumber of shares outstanding at the beginning of the financial year 1 349 078.5650Number of shares issued 355 558.3100Number of shares redeemed -442 714.5850Number of shares outstanding at the end of the financial year 1 261 922.2900Class P-accNumber of shares outstanding at the beginning of the financial year 829 111.4920Number of shares issued 188 431.0530Number of shares redeemed -299 708.1450Number of shares outstanding at the end of the financial year 717 834.4000Class (CHF hedged) P-accNumber of shares outstanding at the beginning of the financial year 384 221.5790Number of shares issued 45 216.2500Number of shares redeemed -104 671.4980Number of shares outstanding at the end of the financial year 324 766.3310Class (EUR hedged) P-accNumber of shares outstanding at the beginning of the financial year 401 774.8240Number of shares issued 117 023.2410Number of shares redeemed -110 038.1220Number of shares outstanding at the end of the financial year 408 759.9430Class P-distNumber of shares outstanding at the beginning of the financial year 309 086.9100Number of shares issued 57 674.7880Number of shares redeemed -148 516.5090Number of shares outstanding at the end of the financial year 218 245.1890Class (CHF hedged) P-distNumber of shares outstanding at the beginning of the financial year 182 921.7270Number of shares issued 97 987.6820Number of shares redeemed -37 799.7700Number of shares outstanding at the end of the financial year 243 109.6390Class (EUR hedged) P-distNumber of shares outstanding at the beginning of the financial year 237 144.2560Number of shares issued 96 947.8080Number of shares redeemed -45 169.6690Number of shares outstanding at the end of the financial year 288 922.3950Class (SGD hedged) P-mdistNumber of shares outstanding at the beginning of the financial year 181 194.9820Number of shares issued 42 180.8960Number of shares redeemed -47 595.7750Number of shares outstanding at the end of the financial year 175 780.1030Class Q-8%-mdistNumber of shares outstanding at the beginning of the financial year 82 507.5360Number of shares issued 23 855.4660Number of shares redeemed -54 078.6870Number of shares outstanding at the end of the financial year 52 284.3150Class Q-accNumber of shares outstanding at the beginning of the financial year 770 554.9030Number of shares issued 221 360.1510Number of shares redeemed -466 204.9530Number of shares outstanding at the end of the financial year 525 710.1010

110 The notes are an integral part of the fi nancial statements.
UBS (Lux) Equity SICAV – Global Income (USD)Annual Report as of 31 May 2018
Class (CHF hedged) Q-accNumber of shares outstanding at the beginning of the financial year 565 966.8860Number of shares issued 189 496.0240Number of shares redeemed -96 653.0120Number of shares outstanding at the end of the financial year 658 809.8980Class (EUR hedged) Q-accNumber of shares outstanding at the beginning of the financial year 214 286.0890Number of shares issued 269 457.7250Number of shares redeemed -76 828.2070Number of shares outstanding at the end of the financial year 406 915.6070Class Q-distNumber of shares outstanding at the beginning of the financial year 374 608.4510Number of shares issued 173 430.3590Number of shares redeemed -106 556.0860Number of shares outstanding at the end of the financial year 441 482.7240Class (CHF hedged) Q-distNumber of shares outstanding at the beginning of the financial year 464 794.2330Number of shares issued 299 288.4420Number of shares redeemed -114 523.4460Number of shares outstanding at the end of the financial year 649 559.2290Class (EUR hedged) Q-distNumber of shares outstanding at the beginning of the financial year 67 355.6590Number of shares issued 87 476.7620Number of shares redeemed -17 689.4300Number of shares outstanding at the end of the financial year 137 142.9910Class U-X-UKdist-mdistNumber of shares outstanding at the beginning of the financial year 5 860.7410Number of shares issued 1 173.4680Number of shares redeemed -1 100.8140Number of shares outstanding at the end of the financial year 5 933.3950
Annual Distribution
UBS (Lux) Equity SICAV – Global Income (USD) Ex-Date Pay-Date Currency Amount per shareI-X-UKdist 15.6.2017 20.6.2017 USD 3.75I-X-UKdist 3.7.2017 6.7.2017 USD 3.59K-1-dist 2.8.2017 7.8.2017 USD 293 583.48(EUR hedged) K-1-dist 2.8.2017 7.8.2017 EUR 166 269.95P-dist 2.8.2017 7.8.2017 USD 5.22(CHF hedged) P-dist 2.8.2017 7.8.2017 CHF 5.04(EUR hedged) P-dist 2.8.2017 7.8.2017 EUR 5.11Q-dist 2.8.2017 7.8.2017 USD 5.99(CHF hedged) Q-dist 2.8.2017 7.8.2017 CHF 5.83(EUR hedged) Q-dist 2.8.2017 7.8.2017 EUR 5.85
Monthly Distribution
UBS (Lux) Equity SICAV – Global Income (USD) Ex-Date Pay-Date Currency Amount per shareI-A1-8%-mdist 10.10.2017 13.10.2017 USD 0.77I-A1-8%-mdist 10.11.2017 15.11.2017 USD 0.68I-A1-8%-mdist 11.12.2017 14.12.2017 USD 0.68I-A1-8%-mdist 10.1.2018 16.1.2018 USD 0.68I-A1-8%-mdist 12.2.2018 15.2.2018 USD 0.68I-A1-8%-mdist 12.3.2018 15.3.2018 USD 0.65I-A1-8%-mdist 10.4.2018 13.4.2018 USD 0.64I-A1-8%-mdist 11.5.2018 16.5.2018 USD 0.65I-A2-8%-mdist 13.6.2017 16.6.2017 USD 0.69I-A2-8%-mdist 10.7.2017 13.7.2017 USD 0.68I-A2-8%-mdist 10.8.2017 16.8.2017 USD 0.68I-A2-8%-mdist 11.9.2017 14.9.2017 USD 0.68I-A2-8%-mdist 10.10.2017 13.10.2017 USD 0.69I-A2-8%-mdist 10.11.2017 15.11.2017 USD 0.69I-A2-8%-mdist 11.12.2017 14.12.2017 USD 0.69I-A2-8%-mdist 10.1.2018 16.1.2018 USD 0.69I-A2-8%-mdist 12.2.2018 15.2.2018 USD 0.69I-A2-8%-mdist 12.3.2018 15.3.2018 USD 0.66I-A2-8%-mdist 10.4.2018 13.4.2018 USD 0.65I-A2-8%-mdist 11.5.2018 16.5.2018 USD 0.66(GBP hedged) I-B-UKdist-mdist 6.6.2017 9.6.2017 GBP 0.73(GBP hedged) I-B-UKdist-mdist 18.7.2017 21.7.2017 GBP 0.43(GBP hedged) I-B-UKdist-mdist 16.8.2017 21.8.2017 GBP 0.58(GBP hedged) I-B-UKdist-mdist 15.9.2017 20.9.2017 GBP 0.50(GBP hedged) I-B-UKdist-mdist 16.10.2017 19.10.2017 GBP 0.44(GBP hedged) I-B-UKdist-mdist 15.11.2017 20.11.2017 GBP 0.40(GBP hedged) I-B-UKdist-mdist 15.12.2017 20.12.2017 GBP 0.50(GBP hedged) I-B-UKdist-mdist 16.1.2018 19.1.2018 GBP 0.51

The notes are an integral part of the fi nancial statements. 111
UBS (Lux) Equity SICAV – Global Income (USD)Annual Report as of 31 May 2018
UBS (Lux) Equity SICAV – Global Income (USD) Ex-Date Pay-Date Currency Amount per share(GBP hedged) I-B-UKdist-mdist 15.2.2018 20.2.2018 GBP 0.46(GBP hedged) I-B-UKdist-mdist 15.3.2018 20.3.2018 GBP 0.59(GBP hedged) I-B-UKdist-mdist 16.4.2018 19.4.2018 GBP 0.67(GBP hedged) I-B-UKdist-mdist 15.5.2018 18.5.2018 GBP 0.70P-8%-mdist 13.6.2017 16.6.2017 USD 0.60P-8%-mdist 10.7.2017 13.7.2017 USD 0.60P-8%-mdist 10.8.2017 16.8.2017 USD 0.60P-8%-mdist 11.9.2017 14.9.2017 USD 0.60P-8%-mdist 10.10.2017 13.10.2017 USD 0.60P-8%-mdist 10.11.2017 15.11.2017 USD 0.61P-8%-mdist 11.12.2017 14.12.2017 USD 0.61P-8%-mdist 10.1.2018 16.1.2018 USD 0.61P-8%-mdist 12.2.2018 15.2.2018 USD 0.61P-8%-mdist 12.3.2018 15.3.2018 USD 0.58P-8%-mdist 10.4.2018 13.4.2018 USD 0.57P-8%-mdist 11.5.2018 16.5.2018 USD 0.57(SGD hedged) P-mdist 15.6.2017 20.6.2017 SGD 0.52(SGD hedged) P-mdist 18.7.2017 21.7.2017 SGD 0.52(SGD hedged) P-mdist 16.8.2017 21.8.2017 SGD 0.59(SGD hedged) P-mdist 15.9.2017 20.9.2017 SGD 0.51(SGD hedged) P-mdist 16.10.2017 19.10.2017 SGD 0.45(SGD hedged) P-mdist 15.11.2017 20.11.2017 SGD 0.42(SGD hedged) P-mdist 15.12.2017 20.12.2017 SGD 0.50(SGD hedged) P-mdist 16.1.2018 19.1.2018 SGD 0.49(SGD hedged) P-mdist 15.2.2018 20.2.2018 SGD 0.48(SGD hedged) P-mdist 15.3.2018 20.3.2018 SGD 0.60(SGD hedged) P-mdist 16.4.2018 19.4.2018 SGD 0.61(SGD hedged) P-mdist 15.5.2018 18.5.2018 SGD 0.61Q-8%-mdist 13.6.2017 16.6.2017 USD 0.67Q-8%-mdist 10.7.2017 13.7.2017 USD 0.67Q-8%-mdist 10.8.2017 16.8.2017 USD 0.67Q-8%-mdist 11.9.2017 14.9.2017 USD 0.67Q-8%-mdist 10.10.2017 13.10.2017 USD 0.67Q-8%-mdist 10.11.2017 15.11.2017 USD 0.68Q-8%-mdist 11.12.2017 14.12.2017 USD 0.68Q-8%-mdist 10.1.2018 16.1.2018 USD 0.68Q-8%-mdist 12.2.2018 15.2.2018 USD 0.68Q-8%-mdist 12.3.2018 15.3.2018 USD 0.65Q-8%-mdist 10.4.2018 13.4.2018 USD 0.64Q-8%-mdist 11.5.2018 16.5.2018 USD 0.64U-X-UKdist-mdist 3.7.2017 6.7.2017 USD 106.45U-X-UKdist-mdist 18.7.2017 21.7.2017 USD 49.81U-X-UKdist-mdist 16.8.2017 21.8.2017 USD 66.47U-X-UKdist-mdist 15.9.2017 20.9.2017 USD 57.67U-X-UKdist-mdist 16.10.2017 19.10.2017 USD 48.65U-X-UKdist-mdist 15.11.2017 20.11.2017 USD 45.82U-X-UKdist-mdist 15.12.2017 20.12.2017 USD 56.81U-X-UKdist-mdist 16.1.2018 19.1.2018 USD 52.14U-X-UKdist-mdist 15.2.2018 20.2.2018 USD 51.88U-X-UKdist-mdist 15.3.2018 20.3.2018 USD 70.34U-X-UKdist-mdist 16.4.2018 19.4.2018 USD 83.32U-X-UKdist-mdist 15.5.2018 18.5.2018 USD 75.50
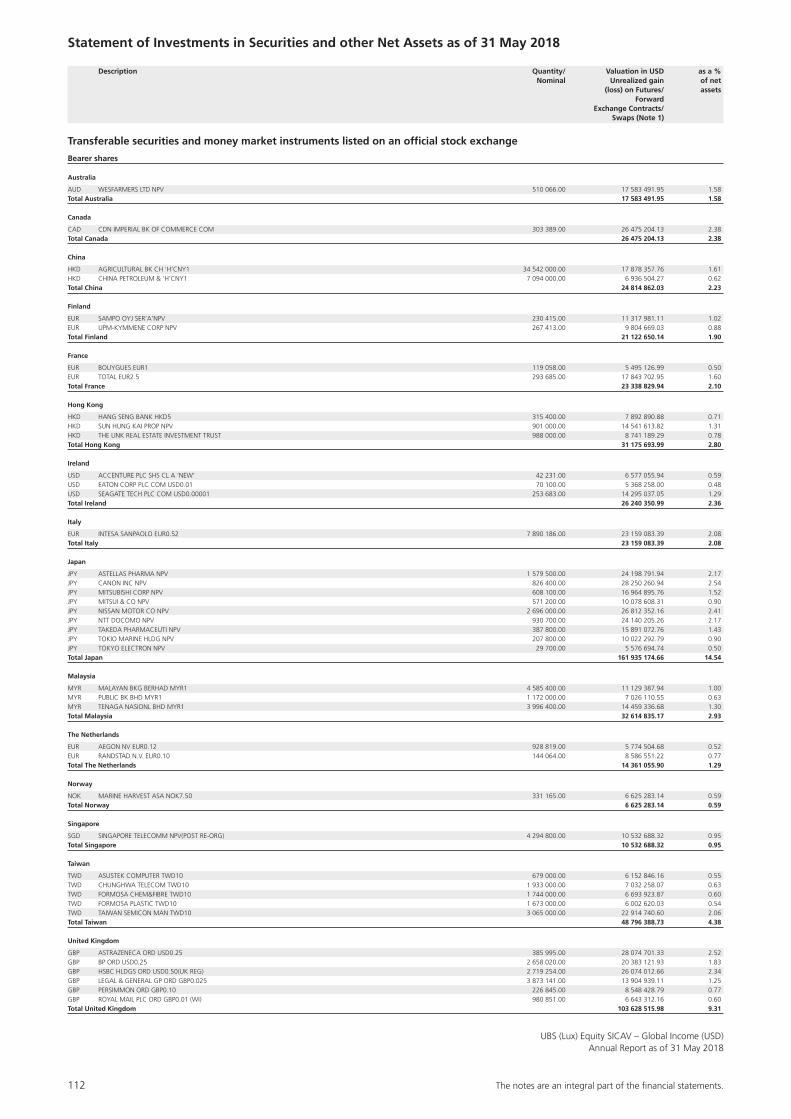
112 The notes are an integral part of the fi nancial statements.
UBS (Lux) Equity SICAV – Global Income (USD)Annual Report as of 31 May 2018
Statement of Investments in Securities and other Net Assets as of 31 May 2018
Description Quantity/ Valuation in USD as a % Nominal Unrealized gain of net (loss) on Futures/ assets Forward Exchange Contracts/ Swaps (Note 1)
Transferable securities and money market instruments listed on an official stock exchange
Bearer shares
Australia
AUD WESFARMERS LTD NPV 510 066.00 17 583 491.95 1.58Total Australia 17 583 491.95 1.58
Canada
CAD CDN IMPERIAL BK OF COMMERCE COM 303 389.00 26 475 204.13 2.38Total Canada 26 475 204.13 2.38
China
HKD AGRICULTURAL BK CH ‘H’CNY1 34 542 000.00 17 878 357.76 1.61HKD CHINA PETROLEUM & ‘H’CNY1 7 094 000.00 6 936 504.27 0.62Total China 24 814 862.03 2.23
Finland
EUR SAMPO OYJ SER’A’NPV 230 415.00 11 317 981.11 1.02EUR UPM-KYMMENE CORP NPV 267 413.00 9 804 669.03 0.88Total Finland 21 122 650.14 1.90
France
EUR BOUYGUES EUR1 119 058.00 5 495 126.99 0.50EUR TOTAL EUR2.5 293 685.00 17 843 702.95 1.60Total France 23 338 829.94 2.10
Hong Kong
HKD HANG SENG BANK HKD5 315 400.00 7 892 890.88 0.71HKD SUN HUNG KAI PROP NPV 901 000.00 14 541 613.82 1.31HKD THE LINK REAL ESTATE INVESTMENT TRUST 988 000.00 8 741 189.29 0.78Total Hong Kong 31 175 693.99 2.80
Ireland
USD ACCENTURE PLC SHS CL A ‘NEW’ 42 231.00 6 577 055.94 0.59USD EATON CORP PLC COM USD0.01 70 100.00 5 368 258.00 0.48USD SEAGATE TECH PLC COM USD0.00001 253 683.00 14 295 037.05 1.29Total Ireland 26 240 350.99 2.36
Italy
EUR INTESA SANPAOLO EUR0.52 7 890 186.00 23 159 083.39 2.08Total Italy 23 159 083.39 2.08
Japan
JPY ASTELLAS PHARMA NPV 1 579 500.00 24 198 791.94 2.17JPY CANON INC NPV 826 400.00 28 250 260.94 2.54JPY MITSUBISHI CORP NPV 608 100.00 16 964 895.76 1.52JPY MITSUI & CO NPV 571 200.00 10 078 608.31 0.90JPY NISSAN MOTOR CO NPV 2 696 000.00 26 812 352.16 2.41JPY NTT DOCOMO NPV 930 700.00 24 140 205.26 2.17JPY TAKEDA PHARMACEUTI NPV 387 800.00 15 891 072.76 1.43JPY TOKIO MARINE HLDG NPV 207 800.00 10 022 292.79 0.90JPY TOKYO ELECTRON NPV 29 700.00 5 576 694.74 0.50Total Japan 161 935 174.66 14.54
Malaysia
MYR MALAYAN BKG BERHAD MYR1 4 585 400.00 11 129 387.94 1.00MYR PUBLIC BK BHD MYR1 1 172 000.00 7 026 110.55 0.63MYR TENAGA NASIONL BHD MYR1 3 996 400.00 14 459 336.68 1.30Total Malaysia 32 614 835.17 2.93
The Netherlands
EUR AEGON NV EUR0.12 928 819.00 5 774 504.68 0.52EUR RANDSTAD N.V. EUR0.10 144 064.00 8 586 551.22 0.77Total The Netherlands 14 361 055.90 1.29
Norway
NOK MARINE HARVEST ASA NOK7.50 331 165.00 6 625 283.14 0.59Total Norway 6 625 283.14 0.59
Singapore
SGD SINGAPORE TELECOMM NPV(POST RE-ORG) 4 294 800.00 10 532 688.32 0.95Total Singapore 10 532 688.32 0.95
Taiwan
TWD ASUSTEK COMPUTER TWD10 679 000.00 6 152 846.16 0.55TWD CHUNGHWA TELECOM TWD10 1 933 000.00 7 032 258.07 0.63TWD FORMOSA CHEM&FIBRE TWD10 1 744 000.00 6 693 923.87 0.60TWD FORMOSA PLASTIC TWD10 1 673 000.00 6 002 620.03 0.54TWD TAIWAN SEMICON MAN TWD10 3 065 000.00 22 914 740.60 2.06Total Taiwan 48 796 388.73 4.38
United Kingdom
GBP ASTRAZENECA ORD USD0.25 385 995.00 28 074 701.33 2.52GBP BP ORD USD0.25 2 658 020.00 20 383 121.93 1.83GBP HSBC HLDGS ORD USD0.50(UK REG) 2 719 254.00 26 074 012.66 2.34GBP LEGAL & GENERAL GP ORD GBP0.025 3 873 141.00 13 904 939.11 1.25GBP PERSIMMON ORD GBP0.10 226 845.00 8 548 428.79 0.77GBP ROYAL MAIL PLC ORD GBP0.01 (WI) 980 851.00 6 643 312.16 0.60Total United Kingdom 103 628 515.98 9.31

The notes are an integral part of the fi nancial statements. 113
UBS (Lux) Equity SICAV – Global Income (USD)Annual Report as of 31 May 2018
Description Quantity/ Valuation in USD as a % Nominal Unrealized gain of net (loss) on Futures/ assets Forward Exchange Contracts/ Swaps (Note 1)
United States
USD ALTRIA GROUP INC COM USD0.333333 458 079.00 25 533 323.46 2.29USD AT&T INC COM USD1 871 115.00 28 154 436.80 2.53USD BRISTOL-MYRS SQUIB COM STK USD0.10 540 976.00 28 466 157.12 2.56USD CA INC COM USD0.10 555 672.00 19 859 717.28 1.78USD CARNIVAL CORP COM USD0.01(PAIRED STOCK) 94 700.00 5 897 916.00 0.53USD COCA-COLA CO COM USD0.25 642 777.00 27 639 411.00 2.48USD DOMINION ENERGY IN COM STK NPV 320 234.00 20 555 820.46 1.85USD DUKE ENERGY CORP COM USD0.001 (POST REV SPLT) 360 240.00 27 796 118.40 2.50USD EMERSON ELEC CO COM 120 882.00 8 563 280.88 0.77USD EXXON MOBIL CORP COM NPV 346 034.00 28 111 802.16 2.52USD FORD MOTOR CO COM STK USD0.01 2 003 520.00 23 140 656.00 2.08USD HOST HOTELS & RESO COM STK USD0.01 381 000.00 8 241 030.00 0.74USD INTL BUSINESS MCHN COM USD0.20 194 708.00 27 514 187.48 2.47USD JOHNSON & JOHNSON COM USD1 217 780.00 26 050 843.60 2.34USD LAS VEGAS SANDS CORP COM 159 643.00 12 868 822.23 1.16USD LYONDELLBASELL IND COM USD0.01 94 617.00 10 608 458.04 0.95USD PAYCHEX INC COM 431 829.00 28 319 345.82 2.54USD PFIZER INC COM USD0.05 773 326.00 27 785 603.18 2.50USD PHILIP MORRIS INTL COM STK NPV ‘WI’ 69 766.00 5 549 187.64 0.50USD PROCTER & GAMBLE COM NPV 349 085.00 25 542 549.45 2.29USD SOUTHERN CO COM 587 902.00 26 396 799.80 2.37USD TAPESTRY INC COM USD0.01 132 728.00 5 802 868.16 0.52USD VERIZON COMMUN COM USD0.10 363 780.00 17 341 392.60 1.56Total United States 465 739 727.56 41.83
Total Bearer shares 1 038 143 836.02 93.25
Preference shares
Brazil
BRL ITAUSA INV ITAU SA PRF NPV 2 532 000.00 7 635 332.50 0.68Total Brazil 7 635 332.50 0.68
Total Preference shares 7 635 332.50 0.68
Registered shares
France
EUR MICHELIN (CGDE) EUR2 49 550.00 6 402 856.45 0.58Total France 6 402 856.45 0.58
Germany
EUR ALLIANZ SE NPV(REGD)(VINKULIERT) 34 916.00 7 188 798.47 0.65Total Germany 7 188 798.47 0.65
Switzerland
USD GARMIN LTD COM CHF10.00 188 372.00 11 319 273.48 1.02CHF ZURICH INSURANCE GRP CHF0.10 89 749.00 26 675 473.30 2.39Total Switzerland 37 994 746.78 3.41
Total Registered shares 51 586 401.70 4.64
Investment funds, closed end
Singapore
SGD ASCENDAS REAL ESTATE INVESTMENT TRUST 3 163 300.00 6 267 707.20 0.56Total Singapore 6 267 707.20 0.56
Total Investment funds, closed end 6 267 707.20 0.56
Total Transferable securities and money market instruments listed on an official stock exchange 1 103 633 277.42 99.13
Transferable securities and money market instruments not listed on an official stock exchange and not traded on another regulated market
Rights
The Netherlands
EUR AEGON NV (STOCK DIVIDEND) RIGHTS 15.06.18 928 819.00 140 841.57 0.01Total The Netherlands 140 841.57 0.01
Total Rights 140 841.57 0.01
Total Transferable securities and money market instruments not listed on an official stock exchange and not traded on another regulated market 140 841.57 0.01
Derivative instruments not listed on an official stock exchange and not traded on another regulated market
Options on shares, classic-styled
CHF
CHF MORGAN STANLEY/ZURICH INSURANCE CALL 333.89670 07.06.18 -40 050.00 -26.55 0.00CHF SOCIETE GENERALE/ZURICH INSURANCE GR CALL 321.62340 26.06.18 -40 380.00 -13 069.77 0.00Total CHF -13 096.32 0.00
EUR
EUR GOLDMAN SACHS/INTESA SANPAOLO EUR CALL 3.10600 07.06.18 -3 484 170.00 -14.03 0.00EUR GOLDMAN SACHS/BOUYGUES CALL 42.93450 26.06.18 -107 150.00 -11 488.85 0.00EUR GOLDMAN SACHS/INTESA SANPAOLO CALL 2.87540 26.06.18 -3 550 580.00 -38 617.11 0.00EUR MORGAN STANLEY/MICHELIN CALL 121.85250 26.06.18 -44 590.00 -3 937.82 0.00

114 The notes are an integral part of the fi nancial statements.
UBS (Lux) Equity SICAV – Global Income (USD)Annual Report as of 31 May 2018
Description Quantity/ Valuation in USD as a % Nominal Unrealized gain of net (loss) on Futures/ assets Forward Exchange Contracts/ Swaps (Note 1)
EUR MORGAN STANLEY/UPM-KYMMENE CORP CALL 32.71800 26.06.18 -240 670.00 -73 332.11 -0.01EUR MORGAN STANLEY/TOTAL CALL 53.77880 26.06.18 -264 310.00 -59 716.64 -0.01EUR MORGAN STANLEY/AEGON NV CALL 5.85890 26.06.18 -835 930.00 -21 647.32 0.00EUR UBS/ALLIANZ SE NPV(REGD CALL 196.56000 26.06.18 -31 420.00 -964.74 0.00EUR UBS/RANDSTAD N.V. CALL 55.54500 26.06.18 -129 650.00 -15 192.01 0.00EUR UBS/SAMPO OYJ SER’A’NPV CALL 44.85600 26.06.18 -207 370.00 -5 710.35 0.00Total EUR -230 620.98 -0.02
GBP
GBP BARCLAYS/BP CALL 5.87970 07.06.18 -1 233 740.00 -41 555.17 0.00GBP HSBC/ASTRAZENECA ORD CALL 55.14600 07.06.18 -184 060.00 -94 684.56 -0.01GBP GOLDMAN SACHS/ROYAL MAIL PLC CALL 5.72670 26.06.18 -882 760.00 -4 347.82 0.00GBP GOLDMAN SACHS/LEGAL & GENERAL GP CALL 2.92110 26.06.18 -3 485 820.00 -2 777.62 0.00GBP HSBC/BP CALL 5.94830 26.06.18 -1 234 570.00 -95 197.79 -0.01GBP GOLDMAN SACHS/ASTRAZENECA CALL 56.99400 26.06.18 -163 330.00 -68 215.20 -0.01GBP UBS/HSBC HLDGS ORD CALL 7.66710 26.06.18 -1 223 660.00 -6 962.86 0.00Total GBP -313 741.02 -0.03
HKD
HKD GOLDMAN SACHS/AGRICULTURAL BK CALL 4.41370 07.06.18 -15 993 210.00 -375.11 0.00HKD GOLDMAN SACHS/SUN HUNG KAI PROP N CALL 131.90050 26.06.18 -810 900.00 -45 013.20 -0.01HKD GOLDMAN SACHS/THE LINK REAL ESTAT CALL 72.41330 26.06.18 -889 200.00 -19 232.62 0.00HKD HSBC/HANG SENG BANK CALL 205.89090 26.06.18 -283 860.00 -13 374.88 0.00HKD GOLDMAN SACHS/AGRICULTURAL BK CALL 4.35110 26.06.18 -16 008 090.00 -26 882.38 0.00HKD GOLDMAN SACHS/CHINA PETROLEUM CALL 8.10150 26.06.18 -6 384 600.00 -87 336.52 -0.01Total HKD -192 214.71 -0.02
JPY
JPY GOLDMAN SACHS/CANON INC CALL 4007.85000 07.06.18 -364 830.00 -0.60 0.00JPY GOLDMAN SACHS/ASTELLAS PHARMA NPV CALL 1748.25000 07.06.18 -725 210.00 -2 156.00 0.00JPY SOCIETE GENERALE/NISSAN MOTOR CO CALL 1162.35000 07.06.18 -1 292 230.00 -5.90 0.00JPY BARCLAYS/MITSUBISHI CORP CALL 3237.15000 26.06.18 -568 260.00 -23 075.56 0.00JPY BARCLAYS/NISSAN MOTOR CO NPV CALL 1172.32500 26.06.18 -1 174 220.00 -2 429.78 0.00JPY BARCLAYS/TOKIO MARINE HLDG N CALL 5530.35000 26.06.18 -187 020.00 -24 426.34 0.00JPY GOLDMAN SACHS/MITSUI & CO NPV CALL 2031.75000 26.06.18 -514 080.00 -11 041.93 0.00JPY GOLDMAN SACHS/CANON INC CALL 3940.65000 26.06.18 -371 880.00 -24 403.94 0.00JPY GOLDMAN SACHS/TAKEDA PHARMACEUTI CALL 4815.52500 26.06.18 -360 990.00 -25 902.22 0.00JPY HSBC/ASTELLAS PHARMA NPV CALL 1764.51230 26.06.18 -696 340.00 -26 138.66 -0.01JPY HSBC/TOKYO ELECTRON NPV CALL 22282.30410 26.06.18 -26 730.00 -19 581.35 0.00Total JPY -159 162.28 -0.01
NOK
NOK UBS/MARINE HARVEST ASA CALL 174.99150 26.06.18 -298 040.00 -23 826.30 0.00Total NOK -23 826.30 0.00
TWD
TWD GOLDMAN SACHS/TAIWAN SEMICON MAN CALL 243.60000 07.06.18 -1 348 040.00 -324.07 0.00TWD MORGAN STANLEY/TAIWAN SEMICON MAN CALL 239.92500 26.06.18 -1 379 250.00 -9 128.47 0.00Total TWD -9 452.54 0.00
USD
USD BARCLAYS/AT&T INC CALL 33.53780 07.06.18 -364 140.00 -7 730.41 0.00USD BARCLAYS/COCA-COLA CO CALL 44.37340 07.06.18 -307 990.00 -1 100.48 0.00USD BARCLAYS/EMERSON ELEC CO CALL 75.20870 07.06.18 -108 790.00 -130.73 0.00USD GOLDMAN SACHS/PROCTER & GAMBLE CALL 76.95380 07.06.18 -161 480.00 -409.10 0.00USD MORGAN STANLEY/BRISTOL-MYRS SQUIB CALL 54.19850 07.06.18 -255 310.00 -45 536.93 -0.01USD MORGAN STANLEY/SEAGATE TECH PLC CALL 61.22740 07.06.18 -221 850.00 -3 339.24 0.00USD MORGAN STANLEY/SOUTHERN CO CALL 46.40900 07.06.18 -281 320.00 -1 986.40 0.00USD MORGAN STANLEY/DOMINION ENERGY IN CALL 66.49430 07.06.18 -187 810.00 -4 671.20 0.00USD MORGAN STANLEY/DUKE ENERGY CORP CALL 81.28640 07.06.18 -169 790.00 -35.12 0.00USD MORGAN STANLEY/ALTRIA GROUP INC CALL 58.95410 07.06.18 -216 060.00 -360.51 0.00USD MORGAN STANLEY/PAYCHEX INC CALL 66.26550 07.06.18 -208 140.00 -67 000.99 -0.01USD UBS/PFIZER INC CALL 36.86210 07.06.18 -365 930.00 -4 521.45 0.00USD UBS/JOHNSON & JOHNSON CALL 130.86540 07.06.18 -101 330.00 0.00 0.00USD UBS/CA INC CALL 36.64440 07.06.18 -302 250.00 -12 210.82 0.00USD BARCLAYS/AT&T INC CALL 34.48460 26.06.18 -392 000.00 -58 109.68 -0.01USD GOLDMAN SACHS/CA INC CALL 37.41960 26.06.18 -197 850.00 -16 462.11 0.00USD GOLDMAN SACHS/CARNIVAL CORP CALL 67.48580 26.06.18 -85 230.00 -5 958.25 0.00USD GOLDMAN SACHS/EATON CORP PLC CALL 83.01330 26.06.18 -69 930.00 -1 309.60 0.00USD GOLDMAN SACHS/LYONDELLBASELL IND CALL 122.16890 26.06.18 -85 150.00 -8 924.83 0.00USD GOLDMAN SACHS/TAPESTRY INC CALL 46.53110 26.06.18 -119 450.00 -11 985.50 0.00USD HSBC/LAS VEGAS SANDS COR CALL 82.64100 26.06.18 -143 670.00 -81 874.65 -0.01USD MORGAN STANLEY/PHILIP MORRIS INTL CALL 85.85370 26.06.18 -62 780.00 -5 484.18 0.00USD MORGAN STANLEY/SEAGATE TECH PLC CALL 61.15900 26.06.18 -6 460.00 -1 657.20 0.00USD MORGAN STANLEY/SOUTHERN CO CALL 46.55100 26.06.18 -247 790.00 -30 734.74 0.00USD MORGAN STANLEY/PAYCHEX INC CALL 69.29520 26.06.18 -180 500.00 -27 795.51 0.00USD MORGAN STANLEY/HOST HOTELS & RESO CALL 22.78630 26.06.18 -342 900.00 -17 072.63 0.00USD MORGAN STANLEY/FORD MOTOR CO CALL 12.22420 26.06.18 -901 580.00 -25 612.30 0.00USD MORGAN STANLEY/DOMINION ENERGY IN CALL 66.49600 26.06.18 -100 400.00 -28 180.66 0.00USD MORGAN STANLEY/ACCENTURE PLC CALL 163.68070 26.06.18 -38 000.00 -13 592.28 0.00USD SOCIETE GENERALE/ALTRIA GROUP INC CALL 58.06970 26.06.18 -196 210.00 -33 225.33 0.00USD SOCIETE GENERALE/BRISTOL-MYRS SQUIB CALL 55.42990 26.06.18 -231 560.00 -62 623.69 -0.01USD UBS/JOHNSON & JOHNSON CALL 127.75130 26.06.18 -94 670.00 -4 322.88 0.00USD UBS/VERIZON COMMUN CALL 51.16930 26.06.18 -327 400.00 -6 524.68 0.00USD UBS/EXXON MOBIL CORP CALL 84.44400 26.06.18 -155 710.00 -64 232.92 -0.01Total USD -654 717.00 -0.06
Total Options on shares, classic-styled -1 596 831.15 -0.14
Total Derivative instruments not listed on an official stock exchange and not traded on anotherregulated market -1 596 831.15 -0.14
Total investments in securities 1 102 177 287.84 99.00

The notes are an integral part of the fi nancial statements. 115
UBS (Lux) Equity SICAV – Global Income (USD)Annual Report as of 31 May 2018
Description Quantity/ Valuation in USD as a % Nominal Unrealized gain of net (loss) on Futures/ assets Forward Exchange Contracts/ Swaps (Note 1)
Forward Foreign Exchange contracts
Forward Foreign Exchange contracts (Purchase/Sale)
USD 26 214 736.31 MYR 103 889 000.00 25.6.2018 195 198.65 0.02USD 51 178 124.37 TWD 1 529 100 000.00 25.6.2018 109 724.88 0.01USD 46 526 701.42 CNY 297 180 000.00 25.6.2018 247 293.24 0.02USD 9 097 809.59 BRL 33 560 000.00 25.6.2018 104 667.93 0.01USD 16 750 616.61 AUD 22 260 000.00 25.6.2018 -94 526.99 -0.01USD 174 203 033.99 JPY 19 348 400 000.00 25.6.2018 -4 148 619.71 -0.37USD 26 794 821.77 CHF 26 715 000.00 25.6.2018 -431 801.97 -0.04CHF 202 130 900.00 USD 202 734 847.11 25.6.2018 3 267 097.92 0.29USD 106 176 244.93 GBP 79 090 000.00 25.6.2018 820 225.71 0.07USD 27 161 439.00 CAD 34 910 000.00 25.6.2018 233 523.09 0.02USD 6 594 580.74 NOK 53 400 000.00 25.6.2018 62 942.39 0.01USD 15 943 987.82 SGD 21 440 000.00 25.6.2018 -92 335.85 -0.01GBP 45 173 000.00 USD 60 643 564.45 25.6.2018 -468 479.66 -0.04SGD 16 852 200.00 USD 12 532 242.14 25.6.2018 72 577.53 0.01USD 88 555 944.98 EUR 75 255 000.00 25.6.2018 564 707.78 0.05USD 39 060 333.00 HKD 306 285 000.00 25.6.2018 -10 557.53 0.00EUR 231 887 700.00 USD 272 872 691.54 25.6.2018 -1 740 067.61 -0.15EUR 5 995 000.00 USD 7 084 717.74 25.6.2018 -75 117.49 -0.01EUR 634 000.00 USD 744 413.00 25.6.2018 -3 114.16 0.00USD 335 782.94 SGD 451 300.00 25.6.2018 -1 772.70 0.00HKD 152 136 083.12 EUR 16 520 000.00 25.6.2018 91 044.90 0.01JPY 972 200 000.00 USD 8 933 297.07 25.6.2018 28 347.19 0.00USD 12 111 443.13 HKD 94 960 000.00 25.6.2018 -2 019.05 0.00CNY 124 895 000.00 USD 19 523 995.62 25.6.2018 -74 279.34 -0.01USD 8 478 282.70 MYR 33 769 000.00 25.6.2018 20 661.90 0.00GBP 508 400.00 USD 677 249.81 25.6.2018 -8.69 0.00CHF 587 700.00 USD 595 708.71 25.6.2018 3 246.44 0.00USD 2 176 779.51 EUR 1 864 500.00 25.6.2018 -3 270.48 0.00USD 3 967 008.75 EUR 3 396 500.00 25.6.2018 -4 318.57 0.00USD 3 161 789.55 CHF 3 110 800.00 25.6.2018 -8 585.94 0.00USD 907 275.24 GBP 681 400.00 25.6.2018 -419.68 0.00Total Forward Foreign Exchange contracts (Purchase/Sale) -1 338 035.87 -0.12
Cash at banks, deposits on demand and deposit accounts and other liquid assets 7 010 564.67 0.63Other assets and liabilities 5 464 591.08 0.49
Total net assets 1 113 314 407.72 100.00

116 The notes are an integral part of the fi nancial statements.
UBS (Lux) Equity SICAV – Global Opportunity Unconstrained (USD)Annual Report as of 31 May 2018
UBS (Lux) Equity SICAV – Global Opportunity Unconstrained (USD)
Three-year comparison
ISIN 31.5.2018 31.5.2017 31.5.2016Net assets in USD 153 360 213.31 110 688 441.57 262 317 589.63Class I-A1-acc1 LU1390335310Shares outstanding - - 101.8920Net asset value per share in USD - - 102.16Issue and redemption price per share in USD2 - - 102.34Class I-B-acc LU1323608122Shares outstanding 95 128.5560 51 150.1010 244 211.9780Net asset value per share in USD 119.50 101.84 98.74Issue and redemption price per share in USD2 119.50 101.84 98.92Class (EUR) I-B-acc3 LU1776281823Shares outstanding 816 943.0000 - -Net asset value per share in EUR 102.14 - -Issue and redemption price per share in EUR2 102.14 - -Class K-1-acc4 LU1314327989Shares outstanding - - 0.2000Net asset value per share in USD - - 4 976 584.95Issue and redemption price per share in USD2 - - 4 985 542.80Class P-4%-mdist LU1278831067Shares outstanding 20 512.4410 43 572.2860 107 249.4980Net asset value per share in USD 107.88 97.58 100.50Issue and redemption price per share in USD2 107.88 97.58 100.68Class (EUR hedged) P-4%-mdist LU1278831570Shares outstanding 5 164.0760 9 925.1620 11 463.5920Net asset value per share in EUR 103.09 95.62 100.12Issue and redemption price per share in EUR2 103.09 95.62 100.30Class P-acc LU1278830929Shares outstanding 181 576.7940 322 364.9400 979 491.0060Net asset value per share in USD 119.64 104.07 102.93Issue and redemption price per share in USD2 119.64 104.07 103.12Class (HKD) P-acc LU1278831737Shares outstanding 195.9450 4 012.9110 11 534.2880Net asset value per share in HKD 1 209.88 1 046.29 1 031.75Issue and redemption price per share in HKD2 1 209.88 1 046.29 1 033.61Class (CHF hedged) P-acc LU1278831224Shares outstanding 3 250.9140 3 424.2760 23 292.7440Net asset value per share in CHF 113.01 101.09 102.18Issue and redemption price per share in CHF2 113.01 101.09 102.36Class (EUR hedged) P-acc LU1278831497Shares outstanding 31 734.0300 39 191.5650 150 561.8290Net asset value per share in EUR 114.28 101.93 102.55Issue and redemption price per share in EUR2 114.28 101.93 102.73Class (SGD hedged) P-acc LU1278831653Shares outstanding 14 405.3790 17 163.8140 63 583.2980Net asset value per share in SGD 116.36 102.04 101.24Issue and redemption price per share in SGD2 116.36 102.04 101.42Class Q-acc LU1294558454Shares outstanding 37 132.1820 59 795.1250 78 512.5300Net asset value per share in USD 125.68 108.22 105.95Issue and redemption price per share in USD2 125.68 108.22 106.14Class (CHF hedged) Q-acc LU1294558611Shares outstanding 8 390.6280 13 392.4580 35 505.8270Net asset value per share in CHF 118.66 105.05 105.14Issue and redemption price per share in CHF2 118.66 105.05 105.33Class (EUR hedged) Q-acc LU1294558538Shares outstanding 34 095.8680 44 584.7770 74 702.4840Net asset value per share in EUR 120.00 105.94 105.51Issue and redemption price per share in EUR2 120.00 105.94 105.70Class U-X-acc LU1278831141Shares outstanding 290.9740 4 333.8580 7 438.9680Net asset value per share in USD 12 655.35 10 780.46 10 443.12Issue and redemption price per share in USD2 12 655.35 10 780.46 10 461.92
1 For the period from 15.4.2016 to 16.5.2017 the share class I-A1-acc was in circulation2 See note 13 First NAV: 22.2.20184 For the period from 13.11.2015 to 6.1.2017 the share class K-1-acc was in circulation

The notes are an integral part of the fi nancial statements. 117
UBS (Lux) Equity SICAV – Global Opportunity Unconstrained (USD)Annual Report as of 31 May 2018
Performance
Currency 2017/2018 2016/2017 2015/2016Class I-A1-acc1 USD - - -Class I-B-acc USD 17.3% 3.1% -Class (EUR) I-B-acc2 EUR - - -Class K-1-acc3 USD - - -Class P-4%-mdist USD 15.0% 0.8% -Class (EUR hedged) P-4%-mdist EUR 12.1% -0.8% -Class P-acc USD 15.0% 0.9% -Class (HKD) P-acc HKD 15.6% 1.2% -Class (CHF hedged) P-acc CHF 11.8% -1.2% -Class (EUR hedged) P-acc EUR 12.1% -0.8% -Class (SGD hedged) P-acc SGD 14.0% 0.6% -Class Q-acc USD 16.1% 2.0% -Class (CHF hedged) Q-acc CHF 13.0% -0.3% -Class (EUR hedged) Q-acc EUR 13.3% 0.2% -Class U-X-acc USD 17.4% 3.2% -
1 For the period from 15.4.2016 to 16.5.2017 the share class I-A1-acc was in circulation. Due to this fact, there is no data for the calculation of the performance available.2 Due to the recent launch, there is no data for the calculation of the performance available.3 For the period from 13.11.2015 to 6.1.2017 the share class K-1-acc was in circulation. Due to this fact, there is no data for the calculation of the performance available.
Historical performance is no indicator of current or future performance.The performance data does not take account of any commissions and costs charged when subscribing and redeeming shares.The performance data were not audited.The subfund has no benchmark.

118 The notes are an integral part of the fi nancial statements.
UBS (Lux) Equity SICAV – Global Opportunity Unconstrained (USD)Annual Report as of 31 May 2018
Report of the Portfolio Manager
In the financial year, from 1 June 2017 to 31 May 2018, Global equity returns were positive. Markets started off strongly, fuelled by solid growth, but February then saw a sell-off led by inflation fears and rising rate expectations. Markets declined further on the back of slowing growth momentum and trade tensions, as US import tariffs led to concerns over retaliation measures.
The subfund’s performance was positive over the finan-cial year driven mainly by the long book. IT was the top contributing sector to performance, as we benefited from our sector allocation and our holding in a software company, which reported strong results thanks to its cloud computing business. In the short book, Energy was the largest detractor, weighed down by our holding in an oilfield services provider.
Structure of the Securities Portfolio
Geographical Breakdown as a % of net assetsUnited States 71.60China 7.63Ireland 4.17Hong Kong 2.90Germany 2.31Japan 1.77Canada 1.37Cayman Islands 1.36Taiwan 1.15Argentina 0.22Total 94.48
Economic Breakdown as a % of net assetsInternet, software & IT services 27.11Banks & credit institutions 8.98Healthcare & social services 7.46Electronics & semiconductors 7.12Retail trade, department stores 6.67Pharmaceuticals, cosmetics & medical products 6.23Finance & holding companies 4.38Aerospace industry 4.33Investment funds 4.17Insurance 3.34Miscellaneous services 2.39Petroleum 2.35Textiles, garments & leather goods 2.00Energy & water supply 1.59Real Estate 1.42Photographic & optics 1.25Graphic design, publishing & media 1.23Computer hardware & network equipment providers 0.81Telecommunications 0.79Food & soft drinks 0.64Precious metals & stones 0.22Total 94.48
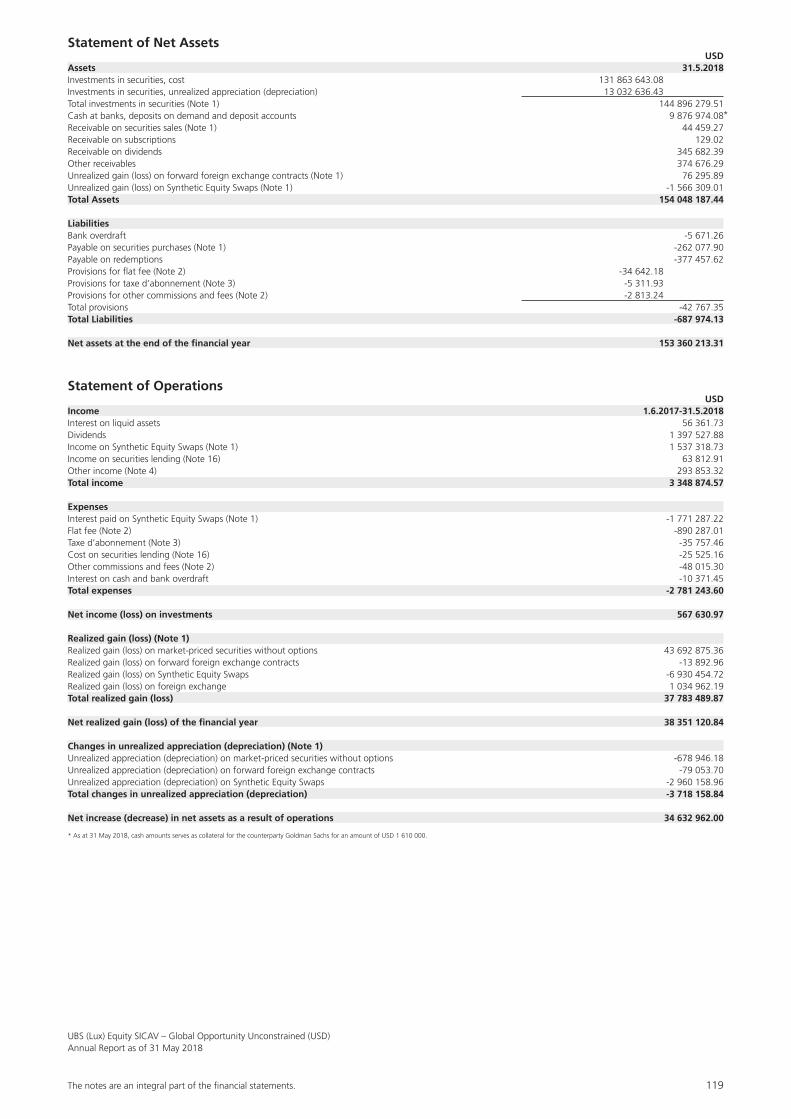
The notes are an integral part of the fi nancial statements. 119
UBS (Lux) Equity SICAV – Global Opportunity Unconstrained (USD)Annual Report as of 31 May 2018
Statement of Net Assets USDAssets 31.5.2018Investments in securities, cost 131 863 643.08Investments in securities, unrealized appreciation (depreciation) 13 032 636.43Total investments in securities (Note 1) 144 896 279.51Cash at banks, deposits on demand and deposit accounts 9 876 974.08Receivable on securities sales (Note 1) 44 459.27Receivable on subscriptions 129.02Receivable on dividends 345 682.39Other receivables 374 676.29Unrealized gain (loss) on forward foreign exchange contracts (Note 1) 76 295.89Unrealized gain (loss) on Synthetic Equity Swaps (Note 1) -1 566 309.01Total Assets 154 048 187.44
LiabilitiesBank overdraft -5 671.26Payable on securities purchases (Note 1) -262 077.90Payable on redemptions -377 457.62Provisions for flat fee (Note 2) -34 642.18Provisions for taxe d’abonnement (Note 3) -5 311.93Provisions for other commissions and fees (Note 2) -2 813.24Total provisions -42 767.35Total Liabilities -687 974.13
Net assets at the end of the financial year 153 360 213.31
Statement of Operations USDIncome 1.6.2017-31.5.2018Interest on liquid assets 56 361.73Dividends 1 397 527.88Income on Synthetic Equity Swaps (Note 1) 1 537 318.73Income on securities lending (Note 16) 63 812.91Other income (Note 4) 293 853.32Total income 3 348 874.57
ExpensesInterest paid on Synthetic Equity Swaps (Note 1) -1 771 287.22Flat fee (Note 2) -890 287.01Taxe d’abonnement (Note 3) -35 757.46Cost on securities lending (Note 16) -25 525.16Other commissions and fees (Note 2) -48 015.30Interest on cash and bank overdraft -10 371.45Total expenses -2 781 243.60
Net income (loss) on investments 567 630.97
Realized gain (loss) (Note 1)Realized gain (loss) on market-priced securities without options 43 692 875.36Realized gain (loss) on forward foreign exchange contracts -13 892.96Realized gain (loss) on Synthetic Equity Swaps -6 930 454.72Realized gain (loss) on foreign exchange 1 034 962.19Total realized gain (loss) 37 783 489.87
Net realized gain (loss) of the financial year 38 351 120.84
Changes in unrealized appreciation (depreciation) (Note 1)Unrealized appreciation (depreciation) on market-priced securities without options -678 946.18Unrealized appreciation (depreciation) on forward foreign exchange contracts -79 053.70Unrealized appreciation (depreciation) on Synthetic Equity Swaps -2 960 158.96Total changes in unrealized appreciation (depreciation) -3 718 158.84
Net increase (decrease) in net assets as a result of operations 34 632 962.00
* As at 31 May 2018, cash amounts serves as collateral for the counterparty Goldman Sachs for an amount of USD 1 610 000.
*

120 The notes are an integral part of the fi nancial statements.
UBS (Lux) Equity SICAV – Global Opportunity Unconstrained (USD)Annual Report as of 31 May 2018
Statement of Changes in Net Assets USD 1.6.2017-31.5.2018Net assets at the beginning of the financial year 110 688 441.57Subscriptions 521 590 694.37Redemptions -513 395 759.18Total net subscriptions (redemptions) 8 194 935.19Dividend paid -156 125.45Net income (loss) on investments 567 630.97Total realized gain (loss) 37 783 489.87Total changes in unrealized appreciation (depreciation) -3 718 158.84Net increase (decrease) in net assets as a result of operations 34 632 962.00Net assets at the end of the financial year 153 360 213.31
Changes in the Number of Shares outstanding
1.6.2017-31.5.2018Class I-B-accNumber of shares outstanding at the beginning of the financial year 51 150.1010Number of shares issued 2 329 778.6640Number of shares redeemed -2 285 800.2090Number of shares outstanding at the end of the financial year 95 128.5560Class (EUR) I-B-accNumber of shares outstanding at the beginning of the financial year 0.0000Number of shares issued 1 736 994.2240Number of shares redeemed -920 051.2240Number of shares outstanding at the end of the financial year 816 943.0000Class P-4%-mdistNumber of shares outstanding at the beginning of the financial year 43 572.2860Number of shares issued 7 293.7650Number of shares redeemed -30 353.6100Number of shares outstanding at the end of the financial year 20 512.4410Class (EUR hedged) P-4%-mdistNumber of shares outstanding at the beginning of the financial year 9 925.1620Number of shares issued 1 557.3340Number of shares redeemed -6 318.4200Number of shares outstanding at the end of the financial year 5 164.0760Class P-accNumber of shares outstanding at the beginning of the financial year 322 364.9400Number of shares issued 6 295.2800Number of shares redeemed -147 083.4260Number of shares outstanding at the end of the financial year 181 576.7940Class (HKD) P-accNumber of shares outstanding at the beginning of the financial year 4 012.9110Number of shares issued 0.0000Number of shares redeemed -3 816.9660Number of shares outstanding at the end of the financial year 195.9450Class (CHF hedged) P-accNumber of shares outstanding at the beginning of the financial year 3 424.2760Number of shares issued 371.9940Number of shares redeemed -545.3560Number of shares outstanding at the end of the financial year 3 250.9140Class (EUR hedged) P-accNumber of shares outstanding at the beginning of the financial year 39 191.5650Number of shares issued 14 445.6810Number of shares redeemed -21 903.2160Number of shares outstanding at the end of the financial year 31 734.0300Class (SGD hedged) P-accNumber of shares outstanding at the beginning of the financial year 17 163.8140Number of shares issued 4 187.3180Number of shares redeemed -6 945.7530Number of shares outstanding at the end of the financial year 14 405.3790Class Q-accNumber of shares outstanding at the beginning of the financial year 59 795.1250Number of shares issued 1 999.4170Number of shares redeemed -24 662.3600Number of shares outstanding at the end of the financial year 37 132.1820Class (CHF hedged) Q-accNumber of shares outstanding at the beginning of the financial year 13 392.4580Number of shares issued 857.9770Number of shares redeemed -5 859.8070Number of shares outstanding at the end of the financial year 8 390.6280

The notes are an integral part of the fi nancial statements. 121
UBS (Lux) Equity SICAV – Global Opportunity Unconstrained (USD)Annual Report as of 31 May 2018
Class (EUR hedged) Q-accNumber of shares outstanding at the beginning of the financial year 44 584.7770Number of shares issued 11 894.5910Number of shares redeemed -22 383.5000Number of shares outstanding at the end of the financial year 34 095.8680Class U-X-accNumber of shares outstanding at the beginning of the financial year 4 333.8580Number of shares issued 3 846.7660Number of shares redeemed -7 889.6500Number of shares outstanding at the end of the financial year 290.9740
Monthly Distribution
UBS (Lux) Equity SICAV – Global Opportunity Unconstrained (USD) Ex-Date Pay-Date Currency Amount per share
P-4%-mdist 13.6.2017 16.6.2017 USD 0.32P-4%-mdist 10.7.2017 13.7.2017 USD 0.31P-4%-mdist 10.8.2017 16.8.2017 USD 0.32P-4%-mdist 11.9.2017 14.9.2017 USD 0.32P-4%-mdist 10.10.2017 13.10.2017 USD 0.33P-4%-mdist 10.11.2017 15.11.2017 USD 0.34P-4%-mdist 11.12.2017 14.12.2017 USD 0.35P-4%-mdist 10.1.2018 16.1.2018 USD 0.35P-4%-mdist 12.2.2018 15.2.2018 USD 0.37P-4%-mdist 12.3.2018 15.3.2018 USD 0.35P-4%-mdist 10.4.2018 13.4.2018 USD 0.35P-4%-mdist 11.5.2018 16.5.2018 USD 0.35(EUR hedged) P-4%-mdist 13.6.2017 16.6.2017 EUR 0.31(EUR hedged) P-4%-mdist 10.7.2017 13.7.2017 EUR 0.30(EUR hedged) P-4%-mdist 10.8.2017 16.8.2017 EUR 0.31(EUR hedged) P-4%-mdist 11.9.2017 14.9.2017 EUR 0.32(EUR hedged) P-4%-mdist 10.10.2017 13.10.2017 EUR 0.32(EUR hedged) P-4%-mdist 10.11.2017 15.11.2017 EUR 0.33(EUR hedged) P-4%-mdist 11.12.2017 14.12.2017 EUR 0.34(EUR hedged) P-4%-mdist 10.1.2018 15.1.2018 EUR 0.34(EUR hedged) P-4%-mdist 12.2.2018 15.2.2018 EUR 0.36(EUR hedged) P-4%-mdist 12.3.2018 15.3.2018 EUR 0.34(EUR hedged) P-4%-mdist 10.4.2018 13.4.2018 EUR 0.33(EUR hedged) P-4%-mdist 11.5.2018 16.5.2018 EUR 0.33

122 The notes are an integral part of the fi nancial statements.
UBS (Lux) Equity SICAV – Global Opportunity Unconstrained (USD)Annual Report as of 31 May 2018
Statement of Investments in Securities and other Net Assets as of 31 May 2018
Description Quantity/ Valuation in USD as a % Nominal Unrealized gain of net (loss) on Futures/ assets Forward Exchange Contracts/ Swaps (Note 1)
Transferable securities and money market instruments listed on an official stock exchange
Bearer shares
Argentina
USD GEOPARK LIMITED COM USD0.001 21 200.00 331 144.00 0.22Total Argentina 331 144.00 0.22
Canada
CAD ENERPLUS CORP COM NPV 70 911.00 866 434.90 0.56CAD IVANHOE MINES LTD COM NPV CL’A’ 132 009.00 332 770.14 0.22CAD KELT EXPLORATION L COM NPV 67 736.00 447 500.40 0.29CAD KINDER MORGAN CANA COM NPV 36 500.00 447 949.43 0.30Total Canada 2 094 654.87 1.37
Cayman Islands
HKD CHINA MAPLE LEAF E HKD0.001 1 096 000.00 2 087 446.06 1.36Total Cayman Islands 2 087 446.06 1.36
China
HKD ANTA SPORTS PRODUC HKD0.10 533 000.00 3 071 282.42 2.00HKD SUNNY OPTICAL TECH HKD0.10 94 600.00 1 924 766.87 1.25HKD TENCENT HLDGS LIMI HKD0.00002 59 840.00 3 045 343.09 1.99Total China 8 041 392.38 5.24
Germany
EUR DEUTSCHE WOHNEN AG NPV (BR) 46 482.00 2 177 391.14 1.42EUR SERVICEWARE SE NPV 26 878.00 807 113.88 0.53EUR STEMMER IMAGING AG NPV 10 504.00 552 678.96 0.36Total Germany 3 537 183.98 2.31
Hong Kong
HKD AIA GROUP LTD NPV 301 800.00 2 770 166.30 1.81HKD SINO BIOPHAMACEUTI HKD0.025 663 000.00 1 676 908.27 1.09Total Hong Kong 4 447 074.57 2.90
Japan
JPY SONY CORP NPV 57 300.00 2 721 413.78 1.77Total Japan 2 721 413.78 1.77
United States
USD ADOBE SYSTEMS INC COM USD0.0001 18 302.00 4 562 322.56 2.97USD AETNA INC COM USD0.01 17 783.00 3 132 119.79 2.04USD ALIGN TECHNOLOGY INC COM 8 664.00 2 876 014.80 1.88USD ALPHABET INC CAP STK USD0.001 CL C 4 486.00 4 867 265.14 3.17USD AMAZON COM INC COM USD0.01 4 469.00 7 282 771.78 4.75USD AMER EXPRESS CO COM USD0.20 25 886.00 2 544 593.80 1.66USD AMPHENOL CORP NEW CL A 8 752.00 760 811.36 0.50USD ANTHEM INC COM USD0.01 9 757.00 2 160 394.94 1.41USD ARISTA NETWORKS IN COM USD0.0001 7 273.00 1 829 595.88 1.19USD BOEING CO COM USD5 6 210.00 2 186 913.60 1.43USD BROADCOM CORP COM USD1.00 2 737.00 689 915.59 0.45USD CHARTER COMMUN INC COM USD0.001 CLASS ‘A’ 4 651.00 1 214 097.04 0.79USD COGNIZANT TECHNOLO COM CL’A’USD0.01 42 056.00 3 168 919.60 2.07USD COMCAST CORP COM CLS’A’ USD0.01 60 633.00 1 890 536.94 1.23USD FACEBOOK INC COM USD0.000006 CL ‘A’ 18 556.00 3 558 669.68 2.32USD FIFTH THIRD BANCORP COM 38 523.00 1 178 033.34 0.77USD FORTINET INC COM USD0.001 30 010.00 1 836 011.80 1.20USD FORTIVE CORP COM USD0.01 28 285.00 2 056 036.65 1.34USD HESS CORPORATION COM USD1 15 729.00 950 346.18 0.62USD HOME DEPOT INC COM USD0.05 15 823.00 2 951 780.65 1.92USD HONEYWELL INTL INC COM 8 750.00 1 294 212.50 0.84USD INTERNATIONAL FLAVORS&FRAGRANC COM 10 079.00 1 230 948.27 0.80USD IPG PHOTONICS CORP COM USD0.0001 3 970.00 957 841.90 0.62USD JOHNSON & JOHNSON COM USD1 13 400.00 1 602 908.00 1.05USD JP MORGAN CHASE & COM USD1 46 360.00 4 960 983.60 3.23USD KOSMOS ENERGY LTD COM USD0.01 114 000.00 885 780.00 0.58USD MARSH & MCLENNAN COM USD1 29 221.00 2 348 491.77 1.53USD MASTERCARD INC COM USD0.0001 CLASS ‘A’ 26 800.00 5 095 216.00 3.32USD MICROSOFT CORP COM USD0.0000125 71 026.00 7 020 209.84 4.58USD MONDELEZ INTL INC COM USD0.01 24 996.00 981 592.92 0.64USD MORGAN STANLEY COM STK USD0.01 52 459.00 2 630 294.26 1.71USD NETFLIX INC COM USD0.001 5 553.00 1 952 434.80 1.27USD NVIDIA CORP COM USD0.001 4 916.00 1 239 766.04 0.81USD RAYTHEON CO COM NEW 15 045.00 3 151 927.50 2.06USD RED HAT INC COM 14 221.00 2 309 774.82 1.51USD SALESFORCE.COM INC COM USD0.001 25 432.00 3 289 120.56 2.14USD SERVICENOW INC COM USD0.001 11 730.00 2 083 365.30 1.36USD STATE STREET CORP COM STK USD1 39 035.00 3 751 653.85 2.45USD THERMO FISHER SCIE COM USD1 12 798.00 2 665 439.46 1.74USD UNITEDHEALTH GRP COM USD0.01 16 820.00 4 062 198.20 2.65USD WEC ENERGY GROUP COM USD0.01 38 635.00 2 439 800.25 1.59USD ZOETIS INC COM USD0.01 CL ‘A’ 25 820.00 2 161 134.00 1.41Total United States 109 812 244.96 71.60
Total Bearer shares 133 072 554.60 86.77
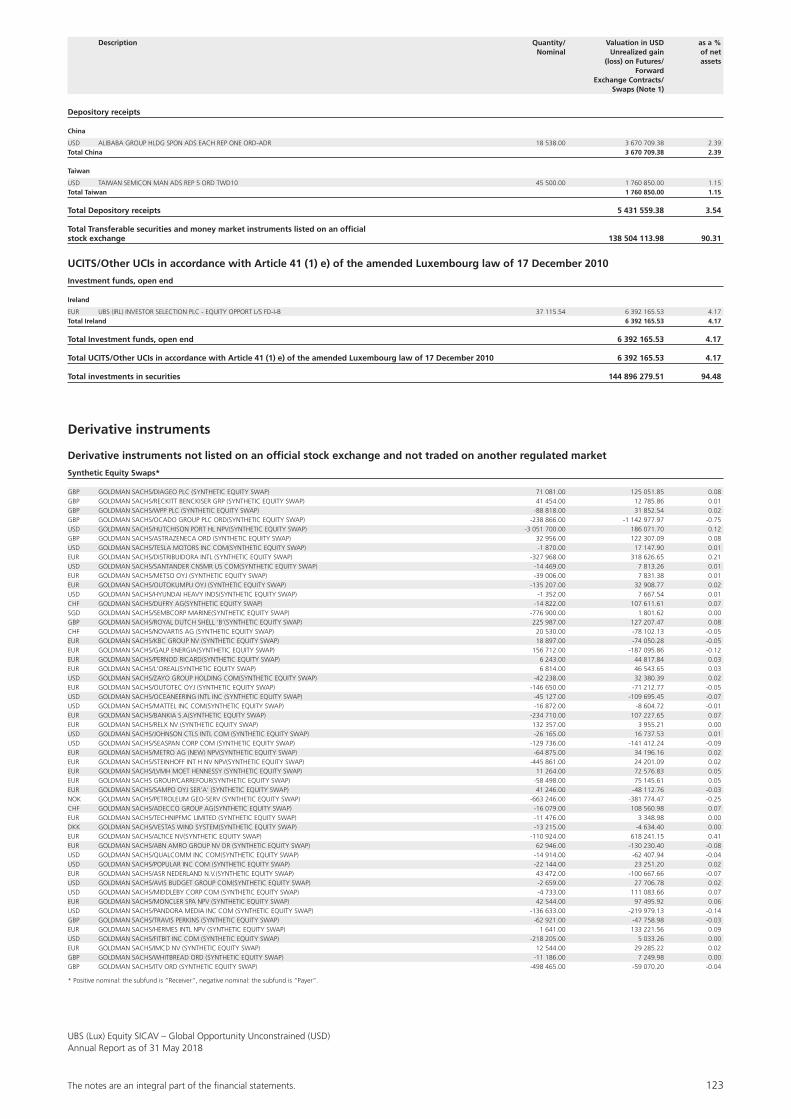
The notes are an integral part of the fi nancial statements. 123
UBS (Lux) Equity SICAV – Global Opportunity Unconstrained (USD)Annual Report as of 31 May 2018
Description Quantity/ Valuation in USD as a % Nominal Unrealized gain of net (loss) on Futures/ assets Forward Exchange Contracts/ Swaps (Note 1)
Depository receipts
China
USD ALIBABA GROUP HLDG SPON ADS EACH REP ONE ORD-ADR 18 538.00 3 670 709.38 2.39Total China 3 670 709.38 2.39
Taiwan
USD TAIWAN SEMICON MAN ADS REP 5 ORD TWD10 45 500.00 1 760 850.00 1.15Total Taiwan 1 760 850.00 1.15
Total Depository receipts 5 431 559.38 3.54
Total Transferable securities and money market instruments listed on an official stock exchange 138 504 113.98 90.31
UCITS/Other UCIs in accordance with Article 41 (1) e) of the amended Luxembourg law of 17 December 2010
Investment funds, open end
Ireland
EUR UBS (IRL) INVESTOR SELECTION PLC - EQUITY OPPORT L/S FD-I-B 37 115.54 6 392 165.53 4.17Total Ireland 6 392 165.53 4.17
Total Investment funds, open end 6 392 165.53 4.17
Total UCITS/Other UCIs in accordance with Article 41 (1) e) of the amended Luxembourg law of 17 December 2010 6 392 165.53 4.17
Total investments in securities 144 896 279.51 94.48
Derivative instruments
Derivative instruments not listed on an official stock exchange and not traded on another regulated market
Synthetic Equity Swaps*
GBP GOLDMAN SACHS/DIAGEO PLC (SYNTHETIC EQUITY SWAP) 71 081.00 125 051.85 0.08GBP GOLDMAN SACHS/RECKITT BENCKISER GRP (SYNTHETIC EQUITY SWAP) 41 454.00 12 785.86 0.01GBP GOLDMAN SACHS/WPP PLC (SYNTHETIC EQUITY SWAP) -88 818.00 31 852.54 0.02GBP GOLDMAN SACHS/OCADO GROUP PLC ORD(SYNTHETIC EQUITY SWAP) -238 866.00 -1 142 977.97 -0.75USD GOLDMAN SACHS/HUTCHISON PORT HL NPV(SYNTHETIC EQUITY SWAP) -3 051 700.00 186 071.70 0.12GBP GOLDMAN SACHS/ASTRAZENECA ORD (SYNTHETIC EQUITY SWAP) 32 956.00 122 307.09 0.08USD GOLDMAN SACHS/TESLA MOTORS INC COM(SYNTHETIC EQUITY SWAP) -1 870.00 17 147.90 0.01EUR GOLDMAN SACHS/DISTRIBUIDORA INTL (SYNTHETIC EQUITY SWAP) -327 968.00 318 626.65 0.21USD GOLDMAN SACHS/SANTANDER CNSMR US COM(SYNTHETIC EQUITY SWAP) -14 469.00 7 813.26 0.01EUR GOLDMAN SACHS/METSO OYJ (SYNTHETIC EQUITY SWAP) -39 006.00 7 831.38 0.01EUR GOLDMAN SACHS/OUTOKUMPU OYJ (SYNTHETIC EQUITY SWAP) -135 207.00 32 908.77 0.02USD GOLDMAN SACHS/HYUNDAI HEAVY INDS(SYNTHETIC EQUITY SWAP) -1 352.00 7 667.54 0.01CHF GOLDMAN SACHS/DUFRY AG(SYNTHETIC EQUITY SWAP) -14 822.00 107 611.61 0.07SGD GOLDMAN SACHS/SEMBCORP MARINE(SYNTHETIC EQUITY SWAP) -776 900.00 1 801.62 0.00GBP GOLDMAN SACHS/ROYAL DUTCH SHELL ‘B’(SYNTHETIC EQUITY SWAP) 225 987.00 127 207.47 0.08CHF GOLDMAN SACHS/NOVARTIS AG (SYNTHETIC EQUITY SWAP) 20 530.00 -78 102.13 -0.05EUR GOLDMAN SACHS/KBC GROUP NV (SYNTHETIC EQUITY SWAP) 18 897.00 -74 050.28 -0.05EUR GOLDMAN SACHS/GALP ENERGIA(SYNTHETIC EQUITY SWAP) 156 712.00 -187 095.86 -0.12EUR GOLDMAN SACHS/PERNOD RICARD(SYNTHETIC EQUITY SWAP) 6 243.00 44 817.84 0.03EUR GOLDMAN SACHS/L’OREAL(SYNTHETIC EQUITY SWAP) 6 814.00 46 543.65 0.03USD GOLDMAN SACHS/ZAYO GROUP HOLDING COM(SYNTHETIC EQUITY SWAP) -42 238.00 32 380.39 0.02EUR GOLDMAN SACHS/OUTOTEC OYJ (SYNTHETIC EQUITY SWAP) -146 650.00 -71 212.77 -0.05USD GOLDMAN SACHS/OCEANEERING INTL INC (SYNTHETIC EQUITY SWAP) -45 127.00 -109 695.45 -0.07USD GOLDMAN SACHS/MATTEL INC COM(SYNTHETIC EQUITY SWAP) -16 872.00 -8 604.72 -0.01EUR GOLDMAN SACHS/BANKIA S.A(SYNTHETIC EQUITY SWAP) -234 710.00 107 227.65 0.07EUR GOLDMAN SACHS/RELX NV (SYNTHETIC EQUITY SWAP) 132 357.00 3 955.21 0.00USD GOLDMAN SACHS/JOHNSON CTLS INTL COM (SYNTHETIC EQUITY SWAP) -26 165.00 16 737.53 0.01USD GOLDMAN SACHS/SEASPAN CORP COM (SYNTHETIC EQUITY SWAP) -129 736.00 -141 412.24 -0.09EUR GOLDMAN SACHS/METRO AG (NEW) NPV(SYNTHETIC EQUITY SWAP) -64 875.00 34 196.16 0.02EUR GOLDMAN SACHS/STEINHOFF INT H NV NPV(SYNTHETIC EQUITY SWAP) -445 861.00 24 201.09 0.02EUR GOLDMAN SACHS/LVMH MOET HENNESSY (SYNTHETIC EQUITY SWAP) 11 264.00 72 576.83 0.05EUR GOLDMAN SACHS GROUP/CARREFOUR(SYNTHETIC EQUITY SWAP) -58 498.00 75 145.61 0.05EUR GOLDMAN SACHS/SAMPO OYJ SER’A’ (SYNTHETIC EQUITY SWAP) 41 246.00 -48 112.76 -0.03NOK GOLDMAN SACHS/PETROLEUM GEO-SERV (SYNTHETIC EQUITY SWAP) -663 246.00 -381 774.47 -0.25CHF GOLDMAN SACHS/ADECCO GROUP AG(SYNTHETIC EQUITY SWAP) -16 079.00 108 560.98 0.07EUR GOLDMAN SACHS/TECHNIPFMC LIMITED (SYNTHETIC EQUITY SWAP) -11 476.00 3 348.98 0.00DKK GOLDMAN SACHS/VESTAS WIND SYSTEM(SYNTHETIC EQUITY SWAP) -13 215.00 -4 634.40 0.00EUR GOLDMAN SACHS/ALTICE NV(SYNTHETIC EQUITY SWAP) -110 924.00 618 241.15 0.41EUR GOLDMAN SACHS/ABN AMRO GROUP NV DR (SYNTHETIC EQUITY SWAP) 62 946.00 -130 230.40 -0.08USD GOLDMAN SACHS/QUALCOMM INC COM(SYNTHETIC EQUITY SWAP) -14 914.00 -62 407.94 -0.04USD GOLDMAN SACHS/POPULAR INC COM (SYNTHETIC EQUITY SWAP) -22 144.00 23 251.20 0.02EUR GOLDMAN SACHS/ASR NEDERLAND N.V.(SYNTHETIC EQUITY SWAP) 43 472.00 -100 667.66 -0.07USD GOLDMAN SACHS/AVIS BUDGET GROUP COM(SYNTHETIC EQUITY SWAP) -2 659.00 27 706.78 0.02USD GOLDMAN SACHS/MIDDLEBY CORP COM (SYNTHETIC EQUITY SWAP) -4 733.00 111 083.66 0.07EUR GOLDMAN SACHS/MONCLER SPA NPV (SYNTHETIC EQUITY SWAP) 42 544.00 97 495.92 0.06USD GOLDMAN SACHS/PANDORA MEDIA INC COM (SYNTHETIC EQUITY SWAP) -136 633.00 -219 979.13 -0.14GBP GOLDMAN SACHS/TRAVIS PERKINS (SYNTHETIC EQUITY SWAP) -62 921.00 -47 758.98 -0.03EUR GOLDMAN SACHS/HERMES INTL NPV (SYNTHETIC EQUITY SWAP) 1 641.00 133 221.56 0.09USD GOLDMAN SACHS/FITBIT INC COM (SYNTHETIC EQUITY SWAP) -218 205.00 5 033.26 0.00EUR GOLDMAN SACHS/IMCD NV (SYNTHETIC EQUITY SWAP) 12 544.00 29 285.22 0.02GBP GOLDMAN SACHS/WHITBREAD ORD (SYNTHETIC EQUITY SWAP) -11 186.00 7 249.98 0.00GBP GOLDMAN SACHS/ITV ORD (SYNTHETIC EQUITY SWAP) -498 465.00 -59 070.20 -0.04
* Positive nominal: the subfund is “Receiver”, negative nominal: the subfund is “Payer”.

124 The notes are an integral part of the fi nancial statements.
UBS (Lux) Equity SICAV – Global Opportunity Unconstrained (USD)Annual Report as of 31 May 2018
CHF GOLDMAN SACHS/SIKA AG (SYNTHETIC EQUITY SWAP) 310.00 171 636.84 0.11EUR GOLDMAN SACHS/AZKO NOBEL(SYNTHETIC EQUITY SWAP) -15 204.00 -16 548.05 -0.01CAD GOLDMAN SACHS/BOMBARDIER INC CLASS(SYNTHETIC EQUITY SWAP) -129 500.00 -90 845.67 -0.06HKD GOLDMAN SACHS/BBMG CORPORATION (SYNTHETIC EQUITY SWAP) -2 284 000.00 39 658.32 0.03EUR GOLDMAN SACHS/AUMANN AG (SYNTHETIC EQUITY SWAP) 27 568.00 183 139.26 0.12EUR GOLDMAN SACHS/VARTA AG (SYNTHETIC EQUITY SWAP) 16 756.00 6 771.48 0.00JPY GOLDMAN SACHS/KEYENCE CORP NPV(SYNTHETIC EQUITY SWAP) 4 220.00 -9 135.35 -0.01JPY GOLDMAN SACHS/HITACHI NPV(SYNTHETIC EQUITY SWAP) 358 664.00 -62 195.80 -0.04GBP GOLDMAN SACHS/XLMEDIA PLC ORD (SYNTHETIC EQUITY SWAP) 227 376.00 -57 486.00 -0.04JPY GOLDMAN SACHS/MITSUBISHI UFJ FIN NPV(SYNTHETIC EQUITY SWAP) 206 200.00 -132 521.03 -0.09USD GOLDMAN SACHS/SNAP-ON INC COM (SYNTHETIC EQUITY SWAP) -10 182.00 -13 139.24 -0.01USD GOLDMAN SACHS/YELP INC COM (SYNTHETIC EQUITY SWAP) -9 819.00 19 638.00 0.01HKD GOLDMAN SACHS/LENOVO GROUP LTD (SYNTHETIC EQUITY SWAP) -2 538 000.00 -131 554.55 -0.09EUR GOLDMAN SACHS/HEINEKEN NV (SYNTHETIC EQUITY SWAP) 30 183.00 -89 096.24 -0.06USD GOLDMAN SACHS/UNDER ARMOUR INC (SYNTHETIC EQUITY SWAP) -18 131.00 -56 931.34 -0.04JPY GOLDMAN SACHS/SEVEN BANK NPV(SYNTHETIC EQUITY SWAP) -245 800.00 45 555.36 0.03CAD GOLDMAN SACHS/PARKLAND FUEL CORP COM (SYNTHETIC EQUITY SWAP) -27 449.00 -29 033.42 -0.02EUR GOLDMAN SACHS/ENI SPA (SYNTHETIC EQUITY SWAP) 105 032.00 -98 815.77 -0.06USD GOLDMAN SACHS/KRATOS DEFENSE (SYNTHETIC EQUITY SWAP) -78 958.00 -62 015.25 -0.04EUR GOLDMAN SACHS/IPSEN (SYNTHETIC EQUITY SWAP) 10 887.00 25 215.92 0.02USD GOLDMAN SACHS/SNAP INC COM(SYNTHETIC EQUITY SWAP) -61 565.00 -39 903.53 -0.03EUR GOLDMAN SACHS/UPM-KYMMENE CORP NPV (SYNTHETIC EQUITY SWAP) 52 288.00 -5 377.25 0.00EUR GOLDMAN SACHS/EIFFAGE (SYNTHETIC EQUITY SWAP) 14 076.00 -52 485.58 -0.03CHF GOLDMAN SACHS/PARTNERS GROUP HLG (SYNTHETIC EQUITY SWAP) 1 736.00 -51 045.36 -0.03DKK GOLDMAN SACHS/ISS A/S (SYNTHETIC EQUITY SWAP) -35 159.00 13 381.03 0.01JPY GOLDMAN SACHS/SKYLARK CO LTD NPV (SYNTHETIC EQUITY SWAP) -67 500.00 -28 498.63 -0.02GBP GOLDMAN SACHS /METRO BANK PLC (SYNTHETIC EQUITY SWAP) -14 343.00 4 142.46 0.00EUR GOLDMAN SACHS/ALTICE NV(SYNTHETIC EQUITY SWAP) -110 924.00 -903 235.04 -0.59CAD GOLDMAN SACHS/ENBRIDGE INC COM(SYNTHETIC EQUITY SWAP) -30 008.00 569.07 0.00USD GOLDMAN SACHS/ALBEMARLE CORP COM (SYNTHETIC EQUITY SWAP) -11 436.00 -7 312.18 0.00SEK GOLDMAN SACHS/ERICSSON (SYNTHETIC EQUITY SWAP) -82 933.00 0.00 0.00Total Synthetic Equity Swaps -1 566 309.01 -1.02
Total Derivative instruments not listed on an official stock exchange and not traded on anotherregulated market -1 566 309.01 -1.02
Total Derivative instruments -1 566 309.01 -1.02
Forward Foreign Exchange contracts
Forward Foreign Exchange contracts (Purchase/Sale)
JPY 851 000 000.00 USD 7 762 473.78 8.6.2018 72 927.78 0.05GBP 4 695 000.00 USD 6 401 040.93 8.6.2018 -152 191.62 -0.10USD 4 564 256.30 TRY 19 660 000.00 8.6.2018 241 326.56 0.16EUR 2 935 000.00 USD 3 520 509.02 8.6.2018 -93 187.33 -0.06JPY 282 700 000.00 USD 2 588 503.09 8.6.2018 14 397.05 0.01GBP 1 495 000.00 USD 2 025 076.17 8.6.2018 -35 293.48 -0.02EUR 880 000.00 USD 1 051 639.60 8.6.2018 -24 026.96 -0.03USD 1 912 567.22 TRY 8 165 000.00 8.6.2018 117 210.08 0.08EUR 8 266 300.00 USD 9 727 327.19 25.6.2018 -62 029.68 -0.04CHF 1 419 100.00 USD 1 423 484.33 25.6.2018 22 793.11 0.01SGD 1 678 300.00 USD 1 249 087.35 25.6.2018 6 218.71 0.00USD 73 692.56 CHF 73 400.00 25.6.2018 -1 113.14 0.00USD 148 253.47 EUR 125 700.00 25.6.2018 1 279.87 0.00USD 50 136.33 EUR 42 700.00 25.6.2018 209.74 0.00USD 4 241.00 SGD 5 700.00 25.6.2018 -22.39 0.00USD 1 767 279.43 TRY 8 270 000.00 8.6.2018 -51 165.58 -0.03JPY 236 200 000.00 USD 2 146 468.58 8.6.2018 28 292.70 0.02GBP 1 285 000.00 USD 1 716 371.42 8.6.2018 -6 089.98 0.00EUR 770 000.00 USD 902 196.68 8.6.2018 -3 035.62 0.00EUR 25 800.00 USD 30 347.92 25.6.2018 -181.50 0.00USD 14 488.05 SGD 19 400.00 25.6.2018 -22.43 0.00Total Forward Foreign Exchange contracts (Purchase/Sale) 76 295.89 0.05
Cash at banks, deposits on demand and deposit accounts and other liquid assets 9 876 974.08* 6.44Bank overdraft and other short-term liabilities -5 671.26 0.00Other assets and liabilities 82 644.10 0.05
Total net assets 153 360 213.31 100.00
* As at 31 May 2018, cash amounts serves as collateral for the counterparty Goldman Sachs for an amount of USD 1 610 000.
Description Quantity/ Valuation in USD as a % Nominal Unrealized gain of net (loss) on Futures/ assets Forward Exchange Contracts/ Swaps (Note 1)

The notes are an integral part of the fi nancial statements. 125
UBS (Lux) Equity SICAV – Global Quantitative (USD)Annual Report as of 31 May 2018
UBS (Lux) Equity SICAV – Global Quantitative (USD)
Three-year comparison
ISIN 31.5.2018 31.5.2017 31.5.2016Net assets in USD 1 859 178 721.04 1 768 749 879.29 1 297 109 613.13Class I-B-acc1 LU1289529346Shares outstanding - - 347 887.6060Net asset value per share in USD - - 109.72Issue and redemption price per share in USD2 - - 109.72Class I-X-acc LU1398086220Shares outstanding 146 550.3720 108 956.0020 110 018.0490Net asset value per share in USD 142.49 121.42 101.95Issue and redemption price per share in USD2 142.49 121.42 101.95Class U-X-acc LU1289529262Shares outstanding 119 835.7940 134 298.7430 113 694.2160Net asset value per share in USD 15 340.13 13 071.76 10 974.36Issue and redemption price per share in USD2 15 340.13 13 071.76 10 974.36
1 For the period from 25.2.2016 to 15.2.2017 the share class I-B-acc was in circulation2 See note 1
Performance
Currency 2017/2018 2016/2017 2016Class I-B-acc1 USD - - -Class I-X-acc USD 17.4% 19.1% -Class U-X-acc USD 17.4% 19.1% -
1 For the period from 25.2.2016 to 15.2.2017 the share class I-B-acc was in circulation. Due to this fact, there is no data for the calculation of the performance available.
Historical performance is no indicator of current or future performance.The performance data does not take account of any commissions and costs charged when subscribing and redeeming shares.The performance data were not audited.The subfund has no benchmark.
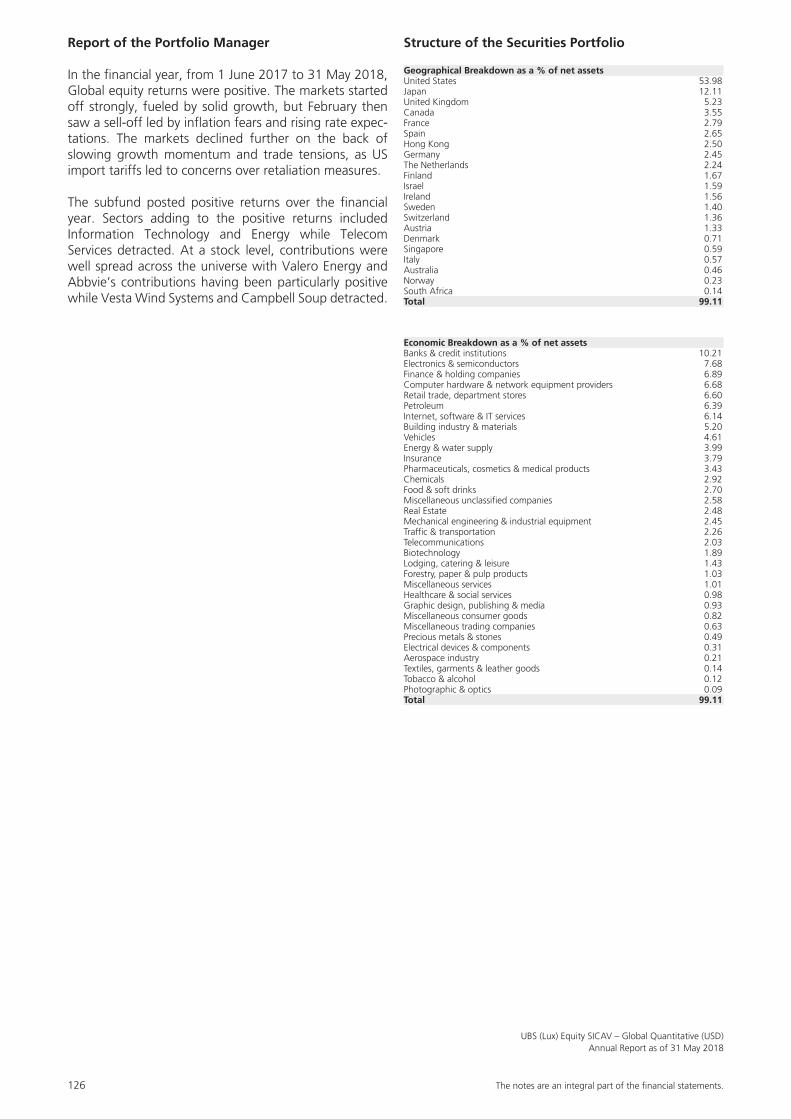
126 The notes are an integral part of the fi nancial statements.
UBS (Lux) Equity SICAV – Global Quantitative (USD)Annual Report as of 31 May 2018
Report of the Portfolio Manager
In the financial year, from 1 June 2017 to 31 May 2018, Global equity returns were positive. The markets started off strongly, fueled by solid growth, but February then saw a sell-off led by inflation fears and rising rate expec-tations. The markets declined further on the back of slowing growth momentum and trade tensions, as US import tariffs led to concerns over retaliation measures.
The subfund posted positive returns over the financial year. Sectors adding to the positive returns included Information Technology and Energy while Telecom Services detracted. At a stock level, contributions were well spread across the universe with Valero Energy and Abbvie’s contributions having been particularly positive while Vesta Wind Systems and Campbell Soup detracted.
Structure of the Securities Portfolio
Geographical Breakdown as a % of net assetsUnited States 53.98Japan 12.11United Kingdom 5.23Canada 3.55France 2.79Spain 2.65Hong Kong 2.50Germany 2.45The Netherlands 2.24Finland 1.67Israel 1.59Ireland 1.56Sweden 1.40Switzerland 1.36Austria 1.33Denmark 0.71Singapore 0.59Italy 0.57Australia 0.46Norway 0.23South Africa 0.14Total 99.11
Economic Breakdown as a % of net assetsBanks & credit institutions 10.21Electronics & semiconductors 7.68Finance & holding companies 6.89Computer hardware & network equipment providers 6.68Retail trade, department stores 6.60Petroleum 6.39Internet, software & IT services 6.14Building industry & materials 5.20Vehicles 4.61Energy & water supply 3.99Insurance 3.79Pharmaceuticals, cosmetics & medical products 3.43Chemicals 2.92Food & soft drinks 2.70Miscellaneous unclassified companies 2.58Real Estate 2.48Mechanical engineering & industrial equipment 2.45Traffic & transportation 2.26Telecommunications 2.03Biotechnology 1.89Lodging, catering & leisure 1.43Forestry, paper & pulp products 1.03Miscellaneous services 1.01Healthcare & social services 0.98Graphic design, publishing & media 0.93Miscellaneous consumer goods 0.82Miscellaneous trading companies 0.63Precious metals & stones 0.49Electrical devices & components 0.31Aerospace industry 0.21Textiles, garments & leather goods 0.14Tobacco & alcohol 0.12Photographic & optics 0.09Total 99.11

The notes are an integral part of the fi nancial statements. 127
UBS (Lux) Equity SICAV – Global Quantitative (USD)Annual Report as of 31 May 2018
Statement of Net Assets USDAssets 31.5.2018Investments in securities, cost 1 576 112 666.40Investments in securities, unrealized appreciation (depreciation) 266 594 102.93Total investments in securities (Note 1) 1 842 706 769.33Cash at banks, deposits on demand and deposit accounts 10 036 824.60Receivable on securities sales (Note 1) 118 734.58Receivable on dividends 6 349 182.94Other receivables 591 490.38Unrealized gain (loss) on forward foreign exchange contracts (Note 1) -539 527.28Total Assets 1 859 263 474.55
LiabilitiesProvisions for taxe d’abonnement (Note 3) -31 156.57Provisions for other commissions and fees (Note 2) -53 596.94Total provisions -84 753.51Total Liabilities -84 753.51
Net assets at the end of the financial year 1 859 178 721.04
Statement of Operations USDIncome 1.6.2017-31.5.2018Interest on liquid assets 72 682.05Dividends 37 075 460.25Income on securities lending (Note 16) 1 165 926.07Other income (Note 4) 145 022.74Total income 38 459 091.11
ExpensesTaxe d’abonnement (Note 3) -187 302.87Cost on securities lending (Note 16) -466 370.40Other commissions and fees (Note 2) -233 321.28Interest on cash and bank overdraft -23 812.64Other expenses -2 260.68Total expenses -913 067.87
Net income (loss) on investments 37 546 023.24
Realized gain (loss) (Note 1)Realized gain (loss) on market-priced securities without options 186 382 662.09Realized gain (loss) on forward foreign exchange contracts -1 479 584.18Realized gain (loss) on foreign exchange 872 303.45Total realized gain (loss) 185 775 381.36
Net realized gain (loss) of the financial year 223 321 404.60
Changes in unrealized appreciation (depreciation) (Note 1)Unrealized appreciation (depreciation) on market-priced securities without options 74 767 154.90Unrealized appreciation (depreciation) on forward foreign exchange contracts -158 182.34Total changes in unrealized appreciation (depreciation) 74 608 972.56
Net increase (decrease) in net assets as a result of operations 297 930 377.16

128 The notes are an integral part of the fi nancial statements.
UBS (Lux) Equity SICAV – Global Quantitative (USD)Annual Report as of 31 May 2018
Statement of Changes in Net Assets USD 1.6.2017-31.5.2018Net assets at the beginning of the financial year 1 768 749 879.29Subscriptions 121 937 747.36Redemptions -329 439 282.77Total net subscriptions (redemptions) -207 501 535.41Net income (loss) on investments 37 546 023.24Total realized gain (loss) 185 775 381.36Total changes in unrealized appreciation (depreciation) 74 608 972.56Net increase (decrease) in net assets as a result of operations 297 930 377.16Net assets at the end of the financial year 1 859 178 721.04
Changes in the Number of Shares outstanding
1.6.2017-31.5.2018Class I-X-accNumber of shares outstanding at the beginning of the financial year 108 956.0020Number of shares issued 37 594.3700Number of shares redeemed 0.0000Number of shares outstanding at the end of the financial year 146 550.3720Class U-X-accNumber of shares outstanding at the beginning of the financial year 134 298.7430Number of shares issued 8 219.5210Number of shares redeemed -22 682.4700Number of shares outstanding at the end of the financial year 119 835.7940

The notes are an integral part of the fi nancial statements. 129
UBS (Lux) Equity SICAV – Global Quantitative (USD)Annual Report as of 31 May 2018
Statement of Investments in Securities and other Net Assets as of 31 May 2018
Description Quantity/ Valuation in USD as a % Nominal Unrealized gain of net (loss) on Futures/ assets Forward Exchange Contracts/ Swaps (Note 1)
Transferable securities and money market instruments listed on an official stock exchange
Bearer shares
Australia
AUD CIMIC GROUP LTD NPV 94 573.00 2 949 647.98 0.16AUD FLIGHT CENTRE TRAVEL GROUP LTD NPV 41 596.00 1 939 404.05 0.10AUD FORTESCUE METALS G NPV 1 026 292.00 3 641 990.62 0.20Total Australia 8 531 042.65 0.46
Austria
EUR OMV AG NPV(VAR) 249 738.00 14 342 743.03 0.77EUR RAIFFEISEN BK INTL NPV (REGD) 327 883.00 10 368 367.71 0.56Total Austria 24 711 110.74 1.33
Canada
CAD BLACKBERRY LTD NPV 485 425.00 5 744 120.99 0.31CAD CANADIAN TIRE LTD CL A 62 871.00 8 000 882.43 0.43CAD CDN IMPERIAL BK OF COMMERCE COM 89 083.00 7 773 817.15 0.42CAD EMPIRE LTD CL A 554 656.00 10 672 381.87 0.58CAD GILDAN ACTIVEWEAR INC COM 59 639.00 1 726 367.91 0.09CAD LINAMAR CORP COM 148 126.00 7 413 151.34 0.40CAD LUNDIN MINING CORP COM 858 125.00 5 378 165.47 0.29CAD MAGNA INTL INC COM NPV 258 260.00 16 552 371.57 0.89CAD METRO INC CL A SUB 80 567.00 2 656 996.81 0.14Total Canada 65 918 255.54 3.55
Denmark
DKK H.LUNDBECK A/S DKK5 151 902.00 10 698 447.94 0.57DKK VESTAS WIND SYSTEM DKK1 39 480.00 2 584 924.45 0.14Total Denmark 13 283 372.39 0.71
Finland
EUR NESTE OIL OYJ NPV 177 245.00 14 404 244.92 0.78EUR UPM-KYMMENE CORP NPV 453 540.00 16 628 995.57 0.89Total Finland 31 033 240.49 1.67
France
EUR AXA EUR2.29 135 055.00 3 361 879.89 0.18EUR BNP PARIBAS EUR2 274 350.00 16 992 398.94 0.91EUR EIFFAGE EUR4 63 128.00 7 103 649.91 0.38EUR PEUGEOT SA EUR1 85 661.00 1 994 342.15 0.11EUR TOTAL EUR2.5 369 465.00 22 447 941.54 1.21Total France 51 900 212.43 2.79
Germany
EUR COVESTRO AG NPV 181 193.00 16 484 823.54 0.89EUR HOCHTIEF AG NPV 70 376.00 12 913 965.03 0.69EUR MAN SE ORD NPV 57 423.00 6 240 480.70 0.34Total Germany 35 639 269.27 1.92
Hong Kong
HKD CLP HOLDINGS HKD5 1 316 500.00 13 829 363.28 0.74HKD HK ELECTRIC INVEST UNITS (STAPLED) 4 308 500.00 4 163 412.22 0.22HKD HYSAN DEVELOPMENT HKD5 512 000.00 2 960 065.78 0.16HKD KERRY PROPERTIES HKD1 2 484 500.00 13 286 943.14 0.72HKD WH GROUP LTD USD0.0001 11 860 500.00 12 171 749.01 0.66Total Hong Kong 46 411 533.43 2.50
Ireland
USD ACCENTURE PLC SHS CL A ‘NEW’ 80 358.00 12 514 954.92 0.67USD SEAGATE TECH PLC COM USD0.00001 294 331.00 16 585 551.85 0.89Total Ireland 29 100 506.77 1.56
Israel
ILS BANK HAPOALIM B.M. ILS1 1 872 979.00 12 922 709.69 0.69ILS BK LEUMI LE ISRAEL ILS1 2 675 530.00 16 674 712.47 0.90Total Israel 29 597 422.16 1.59
Italy
EUR TELECOM ITALIA SPA EUR0.55 8 676 375.00 6 959 915.24 0.38EUR TERNA SPA ORD EUR0.22 672 993.00 3 559 484.40 0.19Total Italy 10 519 399.64 0.57
Japan
JPY AMADA CO LTD NPV 524 200.00 5 712 667.86 0.31JPY ASAHI GLASS CO NPV 404 000.00 16 584 656.45 0.89JPY CENTRAL JAPAN RLWY NPV 80 100.00 16 595 802.85 0.89JPY DAICEL CORP 558 800.00 6 336 615.58 0.34JPY FUJI FILM HLD CORP NPV 158 200.00 6 089 487.78 0.33JPY HITACHI NPV 908 000.00 6 657 580.19 0.36JPY HONDA MOTOR CO NPV 260 700.00 8 271 277.10 0.44JPY JTEKT CORPORATION NPV 130 700.00 1 909 161.95 0.10JPY JXTG HOLDINGS INC NPV 1 371 900.00 8 875 774.40 0.48JPY KAJIMA CORP NPV 494 000.00 4 037 663.95 0.22JPY KANSAI ELEC POWER NPV 978 300.00 14 101 134.89 0.76JPY KDDI CORP NPV 324 800.00 8 805 728.75 0.47JPY KIRIN HOLDINGS CO LTD NPV 87 500.00 2 492 636.57 0.13JPY KURITA WATER INDS NPV 328 400.00 9 461 015.23 0.51JPY LAWSON INC NPV 27 200.00 1 775 028.77 0.09JPY MARUBENI CORP NPV 1 503 900.00 11 743 833.22 0.63

130 The notes are an integral part of the fi nancial statements.
UBS (Lux) Equity SICAV – Global Quantitative (USD)Annual Report as of 31 May 2018
JPY MINEBEA MITSUMI INC 321 700.00 6 123 389.02 0.33JPY MITSUBISHI CHEM HL NPV 1 723 400.00 15 989 573.38 0.86JPY MITSUBISHI GAS CHM NPV 420 800.00 10 771 271.57 0.58JPY MITSUBISHI HVY IND NPV 77 300.00 2 931 345.21 0.16JPY OLYMPUS CORP NPV 48 400.00 1 719 582.13 0.09JPY OSAKA GAS CO NPV 358 000.00 7 824 299.32 0.42JPY POLA ORBIS HOLDINGS IN NPV 120 200.00 5 963 256.48 0.32JPY SHOWA SHELL SEKIYU NPV 640 600.00 8 537 795.57 0.46JPY SONY CORP NPV 218 300.00 10 367 969.07 0.56JPY SUMITOMO CHEM CO NPV 2 413 000.00 14 636 356.94 0.79JPY TAISEI CORP NPV 154 500.00 8 518 155.46 0.46JPY TOKYO GAS CO NPV 85 900.00 2 344 272.63 0.13Total Japan 225 177 332.32 12.11
The Netherlands
USD AERCAP HOLDINGS NV 71 200.00 3 938 072.00 0.21EUR EXOR NV EUR0.01 57 419.00 4 155 562.32 0.22EUR KONINKLIJKE AHOLD EUR0.01 250 887.00 5 755 878.20 0.31EUR KONINKLIJKE PHILIPS NV EUR0.20 181 998.00 7 439 868.21 0.40GBP ROYAL DUTCH SHELL ‘B’SHS EUR0.07 (UK LIST) 512 111.00 18 242 162.24 0.98EUR VOPAK(KON) EUR0.50 40 470.00 1 984 106.50 0.11Total The Netherlands 41 515 649.47 2.23
Norway
NOK EQUINOR ASA NOK2.50 164 432.00 4 326 549.74 0.23Total Norway 4 326 549.74 0.23
Singapore
SGD WILMAR INTERNATIONAL LTD 4 522 700.00 10 956 333.32 0.59Total Singapore 10 956 333.32 0.59
South Africa
GBP MONDI ORD EUR0.20 93 969.00 2 612 082.46 0.14Total South Africa 2 612 082.46 0.14
Spain
EUR ACS ACTIVIDADES CO EUR0.5 41 388.00 1 715 566.66 0.09EUR AENA SME S.A. EUR10 8 416.00 1 614 082.67 0.08EUR CAIXABANK SA EUR1 3 455 305.00 14 665 360.69 0.79EUR ENAGAS SA EUR1.50 570 959.00 15 202 418.85 0.82EUR REPSOL SA EUR1 847 791.00 16 135 859.02 0.87Total Spain 49 333 287.89 2.65
Sweden
SEK SANDVIK AB NPV (POST SPLIT) 439 649.00 7 616 460.82 0.41SEK SWEDISH MATCH NPV 46 985.00 2 223 776.85 0.12SEK VOLVO AB SER’B’NPV (POST SPLIT) 945 365.00 16 243 660.77 0.87Total Sweden 26 083 898.44 1.40
United Kingdom
GBP BARRATT DEVEL ORD GBP0.10 1 210 945.00 8 791 492.67 0.47GBP CARNIVAL PLC ORD USD1.66 115 464.00 7 431 671.84 0.40GBP LEGAL & GENERAL GP ORD GBP0.025 1 178 509.00 4 230 957.73 0.23USD MICHAEL KORS HOLDI COM NPV 143 600.00 8 241 204.00 0.44GBP MORRISON(W)SUPRMKT ORD GBP0.10 4 264 733.00 13 948 823.00 0.75GBP NEXT ORD GBP0.10 38 769.00 2 992 102.25 0.16GBP ROYAL MAIL PLC ORD GBP0.01 (WI) 1 287 415.00 8 719 672.74 0.47GBP SAINSBURY(J) ORD GBP0.28571428 2 040 788.00 8 643 673.79 0.47GBP TAYLOR WIMPEY ORD GBP0.01 870 650.00 2 202 945.61 0.12USD TECHNIPFMC PLC COM USD1 202 700.00 6 314 105.00 0.34GBP VODAFONE GROUP ORD USD0.2095238(POST CONS) 4 828 834.00 12 325 371.01 0.66Total United Kingdom 83 842 019.64 4.51
United States
USD ABBVIE INC COM USD0.01 219 221.00 21 689 725.74 1.17USD AFLAC INC COM USD0.10 118 689.00 5 348 126.34 0.29USD ALLIANCE DATA SYST COM USD0.01 77 981.00 16 439 954.42 0.88USD ALLSTATE CORP COM 93 980.00 8 785 250.40 0.47USD ALPHABET INC CAP STK USD0.001 CL C 7 687.00 8 340 318.13 0.45USD ALPHABET INC CAP STK USD0.001 CL A 7 051.00 7 756 100.00 0.42USD AMAZON COM INC COM USD0.01 13 104.00 21 354 540.48 1.15USD AMERIPRISE FINL INC COM 109 175.00 15 134 930.25 0.81USD AMGEN INC COM USD0.0001 119 098.00 21 392 382.76 1.15USD APPLE INC COM NPV 148 540.00 27 757 669.80 1.49USD APPLIED MATLS INC COM 41 372.00 2 100 870.16 0.11USD ATHENE HOLDING LTD COM USD0.001 CL A 347 747.00 15 533 858.49 0.84USD AVERY DENNISON CORP COM 122 090.00 12 823 112.70 0.69USD BAXTER INTL INC COM USD1 41 568.00 2 944 677.12 0.16USD BEST BUY CO INC COM USD0.10 131 576.00 8 980 062.00 0.48USD BIOGEN INC COM STK USD0.0005 36 634.00 10 768 930.64 0.58USD BLOCK(H&R)INC COM NPV 602 035.00 16 525 860.75 0.89USD CAPITAL ONE FINL COM USD0.01 53 923.00 5 068 762.00 0.27USD CARNIVAL CORP COM USD0.01(PAIRED STOCK) 119 992.00 7 473 101.76 0.40USD CELGENE CORP COM USD0.01 39 042.00 3 071 824.56 0.17USD CIGNA CORP COM USD0.25 15 342.00 2 598 474.54 0.14USD CISCO SYSTEMS COM USD0.001 437 246.00 18 674 776.66 1.00USD CLOROX CO DEL COM 125 939.00 15 217 209.37 0.82USD COMERICA INC COM 169 680.00 15 999 127.20 0.86USD CVS HEALTH CORP COM STK USD0.01 107 716.00 6 828 117.24 0.37USD DISCOVER FINL SVCS COM STK USD0.01 113 191.00 8 360 287.26 0.45USD EASTMAN CHEM CO COM 30 900.00 3 223 179.00 0.17USD ELI LILLY AND CO COM NPV 87 958.00 7 479 948.32 0.40
Description Quantity/ Valuation in USD as a % Nominal Unrealized gain of net (loss) on Futures/ assets Forward Exchange Contracts/ Swaps (Note 1)

The notes are an integral part of the fi nancial statements. 131
UBS (Lux) Equity SICAV – Global Quantitative (USD)Annual Report as of 31 May 2018
USD EXPEDTRS INTL WASH COM USD0.01 200 092.00 14 902 852.16 0.80USD EXPRESS SCRIPTS HL COM USD0.01 194 633.00 14 755 127.73 0.79USD EXXON MOBIL CORP COM NPV 23 016.00 1 869 819.84 0.10USD F5 NETWORK INC COM STK NPV 95 097.00 16 462 241.67 0.89USD FACEBOOK INC COM USD0.000006 CL ‘A’ 22 735.00 4 360 118.30 0.23USD FIFTH THIRD BANCORP COM 407 071.00 12 448 231.18 0.67USD FIRSTENERGY CORP COM USD0.10 306 250.00 10 541 125.00 0.57USD FORD MOTOR CO COM STK USD0.01 1 569 426.00 18 126 870.30 0.96USD GAP INC DEL COM 202 879.00 5 676 554.42 0.31USD HCA HEALTHCARE INC COM USD0.01 174 122.00 17 958 943.08 0.97USD HEWLETT PACKARD EN COM USD0.01 524 756.00 7 997 281.44 0.43USD HOME DEPOT INC COM USD0.05 10 633.00 1 983 586.15 0.11USD HOST HOTELS & RESO COM STK USD0.01 788 400.00 17 053 092.00 0.92USD HUMANA INC COM USD0.166 53 591.00 15 593 909.18 0.84USD INGREDION INC COM USD0.01 20 155.00 2 245 065.45 0.12USD INTEL CORP COM USD0.001 379 479.00 20 947 240.80 1.13USD INTUIT INC COM USD0.01 95 178.00 19 187 884.80 1.03USD JP MORGAN CHASE & COM USD1 80 346.00 8 597 825.46 0.46USD JUNIPER NETWORKS COM USD0.00001 273 441.00 7 284 468.24 0.39USD KLA-TENCOR CORP COM USD0.001 151 588.00 17 164 309.24 0.92USD KOHLS CORPORATION COM USD0.01 150 910.00 10 073 242.50 0.54USD LAM RESEARCH CORP COM USD0.001 81 035.00 16 059 516.30 0.86USD LEAR CORP COM USD0.01 83 507.00 16 534 386.00 0.89USD MACY’S INC COM STK USD0.01 258 558.00 9 026 259.78 0.49USD MARATHON PETROLEUM COM USD0.01 221 283.00 17 487 995.49 0.94USD MAXIM INTEGRATED COM USD0.001 240 221.00 14 088 961.65 0.76USD MICRON TECHNOLOGY COM USD0.10 170 898.00 9 842 015.82 0.53USD MICROSOFT CORP COM USD0.0000125 172 120.00 17 012 340.80 0.91USD NORDSTROM INC COM NPV 190 425.00 9 336 537.75 0.50USD ORACLE CORP COM USD0.01 379 228.00 17 717 532.16 0.95USD OWENS CORNING COM STK USD0.01 50 884.00 3 216 886.48 0.17USD PACCAR INC COM STK USD1 123 134.00 7 662 628.82 0.41USD PEPSICO INC CAP USD0.016666 163 673.00 16 408 218.25 0.88USD PRUDENTIAL FINL COM USD0.01 35 672.00 3 454 476.48 0.19USD REGIONS FINANCIAL CORP NEW COM 882 568.00 16 098 040.32 0.87USD REINSURANCE GROUP COM USD0.01 102 202.00 15 273 066.88 0.82USD ROYAL CARIBBEAN COM USD0.01 17 556.00 1 843 028.88 0.10USD SEI INVESTMENT COM USD0.01 214 785.00 13 698 987.30 0.74USD SMUCKER(JM)CO COM NPV 153 770.00 16 530 275.00 0.89USD SPRINT CORPORATION COM USD0.01 1 535 690.00 7 893 446.60 0.42USD SUNTRUST BKS INC COM 26 921.00 1 817 436.71 0.10USD TARGET CORP COM STK USD0.0833 143 938.00 10 491 640.82 0.56USD TEXAS INSTRUMENTS COM USD1 122 676.00 13 728 671.16 0.74USD THE CHEMOURS CO COM USD0.30 ‘WI’ 57 313.00 2 807 763.87 0.15USD TIME WARNER INC COM USD0.01 158 978.00 14 969 368.48 0.81USD TOLL BROS INC COM USD0.01 149 162.00 5 890 407.38 0.32USD TOTAL SYSTEM SVCS COM STK USD0.10 149 841.00 12 764 954.79 0.69USD TYSON FOODS INC CL A 41 762.00 2 817 682.14 0.15USD UNITED CONTINENTAL COM USD0.01 58 767.00 4 089 595.53 0.22USD VALERO ENERGY CORP NEW COM 152 079.00 18 431 974.80 0.99USD VARIAN MEDICAL SYS COM USD1 138 113.00 16 279 379.31 0.88USD VEREIT INC COM USD0.001 1 792 124.00 12 831 607.84 0.69USD VIACOM INC NEW CL’B’ NON-VTG USD0.001 65 561.00 1 776 703.10 0.10USD VISTRA ENERGY CORP COM USD0.01 740 127.00 18 155 315.31 0.98USD VMWARE INC COM STK USD0.01 CLASS ‘A’ 76 427.00 10 507 183.96 0.57USD WALGREENS BOOTS AL COM USD0.01 24 139.00 1 506 032.21 0.08USD WATERS CORP COM 56 768.00 10 934 652.16 0.59USD WELLS FARGO & CO COM USD1 2/3 218 001.00 11 769 873.99 0.63USD WESTERN DIGITAL CORP COM 199 387.00 16 650 808.37 0.90USD XILINX INC COM USD0.01 196 208.00 13 363 726.88 0.72USD YUM BRANDS INC COM 121 073.00 9 846 867.09 0.53Total United States 1 003 517 213.69 53.98
Total Bearer shares 1 794 009 732.48 96.49
Other shares
Switzerland
CHF ROCHE HLDGS AG GENUSSCHEINE NPV 11 867.00 2 547 584.53 0.14Total Switzerland 2 547 584.53 0.14
United Kingdom
GBP BERKELEY GP HLDGS ORD GBP0.05 236 322.00 13 352 050.97 0.72Total United Kingdom 13 352 050.97 0.72
Total Other shares 15 899 635.50 0.86
Registered shares
Germany
EUR DEUTSCHE LUFTHANSA ORD NPV (REGD)(VINK) 181 638.00 4 929 605.37 0.27EUR HUGO BOSS AG NPV (REGD) 29 688.00 2 664 261.21 0.14EUR PROSIEBENSAT1 MED. NPV 76 749.00 2 254 957.84 0.12Total Germany 9 848 824.42 0.53
Switzerland
CHF BALOISE-HLDGS CHF0.1(REGD) 39 575.00 5 820 918.52 0.31CHF ZURICH INSURANCE GRP CHF0.10 57 058.00 16 958 953.92 0.91Total Switzerland 22 779 872.44 1.22
Total Registered shares 32 628 696.86 1.75
Total Transferable securities and money market instruments listed on an official stock exchange 1 842 538 064.84 99.10
Description Quantity/ Valuation in USD as a % Nominal Unrealized gain of net (loss) on Futures/ assets Forward Exchange Contracts/ Swaps (Note 1)
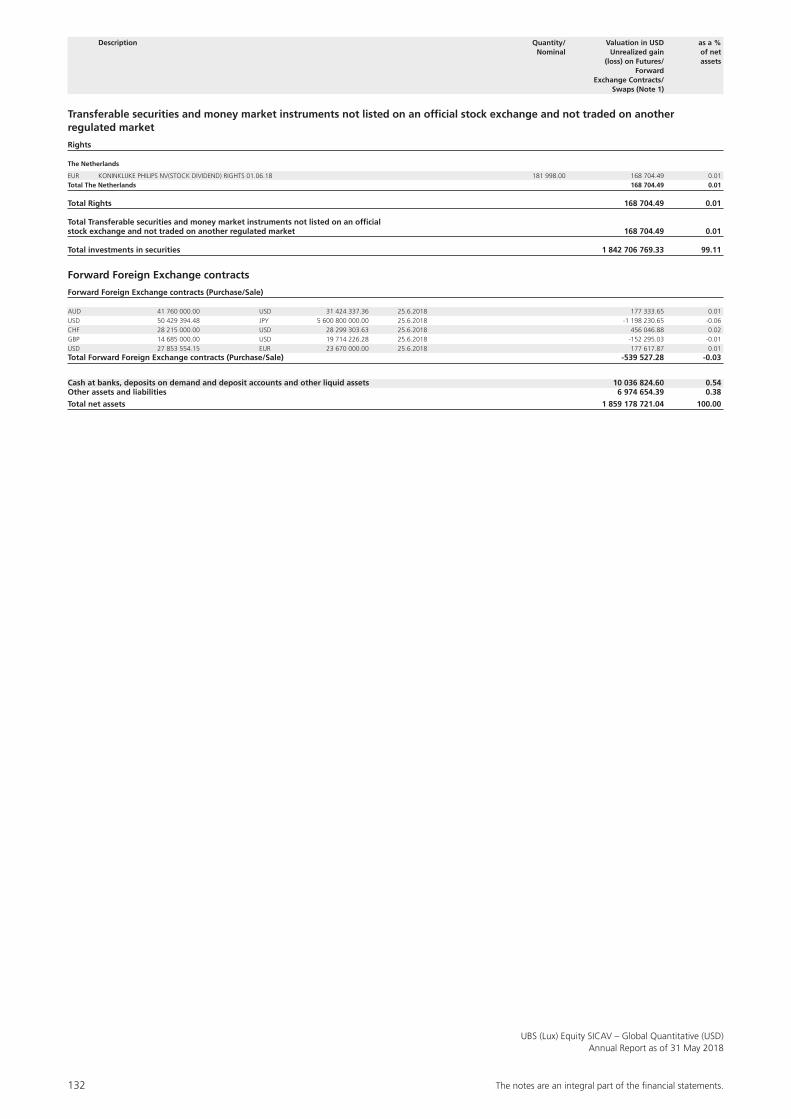
132 The notes are an integral part of the fi nancial statements.
UBS (Lux) Equity SICAV – Global Quantitative (USD)Annual Report as of 31 May 2018
Transferable securities and money market instruments not listed on an official stock exchange and not traded on another regulated market
Rights
The Netherlands
EUR KONINKLIJKE PHILIPS NV(STOCK DIVIDEND) RIGHTS 01.06.18 181 998.00 168 704.49 0.01Total The Netherlands 168 704.49 0.01
Total Rights 168 704.49 0.01
Total Transferable securities and money market instruments not listed on an official stock exchange and not traded on another regulated market 168 704.49 0.01
Total investments in securities 1 842 706 769.33 99.11
Forward Foreign Exchange contracts
Forward Foreign Exchange contracts (Purchase/Sale)
AUD 41 760 000.00 USD 31 424 337.36 25.6.2018 177 333.65 0.01USD 50 429 394.48 JPY 5 600 800 000.00 25.6.2018 -1 198 230.65 -0.06CHF 28 215 000.00 USD 28 299 303.63 25.6.2018 456 046.88 0.02GBP 14 685 000.00 USD 19 714 226.28 25.6.2018 -152 295.03 -0.01USD 27 853 554.15 EUR 23 670 000.00 25.6.2018 177 617.87 0.01Total Forward Foreign Exchange contracts (Purchase/Sale) -539 527.28 -0.03
Cash at banks, deposits on demand and deposit accounts and other liquid assets 10 036 824.60 0.54Other assets and liabilities 6 974 654.39 0.38
Total net assets 1 859 178 721.04 100.00
Description Quantity/ Valuation in USD as a % Nominal Unrealized gain of net (loss) on Futures/ assets Forward Exchange Contracts/ Swaps (Note 1)
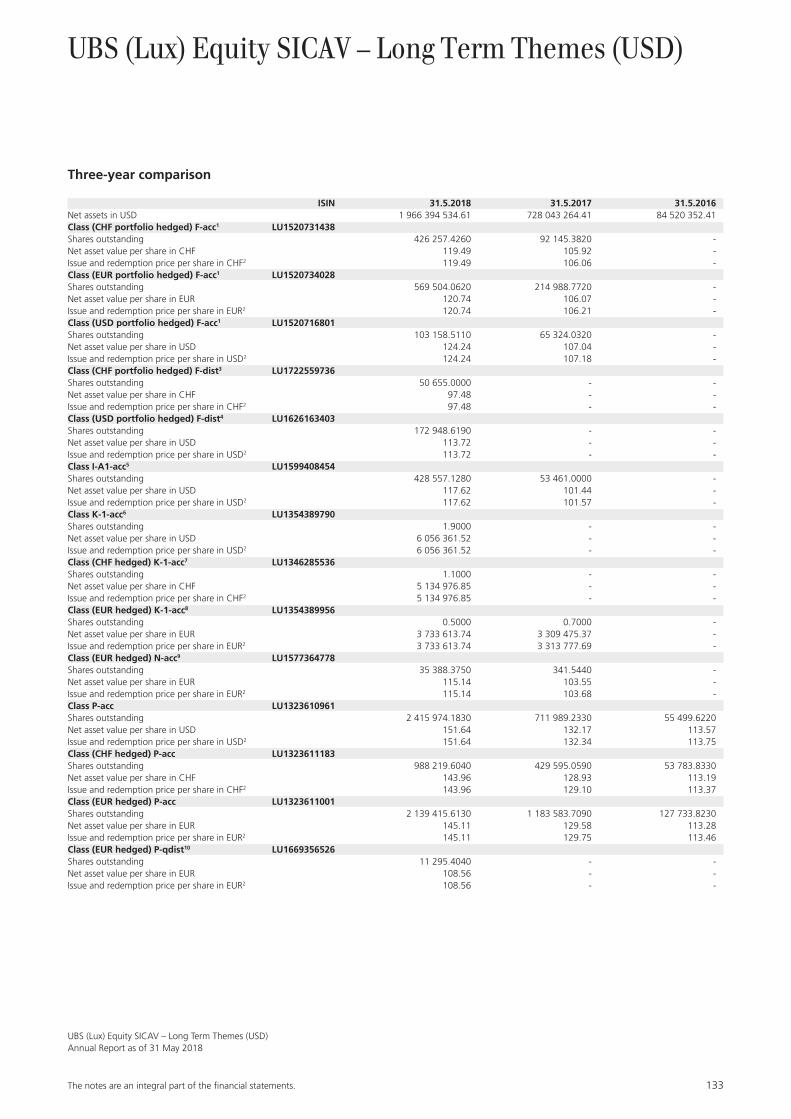
The notes are an integral part of the fi nancial statements. 133
UBS (Lux) Equity SICAV – Long Term Themes (USD)Annual Report as of 31 May 2018
UBS (Lux) Equity SICAV – Long Term Themes (USD)
Three-year comparison
ISIN 31.5.2018 31.5.2017 31.5.2016Net assets in USD 1 966 394 534.61 728 043 264.41 84 520 352.41Class (CHF portfolio hedged) F-acc1 LU1520731438Shares outstanding 426 257.4260 92 145.3820 -Net asset value per share in CHF 119.49 105.92 -Issue and redemption price per share in CHF2 119.49 106.06 -Class (EUR portfolio hedged) F-acc1 LU1520734028Shares outstanding 569 504.0620 214 988.7720 -Net asset value per share in EUR 120.74 106.07 -Issue and redemption price per share in EUR2 120.74 106.21 -Class (USD portfolio hedged) F-acc1 LU1520716801Shares outstanding 103 158.5110 65 324.0320 -Net asset value per share in USD 124.24 107.04 -Issue and redemption price per share in USD2 124.24 107.18 -Class (CHF portfolio hedged) F-dist3 LU1722559736Shares outstanding 50 655.0000 - -Net asset value per share in CHF 97.48 - -Issue and redemption price per share in CHF2 97.48 - -Class (USD portfolio hedged) F-dist4 LU1626163403Shares outstanding 172 948.6190 - -Net asset value per share in USD 113.72 - -Issue and redemption price per share in USD2 113.72 - -Class I-A1-acc5 LU1599408454Shares outstanding 428 557.1280 53 461.0000 -Net asset value per share in USD 117.62 101.44 -Issue and redemption price per share in USD2 117.62 101.57 -Class K-1-acc6 LU1354389790Shares outstanding 1.9000 - -Net asset value per share in USD 6 056 361.52 - -Issue and redemption price per share in USD2 6 056 361.52 - -Class (CHF hedged) K-1-acc7 LU1346285536Shares outstanding 1.1000 - -Net asset value per share in CHF 5 134 976.85 - -Issue and redemption price per share in CHF2 5 134 976.85 - -Class (EUR hedged) K-1-acc8 LU1354389956Shares outstanding 0.5000 0.7000 -Net asset value per share in EUR 3 733 613.74 3 309 475.37 -Issue and redemption price per share in EUR2 3 733 613.74 3 313 777.69 -Class (EUR hedged) N-acc9 LU1577364778Shares outstanding 35 388.3750 341.5440 -Net asset value per share in EUR 115.14 103.55 -Issue and redemption price per share in EUR2 115.14 103.68 -Class P-acc LU1323610961Shares outstanding 2 415 974.1830 711 989.2330 55 499.6220Net asset value per share in USD 151.64 132.17 113.57Issue and redemption price per share in USD2 151.64 132.34 113.75Class (CHF hedged) P-acc LU1323611183Shares outstanding 988 219.6040 429 595.0590 53 783.8330Net asset value per share in CHF 143.96 128.93 113.19Issue and redemption price per share in CHF2 143.96 129.10 113.37Class (EUR hedged) P-acc LU1323611001Shares outstanding 2 139 415.6130 1 183 583.7090 127 733.8230Net asset value per share in EUR 145.11 129.58 113.28Issue and redemption price per share in EUR2 145.11 129.75 113.46Class (EUR hedged) P-qdist10 LU1669356526Shares outstanding 11 295.4040 - -Net asset value per share in EUR 108.56 - -Issue and redemption price per share in EUR2 108.56 - -

134 The notes are an integral part of the fi nancial statements.
UBS (Lux) Equity SICAV – Long Term Themes (USD)Annual Report as of 31 May 2018
ISIN 31.5.2018 31.5.2017 31.5.2016
Class Q-acc LU1323611266Shares outstanding 1 469 355.4120 599 534.2030 125 828.4190Net asset value per share in USD 154.46 133.58 113.89Issue and redemption price per share in USD2 154.46 133.75 114.07Class (CHF hedged) Q-acc LU1323611423Shares outstanding 1 473 103.9510 901 456.0250 170 098.6440Net asset value per share in CHF 146.61 130.29 113.49Issue and redemption price per share in CHF2 146.61 130.46 113.67Class (EUR hedged) Q-acc LU1323611340Shares outstanding 1 795 185.9630 760 006.7120 149 503.5470Net asset value per share in EUR 147.81 130.96 113.59Issue and redemption price per share in EUR2 147.81 131.13 113.77Class (GBP hedged) Q-acc LU1340049755Shares outstanding 455 215.5470 235 144.8450 20 121.3080Net asset value per share in GBP 150.16 131.92 113.80Issue and redemption price per share in GBP2 150.16 132.09 113.98
1 First NAV: 14.12.2016 2 See note 1 3 First NAV: 9.1.2018 4 First NAV: 20.6.2017 5 First NAV: 5.5.2017 6 First NAV: 18.8.2017 7 First NAV: 4.12.2017 8 First NAV: 23.8.2016 9 First NAV: 24.3.201710 First NAV: 12.9.2017
Performance
Currency 2017/2018 2016/2017 2016Class (CHF portfolio hedged) F-acc CHF 12.7% - -Class (EUR portfolio hedged) F-acc EUR 13.7% - -Class (USD portfolio hedged) F-acc USD 15.9% - -Class (CHF portfolio hedged) F-dist1 CHF - - -Class (USD portfolio hedged) F-dist1 USD - - -Class I-A1-acc USD 16.0% - -Class K-1-acc1 USD - - -Class (CHF hedged) K-1-acc1 CHF - - -Class (EUR hedged) K-1-acc EUR 12.7% - -Class (EUR hedged) N-acc EUR 11.1% - -Class P-acc USD 14.6% 16.3% -Class (CHF hedged) P-acc CHF 11.5% 13.9% -Class (EUR hedged) P-acc EUR 11.8% 14.4% -Class (EUR hedged) P-qdist1 EUR - - -Class Q-acc USD 15.5% 17.3% -Class (CHF hedged) Q-acc CHF 12.4% 14.8% -Class (EUR hedged) Q-acc EUR 12.7% 15.3% -Class (GBP hedged) Q-acc GBP 13.7% 15.9% -
1 Due to the recent launch, there is no data for the calculation of the performance available.
Historical performance is no indicator of current or future performance.The performance data does not take account of any commissions and costs charged when subscribing and redeeming shares.The performance data were not audited.The subfund has no benchmark.

The notes are an integral part of the fi nancial statements. 135
UBS (Lux) Equity SICAV – Long Term Themes (USD)Annual Report as of 31 May 2018
Report of the Portfolio Manager
During the financial year, from 1 June 2017 to 31 May 2018, global equity markets rallied whilst volatility incre-ased at the beginning of 2018. All sectors except tele-communication services and consumer staples recorded positive performances as companies globally continued to expand earnings.
The subfund posted a positive performance in the finan-cial year. Stock selection in Consumer Discretionary and Information Technology contributed to performance while stock selection in Industrials and Consumer Stap-les detracted in the financial year. Energy efficiency and automation & robotics are the two largest themes in the strategy. To navigate the current market environment, we have constructed a diversified portfolio of attractively valued, high-quality companies exposed to many secular themes that create a unique investment opportunity for long-term investors despite the short-term equity market volatility that may persist.
Structure of the Securities Portfolio
Geographical Breakdown as a % of net assetsUnited States 50.38United Kingdom 9.53Japan 8.01Hong Kong 3.66France 3.22Germany 2.86Sweden 2.69Norway 2.29Indonesia 1.92Thailand 1.65India 1.54Canada 1.51Australia 1.50Denmark 1.46China 1.31Hungary 1.03Ireland 0.98The Netherlands 0.96Malaysia 0.76Total 97.26
Economic Breakdown as a % of net assetsPharmaceuticals, cosmetics & medical products 11.45Mechanical engineering & industrial equipment 7.89Finance & holding companies 7.88Internet, software & IT services 7.59Electronics & semiconductors 7.39Banks & credit institutions 6.21Retail trade, department stores 5.73Vehicles 4.31Petroleum 4.18Insurance 3.94Healthcare & social services 3.83Chemicals 3.71Environmental services & recycling 3.67Miscellaneous services 3.01Traffic & transportation 2.82Textiles, garments & leather goods 2.25Computer hardware & network equipment providers 2.24Building industry & materials 1.93Aerospace industry 1.65Miscellaneous unclassified companies 1.31Miscellaneous consumer goods 1.22Investment funds 1.09Food & soft drinks 0.80Electrical devices & components 0.58Biotechnology 0.58Total 97.26

136 The notes are an integral part of the fi nancial statements.
UBS (Lux) Equity SICAV – Long Term Themes (USD)Annual Report as of 31 May 2018
Statement of Net Assets USDAssets 31.5.2018Investments in securities, cost 1 720 471 838.56Investments in securities, unrealized appreciation (depreciation) 192 071 052.48Total investments in securities (Note 1) 1 912 542 891.04Cash at banks, deposits on demand and deposit accounts 43 203 734.79Receivable on securities sales (Note 1) 8 421 276.39Receivable on subscriptions 12 360 038.13Receivable on dividends 2 716 953.33Other receivables 197 097.76Unrealized gain (loss) on forward foreign exchange contracts (Note 1) 1 139 266.33Total Assets 1 980 581 257.77
LiabilitiesPayable on securities purchases (Note 1) -8 453 889.65Payable on redemptions -4 406 233.10Provisions for flat fee (Note 2) -1 147 910.29Provisions for taxe d’abonnement (Note 3) -150 020.13Provisions for other commissions and fees (Note 2) -28 669.99Total provisions -1 326 600.41 Total Liabilities -14 186 723.16
Net assets at the end of the financial year 1 966 394 534.61
Statement of Operations USDIncome 1.6.2017-31.5.2018Interest on liquid assets 464 853.86Dividends 20 363 133.47Income on securities lending (Note 16) 675 289.59Other income (Note 4) 879 506.85Total income 22 382 783.77
ExpensesFlat fee (Note 2) -19 034 496.36Taxe d’abonnement (Note 3) -721 051.56Cost on securities lending (Note 16) -270 115.82Other commissions and fees (Note 2) -283 396.53Interest on cash and bank overdraft -9 770.77Total expenses -20 318 831.04
Net income (loss) on investments 2 063 952.73
Realized gain (loss) (Note 1)Realized gain (loss) on market-priced securities without options 22 799 551.74Realized gain (loss) on forward foreign exchange contracts -12 503 043.83Realized gain (loss) on foreign exchange -7 050 378.53Total realized gain (loss) 3 246 129.38
Net realized gain (loss) of the financial year 5 310 082.11
Changes in unrealized appreciation (depreciation) (Note 1)Unrealized appreciation (depreciation) on market-priced securities without options 137 446 556.29Unrealized appreciation (depreciation) on forward foreign exchange contracts -2 727 029.57Total changes in unrealized appreciation (depreciation) 134 719 526.72
Net increase (decrease) in net assets as a result of operations 140 029 608.83

The notes are an integral part of the fi nancial statements. 137
UBS (Lux) Equity SICAV – Long Term Themes (USD)Annual Report as of 31 May 2018
Statement of Changes in Net Assets USD 1.6.2017-31.5.2018Net assets at the beginning of the financial year 728 043 264.41Subscriptions 1 343 564 739.06Redemptions -245 243 077.69Total net subscriptions (redemptions) 1 098 321 661.37Net income (loss) on investments 2 063 952.73Total realized gain (loss) 3 246 129.38Total changes in unrealized appreciation (depreciation) 134 719 526.72Net increase (decrease) in net assets as a result of operations 140 029 608.83Net assets at the end of the financial year 1 966 394 534.61
Changes in the Number of Shares outstanding
1.6.2017-31.5.2018Class (CHF portfolio hedged) F-accNumber of shares outstanding at the beginning of the financial year 92 145.3820Number of shares issued 366 170.3330Number of shares redeemed -32 058.2890Number of shares outstanding at the end of the financial year 426 257.4260Class (EUR portfolio hedged) F-accNumber of shares outstanding at the beginning of the financial year 214 988.7720Number of shares issued 393 388.1210Number of shares redeemed -38 872.8310Number of shares outstanding at the end of the financial year 569 504.0620Class (USD portfolio hedged) F-accNumber of shares outstanding at the beginning of the financial year 65 324.0320Number of shares issued 96 890.0150Number of shares redeemed -59 055.5360Number of shares outstanding at the end of the financial year 103 158.5110Class (CHF portfolio hedged) F-distNumber of shares outstanding at the beginning of the financial year 0.0000Number of shares issued 51 080.0000Number of shares redeemed -425.0000Number of shares outstanding at the end of the financial year 50 655.0000Class (USD portfolio hedged) F-distNumber of shares outstanding at the beginning of the financial year 0.0000Number of shares issued 172 948.6190Number of shares redeemed 0.0000Number of shares outstanding at the end of the financial year 172 948.6190Class I-A1-accNumber of shares outstanding at the beginning of the financial year 53 461.0000Number of shares issued 375 290.0010Number of shares redeemed -193.8730Number of shares outstanding at the end of the financial year 428 557.1280Class K-1-accNumber of shares outstanding at the beginning of the financial year 0.0000Number of shares issued 2.3000Number of shares redeemed -0.4000Number of shares outstanding at the end of the financial year 1.9000Class (CHF hedged) K-1-accNumber of shares outstanding at the beginning of the financial year 0.0000Number of shares issued 1.1000Number of shares redeemed 0.0000Number of shares outstanding at the end of the financial year 1.1000Class (EUR hedged) K-1-accNumber of shares outstanding at the beginning of the financial year 0.7000Number of shares issued 0.0000Number of shares redeemed -0.2000Number of shares outstanding at the end of the financial year 0.5000Class (EUR hedged) N-accNumber of shares outstanding at the beginning of the financial year 341.5440Number of shares issued 36 152.6100Number of shares redeemed -1 105.7790Number of shares outstanding at the end of the financial year 35 388.3750Class P-accNumber of shares outstanding at the beginning of the financial year 711 989.2330Number of shares issued 2 162 083.0510Number of shares redeemed -458 098.1010Number of shares outstanding at the end of the financial year 2 415 974.1830Class (CHF hedged) P-accNumber of shares outstanding at the beginning of the financial year 429 595.0590Number of shares issued 685 820.6320Number of shares redeemed -127 196.0870Number of shares outstanding at the end of the financial year 988 219.6040
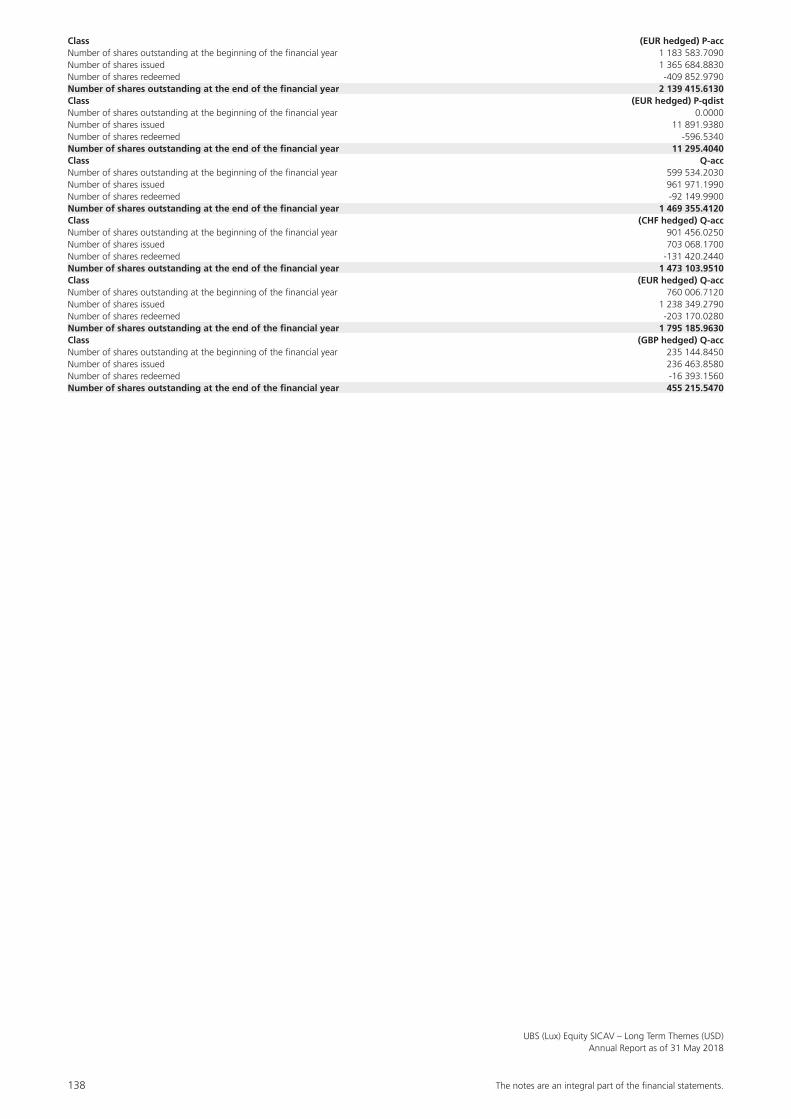
138 The notes are an integral part of the fi nancial statements.
UBS (Lux) Equity SICAV – Long Term Themes (USD)Annual Report as of 31 May 2018
Class (EUR hedged) P-accNumber of shares outstanding at the beginning of the financial year 1 183 583.7090Number of shares issued 1 365 684.8830Number of shares redeemed -409 852.9790Number of shares outstanding at the end of the financial year 2 139 415.6130Class (EUR hedged) P-qdistNumber of shares outstanding at the beginning of the financial year 0.0000Number of shares issued 11 891.9380Number of shares redeemed -596.5340Number of shares outstanding at the end of the financial year 11 295.4040Class Q-accNumber of shares outstanding at the beginning of the financial year 599 534.2030Number of shares issued 961 971.1990Number of shares redeemed -92 149.9900Number of shares outstanding at the end of the financial year 1 469 355.4120Class (CHF hedged) Q-accNumber of shares outstanding at the beginning of the financial year 901 456.0250Number of shares issued 703 068.1700Number of shares redeemed -131 420.2440Number of shares outstanding at the end of the financial year 1 473 103.9510Class (EUR hedged) Q-accNumber of shares outstanding at the beginning of the financial year 760 006.7120Number of shares issued 1 238 349.2790Number of shares redeemed -203 170.0280Number of shares outstanding at the end of the financial year 1 795 185.9630Class (GBP hedged) Q-accNumber of shares outstanding at the beginning of the financial year 235 144.8450Number of shares issued 236 463.8580Number of shares redeemed -16 393.1560Number of shares outstanding at the end of the financial year 455 215.5470

The notes are an integral part of the fi nancial statements. 139
UBS (Lux) Equity SICAV – Long Term Themes (USD)Annual Report as of 31 May 2018
Statement of Investments in Securities and other Net Assets as of 31 May 2018
Description Quantity/ Valuation in USD as a % Nominal Unrealized gain of net (loss) on Futures/ assets Forward Exchange Contracts/ Swaps (Note 1)
Transferable securities and money market instruments listed on an official stock exchange
Bearer shares
Australia
AUD SIMS METAL MANAGEMENT LTD NPV 2 439 156.00 29 437 118.83 1.50Total Australia 29 437 118.83 1.50
Canada
CAD MAGNA INTL INC COM NPV 463 393.00 29 699 733.29 1.51Total Canada 29 699 733.29 1.51
Denmark
DKK NOVO-NORDISK AS DKK0.2 SER’B’ 606 475.00 28 766 082.56 1.46Total Denmark 28 766 082.56 1.46
France
EUR ORPEA EUR2.5 144 690.00 18 967 092.33 0.96EUR SANOFI EUR2 299 680.00 22 958 454.53 1.17EUR VALEO EUR1 (POST SUBD) 337 297.00 21 387 239.13 1.09Total France 63 312 785.99 3.22
Germany
EUR KION GROUP AG NPV 270 139.00 21 928 274.53 1.12EUR SAP AG ORD NPV 304 430.00 34 235 492.13 1.74Total Germany 56 163 766.66 2.86
Hong Kong
HKD GUANGDONG INVEST HKD0.50 19 614 000.00 33 056 109.33 1.68HKD SINO BIOPHAMACEUTI HKD0.025 15 391 000.00 38 928 047.02 1.98Total Hong Kong 71 984 156.35 3.66
Hungary
HUF GEDEON RICHTER PLC HUF100 1 038 771.00 20 292 418.88 1.03Total Hungary 20 292 418.88 1.03
Indonesia
IDR BANK CENTRAL ASIA IDR62.5 23 176 000.00 37 862 229.79 1.92Total Indonesia 37 862 229.79 1.92
Ireland
USD PENTAIR PLC COM USD0.01 440 500.00 19 223 420.00 0.98Total Ireland 19 223 420.00 0.98
Japan
JPY KUBOTA CORP NPV 2 134 000.00 36 003 700.13 1.83JPY NABTESCO CORP NPV 545 800.00 17 884 375.72 0.91JPY OTSUKA HLDGS CO NPV 441 400.00 22 016 168.26 1.12JPY TAKEDA PHARMACEUTI NPV 637 600.00 26 127 251.14 1.33JPY WEST JAPAN RAILWAY NPV 769 300.00 55 428 969.59 2.82Total Japan 157 460 464.84 8.01
Malaysia
MYR GAMUDA BERHAD MYR1 17 823 400.00 14 957 325.63 0.76Total Malaysia 14 957 325.63 0.76
The Netherlands
EUR ASML HOLDING NV EUR0.09 96 360.00 18 829 324.09 0.96Total The Netherlands 18 829 324.09 0.96
Norway
NOK EQUINOR ASA NOK2.50 1 715 605.00 45 141 154.84 2.29Total Norway 45 141 154.84 2.29
Sweden
SEK ASSA ABLOY SER’B’NPV (POST SPLIT) 1 264 324.00 27 142 660.02 1.38SEK HEXAGON AB SER’B’NPV 456 719.00 25 686 145.07 1.31Total Sweden 52 828 805.09 2.69
Thailand
THB AIRPORTS OF THAILA THB1.00(ALIEN MKT) 15 117 700.00 32 371 442.66 1.65Total Thailand 32 371 442.66 1.65
United Kingdom
USD AON PLC COM USD0.01 CL A 219 200.00 30 659 504.00 1.56USD APTIV PLC COM USD0.01 344 365.00 33 575 587.50 1.71USD LIVANOVA PLC ORD GBP1.00 (DI) 333 300.00 31 346 865.00 1.59GBP SAGE GROUP GBP0.01051948 3 740 999.00 32 974 009.16 1.68GBP SPECTRIS ORD GBP0.05 1 278 088.00 47 466 196.42 2.41Total United Kingdom 176 022 162.08 8.95
United States
USD ABBOTT LABS COM 598 536.00 36 827 920.08 1.87USD AGCO CORP COM USD0.01 417 450.00 26 549 820.00 1.35USD ALNYLAM PHARMACEUTICALS INC COM 141 875.00 14 112 306.25 0.72USD AMAZON COM INC COM USD0.01 37 237.00 60 682 159.94 3.08USD CISCO SYSTEMS COM USD0.001 1 033 244.00 44 129 851.24 2.24USD CONAGRA BRANDS IN COM USD5 422 390.00 15 653 773.40 0.80USD COSTCO WHSL CORP NEW COM 109 284.00 21 664 460.16 1.10USD ECOLAB INC COM 338 711.00 48 303 575.71 2.46
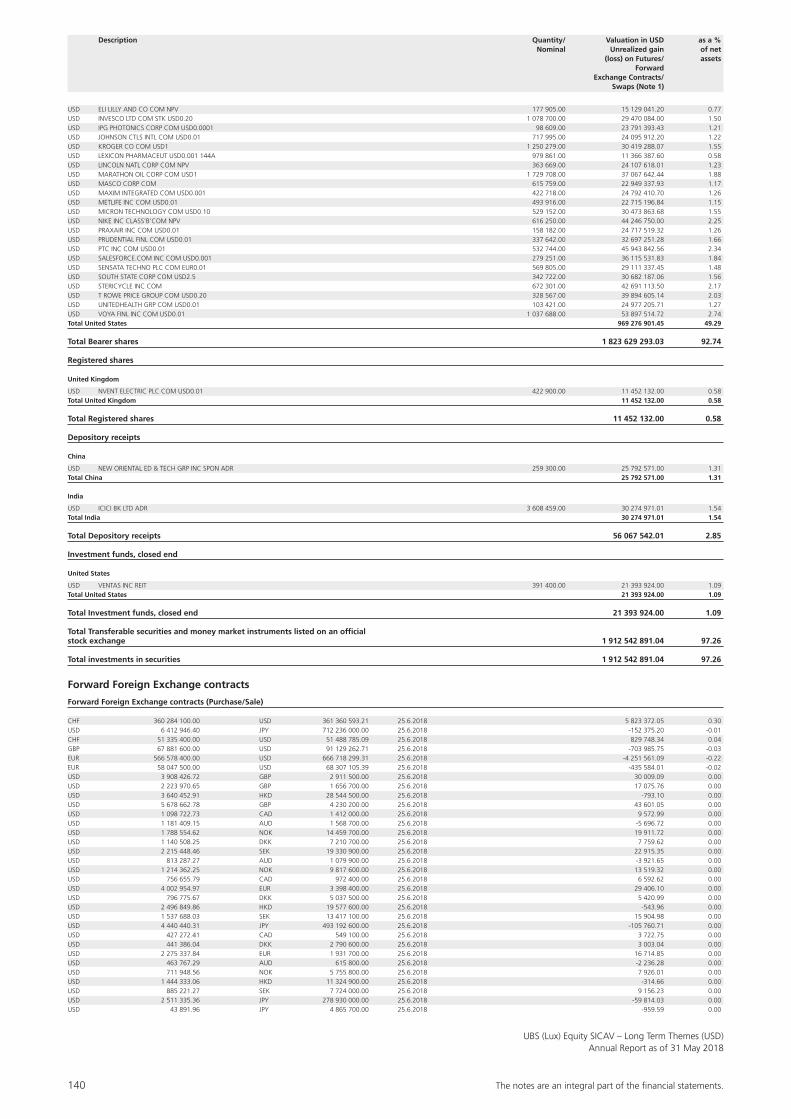
140 The notes are an integral part of the fi nancial statements.
UBS (Lux) Equity SICAV – Long Term Themes (USD)Annual Report as of 31 May 2018
USD ELI LILLY AND CO COM NPV 177 905.00 15 129 041.20 0.77USD INVESCO LTD COM STK USD0.20 1 078 700.00 29 470 084.00 1.50USD IPG PHOTONICS CORP COM USD0.0001 98 609.00 23 791 393.43 1.21USD JOHNSON CTLS INTL COM USD0.01 717 995.00 24 095 912.20 1.22USD KROGER CO COM USD1 1 250 279.00 30 419 288.07 1.55USD LEXICON PHARMACEUT USD0.001 144A 979 861.00 11 366 387.60 0.58USD LINCOLN NATL CORP COM NPV 363 669.00 24 107 618.01 1.23USD MARATHON OIL CORP COM USD1 1 729 708.00 37 067 642.44 1.88USD MASCO CORP COM 615 759.00 22 949 337.93 1.17USD MAXIM INTEGRATED COM USD0.001 422 718.00 24 792 410.70 1.26USD METLIFE INC COM USD0.01 493 916.00 22 715 196.84 1.15USD MICRON TECHNOLOGY COM USD0.10 529 152.00 30 473 863.68 1.55USD NIKE INC CLASS’B’COM NPV 616 250.00 44 246 750.00 2.25USD PRAXAIR INC COM USD0.01 158 182.00 24 717 519.32 1.26USD PRUDENTIAL FINL COM USD0.01 337 642.00 32 697 251.28 1.66USD PTC INC COM USD0.01 532 744.00 45 943 842.56 2.34USD SALESFORCE.COM INC COM USD0.001 279 251.00 36 115 531.83 1.84USD SENSATA TECHNO PLC COM EUR0.01 569 805.00 29 111 337.45 1.48USD SOUTH STATE CORP COM USD2.5 342 722.00 30 682 187.06 1.56USD STERICYCLE INC COM 672 301.00 42 691 113.50 2.17USD T ROWE PRICE GROUP COM USD0.20 328 567.00 39 894 605.14 2.03USD UNITEDHEALTH GRP COM USD0.01 103 421.00 24 977 205.71 1.27USD VOYA FINL INC COM USD0.01 1 037 688.00 53 897 514.72 2.74Total United States 969 276 901.45 49.29
Total Bearer shares 1 823 629 293.03 92.74
Registered shares
United Kingdom
USD NVENT ELECTRIC PLC COM USD0.01 422 900.00 11 452 132.00 0.58Total United Kingdom 11 452 132.00 0.58
Total Registered shares 11 452 132.00 0.58
Depository receipts
China
USD NEW ORIENTAL ED & TECH GRP INC SPON ADR 259 300.00 25 792 571.00 1.31Total China 25 792 571.00 1.31
India
USD ICICI BK LTD ADR 3 608 459.00 30 274 971.01 1.54Total India 30 274 971.01 1.54
Total Depository receipts 56 067 542.01 2.85
Investment funds, closed end
United States
USD VENTAS INC REIT 391 400.00 21 393 924.00 1.09Total United States 21 393 924.00 1.09
Total Investment funds, closed end 21 393 924.00 1.09
Total Transferable securities and money market instruments listed on an official stock exchange 1 912 542 891.04 97.26
Total investments in securities 1 912 542 891.04 97.26
Forward Foreign Exchange contracts
Forward Foreign Exchange contracts (Purchase/Sale)
CHF 360 284 100.00 USD 361 360 593.21 25.6.2018 5 823 372.05 0.30USD 6 412 946.40 JPY 712 236 000.00 25.6.2018 -152 375.20 -0.01CHF 51 335 400.00 USD 51 488 785.09 25.6.2018 829 748.34 0.04GBP 67 881 600.00 USD 91 129 262.71 25.6.2018 -703 985.75 -0.03EUR 566 578 400.00 USD 666 718 299.31 25.6.2018 -4 251 561.09 -0.22EUR 58 047 500.00 USD 68 307 105.39 25.6.2018 -435 584.01 -0.02USD 3 908 426.72 GBP 2 911 500.00 25.6.2018 30 009.09 0.00USD 2 223 970.65 GBP 1 656 700.00 25.6.2018 17 075.76 0.00USD 3 640 452.91 HKD 28 544 500.00 25.6.2018 -793.10 0.00USD 5 678 662.78 GBP 4 230 200.00 25.6.2018 43 601.05 0.00USD 1 098 722.73 CAD 1 412 000.00 25.6.2018 9 572.99 0.00USD 1 181 409.15 AUD 1 568 700.00 25.6.2018 -5 696.72 0.00USD 1 788 554.62 NOK 14 459 700.00 25.6.2018 19 911.72 0.00USD 1 140 508.25 DKK 7 210 700.00 25.6.2018 7 759.62 0.00USD 2 215 448.46 SEK 19 330 900.00 25.6.2018 22 915.35 0.00USD 813 287.27 AUD 1 079 900.00 25.6.2018 -3 921.65 0.00USD 1 214 362.25 NOK 9 817 600.00 25.6.2018 13 519.32 0.00USD 756 655.79 CAD 972 400.00 25.6.2018 6 592.62 0.00USD 4 002 954.97 EUR 3 398 400.00 25.6.2018 29 406.10 0.00USD 796 775.67 DKK 5 037 500.00 25.6.2018 5 420.99 0.00USD 2 496 849.86 HKD 19 577 600.00 25.6.2018 -543.96 0.00USD 1 537 688.03 SEK 13 417 100.00 25.6.2018 15 904.98 0.00USD 4 440 440.31 JPY 493 192 600.00 25.6.2018 -105 760.71 0.00USD 427 272.41 CAD 549 100.00 25.6.2018 3 722.75 0.00USD 441 386.04 DKK 2 790 600.00 25.6.2018 3 003.04 0.00USD 2 275 337.84 EUR 1 931 700.00 25.6.2018 16 714.85 0.00USD 463 767.29 AUD 615 800.00 25.6.2018 -2 236.28 0.00USD 711 948.56 NOK 5 755 800.00 25.6.2018 7 926.01 0.00USD 1 444 333.06 HKD 11 324 900.00 25.6.2018 -314.66 0.00USD 885 221.27 SEK 7 724 000.00 25.6.2018 9 156.23 0.00USD 2 511 335.36 JPY 278 930 000.00 25.6.2018 -59 814.03 0.00USD 43 891.96 JPY 4 865 700.00 25.6.2018 -959.59 0.00
Description Quantity/ Valuation in USD as a % Nominal Unrealized gain of net (loss) on Futures/ assets Forward Exchange Contracts/ Swaps (Note 1)

The notes are an integral part of the fi nancial statements. 141
UBS (Lux) Equity SICAV – Long Term Themes (USD)Annual Report as of 31 May 2018
Forward Foreign Exchange contracts (Continued)
Forward Foreign Exchange contracts (Purchase/Sale)
USD 34 254.41 GBP 25 500.00 25.6.2018 285.79 0.00EUR 7 737 900.00 USD 9 127 503.03 25.6.2018 -80 032.51 0.00CHF 1 113 700.00 USD 1 119 055.80 25.6.2018 15 972.87 0.00USD 34 675.45 EUR 29 400.00 25.6.2018 299.76 0.00USD 14 976.70 AUD 19 800.00 25.6.2018 -6.85 0.00USD 18 151.76 DKK 114 600.00 25.6.2018 148.93 0.00CHF 731 800.00 USD 739 230.30 25.6.2018 6 584.53 0.00EUR 1 160 000.00 USD 1 361 884.54 25.6.2018 -5 564.89 0.00USD 67 744.88 GBP 50 700.00 25.6.2018 207.26 0.00GBP 217 000.00 USD 289 897.90 25.6.2018 -831.57 0.00USD 50 748.03 EUR 43 300.00 25.6.2018 119.89 0.00USD 14 760.31 SEK 129 200.00 25.6.2018 106.30 0.00USD 21 360.88 CAD 27 500.00 25.6.2018 148.69 0.00USD 59 562.50 GBP 44 600.00 25.6.2018 150.71 0.00USD 65 442.84 JPY 7 188 700.00 25.6.2018 -821.89 0.00USD 35 056.09 HKD 274 900.00 25.6.2018 -11.21 0.00USD 742 310.49 EUR 631 100.00 25.6.2018 4 402.45 0.00USD 36 815.59 EUR 31 300.00 25.6.2018 218.34 0.00JPY 11 828 400.00 USD 108 632.04 25.6.2018 400.99 0.00USD 25 915.69 NOK 209 700.00 25.6.2018 266.17 0.00HKD 315 600.00 USD 40 261.11 25.6.2018 -1.96 0.00HKD 153 600.00 USD 19 594.76 25.6.2018 -0.95 0.00EUR 17 600.00 USD 20 552.47 25.6.2018 26.17 0.00GBP 16 600.00 USD 22 120.63 25.6.2018 -7.72 0.00JPY 4 435 200.00 USD 40 650.41 25.6.2018 232.83 0.00JPY 8 922 700.00 USD 81 780.18 25.6.2018 468.39 0.00EUR 5 406 000.00 USD 6 299 802.09 25.6.2018 21 115.17 0.00CHF 1 581 200.00 USD 1 602 347.79 25.6.2018 9 134.05 0.00JPY 17 881 200.00 USD 164 556.17 25.6.2018 270.98 0.00USD 367 489.24 CHF 362 800.00 25.6.2018 -2 258.81 0.00USD 25 388.24 EUR 21 800.00 25.6.2018 -101.22 0.00USD 7 869 779.16 EUR 6 738 000.00 25.6.2018 -8 567.21 0.00USD 5 276 086.39 CHF 5 191 000.00 25.6.2018 -14 327.38 0.00USD 1 180 096.93 GBP 886 300.00 25.6.2018 -545.88 0.00Total Forward Foreign Exchange contracts (Purchase/Sale) 1 139 266.33 0.06
Cash at banks, deposits on demand and deposit accounts and other liquid assets 43 203 734.79 2.20Other assets and liabilities 9 508 642.45 0.48
Total net assets 1 966 394 534.61 100.00
Description Quantity/ Valuation in USD as a % Nominal Unrealized gain of net (loss) on Futures/ assets Forward Exchange Contracts/ Swaps (Note 1)

142 The notes are an integral part of the fi nancial statements.
UBS (Lux) Equity SICAV – Russia (USD)Annual Report as of 31 May 2018
UBS (Lux) Equity SICAV – Russia (USD)
Three-year comparison
ISIN 31.5.2018 31.5.2017 31.5.2016Net assets in USD 185 110 287.76 161 049 377.91 142 728 606.51Class I-A1-acc LU0399028009Shares outstanding 12 950.0000 6 394.0700 11 106.0700Net asset value per share in USD 107.95 93.60 76.28Issue and redemption price per share in USD1 107.95 93.60 76.15Class P-acc LU0246274897Shares outstanding 1 401 834.1090 1 393 349.9050 1 629 269.2020Net asset value per share in USD 108.53 95.52 79.00Issue and redemption price per share in USD1 108.53 95.52 78.87Class Q-acc LU0399027704Shares outstanding 237 316.3490 236 422.9840 139 047.4360Net asset value per share in USD 133.03 115.74 94.66Issue and redemption price per share in USD1 133.03 115.74 94.50
1 See note 1
Performance
Currency 2017/2018 2016/2017 2015/2016Class I-A1-acc USD 15.3% 22.7% -1.0%Class P-acc USD 13.6% 21.1% -2.6%Class Q-acc USD 14.9% 22.5% -1.5%
Historical performance is no indicator of current or future performance.The performance data does not take account of any commissions and costs charged when subscribing and redeeming shares.The performance data were not audited.The subfund has no benchmark.
Report of the Portfolio Manager
Russian equities posted solid gains over the financial year, from 1 June 2017 to 31 May 2018. After a subdued start to 2017 amid the geopolitical overhang, the mar-ket started repricing higher, aided by increased oil prices and improving fundamentals. The start of 2018 was also tumultuous with heightened US sanctions; however this was offset by the continued support of higher oil prices.
The subfund posted a solid return during the financial year. This was driven by the strong performance of financials holdings buoyed by improved fundamentals. Similarly, the subfund’s exposure to commodity-related stocks contributed amid improved commodity prices.
Structure of the Securities Portfolio
Geographical Breakdown as a % of net assetsRussian Federation (CIS) 86.08Cyprus 4.77The Netherlands 4.51Ireland 3.15Total 98.51
Economic Breakdown as a % of net assetsPetroleum 27.37Banks & credit institutions 12.06Mining, coal & steel 10.34Finance & holding companies 9.77Internet, software & IT services 8.37Non-ferrous metals 4.67Chemicals 4.36Retail trade, department stores 4.19Miscellaneous services 3.84Telecommunications 3.28Food & soft drinks 3.27Investment funds 3.14Precious metals & stones 2.61Miscellaneous unclassified companies 1.24Total 98.51

The notes are an integral part of the fi nancial statements. 143
UBS (Lux) Equity SICAV – Russia (USD)Annual Report as of 31 May 2018
Statement of Net Assets USDAssets 31.5.2018Investments in securities, cost 172 010 264.52Investments in securities, unrealized appreciation (depreciation) 10 341 961.61Total investments in securities (Note 1) 182 352 226.13Cash at banks, deposits on demand and deposit accounts 935 162.96Receivable on securities sales (Note 1) 2 315 969.66Receivable on subscriptions 596 704.26Interest receivable on liquid assets 27.16Receivable on dividends 660 881.95Other receivables 266.70Total Assets 186 861 238.82
LiabilitiesPayable on securities purchases (Note 1) -605 645.99Payable on redemptions -951 957.26Provisions for flat fee (Note 2) -175 350.82Provisions for taxe d’abonnement (Note 3) -15 416.93Provisions for other commissions and fees (Note 2) -2 580.06Total provisions -193 347.81 Total Liabilities -1 750 951.06
Net assets at the end of the financial year 185 110 287.76
Statement of Operations USDIncome 1.6.2017-31.5.2018Interest on liquid assets 7 080.64Dividends 7 097 495.20Income on securities lending (Note 16) 342 313.40Other income (Note 4) 252 616.94Total income 7 699 506.18
ExpensesFlat fee (Note 2) -3 612 901.17Taxe d’abonnement (Note 3) -85 611.55Cost on securities lending (Note 16) -136 925.35Other commissions and fees (Note 2) -33 328.71Interest on cash and bank overdraft -207.66Total expenses -3 868 974.44
Net income (loss) on investments 3 830 531.74
Realized gain (loss) (Note 1)Realized gain (loss) on market-priced securities without options 11 325 770.02Realized gain (loss) on foreign exchange -189.02Total realized gain (loss) 11 325 581.00
Net realized gain (loss) of the financial year 15 156 112.74
Changes in unrealized appreciation (depreciation) (Note 1)Unrealized appreciation (depreciation) on market-priced securities without options 4 952 487.88Total changes in unrealized appreciation (depreciation) 4 952 487.88
Net increase (decrease) in net assets as a result of operations 20 108 600.62

144 The notes are an integral part of the fi nancial statements.
UBS (Lux) Equity SICAV – Russia (USD)Annual Report as of 31 May 2018
Statement of Changes in Net Assets USD 1.6.2017-31.5.2018Net assets at the beginning of the financial year 161 049 377.91Subscriptions 151 945 449.98Redemptions -147 993 140.75Total net subscriptions (redemptions) 3 952 309.23Net income (loss) on investments 3 830 531.74Total realized gain (loss) 11 325 581.00Total changes in unrealized appreciation (depreciation) 4 952 487.88Net increase (decrease) in net assets as a result of operations 20 108 600.62Net assets at the end of the financial year 185 110 287.76
Changes in the Number of Shares outstanding
1.6.2017-31.5.2018Class I-A1-accNumber of shares outstanding at the beginning of the financial year 6 394.0700Number of shares issued 10 880.0000Number of shares redeemed -4 324.0700Number of shares outstanding at the end of the financial year 12 950.0000Class P-accNumber of shares outstanding at the beginning of the financial year 1 393 349.9050Number of shares issued 1 272 241.9470Number of shares redeemed -1 263 757.7430Number of shares outstanding at the end of the financial year 1 401 834.1090Class Q-accNumber of shares outstanding at the beginning of the financial year 236 422.9840Number of shares issued 74 212.9950Number of shares redeemed -73 319.6300Number of shares outstanding at the end of the financial year 237 316.3490

The notes are an integral part of the fi nancial statements. 145
UBS (Lux) Equity SICAV – Russia (USD)Annual Report as of 31 May 2018
Statement of Investments in Securities and other Net Assets as of 31 May 2018
Description Quantity/ Valuation in USD as a % Nominal Unrealized gain of net (loss) on Futures/ assets Forward Exchange Contracts/ Swaps (Note 1)
Transferable securities and money market instruments listed on an official stock exchange
Bearer shares
The Netherlands
USD YANDEX N.V. COM USD0.01 CL ‘A’ 248 900.00 8 343 128.00 4.51Total The Netherlands 8 343 128.00 4.51
Russian Federation (CIS)
USD INTER RAO UES JSC RUB0.1 108 502 803.00 7 102 701.99 3.83Total Russian Federation (CIS) 7 102 701.99 3.83
Total Bearer shares 15 445 829.99 8.34
Preference shares
Russian Federation (CIS)
USD SBERBANK PAO 1 366 287.00 4 296 534.04 2.32Total Russian Federation (CIS) 4 296 534.04 2.32
Total Preference shares 4 296 534.04 2.32
Depository receipts
Cyprus
USD TCS GROUP HLDG PLC GDR EACH REPR 1 A REGS 432 724.00 8 827 569.60 4.77Total Cyprus 8 827 569.60 4.77
Russian Federation (CIS)
USD GAZPROM NEFT SPON ADR 287 576.00 7 390 703.20 3.99USD GAZPROM SPON ADR EA REP 2 ORD SHS 1 475 507.00 6 701 752.79 3.62USD LENTA LTD GDR EACH 5 REPR 1 ORD REGS 356 751.00 2 033 480.70 1.10USD MAGNIT GDR(5 GDRS REP 1 ORD) REGS 205 071.00 4 123 977.81 2.23USD MAIL.RU GROUP LTD-GDR REGS 251 913.00 7 144 252.68 3.86USD MOBILE TELESYSTEMS OJSC SPONSORED ADR 403 200.00 3 862 656.00 2.09USD NOVATEK OAO GDR EACH REPR 10 SHS’REG S’ 24 305.00 3 502 350.50 1.89USD NOVOLIPETSK STEEL GDR EACH REP 10 RUB1 ‘REGS’ 336 486.00 8 849 581.80 4.78USD OIL CO LUKOIL PJSC ADR EACH REPR 1 ORD RUB0.02 261 581.00 17 457 915.94 9.43USD ROSNEFT OJSC GDR EACH REPR 1 ORD ‘REGS’ 1 573 330.00 9 597 313.00 5.18USD SEVERSTAL GDR EACH REPR 1 ORD ‘REGS’ 263 931.00 4 196 502.90 2.27USD SISTEMA PJSFC GDR EACH REPR 20 ORD ‘REGS’ 655 804.00 2 215 305.92 1.20USD TATNEFT PJSC ADS (REPR 6 ORD RUB0.1)-ADR 84 070.00 5 380 480.00 2.91USD VTB BANK PJSC GDR REP 2000 ORD ‘REGS’ 2 820 613.00 4 476 312.83 2.42USD X 5 RETAIL GROUP NV-REGS GDR 201 773.00 5 730 353.20 3.09Total Russian Federation (CIS) 92 662 939.27 50.06
Total Depository receipts 101 490 508.87 54.83
Total Transferable securities and money market instruments listed on an official stock exchange 121 232 872.90 65.49
Transferable securities and money market instruments traded on another regulated market
Bearer shares
Russian Federation (CIS)
USD ALROSA ZAO RUB0.50(RUB) 5 692 829.00 8 065 087.77 4.35USD MAGNIT RUB0.01 23 485.00 1 925 824.63 1.04USD MAGNITOGORSK IRON RUB1(RUB) 7 737 263.00 6 093 976.66 3.29USD MICEX-RTS RUB1(RUB) 3 180 827.00 5 745 928.59 3.11USD POLYUS GOLD OAO RUB1 80 355.00 4 834 643.59 2.61USD SBERBANK PAO 3 798 276.00 13 550 756.05 7.32USD UNIPRO PJSC RUB0.4(RUB) 50 294 500.00 2 294 938.04 1.24Total Russian Federation (CIS) 42 511 155.33 22.96
Total Bearer shares 42 511 155.33 22.96
Preference shares
Russian Federation (CIS)
USD SURGUTNEFTEGAZ RUB1 PRF(RUB) 8 467 821.00 4 141 018.50 2.24Total Russian Federation (CIS) 4 141 018.50 2.24
Total Preference shares 4 141 018.50 2.24
Total Transferable securities and money market instruments traded on another regulated market 46 652 173.83 25.20

146 The notes are an integral part of the fi nancial statements.
UBS (Lux) Equity SICAV – Russia (USD)Annual Report as of 31 May 2018
Transferable securities and money market instruments not listed on an official stock exchange and not traded on another regulated market
Depository receipts
Russian Federation (CIS)
USD MMC NORILSK NICKEL ADR EACH REPR 1/10 SHARE (S 485 723.00 8 645 869.40 4.67Total Russian Federation (CIS) 8 645 869.40 4.67
Total Depository receipts 8 645 869.40 4.67
Total Transferable securities and money market instruments not listed on an official stock exchange and not traded on another regulated market 8 645 869.40 4.67
UCITS/Other UCIs in accordance with Article 41 (1) e) of the amended Luxembourg law of 17 December 2010
Investment funds, open end
Ireland
USD UBS (IRL) SELECT MONEY MARKET FUND-USD-S-DIST 582.13 5 821 310.00 3.15Total Ireland 5 821 310.00 3.15
Total Investment funds, open end 5 821 310.00 3.15
Total UCITS/Other UCIs in accordance with Article 41 (1) e) of the amended Luxembourg law of 17 December 2010 5 821 310.00 3.15
Total investments in securities 182 352 226.13 98.51
Cash at banks, deposits on demand and deposit accounts and other liquid assets 935 162.96 0.51Other assets and liabilities 1 822 898.67 0.98
Total net assets 185 110 287.76 100.00
Description Quantity/ Valuation in USD as a % Nominal Unrealized gain of net (loss) on Futures/ assets Forward Exchange Contracts/ Swaps (Note 1)

The notes are an integral part of the fi nancial statements. 147
UBS (Lux) Equity SICAV – Small Caps Europe (EUR)Annual Report as of 31 May 2018
UBS (Lux) Equity SICAV – Small Caps Europe (EUR)
Three-year comparison
ISIN 31.5.2018 31.5.2017 31.5.2016Net assets in EUR 285 205 532.64 332 314 023.59 506 478 904.10Class F-acc LU0946084497Shares outstanding 10 700.4020 8 364.3190 20 619.6870Net asset value per share in EUR 420.56 376.08 332.72Issue and redemption price per share in EUR1 420.56 377.70 332.72Class I-B-acc LU0399031052Shares outstanding 253 848.9930 257 220.9440 264 336.0340Net asset value per share in EUR 260.30 231.31 203.35Issue and redemption price per share in EUR1 260.30 232.30 203.35Class K-1-acc LU0399003945Shares outstanding 1.9000 1.9000 4.3000Net asset value per share in EUR 6 762 346.94 6 069 528.33 5 389 241.90Issue and redemption price per share in EUR1 6 762 346.94 6 095 627.30 5 389 241.90Class P-acc LU0198839143Shares outstanding 220 267.3740 402 076.1580 965 263.6600Net asset value per share in EUR 395.34 358.03 320.77Issue and redemption price per share in EUR1 395.34 359.57 320.77Class (USD hedged) P-acc LU1056569806Shares outstanding 76 568.2020 110 318.4180 208 069.3830Net asset value per share in USD 148.36 131.41 115.68Issue and redemption price per share in USD1 148.36 131.98 115.68Class Q-acc LU0358729738Shares outstanding 50 469.3670 35 805.7910 47 220.4070Net asset value per share in EUR 149.11 133.84 118.84Issue and redemption price per share in EUR1 149.11 134.42 118.84Class (USD hedged) Q-acc LU1240787686Shares outstanding 2 297.3920 1 815.2350 11 161.3510Net asset value per share in USD 127.02 111.51 97.26Issue and redemption price per share in USD1 127.02 111.99 97.26Class U-X-acc LU0399031482Shares outstanding 8 010.1140 8 939.2660 8 964.5730Net asset value per share in EUR 12 133.73 10 774.74 9 466.05Issue and redemption price per share in EUR1 12 133.73 10 821.07 9 466.05
1 See note 1
Performance
Currency 2017/2018 2016/2017 2015/2016Class F-acc EUR 11.3% 13.5% -4.4%Class I-B-acc EUR 12.5% 13.7% -4.2%Class K-1-acc EUR 10.9% 13.1% -4.7%Class P-acc EUR 9.9% 12.1% -5.6%Class (USD hedged) P-acc USD 12.4% 14.1% -6.1%Class Q-acc EUR 10.9% 13.1% -4.8%Class (USD hedged) Q-acc USD 13.4% 15.1% -Class U-X-acc EUR 12.6% 13.8% -
Historical performance is no indicator of current or future performance.The performance data does not take account of any commissions and costs charged when subscribing and redeeming shares.The performance data were not audited.The subfund has no benchmark.

148 The notes are an integral part of the fi nancial statements.
UBS (Lux) Equity SICAV – Small Caps Europe (EUR)Annual Report as of 31 May 2018
Report of the Portfolio Manager
In the financial year, from 1 June 2017 to 31 May 2018, European small caps posted a healthy upward movement mostly driven by earnings growth. Other positive drivers were strong global growth, the approval of significant US tax reforms, Macron’s win in the French election, the ECB decision to extend its asset purchases and lively M&A activ-ity. Key risk factors were Fed rate hikes plus the decision to cut its balance sheet, the strengthening euro, the loom-ing risk of a ‘hard Brexit’ and the persistent geopolitical tensions.
The value of the subfund grew in the reporting year, mostly due to the stock selection. Our mix of stocks with intrinsic value, growth and quality worked well and we benefited from holding stakes in companies such as Wirecard, Aker BP and Bakkafrost. Overall, differences in valuation still per-sist, therefore we see good opportunities for finding stocks with attractive risk/return potential.
Structure of the Securities Portfolio
Geographical Breakdown as a % of net assetsUnited Kingdom 24.05Germany 11.54France 11.39Ireland 10.53Switzerland 7.58Italy 5.94Sweden 5.22The Netherlands 4.67Norway 3.62Belgium 3.18Luxembourg 2.32Faroe Islands 1.96Finland 1.38Austria 1.21Isle of Man 1.04Spain 0.87Jersey 0.81Denmark 0.74Total 98.05
Economic Breakdown as a % of net assetsFinance & holding companies 15.72Telecommunications 8.21Real Estate 6.71Banks & credit institutions 6.54Internet, software & IT services 6.46Building industry & materials 5.75Miscellaneous services 5.17Petroleum 4.92Pharmaceuticals, cosmetics & medical products 4.62Mechanical engineering & industrial equipment 4.04Insurance 3.60Electronics & semiconductors 2.83Miscellaneous unclassified companies 2.44Healthcare & social services 2.19Forestry, paper & pulp products 2.00Agriculture & fishery 1.96Miscellaneous consumer goods 1.84Investment funds 1.67Graphic design, publishing & media 1.60Aerospace industry 1.48Miscellaneous trading companies 1.30Chemicals 1.22Food & soft drinks 1.17Textiles, garments & leather goods 1.07Retail trade, department stores 0.93Energy & water supply 0.80Biotechnology 0.74Electrical devices & components 0.62Computer hardware & network equipment providers 0.45Total 98.05

The notes are an integral part of the fi nancial statements. 149
UBS (Lux) Equity SICAV – Small Caps Europe (EUR)Annual Report as of 31 May 2018
Statement of Net Assets EURAssets 31.5.2018Investments in securities, cost 219 257 025.77Investments in securities, unrealized appreciation (depreciation) 60 392 623.62Total investments in securities (Note 1) 279 649 649.39Cash at banks, deposits on demand and deposit accounts 2 473 967.99Receivable on securities sales (Note 1) 3 851 172.88Receivable on subscriptions 2 472 296.92Interest receivable on liquid assets 850.39Receivable on dividends 313 795.58Other receivables 684 733.06Unrealized gain (loss) on forward foreign exchange contracts (Note 1) 62 624.30Total Assets 289 509 090.51
LiabilitiesPayable on securities purchases (Note 1) -3 806 547.93Payable on redemptions -384 133.02Provisions for flat fee (Note 2) -94 883.47Provisions for taxe d’abonnement (Note 3) -12 651.60Provisions for other commissions and fees (Note 2) -5 341.85Total provisions -112 876.92Total Liabilities -4 303 557.87
Net assets at the end of the financial year 285 205 532.64
Statement of Operations EURIncome 1.6.2017-31.5.2018Interest on liquid assets 2 591.17Dividends 5 415 786.91Income on securities lending (Note 16) 334 620.95Other income (Note 4) 257 300.84Total income 6 010 299.87
ExpensesFlat fee (Note 2) -1 964 552.72Taxe d’abonnement (Note 3) -64 827.27Cost on securities lending (Note 16) -133 848.37Other commissions and fees (Note 2) -51 977.96Interest on cash and bank overdraft -24 839.91Total expenses -2 240 046.23
Net income (loss) on investments 3 770 253.64
Realized gain (loss) (Note 1)Realized gain (loss) on market-priced securities without options 23 659 558.30Realized gain (loss) on forward foreign exchange contracts -535 362.64Realized gain (loss) on foreign exchange 193 343.22Total realized gain (loss) 23 317 538.88
Net realized gain (loss) of the financial year 27 087 792.52
Changes in unrealized appreciation (depreciation) (Note 1)Unrealized appreciation (depreciation) on market-priced securities without options 2 084 340.93Unrealized appreciation (depreciation) on forward foreign exchange contracts 164 493.18Total changes in unrealized appreciation (depreciation) 2 248 834.11
Net increase (decrease) in net assets as a result of operations 29 336 626.63

150 The notes are an integral part of the fi nancial statements.
UBS (Lux) Equity SICAV – Small Caps Europe (EUR)Annual Report as of 31 May 2018
Statement of Changes in Net Assets EUR 1.6.2017-31.5.2018Net assets at the beginning of the financial year 332 314 023.59Subscriptions 49 472 018.58Redemptions -125 917 136.16Total net subscriptions (redemptions) -76 445 117.58Net income (loss) on investments 3 770 253.64Total realized gain (loss) 23 317 538.88Total changes in unrealized appreciation (depreciation) 2 248 834.11Net increase (decrease) in net assets as a result of operations 29 336 626.63Net assets at the end of the financial year 285 205 532.64
Changes in the Number of Shares outstanding
1.6.2017-31.5.2018Class F-accNumber of shares outstanding at the beginning of the financial year 8 364.3190Number of shares issued 3 681.0000Number of shares redeemed -1 344.9170Number of shares outstanding at the end of the financial year 10 700.4020Class I-B-accNumber of shares outstanding at the beginning of the financial year 257 220.9440Number of shares issued 0.0000Number of shares redeemed -3 371.9510Number of shares outstanding at the end of the financial year 253 848.9930Class K-1-accNumber of shares outstanding at the beginning of the financial year 1.9000Number of shares issued 0.0000Number of shares redeemed 0.0000Number of shares outstanding at the end of the financial year 1.9000Class P-accNumber of shares outstanding at the beginning of the financial year 402 076.1580Number of shares issued 111 654.5460Number of shares redeemed -293 463.3300Number of shares outstanding at the end of the financial year 220 267.3740Class (USD hedged) P-accNumber of shares outstanding at the beginning of the financial year 110 318.4180Number of shares issued 21 628.0740Number of shares redeemed -55 378.2900Number of shares outstanding at the end of the financial year 76 568.2020Class Q-accNumber of shares outstanding at the beginning of the financial year 35 805.7910Number of shares issued 22 482.0680Number of shares redeemed -7 818.4920Number of shares outstanding at the end of the financial year 50 469.3670Class (USD hedged) Q-accNumber of shares outstanding at the beginning of the financial year 1 815.2350Number of shares issued 1 014.1570Number of shares redeemed -532.0000Number of shares outstanding at the end of the financial year 2 297.3920Class U-X-accNumber of shares outstanding at the beginning of the financial year 8 939.2660Number of shares issued 0.0000Number of shares redeemed -929.1520Number of shares outstanding at the end of the financial year 8 010.1140

The notes are an integral part of the fi nancial statements. 151
UBS (Lux) Equity SICAV – Small Caps Europe (EUR)Annual Report as of 31 May 2018
Statement of Investments in Securities and other Net Assets as of 31 May 2018
Description Quantity/ Valuation in EUR as a % Nominal Unrealized gain of net (loss) on Futures/ assets Forward Exchange Contracts/ Swaps (Note 1)
Transferable securities and money market instruments listed on an official stock exchange
Bearer shares
Austria
CHF AMS AG NPV (BR) 46 428.00 3 443 748.36 1.21Total Austria 3 443 748.36 1.21
Belgium
EUR GALAPAGOS NV NPV 25 818.00 2 244 100.56 0.79EUR KBC ANCORA NPV (POST SPLIT) 72 861.00 3 494 413.56 1.22EUR ONTEX GROUP NV NPV 142 823.00 3 327 775.90 1.17Total Belgium 9 066 290.02 3.18
Denmark
DKK BAVARIAN NORDIC DKK10 80 539.00 2 120 772.33 0.74Total Denmark 2 120 772.33 0.74
Faroe Islands
NOK P/F BAKKAFROST DKK1 124 378.00 5 581 161.41 1.96Total Faroe Islands 5 581 161.41 1.96
Finland
EUR HUHTAMAKI OYJ NPV’I’ 13 346.00 465 775.40 0.16EUR UPONOR OYJ NPV 248 583.00 3 472 704.51 1.22Total Finland 3 938 479.91 1.38
France
EUR NEXITY EUR5 85 385.00 4 252 173.00 1.49EUR ORPEA EUR2.5 55 714.00 6 256 682.20 2.19EUR RUBIS EUR1.25(POST SPLIT) 112 465.00 6 787 262.75 2.38EUR SARTORIUS STEDIM B EUR0.20 (POST SUBD) 35 268.00 2 990 726.40 1.05EUR SOPRA STERIA GROUP EUR1.00 20 826.00 3 550 833.00 1.24EUR TELEPERFORMANCE EUR2.50 64 054.00 8 660 100.80 3.04Total France 32 497 778.15 11.39
Germany
EUR AAREAL BANK AG NPV 147 585.00 5 413 417.80 1.90EUR DEUTSCHE PFAND AG NPV 415 970.00 5 428 408.50 1.90EUR DWS GROUP SE NPV 123 531.00 3 381 661.13 1.19EUR VOLTABOX AG NPV (REGD) 77 848.00 1 774 934.40 0.62EUR WIRECARD AG NPV 41 894.00 5 536 292.10 1.94Total Germany 21 534 713.93 7.55
Ireland
GBP DCC ORD EUR0.25 64 159.00 5 276 856.38 1.85EUR HIBERNIA REIT PLC ORD EUR0.10 3 016 298.00 4 470 153.64 1.57GBP KEYWORDS STUDIOS P ORD GBP0.01 138 614.00 2 692 514.43 0.94EUR KINGSPAN GROUP ORD EUR0.13(DUBLIN LISTING) 142 396.00 5 638 881.60 1.98EUR PERMANENT TSB GROU ORD EUR0.50 854 285.00 1 512 084.45 0.53EUR SMURFIT KAPPA GRP ORD EUR0.001 160 762.00 5 690 974.80 1.99Total Ireland 25 281 465.30 8.86
Isle of Man
GBP GVC HLDGS PLC ORD EUR0.01 255 154.00 2 958 044.39 1.04Total Isle of Man 2 958 044.39 1.04
Italy
EUR BANCA GENERALI SPA 116 861.00 2 430 708.80 0.85EUR CREDITO EMILIANO EUR1 301 747.00 1 822 551.88 0.64EUR FINECOBANK SPA EUR0.33 481 506.00 4 118 802.32 1.45EUR INFRASTRUTTURE WIR NPV 1 368 987.00 8 563 013.69 3.00Total Italy 16 935 076.69 5.94
Jersey
GBP JTC PLC ORD GBP0.01 531 340.00 2 307 697.29 0.81Total Jersey 2 307 697.29 0.81
Luxembourg
EUR EUROFINS SCIENTIFI EUR0.10 6 497.00 2 854 781.80 1.00EUR STABILUS S.A. EUR0.01 43 645.00 3 766 563.50 1.32Total Luxembourg 6 621 345.30 2.32
The Netherlands
EUR ASR NEDERLAND N.V. EUR0.16 241 774.00 8 752 218.80 3.07Total The Netherlands 8 752 218.80 3.07
Norway
NOK AKER BP ASA NOK1 329 925.00 10 327 976.96 3.62Total Norway 10 327 976.96 3.62
Spain
EUR INDRA SISTEMAS SA EUR0.20 SER ‘A’ 228 143.00 2 475 351.55 0.87Total Spain 2 475 351.55 0.87
Sweden
SEK AHLSELL AB NPV 711 088.00 3 700 550.05 1.30SEK BOOZT AB NPV (WI) 420 024.00 3 055 684.96 1.07

152 The notes are an integral part of the fi nancial statements.
UBS (Lux) Equity SICAV – Small Caps Europe (EUR)Annual Report as of 31 May 2018
SEK SCANDI STANDARD AB NPV 587 605.00 3 345 775.45 1.17SEK THULE GROUP AB NPV 225 154.00 4 782 962.63 1.68Total Sweden 14 884 973.09 5.22
Switzerland
CHF LANDIS & GYR GROUP CHF10 (REGD) 46 588.00 2 920 953.77 1.02Total Switzerland 2 920 953.77 1.02
United Kingdom
GBP ABCAM ORD GBP0.002 188 117.00 2 605 467.59 0.91GBP ALFA FINANCIAL SOF ORD GBP0.001 (WI) 557 773.00 2 002 854.47 0.70GBP ASCENTIAL PLC ORD GBP0.10 799 799.00 3 931 343.23 1.38GBP ASHTEAD GROUP ORD GBP0.10 145 778.00 3 873 607.51 1.36GBP BELLWAY GBP0.125 100 028.00 3 743 465.38 1.31GBP BOVIS HOMES GROUP ORD GBP0.50 211 932.00 3 042 818.59 1.07GBP CVS GROUP PLC ORD GBP0.002 364 929.00 4 014 366.71 1.41GBP DECHRA PHARMA ORD GBP0.01 69 092.00 2 198 996.46 0.77GBP DIXONS CARPHONE ORD GBP0.001 1 247 888.00 2 631 653.40 0.92GBP FDM GROUP PLC ORD GBP0.01 417 335.00 4 852 508.82 1.70GBP MELROSE INDUST PLC ORD GBP0.0685714 2 846 634.00 7 658 169.74 2.69GBP POLYPIPE GROUP PLC ORDS GBP0.001 (WI) 901 372.00 3 976 457.83 1.39GBP PROVIDENT FINL ORD GBX20.727272 213 680.00 1 562 822.24 0.55GBP RIGHTMOVE ORD GBP0.01 64 019.00 3 584 665.18 1.26GBP ROTORK ORD GBP0.005 1 218 452.00 4 634 959.93 1.62GBP SMART METERING SYS ORD GBP0.01 241 603.00 2 285 923.90 0.80GBP TP ICAP PLC ORD GBP0.25 582 426.00 2 781 865.51 0.98GBP TULLOW OIL ORD GBP0.10 1 285 311.00 3 699 567.54 1.30GBP ULTRA ELECTRONIC ORD GBP0.05 229 911.00 4 227 420.71 1.48Total United Kingdom 67 308 934.74 23.60
Total Bearer shares 238 956 981.99 83.78
Other shares
The Netherlands
EUR VAN LANSCHOT KEMPE CVA REP CLASS ‘A’ EUR1 181 705.00 4 551 710.25 1.60Total The Netherlands 4 551 710.25 1.60
Total Other shares 4 551 710.25 1.60
Registered shares
Germany
EUR LEG IMMOBILIEN AG NPV 72 816.00 6 827 228.16 2.39EUR STROEER SE&CO KGAA NPV 83 050.00 4 563 597.50 1.60Total Germany 11 390 825.66 3.99
Switzerland
CHF DUFRY AG CHF5 (REGD) 22 560.00 2 643 137.28 0.93CHF GAM HOLDING AG CHF0.05 (REGD) 222 971.00 2 862 008.68 1.00CHF SFS GROUP AG CHF0.1 41 935.00 4 056 200.78 1.42CHF SUNRISE COMMUNICA CHF1 50 871.00 3 566 285.78 1.25CHF TECAN GROUP AG CHF0.10(REGD) 15 415.00 3 129 819.33 1.10CHF VAT GROUP AG CHF0.10 19 947.00 2 454 325.18 0.86Total Switzerland 18 711 777.03 6.56
United Kingdom
GBP CODEMASTERS GROUP ORD GBP0.01 561 000.00 1 279 010.79 0.45Total United Kingdom 1 279 010.79 0.45
Total Registered shares 31 381 613.48 11.00
Total Transferable securities and money market instruments listed on an official stock exchange 274 890 305.72 96.38
UCITS/Other UCIs in accordance with Article 41 (1) e) of the amended Luxembourg law of 17 December 2010
Investment funds, open end
Ireland
GBP UBS (IRL) SELECT MONEY MARKET FUND-GBP-S-DIST 417.51 4 759 333.67 1.67EUR UBS (IRL) SELECT MONEY MARKET FUND-EUR-S-DIST 0.00 10.00 0.00Total Ireland 4 759 343.67 1.67
Total Investment funds, open end 4 759 343.67 1.67
Total UCITS/Other UCIs in accordance with Article 41 (1) e) of the amended Luxembourg law of 17 December 2010 4 759 343.67 1.67
Total investments in securities 279 649 649.39 98.05
Forward Foreign Exchange contracts
Forward Foreign Exchange contracts (Purchase/Sale)
USD 11 547 300.00 EUR 9 812 916.14 25.6.2018 62 967.80 0.02USD 87 800.00 EUR 75 434.87 25.6.2018 -343.50 0.00Total Forward Foreign Exchange contracts (Purchase/Sale) 62 624.30 0.02
Cash at banks, deposits on demand and deposit accounts and other liquid assets 2 473 967.99 0.87Other assets and liabilities 3 019 290.96 1.06
Total net assets 285 205 532.64 100.00
Description Quantity/ Valuation in EUR as a % Nominal Unrealized gain of net (loss) on Futures/ assets Forward Exchange Contracts/ Swaps (Note 1)
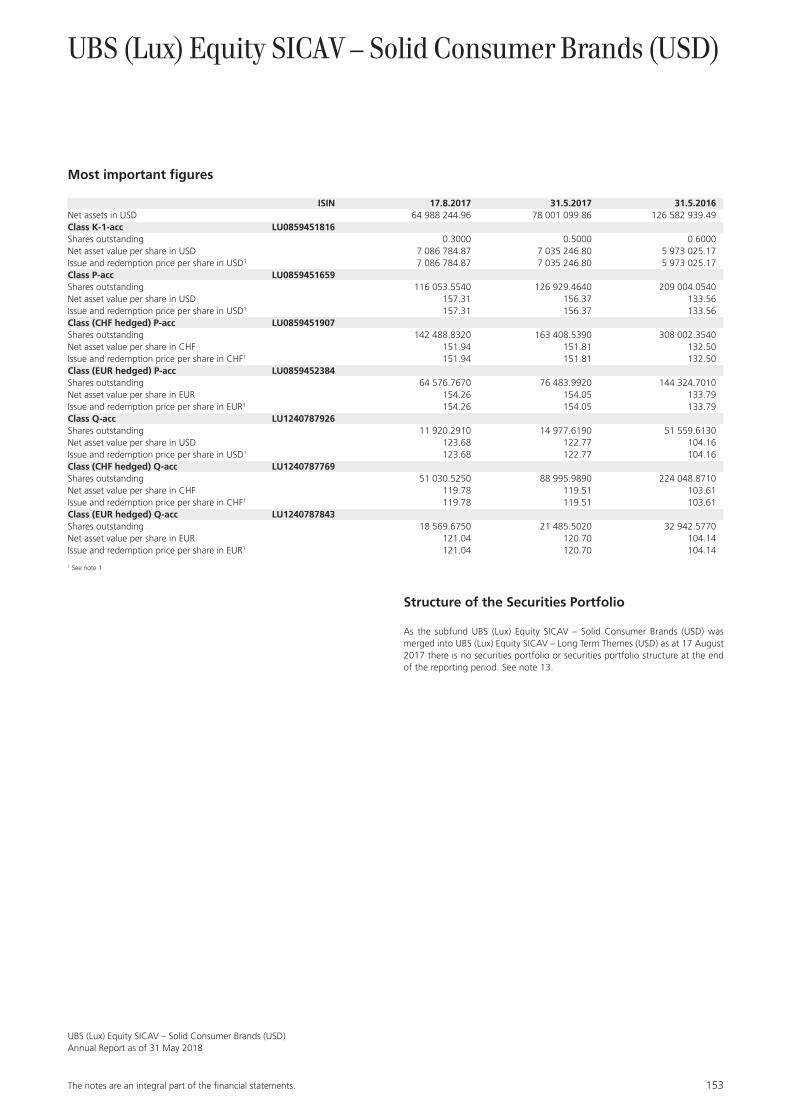
The notes are an integral part of the fi nancial statements. 153
UBS (Lux) Equity SICAV – Solid Consumer Brands (USD) Annual Report as of 31 May 2018
UBS (Lux) Equity SICAV – Solid Consumer Brands (USD)
Most important figures
ISIN 17.8.2017 31.5.2017 31.5.2016Net assets in USD 64 988 244.96 78 001 099.86 126 582 939.49Class K-1-acc LU0859451816Shares outstanding 0.3000 0.5000 0.6000Net asset value per share in USD 7 086 784.87 7 035 246.80 5 973 025.17Issue and redemption price per share in USD1 7 086 784.87 7 035 246.80 5 973 025.17Class P-acc LU0859451659Shares outstanding 116 053.5540 126 929.4640 209 004.0540Net asset value per share in USD 157.31 156.37 133.56Issue and redemption price per share in USD1 157.31 156.37 133.56Class (CHF hedged) P-acc LU0859451907Shares outstanding 142 488.8320 163 408.5390 308 002.3540Net asset value per share in CHF 151.94 151.81 132.50Issue and redemption price per share in CHF1 151.94 151.81 132.50Class (EUR hedged) P-acc LU0859452384Shares outstanding 64 576.7670 76 483.9920 144 324.7010Net asset value per share in EUR 154.26 154.05 133.79Issue and redemption price per share in EUR1 154.26 154.05 133.79Class Q-acc LU1240787926Shares outstanding 11 920.2910 14 977.6190 51 559.6130Net asset value per share in USD 123.68 122.77 104.16Issue and redemption price per share in USD1 123.68 122.77 104.16Class (CHF hedged) Q-acc LU1240787769Shares outstanding 51 030.5250 88 995.9890 224 048.8710Net asset value per share in CHF 119.78 119.51 103.61Issue and redemption price per share in CHF1 119.78 119.51 103.61Class (EUR hedged) Q-acc LU1240787843Shares outstanding 18 569.6750 21 485.5020 32 942.5770Net asset value per share in EUR 121.04 120.70 104.14Issue and redemption price per share in EUR1 121.04 120.70 104.14
1 See note 1
Structure of the Securities Portfolio
As the subfund UBS (Lux) Equity SICAV – Solid Consumer Brands (USD) was merged into UBS (Lux) Equity SICAV – Long Term Themes (USD) as at 17 August 2017 there is no securities portfolio or securities portfolio structure at the end of the reporting period. See note 13.

154 The notes are an integral part of the fi nancial statements.
UBS (Lux) Equity SICAV – Solid Consumer Brands (USD) Annual Report as of 31 May 2018
Statement of Operations USDIncome 1.6.2017-31.5.2018Interest on liquid assets 647.69Dividends 265 443.26Income on securities lending (Note 16) 9 631.50Other income (Note 4) 6 724.37Total income 282 446.82
ExpensesFlat fee (Note 2) -208 650.73Taxe d’abonnement (Note 3) -7 270.86Cost on securities lending (Note 16) -3 852.60Other commissions and fees (Note 2) -14 515.61Interest on cash and bank overdraft -298.30Total expenses -234 588.10
Net income (loss) on investments 47 858.72
Realized gain (loss) (Note 1)Realized gain (loss) on market-priced securities without options 21 988 432.16Realized gain (loss) on forward foreign exchange contracts -165 161.95Realized gain (loss) on foreign exchange 264 982.00Total realized gain (loss) 22 088 252.21
Net realized gain (loss) of the financial year 22 136 110.93
Changes in unrealized appreciation (depreciation) (Note 1)Unrealized appreciation (depreciation) on market-priced securities without options -21 084 855.67Unrealized appreciation (depreciation) on forward foreign exchange contracts -73 177.59Total changes in unrealized appreciation (depreciation) -21 158 033.26
Net increase (decrease) in net assets as a result of operations 978 077.67
Statement of Changes in Net Assets USD 1.6.2017-31.5.2018Net assets at the beginning of the financial year 78 001 099.86Subscriptions 179 804.51Redemptions -79 158 982.04Total net subscriptions (redemptions) -78 979 177.53Net income (loss) on investments 47 858.72Total realized gain (loss) 22 088 252.21Total changes in unrealized appreciation (depreciation) -21 158 033.26Net increase (decrease) in net assets as a result of operations 978 077.67Net assets at the end of the financial year 0.00

The notes are an integral part of the fi nancial statements. 155
UBS (Lux) Equity SICAV – Solid Consumer Brands (USD) Annual Report as of 31 May 2018
Changes in the Number of Shares outstanding
1.6.2017-31.5.2018Class K-1-accNumber of shares outstanding at the beginning of the financial year 0.5000Number of shares issued 0.0000Number of shares redeemed -0.5000Number of shares outstanding at the end of the financial year 0.0000Class P-accNumber of shares outstanding at the beginning of the financial year 126 929.4640Number of shares issued 5.6060Number of shares redeemed -126 935.0700Number of shares outstanding at the end of the financial year 0.0000Class (CHF hedged) P-accNumber of shares outstanding at the beginning of the financial year 163 408.5390Number of shares issued 75.4990Number of shares redeemed -163 484.0380Number of shares outstanding at the end of the financial year 0.0000Class (EUR hedged) P-accNumber of shares outstanding at the beginning of the financial year 76 483.9920Number of shares issued 37.2360Number of shares redeemed -76 521.2280Number of shares outstanding at the end of the financial year 0.0000Class Q-accNumber of shares outstanding at the beginning of the financial year 14 977.6190Number of shares issued 0.0000Number of shares redeemed -14 977.6190Number of shares outstanding at the end of the financial year 0.0000Class (CHF hedged) Q-accNumber of shares outstanding at the beginning of the financial year 88 995.9890Number of shares issued 1 294.8650Number of shares redeemed -90 290.8540Number of shares outstanding at the end of the financial year 0.0000Class (EUR hedged) Q-accNumber of shares outstanding at the beginning of the financial year 21 485.5020Number of shares issued 0.0000Number of shares redeemed -21 485.5020Number of shares outstanding at the end of the financial year 0.0000
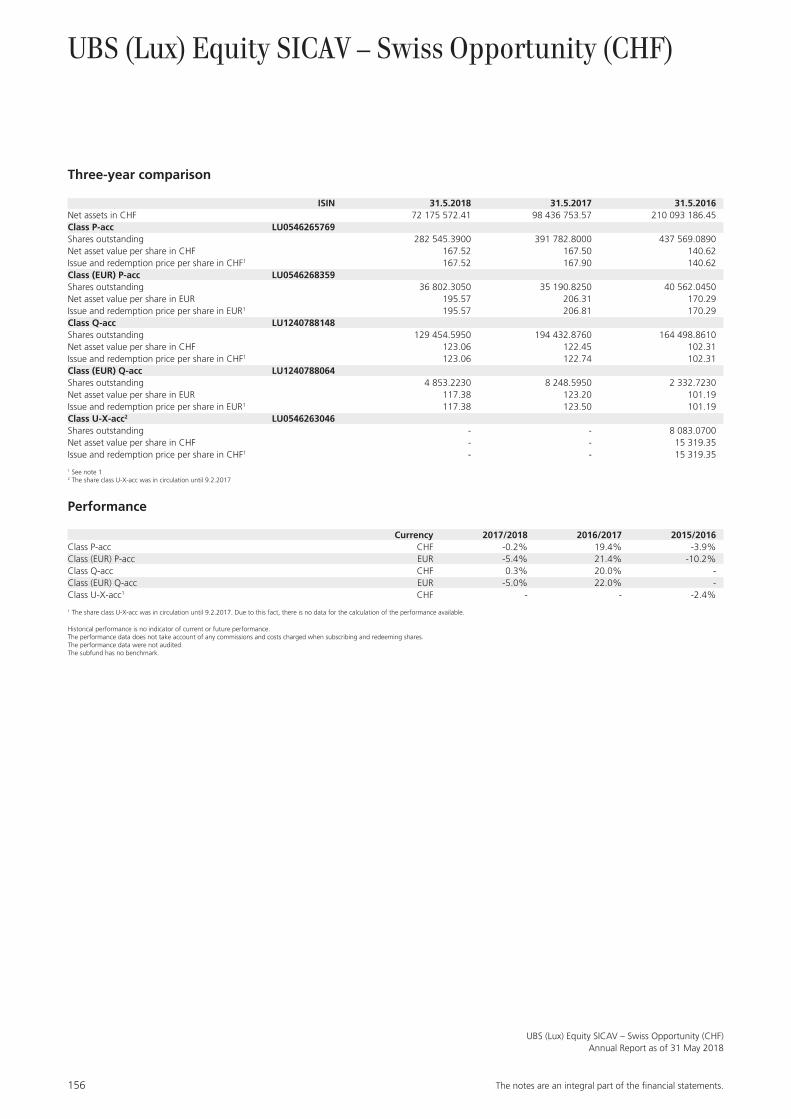
156 The notes are an integral part of the fi nancial statements.
UBS (Lux) Equity SICAV – Swiss Opportunity (CHF)Annual Report as of 31 May 2018
UBS (Lux) Equity SICAV – Swiss Opportunity (CHF)
Three-year comparison
ISIN 31.5.2018 31.5.2017 31.5.2016Net assets in CHF 72 175 572.41 98 436 753.57 210 093 186.45Class P-acc LU0546265769Shares outstanding 282 545.3900 391 782.8000 437 569.0890Net asset value per share in CHF 167.52 167.50 140.62Issue and redemption price per share in CHF1 167.52 167.90 140.62Class (EUR) P-acc LU0546268359Shares outstanding 36 802.3050 35 190.8250 40 562.0450Net asset value per share in EUR 195.57 206.31 170.29Issue and redemption price per share in EUR1 195.57 206.81 170.29Class Q-acc LU1240788148Shares outstanding 129 454.5950 194 432.8760 164 498.8610Net asset value per share in CHF 123.06 122.45 102.31Issue and redemption price per share in CHF1 123.06 122.74 102.31Class (EUR) Q-acc LU1240788064Shares outstanding 4 853.2230 8 248.5950 2 332.7230Net asset value per share in EUR 117.38 123.20 101.19Issue and redemption price per share in EUR1 117.38 123.50 101.19Class U-X-acc2 LU0546263046Shares outstanding - - 8 083.0700Net asset value per share in CHF - - 15 319.35Issue and redemption price per share in CHF1 - - 15 319.35
1 See note 12 The share class U-X-acc was in circulation until 9.2.2017
Performance
Currency 2017/2018 2016/2017 2015/2016Class P-acc CHF -0.2% 19.4% -3.9%Class (EUR) P-acc EUR -5.4% 21.4% -10.2%Class Q-acc CHF 0.3% 20.0% -Class (EUR) Q-acc EUR -5.0% 22.0% -Class U-X-acc1 CHF - - -2.4%
1 The share class U-X-acc was in circulation until 9.2.2017. Due to this fact, there is no data for the calculation of the performance available.
Historical performance is no indicator of current or future performance.The performance data does not take account of any commissions and costs charged when subscribing and redeeming shares.The performance data were not audited.The subfund has no benchmark.

The notes are an integral part of the fi nancial statements. 157
UBS (Lux) Equity SICAV – Swiss Opportunity (CHF)Annual Report as of 31 May 2018
Report of the Portfolio Manager
The Swiss equity market lost slightly in value in the finan-cial year from 1 June 2017 to 31 May 2018. Higher bond yields and rising inflation fears, which complicate the assessment of further monetary policy, as well as geopolitical uncertainties dampened investors’ euphoria. Technology and consumer goods equities outperformed, while healthcare and food stocks lagged.
The performance of the subfund was mostly negative in the financial year, and only the Q-acc share class posted a positive performance. High contributions came from healthcare and industrials. At the stock level, we bene-fited from our holdings in Georg Fischer and Clariant, while avoiding securities that lagged behind such as ABB.Valuation differences still offer opportunities in stocks with an attractive risk/return potential.
Structure of the Securities Portfolio
Geographical Breakdown as a % of net assetsSwitzerland 98.04Austria 0.93The Netherlands 0.46Italy 0.24Total 99.67
Economic Breakdown as a % of net assetsPharmaceuticals, cosmetics & medical products 21.25Finance & holding companies 17.63Chemicals 9.85Food & soft drinks 8.95Insurance 8.93Watches & jewellery 4.78Miscellaneous services 4.67Banks & credit institutions 4.55Electronics & semiconductors 3.83Building industry & materials 3.39Mechanical engineering & industrial equipment 2.99Computer hardware & network equipment providers 2.68Traffic & transportation 2.12Retail trade, department stores 1.71Telecommunications 1.25Biotechnology 0.65Electrical devices & components 0.44Total 99.67

158 The notes are an integral part of the fi nancial statements.
UBS (Lux) Equity SICAV – Swiss Opportunity (CHF)Annual Report as of 31 May 2018
Statement of Net Assets CHFAssets 31.5.2018Investments in securities, cost 61 710 264.48Investments in securities, unrealized appreciation (depreciation) 10 227 395.60Total investments in securities (Note 1) 71 937 660.08Cash at banks, deposits on demand and deposit accounts 192 500.47Receivable on securities sales (Note 1) 757 471.08Receivable on subscriptions 34 581.80Total Assets 72 922 213.43
LiabilitiesBank overdraft -6.44Payable on securities purchases (Note 1) -539 260.12Payable on redemptions -150 101.01Provisions for flat fee (Note 2) -45 333.94Provisions for taxe d’abonnement (Note 3) -6 047.68Provisions for other commissions and fees (Note 2) -5 891.83Total provisions -57 273.45Total Liabilities -746 641.02
Net assets at the end of the financial year 72 175 572.41
Statement of Operations CHFIncome 1.6.2017-31.5.2018Interest on liquid assets 225.63Dividends 1 745 164.71Income on securities lending (Note 16) 43 115.26Other income (Note 4) 23 502.61Total income 1 812 008.21
ExpensesFlat fee (Note 2) -1 235 894.38Taxe d’abonnement (Note 3) -43 301.53Cost on securities lending (Note 16) -17 246.10Other commissions and fees (Note 2) -19 597.33Interest on cash and bank overdraft -163.24Total expenses -1 316 202.58
Net income (loss) on investments 495 805.63
Realized gain (loss) (Note 1)Realized gain (loss) on market-priced securities without options 13 659 173.62Realized gain (loss) on forward foreign exchange contracts -65.67Realized gain (loss) on foreign exchange 3 614.99Total realized gain (loss) 13 662 722.94
Net realized gain (loss) of the financial year 14 158 528.57
Changes in unrealized appreciation (depreciation) (Note 1)Unrealized appreciation (depreciation) on market-priced securities without options -13 231 784.66Total changes in unrealized appreciation (depreciation) -13 231 784.66
Net increase (decrease) in net assets as a result of operations 926 743.91

The notes are an integral part of the fi nancial statements. 159
UBS (Lux) Equity SICAV – Swiss Opportunity (CHF)Annual Report as of 31 May 2018
Statement of Changes in Net Assets CHF 1.6.2017-31.5.2018Net assets at the beginning of the financial year 98 436 753.57Subscriptions 13 016 588.06Redemptions -40 204 513.13Total net subscriptions (redemptions) -27 187 925.07Net income (loss) on investments 495 805.63Total realized gain (loss) 13 662 722.94Total changes in unrealized appreciation (depreciation) -13 231 784.66Net increase (decrease) in net assets as a result of operations 926 743.91Net assets at the end of the financial year 72 175 572.41
Changes in the Number of Shares outstanding
1.6.2017-31.5.2018Class P-accNumber of shares outstanding at the beginning of the financial year 391 782.8000Number of shares issued 41 886.0600Number of shares redeemed -151 123.4700Number of shares outstanding at the end of the financial year 282 545.3900Class (EUR) P-accNumber of shares outstanding at the beginning of the financial year 35 190.8250Number of shares issued 8 580.8630Number of shares redeemed -6 969.3830Number of shares outstanding at the end of the financial year 36 802.3050Class Q-accNumber of shares outstanding at the beginning of the financial year 194 432.8760Number of shares issued 30 106.1930Number of shares redeemed -95 084.4740Number of shares outstanding at the end of the financial year 129 454.5950Class (EUR) Q-accNumber of shares outstanding at the beginning of the financial year 8 248.5950Number of shares issued 750.0000Number of shares redeemed -4 145.3720Number of shares outstanding at the end of the financial year 4 853.2230

160 The notes are an integral part of the fi nancial statements.
UBS (Lux) Equity SICAV – Swiss Opportunity (CHF)Annual Report as of 31 May 2018
Statement of Investments in Securities and other Net Assets as of 31 May 2018
Description Quantity/ Valuation in CHF as a % Nominal Unrealized gain of net (loss) on Futures/ assets Forward Exchange Contracts/ Swaps (Note 1)
Transferable securities and money market instruments listed on an official stock exchange
Bearer shares
Austria
CHF AMS AG NPV (BR) 7 839.00 667 255.68 0.93Total Austria 667 255.68 0.93
Italy
CHF NEWRON PHARMA SPA EUR0.20 (BR) 16 705.00 173 732.00 0.24Total Italy 173 732.00 0.24
The Netherlands
CHF COSMO PHARMA N.V. EUR0.26 (REGD) 2 919.00 331 890.30 0.46Total The Netherlands 331 890.30 0.46
Switzerland
CHF COMET HOLDINGS CHF1 (REGD) 2 463.00 320 436.30 0.44CHF DAETWYLER HLDG CHF0.05 (POST SUBDIVISION) 3 933.00 751 203.00 1.04CHF GALENICA AG CHF0.1 20 572.00 1 104 716.40 1.53CHF SIKA AG CHF0.60 (BR) 228.00 1 794 360.00 2.49Total Switzerland 3 970 715.70 5.50
Total Bearer shares 5 143 593.68 7.13
Participation certificates
Switzerland
CHF SCHINDLER-HLDG AG PTG CERT CHF0.10(POST-SUBD) 7 180.00 1 494 876.00 2.07Total Switzerland 1 494 876.00 2.07
Total Participation certificates 1 494 876.00 2.07
Other shares
Switzerland
CHF ROCHE HLDGS AG GENUSSCHEINE NPV 26 511.00 5 595 146.55 7.75Total Switzerland 5 595 146.55 7.75
Total Other shares 5 595 146.55 7.75
Registered shares
Switzerland
CHF ADECCO GROUP AG CHF0.1 (REGD) 25 136.00 1 486 040.32 2.06CHF CEMBRA MONEY BANK CHF1.00 (REGD) 19 420.00 1 543 890.00 2.14CHF DKSH HOLDING LTD CHF0.1 16 784.00 1 318 383.20 1.83CHF DORMAKABA HOLDING CHF0.10 ‘B’(REGD) 1 500.00 1 155 000.00 1.60CHF DUFRY AG CHF5 (REGD) 9 166.00 1 232 368.70 1.71CHF FORBO HLDGS AG CHF0.10(REGD) 732.00 956 724.00 1.33CHF GAM HOLDING AG CHF0.05 (REGD) 60 972.00 898 117.56 1.24CHF GEORG FISCHER AG CHF1.00 (REGD) 522.00 665 550.00 0.92CHF GIVAUDAN AG CHF10 1 044.00 2 291 580.00 3.18CHF KUEHNE&NAGEL INTL CHF1(REGD)(POST-SUBD) 10 310.00 1 532 066.00 2.12CHF LAFARGEHOLCIM LTD CHF2 (REGD) 48 432.00 2 442 910.08 3.38CHF LOGITECH INTL CHF0.25(REGD) (POST-SUBD) 48 052.00 1 932 651.44 2.68CHF LONZA GROUP AG CHF1(REGD) 11 464.00 3 023 056.80 4.19CHF MOLECULAR PARTNERS CHF0.1 19 836.00 468 129.60 0.65CHF NESTLE SA CHF0.10(REGD) 86 839.00 6 459 084.82 8.95CHF NOVARTIS AG CHF0.50(REGD) 89 232.00 6 510 366.72 9.02CHF OC OERLIKON CORP CHF1.00(REGD) 59 061.00 940 251.12 1.30CHF ORIOR AG CHF4.00 14 493.00 1 276 833.30 1.77CHF RICHEMONT(CIE FIN) CHF1.00 (REG) SER ‘A’ 38 216.00 3 452 433.44 4.78CHF SFS GROUP AG CHF0.1 13 213.00 1 466 643.00 2.03CHF SGS LTD CHF1(REGD) 739.00 1 883 711.00 2.61CHF SONOVA HOLDING AG CHF0.05 (REGD) 10 024.00 1 724 128.00 2.39CHF STRAUMANN HLDG CHF0.1(REGD) 1 562.00 1 014 519.00 1.41CHF SUNRISE COMMUNICA CHF1 11 200.00 901 040.00 1.25CHF SWISS LIFE HLDG CHF5.1(REGD) 6 920.00 2 325 120.00 3.22CHF TECAN GROUP AG CHF0.10(REGD) 2 603.00 606 499.00 0.84CHF UBS GROUP CHF0.10 (REGD) 283 011.00 4 202 713.35 5.82CHF VALIANT HOLDING AG CHF3.30(REGD) 9 492.00 1 027 034.40 1.42CHF VONTOBEL HLDGS AG CHF1(REGD) 12 768.00 843 964.80 1.17CHF ZURICH INSURANCE GRP CHF0.10 14 111.00 4 123 234.20 5.71Total Switzerland 59 704 043.85 82.72
Total Registered shares 59 704 043.85 82.72
Total Transferable securities and money market instruments listed on an official stock exchange 71 937 660.08 99.67
Total investments in securities 71 937 660.08 99.67
Cash at banks, deposits on demand and deposit accounts and other liquid assets 192 500.47 0.27Bank overdraft and other short-term liabilities -6.44 0.00Other assets and liabilities 45 418.30 0.06
Total net assets 72 175 572.41 100.00

The notes are an integral part of the fi nancial statements. 161
UBS (Lux) Equity SICAV – US Income (USD)Annual Report as of 31 May 2018
UBS (Lux) Equity SICAV – US Income (USD)
Three-year comparison
ISIN 31.5.2018 31.5.2017 31.5.2016Net assets in USD 509 672 014.24 478 115 532.20 185 980 354.90Class (EUR hedged) I-A1-dist1 LU1427883142Shares outstanding 42 900.0000 50 000.0000 -Net asset value per share in EUR 107.21 107.10 -Issue and redemption price per share in EUR2 107.21 107.10 -Class I-A2-8%-mdist3 LU1629764272Shares outstanding 100 120.2880 - -Net asset value per share in USD 99.41 - -Issue and redemption price per share in USD2 99.41 - -Class K-1-8%-mdist LU1230950575Shares outstanding 1.0000 1.2000 1.0000Net asset value per share in USD 5 007 320.37 5 136 421.93 4 951 419.04Issue and redemption price per share in USD2 5 007 320.37 5 136 421.93 4 956 370.46Class P-acc LU1149724525Shares outstanding 397 286.5900 555 932.1250 377 308.4150Net asset value per share in USD 126.40 120.25 107.50Issue and redemption price per share in USD2 126.40 120.25 107.61Class (CHF hedged) P-acc LU1149725092Shares outstanding 109 369.3910 131 720.6730 55 535.7190Net asset value per share in CHF 118.88 116.21 106.13Issue and redemption price per share in CHF2 118.88 116.21 106.24Class (EUR hedged) P-acc LU1149724871Shares outstanding 108 154.8630 121 201.2710 25 368.4470Net asset value per share in EUR 121.00 117.85 107.12Issue and redemption price per share in EUR2 121.00 117.85 107.23Class P-dist LU1149724798Shares outstanding 202 125.9140 221 868.1780 138 677.4090Net asset value per share in USD 107.15 108.87 105.51Issue and redemption price per share in USD2 107.15 108.87 105.62Class (CHF hedged) P-dist LU1149725175Shares outstanding 141 435.3920 160 372.3520 67 904.0010Net asset value per share in CHF 100.66 105.15 104.15Issue and redemption price per share in CHF2 100.66 105.15 104.25Class (EUR hedged) P-dist LU1149724954Shares outstanding 18 358.2010 20 142.7650 12 772.0000Net asset value per share in EUR 102.51 106.67 105.14Issue and redemption price per share in EUR2 102.51 106.67 105.25Class P-mdist LU1217041372Shares outstanding 303 802.0340 311 369.0860 33 981.6160Net asset value per share in USD 100.98 103.55 99.86Issue and redemption price per share in USD2 100.98 103.55 99.96Class Q-acc LU1240788734Shares outstanding 592 847.1790 500 400.2790 181 605.0960Net asset value per share in USD 127.21 120.27 106.86Issue and redemption price per share in USD2 127.21 120.27 106.97Class (CHF hedged) Q-acc LU1240788221Shares outstanding 740 093.9900 744 027.1180 302 110.0640Net asset value per share in CHF 120.16 116.74 105.96Issue and redemption price per share in CHF2 120.16 116.74 106.07Class (EUR hedged) Q-acc LU1240788577Shares outstanding 110 371.5150 114 766.3100 21 453.6240Net asset value per share in EUR 118.15 114.36 103.32Issue and redemption price per share in EUR2 118.15 114.36 103.42Class Q-dist LU1240788817Shares outstanding 490 469.2950 380 597.9130 118 205.0000Net asset value per share in USD 112.14 113.74 106.86Issue and redemption price per share in USD2 112.14 113.74 106.97Class (CHF hedged) Q-dist LU1240788494Shares outstanding 910 163.8440 633 898.1870 211 596.6710Net asset value per share in CHF 105.86 110.39 105.97Issue and redemption price per share in CHF2 105.86 110.39 106.08

162 The notes are an integral part of the fi nancial statements.
UBS (Lux) Equity SICAV – US Income (USD)Annual Report as of 31 May 2018
ISIN 31.5.2018 31.5.2017 31.5.2016
Class U-X-acc4 LU1230950732Shares outstanding - - 1 444.5940Net asset value per share in USD - - 10 814.93Issue and redemption price per share in USD2 - - 10 825.74Class U-X-UKdist-mdist5 LU1480122297Shares outstanding 683.9000 982.9810 -Net asset value per share in USD 10 983.39 10 818.57 -Issue and redemption price per share in USD2 10 983.39 10 818.57 -
1 First NAV: 7.12.20162 See note 13 First NAV: 6.7.20174 For the period from 1.6.2015 to 25.1.2017 the share class U-X-acc was in circulation5 First NAV: 16.9.2016
Performance
Currency 2017/2018 2016/2017 2015/2016Class (EUR hedged) I-A1-dist EUR 3.7% - -Class I-A2-8%-mdist1 USD - - -Class K-1-8%-mdist USD 5.6% 12.3% 7.0%Class P-acc USD 5.1% 11.7% 6.5%Class (CHF hedged) P-acc CHF 2.3% 9.4% 5.5%Class (EUR hedged) P-acc EUR 2.7% 9.9% 6.2%Class P-dist USD 5.1% 11.7% 6.5%Class (CHF hedged) P-dist CHF 2.3% 9.4% 5.5%Class (EUR hedged) P-dist EUR 2.7% 9.9% 6.2%Class P-mdist USD 5.1% 11.7% 6.5%Class Q-acc USD 5.8% 12.4% -Class (CHF hedged) Q-acc CHF 2.9% 10.1% -Class (EUR hedged) Q-acc EUR 3.3% 10.6% -Class Q-dist USD 5.8% 12.4% -Class (CHF hedged) Q-dist CHF 2.9% 10.1% -Class U-X-acc2 USD - - 8.1%Class U-X-UKdist-mdist USD 6.9% - -
1 Due to the recent launch, there is no data for the calculation of the performance available.2 The share class U-X-acc was in circulation until 25.1.2017. Due to this fact, there is no data for the calculation of the performance available.
Historical performance is no indicator of current or future performance.The performance data does not take account of any commissions and costs charged when subscribing and redeeming shares.The performance data were not audited.The subfund has no benchmark.

The notes are an integral part of the fi nancial statements. 163
UBS (Lux) Equity SICAV – US Income (USD)Annual Report as of 31 May 2018
Report of the Portfolio Manager
In the financial year, from 1 June 2017 to 31 May 2018, US equities rallied. Eight out of 11 sectors delivered posi-tive returns with only Consumer Staples, Telecoms and Utilities lagging overall market. IT was the best perform-ing sector led by Software, Communications Equipment and Semiconductors. Geopolitical threats brought some uncertainty to the markets, but the US economic data continued to be strong, with falling unemployment, strengthening consumer sentiment and rising business confidence.
The subfund posted a positive performance in the finan-cial year. From its sector positioning, IT, industrials and consumer discretionary contributed most positively to the subfund’s return while Consumer Staples, Financials and Utilities detracted. From a stock perspective, Accen-ture and Garmin added the most value whereas Altria and Renaissance Re detracted most.
Structure of the Securities Portfolio
Geographical Breakdown as a % of net assetsUnited States 84.55Bermuda 8.35Ireland 3.05Switzerland 1.03Guernsey 0.92United Kingdom 0.44Total 98.34
Economic Breakdown as a % of net assetsInsurance 11.99Finance & holding companies 10.89Internet, software & IT services 9.02Lodging, catering & leisure 7.60Healthcare & social services 6.76Pharmaceuticals, cosmetics & medical products 6.16Environmental services & recycling 5.19Miscellaneous consumer goods 5.09Food & soft drinks 4.69Real Estate 4.30Tobacco & alcohol 3.78Miscellaneous trading companies 3.20Traffic & transportation 3.15Miscellaneous services 3.05Retail trade, department stores 3.04Aerospace industry 2.67Banks & credit institutions 2.65Electronics & semiconductors 1.49Energy & water supply 1.12Investment funds 0.93Textiles, garments & leather goods 0.58Computer hardware & network equipment providers 0.54Chemicals 0.45Total 98.34

164 The notes are an integral part of the fi nancial statements.
UBS (Lux) Equity SICAV – US Income (USD)Annual Report as of 31 May 2018
Statement of Net Assets USDAssets 31.5.2018Investments in securities, cost 479 828 324.01Investments in securities, unrealized appreciation (depreciation) 21 398 798.30Total investments in securities (Note 1) 501 227 122.31Cash at banks, deposits on demand and deposit accounts 4 888 952.25Receivable on securities sales (Note 1) 273 031.46Receivable on subscriptions 921 863.29Receivable on dividends 424 588.59Other receivables 7 378.68Unrealized gain (loss) on forward foreign exchange contracts (Note 1) 3 118 920.11Total Assets 510 861 856.69
LiabilitiesPayable on securities purchases (Note 1) -271 826.89Payable on redemptions -613 850.49Provisions for flat fee (Note 2) -253 545.86Provisions for taxe d’abonnement (Note 3) -41 175.47Provisions for other commissions and fees (Note 2) -9 443.74Total provisions -304 165.07Total Liabilities -1 189 842.45
Net assets at the end of the financial year 509 672 014.24
Statement of Operations USDIncome 1.6.2017-31.5.2018Interest on liquid assets 50 091.98Dividends 8 386 692.86Income on securities lending (Note 16) 197 069.51Other income (Note 4) 18 717.41Total income 8 652 571.76
ExpensesFlat fee (Note 2) -5 651 566.02Taxe d’abonnement (Note 3) -237 674.40Cost on securities lending (Note 16) -78 827.80Other commissions and fees (Note 2) -92 619.13Interest on cash and bank overdraft -5 259.74Total expenses -6 065 947.09
Net income (loss) on investments 2 586 624.67
Realized gain (loss) (Note 1)Realized gain (loss) on market-priced securities without options 36 652 417.57Realized gain (loss) on options 1 529 994.38Realized gain (loss) on financial futures 410 262.46Realized gain (loss) on forward foreign exchange contracts -5 495 486.10Realized gain (loss) on foreign exchange -2 922 468.01Total realized gain (loss) 30 174 720.30
Net realized gain (loss) of the financial year 32 761 344.97
Changes in unrealized appreciation (depreciation) (Note 1)Unrealized appreciation (depreciation) on market-priced securities without options -15 333 606.17Unrealized appreciation (depreciation) on options 347 751.20Unrealized appreciation (depreciation) on financial futures -69 975.00Unrealized appreciation (depreciation) on forward foreign exchange contracts 973 587.13Total changes in unrealized appreciation (depreciation) -14 082 242.84
Net increase (decrease) in net assets as a result of operations 18 679 102.13

The notes are an integral part of the fi nancial statements. 165
UBS (Lux) Equity SICAV – US Income (USD)Annual Report as of 31 May 2018
Statement of Changes in Net Assets USD 1.6.2017-31.5.2018Net assets at the beginning of the financial year 478 115 532.20Subscriptions 157 218 783.52Redemptions -129 293 613.86Total net subscriptions (redemptions) 27 925 169.66Dividend paid -15 047 789.75Net income (loss) on investments 2 586 624.67Total realized gain (loss) 30 174 720.30Total changes in unrealized appreciation (depreciation) -14 082 242.84Net increase (decrease) in net assets as a result of operations 18 679 102.13Net assets at the end of the financial year 509 672 014.24
Changes in the Number of Shares outstanding
1.6.2017-31.5.2018Class (EUR hedged) I-A1-distNumber of shares outstanding at the beginning of the financial year 50 000.0000Number of shares issued 0.0000Number of shares redeemed -7 100.0000Number of shares outstanding at the end of the financial year 42 900.0000Class I-A2-8%-mdistNumber of shares outstanding at the beginning of the financial year 0.0000Number of shares issued 100 120.2880Number of shares redeemed 0.0000Number of shares outstanding at the end of the financial year 100 120.2880Class K-1-8%-mdistNumber of shares outstanding at the beginning of the financial year 1.2000Number of shares issued 0.0000Number of shares redeemed -0.2000Number of shares outstanding at the end of the financial year 1.0000Class P-accNumber of shares outstanding at the beginning of the financial year 555 932.1250Number of shares issued 62 028.5130Number of shares redeemed -220 674.0480Number of shares outstanding at the end of the financial year 397 286.5900Class (CHF hedged) P-accNumber of shares outstanding at the beginning of the financial year 131 720.6730Number of shares issued 16 430.7660Number of shares redeemed -38 782.0480Number of shares outstanding at the end of the financial year 109 369.3910Class (EUR hedged) P-accNumber of shares outstanding at the beginning of the financial year 121 201.2710Number of shares issued 35 299.3400Number of shares redeemed -48 345.7480Number of shares outstanding at the end of the financial year 108 154.8630Class P-distNumber of shares outstanding at the beginning of the financial year 221 868.1780Number of shares issued 43 976.6950Number of shares redeemed -63 718.9590Number of shares outstanding at the end of the financial year 202 125.9140Class (CHF hedged) P-distNumber of shares outstanding at the beginning of the financial year 160 372.3520Number of shares issued 27 082.0640Number of shares redeemed -46 019.0240Number of shares outstanding at the end of the financial year 141 435.3920Class (EUR hedged) P-distNumber of shares outstanding at the beginning of the financial year 20 142.7650Number of shares issued 17 771.0190Number of shares redeemed -19 555.5830Number of shares outstanding at the end of the financial year 18 358.2010Class P-mdistNumber of shares outstanding at the beginning of the financial year 311 369.0860Number of shares issued 128 355.0840Number of shares redeemed -135 922.1360Number of shares outstanding at the end of the financial year 303 802.0340Class Q-accNumber of shares outstanding at the beginning of the financial year 500 400.2790Number of shares issued 195 739.0600Number of shares redeemed -103 292.1600Number of shares outstanding at the end of the financial year 592 847.1790Class (CHF hedged) Q-accNumber of shares outstanding at the beginning of the financial year 744 027.1180Number of shares issued 167 501.3290Number of shares redeemed -171 434.4570Number of shares outstanding at the end of the financial year 740 093.9900

166 The notes are an integral part of the fi nancial statements.
UBS (Lux) Equity SICAV – US Income (USD)Annual Report as of 31 May 2018
Class (EUR hedged) Q-accNumber of shares outstanding at the beginning of the financial year 114 766.3100Number of shares issued 43 934.9370Number of shares redeemed -48 329.7320Number of shares outstanding at the end of the financial year 110 371.5150Class Q-distNumber of shares outstanding at the beginning of the financial year 380 597.9130Number of shares issued 162 463.5730Number of shares redeemed -52 592.1910Number of shares outstanding at the end of the financial year 490 469.2950Class (CHF hedged) Q-distNumber of shares outstanding at the beginning of the financial year 633 898.1870Number of shares issued 360 706.7020Number of shares redeemed -84 441.0450Number of shares outstanding at the end of the financial year 910 163.8440Class U-X-UKdist-mdistNumber of shares outstanding at the beginning of the financial year 982.9810Number of shares issued 89.3820Number of shares redeemed -388.4630Number of shares outstanding at the end of the financial year 683.9000
Annual Distribution
UBS (Lux) Equity SICAV – US Income (USD) Ex-Date Pay-Date Currency Amount per share(EUR hedged) I-A1-dist 2.8.2017 7.8.2017 EUR 3.67P-dist 2.8.2017 7.8.2017 USD 6.95(CHF hedged) P-dist 2.8.2017 7.8.2017 CHF 6.74(EUR hedged) P-dist 2.8.2017 7.8.2017 EUR 6.83Q-dist 2.8.2017 7.8.2017 USD 7.75(CHF hedged) Q-dist 2.8.2017 7.8.2017 CHF 7.54
Monthly Distribution
UBS (Lux) Equity SICAV – US Income (USD) Ex-Date Pay-Date Currency Amount per shareI-A2-8%-mdist 10.8.2017 16.8.2017 USD 0.53I-A2-8%-mdist 11.9.2017 14.9.2017 USD 0.66I-A2-8%-mdist 10.10.2017 13.10.2017 USD 0.66I-A2-8%-mdist 10.11.2017 15.11.2017 USD 0.67I-A2-8%-mdist 11.12.2017 14.12.2017 USD 0.68I-A2-8%-mdist 10.1.2018 16.1.2018 USD 0.68I-A2-8%-mdist 12.2.2018 15.2.2018 USD 0.69I-A2-8%-mdist 12.3.2018 15.3.2018 USD 0.66I-A2-8%-mdist 10.4.2018 13.4.2018 USD 0.66I-A2-8%-mdist 11.5.2018 16.5.2018 USD 0.65K-1-8%-mdist 13.6.2017 16.6.2017 USD 34 242.81K-1-8%-mdist 10.7.2017 13.7.2017 USD 34 040.03K-1-8%-mdist 10.8.2017 16.8.2017 USD 33 870.39K-1-8%-mdist 11.9.2017 14.9.2017 USD 33 516.57K-1-8%-mdist 10.10.2017 13.10.2017 USD 33 522.83K-1-8%-mdist 10.11.2017 15.11.2017 USD 33 857.58K-1-8%-mdist 11.12.2017 14.12.2017 USD 34 665.75K-1-8%-mdist 10.1.2018 16.1.2018 USD 34 524.34K-1-8%-mdist 12.2.2018 15.2.2018 USD 35 025.07K-1-8%-mdist 12.3.2018 15.3.2018 USD 33 614.11K-1-8%-mdist 10.4.2018 13.4.2018 USD 33 303.72K-1-8%-mdist 11.5.2018 16.5.2018 USD 33 235.68P-mdist 15.6.2017 20.6.2017 USD 0.61P-mdist 18.7.2017 21.7.2017 USD 0.67P-mdist 16.8.2017 21.8.2017 USD 0.67P-mdist 15.9.2017 20.9.2017 USD 0.62P-mdist 16.10.2017 19.10.2017 USD 0.66P-mdist 15.11.2017 20.11.2017 USD 0.66P-mdist 15.12.2017 20.12.2017 USD 0.54P-mdist 16.1.2018 19.1.2018 USD 0.68P-mdist 15.2.2018 20.2.2018 USD 0.63P-mdist 15.3.2018 20.3.2018 USD 0.67P-mdist 16.4.2018 19.4.2018 USD 0.66P-mdist 15.5.2018 18.5.2018 USD 0.66U-X-UKdist-mdist 18.7.2017 21.7.2017 USD 39.02U-X-UKdist-mdist 16.8.2017 21.8.2017 USD 43.24U-X-UKdist-mdist 15.9.2017 20.9.2017 USD 41.79U-X-UKdist-mdist 16.10.2017 19.10.2017 USD 45.57U-X-UKdist-mdist 15.11.2017 20.11.2017 USD 44.75U-X-UKdist-mdist 15.12.2017 20.12.2017 USD 35.76U-X-UKdist-mdist 16.1.2018 19.1.2018 USD 74.20U-X-UKdist-mdist 15.2.2018 20.2.2018 USD 29.28U-X-UKdist-mdist 15.3.2018 20.3.2018 USD 65.19U-X-UKdist-mdist 16.4.2018 19.4.2018 USD 81.82U-X-UKdist-mdist 15.5.2018 18.5.2018 USD 65.10

The notes are an integral part of the fi nancial statements. 167
UBS (Lux) Equity SICAV – US Income (USD)Annual Report as of 31 May 2018
Statement of Investments in Securities and other Net Assets as of 31 May 2018
Description Quantity/ Valuation in USD as a % Nominal Unrealized gain of net (loss) on Futures/ assets Forward Exchange Contracts/ Swaps (Note 1)
Transferable securities and money market instruments listed on an official stock exchange
Bearer shares
Bermuda
USD ASSURED GUARANTY COM USD0.01 67 700.00 2 402 673.00 0.47USD AXIS CAPITAL HLDGS COM USD0.0125 260 165.00 14 790 380.25 2.90USD GENPACT LIMITED COM STK USD0.01 140 000.00 4 204 200.00 0.83USD MARVELL TECH GROUP COM USD0.002 353 389.00 7 611 999.06 1.49USD RENAISSANCE RE HLG COM USD1 110 329.00 13 545 091.33 2.66Total Bermuda 42 554 343.64 8.35
Guernsey
USD AMDOCS ORD GBP0.01 69 715.00 4 702 973.90 0.92Total Guernsey 4 702 973.90 0.92
Ireland
USD ACCENTURE PLC SHS CL A ‘NEW’ 99 858.00 15 551 884.92 3.05Total Ireland 15 551 884.92 3.05
United Kingdom
USD AON PLC COM USD0.01 CL A 24 000.00 3 356 880.00 0.66Total United Kingdom 3 356 880.00 0.66
United States
USD ALTRIA GROUP INC COM USD0.333333 236 444.00 13 179 388.56 2.59USD AMER EXPRESS CO COM USD0.20 27 259.00 2 679 559.70 0.53USD ANTHEM INC COM USD0.01 27 287.00 6 041 887.54 1.19USD ARCHER DANIELS MIDLAND CO COM 57 433.00 2 510 970.76 0.49USD ASSURANT INC COM 165 323.00 15 432 902.05 3.03USD AUTO DATA PROCESS COM USD0.10 131 640.00 17 115 832.80 3.36USD BEST BUY CO INC COM USD0.10 109 766.00 7 491 529.50 1.47USD BOSTON BEER INC CL A 23 987.00 6 089 099.95 1.19USD CDK GLOBAL INC COM USD0.01 78 576.00 5 056 365.60 0.99USD CENTERPOINT ENERGY INC COM 219 000.00 5 722 470.00 1.12USD CHEESECAKE FACTORY INC COM 93 923.00 4 866 150.63 0.96USD CHURCH & DWIGHT INC COM 256 545.00 12 044 787.75 2.36USD CIGNA CORP COM USD0.25 78 395.00 13 277 761.15 2.61USD CME GROUP INC COM STK USD0.01 CLASS’A’ 90 081.00 14 674 194.90 2.88USD CONAGRA BRANDS IN COM USD5 398 948.00 14 785 012.88 2.90USD DARDEN RESTAURANTS INC COM 127 178.00 11 116 628.98 2.18USD DUKE ENERGY CORP COM USD0.001 (POST REV SPLT) 32 703.00 2 523 363.48 0.50USD EXPEDTRS INTL WASH COM USD0.01 143 883.00 10 716 405.84 2.10USD F5 NETWORK INC COM STK NPV 17 491.00 3 027 867.01 0.59USD GEN DYNAMICS CORP COM USD1 67 566.00 13 628 737.86 2.67USD HUMANA INC COM USD0.166 52 039.00 15 142 308.22 2.97USD INTERCONTINENTAL E COM USD0.01 209 507.00 14 851 951.23 2.91USD INTUITIVE SURGICAL COM USD0.001 35 728.00 16 423 089.76 3.22USD LASALLE HOTEL PPTYS COM SH BEN INT 137 700.00 4 723 110.00 0.93USD M & T BANK CORP COM USD0.50 18 787.00 3 232 866.96 0.63USD MONDELEZ INTL INC COM USD0.01 60 736.00 2 385 102.72 0.47USD NIKE INC CLASS’B’COM NPV 41 111.00 2 951 769.80 0.58USD PARK HOTELS & RESO COM USD0.01 WI 177 224.00 5 710 157.28 1.12USD PAYCHEX INC COM 245 020.00 16 068 411.60 3.15USD PFIZER INC COM USD0.05 416 963.00 14 981 480.59 2.94USD PHILLIPS 66 COM USD0.01 25 288.00 2 945 799.12 0.58USD PPG INDS INC COM 22 972.00 2 318 334.24 0.46USD PROASSURANCE CORP COM 45 735.00 1 756 224.00 0.34USD PROCTER & GAMBLE COM NPV 189 621.00 13 874 568.57 2.72USD PUBLIC STORAGE COM USD0.10 74 200.00 15 718 528.00 3.08USD REPUBLIC SERVICES COM USD0.01 223 141.00 15 046 397.63 2.95USD ROBERT HALF INTL COM USD0.001 43 000.00 2 738 240.00 0.54USD SIMON PROP GROUP COM USD0.0001 15 184.00 2 432 780.48 0.48USD SMUCKER(JM)CO COM NPV 39 243.00 4 218 622.50 0.83USD SOUTHWEST AIRLINES COM USD1 46 834.00 2 392 280.72 0.47USD STARBUCKS CORP COM USD0.001 255 557.00 14 482 415.19 2.84USD SYSCO CORP COM USD1 250 810.00 16 310 174.30 3.20USD TJX COS INC COM USD1 30 777.00 2 779 778.64 0.55USD TRAVELERS CO INC COM NPV 76 342.00 9 811 473.84 1.93USD US BANCORP COM USD0.01 45 310.00 2 265 046.90 0.44USD VISA INC COM STK USD0.0001 51 150.00 6 686 328.00 1.31USD WALT DISNEY CO. DISNEY COM USD0.01 149 784.00 14 899 014.48 2.92USD WASTE MGMT INC DEL COM 138 173.00 11 428 288.83 2.24USD WILLIAMS-SONOMA IN COM USD0.01 94 334.00 5 223 273.58 1.03USD WYNDHAM WORLDWIDE CORP COM 23 530.00 2 551 593.20 0.50Total United States 428 330 327.32 84.04
Total Bearer shares 494 496 409.78 97.02
Registered shares
Switzerland
USD GARMIN LTD COM CHF10.00 91 264.00 5 484 053.76 1.08Total Switzerland 5 484 053.76 1.08
Total Registered shares 5 484 053.76 1.08

168 The notes are an integral part of the fi nancial statements.
UBS (Lux) Equity SICAV – US Income (USD)Annual Report as of 31 May 2018
Investment funds, closed end
United States
USD SL GREEN REALTY CORPORATION 38 700.00 3 774 024.00 0.74Total United States 3 774 024.00 0.74
Total Investment funds, closed end 3 774 024.00 0.74
Total Transferable securities and money market instruments listed on an official stock exchange 503 754 487.54 98.84
Derivative instruments not listed on an official stock exchange and not traded on another regulated market
Options on shares, classic-styled
USD
USD GOLDMAN SACHS/NIKE INC CALL 71.27960 13.06.18 -38 020.00 -44 519.81 -0.01USD GOLDMAN SACHS/PPG INDS INC CALL 112.61660 13.06.18 -21 150.00 -32.40 0.00USD GOLDMAN SACHS/SMUCKER(JM)CO CALL 120.58330 13.06.18 -36 230.00 -6 866.65 0.00USD GOLDMAN SACHS/TJX COS INC CALL 87.83280 13.06.18 -28 230.00 -81 651.34 -0.02USD HSBC/HUMANA INC CALL 287.45900 13.06.18 -48 250.00 -299 546.50 -0.06USD HSBC/GEN DYNAMICS CORP CALL 211.50460 13.06.18 -61 670.00 -6 195.84 0.00USD HSBC/ANTHEM INC CALL 232.41500 13.06.18 -25 240.00 -8 655.27 0.00USD HSBC/ASSURANT INC CALL 90.27760 13.06.18 -153 280.00 -642 770.76 -0.13USD HSBC/ASSURED GUARANTY CALL 36.78140 13.06.18 -62 620.00 -6 891.44 0.00USD HSBC/US BANCORP CALL 53.47320 13.06.18 -41 910.00 -26.84 0.00USD MORGAN STANLEY/AON PLC CALL 148.63710 13.06.18 -22 120.00 -201.55 0.00USD MORGAN STANLEY/AMDOCS CALL 71.44130 13.06.18 -63 800.00 -411.08 0.00USD MORGAN STANLEY/LASALLE HOTEL PPTYS CALL 32.41970 13.06.18 -126 480.00 -254 412.06 -0.05USD MORGAN STANLEY/INTUITIVE SURGICAL CALL 486.30800 13.06.18 -33 120.00 -14 065.81 0.00USD MORGAN STANLEY/INTERCONTINENTAL CALL 75.31980 13.06.18 -194 250.00 -851.41 0.00USD MORGAN STANLEY/GENPACT LIMITED CALL 31.99450 13.06.18 -127 650.00 -232.12 0.00USD MORGAN STANLEY/DARDEN RESTAURANTS CALL 96.61570 13.06.18 -117 200.00 -35.01 0.00USD MORGAN STANLEY/WALT DISNEY CO. DIS CALL 105.16840 13.06.18 -138 870.00 -10 198.03 0.00USD MORGAN STANLEY/CHEESECAKE FACTORY CALL 56.05710 13.06.18 -85 480.00 -2 556.79 0.00USD MORGAN STANLEY/CONAGRA BRANDS IN CALL 39.62880 13.06.18 -369 720.00 -1 672.04 0.00USD MORGAN STANLEY/MARVELL TECH GROUP CALL 24.24510 13.06.18 -322 630.00 -28 910.91 -0.01USD MORGAN STANLEY/AMER EXPRESS CO CALL 105.72600 13.06.18 -24 920.00 -61.47 0.00USD MORGAN STANLEY/M & T BANK CORP CALL 192.76320 13.06.18 -17 360.00 -9.73 0.00USD MORGAN STANLEY/AUTO DATA PROCESS CALL 132.88380 13.06.18 -121 880.00 -73 916.81 -0.01USD MORGAN STANLEY/ARCHER DANIELS MIDL CALL 45.62280 13.06.18 -52 820.00 -1 632.21 0.00USD MORGAN STANLEY/ACCENTURE PLC CALL 162.66020 13.06.18 -92 580.00 -1 965.84 0.00USD MORGAN STANLEY/AXIS CAPITAL HLDGS CALL 60.58470 13.06.18 -241 200.00 -23 798.12 -0.01USD MORGAN STANLEY/TRAVELERS CO INC CALL 135.71850 13.06.18 -70 610.00 -856.84 0.00USD MORGAN STANLEY/SOUTHWEST AIRLINES CALL 54.10710 13.06.18 -43 050.00 -4 530.44 0.00USD MORGAN STANLEY/WILLIAMS-SONOMA IN CALL 52.90770 13.06.18 -87 250.00 -243 117.76 -0.05USD MORGAN STANLEY/SIMON PROP GROUP CALL 166.17770 13.06.18 -14 040.00 -2 455.23 0.00USD MORGAN STANLEY/SL GREEN REALTY COR CALL 106.15730 13.06.18 -35 790.00 -10.91 0.00USD MORGAN STANLEY/BOSTON BEER INC CALL 245.36880 13.06.18 -21 700.00 -228 619.06 -0.05USD MORGAN STANLEY/ROBERT HALF INTL CALL 66.07620 13.06.18 -39 240.00 -4 677.20 0.00USD MORGAN STANLEY/PUBLIC STORAGE CALL 220.42470 13.06.18 -68 820.00 -2 088.29 0.00USD MORGAN STANLEY/PROCTER & GAMBLE CALL 76.13320 13.06.18 -175 830.00 -12 588.21 0.00USD MORGAN STANLEY/PFIZER INC CALL 36.64710 13.06.18 -386 160.00 -32 198.28 -0.01USD MORGAN STANLEY/PAYCHEX INC CALL 65.44490 13.06.18 -227 170.00 -206 392.42 -0.04USD SOCIETE GENERALE/CME GROUP INC CALL 169.05910 13.06.18 -83 520.00 -23 261.55 0.00USD UBS/CDK GLOBAL INC CALL 68.06440 13.06.18 -72 680.00 -3 632.38 0.00USD UBS/MONDELEZ INTL INC CALL 40.78600 13.06.18 -56 180.00 -2 852.11 0.00USD UBS/VISA INC CALL 137.38200 13.06.18 -47 090.00 -3 527.77 0.00USD UBS/SYSCO CORP CALL 66.80200 13.06.18 -232 540.00 -26 214.75 -0.01USD UBS/STARBUCKS CORP CALL 60.00610 13.06.18 -236 120.00 -670.40 0.00USD UBS/PHILLIPS 66 CALL 122.78750 13.06.18 -23 220.00 -3 993.35 0.00USD UBS/PROASSURANCE CORP CALL 43.41900 13.06.18 -42 300.00 -7.11 0.00USD UBS/ALTRIA GROUP INC CALL 58.82780 13.06.18 -218 710.00 -5 227.66 0.00USD UBS/F5 NETWORK INC CALL 180.94400 13.06.18 -16 130.00 -5 722.51 0.00USD UBS/EXPEDTRS INTL WASH CALL 73.71430 13.06.18 -122 390.00 -181 077.86 -0.04USD UBS/DUKE ENERGY CORP CALL 80.74560 13.06.18 -30 250.00 -376.94 0.00USD UBS/CENTERPOINT ENERGY CALL 27.34710 13.06.18 -202 570.00 -2 299.96 0.00USD UBS/CHURCH & DWIGHT INC CALL 49.99430 13.06.18 -236 320.00 -4 553.83 0.00USD UBS/WYNDHAM WORLDWIDE CALL 115.95960 13.06.18 -21 450.00 -2 141.65 0.00USD UBS/BEST BUY CO INC CALL 85.36640 13.06.18 -101 380.00 0.00 0.00USD UBS/CIGNA CORP CALL 178.39820 13.06.18 -72 510.00 -9 629.33 0.00USD MORGAN STANLEY/GARMIN LTD CALL 62.49930 13.06.18 -84 130.00 -2 553.59 0.00Total USD -2 527 365.23 -0.50
Total Options on shares, classic-styled -2 527 365.23 -0.50
Total Derivative instruments not listed on an official stock exchange and not traded on anotherregulated market -2 527 365.23 -0.50
Total investments in securities 501 227 122.31 98.34
Description Quantity/ Valuation in USD as a % Nominal Unrealized gain of net (loss) on Futures/ assets Forward Exchange Contracts/ Swaps (Note 1)

The notes are an integral part of the fi nancial statements. 169
UBS (Lux) Equity SICAV – US Income (USD)Annual Report as of 31 May 2018
Forward Foreign Exchange contracts
Forward Foreign Exchange contracts (Purchase/Sale)
CHF 206 673 400.00 USD 207 290 919.65 25.6.2018 3 340 519.61 0.66EUR 31 293 500.00 USD 36 824 469.66 25.6.2018 -234 824.04 -0.05CHF 834 800.00 USD 838 245.19 25.6.2018 12 542.21 0.00USD 222 724.12 CHF 220 500.00 25.6.2018 -1 998.71 0.00EUR 357 600.00 USD 419 360.38 25.6.2018 -1 239.77 0.00EUR 48 700.00 USD 57 284.64 25.6.2018 -342.60 0.00EUR 175 700.00 USD 205 215.67 25.6.2018 219.99 0.00EUR 155 100.00 USD 180 588.93 25.6.2018 760.36 0.00CHF 393 200.00 USD 396 232.05 25.6.2018 4 498.19 0.00USD 272 270.36 EUR 233 900.00 25.6.2018 -1 215.13 0.00Total Forward Foreign Exchange contracts (Purchase/Sale) 3 118 920.11 0.61
Cash at banks, deposits on demand and deposit accounts and other liquid assets 4 888 952.25 0.96Other assets and liabilities 437 019.57 0.09
Total net assets 509 672 014.24 100.00
Description Quantity/ Valuation in USD as a % Nominal Unrealized gain of net (loss) on Futures/ assets Forward Exchange Contracts/ Swaps (Note 1)

170 The notes are an integral part of the fi nancial statements.
UBS (Lux) Equity SICAV – US Opportunity (USD)Annual Report as of 31 May 2018
UBS (Lux) Equity SICAV – US Opportunity (USD)
Three-year comparison
ISIN 31.5.2018 31.5.2017 31.5.2016Net assets in USD 167 843 917.52 249 585 149.93 142 699 149.14Class I-A1-acc LU0399039113Shares outstanding 6 651.1270 6 651.3690 2 500.0000Net asset value per share in USD 127.62 113.81 145.76Issue and redemption price per share in USD1 127.62 113.81 145.93Class I-B-acc LU0399039899Shares outstanding 79 177.0730 700 239.1580 206 174.2460Net asset value per share in USD 190.60 168.49 138.36Issue and redemption price per share in USD1 190.60 168.49 138.53Class (EUR) I-B-acc2 LU1776282987Shares outstanding - - -Net asset value per share in EUR - - -Issue and redemption price per share in EUR1 - - -Class I-X-acc3 LU0399040046Shares outstanding 90 849.3180 90 849.3180 -Net asset value per share in USD 129.61 114.51 -Issue and redemption price per share in USD1 129.61 114.51 -Class P-acc LU0070848113Shares outstanding 333 384.5290 305 653.5780 366 814.5110Net asset value per share in USD 338.95 305.79 256.20Issue and redemption price per share in USD1 338.95 305.79 256.51Class (EUR hedged) P-acc LU0236040357Shares outstanding 11 184.3980 11 819.6720 15 123.9700Net asset value per share in EUR 246.61 227.92 193.91Issue and redemption price per share in EUR1 246.61 227.92 194.14Class P-dist LU0399005999Shares outstanding 14 654.6780 22 927.9510 24 612.2990Net asset value per share in USD 171.62 154.83 129.72Issue and redemption price per share in USD1 171.62 154.83 129.88Class (GBP) P-dist4 LU0206265349Shares outstanding - - 1 659.2460Net asset value per share in GBP - - 175.82Issue and redemption price per share in GBP1 - - 176.03Class Q-acc LU0358729498Shares outstanding 69 339.7760 80 543.5510 86 312.8420Net asset value per share in USD 185.43 165.59 137.33Issue and redemption price per share in USD1 185.43 165.59 137.49Class (EUR hedged) Q-acc LU0358729571Shares outstanding 43 862.0350 49 651.0700 2 810.7710Net asset value per share in EUR 126.52 115.73 97.46Issue and redemption price per share in EUR1 126.52 115.73 97.58Class Q-dist LU0399038909Shares outstanding 14 813.9050 2 677.8140 625.1090Net asset value per share in USD 129.60 115.79 96.27Issue and redemption price per share in USD1 129.60 115.79 96.39Class (GBP) Q-dist LU0399036879Shares outstanding 670.0000 1 524.7870 4 733.7960Net asset value per share in GBP 156.64 144.25 106.38Issue and redemption price per share in GBP1 156.64 144.25 106.51
1 See note 12 The share class (EUR) I-B-acc was in circulation from 22.2.2018 until 8.3.20183 First NAV: 7.10.20164 The share class (GBP) P-dist was in circulation until 16.9.2016

The notes are an integral part of the fi nancial statements. 171
UBS (Lux) Equity SICAV – US Opportunity (USD)Annual Report as of 31 May 2018
Report of the Portfolio Manager
In the financial year, from 1 June 2017 to 31 May 2018, US equities rallied. Eight out of 11 sectors delivered positive returns with only Consumer Staples, Telecoms and Utilities lagging the overall market. IT was the best performing sector led by Software, Communications Equipment and Semiconductors. Geopolitical threats brought some uncertainty to the markets, but the US economic data continued to be strong, with falling unemployment, strengthening consumer sentiment and rising business confidence.
The fund delivered positive returns in the financial year, driven by stock selection in the Materials and Energy sec-tors. The preference for Financials and small holdings in Utilities also contributed to results. On the other side of the spectrum, securities selection in Consumer Staples and Healthcare detracted from performance. Within the subfund we continued to favor Industrials and Financials and remained cautious on Utilities.
Structure of the Securities Portfolio
Geographical Breakdown as a % of net assetsUnited States 94.00Bermuda 1.62Ireland 1.61United Kingdom 1.35Total 98.58
Economic Breakdown as a % of net assetsBanks & credit institutions 11.66Internet, software & IT services 11.27Electronics & semiconductors 10.30Finance & holding companies 9.57Pharmaceuticals, cosmetics & medical products 8.03Retail trade, department stores 6.77Insurance 4.89Petroleum 4.53Tobacco & alcohol 3.02Computer hardware & network equipment providers 2.90Vehicles 2.77Mechanical engineering & industrial equipment 2.70Biotechnology 2.51Healthcare & social services 2.39Real Estate 2.33Food & soft drinks 1.74Miscellaneous unclassified companies 1.61Aerospace industry 1.60Miscellaneous consumer goods 1.54Traffic & transportation 1.52Mining, coal & steel 1.30Chemicals 1.04Building industry & materials 1.04Environmental services & recycling 0.78Telecommunications 0.77Total 98.58
Performance
Currency 2017/2018 2016/2017 2015/2016Class I-A1-acc USD 12.1% - -7.9%Class I-B-acc USD 13.1% 21.8% -6.9%Class (EUR) I-B-acc1 EUR - - -Class I-X-acc USD 13.2% - -Class P-acc USD 10.8% 19.2% -8.7%Class (EUR hedged) P-acc EUR 8.2% 17.4% -8.7%Class P-dist USD 10.8% 19.2% -8.7%Class (GBP) P-dist2 GBP - - -4.3%Class Q-acc USD 12.0% 20.4% -7.8%Class (EUR hedged) Q-acc EUR 9.3% 18.6% -Class Q-dist USD 12.0% 20.4% -Class (GBP) Q-dist GBP 8.6% 35.8% -
1 The share class (EUR) I-B-acc was in circulation from 22.2.2018 until 8.3.2018. Due to this fact, there is no data for the calculation of the performance available.2 The share class (GBP) P-dist was in circulation until 16.9.2016. Due to this fact, there is no data for the calculation of the performance available.
Historical performance is no indicator of current or future performance.The performance data does not take account of any commissions and costs charged when subscribing and redeeming shares.The performance data were not audited.The subfund has no benchmark.

172 The notes are an integral part of the fi nancial statements.
UBS (Lux) Equity SICAV – US Opportunity (USD)Annual Report as of 31 May 2018
Statement of Net Assets USDAssets 31.5.2018Investments in securities, cost 151 289 812.67Investments in securities, unrealized appreciation (depreciation) 14 166 702.75Total investments in securities (Note 1) 165 456 515.42Cash at banks, deposits on demand and deposit accounts 98 503.18Time deposits and fiduciary deposits 2 635 054.63Receivable on subscriptions 21 042.13Receivable on dividends 194 636.97Other receivables 4 820.69Unrealized gain (loss) on forward foreign exchange contracts (Note 1) -60 327.66Total Assets 168 350 245.36
LiabilitiesBank overdraft -10 446.24Interest payable on bank overdraft -209.39Payable on redemptions -358 638.76Provisions for flat fee (Note 2) -117 528.19Provisions for taxe d’abonnement (Note 3) -12 206.04Provisions for other commissions and fees (Note 2) -7 299.22Total provisions -137 033.45Total Liabilities -506 327.84
Net assets at the end of the financial year 167 843 917.52
Statement of Operations USDIncome 1.6.2017-31.5.2018Interest on liquid assets 24 823.57Dividends 2 312 200.30Income on securities lending (Note 16) 88 811.78Other income (Note 4) 126 445.61Total income 2 552 281.26
ExpensesFlat fee (Note 2) -2 421 248.22Taxe d’abonnement (Note 3) -72 691.17Cost on securities lending (Note 16) -35 524.71Other commissions and fees (Note 2) -40 456.65Interest on cash and bank overdraft -2 457.30Total expenses -2 572 378.05
Net income (loss) on investments -20 096.79
Realized gain (loss) (Note 1)Realized gain (loss) on market-priced securities without options 39 809 399.82Realized gain (loss) on forward foreign exchange contracts 214 712.04Realized gain (loss) on foreign exchange 75 706.11Total realized gain (loss) 40 099 817.97
Net realized gain (loss) of the financial year 40 079 721.18
Changes in unrealized appreciation (depreciation) (Note 1)Unrealized appreciation (depreciation) on market-priced securities without options -5 028 057.61Unrealized appreciation (depreciation) on forward foreign exchange contracts -135 642.15Total changes in unrealized appreciation (depreciation) -5 163 699.76
Net increase (decrease) in net assets as a result of operations 34 916 021.42

The notes are an integral part of the fi nancial statements. 173
UBS (Lux) Equity SICAV – US Opportunity (USD)Annual Report as of 31 May 2018
Statement of Changes in Net Assets USD 1.6.2017-31.5.2018Net assets at the beginning of the financial year 249 585 149.93Subscriptions 217 245 240.49Redemptions -333 901 849.82Total net subscriptions (redemptions) -116 656 609.33Dividend paid -644.50Net income (loss) on investments -20 096.79Total realized gain (loss) 40 099 817.97Total changes in unrealized appreciation (depreciation) -5 163 699.76Net increase (decrease) in net assets as a result of operations 34 916 021.42Net assets at the end of the financial year 167 843 917.52
Changes in the Number of Shares outstanding
1.6.2017-31.5.2018Class I-A1-accNumber of shares outstanding at the beginning of the financial year 6 651.3690Number of shares issued 0.0000Number of shares redeemed -0.2420Number of shares outstanding at the end of the financial year 6 651.1270Class I-B-accNumber of shares outstanding at the beginning of the financial year 700 239.1580Number of shares issued 603 743.6340Number of shares redeemed -1 224 805.7190Number of shares outstanding at the end of the financial year 79 177.0730Class (EUR) I-B-accNumber of shares outstanding at the beginning of the financial year 0.0000Number of shares issued 603 600.1320Number of shares redeemed -603 600.1320Number of shares outstanding at the end of the financial year 0.0000Class I-X-accNumber of shares outstanding at the beginning of the financial year 90 849.3180Number of shares issued 0.0000Number of shares redeemed 0.0000Number of shares outstanding at the end of the financial year 90 849.3180Class P-accNumber of shares outstanding at the beginning of the financial year 305 653.5780Number of shares issued 84 875.6820Number of shares redeemed -57 144.7310Number of shares outstanding at the end of the financial year 333 384.5290Class (EUR hedged) P-accNumber of shares outstanding at the beginning of the financial year 11 819.6720Number of shares issued 2 135.0350Number of shares redeemed -2 770.3090Number of shares outstanding at the end of the financial year 11 184.3980Class P-distNumber of shares outstanding at the beginning of the financial year 22 927.9510Number of shares issued 22.1980Number of shares redeemed -8 295.4710Number of shares outstanding at the end of the financial year 14 654.6780Class Q-accNumber of shares outstanding at the beginning of the financial year 80 543.5510Number of shares issued 12 101.5710Number of shares redeemed -23 305.3460Number of shares outstanding at the end of the financial year 69 339.7760Class (EUR hedged) Q-accNumber of shares outstanding at the beginning of the financial year 49 651.0700Number of shares issued 11 265.5860Number of shares redeemed -17 054.6210Number of shares outstanding at the end of the financial year 43 862.0350Class Q-distNumber of shares outstanding at the beginning of the financial year 2 677.8140Number of shares issued 14 384.4160Number of shares redeemed -2 248.3250Number of shares outstanding at the end of the financial year 14 813.9050Class (GBP) Q-distNumber of shares outstanding at the beginning of the financial year 1 524.7870Number of shares issued 200.0000Number of shares redeemed -1 054.7870Number of shares outstanding at the end of the financial year 670.0000
Annual Distribution
UBS (Lux) Equity SICAV – US Opportunity (USD) Ex-Date Pay-Date Currency Amount per shareP-dist 2.8.2017 7.8.2017 USD 0.00Q-dist 2.8.2017 7.8.2017 USD 0.06(GBP) Q-dist 2.8.2017 7.8.2017 GBP 0.08

174 The notes are an integral part of the fi nancial statements.
UBS (Lux) Equity SICAV – US Opportunity (USD)Annual Report as of 31 May 2018
Statement of Investments in Securities and other Net Assets as of 31 May 2018
Description Quantity/ Valuation in USD as a % Nominal Unrealized gain of net (loss) on Futures/ assets Forward Exchange Contracts/ Swaps (Note 1)
Transferable securities and money market instruments listed on an official stock exchange
Bearer shares
Bermuda
USD MARVELL TECH GROUP COM USD0.002 126 019.00 2 714 449.26 1.62Total Bermuda 2 714 449.26 1.62
Ireland
USD ALLEGION PLC CIM USD0.01 35 300.00 2 697 979.00 1.61Total Ireland 2 697 979.00 1.61
United Kingdom
USD APTIV PLC COM USD0.01 23 185.00 2 260 537.50 1.35Total United Kingdom 2 260 537.50 1.35
United States
USD AGCO CORP COM USD0.01 39 279.00 2 498 144.40 1.49USD ALLERGAN PLC COM USD0.0001 19 989.00 3 014 341.20 1.80USD ALNYLAM PHARMACEUTICALS INC COM 13 672.00 1 359 953.84 0.81USD AMAZON COM INC COM USD0.01 4 336.00 7 066 032.32 4.21USD AMER EXPRESS CO COM USD0.20 45 835.00 4 505 580.50 2.68USD ARISTA NETWORKS IN COM USD0.0001 5 772.00 1 452 004.32 0.86USD ASHLAND GLOBAL HLD COM USD0.01 26 962.00 2 095 486.64 1.25USD BIO RAD LABS INC CL A 6 818.00 1 957 652.34 1.17USD BROADCOM CORP COM USD1.00 8 397.00 2 116 631.79 1.26USD CIRRUS LOGIC INC COM 34 047.00 1 276 081.56 0.76USD COHERUS BIOSCIENCE COM USD0.0001 35 958.00 560 944.80 0.33USD EASTMAN CHEM CO COM 16 755.00 1 747 714.05 1.04USD ELECTRONIC ARTS INC COM 12 250.00 1 603 647.50 0.96USD EXPEDIA GROUP INC COM USD0.001 12 120.00 1 466 883.60 0.87USD FACEBOOK INC COM USD0.000006 CL ‘A’ 32 198.00 6 174 932.44 3.68USD GARDNER DENVER HLD COM USD0.01 113 968.00 3 746 128.16 2.23USD GODADDY INC COM CL A USD0.001 19 887.00 1 423 710.33 0.85USD HESS CORPORATION COM USD1 44 701.00 2 700 834.42 1.61USD INCYTE CORPORATION COM USD0.001 40 746.00 2 781 729.42 1.66USD IRONWOOD PHARMACEU COM CL A USD0.001 77 756.00 1 444 706.48 0.86USD JABIL INC COM USD0.001 49 760.00 1 407 212.80 0.84USD JOHNSON & JOHNSON COM USD1 30 099.00 3 600 442.38 2.14USD JP MORGAN CHASE & COM USD1 39 474.00 4 224 112.74 2.52USD KLA-TENCOR CORP COM USD0.001 12 993.00 1 471 197.39 0.88USD LAB CORP AMER HLDG COM USD0.1 11 601.00 2 095 024.59 1.25USD LAM RESEARCH CORP COM USD0.001 8 007.00 1 586 827.26 0.94USD LEXICON PHARMACEUT USD0.001 144A 75 374.00 874 338.40 0.52USD LKQ CORP COM 75 310.00 2 392 598.70 1.43USD MARSH & MCLENNAN COM USD1 60 941.00 4 897 828.17 2.92USD MASCO CORP COM 46 791.00 1 743 900.57 1.04USD METLIFE INC COM USD0.01 72 035.00 3 312 889.65 1.97USD MICROCHIP TECHNLGY COM USD0.001 15 909.00 1 549 218.42 0.92USD MICRON TECHNOLOGY COM USD0.10 51 286.00 2 953 560.74 1.76USD MONDELEZ INTL INC COM USD0.01 74 234.00 2 915 169.18 1.74USD MSA SAFETY INC COM NPV 12 195.00 1 134 135.00 0.68USD NEWELL BRANDS INC COM USD1 109 899.00 2 591 418.42 1.54USD NOBLE ENERGY INC COM USD0.01 70 386.00 2 512 780.20 1.50USD NORWEGIAN CRUISE L COM USD0.001 32 144.00 1 682 416.96 1.00USD PHILIP MORRIS INTL COM STK NPV ‘WI’ 63 771.00 5 072 345.34 3.02USD SALESFORCE.COM INC COM USD0.001 15 012.00 1 941 501.96 1.16USD SENSATA TECHNO PLC COM EUR0.01 27 770.00 1 418 769.30 0.84USD SIMON PROP GROUP COM USD0.0001 24 387.00 3 907 285.14 2.33USD SKYWORKS SOLUTIONS INC COM 15 360.00 1 514 649.60 0.90USD SPIRIT AEROSYSTEMS COM STK USD0.01 CLASS ‘A’ 31 632.00 2 679 546.72 1.60USD SPIRIT AIRLINES IN COM USD0.0001 69 608.00 2 553 917.52 1.52USD STEEL DYNAMICS INC COM 44 012.00 2 175 513.16 1.30USD STERICYCLE INC COM 20 604.00 1 308 354.00 0.78USD SYNCHRONY FINANCIA COM USD0.001 106 188.00 3 677 290.44 2.19USD T-MOBILE US INC COM USD0.0001 23 129.00 1 288 285.30 0.77USD TAKE TWO INTERACTI COM USD0.01 12 959.00 1 452 444.72 0.86USD TERADYNE INC COM USD0.125 36 533.00 1 384 966.03 0.82USD TJX COS INC COM USD1 47 634.00 4 302 302.88 2.56USD ULTIMATE SOFTWARE GROUP INC COM 5 420.00 1 420 853.00 0.85USD UNITEDHEALTH GRP COM USD0.01 16 606.00 4 010 515.06 2.39USD UNIVERSAL DISPLAY COM USD0.01 14 397.00 1 425 303.00 0.85USD VISA INC COM STK USD0.0001 26 407.00 3 451 923.04 2.06USD VOYA FINL INC COM USD0.01 56 080.00 2 912 795.20 1.74USD WABTEC CORP COM 20 851.00 2 033 181.01 1.21USD WALGREENS BOOTS AL COM USD0.01 36 995.00 2 308 118.05 1.37USD WELLS FARGO & CO COM USD1 2/3 82 939.00 4 477 876.61 2.67USD WESTERN DIGITAL CORP COM 32 956.00 2 752 155.56 1.64USD WORLDPAY INC COM USD0.00001 CL A 25 030.00 1 989 134.10 1.18USD WPX ENERGY INC COM USD1 131 044.00 2 386 311.24 1.42Total United States 157 783 549.66 94.00
Total Bearer shares 165 456 515.42 98.58
Total Transferable securities and money market instruments listed on an official stock exchange 165 456 515.42 98.58
Total investments in securities 165 456 515.42 98.58

The notes are an integral part of the fi nancial statements. 175
UBS (Lux) Equity SICAV – US Opportunity (USD)Annual Report as of 31 May 2018
Forward Foreign Exchange contracts
Forward Foreign Exchange contracts (Purchase/Sale)
EUR 8 198 600.00 USD 9 647 661.56 25.6.2018 -61 521.67 -0.04USD 102 448.49 EUR 87 100.00 25.6.2018 607.59 0.00EUR 106 600.00 USD 124 054.68 25.6.2018 586.42 0.00Total Forward Foreign Exchange contracts (Purchase/Sale) -60 327.66 -0.04
Cash at banks, deposits on demand and deposit accounts and other liquid assets 98 503.18 0.06Time deposits and fiduciary deposits 2 635 054.63 1.57Bank overdraft and other short-term liabilities -10 446.24 -0.01Other assets and liabilities -275 381.81 -0.16
Total net assets 167 843 917.52 100.00
Description Quantity/ Valuation in USD as a % Nominal Unrealized gain of net (loss) on Futures/ assets Forward Exchange Contracts/ Swaps (Note 1)

176 The notes are an integral part of the fi nancial statements.
UBS (Lux) Equity SICAV – US Systematic Defensive (USD)Annual Report as of 31 May 2018
UBS (Lux) Equity SICAV – US SystematicDefensive (USD)
Three-year comparison
ISIN 31.5.2018 31.5.2017 31.5.2016Net assets in USD 249 426 225.37 268 515 602.66 176 927 409.39Class F-acc LU1220256165Shares outstanding 1 660 698.0740 1 996 430.7800 1 635 401.9510Net asset value per share in USD 126.10 114.96 103.44Issue and redemption price per share in USD1 126.10 114.96 103.44Class (CHF hedged) F-acc LU1252258451Shares outstanding 116 147.6080 69 946.6210 24 273.4920Net asset value per share in CHF 119.23 111.71 102.55Issue and redemption price per share in CHF1 119.23 111.71 102.55Class (EUR hedged) F-acc LU1252258295Shares outstanding 183 702.5610 243 649.8550 45 738.6940Net asset value per share in EUR 120.89 112.90 103.16Issue and redemption price per share in EUR1 120.89 112.90 103.16
1 See note 1
Performance
Currency 2017/2018 2016/2017 2015/2016Class F-acc USD 9.7% 11.1% -Class (CHF hedged) F-acc CHF 6.7% 8.9% -Class (EUR hedged) F-acc EUR 7.1% 9.4% -
Historical performance is no indicator of current or future performance.The performance data does not take account of any commissions and costs charged when subscribing and redeeming shares.The performance data were not audited.The subfund has no benchmark.
Report of the Portfolio Manager
In the financial year, from 1 June 2017 to 31 May 2018, US equities rallied. Eight out of 11 sectors delivered posi-tive returns with only Consumer Staples, Telecoms and Utilities lagging the overall market. IT was the best per-forming sector led by Software, Communications Equip-ment and Semiconductors. Geopolitical threats brought some uncertainty to the markets, but the US economic data continued to be strong, with falling unemployment, strengthening consumer sentiment and rising business confidence.
The subfund performed positively during the financial year. At a sector level, contributions from Information Technology, Energy and Health Care contributed to the positive performance. Consumer Staples and Telecom Services detracted slightly. On a stock level, Boeing and Adobe System contributed positively while Philip Morris and Altria detracted.
Structure of the Securities Portfolio
Geographical Breakdown as a % of net assetsUnited States 93.49Bermuda 2.34Ireland 1.52Switzerland 1.33United Kingdom 0.42Canada 0.12Total 99.22
Economic Breakdown as a % of net assetsInsurance 10.76Finance & holding companies 9.70Internet, software & IT services 9.05Pharmaceuticals, cosmetics & medical products 8.76Energy & water supply 7.99Petroleum 6.92Retail trade, department stores 6.60Healthcare & social services 5.92Computer hardware & network equipment providers 4.80Telecommunications 4.28Banks & credit institutions 2.85Food & soft drinks 2.82Mechanical engineering & industrial equipment 2.77Tobacco & alcohol 2.41Electronics & semiconductors 2.03Miscellaneous consumer goods 1.93Real Estate 1.84Aerospace industry 1.63Miscellaneous services 1.52Miscellaneous unclassified companies 1.41Precious metals & stones 0.92Building industry & materials 0.86Graphic design, publishing & media 0.59Environmental services & recycling 0.36Miscellaneous trading companies 0.26Forestry, paper & pulp products 0.14Textiles, garments & leather goods 0.10Total 99.22
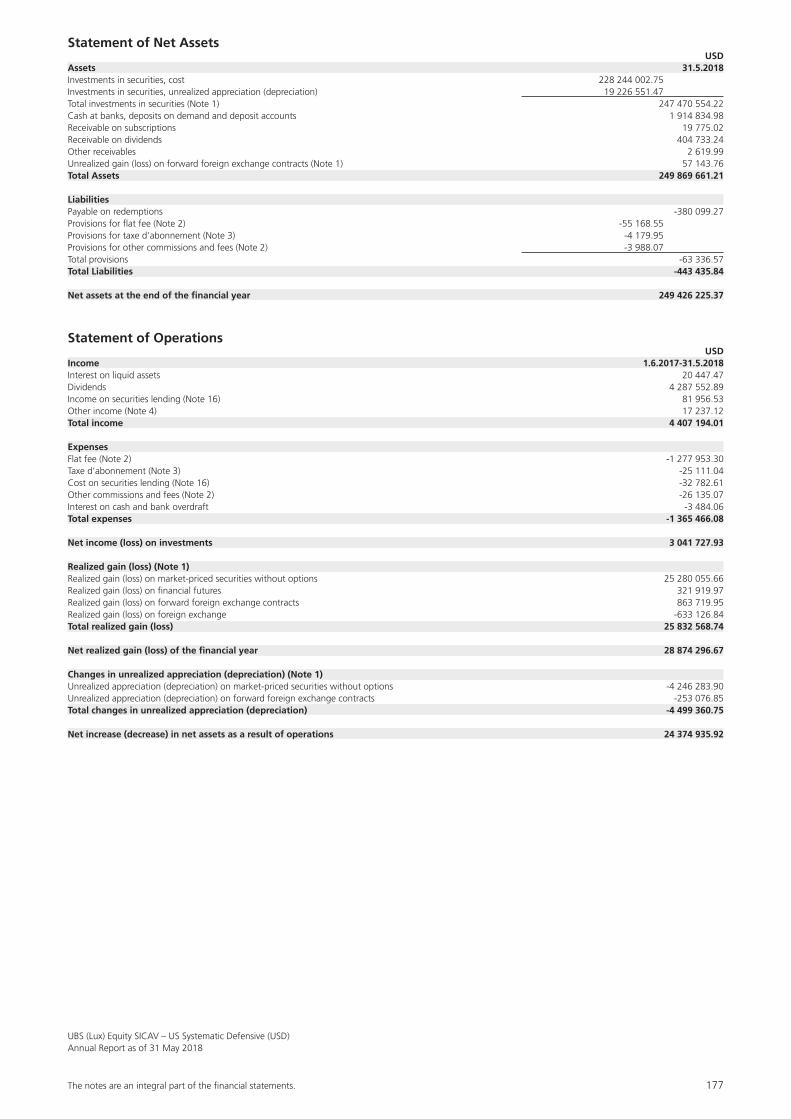
The notes are an integral part of the fi nancial statements. 177
UBS (Lux) Equity SICAV – US Systematic Defensive (USD)Annual Report as of 31 May 2018
Statement of Net Assets USDAssets 31.5.2018Investments in securities, cost 228 244 002.75Investments in securities, unrealized appreciation (depreciation) 19 226 551.47Total investments in securities (Note 1) 247 470 554.22Cash at banks, deposits on demand and deposit accounts 1 914 834.98Receivable on subscriptions 19 775.02Receivable on dividends 404 733.24Other receivables 2 619.99Unrealized gain (loss) on forward foreign exchange contracts (Note 1) 57 143.76Total Assets 249 869 661.21
LiabilitiesPayable on redemptions -380 099.27Provisions for flat fee (Note 2) -55 168.55Provisions for taxe d’abonnement (Note 3) -4 179.95Provisions for other commissions and fees (Note 2) -3 988.07Total provisions -63 336.57Total Liabilities -443 435.84
Net assets at the end of the financial year 249 426 225.37
Statement of Operations USDIncome 1.6.2017-31.5.2018Interest on liquid assets 20 447.47Dividends 4 287 552.89Income on securities lending (Note 16) 81 956.53Other income (Note 4) 17 237.12Total income 4 407 194.01
ExpensesFlat fee (Note 2) -1 277 953.30Taxe d’abonnement (Note 3) -25 111.04Cost on securities lending (Note 16) -32 782.61Other commissions and fees (Note 2) -26 135.07Interest on cash and bank overdraft -3 484.06Total expenses -1 365 466.08
Net income (loss) on investments 3 041 727.93
Realized gain (loss) (Note 1)Realized gain (loss) on market-priced securities without options 25 280 055.66Realized gain (loss) on financial futures 321 919.97Realized gain (loss) on forward foreign exchange contracts 863 719.95Realized gain (loss) on foreign exchange -633 126.84Total realized gain (loss) 25 832 568.74
Net realized gain (loss) of the financial year 28 874 296.67
Changes in unrealized appreciation (depreciation) (Note 1)Unrealized appreciation (depreciation) on market-priced securities without options -4 246 283.90Unrealized appreciation (depreciation) on forward foreign exchange contracts -253 076.85Total changes in unrealized appreciation (depreciation) -4 499 360.75
Net increase (decrease) in net assets as a result of operations 24 374 935.92
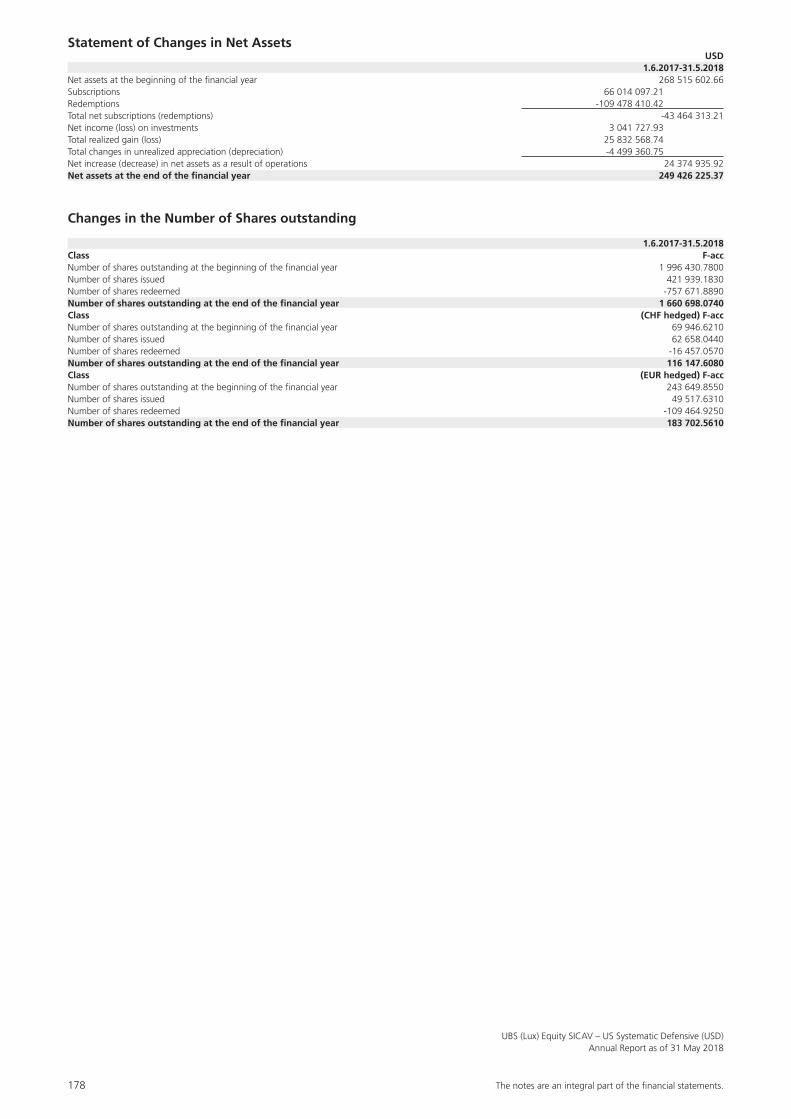
178 The notes are an integral part of the fi nancial statements.
UBS (Lux) Equity SICAV – US Systematic Defensive (USD)Annual Report as of 31 May 2018
Statement of Changes in Net Assets USD 1.6.2017-31.5.2018Net assets at the beginning of the financial year 268 515 602.66Subscriptions 66 014 097.21Redemptions -109 478 410.42Total net subscriptions (redemptions) -43 464 313.21Net income (loss) on investments 3 041 727.93Total realized gain (loss) 25 832 568.74Total changes in unrealized appreciation (depreciation) -4 499 360.75Net increase (decrease) in net assets as a result of operations 24 374 935.92Net assets at the end of the financial year 249 426 225.37
Changes in the Number of Shares outstanding
1.6.2017-31.5.2018Class F-accNumber of shares outstanding at the beginning of the financial year 1 996 430.7800Number of shares issued 421 939.1830Number of shares redeemed -757 671.8890Number of shares outstanding at the end of the financial year 1 660 698.0740Class (CHF hedged) F-accNumber of shares outstanding at the beginning of the financial year 69 946.6210Number of shares issued 62 658.0440Number of shares redeemed -16 457.0570Number of shares outstanding at the end of the financial year 116 147.6080Class (EUR hedged) F-accNumber of shares outstanding at the beginning of the financial year 243 649.8550Number of shares issued 49 517.6310Number of shares redeemed -109 464.9250Number of shares outstanding at the end of the financial year 183 702.5610

The notes are an integral part of the fi nancial statements. 179
UBS (Lux) Equity SICAV – US Systematic Defensive (USD)Annual Report as of 31 May 2018
Statement of Investments in Securities and other Net Assets as of 31 May 2018
Description Quantity/ Valuation in USD as a % Nominal Unrealized gain of net (loss) on Futures/ assets Forward Exchange Contracts/ Swaps (Note 1)
Transferable securities and money market instruments listed on an official stock exchange
Bearer shares
Bermuda
USD ARCH CAPITAL GROUP COM USD0.01 26 959.00 2 114 933.55 0.85USD AXIS CAPITAL HLDGS COM USD0.0125 16 400.00 932 340.00 0.37USD EVEREST RE GROUP COM USD0.01 8 353.00 1 881 847.37 0.75USD RENAISSANCE RE HLG COM USD1 7 487.00 919 178.99 0.37Total Bermuda 5 848 299.91 2.34
Canada
USD WASTE CONNECTIONS COM NPV (POST REV SPLT) 3 725.00 286 378.00 0.12Total Canada 286 378.00 0.12
Ireland
USD ACCENTURE PLC SHS CL A ‘NEW’ 24 346.00 3 791 646.04 1.52Total Ireland 3 791 646.04 1.52
United Kingdom
USD WILLIS TOWERS WATS COM USD0.000304635 6 906.00 1 043 841.90 0.42Total United Kingdom 1 043 841.90 0.42
United States
USD ADOBE SYSTEMS INC COM USD0.0001 15 686.00 3 910 206.08 1.57USD AFLAC INC COM USD0.10 84 280.00 3 797 656.80 1.52USD AGNC INV CORP COM USD0.01 80 217.00 1 509 683.94 0.61USD ALLSTATE CORP COM 38 562.00 3 604 775.76 1.45USD ALLY FINANCIAL INC COM USD0.01 91 330.00 2 342 614.50 0.94USD ALPHABET INC CAP STK USD0.001 CL A 3 479.00 3 826 900.00 1.53USD ALTRIA GROUP INC COM USD0.333333 58 422.00 3 256 442.28 1.31USD AMER FINL GP OHIO COM NPV 2 801.00 307 773.88 0.12USD AMERISOURCEBERGEN COM STK USD0.01 19 241.00 1 580 455.74 0.63USD ANNALY CAPITAL MAN COM USD0.01 232 150.00 2 421 324.50 0.97USD ANTHEM INC COM USD0.01 16 209.00 3 588 996.78 1.44USD APPLE INC COM NPV 20 013.00 3 739 829.31 1.50USD ASSURANT INC COM 3 855.00 359 864.25 0.14USD AT&T INC COM USD1 100 061.00 3 233 971.52 1.30USD BAXTER INTL INC COM USD1 43 411.00 3 075 235.24 1.23USD BERKLEY(WR)CORP COM USD0.20 19 975.00 1 527 488.25 0.61USD BERKSHIRE HATHAWAY CLASS’B’COM USD0.0033 18 839.00 3 608 233.67 1.45USD BOEING CO COM USD5 10 551.00 3 715 640.16 1.49USD BROADRIDGE FIN SOL COM STK USD0.01 23 871.00 2 755 906.95 1.10USD BUNGE LIMITED COM USD0.01 5 013.00 348 654.15 0.14USD CATERPILLAR INC DEL COM 21 993.00 3 340 956.63 1.34USD CENTENE CORP DEL COM 32 366.00 3 792 000.56 1.52USD CENTERPOINT ENERGY INC COM 32 603.00 851 916.39 0.34USD CHARTER COMMUN INC COM USD0.001 CLASS ‘A’ 1 751.00 457 081.04 0.18USD CHEVRON CORP COM USD0.75 29 211.00 3 630 927.30 1.46USD CISCO SYSTEMS COM USD0.001 78 776.00 3 364 522.96 1.35USD CITIZENS FINL GP COM USD0.01 15 707.00 641 630.95 0.26USD CLOROX CO DEL COM 14 519.00 1 754 330.77 0.70USD CME GROUP INC COM STK USD0.01 CLASS’A’ 13 417.00 2 185 629.30 0.88USD COCA-COLA CO COM USD0.25 48 589.00 2 089 327.00 0.84USD COGNIZANT TECHNOLO COM CL’A’USD0.01 6 785.00 511 249.75 0.20USD COMCAST CORP COM CLS’A’ USD0.01 47 029.00 1 466 364.22 0.59USD CONAGRA BRANDS IN COM USD5 6 773.00 251 007.38 0.10USD CONOCOPHILLIPS COM USD0.01 53 410.00 3 599 299.90 1.44USD CONSOLIDATED EDISON INC COM 47 242.00 3 624 878.66 1.45USD COSTCO WHSL CORP NEW COM 4 516.00 895 251.84 0.36USD DEERE & CO COM USD1 23 835.00 3 563 570.85 1.43USD DOLLAR GENERAL CP COM USD0.875 37 581.00 3 287 585.88 1.32USD DOLLAR TREE INC 35 350.00 2 919 556.50 1.17USD DXC TECHNOLOGY CO COM USD0.01 37 687.00 3 471 349.57 1.39USD EDISON INTL COM 8 547.00 531 281.52 0.21USD ELECTRONIC ARTS INC COM 1 889.00 247 288.99 0.10USD ELI LILLY AND CO COM NPV 12 364.00 1 051 434.56 0.42USD ENTERGY CORP NEW COM 26 672.00 2 158 031.52 0.86USD ESTEE LAUDER COS CLASS’A’COM USD0.01 25 329.00 3 785 165.76 1.52USD EXELON CORP COM NPV 96 109.00 3 977 951.51 1.59USD EXPRESS SCRIPTS HL COM USD0.01 48 924.00 3 708 928.44 1.49USD EXXON MOBIL CORP COM NPV 45 433.00 3 690 976.92 1.48USD F5 NETWORK INC COM STK NPV 1 436.00 248 585.96 0.10USD FIDELITY NATL FINL FNF GROUP COM USD0.0001 14 737.00 544 679.52 0.22USD GAP INC DEL COM 9 682.00 270 902.36 0.11USD HCA HEALTHCARE INC COM USD0.01 4 431.00 457 013.34 0.18USD HERSHEY CO COM 8 192.00 737 607.68 0.30USD HOLLYFRONTIER CORP COM USD0.01 33 183.00 2 561 063.94 1.03USD HUMANA INC COM USD0.166 12 670.00 3 686 716.60 1.48USD INTEL CORP COM USD0.001 70 134.00 3 871 396.80 1.55USD INTL BUSINESS MCHN COM USD0.20 18 152.00 2 565 059.12 1.03USD INTUIT INC COM USD0.01 19 658.00 3 963 052.80 1.59USD JOHNSON & JOHNSON COM USD1 28 259.00 3 380 341.58 1.36USD JONES LANG LASALLE INC COM 3 950.00 646 852.00 0.26USD JUNIPER NETWORKS COM USD0.00001 76 240.00 2 031 033.60 0.81USD KELLOGG CO COM USD0.25 4 059.00 261 359.01 0.10USD KIMBERLY CLARK CORP COM 3 404.00 343 293.40 0.14USD KOHLS CORPORATION COM USD0.01 32 870.00 2 194 072.50 0.88USD LAB CORP AMER HLDG COM USD0.1 4 074.00 735 723.66 0.29USD MACY’S INC COM STK USD0.01 13 619.00 475 439.29 0.19

180 The notes are an integral part of the fi nancial statements.
UBS (Lux) Equity SICAV – US Systematic Defensive (USD)Annual Report as of 31 May 2018
USD MARATHON PETROLEUM COM USD0.01 44 442.00 3 512 251.26 1.41USD MARKEL CORP COM 898.00 985 177.84 0.39USD MASTERCARD INC COM USD0.0001 CLASS ‘A’ 19 548.00 3 716 465.76 1.49USD MCKESSON CORP COM USD0.01 18 192.00 2 582 172.48 1.04USD MERCK & CO INC COM USD0.50 32 548.00 1 937 582.44 0.78USD MICRON TECHNOLOGY COM USD0.10 20 825.00 1 199 311.75 0.48USD NETAPP INC COM USD0.001 4 117.00 281 273.44 0.11USD NEWMONT MINING CP COM USD1.60 59 066.00 2 299 439.38 0.92USD NEXTERA ENERGY INC COM USD0.01 16 524.00 2 739 844.44 1.10USD NVR INC COM STK USD0.01 715.00 2 138 236.10 0.86USD PAYCHEX INC COM 45 181.00 2 962 969.98 1.19USD PEPSICO INC CAP USD0.016666 33 286.00 3 336 921.50 1.34USD PFIZER INC COM USD0.05 103 760.00 3 728 096.80 1.49USD PG&E CORP COM 36 639.00 1 587 567.87 0.64USD PHILIP MORRIS INTL COM STK NPV ‘WI’ 34 795.00 2 767 594.30 1.11USD PROCTER & GAMBLE COM NPV 41 920.00 3 067 286.40 1.23USD PROGRESSIVE CP(OH) COM USD1 60 544.00 3 759 176.96 1.51USD PUBLIC SVC ENTERPRISE GROUP COM 50 205.00 2 659 860.90 1.07USD PVH CORP COM USD1 1 615.00 258 400.00 0.10USD RAYTHEON CO COM NEW 1 663.00 348 398.50 0.14USD RED HAT INC COM 3 200.00 519 744.00 0.21USD REINSURANCE GROUP COM USD0.01 11 704.00 1 749 045.76 0.70USD ROSS STORES INC COM USD0.01 39 314.00 3 101 088.32 1.24USD SOUTHERN CO COM 18 916.00 849 328.40 0.34USD SYNCHRONY FINANCIA COM USD0.001 64 849.00 2 245 720.87 0.90USD SYSCO CORP COM USD1 9 874.00 642 106.22 0.26USD T-MOBILE US INC COM USD0.0001 59 506.00 3 314 484.20 1.33USD TARGET CORP COM STK USD0.0833 25 931.00 1 890 110.59 0.76USD TJX COS INC COM USD1 14 399.00 1 300 517.68 0.52USD TORCHMARK CORP COM 4 131.00 350 432.73 0.14USD TOTAL SYSTEM SVCS COM STK USD0.10 34 174.00 2 911 283.06 1.17USD TRAVELERS CO INC COM NPV 27 322.00 3 511 423.44 1.41USD UNITEDHEALTH GRP COM USD0.01 15 277.00 3 689 548.27 1.48USD VALERO ENERGY CORP NEW COM 31 175.00 3 778 410.00 1.51USD VERIZON COMMUN COM USD0.10 76 848.00 3 663 344.16 1.47USD VISA INC COM STK USD0.0001 19 845.00 2 594 138.40 1.04USD VOYA FINL INC COM USD0.01 4 929.00 256 012.26 0.10USD WALMART INC COM USD0.10 36 801.00 3 037 554.54 1.22USD WASTE MGMT INC DEL COM 7 483.00 618 918.93 0.25USD WEC ENERGY GROUP COM USD0.01 4 133.00 260 998.95 0.10USD XCEL ENERGY INC COM 15 213.00 692 495.76 0.28Total United States 233 180 078.23 93.49
Total Bearer shares 244 150 244.08 97.88
Registered shares
Switzerland
USD CHUBB LIMITED ORD CHF24.15 25 406.00 3 320 310.14 1.33Total Switzerland 3 320 310.14 1.33
Total Registered shares 3 320 310.14 1.33
Total Transferable securities and money market instruments listed on an official stock exchange 247 470 554.22 99.22
Total investments in securities 247 470 554.22 99.22
Forward Foreign Exchange contracts
Forward Foreign Exchange contracts (Purchase/Sale)
CHF 13 646 100.00 USD 13 686 873.20 25.6.2018 220 565.70 0.09EUR 21 914 000.00 USD 25 787 189.93 25.6.2018 -164 440.98 -0.07CHF 90 500.00 USD 91 451.28 25.6.2018 781.90 0.00EUR 189 400.00 USD 221 217.12 25.6.2018 237.14 0.00Total Forward Foreign Exchange contracts (Purchase/Sale) 57 143.76 0.02
Cash at banks, deposits on demand and deposit accounts and other liquid assets 1 914 834.98 0.77Other assets and liabilities -16 307.59 -0.01
Total net assets 249 426 225.37 100.00
Description Quantity/ Valuation in USD as a % Nominal Unrealized gain of net (loss) on Futures/ assets Forward Exchange Contracts/ Swaps (Note 1)

The notes are an integral part of the fi nancial statements. 181
UBS (Lux) Equity SICAV – US Total Yield (USD)Annual Report as of 31 May 2018
Three-year comparison
ISIN 31.5.2018 31.5.2017 31.5.2016Net assets in USD 739 605 420.56 1 418 358 427.42 1 540 603 868.98Class F-acc LU1136807846Shares outstanding 2 751.6150 2 329 231.0590 3 910 168.2500Net asset value per share in USD 131.72 114.82 100.83Issue and redemption price per share in USD1 131.72 114.82 100.83Class F-dist2 LU1135392162Shares outstanding - 26 515.0370 27 976.7010Net asset value per share in USD - 102.73 97.92Issue and redemption price per share in USD1 - 102.73 97.92Class I-A1-acc LU0997794549Shares outstanding 15 242.5020 22 371.7860 225 560.4490Net asset value per share in USD 143.87 125.55 110.36Issue and redemption price per share in USD1 143.87 125.55 110.36Class I-A2-acc3 LU0955117915Shares outstanding - - 2 800.0000Net asset value per share in USD - - 126.46Issue and redemption price per share in USD1 - - 126.46Class (EUR hedged) I-A2-dist4 LU1191201109Shares outstanding - - 151 129.0000Net asset value per share in EUR - - 93.24Issue and redemption price per share in EUR1 - - 93.24Class I-A3-acc LU1297653567Shares outstanding 263 497.3230 141 211.0000 134 533.0000Net asset value per share in USD 131.45 114.57 100.61Issue and redemption price per share in USD1 131.45 114.57 100.61Class K-1-acc5 LU0878840312Shares outstanding - 5.5000 5.4000Net asset value per share in USD - 8 187 440.13 7 220 493.91Issue and redemption price per share in USD1 - 8 187 440.13 7 220 493.91Class K-X-acc6 LU1570387024Shares outstanding - 33 600.0000 -Net asset value per share in USD - 100.22 -Issue and redemption price per share in USD1 - 100.22 -Class (EUR hedged) N-8%-mdist LU1121266354Shares outstanding 202 773.2800 802 750.3060 7 122.2790Net asset value per share in EUR 90.95 89.69 88.36Issue and redemption price per share in EUR1 90.95 89.69 88.36Class P-acc LU0868494617Shares outstanding 1 273 894.4260 2 321 146.6710 2 788 486.3980Net asset value per share in USD 181.18 159.55 141.55Issue and redemption price per share in USD1 181.18 159.55 141.55Class (CHF hedged) P-acc LU0868494880Shares outstanding 226 304.9360 374 983.5950 477 400.7300Net asset value per share in CHF 170.23 153.97 139.47Issue and redemption price per share in CHF1 170.23 153.97 139.47Class (EUR hedged) P-acc LU0868495002Shares outstanding 210 415.4220 292 473.4450 284 762.0580Net asset value per share in EUR 173.43 156.38 140.81Issue and redemption price per share in EUR1 173.43 156.38 140.81Class P-dist LU0868494708Shares outstanding 281 905.1070 413 494.1740 570 300.0540Net asset value per share in USD 140.46 129.10 123.39Issue and redemption price per share in USD1 140.46 129.10 123.39Class (CHF hedged) P-dist LU0868494963Shares outstanding 123 792.2690 198 476.2490 239 321.1610Net asset value per share in CHF 131.88 124.51 121.55Issue and redemption price per share in CHF1 131.88 124.51 121.55Class (EUR hedged) P-dist LU0868495184Shares outstanding 43 447.3240 53 383.6550 46 054.5620Net asset value per share in EUR 134.38 126.49 122.72Issue and redemption price per share in EUR1 134.38 126.49 122.72Class P-mdist LU0942090050Shares outstanding 832 882.6190 994 070.3340 1 325 632.4610Net asset value per share in USD 122.57 114.18 108.69Issue and redemption price per share in USD1 122.57 114.18 108.69
UBS (Lux) Equity SICAV – US Total Yield (USD)

182 The notes are an integral part of the fi nancial statements.
UBS (Lux) Equity SICAV – US Total Yield (USD)Annual Report as of 31 May 2018
ISIN 31.5.2018 31.5.2017 31.5.2016
Class (SGD hedged) P-mdist7 LU1257167418Shares outstanding 93 270.7900 37 494.1040 -Net asset value per share in SGD 105.54 98.89 -Issue and redemption price per share in SGD1 105.54 98.89 -Class Q-acc LU1207007581Shares outstanding 741 238.4540 1 282 052.2430 1 383 441.1510Net asset value per share in USD 126.35 110.53 97.42Issue and redemption price per share in USD1 126.35 110.53 97.42Class (CHF hedged) Q-acc LU1240789112Shares outstanding 284 630.4150 685 635.3350 698 412.8250Net asset value per share in CHF 118.52 106.48 95.83Issue and redemption price per share in CHF1 118.52 106.48 95.83Class (EUR hedged) Q-acc LU0979667457Shares outstanding 133 846.4600 175 354.1280 162 045.8140Net asset value per share in EUR 142.60 127.74 114.26Issue and redemption price per share in EUR1 142.60 127.74 114.26Class Q-dist LU1240789625Shares outstanding 118 846.7830 203 659.2220 211 630.4890Net asset value per share in USD 111.44 102.30 96.49Issue and redemption price per share in USD1 111.44 102.30 96.49Class (CHF hedged) Q-dist LU1240789203Shares outstanding 198 509.3330 394 291.4690 410 058.6280Net asset value per share in CHF 105.39 99.39 95.82Issue and redemption price per share in CHF1 105.39 99.39 95.82Class (EUR hedged) Q-dist LU1240789468Shares outstanding 45 115.3280 30 805.2130 33 250.4400Net asset value per share in EUR 106.91 100.50 96.30Issue and redemption price per share in EUR1 106.91 100.50 96.30Class Q-mdist LU1240789898Shares outstanding 51 120.9150 86 863.0090 74 221.0570Net asset value per share in USD 106.01 98.09 92.78Issue and redemption price per share in USD1 106.01 98.09 92.78
1 See note 12 The share class F-dist was in circulation until 15.11.20173 The share class I-A2-acc was in circulation until 27.9.20164 The share class (EUR hedged) I-A2-dist was in circulation until 26.9.20165 The share class K-1-acc was in circulation until 8.5.20186 For the period from 6.3.2017 to 20.9.2017 the share class K-X-acc was in circulation7 First NAV: 27.2.2017
Performance
Currency 2017/2018 2016/2017 2015/2016Class F-acc USD 14.7% 13.9% -Class F-dist1 USD - 13.8% -3.6%Class I-A1-acc USD 14.6% 13.8% -3.7%Class I-A2-acc2 USD - - -3.6%Class (EUR hedged) I-A2-dist3 EUR - - -3.8%Class I-A3-acc USD 14.7% 13.9% -Class K-1-acc4 USD - 13.4% -4.0%Class K-X-acc5 USD - - -Class (EUR hedged) N-8%-mdist EUR 9.8% 9.9% -5.7%Class P-acc USD 13.6% 12.7% -4.6%Class (CHF hedged) P-acc CHF 10.6% 10.4% -5.3%Class (EUR hedged) P-acc EUR 10.9% 11.1% -4.7%Class P-dist USD 13.6% 12.7% -4.5%Class (CHF hedged) P-dist CHF 10.6% 10.4% -5.3%Class (EUR hedged) P-dist EUR 10.9% 11.0% -4.7%Class P-mdist USD 13.5% 12.7% -4.5%Class (SGD hedged) P-mdist SGD 12.8% - -Class Q-acc USD 14.3% 13.5% -3.9%Class (CHF hedged) Q-acc CHF 11.3% 11.1% -Class (EUR hedged) Q-acc EUR 11.6% 11.8% -4.1%Class Q-dist USD 14.3% 13.5% -Class (CHF hedged) Q-dist CHF 11.3% 11.1% -Class (EUR hedged) Q-dist EUR 11.6% 11.8% -Class Q-mdist USD 14.3% 13.4% -
1 The share class F-dist was in circulation until 15.11.2017. Due to this fact, there is no data for the calculation of the performance available.2 The share class I-A2-acc was in circulation until 27.9.2016. Due to this fact, there is no data for the calculation of the performance available.3 The share class (EUR hedged) I-A2-dist was in circulation until 26.9.2016. Due to this fact, there is no data for the calculation of the performance available.4 The share class K-1-acc was in circulation until 8.5.2018. Due to this fact, there is no data for the calculation of the performance available.5 For the period from 6.3.2017 to 20.9.2017 the share class K-X-acc was in circulation. Due to this fact, there is no data for the calculation of the performance available.
Historical performance is no indicator of current or future performance.The performance data does not take account of any commissions and costs charged when subscribing and redeeming shares.The performance data were not audited.The subfund has no benchmark.

The notes are an integral part of the fi nancial statements. 183
UBS (Lux) Equity SICAV – US Total Yield (USD)Annual Report as of 31 May 2018
Report of the Portfolio Manager
In the financial year, from 1 June 2017 to 31 May 2018, US equities rallied. Eight out of 11 sectors delivered posi-tive returns with only Consumer Staples, Telecoms and Utilities lagging the overall market. IT was the best per-forming sector led by Software, Communications Equip-ment and Semiconductors. Geopolitical threats brought some uncertainty to the markets, but the US economic data continued to be strong, with falling unemployment, strengthening consumer sentiment and rising business confidence.
The subfund posted positive returns over the financial year. Exposure in most sectors such as Information Tech-nology, Industrials and Consumer Discretionary added value, but there were negative contributions from Tele-com Services. From a stock perspective, Boston Beer and Valero Energy added the most value while Hewlett Packard Enterprise and Smucker J M detracted.
Structure of the Securities Portfolio
Geographical Breakdown as a % of net assetsUnited States 91.07Bermuda 3.05Ireland 2.05Guernsey 1.04Switzerland 1.04United Kingdom 0.98Total 99.23
Economic Breakdown as a % of net assetsInsurance 11.02Banks & credit institutions 9.94Finance & holding companies 9.08Retail trade, department stores 9.04Traffic & transportation 6.11Electronics & semiconductors 5.99Pharmaceuticals, cosmetics & medical products 5.95Internet, software & IT services 5.15Healthcare & social services 4.01Computer hardware & network equipment providers 3.91Food & soft drinks 3.90Mechanical engineering & industrial equipment 3.04Aerospace industry 2.96Textiles, garments & leather goods 2.10Lodging, catering & leisure 2.02Tobacco & alcohol 2.00Miscellaneous consumer goods 1.93Real Estate 1.06Petroleum 1.04Miscellaneous services 1.04Mining, coal & steel 1.03Miscellaneous unclassified companies 1.02Vehicles 1.02Electrical devices & components 1.00Miscellaneous trading companies 1.00Graphic design, publishing & media 0.96Chemicals 0.96Telecommunications 0.95Total 99.23

184 The notes are an integral part of the fi nancial statements.
UBS (Lux) Equity SICAV – US Total Yield (USD)Annual Report as of 31 May 2018
Statement of Net Assets USDAssets 31.5.2018Investments in securities, cost 682 940 511.06Investments in securities, unrealized appreciation (depreciation) 50 969 606.68Total investments in securities (Note 1) 733 910 117.74Cash at banks, deposits on demand and deposit accounts 5 140 440.27Receivable on securities sales (Note 1) 900 160.42Receivable on subscriptions 2 620 992.81Receivable on dividends 1 111 140.05Other receivables 80 243.43Unrealized gain (loss) on forward foreign exchange contracts (Note 1) 1 176 778.05Total Assets 744 939 872.77
LiabilitiesBank overdraft -2.71Payable on securities purchases (Note 1) -898 315.67Payable on redemptions -3 900 390.55Provisions for flat fee (Note 2) -428 078.59Provisions for taxe d’abonnement (Note 3) -59 479.40Provisions for other commissions and fees (Note 2) -48 185.29Total provisions -535 743.28Total Liabilities -5 334 452.21
Net assets at the end of the financial year 739 605 420.56
Statement of Operations USDIncome 1.6.2017-31.5.2018Interest on liquid assets 69 355.29Dividends 15 004 333.47Income on securities lending (Note 16) 539 093.81Other income (Note 4) 172 174.22Total income 15 784 956.79
ExpensesFlat fee (Note 2) -13 372 161.19Taxe d’abonnement (Note 3) -445 602.96Cost on securities lending (Note 16) -215 637.51Other commissions and fees (Note 2) -239 263.51Interest on cash and bank overdraft -14 550.52Total expenses -14 287 215.69
Net income (loss) on investments 1 497 741.10
Realized gain (loss) (Note 1)Realized gain (loss) on market-priced securities without options 206 665 237.57Realized gain (loss) on financial futures 53 681.27Realized gain (loss) on forward foreign exchange contracts 10 314 951.07Realized gain (loss) on foreign exchange -6 743 023.89Total realized gain (loss) 210 290 846.02
Net realized gain (loss) of the financial year 211 788 587.12
Changes in unrealized appreciation (depreciation) (Note 1)Unrealized appreciation (depreciation) on market-priced securities without options -67 854 925.96Unrealized appreciation (depreciation) on forward foreign exchange contracts -2 108 084.23Total changes in unrealized appreciation (depreciation) -69 963 010.19
Net increase (decrease) in net assets as a result of operations 141 825 576.93

The notes are an integral part of the fi nancial statements. 185
UBS (Lux) Equity SICAV – US Total Yield (USD)Annual Report as of 31 May 2018
Statement of Changes in Net Assets USD 1.6.2017-31.5.2018Net assets at the beginning of the financial year 1 418 358 427.42Subscriptions 293 441 227.30Redemptions -1 095 773 369.39Total net subscriptions (redemptions) -802 332 142.09Dividend paid -18 246 441.70Net income (loss) on investments 1 497 741.10Total realized gain (loss) 210 290 846.02Total changes in unrealized appreciation (depreciation) -69 963 010.19Net increase (decrease) in net assets as a result of operations 141 825 576.93Net assets at the end of the financial year 739 605 420.56
Changes in the Number of Shares outstanding
1.6.2017-31.5.2018Class F-accNumber of shares outstanding at the beginning of the financial year 2 329 231.0590Number of shares issued 144 438.2610Number of shares redeemed -2 470 917.7050Number of shares outstanding at the end of the financial year 2 751.6150Class F-distNumber of shares outstanding at the beginning of the financial year 26 515.0370Number of shares issued 7 411.7750Number of shares redeemed -33 926.8120Number of shares outstanding at the end of the financial year 0.0000Class I-A1-accNumber of shares outstanding at the beginning of the financial year 22 371.7860Number of shares issued 2 035.0000Number of shares redeemed -9 164.2840Number of shares outstanding at the end of the financial year 15 242.5020Class I-A3-accNumber of shares outstanding at the beginning of the financial year 141 211.0000Number of shares issued 219 613.0000Number of shares redeemed -97 326.6770Number of shares outstanding at the end of the financial year 263 497.3230Class K-1-accNumber of shares outstanding at the beginning of the financial year 5.5000Number of shares issued 0.0000Number of shares redeemed -5.5000Number of shares outstanding at the end of the financial year 0.0000Class K-X-accNumber of shares outstanding at the beginning of the financial year 33 600.0000Number of shares issued 0.0000Number of shares redeemed -33 600.0000Number of shares outstanding at the end of the financial year 0.0000Class (EUR hedged) N-8%-mdistNumber of shares outstanding at the beginning of the financial year 802 750.3060Number of shares issued 66 897.2370Number of shares redeemed -666 874.2630Number of shares outstanding at the end of the financial year 202 773.2800Class P-accNumber of shares outstanding at the beginning of the financial year 2 321 146.6710Number of shares issued 263 673.6130Number of shares redeemed -1 310 925.8580Number of shares outstanding at the end of the financial year 1 273 894.4260Class (CHF hedged) P-accNumber of shares outstanding at the beginning of the financial year 374 983.5950Number of shares issued 15 401.8690Number of shares redeemed -164 080.5280Number of shares outstanding at the end of the financial year 226 304.9360Class (EUR hedged) P-accNumber of shares outstanding at the beginning of the financial year 292 473.4450Number of shares issued 386 247.8340Number of shares redeemed -468 305.8570Number of shares outstanding at the end of the financial year 210 415.4220Class P-distNumber of shares outstanding at the beginning of the financial year 413 494.1740Number of shares issued 25 222.6700Number of shares redeemed -156 811.7370Number of shares outstanding at the end of the financial year 281 905.1070Class (CHF hedged) P-distNumber of shares outstanding at the beginning of the financial year 198 476.2490Number of shares issued 12 116.1520Number of shares redeemed -86 800.1320Number of shares outstanding at the end of the financial year 123 792.2690
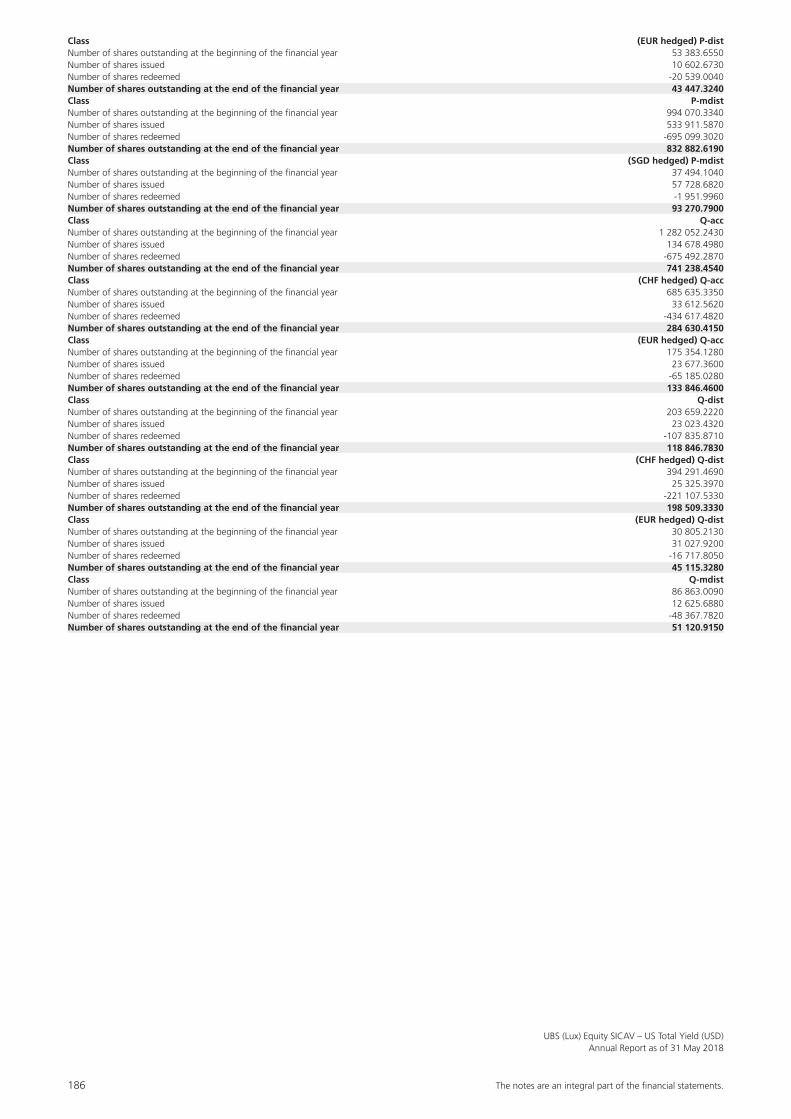
186 The notes are an integral part of the fi nancial statements.
UBS (Lux) Equity SICAV – US Total Yield (USD)Annual Report as of 31 May 2018
Class (EUR hedged) P-distNumber of shares outstanding at the beginning of the financial year 53 383.6550Number of shares issued 10 602.6730Number of shares redeemed -20 539.0040Number of shares outstanding at the end of the financial year 43 447.3240Class P-mdistNumber of shares outstanding at the beginning of the financial year 994 070.3340Number of shares issued 533 911.5870Number of shares redeemed -695 099.3020Number of shares outstanding at the end of the financial year 832 882.6190Class (SGD hedged) P-mdistNumber of shares outstanding at the beginning of the financial year 37 494.1040Number of shares issued 57 728.6820Number of shares redeemed -1 951.9960Number of shares outstanding at the end of the financial year 93 270.7900Class Q-accNumber of shares outstanding at the beginning of the financial year 1 282 052.2430Number of shares issued 134 678.4980Number of shares redeemed -675 492.2870Number of shares outstanding at the end of the financial year 741 238.4540Class (CHF hedged) Q-accNumber of shares outstanding at the beginning of the financial year 685 635.3350Number of shares issued 33 612.5620Number of shares redeemed -434 617.4820Number of shares outstanding at the end of the financial year 284 630.4150Class (EUR hedged) Q-accNumber of shares outstanding at the beginning of the financial year 175 354.1280Number of shares issued 23 677.3600Number of shares redeemed -65 185.0280Number of shares outstanding at the end of the financial year 133 846.4600Class Q-distNumber of shares outstanding at the beginning of the financial year 203 659.2220Number of shares issued 23 023.4320Number of shares redeemed -107 835.8710Number of shares outstanding at the end of the financial year 118 846.7830Class (CHF hedged) Q-distNumber of shares outstanding at the beginning of the financial year 394 291.4690Number of shares issued 25 325.3970Number of shares redeemed -221 107.5330Number of shares outstanding at the end of the financial year 198 509.3330Class (EUR hedged) Q-distNumber of shares outstanding at the beginning of the financial year 30 805.2130Number of shares issued 31 027.9200Number of shares redeemed -16 717.8050Number of shares outstanding at the end of the financial year 45 115.3280Class Q-mdistNumber of shares outstanding at the beginning of the financial year 86 863.0090Number of shares issued 12 625.6880Number of shares redeemed -48 367.7820Number of shares outstanding at the end of the financial year 51 120.9150

The notes are an integral part of the fi nancial statements. 187
UBS (Lux) Equity SICAV – US Total Yield (USD)Annual Report as of 31 May 2018
Annual Distribution
UBS (Lux) Equity SICAV – US Total Yield (USD) Ex-Date Pay-Date Currency Amount per shareF-dist 2.8.2017 7.8.2017 USD 5.26P-dist 2.8.2017 7.8.2017 USD 5.51(CHF hedged) P-dist 2.8.2017 7.8.2017 CHF 5.31(EUR hedged) P-dist 2.8.2017 7.8.2017 EUR 5.39Q-dist 2.8.2017 7.8.2017 USD 4.91(CHF hedged) Q-dist 2.8.2017 7.8.2017 CHF 4.77(EUR hedged) Q-dist 2.8.2017 7.8.2017 EUR 4.81
Monthly Distribution
UBS (Lux) Equity SICAV – US Total Yield (USD) Ex-Date Pay-Date Currency Amount per share(EUR hedged) N-8%-mdist 13.6.2017 16.6.2017 EUR 0.59(EUR hedged) N-8%-mdist 10.7.2017 13.7.2017 EUR 0.59(EUR hedged) N-8%-mdist 10.8.2017 16.8.2017 EUR 0.59(EUR hedged) N-8%-mdist 11.9.2017 14.9.2017 EUR 0.58(EUR hedged) N-8%-mdist 10.10.2017 13.10.2017 EUR 0.60(EUR hedged) N-8%-mdist 10.11.2017 15.11.2017 EUR 0.60(EUR hedged) N-8%-mdist 11.12.2017 14.12.2017 EUR 0.62(EUR hedged) N-8%-mdist 10.1.2018 15.1.2018 EUR 0.62(EUR hedged) N-8%-mdist 12.2.2018 15.2.2018 EUR 0.65(EUR hedged) N-8%-mdist 12.3.2018 15.3.2018 EUR 0.62(EUR hedged) N-8%-mdist 10.4.2018 13.4.2018 EUR 0.60(EUR hedged) N-8%-mdist 11.5.2018 16.5.2018 EUR 0.60P-mdist 15.6.2017 20.6.2017 USD 0.61P-mdist 18.7.2017 21.7.2017 USD 0.55P-mdist 16.8.2017 21.8.2017 USD 0.49P-mdist 15.9.2017 20.9.2017 USD 0.57P-mdist 16.10.2017 19.10.2017 USD 0.52P-mdist 15.11.2017 20.11.2017 USD 0.54P-mdist 15.12.2017 20.12.2017 USD 0.62P-mdist 16.1.2018 19.1.2018 USD 0.60P-mdist 15.2.2018 20.2.2018 USD 0.52P-mdist 15.3.2018 20.3.2018 USD 0.58P-mdist 16.4.2018 19.4.2018 USD 0.63P-mdist 15.5.2018 18.5.2018 USD 0.50(SGD hedged) P-mdist 15.6.2017 20.6.2017 SGD 0.52(SGD hedged) P-mdist 18.7.2017 21.7.2017 SGD 0.47(SGD hedged) P-mdist 16.8.2017 21.8.2017 SGD 0.43(SGD hedged) P-mdist 15.9.2017 20.9.2017 SGD 0.49(SGD hedged) P-mdist 16.10.2017 19.10.2017 SGD 0.45(SGD hedged) P-mdist 15.11.2017 20.11.2017 SGD 0.46(SGD hedged) P-mdist 15.12.2017 20.12.2017 SGD 0.53(SGD hedged) P-mdist 16.1.2018 19.1.2018 SGD 0.51(SGD hedged) P-mdist 15.2.2018 20.2.2018 SGD 0.45(SGD hedged) P-mdist 15.3.2018 20.3.2018 SGD 0.50(SGD hedged) P-mdist 16.4.2018 19.4.2018 SGD 0.54(SGD hedged) P-mdist 15.5.2018 18.5.2018 SGD 0.43Q-mdist 15.6.2017 20.6.2017 USD 0.53Q-mdist 18.7.2017 21.7.2017 USD 0.47Q-mdist 16.8.2017 21.8.2017 USD 0.42Q-mdist 15.9.2017 20.9.2017 USD 0.49Q-mdist 16.10.2017 19.10.2017 USD 0.45Q-mdist 15.11.2017 20.11.2017 USD 0.47Q-mdist 15.12.2017 20.12.2017 USD 0.53Q-mdist 16.1.2018 19.1.2018 USD 0.52Q-mdist 15.2.2018 20.2.2018 USD 0.45Q-mdist 15.3.2018 20.3.2018 USD 0.50Q-mdist 16.4.2018 19.4.2018 USD 0.54Q-mdist 15.5.2018 18.5.2018 USD 0.43

188 The notes are an integral part of the fi nancial statements.
UBS (Lux) Equity SICAV – US Total Yield (USD)Annual Report as of 31 May 2018
Statement of Investments in Securities and other Net Assets as of 31 May 2018
Description Quantity/ Valuation in USD as a % Nominal Unrealized gain of net (loss) on Futures/ assets Forward Exchange Contracts/ Swaps (Note 1)
Transferable securities and money market instruments listed on an official stock exchange
Bearer shares
Bermuda
USD ASSURED GUARANTY COM USD0.01 209 100.00 7 420 959.00 1.00USD AXIS CAPITAL HLDGS COM USD0.0125 134 900.00 7 669 065.00 1.04USD MARVELL TECH GROUP COM USD0.002 346 710.00 7 468 133.40 1.01Total Bermuda 22 558 157.40 3.05
Guernsey
USD AMDOCS ORD GBP0.01 114 523.00 7 725 721.58 1.04Total Guernsey 7 725 721.58 1.04
Ireland
USD ACCENTURE PLC SHS CL A ‘NEW’ 49 214.00 7 664 588.36 1.04USD EATON CORP PLC COM USD0.01 97 500.00 7 466 550.00 1.01Total Ireland 15 131 138.36 2.05
United Kingdom
USD AON PLC COM USD0.01 CL A 51 900.00 7 259 253.00 0.98Total United Kingdom 7 259 253.00 0.98
United States
USD AETNA INC COM USD0.01 43 185.00 7 606 174.05 1.03USD AFLAC INC COM USD0.10 169 002.00 7 615 230.12 1.03USD ALLSTATE CORP COM 78 575.00 7 345 191.00 0.99USD ALTRIA GROUP INC COM USD0.333333 121 390.00 6 766 278.60 0.92USD AMER EXPRESS CO COM USD0.20 75 958.00 7 466 671.40 1.01USD AMERIPRISE FINL INC COM 51 793.00 7 180 063.59 0.97USD ANTHEM INC COM USD0.01 32 579.00 7 213 642.18 0.98USD APPLE INC COM NPV 39 128.00 7 311 849.36 0.99USD APPLIED MATLS INC COM 139 259.00 7 071 572.02 0.96USD ARCHER DANIELS MIDLAND CO COM 170 391.00 7 449 494.52 1.01USD ASSURANT INC COM 79 973.00 7 465 479.55 1.01USD AT&T INC COM USD1 217 086.00 7 016 219.52 0.95USD AUTO DATA PROCESS COM USD0.10 59 507.00 7 737 100.14 1.05USD AVNET INC COM 183 852.00 7 008 438.24 0.95USD BB&T CORP COM USD5 139 702.00 7 334 355.00 0.99USD BEST BUY CO INC COM USD0.10 95 693.00 6 531 047.25 0.88USD BK OF NY MELLON CP COM STK USD0.01 134 674.00 7 373 401.50 1.00USD BOEING CO COM USD5 20 491.00 7 216 110.56 0.98USD BOSTON BEER INC CL A 31 640.00 8 031 814.00 1.09USD BRISTOL-MYRS SQUIB COM STK USD0.10 127 156.00 6 690 948.72 0.90USD CARLISLE COS INC COM 71 578.00 7 686 761.42 1.04USD CASEYS GEN STORES INC COM 72 575.00 7 025 260.00 0.95USD CHEESECAKE FACTORY INC COM 143 221.00 7 420 280.01 1.00USD CHURCH & DWIGHT INC COM 147 213.00 6 911 650.35 0.93USD CIGNA CORP COM USD0.25 43 079.00 7 296 290.23 0.99USD COMCAST CORP COM CLS’A’ USD0.01 228 850.00 7 135 543.00 0.97USD CONAGRA BRANDS IN COM USD5 207 287.00 7 682 056.22 1.04USD CONVERGYS CORP COM 302 067.00 7 140 863.88 0.97USD COSTCO WHSL CORP NEW COM 38 556.00 7 643 341.44 1.03USD CSX CORP COM USD1 120 132.00 7 766 533.80 1.05USD CVS HEALTH CORP COM STK USD0.01 114 901.00 7 283 574.39 0.99USD DELTA AIRLINES INC COM USD0.0001 132 069.00 7 138 329.45 0.97USD DISCOVER FINL SVCS COM STK USD0.01 98 565.00 7 280 010.90 0.98USD EMERSON ELEC CO COM 104 881.00 7 429 770.04 1.00USD EXPEDTRS INTL WASH COM USD0.01 106 261.00 7 914 319.28 1.07USD F5 NETWORK INC COM STK NPV 44 529.00 7 708 415.19 1.04USD FIFTH THIRD BANCORP COM 230 148.00 7 037 925.84 0.95USD FRANKLIN RES INC COM 224 890.00 7 549 557.30 1.02USD GEN DYNAMICS CORP COM USD1 35 566.00 7 174 017.86 0.97USD HARTFORD FINL SVCS COM USD0.01 143 571.00 7 513 070.43 1.02USD HEWLETT PACKARD EN COM USD0.01 443 868.00 6 764 548.32 0.91USD HOME DEPOT INC COM USD0.05 40 930.00 7 635 491.50 1.03USD HUMANA INC COM USD0.166 26 033.00 7 575 082.34 1.02USD INGERSOLL-RAND PLC SHS USD1 85 319.00 7 468 825.26 1.01USD INTERCONTINENTAL E COM USD0.01 107 727.00 7 636 767.03 1.03USD INTL BUSINESS MCHN COM USD0.20 51 318.00 7 251 746.58 0.98USD INTUITIVE SURGICAL COM USD0.001 16 759.00 7 703 609.53 1.04USD LAM RESEARCH CORP COM USD0.001 36 992.00 7 331 074.56 0.99USD LEAR CORP COM USD0.01 38 020.00 7 527 960.00 1.02USD LINCOLN NATL CORP COM NPV 106 269.00 7 044 572.01 0.95USD M & T BANK CORP COM USD0.50 41 995.00 7 226 499.60 0.98USD MARATHON PETROLEUM COM USD0.01 95 919.00 7 580 478.57 1.03USD MCKESSON CORP COM USD0.01 51 396.00 7 295 148.24 0.99USD MERCK & CO INC COM USD0.50 127 349.00 7 581 085.97 1.03USD METLIFE INC COM USD0.01 160 731.00 7 392 018.69 1.00USD MONDELEZ INTL INC COM USD0.01 188 224.00 7 391 556.48 1.00USD NIKE INC CLASS’B’COM NPV 107 558.00 7 722 664.40 1.04USD OREILLY AUTO NEW COM USD0.01 28 193.00 7 595 476.13 1.03USD PAYCHEX INC COM 118 343.00 7 760 933.94 1.05USD PFIZER INC COM USD0.05 206 487.00 7 419 077.91 1.00USD PHILLIPS 66 COM USD0.01 63 750.00 7 426 237.50 1.00USD PPG INDS INC COM 70 408.00 7 105 575.36 0.96USD PROCTER & GAMBLE COM NPV 100 447.00 7 349 706.99 0.99USD PRUDENTIAL FINL COM USD0.01 73 608.00 7 128 198.72 0.96USD PUBLIC STORAGE COM USD0.10 36 900.00 7 816 896.00 1.06USD ROBERT HALF INTL COM USD0.001 119 171.00 7 588 809.28 1.03

The notes are an integral part of the fi nancial statements. 189
UBS (Lux) Equity SICAV – US Total Yield (USD)Annual Report as of 31 May 2018
USD ROSS STORES INC COM USD0.01 93 016.00 7 337 102.08 0.99USD SKYWORKS SOLUTIONS INC COM 77 791.00 7 670 970.51 1.04USD SMUCKER(JM)CO COM NPV 58 809.00 6 321 967.50 0.85USD SNAP-ON INC COM USD1 51 028.00 7 542 958.96 1.02USD SOUTHWEST AIRLINES COM USD1 143 034.00 7 306 176.72 0.99USD SPIRIT AEROSYSTEMS COM STK USD0.01 CLASS ‘A’ 88 345.00 7 483 704.95 1.01USD STARBUCKS CORP COM USD0.001 132 474.00 7 507 301.58 1.02USD SYSCO CORP COM USD1 113 483.00 7 379 799.49 1.00USD TEXAS INSTRUMENTS COM USD1 69 396.00 7 766 106.36 1.05USD TJX COS INC COM USD1 83 744.00 7 563 758.08 1.02USD TORCHMARK CORP COM 88 858.00 7 537 824.14 1.02USD TRACTOR SUPPLY CO COM 106 145.00 7 887 634.95 1.07USD TRAVELERS CO INC COM NPV 56 658.00 7 281 686.16 0.98USD UNION PACIFIC CORP COM USD2.50 53 345.00 7 615 532.20 1.03USD US BANCORP COM USD0.01 152 394.00 7 618 176.06 1.03USD VALERO ENERGY CORP NEW COM 63 628.00 7 711 713.60 1.04USD VF CORP COM NPV 95 804.00 7 775 452.64 1.05USD VISA INC COM STK USD0.0001 59 681.00 7 801 500.32 1.05USD WALGREENS BOOTS AL COM USD0.01 117 949.00 7 358 838.11 0.99USD WALMART INC COM USD0.10 91 142.00 7 522 860.68 1.02USD WALT DISNEY CO. DISNEY COM USD0.01 73 809.00 7 341 781.23 0.99USD WELLS FARGO & CO COM USD1 2/3 134 402.00 7 256 363.98 0.98USD WILLIAMS-SONOMA IN COM USD0.01 138 958.00 7 694 104.46 1.04USD WORTHINGTON INDS INC COM 158 952.00 7 621 748.40 1.03USD ZIONS BANCORP COM NPV 130 062.00 7 128 698.22 0.96Total United States 673 522 454.64 91.07
Total Bearer shares 726 196 724.98 98.19
Registered shares
Switzerland
USD GARMIN LTD COM CHF10.00 128 364.00 7 713 392.76 1.04Total Switzerland 7 713 392.76 1.04
Total Registered shares 7 713 392.76 1.04
Total Transferable securities and money market instruments listed on an official stock exchange 733 910 117.74 99.23
Total investments in securities 733 910 117.74 99.23
Forward Foreign Exchange contracts
Forward Foreign Exchange contracts (Purchase/Sale)
CHF 110 236 900.00 USD 110 566 276.94 25.6.2018 1 781 789.65 0.24SGD 8 411 400.00 USD 6 255 035.36 25.6.2018 36 379.42 0.01EUR 85 306 600.00 USD 100 384 115.02 25.6.2018 -640 134.22 -0.09USD 140 176.12 CHF 139 600.00 25.6.2018 -2 097.38 0.00SGD 587 200.00 USD 437 415.73 25.6.2018 1 788.06 0.00USD 168 482.47 CHF 166 800.00 25.6.2018 -1 511.95 0.00SGD 39 600.00 USD 29 453.90 25.6.2018 165.43 0.00USD 328 006.43 EUR 279 700.00 25.6.2018 969.70 0.00USD 679 618.12 EUR 577 800.00 25.6.2018 4 030.63 0.00USD 243 000.95 CHF 240 100.00 25.6.2018 -1 697.25 0.00SGD 181 800.00 USD 135 720.56 25.6.2018 259.09 0.00SGD 318 700.00 USD 237 690.37 25.6.2018 685.39 0.00USD 175 140.21 CHF 173 800.00 25.6.2018 -1 988.26 0.00USD 356 505.16 CHF 351 800.00 25.6.2018 -2 032.22 0.00SGD 314 000.00 USD 234 600.42 25.6.2018 259.92 0.00USD 135 068.53 CHF 132 700.00 25.6.2018 -172.83 0.00EUR 148 100.00 USD 173 079.73 25.6.2018 84.87 0.00Total Forward Foreign Exchange contracts (Purchase/Sale) 1 176 778.05 0.16
Cash at banks, deposits on demand and deposit accounts and other liquid assets 5 140 440.27 0.70Bank overdraft and other short-term liabilities -2.71 0.00Other assets and liabilities -621 912.79 -0.09
Total net assets 739 605 420.56 100.00
Description Quantity/ Valuation in USD as a % Nominal Unrealized gain of net (loss) on Futures/ assets Forward Exchange Contracts/ Swaps (Note 1)

190 The notes are an integral part of the fi nancial statements.
UBS (Lux) Equity SICAV – USA Enhanced (USD)Annual Report as of 31 May 2018
UBS (Lux) Equity SICAV – USA Enhanced (USD)
Three-year comparison
ISIN 31.5.2018 31.5.2017 31.5.2016Net assets in USD 1 300 918 926.11 1 071 072 870.12 522 317 073.32Class F-acc LU0399034312Shares outstanding 2 786 315.4430 2 157 411.1370 4 872.5230Net asset value per share in USD 149.50 131.37 113.99Issue and redemption price per share in USD1 149.50 131.37 114.10Class (CHF hedged) F-acc LU0999556359Shares outstanding 107 323.5670 120 414.5780 16 583.5280Net asset value per share in CHF 140.89 127.19 112.56Issue and redemption price per share in CHF1 140.89 127.19 112.67Class (EUR hedged) F-acc LU0999558058Shares outstanding 499 114.2860 327 619.3900 19 043.7000Net asset value per share in EUR 148.91 134.07 118.12Issue and redemption price per share in EUR1 148.91 134.07 118.24Class P-acc LU0246276595Shares outstanding 2 148 692.7180 2 681 430.3140 2 472 526.1650Net asset value per share in USD 229.22 202.32 176.35Issue and redemption price per share in USD1 229.22 202.32 176.53Class (EUR hedged) P-acc LU1157384881Shares outstanding 1 174 900.4460 304 701.0050 197.9430Net asset value per share in EUR 127.24 115.04 101.82Issue and redemption price per share in EUR1 127.24 115.04 101.92Class Q-acc LU0399034585Shares outstanding 12 602.8080 6 346.8920 4 546.5690Net asset value per share in USD 132.23 116.43 101.23Issue and redemption price per share in USD1 132.23 116.43 101.33Class U-X-acc LU0399035988Shares outstanding 5 183.5820 7 297.5650 4 889.6620Net asset value per share in USD 21 904.25 19 152.35 16 536.81Issue and redemption price per share in USD1 21 904.25 19 152.35 16 553.35
1 See note 1
Performance
Currency 2017/2018 2016/2017 2015/2016Class F-acc USD 13.8% 15.1% -2.6%Class (CHF hedged) F-acc CHF 10.8% 12.9% -3.3%Class (EUR hedged) F-acc EUR 11.1% 13.4% -2.6%Class P-acc USD 13.3% 14.6% -3.0%Class (EUR hedged) P-acc EUR 10.6% 12.9% -3.1%Class Q-acc USD 13.6% 14.9% -Class U-X-acc USD 14.4% 15.8% -2.1%
Historical performance is no indicator of current or future performance.The performance data does not take account of any commissions and costs charged when subscribing and redeeming shares.The performance data were not audited.The subfund has no benchmark.

The notes are an integral part of the fi nancial statements. 191
UBS (Lux) Equity SICAV – USA Enhanced (USD)Annual Report as of 31 May 2018
Report of the Portfolio Manager
In the financial year, from 1 June 2017 to 31 May 2018, US equities rallied. Eight out of 11 sectors delivered positive returns with only Consumer Staples, Telecoms and Utilities lagging the overall market. IT was the best performing sector led by Software, Communications Equipment and Semiconductors. Geopolitical threats brought some uncertainty to the markets, but the US economic data continued to be strong, with falling unemployment, strengthening consumer sentiment and rising business confidence.
The subfund posted a positive return in the financial year. Exposure in Information Technology, Energy and Health Care contributed positively to returns while exposure in Consumer Staples and Telecom Services detracted. From a stock perspective, Boeing and Apple contributed the most positively whereas PG&E and Edison detracted.
Structure of the Securities Portfolio
Geographical Breakdown as a % of net assetsUnited States 96.28Ireland 1.87Bermuda 0.92Panama 0.43United Kingdom 0.37Total 99.87
Economic Breakdown as a % of net assetsInternet, software & IT services 12.23Finance & holding companies 9.26Pharmaceuticals, cosmetics & medical products 7.74Banks & credit institutions 7.00Petroleum 6.76Insurance 5.69Electronics & semiconductors 5.50Retail trade, department stores 5.42Computer hardware & network equipment providers 4.39Telecommunications 3.80Healthcare & social services 3.67Energy & water supply 3.48Aerospace industry 2.26Biotechnology 2.08Miscellaneous services 1.99Miscellaneous unclassified companies 1.95Vehicles 1.82Traffic & transportation 1.76Mechanical engineering & industrial equipment 1.75Lodging, catering & leisure 1.69Food & soft drinks 1.42Building industry & materials 1.23Real Estate 1.21Chemicals 1.12Graphic design, publishing & media 0.96Tobacco & alcohol 0.78Mining, coal & steel 0.76Forestry, paper & pulp products 0.69Agriculture & fishery 0.66Precious metals & stones 0.44Miscellaneous consumer goods 0.36Total 99.87
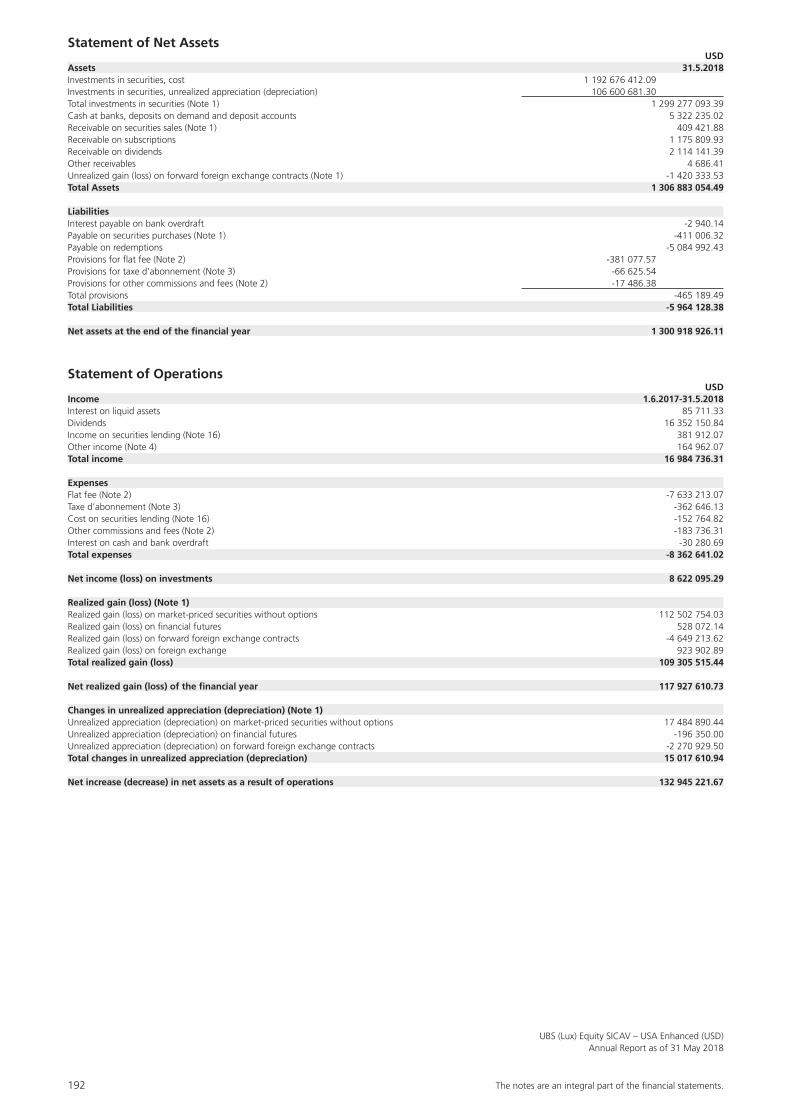
192 The notes are an integral part of the fi nancial statements.
UBS (Lux) Equity SICAV – USA Enhanced (USD)Annual Report as of 31 May 2018
Statement of Net Assets USDAssets 31.5.2018Investments in securities, cost 1 192 676 412.09Investments in securities, unrealized appreciation (depreciation) 106 600 681.30Total investments in securities (Note 1) 1 299 277 093.39Cash at banks, deposits on demand and deposit accounts 5 322 235.02Receivable on securities sales (Note 1) 409 421.88Receivable on subscriptions 1 175 809.93Receivable on dividends 2 114 141.39Other receivables 4 686.41Unrealized gain (loss) on forward foreign exchange contracts (Note 1) -1 420 333.53Total Assets 1 306 883 054.49
LiabilitiesInterest payable on bank overdraft -2 940.14Payable on securities purchases (Note 1) -411 006.32Payable on redemptions -5 084 992.43Provisions for flat fee (Note 2) -381 077.57Provisions for taxe d’abonnement (Note 3) -66 625.54Provisions for other commissions and fees (Note 2) -17 486.38Total provisions -465 189.49Total Liabilities -5 964 128.38
Net assets at the end of the financial year 1 300 918 926.11
Statement of Operations USDIncome 1.6.2017-31.5.2018Interest on liquid assets 85 711.33Dividends 16 352 150.84Income on securities lending (Note 16) 381 912.07Other income (Note 4) 164 962.07Total income 16 984 736.31
ExpensesFlat fee (Note 2) -7 633 213.07Taxe d’abonnement (Note 3) -362 646.13Cost on securities lending (Note 16) -152 764.82Other commissions and fees (Note 2) -183 736.31Interest on cash and bank overdraft -30 280.69Total expenses -8 362 641.02
Net income (loss) on investments 8 622 095.29
Realized gain (loss) (Note 1)Realized gain (loss) on market-priced securities without options 112 502 754.03Realized gain (loss) on financial futures 528 072.14Realized gain (loss) on forward foreign exchange contracts -4 649 213.62Realized gain (loss) on foreign exchange 923 902.89Total realized gain (loss) 109 305 515.44
Net realized gain (loss) of the financial year 117 927 610.73
Changes in unrealized appreciation (depreciation) (Note 1)Unrealized appreciation (depreciation) on market-priced securities without options 17 484 890.44Unrealized appreciation (depreciation) on financial futures -196 350.00Unrealized appreciation (depreciation) on forward foreign exchange contracts -2 270 929.50Total changes in unrealized appreciation (depreciation) 15 017 610.94
Net increase (decrease) in net assets as a result of operations 132 945 221.67
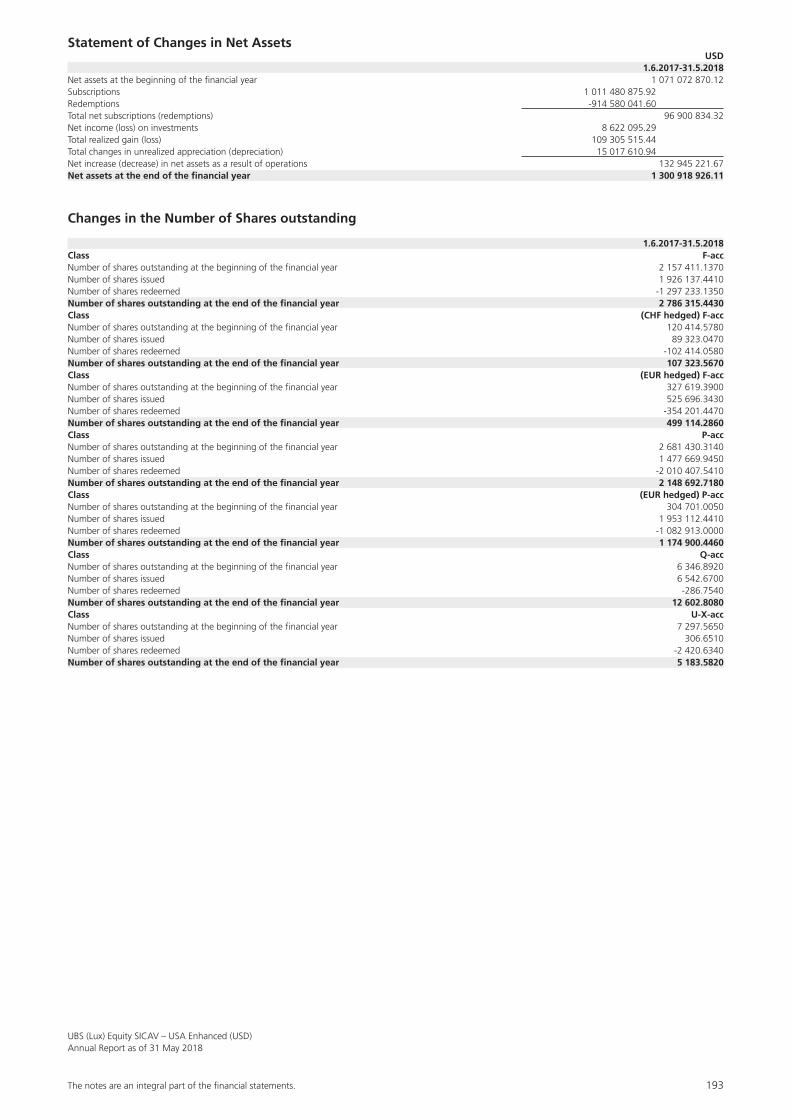
The notes are an integral part of the fi nancial statements. 193
UBS (Lux) Equity SICAV – USA Enhanced (USD)Annual Report as of 31 May 2018
Statement of Changes in Net Assets USD 1.6.2017-31.5.2018Net assets at the beginning of the financial year 1 071 072 870.12Subscriptions 1 011 480 875.92Redemptions -914 580 041.60Total net subscriptions (redemptions) 96 900 834.32Net income (loss) on investments 8 622 095.29Total realized gain (loss) 109 305 515.44Total changes in unrealized appreciation (depreciation) 15 017 610.94Net increase (decrease) in net assets as a result of operations 132 945 221.67Net assets at the end of the financial year 1 300 918 926.11
Changes in the Number of Shares outstanding
1.6.2017-31.5.2018Class F-accNumber of shares outstanding at the beginning of the financial year 2 157 411.1370Number of shares issued 1 926 137.4410Number of shares redeemed -1 297 233.1350Number of shares outstanding at the end of the financial year 2 786 315.4430Class (CHF hedged) F-accNumber of shares outstanding at the beginning of the financial year 120 414.5780Number of shares issued 89 323.0470Number of shares redeemed -102 414.0580Number of shares outstanding at the end of the financial year 107 323.5670Class (EUR hedged) F-accNumber of shares outstanding at the beginning of the financial year 327 619.3900Number of shares issued 525 696.3430Number of shares redeemed -354 201.4470Number of shares outstanding at the end of the financial year 499 114.2860Class P-accNumber of shares outstanding at the beginning of the financial year 2 681 430.3140Number of shares issued 1 477 669.9450Number of shares redeemed -2 010 407.5410Number of shares outstanding at the end of the financial year 2 148 692.7180Class (EUR hedged) P-accNumber of shares outstanding at the beginning of the financial year 304 701.0050Number of shares issued 1 953 112.4410Number of shares redeemed -1 082 913.0000Number of shares outstanding at the end of the financial year 1 174 900.4460Class Q-accNumber of shares outstanding at the beginning of the financial year 6 346.8920Number of shares issued 6 542.6700Number of shares redeemed -286.7540Number of shares outstanding at the end of the financial year 12 602.8080Class U-X-accNumber of shares outstanding at the beginning of the financial year 7 297.5650Number of shares issued 306.6510Number of shares redeemed -2 420.6340Number of shares outstanding at the end of the financial year 5 183.5820
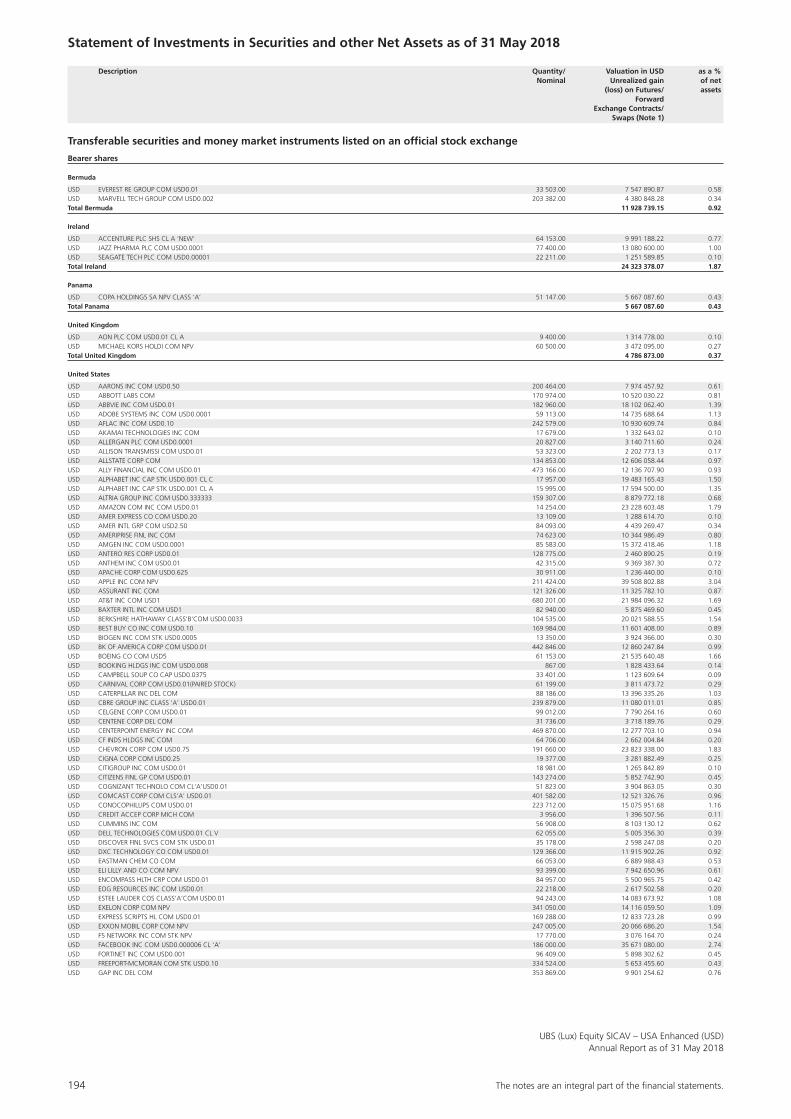
194 The notes are an integral part of the fi nancial statements.
UBS (Lux) Equity SICAV – USA Enhanced (USD)Annual Report as of 31 May 2018
Statement of Investments in Securities and other Net Assets as of 31 May 2018
Description Quantity/ Valuation in USD as a % Nominal Unrealized gain of net (loss) on Futures/ assets Forward Exchange Contracts/ Swaps (Note 1)
Transferable securities and money market instruments listed on an official stock exchange
Bearer shares
Bermuda
USD EVEREST RE GROUP COM USD0.01 33 503.00 7 547 890.87 0.58USD MARVELL TECH GROUP COM USD0.002 203 382.00 4 380 848.28 0.34Total Bermuda 11 928 739.15 0.92
Ireland
USD ACCENTURE PLC SHS CL A ‘NEW’ 64 153.00 9 991 188.22 0.77USD JAZZ PHARMA PLC COM USD0.0001 77 400.00 13 080 600.00 1.00USD SEAGATE TECH PLC COM USD0.00001 22 211.00 1 251 589.85 0.10Total Ireland 24 323 378.07 1.87
Panama
USD COPA HOLDINGS SA NPV CLASS ‘A’ 51 147.00 5 667 087.60 0.43Total Panama 5 667 087.60 0.43
United Kingdom
USD AON PLC COM USD0.01 CL A 9 400.00 1 314 778.00 0.10USD MICHAEL KORS HOLDI COM NPV 60 500.00 3 472 095.00 0.27Total United Kingdom 4 786 873.00 0.37
United States
USD AARONS INC COM USD0.50 200 464.00 7 974 457.92 0.61USD ABBOTT LABS COM 170 974.00 10 520 030.22 0.81USD ABBVIE INC COM USD0.01 182 960.00 18 102 062.40 1.39USD ADOBE SYSTEMS INC COM USD0.0001 59 113.00 14 735 688.64 1.13USD AFLAC INC COM USD0.10 242 579.00 10 930 609.74 0.84USD AKAMAI TECHNOLOGIES INC COM 17 679.00 1 332 643.02 0.10USD ALLERGAN PLC COM USD0.0001 20 827.00 3 140 711.60 0.24USD ALLISON TRANSMISSI COM USD0.01 53 323.00 2 202 773.13 0.17USD ALLSTATE CORP COM 134 853.00 12 606 058.44 0.97USD ALLY FINANCIAL INC COM USD0.01 473 166.00 12 136 707.90 0.93USD ALPHABET INC CAP STK USD0.001 CL C 17 957.00 19 483 165.43 1.50USD ALPHABET INC CAP STK USD0.001 CL A 15 995.00 17 594 500.00 1.35USD ALTRIA GROUP INC COM USD0.333333 159 307.00 8 879 772.18 0.68USD AMAZON COM INC COM USD0.01 14 254.00 23 228 603.48 1.79USD AMER EXPRESS CO COM USD0.20 13 109.00 1 288 614.70 0.10USD AMER INTL GRP COM USD2.50 84 093.00 4 439 269.47 0.34USD AMERIPRISE FINL INC COM 74 623.00 10 344 986.49 0.80USD AMGEN INC COM USD0.0001 85 583.00 15 372 418.46 1.18USD ANTERO RES CORP USD0.01 128 775.00 2 460 890.25 0.19USD ANTHEM INC COM USD0.01 42 315.00 9 369 387.30 0.72USD APACHE CORP COM USD0.625 30 911.00 1 236 440.00 0.10USD APPLE INC COM NPV 211 424.00 39 508 802.88 3.04USD ASSURANT INC COM 121 326.00 11 325 782.10 0.87USD AT&T INC COM USD1 680 201.00 21 984 096.32 1.69USD BAXTER INTL INC COM USD1 82 940.00 5 875 469.60 0.45USD BERKSHIRE HATHAWAY CLASS’B’COM USD0.0033 104 535.00 20 021 588.55 1.54USD BEST BUY CO INC COM USD0.10 169 984.00 11 601 408.00 0.89USD BIOGEN INC COM STK USD0.0005 13 350.00 3 924 366.00 0.30USD BK OF AMERICA CORP COM USD0.01 442 846.00 12 860 247.84 0.99USD BOEING CO COM USD5 61 153.00 21 535 640.48 1.66USD BOOKING HLDGS INC COM USD0.008 867.00 1 828 433.64 0.14USD CAMPBELL SOUP CO CAP USD0.0375 33 401.00 1 123 609.64 0.09USD CARNIVAL CORP COM USD0.01(PAIRED STOCK) 61 199.00 3 811 473.72 0.29USD CATERPILLAR INC DEL COM 88 186.00 13 396 335.26 1.03USD CBRE GROUP INC CLASS ‘A’ USD0.01 239 879.00 11 080 011.01 0.85USD CELGENE CORP COM USD0.01 99 012.00 7 790 264.16 0.60USD CENTENE CORP DEL COM 31 736.00 3 718 189.76 0.29USD CENTERPOINT ENERGY INC COM 469 870.00 12 277 703.10 0.94USD CF INDS HLDGS INC COM 64 706.00 2 662 004.84 0.20USD CHEVRON CORP COM USD0.75 191 660.00 23 823 338.00 1.83USD CIGNA CORP COM USD0.25 19 377.00 3 281 882.49 0.25USD CITIGROUP INC COM USD0.01 18 981.00 1 265 842.89 0.10USD CITIZENS FINL GP COM USD0.01 143 274.00 5 852 742.90 0.45USD COGNIZANT TECHNOLO COM CL’A’USD0.01 51 823.00 3 904 863.05 0.30USD COMCAST CORP COM CLS’A’ USD0.01 401 582.00 12 521 326.76 0.96USD CONOCOPHILLIPS COM USD0.01 223 712.00 15 075 951.68 1.16USD CREDIT ACCEP CORP MICH COM 3 956.00 1 396 507.56 0.11USD CUMMINS INC COM 56 908.00 8 103 130.12 0.62USD DELL TECHNOLOGIES COM USD0.01 CL V 62 055.00 5 005 356.30 0.39USD DISCOVER FINL SVCS COM STK USD0.01 35 178.00 2 598 247.08 0.20USD DXC TECHNOLOGY CO COM USD0.01 129 366.00 11 915 902.26 0.92USD EASTMAN CHEM CO COM 66 053.00 6 889 988.43 0.53USD ELI LILLY AND CO COM NPV 93 399.00 7 942 650.96 0.61USD ENCOMPASS HLTH CRP COM USD0.01 84 957.00 5 500 965.75 0.42USD EOG RESOURCES INC COM USD0.01 22 218.00 2 617 502.58 0.20USD ESTEE LAUDER COS CLASS’A’COM USD0.01 94 243.00 14 083 673.92 1.08USD EXELON CORP COM NPV 341 050.00 14 116 059.50 1.09USD EXPRESS SCRIPTS HL COM USD0.01 169 288.00 12 833 723.28 0.99USD EXXON MOBIL CORP COM NPV 247 005.00 20 066 686.20 1.54USD F5 NETWORK INC COM STK NPV 17 770.00 3 076 164.70 0.24USD FACEBOOK INC COM USD0.000006 CL ‘A’ 186 000.00 35 671 080.00 2.74USD FORTINET INC COM USD0.001 96 409.00 5 898 302.62 0.45USD FREEPORT-MCMORAN COM STK USD0.10 334 524.00 5 653 455.60 0.43USD GAP INC DEL COM 353 869.00 9 901 254.62 0.76

The notes are an integral part of the fi nancial statements. 195
UBS (Lux) Equity SICAV – USA Enhanced (USD)Annual Report as of 31 May 2018
USD GENERAL MOTORS CO COM USD0.01 160 426.00 6 850 190.20 0.53USD GENTEX CORP COM 104 151.00 2 502 748.53 0.19USD HCA HEALTHCARE INC COM USD0.01 103 408.00 10 665 501.12 0.82USD HILTON GRAND VAC.I COM USD0.01 WI 208 319.00 8 282 763.44 0.64USD HOLLYFRONTIER CORP COM USD0.01 67 038.00 5 173 992.84 0.40USD HONEYWELL INTL INC COM 20 645.00 3 053 601.95 0.24USD HP INC COM USD0.01 124 372.00 2 739 915.16 0.21USD HUMANA INC COM USD0.166 47 655.00 13 866 651.90 1.07USD INTEL CORP COM USD0.001 463 160.00 25 566 432.00 1.97USD INTL PAPER CO COM 26 139.00 1 398 436.50 0.11USD INTUIT INC COM USD0.01 67 816.00 13 671 705.60 1.05USD JOHNSON & JOHNSON COM USD1 163 003.00 19 498 418.86 1.50USD JONES LANG LASALLE INC COM 28 801.00 4 716 451.76 0.36USD JP MORGAN CHASE & COM USD1 285 126.00 30 511 333.26 2.35USD KLA-TENCOR CORP COM USD0.001 39 695.00 4 494 664.85 0.35USD KOHLS CORPORATION COM USD0.01 51 759.00 3 454 913.25 0.27USD LAM RESEARCH CORP COM USD0.001 30 715.00 6 087 098.70 0.47USD LAMB WESTON HLDGS COM USD1.00 WI 115 736.00 7 378 170.00 0.57USD LEAR CORP COM USD0.01 62 525.00 12 379 950.00 0.95USD LOUISIANA PACIFIC COM USD1 259 829.00 7 581 810.22 0.58USD LPL FINL HLDGS INC COM USD0.001 41 586.00 2 859 869.22 0.22USD LYONDELLBASELL IND COM USD0.01 103 791.00 11 637 046.92 0.89USD MANPOWER GROUP COM USD0.01 52 541.00 4 728 690.00 0.36USD MARATHON PETROLEUM COM USD0.01 91 221.00 7 209 195.63 0.55USD MASTERCARD INC COM USD0.0001 CLASS ‘A’ 107 846.00 20 503 681.52 1.58USD MAXIMUS INC COM 70 744.00 4 308 309.60 0.33USD METLIFE INC COM USD0.01 47 647.00 2 191 285.53 0.17USD MICRON TECHNOLOGY COM USD0.10 258 016.00 14 859 141.44 1.14USD MICROSOFT CORP COM USD0.0000125 276 839.00 27 362 766.76 2.10USD MURPHY OIL CORP COM USD1 48 314.00 1 485 655.50 0.11USD NORFOLK STHN CORP COM USD1 42 371.00 6 425 562.15 0.49USD NUCOR CORP COM 30 912.00 1 984 241.28 0.15USD NVIDIA CORP COM USD0.001 12 219.00 3 081 509.61 0.24USD NVR INC COM STK USD0.01 2 560.00 7 655 782.40 0.59USD OCCIDENTAL PETRLM COM USD0.20 15 650.00 1 317 730.00 0.10USD ON SEMICONDUCTOR CORP COM 319 657.00 8 032 980.41 0.62USD OWENS CORNING COM STK USD0.01 28 803.00 1 820 925.66 0.14USD PEPSICO INC CAP USD0.016666 90 159.00 9 038 439.75 0.70USD PFIZER INC COM USD0.05 630 620.00 22 658 176.60 1.74USD PG&E CORP COM 86 977.00 3 768 713.41 0.29USD PHILIP MORRIS INTL COM STK NPV ‘WI’ 16 302.00 1 296 661.08 0.10USD PROGRESSIVE CP(OH) COM USD1 217 122.00 13 481 104.98 1.04USD PRUDENTIAL FINL COM USD0.01 131 156.00 12 701 147.04 0.98USD PUBLIC SVC ENTERPRISE GROUP COM 259 831.00 13 765 846.38 1.06USD PULTE GROUP INC COM USD0.01 44 837.00 1 356 319.25 0.10USD QURATE RETAIL GRP COM USD0.01 SER A 396 464.00 8 060 113.12 0.62USD RAYTHEON CO COM NEW 23 211.00 4 862 704.50 0.37USD REALOGY HLDGS CORP COM USD0.01 63 738.00 1 516 327.02 0.12USD REINSURANCE GROUP COM USD0.01 43 662.00 6 524 849.28 0.50USD ROBERT HALF INTL COM USD0.001 38 846.00 2 473 713.28 0.19USD ROPER TECHNOLOGIES COM USD0.01 4 782.00 1 318 827.78 0.10USD ROYAL CARIBBEAN COM USD0.01 93 601.00 9 826 232.98 0.76USD RYDER SYSTEM INC COM USD0.50 19 352.00 1 298 132.16 0.10USD SANDERSON FARM INC COM USD1 12 603.00 1 233 581.64 0.10USD SOUTHWEST AIRLINES COM USD1 193 960.00 9 907 476.80 0.76USD STEEL DYNAMICS INC COM 92 658.00 4 580 084.94 0.35USD SUNTRUST BKS INC COM 37 297.00 2 517 920.47 0.19USD SYNCHRONY FINANCIA COM USD0.001 223 232.00 7 730 524.16 0.59USD T-MOBILE US INC COM USD0.0001 222 791.00 12 409 458.70 0.95USD TARGET CORP COM STK USD0.0833 29 027.00 2 115 778.03 0.16USD THOR INDS INC COM 20 198.00 1 870 334.80 0.14USD TOLL BROS INC COM USD0.01 130 294.00 5 145 310.06 0.40USD TOTAL SYSTEM SVCS COM STK USD0.10 15 347.00 1 307 410.93 0.10USD TRAVELERS CO INC COM NPV 28 190.00 3 622 978.80 0.28USD UGI CORP NEW COM 26 884.00 1 356 835.48 0.10USD UNITED RENTALS INC COM 54 920.00 8 763 584.40 0.67USD UNITED STATES STL CORP NEW COM 89 313.00 3 292 970.31 0.25USD UNITEDHEALTH GRP COM USD0.01 5 456.00 1 317 678.56 0.10USD US FOODS HLDG CORP COM USD0.01 234 461.00 8 365 568.48 0.64USD VALERO ENERGY CORP NEW COM 121 252.00 14 695 742.40 1.13USD VARIAN MEDICAL SYS COM USD1 11 180.00 1 317 786.60 0.10USD VERIZON COMMUN COM USD0.10 316 576.00 15 091 177.92 1.16USD VISA INC COM STK USD0.0001 43 242.00 5 652 594.24 0.43USD VOYA FINL INC COM USD0.01 201 099.00 10 445 082.06 0.80USD WALGREENS BOOTS AL COM USD0.01 183 680.00 11 459 795.20 0.88USD WELLCARE HEALTH PL COM USD0.01 48 038.00 10 648 583.46 0.82USD WELLS FARGO & CO COM USD1 2/3 37 900.00 2 046 221.00 0.16USD WERNER ENTERPRISES COM USD0.01 135 229.00 5 300 976.80 0.41USD WESTERN DIGITAL CORP COM 73 658.00 6 151 179.58 0.47USD WESTLAKE CHEM CORP COM USD0.01 66 125.00 7 652 646.25 0.59USD ZOETIS INC COM USD0.01 CL ‘A’ 30 866.00 2 583 484.20 0.20Total United States 1 252 571 015.57 96.28
Total Bearer shares 1 299 277 093.39 99.87
Total Transferable securities and money market instruments listed on an official stock exchange 1 299 277 093.39 99.87
Total investments in securities 1 299 277 093.39 99.87
Description Quantity/ Valuation in USD as a % Nominal Unrealized gain of net (loss) on Futures/ assets Forward Exchange Contracts/ Swaps (Note 1)

196 The notes are an integral part of the fi nancial statements.
UBS (Lux) Equity SICAV – USA Enhanced (USD)Annual Report as of 31 May 2018
Forward Foreign Exchange contracts
Forward Foreign Exchange contracts (Purchase/Sale)
CHF 15 053 800.00 USD 15 098 779.26 25.6.2018 243 318.76 0.02EUR 221 889 800.00 USD 261 107 712.70 25.6.2018 -1 665 044.13 -0.13USD 17 836.49 CHF 17 700.00 25.6.2018 -202.49 0.00EUR 352 100.00 USD 410 095.45 25.6.2018 1 594.33 0.00Total Forward Foreign Exchange contracts (Purchase/Sale) -1 420 333.53 -0.11
Cash at banks, deposits on demand and deposit accounts and other liquid assets 5 322 235.02 0.41Other assets and liabilities -2 260 068.77 -0.17
Total net assets 1 300 918 926.11 100.00
Description Quantity/ Valuation in USD as a % Nominal Unrealized gain of net (loss) on Futures/ assets Forward Exchange Contracts/ Swaps (Note 1)

The notes are an integral part of the fi nancial statements. 197
UBS (Lux) Equity SICAV – USA Enhanced Sustainable (USD)Annual Report as of 31 May 2018
Most important figures
ISIN 9.5.2018 31.5.2017Net assets in USD 4 671 591.12 34 620 184.54Class F-acc1 LU1483662844Shares outstanding 3 530.0000 39 979.0230Net asset value per share in USD 126.78 113.06Issue and redemption price per share in USD2 126.78 113.06Class (CHF hedged) F-acc3 LU1483663578Shares outstanding - 228 103.5510Net asset value per share in CHF - 111.90Issue and redemption price per share in CHF2 - 111.90Class (EUR hedged) F-acc4 LU1483663149Shares outstanding 27 750.0000 14 769.6570Net asset value per share in EUR 109.56 99.85Issue and redemption price per share in EUR2 109.56 99.85Class (CHF hedged) F-UKdist1 LU1490620843Shares outstanding 5 115.0000 17 820.0000Net asset value per share in CHF 121.67 111.90Issue and redemption price per share in CHF2 121.67 111.90
1 First NAV: 8.11.20162 See note 13 For the period from 8.11.2016 to 13.4.2018 the share class (CHF hedged) F-acc was in circulation4 First NAV: 31.5.2017
UBS (Lux) Equity SICAV – USA Enhanced Sustainable (USD)
Structure of the Securities Portfolio
As all shares of UBS (Lux) Equity SICAV – USA Enhanced Sustainable (USD) have been redeemed as at 9 May 2018, there is no securities portfolio or securities portfolio structure at the end of the reporting period. See note 12.

198 The notes are an integral part of the fi nancial statements.
UBS (Lux) Equity SICAV – USA Enhanced Sustainable (USD)Annual Report as of 31 May 2018
Statement of Operations USDIncome 1.6.2017-31.5.2018Interest on liquid assets 3 697.45Dividends 341 354.21Income on securities lending (Note 16) 8 626.33Other income (Note 4) 20 575.78Total income 374 253.77
ExpensesFlat fee (Note 2) -131 934.99Taxe d’abonnement (Note 3) -2 615.06Cost on securities lending (Note 16) -3 450.53Other commissions and fees (Note 2) -9 222.74Interest on cash and bank overdraft -700.04Total expenses -147 923.36
Net income (loss) on investments 226 330.41
Realized gain (loss) (Note 1)Realized gain (loss) on market-priced securities without options 7 545 005.88Realized gain (loss) on financial futures 49 172.50Realized gain (loss) on forward foreign exchange contracts 167 514.23Realized gain (loss) on foreign exchange -490 629.62Total realized gain (loss) 7 271 062.99
Net realized gain (loss) of the financial year 7 497 393.40
Changes in unrealized appreciation (depreciation) (Note 1)Unrealized appreciation (depreciation) on market-priced securities without options -2 198 645.00Unrealized appreciation (depreciation) on forward foreign exchange contracts -262 942.18Total changes in unrealized appreciation (depreciation) -2 461 587.18
Net increase (decrease) in net assets as a result of operations 5 035 806.22
Statement of Changes in Net Assets USD 1.6.2017-31.5.2018Net assets at the beginning of the financial year 34 620 184.54Subscriptions 11 485 115.53Redemptions -51 129 419.43Total net subscriptions (redemptions) -39 644 303.90Dividend paid -11 686.86Net income (loss) on investments 226 330.41Total realized gain (loss) 7 271 062.99Total changes in unrealized appreciation (depreciation) -2 461 587.18Net increase (decrease) in net assets as a result of operations 5 035 806.22Net assets at the end of the financial year 0.00

The notes are an integral part of the fi nancial statements. 199
UBS (Lux) Equity SICAV – USA Enhanced Sustainable (USD)Annual Report as of 31 May 2018
Changes in the Number of Shares outstanding
1.6.2017-31.5.2018Class F-accNumber of shares outstanding at the beginning of the financial year 39 979.0230Number of shares issued 9 625.1630Number of shares redeemed -49 604.1860Number of shares outstanding at the end of the financial year 0.0000Class (CHF hedged) F-accNumber of shares outstanding at the beginning of the financial year 228 103.5510Number of shares issued 37 111.5220Number of shares redeemed -265 215.0730Number of shares outstanding at the end of the financial year 0.0000Class (EUR hedged) F-accNumber of shares outstanding at the beginning of the financial year 14 769.6570Number of shares issued 44 151.0070Number of shares redeemed -58 920.6640Number of shares outstanding at the end of the financial year 0.0000Class (CHF hedged) F-UKdistNumber of shares outstanding at the beginning of the financial year 17 820.0000Number of shares issued 5 035.0000Number of shares redeemed -22 855.0000Number of shares outstanding at the end of the financial year 0.0000
Monthly Distribution
UBS (Lux) Equity SICAV– USA Enhanced Sustainable (USD) Ex-Date Pay-Date Currency Amount per share
(CHF hedged) F-UKdist 15.6.2017 20.6.2017 CHF 0.60(CHF hedged) F-UKdist 3.7.2017 6.7.2017 CHF 0.04

200 The notes are an integral part of the fi nancial statements.
UBS (Lux) Equity SICAV – USA Growth (USD)Annual Report as of 31 May 2018
UBS (Lux) Equity SICAV – USA Growth (USD)
Three-year comparison
ISIN 31.5.2018 31.5.2017 31.5.2016Net assets in USD 1 717 401 323.08 1 518 743 747.79 2 409 361 276.09Class F-acc LU0946081121Shares outstanding 7 318 660.4100 10 326 220.7660 15 417 953.6030Net asset value per share in USD 39.09 31.82 26.95Issue and redemption price per share in USD1 39.09 31.82 26.95Class (CHF hedged) F-acc LU1050652996Shares outstanding 93 130.9380 63 635.0370 261 694.9480Net asset value per share in CHF 155.73 130.22 112.55Issue and redemption price per share in CHF1 155.73 130.22 112.55Class (EUR hedged) F-acc LU1050658415Shares outstanding 180 076.8170 235 040.6630 141 018.4380Net asset value per share in EUR 158.45 132.18 113.67Issue and redemption price per share in EUR1 158.45 132.18 113.67Class I-A1-acc LU0399032613Shares outstanding 500 087.1390 411 361.7720 576 216.0290Net asset value per share in USD 307.29 250.48 212.40Issue and redemption price per share in USD1 307.29 250.48 212.40Class I-A2-acc2 LU0399032886Shares outstanding - - 151 636.8880Net asset value per share in USD - - 202.55Issue and redemption price per share in USD1 - - 202.55Class I-A3-acc3 LU0399033009Shares outstanding - - 420 000.0000Net asset value per share in USD - - 105.16Issue and redemption price per share in USD1 - - 105.16Class I-B-acc LU0399033348Shares outstanding 154 991.6970 292 277.3460 309 336.1060Net asset value per share in USD 341.63 276.70 233.16Issue and redemption price per share in USD1 341.63 276.70 233.16Class (EUR) I-B-acc4 LU1776284256Shares outstanding - - -Net asset value per share in EUR - - -Issue and redemption price per share in EUR1 - - -Class I-X-acc LU0399033694Shares outstanding 246 896.3930 278 237.3110 1 122 560.8750Net asset value per share in USD 269.50 218.15 183.69Issue and redemption price per share in USD1 269.50 218.15 183.69Class K-1-acc LU0399004596Shares outstanding 0.4000 0.5000 0.6000Net asset value per share in USD 10 428 379.03 8 536 395.12 7 269 276.92Issue and redemption price per share in USD1 10 428 379.03 8 536 395.12 7 269 276.92Class (EUR hedged) N-acc5 LU0611174664Shares outstanding - 5 173.7720 5 731.7460Net asset value per share in EUR - 178.56 156.64Issue and redemption price per share in EUR1 - 178.56 156.64Class P-acc LU0198837287Shares outstanding 16 050 569.5540 15 779 034.3260 30 059 130.8610Net asset value per share in USD 36.30 30.00 25.79Issue and redemption price per share in USD1 36.30 30.00 25.79Class (CHF hedged) P-acc LU0592661101Shares outstanding 79 481.0130 101 819.6810 143 605.7060Net asset value per share in CHF 218.47 185.50 162.77Issue and redemption price per share in CHF1 218.47 185.50 162.77Class (EUR hedged) P-acc LU0511785726Shares outstanding 223 869.6980 218 343.6530 271 106.6850Net asset value per share in EUR 266.34 225.62 197.00Issue and redemption price per share in EUR1 266.34 225.62 197.00Class (SGD hedged) P-acc6 LU0887386083Shares outstanding - 15 014.8540 47 041.5890Net asset value per share in SGD - 163.43 140.75Issue and redemption price per share in SGD1 - 163.43 140.75Class Q-acc LU0358729654Shares outstanding 826 269.7870 903 768.3700 2 133 638.7260Net asset value per share in USD 276.36 226.09 192.41Issue and redemption price per share in USD1 276.36 226.09 192.41

The notes are an integral part of the fi nancial statements. 201
UBS (Lux) Equity SICAV – USA Growth (USD)Annual Report as of 31 May 2018
ISIN 31.5.2018 31.5.2017 31.5.2016
Class (CHF hedged) Q-acc LU1240790045Shares outstanding 129 188.9950 122 733.3740 155 977.6290Net asset value per share in CHF 132.24 111.14 96.54Issue and redemption price per share in CHF1 132.24 111.14 96.54Class (EUR hedged) Q-acc LU0508198768Shares outstanding 332 160.1560 110 774.9190 156 115.9770Net asset value per share in EUR 287.69 241.25 208.52Issue and redemption price per share in EUR1 287.69 241.25 208.52Class U-X-acc LU0236040787Shares outstanding 2 225.0010 3 427.0010 5 822.0070Net asset value per share in USD 35 392.12 28 647.68 24 123.21Issue and redemption price per share in USD1 35 392.12 28 647.68 24 123.21
1 See note 12 The share class I-A2-acc was in circulation until 28.2.20173 The share class I-A3-acc was in circulation until 19.10.20164 The share class (EUR) I-B-acc was in circulation from 22.2.2018 until 8.3.20185 The share class (EUR hedged) N-acc was in circulation until 27.7.20176 The share class (SGD hedged) P-acc was in circulation until 15.3.2018
Performance
Currency 2017/2018 2016/2017 2015/2016Class F-acc USD 22.8% 18.1% 0.3%Class (CHF hedged) F-acc CHF 19.6% 15.7% -0.2%Class (EUR hedged) F-acc EUR 19.9% 16.3% 0.5%Class I-A1-acc USD 22.7% 17.9% 0.2%Class I-A2-acc1 USD - - 0.2%Class I-A3-acc2 USD - - 0.3%Class I-B-acc USD 23.5% 18.7% 0.8%Class (EUR) I-B-acc3 EUR - - -Class I-X-acc USD 23.5% 18.8% 0.9%Class K-1-acc USD 22.2% 17.4% -0.1%Class (EUR hedged) N-acc4 EUR - 14.0% -1.5%Class P-acc USD 21.0% 16.3% -1.2%Class (CHF hedged) P-acc CHF 17.8% 14.0% -1.7%Class (EUR hedged) P-acc EUR 18.0% 14.5% -1.1%Class (SGD hedged) P-acc5 SGD - 16.1% -0.5%Class Q-acc USD 22.2% 17.5% -0.2%Class (CHF hedged) Q-acc CHF 19.0% 15.1% -Class (EUR hedged) Q-acc EUR 19.2% 15.7% 0.0%Class U-X-acc USD 23.5% 18.8% 0.9%
1 The share class I-A2-acc was in circulation until 28.2.2017. Due to this fact, there is no data for the calculation of the performance available.2 The share class I-A3-acc was in circulation until 19.10.2016. Due to this fact, there is no data for the calculation of the performance available.3 The share class (EUR) I-B-acc was in circulation from 22.2.2018 until 8.3.2018. Due to this fact, there is no data for the calculation of the performance available.4 The share class (EUR hedged) N-acc was in circulation until 27.7.2017. Due to this fact, there is no data for the calculation of the performance available.5 The share class (SGD hedged) P-acc was in circulation until 15.3.2018. Due to this fact, there is no data for the calculation of the performance available.
Historical performance is no indicator of current or future performance.The performance data does not take account of any commissions and costs charged when subscribing and redeeming shares.The performance data were not audited.The subfund has no benchmark.

202 The notes are an integral part of the fi nancial statements.
UBS (Lux) Equity SICAV – USA Growth (USD)Annual Report as of 31 May 2018
Report of the Portfolio Manager
The financial year, from 1 June 2017 to 31 May 2018, witnessed strong performance for US equity markets as economic data globally improved and earnings growth benefitted from strong sales and corporate tax cuts in the US. The best performing sector in the benchmark was Information Technology which was driven by secular growth in internet, software, and digital advertising. The prospect of higher interest rates and potential regulatory reform boosted shares of Financials which was the sec-ond best performing sector during the year. Consumer staples was the lone decliner as its sensitivity to higher rates, defensiveness in a buoyant equity market, and structural business challenges weighed on the sector.
The subfund advanced during the financial year as the strategy was cautious on consumer staples, real estate and health care and favoured the information technol-ogy sector, which benefitted performance. Stock selec-tion within information technology, consumer staples, and consumer discretionary contributed to performance during the financial year. Stock selection within industri-als detracted from performance. The subfund reduced some exposure from information technology after the strong performance and added to consumer discretion-ary holdings.
Structure of the Securities Portfolio
Geographical Breakdown as a % of net assetsUnited States 91.77China 3.78Ireland 2.37United Kingdom 1.47Total 99.39
Economic Breakdown as a % of net assetsInternet, software & IT services 30.84Retail trade, department stores 13.35Banks & credit institutions 9.08Pharmaceuticals, cosmetics & medical products 7.39Finance & holding companies 7.15Computer hardware & network equipment providers 6.01Mechanical engineering & industrial equipment 3.94Traffic & transportation 2.95Investment funds 2.36Electrical devices & components 2.17Miscellaneous services 2.16Healthcare & social services 1.88Petroleum 1.84Textiles, garments & leather goods 1.79Lodging, catering & leisure 1.74Building industry & materials 1.74Vehicles 1.47Graphic design, publishing & media 0.79Electronics & semiconductors 0.74Total 99.39

The notes are an integral part of the fi nancial statements. 203
UBS (Lux) Equity SICAV – USA Growth (USD)Annual Report as of 31 May 2018
Statement of Net Assets USDAssets 31.5.2018Investments in securities, cost 1 236 966 239.21Investments in securities, unrealized appreciation (depreciation) 469 891 363.80Total investments in securities (Note 1) 1 706 857 603.01Cash at banks, deposits on demand and deposit accounts 9 824 113.50Receivable on subscriptions 6 071 007.49Interest receivable on liquid assets 0.89Receivable on dividends 1 600 349.83Other receivables 4 223.89Unrealized gain (loss) on forward foreign exchange contracts (Note 1) -583 361.91Total Assets 1 723 773 936.70
LiabilitiesPayable on redemptions -5 350 476.04Provisions for flat fee (Note 2) -896 292.49Provisions for taxe d’abonnement (Note 3) -97 913.26Provisions for other commissions and fees (Note 2) -27 931.83Total provisions -1 022 137.58Total Liabilities -6 372 613.62
Net assets at the end of the financial year 1 717 401 323.08
Statement of Operations USDIncome 1.6.2017-31.5.2018Interest on liquid assets 63 112.77Dividends 12 704 306.15Income on securities lending (Note 16) 521 108.23Other income (Note 4) 117 686.34Total income 13 406 213.49
ExpensesFlat fee (Note 2) -18 652 670.27Taxe d’abonnement (Note 3) -544 878.98Cost on securities lending (Note 16) -208 443.28Other commissions and fees (Note 2) -265 505.78Interest on cash and bank overdraft -15 542.67Total expenses -19 687 040.98
Net income (loss) on investments -6 280 827.49
Realized gain (loss) (Note 1)Realized gain (loss) on market-priced securities without options 296 504 126.43Realized gain (loss) on forward foreign exchange contracts 1 896 180.60Realized gain (loss) on foreign exchange -1 876 803.49Total realized gain (loss) 296 523 503.54
Net realized gain (loss) of the financial year 290 242 676.05
Changes in unrealized appreciation (depreciation) (Note 1)Unrealized appreciation (depreciation) on market-priced securities without options 46 994 301.02Unrealized appreciation (depreciation) on forward foreign exchange contracts -1 946 896.24Total changes in unrealized appreciation (depreciation) 45 047 404.78
Net increase (decrease) in net assets as a result of operations 335 290 080.83
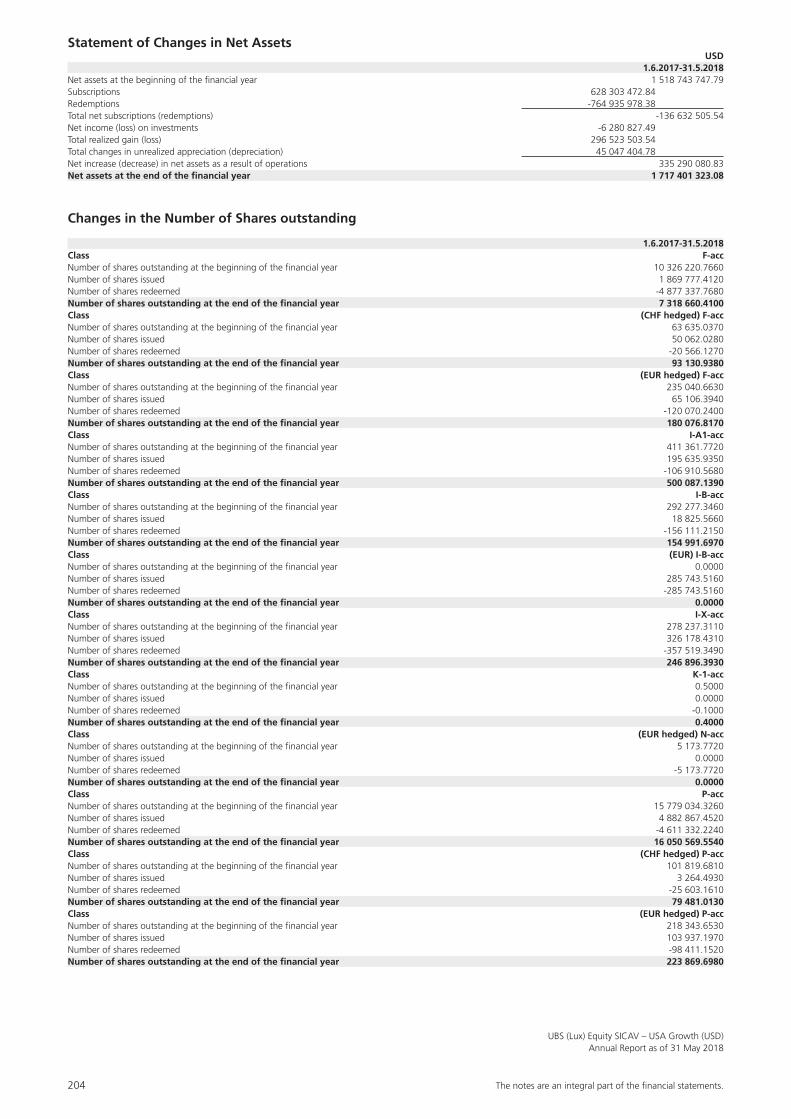
204 The notes are an integral part of the fi nancial statements.
UBS (Lux) Equity SICAV – USA Growth (USD)Annual Report as of 31 May 2018
Statement of Changes in Net Assets USD 1.6.2017-31.5.2018Net assets at the beginning of the financial year 1 518 743 747.79Subscriptions 628 303 472.84Redemptions -764 935 978.38Total net subscriptions (redemptions) -136 632 505.54Net income (loss) on investments -6 280 827.49Total realized gain (loss) 296 523 503.54Total changes in unrealized appreciation (depreciation) 45 047 404.78Net increase (decrease) in net assets as a result of operations 335 290 080.83Net assets at the end of the financial year 1 717 401 323.08
Changes in the Number of Shares outstanding
1.6.2017-31.5.2018Class F-accNumber of shares outstanding at the beginning of the financial year 10 326 220.7660Number of shares issued 1 869 777.4120Number of shares redeemed -4 877 337.7680Number of shares outstanding at the end of the financial year 7 318 660.4100Class (CHF hedged) F-accNumber of shares outstanding at the beginning of the financial year 63 635.0370Number of shares issued 50 062.0280Number of shares redeemed -20 566.1270Number of shares outstanding at the end of the financial year 93 130.9380Class (EUR hedged) F-accNumber of shares outstanding at the beginning of the financial year 235 040.6630Number of shares issued 65 106.3940Number of shares redeemed -120 070.2400Number of shares outstanding at the end of the financial year 180 076.8170Class I-A1-accNumber of shares outstanding at the beginning of the financial year 411 361.7720Number of shares issued 195 635.9350Number of shares redeemed -106 910.5680Number of shares outstanding at the end of the financial year 500 087.1390Class I-B-accNumber of shares outstanding at the beginning of the financial year 292 277.3460Number of shares issued 18 825.5660Number of shares redeemed -156 111.2150Number of shares outstanding at the end of the financial year 154 991.6970Class (EUR) I-B-accNumber of shares outstanding at the beginning of the financial year 0.0000Number of shares issued 285 743.5160Number of shares redeemed -285 743.5160Number of shares outstanding at the end of the financial year 0.0000Class I-X-accNumber of shares outstanding at the beginning of the financial year 278 237.3110Number of shares issued 326 178.4310Number of shares redeemed -357 519.3490Number of shares outstanding at the end of the financial year 246 896.3930Class K-1-accNumber of shares outstanding at the beginning of the financial year 0.5000Number of shares issued 0.0000Number of shares redeemed -0.1000Number of shares outstanding at the end of the financial year 0.4000Class (EUR hedged) N-accNumber of shares outstanding at the beginning of the financial year 5 173.7720Number of shares issued 0.0000Number of shares redeemed -5 173.7720Number of shares outstanding at the end of the financial year 0.0000Class P-accNumber of shares outstanding at the beginning of the financial year 15 779 034.3260Number of shares issued 4 882 867.4520Number of shares redeemed -4 611 332.2240Number of shares outstanding at the end of the financial year 16 050 569.5540Class (CHF hedged) P-accNumber of shares outstanding at the beginning of the financial year 101 819.6810Number of shares issued 3 264.4930Number of shares redeemed -25 603.1610Number of shares outstanding at the end of the financial year 79 481.0130Class (EUR hedged) P-accNumber of shares outstanding at the beginning of the financial year 218 343.6530Number of shares issued 103 937.1970Number of shares redeemed -98 411.1520Number of shares outstanding at the end of the financial year 223 869.6980

The notes are an integral part of the fi nancial statements. 205
UBS (Lux) Equity SICAV – USA Growth (USD)Annual Report as of 31 May 2018
Class (SGD hedged) P-accNumber of shares outstanding at the beginning of the financial year 15 014.8540Number of shares issued 0.0000Number of shares redeemed -15 014.8540Number of shares outstanding at the end of the financial year 0.0000Class Q-accNumber of shares outstanding at the beginning of the financial year 903 768.3700Number of shares issued 298 683.3560Number of shares redeemed -376 181.9390Number of shares outstanding at the end of the financial year 826 269.7870Class (CHF hedged) Q-accNumber of shares outstanding at the beginning of the financial year 122 733.3740Number of shares issued 36 101.6550Number of shares redeemed -29 646.0340Number of shares outstanding at the end of the financial year 129 188.9950Class (EUR hedged) Q-accNumber of shares outstanding at the beginning of the financial year 110 774.9190Number of shares issued 309 975.5760Number of shares redeemed -88 590.3390Number of shares outstanding at the end of the financial year 332 160.1560Class U-X-accNumber of shares outstanding at the beginning of the financial year 3 427.0010Number of shares issued 44.0000Number of shares redeemed -1 246.0000Number of shares outstanding at the end of the financial year 2 225.0010

206 The notes are an integral part of the fi nancial statements.
UBS (Lux) Equity SICAV – USA Growth (USD)Annual Report as of 31 May 2018
Statement of Investments in Securities and other Net Assets as of 31 May 2018
Description Quantity/ Valuation in USD as a % Nominal Unrealized gain of net (loss) on Futures/ assets Forward Exchange Contracts/ Swaps (Note 1)
Transferable securities and money market instruments listed on an official stock exchange
Bearer shares
United Kingdom
USD APTIV PLC COM USD0.01 259 323.00 25 283 992.50 1.47Total United Kingdom 25 283 992.50 1.47
United States
USD ABBOTT LABS COM 622 672.00 38 313 008.16 2.23USD ACTIVISION BLIZZAR COM STK USD0.000001 403 200.00 28 590 912.00 1.66USD ADOBE SYSTEMS INC COM USD0.0001 139 413.00 34 752 872.64 2.02USD ALLERGAN PLC COM USD0.0001 134 599.00 20 297 529.20 1.18USD ALPHABET INC CAP STK USD0.001 CL A 84 750.00 93 225 000.00 5.43USD AMAZON COM INC COM USD0.01 77 011.00 125 498 665.82 7.31USD ANTHEM INC COM USD0.01 145 574.00 32 232 995.08 1.88USD APPLE INC COM NPV 446 427.00 83 423 813.49 4.86USD AUTODESK INC COM USD0.01 297 869.00 38 454 887.90 2.24USD BK OF AMERICA CORP COM USD0.01 708 333.00 20 569 990.32 1.20USD BOOKING HLDGS INC COM USD0.008 21 519.00 45 381 849.48 2.64USD BROADCOM CORP COM USD1.00 78 262.00 19 727 502.34 1.15USD CBOE GLOBAL MARKET COM USD0.01 197 145.00 19 233 466.20 1.12USD CLOVIS ONCOLOGY IN COM USD0.001 129 984.00 6 104 048.64 0.36USD COOPER COS INC COM USD0.10 144 652.00 32 736 194.12 1.91USD DIAMONDBACK ENERGY COM USD0.01 104 187.00 12 581 622.12 0.73USD DOLLAR GENERAL CP COM USD0.875 412 321.00 36 069 841.08 2.10USD ESTEE LAUDER COS CLASS’A’COM USD0.01 197 623.00 29 532 781.12 1.72USD FACEBOOK INC COM USD0.000006 CL ‘A’ 108 865.00 20 878 129.70 1.22USD FIRST REPUBLIC BAN COM USD0.01 185 211.00 18 447 015.60 1.07USD HALLIBURTON COM STK USD2.50 383 157.00 19 058 229.18 1.11USD HOME DEPOT INC COM USD0.05 362 721.00 67 665 602.55 3.94USD ILLINOIS TOOL WKS COM NPV 244 517.00 35 137 092.90 2.05USD JP MORGAN CHASE & COM USD1 193 067.00 20 660 099.67 1.20USD MASTERCARD INC COM USD0.0001 CLASS ‘A’ 152 171.00 28 930 750.52 1.68USD MICROSOFT CORP COM USD0.0000125 1 363 228.00 134 741 455.52 7.85USD NIKE INC CLASS’B’COM NPV 429 166.00 30 814 118.80 1.79USD NVIDIA CORP COM USD0.001 155 115.00 39 118 451.85 2.28USD PARKER-HANNIFIN COM STK USD0.50 190 261.00 32 515 604.90 1.89USD ROCKWELL AUTOMATIO COM USD1 212 659.00 37 302 515.19 2.17USD SALESFORCE.COM INC COM USD0.001 386 951.00 50 044 372.83 2.91USD SERVICENOW INC COM USD0.001 253 557.00 45 034 258.77 2.62USD SHERWIN-WILLIAMS COM USD1 78 677.00 29 838 252.25 1.74USD SQUARE INC COM USD0.0000001 CL A 490 058.00 28 545 878.50 1.66USD UNION PACIFIC CORP COM USD2.50 354 494.00 50 607 563.44 2.95USD UNIVERSAL DISPLAY COM USD0.01 128 070.00 12 678 930.00 0.74USD VERISK ANALYTICS I CL A USD0.001 421 413.00 44 770 917.12 2.61USD VISA INC COM STK USD0.0001 515 001.00 67 320 930.72 3.92USD WALT DISNEY CO. DISNEY COM USD0.01 298 232.00 29 665 137.04 1.73USD YUM BRANDS INC COM 190 619.00 15 503 043.27 0.90Total United States 1 576 005 330.03 91.77
Total Bearer shares 1 601 289 322.53 93.24
Depository receipts
China
USD ALIBABA GROUP HLDG SPON ADS EACH REP ONE ORD-ADR 186 973.00 37 022 523.73 2.15USD CTRIP.COM INTL LTD ADS EA REP 0.25 ORD USD0.01 318 500.00 14 361 165.00 0.84USD TENCENT HLDGS LIMI UNSP ADR EACH REP 1 ORD 266 100.00 13 589 061.75 0.79Total China 64 972 750.48 3.78
Total Depository receipts 64 972 750.48 3.78
Total Transferable securities and money market instruments listed on an official stock exchange 1 666 262 073.01 97.02
UCITS/Other UCIs in accordance with Article 41 (1) e) of the amended Luxembourg law of 17 December 2010
Investment funds, open end
Ireland
USD UBS (IRL) SELECT MONEY MARKET FUND-USD-S-DIST 4 059.55 40 595 530.00 2.37Total Ireland 40 595 530.00 2.37
Total Investment funds, open end 40 595 530.00 2.37
Total UCITS/Other UCIs in accordance with Article 41 (1) e) of the amended Luxembourg law of 17 December 2010 40 595 530.00 2.37
Total investments in securities 1 706 857 603.01 99.39
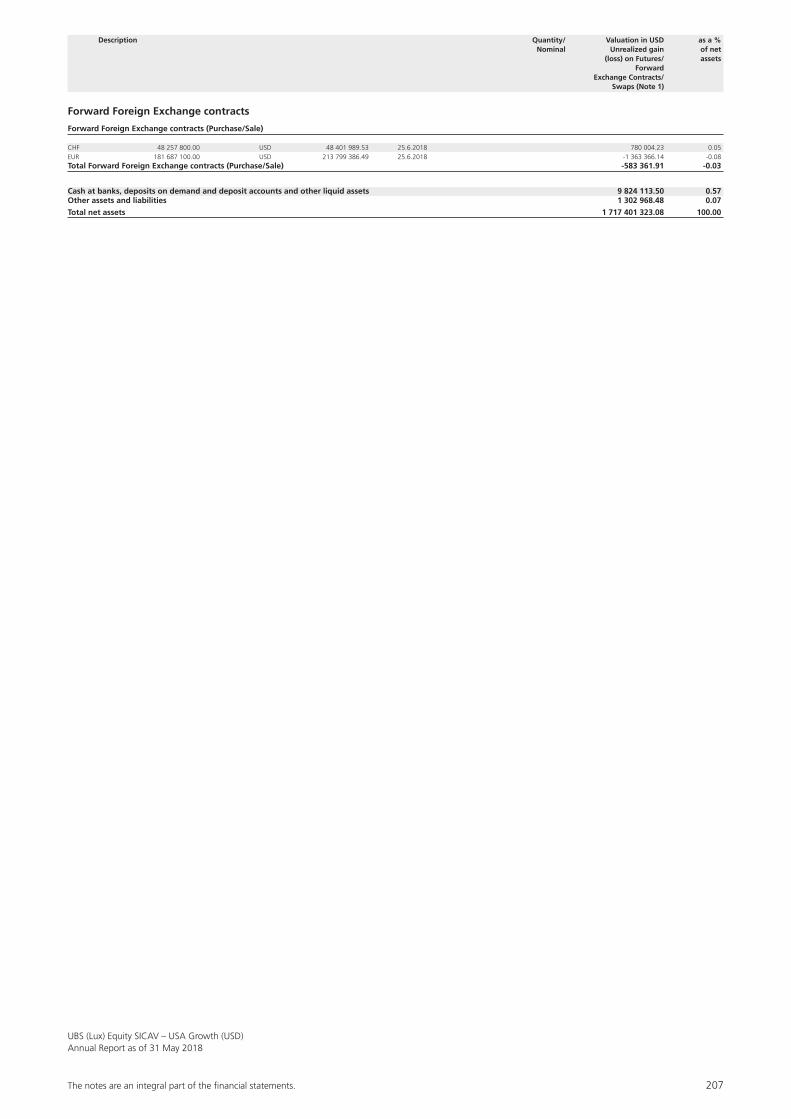
The notes are an integral part of the fi nancial statements. 207
UBS (Lux) Equity SICAV – USA Growth (USD)Annual Report as of 31 May 2018
Forward Foreign Exchange contracts
Forward Foreign Exchange contracts (Purchase/Sale)
CHF 48 257 800.00 USD 48 401 989.53 25.6.2018 780 004.23 0.05EUR 181 687 100.00 USD 213 799 386.49 25.6.2018 -1 363 366.14 -0.08Total Forward Foreign Exchange contracts (Purchase/Sale) -583 361.91 -0.03
Cash at banks, deposits on demand and deposit accounts and other liquid assets 9 824 113.50 0.57Other assets and liabilities 1 302 968.48 0.07
Total net assets 1 717 401 323.08 100.00
Description Quantity/ Valuation in USD as a % Nominal Unrealized gain of net (loss) on Futures/ assets Forward Exchange Contracts/ Swaps (Note 1)

208 The notes are an integral part of the fi nancial statements.
UBS (Lux) Equity SICAVAnnual Report as of 31 May 2018
Note 1 – Summary of significant accountingpolicies
The financial statements have been prepared in accord-ance with the generally accepted accounting principles for investment funds in Luxembourg. The significant account-ing policies are summarised as follows:
a) Calculation of the Net Asset ValueThe net asset value and the issue, redemption and conversion price per share of each subfund or share class are expressed in the reference currency of the subfund or share class concerned and are calculated every business day by dividing the overall net assets of the subfund attributable to each share class by the number of shares in this share class of the subfund.
In this context, ”business day” refers to normal banking days in Luxembourg (i.e. each day on which the banks are open during normal business hours) with the excep-tion of individual, non-statutory rest days as well as days on which exchanges in the main countries in which thesubfund invests are closed or 50% or more of the subfund’s investments cannot be adequately valued.
The percentage of the net asset value which is attributable to each respective share class of a subfund is determined, taking into account the commission charged to that share class, by the ratio of the shares in circulation in each share class to the total number of shares in circulation in the subfund, and will change each time shares are issued or redeemed.
If the total subscriptions or redemptions of all the share classes of a subfund on a single trading day come to a net capital inflow or outflow, the respective subfund’s net asset value per share may be increased or reduced accordingly (single swing pricing). The maximum adjustment amounts to 2% of the net asset value. Estimated transaction costs and tax charges that may be incurred by the subfund as well as the estimated bid/offer spread of the assets in which the subfund invests may be taken into account. The adjustment leads to an increase in the net asset value per share if the net movements result in a net inflow of capital in the subfund concerned. However, this adjust-ment leads to a fall in the net asset value per share if the net movements result in a net outflow of capital. The Board of Directors of the Management Company can set a threshold value for each subfund. This may consist in the net movement on a trading day in relation to the net fund assets or to an absolute amount in the currency of the subfund concerned. The net asset value per share would
be adjusted only if this threshold were to be exceeded on a trading day.
This adjustment is in favour of the subfund and mentioned in the Statement of Operations as “Other income”.
b) Valuation principles– liquid assets (whether in the form of cash and bank
deposits, bills of exchange, cheques, promissory notes, expense advances, cash dividends and declared or accrued interest still receivable) are valued at face value, unless this value is unlikely to be fully paid or received, in which case their value is determined by deducting an amount deemed appropriate to arrive at their real value.
– Securities, derivatives and other assets listed on a stock exchange are valued at the most recent market pri-ces available. If these securities, derivatives or other assets are listed on several stock exchanges, the most recently available price on the stock exchange that represents the major market for this asset shall apply.
In the case of securities, derivatives and other assets not commonly traded on a stock exchange and for which a secondary market exists among securities traders with pricing based on market standards, the Company may value these securities, derivatives and other investments based on these prices. Securities, derivatives and other investments not listed on a stock exchange, but traded on another regulated market that operates regularly and is recognised and open to the public, are valued at the most recently available price on this market.
– Securities and other investments not listed on a stock exchange or traded on another regulated market, and for which no appropriate price can be obtained, are valued by the Company on the basis of the likely sales prices according to other principles chosen by the Company in good faith.
– Derivatives not listed on a stock exchange (OTC derivatives) are valued on the basis of independent pricing sources. If only one independent pricing source is available for a derivative, the plausibility of the valuation obtained will be verified using calcula-tion models that are recognised by the Company and the Company’s auditors, based on the market value of that derivative’s underlying.
– Units of other undertakings for collective investment in transferable securities (UCITS) and/or undertakings for collective investment (UCIs) are valued at their last known asset value.
Certain units or shares of other UCITS and/or UCI can be valued on the basis of an estimation of their value
Notes to the Financial Statements

The notes are an integral part of the fi nancial statements. 209
UBS (Lux) Equity SICAVAnnual Report as of 31 May 2018
that has been provided by reliable service providers, which are independent from the Portfolio Manager or investment adviser (price estimation).
– Money market instruments not traded on a stock exchange or on another regulated market open to the public will be valued on the basis of the relevant curves. Curve-based valuations are calculated from interest rates and credit spreads. The following princi-ples are applied in this process: The interest rate near-est the residual maturity is interpolated for each money market instrument. Thus calculated, the interest rate is converted into a market price by adding a credit spread that reflects the creditworthiness of the underlying borrower. This credit spread is adjusted if there is a sig-nificant change in the borrower’s credit rating.
– Securities, money market instruments, derivatives and other assets denominated in a currency other than the relevant subfund’s currency of account, and not hedged by foreign exchange transactions, are valued using the average exchange rate (between the bid and ask prices) known in Luxembourg or, if none is avail-able, using the rate on the most representative market for that currency.
– Term and fiduciary deposits are valued at their nominal value plus accumulated interest.
– The value of swaps is calculated by an external serv-ice provider and a second independent valuation is provided by another external service provider. Such calculations are based on the net present value of all cash flows (both inflows and outflows). In some spe-cific cases, internal calculations (based on models and market data made available by Bloomberg) and/or broker statement valuations may be used. The valua-tion method depends on the security in question and is chosen pursuant to the applicable UBS valuation policy.
If valuation in accordance with the aforementioned regulations proves to be impossible or inaccurate, the Company is entitled to use other generally recognised and verifiable valuation criteria in good faith in order to achieve a suitable valuation of the net assets. As some of the Company’s subfunds may be invested in markets that are closed at the time their assets are valued, the Board of Directors of the Company may – by way of derogation to the aforementioned provisions – allow the net asset value per share to be adjusted in order to more accurately reflect the fair value of these subfunds’ assets at the time of valuation. In practice, the securities in which the subfunds are invested are generally valued on the basis of the latest available prices at the time of calculating the net asset value per share, as described above. There may, however, be a substantial time difference between the close of the markets in which a subfund invests and the time of valuation.
As a result, developments that may influence the value of these securities and that occur between the closure of the markets and the valuation time are not generally taken into account in the net asset value per share of the subfund concerned. If, as a result of
this, the Board of Directors of the Company deems that the most recently available prices of the securi-ties in a subfund’s portfolio do not reflect their fair value, it may have the Management Company allow the net asset value per share to be adjusted in order to reflect the assumed fair value of the portfolio at the time of valuation. Such an adjustment is based on the investment policy determined by the Board of Directors of the Company and a number of practices. If the value is adjusted as described above, this will be applied consistently to all share classes in the same subfund.
The Board of Directors of the Company reserves the right to apply this measure to the relevant subfunds of the Company whenever it deems this to be appropriate.
Evaluating assets at fair value calls for greater reliability of judgement than evaluating assets for which readily available market quotations can be referred to. Fair-value calculations may also be based on quantitative models used by price reporting providers to determine the fair value. No guarantee can be given that the Company will be in a position to accurately establish the fair value of an asset when it is about to sell the asset around the time at which the Company determines the net asset value per share. As a consequence, if the Company sells or redeems shares at the net asset value at a time when one or more participations are valued at fair value, this may lead to a dilution or increase in the economic participa-tion of the existing shareholders.
Furthermore, in exceptional circumstances, additional valuations can be carried out over the course of the day. These new valuations will then prevail for the subsequent issue, redemption and conversion of shares. Revaluations only take place before publishing the only net asset value for that day. Issues, redemptions and conversions are only processed based on this sole net asset value.
c) Net realized gains (losses) on sales of securitiesThe realized gains or losses on the sales of securities are calculated on the basis of the average cost of the securi-ties sold.
d) Valuation of forward foreign exchange contractsThe unrealized gain (loss) of outstanding forward foreign exchange contracts is valued on the basis of the forward exchange rates prevailing at valuation date.
e) Valuation of financial futures contractsFinancial futures contracts are valued based on the lat-est available published price applicable on the valuation date. Realized gains and losses and the changes in unre-alized gains and losses are recorded in the statement of operations. The realized gains and losses are calculated in accordance with the FIFO method, i.e. the first con-tracts acquired are regarded as the first to be sold.

210 The notes are an integral part of the fi nancial statements.
UBS (Lux) Equity SICAVAnnual Report as of 31 May 2018
f) Valuation on optionsOutstanding options traded on a regulated market are valued on the settlement price or the last available market price of the instruments. Options which are not listed on an official stock exchange (OTC-options) are marked to market based upon daily prices obtained from Bloomberg option pricer functionality and checked against third party pricing agents. The realized gains or losses on options and the change in unrealized appre-ciation or depreciation on options are disclosed in the statement of operations and in the changes in net assets respectively under the positions realized gains (losses) on options and Unrealized appreciation (depreciation) on options.
g) Conversion of foreign currenciesBank accounts, other net assets and the valuation of the investments in securities held denominated in currencies other than the reference currency of the different subfunds are converted at the mid closing spot rates on the valuation date. Income and expenses denominated in currencies other than the currency of the different subfunds are converted at the mid closing spot rates at payment date. Gain or loss on foreign exchange is included in the statement of operations.
The cost of securities denominated in currencies other than the reference currency of the different subfunds is converted at the mid closing spot rate on the day of acquisition.
h) Accounting of securities’ portfolio transactionsThe securities’ portfolio transactions are accounted for the bank business day following the transaction dates.
i) Fair Value pricing principleThe fair value pricing principle applies for funds with main investments in Asian markets. The fair value principle takes into account important movements not reflected in the last available Exchange closing prices, by reevaluating all underlying assets of the Fund portfolio with snapshot prices at a specified time. The net asset value is then cal-culated based on these re-evaluated prices. The fair value principle is applicable only in case the deviation of a Fund specific benchmark exceeds 3%.
j) Consolidated financial statementsThe consolidated financial statements are expressed in USD. The various items of the consolidated statement of net assets and the consolidated statement of opera-tions as of 31 May 2018 are equal to the sum of the corresponding items in the financial statements of each subfund.
The following exchange rates were used for the conversion of foreign consolidated financial statements as of 31 May 2018:
Exchange rates
USD 1 = EUR 0.856678
USD 1 = CHF 0.983100
For the liquidated or merged subfunds, the exchange rate used for the conversion of the consolidated financial statements is the one as at liquidation or merger date.
k) Receivable on securities sales,Payable on securities purchasesThe account ”Receivable on securities sales” can also include receivables from foreign currency transactions. The account ”Payable on securities purchases” can also include payables from foreign currency transactions.
l) Income recognitionDividends, net of withholding taxes, are recognized as income on the date upon which the relevant securities are first listed as “ex-dividend”. Interest income is accrued on a daily basis.
m) Cross-subfund investmentsAs per 31 May 2018 the subfund UBS (Lux) Equity SICAV – European Opportunity Unconstrained (EUR) was invested for 2 905 732.43 EUR in the subfund UBS (Lux) Equity SICAV – Global Opportunity Unconstrained (USD).
The total amount of cross subfund investments amounts to 3 391 861.47 USD. Accordingly, the adjusted consolidated net assets at the end of the financial year are 14 254 484 706.78 USD.
n) SwapsThe Company may enter into interest rate swap contracts, forward rate agreements on interest rates swaptions and credit default swaps, if they are executed with first-class financial institutions that specialize in transactions of this kind.
The value of swap transactions is calculated by an exter-nal service provider and a second independent valuation is made available by another external service provider. The calculation is based on the net present value of all cash flows, both inflows and outflows.
In some specific cases, internal calculations based on models and market data available from Bloomberg and/or broker statement valuations may be used.
The valuation methods depend on the respective security and are determined pursuant to the UBS Valuation Policy.
This valuation method is approved by the Board of Directors.
Changes in unrealized profits and losses are reflected in the statement of operations under “Unrealized appre-ciation (depreciation) on swaps”.
Gains or losses on swaps incurred when closed-out or matured are recorded as “Realized gain (loss) on swaps” in the statement of operations.

The notes are an integral part of the fi nancial statements. 211
UBS (Lux) Equity SICAVAnnual Report as of 31 May 2018
Note 2 – Flat fee
The company pays a maximum monthly flat fee for each of the subfunds and share classes, calculated on the aver-age net asset value of the subfund and share class as shown in the table below:
UBS (Lux) Equity SICAV – All China (USD)
Maximum flat fee p.a.Share classes with “P” in their name 2.150%
Share classes with “N” in their name 2.790%
Share classes with “K-1” in their name 1.570%
Share classes with “K-X” in their name 0.000%
Share classes with “F” in their name 1.020%
Share classes with “Q” in their name 1.290%
Share classes with “I-A1” in their name 1.240%
Share classes with “I-A2” in their name 1.170%
Share classes with “I-A3” in their name 1.020%
Share classes with “I-B” in their name 0.180%
Share classes with “I-X” in their name 0.000%
Share classes with “U-X” in their name 0.000%
* max. 2.150% eff. 1.020%** max. 1.290% eff. 1.020%*** max. 1.240% eff. 1.020%
UBS (Lux) Equity SICAV – Asian Smaller Companies (USD)
Maximum flat fee p.a.Share classes with “P” in their name 1.920%
Share classes with “N” in their name 2.500%
Share classes with “K-1” in their name 1.300%
Share classes with “K-X” in their name 0.000%
Share classes with “F” in their name 0.800%
Share classes with “Q” in their name 1.080%
Share classes with “I-A1” in their name 0.950%
Share classes with “I-A2” in their name 0.900%
Share classes with “I-A3” in their name 0.800%
Share classes with “I-B” in their name 0.180%
Share classes with “I-X” in their name 0.000%
Share classes with “U-X” in their name 0.000%
UBS (Lux) Equity SICAV – Brazil (USD)
Maximum flat fee p.a.Share classes with “P” in their name 1.920%
Share classes with “N” in their name 2.250%
Share classes with “K-1” in their name 1.400%
Share classes with “K-X” in their name 0.000%
Share classes with “F” in their name 0.740%
Share classes with “Q” in their name 0.980%
Share classes with “I-A1” in their name 0.880%
Share classes with “I-A2” in their name 0.820%
Share classes with “I-A3” in their name 0.740%
Share classes with “I-B” in their name 0.180%
Share classes with “I-X” in their name 0.000%
Share classes with “U-X” in their name 0.000%
UBS (Lux) Equity SICAV – Emerging Markets High Dividend (USD)
Maximum flat fee p.a.Share classes with “P” in their name 2.200%
Share classes with “N” in their name 2.750%
Share classes with “K-1” in their name 1.500%
Share classes with “K-X” in their name 0.000%
Share classes with “F” in their name 0.880%
Share classes with “Q” in their name 1.200%
Share classes with “I-A1” in their name 1.050%
Share classes with “I-A2” in their name 0.980%
Share classes with “I-A3” in their name 0.880%
Share classes with “I-B” in their name 0.180%
Share classes with “I-X” in their name 0.000%
Share classes with “U-X” in their name 0.000%
UBS (Lux) Equity SICAV – Emerging Markets Sustainable (USD)
Maximum flat fee p.a.Share classes with “P” in their name 2.040%
Share classes with “N” in their name 2.750%
Share classes with “K-1” in their name 1.500%
Share classes with “K-X” in their name 0.000%
Share classes with “F” in their name 0.950%
Share classes with “Q” in their name 1.200%
Share classes with “I-A1” in their name 1.150%
Share classes with “I-A2” in their name 1.050%
Share classes with “I-A3” in their name 0.950%
Share classes with “I-B” in their name 0.180%
Share classes with “I-X” in their name 0.000%
Share classes with “U-X” in their name 0.000%
UBS (Lux) Equity SICAV – Euro Countries Income (EUR)
Maximum flat fee p.a.Share classes with “P” in their name 1.600%
Share classes with “N” in their name 2.250%
Share classes with “K-1” in their name 1.100%
Share classes with “K-X” in their name 0.000%
Share classes with “F” in their name 0.600%
Share classes with “Q” in their name 0.980%
Share classes with “I-A1” in their name 0.700%
Share classes with “I-A2” in their name 0.650%
Share classes with “I-A3” in their name 0.600%
Share classes with “I-B” in their name 0.065%
Share classes with “I-X” in their name 0.000%
Share classes with “U-X” in their name 0.000%
UBS (Lux) Equity SICAV – European High Dividend (EUR)
Maximum flat fee p.a.Share classes with “P” in their name 1.500%
Share classes with “N” in their name 2.500%
Share classes with “K-1” in their name 0.900%
Share classes with “K-X” in their name 0.000%
Share classes with “F” in their name 0.520%
Share classes with “Q” in their name 0.840%
Share classes with “I-A1” in their name 0.640%
*
**
***
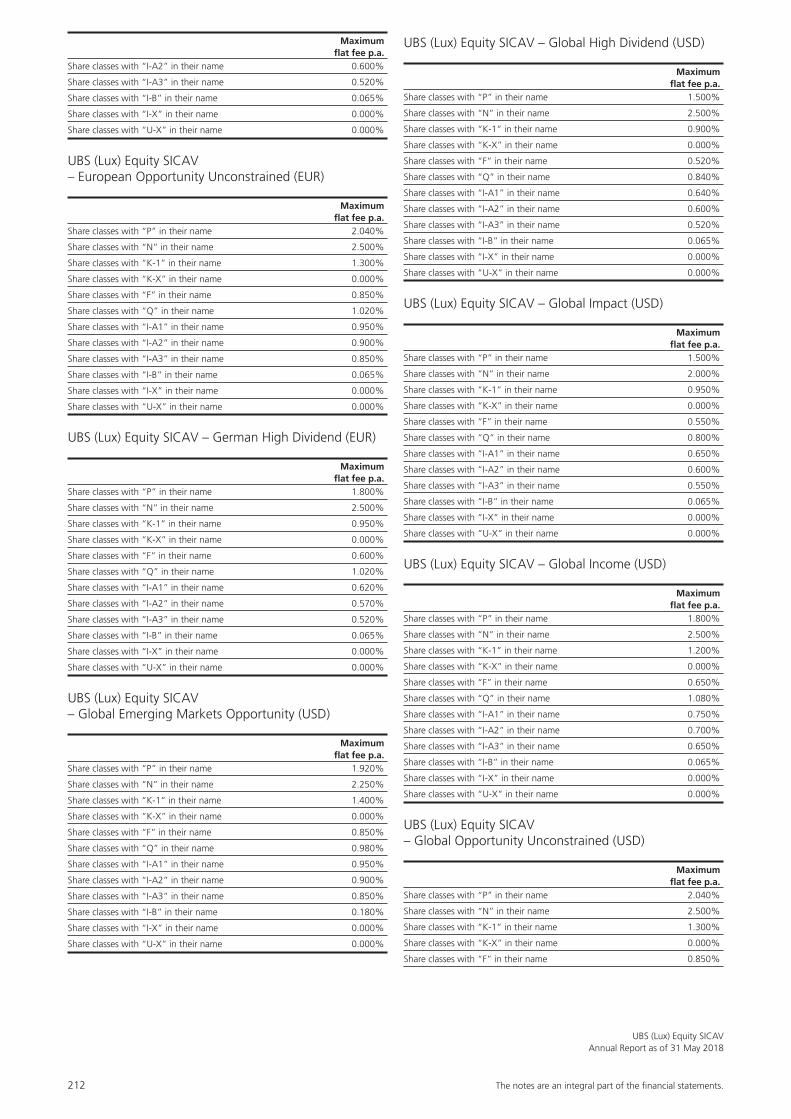
212 The notes are an integral part of the fi nancial statements.
UBS (Lux) Equity SICAVAnnual Report as of 31 May 2018
Maximum flat fee p.a.Share classes with “I-A2” in their name 0.600%
Share classes with “I-A3” in their name 0.520%
Share classes with “I-B” in their name 0.065%
Share classes with “I-X” in their name 0.000%
Share classes with “U-X” in their name 0.000%
UBS (Lux) Equity SICAV – European Opportunity Unconstrained (EUR)
Maximum flat fee p.a.Share classes with “P” in their name 2.040%
Share classes with “N” in their name 2.500%
Share classes with “K-1” in their name 1.300%
Share classes with “K-X” in their name 0.000%
Share classes with “F” in their name 0.850%
Share classes with “Q” in their name 1.020%
Share classes with “I-A1” in their name 0.950%
Share classes with “I-A2” in their name 0.900%
Share classes with “I-A3” in their name 0.850%
Share classes with “I-B” in their name 0.065%
Share classes with “I-X” in their name 0.000%
Share classes with “U-X” in their name 0.000%
UBS (Lux) Equity SICAV – German High Dividend (EUR)
Maximum flat fee p.a.Share classes with “P” in their name 1.800%
Share classes with “N” in their name 2.500%
Share classes with “K-1” in their name 0.950%
Share classes with “K-X” in their name 0.000%
Share classes with “F” in their name 0.600%
Share classes with “Q” in their name 1.020%
Share classes with “I-A1” in their name 0.620%
Share classes with “I-A2” in their name 0.570%
Share classes with “I-A3” in their name 0.520%
Share classes with “I-B” in their name 0.065%
Share classes with “I-X” in their name 0.000%
Share classes with “U-X” in their name 0.000%
UBS (Lux) Equity SICAV – Global Emerging Markets Opportunity (USD)
Maximum flat fee p.a.Share classes with “P” in their name 1.920%
Share classes with “N” in their name 2.250%
Share classes with “K-1” in their name 1.400%
Share classes with “K-X” in their name 0.000%
Share classes with “F” in their name 0.850%
Share classes with “Q” in their name 0.980%
Share classes with “I-A1” in their name 0.950%
Share classes with “I-A2” in their name 0.900%
Share classes with “I-A3” in their name 0.850%
Share classes with “I-B” in their name 0.180%
Share classes with “I-X” in their name 0.000%
Share classes with “U-X” in their name 0.000%
UBS (Lux) Equity SICAV – Global High Dividend (USD)
Maximum flat fee p.a.Share classes with “P” in their name 1.500%
Share classes with “N” in their name 2.500%
Share classes with “K-1” in their name 0.900%
Share classes with “K-X” in their name 0.000%
Share classes with “F” in their name 0.520%
Share classes with “Q” in their name 0.840%
Share classes with “I-A1” in their name 0.640%
Share classes with “I-A2” in their name 0.600%
Share classes with “I-A3” in their name 0.520%
Share classes with “I-B” in their name 0.065%
Share classes with “I-X” in their name 0.000%
Share classes with “U-X” in their name 0.000%
UBS (Lux) Equity SICAV – Global Impact (USD)
Maximum flat fee p.a.Share classes with “P” in their name 1.500%
Share classes with “N” in their name 2.000%
Share classes with “K-1” in their name 0.950%
Share classes with “K-X” in their name 0.000%
Share classes with “F” in their name 0.550%
Share classes with “Q” in their name 0.800%
Share classes with “I-A1” in their name 0.650%
Share classes with “I-A2” in their name 0.600%
Share classes with “I-A3” in their name 0.550%
Share classes with “I-B” in their name 0.065%
Share classes with “I-X” in their name 0.000%
Share classes with “U-X” in their name 0.000%
UBS (Lux) Equity SICAV – Global Income (USD)
Maximum flat fee p.a.Share classes with “P” in their name 1.800%
Share classes with “N” in their name 2.500%
Share classes with “K-1” in their name 1.200%
Share classes with “K-X” in their name 0.000%
Share classes with “F” in their name 0.650%
Share classes with “Q” in their name 1.080%
Share classes with “I-A1” in their name 0.750%
Share classes with “I-A2” in their name 0.700%
Share classes with “I-A3” in their name 0.650%
Share classes with “I-B” in their name 0.065%
Share classes with “I-X” in their name 0.000%
Share classes with “U-X” in their name 0.000%
UBS (Lux) Equity SICAV – Global Opportunity Unconstrained (USD)
Maximum flat fee p.a.Share classes with “P” in their name 2.040%
Share classes with “N” in their name 2.500%
Share classes with “K-1” in their name 1.300%
Share classes with “K-X” in their name 0.000%
Share classes with “F” in their name 0.850%

The notes are an integral part of the fi nancial statements. 213
UBS (Lux) Equity SICAVAnnual Report as of 31 May 2018
Maximum flat fee p.a.Share classes with “Q” in their name 1.020%
Share classes with “I-A1” in their name 0.950%
Share classes with “I-A2” in their name 0.900%
Share classes with “I-A3” in their name 0.850%
Share classes with “I-B” in their name 0.065%
Share classes with “I-X” in their name 0.000%
Share classes with “U-X” in their name 0.000%
UBS (Lux) Equity SICAV – Global Quantitative (USD)
Maximum flat fee p.a.Share classes with “P” in their name 0.900%
Share classes with “N” in their name 1.200%
Share classes with “K-1” in their name 0.700%
Share classes with “K-X” in their name 0.000%
Share classes with “F” in their name 0.500%
Share classes with “Q” in their name 0.650%
Share classes with “I-A1” in their name 0.600%
Share classes with “I-A2” in their name 0.550%
Share classes with “I-A3” in their name 0.500%
Share classes with “I-B” in their name 0.065%
Share classes with “I-X” in their name 0.000%
Share classes with “U-X” in their name 0.000%
UBS (Lux) Equity SICAV – Long Term Themes (USD)
Maximum flat fee p.a.Share classes with “P” in their name 1.800%
Share classes with “N” in their name 2.500%
Share classes with “K-1” in their name 1.080%
Share classes with “K-X” in their name 0.000%
Share classes with “F” in their name 0.670%
Share classes with “Q” in their name 1.020%
Share classes with “I-A1” in their name 0.800%
Share classes with “I-A2” in their name 0.750%
Share classes with “I-A3” in their name 0.670%
Share classes with “I-B” in their name 0.065%
Share classes with “I-X” in their name 0.000%
Share classes with “U-X” in their name 0.000%
UBS (Lux) Equity SICAV – Russia (USD)
Maximum flat fee p.a.Share classes with “P” in their name 2.340%
Share classes with “N” in their name 2.750%
Share classes with “K-1” in their name 1.500%
Share classes with “K-X” in their name 0.000%
Share classes with “F” in their name 0.740%
Share classes with “Q” in their name 1.200%
Share classes with “I-A1” in their name 0.880%
Share classes with “I-A2” in their name 0.820%
Share classes with “I-A3” in their name 0.740%
Share classes with “I-B” in their name 0.180%
Share classes with “I-X” in their name 0.000%
Share classes with “U-X” in their name 0.000%
UBS (Lux) Equity SICAV – Small Caps Europe (EUR)
Maximum flat fee p.a.Share classes with “P” in their name 1.920%
Share classes with “N” in their name 2.500%
Share classes with “K-1” in their name 1.020%
Share classes with “K-X” in their name 0.000%
Share classes with “F” in their name 0.700%
Share classes with “Q” in their name 1.020%
Share classes with “I-A1” in their name 0.780%
Share classes with “I-A2” in their name 0.740%
Share classes with “I-A3” in their name 0.700%
Share classes with “I-B” in their name 0.065%
Share classes with “I-X” in their name 0.000%
Share classes with “U-X” in their name 0.000%
UBS (Lux) Equity SICAV – Solid Consumer Brands (USD)
Maximum flat fee p.a.Share classes with “P” in their name 1.500%
Share classes with “N” in their name 2.500%
Share classes with “K-1” in their name 0.900%
Share classes with “K-X” in their name 0.000%
Share classes with “F” in their name 0.490%
Share classes with “Q” in their name 0.840%
Share classes with “I-A1” in their name 0.550%
Share classes with “I-A2” in their name 0.520%
Share classes with “I-A3” in their name 0.490%
Share classes with “I-B” in their name 0.065%
Share classes with “I-X” in their name 0.000%
Share classes with “U-X” in their name 0.000%
UBS (Lux) Equity SICAV – Swiss Opportunity (CHF)
Maximum flat fee p.a.Share classes with “P” in their name 1.500%
Share classes with “N” in their name 2.500%
Share classes with “K-1” in their name 0.900%
Share classes with “K-X” in their name 0.000%
Share classes with “F” in their name 0.550%
Share classes with “Q” in their name 1.020%
Share classes with “I-A1” in their name 0.720%
Share classes with “I-A2” in their name 0.660%
Share classes with “I-A3” in their name 0.550%
Share classes with “I-B” in their name 0.065%
Share classes with “I-X” in their name 0.000%
Share classes with “U-X” in their name 0.000%
UBS (Lux) Equity SICAV – US Income (USD)
Maximum flat fee p.a.Share classes with “P” in their name 1.600%
Share classes with “N” in their name 2.250%
Share classes with “K-1” in their name 1.100%
Share classes with “K-X” in their name 0.000%
Share classes with “F” in their name 0.600%
Share classes with “Q” in their name 0.980%
Share classes with “I-A1” in their name 0.700%
Share classes with “I-A2” in their name 0.650%
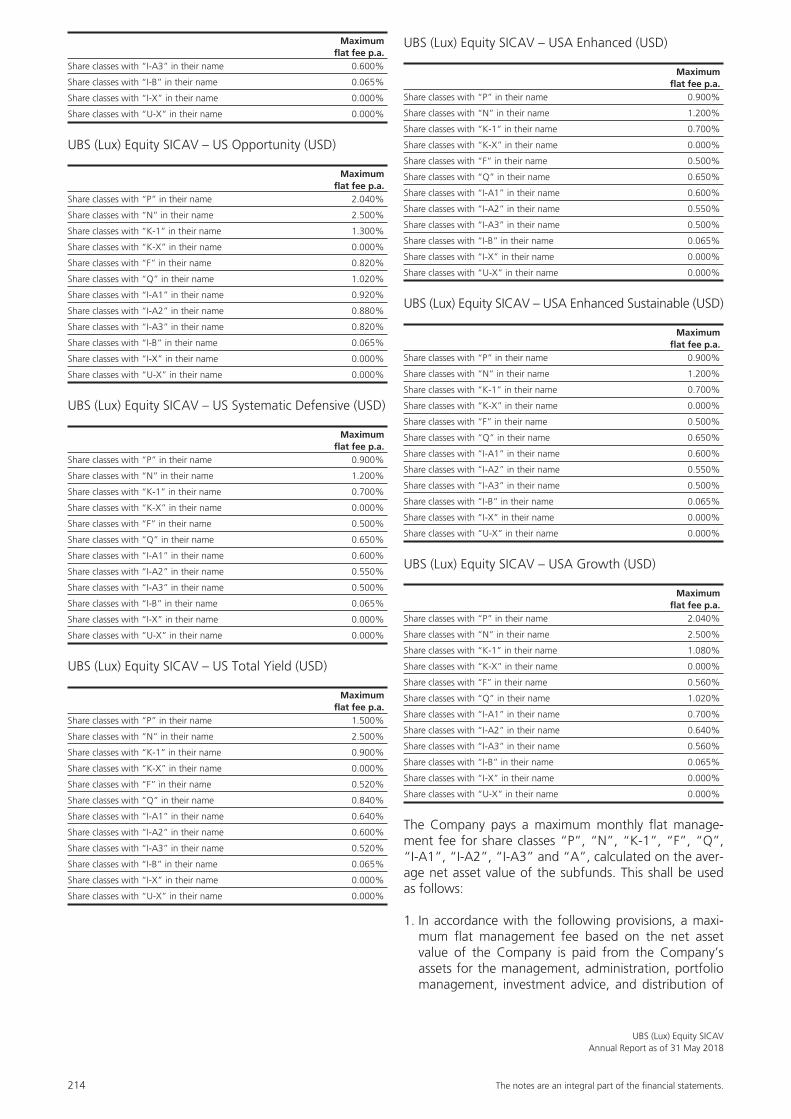
214 The notes are an integral part of the fi nancial statements.
UBS (Lux) Equity SICAVAnnual Report as of 31 May 2018
Maximum flat fee p.a.Share classes with “I-A3” in their name 0.600%
Share classes with “I-B” in their name 0.065%
Share classes with “I-X” in their name 0.000%
Share classes with “U-X” in their name 0.000%
UBS (Lux) Equity SICAV – US Opportunity (USD)
Maximum flat fee p.a.Share classes with “P” in their name 2.040%
Share classes with “N” in their name 2.500%
Share classes with “K-1” in their name 1.300%
Share classes with “K-X” in their name 0.000%
Share classes with “F” in their name 0.820%
Share classes with “Q” in their name 1.020%
Share classes with “I-A1” in their name 0.920%
Share classes with “I-A2” in their name 0.880%
Share classes with “I-A3” in their name 0.820%
Share classes with “I-B” in their name 0.065%
Share classes with “I-X” in their name 0.000%
Share classes with “U-X” in their name 0.000%
UBS (Lux) Equity SICAV – US Systematic Defensive (USD)
Maximum flat fee p.a.Share classes with “P” in their name 0.900%
Share classes with “N” in their name 1.200%
Share classes with “K-1” in their name 0.700%
Share classes with “K-X” in their name 0.000%
Share classes with “F” in their name 0.500%
Share classes with “Q” in their name 0.650%
Share classes with “I-A1” in their name 0.600%
Share classes with “I-A2” in their name 0.550%
Share classes with “I-A3” in their name 0.500%
Share classes with “I-B” in their name 0.065%
Share classes with “I-X” in their name 0.000%
Share classes with “U-X” in their name 0.000%
UBS (Lux) Equity SICAV – US Total Yield (USD)
Maximum flat fee p.a.Share classes with “P” in their name 1.500%
Share classes with “N” in their name 2.500%
Share classes with “K-1” in their name 0.900%
Share classes with “K-X” in their name 0.000%
Share classes with “F” in their name 0.520%
Share classes with “Q” in their name 0.840%
Share classes with “I-A1” in their name 0.640%
Share classes with “I-A2” in their name 0.600%
Share classes with “I-A3” in their name 0.520%
Share classes with “I-B” in their name 0.065%
Share classes with “I-X” in their name 0.000%
Share classes with “U-X” in their name 0.000%
UBS (Lux) Equity SICAV – USA Enhanced (USD)
Maximum flat fee p.a.Share classes with “P” in their name 0.900%
Share classes with “N” in their name 1.200%
Share classes with “K-1” in their name 0.700%
Share classes with “K-X” in their name 0.000%
Share classes with “F” in their name 0.500%
Share classes with “Q” in their name 0.650%
Share classes with “I-A1” in their name 0.600%
Share classes with “I-A2” in their name 0.550%
Share classes with “I-A3” in their name 0.500%
Share classes with “I-B” in their name 0.065%
Share classes with “I-X” in their name 0.000%
Share classes with “U-X” in their name 0.000%
UBS (Lux) Equity SICAV – USA Enhanced Sustainable (USD)
Maximum flat fee p.a.Share classes with “P” in their name 0.900%
Share classes with “N” in their name 1.200%
Share classes with “K-1” in their name 0.700%
Share classes with “K-X” in their name 0.000%
Share classes with “F” in their name 0.500%
Share classes with “Q” in their name 0.650%
Share classes with “I-A1” in their name 0.600%
Share classes with “I-A2” in their name 0.550%
Share classes with “I-A3” in their name 0.500%
Share classes with “I-B” in their name 0.065%
Share classes with “I-X” in their name 0.000%
Share classes with “U-X” in their name 0.000%
UBS (Lux) Equity SICAV – USA Growth (USD)
Maximum flat fee p.a.Share classes with “P” in their name 2.040%
Share classes with “N” in their name 2.500%
Share classes with “K-1” in their name 1.080%
Share classes with “K-X” in their name 0.000%
Share classes with “F” in their name 0.560%
Share classes with “Q” in their name 1.020%
Share classes with “I-A1” in their name 0.700%
Share classes with “I-A2” in their name 0.640%
Share classes with “I-A3” in their name 0.560%
Share classes with “I-B” in their name 0.065%
Share classes with “I-X” in their name 0.000%
Share classes with “U-X” in their name 0.000%
The Company pays a maximum monthly flat manage-ment fee for share classes “P”, “N”, “K-1”, “F”, “Q”, “I-A1”, “I-A2”, “I-A3” and “A”, calculated on the aver-age net asset value of the subfunds. This shall be used as follows:
1. In accordance with the following provisions, a maxi-mum flat management fee based on the net asset value of the Company is paid from the Company’s assets for the management, administration, portfolio management, investment advice, and distribution of

The notes are an integral part of the fi nancial statements. 215
UBS (Lux) Equity SICAVAnnual Report as of 31 May 2018
the Company (if applicable), as well as for all Deposi-tary tasks, such as the safekeeping and supervision of the Company’s assets, the processing of payment transactions and all other tasks listed in the “Deposi-tary and Main Paying Agent” section: This fee is charged to the Company’s assets on a pro rata basis upon every calculation of the net asset value and is paid on a monthly basis (maximum flat management fee). The relevant maximum flat management fee will not be charged until the corresponding share classes have been launched. An overview of the maximum flat management fees can be found under “The subfunds and their special investment policies”. The actual max-imum rate applied to the flat management fee can be found in the annual and semi-annual reports.
2. The maximum flat management fee does not include the following fees and additional expenses, which are also charged to the Company’s assets:
a) all additional expenses related to management of the Company’s assets for the sale and purchase of assets (bid-ask spread, brokerage fees in line with the market, commissions, fees, etc.). As a rule, these expenses are calculated upon the purchase or sale of the respective assets. In derogation hereto, these additional expenses, which arise through the sale and purchase of assets in connection with the settlement of the issue and redemption of units, are covered by the application of the single swing pricing principle pursuant to the section titled “Net asset value, issue, redemption and conversion price”.
b) fees of the supervisory authority for the establish-ment, modification, liquidation and merger of the Company, as well as all charges payable to the supervisory authorities and any stock exchanges on which the subfunds are listed;
c) auditor’s fees for the annual audit and certification in connection with the establishment, modifica-tion, liquidation and merger of the Company, as well as any other fees paid to the audit firm for the services it provides in relation to the administration of the Fund as permitted by law;
d) fees for legal and tax advisers, as well as notaries, in connection with the establishment, registration in distribution countries, modification, liquidation and merger of the Company, as well as for the general safeguarding of the interests of the Company and its investors, insofar as this is not expressly prohib-ited by law;
e) Costs for the publication of the Company’s net asset value and all costs for notices to investors, including translation costs;
f) costs for the Company’s legal documents (prospec-tuses, KIIDs, annual and semi-annual reports, as well as all other documents legally required in the countries of domiciliation and distribution);
g) costs for the Company’s registration with any for-eign supervisory authorities, if applicable, including fees payable to the foreign supervisory authorities,
as well as translation costs and fees for the foreign representative or paying agent;
h) expenses incurred through use of voting or credi-tors’ rights by the Company, including fees for external advisers;
i) costs and fees related to any intellectual property registered in the Company’s name or to the Com-pany’s rights of usufruct;
j) all expenses arising in connection with any extraor-dinary measures taken by the Management Com-pany, Portfolio Manager or Depositary to protect the interests of the investors;
k) If the Management Company participates in class-action suits in the interests of investors, it may charge the Company’s assets for the expenses aris-ing in connection with third parties (e.g. legal and Depositary costs). Furthermore, the Management Company may charge for all administrative costs, provided these are verifiable, and published and/or taken into account in the disclosure of the Com-pany’s total expense ratio (TER).
3. The Management Company may pay retrocessions to cover the distribution activities of the Company.
All taxes levied on the income and assets of the Company, particularly the taxe d’abonnement, will also be borne by the Company.
For purposes of general comparability with fee rules of different fund providers that do not have a flat manage-ment fee, the term “maximum management fee” is set at 80% of the flat management fee.
For share class “I-B”, a fee is charged to cover the costs of fund administration (comprising the costs of the Com-pany, the administrative agent and the Depositary). The costs for asset management and distribution are charged outside of the Company under a separate contract con-cluded directly between the shareholder and UBS Asset Management or one of its authorised representatives.
Unless otherwise provided for in the investment policy of the relevant subfund, the Portfolio Manager shall be paid a performance fee for share classes with “PF” in their name. This shall amount to 20% of the posi-tive difference between (1) the net asset value per share of the subfund (after deduction of all fees accrued dur-ing the period, excluding the performance fee) on the performance fee valuation date (the last valuation date of the performance fee period, as specified below) and (2) the high water mark. The high water mark on a given valuation date is equal to the greater of (1) the initial subscription price and (2) the last end-of-period NAV per share at which a performance fee has been paid. On each valuation date, the calculated performance fee is accrued and adjusted for subscriptions and redemptions during the performance fee period. If shares are redeemed, the accrued performance fee attributable to these redeemed shares will be paid to the Portfolio Manager.

216 The notes are an integral part of the fi nancial statements.
UBS (Lux) Equity SICAVAnnual Report as of 31 May 2018
The performance fee shall be calculated and accrued each time the net asset value is calculated. The perform-ance fee is paid on a yearly basis, calculated for the last valuation date in December.
Shareholders are informed that the performance fee is calculated based on the development of the share classes and not the holdings of the individual shareholders. As a result, shareholders may still be charged a perform-ance fee if the net asset value of their shares remains the same, or even if it falls, because shareholders may, for example, purchase or redeem their shares at a time other than the beginning of the calculation period. Fur-thermore, shareholders who purchase shares during the calculation period may benefit from an increase in the net asset value of their shares without being charged a performance fee, or may be charged a lower perform-ance fee than would be the case if this fee were cal-culated based solely on the holdings of the individual shareholders.
Costs relating to the services performed for share classes I-X, K-X and U-X for asset management, fund administra-tion (comprising the costs of the Company, the admin-istrative agent and the Depositary) and distribution are covered by the compensation to which UBS AG is enti-tled to under a separate contract with the shareholder.
All costs that can be attributed to individual subfunds will be charged to these subfunds.
Costs that can be attributed to individual share classes will be charged to these share classes. If costs are incurred in connection with several or all subfunds/share classes, however, these costs will be charged to these subfunds/share classes in proportion to their relative net asset val-ues.
With regard to subfunds that may invest in other UCIs or UCITS under the terms of their investment policies, fees may be incurred both at the level of the subfund as well as at the level of the relevant target fund. The manage-ment fees of the target fund in which the assets of the subfund are invested may amount to a maximum of 3%, taking into account any trailer fees.
Should a subfund invest in units of funds that are man-aged directly or by delegation by the Management Com-pany or by another company linked to the Management Company through common management or control or through a substantial direct or indirect holding, no issue or redemption charges may be charged to the investing subfund in connection with these target fund units.
Details on the Company’s ongoing charges can be found in the KIIDs.
Note 3 – Taxe d’abonnement
In accordance with the law and the regulations cur-rently in force, the company is subject in Luxembourg to the subscription tax at the annual rate of 0.05%, or a reduced taxe d’abonnement amounting to 0.01% p.a. for some share classes, payable quarterly and calculated on the basis of its net assets at the end of each quarter.
The taxe d’abonnement is waived for that part of the net assets invested in units or shares of other undertakings for collective investment that have already paid the taxe d’abonnement in accordance with the statutory provi-sions of Luxembourg law.
Note 4 – Other income
Other income mainly consist of income resulting from Single Swing Pricing.
Note 5 – Income distribution
Distribution PolicyThe general meeting of shareholders of the respec-tive subfunds shall decide, at the proposal of the Board of Directors and after closing the annual accounts per subfund, whether and to what extent distributions are to be paid out by each subfund or share class. The payment of distributions must not result in the net assets of the company falling below the minimum amount of assets prescribed by law. If a distribution is made, payment will be effected no later than four months after the end of the financial year.
The Board of Directors is authorized to pay interim dividends and to suspend the payment of distributions.
An income equalization amount will be calculated so that the distribution corresponds to the actual income entitlement.
Note 6 – Commitments on Financial Futures, Optionsand Synthetic Equity Swaps
Commitments on Financial Futures, Options and Synthetic Equity Swaps per subfund and respective cur-rency as of 31 May 2018 can be summarised as follows:
a) Financial Future
UBS (Lux) Equity SICAV Financial Futures Financial Futures on Indices (bought) on Indices (sold)
– Euro Countries Income (EUR) 3 022 440.00 EUR - EUR

The notes are an integral part of the fi nancial statements. 217
UBS (Lux) Equity SICAVAnnual Report as of 31 May 2018
b) Options
UBS (Lux) Equity SICAV Options on shares, classic-styled (sold)
– Euro Countries Income (EUR) 34 677 967.78 EUR
– Global Income (USD) 88 487 738.68 USD
– US Income (USD) 82 256 858.42 USD
c) Synthetic Equity Swaps
UBS (Lux) Equity SICAV Synthetic Equity Synthetic Equity Swaps (bought) Swaps (sold)
– European Opportunity Unconstrained (EUR) 492 291 931.80 EUR 332 498 835.82 EUR
– Global Opportunity Unconstrained (USD) 64 208 408.26 USD 50 818 424.46 USD
Note 7 – Soft commission arrangements
During the financial year from 1 June 2017 until 31 May 2018, no ”soft commission arrangements” were entered into on behalf of UBS (Lux) Equity SICAV and “soft commissions“ amount to nil.
Note 8 – Total Expense Ratio (TER)
This ratio was calculated in accordance with the Swiss Funds & Asset Management Association (SFAMA) “Guidelines on the calculation and disclosure of the TER” in the current version and expresses the sum of all costs and commissions charged on an ongoing basis to the net assets (operating expenses) taken retrospectively as a percentage of the net assets.
TER for the last 12 months:
UBS (Lux) Equity SICAV Total Expense Ratio (TER)
– All China (USD) seeding I-A1-acc 1.03%
– All China (USD) P-acc 2.14%
– Asian Smaller Companies (USD) P-acc 2.01%
– Asian Smaller Companies (USD) Q-acc 1.16%
– Brazil (USD) P-acc 2.21%
– Brazil (USD) Q-acc 1.15%
– Emerging Markets High Dividend (USD) I-B-acc 0.21%
– Emerging Markets High Dividend (USD) I-X-dist 0.03%
– Emerging Markets High Dividend (USD) P-acc 2.27%
– Emerging Markets High Dividend (USD) (CHF hedged) P-acc 2.27%
– Emerging Markets High Dividend (USD) (EUR hedged) P-acc 2.26%
– Emerging Markets High Dividend (USD) (CHF hedged) P-dist 2.27%
– Emerging Markets High Dividend (USD) P-mdist 2.30%
– Emerging Markets High Dividend (USD) Q-acc 1.28%
– Emerging Markets High Dividend (USD) (CHF hedged) Q-acc 1.27%
– Emerging Markets High Dividend (USD) (EUR hedged) Q-acc 1.27%
– Emerging Markets High Dividend (USD) (CHF hedged) Q-dist 1.27%
– Emerging Markets Sustainable (USD) P-acc 2.12%
– Emerging Markets Sustainable (USD) (EUR) P-acc 2.12%
– Emerging Markets Sustainable (USD) Q-acc 1.28%
– Emerging Markets Sustainable (USD) (EUR) Q-acc 1.28%
– Euro Countries Income (EUR) I-A1-acc 0.73%
– Euro Countries Income (EUR) K-1-acc 1.17%
UBS (Lux) Equity SICAV Total Expense Ratio (TER)
– Euro Countries Income (EUR) K-X-acc 0.07%
– Euro Countries Income (EUR) (USD hedged) P-8%-mdist 1.68%
– Euro Countries Income (EUR) P-acc 1.68%
– Euro Countries Income (EUR) (CHF hedged) P-acc 1.68%
– Euro Countries Income (EUR) (USD hedged) P-acc 1.68%
– Euro Countries Income (EUR) P-dist 1.68%
– Euro Countries Income (EUR) (CHF hedged) P-dist 1.68%
– Euro Countries Income (EUR) (USD hedged) P-dist 1.68%
– Euro Countries Income (EUR) (USD hedged) Q-8%-mdist 1.07%
– Euro Countries Income (EUR) Q-acc 1.06%
– Euro Countries Income (EUR) (CHF hedged) Q-acc 1.06%
– Euro Countries Income (EUR) (USD hedged) Q-acc 1.05%
– Euro Countries Income (EUR) Q-dist 1.06%
– Euro Countries Income (EUR) (CHF hedged) Q-dist 1.06%
– Euro Countries Income (EUR) (USD hedged) Q-dist 1.05%
– Euro Countries Income (EUR) U-X-UKdist-mdist 0.02%
– European High Dividend (EUR) N-8%-mdist 2.58%
– European High Dividend (EUR) P-acc 1.57%
– European High Dividend (EUR) (CHF) P-acc 1.59%
– European High Dividend (EUR) (USD) P-acc 1.58%
– European High Dividend (EUR) P-dist 1.57%
– European High Dividend (EUR) (CHF hedged) P-dist 1.57%
– European High Dividend (EUR) (GBP) P-dist 1.58%
– European High Dividend (EUR) P-mdist 1.57%
– European High Dividend (EUR) Q-acc 0.91%
– European High Dividend (EUR) (CHF) Q-acc 0.91%
– European High Dividend (EUR) (USD) Q-acc 0.91%
– European High Dividend (EUR) Q-dist 0.91%
– European High Dividend (EUR) (CHF hedged) Q-dist 0.91%
– European High Dividend (EUR) (GBP) Q-dist 0.90%
– European High Dividend (EUR) U-X-acc 0.02%
– European Opportunity Unconstrained (EUR) I-A1-acc 0.97%
– European Opportunity Unconstrained (EUR) (USD hedged) I-A1-acc 0.97%
– European Opportunity Unconstrained (EUR) I-A3-acc 0.87%
– European Opportunity Unconstrained (EUR) I-B-acc 0.09%
– European Opportunity Unconstrained (EUR) (USD hedged) I-B-acc 0.09%
– European Opportunity Unconstrained (EUR) I-X-acc 0.02%
– European Opportunity Unconstrained (EUR) K-1-acc 1.37%
– European Opportunity Unconstrained (EUR) (USD hedged) K-1-acc 1.36%
– European Opportunity Unconstrained (EUR) N-acc 2.56%
– European Opportunity Unconstrained (EUR) P-acc 2.10%
– European Opportunity Unconstrained (EUR) (AUD hedged) P-acc 2.09%
– European Opportunity Unconstrained (EUR) (CHF hedged) P-acc 2.10%
– European Opportunity Unconstrained (EUR) (GBP hedged) P-acc 2.09%
– European Opportunity Unconstrained (EUR) (HKD hedged) P-acc 2.10%
– European Opportunity Unconstrained (EUR) (RMB hedged) P-acc 2.10%
– European Opportunity Unconstrained (EUR) (SEK) P-acc 2.10%
– European Opportunity Unconstrained (EUR) (SGD hedged) P-acc 2.09%
– European Opportunity Unconstrained (EUR) (USD hedged) P-acc 2.10%
– European Opportunity Unconstrained (EUR) Q-acc 1.08%
– European Opportunity Unconstrained (EUR) (CHF hedged) Q-acc 1.08%
– European Opportunity Unconstrained (EUR) (GBP hedged) Q-acc 1.07%
– European Opportunity Unconstrained (EUR) (SEK) Q-acc 1.08%
– European Opportunity Unconstrained (EUR) (USD hedged) Q-acc 1.08%
– European Opportunity Unconstrained (EUR) U-X-acc 0.02%
– German High Dividend (EUR) K-1-acc 1.03%
– German High Dividend (EUR) P-acc 1.88%
– German High Dividend (EUR) (CHF hedged) P-acc 1.87%
– German High Dividend (EUR) P-dist 1.88%

218 The notes are an integral part of the fi nancial statements.
UBS (Lux) Equity SICAVAnnual Report as of 31 May 2018
UBS (Lux) Equity SICAV Total Expense Ratio (TER)
– German High Dividend (EUR) (CHF hedged) P-dist 1.88%
– German High Dividend (EUR) Q-acc 1.10%
– German High Dividend (EUR) (CHF hedged) Q-acc 1.10%
– German High Dividend (EUR) Q-dist 1.10%
– German High Dividend (EUR) (CHF hedged) Q-dist 1.10%
– Global Emerging Markets Opportunity (USD) I-A1-acc 0.99%
– Global Emerging Markets Opportunity (USD) I-A3-acc 0.88%
– Global Emerging Markets Opportunity (USD) (EUR) I-A3-dist 0.88%
– Global Emerging Markets Opportunity (USD) (EUR) I-B-acc 0.07%
– Global Emerging Markets Opportunity (USD) P-4%-mdist 2.09%
– Global Emerging Markets Opportunity (USD) (HKD) P-4%-mdist 2.09%
– Global Emerging Markets Opportunity (USD) P-acc 2.03%
– Global Emerging Markets Opportunity (USD) (EUR hedged) P-acc 2.03%
– Global Emerging Markets Opportunity (USD) (SGD hedged) P-acc 2.00%
– Global Emerging Markets Opportunity (USD) Q-acc 1.07%
– Global Emerging Markets Opportunity (USD) (EUR hedged) Q-acc 1.05%
– Global Emerging Markets Opportunity (USD) Q-dist 1.06%
– Global Emerging Markets Opportunity (USD) U-X-acc 0.03%
– Global High Dividend (USD) F-acc 0.54%
– Global High Dividend (USD) (EUR hedged) F-acc 0.55%
– Global High Dividend (USD) I-A1-acc 0.67%
– Global High Dividend (USD) (CHF hedged) I-A1-acc 0.67%
– Global High Dividend (USD) (EUR hedged) I-A1-acc 0.65%
– Global High Dividend (USD) I-X-acc 0.03%
– Global High Dividend (USD) (CHF hedged) I-X-acc 0.03%
– Global High Dividend (USD) I-X-dist 0.03%
– Global High Dividend (USD) K-1-acc 0.97%
– Global High Dividend (USD) (EUR hedged) N-8%-mdist 2.55%
– Global High Dividend (USD) (EUR hedged) N-dist 2.57%
– Global High Dividend (USD) P-acc 1.57%
– Global High Dividend (USD) (EUR hedged) P-acc 1.57%
– Global High Dividend (USD) (CHF hedged) P-dist 1.57%
– Global High Dividend (USD) (EUR hedged) P-dist 1.58%
– Global High Dividend (USD) P-mdist 1.56%
– Global High Dividend (USD) (AUD hedged) P-mdist 1.55%
– Global High Dividend (USD) Q-acc 0.91%
– Global High Dividend (USD) (EUR hedged) Q-acc 0.91%
– Global High Dividend (USD) (CHF hedged) Q-dist 0.91%
– Global High Dividend (USD) Q-mdist 0.90%
– Global Impact (USD) P-acc 1.76%
– Global Impact (USD) (EUR hedged) P-acc 1.74%
– Global Impact (USD) Q-acc 1.06%
– Global Impact (USD) (EUR hedged) Q-acc 1.06%
– Global Impact (USD) (EUR hedged) Q-dist 1.00%
– Global Income (USD) F-acc 0.67%
– Global Income (USD) (CHF hedged) F-acc 0.67%
– Global Income (USD) (EUR hedged) F-acc 0.67%
– Global Income (USD) I-A1-8%-mdist 0.80%
– Global Income (USD) I-A1-acc 0.78%
– Global Income (USD) I-A2-8%-mdist 0.74%
– Global Income (USD) (EUR) I-A2-acc 0.72%
– Global Income (USD) (EUR hedged) I-A2-acc 0.73%
– Global Income (USD) I-B-acc 0.09%
– Global Income (USD) (GBP hedged) I-B-UKdist-mdist 0.09%
– Global Income (USD) I-X-acc 0.02%
– Global Income (USD) (EUR hedged) I-X-acc 0.02%
– Global Income (USD) I-X-UKdist 0.02%
– Global Income (USD) (EUR hedged) K-1-acc 1.27%
– Global Income (USD) K-1-dist 1.26%
UBS (Lux) Equity SICAV Total Expense Ratio (TER)
– Global Income (USD) (EUR hedged) K-1-dist 1.27%
– Global Income (USD) K-X-acc 0.06%
– Global Income (USD) P-8%-mdist 1.88%
– Global Income (USD) P-acc 1.87%
– Global Income (USD) (CHF hedged) P-acc 1.87%
– Global Income (USD) (EUR hedged) P-acc 1.88%
– Global Income (USD) P-dist 1.87%
– Global Income (USD) (CHF hedged) P-dist 1.88%
– Global Income (USD) (EUR hedged) P-dist 1.88%
– Global Income (USD) (SGD hedged) P-mdist 1.86%
– Global Income (USD) Q-8%-mdist 1.16%
– Global Income (USD) Q-acc 1.15%
– Global Income (USD) (CHF hedged) Q-acc 1.15%
– Global Income (USD) (EUR hedged) Q-acc 1.16%
– Global Income (USD) Q-dist 1.16%
– Global Income (USD) (CHF hedged) Q-dist 1.16%
– Global Income (USD) (EUR hedged) Q-dist 1.16%
– Global Income (USD) U-X-UKdist-mdist 0.02%
– Global Opportunity Unconstrained (USD) I-B-acc 0.11%
– Global Opportunity Unconstrained (USD) (EUR) I-B-acc 0.03%
– Global Opportunity Unconstrained (USD) P-4%-mdist 2.12%
– Global Opportunity Unconstrained (USD) (EUR hedged) P-4%-mdist 2.11%
– Global Opportunity Unconstrained (USD) P-acc 2.12%
– Global Opportunity Unconstrained (USD) (HKD) P-acc 2.10%
– Global Opportunity Unconstrained (USD) (CHF hedged) P-acc 2.12%
– Global Opportunity Unconstrained (USD) (EUR hedged) P-acc 2.12%
– Global Opportunity Unconstrained (USD) (SGD hedged) P-acc 2.11%
– Global Opportunity Unconstrained (USD) Q-acc 1.10%
– Global Opportunity Unconstrained (USD) (CHF hedged) Q-acc 1.10%
– Global Opportunity Unconstrained (USD) (EUR hedged) Q-acc 1.10%
– Global Opportunity Unconstrained (USD) U-X-acc 0.02%
– Global Quantitative (USD) I-X-acc 0.02%
– Global Quantitative (USD) U-X-acc 0.02%
– Long Term Themes (USD) (CHF portfolio hedged) F-acc 0.70%
– Long Term Themes (USD) (EUR portfolio hedged) F-acc 0.70%
– Long Term Themes (USD) (USD portfolio hedged) F-acc 0.70%
– Long Term Themes (USD) (CHF portfolio hedged) F-dist 0.70%
– Long Term Themes (USD) (USD portfolio hedged) F-dist 0.70%
– Long Term Themes (USD) I-A1-acc 0.83%
– Long Term Themes (USD) K-1-acc 1.15%
– Long Term Themes (USD) (CHF hedged) K-1-acc 1.15%
– Long Term Themes (USD) (EUR hedged) K-1-acc 1.14%
– Long Term Themes (USD) (EUR hedged) N-acc 2.62%
– Long Term Themes (USD) P-acc 1.88%
– Long Term Themes (USD) (CHF hedged) P-acc 1.88%
– Long Term Themes (USD) (EUR hedged) P-acc 1.88%
– Long Term Themes (USD) (EUR hedged) P-qdist 1.91%
– Long Term Themes (USD) Q-acc 1.10%
– Long Term Themes (USD) (CHF hedged) Q-acc 1.09%
– Long Term Themes (USD) (EUR hedged) Q-acc 1.10%
– Long Term Themes (USD) (GBP hedged) Q-acc 1.09%
– Russia (USD) I-A1-acc 0.93%
– Russia (USD) P-acc 2.41%
– Russia (USD) Q-acc 1.27%
– Small Caps Europe (EUR) F-acc 0.73%
– Small Caps Europe (EUR) I-B-acc 0.09%
– Small Caps Europe (EUR) K-1-acc 1.09%
– Small Caps Europe (EUR) P-acc 1.99%
– Small Caps Europe (EUR) (USD hedged) P-acc 1.99%

The notes are an integral part of the fi nancial statements. 219
UBS (Lux) Equity SICAVAnnual Report as of 31 May 2018
UBS (Lux) Equity SICAV Total Expense Ratio (TER)
– Small Caps Europe (EUR) Q-acc 1.10%
– Small Caps Europe (EUR) (USD hedged) Q-acc 1.10%
– Small Caps Europe (EUR) U-X-acc 0.02%
– Swiss Opportunity (CHF) P-acc 1.57%
– Swiss Opportunity (CHF) (EUR) P-acc 1.59%
– Swiss Opportunity (CHF) Q-acc 1.08%
– Swiss Opportunity (CHF) (EUR) Q-acc 1.08%
– US Income (USD) (EUR hedged) I-A1-dist 0.72%
– US Income (USD) I-A2-8%-mdist 0.69%
– US Income (USD) K-1-8%-mdist 1.18%
– US Income (USD) P-acc 1.67%
– US Income (USD) (CHF hedged) P-acc 1.67%
– US Income (USD) (EUR hedged) P-acc 1.67%
– US Income (USD) P-dist 1.67%
– US Income (USD) (CHF hedged) P-dist 1.67%
– US Income (USD) (EUR hedged) P-dist 1.66%
– US Income (USD) P-mdist 1.66%
– US Income (USD) Q-acc 1.05%
– US Income (USD) (CHF hedged) Q-acc 1.05%
– US Income (USD) (EUR hedged) Q-acc 1.05%
– US Income (USD) Q-dist 1.05%
– US Income (USD) (CHF hedged) Q-dist 1.05%
– US Income (USD) U-X-UKdist-mdist 0.02%
– US Opportunity (USD) I-A1-acc 0.95%
– US Opportunity (USD) I-B-acc 0.09%
– US Opportunity (USD) I-X-acc 0.02%
– US Opportunity (USD) P-acc 2.11%
– US Opportunity (USD) (EUR hedged) P-acc 2.12%
– US Opportunity (USD) P-dist 2.10%
– US Opportunity (USD) Q-acc 1.09%
– US Opportunity (USD) (EUR hedged) Q-acc 1.09%
– US Opportunity (USD) Q-dist 1.09%
– US Opportunity (USD) (GBP) Q-dist 1.07%
– US Systematic Defensive (USD) F-acc 0.52%
– US Systematic Defensive (USD) (CHF hedged) F-acc 0.52%
– US Systematic Defensive (USD) (EUR hedged) F-acc 0.52%
– US Total Yield (USD) F-acc 0.53%
– US Total Yield (USD) I-A1-acc 0.66%
– US Total Yield (USD) I-A3-acc 0.55%
– US Total Yield (USD) (EUR hedged) N-8%-mdist 2.57%
– US Total Yield (USD) P-acc 1.57%
– US Total Yield (USD) (CHF hedged) P-acc 1.57%
– US Total Yield (USD) (EUR hedged) P-acc 1.56%
– US Total Yield (USD) P-dist 1.57%
– US Total Yield (USD) (CHF hedged) P-dist 1.57%
– US Total Yield (USD) (EUR hedged) P-dist 1.57%
– US Total Yield (USD) P-mdist 1.58%
– US Total Yield (USD) (SGD hedged) P-mdist 1.58%
– US Total Yield (USD) Q-acc 0.91%
– US Total Yield (USD) (CHF hedged) Q-acc 0.90%
– US Total Yield (USD) (EUR hedged) Q-acc 0.91%
– US Total Yield (USD) Q-dist 0.91%
– US Total Yield (USD) (CHF hedged) Q-dist 0.90%
– US Total Yield (USD) (EUR hedged) Q-dist 0.92%
– US Total Yield (USD) Q-mdist 0.92%
– USA Enhanced (USD) F-acc 0.52%
– USA Enhanced (USD) (CHF hedged) F-acc 0.52%
– USA Enhanced (USD) (EUR hedged) F-acc 0.52%
– USA Enhanced (USD) P-acc 0.97%
UBS (Lux) Equity SICAV Total Expense Ratio (TER)
– USA Enhanced (USD) (EUR hedged) P-acc 0.99%
– USA Enhanced (USD) Q-acc 0.72%
– USA Enhanced (USD) U-X-acc 0.02%
– USA Growth (USD) F-acc 0.58%
– USA Growth (USD) (CHF hedged) F-acc 0.58%
– USA Growth (USD) (EUR hedged) F-acc 0.58%
– USA Growth (USD) I-A1-acc 0.72%
– USA Growth (USD) I-B-acc 0.09%
– USA Growth (USD) I-X-acc 0.02%
– USA Growth (USD) K-1-acc 1.15%
– USA Growth (USD) P-acc 2.11%
– USA Growth (USD) (CHF hedged) P-acc 2.11%
– USA Growth (USD) (EUR hedged) P-acc 2.11%
– USA Growth (USD) Q-acc 1.09%
– USA Growth (USD) (CHF hedged) Q-acc 1.09%
– USA Growth (USD) (EUR hedged) Q-acc 1.10%
– USA Growth (USD) U-X-acc 0.02%
The TER for classes of shares which were active less than a 12 month period are annualised.
Transaction costs and any other costs incurred in connec-tion with currency hedging are not included in the TER.
Note 9 – Transaction costs
Transaction costs include brokerage fees, which also include costs from Commission Sharing Arrangements, as well as stamp duty, local taxes and other foreign charges if incurred during the fiscal year. Transaction fees are included in the cost of securities purchased and sold.
For the financial year ended on 31 May 2018, the fund incurred transaction costs relating to purchase or sale of investments in securities and similar transactions, as follows:
UBS (Lux) Equity SICAV Transaction costs
– All China (USD) 7 616.59 USD
– Asian Smaller Companies (USD) 205 410.71 USD
– Brazil (USD) 242 614.52 USD
– Emerging Markets High Dividend (USD) 585 581.49 USD
– Emerging Markets Sustainable (USD) 26 559.26 USD
– Euro Countries Income (EUR) 796 201.52 EUR
– European High Dividend (EUR) 866 759.73 EUR
– European Opportunity Unconstrained (EUR) 1 727 449.83 EUR
– German High Dividend (EUR) 30 322.27 EUR
– Global Emerging Markets Opportunity (USD) 1 268 556.72 USD
– Global High Dividend (USD) 925 907.32 USD
– Global Impact (USD) 7 268.33 USD
– Global Income (USD) 2 410 235.02 USD
– Global Opportunity Unconstrained (USD) 180 186.68 USD
– Global Quantitative (USD) 874 026.63 USD
– Long Term Themes (USD) 1 292 200.22 USD
– Russia (USD) 103 356.34 USD
– Small Caps Europe (EUR) 343 830.10 EUR
– Solid Consumer Brands (USD) 15 213.46 USD
– Swiss Opportunity (CHF) 33 846.95 CHF

220 The notes are an integral part of the fi nancial statements.
UBS (Lux) Equity SICAVAnnual Report as of 31 May 2018
UBS (Lux) Equity SICAV Transaction costs
– US Income (USD) 106 910.04 USD
– US Opportunity (USD) 166 748.09 USD
– US Systematic Defensive (USD) 30 630.70 USD
– US Total Yield (USD) 196 798.41 USD
– USA Enhanced (USD) 291 490.34 USD
– USA Enhanced Sustainable (USD) 7 907.74 USD
– USA Growth (USD) 579 017.11 USD
Not all transaction costs are separately identifiable. For fixed income investments, forward currency contracts and other derivative contracts, transaction costs will be included in the purchase and sale price of the invest-ment. Whilst not separately identifiable these transaction costs will be captured within the performance of each Subfunds.
Note 10 – Related party transactions
The volume of securities and money-market transactions undertaken via a broker that is an affiliate of the Management Company (except options), the Portfolio Manager or the Board of Directors for the financial year from 1 June 2017 to 31 May 2018 for the following subfunds licensed for sale in Hong Kong is:
UBS (Lux) Equity SICAV Volume of transactions As a percentage in other Securities of the total of (except options) with security related parties transactions
– Emerging Markets High Dividend (USD) 2 342 486.12 USD 0.49%
– Global Emerging Markets Opportunity (USD) 2 925 648.32 USD 0.22%
– Russia (USD) 6 060 619.03 USD 2.03%
– US Total Yield (USD) 138 475 346.76 USD 4.00%
– USA Growth (USD) 65 880.00 USD 0.00%
UBS (Lux) Equity SICAV Commissions on As a percentage transactions in other of the total of Securities (except options) security with related parties transactions
– Emerging Markets High Dividend (USD) 2 449.48 USD 0.70%
– Global Emerging Markets Opportunity (USD) 0.00 USD 0.00%
– Russia (USD) 1 689.47 USD 1.68%
– US Total Yield (USD) 13 873.38 USD 7.12%
– USA Growth (USD) 0.00 USD 0.00%
Note 11 – Master Feeder Structure
UBS Investment Funds ICVC V – UBS Global Enhanced Equity Income Fund is a feeder structure (UCITS) and invests at least 85% of its net assets in shares of UBS (Lux) Equity SICAV – Global Income (USD) (“the Master UCITS”). UBS Investment Funds ICVC V is an open-ended investment company with variable capital incorporated in England and Wales.
UBS Investment Funds ICVC V – UBS Global Enhanced Equity Income Fund owns 4.29% of the Net Asset of UBS (Lux) Equity SICAV – Global Income (USD) as at 31 May 2018.
Note 12 – Liquidations
The following liquidations occurred:
UBS (Lux) Equity SICAV liquidated as at
– USA Enhanced Sustainable (USD) 9.5.2018
Note 13 – Merger
The following merger occurred:
Subfund Merged into Date
UBS (Lux) Equity SICAV UBS (Lux) Equity SICAV – Solid Consumer Brands (USD) – Long Term Themes (USD) 17.8.2017
Note 14 – Change of name
With effect 22 December 2017, the Board of Directors of the Company has decided to change the name of the share classes as follows:
Previous name New Name
UBS (Lux) Equity SICAV UBS (Lux) Equity SICAV– Long Term Themes (USD) F-acc – Long Term Themes (USD) (USD portfolio hedged) F-acc
UBS (Lux) Equity SICAV UBS (Lux) Equity SICAV– Long Term Themes (USD) – Long Term Themes (USD)
(CHF hedged) F-acc (CHF portfolio hedged) F-acc
UBS (Lux) Equity SICAV UBS (Lux) Equity SICAV– Long Term Themes (USD) – Long Term Themes (USD)
(EUR hedged) F-acc (EUR portfolio hedged) F-acc
UBS (Lux) Equity SICAV UBS (Lux) Equity SICAV– Long Term Themes (USD) F-dist – Long Term Themes (USD) (USD portfolio hedged) F-dist
Note 15 – Applicable law, place of performance and authoritative language
The Luxembourg District Court is the place of performance for all legal disputes between the shareholders, the company and the Depositary. Luxembourg law applies. However, in matters concerning the claims of investors from other countries, the company and/or the Depositary can elect to make themselves subject to the jurisdiction of the countries in which company shares were bought and sold.
The German version of these financial statements is the authoritative version and only this version was audited by the auditor. However, in the case of company shares sold to investors from the other countries in which company shares can be bought and sold, the company and the Depositary may recognize approved translations (i.e. approved by the company) into the languages concerned as binding upon itself.

The notes are an integral part of the fi nancial statements. 221
UBS (Lux) Equity SICAVAnnual Report as of 31 May 2018
Note 16 – OTC-Derivatives and Securities Lending
If the Company enters into OTC transactions, it may be exposed to risks related to the creditworthiness of the OTC counterparties: when the Company enters into futures contracts, options and swap transactions or uses other derivative techniques it is subject to the risk that an OTC counterparty may not meet (or can-not meet) its obligations under a specific or multiple contracts. Counterparty risk can be reduced by deposi-ting a security. If the Company is owed a security pursuant to an applicable agreement, such security shall be held in custody by the Depositary in favour of the Company. Bankruptcy and insolvency events or other credit events with the OTC counterparty, the Depositary or within their subdepositary/correspondent bank network may result in the rights or recognition of the Company in connection with the security to be delayed, restricted or even eliminated, which would force the Company to fulfil its obligations in the framework of the OTC transaction, in spite of any security that had previously been made available to cover any such obligation.
The Company may lend portions of its securities portfolio to third parties. In general, lendings may only be effected via recognized clearing houses such as Clearstream International or Euroclear, or through the inter-mediary of prime financial institutions that specialise in such activities and in the modus specified by them. Collateral is received in relation to securities lent. Collateral is composed of high quality securities in an amount typically at least equal to the market value of the securities loaned.
UBS Europe SE, Luxembourg Branch, acts as securities lending agent.
OTC-Derivatives*
The OTC-derivatives of the below subfunds with no collateral have margin accounts instead.
Subfund Unrealized gain CollateralCounterparty (loss) received
UBS (Lux) Equity SICAV – Emerging Markets High Dividend (USD)
Goldman Sachs -740.50 USD 0.00 USD
State Street 7 907.12 USD 0.00 USD
UBS AG 1 743.95 USD 0.00 USD
Westpac Banking Corp 1 002 067.86 USD 0.00 USD
UBS (Lux) Equity SICAV – Euro Countries Income (EUR)
Citibank -1 871.67 EUR 0.00 EUR
Goldman Sachs -331 927.80 EUR 0.00 EUR
HSBC -5 118.27 EUR 0.00 EUR
Morgan Stanley -228 468.01 EUR 0.00 EUR
Societe Generale -28 179.14 EUR 0.00 EUR
State Street 691.23 EUR 0.00 EUR
UBS AG 3 083 515.93 EUR 0.00 EUR
Westpac Banking Corp 276 539.10 EUR 0.00 EUR
UBS (Lux) Equity SICAV – European High Dividend (EUR)
Goldman Sachs -2 076.22 EUR 0.00 EUR
UBS AG 1 096 675.59 EUR 0.00 EUR
UBS (Lux) Equity SICAV – European Opportunity Unconstrained (EUR)
Bank of America 703 662.19 EUR 0.00 EUR
Citibank 295 049.73 EUR 0.00 EUR
Goldman Sachs 1 354 885.05 EUR 0.00 EUR
Morgan Stanley 1 029 580.57 EUR 2 520 000.00 EUR
State Street 1 575 628.08 EUR 0.00 EUR
UBS AG 14 726.04 EUR 0.00 EUR
Westpac Banking Corp 813 879.94 EUR 0.00 EUR
UBS (Lux) Equity SICAV – German High Dividend (EUR)
Goldman Sachs -1 875.40 EUR 0.00 EUR
UBS AG 928 386.33 EUR 0.00 EUR
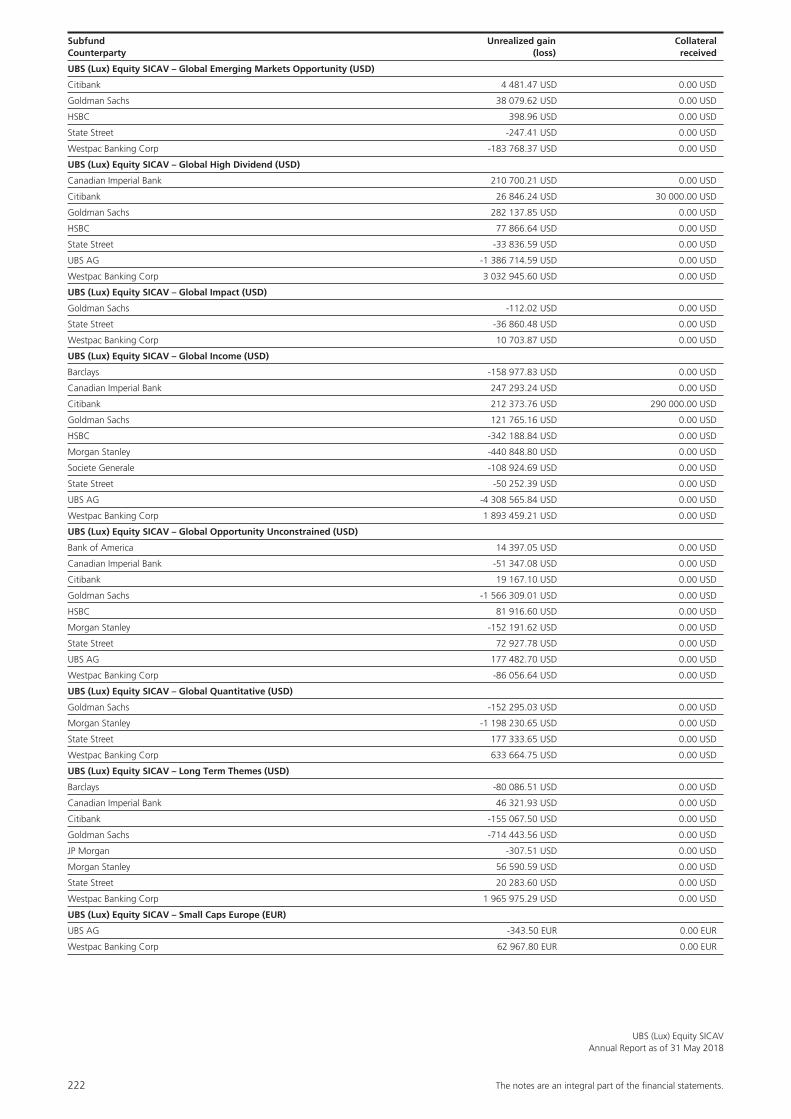
222 The notes are an integral part of the fi nancial statements.
UBS (Lux) Equity SICAVAnnual Report as of 31 May 2018
Subfund Unrealized gain CollateralCounterparty (loss) received
UBS (Lux) Equity SICAV – Global Emerging Markets Opportunity (USD)
Citibank 4 481.47 USD 0.00 USD
Goldman Sachs 38 079.62 USD 0.00 USD
HSBC 398.96 USD 0.00 USD
State Street -247.41 USD 0.00 USD
Westpac Banking Corp -183 768.37 USD 0.00 USD
UBS (Lux) Equity SICAV – Global High Dividend (USD)
Canadian Imperial Bank 210 700.21 USD 0.00 USD
Citibank 26 846.24 USD 30 000.00 USD
Goldman Sachs 282 137.85 USD 0.00 USD
HSBC 77 866.64 USD 0.00 USD
State Street -33 836.59 USD 0.00 USD
UBS AG -1 386 714.59 USD 0.00 USD
Westpac Banking Corp 3 032 945.60 USD 0.00 USD
UBS (Lux) Equity SICAV – Global Impact (USD)
Goldman Sachs -112.02 USD 0.00 USD
State Street -36 860.48 USD 0.00 USD
Westpac Banking Corp 10 703.87 USD 0.00 USD
UBS (Lux) Equity SICAV – Global Income (USD)
Barclays -158 977.83 USD 0.00 USD
Canadian Imperial Bank 247 293.24 USD 0.00 USD
Citibank 212 373.76 USD 290 000.00 USD
Goldman Sachs 121 765.16 USD 0.00 USD
HSBC -342 188.84 USD 0.00 USD
Morgan Stanley -440 848.80 USD 0.00 USD
Societe Generale -108 924.69 USD 0.00 USD
State Street -50 252.39 USD 0.00 USD
UBS AG -4 308 565.84 USD 0.00 USD
Westpac Banking Corp 1 893 459.21 USD 0.00 USD
UBS (Lux) Equity SICAV – Global Opportunity Unconstrained (USD)
Bank of America 14 397.05 USD 0.00 USD
Canadian Imperial Bank -51 347.08 USD 0.00 USD
Citibank 19 167.10 USD 0.00 USD
Goldman Sachs -1 566 309.01 USD 0.00 USD
HSBC 81 916.60 USD 0.00 USD
Morgan Stanley -152 191.62 USD 0.00 USD
State Street 72 927.78 USD 0.00 USD
UBS AG 177 482.70 USD 0.00 USD
Westpac Banking Corp -86 056.64 USD 0.00 USD
UBS (Lux) Equity SICAV – Global Quantitative (USD)
Goldman Sachs -152 295.03 USD 0.00 USD
Morgan Stanley -1 198 230.65 USD 0.00 USD
State Street 177 333.65 USD 0.00 USD
Westpac Banking Corp 633 664.75 USD 0.00 USD
UBS (Lux) Equity SICAV – Long Term Themes (USD)
Barclays -80 086.51 USD 0.00 USD
Canadian Imperial Bank 46 321.93 USD 0.00 USD
Citibank -155 067.50 USD 0.00 USD
Goldman Sachs -714 443.56 USD 0.00 USD
JP Morgan -307.51 USD 0.00 USD
Morgan Stanley 56 590.59 USD 0.00 USD
State Street 20 283.60 USD 0.00 USD
Westpac Banking Corp 1 965 975.29 USD 0.00 USD
UBS (Lux) Equity SICAV – Small Caps Europe (EUR)
UBS AG -343.50 EUR 0.00 EUR
Westpac Banking Corp 62 967.80 EUR 0.00 EUR

The notes are an integral part of the fi nancial statements. 223
UBS (Lux) Equity SICAVAnnual Report as of 31 May 2018
Subfund Unrealized gain CollateralCounterparty (loss) received
UBS (Lux) Equity SICAV – US Income (USD)
Barclays -1 998.71 USD 0.00 USD
Canadian Imperial Bank -342.60 USD 0.00 USD
Goldman Sachs -133 070.20 USD 0.00 USD
HSBC -951 544.44 USD 0.00 USD
JP Morgan 4 498.19 USD 0.00 USD
Morgan Stanley -1 155 019.22 USD 0.00 USD
Societe Generale -23 261.55 USD 0.00 USD
State Street -1 474.55 USD 0.00 USD
UBS AG -251 927.61 USD 0.00 USD
Westpac Banking Corp 3 105 695.57 USD 0.00 USD
UBS (Lux) Equity SICAV – US Opportunity (USD)
Canadian Imperial Bank 586.42 USD 0.00 USD
Goldman Sachs 607.59 USD 0.00 USD
Westpac Banking Corp -61 521.67 USD 0.00 USD
UBS (Lux) Equity SICAV – US Systematic Defensive (USD)
Barclays 781.90 USD 0.00 USD
State Street 237.14 USD 0.00 USD
Westpac Banking Corp 56 124.72 USD 0.00 USD
UBS (Lux) Equity SICAV – US Total Yield (USD)
Barclays -2 523.81 USD 0.00 USD
Citibank -2 032.22 USD 0.00 USD
Goldman Sachs 40 582.01 USD 0.00 USD
HSBC 115.20 USD 0.00 USD
JP Morgan -1 988.26 USD 0.00 USD
State Street 969.70 USD 0.00 USD
Westpac Banking Corp 1 141 655.43 USD 0.00 USD
UBS (Lux) Equity SICAV – USA Enhanced (USD)
Citibank 1 594.33 USD 0.00 USD
JP Morgan -202.49 USD 0.00 USD
Westpac Banking Corp -1 421 725.37 USD 0.00 USD
UBS (Lux) Equity SICAV – USA Growth (USD)
Westpac Banking Corp -583 361.91 USD 0.00 USD
* Derivatives traded on an official exchange are not included in this table as they are guaranteed by a clearing house. In the event of a counterparty default the clearing house assumes the risk of loss.
Composition of collateral by type of assets Weight %
UBS (Lux) Equity SICAV – European Opportunity Unconstrained (EUR)
Morgan Stanley
Cash 100.00%
Bonds 0.00%
Equities 0.00%
UBS (Lux) Equity SICAV – Global High Dividend (USD)
Citibank
Cash 100.00%
Bonds 0.00%
Equities 0.00%
UBS (Lux) Equity SICAV – Global Income (USD)
Citibank
Cash 100.00%
Bonds 0.00%
Equities 0.00%
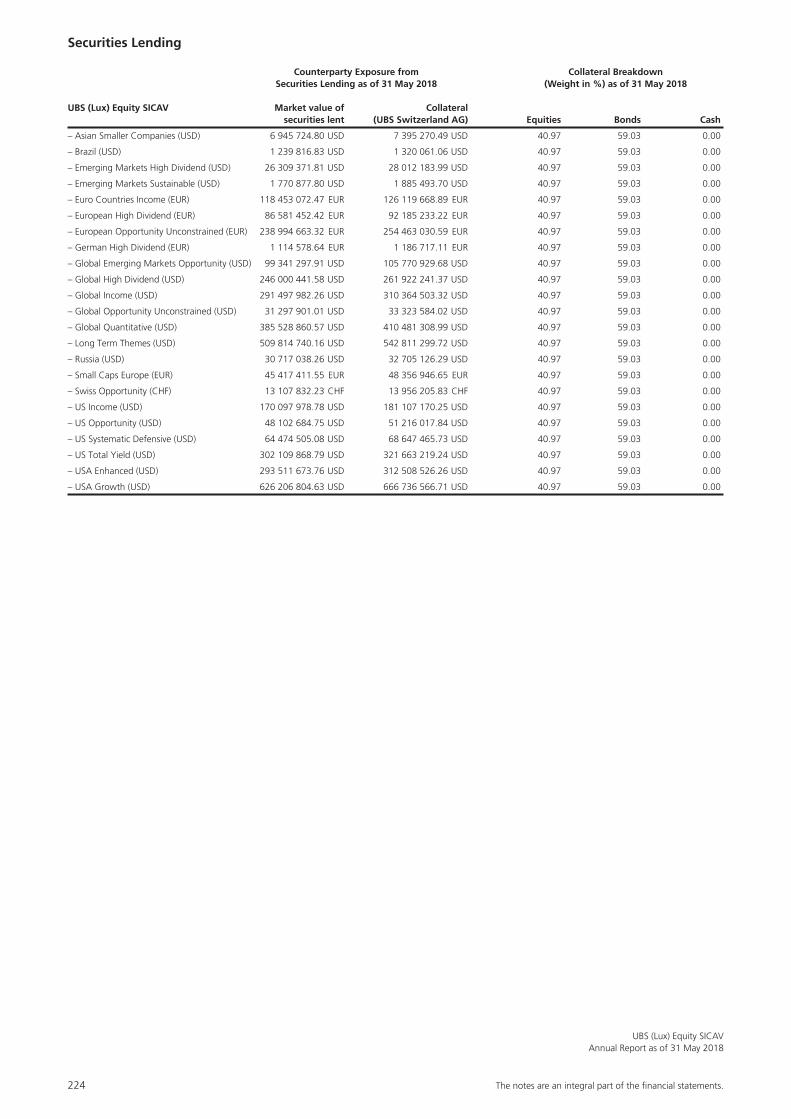
224 The notes are an integral part of the fi nancial statements.
UBS (Lux) Equity SICAVAnnual Report as of 31 May 2018
Securities Lending
Counterparty Exposure from Collateral Breakdown Securities Lending as of 31 May 2018 (Weight in %) as of 31 May 2018 UBS (Lux) Equity SICAV Market value of Collateral securities lent (UBS Switzerland AG) Equities Bonds Cash
– Asian Smaller Companies (USD) 6 945 724.80 USD 7 395 270.49 USD 40.97 59.03 0.00
– Brazil (USD) 1 239 816.83 USD 1 320 061.06 USD 40.97 59.03 0.00
– Emerging Markets High Dividend (USD) 26 309 371.81 USD 28 012 183.99 USD 40.97 59.03 0.00
– Emerging Markets Sustainable (USD) 1 770 877.80 USD 1 885 493.70 USD 40.97 59.03 0.00
– Euro Countries Income (EUR) 118 453 072.47 EUR 126 119 668.89 EUR 40.97 59.03 0.00
– European High Dividend (EUR) 86 581 452.42 EUR 92 185 233.22 EUR 40.97 59.03 0.00
– European Opportunity Unconstrained (EUR) 238 994 663.32 EUR 254 463 030.59 EUR 40.97 59.03 0.00
– German High Dividend (EUR) 1 114 578.64 EUR 1 186 717.11 EUR 40.97 59.03 0.00
– Global Emerging Markets Opportunity (USD) 99 341 297.91 USD 105 770 929.68 USD 40.97 59.03 0.00
– Global High Dividend (USD) 246 000 441.58 USD 261 922 241.37 USD 40.97 59.03 0.00
– Global Income (USD) 291 497 982.26 USD 310 364 503.32 USD 40.97 59.03 0.00
– Global Opportunity Unconstrained (USD) 31 297 901.01 USD 33 323 584.02 USD 40.97 59.03 0.00
– Global Quantitative (USD) 385 528 860.57 USD 410 481 308.99 USD 40.97 59.03 0.00
– Long Term Themes (USD) 509 814 740.16 USD 542 811 299.72 USD 40.97 59.03 0.00
– Russia (USD) 30 717 038.26 USD 32 705 126.29 USD 40.97 59.03 0.00
– Small Caps Europe (EUR) 45 417 411.55 EUR 48 356 946.65 EUR 40.97 59.03 0.00
– Swiss Opportunity (CHF) 13 107 832.23 CHF 13 956 205.83 CHF 40.97 59.03 0.00
– US Income (USD) 170 097 978.78 USD 181 107 170.25 USD 40.97 59.03 0.00
– US Opportunity (USD) 48 102 684.75 USD 51 216 017.84 USD 40.97 59.03 0.00
– US Systematic Defensive (USD) 64 474 505.08 USD 68 647 465.73 USD 40.97 59.03 0.00
– US Total Yield (USD) 302 109 868.79 USD 321 663 219.24 USD 40.97 59.03 0.00
– USA Enhanced (USD) 293 511 673.76 USD 312 508 526.26 USD 40.97 59.03 0.00
– USA Growth (USD) 626 206 804.63 USD 666 736 566.71 USD 40.97 59.03 0.00

225
UBS (Lux) Equity SICAVAnnual Report as of 31 May 2018
1) Global Exposure
Risk managementRisk management in accordance with the commitment approach and the value-at-risk approach is applied pursuant to the applicable laws and regulatory provisions.
LeverageLeverage is defined pursuant to the applicable ESMA directives as the total of the notional values of the derivatives used by the respective subfund. According to this definition, leverage may result in artificially increased leverage amounts, as some derivatives that can be used for hedging purposes may be included in the calculation. Conse-quently, this information does not necessarily reflect the precise actual leverage risk that the investor is exposed to.
UBS (Lux) Equity SICAV Global risk Model Min Min Avg Leverage Reference calculation used VaR (%) VaR (%) VaR (%) as at portfolio method consumption consumption consumption 31.5.2018 (%) (benchmark)
– All China (USD) Commitment approach
– Asian Smaller Companies (USD) Commitment approach
– Brazil (USD) Commitment approach
– Emerging Markets High Dividend (USD) Commitment approach
– Emerging Markets Sustainable (USD) Commitment approach
– Euro Countries Income (EUR) Relative VaR approach Historical 32.8% 41.3% 36.1% 17.0% The reference portfolio VaR reflects the properties of a broadly diversified portfolio of equities from the European Monetary Union (EMU).
– European High Dividend (EUR) Commitment approach
– European Opportunity Relative VaR approach Historical 29.7% 55.2% 39.4% 135.1% The reference portfolioUnconstrained (EUR) VaR reflects the properties of a broadly diversified portfolio of European medium and large caps.
– German High Dividend (EUR) Commitment approach
– Global Emerging Markets Opportunity (USD) Commitment approach
– Global High Dividend (USD) Commitment approach
– Global Impact (USD) Commitment approach
– Global Income (USD) Relative VaR approach Historical 27.4% 57.0% 39.9% 91.8% The reference portfolio VaR reflects the properties of a broadly diversified portfolio of international equities.
Unaudited Information

226
UBS (Lux) Equity SICAVAnnual Report as of 31 May 2018
Unaudited Information
UBS (Lux) Equity SICAV Global risk Model Min Min Avg Leverage Reference calculation used VaR (%) VaR (%) VaR (%) as at portfolio method consumption consumption consumption 31.5.2018 (%) (benchmark)
– Global Opportunity Relative VaR approach Historical 23.7% 53.0% 37.0% 99.2% The reference portfolioUnconstrained (USD) VaR reflects the properties of a broadly diversified portfolio of international equities.
– Global Quantitative (USD) Relative VaR approach Historical 47.5% 68.9% 52.9% 10.6% The reference portfolio VaR reflects the properties of a broadly diversified portfolio of international equities.
– Long Term Themes (USD) Commitment approach
– Russia (USD) Commitment approach
– Small Caps Europe (EUR) Commitment approach
– Swiss Opportunity (CHF) Commitment approach
– US Income (USD) Relative VaR approach Historical 24.7% 61.3% 35.5% 15.0% The reference portfolio VaR reflects the properties of a broadly diversified portfolio of US equities.
– US Opportunity (USD) Commitment approach
– US Systematic Defensive (USD) Commitment approach
– US Total Yield (USD) Commitment approach
– USA Enhanced (USD) Commitment approach
– USA Growth (USD) Commitment approach
2) Remuneration Policy and quantitative disclosure
The Board of Directors of UBS Fund Management (Luxembourg) S.A. has updated the remuneration policy (the “Policy”) on 26 September 2017, whose objectives are on one hand; to ensure that the remuneration frame-work is in line with the applicable laws and regulations, and more specifically with provisions defined under (i) the Articles 111bis and 111ter of the Luxembourg Law of 17 December 2010 on Undertakings for Collective Invest-ment in Transferable Securities as amended from time to time (the UCITS Law) transposing the UCITS Directive 2014/91/EU (the UCITS V Directive), (ii) the Alternative Investment Fund Managers (AIFM) Directive 2011/61/EU, transposed into the Luxembourg AIFM Law dated from 12 July 2013, as amended from time to time, (iii) the ESMA’s guidelines on sound remuneration policies under the UCITS Directive - ESMA/2016/575 published on 14 October 2016 and ESMA’s guidelines on sound remu-neration policies under the AIFMD - ESMA/2016/579 pub-lished on 14 October 2016 amending the ESMA’s guidelines on sound remuneration policies under the UCITS Directive and AIFMD published on 31 March 2016 - ESMA/2016/411 (the ESMA Guidelines) and (iv) the CSSF Circular 10/437 on Guidelines concerning the remuneration policies in the
financial sector issued on 1 February 2010; and on the other hand, to comply with the UBS AG Remuneration policy framework. The Policy is meant not to encour-age excessive risk taking, to contain measures to avoid conflicts of interest, to be consistent with, and promote, sound and effective risk management and to be consis-tent with the UBS Group business strategy, objectives and values.
Further information in relation to UBS AG Remuneration Policy is available in the UBS Group AG Annual Report and in the Compensation report. More details about the remuneration policy of the Management Company, which describes, but not limited to, how remuneration and benefits are determined, are available at http://www.ubs.com/lu/en/asset_management/investor_information.html
Application of the requirements and remuneration disclosure
In accordance with the Article 151 of the UCITS Law, the Management Company is required to disclose at least annually certain information concerning its remu-neration policy and the practices for its identified staff.

227
UBS (Lux) Equity SICAVAnnual Report as of 31 May 2018
Unaudited Information
The Management Company complies with the aforemen-tioned regulatory provisions in a way and to the extent that is appropriate to its size, internal organization and the nature, scope and complexity of its activities.
Considering the total size of funds under management, both UCITs and AIFs although a significant portion is not complex or risky investment, UBS Fund Management (Luxembourg) S.A. judges that the proportional-ity principle may not be applicable at the level of the company but at the level of the Identified staff.
By application of the proportionality principle for the Identified staff, the following requirements on pay-out processes for Identified staff are not applied:
• The payment of variable remuneration in instruments related mainly to the funds in relation to which they perform their activities;
• Deferral requirements;• Retention periods;• Incorporation of ex-post risk factors (i.e. malus or
clawback arrangements);
The deferral requirements remain however applicable when the employee’s total annual compensation is exceeding the threshold defined under the UBS Group Compensation Framework; the variable compensation will be treated in line with the plan rules defined under the UBS Group Compensation Framework.
There is no remuneration paid to identified staff of del-egates from the Management Company.
Remuneration disclosure
For the fiscal year ending 31 December 2017, the aggregate total remuneration paid by UBS Fund Management (Luxembourg) S.A. to all its staff amounted to EUR 411 704, of which EUR 46 627 represented the variable remuneration. The Management Company employed an average of 24.7 staff (full time equivalent) during this period.
The aggregate total remuneration paid by the Management Company to its Identified Staff amounted to EUR 90 534.
Please further note that due to the roles of Management Company staff, this remuneration was calculated in proportion of the net assets of the Fund out of the net assets of all the funds under the governance of UBS Fund Management (Luxembourg) S.A. (including both AIF and UCITS funds).

228
UBS (Lux) Equity SICAVAnnual Report as of 31 May 2018
Unaudited Information
3) Collateral
UBS (Lux) Equity SICAV – Asian Smaller Companies
(USD) (in %)
UBS (Lux) Equity SICAV – Brazil (USD)
(in %)
UBS (Lux) Equity SICAV – Emerging Markets High
Dividend (USD) (in %)
UBS (Lux) Equity SICAV – Emerging Markets
Sustainable (USD) (in %)
UBS (Lux) Equity SICAV – Euro Countries Income
(EUR) (in %)
by Country:– Australia 0.47 0.47 0.47 0.47 0.47– Belgium 1.63 1.63 1.63 1.63 1.63– British Virgin Islands 0.00 0.00 0.00 0.00 0.00– Cayman Islands 2.27 2.27 2.27 2.27 2.27– China 0.43 0.43 0.43 0.43 0.43– Curacao 0.03 0.03 0.03 0.03 0.03– Denmark 1.08 1.08 1.08 1.08 1.08– Germany 4.26 4.26 4.26 4.26 4.26– Ivory Coast 0.01 0.01 0.01 0.01 0.01– Finland 0.07 0.07 0.07 0.07 0.07– France 12.21 12.21 12.21 12.21 12.21– United Kingdom 9.05 9.05 9.05 9.05 9.05– Hong Kong 0.37 0.37 0.37 0.37 0.37– Japan 16.50 16.50 16.50 16.50 16.50– Canada 1.14 1.14 1.14 1.14 1.14– Luxembourg 0.68 0.68 0.68 0.68 0.68– New Zealand 0.33 0.33 0.33 0.33 0.33– The Netherlands 2.82 2.82 2.82 2.82 2.82– Norway 0.40 0.40 0.40 0.40 0.40– Austria 0.31 0.31 0.31 0.31 0.31– Sweden 2.21 2.21 2.21 2.21 2.21– Switzerland 4.44 4.44 4.44 4.44 4.44– Singapore 0.67 0.67 0.67 0.67 0.67– Supranationals 1.24 1.24 1.24 1.24 1.24– Venezuela 0.01 0.01 0.01 0.01 0.01– United Arab Emirates 0.00 0.00 0.00 0.00 0.00– United States 37.37 37.37 37.37 37.37 37.37Total 100.00 100.00 100.00 100.00 100.00
by Credit Rating (Bonds):
– Rating > AA- 57.22 57.22 57.22 57.22 57.22
– Rating <=AA- 28.56 28.56 28.56 28.56 28.56
– without Rating 14.22 14.22 14.22 14.22 14.22
Total 100.00 100.00 100.00 100.00 100.00
Securities Lending
Assets and Revenues / Ratios
Average Invested Assets (1) 58 647 590.74 USD 112 035 952.65 USD 323 393 942.68 USD 17 544 217.06 USD 372 475 560.53 EUR
Average Securities Lent (2) 3 568 212.78 USD 2 417 848.10 USD 25 613 794.63 USD 2 204 902.62 USD 131 922 603.77 EUR
Average Collateral Ratio 105.74% 105.74% 105.74% 105.74% 105.74%
Average Securities Lending Ratio (2)/(1) 6.08% 2.16% 7.92% 12.57% 35.42%
Securities Lending revenues 24 869.57 USD 5 299.27 USD 164 073.79 USD 3 778.08 USD 993 439.34 EUR
Securities Lending costs 9 947.83 USD 2 119.71 USD 65 629.51 USD 1 511.23 USD 397 375.71 EUR
Net Securities Lendingrevenues 14 921.74 USD 3 179.56 USD 98 444.28 USD 2 266.85 USD 596 063.63 EUR

229
UBS (Lux) Equity SICAVAnnual Report as of 31 May 2018
Unaudited Information
UBS (Lux) Equity SICAV – European High Dividend
(EUR) (in %)
UBS (Lux) Equity SICAV – European Opportunity
Unconstrained (EUR) (in %)
UBS (Lux) Equity SICAV – German High Dividend
(EUR) (in %)
UBS (Lux) Equity SICAV – Global Emerging
Markets Opportunity (USD) (in %)
UBS (Lux) Equity SICAV – Global High Dividend
(USD) (in %)
by Country:– Australia 0.47 0.47 0.47 0.47 0.47– Belgium 1.63 1.63 1.63 1.63 1.63– British Virgin Islands 0.00 0.00 0.00 0.00 0.00– Cayman Islands 2.27 2.27 2.27 2.27 2.27– China 0.43 0.43 0.43 0.43 0.43– Curacao 0.03 0.03 0.03 0.03 0.03– Denmark 1.08 1.08 1.08 1.08 1.08– Germany 4.26 4.26 4.26 4.26 4.26– Ivory Coast 0.01 0.01 0.01 0.01 0.01– Finland 0.07 0.07 0.07 0.07 0.07– France 12.21 12.21 12.21 12.21 12.21– United Kingdom 9.05 9.05 9.05 9.05 9.05– Hong Kong 0.37 0.37 0.37 0.37 0.37– Japan 16.50 16.50 16.50 16.50 16.50– Canada 1.14 1.14 1.14 1.14 1.14– Luxembourg 0.68 0.68 0.68 0.68 0.68– New Zealand 0.33 0.33 0.33 0.33 0.33– The Netherlands 2.82 2.82 2.82 2.82 2.82– Norway 0.40 0.40 0.40 0.40 0.40– Austria 0.31 0.31 0.31 0.31 0.31– Sweden 2.21 2.21 2.21 2.21 2.21– Switzerland 4.44 4.44 4.44 4.44 4.44– Singapore 0.67 0.67 0.67 0.67 0.67– Supranationals 1.24 1.24 1.24 1.24 1.24– Venezuela 0.01 0.01 0.01 0.01 0.01– United Arab Emirates 0.00 0.00 0.00 0.00 0.00– United States 37.37 37.37 37.37 37.37 37.37Total 100.00 100.00 100.00 100.00 100.00
by Credit Rating (Bonds):
– Rating > AA- 57.22 57.22 57.22 57.22 57.22
– Rating <=AA- 28.56 28.56 28.56 28.56 28.56
– without Rating 14.22 14.22 14.22 14.22 14.22
Total 100.00 100.00 100.00 100.00 100.00
Securities Lending
Assets and Revenues / Ratios
Average Invested Assets (1) 367 700 391.82 EUR 1 388 483 826.77 EUR 104 419 367.82 EUR 421 632 208.77 USD 744 150 758.44 USD
Average Securities Lent (2) 82 359 044.19 EUR 240 799 560.62 EUR 15 235 814.60 EUR 54 415 483.36 USD 178 836 917.42 USD
Average Collateral Ratio 105.74% 105.74% 105.74% 105.74% 105.74%
Average Securities Lending Ratio (2)/(1) 22.40% 17.34% 14.59% 12.91% 24.03%
Securities Lending revenues 487 635.93 EUR 1 376 288.19 EUR 109 203.75 EUR 80 101.25 USD 493 243.13 USD
Securities Lending costs 195 054.36 EUR 550 515.24 EUR 43 681.50 EUR 32 040.50 USD 197 297.24 USD
Net Securities Lendingrevenues 292 581.57 EUR 825 772.95 EUR 65 522.25 EUR 48 060.75 USD 295 945.89 USD
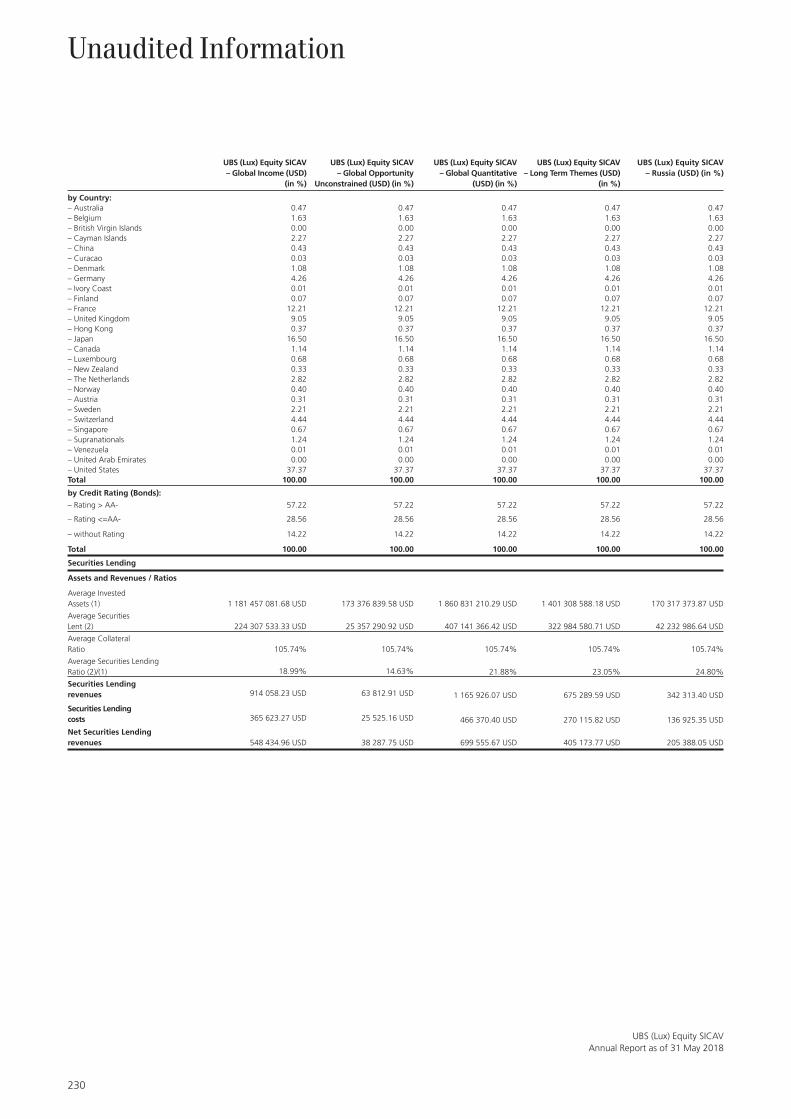
230
UBS (Lux) Equity SICAVAnnual Report as of 31 May 2018
Unaudited Information
UBS (Lux) Equity SICAV – Global Income (USD)
(in %)
UBS (Lux) Equity SICAV – Global Opportunity
Unconstrained (USD) (in %)
UBS (Lux) Equity SICAV – Global Quantitative
(USD) (in %)
UBS (Lux) Equity SICAV – Long Term Themes (USD)
(in %)
UBS (Lux) Equity SICAV – Russia (USD) (in %)
by Country:– Australia 0.47 0.47 0.47 0.47 0.47– Belgium 1.63 1.63 1.63 1.63 1.63– British Virgin Islands 0.00 0.00 0.00 0.00 0.00– Cayman Islands 2.27 2.27 2.27 2.27 2.27– China 0.43 0.43 0.43 0.43 0.43– Curacao 0.03 0.03 0.03 0.03 0.03– Denmark 1.08 1.08 1.08 1.08 1.08– Germany 4.26 4.26 4.26 4.26 4.26– Ivory Coast 0.01 0.01 0.01 0.01 0.01– Finland 0.07 0.07 0.07 0.07 0.07– France 12.21 12.21 12.21 12.21 12.21– United Kingdom 9.05 9.05 9.05 9.05 9.05– Hong Kong 0.37 0.37 0.37 0.37 0.37– Japan 16.50 16.50 16.50 16.50 16.50– Canada 1.14 1.14 1.14 1.14 1.14– Luxembourg 0.68 0.68 0.68 0.68 0.68– New Zealand 0.33 0.33 0.33 0.33 0.33– The Netherlands 2.82 2.82 2.82 2.82 2.82– Norway 0.40 0.40 0.40 0.40 0.40– Austria 0.31 0.31 0.31 0.31 0.31– Sweden 2.21 2.21 2.21 2.21 2.21– Switzerland 4.44 4.44 4.44 4.44 4.44– Singapore 0.67 0.67 0.67 0.67 0.67– Supranationals 1.24 1.24 1.24 1.24 1.24– Venezuela 0.01 0.01 0.01 0.01 0.01– United Arab Emirates 0.00 0.00 0.00 0.00 0.00– United States 37.37 37.37 37.37 37.37 37.37Total 100.00 100.00 100.00 100.00 100.00
by Credit Rating (Bonds):
– Rating > AA- 57.22 57.22 57.22 57.22 57.22
– Rating <=AA- 28.56 28.56 28.56 28.56 28.56
– without Rating 14.22 14.22 14.22 14.22 14.22
Total 100.00 100.00 100.00 100.00 100.00
Securities Lending
Assets and Revenues / Ratios
Average Invested Assets (1) 1 181 457 081.68 USD 173 376 839.58 USD 1 860 831 210.29 USD 1 401 308 588.18 USD 170 317 373.87 USD
Average Securities Lent (2) 224 307 533.33 USD 25 357 290.92 USD 407 141 366.42 USD 322 984 580.71 USD 42 232 986.64 USD
Average Collateral Ratio 105.74% 105.74% 105.74% 105.74% 105.74%
Average Securities Lending Ratio (2)/(1) 18.99% 14.63% 21.88% 23.05% 24.80%
Securities Lending revenues 914 058.23 USD 63 812.91 USD 1 165 926.07 USD 675 289.59 USD 342 313.40 USD
Securities Lending costs 365 623.27 USD 25 525.16 USD 466 370.40 USD 270 115.82 USD 136 925.35 USD
Net Securities Lendingrevenues 548 434.96 USD 38 287.75 USD 699 555.67 USD 405 173.77 USD 205 388.05 USD

231
UBS (Lux) Equity SICAVAnnual Report as of 31 May 2018
Unaudited Information
UBS (Lux) Equity SICAV – Small Caps Europe (EUR)
(in %)
UBS (Lux) Equity SICAV – Swiss Opportunity (CHF)
(in %)
UBS (Lux) Equity SICAV – US Income (USD) (in %)
UBS (Lux) Equity SICAV – US Opportunity (USD)
(in %)
UBS (Lux) Equity SICAV – US Systematic
Defensive (USD) (in %)
by Country:– Australia 0.47 0.47 0.47 0.47 0.47– Belgium 1.63 1.63 1.63 1.63 1.63– British Virgin Islands 0.00 0.00 0.00 0.00 0.00– Cayman Islands 2.27 2.27 2.27 2.27 2.27– China 0.43 0.43 0.43 0.43 0.43– Curacao 0.03 0.03 0.03 0.03 0.03– Denmark 1.08 1.08 1.08 1.08 1.08– Germany 4.26 4.26 4.26 4.26 4.26– Ivory Coast 0.01 0.01 0.01 0.01 0.01– Finland 0.07 0.07 0.07 0.07 0.07– France 12.21 12.21 12.21 12.21 12.21– United Kingdom 9.05 9.05 9.05 9.05 9.05– Hong Kong 0.37 0.37 0.37 0.37 0.37– Japan 16.50 16.50 16.50 16.50 16.50– Canada 1.14 1.14 1.14 1.14 1.14– Luxembourg 0.68 0.68 0.68 0.68 0.68– New Zealand 0.33 0.33 0.33 0.33 0.33– The Netherlands 2.82 2.82 2.82 2.82 2.82– Norway 0.40 0.40 0.40 0.40 0.40– Austria 0.31 0.31 0.31 0.31 0.31– Sweden 2.21 2.21 2.21 2.21 2.21– Switzerland 4.44 4.44 4.44 4.44 4.44– Singapore 0.67 0.67 0.67 0.67 0.67– Supranationals 1.24 1.24 1.24 1.24 1.24– Venezuela 0.01 0.01 0.01 0.01 0.01– United Arab Emirates 0.00 0.00 0.00 0.00 0.00– United States 37.37 37.37 37.37 37.37 37.37Total 100.00 100.00 100.00 100.00 100.00
by Credit Rating (Bonds):
– Rating > AA- 57.22 57.22 57.22 57.22 57.22
– Rating <=AA- 28.56 28.56 28.56 28.56 28.56
– without Rating 14.22 14.22 14.22 14.22 14.22
Total 100.00 100.00 100.00 100.00 100.00
Securities Lending
Assets and Revenues / Ratios
Average Invested Assets (1) 271 443 981.92 EUR 89 887 435.66 CHF 490 979 950.46 USD 237 232 292.57 USD 255 798 771.17 USD
Average Securities Lent (2) 65 626 568.96 EUR 15 880 340.37 CHF 130 149 091.95 USD 59 093 539.04 USD 54 830 481.37 USD
Average Collateral Ratio 105.74% 105.74% 105.74% 105.74% 105.74%
Average Securities Lending Ratio (2)/(1) 24.18% 17.67% 26.51% 24.91% 21.44%
Securities Lending revenues 334 620.95 EUR 43 115.26 CHF 197 069.51 USD 88 811.78 USD 81 956.53 USD
Securities Lending costs 133 848.37 EUR 17 246.10 CHF 78 827.80 USD 35 524.71 USD 32 782.61 USD
Net Securities Lendingrevenues 200 772.58 EUR 25 869.16 CHF 118 241.71 USD 53 287.07 USD 49 173.92 USD

232
UBS (Lux) Equity SICAVAnnual Report as of 31 May 2018
Unaudited Information
UBS (Lux) Equity SICAV – US Total Yield (USD)
(in %)
UBS (Lux) Equity SICAV – USA Enhanced (USD)
(in %)
UBS (Lux) Equity SICAV – USA Growth (USD)
(in %)
by Country:– Australia 0.47 0.47 0.47– Belgium 1.63 1.63 1.63– British Virgin Islands 0.00 0.00 0.00– Cayman Islands 2.27 2.27 2.27– China 0.43 0.43 0.43– Curacao 0.03 0.03 0.03– Denmark 1.08 1.08 1.08– Germany 4.26 4.26 4.26– Ivory Coast 0.01 0.01 0.01– Finland 0.07 0.07 0.07– France 12.21 12.21 12.21– United Kingdom 9.05 9.05 9.05– Hong Kong 0.37 0.37 0.37– Japan 16.50 16.50 16.50– Canada 1.14 1.14 1.14– Luxembourg 0.68 0.68 0.68– New Zealand 0.33 0.33 0.33– The Netherlands 2.82 2.82 2.82– Norway 0.40 0.40 0.40– Austria 0.31 0.31 0.31– Sweden 2.21 2.21 2.21– Switzerland 4.44 4.44 4.44– Singapore 0.67 0.67 0.67– Supranationals 1.24 1.24 1.24– Venezuela 0.01 0.01 0.01– United Arab Emirates 0.00 0.00 0.00– United States 37.37 37.37 37.37Total 100.00 100.00 100.00
by Credit Rating (Bonds):
– Rating > AA- 57.22 57.22 57.22
– Rating <=AA- 28.56 28.56 28.56
– without Rating 14.22 14.22 14.22
Total 100.00 100.00 100.00
Securities Lending
Assets and Revenues / Ratios
Average Invested Assets (1) 1 060 126 436.21 USD 1 168 564 824.02 USD 1 666 021 521.95 USD
Average Securities Lent (2) 313 671 342.13 USD 277 337 923.69 USD 388 055 502.20 USD
Average Collateral Ratio 105.74% 105.74% 105.74%
Average Securities Lending Ratio (2)/(1) 29.59% 23.73% 23.29%
Securities Lending revenues 539 093.81 USD 381 912.07 USD 521 108.23 USD
Securities Lending costs 215 637.51 USD 152 764.82 USD 208 443.28 USD
Net Securities Lendingrevenues 323 456.30 USD 229 147.25 USD 312 664.95 USD

233
UBS (Lux) Equity SICAVAnnual Report as of 31 May 2018
Unaudited Information
4) Securities Financing Transaction Regulation (SFTR)
The Company engages in Securities Financing Transactions (hereafter “SFT”) (as defined in Article 3 of Regulation (EU) 2015/2365). Securities Financing transactions include repurchase transactions, securities or commodities lending and securities or commodities borrowing, buy-sell back transactions or sell-buy back transactions and margin lending transactions through its exposure on reverse repurchase agreements during the year. In accordance with Article 13 of the Regulation, information on securities lendings are detailed below:
Global Data
The following table details the value of securities lending as a proportion of the subfund’s Net Assets Value as well as a proportion of the total lendable securities, as at 31 May 2018.
UBS (Lux) Equity SICAV Securities lent in % of Net Assets
Securities lent in % of Total Lendable
Securities
– Asian Smaller Companies (USD) 9.84% 10.06%
– Brazil (USD) 1.42% 1.46%
– Emerging Markets High Dividend (USD) 8.93% 9.43%
– Emerging Markets Sustainable (USD) 10.58% 10.90%
– Euro Countries Income (EUR) 29.54% 30.32%
– European High Dividend (EUR) 24.93% 25.39%
– European Opportunity Unconstrained (EUR) 24.60% 27.82%
– German High Dividend (EUR) 1.17% 1.23%
– Global Emerging Markets Opportunity (USD) 15.75% 16.29%
– Global High Dividend (USD) 37.84% 39.52%
– Global Income (USD) 26.18% 26.43%
– Global Opportunity Unconstrained (USD) 20.41% 21.67%
– Global Quantitative (USD) 20.74% 21.00%
– Long Term Themes (USD) 25.93% 26.75%
– Russia (USD) 16.59% 18.78%
– Small Caps Europe (EUR) 15.92% 16.57%
– Swiss Opportunity (CHF) 18.16% 18.16%
– US Income (USD) 33.37% 33.88%
– US Opportunity (USD) 28.66% 29.13%
– US Systematic Defensive (USD) 25.85% 26.14%
– US Total Yield (USD) 40.85% 41.31%
– USA Enhanced (USD) 22.56% 22.67%
– USA Growth (USD) 36.46% 37.71%
The total amount (absolute value) of the securities lent is disclosed in Note 16 – OTC-Derivatives and Securities Lending.
Data on collateral reused
Amount of collateral reused, compared with the maximum amount disclosed to investors: None
Cash collateral reinvestment income to the Company: None

234
UBS (Lux) Equity SICAVAnnual Report as of 31 May 2018
Unaudited Information
UBS (Lux) Equity SICAV – European High Dividend
(EUR)
UBS (Lux) Equity SICAV – European Opportunity
Unconstrained (EUR)
UBS (Lux) Equity SICAV – German High Dividend
(EUR)
UBS (Lux) Equity SICAV – Global Emerging
Markets Opportunity (USD)
UBS (Lux) Equity SICAV – Global High Dividend
(USD)
Japan Government Ten 13 498 918.76 37 261 670.40 173 774.01 15 488 306.93 38 353 941.66
French Republic 9 028 894.04 24 922 860.85 116 230.58 10 359 517.28 25 653 437.99United Kingdom 7 425 022.62 20 495 622.69 95 583.65 8 519 277.09 21 096 421.82
United States 7 401 891.66 20 431 773.28 95 285.88 8 492 737.24 21 030 700.77
Amazon.Com Inc 2 163 158.49 5 971 063.34 27 846.73 2 481 951.58 6 146 096.31
Tencent Holdings Ltd 1 976 293.83 5 455 252.43 25 441.19 2 267 547.94 5 615 165.16
Facebook Inc 1 849 613.01 5 105 569.67 23 810.40 2 122 197.67 5 255 231.96
Federal Republic of Germany 1 058 078.79 2 920 662.30 13 620.84 1 214 011.98 3 006 277.23
Fms Wertmanagement Aoer 1 002 757.33 2 767 956.00 12 908.68 1 150 537.58 2 849 094.57
Nestle SA 985 217.66 2 719 540.45 12 682.88 1 130 413.01 2 799 259.79
UBS (Lux) Equity SICAV – Global Income (USD)
UBS (Lux) Equity SICAV – Global Opportunity Unconstrained (USD)
UBS (Lux) Equity SICAV – Global Quantitative
(USD)UBS (Lux) Equity SICAV
– Long Term Themes (USD)UBS (Lux) Equity SICAV
– Russia (USD)
Japan Government Ten 45 447 465.59 4 879 657.38 60 107 824.73 79 485 242.69 4 789 095.04
French Republic 30 398 016.22 3 263 810.25 40 203 751.89 53 164 542.06 3 203 236.67United Kingdom 24 998 184.37 2 684 034.70 33 062 052.31 43 720 518.31 2 634 221.27
United States 24 920 308.27 2 675 673.21 32 959 055.08 43 584 317.08 2 626 014.96
Amazon.Com Inc 7 282 810.80 781 949.47 9 632 086.39 12 737 255.55 767 437.14
Tencent Holdings Ltd 6 653 684.46 714 400.68 8 800 017.64 11 636 946.46 701 142.01
Facebook Inc 6 227 181.97 668 607.46 8 235 934.77 10 891 015.89 656 198.66
Federal Republic of Germany 3 562 285.26 382 479.67 4 711 400.63 6 230 250.79 375 381.17
Fms Wertmanagement Aoer 3 376 031.82 362 481.79 4 465 065.90 5 904 503.26 355 754.43
Nestle SA 3 316 980.15 356 141.46 4 386 965.45 5 801 224.97 349 531.77
UBS (Lux) Equity SICAV – Asian Smaller
Companies (USD)UBS (Lux) Equity SICAV
– Brazil (USD)
UBS (Lux) Equity SICAV – Emerging Markets High
Dividend (USD)
UBS (Lux) Equity SICAV – Emerging Markets
Sustainable (USD)
UBS (Lux) Equity SICAV – Euro Countries Income
(EUR)
Japan Government Ten 1 082 908.31 193 299.91 4 101 895.53 276 097.65 18 468 024.70
French Republic 724 314.64 129 290.68 2 743 596.04 184 670.82 12 352 532.91
United Kingdom 595 649.09 106 323.79 2 256 230.12 151 866.33 10 158 258.12
United States 593 793.49 105 992.56 2 249 201.35 151 393.23 10 126 612.40
Amazon.Com Inc 173 532.59 30 975.69 657 315.62 44 243.76 2 959 441.81
Tencent Holdings Ltd 158 541.96 28 299.85 600 533.34 40 421.76 2 703 790.13
Facebook Inc 148 379.39 26 485.83 562 039.04 37 830.72 2 530 476.65
Federal Republic of Germany 84 881.04 15 151.33 321 516.76 21 641.22 1 447 569.66
Fms Wertmanagement Aoer 80 443.05 14 359.14 304 706.32 20 509.71 1 371 883.74
Nestle SA 79 035.99 14 107.98 299 376.56 20 150.97 1 347 887.51
Concentration Data
Ten largest collateral issuers of SFTs per subfund:
UBS (Lux) Equity SICAV – Small Caps Europe (EUR)
UBS (Lux) Equity SICAV – Swiss Opportunity (CHF)
UBS (Lux) Equity SICAV – US Income (USD)
UBS (Lux) Equity SICAV – US Opportunity (USD)
UBS (Lux) Equity SICAV – US Systematic Defensive (USD)
Japan Government Ten 7 081 031.00 2 043 642.81 26 519 984.73 7 499 692.08 10 052 223.45
French Republic 4 736 222.19 1 366 912.02 17 738 171.21 5 016 248.07 6 723 535.57United Kingdom 3 894 890.86 1 124 097.00 14 587 204.35 4 125 173.60 5 529 182.58
United States 3 882 757.22 1 120 595.13 14 541 761.27 4 112 322.57 5 511 957.68
Amazon.Com Inc 1 134 712.54 327 487.21 4 249 742.61 1 201 801.64 1 610 836.61
Tencent Holdings Ltd 1 036 690.28 299 197.20 3 882 628.17 1 097 983.88 1 471 684.33
Facebook Inc 970 238.23 280 018.60 3 633 750.94 1 027 602.90 1 377 349.07
Federal Republic of Germany 555 028.80 160 185.80 2 078 702.29 587 844.50 787 918.25
Fms Wertmanagement Aoer 526 009.22 151 810.51 1 970 017.71 557 109.15 746 722.08
Nestle SA 516 808.56 149 155.13 1 935 559.26 547 364.51 733 660.84

235
UBS (Lux) Equity SICAVAnnual Report as of 31 May 2018
UBS (Lux) Equity SICAV – US Total Yield (USD)
UBS (Lux) Equity SICAV – USA Enhanced (USD)
UBS (Lux) Equity SICAV – USA Growth (USD)
Japan Government Ten 47 101 965.38 45 761 420.34 97 631 935.52
French Republic 31 504 645.83 30 608 008.16 65 302 148.76United Kingdom 25 908 234.91 25 170 873.84 53 702 029.21
United States 25 827 523.76 25 092 459.77 53 534 732.87
Amazon.Com Inc 7 547 939.09 7 333 121.04 15 645 204.96
Tencent Holdings Ltd 6 895 909.61 6 699 648.64 14 293 692.36
Facebook Inc 6 453 880.44 6 270 199.84 13 377 463.86
Federal Republic of Germany 3 691 969.07 3 586 893.82 7 652 633.66
Fms Wertmanagement Aoer 3 498 935.13 3 399 353.72 7 252 517.09
Nestle SA 3 437 733.70 3 339 894.11 7 125 660.09
The ten largest issuers of SFTs
All SFTs of the subfunds of this Company are currently held with a sole counterparty being UBS Switzerland AG.
Safekeeping of collateral received by the Company as part of SFTs
100% held by UBS Switzerland AG.
Safekeeping of collateral granted by the Company through SFTs
None.
Unaudited Information
Aggregate transaction data separately broken down for each type of SFTs
Type and quality of collateral:
The information on– Type of collateral is available in Note 16 “OTC-Derivatives and Securities Lending”– Quality of collateral is available in Unaudited Information 3) Collateral “by Credit Rating (Bonds)”
Maturity tenor of collateral
UBS (Lux) Equity SICAV – Asian Smaller
Companies (USD)UBS (Lux) Equity SICAV
– Brazil (USD)
UBS (Lux) Equity SICAV – Emerging Markets High
Dividend (USD)
UBS (Lux) Equity SICAV – Emerging Markets
Sustainable (USD)
UBS (Lux) Equity SICAV – Euro Countries Income
(EUR)
Up to 1 day - - - - -
1 day to 1 week - - - - -
1 week to 1 month 88 821.91 15 854.78 336 444.19 22 645.98 1 514 777.65
1 month to 3 months 258 128.21 46 076.07 977 751.25 65 812.21 4 402 143.87
3 months to 1 year 716 988.51 127 982.96 2 715 845.76 182 802.96 12 227 592.39
Above 1 year 3 298 307.78 588 750.29 12 493 498.98 840 934.56 56 249 664.62
Unlimited 3 033 024.08 541 396.96 11 488 643.81 773 297.99 51 725 490.36
UBS (Lux) Equity SICAV – European High Dividend
(EUR)
UBS (Lux) Equity SICAV – European Opportunity
Unconstrained (EUR)
UBS (Lux) Equity SICAV – German High Dividend
(EUR)
UBS (Lux) Equity SICAV – Global Emerging
Markets Opportunity (USD)
UBS (Lux) Equity SICAV – Global High Dividend
(USD)
Up to 1 day - - - - -
1 day to 1 week - - - - -
1 week to 1 month 1 107 203.44 3 056 263.26 14 253.23 1 270 376.31 3 145 853.14
1 month to 3 months 3 217 679.39 8 881 904.63 41 421.77 3 691 881.32 9 142 264.64
3 months to 1 year 8 937 570.69 24 670 776.91 115 054.96 10 254 735.25 25 393 964.58
Above 1 year 41 114 827.66 113 491 101.39 529 278.58 47 174 079.77 116 817 926.68
Unlimited 37 807 952.04 104 362 984.40 486 708.57 43 379 857.03 107 422 232.33

236
UBS (Lux) Equity SICAVAnnual Report as of 31 May 2018
Unaudited Information
Currency of collateral
Currency of collateral Percentage
USD 40.48%EUR 20.50%JPY 16.46%GBP 9.65%CHF 5.35%HKD 2.96%SEK 2.02%DKK 1.07%SGD 0.57%CAD 0.56%AUD 0.17%NOK 0.16%NZD 0.05%TRY 0.00%IDR 0.00%MXN 0.00%Total 100.00%
UBS (Lux) Equity SICAV – Global Income (USD)
UBS (Lux) Equity SICAV – Global Opportunity Unconstrained (USD)
UBS (Lux) Equity SICAV – Global Quantitative
(USD)UBS (Lux) Equity SICAV
– Long Term Themes (USD)UBS (Lux) Equity SICAV
– Russia (USD)
Up to 1 day - - - - -
1 day to 1 week - - - - -
1 week to 1 month 3 727 675.60 400 237.49 4 930 142.28 6 519 509.85 392 809.42
1 month to 3 months 10 833 117.53 1 163 143.01 14 327 644.49 18 946 556.54 1 141 556.05
3 months to 1 year 30 090 553.45 3 230 798.22 39 797 108.36 52 626 805.75 3 170 837.32
Above 1 year 138 423 287.79 14 862 395.70 183 075 615.15 242 095 097.70 14 586 562.12
Unlimited 127 289 868.95 13 667 009.60 168 350 798.71 222 623 329.88 13 413 361.38
UBS (Lux) Equity SICAV – Small Caps Europe (EUR)
UBS (Lux) Equity SICAV – Swiss Opportunity (CHF)
UBS (Lux) Equity SICAV – US Income (USD)
UBS (Lux) Equity SICAV – US Opportunity (USD)
UBS (Lux) Equity SICAV – US Systematic Defensive (USD)
Up to 1 day - - - - -
1 day to 1 week - - - - -
1 week to 1 month 580 797.77 167 622.93 2 175 212.60 615 137.03 824 499.84
1 month to 3 months 1 687 875.00 487 134.37 6 321 455.07 1 787 669.45 2 396 105.41
3 months to 1 year 4 688 317.36 1 353 086.30 17 558 757.29 4 965 510.89 6 655 529.92
Above 1 year 21 567 310.28 6 224 500.15 80 774 217.67 22 842 462.66 30 616 928.81
Unlimited 19 832 646.24 5 723 862.08 74 277 527.62 21 005 237.81 28 154 401.75
UBS (Lux) Equity SICAV – US Total Yield (USD)
UBS (Lux) Equity SICAV – USA Enhanced (USD)
UBS (Lux) Equity SICAV – USA Growth (USD)
Up to 1 day - - -
1 day to 1 week - - -
1 week to 1 month 3 863 380.38 3 753 426.68 8 007 931.33
1 month to 3 months 11 227 493.55 10 907 953.58 23 272 105.91
3 months to 1 year 31 185 989.98 30 298 421.41 64 641 645.82
Above 1 year 143 462 541.27 139 379 526.99 297 366 053.99
Unlimited 131 923 814.06 128 169 197.60 273 448 829.66

237
UBS (Lux) Equity SICAVAnnual Report as of 31 May 2018
Maturity tenor of SFTs broken down by maturity buckets:
UBS (Lux) Equity SICAV – Asian Smaller
Companies (USD)UBS (Lux) Equity SICAV
– Brazil (USD)
UBS (Lux) Equity SICAV – Emerging Markets High
Dividend (USD)
UBS (Lux) Equity SICAV – Emerging Markets
Sustainable (USD)
UBS (Lux) Equity SICAV – Euro Countries Income
(EUR)
Up to 1 day 6 945 724.80 1 239 816.83 26 309 371.81 1 770 877.80 118 453 072.47
1 day to 1 week - - - - -
1 week to 1 month - - - - -
1 month to 3 months - - - - -
3 months to 1 year - - - - -
Above 1 year - - - - -
Unlimited - - - - -
UBS (Lux) Equity SICAV – European High Dividend
(EUR)
UBS (Lux) Equity SICAV – European Opportunity
Unconstrained (EUR)
UBS (Lux) Equity SICAV – German High Dividend
(EUR)
UBS (Lux) Equity SICAV – Global Emerging
Markets Opportunity (USD)
UBS (Lux) Equity SICAV – Global High Dividend
(USD)
Up to 1 day 86 581 452.42 238 994 663.32 1 114 578.64 99 341 297.91 246 000 441.58
1 day to 1 week - - - - -
1 week to 1 month - - - - -
1 month to 3 months - - - - -
3 months to 1 year - - - - -
Above 1 year - - - - -
Unlimited - - - - -
UBS (Lux) Equity SICAV – Global Income (USD)
UBS (Lux) Equity SICAV – Global Opportunity Unconstrained (USD)
UBS (Lux) Equity SICAV – Global Quantitative
(USD)UBS (Lux) Equity SICAV
– Long Term Themes (USD)UBS (Lux) Equity SICAV
– Russia (USD)
Up to 1 day 291 497 982.26 31 297 901.01 385 528 860.57 509 814 740.16 30 717 038.26
1 day to 1 week - - - - -
1 week to 1 month - - - - -
1 month to 3 months - - - - -
3 months to 1 year - - - - -
Above 1 year - - - - -
Unlimited - - - - -
UBS (Lux) Equity SICAV – Small Caps Europe (EUR)
UBS (Lux) Equity SICAV – Swiss Opportunity (CHF)
UBS (Lux) Equity SICAV – US Income (USD)
UBS (Lux) Equity SICAV – US Opportunity (USD)
UBS (Lux) Equity SICAV – US Systematic Defensive (USD)
Up to 1 day 45 417 411.55 13 107 832.23 170 097 978.78 48 102 684.75 64 474 505.08
1 day to 1 week - - - - -
1 week to 1 month - - - - -
1 month to 3 months - - - - -
3 months to 1 year - - - - -
Above 1 year - - - - -
Unlimited - - - - -
UBS (Lux) Equity SICAV – US Total Yield (USD)
UBS (Lux) Equity SICAV – USA Enhanced (USD)
UBS (Lux) Equity SICAV – USA Growth (USD)
Up to 1 day 302 109 868.79 293 511 673.76 626 206 804.63
1 day to 1 week - - -
1 week to 1 month - - -
1 month to 3 months - - -
3 months to 1 year - - -
Above 1 year - - -
Unlimited - - -
Unaudited Information
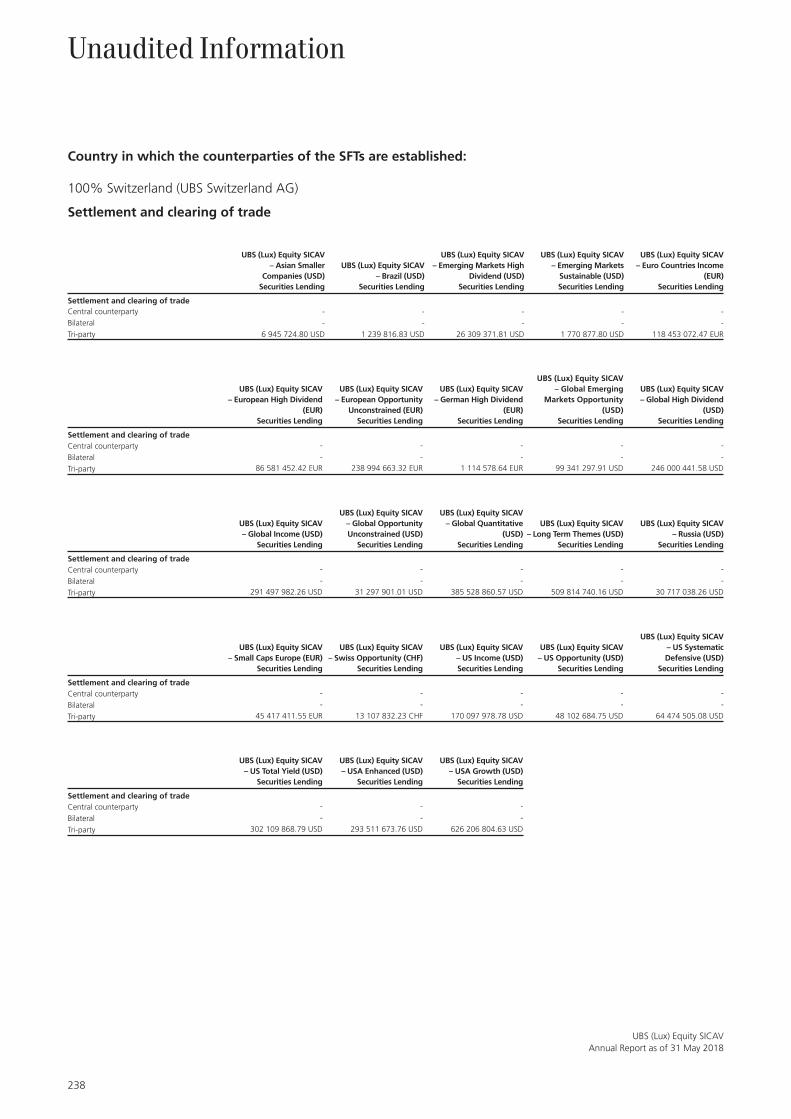
238
UBS (Lux) Equity SICAVAnnual Report as of 31 May 2018
Unaudited Information
Country in which the counterparties of the SFTs are established:
100% Switzerland (UBS Switzerland AG)
Settlement and clearing of trade
UBS (Lux) Equity SICAV – Asian Smaller
Companies (USD)Securities Lending
UBS (Lux) Equity SICAV – Brazil (USD)
Securities Lending
UBS (Lux) Equity SICAV – Emerging Markets High
Dividend (USD)Securities Lending
UBS (Lux) Equity SICAV – Emerging Markets
Sustainable (USD)Securities Lending
UBS (Lux) Equity SICAV – Euro Countries Income
(EUR)Securities Lending
Settlement and clearing of tradeCentral counterparty - - - - -
Bilateral - - - - -
Tri-party 6 945 724.80 USD 1 239 816.83 USD 26 309 371.81 USD 1 770 877.80 USD 118 453 072.47 EUR
UBS (Lux) Equity SICAV – European High Dividend
(EUR)Securities Lending
UBS (Lux) Equity SICAV – European Opportunity
Unconstrained (EUR)Securities Lending
UBS (Lux) Equity SICAV – German High Dividend
(EUR)Securities Lending
UBS (Lux) Equity SICAV – Global Emerging
Markets Opportunity (USD)
Securities Lending
UBS (Lux) Equity SICAV – Global High Dividend
(USD)Securities Lending
Settlement and clearing of tradeCentral counterparty - - - - -
Bilateral - - - - -
Tri-party 86 581 452.42 EUR 238 994 663.32 EUR 1 114 578.64 EUR 99 341 297.91 USD 246 000 441.58 USD
UBS (Lux) Equity SICAV – Global Income (USD)
Securities Lending
UBS (Lux) Equity SICAV – Global Opportunity Unconstrained (USD)
Securities Lending
UBS (Lux) Equity SICAV – Global Quantitative
(USD)Securities Lending
UBS (Lux) Equity SICAV – Long Term Themes (USD)
Securities Lending
UBS (Lux) Equity SICAV – Russia (USD)
Securities Lending
Settlement and clearing of tradeCentral counterparty - - - - -
Bilateral - - - - -
Tri-party 291 497 982.26 USD 31 297 901.01 USD 385 528 860.57 USD 509 814 740.16 USD 30 717 038.26 USD
UBS (Lux) Equity SICAV – Small Caps Europe (EUR)
Securities Lending
UBS (Lux) Equity SICAV – Swiss Opportunity (CHF)
Securities Lending
UBS (Lux) Equity SICAV – US Income (USD)Securities Lending
UBS (Lux) Equity SICAV – US Opportunity (USD)
Securities Lending
UBS (Lux) Equity SICAV – US Systematic Defensive (USD)
Securities Lending
Settlement and clearing of tradeCentral counterparty - - - - -
Bilateral - - - - -
Tri-party 45 417 411.55 EUR 13 107 832.23 CHF 170 097 978.78 USD 48 102 684.75 USD 64 474 505.08 USD
UBS (Lux) Equity SICAV – US Total Yield (USD)
Securities Lending
UBS (Lux) Equity SICAV – USA Enhanced (USD)
Securities Lending
UBS (Lux) Equity SICAV – USA Growth (USD)
Securities Lending
Settlement and clearing of tradeCentral counterparty - - -
Bilateral - - -
Tri-party 302 109 868.79 USD 293 511 673.76 USD 626 206 804.63 USD

239
UBS (Lux) Equity SICAVAnnual Report as of 31 May 2018
Data on income and expense for each type of SFT
All expenses related to the execution of securities lending transactions including collateralization are borne by the Counterparties and the Depositary. The breakdown of the income on securities lending disclosed in the statement of operations is as follows:
– 60% payable to the Company– 40% payable to the Securities Lending Agent
Unaudited Information
Income-Ratio (Company)
UBS (Lux) Equity SICAV Percentage
– Asian Smaller Companies (USD) 0.36%
– Brazil (USD) 0.43%
– Emerging Markets High Dividend (USD) 0.62%
– Emerging Markets Sustainable (USD) 0.21%
– Euro Countries Income (EUR) 0.84%
– European High Dividend (EUR) 0.56%
– European Opportunity Unconstrained (EUR) 0.58%
– German High Dividend (EUR) 9.80%
– Global Emerging Markets Opportunity (USD) 0.08%
– Global High Dividend (USD) 0.20%
– Global Income (USD) 0.31%
– Global Opportunity Unconstrained (USD) 0.20%
– Global Quantitative (USD) 0.30%
– Long Term Themes (USD) 0.13%
– Russia (USD) 1.11%
– Small Caps Europe (EUR) 0.74%
– Swiss Opportunity (CHF) 0.33%
– US Income (USD) 0.12%
– US Opportunity (USD) 0.18%
– US Systematic Defensive (USD) 0.13%
– US Total Yield (USD) 0.18%
– USA Enhanced (USD) 0.13%
– USA Growth (USD) 0.08%

240
UBS (Lux) Equity SICAVAnnual Report as of 31 May 2018
Expense-Ratio (Securities Lending Agent)
UBS (Lux) Equity SICAV Percentage
– Asian Smaller Companies (USD) 0.14%
– Brazil (USD) 0.17%
– Emerging Markets High Dividend (USD) 0.25%
– Emerging Markets Sustainable (USD) 0.09%
– Euro Countries Income (EUR) 0.34%
– European High Dividend (EUR) 0.23%
– European Opportunity Unconstrained (EUR) 0.23%
– German High Dividend (EUR) 3.92%
– Global Emerging Markets Opportunity (USD) 0.03%
– Global High Dividend (USD) 0.08%
– Global Income (USD) 0.13%
– Global Opportunity Unconstrained (USD) 0.08%
– Global Quantitative (USD) 0.12%
– Long Term Themes (USD) 0.05%
– Russia (USD) 0.45%
– Small Caps Europe (EUR) 0.29%
– Swiss Opportunity (CHF) 0.13%
– US Income (USD) 0.05%
– US Opportunity (USD) 0.07%
– US Systematic Defensive (USD) 0.05%
– US Total Yield (USD) 0.07%
– USA Enhanced (USD) 0.05%
– USA Growth (USD) 0.03%
Unaudited Information
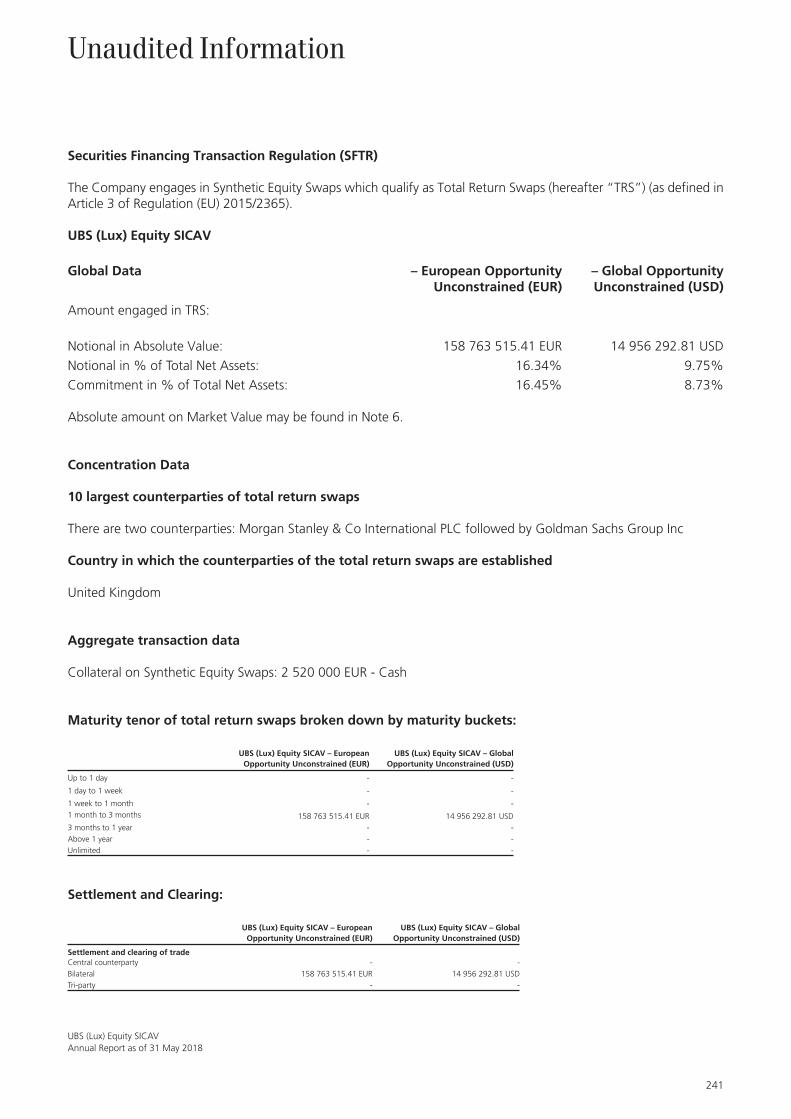
241
UBS (Lux) Equity SICAVAnnual Report as of 31 May 2018
Unaudited Information
Securities Financing Transaction Regulation (SFTR)
The Company engages in Synthetic Equity Swaps which qualify as Total Return Swaps (hereafter “TRS”) (as defined in Article 3 of Regulation (EU) 2015/2365).
UBS (Lux) Equity SICAV
Global Data – European Opportunity Unconstrained (EUR)
– Global Opportunity Unconstrained (USD)
Amount engaged in TRS:
Notional in Absolute Value: 158 763 515.41 EUR 14 956 292.81 USD
Notional in % of Total Net Assets: 16.34% 9.75%
Commitment in % of Total Net Assets: 16.45% 8.73%
Absolute amount on Market Value may be found in Note 6.
Concentration Data
10 largest counterparties of total return swaps
There are two counterparties: Morgan Stanley & Co International PLC followed by Goldman Sachs Group Inc
Country in which the counterparties of the total return swaps are established
United Kingdom
Aggregate transaction data
Collateral on Synthetic Equity Swaps: 2 520 000 EUR - Cash
Maturity tenor of total return swaps broken down by maturity buckets:
UBS (Lux) Equity SICAV – European Opportunity Unconstrained (EUR)
UBS (Lux) Equity SICAV – Global Opportunity Unconstrained (USD)
Up to 1 day - -
1 day to 1 week - -
1 week to 1 month - -
1 month to 3 months 158 763 515.41 EUR 14 956 292.81 USD
3 months to 1 year - -
Above 1 year - -
Unlimited - -
Settlement and Clearing:
UBS (Lux) Equity SICAV – European Opportunity Unconstrained (EUR)
UBS (Lux) Equity SICAV – Global Opportunity Unconstrained (USD)
Settlement and clearing of tradeCentral counterparty - -
Bilateral 158 763 515.41 EUR 14 956 292.81 USD
Tri-party - -

242
UBS (Lux) Equity SICAVAnnual Report as of 31 May 2018
Unaudited Information
Data on income and expense for total return swaps
There are no agreements on Total Return Swaps and 100% of the income/expenses generated are recognised in the Statement of Operations.


ab © U
BS 2
018.
The
key
sym
bol a
nd U
BS a
re a
mon
g th
e re
gist
ered
and
unr
egis
tere
d tr
adem
arks
of
UBS
. All
right
s re
serv
ed.
Als
o av
aila
ble
in G
erm
an. 8
0385
E-18
02