UNIVERSAL REGISTRATION DOCUMENT - Euronext
280
UNIVERSAL REGISTRATION DOCUMENT INCLUDING THE ANNUAL FINANCIAL STATEMENTS 2019
-
Upload
khangminh22 -
Category
Documents
-
view
1 -
download
0
Transcript of UNIVERSAL REGISTRATION DOCUMENT - Euronext

UNIVERSAL REGISTRATION DOCUMENTINCLUDING THE ANNUAL FINANCIAL STATEMENTS2019

6.6 Anti-Takeover Provisions 140
6.7 Obligations of Shareholders and Members
of the Managing Board to Disclose Holdings 140
6.8 Short Positions 141
6.9 Market Abuse Regime 141
6.10 Transparency Directive 142
6.11 Dutch Financial Reporting Supervision Act 142
6.12 Dividends and Other Distributions 143
6.13 2020 Financial Calendar 143
OPERATING AND FINANCIAL REVIEW 145
7.1 Overview 146
7.2 Material contracts and related
party transactions 168
7.3 Legal Proceedings 170
7.4 Insurance 171
7.5 Liquidity and Capital Resources 172
7.6 Tangible Fixed Assets 174
FINANCIAL STATEMENTS 177
8.1 Consolidated Statement of Profi t or Loss 178
8.2 Consolidated Statement of Comprehensive
Income 179
8.3 Consolidated Balance Sheet 180
8.4 Consolidated Statement of Cash Flows 181
8.5 Consolidated Statement of Changes in Equity 182
Notes to the Consolidated Financial Statements 183
Euronext N.V. Company Financial Statements
for the year ended 31 December 2019 245
Notes to the Company Financial Statements 247
OTHER INFORMATION 261
9.1 Profi t Appropriation Section 262
9.2 Independent Auditor’s Report 262
G GLOSSARY & CONCORDANCE TABLES 269
PRESENTATION OF THE GROUP 13
1.1 Company Profi le 14
1.2 Strategy: “Let’s grow together 2022” Strategic
Plan 17
1.3 Description of the Business 19
1.4 Regulation 38
RISK MANAGEMENT & CONTROL STRUCTURE 43
2.1 Risk Factors 44
2.2 Control Structure 53
EURONEXT, A SUSTAINABLE EXCHANGE 59
3.1 Value Creation by Euronext 60
3.2 Euronext’s Five ESG Impact Areas
and the Sustainable Development Goals 64
3.3 ESG Risks Considerations 94
CORPORATE GOVERNANCE 97
4.1 Dutch Corporate Governance Code,
“Comply or Explain” 98
4.2 Management Structure 99
4.3 Report of the Supervisory Board 112
4.4 Remuneration Report 114
SELECTED HISTORICAL CONSOLIDATED FINANCIAL INFORMATION AND OTHER FINANCIAL INFORMATION 127
GENERAL DESCRIPTION OF THE COMPANY AND ITS SHARE CAPITAL 133
6.1 Legal Information on the Company 134
6.2 Share Capital 134
6.3 Shareholder Structure 136
6.4 Share Classes and Major Shareholders 136
6.5 General Meeting of Shareholders
and Voting Rights 139
CONTENTS
: Items above in the Contents of the Universal Registration Document with the symbol DR concern the Directors’ Report within the meaning
of Article 2: 391 of the Dutch Civil Code
INTEGRATED PRESENTATION 2
Euronext N.V. (the “Company” or “Euronext” and together with its subsidiaries, the “Group”) is a Dutch public company with limited
liability (naamloze Vennootschap), whose ordinary shares are admitted to listing and trading on regulated markets in the Netherlands,
France, Belgium and Portugal. The applicable regulations with respect to public information and protection of investors, as well as
the commitments made by the Company to securities and market authorities, are described in this Universal Registration Document
(the “Universal Registration Document”).
In addition to historical information, this Universal Registration Document includes forward-looking statements. The forward-looking
statements are generally identifi ed by the use of forward-looking words, such as “anticipate”, “believe”, “estimate”, “expect”, “intend”,
“plan”, “project”, “predict”, “will”, “should”, “may” or other variations of such terms, or by discussion of strategy. These statements relate
to Euronext’s future prospects, developments and business strategies and are based on analyses or forecasts of future results and
estimates of amounts not yet determinable. These forward-looking statements represent the view of Euronext only as of the dates
they are made, and Euronext disclaims any obligation to update forward-looking statements, except as may be otherwise required
by law. The forward-looking statements in this Universal Registration Document involve known and unknown risks, uncertainties
and other factors that could cause Euronext’s actual future results, performance and achievements to diff er materially from those
forecasted or suggested herein. These include changes in general economic and business conditions, as well as the factors described
under “Risk Factors” below.
This Universal Registration Document has been fi led with the Stichting Autoriteit Financiële Markten (the “AFM”) on 1 April 2020 as
competent authority under Regulation (EU) 2017/1129 without prior approval pursuant to Article 9 of Regulation (EU) 2017/1129. This
Universal Registration Document may be used for the purposes of an off er to the public of securities or admission of securities to
trading on a regulated market if approved by the AFM together with any amendments, if applicable, and a securities note and summary
approved in accordance with Regulation (EU) 2017/1129.
2019 UNIVERSAL REGISTRATION DOCUMENTincluding the Annual Financial Statements
2019 UNIVERSAL REGISTRATION DOCUMENT 1
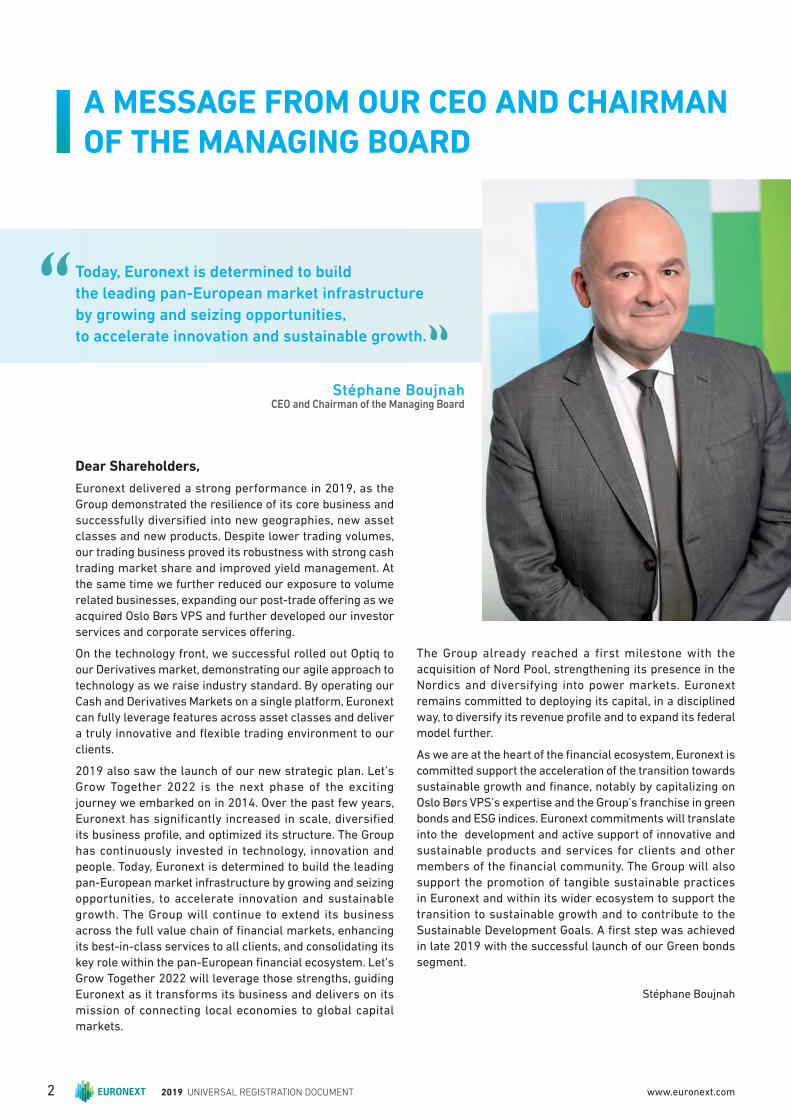
A MESSAGE FROM OUR CEO AND CHAIRMAN OF THE MANAGING BOARD
Today, Euronext is determined to build
the leading pan-European market infrastructure
by growing and seizing opportunities,
to accelerate innovation and sustainable growth.
Dear Shareholders,
Euronext delivered a strong performance in 2019, as the
Group demonstrated the resilience of its core business and
successfully diversifi ed into new geographies, new asset
classes and new products. Despite lower trading volumes,
our trading business proved its robustness with strong cash
trading market share and improved yield management. At
the same time we further reduced our exposure to volume
related businesses, expanding our post-trade off ering as we
acquired Oslo Børs VPS and further developed our investor
services and corporate services off ering.
On the technology front, we successful rolled out Optiq to
our Derivatives market, demonstrating our agile approach to
technology as we raise industry standard. By operating our
Cash and Derivatives Markets on a single platform, Euronext
can fully leverage features across asset classes and deliver
a truly innovative and fl exible trading environment to our
clients.
2019 also saw the launch of our new strategic plan. Let’s
Grow Together 2022 is the next phase of the exciting
journey we embarked on in 2014. Over the past few years,
Euronext has significantly increased in scale, diversified
its business profi le, and optimized its structure. The Group
has continuously invested in technology, innovation and
people. Today, Euronext is determined to build the leading
pan-European market infrastructure by growing and seizing
opportunities, to accelerate innovation and sustainable
growth. The Group will continue to extend its business
across the full value chain of fi nancial markets, enhancing
its best-in-class services to all clients, and consolidating its
key role within the pan-European fi nancial ecosystem. Let’s
Grow Together 2022 will leverage those strengths, guiding
Euronext as it transforms its business and delivers on its
mission of connecting local economies to global capital
markets.
The Group already reached a first milestone with the
acquisition of Nord Pool, strengthening its presence in the
Nordics and diversifying into power markets. Euronext
remains committed to deploying its capital, in a disciplined
way, to diversify its revenue profi le and to expand its federal
model further.
As we are at the heart of the fi nancial ecosystem, Euronext is
committed support the acceleration of the transition towards
sustainable growth and fi nance, notably by capitalizing on
Oslo Børs VPS’s expertise and the Group’s franchise in green
bonds and ESG indices. Euronext commitments will translate
into the development and active support of innovative and
sustainable products and services for clients and other
members of the fi nancial community. The Group will also
support the promotion of tangible sustainable practices
in Euronext and within its wider ecosystem to support the
transition to sustainable growth and to contribute to the
Sustainable Development Goals. A fi rst step was achieved
in late 2019 with the successful launch of our Green bonds
segment.
Stéphane Boujnah
Stéphane BoujnahCEO and Chairman of the Managing Board
2019 UNIVERSAL REGISTRATION DOCUMENT2 www.euronext.com

(1) Percentages compare 2019 data to 2018 data.(2) To be proposed to the AGM on 14 May 2019.(3) Based on H2 2019 reported operating costs excluding D&A, excluding Nord Pool of around €311 million.
ORGANIC MARKET SHARE
ON CASH TRADING
68.8%ORGANIC CASH YIELD
0.53bpsCASH AVERAGE
DAILY VALUE
€7.8bn
58.8%EBITDA MARGIN
€399.4m
+10.9%(1)
ADJUSTED EPS
€3.90EBITDA TO NET
OPERATING CASH FLOW
63.5%
DIVIDEND
PER SHARE
€1.59(2)
AS A RESULT OF THE INTEGRATION OF OSLO BØRS VPS
AND INTERNAL DIGITALIZATION PROJECTS, EURONEXT EXPECTS
ITS OPERATING COSTS EXCLUDING D&A TO TEMPORARILY
INCREASE BY A MID-SINGLE DIGIT IN 2020,
COMPARED TO ITS SECOND HALF 2019 ANNUALISED COST BASE(3)
IN 2020
MARKET CAPITALISATION
ON EURONEXT MARKETS
€4.5trnNEW EQUITY LISTINGS
46ISSUERS
1,500 +
A STRONGPERFORMANCE IN 2019
NET DEBT TO EBITDA RATIO
1.5xEMPLOYEES
+1,200 COUNTRIES
20 +
2019 UNIVERSAL REGISTRATION DOCUMENT 3

DUBLIN
PARIS
BRUSSELS
MUNICH
ZURICH
MADRID
LISBON
PORTO
MILAN
LONDON(1) AMSTERDAM
STOCKHOLMOSLOBERGEN
Euronext is the fi rst pan-European exchange, spanning Belgium, France, Ireland, the Netherlands, Portugal and the UK. This unique model unites marketplaces that date back as far as the start of the 17th century, and is designed to incorporate the individual strengths and assets of each market, combining heritage and forward-looking modernity.We operate six national regulated securities and derivatives markets in Amsterdam, Brussels, Dublin, Lisbon, Oslo and Paris, a regulated derivatives market in Bergen, and the UK-based regulated securities market, Euronext London.(2)
REVENUE IN €M
Euronext historical presence
7 Regulated markets
Sales offi ces
Euronext recent Tech hub expansion
Technology centers
(1) Euronext London is recognised as a Recognised Investment Exchange (RIE) by the Financial Conduct Authority (FCA).(2) On 30 March 2020 Euronext has fi led an application for the revocation of its RIE licence, subject to approval from the FCA. Under the applicable rules this implies that Euronext will have to
cease all regulated activities in the UK as per 30 June 2020. Euronext will ensure an orderly wind down of its limited regulated activities in close consultation with the FCA.
2017
532
2018
615
679
2019
EURONEXT FEDERAL MODEL
SOURCE OF 2019 REVENUE
HELSINKI
BERLIN
NEW-YORK
HONG-KONG
VILNIUS
OTHER OFFICES
TALLINN
SINGAPORE
TOKYO
BENGALORE
30.5%Cash trading
8.2%Clearing
7.4%Custody &
Settlement
6.6%Derivatives trading
19.1%Market Data
& Indices
19.2%Listing
3.4%FX Spot
trading
5.6%Market Solutions
& Other revenue
2019 UNIVERSAL REGISTRATION DOCUMENT4 www.euronext.com
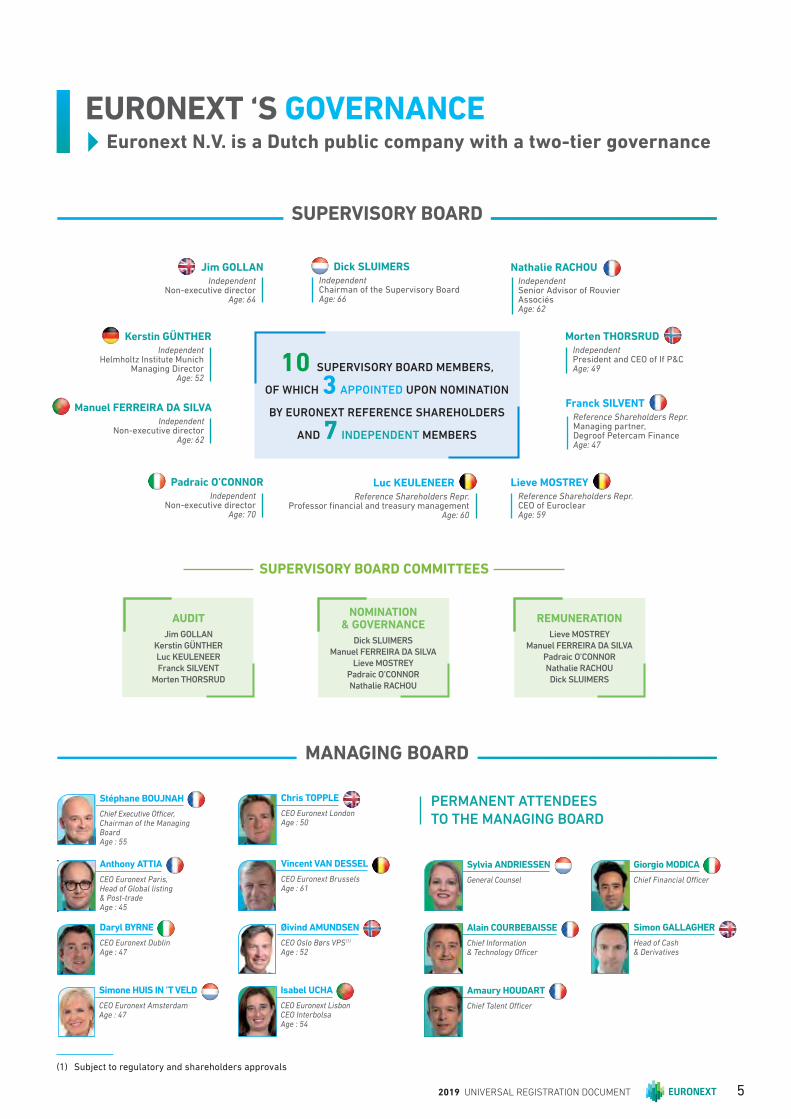
MANAGING BOARD
EURONEXT ‘S GOVERNANCE
Luc KEULENEER Reference Shareholders Repr.
Professor fi nancial and treasury management Age: 60
Franck SILVENT Reference Shareholders Repr.Managing partner, Degroof Petercam FinanceAge: 47
Kerstin GÜNTHERIndependent
Helmholtz Institute MunichManaging Director
Age: 52
Jim GOLLANIndependent
Non-executive directorAge: 64
Padraic O’CONNORIndependent
Non-executive directorAge: 70
Morten THORSRUD IndependentPresident and CEO of If P&CAge: 49
Nathalie RACHOU IndependentSenior Advisor of Rouvier Associés Age: 62
Dick SLUIMERS IndependentChairman of the Supervisory BoardAge: 66
Lieve MOSTREY Reference Shareholders Repr.CEO of EuroclearAge: 59
Manuel FERREIRA DA SILVAIndependent
Non-executive directorAge: 62
PERMANENT ATTENDEES
TO THE MANAGING BOARD
Stéphane BOUJNAH
Chief Executive Offi cer,Chairman of the Managing BoardAge : 55
Anthony ATTIA
CEO Euronext Paris, Head of Global listing & Post-tradeAge : 45
Daryl BYRNE
CEO Euronext DublinAge : 47
Isabel UCHA
CEO Euronext LisbonCEO InterbolsaAge : 54
Vincent VAN DESSEL
CEO Euronext BrusselsAge : 61
Sylvia ANDRIESSEN
General Counsel
Alain COURBEBAISSE
Chief Information & Technology Offi cer
Amaury HOUDART
Chief Talent Offi cer
Giorgio MODICA
Chief Financial Offi cer
Simon GALLAGHER
Head of Cash & Derivatives
Øivind AMUNDSEN
CEO Oslo Børs VPS(1)
Age : 52
SUPERVISORY BOARD
SUPERVISORY BOARD COMMITTEES
Chris TOPPLE
CEO Euronext LondonAge : 50
Simone HUIS IN ’T VELD
CEO Euronext AmsterdamAge : 47
Euronext N.V. is a Dutch public company with a two-tier governance
10 SUPERVISORY BOARD MEMBERS,
OF WHICH 3 APPOINTED UPON NOMINATION
BY EURONEXT REFERENCE SHAREHOLDERS
AND 7 INDEPENDENT MEMBERS
REMUNERATION
Lieve MOSTREY
Manuel FERREIRA DA SILVA
Padraic O’CONNOR
Nathalie RACHOU
Dick SLUIMERS
NOMINATION & GOVERNANCE
Dick SLUIMERS
Manuel FERREIRA DA SILVA
Lieve MOSTREY
Padraic O’CONNOR
Nathalie RACHOU
AUDIT
Jim GOLLAN
Kerstin GÜNTHER
Luc KEULENEER
Franck SILVENT
Morten THORSRUD
(1) Subject to regulatory and shareholders approvals
2019 UNIVERSAL REGISTRATION DOCUMENT 5

EURONEXT’S 2022 STRATEGIC AMBITIONS
EURONEXT STRATEGIC PLAN TO FULFILL ITS AMBITION
LET’S GROW TOGETHER 2022
Leveraging
Euronext’s
unique federal
model, creating
a sustainable
competitive
advantage
n Simplicity of access to European markets
n Proximity to local clients
n Diversity of fl ows
n Strong links with local regulators
n Strong integration track record
n Large investor customer base
n 7 local markets
n Attractive workplace
Building on
strong assets
to deliver
future growth
n Expertise in liquidity and yield management
n Largest liquidty pool in Europe
n Strong national and ESG indices
n Comprehensive suite of Corporate and Investors Services
n Strong listing franchise
n Cutting-edge proprietary technology platform Optiq®
n Strong listing franchise
n Culture of effi ciency
n Agile capital deployment, fl exibility
Execute value-creative M&A
programme
Diversify local and global infrastructures
Deliver operational excellence
Enhance client connectivity
Enable sustainable
fi nance
Empower people
to grow, perform and innovate
Build the leading pan-European market infrastructure
Connect local economies to global capital markets, to accelerate
innovation and sustainable growth
OUR AMBITION OUR MISSION
2019 UNIVERSAL REGISTRATION DOCUMENT6 www.euronext.com
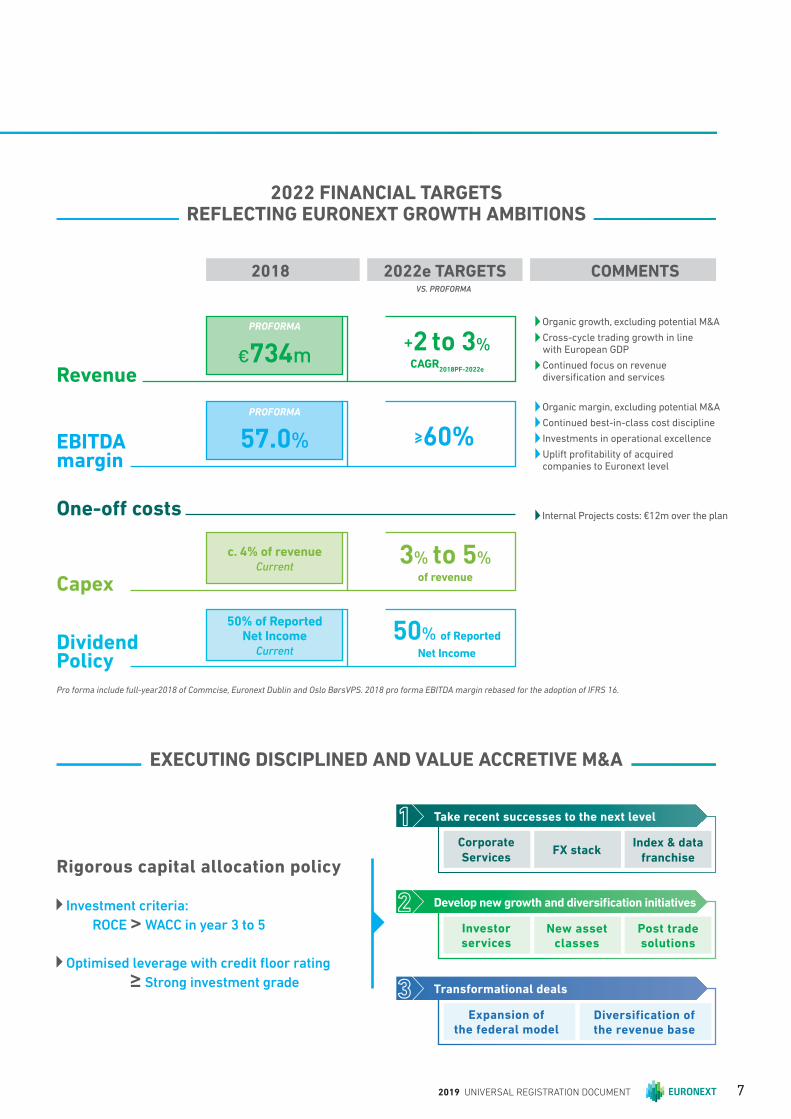
2022 FINANCIAL TARGETS REFLECTING EURONEXT GROWTH AMBITIONS
EXECUTING DISCIPLINED AND VALUE ACCRETIVE M&A
Develop new growth and diversifi cation initiatives 2Investorservices
New asset classes
Post trade solutions
Take recent successes to the next level1Corporate
ServicesFX stack
Index & data
franchise
Transformational deals3Expansion of
the federal modelDiversification of the revenue base
Rigorous capital allocation policy
Investment criteria:
ROCE > WACC in year 3 to 5
Optimised leverage with credit fl oor rating
≥ Strong investment grade
€734m
c. 4% of revenueCurrent
50% of Reported Net Income
Current
+2 to 3%CAGR
2018PF-2022e
3% to 5%of revenue
50% of Reported
Net Income
Organic growth, excluding potential M&A
Cross-cycle trading growth in line with European GDP
Continued focus on revenue diversifi cation and servicesRevenue
Capex
Dividend Policy
PROFORMA
57.0% ≥60%
Organic margin, excluding potential M&A
Continued best-in-class cost discipline
Investments in operational excellence
Uplift profi tability of acquired companies to Euronext level
EBITDA margin
PROFORMA
2018 2022e TARGETS COMMENTSVS. PROFORMA
One-off costs Internal Projects costs: €12m over the plan
Pro forma include full-year2018 of Commcise, Euronext Dublin and Oslo BørsVPS. 2018 pro forma EBITDA margin rebased for the adoption of IFRS 16.
2019 UNIVERSAL REGISTRATION DOCUMENT 7
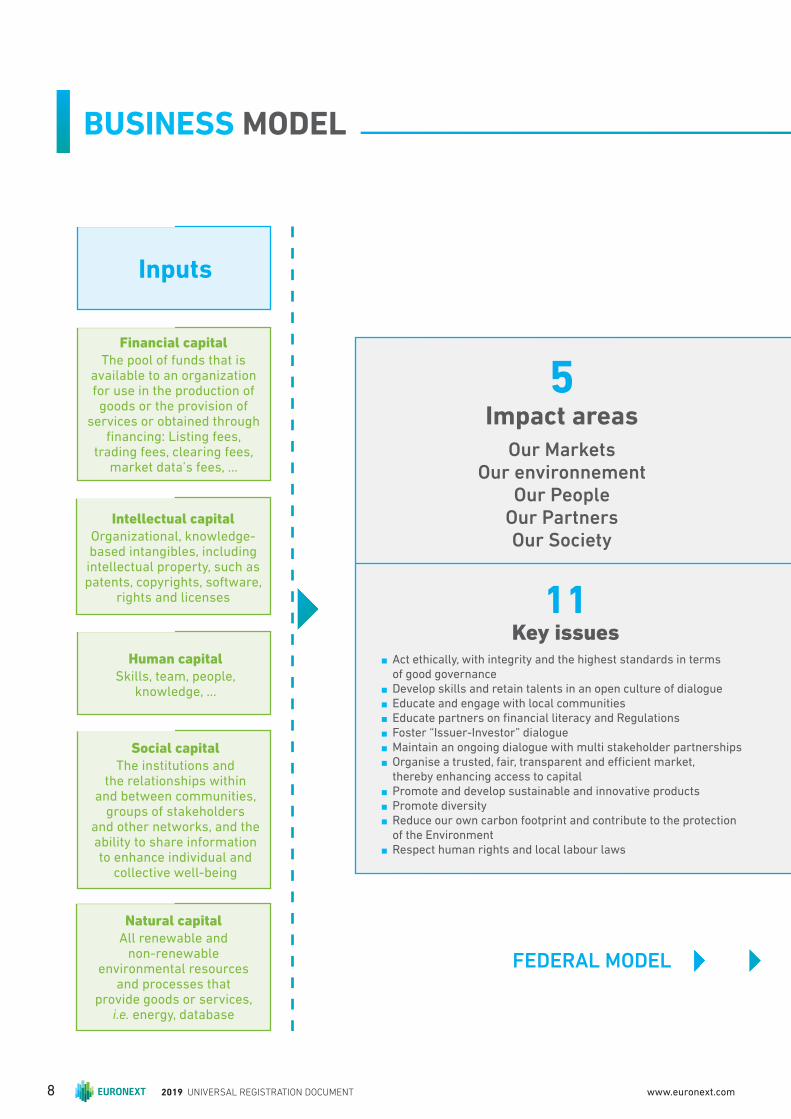
5
Impact areasOur Markets
Our environnementOur People
Our PartnersOur Society
11 Key issues
n Act ethically, with integrity and the highest standards in terms of good governance
n Develop skills and retain talents in an open culture of dialogue
n Educate and engage with local communities
n Educate partners on fi nancial literacy and Regulations
n Foster “Issuer-Investor” dialogue
n Maintain an ongoing dialogue with multi stakeholder partnerships
n Organise a trusted, fair, transparent and effi cient market, thereby enhancing access to capital
n Promote and develop sustainable and innovative products
n Promote diversity
n Reduce our own carbon footprint and contribute to the protection of the Environment
n Respect human rights and local labour laws
BUSINESS MODEL
Financial c apitalThe pool of funds that is
available to an organization for use in the production of goods or the provision of
services or obtained through fi nancing: Listing fees,
trading fees, clearing fees, market data’s fees, …
Intellectual c apitalOrganizational, knowledge-based intangibles, including intellectual property, such as patents, copyrights, software,
rights and licenses
Human c apitalSkills, team, people,
knowledge, …
Social c apitalThe institutions and
the relationships within and between communities,
groups of stakeholders and other networks, and the ability to share information to enhance individual and
collective well-being
Natural c apitalAll renewable and
non-renewable environmental resources
and processes that provide goods or services,
i.e. energy, database
Inputs
FEDERAL MODEL
2019 UNIVERSAL REGISTRATION DOCUMENT8 www.euronext.com
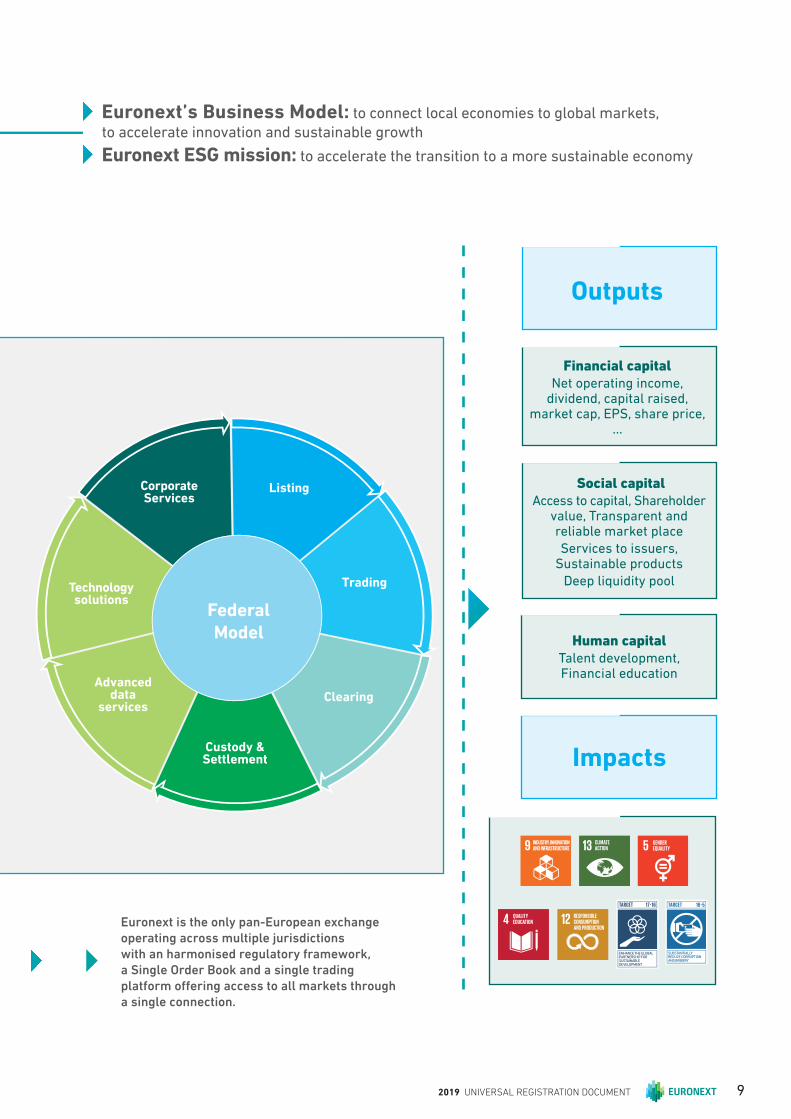
Corporate Services
Technology solutions
FederalModel
Advanced data
services
Listing
Trading
Clearing
Custody & Settlement
Euronext is the only pan-European exchange operating across multiple jurisdictions with an harmonised regulatory framework, a Single Order Book and a single trading platform off ering access to all markets through a single connection.
Euronext’s Business Model: to connect local economies to global markets,
to accelerate innovation and sustainable growth
Euronext ESG mission: to accelerate the transition to a more sustainable economy
Outputs
Impacts
Financial c apitalNet operating income,
dividend, capital raised, market cap, EPS, share price,
…
Social capitalAccess to capital, Shareholder
value, Transparent and reliable market place
Services to issuers, Sustainable products
Deep liquidity pool
Human c apitalTalent development, Financial education
2019 UNIVERSAL REGISTRATION DOCUMENT 9
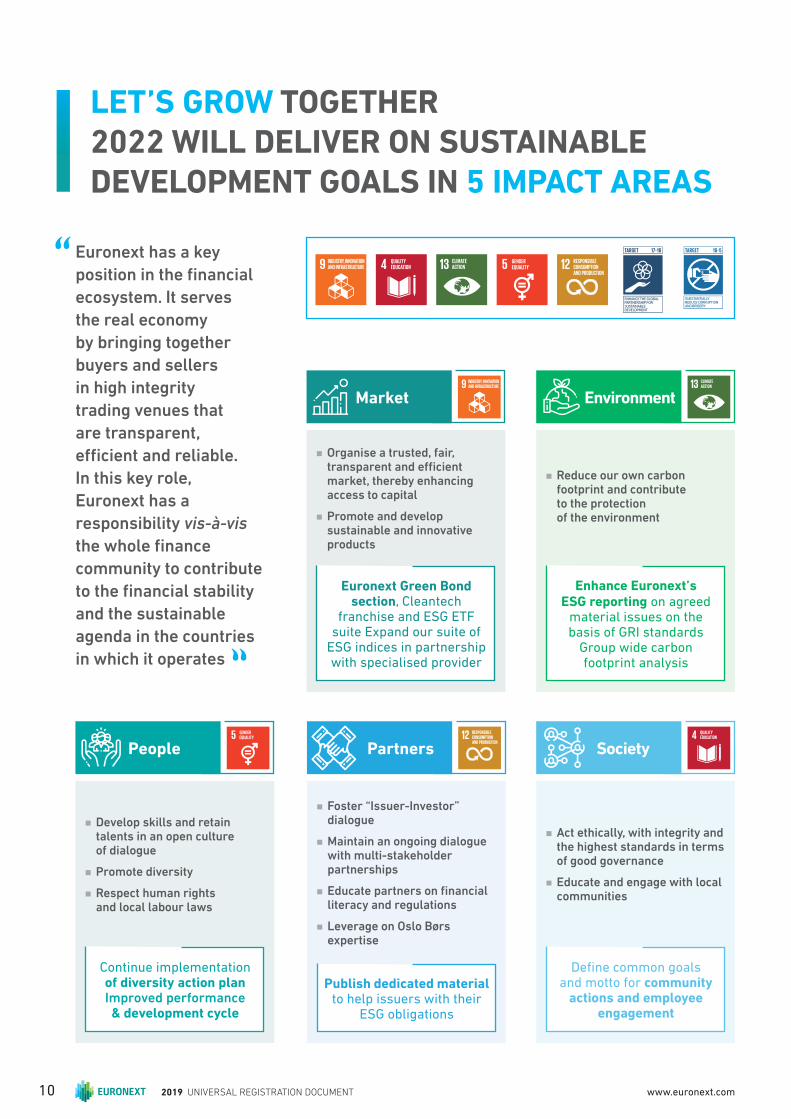
LET’S GROW TOGETHER 2022 WILL DELIVER ON SUSTAINABLE DEVELOPMENT GOALS IN 5 IMPACT AREAS
Euronext has a key
position in the fi nancial
ecosystem. It serves
the real economy
by bringing together
buyers and sellers
in high integrity
trading venues that
are transparent,
effi cient and reliable.
In this key role,
Euronext has a
responsibility vis-à-vis
the whole fi nance
community to contribute
to the fi nancial stability
and the sustainable
agenda in the countries
in which it operates
n Reduce our own carbon footprint and contribute to the protection of the environment
Enhance Euronext’s ESG reporting on agreed
material issues on the basis of GRI standards
Group wide carbon footprint analysis
Environment
n Organise a trusted, fair, transparent and effi cient market, thereby enhancing access to capital
n Promote and develop sustainable and innovative products
Euronext Green Bond section, Cleantech
franchise and ESG ETF suite Expand our suite of
ESG indices in partnership with specialised provider
Market
n Develop skills and retain talents in an open culture of dialogue
n Promote diversity
n Respect human rights and local labour laws
Continue implementation of diversity action plan Improved performance & development cycle
People
n Foster “Issuer-Investor” dialogue
n Maintain an ongoing dialogue with multi-stakeholder partnerships
n Educate partners on fi nancial literacy and regulations
n Leverage on Oslo Børs expertise
Publish dedicated material to help issuers with their
ESG obligations
Partners
n Act ethically, with integrity and the highest standards in terms of good governance
n Educate and engage with local communities
Defi ne common goals and motto for community
actions and employee engagement
Society
2019 UNIVERSAL REGISTRATION DOCUMENT10 www.euronext.com
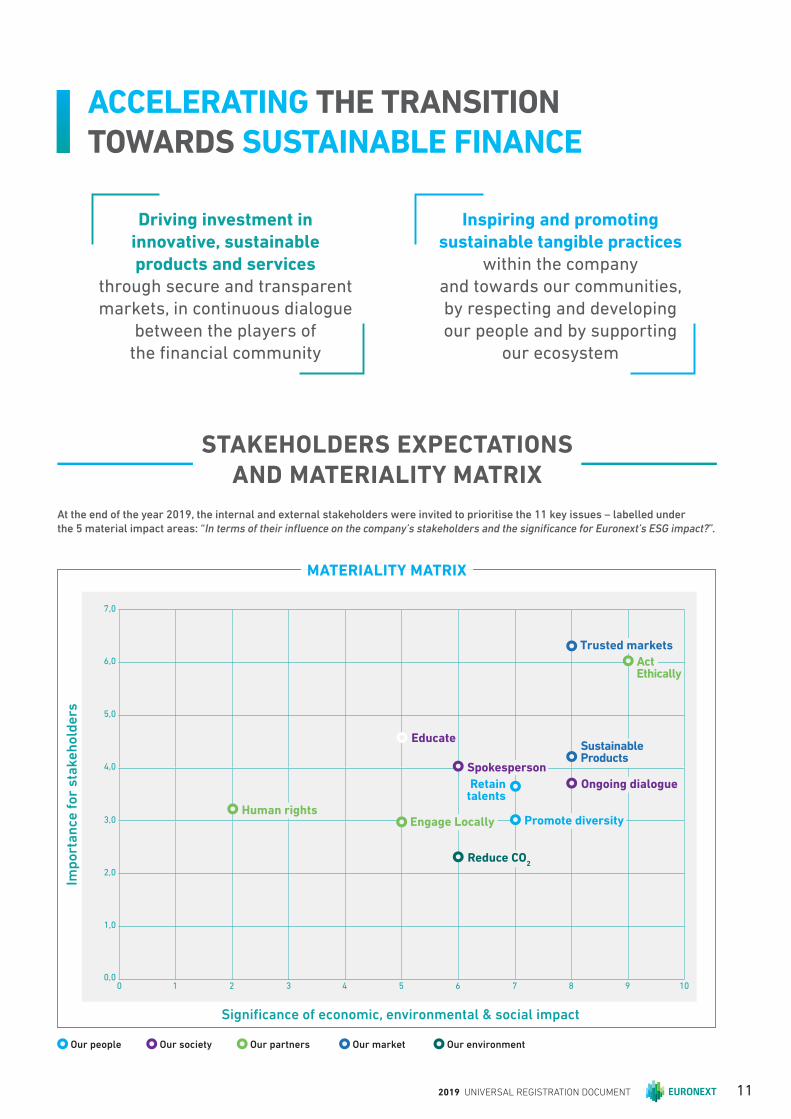
ACCELERATING THE TRANSITION TOWARDS SUSTAINABLE FINANCE
At the end of the year 2019, the internal and external stakeholders were invited to prioritise the 11 key issues – labelled under the 5 material impact areas: “ In terms of their infl uence on the company’s stakeholders and the signifi cance for Euronext’s ESG impact?”.
Driving investment in
innovative, sustainable
products and services
through secure and transparent
markets, in continuous dialogue
between the players of
the fi nancial community
Inspiring and promoting
sustainable tangible practices
within the company
and towards our communities,
by respecting and developing
our people and by supporting
our ecosystem
STAKEHOLDERS EXPECTATIONS AND MATERIALITY MATRIX
Imp
ort
an
ce f
or
sta
ke
ho
lde
rs
1 5 83 7 100 42 6 90,0
1,0
2,0
3,0
4,0
5,0
6,0
7,0
Signifi cance of economic, environmental & social impact
Human rightsEngage Locally
Trusted markets
Sustainable Products
Educate
Spokesperson
Reduce CO2
Ongoing dialogue
Promote diversity
Retain talents
MATERIALITY MATRIX
Act Ethically
Our people Our society Our partners Our market Our environment
2019 UNIVERSAL REGISTRATION DOCUMENT 11

2019 UNIVERSAL REGISTRATION DOCUMENT12 www.euronext.com
1.3 Description of the Business 19
1.3.1 Business Overview 19
1.3.2 Strengths 20
1.3.3 Listing 21
1.3.4 Cash, Derivatives and Spot FX Markets 25
1.3.5 Advanced Data Services 31
1.3.6 Post Trade 33
1.3.7 Euronext Technology Solutions(1) & other 36
1.4 Regulation 38
1.4.1 Overview 38
1.4.2 European Regulation 38
1.4.3 Ownership Limitations and Additional
Notifi cation Requirements 40
1.1 Company Profi le 14
1.1.1 History 15
1.1.2 Ambition 15
1.1.3 Business Environment 16
1.2 Strategy: “Let’s grow together 2022” Strategic Plan 17
1.2.1 “Let’s Grow Together 2022”, Mapping Path
to Build the Leading Pan-European Market
Infrastructure 17
1.2.2 Update in 2019 18
1.2.3 Strategic Targets And Prospects In 2020 18
PRESENTATION OF THE GROUP
2019 UNIVERSAL REGISTRATION DOCUMENT 13

Presentation of the Group11Company Profi le
1.1 Company Profile
Euronext N.V. is a Dutch public company with limited liability
(naamloze Vennootschap) which has its registered office in
Amsterdam. Euronext N.V. is registered with the trade register of
the Chamber of Commerce for Amsterdam, the Netherlands, under
number 60234520. Euronext N.V. has its main subsidiaries in
Belgium, France, Ireland, the Netherlands, Norway, Portugal and the
United Kingdom. Euronext N.V. has expanded its European federal
model, with the acquisition of 100% of the Irish Stock Exchange on
27 March 2018 and of 100% of Oslo Børs VPS since 4 July 2019.
Euronext N.V. has a two-tier governance structure with a Supervisory
Board and a Managing Board.
Euronext was incorporated under the name Euronext Group N.V. on
15 March 2014 in the context of a demerger of Euronext N.V., which
was a company owned by ICE. Euronext Group N.V. changed its name
to Euronext N.V. on 2 May 2014.
The following chart provides with an overview of Euronext N.V.
entities as of 31 December 2019. Percentage refer to both share of
capital and voting rights.
* Sicovam owns a 15.89% stake in Euroclear.
Euronext Markets America LLC 100%Euronext Markets LLC 100%FastMatch Inc. 97.3%
Sicovam Holding S.A. 9.6%
Euronext Technologies S.A.S. 100%Euronext Unipessoal Lda 100%Euronext HK Ltd 100%
EuroCCP 20%
LCH S.A. 11.1%
Euroclear* N.V./S.A. 3.53%Algomi 7.74%Algonext Ltd 50%LiquidShare 13.57%Finance Web Working 60%Tokeny S.a.r.l. 23.5%
iBabs B.V.60%InsiderLog A.B. 80%MSI Services B.V. 60%Company Webcast B.V. 51%IR.Soft Ltd 100%
ISE Old Co Ltd 100%ISE Stock Exchange Services Ltd 100%European Wholesale Securities Market Ltd 80%
Oslo Børs ASA 100%Verdipapirsentralen ASA 100%Oslo Market SOlutions AS 100%Nordic Credit Rating AS 5%
Commicise 78%
EnternextS.A.
100%
100%
100%
100%
100%
100%
100%
100%
100%
Euronnext N.V.
Euronext USInc.
EuronextParis S.A.
EuronextLisbon S.A.
Interbolsa S.A.
EuronextAmsterdam N.V.
EuronextBrusselsN.V./S.A.
EuronextLondon Ltd
Euronext UKHolding Ltd
Euronext IP &IT Holding B.V.
EuronextCorporate
Services B.V.
100% 100%
Oslo Børs VPSHolding ASA
100%100% EuronextNordics
Holding AS
100% Irish StockExchange Plc
2019 UNIVERSAL REGISTRATION DOCUMENT14 www.euronext.com
Presentation of the Group
1
Company Profi le
1.1.1 HISTORY
Today, Euronext is a pan-European exchange group, offering a
diverse range of products and services and combining transparent
and effi cient equity, fi xed income securities and derivatives markets
in Amsterdam, Brussels, Dublin (since March 2018), Lisbon, London(1),
Oslo (since June 2019) and Paris. Euronext’s businesses comprise:
equity, debts, funds and ETFs listing, corporate and investors
services, cash trading, foreign exchange trading, derivatives trading,
advanced data services, post-trade services as well as technology.
In December 2019, Euronext announced the acquisition of 66% of
the capital of Nord Pool expanding into power trading(2 ).
Euronext in its original form was created in 2000 and takes its roots
from the European construction. It was fi rst the result of a three-
way merger of the Paris, Amsterdam and Brussels exchanges,
soon completed by the acquisition of the London-based derivatives
market, LIFFE, and the merger with the Portuguese exchange. The
continental exchanges were combined into a unique federal model
with unifi ed rules and a Single Order Book (except for Portugal),
operating on the same electronic trading platform and cleared by
LCH S.A. CCP, creating the fi rst genuinely cross-border exchange in
Europe and pre-dating all initiatives by policy makers to allow for
the creation of pan-European market places.
In May 2006, Euronext entered into an agreement with NYSE
group for the combination of their respective businesses. The new
holding company of these combined businesses, NYSE Euronext,
was subsequently listed on the New York Stock Exchange and on
Euronext Paris.
In 2010, NYSE Euronext launched Euronext London, a London-based
securities market aiming at attracting international issuers looking
to list in London and benefi ting from Euronext’s value proposition.
In November 2013, ICE, an operator of global markets and clearing
houses, acquired NYSE Euronext. A key element of the overall
transaction was the separation and IPO of NYSE Euronext’s
continental European exchanges as a stand-alone entity. In order
to do this, ICE carved the continental European operations of NYSE
Euronext and Euronext London into a newly formed entity, which
was subsequently renamed Euronext N.V. Since its successful IPO on
20 June 2014, Euronext N.V. has been an independent listed company.
In May 2016, Euronext N.V. launched its strategic plan named
“Agility for Growth” which defi nes the growth ambitions for 2019,
both through organic growth and bolt-on acquisitions. In 2017,
Euronext N.V. has diversifi ed its top line, through the acquisition of
90% of the shares of the forex platform FastMatch, and by investing
in corporates services companies .
In 2018, Euronext N.V. has expanded its listing franchise, welcoming
a new exchange in its federal model with the acquisition of the Irish
Stock Exchange. The Group also strengthened its Corporate Services
off ering with the acquisition of InsiderLog and widen its products
off ering with the launch of Investor Services through the acquisition
of Commcise in December 2018.
In 2019, Euronext N.V. pursued the expansion of its federal model
with the acquisition of Oslo Børs VPS, strengthening its post-trade
franchise and marking the first step of its Nordics expansion
ambitions. The Group also continued to invest into innovative
solutions, investing in Tokeny Solutions and acquiring a majority
stake in OPCVM360 (renamed as Euronext Funds 360). Euronext N.V.
entered, in December 2019, in a binding agreement with Nordics and
Baltics transmission system operators to acquire a majority stake in
Nord Pool, a leading power trading infrastructure(2 ).
1.1.2 AMBITION
Euronext is the leading continental pan-European marketplace for
the real economy. Its core mission and the driver of its strategy is to
power pan-European capital markets to fi nance the real economy,
while delivering value to shareholders.
As a pan-European group with a profi le “united in diversity”, Euronext’s
ambition is to play a constructive role in the local ecosystems and act
as an industry problem solver while contributing to making Europe
an attractive block in a multipolar world. The Group’s model is best
suited to contribute to the construction of a true pan-European
market. It operates regulated markets in Belgium, France, Ireland, the
Netherlands, Norway, Portugal and the United Kingdom, all of which
are connected via a unique, single trading platform with a harmonised
regulatory framework. Euronext can easily connect other independent
exchanges to its single trading platform, as demonstrated with
Euronext Dublin on 4 February 2019 and the planned migration of Oslo
Børs markets in 2020. Euronext’s unique Single Order Book allows
investors to get the benefi t of being able to trade, clear and settle in
a uniform way throughout various jurisdictions while also accessing
a broad and deep pool of liquidity. Euronext is also ready to welcome
other independent Eurozone market platforms within the Euronext
model, which is demanding in terms of commercial and fi nancial
performance, ambitious in terms of innovation, and fundamentally
federal in its governance, as demonstrated by the closing in 2018 of
the acquisition of Euronext Dublin, formerly the Irish Stock Exchange
and in 2019 with the acquisition of Oslo Børs VPS
As an operator of regulated markets, Euronext’s mission is to bring
together buyers and sellers in venues that are transparent, effi cient
and reliable. The Group combines cash, fi xed income securities and
derivatives markets in its seven locations together with a global
foreign exchange trading venue. Euronext’s broad portfolio of products,
services and platforms covers the full range of market services,
including the provision of market information, the development and
operation of information technology systems, investor services and
the ease of access to settlement and clearing facilities.
In the recent years, Euronext has expanded into fast growing revenue
services and new asset classes. Euronext has built a complete
Corporate Services off ering through successive bolt-on deals. This
off ering, also aiming at non-issuers, was designed to meet clients’
needs in today’s critical areas such as regulation, governance,
communication, and compliance. Euronext has also entered new asset
classes with the acquisition of Euronext FX, expanding into the spot
FX market and then targeting a new set of clients around the globe.
These successful integrations highlight Euronext’s value proposition
to benefi t from Euronext’s extended client base and several cross-
selling opportunities.
(1) On 30 March 2020 Euronext has filed an application for the revocation of its RIE licence, subject to approval from the FCA. Under the applicable rules this
implies that Euronext will have to cease all regulated activities in the UK as per 30 June 2020. Euronext will ensure an orderly wind down of its limited
regulated activities in close consultation with the FCA.
(2 ) Transaction completed on 15 January 2020.
2019 UNIVERSAL REGISTRATION DOCUMENT 15
Presentation of the Group11Company Profi le
Euronext aims to be the trusted choice for its clients providing them
access to European fi nancial markets and to transform from an
exchange into a market infrastructure, boosting its presence across
the full value chain of financial markets, offering best-in-class
services to all its clients.
1.1.3 BUSINESS ENVIRONMENT
As an exchange operator, Euronext’s operations and performance
depend signifi cantly on market and economic conditions in Europe,
but also the United States, Asia and the rest of the world. Euronext
is operating in a business environment that is best described as
a complex non-linear system with dependencies on decisions
of policy makers and regulators worldwide, with subsequent
developments in the legal, regulatory and tax environment as well
as the macroeconomic environment both in Europe and abroad.
Competition
On the corporate listing side, competition between exchanges for
domestic issuers is rare. When a domestic issuer lists on another
exchange, it tends to be on an sector specifi c market rather than
on another European stock exchange, in particular in respect of
global companies and SMEs in the technology sector. As part of its
Agility for Growth strategy, Euronext strives to attract issuers from
new markets: Germany, Switzerland, Italy and Spain and therefore
will face the competition of local market operators. Euronext
has offi ces in four European cities outside its core markets – in
Munich (Germany), in Milan (Italy), in Madrid (Spain) and in Zurich
(Switzerland) – to assist Tech companies in developing their business
on a greater scale through capital markets. Euronext has welcomed
16 companies from those countries in 2019 on its markets, with a
combined market capitalization of close to €1 billion. More than 40%
of the 132 TechShare participants were issued from those countries .
While competition in the cash trading market is relatively mature,
in recent years Euronext has faced increased pressure on pricing
and market share in equity options trading, in particular from new
entrants to the market that have fee structures that are signifi cantly
lower than the Company’s fee structure and a reduced cost structure
aligned with their narrower service off ering. However, Euronext
remained the largest liquidity pool in Europe, with a market share
on its cash equity markets above 60%.
The competition for proprietary real-time market data is still
limited as trading participants prefer to receive and use market
data from the home exchange rather than using substitute pricing.
However, Euronext is experiencing an increasing pressure, both
from a regulatory (MiFID II) and competitive perspective (alternative
trading platforms, including MTFs such as CBOE who focus on the
most liquid blue chip stocks). Nevertheless, Euronext believes that
diversity in a wide range of stocks is Euronext’s strength in this
increasingly competitive environment and will help Euronext retain
its position as preferred data source.
In less time critical areas such as reference data – and particularly
corporate actions and historical data – participants want a
consolidated European feed from a single source. Euronext is not
the only source of corporate actions or historical data so there is
more competition in these areas.
As for market operator technology, the market for financial
information technology is intensely competitive and characterised
by rapidly changing technology and new entrants. Euronext has built
the next generation trading platform, Optiq®, and is well positioned
to benefi t from its state-of-the art stability and latency.
Regulated Markets
Regulated markets are markets constituted in an EEA Member
State’s territory that fulfi lled the criteria of the MiFID. Regulated
markets have higher disclosure and transparency requirements than
multi-lateral trading facilities (“MTF”). Trading on regulated markets
is subject to stricter rules than on other types of trading venues.
A regulated market cannot operate without securing prior
authorisation from its regulator(s). Authorisation is subject to
compliance with organisational requirements pertaining to
confl icts of interest, identifi cation and management of operational
risks, systems resilience, the existence of transparent and non-
discriminatory trading rules, as well as suffi cient fi nancial resources.
Multilateral Trading Facilities
Multilateral trading facilities (“MTFs”) are primarily institutional
investor-focused marketplaces off ering trading in pan-European
securities on low latency, low cost platforms and are usually operated
by financial institutions (e.g. banks, brokerages) or operators
of regulated markets. MTFs are also subject to less stringent
disclosure, transparency and trading rules than regulated markets
and have more discretion to operate and organise themselves.
Euronext operates a number of MTFs, including its SME and midcap-
dedicated marketplace Euronext Growth (formerly Alternext)
(Belgium, France, Portugal), Enterprise Securities Market in Ireland,
Euronext Access (formerly the Marché Libre) in Belgium and in France
and Merkur Market in Norway. Euronext also operates several MTFs
in Ireland: Global Exchange Market, for listing debt securities aimed
at professional investors and investment funds, Atlantic Securities
Market, for US listed companies seeking to access euro pools of
capital. In Norway, Euronext operates NOTC, a platform to provide
quotes and allow non-listed fi rms to benefi t from a level of liquidity.
Finally, Euronext operates Euronext Block, a pan-European equity
block pool from the United Kingdom.
Systematic Internaliser
The systematic internaliser (“SI”) regime was introduced by MiFID
in 2007 which defines a SI as an investment firm which, on an
organised, frequent systematic and substantial basis, deals on own
account when executing client orders outside a regulated market,
an MTF or an OTF without operating a multilateral system. SIs are
bilateral trading platforms usually operated by banks or brokers
and off ering them the possibility to match client orders against their
own capital, as an alternative to sending their orders to multilateral
trading venues such as regulated markets or MTFs. SIs are subject
to much lighter organisational, disclosure, and transparency
requirements than regulated markets and MTFs while some
elements of the framework could be amended (see Risk chapter).
Over-the-counter (“OTC”)
In all asset classes, Euronext is faced with competition from
unlicensed marketplaces operating over-the-counter (“OTC”).
2019 UNIVERSAL REGISTRATION DOCUMENT16 www.euronext.com

Presentation of the Group
1
Strategy: “Let’s grow together 2022” Strategic Plan
11.2 Strategy: “Let’s grow together 2022” Strategic Plan
1.2.1 “LET’S GROW TOGETHER 2022”, MAPPING PATH TO BUILD THE LEADING PAN-EUROPEAN MARKET INFRASTRUCTURE
Since the IPO, through optimal resource allocation and cost control,
as well as stronger development of underexploited businesses,
Euronext has strived to deliver its solutions for the real economy.
Following the delivery of its IPO objectives a year in advance, in
May 2016 Euronext published its strategic plan, Agility for Growth,
outlining its growth ambitions to 2019. Euronext achieved most of
its Agility for Growth ambitions one-year in advance, and announced
in October 2019 its new strategic plan, Let’s Grow Together 2022,
introducing its growth ambition to 2022.
Under this plan, Euronext is determined to build the leading pan-
European market infrastructure, connecting local economies to
global capital markets, by growing and seizing opportunities, to
accelerate innovation and sustainable growth. The Group will
continue to extend its business across the full value chain of
fi nancial markets, enhancing its best-in-class services to all clients,
and consolidating its key role within the pan-European fi nancial
ecosystem.
The strategic plan relies on leveraging Euronext’s unique federal
model, creating a sustainable competitive advantage, and building
on its strong assets to deliver future growth.
Euronext’s 2022 Business Ambitions
Euronext will build on its existing core assets to grow and diversify
its local and global infrastructures. Euronext will proactively address
the changing landscape by developing innovative solutions and
models and capitalizing on local expertise.
Euronext will leverage its leadership in listing to expand its sectoral,
Tech and SME expertise and attract even more international
issuers. Euronext will be positioned upstream in the IPO process
to accompany entrepreneurs and corporate leaders while getting
closer to private equity players to become the preferred exit strategy.
The Group will also develop its innovation and sustainable off ering
in Corporate Services to better meet the needs of its clients.
Euronext will develop its leading global position in the listing of debt
and funds, expand ancillary services and its leading green bond
off ering.
Euronext will continue to extract value in cash trading, by leveraging
its federal model and unrivalled European footprint, strengthening
client relationships, and deploying new co-designed market models.
The Group will roll-out its successful cash yield and liquidity
management expertise to the derivatives business. Euronext will
further expand its commodities franchise and target international
clients.
Euronext FX will diversify through the development of new product
sets, specifi cally derivatives, and target new client segments and
geographies.
Euronext will invest in advanced data and build analytics products,
while adapting its off ering to the evolving needs of clients and to
regulation. The Group will expand its agile and cost-eff ective index
franchise.
Euronext will exploit the power of Optiq®, its proprietary new
generation cutting-edge trading platform to build an entire
ecosystem and become the trusted alternative trading platform.
Following the acquisition of VPS, Euronext aims to transform its
post-trade assets from core local market infrastructures to value-
added, innovative solutions.
Euronext’s 2022 Transformation
Euronext will engage in transformation projects that will enable the
Group to grow and make its model scalable.
Euronext will empower teams to grow, perform and innovate. It will
support teams to execute, collaborate and challenge within a positive
performance culture focused on clients.
Euronext will enhance client connectivity by developing new
solutions through a focused client culture, cross-business alignment,
improved data management and innovative tools deployment.
Euronext will deliver operational excellence by improving operating
effi ciency through an integrated technology backbone, enhance
client service interaction and integrate new businesses while
keeping its trademark cost discipline.
Innovation and Sustainable Finance at the Heart of the Strategy
Innovation
Euronext will pursue the development of innovation solutions
and services to enable the Group to capture new opportunities
and proactively address challenges from the industry. Euronext’s
innovation framework to 2022 will be articulated around:
n collective intelligence and co-design;
n accelerated digitalisation;
n enriching Euronext’s core technology capabilities;
n leveraging innovative technology such as tokenisation, bespoke
trading models and artifi cial intelligence.
Sustainable Finance
As a key market infrastructure, at the heart of the financial
ecosystem, Euronext will support the acceleration of the transition
towards sustainable growth and fi nance, notably by capitalizing on
Oslo Børs VPS’s expertise and the Group’s franchise in green bonds
and ESG indices.
Euronext commits to:
n the development and active support of innovative and sustainable
products and services for clients and other members of the
fi nancial community;
2019 UNIVERSAL REGISTRATION DOCUMENT 17
Presentation of the Group11Strategy: “Let’s grow together 2022” Strategic Plan
n the promotion of tangible sustainable practices in Euronext
and within its wider ecosystem to support the transition
to sustainable growth and to contribute to the Sustainable
Development Goals.
Euronext 2022 Financial Targets(1)
Euronext’s growth ambition is reflected in the 2022 financial
targets and a rigorous capital allocation strategy.
n Revenue is expected to grow by 2% to 3% CAGR(2) 2018ProForma-
2022Expected, excluding potential acquisitions, driven by (i) organic
growth, (ii) cross-cycle trading growth in line with European GDP
and (iii) continued focus on revenue diversifi cation and services.
n EBITDA(3 ) margin is expected to be above 60%, excluding
potential acquisitions, driven by (i) continued best-in-class cost
discipline, (ii) investments in operational excellence and (iii) uplift
profi tability of already-acquired companies to Euronext’s level.
n To realise these ambitions, Euronext expects to record one-off
costs of €12M relating to internal project costs over the period.
n Euronext expects to achieve €12M of run-rate cost synergies by
2022 at Oslo Børs VPS, to incur €18M of restructuring costs(4 ),
and to achieve a ROCE(5 ) on this transaction above the WACC
by Year 3.
n Capex is expected to remain between 3% and 5% of revenue.
n Dividend policy set with a 50% pay-out of reported net income.
1.2.2 UPDATE IN 2019
Launch of Euronext Green Bonds Off ering
In November 2019, Euronext announced the creation of a new
Euronext Green Bonds off ering across its six regulated markets.
The initiative is operated out of Euronext Dublin, the Group centre of
excellence for Debt, Funds and ETFs, and is designed to encourage
and promote more sustainable investment in Europe. The Green
Bonds off ering marks the fi rst product launch of Euronext’s new
three-year strategic plan, “Let’s Grow Together 2022”, illustrating
Euronext’s commitment to accelerating the transition towards
sustainable finance, by developing sustainable products and
services for the fi nancial community.
Acquisition of Nord Pool
In December 2019, Euronext entered into a binding agreement to
acquire 66% of the share capital and voting rights of Nord Pool(6),
which runs a leading physical power market in Europe, operating
from its headquarters in Oslo and offi ces in Helsinki, Stockholm,
Tallinn, Berlin and London. Nord Pool is the second largest
power market in Europe, off ering trading, clearing, settlement
and associated services in both intraday and day-ahead physical
markets across 14 European countries, notably in the Nordic and
Baltic regions. The acquisition of Nord Pool diversifi es Euronext
revenue mix to new asset classes not correlated with fi nancial
market cycles, and will strengthen its commodity franchise by
leveraging Nord Pool’s leadership position and know-how in
physical power markets.
1.2.3 STRATEGIC TARGETS AND PROSPECTS IN 2020
As announced at the 2019 Investor Day, Euronext expects to incur
non-recurring costs related to the integration of Oslo Børs VPS
and internal digitalisation projects, which will start generating
savings in 2021. As a result, Euronext expects its operating costs
excluding depreciations and amortisations to temporarily increase
by a mid-single digit in 2020, compared to its second half 2019
annualised cost base.
Euronext will pursue delivering on its 2022 strategic plan as well
as the integration of Oslo Børs VPS with the migration of Oslo Børs
market to the Optiq® trading platform expected in 2020. Despite
the high level of uncertainty resulting from the Covid-19 pandemic,
the management believes that - on the basis of strong credit
worthiness, fl exible fi nancial structure, high level of profi tability
and signifi cant percentage of non-volume related revenues – the
Group is well equipped to cope with the evolving situation and
pursue its strategic objectives of its strategic plan “Let’s Grow
Together 2022”. Please refer to Section 2.1 Risk Factors for more
details on the Covid-19 pandemic.
(1) Based on 2018 proforma figures (including FY 2018 for Oslo Børs VPS and Euronext Dublin) of €734M revenue and 57% EBITDA margin, rebased
for the adoption of IFRS16.
(2 ) Compound annual growth rate.
(3 ) As defined in Chapter 5 and as defined as EBITDA1 in section 7.1.1.
(4 ) Do not meet IAS 37 recognition criteria.
(5 ) Return on Capital Employed.
(6 ) Completed on 15 January 2020.
2019 UNIVERSAL REGISTRATION DOCUMENT18 www.euronext.com
Presentation of the Group
1
Description of the Business
1.3 Description of the Business
1.3.1 BUSINESS OVERVIEW
Euronext is a pan-European exchange group offering a diverse
range of products and services and combining transparent and
effi cient equity, fi xed income securities and derivatives markets
in Amsterdam, Brussels, Dublin, Lisbon, London(1), Oslo and Paris.
Euronext’s businesses comprise listing, cash trading, derivatives
trading, spot FX trading, power trading, investor services, advanced
data services, post-trade and technologies & other.
Euronext’s markets provide the leading listing venues in continental
Europe based on the number of companies listed as of 31 December
2019. Nearly 1,500 issuers representing a combined market
capitalisation of approximately €4.5 trillion were admitted to
trading on Euronext’s markets as at 31 December 2019. In addition,
the Company has 1,240 exchange traded funds (“ETFs”) and over
80,000 structured products. As of 31 December 2019, Euronext
ranked fi rst in Europe in terms of market capitalisation of listed
companies and second in terms of number of companies listed
among the largest exchange groups in Europe, excluding Bolsas y
Mercados Españoles (on which a large proportion of listed issuers
are open-ended investment companies, limiting comparability).
Euronext ranked fi rst in terms of monthly lit order book trading
volume in equity for the last twelve months ended 31 December
2019 among all trading venue in Europe (including BATS-Chi-X).
Euronext’s pan-European cash equities trading venue is the market
leader in cash equity trading in its six home continental European
markets of Belgium, France, Ireland, the Netherlands, Norway and
Portugal, based on domestic market capitalisation as of 31 December
2019. Euronext market share reached 68.8% on cash trading market
over 2019. Euronext provides multiple marketplaces including its
MTFs, for investors, broker-dealers and other market participants to
meet directly to buy and sell cash equities, fi xed income securities
and exchange traded products (“ETPs”).
Euronext’s derivatives trading business has a strong market position
on benchmark index futures and options such as the CAC 40®, AEX®,
BEL 20® and PSI 20®, single stock options and futures and commodity
derivatives. It ranks third among European exchange groups in
terms of open interests of derivatives traded as at 31 December
2019. With the CAC 40® being the second most traded national index
in Europe for example, Euronext off ers options contracts based on
all of the blue-chip equities listed on Euronext, thereby reinforcing
liquidity with respect to those equities. The commodity derivatives
off ered by the derivatives trading business include the milling wheat
futures contract which is a world class contract for the European
Union agriculture market.
Euronext’s advanced data services business distributes and sells
real-time, historic and reference data to global data vendors, such
as Reuters and Bloomberg, as well as to fi nancial institutions and
individual investors. With a portfolio of over 1,100 benchmark
indices and iNAVS, including CAC 40® in France and AEX® in the
Netherlands, the Company is a leading provider of indices and a
provider of advanced analytics products.
Post-trade services are an important part of the services Euronext
provides to its clients. In 2013, the Company entered into a clearing
agreement with LCH S.A., the Paris-based clearing house of LCH
Group Limited (“LCH.group”), in respect of the clearing of Euronext’s
cash products. In 2017, Euronext renewed the separate derivatives
clearing agreement with LCH S.A. that provides for a revenue
sharing arrangement in respect of the clearing of Euronext listed
derivatives, and became minority shareholder with strong pre-
emption rights, with 11.1% of LCH S.A. capital. In addition, Euronext
owns and operates Interbolsa, the Portuguese national Central
Securities Depository (“CSD”) and VPS, the Norwegian national CSD.
Since 2016, Euronext also offer user choice in clearing for the
equity markets within the Eurozone, through the implementation
of a preferred CCP model followed by a fully interoperable service.
Euronext Technology Solutions & other business off ers technology
solutions and services to exchanges and venue operators. These
solutions and services use Optiq® and other applications developed
by Euronext or licensed from third-parties. Optiq® has already been
licensed to fi ve international exchanges. This rapid take-up by the
exchange industry demonstrates the attractiveness of the reliability,
fl exibility and cost of ownership benefi ts that Optiq® off ers.
Euronext continues to provide software support and maintenance
services for the legacy trading platforms, Euronext UTP and Nouveau
Système de Cotation (“NSC™”). Euronext has a perpetual, royalty-free
license from ICE to use, modify and sub-license these platforms
(see section 7.2 “Material contracts and related party transactions”).
In addition to software licensing, Euronext off ers access to its trading
software in the form of managed services. Exchanges and venue
operators can take advantage of fully-hosted trading and clearing
platforms without investing in data center or network infrastructure.
With banks and financial intermediaries increasingly seeing
migration to cloud and software-as-a-service as solutions to the
competing pressures of cost-reduction and regulatory complexity,
Euronext’s experience as a service provider is receiving renewed
interest. Euronext’s MiFID II compliant MTF and SI services build
on Euronext’s own software, processes and infrastructure and
off er clients an eff ective way to reduce costs without increasing
regulatory risk.
The Technologies and other business also receives revenue for
network connectivity and server colocation under a revenue sharing
agreement with ICE. This agreement enables Euronext to benefi t
from service sales to clients who connect to its markets via the ICE
SFTI® network or who take colocation space in the ICE data centers
that house Euronext’s trading platforms.
(1 ) On 30 March 2020 Euronext has filed an application for the revocation of its RIE licence, subject to approval from the FCA. Under the applicable
rules this implies that Euronext will have to cease all regulated activities in the UK as per 30 June 2020. Euronext will ensure an orderly wind
down of its limited regulated activities in close consultation with the FCA.
2019 UNIVERSAL REGISTRATION DOCUMENT 19

Presentation of the Group11Description of the Business
The following table sets out information relating to the sources of total revenue for the year ended 31 December 2019 and for the year
ended 31 December 2018:
In thousands of euros
Year ended 31 December 2019 Year ended 31 December 2018
Revenue % of total revenues Revenue % of total revenues
Listing 128,951 19.0 % 106,490 17.3 %
Trading revenue 272,810 40.2 % 276,572 45.0 %
of which:
n Cash trading 205,565 30.3 % 210,947 34.3 %
n Derivatives trading 44,324 6.5 % 43,910 7.1 %
n Spot FX trading 22,921 3.4 % 21,715 3.5 %
Investor services 5,735 0.8 %
Advanced data services 128,756 19.0 % 118,298 19.2 %
Post-trade 104,831 15.4 % 77,381 12.6 %
of which:
n Clearing 55,237 8.1 % 55,331 9.0 %
n Custody and Settlement 49,594 7.3 % 22,050 3.6 %
Euronext Technology Solutions & other 37,805 5.6 % 36,063 5.9 %
Other income 220 0.0 % 229 0.0 %
TOTAL REVENUE 679,108 615,033
Euronext’s businesses are characterised by recurring revenue
streams which generate resilient and robust free cash fl ow and
allow Euronext to operate and invest in its business with fl exibility.
The Group’s market expertise and proven, multi-asset class
technology infrastructure allow Euronext to launch new products
without substantial additional capital expenditure. Further, the
Company’s trading businesses do not expose it to credit risk or
counterparty risk, which is borne by the counterparties to the trade
and not by the markets. Euronext believes that its capital-light
business and resilient free cash fl ow generation provide a potential
for attractive return for shareholders while observing its regulatory
capital requirements.
Liquidity and Transparency to all Market Participants Through Regulated Exchanges
Euronext’s cash equities markets have a diverse member base by
geography and trading profi le, making for a particularly rich and
diversifi ed order book.
The combination of Euronext’s position as a leading pan-European
trading venue, the quality of its markets and the expertise of the
Company’s teams have enabled Euronext to increase its market
share in cash equities trading of the securities listed on its markets
from 60% in the in 2011 to more than 65% since 2018.
1.3.2 STRENGTHS
focus on core European markets
resilient model delivering consistent
growth and profitability
liquidity and transparency to all market participants through regulated
exchanges
offering of a wide range of product
united in diversity’ with an open federal
model
21
3 4 5
Focus on Core European Markets
Euronext benefits from a diverse client base, both in terms of
geographic distribution and type of trading fl ow. The Company has an
established continental European and United Kingdom client base,
representing 55% of cash equities trading average daily volume
and 71% of derivatives trading average daily volume for the year
ended 31 December 2019. A substantial portion of the fl ow from the
United Kingdom is from global clients with headquarters based in
the United States. While United States and Asian clients accounted
for 42 % and 3% respectively of Euronext’s cash equities trading
average daily volume and 29% and 0% respectively of its derivatives
trading average daily volume for the year ended 31 December 2019,
the Group believes these geographic client segments are currently
underexploited and off er potential for growth.
Resilient Model Delivering Consistent Growth and Profi tability
Euronext’s sources of revenues are diversifi ed across the businesses,
markets and client segments. For the year ended 31 December 2019,
approximately 50% of the Company’s revenues were generated by
the non-volume related businesses. Non-volume related businesses
include advanced data services, listings excluding IPOs, custody and
settlement, and Euronext Technology Solutions & other. This helps
to limit Euronext’s exposure to cyclicality in demand for particular
products or services or in individual markets.
2019 UNIVERSAL REGISTRATION DOCUMENT20 www.euronext.com
Presentation of the Group
1
Description of the Business
The relative share of trading on competing platforms has been
relatively stable over the past five years. The primary tool for
supporting market share is the fl agship Supplemental Liquidity
Provision programme, which rewards liquidity providers for
ensuring Euronext’s market quality remains high, whilst balancing
against yield management considerations. Further tool were
developed to support market share such as dedicated fee schemes
for non-member proprietary fl ows or retail fl ows.
Off ering of a Wide Range Of Product Services and Platforms
Euronext’s issuer base is diverse, comprising about 1,500 companies
from within its home markets as well as elsewhere in Europe,
internationally and span ten sectors by industry classification
benchmark. Euronext’s corporate issuers differ in size and
represent a combined market capitalisation of €4.5 trillion.
The Company is the third-largest exchange traded funds
(“ETF”) market in continental Europe by number of ETF trades,
with 1,240 listed ETFs and an average daily trading value of
approximately €301 million from January to December 2019.
Euronext is the third -largest warrants and certifi cates market in
Europe, with over 80,000 instruments at 31 December 2019, and
in total nearly 250,000 products have been listed in 2019. Close to
6.5 million trades took place on those instruments in the twelve
months ended 31 December 2019.
Euronext is also a leading pan-European derivatives trading venue,
with derivatives trading activities across fi nancial and commodity
derivative products. The Group has established the CAC 40 futures
contract as the second most traded national index in Europe, with an
equivalent of €6.5 billion in nominal value on an average daily basis.
The milling wheat contracts which are the leading wheat derivatives
in continental Europe as well as rapeseed commodity contracts
continue to be included in recognised commodity benchmarks
such as the S&P World Commodity Index and Rogers International
Commodity indices.
Euronext operates an important bond market in Europe with
approximately 49 ,000 corporate, financial institutions and
government bonds listed on its markets and an internationally
recognised derivatives platform.
Optiq®
Euronext has upgraded its core trading platform with Optiq®, a new
enhanced, multi-market trading platform, providing customers
with maximum fl exibility, simplifi ed and harmonized messaging
as well as high performance and stability. Optiq® combines latest
technologies with in-house expertise.
Optiq® has been rolled out across the Euronext markets to replace
the Euronext Universal Trading Platform (“UTP”) in a phased
implementation process. Market data have been managed through
Optiq® for both cash and derivatives since July 2017, already
delivering massive benefits to the clients’ community. In April
and June 2018, Optiq® trading engine went live for fi xed income
and cash markets, with impressive stability and performance.
In December 2019, Euronext completed the successful completion
of the roll-out of its Derivatives market to Optiq®. Oslo Børs markets
are planned to migrate to Optiq® in 2020.
Some of the third party exchange using UTP or former Euronext
solutions have already started projects to migrate to Optiq®. Other
exchanges and market operators have also shown interest in this
best of breed solution.
“United in Diversity” with an Open Federal Model
Euronext is the only pan-European exchange operating across
multiple jurisdictions with a harmonised regulatory framework,
a Single Order Book for its exchanges in Amsterdam, Brussels,
Dublin London(1) and Paris and a single trading platform off ering
access to all markets through a single connection. The Single Order
Book consolidates liquidity in each multi-listed security to tighten
spreads and increase market depth and achieves optimal price
formation. Issuers listing on more than one of the Group’s markets
benefi t from enhanced visibility, qualifi cation for inclusion in more
local indices and greater exposure for their volumes and prices.
The Group has generated sustainable and diversifi ed cash fl ows
across institutional, high frequency and algorithmic trading,
own account, agency brokerage and retail client classes. The
Single Order Book model and pan-European technology are key
to Euronext’s unique federal market structure. This structure
enables the Company to integrate its constituent markets while they
remain subject to regulation by national regulators. As a reminder,
Euronext is also regulated by a college of regulators at Group level
(see section 1.4.2).
1.3.3 LISTING
1.3.3.1 Listing − Products and Services
The Group’s issuer base is diverse, comprised of around 1,500
companies from within its home markets as well as elsewhere
in Europe, and across the globe, spanning ten sectors by industry
classification benchmark. Euronext’s corporate issuers differ
in size and represent a combined market capitalisation of €4.5
trillion. Euronext’s listing franchise includes around 320 large
cap companies (companies with a market capitalisation above
€1 billion) and 1,110 small & mid capitalisation companies as of
31 December 2019.
At the end of December 2019 Euronext’s listed issuers accounted
for 50% of Euro STOXX 50 component securities, and 29% of Euro
STOXX 600 component securities. In addition, since the acquisition
of the Irish Stock Exchange in March 2018 (operating as Euronext
Dublin), Euronext is the number one venue of choice for the listing of
bonds globally, with over 49 ,000 corporate, fi nancial institutions and
government bonds and money market instruments, representing
over 4,200 issuers from over 90 jurisdictions listed on Euronext’s
markets. Euronext is also the number one venue globally for listing
investment funds, with over 250 funds and almost 900 sub-funds
listed.
(1 ) On 30 March 2020 Euronext has filed an application for the revocation of its RIE licence, subject to approval from the FCA. Under the applicable
rules this implies that Euronext will have to cease all regulated activities in the UK as per 30 June 2020. Euronext will ensure an orderly wind
down of its limited regulated activities in close consultation with the FCA.
2019 UNIVERSAL REGISTRATION DOCUMENT 21

Presentation of the Group11Description of the Business
Euronext issuers are also eligible to a family of leading index
products in each of its national markets including the AEX® in
the Netherlands, BEL 20® in Belgium, CAC 40® in France, ISEQ®
in Ireland, PSI 20® in Portugal and the OBX® in Olso. Euronext’s
family of index products provides investors and issuers with
benchmarks enabling them to measure and trade the performance
of key segments and strategies. The Group also off ers extensive
trading opportunities to investors, such as single stock derivatives
on the underlying securities listed on its markets.
Furthermore Euronext off ers issuers an established and credible
fi nancial marketplace for their capital market needs. In order
to attract issuers to Euronext’s marketplace and maintain
relationships with clients (existing issuers, prospects and other
stakeholders) the Company undertakes various initiatives through
direct prospecting and continuous client interaction. In addition,
Euronext organises dedicated events for prospects, issuers and
investors aimed at improving and facilitating access to capital
and promoting its markets on an international and national level.
A market for each step of a company growth
Euronext operates diff erent kinds of markets according to suit the
evolving needs of a company at various stages of growth. These
markets enable corporate clients in different stages of their
development, whether early stage growth companies or more
established businesses, to access a broad range of investors and
provide access to capital.
Main markets: Euronext, Oslo Børs and Oslo Axess
Eur onext in Amsterdam, Brussels, Dublin, Lisbon, London, Paris
as well as Oslo Børs and Oslo Axess are European regulated
markets under MiFID suited to mid and large sized companies with
substantial fi nancing requirements. These main markets provide
access to a large range of international investors and the possibility
of inclusion in well-known European indices. Euronext lists a wide
variety of securities, including domestic and international equity
securities, convertible bonds, debt securities (including corporate
and government bonds), structured products (including warrants
and certificates and structured notes), ETFs, open-ended and
closed-ended investment funds.
Euronext is segmented according to market capitalisation:
n compartment A: companies with a market capitalisation of more
than €1 billion;
n compartment B: companies valued between €150 million and
€1 billion;
n compartment C: companies with a market capitalisation of less
than €150 million.
In 2020, Oslo Børs will form part of the Euronext harmonised
rulebook.
Junior markets: Euronext Growth, Euronext Access and Merkur Market
Euronext Growth (Brussels, Paris, Lisbon and Dublin) the pan-
European MTF dedicated to small & mid-caps – has been offi cially
registered as “SME Growth Market” for both shares and bonds
by the competent authorities in Belgium, France, Ireland and
Portugal. This status, introduced under MiFID II, has been designed
to facilitate access to capital markets for European SMEs by further
developing qualifi ed markets to cater to the specifi c needs of small
and medium-sized companies.
Euronext Growth is dedicated to fast-growing small and mid-caps
seeking to raise funds to fi nance their growth. It off ers lighter
requirements than Euronext’s regulated markets while still
providing access to a signifi cant number of European investors
focused on SMEs. Listed companies have greater flexibility
in their choice of accounting standards and are subject to less
extensive post-listing reporting requirements than companies
listed on regulated markets. Euronext Growth lists a wide variety of
securities, including domestic and international equity securities,
convertible bonds and corporate bonds.
Euronext Access markets and Merkur Market are designed
especially for start-ups and SMEs that wish to join a stock
exchange to finance growth and gain the reputational
advantages of listing but do not meet the criteria for admission
to Euronext’s regulated markets and Euronext Growth or Oslo
Axess. These markets are open to any company, regardless of
size, performance, maturity or industry. Corporate bonds and
structured products are also traded on Euronext Access. Euronext
Access+ is a special compartment of Euronext Access tailored
to the needs of start-ups and SMEs. Launched in 2017, Euronext
Access+ helps smaller companies make a smooth transition and
acclimatisation to other Euronext markets, notably in terms of
investor communications and transparency. This compartment,
which is part of Euronext Access, also serves as a springboard
to other Euronext markets.
Other Markets
Euronext also off ers alternative markets such as: 1) Trading Facility,
a MTF in Belgium, 2) Euronext Expert Market, based in Brussels,
which enables negotiation of prices for unlisted products – such
as shares, real estate certifi cates notes and bonds – once a week,
3) Global Exchange Market (GEM), a multilateral trading facility
based in Dublin, for listing debt securities aimed at professional
investors and investment funds, which is the largest MTF listing
venue in Europe, with over 21,000 bonds and 1,400 investment
funds classes listed and 4) Atlantic Securities Market (ASM), a MTF
in Dublin suited to US listed companies seeking to access euro
pools of capital. 5) NOTC: the Oslo platform to provide quotes and
allow non-listed fi rms to benefi t from a level of liquidity.
Added-Value Services for Issuers
Euronext provides to its issuers a range of services including:
Advocacy Role
Euronext provides advocacy to represent the interests of corporate
client companies at the level of Euronext as well as at national and
European levels for specifi c issues related to fi nancial markets.
As part of this, Euronext regularly communicates with its issuers
and investor relations organisations, arranges issuer Committees
and participates in consultations with regulatory bodies on a wide
range of topics.
2019 UNIVERSAL REGISTRATION DOCUMENT22 www.euronext.com
Presentation of the Group
1
Description of the Business
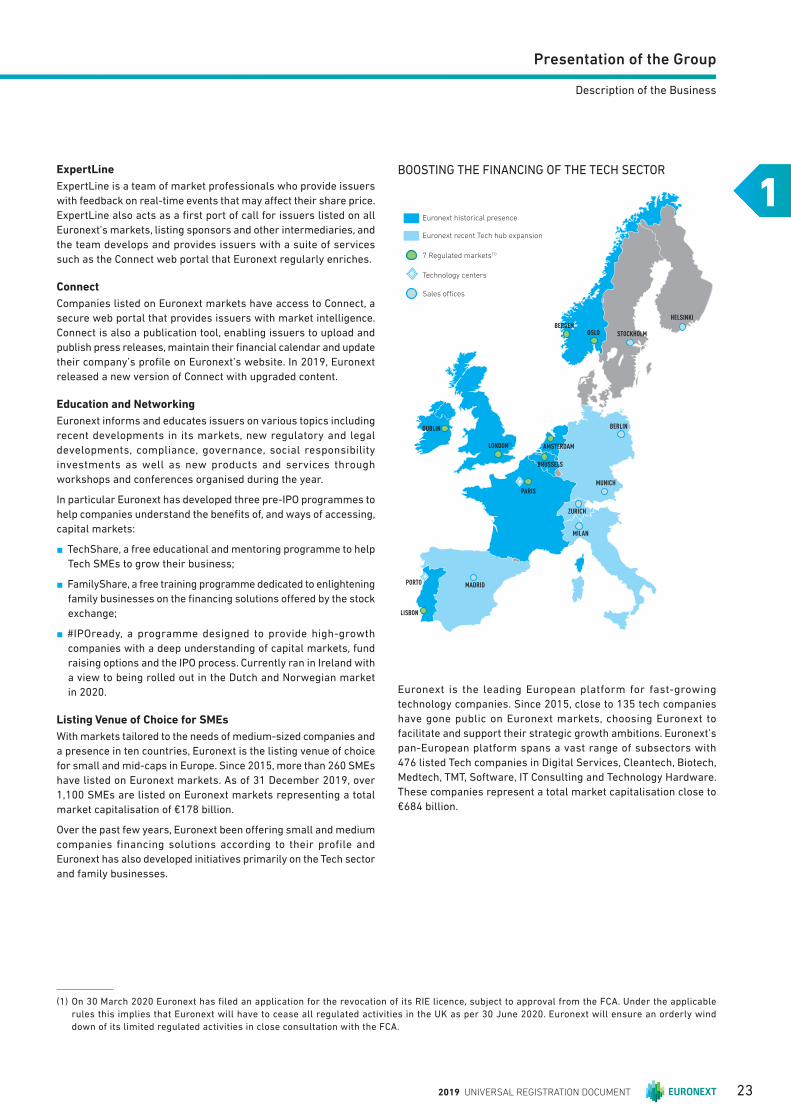
ExpertLine
ExpertLine is a team of market professionals who provide issuers
with feedback on real-time events that may aff ect their share price.
ExpertLine also acts as a fi rst port of call for issuers listed on all
Euronext’s markets, listing sponsors and other intermediaries, and
the team develops and provides issuers with a suite of services
such as the Connect web portal that Euronext regularly enriches.
Connect
Companies listed on Euronext markets have access to Connect, a
secure web portal that provides issuers with market intelligence.
Connect is also a publication tool, enabling issuers to upload and
publish press releases, maintain their fi nancial calendar and update
their company’s profi le on Euronext’s website. In 2019, Euronext
released a new version of Connect with upgraded content.
Education and Networking
Euronext informs and educates issuers on various topics including
recent developments in its markets, new regulatory and legal
developments, compliance, governance, social responsibility
investments as well as new products and services through
workshops and conferences organised during the year.
In particular Euronext has developed three pre-IPO programmes to
help companies understand the benefi ts of, and ways of accessing,
capital markets:
n TechShare, a free educational and mentoring programme to help
Tech SMEs to grow their business;
n FamilyShare, a free training programme dedicated to enlightening
family businesses on the fi nancing solutions off ered by the stock
exchange;
n #IPOready, a programme designed to provide high-growth
companies with a deep understanding of capital markets, fund
raising options and the IPO process. Currently ran in Ireland with
a view to being rolled out in the Dutch and Norwegian market
in 2020.
Listing Venue of Choice for SMEs
With markets tailored to the needs of medium-sized companies and
a presence in ten countries, Euronext is the listing venue of choice
for small and mid-caps in Europe. Since 2015, more than 260 SMEs
have listed on Euronext markets. As of 31 December 2019, over
1,100 SMEs are listed on Euronext markets representing a total
market capitalisation of €178 billion.
Over the past few years, Euronext been off ering small and medium
companies financing solutions according to their profile and
Euronext has also developed initiatives primarily on the Tech sector
and family businesses.
BOOSTING THE FINANCING OF THE TECH SECTOR
Euronext historical presence
7 Regulated markets(1)
(1 ) On 30 March 2020 Euronext has filed an application for the revocation of its RIE licence, subject to approval from the FCA. Under the applicable
rules this implies that Euronext will have to cease all regulated activities in the UK as per 30 June 2020. Euronext will ensure an orderly wind
down of its limited regulated activities in close consultation with the FCA.
Sales offi ces
Euronext recent Tech hub expansion
Technology centers
DUBLIN
PARIS
BRUSSELS
MUNICH
ZURICH
MADRID
LISBON
PORTO
MILAN
LONDON(1) AMSTERDAM
STOCKHOLMOSLOBERGEN
HELSINKI
BERLIN
Euronext is the leading European platform for fast-growing
technology companies. Since 2015, close to 135 tech companies
have gone public on Euronext markets, choosing Euronext to
facilitate and support their strategic growth ambitions. Euronext’s
pan-European platform spans a vast range of subsectors with
476 listed Tech companies in Digital Services, Cleantech, Biotech,
Medtech, TMT, Software, IT Consulting and Technology Hardware.
These companies represent a total market capitalisation close to
€684 billion.
2019 UNIVERSAL REGISTRATION DOCUMENT 23

Presentation of the Group11Description of the Business
ALL TECH SECTORS ARE REPRESENTED ON EURONEXT MARKETS (NUMBER OF ISSUERS BY SECTOR)
Cleantech64
Life Science108Software
71
Digital Services46
Electronic &semiconductors
25Hardware &robotics
49
Media &entertainment
44
Technology Avisory37 Telecomunications
33
In September 2015, Euronext launched TechShare to help companies
reach the next stage of development. TechShare is a 10-month
educational and mentoring programme aimed at familiarizing CEOs
of Tech companies with the fi nancial markets.
Currently active in Belgium, France, Germany, Ireland, Italy, the
Netherlands, Portugal, Spain and Switzerland, the program supports
top executives from fast-growing companies through a combination
of academic seminars, workshop sessions and individual coaching.
TechShare is now a unique Tech network gathering 75 partners from
the fi nancial industry and 275 alumni since the fi rst edition 2015–
2016, of which already four alumni listed on Euronext: Osmozis,
Balyo, Theranexus and Oxatis. The participants are Tech companies
from a wide variety of sectors, including Biotech, software, Medtech,
electronics, hardware, Cleantech, e-commerce and fi ntech.
Supporting Family-Owned Companies
Euronext has attracted an important community of family-owned
companies, composed of 244 issuers representing a total market
capitalisation close to €1,200 billion, including 166 SMEs.
In 2017, Euronext launched FamilyShare, a dedicated programme
off ering support and coaching to unlisted family businesses. The
programme has been set up across the four Euronext domestic
markets and tailored to the specifi c needs of each country. This
unique pan-European initiative is designed to familiarise family-
owned businesses with capital markets, both equity and bonds,
giving them the information they need to bring their companies
to the market. In June 2018, Cogelec was the fi rst IPO from the
FamilyShare programme raising €39 million on Euronext Paris,
followed by one of Portugal’s largest construction companies The
Casais group launching an €18.5M bond in 2019.
Family-owned companies also benefi t from increased assistance in
several areas. This includes European roadshows to meet investors,
improved financial analysis coverage through the Morningstar
programme and Euronext Family Business index®, a new European
index with ninety component companies in the four countries
covered by Euronext.
1.3.3.2 Listing − Recent Developments
Market Activity in 2019
Euronext’s markets in 2019 provided fi nancing to the real economy
with over €1,200 billion raised from equity and debt financing
through securities admitted to trading as of 31 December 2019,
despite the continuation of challenging global market conditions
which was present through 2018. Across all markets in EMEA listing
activity was down almost 40% in 2019 compared to the prior year
with the bulk of the listings waiting until H2 to join the markets.
In total in 2019, Euronext welcomed 46 new list ings – of which 39
were SMEs – raising a total of €4.7 billion across all markets with
a combined market capitalisation of €115 billion. The Tech sector
featured strongly in terms of new listings and accounted for over
40% in 2019, followed by a broad array of sectors notably industrial
and fi nancials listings. In Q3 and Q4 of 2019 Euronext welcomed
some of Europe’s prime listings with technology giant Prosus NV
arriving to the market valued at over €95bn, Verallia’s IPO raised
€863m with a valuation of €3.2bn, along with the privatisation of
La Francaise des Jeux in November which raised €1.8bn and a
valuation of €3.7bn.
In addition, €34 billion was raised in follow-on equity and
€1,242 billion was raised on Euronext in bonds including an
addition of over 12,000 bond listings on Euronext markets. Notable
listings highlight the Group’s strength in key jurisdictions including
Europe, the United States, Asia and the Middle East and include
International Finance Corp (the World Bank), International Bank for
Reconstruction and Development, China and Eastern and Southern
African Trade and Development Bank, along with global fi nancial
institutions including Morgan Stanley, HSBC and Santander.
In November 2019, Euronext launched its GREEN Bonds off ering,
with over €50 billion raised in 2019, and 170 green bonds listed
across Euronext markets by more than 60 issuers, and delivering
a one-stop-shop for investors seeking to access to Green Bonds.
There are almost 5,000 funds classes listed on Euronext and
notable listings during 2019 include Principal, BNY Mellon and
Invesco. Euronext’s funds service off ering will be expanded in 2020
through Euronext Centevo and with the launch of a facility to trade
Euronext Dublin-listed funds. At the end of 2019, there were over
1,200 exchange traded funds listed on Euronext markets.
Euronext − Total money raised (€bn)
2016 585
2017 789
2018 1,078
2019 1,281
Inclusion of Oslo Børs to the Euronext Group
Euronext acquired the Norwegian exchange in Q2 2019 expanding
its pan-European presence and fi rmly cementing a foothold in the
Nordics. Through this acquisition Euronext has not only positioned
itself as a key player in the Oil & Gas, Shipping and Seafood industries
but will now be able to further progress areas of internationalising
under the Euronext Strategy “Lets Grow Together 2022” such
as diversifying local and global infrastructures. At the time of
acquisition Oslo Børs had close to 20% of its issuer base being
2019 UNIVERSAL REGISTRATION DOCUMENT24 www.euronext.com
Presentation of the Group
1
Description of the Business
foreign entities along with a strong Tech franchise which will further
grow by leveraging off our Tech initiatives. Oslo Børs operates three
equity markets, two of which are EU regulated and one OTC platform
along with its wholly owned Central Securities Deposit VPS.
European Tech SMEs initiative
Euronext has seen considerable success in terms of expanding its
international listing presence outside of its core markets having
opened local offi ces in four European countries identifi ed as high-
potential ecosystems known as Tech Hub – in Germany, Switzerland,
Italy and Spain – to assist tech companies in scaling up their
business through capital markets. Euronext had identifi ed the four
target countries to set up and roll-out dedicated off ers to attract
tech companies on Euronext markets with the aim to become the
leading exchange for European tech SMEs in continental Europe.
Over the past two years alone almost 1 in 5 of every new listing
was through Tech Hub.
With 421 listed Tech SME firms representing a total market
capitalisation of over €49 billion, Euronext is already the leading
listing venue in continental Europe for technology stocks. With the
expertise of operating markets in six European countries – in Belgium,
France, Ireland, the Netherlands, Portugal, and Norway, Euronext
believes that it can propose its services to new innovative SMEs in
the four target countries. In order to build networks of partners and
attract the best tech companies in Germany, Switzerland, Italy and
Spain, Euronext has set up a salesforce of experienced FTEs on the
ground to sell its unique value proposition for the tech sector. Since
the opening of the offi ces, Euronext welcomed on its markets 18 new
companies from this particular operation.
Euronext’s pre-IPO education program TechShare is dedicated
to European tech SMEs to support its commercial eff ort. Private
tech SMEs can join the pre-IPO program from Euronext which was
launched in 2015 and is now active in 9 countries. TechShare has
most recently attracted almost 60 participating companies from
Germany, Switzerland, Italy and Spain further increasing our
footprint across Europe (see above).
Corporate Services
Euronext Corporate Services is a fully-owned subsidiary of the
Euronext group launched in 2016 with the ambition to help listed
companies to make the most eff ective use of capital markets and
support organisations with innovative solutions and tailor-made
advisory services in Governance (iBabs), Compliance (InsiderLog),
Communication (Company Webcast), Investor Relations (Advisory
and IR Solutions). Euronext Corporate Services already serves
more than 2,500 clients in over 15 countries, of which are 600 listed
companies. When it comes to listed companies, Euronext Corporate
Services helps them make the most eff ective use of capital markets,
from blue-chip large caps to SMEs, located across all Euronext
markets and beyond (Sweden, UK, Germany, Italy, etc.).
Euronext Corporate Services off ers a unique and comprehensive
value proposition articulated around four main pillars:
i. Investor Relations:
n tai lor-made advisory, market intelligence and decision making
analytics for listed companies,
n complete and intuitive investor relationship management and
targeting platform,
n fl exible and customized market data components for investor
relations websites of listed companies;
ii. Communication: Comprehensive range of webcast, webinar and
conference call services for all types corporate events (investor
relations, internal communication, marketing, training, etc.);
iii. Governance: Digital board portal solution help organisations
secure their board meetings and streamline their decision-
making processes;
iv. Compliance: Innovative solution to automate the management
of insider lists in a way that both saves time and ensures
compliance with the requirements of the Market Abuse
Regulation.
This offering has been built through a combination of organic
developments and acquisitions. To achieve its ambition, Euronext
has acquired four companies providing innovative solutions for
corporates:
n Company Webcast (51% stake at the time of acquisition), a Dutch
leading company specialized in professional webcast and webinar
services;
n IR.Manager (100% stake acquisition), a London-based provider of
investor relations workfl ow and targeting tools;
n iBabs (now renamed Skope) (60% stake at the time of acquisition),
a Dutch leading provider of dematerialized and secured board
portal solutions for corporate and public organizations;
n InsiderLog (80% stake acquisition), a Swedish leading provider
of an insider list management solution, in compliance with the
Market Abuse Regulation.
1.3.4 CASH, DERIVATIVES AND SPOT FX MARKETS
1.3.4.1 Cash, Derivatives and Spot FX Markets − Products and Services(1)
Euronext provides multiple marketplaces for investors, broker-
dealers and other market participants to meet directly to buy and
sell cash equities, fi xed income securities and ETPs. One of the
primary functions of the Group’s markets is to ensure that orders
to purchase and sell securities are executed in a reliable, orderly,
liquid and effi cient manner. Order execution occurs through a variety
of means and Euronext seeks to continue to develop additional and
more effi cient trading processes.
Cash Trading
Equities
The Company is the market leader in cash equity trading in its
six home markets of Belgium, France, Ireland, the Netherlands,
Portugal and Norway. Over 2019, Euronext market share on cash
equity trading averaged 68.8% and the Company had a strong
blue chip issuer presence, with twenty-fi ve issuers included in
the Euro STOXX 50 stock index and 146 issu ers listed on the Euro
(1) Historical figures have been restated to include Oslo Børs VPS.
2019 UNIVERSAL REGISTRATION DOCUMENT 25

Presentation of the Group11Description of the Business
STOXX 600 benchmark index. Euronext is ranked fi rst in Europe as
measured by domestic market capitalisation and fi rst by average
daily lit equity trading value, in cluding BATS-Chi-X. In addition,
the Group has a solid ETF trading franchise based on the listing
of 1,240 ETFs in its markets. In 2019, total Euronext transaction
value on equity was €1,892 billion, down -9.5 % from €2,090 billion
in 2018 and compared to €1,935 billion in 2017. In Equities, Euronext
outperforms peer exchanges in yield extraction while maintaining
high market share. This is achieved through a combination of
superior execution quality, sophisticated liquidity schemes and
advanced pricing segmentation. Euronext off ers a compelling value
proposition across the transaction chain, from blue chips to small
companies, with tailored market models to maximize the depth
and quality of liquidity available for trading those companies in
the secondary market.
Since the introduction of new European Union legislation in 2007,
via MiFID, competition for share trading has been intense. Yet
Euronext has been successful in maintaining market share above
60% throughout the past decade demonstrating the resilience in
its core business. Euronext’s product, pricing and client strategy
and the execution thereof are vital to maintain the high quality
of execution and broad diversity of clients active on Euronext’s
markets.
Euronext operates equity markets of which the main financial
instruments are shares. Shares are any share of capital stock or any
other equity securities issued by a corporation or other incorporated
business enterprise.
Since 2017, in Equities, Euronext’s competitive position has been
enhanced due to evolution in the blue chip liquidity scheme, a new
fee scheme for non-member proprietary fl ow, a new best execution
service for retail investors (Best of Book) and new incentives
embedded in the agency tariff to attract incremental fl ow from
trading members. Euronext has re-positioned both the equity
and warrants business to ensure its off ering to local members in
Euronext’s home markets is attractive and that fl ow from the local
client community is either retained or repatriated. These initiatives
enable Euronext to continue enhancing execution quality available
on Euronext’s markets which is key to add value to clients and to
compete eff ectively.
Best of Book Service for Retail Best Execution
Since 2017, Euronext kept improving its new best execution service
for retail orders. In partnership with dedicated liquidity providers,
Best of Book off ers price improvement in the central order book
for retail brokers. This helps ensure best execution for brokers
executing orders on behalf of retail clients, in a way that ensures
compliance and that the end investor achieves an optimum result.
The service promotes and strengthens the diversity of Euronext’s
order book to the benefi t of the whole market.
Omega Fee Scheme for Non-Member Proprietary Flow
In 2016, Euronext launched a new pilot fee scheme for non-member
proprietary trading fl ow. Non-member proprietary fi rms wishing
to participate in the Omega pilot scheme enter into a tripartite
arrangement with Euronext and the member intermediary. This
scheme provides non-member fi rms with improved value when
trading on Euronext markets while promoting and strengthening the
diversity of Euronext’s order book to the benefi t of the whole market.
Fixed Income
Euronext operates bond trading on its regulated market with a
particular focus on the retail market. Over 100 members trade
5,600 corporate, fi nancial institutions and government listed bonds,
representing a monthly turnover of approximately €0.4 billion.
Euronext Bloc k for SME
Dark trading venues have become crucial alternatives to regulated
markets, and MiFID II regulatory changes have further solidifi ed
the need for such platforms, specifi cally in the large-in-scale (LIS)
space. Investors continue to seek effi cient mechanisms to source
liquidity, and execute trades safely.
Euronext off ers to the local community the Block MTF platform
to establish itself as a hub for SME Block Trading. During the fi rst
phase of the new strategy roll-out, focus is on small- and mid-
cap stocks in the Belgian, Dutch, French, and Portuguese markets.
Euronext is to create a signifi cant off er to the local members and
Euronext is unique in its ability to utilize historical order and trade
data to help trading participants target appropriate counterparties
and increase their potential for trading. In addition to these benefi ts,
onboarding new members is simplifi ed thanks to a streamlined
Euronext membership process.
Exchange Traded Funds
Euronext off ers the ETF community a comprehensive solution
for multi-national listing and trading in ETFs and investments,
within Euronext’s Single Order Book. Euronext’s ETF markets
are supported by robust market infrastructure where product
supply and demand meet within a framework of deep liquidity and
advanced price formation. Euronext develops relations not only with
issuers, but also with liquidity providers, intermediaries, investors,
regulators and others in the ETF community to understand their
challenges and needs, providing strong alignment with Euronext’s
business goals and a strong foundation to co-create new products
to accelerate growth in the ETF industry with the support of its
major participants.
Euronext’s client alignment is demonstrated by Euronext winning
ETF Express award during 2018, and in 2019 – the fourth time in a
row, being consistently recognised as the Best European Exchange
for Listing ETFs. This award is voted for by Euronext’s clients.
AWARD WINNER 2019 AWARDS 2018
Pan-European ETF MTF
Euronext intends to become the one-stop-shop pan-European ETF
platform with an ambition to be the #1 trading venue for ETFs in
Europe. The European ETF market is fragmented and opaque with
approximately 70% of trading volume in the region taking place
off -exchange. Yet ETFs are increasingly popular among both retail
and institutional investors, as the trend for passive investing grows
2019 UNIVERSAL REGISTRATION DOCUMENT26 www.euronext.com
Presentation of the Group
1
Description of the Business
and there is ever increasing focus on investing and managing
risk effi ciently. Euronext is building a dedicated pan-European
platform for ETF trading, with unique features seeking to attract
volume into an exchange environment promoting transparency,
improving effi ciency and deepening liquidity. Euronext’s mission is
to accelerate the growth of the ETF industry in Europe to the benefi t
of end investors and intermediaries, Euronext has strong support
from a diverse set of stakeholders within the ETF community. It is
going to be live in 2020 .
Open Ended Investment Funds
Euronext’s Fund Services off er asset managers ways to achieve
better operational efficiency and enhance asset gathering
opportunities. By engaging in active discussions with key
stakeholders, the Company believes its off ering is a relevant choice
for any issuer considering fund distribution in Europe.
The services include:
n Euronext Fund Service Amsterdam, fi rst launched in 2007, which
enables Fund Managers to further extend the geographic reach
of their funds across Europe and will include a broader choice
of trading solutions;
n Euronext Fund Service Paris, launched in May 2017, which is
a complementary cutting-edge off er providing a global access
to the funds universe, in order to meet the requirements for
modern and automated solutions. This service is available for
both UCITS funds and AIF (Alternative Investment Funds), and
orders will be placed at Net Asset Value (NAV) in euros.
EFS enables both local and global asset managers to list their
funds (whether large or small) on Euronext’s regulated platform,
enhancing the profi le of the funds and helping to attract higher
levels of investment into those funds. As of 31 December, there
were already 101 funds admitted to trading. This is an important
initiative to help service the distribution needs of asset managers
and match those with investor appetite.
Warrants and Certifi cates
Euronext opera tes a retail Structured Products business across
its continental European franchise, servicing the needs of retail
investors via intermediary service provision, namely listing
warrants, certifi cates and structured notes, developing Euronext’s
market model for high quality liquidity provision and ensuring
execution by retail brokers is cost effi cient. Euronext develops
relationships with its issuers not only to expand their usage of
existing tailored services but also to create new and innovative
services for operational effi ciency and business expansion.
Cash Market St ructure and Functionality
Since June 2018, Cash trading on Euronext’s markets is hosted
on the new proprietary strategic architecture Optiq®. The Group’s
trading rules provide for an order-driven market using an open
electronic central order book for each traded security, various
order types and automatic order matching and a guarantee of
full anonymity both for orders and trades. While the core trading
system is built on this order-driven principle, the fl exibility of
Euronext’s technology enables Euronext to develop diff erent types
of matching algorithms and functionalities to suit the diff erent
price formation mechanisms that exist amongst the diff erent
cash asset classes and to cater for diff erent market participant
needs. For example, Euronext continued to develop its best
execution service for retail investors, Best of Book, which brings
retail brokers an additional layer of liquidity specifi cally aimed at
off ering price improvement for retail order fl ow. This service is
integrated into Euronext’s central order book enabling members
to interact with this liquidity through the same connection as for
the core market. As at year end, all of Euronext’s retail brokers
had signed up for the service.
The Company also operates a sophisticated liquidity provider
program for blue chips and liquid mid cap equities which aims
at ensuring Euronext off ers superior market quality. Euronext’s
equity markets continue to yield the best market quality metrics
amongst its competitors. These metrics include, amongst others,
spread, market depth, best price setting and presence time at
the best bid and off er spread. The program encompasses both
a presence time obligation at the best bid and off er spread and
a minimum passive volume obligation. This volume obligation is
of particular interest as, in combination with the presence time
obligation, it creates order persistence and therefore increases
probability of execution. In a fragmented trading environment,
market quality metrics are actively used by trading firms as
decision making parameters embedded in their order routing
systems and therefore contribute to maintaining Euronext’s
market share.
Cash Market Trading Members
As at 31 Decemb er 2019, Euronext had 184 direct trading members
on its cash business, compared to 168 members as at 31 December
2018, 147 members as at 31 December 2017, 205 members as at
31 December 2016 and 213 members as at 31 December 2015,
up in 2019 due to the arrival of 13 new members in Oslo. The
Group has a diverse member base, with a deep presence in its fi ve
domestic markets and a strong international client base in London,
which accounts for approximately two-third of equity trading
volumes. A continued environment of increased regulation, tighter
margins and capital constraints will require cost reduction and
sustainable reform from most of Euronext’s client base, therefore
driving consolidation of continental tier three banks and brokers.
Cash Trading Av erage Daily Volume by Geographic Origin of Customers
The average dai ly volume on Euronext’s cash trading markets for
the last twelve months ended 31 December 2019 amounted to
€8.1 billion (single counted).
2019 UNIVERSAL REGISTRATION DOCUMENT 27
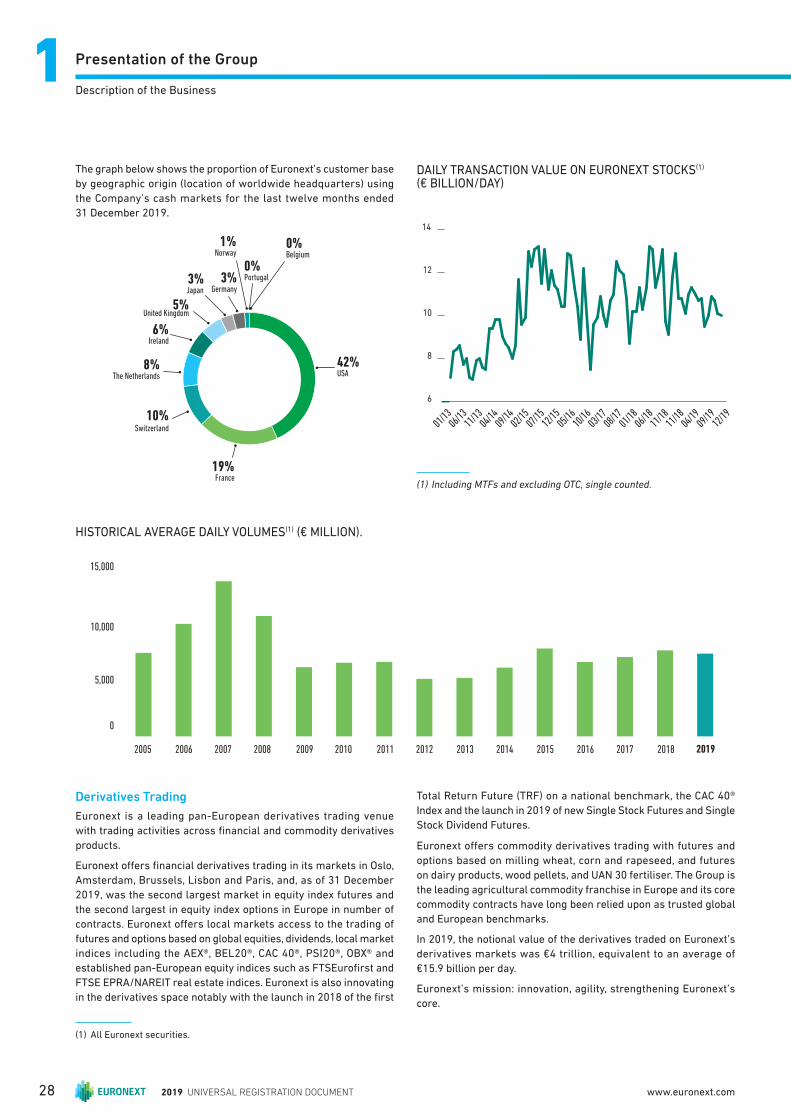
Presentation of the Group11Description of the Business
HISTORICAL AVERAGE DA ILY VOLUMES(1) (€ MILLION).
2005 2006 2007 2008 2009 2010 2011 2012 2013 2014 2015 2016 2017 2018 2019
0
5,000
10,000
15,000
(1) All Euronext securities.
Derivatives Trading
Euron ext is a leading pan-European derivatives trading venue
with trading activities across fi nancial and commodity derivatives
products.
Euronext off ers fi nancial derivatives trading in its markets in Oslo,
Amsterdam, Brussels, Lisbon and Paris, and, as of 31 December
2019, was the second largest market in equity index futures and
the second largest in equity index options in Europe in number of
contracts. Euronext off ers local markets access to the trading of
futures and options based on global equities, dividends, local market
indices including the AEX®, BEL20®, CAC 40®, PSI20®, OBX® and
established pan-European equity indices such as FTSEurofi rst and
FTSE EPRA/NAREIT real estate indices. Euronext is also innovating
in the derivatives space notably with the launch in 2018 of the fi rst
Total Return Future (TRF) on a national benchmark, the CAC 40®
Index and the launch in 2019 of new Single Stock Futures and Single
Stock Dividend Futures.
Euronext off ers commodity derivatives trading with futures and
options based on milling wheat, corn and rapeseed, and futures
on dairy products, wood pellets, and UAN 30 fertiliser. The Group is
the leading agricultural commodity franchise in Europe and its core
commodity contracts have long been relied upon as trusted global
and European benchmarks.
In 2019, the notional value of the derivatives traded on Euronext’s
derivatives markets was €4 trillion, equivalent to an average of
€15.9 billion per day.
Euronext’s mission: innovation, agility, strengthening Euronext’s
core.
The graph below shows the proportion of Euronext’s customer base
by geographic origin (location of worldwide headquarters) using
the Company’s cash markets for the last twelve months ended
31 December 2019.
USA42%
France19%
The Netherlands8%
Ireland6%
United Kingdom5%
Switzerland10%
Japan3%
Germany3%
Norway1%
Portugal0%
Belgium0%
DAILY TRANSACTION VALUE ON EURONEXT STOCKS(1) (€ BILLION/DAY)
6
8
10
12
14
01/13
06/13
11/13
04/14
09/14
02/15
07/15
12/15
05/16
10/16
03/17
08/17
01/18
06/18
11/18
11/18
04/19
09/19
12/19
(1) Including MTFs and excluding OTC, single counted.
2019 UNIVERSAL REGISTRATION DOCUMENT28 www.euronext.com
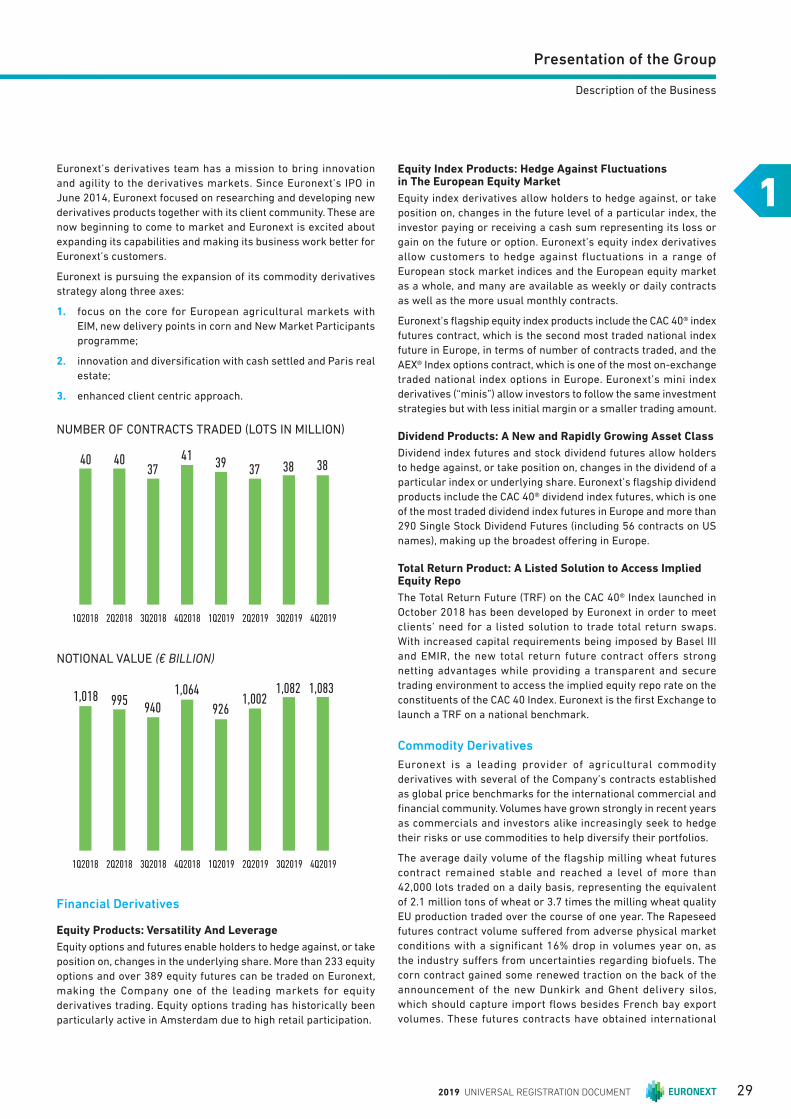
Presentation of the Group
1
Description of the Business
Euronext’s derivatives team has a mission to bring innovation
and agility to the derivatives markets. Since Euronext’s IPO in
June 2014, Euronext focused on researching and developing new
derivatives products together with its client community. These are
now beginning to come to market and Euronext is excited about
expanding its capabilities and making its business work better for
Euronext’s customers.
Euronext is pursuing the expansion of its commodity derivatives
strategy along three axes:
1. focus on the core for European agricultural markets with
EIM, new delivery points in corn and New Market Participants
programme;
2. innovation and diversifi cation with cash settled and Paris real
estate;
3. enhanced client centric approach.
NUMBE R OF CONTRACTS TRADED (LOTS IN MILLION)
1Q2018 2Q2018 3Q2018 4Q2018 1Q2019 2Q2019 3Q2019 4Q2019
40 4037
4139 37 38 38
NOTION AL VALUE (€ BILLION)
1Q2018 2Q2018 3Q2018 4Q2018 1Q2019 2Q2019 3Q2019 4Q2019
1,018 995 940
1,064
926 1,002
1,082 1,083
Financial Derivati ves
Equity Products: Versatility And Leverage
Equity options and futures enable holders to hedge against, or take
position on, changes in the underlying share. More than 233 equi ty
options and over 389 equity futures can be traded on Euronext,
making the Company one of the leading markets for equity
derivatives trading. Equity options trading has historically been
particularly active in Amsterdam due to high retail participation.
Equity Index Products: Hedge Against Fluctuations in The European Equity Market
Equity index derivatives allow holders to hedge against, or take
position on, changes in the future level of a particular index, the
investor paying or receiving a cash sum representing its loss or
gain on the future or option. Euronext’s equity index derivatives
allow customers to hedge against fluctuations in a range of
European stock market indices and the European equity market
as a whole, and many are available as weekly or daily contracts
as well as the more usual monthly contracts.
Euronext’s fl agship equity index products include the CAC 40® index
futures contract, which is the second most traded national index
future in Europe, in terms of number of contracts traded, and the
AEX® Index options contract, which is one of the most on-exchange
traded national index options in Europe. Euronext’s mini index
derivatives (“minis”) allow investors to follow the same investment
strategies but with less initial margin or a smaller trading amount.
Dividend Products: A New and Rapidly Growing Asset Class
Dividend index futures and stock dividend futures allow holders
to hedge against, or take position on, changes in the dividend of a
particular index or underlying share. Euronext’s fl agship dividend
products include the CAC 40® dividend index futures, which is one
of the most traded dividend index futures in Europe and more than
290 Single Stock Dividend Futures (including 56 contracts on US
names), making up the broadest off ering in Europe.
Total Return Product: A Listed Solution to Access Implied Equity Repo
The Total Return Future (TRF) on the CAC 40® Index launched in
October 2018 has been developed by Euronext in order to meet
clients’ need for a listed solution to trade total return swaps.
With increased capital requirements being imposed by Basel III
and EMIR, the new total return future contract offers strong
netting advantages while providing a transparent and secure
trading environment to access the implied equity repo rate on the
constituents of the CAC 40 Index. Euronext is the fi rst Exchange to
launch a TRF on a national benchmark.
Commodity Derivatives
Euronext is a leading provider of agricultural commodity
derivatives with several of the Company’s contracts established
as global price benchmarks for the international commercial and
fi nancial community. Volumes have grown strongly in recent years
as commercials and investors alike increasingly seek to hedge
their risks or use commodities to help diversify their portfolios.
The average daily volume of the fl agship milling wheat futures
contract remained stable and reached a level of more than
42,000 lots traded on a daily basis, representing the equivalent
of 2.1 million tons of wheat or 3.7 times the milling wheat quality
EU production traded over the course of one year. The Rapeseed
futures contract volume suff ered from adverse physical market
conditions with a significant 16% drop in volumes year on, as
the industry suff ers from uncertainties regarding biofuels. The
corn contract gained some renewed traction on the back of the
announcement of the new Dunkirk and Ghent delivery silos,
which should capture import fl ows besides French bay export
volumes. These futures contracts have obtained international
2019 UNIVERSAL REGISTRATION DOCUMENT 29

Presentation of the Group11Description of the Business
recognition status, both of which have been included in the main
global commodity indices (S&P World Commodity Index, Rogers
International Commodity index), making them the fi rst non-U.S.
grains contracts to be included in these global indices.
The commodity team continues to build on the strategy announced
in 2018 which is articulated around:
n focus on building our existing core contracts to their full potential
and, in particular, leveraging on the MATIF brand for grains and
oilseeds. EIM with trade fi nance and repos along with location
swaps will become a core element of the agricultural franchise
and generate growing revenue streams over the next 3–5 years.
It will protect our physically delivered contracts, which have
been suff ering over the last few years from being exposed as
the only major player without a digital contract delivery system;
n cash settled platform will allow the franchise to extend from the
current 3 grain products off ering and enable listing and trading
of a number of desired price reference contracts, as simpler
cash settled products when appropriate (e.g. when physical
delivery is not a key or desired pricing mechanism);
n monitor and capture opportunity to build traction and liquidity in
our new contracts: Euronext launched the PRE futures contract
in June 2019: this Paris Real Estate, cash settled future, is the
fi rst futures contract on Paris Real Estate prices (exclusively
transacted prices registered by the “Notaires”). We continue to
work on building up liquidity and interest in this initiative;
n monitoring of opportunities for non-organic growth, blockchain
applications linked to EIM, etc.: with the recent acquisitions
in Norway, the commodities franchise is becoming a much
stronger and more diverse actor globally, building on the historic
Agricultural footprint to soon off er salmon futures and new ideas
in Power.
Derivatives Trading Me mbers
Trading members in Euronext’s derivative markets are either
dealers, brokers or both. Their activities range from retail broking,
investment banking, dealing, algorithmic and high frequency
trading to international physical trading. The Group’s client bas e
comprises 156 direct trading members (of which 85 are both cash
and derivatives and 79 are commodities trading members) as of
31 December 2019 and is signifi cantly diversifi ed both in terms
of types of clients and geographic coverage. Trading members
can also become market makers or liquidity providers, which is
crucial to the good functioning of the price formation mechanism
for derivative instruments. In such cases, the parties enter into
an agreement with Euronext, specifying their obligations in terms
of displayed liquidity and spreads. Market makers and liquidity
providers are able to place several orders at the same time through
the use of mass quotes, allowing these trading members to send
buy and sell orders for many contract months using only one
message, leading to optimal effi ciency in updating Euronext’s full
range of derivatives prices in a timely manner.
Derivatives Average Da ily Volume by Geographic Origin
The average daily volu me on Euronext’s derivatives markets
for the last twelve months ended 31 December 2019 reached
596,374 contracts representing a total open interest exceeding
15.2 million contracts at the end of December 2019.
The table below shows the proportion of Euronext’s customer base
by geographic origin (location of worldwide headquarters) using
derivatives listed on its markets for the last twelve months ended
31 December 2019.
The Netherlands26%
USA29%
United Kingdom10%
Ireland6%
France16%
Switzerland9%
Germany1%
Sweden1%
Norway1%
Belgium0%
Italy0%
Portugal0%
Others0%
FX Trading
In 2019, FastMatch ( Euronext FX since April rebranding) –
Euronext’s Electronic Communication Network (ECN) in the spot
Foreign Exchange (FX) since its acquisition in August 2017 –
continued to grow its business successfully, and outperformed
its peers despite extremely challenging market conditions
(historical low FX volatility), as a result of continued growth in
client acquisition and focus on eff ective liquidity management
for existing clients. Euronext FX also expanded geographically,
with the launch of the fi rst ever FX matching engine in Singapore,
adding to the platform’s global capabilities – which already
operates in New York, London and Tokyo. In 2020, and in addition
to further development of its market data off ering, Euronext FX
will diversify its product line by launching derivatives, in order
to generate additional revenue, enhance product breadth and
increase client footprint.
1.3.4.2 Cash, Derivatives and Spot FX Markets − Recent Developments
Cash Trading
Advanced Pric ing Strategy
During 2019, Euronext continued to optimize and adjust its pricing
strategy on several key components of the tariff structure. The
flagship liquidity provision program (Supplemental Liquidity
Program) has been substantially revamped both from a pricing
and requirements perspective. In addition to that, a new fee
structure has been implemented for the connections used to
access Euronext’s cash trading systems.
2019 UNIVERSAL REGISTRATION DOCUMENT30 www.euronext.com
Presentation of the Group
1
Description of the Business
Fixed Income Trading
A new pilot scheme (Liquidity Distributor) has been designed for
specifi c members to publish marked up/aggregated liquidity of
Euronext order book on their trading systems and distribution
networks in order to increase matching opportunities on Euronext
markets; this scheme was green-lighted by Euronext’s College of
regulators and will be implemented with a pilot member in Q1’20.
Another initiative is the inclusion of selected Dublin-listed bonds
in Euronext order book with a target implementation in Q1’20.
In 2019, other initiatives aiming at supporting the development of
e-trading workfl ows (widening of trading thresholds, migration of
instruments from the auction to continuous segment, tightening of
Liquidity Providers’ obligations) were successfully implemented.
In the post-MiFID II environment, Fixed Income Regulated Markets
remain active despite the low interest rate environment and the
restart of the ECB QE in Q4’19.
Derivatives Trading
On the financial derivativ es markets, Euronext continued to
reposition and expand its franchise. New products launched
in 2019 included:
n ten Individual Equity Options including two Spotlight Options and
six Options on German underlying;
n three Single Stock Dividend Futures and one Single Stock Future.
In June 2019, the minimum size of Large-in-Scale pre-trade
thresholds have been adjusted on French Individual Equity Options.
During June and July 2019, the matching algorithm of the central
order book has been changed from Price-Time algorithm to Pro-
Rata algorithm on all Individual Equity Options.
During second half of 2019, the semi-annual maturities and
additional monthly maturities have been introduced on 52
contracts of Single Stock Dividend Futures and Single Stock
Futures respectively.
In November, with Optiq® go-live, a new Market Making scheme
has been rolled out with the aim to leverage on the technology
upgrade and establish a harmonized, fair, fl exible and transparent
market making framework across Euronext Derivatives markets.
Euronext is pursuing the expansion of its historic MATIF commodity
derivatives strategy along three axes:
1. focus on the core for European agricultural markets with the
introduction of EIM, Euronext’s more secure, trade fi nance
enabling warehouse receipt delivery system, new delivery
points in corn and wheat and new liquidity provider/market-
making programmes ;
2. innovation and diversifi cation with cash settled and Paris real
estate;
3. enhanced client centric approach.
With the acquisition of the Oslo stock exchange in 2019, the
commodities franchise will include Salmon futures (Fish Pool)
and the integration onto Euronext’s Optiq® trading platform is
scheduled Q4 2020/Q1 2021. Leveraging on Euronext MATIF’s
extensive network of intermediaries and GCMs, as well a fi nancial
users and liquidity providers, Euronext Fish Pool has strong
potential for growth.
Finally, with the closing of the Nord Pool deal occuring in January
2020, Euronext commodities is diversifying away from the Agri
historic roots (including now fi sheries/seafood) and as a key player
in the power and electricity markets. The Group also sees strong
potential for “futurization” of the contract on the Optiq® platform
and CCP.
Optiq®
After the migration of Cash Markets to strategic proprietary trading
platform Optiq® in June 2018, Euronext Derivatives Markets
successfully migrated to Optiq® in November 2019. Optiq® is a new
enhanced, multi-market trading platform, providing customers
with maximum flexibility, simplified and harmonized messaging
as well as high performance and stability. This new platform
leverage on the latest technology to provide our members with high
reliability as well as enhanced throughput and more predictable
latency.
1.3.5 ADVANCED DATA SERVICES(1)
1.3.5.1 Market Data − Products and Services
Euronext’s market data portfolio provides a wide range of data
products to the global investment community, including pre- and
post-trade market prices, indices composition, and reference
data spanning its Cash and Derivatives markets in Amsterdam,
Brussels, Dublin, Lisbon, London, Oslo and Paris. The data is
used by traders and investors to make buy or sell decisions with
confi dence, and by issuers to create new tradable products such
as ETF’s. Euronext’s market data clients range from the largest
investment banks in the world to individual investors trading from
their front room.
Euronext’s market data business consists of two product and
service categories:
Real-Time Market Data
Euronext’s main data off ering involves the distribution of real-time
market data. This data includes price, trade and order book data
on all instruments traded on the Company’s cash and derivatives
markets, as well as information about Euronext’s indices and trade
and transaction reports submitted via the APA and ARM services.
The data is marketed through diff erent information products which
are packaged according to the type of instrument, the depth of the
information, and the type of customer.
Euronext continues to invest in its trading and information
platforms to ensure both execution and data services are of
the highest quality and value, as exemplify by the migration of
the equity derivatives market onto Optiq® in 2019. Additionally,
Euronext cloud based datalake and new analytics platform went
live on September 30, with real time streaming from Optiq®.
(1) Previously reported as Market Data & Indices.
2019 UNIVERSAL REGISTRATION DOCUMENT 31
Presentation of the Group11Description of the Business
The data is disseminated primarily via data vendors but also
directly to fi nancial institutions and other service providers in
the financial sector. Over 400 vendors currently disseminate
Euronext market data to approximately 122,0000 screens in over
110 countries. During 2019 Euronext continued to see an increase
in the use of Euronext’s data in automated trading applications, and
a corresponding decrease in the number of users viewing data on
traditional trading screens.
Retail clients have access to data from Euronext’s markets through
the new Live.Markets section of the website euronext.com and the
market data app, which now has over 48,000 registered users.
A new version of the app will launch in 2020. In accordance with
MiFID II, Euronext now makes delayed post trade data available via
euronext.com for download free of charge.
Historical and Reference Data
In addition to real-time market data, Euronext also provides
daily summary, historical and analytical data services, as well as
reference and corporate action data services.
In 2018 Euronext launched an e-commerc e platform that allows
retail investors to buy data on-line directly from Euronext and will
launch further products via the platform in 2020 aimed at both
professional and retail investors.
Euronext has expanded in bonds and funds data, in bonds through
the acquisition of Dublin, on funds Euronext acquired a funds data
provider in July, OPCVM360, now renamed Euronext Funds360.
Euronext Funds360 is a new generation data provider, specialising
in funds (open-end investment funds, mutual funds, real estate
funds, ETFs, etc.). Euronext Funds360 off ers a series of fund data
solutions and is used by an increasing number of major players
in the asset management, insurance, fi ntech and fi nancial media
industries.
1.3.5.2 Advanced Data − Products and Services
In 2019 Euronext launched Market Flow which shows a daily
breakdown of trading fl ows on the cash orderbook. The new analytic
products are based on Euronext proprietary data, anonymized and
aggregated. These high value high price products have attracted
strong interest and several major clients are already contracted,
diversifying the client base.
Euronext has new diverse sources of data to extract value from
including, Oslo, Dublin, Euronext FX, and Commcise. Euronext
has already co-designed a strong product pipeline with clients,
to expand the current off ering into new asset classes. Euronext
will continue to invest in advanced data products and reinforce
its quant team.
Also in 2019 Euronext, in association with QuantInsight and
Trendrating, launched alternative data products that enable
Fund Managers to satisfy risk management and alpha generation
requirements. Euronext will continue to explore in 2020 new
opportunities in this space.
1.3.5.3 Indices − Products and Services
Euronext owns and operates a leading benchmark and strategy
index franchise that measures diff erent segments of the Euronext
and other global markets, including AEX®, BEL 20®, CAC 40®,
PSI 20®, OBX® and ISEQ® Indices. The Company also creates
new proprietary indices generating added value for its market
participants or to provide measurement tools for all types of
investment categories regardless of listing venue. Euronext off ers
a fully customisable index service which includes index calculation
across equities, commodities and currencies, fi ve days a week, with
two end-of-day runs refl ecting market close in Europe, Asia and the
Americas. Many of Euronext’s indices are licensed as the basis for
ETPs (including ETFs) and structured products. On April 17th 2019,
Euronext was registered by ESMA as Benchmark Administrators
under the new EU Benchmark Regulation (BMR). This compliance
with the provisions of the Benchmark Regulation confi rms the
quality of Euronext’s governance and control principles and rules,
today acknowledged by key European regulators: the AFM in the
Netherlands, AMF in France, CMVM in Portugal, FSMA in Belgium
and CBI in Ireland.
Over the past three years, Euronext has become a leader in
indices for structured products and reinforced its Blue-Chip Index
franchise by:
n developing custom solutions for structured products issuers,
adapted to investors and banks needs;
n strengthening blue-chip indices franchise through increased
transparency, industrialization, and convergence;
n positioning Euronext as an ESG open architecture platform,
onboarding leading ESG data providers and thought leaders in
the climate change assessment;
n sharing risk with product issuers by revenue sharing agreement
in case of “success only”;
n improving drastically time to market for index creation through
industrialization.
As a result, Euronext index business:
n maintained a strong revenue growth in 2019 while diversifying
its business model and source of revenues;
n built global commercial relationship and is now used by the
majority of the world’s top fi nancial institutions.
As a stock exchange committed to sustainability, Euronext is now
well positioned to benefi t from the increased integration of factor
and ESG criteria into the investment process and will continue
to extend over 2019 its ESG index off ering thanks to its partners
expertise, Vigeo Eiris, CDP, Carbone 4, ISS-Oekom and Gresb B.V.:
n in 2019, more than 175 structured products linked to Euronext
ESG indices were launched;
n in France the fi rst 5 ESG indices having the largest structured
products sales volume are all Euronext Indices with a combined
2019 Sales Volume of €1,944 million *;
2019 UNIVERSAL REGISTRATION DOCUMENT32 www.euronext.com

Presentation of the Group
1
Description of the Business
END OF YEAR RECORD FOR ETPS ON THE AEX® TO 3,303 (UP 13.6%)
ETPs Linked to AEX listed on Euronext
Year 2010 2011 2012 2013 2014 2015 2016 2017 2018 2019
Nr. of Products 579 884 823 977 1,369 2,158 1,748 2,816 2,907 3,303
Exchange traded funds (ETFs) linked to Euronext indices decreased to €6.9 billion in Assets Under Management (AUM) at the end of 2019.
ETF AUM (IN MILLIONS) ON EURONEXT INDICES
4,919 5,044 5,084 5,053
6,459 5,962
7,545 7,545
20192011 2012 2013 2014 2015 2016 2017 2018
6,933
Figures based on external third-party data, past fi gures might have
been restated.
Building on its strengths and capabilities, driven by client discussion
and needs, Euronext is increasing investments in the index franchise,
in teams, technology, and partnerships, with 5 key directions for
growth:
n expand beyond Europe to provide world indices for European
and Global Clients;
n accelerate development of ESG based indices. This will be done
through continuous expansion of ESG partnerships bridging
innovative science based companies to investors, at the forefront
of sustainable fi nance;
n leverage on technology to further accelerate index creation
capacity;
n expand products suite on the most successful indices;
n leverage our extended federal model, to replicate locally our
strength, client proximity, time to market, technology, ESG
partners.
1.3.6 POST TRADE
Euronext post-trade business is a combination of partnerships with,
and minority stakes in, global market infrastructures (Euroclear,
LCH SA), and 100% ownership of local market infrastructures (VPS,
Interbolsa).
The Group owns 11,1% of LCH S.A. and has a 10-year agreement
with LCH S.A. for the provision of clearing services on Euronext
derivatives markets.
Euronext also owns c.5% of Euroclear, that provides custody and
settlement services on several Euronext markets.
Finally, Euronext owns 100% and operates two Central Securities
Depositories: Interbolsa, established in Portugal, and VPS,
established in Norway, acquired in 2019 as part of the Oslo Børs
VPS transaction.
Underlying Index
Sales Volume 2019
(€m)*
Euronext Climate Objective 50 Euro EW Dec 5% 689
Euronext Euro 50 ESG EW Dec 50 Points 441
Euronext Eurozone ESG Leaders 40 EW Dec 5% 439
SBF Top 50 ESG EW Dec 50 Points 230
Euronext France Energy Transition Leader 40 EW Dec 5% 145
* SRP data, listed products only , fi gures based on external third-party data.
n the Assets Under Management of the leading European ESG
ETF, the BNP Paribas Easy Low Carbon 100 Europe ETF linked
to the Low Carbon 100 Europe Index, increased by 76% from
€434 million to €763 million. In 2019 the ETF also received the
Febelfi n sustainability label.
As of 31 December 2019, there were over 10,380 Euronext Traded
Products (ETPs) linked to Euronext indices listed on the Company’s
market. This is a slightly below (-2.5%) the all-time record of 2018.
ETP PRODUCTS ON EURONEXT INDICES LISTED ON EURONEXT
0
2,000
4,000
6,000
8,000
10,000
12,000
2009 2010 2011 2012 2013 2014 2015 2016 2017 2018 2019
2019 UNIVERSAL REGISTRATION DOCUMENT 33

Presentation of the Group11Description of the Business
1.3.6.1 Post Trade − Products and Services
Clearing
Euronext does not operate its own Central Counterparty (CCP)
and relies on strong partnership and contractual arrangements
with external providers for the clearing of trades executed on its
markets:
n trades executed on Euronext derivatives markets are cleared
by LCH S.A. according to a specific clearing agreement (the
Derivatives Clearing Agreement);
n trades executed on Euronext cash markets are cleared by
LCH S.A. as the default CCP, according to a separate clearing
agreement (the Cash Clearing Agreement), and by EuroCCP as
an alternative option;
n trades executed on Euronext Dublin are cleared by EuroCCP;
n trades executed on the London Recognized Investment Exchange
are cleared by LCH S.A. (extension of the single order book) and
by EuroCCP if trades are related to ETFs or the “Block facility”;
n trades executed on Olso Børs cash markets are cleared by a set
of 3 interoperable CCPs: EuroCCP, SIX x-clear and LCH Ltd.
LCH S.A.
The partnership between Euronext and LCH S.A. relies on three
pillars: i) Euronext owns 11,1% of LCH SA, has the right to appoint
one Director at LCH S.A. board, ii) Euronext and LCH S.A. have signed
a 10-year agreement for the clearing of derivatives (the Derivatives
Clearing Agreement) and iii) Euronext and LCH S.A. have a clearing
agreement for cash markets (the Cash Clearing Agreement).
LCH S.A. is a EU27 based multi-asset classes CCP covering Listed
and OTC derivatives, Commodities, CDS, Cash equities and ETFs as
well as Repo Fixed income market. Thanks to their position across
those market segments, LCH S.A. have a large pool of collateral
posted by clearing members enabling them to be extremely resilient
to stressed market conditions requiring short term liquidity as
defi ned by ESMA through the CCP stress tests framework. Under the
Derivatives Clearing Agreement, renewed in 2017, Euronext benefi ts
from a signifi cant revenue sharing with LCH S.A., at approximately
the same level of EBITDA(1) as the previous agreement. Euronext
therefore receives clearing fee revenues based on the number of
fi nancial and commodities derivatives trades cleared through LCH
S.A. The Derivatives Clearing Agreement features solid governance
rights as well as pre-emption rights for Euronext, in the case of a
sale of LCH S.A.
Custody & Settlement
Euronext operates and fully owns two CSDs, Interbolsa (Portugal)
and VPS (Norway).
Both CSDs play a central role in the Portuguese and Norwegian
securities markets by providing issuance, custody and settlement
services across multiple asset classes (equities, fixed income,
funds) to issuers or their agents, fi nancial institutions (custodians,
broker-dealers, etc.) and other market infrastructures (CCPs, etc.).
Beyond these core services, Interbolsa and VPS also provide their
customers with a range of value-added services (tax reporting,
information and data, etc.).
Together, Interbolsa and VPS serve 1 600+ issuers of securities
(equity, debt, funds, structured products, etc.), with 175+ directly
connected participants and almost 1 trillion EUR of assets under
custody.
Interbolsa
Interbolsa is a wholly-owned subsidiary of Euronext, established
in Portugal. It provides issuance, custody and settlement services
for c. 350 billion EUR of securities.
Interbolsa is authorized as a CSD under Regulation (EU) n°909/2014
(CSDR) and is the operator a designated securities settlement
system under Directive 98/26/EC.
Interbolsa is also the national numbering agency in charge of the
assignment of ISIN, CFI and FISN codes according to the ISIN, CFI
and FISN codifi cation rules in force (namely to all Portuguese-
issued equities and for debt instruments registered or deposited
in Interbolsa’s systems), nationwide disclosure of assigned ISIN, CFI
and FISN codes and intermediating between national entities, other
national numbering agencies and ANNA Service Bureau.
VPS
VPS is a wholly-owned subsidiary of Euronext, established in
Norway. It provides issuance, custody and settlement services for
c. 580 billion EUR of securities.
VPS is in the process of submitting an application for a CSD licence
under Regulation (EU) n°909/2014 (CSDR), following entry into force
of the Norwegian legal act implementing CSDR in Norway.
1.3.6.2 Post Trade − Recent Developments
Clearing
In 2016, Euronext acquired 20% of EuroCCP with the aim of off ering
customers more choice for the clearing of their trades executed
on Euronext cash markets, in line with the EU policy to favour
competition in clearing services (in particular through open access
provisions enshrined in MiFIR).
In December 2019, Euronext entered into a binding agreement to
sell its 20% minority stake in EuroCCP to Cboe Global Markets,
alongside the other current EuroCCP shareholders. The transaction
is expected to close in H1 2020, subject to receipt of required
regulatory clearances and the arrangement of a supporting liquidity
facility at the EuroCCP clearing entity level.
Custody & Settlement
Integration of VPS
VPS integration into the Group, following the acquisition of 100%
of OB VPS by Euronext, has very signifi cantly increased the size of
Euronext custody & settlement business, from c. 350 billion EUR
of assets under custody to almost 1 trillion EUR of assets under
custody.
As defined in Chapter 5 and defined as EBITDA1 in section 7.1.1
2019 UNIVERSAL REGISTRATION DOCUMENT34 www.euronext.com
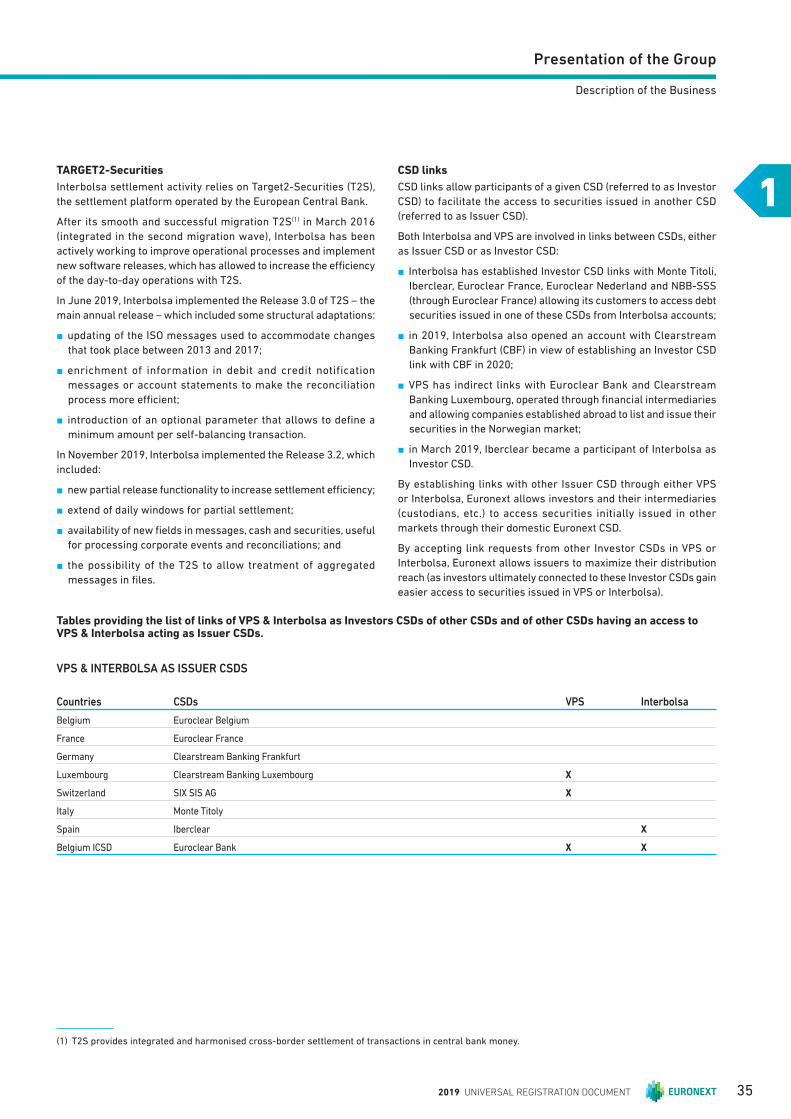
Presentation of the Group
1
Description of the Business
Tables providing the list of links of VPS & Interbolsa as Investors CSDs of other CSDs and of other CSDs having an access to VPS & Interbolsa acting as Issuer CSDs.
VPS & INTERBOLSA AS ISSUER CSDS
Countries CSDs VPS Interbolsa
Belgium Euroclear Belgium
France Euroclear France
Germany Clearstream Banking Frankfurt
Luxembourg Clearstream Banking Luxembourg X
Switzerland SIX SIS AG X
Italy Monte Titoly
Spain Iberclear X
Belgium ICSD Euroclear Bank X X
TARGET2-Securities
Interbolsa settlement activity relies on Target2-Securities (T2S),
the settlement platform operated by the European Central Bank.
After its smooth and successful migration T2S(1) in March 2016
(integrated in the second migration wave), Interbolsa has been
actively working to improve operational processes and implement
new software releases, which has allowed to increase the effi ciency
of the day-to-day operations with T2S.
In June 2019, Interbolsa implemented the Release 3.0 of T2S – the
main annual release – which included some structural adaptations:
n updating of the ISO messages used to accommodate changes
that took place between 2013 and 2017;
n enrichment of information in debit and credit notification
messages or account statements to make the reconciliation
process more effi cient;
n introduction of an optional parameter that allows to defi ne a
minimum amount per self-balancing transaction.
In November 2019, Interbolsa implemented the Release 3.2, which
included:
n new partial release functionality to increase settlement effi ciency;
n extend of daily windows for partial settlement;
n availability of new fi elds in messages, cash and securities, useful
for processing corporate events and reconciliations; and
n the possibility of the T2S to allow treatment of aggregated
messages in fi les.
CSD links
CSD links allow participants of a given CSD (referred to as Investor
CSD) to facilitate the access to securities issued in another CSD
(referred to as Issuer CSD).
Both Inte rbolsa and VPS are involved in links between CSDs, either
as Issuer CSD or as Investor CSD:
n Interbolsa has established Investor CSD links with Monte Titoli,
Iberclear, Euroclear France, Euroclear Nederland and NBB-SSS
(through Euroclear France) allowing its customers to access debt
securities issued in one of these CSDs from Interbolsa accounts;
n in 2019, Interbolsa also opened an account with Clearstream
Banking Frankfurt (CBF) in view of establishing an Investor CSD
link with CBF in 2020;
n VPS has indirect links with Euroclear Bank and Clearstream
Banking Luxembourg, operated through fi nancial intermediaries
and allowing companies established abroad to list and issue their
securities in the Norwegian market;
n in March 2019, Iberclear became a participant of Interbolsa as
Investor CSD.
By establishing links with other Issuer CSD through either VPS
or Interbolsa, Euronext allows investors and their intermediaries
(custodians, etc.) to access securities initially issued in other
markets through their domestic Euronext CSD.
By accepting link requests from other Investor CSDs in VPS or
Interbolsa, Euronext allows issuers to maximize their distribution
reach (as investors ultimately connected to these Investor CSDs gain
easier access to securities issued in VPS or Interbolsa).
(1) T2S provides integrated and harmonised cross-border settlement of transactions in central bank money.
2019 UNIVERSAL REGISTRATION DOCUMENT 35
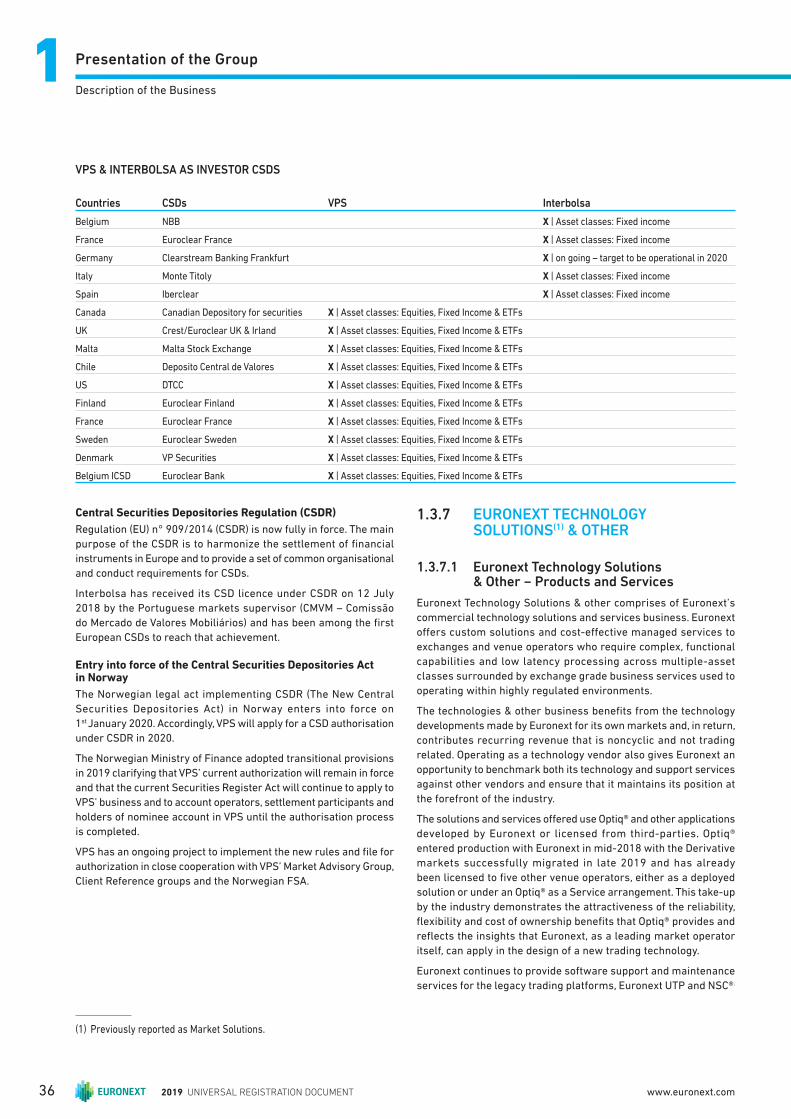
Presentation of the Group11Description of the Business
Central Securities Depositories Regulation (CSDR)
Regulation (EU) n° 909/2014 (CSDR) is now fully in force. The main
purpose of the CSDR is to harmonize the settlement of fi nancial
instruments in Europe and to provide a set of common organisational
and conduct requirements for CSDs.
Interbolsa has received its CSD licence under CSDR on 12 July
2018 by the Portuguese markets supervisor (CMVM – Comissão
do Mercado de Valores Mobiliários) and has been among the fi rst
European CSDs to reach that achievement.
Entry into force of the Central Securities Depositories Act in Norway
The Norwegian legal act implementing CSDR (The New Central
Securities Depositories Act) in Norway enters into force on
1st January 2020. Accordingly, VPS will apply for a CSD authorisation
under CSDR in 2020.
The Norwegian Ministry of Finance adopted transitional provisions
in 2019 clarifying that VPS’ current authorization will remain in force
and that the current Securities Register Act will continue to apply to
VPS’ business and to account operators, settlement participants and
holders of nominee account in VPS until the authorisation process
is completed.
VPS has an ongoing project to implement the new rules and fi le for
authorization in close cooperation with VPS’ Market Advisory Group,
Client Reference groups and the Norwegian FSA.
1.3.7 EURONEXT TECHNOLOGY SOLUTIONS(1) & OTHER
1.3.7.1 Euronext Technology Solutions & Other − Products and Services
Euronext Technology Solutions & other comprises of Euronext’s
commercial technology solutions and services business. Euronext
off ers custom solutions and cost-eff ective managed services to
exchanges and venue operators who require complex, functional
capabilities and low latency processing across multiple-asset
classes surrounded by exchange grade business services used to
operating within highly regulated environments.
The technologies & other business benefi ts from the technology
developments made by Euronext for its own markets and, in return,
contributes recurring revenue that is noncyclic and not trading
related. Operating as a technology vendor also gives Euronext an
opportunity to benchmark both its technology and support services
against other vendors and ensure that it maintains its position at
the forefront of the industry.
The solutions and services off ered use Optiq® and other applications
developed by Euronext or licensed from third-parties. Optiq®
e ntered production with Euronext in mid-2018 with the Derivative
markets successfully migrated in late 2019 and has already
been licensed to fi ve other venue operators, either as a deployed
solution or under an Optiq® as a Service arrangement. This take-up
by the industry demonstrates the attractiveness of the reliability,
fl exibility and cost of ownership benefi ts that Optiq® provides and
refl ects the insights that Euronext, as a leading market operator
itself, can apply in the design of a new trading technology.
Euronext continues to provide software support and maintenance
services for the legacy trading platforms, Euronext UTP and NSC®.
(1) Previously reported as Market Solutions.
VPS & INTERBOLSA AS INVESTOR CSDS
Countries CSDs VPS Interbolsa
Belgium NBB X | Asset classes: Fixed income
France Euroclear France X | Asset classes: Fixed income
Germany Clearstream Banking Frankfurt X | on going – target to be operational in 2020
Italy Monte Titoly X | Asset classes: Fixed income
Spain Iberclear X | Asset classes: Fixed income
Canada Canadian Depository for securities X | Asset classes: Equities, Fixed Income & ETFs
UK Crest/Euroclear UK & Irland X | Asset classes: Equities, Fixed Income & ETFs
Malta Malta Stock Exchange X | Asset classes: Equities, Fixed Income & ETFs
Chile Deposito Central de Valores X | Asset classes: Equities, Fixed Income & ETFs
US DTCC X | Asset classes: Equities, Fixed Income & ETFs
Finland Euroclear Finland X | Asset classes: Equities, Fixed Income & ETFs
France Euroclear France X | Asset classes: Equities, Fixed Income & ETFs
Sweden Euroclear Sweden X | Asset classes: Equities, Fixed Income & ETFs
Denmark VP Securities X | Asset classes: Equities, Fixed Income & ETFs
Belgium ICSD Euroclear Bank X | Asset classes: Equities, Fixed Income & ETFs
2019 UNIVERSAL REGISTRATION DOCUMENT36 www.euronext.com

Presentation of the Group
1
Description of the Business
Euronext has a perpetual, royalty-free license from ICE to use,
modify and sub-license Euronext UTP and NSC® (see section 5.2
“Material contracts and related party transactions”).
At the end of 2019, two Exchange clients remained on Euronext
UTP and both have been off ered options for migrating to Optiq®
ahead of termination of Euronext UTP maintenance. Support for
the previous generation trading platform, NSC®, will cease in 2020
once all clients using NSC® have been migrated to Optiq®. This
will further simplify Euronext’s technology operation and reduce
expenses.
Optiq® enables the technologies business to be more competitive
by off ering solutions that are faster, more resilient and cheaper
to operate. It has been designed for high-volume markets
and so will meet the throughput and resilience needs of most
global exchanges. As a result, Euronext Technology Solutions
priorities for the future Optiq® roadmap will include integrating
new functions and asset classes to increase the flexibility,
confi gurability and extensibility off ered to clients.
Most technology solutions provided to clients include software
for reference data management, price calculation and market
control functions. The high level of commonality between
exchange operations around the world means that many of
these solutions can be delivered to clients with little or no client-
specifi c customisation. In some cases, client requirements can
be met by simple confi guration changes and in others, only minor
software modifi cations are required. Whichever approach is taken,
the rights to new platform capabilities remain with Euronext
and are incorporated into the core product for the benefit of
all users (including Euronext itself). This mutually beneficial,
user-community approach means that Euronext can maintain
an industry leading platform with lower expenses than would
otherwise be the case.
Where Euronext does not off er commercial in-house software for
a function required by a client, third-party software can easily
be integrated with Optiq®. This approach is used for the MAR
surveillance service off ered to MTF operators which provides
monitoring of compliance with the Market Abuse Regulation
as a remotely delivered service. This service enables clients to
outsource their MAR monitoring operations and take advantage
of the investments in staff and processes made by Euronext for
its own markets.
Optiq® will facilitate the development of more such services,
specifi cally those performing analytic and regulatory processing
of the large volumes of trading data generated by electronic
exchanges. Demand for these applications is expected to grow
as the scope and rigour of regulatory monitoring requirements
increase.
Historically, revenue from the Euronext Technology Solutions
& other business came from software license and maintenance
fees. However, Euronext’s ability to confi gure its technology for
a wide range of market models means that the same Optiq®
software can be off ered in the form of a managed service. Optiq®
as a Service enables exchanges and venue operators to take
advantage of fully-hosted trading and clearing platforms without
investing in data centre or network infrastructure. With banks
and fi nancial intermediaries increasingly seeing migration to
cloud and software-as-a-service as solutions to the competing
pressures of cost-reduction and regulatory complexity, Euronext’s
experience as a service provider is receiving renewed interest.
Euronext’s MiFID II compliant MTF and SI services build on
Euronext’s own software, processes and infrastructure and
off er clients an eff ective way to reduce costs without increasing
regulatory risk. At the end of 2019, Euronext had four managed
services in production for European venue operators.
The technologies & other business also receives revenue for
network connectivity and server colocation under a revenue
sharing agreement with ICE. This agreement enables Euronext
to benefi t from service sales to clients who connect to its markets
via the ICE Global Network IGN® or who take colocation space
in the ICE data centers that house Euronext’s trading platforms.
For more information on the IGN® and colocation see section 5.2
“Material contracts and related party transactions”.
By combining our services, software, infrastructure, and
technology developed for our internal markets alongside an
extensive community of members, ISV’s and data vendors who
connect to our systems, Euronext is able to off er a compelling
solution to exchanges and venue operators globally.
1.3.7.2 Euronext Technology Solutions & Other − Recent Developments
The development of a technology centre in Porto has provided a
basis to facilitate quick and cost-eff ective delivery of customized
solutions to technology clients. The successful launch of Optiq®
across Euronext’s Cash and Derivatives markets has coincided
with renewed interest from established exchange groups as well
as new venues in utilizing the technology. The hosted model is seen
as an attractive model for new trading venues who are looking to
outsource both technology and services so they can reduce their
cost of ownership and focus on business development.
2019 UNIVERSAL REGISTRATION DOCUMENT 37
Presentation of the Group11Regulation
1.4 Regulation
1.4.1 OVERVIEW
Euronext is an organisation that provides exchange listing, trading,
post-trade and related services in Europe. The Company operates
exchanges in seven European countries (Belgium, France, Ireland,
the Netherlands, Norway, Portugal and the United Kingdom). Each
of the European exchanges and/or its respective operator holds
an exchange licence granted by the relevant national exchange
regulatory authority and operates under its supervision. Each
market operator is subject to national laws and regulations and
other regulatory requirements imposed by exchange authorities,
central banks and fi nance ministries as appropriate.
The seven national regulatory authorities coordinate their
regulation and supervision of the regulated markets operated by
the Euronext group through the “Euronext College of Regulators”,
acting pursuant to memoranda of understanding which Euronext
has committed to respect.
The Company also operates two Central Securities Depositories
(“CSDs”), in Portugal and in Norway. The Portuguese CSD
(Interbolsa) holds a license under the European Union Central
Securities Depository Regulation (Regulation [EU] 909/2014,
“CSDR”) granted by its national competent authority (Comissão
do Mercado de Valores Mobiliários, “CMVM”) and operates under its
supervision. The Norwegian CSD (VPS) is applying to also obtain the
CSDR authorisation from its national competent authority (NFSA
– Finanstilsynet).
1.4.2 EUROPEAN REGULATION
The regulatory framework in which Euronext operates is
substantially infl uenced and governed by European directives and
regulations in the fi nancial services area, many of which have been
adopted pursuant to the Financial Services Action Plan, which was
adopted by the European Union in 1999 to create a single market
for fi nancial services. This has enabled and increased the degree
of harmonisation of the regulatory regime for fi nancial services,
public off ers, listing and trading, amongst other activities.
Markets and Trading
There are currently two key pieces of European legislation that
govern the fair and orderly operation of markets and trading: the
MiFID II/MiFIR and the MAR/MAD II frameworks (both defi ned as
below).
The MiFID II/MiFIR framework includes the Markets in Financial
Instruments Directive (Directive 2014/65/EU, “MiFID II”) and the
Markets in Financial Instruments Regulation (Regulation [EU]
No 648/2012, “MiFIR”) and has been applicable since 3 January
2018. The objective is to make European fi nancial markets more
transparent and to strengthen investor protection.
The MAR/MAD II framework includes the Market Abuse Regulation
(Regulation [EU] No 596/2014, “MAR”) and the Directive on criminal
sanctions for market abuse (Directive 2014/57/EU “MAD II”) and
has been applicable since 3 July 2016. The objective is to guarantee
the integrity of European fi nancial markets and increase investor
confidence. The concept of market abuse typically consists of
insider dealing, unlawful disclosure of inside information, and
market manipulation.
Clearing and Settlement
EMIR
The European Union Market Infrastructure Regulation (Regulation
[EU] No 648/2012, “EMIR”) is primarily focused on the regulation of
CCPs and includes the obligation for standardised OTC derivative
contracts to be cleared through a CCP. EMIR came into eff ect on
16 August 2012.
CSDR
CSDR sets out uniform requirements for the settlement of
fi nancial instruments and rules on the organisation and conduct
of CSDs in order to ensure secure, effi cient and timely settlement
of transactions. Interbolsa obtained authorisation under CSDR
on 12 July 2018 and Verdipapirsentralen ASA will apply for
authorisation by June 2020.
Euronext, through Interbolsa, has also participated in the ECB’s
TARGET 2 Securities (T2S) platform, since March 2016. T2S brings
substantial benefits to the European post-trading industry by
providing a single pan-European platform for securities settlement
in central bank money.
Listing
The rules regarding public offerings of financial instruments
and prospectuses, as well as on-going disclosure requirements
for listed companies, are set out in the Prospectus Regulation
(Regulation [EU] 2017/1129) and the Transparency Directive
(Directive 2004/109/EC as most recently amended by Directive
2013/50/EU), as implemented in the countries in which Euronext
operates.
Companies seeking to list their securities on Euronext’s regulated
markets must prepare a listing prospectus in accordance with
the requirements of the Prospectus Regulation, comply with the
requirements of Euronext Rulebook I, the harmonised rulebook for
the Euronext Market Subsidiaries, and any additional local listing
requirements in Rulebook II. Following admission, they must
comply with the on-going disclosure requirements set forth by the
competent authority of their home Member State.
The objective of the Transparency Directive is to harmonise the
transparency requirements in relation to information about issuers
whose securities are admitted to trading on a regulated market in
the EU.
Indices
Euronext as an indices administrator has to comply with the
Benchmark Regulation (Regulation [EU] 2016/1011, “BMR”) which
has been applicable since 1 January 2018.
2019 UNIVERSAL REGISTRATION DOCUMENT38 www.euronext.com

Presentation of the Group
1
Regulation
Euronext Amsterdam, Euronext Brussels, Euronext Dublin, Euronext
Lisbon and Euronext Paris are registered by ESMA as benchmark
administrators under BMR. Euronext Oslo is in the process of
obtaining such registration.
The Operation of Regulated Markets and MTFs
MiFID II/MiFIR, MAR/MAD II, ESMA standards and the Euronext
Rulebooks all provide minimum requirements for the monitoring
of trading and enforcement of rules by Euronext as the operator of
regulated markets and MTFs. In particular, market operators are
required to meet, inter alia, all the requirements set out in MiFID
II/MiFIR (and reinforced in MAR/MAD) including the obligation to
ensure that the markets they operate allow fi nancial instruments
to trade “in a fair, orderly and effi cient manner”.
To this end, Euronext has set up a framework to organise market
monitoring by which it:
n monitors trading in order to identify breaches of the rules,
disorderly trading conditions or conduct that may involve market
abuse;
n reports breaches of rules or of legal obligations relating to market
integrity to the competent authority.
Market surveillance and monitoring are implemented through a
two-step process consisting of real-time market surveillance and
post-trade (i.e., “next day”) analysis of executed trades. Euronext
ensures member compliance with its rules by conducting on-site
investigations and inspections.
Group-Wide Supervision and Regulation
The national regulators of Euronext’s markets are parties to a
memorandum of understanding most recently amended and
restated in December 2019 that established a “Euronext College
of Regulators” and provides a framework to coordinate their
supervision and regulation of the business and of the markets
operated by Euronext. The Company commits itself to the
memorandum of understanding, to the extent that any obligations
arising from the memorandum of understanding apply to the
Company or its subsidiaries.
These regulatory authorities have identifi ed certain areas of common
interest and have adopted a coordinated approach to the exercise of
their respective national rules, regulations and supervisory practices
regarding listing requirements, prospectus disclosure requirements,
on-going obligations of listed companies, takeover bid rules and
disclosure of large shareholdings.
National Regulation
Euronext’s market operators each hold licences for operating
regulated markets. Some market operators also operate a number
of markets that do not fall within the European Union defi nition of
“regulated markets” or MTFs. Each market operator is subject to
national laws and regulations pursuant to its market operator status.
The Netherlands
Both Euronext N.V. and Euronext Amsterdam have an exchange
licence from the Dutch authorities to operate regulated markets.
This means that they are subject to the regulation and supervision
of the Dutch minister of Finance and the Autoriteit Financiële
Markten (“AFM”). Since the creation of Euronext in 2000, the Dutch
regulators have taken the view that the direct parent company of
Euronext Amsterdam, as controlling shareholder, has to be seen
as co-market operator and, accordingly, also requires an exchange
licence. Pursuant to section 5: 26 paragraph 1 of the Dutch Financial
Supervision Act it is prohibited in the Netherlands to operate or to
manage a regulated market without a licence granted by the Dutch
minister of Finance.
The Dutch minister of Finance may, at any time, amend or revoke the
licence if necessary to ensure the proper functioning of the markets
or the protection of investors. The licence may also be revoked for
non-compliance with applicable rules.
Belgium
Euronext Brussels is governed by the Belgian Law of 21 November
2017 on the market infrastructures for fi nancial instruments and
transposing MiFID II. Accordingly to the Law, Euronext Brussels is
responsible for matters such as the organisation of the markets and
the admission, suspension and exclusion of members and has been
appointed by law as the “competent authority” for listing matters
within the meaning of the Listing Directive (Directive 2001/34/EC).
Euronext Brussels is subject to the supervision of the Financial
Services and Markets Authority (FSMA), an independent public
authority which strives to ensure the honest and equitable treatment
of fi nancial consumers and the integrity of the fi nancial markets.
Portugal
As a market operator, Euronext Lisbon is governed by Portuguese
Decree of Law No. 357-C/2007 of 31 October 2007 which, along with
the Portuguese Securities Code and regulations of the Comissão
do Mercado de Valores Mobiliários (“CMVM”), governs the regime
applicable to regulated markets and MTFs, market operators and
other companies with related activities in Portugal. The creation
of regulated market operators requires the prior authorisation in
the form of a decree-law from the Portuguese minister of Finance,
following consultation with the CMVM.
As a CSD, Interbolsa is governed by the CSDR and the Portuguese
CSD Legal Framework, approved by Law 35/2018 of 20 July which,
along with the Portuguese Securities Code, the regulations of the
CMVM and Interbolsa self-regulation.
France
As a market operator, Euronext Paris manages the Euronext
regulated markets in France. In accordance with Article L. 421-10
of the French Monetary and Financial Code, Euronext Paris adopts
rules for each of these markets to ensure fair and orderly trading
and effi cient order execution. The requirements for market access
and admission of fi nancial instruments to trading are also covered
by these rules, which are approved by the Autorité des Marchés
Financiers (“AMF”) and published on the market operator’s website.
Euronext Paris markets are subject to the provisions of Article
L. 421-4 et seq. of the French Monetary and Financial Code, which
authorises the French minister of Economy to confer and revoke
regulated market status upon proposal of the AMF, which has to
consult with the Autorité de Contrôle Prudentiel et de Résolution
(“ACPR”).
2019 UNIVERSAL REGISTRATION DOCUMENT 39
Presentation of the Group11Regulation
United Kingdom
Euronext London has been granted recognition by the Financial
Conduct Authority (“FCA”) to operate as a United Kingdom recognised
investment exchange (“RIE”), pursuant to section 290 of the Financial
Services and Markets Act 2000 (the “UK FSMA”). As such, Euronext
London has certain self-regulatory responsibilities for its markets.
In order to retain its status as an RIE, Euronext London is required
to meet various legislative and regulatory requirements and failure
to comply with these requirements could subject it to signifi cant
penalties, including de-recognition.
The regulatory framework applicable to Euronext London is
supplemented by a series of legislative provisions regulating
the conduct of participants. Importantly, the UK FSMA contains
provisions making it an off ense for any person to engage in certain
market behaviour and prohibits market abuse through the misuse
of information, the giving of false or misleading impressions or the
creation of market distortions. Breaches of those provisions give rise
to the risk of sanctions, including fi nancial penalties.
On 30 March 2020 Euronext has filed an application for the
revocation of its RIE licence, subject to approval from the FCA. Under
the applicable rules this implies that Euronext will have to cease
all regulated activities in the UK as per 30 June 2020. Euronext will
ensure an orderly wind down of its limited regulated activities in
close consultation with the FCA.
Republic of Ireland
The Irish Stock Exchange Plc trading as Euronext Dublin is
authorized by the Central Bank of Ireland (“CBI”) as a market
operator pursuant to Article 56 (2) of the European Union (Markets
in Financial Instruments) Regulation 2017 (S.I. 375/2017). As a
market operator, Euronext Dublin operates one regulated market
and three multi-lateral trading facilities and adopts rules for each
of these markets to ensure fair and orderly trading and effi cient
order execution.
In addition, Euronext Dublin has been appointed as the competent
authority for listing by the department of Business, Enterprise and
Innovation pursuant to the European Communities (Admission
to Listing and Miscellaneous Provisions) Regulations 2007, as
amended.
The CBI is responsible for the regulation and supervision of regulated
markets and market operators authorised in Ireland. Euronext Dublin
is required to meet various legislative and regulatory requirements
and failure to comply with these requirements could subject it to
enforcement action by the CBI including signifi cant penalties and/
or revocation of its authorisation as a market operator.
Norway
Oslo Børs has a license as a regulated market from the Norwegian
Ministry of Finance pursuant to section 11.1 of the Norwegian
Securities Trading Act and operates two such regulated markets.
In addition, Oslo Børs operates one multilateral trading facility
pursuant to section 9.8 of the Norwegian Securities Trading Act.
Oslo Børs adopts rules for each of these markets to ensure fair and
orderly trading and effi cient order execution.
In addition, Oslo Børs has been appointed as take-over authority
pursuant to section 6.4 of the Norwegian Securities Trading Act.
Oslo Børs has also delegated authority to supervise compliance
with and to sanction violations of the issuers’ obligation to disclose
inside information pursuant to sections 5.2 and 5.3 of the Norwegian
Securities Trading Act, cf. section 17.1 of the Norwegian Securities
Trading Regulation.
The Norwegian Financial Supervisory Authority is responsible for
the regulation and supervision of regulated markets and multilateral
trading facilities licensed in Norway.
Stichting
In connection with obtaining regulatory approval of the acquisition of
Euronext by the NYSE group, Inc. in 2007, NYSE Euronext implemented
certain special arrangements which included a standby structure
involving a Dutch foundation (stichting). Following the acquisition
of NYSE Euronext by ICE and the Demerger, the Company became
a party to these arrangements, which include a Further Amended
and Restated Governance and Option Agreement (the “GOA”), to
which ICE, the stichting and Euronext are parties. The stichting has
been incorporated to mitigate the eff ects of any potential change
in U.S. law that could have extraterritorial eff ects on the regulated
markets operated by the Euronext Market Subsidiaries as a result
of a U.S. shareholder holding a controlling interest in the Company.
The board members of the stichting are independent from Euronext.
Pursuant to the GOA, while the Company has U.S. shareholders with
a controlling interest in the Company, the stichting is empowered to
take actions to mitigate the adverse eff ects of any potential change
in U.S. law that have certain extraterritorial eff ects on the regulated
markets operated by the Euronext Market Subsidiaries. If there is
no such controlling U.S. shareholder, the stichting becomes dormant
and unable to exercise such powers. If a new U.S. shareholder were
to gain control of the Company, the stichting would be automatically
revived.
Up until 20 June 2014, the stichting was active through ICE’s
shareholding. Since the IPO, ICE sold its shareholding, and there has
been no controlling American’ shareholder. At the Euronext College
of Regulators’ request, the stichting has become dormant.
1.4.3 OWNERSHIP LIMITATIONS AND ADDITIONAL NOTIFICATION REQUIREMENTS
The rules set forth below apply to an acquisition of a direct or
indirect interest in Euronext’s market operators. These rules are
in addition to shareholder reporting rules applicable to listed
companies generally set out above.
n Under Dutch law, a declaration of no-objection of the Dutch
minister of Finance is required for any holding, acquisition or
increase of a Qualifying Participation (defi ned as direct or indirect
participation of at least 10% of the issued capital of the relevant
entity or the power to exercise at least 10% of the voting rights)
in an operator or holder of a regulated market in the Netherlands
which has been granted an Exchange License to operate
such market pursuant to section 5: 26 of the Dutch Financial
Supervision Act. The Dutch minister of Finance has delegated
its powers to grant a declaration of no-objection under section 5:
32d of the Dutch Financial Supervision Act to the AFM, except
2019 UNIVERSAL REGISTRATION DOCUMENT40 www.euronext.com
Presentation of the Group
1
Regulation
in cases where the acquisition of the Qualifying Participation
involves a fundamental change to the shareholding structure of
the relevant licensed operator or holder of a regulated market
in the Netherlands. Euronext N.V. controls Euronext Amsterdam,
which is the licensed holder and operator of a regulated market
in the Netherlands, and has obtained a declaration of no-objection
under section 5: 32d referred to above. Therefore, any acquisition
or holding increase of a direct or indirect interest in the Company
that results in an indirect Qualifying Participation in Euronext
Amsterdam, will trigger the requirement to obtain a declaration
of no-objection of the AFM or, in case of a fundamental change in
the shareholding structure, the Dutch minister of Finance. Such
declaration should be granted unless such holding, the acquisition
or increase: (1) could or would lead to a formal or actual control
structure that is lacking in transparency and would therefore
constitute an impediment to the adequate supervision of the
compliance by the market operator with the rules applicable to
the operator of a regulated market; (2) could or would lead to
an infl uence on the regulated market operator or eff ect on the
exploited or managed regulated market that forms a threat to
the interests which the Dutch Financial Supervision Act seeks to
protect; or (3) could jeopardise the healthy and prudent operation
of the regulated market concerned. Non-compliance with the
requirement to obtain a declaration of no-objection is an economic
off ense and may lead to criminal prosecution. In addition, if a
person acquires or increases a Qualifying Participation without
having obtained a declaration of no-objection, it will be obliged
to cancel the transaction within a period to be set by the Dutch
minister of Finance or the AFM unless the person cures the
offense and obtains a declaration of no-objection. The Dutch
minister of Finance or the AFM may request the District Court in
Amsterdam to annul any resolutions that have been passed in a
general meeting of shareholders in which such person exercised
its voting rights, if such resolution would not have been passed
or would have been passed diff erently if such person would not
have exercised its voting rights. The District Court will not annul
the resolution if the relevant person obtains a declaration of no-
objection prior to the decision of the court.
n Under French law, any person or group of persons acting in
concert who acquires or increases, directly or indirectly, a holding
in Euronext Paris shares or voting rights in excess of 10%, 20%,
33 1/3%, 50% or 66 2/3% is required to inform Euronext Paris,
which in turn must notify the AMF and make the information
public. Any person acquiring direct or indirect control of a
market operator must obtain the prior approval of the minister
of Economy upon proposal of the AMF. Further, Euronext Paris
shall promptly notify the AMF prior to any changes to the identity
and the details of the holding of any existing shareholder or
shareholders, alone or in concert, who is in a position to exercise,
directly or indirectly, signifi cant infl uence (10% or more of the
share capital or voting right) over the management of Euronext
Paris and the proposed change can proceed as long as Euronext
Paris does not receive any objection from the AMF within the
period of time provided by the AMF General Regulation.
n Under Belgian law, any person who intends to acquire securities
in a Belgian market operator and who would, as a result of such
acquisition, hold directly or indirectly 10% or more of the share
capital or of the voting rights in that market operator, must
provide prior notice to the FSMA. The same obligation applies
each time such person intends to increase its ownership by an
additional 5%.
n Under Portuguese law, a shareholder who intends to acquire,
directly or indirectly, a dominant holding (broadly defi ned as
50% or more of the share capital or voting rights) or a dominant
infl uence (broadly defi ned as the majority of voting rights or the
possibility to appoint or dismiss the majority of the members of
the managing or supervisory bodies) in a Portuguese market
operator must obtain the prior authorisation of the Portuguese
Ministry of fi nance (with prior advice of the CMVM). In addition,
all entities envisaging (i) acquiring or disposing of a (direct or
indirect) qualifying holding (10% or more of the share capital or
voting rights or otherwise establishing a signifi cant infl uence)
or increasing a qualifying holding at the level of 10%, 20%,
33 1/3% and 50% or more of the shares capital or voting rights
in a market undertaking in Portugal or (ii) otherwise establishing
a control relationship with a market subsidiary in Portugal,
must notify the CMVM of the acquisition or disposal as soon as
a decision has been taken to proceed within four business days
following the relevant transaction and seek a prior declaration
of non-objection. The disposal/reduction of the aforementioned
qualifying holdings (considering each threshold above) or change
in the control relationship is also required to be notifi ed to the
CMVM.
n Under Irish law, prior notifi cation to the Central Bank of Ireland
of a proposed acquisition of, or increase in, a direct or indirect
qualifying holding (10% or more of the capital or of the voting
rights or which makes it possible to exercise a significant
infl uence over the management of that undertaking) of Euronext
Dublin is required.
n Under Norwegian law, an acquisition resulting in the acquirer
having a signifi cant holding in a market operator for an offi cial
stock exchange, or in the stock exchange itself, requires
authorization from the Norwegian Ministry of Finance. Signifi cant
holding means any direct or indirect holding representing at least
10% of the share capital or the voting rights, or which otherwise
makes it possible to exercise substantial influence over the
management of the undertaking. Shares held or acquired by
related parties shall be deemed equivalent to the acquirer’s own
shares. The acquisition of a right to become holder of shares shall
be deemed equivalent to the holding of shares for the purpose
of the fi rst to third sentence where this must be considered a
benefi cial shareholding. Any acquisition increasing the holding
such as to directly or indirectly exceed 20%, 30% or 50% of
the share capital or voting rights of a stock exchange requires
authorization from the Norwegian Ministry of Finance.
2019 UNIVERSAL REGISTRATION DOCUMENT 41
2019 UNIVERSAL REGISTRATION DOCUMENT42 www.euronext.com
2.1 Risk Factors 44
Strategic 44
Operational Risks 48
Compliance Risk 51
Financial Risk 52
2.2 Control Structure 53
Risk Approach and Internal Control Objectives 53
ERM Framework 53
ERM Framework Governance 54
2.1.1 Second Line of Defence 55
2.1.2 Internal Audit – Third Line of Defense 57
RISK MANAGEMENT & CONTROL STRUCTURE
Euronext analyzes and monitors risks whose occurrence
could have a material impact on the Group’s business.
The table of the Group’s principal risks categorizes these
risks, the most material risks taking into account the impact
and the probability of their occurrence.
2019 UNIVERSAL REGISTRATION DOCUMENT 43
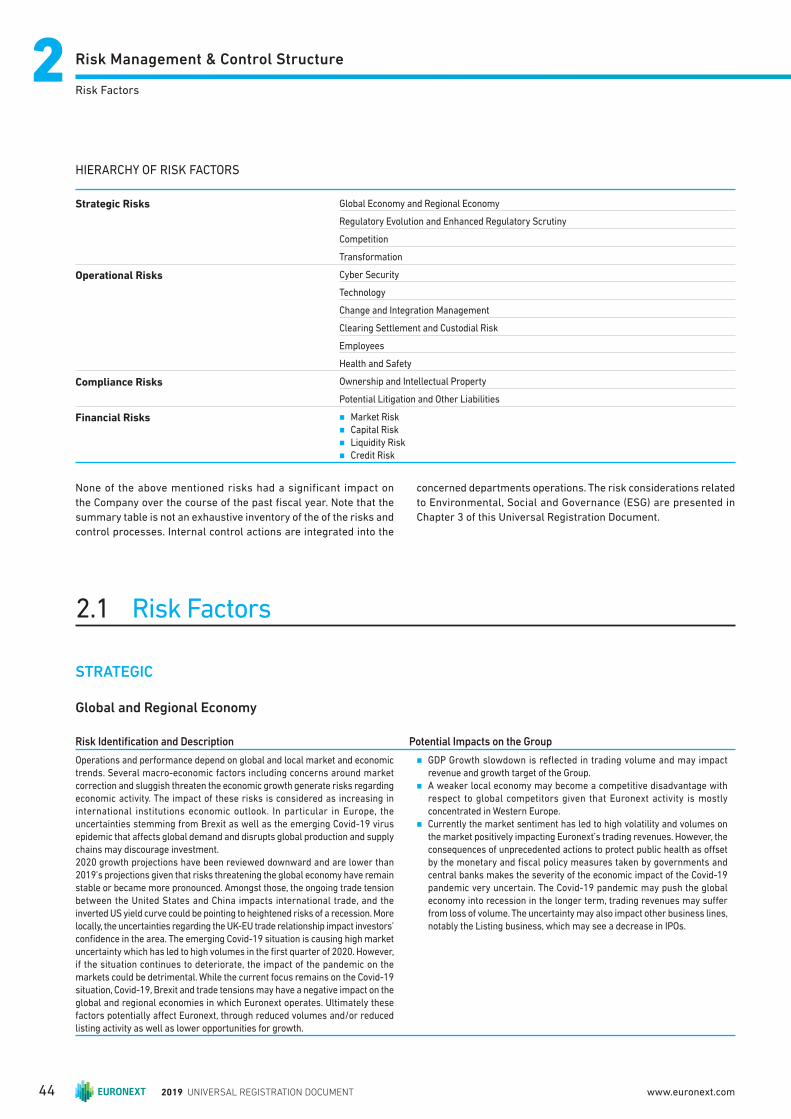
Risk Management & Control Structure22Risk Factors
HIERARCHY OF RISK FACTORS
Strategic Risks Global Economy and Regional Economy
Regulatory Evolution and Enhanced Regulatory Scrutiny
Competition
Transformation
Operational Risks Cyber Security
Technology
Change and Integration Management
Clearing Settlement and Custodial Risk
Employees
Health and Safety
Compliance Risks Ownership and Intellectual Property
Potential Litigation and Other Liabilities
Financial Risks n Market Risk
n Capital Risk n Liquidity Risk
n Credit Risk
2.1 Risk Factors
STRATEGIC
Global and Regional Economy
Risk Identifi cation and Description Potential Impacts on the Group
Operations and performance depend on global and local market and economic trends. Several macro-economic factors including concerns around market
correction and sluggish threaten the economic growth generate risks regarding
economic activity. The impact of these risks is considered as increasing in international institutions economic outlook. In particular in Europe, the uncertainties stemming from Brexit as well as the emerging Covid-19 virus
epidemic that aff ects global demand and disrupts global production and supply
chains may discourage investment.2020 growth projections have been reviewed downward and are lower than 2019’s projections given that risks threatening the global economy have remain
stable or became more pronounced. Amongst those, the ongoing trade tension
between the United States and China impacts international trade, and the inverted US yield curve could be pointing to heightened risks of a recession. More locally, the uncertainties regarding the UK-EU trade relationship impact investors’
confi dence in the area. The emerging Covid-19 situation is causing high market uncertainty which has led to high volumes in the fi rst quarter of 2020. However,
if the situation continues to deteriorate, the impact of the pandemic on the markets could be detrimental. While the current focus remains on the Covid-19 situation, Covid-19, Brexit and trade tensions may have a negative impact on the
global and regional economies in which Euronext operates. Ultimately these factors potentially aff ect Euronext, through reduced volumes and/or reduced
listing activity as well as lower opportunities for growth .
n GDP Growth slowdown is reflected in trading volume and may impact revenue and growth target of the Group.
n A weaker local economy may become a competitive disadvantage with
respect to global competitors given that Euronext activity is mostly concentrated in Western Europe.
n Currently the market sentiment has led to high volatility and volumes on the market positively impacting Euronext’s trading revenues. However, the
consequences of unprecedented actions to protect public health as off set
by the monetary and fi scal policy measures taken by governments and central banks makes the severity of the economic impact of the Covid-19 pandemic very uncertain. The Covid-19 pandemic may push the global
economy into recession in the longer term, trading revenues may suff er
from loss of volume. The uncertainty may also impact other business lines, notably the Listing business, which may see a decrease in IPOs.
None of the above mentioned risks had a significant impact on
the Company over the course of the past fi scal year. Note that the
summary table is not an exhaustive inventory of the of the risks and
control processes. Internal control actions are integrated into the
concerned departments operations. The risk considerations related
to Environmental, Social and Governance (ESG) are presented in
Chapter 3 of this Universal Registration Document.
2019 UNIVERSAL REGISTRATION DOCUMENT44 www.euronext.com
Risk Management & Control Structure
2
Risk Factors
Risk Control & Mitigation
Euronext considers international institutions’ economic outlooks to
assess the level of this risk. With a consensus of about 3.2% global
real GDP growth, and +1.3% in the Euro area for 2019 at the date
of publication of this document, the risk of an adverse impact of
global and regional economy trends is very low but not insignifi cant.
This risk is partially mitigated by Euronext’s strategy of
diversification, geographically and in terms of area of activity.
Euronext has put in to place a wide range of measures to secure
its market operations. Please refer to the operational risk section
Health and Safety.
Regulatory Evolution and Enhanced Regulatory Scrutiny
Risk Identifi cation and Description Potential Impacts on the Group
Euronext’s business in Europe is subject to extensive regulation at the European level and by national regulators in the relevant European jurisdictions where the Group has operations: Belgium, France, Ireland, the Netherlands, Norway, Portugal and the United Kingdom. In addition, the Company has a presence in the United States and Singapore.Regulatory scrutiny following the fi nancial crisis continue to generate risks and opportunities.
n As the Group seeks to grow its product base or the jurisdictions in which it operates, it could become subject to oversight by additional regulatory bodies which may expand the regulatory and compliance requirements.
n Additional regulatory evolutions may aff ect Euronext activity and/or revenue if designed adversely.
n Decisions by any of Euronext’s regulators to impose measures which may impact the competitive situation and possible strategy of the Group.
n New supervisory fees are expected from ESMA by 2022 for its new direct supervision powers on data reporting providers. In addition, potential changes
in the fee structure of Euronext’s supervisory competent authorities may occur
following the implementation of the new EU regulatory framework in the
European securities markets generally.
n Delay or denials of regulatory approval requested by Euronext to, inter alia,
further its strategy, leverage business opportunities and change its governance
– all potentially impacting Euronext’s competitive position. n Potential fi nes if Euronext breaches regulations, impacting results as well as
Euronext’s reputation.
n Reduction of Euronext’s bandwidth to perform business related projects and
agility due to operational implementation.
MiFID II/MiFIR
The regulatory regime within Europe has been amended and extended. The
revised European Union Markets in Financial Instruments Directive (MiFID II/
MiFIR) has been eff ective since 3 January 2018. Compliance with this new
regime by all market actors is changing the competitive landscape and may,
therefore, have an adverse effect on the Company’s business. The main
sources of risk and their possible consequences are closely monitored and
may impact ENX’s market share or directly its revenue.
n Any review of the pricing of market data on a reasonable commercial basis
which may impact a signifi cant stream of revenue for Euronext depending on
how requirements are defi ned. n The tick size regime, initially favoring the growth of trading via systematic
internalisers, is expected to be amended in the fi rst half of 2020 to the benefi t
of exchanges by re-establishing a level playing fi eld. n The open access provisions seek to increase competition by allowing
competitors to improve their value off er or to create derivatives on benchmarks
historically used exclusively by Euronext. Additional resource devoted to increased regulatory reporting requirements may impact cost and compliance.
EU Financial Transaction TaxOngoing discussions on the potential for an EU Financial Transaction Tax
(covering 10 Member States) may have a negative impact on Euronext’s trading
volumes
n Any agreement on the EU10 FTT could have an impact on revenues in certain countries.
IT and Cyber Security Standards
Increased regulatory and policymaking focus on cyber security and data protection issues at European and national levels requires Euronext alignment with all applicable laws and regulations. Regulations have diff erent scope and
impact in terms of Euronext group processes and stakeholders.
Directive on security of Network and Information Systems (“NIS Directive”) is an European directive with specifi c processes per country in terms of processes, reporting and controls that seeks to safeguard IT and computer systems.
Loi de programmation militaire (“LPM”) is a French law where specifi c controls
are mandated.
n While we support such initiatives, current and future legislation will likely
impact the Group’s operational and compliance models and as such may
increase cost.
Regulation of Emerging Technology
Increased regulatory and policymaking focus on the development of Fintech services and products at European and national levels.
n While Fintech services and products should be encouraged and a regulatory framework developed to ensure this, there may be a risk of unlevel playing
fi eld competition between similar products and services.
Other regulatory frameworks/initiativesRecent regulations, including the General Data Protection Regulation (GDPR), Market Abuse Regulation (MAR) Central Securities Depository Regulation
(CSDR) and Benchmark Regulation (BMR) require significant effort to implement, impacting operational capacity as well as increasing risk of non-
compliance.
n The Group operational processes have been adapted across all of its departments to ensure compliance with the GDPR, including a clear
governance structure around data management and the use of personal data. n The Group has engaged in discussions in some of its jurisdictions where
regulatory initiatives are being developed and is monitoring initiatives at the
European level. n The implementation of BMR required eff ort to implement, impacting operational
capacity as well as increasing risk of non-compliance. The increased oversight of the registered benchmarks requires additional resource to maintain.
2019 UNIVERSAL REGISTRATION DOCUMENT 45
Risk Management & Control Structure22Risk Factors
Risk Control & Mitigation
Euronext actively monitors all relevant European and national
legislative and regulatory policy developments and engages in
regular discussions with public authorities’ to ensure that it is able
to provide input and respond to developments. Alongside this the
Group operates comprehensive systems and controls to mitigate
compliance risk.
The appropriateness of Euronext processes and policies are
continuously assessed and improved in relation to the business
activities, organisation and resources of the Company as well
as market conditions, under which the activities of Euronext are
performed to avoid breaches of legal, statutory, regulatory or
contractual obligations related to information security requirements
and to ensure that information security is implemented and operated
in accordance with the global best practices.
Brexit
Euronext maintains a Brexit group which has established a
mitigation plan for the various scenarios and continues to monitor
developments. As part of this approach, Euronext liaises with clients
(including trading fi rms and issuers) in terms of impact and any
proposed actions, and there is engagement with European and
national policy-makers and regulators on developing an outcome
that minimizes the impact on our markets as much as possible.
Regarding the migration of Irish securities to a new settlement
system in the EU, there is a dedicated project in progress to deliver
this by 29 Mar 2021, and temporary equivalence has been secured
from the Commission and ESMA to continue to use the CREST
settlement system in the UK in the interim.
Competition
Risk Identifi cation and Description Potential Impacts on the Group
Market Fragmentation
Concerning the trading activity, fragmentation of markets and increased competition, MiFID II opened the path for new forms of competition, specifi c examples being systematic internalisers and new trading models. The principle
consequence of MIFID 2 has been the reshuffl ing of equity landscape of OTC and
grey markets.Index derivatives may come under some competitive pressure as Open Access to Benchmarks comes in to force in January 2020. Open Access allows any
exchange to buy an index license and trade products based on index on its
markets.
Market FragmentationGlobal competition among trading markets and other execution venues remains
intense. Given that the Company’s current and prospective competitors are
numerous and include both traditional and non-traditional trading venues: multilateral trading facilities (“MTFs”) and a wide range of over-the-counter (“OTC”) services provided by market makers, banks, brokers and internalization
other fi nancial market participants amongst whom some are allowed to off er
better pricing than exchanges. Further, some of these competitors are among Euronext’s largest customers or are owned by its customers.Systematic internalisers have not disrupted the regulated market as signifi cantly
as had initially anticipated however remain closely monitored for any possible
shifts in the environment. Open Access to benchmarks may result in more fi erce competition in the index business.The success of the Group’s business depends on its ability to attract and maintain
order flow, both in absolute terms and relative to other market centres. If
Euronext fails to compete successfully, the loss of order fl ow would deteriorate liquidity and market quality, and may endanger Euronext’s attractivity and impact its fi nancial results.
Listing Business
In the listing segment, Euronext is facing competition from other exchanges developing initiatives to capture primary listing of issuers based in Euronext’s
home markets.Beyond these incumbent competitors, an ever increasing number of private companies favour private equity funding, notably given the lesser regulatory
burden. In recent years, record low-interest rates have amplifi ed leveraged funding in private equity, allowing for higher valuations outside of capital
markets. More recent innovative funding solutions also include Initial Coin Off erings (ICO).
Listing Business
As a result of the growing appeal of private equity and the intensifying competition among exchanges, a number of potential issuers may not join Euronext. This
ultimately has a negative impact on Listing admission fees and future trading fees.
Risk Identifi cation and Description Potential Impacts on the Group
BrexitThe decision of the United Kingdom to withdraw from the European Union (Brexit) should have, at a regulatory level, wide-ranging implications for European fi nancial markets whose full impact will only become clear once the negotiations between the European Union and the United Kingdom regarding withdrawal have clarifi ed the general nature of the post-Brexit relationship (including the extent to which UK-based fi rms have access to the single market in fi nancial services). While the risk of a “no deal” scenario has diminished, it still remains a possible outcome should negotiations on the longer-term framework fail to reach agreement. The level of uncertainty is still too high to positively affi rm that the Brexit will not aff ect ease of access to trading between the UK and the EU, consequently impacting Euronext’s business, we continue to maintain our “no-deal” mitigation plan.
Brexit
n Access of UK-based members to Euronext’s markets.
n Risk that the attractiveness of our markets with high-levels of dual-listings could be negatively impacted as a result of limitations on EU broker access to all signifi cant liquidity pools (due to the Share Trading Obligation).
n Access of Euronext Dublin to UK-based CREST settlement system. n Access of UK-based clearing members to EU clearing houses.
n Use of Euronext’s benchmarks by UK supervised entities.
2019 UNIVERSAL REGISTRATION DOCUMENT46 www.euronext.com

Risk Management & Control Structure
2
Risk Factors
Transformation
Risk Identifi cation and Description Potential Impacts on the Group
The Company is exposed to transformation risks (risk of loss or failure resulting
from change/transformation) given the current levels of change and alignment
activity taking place across the Company.
Technology
Euronext operates in a business environment that continues to experience
signifi cant and rapid technological change. To remain competitive, the Company
must continue to transform in order to enhance and improve the functionality,
capacity, accessibility and reliability of its technology. The Company is ambitious
in its drive for constant innovation and technological transformation in order to
maintain its place in the exchange landscape.
Strategic Acquisitions
Euronext is undergoing companywide transformation programs, such as the
integration of new acquisitions, including Euronext Oslo and VPS. If these
programs are not completed, or do not operate as intended, identifi ed synergies
may not be delivered and the marketplace may be questioned.
The Company has entered and may continue to enter into business combination transactions. The market for acquisition targets and strategic alliances is highly competitive.
Technology is changing rapidly and given the time to market to develop and
implementation changes, Euronext may be impacted if technology is no longer
relevant.
Pursuing strategic transactions requires substantial time and attention of the
management team, which could prevent them from successfully overseeing
other initiatives. Similarly, if acquisitions ambitions are publicly disclosed but
not closed, this may impact our reputation and our strategic growth plan.
Completing and recognising benefi ts of potential transactions takes time and
can impact the Company’s business, and fi nancial results.
In relation to the expansion of the Group’s business, Euronext invests time in
developing new products, improving current product off erings or increase its
presence in other markets. If these product off erings are not successful, a
potential market opportunity may be missed and Euronext may not be able to
off set the cost of such initiatives, which may have a material impact on the
Company’s fi nancial results.
Risk Control & Mitigation
Market Fragmentation
Innovation in the sector and movements in the competitive
landscape are closely monitored and actions are taken to protect
market share and develop new off erings to attract additional fl ow.
Further, Euronext is focused on delivering the highest quality
liquidity management to ensure its position as the deepest pool of
liquidity. Euronext actively seeks the diversifi cation of its business
through the acquisition of non-volume-based businesses, reducing
the Group’s overall exposure to this risk. The Group has several
initiatives and projects in order to offer superior products and
services to clients and issuers alike.
Listing Business
While Euronext is subject to competition from our peers in our local
markets Euronext competes with peers on their home markets –
in particular in respect of global companies and SMEs in the
technology sector as well as in the corporate services market,
where Euronext provides support to newly listed and existing
companies. Furthering Euronext’s geographical reach in Europe,
the Company has established a sales presence in several European
locations building proximity and intimacy with private companies
in Europe this has translated into increased new listing fl ow from
non-Euronext markets.
Euronext actively seeks to identify unlisted companies that require
additional fi nancing to meet their ambitions, to encourage them
to view fi nancial markets as a source of fi nancing, a governance
and transmission tool, a way to enhance their visibility and a
mean of raising their profi le with investors. As a result, Euronext
maintains targeted pre-IPO programmes (TechShare, FamilyShare
and IPOready) to help CEOs familiarise themselves with capital
markets.
Risk Control & Mitigation
Euronext mitigates its exposure to transformation risk through the
close monitoring of transformation programs including set up of
governance bodies to organize implement and follow the integration
of recently acquired entities.
With the growth of the Group size, there has also been an increase
in its capacity, competence and experience in integrating new
companies into the Group and deliver synergies.
Euronext continuously seeks to fi nd, acquire, and innovate products
and services that either enhance current performance and capacity
or drive Group evolution and growth.
Euronext’s strategy 2022, Let’s Grow Together supports the
transformation eff ort.
2019 UNIVERSAL REGISTRATION DOCUMENT 47
Risk Management & Control Structure22Risk Factors
Risk Control & Mitigation
Euronext Group has a specifi c cybersecurity strategy, roadmap and an
established governance model supported with dedicated resources.
The roadmap and strategy are under scrutiny of internal audits,
external auditors and a college of regulators from all countries
where Euronext operates regulated markets.
Euronext follows and implements best security practices aligned
and certifi ed with the recognized global standards (e.g. ISO 9001,
ISO 27001, NIST cybersecurity strategy of Identify, Protect,
Detect, Respond and Recover) to address global data protection
regulations and ensure a high level of cybersecurity maturity.
Additionally, Euronext has a dedicated cybersecurity insurance for
the Group.
The security of infrastructure, websites and networks is assured
at a Group leveI: 1. infrastructure monitoring and management
performed constantly; 2. continuous IT assessments and security
audits (internal, external and third-party) are performed to assess
whether the level of security is adequate; 3. Awareness campaigns
are conducted as are tests on the resilience of the cybersecurity
response in case a cyberattack; 4. Involvement of cybersecurity
architects on the early phases of new projects.
OPERATIONAL RISKS
Cyber Security
Risk Identifi cation and Description Potential Impacts on the Group
The Group Strategy and strategic plan to grow and secure transmission of business confi dential information over public and other networks is a critical element of Euronext’s operations.As a result of its expansion, the Group is more exposed in the digital world, accumulates, stores and uses more business data which is protected by business contracts and regulated by various law, including data protection, in the countries in which it operates.The Group may be vulnerable to exfi ltration, unauthorized access and other security incidents including:
n third parties, including cloud computing services, to whom Euronext provides information and may not be diligent in safeguarding it;
n as the volume of cyber-attacks are increasing in general and, consequently, within the fi nancial sector, the Group systems may experience security incidents from hacking groups or advanced persistent threats – the last
one most eff ective and disruptive as they are cyber-attacks sponsored by
organized crime or states with malicious intentions;
n open source software used by Euronext within its software solutions. As
the source code of open source components is available to the public,
hackers may take advantage from publicly available code to fi nd unknown
or undisclosed vulnerabilities;
n persons who circumvent deployed security measures could wrongfully
access the Group’s or its customers information, or cause interruptions or
malfunctions in the Company’s operations; n data protection regulations increases the risks associated with regulatory
non-compliance.
The impacts of a successful cybersecurity attack would depend on the nature of the attack:
n security breaches, leakage, loss or theft of sensitive, personal, strategic or confi dential data, also impacting data protection laws, and other related security incidents could cause Euronext to incur reputational damage, regulatory sanctions, litigation and/or have an impact on its fi nancial results;
n successful cybersecurity attack on IT systems aff ecting confi dentiality, availability or integrity of information;
n system failures due to vulnerabilities exploitation.While the Group is committed to investment in maintaining and safeguarding IT systems, with a particular attention in external growing threats (such as cybercriminals), any malfunctions, signifi cant disruption, loss or disclosure of sensitive data could disrupt the normal course of business and have fi nancial, operational or reputational consequences leading to a security incident and
proper response.
2019 UNIVERSAL REGISTRATION DOCUMENT48 www.euronext.com
Risk Management & Control Structure
2
Risk Factors
Risk Control & Mitigation
Euronext mitigates the risks related to change and integration
management by ensuring an eff ective project management team
that closely tracks, monitors and implements projects that are in
the pipeline or close to completion. The Project Management team
works closely with and helps to ensure a Group-wide alignment
of strategic and fi nancial objectives. The Risk Management team
actively follows projects, ensuring that the risks are understood,
monitored and escalated when necessary.
Governance and Managing Board oversight is determined by scale,
complexing and level of impact of the change, ensuring budget and
resource management, risks, issues and dependencies.
Technology
Risk Identifi cation and Description Potential Impacts on the Group
Technology is a key component of Euronext’s business strategy, and is crucial to the Company’s success. Euronext’s business depends on the performance and stability of complex computer and communications systems. Heavy use of Euronext’s platforms and order routing systems during peak trading times or at times of unusual market volatility could cause its systems to operate slowly or even to fail for periods of time. These events or other events could cause unanticipated disruptions in service to exchange members and clients, slower response times or delays in trade executions and related impacts.The Group fi nalized the transformation of its Technology organisation through its launch of Optiq® derivatives, bringing leading technology to ensure high capacity and reliability. Euronext’s success will depend, in part, on this continued innovation and investment in its trading systems and related ability to respond to customer demands, understand and react to emerging industry standards and practices on a cost-eff ective and timely basis, as well as in other technologies including leveraging cloud hosting for support and future services.Third Party DependenciesEuronext depends on the services of InterContinental Exchange, (“ICE”) for the
provision of network and colocation and data centre services. Equinix provides
the Company with its back up network and data centre service. Euronext depends
on Amazon Web Services (AWS) for selected post-trade cloud services.
Exploiting technology and the ability to expand system capacity and performance to handle increased demand or any increased regulatory requirements is critical to Euronext’s success. If the Group’s technology is not properly managed or the resources supporting the changes are not properly allocated, Euronext may lose market share or volumes, which could have an eff ect on business and fi nancial results. In case that service failure occurs there may be signifi cant fi nancial losses, litigation as well as reputation damage.While Euronext actively manages its relationships with its key strategic technology suppliers to ensure continual service, a disruption of these services would negatively impact the Company’s operations and reputation depending on the severity of the disruption may have consequential impact on the Group.
Risk Control & Mitigation
The performance and availability of the Group’s systems are
reviewed continuously and monitored to prevent problems
when possible and responding, in a timely and effi cient manner,
when problems do occur. Euronext continuously invests in the
development of its technology in order to maintain and ensure best
in class service and capacity.
The Group seeks to identify, manage and mitigate risks
associated with third party technology risks by partnering with
reputable technology and services providers, via audits of the
technology, backups and business continuity arrangements its
partners.
Change and Integration Management
Risk Identifi cation and Description Potential Impacts on the Group
The Group’s Change agenda is ambitious. It is driven by internally determined
programs, including technology transformation such as the recent completion of Optiq® and other internal IT programs aimed at delivering effi ciencies and higher performance. External drivers of change and integration include the
changing business and regulatory landscape, as well as the Group’s ambitious
inorganic growth strategy.The Company has actively arbitrated in favor of transformation and steady growth and as a result has taken on operational debt that is being continuously
addressed. As a result, the incoming fl ow of acquisitions and integration, project
developments, and regulatory obligations challenge available resources, thus the level of operational debt may not decrease as quickly as expected, which may put growth opportunities and strategy at risk.
The large volume of signifi cant internal programs and recent acquisitions, including the acquisition of Oslo Børs , VPS, in progress simultaneously, with
related impacts, that, if not delivered or delivered as originally designed or with
delays, may have an adverse impact on the business, culture, reputation and fi nancial condition of the Company, including an increased cost base without a proportionate increase in revenues.
In addition, the large volume of initiatives, projects and acquisitions exacerbate
the need for eff ective change and integration management where delays in one project may extend beyond the project in question and aff ect the availability of resources impacting other projects further down the line.
2019 UNIVERSAL REGISTRATION DOCUMENT 49
Risk Management & Control Structure22Risk Factors
Clearing, Settlement and Custodial Risk
Risk Identifi cation and Description Potential Impacts on the Group
The Group relies on key external third parties for post-trade services including clearing and settlement and other services.In particular, Euronext under its clearing service agreements with LCH S.A., the Paris based clearing house of LCH group Ltd, which is majority owned by LSEG. Euronext relies on LCH S.A. to provide Central Counter Party (CCP) services for trades executed on the Company’s cash and derivatives markets and to manage related CCP functions, such as risk, novation and multilateral netting.In addition, Euronext relies on EuroCCP to provide CCP services for trades executed on the Company’s cash markets and to manage related CCP functions for Euronext Dublin and as an alternative CCP for the other cash markets under the User Choice Model.For the Oslo cash markets, Euronext Oslo relies on 3 interoperable CCPs: LCH Ltd, EuroCCP & Six X Clear, while the Oslo Derivatives markets, Euronext Oslo relies on Six X Clear.The Group also relies on the services of Euroclear group (“Euroclear”) for the settlement of cash market trades other than in Portugal.
To the extent that any of the third parties on which Euronext relies experiences diffi culties, materially changes its business relationship with the Company or is unable for any reason to perform its obligations, any such event could have a material adverse effect on the business, reputation, results of operations, fi nancial condition and cash fl ows of Euronext.
Risk Control & Mitigation
Euronext has contracts with each of its post-trade providers that
establish clear governance and service quality.
Specifi cally, with respect to LCH S.A. a long-term contract has been
signed between two entities, in addition to which Euronext holds
11.1% stake in LCH S.A. as well as a seat on the Board of Directors all
of which help ensure a stable durable relationship. Euronext holds
approximately 5% of Euroclear as well as membership on the Board
of Directors ensuring that Euronext’s is involved decision making
at Euroclear.
Health and Safety
Risk Identifi cation and Description Potential Impacts on the Group
The Company depends on secure premises to protect its staff and physical
assets, as well as robust safeguards ensuring IT operations remain uninterrupted.
Given the symbolic nature of the stock exchange, the Group may be subject to a
direct or indirect target of protest and extremist organisations that employ
means to achieve their social or political objectives. The Group is also subject to
threats such as natural disasters and public health emergencies. According to the severity of the threat or incident may disrupt business operations, including
markets disruption, harmed staff and damage to physical assets.
In the event of an attack or a threat of an attack as well as natural disasters or
public health emergencies, the Group may experience a signifi cant delay in
resuming normal business operations which may negatively impact the
reputation. In addition, the closing of the market would translate into a revenue
loss.
Covid-19
The Covid-19 epidemic is a risk that may impact the health of the Group employees and those of our business partners and subsequently the ability to run critical business operations.
Covid-19 The number of confi rmed cases of COVID-19 is increasing. If the pandemic continues and results impact the health of employees, the Group may not have
the human resource to manage the business.
Risk Control & Mitigation
Euronext has rigorous physical security arrangements in place in
order to ensure the physical security of its staff and premises. The
Group is supported by and liaise with local governments and police
in its jurisdictions. The Group also monitors any potential security
threats in its locations.
Euronext has robust Business Continuity Management arrangements
in place in order to minimize the impact of disruptive events should
they occur. These arrangements are reviewed and tested on a
regular and ongoing basis and include staff testing and awareness,
crisis management planning and testing as well as disaster recovery
planning.
Covid-19
Euronext has a comprehensive Business Continuity program with
related plans for all its locations and across the company, which
are regularly tested, including work from home. A pandemic plan
is part of this program, has been leveraged in the current COVID-19
situation, and additional measures have been added such as rotating
teams for all staff members to reinforce separation of teams, to
limit contamination, reinforced cleaning in all locations and currently
curtailed travel and events.
2019 UNIVERSAL REGISTRATION DOCUMENT50 www.euronext.com
Risk Management & Control Structure
2
Risk Factors
Employees
Risk Identifi cation and Description Potential Impacts on the Group
Euronext is dependent on the experience and industry knowledge of management and other key staff to operate its business operations and execute its strategies.Euronext recognises there is a shortage in the employment market for true specialists in a number of areas, such as in the information technology fi eld and the fi eld of operation of markets and particular product niches. In these areas, the Company competes for staff with a large number of other enterprises.
The Company’s success depends in part upon its ability to continue to attract, develop and retain key staff members in a number of disciplines.A loss of, or an inability to attract senior management or other key staff could have a material adverse eff ect on the business, results of operations, fi nancial condition and cash fl ows.
Risk Control & Mitigation
To mitigate risk Euronext has established a Talent Acquisition and
Talent Development policy in accordance with the strategic plan
priorities. Shared processes and tools (HRIS) have been deployed
across locations to consolidate a common framework on talent
acquisition, assessment of skills and performance, training,
compensation, and career mobilities.
To prevent the skills’ shortage – specifically in the information
technology field – Euronext partners with engineering and IT
schools to co-develop projects and improve its visibility as an
attractive employer. Euronext has also developed an “Early Career”
programme to recruit and train students and recent graduates on
the latest technologies and critical skills.
Euronext developed dedicated leadership programmes for the
development of the managers and leaders of the organization.
A Group training plan is rolled out to favor access to training on
the core strategic skills to all employees through monthly sharing
sessions and weeks dedicated to learning opened to all staff .
Moreover, Euronext carries out initiatives to favor the quality of life at
work through its Wellnext programme with actions related to sport,
nutrition and work-life balance and reinforces its ESG commitment
internally and externally.
COMPLIANCE RISK
Ownership and Intellectual Property
Risk Identifi cation and Description Potential Impacts on the Group
Euronext owns or licenses rights to a number of trademarks, service marks,
trade names, copyrights, free or open source software and databases that are
used in its business. There is a risk that this IP could be misappropriated by third
parties. There is also a risk that during its business activities, Euronext could
inadvertently infringe third party IP rights.
In the event that any of IP which Euronext owns is misappropriated by third
parties, the value of that IP may be diminished in value as an asset, while some
licencing or product revenues relating to this may also be diminished. Further,
legal costs may be incurred and management time expended in order to protect
and enforce those IP rights.In the event that Euronext inadvertently infringes a third party’s IP rights, management time may be expended in order to investigate such matters. Legal
and/or other costs may also be incurred in seeking to resolve the matter.
Risk Control & Mitigation
Euronext takes measures to prevent infringement of its own IP
rights, in addition to measures to ensure that it conducts its business
activities in a manner which avoid inadvertently breach any third
party-owned IP rights.
Euronext relies on a combination of trademark laws, copyright laws,
trade secret protection, database laws, confi dentiality agreements
and other contractual arrangements with its affi liates, customers,
strategic investors and others in order to protect its own IP rights.
These contractual arrangements clarify and assert ownership of
these rights and also require employees to maintain trade secrets
and technical secrets.
In order to ensure that Euronext does not infringe on any third-
party IP rights, it has process and procedures in place supported
by the compliance team, including staff training and awareness.
Furthermore, Euronext conducts internal reviews of the use of the
third-party intellectual property in order to sure compliance and
uphold its contractual commitments.
2019 UNIVERSAL REGISTRATION DOCUMENT 51
Risk Management & Control Structure22Risk Factors
FINANCIAL RISK
Risk Identifi cation and Description Potential Impacts on the Group
Market Risk
The Group is exposed to interest rate risk on both fi xed-rate and fl oating rate
fi nancial assets and liabilities, including the fi xed-rate bonds and the Revolving
Credit Facility. The Group is exposed to foreign currency risk arising from the translation of assets and liabilities of subsidiaries with functional currencies other than the Euro.
Market Risk
Unfavorable movements in interest rate could negatively impact the net fi nancial
income of the Group by increasing the cost of borrowing or refi nancing, or reducing interest income. Fluctuations in non-Euro currencies particularly with respect to the NOK, USD and GBP may impact the income generated and the
(regulatory) equity in these currencies when translated in EUR in the Consolidated
Financial Statements.
Capital RiskThe Risk that the Group and its regulated entities do not comply with the regulatory requirements, including capital requirements, imposed by local
regulation.
Capital RiskIn the event that the Group or its regulated subsidiaries do not have suffi cient
regulatory capital, they may incur fines, which may negatively impact the
Euronext brand and its reputation.
Liquidity RiskThe Group would be exposed to a liquidity risk in the case where its short-term liabilities become, at any date, higher than its cash, cash equivalents, short-term
fi nancial investments and available bank facilities and in the case where the
Group is not able to refi nance this liquidity defi cit, for example, through new banking lines.
Liquidity RiskIn the event that the Company fails to maintain a level of liquidity suffi cient to
cover its short term obligations, it will increase its default risk and potentially
damage its creditworthiness and subsequently its reputation.
Credit Risk
The Group is exposed to credit risk in the event of a counterparty’s default. The Group’s exposure to credit risk arises from its operating activities (primarily
trade receivables) and from its fi nancing activities, including the investment of cash equivalents and short-term fi nancial investments.
Credit Risk
The Group is exposed to credit risk from its operating activities (primarily trade
receivables), from its fi nancing activities, from the investment of its cash and cash equivalents and short-term fi nancial investments and from derivatives contracted for hedging purposes.
Potential Litigation Risks and Other Liabilities
Risk Identifi cation and Description Potential Impacts on the Group
Euronext operates in a highly regulated environment so many aspects of Euronext’s business involve potential litigation risks. Other liability risks may arise under laws and regulations relating to insurance, tax, employee behavior, anti-money laundering, fi nancial sanctions, foreign asset controls, data privacy and foreign corrupt practices areas. These risks include potential liability from disputes over terms of a securities trade or from claims that a system or operational failure or delay caused monetary losses to a customer, as well as potential liability from claims that the Group facilitated an unauthorised transaction or that it provided materially false or misleading statements in connection with a transaction. These risks also include potential liability from disputes as regard non-compliance by the Group to its data privacy obligations as controller or processor of personal data.
Euronext could be exposed to fi nes or sanctions from relevant regulators, and this may also result in signifi cant reputational damage to Euronext. In addition, Euronext could incur signifi cant legal expenses in defending claims, even those without merit. Any adverse resolution of any lawsuit or claim against the Group may require it to pay substantial damages or impose restrictions on how it conducts its business, any of which could have an eff ect on both the business and fi nancial results, and the reputation of the Group.
Risk Control & Mitigation
In order to ensure that Euronext remains in compliance has taken
a range of proactive preventative measures. Legal functions have
been established at various locations to ensure coverage of all
business lines and to ensure that local laws are respected. The
legal department provides support to throughout all stages of
various business projects, from embryonic stage to fi nal delivery.
With respect to vendors, the legal department has sought to put
in place appropriate agreements (and where possible, uses model
agreements) in order to adequately protect Euronext’s position in
relation to potential litigious matters.
In order to avoid litigation legal risks are identifi ed, tracked and
reported upon by leveraging the Euronext group risk management
framework. In addition, conduct risk is chiefl y managed by way
of Euronext imposing a wide range of policies and procedures
on employees and enforcing these through regular training and
monitoring, while an employee code of business conduct sets out
the principles of behaviour required of all Company employees and
this is provided to all new joiners.
2019 UNIVERSAL REGISTRATION DOCUMENT52 www.euronext.com
Risk Management & Control Structure
2
Control Structure
2.2 Control Structure
RISK APPROACH AND INTERNAL CONTROL OBJECTIVES
Euronext is dedicated to building a pan-European market
infrastructure and powering capital markets to fi nance the real
economy, while delivering value to shareholders. In order to execute
our ambitions Euronext is committed to preserving a balance
between achieving our strategic ambitions and ensuring operational
excellence. In order to achieve our ambitions and preserve favorable
conditions for the Company to fulfill its mandate Euronext has
adopted the Enterprise Risk Management (ERM) framework.
Enterprise Risk Management framework is designed and operated
to identify potential events that may aff ect the Company, assess risk
to be within the defi ned guidelines, manage the risk through control
mechanisms, and monitor the risk to understand the evolution.
Euronext embeds the risk management philosophy into the Company
culture, in order to make risk and opportunity management a regular
and everyday process for employees. The Supervisory Board and
Managing Board regard ERM as a key management process to steer
Euronext and enable management to eff ectively deal with risks and
opportunities.
ERM FRAMEWORK
The objectives and principles for the ERM process are set forth
in the Company’s ERM Policy. The ERM process is based on
best practices regarding the Internal Control and Enterprise
risk management, including the Committee of Sponsoring
Organisations of the Treadway Commission (“COSO”) initiative.
It uses a bottom-up and top-down process to enable better
management and transparency of risks and opportunities. At the
top, the Supervisory Board and Managing Board discuss major
risks and opportunities, related risk responses and opportunity
capture as well as the status of the ERM process, including
signifi cant changes and planned improvements. The design of the
ERM process seeks to ensure compliance with applicable laws and
regulations with respect to internal control and risk management
addressing both subjects in parallel.
Risk Control & Mitigation
Market Risk
Following the issuance of the fi xed-rate bond (in 2018), the Group
entered in a swap strategy to hedge the interest rate risk related
to the bond. Following the issuance of the second bond (with 10Y
maturity) in 2019 the Group has an exposure to interest rate risk.
This interest rate risk is, however, deemed to be low as the Group
is unlikely to refi nance this bond at the early stage of its lifetime.
Most operating revenue and expenses in the various subsidiaries
of the Group are denominated in the functional currency of each
relevant subsidiary. The Group may use derivatives instruments
designated as hedge of net investment or foreign denominated debt
to manage its net Investment exposures. The decision to hedge the
exposure is considered on a case by case basis since the Group is
generally exposed to major, well established and liquid currencies.
The Group would, by the same token, hedge transaction risk arising
from cash fl ows paid or received in a currency diff erent from the
functional currency of the group contracting entity on a case by case
basis.
Capital Risk
The Group has a policy that provides a framework to ensure that
it maintains the required capital levels. In addition, each of the
Group’s subsidiaries that is an operator of a regulated market and
subsidiaries that are investment fi rms are subject to regulatory
capital requirements relating to their general fi nancial soundness,
which include certain minimum capital requirements. The Group
ensures that each regulated subsidiary maintains suffi cient level
of capital and liquid assets in order to comply with the capital
requirements.
Liquidity Risk
The Group’s policy is to ensure that cash, cash equivalents and
available bank facilities allow the Group to repay its financial
liabilities at all maturities, even disregarding incoming cash fl ows
generated by operational activities, excluding the related party loans
granted by the Group’s subsidiaries to its Parent.
Cash, cash equivalents and short-term fi nancial investments are
managed as a global treasury portfolio invested in non-speculative
fi nancial instruments, readily convertible to cash, such as bank
balances, money market funds, overnight deposits, term deposits
and other money market instruments, thus ensuring a very high
level of liquidity available at any time.
Credit Risk
The Group limits its exposure to credit risk by rigorously selecting the
counterparties with which it executes agreements. Most customers
of the Group are leading fi nancial institutions that are highly rated.
Investments of cash and cash equivalents in bank current accounts
and money market instruments, such as short-term fixed and
floating rate interest deposits, are governed by rules aimed at
reducing credit risk: maturity of deposits strictly depends on credit
ratings, counterparties’ credit ratings are permanently monitored
and individual counterparty limits are reviewed on a regular basis.
In addition to the intrinsic creditworthiness of counterparties, the
Group’s policies also prescribe the diversifi cation of counterparties
(banks, fi nancial institutions, funds) so as to avoid a concentration
of risk. Derivatives are negotiated with leading high-grade banks.
For further details on fi nancial Risks Please refer to the Notes to
the Financial Statements in particular Note 37 of this Universal
Registration Document.
2019 UNIVERSAL REGISTRATION DOCUMENT 53

Risk Management & Control Structure22Control Structure
Supervisory BoardApproves strategic objectives and validates risk appetite
Reviews Euronext's risk management and internal control systemsAssesses these systems effectiveness through its Audit Committee
Oversees the suitable design and sustainable implementation of Enterprise Risk Management (ERM) and internal control systems across the Company
Defines and allocates risk appetite within the Group
Business and Operations Management
Identifies and manages risks for its scope and responsibility
Maintains effective internal control day-to-day
Develops and promotes the ERM framework to support management in the identification, assessment, management, monitoring and reporting of risks
Facilitates consistent and periodic reviews of the design and implementation of internal control systems
Provides independent assurance of effectiveness of risk management and internal control frameworks and activities in the Group
Managing Board
1st Line of Defence 2nd Line of Defence 3rd line of Defence
External Auditors
Regulator
Risk ManagementInternal ControlComplianceSpecialist Functions
Internal Audit
ERM FRAMEWORK GOVERNANCE
The ERM framework and governance is designed to allow the
Managing Board and the Supervisory Board, as part of Euronext’s
business model(1), to identify and assess the Company’s principal
risks to enable strong decision making with regards to the execution
of the stated strategy. Reporting is made and consolidated on a
regular basis to support this process. The ERM also enables the
Supervisory Board and Managing Board to maintain and attest to
the effectiveness of the systems of internal control and risk
management as set out in the Dutch Corporate Governance Code.
Governance Structure and related responsibilities for ERM process
are as follows:
n the Supervisory Board, through the Audit Committee, supervises
the effectiveness of the ERM system, including management
actions to mitigate the risks inherent in the Group’s business
activities;
n the Group’s Chief Executive Officer (“CEO”), backed by the
Managing Board and supported by the Chief Financial Offi cer
(“CFO”) and the Chief Risk Offi cer (“CRO”), is responsible for an
eff ective ERM system;
n the Group’s CRO has primary responsibility for the ERM strategy,
priorities, process design, culture development and related tools;
the risk management organisation is structured cross-division,
networked with risk owners on diff erent organisation levels and
drives a proactive risk management culture;
n the Group’s CFO has primary responsibility for the controls over
fi nancial reporting and regulatory capital requirements;
n the senior management of the Company assume responsibility for
the operation and monitoring of the ERM system in their respective
areas of responsibility, including appropriate responses to reduce
probability and impact of risk exposures and increase probability
and impact of opportunities.
(1) For more information on Euronext activities see section 1.3.1 “Business Overview”.
Euronext’s internal risk management and control is a process
executed by the Managing Board, management and other employee
stakeholders. It is designed to provide reasonable assurance
regarding the achieving of objectives in the following categories:
n eff ectiveness and effi ciency of operations;
n reliability of fi nancial and non-fi nancial information;
n compliance with laws, regulations and internal policies;
n safeguarding of assets, and identification and management
of liabilities; and
n strategic and business objectives.
2019 UNIVERSAL REGISTRATION DOCUMENT54 www.euronext.com
Risk Management & Control Structure
2
Control Structure
No major failings were identifi ed over the course of 2019 in the
Risk and Internal Control Program. Euronext’s fi rst and second
lines of defense perform their roles in risk assessments and
reporting on risk management and control systems. The concluding
results are reported in Group Risk Profi le and discussed regularly
at Managing Board meetings and with the Supervisory Board via
the Audit Committee. Internal Audit, as the third line of defense,
evaluates the design and eff ectiveness of Euronext’s governance,
as well as its risk management and control systems. Audit reports
are discussed with risk and process owners. The Head of Internal
Audit attends Managing Board meetings on a regular to discuss
its fi ndings and recommendations. In 2019, the evaluation of the
adequacy of Euronext’s internal risk management and control
systems were discussed with the Audit Committee and Supervisory
Board.
2.1.1 SECOND LINE OF DEFENCE
2.1.1.1 Risk Management
Risk Appetite is the level and nature of risk the business is willing
to accept in achieving its strategic objectives. Risk appetite sets the
basis for the requirements for monitoring and reporting on risk.
Overall risk appetite is recommended by the Managing Board to the
Supervisory Board as part of setting and implementing strategic and
operational objectives.
Risk appetite is considered at an operational level and strategic level
with quantitative and qualitative components. These components
are used during the assessment process to develop the residual
risks and support what is escalated to the Managing Board and
Supervisory Board.
OVERVIEW TABLE OF PRINCIPAL RISK CATEGORIES AND CORRESPONDING RISK APPETITE
Strategic RisksRisks related to business activities
Operational Risks & Compliance RisksRisks related to the day-to-day operations Financial Risks
Risk appetite is defi ned the level and nature of risk the business is willing to accept in achieving its strategic objectives.
Euronext’s overall risk appetite is defi ned by the Managing Board and approved by the Supervisory Board as part of setting and implementing strategic and
operational objectives.
Euronext is willing to take risks in pursuit of its
strategic objectives
Euronext has a low appetite for risks that may
impact its core business;
Euronext has a low appetite with respect to
compliance risk.
Euronext is willing to take some fi nancial risk,
however aligned with the long term nature of
the business and maintaining its investment grade
profi le and capital requirements.
* For material risks related to the above categories please refer to the previous section of this Chapter.
Risk Identification involves the identification of threats to the
Company as well as causes of loss and potential disruptions. Risks
are composed of the following categories:
n Strategic: the eff ect of uncertainty on Euronext’s strategic and
business aims and objectives; risk of missed opportunities due to
the method of execution decisions, inadequate resource allocation
or failure to respond to changes in business development;
n Operational: the risk of loss or inefficiency resulting from
inadequate or failed internal processes, people and systems,
or from external events; key programmes or projects are not
delivered eff ectively;
n Compliance: the risk of legal or regulatory sanctions, material
financial loss, or loss of reputation which Euronext Could
suff er as a result of its failure to comply with laws. risk of loss
an organization faces when it fails to act in accordance with
industry laws and regulations, internal policies or prescribed
best practices;
n Financial: the risk of loss inherent in fi nancing method which may
impair the ability to provide adequate return; that cash fl ow will
not be adequate to meet fi nancial obligations.
An emphasis is put on operational risk due to the importance of
operations and initiatives for Euronext.
Risk Assessment is made in the possible event of an incident or a
potential risk development. It aims to assess the risk qualitatively
and quantitatively where possible, using supporting information,
such as performance indicators. This assessment, defining
the residual risk level, takes into account mitigation measures
currently in place such as business continuity measures or
insurance policies. The overall Risk Assessment phase is carried
out by the risk management team (“RMT”) in conjunction with Risk
Coordinators (“RCs”) based on data and information produced by
and collected from the relevant areas via the periodic and ad hoc
reporting or upon request of the RMT as necessary. Assessments
are discussed with the business areas. Mitigations for each risk
will be identifi ed, evaluated, and the residual risk will be assessed
and reported.
Risk M anagement determines and implements the most appropriate
treatment to the identifi ed risks. It encompasses the following:
avoidance, reduction, transfer and acceptance. Organizational
units and employees perform risk management and implement
mitigating actions as required by the risk appetite and escalation
process. As noted, risks may remain after such management
process is applied (see Risks section).
2019 UNIVERSAL REGISTRATION DOCUMENT 55
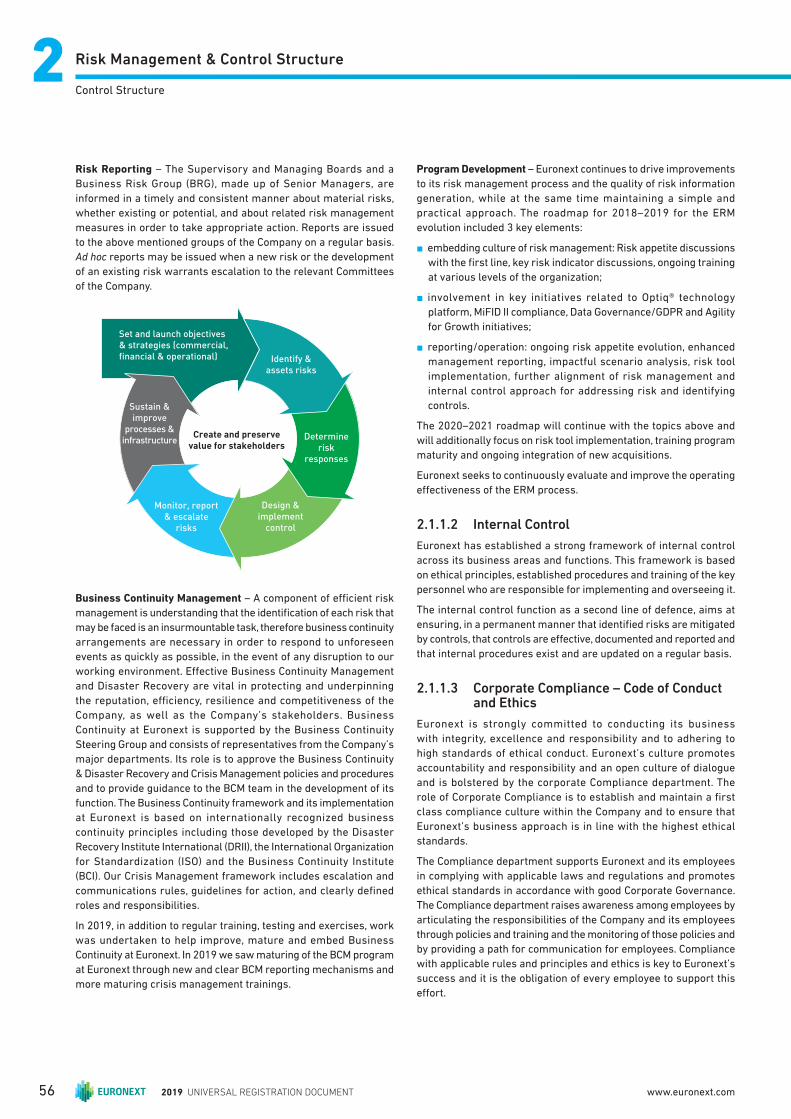
Risk Management & Control Structure22Control Structure
Risk Reporting – The Supervisory and Managing Boards and a
Business Risk Group (BRG), made up of Senior Managers, are
informed in a timely and consistent manner about material risks,
whether existing or potential, and about related risk management
measures in order to take appropriate action. Reports are issued
to the above mentioned groups of the Company on a regular basis.
Ad hoc reports may be issued when a new risk or the development
of an existing risk warrants escalation to the relevant Committees
of the Company.
Set and launch objectives& strategies (commercial,financial & operational)
Sustain & improve
processes & infrastructure
Monitor, report & escalate
risks
Design & implement
control
Determine risk
responses
Identify & assets risks
Create and preservevalue for stakeholders
Business Continuity Management – A component of effi cient risk
management is understanding that the identifi cation of each risk that
may be faced is an insurmountable task, therefore business continuity
arrangements are necessary in order to respond to unforeseen
events as quickly as possible, in the event of any disruption to our
working environment. Eff ective Business Continuity Management
and Disaster Recovery are vital in protecting and underpinning
the reputation, effi ciency, resilience and competitiveness of the
Company, as well as the Company’s stakeholders. Business
Continuity at Euronext is supported by the Business Continuity
Steering Group and consists of representatives from the Company’s
major departments. Its role is to approve the Business Continuity
& Disaster Recovery and Crisis Management policies and procedures
and to provide guidance to the BCM team in the development of its
function. The Business Continuity framework and its implementation
at Euronext is based on internationally recognized business
continuity principles including those developed by the Disaster
Recovery Institute International (DRII), the International Organization
for Standardization (ISO) and the Business Continuity Institute
(BCI). Our Crisis Management framework includes escalation and
communications rules, guidelines for action, and clearly defi ned
roles and responsibilities.
In 2019, in addition to regular training, testing and exercises, work
was undertaken to help improve, mature and embed Business
Continuity at Euronext. In 2019 we saw maturing of the BCM program
at Euronext through new and clear BCM reporting mechanisms and
more maturing crisis management trainings.
Program Development – Euronext continues to drive improvements
to its risk management process and the quality of risk information
generation, while at the same time maintaining a simple and
practical approach. The roadmap for 2018–2019 for the ERM
evolution included 3 key elements:
n embedding culture of risk management: Risk appetite discussions
with the fi rst line, key risk indicator discussions, ongoing training
at various levels of the organization;
n involvement in key initiatives related to Optiq® technology
platform, MiFID II compliance, Data Governance/GDPR and Agility
for Growth initiatives;
n reporting/operation: ongoing risk appetite evolution, enhanced
management reporting, impactful scenario analysis, risk tool
implementation, further alignment of risk management and
internal control approach for addressing risk and identifying
controls.
The 2020–2021 roadmap will continue with the topics above and
will additionally focus on risk tool implementation, training program
maturity and ongoing integration of new acquisitions.
Euronext seeks to continuously evaluate and improve the operating
eff ectiveness of the ERM process.
2.1.1.2 Internal Control
Euronext has established a strong framework of internal control
across its business areas and functions. This framework is based
on ethical principles, established procedures and training of the key
personnel who are responsible for implementing and overseeing it.
The internal control function as a second line of defence, aims at
ensuring, in a permanent manner that identifi ed risks are mitigated
by controls, that controls are eff ective, documented and reported and
that internal procedures exist and are updated on a regular basis.
2.1.1.3 Corporate Compliance – Code of Conduct and Ethics
Euronext is strongly committed to conducting its business
with integrity, excellence and responsibility and to adhering to
high standards of ethical conduct. Euronext’s culture promotes
accountability and responsibility and an open culture of dialogue
and is bolstered by the corporate Compliance department. The
role of Corporate Compliance is to establish and maintain a fi rst
class compliance culture within the Company and to ensure that
Euronext’s business approach is in line with the highest ethical
standards.
The Compliance department supports Euronext and its employees
in complying with applicable laws and regulations and promotes
ethical standards in accordance with good Corporate Governance.
The Compliance department raises awareness among employees by
articulating the responsibilities of the Company and its employees
through policies and training and the monitoring of those policies and
by providing a path for communication for employees. Compliance
with applicable rules and principles and ethics is key to Euronext’s
success and it is the obligation of every employee to support this
eff ort.
2019 UNIVERSAL REGISTRATION DOCUMENT56 www.euronext.com

Risk Management & Control Structure
2
Control Structure
Euronext’s code of business conduct and Ethics sets and reaffi rms
Euronext’s high standards of ethical conduct and reinforces its
business ethics, policies and procedures. Compliance with the Code
is required of all board members (Managing Board, Supervisory
Board and any other board) and all employees including consultants,
contractors and temporary employees. The Code of Business Conduct
and Ethics, which is supplemented by nine corporate compliance
policies, governs without exception all business activities of the
Company. The code of business conduct and Ethics is available on the
Euronext website. The availability of the Code of Business Conduct
and Ethics as well as the compliance policies at all times, in local
languages on the Company intranet, in addition to general training
and awareness sessions and communication targeting all Company
employees as well as targeted training for employees in sensitive
roles that require additional awareness and training determine the
eff ectiveness of the Code. The Code of Business Conduct and Ethics
is also supported by an external confi dential reporting system that
enables employees to report, in an anonymized manner should they
choose, alleged breaches of a general, operational and fi nancial
nature. Relevant policy and procedures ensure that reporters in good
faith are free to do so without fear of retaliation in accordance with
the laws in the countries where Euronext operates. The Company
protects anyone who reports an alleged breach of laws or Company
policies in good faith and ensures that they shall in no way be put at
a disadvantage by the Company as a result of the report.
Guidelines and procedures are defi ned notably to ensure that anti-
money laundering and sanctions, bribery and fraud and confl icts
of interest concerns are managed and that business is always
conducted in a fair manner. The Code of Business Conducted is linked
to other internal compliance policies covering money laundering and
sanctions, gifts meals and entertaining and prevention of bribery,
persona trading and the prevention of fraud are maintained by the
Compliance department (for a complete list of internal compliance
policies please refer to section 3.7 of this Universal Registration
Document). Staff training and awareness sessions are conducted
regularly in all Company locations to promote compliance and ethics
standards.
Finally, given the dual positions of Euronext as a market operator and
a listed issuer on the Euronext markets, the Compliance department
has imposed strict personal dealing rules and a confl icts of interest
procedure to ensure that neither the staff nor the Company itself
could take undue benefi ts from this situation.
Compliance processes are established as follows:
Dialogue
with
businesses
Risk
mitigation
thought
policies
and
procedures
Staff
training
and
awareness
Monitoring
of policies
and
procedures
More information on Euronext’s commitment to Ethics are provided in
Chapter 3 of this Universal Registration Document.
2.1.1.4 Chief Risk and Compliance Offi cer
The Chief Risk and Compliance Officer is appointed by the
Managing Board, reports to the Chief Executive Offi cer and has a
line of communication to the Audit Committee of the Supervisory
Board. This reporting ensures the necessary independence of the
Compliance department activities. Compliance Offi cers are located in
countries where Euronext conducts its activities and are supported
as necessary by local legal staff in order to benefi t from the local
expertise and knowledge of the local business and environment.
2.1.2 INTERNAL AUDIT – THIRD LINE OF DEFENSE
As a third line of defense, Internal Audit has no operational
responsibilities over the entities/processes it reviews. The objectivity
and organisational independence of the internal audit function
is achieved through the Head of Internal Audit not performing
operational management functions and reporting directly to the
Chairman of the Audit Committee. He also has a dotted reporting
line to the CEO.
Validated by the Audit Committee at least annually, the internal audit
plan is developed based on prioritization of the audit universe using
a risk-based methodology, including input of senior management.
For each audit, a formal report is issued and circulated. This includes
recommendations for corrective actions with an implementation
plan and the comments of the auditees. Implementation of accepted
corrective actions is systematically followed up, documented and
reported to the Audit Committee.
2019 UNIVERSAL REGISTRATION DOCUMENT 57

2019 UNIVERSAL REGISTRATION DOCUMENT58 www.euronext.com
3.2.4 Our People 81
3.2.4.1 Develop Skills and Retain Talents
in an Open Culture of Dialogue 83
3.2.4.2 Promoting Diversity 86
3.2.4.3 Respect of the Human Rights and Local
Labour Laws 88
3.2.5 Our Society 89
3.2.5.1 Act Ethically, with Integrity
and the Highest Standards in Terms
of Good Governance 89
3.2.5.2 Educate and engage with our local
Community 92
3.3 ESG Risks Considerations 94
3.1 Value Creation by Euronext 60
3.2 Euronext’s Five ESG Impact Areas and the Sustainable Development Goals 64
3.2.1 Our Markets 64
3.2.1.1 Trusted, Fair and Orderly Markets 64
3.2.1.2 Promote and Develop Sustainable and
Innovative Products With Environmental
(Green And Blue) or Social Added Value 65
3.2.2 Our Partners 72
3.2.2.1 Be the Spokesperson of the Sector
and Fostering Issuer-Investor Dialogue 73
3.2.2.2 Maintain an Ongoing Dialogue
With Multi-Stakeholder Partnerships 73
3.2.2.3 Educate our Partners on Financial
Literacy and Regulations 77
3.2.3 Our Environment 77
EURONEXT, A SUSTAINABLE EXCHANGE
2019 UNIVERSAL REGISTRATION DOCUMENT 59
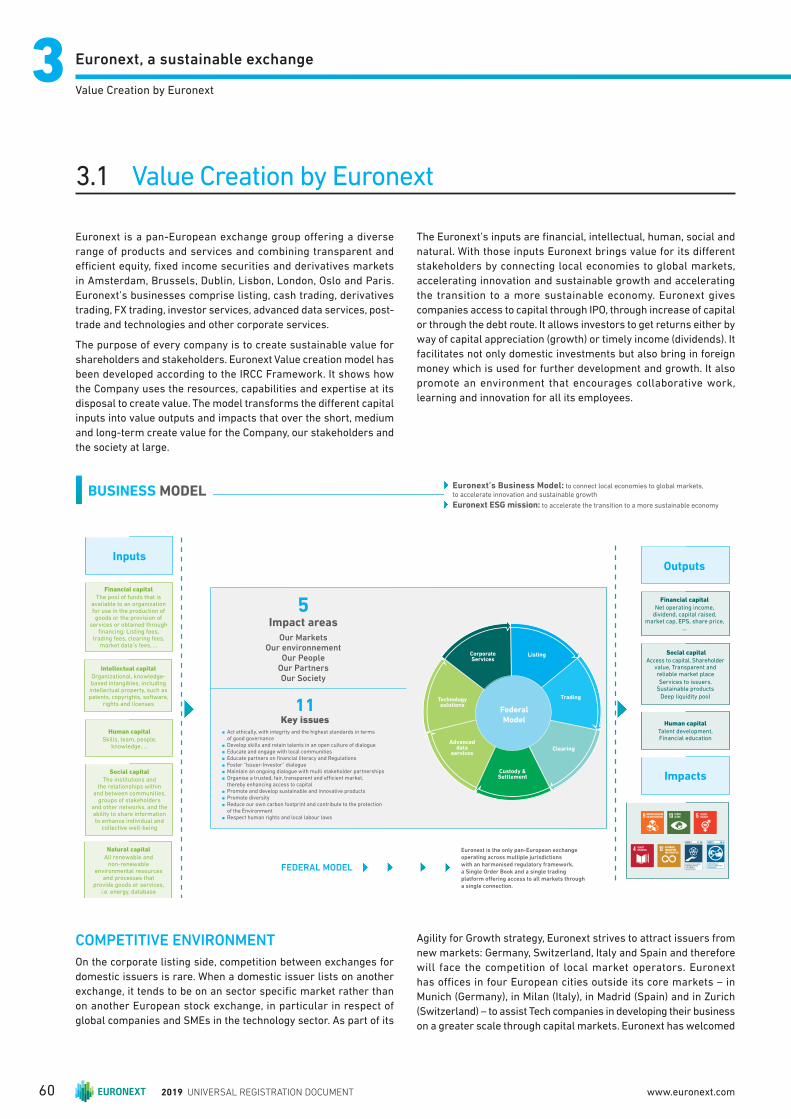
Euronext, a sustainable exchange33Value Creation by Euronext
3.1 Value Creation by Euronext
Euronext is a pan-European exchange group offering a diverse
range of products and services and combining transparent and
effi cient equity, fi xed income securities and derivatives markets
in Amsterdam, Brussels, Dublin, Lisbon, London, Oslo and Paris.
Euronext’s businesses comprise listing, cash trading, derivatives
trading, FX trading, investor services, advanced data services, post-
trade and technologies and other corporate services.
The purpose of every company is to create sustainable value for
shareholders and stakeholders. Euronext Value creation model has
been developed according to the IRCC Framework. It shows how
the Company uses the resources, capabilities and expertise at its
disposal to create value. The model transforms the diff erent capital
inputs into value outputs and impacts that over the short, medium
and long-term create value for the Company, our stakeholders and
the society at large.
The Euronext’s inputs are fi nancial, intellectual, human, social and
natural. With those inputs Euronext brings value for its diff erent
stakeholders by connecting local economies to global markets,
accelerating innovation and sustainable growth and accelerating
the transition to a more sustainable economy. Euronext gives
companies access to capital through IPO, through increase of capital
or through the debt route. It allows investors to get returns either by
way of capital appreciation (growth) or timely income (dividends). It
facilitates not only domestic investments but also bring in foreign
money which is used for further development and growth. It also
promote an environment that encourages collaborative work,
learning and innovation for all its employees.
5 Impact areas
Our MarketsOur environnement
Our PeopleOur PartnersOur Society
11 Key issues
Act ethically, with integrity and the highest standards in terms of good governance
Develop skills and retain talents in an open culture of dialogue
Educate and engage with local communities
Educate partners on fi nancial literacy and Regulations
Foster “Issuer-Investor” dialogue
Maintain an ongoing dialogue with multi stakeholder partnerships
Organise a trusted, fair, transparent and effi cient market, thereby enhancing access to capital
Promote and develop sustainable and innovative products
Promote diversity
Reduce our own carbon footprint and contribute to the protection of the Environment
Respect human rights and local labour laws
BUSINESS MODEL
Financial c apitalThe pool of funds that is
available to an organization for use in the production of goods or the provision of
services or obtained through fi nancing: Listing fees,
trading fees, clearing fees, market data’s fees, …
Intellectual c apitalOrganizational, knowledge-based intangibles, including intellectual property, such as patents, copyrights, software,
rights and licenses
Human c apitalSkills, team, people,
knowledge, …
Social c apitalThe institutions and
the relationships within and between communities,
groups of stakeholders and other networks, and the ability to share information to enhance individual and
collective well-being
Natural c apitalAll renewable and
non-renewable environmental resources
and processes that provide goods or services,
i.e. energy, database
Inputs
Corporate Services
Technology solutions
Federal
Model
Advanced data
services
Listing
Trading
Clearing
Custody & Settlement
FEDERAL MODEL
Euronext is the only pan-European exchange operating across multiple jurisdictions with an harmonised regulatory framework, a Single Order Book and a single trading platform off ering access to all markets through a single connection.
Euronext’s Business Model: to connect local economies to global markets,
to accelerate innovation and sustainable growth
Euronext ESG mission: to accelerate the transition to a more sustainable economy
Outputs
Impacts
Financial c apitalNet operating income,
dividend, capital raised, market cap, EPS, share price,
…
Social capitalAccess to capital, Shareholder
value, Transparent and reliable market place
Services to issuers, Sustainable products
Deep liquidity pool
Human c apitalTalent development, Financial education
COMPETITIVE ENVIRONMENT
On the corporate listing side, competition between exchanges for
domestic issuers is rare. When a domestic issuer lists on another
exchange, it tends to be on an sector specifi c market rather than
on another European stock exchange, in particular in respect of
global companies and SMEs in the technology sector. As part of its
Agility for Growth strategy, Euronext strives to attract issuers from
new markets: Germany, Switzerland, Italy and Spain and therefore
will face the competition of local market operators. Euronext
has offi ces in four European cities outside its core markets – in
Munich (Germany), in Milan (Italy), in Madrid (Spain) and in Zurich
(Switzerland) – to assist Tech companies in developing their business
on a greater scale through capital markets. Euronext has welcomed
2019 UNIVERSAL REGISTRATION DOCUMENT60 www.euronext.com
Euronext, a sustainable exchange
3
Value Creation by Euronext
16 companies from those countries in 2019 on its markets, with a
combined market capitalization of close to €1 billion. More than 40%
of the 132 TechShare participants were issued from those countries .
While competition in the cash trading market is relatively mature,
in recent years Euronext has faced increased pressure on pricing
and market share in equity options trading, in particular from new
entrants to the market that have fee structures that are signifi cantly
lower than the Company’s fee structure and a reduced cost structure
aligned with their narrower service off ering. However, Euronext
remained the largest liquidity pool in Europe, with a market share
on its cash equity markets above 60%.
The competition for proprietary real-time market data is still
limited as trading participants prefer to receive and use market
data from the home exchange rather than using substitute pricing.
However, Euronext is experiencing an increasing pressure, both
from a regulatory (MiFID II) and competitive perspective (alternative
trading platforms, including MTFs such as CBOE who focus on the
most liquid blue chip stocks). Nevertheless, Euronext believes that
diversity in a wide range of stocks is Euronext’s strength in this
increasingly competitive environment and will help Euronext retain
its position as preferred data source.
In less time critical areas such as reference data – and particularly
corporate actions and historical data – participants want a
consolidated European feed from a single source. Euronext is not
the only source of corporate actions or historical data so there is
more competition in these areas.
As for market operator technology, the market for financial
information technology is intensely competitive and characterised
by rapidly changing technology and new entrants. Euronext has built
the next generation trading platform, Optiq®, and is well positioned
to benefi t from its state-of-the art stability and latency.
For more information on the competition, see section 1.1.3. “Business
Environment”
LONG TERM VALUE FOR ALL OUR STAKEHOLDERS
Euronext ESG Mission and Ambition
The world is facing signifi cant challenges in ensuring a sustainable
future for our people and our planet. Many national and international
initiatives are addressing these challenges. Every organisation will
have to play its own role in the transition to a sustainable society,
depending on its impact and its opportunities.
The fi nance sector can be an important contributor to the global
sustainability agenda and can promote sustainable finance, by
incorporating environmental, social and governance (ESG) factors
into investment decision-making, and by supporting the allocation
of capital to sustainable initiatives.
Euronext has a special position in the financial ecosystem. It
serves the real economy by bringing together buyers and sellers
in high integrity trading venues that are transparent, effi cient
and reliable. In this key role Euronext has a responsibility vis-
à-vis the whole fi nance community to contribute to the fi nancial
stability and the sustainable agenda in the countries in which it
operates (see Euronext’s value creation model on the integration
presentation). As a key market infrastructure, at the heart of the
fi nancial ecosystem, Euronext will support the acceleration of
the transition towards sustainable growth and fi nance, notably
by capitalizing on Oslo Børs VPS’s expertise and the Group’s
franchise in green bonds and ESG indices .
In 2019, Euronext has decided to make sustainable fi nance a key
pillar of its strategy “Lets’ grow together” with a strong commitment
to participate to the SDG’s (see below). For more details on the
strategy please refer to section 1.2.
The Euronext ESG ambition is to finance local and global real
economy in its transition towards a sustainable society by:
n driving investment in innovative, sustainable products and
services through secure and transparent markets, in continuous
collaboration with the fi nancial community;
n inspiring and promoting sustainable tangible practices within
the Company and towards our communities, by respecting and
developing our people and by supporting our ecosystem.
This dual ambition is fully aligned with the Action Plan on Financing
Sustainable Growth launched by the European Commission in 2018
and with the Green deal presented by the European Commission in
December 2019.
STAKEHOLDER EXPECTATIONS AND MATERIALITY ANALYSIS
As a fi rst step towards the creation of a Euronext ESG strategy,
Euronext launched, beginning of 2019, a pan-European stakeholder
consultation process to identify the ESG related issues that its
stakeholders believe should be its main areas of attention and
eff ort. Euronext has had the feedback from a wide selection of its
stakeholders, especially investors, analysts and issuers, providing
valuable insights.
On the basis of the results Euronext has performed a materiality
analysis, defining the key issues where Euronext can have the
most impact on the economy, society and environment, and that
most infl uence the decision-making of its stakeholders. Euronext’s
stakeholders recognise that Euronext plays a role in ESG from
diff erent angles: Euronext as a representative of the capital market
ecosystem, Euronext as a business providing relevant products and
as a corporate actor. In each of these roles, Euronext has diff erent
responsibilities. On the ba sis of the feedback received from the
stakeholders Euronext has identified 11 key issues, that were
grouped them into 5 material impact areas, consistent with the
Euronext dual ESG ambition.
2019 UNIVERSAL REGISTRATION DOCUMENT 61
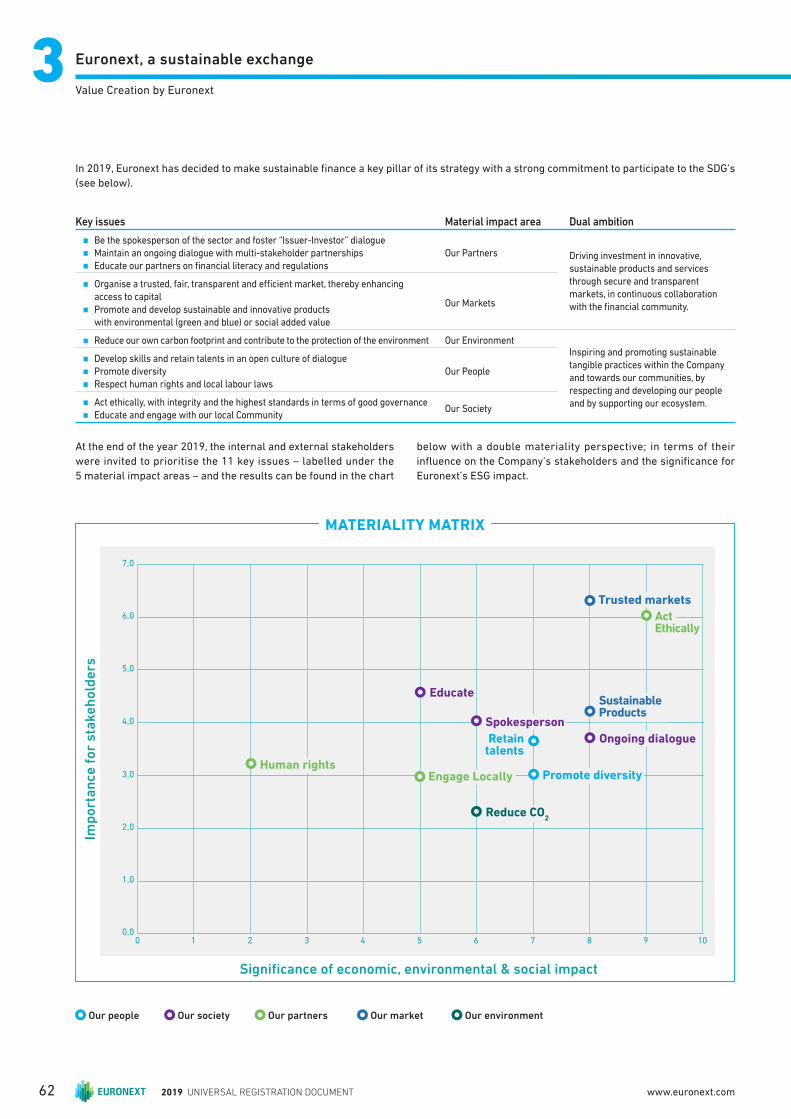
Euronext, a sustainable exchange33Value Creation by Euronext
In 2019, Euronext has decided to make sustainable fi nance a key pillar of its strategy with a strong commitment to participate to the SDG’s
(see below).
Key issues Material impact area Dual ambition
n Be the spokesperson of the sector and foster “Issuer-Investor” dialogue
n Maintain an ongoing dialogue with multi-stakeholder partnerships n Educate our partners on fi nancial literacy and regulations
Our Partners Driving investment in innovative, sustainable products and services through secure and transparent markets, in continuous collaboration with the fi nancial community.
n Organise a trusted, fair, transparent and effi cient market, thereby enhancing access to capital
n Promote and develop sustainable and innovative products with environmental (green and blue) or social added value
Our Markets
n Reduce our own carbon footprint and contribute to the protection of the environment Our EnvironmentInspiring and promoting sustainable tangible practices within the Company and towards our communities, by respecting and developing our people and by supporting our ecosystem.
n Develop skills and retain talents in an open culture of dialogue
n Promote diversity n Respect human rights and local labour laws
Our People
n Act ethically, with integrity and the highest standards in terms of good governance n Educate and engage with our local Community
Our Society
At the end of the year 2019, the internal and external stakeholders
were invited to prioritise the 11 key issues – labelled under the
5 material impact areas – and the results can be found in the chart
below with a double materiality perspective; in terms of their
infl uence on the Company’s stakeholders and the signifi cance for
Euronext’s ESG impact.
Imp
ort
an
ce f
or
sta
ke
ho
lde
rs
1 5 83 7 100 42 6 90,0
1,0
2,0
3,0
4,0
5,0
6,0
7,0
Signifi cance of economic, environmental & social impact
Human rightsEngage Locally
Trusted markets
Sustainable Products
Educate
Spokesperson
Reduce CO2
Ongoing dialogue
Promote diversity
Retain talents
MATERIALITY MATRIX
Act Ethically
Our people Our society Our partners Our market Our environment
2019 UNIVERSAL REGISTRATION DOCUMENT62 www.euronext.com
Euronext, a sustainable exchange
3
Value Creation by Euronext
ESG GOVERNANCE
The General Counsel, part of the Group’s extended Managing
Board, is in charge of coordinating ESG at the Group level, making
sure that all relevant departments integrate the ESG objectives
into their missions. The General Counsel ensures that ESG
initiatives, impacts and challenges are high on the agenda of the
Group’s Managing Board and Supervisory Board, and that the
Company reports on ESG related topics in a transparent way. The
Managing Board and the Supervisory Board have fully endorsed
ESG as part of the Euronext strategy going forward.
A ESG Task Force has been created to support the General
Counsel. The Task Force currently consists of global champions
of the impact areas set out in paragraph 3 below, which are in
their turn supported by local ESG representatives. The Task Force
works in close cooperation with the business to develop new
initiatives aligned with the Group Strategic Plan, and with the
communication and investor relations teams.
Moreover, since the introduction of the new Strategic Plan “Let’s
grow together 2020”, all ESG initiatives are captured by the
Strategic Plan Transformation Offi ce, which monitors the progress
of the whole strategic plan of the group, reports regularly on
these progresses to the Managing Board and the Supervisory
Board and, in this context, has regular update meetings with
the General Counsel and the ESG Task Force. All signifi cant new
ESG related projects are submitted for approval to the Managing
Board. The most recent examples are the Green Bond Off ering,
the company wide Carbon Footprint analysis and the launch of
the ESG reporting Guidelines .
For more information on the role of the Supervisory Board and
the Managing Board regarding the strategy of the Company,
see section 4.2.2 and 4.2.3 of this Universal Registration
Document.
TRANSPARENCY AND REPORTING
Creating transparency by businesses on their diversity and
sustainability efforts is vital in order to identify sustainability
risks, and to enable us to manage change towards a sustainable
global economy by combining long-term profi tability with social
justice and environmental protection. In this context, disclosure
of non-financial information helps the measuring, monitoring
and managing of undertakings’ performance and their impact on
society.
Also, shareholders and other stakeholders are more and more
interested in diversity and non-fi nancial information in order to
have a meaningful, comprehensive understanding of a company’s
development, performance, position and impact of its activity. They
thoroughly analyze this information in their investment-decision
process. In this context, disclosure of non-fi nancial information
helps increasing investor and consumer trust.
European Directive
The European Parliament acknowledged the importance of this
transparency, and, in this context, the European Directive 2014/95/
UE dated 22 October 2014 imposes to public-interest entities which
are large undertakings with more than 500 employees to publish
non-fi nancial information including information on environmental,
social and employee matters, diversity, respect for human rights
and on anti-corruption and bribery matters.
This chapter describes the sustainability vision of Euronext, and how
Euronext fulfi ls the requirements of the Directive, which has been
fully implemented in The Netherlands by a Decree dated 29 August
2017 on disclosure of non-fi nancial information (“Besluit inhoud
bestuursverslag”).
A 2019 reference table with the European Directive may be found
on the Euronext website.
GRI Standards
Moreover Euronext decided to follow the standards developed by
the Global Reporting Initiative (GRI). This report has been prepared
in accordance with the GRI (core option).
The GRI Standards are the most widely used global standards
for sustainability reporting. They feature a modular, interrelated
structure, and represent the global best practice for reporting on a
range of economic, environmental and social impacts. They consist
of a set of 36 interrelated standards, and are designed for fl exibility
to meet a range of sustainability reporting needs. A GRI Index may
be found on the Euronext website .
Transparency Benchmark
In addition Euronext, as a Dutch listed company, has closely followed
the criteria of the Transparency Benchmark 2019, initiated by the
Dutch minister of Economic Aff airs and Climate.
TCFD Guidelines
The Task Force established by the Financial Stability Board
(“FSB”), developed voluntary recommendations on climate-related
information that companies and organisations should disclose to
help investors, lenders, and others make sound fi nancial decisions.
Structured around four thematic areas – Governance, Strategy, Risk
Management and Metrics & Targets – the TCFD Recommendations
provide a framework for companies to respond to the increasing
demand for transparency on climate-related risks and opportunities
from investors. Euronext has endorsed these recommendations and
is working on further implementation in its reporting.
Sustainable Development Goals
As an Offi cial Partner of the Sustainable Stock Exchange Initiative
(SSE)(1), Euronext firmly commits to the UN’s “2030 Agenda for
Sustainable Development” and thereby to the 17 Sustainable
Development Goals (SDGs), which were adopted in September 2015.
(1) “SDG’s – What do they mean for stock exchanges?”, Sustainable Stock Exchanges – https://sseinitiative.org/ourwork/sdgs/
(2) Euronext decides to add SDG’s 4.4 and 16.5 to the ones chosen by SSE: Gender Equality (Goal 5) Sustainability Information (Goal 12) Climate Change
(Goal 13) Global Partnerships (Goal 17).
2019 UNIVERSAL REGISTRATION DOCUMENT 63
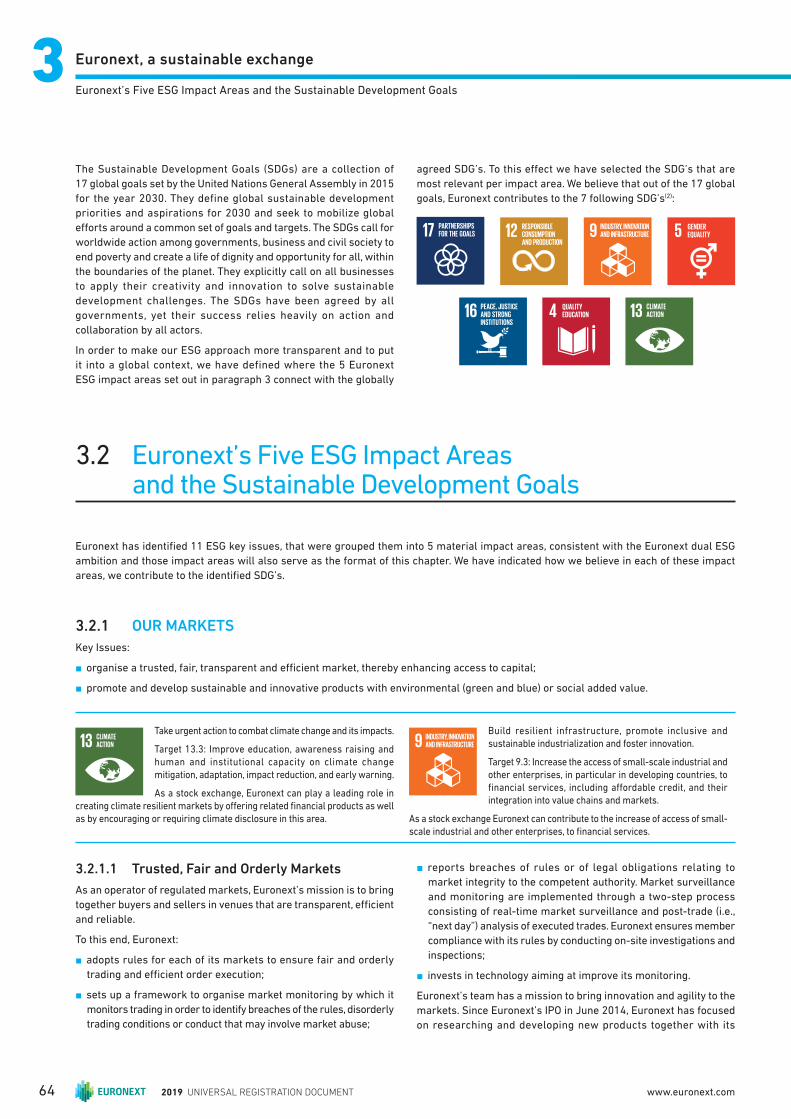
Euronext, a sustainable exchange33Euronext’s Five ESG Impact Areas and the Sustainable Development Goals
3.2 .1.1 Trusted, Fair and Orderly Markets
As an operator of regulated markets, Euronext’s mission is to bring
together buyers and sellers in venues that are transparent, effi cient
and reliable.
To this end, Euronext:
n adopts rules for each of its markets to ensure fair and orderly
trading and effi cient order execution;
n sets up a framework to organise market monitoring by which it
monitors trading in order to identify breaches of the rules, disorderly
trading conditions or conduct that may involve market abuse;
n reports breaches of rules or of legal obligations relating to
market integrity to the competent authority. Market surveillance
and monitoring are implemented through a two-step process
consisting of real-time market surveillance and post-trade (i.e.,
“next day”) analysis of executed trades. Euronext ensures member
compliance with its rules by conducting on-site investigations and
inspections;
n invests in technology aiming at improve its monitoring.
Euronext’s team has a mission to bring innovation and agility to the
markets. Since Euronext’s IPO in June 2014, Euronext has focused
on researching and developing new products together with its
3.2 Euronext’s Five ESG Impact Areas and the Sustainable Development Goals
Euronext has identifi ed 11 ESG key issues, that were grouped them into 5 material impact areas, consistent with the Euronext dual ESG
ambition and those impact areas will also serve as the format of this chapter. We have indicated how we believe in each of these impact
areas, we contribute to the identifi ed SDG’s.
3.2 .1 OUR MARKETS
Key Issues:
n organise a trusted, fair, transparent and effi cient market, thereby enhancing access to capital;
n promote and develop sustainable and innovative products with environmental (green and blue) or social added value.
Take urgent action to combat climate change and its impacts.
Target 13.3: Improve education, awareness raising and human and institutional capacity on climate change mitigation, adaptation, impact reduction, and early warning.
As a stock exchange, Euronext can play a leading role in
creating climate resilient markets by off ering related fi nancial products as well as by encouraging or requiring climate disclosure in this area.
Build resilient infrastructure, promote inclusive and
sustainable industrialization and foster innovation.
Target 9.3: Increase the access of small-scale industrial and other enterprises, in particular in developing countries, to
financial services, including affordable credit, and their
integration into value chains and markets.
As a stock exchange Euronext can contribute to the increase of access of small-
scale industrial and other enterprises, to fi nancial services.
The Sustainable Development Goals (SDGs) are a collection of
17 global goals set by the United Nations General Assembly in 2015
for the year 2030. They define global sustainable development
priorities and aspirations for 2030 and seek to mobilize global
eff orts around a common set of goals and targets. The SDGs call for
worldwide action among governments, business and civil society to
end poverty and create a life of dignity and opportunity for all, within
the boundaries of the planet. They explicitly call on all businesses
to apply their creativity and innovation to solve sustainable
development challenges. The SDGs have been agreed by all
governments, yet their success relies heavily on action and
collaboration by all actors.
In order to make our ESG approach more transparent and to put
it into a global context, we have defined where the 5 Euronext
ESG impact areas set out in paragraph 3 connect with the globally
agreed SDG’s. To this eff ect we have selected the SDG’s that are
most relevant per impact area. We believe that out of the 17 global
goals, Euronext contributes to the 7 following SDG’s(2):
2019 UNIVERSAL REGISTRATION DOCUMENT64 www.euronext.com
Euronext, a sustainable exchange
3
Euronext’s Five ESG Impact Areas and the Sustainable Development Goals
client community. These new products are now beginning to come
to market and Euronext is excited about expanding its capabilities
and making its business work better for Euronext’s customers.
Part of Euronext’s role in maintaining trusted, fair and orderly
markets includes ensuring the security of those markets. The
growth in the digitalization of the fi nance industry over the last years
has revolutionized the sector. This transformation means that an
increasing number of fi nancial services are becoming available to
more and more people at an ever increasing pace. Euronext has
grown and continues to thrive with these changes via increased
storage and processing power enabling us to grow in complexity
and size. With increased size and access comes potential liabilities,
however Euronext through Infosec Management and Cybersecurity
governance has security controls in place in order to protect our
markets from unwanted activity.
Euronext management has a strong commitment to upholding the
security of our markets. Management oversees the information
security/cybersecurity strategy and review process as well as
annual plans, ensuring that the program stays current with the
evolving environment and to avoid and treat potential negative
impacts to Euronext. For further information of cybersecurity
risks please refer to the risk chapter of this Universal Registration
Document.
3.2.1.2 Promote and Develop Sustainable and Innovative Products With Environmental (Green And Blue) or Social Added Value
Euronext has developed sustainable products and services with
environmental added value. In addition it has put a strong focus on
reducing its own footprint. In this chapter we describe the various
initiatives through which we show our commitment to the transition
to a sustainable society.
Euronext continues to grow the range of its ESG products that are
off ered on our exchanges. Euronext started its fi rst ESG product
off ering over a decade ago with the Low Carbon 100 Europe Index
and has continued to increase the number of ESG indices as well
as diversify the ESG product off ering to socially responsible ETFs,
Green Bonds, and specifi c commodity futures. Below is a discussion
of the wide-range of ESG products off ered by Euronext.
A. Sustainable Products
A.1. Sustainable Indices
Euronext ESG Indices are designed to support common approaches
to environmental, social and governance (ESG) investing. Euronext
ESG indices are based on a fully transparent and rules-based
selection process and measures risk and performance across a
variety of Environmental, Social and Governance (ESG) areas.
In 2018; the percentage of ESG Indices versus total indices created
was 56% and this fi gure went up to 82% in 2019, Euronext being the
leading index provider of customized ESG indices in Europe in 2019
(based on Sales Volumes) et une note de bas de page “ See 2020
SRP Europe conference in London”.
As a stock exchange committed to sustainability, Euronext will
continue to extend over 2020 its ESG index off ering thanks to its
partners expertise: Vigeo Eiris, CDP, Carbone 4, GRESB and ISS-
Oekom.
A.1.1. EURONEXT VIGEO EIRIS FAMILY OF INDICES
Euronext entered into a cooperation agreement with Vigeo Eiris
in March 2013. Vigeo Eiris is the leading European expert in the
assessment of companies and organisations with regard to their
practices and performance on environmental, social and governance
(“ESG”) issues. Several families of indices have been created in.
a) Euronext Vigeo Eiris Indices
Launched in 2013, this family is composed of seven indices (Euronext
Vigeo Eiris World 120, Euronext Vigeo Eiris Europe 120, Euronext
Vigeo Eiris Eurozone 120, Euronext Vigeo Eiris US 50, Euronext
Vigeo Eiris France 20, Euronext Vigeo Eiris United Kingdom 20 and
Euronext Vigeo Eiris Benelux 20), whose components are reviewed
and updated twice a year. Euronext Vigeo indices are composed of
the highest-ranking listed companies as evaluated by the Vigeo-
Eiris agency in term of their performance in corporate responsibility.
Companies weights are calculated accordingly to their respective
Equitics scores. The weighting of each component at the review date
refl ects the score of the Company divided by the total sum of the
scores of all components.
b) CAC 40 Governance Index
Launched in February 2017, the CAC 40 Governance Index measures
the performance of the CAC 40 members weighted according to their
respective Vigeo Eiris governance rating. The Corporate Governance
structure specifi es the distribution of rights and responsibilities
among the diff erent participants in the organisation – such as the
board, managers, shareholders and other stakeholders – and lays
down the rules and procedures for decision making (ECB annual
report 2004). According to the Organisation for Economic
Co-operation and Development (“OECD”), there are several benefi ts
resulting from a good Corporate Governance. Utilizing its teams’
expertise and its unique and well-regarded methodologies, Vigeo
Eiris rating provides Euronext with a Corporate Governance score
for each stock of the CAC 40 index.
c) Euronext ESG Leaders Family of Indices
Launched over the last 2 years, these indices measure the
performance of the top performing companies in the ESG/Energy
transition fi eld, with regards to their respective Vigeo Eiris rating.
The fi rst set of indices covers Eurozone/US, Europe, Eurozone and
France and the selection is made by taking the most sustainable
companies with regard to their practices and performance on
environmental, social and governance (“ESG”, “SG” or “E”) issues:
n Euronext France ESG Leaders 40 EW;
n Euronext Eurozone ESG Leaders 40 EW;
n Euronext Europe Sustainable 100 EW;
n SBF Top 50 ESG EW;
n Euronext Euro 50 ESG EW;
n Euronext Eurozone 100 ESG;
n Euronext Transatlantic ESG Leaders 60 EW;
n Euronext Euro 50 Social Governance EW;
n Euronext Green Planet E.
The second set of indices covers Eurozone and France. The selection
is made by taking the companies with the best Energy Transition
Performance scores. The Energy Transition Performance is a
2019 UNIVERSAL REGISTRATION DOCUMENT 65

Euronext, a sustainable exchange33Euronext’s Five ESG Impact Areas and the Sustainable Development Goals
forward-looking approach that analyses a company’s capacity to
adapt their business model and manage sector-specifi c risks and
opportunities related to the transition to a low-carbon economy:
n Euronext France Energy Transition Leaders 40 EW;
n Euronext Eurozone Energy Transition Leaders 50 EW.
A.1.2. EURONEXT CARBONE 4 FAMILY OF INDICES
a) Low Carbon 100 Europe Index – the First One
In 2008, Euronext was the fi rst exchange to launch a pan-European
index focusing on CO2 emissions, designed with the support from a
group of international experts and in close collaboration with Non-
Governmental Organisations. The index measures the performance
of Europe’s 100 largest blue chips with the lowest CO2 emissions
in their respective sectors or sub-sectors. Today, the index is an
underlying for an ETF.
In November 2015, Euronext announced a major change in
the methodology used for its Low Carbon 100 Europe Index,
revolutionizing the traditional approach to assess companies’ CO2
emissions. This new method is based on a more effi cient means of
measuring the energy performance of businesses. The new version
of the index, designed with Carbone 4 and Carbon Disclosure Project
(“CDP”), the leading consulting fi rm specialised in carbon strategy,
is based on a more in depth and relevant assessment of each
company’s carbon footprint.
This identifies, for the first time, businesses making a positive
contribution to the transition process-not only through their own
day to-day performance, but also through the products they sell.
Selection of the companies will also refl ect the emissions avoided
because of their innovative approach to products and services.
In June 2018, the Steering Committee approved to change the
methodology of the Low Carbon 100 Europe Index to exclude
companies with a fossil fuel activity. The companies involved in the
following activities will be excluded from the index by the Expert
Committee at the reviews:
n companies with fossil fuel reserves;
n companies searching, collecting, treating, refi ning or transporting
coal, oil or gas;
n utilities using fossil fuels to produce electricity.
In June 2019, the Steering Committee approved to change the
methodology of the Low Carbon 100 Europe Index in order to keep
it a step ahead:
n maintain a Green pocket at 5% (with a positive trajectory);
n remove companies involved in fossil fuel activities;
n creation of a Climate score;
n inclusion of Social and Governance criteria in the screening
(based on Vigeo Eiris scores);
n removal of the companies at risk with or breaching the principles
of the United Nation Global Compact.
Finally, the Steering Committee has approved to exclude as from
March 2020, Oil Equipment & Services.
In November 2019, the BNP Paribas Easy Low Carbon 100 Europe
ETF tracking the Low Carbon 100 Europe Index received the
Febelfi n sustainability label.
b) Euronext Climate Europe Indices
Launched in 2016, the Euronext Climate Europe is a free fl oat
market cap index designed to be a low carbon Universe. Composed
of 200 large companies based on their climate score. It paves the
way to many climate friendly innovative variants (high yields, low
risk, growth…). These indices are well established with several
Structured Products linked to the index.
To perform this best in class approach, Euronext calculates
a climate score by combining the scores of two cutting-edge
experts, Carbone 4 and the Carbon Disclosure Project (“CDP”).
Carbone 4 assesses the Company’s impact on climate change and
its contribution to reduced Green House Gas (“GHG”) emissions,
while taking into account induced and avoided emissions and the
forward-looking analysis. The CDP performance score assesses
the level of action taken on climate change in term of mitigation,
adaptation and transparency.
Several indices have been derived over 2017 around this Euronext
Climate Euronext Index for investment purpose: The Euronext
Climate Orientation Priority index and Euronext Climate Objective
50 EW index and the Euronext Climate Objective 50 Euro EW
(2018).
A.1.3. EURONEXT CDP FAMILY OF INDICES
a) Euronext CDP Environnement Indices
Launched in 2018 and 2019, these indices measure the
performance of the top performing companies from a broad
universe (World, Eurozone or France) in the environmental fi elds,
with regards to their respective CDP rating. CDP gives a score to
the companies in the universe based on three diff erent themes,
forests, water and climate. The companies that form the index
universe are ranked on their environmental score and the highest
ranking companies will be selected in the indices.
A similar family of indices that screens the universe on Social and
Governance sores was launched in 2019.
A.1.4. EURONEXT OEKOM FAMILY OF INDICES
a) Euronext Responsible Investment Indices
Launched in 2018, the Euronext Responsible Investment indices
are composed of the best companies in terms of Mirova/ISS-
Oekom Sustainability score. The Mirova/ISS-Oekom Sustainability
score is based on the qualitative opportunities assessment and
risk review score.
b) Euronext Water and Ocean Europe 40 EW
Launched in 2019, the index consists of the 40 best companies
from Europe (trading EUR, DKK, SEK or NOK) in term of Water
& Ocean performance score, as evaluated by ISS-Oekom.
A.1.5. EURONEXT REITSMARKET GRESB INDEX
Launched in 2018, the Euronext Reitsmarket GRESB Global
Sustainable Indices are designed to track specifi c factor trends
in listed sustainable real estate securities worldwide through a
risk-optimized portfolio of global real estate securities. The Index
includes exclusively real estate securities that are part of the
Sustainable Investment Universe as determined by GRESP.
2019 UNIVERSAL REGISTRATION DOCUMENT66 www.euronext.com
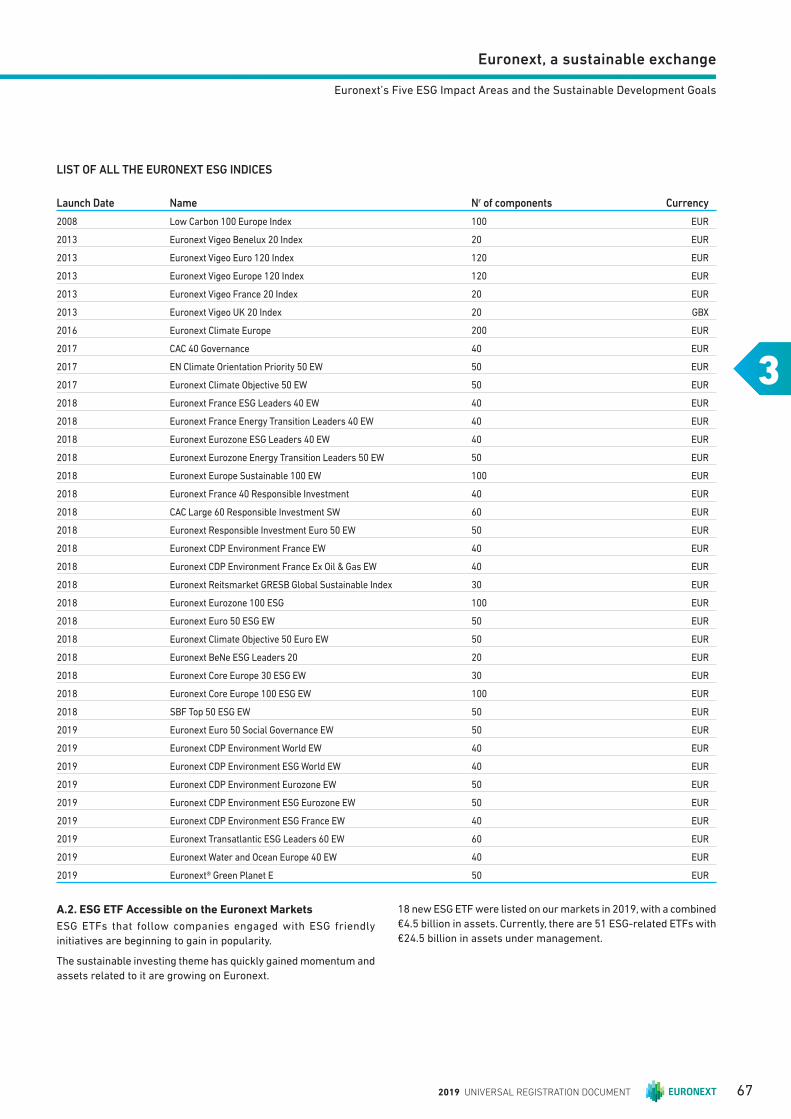
Euronext, a sustainable exchange
3
Euronext’s Five ESG Impact Areas and the Sustainable Development Goals
LIST OF ALL THE EURONEXT ESG INDICES
Launch Date Name Nr of components Currency
2008 Low Carbon 100 Europe Index 100 EUR
2013 Euronext Vigeo Benelux 20 Index 20 EUR
2013 Euronext Vigeo Euro 120 Index 120 EUR
2013 Euronext Vigeo Europe 120 Index 120 EUR
2013 Euronext Vigeo France 20 Index 20 EUR
2013 Euronext Vigeo UK 20 Index 20 GBX
2016 Euronext Climate Europe 200 EUR
2017 CAC 40 Governance 40 EUR
2017 EN Climate Orientation Priority 50 EW 50 EUR
2017 Euronext Climate Objective 50 EW 50 EUR
2018 Euronext France ESG Leaders 40 EW 40 EUR
2018 Euronext France Energy Transition Leaders 40 EW 40 EUR
2018 Euronext Eurozone ESG Leaders 40 EW 40 EUR
2018 Euronext Eurozone Energy Transition Leaders 50 EW 50 EUR
2018 Euronext Europe Sustainable 100 EW 100 EUR
2018 Euronext France 40 Responsible Investment 40 EUR
2018 CAC Large 60 Responsible Investment SW 60 EUR
2018 Euronext Responsible Investment Euro 50 EW 50 EUR
2018 Euronext CDP Environment France EW 40 EUR
2018 Euronext CDP Environment France Ex Oil & Gas EW 40 EUR
2018 Euronext Reitsmarket GRESB Global Sustainable Index 30 EUR
2018 Euronext Eurozone 100 ESG 100 EUR
2018 Euronext Euro 50 ESG EW 50 EUR
2018 Euronext Climate Objective 50 Euro EW 50 EUR
2018 Euronext BeNe ESG Leaders 20 20 EUR
2018 Euronext Core Europe 30 ESG EW 30 EUR
2018 Euronext Core Europe 100 ESG EW 100 EUR
2018 SBF Top 50 ESG EW 50 EUR
2019 Euronext Euro 50 Social Governance EW 50 EUR
2019 Euronext CDP Environment World EW 40 EUR
2019 Euronext CDP Environment ESG World EW 40 EUR
2019 Euronext CDP Environment Eurozone EW 50 EUR
2019 Euronext CDP Environment ESG Eurozone EW 50 EUR
2019 Euronext CDP Environment ESG France EW 40 EUR
2019 Euronext Transatlantic ESG Leaders 60 EW 60 EUR
2019 Euronext Water and Ocean Europe 40 EW 40 EUR
2019 Euronext® Green Planet E 50 EUR
A.2. ESG ETF Accessible on the Euronext Markets
ESG ETFs that follow companies engaged with ESG friendly
initiatives are beginning to gain in popularity.
The sustainable investing theme has quickly gained momentum and
assets related to it are growing on Euronext.
18 new ESG ETF were listed on our markets in 2019, with a combined
€4.5 billion in assets. Currently, there are 51 ESG-related ETFs with
€24.5 billion in assets under management.
2019 UNIVERSAL REGISTRATION DOCUMENT 67
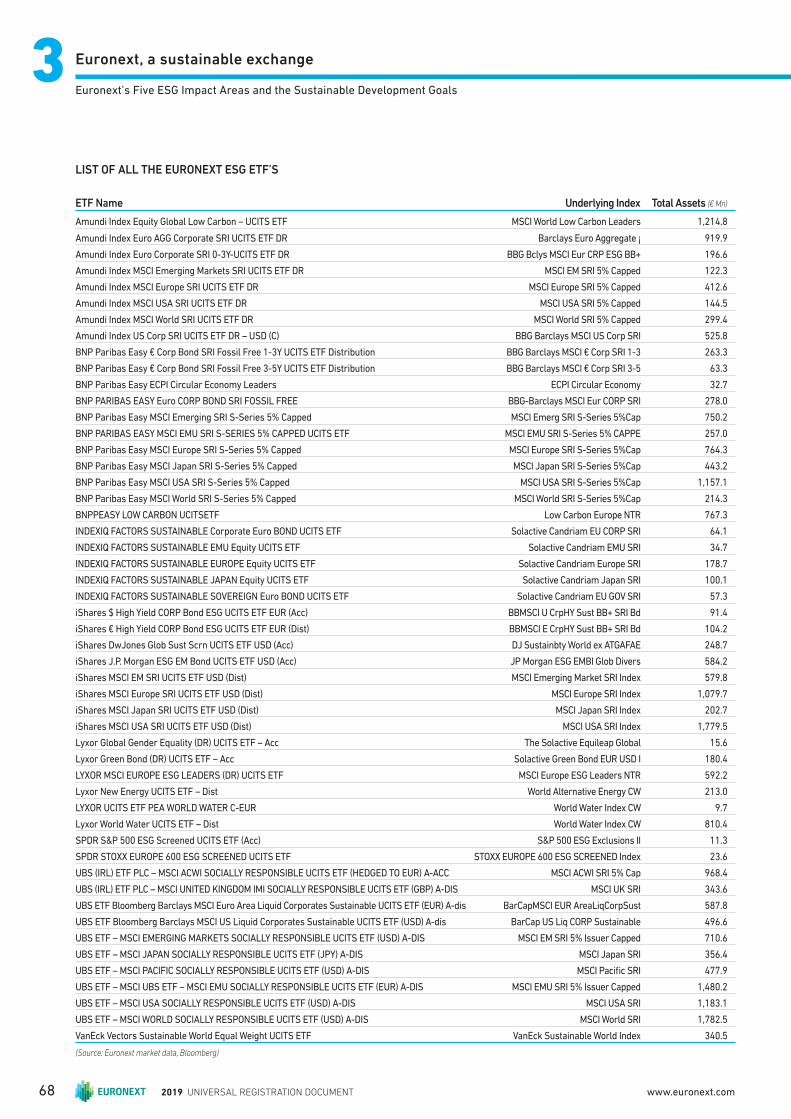
Euronext, a sustainable exchange33Euronext’s Five ESG Impact Areas and the Sustainable Development Goals
LIST OF ALL THE EURONEXT ESG ETF’S
ETF Name Underlying Index Total Assets (€ Mn)
Amundi Index Equity Global Low Carbon – UCITS ETF MSCI World Low Carbon Leaders 1,214.8
Amundi Index Euro AGG Corporate SRI UCITS ETF DR Barclays Euro Aggregate ¡ 919.9
Amundi Index Euro Corporate SRI 0-3Y-UCITS ETF DR BBG Bclys MSCI Eur CRP ESG BB+ 196.6
Amundi Index MSCI Emerging Markets SRI UCITS ETF DR MSCI EM SRI 5% Capped 122.3
Amundi Index MSCI Europe SRI UCITS ETF DR MSCI Europe SRI 5% Capped 412.6
Amundi Index MSCI USA SRI UCITS ETF DR MSCI USA SRI 5% Capped 144.5
Amundi Index MSCI World SRI UCITS ETF DR MSCI World SRI 5% Capped 299.4
Amundi Index US Corp SRI UCITS ETF DR – USD (C) BBG Barclays MSCI US Corp SRI 525.8
BNP Paribas Easy € Corp Bond SRI Fossil Free 1-3Y UCITS ETF Distribution BBG Barclays MSCI € Corp SRI 1-3 263.3
BNP Paribas Easy € Corp Bond SRI Fossil Free 3-5Y UCITS ETF Distribution BBG Barclays MSCI € Corp SRI 3-5 63.3
BNP Paribas Easy ECPI Circular Economy Leaders ECPI Circular Economy 32.7
BNP PARIBAS EASY Euro CORP BOND SRI FOSSIL FREE BBG-Barclays MSCI Eur CORP SRI 278.0
BNP Paribas Easy MSCI Emerging SRI S-Series 5% Capped MSCI Emerg SRI S-Series 5%Cap 750.2
BNP PARIBAS EASY MSCI EMU SRI S-SERIES 5% CAPPED UCITS ETF MSCI EMU SRI S-Series 5% CAPPE 257.0
BNP Paribas Easy MSCI Europe SRI S-Series 5% Capped MSCI Europe SRI S-Series 5%Cap 764.3
BNP Paribas Easy MSCI Japan SRI S-Series 5% Capped MSCI Japan SRI S-Series 5%Cap 443.2
BNP Paribas Easy MSCI USA SRI S-Series 5% Capped MSCI USA SRI S-Series 5%Cap 1,157.1
BNP Paribas Easy MSCI World SRI S-Series 5% Capped MSCI World SRI S-Series 5%Cap 214.3
BNPPEASY LOW CARBON UCITSETF Low Carbon Europe NTR 767.3
INDEXIQ FACTORS SUSTAINABLE Corporate Euro BOND UCITS ETF Solactive Candriam EU CORP SRI 64.1
INDEXIQ FACTORS SUSTAINABLE EMU Equity UCITS ETF Solactive Candriam EMU SRI 34.7
INDEXIQ FACTORS SUSTAINABLE EUROPE Equity UCITS ETF Solactive Candriam Europe SRI 178.7
INDEXIQ FACTORS SUSTAINABLE JAPAN Equity UCITS ETF Solactive Candriam Japan SRI 100.1
INDEXIQ FACTORS SUSTAINABLE SOVEREIGN Euro BOND UCITS ETF Solactive Candriam EU GOV SRI 57.3
iShares $ High Yield CORP Bond ESG UCITS ETF EUR (Acc) BBMSCI U CrpHY Sust BB+ SRI Bd 91.4
iShares € High Yield CORP Bond ESG UCITS ETF EUR (Dist) BBMSCI E CrpHY Sust BB+ SRI Bd 104.2
iShares DwJones Glob Sust Scrn UCITS ETF USD (Acc) DJ Sustainbty World ex ATGAFAE 248.7
iShares J.P. Morgan ESG EM Bond UCITS ETF USD (Acc) JP Morgan ESG EMBI Glob Divers 584.2
iShares MSCI EM SRI UCITS ETF USD (Dist) MSCI Emerging Market SRI Index 579.8
iShares MSCI Europe SRI UCITS ETF USD (Dist) MSCI Europe SRI Index 1,079.7
iShares MSCI Japan SRI UCITS ETF USD (Dist) MSCI Japan SRI Index 202.7
iShares MSCI USA SRI UCITS ETF USD (Dist) MSCI USA SRI Index 1,779.5
Lyxor Global Gender Equality (DR) UCITS ETF – Acc The Solactive Equileap Global 15.6
Lyxor Green Bond (DR) UCITS ETF – Acc Solactive Green Bond EUR USD I 180.4
LYXOR MSCI EUROPE ESG LEADERS (DR) UCITS ETF MSCI Europe ESG Leaders NTR 592.2
Lyxor New Energy UCITS ETF – Dist World Alternative Energy CW 213.0
LYXOR UCITS ETF PEA WORLD WATER C-EUR World Water Index CW 9.7
Lyxor World Water UCITS ETF – Dist World Water Index CW 810.4
SPDR S&P 500 ESG Screened UCITS ETF (Acc) S&P 500 ESG Exclusions II 11.3
SPDR STOXX EUROPE 600 ESG SCREENED UCITS ETF STOXX EUROPE 600 ESG SCREENED Index 23.6
UBS (IRL) ETF PLC – MSCI ACWI SOCIALLY RESPONSIBLE UCITS ETF (HEDGED TO EUR) A-ACC MSCI ACWI SRI 5% Cap 968.4
UBS (IRL) ETF PLC – MSCI UNITED KINGDOM IMI SOCIALLY RESPONSIBLE UCITS ETF (GBP) A-DIS MSCI UK SRI 343.6
UBS ETF Bloomberg Barclays MSCI Euro Area Liquid Corporates Sustainable UCITS ETF (EUR) A-dis BarCapMSCI EUR AreaLiqCorpSust 587.8
UBS ETF Bloomberg Barclays MSCI US Liquid Corporates Sustainable UCITS ETF (USD) A-dis BarCap US Liq CORP Sustainable 496.6
UBS ETF – MSCI EMERGING MARKETS SOCIALLY RESPONSIBLE UCITS ETF (USD) A-DIS MSCI EM SRI 5% Issuer Capped 710.6
UBS ETF – MSCI JAPAN SOCIALLY RESPONSIBLE UCITS ETF (JPY) A-DIS MSCI Japan SRI 356.4
UBS ETF – MSCI PACIFIC SOCIALLY RESPONSIBLE UCITS ETF (USD) A-DIS MSCI Pacifi c SRI 477.9
UBS ETF – MSCI UBS ETF – MSCI EMU SOCIALLY RESPONSIBLE UCITS ETF (EUR) A-DIS MSCI EMU SRI 5% Issuer Capped 1,480.2
UBS ETF – MSCI USA SOCIALLY RESPONSIBLE UCITS ETF (USD) A-DIS MSCI USA SRI 1,183.1
UBS ETF – MSCI WORLD SOCIALLY RESPONSIBLE UCITS ETF (USD) A-DIS MSCI World SRI 1,782.5
VanEck Vectors Sustainable World Equal Weight UCITS ETF VanEck Sustainable World Index 340.5
(Source: Euronext market data, Bloomberg)
2019 UNIVERSAL REGISTRATION DOCUMENT68 www.euronext.com

Euronext, a sustainable exchange
3
Euronext’s Five ESG Impact Areas and the Sustainable Development Goals
Recent academic research has shown that high ESG ratings are
correlated with lower cost of capital, market-based outperformance
and accounting-based outperformance. Harvard Business School
discovered that “high sustainability” firms outperform “low
sustainability” fi rms over the long haul with lower volatility.
A.3. ESG Data Hub
The ESG data hub provides asset managers asset owners and other
investors with access to a range of third party ESG data that provides
greater insight into the ESG status of companies in which they invest.
Investors are increasingly looking for ESG data on companies to
meet commercial and regulatory requirements, but often have
trouble identifying and validating credible sources of this data.
By providing a single point of access to a range of validated ESG
content providers, Euronext can off er a credible one-stop shop to
meet investors requirements.
The ESG hub currently has one product live: China A Share
Environmental Risk Assessment (ERA).
The China A-Share ERA product provides a qualitative environmental
risk analysis on leading Chinese fi rms, considering local factors
and using locally sourced data to create quantitative and objective
indicators that allow investors to measure a company’s true
environmental risk.
n Systematic and objective measurement of geographical and
industrial constraints: The supply of natural resources and
policy constraints vary depending on geographic location. Using
geographical and industrial factors as the basis for methodology
allows a more accurate, stable and credible risk analysis.
n Local methodology: Raw data from official public and local
government sources, combined with company reports. This
reflects the real environmental risk situation of Chinese
companies.
n Detailed data on specific resource stresses: Helps investors
identify the source of the risk.
n Adjusted for company’s environmental management capabilities:
The fi nal score integrates the company’s performance and its
processes for environmental risk resilience.
n Further ESG services will be added to the hub over the course
of 2020.
A.4. Euronext Green Bonds: The inaugural Euronext initiative in the ESG fi xed income space
A green bond is a bond whose proceeds are used to fund
environment-friendly projects. At COP21 (Paris 2015), institutional
investors representing $11.2tn undertook to work to grow a green
bonds market.
The green bond market has seen strong growth, with very healthy
issuance increase from 2014 when $37bn was issued. In 2019,
global green bond issuance reached over $200bn, setting yet another
record. Market consensus projects that green bond issuance in 2020
will exceed 2019 issuance levels.
Statistics vary regarding total outstanding global green bond
issuance. However, approximately 1/6th of total outstanding green
bond issuance is listed on a Euronext market. As illustrated in Fig. 1
below, green bond issuance listed on Euronext increased 54.65%
from 2018 (€33.669bn.) to 2019 (€52.073bn.)
FIG. 1 GROWTH OF GREEN BOND ISSUES LISTING ON EURONEXT.
2012 2013 2014 2015 2016 2017 2018 20190
10 000 000 000
20 000 000 000
30 000 000 000
40 000 000 000
50 000 000 000
60 000 000 000
There are green bonds listed on all Euronext locations with Paris
being the leading listing location and both Dublin and Amsterdam
also very strong. Oslo is an interesting market with a small total
issuance amount but from a large number of issuers (22 of 108
issuers). As of Jan 3rd 2020 there is €131.69bn in green bond
issuance listed on a Euronext market: Paris (€66.08bn), Dublin
(€34.44bn), Amsterdam (€23.11bn), Brussels (€5.05bn), Oslo
(3.030bn) and Lisbon (0.05bn).
FIG. 2 LISTING PER EURONEXT LOCATION
Amsterdam Brussels Dublin Lisbon Paris Oslo0
10 000 000 000
20 000 000 000
30 000 000 000
40 000 000 000
50 000 000 000
60 000 000 000
70 000 000 000
80 000 000 000
Issuer types listed on Euronext include sovereign, non-fi nancial
corporate, local government, government backed entity, fi nancial
corporate, development bank and ABS issuers. Sovereign issuance
accounts for the largest average issuance amount per issuer and
includes issues from The Republic of France, The State of the
Netherlands, The Kingdom of Belgium and the Republic of Ireland.
The Republic of France is Euronext’s largest green bond issuer with
over €20bn in issuance outstanding listed on Euronext Paris.
Euronext green bond listed fi nancial corporates include ABN, ING,
KBC, BPCE, Société Générale and BNP Paribas. Local government
issues are predominantly French and include Région des “ Hauts
de France” and Région “ Ile de France” . Government backed entities
are also mostly French and include Agence FSE d e Dé veloppment,
SNCF Reseau, RATP, Socié té du Grand Paris and EDF. The principle
non-fi nancial corporates are mostly energy companies and include
ENEL, Tennet and Engie.
2019 UNIVERSAL REGISTRATION DOCUMENT 69
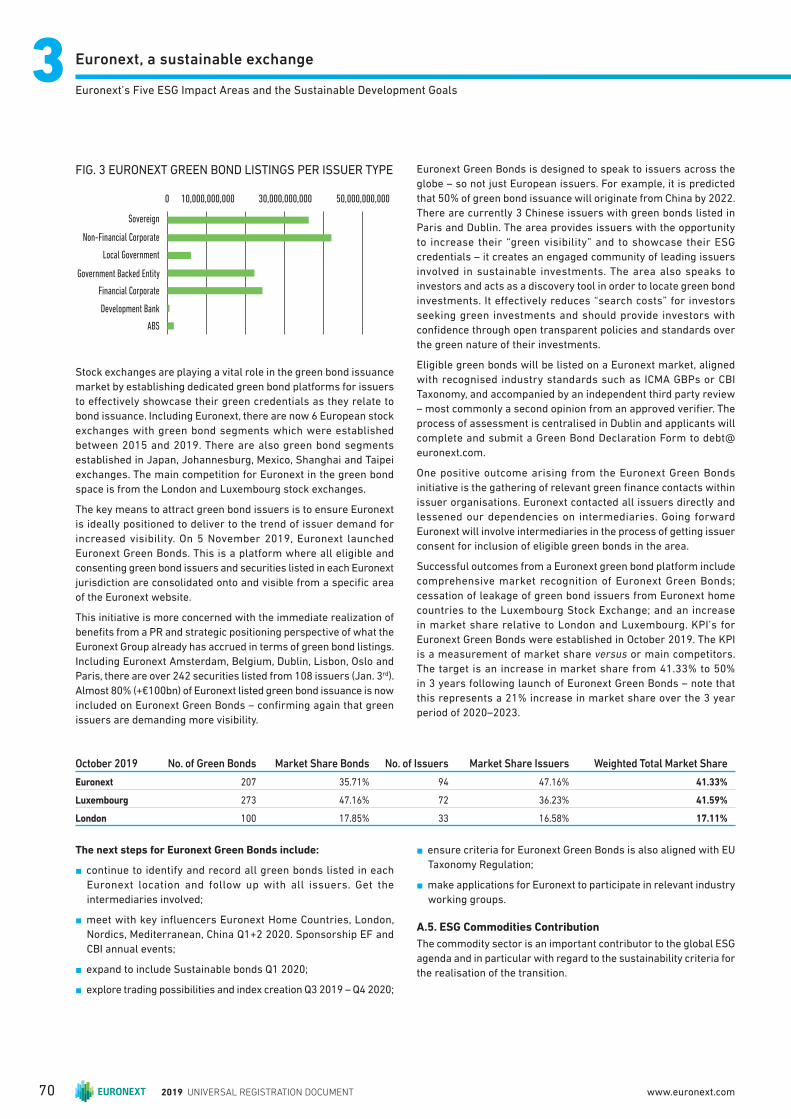
Euronext, a sustainable exchange33Euronext’s Five ESG Impact Areas and the Sustainable Development Goals
FIG. 3 EURONEXT GREEN BOND LISTINGS PER ISSUER TYPE
0 10,000,000,000 30,000,000,000 50,000,000,000
Sovereign
Non-Financial Corporate
Local Government
Government Backed Entity
Financial Corporate
Development Bank
ABS
Stock exchanges are playing a vital role in the green bond issuance
market by establishing dedicated green bond platforms for issuers
to eff ectively showcase their green credentials as they relate to
bond issuance. Including Euronext, there are now 6 European stock
exchanges with green bond segments which were established
between 2015 and 2019. There are also green bond segments
established in Japan, Johannesburg, Mexico, Shanghai and Taipei
exchanges. The main competition for Euronext in the green bond
space is from the London and Luxembourg stock exchanges.
The key means to attract green bond issuers is to ensure Euronext
is ideally positioned to deliver to the trend of issuer demand for
increased visibility. On 5 November 2019, Euronext launched
Euronext Green Bonds. This is a platform where all eligible and
consenting green bond issuers and securities listed in each Euronext
jurisdiction are consolidated onto and visible from a specifi c area
of the Euronext website.
This initiative is more concerned with the immediate realization of
benefi ts from a PR and strategic positioning perspective of what the
Euronext Group already has accrued in terms of green bond listings.
Including Euronext Amsterdam, Belgium, Dublin, Lisbon, Oslo and
Paris, there are over 242 securities listed from 108 issuers (Jan. 3rd).
Almost 80% (+€100bn ) of Euronext listed green bond issuance is now
included on Euronext Green Bonds – confi rming again that green
issuers are demanding more visibility.
Euronext Green Bonds is designed to speak to issuers across the
globe – so not just European issuers. For example, it is predicted
that 50% of green bond issuance will originate from China by 2022.
There are currently 3 Chinese issuers with green bonds listed in
Paris and Dublin. The area provides issuers with the opportunity
to increase their “green visibility” and to showcase their ESG
credentials – it creates an engaged community of leading issuers
involved in sustainable investments. The area also speaks to
investors and acts as a discovery tool in order to locate green bond
investments. It eff ectively reduces “search costs” for investors
seeking green investments and should provide investors with
confi dence through open transparent policies and standards over
the green nature of their investments.
Eligible green bonds will be listed on a Euronext market, aligned
with recognised industry standards such as ICMA GBPs or CBI
Taxonomy, and accompanied by an independent third party review
– most commonly a second opinion from an approved verifi er. The
process of assessment is centralised in Dublin and applicants will
complete and submit a Green Bond Declaration Form to debt@
euronext.com.
One positive outcome arising from the Euronext Green Bonds
initiative is the gathering of relevant green fi nance contacts within
issuer organisations. Euronext contacted all issuers directly and
lessened our dependencies on intermediaries. Going forward
Euronext will involve intermediaries in the process of getting issuer
consent for inclusion of eligible green bonds in the area.
Successful outcomes from a Euronext green bond platform include
comprehensive market recognition of Euronext Green Bonds;
cessation of leakage of green bond issuers from Euronext home
countries to the Luxembourg Stock Exchange; and an increase
in market share relative to London and Luxembourg. KPI’s for
Euronext Green Bonds were established in October 2019. The KPI
is a measurement of market share versus or main competitors.
The target is an increase in market share from 41.33% to 50%
in 3 years following launch of Euronext Green Bonds – note that
this represents a 21% increase in market share over the 3 year
period of 2020–2023.
October 2019 No. of Green Bonds Market Share Bonds No. of Issuers Market Share Issuers Weighted Total Market Share
Euronext 207 35.71% 94 47.16% 41.33%
Luxembourg 273 47.16% 72 36.23% 41.59%
London 100 17.85% 33 16.58% 17.11%
The next steps for Euronext Green Bonds include:
n continue to identify and record all green bonds listed in each
Euronext location and follow up with all issuers. Get the
intermediaries involved;
n meet with key infl uencers Euronext Home Countries, London,
Nordics, Mediterranean, China Q1+2 2020. Sponsorship EF and
CBI annual events;
n expand to include Sustainable bonds Q1 2020;
n explore trading possibilities and index creation Q3 2019 – Q4 2020;
n ensure criteria for Euronext Green Bonds is also aligned with EU
Taxonomy Regulation;
n make applications for Euronext to participate in relevant industry
working groups.
A.5. ESG Commodities Contribution
The commodity sector is an important contributor to the global ESG
agenda and in particular with regard to the sustainability criteria for
the realisation of the transition.
2019 UNIVERSAL REGISTRATION DOCUMENT70 www.euronext.com
Euronext, a sustainable exchange
3
Euronext’s Five ESG Impact Areas and the Sustainable Development Goals
Euronext has a special position in the agricultural ecosystem in
Europe. It serves the real economy by off ering hedging tools to the
whole industry and the supply chain to manage better their price
risk exposure inherent to the agricultural sector.
Buyers and sellers trading with the Euronext venue have the benefi ts
of high transparency, liquidity, price discovery enabling them to
manage price risk and protect margins.
Client consultations and surveys are done on a regular basis, and
specifi c ESG expectations will be surveyed during the course of
2020, the team will ensure that environmental, sustainable and
social responsibility issues are included in the consultation and
then assessed.
A.5.1. SUPPORTING THE NEEDS OF THE INDUSTRY BY CREATING SPECIFIC COMMODITY CONTRACTS
Euronext is pursuing the expansion of its commodity derivatives
strategy by becoming the European specialist content provider
of reference on agricultural products and markets. Euronext will
provide economic analysis, training and establish price reporting
services for European agricultural markets.
Subject to clients demand some specifi c sustainable products could
be listed or existing could be amended to include sustainability
criteria.
A.5.2. WHEAT, RAPESEED AND CORN CONTRACTS
Long-time developed in close cooperation with the agricultural
industry for hedging purposes, Rapeseed products (oilseeds and
meal) and Corn contract are said to be non-GMO or conventional
products as well as the wheat is. The underlying is said to be
conventional, which is defi ned as a product containing no genetically
modifi ed organisms, or containing genetically modifi ed organisms
whose presence is adventitious or technically unavoidable, in
accordance with requirements in force under EU Regulations.
It refers and complies with EC Regulation n°1829/2003 of the
European Parliament and the Council of the 22 September 2003 on
genetically modifi ed food and feed (OJEU 18-10-2003).
A.5.3. WOOD PELLETS FUTURE
Developed in close cooperation with the biomass Committees, the
new futures contract (“Residential Wood Pellets Contract”) launched
in November 2015 has been designed to meet the needs of market
professionals looking for portfolio diversifi cation and price-hedging
tools against fl uctuations in the prices of pellets or closely-related
products.
B. Sustainable Services
B.1. Financing a Greener Economy
Euronext has sought over the course of several years to support
climate-friendly innovation by financing Cleantech companies.
The Cleantech company cluster refers to enterprises that do not
only seek to embody resource effi cient, environmentally benefi cial
business practices in the way they carry out their operations, but
develop, create and sell products and services that are resource
effi cient and benefi t the environment. Their models range from but
are not limited to production, storage and distribution of renewable
or low carbon energy sources as well as pollution mitigation,
conservation, and restoration.
From 2013, Euronext has devoted dedicated resources to create
proximity with innovative companies across its markets, in order
to provide stronger education on the benefi ts of leveraging capital
markets to fund growth. Cleantech companies were then identifi ed
and as such benefi tted from Euronext’s full support.
Some of the major initiatives in this respect include:
n TechShare: 42 Cleantech SMEs part of the community learning
how to leverage capital markets (of which 19 from the class of
2019);
n European Rising Tech Index: 20% of this increasingly important
index is made up Cleantech SMEs;
n Morningstar: the programme fully covers the scope of Cleantech
SME issuers (64).
In 2019, Euronext has attracted 5 new Cleantechs companies to
its markets, providing them with more than €100 million in equity
funding. These deals enriched the Euronext Cleantech’s community,
adding the largest public off ering ever executed on Euronext Growth
Paris: Hoff mann Green Cement Technologies, that raised €72 million
for a €236 million market capitalization. In total of 64 Cleantechs
companies are listed on Euronext, worth a combined €25 billion,
making it the leading Cleantech SME franchise in Europe.
Selected Cleantech’ funding deals for 2019 include:
n Hoff mann Green Cement IPO: this French cleantech is a pioneer
in decarbonated cement, contributing to the transformation of
the construction sector. To fuel its strong R&D, Hoff mann Green
Cement chose to leverage capital markets in October 2019 to
accelerate its growth. It successfully closed the largest ever public
off ering on Euronext Growth Paris (€72 million) and was valued
€236 million;
n Boostheat IPO: this cleantech focuses its efforts on energy
effi ciency, building a highly energy effi cient boiler in a context
were streamlining domestic energy usage is key to combat
climate change. The company was able to raise €35 million for a
€122 million valuation;
n Scatec Solar’s follow-on private placement: After its IPO in 2014
the Norwegian cleantech that develops builds and operate solar
power plants across emerging markets grew at an incredible
pace, multiplying market capitalization by close to 7 (to reach
€1.5 billion) as it leveraged capital markets to fund its fast
growth. A recent example of market utilization to fi nance clean
innovation includes Scatec’s €133 million private placement in
September 2019.
B.2. Corporate Services
Euronext Corporate Services is a fully-owned subsidiary of the
Euronext group launched in 2016 with the ambition to help listed
companies to make the most eff ective use of capital markets and
support organisations with innovative solutions and tailor-made
advisory services in Governance (iBabs), Compliance (InsiderLog),
Communication (Company Webcast), Investor Relations (Advisory
and IR Solutions).
The Euronext Corporate Services offering assists companies
and organisations in reducing their environmental impact. The
board portal solution enables a significant reduction of paper
consumption through paperless and digital meetings. The webcast
2019 UNIVERSAL REGISTRATION DOCUMENT 71
Euronext, a sustainable exchange33Euronext’s Five ESG Impact Areas and the Sustainable Development Goals
and webinar solutions reduce the negative environmental impacts of
transportation through remote and digital conferences. In addition,
Euronext Corporate Services supports the adoption of best practices
in terms of good Corporate Governance as the board portal solution
enables a more collaborative, secured, efficient and informed
decision-making process within Board of Directors and executive
Committees. Finally, Euronext Corporate Services also favors greater
transparency and clarity in the way companies and organisations
communicate not only externally but also internally.
Euronext Corporate Services offering has been built through a
combination of organic developments and acquisitions. Since
February 2017, Euronext Corporate Services has:
n acquired 4 companies providing innovative solutions (namely
Company Webcast, IR.Manager, iBabs and InsiderLog) ;
n developed internally an “Advisory and IR Solutions” practice
providing high touch advisory, market intelligence and decision-
making analytics for listed companies willing to be more active
on capital markets. In 2019, a new “Shareholder Analysis”
has been successfully launched to help listed companies
better understanding their shareholder structure with tailor
made identifi cation, multi-dimensional analysis and follow-up
shareholder moves to build a relevant and efficient investor
relations strategy.
Euronext Corporate Services off ers a unique and comprehensive
value proposition articulated around four main pillars that are
described in section [1.3.3.2.]. Euronext Corporate Services already
serves more than 2,500 clients in over 15 countries, of which are
600 listed companies.
Euronext Corporate Services is committed to creating off ers that
help organizations have a sustainable approach to their operations.
In particular:
n iBabs, the meeting management solution, enables a signifi cant
reduction of paper consumption through paperless and digital
meetings. This solution supports the adoption of best practices
in terms of good Corporate Governance by enabling a more
collaborative, secured, effi cient and informed decision-making
process within Board of Directors and Executive Committees.
n InsiderLog, the solution to automate the management of
inside information and insider lists for both issuers and their
professional advisors, helps listed companies fulfi l conditions
to ensure compliance with EU Market Abuse Regulation (MAR).
n Company Webcast, market leaders in webcast and webinar
solutions, reduces the negative environmental impacts of
transportation through remote and digital conferences,
while delivering making sure that companies deliver regular
communication to its staff , its investors or the equity research
analysts and journalists following its activities.
n Advisory and IR Solutions, reference team in capital market
intelligence, supports listed companies to meet ESG requirements
in a context of increasing compliance and transparency
requirement, growing involvement of shareholders in Corporate
Governance, and pressure from rating agencies on companies.
In particular, the “Shareholder Analysis” off er allows issuers
having a clearer understanding of the shareholding structure,
proactive communication and rationalised targeting of investors.
3.2.2 OUR PARTNERS
Key Issues:
n be the spokesperson of the sector and foster “Issuer-Investor” dialogue;
n maintain an ongoing dialogue with multi-stakeholder partnerships;
n educate our partners on fi nancial literacy and regulations.
Ensure sustainable consumption and production patterns
Target 12.6: Encourage companies, especially large and
transnational companies, to adopt sustainable practices and to integrate sustainability information into their reporting cycle.
As a stock exchange, Euronext can play a key role in providing guidance and
training for companies and in strengthening listing requirements. By focusing on these actions, exchanges play a vital role in achieving this SDG and in
ensuring transparency in their markets.
Strengthen the means of implementation and revitalize the
global partnership for sustainable development
Target 17.16: Enhance the global partnership for sustainable development, complemented by multi-stakeholder
partnerships that mobilize and share knowledge, expertise, technology and financial resources, to support the
achievement of the Sustainable Development Goals in all countries.
As a stock exchange Euronext has always played a key role in bringing
stakeholders together, and now more than ever they will be pivotal players in
achieving global eff orts. By being an Offi cial Partner of SSE, Euronext is already making its mark in this area.
2019 UNIVERSAL REGISTRATION DOCUMENT72 www.euronext.com

Euronext, a sustainable exchange
3
Euronext’s Five ESG Impact Areas and the Sustainable Development Goals
3.2.2.1 Be the Spokesperson of the Sector and Fostering Issuer-Investor Dialogue
Euronext engages with public authorities and policymakers on
regulatory and policy issues that impact the fi nancial sector and
its stakeholders.
As a result of the European Commission’s Action Plan on Financing
Sustainable Growth and the European Green Deal, a number of
legislative proposals have been agreed on which aim to incentivize
investments in sustainable activities.
The agreements were reached on:
n Sustainable disclosure obligations for institutional investors;
n A Taxonomy defi ning the sustainability of investments;
n Changes to the Benchmark Regulation to enhance harmonised
transparency on EU Climate Transition and EU Paris-aligned
Benchmarks.
With ambitious application dates, the focus will now shift towards
their implementation and the development of Level 2 legislation
to further detail the requirements expected from fi nancial market
participants.
Non-Financial Reporting Directive – consultation
The Commission published a set of Climate-related disclosure
guidelines in June to complement the Non-Financial Reporting
Guidelines. Companies subject to the Non-Financial Reporting
Directive (NFRD) are expected to abide by the non-mandatory ESG
reporting requirements (in the same manner as all guidelines under
NRFD) as of 2020, in the scope of the EU ESG reforms package. The
Commission has also published a Consultation in parallel to the
publication of its proposed guidelines.
EU Green Bond Standard
A Technical Expert Group was tasked by the Commission to work
on recommendations for the development of a voluntary EU Green
Bond Standard, with a view to increasing the transparency and
comparability of the green bond market, as well as to provide clarity
to issuers on the steps to follow for an issuance, in order to scale
up sustainable fi nance investments. These recommendations were
published in June 2019 so it is now with the Commission to progress
further, with assistance from the TEG on the operational aspects of
the proposals.
Advocacy
A central element of Euronext’s work involves engagement with
all actors within our ecosystems. Alongside customers, be they
issuers, investors and intermediaries, Euronext also engages
with policymakers and regulators with a view to contribute to the
development of the regulatory framework which governs Euronexts’
activities. This engagement focuses on both the EU institutions,
namely the Commission, Parliament and Member States in Council,
as well as all relevant authorities in the Euronext jurisdictions. It is
also complemented by engagement of trade associations of which
Euronext is a member, notably FESE at European level, as well as
via various national associations.
3.2.2.2 Maintain an Ongoing Dialogue With Multi-Stakeholder Partnerships
A central element of Euronext’s work involves engagement with
all actors within our ecosystems. Alongside customers, be they
issuers, investors and intermediaries, Euronext also dedicates
considerable time and resources to engaging with policymakers
and regulators with a view to shaping positively the regulatory
framework which governs our activities. This engagement focuses
on both the EU institutions, namely the Commission, Parliament
and Member States in Council, as well as all relevant authorities in
the Euronext jurisdictions. It is also complemented by engagement
of trade associations of which Euronext is a member, notably FESE
at European level, as well as via various national associations.
Advisory Committees
In this context, since 2014, each subsidiary exchange of the Group
has one or more exchange Committees (“Advisory Committees”)
consisting of external stakeholders, to advise and assist the local
Managing Board in a non-binding, advisory capacity on new products
and market developments. These Committees discuss strategic
issues at the local level, being the operational and technical issues
linked to the business areas (Cash/Derivatives/Listing). It is also
expected that Committee participants propose new ideas and be
active in raising topics or issues that fall within the scope of the
Committee. The Advisory Committees are consulted on issues of
major interest to Euronext users (i.e. issuers, investors and other
interested parties), where products and services might be developed
to meet users’ needs. Euronext commits to listening to the opinions
of each Committee and taking these into account in its decision-
making process insofar as possible, in the interests of both the
Company and its shareholders.
Clients
Euronext continues to reinforce its business integrity by striving
to improve the services it provides, making responsible business
decisions, and actively managing the social and environmental
impacts of its actions to help individuals, communities, businesses
and economies progress and grow.
Euronext is a leading service provider for issuers, investors,
intermediaries and technology data vendors. The Product and Sales
teams, the Issuer-Client Coverage Group, the Market Supervision
team and the Technology department provide competent care in
the relationship management across all of the Group’s customers.
Within the Listing department, over 4,500 individual meetings
were held with a broad spectrum of listed, non-listed companies
and ecosystem members to promote capital markets benefi ts and
accompany entrepreneurs in their development projects. To fulfi l its
mission, the Listing team capitalises on the local representatives
that have been set up in Paris (and in other major French cities),
Lisbon, Brussels, Amsterdam, Dublin and Oslo as well as in Munich,
Zurich, Madrid and Milan given the recent European expansion.
Pedagogy, education and proximity are core values which underpin
the Listing team’s strategic deployment. In keeping with this
logic, the Listing team seeks to make its issuers aware of social
responsibility issues.
2019 UNIVERSAL REGISTRATION DOCUMENT 73
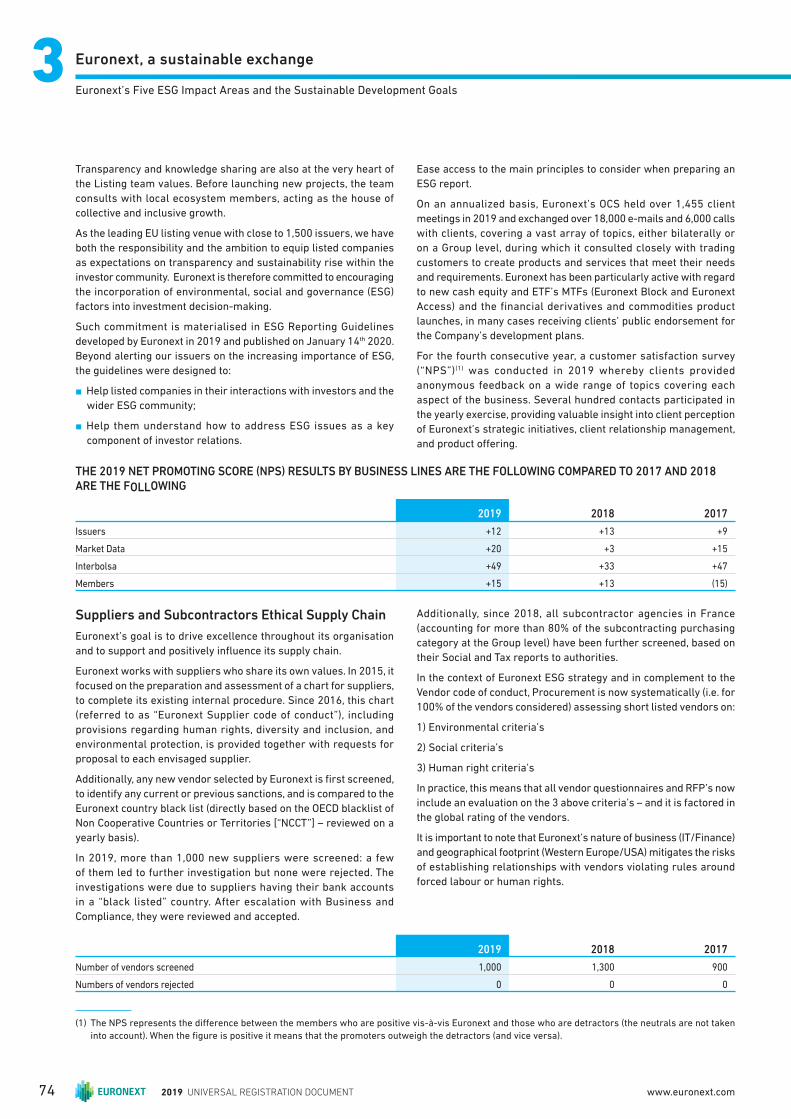
Euronext, a sustainable exchange33Euronext’s Five ESG Impact Areas and the Sustainable Development Goals
Transparency and knowledge sharing are also at the very heart of
the Listing team values. Before launching new projects, the team
consults with local ecosystem members, acting as the house of
collective and inclusive growth.
As the leading EU listing venue with close to 1,500 issuers, we have
both the responsibility and the ambition to equip listed companies
as expectations on transparency and sustainability rise within the
investor community. Euronext is therefore committed to encouraging
the incorporation of environmental, social and governance (ESG)
factors into investment decision-making.
Such commitment is materialised in ESG Reporting Guidelines
developed by Euronext in 2019 and published on January 14th 2020.
Beyond alerting our issuers on the increasing importance of ESG,
the guidelines were designed to:
n Help listed companies in their interactions with investors and the
wider ESG community;
n Help them understand how to address ESG issues as a key
component of investor relations.
Ease access to the main principles to consider when preparing an
ESG report.
On an annualized basis, Euronext’s OCS held over 1,455 client
meetings in 2019 and exchanged over 18,000 e-mails and 6,000 calls
with clients, covering a vast array of topics, either bilaterally or
on a Group level, during which it consulted closely with trading
customers to create products and services that meet their needs
and requirements. Euronext has been particularly active with regard
to new cash equity and ETF’s MTFs (Euronext Block and Euronext
Access) and the financial derivatives and commodities product
launches, in many cases receiving clients’ public endorsement for
the Company’s development plans.
For the fourth consecutive year, a customer satisfaction survey
(“NPS”)(1) was conducted in 2019 whereby clients provided
anonymous feedback on a wide range of topics covering each
aspect of the business. Several hundred contacts participated in
the yearly exercise, providing valuable insight into client perception
of Euronext’s strategic initiatives, client relationship management,
and product off ering.
(1) The NPS represents the difference between the members who are positive vis-à-vis Euronext and those who are detractors (the neutrals are not taken
into account). When the figure is positive it means that the promoters outweigh the detractors (and vice versa).
THE 2019 NET PROMO TING SCORE (NPS) RESULTS BY BUSINESS LINES ARE THE FOLLOWING COMPARED TO 2017 AND 2018 ARE THE FOLLOWING
2019 2018 2017
Issuers +12 +13 +9
Market Data +20 +3 +15
Interbolsa +49 +33 +47
Members +15 +13 (15)
Suppliers and Subcontractors Ethical Supply Chain
Euronext’s goal is to drive excellence throughout its organisation
and to support and positively infl uence its supply chain.
Euronext works with suppliers who share its own values. In 2015, it
focused on the preparation and assessment of a chart for suppliers,
to complete its existing internal procedure. Since 2016, this chart
(referred to as “Euronext Supplier code of conduct”), including
provisions regarding human rights, diversity and inclusion, and
environmental protection, is provided together with requests for
proposal to each envisaged supplier.
Additionally, any new vendor selected by Euronext is fi rst screened,
to identify any current or previous sanctions, and is compared to the
Euronext country black list (directly based on the OECD blacklist of
Non Cooperative Countries or Territories [“NCCT”] – reviewed on a
yearly basis).
In 2019, more than 1,000 new suppliers were screened: a few
of them led to further investigation but none were rejected. The
investigations were due to suppliers having their bank accounts
in a “black listed” country. After escalation with Business and
Compliance, they were reviewed and accepted.
Additionally, since 2018, all subcontractor agencies in France
(accounting for more than 80% of the subcontracting purchasing
category at the Group level) have been further screened, based on
their Social and Tax reports to authorities.
In the context of Euronext ESG strategy and in complement to the
Vendor code of conduct, Procurement is now systematically (i.e. for
100% of the vendors considered) assessing short listed vendors on:
1) Environmental criteria’s
2) Social criteria’s
3) Human right criteria’s
In practice, this means that all vendor questionnaires and RFP’s now
include an evaluation on the 3 above criteria’s – and it is factored in
the global rating of the vendors.
It is important to note that Euronext’s nature of business (IT/Finance)
and geographical footprint (Western Europe/USA) mitigates the risks
of establishing relationships with vendors violating rules around
forced labour or human rights.
2019 2018 2017
Number of vendors screened 1,000 1,300 900
Numbers of vendors rejected 0 0 0
2019 UNIVERSAL REGISTRATION DOCUMENT74 www.euronext.com

Euronext, a sustainable exchange
3
Euronext’s Five ESG Impact Areas and the Sustainable Development Goals
OTHER INDICATORS
Clients and suppliers 2019 2018 2017 2016
Transactions client meetings 1,455 1,500 1,400 750
Exchange of e-mails with clients (EMS + OCS) 66,000 e-mails
Including OCS e-mails* 18,000 e-mails 27,000 e-mails 28,000 e-mails 8,500 emails
Calls with clients 20,000 calls 10,000 calls 13,000 calls 12,000 calls
Number of new suppliers screened 1,000 1,300 900 /
* Only since May 2019
Equities Derivatives ETF Index Bonds W&C Commo
350
450
35
98
50
272
208
average200
01/2019 02/2019 03/2019 04/2019 05/2019 06/2019 07/2019 08/2019 09/2019 10/2019 11/2019 12/2019
6,3995,577
6,532 6,513
3,8384,298
6,638
8,349
4,1455,516average
4,7174,562 4,619
01/2019 02/2019 03/2019 04/2019 05/2019 06/2019 07/2019 08/2019 09/2019 10/2019 11/2019 12/2019
1,689 1,582 1,6021,489
1,682
1,4231,592
1,136
1,441
2,044
2,553
1,824
1,671average
2019 UNIVERSAL REGISTRATION DOCUMENT 75
Euronext, a sustainable exchange33Euronext’s Five ESG Impact Areas and the Sustainable Development Goals
Employees
Eur onext promotes an environment that encourages collaborative
work, learning and innovation allowing each employee to shape his/
her future and the future of the Company. As detailed in the below
section 3.6 the Company undertakes several initiatives to support
and nourish a culture of performance through an ongoing dialogue
with its employees. In 2019 it has identifi ed and signed up with an
employee survey partner with initial rollout and usage of the tool
planned for Dublin and Amsterdam in Q1 2020.
Sha reholders, Analysts and Investors
Euronext has an ongoing dialogue with financial analysts,
shareholders and investors. The Company focuses on communicating
clearly and providing transparent explanations. Euronext has
decided to publish full fi nancial results on a quarterly basis. These
results are commented on in either physical meetings or conference
calls for analysts and investors and are accessible to the general
public via webcast found on the Company’s website.
In addition, Euronext investor relations team met with more than
300 investors and ESG investors in 2019, notably through conducting
roadshows in eight countries (United-Kingdom, France, Germany,
Italy, Switzerland, the Netherlands, the United States, Canada)
and organizing an investor day, and attended eleven investors
conferences. Euronext is willing to continue to engage with its
shareholders on a regular basis so as to enhance the knowledge of
the Company and the understanding of its strategy.
Prior to the IPO, on 27 May 2014, a group of institutional investors
(collectively, the “Reference shareholders”, and each a “Reference
shareholder”) purchased an aggregate percentage of the issued
and outstanding Ordinary Shares from ICE, the selling shareholder
at the IPO. The Reference shareholders have entered into a
reference shareholders’ agreement (the “Reference shareholders
Agreement”) governing the relationship among the Reference
shareholders. This agreement expired on 20 June 2017 and was
extended for a further period of two years commencing on 21 June
2017. On 17 June 2019, Euronext was informed that the Reference
Shareholders had decided to extend an amended version of their
Reference Shareholders Agreement for a further period of two years
commencing on 20 June 2019. The new Reference Shareholders
group from that date comprised of fi ve of the former members and
accounted for 23.27% of Euronext share capital. More information
on Euronext Reference Shareholders are disclosed in section 6.4.1
of this Universal Registration Document.
At the time of its IPO in 2014, Euronext’s dividend policy was
established to achieve a dividend pay-out ratio of approximately
50% of net income, upon the approval of the Annual General Meeting,
and as long as the Company is in position to pay this dividend while
meeting all its various duties and obligations. In May 2017, Euronext
decided to complement this policy, for the remainder of its “Agility for
Growth” strategic plan with the introduction of a fl oor to the dividend
per share. Starting at the Annual General Meeting in 2017 and until
the Annual General Meeting in 2020, Euronext dividend policy is to
distribute the highest of 50% of the reported net income and a fl oor
at €1.42 per share, upon the approval of the Annual General Meeting,
and as long as the Company is in position to pay this dividend while
meeting all its various duties and obligations.
For further information about share capital and shareholder
structure or dividend, please refer to Chapter 6 of this Universal
Registration Document.
Regulators and Finance Industry as a Whole
Euronext is an organisation that provides exchange listing, trading,
post-trade and related services in Europe. The Company operates
exchanges in seven European countries. Each Euronext market
operator is subject to national laws and regulations and other
regulatory requirements imposed by exchange authorities, central
banks and fi nance ministries as appropriate.
The seven national regulatory authorities coordinate their regulation
and supervision of the regulated markets operated by the Group
through the “Euronext College of Regulators”, acting pursuant to
memoranda of understanding which Euronext has committed to
respect. These regulatory authorities have identifi ed certain areas
of common interest and have adopted a coordinated approach to the
exercise of their respective national rules, regulations and supervisory
practices regarding listing requirements, prospectus disclosure
requirements, on-going obligations of listed companies, takeover
bid rules and disclosure of large shareholdings. Representatives of
each national authority meet in working groups on a regular basis
in order to coordinate their actions in areas of common interest and
agree upon measures to promote harmonisation of their respective
National Regulation. Euronext representatives are invited on a
regular basis to part of those meetings.
For more information on the regulation, see section 1.4. “Regulation”
of this Universal Registration Document.
Memberships
FESE
Euronext is a member of the Federation of European Securities
Exchanges (FESE), a trade body located in Brussels representing
European exchanges and engages in advocacy on behalf of this
member community.
United Nations Sustainable Stock Exchange Initiative Membership
Euronext joined the United Nations SSE Initiative in December 2015,
which aims to explore how exchanges can work together with
investors, regulators, and companies to enhance corporate
transparency on Environmental, Social and Corporate Governance
(ESG) issues and encourage responsible long-term approaches to
investment.
As an Offi cial Partner of the Sustainable Stock Exchange Initiative
(SSE), Euronext’s seven market operators have voluntarily committed
− through dialogue with investors, companies and regulators − to
promote sustainable, long-term investment and improved ESG
governance disclosure and performance among the companies
listed on their respective exchange. The decision of membership to
SSE refl ected the commitment of Euronext in these areas.
The Sustainable Stock Exchanges initiative published its Progress
Report in 2018 on the ranking of the world´s stock exchanges in
terms of disclosure of the performance of sustainability indicators.
Euronext Paris is ranked number two, Euronext Amsterdam is
2019 UNIVERSAL REGISTRATION DOCUMENT76 www.euronext.com
Euronext, a sustainable exchange
3
Euronext’s Five ESG Impact Areas and the Sustainable Development Goals
ranked number three and Euronext Brussels is ranked number
twelve. This analysis explored the extent to which the world’s
publicly traded companies are disclosing the seven basic metrics:
employee turnover, energy, greenhouse gas emissions, injury rate,
payroll, water consumption and waste. The next Progress report will
be available in the course of 2020.
Task Force on Climate-related Financial Disclosures (“TCFD”)
On 22 March 2018, Euronext endorsed the Task Force on Climate-
related Financial Disclosures Recommendations and committed
to further support transparency on climate-related risks and
opportunities on fi nancial markets.
The Task Force established by the Financial Stability Board (“FSB”),
developed voluntary recommendations on climate-related information
that companies and organisations should disclose to help investors,
lenders, and others make sound fi nancial decisions. Structured around
four thematic areas – Governance, Strategy, risk management and
Metrics & Targets – the TCFD Recommendations provide a framework
for companies to respond to the increasing demand for transparency
on climate-related risks and opportunities from investors.
The signing of the recommendations took place during an opening
bell ceremony in Brussels, held in presence of Michael Bloomberg
(leader of the Task Force), and during which the Belgian State,
the National Bank of Belgium and the Belgian Financial Services
and Markets Authority (FSMA) also signed up to endorse the TCFD
Recommendations. The bell ringing coincided with the “High Level
Conference: Financing Sustainable Growth” organized by the
European Commission in Brussels.
NGOs
Euronext does not only collaborate with stakeholders with whom it
has direct contact, it also strives to be an engaged member of the
global fi nancial system, and has become a partner in various global
NGOs seeking to improve the global fi nancial ecosystems in terms
of ESG issues. Further, Euronext actively responds to questionnaires
from interested parties inquiring about our ESG practices and
standards in place.
3.2.2.3 Educate our Partners on Financial Literacy and Regulations
Euronext Education Programmes
Endorsing a role of strategic financing advisor, Euronext has
invested significant efforts in accompanying and educating
non-listed companies from various natures, sizes, sectors and
countries. The various Euronext education programmes aim at
helping private companies exploring whether capital markets
are the most appropriate source of funding for their growth,
subsequently equipping them with a capital markets usage
toolbox.
TechShare, IPOready and FamilyShare were launched, in
September 2015, March 2015 and Septermber 2017 respectively.
With a common advisory DNA, these programmes have already
accompanied more than 450 CEOs of private companies from
across Europe (including Belgium, France, Germany, Ireland, Italy,
Portugal, Spain, Switzerland and The Netherlands). Most of Euronext
educational programmes are pre-funded to democratise access to
capital markets education for private.
Financial Literacy
In addition, Euronext promotes the fact that its employees
participate as speakers in conferences to explain the role of
the financial markets and of Euronext in particular. For more
information on the subject, see section “Educate and engage with
our local Community”.
3.2.3 OUR ENVIRONMENT
Key Issues:
n reduce our own carbon footprint and contribute to the protection
of the environment;
n take urgent action to combat climate change
and its impacts;
n as a company, Euronext can contribute to
the global and national challenges of the
climate change.
n target 13.2: Integrate climate change measures into national
policies, strategies and planning.
Reduce our Own Carbon Footprint and Contribute to the Protection of the Environment
Conscious of the challenges linked to climate change, to the need
to reduce its greenhouse gas emissions and to manage natural
resources prudently and sparingly, Euronext has fully integrated
environmental issues into its activities and strategy. In this context,
Euronext has carried out an analysis of its carbon footprint in 2019(1),
as a result of which this report contains signifi cantly more data
than our earlier reports. Euronext will focus in the coming years
on reducing its carbon footprint, and will defi ne clear targets in the
course of 2020. For several years, Euronext has taken care, at group
level, to reduce its consumption of paper and water in its offi ces and
data centers as well as reduce its waste to minimize its ecological
footprint.
(1) Based on 2018 figures. The analysis has been done for the 8 countries in which Euronext has the largest part of its activities. Representative offices were
not taken into account.
2019 UNIVERSAL REGISTRATION DOCUMENT 77
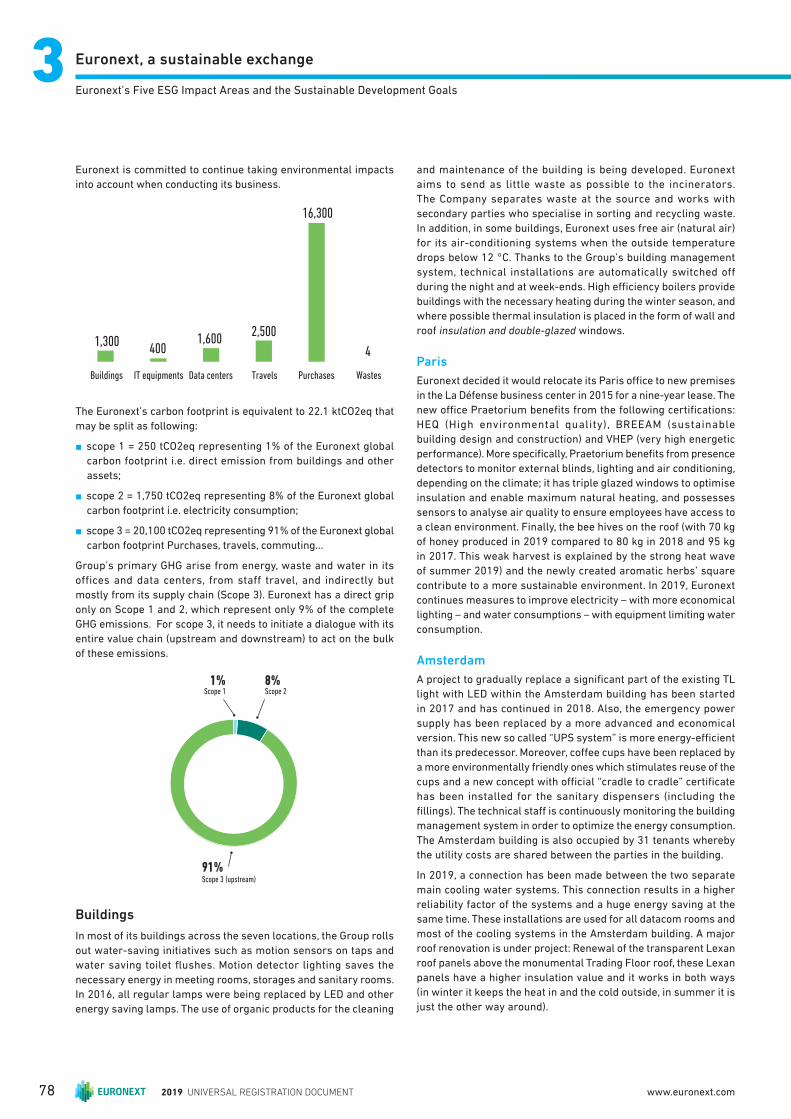
Euronext, a sustainable exchange33Euronext’s Five ESG Impact Areas and the Sustainable Development Goals
Euronext is committed to continue taking environmental impacts
into account when conducting its business.
1,300400
1,6002,500
16,300
4
Buildings IT equipments Data centers Travels Purchases Wastes
The Euronext’s carbon footprint is equivalent to 22.1 ktCO2eq that
may be split as following:
n scope 1 = 250 tCO2eq representing 1% of the Euronext global
carbon footprint i.e. direct emission from buildings and other
assets;
n scope 2 = 1,750 tCO2eq representing 8% of the Euronext global
carbon footprint i.e. electricity consumption;
n scope 3 = 20,100 tCO2eq representing 91% of the Euronext global
carbon footprint Purchases, travels, commuting…
Group’s primary GHG arise from energy, waste and water in its
offices and data centers, from staff travel, and indirectly but
mostly from its supply chain (Scope 3). Euronext has a direct grip
only on Scope 1 and 2, which represent only 9% of the complete
GHG emissions. For scope 3, it needs to initiate a dialogue with its
entire value chain (upstream and downstream) to act on the bulk
of these emissions.
Scope 28%
Scope 3 (upstream)91%
Scope 11%
Buildings
In most of its buildings across the seven locations, the Group rolls
out water-saving initiatives such as motion sensors on taps and
water saving toilet fl ushes. Motion detector lighting saves the
necessary energy in meeting rooms, storages and sanitary rooms.
In 2016, all regular lamps were being replaced by LED and other
energy saving lamps. The use of organic products for the cleaning
and maintenance of the building is being developed. Euronext
aims to send as little waste as possible to the incinerators.
The Company separates waste at the source and works with
secondary parties who specialise in sorting and recycling waste.
In addition, in some buildings, Euronext uses free air (natural air)
for its air-conditioning systems when the outside temperature
drops below 12 °C. Thanks to the Group’s building management
system, technical installations are automatically switched off
during the night and at week-ends. High effi ciency boilers provide
buildings with the necessary heating during the winter season, and
where possible thermal insulation is placed in the form of wall and
roof insulation and double-glazed windows.
Paris
Euronext decided it would relocate its Paris offi ce to new premises
in the La Défense business center in 2015 for a nine-year lease. The
new offi ce Praetorium benefi ts from the following certifi cations:
HEQ (High environmental quality), BREEAM (sustainable
building design and construction) and VHEP (very high energetic
performance). More specifi cally, Praetorium benefi ts from presence
detectors to monitor external blinds, lighting and air conditioning,
depending on the climate; it has triple glazed windows to optimise
insulation and enable maximum natural heating, and possesses
sensors to analyse air quality to ensure employees have access to
a clean environment. Finally, the bee hives on the roof (with 70 kg
of honey produced in 2019 compared to 80 kg in 2018 and 95 kg
in 2017. This weak harvest is explained by the strong heat wave
of summer 2019) and the newly created aromatic herbs’ square
contribute to a more sustainable environment. In 2019, Euronext
continues measures to improve electricity – with more economical
lighting – and water consumptions – with equipment limiting water
consumption.
Amsterdam
A project to gradually replace a signifi cant part of the existing TL
light with LED within the Amsterdam building has been started
in 2017 and has continued in 2018. Also, the emergency power
supply has been replaced by a more advanced and economical
version. This new so called “UPS system” is more energy-effi cient
than its predecessor. Moreover, coff ee cups have been replaced by
a more environmentally friendly ones which stimulates reuse of the
cups and a new concept with offi cial “cradle to cradle” certifi cate
has been installed for the sanitary dispensers (including the
fi llings). The technical staff is continuously monitoring the building
management system in order to optimize the energy consumption.
The Amsterdam building is also occupied by 31 tenants whereby
the utility costs are shared between the parties in the building.
In 2019, a connection has been made between the two separate
main cooling water systems. This connection results in a higher
reliability factor of the systems and a huge energy saving at the
same time. These installations are used for all datacom rooms and
most of the cooling systems in the Amsterdam building. A major
roof renovation is under project: Renewal of the transparent Lexan
roof panels above the monumental Trading Floor roof, these Lexan
panels have a higher insulation value and it works in both ways
(in winter it keeps the heat in and the cold outside, in summer it is
just the other way around).
2019 UNIVERSAL REGISTRATION DOCUMENT78 www.euronext.com
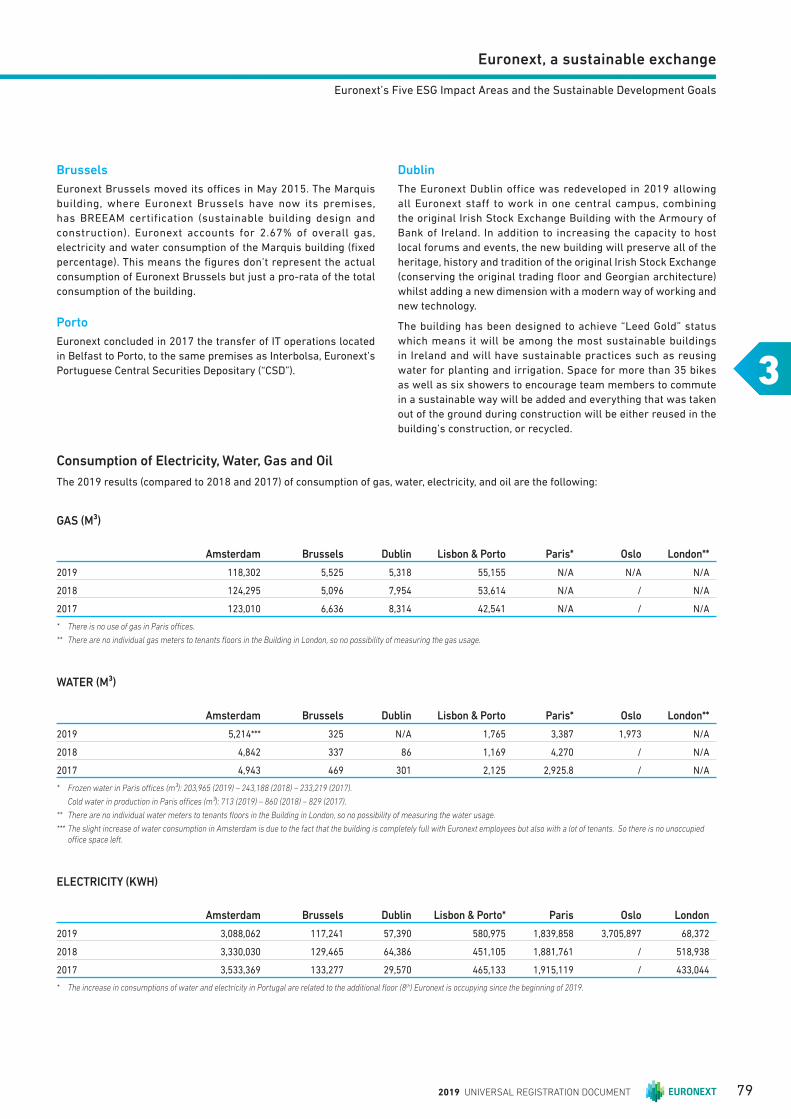
Euronext, a sustainable exchange
3
Euronext’s Five ESG Impact Areas and the Sustainable Development Goals
Brussels
Euronext Brussels moved its offi ces in May 2015. The Marquis
building, where Euronext Brussels have now its premises,
has BREEAM certification (sustainable building design and
construction). Euronext accounts for 2.67% of overall gas,
electricity and water consumption of the Marquis building (fi xed
percentage). This means the fi gures don’t represent the actual
consumption of Euronext Brussels but just a pro-rata of the total
consumption of the building.
Porto
Euronext concluded in 2017 the transfer of IT operations located
in Belfast to Porto, to the same premises as Interbolsa, Euronext’s
Portuguese Central Securities Depositary (“CSD”).
Dublin
The Euron ext Dublin office was redeveloped in 2019 allowing
all Euronext staff to work in one central campus, combining
the original Irish Stock Exchange Building with the Armoury of
Bank of Ireland. In addition to increasing the capacity to host
local forums and events, the new building will preserve all of the
heritage, history and tradition of the original Irish Stock Exchange
(conserving the original trading fl oor and Georgian architecture)
whilst adding a new dimension with a modern way of working and
new technology.
The building has been designed to achieve “Leed Gold” status
which means it will be among the most sustainable buildings
in Ireland and will have sustainable practices such as reusing
water for planting and irrigation. Space for more than 35 bikes
as well as six showers to encourage team members to commute
in a sustainable way will be added and everything that was taken
out of the ground during construction will be either reused in the
building’s construction, or recycled.
Consumption of Electricity, Water, Gas and Oil
The 2019 results (compared to 2018 and 2017) of consumption of gas, water, electricity, and oil are the following:
GAS (M³)
Amsterdam Brussels Dublin Lisbon & Porto Paris* Oslo London**
2019 118,302 5,525 5,318 55,155 N/A N/A N/A
2018 124,295 5,096 7,954 53,614 N/A / N/A
2017 123,010 6,636 8,314 42,541 N/A / N/A
* There is no use of gas in Paris offi ces.
** There are no individual gas meters to tenants fl oors in the Building in London, so no possibility of measuring the gas usage.
WATER (M³)
Amsterdam Brussels Dublin Lisbon & Porto Paris* Oslo London**
2019 5,214*** 325 N/A 1,765 3,387 1,973 N/A
2018 4,842 337 86 1,169 4,270 / N/A
2017 4,943 469 301 2,125 2,925.8 / N/A
* Frozen water in Paris offi ces (m³): 203,965 (2019) – 243,188 (2018) – 233,219 (2017).
Cold water in production in Paris offi ces (m³): 713 (2019) – 860 (2018) – 829 (2017).
** There are no individual water meters to tenants fl oors in the Building in London, so no possibility of measuring the water usage.
*** The slight increase of water consumption in Amsterdam is due to the fact that the building is completely full with Euronext employees but also with a lot of tenants. So there is no unoccupied offi ce space left.
ELECTRICITY (KWH)
Amsterdam Brussels Dublin Lisbon & Porto* Paris Oslo London
2019 3,088,062 117,241 57,390 580,975 1,839,858 3,705,897 68,372
2018 3,330,030 129,465 64,386 451,105 1,881,761 / 518,938
2017 3,533,369 133,277 29,570 465,133 1,915,119 / 433,044
* The increase in consumptions of water and electricity in Portugal are related to the additional fl oor (8th) Euronext is occupying since the beginning of 2019.
2019 UNIVERSAL REGISTRATION DOCUMENT 79
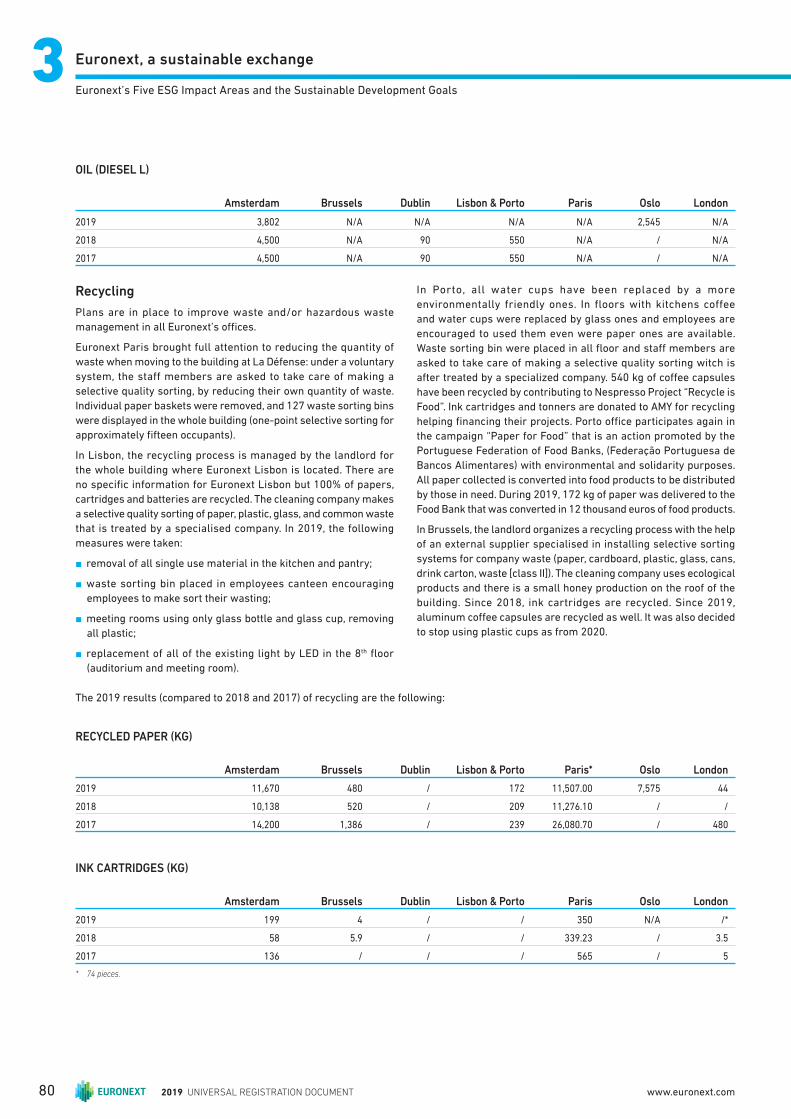
Euronext, a sustainable exchange33Euronext’s Five ESG Impact Areas and the Sustainable Development Goals
Recycling
Plans are in place to improve waste and/or hazardous waste
management in all Euronext’s offi ces.
Euronext Paris brought full attention to reducing the quantity of
waste when moving to the building at La Défense: under a voluntary
system, the staff members are asked to take care of making a
selective quality sorting, by reducing their own quantity of waste.
Individual paper baskets were removed, and 127 waste sorting bins
were displayed in the whole building (one-point selective sorting for
approximately fi fteen occupants).
In Lisbon, the recycling process is managed by the landlord for
the whole building where Euronext Lisbon is located. There are
no specifi c information for Euronext Lisbon but 100% of papers,
cartridges and batteries are recycled. The cleaning company makes
a selective quality sorting of paper, plastic, glass, and common waste
that is treated by a specialised company. In 2019, the following
measures were taken:
n removal of all single use material in the kitchen and pantry;
n waste sorting bin placed in employees canteen encouraging
employees to make sort their wasting;
n meeting rooms using only glass bottle and glass cup, removing
all plastic;
n replacement of all of the existing light by LED in the 8th fl oor
(auditorium and meeting room).
In Porto, all water cups have been replaced by a more
environmentally friendly ones. In floors with kitchens coffee
and water cups were replaced by glass ones and employees are
encouraged to used them even were paper ones are available.
Waste sorting bin were placed in all fl oor and staff members are
asked to take care of making a selective quality sorting witch is
after treated by a specialized company. 540 kg of coff ee capsules
have been recycled by contributing to Nespresso Project “Recycle is
Food”. Ink cartridges and tonners are donated to AMY for recycling
helping fi nancing their projects. Porto offi ce participates again in
the campaign “Paper for Food” that is an action promoted by the
Portuguese Federation of Food Banks, (Federação Portuguesa de
Bancos Alimentares) with environmental and solidarity purposes.
All paper collected is converted into food products to be distributed
by those in need. During 2019, 172 kg of paper was delivered to the
Food Bank that was converted in 12 thousand euros of food products.
In Brussels, the landlord organizes a recycling process with the help
of an external supplier specialised in installing selective sorting
systems for company waste (paper, cardboard, plastic, glass, cans,
drink carton, waste [class II]). The cleaning company uses ecological
products and there is a small honey production on the roof of the
building. Since 2018, ink cartridges are recycled. Since 2019,
aluminum coff ee capsules are recycled as well. It was also decided
to stop using plastic cups as from 2020.
The 2019 results (compared to 2018 and 2017) of recycling are the following:
REC YCLED PAPER (KG)
Amsterdam Brussels Dublin Lisbon & Porto Paris* Oslo London
2019 11,670 480 / 172 11,507. 00 7,575 44
2018 10,138 520 / 209 11,276.10 / /
2017 14,200 1,386 / 239 26,080.70 / 480
INK CARTRIDGES (KG)
Amsterdam Brussels Dublin Lisbon & Porto Paris Oslo London
2019 199 4 / / 350 N/A /*
2018 58 5.9 / / 339.23 / 3.5
2017 136 / / / 565 / 5
* 74 pieces.
OIL (DIESEL L)
Amsterdam Brussels Dublin Lisbon & Porto Paris Oslo London
2019 3,802 N/A N/A N/A N/A 2,545 N/A
2018 4,500 N/A 90 550 N/A / N/A
2017 4,500 N/A 90 550 N/A / N/A
2019 UNIVERSAL REGISTRATION DOCUMENT80 www.euronext.com

Euronext, a sustainable exchange
3
Euronext’s Five ESG Impact Areas and the Sustainable Development Goals
Green IT, Ongoing Actions
Euronext’s goal is to continue to reduce hardware and datacentre
footprints in the future. Optiq®, the new trading system that has
been put in place is less hardware consuming than UTP. In 2019,
the management of the obsolescence of the systems (GL9,10 versus
GL5,6,7), the migration of part of the development environments to
the AWS Cloud and the migration of the UTP trading solution derived
from Optiq® allowed Euronext to reduce its hardware infrastructure
by 20%.
A Hardware refresh initiative has also been launched in 2018. The
replacement and redesign of the network infrastructure within the
primary data center has also made it possible to reduce Euronext’s
footprint and electricity consumption.
In 2018, Euronext has initiated a project to be able to move its
infrastructure in the cloud. At this stage, there are more than 15
services (multi-environment) available on the cloud (Boost, IDS, MTF
solutions, Optiq® Compilation Setup).
3.2.4 OUR PEOPLE
Key Issues:
n develop skills and retain talents in an open culture of dialogue;
n promote diversity;
n respect human rights and local labour laws.
Ensure women’s full and eff ective participation and equal
opportunities for leadership at all levels of decision-making in political, economic and public life.
Target 5.5: Ensure women’s full and eff ective participation
and equal opportunities for leadership at all levels of
decision-making in political, economic and public life
As a stock exchange, Euronext may take leadership in the area of diversity
namely with the bell ringing ceremonies in support of empowering women in the workplace, marketplace and community.
At Euronext, corporate responsibility is part of our identity .
Euronext conducts its business ethically and integrates
consideration of the impact of its actions on its employees. Euronext
promotes an environment that encourages collaborative work,
learning and innovation allowing each employee to shape his/her
future and the future of the Company.
This target is on the SSE list because exchanges may take
leadership in this area, i.e. with the bell ringing ceremonies in
support of empowering women in the workplace, marketplace
and community.
WHO WE ARE: FACTS AND FIGURES
EURONEXT STAFF AS AT 31 DECEMBER 2019
Permanent employees 1.086
Including employees from 2019new acquired entities (Oslo Børs VPS and Euronext Funds 360) 260
The headcount type and its net evolution over the last two years is
shown in the graph below:
Total Regular (Fixed Term
& Permanent)
2018
Trainees
& Apprentices
Agency Workers, VIE
& Contractors
0
200
400
600
800
1,000
1,200
1,400
1,053
1,282
848
1,086
62 86 143 110
2019
As of 31 December 2019, we have the following breakdown of the
1,086 regular employees (permanent & fi xed term):
n of total regular employees (1,086):
n 1,069 (98.4%) are permanent employees and 17 (1.6%) are fi xed
term contract employees,
n 343 (32%) are female and 743 (68%) are male,
n 38 (3.5%) employees work part time hours, of which 29 (76%)
are female, and 9 (24%) are male; with total FTE of 1,074.7;
n females represent 58.8% (10) of fi xed term and 31.6% (333) of
permanent employees, with males representing 41.2% (7) of
fi xed term and 68.4% (736) of permanent employees. Fixed term
contracts are located in the Netherlands (7), France (6), Ireland
(3) and Norway (1).
In addition to above regular employees, 86 trainees and apprentices,
along with 110 agency workers, V.I.E contracts and contractors were
employed. The majority worked with IT (105) and corporate services
(22) with the rest spread across the organization.
BATTERIES (KG)
Amsterdam Brussels Dublin Lisbon & Porto Paris Oslo London
2019 25 / / / 19 16 /
2018 29 / / / 12 / /
2017 26 / / / 15 / 50
2019 UNIVERSAL REGISTRATION DOCUMENT 81

Euronext, a sustainable exchange33Euronext’s Five ESG Impact Areas and the Sustainable Development Goals
The percentage of regular employees located in each of the countries
where Euronext operates is shown in the graph below:
France31%
Norway20%
Portugal12%
Netherlands14%
Ireland8%
United Kingdom5%
Sweden3%
United States3%
Asia3%
Belgium and other Europe1%
HOW WE WORK
Values shape a company’s behaviour and define who they are.
At Euronext, our values are the principles by which we define
ourselves, they are a refl ection of us. They are not an abstract wish
list, but a foundation that we have chosen to be embedded in the
way that we work. Our 5 values are unity, integrity, agility, energy
and accountability. They underly all our actions and are the reason
why Euronext upholds respecting fundamentals rights.
In addition to our values, in 2019 we launched 6 dimensions of a new
Mindset that will complement our values and support the Company
to successfully achieve our new strategy “Let’s Grow Together 2022”.
This Mindset was developed in collaboration with employees and
management through Company surveys and strategy workshops
that involved everyone. The mindset dimensions are:
n Execute with Excellence;
n Collaborate, Challenge & Care for each other;
n Dare to take Risks;
n Empower our People;
n Focus on Clients;
n Adopt a Positive Performance Culture
For each of the mindset dimensions, two Ma naging Board members
have been identified as “guardians”. Th e values and mindset
dimensions are built into our annual performance review process.
“ONE EURONEXT TEAM” TRANSFORMATION PROGRAM
AGILITY
CLIENT
CENTRICITY
Powering
pan-European
capital markets
to finance
the real
economy
ONE
EUROPEAN
TEAM
GROWTH
SHAREH
OLDERS REGU
LATORS
CLIEN
TS
PEOPLE
PARTNERS
As part of the Agility for Growth strategic plan released in May 2016,
client centricity, entrepreneurship, innovation, talent development
and the open federal model of the Company were identifi ed as key
drivers for the Euronext teams to deliver this plan.
Euronext’s Human Resources policy is continuing to evolve, in
accordance with the Agility for Growth strategic plan, while at the
same time recognising that candidates and employee’s expectations
are changing and responding to this.
This evolution is supported by the Euronext values of integrity,
accountability, agility, energy and unity. These values guide the
actions, style and expertise of all Euronext’s activities and are shared
and celebrated with employees, customers and partners to ensure
success.
In this context and for the fourth year, the Company continued to
implement its human resources transformation programme called
“One Euronext Team” in order to improve the Euronext Human
Resources practices, processes and tools over a period of the four
year Agility for Growth strategy.
The People roadmap is composed of four main pillars: Engagement,
Performance, Talent and Human Resources transformation.
Actions are formulated at group and local level, ensuring
cross fertilisation of best initiatives. The Managing Board, local
management teams and Human Resources teams monitor progress
on a monthly basis.
This transformation program aims at motivate and stimulate current
employees and attract new motivated ones.
In addition, a new strategy “Lets’ Grow Together 2022” was
developed in 2019. This encompassed the following six strategic
pillars including an “Empower our People to Grow, Perform and
Innovate” pillar.
2019 UNIVERSAL REGISTRATION DOCUMENT82 www.euronext.com

Euronext, a sustainable exchange
3
Euronext’s Five ESG Impact Areas and the Sustainable Development Goals
STRENGTHEN OUR GLOBAL
AND LOCAL MARKETS
DEVELOP THE PRODUCTS &
SERVICES OF TOMORROW
EMPOWER OUR PEOPLE TO
GROW, PERFORM AND
INNOVATE
ENHANCE CLIENT
CONNECTIVITY
DELIVER OPERATIONAL
EXCELLENCE
ENABLE SUSTAINABLE
FINANCE
The 2020–2022 strategy builds on the success of the 2016–2019
Agility for Growth strategy, and the “Empower our People to Grow,
Perform and Innovate” pillar contains further initiatives under the
areas of Engagement, Performance, Talent and HR Transformation.
Human Resources Transformation
In 2019, the Human Resources team continued to launch projects
to reinforce Euronext’s Human Resources organisation, tools and
processes.
The Human Resources team is organised around countries, functions
(Cash Equities and Derivatives, Global Sales, Debts & Funds Listings
and ETF’s, Listings, Information Technology, Operations, Central
Functions) and specialist skills. The objective of this organisation
is to continue to support the federal model of Euronext, whilst
reinforcing the implementation of the Euronext strategy.
Key transformation resulted in a new and harmonized time
management system deployed for all entities in Europe, completed
with a global payroll system renewed in all locations.
2019 saw the completion of the integration of Euronext Dublin
(formally the Irish Stock Exchange) into the Euronext Group, fully
aligned in all relevant group systems, policies and processes; and
also the completion of phase 1 of the integration of Oslo Børs VPS
entities, which will continue into 2020 and 2021.
3.2.4.1 Develop Skills and Retain Talents in an Open Culture of Dialogue
Euronext promotes an environment that encourages collaborative
work, learning and innovation allowing each employee to shape their
future and the future of the Company.
Euronext runs internal educational and information programmes
including frequent “lunch & learn” sessions, in order to develop
expertise in each of the key functions. 43 Lunch & Learn sessions
were held in the Group in 2018, to which all employees were invited.
A dedicated budget is also set and spent for external vendor training
purposes across Euronext locations.
In 2018, Euronext teams deployed the Career framework in the
Information Technology department. Twelve Career Framework
roles have been identifi ed to represent the main roles within the
Information Technology family. The Career Framework provides a
clear map of the professional roles available within Euronext. The
other role families will be deployed in 2019.
Engagement
The Senior Leadership team, composed of 67 Senior Managers, is
responsible for implementing the Company strategy and sharing
progress, challenges and performance with other members of the
teams. The Company has also continued in 2019 to deliver regular
town halls (all staff meetings) and encourage team meetings in each
country and function, in order to foster a culture of transparency in
communication.
At the end of 2019, Euronext conducted its fourth client satisfaction
survey, the results of which will be available in 2020. Conducted in
parallel, an employee survey allowed the Company to ascertain the
evolving internal perception and understanding of client centricity at
Euronext. Under Euronext’s new Strategy, the survey’s action plans
will be delivered under the Enhance Client Connectivity Strategic
Pillar. Selected employees across the countries and functions
are identifi ed as Client Centricity Champions, supported by group
coordinators to follow the action plan implementation.
In 2019, Euronext continued to reinforce opportunities for employees
to express, share and develop new ideas the design thinking
workshops run in the Paris office, followed by design thinking
workshops with Dublin, Stockholm and Paris fund teams.
As detailed in the Social Dialogue section above, a group wide survey
open to all employees was launched to enable staff provide their
input to help Euronext’s Managing Board shape the new strategic
plan as well as its implementation. It is the first time such an
opportunity has been off ered to employees to openly participate
in this crucial moment of the Company and it refl ects the value
Euronext management places on collective employee engagement.
The results were shared with all staff and local workshops were held
to build on the survey outcome and help develop the fi nal strategic
plan “Let’s Grow Together 2022” as well as the six dimensions of
a new mindset identifi ed as key to supporting the delivery of the
new strategic plan: Execute with Excellence; Collaborate, Challenge
& Care; Dare to Take Risks; Focus on Clients; Empower People; and
Adopt a Positive Performance Culture.
2019 UNIVERSAL REGISTRATION DOCUMENT 83

Euronext, a sustainable exchange33Euronext’s Five ESG Impact Areas and the Sustainable Development Goals
Performance
This aspect aims at strengthening Euronext’s performance culture
by equipping Euronext’s managers with the tools to develop and
motivate their teams, and to recognise the contributions of each
employee within each team.
Since 2016, Euronext has worked to promote the culture of
continuous feedback, encouraging managers and employees to
discuss on a regular basis.
The annual review process, which brings key formalized steps to
this ongoing feedback culture, was deployed starting in November
with the self-appraisal period, followed between December 2019
and January 2020 with an annual review meeting and new objectives
set for 2020, in line with Euronext’s new “Let’s Grow Together 2022”
strategy.
Dedicated sessions on continuous feedback were rolled-out in
all locations giving employees and managers the opportunity
to experiment concrete feedback techniques. It is facilitated by
professional external coaches.
The Human Resources team is monitoring indicators to ensure a written track record of key performance discussions are entered in the
HR system:
2019 2018
Number of employees with an annual performance and career development discussion/form completed 95% 98%
Number of employees with objectives forms completed 96,4% 95%
Number of female/male with annual performance and career development discussion/review completed 94%/96%
Euronext also aims to ensure competitive and fair compensation,
fostering new initiatives, growth and sustainable performance. The
Company provides a competitive base salary in line with market
standards and short-term incentives to reward performance.
The Company also uses a long-term incentive (LTI) plan, in the form of
performance shares reward. The LTI plan for 2019 is a discretionary
performance share plan in which 23.7% of all employees benefi ted
from in 2019. 22.4% of females in the Company participated in LTIP
and 24.2% of males participated in LTIP.
The plan helps to align the interests of Euronext executives and other
eligible employees, with those of the Company and long term (or
prospective) shareholders. It also provides an incentive for longer
term commitment and retention of key employees. LTI vesting is
conditional to presence and performance conditions.
The Remuneration policy also includes local benefi ts plans.
For specific information on Managing Board and Supervisory
Board remuneration please refer to sections 4.2.2 and 4.2.3 of this
document.
Talent
Euronext has established an ambitious Talent Acquisition and Talent
Development policy in accordance with the strategic plan priorities.
Shared processes and tools have been deployed across locations
to consolidate a common framework on Talent Acquisition with the
launch of a new career website, the implementation of an Applicant
Tracking System and the development of a Referral Program.
To reinforce its positioning as an attractive employer, Euronext
strengthened its commitment to be an equal opportunity employer.
Euronext developed its “Early Career” program to recruit and train
students as well as recent graduates on the latest technologies and
critical skills. The program includes partnerships with engineering
and IT universities in France and Portugal to co-develop technical
projects and the participation to academical conferences and job
fairs events. Euronext received the 2019 V.I.E Strategy Awards from
Business France, which increased its visibility as an international
employer.
The Company also implemented tools to promote career mobilities,
training and assessment of skills and performance. The Career
Framework, which is progressively rolled-out and updated across
functions, offers a global view on existing roles and suggests
possible career paths within the Company. Euronext designed
leadership programs for the development of the managers and
leaders of the organization. A Group training plan is rolled out to
favor access to training on the core strategic skills to all employees
through monthly sharing sessions and Learning Weeks opened to
all staff .
Talent reviews are held in a consultative manner by Senior Managers
within one department; this consultation focuses on mutual exchange
of feedback on employee performance and potential. Talent Reviews
also help identify employees’ development needs. Talent reviews
are held in each function, and output is discussed by the Managing
Board. They are also used to identify potential successors in the
organisation’s key roles, and formalise a succession plan.
In addition, Euronext carries out initiatives to favor the quality of life
at work through its Wellnext program with actions related to sport,
nutrition and work-life balance and reinforces its ESG commitment
internally and externally.
2019 UNIVERSAL REGISTRATION DOCUMENT84 www.euronext.com
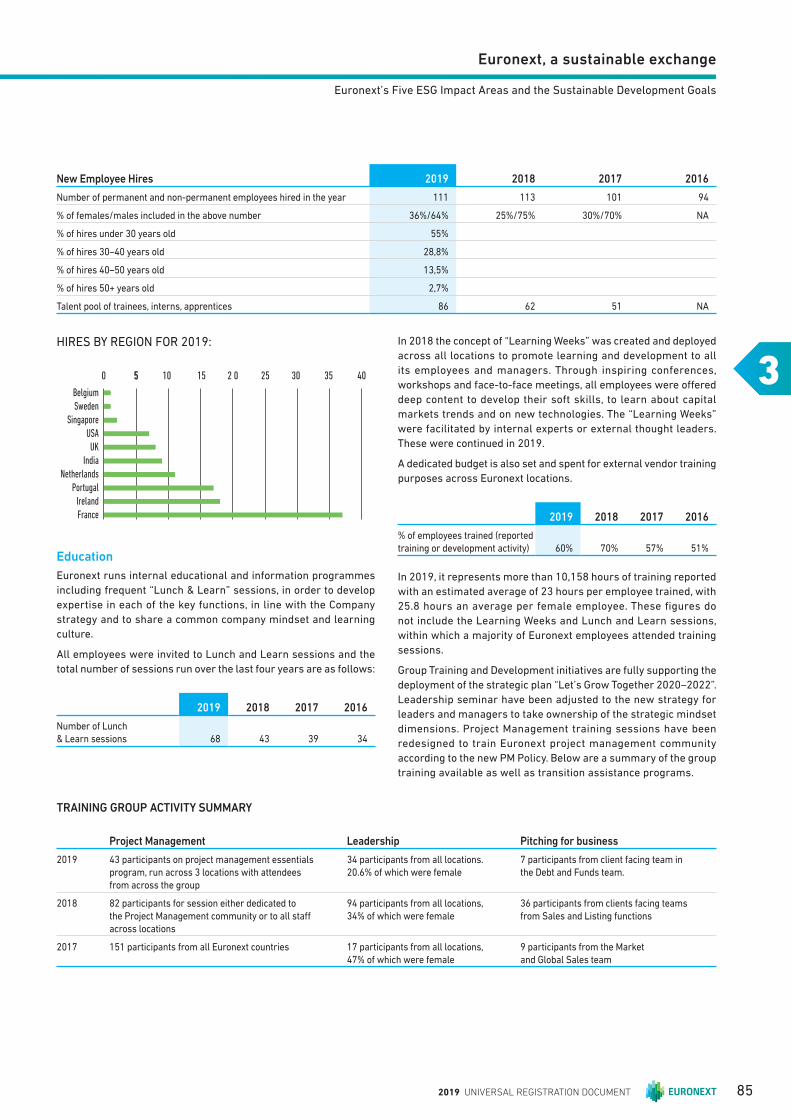
Euronext, a sustainable exchange
3
Euronext’s Five ESG Impact Areas and the Sustainable Development Goals
New Employee Hires 2019 2018 2017 2016
Number of permanent and non-permanent employees hired in the year 111 113 101 94
% of females/males included in the above number 36%/64% 25%/75% 30%/70% NA
% of hires under 30 years old 55%
% of hires 30–40 years old 28,8%
% of hires 40–50 years old 13,5%
% of hires 50+ years old 2,7%
Talent pool of trainees, interns, apprentices 86 62 51 NA
HIRES BY REGION FOR 2019:
0 5 105 15 2 0 25 30 35 40
Belgium
Sweden
Singapore
USA
UK
India
Netherlands
Portugal
Ireland
France
Education
Euronext runs internal educational and information programmes
including frequent “Lunch & Learn” sessions, in order to develop
expertise in each of the key functions, in line with the Company
strategy and to share a common company mindset and learning
culture.
All employees were invited to Lunch and Learn sessions and the
total number of sessions run over the last four years are as follows:
2019 2018 2017 2016
Number of Lunch & Learn sessions 68 43 39 34
In 2018 the concept of “Learning Weeks” was created and deployed
across all locations to promote learning and development to all
its employees and managers. Through inspiring conferences,
workshops and face-to-face meetings, all employees were off ered
deep content to develop their soft skills, to learn about capital
markets trends and on new technologies. The “Learning Weeks”
were facilitated by internal experts or external thought leaders.
These were continued in 2019.
A dedicated budget is also set and spent for external vendor training
purposes across Euronext locations.
2019 2018 2017 2016
% of employees trained (reported
training or development activity) 60% 70% 57% 51%
In 2019, it represents more than 10,158 hours of training reported
with an estimated average of 23 hours per employee trained, with
25.8 hours an average per female employee. These fi gures do
not include the Learning Weeks and Lunch and Learn sessions,
within which a majority of Euronext employees attended training
sessions.
Group Training and Development initiatives are fully supporting the
deployment of the strategic plan “Let’s Grow Together 2020–2022”.
Leadership seminar have been adjusted to the new strategy for
leaders and managers to take ownership of the strategic mindset
dimensions. Project Management training sessions have been
redesigned to train Euronext project management community
according to the new PM Policy. Below are a summary of the group
training available as well as transition assistance programs.
TRAINING GROUP ACTIVITY SUMMARY
Project Management Leadership Pitching for business
2019 43 participants on project management essentials
program, run across 3 locations with attendees from across the group
34 participants from all locations.20.6% of which were female
7 participants from client facing team in the Debt and Funds team.
2018 82 participants for session either dedicated to
the Project Management community or to all staff across locations
94 participants from all locations,
34% of which were female
36 participants from clients facing teams
from Sales and Listing functions
2017 151 participants from all Euronext countries 17 participants from all locations,
47% of which were female
9 participants from the Market
and Global Sales team
2019 UNIVERSAL REGISTRATION DOCUMENT 85
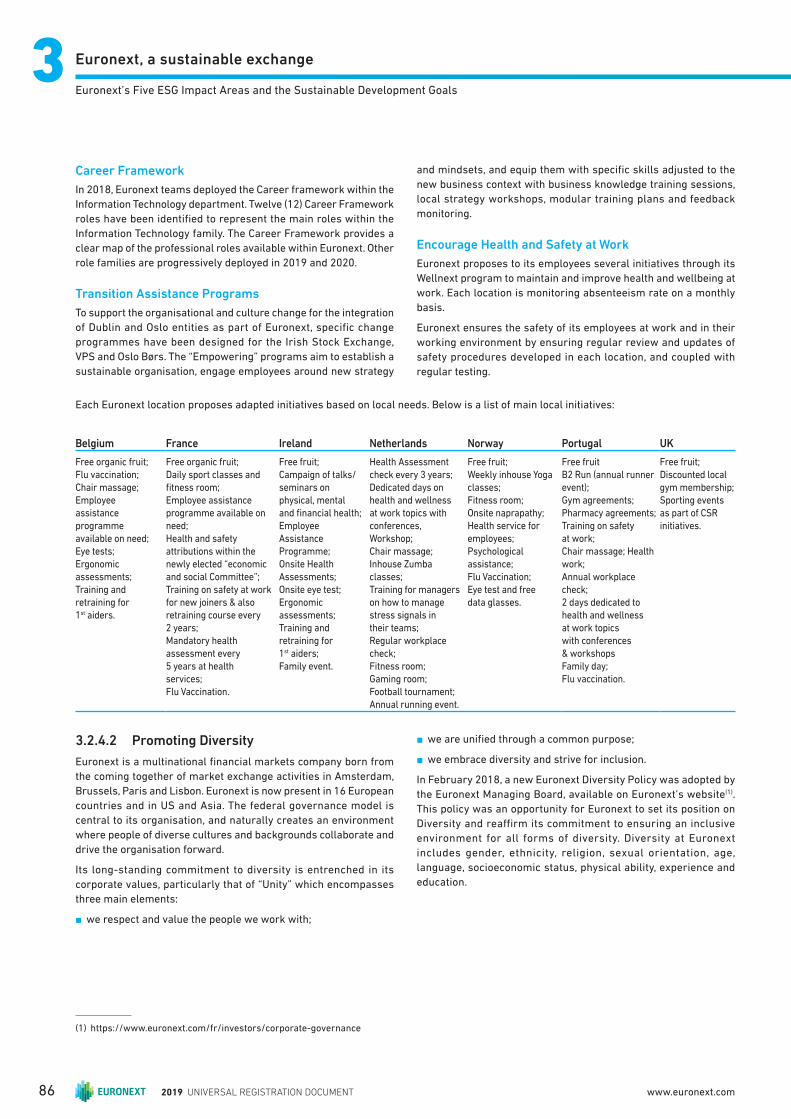
Euronext, a sustainable exchange33Euronext’s Five ESG Impact Areas and the Sustainable Development Goals
Career Framework
In 2018, Euronext teams deployed the Career framework within the
Information Technology department. Twelve (12) Career Framework
roles have been identifi ed to represent the main roles within the
Information Technology family. The Career Framework provides a
clear map of the professional roles available within Euronext. Other
role families are progressively deployed in 2019 and 2020.
Transition Assistance Programs
To support the organisational and culture change for the integration
of Dublin and Oslo entities as part of Euronext, specifi c change
programmes have been designed for the Irish Stock Exchange,
VPS and Oslo Børs . The “Empowering” programs aim to establish a
sustainable organisation, engage employees around new strategy
and mindsets, and equip them with specifi c skills adjusted to the
new business context with business knowledge training sessions,
local strategy workshops, modular training plans and feedback
monitoring.
Encourage Health and Safety at Work
Euronext proposes to its employees several initiatives through its
Wellnext program to maintain and improve health and wellbeing at
work. Each location is monitoring absenteeism rate on a monthly
basis.
Euronext ensures the safety of its employees at work and in their
working environment by ensuring regular review and updates of
safety procedures developed in each location, and coupled with
regular testing.
Each Euronext location proposes adapted initiatives based on local needs. Below is a list of main local initiatives:
Belgium France Ireland Netherlands Norway Portugal UK
Free organic fruit;
Flu vaccination;
Chair massage;
Employee
assistance
programme
available on need;
Eye tests;
Ergonomic
assessments;
Training and
retraining for
1st aiders.
Free organic fruit;
Daily sport classes and
fi tness room;
Employee assistance
programme available on
need;
Health and safety
attributions within the
newly elected “economic
and social Committee”;
Training on safety at work
for new joiners & also
retraining course every
2 years;
Mandatory health
assessment every
5 years at health
services;Flu Vaccination.
Free fruit;
Campaign of talks/
seminars on
physical, mental
and fi nancial health;
Employee
Assistance
Programme;
Onsite Health
Assessments;
Onsite eye test;
Ergonomic
assessments;
Training and
retraining for
1st aiders;
Family event.
Health Assessment
check every 3 years;
Dedicated days on
health and wellness
at work topics with
conferences,
Workshop;
Chair massage;
Inhouse Zumba
classes;
Training for managers
on how to manage
stress signals in
their teams;
Regular workplace
check;
Fitness room;
Gaming room;
Football tournament; Annual running event.
Free fruit;
Weekly inhouse Yoga
classes;
Fitness room;
Onsite naprapathy;
Health service for
employees;
Psychological
assistance;
Flu Vaccination;
Eye test and free
data glasses.
Free fruit
B2 Run (annual runner
event);
Gym agreements;
Pharmacy agreements;
Training on safety
at work;
Chair massage; Health
work;
Annual workplace
check;
2 days dedicated to
health and wellness
at work topics
with conferences
& workshops
Family day;
Flu vaccination.
Free fruit;
Discounted local
gym membership;
Sporting events
as part of CSR
initiatives.
3.2.4.2 Promoting Diversity
Euronext is a multinational fi nancial markets company born from
the coming together of market exchange activities in Amsterdam,
Brussels, Paris and Lisbon. Euronext is now present in 16 European
countries and in US and Asia. The federal governance model is
central to its organisation, and naturally creates an environment
where people of diverse cultures and backgrounds collaborate and
drive the organisation forward.
Its long-standing commitment to diversity is entrenched in its
corporate values, particularly that of “Unity” which encompasses
three main elements:
n we respect and value the people we work with;
n we are unifi ed through a common purpose;
n we embrace diversity and strive for inclusion.
In February 2018, a new Euronext Diversity Policy was adopted by
the Euronext Managing Board, available on Euronext’s website(1).
This policy was an opportunity for Euronext to set its position on
Diversity and reaffi rm its commitment to ensuring an inclusive
environment for all forms of diversity. Diversity at Euronext
includes gender, ethnicity, religion, sexual orientation, age,
language, socioeconomic status, physical ability, experience and
education.
(1) https://www.euronext.com/fr/investors/corporate-governance
2019 UNIVERSAL REGISTRATION DOCUMENT86 www.euronext.com
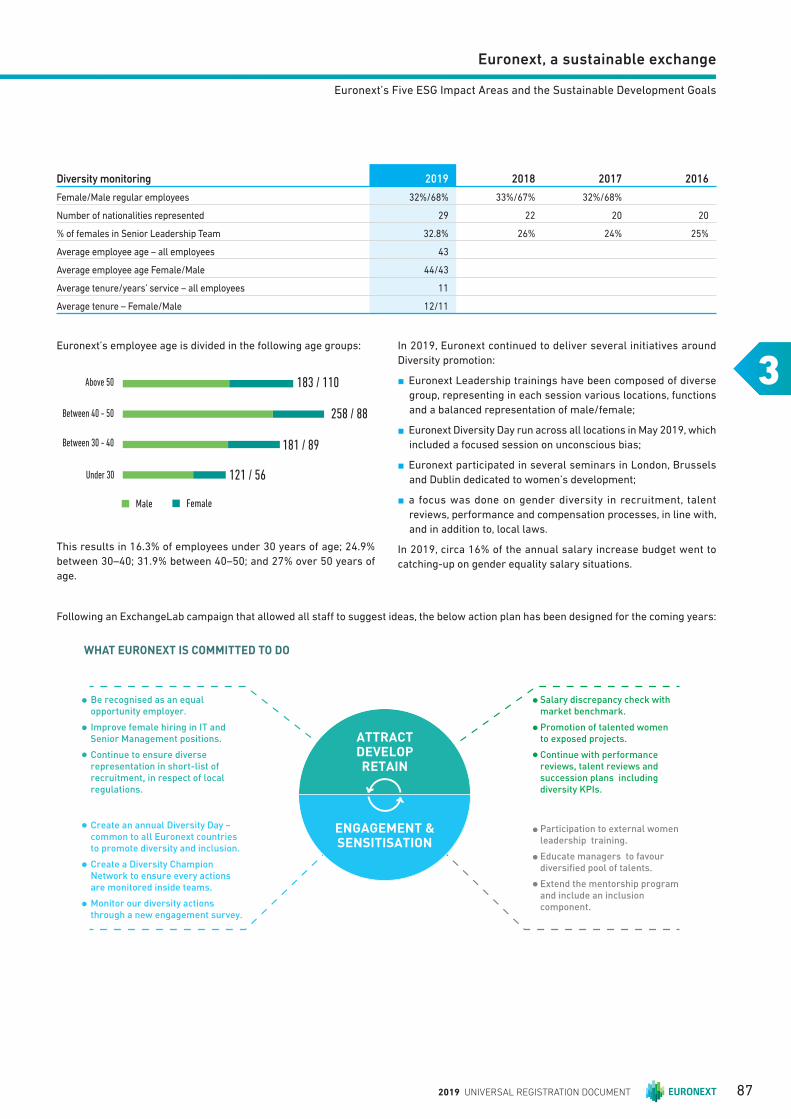
Euronext, a sustainable exchange
3
Euronext’s Five ESG Impact Areas and the Sustainable Development Goals
Diversity monitoring 2019 2018 2017 2016
Female/Male regular employees 32%/68% 33%/67% 32%/68%
Number of nationalities represented 29 22 20 20
% of females in Senior Leadership Team 32.8% 26% 24% 25%
Average employee age – all employees 43
Average employee age Female/Male 44/43
Average tenure/years’ service – all employees 11
Average tenure – Female/Male 12/11
Euronext’s employee age is divided in the following age groups:
Above 50
Between 40 - 50
Between 30 - 40
Under 30
183 / 110
258 / 88
181 / 89
121 / 56
Male Female
This results in 16.3% of employees under 30 years of age; 24.9%
between 30–40; 31.9% between 40–50; and 27% over 50 years of
age.
I n 2019, Euronext continued to deliver several initiatives around
Diversity promotion:
n Euronext Leadership trainings have been composed of diverse
group, representing in each session various locations, functions
and a balanced representation of male/female;
n Euronext Diversity Day run across all locations in May 2019, which
included a focused session on unconscious bias;
n Euronext participated in several seminars in London, Brussels
and Dublin dedicated to women’s development;
n a focus was done on gender diversity in recruitment, talent
reviews, performance and compensation processes, in line with,
and in addition to, local laws.
In 2019, circa 16% of the annual salary increase budget went to
catching-up on gender equality salary situations.
Following an ExchangeLab campaign that allowed all staff to suggest ideas, the below action plan has been designed for the coming years:
WHAT EURONEXT IS COMMITTED TO DO
Be recognised as an equal
opportunity employer.
Improve female hiring in IT and
Senior Management positions.
Continue to ensure diverse
representation in short-list of
recruitment, in respect of local
regulations.
Create an annual Diversity Day –
common to all Euronext countries
to promote diversity and inclusion.
Create a Diversity Champion
Network to ensure every actions
are monitored inside teams.
Monitor our diversity actions
through a new engagement survey.
Salary discrepancy check with
market benchmark.
Promotion of talented women
to exposed projects.
Continue with performance
reviews, talent reviews and
succession plans including
diversity KPIs.
Participation to external women
leadership training.
Educate managers to favour
diversified pool of talents.
Extend the mentorship program
and include an inclusion
component.
ATTRACTDEVELOPRETAIN
ENGAGEMENT &SENSITISATION
2019 UNIVERSAL REGISTRATION DOCUMENT 87
Euronext, a sustainable exchange33Euronext’s Five ESG Impact Areas and the Sustainable Development Goals
Social Dialogue with Unions
Euronext is committed to social dialogue, supporting union
representation rights and facilitating worker representation bodies.
Euronext held very regular meetings with unions in every company
where unions are representatives.
As of 31st December 2019, 55.6% of Euronext employees were
covered by collective bargaining agreements.
In 2019, the following were progressed through the works council
discussions:
n in Amsterdam, new pension plan implemented; restructuring
within Derivatives NL implemented; and new social plan structure
agreed;
n in Norway, agreement on the process, timeline, circle and criteria
for the post acquisition restructuring process; and agreement on
2019 remuneration;
n in Paris, implementation after consultation of new EMS
organization; new Corporate Services organization and new Cash
and Equities Derivatives organization; information on project
management policy;
3 new collective agreements were signed: for Euronext Paris SA,
Right to disconnect and Gender Equality agreements signed; for
Euronext Technologies SAS, employee savings agreement signed
as part of annual collective bargaining negotiations;
n in Portugal, new pension plan agreed and implemented;
annual remuneration discussions concluded and GDPR policy
implemented
Late in 2018, Euronext launched an innovative strategic dialogue
with all its employees to construct its new strategic plan,
continuing into 2019. It first involved a group-wide employee
survey to help develop the future strategy of Euronext. This survey
was completed by close to 50% of the organization, and provided
detailed answers regarding their ambitions and vision for the
future as well as over 2,000 ideas for management to consider.
The survey results and themes were shared with all employees
during a Group Town Hall. Each major location across Euronext
held at least one local strategy workshop session led by their
CEO and senior managers; all staff were invited to discuss the
outcome of the survey and the proposed strategic pillars in order
to provide their input and ideas for inclusion for consideration by
the Managing Board. All of this employee input and engagement
directly fed the development of the new Euronext 2020–2022
Strategic Plan “Let’s Grow Together”.
3.2.4.3 Respect of the Human Rights and Local Labour Laws
Euronext supports the UN Guiding Principles on Business and
Human Rights, together with the International Labor Organization
Conventions and Recommendations. Euronext’s complies with these
fundamental rights, conventions and recommendations, notably
social rights, freedom of association and equality, abolishment of
forced and child labor.
Euronext is committed to social dialogue, supporting union
representation rights and facilitating worker representative bodies.
Euronext is also committed to respecting the right to collective
bargaining, in accordance with local laws of the countries where its
employees are located.
Works Council
In accordance with local laws and regulations, local works
councils are set in France, in the Netherlands and in Portugal
(Porto). The works councils represent Euronext employees, are
informed and/or consulted on economic, fi nancial, social and
organisation matters, and complement collective or national
labour negotiations.
In France, staff representative elections were organized in 2018 in
the two legal entities to renew the Work Councils according to local
regulations.
France Norway The Netherlands Portugal
Number of local Work Council sessions held in 2019 19 (across 2 legal entities) 4 10 3
The Company has also set a social dialogue Committee at the European level, including every European country. European staff representatives
are informed on economic, fi nancial, social and strategic Group matters.
2019 2018 2017 2016
Number of meeting of staff representative at European levels 1 1 2 2
2019 UNIVERSAL REGISTRATION DOCUMENT88 www.euronext.com
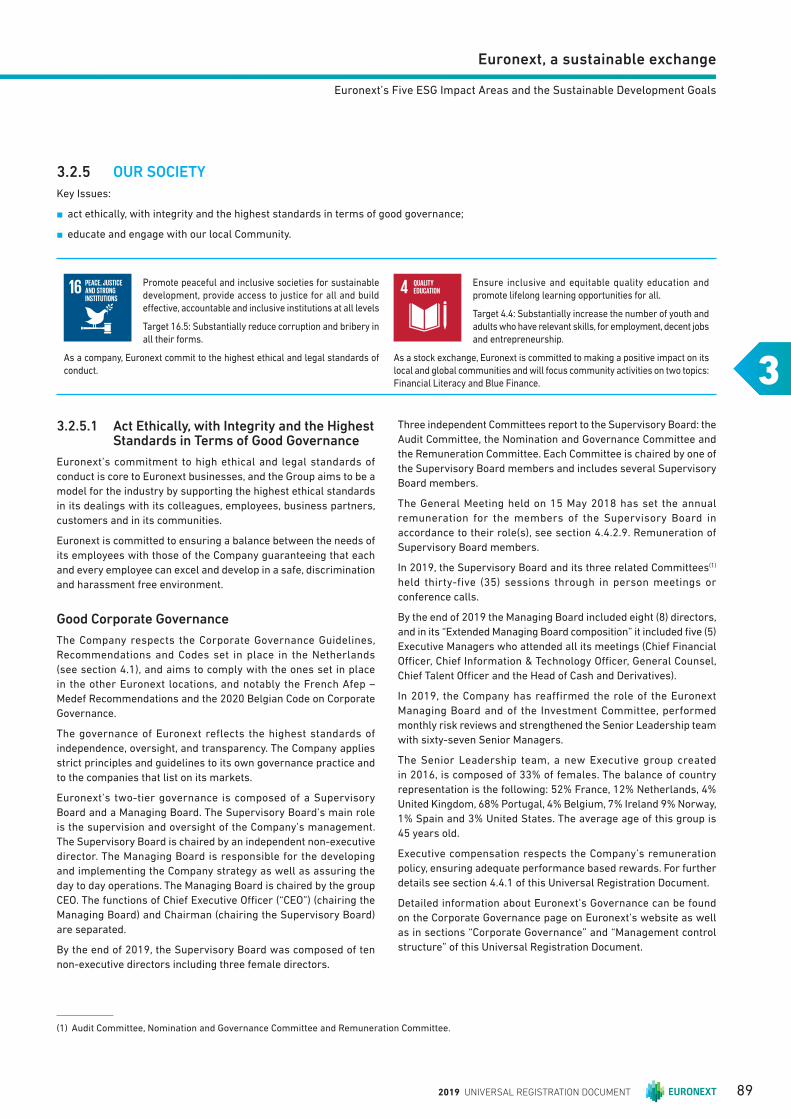
Euronext, a sustainable exchange
3
Euronext’s Five ESG Impact Areas and the Sustainable Development Goals
3.2.5 OUR SOCIETY
Key Issues:
n act ethically, with integrity and the highest standards in terms of good governance;
n educate and engage with our local Community.
Promote peaceful and inclusive societies for sustainable development, provide access to justice for all and build eff ective, accountable and inclusive institutions at all levels
Target 16.5: Substantially reduce corruption and bribery in all their forms.
As a company, Euronext commit to the highest ethical and legal standards of conduct.
Ensure inclusive and equitable quality education and promote lifelong learning opportunities for all.
Target 4.4: Substantially increase the number of youth and adults who have relevant skills, for employment, decent jobs and entrepreneurship.
As a stock exchange, Euronext is committed to making a positive impact on its local and global communities and will focus community activities on two topics: Financial Literacy and Blue Finance.
3.2.5.1 Act Ethically, with Integrity and the Highest Standards in Terms of Good Governance
Euronext’s commitment to high ethical and legal standards of
conduct is core to Euronext businesses, and the Group aims to be a
model for the industry by supporting the highest ethical standards
in its dealings with its colleagues, employees, business partners,
customers and in its communities.
Euronext is committed to ensuring a balance between the needs of
its employees with those of the Company guaranteeing that each
and every employee can excel and develop in a safe, discrimination
and harassment free environment.
Good Corporate Governance
The Company respects the Corporate Governance Guidelines,
Recommendations and Codes set in place in the Netherlands
(see section 4.1), and aims to comply with the ones set in place
in the other Euronext locations, and notably the French Afep –
Medef Recommendations and the 2020 Belgian Code on Corporate
Governance.
The governance of Euronext reflects the highest standards of
independence, oversight, and transparency. The Company applies
strict principles and guidelines to its own governance practice and
to the companies that list on its markets.
Euronext’s two-tier governance is composed of a Supervisory
Board and a Managing Board. The Supervisory Board’s main role
is the supervision and oversight of the Company’s management.
The Supervisory Board is chaired by an independent non-executive
director. The Managing Board is responsible for the developing
and implementing the Company strategy as well as assuring the
day to day operations. The Managing Board is chaired by the group
CEO. The functions of Chief Executive Offi cer (“CEO”) (chairing the
Managing Board) and Chairman (chairing the Supervisory Board)
are separated.
By the end of 2019, the Supervisory Board was composed of ten
non-executive directors including three female directors.
Three independent Committees report to the Supervisory Board: the
Audit Committee, the Nomination and Governance Committee and
the Remuneration Committee. Each Committee is chaired by one of
the Supervisory Board members and includes several Supervisory
Board members.
The General Meeting held on 15 May 2018 has set the annual
remuneration for the members of the Supervisory Board in
accordance to their role(s), see section 4.4.2.9. Remuneration of
Supervisory Board members.
In 2019, the Supervisory Board and its three related Committees(1)
held thirty-five (35) sessions through in person meetings or
conference calls.
By the end of 2019 the Managing Board included eight (8) directors,
and in its “Extended Managing Board composition” it included fi ve (5)
Executive Managers who attended all its meetings (Chief Financial
Offi cer, Chief Information & Technology Offi cer, General Counsel,
Chief Talent Offi cer and the Head of Cash and Derivatives).
In 2019, the Company has reaffirmed the role of the Euronext
Managing Board and of the Investment Committee, performed
monthly risk reviews and strengthened the Senior Leadership team
with sixty-seven Senior Managers.
The Senior Leadership team, a new Executive group created
in 2016, is composed of 33% of females. The balance of country
representation is the following: 52% France, 12% Netherlands, 4%
United Kingdom, 68% Portugal, 4% Belgium, 7% Ireland 9% Norway,
1% Spain and 3% United States. The average age of this group is
45 years old.
Executive compensation respects the Company’s remuneration
policy, ensuring adequate performance based rewards. For further
details see section 4.4.1 of this Universal Registration Document.
Detailed information about Euronext’s Governance can be found
on the Corporate Governance page on Euronext’s website as well
as in sections “Corporate Governance” and “Management control
structure” of this Universal Registration Document.
(1) Audit Committee, Nomination and Governance Committee and Remuneration Committee.
2019 UNIVERSAL REGISTRATION DOCUMENT 89
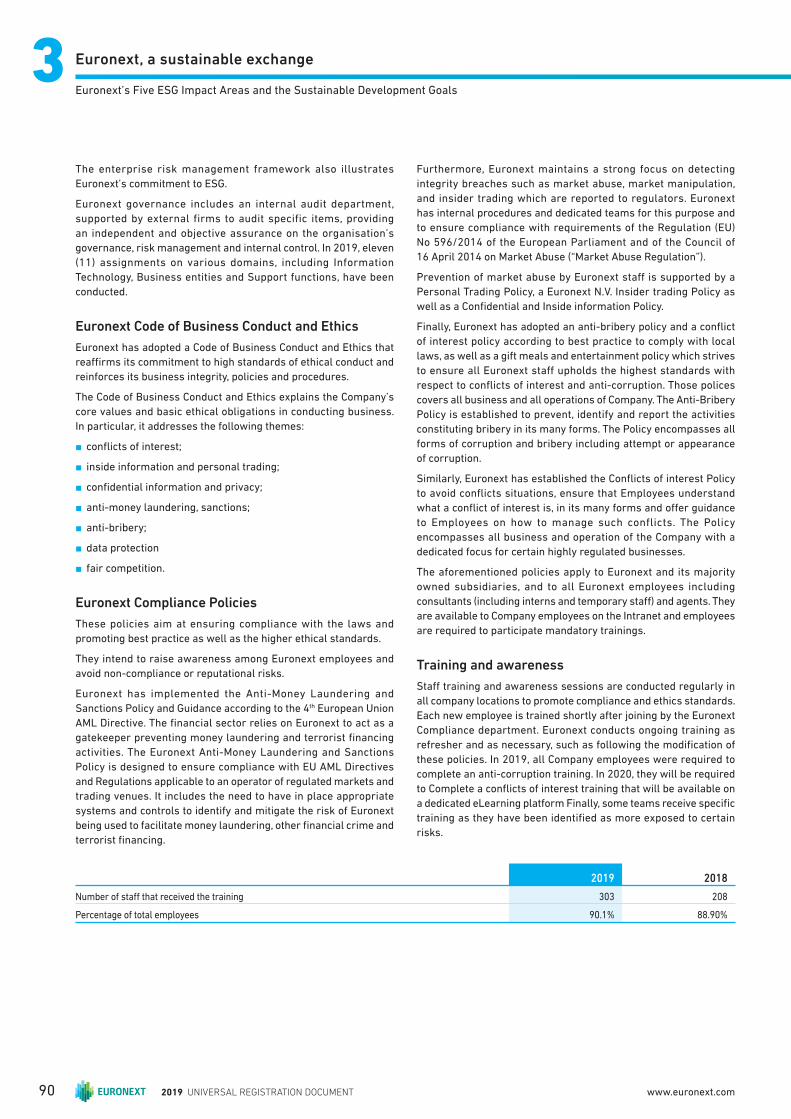
Euronext, a sustainable exchange33Euronext’s Five ESG Impact Areas and the Sustainable Development Goals
2019 2018
Number of staff that received the training 303 208
Percentage of total employees 90.1% 88.90%
The enterprise risk management framework also illustrates
Euronext’s commitment to ESG.
Euronext governance includes an internal audit department,
supported by external firms to audit specific items, providing
an independent and objective assurance on the organisation’s
governance, risk management and internal control. In 2019, eleven
(11) assignments on various domains, including Information
Technology, Business entities and Support functions, have been
conducted.
Euronext Code of Business Conduct and Ethics
Euronext has adopted a Code of Business Conduct and Ethics that
reaffi rms its commitment to high standards of ethical conduct and
reinforces its business integrity, policies and procedures.
The Code of Business Conduct and Ethics explains the Company’s
core values and basic ethical obligations in conducting business.
In particular, it addresses the following themes:
n confl icts of interest;
n inside information and personal trading;
n confi dential information and privacy;
n anti-money laundering, sanctions;
n anti-bribery;
n data protection
n fair competition.
Euronext Compliance Policies
These policies aim at ensuring compliance with the laws and
promoting best practice as well as the higher ethical standards.
They intend to raise awareness among Euronext employees and
avoid non-compliance or reputational risks.
Euronext has implemented the Anti-Money Laundering and
Sanctions Policy and Guidance according to the 4th European Union
AML Directive. The fi nancial sector relies on Euronext to act as a
gatekeeper preventing money laundering and terrorist fi nancing
activities. The Euronext Anti-Money Laundering and Sanctions
Policy is designed to ensure compliance with EU AML Directives
and Regulations applicable to an operator of regulated markets and
trading venues. It includes the need to have in place appropriate
systems and controls to identify and mitigate the risk of Euronext
being used to facilitate money laundering, other fi nancial crime and
terrorist fi nancing.
Furthermore, Euronext maintains a strong focus on detecting
integrity breaches such as market abuse, market manipulation,
and insider trading which are reported to regulators. Euronext
has internal procedures and dedicated teams for this purpose and
to ensure compliance with requirements of the Regulation (EU)
No 596/2014 of the European Parliament and of the Council of
16 April 2014 on Market Abuse (“Market Abuse Regulation”).
Prevention of market abuse by Euronext staff is supported by a
Personal Trading Policy, a Euronext N.V. Insider trading Policy as
well as a Confi dential and Inside information Policy.
Finally, Euronext has adopted an anti-bribery policy and a confl ict
of interest policy according to best practice to comply with local
laws, as well as a gift meals and entertainment policy which strives
to ensure all Euronext staff upholds the highest standards with
respect to confl icts of interest and anti-corruption. Those polices
covers all business and all operations of Company. The Anti-Bribery
Policy is established to prevent, identify and report the activities
constituting bribery in its many forms. The Policy encompasses all
forms of corruption and bribery including attempt or appearance
of corruption.
Similarly, Euronext has established the Confl icts of interest Policy
to avoid confl icts situations, ensure that Employees understand
what a confl ict of interest is, in its many forms and off er guidance
to Employees on how to manage such conflicts. The Policy
encompasses all business and operation of the Company with a
dedicated focus for certain highly regulated businesses.
The aforementioned policies apply to Euronext and its majority
owned subsidiaries, and to all Euronext employees including
consultants (including interns and temporary staff ) and agents. They
are available to Company employees on the Intranet and employees
are required to participate mandatory trainings.
Training and awareness
Staff training and awareness sessions are conducted regularly in
all company locations to promote compliance and ethics standards.
Each new employee is trained shortly after joining by the Euronext
Compliance department. Euronext conducts ongoing training as
refresher and as necessary, such as following the modifi cation of
these policies. In 2019, all Company employees were required to
complete an anti-corruption training. In 2020, they will be required
to Complete a confl icts of interest training that will be available on
a dedicated eLearning platform Finally, some teams receive specifi c
training as they have been identifi ed as more exposed to certain
risks.
2019 UNIVERSAL REGISTRATION DOCUMENT90 www.euronext.com
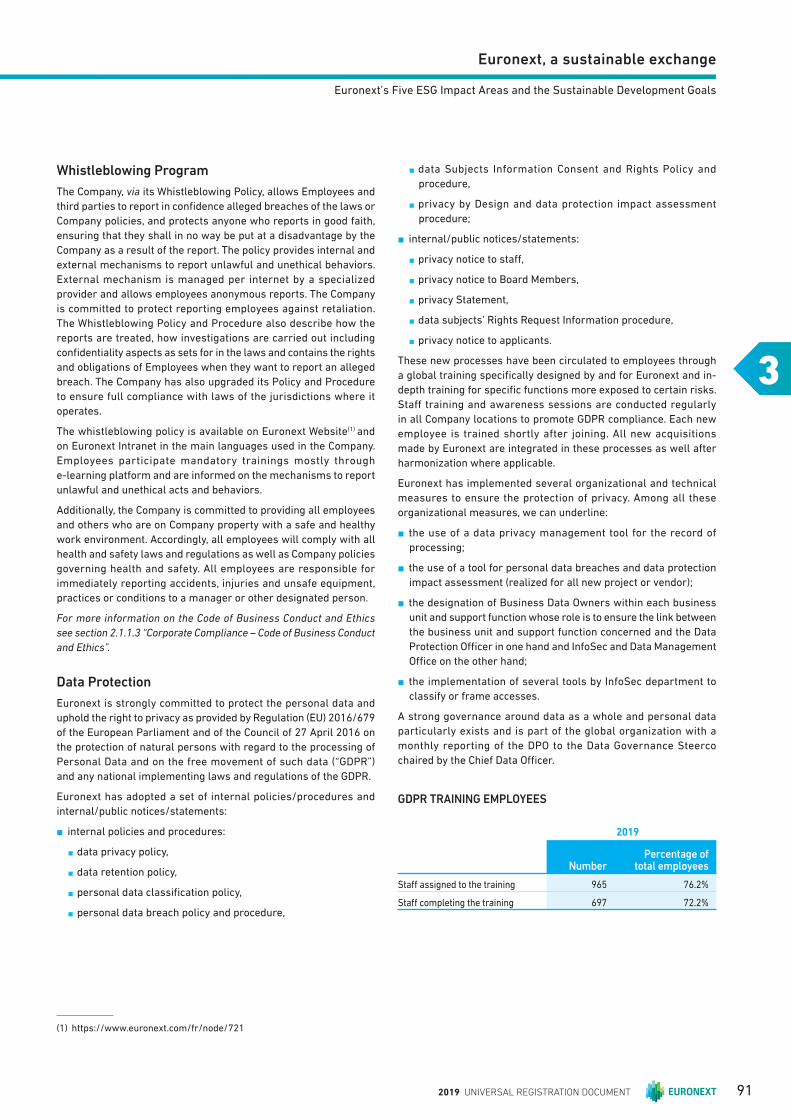
Euronext, a sustainable exchange
3
Euronext’s Five ESG Impact Areas and the Sustainable Development Goals
Whistleblowing Program
The Company, via its Whistleblowing Policy, allows Employees and
third parties to report in confi dence alleged breaches of the laws or
Company policies, and protects anyone who reports in good faith,
ensuring that they shall in no way be put at a disadvantage by the
Company as a result of the report. The policy provides internal and
external mechanisms to report unlawful and unethical behaviors.
External mechanism is managed per internet by a specialized
provider and allows employees anonymous reports. The Company
is committed to protect reporting employees against retaliation.
The Whistleblowing Policy and Procedure also describe how the
reports are treated, how investigations are carried out including
confi dentiality aspects as sets for in the laws and contains the rights
and obligations of Employees when they want to report an alleged
breach. The Company has also upgraded its Policy and Procedure
to ensure full compliance with laws of the jurisdictions where it
operates.
The whistleblowing policy is available on Euronext Website(1) and
on Euronext Intranet in the main languages used in the Company.
Employees participate mandatory trainings mostly through
e-learning platform and are informed on the mechanisms to report
unlawful and unethical acts and behaviors.
Additionally, the Company is committed to providing all employees
and others who are on Company property with a safe and healthy
work environment. Accordingly, all employees will comply with all
health and safety laws and regulations as well as Company policies
governing health and safety. All employees are responsible for
immediately reporting accidents, injuries and unsafe equipment,
practices or conditions to a manager or other designated person.
For more information on the Code of Business Conduct and Ethics
see section 2.1.1.3 “Corporate Compliance – Code of Business Conduct
and Ethics”.
Data Protection
Euronext is strongly committed to protect the personal data and
uphold the right to privacy as provided by Regulation (EU) 2016/679
of the European Parliament and of the Council of 27 April 2016 on
the protection of natural persons with regard to the processing of
Personal Data and on the free movement of such data (“GDPR”)
and any national implementing laws and regulations of the GDPR.
Euronext has adopted a set of internal policies/procedures and
internal/public notices/statements:
n internal policies and procedures:
n data privacy policy,
n data retention policy,
n personal data classifi cation policy,
n personal data breach policy and procedure,
n data Subjects Information Consent and Rights Policy and
procedure,
n privacy by Design and data protection impact assessment
procedure;
n internal/public notices/statements:
n privacy notice to staff ,
n privacy notice to Board Members,
n privacy Statement,
n data subjects’ Rights Request Information procedure,
n privacy notice to applicants.
These new processes have been circulated to employees through
a global training specifi cally designed by and for Euronext and in-
depth training for specifi c functions more exposed to certain risks.
Staff training and awareness sessions are conducted regularly
in all Company locations to promote GDPR compliance. Each new
employee is trained shortly after joining. All new acquisitions
made by Euronext are integrated in these processes as well after
harmonization where applicable.
Euronext has implemented several organizational and technical
measures to ensure the protection of privacy. Among all these
organizational measures, we can underline:
n the use of a data privacy management tool for the record of
processing;
n the use of a tool for personal data breaches and data protection
impact assessment (realized for all new project or vendor);
n the designation of Business Data Owners within each business
unit and support function whose role is to ensure the link between
the business unit and support function concerned and the Data
Protection Offi cer in one hand and InfoSec and Data Management
Offi ce on the other hand;
n the implementation of several tools by InfoSec department to
classify or frame accesses.
A strong governance around data as a whole and personal data
particularly exists and is part of the global organization with a
monthly reporting of the DPO to the Data Governance Steerco
chaired by the Chief Data Offi cer.
GDPR TRAINING EMPLOYEES
2019
NumberPercentage of
total employees
Staff assigned to the training 965 76.2%
Staff completing the training 697 72.2%
(1) https://www.euronext.com/fr/node/721
2019 UNIVERSAL REGISTRATION DOCUMENT 91
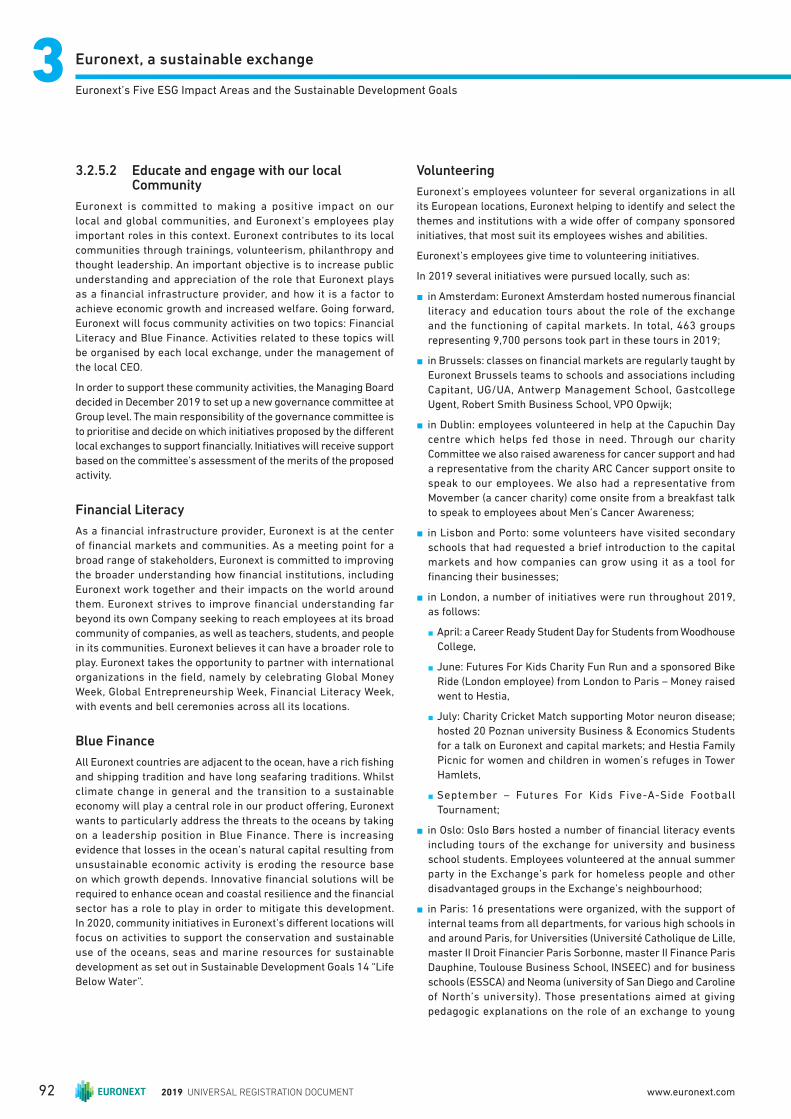
Euronext, a sustainable exchange33Euronext’s Five ESG Impact Areas and the Sustainable Development Goals
3.2.5.2 Educate and engage with our local Community
Euronext is committed to making a positive impact on our
local and global communities, and Euronext’s employees play
important roles in this context. Euronext contributes to its local
communities through trainings, volunteerism, philanthropy and
thought leadership. An important objective is to increase public
understanding and appreciation of the role that Euronext plays
as a fi nancial infrastructure provider, and how it is a factor to
achieve economic growth and increased welfare. Going forward,
Euronext will focus community activities on two topics: Financial
Literacy and Blue Finance. Activities related to these topics will
be organised by each local exchange, under the management of
the local CEO.
In order to support these community activities, the Managing Board
decided in December 2019 to set up a new governance committee at
Group level. The main responsibility of the governance committee is
to prioritise and decide on which initiatives proposed by the diff erent
local exchanges to support fi nancially. Initiatives will receive support
based on the committee’s assessment of the merits of the proposed
activity.
Financial Literacy
As a fi nancial infrastructure provider, Euronext is at the center
of fi nancial markets and communities. As a meeting point for a
broad range of stakeholders, Euronext is committed to improving
the broader understanding how fi nancial institutions, including
Euronext work together and their impacts on the world around
them. Euronext strives to improve fi nancial understanding far
beyond its own Company seeking to reach employees at its broad
community of companies, as well as teachers, students, and people
in its communities. Euronext believes it can have a broader role to
play. Euronext takes the opportunity to partner with international
organizations in the fi eld, namely by celebrating Global Money
Week, Global Entrepreneurship Week, Financial Literacy Week,
with events and bell ceremonies across all its locations.
Blue Finance
All Euronext countries are adjacent to the ocean, have a rich fi shing
and shipping tradition and have long seafaring traditions. Whilst
climate change in general and the transition to a sustainable
economy will play a central role in our product off ering, Euronext
wants to particularly address the threats to the oceans by taking
on a leadership position in Blue Finance. There is increasing
evidence that losses in the ocean’s natural capital resulting from
unsustainable economic activity is eroding the resource base
on which growth depends. Innovative fi nancial solutions will be
required to enhance ocean and coastal resilience and the fi nancial
sector has a role to play in order to mitigate this development.
In 2020, community initiatives in Euronext’s diff erent locations will
focus on activities to support the conservation and sustainable
use of the oceans, seas and marine resources for sustainable
development as set out in Sustainable Development Goals 14 “Life
Below Water”.
Volunteering
Euronext’s employees volunteer for several organizations in all
its European locations, Euronext helping to identify and select the
themes and institutions with a wide off er of company sponsored
initiatives, that most suit its employees wishes and abilities.
Euronext’s employees give time to volunteering initiatives.
In 2019 several initiatives were pursued locally, such as:
n in Amsterdam: Euronext Amsterdam hosted numerous fi nancial
literacy and education tours about the role of the exchange
and the functioning of capital markets. In total, 463 groups
representing 9,700 persons took part in these tours in 2019;
n in Brussels: classes on fi nancial markets are regularly taught by
Euronext Brussels teams to schools and associations including
Capitant, UG/UA, Antwerp Management School, Gastcollege
Ugent, Robert Smith Business School, VPO Opwijk;
n in Dublin: employees volunteered in help at the Capuchin Day
centre which helps fed those in need. Through our charity
Committee we also raised awareness for cancer s upport and had
a representative from the charity ARC Cancer support onsite to
speak to our employees. We also had a representative from
Movember (a cancer charity) come onsite from a breakfast talk
to speak to employees about Men’s Cancer Awareness;
n in Lisbon and Porto: some volunteers have visited secondary
schools that had requested a brief introduction to the capital
markets and how companies can grow using it as a too l for
fi nancing their businesses;
n in London, a number of initiatives were run throughout 2019,
as follows:
n April: a Career Ready Student Day for Students from Woodhouse
College,
n June: Futures For Kids Charity Fun Run and a sponsored Bike
Ride (London employee) from London to Paris – Money raised
went to Hestia,
n July: Charity Cricket Match supporting Motor neuron disease;
hosted 20 Poznan university Business & Economics Students
for a talk on Euronext and capital markets; and Hestia Family
Picnic for women and children in women’s refuges in Tower
Hamlets,
n September – Futures For Kids Five-A-Side Football
Tournament;
n in Oslo: Oslo Børs hosted a number of fi nancial literacy events
including tours of the exchange for university and business
school students. Employees volunteered at the annual summer
party in the Exchange’s park for homeless people and other
disadvantaged groups in the Exchange’s neighbourhood;
n in Paris: 16 presentations were organized, with the support of
internal teams from all departments, for various high schools in
and around Paris, for Universities (Université Catholique de Lille,
master II Droit Financier Paris Sorbonne, master II Finance Paris
Dauphine, Toulouse Business School, INSEEC) and for business
schools (ESSCA) and Neoma (university of San Diego and Caroline
of North’s university). Those presentations aimed at giving
pedagogic explanations on the role of an exchange to young
2019 UNIVERSAL REGISTRATION DOCUMENT92 www.euronext.com

Euronext, a sustainable exchange
3
Euronext’s Five ESG Impact Areas and the Sustainable Development Goals
high school students, and entering into more elaborate details
on the functions of an exchange for students in universities and
business schools. T he Euronext group CEO dedicated a half-day
presentation of the role of an exchange to young students from
a Collège in Pantin, Bagnolet et Drancy, and several members of
Euronext Paris management dedicated time for Finance education
sessions in the context of the Journée Nationale des Jeunes.
Giving Visibility
One of the most unique aspects of Euronext’s ESG’s strategy is
the way in which the Company allocates its resources. Our status
allows and business ecosystem provides us with a unique position
to raise awareness and to promote leadership and best practices.
Companies, NGOs, non-profi ts, associations and foundations are
invited to participate to Euronext’s opening and closing stock
markets bell ceremonies, conferences and seminars.
Euronext has a program of opening or closing the markets with
a bell event (“Gong” in Amsterdam). Some of these events gave
visibility to international causes or charities – in particular to the
following:
n in Amsterdam: 33 bell events have been hosted in relation to
international causes or charities such as Women in ETF and
Global Money Week;
n in Brussels: bell ceremonies for International Women’s Day,
Diversity Day and for the Sustainable Value for Money conference.
Euronext Brussels signed Febelfi n’s “Gender Diversity in Finance”
Charter for a better gender balance in the fi nancial sector, taking
the commitment to act in favor of diversity in the workplace and
daily business life.
n in Dublin: a “Ring the Bell for Gender Equality” ceremony that was
organized on 8 March 2019 with Women in ETFS (WE);
n in Lisbon and Porto: organization of the International Women’s
Rights Day and collaboration with and support to the Business
Council for Sustainable Development (an initiative of many
leading fi rms to promote environment, social and governance
development);
n in London: “Power of Profi le” breakfast session with women of
the London team with Vanessa Vallely, OBE (We Are The City);
Unconscious Bias training session with external diversity
& leadership training provider Scene Change; Euronext London
Women attended “We Are The City” conference; Euronext London
Women attended “International Women in Business” Conference;
Hestia Women’s Empowerment Talk and Lunch;
n in Oslo: International Women’s Rights Day bell ceremony
and conference for female students in IT, Finance and Law in
cooperation with UN Global Compact. First closing auction bell
ceremony for the Church City Mission in Oslo to give visibility
to homeless people and other disadvantaged groups in the
neighborhood of the Exchange;
n in Paris: International Women’s Rights Day bell ceremony as well
as for the National Youth Day (21th of March 2019), for students
from 2 classrooms were invited.
Sponsoring and Donations
The Company encourages its staff to volunteer in the fi nancial
literacy fi eld, but has also granted a few sponsorship or donations:
n in Amsterdam: Donations were made to September for
people living with cerebral palsy and a team of Euronext has
participated in September (10.000 steps per day for 28 days)
raising money for the organization;
n in Brussels, two donations have been made in 2019: a donation
of 5.000 € to Capitant, a student organisation which aims to
introduce students to and further guide them in the fi nancial
markets, in all aspects and worldwide, and a donation of 3.000 €
to Zam-med ’objective . The Zam-Med is a non-profi t organization
which aims at fi nancing projects that allowing people to access
drinking water in the region of Djuma, in the province of Kwilu,
in the Democratic Republic of Congo;
n in Dublin, a coff ee morning fundraiser was held for the Peter
McVerry (homelessness) Trust; a bake sale and raffl e held for
our lady’s hospice; and a quiz night for Stuart’s School with a
€2,000 Company donation;
n in Lisbon and Porto, Euronext has been one of the key
promoters and sponsors of the national initiative Finance for
Growth: a program created with the support of the Portuguese
government dedicated to enlightening SMC businesses on
the diff erent fi nancing solutions. The initiative aims to get to
1,500 companies, via conferences and a roadshow all over the
country, to work closely with those who wants to know more
about the tools that better suit their financing needs. Also,
EPIS – donation of social responsibility; SIR – forum sponsor
for Investor relation (Social Business); AEM – sponsor of
association of listed Companies; BCSD – sponsor of ESG; APAF
– Portuguese Financial Analyst annual donation and sponsoring
IB; AEP: sponsoring of fi nancial institution; PFA – sponsor of
Portugal Fintech Association;
n in London: a donation of £7,000 was done for Refurbishment of
School Library to the Sir John Cass Primary School;
n in Oslo: Sponsor of and event collaboration with AksjeNorge, a
non-profi t organisation that contributes to increased knowledge
about the securities markets and how to invest long term in
listed companies and mutual funds. Donation of the surplus
from the violation charges paid by companies on Merkur Market
to the Church City Mission. Auction of bell ceremony to raise
funds for CARE Norge’s work to empower women and girls in
some of the world’s poorest countries;
n in Paris, a donation of €5,000 to the Banyan association, which
sponsors, in particular, the National Youth Day organized each
year (which helps teenagers with their professional orientation
and the development of their competences and knowledge of the
professional world); €1,000 donation was made to International
Women’s Rights Day.
2019 UNIVERSAL REGISTRATION DOCUMENT 93
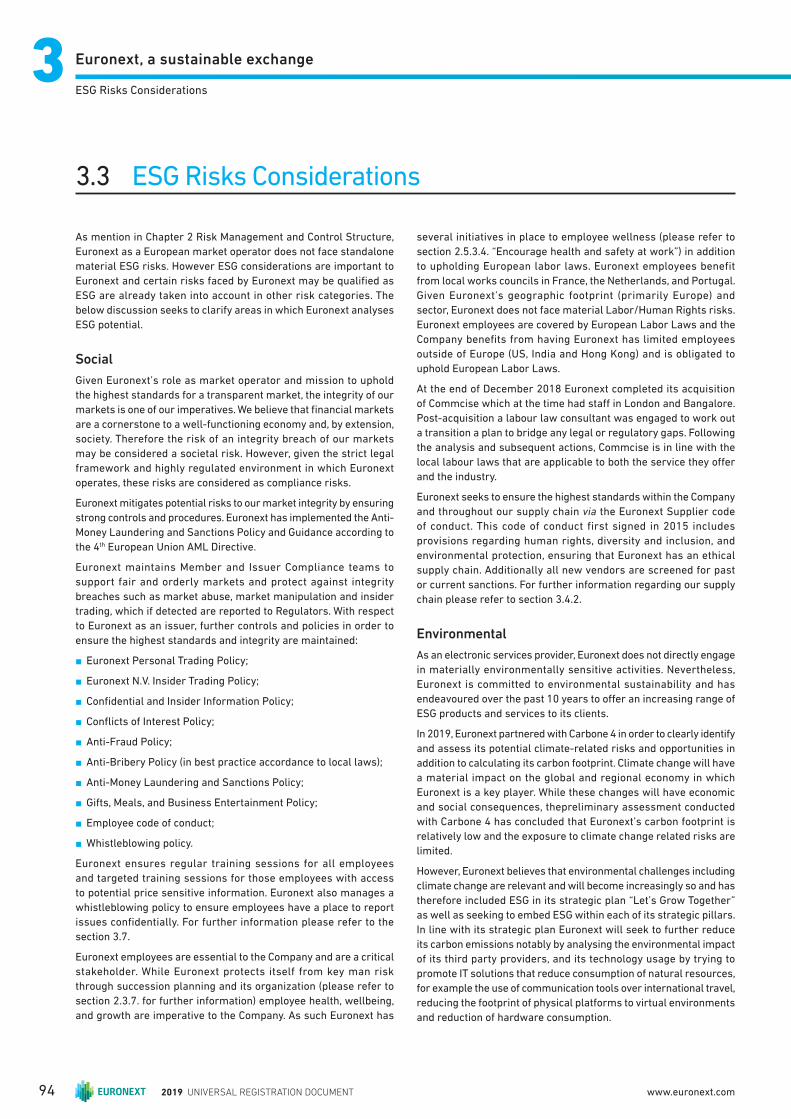
Euronext, a sustainable exchange33ESG Risks Considerations
As mention in Chapter 2 Risk Management and Control Structure,
Euronext as a European market operator does not face standalone
material ESG risks. However ESG considerations are important to
Euronext and certain risks faced by Euronext may be qualifi ed as
ESG are already taken into account in other risk categories. The
below discussion seeks to clarify areas in which Euronext analyses
ESG potential.
Social
Given Euronext’s role as market operator and mission to uphold
the highest standards for a transparent market, the integrity of our
markets is one of our imperatives. We believe that fi nancial markets
are a cornerstone to a well-functioning economy and, by extension,
society. Therefore the risk of an integrity breach of our markets
may be considered a societal risk. However, given the strict legal
framework and highly regulated environment in which Euronext
operates, these risks are considered as compliance risks.
Euronext mitigates potential risks to our market integrity by ensuring
strong controls and procedures. Euronext has implemented the Anti-
Money Laundering and Sanctions Policy and Guidance according to
the 4th European Union AML Directive.
Euronext maintains Member and Issuer Compliance teams to
support fair and orderly markets and protect against integrity
breaches such as market abuse, market manipulation and insider
trading, which if detected are reported to Regulators. With respect
to Euronext as an issuer, further controls and policies in order to
ensure the highest standards and integrity are maintained:
n Euronext Personal Trading Policy;
n Euronext N.V. Insider Trading Policy;
n Confi dential and Insider Information Policy;
n Confl icts of Interest Policy;
n Anti-Fraud Policy;
n Anti-Bribery Policy (in best practice accordance to local laws);
n Anti-Money Laundering and Sanctions Policy;
n Gifts, Meals, and Business Entertainment Policy;
n Employee code of conduct;
n Whistleblowing policy.
Euronext ensures regular training sessions for all employees
and targeted training sessions for those employees with access
to potential price sensitive information. Euronext also manages a
whistleblowing policy to ensure employees have a place to report
issues confi dentially. For further information please refer to the
section 3.7 .
Euronext employees are essential to the Company and are a critical
stakeholder. While Euronext protects itself from key man risk
through succession planning and its organization (please refer to
section 2.3.7. for further information) employee health, wellbeing,
and growth are imperative to the Company. As such Euronext has
several initiatives in place to employee wellness (please refer to
section 2.5.3.4. “Encourage health and safety at work”) in addition
to upholding European labor laws. Euronext employees benefit
from local works councils in France, the Netherlands, and Portugal.
Given Euronext’s geographic footprint (primarily Europe) and
sector, Euronext does not face material Labor/Human Rights risks.
Euronext employees are covered by European Labor Laws and the
Company benefi ts from having Euronext has limited employees
outside of Europe (US, India and Hong Kong) and is obligated to
uphold European Labor Laws.
At the end of December 2018 Euronext completed its acquisition
of Commcise which at the time had staff in London and Bangalore .
Post-acquisition a labour law consultant was engaged to work out
a transition a plan to bridge any legal or regulatory gaps. Following
the analysis and subsequent actions, Commcise is in line with the
local labour laws that are applicable to both the service they off er
and the industry.
Euronext seeks to ensure the highest standards within the Company
and throughout our supply chain via the Euronext Supplier code
of conduct. This code of conduct first signed in 2015 includes
provisions regarding human rights, diversity and inclusion, and
environmental protection, ensuring that Euronext has an ethical
supply chain. Additionally all new vendors are screened for past
or current sanctions. For further information regarding our supply
chain please refer to section 3.4.2 .
Environmental
As an electronic services provider, Euronext does not directly engage
in materially environmentally sensitive activities. Nevertheless,
Euronext is committed to environmental sustainability and has
endeavoured over the past 10 years to off er an increasing range of
ESG products and services to its clients.
In 2019, Euronext partnered with Carbone 4 in order to clearly identify
and assess its potential climate-related risks and opportunities in
addition to calculating its carbon footprint. Climate change will have
a material impact on the global and regional economy in which
Euronext is a key player. While these changes will have economic
and social consequences, thepreliminary assessment conducted
with Carbone 4 has concluded that Euronext’s carbon footprint is
relatively low and the exposure to climate change related risks are
limited.
However, Euronext believes that environmental challenges including
climate change are relevant and will become increasingly so and has
therefore included ESG in its strategic plan “Let’s Grow Together”
as well as seeking to embed ESG within each of its strategic pillars.
In line with its strategic plan Euronext will seek to further reduce
its carbon emissions notably by analysing the environmental impact
of its third party providers, and its technology usage by trying to
promote IT solutions that reduce consumption of natural resources,
for example the use of communication tools over international travel,
reducing the footprint of physical platforms to virtual environments
and reduction of hardware consumption.
3.3 ESG Risks Considerations
2019 UNIVERSAL REGISTRATION DOCUMENT94 www.euronext.com
Euronext, a sustainable exchange
3
ESG Risks Considerations
Please refer to page 81 for further details on Euronext’s Green IT
Initiative and section 3.5 for information regarding the ESG products
off ered by Euronext.
Governance
Euronext upholds the highest standards of Corporate Governance
and complies with the Dutch Code of Governance. Euronext’s two-
tiered board structure ensures strong oversight over management.
Euronext maintains a majority independent Supervisory Board in
order to ensure all shareholders are appropriately represented.
Finally, Euronext seeks to ensure that executive remuneration and
non-executive director remuneration are not excessive with respect
to market and sector peers, and that for executive directors, variable
compensation is aligned with Company performance. For more
information on the composition of the Supervisory Board, please
refer to section 4.2.2. for details regarding non-executive and
executive remuneration please refer to 4.4 section of this document.
2019 UNIVERSAL REGISTRATION DOCUMENT 95

2019 UNIVERSAL REGISTRATION DOCUMENT96 www.euronext.com

4.4 Remuneration Report 114
4.4.1 Remuneration Principles And Components 114
4.4.2 2019 Remuneration Report 116
4.1 Dutch Corporate Governance Code, “Comply or Explain” 98
4.2 Management Structure 99
4.2.1 General Information 99
4.2.2 Supervisory Board 100
4.2.3 Managing Board 105
4.3 Report of the Supervisory Board 112
4.3.1 Meetings 112
4.3.2 Supervisory Board Attendance Record 112
4.3.3 Supervisory Board Activities 113
4.3.4 Board Evaluation 113
4.3.5 Report Audit Committee 113
4.3.6 Report Remuneration Committee 114
4.3.7 Report Nomination and Governance Committee 114
4.3.8 Financial Statements 114
CORPORATE GOVERNANCE
A description of the shareholding structure of the Company is provided in section 6 “General description of the Company
and its share capital”.
2019 UNIVERSAL REGISTRATION DOCUMENT 97
Corporate Governance44Dutch Corporate Governance Code, “Comply or Explain”
4.1 Dutch Corporate Governance Code, “Comply or Explain”
The Dutch Corporate Governance Code (“the Code”) became eff ective
in 2016 and fi nds its statutory basis in Book 2 of the Dutch Civil
Code. The Code applies to Euronext as it has its registered offi ce in
the Netherlands and its shares are listed on the regulated markets
of Euronext Amsterdam, Euronext Brussels, Euronext Lisbon and
Euronext Paris. A Dutch and an English version of the Code can be
found at www.commissiecorporategovernance.nl
The Code is based on the notion that a company is a long-term
alliance between the various stakeholders of the Company.
Stakeholders are groups and individuals who, directly or indirectly,
infl uence – or are infl uenced by – the attainment of the Company’s
objectives: employees, shareholders and other lenders, suppliers,
customers and other stakeholders. The Managing Board and the
Supervisory Board have responsibility for weighing up these
interests, generally with a view to ensuring the continuity of the
Company and its subsidiaries, as the Company seeks to create long-
term value. If stakeholders are to cooperate within and with the
Company, they need to be confi dent that their interests are duly
taken into consideration. Good entrepreneurship and effective
supervision are essential conditions for stakeholder confi dence
in management and supervision. This includes integrity and
transparency of the Managing Board’s actions and accountability
for the supervision by the Supervisory Board.
The Code is based on a “comply or explain” principle. Accordingly,
companies are required to state the extent to which they comply
with the principles and best practice provisions of the Code in the
director’s report and, where it does not comply with them, why and
to what extent it deviates from them.
Euronext acknowledges the importance of good Corporate
Governance and endeavors to comply with the provisions of
the Code. However, there are a limited number of best practice
provisions that it currently does not comply with, as further
explained below. The fact that Euronext is not compliant with a
number of best practice provisions is partly related to the fact
that Euronext is an international company uniquely supervised
since its creation in 2000 by a College of international Regulators,
supervising Euronext on a joint basis, which has required some
specifi c features which may interfere with the specifi c provisions
of the Dutch Code. Euronext is active in a number of European
jurisdictions, each with diff erent laws, regulations, best practices,
codes of conduct, regulatory guidelines and views.
Provisions of the Dutch Code regarding corporate law matters, that Euronext did not apply in 2019:
n Euronext did not fully apply best practice provision 2.2.1 (“a Managing
Board member is appointed for a maximum period of four years”).
The terms of appointment of the members of the Managing Board
who had been appointed for an indefi nite term before Euronext
became a listed company have remained unchanged. With regard
to the members of the Managing Board who were appointed since
Euronext became a listed company, Euronext complied with this
best practice provision. It is envisaged that the full Managing Board’s
members’ appointment terms are progressively harmonised to
comply with this best practice provision;
n Euronext did not apply best practice provision 2.1.7, item iii (“for
each shareholder, or group of affi liated shareholders, who directly or
indirectly hold more than ten percent of the shares in the Company,
there is at most one Supervisory Board member who can be considered
to be affi liated with or representing them”). Three members of the
Supervisory Board namely Luc Keuleneer, Lieve Mostrey and Franck
Silvent, have been proposed by Euronext’s Reference shareholders,
who as a group acting via the Reference shareholders’ Agreement
hold 23.27% of Euronext’s shares. This group of shareholders acts
jointly and has been granted a declaration of non-objection by the
Dutch Ministry of Finance. The background of the presence of three
members in Euronext’s Supervisory Board who can be considered
to be affi liated with or representing the Reference shareholders is
related to the request of the Euronext College of Regulators at the
moment of its IPO in 2014 for it to have a number of stable, long-
term shareholders who could propose one third of the members
of the Supervisory Board.
Provision of the Dutch Code regarding the remuneration policy of the Managing Board that Euronext did not apply in 2019:
n Euronext did not apply best practice provision 3.1. 2 vi (“… Shares
should be held for at least fi ve years after they are awarded”).
Euronext has launched its 5-years LTI plan in 2015 with a three-
years cliff vesting performance share plan to support its strategy.
Euronext retained the fl exibility as the one-size-fi ts-all principle
could not apply, and adjusted this policy to its current needs of
fl exible monitoring and retention. Euronext executives are located
in each of our European countries with specifi c lockup guidelines:
the Netherlands, Ireland, France, the United Kingdom, Portugal
and Belgium.
n Euronext did not apply best practice provision 3.2.3
(“the remuneration in the event of dismissal should not exceed one
year’s salary [the “fi xed” remuneration component”]). In the event of
termination by the Company of a member of the Managing Board
the Company has decided to align progressively all Managing
Board members’ contracts on the same line as was decided at
the time of recruitment of the Chairman of the Managing Board in
September 2015, and disclosed at the Shareholders’ Meeting of
27 October 2015: the limitation to twelve months of fi xed salary
as provided in the Dutch Corporate Governance Code has been
balanced against the French AFEP-MEDEF Corporate Governance
Code recommendations, which provide for a maximum termination
indemnity of twenty-four months compensation, fi xed and variable
remuneration. The termination indemnity has been limited to
twice the annual fi xed salary, which is in line with the relevant best
practices in the various other jurisdictions in which it is active.
Managing Board members’ contracts have been amended to that
eff ect.
2019 UNIVERSAL REGISTRATION DOCUMENT98 www.euronext.com
Corporate Governance
4
Management Structure
Provision of the Dutch Code regarding meetings with analysts that Euronext did not apply in 2019:
n Euronext did not apply best practice provision 4.2.3 (“meetings with
analysts, presentations to analysts, presentations to investors and
institutional investors and press conferences shall be announced
in advance on the Company’s website and by means of press
releases, enabling all shareholders to follow these meetings and
presentations in real time, for example by means of webcasting or
telephone”): Euronext always ensures that all shareholders and
other parties are provided with equal and simultaneous information
about matters that may influence the share price through the
distribution via an authorized wire. All material developments are
disclosed via press releases and all presentations used during
analysts and investors meetings are available on Euronext’s
website at the time the presentation starts. Euronext also provides
real time webcast and conference call facilities for all its results
presentations and other fi nancial presentations.
4.2 Management Structure
4.2.1 GENERAL INFORMATION
No information on family relationships between members of
the Supervisory Board, members of the Managing Board and
senior staff, as well as on convictions in relation to fraudulent
off ences, bankruptcies, receiverships, liquidations or offi cial public
incriminations with regard to these persons has been included in
this Universal Registration Document, as these matters are to the
best knowledge of Euronext not applicable to these persons.
Further, to the best of Euronext’s knowledge, the members of the
Supervisory Board and the Managing Board do not have potential
confl icts of interest with the Company in 2019 and up to date of the
publication of this Universal Registration Document. When new fi les
are discussed at Supervisory Board and Managing Board meetings,
generally concerning Merger and Acquisitions items, a regular
confl ict check is run and the Confl ict of Interest policy then applies,
the confl icted board director being withdrawn from the discussion.
Statement of the Managing Board
Responsibilities for the Financial Statements and Directors’ Report
In accordance with Article 5: 25c(2)(c) of the Dutch Financial
Supervision Act (Wet op het fi nancieel toezicht), the Managing Board
of Euronext hereby declares that, to the best of its knowledge, (i) the
Financial Statements prepared in accordance with IFRS as adopted
by the European Union and with Part 9, Book 2 of the Dutch Civil Code
give a true and fair view of the assets, liabilities, fi nancial position
and profi t or loss of Euronext and the enterprises included in the
consolidation as a whole, and (ii) the directors’ report gives a true
and fair view of the position on the balance sheet date, the course
of events during the fi nancial year of Euronext and the enterprises
included in the consolidation as a whole, together with a description
of the principal risks that Euronext faces.
Responsibility for this Universal Registration Document
The Managing Board declares that, having taken all reasonable care
to ensure that such is the case, the information contained in the
Universal Registration Document, including the Financial Statements
and the directors’ report, is, to the best of the Company’s knowledge,
in accordance with the facts and contains no omission likely to aff ect
its import.
In Control Statement
Euronext’s fi rst and second lines of defence perform their roles
in risk assessments, evaluations of the operating eff ectiveness
of controls, and reporting on risk management and control.
The concluding results are regularly discussed at senior and
executive management level. Group Audit, as the third line of
defence, evaluates both the design and eff ectiveness of Euronext’s
governance, risk management and control processes. Audit
reports are discussed with risk and process owners and the Audit
Committee.
Based on the risk management processes, the Managing
Board makes the following statements regarding internal risk
management and control, taking into account Euronext’s strategy
and risk profi le.
In accordance with best practice provisions 1.4.2. and 1.4.3 of the
Dutch Corporate Governance Code, Euronext’s Managing Board
is of the opinion that, in respect of fi nancial reporting risks, the
design and operation of the internal risk management and control
system, as described in 2.1.1.1 “Risk management” and 2.1.1.2
“Internal control” (i) provides a reasonable level of assurance that
the fi nancial reporting in this Universal Registration Document
does not contain any errors of material importance, and (ii) has
worked properly during the fi nancial year 2019.
As set out in section 2.2, Euronext has a robust Enterprise
Risk Management Framework and Governance, which allow
the Managing Board to identify and assess the Company’s
principal risks to enable strong decision making with regards
to the execution of the stated strategy. On the basis hereof the
Managing Board has assessed the risk profi le and the design
and operating eff ectiveness of the risk management and control
systems; this was discussed with the Audit Committee of the
Supervisory Board.
The Managing Board declares that, based on the current state of
aff airs, the implementation of the Business Continuity Framework
and the reporting process on existing or potential material risks,
as set out under 2.2.1, it is justifi ed that the fi nancial reporting
is prepared on a going concern basis; and that this Universal
Registration Document is to the best of the Managing Board’s
knowledge, in accordance with the facts and contains no omission
likely to aff ect its import. Furthermore, as described in the 1.2
and the chapter “Risks”, this Universal Registration Document
2019 UNIVERSAL REGISTRATION DOCUMENT 99
Corporate Governance44Management Structure
refl ects the material risks and uncertainties that are relevant
to the expectation of the Company’s continuity for the period of
twelve months after the preparation of this Universal Registration
Document.
Stéphane Boujnah,
CEO and Chairman of the Managing Board
Anthony Attia,
CEO of Euronext Paris & Global Head of Listing and Post Trade
Daryl Byrne,
CEO of Euronext Dublin & Head of Debt & Funds Listings and ETFs
Simone Huis in ’t Veld,
CEO of Euronext Amsterdam
Chris Topple,
CEO of Euronext London & Head of Global Sales
Isabel Ucha,
CEO of Euronext Lisbon & CEO of Interbolsa
Vincent Van Dessel,
CEO of Euronext Brussels
Availability of Documentation
The Articles of Association of Euronext, historical information and
relevant documentation for investors and shareholders may be
viewed on Euronext’s website in the Investor Relations section at
www.euronext.com/en/investors.
4.2.2 SUPERVISORY BOARD
Euronext has a two-tier governance structure with a Supervisory
Board and a Managing Board. The governance arrangements
of the Supervisory Board described in this section are based on,
among other things, Dutch law, Euronext’s Articles of Association
and the rules of procedures for the Supervisory Board. These
arrangements include additional provisions and modifications
agreed with the Euronext College of Regulators designed to ensure
the long-term stability and autonomy of Euronext and curb possible
disproportionate levels of infl uence that large shareholders may
have on it.
Responsibilities
The Supervisory Board is responsible for the supervision of the
activities of the Managing Board and the supervision of the general
course of the business of Euronext. The Supervisory Board may
on its own initiative provide the Managing Board with advice and
may request any information from the Managing Board that it
deems appropriate. In performing their duties, the members of the
Supervisory Board must act in the interests of Euronext and those
of its business. The Supervisory Board is collectively responsible
for carrying out its duties.
Appointment and Dismissal
Members of the Supervisory Board are appointed by the General
Meeting (i) in accordance with a proposal of the Supervisory Board
or (ii) from a binding nomination to be drawn up by the Supervisory
Board, with due observance of the profi le (profi elschets) for the size
and the composition of the Supervisory Board adopted by the
Supervisory Board and reviewed annually. The profi le sets out the
scope and composition of the Supervisory Board, taking into account
the nature of the business, its activities, and the desired expertise,
experience, diversity and independence in matters of capital markets
in general and in particular in the areas of finance, economics,
human resources and organisation, information technology and data
processing, legislation and regulation, legal matters and compliance.
The Articles of Association of Euronext provide that each member
of the Supervisory Board is appointed for a maximum period of four
years provided that unless such member of the Supervisory Board
has resigned or is removed at an earlier date or unless otherwise
specifi ed in the relevant proposal for appointment, his or her term
of offi ce shall ultimately lapse immediately after the day of the fi rst
General Meeting to be held during the fourth year after the year of
his or her appointment. An appointment can be renewed for a term
of up to four years at a time.
The General Meeting may suspend or dismiss a member of
the Supervisory Board at all times. The Supervisory Board can
make a proposal for the suspension or dismissal of a member
of the Supervisory Board. If the suspension or dismissal occurs
in accordance with a proposal thereto by the Supervisory Board,
a resolution of the General Meeting for suspension or dismissal
of a member of the Supervisory Board requires an absolute
majority of the votes cast. However, such resolution of the General
Meeting requires a majority of at least two-thirds of the votes cast
representing more than one third of the outstanding and issued
share capital, if the suspension or dismissal does not occur in
accordance with a proposal by the Supervisory Board.
Meetings and Decision-Making
The Articles of Association provide that the Supervisory Board shall
adopt resolutions by an absolute majority of the votes cast. Each
member of the Supervisory Board has one vote. In the event of a tie
of votes, the Chairman of the Supervisory Board has a casting vote.
A member of the Supervisory Board may not participate in the
deliberation and the decision-making process of the Supervisory
Board if it concerns a subject in which this member of the
Supervisory Board has a direct or indirect personal interest which
confl icts with the interest of Euronext and its business enterprise.
In such event, the other members of the Supervisory Board shall be
authorised to adopt the resolution. If all members of the Supervisory
Board have a confl ict of interest as indicated, the resolution shall
nevertheless be adopted by the Supervisory Board, notwithstanding
the confl icts of interest. In 2019, no transactions have taken place
in which members of the Managing Board and Supervisory Board
were confl icted.
Members of the Su pervisory Board
The Articles of Association provide that the number of members
of the Supervisory Board will be determined by the Supervisory
Board and will consist of a minimum of three members. Only natural
persons can be members of the Supervisory Board. In the event of a
vacancy, the Supervisory Board continues to be validly constituted
by the remaining member or members of the Supervisory Board.
2019 UNIVERSAL REGISTRATION DOCUMENT100 www.euronext.com
Corporate Governance
4
Management Structure
As per 1 January 2019, the Supervisory Board was composed of
Dick Suimers, Ramon Fernandez, Manuel Ferreira da Silva, Jim
Gollan, Kerstin Günther, Luc Keuleneer, Lieve Mostrey, Padraic
O’Connor and Franck Silvent. Ramon Fernandez retired from the
Supervisory Board following the Annual General Meeting that was
held on 16 May 2019. In the same meeting, Jim Gollan was re-
appointed to the Supervisory Board for a term of four years. In an
Extraordinary General Meeting held on 8 October 2019, Nathalie
Rachou and Morten Thorsrud were appointed to the Supervisory
Board, each for a term of four years, subject to regulatory approval.
These appointments took eff ect on 5 November 2019.
Dick Sluimers is the Chairman of the Supervisory Board. The
Chairman of the Supervisory Board is not a former member of the
Managing Board of the Company and is independent within the
meaning of best practice provision 2.1.8 of the Dutch Corporate
Governance Code.
Euronext has assessed that the appointments to the Supervisory
Board in 2019 are in compliance with the requirements as included
in art. 5:29a of the Dutch “Wet op het fi nancieel toezicht” regarding
the maximum number of Supervisory Board positions.
Nathalie Rachou and Morten Thorsrud took part in an induction
program off ered by Euronext. The induction program consisted of
a series of meetings with key staff members, with whom the various
aspects of Euronext business, clients and initiatives, governance
and regulatory environment, fi nance and the risk and compliance
program at Euronext were discussed.
The Supervisory Board consisted of ten members as at 31 December
2019 and was composed as follows:
Dick Sluimers
Dick Sluimers is the Chairman of the Supervisory Board, chairs the
Nomination and Governance Committee and is a member of the
Remuneration Committee. He was appointed to the Supervisory
Board in 2016. He is also the Chairman of the Supervisory Board of
Euronext Amsterdam.
Mr Sluimers is the former CEO of APG group. He currently is
Extraordinary State Councillor at the Dutch Council of State.
Furthermore he is the Chairman of the Supervisory Board of NIBC
B.V. and a member of the Supervisory Board of AkzoNobel N.V., as
well as a member of the Board of Directors of FWD group Limited.
He is also a member of the board of Governors of the State Academy
of Finance and Economics, a Trustee of the Erasmus university
Trustfund, a member of the board of the Amsterdam Concert Hall
Fund, and a member of the Electoral Committee of the Dutch Liberal
Party, and a member of the advisory boards of Quore Capital and
Hemingway Corporate Finance.
Mr Sluimers was CFO and later CEO in the Management Board
of pension fund ABP from 2003 to 2008. Between 1991 and 2003
he held various positions at the Dutch Ministry of Finance, most
recently as Director General of the Budget. Prior to that he was
Deputy Director General at the Ministry of Public Health and held
senior positions at the Ministry of Social Aff airs and the Ministry of
Finance. In addition, he was a member of the Supervisory Boards
of Fokker N.V., the National Investment Bank N.V., Inter Access N.V.
and ABP Insurance N.V. He was also Trustee of the International
Financial Reporting Standards Foundation (IFRS), a member of the
Advisory Board of Rabobank, Chairman of the board of Governors of
the Postgraduate Programme for Treasury Management at the Vrije
Universiteit Amsterdam, a member of the Advisory Board of Netspar
and a board member of Holland Financial Centre.
He studied economics at the Erasmus university in Rotterdam and
read politics at the university of Amsterdam for several years.
Manuel Ferreira da Silva
Manuel Ferreira da Silva is a member of the Supervisory Board,
a member of the Remuneration Committee and a member of the
Nomination and Governance Committee. He was appointed to the
Supervisory Board of Euronext N.V. in 2012.
Mr Ferreira da Silva is Vice-Chairman of the board of the SERRALVES
Foundation, Museum of Contemporary Art. He served for thirty-fi ve
years as a banker at Banco BPI where he was executive member
of the board for the last sixteen years and the CEO of its wholly-
owned investment bank. He was a member and, between 2012
and 2014, Chairman of the council of the university of Porto School
of Economics and is the Vice-Chairman of the Supervisory Board
of Porto Business School. He was member of the board of the
Lisbon and Porto Stock Exchanges between 2000 and 2001 and
a member of the Advisory Board of the Portuguese Securities
Market Commission (CMVM) between 2001 and 2005. Between 1980
and 1989, Mr Ferreira da Silva lectured at the university of Porto
School of Economics and spent two years as an assistant director
of the Navy’s Centre of Operational Research. He graduated with a
degree in Economics from the Universidade do Porto in 1980 and
holds a MBA from the Nova School of Business and Economics
(Lisbon, 1982).
Jim Gollan
Jim Gollan is a member of the Supervisory Board and chairs the
Audit Committee. He was appointed to the Supervisory Board
in 2015. He is also the Chairman of Euronext London.
Currently, Mr Gollan is the Audit Committee Chair of Citibank Europe
Plc and the Chair of the charity Brain Research UK. Previously, he
was a board member of NYSE LIFFE and a non-executive director
of Merrill Lynch International, where he chaired the board Risk
Committee, and Bank of America Merrill Lynch International
Limited, where he chaired the Board. His executive career includes
roles as Board Chair, CEO and CFO, working in the United Kingdom,
Europe and Asia in banking, fund management and financial
markets with Standard Chartered, Lloyds Bank, Gartmore and SIX
Group. Mr Gollan was also the practice leader of KPMG’s Financial
Services Consulting, Asia and is a Fellow of the Institute of Chartered
Accountants in England and Wales.
Kerstin Günther
Kerstin Günther is a member of the Supervisory Board and a member
of the Audit Committee. She was appointed to the Supervisory Board
in 2016.
Ms Günther is a senior digitalization and transformation executive
with 26 years international management experience in the ICT
sector. In April 2019, Ms Günther joined the Helmholtz Institute
Munich as scientifi c technical Managing Director. From 1991 till
2017 she worked for the Deutsche Telekom Group with focus on
2019 UNIVERSAL REGISTRATION DOCUMENT 101
Corporate Governance44Management Structure
Central and Eastern Europe, where she held various management
positions. Ms Günther was Senior Vice-President Technology (CTIO)
Europe before she founded “Deutsche Telekom Pan-Net” in 2015,
Deutsche Telekom’s international, digital, virtualized infrastructure
cloud and centralized European service production, which she lead
as Managing Director until 2017. From 2013 until 2017 she was
Chairperson of the Board of Magyar Telekom and Vice-Chairperson
of the Board of Slovak Telekom. Until March 2019, she was CFO and a
member of the Board of the foundation “Bürgerstiftung Rheinviertel”
in Bonn, Germany. She is a graduate of the Technical university of
Wroclaw, Poland (MSc 1991) and of Case Western Reserve university
Cleveland, USA (MBA 1999).
Luc Keuleneer
Luc Keuleneer is a member of the Supervisory Board and a member
of the Audit Committee. He was appointed to the Supervisory Board
in 2018. He is also a member of the Supervisory Board of Euronext
Amsterdam and a non-executive member of the Board of Directors
of Euronext Brussels.
Mr Keuleneer is professor fi nancial and treasury management at
several universities in Belgium and the Netherlands. He is a non-
executive director and member of the Audit Committee of SFPI-
FPIM, the Federal Holding and Investment company of the Belgian
State, and a number of other companies. He is the government
commissioner of the Belgian “Protection fund for deposits and
fi nancial instruments”. Previously, Mr Keuleneer worked for Paribas
Bank Belgium, the Belgian Institute of Chartered Accountants, Deloitte
& Touche Management Solutions KPMG Corporate fi nance and as
expert-advisor fi nancial institutions and public enterprises to the
Belgian minister of Finance. He holds a MSc in Business Engineering
of the Catholic University Leuven (Belgium) and a master in Business
Administration with a specialisation in fi nance from the university
of Chicago (US), and has had additional training in Strategic Finance
at IMD-Lausanne and in Financial risk management at the Swiss
Finance Institute.
Lieve Mostrey
Lieve Mostrey is a member of the Supervisory Board, chairs the
Remuneration Committee, and is a member of the Nomination and
Governance Committee. She was appointed to the Supervisory
Board in 2014. On 1 January 2020, she retired as the Remuneration
Committee’s Chair and continued as a member.
Since January 2017, Ms Mostrey has been appointed Chief Executive
Offi cer of Euroclear Group. She joined Euroclear in 2010 as Executive
Director and Chief Technology & Services Offi cer. Previously, Ms
Mostrey was a member of the Executive Committee of BNP Paribas
Fortis in Brussels, where she was responsible for IT technology,
operations (including securities, payments, credit cards, mortgages,
clients and accounts), property and purchasing. Ms Mostrey began
her career in 1983 within the IT department of Generale Bank in
Brussels, moving to Operations in 1997 and, upon its merger with
Fortis in 2006, became country manager for Fortis Bank Belgium.
She became Chief Operating Offi cer of Fortis Bank in 2008, which
was acquired by BNP Paribas in 2009. She was also a non-executive
director of the Boards of Euroclear PLC and Euroclear S.A./N.V.
between 2006 and 2010 and of RealDolmen between 2013 and 2017.
Having earned a degree in civil engineering from Katholieke
Universiteit Leuven in 1983, Ms Mostrey completed a post-graduate
degree in economics from Vrije Universiteit Brussel in 1988
Padraic O’Connor
Padraic O’Connor is a member of the Supervisory Board, a member
of the Remuneration Committee and a member of the Nomination
and Governance Committee. He was appointed to the Supervisory
Board in 2018. He previously was the Chairman of the Irish Stock
Exchange.
Mr O’Connor is non-executive Chairman of U.S. Bank Global Fund
Services (Ireland) Ltd, LGIM (Europe) Ltd, Sarasin Funds Management
(Ireland) Ltd and Fideuram Asset Management Ireland DAC. He is
also a Director of European Wholesale Securities Market Limited, a
subsidiary of Euronext. He was the Managing Director of NCB group
between 1991 and 1999 prior to which he was Chief Economist at
the fi rm. Before joining NCB, Mr O’Connor worked at the department
of Finance and the Central Bank of Ireland. He holds primary and
postgraduate degrees in Economics from university College Dublin.
Nathalie Rachou
Nathalie Rachou is a member of the Supervisory Board, a member of
the Remuneration Committee and a member of the Nomination and
Governance Committee. She was appointed to the Supervisory Board
in November 2019. She became the Remuneration Committee’s
Chair on 1 January 2020.
Ms Rachou is a Non-Executive Director at Altran Technologies (since
2012), Société Générale (since 2008) and Veolia Environnement
(since 2012). In addition, she is Senior Advisor of Rouvier Associés
(since 2015). In 1999, she founded Topiary Finance Ltd, an asset
management company based in London, of which she remained
the CEO until its merger with Rouvier Associés in 2015. Prior to
that, from 1978 to 1999, she held a number of positions within
Banque Indosuez and Crédit Agricole Indosuez, mostly in capital
markets. She was a Non-Executive Director at Laird plc from 2016
to 2018. Ms Rachou has a Masters in Management at Ecole des
Hautes Etudes Commerciales (HEC) and completed an executive
program at INSEAD.
Franck Silvent
Franck Silvent is a member of the Supervisory Board and a member
of the Audit Committee. He was appointed to the Supervisory Board
in 2017.
Mr Silvent is a Managing Partner of Degroof Petercam Finance.
Mr Silvent worked in the French Ministry of Finance (Inspection
Générale des Finances) as an auditor from 1998 to 2002. In 2002
he was appointed Deputy Director of Strategy, Finance, Management
Control and Accounting at Caisse des Dépôts. From 2005 to 2012 he
worked at Compagnie des Alpes (CDA) where he served as Director
of Finance, Strategy and Development, before becoming Deputy CEO.
From 2013 to August 2017, Mr Silvent has been Director of Finance,
Strategy and Holdings at Caisse des Dépôts.
He graduated from the École Nationale d’Administration.
2019 UNIVERSAL REGISTRATION DOCUMENT102 www.euronext.com
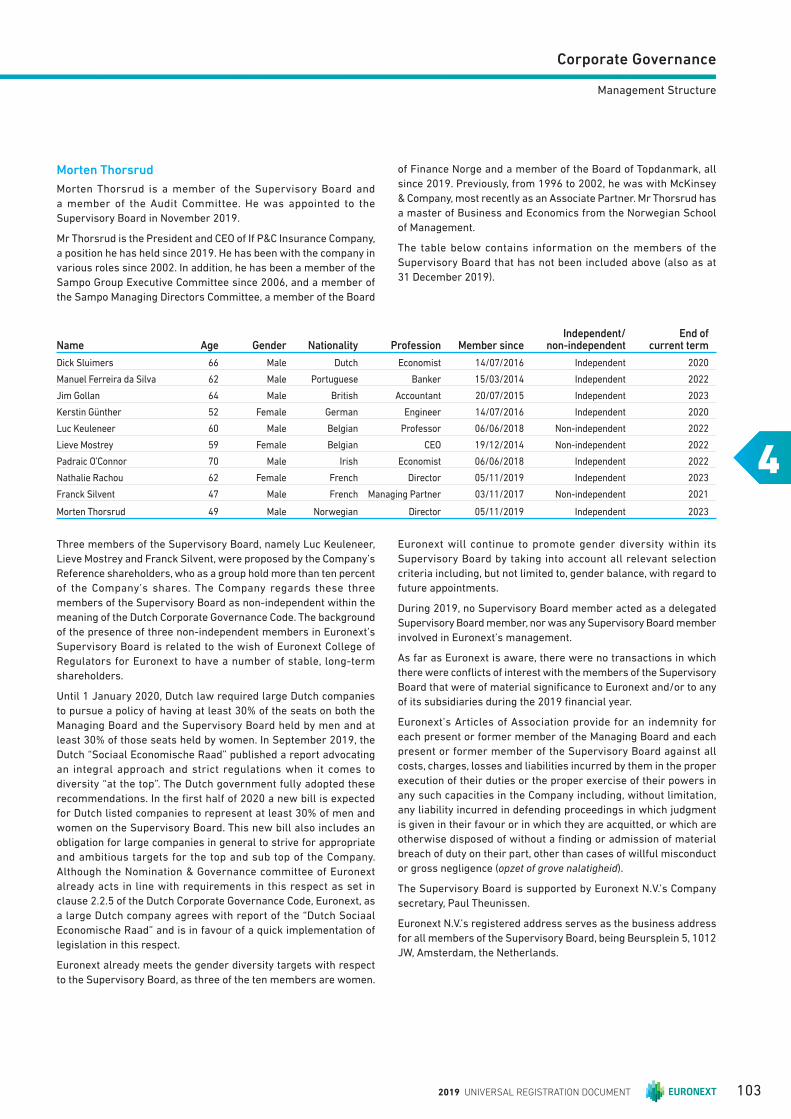
Corporate Governance
4
Management Structure
Morten Thorsrud
Morten Thorsrud is a member of the Supervisory Board and
a member of the Audit Committee. He was appointed to the
Supervisory Board in November 2019.
Mr Thorsrud is the President and CEO of If P&C Insurance Company,
a position he has held since 2019. He has been with the company in
various roles since 2002. In addition, he has been a member of the
Sampo Group Executive Committee since 2006, and a member of
the Sampo Managing Directors Committee, a member of the Board
of Finance Norge and a member of the Board of Topdanmark, all
since 2019. Previously, from 1996 to 2002, he was with McKinsey
& Company, most recently as an Associate Partner. Mr Thorsrud has
a master of Business and Economics from the Norwegian School
of Management.
The table below contains information on the members of the
Supervisory Board that has not been included above (also as at
31 December 2019).
Name Age Gender Nationality Profession Member sinceIndependent/
non-independentEnd of
current term
Dick Sluimers 66 Male Dutch Economist 14/07/2016 Independent 2020
Manuel Ferreira da Silva 62 Male Portuguese Banker 15/03/2014 Independent 2022
Jim Gollan 64 Male British Accountant 20/07/2015 Independent 2023
Kerstin Günther 52 Female German Engineer 14/07/2016 Independent 2020
Luc Keuleneer 60 Male Belgian Professor 06/06/2018 Non-independent 2022
Lieve Mostrey 59 Female Belgian CEO 19/12/2014 Non-independent 2022
Padraic O’Connor 70 Male Irish Economist 06/06/2018 Independent 2022
Nathalie Rachou 62 Female French Director 05/11/2019 Independent 2023
Franck Silvent 47 Male French Managing Partner 03/11/2017 Non-independent 2021
Morten Thorsrud 49 Male Norwegian Director 05/11/2019 Independent 2023
Three members of the Supervisory Board, namely Luc Keuleneer,
Lieve Mostrey and Franck Silvent, were proposed by the Company’s
Reference shareholders, who as a group hold more than ten percent
of the Company’s shares. The Company regards these three
members of the Supervisory Board as non-independent within the
meaning of the Dutch Corporate Governance Code. The background
of the presence of three non-independent members in Euronext’s
Supervisory Board is related to the wish of Euronext College of
Regulators for Euronext to have a number of stable, long-term
shareholders.
Until 1 January 2020, Dutch law required large Dutch companies
to pursue a policy of having at least 30% of the seats on both the
Managing Board and the Supervisory Board held by men and at
least 30% of those seats held by women. In September 2019, the
Dutch “Sociaal Economische Raad” published a report advocating
an integral approach and strict regulations when it comes to
diversity “at the top”. The Dutch government fully adopted these
recommendations. In the fi rst half of 2020 a new bill is expected
for Dutch listed companies to represent at least 30% of men and
women on the Supervisory Board. This new bill also includes an
obligation for large companies in general to strive for appropriate
and ambitious targets for the top and sub top of the Company.
Although the Nomination & Governance committee of Euronext
already acts in line with requirements in this respect as set in
clause 2.2.5 of the Dutch Corporate Governance Code, Euronext, as
a large Dutch company agrees with report of the “Dutch Sociaal
Economische Raad” and is in favour of a quick implementation of
legislation in this respect.
Euronext already meets the gender diversity targets with respect
to the Supervisory Board, as three of the ten members are women.
Euronext will continue to promote gender diversity within its
Supervisory Board by taking into account all relevant selection
criteria including, but not limited to, gender balance, with regard to
future appointments.
During 2019, no Supervisory Board member acted as a delegated
Supervisory Board member, nor was any Supervisory Board member
involved in Euronext’s management.
As far as Euronext is aware, there were no transactions in which
there were confl icts of interest with the members of the Supervisory
Board that were of material signifi cance to Euronext and/or to any
of its subsidiaries during the 2019 fi nancial year.
Euronext’s Articles of Association provide for an indemnity for
each present or former member of the Managing Board and each
present or former member of the Supervisory Board against all
costs, charges, losses and liabilities incurred by them in the proper
execution of their duties or the proper exercise of their powers in
any such capacities in the Company including, without limitation,
any liability incurred in defending proceedings in which judgment
is given in their favour or in which they are acquitted, or which are
otherwise disposed of without a fi nding or admission of material
breach of duty on their part, other than cases of willful misconduct
or gross negligence (opzet of grove nalatigheid).
The Supervisory Board is supported by Euronext N.V.’s Company
secretary, Paul Theunissen.
Euronext N.V.’s registered address serves as the business address
for all members of the Supervisory Board, being Beursplein 5, 1012
JW, Amsterdam, the Netherlands.
2019 UNIVERSAL REGISTRATION DOCUMENT 103
Corporate Governance44Management Structure
Committees of the Supervisory Board
Audit Committee
As per 1 January 2019, the Audit Committee was composed of Jim
Gollan, Kerstin Günther, Luc Keuleneer and Franck Silvent. Dick
Sluimers was appointed to the Audit Committee on 15 May 2019 and
retired from it on 5 November 2019, at which date Morten Thorsrud
was appointed to the Audit Committee. As per 31 December 2019, the
Audit Committee was composed of Jim Gollan, Kerstin Günther, Luc
Keuleneer, Franck Silvent and Morten Thorsrud. The Committee has
been chaired by Jim Gollan throughout 2019. The Audit Committee
has a majority of independent members.
The Audit Committees assists the Supervisory Board in supervising
and monitoring the Managing Board by advising on matters such as
the compliance by Euronext with applicable laws and regulations,
Euronext’s disclosure of financial information, including its
accounting principles, the recommendation for the appointment
of Euronext’s external auditor to the General Meeting, the
recommendations from Euronext’s internal auditor and external
auditor, and the review of the internal risk management and control
systems and IT and business continuity safeguards, as well as
technologies and security issues.
The roles and responsibilities of the Audit Committee as well as the
composition and the manner in which it discharges its duties are set
out in the charter of the Audit Committee included in the regulations
of the Supervisory Board. The Audit Committee will meet as often as
the Chairman of the Audit Committee or a majority of the members
of the Audit Committee deems necessary but in any event at least
twice a year.
Nomination and Governance Committee
As per 1 January 2019, the Nomination and Governance Committee
was composed of Dick Sluimers, Ramon Fernandez, Manuel Ferreira
da Silva and Lieve Mostrey. Following the Annual General Meeting
that was held on 16 May 2019, Ramon Fernandez retired from the
Committee. Padraic O’Connor was appointed to the Committee on
31 July 2019, and Nathalie Rachou on 5 November 2019. As per
31 December 2019, the Nomination and Governance Committee was
composed of Dick Sluimers, Manuel Ferreira da Silva, Lieve Mostrey,
Padraic O’Connor and Nathalie Rachou. The Committee has been
chaired by Dick Sluimers throughout 2019.
The responsibilities of the Nomination and Governance Committee
relating to selection and appointment include recommending
criteria and procedures to the Supervisory Board for the selection
of candidates to the Managing Board and the Supervisory Board and
its Committees, identifying and recommending to the Supervisory
Board candidates eligible to serve on the Managing Board and the
Supervisory Board and its Committees, establishing and overseeing
self-assessment by the Managing Board and the Supervisory Board
and its Committees, conducting timely succession planning for
the CEO and the other positions of the Supervisory Board and the
Managing Board and reviewing and evaluating the size, composition,
function and duties of the Managing Board and the Supervisory
Board, consistent with their respective needs.
The responsibilities of the Nomination and Governance Committee
relating to governance include the supervision and evaluation of
compliance with the Dutch Corporate Governance Code.
The roles and responsibilities of the Nomination and Governance
Committee as well as the composition and the manner in which it
discharges its duties are set out in the charter of the Nomination
and Governance Committee included in the regulations of the
Supervisory Board. The Nomination and Governance Committee
will meet as often as necessary and whenever any of its members
requests a meeting.
Remuneration Committee
As per 1 January 2019, the Remuneration Committee was composed
of Lieve Mostrey, Ramon Fernandez, Manuel Ferreira da Silva and
Padraic O’Conner. Following the Annual General Meeting that was
held on 16 May 2019, Ramon Fernandez retired from the Committee.
Nathalie Rachou and Dick Sluimers were appointed to the Committee
on 5 November 2019. As per 31 December 2019, the Remuneration
Committee was composed of Lieve Mostrey, Manuel Ferreira da
Silva, Padraic O’Connor, Nathalie Rachou and Dick Sluimers. The
Committee has been chaired by Lieve Mostrey throughout 2019.
Nathalie Rachou has succeeded her as the Committee’s Chair on
1 January 2020.
The responsibilities of the Remuneration Committee include
analysing the possible outcomes of the variable remuneration
components and how they may affect the remuneration of the
members of the Managing Board, preparing proposals for the
Supervisory Board concerning remuneration policies for the
Managing Board to be adopted by the General Meeting, preparing
proposals for the Supervisory Board concerning the terms of
the service agreements and total compensation of the individual
members of the Managing Board, preparing proposals for the
Supervisory Board concerning the performance criteria and the
application thereof for the Managing Board, preparing proposals for
the Supervisory Board concerning the approval of any compensation
plans in the form of share or options, reviewing the terms of
employment and total compensation of employees directly reporting
to the Managing Board and the total compensation of certain other
specifi ed employees, defi ned in consultation with the Managing
Board, overseeing the total cost of the approved compensation
programmes, preparing and publishing on an annual basis a report
of its deliberations and fi ndings and appointing any consultant in
respect of executive remuneration.
The roles and responsibilities of the Remuneration Committee as well
as the composition and the manner in which it discharges its duties
are set out in the charter of the Remuneration Committee included
in the regulations of the Supervisory Board. The Remuneration
Committee will meet as often as necessary and whenever any of
its members requests a meeting.
Other than as set out in section 2.1 above and in accordance with
provision 2.1.10 of the Dutch Corporate Governance Code, the
Supervisory Board complies with the requirements of independence,
as set out in the best practice provisions 2.1.7–2.1.9 of the Code.
2019 UNIVERSAL REGISTRATION DOCUMENT104 www.euronext.com
Corporate Governance
4
Management Structure
4.2.3 MANAGING BOARD
The Managing Board is responsible for the day-to-day management
of the operations of Euronext and is supervised by the Supervisory
Board. As described in the Articles of Associations, the Managing
Board is required to inform or seek approval from the Supervisory
Board depending on the matter. In performing their duties,
the members of the Managing Board must act in the interest of
Euronext and that of its business. The Managing Board, as a whole
or represented by two of its members, is authorised to represent
Euronext. In addition, specific authorisations to other senior
members of staff are in place.
As per rules of procedure of the Managing Board, the Managing
Board currently consists of the Chief Executive Offi cer (“CEO”) of
the Euronext group, the Head of Markets and Global Sales and the
CEOs of the local exchanges. The members of the Managing Board
are appointed by the General Meeting only in accordance with a
proposal of the Supervisory Board or upon a binding nomination by
the Supervisory Board. Prior to making a nomination, the proposed
nomination must be submitted to the College of Regulators and the
Dutch Ministry of Finance for approval.
The Managing Board shall adopt resolutions by an absolute majority
of the votes cast knowing that confl icted members cannot participate
and that the Chairman of the Managing Board has a casting vote.
The following matters require the approval of the Supervisory Board:
n issue and acquisition of shares in the capital of Euronext and debt
instruments issued by it or of debt instruments issued by a limited
partnership or general partnership of which Euronext is a fully
liable partner;
n application for admission of such shares to trading on a regulated
market or a multilateral trading facility as described in section 1:
1 of the Dutch Financial Supervision Act or a similar system
comparable to a regulated market or multilateral trading facility
from a State which is not a member State or the withdrawal of
such admission;
n a proposal to reduce the issued share capital;
n entering into or terminating a long-term cooperation with a legal
entity or company or as fully liable partner in a limited partnership
or general partnership, if such cooperation or termination is of
major signifi cance to Euronext;
n the acquisition or disposal of a participating interest in the capital
of a company, if the participating interest represents an amount
of at least €50 million or such greater amount as the Supervisory
Board may determine from time to time and communicates to the
Managing Board in writing;
n other investments representing an amount of at least of
€25 million or such greater amount as the Supervisory Board may
determine from time to time and communicates to the Managing
Board in writing;
n a proposal to amend the Articles of Association;
n a proposal to dissolve Euronext;
n a proposal to conclude a legal merger or a legal demerger or to
convert Euronext in another legal form;
n application for bankruptcy and for suspension of payments;
n termination of the employment of a considerable number of
employees at the same time or within a short period of time;
n far-reaching changes in the employment conditions of a signifi cant
number of employees, or far-reaching changes in management
incentive schemes or pension schemes;
n the annual budget for the next financial year, including the
underlying budgets of the Euronext Market Subsidiaries; and
n proposed investments not covered by the budgets referred to
in the preceding paragraph, including proposed investments
submitted to the Managing Board by any of the local exchanges,
in each case involving an amount greater than such amount as
the Supervisory Board may determine from time to time and
communicates to the Managing Board in writing.
Additionally, pursuant to Dutch law, resolutions of the Managing
Board involving a major change in Euronext’s identity or its
business require the prior approval of the General Meeting and the
Supervisory Board, which in any case include:
n the transfer of the enterprise or practically the whole enterprise
to third parties;
n the entering into or the termination of a long-term joint cooperation
with another legal entity or company or as fully liable partner in
a limited partnership or a general partnership if this cooperation
or termination of such a cooperation is of major signifi cance to
Euronext;
n the acquisition or disposal of a participating interest in the capital
of a company having a value of at least one-third of the amount of
the assets according to the balance sheet with explanatory notes
thereto, or if Euronext prepares a consolidated balance sheet,
according to such consolidated balance sheet with explanatory
notes in the last adopted annual accounts.
The Rules of Procedure of the Managing Board provide that the
Managing Board of a Euronext Market Subsidiary has the right to
reject a resolution by the Managing Board if such resolution solely or
principally has an impact on the exchange operated by such Euronext
Market Subsidiary and such impact is material or of strategic
importance for the Exchange operated by such Euronext Market
Subsidiary. Each member of the Managing Board of such Euronext
Market Subsidiary has the right to request that the item is placed on
the agenda of the Supervisory Board of Euronext. The Supervisory
Board shall then discuss the matter with the Managing Board of
Euronext, and consider the arguments of the Managing Board of the
Euronext Market Subsidiary, following which the Supervisory Board
will take a fi nal and binding decision on the matter.
Appointment and Dismissal
Members of the Managing Board are appointed by the General
Meeting of shareholders (i) in accordance with a proposal of the
Supervisory Board or (ii) from a binding nomination to be drawn up
by the Supervisory Board.
The General Meeting of shareholders may suspend or dismiss
a member of the Managing Board at all times. Managing Board
members may also be suspended by the Supervisory Board.
2019 UNIVERSAL REGISTRATION DOCUMENT 105
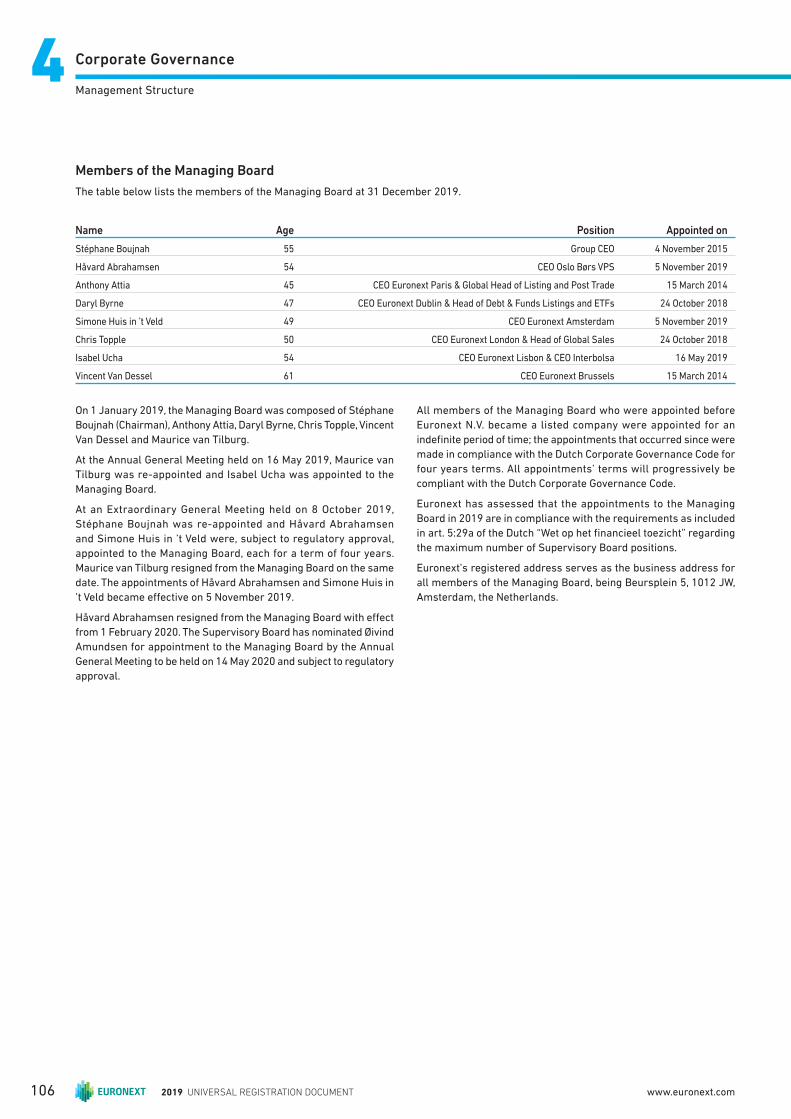
Corporate Governance44Management Structure
Members of the Managing Board
The table below lists the members of the Managing Board at 31 December 2019.
Name Age Position Appointed on
Stéphane Boujnah 55 Group CEO 4 November 2015
Håvard Abrahamsen 54 CEO Oslo Børs VPS 5 November 2019
Anthony Attia 45 CEO Euronext Paris & Global Head of Listing and Post Trade 15 March 2014
Daryl Byrne 47 CEO Euronext Dublin & Head of Debt & Funds Listings and ETFs 24 October 2018
Simone Huis in ’t Veld 49 CEO Euronext Amsterdam 5 November 2019
Chris Topple 50 CEO Euronext London & Head of Global Sales 24 October 2018
Isabel Ucha 54 CEO Euronext Lisbon & CEO Interbolsa 16 May 2019
Vincent Van Dessel 61 CEO Euronext Brussels 15 March 2014
On 1 January 2019, the Managing Board was composed of Stéphane
Boujnah (Chairman), Anthony Attia, Daryl Byrne, Chris Topple, Vincent
Van Dessel and Maurice van Tilburg.
At the Annual General Meeting held on 16 May 2019, Maurice van
Tilburg was re-appointed and Isabel Ucha was appointed to the
Managing Board.
At an Extraordinary General Meeting held on 8 October 2019,
Stéphane Boujnah was re-appointed and Håvard Abrahamsen
and Simone Huis in ’t Veld were, subject to regulatory approval,
appointed to the Managing Board, each for a term of four years.
Maurice van Tilburg resigned from the Managing Board on the same
date. The appointments of Håvard Abrahamsen and Simone Huis in
’t Veld became eff ective on 5 November 2019.
Håvard Abrahamsen resigned from the Managing Board with eff ect
from 1 February 2020. The Supervisory Board has nominated Øivind
Amundsen for appointment to the Managing Board by the Annual
General Meeting to be held on 14 May 2020 and subject to regulatory
approval.
All members of the Managing Board who were appointed before
Euronext N.V. became a listed company were appointed for an
indefi nite period of time; the appointments that occurred since were
made in compliance with the Dutch Corporate Governance Code for
four years terms. All appointments’ terms will progressively be
compliant with the Dutch Corporate Governance Code.
Euronext has assessed that the appointments to the Managing
Board in 2019 are in compliance with the requirements as included
in art. 5:29a of the Dutch “Wet op het fi nancieel toezicht” regarding
the maximum number of Supervisory Board positions.
Euronext’s registered address serves as the business address for
all members of the Managing Board, being Beursplein 5, 1012 JW,
Amsterdam, the Netherlands.
2019 UNIVERSAL REGISTRATION DOCUMENT106 www.euronext.com
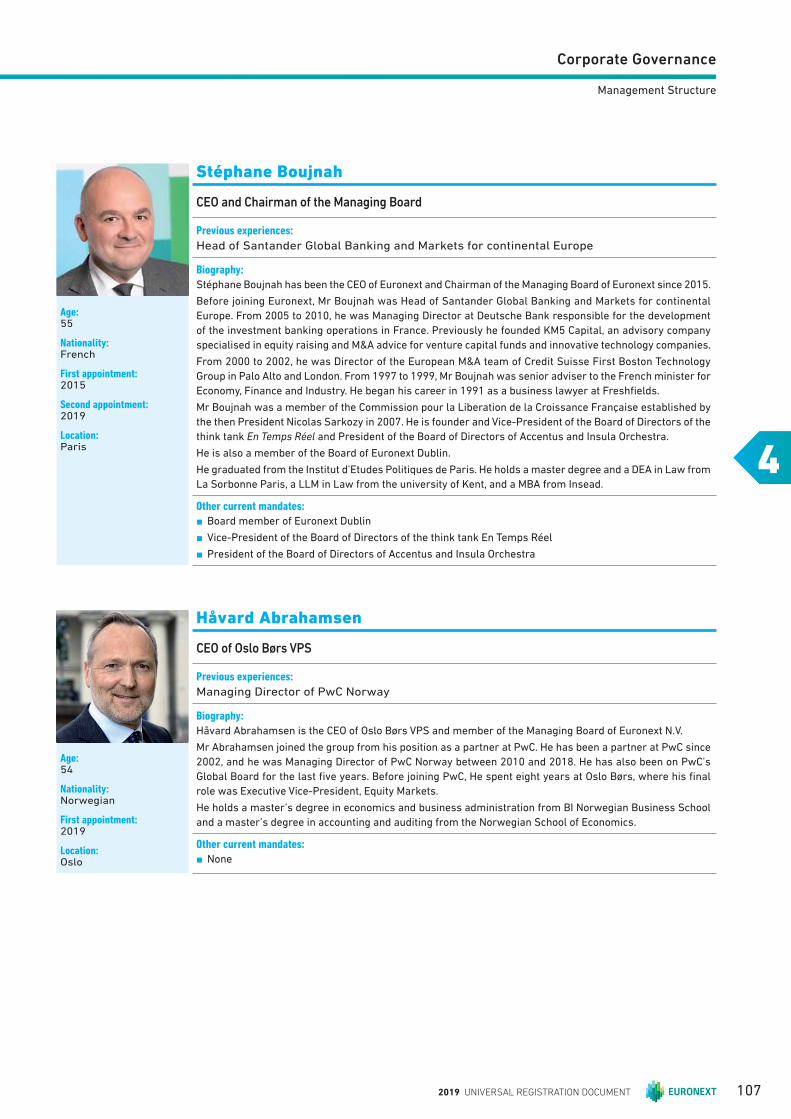
Corporate Governance
4
Management Structure
Age:55
Nationality:French
First appointment:2015
Second appointment:2019
Location:Paris
Stéphane Boujnah
CEO and Chairman of the Managing Board
Previous experiences:
Head of Santander Global Banking and Markets for continental Europe
Biography:
Stéphane Boujnah has been the CEO of Euronext and Chairman of the Managing Board of Euronext since 2015.
Before joining Euronext, Mr Boujnah was Head of Santander Global Banking and Markets for continental
Europe. From 2005 to 2010, he was Managing Director at Deutsche Bank responsible for the development
of the investment banking operations in France. Previously he founded KM5 Capital, an advisory company
specialised in equity raising and M&A advice for venture capital funds and innovative technology companies.
From 2000 to 2002, he was Director of the European M&A team of Credit Suisse First Boston Technology
Group in Palo Alto and London. From 1997 to 1999, Mr Boujnah was senior adviser to the French minister for
Economy, Finance and Industry. He began his career in 1991 as a business lawyer at Freshfi elds.
Mr Boujnah was a member of the Commission pour la Liberation de la Croissance Française established by
the then President Nicolas Sarkozy in 2007. He is founder and Vice-President of the Board of Directors of the
think tank En Temps Réel and President of the Board of Directors of Accentus and Insula Orchestra.
He is also a member of the Board of Euronext Dublin.
He graduated from the Institut d’Etudes Politiques de Paris. He holds a master degree and a DEA in Law from
La Sorbonne Paris, a LLM in Law from the university of Kent, and a MBA from Insead.
Other current mandates:
n Board member of Euronext Dublin
n Vice-President of the Board of Directors of the think tank En Temps Réel
n President of the Board of Directors of Accentus and Insula Orchestra
Age:54
Nationality:Norwegian
First appointment:2019
Location:Oslo
Håvard Abrahamsen
CEO of Oslo Børs VPS
Previous experiences:
Managing Director of PwC Norway
Biography:
Håvard Abrahamsen is the CEO of Oslo Børs VPS and member of the Managing Board of Euronext N.V.
Mr Abrahamsen joined the group from his position as a partner at PwC. He has been a partner at PwC since
2002, and he was Managing Director of PwC Norway between 2010 and 2018. He has also been on PwC’s
Global Board for the last fi ve years. Before joining PwC, He spent eight years at Oslo Børs, where his fi nal
role was Executive Vice-President, Equity Markets.
He holds a master’s degree in economics and business administration from BI Norwegian Business School
and a master’s degree in accounting and auditing from the Norwegian School of Economics.
Other current mandates:
n None
2019 UNIVERSAL REGISTRATION DOCUMENT 107
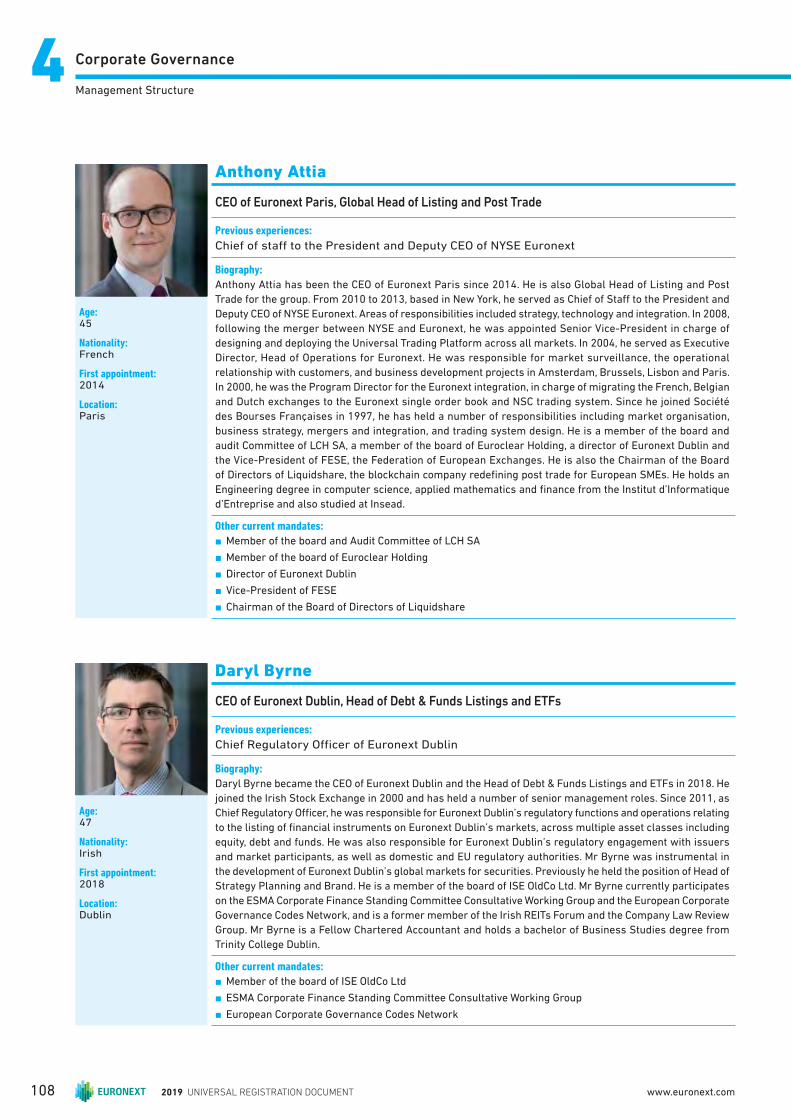
Corporate Governance44Management Structure
Age:45
Nationality:French
First appointment:2014
Location:Paris
Anthony Attia
CEO of Euronext Paris, Global Head of Listing and Post Trade
Previous experiences:
Chief of staff to the President and Deputy CEO of NYSE Euronext
Biography:
Anthony Attia has been the CEO of Euronext Paris since 2014. He is also Global Head of Listing and Post
Trade for the group. From 2010 to 2013, based in New York, he served as Chief of Staff to the President and
Deputy CEO of NYSE Euronext. Areas of responsibilities included strategy, technology and integration. In 2008,
following the merger between NYSE and Euronext, he was appointed Senior Vice-President in charge of
designing and deploying the Universal Trading Platform across all markets. In 2004, he served as Executive
Director, Head of Operations for Euronext. He was responsible for market surveillance, the operational
relationship with customers, and business development projects in Amsterdam, Brussels, Lisbon and Paris.
In 2000, he was the Program Director for the Euronext integration, in charge of migrating the French, Belgian
and Dutch exchanges to the Euronext single order book and NSC trading system. Since he joined Société
des Bourses Françaises in 1997, he has held a number of responsibilities including market organisation,
business strategy, mergers and integration, and trading system design. He is a member of the board and
audit Committee of LCH SA, a member of the board of Euroclear Holding, a director of Euronext Dublin and
the Vice-President of FESE, the Federation of European Exchanges. He is also the Chairman of the Board
of Directors of Liquidshare, the blockchain company redefi ning post trade for European SMEs. He holds an
Engineering degree in computer science, applied mathematics and fi nance from the Institut d’Informatique
d’Entreprise and also studied at Insead.
Other current mandates:
n Member of the board and Audit Committee of LCH SA
n Member of the board of Euroclear Holding
n Director of Euronext Dublin
n Vice-President of FESE
n Chairman of the Board of Directors of Liquidshare
Age:47
Nationality:Irish
First appointment:2018
Location:Dublin
Daryl Byrne
CEO of Euronext Dublin, Head of Debt & Funds Listings and ETFs
Previous experiences:
Chief Regulatory Offi cer of Euronext Dublin
Biography:
Daryl Byrne became the CEO of Euronext Dublin and the Head of Debt & Funds Listings and ETFs in 2018. He
joined the Irish Stock Exchange in 2000 and has held a number of senior management roles. Since 2011, as
Chief Regulatory Offi cer, he was responsible for Euronext Dublin’s regulatory functions and operations relating
to the listing of fi nancial instruments on Euronext Dublin’s markets, across multiple asset classes including
equity, debt and funds. He was also responsible for Euronext Dublin’s regulatory engagement with issuers
and market participants, as well as domestic and EU regulatory authorities. Mr Byrne was instrumental in
the development of Euronext Dublin’s global markets for securities. Previously he held the position of Head of
Strategy Planning and Brand. He is a member of the board of ISE OldCo Ltd. Mr Byrne currently participates
on the ESMA Corporate Finance Standing Committee Consultative Working Group and the European Corporate
Governance Codes Network, and is a former member of the Irish REITs Forum and the Company Law Review
Group. Mr Byrne is a Fellow Chartered Accountant and holds a bachelor of Business Studies degree from
Trinity College Dublin.
Other current mandates:
n Member of the board of ISE OldCo Ltd
n ESMA Corporate Finance Standing Committee Consultative Working Group
n European Corporate Governance Codes Network
2019 UNIVERSAL REGISTRATION DOCUMENT108 www.euronext.com
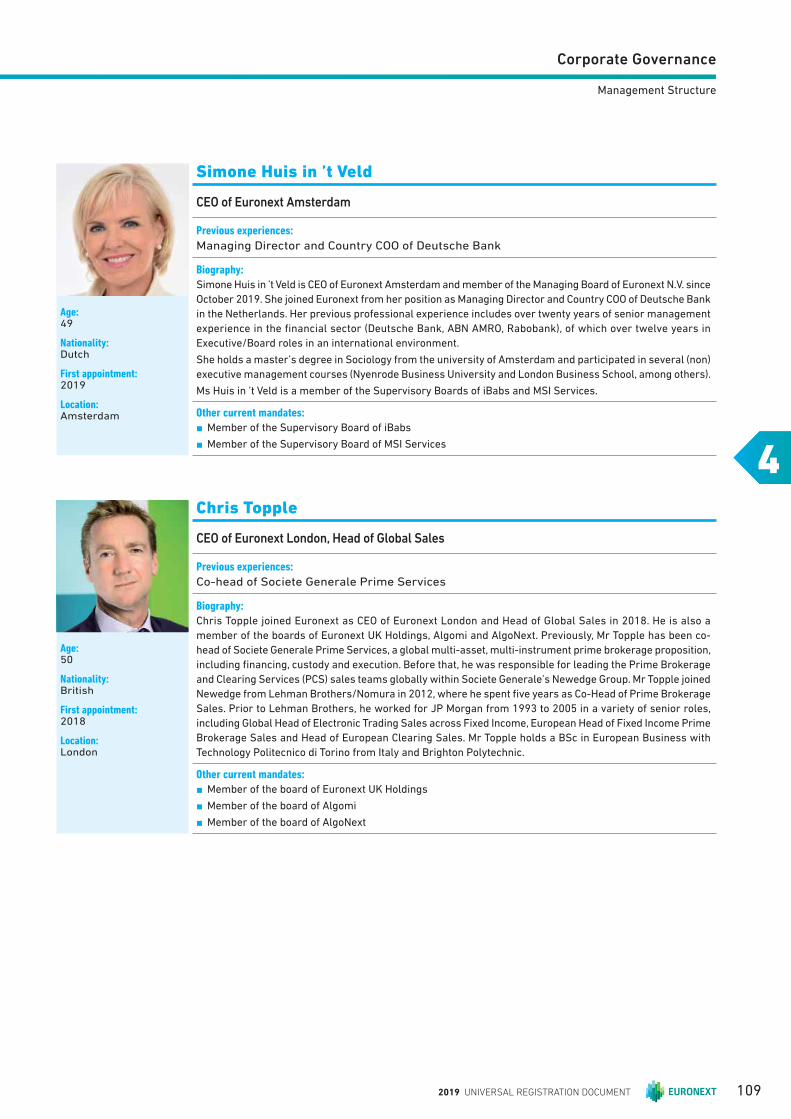
Corporate Governance
4
Management Structure
Age:49
Nationality:Dutch
First appointment:2019
Location:Amsterdam
Simone Huis in ’t Veld
CEO of Euronext Amsterdam
Previous experiences:
Managing Director and Country COO of Deutsche Bank
Biography:
Simone Huis in ’t Veld is CEO of Euronext Amsterdam and member of the Managing Board of Euronext N.V. since
October 2019. She joined Euronext from her position as Managing Director and Country COO of Deutsche Bank
in the Netherlands. Her previous professional experience includes over twenty years of senior management
experience in the fi nancial sector (Deutsche Bank, ABN AMRO, Rabobank), of which over twelve years in
Executive/Board roles in an international environment.
She holds a master’s degree in Sociology from the university of Amsterdam and participated in several (non)
executive management courses (Nyenrode Business University and London Business School, among others).
Ms Huis in ’t Veld is a member of the Supervisory Boards of iBabs and MSI Services.
Other current mandates:
n Member of the Supervisory Board of iBabs
n Member of the Supervisory Board of MSI Services
Age:50
Nationality:British
First appointment:2018
Location:London
Chris Topple
CEO of Euronext London, Head of Global Sales
Previous experiences:
Co-head of Societe Generale Prime Services
Biography:
Chris Topple joined Euronext as CEO of Euronext London and Head of Global Sales in 2018. He is also a
member of the boards of Euronext UK Holdings, Algomi and AlgoNext. Previously, Mr Topple has been co-
head of Societe Generale Prime Services, a global multi-asset, multi-instrument prime brokerage proposition,
including fi nancing, custody and execution. Before that, he was responsible for leading the Prime Brokerage
and Clearing Services (PCS) sales teams globally within Societe Generale’s Newedge Group. Mr Topple joined
Newedge from Lehman Brothers/Nomura in 2012, where he spent fi ve years as Co-Head of Prime Brokerage
Sales. Prior to Lehman Brothers, he worked for JP Morgan from 1993 to 2005 in a variety of senior roles,
including Global Head of Electronic Trading Sales across Fixed Income, European Head of Fixed Income Prime
Brokerage Sales and Head of European Clearing Sales. Mr Topple holds a BSc in European Business with
Technology Politecnico di Torino from Italy and Brighton Polytechnic.
Other current mandates:
n Member of the board of Euronext UK Holdings
n Member of the board of Algomi
n Member of the board of AlgoNext
2019 UNIVERSAL REGISTRATION DOCUMENT 109
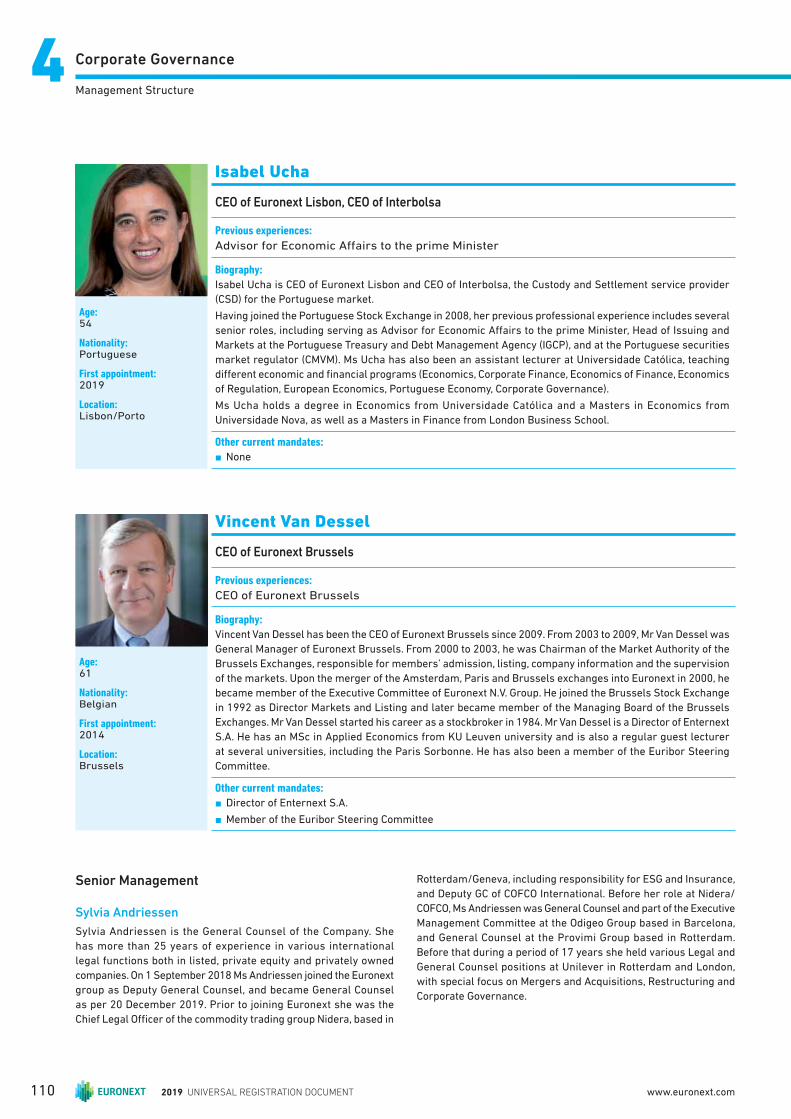
Corporate Governance44Management Structure
Age:54
Nationality:Portuguese
First appointment:2019
Location:Lisbon/Porto
Isabel Ucha
CEO of Euronext Lisbon, CEO of Interbolsa
Previous experiences:
Advisor for Economic Aff airs to the prime Minister
Biography:
Isabel Ucha is CEO of Euronext Lisbon and CEO of Interbolsa, the Custody and Settlement service provider
(CSD) for the Portuguese market.
Having joined the Portuguese Stock Exchange in 2008, her previous professional experience includes several
senior roles, including serving as Advisor for Economic Aff airs to the prime Minister, Head of Issuing and
Markets at the Portuguese Treasury and Debt Management Agency (IGCP), and at the Portuguese securities
market regulator (CMVM). Ms Ucha has also been an assistant lecturer at Universidade Católica, teaching
diff erent economic and fi nancial programs (Economics, Corporate Finance, Economics of Finance, Economics
of Regulation, European Economics, Portuguese Economy, Corporate Governance).
Ms Ucha holds a degree in Economics from Universidade Católica and a Masters in Economics from
Universidade Nova, as well as a Masters in Finance from London Business School.
Other current mandates:
n None
Age:61
Nationality:Belgian
First appointment:2014
Location:Brussels
Vincent Van Dessel
CEO of Euronext Brussels
Previous experiences:
CEO of Euronext Brussels
Biography:
Vincent Van Dessel has been the CEO of Euronext Brussels since 2009. From 2003 to 2009, Mr Van Dessel was
General Manager of Euronext Brussels. From 2000 to 2003, he was Chairman of the Market Authority of the
Brussels Exchanges, responsible for members’ admission, listing, company information and the supervision
of the markets. Upon the merger of the Amsterdam, Paris and Brussels exchanges into Euronext in 2000, he
became member of the Executive Committee of Euronext N.V. Group. He joined the Brussels Stock Exchange
in 1992 as Director Markets and Listing and later became member of the Managing Board of the Brussels
Exchanges. Mr Van Dessel started his career as a stockbroker in 1984. Mr Van Dessel is a Director of Enternext
S.A. He has an MSc in Applied Economics from KU Leuven university and is also a regular guest lecturer
at several universities, including the Paris Sorbonne. He has also been a member of the Euribor Steering
Committee.
Other current mandates:
n Director of Enternext S.A.
n Member of the Euribor Steering Committee
Senior Management
Sylvia Andriessen
Sylvia Andriessen is the General Counsel of the Company. She
has more than 25 years of experience in various international
legal functions both in listed, private equity and privately owned
companies. On 1 September 2018 Ms Andriessen joined the Euronext
group as Deputy General Counsel, and became General Counsel
as per 20 December 2019. Prior to joining Euronext she was the
Chief Legal Offi cer of the commodity trading group Nidera, based in
Rotterdam/Geneva, including responsibility for ESG and Insurance,
and Deputy GC of COFCO International. Before her role at Nidera/
COFCO, Ms Andriessen was General Counsel and part of the Executive
Management Committee at the Odigeo Group based in Barcelona,
and General Counsel at the Provimi Group based in Rotterdam.
Before that during a period of 17 years she held various Legal and
General Counsel positions at Unilever in Rotterdam and London,
with special focus on Mergers and Acquisitions, Restructuring and
Corporate Governance.
2019 UNIVERSAL REGISTRATION DOCUMENT110 www.euronext.com

Corporate Governance
4
Management Structure
Alain Courbebaisse
Alain Courbebaisse is the Chief Information and Technology
Offi cer of the Company. He leads the IT function across Euronext.
Mr Courbebaisse joined Euronext in 2017.
Prior to joining Euronext, Mr Courbebaisse was Head of Prime
Brokerage and Clearing Services and Head Of Platform Sales at
Societe Generale Americas Services, and prior to this he was the
Global CIO of Newedge. In his earlier roles, he was European CIO
and Global head of Development at Fimat, Head of IT at Draeger
Medical S.A., Consultant and Developer for IBM. Mr Courbebaisse is
President of Euronext Technologies S.A.S., Chairman of the board of
FastMatch Inc., a member of the Supervisory Board of Tredzone and
a member of the boards of Euronext IP & IT Holding B.V ., Euronext
Synapse LLC, Euronext Technologies Unipessoal Lda, and AlgoNext
Ltd. Mr Courbebaisse graduated from Conservatoire National des
Arts et Metiers in Computer science.
Simon Gallagher
Simon Gallagher is Head of Cash and Derivatives at Euronext, with
overall P&L responsibility for these activities, including the product
offer, market model, client strategy and liquidity programmes.
Current priorities include revamping Euronext’s retail and
institutional off ers, with a particular focus on enhancing liquidity
experience of institutional traders, as well as the development of
Euronext Block, a Large-in-Scale block trading MTF for Equities.
Prior to this role, he held several positions within Euronext in
Corporate Finance and Strategy, and occupied various roles in the
oil and gas sector. He is a CFA charter-holder who holds an MBA
from the university of Birmingham and a degree in Economics from
the university of Surrey.
Amaury Houdart
Amaury Houdart is the Chief Talent Offi cer of the Company. He leads
the Human Resources function and strategic initiatives related to
employee engagement, talent development, and organisational
changes across Euronext. Mr Houdart joined Euronext in 2016.
Prior to joining Euronext, Mr Houdart was Group Director of Human
Resources and Employee Shareholding at Groupe Steria SCA, a
leading European IT services company. In his earlier roles, he was
Business Consulting Manager, Mergers & Acquisitions Director and
then Human Resources Director at Unilog LogicaCMG, a leading
international IT services company. Mr Houdart graduated from Paris
Dauphine university in International Aff airs.
Giorgio Modica
Giorgio Modica is the Chief Financial Offi cer of the Company. He
joined Euronext in 2016. His responsibilities include both Euronext’s
fi nancial and corporate facilities and services. Mr Modica joined from
BNP Paribas (Paris and Milan), where he was a senior Corporate
Finance banker in Financial Institutions for nine years, holding the
responsibility for the Stock Exchange sector globally and for the
overall FIG markets in Italy and Spain. In over fi fteen years of
international investment banking experience, Mr Modica covered
both M&A and ECM, as well as the structuring of fi nancing solutions
(equity and debt).
Since 2011, as advisor to NYSE Euronext and then Euronext,
Mr Modica has supported the Euronext group very closely
throughout its key milestone transactions, including the attempted
combination with Deutsche Börse, the carve-out of Euronext and
its subsequent IPO. Mr Modica started his career at the venture
capitalist fi rm MyQube in Geneva, and then moved to investment
banking at HSBC in Milan and MCC/Capitalia in Rome. He is a
director of Euronext UK Holdings Ltd, Euronext US Inc., FastMatch
Inc., Euronext Dublin, and Irish Stock Exchange Services Limited.
Mr Modica graduated cum-laude from Bocconi university and holds
a master in Finance from SDA Bocconi.
Diversity
Until 1 January 2020 Dutch law required large Dutch companies
to pursue a policy of having at least 30% of the seats on both
the Managing Board and the Supervisory Board held by men
and at least 30% of those seats held by women. Although the
Nomination & Governance committee of Euronext already acts
in line with requirements in this respet as set in clause 2.2.5 of
the Dutch Corporate Governance Code, f ollowing a report of the
Dutch “Sociaal Economische Raad” new legislation for Dutch
listed is expected in the fi rst half of 2020. In line with the expected
legislation Euronext strives for appropriate and ambitious diversity
targets at the top and sub top.
Euronext qualifi es as a large Dutch company and has set a goal
to improve the the gender diversity targets with respect to the
Managing Board, as less than 30% of its members are women.
This is partly related to historical circumstances and partly to
the sectors in which Euronext is active. The Managing Board is
geographically balanced and is composed of members from each
local Euronext market operator. Out of twelve members (including
Extended Managing Board members and Stéphane Boujnah), three
members are female.
Th e Senior Leadership team in 2019 was composed of 33% of
women. The balance of country representation was the following:
52% France, 12% the Netherlands, 4% United Kingdom, 6%
Portugal, 4% Belgium, 7% Ireland, 9% Norway, 1% Spain and 3%
United States. The average age of this group is 45 years.
Euronext will continue to promote gender diversity within its
Managing Board by striving to increase the proportion of female
members by taking into account all relevant selection criteria
including, but not limited to, gender balance, with regard to future
appointments.
2019 UNIVERSAL REGISTRATION DOCUMENT 111
Corporate Governance44Report of the Supervisory Board
4.3 Report of the Supervisory Board
4.3.1 MEETINGS
The Supervisory Board met fi fteen times in 2019: there were seven
in-person meetings and eight conference calls. The Supervisory Board
discussed amongst others the following topics: the quarterly, half
year and full year results, the dividend proposal, the 2020 budget
and 2021 forecast, the agendas of the General Meetings, including
the nomination for appointments to the Supervisory Board and the
Managing Board, the nomination of the external auditor, the strategy,
the implementation of the strategy and the principal risks associated
with it, the risk profile, and M&A opportunities. It monitored the
activities of the Managing Board with regard to creating a culture
aimed at long-term value creation for the company and its affi liated
enterprise, and with regard to procedures for reporting actual or
suspected irregularities.
It also discussed the items that its committees reported on, and
their deliberations and fi ndings. Among those items were, in addition
to the items mentioned above, the investor base, the share price
development, the internal and external audit planning and reports,
litigations, the external auditors’ reports, the Remuneration Policy,
annual performance criteria, compensation programs, the evaluation
and assessment of the Managing Board and the Supervisory Board,
the composition of the Managing Board, the composition and rotation
schedule of the Supervisory Board and succession planning .
4.3.2 SUPERVISORY BOARD ATTENDANCE RECORD
On average, 99.11% of the Supervisory Board members were present at the Supervisory Board meetings. Not taking part in the Supervisory
Board’s deliberations in relation to a potential confl ict of interest is not counted as being absent.
In 2019, fi fteen Supervisory Board meetings were held.
Name Attended Absence ratio
Dick Sluimers 15 out of 15 meetings 0%
Ramon Fernandez (retired 16 May 2019) 8 out of 8 meetings 0%
Manuel Ferreira da Silva 15 out of 15 meetings 0%
Jim Gollan 13 out of 15 meetings 13.33%
Kerstin Günther 15 out of 15 meetings 0%
Luc Keuleneer 15 out of 15 meetings 0%
Lieve Mostrey 15 out of 15 meetings 0%
Padraic O’Connor 15 out of 15 meetings 0%
Nathalie Rachou (appointed 5 November 2019) 4 out of 4 meetings 0%
Franck Silvent 15 out of 15 meetings 0%
Morten Thorsrud (appointed 5 November 2019) 4 out of 4 meetings 0%
In 2019, six Audit Committee meetings were held.
Name Attended Absence ratio
Jim Gollan 6 out of 6 meetings 0%
Kerstin Günther 6 out of 6 meetings 0%
Luc Keuleneer 6 out of 6 meetings 0%
Franck Silvent 6 out of 6 meetings 0%
Dick Sluimers (appointed 15 May 2019, retired 5 November 2019) 1 out of 1 meeting 0%
Morten Thorsrud (appointed 5 November 2019) 1 out of 1 meeting 0%
In 2019, seven Nomination and Governance Committee meetings were held.
Name Attended Absence ratio
Dick Sluimers 7 out of 7 meetings 0%
Ramon Fernandez (retired 16 May 2019) 2 out of 2 meetings 0%
Manuel Ferreira da Silva 7 out of 7 meetings 0%
Lieve Mostrey 7 out of 7 meetings 0%
Padraic O’Connor (appointed 31 July 2019) 2 out of 2 meetings 0%
Nathalie Rachou (appointed 5 November 2019) 1 out of 1 meeting 0%
2019 UNIVERSAL REGISTRATION DOCUMENT112 www.euronext.com
Corporate Governance
4
Report of the Supervisory Board
In 2019, seven Remuneration Committee meetings were held.
Name Attended Absence ratio
Lieve Mostrey 7 out of 7 meetings 0%
Ramon Fernandez (retired 16 May 2019) 1 out of 1 meeting 0%
Manuel Ferreira da Silva 7 out of 7 meetings 0%
Padraic O’Connor 7 out of 7 meetings 0%
Nathalie Rachou (appointed 5 November 2019) 2 out of 2 meetings 0%
Dick Sluimers (appointed 5 November 2019) 2 out of 2 meetings 0%
Most Supervisory Board meetings were also attended by all or by most members of the Managing Board. In addition, several managers
were invited to discuss specifi c items included on the Supervisory Board’s agenda.
4.3.3 SUPERVISORY BOARD ACTIVITIES
The Supervisory Board was informed and consulted by the Managing
Board in almost all of its meetings on the course of business and
the main risks attached to it, Euronext’s fi nancial and operational
performance and matters related to the Euronext’s governance and
strategy. Large parts of the meetings of the Supervisory Board that
were held on 21 March 2019, 20 September 2019 and 18 November
2019 were dedicated to Euronext’s strategy.
During the meetings held in 2019, the Supervisory Board approved
the quarterly and semi-annual statements, the semi-annual report,
the annual report for 2018, the budget for 2020, and the agendas of
the General Meetings, including the nomination for appointments
to the Supervisory Board and the Managing Board, the nomination
of the external auditor, and a proposal regarding the dividend. All
meetings of the Supervisory Board were prepared by the Chairman
of the Managing Board in close co-operation with the Chairman of
the Supervisory Board.
4.3.4 BOARD EVALUATION
The annual evaluation of the Supervisory Board, its Committees
and Managing Board by the Supervisory Board relating to the year
2019 took place in January and February 2020. This evaluation
was conducted through questionnaires, the results of which were
compiled by the Corporate Secretary. The report on the outcome of
the questionnaires was discussed initially by the Nomination and
Governance Committee and subsequently by the Supervisory Board
as a whole.
The topics included in the questionnaires covered, among other
items, the interaction with the Managing Board, the Supervisory
Board meetings, Chairmanship, communications, decision making
processes, lessons learned from events that occurred through the
year, succession and development planning, shareholder value, the
composition and profi le of the Supervisory Board, the Committee
structure and the competencies and expertise of its members.
The performance of the individual Management Board members
and the Management Board as a whole was discussed during the
physical meetings of the Nomination and Governance Committee and
the executive session of the Supervisory Board in December 2019
and February 2020.
After discussing the results of the questionnaires, the Supervisory
Board concluded that the Supervisory Board and its Committees had
properly discharged their responsibilities during 2019. During the
board evaluation, the Supervisory Board further concluded that the
relation and interaction with the Managing Board, including the fl ow
of information, was good. The Chair of the Remuneration Committee
led the review of the performance of the Chairman. The Supervisory
Board concluded that the Chairman had performed his duties well.
The Supervisory Board and its Committees agreed that during 2020
they will increase their attention for items such as cybersecurity
and ESG.
4.3.5 REPORT AUDIT COMMITTEE
As per 1 January 2019, the Audit Committee was composed of Jim
Gollan, Kerstin Günther, Luc Keuleneer and Franck Silvent Dick
Sluimers was appointed to the Committee on 15 May 2019 and
retired from it on 5 November 2019. Morten Thorsrud was appointed
to the Committee on 5 November 2019. As per 31 December 2019,
the Audit Committee was composed of Jim Gollan, Kerstin Günther,
Luc Keuleneer, Franck Silvent and Morten Thorsrud. The Committee
has been chaired by Jim Gollan throughout 2019.
The Audit Committee convened six times in 2019. These meetings
were regularly attended by, in addition to the members of the Audit
Committee, the Chairman of the Supervisory Board, the CEO, the
CFO, the member of the Managing Board in charge of Operations,
the Chief Information and Technology Offi cer, the Head of Risk and
Compliance department, the General Counsel, the Head of Internal
Audit and the external auditors.
In addition, the Audit Committee held regular individual discussions
with the external auditors and the Head of Internal Audit. The
Supervisory Board was regularly informed about the results of these
discussions. The Chairman of the Audit Committee reported to the
Supervisory Board about the activities of the Committee and about
its meetings and discussions in the Supervisory Board meetings.
Among the items that were discussed by the Audit Committee were
the annual, semi-annual and quarterly fi gures, risk management,
the investor base, the share price development, the appointment of
the external auditors, the internal and external audit planning and
reports, litigations, and the external Auditors’ reports.
2019 UNIVERSAL REGISTRATION DOCUMENT 113

Corporate Governance44Remuneration Report
4.3.6 REPORT REMUNERATION COMMITTEE
As per 1 January 2019, the Remuneration Committee was composed
of Lieve Mostrey, Ramon Fernandez, Manuel Ferreira da Silva and
Padraic O’Connor. Ramon Fernandez retired from the Committee on
16 May 2019, and Nathalie Rachou and Dick Sluimers were appointed
to the Committee on 5 November 2019. As per 31 December 2019,
the Remuneration Committee was composed of Lieve Mostrey,
Manuel Ferreira da Silva, Padraic O’Connor, Nathalie Rachou and
Dick Sluimers. The Committee has been chaired by Lieve Mostrey
throughout 2019. She was succeeded as the Committee’s Chair by
Nathalie Rachou on 1 January 2020.
The Remuneration Committee held seven meetings in 2019.
The Committee focused on reviewing short term and long term
incentives decisions after year end results. The Committee also
reviewed a Compensation policy adjustment proposal and proposed
compensation for new hires. In 2019, the Remuneration Committee:
n proposed to the Supervisory Board an adjustment of the
Remuneration Policy following external benchmarks delivered
in 2019 on Managing Board roles. The proposed amended
Remuneration Policy was adopted by the General Meeting on
8 October 2019;
n analysed as every year the outcome of the annual performance
criteria, their impact on short term incentive, long term incentive
and total compensation of the members of the Managing Board,
and proposed subsequent decisions to the Supervisory Board;
n reviewed as every year the total cost of the approved compensation
programs for all employees, and proposed subsequent decisions
to the Supervisory Board.
4.3.7 REPORT NOMINATION AND GOVERNANCE COMMITTEE
As per 1 January 2019, the Nomination and Governance Committee
was composed of Dick Sluimers, Ramon Fernandez, Manuel Ferreira
da Silva and Lieve Mostrey. Padraic O’Connor was appointed as a
member of the Committee on 31 July 2019, and Nathalie Rachou
was appointed as a member of the Committee on 5 November
2019. As per 31 December 2019, the Nomination and Governance
Committee was composed of Dick Sluimers, Manuel Ferreira da
Silva, Lieve Mostrey, Padraic O’Connor, Nathalie Rachou and Dick
Sluimers. The Committee has been chaired by Dick Sluimers
throughout 2019.
The Nomination and Governance Committee met seven times
in 2019. Topics that were discussed in the Committee’s meetings
included the evaluation and assessment of the Managing Board,
the evaluation and assessment of the Supervisory Board, the
composition of the Managing Board, the composition and rotation
schedule of the Supervisory Board and succession planning.
4.3.8 FINANCIAL STATEMENTS
The Managing Board has prepared the 2019 Financial Statements
and has discussed these with the Supervisory Board. The Financial
Statements will be submitted for adoption at the 2020 Annual
General Meeting as part of the Universal Registration Document.
4.4 Remuneration Report
4.4.1 REMUNERATION PRINCIPLES AND COMPONENTS
Remuneration
Euronext operates in European and global fi nancial markets where
it competes for a limited pool of talented executives. Highly qualifi ed
people, who are capable of achieving stretched performance targets,
are essential to generating superior and sustainable returns for
Euronext and its shareholders, while creating long term value for the
overall ecosystem. Our people and remuneration strategies aim to
enable Euronext to attract, develop and retain talent that will ensure
that we maximise long term shareholder value and support the
development of capital markets and the growth of the real economy .
The majority of remuneration for the members of the Managing
Board is linked to demanding performance targets, in line with our
ambitious performance culture, over both the short (calendar year)
and long-term (3-year period) to ensure that executive rewards are
aligned with performance delivered for shareholders and long term
value creation for all stakeholders.
In determining the level and structure of the remuneration of the
members of the Managing Board, the Remuneration Committee
takes into account, among other things, the fi nancial and operational
results as well as non-fi nancial indicators relevant to Euronext’s
long-term objectives. The Remuneration Committee has performed
and will perform scenario analyses to assess that the outcomes
of variable remuneration components appropriately reflect
performance and with due regard for the risks to which variable
remuneration may expose the Company.
In determining the Remuneration Policy and the compensation of
members of the Managing Board, the Supervisory Board has taken
and will take into account (i) the transformation of Euronext, (ii) the
local market practices and the competitive environment where
Euronext operates, (iii) the impact of the overall remuneration of
the Managing Board on the pay diff erentials within the Company
and (iv) the employment terms of the employees in the Company
and its subsidiaries.
The remuneration of the members of the Managing Board consists
of the following components:
n an Annual Fixed Salary component (“AFS”);
n a Short Term Incentive in the form of cash reward (“STI”);
2019 UNIVERSAL REGISTRATION DOCUMENT114 www.euronext.com

Corporate Governance
4
Remuneration Report
n a Long Term Incentive in the form of equity (“LTI”); and
n pension provisions (post-employment benefi ts), employee share
plan and fringe benefi ts.
Euronext believes that it is crucial to provide shareholders with
transparent and comprehensible information about its remuneration
philosophy. The fi rst source of information for shareholders is
the remuneration report. The information provided during the
Company’s analyst presentations, meetings with shareholders and
during the Annual General Meeting of shareholders is the second
most important source of information. It is also critical to explain
to shareholders why a proper remuneration system has a positive
impact on the Company and how it helps to align the interest of all
stakeholders.
For instance, in some countries, listed companies already
have to submit the remuneration of their executives (Board of
Directors, Executive Committee and/or Advisory Board) to a
binding shareholders say-on-pay vote at the Annual General
Meeting. In other countries strong recommendations by national
or international Corporate Governance bodies (such as the
International Corporate Governance Network) exist. Euronext is
committed to implement best practice for say-on-pay, considering
existing applicable legislation, the European shareholders rights
Directive II, and recommendations in the jurisdictions in which it is
active as guiding principles. Other best practices will be followed
such as benchmarking against comparable institutions, defi ning
measurable performance targets and balancing short-term and
long-term remuneration components notably through an adequate
cash-to-stock ratio.
The application of these principles to the remuneration of the
Managing Board was reviewed by the Remuneration Committee
and Supervisory Board in 2019, following a comprehensive
total compensation benchmark conducted in 2019. The updated
framework of the Remuneration Policy was adopted by the Annual
General Meeting in October 2019.
The tables hereafter reflect the current remuneration of the
Managing Board.
Executive Remuneration Summary
The remuneration of the Managing Board is composed of the following key elements:
Element Purpose Commentary
AFS
Refl ect the responsibility and scope
of the role taking into account seniority
and experience
Annual Fixed Salary is reviewed annually through our compensation review process to ensure
competitiveness against competitors.
STIReward annual fi nancial and individual
performance
Target 75% of Annual Fixed Salary for the CEO and 50% or 40% of Annual Fixed Salary
for other Managing Board members.
For the Managing Board, 100% of total STI is paid in cash.
The performance criteria are based on delivery against pre-set EBITDA, market share and cost
targets, on successful execution of the strategic plan and on individual qualitative targets.
See next chapter for more details.
LTIIncentivise performance over the longer term and aim to retain key employees
150% of Annual Fixed Salary for the CEO, and ranging from 50% to 75% for other Managing
Board members depending on role and seniority. LTI awards vest after three years. The grant of LTI awards will be determined on the rules set by the Remuneration Committee and are linked to performance criteria.
The grant of the LTI is conditional and depends on two performance measures to be met:
Total shareholders Return compared with a selected Index and actual EBITDA compared to
a target cumulated EBITDA, both over a 3 years period. Both criteria having equal weight and being used as the discount or multiplier percentage on the conditionally granted LTI.See next chapter for more details.
Pension arrangements
and fringe benefi ts
Ensure competitive benefi ts package and
conformity with local market practice
The pension arrangements of the member of the Managing Board consist of state pension and additional pension schemes that are in line with local practice in the countries where Euronext
operates. In addition members of the Managing Board are entitled to the usual fringe benefi ts such as a company car, expense allowance, medical insurance, accident insurance in line with
local market practice in the countries where Euronext operates.
2019 UNIVERSAL REGISTRATION DOCUMENT 115

Corporate Governance44Remuneration Report
4.4.2 2019 REMUNERATION REPORT
4.4.2.1 Introduction
4.4.2.1.1 2019 Report of the Remuneration Committee
The Remuneration Committee of Euronext assists the Supervisory
Board with respect to the Company’s remuneration strategy and
principles for members of the Managing Board of the Company (the
“Managing Board”), the administration of its cash and equity based
compensation plans and draft proposals to the Supervisory Board
and oversees the remuneration programs and remuneration of the
Company’s senior managers and other personnel.
Considering the re-appointment of the CEO and the transformation
of Euronext, the Remuneration Committee undertook early in 2019
a review of the Remuneration Structure for the Managing Board,
including a benchmark analysis with 4 peer groups as detailed in
this Remuneration Report. The amended remuneration for the CEO
was adopted by the shareholders on 8 October 2019.
The Company’s major investors, and organisation representing
institutional shareholders, have been consulted throughout the
year. In line with their feedback, and according to applicable
regulatory requirements, and in particular the EU Shareholders’
Rights Directive, the level of disclosure has been reinforced in the
Remuneration Policy and in this Remuneration Report.
No signifi cant adjustments to the Managing Board Remuneration
Policy are proposed in 2020, also considering the recent adjustments
proposed to and approved by the EGM on 8 October 2019. However,
the adjusted Remuneration Policy will be submitted to the General
Meeting of May 2020 in line with shareholders feedback and with the
underlying guiding principles of the Shareholder Rights Directive II.
4.4.2.1.2 Performance and Eff ect on Remuneration in 2019
In 2019, the Euronext team delivered major operational, fi nancial
and strategic milestones which have clearly transformed Euronext.
(i) The continued focus on growth and operational efficiency
allowed Euronext to grow double digits on various metrics(1):
1. revenues at €679m, +10.4% above 2018;
2. EBITDA at €399.4 m, +12.8% above 2018;
3. EBITDA margin at 58.8%, 120bps above 2018;
4. Adjusted EPS at €3.90, +10.9% above 2018.
(ii) Euronext delivered our second geographic footprint
enlargement since 2002, after the acquisition of Dublin in 2018,
with the acquisition of Oslo Børs VPS.
(iii) Euronext executed successfully on its plan to make Oslo
the hub of Euronext’s Nordic ambitions entering into a binding
agreement for the acquisition of Nord Pool(2).
(iv) Significant steps were delivered to diversify the Euronext
topline in order to materially improve the quality of the
revenue mix:
1. successful integration of FastMatch, now Euronext FX, with
the fi rst expansion steps in Singapore;
2. consistent deployment of our Corporate Services businesses
which delivered +43% annual growth mostly coming from
subscription-based revenues;
3. acquisition of VPS, contributing signifi cantly to the increase
of non-volume driven revenues;
4. acquisition of Nord Pool, adding Power as a new asset class
on Euronext markets, with no correlation to the core equities
trading businesses of Euronext.
(v) Optiq®, our cutting-edge technology platform has been
completed, delivered and fully deployed on time to secure the
mid-term technology future of Euronext and its repositioning
as a technology-leader in the industry landscape.
(vi) Let’s Grow Together 2022, our new strategic plan released in
October 2019 met strong support of our shareholders, and is
fully owned by our employees. This plan has been designed
in-house through a thorough iterative process involving the
entire organization over a period of 10 months. It sets an
ambitious objective to become the leading pan-European
market infrastructure.
These key performance indicators and strategic achievements are
the basis for the Remuneration decisions described in this report.
4.4.2.2 Annual Fixed Salary (AFS)
AFS, STI and LTI are determined on the basis of benchmarking
comparable companies in relevant markets and take into account
role, scope, accountability, and experience. Typically, AFS will be
positioned at the median level of the peer group benchmark in
line with the overall job responsibilities of the individual Managing
Board member.
The AFS refl ects the responsibility and scope of each role, taking
into account seniority, experience and market practice.
In 2019 the Remuneration Committee conducted its annual review
of the Annual Fixed Salary levels of our Managing Board Members
and in accordance with the Remuneration Policy, a benchmark
analysis has been conducted to support those decisions.
Euronext has become signifi cantly larger with a more mature and
complex fi nancial profi le, an ambitious performance culture and
more complex and diverse operations to face new challenges to
come, that will be of a diff erent natur and complexity in terms of
cross-cultural management, strategic challenges, regulatory and
fi nancial complexity, operational and technological threats.
Considering, the transformation of Euronext and the competitive
environment in which it operates, it has been decided to amend the
remuneration of the Group CEO’s and two other members of the
Managing Board, based on their enlarged responsibilities. The
(1) Please refer to the EBITDA definition provided in Chapter 5 and as defined as EBIDTDA1 in section 7.1.1.
(2) Acquisition completed on 15 January 2020.
2019 UNIVERSAL REGISTRATION DOCUMENT116 www.euronext.com
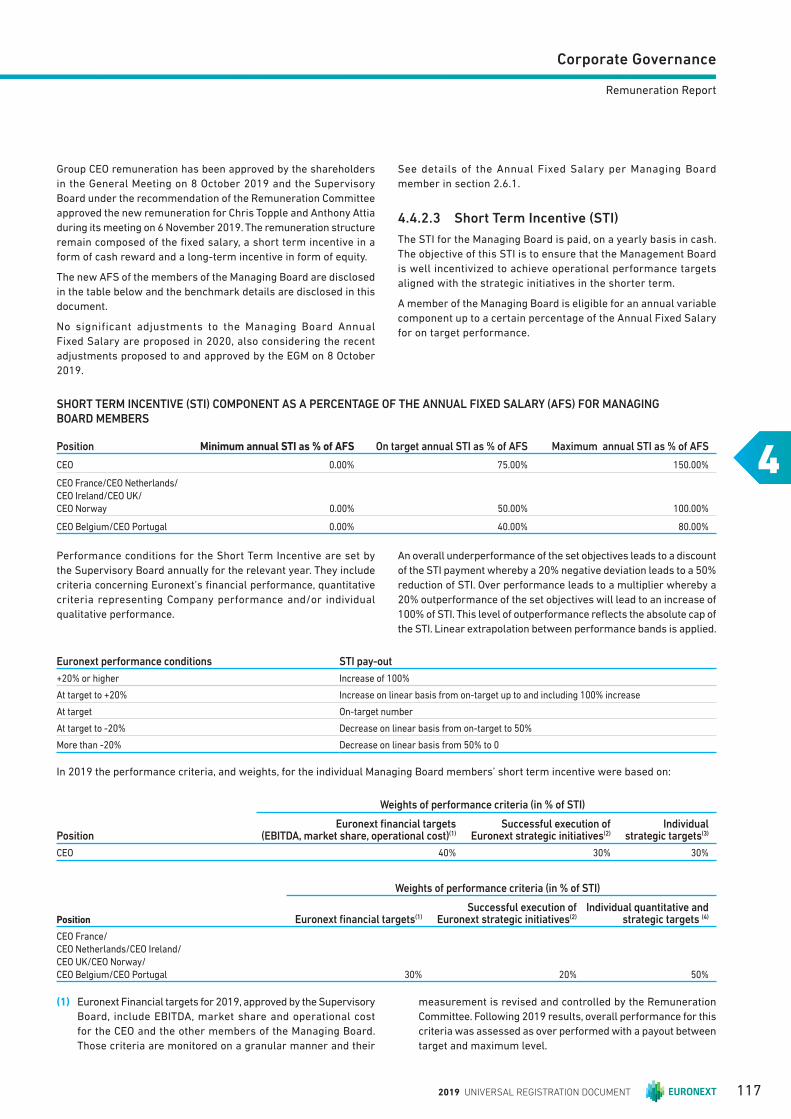
Corporate Governance
4
Remuneration Report
Group CEO remuneration has been approved by the shareholders
in the General Meeting on 8 October 2019 and the Supervisory
Board under the recommendation of the Remuneration Committee
approved the new remuneration for Chris Topple and Anthony Attia
during its meeting on 6 November 2019. The remuneration structure
remain composed of the fi xed salary, a short term incentive in a
form of cash reward and a long-term incentive in form of equity.
The new AFS of the members of the Managing Board are disclosed
in the table below and the benchmark details are disclosed in this
document.
No significant adjustments to the Managing Board Annual
Fixed Salary are proposed in 2020, also considering the recent
adjustments proposed to and approved by the EGM on 8 October
2019.
See details of the Annual Fixed Salary per Managing Board
member in section 2.6.1.
4.4.2.3 Short Term Incentive (STI)
The STI for the Managing Board is paid, on a yearly basis in cash.
The objective of this STI is to ensure that the Management Board
is well incentivized to achieve operational performance targets
aligned with the strategic initiatives in the shorter term.
A member of the Managing Board is eligible for an annual variable
component up to a certain percentage of the Annual Fixed Salary
for on target performance.
SHORT TERM INCENTIVE (STI) COMPONENT AS A PERCENTAGE OF THE ANNUAL FIXED SALARY (AFS) FOR MANAGING BOARD MEMBERS
Position Minimum annual STI as % of AFS On target annual STI as % of AFS Maximum annual STI as % of AFS
CEO 0.00% 75.00% 150.00%
CEO France/CEO Netherlands/
CEO Ireland/CEO UK/
CEO Norway 0.00% 50.00% 100.00%
CEO Belgium/CEO Portugal 0.00% 40.00% 80.00%
(1) Euronext Financial targets for 2019, approved by the Supervisory
Board, include EBITDA, market share and operational cost
for the CEO and the other members of the Managing Board.
Those criteria are monitored on a granular manner and their
measurement is revised and controlled by the Remuneration
Committee. Following 2019 results, overall performance for this
criteria was assessed as over performed with a payout between
target and maximum level.
Performance conditions for the Short Term Incentive are set by
the Supervisory Board annually for the relevant year. They include
criteria concerning Euronext’s fi nancial performance, quantitative
criteria representing Company performance and/or individual
qualitative performance.
An overall underperformance of the set objectives leads to a discount
of the STI payment whereby a 20% negative deviation leads to a 50%
reduction of STI. Over performance leads to a multiplier whereby a
20% outperformance of the set objectives will lead to an increase of
100% of STI. This level of outperformance refl ects the absolute cap of
the STI. Linear extrapolation between performance bands is applied.
Euronext performance conditions STI pay-out
+20% or higher Increase of 100%
At target to +20% Increase on linear basis from on-target up to and including 100% increase
At target On-target number
At target to -20% Decrease on linear basis from on-target to 50%
More than -20% Decrease on linear basis from 50% to 0
In 2019 the performance criteria, and weights, for the individual Managing Board members’ short term incentive were based on:
Weights of performance criteria (in % of STI)
PositionEuronext fi nancial targets
(EBITDA, market share, operational cost)(1)Successful execution of
Euronext strategic initiatives(2)Individual
strategic targets(3)
CEO 40% 30% 30%
Weights of performance criteria (in % of STI)
Position Euronext fi nancial targets(1) Successful execution of
Euronext strategic initiatives(2) Individual quantitative and
strategic targets (4)
CEO France/CEO Netherlands/CEO Ireland/
CEO UK/CEO Norway/CEO Belgium/CEO Portugal 30% 20% 5 0%
2019 UNIVERSAL REGISTRATION DOCUMENT 117
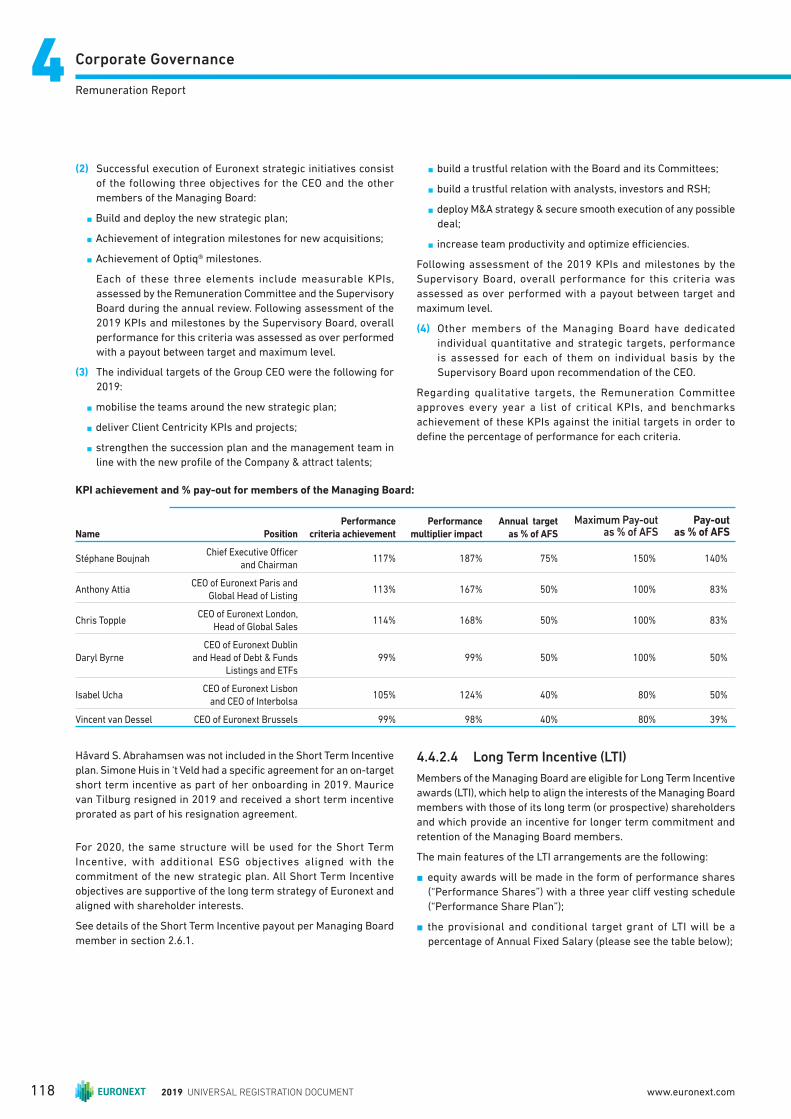
Corporate Governance44Remuneration Report
Håvard S. Abrahamsen was not included in the Short Term Incentive
plan. Simone Huis in ‘t Veld had a specifi c agreement for an on-target
short term incentive as part of her onboarding in 2019. Maurice
van Tilburg resigned in 2019 and received a short term incentive
prorated as part of his resignation agreement.
For 2020, the same structure will be used for the Short Term
Incentive, with additional ESG objectives aligned with the
commitment of the new strategic plan. All Short Term Incentive
objectives are supportive of the long term strategy of Euronext and
aligned with shareholder interests.
See details of the Short Term Incentive payout per Managing Board
member in section 2.6.1.
4.4.2.4 Long Term Incentive (LTI)
Members of the Managing Board are eligible for Long Term Incentive
awards (LTI), which help to align the interests of the Managing Board
members with those of its long term (or prospective) shareholders
and which provide an incentive for longer term commitment and
retention of the Managing Board members.
The main features of the LTI arrangements are the following:
n equity awards will be made in the form of performance shares
(“Performance Shares”) with a three year cliff vesting schedule
(“Performance Share Plan”);
n the provisional and conditional target grant of LTI will be a
percentage of Annual Fixed Salary (please see the table below);
KPI achievement and % pay-out for members of the Managing Board:
Name Position
Performance
criteria achievement
Performance
multiplier impact
Annual target
as % of AFS
Maximum Pay-out as % of AFS
Pay-out as % of AFS
Stéphane Boujnah Chief Executive Offi cer
and Chairman 117% 187% 75% 150% 140%
Anthony Attia CEO of Euronext Paris and
Global Head of Listing 113% 167% 50% 100% 83%
Chris ToppleCEO of Euronext London,
Head of Global Sales114% 168% 50% 100% 83%
Daryl Byrne
CEO of Euronext Dublin
and Head of Debt & Funds
Listings and ETFs
99% 99% 50% 100% 50%
Isabel UchaCEO of Euronext Lisbon
and CEO of Interbolsa105% 124% 40% 80% 50%
Vincent van Dessel CEO of Euronext Brussels 99% 98% 40% 80% 39%
(2) Successful execution of Euronext strategic initiatives consist
of the following three objectives for the CEO and the other
members of the Managing Board:
n Build and deploy the new strategic plan;
n Achievement of integration milestones for new acquisitions;
n Achievement of Optiq® milestones.
Each of these three elements include measurable KPIs,
assessed by the Remuneration Committee and the Supervisory
Board during the annual review. Following assessment of the
2019 KPIs and milestones by the Supervisory Board, overall
performance for this criteria was assessed as over performed
with a payout between target and maximum level.
(3) The individual targets of the Group CEO were the following for
2019:
n mobilise the teams around the new strategic plan;
n deliver Client Centricity KPIs and projects;
n strengthen the succession plan and the management team in
line with the new profi le of the Company & attract talents;
n build a trustful relation with the Board and its Committees;
n build a trustful relation with analysts, investors and RSH;
n deploy M&A strategy & secure smooth execution of any possible
deal;
n increase team productivity and optimize effi ciencies.
Following assessment of the 2019 KPIs and milestones by the
Supervisory Board, overall performance for this criteria was
assessed as over performed with a payout between target and
maximum level.
(4) Other members of the Managing Board have dedicated
individual quantitative and strategic targets, performance
is assessed for each of them on individual basis by the
Supervisory Board upon recommendation of the CEO.
Regarding qualitative targets, the Remuneration Committee
approves every year a list of critical KPIs, and benchmarks
achievement of these KPIs against the initial targets in order to
defi ne the percentage of performance for each criteria.
2019 UNIVERSAL REGISTRATION DOCUMENT118 www.euronext.com

Corporate Governance
4
Remuneration Report
A summary table of the above is as follows.
Euronext performance conditions (for each part of the performance conditions) Vesting % of the number of shares
Total Shareholder Return (TSR)
Earnings Before Interest, Tax, Depreciation and Amortization (EBITDA)
+20% or higher Ratio i/ii is at 1.1 or higher Increase of 100%
At target to +20% Ratio i/ii is between 1 and 1.1 Increase on linear basis from original grant up to and including 100% increase
At target Ratio i/ii is equal to 1 Original granted number
At target to -20% Ratio i/ii is between 1 and 0.9 Decrease on linear basis from original grant to lapse of 50% of the shares
More than -20% Ratio i/ii is below 0.9 Lapse of 100% of the shares
n at vesting date the actual grant will be determined taking into
consideration the performance of Euronext against the criteria of
TSR for 50% of the performance shares granted and the absolute
EBITDA(1) performance for 50% of the performance shares granted
(as described below);
n participants are not entitled to dividends during the vesting period.
An important objective of the LTI is to provide an incentive to the
Managing Board members to continue their employment relationship
with Euronext and to focus on the creation of sustainable shareholder
value.
As a reminder, Long Term Incentive (LTI) component
as a percentage of the Annual Fixed Salary (AFS)
for Managing Board members:
PositionA nnual LTI
as % of AFS
CEO 150.00%
CEO France/CEO Netherlands/CEO Ireland/CEO UK 75.00%
CEO Belgium/CEO Portugal/CEO Norway 50.00%
4.4.2.4.1 Granted Shares
In 2019, the actual number of conditional LTI Performance Share
Plan (“PSP”) awards granted depends on the performance of the
following two performance measures:
n Total Shareholder Return (“TSR”) (50% weighting): The
TSR performance will be based on an absolute difference
between the Total Shareholders Return Index of Euronext and
Total Shareholders Return Index of the STOXX Europe 600
Financial Services index during the vesting period. An overall
underperformance in reference to the index will lead to a
discount on the conditional LTI at vesting date whereby a 20%
negative deviation leads to a 50% reduction of conditionally
granted LTI at vesting date. Below 20% the multiplier will
be 0%. Over performance will lead to a multiplier whereby a
20% outperformance of the index will lead to an increase of
100% in conditionally granted LTI at vesting date. This level of
outperformance refl ects the absolute cap of the LTI allotment;
n Absolute Earnings Before Interest, Tax, Depreciation and
Amortisation (EBITDA (1)) (50% weighting): The EBITDA
performance will be based on the ratio between (i) the actual
cumulated EBITDA of the Company for the three year period, as
reported in the audited fi nancial statement of the Company, and
(ii) a cumulated target EBITDA for the same period computed
based on a target yearly EBITDA growth rate (“y”) as approved
by the Remuneration Committee. The multiplier of the shares
granted in year N+1 (e.g. grant year), will be computed at the end
of the three-year period (i.e. N+3), based on the ratio i/ii. An overall
underperformance in reference to this ratio will lead to a discount
on the conditional LTI at vesting date whereby a 0.9 ratio leads
to a 50% reduction of conditionally granted LTI at vesting date.
Below 0.9 the multiplier will be 0%. Over performance will lead
to a multiplier whereby a 1.1 ratio will lead to an increase of
100% in conditionally granted LTI at vesting date. This level of
outperformance refl ects the absolute cap of the LTI allotment.
These percentages are independent and both weighted equally;
they are being used as the discount or multiplier percentage on the
conditionally granted LTI.
(1) As defined in Chapter 5, and as defined as EBITDA1 in section 7.1.1.
2019 UNIVERSAL REGISTRATION DOCUMENT 119
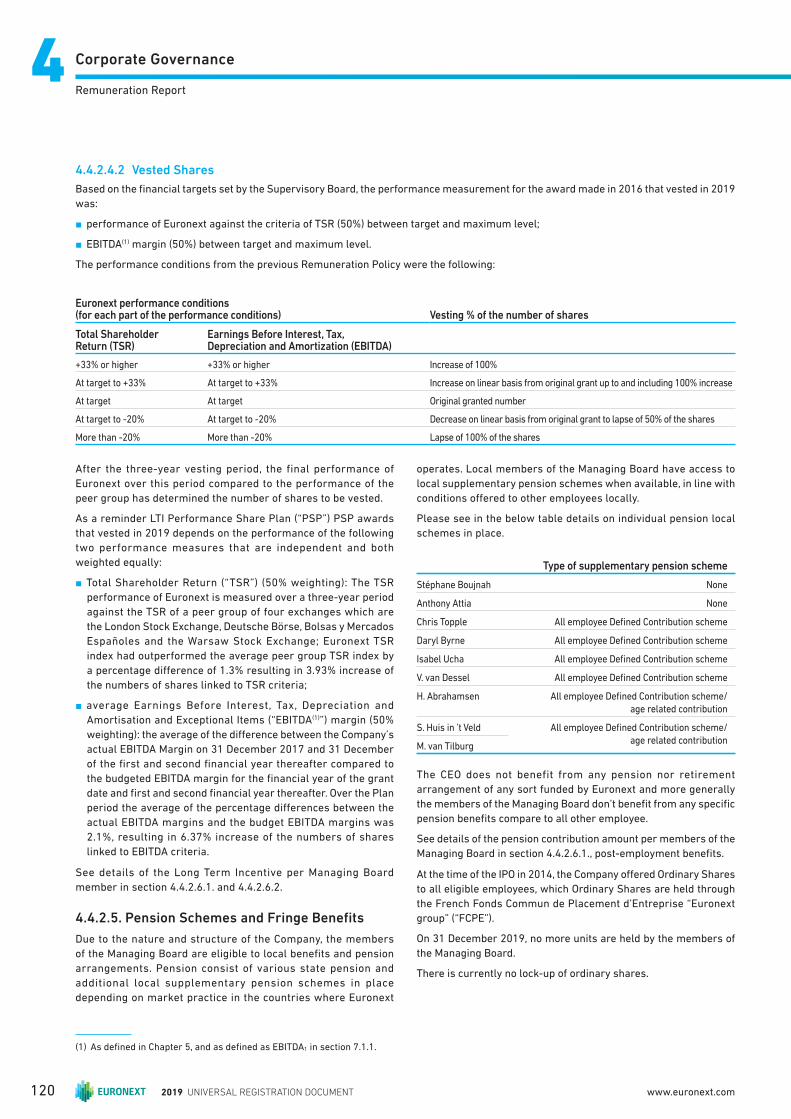
Corporate Governance44Remuneration Report
After the three-year vesting period, the final performance of
Euronext over this period compared to the performance of the
peer group has determined the number of shares to be vested.
As a reminder LTI Performance Share Plan (“PSP”) PSP awards
that vested in 2019 depends on the performance of the following
two performance measures that are independent and both
weighted equally:
n Total Shareholder Return (“TSR”) (50% weighting): The TSR
performance of Euronext is measured over a three-year period
against the TSR of a peer group of four exchanges which are
the London Stock Exchange, Deutsche Börse, Bolsas y Mercados
Españoles and the Warsaw Stock Exchange; Euronext TSR
index had outperformed the average peer group TSR index by
a percentage diff erence of 1.3 % resulting in 3.93% increase of
the numbers of shares linked to TSR criteria;
n average Earnings Before Interest, Tax, Depreciation and
Amortisation and Exceptional Items (“EBITDA(1)”) margin (50%
weighting): the average of the diff erence between the Company’s
actual EBITDA Margin on 31 December 2017 and 31 December
of the fi rst and second fi nancial year thereafter compared to
the budgeted EBITDA margin for the fi nancial year of the grant
date and fi rst and second fi nancial year thereafter. Over the Plan
period the average of the percentage diff erences between the
actual EBITDA margins and the budget EBITDA margins was
2.1%, resulting in 6.37% increase of the numbers of shares
linked to EBITDA criteria.
See details of the Long Term Incentive per Managing Board
member in section 4.4.2.6.1. and 4.4.2.6.2.
4.4.2.5. Pension Schemes and Fringe Benefi ts
Due to the nature and structure of the Company, the members
of the Managing Board are eligible to local benefi ts and pension
arrangements. Pension consist of various state pension and
additional local supplementary pension schemes in place
depending on market practice in the countries where Euronext
operates. Local members of the Managing Board have access to
local supplementary pension schemes when available, in line with
conditions off ered to other employees locally.
Please see in the below table details on individual pension local
schemes in place.
Type of supplementary pension scheme
Stéphane Boujnah None
Anthony Attia None
Chris Topple All employee Defi ned Contribution scheme
Daryl Byrne All employee Defi ned Contribution scheme
Isabel Ucha All employee Defi ned Contribution scheme
V. van Dessel All employee Defi ned Contribution scheme
H. Abrahamsen All employee Defi ned Contribution scheme/age related contribution
S. Huis in ’t Veld All employee Defi ned Contribution scheme/age related contribution
M. van Tilburg
The CEO does not benefit from any pension nor retirement
arrangement of any sort funded by Euronext and more generally
the members of the Managing Board don’t benefi t from any specifi c
pension benefi ts compare to all other employee.
See details of the pension contribution amount per members of the
Managing Board in section 4.4.2.6.1., post-employment benefi ts.
At the time of the IPO in 2014, the Company off ered Ordinary Shares
to all eligible employees, which Ordinary Shares are held through
the French Fonds Commun de Placement d’Entreprise “Euronext
group” (“FCPE”).
On 31 December 2019, no more units are held by the members of
the Managing Board.
There is currently no lock-up of ordinary shares.
4.4.2.4.2 Vested Shares
Based on the fi nancial targets set by the Supervisory Board, the performance measurement for the award made in 2016 that vested in 2019
was:
n performance of Euronext against the criteria of TSR (50%) between target and maximum level;
n EBITDA(1) margin (50%) between target and maximum level.
The performance conditions from the previous Remuneration Policy were the following:
Euronext performance conditions (for each part of the performance conditions) Vesting % of the number of shares
Total Shareholder Return (TSR)
Earnings Before Interest, Tax,Depreciation and Amortization (EBITDA)
+33% or higher +33% or higher Increase of 100%
At target to +33% At target to +33% Increase on linear basis from original grant up to and including 100% increase
At target At target Original granted number
At target to -20% At target to -20% Decrease on linear basis from original grant to lapse of 50% of the shares
More than -20% More than -20% Lapse of 100% of the shares
(1) As defined in Chapter 5, and as defined as EBITDA1 in section 7.1.1.
2019 UNIVERSAL REGISTRATION DOCUMENT120 www.euronext.com

Corporate Governance
4
Remuneration Report
4.4.2.6 Remuneration of Managing Board Members for 2019 and Previous Years
4.4.2.6.1 Five year Remuneration Overview
The remuneration for 2019 and previous years, is presented in the
table below.
The actual remuneration expensed for the members of the Managing
Board, for the year 2019 amounts to €7,524,135. This amount
includes a pro rata compensation related to Isabel Ucha, Simone
Huis in ’t Veld, Maurice van Tilburg and Håvard S. Abrahamsen.
The total remuneration consists of (i) an aggregate Annual Fixed
Salary, (ii) the aggregate Short Term Incentive compensation based
on the achievements against objective measurable criteria and
(iii) the aggregate Long Term Incentive compensation recognised in
accordance with IFRS 2 and (iv) an amount to be contributed to post-
employment benefi ts. The table also presents the fi xed to variable
remuneration ratio.
The pay-for-performance philosophy and long-term value creation
is, amongst others, realized by the pay mix, with more than two-
thirds of the CEO total package in variable pay. A signifi cant part of
the pay package is conditional upon the achievement of long term
performance targets, with long term variable pay representing
almost half of the pay package. Such balance is considered to
support the Company’s strategy and the long term sustainable
interests of the Company and all its stakeholders including its
shareholders.
MANAGING BOARD REMUNERATION
Name Title Currency Year AFS STILTI based
on IFRS 2(1)Post-employ-ment benefi ts
% fi xed
% variable
Stéphane
Boujnah
Chief Executive Offi cer and
Chairman
EUR 2019 825,000 1,155,000 1,023,586 0 27% 73%
EUR 2018 725,000 1,015,000 532,813 0 32% 68%
EUR 2017 725,000 815,625 291,045 0 40% 60%
EUR 2016 725,000 797,500 65,924 0 46% 54%
EUR 2015 725,000 250,000 0 0 74% 26%
Anthony AttiaCEO of Euronext Paris and Global
Head of Listing
EUR 2019 360,000 300,000 301,635 0 37% 63%
EUR 2018 300,000 270,000 352,996 0 33% 67%
EUR 2017 300,000 225,000 257,948 0 38% 62%
EUR 2016 300,000 210,000 160,886 0 45% 55%
EUR 2015 300,000 225,000 218,261 0 40% 60%
Chris ToppleCEO of Euronext London, Head of
Global Sales
GBP 2019 360,000 300,000 347,493 23,357 36% 64%
GBP 2018 320,000 320,000 17,492 4,891 49% 51%
Daryl ByrneCEO of Euronext Dublin and Head
of Debt & Funds Listings and ETFs
EUR 2019 270,000 135,000 19,504 32,400 64% 36%
EUR 2018 270,000 100,000 6,224 6,750 72% 28%
Isabel UchaCEO of Euronext Lisbon and CEO of Interbolsa
EUR 2019 230,000 115,000 21,606 21,645 63% 37%
Vincent Van Dessel
CEO of Euronext Brussels
EUR 2019 282,722 112,843 179,996 35,596 49% 51%
EUR 2018 275,655 110,000 181,860 34,631 49% 51%
EUR 2017 270,701 110,000 157,460 33,853 50% 50%
EUR 2016 264,764 105,905 77,374 33,507 59% 41%
EUR 2015 263,630 132,000 100,349 33,388 53% 47%
Håvard S. Abrahamsen(2) CEO Oslo Børs VPS NOK 2019 4,000,000 0 0 25,309 100% 0%
Simone Huis in ’t Veld(1) CEO of Euronext Amsterdam EUR 2019 270,000 135,000 0 4,458 67% 33%
Maurice van
Tilburg(3)
CEO of Euronext
Amsterdam and Headof Market Operationsand Client Centricity
EUR 2019 270,000 150,000 139,256 14,878 48% 52%
EUR 2018 270,000 190,000 280,721 16,667 36% 64%
EUR 2017 270,000 190,000 71,539 16,869 51% 49%
EUR 2016 270,000 162,000 86,394 16,093 52% 48%
EUR 2015 220,000 164,000 51,623 11,536 51% 49%
(1) IFRS standard 2 on “Shared-based payments” prescribes recognition of expense for share based grants on the fair value as per grant date. This “grant date fair value” is expensed over the 3-year vesting period.
(2) 2019 Short Term Incentive for new joiners are refl ecting a contractual arrangement at the time of hiring for Simone Huis in ’t Veld.
(3) On 31 October 2019 Maurice van Tilburg’s resignation became eff ective.
2019 UNIVERSAL REGISTRATION DOCUMENT 121
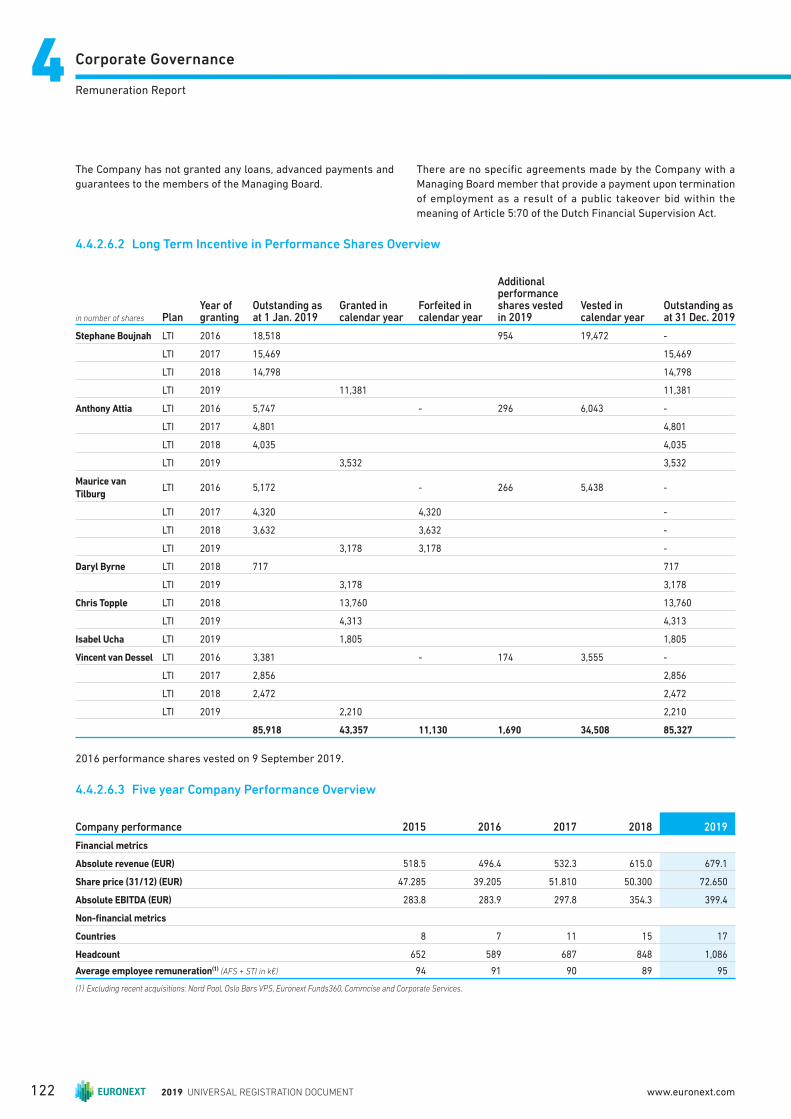
Corporate Governance44Remuneration Report
4.4.2.6.2 Long Term Incentive in Performance Shares Overview
in number of shares PlanYear of granting
Outstanding as at 1 Jan. 2019
Granted in calendar year
Forfeited in calendar year
Additional performance shares vested in 2019
Vested in calendar year
Outstanding as at 31 Dec. 2019
Stephane Boujnah LTI 2016 18,518 954 19,472 -
LTI 2017 15,469 15,469
LTI 2018 14,798 14,798
LTI 2019 11,381 11,381
Anthony Attia LTI 2016 5,747 - 296 6,043 -
LTI 2017 4,801 4,801
LTI 2018 4,035 4,035
LTI 2019 3,532 3,532
Maurice van
TilburgLTI 2016 5,172 - 266 5,438 -
LTI 2017 4,320 4,320 -
LTI 2018 3,632 3,632 -
LTI 2019 3,178 3,178 -
Daryl Byrne LTI 2018 717 717
LTI 2019 3,178 3,178
Chris Topple LTI 2018 13,760 13,760
LTI 2019 4,313 4,313
Isabel Ucha LTI 2019 1,805 1,805
Vincent van Dessel LTI 2016 3,381 - 174 3,555 -
LTI 2017 2,856 2,856
LTI 2018 2,472 2,472
LTI 2019 2,210 2,210
85,918 43,357 11,130 1,690 34,508 85,327
2016 performance shares vested on 9 September 2019.
4.4.2.6.3 Five year Company Performance Overview
Company performance 2015 2016 2017 2018 2019
Financial metrics
Absolute revenue (EUR) 518.5 496.4 532.3 615.0 679.1
Share price (31/12) (EUR) 47.285 39.205 51.810 50.300 72.650
Absolute EBITDA (EUR) 283.8 283.9 297.8 354.3 399.4
Non-fi nancial metrics
Countries 8 7 11 15 17
Headcount 652 589 687 848 1,086
Average employee remuneration(1) (AFS + STI in k€) 94 91 90 89 95
(1) Excluding recent acquisitions: Nord Pool, Oslo Børs VPS, Euronext Funds360, Commcise and Corporate Services.
The Company has not granted any loans, advanced payments and
guarantees to the members of the Managing Board.
There are no specifi c agreements made by the Company with a
Managing Board member that provide a payment upon termination
of employment as a result of a public takeover bid within the
meaning of Article 5:70 of the Dutch Financial Supervision Act.
2019 UNIVERSAL REGISTRATION DOCUMENT122 www.euronext.com

Corporate Governance
4
Remuneration Report
4.4.2.7 2019 Group CEO Pay Ratio
Euronext takes into account the internal pay ratios when formulating
the Remuneration Policy. In light of transparency and clarity,
Euronext applies a methodology using total cash, including base
salary and short term
Incentive that are disclosed in the table above.
The ratio between the total annual remuneration of the group CEO
and the average annual employee compensation in 2019 was 20.9.
The comparable 2018 ratio was 19.6. (please refer to the table above
for further details on Managing Board remuneration). This change of
ratio is linked to the adjustment to the CEO remuneration approved
by the EGM on 8 October 2019.
4.4.2.8 2019 Benchmark Analysis
In accordance with the Remuneration Policy, a benchmark analysis
has been conducted (by a third-party provider in April 2019) against
four diff erent peer groups to assess compensation levels of the
CEO. First two reference markets consist of European headquartered
companies of comparable size and scope, primarily active in
the Finance & IT industries and relevant direct competitors. To
complement these two peer groups, an analysis was performed
against two local markets on equivalent position (France where
the CEO is based, and the Netherlands/AEX). This analysis showed
that the current target total compensation package was positioned
below European Market, signifi cantly below the median of the French
Market and the lower quartile of the Direct Competitors and slightly
lower than the Dutch Market.
The detailed results are as follow:
n Peer group 1: European market(1)
n Total Direct Compensation was at 87% of the market median,
n 21 companies in the Finance, Technology and Infrastructure
industries compose this peer group with a market capitalization
between €2 and €9 billion.
n Peer group 2: Direct competitors(2)
n Total Direct Compensation was at 46% of the market median:
— For the European competitors, Total Direct Compensation was
at 71% of the median,
— For the U.S. competitors, Total Direct Compensation was at
24% of the median,
n 14 listed companies and 9 non-listed companies compose
this peer group with a market capitalization (for those listed)
between €2 and €52 billion.
n Peer group 3: Local Market (France)(3)
n Total Direct Compensation was at 80% of the market median,
n 25 companies in the Finance, Technology and Infrastructure
industries compose this peer group with a market capitalization
between €2 and €12 billion.
n Peer group 4: Local Market (the Netherlands – AEX Market)(4)
n Total Direct Compensation was at 99% of the market median,
n 18 companies compose this peer group with a market
capitalization between €2 and €12 billion.
4.4.2.9 Remuneration of Supervisory Board Members
4.4.2.9.1 2019 Remuneration
The principles of the Supervisory Board Remuneration Policy are
to incentivise Supervisory Board members to utilize their skills and
competences to the maximum extent possible to execute the tasks
which include but are not limited to those responsibilities required
by the Civil Code, Dutch Corporate Governance Code and the Articles
of Association.
The gross amounts that were paid to members of the Supervisory
Board in 2019 are disclosed in the below table. They reflects
each role’s responsibilities as well as the time spent since the
number of meetings in 2019 was quite high. The development of
the remuneration of Dick Sluimers also refl ects his appointment
as Chairman of the Supervisory Board in 2018. Other changes in
remuneration are mainly the result of mid-year appointments or
resignations.
(1) Peer group 1: Sage Group, Cellnex Telecom SA, Standard Life Aberdeen PLC, Elisa Oyj Class A, United Internet AG, AVEVA Group plc, Nemetschek SE, 1&1
Drillisch AG, SES SA FDR (Class A), Iliad SA, Investec plc, Infrastrutture Wireless Italiane S.p.A., Gemalto N.V., Telekom Austria AG, Eutelsat Communications
SA, SimCorp A/S, VEON Ltd., KBC Ancora SCA, Quilter Plc, Inmarsat plc, Sunrise Communications Group Ltd.
(2) Peer group 2: Listed competitors: CME Group Inc. Class A, S&P Global, Inc., Intercontinental Exchange, Inc., Thomson Reuters Corporation, Deutsche
Boerse AG, IHS Markit Ltd., London Stock Exchange Group plc, MSCI Inc. Class A, NASDAQ, Inc., Cboe Global Markets Inc., FactSet Research Systems
Inc., MarketAxess Holdings Inc., Morningstar, Inc., Bolsas y Mercados Espanoles/Non-listed direct competitors: CLS Group Holdings AG, Depository Trust
& Clearing Corporation, Euroclear Plc, Fitch Group, Inc., London Metal Exchange Ltd., LCH.Clearnet Group Ltd, NEX Group Limited, SIX Group Ltd., SWIFT
(3) Peer group 3: Amundi SA, Gecina SA, Edenred SA, Worldline SA, Teleperformance SE, Bureau Veritas SA, Atos SE, Ubisoft Entertainment SA, Covivio SA,
Getlink SE, Scor SE, SES SA FDR (Class A), Iliad SA, Wendel SE, Eurazeo SA, ALD SA, Air France-KLM SA, Ingenico Group SA, Eutelsat Communications
SA, Alten SA, Elis SA, Altran Technologies SA, Nexity SA Class A, Soitec SA, Rothschild & Co. SCA Finance.
(4) Peer group 4: NN Group N.V., Royal KPN NV, Aegon N.V., Randstad NV, Galapagos NV, Royal Vopak NV, ASR Nederland NV, OCI NV, GrandVision NV, Gemalto
N.V., IMCD N.V., Takeaway.com Holding BV, SBM Offshore NV, Aalberts Industries N.V., Koninklijke Boskalis Westminster N.V., Signify NV, Core Laboratories,
ASM International N.V.
2019 UNIVERSAL REGISTRATION DOCUMENT 123

Corporate Governance44Remuneration Report
Group Supervisory Board 2019 2018 2017 2016 2015
Dick Sluimers €129,000 €112,500 €81,000 €40,883
Manuel Ferreira da Silva €87,000 €72,000 €67,000 €67,000 €68,742
Jim Gollan €85,000 €72,500 €65,000 €63,538 €27,283
Kerstin Günther €81,000 €66,000 €57,585 €35,014
Luc Keuleneer €81,000 €49,875
Lieve Mostrey €0 €0 €0 €0 €0
Padraic O’Connor €84,000 €42,375
Nathalie Rachou €18,121
Franck Silvent €81,000 €63,500 €8,890
Morten Thorsrud €17,184
Ramon Fernandez €37,000 €69,500 €61,000 €58,820 €24,599
Two members of the Supervisory Board, Dick Sluimers and Luc
Keuleneer, also received remuneration in relation to their positions
in the Supervisory Board of Euronext Amsterdam, one of Euronext’s
subsidiaries. One member of the Supervisory Board, Jim Gollan, also
received remuneration in relation to his position as Chairman of the
board of Euronext London Limited, one of Euronext’s subsidiaries.
These remunerations are disclosed in the fi gures as illustrated
below.
Local Boards 2019 2018 2017 2016 2015
Dick Sluimers €15,000 €15,000 €15,000 €10,779
Jim Gollan 30,000 GBP 30,000 GBP 30,000 GBP 30,000 GBP 30,000 GBP
Luc Keuleneer €15,000 €15,000
The Remuneration Policy for the members of the Supervisory Board
will be submitted to the General Meeting of May 2020.
Euronext does not issue option or share plans or other incentive
plans to the Supervisory Board. Euronext has not granted any loans
to members of the Supervisory Board. There are no service contracts
which provide for benefi ts upon termination of employment with
members of the Supervisory Board.
4.4.2.9.2. Appointment and dismissal
Ramon Fernandez retired after the Annual General Meeting held on
16 May 2019. Nathalie Rachou and Morten Thorsrud were appointed
in the Extraordinary General Meeting of 8 October 2019.
2019 UNIVERSAL REGISTRATION DOCUMENT124 www.euronext.com
Corporate Governance
4
THIS PAGE HAS BEEN INTENTIONALLY LEFT BLANK
2019 UNIVERSAL REGISTRATION DOCUMENT 125

2019 UNIVERSAL REGISTRATION DOCUMENT126 www.euronext.com

SELECTED HISTORICAL CONSOLIDATED FINANCIAL INFORMATION AND OTHER
FINANCIAL INFORMATION
2019 UNIVERSAL REGISTRATION DOCUMENT 127
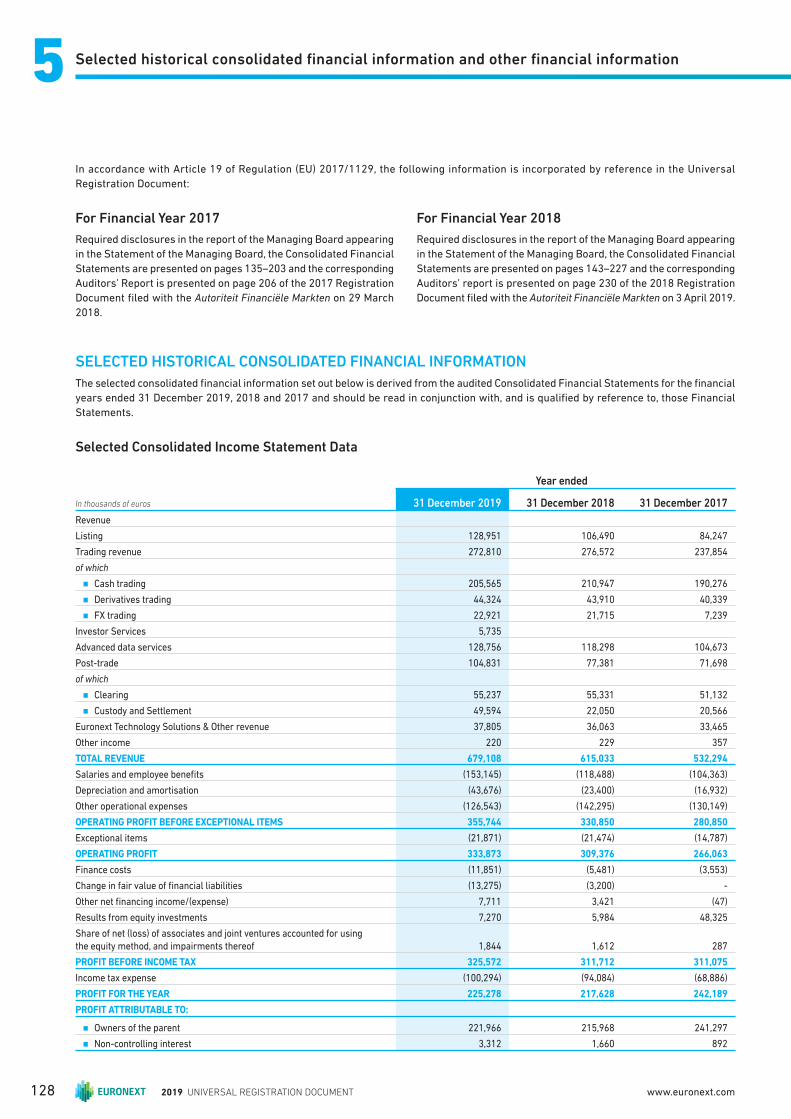
Selected historical consolidated fi nancial information and other fi nancial information55
In accordance with Article 19 of Regulation (EU) 2017/1129 , the following information is incorporated by reference in the Universal
Registration Document:
For Financial Year 2017
Required disclosures in the report of the Managing Board appearing
in the Statement of the Managing Board, the Consolidated Financial
Statements are presented on pages 135–203 and the corresponding
Auditors’ Report is presented on page 206 of the 2017 Registration
Document fi led with the Autoriteit Financiële Markten on 29 March
2018.
For Financial Year 2018
Required disclosures in the report of the Managing Board appearing
in the Statement of the Managing Board, the Consolidated Financial
Statements are presented on pages 143–227 and the corresponding
Auditors’ report is presented on page 230 of the 2018 Registration
Document fi led with the Autoriteit Financiële Markten on 3 April 2019.
SELECTED HISTORICAL CONSOLIDATED FINANCIAL INFORMATION
The selected consolidated fi nancial information set out below is derived from the audited Consolidated Financial Statements for the fi nancial
years ended 31 December 2019, 2018 and 2017 and should be read in conjunction with, and is qualifi ed by reference to, those Financial
Statements.
Selected Consolidated Income Statement Data
In thousands of euros
Year ended
31 December 2019 31 December 2018 31 December 2017
Revenue
Listing 128,951 106,490 84,247
Trading revenue 272,810 276,572 237,854
of which
n Cash trading 205,565 210,947 190,276
n Derivatives trading 44,324 43,910 40,339
n FX trading 22,921 21,715 7,239
Investor Services 5,735
Advanced data services 128,756 118,298 104,673
Post-trade 104,831 77,381 71,698
of which
n Clearing 55,237 55,331 51,132
n Custody and Settlement 49,594 22,050 20,566
Euronext Technology Solutions & Other revenue 37,805 36,063 33,465
Other income 220 229 357
TOTAL REVENUE 679,108 615,033 532,294
Salaries and employee benefi ts (153,145) (118,488) (104,363)
Depreciation and amortisation (43,676) (23,400) (16,932)
Other operational expenses (126,543) (142,295) (130,149)
OPERATING PROFIT BEFORE EXCEPTIONAL ITEMS 355,744 330,850 280,850
Exceptional items (21,871) (21,474) (14,787)
OPERATING PROFIT 333,873 309,376 266,063
Finance costs (11,851) (5,481) (3,553)
Change in fair value of fi nancial liabilities (13,275) (3,200) -
Other net fi nancing income/(expense) 7,711 3,421 (47)
Results from equity investments 7,270 5,984 48,325
Share of net (loss) of associates and joint ventures accounted for using the equity method, and impairments thereof 1,844 1,612 287
PROFIT BEFORE INCOME TAX 325,572 311,712 311,075
Income tax expense (100,294) (94,084) (68,886)
PROFIT FOR THE YEAR 225,278 217,628 242,189
PROFIT ATTRIBUTABLE TO:
n Owners of the parent 221,966 215,968 241,297
n Non-controlling interest 3,312 1,660 892
2019 UNIVERSAL REGISTRATION DOCUMENT128 www.euronext.com
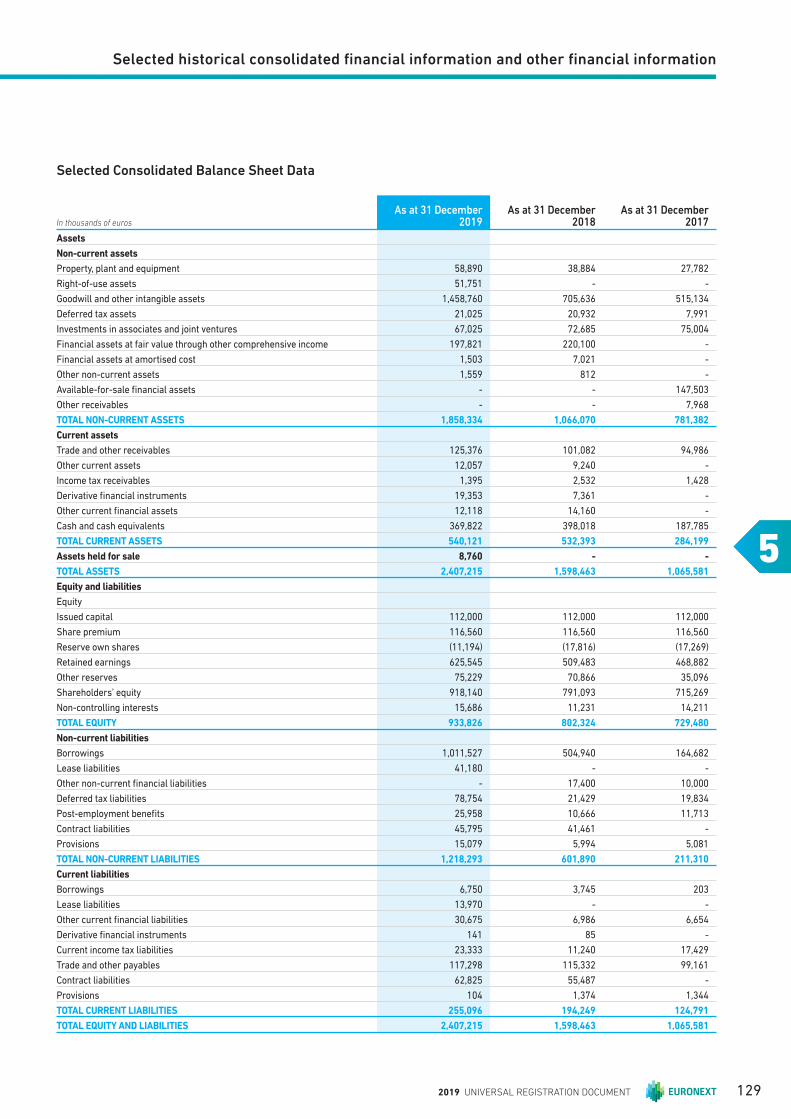
Selected historical consolidated fi nancial information and other fi nancial information
5
Selected Consolidated Balance Sheet Data
In thousands of euros
As at 31 December 2019
As at 31 December 2018
As at 31 December 2017
Assets
Non-current assets
Property, plant and equipment 58,890 38,884 27,782
Right-of-use assets 51,751 - -
Goodwill and other intangible assets 1,458,760 705,636 515,134
Deferred tax assets 21,025 20,932 7,991
Investments in associates and joint ventures 67,025 72,685 75,004
Financial assets at fair value through other comprehensive income 197,821 220,100 -
Financial assets at amortised cost 1,503 7,021 -
Other non-current assets 1,559 812 -
Available-for-sale fi nancial assets - - 147,503
Other receivables - - 7,968
TOTAL NON-CURRENT ASSETS 1,858,334 1,066,070 781,382
Current assets
Trade and other receivables 125,376 101,082 94,986
Other current assets 12,057 9,240 -
Income tax receivables 1,395 2,532 1,428
Derivative fi nancial instruments 19,353 7,361 -
Other current fi nancial assets 12,118 14,160 -
Cash and cash equivalents 369,822 398,018 187,785
TOTAL CURRENT ASSETS 540,121 532,393 284,199
Assets held for sale 8,760 - -
TOTAL ASSETS 2,407,215 1,598,463 1,065,581
Equity and liabilities
Equity
Issued capital 112,000 112,000 112,000
Share premium 116,560 116,560 116,560
Reserve own shares (11,194) (17,816) (17,269)
Retained earnings 625,545 509,483 468,882
Other reserves 75,229 70,866 35,096
Shareholders’ equity 918,140 791,093 715,269
Non-controlling interests 15,686 11,231 14,211
TOTAL EQUITY 933,826 802,324 729,480
Non-current liabilities
Borrowings 1,011,527 504,940 164,682
Lease liabilities 41,180 - -
Other non-current fi nancial liabilities - 17,400 10,000
Deferred tax liabilities 78,754 21,429 19,834
Post-employment benefi ts 25,958 10,666 11,713
Contract liabilities 45,795 41,461 -
Provisions 15,079 5,994 5,081
TOTAL NON-CURRENT LIABILITIES 1,218,293 601,890 211,310
Current liabilities
Borrowings 6,750 3,745 203
Lease liabilities 13,970 - -
Other current fi nancial liabilities 30,675 6,986 6,654
Derivative fi nancial instruments 141 85 -
Current income tax liabilities 23,333 11,240 17,429
Trade and other payables 117,298 115,332 99,161
Contract liabilities 62,825 55,487 -
Provisions 104 1,374 1,344
TOTAL CURRENT LIABILITIES 255,096 194,249 124,791
TOTAL EQUITY AND LIABILITIES 2,407,215 1,598,463 1,065,581
2019 UNIVERSAL REGISTRATION DOCUMENT 129
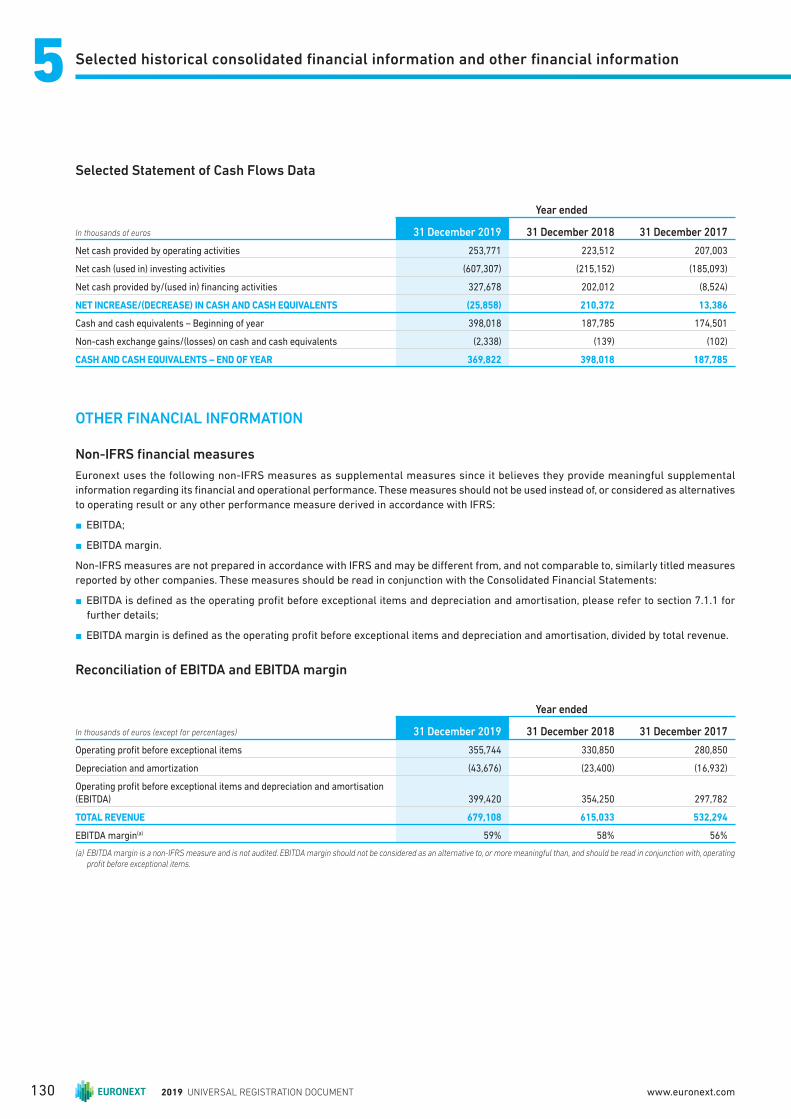
Selected historical consolidated fi nancial information and other fi nancial information55
Selected Statement of Cash Flows Data
In thousands of euros
Year ended
31 December 2019 31 December 2018 31 December 2017
Net cash provided by operating activities 253,771 223,512 207,003
Net cash (used in) investing activities (607,307) (215,152) (185,093)
Net cash provided by/(used in) fi nancing activities 327,678 202,012 (8,524)
NET INCREASE/(DECREASE) IN CASH AND CASH EQUIVALENTS (25,858) 210,372 13,386
Cash and cash equivalents – Beginning of year 398,018 187,785 174,501
Non-cash exchange gains/(losses) on cash and cash equivalents (2,338) (139) (102)
CASH AND CASH EQUIVALENTS – END OF YEAR 369,822 398,018 187,785
OTHER FINANCIAL INFORMATION
Non-IFRS fi nancial measures
Euronext uses the following non-IFRS measures as supplemental measures since it believes they provide meaningful supplemental
information regarding its fi nancial and operational performance. These measures should not be used instead of, or considered as alternatives
to operating result or any other performance measure derived in accordance with IFRS:
n EBITDA;
n EBITDA margin.
Non-IFRS measures are not prepared in accordance with IFRS and may be diff erent from, and not comparable to, similarly titled measures
reported by other companies. These measures should be read in conjunction with the Consolidated Financial Statements:
n EBITDA is defi ned as the operating profi t before exceptional items and depreciation and amortisation, please refer to section 7.1.1 for
further details;
n EBITDA margin is defi ned as the operating profi t before exceptional items and depreciation and amortisation, divided by total revenue.
Reconciliation of EBITDA and EBITDA margin
In thousands of euros (except for percentages)
Year ended
31 December 2019 31 December 2018 31 December 2017
Operating profi t before exceptional items 355,744 330,850 280,850
Depreciation and amortization (43,676) (23,400) (16,932)
Operating profi t before exceptional items and depreciation and amortisation
(EBITDA) 399,420 354,250 297,782
TOTAL REVENUE 679,108 615,033 532,294
EBITDA margin(a) 59% 58% 56%
(a) EBITDA margin is a non-IFRS measure and is not audited. EBITDA margin should not be considered as an alternative to, or more meaningful than, and should be read in conjunction with, operating profi t before exceptional items.
2019 UNIVERSAL REGISTRATION DOCUMENT130 www.euronext.com
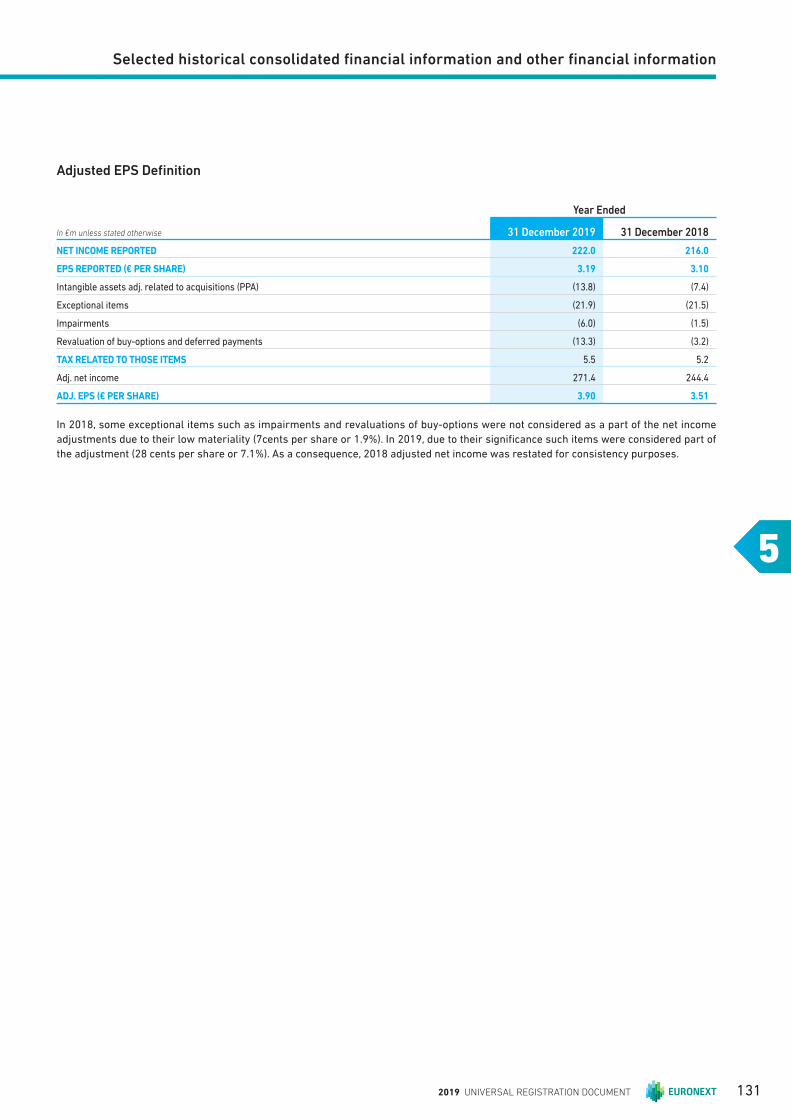
Selected historical consolidated fi nancial information and other fi nancial information
5
Adjusted EPS Defi nition
Year Ended
In €m unless stated otherwise 31 December 2019 31 December 2018
NET INCOME REPORTED 222.0 216.0
EPS REPORTED (€ PER SHARE) 3.19 3.10
Intangible assets adj. related to acquisitions (PPA) (13.8) (7.4)
Exceptional items (21.9) (21.5)
Impairments (6.0) (1.5)
Revaluation of buy-options and deferred payments (13.3) (3.2)
TAX RELATED TO THOSE ITEMS 5.5 5.2
Adj. net income 271.4 244.4
ADJ. EPS (€ PER SHARE) 3.90 3.51
In 2018, some exceptional items such as impairments and revaluations of buy-options were not considered as a part of the net income
adjustments due to their low materiality (7cents per share or 1.9%). In 2019, due to their signifi cance such items were considered part of
the adjustment (28 cents per share or 7.1%). As a consequence, 2018 adjusted net income was restated for consistency purposes.
2019 UNIVERSAL REGISTRATION DOCUMENT 131

2019 UNIVERSAL REGISTRATION DOCUMENT132 www.euronext.com
GENERAL DESCRIPTION OF THE COMPANY
AND ITS SHARE CAPITAL
6.1 Legal Information on the Company 134
6.1.1 General 134
6.1.2 Corporate Objects 134
6.2 Share Capital 134
6.2.1 Authorised and Issued Share Capital 134
6.2.2 Issue of Shares 134
6.2.3 Pre-Emption Rights 135
6.2.4 Acquisition of Shares in Euronext’s Capital 135
6.2.5 Reduction of Share Capital 135
6.3 Shareholder Structure 136
6.4 Share Classes and Major Shareholders 136
6.4.1 Reference Shareholders 136
6.4.2 Major Shareholdings 138
6.5 General Meeting of Shareholders and Voting Rights 139
6.6 Anti-Takeover Provisions 140
6.7 Obligations of Shareholders and Members of the Managing Board to Disclose Holdings 140
6.8 Short Positions 141
6.9 Market Abuse Regime 141
6.10 Transparency Directive 142
6.11 Dutch Financial Reporting Supervision Act 142
6.12 Dividends and Other Distributions 143
6.13 2020 Financial Calendar 143
1332019 UNIVERSAL REGISTRATION DOCUMENT
General Description of the Company and Its Share Capital66Legal Information on the Company
6.1 Legal Information on the Company
6.1.1 GENERAL
Euronext is a public company with limited liability (naamloze
Vennootschap) incorporated under the laws of the Netherlands and
is domiciled in the Netherlands. The Company was incorporated
in the Netherlands on 15 March 2014. Euronext’s statutory seat
(statutaire zetel) is in Amsterdam, the Netherlands, and its registered
offi ce and principal place of business is at Beursplein 5, 1012 JW
Amsterdam, the Netherlands. The Company is registered with the
trade register of the Chamber of Commerce for Amsterdam, the
Netherlands, under number 60234520, and the telephone number
is +31 (0)20-7214444. Euronext’s LEI is 724500QJ4QSZ3H9QU415
and its corporate website is https://www.euronext.com/en.
6.1.2 CORPORATE OBJECTS
Euronext’s corporate objects, as set out in Article 3 of the Articles
of Association, are to participate and to manage other enterprises
and companies of which the objects are to set up, develop, hold
and operate, directly or indirectly, one or more regulated and
other markets or other facilities with regard to the listing of, the
trading in, the post-trade processing of transactions in, and related
services and process in, securities and derivatives, as well as to
manage and fi nance subsidiaries, to enter into joint ventures with
other enterprises and other companies engaged in one or more of
the activities referred to above; to acquire, operate and dispose of
industrial and intellectual property rights as well as real property;
to provide security for the debts of the Company, its subsidiaries or
any other legal person and to undertake all that is connected to the
foregoing or in furtherance thereof.
6.2 Share Capital
6.2.1 AUTHORISED AND ISSUED SHARE CAPITAL
Under the Articles of Association, Euronext’s authorised share capital
amounts to €200,000,001.60 and is divided into 125,000,000 Ordinary
Shares, each with a nominal value of €1.60 and one priority share
with a nominal value of €1.60. All of Euronext’s shares have been
or will be created under Dutch law.
As of 31 December 2019, Euronext’s issued share capital amounts
to €112,000,000 and is divided into 70,000,000 Ordinary Shares.
The Priority Share is currently not outstanding. As of 31 December
2019, Euronext held 232,625 shares in its own share capital after
settlement and custody of trades made on 30 and 31 December
2019. All shares that are issued at the date of the Registration
Document are fully paid up.
Euronext is subject to the provisions of the Dutch Financial
Supervision Act and the Articles of Association with regard to the
issue of shares following admission. The shares are in registered
form and are only available in the form of an entry in Euronext’s
shareholders’ register and not in certifi cated form.
6.2.2 ISSUE OF SHARES
Under its Articles of Association Euronext may issue shares, or grant
rights to subscribe for shares, only pursuant to a resolution of the
General Meeting upon proposal of the Supervisory Board or upon
proposal of the Managing Board, which proposal has been approved
by the Supervisory Board.
Euronext’s Articles of Association provide that the General Meeting
may designate the authority to issue shares or grant rights to
subscribe for shares, to the Managing Board upon proposal of the
Supervisory Board on a proposal of the Managing Board, which
proposal has been approved by the Supervisory Board. Pursuant
to the Dutch Civil Code and Euronext’s Articles of Association, the
period of designation may not exceed fi ve years. Such designation
may be renewed by a resolution of the General Meeting for a
subsequent period of up to five years each time. Unless the
resolution determines otherwise, the designation is irrevocable.
At the designation, the number of shares which may be issued by
the Managing Board must be determined.
On 16 May 2019, the General Meeting designated the Managing
Board as per 16 May 2019 for a period of eighteen months or until
the date on which the meeting again extends the designation, if
earlier, as the competent body to, subject to the approval of the
Supervisory Board, issue ordinary shares and to grant rights to
subscribe for ordinary shares up to a total of 10% of the currently
issued ordinary share capital, which 10% can be used for general
purposes, including but not limited to the fi nancing (in cash or in
kind by way of ordinary shares) of mergers and acquisitions as well
as facilitating grants under the Company’s employee remuneration
and long term incentive plans; whereby not more than 2% of the
currently issued ordinary share capital out of the aforementioned
10% will be issued for facilitating these plans, it being understood
that it is the intention of the Company that they will in principle be
funded by means of ordinary shares held as treasury stock (if need
be, purchased from the market for this purpose).
2019 UNIVERSAL REGISTRATION DOCUMENT134 www.euronext.com

General Description of the Company and Its Share Capital
6
Share Capital
6.2.3 PRE-EMPTION RIGHTS
Dutch company law and Euronext’s Articles of Association in most
cases give shareholders pre-emption rights to subscribe on a pro
rata basis for any issue of new shares or upon a grant of rights to
subscribe for shares. Exceptions to these pre-emption rights include
the issue of shares and the grant of rights to subscribe for shares (i)
to Euronext’s employees, (ii) in return for non-cash consideration, or
(iii) the issue of shares to persons exercising a previously granted
right to subscribe for shares.
A shareholder may exercise pre-emption rights during a period of
two weeks from the date of the announcement of the issue or grant.
The General Meeting or the Managing Board, if so designated by
the General Meeting, may restrict the right or exclude shareholder
pre-emption rights. A resolution by the General Meeting to designate
the authority to exclude or limit pre-emption rights to the Managing
Board requires a majority of at least two-thirds of the votes cast if
less than 50% of Euronext’s issued share capital is represented and
can only be taken upon proposal of the Supervisory Board or upon
proposal of the Managing Board, which proposal has been approved
by the Supervisory Board. If the General Meeting has not designated
this authority to the Managing Board, the General Meeting may itself
vote to limit or exclude pre-emption rights and will also require a
majority of at least two-thirds of the votes cast, if less than 50%
of Euronext’s issued share capital is represented at the General
Meeting.
On 16 May 2019, the General Meeting designated the Managing Board
as per 16 May 2019 for a period of eighteen months or until the date
on which the meeting again extends the designation, if earlier, as
the competent body to, subject to the approval of the Supervisory
Board, restrict or exclude the pre-emptive rights of shareholders
pertaining to (the right to subscribe for) ordinary shares upon any
issuance of ordinary shares (as referred to in Item 6a of the agenda
of the meeting) to the extent such issuance pertains to the payment
in ordinary shares in case of mergers and acquisitions or facilitating
grants under the Company’s employee remuneration and long term
incentive plans.
The Company has an agreement with its Reference shareholders
(see section 4.4.1.) to give reasonable prior notice if Euronext uses
this authority for share issuances in case of a merger or acquisition
transaction.
6.2.4 ACQUISITION OF SHARES IN EURONEXT’S CAPITAL
Euronext may acquire fully paid shares at any time for no
consideration (om niet), or, subject to the following provisions of
Dutch law and its Articles of Association, Euronext may acquire
fully paid shares for consideration, namely if (i) its shareholders’
equity, less the payment required to make the acquisition, does not
fall below the sum of paid-in and called-up share capital and any
statutory reserves, (ii) Euronext and its subsidiaries would thereafter
not hold shares or hold a pledge over Euronext shares with an
aggregate nominal value exceeding 50% of its issued share capital,
and (iii) the Managing Board has been authorised by the General
Meeting, with the prior approval of the Supervisory Board.
Authorisation from the General Meeting to acquire Euronext shares
must specify the number and class of shares that may be acquired,
the manner in which shares may be acquired and the price range
within which shares may be acquired. Such authorisation will be
valid for no more than eighteen months. Any shares Euronext holds
may not be voted or counted for voting quorum purposes.
On 16 May 2019, the General Meeting designated the Managing
Board as per 16 May 2019 for a period of eighteen months or until
the date on which the meeting again extends the authorisation, if
earlier, to, subject to the approval of the Supervisory Board, have
the Company acquire ordinary shares in the share capital of the
Company through purchase on a stock exchange or otherwise. The
authorisation is given for the purchase of up to 10% of the issued
ordinary shares at the time of the purchase, for a purchase price
between (a) the par value of the ordinary shares at the time of the
purchase and (b) the average closing price of the ordinary shares
on Euronext Paris, Euronext Amsterdam, Euronext Brussels and
Euronext Lisbon, during the fi ve trading days preceding the day
of purchase within a margin of 10% of that purchase price. Under
the Facilities Agreement (see section 5.1.10), Euronext’s ability to
acquire its shares is restricted, subject to certain exceptions.
6.2.5 REDUCTION OF SHARE CAPITAL
Under Euronext’s Articles of Association, upon a proposal from the
Supervisory Board, or upon proposal of the Managing Board, which
has been approved by the Supervisory Board, the General Meeting
may resolve to reduce Euronext’s issued and outstanding share
capital by cancelling its shares, or by amending Euronext’s Articles
of Association to reduce the nominal value of its shares. The decision
to reduce Euronext’s share capital requires a majority of at least two-
thirds of the votes cast if less than 50% of Euronext’s issued share
capital is present or represented at the General Meeting.
2019 UNIVERSAL REGISTRATION DOCUMENT 135
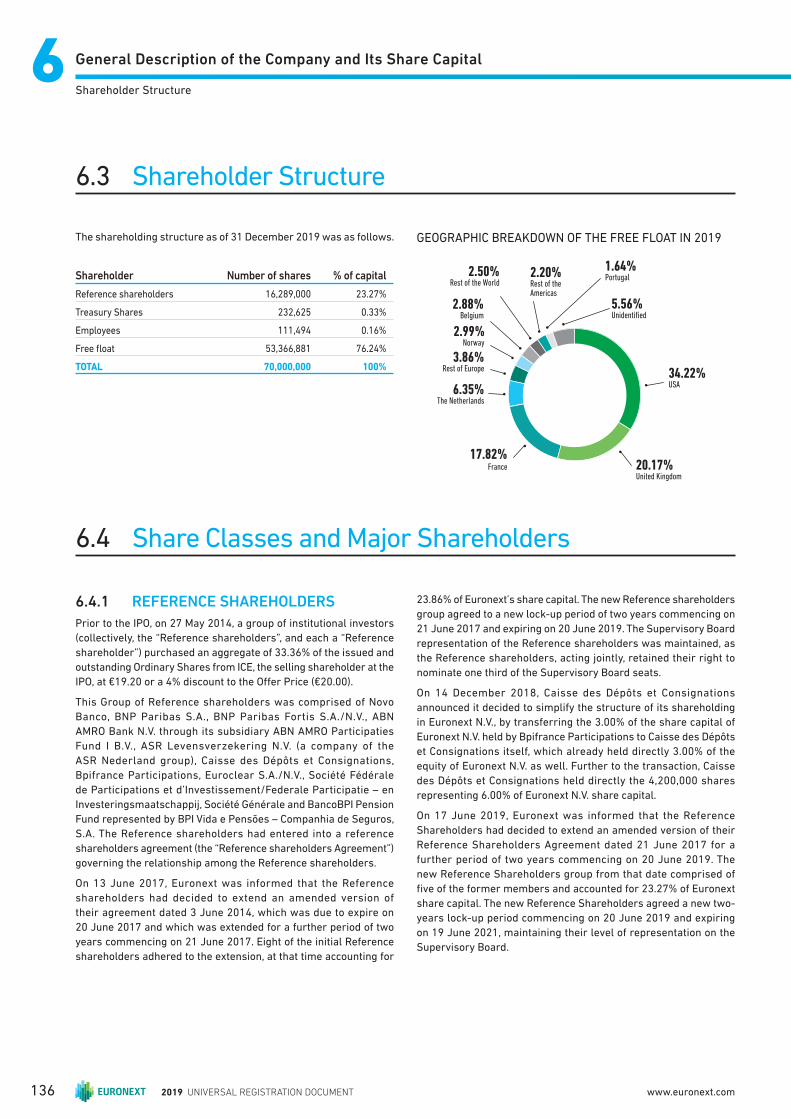
General Description of the Company and Its Share Capital66Shareholder Structure
6.3 Shareholder Structure
The shareholding structure as of 31 December 2019 was as follows.
Shareholder Number of shares % of capital
Reference shareholders 16,289,000 23.27%
Treasury Shares 232,625 0.33%
Employees 111,494 0.16%
Free fl oat 53,366,881 76.24%
TOTAL 70,000,000 100%
GEOGRAPHIC BREAKDOWN OF THE FREE FLOAT IN 2019
USA34.22%
United Kingdom20.17%
The Netherlands6.35%
Rest of Europe3.86%
France17.82%
Norway2.99%
Belgium2.88%
Rest of theAmericas
2.20% Portugal1.64%
Rest of the World2.50%
Unidentified5.56%
6.4 Share Classes and Major Shareholders
6.4.1 REFERENCE SHAREHOLDERS
Prior to the IPO, on 27 May 2014, a group of institutional investors
(collectively, the “Reference shareholders”, and each a “Reference
shareholder”) purchased an aggregate of 33.36% of the issued and
outstanding Ordinary Shares from ICE, the selling shareholder at the
IPO, at €19.20 or a 4% discount to the Off er Price (€20.00).
This Group of Reference shareholders was comprised of Novo
Banco, BNP Paribas S.A., BNP Paribas Fortis S.A./N.V., ABN
AMRO Bank N.V. through its subsidiary ABN AMRO Participaties
Fund I B.V., ASR Levensverzekering N.V. (a company of the
ASR Nederland group), Caisse des Dépôts et Consignations,
Bpifrance Participations, Euroclear S.A./N.V., Société Fédérale
de Participations et d’Investissement/Federale Participatie – en
Investeringsmaatschappij, Société Générale and BancoBPI Pension
Fund represented by BPI Vida e Pensões – Companhia de Seguros,
S.A. The Reference shareholders had entered into a reference
shareholders agreement (the “Reference shareholders Agreement”)
governing the relationship among the Reference shareholders.
On 13 June 2017, Euronext was informed that the Reference
shareholders had decided to extend an amended version of
their agreement dated 3 June 2014, which was due to expire on
20 June 2017 and which was extended for a further period of two
years commencing on 21 June 2017. Eight of the initial Reference
shareholders adhered to the extension, at that time accounting for
23.86% of Euronext’s share capital. The new Reference shareholders
group agreed to a new lock-up period of two years commencing on
21 June 2017 and expiring on 20 June 2019. The Supervisory Board
representation of the Reference shareholders was maintained, as
the Reference shareholders, acting jointly, retained their right to
nominate one third of the Supervisory Board seats.
On 14 December 2018, Caisse des Dépôts et Consignations
announced it decided to simplify the structure of its shareholding
in Euronext N.V., by transferring the 3.00% of the share capital of
Euronext N.V. held by Bpifrance Participations to Caisse des Dépôts
et Consignations itself, which already held directly 3.00% of the
equity of Euronext N.V. as well. Further to the transaction, Caisse
des Dépôts et Consignations held directly the 4,200,000 shares
representing 6.00% of Euronext N.V. share capital.
On 17 June 2019, Euronext was informed that the Reference
Shareholders had decided to extend an amended version of their
Reference Shareholders Agreement dated 21 June 2017 for a
further period of two years commencing on 20 June 2019. The
new Reference Shareholders group from that date comprised of
fi ve of the former members and accounted for 23.27% of Euronext
share capital. The new Reference Shareholders agreed a new two-
years lock-up period commencing on 20 June 2019 and expiring
on 19 June 2021, maintaining their level of representation on the
Supervisory Board.
2019 UNIVERSAL REGISTRATION DOCUMENT136 www.euronext.com
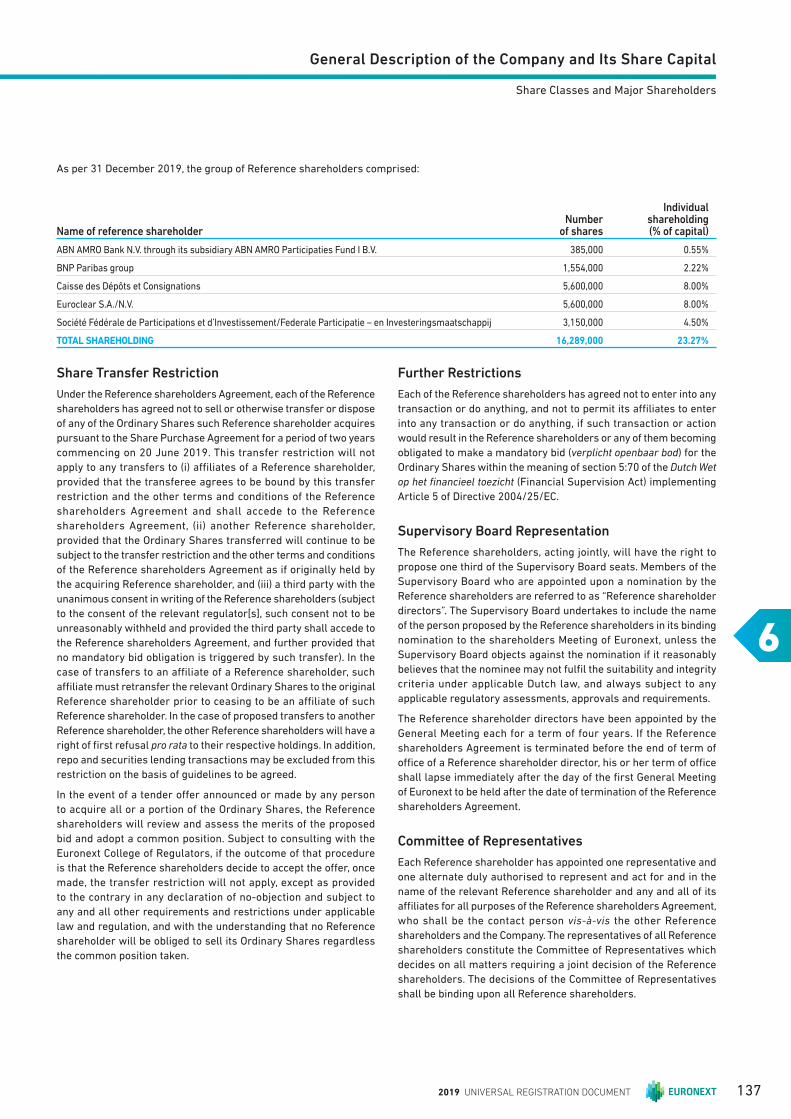
General Description of the Company and Its Share Capital
6
Share Classes and Major Shareholders
As per 31 December 2019, the group of Reference shareholders comprised:
Name of reference shareholderNumber
of shares
Individual shareholding (% of capital)
ABN AMRO Bank N.V. through its subsidiary ABN AMRO Participaties Fund I B.V. 385,000 0.55%
BNP Paribas group 1,554,000 2.22%
Caisse des Dépôts et Consignations 5,600,000 8.00%
Euroclear S.A./N.V. 5,600,000 8.00%
Société Fédérale de Participations et d’Investissement/Federale Participatie – en Investeringsmaatschappij 3,150,000 4.50%
TOTAL SHAREHOLDING 16,289,000 23.27%
Share Transfer Restriction
Under the Reference shareholders Agreement, each of the Reference
shareholders has agreed not to sell or otherwise transfer or dispose
of any of the Ordinary Shares such Reference shareholder acquires
pursuant to the Share Purchase Agreement for a period of two years
commencing on 20 June 2019. This transfer restriction will not
apply to any transfers to (i) affi liates of a Reference shareholder,
provided that the transferee agrees to be bound by this transfer
restriction and the other terms and conditions of the Reference
shareholders Agreement and shall accede to the Reference
shareholders Agreement, (ii) another Reference shareholder,
provided that the Ordinary Shares transferred will continue to be
subject to the transfer restriction and the other terms and conditions
of the Reference shareholders Agreement as if originally held by
the acquiring Reference shareholder, and (iii) a third party with the
unanimous consent in writing of the Reference shareholders (subject
to the consent of the relevant regulator[s], such consent not to be
unreasonably withheld and provided the third party shall accede to
the Reference shareholders Agreement, and further provided that
no mandatory bid obligation is triggered by such transfer). In the
case of transfers to an affi liate of a Reference shareholder, such
affi liate must retransfer the relevant Ordinary Shares to the original
Reference shareholder prior to ceasing to be an affi liate of such
Reference shareholder. In the case of proposed transfers to another
Reference shareholder, the other Reference shareholders will have a
right of fi rst refusal pro rata to their respective holdings. In addition,
repo and securities lending transactions may be excluded from this
restriction on the basis of guidelines to be agreed.
In the event of a tender off er announced or made by any person
to acquire all or a portion of the Ordinary Shares, the Reference
shareholders will review and assess the merits of the proposed
bid and adopt a common position. Subject to consulting with the
Euronext College of Regulators, if the outcome of that procedure
is that the Reference shareholders decide to accept the off er, once
made, the transfer restriction will not apply, except as provided
to the contrary in any declaration of no-objection and subject to
any and all other requirements and restrictions under applicable
law and regulation, and with the understanding that no Reference
shareholder will be obliged to sell its Ordinary Shares regardless
the common position taken.
Further Restrictions
Each of the Reference shareholders has agreed not to enter into any
transaction or do anything, and not to permit its affi liates to enter
into any transaction or do anything, if such transaction or action
would result in the Reference shareholders or any of them becoming
obligated to make a mandatory bid (verplicht openbaar bod) for the
Ordinary Shares within the meaning of section 5:70 of the Dutch Wet
op het fi nancieel toezicht (Financial Supervision Act) implementing
Article 5 of Directive 2004/25/EC.
Supervisory Board Representation
The Reference shareholders, acting jointly, will have the right to
propose one third of the Supervisory Board seats. Members of the
Supervisory Board who are appointed upon a nomination by the
Reference shareholders are referred to as “Reference shareholder
directors”. The Supervisory Board undertakes to include the name
of the person proposed by the Reference shareholders in its binding
nomination to the shareholders Meeting of Euronext, unless the
Supervisory Board objects against the nomination if it reasonably
believes that the nominee may not fulfi l the suitability and integrity
criteria under applicable Dutch law, and always subject to any
applicable regulatory assessments, approvals and requirements.
The Reference shareholder directors have been appointed by the
General Meeting each for a term of four years. If the Reference
shareholders Agreement is terminated before the end of term of
offi ce of a Reference shareholder director, his or her term of offi ce
shall lapse immediately after the day of the fi rst General Meeting
of Euronext to be held after the date of termination of the Reference
shareholders Agreement.
Committee of Representatives
Each Reference shareholder has appointed one representative and
one alternate duly authorised to represent and act for and in the
name of the relevant Reference shareholder and any and all of its
affi liates for all purposes of the Reference shareholders Agreement,
who shall be the contact person vis-à-vis the other Reference
shareholders and the Company. The representatives of all Reference
shareholders constitute the Committee of Representatives which
decides on all matters requiring a joint decision of the Reference
shareholders. The decisions of the Committee of Representatives
shall be binding upon all Reference shareholders.
2019 UNIVERSAL REGISTRATION DOCUMENT 137
General Description of the Company and Its Share Capital66Share Classes and Major Shareholders
Voting
Depending on the decision concerned, the decisions of the Committee
of Representatives shall be adopted by absolute majority of the
votes cast or by qualifi ed majority of two thirds of the votes cast, as
indicated below. Each Reference shareholder will have such number
of votes equal to the aggregate number of Ordinary Shares held
by the Reference shareholder and its affi liates, provided that no
Reference shareholder shall at any time have one-third or more of
the votes within the Committee of Representatives regardless of the
number of Ordinary Shares held.
In all instances where the Reference shareholders Agreement
calls for joint decision making of the Reference shareholders in
the General Meeting, each Reference shareholder will exercise,
and will cause any of its affi liates to exercise, its voting rights in
such Shareholders’ Meeting in accordance with the decision of the
Committee of Representatives on the relevant subject.
The Reference shareholders agree to vote in accordance with the
decision of the Committee of Representatives on any proposed
shareholders’ resolutions.
The following resolutions require a qualifi ed majority of two thirds
of the votes cast:
n any issuance of Ordinary Shares by the Company or rights to
acquire Ordinary Shares (and exclusion or limitation or pre-
emption rights, as the case may be);
n any decrease in the share capital of the Company;
n any authorisation for the Company to acquire its own shares;
n any issuance of securities other than Ordinary Shares, to the
extent these give exposure to Ordinary Shares, including but not
limited to hybrids and covered bonds;
n any proposal to appoint, suspend or remove any member of the
Supervisory Board (including but not limited to any Reference
shareholders director);
n any going private transaction or other change of control of the
Company;
n any major identity transforming transactions requiring
shareholders’ approval pursuant to section 2: 107a of the Dutch
Civil Code;
n any other major acquisitions or disposals not requiring approval
under section 2: 107a of the Dutch Civil Code;
n any amendment of the Articles of Association of the Company; and
n any proposal for legal merger, demerger, conversion or dissolution
of the Company.
For the following resolutions, the adoption is by absolute majority
of the votes cast:
n any proposal to appoint, suspend or remove any member of the
Managing Board;
n adoption of the annual Financial Statements of the Company;
n discharge of the members of the Managing Board and the
Supervisory Board; and
n any dividend or other distribution to shareholders.
Termination
The Reference shareholders Agreement and all restrictions and
requirements thereunder or pursuant thereto shall terminate upon
the earlier of (i) expiry of the Restricted Period, unless extended by
written agreement signed by all Reference shareholders, subject to
any regulatory declarations of no objection or regulatory approvals,
(ii) the Company becoming bankrupt or being granted a (provisional)
suspension of payment, and (iii) at any time after the Restricted
Period, the aggregate shareholding of the Reference shareholders
becoming less than 21% of the issued share capital of the Company
unless increased to at least 21% again within 30 days after such
event. The Reference shareholders Agreement is terminating on
21 June 2021.
Letter Agreement
In addition to the renewed Reference shareholders Agreement,
the Letter Agreement of 4 June 2014 between Euronext and its
Reference shareholders, as supplemented on 25 March 2015 and
as amended and extended on 13 June 2017, has been amended
and extended on 17 June 2019. The focus of the revised Letter
Agreement dated 17 June 2019 is to strengthen the regular dialogue
between Euronext and its Reference shareholders, addressing (i)
the right of the Reference shareholders to retain one third of the
Supervisory Board seats, (ii) the use by Euronext of the delegated
authorities for the issuance/repurchase of shares, with the possible
exclusion or restriction of pre-emption rights, (iii) the process of
communication between Euronext and the Reference shareholders,
which includes periodical meetings on topics including strategy,
governance and fi nancing structure; and (iv) the involvement of the
Reference shareholders in the selection procedure in case of any
vacancies for the CEO, the COO or Supervisory Board positions.
6.4.2 MAJOR SHAREHOLDINGS
On top of the Reference shareholders who own jointly 23.27% and
whose individual holdings are disclosed above and according to the
AFM any substantial holding and gross short positions in issuing
institutions and shares with special controlling rights have to be
notifi ed.
An issuing institution is: a public limited company (naamloze
Vennootschap) incorporated under Dutch law whose (depositary
receipts for) shares are admitted to trading on a regulated market
in the Netherlands or in another Member State of the European
Union or an EEA State, or a legal entity incorporated under the
law of a State that is not an European Union Member State and
whose (depositary receipts for) shares are admitted to trading on a
regulated market in the Netherlands.
As soon as the substantial holding or short position equals or
exceeds 3% of the issued capital, the holder should report this.
Subsequently, it should notify the AFM again when its substantial
holding or short position consequently reaches, exceeds or falls
below a threshold. This can be caused by the acquisition or disposal
of shares by the shareholder or because the issued capital of the
issuing institution is increased or decreased. Thresholds are: 3%,
5%, 10%, 15%, 20%, 25%, 30%, 40%, 50%, 60%, 75% and 95%.
The duty to notify applies to legal entities as well as natural persons.
2019 UNIVERSAL REGISTRATION DOCUMENT138 www.euronext.com

General Description of the Company and Its Share Capital
6
General Meeting of Shareholders and Voting Rights
In 2019 and from 1 January 2020 until the publication of this report, the following crossings of thresholds were declared:
Date Shareholder having crossed the threshold
Crossing of threshold in capital
and voting rights TypeNo of
shares
% of voting rights at date of declaration
14/02/2019 Massachussets Financial Services Company 3% Increase 2,129,492 3.04%
08/03/2019 Amundi Asset Management 5% Decrease 3,488,519 4.98%
12/03/2019 Massachussets Financial Services Company 3% Increase 2,934,626 4.16%
25/03/2019 Capital Research and Management Company 5% Increase 3,544,244 5.06%
18/04/2019 Massachussets Financial Services Company 5% Increase 3,660,317 5.23%
17/05/2019 Blackrock, Inc. 3% Increase 2,112,927 3.02%
20/05/2019 Blackrock, Inc. 3% Decrease 2,096,268 2.99%
17/05/2019 Blackrock, Inc. 3% Increase 2,145,849 3.07%
31/05/2019 Blackrock, Inc. 3% Decrease 2,083,729 2.98%
03/06/2019 Blackrock, Inc. 3% Increase 2,241,173 3.20%
13/06/2019 Blackrock, Inc. 3% Decrease 2,204,818 3.15%
20/06/2019 Blackrock, Inc. 3% Decrease 2,084,290 2.98%
20/06/2019 Société Générale S.A. 3% Decrease 350,000 0.50%
01/07/2019 Capital Group International Inc. 5% Decrease 0 0.00%
24/10/2019 Blackrock, Inc. 3% Increase 2,160,425 3.09%
04/11/2019 Blackrock, Inc. 3% Decrease 1,969,256 2.99%
26/11/2019 Blackrock, Inc. 3% Increase 2,107,442 3.01%
09/12/2019 Blackrock, Inc. 3% Decrease 2,051,733 2.93%
12/12/2019 Massachussets Financial Services Company 5% Increase 4,813,795 6.88%
None of Euronext’s shareholders hold 10% or more in the capital of the Company.
As of the date of publication of the 2019 Universal Registration Document, the only shareholders owning more than 3% (excluding Reference
shareholders) and declaring it to the AFM are listed below:
Shareholder having crossed the threshold Nb of shares% of voting rights
at date of declaration
Amundi Asset Management 3,488,519 4.98%
Massachussets Financial Services Company 4,813,795 6.88%
6.5 General Meeting of Shareholders and Voting Rights
The Annual General Meeting must be held within six months after
the end of each fi nancial year. An Extraordinary General Meeting
may be convened, whenever Euronext’s interests so require, by
the Managing Board or the Supervisory Board. Shareholders
representing alone or in aggregate at least one-tenth of Euronext’s
issued and outstanding share capital may, pursuant to the Dutch
Civil Code, request that a general meeting be convened. Within
three months of it becoming apparent to the Managing Board that
Euronext’s equity has decreased to an amount equal to or lower than
one-half of the paid-in and called-up capital, a general meeting will
be held to discuss any requisite measures.
Euronext will give notice of each general meeting by publication on
its website and in any other manner that Euronext may be required
to follow in order to comply with and the applicable requirements
of regulations pursuant to the listing of its shares on Euronext
Amsterdam, Euronext Brussels, Euronext Lisbon and Euronext
Paris. The notice convening any General Meeting must include,
among other items, an agenda indicating the place and date of the
meeting, the items for discussion and voting, the proceedings for
registration including the registration date, as well as any proposals
for the agenda. Pursuant to Dutch law, shareholders holding
at least 3% of Euronext’s issued and outstanding share capital
have a right to request the Managing Board and the Supervisory
Board to include items on the agenda of the General Meeting.
2019 UNIVERSAL REGISTRATION DOCUMENT 139
General Description of the Company and Its Share Capital66Anti-Takeover Provisions
6.6 Anti-Takeover Provisions
Euronext currently does not have any anti-takeover provisions.
6.7 Obligations of Shareholders and Members of the Managing Board to Disclose Holdings
Shareholders may be subject to notifi cation obligations under the
Dutch Financial Supervision Act. Pursuant to chapter 5.3 of the Dutch
Financial Supervision Act, any person who, directly or indirectly,
acquires or disposes of an actual or potential capital interest and/or
voting rights in the Company must immediately give written notice to
the AFM of such acquisition or disposal by means of a standard form
if, as a result of such acquisition or disposal, the percentage of capital
interest and/or voting rights held by such person reaches, exceeds
or falls below the following thresholds: 3%, 5%, 10%, 15%, 20%, 25%,
30%, 40%, 50%, 60%, 75% and 95%. In addition, any person whose
capital interest or voting rights reaches, exceeds or falls below a
threshold due to a change in Euronext’s outstanding share capital, or
The Managing Board and the Supervisory Board must agree to
these requests, provided that (i) the request was made in writing
and motivated, and (ii) the request was received by the Chairman of
the Managing Board or the Chairman of the Supervisory Board at
least sixty days prior to the date of the General Meeting.
The Managing Board must give notice of a general meeting, by at
least such number of days prior to the day of the meeting as required
by Dutch law, which is currently forty-two days.
Each shareholder (as well as other persons with voting rights or
meeting rights) may attend the General Meeting, to address the
General Meeting and, in so far as they have such right, to exercise
voting rights pro rata to its shareholding, either in person or by proxy.
Shareholders may exercise these rights, if they are the holders of
shares on the registration date which is currently the 28th day before
the day of the meeting, and they or their proxy have notifi ed Euronext
of their intention to attend the meeting in writing at the address and
by the date specifi ed in the notice of the meeting.
The Managing Board may decide that persons entitled to attend
general meetings and vote there may, within a period prior to
the General Meeting to be set by the Managing Board, which
period cannot start prior to the registration date, cast their vote
electronically or by post in a manner to be decided by the Managing
Board. Votes cast in accordance with the previous sentence are equal
to votes cast at the meeting.
Each shareholder may cast one vote for each Ordinary Share held.
Members of the Managing Board and the Supervisory Board may
attend a general meeting in which they have an advisory role. The
voting rights attached to shares are suspended as long as such
shares are held by Euronext. The rights of the holders of Ordinary
Shares that were off ered and sold in the Off ering rank pari passu
with each other and with all other holders of the Ordinary Shares,
including the Reference shareholders, with respect to voting rights
and distributions. Euronext has no intention of changing the rights
of shareholders.
Resolutions of the General Meeting are taken by an absolute majority,
except where Dutch law or Euronext’s Articles of Association provide
for a qualifi ed majority or unanimity.
Two general meetings were held in 2019.
The Annual General Meeting was held on 16 May 2019. In this
meeting decisions were taken on the adoption of the 2018 Financial
Statements, a dividend of €1.54 per ordinary share, the discharge
the members of the Managing Board and Supervisory Board in
respect of their duties performed during the year 2018, the re-
appointment of Jim Gollan as a member of the Supervisory Board,
the re-appointment of Maurice van Tilburg as a member of the
Managing Board, the appointment of Isabel Ucha as a member of
the Managing Board, the acquisition of up to 100% of the issued
share capital of Oslo Børs VPS Holding ASA, the appointment of Ernst
& Young Accountants LLP(1) as the Company’s external auditors and
the designation of the Managing Board as the competent body to
1) issue ordinary shares, 2) to restrict or exclude the pre-emptive
rights of shareholders and 3) to acquire ordinary shares in the share
capital of the Company on behalf of the Company.
An Extraordinary General Meeting was held on 8 October 2019.
In that meeting decisions were taken on the appointment of Nathalie
Rachou and Morten Thorsrud as members of the Supervisory
Board, the re-appointment of Stéphane Boujnah as a member of
the Managing Board, the appointments of Håvard Abrahamsen and
Simone Huis in ’t Veld as members of the Managing Board, and the
remuneration policy.
(1) Whose principal place of business is at Boompjes 258, 3011 XZ Rotterdam, the Netherlands. Ernst & Young Accountants LLP is registered at the Chamber
of Commerce of Rotterdam in the Netherlands under number 24432944. The office address of the independent auditor of Ernst & Young Accountants LLP
that signed the independent auditor’s report is Cross Towers, Antonio Vivaldistraat 150, 1083 HP Amsterdam, the Netherlands.
2019 UNIVERSAL REGISTRATION DOCUMENT140 www.euronext.com
General Description of the Company and Its Share Capital
6
Market Abuse Regime
in votes that can be cast on the shares as notifi ed to the AFM by the
Company, should notify the AFM no later than the fourth trading day
after the AFM has published Euronext’s notifi cation of the change in
its outstanding share capital.
Each person holding an interest in Euronext’s share capital or voting
rights of 3% or more at the time of admission of Euronext’s shares
to trading must immediately notify the AFM. Furthermore, every
holder of 3% or more of the Company’s share capital or voting rights
whose interest at 31 December at midnight diff ers from a previous
notifi cation to the AFM must notify the AFM within four weeks.
For the purpose of calculating the percentage of capital interest or
voting rights, the following interests must be taken into account: (i)
shares and/or voting rights directly held (or acquired or disposed
of) by any person, (ii) shares and/or voting rights held (or acquired
or disposed of) by such person’s subsidiaries or by a third party for
such person’s account or by a third party with whom such person
has concluded an oral or written voting agreement, (iii) voting rights
acquired pursuant to an agreement providing for a temporary
transfer of voting rights in consideration for a payment, and (iv)
shares and/or voting rights which such person, or any controlled
entity or third party referred to above, may acquire pursuant to any
option or other right to acquire shares and/or the attached voting
rights.
Special rules apply to the attribution of shares and/or voting rights
that are part of the property of a partnership or other form of joint
ownership. A holder of a pledge or right of usufruct in respect of
shares can also be subject to notifi cation obligations, if such person
has, or can acquire, the right to vote on the shares. The acquisition of
(conditional) voting rights by a pledgee or benefi cial owner may also
trigger notifi cation obligations as if the pledgee or benefi cial owner
were the legal holder of the shares and/or voting rights. Under the
Dutch Financial Supervision Act, Euronext was required to fi le a
report with the AFM promptly after the date of listing its shares
setting out its issued and outstanding share capital and voting rights.
Thereafter, Euronext is required to notify the AFM promptly of any
change of 1% or more in its issued and outstanding share capital
or voting rights since the previous notifi cation. The AFM must be
notifi ed of other changes in Euronext’s issued and outstanding share
capital or voting rights within eight days after the end of the quarter
in which the change occurred. The AFM will publish all Euronext’s
notifi cations of its issued and outstanding share capital and voting
rights in a public register. If a person’s capital interest and/or voting
rights reach, exceed or fall below the above-mentioned thresholds
as a result of a change in Euronext’s issued and outstanding share
capital or voting rights, such person is required to make a notifi cation
not later than on the fourth trading day after the AFM has published
Euronext’s notifi cation as described above.
Furthermore, each member of the Managing Board, the Supervisory
Board and certain other persons who, inter alia, have (co-)managerial
responsibilities in respect of the Company, as well as certain persons
closely associated with any such members or other persons, must
immediately give written notice to the AFM by means of a standard
form of all shares and voting rights in Euronext held by him or her at
the time of admission of Euronext’s shares to listing and thereafter
of any change in his or her holding of shares and voting rights in
Euronext.
6.8 Short Positions
Each person holding a net short position amounting to 0.2% or more
of the issued share capital of a Dutch listed company must report it
to the AFM. Each subsequent increase of this position by 0.1% above
0.2% will also have to be reported. Each net short position equal to
0.5% of the issued share capital of a Dutch-listed company and any
subsequent increase of that position by 0.1% will be made public
via the AFM short selling register. To calculate whether a natural
person or legal person has a net short position, their short positions
and long positions must be set off . A short transaction in a share
can only be contracted if a reasonable case can be made that the
shares sold can actually be delivered, which requires confi rmation
of a third party that the shares have been located. There is also an
obligation to notify the AFM of gross short positions. The notifi cation
thresholds are the same as apply in respect of the notifi cation of
actual or potential capital interests in the capital and/or voting
rights, as described above.
The AFM keeps a public register of all notifi cation made pursuant to
these disclosure obligations and publishes any notifi cation received.
In 2019, no short position was declared to the AFM
6.9 Market Abuse Regime
The Market Abuse Regulation (Regulation [EU] nr. 596/2014) (the
“MAR”) and related Commission Implementing Regulations and
Delegated Regulations, provide for specific rules that intend to
prevent market abuse, such as the prohibitions on insider trading,
divulging inside information and tipping, and market manipulation
(the “European Union Market Abuse Rules”). Euronext is subject
to the European Union Market Abuse Rules and non-compliance
with these rules may lead to criminal fi nes, administrative fi nes,
imprisonment or other sanctions.
2019 UNIVERSAL REGISTRATION DOCUMENT 141

General Description of the Company and Its Share Capital66Transparency Directive
6.10 Transparency Directive
After the admission to listing of its shares on Euronext Amsterdam,
Euronext Brussels and Euronext Paris on 20 June 2014, and
on Euronext Lisbon on 17 September 2014, Euronext became a
listed public limited liability company (naamloze Vennootschap)
incorporated and existing under the laws of the Netherlands. The
Netherlands is Euronext’s home member State for the purposes of
the Transparency Directive (Directive 2004/109/EC as most recently
amended by Directive 2013/50/EU) as a consequence of which it is
subject to the Dutch Financial Supervision Act in respect of certain
on-going transparency and disclosure obligations upon admission
to listing and trading of its shares on Euronext Amsterdam, Euronext
Brussels, Euronext Lisbon and Euronext Paris.
6.11 Dutch Financial Reporting Supervision Act
The Dutch Financial Reporting Supervision Act (Wet toezicht fi nanciële
verslaggeving) (the “FRSA”) applies to financial years starting
from 1 January 2006. On the basis of the FRSA, the AFM supervises
the application of fi nancial reporting standards by, among others,
companies whose corporate seat is in the Netherlands and whose
securities are listed on a Dutch Regulated Market or foreign stock
exchange. Pursuant to the FRSA, the AFM has an independent right
to (i) request an explanation from Euronext regarding its application
of the applicable fi nancial reporting standards and (ii) recommend
to Euronext the making available of further explanations. If Euronext
does not comply with such a request or recommendation, the AFM
may request that the Enterprise Chamber order Euronext to (i)
make available further explanations as recommended by the AFM,
(ii) provide an explanation of the way it has applied the applicable
fi nancial reporting standards to its fi nancial reports or (iii) prepare
Euronext’s financial reports in accordance with the Enterprise
Chamber’s instructions.
This Universal Registration Document also concerns the annual
financial reporting within the meaning of 5:25c(2) of the Dutch
Financial Supervision Act. The Chapters 1, 2, 3, 5, 6 and 7, as well as
sections 4.1 and 4.2 concern the directors’ report within the meaning
of 2:391 of the Dutch Civil Code, the statement of the Managing Board
has been included in section 4.2.1 and the Financial Statements in
Chapter 8.
The European Union Market Abuse Rules on market manipulation
may restrict Euronext’s ability to buy back its shares. In certain
circumstances, investors in Euronext can also be subject to
the European Union Market Abuse Rules. Pursuant to Article 19
of the MAR (“Managers’ transactions”), members of the Managing
Board, Supervisory Board and any senior executive who has
regular access to inside information relating directly or indirectly to
Euronext and has the power to take managerial decisions aff ecting
the future developments and business prospects of Euronext,
(persons discharging managerial responsibilities [PDMR’S]; in case
of Euronext Supervisory Board, Managing Board and permanent
invitees to Management Board meetings), must notify the AFM of
every transaction conducted on their own account relating to the
shares or debt instruments of Euronext or to derivatives or other
fi nancial instruments linked thereto.
In addition, certain persons closely associated with members of
Euronext’s Managing Board or any of the other persons as described
above and designated by the MAR PDMR’S must also notify the
AFM of every transaction conducted on their own account relating
to the shares or debt instruments of Euronext or to derivatives or
other fi nancial instruments linked thereto. The MAR determines
the following categories of persons: (i) the spouse or any partner
considered by national law as equivalent to the spouse, (ii) dependent
children, (iii) other relatives who have shared the same household
for at least one year at the relevant transaction date and (iv) a
legal person, trust or partnership, the managerial responsibilities
of which are discharged by a person discharging managerial
responsibilities or by a person referred to in point (i), (ii) or (iii),
which is directly or indirectly controlled by such a person, which is
set up for the benefi t of such a person, or the economic interests of
which are substantially equivalent to those of such a person. These
notifi cations must be made no later than on the third business day
following the transaction date and by means of a standard form. The
notifi cation may be postponed until the moment that the value of the
transactions performed for the PDMR that person’s own account, or
transactions carried out by the persons closely associated with that
person, reaches or exceeds an amount of €5,000 in the calendar
year in question.
The AFM keeps a public register of all notifi cations under art. 19
of the MAR. Third parties can request to be notifi ed automatically
by e-mail of changes to the public register. Pursuant to the MAR,
Euronext will maintain a list of its insiders. In addition, to further
ensure compliance with MAR, Euronext has adopted an internal
policy relating to the possession of and transactions by members
of its PDMR’S and employees in Euronext shares or in fi nancial
instruments of which the value is (co-) determined by the value of the
shares. Euronext N.V. Insider Trading Policy has been published on
its website on https://www.euronext.com/en/investors/corporate-
governance.
2019 UNIVERSAL REGISTRATION DOCUMENT142 www.euronext.com
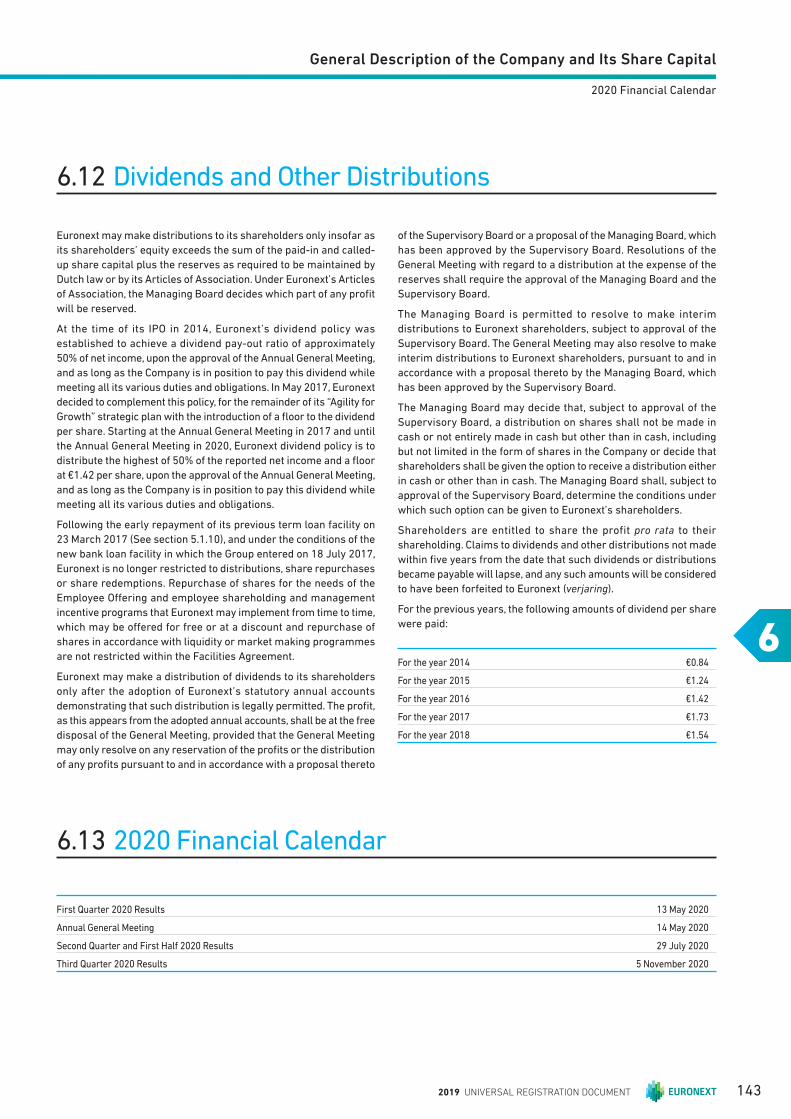
General Description of the Company and Its Share Capital
6
2020 Financial Calendar
6.12 Dividends and Other Distributions
Euronext may make distributions to its shareholders only insofar as
its shareholders’ equity exceeds the sum of the paid-in and called-
up share capital plus the reserves as required to be maintained by
Dutch law or by its Articles of Association. Under Euronext’s Articles
of Association, the Managing Board decides which part of any profi t
will be reserved.
At the time of its IPO in 2014, Euronext’s dividend policy was
established to achieve a dividend pay-out ratio of approximately
50% of net income, upon the approval of the Annual General Meeting,
and as long as the Company is in position to pay this dividend while
meeting all its various duties and obligations. In May 2017, Euronext
decided to complement this policy, for the remainder of its “Agility for
Growth” strategic plan with the introduction of a fl oor to the dividend
per share. Starting at the Annual General Meeting in 2017 and until
the Annual General Meeting in 2020, Euronext dividend policy is to
distribute the highest of 50% of the reported net income and a fl oor
at €1.42 per share, upon the approval of the Annual General Meeting,
and as long as the Company is in position to pay this dividend while
meeting all its various duties and obligations.
Following the early repayment of its previous term loan facility on
23 March 2017 (See section 5.1.10), and under the conditions of the
new bank loan facility in which the Group entered on 18 July 2017,
Euronext is no longer restricted to distributions, share repurchases
or share redemptions. Repurchase of shares for the needs of the
Employee Off ering and employee shareholding and management
incentive programs that Euronext may implement from time to time,
which may be off ered for free or at a discount and repurchase of
shares in accordance with liquidity or market making programmes
are not restricted within the Facilities Agreement.
Euronext may make a distribution of dividends to its shareholders
only after the adoption of Euronext’s statutory annual accounts
demonstrating that such distribution is legally permitted. The profi t,
as this appears from the adopted annual accounts, shall be at the free
disposal of the General Meeting, provided that the General Meeting
may only resolve on any reservation of the profi ts or the distribution
of any profi ts pursuant to and in accordance with a proposal thereto
of the Supervisory Board or a proposal of the Managing Board, which
has been approved by the Supervisory Board. Resolutions of the
General Meeting with regard to a distribution at the expense of the
reserves shall require the approval of the Managing Board and the
Supervisory Board.
The Managing Board is permitted to resolve to make interim
distributions to Euronext shareholders, subject to approval of the
Supervisory Board. The General Meeting may also resolve to make
interim distributions to Euronext shareholders, pursuant to and in
accordance with a proposal thereto by the Managing Board, which
has been approved by the Supervisory Board.
The Managing Board may decide that, subject to approval of the
Supervisory Board, a distribution on shares shall not be made in
cash or not entirely made in cash but other than in cash, including
but not limited in the form of shares in the Company or decide that
shareholders shall be given the option to receive a distribution either
in cash or other than in cash. The Managing Board shall, subject to
approval of the Supervisory Board, determine the conditions under
which such option can be given to Euronext’s shareholders.
Shareholders are entitled to share the profit pro rata to their
shareholding. Claims to dividends and other distributions not made
within fi ve years from the date that such dividends or distributions
became payable will lapse, and any such amounts will be considered
to have been forfeited to Euronext (verjaring).
For the previous years, the following amounts of dividend per share
were paid:
For the year 2014 €0.84
For the year 2015 €1.24
For the year 2016 €1.42
For the year 2017 €1.73
For the year 2018 €1.54
6.13 2020 Financial Calendar
First Quarter 2020 Results 13 May 2020
Annual General Meeting 14 May 2020
Second Quarter and First Half 2020 Results 29 July 2020
Third Quarter 2020 Results 5 November 2020
2019 UNIVERSAL REGISTRATION DOCUMENT 143

2019 UNIVERSAL REGISTRATION DOCUMENT144 www.euronext.com
7.2 Material contracts and related party transactions 168
7.2.1 Material Contracts 168
7.2.2 Related Party Transactions 168
7.3 Legal Proceedings 170
7.3.1 Euronext Amsterdam Pension Fund 170
7.4 Insurance 171
7.5 Liquidity and Capital Resources 172
7.5.1 Liquidity 172
7.5.2 Consolidated Regulatory Capital Requirements 172
7.6 Tangible Fixed Assets 174
7.6.1 Principal properties 174
7.1 Overview 146
7.1.1 Defi nitions 146
7.1.2 Establishment of Euronext as an Independent,
Publicly Traded Company 146
7.1.3 Sources of Revenues 147
7.1.4 Components of Expenses 148
7.1.5 Key Factors Aff ecting Businesses
and Results of Operations 149
7.1.6 Goodwill 153
7.1.7 Financial and Trading Position 153
7.1.8 Results of Operations 154
7.1.9 Cash fl ow 161
7.1.10 Facilities Agreement and BondS 161
7.1.11 Contractual Obligations 163
7.1.12 Off -Balance Sheet Arrangements 163
7.1.13 Quantitative and Qualitative Disclosures
about Market Risk 163
7.1.14 Signifi cant Accounting Policies 166
7.1.15 Critical Accounting Estimates and Judgments 166
OPERATING AND FINANCIAL REVIEW
2019 UNIVERSAL REGISTRATION DOCUMENT 145
Operating and fi nancial review77Overview
7.1 Overview
The following review relates to Euronext historical fi nancial condition and results of operations for the years ended 31 December 2019,
2018 and 2017. This “Operating and Financial Review” is based on the audited Financial Statements for the years ended 31 December
2019, 2018 and 2017, which are included and incorporated by reference in this Registration Document and should be read in conjunction
with “General description of the Company” and “Financial Statements”. Prospective investors should read the entire Registration Document
and not just rely on the information set out below. The fi nancial information included in this “Operating and Financial Review” has been
extracted from the audited Consolidated Financial Statements.
The following discussion of Euronext results of operations and fi nancial condition contains forward-looking statements. Euronext actual
results could diff er materially from those that are discussed in these forward-looking statements. Factors that could cause or contribute
to such diff erences include those discussed below and elsewhere in this Registration Document, particularly under “Risk Factors”.
Euronext is a pan-European exchange group, off ering a diverse
range of products and services and combining transparent and
effi cient equity, fi xed income securities and derivatives markets
in Amsterdam, Bergen, Brussels, Dublin, Lisbon, London, Oslo
and Paris. Euronext businesses comprise: listing, cash trading,
derivatives trading, spot FX trading, investor services, advanced
data services, post-trade and technologies & other.
Euronext management reviews the performance of the business,
and makes decisions on allocation of resources, only on a company-
wide basis. Therefore, Euronext has one reportable segment.
Euronext has been operating as an independent, publicly traded
company since 20 June 2014. Prior to June 2014, Euronext’s
businesses were part of ICE as a result of ICE’s acquisition of NYSE
Euronext on 13 November 2013.
7.1.1 DEFINITIONS
The following defi ned terms are used in this Operating and Financial
Review:
“Legacy Euronext” means the historical operations of the former
Euronext N.V. (existing prior to 15 March 2014) and its subsidiaries,
including LIFFE.
Segments are reported in a manner consistent with how the
business is operated and reviewed by the chief operating decision
maker (“CODM”), who is responsible for allocating resources and
assessing performance of the operating segments. The chief
operating decision maker of the Group is the Managing Board. The
organisation of the Group refl ects the high level of mutualisation of
resources across geographies and product lines. Operating results
are monitored on a group-wide basis and, accordingly, the Group
represents one operating segment and one reportable segment.
Operating results reported to the Managing Board are prepared on
a measurement basis consistent with the reported Consolidated
Statement of Profi t or Loss.
In presenting and discussing the Group’s financial position,
operating results and net results, management uses certain
Alternative performance measures not defi ned by IFRS. These
Alternative performance measures (APMs) should not be viewed
in isolation as alternatives to the equivalent IFRS measures and
should be used as supplementary information in conjunction
with the most directly comparable IFRS measures. Alternative
performance measures do not have standardised meaning under
IFRS and therefore may not be comparable to similar measures
presented by other companies. The Group measures performance
based on EBITDA1, as management believes that this measurement
is most relevant in evaluating the operating results of the Group.
This measure is included in the internal management reports that
are reviewed by the CODM.
Reference is made to one of the below defi nitions, whenever the term
‘EBITDA’ is used throughout this Universal Registration Document:
n EBITDA1 : Operating profit before (i)exceptional items and
(ii) depreciation and amortization, taking into account the lines
described in the Consolidated Statement of Profi t or Loss, and
defi ned in Chapter 5;
n EBITDA2 : Profi t before (i)interest expense, (ii)tax, (iii)any share of
the profi t of any associated company or undertaking, except
for dividends received in cash by any member of the Group,
(iv) exceptional items; and (v) depreciation and amortization;
n EBITDA3 : EBITDA as defi ned in the Share Purchase Agreement of
any applicable acquisition.
7.1.2 ESTABLISHMENT OF EURONEXT AS AN INDEPENDENT, PUBLICLY TRADED COMPANY
The legal entities of the Group have been owned by Euronext N.V.
since the date that the internal reorganisation was finalised in
March 2014. The Consolidated Financial Statements as of and for
financial years ended 31 December 2019, 2018 and 2017 have
been prepared as described further in Note 3 to the Consolidated
Financial Statements (see “Financial Statements”). All transactions
and balances between subsidiaries have been eliminated on
consolidation.
2019 UNIVERSAL REGISTRATION DOCUMENT146 www.euronext.com
Operating and fi nancial review
7
Overview
7.1.3 SOURCES OF REVENUES
Listing
Admission fees comprise fees paid by companies to list and
admit to trading equity and debt securities on Euronext markets.
Corporate activity and other fees primarily consist of fees charged
for centralising securities in connection with new listings and tender
off ers, they also include delisting fees. In addition, companies whose
securities are listed or admitted to trading on Euronext markets
pay annual fees.
Other than for Euronext Dublin and Oslo Børs which have separate
fee schedules, Euronext has adopted a common set of admission
and annual fees for the Euronext and Euronext Growth™ markets.
Companies having equity securities listed or admitted to trading on
Euronext or Euronext Growth™ markets are subject to the following
types of fees:
n initial admission fee charged based on the market capitalisation
at first admission and calculated on a cumulative scale with
decreasing rates and capped;
n subsequent admission fees charged based on the amount
of capital raised and calculated on a cumulative scale with
decreasing rates and capped; this also applies for other corporate
events related fees;
n annual fees based on a variable decreasing percentage of the
number of outstanding securities and a fi xed fee based on the
issuer’s market capitalisation a beyond a defi ned threshold. The
annual fee is capped.
Companies having equity securities listed or admitted to trading on
Oslo Børs, Oslo Axess or Merkur Market are subject to the following
types of fees:
n initial admission fee based on a fi xed fee and market capitalization
at first admission capped at minimum and maximum fee
depending on type of listing process;
n subsequent admission fees charged based on the amount of
capital raised and calculated on a cumulative scale and capped;
other corporate events related fees are generally fi xed fees;
n annual fees based on market capitalization and capped at
minimum and maximum fee.
Oslo Børs is the Norwegian takeover authority and charges a fi xed
fee and market capitalization up to a maximum amount for the
inspection of off er documents. Further fees related to inspection of
off er documents may also apply.
Euronext Dublin has debt fee schedules for its regulated market and
its Global Exchange Market. For other Euronext markets, admission
fees for debt securities, issued both on a stand-alone basis or under
a note program, are based on the maturity and principal amount
admitted to trading, and, in respect of long-term debt (maturity
over one year), number of years to maturity. Euronext off ers lower
admission fees for issuers that access the debt capital markets
frequently and for issuers qualifying as SMEs.
Oslo Børs has debt fee schedules for both its regulated market and its
Nordic ABM. Annual fee for listing and registration for debt securities
are based on the registered capital admitted to trading. Prices are
the same for stand-alone basis or under a note program. The prices
are the same for both markets with a minimum and maximum fee.
Oslo Børs has a registration fee based on the type and the security
of the bond. For municipal bonds listed on Oslo Børs and for bonds
listed on Nordic ABM there will also be an inspection fee. The
inspection fee is based on the type of the bond. For new issuers there
will also be charged an additional inspection fee for the description
of the issuer or the issuer’s business activities.
Euronext off ers centralisation services for orders in connection with
a public off er, a public tender off er or a sales facility, in respect
of securities admitted or to be admitted to any Euronext markets
whether regulated or not.
A common set of admission and annual fees apply to ETPs. Issuers
of ETPs listed and/or admitted to trading on Euronext markets are
subject to the following types of fees:
n for warrants & certifi cates traded via the quote driven model,
issuers are invoiced listing fees based on the average size of their
products range (grouped in packages). There are several discounts
available for which issuers can qualify in order to reduce their
listing fees. A one-time admission fee is charged to issuers of
structured notes and certifi cates not traded via the quote driven
model, as well as a market access fee per instrument;
n primary and secondary listings of ETFs, exchange traded vehicles
and exchange traded notes are charged initial admission fees.
Additional admission fees are charged per cross and multi-
currency listing; charges are also applicable on delisting and
merger of instruments. An annual fee is charged each entire
calendar year based in part on the value of the total shares
outstanding under each ISIN;
n fund issuers are charged a one-time admission fee and a fl at annual
fee per listed open-end investment fund. A monthly service fee is
also charged per fund traded on the net asset value trading facility.
A fl at delisting fee is charged per open-end investment fund;
For Oslo Børs, warrants, ETNs and Structured products are charged
admission fees and a periodic (monthly or quarterly) fee per ISIN.
Periodic fees are subject to rebates based on the total number
of products listed by the same issuer during that calendar year.
The aggregate monthly and quarterly fees for Warrants, ETNs and
Structured Products has a combined annual cap. ETF listings are
charged with admission and annual fees, per listed ETF and capped.
Corporate Services
Euronext Corporate Services off ers innovative solutions and tailor-
made advisory services articulated around the four following pillars:
Governance (iBabs), Compliance (InsiderLog), Communication
(Company Webcast), and Investor Relations (Advisory and IR
Solutions).
A major part of these Corporate Services products are Software-as-
a-Services (SaaS) solutions generating recurring revenues through
annual subscriptions. In addition, Euronext Corporate Services also
generate revenues on renewable advisory mandates or on one-off
missions and events.
Cash, Derivatives and spot FX Trading
Revenues from Euronext cash trading and derivatives trading
businesses consist of transaction-based fees for executing trades on
Euronext cash markets and derivatives markets. These transaction
fees are charged per executed order and based on value traded in
2019 UNIVERSAL REGISTRATION DOCUMENT 147
Operating and fi nancial review77Overview
cash equities and are charged per lot in derivatives. Trading volume
in equity products is primarily driven by price volatility in equity
markets and indices. The level of trading activity for all products is
also infl uenced by market conditions and other factors.
Derivatives trading revenues received from transactions conducted
on Euronext markets are variable, based on the volume and value
of traded contracts, and recognised when executed. The principal
types of derivative contracts traded are equity and index products
and commodities products.
Spot FX trading revenues consist of transaction-based fees for
executing trades. These transaction fees are charged per executed
order and based on value traded.
Investor Services
Investor services primarily encompass the activity of Commcise,
that offers cloud-based research commission management,
evaluation and accounting solutions and whose revenue model is
based on recurring software licence fees
Advanced Data Services
The Group charges data vendors and end users, taking data via
a direct feed, on a per-user basis for the access to its real-time
data and Enterprise licenses are charged for non-display use,
including advanced analytic products, and access to historic and
reference data products. The Group also collects periodic license
fees from vendors for the right to distribute the Group data to
third parties. These fees are recognised on a monthly basis as
services are rendered. The Group charges an index licence fee
to trading desks, investment banks and asset managers for the
creations of Structured Products (SP), Exchange Traded Products
(ETPs) and exchange traded funds (ETFs) on Euronext owned
(trademark) indices. The Group also collects fees for third party
index calculations, iNAV calculation and partnerships stakes. The
fees are recognized to the applicable period of the products.
Post-Trade
Custody and Settlement
Euronext operates two national CSDs.
The Group operates Interbolsa, the Portuguese national CSD, and
receives fees mainly with respect to the settlement instructions and
the custody of securities registered/deposited in the centralised
securities systems, namely listed and non-listed securities in
Portugal.
Euronext also operates VPS, the Norwegian national CSD and
primarily receives fees with respect to the settlement instructions
and the custody of securities registered/deposited in the centralised
securities systems, namely listed and non-listed securities in
Norway, as well as from ancillary services.
Clearing
Euronext also receives a share of clearing income based on treasury
services resulting from placement of collateral and the number of
cleared derivatives trades cleared through LCH SA, in exchange for
which Euronext pays LCH SA a fi xed fee plus a variable fee based
on derivatives trading volume.
Euronext Technology Solutions & Other
Euronext Technologies & other revenue includes license fees and
professional services fees for Optiq® software deployment, for
managed IT services provided to third-party market operators
(Optiq® as a Service), and for connection and data centre co-
location services provided to market participants. Fees for
software customisation and deployment services are recognised
either on a time and materials basis or under the percentage
completion method, depending upon the nature of the contract
with the client. Percentage of completion is calculated based on
the number of man days incurred to date as a percentage of the
total estimated number of man days to complete the work. License
fees, maintenance fees and support fees for deployed software
are recognized pro rata over the life of the relevant contract.
For Optiq® as a Service, setup fees and annual support fees are
recognised pro rate over the life of the service contract. Connection
and colocation service fees are recognised pro rata over the life of
the client commitment.
7.1.4 COMPONENTS OF EXPENSES
Euronext’s operating expenses include salaries and employee
benefits, depreciation and amortisation, and other operational
expenses, which include systems and communications, professional
services, accommodation and other expenses.
Salaries and Employee Benefi ts
Salaries and employee benefi ts expenses include employee salaries,
incentive compensation (including stock-based compensation) and
related benefi ts expenses, including pension and medical charges.
Depreciation and Amortisation
Depreciation and amortisation expenses consist of costs from
depreciating fixed assets (including computer hardware and
capitalised software) and amortising intangible assets over their
estimated useful lives.
Systems and Communications
Systems and communications expenses include costs for
development, operation and maintenance of trading, regulatory and
administrative systems; investments in system capacity, reliability
and security; and cost of network connectivity between customers
and data centres, as well as connectivity to various other market
centres. Systems and communications expenses also include
fees paid to third-party providers of networks and information
technology resources, including fees for consulting, research and
development services, software rental costs and licenses, hardware
rental and related fees paid to third-party maintenance providers.
Professional Services
Professional services expenses include consulting charges related
to various technological and operational initiatives as well as legal
and audit fees.
2019 UNIVERSAL REGISTRATION DOCUMENT148 www.euronext.com
Operating and fi nancial review
7
Overview
Accommodation
Accommodation expenses include costs of leasing the properties
used by the Group, as well as utilities, maintenance and security
costs to maintain the properties used by the Group.
Other Expenses
Other expenses include marketing, taxes, insurance, travel,
professional membership fees and other expenses.
7.1.5 KEY FAC TORS AFFECTING BUSINESSES AND RESULTS OF OPERATIONS
The economic and business environment in which Euronext operates
directly aff ects Euronext’s results of operations. The results have
been and will continue to be aff ected by many factors, including
the factors set out below. Euronext continues to focus its strategy
to broaden and diversify its revenue streams, as well as on its
company-wide expense reduction initiatives in order to mitigate
these uncertainties.
Trading Activity
A large proportion of Euronext’s business is transaction-based.
For the year ended 31 December 2019, Euronext derived 40% of
its revenue from its cash trading, derivatives and spot FX trading
businesses. Accordingly, fl uctuations in the trading volumes directly
aff ect Euronext revenues. During any period, the level of trading
activity in Euronext markets is signifi cantly infl uenced by factors
such as general market conditions, market volatility, competition,
regulatory changes, capital maintenance requirements, market
share and the pace of industry consolidation.
A reduction in trading activity could make Euronext’s markets less
attractive to market participants as a source of liquidity, which
in turn could further discourage existing and potential market
participants and thus accelerate a decline in the level of trading
activity in these markets. Because Euronext’s cost structure is
largely fi xed, if the trading volumes and the resulting transaction
fee revenues decline, Euronext may not be able to adjust its cost
structure to counteract the associated decline in revenues, which
would adversely aff ect its net income. Euronext’s largely fi xed cost
structure also provides operational leverage, such that an increase
in its trading volumes and the resulting transaction fee revenues
would have a positive eff ect on its margins.
Targeted Operating Optimisation
From its origination, Euronext has identified various ways to
streamline its processes and enhance its operational effi ciency.
As such Euronext had identifi ed the potential for pre-tax operating
optimisation and net effi ciencies of approximately €85 million by
the end of 2016 on a run-rate basis, i.e. taking into account the full-
year impact of any cost saving measure to be undertaken before the
end of this period. This target was reached in a reduced timeline,
by the end of Q1 of 2016.
As part of the Agility for Growth strategic plan released in
May 2016, an additional cost reduction program was announced,
aiming to deliver €22 million additional savings (€15 million, net of
infl ation) by the end of 2019, through infrastructure optimisation
and further streamlining of the organisation. In February 2019,
Euronext announced it achieved €23.8 million of savings, against
the €22 million previously expected.
As part of its Let’s Grow Together 2022 strategic plan, Euronext aims
at pursuing operating effi ciency while maintaining a best-in-class
cost discipline and investing in operational excellence.
Infrastructure optimisation: Euronext makes continuous eff orts to
improve its asset utilisation. Together with a rationalisation of the
number of sites and the set-up of Euronext’s IT team in Porto, it
continues its eff ort to reinforce the culture of effi ciency.
Expenses incurred to realise the effi ciencies described above are
classifi ed as “Exceptional items” in the Income statement, for a total
of €5.7 million in 2019 (2018: €8.1 million). This expense is included
in the total amount of exceptional items of €21.9 million in 2019
(2018: €21.5 million), disclosed in Note 12 of the Consolidated
Financial Statements.
Derivatives Clearing Agreement
On 14 October 2013, Euronext entered into the Derivatives Clearing
Agreement with LCH SA in respect of the clearing of trades on its
continental Europe derivatives markets. Under the terms of the
Derivatives Clearing Agreement, eff ective starting 1 April 2014,
Euronext has agreed with LCH SA to share revenues. Euronext
receives a share of clearing income based on treasury services
and the number of derivatives trades cleared through LCH SA, in
exchange for which Euronext pays LCH SA a fi xed fee plus a variable
fee based on derivatives trading volume.
The term of the existing Derivatives Clearing Agreement was
through 31 December 2018. On November 2017, Euronext
announced the signing of the renewal of its agreement with LCH SA
on the continued provision of derivatives and commodities clearing
services for a period of 10 years.
For the year ended 31 December 2017, revenues derived from the
Derivatives Clearing agreement are €51.1 million and the associated
expense is €27.2 million. For the year ended 31 December 2018,
those revenue are €55.3 million and the associated expense is
€28.3 million. For the year ended 31 December 2019, those revenue
are €55.2 million and the associated expense is €28.1 million.
Facilities Agreements and Bonds
On 6 May 2014, Euronext entered into a syndicated bank loan
facilities agreement (“the Facilities Agreement”), with BNP
Paribas and ING Bank N.V. as Lead Arrangers, providing for
a (i) a €250 million term loan facility and (ii) a €250 million
revolving credit facility, both maturing or expiring in three
years. On 20 February 2015, Euronext entered into the amended
and extended facilities agreement. Based on this agreement,
eff ectively on 23 March 2015 (i) the undrawn revolving credit
facility has been increased with €140 million to €390 million and
(ii) €140 million has been repaid as an early redemption of the
€250 million term loan facility. The facilities agreement mature in
2019 UNIVERSAL REGISTRATION DOCUMENT 149
Operating and fi nancial review77Overview
three years on 23 March 2018, with a two times one year extension
possibility, resulting in (i) a €390 million undrawn revolving credit
facility and (ii) a net non-current borrowing of €108 million as
of 31 December 2015. On 23 September 2016, Euronext repaid
€40 million as an early redemption of the €110 million term loan
facility, resulting in a net non-current borrowing of €69 million as
of 31 December 2016.
On 23 March 2017, the Group repaid the remaining outstanding non-
current borrowing of €70 million, enabling the Group to terminate
its term loan facility, which was supposed to mature on 23 March
2018. The Group also terminated its €390 million revolving credit
facility agreement and entered into a new €250 million revolving
credit facility (“The Facility”) on 12 April 2017.
The Group signed a new bank loan facility (“The Bank Loan facility”)
as per 18 July 2017 with fi ve banks to the amount of €175 million
and accordion of €125 million. The new bank loan facility was used
to fund the acquisitions of iBabs B.V. and FastMatch Inc., resulting
in the recognition of a non-current borrowing of €165.0 million as
per 31 December 2017.
On 18 April 2018, the Group issued a €500 million Bond (“Senior
Unsecured Note #1”) to refi nance its 2017 and 2018 acquisitions
and diversify its fi nancing mix. The Bond has a seven year maturity,
with an annual coupon of 1%. On 18 April 2018 the Bond, rated
“A” by Standard & Poor’s rating agency, was listed on Euronext
Dublin. Following receipt of the proceeds of the issued Bond, the
Group repaid the €165.0 million “Bank Loan facility”. The existing
€250.0 million “Facility” agreement remained unchanged and
matures on 12 April 2022, with a two times one year extension
possibility.
On 8 April 2019, the Group signed a supplemental agreement
with nine banks to amend the €250 million “Facility” agreement
originally dated 12 April 2017. This new agreement enabled the
Group to increase the “Facility” to €400.0 million and set a new
maturity of 5 years plus a two-year extension possibility.
On 4 June 2019, the Group issued another €500 million Bond
(“Senior Unsecured Note #2”) to (i) pre-fi nance the outstanding
shares of Oslo Børs VPS Holding ASA not already owned by the
Group and (ii) for general corporate purposes in line with the
Group’s strategy. The Bond has a ten year maturity, with an annual
coupon of 1.125%. On 12 June 2019 the Bond, rated “A-” by S&P
Global Ratings Limited, was listed on Euronext Dublin.
Reference is made to section 7.1.10 for more details on the Facility
and the Bonds.
Acquisitions of subsidiaries
The following acquisitions of subsidiaries were made in 2019:
n Acquisition of Oslo Børs VPS Holding ASA
On 14 June 2019, the Group acquired a majority stake in Oslo
Børs VPS, the Norwegian Stock Exchange and national CSD
operator, increasing its ownership to 97.8% as per that date.
The total purchase consideration of the transaction amounted to
€693.4 million. Subsequent to the transaction, the Group acquired
the remaining 2.2% minority stake, making the Group the benefi cial
owner of 100% of the Oslo Børs VPS shares as per 4 July 2019.
n Acquisition of Finance Web Working SAS (Euronext Funds360)
On 9 July 2019, the Group acquired 60% of Finance Web Working
SAS, a leading fund data provider in France, operating under the
business name Euronext Funds360 (formerly OPCVM360), with an
option to acquire the remaining capital in 2023.
The following acquisitions of subsidiaries were made in 2018:
n Acquisition of The Irish Stock Exchange Plc.
On 27 March 2018, the Group announced the completion of the
acquisition of 100% of the shares and voting rights of the Irish Stock
Exchange Plc., Ireland’s incumbent stock exchange operator and
a leading global debt and fund listing venue. The total purchase
consideration of the transaction amounted to €174.5 million. The
Irish Stock Exchange Plc. will operate under the business name
Euronext Dublin.
n Acquisition of InsiderLog AB
On 17 January 2018, the Group acquired 80% of the capital of
InsiderLog AB, a Stockholm-based leading player in the fi eld of
insider list management, for a cash consideration of €5.8 million,
plus a contingent earn-out payment depending on future fi nancial
performance.
n Acquisition of Commcise Ltd
On 20 December 2018, the Group acquired 78% of the shares and
voting rights of Commcise Ltd., a Software as a Service (“SaaS”)
provider of research evaluation and commission management
solutions for fi nancial services fi rms, from its founders for an initial
cash consideration of £27 million.
n Acquisition of additional interest in FastMatch Inc.
On 1 February 2019, a settlement was reached between
FastMatch Inc., Euronext US Inc. and the former CEO of FastMatch
Inc. Between the parties it was agreed that $0.8 million would be
paid to the former CEO in settlement of claims of alleged breach
by FastMatch of his employment agreement, and an amount of
$8.1 million as additional consideration for the 1,437,575 shares
of common stock of FastMatch Inc. (representing 7.52% of interest)
that were transferred by the former CEO to Euronext US Inc. for
$.001 per share on 10 August 2018.
The following acquisitions of subsidiaries were made in 2017:
n Acquisition of Company Webcast B.V.
On 14 February 2017, the Group acquired a 51% majority stake in
Company Webcast B.V., a Dutch company specialised in professional
webcast and webinar services. The transaction includes an initial
cash payment of €3.6 million and a deferred payment estimated
at €1.8 million. Call- and put options were granted by minority
shareholders and the Group, with similar conditions. When
executed, the Group acquires the minority stake of 49%, in 2020
at the earliest. A redemption liability is recorded at fair value of
€8.2 million refl ecting this commitment.
n Acquisition of iBabs B.V.
On 7 July 2017, the Group acquired a 60% majority stake in iBabs
B.V., a Dutch provider of dematerialised board portal solutions for
corporate and public organisations, for an initial consideration of
€30.1 million. iBabs’ solutions will be integrated into the Euronext
Corporate Services off ering. The founding management team of
iBabs B.V. will remain in place.
2019 UNIVERSAL REGISTRATION DOCUMENT150 www.euronext.com
Operating and fi nancial review
7
Overview
n Acquisition of FastMatch Inc.
On 14 August 2017, the Group acquired a 90% majority stake in
FastMatch Inc., a US-based Electronic Communication Network
in the spot Foreign Exchange market. The acquisition includes an
initial cash payment of $153 million (on a cash-free and debt-free
basis), a contingent earn-out payment for an additional $10 million
and customary minority rights for the management of FastMatch
Inc. that will remain committed to the development of the business
and stay invested with a 10% interest.
More details on the 2019 acquisitions can be found in Note 5
“Business Combinations” of the Consolidated Financial Statements
(section 8).
Investments in Associates and Joint Ventures
n Tredzone
On 22 July 2016, Euronext acquired a 34.04% stake in Tredzone
S.A.S., a highly specialised low latency software developer, as part
of its innovation strategy. Euronext has assessed the high level
of performance of the Tredzone technology by using it to develop
the next generation trading platform “Optiq®”. This agreement will
enable Tredzone to strengthen its leading edge technology and
will allow Euronext to benefi t from future developments made
by Tredzone. Software development tools from Tredzone allow
Euronext to fully leverage multi-core processing, hence enabling
substantial savings in use of hardware, simplifying and securing
IT infrastructure. Designed by a team of experts from fi nancial
markets software design, these tools are specifi cally adapted
to handle large amounts of data in real time within a complex
environment. The €1.4 million investment was recognised as
an investment in associate as at 31 December 2016. As per
31 December 2017 the investment amounted to €1.1 million. As
per 31 December 2018, following a review for impairment of its
associates and joint ventures, the Group recognised an impairment
of its interest in Tredzone S.A.S., bringing its value down to zero.
There were no changes to this value as per 31 December 2019.
n European Central Counterparty N.V. (“EuroCCP”)
In August 2016, Euronext announced it had signed a defi nitive
agreement to acquire a 20% stake in European Central
Counterparty N.V. (“EuroCCP”), the leading CCP for pan-European
equity markets, providing clearing and settlement services. This
deal will enable Euronext to off er user choice in clearing for the
equity markets within the Eurozone, through the implementation
of a preferred CCP model followed by a fully interoperable
service, which will be open to other CCPs in due course. Following
regulatory approvals, the completion of the transaction was
fi nalised on 15 December 2016 for an amount of €13.4 million.
The investment in EuroCCP has been recognised as an investment
in associate as at 31 December 2016. As per 31 December 2017
the investment amounted to €14.1 million. As per 31 December
2018 the investment amounted to €14.4 million.
On 10 December 2019, Euronext announced that it entered into
a binding agreement to sell its 20% minority stake in EuroCCP
to CBOE Global Markets, alongside the other current EuroCCP
shareholders. The transaction is expected to close in the fi rst half
of 2020, subject to receipt of required regulatory clearances and
the arrangement of a supporting liquidity facility at the EuroCCP
clearing entity level. The Group expects to receive net proceeds
of approximately €8.8 million from the sale of its minority stake.
As a result of this agreement, the Group impaired the value of
its investment by approximately €6.0 million, and classifi ed the
investment as an asset held for sale as per 31 December 2019.
n Algonext Ltd
In November 2016, Euronext announced a 10 year partnership with
fi xed income technology provider Algomi to create a long-term
joint venture. This joint venture, capitalised by Euronext, would
have deployed Algomi’s technology to a new multilateral trading
facility (“MTF”) “Synapse”. Dealers would have been able to access
the trading interface either directly through their existing Algomi
technology or through their stand-alone systems. The platform
would have used algorithmic smart matching processes to create
an auction between dealers to improve liquidity and search for
best execution. Algonext was incorporated on 16 December 2016
and, based on shared ownership, Euronext has an interest of 50%.
The investment in Algonext amounting to €1.2 million has been
recognised as an investment in joint ventures as at 31 December
2016. As per 31 December 2018, following a review for impairment
of its associates and joint ventures, the Group recognised an
impairment of its interest in Algonext Ltd., bringing its value
down to zero (see also “Algomi investment” within the “Equity
investments” section). There were no changes to this value as per
31 December 2019.
n LiquidShare S.A.
On 10 July 2017 the Group, together with six other leading fi nancial
institutions, incorporated LiquidShare S.A., a fi ntech joint venture
with the objective to improve SME’s access to capital markets and
improving the transparency and security of post-trading operations
using blockchain technology. The Group shares joint control with
the other founders and has an interest of 16.23% in LiquidShare
(2018 and 2017: 13.57%). In 2019, the Group made a capital
contribution of €1.2 million in LiquidShare S.A. The investment
amounted to €1.9 million as per 31 December 2019 (31 December,
2018 and 2017: €0.9 million).
n LCH S.A.
In the second half of 2017, the Group announced its intentions to
swap its 2.31% stake in LCH Group for a 11.1% stake in LCH SA,
subject to regulatory approvals and other customary conditions.
The transaction was finalised on 29 December 2017 and will
strengthen the long-standing relationship between Euronext and
LCH SA. Euronext will remain on the Board of LCH SA following
completion of the share swap. Euronext will also nominate one
representative to LCH SA Audit Committee and will continue to
be represented at LCH SA Risk Committee. A new Consultative
Committee dedicated to Euronext derivatives business will be
created. The parties have agreed that Euronext will have certain
minority protection rights connected with its new shareholding
in LCH SA.
As the Group concluded it has signifi cant infl uence, the 11.1%
stake in LCH SA amounting to €58.0 million was recognised in
investments in associates and joint ventures as per 31 December
2017. As per 31 December 2019 the investment amounted to
€60.0 million (31 December 2018: €57.4 million).
2019 UNIVERSAL REGISTRATION DOCUMENT 151

Operating and fi nancial review77Overview
n Investment in Tokeny Solutions
On 28 June 2019, the Group acquired a 23.5% stake in Tokeny
Solutions, a tokenization platform that provides users end-to-end
solutions to issue, manage and transfer tokenized securities on
public blockchain. The Group recognised the acquired interest as an
investment in associate. As per 31 December 2019 the investment
amounted to €4.8 million.
Equity Investments
n Euroclear Investment
On 30 April 2014, ICE contributed to the Group a 2.75% ownership
interest into Euroclear plc., an unlisted company involved in the
settlement of securities transaction and related banking services.
The fair value of the investment at that time was €63 million. Due to
share buy-backs by Euroclear plc. in 2015 the direct investment in
Euroclear plc. increased from 2.75% to 3.26% as per 31 December
2015. The fair value of the investment in Euroclear plc. was
measured at €67.1 million as per 31 December 2015.
In 2016 this share buy-back program did not continue, however
other valuation approaches were applied in a consistent manner
to 2015, leading to an adjustment of fair value through Other
Comprehensive Income of €0.5 million in 2016, bringing the
fair value of the 3.26% direct investment in Euroclear plc. to
€67.6 million as per 31 December 2016.
Due to share buy-backs by Euroclear plc. in 2017 the direct
investment in Euroclear plc. increased from 3.26% to 3.34% as
per 31 December 2017. The Group also holds an 1.53% indirect
investment in Euroclear plc., through its 9.60% ownership interest
in Sicovam Holding S.A.
Following the outcome of EU referendum in the UK and elections
in the US, euro-zone was facing additional political pressure
at the end of 2016. Increased political risk in economies long
considered bastions of political stability were expected to aff ect
risk-free rates, potentially reviving the euro crisis and raising the
risk of an EU break-up scenario. In the fi rst part of the year, this
risk of destabilization in Europe was reduced by the results of
elections in the Netherlands, France and Germany. The economic
sentiment and outlook significantly improved and funds are
fl owing back to the euro-zone and translated into a robust share
price performance across listed fi nancial institutions within the
EU.
This changing environment had an impact on the valuation
of the Group’s available-for-sale financial assets, especially
on investments in financial institutions with a significant EU
exposure, such as Euroclear plc. The sentiment in Europe, that
had a dampening eff ect on the value of our direct- and indirect
(through Sicovam Holding S.A.) equity investment in Euroclear
plc at the end of 2016, positively impacted this value as per
31 December 2017. This ultimately led to an increase in fair
value of the Group’s investments in Euroclear plc and Sicovam
S.A. in 2017 of €40.2 million.
As per 31 December 2017, following the above, the fair value of
the investment in Euroclear plc. was measured at €96.2 million
and the fair value of the investment in Sicovam Holding S.A. was
measured at €41.7 million.
In 2018, the Group increased its interest in Euroclear plc
from 3.34% to 3.53%, which was due to the acquisition of the
Irish Stock Exchange Plc., that holds an 0.19% ownership interest
in Euroclear plc. valued at €5.5 million on acquisition.
In 2018, as part of the fair value estimation of its investment in
Euroclear plc. the Group considered two observable transactions
for the determination of the fair value in addition to its primary
valuation technique and applied a weighted approach taken
into account a illiquidity discount for the limited number of
transactions. This ultimately led to an increase in fair value of
the Group’s investments in Euroclear plc and Sicovam S.A. of
€45.0 million in 2018. This revaluation was recorded in Other
Comprehensive Income.
As per 31 December 2018, following the above, the fair value of
the investment in Euroclear plc. was measured at €133.8 million
and the fair value of the investment in Sicovam Holding S.A. was
measured at €54.5 million.
In 2019, the Group considered the two transactions observed
in 2018 for the determination of the fair value in addition to its
primary valuation technique and applied a weighted approach
taking into account an illiquidity discount accounting for the limited
number of transactions. This ultimately led to an increase in fair
value of the Group’s investments in Euroclear plc and Sicovam S.A.
of €9.1 million in 2019 . This revaluation was recorded in Other
Comprehensive Income.
As per 31 December 2019, following the above, the fair value of
the investment in Euroclear plc. was measured at €140.4 million
and the fair value of the investment in Sicovam Holding S.A. was
measured at €57.1 million.
n Algomi Limited Investment (“Algomi”)
In November 2016, Euronext announced a 10-year partnership
with would have used fi xed-income technology provider Algomi
Limited (“Algomi”) to create a long-term joint venture “Algonext”.
This JV, initially capitalised by Euronext for $2.3 million, would
have deployed Algomi’s technology to a new multilateral trading
facility (“MTF”), owned and operated by Euronext. Based on shared
ownership and governance, Euronext has recognised its 50%
shareholding in Algonext as an “Investment in associates and
joint ventures” from the date of incorporation.
On 2 March 2017, Euronext acquired a 7.59% stake in JV partner
Algomi for $10 million. This investment is recognized as an
“Financial asset at fair value through OCI” from acquisition date.
As part of the purchase agreement, Euronext was granted a
warrant, allowing it to purchase 88,384 additional Algomi shares,
that was exercised in the second half of 2017. The investment was
recognized as an available-for-sale fi nancial asset at fair value
for €9.6 million as per 31 December 2017.
The management of Algomi decided to change its strategic
course of direction in the second half of 2018, by focusing on
their “Alpha” product, rather than further maintaining the
“Honeycomb/Synchronicity” network. This has resulted in many
banks terminating their contracts with Algomi. The Honeycomb/
Synchronicity network is the major source of data to feed the
MTF and without this data the MTF is not expected to generate
any trade. The Group expects that this change in focus will have
an adverse impact on the financial situations on both Algomi
2019 UNIVERSAL REGISTRATION DOCUMENT152 www.euronext.com

Operating and fi nancial review
7
Overview
and Algonext, as these entities will not be generating license fee
revenues going forward.
Considering this, the Group recorded a downward revaluation of
its investment in Algomi to refl ect its revised estimated fair value
(to zero), which is recognized in Other Comprehensive Income
as per 31 December 2018. Further in 2018, it recognized an
impairment of its investment in joint venture Algonext bringing
its carrying value to zero. Certain assets that were recognized
for Algomi exclusivity rights and prepaid expenses for the joint
venture have been impaired for which a charge has been recorded
in Exceptional items.
In 2019, fair value (zero) did not change for this investment.
n Oslo Børs VPS Holding ASA (“Oslo Børs VPS”)
On 24 December 2018, Euronext announced it had approached
the Board of Directors of Oslo Børs VPS Holding ASA (“Oslo Børs
VPS”) to seek its support for a €625m cash tender off er for all
the outstanding shares of Oslo Børs VPS, the Norwegian Stock
Exchange and national CSD operator, headquartered in Oslo. As
per 31 December 2018, following share purchases made by the
Group at end of 2018, the Group held a 5.1% ownership interest in
Oslo Børs VPS amounting to €31.7 million. The Group irrevocably
elected to classify the 5.1% investment in Oslo Børs VPS as an
equity investment at fair value through other comprehensive
income. The Group considered the purchase price of NOK 145
per share to be best proxy for fair value as per 31 December 2018,
supported by prices of Oslo Børs VPS shares traded at the end of
December 2018 and beginning of 2019.
During 2019, the Group made additional share purchases for
€22.1 million, increasing its ownership in Oslo Børs VPS to 8.3%,
before acquiring the majority stake on 14 June 2019. Immediately
before obtaining the majority stake and as part of the total
purchase consideration, the equity investment was revaluated
to its acquisition-date fair value of €57.4 million (at NOK 158 per
share plus interest payments) resulting in a gain of €3.6 million,
which was recognised in Other Comprehensive Income. As a
consequence of the transaction, the equity investment in Oslo
Børs VPS was fully derecognised and its historical revaluation
gain, recognised in Other Comprehensive Income, was transferred
to retained earnings on the date of acquiring the majority stake.
n LCH Group Investment
As per 31 December 2016, the Group held an 2.31% ownership
in LCH Group Limited (“LCH Group”) (2015: 2.31%). LCH Group
is a multi-asset international clearing house managing and
mitigating counterparty risks in market transactions. Management
determined fair value for its stockholding in LCH Group based
on updated information available as of 31 December 2016. The
updated information provided Management with suffi cient input
to record a change in fair value for its investment in LCH Group
of €1.7 million in 2016 (2015: €0.0 million) to €19.2 million as per
31 December 2016 (31 December 2015: €17.5 million).
In 2017, the Group entered into a share swap transaction of its
2.31% interest in LCH Group for an 11.1% interest in LCH SA, which
was fi nalised on 29 December 2017. The share swap transaction
led to a change in fair value of €38.4 million and subsequent
de-recognition in available-for-sale fi nancial assets with carrying
value of €57.6 million, in relation to the 2.31% stake in LCH Group
Ltd. leaving no value for this investment as per 31 December 2017.
The share swap transaction resulted in a capital gain recognised
in results from equity investments of €40.6 million, from the
recycling to profi t or loss of cumulative historical revaluations
that were recognised in Other Comprehensive Income.
7.1.6 GOODWILL
Goodwill recorded includes the entire goodwill that arose from
the acquisition of the Amsterdam and Brussels stock exchanges
in 2000 and the Lisbon stock exchange in 2002. It also includes
an allocation of the goodwill that arose from the acquisition of
Atos Euronext Market Solutions (“AEMS”), Euronext’s preferred
IT service provider, in 2008. In 2017, additional goodwill was
recorded in relation to the acquisitions of Company Webcast,
iBabs and FastMatch. In 2018, additional goodwill was recorded in
relation to the acquisitions of InsiderLog, the Irish Stock Exchange
and Commcise. In 2019, additional goodwill was recorded in
relation to the acquisitions of Oslo Børs VPS and Finance Web
Working SAS.
7.1.7 FINANCIAL AND TRADING POSITION
Other than as described below, there has been no significant
change in Euronext’s fi nancial or trading position since 1 January
2020.
n Acquisition of Nord Pool Group
On 5 December 2019, the Group announced it entered into binding
agreements to acquire 66% of the share capital and voting rights of
the Nord Pool Group, which runs a leading physical power market
in Europe, operating from its headquarters in Oslo and offi ces in
Helsinki, Stockholm, Tallinn, Berlin and London. The enterprise
value on a debt-free cash-free basis for 100% is NOK850 million
(€84 million). The transaction was subject to regulatory and
competition approvals and was completed on 15 January 2020.
With the acquisition of Nord Pool Group, the second largest power
market in Europe, Euronext diversifi es its revenue mix by entering
the power market, and reinforces its commodity franchise. This
transaction also contributes to the Group’s ambition to grow
its presence in the Nordic region and further strengthens Oslo
as Euronext’s main hub in the Nordics. The Nordic and Baltic
Transmission System Operators (TSOs) that formerly owned Nord
Pool Group, will retain a 34% stake.
n Payment of contingent consideration payable and exercise
of call option for remaining shares in InsiderLog AB
During the fi rst quarter of 2020, the Group paid the €3.6 million
contingent consideration payable to InsiderLog AB, as part of the 80%
majority stake that was acquired on 17 January 2018. In addition, the
Group exercised its call option for the remaining 20% of the shares
in InsiderLog AB for an amount of €5.7 million. Consequently, the
Group now has an ownership of 100% in InsiderLog AB.
2019 UNIVERSAL REGISTRATION DOCUMENT 153

Operating and fi nancial review77Overview
n Payment of contingent consideration payable and exercise
of put option for remaining shares in Company Webcast B.V.
During the fi rst quarter of 2020, the Group paid the €5.0 million
contingent consideration payable to Company Webcast B.V., as part
of the 51% majority stake that was acquired on 14 February 2017.
In addition, the minority shareholders exercised their put option
for selling the remaining 49% of the shares in Company Webcast
B.V. for an amount of €22.2 million. Consequently, the Group now
has an ownership of 100% in Company Webcast B.V.
n Sale of investment in Algomi Ltd.
During the fi rst quarter of 2020, the Group entered into binding
agreements to sell its 7.74% minority stake in Algomi Ltd. to BGC
Partners. The transaction is expected to close in the course of 2020.
The Group expects to receive net proceeds of approximately $3.0
million from the sale of its minority stake.
7.1.8 RESULTS OF OPERATIONS
Year ended 31 December 2019 compared to year ended 31 December 2018 and 31 December 2017
The table below sets forth Euronext’s results of operations for the years ended 31 December 2019, 2018 and 2017.
In thousands of euros
Year ended
31 December 2019 31 December 2018 31 December 2017
Revenue 679,108 615,033 532,294
Total revenue 679,108 615,033 532,294
Salaries and employee benefi ts (153,145) (118,488) (104,363)
Depreciation and amortisation (43,676) (23,400) (16,932)
Other operational expenses (126,543) (142,295) (130,149)
Operating profi t before exceptional items 355,744 330,850 280,850
Exceptional items (21,871) (21,474) (14,787)
Operating profi t 333,873 309,376 266,063
Finance costs (11,851) (5,481) (3,553)
Change in fair value of fi nancial liabilities (13,275) (3,200) -
Other net fi nancing income/(expense) 7,711 3,421 (47)
Results from equity investments 7,270 5,984 48,325
Share of net profi t/(loss) of associates and joint ventures accounted
for using the equity method, and impairments thereof 1,844 1,612 287
Profi t before income tax 325,572 311,712 311,075
Income tax expense (100,294) (94,084) (68,886)
PROFIT FOR THE YEAR 225,278 217,628 242,189
Profi t attributable to:
n Owners of the parent 221,966 215,968 241,297
n Non-controlling interests 3,312 1,660 892
2019 UNIVERSAL REGISTRATION DOCUMENT154 www.euronext.com
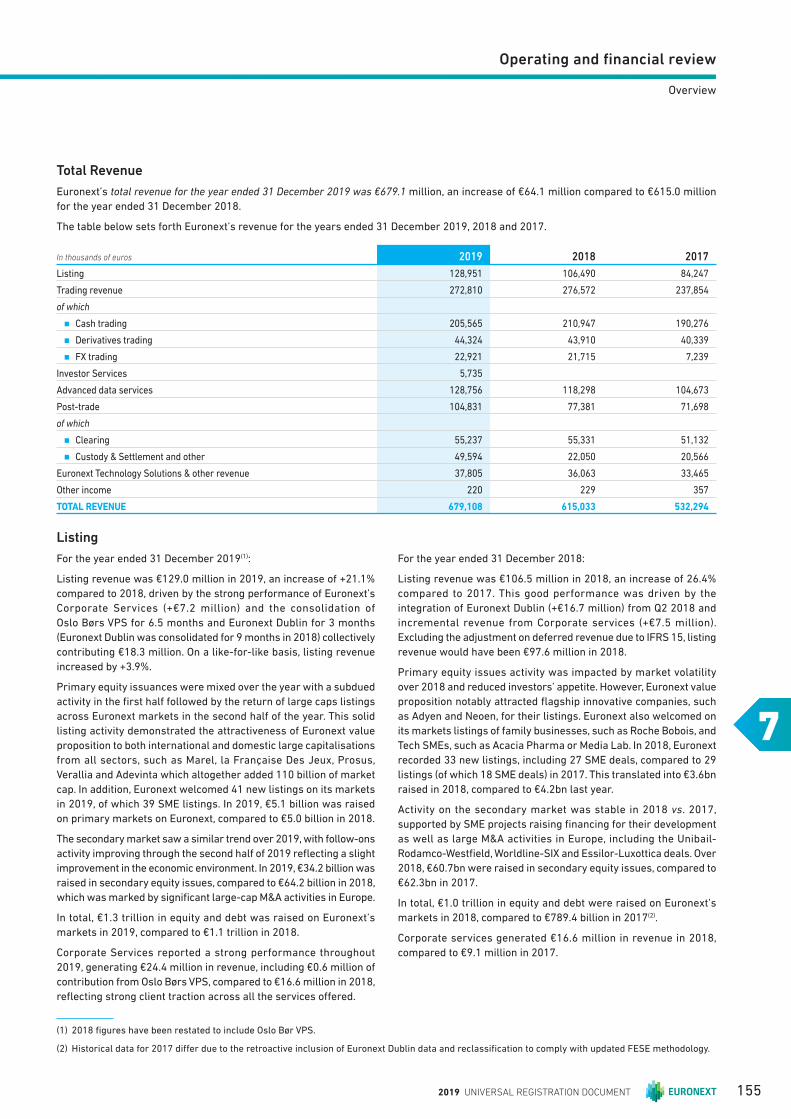
Operating and fi nancial review
7
Overview
Listing
For the year ended 31 December 2019(1):
Listing revenue was €129.0 million in 2019, an increase of +21.1%
compared to 2018, driven by the strong performance of Euronext’s
Corporate Services (+€7.2 million) and the consolidation of
Oslo Børs VPS for 6.5 months and Euronext Dublin for 3 months
(Euronext Dublin was consolidated for 9 months in 2018) collectively
contributing €18.3 million. On a like-for-like basis, listing revenue
increased by +3.9%.
Primary equity issuances were mixed over the year with a subdued
activity in the fi rst half followed by the return of large caps listings
across Euronext markets in the second half of the year. This solid
listing activity demonstrated the attractiveness of Euronext value
proposition to both international and domestic large capitalisations
from all sectors, such as Marel, la Française Des Jeux, Prosus,
Verallia and Adevinta which altogether added 110 billion of market
cap. In addition, Euronext welcomed 41 new listings on its markets
in 2019, of which 39 SME listings. In 2019, €5.1 billion was raised
on primary markets on Euronext, compared to €5.0 billion in 2018.
The secondary market saw a similar trend over 2019, with follow-ons
activity improving through the second half of 2019 refl ecting a slight
improvement in the economic environment. In 2019, €34.2 billion was
raised in secondary equity issues, compared to €64.2 billion in 2018,
which was marked by signifi cant large-cap M&A activities in Europe.
In total, €1.3 trillion in equity and debt was raised on Euronext’s
markets in 2019, compared to €1.1 trillion in 2018.
Corporate Services reported a strong performance throughout
2019, generating €24.4 million in revenue, including €0.6 million of
contribution from Oslo Børs VPS, compared to €16.6 million in 2018,
refl ecting strong client traction across all the services off ered.
For the year ended 31 December 2018:
Listing revenue was €106.5 million in 2018, an increase of 26.4%
compared to 2017. This good performance was driven by the
integration of Euronext Dublin (+€16.7 million) from Q2 2018 and
incremental revenue from Corporate services (+€7.5 million).
Excluding the adjustment on deferred revenue due to IFRS 15, listing
revenue would have been €97.6 million in 2018.
Primary equity issues activity was impacted by market volatility
over 2018 and reduced investors’ appetite. However, Euronext value
proposition notably attracted fl agship innovative companies, such
as Adyen and Neoen, for their listings. Euronext also welcomed on
its markets listings of family businesses, such as Roche Bobois, and
Tech SMEs, such as Acacia Pharma or Media Lab. In 2018, Euronext
recorded 33 new listings, including 27 SME deals, compared to 29
listings (of which 18 SME deals) in 2017. This translated into €3.6bn
raised in 2018, compared to €4.2bn last year.
Activity on the secondary market was stable in 2018 vs. 2017,
supported by SME projects raising fi nancing for their development
as well as large M&A activities in Europe, including the Unibail-
Rodamco-Westfi eld, Worldline-SIX and Essilor-Luxottica deals. Over
2018, €60.7bn were raised in secondary equity issues, compared to
€62.3bn in 2017.
In total, €1.0 trillion in equity and debt were raised on Euronext’s
markets in 2018, compared to €789.4 billion in 2017(2 ).
Corporate services generated €16.6 million in revenue in 2018,
compared to €9.1 million in 2017.
(1) 2018 figures have been restated to include Oslo Bør VPS.
(2 ) Historical data for 2017 differ due to the retroactive inclusion of Euronext Dublin data and reclassification to comply with updated FESE methodology.
Total Revenue
Euronext’s total revenue for the year ended 31 December 2019 was €679.1 million, an increase of €64.1 million compared to €615.0 million
for the year ended 31 December 2018.
The table below sets forth Euronext’s revenue for the years ended 31 December 2019, 2018 and 2017.
In thousands of euros 2019 2018 2017
Listing 128,951 106,490 84,247
Trading revenue 272,810 276,572 237,854
of which
n Cash trading 205,565 210,947 190,276
n Derivatives trading 44,324 43,910 40,339
n FX trading 22,921 21,715 7,239
Investor Services 5,735
Advanced data services 128,756 118,298 104,673
Post-trade 104,831 77,381 71,698
of which
n Clearing 55,237 55,331 51,132
n Custody & Settlement and other 49,594 22,050 20,566
Euronext Technology Solutions & other revenue 37,805 36,063 33,465
Other income 220 229 357
TOTAL REVENUE 679,108 615,033 532,294
2019 UNIVERSAL REGISTRATION DOCUMENT 155
Operating and fi nancial review77Overview
Trading
Cash Trading
For the year ended 31 December 2019(1 ):
Cash trading revenue decreased by -2.6% in 2019, to a total of
€205.6 million, resulting from a decline in trading volumes in a low
volatility environment with average daily volume for cash trading
decreasing to €7.8 billion in 2019, down -3.8% compared to 2018.
On a like-for-like basis, cash trading revenue decreased by -5.8%.
The average yield over the year was 0.52bps, and amounted to
0.53bps on a like-for-like basis, compared to 0.51bps in 2018. The
cash trading market share throughout 2019 averaged 68.8% like-
for-like, an increase from 66.1% in 2018.
The average daily transaction value of ETFs on the electronic order
book was €216 million over 2019, down -18.8% compared to 2018,
driven by low volatility levels. The total number of ETFs listed on
Euronext was 1,236 at end of December 2019.
For the year ended 31 December 2018:
Average daily volume for cash trading increased to €8.1 billion
in 2018, up +5.7% compared to 2017(2 ). With volumes supported
by volatility peaks through the year, and thanks to eff ective yield
management, cash trading revenue increased by +10.9% in 2018,
to a total of €210.9 million, thanks to an average yield over the year
of 0.51bps, up +4.9% compared to 2017.
Euronext strengthened its cash trading market share throughout
2018, averaging 66.1% in 2018, compared to 64.4% in 2017.
The average daily transaction value of ETFs on the electronic order
book was €266 million over 2018, up +7.0% compared to 2017,
supported by market volatility. The total number of ETFs listed on
Euronext was 1,150 at the end of December 2018.
Derivatives Trading
For the year ended 31 December 2019:
Derivatives trading revenue increased +0.9% in 2019, to
€44.3 million, compared to €43.9 million in 2018. On a like-for-
like basis, derivatives trading revenue was down -1.8%. Average
daily volume on individual equity derivatives was down -4.2% at
295,227 contracts, while the average daily volume on equity index
derivatives was down -2.0% to 240,550 contracts.
Commodity products recorded an decrease in average daily
volumes in 2019, down -7.3% to 53,224 contracts compared to 2018.
Yield on derivatives averaged €0.30 in 2019, up +1.7% compared to
2018, resulting from enhanced yield management.
For the year ended 31 December 2018:
Derivatives trading revenue increased in 2018, to €43.9 million,
compared to €40.3 million in 2017. Average daily volume on
individual equity derivatives was up +7.4% at 297,012 contracts,
while the average daily volume on equity index derivatives was up
+4.1% to 231,107 contracts.
Commodity products recorded increasing average daily volumes
in 2018, up +10.8% to 57,191 contracts.
Yield on derivatives averaged 0.29bps in 2018, stable compared
to 2017.
Yield on derivatives averaged 0.29 bps over 2017, a decrease
from 0.32 bps in 2016, due to the special Dutch circumstances
stated above.
Spot FX Trading
For the year ended 31 December 2019:
Spot FX trading activity on the Euronext FX spot foreign exchange
market recorded average daily volumes of $18.3 billion in 2019,
down -9.2% compared to $20.1 billion in 2018, impacted by a low
volatility environment through 2019. Spot FX trading generated
€22.9 million of revenue in 2019, up +5.6% compared to €21.7 million
in 2018, thanks to improved yield management.
For the year ended 31 December 2018:
Spot FX trading activity on FastMatch’s spot foreign exchange market
recorded average daily volumes of $20.1 billion, up +9.3% compared
to 2017, supported by markets volatility through the year. As a result,
spot FX trading generated €21.7 million of revenue in 2018. In 2017,
spot FX trading generated €7.2 million of revenue for 4.6 months
of consolidation.
Investor Services
For the year ended 31 December 2019:
Investor Services, created in 2019, encompassing primarily the
activities of Commcise, of which Euronext acquired 78% of the
capital in December 2018, as well as Investor Services activities
from Oslo Børs VPS, reported €5.7 million of revenue in 2019 as the
business benefi ted from Euronext’s commercial reach and expertise
throughout the year.
Advanced data services
For the year ended 31 December 2019:
Advanced Data Services reported revenue up +8.8% to €128.8 million
in 2019 due to the good performance of index activities, particularly
on ESG products and structured products, and the consolidation
of Oslo Børs VPS. On a like-for-like basis, Advanced Data Services
revenues were up +1.1% compared to 2018, thanks to the good
performance of the indices business, offset by the decrease of
market data revenue.
For the year ended 31 December 2018:
Advanced data services reported a strong 2018 performance, with
revenue up +13.0% to €118.3 million in 2018, resulting from new
market data agreements, good traction from indices business, and
refl ecting the consolidation of Euronext Dublin activities.
Post-Trade
Clearing
For the year ended 31 December 2019:
Clearing revenue was stable in 2019, at €55.2 million, slightly down
-0.2% compared to 2018, as lower derivatives trading volumes were
partially off set by higher treasury income.(1) 2018 figures has been restated to include Oslo Bør VPS.
(2 ) Historical data for 2017 differ due to the retroactive inclusion of Euronext Dublin data and reclassification to comply with updated FESE methodology.
2019 UNIVERSAL REGISTRATION DOCUMENT156 www.euronext.com

Operating and fi nancial review
7
Overview
For the year ended 31 December 2018:
Clearing revenue increased in 2018, to €55.3 million, +8.2%
compared to 2017, refl ecting a dynamic commodities activity during
the year, and higher treasury income.
Settlement & Custody
For the year ended 31 December 2019:
Revenue from Custody, Settlement and other post-trade activities,
notably encompassing Interbolsa and VPS activities, increased
by +124.9% to €49.6 million in 2019, resulting mainly from the
consolidation of Oslo Børs VPS. Both VPS and Interbolsa reported a
good performance driven by an increased activity in both custody
and settlement. On a like-for-like basis, revenue from Custody,
Settlement and other post-trade was up +1.0%.
For the year ended 31 December 2018:
Revenue from Interbolsa in Portugal and other post trade activities
increased by +7.2%, to €22.1 million in 2018, driven by an increase
in equities and public debt under custody and settlement activity
compared to 2017.
Euronext Technology Solutions
For the year ended 31 December 2019:
Euronext Technology Solutions & Other revenue increased by
+4.8% in 2019, to €37.8 million, as a result of good performance of
SFTI/Colocation services, hosted services, connection fees and the
consolidation of Oslo Børs VPS. On a like-for-like basis, revenue was
up +0.6% compared to last year.
For the year ended 31 December 2018:
Euronext Technology Solutions revenue increased by +7.8% in 2018,
to €36.1 million as the activity continued to benefi t from Optiq®
project work on commercial releases for international clients, as
well as an increased activity in Managed Services solutions and in
SFTI/Colocation services.
EURONEXT 2019 THIRD PARTY REVENUE BY GEOGRAPHY
France48.78%
United Kingdom0.78%
Belgium4.56%
Netherlands23.57%
Portugal4.89%
Ireland5.25%
USA3.42%
Norway8.40% Sweden
0.34%
Hong Kong0.01%
2019
EURONEXT 2018 THIRD PARTY REVENUE BY GEOGRAPHY
France53,37%
United Kingdom0,05%
Belgium5,35%
Netherlands27,80%
Portugal5,69%
Ireland3,99%
USA3,55%
Sweden0,20%
Hong Kong0,01%
2018
Operating Expenses
In thousands of euros
Year ended
2019 2018 2017
Salaries and employee benefi ts (153,145) (118,488) (104,363)
Depreciation and amortisation (43,676) (23,400) (16,932)
Other operational expenses (126,543) (142,295) (130,149)
TOTAL OPERATING EXPENSES (323,364) (284,183) (251,444)
For the year ended 31 December 2019:
Euronext operating expenses in 2019 were €323.4 million, compared
to €284.2 million in 2018, an increase of €39.2 million or 13.8%. The
overall cost increase in 2019 was due to:
n the acquisitions of Oslo Børs VPS, Commcise and OPCVM360
in 2019, and the full year cost impact from the acquisitions of
Euronext Dublin;
n PPA and earn-out adjustment, related to the acquisitions
mentioned above;
Euronext operating expenses comprise salaries and employee
benefits, depreciation and amortisation, and other operational
expenses.
For the year ended 31 December 2018:
Euronext operating expenses in 2018 were €284.2 million, compared
to €251.4 million in 2017, an increase of €32.7 million or 13.0%. The
overall cost increase in 2018 was due to:
n the acquisitions of InsiderLog and Euronext Dublin; in 2018,
and the full year cost impact from the acquisitions of iBabs and
FastMatch;
2019 UNIVERSAL REGISTRATION DOCUMENT 157
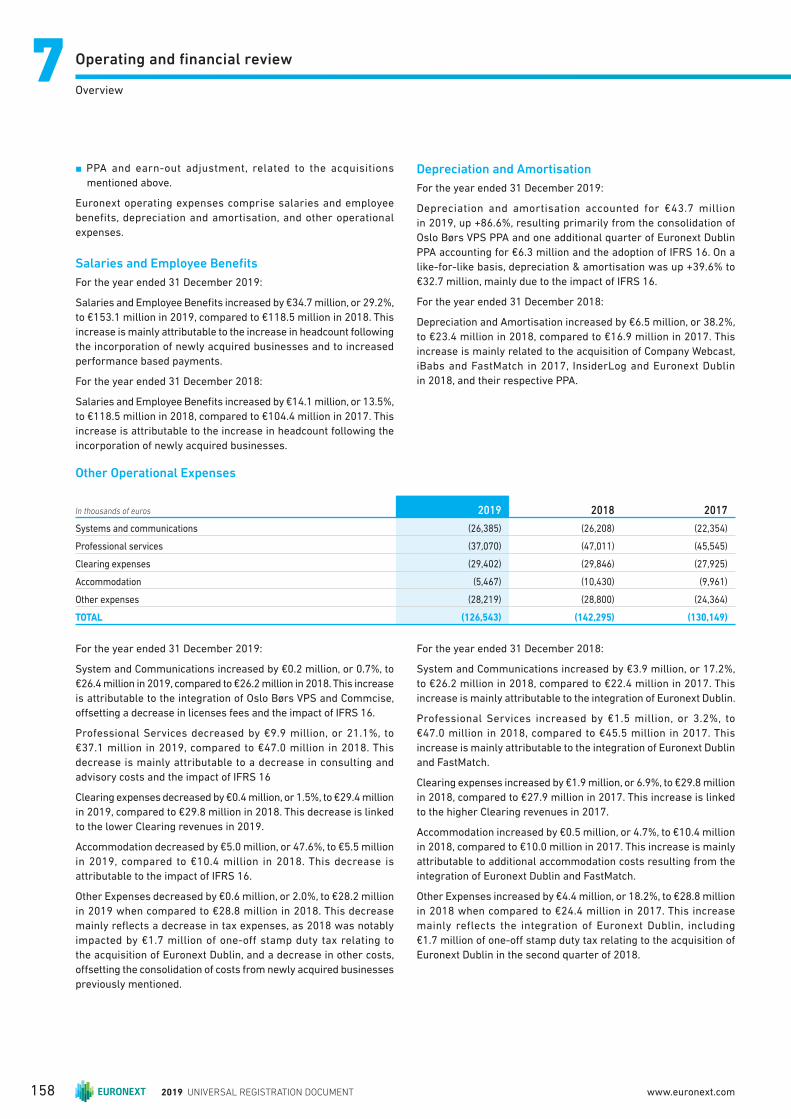
Operating and fi nancial review77Overview
Other Operational Expenses
In thousands of euros 2019 2018 2017
Systems and communications (26,385) (26,208) (22,354)
Professional services (37,070) (47,011) (45,545)
Clearing expenses (29,402) (29,846) (27,925)
Accommodation (5,467) (10,430) (9,961)
Other expenses (28,219) (28,800) (24,364)
TOTAL (126,543) (142,295) (130,149)
For the year ended 31 December 2019:
System and Communications increased by €0.2 million, or 0.7%, to
€26.4 million in 2019, compared to €26.2 million in 2018. This increase
is attributable to the integration of Oslo Børs VPS and Commcise,
off setting a decrease in licenses fees and the impact of IFRS 16.
Professional Services decreased by €9.9 million, or 21.1%, to
€37.1 million in 2019, compared to €47.0 million in 2018. This
decrease is mainly attributable to a decrease in consulting and
advisory costs and the impact of IFRS 16
Clearing expenses decreased by €0.4 million, or 1.5%, to €29.4 million
in 2019, compared to €29.8 million in 2018. This decrease is linked
to the lower Clearing revenues in 2019.
Accommodation decreased by €5.0 million, or 47.6%, to €5.5 million
in 2019, compared to €10.4 million in 2018. This decrease is
attributable to the impact of IFRS 16.
Other Expenses decreased by €0.6 million, or 2.0%, to €28.2 million
in 2019 when compared to €28.8 million in 2018. This decrease
mainly refl ects a decrease in tax expenses, as 2018 was notably
impacted by €1.7 million of one-off stamp duty tax relating to
the acquisition of Euronext Dublin, and a decrease in other costs,
off setting the consolidation of costs from newly acquired businesses
previously mentioned.
For the year ended 31 December 2018:
System and Communications increased by €3.9 million, or 17.2%,
to €26.2 million in 2018, compared to €22.4 million in 2017. This
increase is mainly attributable to the integration of Euronext Dublin.
Professional Services increased by €1.5 million, or 3.2%, to
€47.0 million in 2018, compared to €45.5 million in 2017. This
increase is mainly attributable to the integration of Euronext Dublin
and FastMatch.
Clearing expenses increased by €1.9 million, or 6.9%, to €29.8 million
in 2018, compared to €27.9 million in 2017. This increase is linked
to the higher Clearing revenues in 2017.
Accommodation increased by €0.5 million, or 4.7%, to €10.4 million
in 2018, compared to €10.0 million in 2017. This increase is mainly
attributable to additional accommodation costs resulting from the
integration of Euronext Dublin and FastMatch.
Other Expenses increased by €4.4 million, or 18.2%, to €28.8 million
in 2018 when compared to €24.4 million in 2017. This increase
mainly reflects the integration of Euronext Dublin, including
€1.7 million of one-off stamp duty tax relating to the acquisition of
Euronext Dublin in the second quarter of 2018.
n PPA and earn-out adjustment, related to the acquisitions
mentioned above.
Euronext operating expenses comprise salaries and employee
benefits, depreciation and amortisation, and other operational
expenses.
Salaries and Employee Benefi ts
For the year ended 31 December 2019:
Salaries and Employee Benefi ts increased by €34.7 million, or 29.2%,
to €153.1 million in 2019, compared to €118.5 million in 2018. This
increase is mainly attributable to the increase in headcount following
the incorporation of newly acquired businesses and to increased
performance based payments.
For the year ended 31 December 2018:
Salaries and Employee Benefi ts increased by €14.1 million, or 13.5%,
to €118.5 million in 2018, compared to €104.4 million in 2017. This
increase is attributable to the increase in headcount following the
incorporation of newly acquired businesses.
Depreciation and Amortisation
For the year ended 31 December 2019:
Depreciation and amortisation accounted for €43.7 million
in 2019, up +86.6%, resulting primarily from the consolidation of
Oslo Børs VPS PPA and one additional quarter of Euronext Dublin
PPA accounting for €6.3 million and the adoption of IFRS 16. On a
like-for-like basis, depreciation & amortisation was up +39.6% to
€32.7 million, mainly due to the impact of IFRS 16.
For the year ended 31 December 2018:
Depreciation and Amortisation increased by €6.5 million, or 38.2%,
to €23.4 million in 2018, compared to €16.9 million in 2017. This
increase is mainly related to the acquisition of Company Webcast,
iBabs and FastMatch in 2017, InsiderLog and Euronext Dublin
in 2018, and their respective PPA.
2019 UNIVERSAL REGISTRATION DOCUMENT158 www.euronext.com
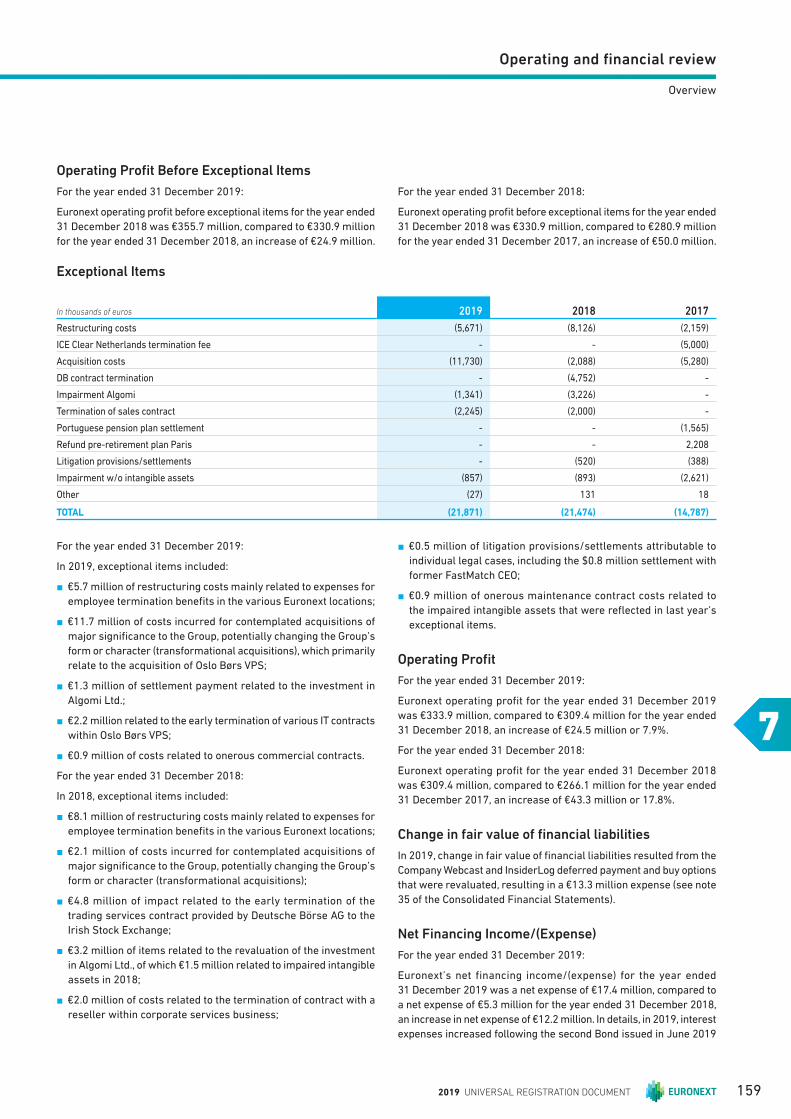
Operating and fi nancial review
7
Overview
Exceptional Items
In thousands of euros 2019 2018 2017
Restructuring costs (5,671) (8,126) (2,159)
ICE Clear Netherlands termination fee - - (5,000)
Acquisition costs (11,730) (2,088) (5,280)
DB contract termination - (4,752) -
Impairment Algomi (1,341) (3,226) -
Termination of sales contract (2,245) (2,000) -
Portuguese pension plan settlement - - (1,565)
Refund pre-retirement plan Paris - - 2,208
Litigation provisions/settlements - (520) (388)
Impairment w/o intangible assets (857) (893) (2,621)
Other (27) 131 18
TOTAL (21,871) (21,474) (14,787)
For the year ended 31 December 2019:
In 2019, exceptional items included:
n €5.7 million of restructuring costs mainly related to expenses for
employee termination benefi ts in the various Euronext locations;
n €11.7 million of costs incurred for contemplated acquisitions of
major signifi cance to the Group, potentially changing the Group’s
form or character (transformational acquisitions), which primarily
relate to the acquisition of Oslo Børs VPS;
n €1.3 million of settlement payment related to the investment in
Algomi Ltd.;
n €2.2 million related to the early termination of various IT contracts
within Oslo Børs VPS;
n €0.9 million of costs related to onerous commercial contracts.
For the year ended 31 December 2018:
In 2018, exceptional items included:
n €8.1 million of restructuring costs mainly related to expenses for
employee termination benefi ts in the various Euronext locations;
n €2.1 million of costs incurred for contemplated acquisitions of
major signifi cance to the Group, potentially changing the Group’s
form or character (transformational acquisitions);
n €4.8 million of impact related to the early termination of the
trading services contract provided by Deutsche Börse AG to the
Irish Stock Exchange ;
n €3.2 million of items related to the revaluation of the investment
in Algomi Ltd. , of which €1.5 million related to impaired intangible
assets in 2018 ;
n €2.0 million of costs related to the termination of contract with a
reseller within corporate services business;
n €0.5 million of litigation provisions/settlements attributable to
individual legal cases, including the $0.8 million settlement with
former FastMatch CEO ;
n €0.9 million of onerous maintenance contract costs related to
the impaired intangible assets that were refl ected in last year’s
exceptional items.
Operating Profi t
For the year ended 31 December 2019:
Euronext operating profi t for the year ended 31 December 2019
was €333.9 million, compared to €309.4 million for the year ended
31 December 2018, an increase of €24.5 million or 7.9%.
For the year ended 31 December 2018:
Euronext operating profi t for the year ended 31 December 2018
was €309.4 million, compared to €266.1 million for the year ended
31 December 2017, an increase of €43.3 million or 17.8%.
Change in fair value of fi nancial liabilities
In 2019, change in fair value of fi nancial liabilities resulted from the
Company Webcast and InsiderLog deferred payment and buy options
that were revaluated, resulting in a €13.3 million expense (see note
35 of the Consolidated Financial Statements).
Net Financing Income/(Expense)
For the year ended 31 December 2019:
Euronext’s net financing income/(expense) for the year ended
31 December 2019 was a net expense of €17.4 million, compared to
a net expense of €5.3 million for the year ended 31 December 2018,
an increase in net expense of €12.2 million. In details, in 2019, interest
expenses increased following the second Bond issued in June 2019
Operating Profi t Before Exceptional Items
For the year ended 31 December 2019:
Euronext operating profi t before exceptional items for the year ended
31 December 2018 was €355.7 million, compared to €330.9 million
for the year ended 31 December 2018, an increase of €24.9 million.
For the year ended 31 December 2018:
Euronext operating profi t before exceptional items for the year ended
31 December 2018 was €330.9 million, compared to €280.9 million
for the year ended 31 December 2017, an increase of €50.0 million.
2019 UNIVERSAL REGISTRATION DOCUMENT 159

Operating and fi nancial review77Overview
Result from equity investments
For the year ended 31 December 2019:
In 2019, the €9.1 million of results from equity investments mainly
related to the following items:
n €7.3 million of dividends received from Euroclear plc and Sicovam
Holding S.A.;
n €1.8 million of investment in associates resulting from the
impairment of EuroCCP stake sold in 2019, off setby €7.7 million
of investments in associates refl ecting the 11.1% stake in LCH SA.
For the year ended 31 December 2018:
In 2018, the €7.6 million of results from equity investments mainly
related to the following items:
n €6.0 million of dividends received from Euroclear plc and Sicovam
Holding S.A.;
n €1.6 million of investments in associates.
Profi t before Income Tax
For the year ended 31 December 2019:
Euronext profi t before income tax for the year ended 31 December
2019 was €325.6 million, compared to €311.7 million for the year
ended 31 December 2018, an increase of €13.9 million or +4.4%.
For the year ended 31 December 2018:
Euronext profi t before income tax for the year ended 31 December
2018 was €311.7 million, compared to €311.1 million for the year
ended 31 December 2017, an increase of €0.6 million or +0.2%.
Income Tax Expense
For the year ended 31 December 2019:
Euronext’s income tax expense for the year ended 31 December 2019
was €100.3 million, compared to €94.1 million for the year ended
31 December 2018, an increase of €6.2 million or 6.6%. Euronext’s
eff ective tax rate was 30.8% for the year ended 31 December 2019
compared to 30.2% for the year ended 31 December 2018. The
increase of the eff ective tax rate in 2019 is primarily attributable to:
n non-deductible acquisition costs;
n the impact of the rate decrease on the deferred tax assets in
France and a tax rate increase in the Netherlands impacting the
deferred liability;
n non-deductible expenses linked to the recognition of earn out
liabilities in connection with the buy out of Company Webcast
and Insiderlog.
For the year ended 31 December 2018:
Euronext’s income tax expense for the year ended 31 December
2018 was €94.1 million, compared to €68.9 million for the year ended
31 December 2017, an increase of €25.2 million or 36.6%. Euronext’s
eff ective tax rate was 30.2% for the year ended 31 December 2018
compared to 22.1% for the year ended 31 December 2017. The
increase of the eff ective tax rate in 2018 is primarily attributable to:
n the release of a €20.4 million tax provision due to the lapse of the
statute of limitations recorded in 2017, while in 2018 €4.0 of tax
provisions were release.
In thousands of euros 2019 2018 2017
Interest expense (eff ective interest method) (11,632) (5,558) (2,373)
Interest in respect of lease liabilities (555)
Other fi nance costs 336 77 (1,180)
Finance costs (11,851) (5,481) (3,553)
Contingent liabilities (1,310) (1,200) -
Redemption liabilities (11,965) (2,000) -
Change in fair value of fi nancial liabilities (13,275) (3,200) -
Interest income (eff ective interest method) 1,879 487 314
Interest income from interest rate swaps 4,971 3,534 -
Hedging result 124 (638) -
Gain/(loss) on disposal of treasury investments 198 (220) (5)
Net foreign exchange gain/(loss) 539 258 (356)
Other net fi nancing income/(expense) 7,711 3,421 (47)
TOTAL (17,415) (5,260) (3,600)
(see Note 29 of the Consolidated Financial Statements) and other net
fi nancing income was positively impacted by income from interest
rate swaps, as a result of the Group entering into interest rate swap
agreements related to the first issued bond (see Note 23 of the
Consolidated Financial).
For the year ended 31 December 2018:
Euronext’s net financing income/(expense) for the year ended
31 December 2018 was a net expense of €5.3 million, compared
to a net expense of €3.6 million for the year ended 31 December
2017, an increase in net expense of €1.7 million. This increase
refl ects mainly the revaluation of earn-outs related to Company
Webcast and InsiderLog. In details, in 2018, interest expenses
increased following the Bond issued in April 2018 (see Note 29 of the
Consolidated Financial Statements), non-current fi nancial liabilities
were remeasured by €3.2 million (see Note 35 of the Consolidated
Financial Statements) and other net fi nancing income was positively
impacted by income from interest rate swaps, as a result of the
Group entering into interest rate swap agreements (see Note 23 of
the Consolidated Financial Statements).
2019 UNIVERSAL REGISTRATION DOCUMENT160 www.euronext.com
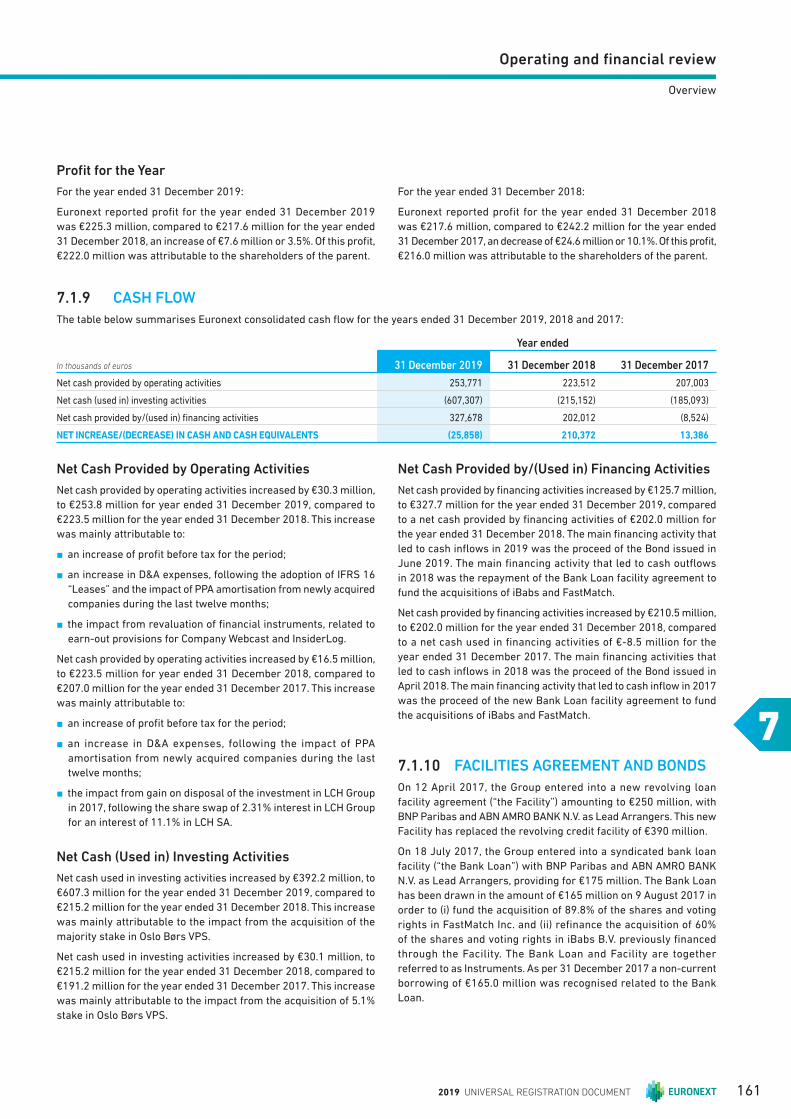
Operating and fi nancial review
7
Overview
7.1.9 CASH FLOW
The table below s ummarises Euronext consolidated cash fl ow for the years ended 31 December 2019, 2018 and 2017:
In thousands of euros
Year ended
31 December 2019 31 December 2018 31 December 2017
Net cash provided by operating activities 253,771 223,512 207,003
Net cash (used in) investing activities (607,307) (215,152) (185,093)
Net cash provided by/(used in) fi nancing activities 327,678 202,012 (8,524)
NET INCREASE/(DECREASE) IN CASH AND CASH EQUIVALENTS (25,858) 210,372 13,386
Net Cash Provided by Operating Activities
Net cash provided by operating activities increased by €30.3 million,
to €253.8 million for year ended 31 December 2019, compared to
€223.5 million for the year ended 31 December 2018. This increase
was mainly attributable to:
n an increase of profi t before tax for the period;
n an increase in D&A expenses, following the adoption of IFRS 16
“Leases” and the impact of PPA amortisation from newly acquired
companies during the last twelve months;
n the impact from revaluation of fi nancial instruments, related to
earn-out provisions for Company Webcast and InsiderLog.
Net cash provided by operating activities increased by €16.5 million,
to €223.5 million for year ended 31 December 2018, compared to
€207.0 million for the year ended 31 December 2017. This increase
was mainly attributable to:
n an increase of profi t before tax for the period;
n an increase in D&A expenses, following the impact of PPA
amortisation from newly acquired companies during the last
twelve months;
n the impact from gain on disposal of the investment in LCH Group
in 2017, following the share swap of 2.31% interest in LCH Group
for an interest of 11.1% in LCH SA.
Net Cash (Used in) Investing Activities
Net cash used in investing activities increased by €392.2 million, to
€607.3 million for the year ended 31 December 2019, compared to
€215.2 million for the year ended 31 December 2018. This increase
was mainly attributable to the impact from the acquisition of the
majority stake in Oslo Børs VPS.
Net cash used in investing activities increased by €30.1 million, to
€215.2 million for the year ended 31 December 2018, compared to
€191.2 million for the year ended 31 December 2017. This increase
was mainly attributable to the impact from the acquisition of 5.1%
stake in Oslo Børs VPS.
Net Cash Provided by/(Used in) Financing Activities
Net cash provided by fi nancing activities increased by €125.7 million,
to €327.7 million for the year ended 31 December 2019, compared
to a net cash provided by fi nancing activities of €202.0 million for
the year ended 31 December 2018. The main fi nancing activity that
led to cash infl ows in 2019 was the proceed of the Bond issued in
June 2019. The main fi nancing activity that led to cash outfl ows
in 2018 was the repayment of the Bank Loan facility agreement to
fund the acquisitions of iBabs and FastMatch.
Net cash provided by fi nancing activities increased by €210.5 million,
to €202.0 million for the year ended 31 December 2018, compared
to a net cash used in fi nancing activities of €-8.5 million for the
year ended 31 December 2017. The main fi nancing activities that
led to cash infl ows in 2018 was the proceed of the Bond issued in
April 2018. The main fi nancing activity that led to cash infl ow in 2017
was the proceed of the new Bank Loan facility agreement to fund
the acquisitions of iBabs and FastMatch.
7.1.10 FACILITIES AG REEMENT AND BONDS
On 12 April 2017, the Group entered into a new revolving loan
facility agreement (“the Facility”) amounting to €250 million, with
BNP Paribas and ABN AMRO BANK N.V. as Lead Arrangers. This new
Facility has replaced the revolving credit facility of €390 million.
On 18 July 2017, the Group entered into a syndicated bank loan
facility (“the Bank Loan”) with BNP Paribas and ABN AMRO BANK
N.V. as Lead Arrangers, providing for €175 million. The Bank Loan
has been drawn in the amount of €165 million on 9 August 2017 in
order to (i) fund the acquisition of 89.8% of the shares and voting
rights in FastMatch Inc. and (ii) refi nance the acquisition of 60%
of the shares and voting rights in iBabs B.V. previously fi nanced
through the Facility. The Bank Loan and Facility are together
referred to as Instruments. As per 31 December 2017 a non-current
borrowing of €165.0 million was recognised related to the Bank
Loan.
Profi t for the Year
For the year ended 31 December 2019:
Euronext reported profi t for the year ended 31 December 2019
was €225.3 million, compared to €217.6 million for the year ended
31 December 2018, an in crease of €7.6 million or 3.5%. Of this profi t,
€222.0 million was attributable to the shareholders of the parent.
For the year ended 31 December 2018:
Euronext reported profit for the year ended 31 December 2018
was €217.6 million, compared to €242.2 million for the year ended
31 December 2017, an decrease of €24.6 million or 10.1%. Of this profi t,
€216.0 million was attributable to the shareholders of the parent.
2019 UNIVERSAL REGISTRATION DOCUMENT 161
Operating and fi nancial review77Overview
On 18 April 2018, the Group issued a €500 million Bond (“Senior
Unsecured Note #1”) to refi nance its 2017 and 2018 acquisitions
and diversify its fi nancing mix. The Bond has a seven year maturity,
with an annual coupon of 1%. On 18 April 2018 the Bond, rated “A” by
Standard & Poor’s rating agency, was listed on Euronext Dublin. The
Bond issue included €2.9 million of Bond discount and €0.5 million
of issue costs, which are subsequently accounted for under the
Eff ective Interest Rate method. Following receipt of the proceeds
of the issued Bond, the Group repaid the €165.0 million Bank Loan.
On 4 June 2019, the Group issued a €500 million Bond (“Senior
Unsecured Note #2”) to (i) pre-fi nance the outstanding shares of
Oslo Børs VPS Holding ASA not already owned by the Group and
(ii) for general corporate purposes in line with the Group’s strategy.
The Bond has a ten year maturity, with an annual coupon of 1.125%.
On 12 June 2019 the Bond, rated “A-” by S&P Global Ratings Limited,
was listed on Euronext Dublin. The Bond issue included €6.1 million
of Bond discount and issue costs, which are subsequently accounted
for under the Eff ective Interest Rate method.
On 8 April 2019, the Group signed a supplemental agreement with
nine banks to amend the €250 million Facility originally dated
12 April 2017. This new agreement enabled the Group to increase
the Facility to €400.0 million and set a new maturity of 5 years plus
a two-year extension possibility.
The revolving credit facility agreement allows the Group to apply
all amounts borrowed by it towards (i) general corporate and/
or working capital purposes of the Group, (ii) satisfaction of the
consideration payable for an acquisition and/or (iii) the payment
of fees, costs and expense incurred in relation to an acquisition.
The revolving credit facility bears an interest rate of EURIBOR
plus a margin initially set at 0.25%, which increased to 0.30% on
31 May 2019, based on the “A-” rating. It should be noted that as
at 31 December 2019, no advances have been drawn under the
revolving credit facility. During the year, the Group had temporarily
drawn €45.0 million which it used for repayment of the bond loan,
that was included in the acquisition of Oslo Børs VPS. The Group
repaid this €45.0 million at the end of 2019.
Euronext is required to maintain compliance with a maximum
leverage ratio if the credit rating would drop below BBB+. The
maximum leverage ratio measures Euronext total gross debt to
EBITDA(1) (as such terms are defi ned in the Facilities Agreement).
Euronext is required to maintain a leverage ratio of no more than 3.5x.
Term, Repayment and Cancellation
The Facility matures in fi ve years, respectively and initially included
a two times one year extension possibility. In 2019, the Group signed
a supplemental agreement, which set a new maturity of fi ve years
plus a two-year extension possibility. Euronext has the possibility to
voluntarily cancel the Facility in whole or part or prepay amounts drawn.
Interest Rates and Fees
The Facility has borne an interest rate of EURIBOR plus a margin
initially set at 0.25%, which increased to 0.30% on 31 May 2019.
It should be noted that as at 31 December 2019, there was no
outstanding advance drawn under the Facility. EURIBOR is fl oored
at 0%.
An extension fee of (i) 0.05% of the full amount is payable if Euronext
requests that the initial maturity date be extended to the first
relevant anniversary date or, (ii) 0.10% of the full amount of the
relevant Instrument is payable if Euronext requests that the initial
maturity date be extended to the second relevant anniversary date.
A utilisation fee accrues on a daily basis at the following applicable
rate per annum to be applied on the amount drawn:
n if less than 33.33% of the total commitment under the Facility
has been drawn at the relevant date, 0.10%;
n if 33.33% or more (but less than 66.67%) of the total commitment
under the Facility has been drawn at the relevant date, 0.20%; or
n if 66.67% or more of the total commitment under the Facility has
been drawn at the relevant date, 0.40%.
Euronext must also pay customary commitment fees at a rate per
annum equal to 35% of the then applicable margin for the relevant
Instrument on each lender’s available commitment under the
relevant Instrument during its availability period.
Certain Covenants and Undertakings
The Facility contains a number of additional undertakings and
covenants that, among other things, restrict, subject to certain
exceptions, Euronext ability to:
n grant security interests over their assets;
n sell, transfer or dispose of certain assets;
n make certain loans or grant certain credit;
n enter into any amalgamation, demerger, merger or corporate
reconstruction, unless the Company remains the surviving entity;
n make any substantial change to the general nature of Euronext
business.
Euronext is permitted, among other things, to dispose of assets in
the ordinary course of trading on arm’s length terms for full market
value without restriction, and otherwise where the aggregate fair
value of the assets disposed of does not exceed 5% of Euronext
consolidated total assets in any fi nancial year.
In case of a downgrading event of Euronext, below BBB+ or
equivalent by rating agencies, Euronext shall ensure that the
leverage ratio as defi ned in the Bank Loan Agreement would not
be greater than 3.5x.
Events of Default
The Facility contains customary events of default, in each case with
customary and appropriate grace periods and thresholds, including,
but not limited to:
n non-payment of principal or interest;
n violation of fi nancial covenants or other obligations;
n representations or statements being materially incorrect or
misleading;
n cross-default and cross-acceleration relating to indebtedness of
at least €50.0 million;
n certain liquidation, insolvency, winding-up or bankruptcy events;
(1) As defined in section 7.1.1 as EBITDA2.
2019 UNIVERSAL REGISTRATION DOCUMENT162 www.euronext.com

Operating and fi nancial review
7
Overview
n creditors’ process and attachment having an aggregate value of
more than €25.0 million;
n invalidity and unlawfulness;
n cessation of business;
n loss of any license required to carry on the Company’s or any
material subsidiary’s business; and
n repudiation by the Company of a fi nance document.
The fair value of the Facility approximates its carrying value.
7.1.11 CONTRACTUAL OBLIGATIONS
The table below summarises Euronext debt, future minimum payment lease obligations under non-cancellable leases and capital expenditure
commitments as at 31 December 2019:
In thousands of euros
Payments due by year
Total 2020 2021–2024 ThereafterNotes of the Consolidated
Financial Statements
Debt (principal and accrued interest obligations) 1,006,750 6,750 - 1,000,000 Note 37.1 – Liquidity risk
Debt (future interest obligations) 79,500 3,875 42,500 33,125 Note 37.1 – Liquidity risk
Lease liabilities – minimum payments 55,150 13,970 40,000 1,180 Note 37.1 – Liquidity risk
Capital expenditure commitments 10,929 10,740 189 - Note 39.1 – Capital Commitments
TOTAL 1,152,329 35,335 82,689 1,034,305
Capital Expenditures
Euronext’s capital expenditures were €26.1 million and €22.3 million
for the years ended 31 December 2019 and 2018, respectively. Capital
expenditures increased in 2019 when compared to 2018, which is
primarily driven by investments done last year for the Armoury
building in Dublin. Euronext’s capital expenditure requirements
depend on many factors, including the rate of its trading volume
growth, strategic plans and acquisitions, required technology
initiatives, regulatory requirements, the timing and introduction
of new products and enhancements to existing products, the
geographic mix of Euronext’s business, and the continuing market
acceptance of its electronic platform.
For the year ending 31 December 2019, Euronext has made
operational capital expenditures as well as incurred capitalised
software development costs. These expenditures were aimed
at enhancing Euronext technology and supporting the continued
expansion of Euronext’s businesses. In 2019, Euronext spent
approximately €14.7 million on hardware and investments in
properties and €11.4 million on development eff orts and acquisition
of third party licenses.
7.1.12 OFF-BALANCE SHEET ARRANGEMENTS
Euronext is not a party to any off -balance sheet arrangements that
have, or are reasonably likely to have, a current or future material
effect on Euronext’s financial condition, results of operations,
liquidity, capital expenditure or capital resources, other than the
€400 million revolving credit facility under the Facilities Agreement
and the commitments described in Note 39 of the Consolidated
Financial Statements.
7.1.13 QUANTITATIVE AND QUALITATIVE DISCLOSURES ABOUT MARKET RISK
As a result of its operating and fi nancing activities, the Group is
exposed to market risks such as interest rate risk, currency risk
and credit risk. The Group has implemented policies and procedures
designed to measure, manage, monitor and report risk exposures,
which are regularly reviewed by the appropriate management and
supervisory bodies. The Group’s central treasury team is charged
with identifying risk exposures and monitoring and managing such
risks on a daily basis. To the extent necessary and permitted by
local regulation, the Group’s subsidiaries centralise their cash
investments, report their risks and hedge their exposures in
coordination with the Group’s central treasury team. The Group
performs sensitivity analyses to determine the eff ects that may
result from market risk exposures. The Group uses derivative
instruments solely to hedge fi nancial risks related to its fi nancial
position or risks that are otherwise incurred in the normal course
of its commercial activities. The Group does not use derivative
instruments for speculative purposes.
Interest Rate Risk
Substantially all interest-bearing fi nancial assets and liabilities
of the Group are either based on fl oating rates or based on fi xed
rates with an interest term of less than one year, except for the
fi xed-rated Bonds #1 and #2 with an aggregated notional amount of
€1,000 million, which have maturities of respectively seven and ten
years. The Group entered into interest rate swap contracts in order
to hedge the interest rate risk inherent to the fi xed-rate Bond #1. As
a result, the Group is exposed to fair value risk aff ecting fi xed-rate
fi nancial assets and liabilities only through its fi xed-rate Bond #2.
As at 31 December 2019, the Group had an aggregated notional of
€500 million fi xed-to-fl oating interest rate swaps outstanding in
relation to the fair value hedge of the €500 million Bond #1.
The Group is exposed to cash-fl ow risk arising from net fl oating-rate
positions. The Group was a net borrower in Euros at 31 December,
2019 UNIVERSAL REGISTRATION DOCUMENT 163
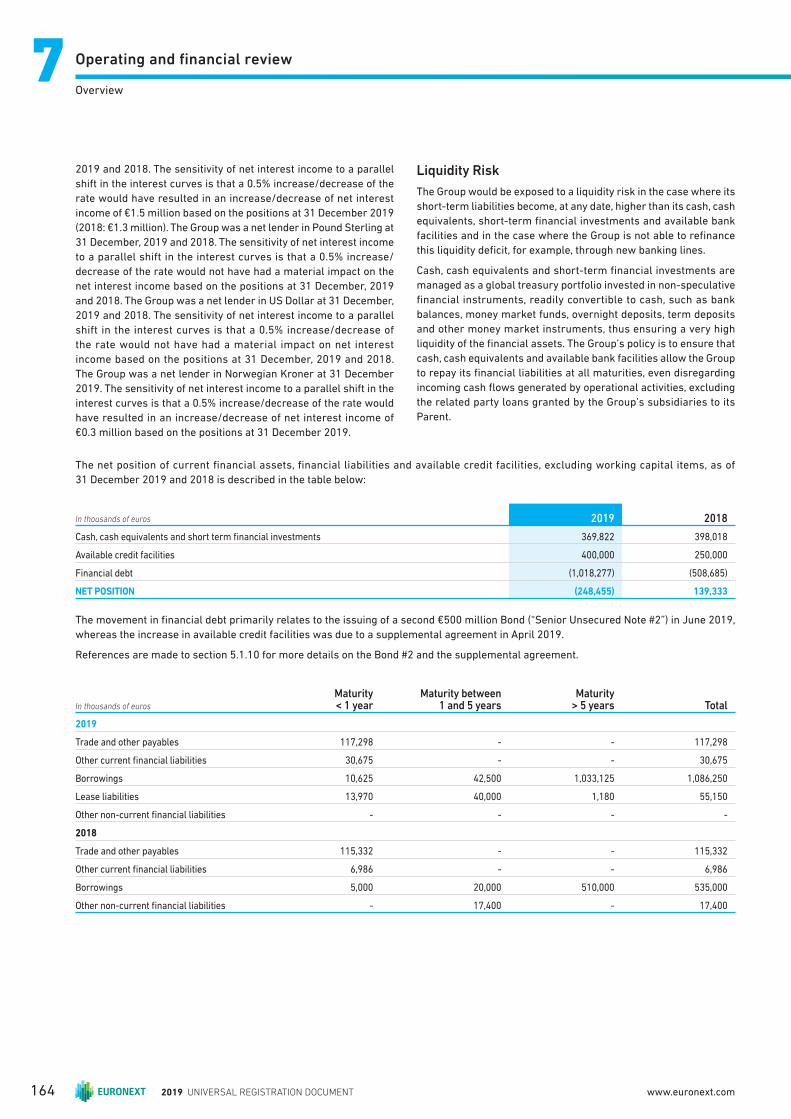
Operating and fi nancial review77Overview
The net position of current fi nancial assets, fi nancial liabilities and available credit facilities, excluding working capital items, as of
31 December 2019 and 2018 is described in the table below:
In thousands of euros 2019 2018
Cash, cash equivalents and short term fi nancial investments 369,822 398,018
Available credit facilities 400,000 250,000
Financial debt (1,018,277) (508,685)
NET POSITION (248,455) 139,333
The movement in fi nancial debt primarily relates to the issuing of a second €500 million Bond (“Senior Unsecured Note #2”) in June 2019,
whereas the increase in available credit facilities was due to a supplemental agreement in April 2019.
References are made to section 5.1.10 for more details on the Bond #2 and the supplemental agreement.
In thousands of euros
Maturity < 1 year
Maturity between 1 and 5 years
Maturity > 5 years Total
2019
Trade and other payables 117,298 - - 117,298
Other current fi nancial liabilities 30,675 - - 30,675
Borrowings 10,625 42,500 1,033,125 1,086,250
Lease liabilities 13,970 40,000 1,180 55,150
Other non-current fi nancial liabilities - - - -
2018
Trade and other payables 115,332 - - 115,332
Other current fi nancial liabilities 6,986 - - 6,986
Borrowings 5,000 20,000 510,000 535,000
Other non-current fi nancial liabilities - 17,400 - 17,400
2019 and 2018. The sensitivity of net interest income to a parallel
shift in the interest curves is that a 0.5% increase/decrease of the
rate would have resulted in an increase/decrease of net interest
income of €1.5 million based on the positions at 31 December 2019
(2018: €1.3 million). The Group was a net lender in Pound Sterling at
31 December, 2019 and 2018. The sensitivity of net interest income
to a parallel shift in the interest curves is that a 0.5% increase/
decrease of the rate would not have had a material impact on the
net interest income based on the positions at 31 December, 2019
and 2018. The Group was a net lender in US Dollar at 31 December,
2019 and 2018. The sensitivity of net interest income to a parallel
shift in the interest curves is that a 0.5% increase/decrease of
the rate would not have had a material impact on net interest
income based on the positions at 31 December, 2019 and 2018.
The Group was a net lender in Norwegian Kroner at 31 December
2019. The sensitivity of net interest income to a parallel shift in the
interest curves is that a 0.5% increase/decrease of the rate would
have resulted in an increase/decrease of net interest income of
€0.3 million based on the positions at 31 December 2019.
Liquidity Risk
The Group would be exposed to a liquidity risk in the case where its
short-term liabilities become, at any date, higher than its cash, cash
equivalents, short-term fi nancial investments and available bank
facilities and in the case where the Group is not able to refi nance
this liquidity defi cit, for example, through new banking lines.
Cash, cash equivalents and short-term fi nancial investments are
managed as a global treasury portfolio invested in non-speculative
fi nancial instruments, readily convertible to cash, such as bank
balances, money market funds, overnight deposits, term deposits
and other money market instruments, thus ensuring a very high
liquidity of the fi nancial assets. The Group’s policy is to ensure that
cash, cash equivalents and available bank facilities allow the Group
to repay its fi nancial liabilities at all maturities, even disregarding
incoming cash fl ows generated by operational activities, excluding
the related party loans granted by the Group’s subsidiaries to its
Parent.
2019 UNIVERSAL REGISTRATION DOCUMENT164 www.euronext.com
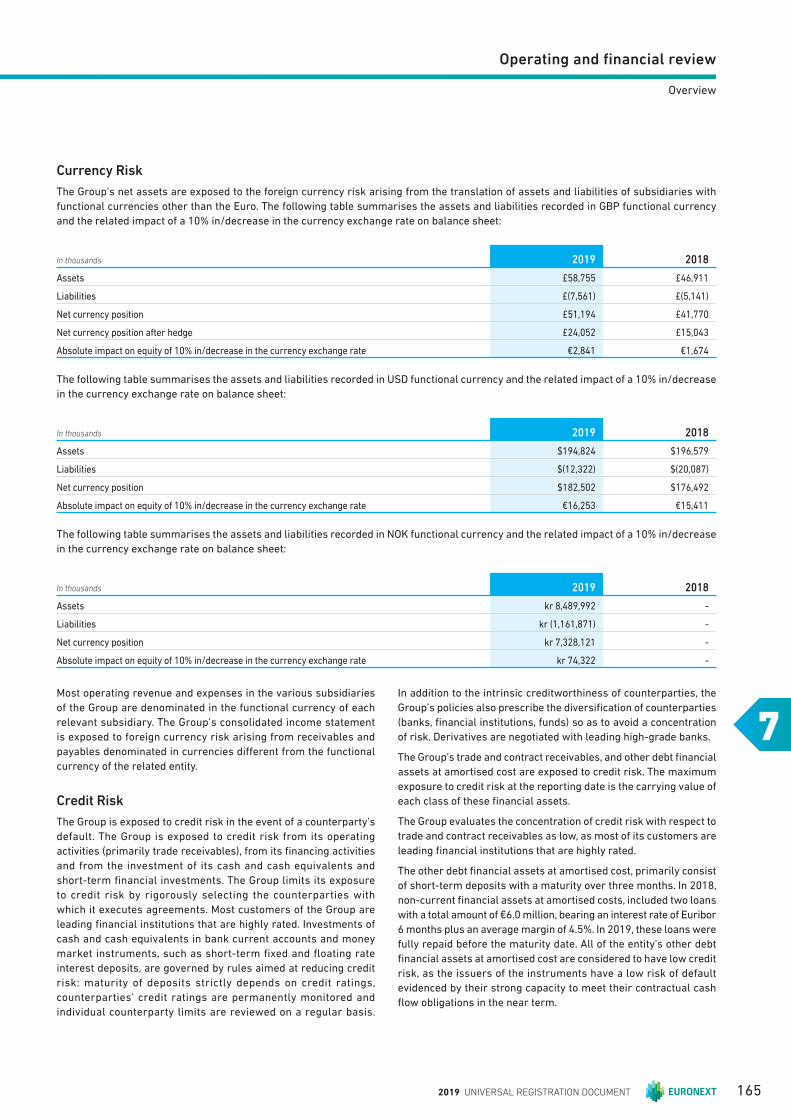
Operating and fi nancial review
7
Overview
Most operating revenue and expenses in the various subsidiaries
of the Group are denominated in the functional currency of each
relevant subsidiary. The Group’s consolidated income statement
is exposed to foreign currency risk arising from receivables and
payables denominated in currencies diff erent from the functional
currency of the related entity.
Credit Risk
The Group is exposed to credit risk in the event of a counterparty’s
default. The Group is exposed to credit risk from its operating
activities (primarily trade receivables), from its fi nancing activities
and from the investment of its cash and cash equivalents and
short-term fi nancial investments. The Group limits its exposure
to credit risk by rigorously selecting the counterparties with
which it executes agreements. Most customers of the Group are
leading fi nancial institutions that are highly rated. Investments of
cash and cash equivalents in bank current accounts and money
market instruments, such as short-term fi xed and fl oating rate
interest deposits, are governed by rules aimed at reducing credit
risk: maturity of deposits strictly depends on credit ratings,
counterparties’ credit ratings are permanently monitored and
individual counterparty limits are reviewed on a regular basis.
In addition to the intrinsic creditworthiness of counterparties, the
Group’s policies also prescribe the diversifi cation of counterparties
(banks, fi nancial institutions, funds) so as to avoid a concentration
of risk. Derivatives are negotiated with leading high-grade banks.
The Group’s trade and contract receivables, and other debt fi nancial
assets at amortised cost are exposed to credit risk. The maximum
exposure to credit risk at the reporting date is the carrying value of
each class of these fi nancial assets.
The Group evaluates the concentration of credit risk with respect to
trade and contract receivables as low, as most of its customers are
leading fi nancial institutions that are highly rated.
The other debt fi nancial assets at amortised cost, primarily consist
of short-term deposits with a maturity over three months. In 2018,
non-current fi nancial assets at amortised costs, included two loans
with a total amount of €6.0 million, bearing an interest rate of Euribor
6 months plus an average margin of 4.5%. In 2019, these loans were
fully repaid before the maturity date. All of the entity’s other debt
fi nancial assets at amortised cost are considered to have low credit
risk, as the issuers of the instruments have a low risk of default
evidenced by their strong capacity to meet their contractual cash
fl ow obligations in the near term.
Currency Risk
The Group’s net assets are exposed to the foreign currency risk arising from the translation of assets and liabilities of subsidiaries with
functional currencies other than the Euro. The following table summarises the assets and liabilities recorded in GBP functional currency
and the related impact of a 10% in/decrease in the currency exchange rate on balance sheet:
In thousands 2019 2018
Assets £58,755 £46,911
Liabilities £(7,561) £(5,141)
Net currency position £51,194 £41,770
Net currency position after hedge £24,052 £15,043
Absolute impact on equity of 10% in/decrease in the currency exchange rate €2,841 €1,674
The following table summarises the assets and liabilities recorded in USD functional currency and the related impact of a 10% in/decrease
in the currency exchange rate on balance sheet:
In thousands 2019 2018
Assets $194,824 $196,579
Liabilities $(12,322) $(20,087)
Net currency position $182,502 $176,492
Absolute impact on equity of 10% in/decrease in the currency exchange rate €16,253 €15,411
The following table summarises the assets and liabilities recorded in NOK functional currency and the related impact of a 10% in/decrease
in the currency exchange rate on balance sheet:
In thousands 2019 2018
Assets kr 8,489,992 -
Liabilities kr (1,161,871) -
Net currency position kr 7,328,121 -
Absolute impact on equity of 10% in/decrease in the currency exchange rate kr 74,322 -
2019 UNIVERSAL REGISTRATION DOCUMENT 165
Operating and fi nancial review77Overview
7.1.14 SIGNIFICANT ACCOUNTING POLICIES
Euronext Consolidated Financial Statements included in this
Registration Document have been prepared and presented in
accordance with International Financial Reporting Standards (IFRS),
issued by the International Accounting Standards Board (IASB) and
adopted by the European Union. See also Note 3 of the Consolidated
Financial Statements, on “Significant accounting policies and
judgements”.
7.1.15 CRITICAL ACCOUNTING ESTIMATES AND JUDGMENTS
In the application of the Group’s accounting policies, management
is required to make judgments, estimates and assumptions about
the carrying amounts of assets and liabilities that are not readily
apparent from other sources. The estimates and associated
assumptions are based on historical experience and other factors
that are considered to be relevant. All assumptions, expectations
and forecasts used as a basis for certain estimates within Euronext
Financial Statements represent good faith assessments of its future
performance for which Euronext management believes there is a
reasonable basis. These estimates and assumptions represent
Euronext’s view at the times they are made, and only then. They
involve risks, uncertainties and other factors that could cause
Euronext actual future results, performance and achievements to
diff er materially from those estimated or forecasted. The estimates
and underlying assumptions are reviewed on an on-going basis.
Revisions to accounting estimates are recognised in the period in
which the estimate is revised if the revision aff ects only that period or
in the period of the revision and future periods if the revision aff ects
both current and future periods. The estimates and assumptions that
may have a risk of causing a material adjustment to the carrying
amounts of assets and liabilities within the next fi nancial year are
described below. Euronext has discussed the development and
selection of these critical accounting policies and estimates with
its independent auditors.
Signifi cant judgments made in the preparation of the Consolidated
Financial Statements include the following:
Impairment of Goodwill
Goodwill represents the excess of the consideration transferred in
a business combination over the Group’s share in the fair value of
the net identifi able assets and liabilities of the acquired business
at the date of acquisition. Goodwill is not amortised but is tested at
least annually for impairment, or whenever an event or change in
circumstances indicate a potential impairment.
For the purpose of impairment testing, goodwill arising in a business
combination is allocated to the cash-generating units (“CGUs”) or
groups of CGUs that are expected to benefi t from the synergies of the
combination. Each CGU or CGU Group to which goodwill is allocated
represents the lowest level within the Group at which the goodwill
is monitored for internal management purposes.
The carrying value of a CGU Group is compared to its recoverable
amount, which is the higher of its value in use and its fair value
less costs of disposal. Impairment losses on goodwill are not
subsequently reversed. Value in use is derived from the discounted
future free cash fl ows of the CGU Group. Fair value less costs of
disposal is based on discounted cash fl ows and market multiples
applied to forecasted earnings. Cash fl ow projections are based on
budget and business plan approved by management and covering
a 2-year period in total. Cash fl ows beyond the business plan period
are extrapolated using a perpetual growth rate. Key assumptions
used in goodwill impairment test are described in Note 18 of the
Consolidated Financial Statements.
Income Taxes
Due to the inherent complexities arising from the nature of the
Group’s business, from conducting business and being taxed in
a substantial number of jurisdictions, signifi cant judgments and
estimates are required to be made for income taxes. The Group
computes income tax expense for each of the jurisdictions in
which it operates. However, actual amounts of income tax due only
become fi nal upon fi ling and acceptance of the tax return by relevant
authorities, which may not occur for several years subsequent to
issuance of the Consolidated Financial Statements.
The estimation of income taxes also includes evaluating the
recoverability of deferred income tax assets based on an assessment
of the ability to use the underlying future tax deductions against
future taxable income before they expire. This assessment is based
upon existing tax laws and estimates of future taxable income. To
the extent estimates diff er from the fi nal tax return, earnings may
be aff ected in a subsequent period.
The Group operates in various countries with local tax regulations.
New tax legislation being issued in certain territories as well as
transactions that the Group enters into regularly result in potential
tax exposures. The calculation of Euronext’s tax liabilities involves
uncertainties in the application of complex tax laws. Euronext’s
estimate for the potential outcome of any uncertain tax position
is highly judgmental. However, Euronext believes that it has
adequately provided for uncertain tax positions. Settlement of these
uncertainties in a manner inconsistent with Euronext’s expectations
could have a material impact on its results of operations, fi nancial
condition and cash flows. The Group recognises a liability for
uncertain tax positions when it is not probable that a taxation
authority will accept an uncertain tax treatment.
Fair Value of Equity Investments
The Group holds investments in unlisted equity securities which are
carried at fair value in the balance sheet. The valuation methodology
and critical assumptions are described in Note 20 of the Consolidated
Financial Statements.
Classifi cation of investments in associates
The Group classifi es the interest in LCH SA as an investment in
associate suggesting significant influence even though it owns
less than 20% of the voting rights (see Note 7 of the Consolidated
Financial Statements included in this Registration Document). The
Group concludes it has signifi cant infl uence over this investment,
which is derived from the governance structure that was put in place
and the Group’s position as the largest customer and sole minority
shareholder of LCH SA.
2019 UNIVERSAL REGISTRATION DOCUMENT166 www.euronext.com
Operating and fi nancial review
7
Overview
Contingent consideration and buy options resulting from business combinations
The Group may structure its business combinations in a way
that leads to recognition of contingent consideration to selling
shareholders and/or buy options for equity held by non-controlling
interests. Contingent consideration and buy options are recognized
at fair value on acquisition date. When the contingent consideration
or buy option meets the defi nition of a fi nancial liability or fi nancial
instrument, it is subsequently re-measured to fair value at each
reporting date. The determination of fair value is based on the
expected level of EBITDA(1) over the last 12 months that precede
the contractual date (in case of contingent consideration) or exercise
date of the underlying call- and put options (in case of buy option).
The Group monitors the expected EBITDA based on updated forecast
information from the acquired companies involved.
Purchase price allocation
The cost of other intangible assets that are acquired in the course
of business combinations, corresponds to their acquisition date fair
values. Depending on the nature of the intangible asset, fair value is
determined by application of:
n market approach (by reference to comparable transactions);
n income approach (Relief-from-Royalty- or Multi-period Excess
Earnings Method);
n cost approach.
Assets with a fi nite useful life are amortized using the straight-line
method over their expected useful life. Assets with an indefi nite
useful life are tested for impairment at least once a year.
Revenue from contracts with customers
The Group applied the following judgments that significantly
aff ect the determination of the amount and timing of revenue from
contracts with customers:
(i) Identifying performance obligations and determining
the timing of revenue recognition of Listing admission fees
The Group provides services related to the initial (and subsequent)
listing of securities on its markets and hereto directly related
corporate action services, and ongoing services related to the
continuous listing.
The Group determined that the admission services around initial
(and subsequent) admission and its directly related corporate action
services do not transfer a good or service to the customer, but are
considered activities that the Group needs to undertake to enable
the customer to be listed. The Group concluded that these activities
should be combined with the ongoing listing services and should be
used as inputs to produce the combined output, which is the service
of being listed. As the service of being listed is satisfi ed over a period
of time, as the customer simultaneously receives and consumes
the benefi ts from the service, the related revenues are therefore
recognised over a period of time.
The Group determined that the period of time that best refl ects the
satisfaction of listing admission services is the period over which the
customer actually benefi ts from the admission. An average lifetime
of companies being listed on Euronext’s markets would serve as
best proxy for the period that a listing customer benefi ts from an
admission. Based on historic evidence, the Group has defi ned the
following average lifetimes for the relevant groupings of listed
securities:
Equity admissions: 5 years
Bond- and fund admissions: 3 years
Equity subsequent admissions (“follow-on’s”): 3 years
Revenue from the listing admission services is therefore recognised
over those periods of time.
(ii) Cost to obtain or fulfi l a contract related to listing admission
services
The Group has considered the type of cost that is directly associated
to a listing contract and that can be separately identifi able. Such
cost would typically concern staff cost incurred by the Listings team
involved in admission – and subsequent listing of an issuer. There is
no correlation between number of listings and staff cost associated
to the Listings team.
The majority of the cost to obtain and fulfi l the contract is incurred
in the period before the actual admission. The remaining cost
associated to an admission and subsequent listing that is recorded
post-admission, and its impact on the Group’s income statement,
would be marginal, therefore the Group has decided not to capitalize
cost incurred to obtain – or fulfi l listing contracts.
(iii) Principal versus agent considerations
On 14 October 2013, the Group entered into a clearing agreement
with LCH SA in respect of the clearing of trades on our continental
Europe derivatives markets (the “Derivatives Clearing Agreement”).
Under the terms of this Derivatives Clearing Agreement Euronext
agreed with LCH SA to share revenues and receives clearing fee
revenues based on the number of trades on these markets cleared
through LCH SA. In exchange for that, we have agreed to pay LCH
SA a fi xed fee plus a variable fee based on revenues.
The defi nition of the accounting treatment of this agreement requires
signifi cant management judgment for the valuation and weighting of
the indicators leading the principal versus agent accounting analysis.
Based on all facts and circumstances around this arrangement,
management has concluded that Euronext is “principal” in providing
Derivatives clearing services to its trading members. Therefore
Euronext recognizes (i) the clearing fees received are classifi ed as
post trade revenues, and (ii) the fi xed and variable fees paid to LCH
SA as other operational expenses.
Provision for expected credit losses of trade and contract receivables
The Group uses a provision matrix to calculate ECLs for trade and
contract receivables. To measure expected credit losses, trade and
contract receivables have been grouped based on shared credit
risk characteristics and the days past due. The historical loss rates
are based on the payment profi les of the sales over a period of 24
months before reporting date and the corresponding historical credit
losses experience within this period. The historical loss rates are
adjusted to refl ect current and forward-looking factors specifi c to
the debtors and economic environment.
(1) As defined in section 7.1.1 as EBITDA3.
2019 UNIVERSAL REGISTRATION DOCUMENT 167

Operating and fi nancial review77Material contracts and related party transactions
7.2 Material contracts and related party transactions
7.2.1 MATERIAL CONTRACTS
The major contracts for Euronext, entered into the ordinary course
of business, but essential for its activity as a regulated markets
operator, are:
n the clearing agreements signed with LCH SA;
n the clearing agreements signed with SIX following OB VPS
acquisition;
n the clearing agreements signed with NASDAQ following OB VPS
acquisition;
n the post-trade services agreement signed with EuroCCP following
the acquisition of Euronext Dublin;
n the clearing agreements signed with EuroCCP following OB VPS
acquisition;
n the clearing agreements signed with LCH Ltd following OB VPS
acquisition;
n the Technology Services agreement signed with London Stock
Exchange plc following OB VPS acquisition;
n the Data Centre Services agreement signed with ICE;
n the Enterprise agreement signed with Amazon Web Services.
The Clearing Agreements are referred to in section 1.3.6
“Description of the Business/Post Trade/LCH SA” and 5.1.5 “Key
Factors Aff ecting Businesses and Results of Operation/Derivatives
Clearing Agreement”.
7.2.2 RELATED PARTY TRANSACTIONS
Euronext has related party relationships with its associates and
joint ventures, as disclosed in Note 31 of the Consolidated Financial
Statements. The other related parties disclosure relates entirely
to the key management of Euronext. For the transactions with its
key management personnel, see section 4 .4 Remuneration Report.
From the IPO on 20 June 2014, the transactions with ICE do not
qualify as “related party transactions” under IAS 24. Nevertheless
the agreements between Euronext and ICE were in force after
the IPO. Some of them are long term agreements. Some of these
services have been progressively terminated and replaced over the
period 2014–2016.
Over the year 2019, services received from or rendered to ICE
include the use of Data centre service, Colocation, Connectivity, UTP
and other intellectual property rights as well as ancillary services.
As at 31 December 2019, the following agreements remain active:
n data Centre Services Agreement;
n colocation Agreement;
n connectivity Agreement;
n UTP and Trading Technology Licence Deed;
n intellectual Property Agreement;
n Euronext Equity Index Trademark Licence Agreement.
The provision matrix is initially based on the Group’s historical
observed default rates. The Group will calibrate the matrix to
adjust the historical credit loss experience with forward-looking
information. At every reporting date, the historical observed default
rates are updated and changes in the forward-looking estimates
are analysed.
The assessment of the correlation between historical observed
default rates, forecast economic conditions and ECLs is a
signifi cant estimate. The amount of ECLs is sensitive to changes
in circumstances and of forecast economic conditions. The Group’s
historical credit loss experience and forecast of economic conditions
may also not be representative of customer’s actual default in the
future. The information about the ECLs on the Group’s trade and
contract receivables is disclosed in Note 37.4 of the Consolidated
Financial Statements included in this Registration Document.
Determining the lease term of contract with extension and termination options
In determining the lease term, management assesses the period
for which the contract is enforceable. It considers all facts and
circumstances that create an economic incentive to exercise an
extension option, or not exercise a termination option. Extension
options (or periods after termination options) are only included in the
lease term if the lease is reasonably certain to be extended (or not
terminated). If the Group concludes that the contract is enforceable
beyond the notice period of a cancellable lease (or the initial period
of a renewable lease), it then need to assess whether the Group is
reasonably certain not to exercise the option to terminate the lease.
However in general, the Group’s lease portfolio contains very limited
leases that include renewal – or termination options.
Estimating the incremental borrowing rate (IBR)
The Group cannot readily determine the interest rate implicit in
the lease, therefore, it uses its incremental borrowing rate (IBR)
to measure lease liabilities. The IBR is the rate of interest that the
Group would have to pay to borrow over a similar term, and with a
similar security, the funds necessary to obtain an asset of a similar
value to the right-of-use asset in a similar economic environment.
The IBR therefore refl ects what the Group “would have to pay”, which
requires estimation when no observable rates are available or when
they need to be adjusted to refl ect the terms and conditions of the
lease. The Group estimates the IBR using the observable inputs (such
as market interest rates) when available and makes certain entity-
specifi c estimates if needed.
2019 UNIVERSAL REGISTRATION DOCUMENT168 www.euronext.com
Operating and fi nancial review
7
Material contracts and related party transactions
Data Centre Services Agreement
ICE provides data centre services to Euronext from the Basildon
site. Specifi cally, ICE houses the data centre equipment in the Data
Centre and provides sub-services, such as power, access, physical
security, environment, fire protection, connectivity, monitoring,
support, remote hands, installation, receiving and warehouse space.
The agreement will subsist for an initial term of fi ve years, starting
1 April 2014, with automatic renewal for a further fi ve-year period,
unless notice of termination is provided by either party at least
twelve months before expiry of the initial term but no earlier than
24 months before the end of the initial term. ICE will guarantee to
continue providing the services for a further two-year period from
the date on which notice of non-renewal is received. Accordingly,
the minimum period for this service is fi ve years. In the course of
2015, the agreement has been renegotiated, leading to, under certain
conditions, a lower price structure, to come into eff ect on 1 January
2016.
In December 2018, the contract has been renewed for a 5 years
period, and adjusted on some specifi c clauses (e.g. exit clause, Data
Protection).
Colocation Agreement
ICE provides co-location services directly to Euronext members
on terms that are no worse than the terms on which ICE currently
provides equivalent co-location services to its members. As the
service is provided to members, there is no services agreement
between ICE and Euronext but rather a commitment and payment of
commission to Euronext by ICE for the right to provide the services.
This agreement will remain in force for a period of fi ve years, starting
1 April 2014, unless terminated earlier with mutual agreement. ICE
will commit not to increase the pricing, nor reduce the service or
performance levels of colocation for the initial two-year period to
ensure that Euronext customers receive colocation services at an
equal (or better) standard to that currently provided by Euronext
without any adverse price impact. Euronext is free to build its own
colocation facility after the end of this two-year period if it wishes
to do so, and in that case ICE will have the right to terminate the
agreement on six months’ notice.
ICE pays to Euronext commission in respect of the fees received
under the colocation contracts as follows: 35% of the colocation
hosting fee; 35% of any Liquidity Centre Network (“LCN”) fees;
and 100% of any subscription fees (for specifi c Euronext exchanges).
In December 2018, the contract has been renewed for a 5 years
period, and adjusted on some specifi c clauses (e.g. exit clause, Data
Protection)
Connectivity Agreement
Euronext’s customers are connected to the SFTI® network either
via an SFTI® managed connection, a direct connection, or a third-
party connection. ICE provides application services, including
logical connections to the relevant Euronext products between
the subscriber and host infrastructure. ICE agrees to provide the
SFTI® services to Euronext customers on terms (including pricing,
service, and performance) that, in the aggregate, are no worse than
the standard terms on which ICE provides equivalent connectivity
services to its customers.
This agreement will remain in force for five years, starting on
1 April 2014, unless terminated earlier with mutual agreement. This
agreement contains substantially the same terms as the colocation
agreement, including a general commitment not to raise fees or
reduce services for two years. Euronext receives a commission
based on 50% of the revenue earned from the access/subscription
fees to Euronext markets via SFTI®.
In December 2018, the contract has been renewed for a 5 years
period, and adjusted on some specifi c clauses (e.g. exit clause, Data
Protection).
UTP and Trading Technology Licence Deed
The intellectual property in the UTP and other trading technology,
including core software and technology (“Core Items”) and related
support items (“Support Items”) that are currently being used for
the continental Euronext market is licensed by ICE (through NYSE
Arca, LLC) to Euronext (through one of its subsidiaries) for the
operation of the Euronext trading platforms.
Under the licence agreement, Euronext has been granted a
perpetual, irrevocable, worldwide, non-exclusive, royalty-free
and fully paid-up licence in respect of the use, modifi cation and
maintenance of the Core Items for any purpose and in respect of
the use, modifi cation and maintenance of the Support Items for
the sole purpose of enabling the use of the Core Items. The licence
includes any improvements or enhancements to the Core Items
and the Support Items that are made before the IPO on 20 June
2014. Euronext owns improvements or enhancements that it makes
or have made to the Core Items and the Support Items after the
IPO, and Euronext and ICE are not obliged to share their respective
improvements or enhancements after the IPO.
Euronext may sub-licence its rights, including through multiple
tiers of sub-licences. However, for a period of two years from the
IPO, neither Euronext nor ICE is entitled to permit a defi ned list of
exchange operators or owners of registered swap execution facilities
or their affi liates to use UTP (though this will not aff ect any licences
that were already in place as at 13 November 2013). The restricted
list includes any of NASDAQ OMX, CME Group, Inc., BM&F Bovespa,
London Stock Exchange Group Plc, Singapore Exchange Limited,
Hong Kong Stock Exchange, Deutsche Börse Group, BATS Global
Markets, Inc., Direct Edge, or Chi-X Global Holdings LLC; any person
that acquires all or substantially all of the business of any of these
entities; any person that at the time of the assignment or licence
operates a registered swap execution facility; and any affi liate of any
such persons. This restriction terminated in June 2016.
There are no circumstances in which the licence may be terminated
by ICE.
Except where there is a breach of warranty by the indemnified
parties, Euronext will indemnify NYSE Arca and its affi liates within ICE
for all liability incurred under a third-party claim in connection with
use of the UTP by Euronext or any of its sub-licensees after the IPO.
In the event of any infringement of the licensed rights, ICE will have
the right to determine what enforcement action to take. ICE will off er
Euronext the right to participate in any action it takes. If ICE does not
take any enforcement action, Euronext will have the sole right to
determine what enforcement action to take. If Euronext or any sub-
licensee of Euronext is sued for infringement, ICE will provide all such
information and assistance as Euronext may reasonably require.
2019 UNIVERSAL REGISTRATION DOCUMENT 169

Operating and fi nancial review77Legal Proceedings
Intellectual Property Agreement
Under this agreement, Euronext is granted a perpetual, irrevocable,
worldwide, non-exclusive, royalty-free and fully paid-up licence to
use and sub-license the name “Euronext UTP” in connection with
its use of the UTP technology. The licence is not supported by any
warranties from ICE. There are no circumstances in which the
licence may be terminated by ICE.
To the extent that ICE wishes to use the name “UTP” in connection
with its version of the UTP technology, ICE has agreed that it will use
the name “NYSE UTP”.
Also under this agreement, Euronext and ICE have permitted each
other’s groups to have until 1 June 2015 to cease current uses of
each other’s trademarks. From that date onwards, Euronext and ICE
have ceased using each other’s trademarks.
Euronext Equity Index Trademark Licence Agreement
Under the licence agreement, LIFFE is granted a worldwide and
non-exclusive licence in relation to the trademarks and associated
logos for the indices generated by the Euronext Regulated Markets.
The licence permits the use of these trademarks and associated
logos in connection with the marketing, listing and trading of any
tradable contract. However, until 1 January 2016, the licensed use
is limited to LIFFE’s current tradable contracts for listings on Bclear
and only in respect of equity indices for AEX®, BEL 20®, CAC 40®,
and PSI 20®. This limitation will terminate early in case a third-
party infrastructure provider acquires control of any Euronext
company, or is granted a licence by Euronext company to use any
of the trademarks for any of the indices generated by the Euronext
Regulated Markets. Subject to appropriate limitations, LIFFE may
sub-license the rights to ICE.
For its use of the licensed trademarks and associated logos, LIFFE
pays the greater of (i) €0.05 per traded contract and (ii) 15% of the
exchange and clearing fees on the traded contracts.
LIFFE will indemnify Euronext and its affiliates for all liability
incurred under a third-party claim in connection with ICE’s use of
the licensed trademarks, other than where the third-party claim is
for trademark infringement.
The licence agreement recognises that the parties may need to
renegotiate the terms where Euronext is required, by a change in the
law, to grant licences at market rates and on a non-discriminatory
basis albeit such renegotiation shall take due account for the fact
that ICE has already provided value for the use of the equity indices
as part of the acquisition of NYSE Euronext by ICE.
Also, in connection with the separation of Euronext from ICE,
Euronext and ICE entered into a series of transitional services
agreements (“SLAs”). There were some ancillary services provided
by ICE to Euronext (“ICE Ancillary Services”) and ancillary services
provided by Euronext to ICE (“Euronext Ancillary”).
Crossfi nder licence agreement
FastMatch’s operating system for its matching engine is based
on the Crossfi nder® software licensed by FastMatch from Credit
Suisse pursuant to a perpetual license. The license granted by Credit
Suisse is limited in scope to use by FastMatch in its operations as an
electronic exchange for the trading of foreign exchange. Pursuant to
that license, FastMatch has exclusive and unrestricted ownership of
all modifi cations made to the Crossfi nder code by FastMatch, as well
as to any software developed by FastMatch independently.
7.3 Legal Proceedings
The Group is involved in a number of legal proceedings that have
arisen in the ordinary course of its business. Other than as discussed
below, management does not expect these pending or threatening
legal proceedings to have a signifi cant eff ect on the Group’s fi nancial
position or profi tability. The outcome of legal proceedings, however,
can be extremely diffi cult to predict and the fi nal outcome may be
materially diff erent from management’s expectations.
7.3.1 EURONEXT AMSTERDAM PENSION FUND
Approximately 120 retired and/or former Euronext Amsterdam
employees, united in an association, served summons on Euronext
Amsterdam on 3 April 2014. The claim is based on the fact that
Euronext Amsterdam terminated its pension agreement with the
pension fund Mercurius (“PMA”) and transferred the pension of the
current employees of Euronext to Delta Lloyd Asset Management
(“Delta Lloyd”). The pension entitlements of the retired and/or former
employees of Euronext Amsterdam have also been transferred by
PMA to Delta Lloyd. The retired and/or former employees have been
informed by PMA that the transfer of their entitlements to Delta Lloyd
will result in a nominal pension entitlement without indexation in
the future. The association claims that Euronext Amsterdam should
guarantee the same pension entitlements of the retired Euronext
Amsterdam employees under the same or similar conditions as
those in the agreement between Euronext Amsterdam and PMA with
the considerations that (i) the administration fee will be covered,
(ii) the liability ratio will be covered and (iii) the loyalty and solidarity
between retired and current employees is provided for. The amount
will need to be calculated by an actuary.
After Euronext Amsterdam fi led a statement of defence on 27 June
2014, the Subdistrict (Kanton) Division of the Court of Amsterdam on
11 July 2014 granted the retired and/or former employees Euronext
Amsterdam a term until 8 August 2014 in order to fi le a rejoinder.
On that date the counterparty was granted a postponement until
5 September 2014 for its statement of reply.
2019 UNIVERSAL REGISTRATION DOCUMENT170 www.euronext.com

Operating and fi nancial review
7
Insurance
Both parties have fi led all documents and statements and an oral
hearing took place on 11 June 2015. The judge asked both parties
to explore a settlement and Euronext currently assesses the costs
of potential out of court solutions. The Court has been informed
that no agreement on such a settlement could be reached.
On 24 June 2016 the judge delivered a decision. The claim
is rejected that Euronext Amsterdam should guarantee the
same pension entitlements of the retired Euronext Amsterdam
employees under the same or similar conditions as those in the
agreement between Euronext Amsterdam and PMA. However,
the judge did hold that there has been an attributable breach
by Euronext Amsterdam in the performance of the pension
agreements with the members of the association. Euronext
Amsterdam is ordered to pay for damages resulting from the loss
of indexation perspective incurred by the claimants other than
the association. The association is not eligible to claim damages.
The amount of the damages needs to be determined in a separate
procedure (a “schadestaatprocedure”). Management believes that
the decision is insuffi ciently motivated. On 21 September 2016
Euronext Amsterdam has fi led for appeal against the decision.
The grounds for appeal were filed on 6 December 2016. On
14 February 2017 the claimants fi led their responses and also
fi led for appeal against certain parts of the decision of 24 June
2016. Euronext has responded to the grounds for appeal raised
by claimants on 25 April 2017. An oral hearing took place on
24 November 2017.
On 25 April 2019, Euronext Amsterdam unexpectedly received
an interlocutory judgment. The higher court intends to confi rm
the verdict of the judgement of 24 June 2016. However, the
higher court needs further information to assess if Euronext
can be sentenced to enter into a new implementation agreement
(uitvoeringsovereenkomst) with a pension provider who can provide
the same or at least equal rights and warranties as set out in the
implementation agreement 2007–2012, or the implementation
agreement 2013; or subsidiary if Euronext can be sentenced to,
as substitution for the implementation agreement, pay an amount
of money to a pension provider to make sure that the pensioners
will be placed in the same position as they would have been in the
event the implementation agreement would have been continued
unaltered. Euronext has provided the information. The actuaries
of Euronext had already calculated that the pensioners would
have lower pension rights in the event that the implementation
agreement would have been continued. These calculations are based
on all the fi nancial obligations of the implementation agreement
and the fi nancial position of the pension fund. Furthermore the
calculations are based on the legal parameters of the Pension
Act 2007, therefore, Euronext has called for rejection of the claims
of the pensioners because there is no fi nancial loss. The pensioners
have responded to this information on 23 July 2019. There is no
possibility to appeal at this stage. The fi nal judgement of the higher
court is expected 19 May 2020, but it is possible that the judgment
will be postponed until later in 2020. Once there is a fi nal decision
Euronext shall consider if it should lodge an appeal in cassation. No
provision has been booked in connection with this case.
7.4 Insurance
Eurone xt maintains a comprehensive insurance program with the
assistance of an insurance broker allowing Euronext to make an
assessment of its risks, take out the proper insurance policies and
deal with insurance management as smoothly as possible.
The main characteristics of the insurance program are the following:
n the main insurance policies are consolidated at the Euronext
group level in order to ensure consistency of coverage across
the Euronext group and to benefi t from lower premiums;
n the scope of risks covered is determined by reference to
Euronext’s activities (listing, trading, market data, post-trade and
technologies & other); and
n all insurance carriers are analysed from a credit rating
perspective.
The main risks covered by Euronext’s insurance program are the
following:
n directors’ & offi cers’ liability: this policy covers losses related
to an alleged wrongful Act committed by members of Euronext
Managing Board, Euronext Supervisory Board and other senior
management. Under this policy, any of Euronext past, present or
future directors or offi cers will be insured against liability for
negligence, default or breach of duty or other liability, other than
cases of willful misconduct or gross negligence (opzet of grove
nalatigheid);
n professional indemnity & crime: this policy provides fi rst party
coverage and indemnifi cation against third-party claims arising
out of negligence, errors or omissions in connection with
professional services or failure to meet contractual obligations in
the conduct of exchange activities and exchange related activities.
This policy also covers fi rst party losses resulting directly from
dishonest or fraudulent acts committed by Euronext employees
or third parties working with Euronext employees;
n cyber: this policy provides coverage for an Euronext’s business
interruption following malicious action on an IT system.
Coverage is provided for claims arising from the interruption
of systems or other failures of IT Security caused by damage
to computer programs or data that results from a computer
attack or unauthorised access or use of system. This policy also
covers claims for the failure to protect personality identifi able
information or unauthorised disclosure of confi dential corporate
information in any form;
2019 UNIVERSAL REGISTRATION DOCUMENT 171
Operating and fi nancial review77Liquidity and Capital Resources
7.5 Liquidity and Capital Resources
7.5.1 LIQUIDITY
Euronext’s financial policy seeks to finance the growth of the
business, remunerate shareholders and ensure fi nancial fl exibility,
while maintaining strong creditworthiness and liquidity.
Euronext primary sources of liquidity are cash fl ows from operating
activities, current assets and existing bank facilities. Euronext’s
principal liquidity requirements are for working capital, capital
expenditures and general corporate use.
Euronext business is highly dependent upon the levels of activity
in its exchanges, and in particular upon the volume of fi nancial
instruments traded, the number of shares outstanding of listed
issuers, the number of new listings, the number of traders in the
market and similar factors. Euronext has no direct control over
these activities, which have historically resulted in volatility. While
Euronext activities are not subject to signifi cant seasonal trends,
cash flows vary from month to month due to Euronext billing
and collection eff orts (most notably the annual billings for listed
companies during the fi rst quarter).
Euronext business has historically generated signifi cant cash fl ow
from operating activities to meet its cash requirements as well as
to distribute dividends to its shareholders. Euronext expects future
cash fl ow from operating activities to be suffi cient to fund its capital
expenditures, distribute dividends as well as repay its debts as they
become due. In addition, Euronext has access to a €400 million
revolving credit facility (see section 5.1.10 “Facilities Agreement”).
More information on Euronext’s cash flows is provided in
section 5.1.9 “Cash Flow”
Because of its strict financial policy of maintaining strong
creditworthiness and liquidity, and its signifi cant operating cash fl ow
generation capacities, Euronext N.V. considers its fi nancial position
as at 31 December 2019 as solid, both from a solvency and a liquidity
perspective.
The fi nancial resources ultimo 2019 can be summarised as follows:
In thousands of euros Financial resources
Cash & cash equivalent 369,822
Revolving credit facility 400,000
TOTAL FINANCIAL RESOURCES 769,822
7.5.2 CONSOLIDATED REGULATORY CAPITAL REQUIREMENTS
Euronext N.V. is subject to regulatory capital requirements. These
requirements were fi rst set out in the Exchange License that was
issued by the Dutch minister of Finance in June 2014. Following
discussion with the Dutch minister of Finance in 2015 and 2016 a
new exchange license was granted on 23 May 2016, including new
capital requirements for both Euronext consolidated and Euronext
Amsterdam N.V.
As from 23 May 2016 the following capital requirements apply to
Euronext.
Euronext N.V. is subject to minimum regulatory capital requirements
defined by the minister of Finance and the AFM, under which
Euronext is required:
n to ensure that its shareholders equity, liquidity and solvency
satisfy what is required with a view to the interests which the
Dutch Act on Financial Supervision (Wet op het fi nancieel toezicht–
Wft) aims to protect;
n Euronext shall have a minimum shareholders equity on a
consolidated basis of at least Euro 250 million;
n property damage & business interruption: this policy provides
fi rst party coverage for losses to Euronext’s property or business
interruption. The coverage includes tenant’s liability and liability
to third parties;
n terrorism; and
n commercial general liability: this policy provides coverage for
negligent acts and/or omissions resulting in bodily injury, property
damage, consequential losses and pure fi nancial losses to third
parties, their reputation, or their property as a result of using
Euronext products and services.
In addition to the insurance program, risk management and
business continuity plan policy and procedures are implemented
in a complementary manner. Euronext believes that its existing
insurance coverage, including the amounts of coverage and the
conditions, provides reasonable protection, taking into account the
costs for the insurance coverage and the potential risks to business
operations.
2019 UNIVERSAL REGISTRATION DOCUMENT172 www.euronext.com
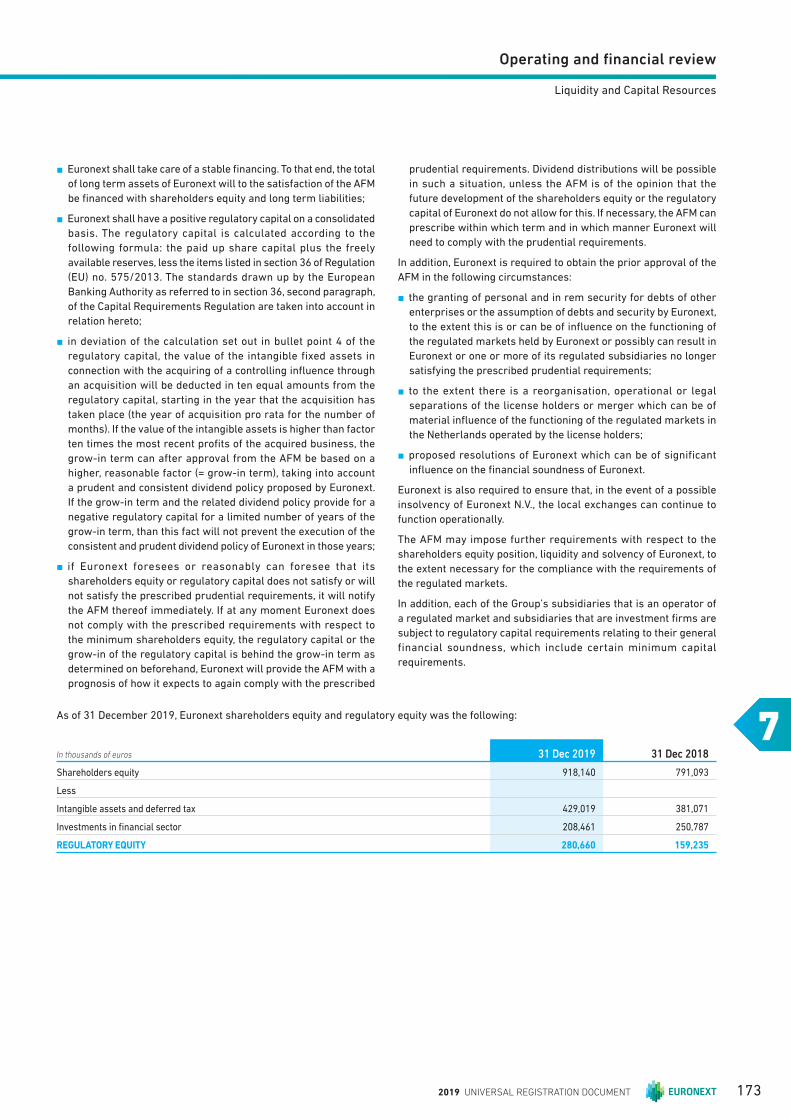
Operating and fi nancial review
7
Liquidity and Capital Resources
n Euronext shall take care of a stable fi nancing. To that end, the total
of long term assets of Euronext will to the satisfaction of the AFM
be fi nanced with shareholders equity and long term liabilities;
n Euronext shall have a positive regulatory capital on a consolidated
basis. The regulatory capital is calculated according to the
following formula: the paid up share capital plus the freely
available reserves, less the items listed in section 36 of Regulation
(EU) no. 575/2013. The standards drawn up by the European
Banking Authority as referred to in section 36, second paragraph,
of the Capital Requirements Regulation are taken into account in
relation hereto;
n in deviation of the calculation set out in bullet point 4 of the
regulatory capital, the value of the intangible fixed assets in
connection with the acquiring of a controlling infl uence through
an acquisition will be deducted in ten equal amounts from the
regulatory capital, starting in the year that the acquisition has
taken place (the year of acquisition pro rata for the number of
months). If the value of the intangible assets is higher than factor
ten times the most recent profi ts of the acquired business, the
grow-in term can after approval from the AFM be based on a
higher, reasonable factor (= grow-in term), taking into account
a prudent and consistent dividend policy proposed by Euronext.
If the grow-in term and the related dividend policy provide for a
negative regulatory capital for a limited number of years of the
grow-in term, than this fact will not prevent the execution of the
consistent and prudent dividend policy of Euronext in those years;
n if Euronext foresees or reasonably can foresee that its
shareholders equity or regulatory capital does not satisfy or will
not satisfy the prescribed prudential requirements, it will notify
the AFM thereof immediately. If at any moment Euronext does
not comply with the prescribed requirements with respect to
the minimum shareholders equity, the regulatory capital or the
grow-in of the regulatory capital is behind the grow-in term as
determined on beforehand, Euronext will provide the AFM with a
prognosis of how it expects to again comply with the prescribed
prudential requirements. Dividend distributions will be possible
in such a situation, unless the AFM is of the opinion that the
future development of the shareholders equity or the regulatory
capital of Euronext do not allow for this. If necessary, the AFM can
prescribe within which term and in which manner Euronext will
need to comply with the prudential requirements.
In addition, Euronext is required to obtain the prior approval of the
AFM in the following circumstances:
n the granting of personal and in rem security for debts of other
enterprises or the assumption of debts and security by Euronext,
to the extent this is or can be of infl uence on the functioning of
the regulated markets held by Euronext or possibly can result in
Euronext or one or more of its regulated subsidiaries no longer
satisfying the prescribed prudential requirements;
n to the extent there is a reorganisation, operational or legal
separations of the license holders or merger which can be of
material infl uence of the functioning of the regulated markets in
the Netherlands operated by the license holders;
n proposed resolutions of Euronext which can be of significant
infl uence on the fi nancial soundness of Euronext.
Euronext is also required to ensure that, in the event of a possible
insolvency of Euronext N.V., the local exchanges can continue to
function operationally.
The AFM may impose further requirements with respect to the
shareholders equity position, liquidity and solvency of Euronext, to
the extent necessary for the compliance with the requirements of
the regulated markets.
In addition, each of the Group’s subsidiaries that is an operator of
a regulated market and subsidiaries that are investment fi rms are
subject to regulatory capital requirements relating to their general
financial soundness, which include certain minimum capital
requirements.
As of 31 December 2019, Euronext shareholders equity and regulatory equity was the following:
In thousands of euros 31 Dec 2019 31 Dec 2018
Shareholders equity 918,140 791,093
Less
Intangible assets and deferred tax 429,019 381,071
Investments in fi nancial sector 208,461 250,787
REGULATORY EQUITY 280,660 159,235
2019 UNIVERSAL REGISTRATION DOCUMENT 173

Operating and fi nancial review77Tangible Fixed Assets
7.6 Tangible Fixed Assets
The main tangible fi xed assets of the Group consist of the following categories:
n land & buildings;
n hardware & IT equipment;
n other Property & Equipment.
7.6.1 PRINCIPAL PROPERTIES
Euronext’s headquarters are located in Amsterdam, the Netherlands at Beursplein 5, and in Paris, France, at La Défense (92054), 14 Place
des Refl ets. Euronext’s registered offi ce is located at Beursplein 5, 1012 JW Amsterdam, the Netherlands.
Real estate Euronext – per 31 December 2019
Location/Building Address ZIP City CountryLease
commenceLease expiry
Surfaces (sqm)
Owned/Leased
Amsterdam, BEURSPLEIN 5 5 Beursplein 1012 JW Amsterdam Netherlands N/A N/A 14,450 Owned
London 110 Cannon street EC4N6EU London UK 2017 2022 540 Leased
Brussels/LE MARQUIS 1 rue de Marquis 1000 Brussels Belgium 2014 2030 860 Leased
Lisbon/VICTORIA-Seurosvida 196-7 avenida da Liberdade 1250-147 Lisbon Portugal 2018 2021 554 Leased
Porto – Interbolsa/ENX
Technologies
3433 avenida da Boavista 410-138 Porto Portugal 2016 2021 3,136 Leased
Paris/PRAETORIUM 14 place des Refl ets 92054 Paris Cedex France 2015 2024 10,217 Leased
ZI Rosny sous Bois 17 rue Montgolfi er 93110 Rosny sous
Bois
France 2012 2022 328 Leased
Enternext Nantes 6 rue Bisson 44000 Nantes France 2017 2020 15 Leased
Enternext Lyon 3 place de la Bourse 69002 Lyon France 2017 2020 15 Leased
Enternext Bordeaux 17 place de la Bourse 33076 Bordeaux
Cedex
France 2017 2020 15 Leased
Enternext Marseille 10 place de la Jollette 13567 Marseille Cedex
France 2017 2020 13 Leased
Suisse/TECHNOPARK 1 Technoparkstrasse CH-8005 Zurich Switzerland 2017 2020 24 Leased
Espagne/REGUS/Cuzco IV 141 Paseo de Castellana –
5 fl oor
28046 Madrid Spain 2017 2020 12 Leased
Italy/Thurma Business Center 1 Corso Italia 20122 Milan Italy 2017 2020 16 Leased
Munich/Design Offi ces 4 Mies-van-der-Rohe-Str. 80807 Munich Germany 2017 2020 15 Leased
Hong Kong 14 Taiko Wan Road Quarry Bay Hong Kong Hong Kong 2017 2020 2 Leased
New York 180 Maiden Lane NY10038 New York USA 2016 2026 854 Leased
Bengalore/Obeya 17 Cross Road, AJ Forte 560102IN Bengalore India 2018 2020 120 Leased
Dublin/Calaghan House 13-16 Dame street Dublin Ireland 2017 2020 209 Leased
Dublin Exchange building Foster Place 2 Dublin Ireland N/A N/A 1,525 Owned
London/Francis House Francis street SW1P1DE London UK 2017 2020 124 Leased
Stock Exchange Anglesea street Dublin Ireland N/A N/A 1,330 Owned
Dublin Foster Place 5/6 Dublin Ireland 2013 2021 508 Leased
Oslo Børs Tollbugata 2 Oslo Norway N/A N/A 3,004 Owned
Oslo VPS building Fred Olsensgate 1 Oslo Norway 2018 2023 3,221 Leased
Fishpool Bergen Fantoftvehen 38 Bergen Norway 2019 2023 140 Leased
Centevo Stockholm Sveavagen 52 Stockholm Sweden 2019 2022 15 Leased
2019 UNIVERSAL REGISTRATION DOCUMENT174 www.euronext.com
Operating and fi nancial review
7
THIS PAGE HAS BEEN INTENTIONALLY LEFT BLANK
2019 UNIVERSAL REGISTRATION DOCUMENT 175

2019 UNIVERSAL REGISTRATION DOCUMENT176 www.euronext.com
Notes to the Consolidated Financial Statements 183
Euronext N.V. Company Financial Statements for the year ended 31 December 2019 245
Notes to the Company Financial Statements 247
8.1 Consolidated Statement of Profi t or Loss 178
8.2 Consolidated Statement of Comprehensive Income 179
8.3 Consolidated Balance Sheet 180
8.4 Consolidated Statement of Cash Flows 181
8.5 Consolidated Statement of Changes in Equity 182
FINANCIAL STATEMENTS
2019 UNIVERSAL REGISTRATION DOCUMENT 177
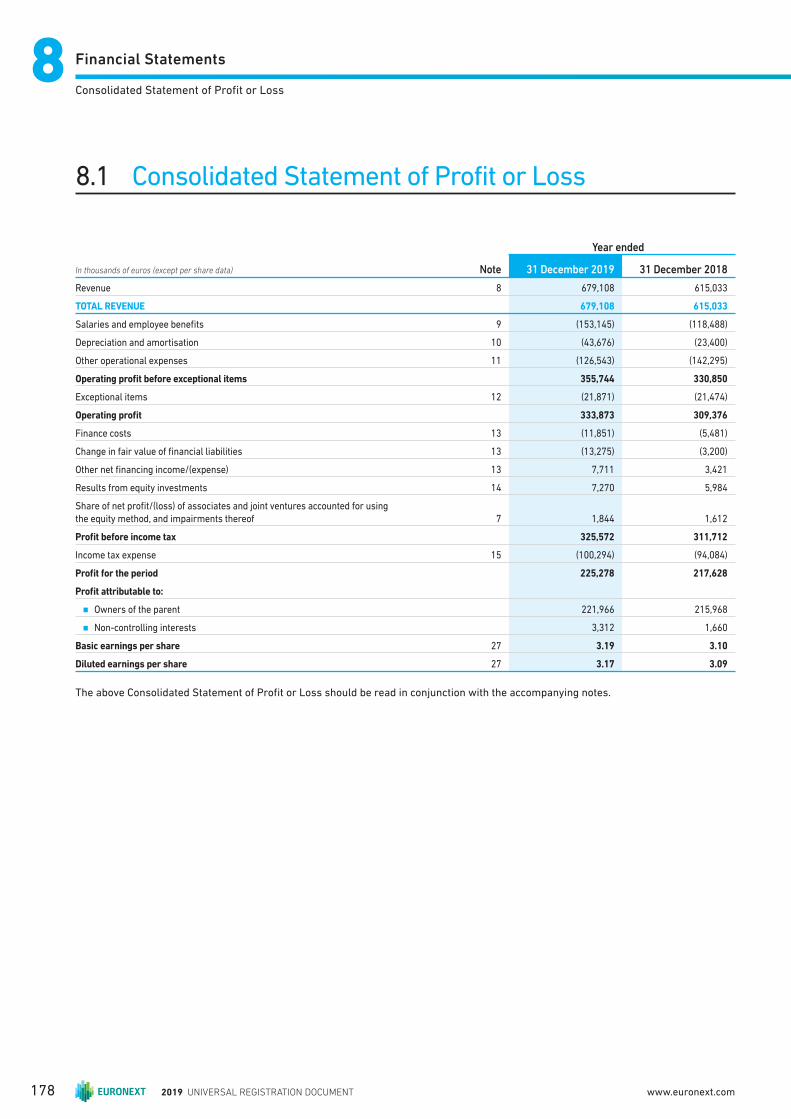
Financial Statements88Consolidated Statement of Profi t or Loss
8.1 Consolidated Statement of Profit or Loss
In thousands of euros (except per share data) Note
Year ended
31 December 2019 31 December 2018
Revenue 8 679,108 615,033
TOTAL REVENUE 679,108 615,033
Salaries and employee benefi ts 9 (153,145) (118,488)
Depreciation and amortisation 10 (43,676) (23,400)
Other operational expenses 11 (126,543) (142,295)
Operating profi t before exceptional items 355,744 330,850
Exceptional items 12 (21,871) (21,474)
Operating profi t 333,873 309,376
Finance costs 13 (11,851) (5,481)
Change in fair value of fi nancial liabilities 13 (13,275) (3,200)
Other net fi nancing income/(expense) 13 7,711 3,421
Results from equity investments 14 7,270 5,984
Share of net profi t/(loss) of associates and joint ventures accounted for using
the equity method, and impairments thereof 7 1,844 1,612
Profi t before income tax 325,572 311,712
Income tax expense 15 (100,294) (94,084)
Profi t for the period 225,278 217,628
Profi t attributable to:
n Owners of the parent 221,966 215,968
n Non-controlling interests 3,312 1,660
Basic earnings per share 27 3.19 3.10
Diluted earnings per share 27 3.17 3.09
The above Consolidated Statement of Profi t or Loss should be read in conjunction with the accompanying notes.
2019 UNIVERSAL REGISTRATION DOCUMENT178 www.euronext.com

Financial Statements
8
Consolidated Statement of Comprehensive Income
8.2 Consolidated Statement of Comprehensive Income
In thousands of euros Note
Year ended
31 December 2019 31 December 2018
Profi t for the period 225,278 217,628
Other comprehensive income
Items that may be reclassifi ed to profi t or loss:
n Exchange diff erences on translation of foreign operations (2,206) 5,963
Items that will not be reclassifi ed to profi t or loss:
n Change in value of equity investments at fair value through other comprehensive income 20 12,500 35,399
n Income tax impact on change in value of equity investments at fair value through other comprehensive income 19 (2,159) (5,529)
n Remeasurements of post-employment benefi t obligations 30 (1,410) 1,677
n Income tax impact on remeasurements of post-employment benefi t
obligations 19 (223) (67)
Other comprehensive income for the period, net of tax 6,502 37,443
TOTAL COMPREHENSIVE INCOME FOR THE PERIOD 231,780 255,071
Comprehensive income attributable to:
n Owners of the parent 228,294 253,348
n Non-controlling interests 3,486 1,723
The above Consolidated Statement of Comprehensive Income should be read in conjunction with the accompanying notes.
2019 UNIVERSAL REGISTRATION DOCUMENT 179
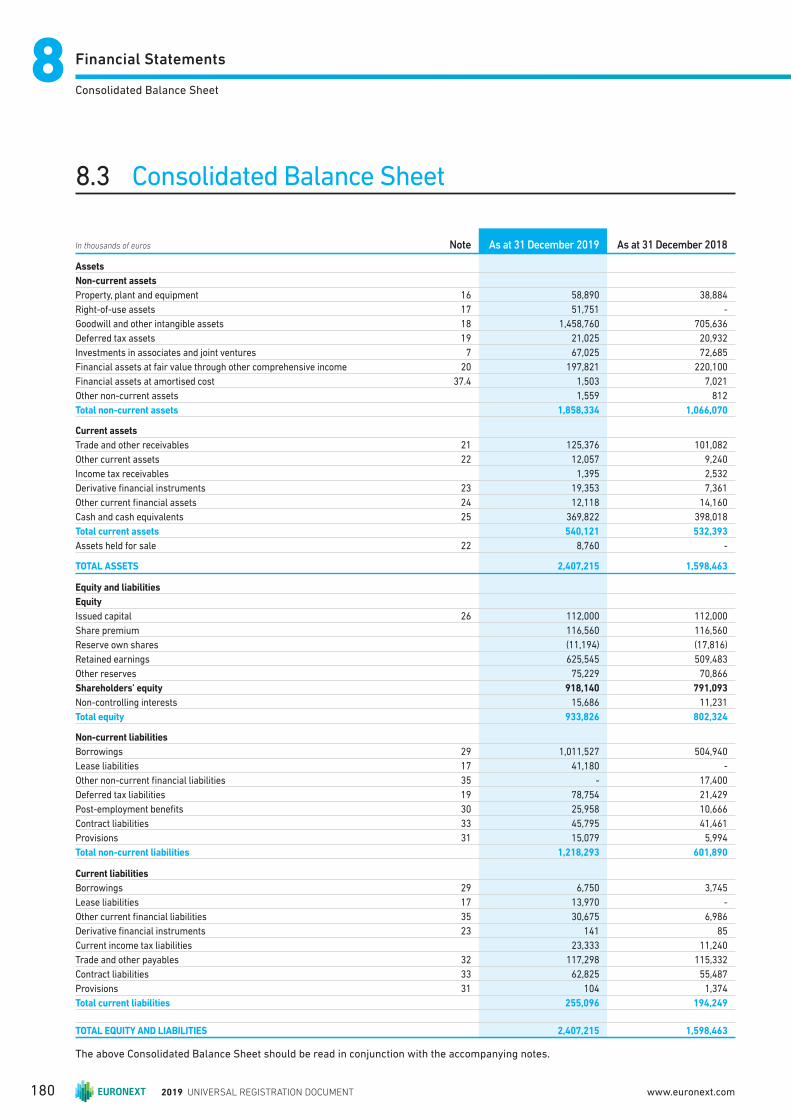
Financial Statements88Consolidated Balance Sheet
8.3 Consolidated Balance Sheet
In thousands of euros Note As at 31 December 2019 As at 31 December 2018
Assets
Non-current assets
Property, plant and equipment 16 58,890 38,884
Right-of-use assets 17 51,751 -
Goodwill and other intangible assets 18 1,458,760 705,636
Deferred tax assets 19 21,025 20,932
Investments in associates and joint ventures 7 67,025 72,685
Financial assets at fair value through other comprehensive income 20 197,821 220,100
Financial assets at amortised cost 37.4 1,503 7,021
Other non-current assets 1,559 812
Total non-current assets 1,858,334 1,066,070
Current assets
Trade and other receivables 21 125,376 101,082
Other current assets 22 12,057 9,240
Income tax receivables 1,395 2,532
Derivative fi nancial instruments 23 19,353 7,361
Other current fi nancial assets 24 12,118 14,160
Cash and cash equivalents 25 369,822 398,018
Total current assets 540,121 532,393
Assets held for sale 22 8,760 -
TOTAL ASSETS 2,407,215 1,598,463
Equity and liabilities
Equity
Issued capital 26 112,000 112,000
Share premium 116,560 116,560
Reserve own shares (11,194) (17,816)
Retained earnings 625,545 509,483
Other reserves 75,229 70,866
Shareholders’ equity 918,140 791,093
Non-controlling interests 15,686 11,231
Total equity 933,826 802,324
Non-current liabilities
Borrowings 29 1,011,527 504,940
Lease liabilities 17 41,180 -
Other non-current fi nancial liabilities 35 - 17,400
Deferred tax liabilities 19 78,754 21,429
Post-employment benefi ts 30 25,958 10,666
Contract liabilities 33 45,795 41,461
Provisions 31 15,079 5,994
Total non-current liabilities 1,218,293 601,890
Current liabilities
Borrowings 29 6,750 3,745
Lease liabilities 17 13,970 -
Other current fi nancial liabilities 35 30,675 6,986
Derivative fi nancial instruments 23 141 85
Current income tax liabilities 23,333 11,240
Trade and other payables 32 117,298 115,332
Contract liabilities 33 62,825 55,487
Provisions 31 104 1,374
Total current liabilities 255,096 194,249
TOTAL EQUITY AND LIABILITIES 2,407,215 1,598,463
The above Consolidated Balance Sheet should be read in conjunction with the accompanying notes.
2019 UNIVERSAL REGISTRATION DOCUMENT180 www.euronext.com
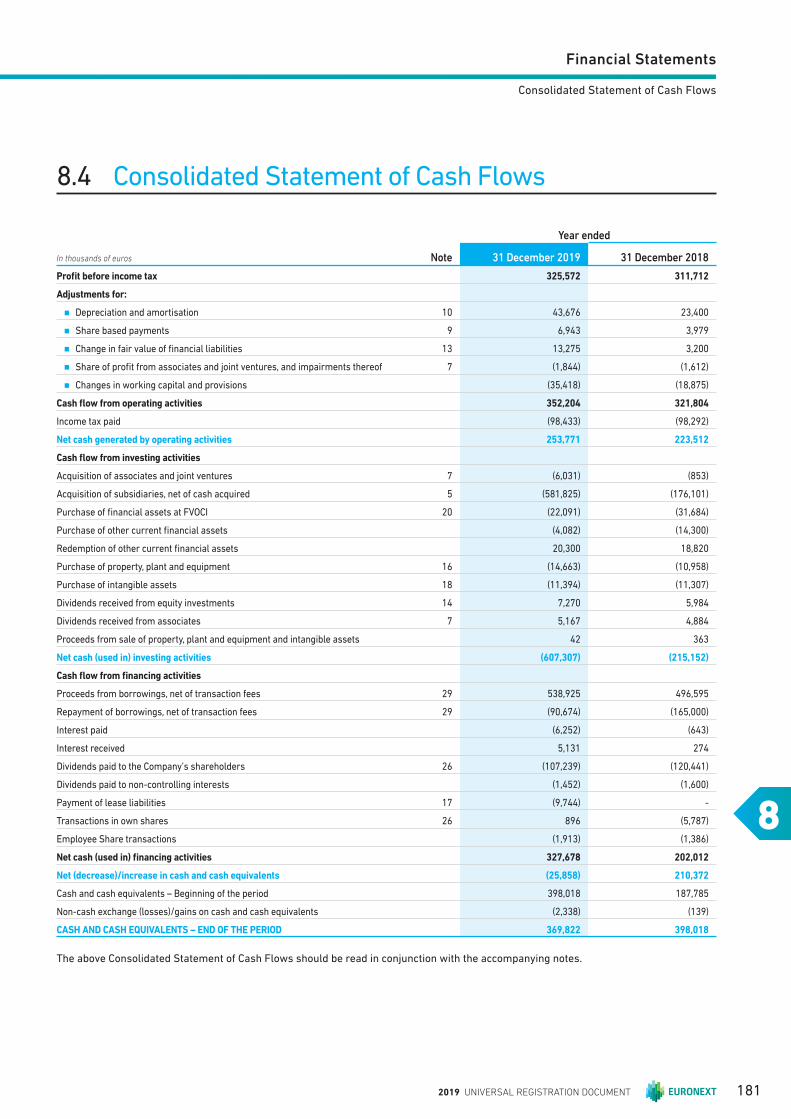
Financial Statements
8
Consolidated Statement of Cash Flows
8.4 Consolidated Statement of Cash Flows
In thousands of euros Note
Year ended
31 December 2019 31 December 2018
Profi t before income tax 325,572 311,712
Adjustments for:
n Depreciation and amortisation 10 43,676 23,400
n Share based payments 9 6,943 3,979
n Change in fair value of fi nancial liabilities 13 13,275 3,200
n Share of profi t from associates and joint ventures, and impairments thereof 7 (1,844) (1,612)
n Changes in working capital and provisions (35,418) (18,875)
Cash fl ow from operating activities 352,204 321,804
Income tax paid (98,433) (98,292)
Net cash generated by operating activities 253,771 223,512
Cash fl ow from investing activities
Acquisition of associates and joint ventures 7 (6,031) (853)
Acquisition of subsidiaries, net of cash acquired 5 (581,825) (176,101)
Purchase of fi nancial assets at FVOCI 20 (22,091) (31,684)
Purchase of other current fi nancial assets (4,082) (14,300)
Redemption of other current fi nancial assets 20,300 18,820
Purchase of property, plant and equipment 16 (14,663) (10,958)
Purchase of intangible assets 18 (11,394) (11,307)
Dividends received from equity investments 14 7,270 5,984
Dividends received from associates 7 5,167 4,884
Proceeds from sale of property, plant and equipment and intangible assets 42 363
Net cash (used in) investing activities (607,307) (215,152)
Cash fl ow from fi nancing activities
Proceeds from borrowings, net of transaction fees 29 538,925 496,595
Repayment of borrowings, net of transaction fees 29 (90,674) (165,000)
Interest paid (6,252) (643)
Interest received 5,131 274
Dividends paid to the Company’s shareholders 26 (107,239) (120,441)
Dividends paid to non-controlling interests (1,452) (1,600)
Payment of lease liabilities 17 (9,744) -
Transactions in own shares 26 896 (5,787)
Employee Share transactions (1,913) (1,386)
Net cash (used in) fi nancing activities 327,678 202,012
Net (decrease)/increase in cash and cash equivalents (25,858) 210,372
Cash and cash equivalents – Beginning of the period 398,018 187,785
Non-cash exchange (losses)/gains on cash and cash equivalents (2,338) (139)
CASH AND CASH EQUIVALENTS – END OF THE PERIOD 369,822 398,018
The above Consolidated Statement of Cash Flows should be read in conjunction with the accompanying notes.
2019 UNIVERSAL REGISTRATION DOCUMENT 181

Financial Statements88Consolidated Statement of Changes in Equity
8.5 Consolidated Statement of Changes in Equity
Other reserve
In thousands of euros NoteIssued capital
Share premium
Reserve own
sharesRetained Earnings
Foreign currency
translation reserve
Fair value reserve of
fi nancial assets at
FVOCI
Total other
reserves
Total Shareholders’
equity
Non-controlling
interestsTotal
equity
Balance as at 1 January 2018 112,000 116,560 (17,269) 418,585 (2,549) 37,645 35,096 664,972 14,211 679,183
Profi t for the year - - - 215,968 - - - 215,968 1,660 217,628
Other comprehensive income for the year - - - 1,610 5,900 29,870 35,770 37,380 63 37,443
Total comprehensive income for the year - - - 217,578 5,900 29,870 35,770 253,348 1,723 255,071
Share based payments - - - 3,979 - - - 3,979 - 3,979
Dividends paid - - - (120,441) - - - (120,441) (1,600) (122,041)
Acquisitions of own
shares - - (5,787) - - - - (5,787) - (5,787)
Acquisition of
non-controlling interest - - - (3,575) - - - (3,575) (3,575) (7,150)
Non-controlling
interests on acquisition
of subsidiary - - - - - - - - 472 472
Other movements - - 5,240 (6,644) - - - (1,404) - (1,404)
Balance as at
1 January 2019 112,000 116,560 (17,816) 509,483 3,351 67,515 70,866 791,093 11,231 802,324
Profi t for the year - - - 221,966 - - - 221,966 3,312 225,278
Other comprehensive
income for the year - - - (1,633) (2,380) 10,341 7,961 6,328 174 6,502
Total comprehensive
income for the year - - - 220,333 (2,380) 10,341 7,961 228,293 3,486 231,780
Transfer of revaluation
result to retained earnings 20 - - - 3,597 - (3,597) (3,597) - - -
Share based payments - - - 6,943 - - - 6,943 - 6,943
Dividends paid - - - (107,239) - - - (107,239) (1,452) (108,691)
Transactions in own
shares - - 896 - - - - 896 - 896
Non-controlling
interests on acquisition of subsidiary - - - - - - - - 2,420 2,420
Other movements - - 5,726 (7,572) - - - (1,846) - (1,846)
BALANCE AS AT 31 DECEMBER 2019 112,000 116,560 (11,194) 625,545 970 74,259 75,229 918,140 15,686 933,826
The above Consolidated Statement of Changes in Equity should be read in conjunction with the accompanying notes.
2019 UNIVERSAL REGISTRATION DOCUMENT182 www.euronext.com
Financial Statements
8
Consolidated Statement of Changes in Equity
Notes to the Consolidated Financial Statements
NOTE 1 GENERAL INFORMATION
Euronext N.V. (“the Group” or “the Company”) is a public limited
liability company incorporated and domiciled at Beursplein 5, 1012
JW Amsterdam in the Netherlands under Chamber of Commerce
number 60234520 and is listed at all Continental Euronext local
markets i.e. Euronext Amsterdam, Euronext Brussels, Euronext
Lisbon and Euronext Paris.
The Group operates securities and derivatives exchanges in
Continental Europe, Ireland and Norway. It off ers a full range of
exchange- and corporate services, including security listings, cash
and derivatives trading, and market data dissemination. It combines
the Amsterdam, Brussels, Dublin, Lisbon, Oslo and Paris exchanges
in a highly integrated, cross-border organisation.
The Group also has a securities exchange in London (Euronext
London Ltd.), operates Interbolsa S.A. and Verdipapirsentralen ASA
(“VPS”) (respectively the Portuguese and the Norwegian national
Central Securities Depositories [“CSD”]) and has a majority stake in
Euronext FX Inc., a US-based Electronic Communication Network
in the spot foreign exchange market. The Group’s in-house IT
function supports its exchange operations. In addition, the Group
provides software licenses as well as IT development, operation
and maintenance services to third-party exchanges.
These Consolidated Financial Statements were authorised for
issuance by Euronext N.V.’s Supervisory Board on 1 April 2020 and
will be submitted for adoption by the Annual General Meeting (AGM)
of Shareholders on 14 May 2020.
NOTE 2 SIGNIFICANT EVENTS AND TRANSACTIONS
The fi nancial position and performance of the Group was particularly
aff ected by the following events and transactions that have occurred
during the year:
Acquisition of Oslo Børs VPS Holding ASA (“Oslo Børs VPS”)
On 14 June 2019, the Group acquired a majority stake in Oslo Børs
VPS, the Norwegian Stock Exchange and national CSD operator,
increasing its ownership to 97.8% as per that date. The total purchase
consideration of the transaction amounted to €693.4 million.
Subsequent to the transaction, the Group acquired the remaining
2.2% minority stake, making the Group the benefi cial owner of 100%
of the Oslo Børs VPS shares as per 4 July 2019 (see Note 5).
Bond Issue
On 4 June 2019, the Group launched a €500.0 million, 10-year
Bond issue, rated “A-” by S&P, with an annual coupon of 1.125%
and listed on Euronext Dublin. The proceeds of the issue were used
to (i) fi nance the acquisition of Oslo Børs VPS and (ii) for general
corporate purposes in line with the Group’s strategy (see Note 29).
Amendment to the Revolving Credit Facility (“RCF”)
On 8 April 2019, the Group signed a supplemental agreement with
nine banks aiming to amend the €250 million RCF originally dated
12 April 2017. This new agreement enabled the Group to increase
the RCF to €400.0 million and set a new maturity of 5 years plus
a two-year extension possibility. As per 31 December 2019, no
amounts were drawn under the RCF (see Note 29).
Long-Term Incen tive Plan 2018 and share repurchase program
On 17 May 2019, a Long-Term Incentive plan (“LTI 2019”) was
established under the revised Remuneration Policy that was
approved by the AGM on 6 May 2015. The LTI cliff vests after 3 years
whereby performance criteria will impact the actual number of
shares at vesting date. The share price for this grant at grant date
was €63.70 and 132,053 Restricted Stock Units (RSU’s) were granted.
The total share based payment expense at the vesting date in 2022 is
estimated to be €8.5 million. Compensation expense recorded during
the year for this LTI 2019 plan amounted to €1.6 million (see Notes 9
and 28).
Acquisition of Finance Web Working SAS
On 9 July 2019, the Group acquired 60% of Finance Web Working
SAS, a leading fund data provider in France, with an option to acquire
the remaining capital in 2023 (see Note 5).
Investment in Tokeny sàrl (“Tokeny Solutions”)
On 28 June 2019, the Group acquired a 23.5% stake in Tokeny
Solutions, a tokenization platform that provides users end-to-end
solutions to issue, manage and transfer tokenized securities on
public blockchain. The Group recognised the acquired interest as
an investment in associate (see Note 7).
Acquisition of Nord Pool Group
On 5 December 2019, the Group announced it entered into binding
agreements to acquire 66% of the share capital and voting rights of
the Nord Pool Group, which runs a leading physical power market
2019 UNIVERSAL REGISTRATION DOCUMENT 183
Financial Statements88Consolidated Statement of Changes in Equity
in Europe, operating from its headquarters in Oslo and offi ces in
Helsinki, Stockholm, Tallinn, Berlin and London. The enterprise
value on a debt-free cash-free basis for 100% is NOK850 million
(€84 million). The Nordic and Baltic Transmission System Operators
(TSOs) that currently own Nord Pool Group, will retain a 34% stake.
The transaction was subject to competition approvals and was
closed on 15 January 2020. For more details on the acquisition,
reference is made to Note 40 “Events after the reporting period”.
Sale of Investment in Associate EuroCCP
On 10 December 2019, Euronext announced that it entered into a
binding agreement to sell its 20% minority stake in EuroCCP to CBOE
Global Markets, alongside the other current EuroCCP shareholders.
The transaction is expected to close in the fi rst half of 2020, subject
to receipt of required regulatory clearances and the arrangement of
a supporting liquidity facility at the EuroCCP clearing entity level. The
Group expects to receive net proceeds of approximately €8.8 million
from the sale of its minority stake. As a result of this agreement,
the Group impaired the value of its investment by approximately
€6.0 million, and classifi ed the investment as an asset held for sale
as per 31 December 2019.
Changes in the Group’s Key Management Personnel During 2019
At the Annual General Meeting held on 16 May 2019, Isabel Ucha
was offi cially appointed as a member of the Managing Board. On
20 August 2019, the Group announced that Maurice van Tilburg
resigned from the Managing Board. Simone Huis in ’t Veld was
appointed as his successor at the Extraordinary General Meeting
(EGM) that took place on 8 October 2019. At that same meeting
Håvard Abrahamsen was officially appointed as a member of
the Managing Board. On 29 January 2020, Euronext announced
that Håvard Abrahamsen resigned from his role as member of
the Managing Board of Euronext N.V. The Supervisory Board of
Euronext N.V. has subsequently nominated Øivind Amundsen as
member of the Managing Board of Euronext N.V., subject to formal
appointment by an Annual Shareholders’ Meeting of Euronext N.V.
and the usual regulatory non-objections.
Immediately after the Annual General Meeting (AGM) held on 16 May
2019, Ramon Fernandez stepped down from the Supervisory
Board. At the Extraordinary General Meeting (EGM) that took place
on 8 October 2019, Nathalie Rachou and Morten Thorsrud were
offi cially appointed as members of the Supervisory Board.
See Note 36, for more details on the Group’s key management
personnel.
NOTE 3 SIGNIFICANT ACCOUNTING POLICIES AND JUDGMENTS
The signifi cant accounting policies applied in the preparation of
these Consolidated Financial Statements are set out below. These
policies have been consistently applied to all the years presented,
unless stated otherwise. The Financial Statements are for the Group
consisting of Euronext N.V. and its subsidiaries.
A. Basis of Preparation
The Consolidated Financial Statements of the Group have been
prepared in accordance with International Financial Reporting
Standards (IFRS) adopted by the European Union. They also comply
with the fi nancial reporting requirements included in Title 9 Book 2
of the Dutch Civil Code, as far as applicable.
The Consolidated Financial Statements have been prepared on a
historical cost basis, unless stated otherwise.
B. Basis of Consolidation
These Consolidated Financial Statements include the financial
results of all subsidiaries in which entities in the Group have a
controlling fi nancial interest and it also incorporates the share of
results from associates and joint ventures. The list of individual
legal entities which together form the Group, is provided in
Note 4. All transactions and balances between subsidiaries have
been eliminated on consolidation. All transactions and balances
with associates and joint ventures are refl ected as related party
transactions and balances (see Note 36).
(i) Subsidiaries
Subsidiaries are all entities controlled by the Group. The Group
controls an entity when the Group is exposed to, or has rights to,
variable returns from its involvement with the entity and has the
ability to aff ect those returns through its power to direct the activities
of the entity. Subsidiaries are fully consolidated from the date on
which control is transferred to the Group. They are deconsolidated
from the date that control ceases.
The acquisition method of accounting is used to account for business
combinations by the Group.
Intergroup transactions, balances and unrealised gains and losses
on transactions between companies within the Group are eliminated
upon consolidation unless they provide evidence of impairment.
Accounting policies of subsidiaries have been changed where
necessary to ensure consistency with the policies adopted by the
Group.
Non-controlling interest in the results and equity of subsidiaries are
shown separately in the consolidated statement or profi t or loss,
statement of comprehensive income, statement of changes in equity
and balance sheet respectively.
(ii) Associates and joint arrangements
Associates are entities over which the Group has the ability to
exercise significant influence, but does not control. Generally,
signifi cant infl uence is presumed to exist when the Group holds
20% to 50% of the voting rights in an entity. Joint arrangements are
joint operations or joint-ventures over which the Group, together with
2019 UNIVERSAL REGISTRATION DOCUMENT184 www.euronext.com

Financial Statements
8
Consolidated Statement of Changes in Equity
another party or several other parties, has joint control. Investments
in associates and joint ventures are accounted for using the equity
method of accounting.
Under the equity method of accounting, the investments are
initially recognised at cost and adjusted thereafter to recognise
the Group’s share of the post-acquisition profi ts or losses of the
investee in profi t or loss, and the Group’s share of movements in
other comprehensive income of the investee in other comprehensive
income. Dividends received or receivable from associates and joint
ventures are recognised as a reduction in the carrying amount of
the investment. When the Group’s share of losses in an equity-
accounted investment equals or exceeds its interest in the entity,
including any other unsecured long-term receivables, the Group
does not recognise further losses, unless it has incurred obligations
or made payments on behalf of the other entity. Unrealised gains
on transactions between the Group and its associates and joint
ventures are eliminated to the extent of the Group’s interest
in these entities. Unrealised losses are also eliminated unless
the transaction provides evidence of an impairment of the asset
transferred. Accounting policies of equity accounted investees
have been changed where necessary to ensure consistency with
the policies adopted by the Group. The carrying amount of equity-
accounted investments is tested for impairment.
C. Business Combinations
Acquisition-related costs are expensed as incurred. Identifi able
assets acquired and liabilities and contingent liabilities assumed in
a business combination are measured initially at their fair values at
the acquisition date. On an acquisition by acquisition basis, the Group
recognises any non-controlling interest in the acquiree either at fair
value or at the non-controlling interest’s proportionate share of the
acquiree’s net assets. The consideration transferred is measured
at the fair value of any assets transferred, liabilities incurred and
equity interests issued. The excess of the consideration transferred
over the fair value of the Group’s share of the identifiable net
assets acquired is recorded as goodwill. To the extent applicable,
any non-controlling interest in the acquiree and the acquisition-
date fair value of any previous equity interest in the acquiree are
added to consideration transferred for purposes of calculating
goodwill. Contingent consideration is classifi ed either as equity or
as a fi nancial liability. Amounts classifi ed as a fi nancial liability are
subsequently re-measured to fair value with changes in fair value
recognised in profi t or loss.
D. Segment Reporting
Segments are reported in a manner consistent with how the
business is operated and reviewed by the chief operating decision
maker (“CODM”), who is responsible for allocating resources and
assessing performance of the operating segments. The chief
operating decision maker of the Group is the Managing Board. The
organisation of the Group refl ects the high level of mutualisation of
resources across geographies and product lines. Operating results
are monitored on a group-wide basis and, accordingly, the Group
represents one operating segment and one reportable segment.
Operating results reported to the Managing Board are prepared on
a measurement basis consistent with the reported Consolidated
Statement of Profi t or Loss.
In presenting and discussing the Group’s financial position,
operating results and net results, management uses certain
Alternative performance measures not defi ned by IFRS. These
Alternative performance measures (APMs) should not be viewed
in isolation as alternatives to the equivalent IFRS measures and
should be used as supplementary information in conjunction
with the most directly comparable IFRS measures. Alternative
performance measures do not have standardised meaning under
IFRS and therefore may not be comparable to similar measures
presented by other companies. The Group measures performance
based on EBITDA1 , as management believes that this measurement
is most relevant in evaluating the operating results of the Group.
This measure is included in the internal management reports
that are reviewed by the CODM. The Group defi nes its “EBITDA”
performance measure as follows (taking into account the line
items as provided in the Consolidated Statement of Profi t or Loss):
“Operating income before exceptional items”, less “Depreciation and
amortisation”. Reference is made to one of the below defi nitions,
whenever the term ‘EBITDA’ is used throughout these Consolidated
Financial Statements:
n EBITDA1 : Operating profit before (i)exceptional items and (ii)
depreciation and amortization, taking into account the lines
described in the Consolidated Statement of Profi t or Loss;
n EBITDA2 : Profi t before (i)interest expense, (ii)tax, (iii)any share of
the profi t of any associated company or undertaking, except
for dividends received in cash by any member of the Group, (iv)
exceptional items; and (v) depreciation and amortization;
n EBITDA3 : EBITDA as defi ned in the Share Purchase Agreements
of the acquired companies involved.
E. Foreign Currency Transactions and Translation
(i) Functional and presentation currency
These Consolidated Financial Statements are presented in Euro
(EUR), which is the Group’s presentation currency. The functional
currency of each Group entity is the currency of the primary
economic environment in which the entity operates.
(ii) Transactions and balances
Foreign currency transactions are converted into the functional
currency using the rate ruling at the date of the transactions.
Foreign exchange gains or losses resulting from the settlement
of such transactions and from the translation at year-end rates of
monetary assets and liabilities denominated in foreign currencies
are recognised in the Income Statement.
Exceptions to this are where the monetary items form part of the
net investment in a foreign operation or are designated as hedges
of a net investment, in which case the exchange diff erences are
recognised in Other Comprehensive Income.
(iii) Group companies
The results and financial position of Group entities that have a
functional currency diff erent from the presentation currency are
converted into the presentation currency as follows:
n assets and liabilities (including goodwill) are converted at the
closing balance sheet rate;
2019 UNIVERSAL REGISTRATION DOCUMENT 185
Financial Statements88Consolidated Statement of Changes in Equity
n income and expenses are translated at average exchange rates
(unless this is not a reasonable approximation of the cumulative
eff ect of the rates prevailing on the transaction dates, in which
case income and expenses are translated at the dates of the
transactions); and
n all resulting exchange diff erences are recognised as currency
translation adjustments within Other Comprehensive Income.
F. Property, plant and equipment
Property, plant and equipment is carried at historical cost, less
accumulated depreciation and any impairment loss. The cost
of purchased property, plant and equipment is the value of the
consideration given to acquire the assets and the value of other
directly attributable costs. All repairs and maintenance costs are
charged to expense as incurred.
Property, plant and equipment is depreciated on a straight-line
basis over the estimated useful lives of the assets, except land
and construction in process assets, which are not depreciated. The
estimated useful lives, which are reviewed annually and adjusted
if appropriate, used by the Group in all reporting periods presented
are as follows:
n Buildings (including leasehold improvements) 5 to 40 years
n IT equipment 2 to 3 years
n Other equipment 5 to 12 years
n Fixtures and fi ttings 4 to 10 years
G. Leases
(i) Right-of-use assets
The Group recognises right-of-use assets at the commencement
date of the lease (i.e., the date the underlying asset is available for
use). Right-of-use assets are measured at cost less any accumulated
depreciation and if necessary any accumulated impairment. The cost
of a right-of-use asset comprise the present value of the outstanding
lease payments, any lease payments made at or before the
commencement date less any lease incentives received, any initial
direct costs and an estimate of costs to be incurred in dismantling
or removing the underlying asset. If the lease transfers ownership
of the underlying asset to the lessee at the end o f the lease term
or if the cost of the right-of-use asset refl ects that the lessee will
exercise a purchase option, the right-of-use asset is depreciated
to the end of the useful life of the underlying asset. Otherwise the
right-of-use asset is depreciated to the end of the lease term.
(ii) Lease liabilities
At the commencement date of the lease, the Group recognises
lease liabilities measured at the present value of lease payments
to be made over the lease term. The lease payments include fi xed
payments (including in-substance fi xed payments) less any lease
incentives receivable, variable payments that depend on an index
or rate and amounts expected to be paid under residual value
guarantees. The lease payments also include the exercise price of
a purchase option reasonably certain to be exercised by the Group
and payments for penalties for terminating a lease, if the lease term
refl ects the Group exercising the option to terminate. Variable lease
payments that do not depend on an index or a rate are recognised as
expense in the period on which the event or condition that triggers
the payment occurs. In this context, the Group also applies the
practical expedient that the payments for non-lease components are
generally recognised as lease payments. In calculating the present
value of lease payments, the Group uses the incremental borrowing
rate at the lease commencement date if the interest rate implicit in
the lease is not readily determinable. After the commencement date,
the amount of lease liabilities is increased to refl ect the accretion
of interest and reduced for the lease payments made. In addition,
the carrying amount of lease liabilities is remeasured if there is
a modification, a change in the lease term, a change in the in-
substance fi xed lease payments or a change in the assessment to
purchase the underlying asset.
(iii) Short-term leases and leases of low-value assets
The Group applies the short-term lease recognition exemption
to leases that have a lease term of 12 months or less from the
commencement date and do not contain a purchase option. It also
applies the lease of low-value assets recognition exemption to
leases of offi ce IT equipment and other staff equipment that are
of low value. Lease payments on short-term leases and leases of
low-value assets are recognised as expense on a straight-line basis
over the lease term.
(iv) Leases – (accounting policies applied until 31 December 2018)
The Group adopted IFRS 16 using the modifi ed retrospective method
of adoption, without restating comparative information. As a result
the comparative information provided continues to be accounted
for in accordance with the Group’s previous accounting policy as
described below.
Leases are classifi ed as fi nance leases whenever the terms of the
lease transfer substantially all the risks and rewards to the lessee.
When the Group is the lessee in a fi nance lease, the underlying asset
is recognised in the balance sheet at the inception of the lease, at
its fair value or at the present value of minimum lease payments,
whichever is lower. The corresponding liability to the lessor is
included within borrowings. Payments made under operating leases
are recognised in the Income Statement on a straight-line basis over
the term of the lease.
H. Goodwill and Other Intangible Assets
(i) Goodwill
Goodwill represents the excess of the consideration transferred in
a business combination over the Group’s share in the fair value of
the net identifi able assets and liabilities of the acquired business
at the date of acquisition. Goodwill is not amortised but is tested
at least annually for impairment, or whenever an event or change
in circumstances indicate a potential impairment.
For the purpose of impairment testing, goodwill arising in a
business combination is allocated to the cash-generating units
(“CGUs”) or groups of CGUs that are expected to benefi t from the
synergies of the combination. Each CGU or CGU Group to which
goodwill is allocated represents the lowest level within the Group
at which the goodwill is monitored for internal management
purposes.
The carrying value of a CGU Group is compared to its recoverable
amount, which is the higher of its value in use and its fair value
less costs of disposal. Impairment losses on goodwill are not
subsequently reversed. Value in use is derived from the discounted
2019 UNIVERSAL REGISTRATION DOCUMENT186 www.euronext.com
Financial Statements
8
Consolidated Statement of Changes in Equity
future free cash fl ows of the CGU Group. Fair value less costs of
disposal is based on discounted cash fl ows and market multiples
applied to forecasted earnings. Cash fl ow projections are based on
budget and business plan approved by management and covering a
2-year period in total. Cash fl ows beyond the business plan period
are extrapolated using a perpetual growth rate. Key assumptions
used in goodwill impairment test are described in Note 18.
(ii) Internally generated intangible assets
Software development costs are capitalised only from the date when
all of the following conditions are met:
n the technical feasibility of the development project is
demonstrated;
n it is probable that the project will be completed and will generate
future economic benefi ts; and
n the project development costs can be reliably measured.
Capitalised software development costs are amortised on a straight-
line basis over their useful lives, generally from 2 to 7 years. Other
development expenditures that do not meet these criteria, as well
as software maintenance and minor enhancements, are expensed
as incurred.
(iii) Other intangible assets
Other intangible assets, which are acquired by the Group, are stated
at cost less accumulated amortisation and impairment losses (if
applicable). The estimated useful lives are as follows:
n purchased software and licenses: 2–8 years;
n customer relationships: 11–40 years;
n brand names: indefi nite.
I. Impairment of Non-Financial Assets Other Than Goodwill
Assets that are subject to amortisation and depreciation are reviewed
for impairment whenever events or circumstances indicate that
the carrying amount may not be recoverable. Assets that have an
indefi nite useful life are not subject to amortisation nor depreciation
and are tested at least annually for impairment. An impairment loss
is recognised for the amount by which the asset’s carrying amount
exceeds its recoverable amount. The recoverable amount is the
higher of an asset’s fair value less costs to sell or value in use. For
purposes of assessing impairment, assets are grouped into Cash
Generating Units (“CGUs”). A CGU is the smallest identifi able group of
assets that generates cash infl ows that are largely independent from
other groups of assets. Non-fi nancial assets, other than goodwill,
that were previously impaired are reviewed for possible reversal of
the impairment at each reporting date.
J. Derivative Financial Instruments and Hedging Activities
(i) Initial recognition and measurement
The Group uses derivative fi nancial instruments, such as forward
currency contracts and interest rate swaps, to hedge its foreign
currency risk and interest rate risks. Such derivative financial
instruments are initially recognised at fair value on the date on
which a derivative contract is entered into and are subsequently
remeasured at fair value. Derivatives are carried as fi nancial assets
when the fair value is positive and as fi nancial liabilities when the
fair value is negative.
For the purpose of hedge accounting, hedges are classifi ed as fair
value hedges when hedging the exposure to changes in the fair
value of a recognised asset or liability or an unrecognised fi rm
commitment.
At the inception of a hedge relationship, the Group formally
designates and documents the hedge relationship to which it wishes
to apply hedge accounting and the risk management objective and
strategy for undertaking the hedge.
The documentation includes identifi cation of the hedging instrument,
the hedged item, the nature of the risk being hedged and how the
Group will assess whether the hedging relationship meets the hedge
eff ectiveness requirements (including the analysis of sources of
hedge ineffectiveness and how the hedge ratio is determined).
A hedging relationship qualifi es for hedge accounting if it meets all
of the following eff ectiveness requirements:
n there is “an economic relationship” between the hedged item and
the hedging instrument;
n the eff ect of credit risk does not “dominate the value changes”
that result from that economic relationship;
n the hedge ratio of the hedging relationship is the same as that
resulting from the quantity of the hedged item that the Group
actually hedges and the quantity of the hedging instrument that
the Group actually uses to hedge that quantity of hedged item.
The hedges relevant to the Group, that meet all the qualifying criteria
for hedge accounting are accounted for, as described below:
Fair Value Hedges
The change in the fair value of a hedging instrument is recognised
in the statement of profi t or loss. The change in the fair value of the
hedged item attributable to the risk hedged is recorded as part of
the carrying value of the hedged item and is also recognised in the
statement of profi t or loss.
For fair value hedges relating to items carried at amortised cost,
any adjustment to carrying value is amortised through profi t or loss
over the remaining term of the hedge using the Eff ective Interest
Rate (EIR) method. The EIR amortisation may begin as soon as an
adjustment exists and no later than when the hedged item ceases
to be adjusted for changes in its fair value attributable to the risk
being hedged.
If the hedged item is derecognised, the unamortised fair value is
recognised immediately in profi t or loss.
When an unrecognised fi rm commitment is designated as a hedged
item, the subsequent cumulative change in the fair value of the fi rm
commitment attributable to the hedged risk is recognised as an
asset or liability with a corresponding gain or loss recognised in
profi t or loss.
Hedges of a Net Investment
Hedges of a net investment in a foreign operation, including a
hedge of a monetary item that is accounted for as part of the net
investment, are accounted for as follows:
2019 UNIVERSAL REGISTRATION DOCUMENT 187
Financial Statements88Consolidated Statement of Changes in Equity
Gains or losses on the hedging instrument relating to the eff ective
portion of the hedge are recognised as Other Comprehensive Income
while any gains or losses relating to the ineff ective portion are
recognised in the statement of profi t or loss. On disposal of the
foreign operation, the cumulative value of any such gains or losses
recorded in equity is transferred to the statement of profi t or loss.
The Group uses a foreign exchange forward contract as a hedge of
its exposure to foreign exchange risk on its investments in foreign
subsidiaries. Refer to Note 23 for more details.
K. Financial Assets
The Group classifies its financial assets in the following
measurement categories:
n fi nancial assets measured at amortised cost;
n financial assets measured at fair value through Other
Comprehensive Income (FVOCI);
n fi nancial assets measured at fair value through profi t or loss
(FVPL).
The classification depends on the entity’s business model for
managing the fi nancial assets and the contractual terms of the cash
fl ows. For assets measured at fair value, gains and losses will either
be recorded in profi t or loss or Other Comprehensive Income. For
investments in equity instruments that are not held for trading, this
will depend on whether the Group has made an irrevocable election
at the time of initial recognition to account for the equity investment
at fair value through Other Comprehensive Income (FVOCI).
Except for trade receivables, at initial recognition the Group measures
a fi nancial asset at its fair value plus, in the case of a fi nancial asset
not at fair value through profi t or loss (FVPL), transaction costs that
are directly attributable to the acquisition of the fi nancial asset.
Transaction costs of fi nancial assets carried at FVPL are expensed
in profi t or loss. Financial assets with embedded derivatives are
considered in their entirety when determining whether their cash
fl ows are solely payment of principal and interest. Trade receivables
are initially measured at their transaction price if they do not contain
a signifi cant fi nancing component in accordance with IFRS 15.
(i) Debt instruments
Subsequent measurement of debt instruments depends on the
Group’s business model for managing the asset and the cash
fl ow characteristics of the asset. There are three measurement
categories into which the Group classifi es its debt instruments:
Amortised Cost
Assets that are held for collection of contractual cash fl ows where
those cash fl ows represent solely payments of principal and interest
are measured at amortised cost. Interest income from these fi nancial
assets is included in fi nance income using the eff ective interest rate
method. Any gain or loss arising on de-recognition is recognised
directly in profit or loss and presented in other gains/(losses),
together with foreign exchange gains and losses. Impairment losses
are presented as separate line item in the statement of profi t or
loss. The Group’s fi nancial assets at amortised cost includes the
Group’s Trade and other receivables, loans and deposits included
under (non-current) Financial assets at amortised cost, short-term
deposits with a maturity of more than three months included under
Other current fi nancial assets and Cash and cash equivalents.
Fair value through Other Comprehensive Income
Assets that are held for collection of contractual cash fl ows and
for selling the financial assets, where the assets’ cash flows
represent solely payments of principal and interest, are measured
at FVOCI. Movements in the carrying amount are taken through Other
Comprehensive Income, except for the recognition of impairment
gains or losses, interest revenue and foreign exchange gains and
losses which are recognised in profi t or loss. When the fi nancial asset
is derecognised, the cumulative gain or loss previously recognised
in Other Comprehensive Income is reclassifi ed from equity to profi t
or loss and recognised in other gains/(losses). Interest income
from these fi nancial assets is included in fi nance income using the
eff ective interest rate method. Foreign exchange gains and losses
are presented in other gains/(losses) and impairment expenses are
presented as separate line item in the statement of profi t or loss.
Fair Value Through Profi t or Loss
Assets that do not meet the criteria for amortised cost or FVOCI
are measured at FVPL. A gain or loss on a debt investment that is
subsequently measured at FVPL is recognised in profi t or loss and
presented net within other gains/(losses) in the period in which it
arises.
The Group reclassifi es debt investments when and only when its
business model for managing those assets changes.
(ii) Equity instruments
The Group subsequently measures all equity investments at fair
value. Where the Group’s management has elected to present
fair value gains and losses on equity investments in Other
Comprehensive Income, there is no subsequent reclassifi cation
of fair value gains and losses to profi t or loss following the de-
recognition of the investment. Dividends from such investments will
be recognised in profi t or loss as results from equity investments
when the Group’s right to receive payments is established, except
when the Group benefi ts from such proceeds as a recovery of part
of the cost of the fi nancial asset, in which case, such gains are
recorded in Other Comprehensive Income. The Group elected to
classify irrevocably its unlisted equity securities that are held as
long-term strategic investments that are not expected to be sold in
the foreseeable future.
Changes in the fair value of fi nancial assets at FVPL are recognised
in other gains/(losses) in the statement of profi t or loss as applicable.
Impairment losses (and reversal of impairment losses) on equity
investments measured at FVOCI are not reported separately from
other changes in fair value.
(ii) Impairment of fi nancial assets
The Group recognises an allowance for expected credit losses (ECLs)
for all debt instruments not held at fair value through profi t or loss.
ECLs are based on the diff erence between the contractual cash
fl ows due in accordance with the contract and all the cash fl ows
that the Group expects to receive, discounted at an approximation
of the original eff ective interest rate. The expected cash fl ows will
include cash fl ows from the sale of collateral held or other credit
enhancements that are integral to the contractual terms.
ECLs are recognised in two stages. For credit exposures for which
there has not been a signifi cant increase in credit risk since initial
recognition, ECLs are provided for credit losses that result from
2019 UNIVERSAL REGISTRATION DOCUMENT188 www.euronext.com
Financial Statements
8
Consolidated Statement of Changes in Equity
default events that are possible within the next 12-months (a
12-month ECL). For those credit exposures for which there has
been a signifi cant increase in credit risk since initial recognition,
a loss allowance is required for credit losses expected over the
remaining life of the exposure, irrespective of the timing of the
default (a lifetime ECL).
For trade and contract receivables, the Group applies a simplifi ed
approach in calculating ECLs. Therefore, the Group does not track
changes in credit risk, but instead recognises a loss allowance based
on lifetime ECLs at each reporting date. The Group has established a
provision matrix that is based on its historical credit loss experience,
adjusted for forward-looking factors specifi c to the debtors and the
economic environment.
Further disclosures relating to impairment of fi nancial assets are
also provided in Note 37.4. The Group considers a fi nancial asset in
default when contractual payments are 90 days past due. However,
in certain cases, the Group may also consider a fi nancial asset
to be in default when internal or external information indicates
that the Group is unlikely to receive the outstanding contractual
amounts. A fi nancial asset is written off when there is no reasonable
expectation of recovering the contractual cash fl ows.
L. Trade Receivables
Trade receivables are amounts due from customers for services
performed in the ordinary course of business. They are generally
due for settlement within 30 days and therefore are all classifi ed as
current. Trade receivables are recognised initially at the amount of
consideration that is unconditional unless they contain signifi cant
fi nancing components, when they are recognised at fair value. The
Group holds the trade receivables with the objective to collect the
contractual cash fl ows and therefore measures them subsequently
at amortised cost using the eff ective interest method, less loss
allowance.
M. Cash and Cash Equivalents
Cash and cash equivalents comprise cash at banks, highly liquid
investments with original maturities of three months or less and
investments in money market funds that are readily convertible
to known amounts of cash and are subject to insignifi cant risk of
changes in value.
N. Borrowings
Borrowings are initially recorded at the fair value of proceeds
received, net of transaction costs. Subsequently, these liabilities
are carried at amortised cost, and interest is charged to profi t or
loss over the period of the borrowings using the eff ective interest
method. Accordingly, any diff erence between the proceeds received,
net of transaction costs, and the redemption value is recognised in
profi t or loss over the period of the borrowings using the eff ective
interest rate method. Fees paid on the establishment of loan facilities
are recognised as transaction costs of the loan to the extent that
it is probable that some or all of the facility will be drawn down.
In this case, the fee is deferred until the draw down occurs. To the
extent there is no evidence that it is probable that some or all of the
facility will be drawn down, the fee is capitalized as a prepayment
for liquidity services and amortised over the period of the facility
to which it relates.
O. Provisions
Provisions are recognised when the Group has a present legal or
constructive obligation as a result of past events; it is probable that
an outfl ow of resources will be required to settle the obligation;
and the amount can be reliably estimated. Restructuring provisions
primarily comprise employee termination payments. Provisions
are not recognised for future operating losses, unless there is an
onerous contract. Provisions are measured at the present value of
the expenditures expected to be required to settle the obligation
using a pre-tax risk-free discount rate. The increase in the provision
due to passage of time is recognised as interest expense.
An onerous contract is a contract in which the unavoidable costs
of meeting the obligations under the contract exceed the economic
benefi ts expected to be received under it. The unavoidable costs
under a contract refl ect the least net cost of exiting from the contract,
which is the lower of the cost of fulfi lling it and any compensation
or penalties arising from failure to fulfi l it.
P. Trade and Other Payables
Trade payables are obligations to pay for goods or services that
have been acquired in the ordinary course of business. Trade and
other payables are recognised initially at fair value and subsequently
measured at amortised cost using the eff ective interest method.
Q. Post-Employment Benefi ts
The Group operates defi ned benefi t pension schemes and defi ned
contribution pension schemes. When the Group pays fixed
contributions to a pension fund or pension insurance plan and
the Group has no legal or constructive obligation to make further
contributions if the fund’s assets are insuffi cient to pay all pension
benefi ts, the plan is considered to be a defi ned contribution plan.
In that case, contributions are recognised as employee expense
when they become due.
For the defi ned benefi t schemes, the net asset or liability recognised
on the balance sheet comprises the diff erence between the present
value of the defi ned benefi t pension obligation and the fair value of
plan assets. A net asset is recognised only to the extent the Group
has the right to eff ectively benefi t from the plan surplus. The service
cost, representing benefi ts accruing to employees in the period, and
the net interest income or expense arising from the net defi ned
benefi t asset or liability are recorded within operating expenses in
the Statement of Profi t or Loss. Actuarial gains and losses arising
from experience adjustments, changes in actuarial assumptions
or differences between actual and expected returns on assets
are recognised in equity as a component of Other Comprehensive
Income. The impact of a plan amendment, curtailment or settlement
is recognised immediately when it arises in profi t or loss.
R. Share-Based Compensation
Certain employees of the Group participate in Euronext’s share-
based compensation plans. Awards granted by Euronext under
the plans are restricted stock units (“RSUs”). Under these plans,
Euronext receives services from its employees as consideration for
equity instruments of the Group. As the awards are settled in shares
of Euronext N.V., they are classifi ed as equity settled awards.
2019 UNIVERSAL REGISTRATION DOCUMENT 189
Financial Statements88Consolidated Statement of Changes in Equity
The share-based compensation refl ected in the Statement of Profi t
or Loss relates to the RSUs granted by Euronext to the Group’s
employees. The equity instruments granted do not vest until the
employee completes a specifi ed period of service, typically three
years. The grant-date fair value of the equity settled RSUs is
recognised as compensation expense over the required vesting
period, with a corresponding credit to equity.
Euronext has performance share plans, under which shares
are conditionally granted to certain employees. The fair value of
awards at grant date is calculated using market-based pricing, i.e.
the fair value of Euronext shares. This value is expensed over their
vesting period, with a corresponding credit to equity. The expense
is reviewed and adjusted to refl ect changes to the level of awards
expected to vest, except where this arises from a failure to meet
a market condition or a non-vesting condition in which case no
adjustment applies.
S. Treasury Shares
The Group reacquires its own equity instruments. Those
instruments (“treasury shares”) are deducted from equity. No
gain or loss is recognised in profi t or loss on the purchase, sale,
issue or cancellation of an entity’s own equity instruments. Such
treasury shares may be acquired and held by the entity or by other
members of the consolidated group. Consideration paid or received
is recognised directly in equity.
T. Revenue From Contracts With Customers
The Group is in the business of providing a diverse range of
products and services combining transparent and effi cient equity,
fi xed income securities and derivatives markets. The Group’s main
businesses comprise listing, cash trading, derivatives trading, spot
FX trading, market data and indices, post-trade and market solutions
& other. Revenue from contracts with customers is recognised when
control of the good and services are transferred to the customer
at an amount that refl ects the consideration to which the Group
expects to be entitled in exchange for those goods or services. The
Group has generally concluded that, except for the revenue sharing
agreement with Intercontinental Exchange (ICE), it is principal in its
revenue arrangements because it typically controls the goods or
services before transferring them to the customer.
The disclosures of signifi cant accounting judgements, estimates and
assumptions relating to revenue from contracts with customers are
provided in section “Critical accounting estimates and assumptions”.
(i) Listing
Listing fees primarily consist of original listing fees paid by issuers
to list securities on the various cash markets (admission fees),
subsequent admission fees for other corporate actions (such as
admission of additional securities) and annual listing fees paid
by companies whose fi nancial instruments are listed on the cash
markets. The admission services around initial (and subsequent)
admission and its directly related corporate action services are
considered activities that the Group needs to undertake to enable the
customer to be listed. These activities are combined with the ongoing
listing services and are used as inputs to produce the combined
output, which is the service of being listed. Consequently, revenue
generated from this combined performance obligation is recognised
based on time elapsed over the listing period, as this best refl ects
the continuous transfer of the listing services.
(ii) Trading
The Group earns cash trading fees for customer orders of equity
securities, debt securities and other cash instruments on the Group’s
cash markets and earns derivative trading fees for the execution of
trades of derivative contracts on the Group’s derivative markets.
Spot FX trading fees are earned for execution of trades of foreign
exchange contracts on the FastMatch markets. Customers obtain
control over the service provided at execution of the trade, which
is the only performance obligation. Revenue is recognised at that
point in time.
(iii) Advanced data services
The Group charges clients on a per-user basis for the access to
its real-time and proprietary market data information services.
The Group also collects periodic license fees from clients for the
right to distribute the Group data to third parties. Customers obtain
control over the market data service provided during the period over
which it has access to the data. Consequently revenue is recognised
based on time elapsed over the market data access period, as the
Group meets its obligation to deliver data consistently throughout
this period.
The Group generates indices revenues from Index licensing fees,
which gives customers the right to apply Euronext Index Trademark
names in their products and ETFs. The nature of an index-license
is considered a distinct “right-to-access” license as the customer
can reasonably expect the Group to undertake ongoing activities to
support and maintain the value of its trademark names. Revenue
generated from these licenses are therefore recognised evenly
over the contractual period of the license, as this best refl ects the
continuous benefi t from the license by the customer throughout this
period.
(iv) Post trade
Post-trade revenue primarily include clearing, settlement and
custody fees. Clearing fees are recognised when the clearing of the
trading transaction is completed. Customers obtain control over the
service provided at completion of clearing the securities, which is the
only performance obligation. Revenue is recognised at that point in
time. As the Group does not own its own clearing operation, it has put
in place an agreement with LCH SA. in which the latter is providing
clearing service as a service provider, executing the service under
control of the Group. The nature of the promise is the execution
of a cleared trade on the Group’s trading platforms. The Group
controls the services that are derived from that promise, before it
is transferred to the customer. This makes the Group the principal
in the transaction of providing clearing services to its customers
and consequently the Group recognises its clearing revenue on a
gross basis.
Settlement fees are recognised when the settlement of the trading
transaction is completed. Customers obtain control over the service
provided at completion of the settlement of the securities, which
is the only performance obligation. Revenue is recognised at that
point in time. Custody fees are recognised as the service of holding
the customer’s securities in custody is performed. Revenue is
recognised based on time elapsed over that period of time, as this
best refl ects the continuous transfer of services.
2019 UNIVERSAL REGISTRATION DOCUMENT190 www.euronext.com

Financial Statements
8
Consolidated Statement of Changes in Equity
(v) Euronext Technologies & other
Euronext Technologies and other revenue include software license
and maintenance services, IT (hosting) services provided to third-
party market operators, connection services and data center
colocation services provided to market participants, and other
revenue.
Software licenses that are distinct can be considered a “right-
to-use” license, given the signifi cant stand-alone functionality of
the underlying intellectual property. Consequently revenue will
be recognised at the point in time of acceptance of the software
and the source code by the customer. For software licenses that
are combined with a significant modification service revenues
are recognised over time, using the input method of labor hours
spend during the signifi cant modifi cation period, as the Group has
no alternative use for these combined performance obligations
and would have an enforceable right to payment for performance
completed to date. Revenue from software maintenance services
are recognised evenly over the maintenance agreement period, as
this best refl ects the continuous transfer of maintenance services
throughout the contract period.
The Group delivers hosting services to customers that are using the
software installed in the Euronext data center to use the Group’s
trading platforms. Installation services provided before the start of
a hosting service do not include signifi cant client customisation of
the software installed in the Euronext data center. The installation
service itself does not transfer a good or service to the customer,
but are required to successfully transfer the only performance
obligation for which the customer has contracted, which is the
hosting service. Revenue generated from this performance
obligation is recognised evenly over the full service period of the
hosting contract, as this best refl ects the continuous transfer of
hosting services to the customer.
Connection services and data center colocation services are provided
under a revenue sharing agreement with Intercontinental Exchange
(ICE). Euronext is providing ICE the right to provide services directly
to Euronext customers, to which Euronext provides a continuous
customer access to the relevant Euronext group markets and as
such, Euronext is arranging for the specifi ed services to be provided
by another party as an agent. Euronext customers connect to its
markets via the ICE SFTI® network or rent colocation space in the
ICE data centers that house Euronext’s trading platforms. ICE
receives fees from Euronext customers over the period of access
to the SFTI® network and over the colocation rental period. The
Group recognises its revenue share over that same period of time,
using the practical expedient provided in IFRS 15.B16 that allows
an entity to recognise revenue in the amount to which it has the
right to invoice. The entitled amount that Euronext invoices to ICE
corresponds directly with the value that Euronext’s performance
obligation has to ICE, which equals to the agreed commission.
The Group also generates revenue from other connection services
that trading members are using primarily for the purpose of
placing their cash and derivatives trading orders. Members enter
into contracts that generate access availability for placing trading
orders (the active logon session). Customers obtain control over the
service provided during the period of access to their active logon
session. Revenue is recognised evenly over that period of time, as
this best refl ects the continuous transfer of technology services.
(vi) Contract balances
Receivables
A receivable represents the Group’s right to an amount of consideration
that is unconditional (i.e., only the passage of time is required before
payment of the consideration is due from the customer). The Group
refers to billed receivables as trade receivables, whereas unbilled
receivables are referred to as contract receivables by the Group.
Contract Assets
A contract asset is the conditional right to consideration in exchange
for goods or services transferred to the customer. Contract assets
are transferred to receivables when the entitlement to consideration
becomes unconditional and only the passage of time is required
before payment is due.
Contract Liabilities
A contract liability is the obligation to transfer goods or services to
a customer for which the Group has received consideration (or an
amount of consideration is due) from the customer. If a customer
pays consideration before the Group transfers goods or services to
the customer, a contract liability is recognised when the payment is
made or the payment is due (whichever is earlier). Contract liabilities
are recognised as revenue when the Group performs under the
contract.
(vii) Signifi cant fi nancing component
Generally, the Group does not expect to have any contracts where
the period between the transfer of the promised goods or services
to the customer and payment by the customer exceeds one year. The
primary exception considers contracts containing listing services. As
the payment for listing admission services appears upfront the start
of the contract, the period between revenue recognition from listing
admission services and payment by the customer can exceed one
year. However the Group determined that the payment terms were
structured not with the primary purpose of obtaining fi nancing from
the customer, but to minimize the risk of non-payment as there is
not a stated duration of the period of the listing. As a consequence,
the Group does not adjust any of the transaction prices for the time
value of money.
(viii) Cost to obtain or fulfi ll a contract
The Group does not incur material costs to obtain contracts such
as sales commissions. Costs to fulfill a contract are costs that
relate directly to a contract or a specifi cally anticipated contract,
generate or enhance resources of the Group that will be used to
satisfy future performance obligations, and are recoverable. Costs
to fulfi ll a contract are capitalised and amortised on a straight line
basis over the term of the specifi c contract it relates to, consistent
with the pattern of recognition of the associated revenue.
U. Exceptional Items
Exceptional income and expense are identifi ed based on their size,
nature and incidence, and are disclosed separately in the Statement
of Profi t or Loss in order to provide further understanding of the
fi nancial performance of the Group. It includes clearly identifi able
income and expense items which are infrequent and unusual by
their size or by their nature.
2019 UNIVERSAL REGISTRATION DOCUMENT 191

Financial Statements88Consolidated Statement of Changes in Equity
V. Taxation
The income tax expense for the fi scal year is comprised of current
and deferred income tax. Income tax expense is recognised in the
Income Statements, except to the extent that it relates to items
recognised in other comprehensive income or directly in equity.
In this case, the income tax impact is also recognised in other
comprehensive income or directly in equity.
(i) Current income tax
The current income tax expense is calculated on the basis of the
tax laws enacted or substantively enacted at the balance sheet date
in the countries where the Group operates and generates taxable
income. The Group recognises liabilities for uncertain tax treatment
when it is not probable that the tax authorities will accept the tax
treatment. The liabilities are measured through one of the following
methods depending on which method is expected to best predict
the resolution of the tax uncertainty:
n the most likely amount – the single most likely amount in a range
of possible outcomes. The most likely amount may better predict
the resolution of the uncertainty if the possible outcomes are
binary or are concentrated on one value;
n the expected value – the sum of the probability-weighted amounts
in a range of possible outcomes. The expected value may better
predict the resolution of the uncertainty if there is a range of
possible outcomes that are neither binary nor concentrated on
one value.
Estimated liabilities for uncertain tax treatments, along with
estimates of interest and penalties, are presented within income
taxes payable on the Balance Sheet and are included in current
income tax expense in the Statement of Profi t or Loss.
(ii) Deferred income tax
Deferred income tax is recognised on temporary diff erences arising
between the tax basis of assets and liabilities and their carrying
amounts in these Consolidated Financial Statements. However,
deferred income tax liabilities are not recognised if they arise
from the initial recognition of goodwill. Deferred income tax is
not accounted for if it arises from initial recognition of an asset or
liability in a transaction, other than a business combination, that at
the time of the transaction aff ects neither accounting nor taxable
profi t or loss and at the time of the transaction, does not give rise to
equal amounts of taxable and deductible temporary diff erences. If
a transaction that is not a business combination gives rise to equal
amounts of taxable and deductible diff erences, deferred taxation
on the taxable temporary diff erence and the deductible temporary
diff erences will be accounted for, which at initial recognition are
equal and off set to zero (i.e. leases).
Deferred income tax is determined using tax rates that have
been enacted or substantively enacted at the balance sheet date
and are expected to apply when the related deferred income tax
asset is realised or the deferred income tax liability is settled.
Deferred income tax assets are recognised only to the extent that
it is probable that future taxable profi t will be available against
which the temporary differences or tax losses can be utilised.
Deferred income tax is provided on temporary diff erences arising
from investments in subsidiaries and associates, except where the
timing of the reversal of the temporary diff erence is controlled by
the Group and it is probable that the temporary diff erence will not
reverse in the foreseeable future. Deferred income tax assets and
liabilities are off set when there is a legally enforceable right to
off set current tax assets against current tax liabilities and when
they relate to income taxes levied by the same taxation authority
on the same taxable entity.
W. Non-current assets held for sale
The Group classifi es non-current assets and disposal groups as
held for sale if their carrying amounts will be recovered principally
through a sale transaction rather than through continuing use. Non-
current assets and disposal groups classifi ed as held for sale are
measured at the lower of their carrying amount and fair value
less costs to sell. Costs to sell are the incremental costs directly
attributable to the disposal of an asset (disposal group), excluding
fi nance costs and income tax expense.
The criteria for held for sale classifi cation is regarded as met only
when the sale is highly probable and the asset or disposal group
is available for immediate sale in its present condition. Actions
required to complete the sale should indicate that it is unlikely that
signifi cant changes to the sale will be made or that the decision to
sell will be withdrawn. Management must be committed to the plan
to sell the asset and the sale expected to be completed within one
year from the date of the classifi cation.
Property, plant and equipment and intangible assets are not
depreciated or amortised once classifi ed as held for sale. Assets
and liabilities classifi ed as held for sale are presented separately
as current items in the statement of fi nancial position.
X. Critical Accounting Estimates and Assumptions
In the application of the Group’s accounting policies, management
is required to make estimates and assumptions about the carrying
amounts of assets and liabilities that are not readily apparent
from other sources. The estimates and associated assumptions
are based on historical experience and other factors that are
considered to be relevant. Actual results may diff er from these
estimates. The estimates and underlying assumptions are
reviewed on an ongoing basis. Revisions to accounting estimates
are recognised in the period in which the estimate is revised if the
revision aff ects only that period or in the period of the revision
and future periods if the revision aff ects both current and future
periods.
The following critical assumptions concerning the future, and other
critical sources of estimation uncertainty at the end of the reporting
period, have a signifi cant risk of causing a material adjustment to the
carrying amounts of assets and liabilities within the next fi nancial
year:
(i) Impairment of goodwill
The Group performs goodwill impairment reviews in accordance with
the accounting policy described above in Note 18. The recoverable
amount of a CGU Group is determined based on a discounted cash
fl ow approach, which requires the use of estimates. The critical
assumptions used and the related sensitivity analysis are described
in Note 18.
2019 UNIVERSAL REGISTRATION DOCUMENT192 www.euronext.com

Financial Statements
8
Consolidated Statement of Changes in Equity
(ii) Income taxes
Due to the inherent complexities arising from the nature of the
Group’s business, and from conducting business and being taxed
in a substantial number of jurisdictions, critical assumptions and
estimates are required to be made for income taxes. The Group
computes income tax expense for each of the jurisdictions in
which it operates. However, actual amounts of income tax due only
become fi nal upon fi ling and acceptance of the tax return by relevant
authorities, which may not occur for several years subsequent to
issuance of these Consolidated Financial Statements.
The estimation of income taxes also includes evaluating the
recoverability of deferred income tax assets based on an assessment
of the ability to use the underlying future tax deductions against
future taxable income before they expire. This assessment is based
upon existing tax laws and estimates of future taxable income. To
the extent estimates diff er from the fi nal tax return, earnings may
be aff ected in a subsequent period.
The Group operates in various countries with local tax regulations.
New tax legislation being issued in certain territories as well
as transactions that the Group enters into regularly result in
potential tax exposures. The calculation of our tax liabilities
involves uncertainties in the application of complex tax laws. Our
estimate for the potential outcome of any uncertain tax treatment
is highly judgmental. However, the Group believes that it has
adequately provided for uncertain tax treatments. Settlement of
these uncertainties in a manner inconsistent with our expectations
could have a material impact on our results of operations, fi nancial
condition and cash flows. The Group recognises a liability for
uncertain tax treatments when it is not probable that a taxation
authority will accept an uncertain tax treatment.
(iii) Fair value of equity investments
The Group holds investments in unlisted equity securities which are
carried at fair value in the balance sheet. The valuation methodology
and critical assumptions are described in Note 20.
(iv) Classifi cation of investments in associates
The Group classifi es the interest in LCH SA as an investment in
associate suggesting signifi cant infl uence even though it owns less
than 20% of the voting rights (see Note 7). The Group concluded that
it has signifi cant infl uence over this investment, which is derived
from the governance structure that was put in place, the Group’s
position as the largest customer and sole minority shareholder of
LCH SA.
(v) Contingent consideration and buy options resulting from
business combinations
The Group may structure its business combinations in a way
that leads to recognition of contingent consideration to selling
shareholders and/or buy options for equity held by non-controlling
interests. Contingent consideration and buy options are recognized
at fair value on acquisition date. When the contingent consideration
or buy option meets the defi nition of a fi nancial liability or fi nancial
instrument, it is subsequently re-measured to fair value at each
reporting date. The determination of fair value is based on the
expected level of EBITDA3 over the last 12 months that precede the
contractual date (in case of contingent consideration) or exercise
date of the underlying call- and put options (in case of buy option).
The Group monitors the expected EBITDA3 based on updated forecast
information from the acquired companies involved.
(vi) Purchase price allocation
The cost of other intangible assets that are acquired in the course
of business combinations, corresponds to their acquisition date fair
values. Depending on the nature of the intangible asset, fair value is
determined by application of:
n market approach (by reference to comparable transactions);
n income approach (Relief-from-Royalty- or Multi-period Excess
Earnings Method);
n cost approach.
Assets with a fi nite useful life are amortized using the straight-line
method over their expected useful life. Assets with an indefi nite
useful life are tested for impairment at least once a year.
(vii) Revenue from contracts with customers
The Group applied the following judgments that significantly
aff ect the determination of the amount and timing of revenue from
contracts with customers:
Identifying Performance Obligations and Determining the Timing of Revenue Recognition of Listing Admission Fees
The Group provides services related to the initial (and subsequent)
listing of securities on its markets and hereto directly related
corporate action services, and ongoing services related to the
continuous listing.
The Group determined that the admission services around initial
(and subsequent) admission and its directly related corporate action
services do not transfer a good or service to the customer, but are
considered activities that the Group needs to undertake to enable
the customer to be listed. The Group concluded that these activities
should be combined with the ongoing listing services and should be
used as inputs to produce the combined output, which is the service
of being listed. As the service of being listed is satisfi ed over a period
of time, as the customer simultaneously receives and consumes
the benefi ts from the service, the related revenues are therefore
recognised over a period of time.
The Group determined that the period of time that best refl ects the
satisfaction of listing admission services is the period over which the
customer actually benefi ts from the admission. An average lifetime
of companies being listed on Euronext’s markets would serve as
best proxy for the period that a listing customer benefi ts from an
admission. Based on historic evidence, the Group has defi ned the
following average lifetimes for the relevant groupings of listed
securities:
n Equity admissions: 5 years
n Bond- and fund admissions: 3 years
n Equity subsequent admissions (“follow-on’s”): 3 years
Revenue from the listing admission services is therefore recognised
over those periods of time.
Cost to Obtain or Fulfi l a Contract Related to Listing Admission Services
The Group has considered the type of cost that is directly associated
to a listing contract and that can be separately identifi able. Such
cost would typically concern staff cost incurred by the Listings team
involved in admission – and subsequent listing of an issuer. There is
2019 UNIVERSAL REGISTRATION DOCUMENT 193
Financial Statements88Consolidated Statement of Changes in Equity
no correlation between number of listings and staff cost associated
to the Listings team.
The majority of the cost to obtain and fulfi l the contract is incurred
in the period before the actual admission. The remaining cost
associated to an admission and subsequent listing that is recorded
post-admission, and its impact on the Group’s income statement,
would be marginal, therefore the Group has decided not to capitalize
cost incurred to obtain or fulfi l listing contracts.
Principal Versus Agent Considerations
The Group entered into a clearing agreement with LCH SA in respect
of the clearing of trades on our continental Europe derivatives
markets (the “Derivatives Clearing Agreement”). Under the terms
of this Derivatives Clearing Agreement Euronext agreed with LCH
SA to share revenues and receives clearing fee revenues based on
the number of trades on these markets cleared through LCH SA.
In exchange for that, we have agreed to pay LCH SA a fi xed fee plus
a variable fee based on revenues.
The defi nition of the accounting treatment of this agreement requires
signifi cant management judgment for the valuation and weighting of
the indicators leading the principal versus agent accounting analysis.
Based on all facts and circumstances around this arrangement,
management has concluded that Euronext is “principal” in providing
Derivatives clearing services to its trading members. Therefore
Euronext recognizes (i) the clearing fees received are classifi ed as
post trade revenues, and (ii) the fi xed and variable fees paid to LCH
SA as other operational expenses.
(viii) Provision for expected credit losses of trade and contract
receivables
The Group uses a provision matrix to calculate ECLs for trade and
contract receivables. To measure expected credit losses, trade and
contract receivables have been grouped based on shared credit
risk characteristics and the days past due. The historical loss rates
are based on the payment profi les of the sales over a period of 24
months before reporting date and the corresponding historical credit
losses experience within this period. The historical loss rates are
adjusted to refl ect current and forward-looking factors specifi c to
the debtors and economic environment.
The provision matrix is initially based on the Group’s historical
observed default rates. The Group will calibrate the matrix to adjust
the historical credit loss experience with forward-looking information.
At every reporting date, the historical observed default rates are
updated and changes in the forward-looking estimates are analysed.
The assessment of the correlation between historical observed
default rates, forecast economic conditions and ECLs is a
signifi cant estimate. The amount of ECLs is sensitive to changes
in circumstances and of forecast economic conditions. The Group’s
historical credit loss experience and forecast of economic conditions
may also not be representative of customer’s actual default in the
future. The information about the ECLs on the Group’s trade and
contract receivables is disclosed in Note 37.4.
(ix) Determining the lease term of contracts with extension and
termination options
In determining the lease term, management assesses the period
for which the contract is enforceable. It considers all facts and
circumstances that create an economic incentive to exercise an
extension option, or not exercise a termination option. Extension
options (or periods after termination options) are only included in the
lease term if the lease is reasonably certain to be extended (or not
terminated). If the Group concludes that the contract is enforceable
beyond the notice period of a cancellable lease (or the initial period
of a renewable lease), it then need to assess whether the Group is
reasonably certain not to exercise the option to terminate the lease.
However in general, the Group’s lease portfolio contains very limited
leases that include renewal – or termination options.
(x) Estimating the incremental borrowing rate (IBR)
The Group cannot readily determine the interest rate implicit in
the lease, therefore, it uses its incremental borrowing rate (IBR)
to measure lease liabilities. The IBR is the rate of interest that the
Group would have to pay to borrow over a similar term, and with a
similar security, the funds necessary to obtain an asset of a similar
value to the right-of-use asset in a similar economic environment.
The IBR therefore refl ects what the Group “would have to pay”, which
requires estimation when no observable rates are available or when
they need to be adjusted to refl ect the terms and conditions of the
lease. The Group estimates the IBR using the observable inputs (such
as market interest rates) when available and makes certain entity-
specifi c estimates if needed.
Y. Changes in Accounting Policies and Disclosures
The International Accounting Standards Board (IASB) continues
to issue new standards and interpretations, and amendments to
existing standards. The Group applies these new standards when
eff ective and endorsed by the European Union. The Group has not
opted for early adoption for any of these standards.
(i) New and amended standards and interpretations
The Group has applied the following standards and amendments
for the fi rst time for their annual reporting period commencing
1 January 2019. The Group had to change its accounting policies as
a result of adopting IFRS 16. The nature and eff ect of the changes as
a result of adoption of this new accounting standard are described
below.
IFRS 16 “Leases”
IFRS 16 supersedes IAS 17 “Leases”, IFRIC 4 “Determining whether
an Arrangement contains a Lease” and other interpretations. The
standard sets out the principles for the recognition, measurement,
presentation and disclosure of leases and requires lessees to
account for all leases under a single on-balance sheet model. Lessor
accounting has been taken over almost identically from IAS 17 into
IFRS 16.
The Group adopted IFRS 16 using the modified retrospective
method of adoption with the date of initial application of 1 January
2019. Under this method, the standard is applied retrospectively
with the cumulative effect of initially applying the standard
recognised at the date of initial application. The Group also elected
to use the recognition exemptions for lease contracts that, at the
commencement date, have a lease term of 12 months or less and
do not contain a purchase option (“short-term leases”) and lease
contracts for which the underlying asset is of low value (“low-value
assets”).
2019 UNIVERSAL REGISTRATION DOCUMENT194 www.euronext.com
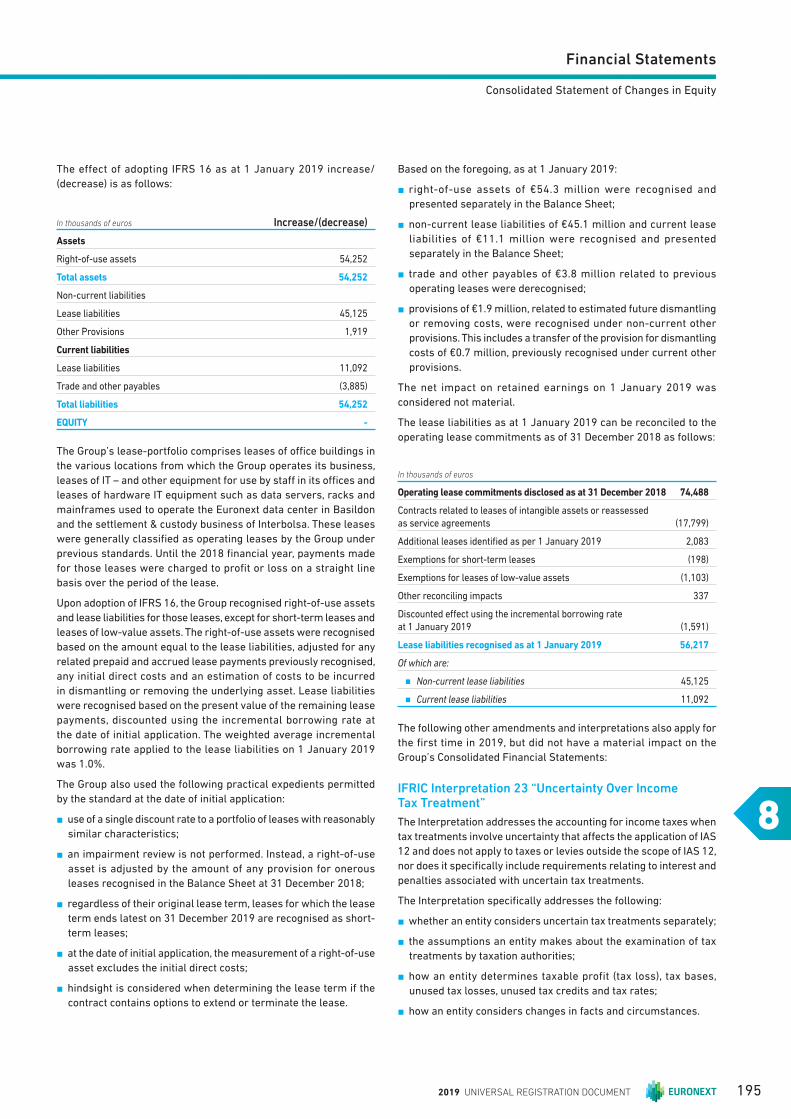
Financial Statements
8
Consolidated Statement of Changes in Equity
The effect of adopting IFRS 16 as at 1 January 2019 increase/
( decrease ) is as follows:
In thousands of euros Increase/(decrease)
Assets
Right-of-use assets 54,252
Total assets 54,252
Non-current liabilities
Lease liabilities 45,125
Other Provisions 1,919
Current liabilities
Lease liabilities 11,092
Trade and other payables (3,885)
Total liabilities 54,252
EQUITY -
The Group’s lease-portfolio comprises leases of offi ce buildings in
the various locations from which the Group operates its business,
leases of IT – and other equipment for use by staff in its offi ces and
leases of hardware IT equipment such as data servers, racks and
mainframes used to operate the Euronext data center in Basildon
and the settlement & custody business of Interbolsa. These leases
were generally classifi ed as operating leases by the Group under
previous standards. Until the 2018 fi nancial year, payments made
for those leases were charged to profi t or loss on a straight line
basis over the period of the lease.
Upon adoption of IFRS 16, the Group recognised right-of-use assets
and lease liabilities for those leases, except for short-term leases and
leases of low-value assets. The right-of-use assets were recognised
based on the amount equal to the lease liabilities, adjusted for any
related prepaid and accrued lease payments previously recognised,
any initial direct costs and an estimation of costs to be incurred
in dismantling or removing the underlying asset. Lease liabilities
were recognised based on the present value of the remaining lease
payments, discounted using the incremental borrowing rate at
the date of initial application. The weighted average incremental
borrowing rate applied to the lease liabilities on 1 January 2019
was 1.0%.
The Group also used the following practical expedients permitted
by the standard at the date of initial application:
n use of a single discount rate to a portfolio of leases with reasonably
similar characteristics;
n an impairment review is not performed. Instead, a right-of-use
asset is adjusted by the amount of any provision for onerous
leases recognised in the Balance Sheet at 31 December 2018;
n regardless of their original lease term, leases for which the lease
term ends latest on 31 December 2019 are recognised as short-
term leases;
n at the date of initial application, the measurement of a right-of-use
asset excludes the initial direct costs;
n hindsight is considered when determining the lease term if the
contract contains options to extend or terminate the lease.
Based on the foregoing, as at 1 January 2019:
n right-of-use assets of €54.3 million were recognised and
presented separately in the Balance Sheet;
n non-current lease liabilities of €45.1 million and current lease
liabilities of €11.1 million were recognised and presented
separately in the Balance Sheet;
n trade and other payables of €3.8 million related to previous
operating leases were derecognised;
n provisions of €1.9 million, related to estimated future dismantling
or removing costs, were recognised under non-current other
provisions. This includes a transfer of the provision for dismantling
costs of €0.7 million, previously recognised under current other
provisions.
The net impact on retained earnings on 1 January 2019 was
considered not material.
The lease liabilities as at 1 January 2019 can be reconciled to the
operating lease commitments as of 31 December 2018 as follows:
In thousands of euros
Operating lease commitments disclosed as at 31 December 2018 74,488
Contracts related to leases of intangible assets or reassessed
as service agreements (17,799)
Additional leases identifi ed as per 1 January 2019 2,083
Exemptions for short-term leases (198)
Exemptions for leases of low-value assets (1,103)
Other reconciling impacts 337
Discounted eff ect using the incremental borrowing rate
at 1 January 2019 (1,591)
Lease liabilities recognised as at 1 January 2019 56,217
Of which are:
n Non-current lease liabilities 45,125
n Current lease liabilities 11,092
The following other amendments and interpretations also apply for
the fi rst time in 2019, but did not have a material impact on the
Group’s Consolidated Financial Statements:
IFRIC Interpretation 23 “Uncertainty Over Income Tax Treatment”
The Interpretation addresses the accounting for income taxes when
tax treatments involve uncertainty that aff ects the application of IAS
12 and does not apply to taxes or levies outside the scope of IAS 12,
nor does it specifi cally include requirements relating to interest and
penalties associated with uncertain tax treatments.
The Interpretation specifi cally addresses the following:
n whether an entity considers uncertain tax treatments separately;
n the assumptions an entity makes about the examination of tax
treatments by taxation authorities;
n how an entity determines taxable profit (tax loss), tax bases,
unused tax losses, unused tax credits and tax rates;
n how an entity considers changes in facts and circumstances.
2019 UNIVERSAL REGISTRATION DOCUMENT 195
Financial Statements88Consolidated Statement of Changes in Equity
The Group determines whether to consider each uncertain tax
treatment separately or together with one or more other uncertain
tax treatments and uses the approach that better predicts the
resolution of the uncertainty. The Group applies signifi cant judgement
in identifying uncertainties over income tax treatments. The Group
determined, based on its tax compliance, that it is probable that its
tax treatments (including those for the subsidiaries) will be accepted
by the taxation authorities. The Interpretation did not have an impact
on the Consolidated Financial Statements of the Group.
Amendments to IFRS 9: “Prepayment Features With Negative Compensation”
Under IFRS 9, a debt instrument can be measured at amortised cost
or at fair value through other comprehensive income, provided that
the contractual cash fl ows are “solely payments of principal and
interest on the principal amount outstanding” (the SPPI criterion) and
the instrument is held within the appropriate business model for that
classifi cation. The amendments to IFRS 9 clarify that a fi nancial asset
passes the SPPI criterion regardless of an event or circumstance
that causes the early termination of the contract and irrespective of
which party pays or receives reasonable compensation for the early
termination of the contract. These amendments had no impact on
the Consolidated Financial Statements of the Group.
Amendments to IAS 19 – “Plan Amendment, Curtailment or Settlement”
The amendments to IAS 19 address the accounting when a plan
amendment, curtailment or settlement occurs during a reporting
period. The amendments specify that when a plan amendment,
curtailment or settlement occurs during the annual reporting period,
an entity is required to determine the current service cost for the
remainder of the period after the plan amendment, curtailment or
settlement, using the actuarial assumptions used to remeasure the
net defi ned benefi t liability (asset) refl ecting the benefi ts off ered
under the plan and the plan assets after that event. An entity is
also required to determine the net interest for the remainder of the
period after the plan amendment, curtailment or settlement using
the net defi ned benefi t liability (asset) refl ecting the benefi ts off ered
under the plan and the plan assets after that event, and the discount
rate used to remeasure that net defi ned benefi t liability (asset). The
amendments had no material impact on the Consolidated Financial
Statements of the Group.
Amendments to IAS 28: Long-term Interests in Associates and Joint Ventures
The amendments clarify that an entity applies IFRS 9 to long-
term interests in an associate or joint venture to which the equity
method is not applied but that, in substance, form part of the net
investment in the associate or joint venture (long-term interests).
This clarifi cation is relevant because it implies that the expected
credit loss model in IFRS 9 applies to such long-term interests. The
amendments also clarifi ed that, in applying IFRS 9, an entity does not
take account of any losses of the associate or joint venture, or any
impairment losses on the net investment, recognised as adjustments
to the net investment in the associate or joint venture that arise
from applying IAS 28 Investments in Associates and Joint Ventures.
These amendments had no impact on the Consolidated Financial
Statements as the Group does not have long-term interests in its
associate and joint venture.
Annual Improvements 2015–2017 Cycle
These improvements include:
IFRS 3 Business Combinations
The amendments clarify that, when an entity obtains control of a
business that is a joint operation, it applies the requirements for a
business combination achieved in stages, including remeasuring
previously held interests in the assets and liabilities of the joint
operation at fair value. In doing so, the acquirer remeasures its entire
previously held interest in the joint operation. An entity applies those
amendments to business combinations for which the acquisition
date is on or after the beginning of the first annual reporting
period beginning on or after 1 January 2019, with early application
permitted. These amendments had no impact on the Consolidated
Financial Statements of the Group as there is no transaction where
joint control is obtained.
IFRS 11 Joint Arrangements
An entity that participates in, but does not have joint control of, a joint
operation might obtain joint control of the joint operation in which
the activity of the joint operation constitutes a business as defi ned
in IFRS 3. The amendments clarify that the previously held interests
in that joint operation are not remeasured. An entity applies those
amendments to transactions in which it obtains joint control on or
after the beginning of the fi rst annual reporting period beginning
on or after 1 January 2019, with early application permitted.
These amendments had no impact on the Consolidated Financial
Statements of the Group as there is no transaction where a joint
control is obtained.
IAS 12 Income Taxes
The amendments clarify that the income tax consequences of
dividends are linked more directly to past transactions or events
that generated distributable profi ts than to distributions to owners.
Therefore, an entity recognises the income tax consequences of
dividends in profi t or loss, other comprehensive income or equity
according to where it originally recognised those past transactions
or events. An entity applies the amendments for annual reporting
periods beginning on or after 1 January 2019, with early application
permitted. When the entity fi rst applies those amendments, it applies
them to the income tax consequences of dividends recognised on
or after the beginning of the earliest comparative period. Since the
Group’s current practice is in line with these amendments, they had
no impact on the Consolidated Financial Statements of the Group.
IAS 23 Borrowing Costs
The amendments clarify that an entity treats as part of general
borrowings any borrowing originally made to develop a qualifying
asset when substantially all of the activities necessary to prepare
that asset for its intended use or sale are complete. The entity
applies the amendments to borrowing costs incurred on or after
the beginning of the annual reporting period in which the entity fi rst
applies those amendments. An entity applies those amendments for
annual reporting periods beginning on or after 1 January 2019, with
early application permitted. Since the Group’s current practice is in
line with these amendments, they had no impact on the Consolidated
Financial Statements of the Group.
2019 UNIVERSAL REGISTRATION DOCUMENT196 www.euronext.com

Financial Statements
8
Consolidated Statement of Changes in Equity
(ii) Provision for expected credit losses of trade and contract
receivables Future Implications of New and Amended Standards
and Interpretations Not Yet Adopted
The new and amended standards and interpretations that are
issued, but not yet eff ective, up to the date of issuance of the Group’s
Financial Statements are disclosed below. The Group intends to
adopt these new and amended standards and interpretations, if
applicable, when they become eff ective.
IFRS 17 “Insurance Contracts”
In May 2017, the IASB issued IFRS 17 Insurance Contracts (IFRS 17),
a comprehensive new accounting standard for insurance contracts
covering recognition and measurement, presentation and disclosure.
IFRS 17 is effective for reporting periods beginning on or after
1 January 2021, with comparative fi gures required. This standard
does not aff ect the Group.
Amendments to IFRS 3: Defi nition of a Business
In October 2018, the IASB issued amendments to the defi nition of a
business in IFRS 3 Business Combinations to help entities determine
whether an acquired set of activities and assets is a business or not.
They clarify the minimum requirements for a business, remove the
assessment of whether market participants are capable of replacing
any missing elements, add guidance to help entities assess
whether an acquired process is substantive, narrow the defi nitions
of a business and of outputs, and introduce an optional fair value
concentration test. New illustrative examples were provided along
with the amendments. Since the amendments apply prospectively
to transactions or other events that occur on or after the date of fi rst
application, the Group will not be aff ected by these amendments on
the date of transition.
Amendments to IAS 1 and IAS 8: Defi nition of Material
In October 2018, the IASB issued amendments to IAS 1 Presentation
of Financial Statements and IAS 8 Accounting Policies, Changes in
Accounting Estimates and Errors to align the defi nition of “material”
across the standards and to clarify certain aspects of the defi nition.
The new defi nition states that, “Information is material if omitting,
misstating or obscuring it could reasonably be expected to infl uence
decisions that the primary users of general purpose Financial
Statements make on the basis of those Financial Statements, which
provide fi nancial information about a specifi c reporting entity”. The
amendments to the defi nition of material is not expected to have a
signifi cant impact on the Group’s Consolidated Financial Statements.
There are no other IFRS’s or IFRIC interpretations not yet eff ective,
that would be expected to have a material impact on the Group in
the current or future reporting periods and on foreseeable future
transactions.
NOTE 4 GROUP INFORMATION
The following tables provide an overview of the Group’s subsidiaries, associates, joint-ventures and non-current investments:
Subsidiaries Domicile As at 31 December 2019 As at 31 December 2018
Enternext S.A. France 100.00% 100.00%
Euronext Amsterdam N.V. The Netherlands 100.00% 100.00%
Euronext Brussels S.A./N.V. Belgium 100.00% 100.00%
Euronext IP & IT Holding B.V. The Netherlands 100.00% 100.00%
Euronext Hong Kong Limited Hong Kong 100.00% 100.00%
Euronext Lisbon S.A.(a) Portugal 100.00% 100.00%
Euronext London Ltd. United Kingdom 100.00% 100.00%
Euronext Paris S.A. France 100.00% 100.00%
Euronext Technologies S.A.S. France 100.00% 100.00%
Euronext Technologies Unipessoal Lda. Portugal 100.00% 100.00%
Interbolsa S.A.(b) Portugal 100.00% 100.00%
The Irish Stock Exchange Plc.(c) Ireland 100.00% 100.00%
ISE Old Co. Ltd. Ireland 100.00% 100.00%
Irish Stock Exchange Services Ltd. Ireland 100.00% 100.00%
European Wholesale Markets Ltd. Malta 80.00% 80.00%
Euronext Corporate Services B.V. The Netherlands 100.00% 100.00%
Company Webcast B.V. The Netherlands 51.00% 51.00%
iBabs B.V. The Netherlands 60.00% 60.00%
MSI Services B.V. The Netherlands 60.00% 60.00%
IR Soft Ltd. United Kingdom 100.00% 100.00%
2019 UNIVERSAL REGISTRATION DOCUMENT 197
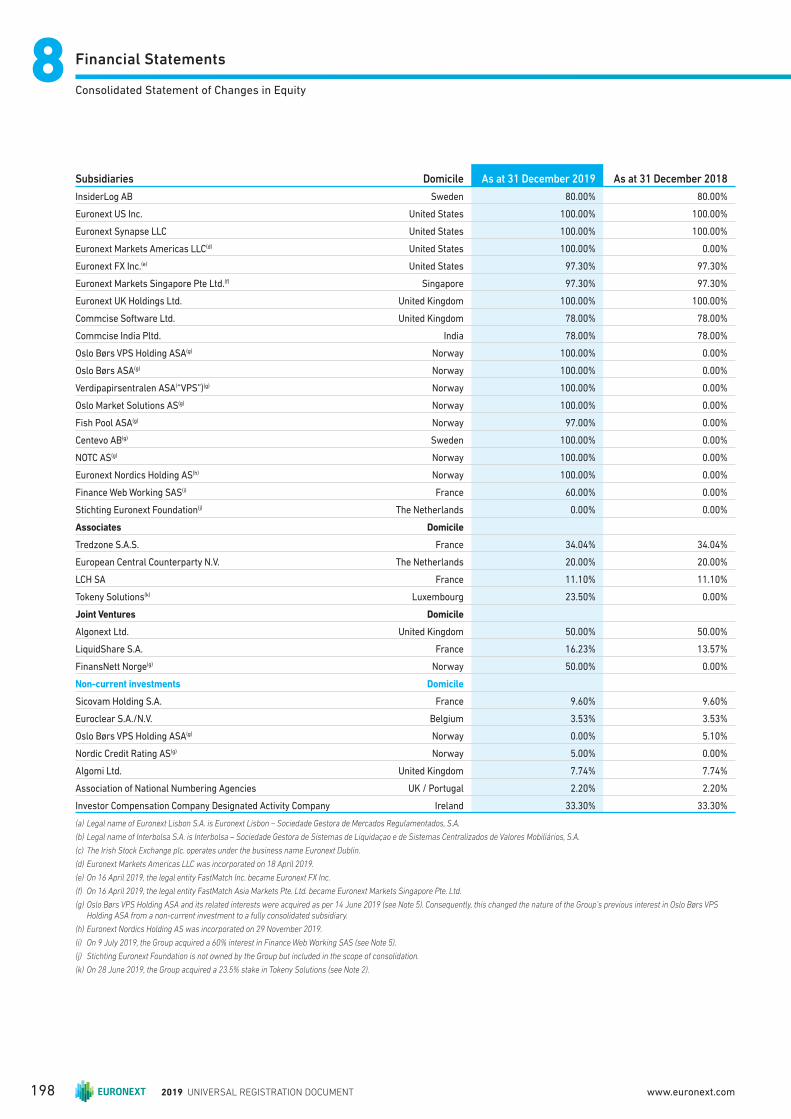
Financial Statements88Consolidated Statement of Changes in Equity
Subsidiaries Domicile As at 31 December 2019 As at 31 December 2018
InsiderLog AB Sweden 80.00% 80.00%
Euronext US Inc. United States 100.00% 100.00%
Euronext Synapse LLC United States 100.00% 100.00%
Euronext Markets Americas LLC(d) United States 100.00% 0.00%
Euronext FX Inc.(e) United States 97.30% 97.30%
Euronext Markets Singapore Pte Ltd.(f) Singapore 97.30% 97.30%
Euronext UK Holdings Ltd. United Kingdom 100.00% 100.00%
Commcise Software Ltd. United Kingdom 78.00% 78.00%
Commcise India Pltd. India 78.00% 78.00%
Oslo Børs VPS Holding ASA(g) Norway 100.00% 0.00%
Oslo Børs ASA(g) Norway 100.00% 0.00%
Verdipapirsentralen ASA(“VPS”)(g) Norway 100.00% 0.00%
Oslo Market Solutions AS(g) Norway 100.00% 0.00%
Fish Pool ASA(g) Norway 97.00% 0.00%
Centevo AB(g) Sweden 100.00% 0.00%
NOTC AS(g) Norway 100.00% 0.00%
Euronext Nordics Holding AS(h) Norway 100.00% 0.00%
Finance Web Working SAS(i) France 60.00% 0.00%
Stichting Euronext Foundation(j) The Netherlands 0.00% 0.00%
Associates Domicile
Tredzone S.A.S. France 34.04% 34.04%
European Central Counterparty N.V. The Netherlands 20.00% 20.00%
LCH SA France 11.10% 11.10%
Tokeny Solutions(k) Luxembourg 23.50% 0.00%
Joint Ventures Domicile
Algonext Ltd. United Kingdom 50.00% 50.00%
LiquidShare S.A. France 16.23% 13.57%
FinansNett Norge(g) Norway 50.00% 0.00%
Non-current investments Domicile
Sicovam Holding S.A. France 9.60% 9.60%
Euroclear S.A./N.V. Belgium 3.53% 3.53%
Oslo Børs VPS Holding ASA(g) Norway 0.00% 5.10%
Nordic Credit Rating AS(g) Norway 5.00% 0.00%
Algomi Ltd. United Kingdom 7.74% 7.74%
Association of National Numbering Agencies UK / Portugal 2.20% 2.20%
Investor Compensation Company Designated Activity Company Ireland 33.30% 33.30%
(a) Legal name of Euronext Lisbon S.A. is Euronext Lisbon – Sociedade Gestora de Mercados Regulamentados, S.A.
(b) Legal name of Interbolsa S.A. is Interbolsa – Sociedade Gestora de Sistemas de Liquidaçao e de Sistemas Centralizados de Valores Mobiliários, S.A.
(c) The Irish Stock Exchange plc. operates under the business name Euronext Dublin.
(d) Euronext Markets Americas LLC was incorporated on 18 April 2019.
(e) On 16 April 2019, the legal entity FastMatch Inc. became Euronext FX Inc.
(f) On 16 April 2019, the legal entity FastMatch Asia Markets Pte. Ltd. became Euronext Markets Singapore Pte. Ltd.
(g) Oslo Børs VPS Holding ASA and its related interests were acquired as per 14 June 2019 (see Note 5). Consequently, this changed the nature of the Group’s previous interest in Oslo Børs VPS Holding ASA from a non-current investment to a fully consolidated subsidiary.
(h) Euronext Nordics Holding AS was incorporated on 29 November 2019.
(i) On 9 July 2019, the Group acquired a 60% interest in Finance Web Working SAS (see Note 5).
(j) Stichting Euronext Foundation is not owned by the Group but included in the scope of consolidation.
(k) On 28 June 2019, the Group acquired a 23.5% stake in Tokeny Solutions (see Note 2).
2019 UNIVERSAL REGISTRATION DOCUMENT198 www.euronext.com
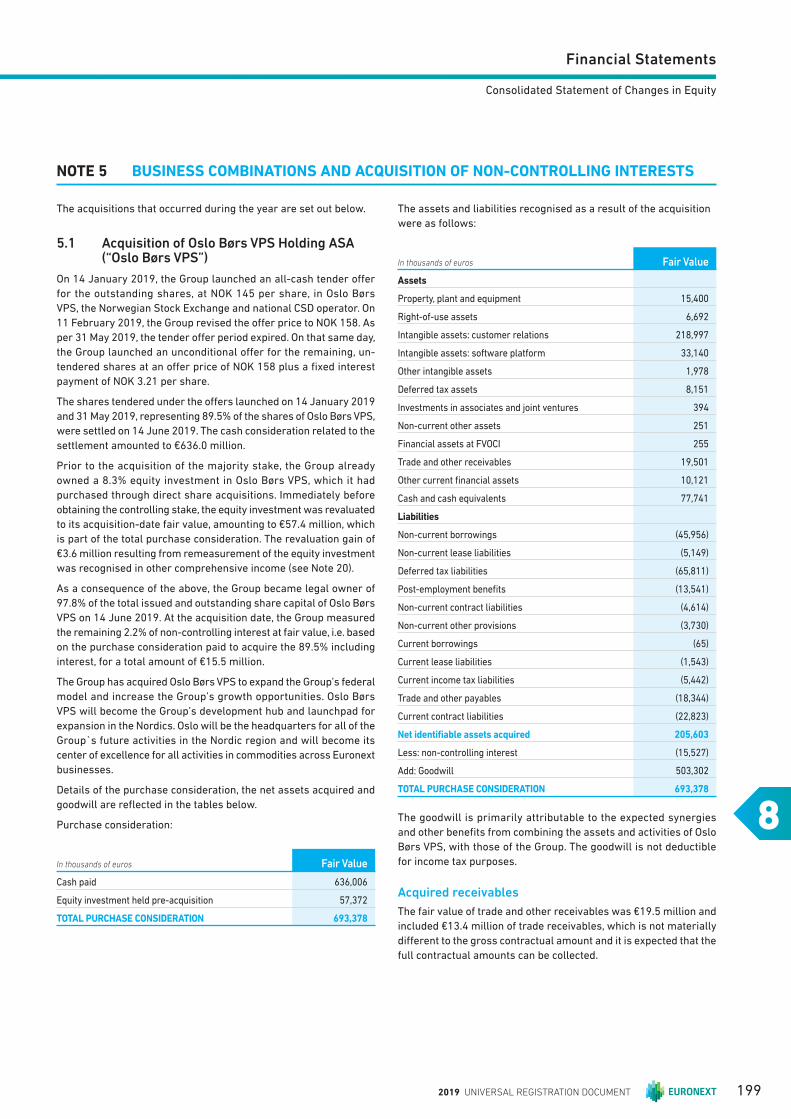
Financial Statements
8
Consolidated Statement of Changes in Equity
NOTE 5 BUSINESS COMBINATIONS AND ACQUISITION OF NON-CONTROLLING INTERESTS
The acquisitions that occurred during the year are set out below.
5.1 Acquisition of Oslo Børs VPS Holding ASA (“Oslo Børs VPS”)
On 14 January 2019, the Group launched an all-cash tender off er
for the outstanding shares, at NOK 145 per share, in Oslo Børs
VPS, the Norwegian Stock Exchange and national CSD operator. On
11 February 2019, the Group revised the off er price to NOK 158. As
per 31 May 2019, the tender off er period expired. On that same day,
the Group launched an unconditional off er for the remaining, un-
tendered shares at an off er price of NOK 158 plus a fi xed interest
payment of NOK 3.21 per share.
The shares tendered under the off ers launched on 14 January 2019
and 31 May 2019, representing 89.5% of the shares of Oslo Børs VPS,
were settled on 14 June 2019. The cash consideration related to the
settlement amounted to €636.0 million.
Prior to the acquisition of the majority stake, the Group already
owned a 8.3% equity investment in Oslo Børs VPS, which it had
purchased through direct share acquisitions. Immediately before
obtaining the controlling stake, the equity investment was revaluated
to its acquisition-date fair value, amounting to €57.4 million, which
is part of the total purchase consideration. The revaluation gain of
€3.6 million resulting from remeasurement of the equity investment
was recognised in other comprehensive income (see Note 20).
As a consequence of the above, the Group became legal owner of
97.8% of the total issued and outstanding share capital of Oslo Børs
VPS on 14 June 2019. At the acquisition date, the Group measured
the remaining 2.2% of non-controlling interest at fair value, i.e. based
on the purchase consideration paid to acquire the 89.5% including
interest, for a total amount of €15.5 million.
The Group has acquired Oslo Børs VPS to expand the Group’s federal
model and increase the Group’s growth opportunities. Oslo Børs
VPS will become the Group’s development hub and launchpad for
expansion in the Nordics. Oslo will be the headquarters for all of the
Group`s future activities in the Nordic region and will become its
center of excellence for all activities in commodities across Euronext
businesses.
Details of the purchase consideration, the net assets acquired and
goodwill are refl ected in the tables below.
Purchase consideration:
In thousands of euros Fair Value
Cash paid 636,006
Equity investment held pre-acquisition 57,372
TOTAL PURCHASE CONSIDERATION 693,378
The assets and liabilities recognised as a result of the acquisition
were as follows:
In thousands of euros Fair Value
Assets
Property, plant and equipment 15,400
Right-of-use assets 6,692
Intangible assets: customer relations 218,997
Intangible assets: software platform 33,140
Other intangible assets 1,978
Deferred tax assets 8,151
Investments in associates and joint ventures 394
Non-current other assets 251
Financial assets at FVOCI 255
Trade and other receivables 19,501
Other current fi nancial assets 10,121
Cash and cash equivalents 77,741
Liabilities
Non-current borrowings (45,956)
Non-current lease liabilities (5,149)
Deferred tax liabilities (65,811)
Post-employment benefi ts (13,541)
Non-current contract liabilities (4,614)
Non-current other provisions (3,730)
Current borrowings (65)
Current lease liabilities (1,543)
Current income tax liabilities (5,442)
Trade and other payables (18,344)
Current contract liabilities (22,823)
Net identifiable assets acquired 205,603
Less: non-controlling interest (15,527)
Add: Goodwill 503,302
TOTAL PURCHASE CONSIDERATION 693,378
The goodwill is primarily attributable to the expected synergies
and other benefi ts from combining the assets and activities of Oslo
Børs VPS, with those of the Group. The goodwill is not deductible
for income tax purposes.
Acquired receivables
The fair value of trade and other receivables was €19.5 million and
included €13.4 million of trade receivables, which is not materially
diff erent to the gross contractual amount and it is expected that the
full contractual amounts can be collected.
2019 UNIVERSAL REGISTRATION DOCUMENT 199
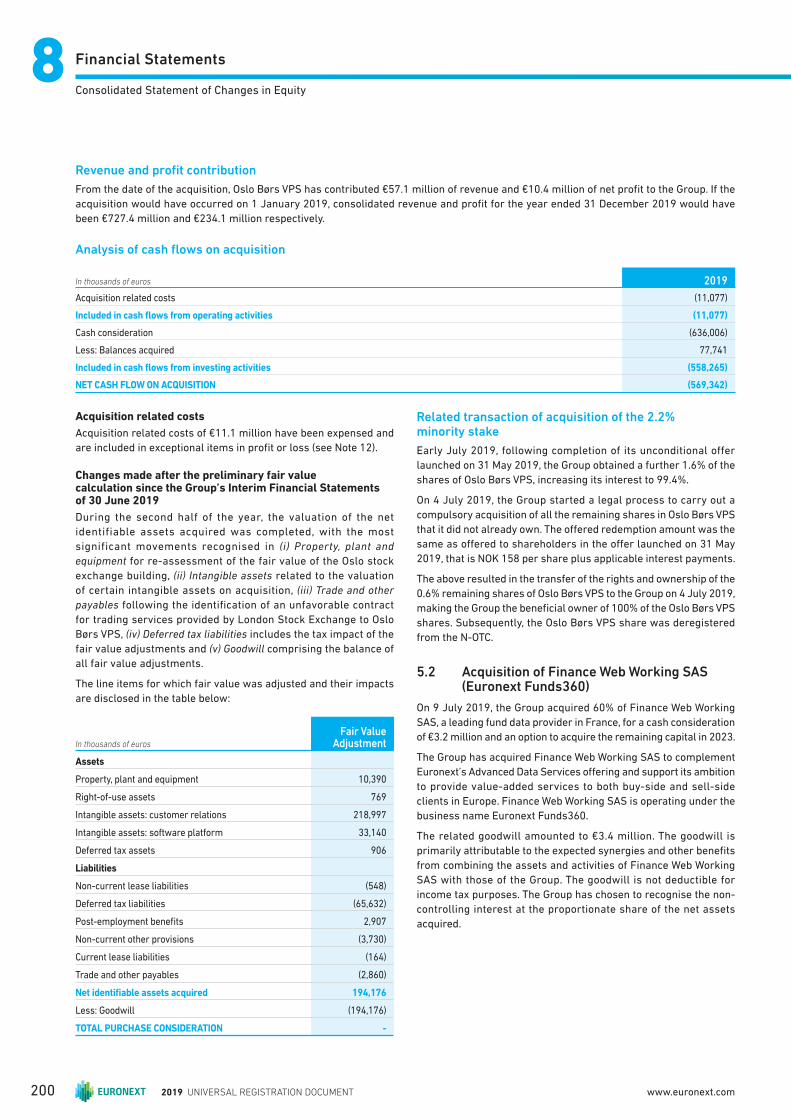
Financial Statements88Consolidated Statement of Changes in Equity
Revenue and profi t contribution
From the date of the acquisition, Oslo Børs VPS has contributed €57.1 million of revenue and €10.4 million of net profi t to the Group. If the
acquisition would have occurred on 1 January 2019, consolidated revenue and profi t for the year ended 31 December 2019 would have
been €727.4 million and €234.1 million respectively.
Analysis of cash fl ows on acquisition
In thousands of euros 2019
Acquisition related costs (11,077)
Included in cash flows from operating activities (11,077)
Cash consideration (636,006)
Less: Balances acquired 77,741
Included in cash flows from investing activities (558,265)
NET CASH FLOW ON ACQUISITION (569,342)
Acquisition related costs
Acquisition related costs of €11.1 million have been expensed and
are included in exceptional items in profi t or loss (see Note 12).
Changes made after the preliminary fair value calculation since the Group’s Interim Financial Statements of 30 June 2019
During the second half of the year, the valuation of the net
identifiable assets acquired was completed, with the most
significant movements recognised in (i) Property, plant and
equipment for re-assessment of the fair value of the Oslo stock
exchange building, (ii) Intangible assets related to the valuation
of certain intangible assets on acquisition, (iii) Trade and other
payables following the identifi cation of an unfavorable contract
for trading services provided by London Stock Exchange to Oslo
Børs VPS, (iv) Deferred tax liabilities includes the tax impact of the
fair value adjustments and (v) Goodwill comprising the balance of
all fair value adjustments.
The line items for which fair value was adjusted and their impacts
are disclosed in the table below:
In thousands of euros
Fair Value Adjustment
Assets
Property, plant and equipment 10,390
Right-of-use assets 769
Intangible assets: customer relations 218,997
Intangible assets: software platform 33,140
Deferred tax assets 906
Liabilities
Non-current lease liabilities (548)
Deferred tax liabilities (65,632)
Post-employment benefi ts 2,907
Non-current other provisions (3,730)
Current lease liabilities (164)
Trade and other payables (2,860)
Net identifiable assets acquired 194,176
Less: Goodwill (194,176)
TOTAL PURCHASE CONSIDERATION -
Related transaction of acquisition of the 2.2% minority stake
Early July 2019, following completion of its unconditional offer
launched on 31 May 2019, the Group obtained a further 1.6% of the
shares of Oslo Børs VPS, increasing its interest to 99.4%.
On 4 July 2019, the Group started a legal process to carry out a
compulsory acquisition of all the remaining shares in Oslo Børs VPS
that it did not already own. The off ered redemption amount was the
same as off ered to shareholders in the off er launched on 31 May
2019, that is NOK 158 per share plus applicable interest payments.
The above resulted in the transfer of the rights and ownership of the
0.6% remaining shares of Oslo Børs VPS to the Group on 4 July 2019,
making the Group the benefi cial owner of 100% of the Oslo Børs VPS
shares. Subsequently, the Oslo Børs VPS share was deregistered
from the N-OTC.
5.2 Acquisition of Finance Web Working SAS (Euronext Funds360)
On 9 July 2019, the Group acquired 60% of Finance Web Working
SAS, a leading fund data provider in France, for a cash consideration
of €3.2 million and an option to acquire the remaining capital in 2023.
The Group has acquired Finance Web Working SAS to complement
Euronext’s Advanced Data Services off ering and support its ambition
to provide value-added services to both buy-side and sell-side
clients in Europe. Finance Web Working SAS is operating under the
business name Euronext Funds360.
The related goodwill amounted to €3.4 million. The goodwill is
primarily attributable to the expected synergies and other benefi ts
from combining the assets and activities of Finance Web Working
SAS with those of the Group. The goodwill is not deductible for
income tax purposes. The Group has chosen to recognise the non-
controlling interest at the proportionate share of the net assets
acquired.
2019 UNIVERSAL REGISTRATION DOCUMENT200 www.euronext.com

Financial Statements
8
Consolidated Statement of Changes in Equity
5.3 Information on acquisitions in prior periods
On 20 December 2018, the Group acquired 78% of the shares and voting rights of Commcise Software Ltd. (“Commcise”).
Following the fi nalisation of the fair value calculation during 2019, the adjusted net identifi able assets acquired, non-controlling interest
and goodwill are refl ected in the table below:
In thousands of euros
Preliminary calculation Fair Value Adjustments Final Fair Value
Assets
Property, plant and equipment 64 (30) 34
Intangible assets: customer relations - 4,033 4,033
Intangible assets: software platform - 5,779 5,779
Non-current fi nancial assets 37 - 37
Current income tax receivables - 14 14
Trade and other receivables 1,290 - 1,290
Cash and cash equivalents 2,570 - 2,570
Liabilities
Deferred tax liabilities (3) (1,867) (1,870)
Trade and other payables (2,009) (356) (2,365)
Net identifiable assets acquired 1,949 7,574 9,523
Less: non-controlling interest (429) (1,666) (2,095)
Add: Goodwill 28,606 (5,908) 22,699
TOTAL PURCHASE CONSIDERATION 30,126 - 30,126
Other details of the business combination remained unchanged and are disclosed in Note 5 of the Group’s Consolidated Financial Statements
for the year ended 31 December 2018, including the preliminary fair value calculation of the transaction.
NOTE 6 NON-CONTROLLING INTERESTS (NCI)
Financial information of subsidiaries that have material non-controlling interest is provided below.
Proportion of equity interest held by non-controlling interests:
Name of entityPlace of business/
country of Incorporation
% of ownership interest held by NCI
2019 (in %) 2018 (in %)
Company Webcast B.V. The Netherlands 49.00 49.00
iBabs B.V. The Netherlands 40.00 40.00
FastMatch Inc. United States 2.70 2.70
Commcise Software Ltd. United Kingdom 22.00 22.00
2019 UNIVERSAL REGISTRATION DOCUMENT 201
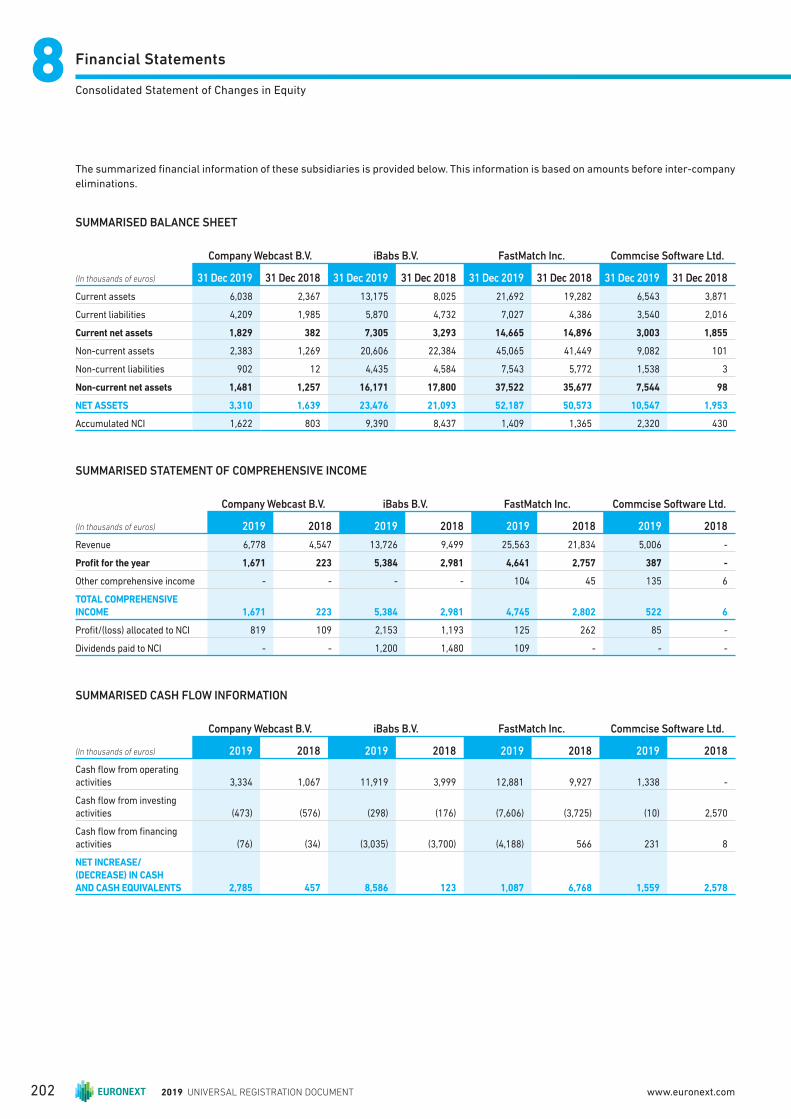
Financial Statements88Consolidated Statement of Changes in Equity
The summarized fi nancial information of these subsidiaries is provided below. This information is based on amounts before inter-company
eliminations.
SUMMARISED BALANCE SHEET
(In thousands of euros)
Company Webcast B.V. iBabs B.V. FastMatch Inc. Commcise Software Ltd.
31 Dec 2019 31 Dec 2018 31 Dec 2019 31 Dec 2018 31 Dec 2019 31 Dec 2018 31 Dec 2019 31 Dec 2018
Current assets 6,038 2,367 13,175 8,025 21,692 19,282 6,543 3,871
Current liabilities 4,209 1,985 5,870 4,732 7,027 4,386 3,540 2,016
Current net assets 1,829 382 7,305 3,293 14,665 14,896 3,003 1,855
Non-current assets 2,383 1,269 20,606 22,384 45,065 41,449 9,082 101
Non-current liabilities 902 12 4,435 4,584 7,543 5,772 1,538 3
Non-current net assets 1,481 1,257 16,171 17,800 37,522 35,677 7,544 98
NET ASSETS 3,310 1,639 23,476 21,093 52,187 50,573 10,547 1,953
Accumulated NCI 1,622 803 9,390 8,437 1,409 1,365 2,320 430
SUMMARISED STATEMENT OF COMPREHENSIVE INCOME
Company Webcast B.V. iBabs B.V. FastMatch Inc. Commcise Software Ltd.
(In thousands of euros) 2019 2018 2019 2018 2019 2018 2019 2018
Revenue 6,778 4,547 13,726 9,499 25,563 21,834 5,006 -
Profi t for the year 1,671 223 5,384 2,981 4,641 2,757 387 -
Other comprehensive income - - - - 104 45 135 6
TOTAL COMPREHENSIVE
INCOME 1,671 223 5,384 2,981 4,745 2,802 522 6
Profi t/(loss) allocated to NCI 819 109 2,153 1,193 125 262 85 -
Dividends paid to NCI - - 1,200 1,480 109 - - -
SUMMARISED CASH FLOW INFORMATION
Company Webcast B.V. iBabs B.V. FastMatch Inc. Commcise Software Ltd.
(In thousands of euros) 2019 2018 2019 2018 2019 2018 2019 2018
Cash fl ow from operating activities 3,334 1,067 11,919 3,999 12,881 9,927 1,338 -
Cash fl ow from investing activities (473) (576) (298) (176) (7,606) (3,725) (10) 2,570
Cash fl ow from fi nancing
activities (76) (34) (3,035) (3,700) (4,188) 566 231 8
NET INCREASE/
(DECREASE) IN CASH
AND CASH EQUIVALENTS 2,785 457 8,586 123 1,087 6,768 1,559 2,578
2019 UNIVERSAL REGISTRATION DOCUMENT202 www.euronext.com

Financial Statements
8
Consolidated Statement of Changes in Equity
NOTE 7 INVESTMENTS IN ASSOCIATES AND JOINT VENTURES
7.1 Interests in Associates and Joint Ventures
Set out below are the associates and joint ventures of the Group as at 31 December 2019. The country of incorporation or registration is also
their principal place of business, and the proportion of ownership interest is the same as the proportion of voting rights held.
Name of entityPlace of business/
country of Incorporation
% of ownership interestNature of
relationship
Carrying amount(In thousands of euros)
2019 2018 2019 2018
European Central Counterparty N.V. The Netherlands 20.0 20.0 Associate (a) - 14,364
LCH SA France 11.1 11.1 Associate (b) 59,957 57,401
Immaterial joint ventures 2,270 920
Immaterial associates 4,799 -
TOTAL EQUITY ACCOUNTED INVESTMENTS 67,025 72,685
(a) European Central Counterparty N.V. (“EuroCCP”) is a CCP for pan-European equity markets providing clearing and settlement services.
(b) LCH SA is a Continental European clearing house, off ering clearing services for a diverse range of asset classes. As described in Note 3, the Group has determined that it has signifi cant infl uence over LCH SA even though it only holds 11.1% of the voting rights.
On 10 December 2019, the Group announced that it entered into
binding agreements to sell its 20% minority stake in EuroCCP to CBOE
Global Markets, alongside the other current EuroCCP shareholders.
The transaction is expected to close in the fi rst half of 2020. The
Group expects to receive net proceeds of approximately €8.8 million
from the sale of its minority stake. As a result of this agreement,
the Group impaired the value of its investment by approximately
€6.0 million and reclassifi ed the remaining value of its investment
in EuroCCP to the line “assets held for sale” (see Note 22).
7. 2 Commitments and Contingent Liabilities in Respect of Associates and Joint Ventures
The Group has no outstanding contingent liabilities with respect to
its associates or joint ventures.
7.3 Summarised Financial Information For Associates and Joint Ventures
The tables below provide summarised fi nancial information for
those associates and joint ventures that are material to the Group.
The information disclosed refl ects the amounts presented in the
Financial Statements of the relevant associates or joint ventures and
not Euronext’s share of those amounts. They have been amended
to refl ect adjustments made by the entity when using the equity
method, including fair value adjustments and modifications for
diff erences in accounting policy.
2019 UNIVERSAL REGISTRATION DOCUMENT 203
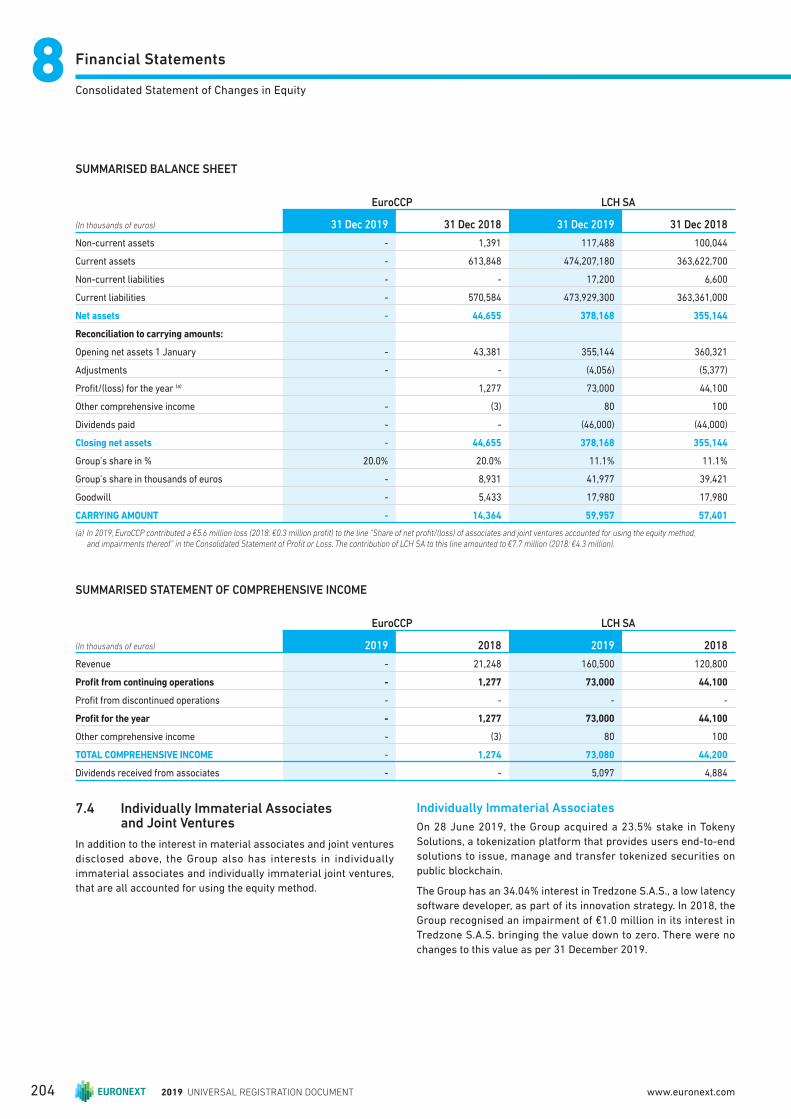
Financial Statements88Consolidated Statement of Changes in Equity
SUMMARISED BALANCE SHEET
(In thousands of euros)
EuroCCP LCH SA
31 Dec 2019 31 Dec 2018 31 Dec 2019 31 Dec 2018
Non-current assets - 1,391 117,488 100,044
Current assets - 613,848 474,207,180 363,622,700
Non-current liabilities - - 17,200 6,600
Current liabilities - 570,584 473,929,300 363,361,000
Net assets - 44,655 378,168 355,144
Reconciliation to carrying amounts:
Opening net assets 1 January - 43,381 355,144 360,321
Adjustments - - (4,056) (5,377)
Profi t/(loss) for the year (a) 1,277 73,000 44,100
Other comprehensive income - (3) 80 100
Dividends paid - - (46,000) (44,000)
Closing net assets - 44,655 378,168 355,144
Group’s share in % 20.0% 20.0% 11.1% 11.1%
Group’s share in thousands of euros - 8,931 41,977 39,421
Goodwill - 5,433 17,980 17,980
CARRYING AMOUNT - 14,364 59,957 57,401
(a) In 2019, EuroCCP contributed a €5.6 million loss (2018: €0.3 million profi t) to the line “Share of net profi t/(loss) of associates and joint ventures accounted for using the equity method, and impairments thereof” in the Consolidated Statement of Profi t or Loss. The contribution of LCH SA to this line amounted to €7.7 million (2018: €4.3 million).
SUMMARISED STATEMENT OF COMPREHENSIVE INCOME
(In thousands of euros)
EuroCCP LCH SA
2019 2018 2019 2018
Revenue - 21,248 160,500 120,800
Profi t from continuing operations - 1,277 73,000 44,100
Profi t from discontinued operations - - - -
Profi t for the year - 1,277 73,000 44,100
Other comprehensive income - (3) 80 100
TOTAL COMPREHENSIVE INCOME - 1,274 73,080 44,200
Dividends received from associates - - 5,097 4,884
7.4 Individually Immaterial Associates and Joint Ventures
In addition to the interest in material associates and joint ventures
disclosed above, the Group also has interests in individually
immaterial associates and individually immaterial joint ventures,
that are all accounted for using the equity method.
Individually Immaterial Associates
On 28 June 2019, the Group acquired a 23.5% stake in Tokeny
Solutions, a tokenization platform that provides users end-to-end
solutions to issue, manage and transfer tokenized securities on
public blockchain.
The Group has an 34.04% interest in Tredzone S.A.S., a low latency
software developer, as part of its innovation strategy. In 2018, the
Group recognised an impairment of €1.0 million in its interest in
Tredzone S.A.S. bringing the value down to zero. There were no
changes to this value as per 31 December 2019.
2019 UNIVERSAL REGISTRATION DOCUMENT204 www.euronext.com
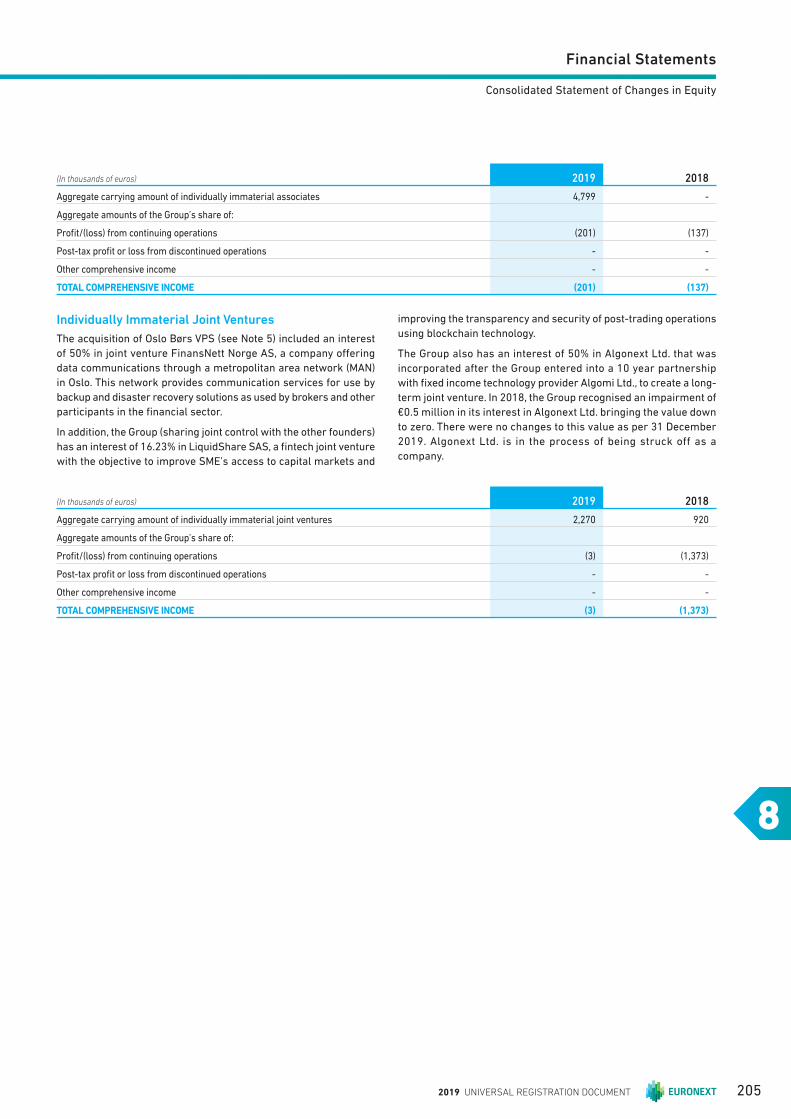
Financial Statements
8
Consolidated Statement of Changes in Equity
(In thousands of euros) 2019 2018
Aggregate carrying amount of individually immaterial associates 4,799 -
Aggregate amounts of the Group’s share of:
Profi t/(loss) from continuing operations (201) (137)
Post-tax profi t or loss from discontinued operations - -
Other comprehensive income - -
TOTAL COMPREHENSIVE INCOME (201) (137)
Individually Immaterial Joint Ventures
The acquisition of Oslo Børs VPS (see Note 5) included an interest
of 50% in joint venture FinansNett Norge AS, a company off ering
data communications through a metropolitan area network (MAN)
in Oslo. This network provides communication services for use by
backup and disaster recovery solutions as used by brokers and other
participants in the fi nancial sector.
In addition, the Group (sharing joint control with the other founders)
has an interest of 16.23% in LiquidShare SAS, a fi ntech joint venture
with the objective to improve SME’s access to capital markets and
improving the transparency and security of post-trading operations
using blockchain technology.
The Group also has an interest of 50% in Algonext Ltd. that was
incorporated after the Group entered into a 10 year partnership
with fi xed income technology provider Algomi Ltd., to create a long-
term joint venture. In 2018, the Group recognised an impairment of
€0.5 million in its interest in Algonext Ltd. bringing the value down
to zero. There were no changes to this value as per 31 December
2019. Algonext Ltd. is in the process of being struck off as a
company.
(In thousands of euros) 2019 2018
Aggregate carrying amount of individually immaterial joint ventures 2,270 920
Aggregate amounts of the Group’s share of:
Profi t/(loss) from continuing operations (3) (1,373)
Post-tax profi t or loss from discontinued operations - -
Other comprehensive income - -
TOTAL COMPREHENSIVE INCOME (3) (1,373)
2019 UNIVERSAL REGISTRATION DOCUMENT 205

Financial Statements88Consolidated Statement of Changes in Equity
NOTE 8 REVENUE FROM CONTRACTS WITH CUSTOMERS
8.1 Disaggregated revenue information
Substantially all of the Group’s revenues are considered to be revenues from contracts with customers. At 31 December 2019 and 2018,
there were no customers that individually exceeded 10% of the Group’s revenue.
Set out below is the disaggregation of the Group’s revenue from contracts with customers:
Major revenue streamIn thousands of euros
Year ended31 December
2019
Timing of revenue recognition
Year ended31 December
2018
Timing of revenue recognition
Product or service transferred Product or service transferred
at a point in time over time
at a point in time over time
Listing 128,951 7,587 121,364 106,490 4,704 101,786
Trading revenue 272,810 272,810 - 276,572 276,572 -
of which
Cash trading 205,565 205,565 - 210,947 210,947 -
Derivatives trading 44,324 44,324 - 43,910 43,910 -
FX trading 22,921 22,921 - 21,715 21,715 -
Investor services 5,735 244 5,491 - - -
Advanced data services 128,756 1,210 127,546 118,298 1,003 117,295
Post-trade 104,831 70,791 34,040 77,381 57,672 19,709
of which
Clearing 55,237 55,237 - 55,331 55,331 -
Custody & Settlement and other 49,594 15,554 34,040 22,050 2,341 19,709
Euronext Technology Solutions & other revenue 37,805 1,885 35,920 36,063 813 35,250
Other income 220 220 - 229 229 -
TOTAL REVENUE FROM CONTRACTS
WITH CUSTOMERS 679,108 354,747 324,361 615,033 340,993 274,040
Set out below is the geographical information of the Group’s revenue from contracts with customers:
In thousands of euros France NetherlandsUnited
Kingdom Belgium Portugal IrelandUnited States Norway Sweden
Hong Kong Total
2019
Revenue from contracts with customers(a) 331,248 160,072 5,299 30,966 33,236 35,668 23,202 57,075 2,293 49 679,108
2018
Revenue from contracts with customers(a) 328,255 170,990 286 32,874 35,021 24,517 21,835 - 1,202 53 615,033
(a) Advanced data services revenues are attributed to the country where the exchange is domiciled. Revenues from other categories are attributed to the billing entity.
8.2 Contract balances
The Group has recognised the following assets and liabilities related to contracts with customers:
In thousands of euros 31 December 2019 31 December 2018 1 January 2018
Trade receivables (Note 21) 93,856 70,815 61,156
Contract receivables (Note 21) 19,878 21,996 15,814
Contract liabilities (Note 33) 108,620 96,948 76,342
2019 UNIVERSAL REGISTRATION DOCUMENT206 www.euronext.com

Financial Statements
8
Consolidated Statement of Changes in Equity
NOTE 9 SALARIES AND EMPLOYEE BENEFITS
In thousands of euros
Year ended
31 December 2019 31 December 2018
Salaries and other short term benefi ts (108,443) (86,420)
Social security contributions (32,993) (24,851)
Share-based payment costs (6,943) (3,979)
Pension cost – defi ned benefi t plans (1,292) (1,310)
Pension cost – defi ned contribution plans (3,474) (1,928)
TOTAL (153,145) (118,488)
Trade receivables are non-interest bearing and are generally due
on terms of 30 to 90 days and represent amounts in respect of
billed revenue, for which the Group has an unconditional right
to consideration (i.e. only the passage of time is required before
payment of the consideration is due). Trade receivables increased by
€23.0 million, which is mainly attributable to the acquisitions of new
subsidiaries (primarily Oslo Børs VPS) for €13.9 million (see Note 5)
and increased invoicing in listing business of €4.3 million,
following new IPO’s in the fourth quarter of 2019. Furthermore,
a reclassification was made from contract receivables to trade
receivables for €2.5 million related to connectivity fees.
Contract receivables represent amounts in respect of unbilled
revenue, for which the Group has an unconditional right to
consideration (i.e. only the passage of time is required before
payment of the consideration is due). Contract receivables decreased
by €2.1 million, primarily caused by last year’s contract receivable
positions for market data – and connectivity revenues, which were
reclassifi ed to trade receivables in 2019. This eff ect was partly off set
by the increasing impact from the acquisitions of new subsidiaries
for €1.2 million (see Note 5). In 2019, €1.6 million (2018: €1.5 million)
was recognised as provision for expected credit losses on trade and
contract receivables (see Notes 21 and 37.4).
Contract liabilities primarily relate to received consideration (or an
amount of consideration is due) from customers for the initial (or
subsequent) listing of equity securities, bond lifetime fees, indices
licenses, software maintenance & hosting and corporate services.
The increase of €11.7 million in contract liabilities, was primarily
attributable to the acquisition of Oslo Børs VPS (see Note 5), which
included contract liabilities related to initial and subsequent listing.
Other impacts contributing to the increase in contract liabilities
were amounts received or due from customers related to investor
services business (Commcise), Indices licenses and corporate
services, following growing activity in those businesses.
Revenue recognised in the reporting period that was included in the
contract liability balance at the beginning of the period amounted
to €47.1 million (2018: €39.3 million). The amount of revenue
recognised in the reporting period from performance obligations
satisfi ed (or partially satisfi ed) in previous periods was considered
not signifi cant (2018: not material).
8.3 Performance obligations
Information about the Group’s performance obligations are
described in Note 3 “Signifi cant accounting policies and judgements”.
The transaction price allocated to the remaining performance
obligations (unsatisfi ed or partially unsatisfi ed) are as follows:
In thousands of euros 31 December 2019 31 December 2018
Within one year 65,528 57,617
More than one year 61,384 63,873
TOTAL 126,912 121,490
The remaining performance obligations expected to be recognised
in more than one year primarily relate to the initial (or subsequent)
listing of equity securities and bond lifetime fees which are
recognised over the related listing period. Other performance
obligations included in this category are software maintenance
& hosting contracts, Indices license contracts and corporate services
license contracts.
At the end of the year, the number of employees, based on full-time
equivalents (FTE) stood at 1,070.7 (2018: 809.1). The increase in
FTE was primarily caused by the newly acquired companies during
the year.
Salaries, other short term benefi ts, social security contributions and
pension cost (defi ned contribution plans) primarily increased due to
newly acquired subsidiaries in 2019.
In 2019, “Share based payments costs” primarily contain costs
related to the LTI Plans 2016, 2017, 2018 and 2019. Details of these
plans are disclosed in Note 28.
2019 UNIVERSAL REGISTRATION DOCUMENT 207

Financial Statements88Consolidated Statement of Changes in Equity
NOTE 10 DEPRECIATION AND AMORTIZATION
In thousands of euros
Year ended
31 December 2019 31 December 2018
Depreciation of tangible fi xed assets (9,898) (7,224)
Amortisation of intangible fi xed assets (22,831) (16,176)
Amortisation of right-of-use assets (10,947) -
TOTAL (43,676) (23,400)
NOTE 11 OTHER OPERATIONAL EXPENSES
In thousands of euros
Year ended
31 December 2019 31 December 2018
Systems and communications (26,385) (26,208)
Professional services (37,070) (47,011)
Clearing expenses (29,402) (29,846)
Accommodation (5,467) (10,430)
Other expenses(a) (28,219) (28,800)
TOTAL (126,543) (142,295)
(a) Other expenses include marketing, taxes, insurance, travel, professional membership fees, corporate management and other expenses.
Professional services expenses decreased following Optiq® go-live for Cash markets in 2018. The decrease in accommodation expenses is
related to the adoption of IFRS 16 in 2019.
NOTE 12 EXCEPTIONAL ITEMS
In thousands of euros
Year ended
31 December 2019 31 December 2018
Restructuring costs (5,671) (8,126)
Acquisition costs (11,730) (2,088)
DB contract termination - (4,752)
Settlement Algomi investment and related items (1,341) (3,226)
Termination of contracts (2,245) (2,000)
Litigation provisions/settlements - (520)
Onerous contract costs (857) (893)
Other (27) 131
TOTAL (21,871) (21,474)
Depreciation of tangible fi xed assets primarily increased due to
newly acquired subsidiaries in 2019.
Amortisation of intangible fi xed assets included €14.5 million (2018:
€7.3 million) of software and customer relations amortisation
from newly acquired companies as from their acquisition dates
(see Note 18).
The adoption of IFRS 16 led to the recognition of amortisation of
right-of-use assets in 2019.
2019 UNIVERSAL REGISTRATION DOCUMENT208 www.euronext.com

Financial Statements
8
Consolidated Statement of Changes in Equity
NOTE 13 NET FINANCING INCOME/(EXPENSE)
In 2019, exceptional items included:
n €5.7 million of restructuring costs mainly rela ted to expenses for
employee termination benefi ts in the various Euronext locations;
n €11.7 million of costs incurred for contemplated acquisitions of
major signifi cance to the Group, potentially changing the Group’s
form or character (transformational acquisitions), which primarily
relate to the acquisition of Oslo Børs VPS (see Note 5);
n €1.3 million of settl ement payment related to the investment in
Algomi Ltd.;
n €2.2 million related to the early termination of various IT contracts
within Oslo Børs VPS;
n €0.9 million of costs related to onerous commercial contracts.
In 2018, exceptional items included:
n €8.1 million of restructuring costs mainly related to expenses for
employee termination benefi ts in the various Euronext locations;
n €2.1 million of costs incurred for contemplated acquisitions of
major signifi cance to the Group, potentially changing the Group’s
form or character (transformational acquisitions);
n €4.8 million of impact related to the early termination of the
trading services contract provided by Deutsche Börse AG to the
Irish Stock Exchange;
n €3.2 million of items related to the revaluation of the investment
in Algomi Ltd., of which €1.5 million related to impaired intangible
assets in 2018;
n €2.0 million of costs related to the termination of contract with a
reseller within corporate services business;
n €0.5 million of litigation provisions/settlements attributable to
individual legal cases, including a $0.8 million settlement with
former FastMatch CEO;
n €0.9 million of onerous maintenance contract costs related to
impaired intangible assets that were refl ected in exceptional
items of 2017.
If the exceptional items were presented by nature, salaries and
employee benefi ts would increase to €5.7 million (2018: €8.1 million),
depreciation and amortization would increase to €0.0 million (2018:
€1.7 million) and other operational expenses would increase to
€16.2 million (2018: €11.7 million). They relate to both income and
expenses.
In thousands of euros
Year ended
31 December 2019 31 December 2018
Interest expense (eff ective interest method) (11,632) (5,558)
Interest in respect of lease liabilities (555) -
Other fi nance costs 336 77
Finance costs (11,851) (5,481)
Contingent liabilities (see Note 35) (1,310) (1,200)
Redemption liabilities (see Note 35) (11,965) (2,000)
Change in fair value of financial liabilities (13,275) (3,200)
Interest income (eff ective interest method) 1,879 487
Interest income from interest rate swaps 4,971 3,534
Hedging result 124 (638)
Gain/(loss) on disposal of treasury investments 198 (220)
Net foreign exchange gain/(loss) 539 258
Other net financing income/(expense) 7,711 3,421
TOTAL (17,415) (5,260)
Interest expense for the year comprises the full year impact of
interest expenses related to the Bond issued in April 2018 (Bond
#1) and the interest expenses following the Bond that was issued
in June 2019 (Bond #2) (see Notes 2 and 29).
In 2019, the contingent consideration payables recognised in
current fi nancial liabilities, which relate to Company Webcast B.V.
and InsiderLog AB, were remeasured through profit or loss by
€13.3 million (see Note 35).
Other net financing income was positively impacted by the full
year impact of income from interest rate swaps, as a result of the
Group entering into interest rate swap agreements in April 2018
(see Note 23) and interest income from newly acquired subsidiaries.
Hedging result consists of gains or losses resulting from the
ineff ective part of the fair value hedge and net investment hedge
(see Note 23).
2019 UNIVERSAL REGISTRATION DOCUMENT 209

Financial Statements88Consolidated Statement of Changes in Equity
NOTE 14 RESULTS FROM EQUITY INVESTMENTS
In thousands of euros
Year ended
31 December 2019 31 December 2018
Dividend income 7,270 5,984
TOTAL 7,270 5,984
In 2019 and 2018, dividend income relates to dividends received from the Group’s non-current equity investments at fair value through
other comprehensive income Euroclear S.A. and Sicovam Holding SAS (see Note 20).
NOTE 15 INCOME TAX EXPENSE
In thousands of euros 2019 2018
Current tax expense (106,513) (91,974)
Deferred tax expense 6,219 (2,110)
TOTAL (100,294) (94,084)
The actual tax charge incurred on the Group’s profi t before income tax diff ers from the theoretical amount that would arise using the weighted
average tax rates applicable to profi t before income tax of the consolidated entities as follows:
RECONCILIATION OF EFFECTIVE TAX CHARGE
In thousands of euros 2019 2018
Profi t before income tax 325,572 311,712
Income tax calculated at domestic tax rates applicable to profi ts in the respective countries (92,492) (93,854)
Tax eff ects of:
Non-deductible expenses(a) (8,847) (3,546)
Other tax exempt income(b) 205 2,520
Over provided in prior years(c) 275 3,548
Other (d) 565 (2,752)
TOTAL (100,294) (94,084)
(a) In 2019, non-deductible expenses mainly relate to non-deductible M&A expenses and increased redemption liability.
(b) In 2018 other tax exempt income mainly relates to dividends received and revaluation of Sicovam Holding SAS.
(c) In 2018 “over provided in prior years” were positively impacted by the release of €4.0 million tax provisions recognised in 2014, as a result of the lapse of statute of limitations.
(d) As from 2014, the Company applies the statutory tax rates without (temporary) surcharges (in Portugal and France) to the profi t before income tax to calculate tax at domestic rates. The (temporary) surcharges have been included in the line “Other”.
The Netherlands, France and Belgium have changed their future
tax rates (see Note 19). The recalculation of deferred tax resulting
from these changes had a positive impact of €1.5 million, which is
included in the line “Other”.
The eff ective tax rate increased from 30.2% for the year ended
31 December 2018 to 30.8% for the year ended 31 December 2019.
These rates are practically in line with the normalized tax rate.
2019 UNIVERSAL REGISTRATION DOCUMENT210 www.euronext.com

Financial Statements
8
Consolidated Statement of Changes in Equity
NOTE 16 PROPERTY, PLANT AND EQUIPMENT
In thousands of euros Land & Buildings Hardware & IT Other Equipment (a) Total
As at 31 December 2017
Cost 14,776 24,702 50,204 89,682
Accumulated depreciation and impairment (4,673) (18,109) (39,118) (61,900)
Net book amount 10,103 6,593 11,086 27,782
As at 1 January 2018 net book amount 10,103 6,593 11,086 27,782
Exchange diff erences - 30 8 38
Additions 3,539 6,364 1,055 10,958
Disposals & other - 23 (338) (315)
Acquisitions of subsidiaries (Note 5) 6,973 309 363 7,645
Transfers - - - -
Depreciation charge (Note 10) (281) (4,750) (2,193) (7,224)
As at 31 December 2018 net book amount 20,334 8,569 9,981 38,884
As at 31 December 2018
Cost 25,779 34,576 50,564 110,919
Accumulated depreciation and impairment (5,445) (26,007) (40,583) (72,035)
Net book amount 20,334 8,569 9,981 38,884
As at 1 January 2019 net book amount 20,334 8,569 9,981 38,884
Exchange diff erences (81) 16 (19) (84)
Additions 7,674 2,930 4,059 14,663
Disposals & other (1) 42 (90) (49)
Acquisitions of subsidiaries (Note 5) 11,250 - 4,123 15,373
Depreciation charge (Note 10) (680) (4,745) (4,473) (9,898)
As at 31 December 2019 net book amount 38,496 6,812 13,582 58,890
As at 31 December 2019
Cost 48,455 37,632 74,649 160,736
Accumulated depreciation and impairment (9,959) (30,820) (61,067) (101,846)
Net book amount 38,496 6,812 13,582 58,890
(a) Other Equipment includes building fi xtures and fi tting and lease improvements
The increase in Property Plant and Equipment was primarily related to the acquired stock exchange building included in the acquisition of
Oslo Børs VPS.
NOTE 17 LEASES
The Group leases offi ces in the various locations from which the
Group operates its business, IT-hardware equipment such as data
servers, racks and mainframes and leases of other equipment for
use by its staff in offi ces. Lease of offi ces generally have an average
lease term of 4 years, while hardware IT equipment generally have
an average lease term of 3 years. Rental contracts are typically
made for fi xed periods, but may occasionally have extension options.
Furthermore, the Group has very limited leases that contain variable
lease payments and has no leases that are exposed to residual value
guarantees. Payments associated with short-term leases (containing
a lease term of 12 months or less) and leases of low-value assets
are recognised on a straight-line basis as an expense in profi t or
loss.
2019 UNIVERSAL REGISTRATION DOCUMENT 211

Financial Statements88Consolidated Statement of Changes in Equity
17.1 Amounts Recognised in the Balance Sheet
Set out below are the carrying amounts of right-of-use assets recognised and the movements during the period:
In thousands of euros
Right-of-use assets
Building Equipment Other Total
At 1 January 2019 52,066 2,186 - 54,252
Additions 1,794 - - 1,794
Acquisition of subsidiary 6,692 - - 6,692
Depreciation charge (10,042) (905) - (10,947)
Exchange impacts and other (39) - - (39)
At 31 December 2019 50,470 1,281 - 51,751
Set out below are the carrying amounts of lease liabilities and the movements during the period:
In thousands of euros Lease liabilities
At 1 January 2019 56,217
Additions 1,673
Acquisition of subsidiary 6,692
Accretion of interest 555
Payments (9,744)
Exchange impacts and other (242)
At 31 December 2019 55,150
Of which are:
Non-current lease liabilities 41,180
Current lease liabilities 13,970
The maturity analysis of the lease liabilities are as follows:
In thousands of euros
Less than 1 year
between 1 and 3 years
between 3 and 5 years
More than 5 years Total
2019
Lease liabilities 13,970 23,541 16,459 1,180 55,150
17.2 Amounts Recognised in the Statement of Profi t or Loss
The statement of profi t or loss shows the following amounts related to leases:
In thousands of euros 2019 2018
Depreciation charge of right-of-use assets
Building (10,042) -
Equipment (905) -
Other - -
Interest expense (included in fi nance cost) (555) -
Expenses related to short-term leases (included in other operational expenses) (350) -
Expenses related to leases of low-value asset (included in other operational expenses) (650) -
TOTAL (12,503) -
The total cash outfl ow for leases in 2019 was €10.7 million. The Group’s exposure to potential future cash outfl ows related to variable lease
payments, extension or termination options and residual value guarantees was not material.
2019 UNIVERSAL REGISTRATION DOCUMENT212 www.euronext.com
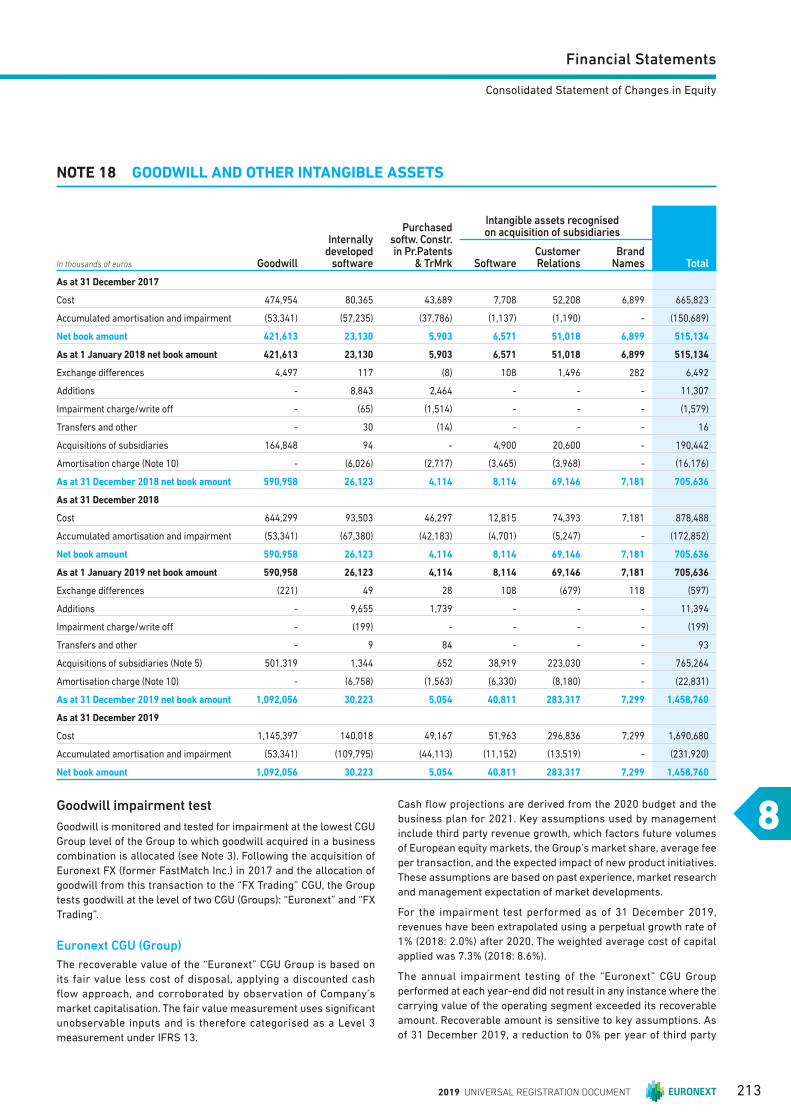
Financial Statements
8
Consolidated Statement of Changes in Equity
NOTE 18 GOODWILL AND OTHER INTANGIBLE ASSETS
Goodwill impairment test
Goodwill is monitored and tested for impairment at the lowest CGU
Group level of the Group to which goodwill acquired in a business
combination is allocated (see Note 3). Following the acquisition of
Euronext FX (former FastMatch Inc.) in 2017 and the allocation of
goodwill from this transaction to the “FX Trading” CGU, the Group
tests goodwill at the level of two CGU (Groups): “Euronext” and “FX
Trading”.
Euronext CGU (Group)
The recoverable value of the “Euronext” CGU Group is based on
its fair value less cost of disposal, applying a discounted cash
flow approach, and corroborated by observation of Company’s
market capitalisation. The fair value measurement uses signifi cant
unobservable inputs and is therefore categorised as a Level 3
measurement under IFRS 13.
Cash fl ow projections are derived from the 2020 budget and the
business plan for 2021. Key assumptions used by management
include third party revenue growth, which factors future volumes
of European equity markets, the Group’s market share, average fee
per transaction, and the expected impact of new product initiatives.
These assumptions are based on past experience, market research
and management expectation of market developments.
For the impairment test performed as of 31 December 2019,
revenues have been extrapolated using a perpetual growth rate of
1% (2018: 2.0%) after 2020. The weighted average cost of capital
applied was 7.3% (2018: 8.6%).
The annual impairment testing of the “Euronext” CGU Group
performed at each year-end did not result in any instance where the
carrying value of the operating segment exceeded its recoverable
amount. Recoverable amount is sensitive to key assumptions. As
of 31 December 2019, a reduction to 0% per year of third party
In thousands of euros Goodwill
Internally developed
software
Purchased softw. Constr. in Pr.Patents
& TrMrk
Intangible assets recognised on acquisition of subsidiaries
TotalSoftwareCustomer Relations
Brand Names
As at 31 December 2017
Cost 474,954 80,365 43,689 7,708 52,208 6,899 665,823
Accumulated amortisation and impairment (53,341) (57,235) (37,786) (1,137) (1,190) - (150,689)
Net book amount 421,613 23,130 5,903 6,571 51,018 6,899 515,134
As at 1 January 2018 net book amount 421,613 23,130 5,903 6,571 51,018 6,899 515,134
Exchange diff erences 4,497 117 (8) 108 1,496 282 6,492
Additions - 8,843 2,464 - - - 11,307
Impairment charge/write off - (65) (1,514) - - - (1,579)
Transfers and other - 30 (14) - - - 16
Acquisitions of subsidiaries 164,848 94 - 4,900 20,600 - 190,442
Amortisation charge (Note 10) - (6,026) (2,717) (3,465) (3,968) - (16,176)
As at 31 December 2018 net book amount 590,958 26,123 4,114 8,114 69,146 7,181 705,636
As at 31 December 2018
Cost 644,299 93,503 46,297 12,815 74,393 7,181 878,488
Accumulated amortisation and impairment (53,341) (67,380) (42,183) (4,701) (5,247) - (172,852)
Net book amount 590,958 26,123 4,114 8,114 69,146 7,181 705,636
As at 1 January 2019 net book amount 590,958 26,123 4,114 8,114 69,146 7,181 705,636
Exchange diff erences (221) 49 28 108 (679) 118 (597)
Additions - 9,655 1,739 - - - 11,394
Impairment charge/write off - (199) - - - - (199)
Transfers and other - 9 84 - - - 93
Acquisitions of subsidiaries (Note 5) 501,319 1,344 652 38,919 223,030 - 765,264
Amortisation charge (Note 10) - (6,758) (1,563) (6,330) (8,180) - (22,831)
As at 31 December 2019 net book amount 1,092,056 30,223 5,054 40,811 283,317 7,299 1,458,760
As at 31 December 2019
Cost 1,145,397 140,018 49,167 51,963 296,836 7,299 1,690,680
Accumulated amortisation and impairment (53,341) (109,795) (44,113) (11,152) (13,519) - (231,920)
Net book amount 1,092,056 30,223 5,054 40,811 283,317 7,299 1,458,760
2019 UNIVERSAL REGISTRATION DOCUMENT 213
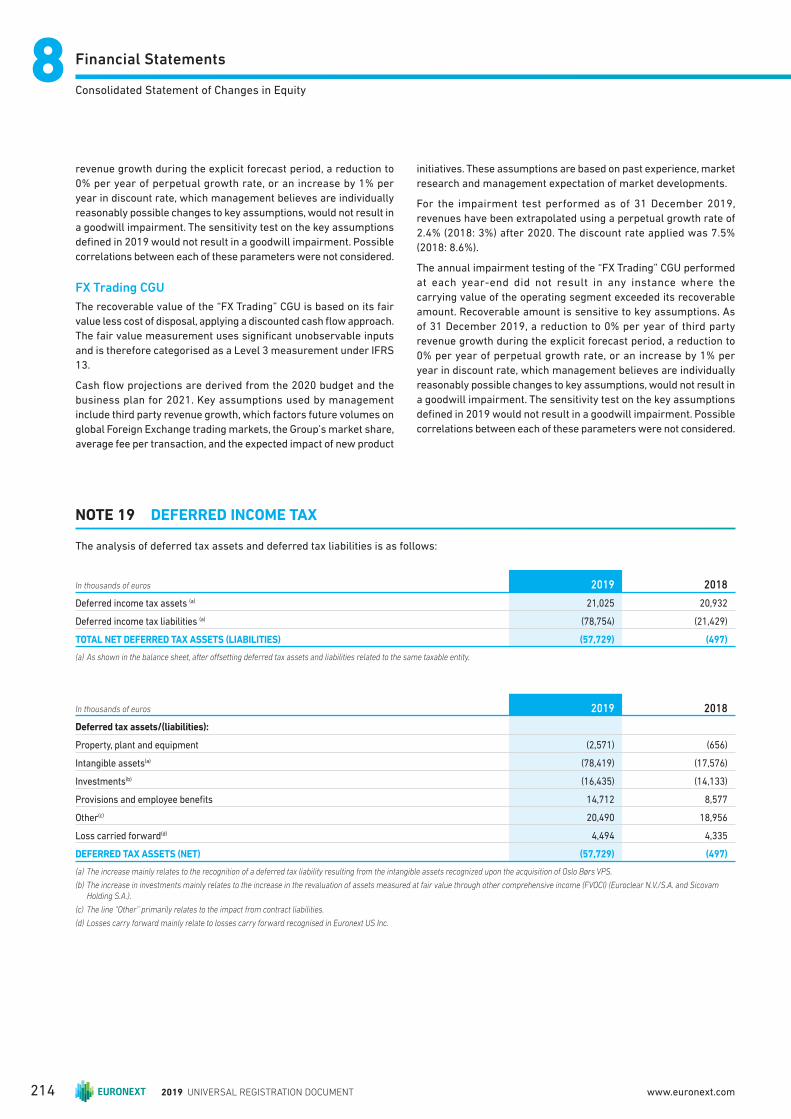
Financial Statements88Consolidated Statement of Changes in Equity
revenue growth during the explicit forecast period, a reduction to
0% per year of perpetual growth rate, or an increase by 1% per
year in discount rate, which management believes are individually
reasonably possible changes to key assumptions, would not result in
a goodwill impairment. The sensitivity test on the key assumptions
defi ned in 2019 would not result in a goodwill impairment. Possible
correlations between each of these parameters were not considered.
FX Trading CGU
The recoverable value of the “FX Trading” CGU is based on its fair
value less cost of disposal, applying a discounted cash fl ow approach.
The fair value measurement uses signifi cant unobservable inputs
and is therefore categorised as a Level 3 measurement under IFRS
13.
Cash fl ow projections are derived from the 2020 budget and the
business plan for 2021. Key assumptions used by management
include third party revenue growth, which factors future volumes on
global Foreign Exchange trading markets, the Group’s market share,
average fee per transaction, and the expected impact of new product
initiatives. These assumptions are based on past experience, market
research and management expectation of market developments.
For the impairment test performed as of 31 December 2019,
revenues have been extrapolated using a perpetual growth rate of
2.4% (2018: 3%) after 2020. The discount rate applied was 7.5%
(2018: 8.6%).
The annual impairment testing of the “FX Trading” CGU performed
at each year-end did not result in any instance where the
carrying value of the operating segment exceeded its recoverable
amount. Recoverable amount is sensitive to key assumptions. As
of 31 December 2019, a reduction to 0% per year of third party
revenue growth during the explicit forecast period, a reduction to
0% per year of perpetual growth rate, or an increase by 1% per
year in discount rate, which management believes are individually
reasonably possible changes to key assumptions, would not result in
a goodwill impairment. The sensitivity test on the key assumptions
defi ned in 2019 would not result in a goodwill impairment. Possible
correlations between each of these parameters were not considered.
NOTE 19 DEFERRED INCOME TAX
The analysis of deferred tax assets and deferred tax liabilities is as follows:
In thousands of euros 2019 2018
Deferred income tax assets (a) 21,025 20,932
Deferred income tax liabilities (a) (78,754) (21,429)
TOTAL NET DEFERRED TAX ASSETS (LIABILITIES) (57,729) (497)
(a) As shown in the balance sheet, after off setting deferred tax assets and liabilities related to the same taxable entity.
In thousands of euros 2019 2018
Deferred tax assets/(liabilities):
Property, plant and equipment (2,571) (656)
Intangible assets(a) (78,419) (17,576)
Investments(b) (16,435) (14,133)
Provisions and employee benefi ts 14,712 8,577
Other(c) 20,490 18,956
Loss carried forward(d) 4,494 4,335
DEFERRED TAX ASSETS (NET) (57,729) (497)
(a) The increase mainly relates to the recognition of a deferred tax liability resulting from the intangible assets recognized upon the acquisition of Oslo Børs VPS.
(b) The increase in investments mainly relates to the increase in the revaluation of assets measured at fair value through other comprehensive income (FVOCI) (Euroclear N.V./S.A. and Sicovam Holding S.A.).
(c) The line “Other” primarily relates to the impact from contract liabilities.
(d) Losses carry forward mainly relate to losses carry forward recognised in Euronext US Inc.
2019 UNIVERSAL REGISTRATION DOCUMENT214 www.euronext.com
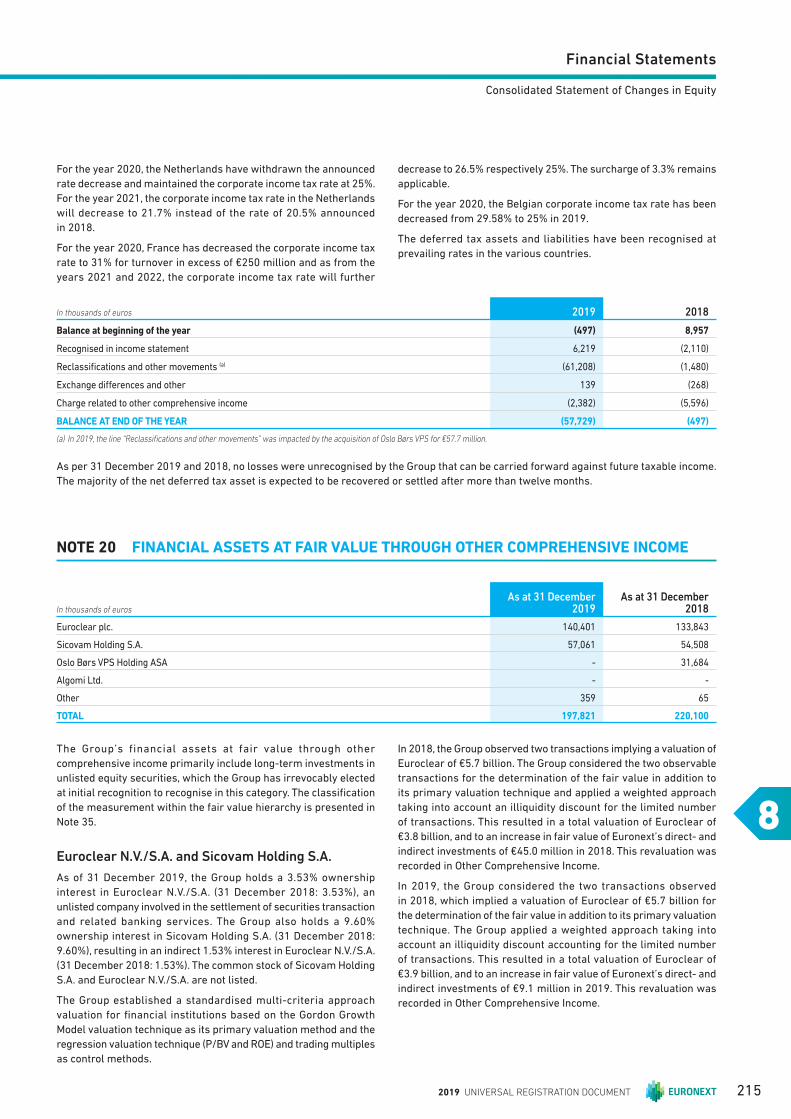
Financial Statements
8
Consolidated Statement of Changes in Equity
For the year 2020, the Netherlands have withdrawn the announced
rate decrease and maintained the corporate income tax rate at 25%.
For the year 2021, the corporate income tax rate in the Netherlands
will decrease to 21.7% instead of the rate of 20.5% announced
in 2018.
For the year 2020, France has decreased the corporate income tax
rate to 31% for turnover in excess of €250 million and as from the
years 2021 and 2022, the corporate income tax rate will further
decrease to 26.5% respectively 25%. The surcharge of 3.3% remains
applicable.
For the year 2020, the Belgian corporate income tax rate has been
decreased from 29.58% to 25% in 2019.
The deferred tax assets and liabilities have been recognised at
prevailing rates in the various countries.
NOTE 20 FINANCIAL ASSETS AT FAIR VALUE THROUGH OTHER COMPREHENSIVE INCOME
In thousands of euros
As at 31 December 2019
As at 31 December 2018
Euroclear plc. 140,401 133,843
Sicovam Holding S.A. 57,061 54,508
Oslo Børs VPS Holding ASA - 31,684
Algomi Ltd. - -
Other 359 65
TOTAL 197,821 220,100
The Group’s financial assets at fair value through other
comprehensive income primarily include long-term investments in
unlisted equity securities, which the Group has irrevocably elected
at initial recognition to recognise in this category. The classifi cation
of the measurement within the fair value hierarchy is presented in
Note 35.
Euroclear N.V./S.A. and Sicovam Holding S.A.
As of 31 December 2019, the Group holds a 3.53% ownership
interest in Euroclear N.V./S.A. (31 December 2018: 3.53%), an
unlisted company involved in the settlement of securities transaction
and related banking services. The Group also holds a 9.60%
ownership interest in Sicovam Holding S.A. (31 December 2018:
9.60%), resulting in an indirect 1.53% interest in Euroclear N.V./S.A.
(31 December 2018: 1.53%). The common stock of Sicovam Holding
S.A. and Euroclear N.V./S.A. are not listed.
The Group established a standardised multi-criteria approach
valuation for fi nancial institutions based on the Gordon Growth
Model valuation technique as its primary valuation method and the
regression valuation technique (P/BV and ROE) and trading multiples
as control methods.
In 2018, the Group observed two transactions implying a valuation of
Euroclear of €5.7 billion. The Group considered the two observable
transactions for the determination of the fair value in addition to
its primary valuation technique and applied a weighted approach
taking into account an illiquidity discount for the limited number
of transactions. This resulted in a total valuation of Euroclear of
€3.8 billion, and to an increase in fair value of Euronext’s direct- and
indirect investments of €45.0 million in 2018. This revaluation was
recorded in Other Comprehensive Income.
In 2019, the Group considered the two transactions observed
in 2018, which implied a valuation of Euroclear of €5.7 billion for
the determination of the fair value in addition to its primary valuation
technique. The Group applied a weighted approach taking into
account an illiquidity discount accounting for the limited number
of transactions. This resulted in a total valuation of Euroclear of
€3.9 billion, and to an increase in fair value of Euronext’s direct- and
indirect investments of €9.1 million in 2019. This revaluation was
recorded in Other Comprehensive Income.
In thousands of euros 2019 2018
Balance at beginning of the year (497) 8,957
Recognised in income statement 6,219 (2,110)
Reclassifi cations and other movements (a) (61,208) (1,480)
Exchange diff erences and other 139 (268)
Charge related to other comprehensive income (2,382) (5,596)
BALANCE AT END OF THE YEAR (57,729) (497)
(a) In 2019, the line “Reclassifi cations and other movements” was impacted by the acquisition of Oslo Børs VPS for €57.7 million.
As per 31 December 2019 and 2018, no losses were unrecognised by the Group that can be carried forward against future taxable income.
The majority of the net deferred tax asset is expected to be recovered or settled after more than twelve months.
2019 UNIVERSAL REGISTRATION DOCUMENT 215
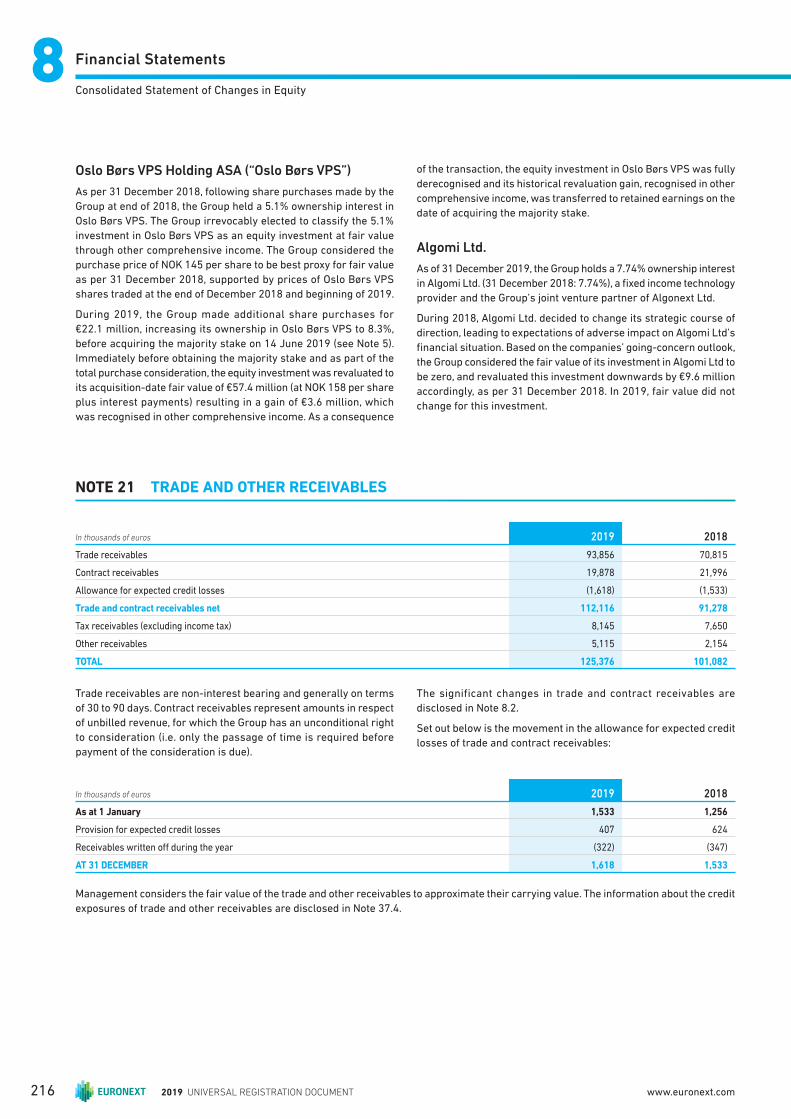
Financial Statements88Consolidated Statement of Changes in Equity
Oslo Børs VPS Holding ASA (“Oslo Børs VPS”)
As per 31 December 2018, following share purchases made by the
Group at end of 2018, the Group held a 5.1% ownership interest in
Oslo Børs VPS. The Group irrevocably elected to classify the 5.1%
investment in Oslo Børs VPS as an equity investment at fair value
through other comprehensive income. The Group considered the
purchase price of NOK 145 per share to be best proxy for fair value
as per 31 December 2018, supported by prices of Oslo Børs VPS
shares traded at the end of December 2018 and beginning of 2019.
During 2019, the Group made additional share purchases for
€22.1 million, increasing its ownership in Oslo Børs VPS to 8.3%,
before acquiring the majority stake on 14 June 2019 (see Note 5).
Immediately before obtaining the majority stake and as part of the
total purchase consideration, the equity investment was revaluated to
its acquisition-date fair value of €57.4 million (at NOK 158 per share
plus interest payments) resulting in a gain of €3.6 million, which
was recognised in other comprehensive income. As a consequence
of the transaction, the equity investment in Oslo Børs VPS was fully
derecognised and its historical revaluation gain, recognised in other
comprehensive income, was transferred to retained earnings on the
date of acquiring the majority stake.
Algomi Ltd.
As of 31 December 2019, the Group holds a 7.74% ownership interest
in Algomi Ltd. (31 December 2018: 7.74%), a fi xed income technology
provider and the Group’s joint venture partner of Algonext Ltd.
During 2018, Algomi Ltd. decided to change its strategic course of
direction, leading to expectations of adverse impact on Algomi Ltd’s
fi nancial situation. Based on the companies’ going-concern outlook,
the Group considered the fair value of its investment in Algomi Ltd to
be zero, and revaluated this investment downwards by €9.6 million
accordingly, as per 31 December 2018. In 2019, fair value did not
change for this investment.
NOTE 21 TRADE AND OTHER RECEIVABLES
In thousands of euros 2019 2018
Trade receivables 93,856 70,815
Contract receivables 19,878 21,996
Allowance for expected credit losses (1,618) (1,533)
Trade and contract receivables net 112,116 91,278
Tax receivables (excluding income tax) 8,145 7,650
Other receivables 5,115 2,154
TOTAL 125,376 101,082
Trade receivables are non-interest bearing and generally on terms
of 30 to 90 days. Contract receivables represent amounts in respect
of unbilled revenue, for which the Group has an unconditional right
to consideration (i.e. only the passage of time is required before
payment of the consideration is due).
The significant changes in trade and contract receivables are
disclosed in Note 8.2.
Set out below is the movement in the allowance for expected credit
losses of trade and contract receivables:
In thousands of euros 2019 2018
As at 1 January 1,533 1,256
Provision for expected credit losses 407 624
Receivables written off during the year (322) (347)
AT 31 DECEMBER 1,618 1,533
Management considers the fair value of the trade and other receivables to approximate their carrying value. The information about the credit
exposures of trade and other receivables are disclosed in Note 37.4.
2019 UNIVERSAL REGISTRATION DOCUMENT216 www.euronext.com
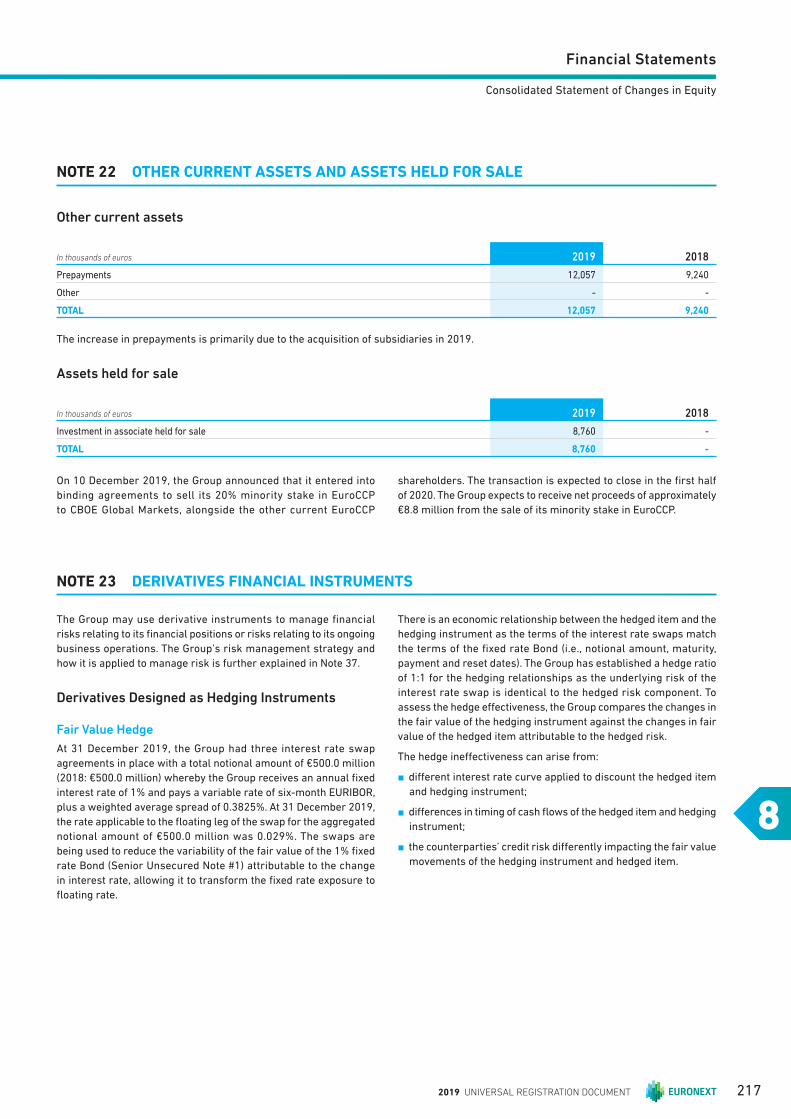
Financial Statements
8
Consolidated Statement of Changes in Equity
NOTE 22 OTHER CURRENT ASSETS AND ASSETS HELD FOR SALE
Other current assets
In thousands of euros 2019 2018
Prepayments 12,057 9,240
Other - -
TOTAL 12,057 9,240
The increase in prepayments is primarily due to the acquisition of subsidiaries in 2019.
Assets held for sale
In thousands of euros 2019 2018
Investment in associate held for sale 8,760 -
TOTAL 8,760 -
N OTE 23 DERIVATIVES FINANCIAL INSTRUMENTS
The Group may use derivative instruments to manage fi nancial
risks relating to its fi nancial positions or risks relating to its ongoing
business operations. The Group’s risk management strategy and
how it is applied to manage risk is further explained in Note 37.
Derivatives Designed as Hedging Instruments
Fair Value Hedge
At 31 December 2019, the Group had three interest rate swap
agreements in place with a total notional amount of €500.0 million
(2018: €500.0 million) whereby the Group receives an annual fi xed
interest rate of 1% and pays a variable rate of six-month EURIBOR,
plus a weighted average spread of 0.3825%. At 31 December 2019,
the rate applicable to the fl oating leg of the swap for the aggregated
notional amount of €500.0 million was 0.029%. The swaps are
being used to reduce the variability of the fair value of the 1% fi xed
rate Bond (Senior Unsecured Note #1) attributable to the change
in interest rate, allowing it to transform the fi xed rate exposure to
fl oating rate.
There is an economic relationship between the hedged item and the
hedging instrument as the terms of the interest rate swaps match
the terms of the fi xed rate Bond (i.e., notional amount, maturity,
payment and reset dates). The Group has established a hedge ratio
of 1:1 for the hedging relationships as the underlying risk of the
interest rate swap is identical to the hedged risk component. To
assess the hedge eff ectiveness, the Group compares the changes in
the fair value of the hedging instrument against the changes in fair
value of the hedged item attributable to the hedged risk.
The hedge ineff ectiveness can arise from:
n diff erent interest rate curve applied to discount the hedged item
and hedging instrument;
n diff erences in timing of cash fl ows of the hedged item and hedging
instrument;
n the counterparties’ credit risk diff erently impacting the fair value
movements of the hedging instrument and hedged item.
On 10 December 2019, the Group announced that it entered into
binding agreements to sell its 20% minority stake in EuroCCP
to CBOE Global Markets, alongside the other current EuroCCP
shareholders. The transaction is expected to close in the fi rst half
of 2020. The Group expects to receive net proceeds of approximately
€8.8 million from the sale of its minority stake in EuroCCP.
2019 UNIVERSAL REGISTRATION DOCUMENT 217

Financial Statements88Consolidated Statement of Changes in Equity
Hedge of net investment in foreign operations
The Group has designated a EUR/GBP foreign exchange contract
as a hedge of the investment in Commcise Software Ltd., a group
subsidiary in the United Kingdom, that was acquired by the end of
2018 (see Note 5).
There is an economic relationship between the hedged item and
the hedging instrument as the net investment creates a translation
risk that will match the foreign exchange risk on the GBP foreign
exchange contract. The Group has established a hedge ratio of 1:1
as the underlying risk of the hedging instrument is identical to the
hedged risk component. The hedge eff ectiveness is assessed by
comparing changes in the carrying amount of the foreign exchange
contract that is attributable to a change in the spot rate with changes
in the investment in the foreign operation due to movements in
the spot rate (the off set method). Gains or losses on this foreign
exchange contract related to the eff ective part of the hedge are
transferred to other comprehensive income to off set any gains and
losses on translation of the net investment in the subsidiary.
As per 31 December 2018, the EUR/GBP foreign exchange contract
had a notional amount of £26.7 million and expired on 21 June 2019.
There was a diff erence of £0.42 million between the notional of the
foreign exchange contract and the amount of net investment hedged
at the inception of the hedge. The ineff ectiveness caused by this
diff erence was not material as per 31 December 2018.
On 21 June 2019, the Group entered into a new EUR/GBP foreign
exchange contract with a notional amount of £27.1 million, which
expired on 20 December 2019. The ineff ectiveness caused by the
hedge was not material.
On 20 December 2019, the Group entered into a new EUR/GBP
foreign exchange contract with a notional amount of £27.1 million,
expiring in six months. As at 31 December 2019 the hedge was
eff ective.
The impact of respectively the hedging instrument and the hedged item on the balance sheet as at 31 December 2019 was as follows:
In thousands of euros Notional amount Carrying amountLine item in
the balance sheet
Change in fair value used for measuring
ineff ectiveness for the period
Interest rate swaps 500,000 19,353Derivative fi nancial
instruments 11,992
In thousands of euros Carrying amountAccumulated fair
value adjustmentsLine item in the balance
sheet
Change in fair value used for measuring
ineff ectiveness for the period
Senior Unsecured Note #1 519,866 19,866 Non-currrent Borrowings 11,867
The impact of respectively the hedging instrument and the hedged item on the balance sheet as at 31 December 2018 was as follows:
In thousands of euros Notional amount Carrying amountLine item in
the balance sheet
Change in fair value used for measuring
ineff ectiveness for the period
Interest rate swaps 500,000 7,361
Derivative fi nancial
instruments 7,361
In thousands of euros Carrying amountAccumulated fair
value adjustmentsLine item in
the balance sheet
Change in fair value used for measuring
ineff ectiveness for the period
Senior Unsecured Note #1 507,999 7,999 Non-currrent Borrowings 7,999
As per 31 December 2019, the ineff ective part of the hedge was a profi t of €0.1 million (2018: loss of €0.6 million) recognised in “hedging
result” in the Statement of Profi t or Loss (see Note 13).
2019 UNIVERSAL REGISTRATION DOCUMENT218 www.euronext.com
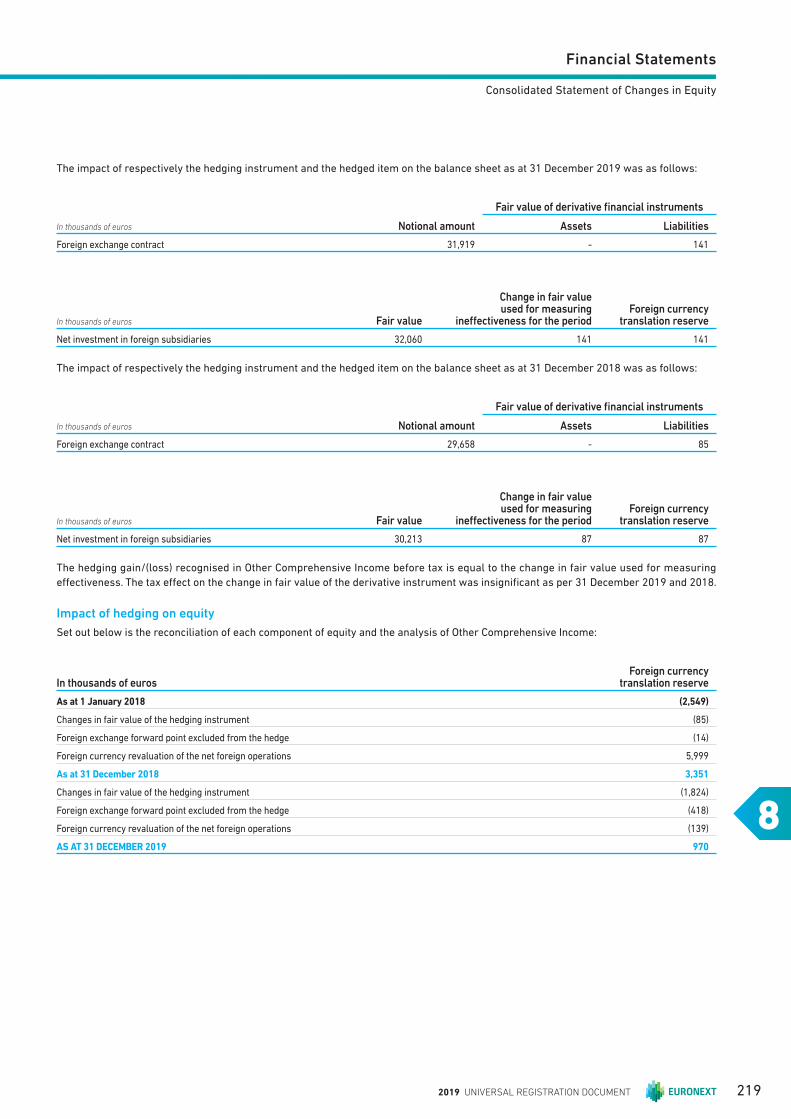
Financial Statements
8
Consolidated Statement of Changes in Equity
The impact of respectively the hedging instrument and the hedged item on the balance sheet as at 31 December 2019 was as follows:
In thousands of euros Notional amount
Fair value of derivative fi nancial instruments
Assets Liabilities
Foreign exchange contract 31,919 - 141
In thousands of euros Fair value
Change in fair value used for measuring
ineff ectiveness for the periodForeign currency
translation reserve
Net investment in foreign subsidiaries 32,060 141 141
The impact of respectively the hedging instrument and the hedged item on the balance sheet as at 31 December 2018 was as follows:
In thousands of euros Notional amount
Fair value of derivative fi nancial instruments
Assets Liabilities
Foreign exchange contract 29,658 - 85
In thousands of euros Fair value
Change in fair value used for measuring
ineff ectiveness for the periodForeign currency
translation reserve
Net investment in foreign subsidiaries 30,213 87 87
The hedging gain/(loss) recognised in Other Comprehensive Income before tax is equal to the change in fair value used for measuring
eff ectiveness. The tax eff ect on the change in fair value of the derivative instrument was insignifi cant as per 31 December 2019 and 2018.
Impact of hedging on equity
Set out below is the reconciliation of each component of equity and the analysis of Other Comprehensive Income:
In thousands of eurosForeign currency
translation reserve
As at 1 January 2018 (2,549)
Changes in fair value of the hedging instrument (85)
Foreign exchange forward point excluded from the hedge (14)
Foreign currency revaluation of the net foreign operations 5,999
As at 31 December 2018 3,351
Changes in fair value of the hedging instrument (1,824)
Foreign exchange forward point excluded from the hedge (418)
Foreign currency revaluation of the net foreign operations (139)
AS AT 31 DECEMBER 2019 970
2019 UNIVERSAL REGISTRATION DOCUMENT 219
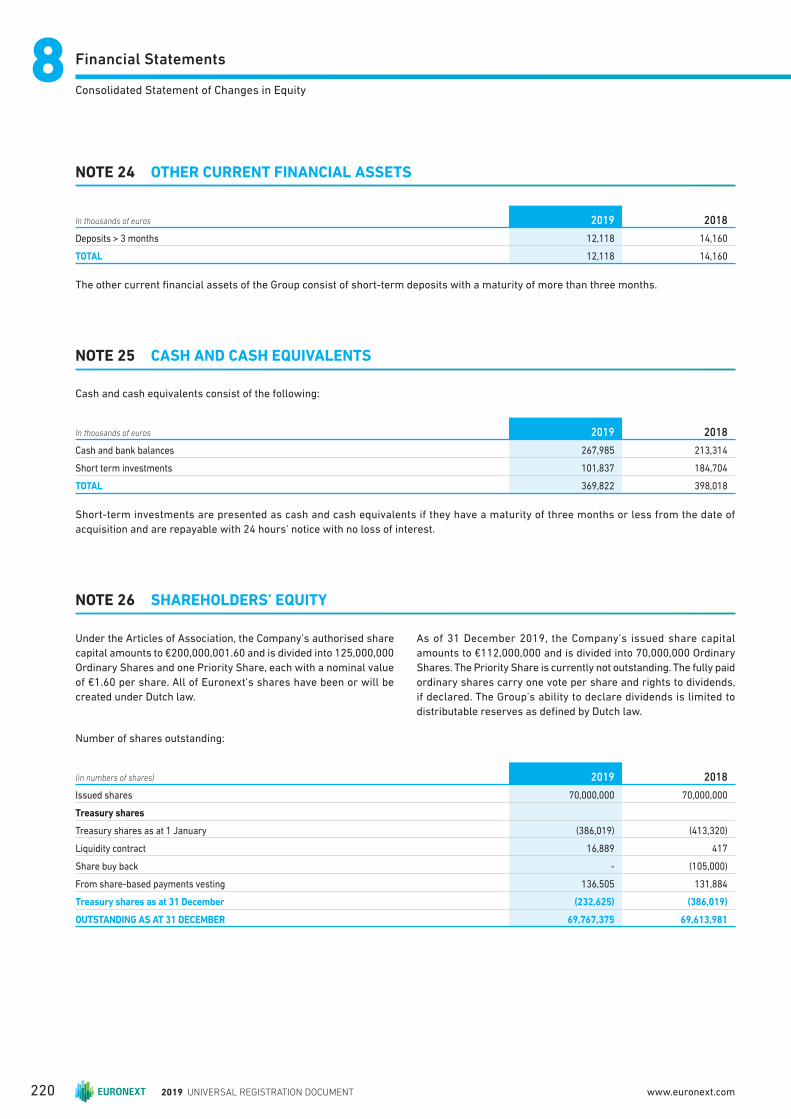
Financial Statements88Consolidated Statement of Changes in Equity
NOTE 24 OTHER CURRENT FINANCIAL ASSETS
NOTE 25 CASH AND CASH EQUIVALENTS
In thousands of euros 2019 2018
Deposits > 3 months 12,118 14,160
TOTAL 12,118 14,160
The other current fi nancial assets of the Group consist of short-term deposits with a maturity of more than three months.
Cash and cash equivalents consist of the following:
In thousands of euros 2019 2018
Cash and bank balances 267,985 213,314
Short term investments 101,837 184,704
TOTAL 369,822 398,018
Short-term investments are presented as cash and cash equivalents if they have a maturity of three months or less from the date of
acquisition and are repayable with 24 hours’ notice with no loss of interest.
NOTE 26 SHAREHOLDERS’ EQUITY
Under the Articles of Association, the Company’s authorised share
capital amounts to €200,000,001.60 and is divided into 125,000,000
Ordinary Shares and one Priority Share, each with a nominal value
of €1.60 per share. All of Euronext’s shares have been or will be
created under Dutch law.
As of 31 December 2019, the Company’s issued share capital
amounts to €112,000,000 and is divided into 70,000,000 Ordinary
Shares. The Priority Share is currently not outstanding. The fully paid
ordinary shares carry one vote per share and rights to dividends,
if declared. The Group’s ability to declare dividends is limited to
distributable reserves as defi ned by Dutch law.
Number of shares outstanding:
(in numbers of shares) 2019 2018
Issued shares 70,000,000 70,000,000
Treasury shares
Treasury shares as at 1 January (386,019) (413,320)
Liquidity contract 16,889 417
Share buy back - (105,000)
From share-based payments vesting 136,505 131,884
Treasury shares as at 31 December (232,625) (386,019)
OUTSTANDING AS AT 31 DECEMBER 69,767,375 69,613,981
2019 UNIVERSAL REGISTRATION DOCUMENT220 www.euronext.com
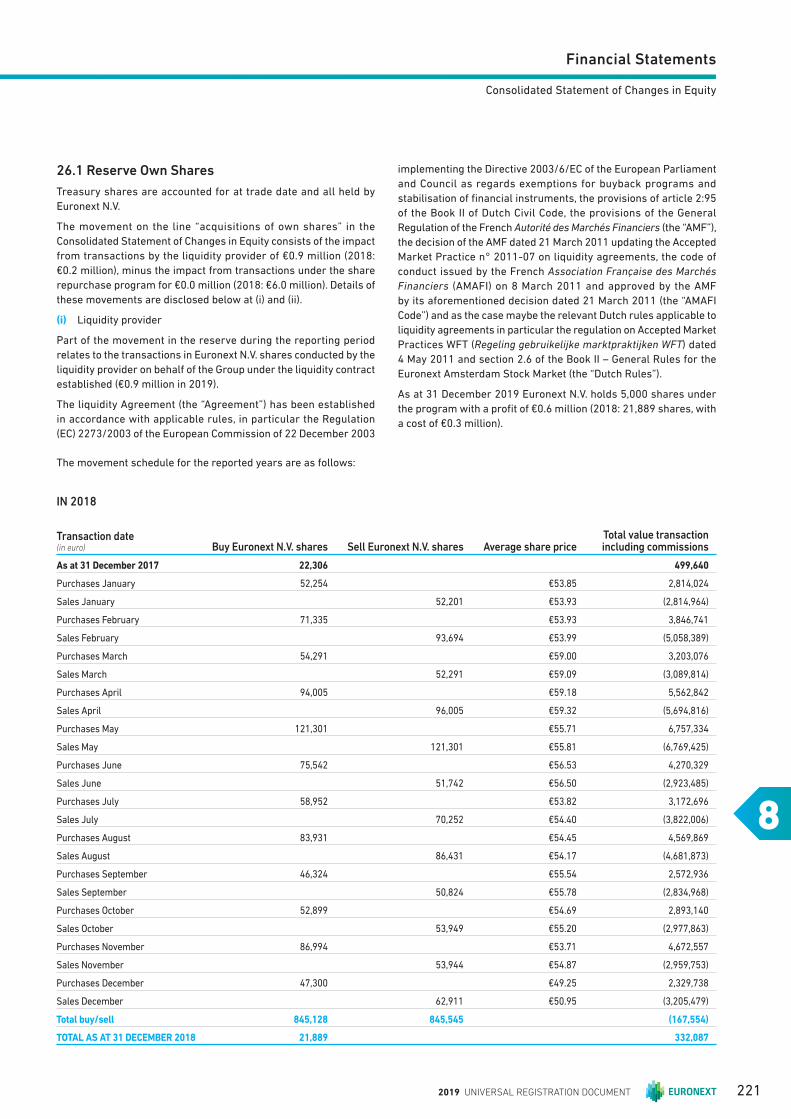
Financial Statements
8
Consolidated Statement of Changes in Equity
26.1 Reserve Own Shares
Treasury shares are accounted for at trade date and all held by
Euronext N.V.
The movement on the line “acquisitions of own shares” in the
Consolidated Statement of Changes in Equity consists of the impact
from tran sactions by the liquidity provider of €0.9 million (2018:
€0.2 million), minus the impact from transactions under the share
repurchase program for €0.0 million (2018: €6.0 million). Details of
these movements are disclosed below at (i) and (ii).
(i) Liquidity provider
Part of the movement in the reserve during the reporting period
relates to the transactions in Euronext N.V. shares conducted by the
liquidity provider on behalf of the Group under the liquidity contract
established (€0.9 million in 2019).
The liquidity Agreement (the “Agreement”) has been established
in accordance with applicable rules, in particular the Regulation
(EC) 2273/2003 of the European Commission of 22 December 2003
implementing the Directive 2003/6/EC of the European Parliament
and Council as regards exemptions for buyback programs and
stabilisation of fi nancial instruments, the provisions of article 2:95
of the Book II of Dutch Civil Code, the provisions of the General
Regulation of the French Autorité des Marchés Financiers (the “AMF”),
the decision of the AMF dated 21 March 2011 updating the Accepted
Market Practice n° 2011-07 on liquidity agreements, the code of
conduct issued by the French Association Française des Marchés
Financiers (AMAFI) on 8 March 2011 and approved by the AMF
by its aforementioned decision dated 21 March 2011 (the “AMAFI
Code”) and as the case maybe the relevant Dutch rules applicable to
liquidity agreements in particular the regulation on Accepted Market
Practices WFT (Regeling gebruikelijke marktpraktijken WFT) dated
4 May 2011 and section 2.6 of the Book II – General Rules for the
Euronext Amsterdam Stock Market (the “Dutch Rules”).
As at 31 December 2019 Euronext N.V. holds 5,000 shares under
the program with a profi t of €0.6 million (2018: 21,889 shares, with
a cost of €0.3 million).
The movement schedule for the reported years are as follows:
IN 2018
Transaction date(in euro) Buy Euronext N.V. shares Sell Euronext N.V. shares Average share price
Total value transaction including commissions
As at 31 December 2017 22,306 499,640
Purchases January 52,254 €53.85 2,814,024
Sales January 52,201 €53.93 (2,814,964)
Purchases February 71,335 €53.93 3,846,741
Sales February 93,694 €53.99 (5,058,389)
Purchases March 54,291 €59.00 3,203,076
Sales March 52,291 €59.09 (3,089,814)
Purchases April 94,005 €59.18 5,562,842
Sales April 96,005 €59.32 (5,694,816)
Purchases May 121,301 €55.71 6,757,334
Sales May 121,301 €55.81 (6,769,425)
Purchases June 75,542 €56.53 4,270,329
Sales June 51,742 €56.50 (2,923,485)
Purchases July 58,952 €53.82 3,172,696
Sales July 70,252 €54.40 (3,822,006)
Purchases August 83,931 €54.45 4,569,869
Sales August 86,431 €54.17 (4,681,873)
Purchases September 46,324 €55.54 2,572,936
Sales September 50,824 €55.78 (2,834,968)
Purchases October 52,899 €54.69 2,893,140
Sales October 53,949 €55.20 (2,977,863)
Purchases November 86,994 €53.71 4,672,557
Sales November 53,944 €54.87 (2,959,753)
Purchases December 47,300 €49.25 2,329,738
Sales December 62,911 €50.95 (3,205,479)
Total buy/sell 845,128 845,545 (167,554)
TOTAL AS AT 31 DECEMBER 2018 21,889 332,087
2019 UNIVERSAL REGISTRATION DOCUMENT 221
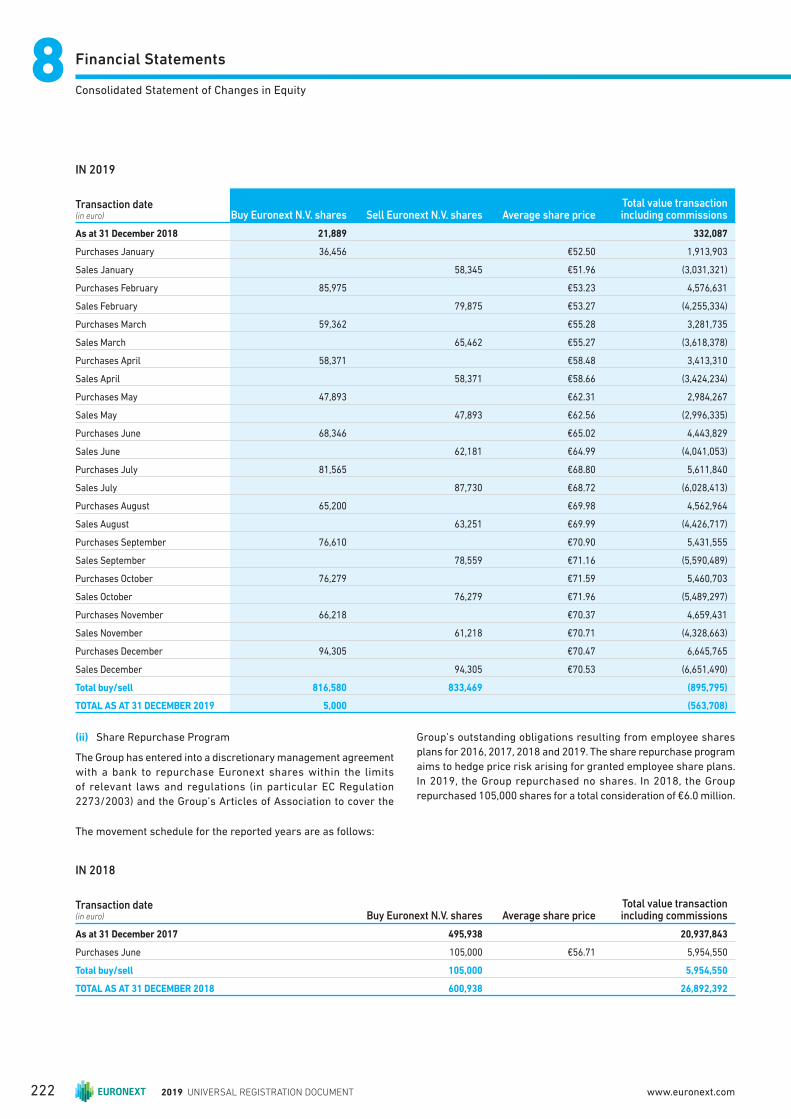
Financial Statements88Consolidated Statement of Changes in Equity
IN 2019
Transaction date(in euro) Buy Euronext N.V. shares Sell Euronext N.V. shares Average share price
Total value transaction including commissions
As at 31 December 2018 21,889 332,087
Purchases January 36,456 €52.50 1,913,903
Sales January 58,345 €51.96 (3,031,321)
Purchases February 85,975 €53.23 4,576,631
Sales February 79,875 €53.27 (4,255,334)
Purchases March 59,362 €55.28 3,281,735
Sales March 65,462 €55.27 (3,618,378)
Purchases April 58,371 €58.48 3,413,310
Sales April 58,371 €58.66 (3,424,234)
Purchases May 47,893 €62.31 2,984,267
Sales May 47,893 €62.56 (2,996,335)
Purchases June 68,346 €65.02 4,443,829
Sales June 62,181 €64.99 (4,041,053)
Purchases July 81,565 €68.80 5,611,840
Sales July 87,730 €68.72 (6,028,413)
Purchases August 65,200 €69.98 4,562,964
Sales August 63,251 €69.99 (4,426,717)
Purchases September 76,610 €70.90 5,431,555
Sales September 78,559 €71.16 (5,590,489)
Purchases October 76,279 €71.59 5,460,703
Sales October 76,279 €71.96 (5,489,297)
Purchases November 66,218 €70.37 4,659,431
Sales November 61,218 €70.71 (4,328,663)
Purchases December 94,305 €70.47 6,645,765
Sales December 94,305 €70.53 (6,651,490)
Total buy/sell 816,580 833,469 (895,795)
TOTAL AS AT 31 DECEMBER 2019 5,000 (563,708)
(ii) Share Repurchase Program
The Group has entered into a discretionary management agreement
with a bank to repurchase Euronext shares within the limits
of relevant laws and regulations (in particular EC Regulation
2273/2003) and the Group’s Articles of Association to cover the
Group’s outstanding obligations resulting from employee shares
plans for 2016, 2017, 2018 and 2019. The share repurchase program
aims to hedge price risk arising for granted employee share plans.
In 2019, the Group repurchased no shares. In 2018, the Group
repurchased 105,000 shares for a total consideration of €6.0 million.
The movement schedule for the reported years are as follows:
IN 2018
Transaction date(in euro) Buy Euronext N.V. shares Average share price
Total value transaction including commissions
As at 31 December 2017 495,938 20,937,843
Purchases June 105,000 €56.71 5,954,550
Total buy/sell 105,000 5,954,550
TOTAL AS AT 31 DECEMBER 2018 600,938 26,892,392
2019 UNIVERSAL REGISTRATION DOCUMENT222 www.euronext.com
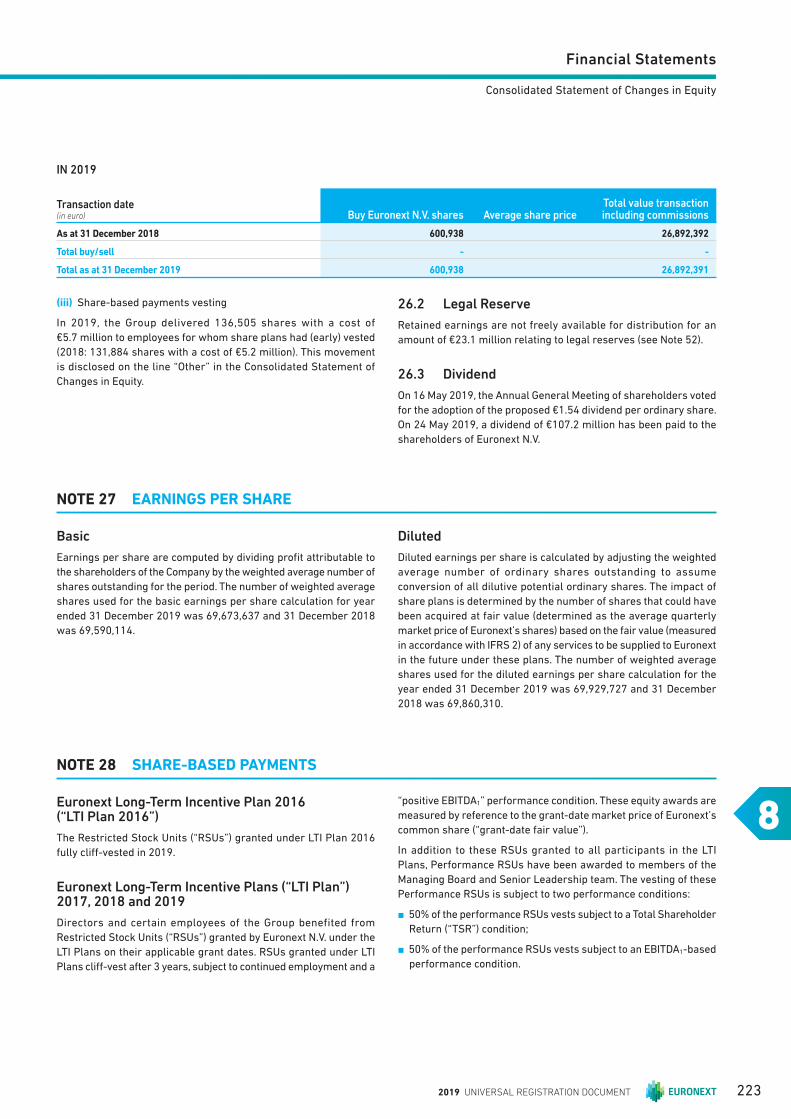
Financial Statements
8
Consolidated Statement of Changes in Equity
IN 2019
Transaction date(in euro) Buy Euronext N.V. shares Average share price
Total value transaction including commissions
As at 31 December 2018 600,938 26,892,392
Total buy/sell - -
Total as at 31 December 2019 600,938 26,892,391
(iii) Share-based payments vesting
In 2019, the Group delivered 136,505 shares with a cost of
€5.7 million to employees for whom share plans had (early) vested
(2018: 131,884 shares with a cost of €5.2 million). This movement
is disclosed on the line “Other” in the Consolidated Statement of
Changes in Equity.
26.2 Legal Reserve
Retained earnings are not freely available for distribution for an
amount of €23.1 million relating to legal reserves (see Note 52).
26.3 Dividend
On 16 May 2019, the Annual General Meeting of shareholders voted
for the adoption of the proposed €1.54 dividend per ordinary share.
On 24 May 2019, a dividend of €107.2 million has been paid to the
shareholders of Euronext N.V.
NOTE 27 EARNINGS PER SHARE
Basic
Earnings per share are computed by dividing profi t attributable to
the shareholders of the Company by the weighted average number of
shares outstanding for the period. The number of weighted average
shares used for the basic earnings per share calculation for year
ended 31 December 2019 was 69,673,637 and 31 December 2018
was 69,590,114.
Diluted
Diluted earnings per share is calculated by adjusting the weighted
average number of ordinary shares outstanding to assume
conversion of all dilutive potential ordinary shares. The impact of
share plans is determined by the number of shares that could have
been acquired at fair value (determined as the average quarterly
market price of Euronext’s shares) based on the fair value (measured
in accordance with IFRS 2) of any services to be supplied to Euronext
in the future under these plans. The number of weighted average
shares used for the diluted earnings per share calculation for the
year ended 31 December 2019 was 69,929,727 and 31 December
2018 was 69,860,310.
NOTE 28 SHARE-BASED PAYMENTS
Euronext Long-Term Incentive Plan 2016 (“LTI Plan 2016”)
The Restricted Stock Units (“RSUs”) granted under LTI Plan 2016
fully cliff -vested in 2019.
Euronext Long-Term Incentive Plans (“LTI Plan”) 2017, 2018 and 2019
Directors and certain employees of the Group benefited from
Restricted Stock Units (“RSUs”) granted by Euronext N.V. under the
LTI Plans on their applicable grant dates. RSUs granted under LTI
Plans cliff -vest after 3 years, subject to continued employment and a
“positive EBITDA1” performance condition. These equity awards are
measured by reference to the grant-date market price of Euronext’s
common share (“grant-date fair value”).
In addition to these RSUs granted to all participants in the LTI
Plans, Performance RSUs have been awarded to members of the
Managing Board and Senior Leadership team. The vesting of these
Performance RSUs is subject to two performance conditions:
n 50% of the performance RSUs vests subject to a Total Shareholder
Return (“TSR”) condition;
n 50% of the performance RSUs vests subject to an EBITDA1-based
performance condition.
2019 UNIVERSAL REGISTRATION DOCUMENT 223
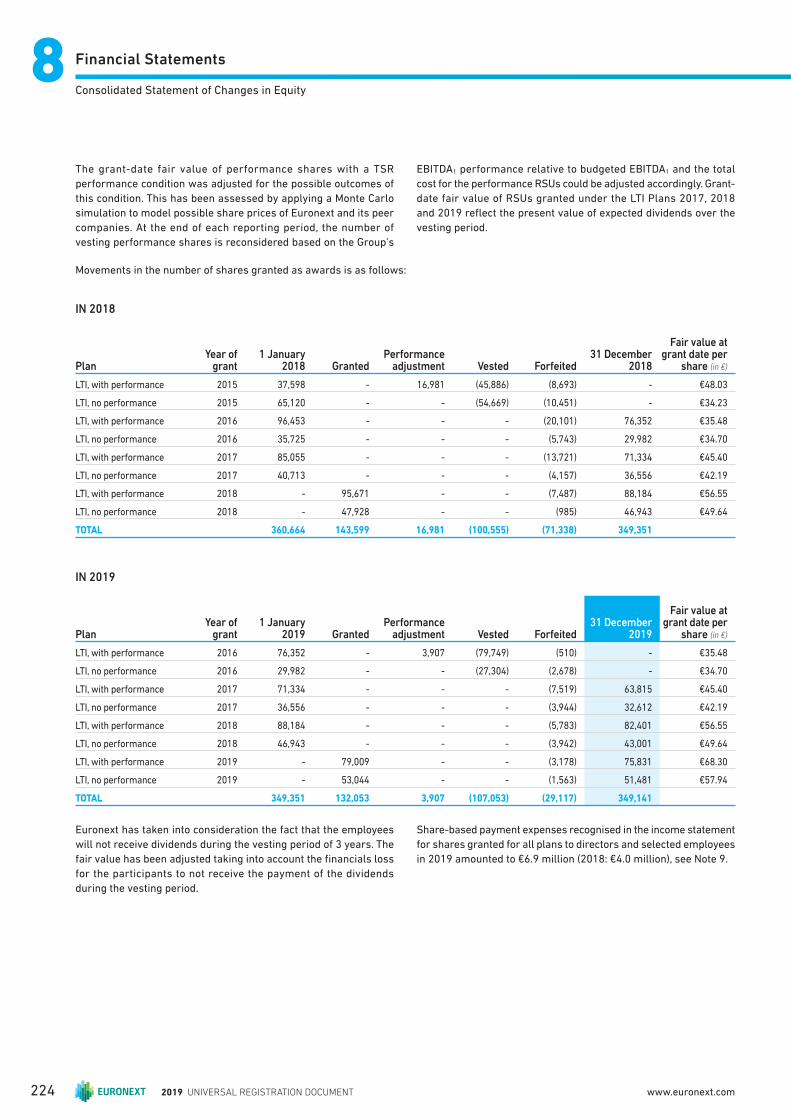
Financial Statements88Consolidated Statement of Changes in Equity
The grant-date fair value of performance shares with a TSR
performance condition was adjusted for the possible outcomes of
this condition. This has been assessed by applying a Monte Carlo
simulation to model possible share prices of Euronext and its peer
companies. At the end of each reporting period, the number of
vesting performance shares is reconsidered based on the Group’s
EBITDA1 performance relative to budgeted EBITDA1 and the total
cost for the performance RSUs could be adjusted accordingly. Grant-
date fair value of RSUs granted under the LTI Plans 2017, 2018
and 2019 refl ect the present value of expected dividends over the
vesting period.
Movements in the number of shares granted as awards is as follows:
IN 2018
PlanYear of
grant1 January
2018 GrantedPerformance
adjustment Vested Forfeited31 December
2018
Fair value at grant date per
share (in €)
LTI, with performance 2015 37,598 - 16,981 (45,886) (8,693) - €48.03
LTI, no performance 2015 65,120 - - (54,669) (10,451) - €34.23
LTI, with performance 2016 96,453 - - - (20,101) 76,352 €35.48
LTI, no performance 2016 35,725 - - - (5,743) 29,982 €34.70
LTI, with performance 2017 85,055 - - - (13,721) 71,334 €45.40
LTI, no performance 2017 40,713 - - - (4,157) 36,556 €42.19
LTI, with performance 2018 - 95,671 - - (7,487) 88,184 €56.55
LTI, no performance 2018 - 47,928 - - (985) 46,943 €49.64
TOTAL 360,664 143,599 16,981 (100,555) (71,338) 349,351
IN 2019
PlanYear of
grant1 January
2019 GrantedPerformance
adjustment Vested Forfeited31 December
2019
Fair value at grant date per
share (in €)
LTI, with performance 2016 76,352 - 3,907 (79,749) (510) - €35.48
LTI, no performance 2016 29,982 - - (27,304) (2,678) - €34.70
LTI, with performance 2017 71,334 - - - (7,519) 63,815 €45.40
LTI, no performance 2017 36,556 - - - (3,944) 32,612 €42.19
LTI, with performance 2018 88,184 - - - (5,783) 82,401 €56.55
LTI, no performance 2018 46,943 - - - (3,942) 43,001 €49.64
LTI, with performance 2019 - 79,009 - - (3,178) 75,831 €68.30
LTI, no performance 2019 - 53,044 - - (1,563) 51,481 €57.94
TOTAL 349,351 132,053 3,907 (107,053) (29,117) 349,141
Euronext has taken into consideration the fact that the employees
will not receive dividends during the vesting period of 3 years. The
fair value has been adjusted taking into account the fi nancials loss
for the participants to not receive the payment of the dividends
during the vesting period.
Share-based payment expenses recognised in the income statement
for shares granted for all plans to directors and selected employees
in 2019 amounted to €6.9 million (2018: €4.0 million), see Note 9.
2019 UNIVERSAL REGISTRATION DOCUMENT224 www.euronext.com
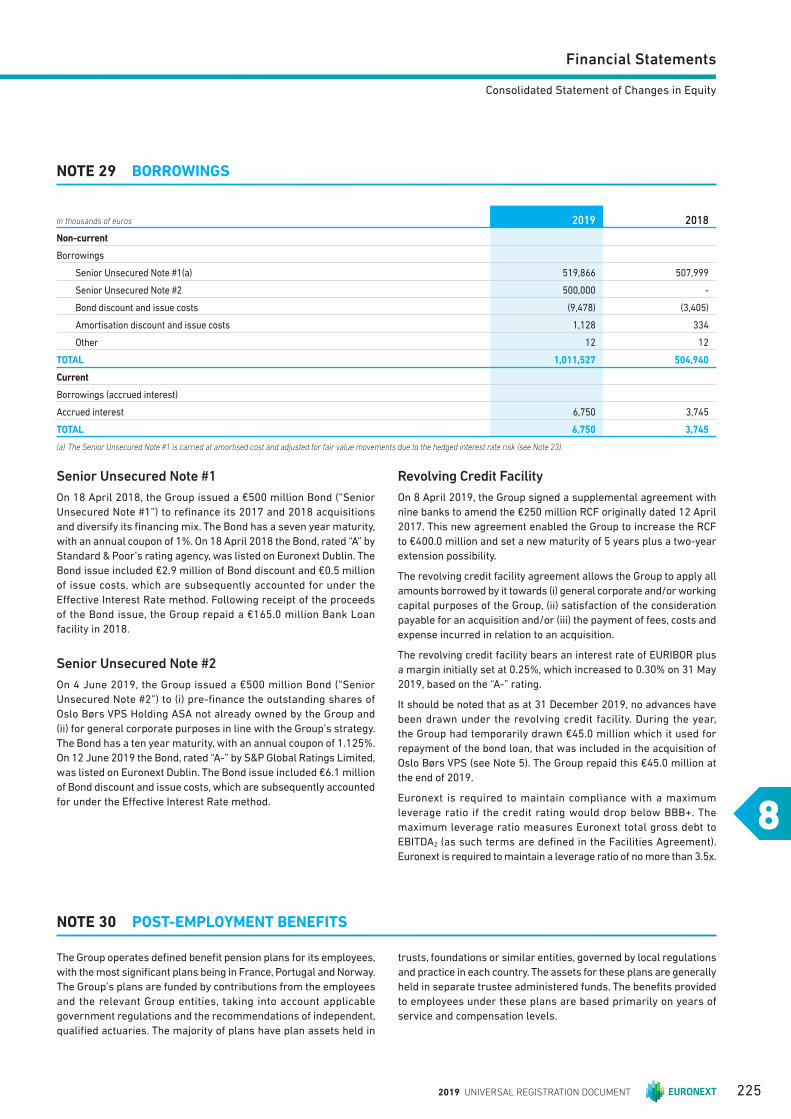
Financial Statements
8
Consolidated Statement of Changes in Equity
NOTE 29 BORROWINGS
In thousands of euros 2019 2018
Non-current
Borrowings
Senior Unsecured Note #1(a) 519,866 507,999
Senior Unsecured Note #2 500,000 -
Bond discount and issue costs (9,478) (3,405)
Amortisation discount and issue costs 1,128 334
Other 12 12
TOTAL 1,011,527 504,940
Current
Borrowings (accrued interest)
Accrued interest 6,750 3,745
TOTAL 6,750 3,745
(a) The Senior Unsecured Note #1 is carried at amortised cost and adjusted for fair value movements due to the hedged interest rate risk (see Note 23).
Senior Unsecured Note #1
On 18 April 2018, the Group issued a €500 million Bond (“Senior
Unsecured Note #1”) to refi nance its 2017 and 2018 acquisitions
and diversify its fi nancing mix. The Bond has a seven year maturity,
with an annual coupon of 1%. On 18 April 2018 the Bond, rated “A” by
Standard & Poor’s rating agency, was listed on Euronext Dublin. The
Bo nd issue included €2.9 million of Bond discount and €0.5 million
of issue costs, which are subsequently accounted for under the
Eff ective Interest Rate method. Following receipt of the proceeds
of the Bond issue, the Group repaid a €165.0 million Bank Loan
facility in 2018.
Senior U n secured Note #2
On 4 June 2019, the Group issued a €500 million Bond (“Senior
Unsecured Note #2”) to (i) pre-fi nance the outstanding shares of
Oslo Børs VPS Holding ASA not already owned by the Group and
(ii) for general corporate purposes in line with the Group’s strategy.
The Bond has a ten year maturity, with an annual coupon of 1.125%.
On 12 June 2019 the Bond, rated “A-” by S&P Global Ratings Limited,
was listed on Euronext Dublin. The Bond issue included €6.1 million
of Bond discount and issue costs, which are subsequently accounted
for under the Eff ective Interest Rate method.
Revolving Credit Facility
On 8 April 2019, the Group signed a supplemental agreement with
nine banks to amend the €250 million RCF originally dated 12 April
2017. This new agreement enabled the Group to increase the RCF
to €400.0 million and set a new maturity of 5 years plus a two-year
extension possibility.
The revolving credit facility agreement allows the Group to apply all
amounts borrowed by it towards (i) general corporate and/or working
capital purposes of the Group, (ii) satisfaction of the consideration
payable for an acquisition and/or (iii) the payment of fees, costs and
expense incurred in relation to an acquisition.
The revolving credit facility bears an interest rate of EURIBOR plus
a margin initially set at 0.25%, which increased to 0.30% on 31 May
2019, based on the “A-” rating.
It should be not ed that as at 31 December 2019, no advances have
been drawn under the revolving credit facility. During the year,
the Group had temporarily drawn €45.0 million which it used for
repayment of the bond loan, that was included in the acquisition of
Oslo Børs VPS (see Note 5). The Group repaid this €45.0 million at
the end of 2019.
Euronext is required to maintain compliance with a maximum
leverage ratio if the credit rating would drop below BBB+. The
maximum leverage ratio measures Euronext total gross debt to
EBITDA2 (as such terms are defi ned in the Facilities Agreement).
Euronext is required to maintain a leverage ratio of no more than 3.5x.
NOTE 30 POST-EMPLOYMENT BENEFITS
The Group operates defi ned benefi t pension plans for its employees,
with the most signifi cant plans being in France, Portugal and Norway.
The Group’s plans are funded by contributions from the employees
and the relevant Group entities, taking into account applicable
government regulations and the recommendations of independent,
qualifi ed actuaries. The majority of plans have plan assets held in
trusts, foundations or similar entities, governed by local regulations
and practice in each country. The assets for these plans are generally
held in separate trustee administered funds. The benefi ts provided
to employees under these plans are based primarily on years of
service and compensation levels.
2019 UNIVERSAL REGISTRATION DOCUMENT 225
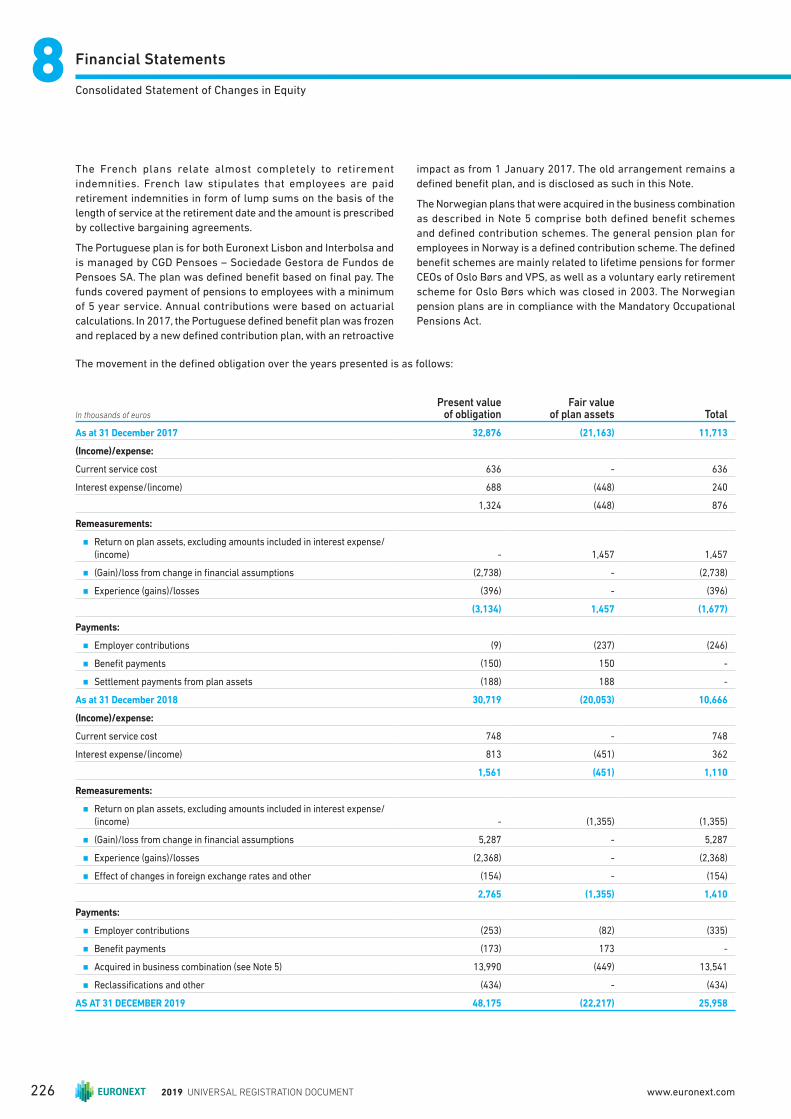
Financial Statements88Consolidated Statement of Changes in Equity
The movement in the defi ned obligation over the years presented is as follows:
In thousands of euros
Present value of obligation
Fair value of plan assets Total
As at 31 December 2017 32,876 (21,163) 11,713
(Income)/expense:
Current service cost 636 - 636
Interest expense/(income) 688 (448) 240
1,324 (448) 876
Remeasurements:
n Return on plan assets, excluding amounts included in interest expense/
(income) - 1,457 1,457
n (Gain)/loss from change in fi nancial assumptions (2,738) - (2,738)
n Experience (gains)/losses (396) - (396)
(3,134) 1,457 (1,677)
Payments:
n Employer contributions (9) (237) (246)
n Benefi t payments (150) 150 -
n Settlement payments from plan assets (188) 188 -
As at 31 December 2018 30,719 (20,053) 10,666
(Income)/expense:
Current service cost 748 - 748
Interest expense/(income) 813 (451) 362
1,561 (451) 1,110
Remeasurements:
n Return on plan assets, excluding amounts included in interest expense/(income) - (1,355) (1,355)
n (Gain)/loss from change in fi nancial assumptions 5,287 - 5,287
n Experience (gains)/losses (2,368) - (2,368)
n Eff ect of changes in foreign exchange rates and other (154) - (154)
2,765 (1,355) 1,410
Payments:
n Employer contributions (253) (82) (335)
n Benefi t payments (173) 173 -
n Acquired in business combination (see Note 5) 13,990 (449) 13,541
n Reclassifi cations and other (434) - (434)
AS AT 31 DECEMBER 2019 48,175 (22,217) 25,958
The French plans relate almost completely to retirement
indemnities. French law stipulates that employees are paid
retirement indemnities in form of lump sums on the basis of the
length of service at the retirement date and the amount is prescribed
by collective bargaining agreements.
The Portuguese plan is for both Euronext Lisbon and Interbolsa and
is managed by CGD Pensoes – Sociedade Gestora de Fundos de
Pensoes SA. The plan was defi ned benefi t based on fi nal pay. The
funds covered payment of pensions to employees with a minimum
of 5 year service. Annual contributions were based on actuarial
calculations. In 2017, the Portuguese defi ned benefi t plan was frozen
and replaced by a new defi ned contribution plan, with an retroactive
impact as from 1 January 2017. The old arrangement remains a
defi ned benefi t plan, and is disclosed as such in this Note.
The Norwegian plans that were acquired in the business combination
as described in Note 5 comprise both defined benefit schemes
and defi ned contribution schemes. The general pension plan for
employees in Norway is a defi ned contribution scheme. The defi ned
benefi t schemes are mainly related to lifetime pensions for former
CEOs of Oslo Børs and VPS, as well as a voluntary early retirement
scheme for Oslo Børs which was closed in 2003. The Norwegian
pension plans are in compliance with the Mandatory Occupational
Pensions Act.
2019 UNIVERSAL REGISTRATION DOCUMENT226 www.euronext.com
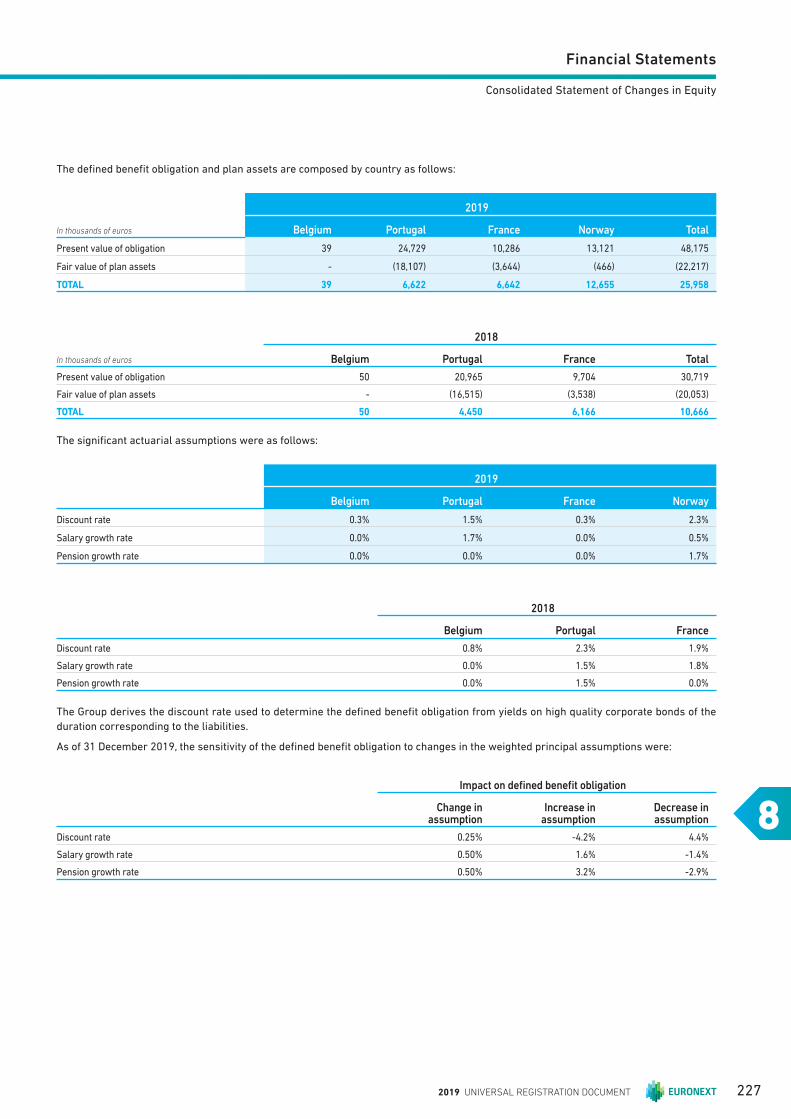
Financial Statements
8
Consolidated Statement of Changes in Equity
The defi ned benefi t obligation and plan assets are composed by country as follows:
In thousands of euros
2019
Belgium Portugal France Norway Total
Present value of obligation 39 24,729 10,286 13,121 48,175
Fair value of plan assets - (18,107) (3,644) (466) (22,217)
TOTAL 39 6,622 6,642 12,655 25,958
In thousands of euros
2018
Belgium Portugal France Total
Present value of obligation 50 20,965 9,704 30,719
Fair value of plan assets - (16,515) (3,538) (20,053)
TOTAL 50 4,450 6,166 10,666
The signifi cant actuarial assumptions were as follows:
2019
Belgium Portugal France Norway
Discount rate 0.3% 1.5% 0.3% 2.3%
Salary growth rate 0.0% 1.7% 0.0% 0.5%
Pension growth rate 0.0% 0.0% 0.0% 1.7%
2018
Belgium Portugal France
Discount rate 0.8% 2.3% 1.9%
Salary growth rate 0.0% 1.5% 1.8%
Pension growth rate 0.0% 1.5% 0.0%
The Group derives the discount rate used to determine the defi ned benefi t obligation from yields on high quality corporate bonds of the
duration corresponding to the liabilities.
As of 31 December 2019, the sensitivity of the defi ned benefi t obligation to changes in the weighted principal assumptions were:
Impact on defi ned benefi t obligation
Change in assumption
Increase in assumption
Decrease in assumption
Discount rate 0.25% -4.2% 4.4%
Salary growth rate 0.50% 1.6% -1.4%
Pension growth rate 0.50% 3.2% -2.9%
2019 UNIVERSAL REGISTRATION DOCUMENT 227
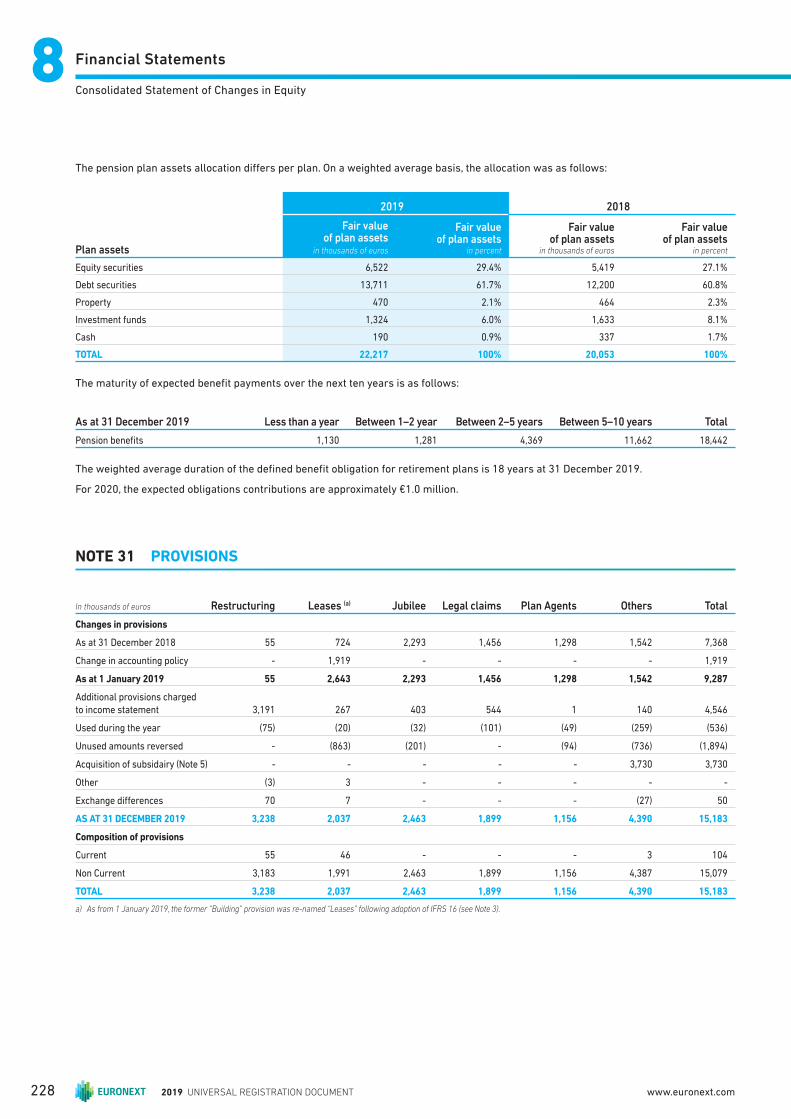
Financial Statements88Consolidated Statement of Changes in Equity
The pension plan assets allocation diff ers per plan. On a weighted average basis, the allocation was as follows:
Plan assets
2019 2018
Fair value of plan assets
in thousands of euros
Fair value of plan assets
in percent
Fair value of plan assets
in thousands of euros
Fair value of plan assets
in percent
Equity securities 6,522 29.4% 5,419 27.1%
Debt securities 13,711 61.7% 12,200 60.8%
Property 470 2.1% 464 2.3%
Investment funds 1,324 6.0% 1,633 8.1%
Cash 190 0.9% 337 1.7%
TOTAL 22,217 100% 20,053 100%
The maturity of expected benefi t payments over the next ten years is as follows:
As at 31 December 2019 Less than a year Between 1–2 year Between 2–5 years Between 5–10 years Total
Pension benefi ts 1,130 1,281 4,369 11,662 18,442
The weighted average duration of the defi ned benefi t obligation for retirement plans is 18 years at 31 December 2019.
For 2020, the expected obligations contributions are approximately €1.0 million.
NOTE 31 PROVISIONS
In thousands of euros Restructuring Leases (a) Jubilee Legal claims Plan Agents Others Total
Changes in provisions
As at 31 December 2018 55 724 2,293 1,456 1,298 1,542 7,368
Change in accounting policy - 1,919 - - - - 1,919
As at 1 January 2019 55 2,643 2,293 1,456 1,298 1,542 9,287
Additional provisions charged to income statement 3,191 267 403 544 1 140 4,546
Used during the year (75) (20) (32) (101) (49) (259) (536)
Unused amounts reversed - (863) (201) - (94) (736) (1,894)
Acquisition of subsidairy (Note 5) - - - - - 3,730 3,730
Other (3) 3 - - - - -
Exchange diff erences 70 7 - - - (27) 50
AS AT 31 DECEMBER 2019 3,238 2,037 2,463 1,899 1,156 4,390 15,183
Composition of provisions
Current 55 46 - - - 3 104
Non Current 3,183 1,991 2,463 1,899 1,156 4,387 15,079
TOTAL 3,238 2,037 2,463 1,899 1,156 4,390 15,183
a) As from 1 January 2019, the former “Building” provision was re-named “Leases” following adoption of IFRS 16 (see Note 3).
2019 UNIVERSAL REGISTRATION DOCUMENT228 www.euronext.com
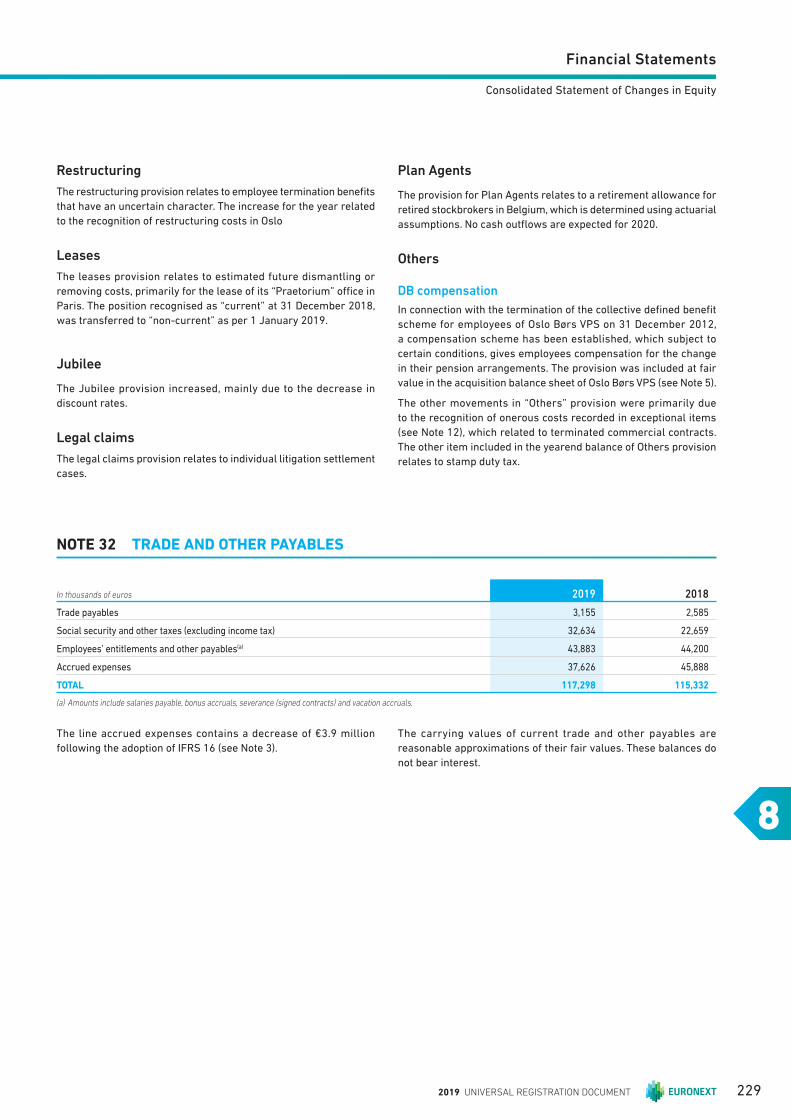
Financial Statements
8
Consolidated Statement of Changes in Equity
NOTE 32 TRADE AND OTHER PAYABLES
In thousands of euros 2019 2018
Trade payables 3,155 2,585
Social security and other taxes (excluding income tax) 32,634 22,659
Employees’ entitlements and other payables(a) 43,883 44,200
Accrued expenses 37,626 45,888
TOTAL 117,298 115,332
(a) Amounts include salaries payable, bonus accruals, severance (signed contracts) and vacation accruals.
The line accrued expenses contains a decrease of €3.9 million
following the adoption of IFRS 16 (see Note 3).
The carrying values of current trade and other payables are
reasonable approximations of their fair values. These balances do
not bear interest.
Restructuring
The restructuring provision relates to employee termination benefi ts
that have an uncertain character. The increase for the year related
to the recognition of restructuring costs in Oslo
Leases
The leases provision relates to estimated future dismantling or
removing costs, primarily for the lease of its “Praetorium” offi ce in
Paris. The position recognised as “current” at 31 December 2018,
was transferred to “non-current” as per 1 January 2019.
Jubilee
The Jubilee provision increased, mainly due to the decrease in
discount rates.
Legal claims
The legal claims provision relates to individual litigation settlement
cases.
Plan Agents
The provision for Plan Agents relates to a retirement allowance for
retired stockbrokers in Belgium, which is determined using actuarial
assumptions. No cash outfl ows are expected for 2020.
Others
DB compensation
In connection with the termination of the collective defi ned benefi t
scheme for employees of Oslo Børs VPS on 31 December 2012,
a compensation scheme has been established, which subject to
certain conditions, gives employees compensation for the change
in their pension arrangements. The provision was included at fair
value in the acquisition balance sheet of Oslo Børs VPS (see Note 5).
The other movements in “Others” provision were primarily due
to the recognition of onerous costs recorded in exceptional items
(see Note 12), which related to terminated commercial contracts.
The other item included in the yearend balance of Others provision
relates to stamp duty tax.
2019 UNIVERSAL REGISTRATION DOCUMENT 229
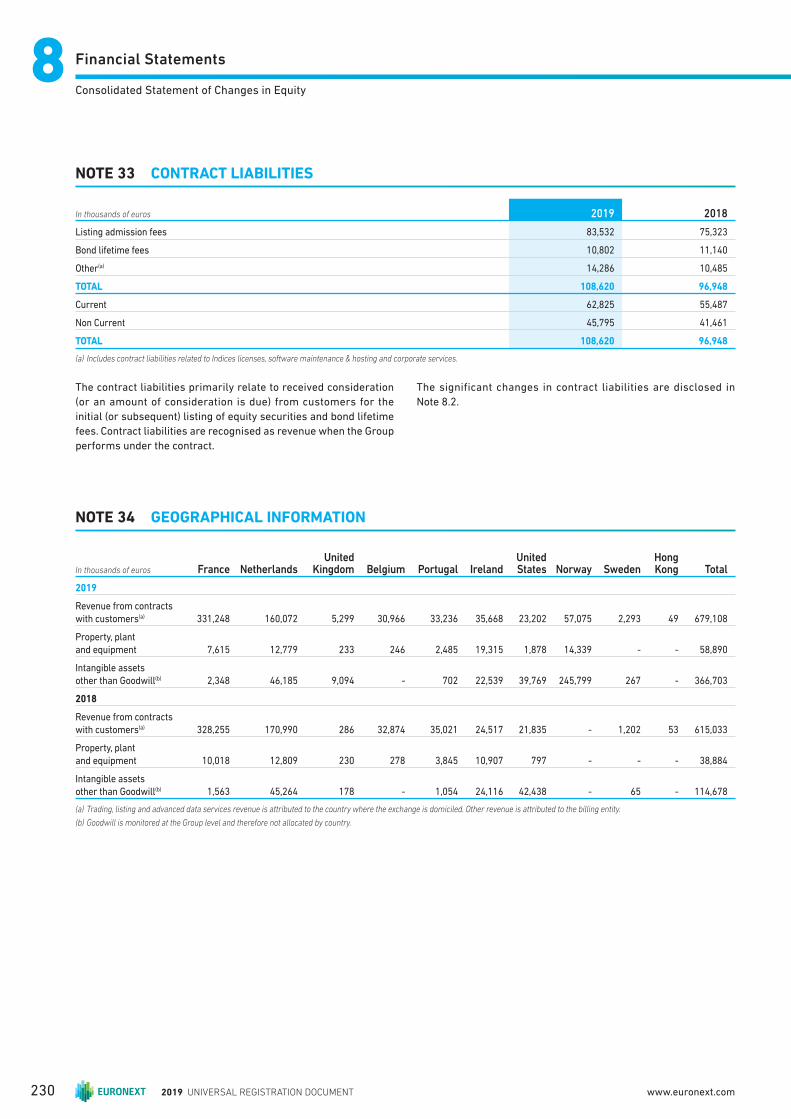
Financial Statements88Consolidated Statement of Changes in Equity
NOTE 34 GEOGRAPHICAL INFORMATION
In thousands of euros France NetherlandsUnited
Kingdom Belgium Portugal IrelandUnited States Norway Sweden
Hong Kong Total
2019
Revenue from contracts
with customers(a) 331,248 160,072 5,299 30,966 33,236 35,668 23,202 57,075 2,293 49 679,108
Property, plant
and equipment 7,615 12,779 233 246 2,485 19,315 1,878 14,339 - - 58,890
Intangible assets
other than Goodwill(b) 2,348 46,185 9,094 - 702 22,539 39,769 245,799 267 - 366,703
2018
Revenue from contracts with customers(a) 328,255 170,990 286 32,874 35,021 24,517 21,835 - 1,202 53 615,033
Property, plant
and equipment 10,018 12,809 230 278 3,845 10,907 797 - - - 38,884
Intangible assets
other than Goodwill(b) 1,563 45,264 178 - 1,054 24,116 42,438 - 65 - 114,678
(a) Trading, listing and advanced data services revenue is attributed to the country where the exchange is domiciled. Other revenue is attributed to the billing entity.
(b) Goodwill is monitored at the Group level and therefore not allocated by country.
NOTE 33 CONTRACT LIABILITIES
In thousands of euros 2019 2018
Listing admission fees 83,532 75,323
Bond lifetime fees 10,802 11,140
Other(a) 14,286 10,485
TOTAL 108,620 96,948
Current 62,825 55,487
Non Current 45,795 41,461
TOTAL 108,620 96,948
(a) Includes contract liabilities related to Indices licenses, software maintenance & hosting and corporate services.
The contract liabilities primarily relate to received consideration
(or an amount of consideration is due) from customers for the
initial (or subsequent) listing of equity securities and bond lifetime
fees. Contract liabilities are recognised as revenue when the Group
performs under the contract.
The significant changes in contract liabilities are disclosed in
Note 8.2.
2019 UNIVERSAL REGISTRATION DOCUMENT230 www.euronext.com
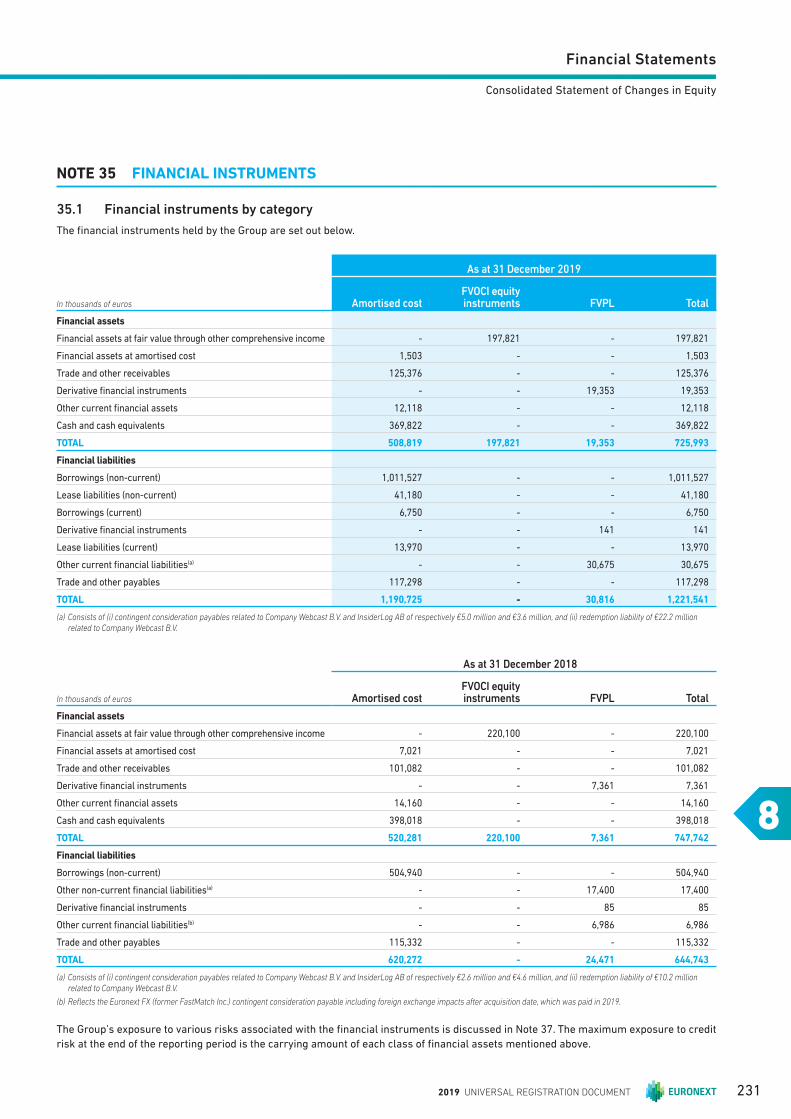
Financial Statements
8
Consolidated Statement of Changes in Equity
NOTE 35 FINANCIAL INSTRUMENTS
35.1 Financial instruments by category
The fi nancial instruments held by the Group are set out below.
In thousands of euros
As at 31 December 2019
Amortised costFVOCI equity instruments FVPL Total
Financial assets
Financial assets at fair value through other comprehensive income - 197,821 - 197,821
Financial assets at amortised cost 1,503 - - 1,503
Trade and other receivables 125,376 - - 125,376
Derivative fi nancial instruments - - 19,353 19,353
Other current fi nancial assets 12,118 - - 12,118
Cash and cash equivalents 369,822 - - 369,822
TOTAL 508,819 197,821 19,353 725,993
Financial liabilities
Borrowings (non-current) 1,011,527 - - 1,011,527
Lease liabilities (non-current) 41,180 - - 41,180
Borrowings (current) 6,750 - - 6,750
Derivative fi nancial instruments - - 141 141
Lease liabilities (current) 13,970 - - 13,970
Other current fi nancial liabilities(a) - - 30,675 30,675
Trade and other payables 117,298 - - 117,298
TOTAL 1,190,725 - 30,816 1,221,541
(a) Consists of (i) contingent consideration payables related to Company Webcast B.V. and InsiderLog AB of respectively €5.0 million and €3.6 million, and (ii) redemption liability of €22.2 million related to Company Webcast B.V.
In thousands of euros
As at 31 December 2018
Amortised costFVOCI equity instruments FVPL Total
Financial assets
Financial assets at fair value through other comprehensive income - 220,100 - 220,100
Financial assets at amortised cost 7,021 - - 7,021
Trade and other receivables 101,082 - - 101,082
Derivative fi nancial instruments - - 7,361 7,361
Other current fi nancial assets 14,160 - - 14,160
Cash and cash equivalents 398,018 - - 398,018
TOTAL 520,281 220,100 7,361 747,742
Financial liabilities
Borrowings (non-current) 504,940 - - 504,940
Other non-current fi nancial liabilities(a) - - 17,400 17,400
Derivative fi nancial instruments - - 85 85
Other current fi nancial liabilities(b) - - 6,986 6,986
Trade and other payables 115,332 - - 115,332
TOTAL 620,272 - 24,471 644,743
(a) Consists of (i) contingent consideration payables related to Company Webcast B.V. and InsiderLog AB of respectively €2.6 million and €4.6 million, and (ii) redemption liability of €10.2 million related to Company Webcast B.V.
(b) Refl ects the Euronext FX (former FastMatch Inc.) contingent consideration payable including foreign exchange impacts after acquisition date, which was paid in 2019.
The Group’s exposure to various risks associated with the fi nancial instruments is discussed in Note 37. The maximum exposure to credit
risk at the end of the reporting period is the carrying amount of each class of fi nancial assets mentioned above.
2019 UNIVERSAL REGISTRATION DOCUMENT 231
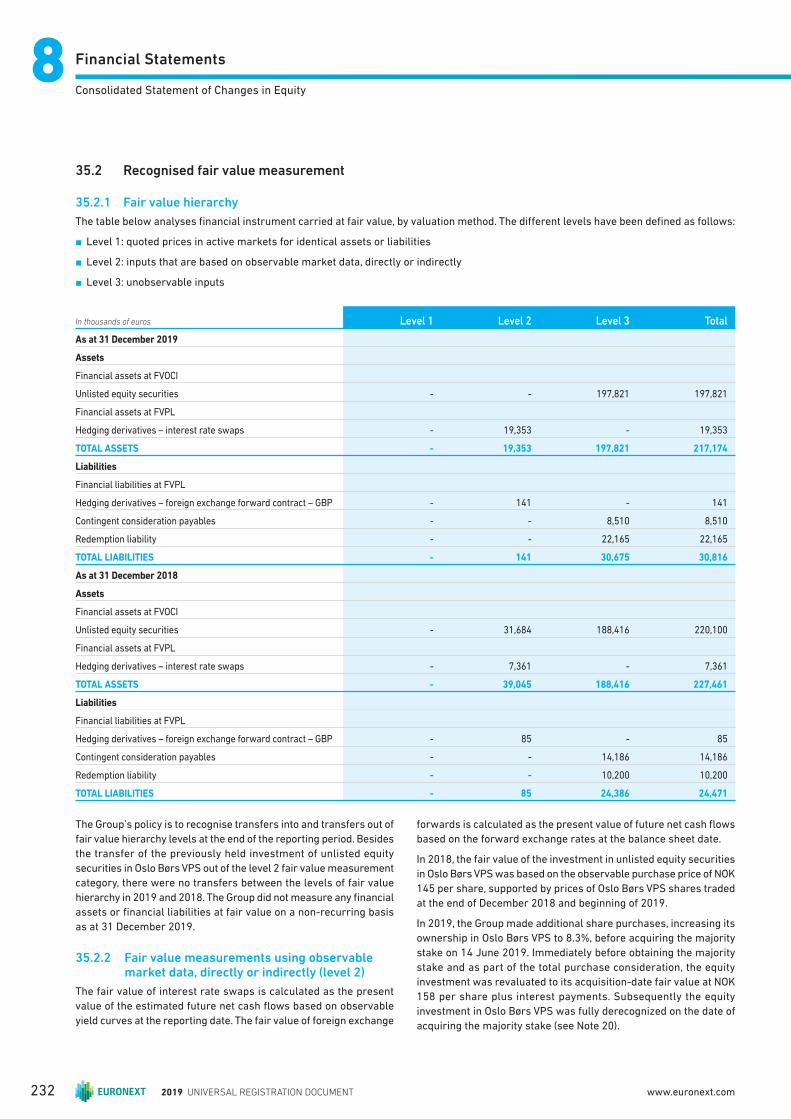
Financial Statements88Consolidated Statement of Changes in Equity
35.2 Recognised fair value measurement
35.2. 1 Fair value hierarchy
The table below analyses fi nancial instrument carried at fair value, by valuation method. The diff erent levels have been defi ned as follows:
n Level 1: quoted prices in active markets for identical assets or liabilities
n Level 2: inputs that are based on observable market data, directly or indirectly
n Level 3: unobservable inputs
In thousands of euros Level 1 Level 2 Level 3 Total
As at 31 December 2019
Assets
Financial assets at FVOCI
Unlisted equity securities - - 197,821 197,821
Financial assets at FVPL
Hedging derivatives – interest rate swaps - 19,353 - 19,353
TOTAL ASSETS - 19,353 197,821 217,174
Liabilities
Financial liabilities at FVPL
Hedging derivatives – foreign exchange forward contract – GBP - 141 - 141
Contingent consideration payables - - 8,510 8,510
Redemption liability - - 22,165 22,165
TOTAL LIABILITIES - 141 30,675 30,816
As at 31 December 2018
Assets
Financial assets at FVOCI
Unlisted equity securities - 31,684 188,416 220,100
Financial assets at FVPL
Hedging derivatives – interest rate swaps - 7,361 - 7,361
TOTAL ASSETS - 39,045 188,416 227,461
Liabilities
Financial liabilities at FVPL
Hedging derivatives – foreign exchange forward contract – GBP - 85 - 85
Contingent consideration payables - - 14,186 14,186
Redemption liability - - 10,200 10,200
TOTAL LIABILITIES - 85 24,386 24,471
The Group’s policy is to recognise transfers into and transfers out of
fair value hierarchy levels at the end of the reporting period. Besides
the transfer of the previously held investment of unlisted equity
securities in Oslo Børs VPS out of the level 2 fair value measurement
category, there were no transfers between the levels of fair value
hierarchy in 2019 and 2018. The Group did not measure any fi nancial
assets or fi nancial liabilities at fair value on a non-recurring basis
as at 31 December 2019.
35.2.2 Fair value measurements using observable market data, directly or indirectly (level 2)
The fair value of interest rate swaps is calculated as the present
value of the estimated future net cash fl ows based on observable
yield curves at the reporting date. The fair value of foreign exchange
forwards is calculated as the present value of future net cash fl ows
based on the forward exchange rates at the balance sheet date.
In 2018, the fair value of the investment in unlisted equity securities
in Oslo Børs VPS was based on the observable purchase price of NOK
145 per share, supported by prices of Oslo Børs VPS shares traded
at the end of December 2018 and beginning of 2019.
In 2019, the Group made additional share purchases, increasing its
ownership in Oslo Børs VPS to 8.3%, before acquiring the majority
stake on 14 June 2019. Immediately before obtaining the majority
stake and as part of the total purchase consideration, the equity
investment was revaluated to its acquisition-date fair value at NOK
158 per share plus interest payments. Subsequently the equity
investment in Oslo Børs VPS was fully derecognized on the date of
acquiring the majority stake (see Note 20).
2019 UNIVERSAL REGISTRATION DOCUMENT232 www.euronext.com

Financial Statements
8
Consolidated Statement of Changes in Equity
35.2.3 Fair value measurements using unobservable inputs (level 3)
The following table presents the changes in level 3 instruments for the period ended 31 December 2019:
In thousands of euros
Unlisted equity securities
Contingent consideration
payables Redemption liability Total
As at 31 December 2017 147,503 (8,454) (8,200) 130,849
Revaluations recognised in OCI 35,399 - - 35,399
Revaluations recognised in P&L - (1,200) (2,000) (3,200)
Acquisitions/(incurrences) 5,514 (4,200) - 1,314
Exchange diff erences - (332) - (332)
As at 31 December 2018 188,416 (14,186) (10,200) 164,030
Revaluations recognised in OCI 8,903 - - 8,903
Revaluations recognised in P&L - (1,310) (11,965) (13,275)
Additions 246 - - 246
Payments - 6,888 - 6,888
Acquisitions/(incurrences) 255 - - 255
Exchange diff erences - 98 - 98
As at 31 December 2019 197,821 (8,510) (22,165) 167,145
Valuation process
Concerning the valuation process for fair value measurement
categorised within level 3 of the fair value hierarchy, the Group’s
Central Treasury department collects and validates the available
level 3 inputs and performs the valuation according to the Group’s
valuation methodology for each reporting period. The fair value
estimates are discussed with-, and challenged by the Group
Finance Director and the Chief Financial Officer. Periodically
the values of investments categorized in “level 3” are validated
by staff with extensive knowledge of the industry in which the
invested companies operate. Although valuation techniques are
applied consistently as a principle, Management, upon advice from
the Group’s valuation experts, may decide to replace a valuation
technique if such a change would improve the quality or the
reliability of the valuation process.
Unlisted equity securities in Euroclear S.A./N.V. and Sicovam Holding S.A.
For measuring fair value of its long-term investments in unlisted
equity securities in Euroclear S.A./N.V. and Sicovam Holding S.A.,
the Group applies the Gordon Growth Model valuation technique as
its primary valuation method with return on equity and expected
dividend growth rate as key non-observable parameters. In 2018, the
Group considered also two observable transactions as part of fair
value estimation of those investments. In 2019, these two observable
transactions were considered again as part of fair value estimation
of those investments. In addition, for measuring the fair value of
Sicovam Holding S.A., the Group applied an illiquidity discount as an
unobservable input for which a sensitivity impact of +10%/(-10%)
would amount to a decrease or (increase) of €6.3 million in the fair
value (2018: €6.0 million). More information on the investments is
further disclosed in Note 20 .
The key assumptions used in the Gordon Growth Model valuation model are as follows:
2019
In thousands of euros
Fair value at 31 December 2019
Unobservable inputs*
Range of inputs (probaility-
weighted average)
Relationship of unobservable inputs to fair value
Increase decrease
Euroclear S.A./N.V. 140,401
Return on equity 7.9%–8.9% (8.4%)
4,283 (5,816)Expected dividend growth rate
0.73%–1.73% (1.23%)
Sicovam Holding S.A. 57,061
Return on equity 7.9%–8.9% (8.4%)
1,666 (2,262)Expected dividend growth rate
0.73%–1.73% (1.23%)
* There were no signifi cant inter-relationships between unobservable inputs that materially aff ect fair value
2019 UNIVERSAL REGISTRATION DOCUMENT 233

Financial Statements88Consolidated Statement of Changes in Equity
2018
In thousands of euros
Fair value at 31 December 2018
Unobservable inputs*
Range of inputs (probaility-
weighted average)
Relationship of unobservable inputs to fair value
Increase decrease
Euroclear Plc 133,843
Return on equity 7.5%–8.5% (8%)
5,914 (6,653)Expected dividend growth rate
1%–2% (1.5%)
Sicovam Holding S.A. 54,508
Return on equity 7.5%–8.5% (8%)
2,214 (2,674)Expected dividend growth rate
1%–2% (1.5%)
* There were no signifi cant inter-relationships between unobservable inputs that materially aff ect fair value.
The sensitivity analysis shows the impact on fair value using the most
favorable combination (increase), or least favorable combination
(decrease) of the unobservable inputs per investment in unlisted equity
securities.
Unlisted equity securities in Algomi Ltd.
Based on the companies’ going-concern outlook, the Group
considered the fair value of its investment in Algomi Ltd to be
zero, and revaluated this investment downwards by €9.6 million
accordingly, as per 31 December 2018. In 2019, fair value did not
change for this investment.
Contingent consideration payables and redemption liability
The contingent consideration payable of €6.9 million related to
Euronext FX (former FastMatch Inc.) was fully paid in 2019. The fair
value of the contingent consideration payable of €5.0 million related
to Company Webcast B.V. (including a revaluation of €2.4 million
in 2019 [2018: €0.8 million]) was estimated based on a multiple of
earnings and the average of actual 2016 and 2019 EBITDA3. The fair
value of the contingent consideration payable of €3.6 million related
to InsiderLog AB (including a devaluation of €1.0 million in 2019
[2018: €0.4 million]) was estimated based on EBITDA3 multiple.
The fair value of the redemption liability of €22.2 million related
to Company Webcast B.V. (including a revaluation of €12.0 million
in 2019 [2018: €2.0 million]) was estimated based on a multiple of
earnings and the 2019 EBITDA3.
35.2.4 Fair values of other fi nancial instruments
The Group also has a number of fi nancial instruments which are not
measured at fair value in the balance sheet. For these instruments
the fair values approximate their carrying amounts.
NOTE 36 RELATED PARTIES
36.1 Transactions with Related Parties
The Group has related party relationships with its associates and
joint ventures (as described in Note 7). Transactions with associates
and joint ventures are generally conducted with terms equivalent
to arm’s length transactions. Transactions between subsidiaries
are not included in the description as these are eliminated in
the Consolidated Financial Statements. The interests in Group
Companies are set out in Note 4.
The transactions with related parties and outstanding year-end balances are reported in the tables below:
In thousands of euros 2019 2018
Sales to related parties 50,158 55,668
Purchases from related parties 29,804 30,208
In thousands of euros
As at 31 December 2019
As at 31 December 2018
Receivables from related parties 2,191 3,472
Payables to related parties 381 -
2019 UNIVERSAL REGISTRATION DOCUMENT234 www.euronext.com
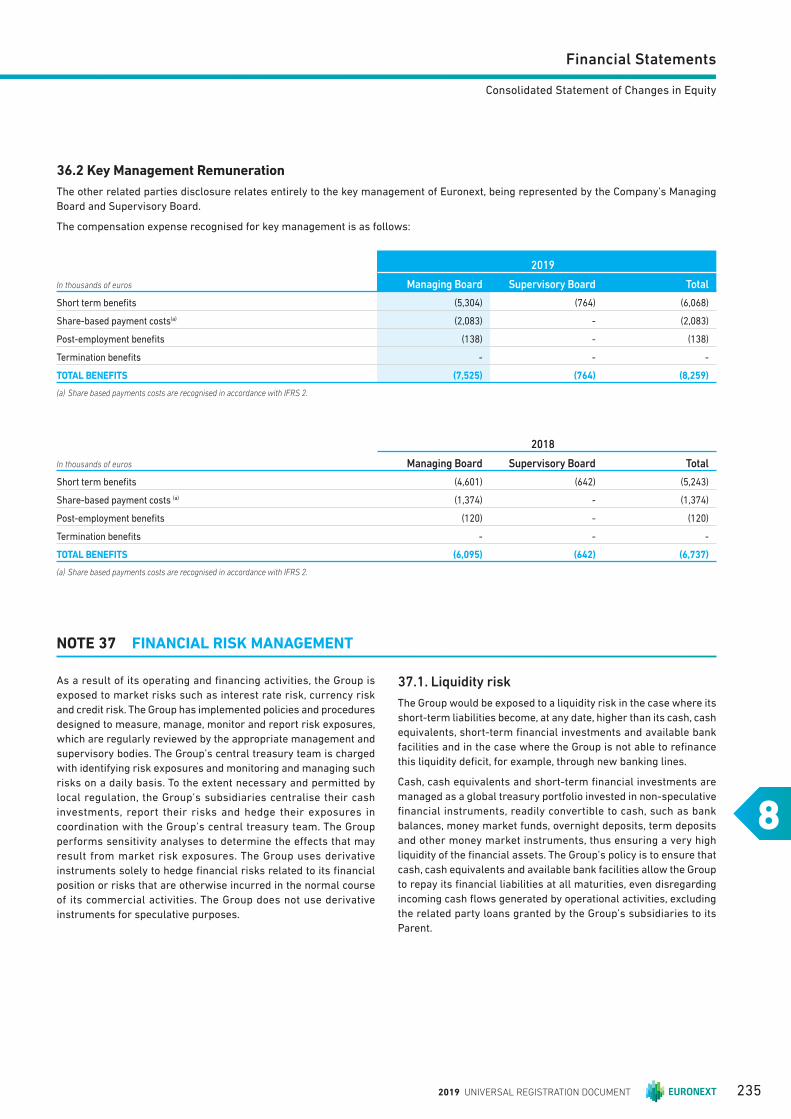
Financial Statements
8
Consolidated Statement of Changes in Equity
36.2 Key Management Remuneration
The other related parties disclosure relates entirely to the key management of Euronext, being represented by the Company’s Managing
Board and Supervisory Board.
The compensation expense recognised for key management is as follows:
In thousands of euros
2019
Managing Board Supervisory Board Total
Short term benefi ts (5,30 4) (764) (6,06 8)
Share-based payment costs(a) (2,083) - (2,083)
Post-employment benefi ts (138) - (138)
Termination benefi ts - - -
TOTAL BENEFITS (7,52 5) (764) (8, 259)
(a) Share based payments costs are recognised in accordance with IFRS 2.
In thousands of euros
2018
Managing Board Supervisory Board Total
Short term benefi ts (4,601) (642) (5,243)
Share-based payment costs (a) (1,374) - (1,374)
Post-employment benefi ts (120) - (120)
Termination benefi ts - - -
TOTAL BENEFITS (6,095) (642) (6,737)
(a) Share based payments costs are recognised in accordance with IFRS 2.
NOTE 37 FINANCIAL RISK MANAGEMENT
As a result of its operating and fi nancing activities, the Group is
exposed to market risks such as interest rate risk, currency risk
and credit risk. The Group has implemented policies and procedures
designed to measure, manage, monitor and report risk exposures,
which are regularly reviewed by the appropriate management and
supervisory bodies. The Group’s central treasury team is charged
with identifying risk exposures and monitoring and managing such
risks on a daily basis. To the extent necessary and permitted by
local regulation, the Group’s subsidiaries centralise their cash
investments, report their risks and hedge their exposures in
coordination with the Group’s central treasury team. The Group
performs sensitivity analyses to determine the eff ects that may
result from market risk exposures. The Group uses derivative
instruments solely to hedge fi nancial risks related to its fi nancial
position or risks that are otherwise incurred in the normal course
of its commercial activities. The Group does not use derivative
instruments for speculative purposes.
37.1. Liquidity risk
The Group would be exposed to a liquidity risk in the case where its
short-term liabilities become, at any date, higher than its cash, cash
equivalents, short-term fi nancial investments and available bank
facilities and in the case where the Group is not able to refi nance
this liquidity defi cit, for example, through new banking lines.
Cash, cash equivalents and short-term fi nancial investments are
managed as a global treasury portfolio invested in non-speculative
fi nancial instruments, readily convertible to cash, such as bank
balances, money market funds, overnight deposits, term deposits
and other money market instruments, thus ensuring a very high
liquidity of the fi nancial assets. The Group’s policy is to ensure that
cash, cash equivalents and available bank facilities allow the Group
to repay its fi nancial liabilities at all maturities, even disregarding
incoming cash fl ows generated by operational activities, excluding
the related party loans granted by the Group’s subsidiaries to its
Parent.
2019 UNIVERSAL REGISTRATION DOCUMENT 235
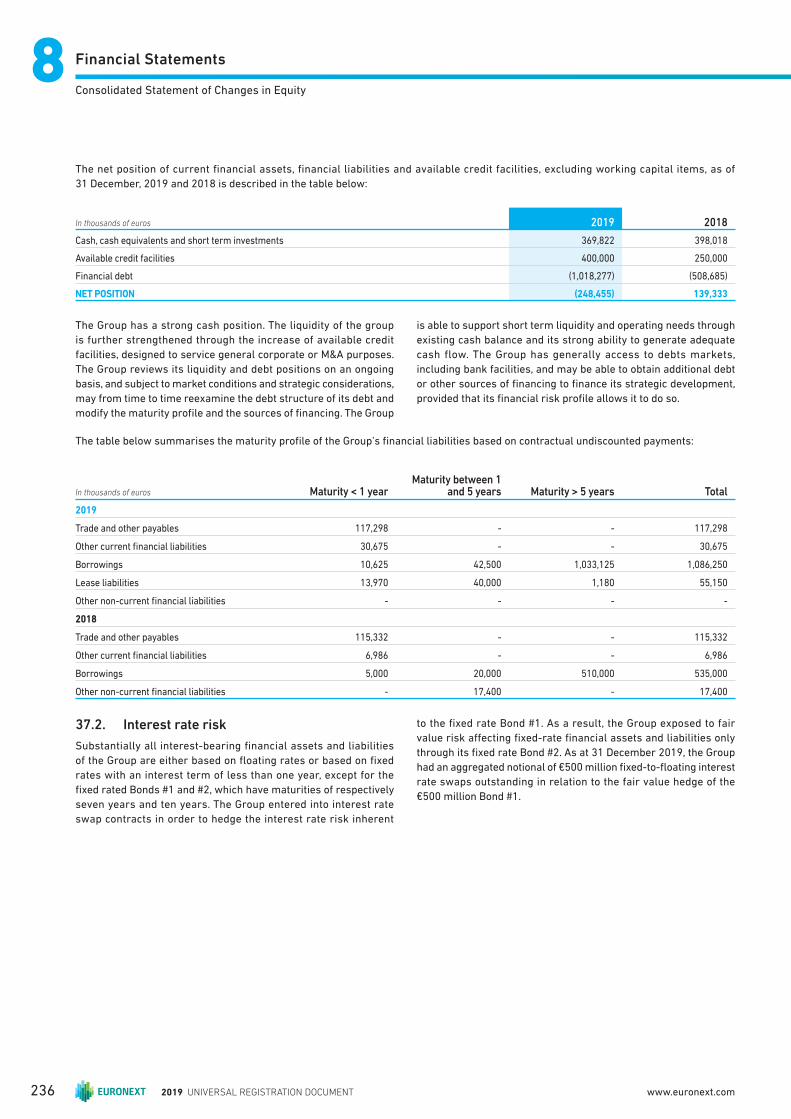
Financial Statements88Consolidated Statement of Changes in Equity
The net position of current fi nancial assets, fi nancial liabilities and available credit facilities, excluding working capital items, as of
31 December, 2019 and 2018 is described in the table below:
In thousands of euros 2019 2018
Cash, cash equivalents and short term investments 369,822 398,018
Available credit facilities 400,000 250,000
Financial debt (1,018,277) (508,685)
NET POSITION (248,455) 139,333
The Group has a strong cash position. The liquidity of the group
is further strengthened through the increase of available credit
facilities, designed to service general corporate or M&A purposes.
The Group reviews its liquidity and debt positions on an ongoing
basis, and subject to market conditions and strategic considerations,
may from time to time reexamine the debt structure of its debt and
modify the maturity profi le and the sources of fi nancing. The Group
is able to support short term liquidity and operating needs through
existing cash balance and its strong ability to generate adequate
cash flow. The Group has generally access to debts markets,
including bank facilities, and may be able to obtain additional debt
or other sources of fi nancing to fi nance its strategic development,
provided that its fi nancial risk profi le allows it to do so.
The table below summarises the maturity profi le of the Group’s fi nancial liabilities based on contractual undiscounted payments:
In thousands of euros Maturity < 1 yearMaturity between 1
and 5 years Maturity > 5 years Total
2019
Trade and other payables 117,298 - - 117,298
Other current fi nancial liabilities 30,675 - - 30,675
Borrowings 10,625 42,500 1,033,125 1,086,250
Lease liabilities 13,970 40,000 1,180 55,150
Other non-current fi nancial liabilities - - - -
2018
Trade and other payables 115,332 - - 115,332
Other current fi nancial liabilities 6,986 - - 6,986
Borrowings 5,000 20,000 510,000 535,000
Other non-current fi nancial liabilities - 17,400 - 17,400
37.2. Interest rate risk
Substantially all interest-bearing fi nancial assets and liabilities
of the Group are either based on fl oating rates or based on fi xed
rates with an interest term of less than one year, except for the
fi xed rated Bonds #1 and #2, which have maturities of respectively
seven years and ten years. The Group entered into interest rate
swap contracts in order to hedge the interest rate risk inherent
to the fi xed rate Bond #1. As a result, the Group exposed to fair
value risk aff ecting fi xed-rate fi nancial assets and liabilities only
through its fi xed rate Bond #2. As at 31 December 2019, the Group
had an aggregated notional of €500 million fi xed-to-fl oating interest
rate swaps outstanding in relation to the fair value hedge of the
€500 million Bond #1.
2019 UNIVERSAL REGISTRATION DOCUMENT236 www.euronext.com
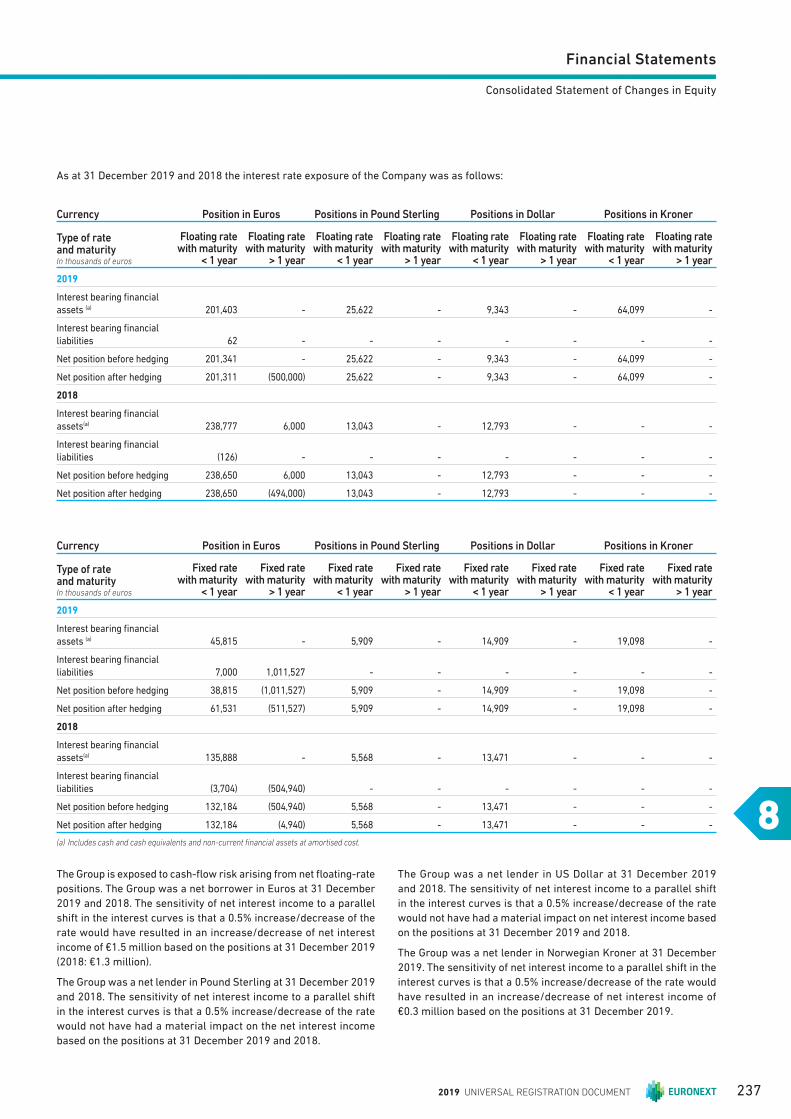
Financial Statements
8
Consolidated Statement of Changes in Equity
As at 31 December 2019 and 2018 the interest rate exposure of the Company was as follows:
Currency Position in Euros Positions in Pound Sterling Positions in Dollar Positions in Kroner
Type of rate and maturityIn thousands of euros
Floating rate with maturity
< 1 year
Floating rate with maturity
> 1 year
Floating rate with maturity
< 1 year
Floating rate with maturity
> 1 year
Floating rate with maturity
< 1 year
Floating rate with maturity
> 1 year
Floating rate with maturity
< 1 year
Floating rate with maturity
> 1 year
2019
Interest bearing fi nancial assets (a) 201,403 - 25,622 - 9,343 - 64,099 -
Interest bearing fi nancial liabilities 62 - - - - - - -
Net position before hedging 201,341 - 25,622 - 9,343 - 64,099 -
Net position after hedging 201,311 (500,000) 25,622 - 9,343 - 64,099 -
2018
Interest bearing fi nancial assets(a) 238,777 6,000 13,043 - 12,793 - - -
Interest bearing fi nancial
liabilities (126) - - - - - - -
Net position before hedging 238,650 6,000 13,043 - 12,793 - - -
Net position after hedging 238,650 (494,000) 13,043 - 12,793 - - -
Currency Position in Euros Positions in Pound Sterling Positions in Dollar Positions in Kroner
Type of rate and maturityIn thousands of euros
Fixed rate with maturity
< 1 year
Fixed rate with maturity
> 1 year
Fixed rate with maturity
< 1 year
Fixed rate with maturity
> 1 year
Fixed rate with maturity
< 1 year
Fixed rate with maturity
> 1 year
Fixed rate with maturity
< 1 year
Fixed rate with maturity
> 1 year
2019
Interest bearing fi nancial
assets (a) 45,815 - 5,909 - 14,909 - 19,098 -
Interest bearing fi nancial
liabilities 7,000 1,011,527 - - - - - -
Net position before hedging 38,815 (1,011,527) 5,909 - 14,909 - 19,098 -
Net position after hedging 61,531 (511,527) 5,909 - 14,909 - 19,098 -
2018
Interest bearing fi nancial assets(a) 135,888 - 5,568 - 13,471 - - -
Interest bearing fi nancial
liabilities (3,704) (504,940) - - - - - -
Net position before hedging 132,184 (504,940) 5,568 - 13,471 - - -
Net position after hedging 132,184 (4,940) 5,568 - 13,471 - - -
(a) Includes cash and cash equivalents and non-current fi nancial assets at amortised cost.
The Group is exposed to cash-fl ow risk arising from net fl oating-rate
positions. The Group was a net borrower in Euros at 31 December
2019 and 2018. The sensitivity of net interest income to a parallel
shift in the interest curves is that a 0.5% increase/decrease of the
rate would have resulted in an increase/decrease of net interest
income of €1.5 million based on the positions at 31 December 2019
(2018: €1.3 million).
The Group was a net lender in Pound Sterling at 31 December 2019
and 2018. The sensitivity of net interest income to a parallel shift
in the interest curves is that a 0.5% increase/decrease of the rate
would not have had a material impact on the net interest income
based on the positions at 31 December 2019 and 2018.
The Group was a net lender in US Dollar at 31 December 2019
and 2018. The sensitivity of net interest income to a parallel shift
in the interest curves is that a 0.5% increase/decrease of the rate
would not have had a material impact on net interest income based
on the positions at 31 December 2019 and 2018.
The Group was a net lender in Norwegian Kroner at 31 December
2019. The sensitivity of net interest income to a parallel shift in the
interest curves is that a 0.5% increase/decrease of the rate would
have resulted in an increase/decrease of net interest income of
€0.3 million based on the positions at 31 December 2019.
2019 UNIVERSAL REGISTRATION DOCUMENT 237
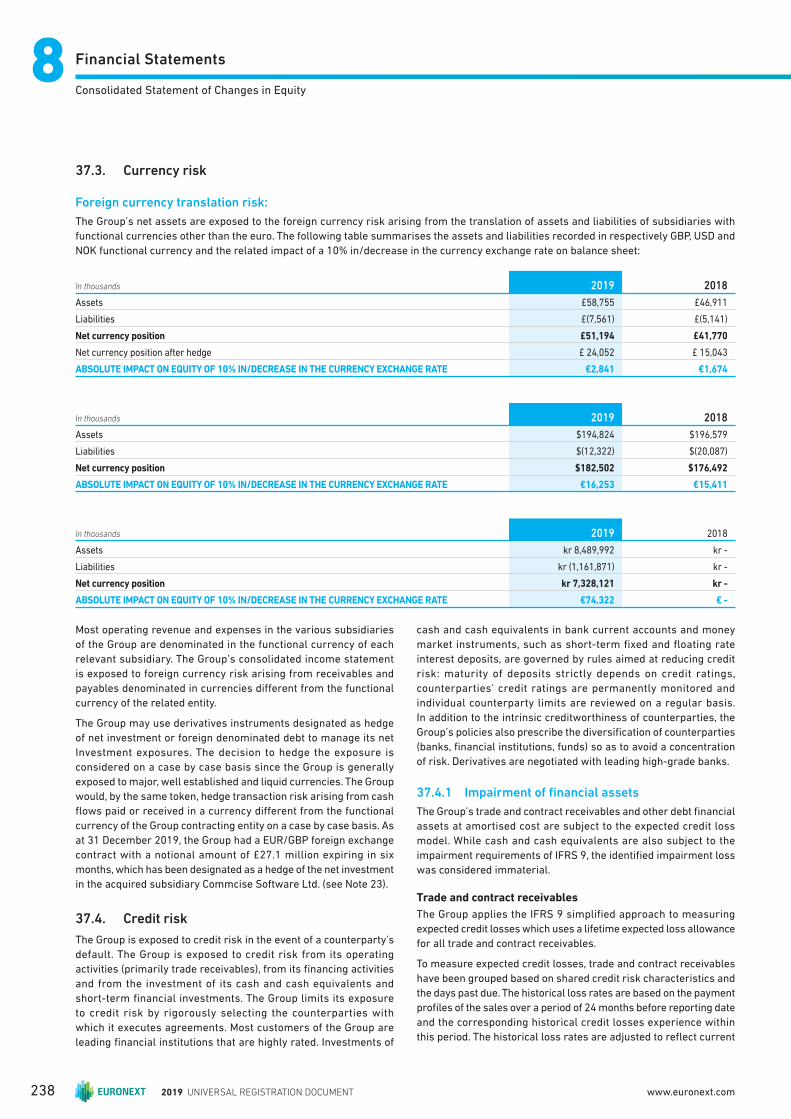
Financial Statements88Consolidated Statement of Changes in Equity
37.3. Currency risk
Foreign currency translation risk:
The Group’s net assets are exposed to the foreign currency risk arising from the translation of assets and liabilities of subsidiaries with
functional currencies other than the euro. The following table summarises the assets and liabilities recorded in respectively GBP, USD and
NOK functional currency and the related impact of a 10% in/decrease in the currency exchange rate on balance sheet:
In thousands 2019 2018
Assets £58,755 £46,911
Liabilities £(7,561) £(5,141)
Net currency position £51,194 £41,770
Net currency position after hedge £ 24,052 £ 15,043
ABSOLUTE IMPACT ON EQUITY OF 10% IN/DECREASE IN THE CURRENCY EXCHANGE RATE €2,841 €1,674
In thousands 2019 2018
Assets $194,824 $196,579
Liabilities $(12,322) $(20,087)
Net currency position $182,502 $176,492
ABSOLUTE IMPACT ON EQUITY OF 10% IN/DECREASE IN THE CURRENCY EXCHANGE RATE €16,253 €15,411
In thousands 2019 2018
Assets kr 8,489,992 kr -
Liabilities kr (1,161,871) kr -
Net currency position kr 7,328,121 kr -
ABSOLUTE IMPACT ON EQUITY OF 10% IN/DECREASE IN THE CURRENCY EXCHANGE RATE €74,322 € -
Most operating revenue and expenses in the various subsidiaries
of the Group are denominated in the functional currency of each
relevant subsidiary. The Group’s consolidated income statement
is exposed to foreign currency risk arising from receivables and
payables denominated in currencies diff erent from the functional
currency of the related entity.
T he Group may use derivatives instruments designated as hedge
of net investment or foreign denominated debt to manage its net
Investment exposures. The decision to hedge the exposure is
considered on a case by case basis since the Group is generally
exposed to major, well established and liquid currencies. The Group
would, by the same token, hedge transaction risk arising from cash
fl ows paid or received in a currency diff erent from the functional
currency of the Group contracting entity on a case by case basis. As
at 31 December 2019, the Group had a EUR/GBP foreign exchange
contract with a notional amount of £27.1 million expiring in six
months, which has been designated as a hedge of the net investment
in the acquired subsidiary Commcise Software Ltd. (see Note 23).
37.4. Credit risk
The Group is exposed to credit risk in the event of a counterparty’s
default. The Group is exposed to credit risk from its operating
activities (primarily trade receivables), from its fi nancing activities
and from the investment of its cash and cash equivalents and
short-term fi nancial investments. The Group limits its exposure
to credit risk by rigorously selecting the counterparties with
which it executes agreements. Most customers of the Group are
leading fi nancial institutions that are highly rated. Investments of
cash and cash equivalents in bank current accounts and money
market instruments, such as short-term fi xed and fl oating rate
interest deposits, are governed by rules aimed at reducing credit
risk: maturity of deposits strictly depends on credit ratings,
counterparties’ credit ratings are permanently monitored and
individual counterparty limits are reviewed on a regular basis.
In addition to the intrinsic creditworthiness of counterparties, the
Group’s policies also prescribe the diversifi cation of counterparties
(banks, fi nancial institutions, funds) so as to avoid a concentration
of risk. Derivatives are negotiated with leading high-grade banks.
37.4.1 Impairment of fi nancial assets
The Group’s trade and contract receivables and other debt fi nancial
assets at amortised cost are subject to the expected credit loss
model. While cash and cash equivalents are also subject to the
impairment requirements of IFRS 9, the identifi ed impairment loss
was considered immaterial.
Trade and contract receivables
The Group applies the IFRS 9 simplifi ed approach to measuring
expected credit losses which uses a lifetime expected loss allowance
for all trade and contract receivables.
To measure expected credit losses, trade and contract receivables
have been grouped based on shared credit risk characteristics and
the days past due. The historical loss rates are based on the payment
profi les of the sales over a period of 24 months before reporting date
and the corresponding historical credit losses experience within
this period. The historical loss rates are adjusted to refl ect current
2019 UNIVERSAL REGISTRATION DOCUMENT238 www.euronext.com
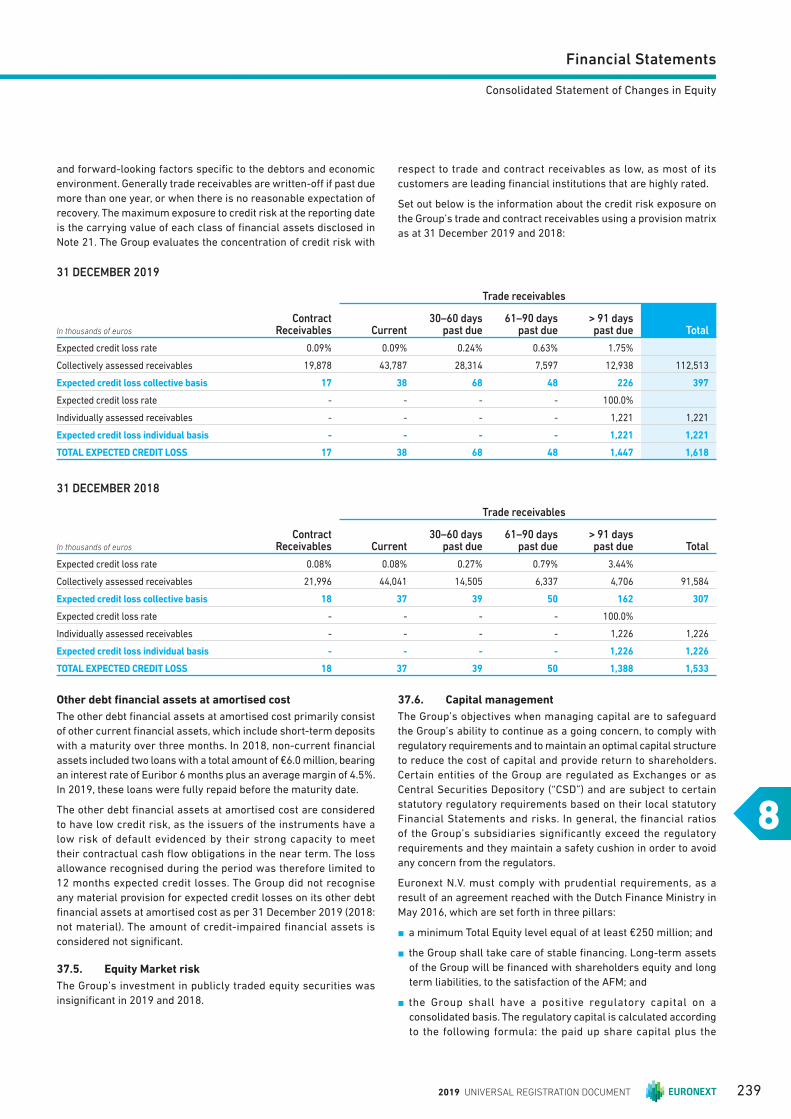
Financial Statements
8
Consolidated Statement of Changes in Equity
31 DECEMBER 2019
In thousands of euros
Contract Receivables
Trade receivables
Current30–60 days
past due61–90 days
past due> 91 days past due Total
Expected credit loss rate 0.09% 0.09% 0.24% 0.63% 1.75%
Collectively assessed receivables 19,878 43,787 28,314 7,597 12,938 112,513
Expected credit loss collective basis 17 38 68 48 226 397
Expected credit loss rate - - - - 100.0%
Individually assessed receivables - - - - 1,221 1,221
Expected credit loss individual basis - - - - 1,221 1,221
TOTAL EXPECTED CREDIT LOSS 17 38 68 48 1,447 1,618
31 DECEMBER 2018
In thousands of euros
Contract Receivables
Trade receivables
Current30–60 days
past due61–90 days
past due> 91 days past due Total
Expected credit loss rate 0.08% 0.08% 0.27% 0.79% 3.44%
Collectively assessed receivables 21,996 44,041 14,505 6,337 4,706 91,584
Expected credit loss collective basis 18 37 39 50 162 307
Expected credit loss rate - - - - 100.0%
Individually assessed receivables - - - - 1,226 1,226
Expected credit loss individual basis - - - - 1,226 1,226
TOTAL EXPECTED CREDIT LOSS 18 37 39 50 1,388 1,533
Other debt financial assets at amortised cost
The other debt fi nancial assets at amortised cost primarily consist
of other current fi nancial assets, which include short-term deposits
with a maturity over three months. In 2018, non-current fi nancial
assets included two loans with a total amount of €6.0 million, bearing
an interest rate of Euribor 6 months plus an average margin of 4.5%.
In 2019, these loans were fully repaid before the maturity date.
The other debt fi nancial assets at amortised cost are considered
to have low credit risk, as the issuers of the instruments have a
low risk of default evidenced by their strong capacity to meet
their contractual cash fl ow obligations in the near term. The loss
allowance recognised during the period was therefore limited to
12 months expected credit losses. The Group did not recognise
any material provision for expected credit losses on its other debt
fi nancial assets at amortised cost as per 31 December 2019 (2018:
not material). The amount of credit-impaired fi nancial assets is
considered not signifi cant.
37.5. Equity Market risk
The Group’s investment in publicly traded equity securities was
insignifi cant in 2019 and 2018.
37.6. Capital management
T he Group’s objectives when managing capital are to safeguard
the Group’s ability to continue as a going concern, to comply with
regulatory requirements and to maintain an optimal capital structure
to reduce the cost of capital and provide return to shareholders.
Certain entities of the Group are regulated as Exchanges or as
Central Securities Depository (“CSD”) and are subject to certain
statutory regulatory requirements based on their local statutory
Financial Statements and risks. In general, the financial ratios
of the Group’s subsidiaries significantly exceed the regulatory
requirements and they maintain a safety cushion in order to avoid
any concern from the regulators.
Euronext N.V. must comply with prudential requirements, as a
result of an agreement reached with the Dutch Finance Ministry in
May 2016, which are set forth in three pillars:
n a minimum Total Equity level equal of at least €250 million; and
n the Group shall take care of stable fi nancing. Long-term assets
of the Group will be fi nanced with shareholders equity and long
term liabilities, to the satisfaction of the AFM; and
n the Group shall have a positive regulatory capital on a
consolidated basis. The regulatory capital is calculated according
to the following formula: the paid up share capital plus the
and forward-looking factors specifi c to the debtors and economic
environment. Generally trade receivables are written-off if past due
more than one year, or when there is no reasonable expectation of
recovery. The maximum exposure to credit risk at the reporting date
is the carrying value of each class of fi nancial assets disclosed in
Note 21. The Group evaluates the concentration of credit risk with
respect to trade and contract receivables as low, as most of its
customers are leading fi nancial institutions that are highly rated.
Se t out below is the information about the credit risk exposure on
the Group’s trade and contract receivables using a provision matrix
as at 31 December 2019 and 2018:
2019 UNIVERSAL REGISTRATION DOCUMENT 239
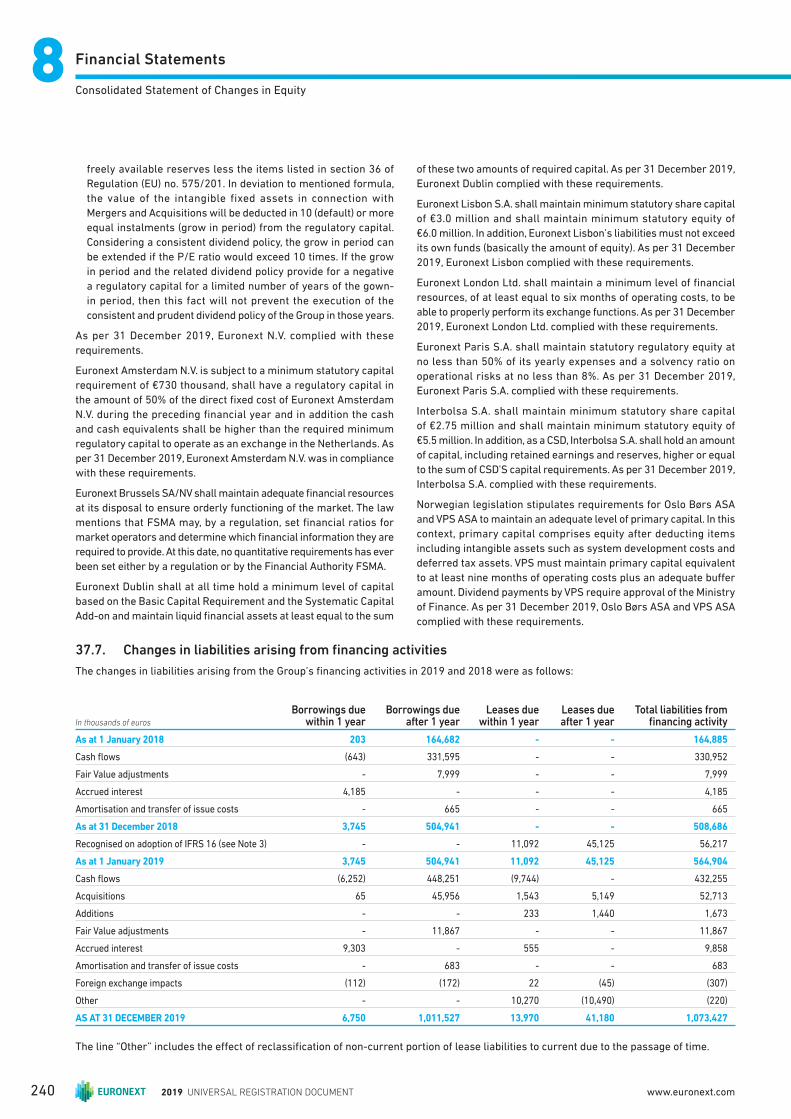
Financial Statements88Consolidated Statement of Changes in Equity
37.7. Changes in liabilities arising from fi nancing activities
The changes in liabilities arising from the Group’s fi nancing activities in 2019 and 2018 were as follows:
In thousands of euros
Borrowings due within 1 year
Borrowings due after 1 year
Leases due within 1 year
Leases due after 1 year
Total liabilities from fi nancing activity
As at 1 January 2018 203 164,682 - - 164,885
Cash fl ows (643) 331,595 - - 330,952
Fair Value adjustments - 7,999 - - 7,999
Accrued interest 4,185 - - - 4,185
Amortisation and transfer of issue costs - 665 - - 665
As at 31 December 2018 3,745 504,941 - - 508,686
Recognised on adoption of IFRS 16 (see Note 3) - - 11,092 45,125 56,217
As at 1 January 2019 3,745 504,941 11,092 45,125 564,904
Cash fl ows (6,252) 448,251 (9,744) - 432,255
Acquisitions 65 45,956 1,543 5,149 52,713
Additions - - 233 1,440 1,673
Fair Value adjustments - 11,867 - - 11,867
Accrued interest 9,303 - 555 - 9,858
Amortisation and transfer of issue costs - 683 - - 683
Foreign exchange impacts (112) (172) 22 (45) (307)
Other - - 10,270 (10,490) (220)
AS AT 31 DECEMBER 2019 6,750 1,011,527 13,970 41,180 1,073,427
The line “Other” includes the eff ect of reclassifi cation of non-current portion of lease liabilities to current due to the passage of time.
freely available reserves less the items listed in section 36 of
Regulation (EU) no. 575/201. In deviation to mentioned formula,
the value of the intangible fixed assets in connection with
Mergers and Acquisitions will be deducted in 10 (default) or more
equal instalments (grow in period) from the regulatory capital.
Considering a consistent dividend policy, the grow in period can
be extended if the P/E ratio would exceed 10 times. If the grow
in period and the related dividend policy provide for a negative
a regulatory capital for a limited number of years of the gown-
in period, then this fact will not prevent the execution of the
consistent and prudent dividend policy of the Group in those years.
As per 31 December 2019, Euronext N.V. complied with these
requirements.
Euronext Amsterdam N.V. is subject to a minimum statutory capital
requirement of €730 thousand, shall have a regulatory capital in
the amount of 50% of the direct fi xed cost of Euronext Amsterdam
N.V. during the preceding fi nancial year and in addition the cash
and cash equivalents shall be higher than the required minimum
regulatory capital to operate as an exchange in the Netherlands. As
per 31 December 2019, Euronext Amsterdam N.V. was in compliance
with these requirements.
Euronext Brussels SA/NV shall maintain adequate fi nancial resources
at its disposal to ensure orderly functioning of the market. The law
mentions that FSMA may, by a regulation, set fi nancial ratios for
market operators and determine which fi nancial information they are
required to provide. At this date, no quantitative requirements has ever
been set either by a regulation or by the Financial Authority FSMA.
Euronext Dublin shall at all time hold a minimum level of capital
based on the Basic Capital Requirement and the Systematic Capital
Add-on and maintain liquid fi nancial assets at least equal to the sum
of these two amounts of required capital. As per 31 December 2019,
Euronext Dublin complied with these requirements.
Euronext Lisbon S.A. shall maintain minimum statutory share capital
of €3.0 million and shall maintain minimum statutory equity of
€6.0 million. In addition, Euronext Lisbon’s liabilities must not exceed
its own funds (basically the amount of equity). As per 31 December
2019, Euronext Lisbon complied with these requirements.
Euronext London Ltd. shall maintain a minimum level of fi nancial
resources, of at least equal to six months of operating costs, to be
able to properly perform its exchange functions. As per 31 December
2019, Euronext London Ltd. complied with these requirements.
Euronext Paris S.A. shall maintain statutory regulatory equity at
no less than 50% of its yearly expenses and a solvency ratio on
operational risks at no less than 8%. As per 31 December 2019,
Euronext Paris S.A. complied with these requirements.
Interbolsa S.A. shall maintain minimum statutory share capital
of €2.75 million and shall maintain minimum statutory equity of
€5.5 million. In addition, as a CSD, Interbolsa S.A. shall hold an amount
of capital, including retained earnings and reserves, higher or equal
to the sum of CSD’S capital requirements. As per 31 December 2019,
Interbolsa S.A. complied with these requirements.
Norwegian legislation stipulates requirements for Oslo Børs ASA
and VPS ASA to maintain an adequate level of primary capital. In this
context, primary capital comprises equity after deducting items
including intangible assets such as system development costs and
deferred tax assets. VPS must maintain primary capital equivalent
to at least nine months of operating costs plus an adequate buff er
amount. Dividend payments by VPS require approval of the Ministry
of Finance. As per 31 December 2019, Oslo Børs ASA and VPS ASA
complied with these requirements.
2019 UNIVERSAL REGISTRATION DOCUMENT240 www.euronext.com

Financial Statements
8
Consolidated Statement of Changes in Equity
NOTE 38 CONTINGENCIES
The Group is involved in a number of legal proceedings that have
arisen in the ordinary course of our business. Other than as discussed
below, management does not expect these pending or threatening
legal proceedings to have a signifi cant eff ect on the Group’s fi nancial
position or profi tability. The outcome of legal proceedings, however,
can be extremely diffi cult to predict and the fi nal outcome may be
materially diff erent from managements’ expectation.
Euronext Amsterdam Pension Fund
Approximately 120 retired and/or former Euronext Amsterdam
employees, united in an association, served summons on Euronext
Amsterdam on 3 April 2014. The claim is based on the fact that
Euronext Amsterdam terminated its pension agreement with
the pension fund Mercurius (“PMA”) and transferred the pension
of the current employees of Euronext Amsterdam to Delta Lloyd
Asset Management (“Delta Lloyd”). The pension entitlements of
the retired and/or former employees of Euronext Amsterdam have
also been transferred by PMA to Delta Lloyd. The retired and/or
former employees have been informed by PMA that the transfer
of their entitlements to Delta Lloyd will result in a nominal pension
entitlement without indexation in the future. The association claims
that Euronext Amsterdam should guarantee the same pension
entitlements of the retired Euronext Amsterdam employees
under the same or similar conditions as those in the agreement
between Euronext Amsterdam and PMA with the consideration
that (i) the administration fee will be covered, (ii) the liability ratio
will be covered and (iii) the loyalty and solidarity between retired
and current employees is provided for. The amount will need to be
calculated by an actuary.
After Euronext Amsterdam fi led a statement of defense on 27 June
2014, the Subdistrict (Kanton) Division of the Court of Amsterdam
on 11 July 2014 granted the retired and/or former employees of
Euronext Amsterdam a term until 8 August 2014 in order to fi le a
rejoinder. On that date the counterparty was granted a postponement
until 5 September 2014 for its statement of reply. Both parties
have fi led all documents and statements and an oral hearing took
place on 11 June 2015. The judge asked both parties to explore a
settlement and Euronext assessed the costs of potential out of court
solutions. The Court has been informed that no arrangement on such
settlement could be reached.
On 24 June 2016 the judge delivered a decision. The claim
that Euronext Amsterdam should guarantee the same pension
entitlements of the retired Euronext Amsterdam employees under
the same or similar conditions as those in the agreement between
Euronext Amsterdam and PMA is rejected. However, the judge
did hold that there has been an attributable breach by Euronext
Amsterdam in the performance of the pension agreements with
the members of the association. Euronext Amsterdam is ordered to
pay for damages resulting from the loss of indexation perspective
incurred by the claimants other than the association. The association
is not eligible to claim damages. The amount of the damages needs
to be determined in a separate procedure (a “schadestaatprocedure”).
Management believes that the decision is insuffi ciently motivated.
On 21 September 2016, Euronext Amsterdam has filed for
appeal against the decision. The grounds for appeal were filed
on 6 December 2016. On 14 February 2017 claimants fi led their
responses and also fi led for appeal against certain parts of the
decision of 24 June 2016. Euronext Amsterdam has responded to
the grounds for appeal raised by claimants on 25 April 2017. An oral
hearing took place on 24 November 2017.
On 25 April 2019, Euronext Amsterdam unexpectedly received an
interlocutory judgment . The verdict of the judgement of 24 June
2016. However, the higher Court needs further information to assess
if Euronext can be sentenced to enter into a new implementation
agreement (“uitvoeringsovereenkomst”) with a pension provider
who can provide the same or at least equal rights and warranties
as set out in the implementation agreement 2007–2012, or the
implementation agreement 2013; or subsidiary if Euronext can be
sentenced to, as substitution for the implementation agreement,
pay an amount of money to a pension provider to make sure that
the pensioners will be placed in the same position as they would
have been in the event the implementation agreement would have
been continued unaltered. Euronext has provided the information.
The actuaries of Euronext had already calculated that the pensioners
would have lower pension rights in the event that the implementation
agreement would have been continued. These calculations are based
on all the fi nancial obligations of the implementation agreement
and the fi nancial position of the pension fund. Furthermore, the
calculations are based on the legal parameters of the Pension
Act 2007. T herefore, Euronext has called for rejection of the claims
of the pensioners because there is no fi nancial loss. The pensioners
have responded to this information on 23 July 2019. There is no
possibility to appeal at this stage.
The fi nal judgement of the higher Court is expected on 19 May 2020,
but it is possible that the judgment will be postponed until later
in 2020. Once there is a fi nal decision Euronext shall consider if it
should lodge an appeal in cassation. No provision has been booked
in connection with this case.
2019 UNIVERSAL REGISTRATION DOCUMENT 241
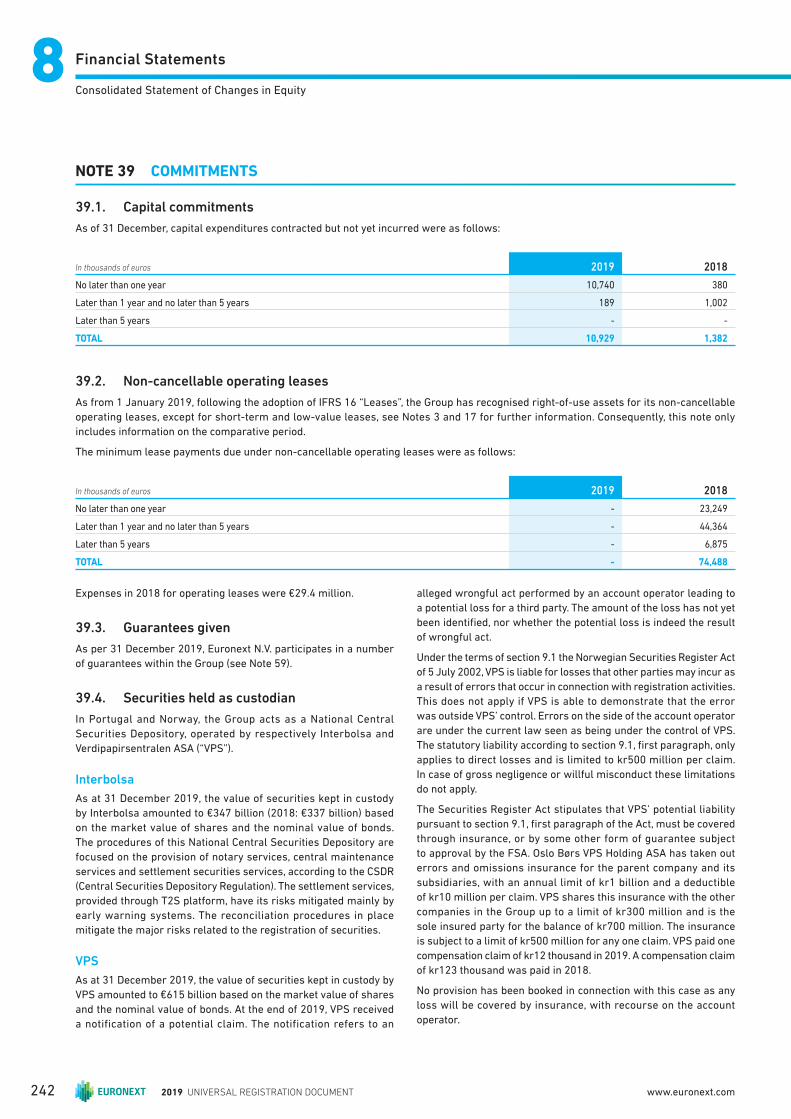
Financial Statements88Consolidated Statement of Changes in Equity
NOTE 39 COMMITMENTS
39.1. Capital commitments
As of 31 December, capital expenditures contracted but not yet incurred were as follows:
In thousands of euros 2019 2018
No later than one year 10,740 380
Later than 1 year and no later than 5 years 189 1,002
Later than 5 years - -
TOTAL 10,929 1,382
39.2. Non-cancellable operating leases
As from 1 January 2019, following the adoption of IFRS 16 “Leases”, the Group has recognised right-of-use assets for its non-cancellable
operating leases, except for short-term and low-value leases, see Notes 3 and 17 for further information. Consequently, this note only
includes information on the comparative period.
The minimum lease payments due under non-cancellable operating leases were as follows:
In thousands of euros 2019 2018
No later than one year - 23,249
Later than 1 year and no later than 5 years - 44,364
Later than 5 years - 6,875
TOTAL - 74,488
Expenses in 2018 for operating leases were €29.4 million.
39.3. Guarantees given
As per 31 December 2019, Euronext N.V. participates in a number
of guarantees within the Group (see Note 59).
39.4. Securities held as custodian
In Portugal and Norway, the Group acts as a National Central
Securities Depository, operated by respectively Interbolsa and
Verdipapirsentralen ASA (“VPS”).
Int erbolsa
As at 31 December 2019, the value of securities kept in custody
by Interbolsa amounted to €347 billion (2018: €337 billion) based
on the market value of shares and the nominal value of bonds.
The procedures of this National Central Securities Depository are
focused on the provision of notary services, central maintenance
services and settlement securities services, according to the CSDR
(Central Securities Depository Regulation). The settlement services,
provided through T2S platform, have its risks mitigated mainly by
early warning systems. The reconciliation procedures in place
mitigate the major risks related to the registration of securities.
VPS
As at 31 December 2019, the value of securities kept in custody by
VPS amounted to €615 billion based on the market value of shares
and the nominal value of bonds. At the end of 2019, VPS received
a notification of a potential claim. The notification refers to an
alleged wrongful act performed by an account operator leading to
a potential loss for a third party. The amount of the loss has not yet
been identifi ed, nor whether the potential loss i s indeed the result
of wrongful act.
Under the terms of section 9.1 the Norwegian Securities Register Act
of 5 July 2002, VPS is liable for losses that other parties may incur as
a result of errors that occur in connection with registration activities.
This does not apply if VPS is able to demonstrate that the error
was outside VPS’ control. Errors on the side of the account operator
are under the current law seen as being under the control of VPS.
The statutory liability according to section 9.1, fi rst paragraph, only
applies to direct losses and is limited to kr500 million per claim.
In case of gross negligence or willful misconduct these limitations
do not apply.
The Securities Register Act stipulates that VPS’ potential liability
pursuant to section 9.1, fi rst paragraph of the Act, must be covered
through insurance, or by some other form of guarantee subject
to approval by the FSA. Oslo Børs VPS Holding ASA has taken out
errors and omissions insurance for the parent company and its
subsidiaries, with an annual limit of kr1 billion and a deductible
of kr10 million per claim. VPS shares this insurance with the other
companies in the Group up to a limit of kr300 million and is the
sole insured party for the balance of kr700 million. The insurance
is subject to a limit of kr500 million for any one claim. VPS paid one
compensation claim of kr12 thousand in 2019. A compensation claim
of kr123 thousand was paid in 2018.
No provision has been booked in connection with this case as any
loss will be covered by insurance, with recourse on the account
operator.
2019 UNIVERSAL REGISTRATION DOCUMENT242 www.euronext.com

Financial Statements
8
Consolidated Statement of Changes in Equity
NOTE 40 EVENTS AFTER THE REPORTING PERIOD
The signifi cant events that occurred between 31 December 2019
and the date of this report that could have a material impact on the
economic decisions made based on these Financial Statements are
listed below:
Acquisition of Nord Pool Group
On 15 January 2020, Euronext completed the acquisition of 66%
of the share capital and voting rights of the Nord Pool Group,
after receiving regulatory approvals, for a cash consideration of
€65.4 million. With the acquisition of Nord Pool, the second largest
power market in Europe, Euronext diversifi es its revenue mix by
entering the power market, and reinforces its commodity franchise.
This transaction also contributes to the Group’s ambition to grow
its presence in the Nordic region and further strengthens Oslo
as Euronext’s main hub in the Nordics. The Transmission System
Operators (TSOs), formerly the sole owners, will retain a 34% stake
in Nord Pool Group.
Details of the purchase consideration, the preliminary net assets
acquired and goodwill are refl ected in the tables below:
PURCHASE CONSIDERATION
In thousands of euros Fair value
Cash paid 65,429
TOTAL PURCHASE CONSIDERATION 65,429
The preliminary purchase price allocation yielded the following results:
In thousands of euros
Preliminary calculation Fair Value(a)
Assets
Property, plant and equipment 549
Right-of-use assets 2,272
Other intangible assets 2,036
Deferred tax assets 162
Derivatives fi nancial instruments 12
Trade and other receivables 95,330
Cash and cash equivalents 163,316
Liabilities
Non-current lease liabilities (1,547)
Post-employment benefi ts (278)
Current lease liabilities (727)
Current income tax liabilities (1,900)
Trade and other payables (229,694)
Net identifiable assets acquired 29,531
Less: non-controlling interest (10,041)
Add: Goodwill 45,939
TOTAL PURCHASE CONSIDERATION 65,429
(a) The valuation of the net identifi able assets had not been completed by the date these Consolidated Financial Statements were authorized for issuance by Euronext N.V.’s Supervisory Board, as the transaction was only closed in the fi rst quarter of 2020. It is expected that all line items, except for cash and cash equivalents, may need to be subsequently adjusted, with a corresponding adjustment to Goodwill.
The goodwill is primarily attributable to the expected synergies and
other benefi ts from combining the assets and activities of Nord Pool
Group, with those of the Group. The goodwill is not deductible for
income tax purposes.
Acquired receivables
The fair value of trade and other receivables was €95.3 million,
and included €89.9 million of trade receivables, which is not
materially diff erent to the gross contractual amount. None of the
trade receivables have been impaired and it is expected that the full
contractual amounts can be collected.
Non-controlling interest
The Group has chosen to recognise the non-controlling interest at
the proportionate share of the net assets acquired. As such, non-
controlling interest on acquisition amounted to €10.0 million (34%
of €29.5 million).
Acquisition related costs
Acquisition related costs of €2.0 million were expenses and
recognised in professional services in profi t or loss.
2019 UNIVERSAL REGISTRATION DOCUMENT 243

Financial Statements88Consolidated Statement of Changes in Equity
Payment of contingent consideration payable and exercise of call option for remaining shares in InsiderLog AB
In February 2020, the Group paid the €3.6 million contingent
consideration payable in relation to InsiderLog AB, as part of the 80%
majority stake that was acquired on 17 January 2018. In addition, the
Group exercised its call option for the remaining 20% of the shares
in InsiderLog AB for an amount of €5.7 million. Consequently, the
Group now has an ownership of 100% in InsiderLog AB.
Payment of contingent consideration payable and exercise of put option for remaining shares in Company Webcast B.V.
In March 2020, the Group paid the €5.0 million contingent
consideration payable to Company Webcast B.V., as part of the
51% majority stake that was acquired on 14 February 2017. In
addition, the minority shareholders exercised their put option for
selling the remaining 49% of the shares in Company Webcast B.V.
for an amount of €22.3 million. Consequently, the Group now has
an ownership of 100% in Company Webcast B.V.
Sale of investment in Algomi Ltd.
During the fi rst quarter of 2020, the Group entered into binding
agreements to sell its 7.74% minority stake in Algomi Ltd. to BGC
Partners. The transaction is expected to close in the course of
2020. The Group expects to receive net proceeds of approximately
$3.0 million from the sale of its minority stake.
Covid-19 outbreak
The recent and emerging outbreak of Covid-19 is causing
high market uncertainty which has led to high volumes in the
first quarter of 2020. However, if the situation continues to
deteriorate, the impact of the pandemic on the markets could
be detrimental.
Governments around the world and in most Euronext countries
have implemented or announced unprecedented monetary and
fiscal responses. Those measures are aimed at avoiding or
mitigating the consequences of a potential downturn, however
their duration, scope and effectiveness remain uncertain.
Currently the market sentiment has led to high volatility and
volumes on the market positively impacting Euronext’s trading
revenues. However, as the Covid-19 pandemic may push the
global economy into a recession in the longer term, trading
revenues may suffer from loss of volume. The uncertainty may
also impact other business lines, notably the Listing business,
which may see a decrease in IPOs.
The ultimate severity of the Covid-19 pandemic is very uncertain
and therefore the Group cannot reasonably estimate the impact
it may have on its financial statements at this stage.
Authorisation of Consolidated Financial Statements
Amsterdam, 1 April 2020
Supervisory Board Managing Board
Dick Sluimers (Chairman) Stéphane Boujnah (CEO and Chairman)
Jim Gollan Anthony Attia
Manuel Ferreira da Silva Vincent van Dessel
Jim Gollan Daryl Byrne
Kerstin Günther Chris Topple
Lieve Mostrey Simone Huis in ’t Veld
Franck Silvent Isabel Ucha
Luc Keuleneer
Padraic O’Connor
Nathalie Rachou
Morten Thorsrud
2019 UNIVERSAL REGISTRATION DOCUMENT244 www.euronext.com
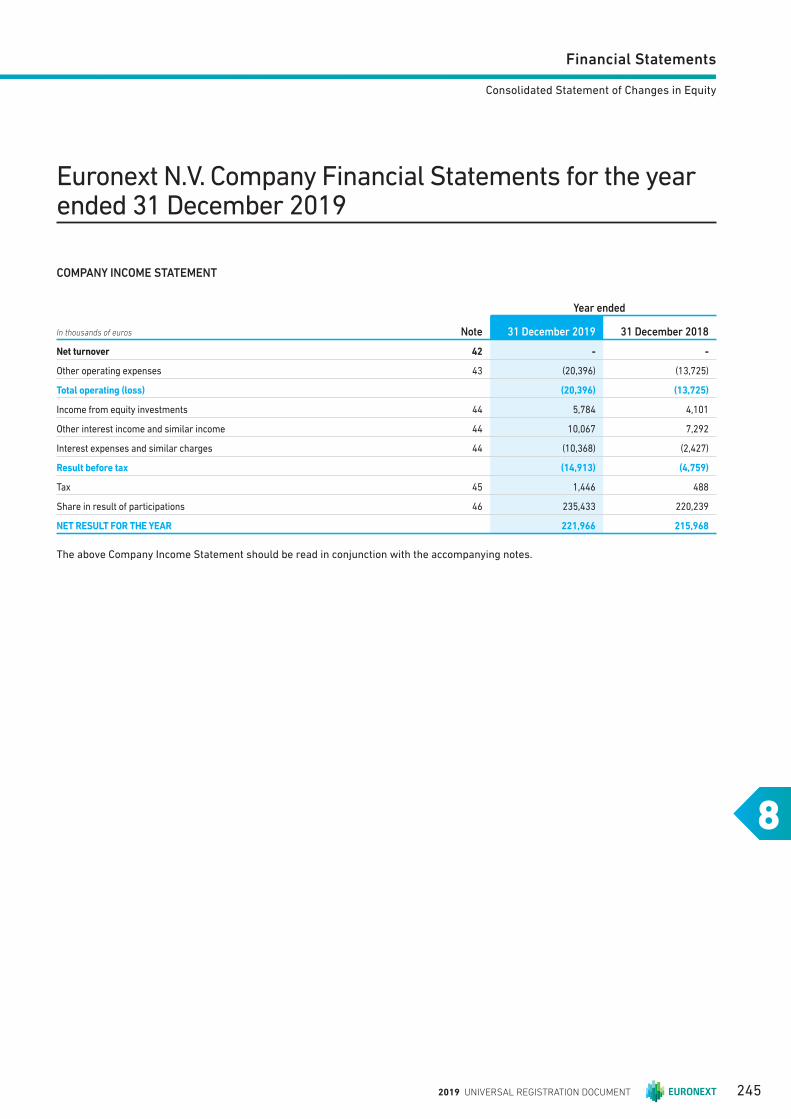
Financial Statements
8
Consolidated Statement of Changes in Equity
COMPANY INCOME STATEMENT
In thousands of euros Note
Year ended
31 December 2019 31 December 2018
Net turnover 42 - -
Other operating expenses 43 (20,396) (13,725)
Total operating (loss) (20,396) (13,725)
Income from equity investments 44 5,784 4,101
Other interest income and similar income 44 10,067 7,292
Interest expenses and similar charges 44 (10,368) (2,427)
Result before tax (14,913) (4,759)
Tax 45 1,446 488
Share in result of participations 46 235,433 220,239
NET RESULT FOR THE YEAR 221,966 215,968
The above Company Income Statement should be read in conjunction with the accompanying notes.
Euronext N.V. Company Financial Statements for the year ended 31 December 2019
2019 UNIVERSAL REGISTRATION DOCUMENT 245
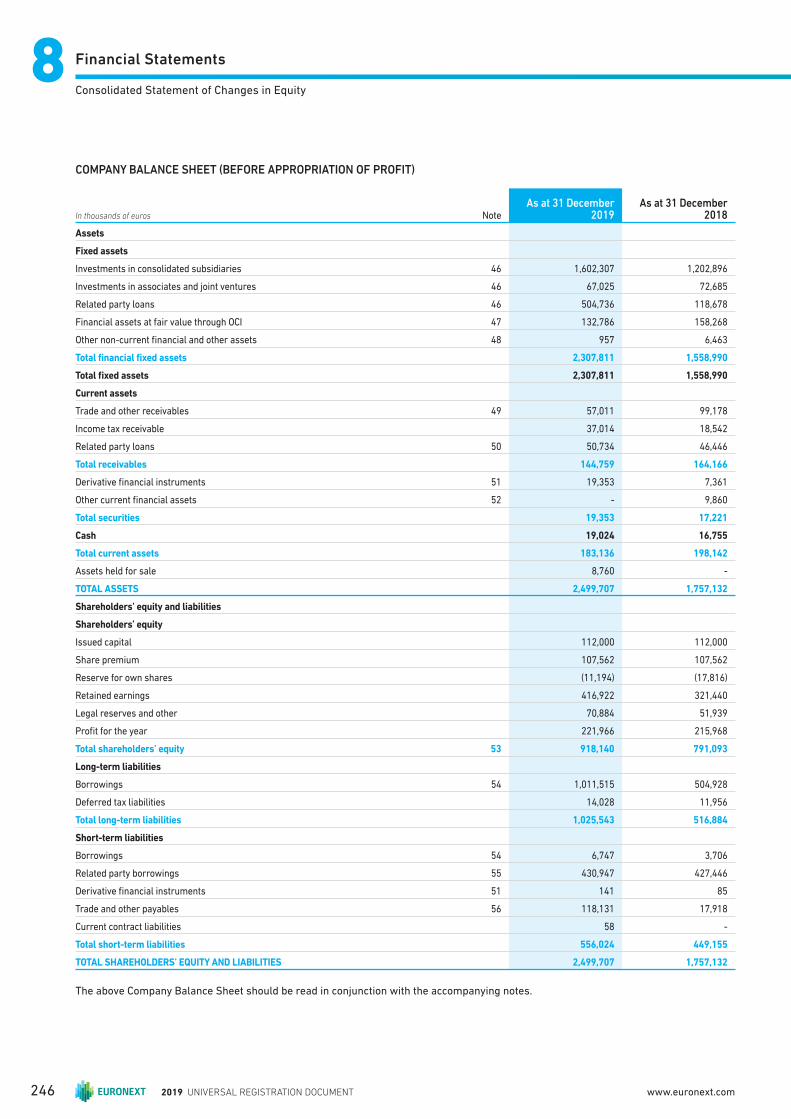
Financial Statements88Consolidated Statement of Changes in Equity
COMPANY BALANCE SHEET (BEFORE APPROPRIATION OF PROFIT)
In thousands of euros NoteAs at 31 December
2019As at 31 December
2018
Assets
Fixed assets
Investments in consolidated subsidiaries 46 1,602,307 1,202,896
Investments in associates and joint ventures 46 67,025 72,685
Related party loans 46 504,736 118,678
Financial assets at fair value through OCI 47 132,786 158,268
Other non-current fi nancial and other assets 48 957 6,463
Total financial fixed assets 2,307,811 1,558,990
Total fi xed assets 2,307,811 1,558,990
Current assets
Trade and other receivables 49 57,011 99,178
Income tax receivable 37,014 18,542
Related party loans 50 50,734 46,446
Total receivables 144,759 164,166
Derivative fi nancial instruments 51 19,353 7,361
Other current fi nancial assets 52 - 9,860
Total securities 19,353 17,221
Cash 19,024 16,755
Total current assets 183,136 198,142
Assets held for sale 8,760 -
TOTAL ASSETS 2,499,707 1,757,132
Shareholders’ equity and liabilities
Shareholders’ equity
Issued capital 112,000 112,000
Share premium 107,562 107,562
Reserve for own shares (11,194) (17,816)
Retained earnings 416,922 321,440
Legal reserves and other 70,884 51,939
Profi t for the year 221,966 215,968
Total shareholders’ equity 53 918,140 791,093
Long-term liabilities
Borrowings 54 1,011,515 504,928
Deferred tax liabilities 14,028 11,956
Total long-term liabilities 1,025,543 516,884
Short-term liabilities
Borrowings 54 6,747 3,706
Related party borrowings 55 430,947 427,446
Derivative fi nancial instruments 51 141 85
Trade and other payables 56 118,131 17,918
Current contract liabilities 58 -
Total short-term liabilities 556,024 449,155
TOTAL SHAREHOLDERS’ EQUITY AND LIABILITIES 2,499,707 1,757,132
The above Company Balance Sheet should be read in conjunction with the accompanying notes.
2019 UNIVERSAL REGISTRATION DOCUMENT246 www.euronext.com
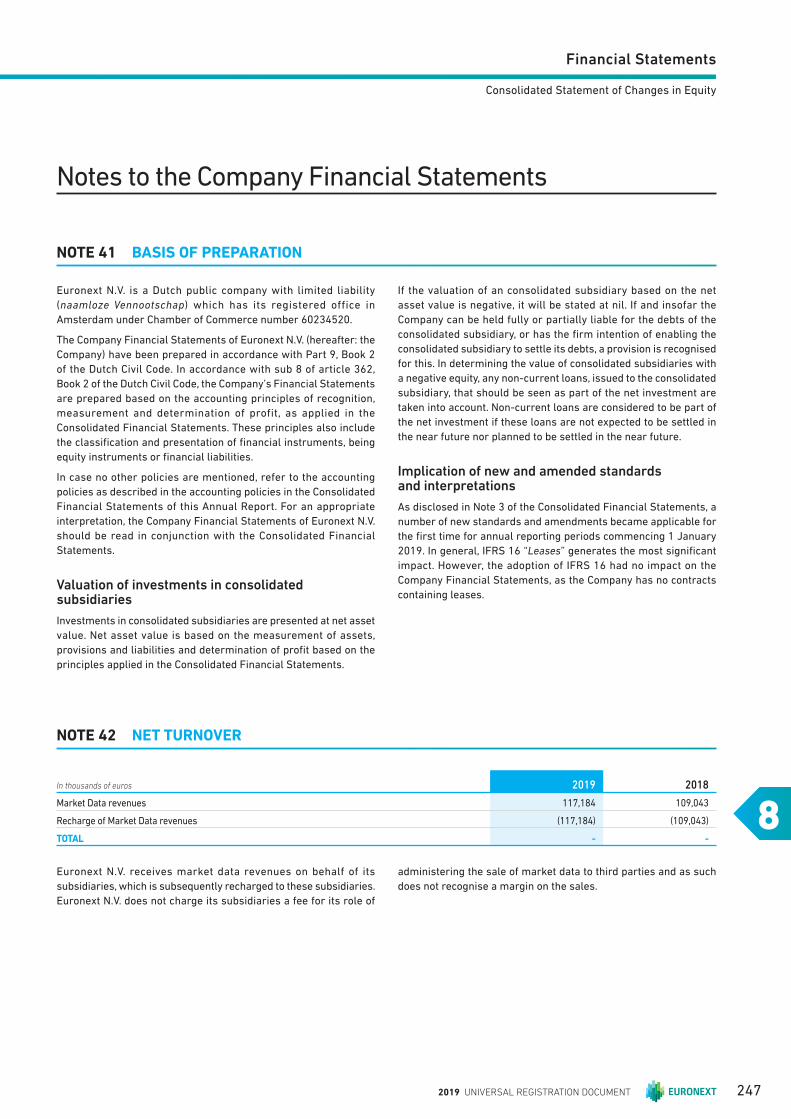
Financial Statements
8
Consolidated Statement of Changes in Equity
Notes to the Company Financial Statements
NOTE 41 BASIS OF PREPARATION
Euronext N.V. is a Dutch public company with limited liability
(naamloze Vennootschap) which has its registered office in
Amsterdam under Chamber of Commerce number 60234520.
The Company Financial Statements of Euronext N.V. (hereafter: the
Company) have been prepared in accordance with Part 9, Book 2
of the Dutch Civil Code. In accordance with sub 8 of article 362,
Book 2 of the Dutch Civil Code, the Company’s Financial Statements
are prepared based on the accounting principles of recognition,
measurement and determination of profit, as applied in the
Consolidated Financial Statements. These principles also include
the classifi cation and presentation of fi nancial instruments, being
equity instruments or fi nancial liabilities.
In case no other policies are mentioned, refer to the accounting
policies as described in the accounting policies in the Consolidated
Financial Statements of this Annual Report. For an appropriate
interpretation, the Company Financial Statements of Euronext N.V.
should be read in conjunction with the Consolidated Financial
Statements.
Valuation of investments in consolidated subsidiaries
Investments in consolidated subsidiaries are presented at net asset
value. Net asset value is based on the measurement of assets,
provisions and liabilities and determination of profi t based on the
principles applied in the Consolidated Financial Statements.
If the valuation of an consolidated subsidiary based on the net
asset value is negative, it will be stated at nil. If and insofar the
Company can be held fully or partially liable for the debts of the
consolidated subsidiary, or has the fi rm intention of enabling the
consolidated subsidiary to settle its debts, a provision is recognised
for this. In determining the value of consolidated subsidiaries with
a negative equity, any non-current loans, issued to the consolidated
subsidiary, that should be seen as part of the net investment are
taken into account. Non-current loans are considered to be p art of
the net investment if these loans are not expected to be settled in
the near future nor planned to be settled in the near future.
Implication of new and amended standards and interpretations
As disclosed in Note 3 of the Consolidated Financial Statements, a
number of new standards and amendments became applicable for
the fi rst time for annual reporting periods commencing 1 January
2019. In general, IFRS 16 “Leases” generates the most signifi cant
impact. However, the adoption of IFRS 16 had no impact on the
Company Financial Statements, as the Company has no contracts
containing leases.
NOTE 42 NET TURNOVER
In thousands of euros 2019 2018
Market Data revenues 117,184 109,043
Recharge of Market Data revenues (117,184) (109,043)
TOTAL - -
Euronext N.V. receives market data revenues on behalf of its
subsidiaries, which is subsequently recharged to these subsidiaries.
Euronext N.V. does not charge its subsidiaries a fee for its role of
administering the sale of market data to third parties and as such
does not recognise a margin on the sales.
2019 UNIVERSAL REGISTRATION DOCUMENT 247

Financial Statements88Consolidated Statement of Changes in Equity
NOTE 43 OTHER OPERATING EXPENSES
In thousands of euros 2019 2018
Systems and communications (94) (148)
Professional Services (16,984) (7,390)
Other expenses (3,318) (6,187)
TOTAL (20,396) (13,725)
In 2019, professional services expenses contained €11.7 million
(2018: €2.1 million) of acquisition costs.
In 2019, other expenses contained €1.3 million that is related to a
settlement payment regarding the investment in Algomi Ltd.
In 2018, other expenses is primarily due to €3.0 million of items
that relate to the revaluation of the investment in Algomi Ltd. and
the impairment of the investment in joint venture Algonext Ltd.
In addition, other expenses contains €1.8 million of stamp duty taxes
which were recognised at acquisition of the Irish Stock Exchange
plc in 2018.
Number of employees
Euronext N.V. had no employees during 2019 and 2018. The
remuneration of the Supervisory Board is included in other expenses.
NOTE 44 FINANCIAL INCOME AND EXPENSES
In thousands of euros 2019 2018
Income from equity investments 5,784 4,101
Interest and similar income 10,067 7,292
Interest and similar expenses (10,944) (6,788)
Exchange diff erences 576 4,361
TOTAL 5,483 8,966
NOTE 45 TAX
In thousands of euros 2019 2018
Result before tax (14,913) (4,759)
Corporate income tax current fi nancial year 1,446 753
Corporate income tax previous fi nancial years - (265)
TOTAL 1,446 488
The income from equity investments refl ects the dividend received
from Euroclear S.A./N.V.
Interest and similar income was positively impacted by income of
€5.0 million (2018: €3.5 million) from interest rate swaps entered
into by the Group (see Note 23 of the Consolidated Financial
Statements) and increased interest income on related party loans
for €0.9 million in 2019.
Interest and similar expenses increased, following the Senior
Unsecured Note #2 issued in June 2019. In 2018, the Senior
Unsecured Note #1 was issued in April 2018 (see Note 29 of the
Consolidated Financial Statements).
The exchange diff erences are mainly triggered by revaluations of
the non-current related party loans with Euronext UK Holdings Ltd.,
Oslo Børs VPS, Euronext Nordics Holding AS and Euronext US Inc.
(see Note 46). In 2018, exchange diff erences contained signifi cant
impacts resulting from revaluation of the $110 million non-current
related party loan with Euronext US Inc.
The eff ective tax rate mainly deviates from the applicable tax rate
as a result of the non-deductible expenses. For the year 2020, the
Netherlands have withdrawn the announced rate decrease and
maintained the corporate income tax rate at 25%. For the year 2021,
the corporate income tax rate in the Netherlands will decrease to
21.7% instead of the rate of 20.5% announced in 2018. Reference is
made to Notes 15 and 19 of the Consolidated Financial Statements
for more information on the tax rate changes.
2019 UNIVERSAL REGISTRATION DOCUMENT248 www.euronext.com
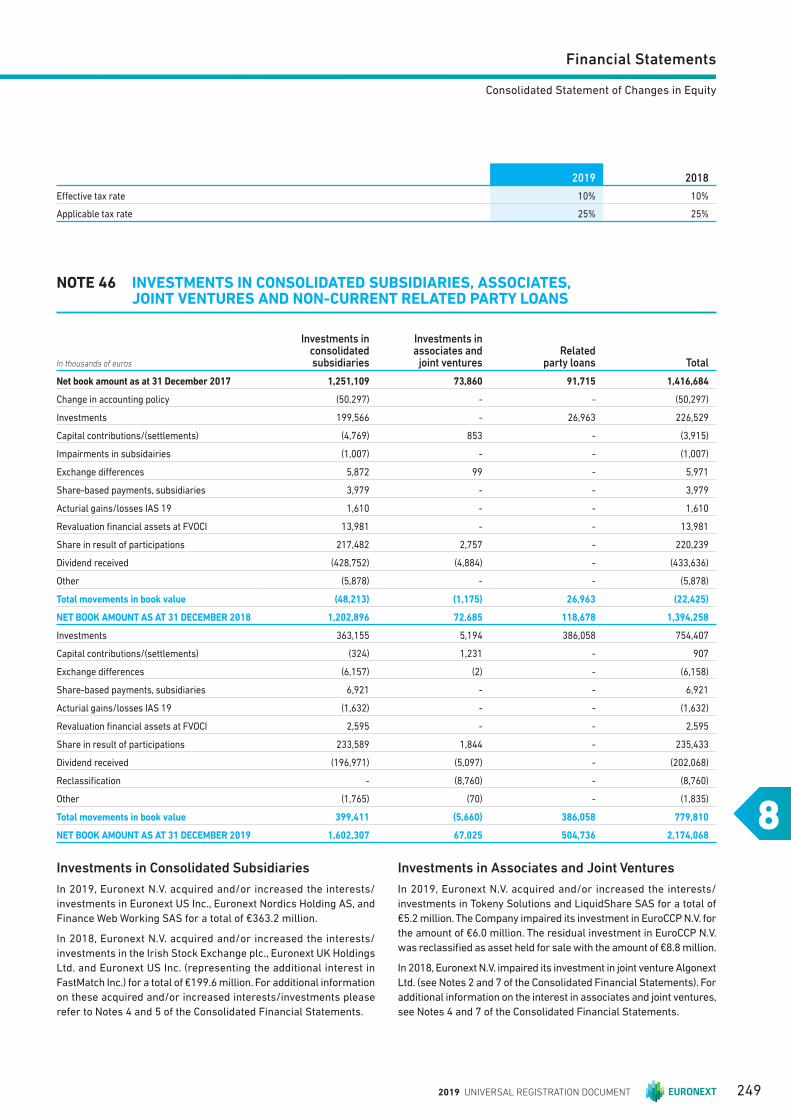
Financial Statements
8
Consolidated Statement of Changes in Equity
2019 2018
Eff ective tax rate 10% 10%
Applicable tax rate 25% 25%
NOTE 46 INVESTMENTS IN CONSOLIDATED SUBSIDIARIES, ASSOCIATES, JOINT VENTURES AND NON-CURRENT RELATED PARTY LOANS
In thousands of euros
Investments in consolidated subsidiaries
Investments in associates and
joint venturesRelated
party loans Total
Net book amount as at 31 December 2017 1,251,109 73,860 91,715 1,416,684
Change in accounting policy (50,297) - - (50,297)
Investments 199,566 - 26,963 226,529
Capital contributions/(settlements) (4,769) 853 - (3,915)
Impairments in subsidairies (1,007) - - (1,007)
Exchange diff erences 5,872 99 - 5,971
Share-based payments, subsidiaries 3,979 - - 3,979
Acturial gains/losses IAS 19 1,610 - - 1,610
Revaluation fi nancial assets at FVOCI 13,981 - - 13,981
Share in result of participations 217,482 2,757 - 220,239
Dividend received (428,752) (4,884) - (433,636)
Other (5,878) - - (5,878)
Total movements in book value (48,213) (1,175) 26,963 (22,425)
NET BOOK AMOUNT AS AT 31 DECEMBER 2018 1,202,896 72,685 118,678 1,394,258
Investments 363,155 5,194 386,058 754,407
Capital contributions/(settlements) (324) 1,231 - 907
Exchange diff erences (6,157) (2) - (6,158)
Share-based payments, subsidiaries 6,921 - - 6,921
Acturial gains/losses IAS 19 (1,632) - - (1,632)
Revaluation fi nancial assets at FVOCI 2,595 - - 2,595
Share in result of participations 233,589 1,844 - 235,433
Dividend received (196,971) (5,097) - (202,068)
Reclassifi cation - (8,760) - (8,760)
Other (1,765) (70) - (1,835)
Total movements in book value 399,411 (5,660) 386,058 779,810
NET BOOK AMOUNT AS AT 31 DECEMBER 2019 1,602,307 67,025 504,736 2,174,068
Investments in Consolidated Subsidiaries
In 2019, Euronext N.V. acquired and/or increased the interests/
investments in Euronext US Inc., Euronext Nordics Holding AS, and
Finance Web Working SAS for a total of €363.2 million.
In 2018, Euronext N.V. acquired and/or increased the interests/
investments in the Irish Stock Exchange plc., E uronext UK Holdings
Ltd. and Euronext US Inc. (representing the additional interest in
FastMatch Inc.) for a total of €199.6 million. For additional information
on these acquired and/or increased interests/investments please
refer to Notes 4 and 5 of the Consolidated Financial Statements.
Investments in Associates and Joint Ventures
In 2019, Euronext N.V. acquired and/or increased the interests/
investments in Tokeny Solutions and LiquidShare SAS for a total of
€5.2 million. The Company impaired its investment in EuroCCP N.V. for
the amount of €6.0 million. The residual investment in EuroCCP N.V.
was reclassifi ed as asset held for sale with the amount of €8.8 million.
In 2018, Euronext N.V. impaired its investment in joint venture Algonext
Ltd. (see Notes 2 and 7 of the Consolidated Financial Statements). For
additional information on the interest in associates and joint ventures,
see Notes 4 and 7 of the Consolidated Financial Statements.
2019 UNIVERSAL REGISTRATION DOCUMENT 249

Financial Statements88Consolidated Statement of Changes in Equity
Amounts Due From Subsidiaries
On 1 August 2019, Euronext N.V. entered into a loan agreement of
kr275 million with Oslo Børs VPS. The loan has a maturity of fi ve
years and bears an interest rate of NIBOR 3 month plus 0.300%. On
23 December 2019, Euronext N.V. entered into a loan agreement of
kr3,500 million with Euronext Nordics Holding AS. The loan has a
maturity of ten years with a fi xed interest rate of 3%. Both loans are
drawn to facilitate the acquisition of Oslo Børs VPS.
On 19 December 2018, Euronext N.V. entered into a loan agreement
of £16.3 million with Euronext UK Holdings Ltd. to enable the
acquisition of Commcise Software Ltd. The loan has a maturity
of ten years and bears an interest rate of LIBOR UK 1 month plus
0.125%. The interest amount is received monthly and is recognised
in Note 50.
In 2018, two new loan agreements were entered into with Euronext
US Inc. at a total amount of $5.2 million. Both loans have a maturity of
ten years with a fi xed interest rate of 3.25% and 3.84% respectively.
The interest amounts of these loans are received annually and are
recognised in Note 50.
NOTE 47 FINANCIAL ASSETS AT FAIR VALUE THROUGH OTHER COMPREHENSIVE INCOME
In 2019, the fi nancial assets at fair value through Other Comprehensive Income of €132.8 million represent the direct investment in Euroclear
S.A./N.V. and Algomi Ltd., whereas in the comparative period also the equity investment in Oslo Børs VPS was included. For additional
information on these investments, reference is made to Note 20 of the Consolidated Financial Statements.
NOTE 48 OTHER NON-CURRENT FINANCIAL AND OTHER ASSETS
The decrease of other non-current fi nancial and other assets are due to the repayment of the two loans granted in the total amount of
€6.0 million For additional information of these positions and their credit exposure, reference is made to Note 37.4 of the Consolidated
Financial Statements.
NOTE 49 TRADE AND OTHER RECEIVABLES
In thousands of euros
As at 31 December 2019
As at 31 December 2018
Trade receivables 14,701 15,240
Contract receivables 9,124 8,511
Allowance for expected credit losses (35) (34)
Trade and contract receivables net 23,790 23,717
Related party receivables 27,168 71,616
Tax receivables (excluding income tax) 1,619 1,954
Prepayments and accrued income 136 152
Other receivables 4,298 1,739
TOTAL 57,011 99,178
Trade receivables are non-interest bearing and generally on terms
of 30 to 90 days. Contract receivables represent amounts in respect
of unbilled revenue, for which the Group has an unconditional right
to consideration (i.e. only the passage of time is required before
payment of the consideration is due).
The higher related party receivable of 2018 is mainly due to the
receipt of dividends from Euronext Paris S.A. which changed the
signifi cant payable position with this subsidiary into a receivable
position of €63.2 million as per 31 December 2018 (see also Note 56).
In 2019, the increase of other receivables was mainly related to the
accrued interest income from the interest rate swaps, entered into in
April 2018 (see Note 23). Other items in the other receivables were
the transactions in own shares by the liquidity provider, which were
settled right after the reporting date.
The fair value of the receivables approximates the book value, due
to their short-term character.
2019 UNIVERSAL REGISTRATION DOCUMENT250 www.euronext.com
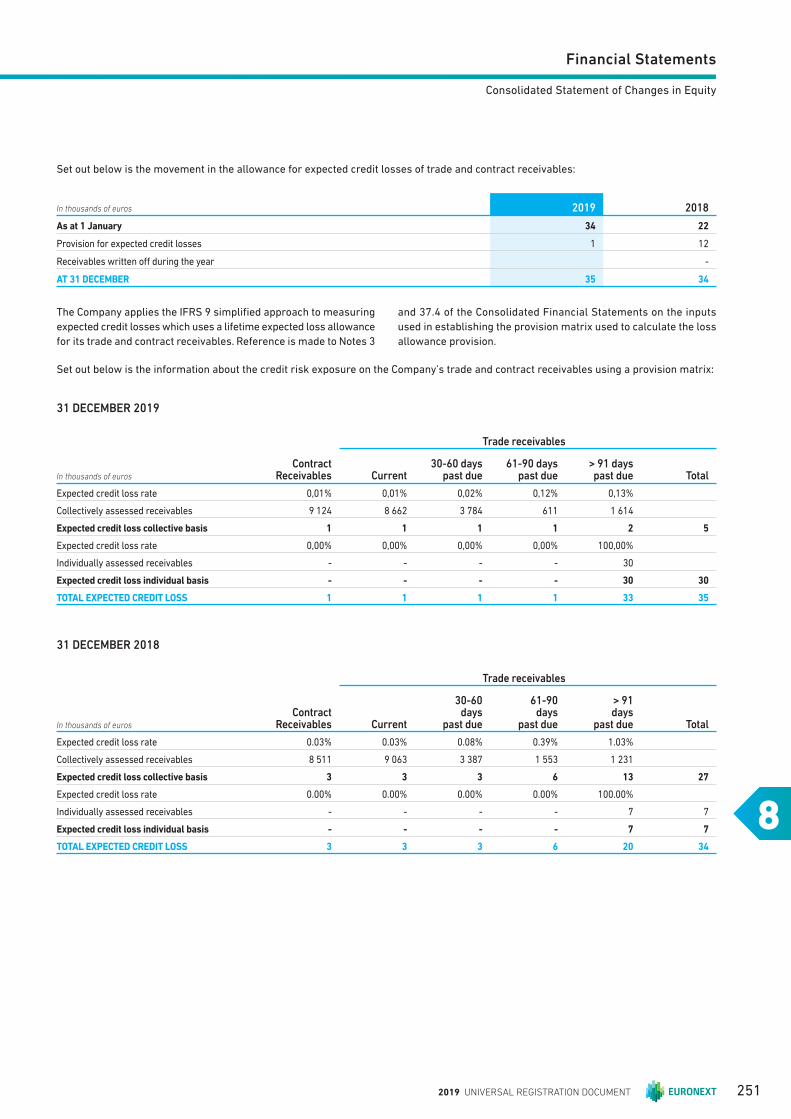
Financial Statements
8
Consolidated Statement of Changes in Equity
Set out below is the movement in the allowance for expected credit losses of trade and contract receivables:
In thousands of euros 2019 2018
As at 1 January 34 22
Provision for expected credit losses 1 12
Receivables written off during the year -
AT 31 DECEMBER 35 34
The Company applies the IFRS 9 simplifi ed approach to measuring
expected credit losses which uses a lifetime expected loss allowance
for its trade and contract receivables. Reference is made to Notes 3
and 37.4 of the Consolidated Financial Statements on the inputs
used in establishing the provision matrix used to calculate the loss
allowance provision.
Set out below is the information about the credit risk exposure on the Company’s trade and contract receivables using a provision matrix:
31 DECEMBER 2019
Trade receivables
In thousands of euros
Contract Receivables Current
30-60 days past due
61-90 days past due
> 91 days past due Total
Expected credit loss rate 0,01% 0,01% 0,02% 0,12% 0,13%
Collectively assessed receivables 9 124 8 662 3 784 611 1 614
Expected credit loss collective basis 1 1 1 1 2 5
Expected credit loss rate 0,00% 0,00% 0,00% 0,00% 100,00%
Individually assessed receivables - - - - 30
Expected credit loss individual basis - - - - 30 30
TOTAL EXPECTED CREDIT LOSS 1 1 1 1 33 35
31 DECEMBER 2018
Trade receivables
In thousands of euros
Contract Receivables Current
30-60days
past due
61-90 days
past due
> 91days
past due Total
Expected credit loss rate 0.03% 0. 03% 0. 08% 0. 39% 1. 03%
Collectively assessed receivables 8 511 9 063 3 387 1 553 1 231
Expected credit loss collective basis 3 3 3 6 13 27
Expected credit loss rate 0. 00% 0. 00% 0. 00% 0. 00% 100. 00%
Individually assessed receivables - - - - 7 7
Expected credit loss individual basis - - - - 7 7
TOTAL EXPECTED CREDIT LOSS 3 3 3 6 20 34
2019 UNIVERSAL REGISTRATION DOCUMENT 251
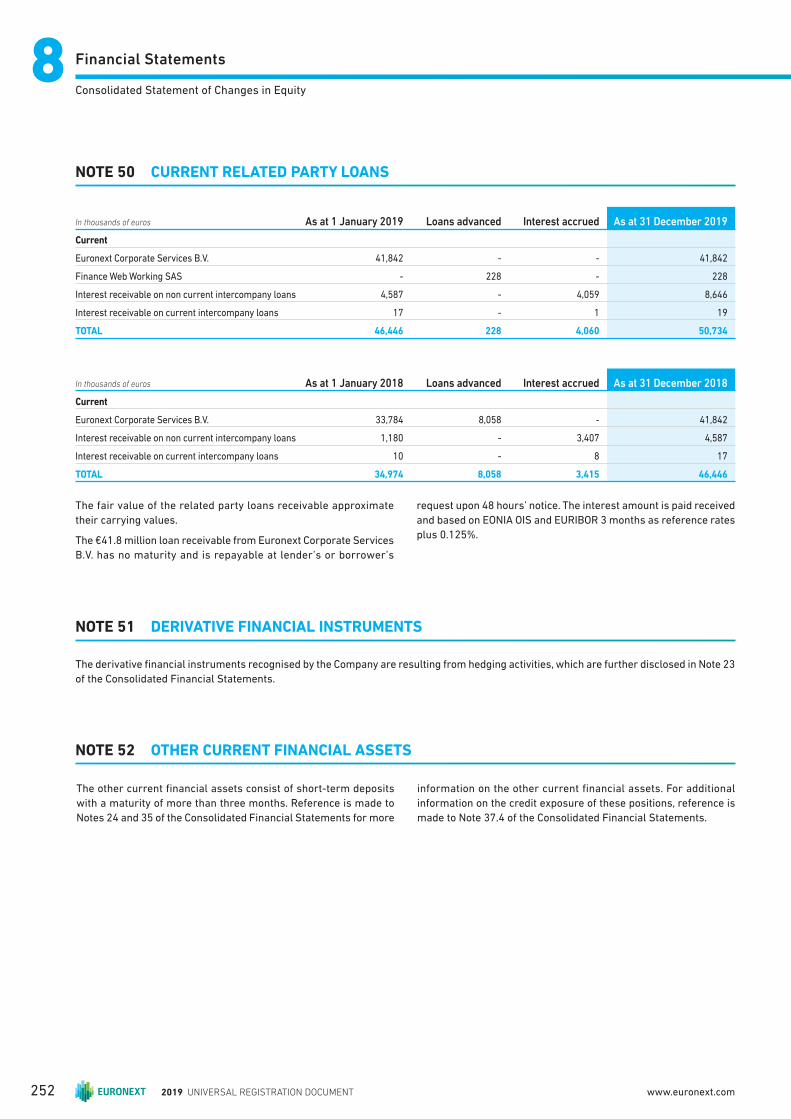
Financial Statements88Consolidated Statement of Changes in Equity
NOTE 50 CURRENT RELATED PARTY LOANS
In thousands of euros As at 1 January 2019 Loans advanced Interest accrued As at 31 December 2019
Current
Euronext Corporate Services B.V. 41,842 - - 41,842
Finance Web Working SAS - 228 - 228
Interest receivable on non current intercompany loans 4,587 - 4,059 8,646
Interest receivable on current intercompany loans 17 - 1 19
TOTAL 46,446 228 4,060 50,734
In thousands of euros As at 1 January 2018 Loans advanced Interest accrued As at 31 December 2018
Current
Euronext Corporate Services B.V. 33,784 8,058 - 41,842
Interest receivable on non current intercompany loans 1,180 - 3,407 4,587
Interest receivable on current intercompany loans 10 - 8 17
TOTAL 34,974 8,058 3,415 46,446
The fair value of the related party loans receivable approximate
their carrying values.
The €41.8 million loan receivable from Euronext Corporate Services
B.V. has no maturity and is repayable at lender’s or borrower’s
request upon 48 hours’ notice. The interest amount is paid received
and based on EONIA OIS and EURIBOR 3 months as reference rates
plus 0.125%.
NOTE 51 DERIVATIVE FINANCIAL INSTRUMENTS
The derivative fi nancial instruments recognised by the Company are resulting from hedging activities, which are further disclosed in Note 23
of the Consolidated Financial Statements.
NOTE 52 OTHER CURRENT FINANCIAL ASSETS
The other current fi nancial assets consist of short-term deposits
with a maturity of more than three months. Reference is made to
Notes 24 and 35 of the Consolidated Financial Statements for more
information on the other current fi nancial assets. For additional
information on the credit exposure of these positions, reference is
made to Note 37.4 of the Consolidated Financial Statements.
2019 UNIVERSAL REGISTRATION DOCUMENT252 www.euronext.com
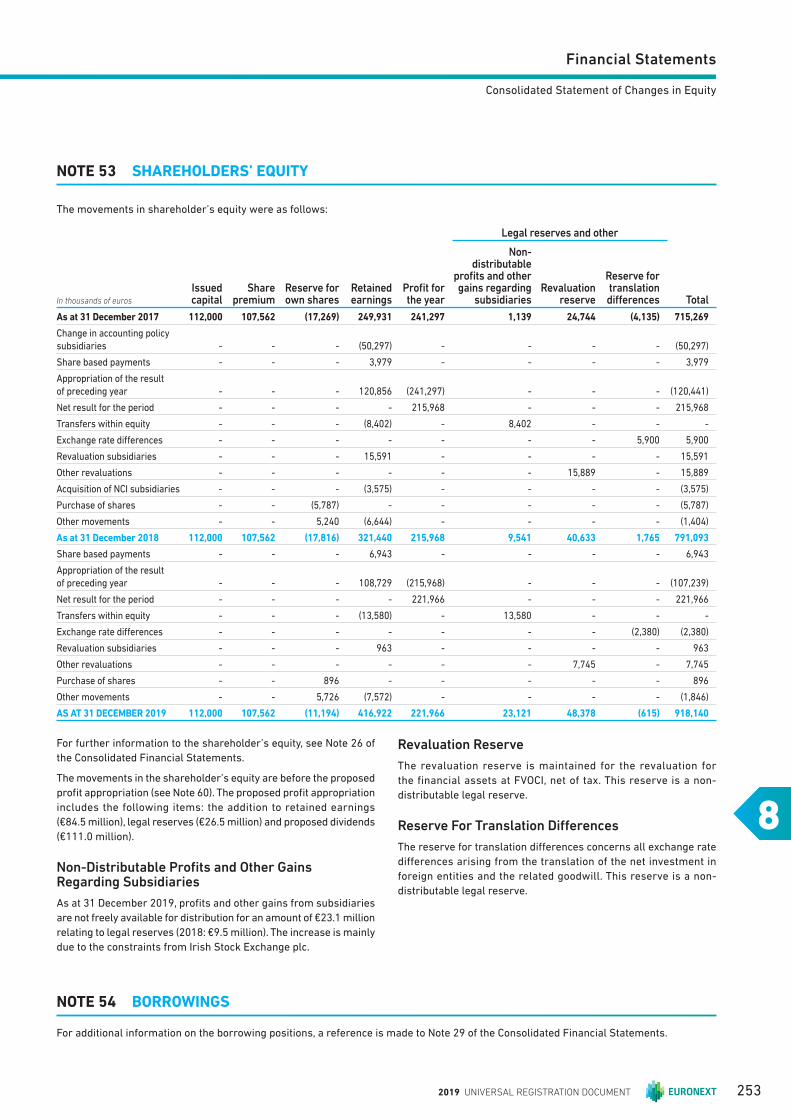
Financial Statements
8
Consolidated Statement of Changes in Equity
NOTE 53 SHAREHOLDERS’ EQUITY
The movements in shareholder’s equity were as follows:
In thousands of euros
Issued capital
Share premium
Reserve for own shares
Retained earnings
Profi t for the year
Legal reserves and other
Total
Non-distributable
profi ts and other gains regarding
subsidiariesRevaluation
reserve
Reserve for translation diff erences
As at 31 December 2017 112,000 107,562 (17,269) 249,931 241,297 1,139 24,744 (4,135) 715,269
Change in accounting policy subsidiaries - - - (50,297) - - - - (50,297)
Share based payments - - - 3,979 - - - - 3,979
Appropriation of the result of preceding year - - - 120,856 (241,297) - - - (120,441)
Net result for the period - - - - 215,968 - - - 215,968
Transfers within equity - - - (8,402) - 8,402 - - -
Exchange rate diff erences - - - - - - - 5,900 5,900
Revaluation subsidiaries - - - 15,591 - - - - 15,591
Other revaluations - - - - - - 15,889 - 15,889
Acquisition of NCI subsidiaries - - - (3,575) - - - - (3,575)
Purchase of shares - - (5,787) - - - - - (5,787)
Other movements - - 5,240 (6,644) - - - - (1,404)
As at 31 December 2018 112,000 107,562 (17,816) 321,440 215,968 9,541 40,633 1,765 791,093
Share based payments - - - 6,943 - - - - 6,943
Appropriation of the result
of preceding year - - - 108,729 (215,968) - - - (107,239)
Net result for the period - - - - 221,966 - - - 221,966
Transfers within equity - - - (13,580) - 13,580 - - -
Exchange rate diff erences - - - - - - - (2,380) (2,380)
Revaluation subsidiaries - - - 963 - - - - 963
Other revaluations - - - - - - 7,745 - 7,745
Purchase of shares - - 896 - - - - - 896
Other movements - - 5,726 (7,572) - - - - (1,846)
AS AT 31 DECEMBER 2019 112,000 107,562 (11,194) 416,922 221,966 23,121 48,378 (615) 918,140
For further information to the shareholder’s equity, see Note 26 of
the Consolidated Financial Statements.
The movements in the shareholder’s equity are before the proposed
profi t appropriation (see Note 60). The proposed profi t appropriation
includes the following items: the addition to retained earnings
(€84.5 million), legal reserves (€26.5 million) and proposed dividends
(€111.0 million).
Non-Distributable Profi ts and Other Gains Regarding Subsidiaries
As at 31 December 2019, profi ts and other gains from subsidiaries
are not freely available for distribution for an amount of €23.1 million
relating to legal reserves (2018: €9.5 million). The increase is mainly
due to the constraints from Irish Stock Exchange plc.
Revaluation Reserve
The revaluation reserve is maintained for the revaluation for
the financial assets at FVOCI, net of tax. This reserve is a non-
distributable legal reserve.
Reserve For Translation Diff erences
The reserve for translation diff erences concerns all exchange rate
diff erences arising from the translation of the net investment in
foreign entities and the related goodwill. This reserve is a non-
distributable legal reserve.
NOTE 54 BORROWINGS
For additional information on the borrowing positions, a reference is made to Note 29 of the Consolidated Financial Statements.
2019 UNIVERSAL REGISTRATION DOCUMENT 253
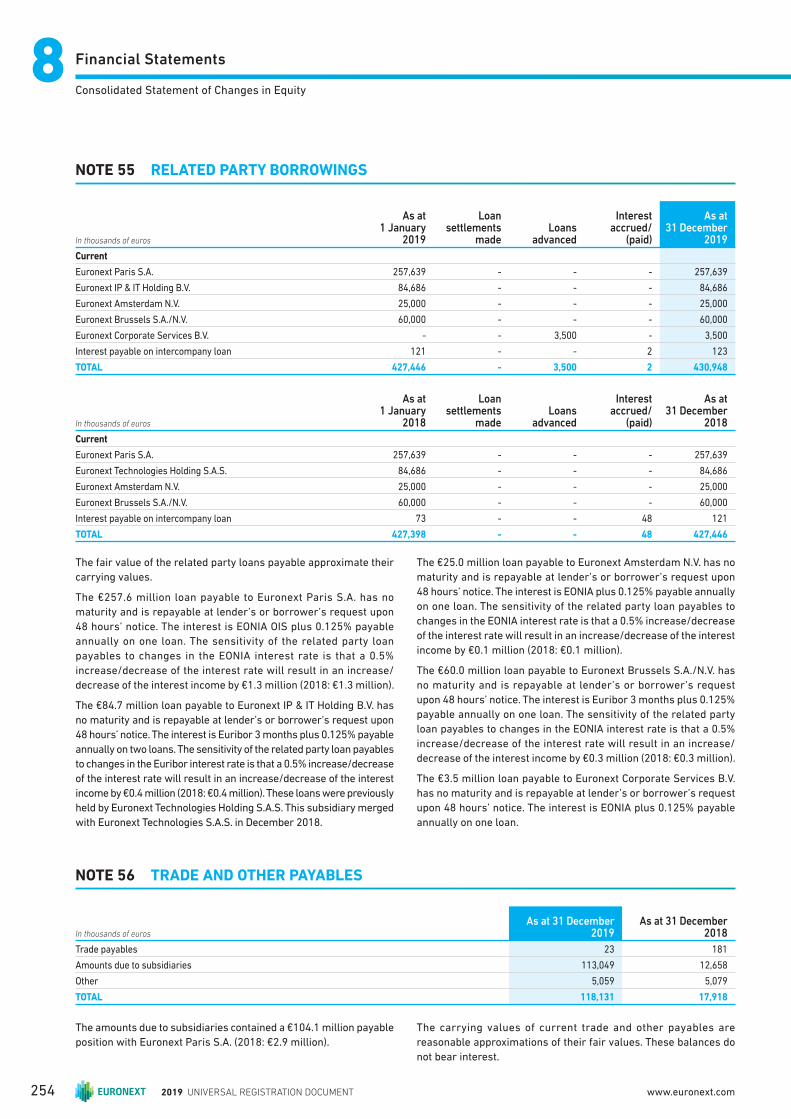
Financial Statements88Consolidated Statement of Changes in Equity
NOTE 55 RELATED PARTY BORROWINGS
In thousands of euros
As at 1 January
2019
Loan settlements
madeLoans
advanced
Interest accrued/
(paid)
As at 31 December
2019
Current
Euronext Paris S.A. 257,639 - - - 257,639
Euronext IP & IT Holding B.V. 84,686 - - - 84,686
Euronext Amsterdam N.V. 25,000 - - - 25,000
Euronext Brussels S.A./N.V. 60,000 - - - 60,000
Euronext Corporate Services B.V. - - 3,500 - 3,500
Interest payable on intercompany loan 121 - - 2 123
TOTAL 427,446 - 3,500 2 430,948
In thousands of euros
As at 1 January
2018
Loan settlements
madeLoans
advanced
Interest accrued/
(paid)
As at 31 December
2018
Current
Euronext Paris S.A. 257,639 - - - 257,639
Euronext Technologies Holding S.A.S. 84,686 - - - 84,686
Euronext Amsterdam N.V. 25,000 - - - 25,000
Euronext Brussels S.A./N.V. 60,000 - - - 60,000
Interest payable on intercompany loan 73 - - 48 121
TOTAL 427,398 - - 48 427,446
The fair value of the related party loans payable approximate their
carrying values.
The €257.6 million loan payable to Euronext Paris S.A. has no
maturity and is repayable at lender’s or borrower’s request upon
48 hours’ notice. The interest is EONIA OIS plus 0.125% payable
annually on one loan. The sensitivity of the related party loan
payables to changes in the EONIA interest rate is that a 0.5%
increase/decrease of the interest rate will result in an increase/
decrease of the interest income by €1.3 million (2018: €1.3 million).
The €84.7 million loan payable to Euronext IP & IT Holding B.V. has
no maturity and is repayable at lender’s or borrower’s request upon
48 hours’ notice. The interest is Euribor 3 months plus 0.125% payable
annually on two loans. The sensitivity of the related party loan payables
to changes in the Euribor interest rate is that a 0.5% increase/decrease
of the interest rate will result in an increase/decrease of the interest
income by €0.4 million (2018: €0.4 million). These loans were previously
held by Euronext Technologies Holding S.A.S. This subsidiary merged
with Euronext Technologies S.A.S. in December 2018.
The €25.0 million loan payable to Euronext Amsterdam N.V. has no
maturity and is repayable at lender’s or borrower’s request upon
48 hours’ notice. The interest is EONIA plus 0.125% payable annually
on one loan. The sensitivity of the related party loan payables to
changes in the EONIA interest rate is that a 0.5% increase/decrease
of the interest rate will result in an increase/decrease of the interest
income by €0.1 million (2018: €0.1 million).
The €60.0 million loan payable to Euronext Brussels S.A./N.V. has
no maturity and is repayable at lender’s or borrower’s request
upon 48 hours’ notice. The interest is Euribor 3 months plus 0.125%
payable annually on one loan. The sensitivity of the related party
loan payables to changes in the EONIA interest rate is that a 0.5%
increase/decrease of the interest rate will result in an increase/
decrease of the interest income by €0.3 million (2018: €0.3 million).
The €3.5 million loan payable to Euronext Corporate Services B.V.
has no maturity and is repayable at lender’s or borrower’s request
upon 48 hours’ notice. The interest is EONIA plus 0.125% payable
annually on one loan.
NOTE 56 TRADE AND OTHER PAYABLES
In thousands of euros
As at 31 December 2019
As at 31 December 2018
Trade payables 23 181
Amounts due to subsidiaries 113,049 12,658
Other 5,059 5,079
TOTAL 118,131 17,918
The amounts due to subsidiaries contained a €104.1 million payable
position with Euronext Paris S.A. (2018: €2.9 million).
The carrying values of current trade and other payables are
reasonable approximations of their fair values. These balances do
not bear interest.
2019 UNIVERSAL REGISTRATION DOCUMENT254 www.euronext.com
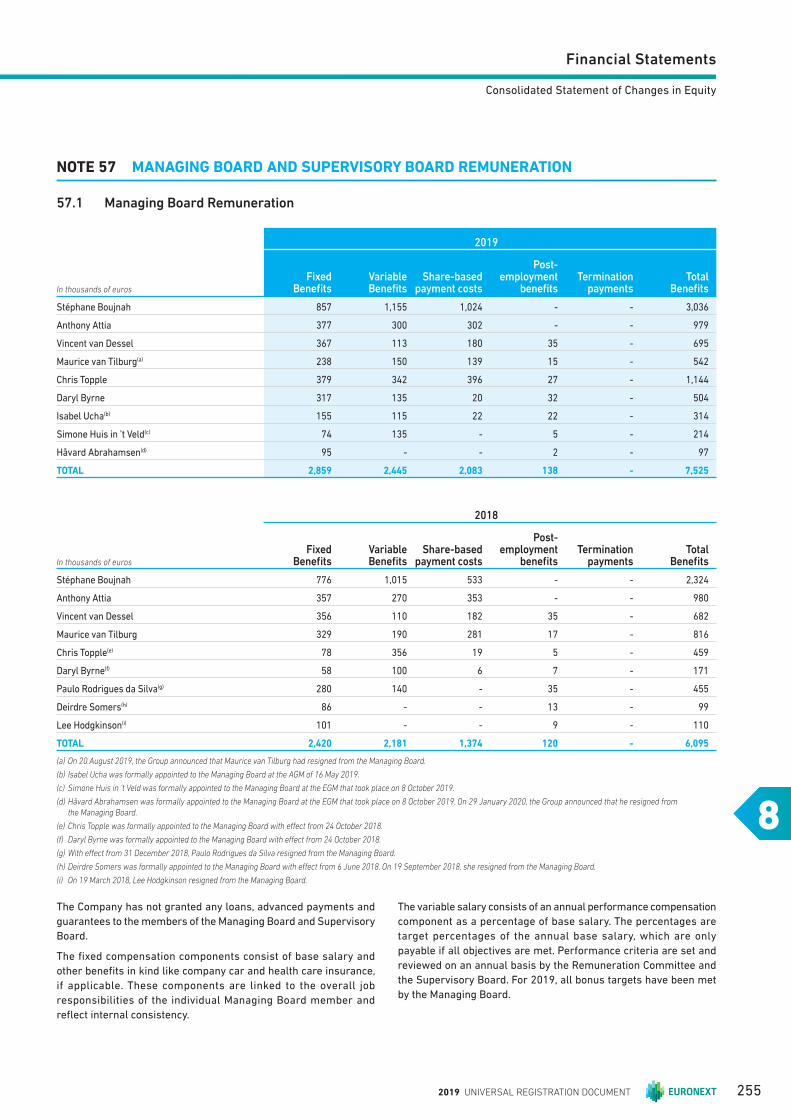
Financial Statements
8
Consolidated Statement of Changes in Equity
NO TE 57 MANAGING BOARD AND SUPERVISORY BOARD REMUNERATION
57.1 Managing Board Remuneration
In thousands of euros
2019
Fixed Benefi ts
Variable Benefi ts
Share-based payment costs
Post-employment
benefi tsTermination
paymentsTotal
Benefi ts
Stéphane Boujnah 857 1,155 1,024 - - 3,036
Anthony Attia 377 300 302 - - 979
Vincent van Dessel 367 113 180 35 - 695
Maurice van Tilburg(a) 238 150 139 15 - 542
Chris Topple 379 342 396 27 - 1,144
Daryl Byrne 317 135 20 32 - 504
Isabel Ucha(b) 155 115 22 22 - 314
Simone Huis in ’t Veld(c) 74 135 - 5 - 214
Håvard Abrahamsen(d) 95 - - 2 - 97
TOTAL 2,85 9 2,445 2,083 138 - 7,52 5
In thousands of euros
2018
Fixed Benefi ts
Variable Benefi ts
Share-based payment costs
Post-employment
benefi tsTermination
paymentsTotal
Benefi ts
Stéphane Boujnah 776 1,015 533 - - 2,324
Anthony Attia 357 270 353 - - 980
Vincent van Dessel 356 110 182 35 - 682
Maurice van Tilburg 329 190 281 17 - 816
Chris Topple(e) 78 356 19 5 - 459
Daryl Byrne(f) 58 100 6 7 - 171
Paulo Rodrigues da Silva(g) 280 140 - 35 - 455
Deirdre Somers(h) 86 - - 13 - 99
Lee Hodgkinson(i) 101 - - 9 - 110
TOTAL 2,420 2,181 1,374 120 - 6,095
(a) On 20 August 2019, the Group announced that Maurice van Tilburg had resigned from the Managing Board.
(b) Isabel Ucha was formally appointed to the Managing Board at the AGM of 16 May 2019.
(c) Simone Huis in ’t Veld was formally appointed to the Managing Board at the EGM that took place on 8 October 2019.
(d) Håvard Abrahamsen was formally appointed to the Managing Board at the EGM that took place on 8 October 2019. On 29 January 2020, the Group announced that he resigned from the Managing Board.
(e) Chris Topple was formally appointed to the Managing Board with eff ect from 24 October 2018.
(f) Daryl Byrne was formally appointed to the Managing Board with eff ect from 24 October 2018.
(g) With eff ect from 31 December 2018, Paulo Rodrigues da Silva resigned from the Managing Board.
(h) Deirdre Somers was formally appointed to the Managing Board with eff ect from 6 June 2018. On 19 September 2018, she resigned from the Managing Board.
(i) On 19 March 2018, Lee Hodgkinson resigned from the Managing Board.
The Company has not granted any loans, advanced payments and
guarantees to the members of the Managing Board and Supervisory
Board.
The fi xed compensation components consist of base salary and
other benefi ts in kind like company car and health care insurance,
if applicable. These components are linked to the overall job
responsibilities of the individual Managing Board member and
refl ect internal consistency.
The variable salary consists of an annual performance compensation
component as a percentage of base salary. The percentages are
target percentages of the annual base salary, which are only
payable if all objectives are met. Performance criteria are set and
reviewed on an annual basis by the Remuneration Committee and
the Supervisory Board. For 2019, all bonus targets have been met
by the Managing Board.
2019 UNIVERSAL REGISTRATION DOCUMENT 255
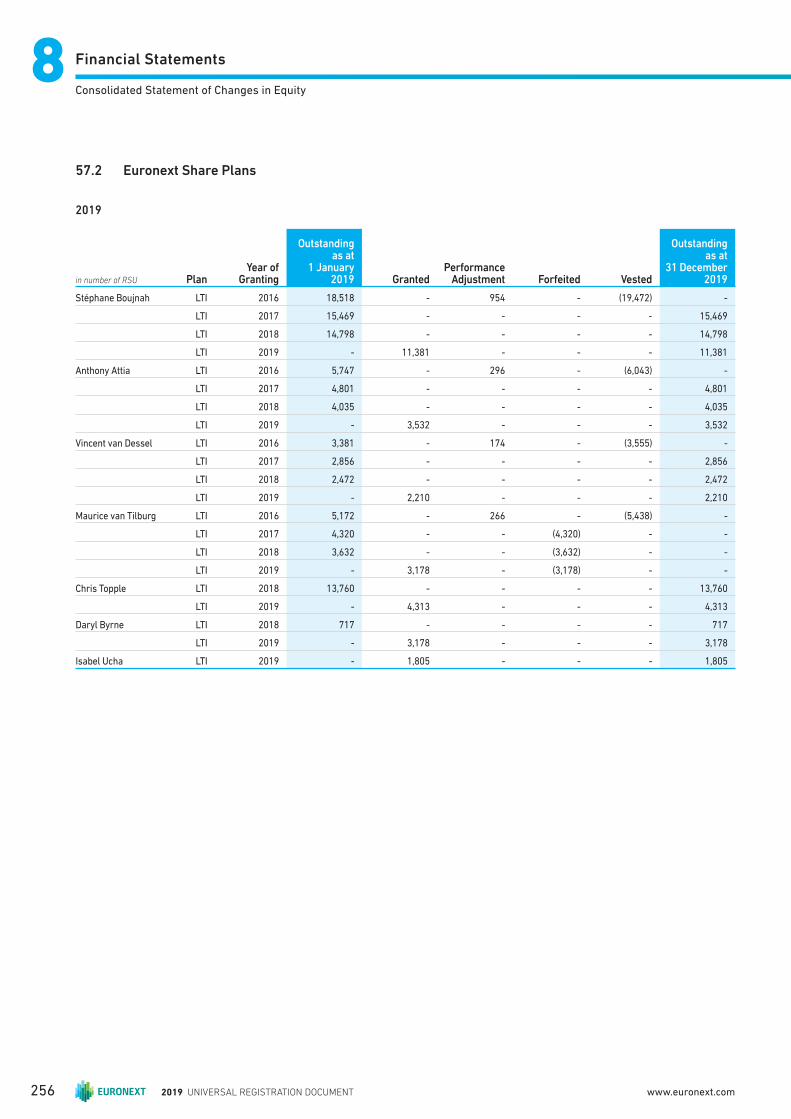
Financial Statements88Consolidated Statement of Changes in Equity
57.2 Euronext Share Plans
2019
in number of RSU PlanYear of
Granting
Outstanding as at
1 January 2019 Granted
Performance Adjustment Forfeited Vested
Outstanding as at
31 December 2019
Stéphane Boujnah LTI 2016 18,518 - 954 - (19,472) -
LTI 2017 15,469 - - - - 15,469
LTI 2018 14,798 - - - - 14,798
LTI 2019 - 11,381 - - - 11,381
Anthony Attia LTI 2016 5,747 - 296 - (6,043) -
LTI 2017 4,801 - - - - 4,801
LTI 2018 4,035 - - - - 4,035
LTI 2019 - 3,532 - - - 3,532
Vincent van Dessel LTI 2016 3,381 - 174 - (3,555) -
LTI 2017 2,856 - - - - 2,856
LTI 2018 2,472 - - - - 2,472
LTI 2019 - 2,210 - - - 2,210
Maurice van Tilburg LTI 2016 5,172 - 266 - (5,438) -
LTI 2017 4,320 - - (4,320) - -
LTI 2018 3,632 - - (3,632) - -
LTI 2019 - 3,178 - (3,178) - -
Chris Topple LTI 2018 13,760 - - - - 13,760
LTI 2019 - 4,313 - - - 4,313
Daryl Byrne LTI 2018 717 - - - - 717
LTI 2019 - 3,178 - - - 3,178
Isabel Ucha LTI 2019 - 1,805 - - - 1,805
2019 UNIVERSAL REGISTRATION DOCUMENT256 www.euronext.com
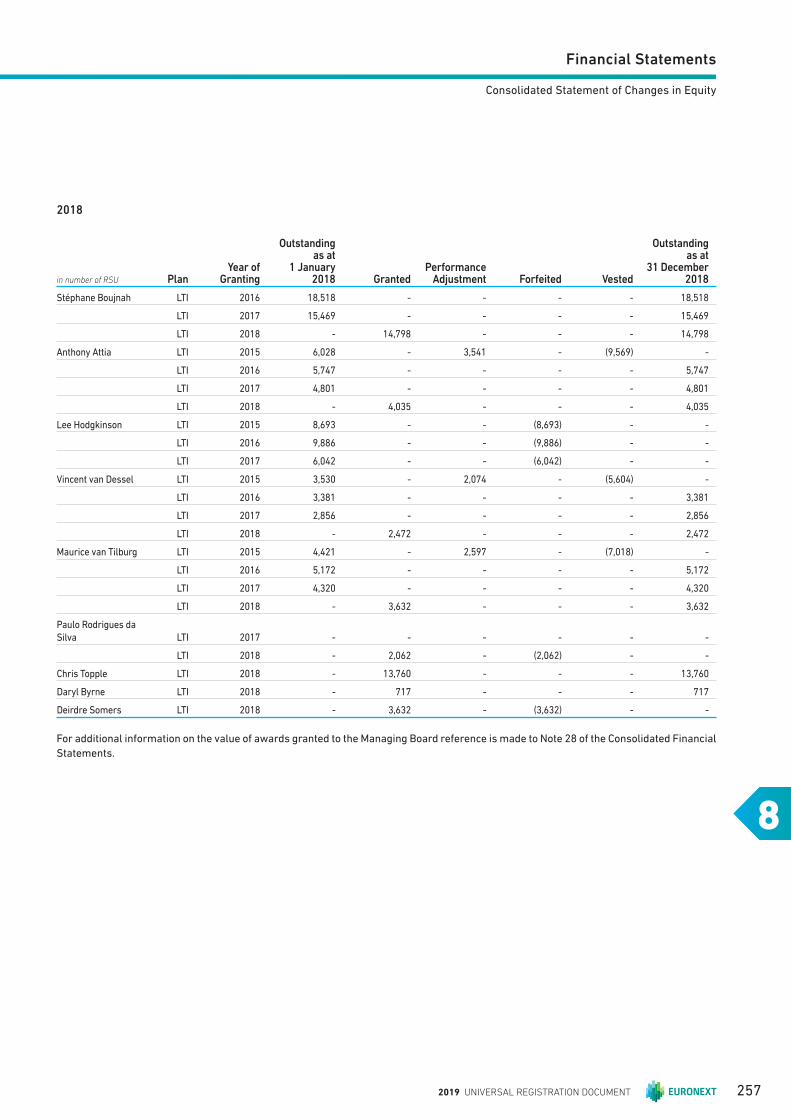
Financial Statements
8
Consolidated Statement of Changes in Equity
2018
in number of RSU PlanYear of
Granting
Outstanding as at
1 January 2018 Granted
Performance Adjustment Forfeited Vested
Outstanding as at
31 December 2018
Stéphane Boujnah LTI 2016 18,518 - - - - 18,518
LTI 2017 15,469 - - - - 15,469
LTI 2018 - 14,798 - - - 14,798
Anthony Attia LTI 2015 6,028 - 3,541 - (9,569) -
LTI 2016 5,747 - - - - 5,747
LTI 2017 4,801 - - - - 4,801
LTI 2018 - 4,035 - - - 4,035
Lee Hodgkinson LTI 2015 8,693 - - (8,693) - -
LTI 2016 9,886 - - (9,886) - -
LTI 2017 6,042 - - (6,042) - -
Vincent van Dessel LTI 2015 3,530 - 2,074 - (5,604) -
LTI 2016 3,381 - - - - 3,381
LTI 2017 2,856 - - - - 2,856
LTI 2018 - 2,472 - - - 2,472
Maurice van Tilburg LTI 2015 4,421 - 2,597 - (7,018) -
LTI 2016 5,172 - - - - 5,172
LTI 2017 4,320 - - - - 4,320
LTI 2018 - 3,632 - - - 3,632
Paulo Rodrigues da
Silva LTI 2017 - - - - - -
LTI 2018 - 2,062 - (2,062) - -
Chris Topple LTI 2018 - 13,760 - - - 13,760
Daryl Byrne LTI 2018 - 717 - - - 717
Deirdre Somers LTI 2018 - 3,632 - (3,632) - -
For additional information on the value of awards granted to the Managing Board reference is made to Note 28 of the Consolidated Financial
Statements.
2019 UNIVERSAL REGISTRATION DOCUMENT 257
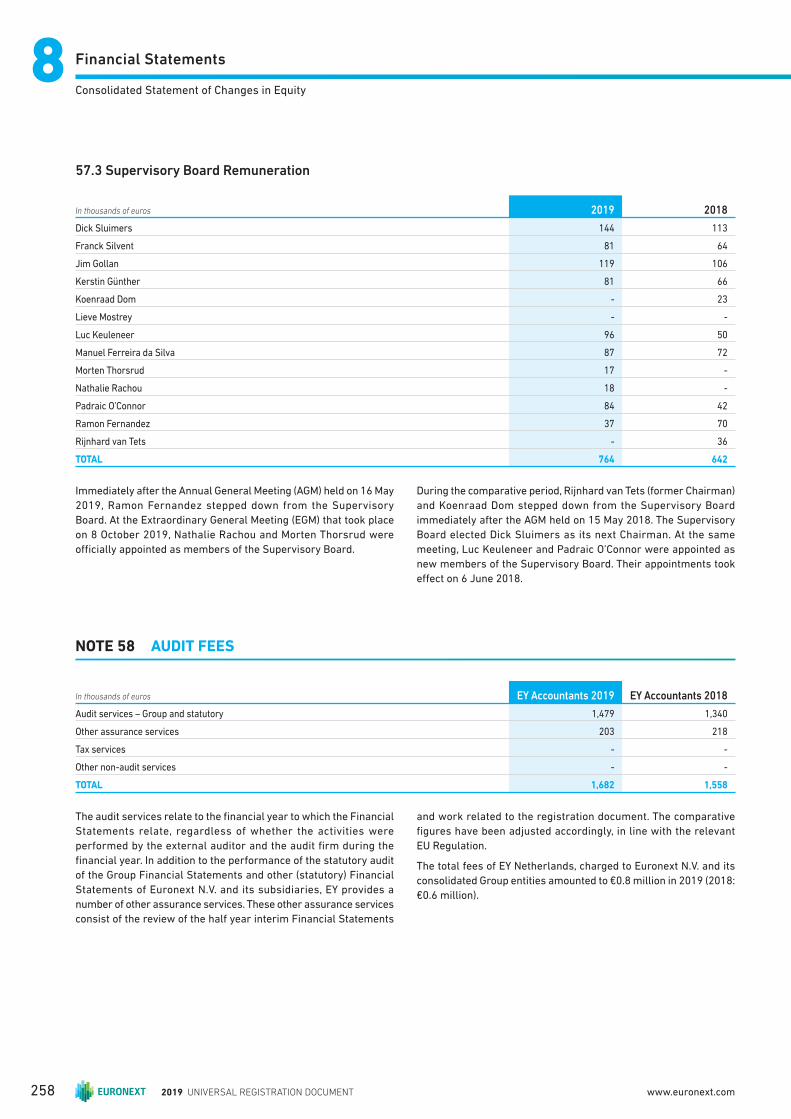
Financial Statements88Consolidated Statement of Changes in Equity
57.3 Supervisory Board Remuneration
In thousands of euros 2019 2018
Dick Sluimers 144 113
Franck Silvent 81 64
Jim Gollan 119 106
Kerstin Günther 81 66
Koenraad Dom - 23
Lieve Mostrey - -
Luc Keuleneer 96 50
Manuel Ferreira da Silva 87 72
Morten Thorsrud 17 -
Nathalie Rachou 18 -
Padraic O’Connor 84 42
Ramon Fernandez 37 70
Rijnhard van Tets - 36
TOTAL 764 642
Immediately after the Annual General Meeting (AGM) held on 16 May
2019, Ramon Fernandez stepped down from the Supervisory
Board. At the Extraordinary General Meeting (EGM) that took place
on 8 October 2019, Nathalie Rachou and Morten Thorsrud were
offi cially appointed as members of the Supervisory Board.
During the comparative period, Rijnhard van Tets (former Chairman)
and Koenraad Dom stepped down from the Supervisory Board
immediately after the AGM held on 15 May 2018. The Supervisory
Board elected Dick Sluimers as its next Chairman. At the same
meeting, Luc Keuleneer and Padraic O’Connor were appointed as
new members of the Supervisory Board. Their appointments took
eff ect on 6 June 2018.
N OTE 58 AUDIT FEES
In thousands of euros EY Accountants 2019 EY Accountants 2018
Audit services – Group and statutory 1,479 1,340
Other assurance services 203 218
Tax services - -
Other non-audit services - -
TOTAL 1,682 1,558
The audit services relate to the fi nancial year to which the Financial
Statements relate, regardless of whether the activities were
performed by the external auditor and the audit fi rm during the
fi nancial year. In addition to the performance of the statutory audit
of the Group Financial Statements and other (statutory) Financial
Statements of Euronext N.V. and its subsidiaries, EY provides a
number of other assurance services. These other assurance services
consist of the review of the half year interim Financial Statements
and work related to the registration document. The comparative
fi gures have been adjusted accordingly, in line with the relevant
EU Regulation.
The total fees of EY Netherlands, charged to Euronext N.V. and its
consolidated Group entities amounted to €0.8 million in 2019 (2018:
€0.6 million).
2019 UNIVERSAL REGISTRATION DOCUMENT258 www.euronext.com

Financial Statements
8
Consolidated Statement of Changes in Equity
NOTE 59 COMMITMENTS AND CONTINGENCIES NOT INCLUDED IN THE BALANCE SHEET
Tax Group
The Company is the head of a fi scal unity with Euronext Amsterdam
N.V., Euronext IP & IT B.V. and Euronext Corporate Services B.V. Under
the standard conditions, the members of the tax group are jointly
and severally liable for any taxes payable by the fi scal unity. Each
company within the fi scal unity recognises its own tax position on
its company balance sheet.
The Financial Statements of Euronext N.V., Euronext Amsterdam N.V.,
Euronext IP & IT B.V., and Euronext Corporate Services B.V. recognise
a tax liability based on their taxable profi t.
Guarantees
The Company participates in a number of guarantees within the
Group, the Company act in the guarantor for certain liabilities of its
subsidiary up to an amount of €8.1 million. It should be noted that the
Group consistently waives guarantee fees for intergroup guarantees,
meaning these transactions are not at arm’s length.
NOTE 6 0 APPROPRIATION OF PROFIT
Proposed profi t appropriation
The Management Board proposes to appropriate the profi t of €222.0 million as follows:
In thousands of euros 2019 2018
Addition to legal reserves 13,580 8,402
Addition to retained earnings 97,403 99,582
At the disposal of the Annual General Meeting of Shareholders (Dividend) 110,983 107,984
TOTAL 221,966 215,968
A dividend in respect of the year ended 31 December 2019 of €1.59
per share (2018: €1.54 per share), amounting to a total dividend
of €111.0 million, representing a 50% pay-out ratio of net profi t,
is to be proposed at the Annual General Meeting on 14 May 2020.
These Financial Statements do not refl ect the dividend payable of
the result 2019.
In 2019, a total amount of €13.6 million was added to the legal
reserves, which was due to the new distribution restrictions
applicable to the Irish Stock Exchange plc.
NOTE 61 EVENTS AFTER THE REPORTING PERIOD
The events occurred between 31 December 2019 and the date of this report that could have a material impact on the economic decisions
made based on these Financial Statements, are described in Note 40 of the Consolidated Financial Statements.
Authorisation of Company Financial Statements
Amsterdam, 1 April 2020
Supervisory Board Managing Board
Dick Sluimers (Chairman) Stéphane Boujnah (CEO and Chairman)
Jim Gollan Anthony Attia
Manuel Ferreira da Silva Vincent van Dessel
Jim Gollan Daryl Byrne
Kerstin Günther Chris Topple
Lieve Mostrey Simone Huis in ’t Veld
Franck Silvent Isabel Ucha
Luc Keuleneer
Padraic O’Connor
Nathalie Rachou
Morten Thorsrud
2019 UNIVERSAL REGISTRATION DOCUMENT 259

2019 UNIVERSAL REGISTRATION DOCUMENT260 www.euronext.com
9.2 Independent Auditor’s Report 262
Report on the audit of the fi nancial statements 2019
included in the universal registration document 262
Our audit approach 263
Report on other information included in the universal
registration document 266
Report on other legal and regulatory requirements 266
Description of responsibilities for the fi nancial statements 267
9.1 Profi t Appropriation Section 262
OTHER INFORMATION
2612019 UNIVERSAL REGISTRATION DOCUMENT

Other information99Profi t Appropriation Section
9.1 Profit Appropriation Section
Provisions in the Articles of Association relating to profit
appropriation.
Article 28.2 of the Articles of Association states that from the profi ts,
as they appear from the adopted annual accounts, fi rst, in the event
that the priority share has been issued and is held by a party other
than the Company, a dividend of ten per cent (10%) of the par value
of the priority share will be paid to the holder of the priority share.
The profi ts which remain after application of the fi rst sentence of
this Article 28.2 shall be at the free disposal of the General Meeting,
provided that there shall be no further distribution on the priority
share, and provided that the General Meeting may only resolve
on any reservation or distribution of profits pursuant to and in
accordance with a proposal thereto of the Supervisory Board or a
proposal of the Managing Board, which proposal has been approved
by the Supervisory Board.
9.2 Independent Auditor’s Report
To: the shareholders and supervisory board of Euronext N.V.
REPORT ON THE AUDIT OF THE FINANCIAL STATEMENTS 2019 INCLUDED IN THE UNIVERSAL REGISTRATION DOCUMENT
Our opinion
We have audited the fi nancial statements 2019 of Euronext N.V. (the
company), based in Amsterdam. The fi nancial statements include
the consolidated fi nancial statements and the company fi nancial
statements.
In our opinion:
n The accompanying consolidated fi nancial statements give a true
and fair view of the fi nancial position of Euronext N.V. as at 31
December 2019, and of its result and its cash fl ows for 2019 in
accordance with International Financial Reporting Standards as
adopted by the European Union (EU IFRS) and with Part 9 of Book
2 of the Dutch Civil Code;
n The accompanying company financial statements give a true
and fair view of the fi nancial position of Euronext N.V. as at 31
December 2019, and of its result for 2019 in accordance with Part
9 of Book 2 of the Dutch Civil Code.
The consolidated fi nancial statements comprise:
n The consolidated balance sheet as at 31 December 2019;
n The consolidated statements of profi t or loss, comprehensive
income, changes in equity and cash fl ows for 2019;
n The notes comprising a summary of the signifi cant accounting
policies and other explanatory information.
The company fi nancial statements comprise:
n The company balance sheet as at 31 December 2019;
n The company income statement for 2019;
n The notes comprising a summary of the accounting policies and
other explanatory information.
Basis for our opinion
We conducted our audit in accordance with Dutch law, including the
Dutch Standards on Auditing.
Our responsibilities under those standards are further described in
the “Our responsibilities for the audit of the fi nancial statements”
section of our report.
We are independent of Euronext N.V. in accordance with the EU
Regulation on specifi c requirements regarding statutory audit of
public-interest entities, the “Wet toezicht accountantsorganisaties”
(Wta, Audit firms supervision act), the “Verordening inzake de
onafhankelijkheid van accountants bij assurance-opdrachten”
(ViO, Code of Ethics for Professional Accountants, a regulation
with respect to independence) and other relevant independence
regulations in the Netherlands.
Furthermore, we have complied with the “Verordening gedrags- en
beroepsregels accountants” (VGBA, Dutch Code of Ethics).
We believe the audit evidence we have obtained is suffi cient and
appropriate to provide a basis for our opinion.
2019 UNIVERSAL REGISTRATION DOCUMENT262 www.euronext.com
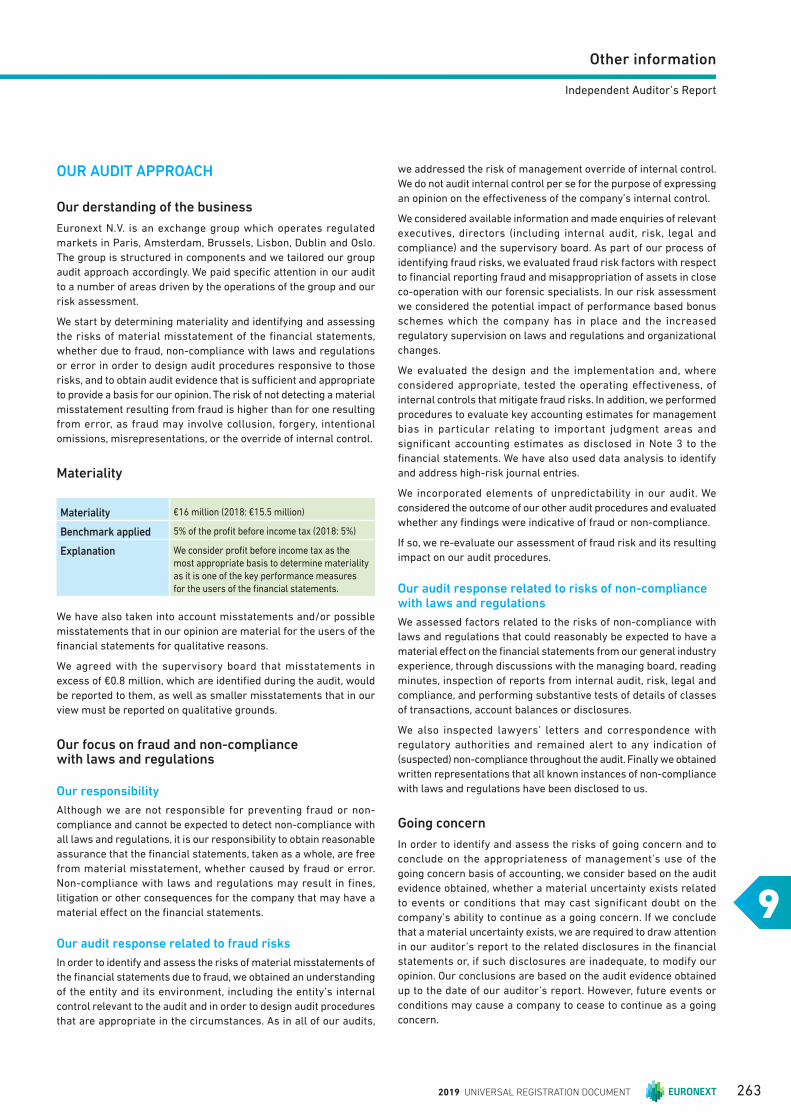
Other information
9
Independent Auditor’s Report
OUR AUDIT APPROACH
Our derstanding of the business
Euronext N.V. is an exchange group which operates regulated
markets in Paris, Amsterdam, Brussels, Lisbon, Dublin and Oslo.
The group is structured in components and we tailored our group
audit approach accordingly. We paid specifi c attention in our audit
to a number of areas driven by the operations of the group and our
risk assessment.
We start by determining materiality and identifying and assessing
the risks of material misstatement of the financial statements,
whether due to fraud, non-compliance with laws and regulations
or error in order to design audit procedures responsive to those
risks, and to obtain audit evidence that is suffi cient and appropriate
to provide a basis for our opinion. The risk of not detecting a material
misstatement resulting from fraud is higher than for one resulting
from error, as fraud may involve collusion, forgery, intentional
omissions, misrepresentations, or the override of internal control.
Materiality
Materiality €16 million (2018: €15.5 million)
Benchmark applied 5% of the profi t before income tax (2018: 5%)
Explanation We consider profi t before income tax as the
most appropriate basis to determine materiality
as it is one of the key performance measures
for the users of the fi nancial statements.
We have also taken into account misstatements and/or possible
misstatements that in our opinion are material for the users of the
fi nancial statements for qualitative reasons.
We agreed with the supervisory board that misstatements in
excess of €0.8 million, which are identifi ed during the audit, would
be reported to them, as well as smaller misstatements that in our
view must be reported on qualitative grounds.
Our focus on fraud and non-compliance with laws and regulations
Our responsibility
Although we are not responsible for preventing fraud or non-
compliance and cannot be expected to detect non-compliance with
all laws and regulations, it is our responsibility to obtain reasonable
assurance that the fi nancial statements, taken as a whole, are free
from material misstatement, whether caused by fraud or error.
Non-compliance with laws and regulations may result in fines,
litigation or other consequences for the company that may have a
material eff ect on the fi nancial statements.
Our audit response related to fraud risks
In order to identify and assess the risks of material misstatements of
the fi nancial statements due to fraud, we obtained an understanding
of the entity and its environment, including the entity’s internal
control relevant to the audit and in order to design audit procedures
that are appropriate in the circumstances. As in all of our audits,
we addressed the risk of management override of internal control.
We do not audit internal control per se for the purpose of expressing
an opinion on the eff ectiveness of the company’s internal control.
We considered available information and made enquiries of relevant
executives, directors (including internal audit, risk, legal and
compliance) and the supervisory board. As part of our process of
identifying fraud risks, we evaluated fraud risk factors with respect
to fi nancial reporting fraud and misappropriation of assets in close
co-operation with our forensic specialists. In our risk assessment
we considered the potential impact of performance based bonus
schemes which the company has in place and the increased
regulatory supervision on laws and regulations and organizational
changes.
We evaluated the design and the implementation and, where
considered appropriate, tested the operating effectiveness, of
internal controls that mitigate fraud risks. In addition, we performed
procedures to evaluate key accounting estimates for management
bias in particular relating to important judgment areas and
significant accounting estimates as disclosed in Note 3 to the
fi nancial statements. We have also used data analysis to identify
and address high-risk journal entries.
We incorporated elements of unpredictability in our audit. We
considered the outcome of our other audit procedures and evaluated
whether any fi ndings were indicative of fraud or non-compliance.
If so, we re-evaluate our assessment of fraud risk and its resulting
impact on our audit procedures.
Our audit response related to risks of non-compliance with laws and regulations
We assessed factors related to the risks of non-compliance with
laws and regulations that could reasonably be expected to have a
material eff ect on the fi nancial statements from our general industry
experience, through discussions with the managing board, reading
minutes, inspection of reports from internal audit, risk, legal and
compliance, and performing substantive tests of details of classes
of transactions, account balances or disclosures.
We also inspected lawyers’ letters and correspondence with
regulatory authorities and remained alert to any indication of
(suspected) non-compliance throughout the audit. Finally we obtained
written representations that all known instances of non-compliance
with laws and regulations have been disclosed to us.
Going concern
In order to identify and assess the risks of going concern and to
conclude on the appropriateness of management’s use of the
going concern basis of accounting, we consider based on the audit
evidence obtained, whether a material uncertainty exists related
to events or conditions that may cast significant doubt on the
company’s ability to continue as a going concern. If we conclude
that a material uncertainty exists, we are required to draw attention
in our auditor’s report to the related disclosures in the fi nancial
statements or, if such disclosures are inadequate, to modify our
opinion. Our conclusions are based on the audit evidence obtained
up to the date of our auditor’s report. However, future events or
conditions may cause a company to cease to continue as a going
concern.
2019 UNIVERSAL REGISTRATION DOCUMENT 263
Other information99Independent Auditor’s Report
Scope of the group audit
Euronext N.V. is at the head of a group of entities. The fi nancial
information of this group is included in the consolidated fi nancial
statements of Euronext N.V.
Because we are ultimately responsible for the opinion, we are
also responsible for directing, supervising and performing the
group audit. In this respect we have determined the nature and
extent of the audit procedures to be carried out for group entities.
Decisive were the size and/or the risk profi le of the group entities
or operations. On this basis, we selected group entities for which an
audit or review had to be carried out on the complete set of fi nancial
information or specifi c items.
We have:
n Performed audit procedures ourselves at group entities Euronext
Paris SA, Euronext Technologies SAS, Euronext Amsterdam N.V.
and Euronext N.V.;
n Used the work of EY auditors when auditing entity Euronext
Dublin plc;
n Used the work of non-EY auditors when auditing Oslo Børs VPS
Holding ASA;
n Performed risk-focused specifi c audit procedures at group entities
Fastmatch Inc and Interbolsa SA.
By performing the procedures mentioned above at group entities,
together with additional procedures such as analytical reviews on
out of scope entities at group level, we have been able to obtain
suffi cient and appropriate audit evidence about the group’s fi nancial
information to provide an opinion about the consolidated fi nancial
statements.
Teaming and use of specialists
We ensured that the audit teams both at group and at component
levels included the appropriate skills and competences which are
needed for the audit of a listed client in the market infrastructure
industry. We included specialists in the areas of IT audit, forensic,
compliance and income tax and have made use of our own experts
in the areas of valuation of derivatives, hedge accounting, employee
benefits, fair value disclosures, purchase price accounting,
impairment analysis of goodwill and other intangibles.
General audit procedures
Our audit further included among others:
n Performing audit procedures responsive to the risks identifi ed,
and obtaining audit evidence that is suffi cient and appropriate to
provide a basis for our opinion;
n Evaluating the appropriateness of accounting policies used
and the reasonableness of accounting estimates and related
disclosures made by management;
n Evaluating the overall presentation, structure and content of the
fi nancial statements, including the disclosures;
n Evaluating whether the financial statements represent the
underlying transactions and events in a manner that achieves
fair presentation.
Our key audit matters
Key audit matters are those matters that, in our professional
judgment, were of most signifi cance in our audit of the fi nancial
statements. We have communicated the key audit matters to the
supervisory board. The key audit matters are not a comprehensive
refl ection of all matters discussed.
These matters were addressed in the context of our audit of the
fi nancial statements as a whole and in forming our opinion thereon,
and we do not provide a separate opinion on these matters.
Two key audit matters changed compared to the audit of the fi nancial
statements 2018 of Euronext N.V. The key audit matter related to
accounting for the acquisition of business specifi cally addresses
the Oslo Børs VPS, whereas in 2018 it regarded the acquisition of
the Dublin stock exchange. The implementation of IFRS 15 Revenue
Recognition is no longer a key audit matter as it specifi cally related
to 2018.
2019 UNIVERSAL REGISTRATION DOCUMENT264 www.euronext.com
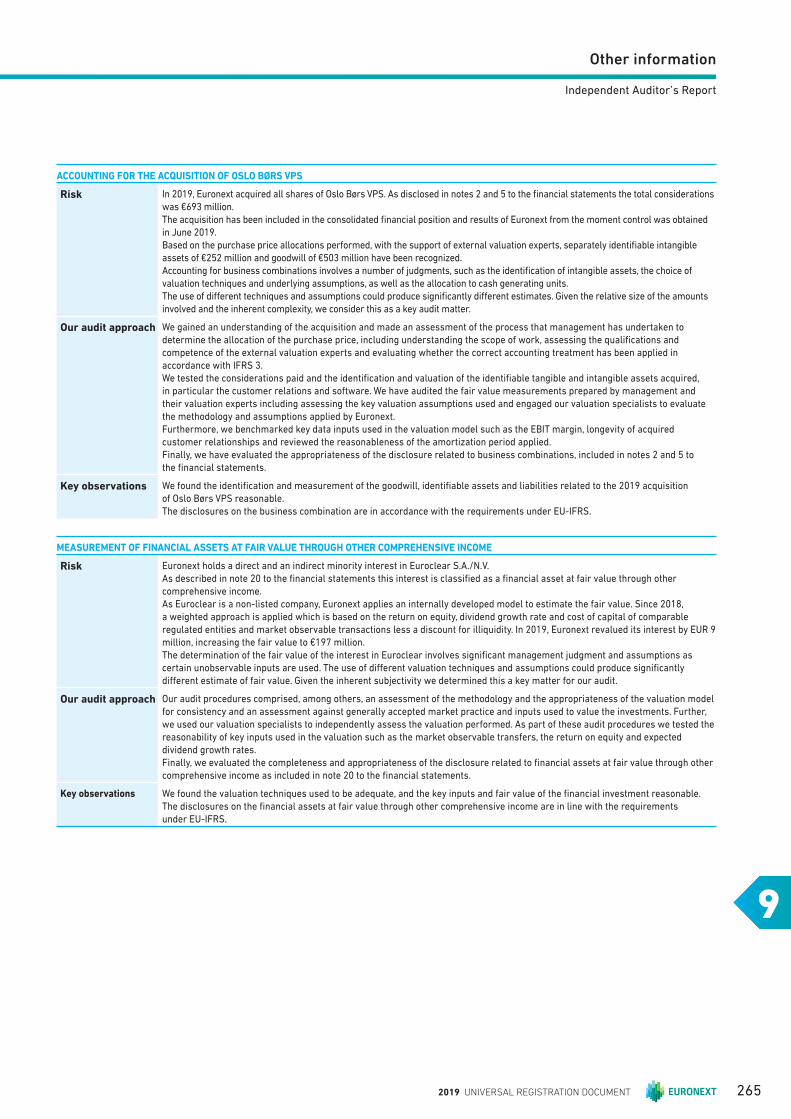
Other information
9
Independent Auditor’s Report
ACCOUNTING FOR THE ACQUISITION OF OSLO BØRS VPS
Risk In 2019, Euronext acquired all shares of Oslo Børs VPS. As disclosed in notes 2 and 5 to the fi nancial statements the total considerations was €693 million. The acquisition has been included in the consolidated fi nancial position and results of Euronext from the moment control was obtained in June 2019. Based on the purchase price allocations performed, with the support of external valuation experts, separately identifi able intangible assets of €252 million and goodwill of €503 million have been recognized. Accounting for business combinations involves a number of judgments, such as the identifi cation of intangible assets, the choice of valuation techniques and underlying assumptions, as well as the allocation to cash generating units. The use of diff erent techniques and assumptions could produce signifi cantly diff erent estimates. Given the relative size of the amounts involved and the inherent complexity, we consider this as a key audit matter.
Our audit approach We gained an understanding of the acquisition and made an assessment of the process that management has undertaken to determine the allocation of the purchase price, including understanding the scope of work, assessing the qualifi cations and competence of the external valuation experts and evaluating whether the correct accounting treatment has been applied in accordance with IFRS 3.We tested the considerations paid and the identifi cation and valuation of the identifi able tangible and intangible assets acquired, in particular the customer relations and software. We have audited the fair value measurements prepared by management and their valuation experts including assessing the key valuation assumptions used and engaged our valuation specialists to evaluate the methodology and assumptions applied by Euronext. Furthermore, we benchmarked key data inputs used in the valuation model such as the EBIT margin, longevity of acquired
customer relationships and reviewed the reasonableness of the amortization period applied.
Finally, we have evaluated the appropriateness of the disclosure related to business combinations, included in notes 2 and 5 to
the fi nancial statements.
Key observations We found the identifi cation and measurement of the goodwill, identifi able assets and liabilities related to the 2019 acquisition
of Oslo Børs VPS reasonable.
The disclosures on the business combination are in accordance with the requirements under EU-IFRS.
MEASUREMENT OF FINANCIAL ASSETS AT FAIR VALUE THROUGH OTHER COMPREHENSIVE INCOME
Risk Euronext holds a direct and an indirect minority interest in Euroclear S.A./N.V.
As described in note 20 to the fi nancial statements this interest is classifi ed as a fi nancial asset at fair value through other
comprehensive income.
As Euroclear is a non-listed company, Euronext applies an internally developed model to estimate the fair value. Since 2018,
a weighted approach is applied which is based on the return on equity, dividend growth rate and cost of capital of comparable
regulated entities and market observable transactions less a discount for illiquidity. In 2019, Euronext revalued its interest by EUR 9
million, increasing the fair value to €197 million.
The determination of the fair value of the interest in Euroclear involves signifi cant management judgment and assumptions as
certain unobservable inputs are used. The use of diff erent valuation techniques and assumptions could produce signifi cantly
diff erent estimate of fair value. Given the inherent subjectivity we determined this a key matter for our audit.
Our audit approach Our audit procedures comprised, among others, an assessment of the methodology and the appropriateness of the valuation model for consistency and an assessment against generally accepted market practice and inputs used to value the investments. Further,
we used our valuation specialists to independently assess the valuation performed. As part of these audit procedures we tested the
reasonability of key inputs used in the valuation such as the market observable transfers, the return on equity and expected dividend growth rates. Finally, we evaluated the completeness and appropriateness of the disclosure related to fi nancial assets at fair value through other
comprehensive income as included in note 20 to the fi nancial statements.
Key observations We found the valuation techniques used to be adequate, and the key inputs and fair value of the fi nancial investment reasonable.
The disclosures on the fi nancial assets at fair value through other comprehensive income are in line with the requirements under EU-IFRS.
2019 UNIVERSAL REGISTRATION DOCUMENT 265
Other information99Independent Auditor’s Report
RELIABILITY AND CONTINUITY OF THE IT ENVIRONMENT
Risk The activities and fi nancial reporting of Euronext N.V. are highly dependent on the reliability and continuity of the IT environment. Eff ective general IT controls with respect to change management, logical access, infrastructure and operations, secure to a large extent the integrity and continuity of the IT systems as well as the operating eff ectiveness of the automated controls. Furthermore, the increased granularity of fi nancial and non-fi nancial data are important to stakeholders and supervisors and require processing of high quality data.As described in the risk management section 2 in the universal registration document, the IT environment and the IT organization of Euronext N.V. are constantly changing in the context of process improvement and digitization. During these changes there is a risk that the generic IT control measures may not always operate as intended. Therefore we identifi ed the reliability and continuity of the IT environment a key audit matter.
Our audit approach With the assistance of our IT audit specialists, we assessed the reliability and continuity of the IT environment, to the extent necessary for the scope of our audit of the fi nancial statements. In this context, we performed walk through procedures on the IT processes and tested the operating eff ectiveness of the general IT controls. In some areas we performed additional substantive procedures on access management for the related systems. We also assessed the possible impact of changes during the year resulting from the internal transformation activities on the general IT controls.
Key observations Our testing of the general IT controls and the other tests performed, provided suffi cient evidence to enable us to rely on the adequate and continued operation of the IT systems relevant for our audit of the fi nancial statements.
Emphasis of matter relating to Covid-19
The developments surrounding the Covid-19 virus epidemic
have a profound impact on people’s health and our society as a
whole, as well as on the operational and fi nancial performance of
organizations.
The situation changes on a daily basis giving rise to inherent
uncertainty. The impact of these developments on Euronext are
disclosed in par 1.2.3 “strategic targets and prospects for 2020”
and in the risk section par 2.1. both part of the director’s report
and in note 40 ’events after the reporting period’ of the fi nancial
statements. We draw the attention to these disclosures.
Our opinion is not modifi ed in respect of this matter.
REPORT ON OTHER INFORMATION INCLUDED IN THE UNIVERSAL REGISTRATION DOCUMENT
In addition to the financial statements and our auditor’s report
thereon, the universal registration document contains other
information that consists of:
n The section Risks and the chapters 1, 2, 3, 4 (excluding 4.3 and
4.4), 5, 6 and 7 comprise the managing board report within the
meaning of 2:391 of the Dutch Civil Code;
n The section 4.3 Report of the supervisory board and the section
4.4 Remuneration report;
n Other information.
Based on the following procedures performed, we conclude that
the other information:
n Is consistent with the fi nancial statements and does not contain
material misstatements;
n Contains the information as required by Part 9 of Book 2 and
Section 2:135b of the Dutch Civil Code.
We have read the other information. Based on our knowledge
and understanding obtained through our audit of the financial
statements or otherwise, we have considered whether the other
information contains material misstatements. By performing these
procedures, we comply with the requirements of Part 9 of Book 2
and Section 2:135b sub-Section 7 of the Dutch Civil Code and the
Dutch Standard 720. The scope of the procedures performed is
substantially less than the scope of those performed in our audit of
the fi nancial statements.
Management is responsible for the preparation of the other
information, including the managing board report in accordance
with Part 9 of Book 2 of the Dutch Civil Code, other information
required by
Part 9 of Book 2 of the Dutch Civil Code and the remuneration report
in accordance with Section 2:135b of the Dutch Civil Code.
REPORT ON OTHER LEGAL AND REGULATORY REQUIREMENTS
Engagement
We were engaged by the general meeting of shareholders as auditor
of Euronext N.V. on 19 May 2017, as of the audit for the year 2017
and have operated as statutory auditor since that date.
No prohibited non-audit services
We have not provided prohibited non-audit services as referred to in
Article 5(1) of the EU Regulation on specifi c requirements regarding
statutory audit of public-interest entities.
2019 UNIVERSAL REGISTRATION DOCUMENT266 www.euronext.com
Other information
9
Independent Auditor’s Report
DESCRIPTION OF RESPONSIBILITIES FOR THE FINANCIAL STATEMENTS
Responsibilities of the managing board and the supervisory board for the fi nancial statements
Management is responsible for the preparation and fair presentation
of the fi nancial statements in accordance with EU-IFRS and Part
9 of Book 2 of the Dutch Civil Code. Furthermore, management is
responsible for such internal control as management determines
is necessary to enable the preparation of the fi nancial statements
that are free from material misstatement, whether due to fraud
or error.
As part of the preparation of the fi nancial statements, management
is responsible for assessing the company’s ability to continue as
a going concern. Based on the fi nancial reporting frameworks
mentioned, management should prepare the fi nancial statements
using the going concern basis of accounting unless management
either intends to liquidate the company or to cease operations,
or has no realistic alternative but to do so. Management should
disclose events and circumstances that may cast signifi cant doubt
on the company’s ability to continue as a going concern in the
fi nancial statements.
The supervisory board is responsible for overseeing the company’s
fi nancial reporting process.
Our responsibilities for the audit of the fi nancial statements
Our objective is to plan and perform the audit engagement in a
manner that allows us to obtain suffi cient and appropriate audit
evidence for our opinion.
Our audit has been performed with a high, but not absolute, level of
assurance, which means we may not detect all material errors and
fraud during our audit.
Misstatements can arise from fraud or error and are considered
material if, individually or in the aggregate, they could reasonably be
expected to infl uence the economic decisions of users taken
on the basis of these fi nancial statements. The materiality aff ects the
nature, timing and extent of our audit procedures and the evaluation
of the eff ect of identifi ed misstatements on our opinion.
We have exercised professional judgment and have maintained
professional skepticism throughout the audit, in accordance
with Dutch Standards on Auditing, ethical requirements and
independence requirements. The Our audit approach section above
includes an informative summary of our responsibilities and the
work performed as the basis for our opinion.
Communication
We communicate with the supervisory board regarding, among other
matters, the planned scope and timing of the audit and signifi cant
audit fi ndings, including any signifi cant fi ndings in internal control
that we identify during our audit. In this respect we also submit
an additional report to the audit committee in accordance with
Article 11 of the EU Regulation on specifi c requirements regarding
statutory audit of public-interest entities. The information included
in this additional report is consistent with our audit opinion in this
auditor’s report.
We provide the supervisory board with a statement that we
have complied with relevant ethical requirements regarding
independence, and to communicate with them all relationships
and other matters that may reasonably be thought to bear on our
independence, and where applicable, related safeguards.
From the matters communicated with the supervisory board, we
determine the key audit matters:
those matters that were of most signifi cance in the audit of the
fi nancial statements. We describe these matters in our auditor’s
report unless law or regulation precludes public disclosure
about the matter or when, in extremely rare circumstances, not
communicating the matter is in the public interest.
Amsterdam, 1 April 2020
Ernst & Young Accountants LLP
Signed by A.B. Roeders
2019 UNIVERSAL REGISTRATION DOCUMENT 267

2019 UNIVERSAL REGISTRATION DOCUMENT268 www.euronext.com
GLOSSARY & CONCORDANCE TABLES
G
2019 UNIVERSAL REGISTRATION DOCUMENT 269
GLOSSARY & CONCORDANCE TABLESGG
GLOSSARY
ACPR The French Prudential Supervision and Resolution Authority (Autorité de Contrôle Prudentiel et de Résolution)
AFM Stichting Autoriteit Financiële Markten, the Netherlands Authority for the Financial Markets
Alternext Multilateral trading facilities operated by the Company in Paris, Brussels and Lisbon
AMF French Authority for the Financial Markets (Autorité des Marchés Financiers)
Articles of Association The Articles of Association (statuten) of the Company
Brexit British exit, referring to the UK’s decision in a referendum on 23 June 2016 to leave the European Union
CAGR Compounded annual growth rate
Cash Clearing AgreementThe Cash Clearing Agreement entered into between Euronext and certain of its affi liates and LCH SA and LCH SA Group Limited on 22 January 2013
CCPs Central counterparties
CDPCarbon Disclosure Project: CDP is a not-for-profi t organization that runs the global disclosure system for investors, companies,
cities, states and regions to manage their environmental impacts
CEO Chief Executive Offi cer
CFO Chief Financial Offi cer
Clearing ServicesClearing Services is the procedure by which an organisation (CCP) acts as an intermediary and assumes the role of a buyer
and seller in a transaction through the process of novation in order to reconcile orders between transacting parties
CMVM Comissão do Mercado de Valores Mobiliários, the Portuguese Securities Markets Commission
Code of conduct and ethicsCode that reaffi rms the Euronext N.V.’s commitment to high standards of ethical conduct and reinforces its business ethics, policies
and procedures
Company Euronext N.V. and its consolidated subsidiaries, unless otherwise indicated
Compliance department The Compliance department of Euronext N.V.
COO Chief Operating Offi cer
Core Items The intellectual property in the UTP and other trading technology, including core software and technology
CSD Central Securities Depositories
CSD RegulationEU Regulation on securities settlement and central securities depositories (published on the Offi cial Journal of the European Union
on 23 July 2014)
DBAG Deutsche Börse AG
DMA Direct market access
Derivatives Clearing Agreement
The Derivatives Clearing Agreement entered into between Euronext and certain of its affi liates and LCH SA and LCH SA Group Limited on 14 October 2013. The revenue sharing agreement became eff ective as of 1 April 2014
Code The Dutch Corporate Governance Code
Dutch Financial
Supervision ActThe Dutch Financial Supervision Act (Wet op het Financieel Toezicht) and the rules promulgated thereunder
EBITDA Operating Profi t Before Exceptional Items and Depreciation and Amortisation
ECB European Central Bank
EEA European Economic Area
EMEA Europe, Middle East and Africa
EMIR The EU Regulation on OTC derivative transactions, central counterparties and trade repositories (Regulation 648/2012)
ESG Environmental, Social and Governance
ESMA European Securities and Markets Authority
ETF or ETFs Exchange traded funds
ETPs Exchange traded products
EU European Union
EU Market Abuse RulesThe EU Market Abuse Regulation 596/2014/EU, providing for specifi c rules that intend to prevent market abuse,
such as the prohibitions on insider trading, divulging inside information and tipping, and market manipulation
€, Euro The lawful currency of the Member states of the European Union that have adopted it
Euroclear Euroclear Bank S.A./N.V.
2019 UNIVERSAL REGISTRATION DOCUMENT270 www.euronext.com
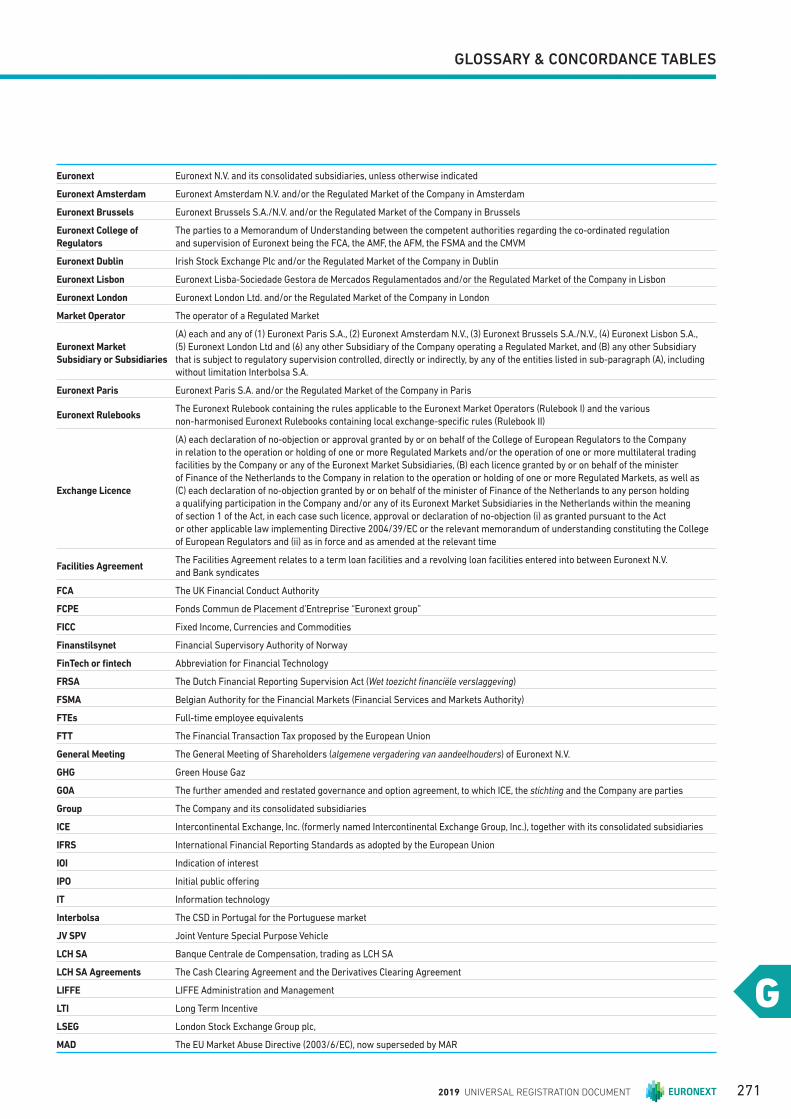
GLOSSARY & CONCORDANCE TABLES
G
Euronext Euronext N.V. and its consolidated subsidiaries, unless otherwise indicated
Euronext Amsterdam Euronext Amsterdam N.V. and/or the Regulated Market of the Company in Amsterdam
Euronext Brussels Euronext Brussels S.A./N.V. and/or the Regulated Market of the Company in Brussels
Euronext College of Regulators
The parties to a Memorandum of Understanding between the competent authorities regarding the co-ordinated regulation and supervision of Euronext being the FCA, the AMF, the AFM, the FSMA and the CMVM
Euronext Dublin Irish Stock Exchange Plc and/or the Regulated Market of the Company in Dublin
Euronext Lisbon Euronext Lisba-Sociedade Gestora de Mercados Regulamentados and/or the Regulated Market of the Company in Lisbon
Euronext London Euronext London Ltd. and/or the Regulated Market of the Company in London
Market Operator The operator of a Regulated Market
Euronext Market Subsidiary or Subsidiaries
(A) each and any of (1) Euronext Paris S.A., (2) Euronext Amsterdam N.V., (3) Euronext Brussels S.A./N.V., (4) Euronext Lisbon S.A., (5) Euronext London Ltd and (6) any other Subsidiary of the Company operating a Regulated Market, and (B) any other Subsidiary that is subject to regulatory supervision controlled, directly or indirectly, by any of the entities listed in sub-paragraph (A), including without limitation Interbolsa S.A.
Euronext Paris Euronext Paris S.A. and/or the Regulated Market of the Company in Paris
Euronext RulebooksThe Euronext Rulebook containing the rules applicable to the Euronext Market Operators (Rulebook I) and the various non-harmonised Euronext Rulebooks containing local exchange-specifi c rules (Rulebook II)
Exchange Licence
(A) each declaration of no-objection or approval granted by or on behalf of the College of European Regulators to the Company
in relation to the operation or holding of one or more Regulated Markets and/or the operation of one or more multilateral trading
facilities by the Company or any of the Euronext Market Subsidiaries, (B) each licence granted by or on behalf of the minister
of Finance of the Netherlands to the Company in relation to the operation or holding of one or more Regulated Markets, as well as
(C) each declaration of no-objection granted by or on behalf of the minister of Finance of the Netherlands to any person holding
a qualifying participation in the Company and/or any of its Euronext Market Subsidiaries in the Netherlands within the meaning
of section 1 of the Act, in each case such licence, approval or declaration of no-objection (i) as granted pursuant to the Act
or other applicable law implementing Directive 2004/39/EC or the relevant memorandum of understanding constituting the College
of European Regulators and (ii) as in force and as amended at the relevant time
Facilities AgreementThe Facilities Agreement relates to a term loan facilities and a revolving loan facilities entered into between Euronext N.V.
and Bank syndicates
FCA The UK Financial Conduct Authority
FCPE Fonds Commun de Placement d’Entreprise “Euronext group”
FICC Fixed Income, Currencies and Commodities
Finanstilsynet Financial Supervisory Authority of Norway
FinTech or fi ntech Abbreviation for Financial Technology
FRSA The Dutch Financial Reporting Supervision Act (Wet toezicht fi nanciële verslaggeving)
FSMA Belgian Authority for the Financial Markets (Financial Services and Markets Authority)
FTEs Full-time employee equivalents
FTT The Financial Transaction Tax proposed by the European Union
General Meeting The General Meeting of Shareholders (algemene vergadering van aandeelhouders) of Euronext N.V.
GHG Green House Gaz
GOA The further amended and restated governance and option agreement, to which ICE, the stichting and the Company are parties
Group The Company and its consolidated subsidiaries
ICE Intercontinental Exchange, Inc. (formerly named Intercontinental Exchange Group, Inc.), together with its consolidated subsidiaries
IFRS International Financial Reporting Standards as adopted by the European Union
IOI Indication of interest
IPO Initial public off ering
IT Information technology
Interbolsa The CSD in Portugal for the Portuguese market
JV SPV Joint Venture Special Purpose Vehicle
LCH SA Banque Centrale de Compensation, trading as LCH SA
LCH SA Agreements The Cash Clearing Agreement and the Derivatives Clearing Agreement
LIFFE LIFFE Administration and Management
LTI Long Term Incentive
LSEG London Stock Exchange Group plc,
MAD The EU Market Abuse Directive (2003/6/EC), now superseded by MAR
2019 UNIVERSAL REGISTRATION DOCUMENT 271
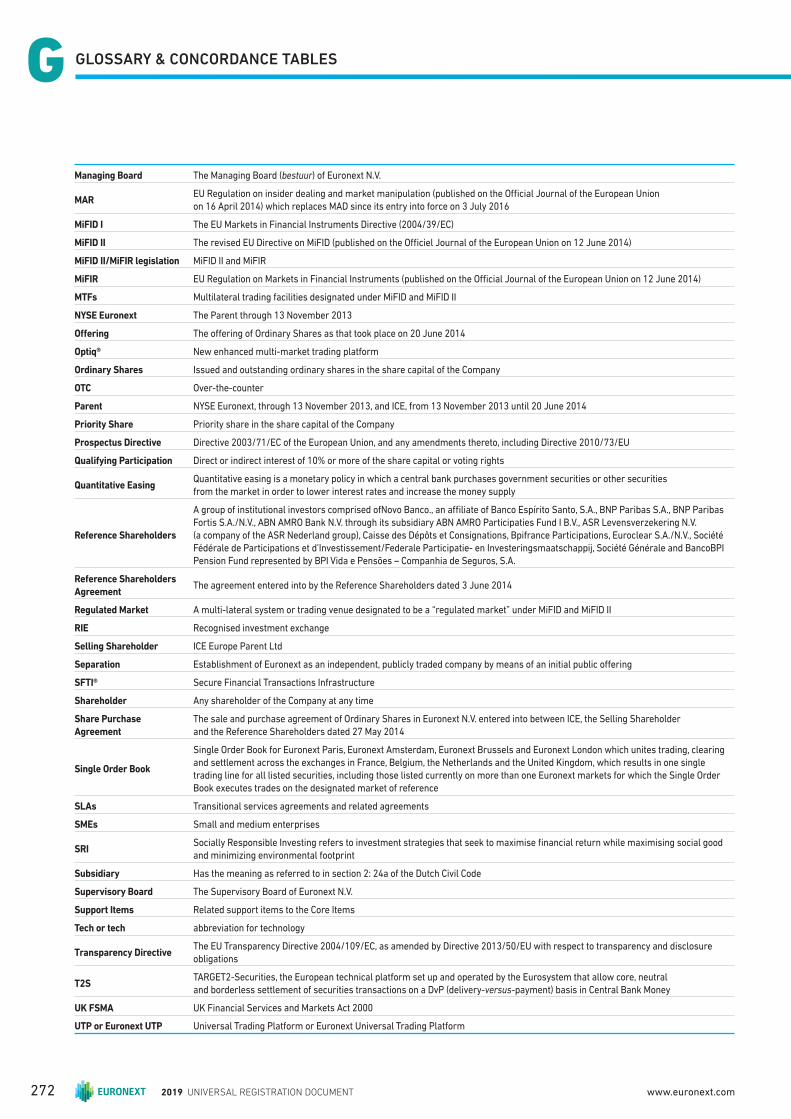
GLOSSARY & CONCORDANCE TABLESGG
Managing Board The Managing Board (bestuur) of Euronext N.V.
MAREU Regulation on insider dealing and market manipulation (published on the Offi cial Journal of the European Union on 16 April 2014) which replaces MAD since its entry into force on 3 July 2016
MiFID I The EU Markets in Financial Instruments Directive (2004/39/EC)
MiFID II The revised EU Directive on MiFID (published on the Offi ciel Journal of the European Union on 12 June 2014)
MiFID II/MiFIR legislation MiFID II and MiFIR
MiFIR EU Regulation on Markets in Financial Instruments (published on the Offi cial Journal of the European Union on 12 June 2014)
MTFs Multilateral trading facilities designated under MiFID and MiFID II
NYSE Euronext The Parent through 13 November 2013
Off ering The off ering of Ordinary Shares as that took place on 20 June 2014
Optiq® New enhanced multi-market trading platform
Ordinary Shares Issued and outstanding ordinary shares in the share capital of the Company
OTC Over-the-counter
Parent NYSE Euronext, through 13 November 2013, and ICE, from 13 November 2013 until 20 June 2014
Priority Share Priority share in the share capital of the Company
Prospectus Directive Directive 2003/71/EC of the European Union, and any amendments thereto, including Directive 2010/73/EU
Qualifying Participation Direct or indirect interest of 10% or more of the share capital or voting rights
Quantitative EasingQuantitative easing is a monetary policy in which a central bank purchases government securities or other securities
from the market in order to lower interest rates and increase the money supply
Reference Shareholders
A group of institutional investors comprised ofNovo Banco., an affi liate of Banco Espírito Santo, S.A., BNP Paribas S.A., BNP Paribas
Fortis S.A./N.V., ABN AMRO Bank N.V. through its subsidiary ABN AMRO Participaties Fund I B.V., ASR Levensverzekering N.V.
(a company of the ASR Nederland group), Caisse des Dépôts et Consignations, Bpifrance Participations, Euroclear S.A./N.V., Société
Fédérale de Participations et d’Investissement/Federale Participatie- en Investeringsmaatschappij, Société Générale and BancoBPI
Pension Fund represented by BPI Vida e Pensões – Companhia de Seguros, S.A.
Reference Shareholders
AgreementThe agreement entered into by the Reference Shareholders dated 3 June 2014
Regulated Market A multi-lateral system or trading venue designated to be a “regulated market” under MiFID and MiFID II
RIE Recognised investment exchange
Selling Shareholder ICE Europe Parent Ltd
Separation Establishment of Euronext as an independent, publicly traded company by means of an initial public off ering
SFTI® Secure Financial Transactions Infrastructure
Shareholder Any shareholder of the Company at any time
Share Purchase
Agreement
The sale and purchase agreement of Ordinary Shares in Euronext N.V. entered into between ICE, the Selling Shareholder
and the Reference Shareholders dated 27 May 2014
Single Order Book
Single Order Book for Euronext Paris, Euronext Amsterdam, Euronext Brussels and Euronext London which unites trading, clearing
and settlement across the exchanges in France, Belgium, the Netherlands and the United Kingdom, which results in one single trading line for all listed securities, including those listed currently on more than one Euronext markets for which the Single Order Book executes trades on the designated market of reference
SLAs Transitional services agreements and related agreements
SMEs Small and medium enterprises
SRISocially Responsible Investing refers to investment strategies that seek to maximise fi nancial return while maximising social good
and minimizing environmental footprint
Subsidiary Has the meaning as referred to in section 2: 24a of the Dutch Civil Code
Supervisory Board The Supervisory Board of Euronext N.V.
Support Items Related support items to the Core Items
Tech or tech abbreviation for technology
Transparency DirectiveThe EU Transparency Directive 2004/109/EC, as amended by Directive 2013/50/EU with respect to transparency and disclosure obligations
T2STARGET2-Securities, the European technical platform set up and operated by the Eurosystem that allow core, neutral and borderless settlement of securities transactions on a DvP (delivery-versus-payment) basis in Central Bank Money
UK FSMA UK Financial Services and Markets Act 2000
UTP or Euronext UTP Universal Trading Platform or Euronext Universal Trading Platform
2019 UNIVERSAL REGISTRATION DOCUMENT272 www.euronext.com
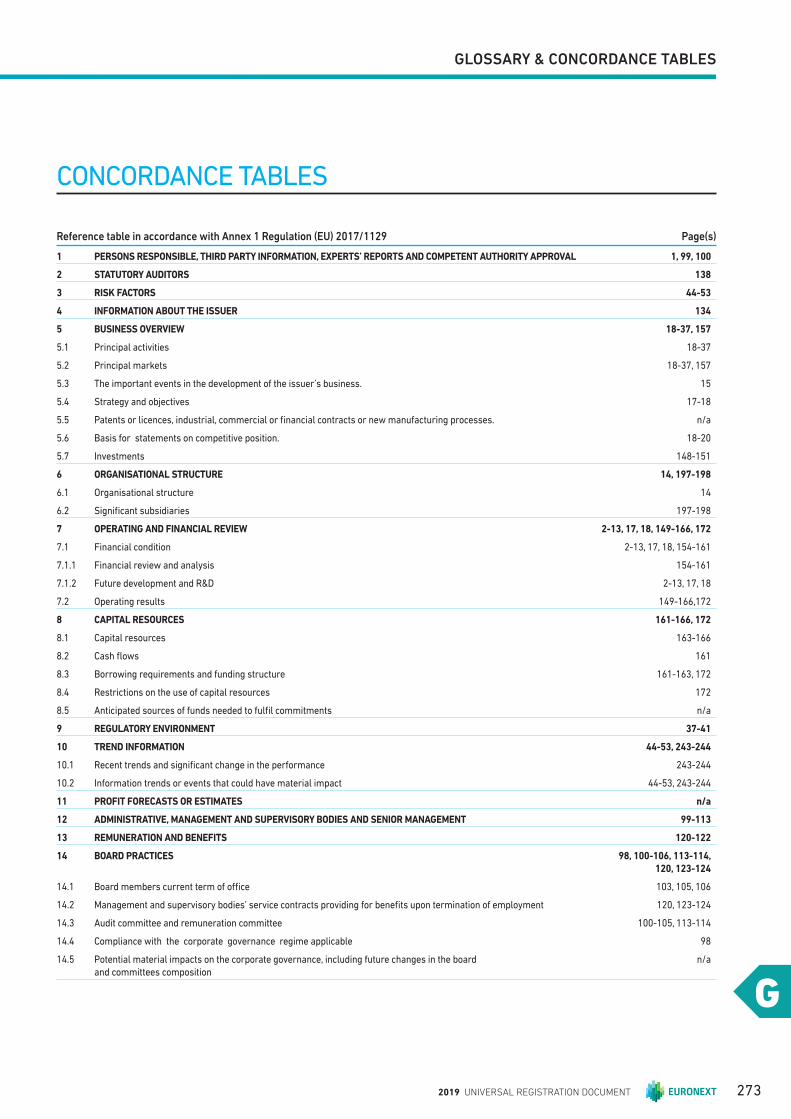
GLOSSARY & CONCORDANCE TABLES
G
CONCORDANCE TABLES
Reference table in accordance with Annex 1 Regulation (EU) 2017/1129 Page(s)
1 PERSONS RESPONSIBLE, THIRD PARTY INFORMATION, EXPERTS’ REPORTS AND COMPETENT AUTHORITY APPROVAL 1, 99, 100
2 STATUTORY AUDITORS 138
3 RISK FACTORS 44-53
4 INFORMATION ABOUT THE ISSUER 134
5 BUSINESS OVERVIEW 18-37, 157
5.1 Principal activities 18-37
5.2 Principal markets 18-37, 157
5.3 The important events in the development of the issuer’s business. 15
5.4 Strategy and objectives 17-18
5.5 Patents or licences, industrial, commercial or fi nancial contracts or new manufacturing processes. n/a
5.6 Basis for statements on competitive position. 18-20
5.7 Investments 148-151
6 ORGANISATIONAL STRUCTURE 14, 197-198
6.1 Organisational structure 14
6.2 Signifi cant subsidiaries 197-198
7 OPERATING AND FINANCIAL REVIEW 2-13, 17, 18, 149-166, 172
7.1 Financial condition 2-13, 17, 18, 154-161
7.1.1 Financial review and analysis 154-161
7.1.2 Future development and R&D 2-13, 17, 18
7.2 Operating results 149-166,172
8 CAPITAL RESOURCES 161-166, 172
8.1 Capital resources 163-166
8.2 Cash fl ows 161
8.3 Borrowing requirements and funding structure 161-163, 172
8.4 Restrictions on the use of capital resources 172
8.5 Anticipated sources of funds needed to fulfi l commitments n/a
9 REGULATORY ENVIRONMENT 37-41
10 TREND INFORMATION 44-53 , 243-244
10.1 Recent trends and signifi cant change in the performance 243-244
10.2 Information trends or events that could have material impact 44-53 , 243-244
11 PROFIT FORECASTS OR ESTIMATES n/a
12 ADMINISTRATIVE, MANAGEMENT AND SUPERVISORY BODIES AND SENIOR MANAGEMENT 99-113
13 REMUNERATION AND BENEFITS 120-122
14 BOARD PRACTICES 98, 100-106, 113-114,
120, 123-124
14.1 Board members current term of offi ce 103, 105, 106
14.2 Management and supervisory bodies’ service contracts providing for benefi ts upon termination of employment 120, 123-124
14.3 Audit committee and remuneration committee 100-105, 113-114
14.4 Compliance with the corporate governance regime applicable 98
14.5 Potential material impacts on the corporate governance, including future changes in the board
and committees composition
n/a
2019 UNIVERSAL REGISTRATION DOCUMENT 273
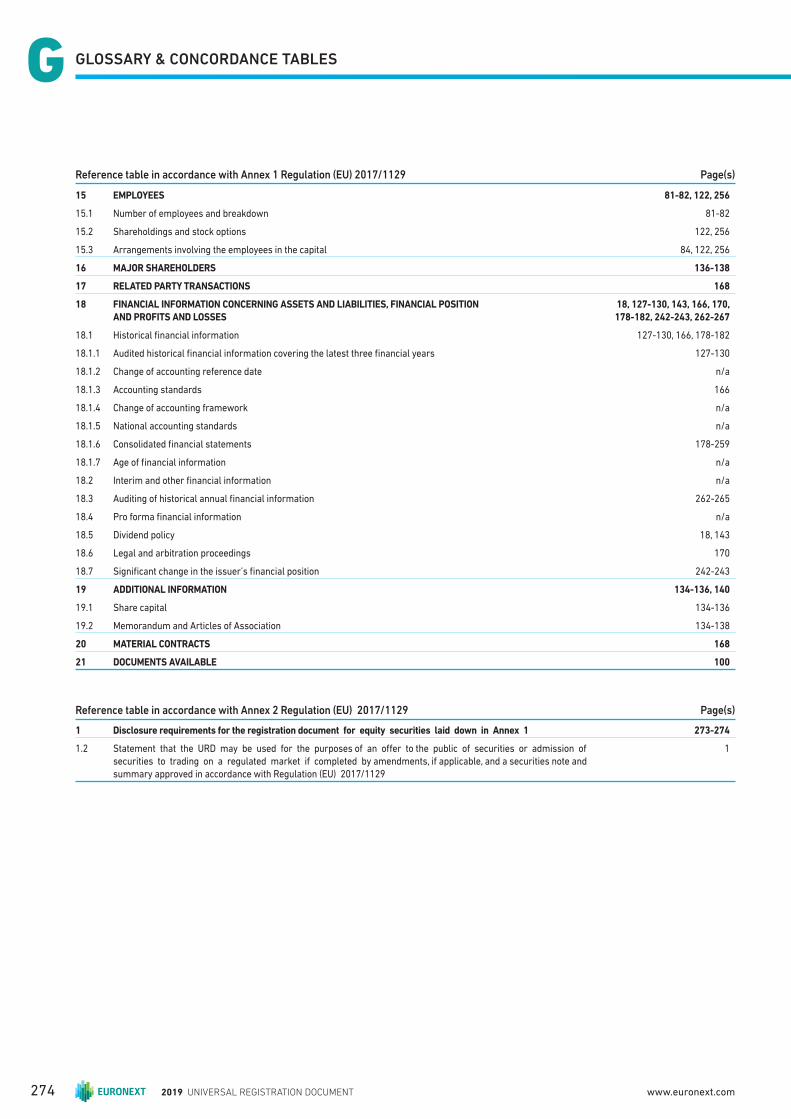
GLOSSARY & CONCORDANCE TABLESGG
Reference table in accordance with Annex 1 Regulation (EU) 2017/1129 Page(s)
15 EMPLOYEES 81-82, 122, 256
15.1 Number of employees and breakdown 81-82
15.2 Shareholdings and stock options 122, 256
15.3 Arrangements involving the employees in the capital 84, 122, 256
16 MAJOR SHAREHOLDERS 136-138
17 RELATED PARTY TRANSACTIONS 168
18 FINANCIAL INFORMATION CONCERNING ASSETS AND LIABILITIES, FINANCIAL POSITION AND PROFITS AND LOSSES
18, 127-130, 143, 166, 170, 178-182, 242-243, 262-267
18.1 Historical fi nancial information 127-130, 166, 178-182
18.1.1 Audited historical fi nancial information covering the latest three fi nancial years 127-130
18.1.2 Change of accounting reference date n/a
18.1.3 Accounting standards 166
18.1.4 Change of accounting framework n/a
18.1.5 National accounting standards n/a
18.1.6 Consolidated fi nancial statements 178-259
18.1.7 Age of fi nancial information n/a
18.2 Interim and other fi nancial information n/a
18.3 Auditing of historical annual fi nancial information 262-265
18.4 Pro forma fi nancial information n/a
18.5 Dividend policy 18, 143
18.6 Legal and arbitration proceedings 170
18.7 Signifi cant change in the issuer’s fi nancial position 242-243
19 ADDITIONAL INFORMATION 134-136, 140
19.1 Share capital 134-136
19.2 Memorandum and Articles of Association 134-138
20 MATERIAL CONTRACTS 168
21 DOCUMENTS AVAILABLE 100
Reference table in accordance with Annex 2 Regulation (EU) 2017/1129 Page(s)
1 Disclosure requirements for the registration document for equity securities laid down in Annex 1 273-274
1.2 Statement that the URD may be used for the purposes of an off er to the public of securities or admission of securities to trading on a regulated market if completed by amendments, if applicable, and a securities note and summary approved in accordance with Regulation (EU) 2017/1129
1
2019 UNIVERSAL REGISTRATION DOCUMENT274 www.euronext.com

G
THIS PAGE HAS BEEN INTENTIONALLY LEFT BLANK
2019 UNIVERSAL REGISTRATION DOCUMENT 275

2019 UNIVERSAL REGISTRATION DOCUMENT276 www.euronext.com

This document is printed in France by an Imprim’Vert certifi ed printer
on PEFC certifi ed paper produced from sustainably managed forest.