UNIVERSAL REGISTRATION DOCUMENT - Verallia
354
1 Verallia Public limited company with a share capital of €400,171,523.96 Registered Office: 31 Place des Corolles, Carpe Diem Tower, North Esplanade, 92400 Courbevoie, France Registered in the Nanterre Trade and Companies Register under number 812 163 913 UNIVERSAL REGISTRATION DOCUMENT The French version of the Universal Registration Document was approved by the French Financial Markets Authority (Autorité des marchés financiers - AMF) on 29 April 2020, as the competent authority under Regulation (EU) 2017/1129. The AMF approves this document after verifying that the information contained in it is complete, consistent and comprehensible. The Universal Registration Document has the following approval number: R. 20-006 Such approval should not be considered as a favourable opinion on the issuer covered by the Universal Registration Document. The Universal Registration Document may be used for the purpose of offering to the public financial securities or for the admission of financial securities to trading on a regulated market if it is supplemented by a securities note and, where appropriate, a summary and its supplement(s). The package thus formed is approved by the AMF in accordance with Regulation (EU) 2017/1129. It is valid until 29 April 2021 and, during that period and at the latest at the same time as the securities note and under the conditions of Articles 10 and 23 of Regulation (EU) 2017/1129, must be completed by a supplement to the Universal Registration Document in the event of significant new developments or material errors or inaccuracies. Copies of this Universal Registration Document are available free of charge from Verallia, 31 place des Corolles, Carpe Diem Tower, Esplanade Nord, 92400 Courbevoie, France and on the websites of Verallia (www.verallia.com) and the French Financial Markets Authority (www.amf-france.org). This document is a free translation of Verallia’s document d’enregistrement universel dated 29 April 2020, publicly available, in its original French version, at www.amf-france.org and www.verallia.com. This translation is provided for your convenience only. In the event of any ambiguity or conflict between the corresponding statements or other items contained herein, the French language document d’enregistrement universel shall prevail.
-
Upload
khangminh22 -
Category
Documents
-
view
0 -
download
0
Transcript of UNIVERSAL REGISTRATION DOCUMENT - Verallia

1
Verallia
Public limited company with a share capital of €400,171,523.96
Registered Office: 31 Place des Corolles, Carpe Diem Tower, North Esplanade, 92400 Courbevoie,
France
Registered in the Nanterre Trade and Companies Register under number 812 163 913
UNIVERSAL REGISTRATION DOCUMENT
The French version of the Universal Registration Document was approved by the French Financial
Markets Authority (Autorité des marchés financiers - AMF) on 29 April 2020, as the competent authority
under Regulation (EU) 2017/1129.
The AMF approves this document after verifying that the information contained in it is
complete, consistent and comprehensible. The Universal Registration Document has the following
approval number: R. 20-006
Such approval should not be considered as a favourable opinion on the issuer covered by the Universal
Registration Document.
The Universal Registration Document may be used for the purpose of offering to the public financial
securities or for the admission of financial securities to trading on a regulated market if it is supplemented
by a securities note and, where appropriate, a summary and its supplement(s). The package thus formed is
approved by the AMF in accordance with Regulation (EU) 2017/1129.
It is valid until 29 April 2021 and, during that period and at the latest at the same time as the securities
note and under the conditions of Articles 10 and 23 of Regulation (EU) 2017/1129, must be completed by
a supplement to the Universal Registration Document in the event of significant new developments or
material errors or inaccuracies.
Copies of this Universal Registration Document are available free of charge from Verallia, 31 place des
Corolles, Carpe Diem Tower, Esplanade Nord, 92400 Courbevoie, France and on the websites of Verallia
(www.verallia.com) and the French Financial Markets Authority (www.amf-france.org).
This document is a free translation of Verallia’s document d’enregistrement universel dated 29 April 2020, publicly available, in its original French version, at www.amf-france.org and www.verallia.com. This translation is provided for your convenience only. In the event of any ambiguity or conflict between the corresponding statements or other items contained herein, the French language document d’enregistrement universel shall prevail.
2
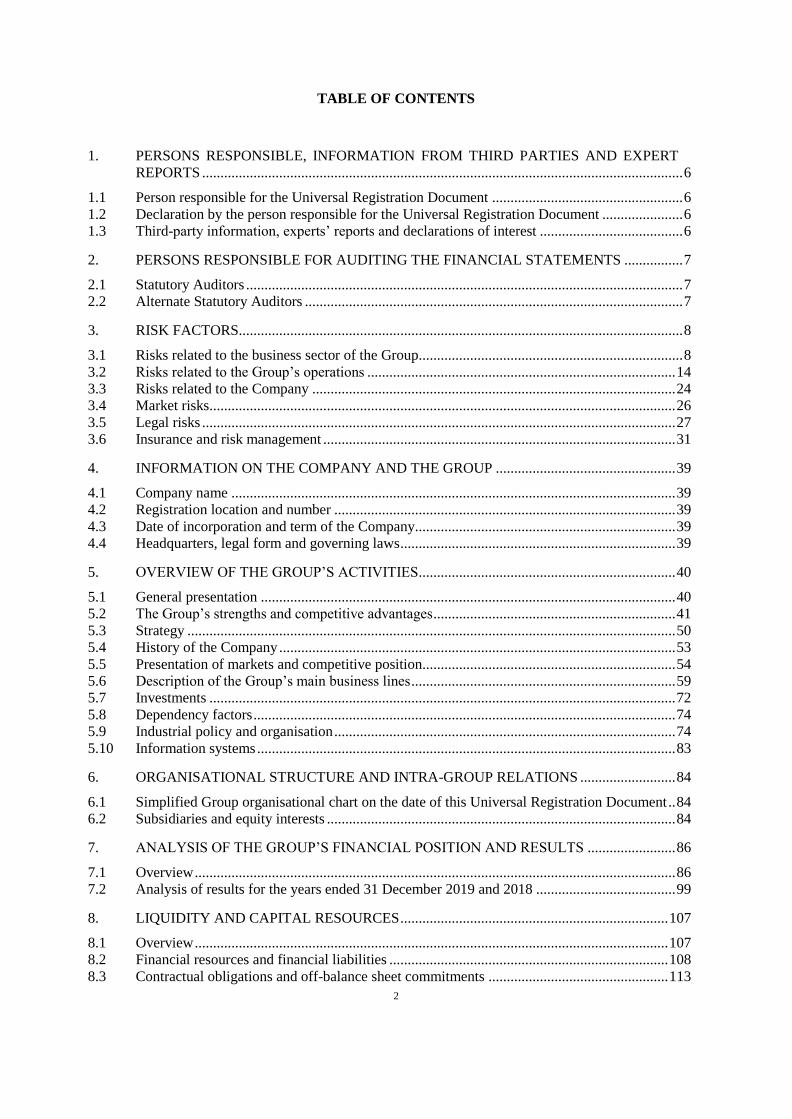
TABLE OF CONTENTS
1. PERSONS RESPONSIBLE, INFORMATION FROM THIRD PARTIES AND EXPERT
REPORTS ................................................................................................................................... 6
1.1 Person responsible for the Universal Registration Document .................................................... 6 1.2 Declaration by the person responsible for the Universal Registration Document ...................... 6 1.3 Third-party information, experts’ reports and declarations of interest ....................................... 6
2. PERSONS RESPONSIBLE FOR AUDITING THE FINANCIAL STATEMENTS ................ 7
2.1 Statutory Auditors ....................................................................................................................... 7 2.2 Alternate Statutory Auditors ....................................................................................................... 7
3. RISK FACTORS ......................................................................................................................... 8
3.1 Risks related to the business sector of the Group........................................................................ 8 3.2 Risks related to the Group’s operations .................................................................................... 14 3.3 Risks related to the Company ................................................................................................... 24 3.4 Market risks............................................................................................................................... 26 3.5 Legal risks ................................................................................................................................. 27 3.6 Insurance and risk management ................................................................................................ 31
4. INFORMATION ON THE COMPANY AND THE GROUP ................................................. 39
4.1 Company name ......................................................................................................................... 39 4.2 Registration location and number ............................................................................................. 39 4.3 Date of incorporation and term of the Company....................................................................... 39 4.4 Headquarters, legal form and governing laws ........................................................................... 39
5. OVERVIEW OF THE GROUP’S ACTIVITIES...................................................................... 40
5.1 General presentation ................................................................................................................. 40 5.2 The Group’s strengths and competitive advantages .................................................................. 41 5.3 Strategy ..................................................................................................................................... 50 5.4 History of the Company ............................................................................................................ 53 5.5 Presentation of markets and competitive position..................................................................... 54 5.6 Description of the Group’s main business lines ........................................................................ 59 5.7 Investments ............................................................................................................................... 72 5.8 Dependency factors ................................................................................................................... 74 5.9 Industrial policy and organisation ............................................................................................. 74 5.10 Information systems .................................................................................................................. 83
6. ORGANISATIONAL STRUCTURE AND INTRA-GROUP RELATIONS .......................... 84
6.1 Simplified Group organisational chart on the date of this Universal Registration Document .. 84 6.2 Subsidiaries and equity interests ............................................................................................... 84
7. ANALYSIS OF THE GROUP’S FINANCIAL POSITION AND RESULTS ........................ 86
7.1 Overview ................................................................................................................................... 86 7.2 Analysis of results for the years ended 31 December 2019 and 2018 ...................................... 99
8. LIQUIDITY AND CAPITAL RESOURCES ......................................................................... 107
8.1 Overview ................................................................................................................................. 107 8.2 Financial resources and financial liabilities ............................................................................ 108 8.3 Contractual obligations and off-balance sheet commitments ................................................. 113
3
8.4 Description and analysis of the principal categories of the use of Group cash ....................... 113 8.5 Group consolidated cash flows ............................................................................................... 115
9. LEGISLATIVE AND REGULATORY ENVIRONMENT ................................................... 121
9.1 Legislation and regulations in European Union Member States ............................................. 121 9.2 Legislative and regulatory environment in Latin America ..................................................... 125
10. TREND INFORMATION ...................................................................................................... 126
10.1 Trends in activities .................................................................................................................. 126 10.2 Medium-term outlook ............................................................................................................. 127
11. PROFIT FORECASTS OR ESTIMATES .............................................................................. 129
12. SUPERVISORY AND MANAGEMENT BODIES............................................................... 130
12.1 Composition and operation of supervisory and management bodies ...................................... 130 12.2 Statements relating to administrative bodies ........................................................................... 139 12.3 Conflicts of interest ................................................................................................................. 139 12.4 Information on services agreements between members of the board and the company or any
of its subsidiaries ..................................................................................................................... 139
13. COMPENSATION AND BENEFITS .................................................................................... 140
14. OPERATION OF THE ADMINISTRATIVE AND MANAGEMENT BODIES ................. 141
15. EMPLOYEES ......................................................................................................................... 142
15.1 Employment data .................................................................................................................... 142 15.2 Compensation policy ............................................................................................................... 145 15.3 Stock options and free share grants ......................................................................................... 146 15.4 Profit-sharing and incentive agreements ................................................................................. 146 15.5 Employee share ownership ..................................................................................................... 146 15.6 Social relations ........................................................................................................................ 147
16. MAIN SHAREHOLDERS ..................................................................................................... 148
16.1 Shareholders ............................................................................................................................ 148 16.2 Statement relating to control of the Company ........................................................................ 149 16.3 Agreements that could lead to a change of control ................................................................. 150
17. RELATED PARTY AGREEMENTS ..................................................................................... 151
17.1 Principal transactions with related parties ............................................................................... 151 17.2 Statutory Auditors’ special report on related party agreements for the financial year ended 31
December 2019 ....................................................................................................................... 151
18. FINANCIAL INFORMATION CONCERNING THE ISSUER’S ASSETS, LIABILITIES,
FINANCIAL POSITION, PROFITS AND LOSSES ............................................................. 153
18.1 Group’s consolidated accounts for the year ended 31 December 2019 and the Auditors’ Report
................................................................................................................................................. 153 18.2 Parent company annual financial statements for the year ended 31 December 2019 and
Statutory Auditors’ report ....................................................................................................... 238 18.3 Date of the last financial information ...................................................................................... 259 18.4 Dividend distribution policy ................................................................................................... 259 18.5 Judicial and arbitration proceedings ........................................................................................ 259 18.6 Significant change in the issuer’s financial position ............................................................... 261 18.7 Other information .................................................................................................................... 266
4
19. ADDITIONAL INFORMATION ........................................................................................... 268
19.1 Share capital ............................................................................................................................ 268 19.2 Memorandum and Articles of Association ............................................................................. 271
20. IMPORTANT CONTRACTS ................................................................................................. 280
21. DOCUMENTS AVAILABLE TO THE PUBLIC .................................................................. 281
GLOSSARY ......................................................................................................................................... 282
ANNEXES ........................................................................................................................................... 284
5
GENERAL COMMENTS
Verallia S.A., a French public limited company (société anonyme), with share capital of €400,171,523.96, registered
at 31 Place des Corolles, Tour Carpe Diem, Esplanade Nord, 92400 Courbevoie, France, under the identification
number 812 163 913 (Nanterre Trade and Companies Register) is referred to as the “Company” in this Universal
Registration Document. The term “the Group” used herein, unless otherwise stated, refers to the Company, its
subsidiaries and its direct and indirect equity interests.
“Apollo” refers to certain investment funds advised by Apollo Global Management Inc. and/or its subsidiaries.
This Universal Registration Document contains information on the outlook and growth vectors for the Group. This
information is sometimes identified by the use of the future tense, the conditional mood and forward-looking terms,
such as “consider”, “plan”, “think”, “have the objective”, “expect”, “intend”, “should”, “aim”, “estimate”,
“believe”, “wish”, “could” or, as applicable, the negative form of these terms or any other variant or similar
terminology. This information is not historical data and must not be interpreted as guarantees that the facts and data
set forth will occur. This information is based on data, assumptions and estimates that the Group believes are
reasonable. They may change or be modified because of uncertainties related, for example, to the economic (in
particular due to the consequences of the Covid-19 pandemic), financial, competitive or regulatory environment.
Moreover, the occurrence of certain risks described in Chapter 3 “Risk Factors” of this Universal Registration
Document could have an impact on the activities, financial position and the results of the Group and its ability to
achieve its objectives.
Investors are invited to carefully consider the risk factors described in Chapter 3 “Risk Factors” of this Universal
Registration Document. The realisation of all or some of these risks could have a significant unfavourable impact on
the Group, its activity, its financial position, its results or its outlook. Moreover, other risks not yet identified or not
considered material by the Group could have the same adverse impact.
This Universal Registration Document contains information about the Group’s markets and its competitive positions,
including information on the size and growth outlook of these markets and the Group’s market share. In addition to
the estimates made by the Group, the items on which the Group’s declarations are based come from studies and
statistics of third party organisations (see Section 1.3 “Information from third parties, expert declarations and
declarations of interest” in this Universal Registration Document) and from professional organisations or even from
data published by competitors, suppliers and customers of the Group. Some information contained in this Universal
Registration Document is publicly available information that the Company believes is reliable, but that has not yet
been verified by an independent expert. The Company cannot guarantee that a third party using different methods to
collect, analyse or calculate the data on the business segments would obtain the same results. The Company makes
no commitment and no guarantee as to the accuracy of this information. It is possible that this information is
incorrect or is no longer up to date. The Group makes no commitment to publish updates of this information except
in the context of any legal or regulatory obligation to which it is subject.
Certain calculated data (including data expressed in thousands or millions) and percentages presented in this
Universal Registration Document have been rounded. In that case it is possible that the total presented in this
Universal Registration Document may present insignificant differences with the totals that would have been obtained
by adding the exact values (not rounded) of these calculated data.
In this Universal Registration Document, except where otherwise indicated, a reference to the Southern and Western
European market or the Latin American market, as applicable, should be understood as a reference to the
corresponding operational segment, i.e., the operating segment of, respectively, (i) Southern and Western Europe,
consisting of the production sites located in France, Italy, Spain and Portugal, and (ii) Latin America, composed of
the production sites located in Brazil, Argentina and Chile. References to the Northern and Eastern Europe market
include Germany, Russia and Ukraine, excluding Poland.
A glossary providing the definitions of the main technical terms and financial aggregates used herein appears at the
end of this Universal Registration Document.
6
1. PERSONS RESPONSIBLE, INFORMATION FROM THIRD PARTIES AND EXPERT
REPORTS
1.1 Person responsible for the Universal Registration Document
Michel Giannuzzi, Chairman and Chief Executive Officer of the Company
1.2 Declaration by the person responsible for the Universal Registration Document
“I declare, after having taken all reasonable measures to this effect, that the information contained in this
Universal Registration Document is, to the best of my knowledge, in accordance with the facts and
contains no omission that might affect its scope.
I certify, to my knowledge, that the accounts are drawn up in accordance with the applicable accounting
standards and give a faithful picture of the assets, financial position and results of the company and of all
the companies included in the consolidation, and that the information included in this Universal
Registration Document that falls within the management report of the board of directors listed in the
concordance table in Annex IV of this Universal Registration Document presents a faithful picture of the
evolution of the business, the results and financial position of the Company and all the companies included
in the consolidation and a description of the main risks and uncertainties they face.”
In Courbevoie, on 29 April 2020
Michel Giannuzzi,
Chairman and Chief Executive Officer
1.3 Third-party information, experts’ reports and declarations of interest
This Universal Registration Document contains information about the Group’s markets and its positioning
in these markets, including information on the size of these markets, the competitive environment and
dynamics, and the outlook for growth in these markets. In addition to the estimates made by the Group,
the elements on which the Group has based its statements herein come primarily from a market study
conducted in connection with the Company’s initial public offering by Advancy at the Company’s request,
and from studies and statistics published by independent third parties and professional organisations and
from data published by the Group’s competitors, suppliers and customers.
To the Company’s knowledge, the information taken from third-party sources has been faithfully
reproduced in this Universal Registration Document, and no fact has been omitted that would make this
information incorrect or misleading. The Company cannot, however, guarantee that a third party using
different methods to collect, analyse or calculate the data on these markets would obtain the same results.

7
2. PERSONS RESPONSIBLE FOR AUDITING THE FINANCIAL STATEMENTS
2.1 Statutory Auditors
PricewaterhouseCoopers Audit Member of the Compagnie régionale des Commissaires aux comptes de Versailles
Represented by Itto El Hariri
63, rue de Villiers
92200 Neuilly-sur-Seine, France
Appointed by the Articles of Association of the Company on 18 June 2015 for a term of six years, which
is until the Ordinary General Shareholders’ Meeting called to approve the financial statements for the year
ended 31 December 2019.
BM&A
Member of the Compagnie régionale des Commissaires aux comptes de Paris
Represented by Gilles Rabier
11, rue de Laborde
75008 Paris, France
Appointed by decision of the sole shareholder on 24 July 2019 for a term of six years, which is until the
Ordinary General Shareholders’ Meeting called to approve the financial statements for the year ended 31
December 2024.
2.2 Alternate Statutory Auditors
Jean-Christophe Georghiou
Member of the Compagnie régionale des Commissaires aux comptes de Versailles
63, rue de Villiers
92200 Neuilly-sur-Seine Cedex, France
Appointed by the Articles of Association of the Company on 18 June 2015 for a term of six years, which
is until the Ordinary General Shareholders’ Meeting called to approve the financial statements for the year
ended 31 December 2019.
8
3. RISK FACTORS
Before proceeding with an investment in shares of the Company, investors are invited to examine all of
the information contained in this Universal Registration Document, including the risk factors described
below. At the date of this Universal Registration Document, these risks are those that the Company
believes could have a material adverse effect on the Group, its business, financial position, results or
outlook, and that are material to its investment decisions. The attention of investors is nonetheless drawn
to the fact that the overview of risks presented in Section 3 of this Universal Registration Document is not
exhaustive and that other risks, unknown or not considered herein at the date of this Universal Registration
Document and that could have a material adverse effect on the Group, its business, financial position,
results or outlook, may or could exist or arise.
This chapter presents the principal risks that could, on the date of this Universal Registration Document,
impact the business, financial position, reputation, results or the outlook of the Group, as identified
primarily in the preparation of the Group’s major risk mapping, which assesses their criticality, that is,
their seriousness and probability of occurrence, after taking into account the action plan put in place.
Within each of the risk categories described below, the risk factors that the Company considers to be the
most material on the date of this Universal Registration Document (identified with an asterisk) are
described first.
3.1 Risks related to the business sector of the Group
Risks related to changes in demand for glass packaging*
The Group’s business consists of producing glass packaging used for the packaging of liquid or solid food
products for everyday or occasional consumption intended for private individuals.
Demand for glass packaging may be affected by factors such as changing consumption patterns, which in
turn are influenced by changing lifestyles, food preferences, legislative or sociological developments, or
public health and safety considerations. The COVID-19 pandemic, in particular with respect to its potential
consequences on the Group’s supplies or on consumption in the affected regions (in particular, as of the
date of this universal registration document, Asia, Europe and the United States); the long-term decline in
wine consumption in mature markets (in France, for example); the prohibition, in certain European
countries, of glass containers in certain places open to the public; anti-corruption measures taken in China,
which have reduced demand by the Group’s customers for wine and spirits bottles; or measures taken in
Russia or Ukraine to reduce alcohol consumption, could, for example, have an adverse impact on demand
for the Group’s products. Moreover, the establishment or increase of customs tariffs and other trade
restrictions by some countries (due in particular to the COVID-19 pandemic) could generally cause a
slowdown in demand for glass packaging, which could have an adverse effect on the Group’s customers’
business, leading in particular, to a decrease in their orders from the Group. In addition, demand for glass
packaging, currently driven in particular by the health benefits attached to glass, could be affected by
competition from other types of packaging, such as aluminium, steel or plastic packaging, or other food
packaging methods, such as bulk packaging, due to changing consumer habits linked to regulatory or
environmental considerations, for example (see Section 3.1.5 “Risks related to competition from
manufacturers of other types of packaging and a possible substitution of glass packaging by other
materials”). Finally, the development of deposit glass packaging1 to encourage the reuse of packaging
returned by consumers, as is the case in Germany, could result in reduced use of new packaging and thus
have an adverse effect on the Group’s activities. Changes in the levels and consumption habits of
individuals regarding glass products marketed by the Group’s customers could thus have the effect of
reducing demand for glass packaging, which could have a material adverse effect on the Group’s business,
results, financial position and outlook.
1 The deposit is an additional sum of money paid by the consumer for the packaging, and is reimbursed when the packaging
is returned to the store.
9
Demand for glass packaging may also change due to the seasonal nature of some of the glass products sold
by the Group’s customers, or to weather and climate conditions, particularly in Europe. Demand for glass
packaging is typically stronger in the first six months of the year, which generally has the effect of
generating higher revenue in the first half than in the second half of a given year (during the six-month
period ended 30 June 2019, the Group recorded consolidated revenue of €1,329.4 million, or 51.4% of the
consolidated revenue recorded for the year ended 31 December 2019). In practice, customers generally
place their orders during this period in order to anticipate the increase in demand for their products, such
as beer and rosé wine, experienced in summer. High temperatures can therefore have a positive effect on
the Group’s activities, as an increase in demand for products sold by its beverage producing customers
will result in them buying more glass packaging. Conversely, abnormally low temperatures during the
summer may result in a reduction in demand for certain beverages contained in packaging sold by the
Group, resulting in a reduction in orders from its customers. The seasonal nature of some of the products
offered by the Group could therefore have a material adverse effect on the Group’s business, financial
position, results and outlook.
In addition, weather and climate hazards can affect agricultural harvests, thus impacting the demand for
glass packaging. Long-term climate changes observed globally in recent years and their consequences
(such as intense heat waves, hail or the appearance of new insects in some areas) have had and could have
a negative impact on agricultural yields in the future. As such, the wine production sector, as well as fruit
and vegetable production, have observed a decline in crop yields in recent years, due to short- or long-
term seasonal trends resulting from these climatic changes, as was the case in Spain, which was affected
by droughts in 2018. Finally, bacteria can contaminate certain fruits and vegetables, thus affecting
agricultural, viticultural or olive yields, as was the case for olive trees in Italy in 2018, affected by the
xylella fastidiosa bacteria, which had an impact on olive oil production volumes and in 2019, the “tomato
brown rugose fruit virus” (TOBRFV), which renders tomatoes unmarketable, has spread in France (after
Germany and the south of Italy in 2018). These events, which have an impact on the volumes produced
by the Group’s customers, could thus reduce demand for certain of the Group’s products and have a
material adverse effect on the Group’s business, financial position, results and outlook.
Finally, the Group’s business is generally sensitive to changes in the economic environment. Most of the
Group’s production is destined for Europe and Latin America (which are also the Group’s manufacturing
areas), as well as, indirectly, through its customers’ exports, for Asia, a region where wine and spirits are
consumed substantially, and the United States. Any significant economic slowdown or recession in one of
these geographical areas is likely to have a downward impact on the consumption of the Group’s products
and/or their selling price and, consequently, to have a material adverse effect on the Group’s business,
financial position, results and outlook. Sensitivity to changes in the economic environment is more
pronounced for occasional consumer products, particularly spirits and champagne, which generally
command higher margins, than for everyday food products and/or essential food for daily consumption,
for which the Group produces packaging, which are less affected by economic cycles than consumption
as a whole. In addition, the effects of unfavourable economic conditions may have a greater impact on
producing countries than on consuming countries (for example, exports of champagne and spirits by
companies based in France). For example, between 2008 and 2009, the Group recorded a significant
decline in its European revenue of around - 8%, due to the reduction in volumes as a result of weak demand,
impacted by the economic crisis. In addition, between 2012 and 2013, the Group recorded a drop of around
- 3% in its European sales, primarily driven by a decrease in volumes against a backdrop of substantial
available capacities and economic crisis, and the resulting stiffer competition on prices.
In addition, the Covid-19 pandemic should have a significant negative impact on the global economy in
2020; the global economy should record a strong recession of 3% in 2020, including -7.5% for Euro zone
countries and -7.2% for France2. In this context, the Group has, on 7 April 2020, withdrawn its annual
financial objectives for the 2020 financial year (see chapter 11 of this Universal registration document).
2 International Monetary Fund, World Economic Outlook, April 2020.
10
If the current economic situation in the markets where the Group operates or is trying to gain a foothold
were to continue to deteriorate, particularly in Europe, this could thus have a material adverse effect on its
business, financial position, results and outlook.
Risks related to changes in energy costs*
The Group’s manufacturing activities are highly energy-intensive, particularly for natural gas, electricity
and fuel oil, as the furnaces used to produce glass must operate continuously at very high temperatures.
For the year ended 31 December 2019, energy costs represented 19% of the Group’s cost of sales. An
increase in energy costs would therefore result in an increase in the manufacturing costs of glass packaging,
as well as in transport costs (for sales and for purchases). Given the very nature of glass packaging and the
materials necessary for its manufacture (sand and cullet), the cost of transport (for sale and purchase)
represents a significant part of the final price of this packaging and is itself affected by the cost of fuel.
The cost of energy rose by 6.7% during the year ended 31 December 2019, and significantly impacted the
Group’s cost trends during this period.
Most of the sales contracts entered into by the Group are concluded for a period of one year, which can be
renewed upon the agreement of the parties, and do not include price adjustment clauses that automatically
pass on a portion of energy cost increases or decreases to sale prices. The impact of the Group’s production
cost increases is therefore subject to commercial negotiations with customers when orders are placed or
when contracts are renewed annually, and by consequence such increases may be more or less delayed in
time or only partially passed on, if they can be passed on at all. Moreover, and even for the limited part of
sales covered by contracts with price revision clauses (generally multi-year contracts concluded with the
Group’s most significant customers) that provide the Group with a contractual basis for the annual
renegotiation of its sales prices, there often is a period of several months during which the Group’s margins
may be negatively affected in the event of an increase in energy costs, or positively affected in the event
of a decrease in energy costs, due to the time lag between purchases of natural gas, electricity and fuel oil
and sales to Group customers (see Section 7.1.2.3 “Changes in prices for raw materials and energy” of
this Universal Registration Document). For all of the above reasons, the Group cannot guarantee that it
will be able to pass on all of these cost increases instantaneously and in full during these negotiations.
Moreover, the above price revision clauses may also require the Group to reduce its sale prices in the event
of a decrease in energy costs.
Apart from purchases of energy at a fixed price, negotiated, where applicable, directly with suppliers by
the purchasing department, the Group has set up transactions to hedge part of the risks linked to energy
costs in the event that contractual adjustment mechanisms could not be provided. This applies to most of
the sales contracts concluded by the Group (see Section 3.6.2.2 “Management of operational risks” of this
Universal Registration Document). However, it cannot guarantee that these mechanisms and hedges,
which themselves represent a cost for the Group, will fully cover the additional costs generated by future
increases in natural gas, electricity or fuel oil prices; they mainly depend on the Group’s underlying
assumptions on cost changes. Although these hedges offer short-term protection against fluctuations in
natural gas, electricity and fuel oil prices, they do not mitigate the long-term effects of structural worldwide
energy price increases during periods of growth. Finally, in case of an unforeseen decrease of energy
prices, in particular in the current context of significant decrease in oil prices, hedges implemented by the
Group against a potential increase of energy prices could represent a cost for the Group, by depriving it
from the opportunity to benefit from the price decrease.
Thus, any significant increase and/or volatility in the price of natural gas, electricity or fuel oil could have
a material adverse effect on the Group’s business, results, financial position and outlook.
Finally, some of the Group’s subsidiaries, notably in Germany and Italy, have received energy cost
subsidies from local authorities, mainly in the form of discounts on energy taxes applicable in the relevant
countries (see Section 9.1.2 “Regulations relating to the glass industry” of this Universal Registration
Document). These subsidies could be called into question, in particular due to the application of European
rules on state aid. If that were to occur, the Group’s energy costs in the relevant countries, such as Germany

11
and Italy, could increase, which could have a material adverse effect on the Group’s business, financial
position, results and outlook.
Risks related to changes in the price of raw materials*
The Group’s manufacturing processes also use a large amount of raw materials for the manufacture of
glass. These raw materials include varying amounts of glass sand, limestone, natural and synthetic soda
ash, and cullet (recycled glass), depending on the products manufactured. During the year ended 31
December 2019, purchases of raw materials represented 28% of the Group’s total purchases. At the date
of this Universal Registration Document, the Group has not entered into any hedges on raw materials.
In recent years, the market for cullet has experienced an imbalance between supply and demand, which
has contributed to a significant price increase. However, the price of cullet, having accounted for almost
half of the Group’s commodity purchases during the year ended 31 December 2019, remains highly
variable from one geographic region to another. In Southern and Western European countries, the cullet
market in Germany, Spain and Italy in particular experienced difficulties due to pressure on collection or
on available processing capacity, as applicable. The price of cullet moreover varies widely from one region
to another, due to regulatory and financial disparities in the collection and recycling of used glass and the
distance of cullet supply centres from production sites. New glass collection and recycling regulations
could have a major effect on cullet availability and its cost for the Group. Lastly, if the Group were unable
to obtain sufficient supplies of cullet, or if cullet prices were to significantly increase, a higher proportion
of soda ash would be required for the Group’s glass production, which would increase energy costs as the
melting temperature of soda ash is higher than that of cullet.
Although the Group includes price revision clauses in certain commercial contracts that take into account,
directly or indirectly, changes in raw material costs, most of its commercial contracts do not. The impact
of the Group’s production cost increases is therefore subject to commercial negotiations with customers
when orders are placed, or when contracts are renewed annually, and consequently may be more or less
delayed in time or only partially passed on, if it can be passed on at all. As a result, any significant increase
in the price of raw materials used by the Group to make glass or cullet could have a material adverse effect
on the Group’s operations, profits, financial position and outlook. During the year ended 31 December
2019, the cost of raw materials rose 0.9%.
Risks related to significant costs to comply with applicable environmental, public health and
safety regulations*
The Group operates in a restrictive legislative and regulatory environment with respect to environmental
protection, public health and safety. These rules, which differ from country to country, include pollution
prevention, treatment of industrial discharges of all kinds (including gases and effluents), control of
industrial sites and their operating conditions, their possible remediation (in particular soil), the treatment
of packaging waste, noise pollution, production, storage, handling, transport and treatment of hazardous
waste, dust and fumes, and, more generally, public health and food safety. An overview of the main
regulations to which the Group is subject is provided in Chapter 9 of this Universal Registration Document.
In particular, as a result of changes in legislation or case law, the Group may also have to deal with
increasing claims by employees who have contracted diseases that could be related to its activities (such
as, for example, the use by the Group, in the past, of asbestos elements to protect its employees and
equipment from heat) (see Section 3.2.12 “Risks related to occupational health and safety” and Section
18.5 “Legal and arbitration proceedings” of this Universal Registration Document). In addition, the
Covid-19 pandemic creates a new framework for the assessment of health risks and reinforce the safety
and health prevention obligations towards employees, increasing the risk of legal actions that the Group
may have to face.
In addition, the glass sector is subject to standards for atmospheric emissions of carbon dioxide, nitrogen
oxide and sulphur oxide. The Group’s activities also require numerous permits and authorisations in
12
various fields, including those relating to the environment, safety and public health, such as operating
permits, wastewater discharge permits, water abstraction permits and authorisations for the transportation
and disposal of hazardous waste, which are subject to renewal, modification, suspension and possible
revocation by administrative and governmental authorities. In the current context of sanitary crisis related
to the Covid-19 pandemic and in light of confinement measures implemented by public authorities in some
of the countries where the Group operates, the time for obtaining these authorisations by administrative
and governmental authorities might be significantly longer, which could have an impact on the granting
of operating authorisations, or even delay the starting of furnaces under construction or reconstruction. In
addition, in some countries, and although it is not the case as of the date of this universal registration
document, the Group could be required by administrative and governmental authorities to close its
production sites, pursuant to containment measures which would apply to the Group’s activities.
Thus, the Group has incurred, and will continue to incur, significant costs (both capital and operating
expenses) to meet current legal and regulatory requirements and it is likely that these costs will increase
significantly in the future. In addition, increased attention by public authorities to potential nuisances from
production sites located near urban areas or protected areas could require the Group to incur additional
capital expenditure in order to, for example, outfit its sites with quieter machines and invest in specific
building insulation systems.
The Group, as an operator of glass-producing sites, which by its very nature emit carbon dioxide (in 2019,
the Group emitted 0.510 tons of carbon dioxide per tonne of good glass3, or tonnes of packaged glass,
scope 1 and scope 24 (See the Non-Financial Performance Statement attached to this Universal
Registration Document)), is subject to increasingly stringent limits on carbon dioxide emissions, in
particular, as a result of growing concerns about the impact of carbon dioxide emissions on climate control
(see Chapter 9, “Legislative and Regulatory Environment” and Section 3.5.1, “Regulatory risks, including
Environmental risks, and its evolution” of this Universal Registration Document).
The Group’s industrial sites use large amounts of water to cool their facilities and the Group is therefore
also exposed to the risk of water shortages in certain regions where there may be situations of increased
water stress, such as in particular the production sites in Vicsa, Seville and Montblanc, Spain, and Rosario,
Chile. If legislative and/or regulatory changes were to occur in this domain, these changes could require
the Group to make significant investments.
If the Group is unable to meet the regulatory requirements that are applicable to its activities, fails to obtain
or retain the necessary authorisations and permits for its activities, if it was no longer able to operate these
sites in satisfactory economic terms, or if it is subject to civil and/or criminal liability in environmental,
safety or public health matters, this situation could damage the Group’s reputation and lead it to incur
significant costs (including costs for restoring, shutting down or closing facilities), criminal or
administrative sanctions and compensation for damage caused to third parties, to its employees or to the
environment, which could have a material adverse effect on its business, results, financial position and
outlook.
Risks related to competition from manufacturers of other types of packaging and a possible
substitution of glass packaging by other materials*
The Group competes against manufacturers of other types of packaging, which differ according to market
segment. These are mainly manufacturers of aluminium and steel cans in the beer and soft drinks market;
3 One tonne of good glass, or tonne of packed glass corresponds to one tonne of drawn glass as measured at the furnace’s exit
after taking into account production losses related in particular to the shutdown of furnaces or other equipment for
maintenance or quality issues.
4 “Scope 1” corresponds to direct emissions, i.e. CO2 emissions within the physical boundaries of the plant, related to carbonated
raw materials, heavy and domestic fuel, natural gas (fusion and non-fusion). “Scope 2” corresponds to indirect emissions,
i.e. emissions related to the electricity consumption necessary for the plant’s operation.
13
rigid or flexible plastic packaging (bags), including polyethylene terephthalate (“PET”) packaging in the
water and soft drinks market; aseptic carton packs in the juice and milk market; and “bag-in-box” in the
wine market. Furthermore, glass packaging may compete with other forms of food packaging (draught
beer, coffee capsules, individual dispensers, bulk, etc.).
In mature markets such as Western Europe, glass packaging manufacturers have thus faced, and continue
to face, competition from other forms of packaging, which is more or less pronounced depending on the
relevant markets. In these regional markets, this competition has been reflected, since the 1970s, by a
gradual decline in demand for the Group’s products, particularly those relating to beer, soft drinks, fruit
juices and mineral waters. In France, in the past decade the Group’s wine packaging activities have been
affected by a substitution of bottles for the bag-in-box (over the 2008-2018 period, the penetration rate of
bag-in-box against glass material for packaging wine increased from 19% in 2008 to 41% in 2018). This
competition, combined with competition from the Group’s direct competitors (see Sections 3.2.1 “Risks
related to the balance between supply and demand and the adaptation of manufacturing facilities” of this
Universal Registration Document), has caused in the past (most recently, for the years 2012 and 2013,
glass packaging sales volumes in Europe5 decreased by -2.2% and -0.4%, respectively), and could cause
in the future, excess capacity in certain countries, and consequently price decreases for the sector, for
various durations.
Factors that may favour the substitution of glass packaging for other forms of packaging include: the
respective prices of the different types of packaging, the availability of the types of packaging in sufficient
quantity and the respective advantages of the different types of packaging as perceived by customers and
final consumers.
Glass material is valued by customers for its environmental benefits, in particular its full recyclability,
health benefits and ability to preserve flavours (see Section 5.5 of this Universal Registration Document).
However, this advantage could be eroded by technological advancements and investments by
manufacturers of non-glass packaging. Consequently, the Group cannot guarantee that consumer
preference will not shift to new materials.
In particular, a material such as plastic is generally perceived as lighter than glass. In response to the
growing demand from the Group’s customers for lighter packaging, in particular to reduce their logistics
costs, the Group has developed the products in its ECOVA range, which are lighter than conventional
glass packaging, but it cannot guarantee that its customers will not prefer a material such as plastic in the
future.
Some of the Group's customers have in the past opted for the use of non-glass packaging for their products,
particularly in the market for certain food products and in certain beer segments, due to changes in
lifestyles or for other reasons (including marketing), and may in the future opt to promote the use of such
packaging by consumers in certain markets. A significant diversion of customer or consumer interest in
glass packaging could lead to a significant decrease in sales and/or prices of glass packaging, which could
have a material adverse effect on the Group’s business, results, financial position and outlook.
Risks related to customs barriers
Although exports of the Group’s products represent a limited portion of its revenue, a growing proportion
of its customers, particularly wine and spirits producers in France, Italy and Spain, derive a significant
portion of their revenue from their exports, which has contributed to the Group’s revenue growth over the
past three financial years. The volume of exports should be impacted by the Covid-19 pandemic, in
addition to the cost of exports depending mainly on the applicable customs tariffs. Therefore, the
introduction of borders shutdowns, due to the pandemic, or increase of customs barriers and other trade
restrictions by certain countries could cause a slowdown in world trade in general and in particular a
decrease in export volumes. This could have an adverse effect on the business of the Group’s customers,
5 Comprises the 28 member countries of the European Union, plus Switzerland and Turkey.
14
particularly if their products were to be targeted by such measures, resulting in a decrease in their orders
with the Group. For example, the US government recently increased tariffs on products from certain
sectors and countries which spurred retaliatory increases in tariffs by the affected countries on imports
from the United States. In addition, following the World Trade Organization’s decision to authorise the
United States to tax certain exports from European countries in compensation for damage to the country
in respect of subsidies granted to certain European companies, on 2 October 2019, the US authorities
decided to impose additional tariffs of 25%, affecting, inter alia, still wines from France and Spain. These
measures have been effective since 18 October 2019; the US authorities could change the amount and
scope of these tariffs. In addition, following an investigation by the United States Trade Representative
office, which concluded that the French digital services tax (“GAFA Tax”) was detrimental to US
companies. the US administration announced in December 2019 that it was planning to apply a 100%
super tax on French products, including sparkling wine. However, this tax proposal must be endorsed by
the President of the United States before sanctions can be applied.
Moreover, the absence of an agreement between the European Union and the United Kingdom following
its exit from the European Union on 31 January 2020, could result in an increase in the tariffs applied to
exports of the Group’s customers to the United Kingdom. An increase in customs barriers could also lead
to an increased use of packaging methods other than glass, for which the applicable customs tariffs would
be lower, in particular due to the lower weight of the goods, which could lead to a decrease in demand for
glass packaging. If the aforementioned risks were to materialise, this could have a material adverse effect
on the Group’s business, financial position, results and outlook.
3.2 Risks related to the Group’s operations
Risks related to the balance between supply and demand and the adaptation of the
manufacturing facilities*
The Group’s business in its regional markets depends on the balance between glass packaging production
capacity on the one hand and the volume of demand for such packaging on the other. This relationship
between production capacity and volume of demand is particularly relevant for the Group at the regional
level, as the cost of transporting glass packaging often renders it difficult to transfer excess capacity from
one market to another when the markets involved are distant.
The addition of new production capacity in a given market, against a background of strong competition
between container glass producers, can result in an imbalance between a sudden increase in supply and a
more gradual increase in demand. Such imbalance may also be caused by a sudden drop in demand, due
in particular to unforeseeable events such as the Covid-19 pandemic, or an increase in demand that is
below the Group’s or its competitors’ forecasts. Coupled with the essentially regional nature of the Group’s
markets, the occurrence of such events may result in downward pressure on prices in the market in question
until demand adjusts to supply, which could have a material adverse effect on the Group’s commercial
and financial performance, its results and outlook. The 2012 and 2013 financial years in particular were
marked by significant available capacity on the market, with supply exceeding demand in certain regions,
following a decrease in glass packaging sales volumes in Europe6 of -2.2% and -0.4%, respectively.
On the other hand, some events can result in a rapid and significant increase in demand for packaging.
However, the Group’s industrial organisation (non-stop work over five shifts, 365 days a year) limits the
ability to immediately adapt supply to more volatile demand. Moreover, additional capacity requires a
large investment and takes considerable time to install and start up. The German wine production market
thus experienced a shortage of glass packaging at the beginning of 2019 due to capacity constraints. In
addition, the 2017, 2018 and 2019 financial years saw available capacity squeezed in Spain and in Italy,
(where there had been strong growth) which led to demand exceeding supply. In order to meet demand,
the Group began the construction of a new furnace in Azuqueca, Spain, and in Villa Poma, Italy, in 2019,
which should be operational in 2020, subject to the impact that the Covid-19 pandemic could have on the
6 Comprises the 28 member countries of the European Union, plus Switzerland and Turkey.
15
glass packaging market and the construction works relating to these furnaces, for which the start schedule
will be adapted to demand on markets they have to serve which is, as of the date of this universal
registration document, subject to the impact of the consequences of the Covid-19 pandemic (see Sections
3.1.1 and 5.7 “Investments” of this Universal Registration Document). The temporary inability to satisfy
a sudden increase in demand for glass packaging could cause some of the Group’s customers to substitute
other types of packaging for their products from the Group’s competitors, or result in new conditions that
could favour the export of competing products by competitors located in border areas. Such events could
therefore have a material adverse effect on the Group’s business, results, financial position and outlook.
In addition, cyclical situations where demand for glass packaging exceeds supply (or is perceived as such
and therefore generates demand for precautionary storage) may occasionally favour the Group’s business.
However, such situations could be only temporary and could turn around abruptly as customers deplete
downstream inventory, new production capacity is brought on line, or demand drops off. Such events could
have a material adverse effect on the Group’s business, financial position, results and outlook.
Lastly, the Group may have to resize, upwards or downwards, its industrial base in certain regions in order
to adapt to these significant changes in supply or demand. These fluctuations could lead the Group to
temporarily or permanently shut down certain furnaces or plants, which could entail significant costs. In
case of an anticipated significant increase in demand relative to supply or a lack of production capacity,
such as due to repairs, the Group may instead build up stocks as a precautionary measure. In order to
increase its production capacity, the Group would need to expand certain facilities or commission new
furnaces, which usually takes 18 to 24 months. In these cases, the resized manufacturing facilities may no
longer be adapted to the then-applicable market conditions, or demand may no longer be as high as when
the expansion or commissioning of new furnaces began.
Such upward or downward resizing of manufacturing capacity could, if it does not enable the Group to
adapt to changes in supply and demand, have a material adverse effect on its business, financial position,
results and outlook.
Risks related to the implementation of the operational excellence programme of the Group*
As part of its industrial strategy, the Group has implemented an operational excellence programme for the
last several years (see Section 5.3.2 of this Universal Registration Document), which has been significantly
strengthened with the deployment of the Verallia Industrial Management (VIM) 2.0 initiative, applied
since the beginning of 2018, which focuses on security, quality, industrial performance, reduction of
production costs, (in particular due to the implementation of the Performance Action Plan (PAP) to
improve industrial performance), and team management. This programme has helped the Group to
significantly improve its profitability, as the implementation of these initiatives has also led to a decrease
in cash production costs7, amounting to €44 million for the year ended 31 December 2019, which had a
positive impact on the Group’s adjusted EBITDA (see Section 7.2.9 “Adjusted EBITDA” in the Universal
Registration Document). The Group intends to continue to implement this plan in support of its
development strategy and the achievement of its mid-term objectives set out in Chapter 10 of this Universal
Registration Document.
The Group may not be able to implement this plan within the timeframe and in accordance with the terms
initially planned, or may not derive the benefits initially expected from it, which could have a material
adverse effect on its business, financial position, results and outlook.
Moreover, if the Group were unable to achieve certain of the objectives set under this plan, it could
encounter difficulties in maintaining its competitive position and effectively managing its production
costs, which could have a material adverse effect on its business, financial position, results and outlook.
In addition, the Group could face risks related to the results of the transformations induced by this plan,
7 Production costs excluding commercial, general and administrative costs, transport costs, depreciation and amortisation and
provisions for claims.

16
such as an unexpected and temporary decline in the performance of its production processes. Finally, the
initiatives put in place and their results, in particular cost reductions, may not be sustainable. The
occurrence of any of the events described above could have a material adverse effect on the Group’s
business, financial position, results and outlook.
Risks related to the operation of industrial sites*
The Group’s manufacturing processes involve working molten materials at very high temperatures, using
heavy machinery and equipment. These production processes entail risks such as industrial accidents,
molten glass spillage and explosions, fires and environmental hazards such as accidental releases of
polluting or hazardous products – including their fumes. Such events may cause unforeseen interruptions
in the Group’s activity, the total or partial destruction of its facilities, environmental pollution or even
personal injury or the death of Group employees and/or local residents (despite the expertise brought for
the design and operation of these furnaces and facilities) as a result of human errors, equipment failures,
defects or malicious acts, terrorism or exceptional events such as the Covid-19 pandemic or force majeure.
Those risks are aggravated for sites exposed to an increased risk of natural disasters (in particular droughts,
fires, flooding or earthquake).
For example, the partial collapse of a furnace vault in 2019 at the Kamyshin site in Russia, resulted in a
repair cost of approximately €0.2 million for the Group and required the production to be interrupted for
about 20 days; and the furnace fire at the Chalon-sur-Saône site, France, partially damaged the fibrocement
roof.
Such events, particularly if they concerned sites operated by the Group near urban areas (such as in Chalon-
sur-Saône, France), could subject the Group to legal proceedings brought against it by potential victims
for damages and/or result in penalties.
In addition, the operations and results of the Group depend on its ability to maximise the utilisation of its
industrial tool, in order to achieve the optimal production level. The production processes of the Group
feature high fixed production costs and a continuous production requiring heating furnaces at high
temperatures 24 hours a day.
Prolonged interruptions of supplies of energies (for example: gas, electricity, fuel) or materials necessary
for the supply of furnaces (for example: sand, soda ash, cullet) can lead to the deterioration, or even the
loss of the production tool.
Some of the geographical zones in which the Group operates such as Latin America, Ukraine and Russia
are subject to frequent energy supply shortfalls (notably electricity), which could lead to a shut-down of
furnaces and thus a halt in production. Argentina experiences frequent power outages, especially during
winter.
In addition, due to the Covid-19 pandemic, some production sites of the Group could experience
difficulties for their supplies in raw materials. Since the beginning of the containment measures in Europe,
the Group has been forced to limit the production of some of its sites in this geographical zone due in
particular to the local circulation restriction or containment measures or requests of withdrawal rights of
some of its employees. Generally, due to the circulation restriction measures related to the sanitary crisis,
the Group’s employees could no longer have access to the production sites.
Any interruption in the production process is likely to cause loss of revenue for the Group while continuing
to incur fixed costs, prevent the Group from fulfilling orders from its customers and/or lose customers.
The loss of customers could add to contractual penalties, in case of delayed deliveries. The Group could
also face significant delays in respect of reconstruction works of its furnaces or unscheduled investments
such as furnace repair that become necessary following the occurrence of incidents, liability claims and a
significant increase in the cost of its insurance policies.
17
Such interruptions or accidents are likely to result in a loss of revenue and thus have a material adverse
effect on the Group’s business, reputation, financial position, results and outlook.
Risks related to the occurrence of natural disasters
The Group’s industrial facilities are exposed to risks related to the occurrence of natural disasters such as
fires, floods, hurricanes and earthquakes (or other climatic events). In 2019, in Italy, in the Savone region,
one of the Group's external storage warehouses was flooded, and products were damaged; in addition, a
warehouse collapsed at the Bad Wurzach site in Germany, following heavy snowfall and rain.
Furthermore, some production sites are located in Chile and Argentina, where earthquake risk is elevated.
In addition, the Essen production site in Germany and the Group sites in the Italian Po river valley are
located in flood zones.
These climatic events may require the Group to set up additional means of protection on sites in high-risk
areas, which would entail additional costs. Moreover, the insurance market, due to the extent of the damage
that may be caused by such events, is likely to increase the cost and/or limit, or even refuse to maintain
coverage subscribed by the Group for natural disasters and in particular for earthquakes due to the Group’s
strong exposure in Argentina and Chile. Thus, when the Group renewed its damage policy in 2019 for
2020, it could only maintain its 2019 earthquake coverage in 2020 for these two countries by accepting a
sharp increase in premiums and an increase in deductible for this risk.
The occurrence of a natural disaster could result in the destruction of all or part of the Group’s facilities,
personal injury or death of employees and local residents and interrupt production as well as the ability to
fulfil customer orders for an indefinite period. The inability to resume deliveries quickly following a
natural disaster at a production site or the various costs and constraints related to repairs or associated
temporary palliative measures could have a material adverse effect on the Group’s business, financial
position, results and outlook. In particular, in the aforementioned countries, such as Argentina and Chile,
the Group has only one production site, which limits in particular the possibilities for alternative supplies
from another Group production site. Furthermore, such events could involve the Group in legal
proceedings brought against it by potential victims for damages and/or result in the application of penalties,
which could have a material adverse effect on the Group’s business, financial position, results and outlook.
Risks related to environmental liabilities
Some of the Group’s industrial sites have been involved in glass production or decoration for several
decades. These are either production sites historically operated by the Group or production sites initially
operated by third parties and subsequently acquired by the Group. Some of the Group’s sites were
previously used by other heavy industries, especially in Germany and Russia, or for military production
or storage.
Due to their age and/or their original location or use, the building materials and/or equipment of certain
Group sites, including French, may contain components with asbestos. In addition, it cannot be excluded
that some Group sites may have undergone soil or water contamination in the past. As a result, they may
have an environmental liability, which could result in costly obligations to remove or isolate contaminated
materials. For example, in Brazil, the closure of the Canoas site in 2012 required pollution control
operations, at the request of the local government, which are still ongoing as of the date of this universal
registration document.
In addition, cases of soil contamination have been detected at some of the Group’s production sites in the
past. Remediation obligations may be imposed on the owners, operators or past or present users of
contaminated sites, including sites belonging to third parties where waste may have been sent, without
seeking fault or non-compliance with the law in respect of the activities causing such contamination. The
Group cannot exclude that such costs may be imposed on it in the future, due to the identification of
additional environmental impacts or additional obligations. In particular, in 2019, the Group left the Agua
Branca production site located in the Sao Paulo metropolitan area of Brazil. It cannot be excluded that a

18
remediation obligation may be imposed in the event that soil contamination is detected during the closure
of the site or in the future. The Group may also be required, under European directive 2010/75/EU on
industrial emissions, as amended (the “IED Directive”), or under other laws and regulations, to conduct
soil and groundwater assessments at some of its sites, which may reveal previously unknown
contamination. The Group has therefore recorded “provisions for environmental risks” for a total of €13
million as of 31 December 2019; no assurance can be given that these provisions will cover the actual
costs incurred in relation to the identified liabilities.
Environmental liabilities that may arise from the sale of sites or the discontinuation of operations, and
more generally during the operation of the Group’s sites, could have a material adverse effect on the
business, image, results, financial position, and outlook of the Group.
Risks related to substantial investments and their financing
In order to maintain the operational excellence of its industrial facilities, the Group makes significant
recurring investments, representing approximately €200 million per year in recent years, including
expenses related to the construction of new equipment and the reconstruction and maintenance of its
existing facilities. The Group intends to continue to pursue a disciplined investment policy, aimed at
limiting recurring investments to approximately 8% of the Group’s consolidated revenue (excluding the
capitalisation of the right of use related to the application of IFRS 16).
The Group must generally rebuild five to seven furnaces per year on average. For example, the Group
invested, during the year ended 31 December 2019, €24 million to completely rebuild one of the two
furnaces at the Lagnieu site (France) and €33 million to rebuild one of the two furnaces at the Burgos site
(Spain) and to modernise the production lines at these two sites. The Group also announced an additional
€10 million in 2020 for the renovation of the second furnace and its production lines at the Burgos site.
The Group has also completed the construction of a new site in Jacutinga, Brazil, and in Chile (in
connection with the stoppage of the site’s old furnace) which started in February 2020. The Group also
started the construction of a new furnace on the sites of Azuqueca in Spain and Villa Poma in Italy (see
Section 5.7 “Investments” of this universal registration document).
The Group intends to continue its disciplined investment policy, with recurring investments amounting to
approximately 8% of the consolidated revenue of the Group (see Section 5.7 “Investments” of this
universal registration document). The Group may be unable to finance such expenditures if it does not
generate enough cash from operations or if its available credit lines are insufficient. The Group’s ability
to generate cash flows depends in particular on demand for the Group’s products, the cost of energy and
raw materials, and the Group’s success in developing and manufacturing new products. The Group may
not be able to incur its capital expenditure if operating cash flows are not sufficient or if it is unable to
obtain the necessary funds under its existing credit agreements or if it is unable to incur additional debt as
a result of such events.
If the Group were unable to meet its investment needs for any reason, it could be unable to maintain and
develop its production capacities, which could have a material adverse effect on its business, results,
financial position and outlook.
Risks related to defective products
Although the Group implements stringent control measures (see Section 3.6.2.2 of this Universal
Registration Document), if one of its products does not comply with its standards, in particular due to
accidental or intentional contamination of raw materials, failure of production equipment or human error,
the Group could be forced to incur substantial costs in order to carry out the necessary corrective actions
while suffering damage to its image or that of the brands used. These actions could result in the Group
suspending the production of certain products and/or recall products from its customers and/or have its
own customers recall their products from their entire distribution chain, including from end consumers.
The Group could then be required to compensate its customers and/or other companies along the
19
distribution chain and/or end consumers for any damages, which could include bodily injury (if, for
example, the Group’s packaging fails to withstand the pressure from carbonated beverages). In some
countries, the Group’s direct customers, other companies along the distribution chain, and its indirect
customers, or end consumers could obtain a court order requiring the Group to pay compensation even if
the Group is not negligent or at fault. The Group could also be subject to regulatory investigations, market
withdrawal, affirmative injunctions, and/or legal proceedings if it introduces a new product on the market
that is deemed dangerous, fails to notify regulators of a safety problem, or fails to take corrective measures.
Any defect in the quality or safety of any of the Group’s products could result in liability claims by its
direct customers or end consumers for any damage suffered as a result of this defect, and could also lead
to negative publicity, damage to its reputation and loss of market share. Such events could have a material
adverse effect on the Group’s business, reputation, results, financial position or outlook.
Risks related to the international activities of the Group
As of 31 December 2019, the Group operated 32 production sites (with a total of 57 furnaces) and 3
decoration sites in 11 countries in which it has a manufacturing presence.
The Group recorded 16% of its consolidated sales for the year ended 31 December 2019 in Eastern
European countries, as well as Latin America, i.e., Russia, Ukraine, Brazil, Argentina and Chile.
In general, the Group’s activities in these countries involve higher risks than in Western European
countries, including:
volatility of gross domestic product (for example, Argentina recorded a 2.2% decline in its gross
domestic product in 2019, after posting decline of 2.5% in 2018, which itself followed a growth
of 2.7% in 20178);
a relatively unstable economic situation (inflation rates are frequently higher and fluctuating, such
as in Argentina (which is facing hyperinflation (see Section 3.4.1 “Risks related to exchange rates”
of this Universal Registration Document) and Brazil) and social and political instability;
increased risks relating to corruption and business ethics;
weaknesses of health systems which renders them vulnerable in case of a crisis such as the Covid-
19 pandemic;
changes in regulations, which can be significant, particularly tax regulations, or their imperfect
application, and complex tax regimes, such as in Brazil, Russia or Ukraine;
difficulties in obtaining enforcement of contracts or court decisions (notably in Russia and
Ukraine) or difficulties in recovery or in obtaining enforcement of, or complying with, vague or
ambiguous legal provisions;
nationalisation or expropriation of private property (expropriation without sufficient
compensation to rebuild the plant or equipment identically);
exposure to various legal regimes, including those relating to intellectual property and collective
proceedings;
customs duties, protectionist measures and licensing obligations for imports and exports;
difficulties in recruiting or retaining employees;
8 Source: World Bank.
20
non-compliance with the Group’s risk management procedures due to the Group’s decentralised
structure;
significant fluctuations in interest and exchange rates (such as the devaluation of the Argentine
peso and hyperinflation in Argentina (see Note 2.5 to the Notes of the Group’s consolidated
financial statements for the year ended 31 December 2019) or the recent depreciation of the
Chilean peso;
exchange controls and other adverse interventions or restrictions imposed by governments, such
as, for example, in Argentina (including limitations on the payment of dividends or other payments
from foreign subsidiaries, withholding taxes or any other taxation based on payments or
investments made by foreign subsidiaries and any other restrictions imposed by foreign
governments);
the risk of war, which materialised in Ukraine with the Crimean crisis (including the risk that
employees in these countries could be mobilised);
Frequent public unrest (such as the context of current social tensions in Chile) and corrupt
practices;
risks of sanctions in certain countries (notably Russia and Ukraine), which may in particular target
the Group’s customers or suppliers, or the risk of a conflict between sanctions measures taken by
different countries or between applicable local regulations more generally, placing the Group in a
situation where compliance by the Group with a sanction measure taken by a given country leads
to the violation of a sanction measure taken by another country; and
acts of terrorism.
Although the Group’s activities in the above-mentioned regions are not concentrated in a single country,
the occurrence of adverse events or circumstances in one or more of the countries in which the Group
operates could have a material adverse effect on the Group’s business, financial position, results and
outlook.
Risks related to relations with certain suppliers and subcontractors
The Group uses many suppliers of raw materials and components. The Group’s top 10 suppliers accounted
for approximately 16% of the Group’s supplies for the year ended 31 December 2019. However, for certain
very specific supplies, the Group may rely on a limited number of suppliers. This is the case in particular
for the supply of soda ash, in a sector where production is highly concentrated, and for the Group’s sand
supplies.
A failure of one or more significant suppliers or an exclusive supplier, including as a result of labour
unrest, unexpected stock shortages, quality defects, export restrictions or sanctions and, more generally,
any disruption in supply could therefore alter the Group’s production capacities or result in additional costs
that could have an adverse impact on its business, results, financial position, assets and outlook.
In addition, the Group may, for a limited number of services and products provided to its customers, use
subcontractors acting in the name and on behalf of the Group, which remains responsible for the services
performed by them. In the context of these subcontracting activities, the Group is exposed to the risk
related to the management of these subcontractors and the risk that they may not perform their work
satisfactorily, in accordance with applicable regulations, or within the time limits set. For example, the
Group uses a large number of transport companies to deliver its products to its customers, exposing it in
particular to the risk of carriers’ availability (such as in the event of a strike by their employees, as was the
case in Brazil in May 2018, or in all the European countries where the Group is located due to the Covid-
19 pandemic), which could result in significant delivery delays if the Group does not have a carrier capable
of delivering the relevant products on the required date. In France, the yellow jackets movement triggered
21
transport blockages in 2019, and at the end of the year, strikes related to pension reform affected the
movement of freight trains, with an impact on the costs of raw material delivery. The Group also uses
external service providers for the storage of its products prior to delivery, mainly in France, which requires
appropriate logistical processes with these service providers for the efficient delivery and secure storage
of its products. If these subcontractors were unable to comply with their obligations, the Group’s ability
to meet its commitments, comply with current regulations or satisfy the expectations of its customers could
be jeopardised, or the Group could be held liable, which could damage its reputation and have a material
adverse effect on its business, results, financial position and outlook.
In addition, in France, the Group’s subcontractors are generally small companies, which may generate an
important part of their revenue, or even their whole revenue, from the Group. Due to the legislative
provisions governing the termination of contracts in France when one of the parties is in a situation of
economic dependence, the Group could face difficulties in terminating a subcontracting contract with a
defaulting subcontractor, or could be required to pay compensation in this respect, which could, in the
event that this situation persists, have a material adverse effect on the Group’s business, financial position,
results or outlook.
Lastly, the Group cannot guarantee that its suppliers and subcontractors comply with local labour laws and
environmental and ethical standards in the course of their activities. If it turns out that these suppliers and
subcontractors have not complied with local labour laws or environmental or ethical standards, the Group’s
reputation and results could be adversely affected. In addition, the replacement of a supplier or
subcontractor as a result of such events could force the Group to bear additional costs and disruptions or
interruptions in production. The occurrence of one or more of these risks could therefore have a material
adverse effect on the Group’s business, financial position, results and outlook.
Risks related to relations with the Group’s customer base
For the year ended 31 December 2019, the Group generated 17% of its consolidated revenue from its top
10 customers.
Although the Group generally has long-term commercial relationships with its main customers, it cannot
guarantee that these, or any of its other contracts and commercial relationships, will actually be renewed.
The Group cannot guarantee that if these contracts are renewed, they will be done so on favourable terms
and conditions. Some of the Group’s contracts or commercial relationships could be terminated under
certain circumstances, such as if the Group fails to meet its contractual obligations. Finally, the
phenomenon of customer concentration (such as the mergers of brewers AB InBev and SAB Miller in the
beer sector or of the subsidiaries of Heineken and Kirin in Brazil in recent years) could also lead to these
customers concentrating their glass packaging supplies, which could benefit a competitor of the Group,
increase pricing pressure or lead to the Group’s dependence on these “major accounts” in markets where
their share of sales is significant.
The loss of one or more of the Group’s main customers, a significant reduction in the Group’s sales to its
main customers or a substantial change in the conditions governing its commercial relations, due of the
above-mentioned events, could have a material adverse effect on the Group’s business, reputation results
and outlook.
Moreover, under trade practices in the markets in which the Group operates, a significant number of the
agreements entered into by the Group with its customers, notably with medium or small-sized customers
as well as with some of its major customers, are not particularly formalised and generally consist of either
periodically renegotiated pricing agreements among the parties (generally without prior agreement on
volumes) or informal and adjustable partnership agreements with a duration varying from a few months
to three years depending on the geographical area. However, this flexibility may result in a less precise
definition of the parties’ rights and, in the event of disagreement between the parties on the substance of
their agreement, could lead to disputes, disagreements or conflicts that could have a significant adverse
impact on the Group’s business, financial position, results and outlook.
22
Finally, certain Group customers could decide to develop their own glass packaging production or relocate
their packing and packaging zones, which could lead to the loss of some customers. The occurrence of
such events could have a material adverse effect on the Group’s business, financial position, results and
outlook.
Risks related to IT systems
The Group relies on its information systems to ensure the conduct of its activities (including to monitor its
supplies, orders and product invoicing, communicate with its customers, manage its personnel and provide
necessary information to its various operational managers for decision-making). The management of its
activity is thus increasingly dependent on information systems (infrastructure, networks and software
applications). Despite a policy of strengthening and continuously monitoring the resilience and security of
its information systems, a major failure or interruption resulting from an incident (such as a power outage
or fire), computer virus, computer attack or other cause could have a negative impact on the conduct of
the Group’s business.
In June 2017, the Group, like many other companies and organisations in France and abroad, was affected
by the NotPetya cyberattack. The Group immediately isolated all of its systems in order to preserve its
data and stop the spread of the virus, and suspended its e-mail service. The Group’s plants continued
production but some deliveries to customers were nevertheless interrupted during this period.
In addition, the Group outsources certain elements of its information systems and certain activities in order
to optimise the management of its resources and improve the efficiency and security of its IT infrastructure.
The Group relies on the quality of work and the expertise of its service providers in this area and, despite
the care taken in selecting these providers, is therefore exposed to the risk that they may fail to fulfil their
obligations.
Finally, the Group grants access rights to certain parts of its information systems to a significant number
of its employees as well as to third parties, such as external service providers (IT service providers and
consultants, in particular). Despite the control procedures in place, the Group cannot guarantee that a user
could not access data or functionalities to which he or she was not supposed to have access, which could
lead, for example, to the disclosure of sensitive data or the manipulation of the Group’s operational or
financial data.
The occurrence of such events could have a material adverse effect on the Group’s business, financial
position, results and outlook.
Risks related to occupational health and safety
Human resources are one of the pillars of the Group’s business. Regulations in the field of labour law,
including occupational health and safety and the use of temporary workers, particularly affect its business.
Although the Group makes significant efforts to ensure compliance with these regulations and to ensure
that temporary employees have an equivalent level of training, qualification and reliability compared to
its own employees, it cannot guarantee the absence of potential deficiencies in these areas. Any failure by
the Group, its employees (notably its temporary employees) or its subcontractors to comply with these
obligations could result in significant fines, claims against the Group and the company that employs such
persons related to the violation of these provisions or the loss of authorisations and qualifications. In
addition, these regulations are subject to regular changes and the constraints imposed may be reinforced;
adapting the Group’s organisation to comply with such regulations could generate significant costs.
The Group is also exposed to the risk of accidents involving its employees or sub-contractors at their
workplace (particularly industrial sites) or in transit, or involving employees of external service providers
working on the Group’s sites. Despite the attention paid to safety and working conditions, the Group
cannot exclude the occurrence or increase, in frequency and severity, of work-related accidents and
illnesses.
23
In particular, the Group’s glass business requires its employees to work in an environment requiring
control of heat radiation and contact with hot parts in order to preserve both employees and the
installations, which in the past led to the use of asbestos at certain Group production sites.
As such, the Group is exposed to claims for recognition and compensation for asbestos-related
occupational diseases in addition to obligations that may be provided for under various social protection
schemes in the countries where the Group operates, including under the “employer’s inexcusable
misconduct” clause in France (see Section 3.5.2 “Risks related to claims for occupational illnesses” of this
Universal Registration Document). As at 31 December 2019, the amount provided for these applications
for inexcusable misconduct amounted to €1.1 million. In addition, the Group is also facing claims by its
employees and former employees to repair potential anxiety damage suffered due to alleged exposure to
harmful or toxic substances which may generate a high risk to develop severe pathology, on the grounds
of statutory law and breach of the employer’s safety obligation (see Section 18.5 “Judicial and Arbitration
Procedures” of this Universal Registration Document). Group employees are also likely to be exposed to
other materials which, even if they are considered harmless today, could in the future be considered
dangerous to health, as was the case for asbestos in the past. Furthermore, new technologies, as well as the
implementation of new procedures, following in particular events such as the Covid-19 pandemic,
services, tools and machines could have unexpected effects on the working conditions of the Group’s
employees, which in turn could have significant adverse consequences for the Group. Finally, in the
context of the Covid-19 pandemic outbreak affecting, inter alia, regions where the Group has production
facilities, the occurrence of one or more cases of Covid-19 pandemic affecting the Group’s employees or
sub-contractors could force the Group to limit, or even to completely interrupt production at the sites where
the employees or sub-contractors concerned work, which could have an adverse impact on the Group’s
activities.
Risks related to labour relations
The Group’s operations may be disrupted by labour disputes such as strikes, walkouts, industrial action or
other social unrest, which could also have a material adverse effect on the Group’s operations, profits and
image. A substantial number of hours are typically lost to strikes every year in France. Verallia France,
for example, experienced several sustained strike movements during the 2019 year, notably at the Cognac
and Chalon sur Saône production sites, as well as a general movement at the end of the year related to the
pension reform.
In the various countries where its plants are located, the Group, in accordance with its principles of action
and its concern for social dialogue, is a party to numerous collective agreements stemming from
negotiations with the social partners, some of which are concluded for a fixed period and are therefore
subject to periodic renegotiation. These negotiations have caused and could continue to cause labour
tension or strikes when the parties involved have difficulty agreeing on mutually-acceptable terms and
conditions. Social negotiations, and in particular the negotiations of the above-mentioned collective
agreements or periodic wage negotiations, are likely to increase operating costs due to the resulting
payment of higher salaries or benefits in kind or in cash, which could have a material adverse effect on the
Group’s business, results, financial position and outlook.
Risks related to acquisitions
The Group may consider value-creating acquisitions in order to generate additional revenue growth.
In the context of such acquisitions, the Group could encounter the following difficulties:
the integration of new companies could result in substantial costs, as well as delays or other
financial and operational difficulties;
the assumptions made in the business plans of the acquired companies could prove to be incorrect,
particularly in terms of synergies and performance;
24
the completion of acquisitions in a new country and/or in a country that is not the Group’s home
country could involve increased risks; and
the acquisition of new companies could generate unforeseen legal constraints, such as liabilities
that are more significant than those assessed during the due diligence phase of acquisition.
In general, the expected benefits of future or completed acquisitions may not materialise within the
expected timeframe and at the expected levels, which could have a material adverse effect on the Group’s
business, financial position, results and outlook.
For example, the Group acquired Alver, an Algerian glassmaker in 2011; in view of the deterioration in
operational performance and the limited prospects for improving the subsidiary’s results, the Group then
sold it in May 2018 for a symbolic price.
Risks related to partnerships
As part of its activities, the Group has entered into and may enter into a number of strategic partnerships
and joint ventures with local companies, as is the case in Argentina through the Group’s Rayen Cura
subsidiary, in which it holds 60% of the shares, alongside the diversified Chilean group Cristalerias Chile.
As part of the corresponding partnership or joint venture agreements, the Group may be required, for the
purpose of taking certain decisions, to seek the agreement of its partners, whose interests may not be
aligned with its own.
In addition, if one of the Group’s partners were to face financial hardship, change its strategy, wish to
terminate a strategic partnership or, more generally, if there is disagreement on the terms of the partnership
(as was the case for the IVN joint venture, established by the Group in Brazil (see Sections 7.1.2.7.
“Acquisitions, disposals and changes in scope” and 18.5 “Legal and arbitration proceedings” of this
Universal Registration Document), this could, for example, affect the Group’s ability to implement its
strategy, force it to cease operations under sub-optimal conditions and expose it to the risk of litigation,
particularly with its partner, and consequently have a material adverse effect on its business, financial
position, results and outlook.
3.3 Risks related to the Company
Risks related to the Group’s debt and the restrictive clauses of its financing contracts
As of 31 December 2019, the Group’s total gross debt amounted to €1,809.8 million (see Section 8.2.2
“Financial liabilities” of this Universal Registration Document).
The Group’s debt could have negative consequences, including:
requiring the Group to devote a significant portion of its cash flows from operating activities to
debt service and repayment, reducing the Group’s ability to use available cash flows to finance
organic growth, investments and other general corporate purposes;
increasing the Group’s vulnerability to business slowdown or economic conditions;
placing the Group in a less favourable position compared to competitors that have less debt relative
to cash flow;
limiting the Group’s flexibility to plan or react to changes in its activities and sectors;
limiting the Group’s ability to make investments for growth;
limiting the Group’s ability to carry out its external growth policy; and
25
limiting the ability of the Group and its subsidiaries to borrow additional funds or raise capital in
the future, and increasing the costs of such additional financing.
In addition, the Group’s ability to meet its obligations, pay interest on its borrowings or refinance or repay
its borrowings under the terms and conditions provided for therein will depend on its future operating
performance and may be affected by several factors (including economic conditions, debt market
conditions, regulatory developments, etc.), some of which are independent of the Group.
The Group is also exposed to the risk of interest rate fluctuations insofar as a significant portion of its debt
bears interest at a variable rate equal to EURIBOR plus a margin. In addition to potential fluctuations in
EURIBOR (see Section 3.4.3 “Risks related to interest rates” of this Universal Registration Document),
margins applicable under the Senior Facilities Agreement, which constitutes a significant proportion of
the Group’s debt, increase according to the total net debt to pro forma consolidated EBITDA ratio as
defined in the Senior Facilities Agreement (pro forma consolidated EBITDA corresponds to adjusted
EBITDA as defined in this universal registration document) (see Section 8.2.2.1 “Senior Facilities
Agreement” of this Universal Registration Document).
In the event of insufficient liquidity to service its debt, the Group may be forced to reduce or defer
acquisitions or investments, sell assets, refinance its debt or seek additional financing, which could have a
material adverse effect on its business or financial position. The Group may not be able to refinance its
debt or obtain additional financing on satisfactory terms.
Furthermore, the Senior Facilities Agreement requires the Group to comply with specific covenants,
particularly financial covenants and a specific ratio (see Section 8 “Liquidity and capital resources” of
this Universal Registration Document). Subject to exceptions customary for this type of financing, these
covenants limit, among other things, the Group’s ability to:
- grant security interests;
- disposals of assets;
- carry out certain mergers; and
- change the nature of the Group’s activities.
The restrictions contained in the Senior Facilities Agreement could affect the Group’s ability to carry out
its operations and limit its ability to react to market conditions or to seize business opportunities that may
arise. For example, these restrictions could affect the Group’s ability to finance business investments,
make strategic acquisitions, investments or alliances, restructure its organisation or finance its capital
requirements. In addition, the Group’s ability to comply with these covenants could be affected by events
beyond its control, such as economic, financial and industrial conditions. A breach by the Group of its
commitments or restrictions could constitute an event of default under the terms of the Senior Facilities
Agreement.
In the event of default which is neither remedied nor waived, the creditors concerned may terminate their
commitment and/or require that all outstanding amounts become immediately due. This could activate
cross-default clauses on other contracts of the Group. Such events could have a material adverse effect on
the Group, and even lead to its bankruptcy or liquidation.
The occurrence of one of the risks described above could have a material adverse effect on the Group’s
business, operating results and financial position.
Risks related to the control of the Company by its majority shareholder
As of 31 December 2019, Horizon Investment Holdings, a company held at 100% by Horizon Parent
Holdings S.à.r.l., itself held at 100% by AIF VIII Euro Leverage, L.P., an investment fund managed by an
26
affiliate of Apollo Global Management, Inc., holds 55.3% of the share capital and voting rights of the
Company. As a result, Horizon Investment Holdings will be in a position to have a significant influence
on the strategic decisions to be taken by the Company and/or, depending on attendance levels at general
meetings, on the approval or rejection of any resolutions submitted to the ordinary general assembly of
shareholders and to the extraordinary assembly of shareholders including the nomination of board
members, approval of the annual financial statements, distribution of dividends, authorisation to increase
the share capital or to issue securities, authorisations of mergers or similar transactions or any other
decision requiring shareholder approval in the circumstances described above. In addition, in light of its
size, if a partial or total sale of its stake by Horizon Investment Holdings were to take place, or if such sale
was perceived as probable or imminent, the market price of the shares of the Company may be significantly
and negatively affected.
3.4 Market risks
Risk associated with exchange rates*
A part of the Group’s assets, liabilities, income and expenses are denominated in currencies other than the
euro. The preparation of the Group’s financial statements (denominated in euros) requires the conversion
of these assets, liabilities, income and expenses into euros at the then-applicable exchange rates.
Consequently, changes in exchange rates against the euro affect the amount of the relevant line items in
the Group’s financial statements even if their value remains unchanged in their original currency (foreign
exchange translation risk).
Beyond this conversion risk, the Group’s results are not significantly affected by changes in exchange
rates, since, as a general rule, the Group’s costs and revenues are denominated in the same currency. This
is due to the regional or local nature of the Group’s markets.
However, some subsidiaries located in Eastern European countries that export products in the currency of
the importing country may be exposed to exchange rate fluctuations; the same applies to subsidiaries
located in Latin American countries that purchase raw materials and energy or make investments in US
dollars and euros (foreign exchange transaction risk). In the normal course of business, the Group may
also be exposed to foreign exchange risk on certain financial liabilities denominated in a currency other
than the functional currency of certain subsidiaries. As of 31 December 2019, the fair value of total foreign
exchange derivative financial instruments amounted to -€1.1 million.
The main currencies of the Group’s exposure to translational foreign exchange risk are Brazilian real,
Argentine peso and Russian ruble, which sensitivity to equity is described in Note 20.2.2 “Foreign
exchange risk” of the Group's consolidated financial statements for the year ended 31 2019.
During the year ended 31 December 2019, the Group’s results were impacted by the sharp devaluation of
the Argentine peso and, to a lesser extent, the Brazilian real, which were impacted by the economic and
political crises affecting these countries (see Section 7.1.2.4 of this Universal Registration Document).
Moreover, following the sharp increase in the cumulative inflation rate over several years in Argentina,
such that it is considered to be a hyperinflationary economy, the Group was required to apply IAS 29
Financial Reporting in Hyperinflationary Economies to its activities in Argentina as from 1 January 2018.
Applying this standard requires the revaluation of non-monetary assets and liabilities, equity and profit
and loss to reflect changes in purchasing power in local currency. These revaluations may lead to a gain
or loss on the net monetary position included in net financial income. In addition, this standard requires
the subsidiary’s income statement to be converted at the closing rate rather than the average rate for the
period. For the year ended 31 December 2019, the net impact on revenue of hyperinflation in Argentina
was €3.1 million.
27
Liquidity risk
Liquidity risk is the risk of not having the necessary funds to meet commitments when they come due.
This includes, on the one hand, the risk that assets cannot be sold quickly under satisfactory conditions if
necessary and, on the other hand, the risk of early repayment of liabilities or non-access to credit under
satisfactory conditions.
In the context of a crisis, the Group may not be able to obtain the financing or refinancing necessary to
implement its investment plan or to obtain such financing or refinancing on acceptable terms.
The contractual expiration dates of the Group’s financial liabilities, including interest payments, are
presented in Note 20.1 “Liquidity risk” of the Group’s consolidated accounts for the year ended 31
December 2019.
In addition to financial debt, as of 31 December 2019, the Group’s financial liabilities include €383.6
million in trade payables and €277.0 million in other current liabilities (including amounts due under fuel
and gas swaps).
Risks related to interest rates
The Group is exposed to the risk of interest rate fluctuations due to the fact that some of its debts bear
interest rates that are indexed to the European interbank offered rate (“EURIBOR”), plus a margin. In
addition, the Senior Facilities Agreement also bears interest at a variable rate indexed to EURIBOR.
EURIBOR could increase considerably in the future, resulting in higher interest expense for the Group,
reducing free cash flow for investments and limiting its ability to service its debts. As of 31 December
2019, the Group’s outstanding variable rate debt, after taking into account derivative instruments,
amounted to €297.8 million and the Group’s outstanding fixed rate debt amounted to €1,512.1 million,
including accrued interests. In 2018, the Group entered into interest rate swaps for a nominal amount of
€1,500 million with a maturity date in August 2022 (see Section 3.6.2.2.2 “Operational risk management”
of this Universal Registration Document). In October 2019, following the Refinancing, the Group
proceeded to the unwinding of €250 million of interest rate swaps.
The sensitivity, as at 31 December 2019, of pre-tax income to the impact of changes in the interest rate
applicable to the Group’s debt cost is presented in Note 20.2.1 “Interest rate risk” of the Group’s
consolidated accounts for the year ended 31 December 2019.
Credit risk and counterparty risk
Credit and/or counterparty risk is the risk that a party to a contract with the Group will default on its
contractual obligations resulting in a financial loss to the Group.
Financial assets that could expose the Group to credit and/or counterparty risks are mainly receivables
from its suppliers or partners (in particular in the event of non-payment or failure to meet payment
deadlines), cash and cash equivalents, investments and derivative financial instruments.
3.5 Legal risks
Risks related to regulations, in particular environmental regulations and their changes*
The Group’s activities are subject to various regulations (including the stock market regulation since the
Company’s initial public offering), in particular with regard to the compliance and compatibility of the
products it sells with their own regulations, industrial, safety, health and environmental standards (see
Section 9 “Legislative and regulatory environment” of this Universal Registration Document).
A modification or strengthening of the regulatory provisions applicable to the Group’s activities, a
tightening of their application, a conflict between the laws and regulations adopted by different countries
and/or a change in their interpretation by the competent authorities, such as with respect to environmental
28
liability laws based on the “polluter pays” principle and resulting from European Directive 2004/35/EC
(see Chapter 9 of this Universal Registration Document), could result in additional costs or investments
that could be significant, and which could have a significant adverse effect on the Group’s business, results,
financial position and outlook.
New regulations such as those related to recycling or deposit containers could give rise to additional costs
or logistical constraints for certain Group customers, who could in turn decide to scale back or stop their
use of glass packaging. This could cause the Group to reduce, suspend, or terminate the production of
certain types of products or shut down one or more of its production plants, with no assurance that it would
be able to offset the corresponding losses or restart a plant that had been shut down. Regulatory changes
could also affect the Group’s prices, margins, capital expenditure, and operations, especially if these
regulations lead to significant or structural changes in the food packaging market that could affect the
Group’s share of the glass market, production volumes, or production costs. The occurrence of one or
more of the above events could have a significant adverse effect on the Group’s business, results, financial
position and outlook.
For example, due to growing concerns about the impact of carbon dioxide emissions (a so-called
“greenhouse gas”) on climate change, some environmental regulations to reduce carbon dioxide emissions
have been, and will continue to be, adopted (see Chapter 9 “Legislative and regulatory environment” of
this Universal Registration Document.) Thus, in accordance with the regulation on carbon dioxide
emission quotas (see chapter 9 above) and in view of the Group’s quota deficit, the Group recorded a
provision of €37.7 million during the 2019 financial year. Moreover, in order to secure the prices at which
it will have to acquire allowances, and in anticipation of the end of Phase III (see chapter 9 above), the
Group has made forward purchases of carbon dioxide allowances on the market for a total amount of €34.9
million as of 31 December 2019, corresponding to the expected deficits under Phase III. The settlement of
forward purchases and the delivery of allowances will result in a cash outflow for the Group (which will
therefore record a reversal of the aforementioned provision in the amount of such outflows), mainly in
2021. Moreover, taking into account future changes in the applicable regulations (see chapter 9 above),
the Group already anticipates that the number of allowances allocated free of charge will be lower than in
the past, as a result of which it will probably not be able to meet its carbon dioxide emissions restitution
obligations. In light of the start of Phase IV (2021-2030) (see chapter 9 above), the Group has already
made forward purchases of carbon dioxide quotas on the market during the year 2019 for a total amount
of €24.6 million as of 31 December 2019. In addition, in the event of a significant increase in the
production capacity of one or more of its sites, the Group would have to ask the competent authorities to
revise the level of quotas allocated to such site or sites, without any assurance that such a request would
be favourably received or on the level of quotas to be allocated. The Group therefore believes that, despite
the efforts it may make to reduce its carbon dioxide emissions, it will be required to pursue its policy of
acquiring allowances on the market for significant amounts, which could result in an increase of its
operating costs and could have a material adverse effect on its business, results, financial position and
outlook. This situation could also force the Group to make a technological change, resulting in significant
investments in the sites concerned, in particular to design and build low-carbon dioxide furnaces, which
may result in an increase in its capital expenditure and could have a material adverse effect on its business,
results, financial position and outlook.
Furthermore, a change in legislation or the position of the administrations responsible for the issue of
operating authorisations, in particular in Germany, Ukraine and Italy on the date of this Universal
Registration Document, could force the Group to meet significantly lower limits on nitrogen oxide
emissions than those currently applicable to its production sites. These new limits could in particular apply,
depending on the country, to existing facilities, newly constructed furnaces or reconstructions of furnaces
with an increase of capacity. The application to the relevant sites of a significantly lower limit on the
emission of nitrogen oxide than that currently in force could imply, in order to comply with this, the
installation of a filter, the cost of which is estimated at approximately €1.5 million.

29
Environmental concerns may cause State and Community authorities to implement other regulations that
are likely to be binding on the Group and could have a material adverse effect on its business, results,
financial position and outlook. In the European Union, in principle each bottle may not contain more than
100 ppm of heavy metals (limit imposed by Directive 94/62/EC “Packaging and Packaging Waste”, as
amended). By way of derogation, bottles made from recycled glass may contain more than 100 ppm of
heavy metals (see Chapter 9 of this Universal Registration Document). However, this exemption does not
apply to bottles decorated with enamels containing heavy metals, even in tiny amounts. Given the difficulty
of complying with the 100 ppm per bottle limit, certain bottles produced by the Group from recycled glass
may no longer be allowed to be adorned with decoration containing heavy metals, in order not to lose the
benefit of the above derogation, which could limit the Group’s production options and which could have
an adverse effect on the Group’s business, results, financial position and outlook. In addition, a number of
States of the United States in which some of the Group’s customers are likely to sell their products
packaged in bottles produced by the Group, such as still and sparkling wine bottles and spirits containers,
impose a limit of 100 ppm per bottle, with no possible derogation for bottles made with recycled glass.
The Group cannot control its customers’ final exports and cannot therefore exclude the possibility that
bottles that it has produced at production sites located in the European Union from recycled glass and
containing more than 100 ppm per bottle, as authorised under the above-mentioned derogation, will be
used for the packaging of products sold in the aforementioned States, in violation of applicable local
regulations, which could expose it to financial sanctions and have a significant adverse effect on the
Group’s results, business, financial position and outlook.
Lastly, the Group has been, and still is, a party to various legal or pre-litigation proceedings as a result of
its involvement in violations of applicable environmental regulations. Thus, in 2019, following an accident
that led to the death of an employee of a subcontractor one of the Group’s French sites, the restart of an
electrofilter stopped for maintenance and on which the fatal accident occurred, has been delayed due to
ongoing legal proceedings related to this fatal accident. As emissions from this site then became higher
than the limits authorised for a time exceeding that authorised by the administration, threat was made to
limit its production in order to comply (without filter) with the operating conditions given by its
authorisation.
If the Group fails to comply with environmental regulations, thus exposing itself to financial and/or
criminal penalties, or even temporary or permanent closure of the sites concerned, this could have a
significant adverse effect on the Group’s results, business, financial position and outlook.
Risks related to claims for occupational illnesses*
The Group’s glass-making operations require its employees to work very carefully with hot elements and
thermal radiation in order to protect their own safety and to preserve plant equipment. In the past, the glass
industry – like many industries using high-temperature processes – used asbestos-containing materials,
primarily protective equipment, until technological advancements made it possible for the asbestos to be
replaced by other materials. Since the mid-1990s, asbestos elements have gradually been removed from
the Group’s sites in Western Europe, both in human protection and in production equipment. Due to the
age of some of the Group’s sites, construction may have used fibrocement. When modernising or repairing
these buildings, the cost of these repairs is increased due to the constraints associated with the removal of
these types of materials.
Nevertheless, in some countries where the Group operates, particularly Russia and Ukraine, some of its
production sites may still contain asbestos elements. In these countries, the Group is making its best efforts
to implement plans to remove asbestos elements likely to be present on its equipment. These plans can
take several years to complete.
The Group has received compensation claims for occupational diseases resulting from exposure to
asbestos at Group sites, especially in France under the “employer’s inexcusable misconduct” clause. Such
compensation would be in addition to the coverage provided by the different social security systems in the
countries where the Group operates. Moreover, the Group’s social security contributions could rise
30
considerably due to the higher costs faced by these systems. As at 31 December 2019, the amount provided
for inexcusable misconduct claims amounted to €1.1 million. In addition, the Group is also facing claims
by its employees and former employees to repair potential anxiety damage suffered due to alleged exposure
to harmful or toxic substances which may generate a high risk of developing serious pathology on the
grounds of statutory law and for breach of the employer’s safety obligation (see Section 18.5 “Judicial
and Arbitration Procedures” of this Universal Registration Document).
Although the Group has an occupational health and safety policy aimed at improving the working
conditions at all its sites, workplace-related claims (apart from those related to asbestos) have been filed
against the Group in the past and more could be filed in the future. This is the case in particular for requests
relating to the noise environment generated by forming machines (such as claims that have been filed in
Brazil), the use of glass sand in the composition of glass and products likely to contain heavy metals or
solvents for decoration activities or exposure to fumes. Claims could also be filed against the Group for
occupational diseases resulting from substances found at certain Group production sites; such claims could
relate to asbestos-related illnesses (as mentioned above), silicosis, or legionellosis. The Group is also
exposed to an increase in claims for recognition of diseases related to musculoskeletal disorders (MSDs)
resulting from certain repetitive operations or procedures. If such claims are successful, they could have a
material adverse effect on the Group’s business, financial position, results and outlook.
Risks related to litigation and ongoing investigations
During their ordinary course of business, the Group’s companies could be involved in legal,
administrative, criminal, or arbitration proceedings, especially concerning civil liability, competition,
industrial, fiscal, or intellectual property claims, or claims relating to the environment and discrimination.
The most significant ongoing disputes or for which the Group has received notifications are described in
Section 18.5 of this Universal Registration Document. In some of these proceedings, significant monetary
claims have been made or may be made against one or more Group companies. The relevant provisions,
if any, that the Group may have to record in its financial statements may not be sufficient, which could
have a material adverse effect on its business, financial position, results and outlook. As of 31 December
2019, the Group’s total provisions for litigation amounted to €8.1 million (see Note 18 to the Group’s
consolidated financial statements for the year ended 31 December 2019, contained in Section 18.1.1 of
this Universal Registration Document).
New proceedings, stemming from existing proceedings or otherwise, related to risks already identified by
the Group or to new risks, could be initiated against a Group entity. These procedures, if they were to have
an unfavourable outcome, could have a material adverse effect on the Group’s business, financial position,
results and outlook.
Risks related to taxation and its changes
The Group is subject to complex and evolving tax legislation in the various countries in which it operates.
In particular, because of its international activity, it is subject to transfer pricing rules, which can be
particularly complex and subject to divergent interpretations. The Group is also subject to rules limiting
the deductibility of interest in France.
Changes in tax legislation could have a material adverse effect on the Group’s tax position, its effective
tax rate or the amount of taxes and other levies to which it is subject and its reporting obligations. In
addition, the tax laws and regulations of the various countries in which the Group operates may subject to
very different interpretations. The tax and social security regime applied to the Group’s business activities
and past or future intra-group reorganisations involving Group companies, shareholders, employees and/or
managers is or may be based on interpretations of French or foreign laws and regulations. The Group
therefore cannot guarantee that the relevant tax authorities will agree with its interpretation of the
applicable legislation in their jurisdictions. Furthermore, tax laws and regulations or other compulsory
levies may be changed and their interpretation and application by the jurisdictions or administrations
involved may change, in particular in the context of joint initiatives taken at international or Community
31
level (OECD, G20, European Union), which could increase the tax burden on the Group. A challenge to
its tax position by the relevant authorities could result in the Group paying additional taxes, potentially
significant reassessments and penalties or increase the costs of its products or services in order to pass on
these taxes, which could have a significant adverse effect on its business, results, financial position and
outlook.
Risks relating to competition law regulations
The Group is subject to competition law regulations at a national and European level. In markets where
the Group has a strong presence, these regulations may reduce its operational flexibility and limit its ability
to make significant new acquisitions and thus implement its external growth strategy.
The Group also receives periodic requests for information from the competition authorities. Thus, its
Russian subsidiaries (KMS and Kamyshin) have been the subject of requests for information from the
Russian competition authorities concerning the glass bottle market for wine and the possible impossibility
for the glassmakers to cope with demand, including for Crimea. At the date of this Universal Registration
Document, the Company does not have any information about the investigations conducted by the Russian
competition authorities on this market.
If, as the result of a request for information and/or an inquiry, a competent competition authority were to
conclude that the Group was participating in anti-competitive practices, the Group could be subject to
sanctions that could include fines. The Group or some of its employees could also be subject to criminal
proceedings in this context. In addition, the Group could also be subject to subsequent claims for
significant damages before the civil courts by direct or indirect customers of the relevant products. Any
such anti-competitive practices could damage the Group’s reputation and, if held liable, expose it to fines
or other significant sanctions (including exclusion from certain markets).
The occurrence of such events could have a material adverse effect on the Group’s business, results,
financial position and outlook.
3.6 Insurance and risk management
Insurance policy
The Group’s insurance policy is coordinated by the Group’s Legal Department, with the support of the
operational departments.
The Industrial Department is responsible for defining industrial risk management policy. In coordination
with the Industrial Department, each Group company provides the Legal Department with the information
required to identify and qualify risks that are insured or insurable by the Group and implements the useful
means to ensure business continuity in the event of a disaster. On this basis, the Legal Department, with
the assistance of the broker, negotiates annually with the major insurance carriers to set up the most
appropriate coverage for these risks.
The Group’s main policies, underwritten by internationally renowned insurance companies, include civil
liability insurance and property damage and subsequent business interruption insurance. Group policies
are supplemented, for risks not covered by them, on a case-by-case basis, by policies taken out locally for
a subsidiary or site in question.
The implementation of insurance policies is based on the determination of the level of coverage necessary
to deal with the reasonably estimated occurrence of liability, damage or other risks. This assessment takes
into account the evaluations made by insurers as policyholders of the risks and with respect to damage to
property, the findings of the annual audits carried out by the lead contractor’s engineering services of the
Group’s programmes. The underwriting criteria take into account the supply of the insurance market,
which excludes certain risks, or imposes specific limits, for example, in the event of natural events such
32
as floods, storms, earthquakes and tsunamis. These events could have a significant uninsured financial
impact, both for the cost of reconstruction and for lost production, in the case of extreme scenarios.
Due to the tightening of market conditions and the increase in the deductibles of its damage programme,
the Group has chosen for its damage 2020 programme a risk transfer to the insurance market through a
reinsurance captive established in Europe which intervenes in excess of €2 million per loss with a limit of
€3 million in aggregate per year for all the Group entities.
The joint subsidiaries in which the Group is a minority and holds non-controlling interests are outside the
scope of the above programmes. Insurance is contracted separately.
Risk management policy
Objectives, organisation, mechanism
Objectives
Risk management is closely monitored by the Group’s management, which closely involves the internal
control and internal audit functions.
The main mission of risk management is to identify, assess and prioritise risks and to assist the
Group’s management in choosing the most appropriate risk management strategy and, in order to
limit significant residual risks, define and monitor related action plans;
The identification and treatment of the Group’s major risks are monitored by a dedicated
organisation under the supervision of the Group Risk Committee;
The main objective of internal control is to enable the Group to achieve its objectives by defining
and implementing appropriate internal controls to address the risks identified in the conduct of the
Group’s business. Internal control also implements an annual self-assessment campaign of its
internal control systems by each Group entity and monitors related action plans;
The main mission of internal audit is to ensure the effectiveness of internal control systems and to
provide recommendations for improvement where necessary.
Organisational framework
The identification and treatment of major risks is insured under the responsibility of the Group Risk
Committee, which draws on its risk referents, and thus enables the Group to identify and prevent the risks
it may face. The Audit and Internal Control Department, which reports directly to the Chief Financial
Officer and functionally to the Chairman and Chief Executive Officer of the Group, is responsible for (i)
developing an audit program that takes into account, in particular, the mapping of major risks and (ii)
monitoring risk management in close collaboration with the Group Risk Committee.
Risk management and internal control are the responsibility of the operational departments of each of the
Group’s entities, under the functional control of the Audit and Internal Control Department. Within each
of these entities, the person responsible for risk management (generally the chief financial officer, or a
person under his or her hierarchical or functional responsibility) is in charge of verifying the proper
application of prevention procedures and has the possibility of implementing new procedures, which, after
review by the Audit and Internal Control Department, can be applied to the entire Group. The Audit and
Internal Control Department plays a central role in establishing an internal control system at the Group
level that defines the appropriate controls to be put in place to address the Group’s identified risks. This
system defines the framework within which subsidiaries exercise their responsibilities in terms of risk
management and internal control. It also coordinates the operation of the entire system.
In addition, since January 2019, a Group Risk Committee, comprising in particular the Chairman and Chief
Executive Officer of the Group, the Chief Financial Officer, the General Counsel, the Human Resources
33
Director, the Director of Audit and Internal Control and the Director of Major Risks, has been meeting at
least three times a year to monitor action plans in the areas of internal control, risk management and audit.
Furthermore, risk committees meet regularly at regional level, including the chief operating officer, the
General Counsel, the Human Resources Director and the Chief Financial Officer of the operational region
concerned.
Risk management and internal control system
The Group’s overall risk management and internal control system is applied at different levels (sites,
functional departments, subsidiaries, regions) and is based on several elements, including:
– management of industrial risks;
– management of other operational risks;
– mapping of the Group’s major risks;
– monitoring the Group’s internal control system;
– the compliance monitoring system;
– the internal audit, which, as an independent audit role, evaluates the effectiveness and functioning
of the main processes of the audited companies, in coordination with other risk management
systems, and reports to the Group Risk Committee.
With regard to internal control and risk management, at the date of this Universal Registration Document,
the Group follows the main recommendations proposed by the AMF’s reference framework and
application guides as updated in July 2010, and the recommendations of the working group’s report on the
audit committee, also published in July 2010.
Operational risk management
Risk management refers to the measures implemented by the Group to identify, analyse and control the
risks to which it is exposed. The risk management system is regularly monitored by the management of
the Group’s operating entities. The chief executive officers of the regions and the functional managers of
Verallia Packaging report major risks to the Group Risk Committee and other operational risks to the Audit
and Internal Control Department.
As part of its major risk management procedure, the Group draws up a mapping of the main risks. The
process of developing and reviewing the mapping of major risks, which was initiated in 2016 by the Audit
and Internal Control Department, makes it possible to identify the major risks to which the Group is
exposed and to assess, for each of them, their potential impact, taking into account their criticality, that is,
their seriousness and probability of occurrence, after taking into account the action plan put in place, and
in particular the persons responsible within the Group for monitoring and associated controls.
This mapping of major risks was updated at the end of 2019 and enables the Group to define and monitor
the various specific action plans implemented to control the identified risks.
For example, the internal action and policy plans implemented by the entities or departments concerned to
manage the major risks and other risks identified by the Group include the following:
– Risks related to changes in the demand for glass packaging. In order to limit the negative impact
that certain factors such as changes in consumer habits, food preferences, legislative or
sociological changes or public health and safety considerations may have on the demand for glass
packaging produced by the Group, the Group strives to offer its customers products that are best
suited to their needs and meet high quality and safety standards, enabling it to maintain a leading
competitive position despite the existence of any economic difficulties that may be present. In

34
addition, the Group has a diversified portfolio of customers (as of 31 December 2019, the Group’s
top 10 customers accounted for 17% of consolidated revenue and the most significant customer
accounted for approximately 4% of consolidated revenue), enabling it to limit its dependence on
a country, a sector of the glass packaging market or customer, and has developed a flexible and
adaptable industrial base, with the objective of being able to quickly allocate and adjust
production.
– Risks related to changes in energy costs. Exposure to changes in energy costs is managed under
the terms of a policy defined and implemented by the Group Purchasing Department, in
consultation with the Group’s Finance Department and Treasury, and in accordance with the
guidelines set by the company’s Board of Directors. Most of the Group’s sales contracts are
concluded for a renewable one-year period, and do not include price adjustment clauses that
automatically reflect some of the increases or decreases in energy costs in the sales prices. For
these contracts, the Group endeavours, when placing orders or renewing contracts annually, to
negotiate with its customers an increase in the sales price allowing it to pass on, in full if necessary,
the expected increase in energy costs. In addition, the Group endeavours to include price revision
clauses in its multi-year sales contracts with some of its most significant customers, taking into
account in particular changes in energy costs and inflation, which may make it possible to pass on
some of the increases (but also decreases) in energy costs to sales prices. Other than fixed-price
energy purchases that may be negotiated directly with suppliers by the purchasing department, if
contractual mechanisms cannot be negotiated (which covers most of the Group’s sales contracts),
the Group also enters into energy cost hedging transactions in the form of derivative instruments.
The objective of the hedging strategy is to limit significant year-on-year cost increases, while at
the same time allowing the Group to capture market opportunities when prices are low. The
parameters of this strategy are defined according to market conditions, for a 3-year period, with a
target coverage rate at the end of year N of 100% for year N+1, 50% for year N+2 and 25% for
year N+3. These parameters are then and validated by energy committees including the Chairman
and Chief Executive Officer, the Chief Financial Officer and the Group Purchasing Director.
As from the 2018 financial year, the Group has implemented a new pricing policy, under which
the Group negotiates sales price increases with its customers – at the time of placing orders or
when renewing contracts annually, as the case may be – at the end of the year, based on anticipated
changes in production costs, based, where applicable, on the prices negotiated with its suppliers
for the coming year or the parameters of any derivative instruments put in place (in the case of
energy purchases, for example), thus giving it visibility on the impact of changes in production
costs in the coming year and enabling it to pass this on as effectively as possible to its sales prices.
This policy has enabled the Group to generate a positive spread9 on its sales as of the 2018 financial
year (see Section 7.2.9 of this Universal Registration Document).
9 The spread represents the difference between (i) the increase in selling prices and the mix applied by the Group after passing
on the increase in its production costs, and (ii) the increase in its production costs. The spread is positive when the increase
in selling prices applied by the Group is greater than the increase in its production costs. The increase in production costs is
recorded by the Group at constant production volumes and before production gap and the impact of the Performance Action
Plan (PAP).
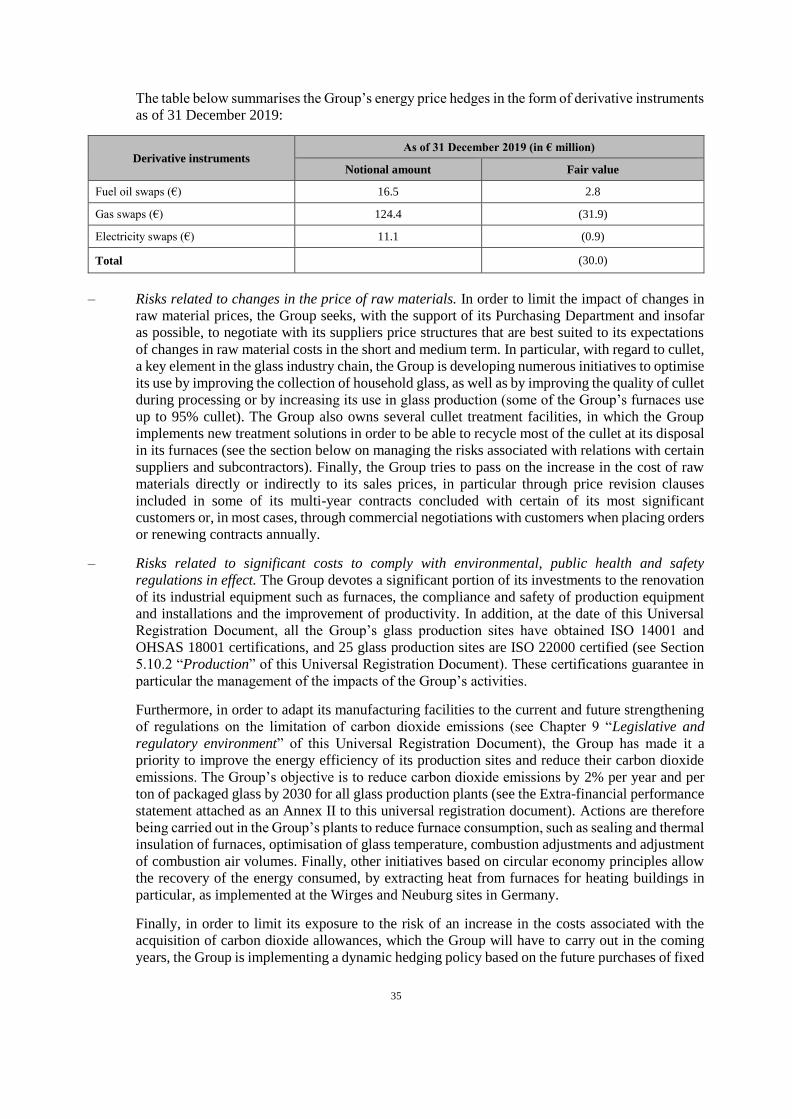
35
The table below summarises the Group’s energy price hedges in the form of derivative instruments
as of 31 December 2019:
Derivative instruments As of 31 December 2019 (in € million)
Notional amount Fair value
Fuel oil swaps (€) 16.5 2.8
Gas swaps (€) 124.4 (31.9)
Electricity swaps (€) 11.1 (0.9)
Total (30.0)
– Risks related to changes in the price of raw materials. In order to limit the impact of changes in
raw material prices, the Group seeks, with the support of its Purchasing Department and insofar
as possible, to negotiate with its suppliers price structures that are best suited to its expectations
of changes in raw material costs in the short and medium term. In particular, with regard to cullet,
a key element in the glass industry chain, the Group is developing numerous initiatives to optimise
its use by improving the collection of household glass, as well as by improving the quality of cullet
during processing or by increasing its use in glass production (some of the Group’s furnaces use
up to 95% cullet). The Group also owns several cullet treatment facilities, in which the Group
implements new treatment solutions in order to be able to recycle most of the cullet at its disposal
in its furnaces (see the section below on managing the risks associated with relations with certain
suppliers and subcontractors). Finally, the Group tries to pass on the increase in the cost of raw
materials directly or indirectly to its sales prices, in particular through price revision clauses
included in some of its multi-year contracts concluded with certain of its most significant
customers or, in most cases, through commercial negotiations with customers when placing orders
or renewing contracts annually.
– Risks related to significant costs to comply with environmental, public health and safety
regulations in effect. The Group devotes a significant portion of its investments to the renovation
of its industrial equipment such as furnaces, the compliance and safety of production equipment
and installations and the improvement of productivity. In addition, at the date of this Universal
Registration Document, all the Group’s glass production sites have obtained ISO 14001 and
OHSAS 18001 certifications, and 25 glass production sites are ISO 22000 certified (see Section
5.10.2 “Production” of this Universal Registration Document). These certifications guarantee in
particular the management of the impacts of the Group’s activities.
Furthermore, in order to adapt its manufacturing facilities to the current and future strengthening
of regulations on the limitation of carbon dioxide emissions (see Chapter 9 “Legislative and
regulatory environment” of this Universal Registration Document), the Group has made it a
priority to improve the energy efficiency of its production sites and reduce their carbon dioxide
emissions. The Group’s objective is to reduce carbon dioxide emissions by 2% per year and per
ton of packaged glass by 2030 for all glass production plants (see the Extra-financial performance
statement attached as an Annex II to this universal registration document). Actions are therefore
being carried out in the Group’s plants to reduce furnace consumption, such as sealing and thermal
insulation of furnaces, optimisation of glass temperature, combustion adjustments and adjustment
of combustion air volumes. Finally, other initiatives based on circular economy principles allow
the recovery of the energy consumed, by extracting heat from furnaces for heating buildings in
particular, as implemented at the Wirges and Neuburg sites in Germany.
Finally, in order to limit its exposure to the risk of an increase in the costs associated with the
acquisition of carbon dioxide allowances, which the Group will have to carry out in the coming
years, the Group is implementing a dynamic hedging policy based on the future purchases of fixed
36
price allowances, in which parameters are defined for a three-year period, with a target coverage
rate at the end of year N of 100% for year N+1, 75% for year N+2 and 50% for year N+3.
In order to secure the prices at which it will have to acquire the allowances, and in anticipation of
the end of Phase III (2013-2020), the Group has made forward purchases of carbon dioxide
allowances on the market for a total amount of €34.9 million as of 31 December 2019,
corresponding to the expected deficits. In anticipation of the start of Phase IV (2021-2030), the
Group has already made forward purchases of carbon dioxide allowances on the market during
the 2019 financial year for a total amount of €24.6 million as of 31 December 2019.
– Risks related to the operation of industrial sites. The Group’s industrial risk management policy
is based on two main areas: (i) prevention through an independent audit performed annually at
each site, which results in the preparation of a report containing recommendations for personnel
and equipment; and (ii) protection through risk mitigation plans including objectives for short-
and medium-term capital expenditure, management actions, and new procedures or processes. In
order to protect itself against prolonged interruptions in the supply of energy or materials needed
to operate machines and equipment, the Group has set up a business continuity plan at each of its
key sites. Each business continuity plan defines different actions to be implemented in the event
of a disaster, which contributes to securing the relevant production site.
The Group also continuously strives to develop and operate safe industrial processes, promote a
zero accident culture and ensure the protection of the health and safety of its employees. The
Group implements Health, Safety and Hygiene procedures that take into account the main issues
related to industrial processes such as workstation ergonomics, the reduction of potential dust
exposure, exposure to noise and heat and chemical risk management.
– Risks related to defective products. In order to reduce the risk of warranty or liability claims for
damage caused by the products delivered, internal verification and validation procedures are in
place within the Group, which ensure that its teams’ activities comply with a strict quality
approach (the Hazard Analysis Critical Control Point (HACCP) approach – see Section 9.1.1.1 –
and/or ISO 22000). These procedures are based on monitoring equipment, in which the Group
regularly invests, to control the quality and safety of its products throughout the production
process and at each of its production sites, and include visual, mechanical, video or light beam
inspection to check the closure, dimensions, thickness of the glass and the appearance of the
packaging. Any container that does not comply with the Group’s quality standards is automatically
rejected and recycled. The Group also implements traceability procedures to identify any issues
related to the quality of its products. Lastly, any harmful consequences caused by the products
delivered by the Group are covered by an insurance policy taken out by the Group.
– Risks related to the development and introduction of new products. The Group is committed to
implementing all necessary means to ensure that the developed products are adapted to the
increasing complexity of production methods and to changes in consumer preferences and legal
and regulatory obligations, particularly in terms of safety.
– Risks related to relations with certain suppliers and subcontractors. To the extent possible, the
Group ensures that it has several suppliers, diversifies their geographical origin and chooses those
offering the most innovative products, and conducts a number of initiatives, in particular to
identify new suppliers each year, in order to limit dependence on particular suppliers, or develops
the internalisation of the supply of certain raw materials. For example, with regard to the supply
of cullet, the Group operates 8 cullet processing centres, including two located in France, operated
through Everglass; three located in Italy including two operated through Ecoglass and one
operated in a partnership with Vetreco; one located in Germany and two in Spain, one of which is
operated through a partnership with Calcin Iberico. In addition, the Group carefully ensures that
its suppliers and subcontractors comply with applicable labour laws, social protection laws and
37
social and environmental standards. For example, the Group has set up a charter concerning
environmental and ethical standards that its suppliers must follow.
– Risks related to business ethics and corruption. The Group pays strict attention to the compliance
of its procedures and employee practices with applicable regulations. All employees must be
familiar with and comply with the Group’s policies, including the compliance program. The
compliance program is implemented through the definition of policies, procedures, information,
training and controls. The main themes of the Group’s compliance program are (i) prevention of
corruption, (ii) compliance with competition law rules, (iii) compliance with economic sanctions
and embargoes, and (iv) protection of personal data. As part of the implementation of Regulation
(EU) 2016/679 of 27 April 2016 on the protection of natural persons with regard to the processing
of personal data and on the free movement of such data (GDPR), which is effective as of 25 May
2018, the Group has initiated a compliance process, which is currently underway. With regard to
the prevention of corruption, the Group has implemented an anti-corruption code of conduct, as
well as specific training for those most exposed to the risks of corruption, and an alert system as
part of the measures put in place in accordance with the French law of 9 December 2016 on
transparency, the fight against corruption and influence peddling and the modernisation of
economic life (the so-called “Sapin II” law). In addition, the Group has joined the United Nations
Global Compact, one of the fundamental principles of which is the fight against corruption in all
its forms. Policies, training and controls are also in place for the other themes of the compliance
program. Lastly, in 2018 the Group reviewed its overall IT policy. In order to limit, in particular,
the fraudulent use of data (by employees or third parties), the Group is strengthening its
authorisation structure and implementing stricter procedures to control access rights.
– Risks related to management teams. The Group’s success depends to a certain extent on the
continuity and skills of its management team. In order to manage the risk related to the possible
departure of one or more members of its management team, the Group has, in recent years, ensured
that it is gradually reinforced with the arrival of new talent and that management is closely
involved in the Group’s success and performance, notably by including a significant variable short
and mid-term portion in their compensation.
– Liquidity risk. The Group’s overall exposure to liquidity risk is managed by the Group’s Treasury
and Financing Department. Subsidiaries generally contract their short- or long-term financial debt
with Verallia Packaging. The Group’s policy aims to ensure the sustainability of its financing and,
in line with this objective, to optimise its financial cost. Long-term debt therefore systematically
represents a high percentage of overall debt.
– Credit risk and counterparty risk. With regard to its financial counterparties, the Group limits the
exposure to default risk of these counterparties by using only reputable institutions and by
regularly monitoring their ratings by the main rating agencies. Nevertheless, the credit quality of
a financial counterparty may change rapidly and the high rating of a counterparty does not
eliminate the risk of a rapid deterioration in the financial situation of that counterparty.
– Risks related to exchange rates. The Group regularly monitors and evaluates trends in exchange
rate fluctuations, and its operating subsidiaries seek to invoice or be invoiced in their functional
currency. The Group also ensures that its production sites are located as close as possible to its
customers. Further, in order to hedge transactional currency risk, the subsidiaries involved enter
into currency hedging derivatives either with Verallia Packaging, which concludes – in its own
name but on behalf of the subsidiaries – these transactions, or, failing which, with their relationship
banks. The Group’s interest rate hedging policy is to align the main features of the hedging
instrument with those of the underlying whenever possible in order to minimise potential sources
of ineffectiveness and the impact on related income.
– Risks related to interest rates. This risk is managed by the Treasury and Financing Department,
which has implemented, in accordance with the guidelines set by the Company’s Board of
38
Directors, a policy to guarantee the financial cost of the Group’s global medium-term debt against
the risk of interest rate fluctuations. As part of this policy, certain Group subsidiaries have entered
into hedging derivatives with Verallia Packaging, which has entered into interest rate hedging
transactions for this purpose – in its name and on its behalf but also for the benefit of these
subsidiaries. In 2018, the Group hedged a significant portion of its exposure against an increase
in EURIBOR by setting up interest rate swaps for a nominal amount of €1,500 million with a
maturity in August 2022 (in October 2019, following the Refinancing, the Group has proceeded
to the unwinding of €250 million of interest rate swaps). As with the management of exchange
rate risks, the Group’s interest rate risk hedging policy is to align the main features of the hedging
instrument with those of the underlying whenever possible in order to minimise potential sources
of ineffectiveness and the impact on related income.

39
4. INFORMATION ON THE COMPANY AND THE GROUP
4.1 Company name
At the date of this Universal Registration Document, the Company’s name is “Verallia”.
4.2 Registration location and number
The Company is registered with the Nanterre Trade and Companies Register (RCS Nanterre) under
number 812 163 913.
LEI: 5299007YZU978DE0ZY32
4.3 Date of incorporation and term of the Company
The Company was incorporated on 23 June 2015 for a term of 99 years, unless it is dissolved early or
extended by collective decision of the shareholders pursuant to law and the Articles of Association.
The corporate year begins on 1 January and closes on 31 December of each year.
4.4 Headquarters, legal form and governing laws
The registered office of the Company is located at 31 Place des Corolles, Tour Carpe Diem, Esplanade
Nord, 92400 Courbevoie, France. The telephone number of the registered office is +33 1 71 13 11 00.
At the date of this Universal Registration Document, the Company is a French public limited company
(société anonyme).
The address of the Company’s website is: www.verallia.com. The information provided on the Company’s
website is not part of this Universal Registration Document.
40
5. OVERVIEW OF THE GROUP’S ACTIVITIES10
5.1 General presentation
The Group is the third largest producer in the world and the leading European producer11 (based on
revenue) of glass packaging for beverages and food. In terms of volumes sold, it is the second largest
producer in Latin America12. The Group offers innovative, customised and environmentally friendly
solutions to more than 10,00013 customers worldwide.
During the year ended 31 December 2019, the Group reported consolidated revenue of €2,585.9 million
and consolidated adjusted EBITDA14 of €615.2 million.
The Group’s business lines are organised into three operating segments:
– Southern and Western Europe, comprising production plants located in France, Italy, Spain and
Portugal. Southern and Western Europe accounted for 68% of consolidated revenue and 67% of
the Group’s adjusted EBITDA for the year ended 31 December 2019. The Group’s operations in
Southern and Western Europe are mainly oriented towards bottles for still and sparkling wines
and packaging for spirits, which are export-driven market segments;
– Northern and Eastern Europe, comprising production plants located in Germany, Russia, Ukraine
and Poland. Northern and Eastern Europe accounted for 22% of consolidated revenue and 20% of
the Group’s adjusted EBITDA for the year ended 31 December 2019. The Group’s operations in
Northern and Eastern Europe are mainly oriented towards bottles for beer, particularly in
Germany, and jars and bottles for food, mostly for local markets;
– Latin America, comprising production plants located in Brazil, Argentina and Chile. Latin
America accounted for 10% of consolidated revenue and 13% of the Group’s adjusted EBITDA
for the year ended 31 December 2019. The Group’s operations in Latin America are mainly
oriented towards bottles for still wines, an export-driven market segment, as well as bottles for
beer, in Brazil.
The Group’s “Glo-Cal” business model is built on the strength of its international network - illustrated by
an industrial presence in 11 countries, with 32 glass production sites combining 57 furnaces, 3 decoration
plants, 5 technical centres, 13 product development centres and 8 cullet processing centres as of 31
December 2019 (including two in joint-venture) - combined with proximity relationships maintained with
its customers by nearly 10,000 employees, including a significant sales force of more than 300 employees.
The Group’s strong global presence enables it to meet the needs of its international customers, such as
leading multinational companies, by implementing a global commercial approach, while ensuring that all
10 Unless otherwise stated, market information in this Chapter 5, including size and growth prospects, is principally from third-
party sources presented in Section 1.3 “Third-party information, statements by experts and declarations of interest” of this
Universal Registration Document.
11 On the basis of the revenue earned in 2019 by market players in Europe (as defined by these players), as extracted from publicly
available information (annual reports and press releases in particular) and on the basis of Company estimates.
12 Based on volumes sold in 2019 in Argentina, Brazil and Chile.
13Customers who placed at least one order during the 2017–2019 period.
14Adjusted EBITDA corresponds to operating profit adjusted for certain expenses and/or income of a non-recurring nature or
likely to distort the interpretation of the Group’s performance, such as depreciation and amortisation, restructuring costs,
acquisition and M&A costs, hyperinflationary effects, management share ownership plans, disposal effects, closing and carve-
out expenses, and other items. Adjusted EBITDA is not a standardised accounting measure meeting a single, generally accepted
definition. It should not be considered as a substitute for operating profit, net income or cash flows from operating activities, or
a substitute of liquidity. Other issuers may calculate adjusted EBITDA differently from the definition used by the Group. A
reconciliation of adjusted EBITDA to operating profit found in the IFRS consolidated financial statements is presented in
Section 7.1.4 of this Universal Registration Document.

41
countries in which it conducts business can benefit from its innovation capacities and leading technical
expertise. Furthermore, the Group’s international organisation enables it to set up the best industrial and
commercial practices at the Group level, which it then strives to share consistently across its different sites,
and also provides the means to develop a global purchasing policy and obtain the best conditions for its
procurement operations.
In addition, thanks to the Group’s locally-situated production sites, designed according to a decentralised
organisation based on local entities with a large capacity to act independently, the Group has commercial
and industrial flexibility that allows it to adapt to the needs of its customers according to local specificities.
Furthermore, in order to establish long term relationships with its customers, the Group relies on strong
sales team of more than 300 employees, based locally, and is able to propose co-development offerings to
its customers while implementing flexible production facilities, adapted to the needs of its customers.
Moreover, the Group tailors its offering to the specific features of each regional or local market by
proposing a large portfolio of differentiated products according to the geographic area or country. Lastly,
this densely woven geographic presence allows the Group to offer its customers premium-quality service
while reducing delivery deadlines, transport costs, customs duties and working capital requirements.
5.2 The Group’s strengths and competitive advantages
5.2.1 Glass packaging, a market supported by favourable global trends and benefitting from
attractive dynamics in the Group’s end markets
Global trends favouring the use of glass
The glass packaging market is driven by favourable trends, mainly fuelled by the growing use of glass by
consumers.
The glass packaging market is currently fuelled by the trend toward alternative materials, for plastic in
particular, and the choice for glass, illustrated by growing consumer preference for glass because of its
environmental qualities, its ability to be fully recycled and its inert properties (no risk of migration of
chemical products, such as Bisphenol-A, which is a health hazard), and its capacity to protect flavours.
According to a study conducted for the European Container Glass Federation (FEVE) in 2017 by the
Friends of Glass organisation, over 50% of European consumers indicated that they had given priority
over the last three years to the use of glass packaging over other packaging materials such as plastics or
metal.
Glass is the preferred choice for upmarket products because of its inherent premium image, particularly
for sparkling wines (nearly 100% penetration15 in 2018), spirits (nearly 100% penetration15 in 2018), and
still wines (around 75% penetration15 in 2018), products in respect of which the Group has a strong
presence. Glass is also used to package beer, but to a lesser extent (around 65% penetration15 in 2018).
A European market that has been significantly consolidated and benefits from a dynamic offer and
favourable demand
The European glass packaging market has been significantly consolidated in the last 20 years. The first
five market players, including the Group, represented around 71% of market shares in Europe in 201916.
Furthermore, at the date of this Universal Registration Document, the Group considers that the overall
production capacity utilisation ratio on the glass packaging market has been high during the year ended 31
15 The penetration rates presented correspond to the portion represented by glass (in terms of volumes for a sample of five
European countries, namely France, Italy, Spain, Portugal and Germany) as packaging material for food and beverages,
compared to other packaging materials (mainly plastic, cardboard, bag-in-box and metal cans).
16 Based on revenue generated in 2019 by market players in the EU 28 countries and in Switzerland, Ukraine, Turkey and Russia,
as extracted from publicly available information (annual reports and press releases in particular).
42
December 2019, high in the geographic areas where it carries out its business operations, limiting the risk
of overcapacity. In Southern and Western Europe and Northern and Eastern Europe17, domestic demand
for glass packaging increased over the 2014-2018 period by around 1.2 million tonnes, which is higher
than production capacity (which increased by around 0.4 million tonnes over the same period).
A market characterised by strong technical, logistical and capital constraints
The glass packaging production business requires command of complex technologies and know-how as
well as the investment of significant amounts of capital.
The Group’s business operations require command of industrial processes with a strong technical
component to guarantee the safety, quality and durability of products for consumers, as well as the use of
qualified labour and a first-class procurement policy. Furthermore, the geographical proximity with
customers is a key factor in the glass production business, due to the significant impact of transportation
costs, the need to be responsive in terms of services and the Group’s and its customers’ determination to
reduce the carbon footprint of their activities.
In order to maintain a high level of technical expertise, the Group uses qualified and experienced labour
(furnace operators, a highly technical sector, have on average 20 years of experience) and has put in place
significant employee training plans, such as talent development programmes, on-line training and the
creation of glass manufacturing schools. The Group also relies on the density of its industrial footprint,
the local establishment of its production sites and its first-class logistics processes to maintain geographic
proximity with its customers.
The glass production business requires the investment of significant amounts of capital. In particular, the
cost of building an entire plant and one furnace (and its associated facilities, such as mixing equipment, a
distribution canal, feeders, blowing machines, annealing lehrs and inspection and palletisation equipment)
represents approximately €80 million for one site with an annual production capacity of around 80,000
tonnes, according to Group estimates. Furthermore, the commissioning of a new production site is
relatively long, generally taking two years for production to begin after the start of construction. Lastly,
plants have to be operated around the clock and at a high capacity level to ensure the profitability of
invested capital, requiring precise planning of production capacities.
Profitability is also linked to the achievement of significant minimum volumes, taking into account the
substantial fixed costs base and the high initial investment level inherent in the glass production sector.
Achieving these minimum production volumes requires having an established customer base and a strong
local presence.
The Group believes that these characteristics of the glass production sector are a source of significant
competitive advantage, due to the Group’s size, density and the strong local presence of its industrial
facilities, combined with its cutting-edge technical expertise derived from its extensive sector-based
experience.
Positioning at the heart of a circular economy
The Group’s activities are carried out in the context of a circular economy approach, in which glass, which
can be infinitely recycled without any alteration regardless of the number of times it is recycled, is a natural
component, with recycled bottles and jars being transformed into new packaging. In this context, cullet
(made up of glass from selective sorting) is a key link in the circular chain (see the Extra-Financial
Performance Declaration annexed to this Universal Registration Document).
17 Excluding Poland.
43
5.2.2 A differentiated positioning with a strong value proposal for the Group’s customers
A solid competitive positioning in the main geographic areas of the global glass packaging market
The Group is the third largest producer globally and the leading European producer18 (based on revenue)
of glass packaging for beverages and food products in 2019. In particular, the Group considers itself to be
a co-leader in the markets for still wines and sparkling wines and spirits, a market that is particularly driven
by exports. The Group also enjoys a strong positioning in the markets for non-alcoholic beverages and
food products.
Additionally, in terms of volumes sold, the Group is the second largest producer in Latin America (10%
of the Group’s consolidated revenue for the year ended 31 December 2019), with a leadership position in
the market for still wines and sparkling wines, the largest market in Latin America and mainly driven by
exports of Chilean and Argentine wines. The beer bottles market in Brazil is a high-growth market, fuelled
by the growth in demand for beer, and by a growing trend towards the use of single-use bottles.
A mix of attractive end markets
The end markets addressed by the Group are diversified, broken down between bottles for still wine (33%
of the Group’s revenue19 for the year ended 31 December 2019), bottles for sparkling wine (12% of the
Group’s revenue19 for the year ended 31 December 2019), containers for spirits (13% of the Group’s
revenue19 for the year ended 31 December 2019), bottles for beer (13% of the Group’s revenue19 for the
year ended 31 December 2019), jars and bottles for the food market (17% of the Group’s revenue19 for the
year ended 31 December 2019) and bottles for soft drinks (12% of the Group’s revenue19 for the year
ended 31 December 2019).
The Group considers that it is the world co-leader (in terms of revenue) in the markets for still wines and
sparkling wines and is particularly present in the market for spirits, which have numerous competitive
advantages, which represented 58%19 of its revenue in the year ended 31 December 2019.
The markets for still wines and sparkling wines are characterised by a fragmented customer base,
composed of a large number of local and regional wine producers, thus reducing the Group’s dependency
on a single customer or a small number of significant customers. On the other hand, the beer market is
highly consolidated, in particular in the United States, where the Group is not present. Sales of bottles for
beer, representing a significant portion of the revenues generated by certain major players in the glass
packaging market, only accounted for 13% of the Group’s revenue19 for the year ended 31 December 2019.
Strong presence on premium products
A significant portion of the Group’s revenue (58% for the year ended 31 December 2019)19 comes from
the sale of bottles for still wines, bottles for sparkling wines and containers for spirits.
The Group has a particularly strong presence in countries that produce premium wines and spirits, such as
France, Italy, Spain and Portugal.
The Group has developed strong exposure to premium products by relying firstly on its dense industrial
base, which enables it to forge long-term relationships with locally established producers of champagne
and cognac, and secondly, by offering a range of differentiated products, including under its Selective Line
brand, which allows it to provide customised packaging solutions for premium products in particular. The
Group's customer base includes leading premium brands.
18 On the basis of the revenue earned in 2019 by market players in Europe (as defined by these players), as extracted from
publicly available information (annual reports and press releases in particular) and on the basis of Company estimates.
19 Based on revenue generated solely from the sale of jars and bottles, accounting for 97.4% of the Group’s consolidated revenue
for the year ended 31 December 2019.

44
Premium products are characterised in particular by lower sensitivity to price fluctuations compared to
other more standardised products, as the personalisation and high quality of these products are strong
factors in the purchasing decisions of this customer segment, for whom the cost of glass packaging, even
for premium products, remains marginal compared to the total cost of the final product.
A large range of products and flexible production facilities to address a significant and diversified
customer base
Packaging is a major component of the marketing strategy for agrifood and beverage producing industries,
which comprise the Group’s customers, which it accompanies throughout the glass packaging creation
process.
To meet the needs of its customers, the Group designs and manufactures a large range of products covering
the entire spectrum of the glass packaging end market for beverages and food, with each product able to
be proposed in a range of colours, shapes, sizes and styles.
The Group also stands out for its proven capacity to improve its standard products, for stronger
customisation. In 2019, 95% of the revenue earned by the Group in Southern Europe and Western Europe
and in Northern and Eastern Europe (excluding Ukraine and Russia) was generated by the sale of 60% of
items in its product range. The sale of 40% of the remaining items represented 5% of revenue for the same
period. The margin earned on the sale of the 40% of items representing 5% of revenue is on average 10
percentage points higher than the margin earned on the sale of 60% of the remaining items.
In order to propose differentiated products, the Group mainly draws on its decoration activities, run by its
Saga Décor and Société Charentaise de Décor subsidiaries in France and Verallia Polska in Poland. These
subsidiaries specialise in bottle finishing and using glass decoration techniques such as satin-finishing,
lacquering, screen-printing, decal transfers or hot marking.
The Group’s innovation capacities and technical expertise led it to win prizes in 2019 at both the A’Design
Awards and the Packaging Oscars of the Italian Institute of Packaging (Quality Design category) for its
Estathé glass bottle (iced tea by Ferrero, which is one of the group’s iconic products in Italy); in 2018, it
brought home the first Design Award at the Pink Rosé Festival 2018 for the Roseline Prestige vintage
wine bottle, and the Design Award at the 2018 Inspirational Packaging Awards for the MG gin bottle.
The Group has developed a range of high value added services to address as best as possible marketing
expectations, the economic needs of its customers and the growing trend for upmarket, customised
products observed in the glass packaging market.
This is why the Group offers a joint-development service in which it develops unique models with its
customers (speciality products) through 13 product development centres located in each country where the
Group has operations. Thanks to their technical know-how, these centres are able to improve on customer
proposals to ensure that the bottle or jar designs envisaged by customers are industrially feasible.
Furthermore, in order to respond to the growing demand for upmarket glass bottles from its most
demanding international customers in still and sparkling wines, spirits, beers and mineral water, the Group
has developed the Selective Line, which became a registered trademark in 2008 and offers an up-market
catalogue of models.
The Group also has a range of eco-designed products, ECOVA, to address the desire of some of its
customers to propose image-enhancing products, which are attractive to consumers while guaranteeing
reduced environmental impact for each container over its lifetime.
More recently, the Group launched a series of digital applications for its customers to accompany them in
the context of joint development activities (see Section 5.6.1.2 “Services - “Digital applications” of this
Universal Registration Document).
45
Lastly, each year, the Group organises design competitions in several countries. Known as the “Verallia
Design Awards”, these competitions bring together hundreds of participants from the best design and
packaging schools, invited to propose projects for bottles and jars as a way of encouraging future thinking
about uses of glass packaging and creating a portfolio of innovative and ready-to-be-developed designs
that can be proposed to customers (see Section 5.6.1.2 “Services - Joint-development” of this Universal
Registration Document).
Furthermore, the Group applies significant industrial resources to offer its customers products that meet
the highest market standards for quality. In this way, the Group endeavours to constantly improve the
quality of its products thanks to cutting-edge quality control systems, a comprehensive employee training
program and a very rigorous control of production processes. The Group’s historic presence in the glass
packaging market and the quality and reliability of its products underpin its status as a glass packaging
producer with recognised expertise. For example, the modernisation of the Lagnieu site (France) during
the year ended 31 December 2019 also provided an opportunity to roll out a training programme of over
1,000 hours, organised around the use of modernised machines, safety at work, production quality and
industrial excellence.
The Group’s robust historic presence on the glass packaging market has also enabled it to forge strong and
long-term relationships with its more than 10,000 customers20, including both locally-based small-sized
companies (such as regional wine producers or local breweries) and leading multinationals (such as Pernod
Ricard, LVMH, Heineken, Andros and Nestlé). In order to develop long-term relationships and retain the
loyalty of its customers, the Group depends on its strong local presence, and on the strength of its sales
force of more than 300 people.
The Group’s customer base is not very concentrated, with its top ten customers representing 17% of
consolidated revenue and the Group’s most significant customer representing approximately 4% of
consolidated revenue for the year ended 31 December 2019. The concentration of customers varies
depending on the markets concerned.
The customer base for still and sparkling wine bottles, the Group’s largest end market in terms of revenue
(45% of the Group’s revenue21 for the year ended 31 December 2019), is very fragmented and locally
based. In order to forge long-term relationships with wine producers, the Group relies on its strong local
presence in the wine-growing regions and its capacity to offer products and services that are tailored to the
needs of its customers.
Customers for beer bottles, bottles for soft drinks and containers for spirits (respectively 13%, 12% and
13%21 of the Group’s revenue for each of these market segments for the year ended 31 December 2019)
are more concentrated and are mainly represented by a limited number of leading world-class players, with
a certain number of local players on the spirits market. The concentration of customers for jars and bottles
for the food market (17% of the Group’s revenue21 for the year ended 31 December 2019) is moderate,
with a certain number of local players existing alongside a limited number of leading global players.
5.2.3 Operational excellence initiatives to support enhanced profitability
The implementation of a programme to improve industrial performance to support robust financial
performance
The Group deploys significant efforts to maintain a high level of operational excellence, relying in
particular on cutting-edge industrial facilities and a solid organisation for its procurements in each
geographic area and country. The Group also benefits from the support of an integrated network of
20 Customers who placed at least one order during the 2017–2019 period.
21 Based on revenue generated solely from the sale of jars and bottles, accounting for 97.4% of the Group’s consolidated revenue
for the year ended 31 December 2019.
46
industrial experts capable of assisting the Group’s management and operational teams on all of its
investments and projects.
The Group’s industrial policy is based in particular on regular audits of production sites and constant
modernisation and adaptation of its industrial facilities in order to meet the needs of the Group’s customers
and evolving regulations in each of the countries where it operates.
The Group also continuously implements measures to improve the operational efficiency of its production
sites. In the context of its industrial strategy, the Group has been implementing an operational excellence
programme over the past few years, which has been significantly enhanced since the beginning of the 2018
financial year with the deployment of the Verallia Industrial Management (VIM) 2.0 initiative, focused on
safety, quality, industrial performance and reducing manufacturing costs, thanks in particular to an
industrial performance improvement plan (Performance Action Plan (PAP)) and the management of teams.
For example, under the programme, more than 500 projects managed by 250 managers at the production
site level are being deployed by the Group, with the goal of systematically reducing cash production costs22
by 2% per year. The Group applies costs optimisation measures inspired by World Class Manufacturing
to all its production sites, which are based mainly on cost deployment23, and has developed more generally
an in-depth industrial methodology based on root cause analysis24 with its employees and within its sites,
in order to optimise its costs while improving the quality of its products. The Group also implements stock
management optimisation measures or measures aimed at improving the flexibility of its production lines,
including weekly production plans and monthly industrial and commercial plans. Furthermore, the Group
continuously improves its logistics processes to ensure on-time delivery to its customers. Lastly, the Group
conducts in-depth comparative analyses on its production sites in order to align its industrial processes
with industry best practices.
The performance action plan implemented by the Group has led to an increase of its production capacities
and improved the effectiveness of its production sites, while improving product quality, all for a relatively
limited level of investment. This had a positive impact on the Group’s results over the 2017-2019 period,
with a full impact on 2018 and 2019. As such, the Group has increased its production capacities over the
last three years while improving the yield of its production sites25 and has significantly reduced the rate of
blocked pallets26 and the rate of customer claims. For example, improving the output of its production sites
and production speed in 2019 helped to generate additional production capacity of 48 kT without additional
investment, which supported volume growth during the 2019 financial year estimated at 0.8%, or the
equivalent of an additional half furnace. The implementation of these initiatives also led to a decrease in
cash production costs27 of €44 million for the year ended 31 December 2019, with a positive impact on
the Group’s adjusted EBITDA.
In addition to improving the Group’s industrial and financial performance, the roll-out of the Group’s
operational excellence goal is also reflected through its sustainable development policy (see the Extra-
Financial Performance Declaration annexed to this Universal Registration Document).
22 Production costs excluding commercial, general and administrative costs, transport costs, depreciation and amortisation and
provisions for claims.
23 World Class Manufacturing is based on 10 pillars, one of the most fundamental of which is cost deployment. This consists
of associating a cost with the various issues identified and taking specific action to reduce them.
24 This method involves addressing the causes of a problem, rather than treating its immediate symptoms.
25 Measured by the ratio of saleable glass tonnage to tonne of pulled glass. One packed glass tonnage corresponds to one tonne
of pulled glass measured straight out of the furnace and taking into account production losses linked in particular to
shutdowns of the furnace or other equipment for maintenance or quality issues.
26 The rate of blocked pallets represent the rate of jars and bottles affected by a quality defect that was not detected during the
quality inspections set up throughout the production process, but detected at the end of the production process and before
delivery to the customer.
27 Production costs excluding commercial, general and administrative costs, transport costs, depreciation and amortisation and
provisions for claims.
47
Investments that have supported the development of a dense and flexible industrial base and leading
technical expertise
The Group develops, produces and sells a large range of products, designed to address the specific needs
of the local markets in which it operates. The performance of the Group’s production sites and their
capacity to adapt to different markets are essential in light of the high investment costs required by the
production of glass packaging. To attain this objective, the Group has developed an operational model
known as “Glo-Cal”, based on the combination of the strength of its international network (illustrated by
an industrial presence in 11 countries, with 32 glass production sites combining 57 furnaces, 3 decoration
plants, 5 technical centres, 13 product development centres and 8 cullet processing centres as of 31
December 2019) combined with proximity relationships maintained with its customers by nearly 10,000
employees, including a significant sales force of more than 300 employees.
The development of a flexible, interconnected and standardised industrial base enables the Group to
optimise its production and logistics costs and to temporarily transfer production from one site to another,
within the same geographic area, in case of repair of furnaces or other equipment or a one-off increase in
demand at the local level.
In order to maintain leading industrial facilities, the Group carries out significant investments, based on
strict outlay criteria. Thus, during the year ended 31 December 2019, the Group incurred investment
expenses28 totalling €252.5 million.
Most of the Group’s Capex is made up of so-called recurring investments, the main ones being the furnace
renovation and IS machines maintenance operations. The Group’s recurring investments amounted to
€206.7 million for the year ended 31 December 2019. The Group’s investment strategy in recent years has
been more particularly focused on standardising and streamlining its industrial facilities, as well as on
research and development programmes mainly aimed at spurring the innovation of the production process
and reducing the environmental impact (reduction of carbon dioxide emissions in particular) of the
Group’s business operations.
The Group regularly carries out repairs on its furnaces in order to maintain efficient and fully operational
industrial facilities, thus maximising the use of its production capacities. A complete reconstruction of a
furnace is generally required after a production period of around 10 to 14 years, for an amount of around
€10 to €15 million in general.
Repairing furnaces can also be the opportunity for the Group to make changes in the equipment to improve
productivity. For example, the Company invested, during the year ended 31 December 2019, €24 million
to rebuild one of the furnaces at the Lagnieu site (France) and €33 million to rebuild one of the two furnaces
at the Burgos site (Spain) and to modernise the production lines at these two sites. The Company also
announced it would invest an additional €10 million in 2020 to update the second furnace at the Burgos
site and the modernisation of its production lines.
In addition to these recurring investments, the Group also performed a number of strategic investments
during the year ended 31 December 2019, amounting to €45.8 million, relating primarily to the
construction of a new plant in Jacutinga, Brazil (located in the Sao Paulo metropolitan area) following the
shutdown of the Agua Branca plant, and to a lesser extent, during the year 2019, the construction of a two
new furnaces (one in Azuqueca, Spain and the other in Villa Poma, Italy) in order to raise its production
capacities in response to increased demand in certain markets.
28 The Group’s capital expenditure represents purchases of property, plant and equipment and intangible
assets required to (i) maintain the value of an asset and/or adapt to market demands and to
environmental, health and safety constraints (known as “recurring Capex”) or (ii) increase the
Group’s capacities. The acquisition of securities is excluded.
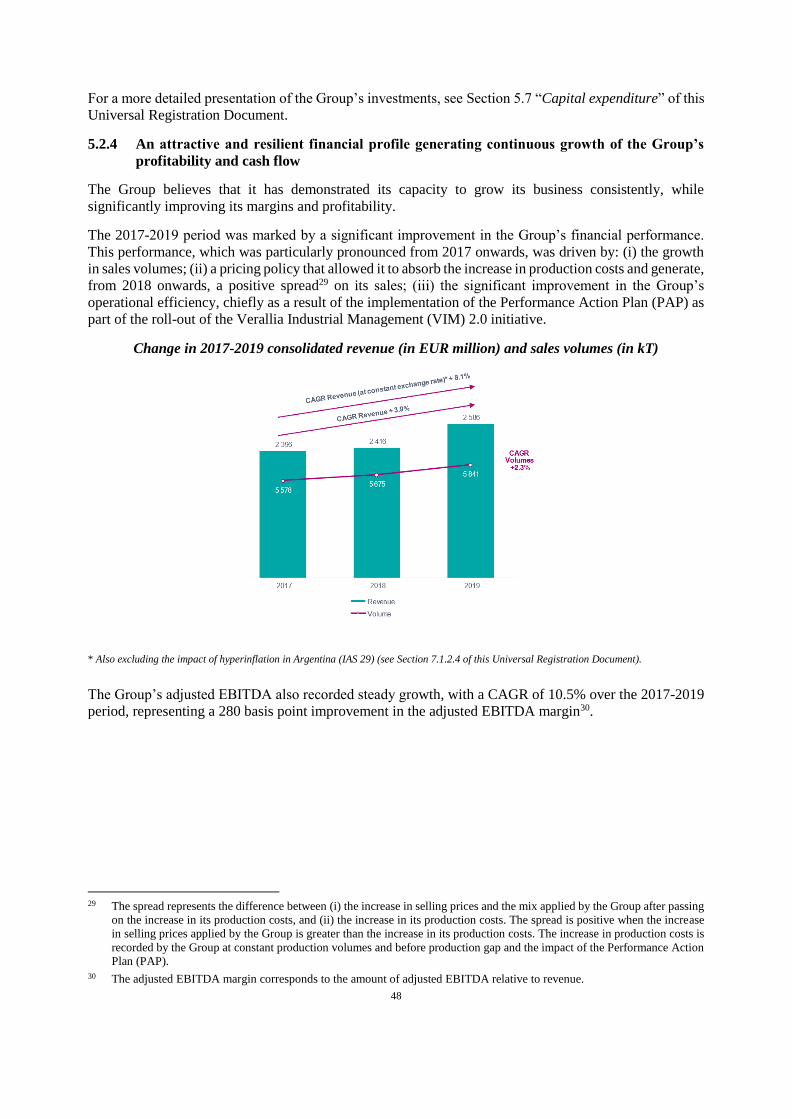
48
For a more detailed presentation of the Group’s investments, see Section 5.7 “Capital expenditure” of this
Universal Registration Document.
5.2.4 An attractive and resilient financial profile generating continuous growth of the Group’s
profitability and cash flow
The Group believes that it has demonstrated its capacity to grow its business consistently, while
significantly improving its margins and profitability.
The 2017-2019 period was marked by a significant improvement in the Group’s financial performance.
This performance, which was particularly pronounced from 2017 onwards, was driven by: (i) the growth
in sales volumes; (ii) a pricing policy that allowed it to absorb the increase in production costs and generate,
from 2018 onwards, a positive spread29 on its sales; (iii) the significant improvement in the Group’s
operational efficiency, chiefly as a result of the implementation of the Performance Action Plan (PAP) as
part of the roll-out of the Verallia Industrial Management (VIM) 2.0 initiative.
Change in 2017-2019 consolidated revenue (in EUR million) and sales volumes (in kT)
* Also excluding the impact of hyperinflation in Argentina (IAS 29) (see Section 7.1.2.4 of this Universal Registration Document).
The Group’s adjusted EBITDA also recorded steady growth, with a CAGR of 10.5% over the 2017-2019
period, representing a 280 basis point improvement in the adjusted EBITDA margin30.
29 The spread represents the difference between (i) the increase in selling prices and the mix applied by the Group after passing
on the increase in its production costs, and (ii) the increase in its production costs. The spread is positive when the increase
in selling prices applied by the Group is greater than the increase in its production costs. The increase in production costs is
recorded by the Group at constant production volumes and before production gap and the impact of the Performance Action
Plan (PAP).
30 The adjusted EBITDA margin corresponds to the amount of adjusted EBITDA relative to revenue.
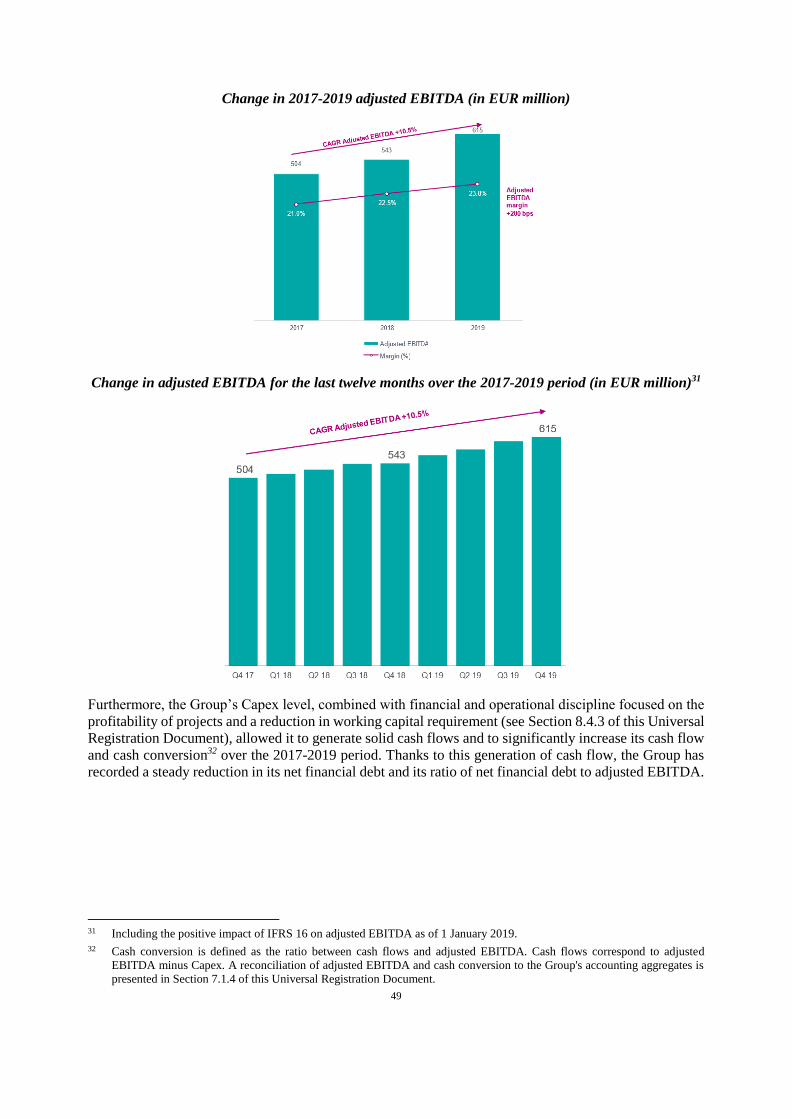
49
Change in 2017-2019 adjusted EBITDA (in EUR million)
Change in adjusted EBITDA for the last twelve months over the 2017-2019 period (in EUR million)31
Furthermore, the Group’s Capex level, combined with financial and operational discipline focused on the
profitability of projects and a reduction in working capital requirement (see Section 8.4.3 of this Universal
Registration Document), allowed it to generate solid cash flows and to significantly increase its cash flow
and cash conversion32 over the 2017-2019 period. Thanks to this generation of cash flow, the Group has
recorded a steady reduction in its net financial debt and its ratio of net financial debt to adjusted EBITDA.
31 Including the positive impact of IFRS 16 on adjusted EBITDA as of 1 January 2019.
32 Cash conversion is defined as the ratio between cash flows and adjusted EBITDA. Cash flows correspond to adjusted
EBITDA minus Capex. A reconciliation of adjusted EBITDA and cash conversion to the Group's accounting aggregates is
presented in Section 7.1.4 of this Universal Registration Document.
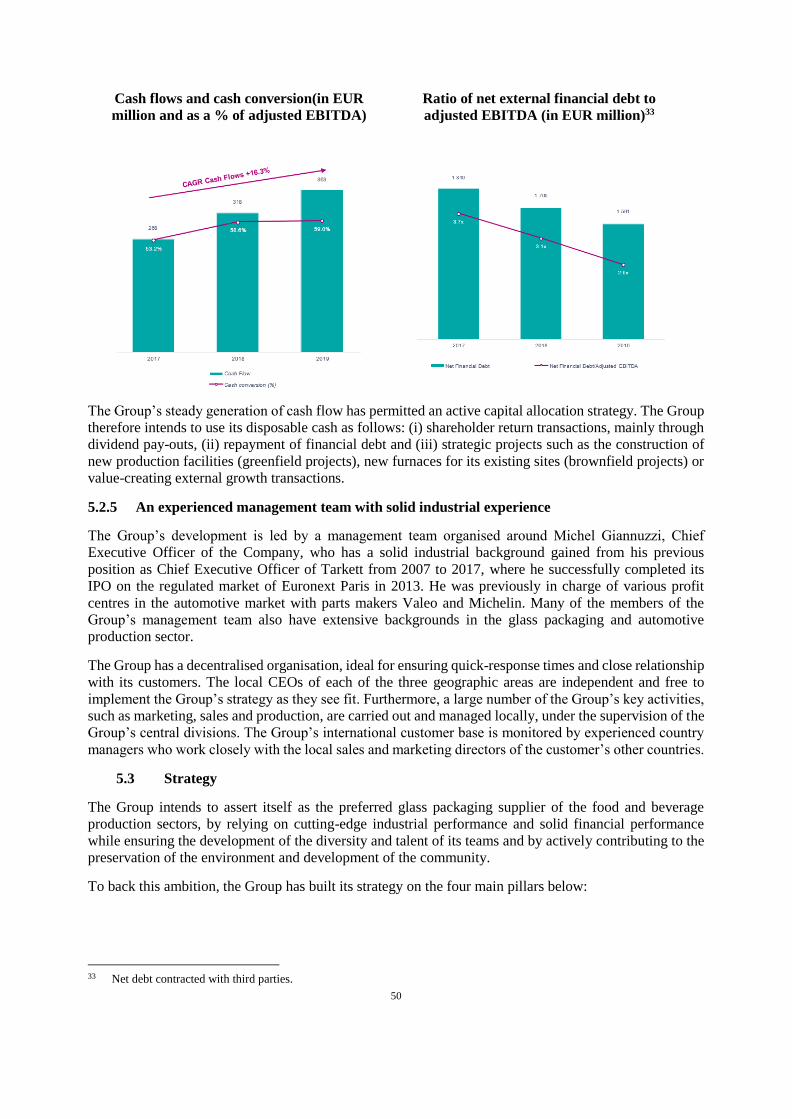
50
Cash flows and cash conversion(in EUR
million and as a % of adjusted EBITDA)
Ratio of net external financial debt to
adjusted EBITDA (in EUR million)33
The Group’s steady generation of cash flow has permitted an active capital allocation strategy. The Group
therefore intends to use its disposable cash as follows: (i) shareholder return transactions, mainly through
dividend pay-outs, (ii) repayment of financial debt and (iii) strategic projects such as the construction of
new production facilities (greenfield projects), new furnaces for its existing sites (brownfield projects) or
value-creating external growth transactions.
5.2.5 An experienced management team with solid industrial experience
The Group’s development is led by a management team organised around Michel Giannuzzi, Chief
Executive Officer of the Company, who has a solid industrial background gained from his previous
position as Chief Executive Officer of Tarkett from 2007 to 2017, where he successfully completed its
IPO on the regulated market of Euronext Paris in 2013. He was previously in charge of various profit
centres in the automotive market with parts makers Valeo and Michelin. Many of the members of the
Group’s management team also have extensive backgrounds in the glass packaging and automotive
production sector.
The Group has a decentralised organisation, ideal for ensuring quick-response times and close relationship
with its customers. The local CEOs of each of the three geographic areas are independent and free to
implement the Group’s strategy as they see fit. Furthermore, a large number of the Group’s key activities,
such as marketing, sales and production, are carried out and managed locally, under the supervision of the
Group’s central divisions. The Group’s international customer base is monitored by experienced country
managers who work closely with the local sales and marketing directors of the customer’s other countries.
5.3 Strategy
The Group intends to assert itself as the preferred glass packaging supplier of the food and beverage
production sectors, by relying on cutting-edge industrial performance and solid financial performance
while ensuring the development of the diversity and talent of its teams and by actively contributing to the
preservation of the environment and development of the community.
To back this ambition, the Group has built its strategy on the four main pillars below:
33 Net debt contracted with third parties.
51
5.3.1 Continue disciplined growth
The Group intends to continue the growth of its activities while improving its customer satisfaction rate,
in order to enhance customer loyalty and generate recurring income, and continue to improve the efficiency
of its logistics processes. Improving logistics, reliability and delivery lead times is a major objective for
the Group, which has invested significantly in tools for managing its product portfolio. Furthermore, the
Group seeks to improve identification of its customers’ needs that may not have been addressed; the Group
therefore plans to develop its customer experience continuous improvement programme, based on the NPS
(Net Promoter Score) indicator to track the recommendation intentions of customers, which is currently
being rolled out in the Group.
The Group also intends to continue its disciplined pricing policy in order to at least offset the impact of
growing production costs, in particular the cost of energy, and thus maintain its margins. The Group also
seeks to roll out a pricing policy based on the added value of its products and reflecting the specific nature
of the different segments of its customer base, targeting lower margin activities in particular. The Group
has also set a target of increasing the margin generated on its products by relying on software with an AI-
based price optimisation model and will further optimise its product portfolio.
To generate additional growth of its revenue, the Group also plans to make value-creating acquisitions.
5.3.2 Accelerate the deployment of the Group’s operational excellence programme
As part of its industrial strategy, the Group has been implementing an operational excellence programme
for the past few years, significantly enhanced since the beginning of the 2018 financial year with the
deployment of the Verallia Industrial Management (VIM) 2.0 initiative, focused on security, quality,
industrial performance and cost reduction, thanks in particular to the implementation of the Performance
Action Plan (PAP)) and the management of teams. The Group seeks to speed up the deployment of this
programme in order to continue increasing its margins.
First of all, the Group intends to speed up the Verallia Industrial Management (VIM) 2.0 initiative, by
focusing more particularly on the elimination of unsafe practices in order to reach “zero accidents” and
improving working conditions in order to position the Group’s work environment as one of the safest in
the sector. In connection with VIM 2.0, the Group intends to further improve its industrial methodology
based on root cause analysis in order to increase the number of issues solved and by getting more managers
and all its employees involved. Lastly, the Group will continue to implement measures to improve the
daily management of its production sites, with the standardisation of management processes at the plant
level and the implementation of a Shop Floor Management method34.
In addition, the Group continues its efforts to improve the quality of its products, improving the ratio of
products that are compliant on the first attempt (through increased responsiveness of production teams in
the decision-making process).
Furthermore, the Group intends to continue improving the Overall Equipment Effectiveness (OEE) of its
sites, by better identifying capacity problems and potentially under-utilised furnaces, and seeks to increase
the output of its IS machines in order to improve its yields.
The Group also continues to implement selective action plans as part of its industrial performance action
plan (PAP), by intensifying in particular its comparative analysis efforts for its 32 glass production sites
and by systematically implementing a cost deployment method across all of its production sites, with the
34 Lean management method specific to production workshops, that involves the development of overall workshop
management, including with respect to inventory, equipment, operations, manufacturing and treatment, and based on direct
cooperation between employees and managers in order to resolve issues directly on-site and continuously improve the
production process.
52
goal of systematically reducing cash production costs35 by 2% a year. To this end, more than 500 projects
involving approximately 250 managers are being deployed and regular reviews have been implemented to
ensure that goals are achieved.
Furthermore, the Group continues to implement projects launched at the end of 2018 aimed at improving
the performance of its logistics chain, in order to improve the delivery rate to customers within fixed
deadlines, and intends to strengthen the steps taken to cut storage and transport costs.
Finally, the Group continues to strictly manage its working capital requirements, by reducing excess costs
through improvement of the logistics chain, with the goal of reducing the turnover rate of finished goods,
and intends to improve the management of moulds and spare parts, with the goal of reducing the inventory
value of moulds and spare parts.
5.3.3 Continue a strict investment policy for the Group’s future sustainable development
The Group intends to optimise the allocation of its capital expenditure, by pursuing a disciplined
investment policy aimed at maintaining recurring investments at around 8% of consolidated revenue
(excluding capitalisation of the right to use an asset as required by the application of IFRS 16), to maintain
the operational excellence of its production facilities and a solid return on invested capital.
The Group continues its research and development programmes focused on innovation in industrial
processes and on its sustainable development strategy. The Group thus intends to build on its strong
industrial expertise and innovation capacity in order to reduce carbon dioxide emissions and energy
consumption (see the Extra-Financial Performance Declaration in Annex II of this Universal Registration
Document).
The Group also intends to rely on the development of Industry 4.0, and in particular on data analytics and
artificial intelligence. Accordingly, through its research and development activities, the Group is
considering an IA-based software that will be ultimately applied to the entire production process and will
specifically enable the optimisation of furnace combustion settings at the glass fusion stage, the
optimisation of the settings of IS machines when transitioning to the “hot end” sector, and the improvement
of control processes, including through improved use of information supplied by the control machines that
detect defects.
5.3.4 Develop a strong entrepreneurial culture
The glass production sector requires permanent commitment and advanced technical skills. That is why
the Group’s human resources are essential for its development and the pursuit of profitable growth. The
Group considers the safety of its employees as a key priority, and is committed to supporting them in their
professional development in order to develop a strong entrepreneurial culture.
To back this ambition, the Group intends to further strengthen the application of its values inside the group,
including (i) customer care, (ii) respect for individuals, laws and the environment, (iii) empowerment and
accountability and (iv) teamwork.
The Group also strives to encourage its teams to take responsibility, take quick action and be responsive,
including by helping production site managers to become genuine managers, and by developing
communication within the teams through cross-functional workshops, established to reflect specific goals
and based on advanced comparative analyses.
The Group also intends to continue is training efforts, by specifically relying on the sharing of its teams’
know-how and by training them in project management in particular. Lastly, the Group may use external
talent in order to further enhance its know-how and the diversity of its teams.
35 Production costs excluding commercial, general and administrative costs, transport costs, depreciation and amortisation and
provisions for claims.
53
A dynamic policy of employee share-ownership is a strategic initiative to support the Group’s profitable
growth, by connecting all employees with the Group’s development. In this respect, as a result of plans
launched by the Group between 2016 and 2019, more than 2,000 employees have become shareholders of
the Company through FCPE Verallia (see Section 15.5 “Employee share ownership” in this Universal
Registration Document). In addition, the Group should launch a capital increase in the next coming months
for employees who are members of a Group corporate savings plan. The Company thus plans to actively
continue its employee share-ownership development policy, with the goal of increasing the equity stake
of the Group’s employees in its share capital by around 3% over the 2020-2025 period.
5.4 History of the Company
The Group began its glass packaging or “hollow glass” business operations in 1827, with the opening of
its first plant in Vauxrot (Verreries à Bouteilles du Nord).
Starting from 1918, the Group’s hollow glass production business was run by Compagnie de Saint-Gobain
until 1972 when the bottles and jars business segment was transferred to Saint-Gobain Emballage, which
became the holding company of Saint-Gobain group’s various hollow glass, or packaging glass,
production operations.
Key dates
1827 The Group’s first plant opens in Vauxrot.
1918 Compagnie de Saint-Gobain acquires its first equity interest in Verreries à Bouteilles
du Nord.
1972 Compagnie de Saint-Gobain transfers its glass bottle and jar making business to Saint-
Gobain Emballage.
1987 The Group acquires Vidreira do Mondego’s production facilities at Figueira da Foz,
Portugal.
1989 Acquisition of a controlling interest in Vetri in Italy.
1991 Acquisition of a controlling interest in Oberland Glas AG in Germany.
1995 Acquisition of a controlling interest in Ball Foster Glass in the United States.
1998 Acquisition of a controlling interest in Rayen Cura (60% joint venture) in Argentina.
Acquisition of Verrerie d’Albi in France.
2005 Acquisition of a controlling interest in Zorya, a Ukrainian company, and Verallia
Polska (formerly Euroverlux), a Polish hollow glass decoration company.
Acquisition of a controlling interest in KMS, a Russian company based in
Kavminstelko.
2006 Acquisition of a controlling interest in BO Glass Containers SA in Chile.
2007 Disposal of all equity holdings in Saint-Gobain Desjonquères and its subsidiaries
(“Bottling” business line).
2008 Acquisition of Kamyshinsky (KSZ), a Russian company.
2009 The Group sets up an Indian subsidiary, Accuramech Industrial Engineering, which
acquired a business specialised in the sourcing and inspection of IS machine parts.
2010 Adoption of the Verallia trademark.
2011 Acquisition of Alver, a glass manufacturer in Algeria.
54
2014 Disposal of Verallia North America (formerly Ball Foster Glass) – refocus on Europe
and Latin America.
2015 Acquisition of Verallia by Apollo (90%) and Bpifrance (10%) from Compagnie Saint-
Gobain and of certain of its subsidiaries.
2018 Disposal of Alver in Algeria.
Disposal of the minority interest in the Brazilian joint-venture Indústria Vidreira do
Nordeste (IVN).
Acquisition in the Canary Islands by Vidrieras Canarias of Recicladora de Vidrio de
Canarias, a company specialised in glass recycling.
2019 Creation of a joint subsidiary specialised in glass recycling in Spain. Known as Calcin
Iberico, it is owned by Verallia Spain (49% of the share capital and voting rights) and
TM Alcudia Reciclatges SL (51% of the share capital and voting rights).
Initial public offering of the Company on the regulated market of Euronext Paris.
Admission of the Company to the SBF 120 index.
5.5 Presentation of markets and competitive position36
5.5.1 Description of the glass packaging market
The Group operates in the glass packaging market for beverages and food products where it is, in terms of
revenue, the third largest producer in the world and the leading producer in Europe37. In terms of volumes
sold, it is the second largest producer in Latin America38.
5.5.1.1 Market trends
This paragraph describes the general trends of the glass packaging market and trends for each end market.
The Group estimates that the impact of the Covid-19 pandemic on the general economic context, which
is, as of the date of this universal registration document, difficult to assess, could affect some of the trends
and growth outlook related to certain end markets, although the fundamental trends of the glass packaging
market, mainly related to the inherent features of glass, should not be significantly affected. The Group
thus estimates, on the basis of information available as of the date of this universal registration document,
that the markets for still and sparkling wines and spirits in particular, which are markets supported by
exports, should be affected by the consequences of this sanitary crisis.
(a) General trends in the glass packaging market
The glass packaging market benefits from favourable trends, mainly fuelled by the increasing appreciation
of glass by consumers.
The glass packaging market is currently fuelled by the trend toward alternative materials, for plastic in
particular, and the choice for glass, illustrated by growing consumer preference for glass because of its
36 The market information in this Section 5.5, including size and growth prospects, is principally derived from the third-party
sources presented in Section 1.3 “Third-Party Information, Statement of Experts and Declarations of Interest” of this
Universal Registration Document and in particular, unless otherwise indicated, from the market study conducted by Advancy
at the Company’s request as part of its initial public offering.
37 On the basis of the revenue earned in 2019 by market players in Europe (as defined by these players), as extracted from
publicly available information (annual reports and press releases in particular) and on the basis of Company estimates.
38 Based on volumes sold in 2019 in Argentina, Brazil and Chile.
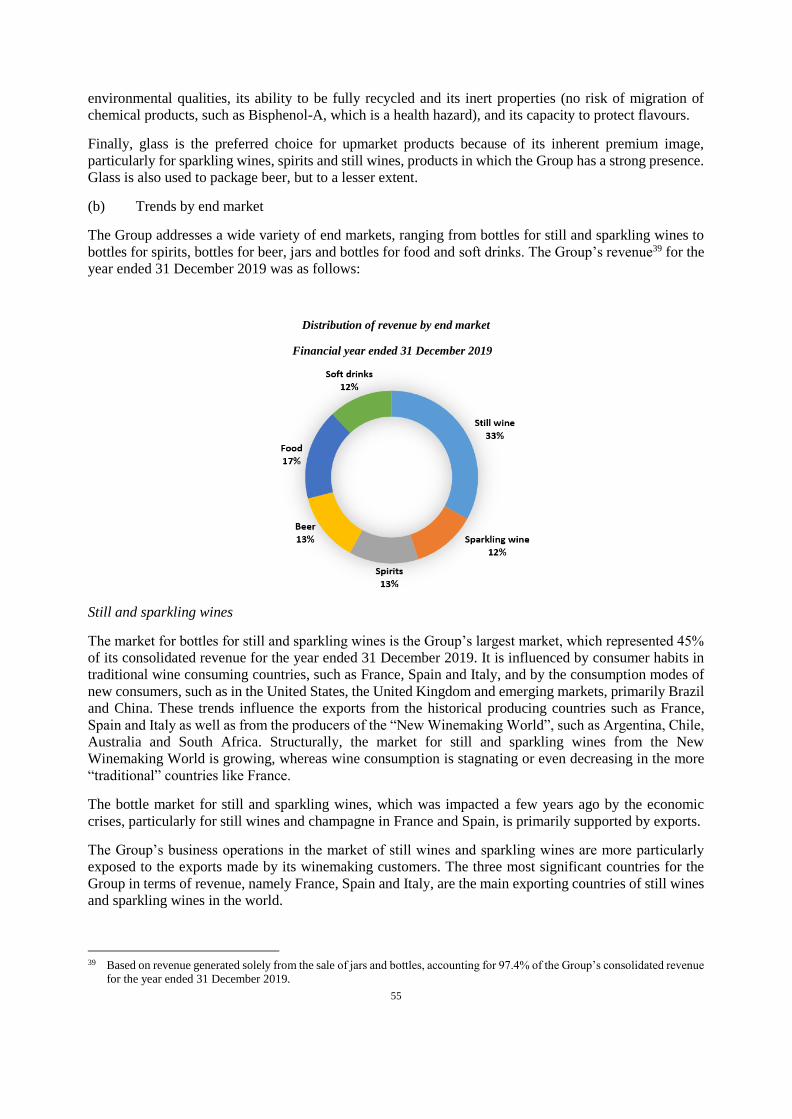
55
environmental qualities, its ability to be fully recycled and its inert properties (no risk of migration of
chemical products, such as Bisphenol-A, which is a health hazard), and its capacity to protect flavours.
Finally, glass is the preferred choice for upmarket products because of its inherent premium image,
particularly for sparkling wines, spirits and still wines, products in which the Group has a strong presence.
Glass is also used to package beer, but to a lesser extent.
(b) Trends by end market
The Group addresses a wide variety of end markets, ranging from bottles for still and sparkling wines to
bottles for spirits, bottles for beer, jars and bottles for food and soft drinks. The Group’s revenue39 for the
year ended 31 December 2019 was as follows:
Distribution of revenue by end market
Financial year ended 31 December 2019
Still and sparkling wines
The market for bottles for still and sparkling wines is the Group’s largest market, which represented 45%
of its consolidated revenue for the year ended 31 December 2019. It is influenced by consumer habits in
traditional wine consuming countries, such as France, Spain and Italy, and by the consumption modes of
new consumers, such as in the United States, the United Kingdom and emerging markets, primarily Brazil
and China. These trends influence the exports from the historical producing countries such as France,
Spain and Italy as well as from the producers of the “New Winemaking World”, such as Argentina, Chile,
Australia and South Africa. Structurally, the market for still and sparkling wines from the New
Winemaking World is growing, whereas wine consumption is stagnating or even decreasing in the more
“traditional” countries like France.
The bottle market for still and sparkling wines, which was impacted a few years ago by the economic
crises, particularly for still wines and champagne in France and Spain, is primarily supported by exports.
The Group’s business operations in the market of still wines and sparkling wines are more particularly
exposed to the exports made by its winemaking customers. The three most significant countries for the
Group in terms of revenue, namely France, Spain and Italy, are the main exporting countries of still wines
and sparkling wines in the world.
39 Based on revenue generated solely from the sale of jars and bottles, accounting for 97.4% of the Group’s consolidated revenue
for the year ended 31 December 2019.

56
Glass is the preferred material for packaging still wines and particularly for sparkling wines because of
the product’s image, wine-making processes, requirements for pressure resistance and its exceptional
organoleptic qualities. The substitution of other packaging materials is also limited due to consumers’
preference for glass and the image of quality associated with this packaging, the existence of glass bottling
infrastructure and the existence of pressure resistance requirements for sparkling wines. The Group is
nevertheless competing with alternative types of packaging, such as the bag-in-box in still wines, primarily
for down-market wines, and brick pack containers, especially in certain geographic areas such as
Argentina, Spain, and Portugal, and, to a lesser extent, bottles made from polyethylene terephthalate
(“PET”).
Containers for spirits
Containers for spirits represented 13% of the Group’s consolidated revenue for the year ended 31
December 2019.
Growth in the spirits market is primarily driven by exports intended primarily for the United States and
Asia. Cognac, brandies and gin have found valuable export niches (in neat form and in cocktails). This
market is characterised by a sharp increase in upscale packaging, similar to that seen in the perfume market.
In terms of customers, the sector is highly consolidated, with the major global brands in spirits owned by
a limited number of companies. In each region, numerous local spirit brands remain independent and active
in the market.
At the global level, the market for spirits, which are non-essential products, suffered from the financial
crisis (particularly in Brazil, Russia, India and China). In Russia and Ukraine, demand was also affected
by certain measures taken by public authorities to reduce alcohol consumption, as well as by political
instability in the region. However, this market saw growth in recent years, particularly in Southern and
Western Europe.
The risk of substitution for packaging other than glass is relatively limited in the spirits segment, primarily
because of producers’ desire to use glass bottles (often customised) to maintain the image and recognition
of their brands. However, certain containers (other than the litre, pocket flasks or miniatures) are packaged
in PET, marginally and in low-end segments, and mostly in the United States.
Beers
Beer bottles represented 13% of the Group’s consolidated revenue for the year ended 31 December 2019.
The highly concentrated beer market, considered a “mass market”, is growing, particularly in emerging
markets. Glass packaging is particularly favoured by certain brewers to provide up-market appeal,
especially in developed countries, and to create value in a market that has historically had little
differentiation.
However, certain customers may periodically or permanently substitute traditional glass packaging, which
has a premium positioning, for other packaging such as metal cans. This change may be brought about for
sales and marketing reasons, to control costs in view of the economic context, or due to changes in strategy.
In the beer packaging market, glass remains the favoured packaging for brewers in the premium beer
growth segment that seek to make their products stand out from the competition with an up-market image
designed to highlight the distinctive taste of their beers. This is especially true for local or craft brewers.
This market is facing competition from other modes of consumption, particularly the mini-barrel and
draught beer. Plastic is more marginal, except for specific uses (during sports events, for example) and for
large containers, particularly in the Russian and Ukrainian markets. In Latin America, the traditional
deposit bottle for beer is progressively being replaced by single use packaging in metal or glass. This trend
is expected to continue in the future, particularly in Brazil.
Jars and bottles for food
57
Jars and bottles for food represented 17% of the Group’s consolidated revenue for the year ended 31
December 2019.
The market for food jars and bottles consists of a very large number of niche markets, including traditional
jams and yoghurts, baby food, certain types of sauces and jarred food and even soluble products that vary
depending on the eating habits of each country. Overall, glass occupies relatively stable positions
compared with other materials. The growth of this market primarily tracks the growth in household
consumption. The intrinsic, technical qualities of glass, particularly the possibilities for sterilisation and
high-temperature cooking, as well as the innovation potential it offers, allow differentiation of food
products packaged in glass compared with products packaged in other materials.
In the food packaging market, substitution is mainly in jars and bottles for condiments, sauces and dairy
products where consumers are more indifferent to the use of PET. However, the favourable positioning of
glass for small containers, the unsuitability of plastic for certain techniques in the food industry (such as
sterilisation and high-temperature cooking), and the development of niche markets where the use of glass
is associated with the perceived qualities of the product or when it is the preferred medium for innovation
(such as packaging for spreads), allow glass to maintain, and even increase, its market share in this market.
On featured or premium segments, glass is often used as a substitute for other types of packaging. Since
2009, changes in consumer habits due the difficult economic context have had a variety of consequences
for food packaging. For example, the increase in the number of meals eaten at home has had a positive
impact on the purchase of food in jars, but was largely offset by a tendency to purchase more plastic
containers, considered to be cheaper. Consolidation of the customer base in this market is moderate.
Overall, due to the wide range of glass packaging used by the food industry, the financial crisis had a fairly
limited impact on the Group’s business in this market. However, this relative stability can hide contrasting
situations in particular niches.
Bottles for soft drinks
Bottles for soft drinks represented 12% of the Group’s consolidated revenue for the year ended 31
December 2019.
In this market, packaging in materials other than glass have already largely replaced glass packaging.
Substitution may still exist in the fruit juice segments, where glass is nevertheless well positioned in small
containers, particularly for restaurants and cafés and upmarket products. High value added niches have
also developed in recent years, for which glass is particularly well positioned, such as table waters, energy
drinks and certain sodas.
5.5.1.2 Competitive position and environment of the Group in the glass packaging market
In terms of revenue, the Group is the third largest producer in the world and the first largest producer in
Europe40 of glass packaging; and, in addition, in terms of volumes sold, it is the second largest producer
in Latin America41.
The Group’s main competitors worldwide are global players with a global presence, such as Owens-
Illinois, Ardagh, Vidrala, BA Vidro and Vetropack. The two most significant competitors of the Group in
terms of revenue are Owens-Illinois and Ardagh.
The Group’s markets are, for the most part, regional, primarily because of the costs to transport glass
packaging, and the Group also competes with a number of regional glass packaging producers (see Section
5.5.2.2 “Group’s competitive position and environment in the regional markets” in this Universal
Registration Document). Moreover, the Group may face competition from actors conducting periodic
40 On the basis of the revenue earned in 2019 by market players in Europe (as defined by these players), as extracted from
publicly available information (annual reports and press releases in particular) and on the basis of Company estimates.
41 Based on volumes sold in 2019 in Argentina, Brazil and Chile.

58
export operations, primarily when the domestic markets of these importers face overcapacity or when
permitted by logistics costs or changes in exchange rates.
Due to the local nature of the markets, companies in this sector install their production sites near food and
beverage production and packaging sites (such as in wine-making regions or near large brewers).
5.5.2 Description of the geographic markets
The Group conducts its activities in the following geographic markets, which make up its three operating
segments: (i) Southern and Western Europe, consisting of the production sites located in France, Italy,
Spain and Portugal, which represented 68% of the Group’s consolidated revenue for the year ended 31
December 2019; (ii) Northern and Eastern Europe, consisting of the production sites located in Germany,
Russia, Ukraine and Poland, which represented 22% of the Group’s consolidated revenue for the year
ended 31 December 2019; and (iii) Latin America, consisting of the production sites located in Brazil,
Argentina and Chile, which represented 10% of the Group’s consolidated revenue for the year ended 31
December 2019.
These geographic markets reflect the trends common to the entire glass packaging market described in
Section 5.5.1.1 above, as well as their own specific trends.
5.5.2.1 Trends by geographic market
Southern and Western Europe
Southern and Western Europe accounted for 68% of the Group’s consolidated revenue for the year ended
31 December 2019.
The main end markets in Southern and Western Europe in 2019 in terms of bottled volumes are still wine
and sparkling wines bottles and containers for spirits.
In 2019, the growth in the volumes of bottled still wines was driven primarily by the increase in global
demand for still wines, particularly in Asia and North America, which contributed to the growth in exports.
Domestic consumption of still wines grew at a more moderate pace.
Northern and Eastern Europe
Northern and Eastern Europe accounted for 22% of the Group’s consolidated revenue for the year ended
31 December 2019.
Bottles for beer and jars and bottles for food are the largest end markets in Northern and Eastern Europe
in 2019.
In 2019, bottled volumes of beer bottles saw slight growth primarily driven by beer exports from Germany,
which offset the decrease in this country’s domestic consumption, and by the growth in demand for beer
in Eastern European countries, primarily Ukraine.
Latin America
Latin American accounted for 10% of the Group’s consolidated revenue for the year ended 31 December
2019.
Bottled beer is the largest end market in Latin America, particularly in Brazil. This end market should see
steady growth by 2022, buoyed in particular by craft and premium beers and the development of single-
use bottles in Brazil, as well as by the increase in glass penetration against metal cans in Chile.
Bottles for still wines are the second end market in Latin America, particularly Argentina and Chile, driven
by exports.
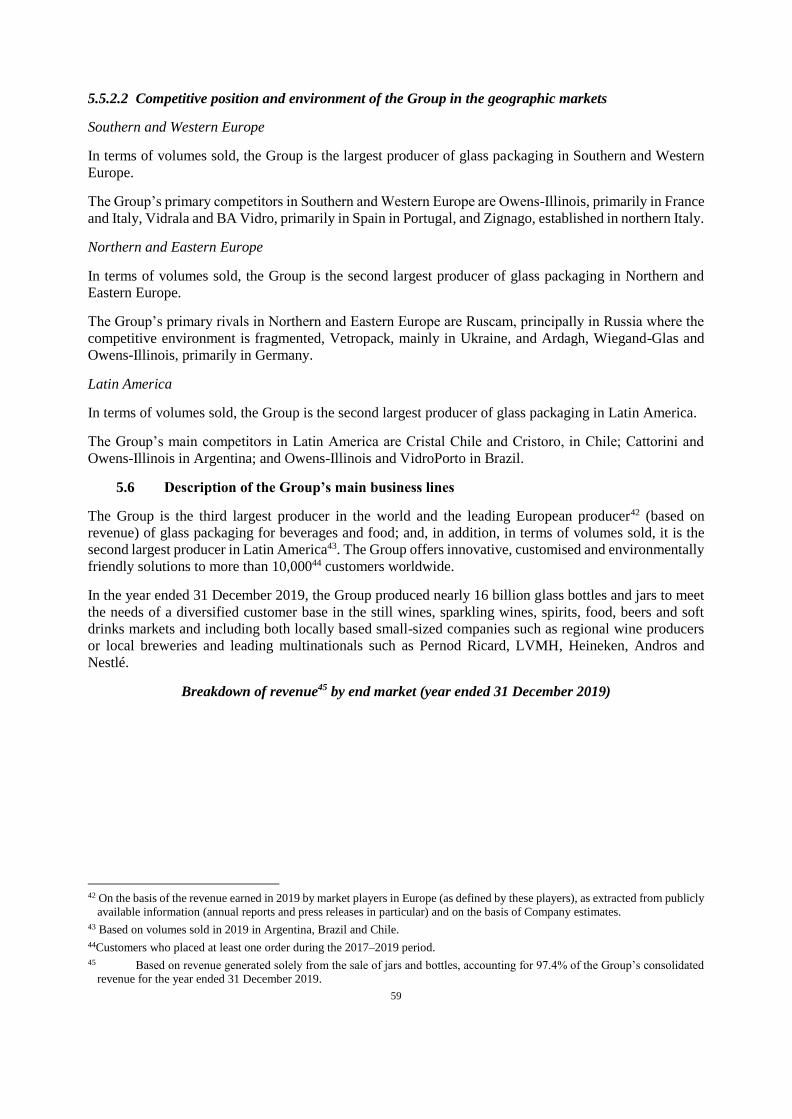
59
5.5.2.2 Competitive position and environment of the Group in the geographic markets
Southern and Western Europe
In terms of volumes sold, the Group is the largest producer of glass packaging in Southern and Western
Europe.
The Group’s primary competitors in Southern and Western Europe are Owens-Illinois, primarily in France
and Italy, Vidrala and BA Vidro, primarily in Spain in Portugal, and Zignago, established in northern Italy.
Northern and Eastern Europe
In terms of volumes sold, the Group is the second largest producer of glass packaging in Northern and
Eastern Europe.
The Group’s primary rivals in Northern and Eastern Europe are Ruscam, principally in Russia where the
competitive environment is fragmented, Vetropack, mainly in Ukraine, and Ardagh, Wiegand-Glas and
Owens-Illinois, primarily in Germany.
Latin America
In terms of volumes sold, the Group is the second largest producer of glass packaging in Latin America.
The Group’s main competitors in Latin America are Cristal Chile and Cristoro, in Chile; Cattorini and
Owens-Illinois in Argentina; and Owens-Illinois and VidroPorto in Brazil.
5.6 Description of the Group’s main business lines
The Group is the third largest producer in the world and the leading European producer42 (based on
revenue) of glass packaging for beverages and food; and, in addition, in terms of volumes sold, it is the
second largest producer in Latin America43. The Group offers innovative, customised and environmentally
friendly solutions to more than 10,00044 customers worldwide.
In the year ended 31 December 2019, the Group produced nearly 16 billion glass bottles and jars to meet
the needs of a diversified customer base in the still wines, sparkling wines, spirits, food, beers and soft
drinks markets and including both locally based small-sized companies such as regional wine producers
or local breweries and leading multinationals such as Pernod Ricard, LVMH, Heineken, Andros and
Nestlé.
Breakdown of revenue45 by end market (year ended 31 December 2019)
42 On the basis of the revenue earned in 2019 by market players in Europe (as defined by these players), as extracted from publicly
available information (annual reports and press releases in particular) and on the basis of Company estimates.
43 Based on volumes sold in 2019 in Argentina, Brazil and Chile.
44Customers who placed at least one order during the 2017–2019 period.
45 Based on revenue generated solely from the sale of jars and bottles, accounting for 97.4% of the Group’s consolidated
revenue for the year ended 31 December 2019.
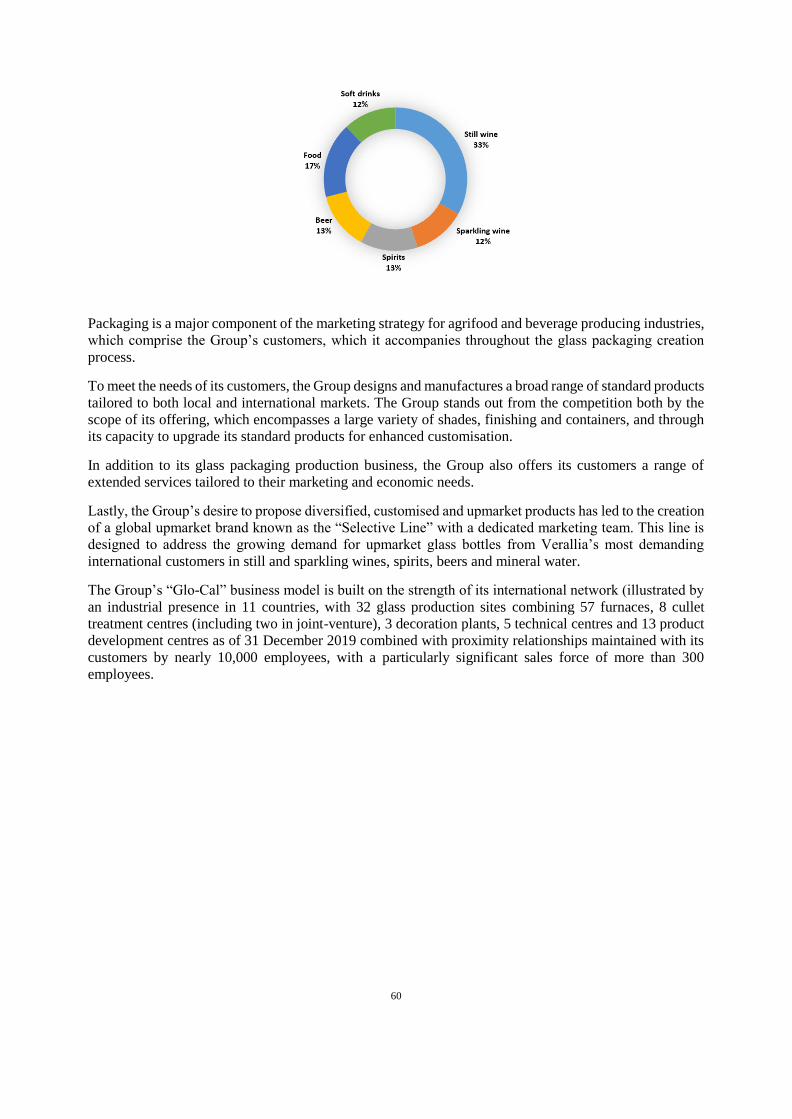
60
Packaging is a major component of the marketing strategy for agrifood and beverage producing industries,
which comprise the Group’s customers, which it accompanies throughout the glass packaging creation
process.
To meet the needs of its customers, the Group designs and manufactures a broad range of standard products
tailored to both local and international markets. The Group stands out from the competition both by the
scope of its offering, which encompasses a large variety of shades, finishing and containers, and through
its capacity to upgrade its standard products for enhanced customisation.
In addition to its glass packaging production business, the Group also offers its customers a range of
extended services tailored to their marketing and economic needs.
Lastly, the Group’s desire to propose diversified, customised and upmarket products has led to the creation
of a global upmarket brand known as the “Selective Line” with a dedicated marketing team. This line is
designed to address the growing demand for upmarket glass bottles from Verallia’s most demanding
international customers in still and sparkling wines, spirits, beers and mineral water.
The Group’s “Glo-Cal” business model is built on the strength of its international network (illustrated by
an industrial presence in 11 countries, with 32 glass production sites combining 57 furnaces, 8 cullet
treatment centres (including two in joint-venture), 3 decoration plants, 5 technical centres and 13 product
development centres as of 31 December 2019 combined with proximity relationships maintained with its
customers by nearly 10,000 employees, with a particularly significant sales force of more than 300
employees.
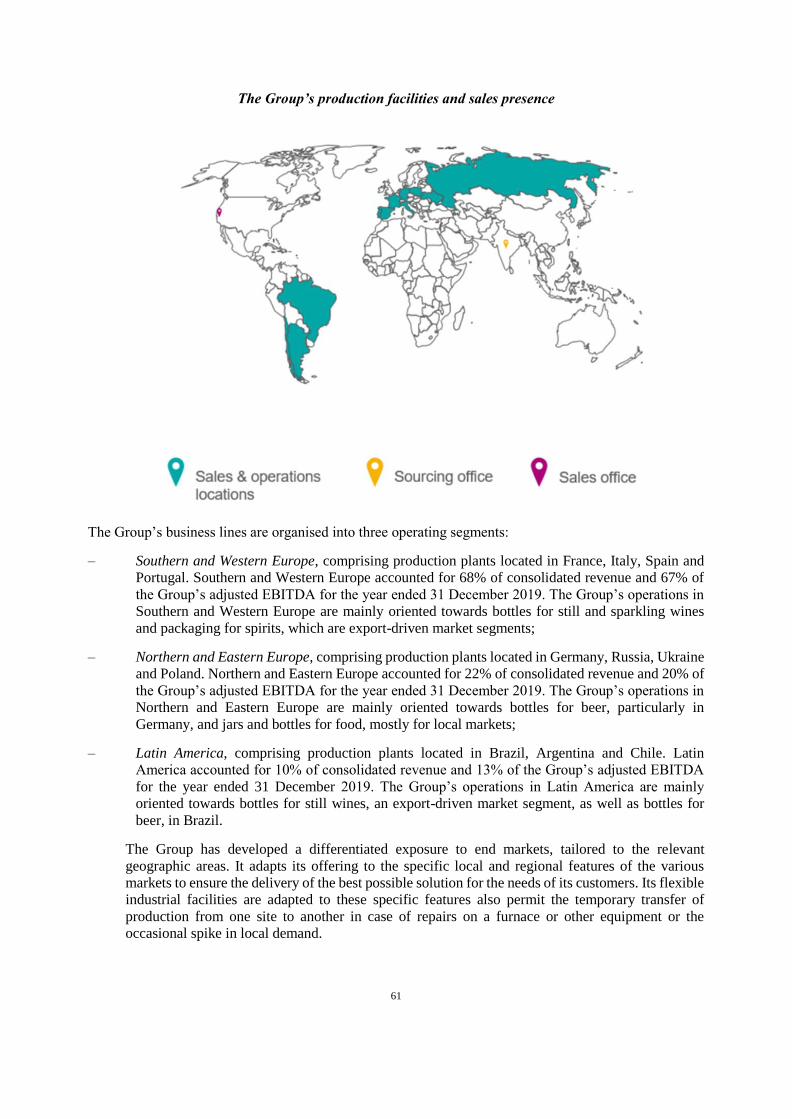
61
The Group’s production facilities and sales presence
The Group’s business lines are organised into three operating segments:
– Southern and Western Europe, comprising production plants located in France, Italy, Spain and
Portugal. Southern and Western Europe accounted for 68% of consolidated revenue and 67% of
the Group’s adjusted EBITDA for the year ended 31 December 2019. The Group’s operations in
Southern and Western Europe are mainly oriented towards bottles for still and sparkling wines
and packaging for spirits, which are export-driven market segments;
– Northern and Eastern Europe, comprising production plants located in Germany, Russia, Ukraine
and Poland. Northern and Eastern Europe accounted for 22% of consolidated revenue and 20% of
the Group’s adjusted EBITDA for the year ended 31 December 2019. The Group’s operations in
Northern and Eastern Europe are mainly oriented towards bottles for beer, particularly in
Germany, and jars and bottles for food, mostly for local markets;
– Latin America, comprising production plants located in Brazil, Argentina and Chile. Latin
America accounted for 10% of consolidated revenue and 13% of the Group’s adjusted EBITDA
for the year ended 31 December 2019. The Group’s operations in Latin America are mainly
oriented towards bottles for still wines, an export-driven market segment, as well as bottles for
beer, in Brazil.
The Group has developed a differentiated exposure to end markets, tailored to the relevant
geographic areas. It adapts its offering to the specific local and regional features of the various
markets to ensure the delivery of the best possible solution for the needs of its customers. Its flexible
industrial facilities are adapted to these specific features also permit the temporary transfer of
production from one site to another in case of repairs on a furnace or other equipment or the
occasional spike in local demand.
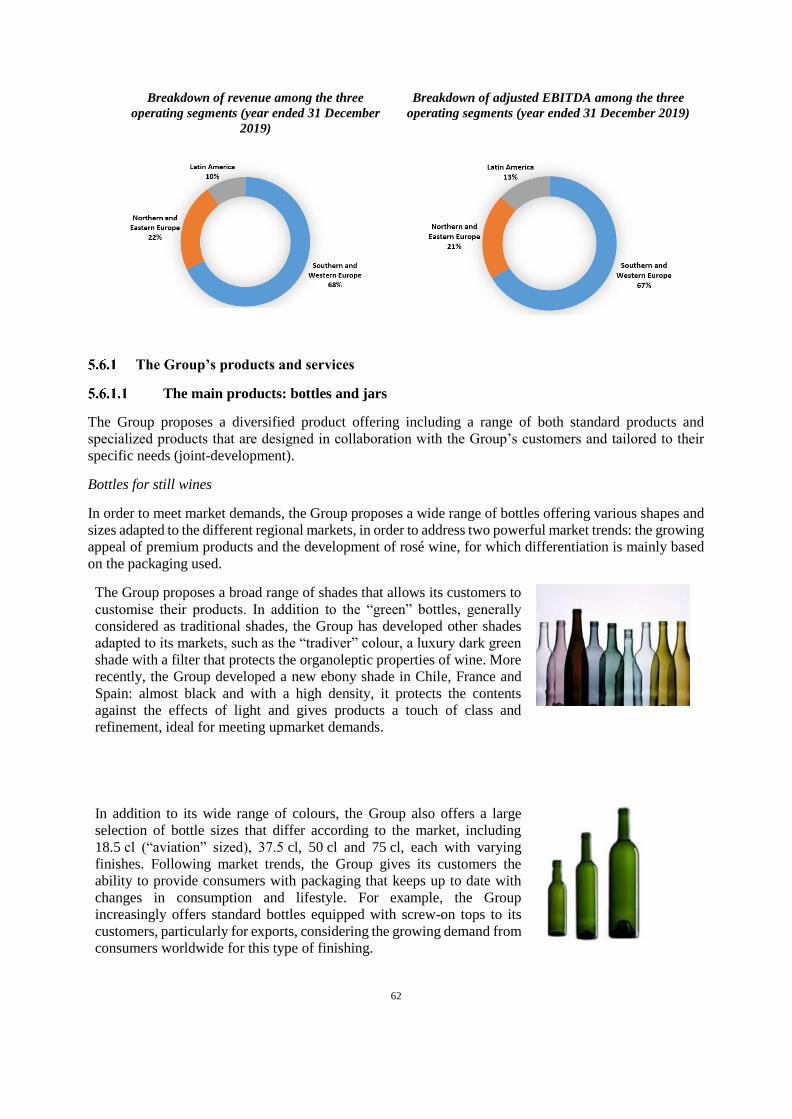
62
Breakdown of revenue among the three
operating segments (year ended 31 December
2019)
Breakdown of adjusted EBITDA among the three
operating segments (year ended 31 December 2019)
The Group’s products and services
The main products: bottles and jars
The Group proposes a diversified product offering including a range of both standard products and
specialized products that are designed in collaboration with the Group’s customers and tailored to their
specific needs (joint-development).
Bottles for still wines
In order to meet market demands, the Group proposes a wide range of bottles offering various shapes and
sizes adapted to the different regional markets, in order to address two powerful market trends: the growing
appeal of premium products and the development of rosé wine, for which differentiation is mainly based
on the packaging used.
The Group proposes a broad range of shades that allows its customers to
customise their products. In addition to the “green” bottles, generally
considered as traditional shades, the Group has developed other shades
adapted to its markets, such as the “tradiver” colour, a luxury dark green
shade with a filter that protects the organoleptic properties of wine. More
recently, the Group developed a new ebony shade in Chile, France and
Spain: almost black and with a high density, it protects the contents
against the effects of light and gives products a touch of class and
refinement, ideal for meeting upmarket demands.
In addition to its wide range of colours, the Group also offers a large
selection of bottle sizes that differ according to the market, including
18.5 cl (“aviation” sized), 37.5 cl, 50 cl and 75 cl, each with varying
finishes. Following market trends, the Group gives its customers the
ability to provide consumers with packaging that keeps up to date with
changes in consumption and lifestyle. For example, the Group
increasingly offers standard bottles equipped with screw-on tops to its
customers, particularly for exports, considering the growing demand from
consumers worldwide for this type of finishing.
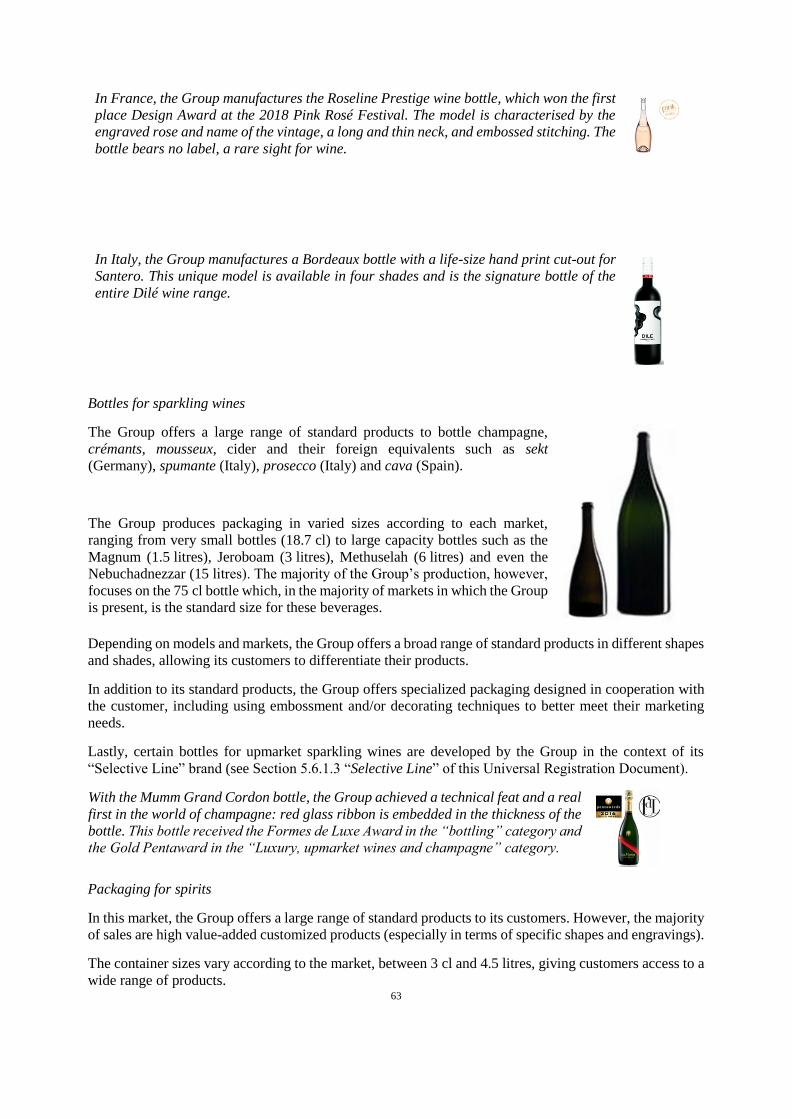
63
In France, the Group manufactures the Roseline Prestige wine bottle, which won the first
place Design Award at the 2018 Pink Rosé Festival. The model is characterised by the
engraved rose and name of the vintage, a long and thin neck, and embossed stitching. The
bottle bears no label, a rare sight for wine.
In Italy, the Group manufactures a Bordeaux bottle with a life-size hand print cut-out for
Santero. This unique model is available in four shades and is the signature bottle of the
entire Dilé wine range.
Bottles for sparkling wines
The Group offers a large range of standard products to bottle champagne,
crémants, mousseux, cider and their foreign equivalents such as sekt
(Germany), spumante (Italy), prosecco (Italy) and cava (Spain).
The Group produces packaging in varied sizes according to each market,
ranging from very small bottles (18.7 cl) to large capacity bottles such as the
Magnum (1.5 litres), Jeroboam (3 litres), Methuselah (6 litres) and even the
Nebuchadnezzar (15 litres). The majority of the Group’s production, however,
focuses on the 75 cl bottle which, in the majority of markets in which the Group
is present, is the standard size for these beverages.
Depending on models and markets, the Group offers a broad range of standard products in different shapes
and shades, allowing its customers to differentiate their products.
In addition to its standard products, the Group offers specialized packaging designed in cooperation with
the customer, including using embossment and/or decorating techniques to better meet their marketing
needs.
Lastly, certain bottles for upmarket sparkling wines are developed by the Group in the context of its
“Selective Line” brand (see Section 5.6.1.3 “Selective Line” of this Universal Registration Document).
With the Mumm Grand Cordon bottle, the Group achieved a technical feat and a real
first in the world of champagne: red glass ribbon is embedded in the thickness of the
bottle. This bottle received the Formes de Luxe Award in the “bottling” category and
the Gold Pentaward in the “Luxury, upmarket wines and champagne” category.
Packaging for spirits
In this market, the Group offers a large range of standard products to its customers. However, the majority
of sales are high value-added customized products (especially in terms of specific shapes and engravings).
The container sizes vary according to the market, between 3 cl and 4.5 litres, giving customers access to a
wide range of products.
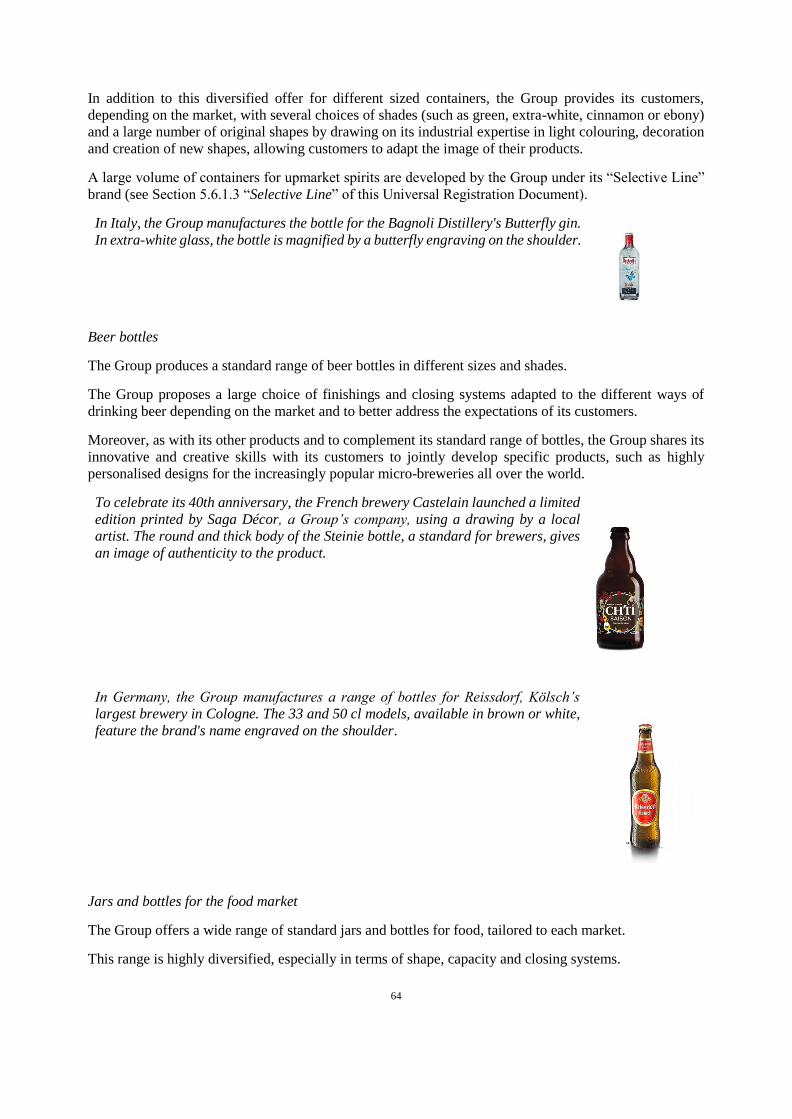
64
In addition to this diversified offer for different sized containers, the Group provides its customers,
depending on the market, with several choices of shades (such as green, extra-white, cinnamon or ebony)
and a large number of original shapes by drawing on its industrial expertise in light colouring, decoration
and creation of new shapes, allowing customers to adapt the image of their products.
A large volume of containers for upmarket spirits are developed by the Group under its “Selective Line”
brand (see Section 5.6.1.3 “Selective Line” of this Universal Registration Document).
In Italy, the Group manufactures the bottle for the Bagnoli Distillery's Butterfly gin.
In extra-white glass, the bottle is magnified by a butterfly engraving on the shoulder.
Beer bottles
The Group produces a standard range of beer bottles in different sizes and shades.
The Group proposes a large choice of finishings and closing systems adapted to the different ways of
drinking beer depending on the market and to better address the expectations of its customers.
Moreover, as with its other products and to complement its standard range of bottles, the Group shares its
innovative and creative skills with its customers to jointly develop specific products, such as highly
personalised designs for the increasingly popular micro-breweries all over the world.
To celebrate its 40th anniversary, the French brewery Castelain launched a limited
edition printed by Saga Décor, a Group’s company, using a drawing by a local
artist. The round and thick body of the Steinie bottle, a standard for brewers, gives
an image of authenticity to the product.
In Germany, the Group manufactures a range of bottles for Reissdorf, Kölsch’s
largest brewery in Cologne. The 33 and 50 cl models, available in brown or white,
feature the brand's name engraved on the shoulder.
Jars and bottles for the food market
The Group offers a wide range of standard jars and bottles for food, tailored to each market.
This range is highly diversified, especially in terms of shape, capacity and closing systems.
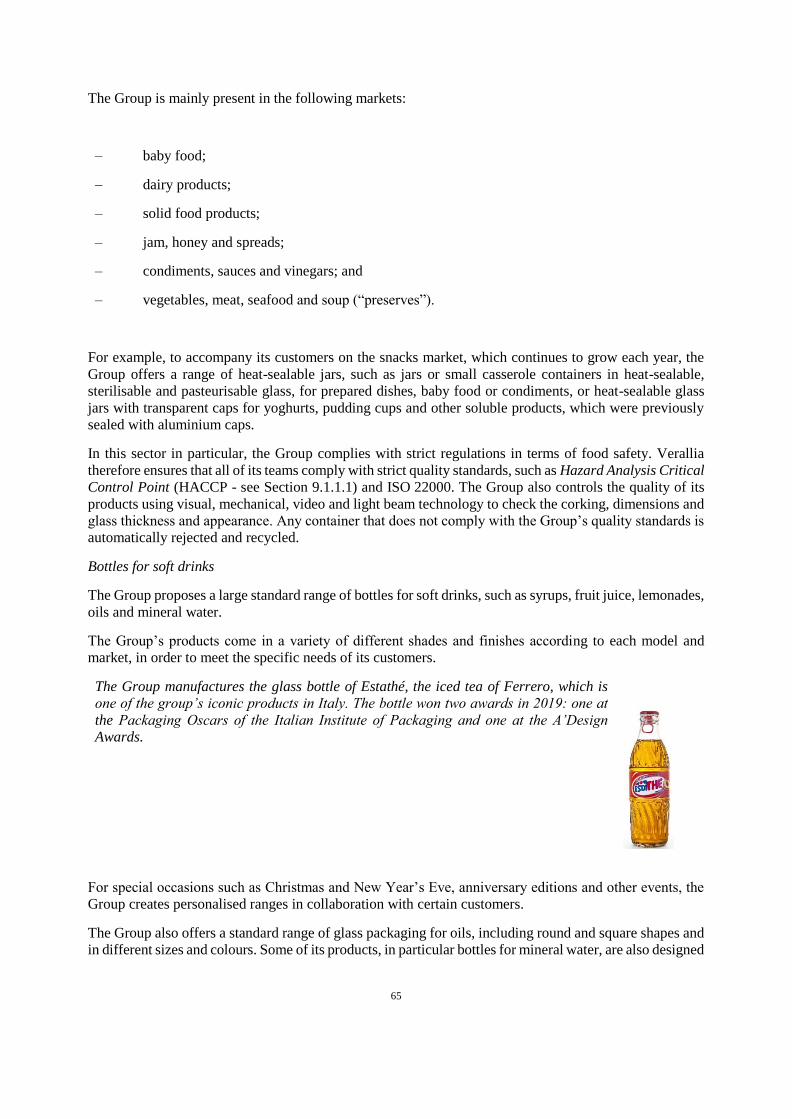
65
The Group is mainly present in the following markets:
– baby food;
– dairy products;
– solid food products;
– jam, honey and spreads;
– condiments, sauces and vinegars; and
– vegetables, meat, seafood and soup (“preserves”).
For example, to accompany its customers on the snacks market, which continues to grow each year, the
Group offers a range of heat-sealable jars, such as jars or small casserole containers in heat-sealable,
sterilisable and pasteurisable glass, for prepared dishes, baby food or condiments, or heat-sealable glass
jars with transparent caps for yoghurts, pudding cups and other soluble products, which were previously
sealed with aluminium caps.
In this sector in particular, the Group complies with strict regulations in terms of food safety. Verallia
therefore ensures that all of its teams comply with strict quality standards, such as Hazard Analysis Critical
Control Point (HACCP - see Section 9.1.1.1) and ISO 22000. The Group also controls the quality of its
products using visual, mechanical, video and light beam technology to check the corking, dimensions and
glass thickness and appearance. Any container that does not comply with the Group’s quality standards is
automatically rejected and recycled.
Bottles for soft drinks
The Group proposes a large standard range of bottles for soft drinks, such as syrups, fruit juice, lemonades,
oils and mineral water.
The Group’s products come in a variety of different shades and finishes according to each model and
market, in order to meet the specific needs of its customers.
The Group manufactures the glass bottle of Estathé, the iced tea of Ferrero, which is
one of the group’s iconic products in Italy. The bottle won two awards in 2019: one at
the Packaging Oscars of the Italian Institute of Packaging and one at the A’Design
Awards.
For special occasions such as Christmas and New Year’s Eve, anniversary editions and other events, the
Group creates personalised ranges in collaboration with certain customers.
The Group also offers a standard range of glass packaging for oils, including round and square shapes and
in different sizes and colours. Some of its products, in particular bottles for mineral water, are also designed
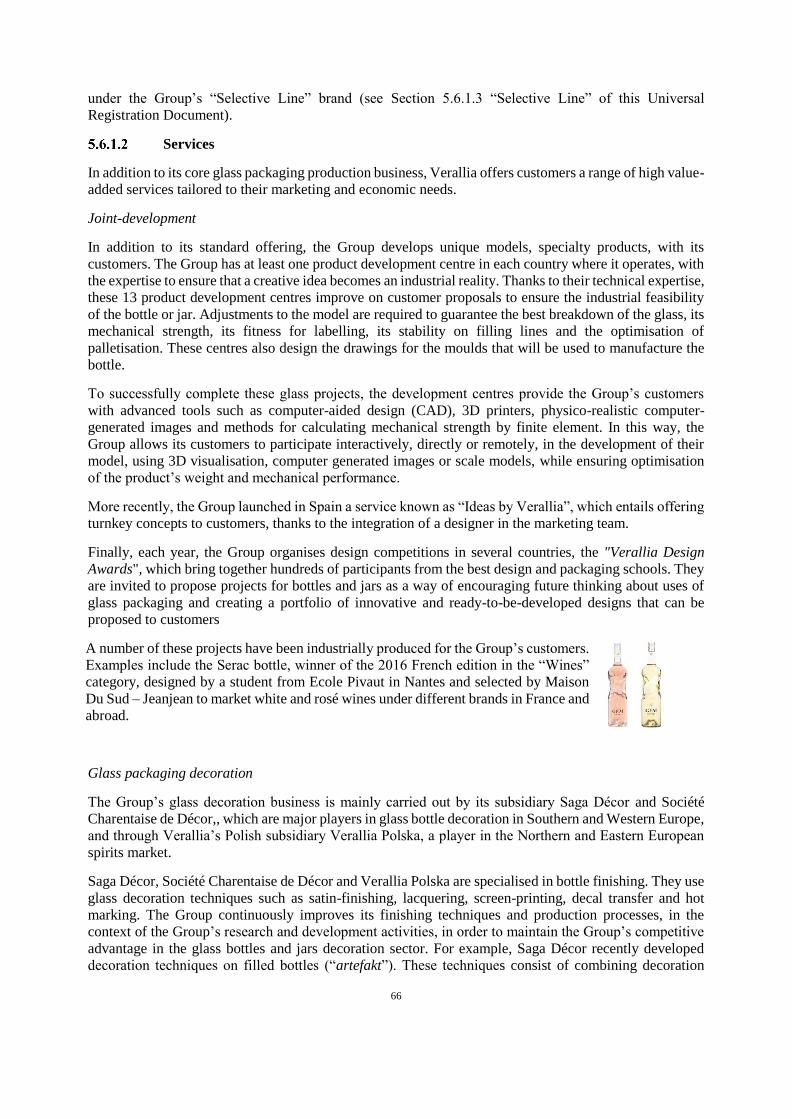
66
under the Group’s “Selective Line” brand (see Section 5.6.1.3 “Selective Line” of this Universal
Registration Document).
Services
In addition to its core glass packaging production business, Verallia offers customers a range of high value-
added services tailored to their marketing and economic needs.
Joint-development
In addition to its standard offering, the Group develops unique models, specialty products, with its
customers. The Group has at least one product development centre in each country where it operates, with
the expertise to ensure that a creative idea becomes an industrial reality. Thanks to their technical expertise,
these 13 product development centres improve on customer proposals to ensure the industrial feasibility
of the bottle or jar. Adjustments to the model are required to guarantee the best breakdown of the glass, its
mechanical strength, its fitness for labelling, its stability on filling lines and the optimisation of
palletisation. These centres also design the drawings for the moulds that will be used to manufacture the
bottle.
To successfully complete these glass projects, the development centres provide the Group’s customers
with advanced tools such as computer-aided design (CAD), 3D printers, physico-realistic computer-
generated images and methods for calculating mechanical strength by finite element. In this way, the
Group allows its customers to participate interactively, directly or remotely, in the development of their
model, using 3D visualisation, computer generated images or scale models, while ensuring optimisation
of the product’s weight and mechanical performance.
More recently, the Group launched in Spain a service known as “Ideas by Verallia”, which entails offering
turnkey concepts to customers, thanks to the integration of a designer in the marketing team.
Finally, each year, the Group organises design competitions in several countries, the "Verallia Design
Awards", which bring together hundreds of participants from the best design and packaging schools. They
are invited to propose projects for bottles and jars as a way of encouraging future thinking about uses of
glass packaging and creating a portfolio of innovative and ready-to-be-developed designs that can be
proposed to customers
A number of these projects have been industrially produced for the Group’s customers.
Examples include the Serac bottle, winner of the 2016 French edition in the “Wines”
category, designed by a student from Ecole Pivaut in Nantes and selected by Maison
Du Sud – Jeanjean to market white and rosé wines under different brands in France and
abroad.
Glass packaging decoration
The Group’s glass decoration business is mainly carried out by its subsidiary Saga Décor and Société
Charentaise de Décor,, which are major players in glass bottle decoration in Southern and Western Europe,
and through Verallia’s Polish subsidiary Verallia Polska, a player in the Northern and Eastern European
spirits market.
Saga Décor, Société Charentaise de Décor and Verallia Polska are specialised in bottle finishing. They use
glass decoration techniques such as satin-finishing, lacquering, screen-printing, decal transfer and hot
marking. The Group continuously improves its finishing techniques and production processes, in the
context of the Group’s research and development activities, in order to maintain the Group’s competitive
advantage in the glass bottles and jars decoration sector. For example, Saga Décor recently developed
decoration techniques on filled bottles (“artefakt”). These techniques consist of combining decoration
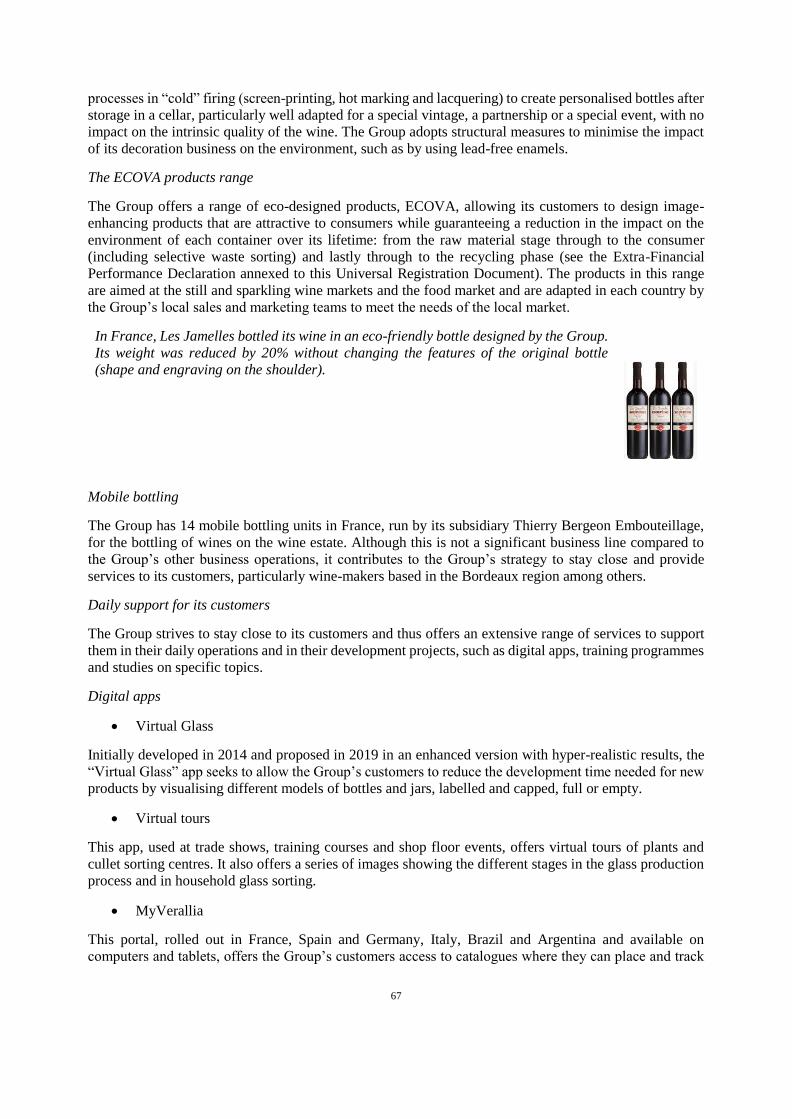
67
processes in “cold” firing (screen-printing, hot marking and lacquering) to create personalised bottles after
storage in a cellar, particularly well adapted for a special vintage, a partnership or a special event, with no
impact on the intrinsic quality of the wine. The Group adopts structural measures to minimise the impact
of its decoration business on the environment, such as by using lead-free enamels.
The ECOVA products range
The Group offers a range of eco-designed products, ECOVA, allowing its customers to design image-
enhancing products that are attractive to consumers while guaranteeing a reduction in the impact on the
environment of each container over its lifetime: from the raw material stage through to the consumer
(including selective waste sorting) and lastly through to the recycling phase (see the Extra-Financial
Performance Declaration annexed to this Universal Registration Document). The products in this range
are aimed at the still and sparkling wine markets and the food market and are adapted in each country by
the Group’s local sales and marketing teams to meet the needs of the local market.
In France, Les Jamelles bottled its wine in an eco-friendly bottle designed by the Group.
Its weight was reduced by 20% without changing the features of the original bottle
(shape and engraving on the shoulder).
Mobile bottling
The Group has 14 mobile bottling units in France, run by its subsidiary Thierry Bergeon Embouteillage,
for the bottling of wines on the wine estate. Although this is not a significant business line compared to
the Group’s other business operations, it contributes to the Group’s strategy to stay close and provide
services to its customers, particularly wine-makers based in the Bordeaux region among others.
Daily support for its customers
The Group strives to stay close to its customers and thus offers an extensive range of services to support
them in their daily operations and in their development projects, such as digital apps, training programmes
and studies on specific topics.
Digital apps
Virtual Glass
Initially developed in 2014 and proposed in 2019 in an enhanced version with hyper-realistic results, the
“Virtual Glass” app seeks to allow the Group’s customers to reduce the development time needed for new
products by visualising different models of bottles and jars, labelled and capped, full or empty.
Virtual tours
This app, used at trade shows, training courses and shop floor events, offers virtual tours of plants and
cullet sorting centres. It also offers a series of images showing the different stages in the glass production
process and in household glass sorting.
MyVerallia
This portal, rolled out in France, Spain and Germany, Italy, Brazil and Argentina and available on
computers and tablets, offers the Group’s customers access to catalogues where they can place and track
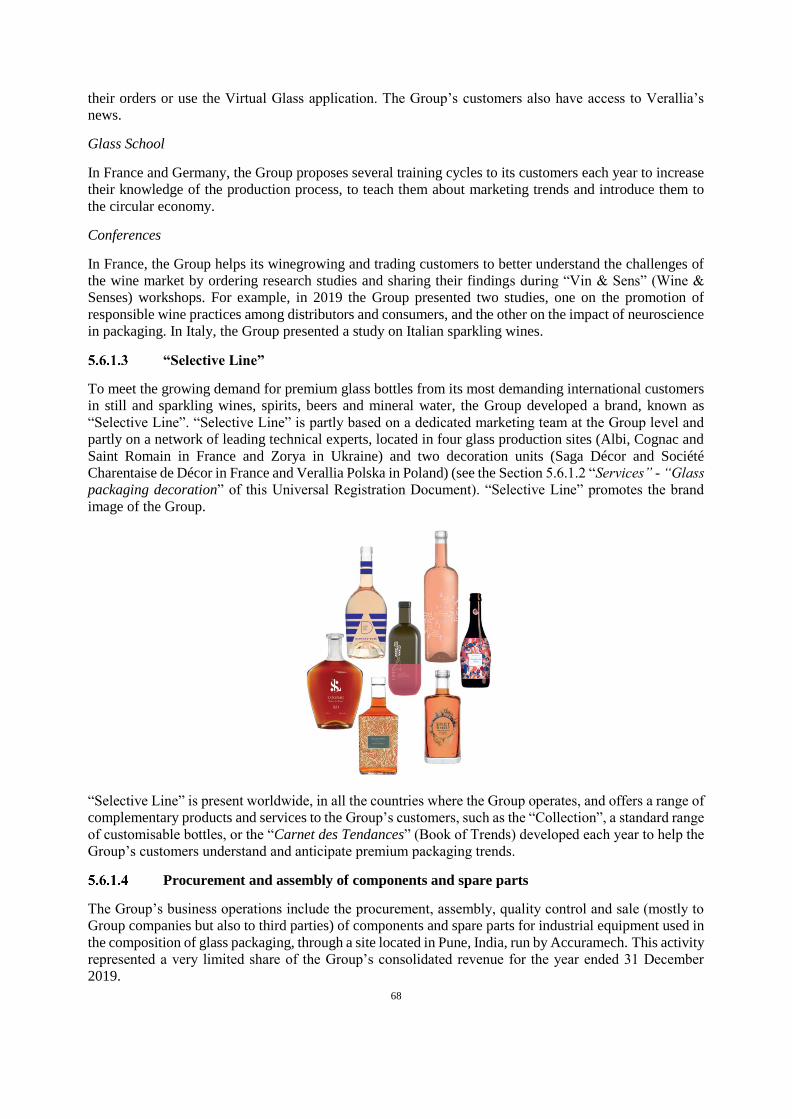
68
their orders or use the Virtual Glass application. The Group’s customers also have access to Verallia’s
news.
Glass School
In France and Germany, the Group proposes several training cycles to its customers each year to increase
their knowledge of the production process, to teach them about marketing trends and introduce them to
the circular economy.
Conferences
In France, the Group helps its winegrowing and trading customers to better understand the challenges of
the wine market by ordering research studies and sharing their findings during “Vin & Sens” (Wine &
Senses) workshops. For example, in 2019 the Group presented two studies, one on the promotion of
responsible wine practices among distributors and consumers, and the other on the impact of neuroscience
in packaging. In Italy, the Group presented a study on Italian sparkling wines.
“Selective Line”
To meet the growing demand for premium glass bottles from its most demanding international customers
in still and sparkling wines, spirits, beers and mineral water, the Group developed a brand, known as
“Selective Line”. “Selective Line” is partly based on a dedicated marketing team at the Group level and
partly on a network of leading technical experts, located in four glass production sites (Albi, Cognac and
Saint Romain in France and Zorya in Ukraine) and two decoration units (Saga Décor and Société
Charentaise de Décor in France and Verallia Polska in Poland) (see the Section 5.6.1.2 “Services” - “Glass
packaging decoration” of this Universal Registration Document). “Selective Line” promotes the brand
image of the Group.
“Selective Line” is present worldwide, in all the countries where the Group operates, and offers a range of
complementary products and services to the Group’s customers, such as the “Collection”, a standard range
of customisable bottles, or the “Carnet des Tendances” (Book of Trends) developed each year to help the
Group’s customers understand and anticipate premium packaging trends.
Procurement and assembly of components and spare parts
The Group’s business operations include the procurement, assembly, quality control and sale (mostly to
Group companies but also to third parties) of components and spare parts for industrial equipment used in
the composition of glass packaging, through a site located in Pune, India, run by Accuramech. This activity
represented a very limited share of the Group’s consolidated revenue for the year ended 31 December
2019.
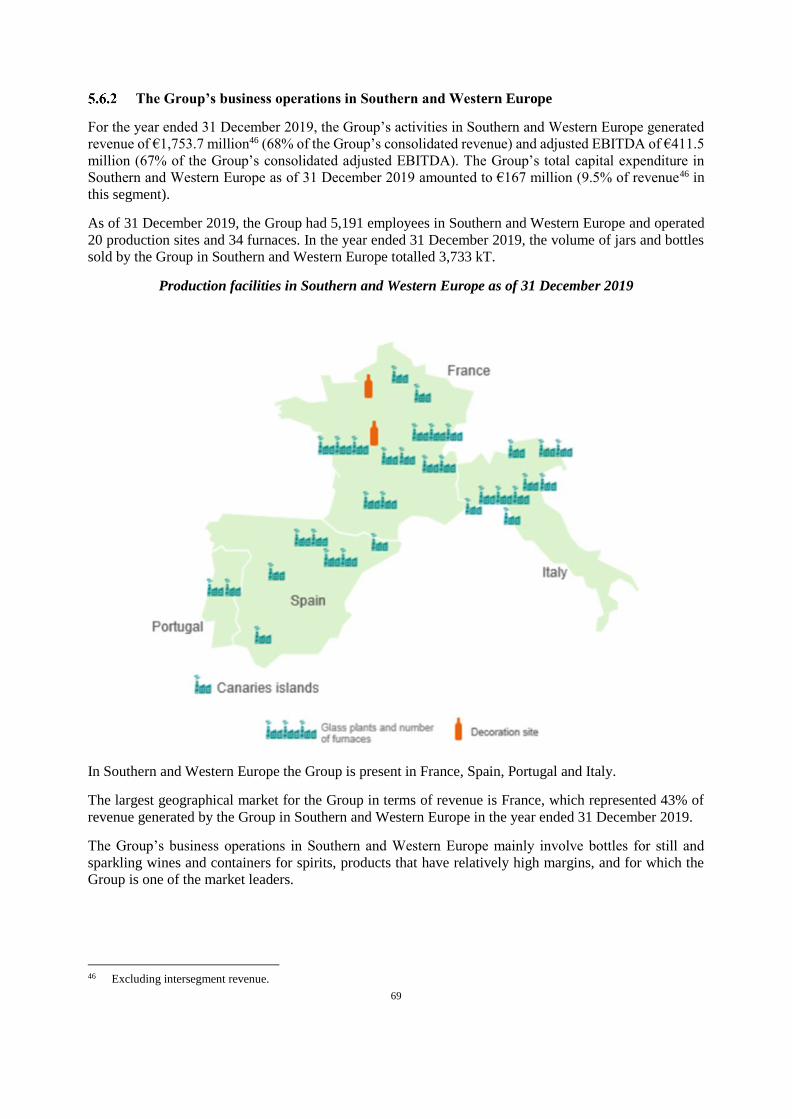
69
The Group’s business operations in Southern and Western Europe
For the year ended 31 December 2019, the Group’s activities in Southern and Western Europe generated
revenue of €1,753.7 million46 (68% of the Group’s consolidated revenue) and adjusted EBITDA of €411.5
million (67% of the Group’s consolidated adjusted EBITDA). The Group’s total capital expenditure in
Southern and Western Europe as of 31 December 2019 amounted to €167 million (9.5% of revenue46 in
this segment).
As of 31 December 2019, the Group had 5,191 employees in Southern and Western Europe and operated
20 production sites and 34 furnaces. In the year ended 31 December 2019, the volume of jars and bottles
sold by the Group in Southern and Western Europe totalled 3,733 kT.
Production facilities in Southern and Western Europe as of 31 December 2019
In Southern and Western Europe the Group is present in France, Spain, Portugal and Italy.
The largest geographical market for the Group in terms of revenue is France, which represented 43% of
revenue generated by the Group in Southern and Western Europe in the year ended 31 December 2019.
The Group’s business operations in Southern and Western Europe mainly involve bottles for still and
sparkling wines and containers for spirits, products that have relatively high margins, and for which the
Group is one of the market leaders.
46 Excluding intersegment revenue.
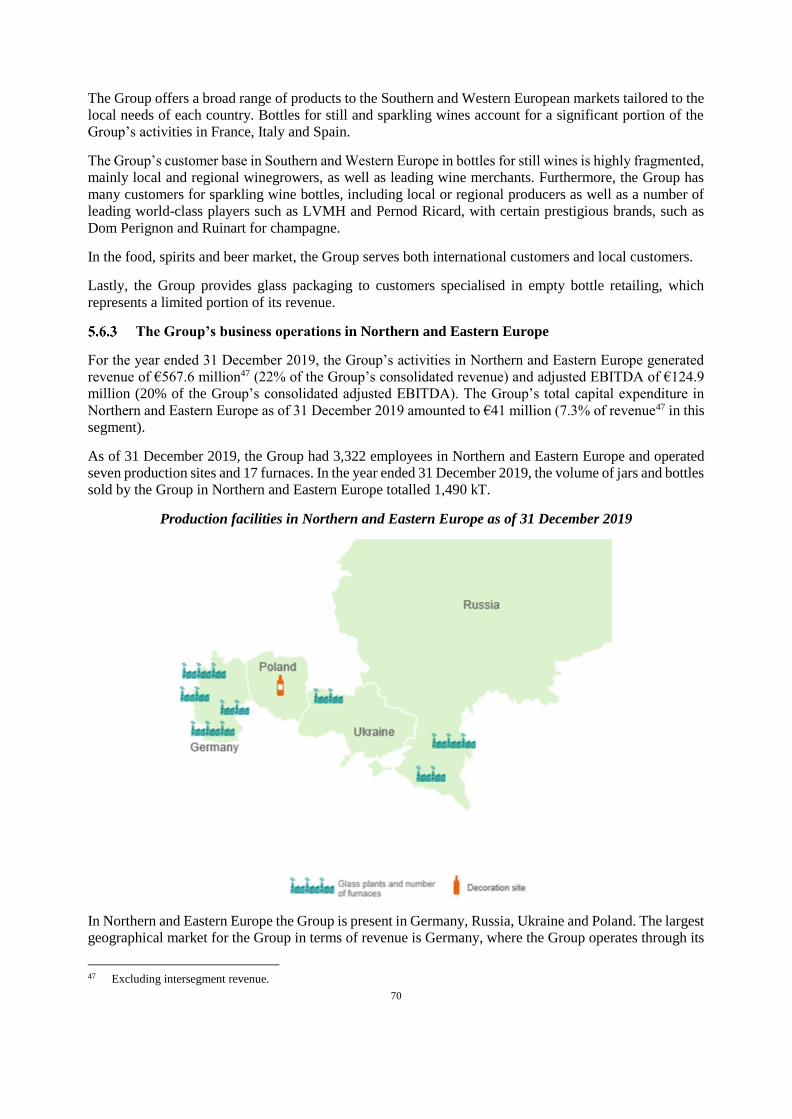
70
The Group offers a broad range of products to the Southern and Western European markets tailored to the
local needs of each country. Bottles for still and sparkling wines account for a significant portion of the
Group’s activities in France, Italy and Spain.
The Group’s customer base in Southern and Western Europe in bottles for still wines is highly fragmented,
mainly local and regional winegrowers, as well as leading wine merchants. Furthermore, the Group has
many customers for sparkling wine bottles, including local or regional producers as well as a number of
leading world-class players such as LVMH and Pernod Ricard, with certain prestigious brands, such as
Dom Perignon and Ruinart for champagne.
In the food, spirits and beer market, the Group serves both international customers and local customers.
Lastly, the Group provides glass packaging to customers specialised in empty bottle retailing, which
represents a limited portion of its revenue.
The Group’s business operations in Northern and Eastern Europe
For the year ended 31 December 2019, the Group’s activities in Northern and Eastern Europe generated
revenue of €567.6 million47 (22% of the Group’s consolidated revenue) and adjusted EBITDA of €124.9
million (20% of the Group’s consolidated adjusted EBITDA). The Group’s total capital expenditure in
Northern and Eastern Europe as of 31 December 2019 amounted to €41 million (7.3% of revenue47 in this
segment).
As of 31 December 2019, the Group had 3,322 employees in Northern and Eastern Europe and operated
seven production sites and 17 furnaces. In the year ended 31 December 2019, the volume of jars and bottles
sold by the Group in Northern and Eastern Europe totalled 1,490 kT.
Production facilities in Northern and Eastern Europe as of 31 December 2019
In Northern and Eastern Europe the Group is present in Germany, Russia, Ukraine and Poland. The largest
geographical market for the Group in terms of revenue is Germany, where the Group operates through its
47 Excluding intersegment revenue.
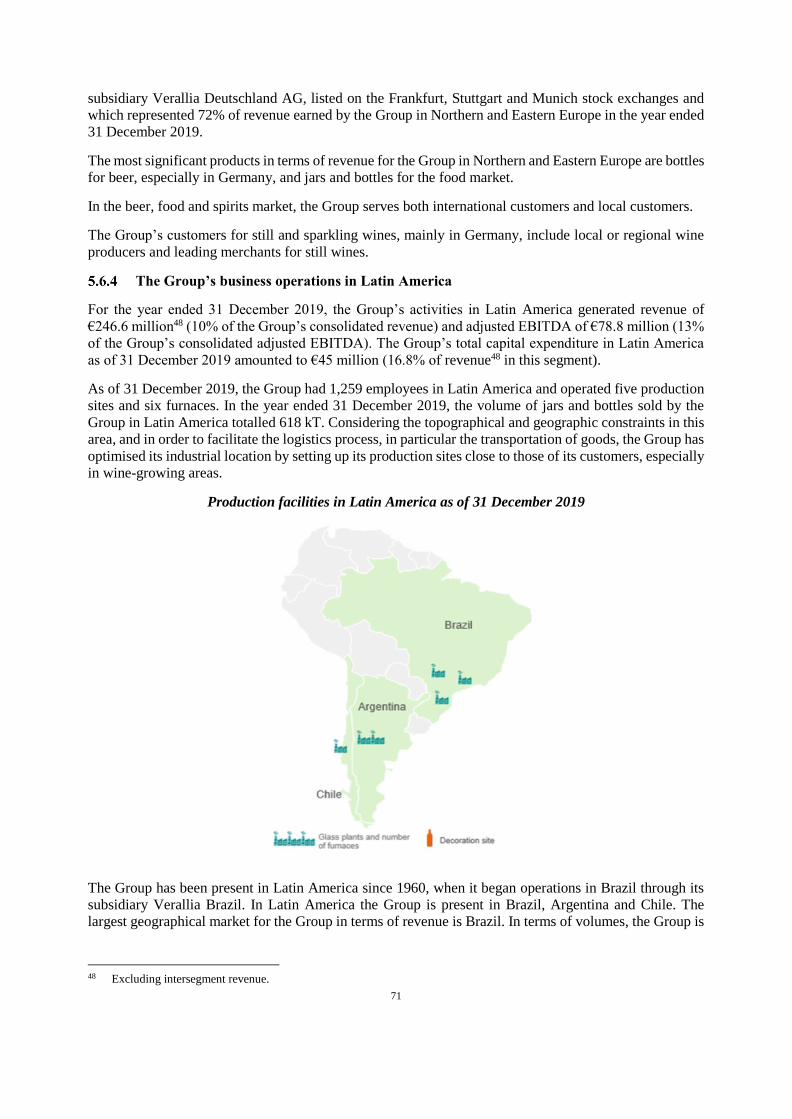
71
subsidiary Verallia Deutschland AG, listed on the Frankfurt, Stuttgart and Munich stock exchanges and
which represented 72% of revenue earned by the Group in Northern and Eastern Europe in the year ended
31 December 2019.
The most significant products in terms of revenue for the Group in Northern and Eastern Europe are bottles
for beer, especially in Germany, and jars and bottles for the food market.
In the beer, food and spirits market, the Group serves both international customers and local customers.
The Group’s customers for still and sparkling wines, mainly in Germany, include local or regional wine
producers and leading merchants for still wines.
The Group’s business operations in Latin America
For the year ended 31 December 2019, the Group’s activities in Latin America generated revenue of
€246.6 million48 (10% of the Group’s consolidated revenue) and adjusted EBITDA of €78.8 million (13%
of the Group’s consolidated adjusted EBITDA). The Group’s total capital expenditure in Latin America
as of 31 December 2019 amounted to €45 million (16.8% of revenue48 in this segment).
As of 31 December 2019, the Group had 1,259 employees in Latin America and operated five production
sites and six furnaces. In the year ended 31 December 2019, the volume of jars and bottles sold by the
Group in Latin America totalled 618 kT. Considering the topographical and geographic constraints in this
area, and in order to facilitate the logistics process, in particular the transportation of goods, the Group has
optimised its industrial location by setting up its production sites close to those of its customers, especially
in wine-growing areas.
Production facilities in Latin America as of 31 December 2019
The Group has been present in Latin America since 1960, when it began operations in Brazil through its
subsidiary Verallia Brazil. In Latin America the Group is present in Brazil, Argentina and Chile. The
largest geographical market for the Group in terms of revenue is Brazil. In terms of volumes, the Group is
48 Excluding intersegment revenue.
72
the second largest producer on the glass packaging market in Latin America, with a strong competitive
positioning for bottles for still wines and bottles for sparkling wines.
The Group’s operations in Latin America are mainly oriented towards bottles for still wines, an export-
driven market segment, as well as bottles for beer, in Brazil. The Group prioritises a strong industrial
presence in wine-growing areas and a positioning tailored to local specific needs outside these areas,
depending on the specific features of each country.
In the still wines, sparkling wines and food market, the Group serves both international customers and
local customers.
5.7 Investments
The Group’s main capital expenditure over the past three years
The Group’s total capital expenditure amounted to €252.5 million for the year ended 31 December 2019,
compared to €225 million for the year ended 31 December 2018 and €235.7 million for the year ended 31
December 2017. These capital expenditure comprised recurring capital expenditure and strategic capital
expenditure as indicated in the table below:
(in € million) Year ended 31
December 2019
Year ended
31 December 2018
Year ended
31 December 2017
Recurring
Capex
206.7 198.6 206.1
As a % of
revenue
8.0% 8.2% 8.6%
Strategic Capex 45.8 26.4 29.6
Total Capex 252.5 225.0 235.7
As a % of
revenue
9.8% 9.3% 9.8%
Recurring Capex
Recurring Capex mainly includes the purchase of property, plant and equipment and intangible fixed assets
required to run the business under the same conditions as applied previously. It mainly includes furnace
renovation and maintenance of IS machines. Even if the Group’s research and development work has
allowed the useful lives of its furnaces to reach 10, 12, or even 14 years, they still need to be renovated
periodically (since the molten glass in the furnaces wears down the refractory slabs).
The cost of completely renovating a furnace (excluding cost of its associated equipment) generally ranges
from €10 million to €15 million, and furnaces typically need to be renovated after 10 to 14 years of
operation. In the case of furnaces with intensive use of cullet, partial repairs at a cost of around €5 to €10
million must be planned after 6 to 8 years of operation.
The Group also performs maintenance operations on 20 to 30 IS machines every year on average,
representing a total amount of approximately €15 million per year.
The time required to renovate a furnace is generally 65 days on average and the downtime of a production
line for the maintenance of an IS machine is generally 3 weeks on average.

73
Recurring capital expenditure also include projects to increase the Group’s production capacity, comply
with applicable regulation, improve the flexibility of production facilities and the quality of products and
reduce operating costs.
Capacity capital expenditure include new commissioned lines, new sections added to a line and
capacity increases included in furnace renovation. The Group may decide to take advantage of furnace
renovation work to expand a furnace’s size and therefore increase its production capacity according
to expected demand.
Legally required capital expenditure correspond to investments required to comply with changes in
regulations applicable to the Group’s business lines. They mainly concern investments made to
comply with air emission standards or waste water quality.
Productivity/cost-cutting capital expenditure are linked to investments aimed at enhancing
productivity especially by increasing effectiveness or speed/reducing operating costs (for example
investments to reduce energy or raw material use).
Other capital expenditure mainly include non-industrial capital expenditure, such as IT and Research
& Development capital expenditure.
Strategic Capex
Strategic Capex corresponds to acquisitions of strategic assets that significantly enhance the Group’s
capacity or its scope (for example, the acquisition of plants or similar facilities, greenfield or brownfield
investments), including the building of additional new furnaces.
According to the Group’s estimates, the cost of building an entire plant with a single furnace (including
the associated equipment, such as a mixing equipment, distribution canal, feeder lines, blowing machines,
annealing lehrs and inspection and palletisation equipment) is typically around €80 million for annual
production of around 80,000 tonnes, depending, in particular, on the number of installed lines, machine
sizes, and utility and transportation connections (water, gas, electricity, roads, railways, etc.).
Main capital expenditure in progress or planned for the future
Main capital expenditure in progress
The main strategic investment finalised during the year ended 31 December 2019 is a “greenfield”
investment at the Jacutinga site in Brazil, which began operations in March 2019. This year also saw the
start of work on the new furnaces being built at the Azuqueca site in Spain and the Villa Poma site in Italy,
the other two strategic investments currently underway for the Group.
Main future capital expenditure
As of the date of this universal registration document, the Group's main strategic investments will be the
new furnaces under construction in Azuqueca and Villa Poma, for a cumulative amount of around €50
million. The construction of these furnaces should be completed for the second semester of 2020 (subject
to the impact that the Covid-19 pandemic might have on these works). The starting schedule of these two
new capacities will be adapted to demand of markets which are to be served, which is, as of the date of
this universal registration document, subject to the impact of the consequences of the Covid-19 pandemic
(see in particular paragraph 3.1.1. of this universal registration document).
Information on ownership interests
Information on ownership interests is contained in Note 3 of the Group's consolidated financial statements
for the year ended 31 December 2019.
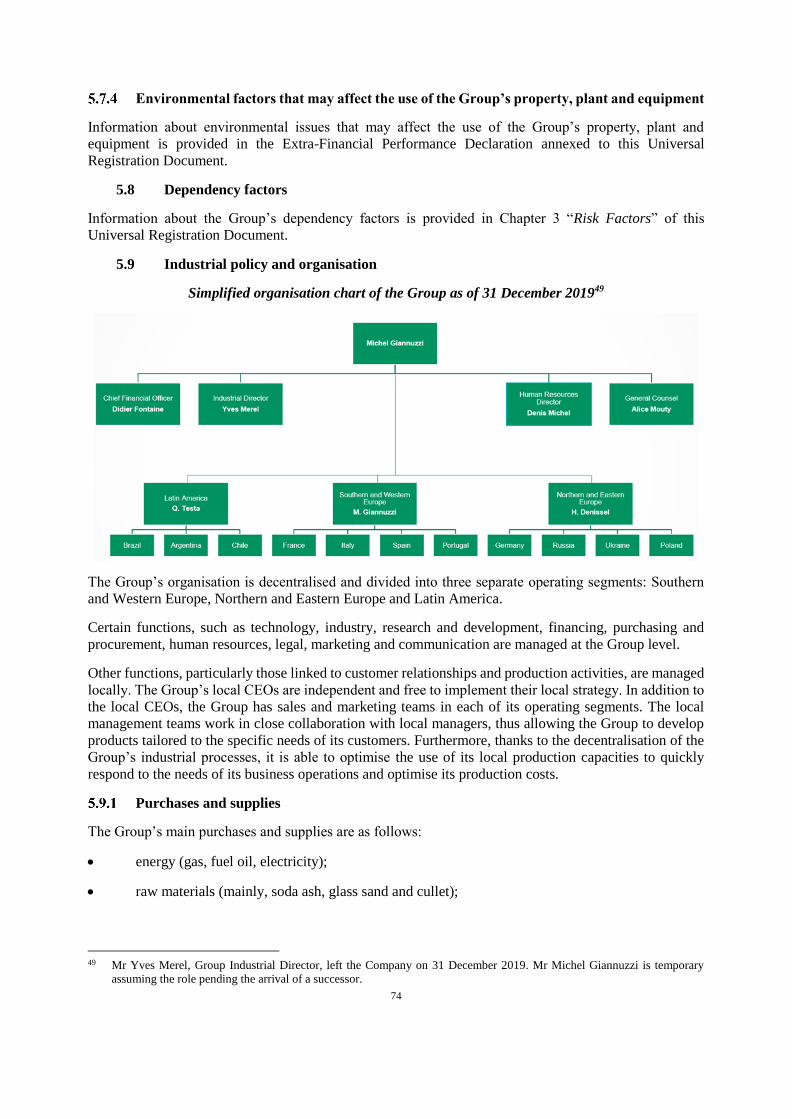
74
Environmental factors that may affect the use of the Group’s property, plant and equipment
Information about environmental issues that may affect the use of the Group’s property, plant and
equipment is provided in the Extra-Financial Performance Declaration annexed to this Universal
Registration Document.
5.8 Dependency factors
Information about the Group’s dependency factors is provided in Chapter 3 “Risk Factors” of this
Universal Registration Document.
5.9 Industrial policy and organisation
Simplified organisation chart of the Group as of 31 December 201949
The Group’s organisation is decentralised and divided into three separate operating segments: Southern
and Western Europe, Northern and Eastern Europe and Latin America.
Certain functions, such as technology, industry, research and development, financing, purchasing and
procurement, human resources, legal, marketing and communication are managed at the Group level.
Other functions, particularly those linked to customer relationships and production activities, are managed
locally. The Group’s local CEOs are independent and free to implement their local strategy. In addition to
the local CEOs, the Group has sales and marketing teams in each of its operating segments. The local
management teams work in close collaboration with local managers, thus allowing the Group to develop
products tailored to the specific needs of its customers. Furthermore, thanks to the decentralisation of the
Group’s industrial processes, it is able to optimise the use of its local production capacities to quickly
respond to the needs of its business operations and optimise its production costs.
Purchases and supplies
The Group’s main purchases and supplies are as follows:
energy (gas, fuel oil, electricity);
raw materials (mainly, soda ash, glass sand and cullet);
49 Mr Yves Merel, Group Industrial Director, left the Company on 31 December 2019. Mr Michel Giannuzzi is temporary
assuming the role pending the arrival of a successor.
75
transport of finished goods (mainly by road);
packaging (cardboard, plastic film, pallets, spacers);
industrial equipment; and
moulds.
The Group’s purchases and supplies are under the responsibility of the Group’s purchasing department,
comprising a director who coordinates the Group’s entire purchasing function and assisted by lead buyers
in charge of strategic families of Capex purchasing (some of whom work as operating buyers in a
purchasing department of a subsidiary or country where the Group has operations). The Group’s
purchasing department is more generally in charge of carrying out or coordinating the purchases of the
most strategic products.
The Group also has purchasing departments within its subsidiaries or in countries where the Group has
operations, which are generally in charge of operating purchases (such as transport or packaging). Some
purchases are pooled together regionally between the Group’s different companies, generally under the
responsibility of the Group’s purchasing department (in particular with respect to energy, raw material
purchases, and overheads).
Raw materials
Raw materials costs account for a significant portion of the Group’s production costs. During the year
ended 31 December 2019, the cost of raw materials rose 0.9%.
Glass intended for packaging is composed (by volume) (excluding cullet) of glass sand (between 60 and
70%), soda ash (between 10 and 20%), limestone (between 15 and 20%) and other substances, such as
colouring (between 0.5 and 5%). This composition varies significantly depending on the colours. Cullet,
derived from either waste from the glass production process or cullet processing plants, accounted for
nearly half of the Group’s raw materials for the year ended 31 December 2019. Cullet is used to optimise
production costs, as it helps to reduce energy use due to its relatively low molten temperature (a 10%
increase in the use of cullet leads to an average reduction in energy use by 2.5%). The use of cullet
significantly varies depending on the type of glass produced, and its utilisation rate can reach 95% for
certain types of glass. The Group’s goal is to use all the cullet at its disposal in order to reduce its energy
use and its carbon dioxide emissions and thus improve the carbon footprint of the glass packaging that it
produces. To this end, the Group has developed numerous initiatives, such as improving the collection of
domestic glass, improving the quality of cullet during its treatment or increasing the use of cullet in glass
production. Furthermore, to improve the cullet processing process and increase recycling, the Group has
made long-term investments in its eight cullet processing centres: two in France, operated through
Everglass; three in Italy, two of which are operated through Ecoglass and one in partnership with Vetreco;
one in Germany; and two in Spain, including a site operated in partnership with Calcin Iberico, allowing
it to directly power its glass production sites located close by (see the Extra-Financial Performance
Declaration annexed to this Universal Registration Document). In the case of furnaces with intensive use
of cullet, partial repairs at a cost of around €5 million to €10 million must be planned after 6 to 8 years of
operation.
Most of the Group’s soda ash and glass sand procurement contracts are signed for terms of six months to
one year. The limestone market is a local market; consequently, the Group signs a contract for each
production site, generally for one year.
Although the Group inserts price adjustment clauses in its commercial contracts, which directly or
indirectly reflect the changes in raw materials costs, most of its commercial contracts (signed for a period
of one year and which can be renewed upon the agreement of parties) do not have such clauses.
76
Energy costs
The Group’s main sources of energy are natural gas and, to a lesser extent, electricity and fuel oil. The
structure of the Group’s energy cost varies significantly depending on the production site concerned,
especially regarding the possibility of powering natural gas and fuel oil furnaces. During the year ended
31 December 2019, the cost of energy rose 6.7%. As energy is mainly consumed during glass melting,
each new furnace construction is an opportunity to improve the Group's performance in these areas.
Throughout the service life of furnaces (from 10 to 12 years, sometimes 14 years), the Group renovates its
furnaces in order to improve their consumption, especially with respect to sealing and thermal insulation,
optimisation of the temperature of the glass, combustion settings and adjustment of combustion air
volumes. Furthermore, to significantly reduce carbon dioxide emissions emitted when supplying power to
its furnaces, the Group has decided to prioritise natural gas over fuel oil. Other initiatives modelled on the
principles of the circular economy include using the heat recovered from furnace walls or smoke as a
heating source for the Group’s buildings or neighbouring towns. The Group has also invested in Industry
4.0 by introducing artificial intelligence into its plants (see the Extra-Financial Performance Declaration
annexed to this Universal Registration Document).
Most of the Group’s sales contracts are entered into for one year and may be renewed with the agreement
of both parties and do not include price adjustment clauses allowing a percentage of the increase or
decrease in energy costs to be reflected automatically in selling prices. The passing on of increases in the
Group’s production costs is then negotiated with customers when orders are placed or at the annual renewal
of contracts. Apart from purchases of energy at a fixed price that may be negotiated directly with suppliers
by the purchasing department, the Group has set up transactions to hedge part of the risks linked to energy
costs in situations where contractual adjustment mechanisms could not be provided. This applies to most
of the sales contracts concluded by the Group (see Section 3.6.2.2 “Management of operational risks” of
this Universal Registration Document).
Production
The manufacture of packaging glass requires command over technically complex industrial processes
requiring the use of heavy equipment. The production of container glassware mainly involves
transformation, by melting the different materials in the composition of glass or a mix of vitrifiable liquid
at extremely high temperatures, in order to subsequently shape the glass using forming techniques (blown-
blown/pressed-blown).
Thanks to its expertise in these fundamental skills of the glass production cycle and efficient industrial
facilities, the Group was able to produce around 16 billion bottles and jars in the year ended 31 December
2019.
The glass production cycle of bottles and jars
The glass production cycle includes three essential phases:
– The fusion of raw materials and cullet:
Once mixed together, raw materials and cullet are melted in furnaces at a temperature of around 1,550°C.
There is a time span of 24 hours between the introduction of the mix and the removal of the molten glass
from the furnace. The extremely high temperatures reached involve continuous production. Consequently,
these furnaces operate round the clock, 24/7. In addition to safety issues, the extremely high temperatures
are an environmental concern, given that the mass of molten glass releases large quantities of carbon
dioxide and smoke. The carbon dioxide is evacuated through chimneys fitted with filters.
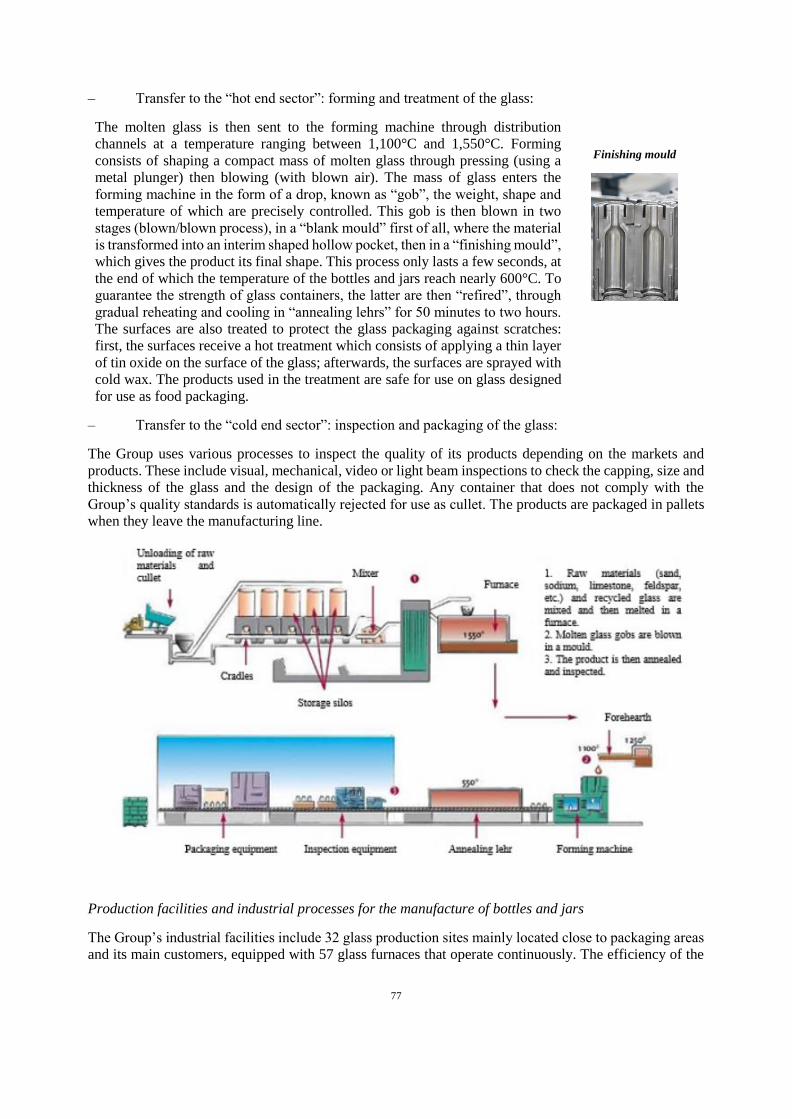
77
– Transfer to the “hot end sector”: forming and treatment of the glass:
The molten glass is then sent to the forming machine through distribution
channels at a temperature ranging between 1,100°C and 1,550°C. Forming
consists of shaping a compact mass of molten glass through pressing (using a
metal plunger) then blowing (with blown air). The mass of glass enters the
forming machine in the form of a drop, known as “gob”, the weight, shape and
temperature of which are precisely controlled. This gob is then blown in two
stages (blown/blown process), in a “blank mould” first of all, where the material
is transformed into an interim shaped hollow pocket, then in a “finishing mould”,
which gives the product its final shape. This process only lasts a few seconds, at
the end of which the temperature of the bottles and jars reach nearly 600°C. To
guarantee the strength of glass containers, the latter are then “refired”, through
gradual reheating and cooling in “annealing lehrs” for 50 minutes to two hours.
The surfaces are also treated to protect the glass packaging against scratches:
first, the surfaces receive a hot treatment which consists of applying a thin layer
of tin oxide on the surface of the glass; afterwards, the surfaces are sprayed with
cold wax. The products used in the treatment are safe for use on glass designed
for use as food packaging.
Finishing mould
– Transfer to the “cold end sector”: inspection and packaging of the glass:
The Group uses various processes to inspect the quality of its products depending on the markets and
products. These include visual, mechanical, video or light beam inspections to check the capping, size and
thickness of the glass and the design of the packaging. Any container that does not comply with the
Group’s quality standards is automatically rejected for use as cullet. The products are packaged in pallets
when they leave the manufacturing line.
Production facilities and industrial processes for the manufacture of bottles and jars
The Group’s industrial facilities include 32 glass production sites mainly located close to packaging areas
and its main customers, equipped with 57 glass furnaces that operate continuously. The efficiency of the
78
facilities is based on the optimal use of equipment, meeting the highest standards in the markets in which
it operates.
The strong performance of these production facilities and their ability to adapt to different markets is
essential considering the high investment costs for equipment used in the industry.
The efficiency of the equipment used is measured with respect to its productivity, flexibility and its
capability in terms of production requirements. Heavy machinery has been standardised, which gives the
Group the freedom to shift the production of a range of products from one production line to another and
even from one site to another. On certain production lines, known as “flex lines”, the use of versatile
machinery means that between two and four different types of items can be produced on the same
production line. The Group takes advantage of the flexibility of its production facilities to optimise its
responsiveness and accordingly reduce the storage of finished goods. Standardising equipment by product
family fosters the development of technical synergies (such as transfer of best practices and know-how
from one site to another).
The efficiency of the Group’s industrial processes also lies in its capacity to maintain a high utilisation
rate of its equipment, in particular its furnaces. Factors affecting the utilisation rate of furnaces mainly
include the number of changes to the colour of the glass and the optimisation of the packaging mix on all
lines, in order to maximise utilisation of the furnace draught. The possibility of producing a high number
of bottles of the same colour at the same time and the flexibility of production lines provide opportunities
for the Group to obtain maximum advantage from the utilisation capacity of a furnace.
Furthermore, the Group strives to have powerful and effective furnaces, in terms of energy consumption
and life span. The Group’s industrial and commercial location can allow it to temporarily transfer
production from one site to another in order to meet a specific demand or limit the impact of certain
industrial constraints, such as a furnace under repair. Lastly, in order to address the change in demand, in
2019, the Group started building a new furnace in Azuqueca, Spain and another in Villa Poma, Italy,
expected to be operational by 2020, subject to the impact that the Covid-19 pandemic might have on the
glass packaging market and construction works related to these furnaces, the starting schedule of which
will be adapted to demand on the markets they will serve, which is, as of the date of this universal
registration document, subject to the impact of the consequences of the Covid-19 pandemic (see Sections
3.1.1 and 5.7 “Capital expenditure” of this Universal Registration Document).
The Group’s quality, environment, health and safety certification policy
In all the territories where it has business operations, the Group sets up standards for quality, logistics,
management of customer satisfaction and environmental performance.
The Group has a history of investing substantially to ensure that all of its teams participate in a quality
approach, which specifically includes the existence of jointly written processes that can be shared as well
as track their modification if necessary. As such, the Group performs different audits every year to ensure
that the quality and standards with respect to the environment, hygiene and safety are complied with.
The main standards and methods in force in the Group refer to the following standards:
ISO 14001: This standard states the requirements for an environmental management system
(EMS) serving as the framework for defining a policy and objectives that reflect legislative
requirements and disclosures on significant environmental impacts.
ISO 9001: This standard states the organisational requirements for the existence of a quality
management system that can be used to provide, on a regular basis, a product compliant with the
customer’s requirements and with the applicable regulatory requirements and focuses on
implementing continuous improvement processes.

79
ISO 22000: This standard guarantees that food risk for consumers is taken into account on the
entire production process. In concrete terms, this standard sets out the requirements that must be
met by a food safety management system (FSMS), a collection of processes designed to enable
the company’s management to guarantee the effective application of its policy for controlling the
risks linked to food safety and the constant improvement of its objectives, in order to propose safe
products that will meet customer and regulatory requirements.
HACCP (Hazard Analysis Critical Control Point): This system identifies, assesses and controls
significant dangers with respect to food safety. There is no “HACCP certification” properly
speaking, because it is a process that is part of the ISO 22000 standard.
OHSAS 18001 (Occupational Health and Safety Assessment Systems): This occupational health
and safety management system model aims to reduce risks in terms of health and safety in the
work environment.
At the date of this Universal Registration Document, all of the Group’s glass production sites had obtained
ISO 9001, ISO 14001 and OHSAS 18001 certification. 25 of the Group’s 32 glass production sites are
certified ISO 22000. The Group is continuing the site certification process, with a goal of 100% of sites
certified in 2021. The Group’s plants in France were the first food industry packaging glass production
sites to obtain ISO 22000 certification in Europe.
Sales and marketing policies
The Group’s main business is centred on the development, production and sale of glass packaging for the
food and beverage industries.
In terms of marketing, and in general, all of the Group’s companies must be able to offer customers
services tailored to their local market. This requires efficient tools that are compliant with local standards.
These policies are aligned as closely as possible to the history, trends and sensitivity of each of the regional
markets. The marketing and product development organisation of each of the Group’s companies has been
developed accordingly. The Group also relies on its sales force of more than 300 locally based employees,
who work in close collaboration with customers.
The Group believes that its understanding of local markets, customers’ expectations and competition allow
it to better adapt its price, product and service policy to obtain the best performance. This policy is mainly
reflected in an extended and scalable offering in terms of products and services (see Section 5.6.1 “The
Group’s products and services” in this Universal Registration Document).
Research and development, patents and licences
Research and development
Innovation constitutes an ongoing challenge for the Group's companies within the broader context of the
Group’s focus on establishing an up-market position for its products and the sale of products and services,
using effective and environmentally-friendly production facilities that offer a high level of added value.
Innovation within the Group is centred around three main principles addressed within the framework of a
structural project:
respect for health, the environment and sustainable development, assessed throughout the life
cycle of the Group’s products, including the reduction of greenhouse gases and recycling;
value creation and differentiation achieved through the Group's products and services; and
quality of products and services in order to satisfy the expectations of the Group's customers.
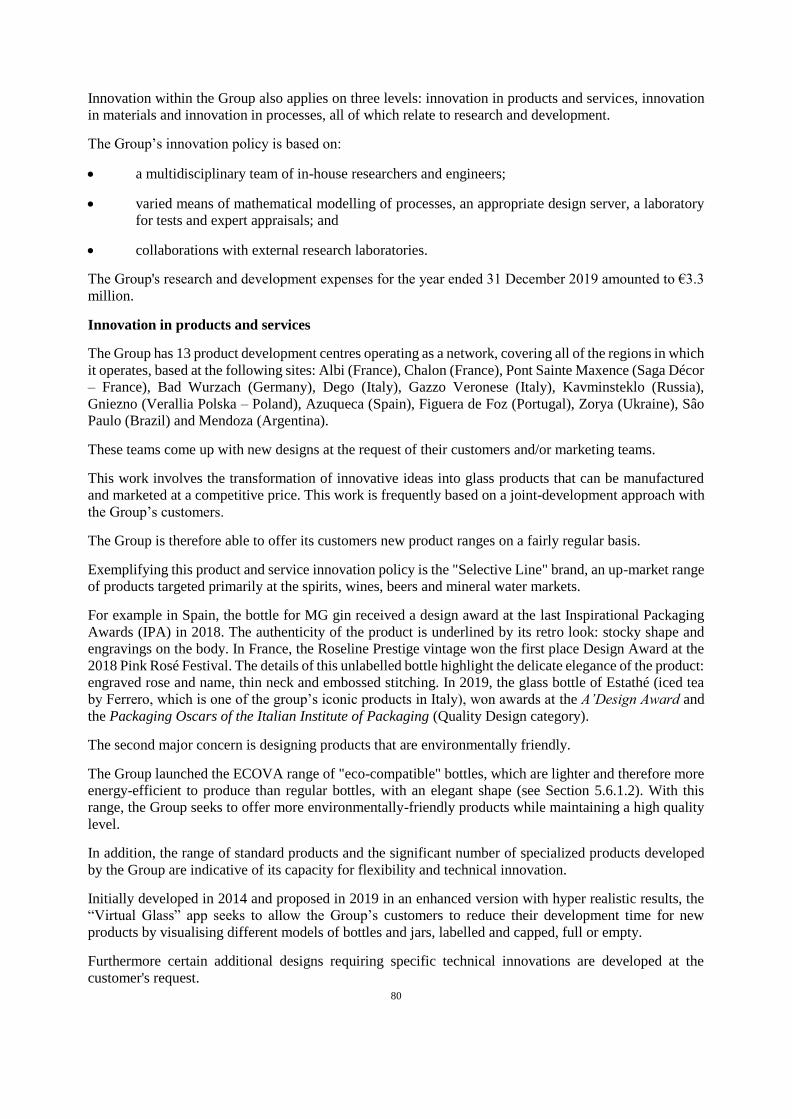
80
Innovation within the Group also applies on three levels: innovation in products and services, innovation
in materials and innovation in processes, all of which relate to research and development.
The Group’s innovation policy is based on:
a multidisciplinary team of in-house researchers and engineers;
varied means of mathematical modelling of processes, an appropriate design server, a laboratory
for tests and expert appraisals; and
collaborations with external research laboratories.
The Group's research and development expenses for the year ended 31 December 2019 amounted to €3.3
million.
Innovation in products and services
The Group has 13 product development centres operating as a network, covering all of the regions in which
it operates, based at the following sites: Albi (France), Chalon (France), Pont Sainte Maxence (Saga Décor
– France), Bad Wurzach (Germany), Dego (Italy), Gazzo Veronese (Italy), Kavminsteklo (Russia),
Gniezno (Verallia Polska – Poland), Azuqueca (Spain), Figuera de Foz (Portugal), Zorya (Ukraine), Sâo
Paulo (Brazil) and Mendoza (Argentina).
These teams come up with new designs at the request of their customers and/or marketing teams.
This work involves the transformation of innovative ideas into glass products that can be manufactured
and marketed at a competitive price. This work is frequently based on a joint-development approach with
the Group’s customers.
The Group is therefore able to offer its customers new product ranges on a fairly regular basis.
Exemplifying this product and service innovation policy is the "Selective Line" brand, an up-market range
of products targeted primarily at the spirits, wines, beers and mineral water markets.
For example in Spain, the bottle for MG gin received a design award at the last Inspirational Packaging
Awards (IPA) in 2018. The authenticity of the product is underlined by its retro look: stocky shape and
engravings on the body. In France, the Roseline Prestige vintage won the first place Design Award at the
2018 Pink Rosé Festival. The details of this unlabelled bottle highlight the delicate elegance of the product:
engraved rose and name, thin neck and embossed stitching. In 2019, the glass bottle of Estathé (iced tea
by Ferrero, which is one of the group’s iconic products in Italy), won awards at the A’Design Award and
the Packaging Oscars of the Italian Institute of Packaging (Quality Design category).
The second major concern is designing products that are environmentally friendly.
The Group launched the ECOVA range of "eco-compatible" bottles, which are lighter and therefore more
energy-efficient to produce than regular bottles, with an elegant shape (see Section 5.6.1.2). With this
range, the Group seeks to offer more environmentally-friendly products while maintaining a high quality
level.
In addition, the range of standard products and the significant number of specialized products developed
by the Group are indicative of its capacity for flexibility and technical innovation.
Initially developed in 2014 and proposed in 2019 in an enhanced version with hyper realistic results, the
“Virtual Glass” app seeks to allow the Group’s customers to reduce their development time for new
products by visualising different models of bottles and jars, labelled and capped, full or empty.
Furthermore certain additional designs requiring specific technical innovations are developed at the
customer's request.

81
The Group also offers its customers new glass packaging possibilities thanks to its innovation on heat-
sealing, pasteurisation and sterilisation procedures. This new function allows the Group to redesign
product ranges and to consider replacing other packaging materials with glass packaging.
Innovation in materials
The Group is working on developing the performance and properties of glass used as a packaging material
for food and drink products. This project requires the support of experienced chemical engineers
specialising in studying and analysing glass composition.
Innovation in glass melting and forming processes
In addition to the composition of glass, the Group is pursuing research and development activities relating
to the strategic production processes of glass melting and forming.
Using modelling tools, the Group is working to optimise its "hot" and "cold" processes.
Research and development activities linked to forming are mainly intended to improve the operation of
certain forming machines by optimising heat exchanges during forming operations; as well as reducing
the greasing of moulds or making them automated, with a dual goal of protecting occupational health and
the environment.
Research and development activities relating to glass melting operations aim to improve furnace
performance, with the main goal of reducing greenhouse gas emissions and pollutants by optimising firing
and reducing consumption.
Furthermore, the Group is committed to its future and to that of communities in a global initiative that
includes research and development in order to reduce the carbon footprint of its glass production, at the
level of both fusion and raw materials.
One of the pillars is using renewable energy, which helps to cut carbon dioxide fossil fuel emissions from
production plants and also contributes to reducing the environmental impact through waste recovery in the
region in which the emissions are located.
Trademarks, patents and models
Patents
The Group has an industrial protection policy that protects its inventions and ideas using one of three
possible solutions:
applying for a patent, which presents advantages in terms of the legal protection afforded but
exposes the Group to high costs, particularly when applying for international patent protection;
applying for a "Soleau envelope", which presents the advantages of low cost and a high level of
confidentiality, but does not allow the Group to oppose the development of the same application
by a rival; and
the sale of the invention or transfer of rights of use by a partner, in the case of equipment not
expected to be subject to absolute exclusivity.
As of the date of this Universal Registration Document, and after cost-optimising and rationalising the
management of the portfolio of patents held, which led to the abandonment of four patent families, the
Group has approximately 40 patent families in force or in process, the majority of which are granted or
pending in several countries, representing a total of more than 390 patents.
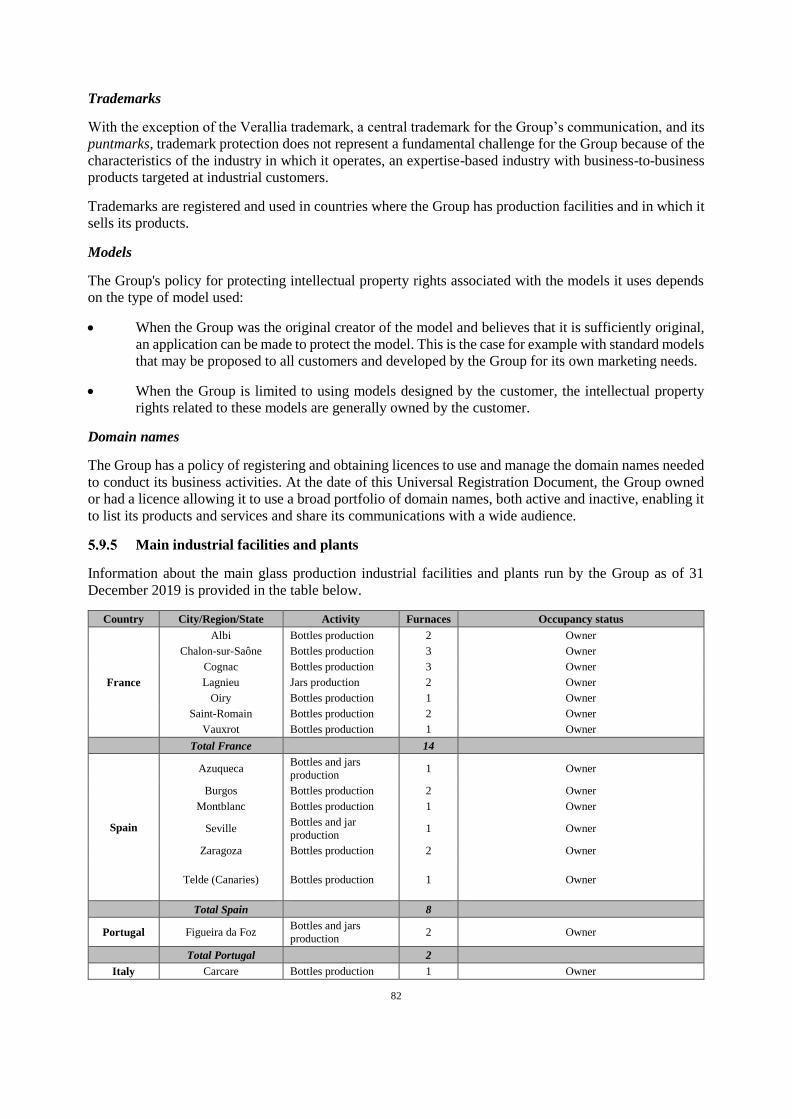
82
Trademarks
With the exception of the Verallia trademark, a central trademark for the Group’s communication, and its
puntmarks, trademark protection does not represent a fundamental challenge for the Group because of the
characteristics of the industry in which it operates, an expertise-based industry with business-to-business
products targeted at industrial customers.
Trademarks are registered and used in countries where the Group has production facilities and in which it
sells its products.
Models
The Group's policy for protecting intellectual property rights associated with the models it uses depends
on the type of model used:
When the Group was the original creator of the model and believes that it is sufficiently original,
an application can be made to protect the model. This is the case for example with standard models
that may be proposed to all customers and developed by the Group for its own marketing needs.
When the Group is limited to using models designed by the customer, the intellectual property
rights related to these models are generally owned by the customer.
Domain names
The Group has a policy of registering and obtaining licences to use and manage the domain names needed
to conduct its business activities. At the date of this Universal Registration Document, the Group owned
or had a licence allowing it to use a broad portfolio of domain names, both active and inactive, enabling it
to list its products and services and share its communications with a wide audience.
Main industrial facilities and plants
Information about the main glass production industrial facilities and plants run by the Group as of 31
December 2019 is provided in the table below.
Country City/Region/State Activity Furnaces Occupancy status
France
Albi Bottles production 2 Owner
Chalon-sur-Saône Bottles production 3 Owner
Cognac Bottles production 3 Owner
Lagnieu Jars production 2 Owner
Oiry Bottles production 1 Owner
Saint-Romain Bottles production 2 Owner
Vauxrot Bottles production 1 Owner
Total France 14
Spain
Azuqueca Bottles and jars
production 1 Owner
Burgos Bottles production 2 Owner
Montblanc Bottles production 1 Owner
Seville Bottles and jar
production 1 Owner
Zaragoza Bottles production 2 Owner
Telde (Canaries) Bottles production 1 Owner
Total Spain 8
Portugal Figueira da Foz Bottles and jars
production 2 Owner
Total Portugal 2
Italy Carcare Bottles production 1 Owner
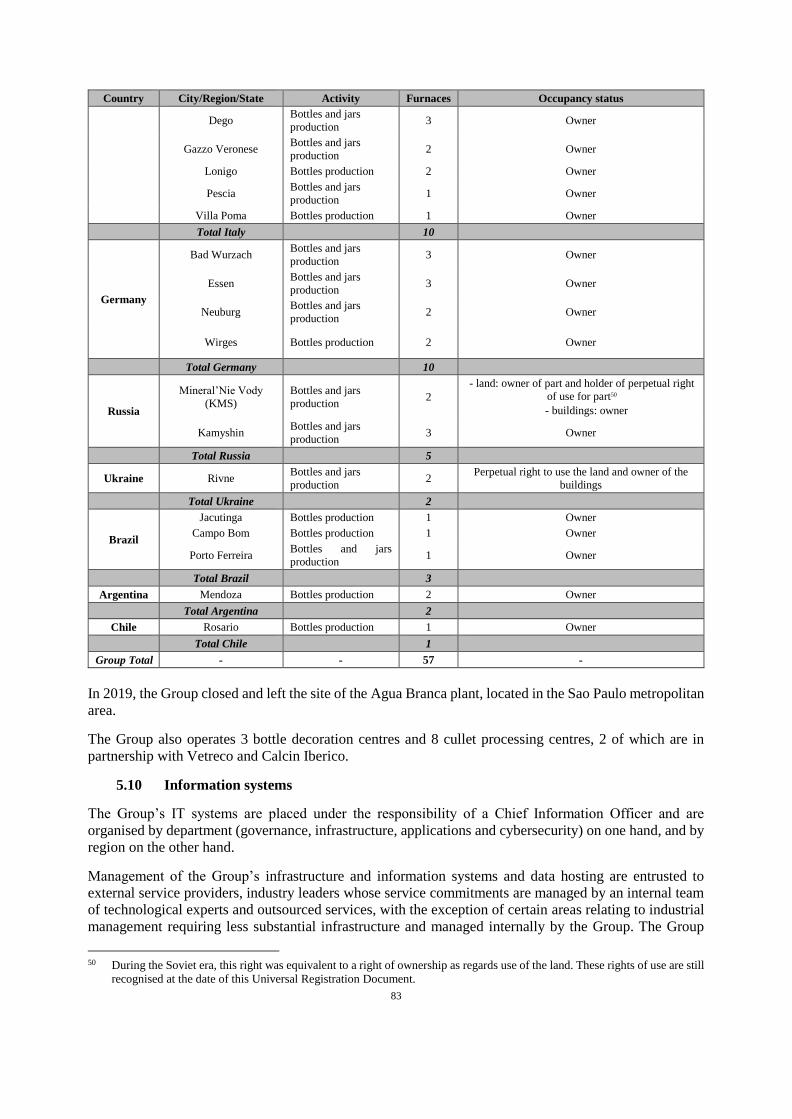
83
Country City/Region/State Activity Furnaces Occupancy status
Dego Bottles and jars
production 3 Owner
Gazzo Veronese Bottles and jars
production 2 Owner
Lonigo Bottles production 2 Owner
Pescia Bottles and jars
production 1 Owner
Villa Poma Bottles production 1 Owner
Total Italy 10
Germany
Bad Wurzach Bottles and jars
production 3 Owner
Essen Bottles and jars
production 3 Owner
Neuburg Bottles and jars
production 2 Owner
Wirges Bottles production 2 Owner
Total Germany 10
Russia
Mineral’Nie Vody
(KMS)
Bottles and jars
production 2
- land: owner of part and holder of perpetual right
of use for part50
- buildings: owner
Kamyshin Bottles and jars
production 3 Owner
Total Russia 5
Ukraine Rivne Bottles and jars
production 2
Perpetual right to use the land and owner of the
buildings
Total Ukraine 2
Brazil
Jacutinga Bottles production 1 Owner
Campo Bom Bottles production 1 Owner
Porto Ferreira Bottles and jars
production 1 Owner
Total Brazil 3
Argentina Mendoza Bottles production 2 Owner
Total Argentina 2
Chile Rosario Bottles production 1 Owner
Total Chile 1
Group Total - - 57 -
In 2019, the Group closed and left the site of the Agua Branca plant, located in the Sao Paulo metropolitan
area.
The Group also operates 3 bottle decoration centres and 8 cullet processing centres, 2 of which are in
partnership with Vetreco and Calcin Iberico.
5.10 Information systems
The Group’s IT systems are placed under the responsibility of a Chief Information Officer and are
organised by department (governance, infrastructure, applications and cybersecurity) on one hand, and by
region on the other hand.
Management of the Group’s infrastructure and information systems and data hosting are entrusted to
external service providers, industry leaders whose service commitments are managed by an internal team
of technological experts and outsourced services, with the exception of certain areas relating to industrial
management requiring less substantial infrastructure and managed internally by the Group. The Group
50 During the Soviet era, this right was equivalent to a right of ownership as regards use of the land. These rights of use are still
recognised at the date of this Universal Registration Document.
84
owns most of its servers, while the rest of the servers are rented on the cloud of an external service provider,
a leading Cloud services company.
Furthermore, in 2018 the Group defined a comprehensive security policy for its IT systems, which
particularly factored in the NotPetya cyber-attack (see Section 3.2.13 “Risks linked to IT systems” of this
Universal Registration Document) and mainly included the drafting of a Group-wide security policy for
IT systems (also covering industrial IT) and rules and the installation of effective flagship industry security
software and applications. The Group performs regular security audits on its IT systems. This policy is
reviewed annually to take into account the evolution of threats and the results of the various audits.
The Group’s IT systems include a large number of software and applications, mostly purchased off-the-
shelf, such as the SAP software suite, and used in particular to manage the logistics chain, produce
consolidated financial data, and manage customers, reporting, supplies and employee pay. The
applications are managed at the central level by the Group Applications Director, who works with a local
counterpart.
6. ORGANISATIONAL STRUCTURE AND INTRA-GROUP RELATIONS
6.1 Simplified Group organisational chart on the date of this Universal Registration
Document
AIF VIII Euro Leverage, L.P. is an investment fund managed by an affiliate of Apollo Global Management Inc.
The legal reorganisation implemented in relation to the initial public offering of the Company are described
in note 1 of the consolidated financial statements of the Group for the financial year ended 31 December
2019 included in paragraph 18.1.1 of this universal registration document.
6.2 Subsidiaries and equity interests
(i) Principal subsidiaries
The principal direct or indirect subsidiaries of the Company as of 31 December 2019 are described below:
– Verallia Packaging is a French simplified joint stock company (société par actions simplifiée),
capitalised at €5,992,464, with its registered office at Tour Carpe Diem, Place des Corolles,
Esplanade Nord, 92400 Courbevoie, France, and registered under number 811 530 302 in the
Nanterre Trade and Companies Register.
85
– Verallia France is a French joint stock company (société anonyme), capitalised at €34,378,708,
with its registered office at Tour Carpe Diem, Place des Corolles, Esplanade Nord, 92400
Courbevoie, France, and registered under 722 034 592 in the Nanterre Trade and Companies
Register.
– VOA Verrerie d’Albi is a French simplified joint stock company (société par actions simplifiée),
capitalised at €18,032,996, with registered office at rue François Arago, Zone Industrielle Saint-
Juéry, 81011 Albi Cedex 9, France, and registered under number 321 354 516 in the Albi Trade
and Companies Register.
– Verallia Italia S.p.A. is an Italian stock company (società per azioni), capitalised at
€14,845,808.64, with registered office at Via Del Lavoro 1, 36045 Lonigo, Loc. Almisano
(Vicenza), Italy, and registered under number 00730720240 (tax code) in the Italian Companies
Register (registro delle imprese di Vicenza).
– Verallia Brasil S.A. is a Brazilian company, capitalised at 688,590,008.84 Brazilian reals, with
registered office at Rua Werner Von Siemens, Nº 111, Torre A, 8th Floor, Lapa de Baixo, São
Paulo/SP, Brazil, and registered under number 60.853.942/0001-44 in the National Register of
Legal Entities.
– Verallia Spain is a Spanish joint stock company (sociedad anonima), capitalised at
€40,171,921.80, with registered office at Principe de Vergara 132, 28046 Madrid, Spain and
registered under number CIF A19001304, volume 1355, page 814, Sheet M-95028 in the Spanish
Business Register (registradores de España).
– Verallia Portugal is a Portuguese joint stock company (sociedade anonima), capitalised at
€22,446,000, with registered office at Rua da Vidreira 68, Fontela, 3090 641 Figueira da Foz,
Portugal, and registered under number NIPC 501793160 in the Portuguese Commercial Register
(registo comercial).
– Rayen Curá is an Argentine company capitalised at 74,112,250 Argentine pesos, with its
registered office at Calle Carril Nacional, Nº 6070, Rodeo de la Cruz, Mendoza, Argentina, and
registered under number 3627, page 327, volume A of the Public Commerce Registry of Mendoza.
– Verallia Deutschland is a German company (aktiengesellschaft), capitalised at €26,000,000, with
registered office at 1-8 Oberlandstrasse, 88410 Bad Wurzarch, Germany, and registered under
number HRB 610192 in the German Business Register (Handelregister B des Amtsgerichts Um).
– Verallia Ukraine is a Ukrainian company, capitalised at 362,006,759.40 Ukrainian hryvnias, with
its registered office at 1 Promyslova St., Village of Zorya, Rivnensky Rayon, Rivnenska Oblast,
35314, Ukraine and registered under number 22555135 in the Ukrainian Business Register.
(ii) Recent acquisitions and disposals
The Group’s recent acquisitions and disposals are described in Section 7.1.2.7 of this Universal
Registration Document.
86
7. ANALYSIS OF THE GROUP’S FINANCIAL POSITION AND RESULTS
Readers are invited to read the following information on the Group’s results in conjunction with the
Group’s consolidated financial statements for the financial year ended 31 December 2019, as contained
in Section 18.1 of this Universal Registration Document.
The Group’s consolidated financial statements for the financial year ended 31 December 2019 have been
prepared in accordance with International Financial Reporting Standards (IFRS), as adopted by the
European Union. The Statutory Auditors’ audit report on the consolidated financial statements of the
Group for the financial year ended 31 December 2019 is contained in Section 18.1.2 of this Universal
Registration Document.
In accordance with article 19 of Regulation (EU) n° 2017/1129 of the European Parliament and the
Council of 14 June 2017, the comparison of the results of the Group for the financial years ended 31
December 2018 and 2017 set out in chapter 7 “Analysis of the Group’s financial position and results” of
the registration document of the Company approved by the Financial markets authority on 4 September
2019 under number I. 19-031 (the “Registration Document”) is incorporated by reference in this
Universal registration document.
7.1 Overview
Introduction
The Group is the third largest producer in the world and the leading European producer51 (based on revenue) of glass packaging for beverages and food. In terms of volumes sold, it is the second largest producer in Latin America52. The Group offers innovative, customised and environmentally friendly solutions to more than 10,000 customers53 worldwide.
The Group uses the following segmentation for reporting purposes based on geographical area,
depending on the location of the assets:
– Southern and Western Europe, comprising production plants located in France, Italy, Spain and
Portugal. Southern and Western Europe accounted for 68% of consolidated revenue and 67%
of the Group’s adjusted EBITDA for the year ended 31 December 2019. The Group’s
operations in Southern and Western Europe are mainly oriented towards bottles for still and
sparkling wines and packaging for spirits, which are export-driven market segments;
– Northern and Eastern Europe, comprising production plants located in Germany, Russia,
Ukraine and Poland. Northern and Eastern Europe accounted for 22% of consolidated revenue
and 20% of the Group’s adjusted EBITDA for the year ended 31 December 2019. The Group’s
operations in Northern and Eastern Europe are mainly oriented towards bottles for beer,
particularly in Germany, and jars and bottles for food, mostly for local markets;
– Latin America, comprising production plants located in Brazil, Argentina and Chile. Latin
America accounted for 10% of consolidated revenue and 13% of the Group’s adjusted EBITDA
for the year ended 31 December 2019. The Group’s operations in Latin America are mainly
oriented towards bottles for still wines, an export-driven market segment, as well as bottles for
beer in Brazil.
The Group addresses a wide variety of end markets, ranging from bottles for still and sparkling
wines to bottles for spirits, bottles for beer, and jars and bottles for food and soft drinks. The
51 On the basis of the revenue earned in 2019 by market players in Europe (as defined by these players), as extracted from
publicly available information (annual reports and press releases in particular) and on the basis of Company estimates.
52 Based on volumes sold in 2019 in Argentina, Brazil and Chile.
53 Customers who placed at least one order during the 2016–2019 period.
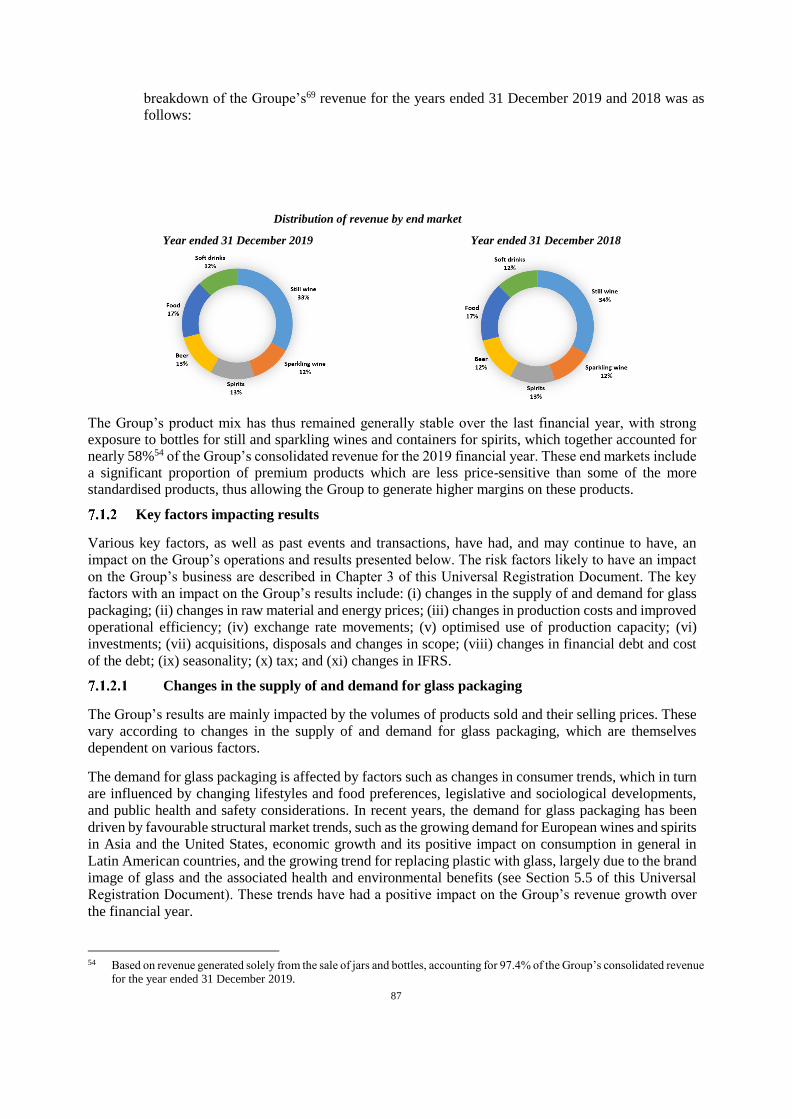
87
breakdown of the Groupe’s69 revenue for the years ended 31 December 2019 and 2018 was as
follows:
Distribution of revenue by end market
Year ended 31 December 2019 Year ended 31 December 2018
The Group’s product mix has thus remained generally stable over the last financial year, with strong exposure to bottles for still and sparkling wines and containers for spirits, which together accounted for nearly 58%54 of the Group’s consolidated revenue for the 2019 financial year. These end markets include a significant proportion of premium products which are less price-sensitive than some of the more standardised products, thus allowing the Group to generate higher margins on these products.
Key factors impacting results
Various key factors, as well as past events and transactions, have had, and may continue to have, an
impact on the Group’s operations and results presented below. The risk factors likely to have an impact
on the Group’s business are described in Chapter 3 of this Universal Registration Document. The key
factors with an impact on the Group’s results include: (i) changes in the supply of and demand for glass
packaging; (ii) changes in raw material and energy prices; (iii) changes in production costs and improved
operational efficiency; (iv) exchange rate movements; (v) optimised use of production capacity; (vi)
investments; (vii) acquisitions, disposals and changes in scope; (viii) changes in financial debt and cost
of the debt; (ix) seasonality; (x) tax; and (xi) changes in IFRS.
Changes in the supply of and demand for glass packaging
The Group’s results are mainly impacted by the volumes of products sold and their selling prices. These
vary according to changes in the supply of and demand for glass packaging, which are themselves
dependent on various factors.
The demand for glass packaging is affected by factors such as changes in consumer trends, which in turn
are influenced by changing lifestyles and food preferences, legislative and sociological developments,
and public health and safety considerations. In recent years, the demand for glass packaging has been
driven by favourable structural market trends, such as the growing demand for European wines and spirits
in Asia and the United States, economic growth and its positive impact on consumption in general in
Latin American countries, and the growing trend for replacing plastic with glass, largely due to the brand
image of glass and the associated health and environmental benefits (see Section 5.5 of this Universal
Registration Document). These trends have had a positive impact on the Group’s revenue growth over
the financial year.
54 Based on revenue generated solely from the sale of jars and bottles, accounting for 97.4% of the Group’s consolidated revenue
for the year ended 31 December 2019.
88
The demand for glass packaging may also fluctuate due to the seasonal nature of some of the Group’s
products, or as a result of the weather or climate, particularly the long-term global climate change
observed in recent years and its consequences.
In some cases, the glass packaging market may also experience a surge in demand for certain types of
packaging, which cannot be fully met by suppliers due to insufficient production capacity. In the event
of a structural increase in demand, the Group must create extra production capacity by expanding its
production plants or commissioning new furnaces. These generally take 18 to 24 months to build, during
which time the imbalance between supply and demand may continue.
For example, the German wine production market experienced a shortage of glass packaging at the
beginning of 2019 due to capacity constraints. 2017, 2018, and 2019 financial years have been
characterised by high tensions over the capacity available in Spain and Italy, markets which have grown
sharply, resulting demand exceeding supply. In response to changing demand, in 2019 the Group began
the construction of a new furnace in Azuqueca, Spain and another in Villa Poma, Italy, which will be
operational in the second semester of 2020, subject to the impact that the Covid-19 pandemic may have
on the glass packaging market and the construction works related to these furnaces, the starting schedule
of which will be adapted to demand on the markets they serve, which is, as of the date of this universal
registration document, subject to the impact of the consequences of the Covid-19 pandemic (see Sections
3.1.1 and 5.7 “Capital expenditure” of this Universal Registration Document). The Group also strives to
maintain flexible, efficient production facilities, which allow it to rapidly adjust its production capacity
whenever there is a change in demand.
Any increase in demand for glass packaging, especially when it exceeds supply – as has been the case,
for example, from 2017 to 2019, which saw intense pressure on available capacity – is generally positive
for the Group’s business, particularly when it comes to the prices that the Group can charge. Conversely,
a fall in demand for or oversupply of glass packaging – particularly when developing new production
capacity in a regional market and if caused by the Group’s competitors – could force the Group to lower
its prices in order to maintain or capture market share, or could require it to store unsold inventory, which
could have a negative impact on results. For example, the 2012 and 2013 financial years were marked by
overcapacity in Europe in particular.
However, the Group’s flexible, interconnected and standardised production facilities mean that if there
is a surge in demand, it can temporarily transfer production between plants in the same region (between
a Spanish plant and a French plant, for example).
Changes in raw material and energy prices
The Group’s manufacturing processes use large amounts of raw materials for the production of glass.
These raw materials include glass sand, limestone, natural and synthetic soda ash, and cullet (recycled
glass), in variable proportions depending on the type of product that is being manufactured. The expenses
associated with the purchase of raw materials are entirely variable. Raw material purchases made up 20%
of the Group’s cost of sales for the year ended 31 December 2019.
The purchase price of raw materials depends on market conditions, relations with suppliers, purchasing
volumes and purchasing terms negotiated with suppliers. The purchase price varies significantly both
over time and depending on the region concerned.
For example, the price of cullet, a raw material that accounted for nearly half of raw material purchases
for the year ended 31 December 2019, varies widely from one region to the next, mainly because of
regulatory and financial disparities concerning the collection and recycling of used glass, as well as the
distance of cullet supply centres from production plants. As of 31 December 2019, the Group had no raw
materials hedging instruments in place. To mitigate the impact of differences in the prices of raw
materials, wherever possible the Group, through its Purchasing Department, seeks to negotiate with
suppliers the best price structure in view of expected changes in raw material costs in the short and
medium term (see Section 3.6.2.2 “Operational risk management” of this Universal Registration
89
Document). The Group also endeavours to pass on the increase in raw material costs to its selling prices,
whether directly or indirectly. It does this in particular through price revision clauses included in some
of its multi-year contracts with key customers or, in the majority of cases, through commercial
negotiations with customers placing orders or renewing annual contracts.
The Group’s manufacturing activities are also energy-intensive, particularly in natural gas, electricity and
fuel oil, since the furnaces used for glass production must operate continuously at very high temperatures.
For the year ended 31 December 2019, energy costs made up approximately 19% of the Group’s cost of
sales.
The purchase price of energy depends on market prices. Expenses relating to energy costs are partly
fixed, because of the need to keep furnaces at a certain temperature so as not to damage them. The
purchase price for energy also varies significantly both over time and depending on the region concerned,
mainly due to regulatory differences between countries. In Germany and Italy, for example, energy costs
are subsidised annually by the government, mainly in the form of lower energy taxes in those countries
(see Section 9.1.2 “Regulations relating to the glass industry” of this Universal Registration Document).
Lastly, the Group’s energy costs depend on the age of its furnaces (an old furnace will need more energy
to operate at an adequate level). In this respect, the Group carries out specific actions in its plants to
reduce furnace consumption, such as improving seals and insulation, optimising the glass temperature
and combustion settings, and adjusting the volumes of combustion air. In addition, by applying circular
economy principles, other initiatives allow the energy consumed to be recovered by extracting the heat
from furnaces and using it to heat buildings, as seen at the different sites. Finally, the Group seeks to use
all the cullet at its disposal to optimise production costs, especially energy costs, since the lower melting
point of cullet reduces energy consumption (on average, a 10% increase in the use of cullet leads to a
2.5% reduction in energy consumption).
During the year ended 31 December 2019, the increase in energy costs had a negative impact on the
Group’s cost of sales.
Most of the Group’s sales contracts are entered into for one year and may be renewed with the agreement
of both parties and do not include price adjustment clauses allowing a percentage of the increase or
decrease in energy costs to be reflected automatically in selling prices. Passing on increases in the
Group’s production costs is therefore negotiated with customers when placing orders or renewing annual
contracts, on the basis of recent and expected changes in these costs. However, there may be a time lag
and the price increases may only be passed on partially, if at all. A minority of the Group’s sales are also
covered by contracts containing price revision clauses (generally multi-year and entered into with the
Group’s key customers), taking into account fluctuations in energy costs and inflation, and providing the
Group with a contractual basis for the annual renegotiation of its selling prices. Lastly, the Group hedges
some of the risks relating to energy costs if contractual adjustment mechanisms are not in place (see
Section 3.6.2.2 “Operational risk management” of this Universal Registration Document).
The Group considers that it has been able to pass on increases in its production costs, especially energy
costs, to its selling prices during the 2019 and 2018 financial years. This is due to its dynamic pricing
policy, which enables it to neutralise the impact of higher energy costs and to generate a positive spread55
on its sales, yielding a significant improvement in its profitability during the aforementioned financial
years.
55 The spread represents the difference between (i) the increase in selling prices and the mix applied by the Group after
passing on the increase in its production costs, and (ii) the increase in its production costs. The spread is positive when
the increase in selling prices applied by the Group is greater than the increase in its production costs. The increase in
production costs is recorded by the Group at constant production volumes and before production gap and the impact of
the Performance Action Plan (PAP).

90
The positive spread generated since 2018 is mainly due to the introduction of a new pricing policy starting
in 2018. Under this policy, the Group negotiates higher selling prices with its customers when they place
orders or renew annual contracts at year-end, depending on production cost estimates. These estimates
are based on prices negotiated with its suppliers for the coming year, or on the parameters of any
derivative instrument put in place (in case of energy purchases, for example), thus giving it visibility over
the impact of production costs for that year and allowing it to pass this on to its selling prices as much as
possible (see Section 3.6.6.2 “Operational risk management” of this Universal Registration Document).
Lastly, as a manufacturer of glass packaging, the Group is subject to the provisions of the EU Emissions
Trading System Directive (see Section 9.1.2 “Regulation of the glass industry” of this Universal
Registration Document). In view of the Group's quota deficit, a provision was recorded in the 2019 and
2018 financial years respectively, amounting to €37.7 million and €27.6 million. In addition, in order to
secure the prices at which it will have to acquire the quotas, and with the prospect of the end of Phase III,
the Group made forward purchases of carbon dioxide quotas on the market for a total amount of €34.9
million as of 31 December 2019, corresponding to the deficits expected. The settlement of forward
purchases and the delivery of allowances will result in a cash outflow for the Group (which will therefore
record a reversal of the aforementioned provision in the amount of such outflows), mainly in 2021.
For Phase IV (2021-2030), as defined by the Emissions Trading System Directive, the level of free
allowances allocated to the Group will only be known at the beginning of 2021 for the 2021-2025 period
and at the beginning of 2026 for the 2026-2030 period. Despite uncertainty over the size of the free
allocation for Phase IV, the Group already expects this to be slightly smaller than its free allocation during
Phase III. In any event, it is unlikely to meet its obligation to surrender carbon emissions allowances,
forcing it to pursue its policy of spending a significant amount on purchasing allowances on the market
(see Section 3.1.4 “Risks related to significant costs to comply with applicable environmental, public
health and safety regulations” of this Universal Registration Document). In light of the start of Phase IV,
the Group has already made forward purchases of carbon dioxide quotas on the market for a total amount
of €24.6 million as of 31 December 2019.
Change in production costs and improved operational efficiency
The Group’s production costs include fixed costs and variable expenses, including: (1) raw material costs
(20% of cost of sales and 16% of consolidated revenue for the year ended 31 December 2019), which are
entirely variable; (2) energy costs (19% of cost of sales and 15% of consolidated revenue for the year
ended 31 December 2019), partly fixed (due to the need to maintain furnaces at melting temperature) and
partly variable (linked to production itself); (3) costs of purchasing carbon emissions allowances, which
are mainly variable; (4) personnel expenses (21% of cost of sales and 16% of consolidated revenue for
the year ended 31 December 2019), which are mainly fixed; (5) packaging materials (cardboard, pallets,
plastic film) and freight costs (13% of cost of sales and 10% of consolidated revenue for the year ended
31 December 2019), which are mainly variable; and (6) plant depreciation and maintenance costs, which
are mainly fixed. The most significant costs for the Group are raw material costs, energy costs and
personnel expenses. Personnel expenses can vary considerably depending on the production region. This
is particularly apparent between developed and emerging countries, where personnel expenses are lower,
although the gap is closing. The cost of packaging materials, which is mainly variable, primarily includes
the cost of pallets, dividers and plastic film. The Group’s transport costs make up a significant portion of
the cost of sales. Therefore, the Group’s glass packaging production takes place at the regional or local
level so as to be as close as possible to its customers’ production plants and thus reduce transport distances
and the associated costs. As a rule, it is difficult to adjust fixed costs, for example in response to a fall in
demand, and even if an adjustment is possible, it might involve a time lag. The Group’s adjusted EBITDA
margin therefore depends on the Group’s ability to absorb fixed costs through its production volumes
and to reduce the share of fixed costs in its overall cost of production for a given production level.
In addition, the Group continually takes steps to improve the operational efficiency of its production
plants. As part of its industrial strategy, the Group has been implementing an operational excellence
programme for the past few years. In early 2018, this was ramped up with the launch of the Verallia
91
Industrial Management (VIM) 2.0 initiative, which focuses on safety, quality, industrial performance,
lower manufacturing costs – mainly through the implementation of the Performance Action Plan (PAP)
– and team management (see Section 5.3.2 of this Universal Registration Document).
For example, under this programme, more than 500 projects managed by 250 managers at the production plant level are being rolled out by the Group. The Group is also adopting cost-optimisation measures inspired by World Class Manufacturing56 at all of its production plants, chiefly through cost deployment.
More generally, it has developed an in-depth industrial methodology based on root cause analysis57for its employees and plants, in a bid to optimise its costs while continuing to improve product quality. The Group is also putting measures in place to optimise inventory management and improve the flexibility of its production lines, with the introduction of weekly production plans and monthly industrial and commercial plans. In addition, the Group is actively pursuing the roll-out of continuous improvement initiatives in its logistics processes in order to ensure on-time delivery to its customers and reduce storage and transportation costs. Lastly, the Group conducts in-depth comparative analyses of its production plants in order to align its industrial processes with industry best practice. This plan has reduced production costs in various areas, such as raw materials, packaging, energy, wages and maintenance costs.
In return for a relatively small investment, this industrial performance improvement plan has increased
production capacity and boosted the efficiency of the Group’s production plants while improving product
quality (see Section 7.1.2.6 of this Universal Registration Document), positively impacting the Group’s
results for 2019 and 2018.
Fluctuations in exchange rates
The Group combines a global presence with local industrial facilities (the “Glo-Cal” model). Its customers,
situated near the Group’s local production plants, export products all over the world, packaged in the
bottles and jars manufactured by the Group. Consequently, its results are affected by fluctuations in
exchange rates.
The Group’s results are mainly impacted by the currency translation effect. Although most of the Group’s
consolidated revenue is denominated in euros, a significant portion of the Group’s assets, liabilities,
income and expenses are denominated in currencies other than the euro, mainly the Brazilian real, the
Argentine peso, the Russian rouble and the Ukrainian hryvnia. In order to prepare the Group’s financial
statements, denominated in euros, these assets, liabilities, income and expenses therefore need to be
translated at the applicable exchange rates. As a result, fluctuations in the euro against other currencies,
including those mentioned above, lead to currency translation differences that affect the amount of the line
items concerned in the Group’s financial statements, even though the value remains the same in the original
currency. Thus, when the euro strengthens against local currencies, the equivalent amount in euros of gains
made in local currency decreases, with a negative impact on the Group’s results. In 2019, based on the
closing exchange rate at 31 December 2019, the value of the Argentine peso, the Brazilian real and the
Chilean peso fell by 56%, 1.6% and 3.6%, against the euro. This significantly affected the value of the
Group’s revenue, assets, liabilities, expenses and results for the year ended 31 December 2019, especially
in Latin America. The Group’s exposure to currency translation effects is not hedged.
Following the sharp increase in the cumulative inflation rate over several years in Argentina, such that is
considered to be a hyperinflationary economy, the Group was obliged to apply IAS 29 Financial Reporting
in Hyperinflationary Economies to its operations in Argentina from 1 January 2018. Applying this standard
requires the revaluation of non-monetary assets and liabilities, equity and profit and loss to reflect changes
56 World Class Manufacturing is based on 10 pillars, one of the most fundamental of which is cost deployment. This consists
of associating a cost with the various issues identified and taking specific action to reduce them.
57 This method involves addressing the causes of a problem, rather than treating its immediate symptoms.
92
in purchasing power in local currency. These revaluations may lead to a gain or loss on the net monetary
position included in net financial income. In addition, this standard requires the subsidiary’s income
statement to be translated into euros at the closing rate rather than at the average rate for the period. Items
in the statement of financial position and statement of comprehensive income remain translated into euros
at the closing exchange rate for the period concerned. For the financial year ended 31 December 2019, the
net impact on revenue of hyperinflation in Argentina was -€3.1 million; it was -€7.8 million for the
financial year ended 31 December 2018. The impact of hyperinflation is excluded from consolidated
adjusted EBITDA as presented in Section 7.1.4 “Key performance indicators” below.
Other than the currency translation effect, the Group’s results are not materially impacted by the effect
of changes in exchange rates, insofar as the Group’s expenses and operating revenues are generally in
the same currency. This is due to the regional or local nature of the Group’s markets.
The Group is nevertheless exposed to changes in exchange rates on its transactions when one of its
subsidiaries makes a purchase or sale in a currency other than the functional currency. For example,
subsidiaries located in countries in Latin America and Northern and Eastern Europe that are required to
import capital goods produced in Southern and Western Europe, or more specifically purchase raw
materials or energy in US dollars, may be exposed to the impact of exchange rate fluctuations on these
transactions. The Group routinely hedges currency positions when it believes that material financial
transactions may give rise to currency risk.
Optimum use of production capacity
The Group’s results largely depend on optimum use of its production capacity, especially its furnaces, to
maximise the performance of its industrial facilities.
Factors affecting the optimum use of furnaces are scheduled or unscheduled furnace repairs, the number
of changes in glass colour and optimisation of the packaging mix on all lines, so as to make maximum
use of the furnace draft. The Group generally schedules furnace closings for repair during the second half
of the year, when most of its employees are on leave and after large customer orders have been taken
(usually during the first half of the year). In addition, to minimise the time taken to change the glass
colour or type of packaging on its production line, the Group is developing production facilities offering
the flexibility to quickly change the necessary tools.
Unscheduled furnace repairs or furnace incidents, such as the partial collapse of a furnace vault at the
Kamyshin, Russia site in 2019, could therefore affect the Group’s results, reduce the capacity utilisation
rate, result in lower absorption of fixed costs such as wage costs, and increase other costs such as transport
costs due to the additional imports required to make up the production shortfall.
To optimise capacity utilisation, the Group makes targeted investments (see Section 5.7 “Capital
expenditure” of this Universal Registration Document) to ensure that its furnaces are operational and
efficient (particularly in terms of energy consumption). It also seeks to adjust the size of its production
facilities in line with expected changes in market supply and demand.
Investments
The Group operates in a highly capital-intensive industry that requires permanent investment in order to
maintain and/or increase production capacity, update its assets and technology, and comply with
regulations. To this end, the Group has a disciplined investment policy that is mainly aimed at ensuring
that its furnaces are operational and as efficient as possible (particularly in terms of energy consumption),
and that production capacity is continually adjusted to changes in supply and demand and the capacity
available on the market.
93
The main recurring investments58 relate to the rebuilding of furnaces and maintenance operations.
Although the Group’s research and development efforts have allowed it to increase the lifespan of its
furnaces to up to 10 to 12 years or even 14 years in some cases, its furnaces still need to be rebuilt
periodically, as the refractory bricks with which they are built wear away on contact with molten glass
and energy consumption increases as furnaces become worn down. The Group is also making strategic
investments to acquire assets that significantly increase the Group’s capacity or scope (for example, by
purchasing plants or similar facilities, or making greenfield or brownfield investments), including
building new furnaces.
The total amount of recurring and strategic investments for the years ended 31 December 2019 and 2018
respectively amounted to €252.5 million (of which €206.7 million was recurring and €45.8 million was
strategic) and €225 million (of which €198.6 million was recurring and €26.4 million was strategic) (see
Section 5.7 “Capital expenditure” of this Universal Registration Document). The Group intends to pursue
its disciplined investment policy with recurring investments amounting to around 8% of the Group’s
consolidated revenue (excluding capitalisation of the right of use related to the application of IFRS 16
Leases).
In 2019, non-recurring investments concerned (i) the construction of a new plant in Jacutinga, Brazil
following the closure of the Sao Paulo plant and (ii) the construction of two new furnaces in Spain and
Italy.
In addition, the Group operates in a strict legislative and regulatory environment when it comes to
environmental protection, public health and safety. As such, it has had to incur, and will continue to incur,
significant costs (in terms of both capital expenditure and operating expenditure) to meet the legal and
regulatory requirements. Moreover, it is likely that these costs will increase in the future. The Group
could be compelled therefore to make significant investments to build furnaces with low carbon
emissions, such as electric furnaces, so as to reduce the need to purchase emissions allowances on the
market and to minimise the associated costs.
Acquisitions, disposals and changes in scope
In order to become more competitive and support its growth, the Group may acquire companies in the
sector. In addition, it may sell some of its non-strategic operations, or even close down production plants
or furnaces if it wants to withdraw from a particular business sector or in order to adapt its capacity to
demand. The frequency of acquisitions and disposals varies and depends on the expansion opportunities
offered to the Group and the development of its strategic decisions in the light of market conditions.
In the context of the reorganisation operations of the Verallia Group completed as from the listing of the
ordinary shares of the Company on the regulated market of Euronext Paris, the Company took direct and
exclusive control of Verallia Packaging SAS.
During the year ended 31 December 2018 (see also Note 3.1 “Change in scope” of the Group’s
consolidated financial statements for the financial years ended 31 December 2019 and 2018), the Group
withdrew from Algeria with the sale of its subsidiary Alver, generating a loss of €3.6 million (the
subsidiary’s property, plant and equipment had been fully written down by €35.0 million in 2017). The
Group had previously decided to suspend all financing of Alver’s working capital requirement in view
of the political and economic climate in Algeria and the decline in operational performance, as well as
the limited prospects for improving the subsidiary’s results. In the same year, the Group also finalised
the sale of its stake in IVN, its joint venture in Brazil. The impact of the transfer of IVN on pre-tax income
as of 31 December 2018 was a pre-tax profit of €14.0 million (corresponding to (i) a capital gain on the
58 Recurring investments consist of purchases of property, plant and equipment and intangible assets necessary to maintain the
value of an asset and/or adapt to market demand, as well as to environmental, health and safety constraints.
94
sale of securities of €1.0 million and (ii) the reversal of impairment loss for shareholder loans of €13.0
million).
Changes in financial debt
As of 31 December 2019, the Group’s total gross financial debt59 stood at €1,809.8 million (€2,244.6
million as of 31 December 2018), while its net financial debt totalled €1,590.6 million (€1,982.5 million
as of 31 December 2018). For the year ended 31 December 2019, net financial debt amounted to €81.4
million (€104.6 million as of 31 December 2018) (see Note 7 “Net financial income” of the Group’s
consolidated financial statements for the years ended 31 December 2019 and 2018). The Group’s net
financial debt/adjusted EBITDA ratio was 2.6x as of 31 December 2019. As of 31 December 2018, the
same ratio was 3.1x, taking into account only third-party debt, thus excluding the intragroup loan which
had been granted on 28 October 2015, by the sole shareholder of the Company before the initial public
offering of the Company, for an initial principal amount of 346,783,800, bearing capitalised annual
interest at a rate of 8.123% (the “Intragroup Loan”), this Intragroup Loan having been capitalised up to
an amount of €251.4 million at 20 September 2019.
Over the 2019 financial year, the Group’s policy has been to optimise its financial structure.
On the occasion of its initial public offering on the Euronext Paris regulated market in October 2019, the
Group refinanced its existing debt, in particular by fully repaying term loans and cancelling the revolving
credit facility that had been made available as part of the financing documentation concluded on 7 August
2015 (as subsequently amended) for a notional amount of €1,825 million thanks (x) to the €1,500 million
in proceeds from the drawing carried out by Verallia Packaging on the term loan (Term Loan A) made
available under the Senior Facilities Agreement, (y) to the proceeds from the drawings carried out on the
NEU CP programme and (z) to the balance, with a portion of the Group’s available cash flow (see Section
8.2.2 "Financial liabilities" of this Universal Registration Document).
As of 31 December 2019, the Group’s outstanding variable-rate financial debt, including derivative
instruments, stood at €297.8 million (€350.2 million as of 31 December 2018), or 16.5% of its gross
financial debt (15.6% for 2018). In August 2018, the Group hedged a large portion of its exposure to a
rise in the Euribor rate through rate swaps with a face value of €1,500 million and maturing in August
2022. In October 2019, after repaying part of its debt, the Group settled for a nominal amount of €250
million in rate swaps. The Group’s ability to manage its interest rate exposure appropriately in the future
or to continue to do so at a reasonable cost could affect its results (see Section 3.4.3 “Risks related to
interest rates” of this Universal Registration Document).
Seasonality
The Group’s revenue is affected by the seasonal nature of the products sold to its customers. For example,
demand for glass packaging is typically higher in the first six months of the year, particularly in Europe.
In practice, customers in this geographical region generally place their orders during this period in order
to anticipate the increase in demand for their products, such as beer and rosé wine, experienced in
summer. High temperatures can therefore have a positive effect on the Group's activities, as an increase
in demand for products sold by its customers will result in them buying more glass packaging.
Conversely, abnormally low temperatures during the summer may result in a drop in demand for certain
beverages contained in packaging sold by the Group, resulting in a reduction in orders from its customers.
In addition, changes in the Group’s working capital requirement during the year reflect the seasonality
of its operations. The high working capital requirement, particularly from April to August, is due to the
build-up of inventories and the increase in trade receivables ahead of significant deliveries that take place
59 Corresponds to the item “Non-current financial liabilities and financial derivatives” and “Current financial liabilities and
derivatives” of the Group’s consolidated balance sheet.
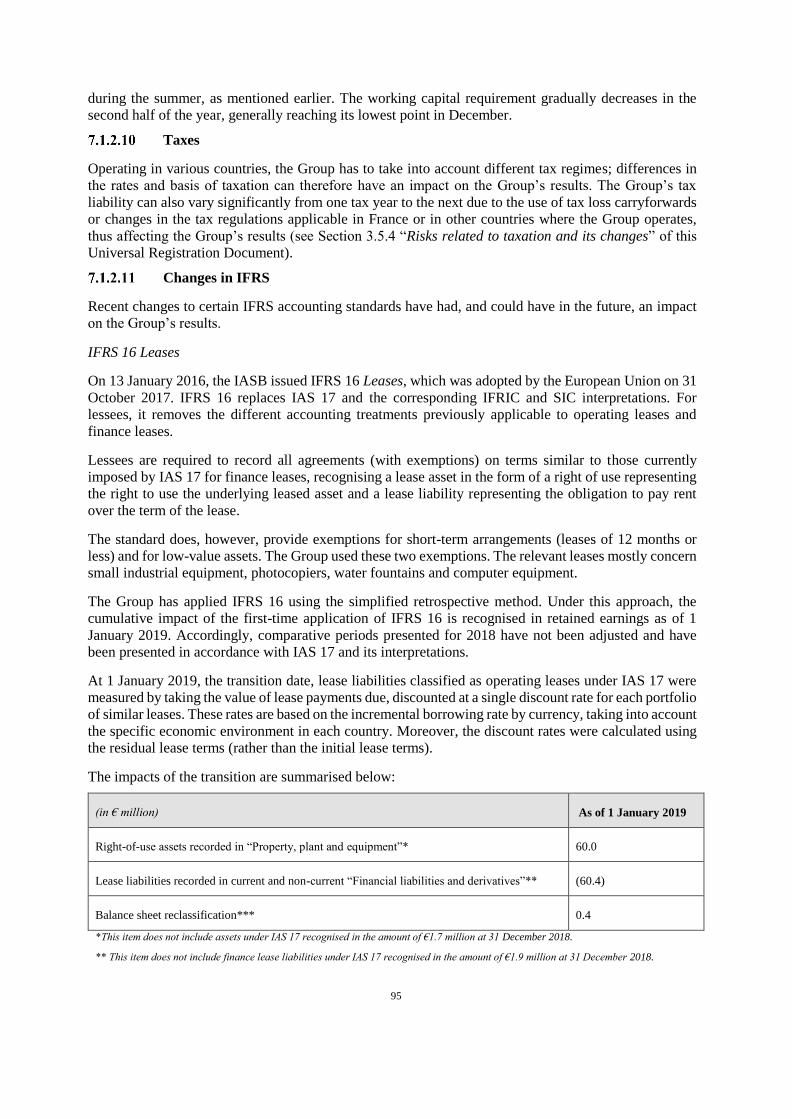
95
during the summer, as mentioned earlier. The working capital requirement gradually decreases in the
second half of the year, generally reaching its lowest point in December.
Taxes
Operating in various countries, the Group has to take into account different tax regimes; differences in
the rates and basis of taxation can therefore have an impact on the Group’s results. The Group’s tax
liability can also vary significantly from one tax year to the next due to the use of tax loss carryforwards
or changes in the tax regulations applicable in France or in other countries where the Group operates,
thus affecting the Group’s results (see Section 3.5.4 “Risks related to taxation and its changes” of this
Universal Registration Document).
Changes in IFRS
Recent changes to certain IFRS accounting standards have had, and could have in the future, an impact
on the Group’s results.
IFRS 16 Leases
On 13 January 2016, the IASB issued IFRS 16 Leases, which was adopted by the European Union on 31
October 2017. IFRS 16 replaces IAS 17 and the corresponding IFRIC and SIC interpretations. For
lessees, it removes the different accounting treatments previously applicable to operating leases and
finance leases.
Lessees are required to record all agreements (with exemptions) on terms similar to those currently
imposed by IAS 17 for finance leases, recognising a lease asset in the form of a right of use representing
the right to use the underlying leased asset and a lease liability representing the obligation to pay rent
over the term of the lease.
The standard does, however, provide exemptions for short-term arrangements (leases of 12 months or
less) and for low-value assets. The Group used these two exemptions. The relevant leases mostly concern
small industrial equipment, photocopiers, water fountains and computer equipment.
The Group has applied IFRS 16 using the simplified retrospective method. Under this approach, the
cumulative impact of the first-time application of IFRS 16 is recognised in retained earnings as of 1
January 2019. Accordingly, comparative periods presented for 2018 have not been adjusted and have
been presented in accordance with IAS 17 and its interpretations.
At 1 January 2019, the transition date, lease liabilities classified as operating leases under IAS 17 were
measured by taking the value of lease payments due, discounted at a single discount rate for each portfolio
of similar leases. These rates are based on the incremental borrowing rate by currency, taking into account
the specific economic environment in each country. Moreover, the discount rates were calculated using
the residual lease terms (rather than the initial lease terms).
The impacts of the transition are summarised below:
(in € million) As of 1 January 2019
Right-of-use assets recorded in “Property, plant and equipment”* 60.0
Lease liabilities recorded in current and non-current “Financial liabilities and derivatives”** (60.4)
Balance sheet reclassification*** 0.4
*This item does not include assets under IAS 17 recognised in the amount of €1.7 million at 31 December 2018.
** This item does not include finance lease liabilities under IAS 17 recognised in the amount of €1.9 million at 31 December 2018.
96
***Reclassification of accrued liabilities in connection with the rent exemption spread deducted from the "right of use" asset, 0.2 million of
which impact on equity opening.
Impacts on the 2019 fiscal year accounts
As a result of the application of IFRS 16 to leases previously classified as operating leases, the Group
recorded €52.3 million in right-of-use assets, €53.3 million in lease liabilities, and €0.9 million in deferred
tax assets in its accounts as of 31 December 2019.
With regard to these leases, the Group also recorded depreciation costs and interest expenses instead of
the rents relating to operating leases. It thus recorded €18.8 million in depreciation and €2.1 million in
interest expense in respect of these leases. This resulted in a decrease of lease expenses accounted for in
adjusted EBITDA, which had a positive impact on adjusted EBITDA of €20.2 million, a positive impact
on the adjusted EBITDA margin of 78 basis points and a positive impact on cash conversion of 140 basis
points for the year ended 31 December 2019.
7.1.3 Main items of the statement of consolidated income
The main income statement line items used by Group management to analyse its consolidated financial
results are described below:
Revenue
Revenue is mainly generated from the sale of glass packaging for beverage and food (bottles and jars).
Revenue is the amount receivable for goods provided in the normal course of business, excluding
amounts collected on behalf of third parties, such as sales taxes, goods and services taxes, and value
added taxes. The revenue generated by the sale of bottles and jars is recognised when the control of the
asset is transferred to the customer, i.e., when the product is shipped or delivered, according to the
incoterms (International Commercial Terms published by the International Chamber of Commerce).
Cost of sales
Cost of sales includes all costs directly or indirectly related to the products sold. The main components
are the cost of raw materials, energy, wages and transport, and the depreciation of production equipment.
It does not include the amortisation of customer relationships, which is included in acquisition-related
items.
Selling, general and administrative expenses
Selling, general and administrative expenses include all expenses related to general management,
marketing, finance and accounting, IT, legal, human resources, technical, and research and development
activities.
Acquisition-related items
Acquisition-related items mainly cover the impact of the adjustments recognised in connection with the
allocation of the purchase price (amortisation of assets exclusively recognised through business
combinations, such as customer relationships (original gross amount of €740.0 million over a 12-year
useful life)), as well as acquisition costs including miscellaneous fees and due diligence costs in
connection with completed or prospective acquisitions. These elements are present on a different line
from “selling, general and administrative expenses" in view of their materiality.
Other operating income and expenses
Other operating income and expenses reflect significant events occurring during the year that may distort
the reading of the company’s performance. They particularly include gains and losses on disposals,
impairment losses, significant litigation outside the normal course of business, restructuring costs
incurred upon disposal or closure, and in relation to downsizing measures.
97
Operating profit
Operating profit is the difference between revenue and cost of sales, selling, general and administrative
expense, acquisition-related items and other operating income and expenses.
Financial income and expense
Financial income and expense mainly covers interest expense on borrowings, accretion of financial assets
and provisions, financial expense related to pension plans and other post-employment benefits, factoring
fees, bank charges, changes in the fair value of derivative instruments not designated as hedging
instruments, and unrealised and realised foreign exchange gains and losses. It includes interest on lease
liabilities determined in accordance with IFRS 16 on all leases (excluding exemptions).
Financial income mainly comprises income from cash and cash equivalents.
Income tax
Income tax expense represents the sum of current tax and deferred tax.
Tax expense is calculated based on the tax laws in force or substantively in force at the reporting date in
the countries where the Company and its subsidiaries operate.
The amount of current tax payable (or receivable) is determined on the basis of the best estimate of the
amount of tax the Group expects to pay (or receive) reflecting, where appropriate, the uncertainties
associated with it.
Current tax and deferred tax are recognised in profit or loss unless they relate to items that have been
recognised in other comprehensive income or directly in equity. If current tax or deferred tax arises from
the initial recognition of a business combination, the tax effect is included in the business combination
accounting.
Deferred tax assets and liabilities are recognised on the basis of temporary differences between the
carrying amounts of assets and liabilities on the statement of financial position and their respective tax
values (with some exceptions).
The impact of a change in tax rates and tax laws on deferred income tax assets and liabilities is generally
recognised as tax income/expense over the period that the change was substantively in effect. Deferred
tax assets and liabilities are measured at the expected tax rates for the period of realisation of the asset or
the settlement of the liability, based on tax rates and tax laws applicable or substantively in force at the
reporting date.
Deferred tax assets are recognised in respect of deductible temporary differences, unused tax losses and
unused tax credits only if it is probable that the Group will have sufficient future taxable profits against
which they can be used. They are reviewed at each reporting date and are impaired if it no longer appears
likely that sufficient future taxable income will be available. To determine whether deferred tax assets
should be recognised in respect of tax loss carryforwards, the Group applies various criteria that take into
account the likely recovery period based on economic projections and the strategy for recovering tax
losses over the long term applied in each country.
7.1.4 Key performance indicators
The Group uses revenue (see Section 7.2.1 below for an analysis of the change in revenue for the years
ended 31 December 2019 and 2018), adjusted EBITDA, cash conversion and investments (see Section 5.7
“Capital expenditure” of this Universal Registration Document) as key performance indicators. The Group
regularly reviews these performance indicators to analyse and evaluate its operations and their trends,
measure their performance, prepare results forecasts and make strategic decisions.

98
(in € million) Year ended
31 December 2019
Year ended
31 December 2018
Change
Adjusted EBITDA (in €
million) 615.2 543.3 13.2%
Adjusted EBITDA margin 23.8% 22.5% 130Pb
Cash conversion 59.0% 58.6% 40Pb
Adjusted EBITDA and cash conversion are alternative performance measures according to AMF Position
No. 2015-12.
Adjusted EBITDA and cash conversion are not standardised accounting measures meeting a single
definition generally accepted by IFRS. They should not be considered a substitute for operating profit,
net income or cash flows from operating activities, which are measures defined by IFRS, or a substitute
measure of liquidity. Other issuers may calculate adjusted EBITDA and cash conversion differently from
the definitions used by the Group.
Adjusted EBITDA
Adjusted EBITDA is calculated based on operating income adjusted for depreciation, amortisation and
impairment, restructuring costs, acquisition and M&A costs, hyperinflationary effects, management
share ownership plan costs, disposal-related effects and subsidiary contingencies, site closing expenses,
and other items. Adjusted EBITDA has been used as a performance indicator in the Group’s external
financial communications since 2015, in particular in connection with its bond issuances. This indicator
is also used as a performance indicator by several companies in the packaging sector.
Reconciliation of operating profit to adjusted EBITDA
(in € million) Year ended
31 December 2019
Year ended
31 December 2018 Change
Operating profit 295.1 221.2 73.9
Depreciation, amortisation and
impairment(1)
283.5 298.2 (14.7)
Restructuring costs(2) 2.9 7.2 (4.3)
Acquisition and M&A costs(3) (2.1) 0.2 (2.3)
IAS 29, Hyperinflation
(Argentina)
1.6 2.5 (0.9)
Management equity plan
related costs(4)
11.5 5.7 5.8
Disposal and risks related to
subsidiaries(5)
- (8.8) 8.8
Sao Paolo site closure(6) 2.4 11.4 (9.0)
Other(7) 20.3 5.8 14.5
Adjusted EBITDA 615.2 543.3 71.9
(1) Includes depreciation and amortisation of intangible assets and property, plant and equipment (Note 5.2 of the Group’s consolidated financial statements), amortisation of intangible assets acquired through business combinations (Note 6.1 of the
Group’s consolidated financial statements) and impairment of property, plant and equipment (Note 6.2 of the Group’s consolidated
financial statements).
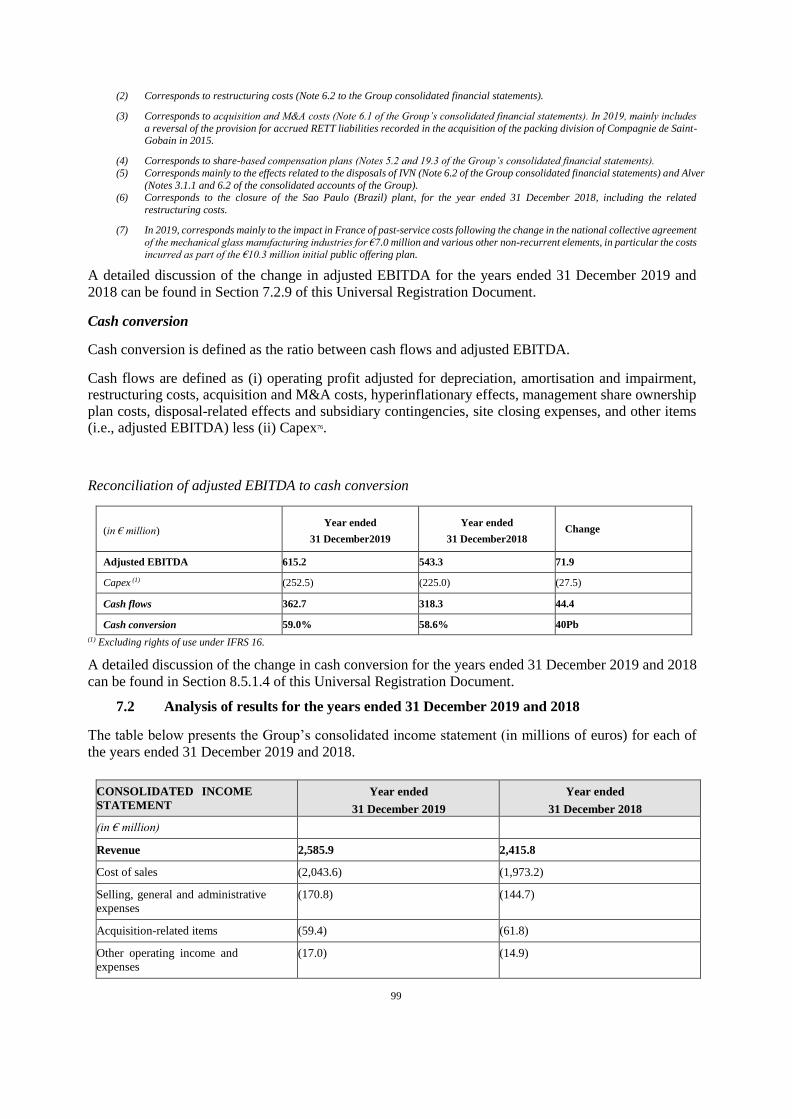
99
(2) Corresponds to restructuring costs (Note 6.2 to the Group consolidated financial statements).
(3) Corresponds to acquisition and M&A costs (Note 6.1 of the Group’s consolidated financial statements). In 2019, mainly includes
a reversal of the provision for accrued RETT liabilities recorded in the acquisition of the packing division of Compagnie de Saint-Gobain in 2015.
(4) Corresponds to share-based compensation plans (Notes 5.2 and 19.3 of the Group’s consolidated financial statements).
(5) Corresponds mainly to the effects related to the disposals of IVN (Note 6.2 of the Group consolidated financial statements) and Alver
(Notes 3.1.1 and 6.2 of the consolidated accounts of the Group). (6) Corresponds to the closure of the Sao Paulo (Brazil) plant, for the year ended 31 December 2018, including the related
restructuring costs.
(7) In 2019, corresponds mainly to the impact in France of past-service costs following the change in the national collective agreement
of the mechanical glass manufacturing industries for €7.0 million and various other non-recurrent elements, in particular the costs incurred as part of the €10.3 million initial public offering plan.
A detailed discussion of the change in adjusted EBITDA for the years ended 31 December 2019 and
2018 can be found in Section 7.2.9 of this Universal Registration Document.
Cash conversion
Cash conversion is defined as the ratio between cash flows and adjusted EBITDA.
Cash flows are defined as (i) operating profit adjusted for depreciation, amortisation and impairment, restructuring costs, acquisition and M&A costs, hyperinflationary effects, management share ownership plan costs, disposal-related effects and subsidiary contingencies, site closing expenses, and other items (i.e., adjusted EBITDA) less (ii) Capex76.
Reconciliation of adjusted EBITDA to cash conversion
(in € million) Year ended
31 December2019
Year ended
31 December2018 Change
Adjusted EBITDA 615.2 543.3 71.9
Capex (1) (252.5) (225.0) (27.5)
Cash flows 362.7 318.3 44.4
Cash conversion 59.0% 58.6% 40Pb
(1) Excluding rights of use under IFRS 16.
A detailed discussion of the change in cash conversion for the years ended 31 December 2019 and 2018
can be found in Section 8.5.1.4 of this Universal Registration Document.
7.2 Analysis of results for the years ended 31 December 2019 and 2018
The table below presents the Group’s consolidated income statement (in millions of euros) for each of
the years ended 31 December 2019 and 2018.
CONSOLIDATED INCOME
STATEMENT
Year ended
31 December 2019
Year ended
31 December 2018
(in € million)
Revenue 2,585.9 2,415.8
Cost of sales (2,043.6) (1,973.2)
Selling, general and administrative
expenses
(170.8) (144.7)
Acquisition-related items (59.4) (61.8)
Other operating income and
expenses
(17.0) (14.9)
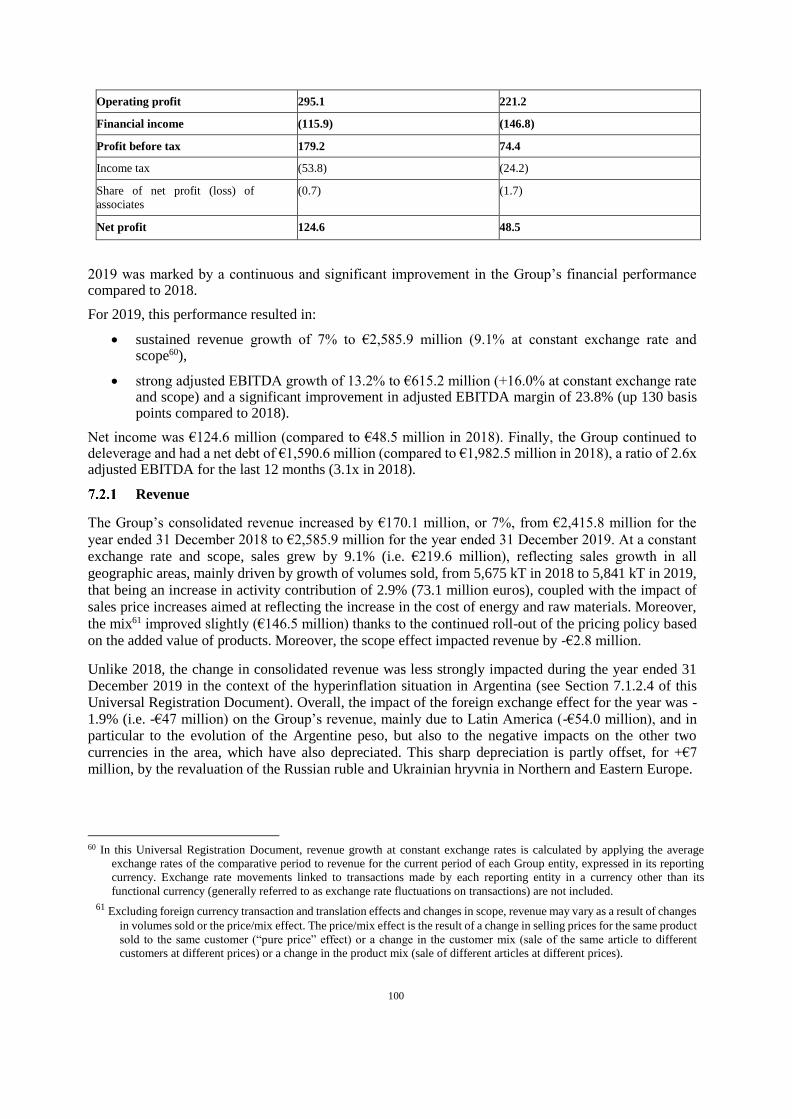
100
Operating profit 295.1 221.2
Financial income (115.9) (146.8)
Profit before tax 179.2 74.4
Income tax (53.8) (24.2)
Share of net profit (loss) of
associates
(0.7) (1.7)
Net profit 124.6 48.5
2019 was marked by a continuous and significant improvement in the Group’s financial performance compared to 2018.
For 2019, this performance resulted in:
sustained revenue growth of 7% to €2,585.9 million (9.1% at constant exchange rate and scope60),
strong adjusted EBITDA growth of 13.2% to €615.2 million (+16.0% at constant exchange rate and scope) and a significant improvement in adjusted EBITDA margin of 23.8% (up 130 basis points compared to 2018).
Net income was €124.6 million (compared to €48.5 million in 2018). Finally, the Group continued to deleverage and had a net debt of €1,590.6 million (compared to €1,982.5 million in 2018), a ratio of 2.6x adjusted EBITDA for the last 12 months (3.1x in 2018).
Revenue
The Group’s consolidated revenue increased by €170.1 million, or 7%, from €2,415.8 million for the
year ended 31 December 2018 to €2,585.9 million for the year ended 31 December 2019. At a constant
exchange rate and scope, sales grew by 9.1% (i.e. €219.6 million), reflecting sales growth in all
geographic areas, mainly driven by growth of volumes sold, from 5,675 kT in 2018 to 5,841 kT in 2019,
that being an increase in activity contribution of 2.9% (73.1 million euros), coupled with the impact of
sales price increases aimed at reflecting the increase in the cost of energy and raw materials. Moreover,
the mix61 improved slightly (€146.5 million) thanks to the continued roll-out of the pricing policy based
on the added value of products. Moreover, the scope effect impacted revenue by -€2.8 million.
Unlike 2018, the change in consolidated revenue was less strongly impacted during the year ended 31 December 2019 in the context of the hyperinflation situation in Argentina (see Section 7.1.2.4 of this Universal Registration Document). Overall, the impact of the foreign exchange effect for the year was -1.9% (i.e. -€47 million) on the Group’s revenue, mainly due to Latin America (-€54.0 million), and in particular to the evolution of the Argentine peso, but also to the negative impacts on the other two
currencies in the area, which have also depreciated. This sharp depreciation is partly offset, for +€7 million, by the revaluation of the Russian ruble and Ukrainian hryvnia in Northern and Eastern Europe.
60 In this Universal Registration Document, revenue growth at constant exchange rates is calculated by applying the average
exchange rates of the comparative period to revenue for the current period of each Group entity, expressed in its reporting
currency. Exchange rate movements linked to transactions made by each reporting entity in a currency other than its
functional currency (generally referred to as exchange rate fluctuations on transactions) are not included.
61 Excluding foreign currency transaction and translation effects and changes in scope, revenue may vary as a result of changes
in volumes sold or the price/mix effect. The price/mix effect is the result of a change in selling prices for the same product
sold to the same customer (“pure price” effect) or a change in the customer mix (sale of the same article to different
customers at different prices) or a change in the product mix (sale of different articles at different prices).

101
The change in consolidated revenue during the year ended 31 December 2019 was driven by the revenue
growth from sales of beer bottles, containers for spirits and bottles for soft drinks.
The increase in revenue during the year ended 31 December 2019 concerned all three geographical
regions, and in particular Northern and Eastern Europe and Latin America, against a backdrop of high
inflation. This revenue growth was driven by an increase in sales of all products.
(in € million) Year ended
31 December 2019
Change 2018 - 2019
Year ended
31 December 2018
In € million In %
Southern and Western Europe 1,753.7 104.8 6.4 1,648.9
Northern and Eastern Europe 567.6 46.7 9.0 520.9
Latin America 264.6 18.6 7.5 246.0
Consolidated revenue 2,585.9 170.1 7.0 2,415.8
Southern and Western Europe
Revenue in Southern and Western Europe increased by €104.8 million, or 6.4% (6.5% at constant
exchange rate and scope), from €1,648.9 million for the year ended 31 December 2018 to €1,753.7
million for the year ended 31 December 2019.
During the year ended 31 December 2019, all countries in Southern and Western Europe experienced
growth in revenue associated with a general price increase. Growth has thus been more pronounced in
Spain and Italy, which have benefited from strong growth in demand, driven mainly by beer, spirits and
sparkling wines. Although lower than in other countries in the area, revenue growth remained sustained
in France.
Northern and Eastern Europe
Revenue in Northern and Eastern Europe increased by €46.7 million, or 9% (7.6% at constant exchange
rate and scope), from €520.9 million for the for the year ended 31 December 2018 to €567.6 million for
the year ended 31 December 2019.
During the year ended 31 December 2019, all the countries in Northern and Eastern Europe experienced
revenue growth, mainly due to volume growth from 1,444 kT for the year ended 31 December 2018 to
1,490 kT for the year ended 31 December 2019, driven by the solid recovery of Russia and the dynamism
of the beer and still wine markets in Germany. Sales price increases also took place as anticipated
throughout the year to offset higher costs. However, revenue growth in Northern and Eastern Europe
during the year was also positively affected by positive exchange rate fluctuations in Russia and Ukraine,
with the revaluation of the Russian ruble and the Ukrainian hryvnia (+€7.0 million).
Latin America
Revenue in Latin America increased by €18.6 million, or 7.5%, from €246 million for the financial year
ended 31 December 2018 to €264.6 million for the financial year ended 31 December 2019.
The increase in revenue during the year ended 31 December 2019 was reduced by the depreciation of
currencies in the region, mainly the Argentine Peso. At a constant exchange rate and scope, Latin

102
America is experiencing a strong growth of 29.4% (12.4% outside Argentina), driven mainly by price
increases, particularly in Argentina, where the pricing policy remains very dynamic in a highly
inflationary context. Volumes also increased from 606 kT for the year ended 31 December 2018 to 618
kT for the year ended 31 December 2019, thanks to the positive commercial trend of still wines, beers
and soft drinks in Brazil, the successful commissioning of the new plant in Jacutinga during the first half
of 2019 and good business activity in Argentina.
Sales costs
Sales costs increased by €70.4 million, or + 3.6%, from €1,973.2 million for the year ended 31 December
2018 to €2,043.6 million for the year ended 31 December 2019.
The change in sales costs is due, in particular, to the increase in transport costs by 4.6%, raw materials
by 0.9%, energy costs by 6.7% and staff costs by 4.9%.
As a percentage of revenue, however, the cost of sales decreased by 270 basis points during the year
ended 31 December 2019, from 81.7% for the year ended 31 December 2018 to 79% for the year ended
31 December 2019. The Group has been able to limit the increase in sales costs despite the growth of its
business, thanks in particular to the measures implemented under its Industrial Performance Action Plan
(PAP) as part of the Verallia Industrial Management (VIM) 2.0 initiative (see, in particular, Section
7.1.2.4 "Change in production costs and improved operational efficiency" of this Universal Registration
Document). The Group’s dynamic pricing policy has also allowed it to pass on increases in costs –
particularly energy costs – to selling prices, and to generate a positive spread on its sales.
Selling, general and administrative expenses
Selling, general and administrative expenses increased by €26.1 million, or +18%, from €144.7 million
for the year ended 31 December 2018 to €170.8 million for the year ended 31 December 2019.
The increase in selling, general and administrative expenses during the year ended 31 December 2019
was mainly due to the business growth witnessed during the period, and an increase in the Group’s
structural costs.
Other operating income and expenses
Other operating income and expenses increased in 2019, from a net expense of €14.9 million for the year
ended 31 December 2018 to a net expense of €17 million for the year ended 31 December 2019,
representing an increase of €2.1 million or 14.1%.
Other operating income and expenses for the year ended 31 December 2019 primarily correspond to the
costs of the Company’s initial public offering in October 2019, which amounted to €10.3 million.
In 2018, these other operating income and expenses had been impacted by asset impairment reversals of
€13.6 million related to the Group's disposal of its holdings in the IVN joint venture in Brazil, and by
restructuring costs of €10.7 million and asset impairments of €10.3 million, mainly related to the closure
of the Group’s plant in Sao Paulo, Brazil to relocate production to the new site in Jacutinga, Brazil.
Operating profit
Operating profit increased by €73.9 million, or 33.4%, from €221.2 million for the year ended 31
December 2018 to €295.1 million for the year ended 31 December 2019.
The increase in operating profit for the year ended 31 December 2019 is primarily due to revenue growth.
It also benefits from a significant improvement in the Group’s profitability, despite higher costs,
particularly energy costs and selling, general and administrative expenses. This increase in the operating
profit is also a result of the continued rationalisation of production costs under the Group’s industrial
performance improvement plan.
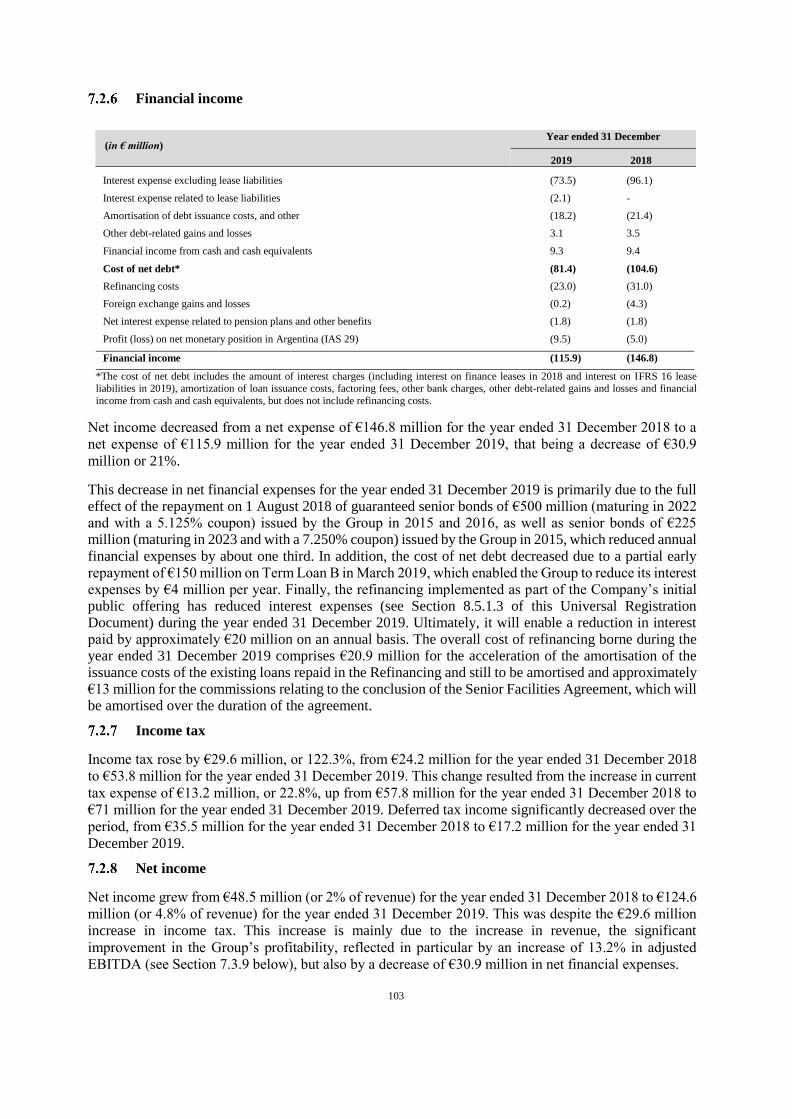
103
Financial income
Interest expense excluding lease liabilities (73.5) (96.1)
Interest expense related to lease liabilities (2.1) -
Amortisation of debt issuance costs, and other (18.2) (21.4)
Other debt-related gains and losses 3.1 3.5
Financial income from cash and cash equivalents 9.3 9.4
Cost of net debt* (81.4) (104.6)
Refinancing costs (23.0) (31.0)
Foreign exchange gains and losses (0.2) (4.3)
Net interest expense related to pension plans and other benefits (1.8) (1.8)
Profit (loss) on net monetary position in Argentina (IAS 29) (9.5) (5.0)
Financial income (115.9) (146.8)
*The cost of net debt includes the amount of interest charges (including interest on finance leases in 2018 and interest on IFRS 16 lease liabilities in 2019), amortization of loan issuance costs, factoring fees, other bank charges, other debt-related gains and losses and financial
income from cash and cash equivalents, but does not include refinancing costs.
Net income decreased from a net expense of €146.8 million for the year ended 31 December 2018 to a
net expense of €115.9 million for the year ended 31 December 2019, that being a decrease of €30.9
million or 21%.
This decrease in net financial expenses for the year ended 31 December 2019 is primarily due to the full effect of the repayment on 1 August 2018 of guaranteed senior bonds of €500 million (maturing in 2022 and with a 5.125% coupon) issued by the Group in 2015 and 2016, as well as senior bonds of €225 million (maturing in 2023 and with a 7.250% coupon) issued by the Group in 2015, which reduced annual
financial expenses by about one third. In addition, the cost of net debt decreased due to a partial early repayment of €150 million on Term Loan B in March 2019, which enabled the Group to reduce its interest expenses by €4 million per year. Finally, the refinancing implemented as part of the Company’s initial public offering has reduced interest expenses (see Section 8.5.1.3 of this Universal Registration Document) during the year ended 31 December 2019. Ultimately, it will enable a reduction in interest paid by approximately €20 million on an annual basis. The overall cost of refinancing borne during the year ended 31 December 2019 comprises €20.9 million for the acceleration of the amortisation of the issuance costs of the existing loans repaid in the Refinancing and still to be amortised and approximately €13 million for the commissions relating to the conclusion of the Senior Facilities Agreement, which will be amortised over the duration of the agreement.
Income tax
Income tax rose by €29.6 million, or 122.3%, from €24.2 million for the year ended 31 December 2018
to €53.8 million for the year ended 31 December 2019. This change resulted from the increase in current
tax expense of €13.2 million, or 22.8%, up from €57.8 million for the year ended 31 December 2018 to
€71 million for the year ended 31 December 2019. Deferred tax income significantly decreased over the
period, from €35.5 million for the year ended 31 December 2018 to €17.2 million for the year ended 31
December 2019.
Net income
Net income grew from €48.5 million (or 2% of revenue) for the year ended 31 December 2018 to €124.6
million (or 4.8% of revenue) for the year ended 31 December 2019. This was despite the €29.6 million
increase in income tax. This increase is mainly due to the increase in revenue, the significant
improvement in the Group’s profitability, reflected in particular by an increase of 13.2% in adjusted
EBITDA (see Section 7.3.9 below), but also by a decrease of €30.9 million in net financial expenses.
(in € million) Year ended 31 December
2019 2018
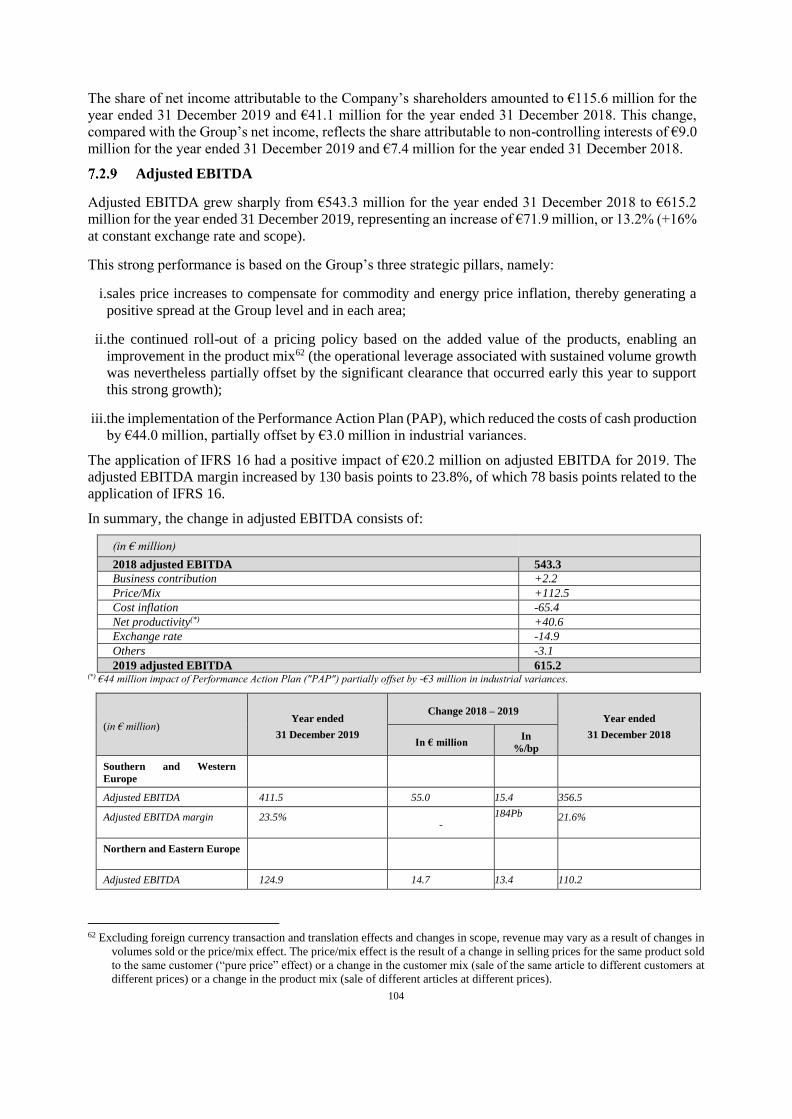
104
The share of net income attributable to the Company’s shareholders amounted to €115.6 million for the
year ended 31 December 2019 and €41.1 million for the year ended 31 December 2018. This change,
compared with the Group’s net income, reflects the share attributable to non-controlling interests of €9.0
million for the year ended 31 December 2019 and €7.4 million for the year ended 31 December 2018.
Adjusted EBITDA
Adjusted EBITDA grew sharply from €543.3 million for the year ended 31 December 2018 to €615.2
million for the year ended 31 December 2019, representing an increase of €71.9 million, or 13.2% (+16%
at constant exchange rate and scope).
This strong performance is based on the Group’s three strategic pillars, namely:
i.sales price increases to compensate for commodity and energy price inflation, thereby generating a
positive spread at the Group level and in each area;
ii.the continued roll-out of a pricing policy based on the added value of the products, enabling an
improvement in the product mix62 (the operational leverage associated with sustained volume growth
was nevertheless partially offset by the significant clearance that occurred early this year to support
this strong growth);
iii.the implementation of the Performance Action Plan (PAP), which reduced the costs of cash production
by €44.0 million, partially offset by €3.0 million in industrial variances.
The application of IFRS 16 had a positive impact of €20.2 million on adjusted EBITDA for 2019. The
adjusted EBITDA margin increased by 130 basis points to 23.8%, of which 78 basis points related to the
application of IFRS 16.
In summary, the change in adjusted EBITDA consists of:
(in € million)
2018 adjusted EBITDA 543.3
Business contribution +2.2
Price/Mix +112.5
Cost inflation -65.4
Net productivity(*) +40.6
Exchange rate -14.9
Others -3.1
2019 adjusted EBITDA 615.2 (*) €44 million impact of Performance Action Plan ("PAP") partially offset by -€3 million in industrial variances.
(in € million) Year ended
31 December 2019
Change 2018 – 2019 Year ended
31 December 2018 In € million
In
%/bp
Southern and Western
Europe
Adjusted EBITDA 411.5 55.0 15.4 356.5
Adjusted EBITDA margin 23.5% -
184Pb 21.6%
Northern and Eastern Europe
Adjusted EBITDA 124.9 14.7 13.4 110.2
62 Excluding foreign currency transaction and translation effects and changes in scope, revenue may vary as a result of changes in
volumes sold or the price/mix effect. The price/mix effect is the result of a change in selling prices for the same product sold
to the same customer (“pure price” effect) or a change in the customer mix (sale of the same article to different customers at
different prices) or a change in the product mix (sale of different articles at different prices).

105
Adjusted EBITDA margin 22.0% -
87Pb 21.1%
Latin America
Adjusted EBITDA 78.8 2.1 2.8 76.7
Adjusted EBITDA margin 29.8% -
-138
Bp 31.2%
Consolidated adjusted
EBITDA
615.2 71.9 13.2 543.3
Consolidated adjusted
EBITDA margin
23.8% -
130
Bp 22.5%
Southern and Western Europe
In Southern and Western Europe, adjusted EBITDA increased by €55 million, or a robust 15.4%, from
€356.5 million for the year ended 31 December 2018 to €411.5 million for the year ended 31 December
2019.
The increase in adjusted EBITDA during the year ended 31 December 2019 is primarily a result of the
Group’s sales volume increases in the area, a positive spread on sales and an improvement in industrial
performance. This allowed the Group to increase the adjusted EBITDA margin in Southern and Western
Europe by 184 basis points, or 23.5%, in 2019 compared to 21.6% in 2018.
The application of IFRS 16 had a positive impact of €16.6 million on adjusted EBITDA in Southern and
Western Europe for the year ended 31 December 2019.
Northern and Eastern Europe
In Northern and Eastern Europe, adjusted EBITDA increased by €14.7 million, or a robust 13.4% (11.6%
at a constant exchange rate and scope), from €110.2 million for the year ended 31 December 2018 to
€124.9 million for the year ended 31 December 2019. The adjusted EBITDA margin for this area
therefore increased to 22%, compared to 21.1% in 2018.
The increase in adjusted EBITDA during the year ended 31 December 2019 is primarily a result of the
Group’s sales volume increase in the area, a positive spread on sales and an improvement in industrial
performance. This allowed the adjusted EBITDA margin in Northern and Eastern Europe to increase by
87 basis points, or 22%, in 2019 compared to 21.1% in 2018.
The application of IFRS 16 had a positive impact of €2.4 million on adjusted EBITDA in Northern and
Eastern Europe for the year ended 31 December 2019.
Latin America
In Latin America, adjusted EBITDA rose by €2.1 million, or 2.8% (24.8% at a constant exchange rate
and scope), from €76.7 million for the year ended 31 December 2018 to €78.8 million for the year ended
31 December 2019.
Adjusted EBITDA grew in value during the year ended 31 December 2019 and resulted from higher volumes, higher selling prices in order to limit the impact of high inflation in this geographic area, as well as the overall improvement in the Group’s industrial performance in this area. However, adjusted EBITDA was impacted by the negative effect of exchange rate developments, due to the significant depreciation of the Argentine Peso and, to a lesser extent, the Brazilian real and Chilean Peso. Argentina has been classified as a hyperinflationary economy since 1 January 2018, requiring the application of IAS 29.
Overall, the area-adjusted EBITDA margin decreased by 138 basis points, or 29.8% in 2019, compared to 31.2% in 2018.

106
The application of IFRS 16 had a positive impact of €1.2 million on adjusted EBITDA in Latin America for the year ended 31 December 2019.
107
8. LIQUIDITY AND CAPITAL RESOURCES
8.1 Overview
The Group’s principal financing needs include its working capital, its capital expenditure (particularly
the construction of new industrial sites or the construction or renovation of furnaces (see Section 5.7
“Capital Expenditure” of this Universal Registration Document)), its tax payments and its interest
payments.
The main sources of liquidity for the Group as of 31 December 2019 are the following:
– cash flows from operating activities, which totalled €496.8 million for the year ended 31
December 2019 and €429.3 million for the year ended 31 December 2018 (see Section 8.2.1 of
this Universal Registration Document);
– a term loan (Term Loan A) for a total principal amount of €1,500 million as of 31 December
2019 made available to the Group on 7 October 2019 under the Senior Facilities Agreement
(see Section 8.2.2.1 of this Universal Registration Document), direct loans from banks and
other lenders and short-term bank credit lines;
– a €500 million revolving credit facility as of 31 December 2019, made available to the Group
under the Senior Facilities Agreement, drawn for €200 million on 20 March 2020 (see Section
8.2.2.1 of this Universal Registration Document);
– an unsecured Negotiable European Commercial Paper (NEU CP) programme for a maximum
principal amount of €400 million as of 31 December 2019, issued by the Company’s subsidiary,
Verallia Packaging, €188.2 million of which was issued as of 31 December 2019 (see Section
8.2.2.3 of this Universal Registration Document);
– a pan-European factoring programme with a financing line for a maximum of €400.0 million,
plus local factoring lines that may be used for up to an additional €50.0 million (see Section
8.2.2.4 of this Universal Registration Document).
On the occasion of its initial public offering, the Group proceeded, on the date of the settlement-delivery
of the Company’s shares offered as part of their admission for trading on the Euronext Paris regulated
market on 7 October 2019, to fully repay term loans B and C and cancel the revolving credit facility
that had been made available as part of the financing documentation concluded on 7 August 2015 (as
subsequently amended) for a notional amount of €1,825 million thanks (x) to the €1,500 million in
proceeds from the drawing carried out by the Verallia Packaging on Term Loan A made available under
the Senior Facilities Agreement (see Section 8.2.2.1 of this Universal Registration Document), (y) to
the proceeds from the drawings carried out on the NEU CP programme and (z) to the balance, with a
portion of the Group’s available cash flow.
In addition, in order to further strengthen its liquidity position in the current context of health crisis, the
Group successfully set up an additional €250m Revolving Credit line with a one-year maturity,
extendable by six months at the Group’s discretion, on April 24, 2020 (see also paragraph 18.6 of this
Universal registration document).
The Group estimates that, for the year 2020, its financing needs will mainly include its current operating
needs, investment expenses, tax payments, interest payments and, subject to its approval by the General
meeting of the Company’s shareholders, the payment of a dividend slightly above €100 million. On the
basis of updated cash projections, the Group believes it will be able to meet its liquidity needs during
the 12 months following the date of this Universal Registration Document.
Readers are invited to read the following information on cash flows with the consolidated financial
statements of the Group for the year ended 31 December 2019, presented respectively in Section 18.1.1
108
of this Universal Registration Document, having been the subject of a Statutory Auditors’ audit report
contained in Section 18.1.2 of this Universal Registration Document.
In accordance with article 19 of Regulation (EU) n° 2017/1129 of the European Parliament and the
Council of 14 June 2017, information relating to liquidity and capital resources of the Group for the
financial years ended 31 December 2018 and 2017 set out in chapter 8 “Liquidity and capital resources”
of the Registration Document are incorporated by reference in this Universal registration document.
8.2 Financial resources and financial liabilities
Group cash flows from operating activities
The cash flows from operating activities totalled €496.8 million and €429.3 million respectively for the
years ended 31 December 2019 and 2018. A detailed analysis of the Group’s cash flows from operating
activities for the years ended 31 December 2019 and 2018 is presented in Section 8.5.1.1 of this
Universal Registration Document.
The Group uses its cash and cash equivalents to finance its current operating needs as well as its capital
expenditure. The Group’s cash is primarily denominated in euros.
The Group’s ability to generate cash in the future from its operating activities will depend on its future
operating performance, which is itself dependent, to a certain extent, on economic, financial,
competitive, market, regulatory and other factors, most of which are outside the Group’s control.
The Group’s policy is to centralise its subsidiaries’ cash at the level of Verallia Packaging, when
possible, through centralised management of accounts (cash pooling in the Eurozone primarily), intra-
group loans or credit lines and dividend payments.
Financial liabilities
The Group's financial liabilities amounted to €1,809.9 million and €2,244.6 million as of 31 December
2019 and 2018, respectively. The evolution of the Group’s net debt is detailed in note 17.2 of the
Group’s consolidated financial statements for the years ended 31 December 2019 and 31 December
2018.

109
The following table shows the distribution of the Group’s debt at the dates indicated:
(in € million) 31 December 2019 31 December 2018 2019 applicable interest rates
Revolving credit facility (RCF)(1) - -
After refinancing:
EURIBOR* + 1.35%
Non-use commission: 0.405%
Term Loan A(2) 1,490.7 - EURIBOR* + 1.75%
Term Loan B (3) - 1,256.7 EURIBOR* + 2.75%
Term Loan C(3) - 545.0 EURIBOR* + 2.75%
Intragroup Loan(4) - 273.7 8.123%
Lease / Finance lease liabilities(5) 53.3 1.9 -
Other borrowings 56.9 67.5 -
Total long-term debt 1,600.9 2,144.8 -
Financial derivatives 9.6 6.7 -
Total long-term debt and derivative
financial instruments 1,610.5 2,151.5 -
Negotiable commercial paper (NEU CP) (6) 188.2 80.0 -
Other borrowings(7) 11.2 13.1 -
Total short-term debt 199.4 93.1 -
Gross debt 1,809.9 2,244.6 -
Cash and cash equivalents (219.2) (262.1) -
Net debt 1,590.6 1,982.5 -
*Euribor with a floor rate of 0%
(1) the revolving credit facility for a principal amount of €500 million, made available under the Senior Facilities Agreement, had not
been drawn down as of 31 December 2019 but has been drawn for €200 million on 20 March 2020. The revolving credit facility for a principal amount of €325 million, made available in the financing documentation concluded on 7 August 2015 (as subsequently
amended) had not been used as of 31 December 2018.
(2) Term Loan A was fully drawn down on 7 October 2019 as part of the Group’s refinancing for a principal amount of €1,500 million.
(3) Term Loans B and C were fully repaid as part of the Group's refinancing on 7 October 2019.
(4) As of 20 September 2019, the Company incorporated the balance of the Intragroup Loan of €251.4 million into its capital.
(5) Figure taking into account the impact of IFRS 16 applied by the Group as of 1 January 2019 (see Section
7.1.2.11 "Changes in IFRS" in this Universal Registration Document).
(6) In June 2018, the Group established a €250.0 million Negotiable European Commercial Paper (NEU CP) programme (increased
to €400.0 million in July 2019), €188.2 million of which was issued as of 31 December 2019.
(7) Including factoring liabilities, which correspond to assignment of receivables with recourse (see Note 14.4 “Factoring” and Note
17.2 “Change in gross debt” to the Group consolidated financial statements for the years ended 31 December 2019 and 31
December 2018).
As of 31 December 2019, the Group’s net financial debt/adjusted EBITDA ratio was 2.6x. As of 31
December 2018, the same ratio was 3.1x, taking into account only third-party debt (see Section 8.2.2.5
of this Universal Registration Document).
The overall expenses for refinancing, which occurred on 7 October 2019, include an amount of €20.9
million for the acceleration of the amortisation of the fees relating to the existing term loans repaid in
the refinancing and still to be amortised. The cost of this refinancing includes an amount of
approximately €13 million for fees related to the conclusion of the Senior Facilities Agreement, to be
amortised over the duration of the Senior Facilities Agreement. The Refinancing operation will enable
a reduction in interest paid by approximately €20 million on an annual basis.
The main elements of the Group’s financial liabilities are described below.
110
Senior Facilities Agreement (Term Loan A)
On the occasion of its initial public offering, the Group proceeded, on 7 October 2019, the date of the
settlement-delivery of the Company’s shares as part of their admission for trading on the Euronext Paris
regulated market, to fully repay its existing financial debt under the financing documentation concluded
on 7 August 2015 (as subsequently amended).
To this end, on 17 July 2019, the Group entered into a new senior facilities agreement called “Senior
Term and Revolving Facilities Agreement” with a trade union of international banks including Banco
Santander S.A., Paris Branch, BNP Paribas, Citibank Europe plc, Crédit Agricole Corporate and
Investment Bank, Credit Suisse International, Deutsche Bank Luxembourg S.A., Société Générale,
Banco de Sabadell S.A., Allied Irish Banks plc, Commerzbank Aktiengesellschaft, Filiale Luxemburg,
Cooperatieve Rabobank U.A., Crédit Industriel et Commercial, La Banque Postale, Mediobanca -
Banca di Credito Finanziario S.p.A. and Raiffeisen Bank International AG (the “Lenders”), for a period
of five years from the date of the drawing of the Term Loan A, which took place on 7 October 2019.
The Senior Facilities Agreement is governed by French law.
i. Credit lines
The Senior Facilities Agreement provides two lines of credit for a total principal amount of €2.0 billion,
broken down as follows:
– a term loan (Term Loan A) for the principal amount of €1,500.0 million, with a maturity of five
years from 7 October 2019, repayable in full at maturity; and
– a revolving credit facility (which can be used up to a maximum principal amount of €50.0
million as a swingline loan (a very short-term line)) for a maximum principal amount of €500.0
million with a maturity of five years from 7 October 2019.
The Senior Facilities Agreement also provides for additional uncommitted term and revolving loans
subject to meeting certain conditions.
ii. Interest and fees
The loans borrowed under the Senior Facilities Agreement will bear interest at a variable rate indexed
to EURIBOR (in the case of advances denominated in euros) or LIBOR (in the case of advances
denominated in a currency other than the euro), in each case with a floor rate at 0% and increased by
the applicable margin. The applicable margin is initially set at (i) 1.75% per annum for the term loan
(Term Loan A) and (ii) 1.35% per annum for the revolving facility, in each case with an up or down
adjustment mechanism (ratchet). The following fees will also apply to the revolving facility: (i) a
commitment fee due for the available credit commitment of each lender under the revolving credit
facility a rate of 30% of the applicable margin and (ii) use fees of 20 basis points, or, as the case may
be, 40 basis points respectively in the case of drawing above a threshold of 33.1/3%, or, as the case may
be, 66.2/3% of the commitments available under the revolving credit facility.
The table below shows the breakdown of the margins that apply to each of the facilities as a function of
the ratio of the Group’s total net debt to pro forma consolidated EBITDA as defined in the Senior
Facilities Agreement. These margins will be reviewed semi-annually, and for the first time on the date
that falls six months after 7 October 2019.
Leverage ratio (total net debt/pro forma consolidated EBITDA) Revolving Loan Margin Term Loan A
margin
Less than or equal to 1.0x 0.35% 0.75%
Higher than 1.0x and less than or equal to 1.5x 0.60% 1.00%
111
Higher than 1.5x and less than or equal to 2.0x 0.85% 1.25%
Higher than 2.0x and less than or equal to 2.5x 1.10% 1.50%
Higher than 2.5x and less than or equal to 3.0x 1.35% 1.75%
Higher than 3.0x 1.60% 2.00%
Total net debt is defined in the Senior Facilities Agreement as the Group’s consolidated financial debt,
excluding intra-group debt and obligations related to interest rate and foreign exchange hedging
instruments, after deduction of cash and cash equivalents. Pro forma consolidated EBITDA corresponds
to adjusted EBITDA as defined in this Universal Registration Document.
iii. Guarantees and security interests
The Company is a guarantor of the payment of amounts due under the Senior Facilities Agreement and
Verallia Packaging is the initial borrower and (subject to the usual limitations) guarantor of the other
borrowers’ and/or guarantors’ commitments under the Senior Facilities Agreement. Verallia France,
Verallia Italia, Verallia Brasil, Verallia Spain, Verallia Portugal and Verallia Deutschland have acceded
(subject to the usual limitations) as guarantors of the commitments of other borrowers and/or guarantors
under the Senior Facilities Agreement within 120 days of the date of the first draw under the Senior
Facilities Agreement, in accordance with its terms.
Any member of the Group that becomes a borrower under the Senior Facilities Agreement must be a
guarantor of the obligations of the other borrowers, subject to applicable rules limiting guarantees. In
addition, within 90 days (or 120 days if the member of the Group in question is registered in a
jurisdiction in which no existing borrower and/or guarantor is registered) of the date on which the
Company's annual consolidated financial statements are to be issued to the agent pursuant to the Senior
Facilities Agreement, in accordance with its provisions, any company that is a material subsidiary (as
defined in English in the Senior Facilities Agreement, the “Material Subsidiary”) of the Company will
be required to become a guarantor of the Senior Facilities Agreement, in accordance with the Agreed
Guarantee Principles (as defined in English in the Senior Facilities Agreement). At these same dates,
the Company must procure that other members of the Group accede such that the consolidated EBITDA
of all members of the Group that are guarantors under the Senior Facilities Agreement represent in total
at least 80% of the Group’s consolidated EBITDA (as specified in the Senior Facilities Agreement).
The Senior Facilities Agreement does not require the Group to constitute collateral.
iv. Covenants and restrictive clauses
The Senior Facilities Agreement contains certain affirmative and negative covenants, including
limitations on the following:
– the constitution of collateral;
– the incurrence of financial debt exceeding 20% of the Group’s total net debt by Group
companies that are not either guarantors or borrowers under the Senior Facilities Agreement;
– disposals/transfers of assets;
– certain mergers, spin offs, partial asset contributions and similar transactions; and
– a change in the nature of the Group’s activities,
subject in each case to the de minimis amounts stipulated and usual exceptions for this type of financing.
The Senior Facilities Agreement also contains affirmative covenants to maintain insurance policies,
comply with applicable laws, maintain the borrowings at the same rank as other unsecured debts of the
borrowers and guarantors under the Senior Facilities Agreement, procure that the Group’s Material
Subsidiaries become guarantors under the Senior Facilities Agreement and to procure that the combined
112
consolidated EBITDA of all Group members that are guarantors under the Senior Facilities Agreement
represent together at least 80% of the Group’s total consolidated EBITDA (as specified in the Senior
Facilities Agreement). Finally, the Senior Facilities Agreement requires compliance with a financial
ratio that will limit the amount of debt that may be contracted by the members of the Group. Specifically,
the Group will be required to maintain a leverage ratio (total net debt to pro forma consolidated
EBITDA, the pro forma consolidated EBITDA corresponding to the adjusted EBITDA as defined in
this universal registration document), which is tested at the end of each six-month period and for the
first time for the period ending 31 December 2020, and must be less than or equal to 5x until the maturity
of the Senior Facilities Agreement.
For the record, as of 31 December 2019, no default has occurred or continues under the Senior Facilities
Agreement.
v. Voluntary prepayment
The Senior Facilities Agreement authorizes voluntary prepayments with advance notice and subject to
a minimum amount.
vi. Cases of mandatory prepayment
The Senior Facilities Agreement provides for prepayment or early termination in the event of a change
in control at the request of any lender made within 30 calendar days after receipt by the lenders of
notification by the agent of the Company’s notification informing the agent of the occurrence of such a
case of prepayment/early termination. The available commitments of the lender concerned under the
non-renewable credit facility will be cancelled upon receipt by the agent of the application of the lender
concerned and the participation of the lender concerned in current drawings under the term loan and, if
applicable, the revolving credit facility will have to be reimbursed within 15 business days of the agent
receiving the application of the relevant lender. A change in control is deemed to occur in the event that
a person or a group of persons acting in concert, as defined in Article L. 233-10 of the French
Commercial Code (other than the shareholders of the Company on the date the Senior Facilities
Agreement is signed, or persons affiliated with such shareholders and any other person approved by the
Lenders Majority (as defined in the Senior Facilities Agreement)) who does not control the Group on
the date the Senior Facilities Agreement is signed, within the meaning of L. 233-3 of the French
Commercial Code, directly or indirectly acquires more than 50% of the share capital and voting rights
of the Company.
vii. Acceleration events
The Senior Facilities Agreement provides for accelerated maturity in certain cases that are usual for this
type of financing, including payment defaults, failure to meet the financial ratio or any other
undertaking, the inaccuracy of any declaration, the occurrence of a case of cross acceleration, the
initiation of collection proceedings and insolvency, enforced collection proceedings or the occurrence
of a material adverse event.
Negotiable European Commercial Paper (NEU CP)
In June 2018, the Group launched a Negotiable European Commercial Paper (NEU CP) short-term
financing programme with a cap of €250.0 million.
As of 31 December 2018, outstanding issues amounted to €80 million at an average rate of 0.28%.
On 25 July 2019, the cap for this programme was increased to €400 million.
As of 31 December 2019, outstanding issues amounted to €188.2 million at an average rate of 0.25%.
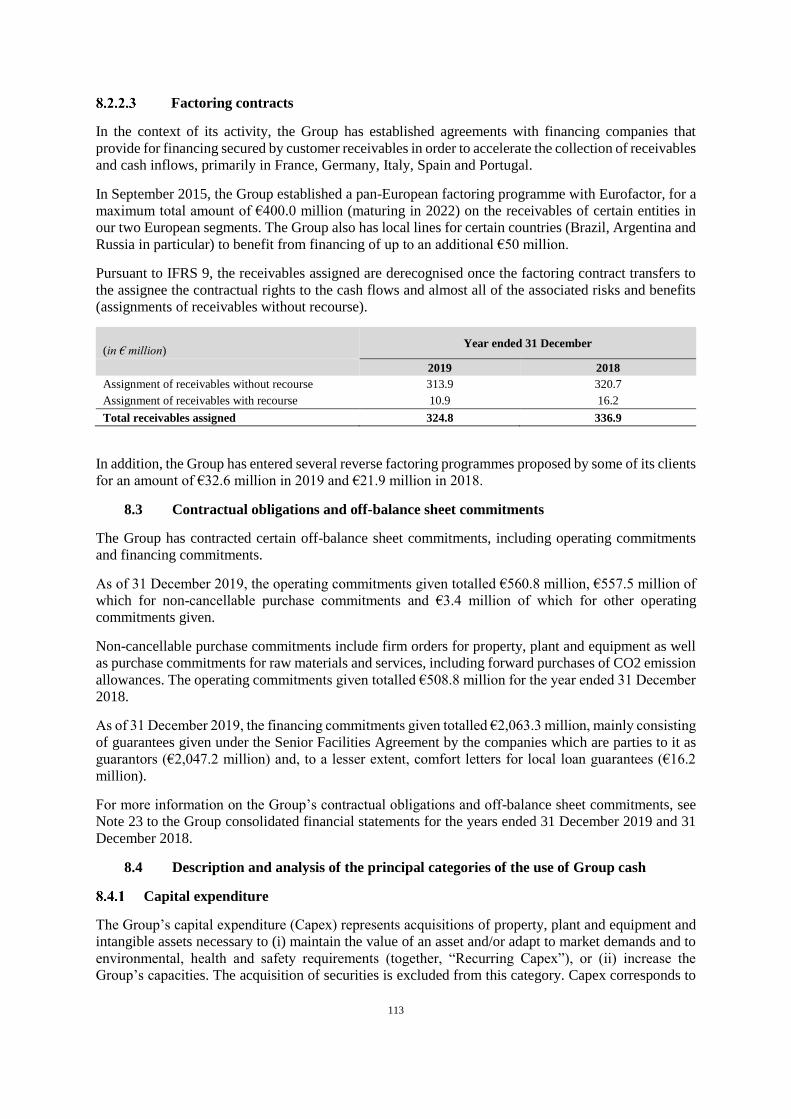
113
Factoring contracts
In the context of its activity, the Group has established agreements with financing companies that
provide for financing secured by customer receivables in order to accelerate the collection of receivables
and cash inflows, primarily in France, Germany, Italy, Spain and Portugal.
In September 2015, the Group established a pan-European factoring programme with Eurofactor, for a
maximum total amount of €400.0 million (maturing in 2022) on the receivables of certain entities in
our two European segments. The Group also has local lines for certain countries (Brazil, Argentina and
Russia in particular) to benefit from financing of up to an additional €50 million.
Pursuant to IFRS 9, the receivables assigned are derecognised once the factoring contract transfers to
the assignee the contractual rights to the cash flows and almost all of the associated risks and benefits
(assignments of receivables without recourse).
(in € million) Year ended 31 December
2019 2018
Assignment of receivables without recourse 313.9 320.7
Assignment of receivables with recourse 10.9 16.2
Total receivables assigned 324.8 336.9
In addition, the Group has entered several reverse factoring programmes proposed by some of its clients
for an amount of €32.6 million in 2019 and €21.9 million in 2018.
8.3 Contractual obligations and off-balance sheet commitments
The Group has contracted certain off-balance sheet commitments, including operating commitments
and financing commitments.
As of 31 December 2019, the operating commitments given totalled €560.8 million, €557.5 million of
which for non-cancellable purchase commitments and €3.4 million of which for other operating
commitments given.
Non-cancellable purchase commitments include firm orders for property, plant and equipment as well
as purchase commitments for raw materials and services, including forward purchases of CO2 emission
allowances. The operating commitments given totalled €508.8 million for the year ended 31 December
2018.
As of 31 December 2019, the financing commitments given totalled €2,063.3 million, mainly consisting
of guarantees given under the Senior Facilities Agreement by the companies which are parties to it as
guarantors (€2,047.2 million) and, to a lesser extent, comfort letters for local loan guarantees (€16.2
million).
For more information on the Group’s contractual obligations and off-balance sheet commitments, see
Note 23 to the Group consolidated financial statements for the years ended 31 December 2019 and 31
December 2018.
8.4 Description and analysis of the principal categories of the use of Group cash
Capital expenditure
The Group’s capital expenditure (Capex) represents acquisitions of property, plant and equipment and
intangible assets necessary to (i) maintain the value of an asset and/or adapt to market demands and to
environmental, health and safety requirements (together, “Recurring Capex”), or (ii) increase the
Group’s capacities. The acquisition of securities is excluded from this category. Capex corresponds to
114
the line item “Acquisition of property, plant and equipment and intangible assets” in the consolidated
statement of cash flows.
The Group’s capital expenditure primarily involves the construction of new industrial sites or the
reconstruction or expansion of existing industrial sites, the construction of new furnaces or the
renovation of existing furnaces, and the replacement of other property, plant and equipment and
intangible assets, particularly machines (blowers or forming machines, for example) and equipment.
The Group’s capital expenditure for the years ended 31 December 2019 and 2018 amounted to €252.5
million63 and €225 million respectively. For more information on the Group’s historical, current and
future capital expenditure, see Section 5.7 “Capital Expenditure” of this Universal Registration
Document.
Interest payments and repayment of financial debt
A portion of the Group’s cash flows is allocated to servicing and repayment of its debt (see Section
8.2.2 “Financial liabilities” of this Universal Registration Document). The Group paid interest in the
amounts of €70.4 million and €99.8 million respectively during the years ended 31 December 2019 and
2018. It also paid, as repayment for its financial debts, €1,891 million and €741.4 million respectively
during the years ended 31 December 2019 and 2018.
The 2019 financial year was mainly marked by the full repayment of Term Loan B and C for a notional
amount of €1,825 million, and by the incorporation of the Intragroup Loan with a capital of €251.4
million as of 20 September 2019.
Financing of working capital requirements
Net working capital primarily corresponds to the value of inventories plus trade receivables and other
operating receivables minus debts to suppliers and other operating liabilities (see Note 14 of the Group's
consolidated financial statements for the years ended 31 December 2019 and 2018).
The net working capital amounted to (€24.9) million during the year ended 31 December 2019 and
€35.2 million during the year ended 31 December 2018. The change in net working capital thus
amounted to (€60.1) million during the year ended 31 December 2019, compared to (€19.7) million
during the year ended 31 December 2018.
The value of inventories decreased during 2019 to €455.2 million as of 31 December 2019, compared
to €477.9 million as of 31 December 2018, reflecting a decrease in finished product and raw material
inventories, particularly as a result of clearances during the year. Trade receivables also decreased
during the 2019 to €178.9 million as of 31 December 2019, compared to €190.9 million as of 31
December 2018. Likewise, trade payables also decreased during the year ended 31 December 2019 to
€383.6 million as of 31 December 2019, compared to €408.4 million as of 31 December 2018. The first
half of the year ended 31 December 2019 was marked by a significant decrease in trade payables (-
€35.9 million) which was partly offset in the second half of the year.
Acquisitions of companies or activities
The Group made no acquisitions of companies or businesses during the year ended 31 December 2019.
Dividends
Subject to the approval of the annual General Meeting of the Company’s shareholders, the Group
intends to distribute, in 2020, an annual dividend slightly above €100 million for the year ended 31
December 2019.
63 Excluding rights of use under IFRS 16.
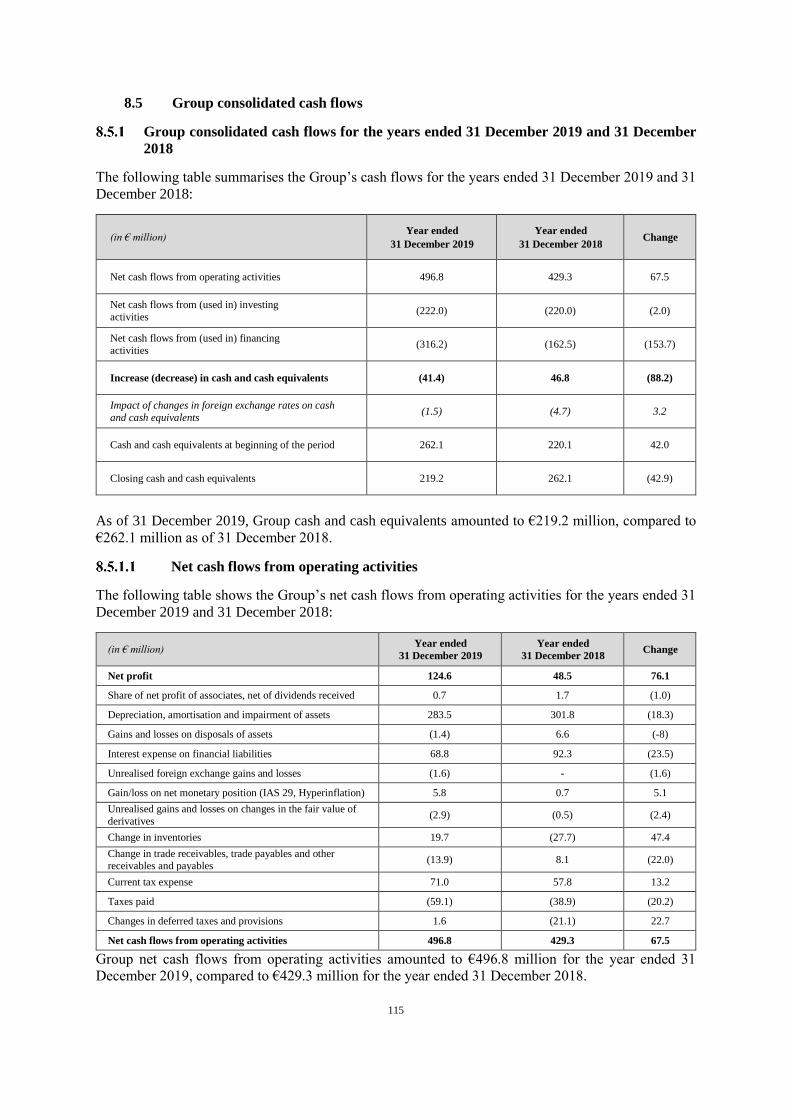
115
8.5 Group consolidated cash flows
Group consolidated cash flows for the years ended 31 December 2019 and 31 December
2018
The following table summarises the Group’s cash flows for the years ended 31 December 2019 and 31
December 2018:
(in € million) Year ended
31 December 2019
Year ended
31 December 2018 Change
Net cash flows from operating activities 496.8 429.3 67.5
Net cash flows from (used in) investing
activities (222.0) (220.0) (2.0)
Net cash flows from (used in) financing
activities (316.2) (162.5) (153.7)
Increase (decrease) in cash and cash equivalents (41.4) 46.8 (88.2)
Impact of changes in foreign exchange rates on cash
and cash equivalents (1.5) (4.7) 3.2
Cash and cash equivalents at beginning of the period 262.1 220.1 42.0
Closing cash and cash equivalents 219.2 262.1 (42.9)
As of 31 December 2019, Group cash and cash equivalents amounted to €219.2 million, compared to
€262.1 million as of 31 December 2018.
Net cash flows from operating activities
The following table shows the Group’s net cash flows from operating activities for the years ended 31
December 2019 and 31 December 2018:
(in € million) Year ended
31 December 2019
Year ended
31 December 2018 Change
Net profit 124.6 48.5 76.1
Share of net profit of associates, net of dividends received 0.7 1.7 (1.0)
Depreciation, amortisation and impairment of assets 283.5 301.8 (18.3)
Gains and losses on disposals of assets (1.4) 6.6 (-8)
Interest expense on financial liabilities 68.8 92.3 (23.5)
Unrealised foreign exchange gains and losses (1.6) - (1.6)
Gain/loss on net monetary position (IAS 29, Hyperinflation) 5.8 0.7 5.1
Unrealised gains and losses on changes in the fair value of
derivatives (2.9) (0.5) (2.4)
Change in inventories 19.7 (27.7) 47.4
Change in trade receivables, trade payables and other
receivables and payables (13.9) 8.1 (22.0)
Current tax expense 71.0 57.8 13.2
Taxes paid (59.1) (38.9) (20.2)
Changes in deferred taxes and provisions 1.6 (21.1) 22.7
Net cash flows from operating activities 496.8 429.3 67.5
Group net cash flows from operating activities amounted to €496.8 million for the year ended 31
December 2019, compared to €429.3 million for the year ended 31 December 2018.

116
The increase in net cash flows from the Group’s business of €67.5 million between the two periods of
the year ended 31 December 2019 is primarily a result of the increase in net income (see Section 7.3.8
"Net income" of this Universal Registration Document) as well as the decrease in working capital over
the period concerned, mainly due to the decrease in inventories and trade receivables.
Net cash flows from (used in) investing activities
The following table shows the Group’s net cash flows from investing activities for the years ended 31
December 2019 and 31 December 2018:
(in € million) Year ended
31 December 2019
Year ended
31 December 2018 Change
Acquisition of property, plant and equipment and intangible
assets (252.5) (225.0) (27.5)
Increase (decrease) in debt on fixed assets 19.3 (5.6) 24.9
Acquisitions of subsidiaries, net of cash acquired (0.5) - (0.5)
Deferred payment related to the acquisition of a subsidiary - - -
Capital expenditure (233.7) (230.6) (3.1)
Disposals of property, plant and equipment and intangible
assets 3.7 - 3.7
Sale of equity-accounted securities - 14.0 (14.0)
Disposals 3.7 14.0 (10.3)
Increase in loans, deposits and short-term borrowings (5.7) (3.8) (1.9)
Reduction in loans, deposits and short-term borrowings 13.7 0.4 13.3
Changes in loans and deposits 8.0 (3.4) 11.4
Net cash flows used in investing activities (222.0) (220.0) (2.0)
The Group’s net cash flows from investing activities, which primarily reflect acquisitions of property,
plant and equipment and intangible assets (or capital expenditure (Capex) (see Sections 5.7 “Capital
expenditure” and 8.4.1 “Capital expenditure” of this Universal Registration Document)), totalled
€(252.5) million for the year ended 31 December 2019 and €(225.0) million for the year ended 31
December 2018.
Net cash flows from the Group’s investing activities increased by €2.0 million between the two periods
of the year ended 31 December 2019, mainly due to an increase in 2019 in investments, a decrease in
disposals (2018 was marked by the disposal of the holdings in the IVN joint venture in Brazil) and by
an improvement in loans, deposits, and security accounts under factoring contracts.
Net cash flows from (used in) financing activities
The following table shows the Group’s net cash flows from financing activities for the year ended 31
December 2019 and 31 December 2018:
(in € million) Year ended
31 December 2019
Year ended
31 December 2018
Change
Capital increase (decrease) - - -
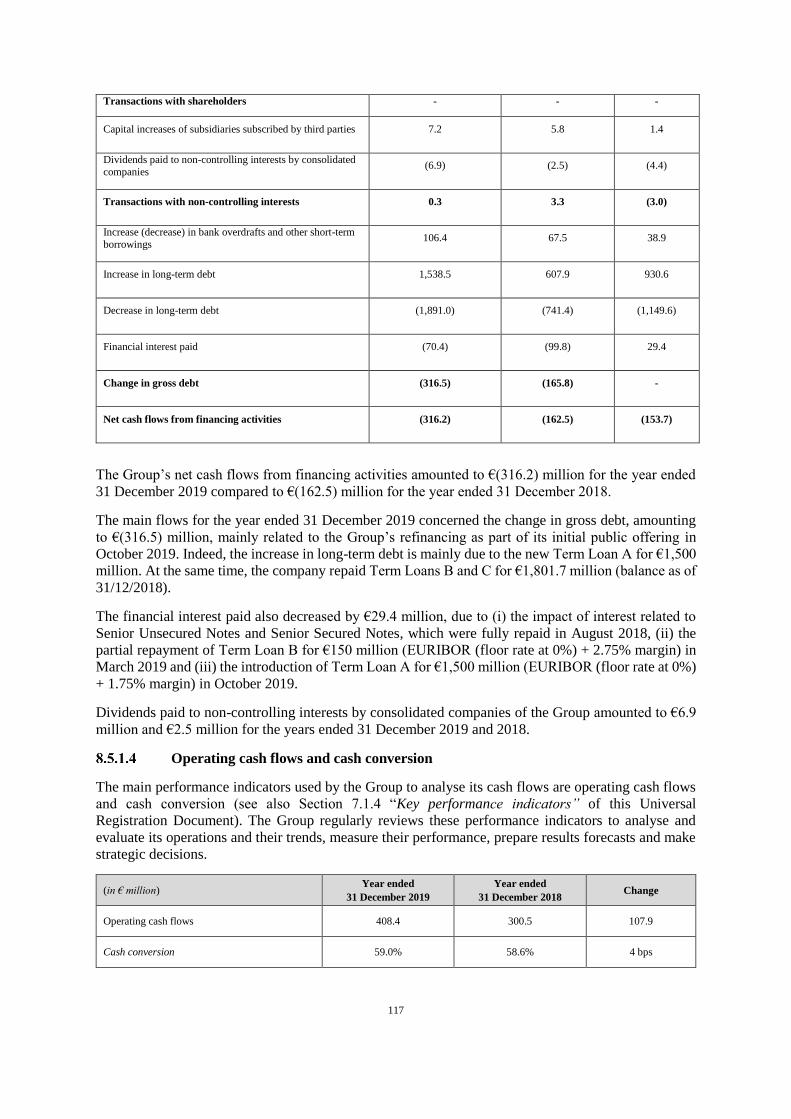
117
Transactions with shareholders - - -
Capital increases of subsidiaries subscribed by third parties 7.2 5.8 1.4
Dividends paid to non-controlling interests by consolidated
companies (6.9) (2.5) (4.4)
Transactions with non-controlling interests 0.3 3.3 (3.0)
Increase (decrease) in bank overdrafts and other short-term
borrowings 106.4 67.5 38.9
Increase in long-term debt 1,538.5 607.9 930.6
Decrease in long-term debt (1,891.0) (741.4) (1,149.6)
Financial interest paid (70.4) (99.8) 29.4
Change in gross debt (316.5) (165.8) -
Net cash flows from financing activities (316.2) (162.5) (153.7)
The Group’s net cash flows from financing activities amounted to €(316.2) million for the year ended
31 December 2019 compared to €(162.5) million for the year ended 31 December 2018.
The main flows for the year ended 31 December 2019 concerned the change in gross debt, amounting
to €(316.5) million, mainly related to the Group’s refinancing as part of its initial public offering in
October 2019. Indeed, the increase in long-term debt is mainly due to the new Term Loan A for €1,500
million. At the same time, the company repaid Term Loans B and C for €1,801.7 million (balance as of
31/12/2018).
The financial interest paid also decreased by €29.4 million, due to (i) the impact of interest related to
Senior Unsecured Notes and Senior Secured Notes, which were fully repaid in August 2018, (ii) the
partial repayment of Term Loan B for €150 million (EURIBOR (floor rate at 0%) + 2.75% margin) in
March 2019 and (iii) the introduction of Term Loan A for €1,500 million (EURIBOR (floor rate at 0%)
+ 1.75% margin) in October 2019.
Dividends paid to non-controlling interests by consolidated companies of the Group amounted to €6.9
million and €2.5 million for the years ended 31 December 2019 and 2018.
Operating cash flows and cash conversion
The main performance indicators used by the Group to analyse its cash flows are operating cash flows
and cash conversion (see also Section 7.1.4 “Key performance indicators” of this Universal
Registration Document). The Group regularly reviews these performance indicators to analyse and
evaluate its operations and their trends, measure their performance, prepare results forecasts and make
strategic decisions.
(in € million) Year ended
31 December 2019
Year ended
31 December 2018 Change
Operating cash flows 408.4 300.5 107.9
Cash conversion 59.0% 58.6% 4 bps
118
Operating cash flows and cash conversion are alternative performance measures according to the
position of AMF No. 2015-12.
Operating cash flows and cash conversion are not standardised accounting measures meeting a single
definition generally accepted by IFRS. They should not be considered a substitute for operating profit,
net income or cash flows from operating activities, which are measures defined by IFRS, or a substitute
measure of liquidity. Other issuers may calculate operating cash flows and cash conversion differently
from the definitions used by the Group.
Operating cash flows
Operating cash flows represent cash flows plus the change in operating working capital.
Cash flows correspond to operating profit adjusted for depreciation, amortisation and impairment,
restructuring costs, acquisition and M&A costs, hyperinflationary effects, management share ownership
plans, disposal-related effects and subsidiary contingencies, site closure expenses and other items (i.e.,
adjusted EBITDA) less Capex.
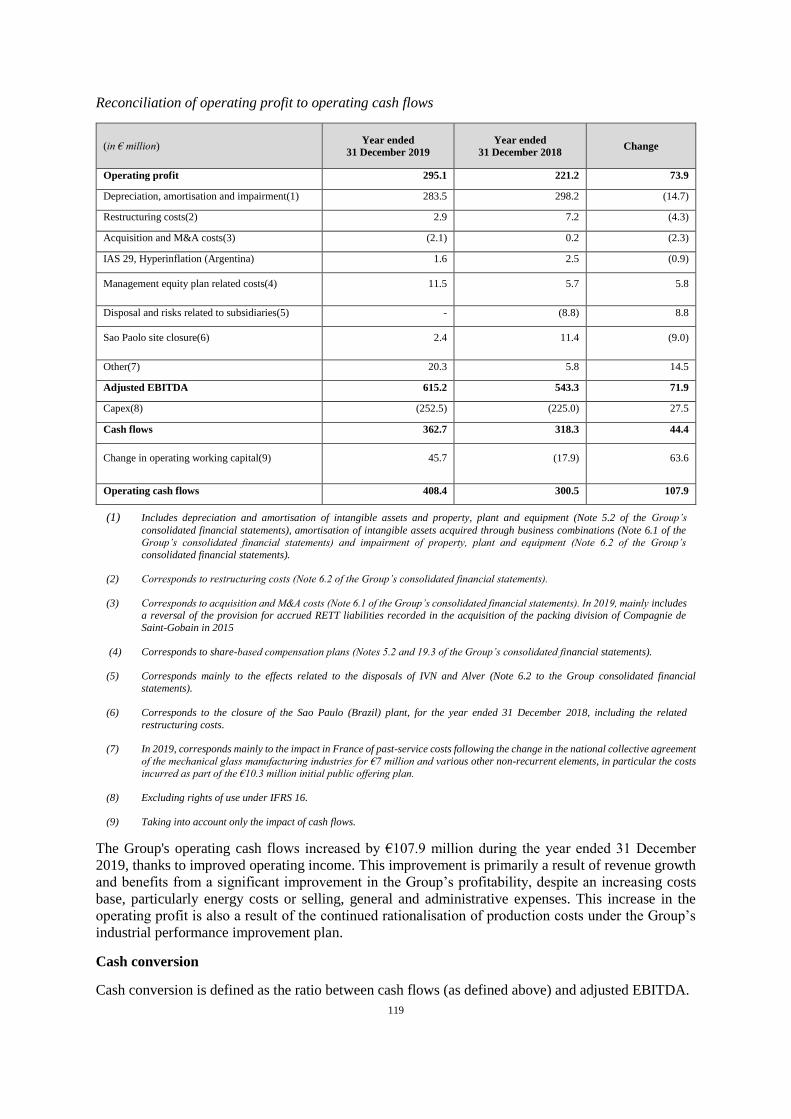
119
Reconciliation of operating profit to operating cash flows
(in € million) Year ended
31 December 2019
Year ended
31 December 2018 Change
Operating profit 295.1 221.2 73.9
Depreciation, amortisation and impairment(1) 283.5 298.2 (14.7)
Restructuring costs(2) 2.9 7.2 (4.3)
Acquisition and M&A costs(3) (2.1) 0.2 (2.3)
IAS 29, Hyperinflation (Argentina) 1.6 2.5 (0.9)
Management equity plan related costs(4) 11.5 5.7 5.8
Disposal and risks related to subsidiaries(5) - (8.8) 8.8
Sao Paolo site closure(6) 2.4 11.4 (9.0)
Other(7) 20.3 5.8 14.5
Adjusted EBITDA 615.2 543.3 71.9
Capex(8) (252.5) (225.0) 27.5
Cash flows 362.7 318.3 44.4
Change in operating working capital(9) 45.7 (17.9) 63.6
Operating cash flows 408.4 300.5 107.9
(1) Includes depreciation and amortisation of intangible assets and property, plant and equipment (Note 5.2 of the Group’s
consolidated financial statements), amortisation of intangible assets acquired through business combinations (Note 6.1 of the
Group’s consolidated financial statements) and impairment of property, plant and equipment (Note 6.2 of the Group’s
consolidated financial statements).
(2) Corresponds to restructuring costs (Note 6.2 of the Group’s consolidated financial statements).
(3) Corresponds to acquisition and M&A costs (Note 6.1 of the Group’s consolidated financial statements). In 2019, mainly includes a reversal of the provision for accrued RETT liabilities recorded in the acquisition of the packing division of Compagnie de
Saint-Gobain in 2015
(4) Corresponds to share-based compensation plans (Notes 5.2 and 19.3 of the Group’s consolidated financial statements).
(5) Corresponds mainly to the effects related to the disposals of IVN and Alver (Note 6.2 to the Group consolidated financial
statements).
(6) Corresponds to the closure of the Sao Paulo (Brazil) plant, for the year ended 31 December 2018, including the related
restructuring costs.
(7) In 2019, corresponds mainly to the impact in France of past-service costs following the change in the national collective agreement
of the mechanical glass manufacturing industries for €7 million and various other non-recurrent elements, in particular the costs
incurred as part of the €10.3 million initial public offering plan.
(8) Excluding rights of use under IFRS 16.
(9) Taking into account only the impact of cash flows.
The Group's operating cash flows increased by €107.9 million during the year ended 31 December
2019, thanks to improved operating income. This improvement is primarily a result of revenue growth
and benefits from a significant improvement in the Group’s profitability, despite an increasing costs
base, particularly energy costs or selling, general and administrative expenses. This increase in the
operating profit is also a result of the continued rationalisation of production costs under the Group’s
industrial performance improvement plan.
Cash conversion
Cash conversion is defined as the ratio between cash flows (as defined above) and adjusted EBITDA.
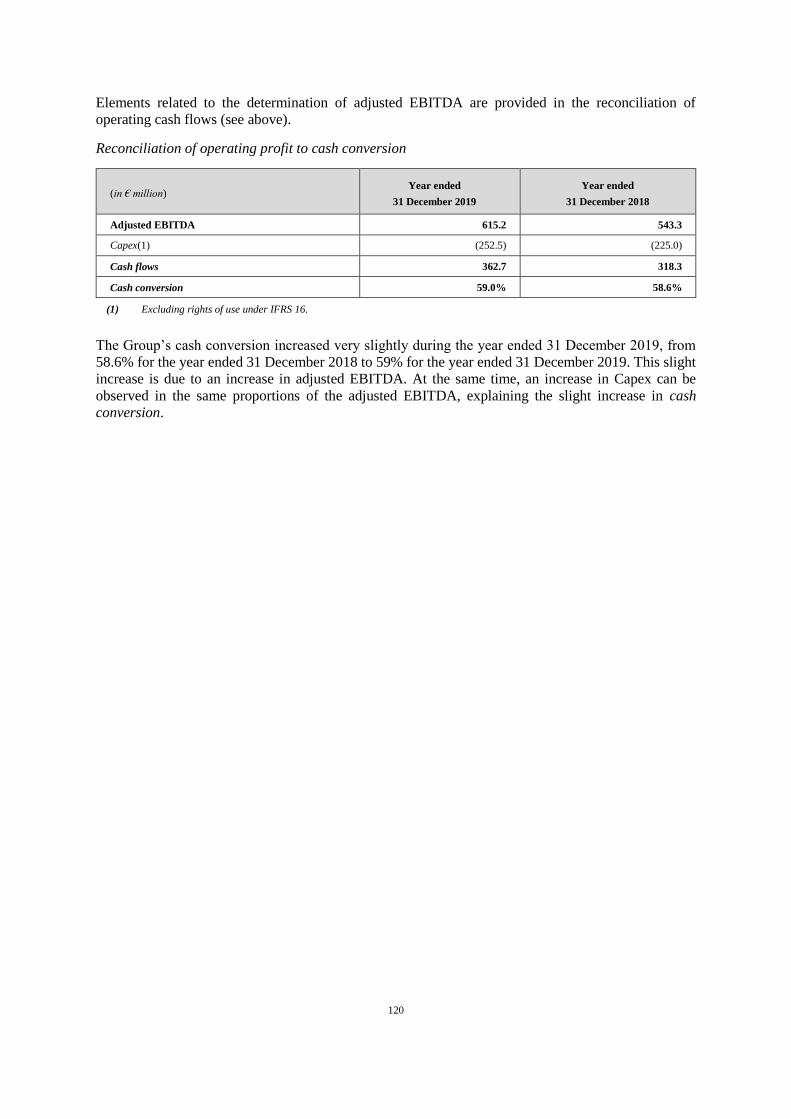
120
Elements related to the determination of adjusted EBITDA are provided in the reconciliation of
operating cash flows (see above).
Reconciliation of operating profit to cash conversion
(in € million) Year ended
31 December 2019
Year ended
31 December 2018
Adjusted EBITDA 615.2 543.3
Capex(1) (252.5) (225.0)
Cash flows 362.7 318.3
Cash conversion 59.0% 58.6%
(1) Excluding rights of use under IFRS 16.
The Group’s cash conversion increased very slightly during the year ended 31 December 2019, from
58.6% for the year ended 31 December 2018 to 59% for the year ended 31 December 2019. This slight
increase is due to an increase in adjusted EBITDA. At the same time, an increase in Capex can be
observed in the same proportions of the adjusted EBITDA, explaining the slight increase in cash
conversion.
121
9. LEGISLATIVE AND REGULATORY ENVIRONMENT
9.1 Legislation and regulations in European Union Member States
Regulations for packaging products
Health regulations
The Group, as a manufacturer of packaging for beverages and food products, is subject to European
regulations aimed at protecting consumer health.
Contact with food
EC Regulation no. 1935/2004 dated 27 October 2004 governing the materials and items that come into
contact with liquid and solid foodstuffs is intended to ensure a high level of protection of human health
and consumer interests.
This regulation covers materials and items destined to come into contact with food or which are already
in contact with food. This regulation is therefore particularly aimed at packaging and containers like
those produced by the Group.
This regulation states that packaging must be sufficiently inert. Thus, materials and items must be
manufactured in line with good manufacturing practices so that, under normal or foreseeable conditions
of use, they are not transferred to food in quantities large enough to endanger human health, to bring
about an unacceptable change in the composition of the food, or cause a deterioration in its organoleptic
properties. In terms of migration limits, glass in certain countries is subject to the directive on ceramic
articles, in particular Directive 84/500/EEC, which was modified by Directive 2005/31/EC, which sets
forth migration limits for lead and cadmium.
The commercialisation of packaging destined to come into contact with food that does not abide with
these regulations is prohibited.
For glass packaging producers, the traceability of labelled packaging is ensured when products are
stored on pallets. This makes the inspection of products and the removal of defective items easier.
Packaging hygiene
The Group is also subject to European regulations regarding packaging hygiene. EC Regulation no.
852/2004 dated 29 April 2004 stipulates general hygiene rules that apply to all food and requires that
packaging and container materials must not be a source of chemical, bacterial or physical contamination
of food.
The regulation also stresses that every food business operator along the food chain should ensure that
food safety is not compromised. This includes the storage of packaging and the process of packaging
food.
So that each of the Group’s companies complies with these requirements, a Hazard Analysis Critical
Control Point (HACCP) methodology has been implemented, which includes documentation that
identifies and evaluates significant food risk factors. On a voluntary basis, some of the Group’s
companies have obtained ISO 22000 certification for their internal procedures. Twenty-two of the
Group’s production facilities are now ISO 22000 certified.
Environmental regulations
In its role as a producer of packaging, the Group is subject to regulations governing packaging and
packaging waste enacted with the aim of protecting the environment.
122
Directive 94/62/EC of 20 December 1994 on packaging and packaging waste (the “Packaging and
Packaging Waste Directive”), transposed in France in Articles R. 543-42 to R. 543-52 of the
Environmental Code, and in all the European countries in which the Group has industrial facilities, aims
to harmonise national legislation governing packaging and packaging waste in order to decrease their
impact on the environment.
To do so, the Packaging and Packaging Waste Directive sets out guidelines for the prevention of
packaging waste, its reuse, recycling and recoverability. These requirements apply to the production
and composition of the packaging as well as its reusable or recoverable features.
The Group must notably keep the mass and volume of its packaging to the minimum possible within
safety and hygiene standards, while maintaining the needed functionality and respecting customers’
expectations in terms of quality. The Group must also produce packaging in such a way that it can be
reused or recovered, including recycled.
This recovery and recycling of packaging is carried out through glass packaging collection schemes
that vary from one country to another. The main collection and recycling schemes in force in the
Member States of the European Union where the Group has production facilities are described below.
France
The Packaging and Packaging Waste Directive, and its application orders codified in the Environmental
Code, favour recycling and packaging recoverability.
The schemes in place distinguish between household and non-household waste.
If the end users are households, the collection and recycling scheme for household waste in France was
established, even before the Packaging and Packaging Waste Directive, by law no. 75-633 of 15 July
1975, as amended, regarding the disposal of waste and the recovery of materials and its implementing
decree no. 92-377 of 1 April 1992 (included in the Environmental Code in Articles R. 543-53 et seq).
This law requires all producers that package their products (either directly or through a third party) for
sale on the national market to provide waste-disposal schemes to households for this packaging. The
producer can delegate the provision of this scheme to a company authorised by the public authorities in
exchange for financial payment. In return, the two authorised companies in France (Citeo and Adelphe)
provide financial assistance to local authorities to set up selective household packaging waste collection.
The authorised companies coordinate between the companies that commercialise packaged products,
the local authorities that are in charge of setting up waste collection and treatment schemes, and the
recycling professionals.
The Chambre Syndicale des Verreries Mécaniques de France (“CSVMF”), the French glass industry
federation, undertakes to take charge of all the glass packaging waste collected by local authorities
pursuant to a framework agreement with the authorised companies. The CSVMF designates glass
producers to recover the glass according to on their collection zones.
The glass makers execute the commitment made by the CSVMF by signing a recovery guarantee
contract with local authorities. They recover the glass packaging collected by the local authorities,
transport it and transform it into cullet through the intermediary of cullet treatment centres.
The collection and recycling scheme for non-household waste is outlined in directive no. 94-609 of 13
July 1994 (included in the Environmental Code under articles R. 543-66 et seq). Under this scheme, the
Group has three options for recovering its waste: recover the waste itself at an authorised installation;
transfer the waste to an operator of an authorised installation; or transfer the waste to an authorised third
party.
123
Germany
Since 1 January 2019, the packaging law (Verpackungsgesetz) has replaced the regulations that entered
into force in 1991 (Verpackungsverordnung). In particular, this law requires glass producers to
participate in a German eco-organisation for the collection and recycling of packaging waste. One of
the largest collective recycling companies in Germany is DSD (Duales System Deutschland GmbH).
The glass producers obtain cullet from these recycling companies.
Spain
Spain’s recycling system is governed by law no. 11/1997 of 24 April 1997 on packaging and packaging
waste. It includes an integrated glass bottle collection system. The entity in charge of glass collection
and recycling is the not-for-profit organisation Ecovidrio.
Portugal
Portugal has also enforced a glass collection and recycling scheme. Under the terms of Legislative
Decree No. 152-D/2017 of 11 December 2017, drink and food producers are responsible for recycling.
Glass packaging producers must, therefore, in cooperation with producers of beverages and food
products and the importers of packaged products, work to incorporate secondary raw materials coming
from the recycling of packaging waste in their production process.
Glass packaging producers are required to recycle at least 60% of the glass packaging used within the
country. The objective is to reach a recycling rate of 70% by 2025 and 75% by 2030.
In order to comply with these obligations, producers of food and beverage products and importers may
subcontract the management of their packaging and waste.
Italy
In Italy, legislative decree number 22/97 dictates obligations in terms of glass collection and recycling.
Based on this decree, “Co.Re.Ve” (the glass recovery consortium) was created in October 1997 and is
charged with collecting and recycling used glass.
Regulations for the glass making industry
The Group is also subject to regulations aimed at managing the emissions of pollutants, which have
increased in recent years.
Pursuant to European Council Directive 96/61 EC of 24 September 1996 on the prevention and
integrated reduction of pollutants (the “IPPC Directive”), for an operating permit to be granted, the
Group’s facilities had to be operated so that all of the “best available techniques” were implemented to
prevent pollution. Directive 2010/75/EU, the Industrial Emissions Directive (“IED”), replaced and
reinforced the IPPC Directive. Thus, for an operating permit to be granted, the emissions from the
Group’s facilities must not exceed certain limits, the value of which is established based on the “best
available techniques” as defined in the European Commission’s enforcement decision establishing
conclusions on the best available techniques for the production of glass under the IED of 28 February
2012. The IED was adapted in France within the framework of the Regulation on Classified Facilities,
in Articles L.515-28 et seq. of the French Environmental Code.
Moreover, Directive no. 2003/87/EC of the European Parliament and of the Council of 13 October
2003, establishing a Community System for Greenhouse Gas Emissions Trading within the Community,
known as the “EU Emissions Trading System” (EU ETS), introduced greenhouse gas emission quotas
in the European Union for carbon dioxide only.
The ETS Directive is designed to reduce emissions of gas pollutants in the air by creating an EU
Community-based trading system in greenhouse gas emission allowances. The European glass industry
to which the Group belongs is covered in Annex I of this Directive.
124
The Emission Trading System Scheme states that each Member State should develop a National
Allocation Plan (NAP) setting the total emissions allowance for a given period (first period: 2005-2007;
second period: 2008-2012; third period: 2013-2020) and the breakdown of this allowance by site.
The Emissions Trading Directive thus allows member States to impose a cap on the greenhouse gas
emissions of the relevant facilities, and then to allocate freely the quotas corresponding to this cap. The
companies covered by the Directive also have the option to trade allowances on the ETS. As a result, a
facility that emits more than its allocation must obtain the missing quotas; this is the polluter-pays
principle; and, inversely, a facility that emits less than its allocation may sell its unused allowances and
thus generate revenue.
The Emissions Trading Directive was transposed to French law by the Decree No. 2004-832 of 19
August 2004, as amended by Decree No. 2019-190 of 14 March 2019, now codified in Articles R. 229-
5 et seq. of the Environmental Code; the distribution of quotas by operator was set for the period 2013-
2020 by an order of 24 January 2014, as amended.
For the period between 2013 and 2020 (Phase III), the Emissions Trading System was amended by
Directive 29/2009/EC, which defines the gradual reduction in the quantity of allowances issued and
revises the allocation system for free allowances by introducing a European system based on
benchmarks by product. It also stipulates special provisions for industrial sectors that are considered to
be exposed to “carbon leaks”64. The hollow glass sector, in which the Group operates, meets the criteria
set out by the European Commission to be considered as an exposed sector, and is therefore eligible for
free carbon credits, the total volume of which may not exceed the benchmark calculated on the basis of
the average performance of the most efficient installations in the European Union. European
Commission Regulation 1031/2010 of 12 November 2010 on a scheme for greenhouse gas emission
quotas trading for the 2013-2020 period completes this Regulation.
For the period from 2021 to 2030 (Phase IV), Directive 2018/410/EU of 14 March 2018 on improving
the cost-efficiency ratio from lower emissions and favouring low carbon-intensity investments
stipulates an acceleration in the annual reduction of the total number of allowances in circulation, in
order to increase the rate of emission reductions.
Given the Group’s quota deficit, a provision was recognised in for the 2018 and 2019 years for an
amount of €27.6 million and €37.7 million, respectively. In addition, in order to secure the prices at
which it will have to acquire the quotas, and with the prospect of the end of Phase III, the Group made
forward purchases of carbon dioxide quotas on the market for a total amount of €34.9 million as of 31
December 2019, corresponding to the deficits expected. The unwinding of the forward purchases and
the delivery of the quotas will result in a cash disbursement by the Group (which will therefore record
a reversal of the aforementioned provision in the amount of such disbursements), primarily in 2021.
For Phase IV (2021–2030), the level of allowances freely allocated to the Group will not be known until
the beginning of 2021 for the period from 2021-2025 and at the beginning of 2026 for the period from
2026-2030. Despite the uncertainty about the number of quotas it will be allocated for Phase IV, the
Group already anticipates that this number will be lower than the number it was freely allocated in
Phase III and that, in any case, it will probably not allow the Group to meet its restitution obligations
for its carbon dioxide emissions. In light of this prospect, the Group has already made forward purchases
of carbon dioxide quotas on the market during the financial year 2019 for a total amount of €24.6
million. In addition, in the event of a significant increase in the production capacity of one or more of
its sites during Phase IV, the Group would have to ask the competent authorities to revise the level of
quotas allocated to such site or sites, without any assurance that such a request would be favourably
received or on the level of quotas to be allocated. The Group therefore believes that, despite the efforts
64 A “carbon leak” is a situation in which a company, in order to escape the costs related to climate policies, moves its
production to another country that applies less stringent rules for limiting emissions.
125
it may make to lower its carbon dioxide emissions, it will be forced to continue its policy of purchasing
quotas on the market for substantial amounts.
The Group’s activities are also subject to the requirements resulting from directives on air quality, such
as Directive 2008/50/EC of the European Parliament and the Council of 21 May 2008 governing the
quality of ambient air and pure air in Europe, as amended, which merged most of the existing directives
on air quality and which also imposes emission limits on certain substances, such as sulphur dioxide.
Moreover, the Group’s operations must comply with the requirements stipulated by the framework
directive 2000/60/EC on water of the European Parliament and Council adopted on 23 October 2000
aimed at preventing and reducing water pollution. The Group must also comply with the national
regulations that transpose Directive 2002/49/EC of the European Parliament and Council of 25 June
2002 on the assessment and management of noise in the environment.
The Group is also subject to Directive 2004/35/EC of the European Parliament and Council dated 21
April 2004 on environmental responsibility for the prevention and repair of environmental damage on
the basis of the “polluter pays” principle. In addition, national regulations generally impose
decontamination obligations on present and past owners, operators or users of contaminated sites, as
applicable.
Finally, some countries in which the Group is present, including Germany and Italy, have established
subsidies tied to the cost of energy. In Germany, the Group, as a high energy-consumption company,
thus benefits from an exemption or reductions in some taxes applied to electricity prices. In Italy, a
mechanism set up in 2005, from which the Group benefits, provides for the award of energy savings
certificates (Certificati Bianchi), if measures to improve energy efficiency are implemented. These
certificates can be traded on a regulated market and sold to power distributors. In addition, since the
second half of 2013, the Group has benefited in Italy from subsidies on certain items included in the
prices of its electricity consumption. Until 31 December 2017, these subsidies were in the form of
reimbursements; as of 1 January 2018, they result in a reduction in the cost of its power consumption.
Regulations regarding chemical substances
EC Regulation no. 1907/2006 of the European Parliament and of the Council of 18 December 2006
concerning the Registration, Evaluation, Authorisation and Restriction of Chemicals (“REACH
Regulation”) imposes a series of obligations on all industrial sectors, including the glass industry, in
the area of registration, use and restrictions applicable to the chemical substances used in production
processes. For example, the Group must provide information to users directly down the supply chain,
such as a declaration that the substance is not subject to authorisation or the details of any restriction
imposed. Moreover, although glass is exempt from the registration obligation as a downstream user of
substances, the Group must communicate its uses of substances to suppliers so that they are covered in
their registration files.
The Group keeps a close eye on changes to the list of substances that are subject to authorisation or
restrictions in order to fulfil, where necessary, its obligation to communicate with its customers.
9.2 Legislative and regulatory environment in Latin America
In Latin America, the Group is also subject, particularly in Brazil and Argentina, to a legislative and
regulatory environment similar to the one described above, particularly for the protection of consumer
health and protection of the environment.
Brazil
Pursuant to Resolution no. 237/1997 of the National Environment Council, industrial activities that use
environmental resources and are considered to be potentially polluting, or that can cause environmental
damage, are subject to environmental authorisation. Industrial activities, like those of the Group’s
Brazilian subsidiary, must comply with the parameters for atmospheric emissions defined by the
126
national air quality monitoring programme established by Resolution no. 05/89. In addition, in
accordance with the national policy on solid waste (Federal Law no. 12.305/2010), the producer is
responsible for the elimination of the hazardous and non-hazardous waste that it produces. Moreover,
packaging materials that are in contact with liquid and solid food must comply with the rules stipulated
by the National Health Monitoring Agency. Finally, in the coming months, Brazil intends to develop a
control system for chemical substances inspired by the European directives.
Argentina
Law no. 24.051, the “Hazardous Waste Law”, promulgated in 1992 (the “HWL”), and Decree no.
831/93 govern the production, transport, treatment and elimination of hazardous waste. The HWL
defines hazardous waste as waste that could harm humans, flora or fauna, or pollute the soil, water, or
the environment in general. All companies involved in the production, transport, treatment and
elimination of hazardous waste, like the Group’s Argentine subsidiary, must be registered in the register
of producers and users of hazardous waste, which is kept by the Office of Natural Resources and the
Environment, the governmental organisation responsible for applying the law. This organisation issues
environmental certificates authorising the production, transport, treatment and elimination of hazardous
waste, subject to compliance with certain requirements of the HWL. In addition, the National Food
Code stipulates that packaging products that come in contact with liquid and solid food must first be
authorised by the competent government authority. This obligation applies to packaging products
manufactured in Argentina and to products imported from a third country.
10. TREND INFORMATION
10.1 Trends in activities
A detailed description of the Group’s results for the year ended 31 December 2019 can be found in
Chapter 7 “Analysis of the Group’s financial position and results” of this Universal Registration
Document.
127
10.2 Medium-term outlook
The important consequences on the economy of the Covid-19 pandemic, the extent and duration of
which are still uncertain, have led the Group to withdraw its objectives for the 2020 financial year (see
chapter 11 of this universal registration document).
The Group’s outlook and objectives below, which are taken from the Group’s overall strategy, are not
intended as forecasts or as estimates of the Group’s results. The figures, data, assumptions, estimates
and objectives presented below are subject to unforeseen changes or modifications over the next
months, depending in particular on the evolution of the current health crisis, changes in the economic,
financial, competitive, legal, regulatory, accounting and tax environments, or other factors of which the
Group is unaware of at the date of this universal registration document.
In addition, the materialisation of certain risks described in Chapter 3 “Risk Factors” of this universal
registration document could have a negative impact on the Group’s operations, financial position,
market position, results or outlook, and thus jeopardise its ability to achieve the objectives described
below.
Furthermore, achieving these objectives presupposes the success of the Group’s strategy.
Accordingly, the Group makes no undertaking and gives no guarantee as to the achievement of the
objectives contained in this section.
Outlook for the evolution of the Group’s activities and financial objectives
The Group estimates that the impact of the Covid-19 pandemic on the general economic context, which
is, as of the date of this universal registration document, difficult to assess, could affect some of the
trends and growth outlook related to certain end markets, although the fundamental trends of the glass
packaging market, mainly related to the inherent features of glass, should not be significantly affected.
In this difficult context, over the 2021-2022 period, the Group is aiming to implement a strategy of
profitable growth in its activities based primarily on (i) continued disciplined growth, (ii) ongoing
deployment of its operational excellence programme, (iii) continuation of a rigorous investment policy
for the Group’s future sustainable development, and (iv) development of a strong entrepreneurial
culture.
Over the 2021-2022 period, the Group’s objective is to record an organic CAGR65 of between 3% and
5% in its consolidated revenue. In support of this objective, the Group intends to rely primarily on:
i. the favourable fundamental trends of the glass packaging market and some of its end markets
over the 2021-2022 period (see Section 5.5 of this Registration Document);
ii. an ongoing improvement to the mix due to premiumisation trends in its product range; and
iii. an increase in the Group’s selling prices designed to pass on the increase in production costs
under its pricing policy.
The Group also expects to benefit from past and future capital expenditure to increase its production
capacities with (a) the addition of new production capacities with the addition in 2020 of a new furnace
at the Rosario site in Chile that is set to generate additional annual production capacities of around 50
kT; the construction of a new furnace with two production lines at the Villa Poma site in Italy that will
generate around 80 kT of additional annual production capacity, with the possibility of extending this
production capacity up to around 115 kT by 2022, if necessary; and the construction of a new furnace
with two productions lines at the Azuqueca site in Spain that is scheduled to generate an additional
annual production capacity of around 85 kT (see Section 5.7 “Capital expenditure” of this Registration
65 On a like-for-like basis (excluding changes in exchange rates and scope).
128
Document) and (b) the creation of additional production capacities on existing production lines, relying
on improved yields from the Group’s production sites (“debottlenecking”) within the framework of the
implementation of its operational excellence programme (see Section 5.2.3 of this Registration
Document).
The Group is also targeting an adjusted EBITDA margin above 25% in 2022, primarily through (i)
favourable fundamental trends of the glass packaging market and some of its end markets, (ii) continued
implementation of the plan to improve the Group’s industrial performance (Performance Action Plan
(PAP)), and the reduction in costs, and (iii) the continuation of its dynamic pricing policy. This target
adjusted EBITDA margin integrates the impact of unwinding the forward purchases of carbon dioxide
quotas (see Section 9.1.2 “Regulations governing the glass industry” of this Registration Document).
The Group also intends to optimise the allocation of its capital expenditure by pursuing a disciplined
investment policy aimed at maintaining recurring capital expenditure at around 8% of its annual
consolidated revenue (excluding capitalisation of the right of use related to the application of IFRS 16)
over the 2021-2022 period.
The Group also intends to maintain its ratio of net financial debt to adjusted EBITDA between 2x and
3x over the 2021-2022 period.
Finally, the Group’s objective is to distribute dividends over the 2021-2022 period in an annual amount
greater than 40% of its consolidated net income and at a minimum annual amount of €100 million,
subject to approval by the general meeting of the Company’s shareholders.
129
11. PROFIT FORECASTS OR ESTIMATES
Given the unprecedented nature of the situation caused by the Covid-19 pandemic and
the corresponding lack of visibility, the Group withdrew on 7 April 2020 its annual objectives, which
had been announced on 20 February 2020.
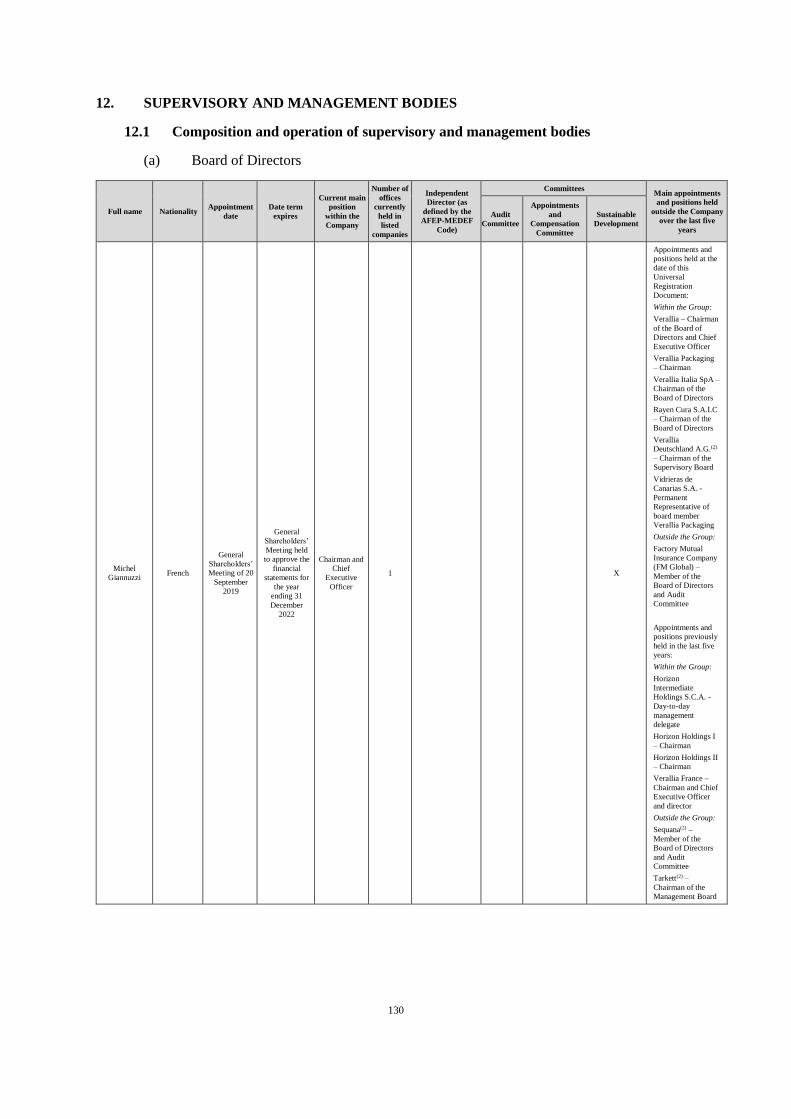
130
12. SUPERVISORY AND MANAGEMENT BODIES
12.1 Composition and operation of supervisory and management bodies
(a) Board of Directors
Full name Nationality Appointment
date
Date term
expires
Current main
position
within the
Company
Number of
offices
currently
held in
listed
companies
Independent
Director (as
defined by the
AFEP-MEDEF
Code)
Committees Main appointments
and positions held
outside the Company
over the last five
years
Audit
Committee
Appointments
and
Compensation
Committee
Sustainable
Development
Michel
Giannuzzi French
General
Shareholders’
Meeting of 20
September
2019
General
Shareholders’
Meeting held
to approve the
financial
statements for
the year
ending 31
December
2022
Chairman and
Chief
Executive
Officer
1 X
Appointments and
positions held at the
date of this
Universal
Registration
Document:
Within the Group:
Verallia – Chairman
of the Board of
Directors and Chief
Executive Officer
Verallia Packaging
– Chairman
Verallia Italia SpA –
Chairman of the
Board of Directors
Rayen Cura S.A.I.C
– Chairman of the
Board of Directors
Verallia
Deutschland A.G.(2)
– Chairman of the
Supervisory Board
Vidrieras de
Canarias S.A. -
Permanent
Representative of
board member
Verallia Packaging
Outside the Group:
Factory Mutual
Insurance Company
(FM Global) –
Member of the
Board of Directors
and Audit
Committee
Appointments and
positions previously
held in the last five
years:
Within the Group:
Horizon
Intermediate
Holdings S.C.A. -
Day-to-day
management
delegate
Horizon Holdings I
– Chairman
Horizon Holdings II
– Chairman
Verallia France –
Chairman and Chief
Executive Officer
and director
Outside the Group:
Sequana(2) –
Member of the
Board of Directors
and Audit
Committee
Tarkett(2) –
Chairman of the
Management Board
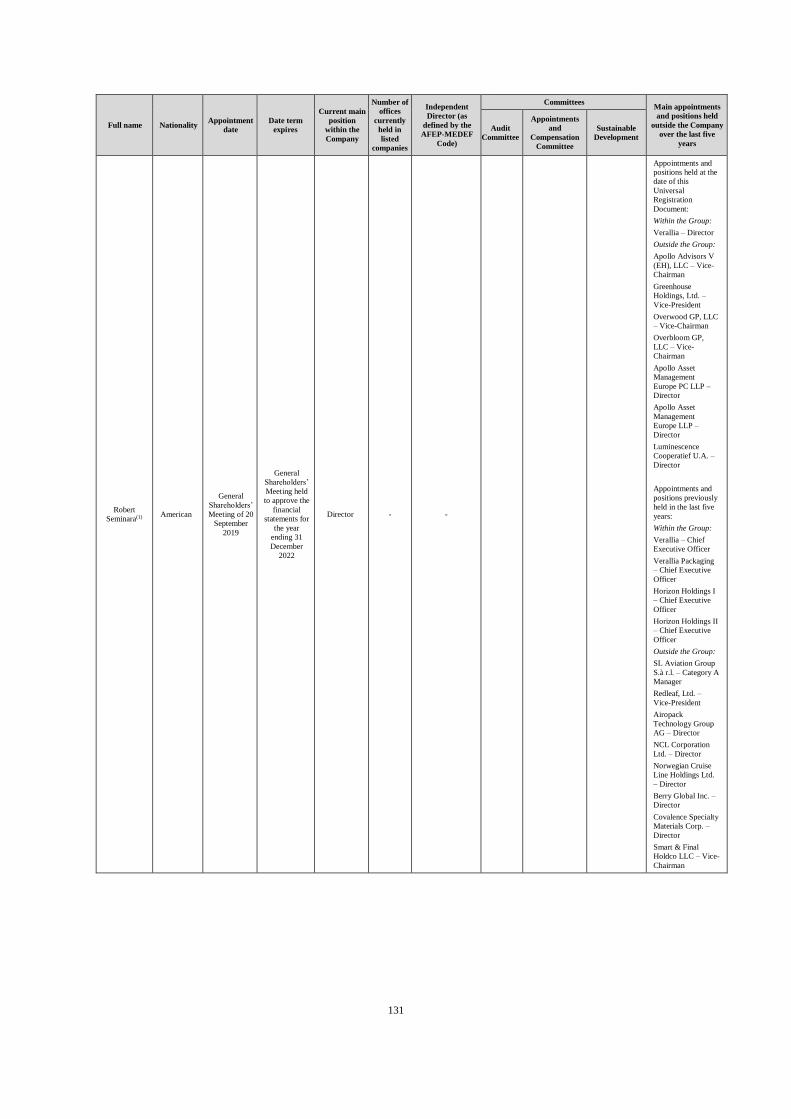
131
Full name Nationality Appointment
date
Date term
expires
Current main
position
within the
Company
Number of
offices
currently
held in
listed
companies
Independent
Director (as
defined by the
AFEP-MEDEF
Code)
Committees Main appointments
and positions held
outside the Company
over the last five
years
Audit
Committee
Appointments
and
Compensation
Committee
Sustainable
Development
Robert
Seminara(1) American
General
Shareholders’
Meeting of 20
September
2019
General
Shareholders’
Meeting held
to approve the
financial
statements for
the year
ending 31
December
2022
Director - -
Appointments and
positions held at the
date of this
Universal
Registration
Document:
Within the Group:
Verallia – Director
Outside the Group:
Apollo Advisors V
(EH), LLC – Vice-
Chairman
Greenhouse
Holdings, Ltd. –
Vice-President
Overwood GP, LLC
– Vice-Chairman
Overbloom GP,
LLC – Vice-
Chairman
Apollo Asset
Management
Europe PC LLP –
Director
Apollo Asset
Management
Europe LLP –
Director
Luminescence
Cooperatief U.A. –
Director
Appointments and
positions previously
held in the last five
years:
Within the Group:
Verallia – Chief
Executive Officer
Verallia Packaging
– Chief Executive
Officer
Horizon Holdings I
– Chief Executive
Officer
Horizon Holdings II
– Chief Executive
Officer
Outside the Group:
SL Aviation Group
S.à r.l. – Category A
Manager
Redleaf, Ltd. –
Vice-President
Airopack
Technology Group
AG – Director
NCL Corporation
Ltd. – Director
Norwegian Cruise
Line Holdings Ltd.
– Director
Berry Global Inc. –
Director
Covalence Specialty
Materials Corp. –
Director
Smart & Final
Holdco LLC – Vice-
Chairman
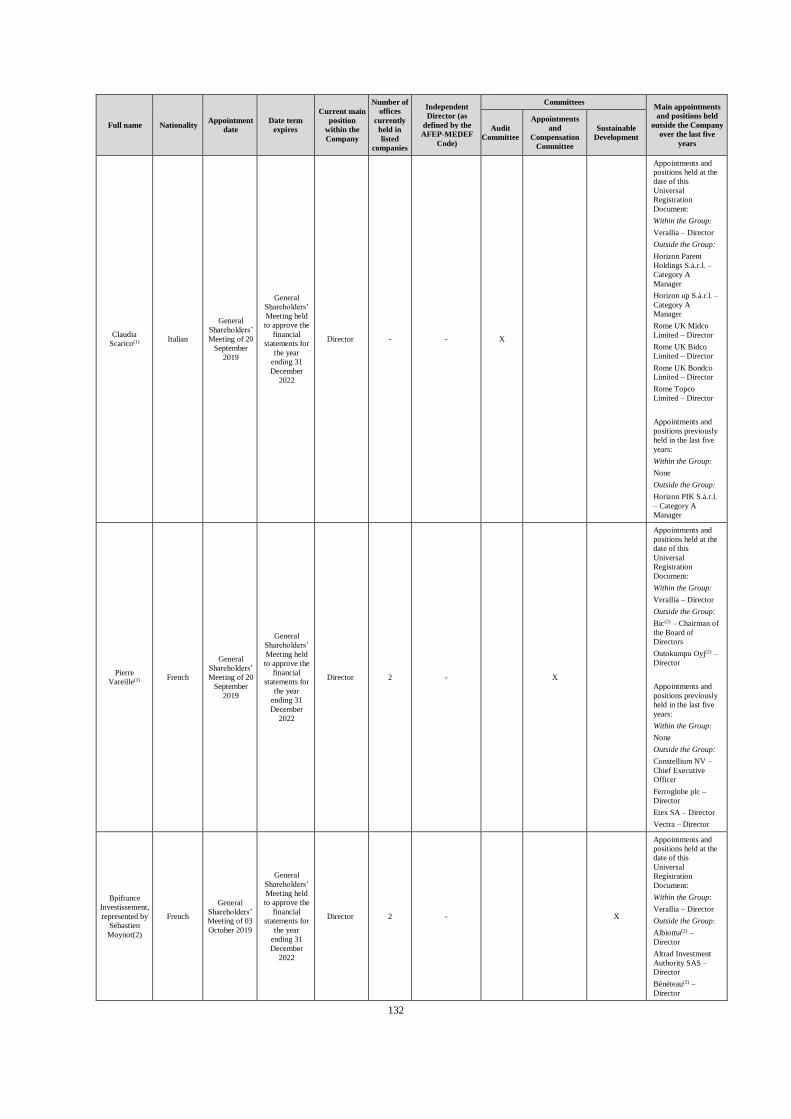
132
Full name Nationality Appointment
date
Date term
expires
Current main
position
within the
Company
Number of
offices
currently
held in
listed
companies
Independent
Director (as
defined by the
AFEP-MEDEF
Code)
Committees Main appointments
and positions held
outside the Company
over the last five
years
Audit
Committee
Appointments
and
Compensation
Committee
Sustainable
Development
Claudia
Scarico(1) Italian
General
Shareholders’
Meeting of 20
September
2019
General
Shareholders’
Meeting held
to approve the
financial
statements for
the year
ending 31
December
2022
Director - - X
Appointments and
positions held at the
date of this
Universal
Registration
Document:
Within the Group:
Verallia – Director
Outside the Group:
Horizon Parent
Holdings S.à.r.l. –
Category A
Manager
Horizon up S.à.r.l. –
Category A
Manager
Rome UK Midco
Limited – Director
Rome UK Bidco
Limited – Director
Rome UK Bondco
Limited – Director
Rome Topco
Limited – Director
Appointments and
positions previously
held in the last five
years:
Within the Group:
None
Outside the Group:
Horizon PIK S.à.r.l.
– Category A
Manager
Pierre
Vareille(1) French
General
Shareholders’
Meeting of 20
September
2019
General
Shareholders’
Meeting held
to approve the
financial
statements for
the year
ending 31
December
2022
Director 2 - X
Appointments and
positions held at the
date of this
Universal
Registration
Document:
Within the Group:
Verallia – Director
Outside the Group:
Bic(2) – Chairman of
the Board of
Directors
Outokumpu Oyj(2) –
Director
Appointments and
positions previously
held in the last five
years:
Within the Group:
None
Outside the Group:
Constellium NV –
Chief Executive
Officer
Ferroglobe plc –
Director
Etex SA – Director
Vectra – Director
Bpifrance
Investissement,
represented by
Sébastien
Moynot(2)
French
General
Shareholders’
Meeting of 03
October 2019
General
Shareholders’
Meeting held
to approve the
financial
statements for
the year
ending 31
December
2022
Director 2 - X
Appointments and
positions held at the
date of this
Universal
Registration
Document:
Within the Group:
Verallia – Director
Outside the Group:
Albioma(2) –
Director
Altrad Investment
Authority SAS –
Director
Bénéteau(2) –
Director
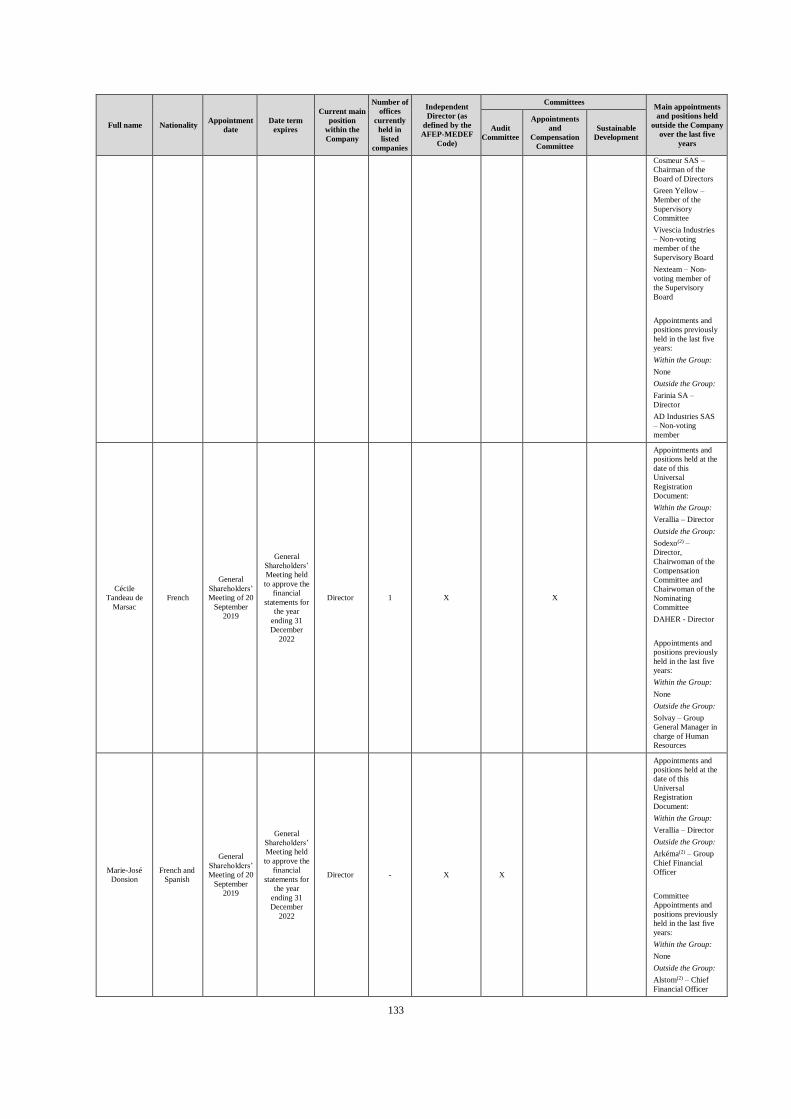
133
Full name Nationality Appointment
date
Date term
expires
Current main
position
within the
Company
Number of
offices
currently
held in
listed
companies
Independent
Director (as
defined by the
AFEP-MEDEF
Code)
Committees Main appointments
and positions held
outside the Company
over the last five
years
Audit
Committee
Appointments
and
Compensation
Committee
Sustainable
Development
Cosmeur SAS –
Chairman of the
Board of Directors
Green Yellow –
Member of the
Supervisory
Committee
Vivescia Industries
– Non-voting
member of the
Supervisory Board
Nexteam – Non-
voting member of
the Supervisory
Board
Appointments and
positions previously
held in the last five
years:
Within the Group:
None
Outside the Group:
Farinia SA –
Director
AD Industries SAS
– Non-voting
member
Cécile
Tandeau de
Marsac
French
General
Shareholders’
Meeting of 20
September
2019
General
Shareholders’
Meeting held
to approve the
financial
statements for
the year
ending 31
December
2022
Director 1 X X
Appointments and
positions held at the
date of this
Universal
Registration
Document:
Within the Group:
Verallia – Director
Outside the Group:
Sodexo(2) –
Director,
Chairwoman of the
Compensation
Committee and
Chairwoman of the
Nominating
Committee
DAHER - Director
Appointments and
positions previously
held in the last five
years:
Within the Group:
None
Outside the Group:
Solvay – Group
General Manager in
charge of Human
Resources
Marie-José
Donsion
French and
Spanish
General
Shareholders’
Meeting of 20
September
2019
General
Shareholders’
Meeting held
to approve the
financial
statements for
the year
ending 31
December
2022
Director - X X
Appointments and
positions held at the
date of this
Universal
Registration
Document:
Within the Group:
Verallia – Director
Outside the Group:
Arkéma(2) – Group
Chief Financial
Officer
Committee
Appointments and
positions previously
held in the last five
years:
Within the Group:
None
Outside the Group:
Alstom(2) – Chief
Financial Officer
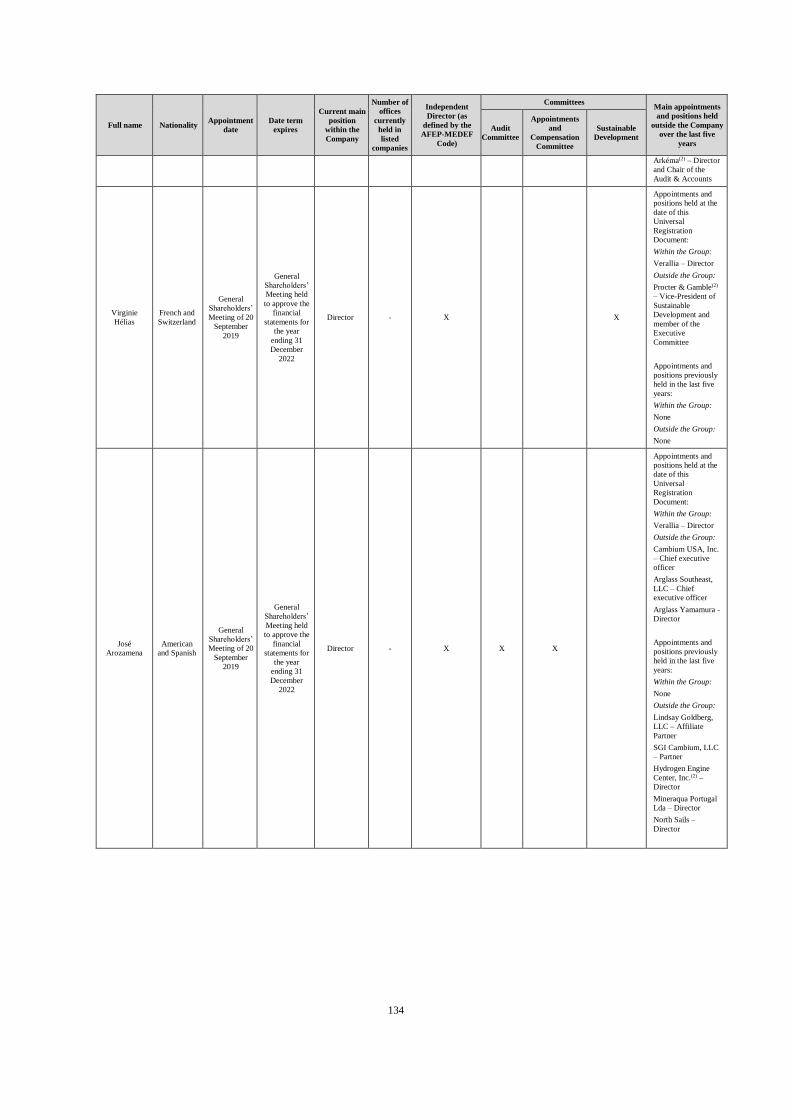
134
Full name Nationality Appointment
date
Date term
expires
Current main
position
within the
Company
Number of
offices
currently
held in
listed
companies
Independent
Director (as
defined by the
AFEP-MEDEF
Code)
Committees Main appointments
and positions held
outside the Company
over the last five
years
Audit
Committee
Appointments
and
Compensation
Committee
Sustainable
Development
Arkéma(2) – Director
and Chair of the
Audit & Accounts
Virginie
Hélias
French and
Switzerland
General
Shareholders’
Meeting of 20
September
2019
General
Shareholders’
Meeting held
to approve the
financial
statements for
the year
ending 31
December
2022
Director - X X
Appointments and
positions held at the
date of this
Universal
Registration
Document:
Within the Group:
Verallia – Director
Outside the Group:
Procter & Gamble(2)
– Vice-President of
Sustainable
Development and
member of the
Executive
Committee
Appointments and
positions previously
held in the last five
years:
Within the Group:
None
Outside the Group:
None
José
Arozamena
American
and Spanish
General
Shareholders’
Meeting of 20
September
2019
General
Shareholders’
Meeting held
to approve the
financial
statements for
the year
ending 31
December
2022
Director - X X X
Appointments and
positions held at the
date of this
Universal
Registration
Document:
Within the Group:
Verallia – Director
Outside the Group:
Cambium USA, Inc.
– Chief executive
officer
Arglass Southeast,
LLC – Chief
executive officer
Arglass Yamamura -
Director
Appointments and
positions previously
held in the last five
years:
Within the Group:
None
Outside the Group:
Lindsay Goldberg,
LLC – Affiliate
Partner
SGI Cambium, LLC
– Partner
Hydrogen Engine
Center, Inc.(2) –
Director
Mineraqua Portugal
Lda – Director
North Sails –
Director
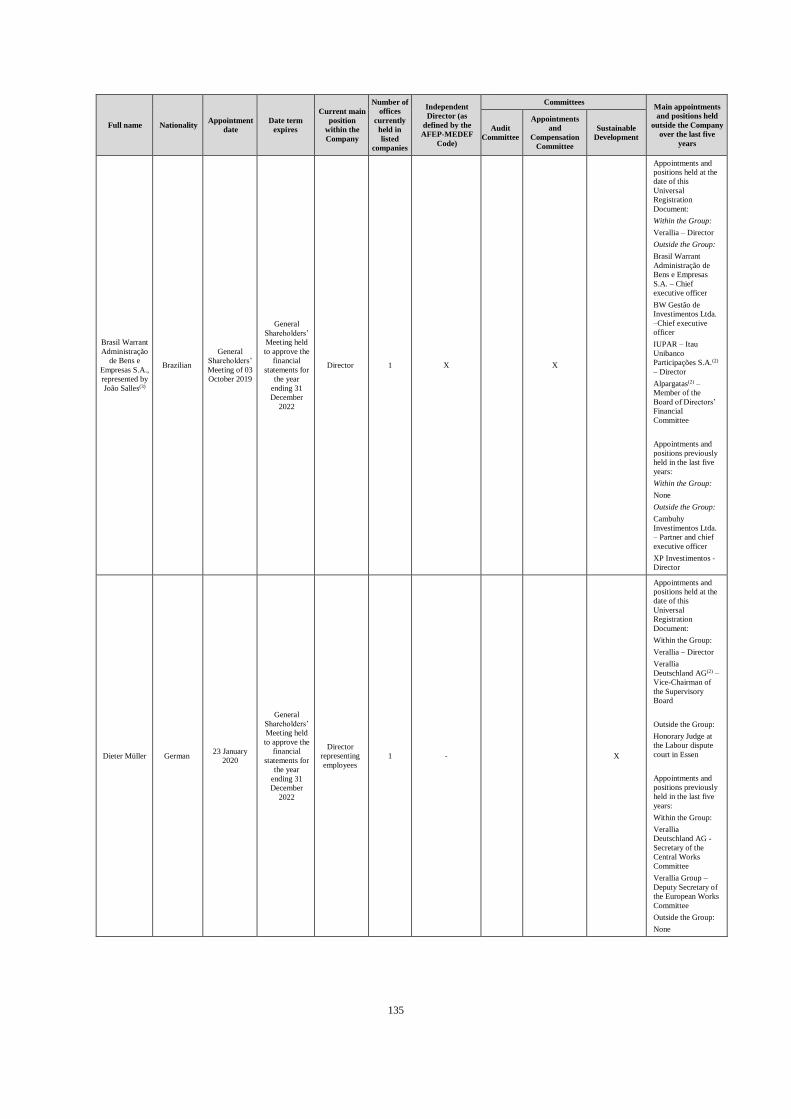
135
Full name Nationality Appointment
date
Date term
expires
Current main
position
within the
Company
Number of
offices
currently
held in
listed
companies
Independent
Director (as
defined by the
AFEP-MEDEF
Code)
Committees Main appointments
and positions held
outside the Company
over the last five
years
Audit
Committee
Appointments
and
Compensation
Committee
Sustainable
Development
Brasil Warrant
Administração
de Bens e
Empresas S.A.,
represented by
João Salles(3)
Brazilian
General
Shareholders’
Meeting of 03
October 2019
General
Shareholders’
Meeting held
to approve the
financial
statements for
the year
ending 31
December
2022
Director 1 X X
Appointments and
positions held at the
date of this
Universal
Registration
Document:
Within the Group:
Verallia – Director
Outside the Group:
Brasil Warrant
Administração de
Bens e Empresas
S.A. – Chief
executive officer
BW Gestão de
Investimentos Ltda.
–Chief executive
officer
IUPAR – Itau
Unibanco
Participações S.A.(2)
– Director
Alpargatas(2) –
Member of the
Board of Directors’
Financial
Committee
Appointments and
positions previously
held in the last five
years:
Within the Group:
None
Outside the Group:
Cambuhy
Investimentos Ltda.
– Partner and chief
executive officer
XP Investimentos -
Director
Dieter Müller German 23 January
2020
General
Shareholders’
Meeting held
to approve the
financial
statements for
the year
ending 31
December
2022
Director
representing
employees
1 - X
Appointments and
positions held at the
date of this
Universal
Registration
Document:
Within the Group:
Verallia – Director
Verallia
Deutschland AG(2) –
Vice-Chairman of
the Supervisory
Board
Outside the Group:
Honorary Judge at
the Labour dispute
court in Essen
Appointments and
positions previously
held in the last five
years:
Within the Group:
Verallia
Deutschland AG -
Secretary of the
Central Works
Committee
Verallia Group –
Deputy Secretary of
the European Works
Committee
Outside the Group:
None
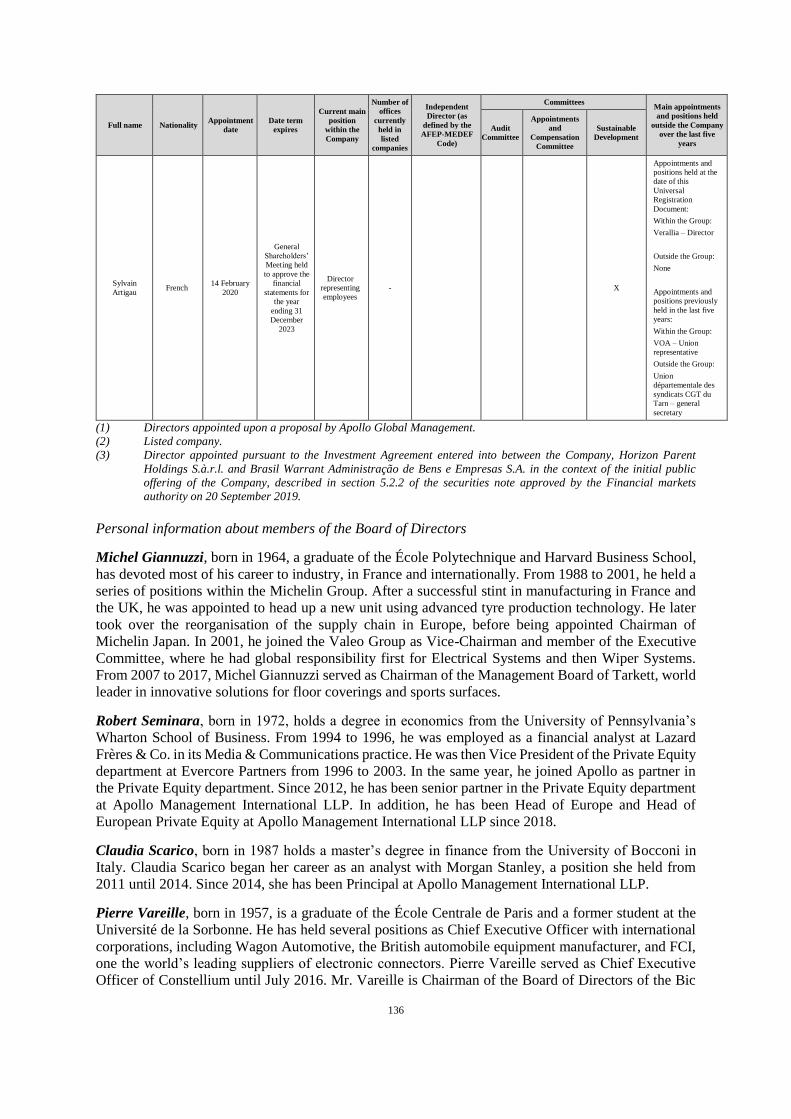
136
Full name Nationality Appointment
date
Date term
expires
Current main
position
within the
Company
Number of
offices
currently
held in
listed
companies
Independent
Director (as
defined by the
AFEP-MEDEF
Code)
Committees Main appointments
and positions held
outside the Company
over the last five
years
Audit
Committee
Appointments
and
Compensation
Committee
Sustainable
Development
Sylvain
Artigau French
14 February
2020
General
Shareholders’
Meeting held
to approve the
financial
statements for
the year
ending 31
December
2023
Director
representing
employees
- X
Appointments and
positions held at the
date of this
Universal
Registration
Document:
Within the Group:
Verallia – Director
Outside the Group:
None
Appointments and
positions previously
held in the last five
years:
Within the Group:
VOA – Union
representative
Outside the Group:
Union
départementale des
syndicats CGT du
Tarn – general
secretary
(1) Directors appointed upon a proposal by Apollo Global Management.
(2) Listed company.
(3) Director appointed pursuant to the Investment Agreement entered into between the Company, Horizon Parent
Holdings S.à.r.l. and Brasil Warrant Administração de Bens e Empresas S.A. in the context of the initial public
offering of the Company, described in section 5.2.2 of the securities note approved by the Financial markets
authority on 20 September 2019.
Personal information about members of the Board of Directors
Michel Giannuzzi, born in 1964, a graduate of the École Polytechnique and Harvard Business School,
has devoted most of his career to industry, in France and internationally. From 1988 to 2001, he held a
series of positions within the Michelin Group. After a successful stint in manufacturing in France and
the UK, he was appointed to head up a new unit using advanced tyre production technology. He later
took over the reorganisation of the supply chain in Europe, before being appointed Chairman of
Michelin Japan. In 2001, he joined the Valeo Group as Vice-Chairman and member of the Executive
Committee, where he had global responsibility first for Electrical Systems and then Wiper Systems.
From 2007 to 2017, Michel Giannuzzi served as Chairman of the Management Board of Tarkett, world
leader in innovative solutions for floor coverings and sports surfaces.
Robert Seminara, born in 1972, holds a degree in economics from the University of Pennsylvania’s
Wharton School of Business. From 1994 to 1996, he was employed as a financial analyst at Lazard
Frères & Co. in its Media & Communications practice. He was then Vice President of the Private Equity
department at Evercore Partners from 1996 to 2003. In the same year, he joined Apollo as partner in
the Private Equity department. Since 2012, he has been senior partner in the Private Equity department
at Apollo Management International LLP. In addition, he has been Head of Europe and Head of
European Private Equity at Apollo Management International LLP since 2018.
Claudia Scarico, born in 1987 holds a master’s degree in finance from the University of Bocconi in
Italy. Claudia Scarico began her career as an analyst with Morgan Stanley, a position she held from
2011 until 2014. Since 2014, she has been Principal at Apollo Management International LLP.
Pierre Vareille, born in 1957, is a graduate of the École Centrale de Paris and a former student at the
Université de la Sorbonne. He has held several positions as Chief Executive Officer with international
corporations, including Wagon Automotive, the British automobile equipment manufacturer, and FCI,
one the world’s leading suppliers of electronic connectors. Pierre Vareille served as Chief Executive
Officer of Constellium until July 2016. Mr. Vareille is Chairman of the Board of Directors of the Bic
137
company director of Outokumpu Oyj, Finland. He is also co-founder of The Vareille Foundation, an
international foundation of recognised public interest.
Sébastien Moynot, born in 1972, is an alumnus of the École Normale Supérieure in Paris. He holds a
postgraduate degree in probability and is a mathematician. He is also a graduate of the École Nationale
de la Statistique et de l’Administration Économique. Since 2013, he has been a member of the Capital
Development Steering Committee at Bpifrance Investissement, where he is in charge of equity
investments in midcaps and large corporates. He joined the Fonds Stratégique d’Investissement when
it was created in 2009, as Head of Investment. Previously, Sébastien Moynot spent around 10 years
working in various roles at the Ministry of Finance Treasury Department. He was notably in charge of
the transport sector at the Agence des Participations de l’État, and was previously Head of Strategy and
then Market Operations at the Agence France Trésor.
Marie-José Donsion, born in 1971, graduated from the European School of Management (Paris)
business school and has served as Chief Financial Officer of Arkema since June 2018. She was also a
director of the Arkema Board of Directors and Chair of its audit committee until May 2018. Prior to
that, within the Alstom Group, she was Chief Financial Officer of the Group, after holding various
financial functions in several subsidiaries in France and abroad. Prior to joining Alstom, Marie-José
Donsion began her career with Coopers & Lybrand in the audit branch between 1994 and 1997.
Cécile Tandeau de Marsac, born in 1963, a former student of NEOMA Business School, holds a
Master’s degree in Economics, has been since 2016, an independent director of the Board of Directors
of the Sodexo Group, of which she chairs the Appointments Committee and the Remuneration
Committee. From 2012 to 2019, she was General Manager in charge of Human Resources for the Solvay
Group in Belgium. From 2011 to 2012, she led the integration of the Rhodia and Solvay groups. Prior
to that, she held various functions in the Rhodia Group in the Human Resources Department from 2007
to 2011, and at Nestlé in marketing, sales, communication and human resources from 1987 to 2006.
Virginie Helias, born in 1965, former student of HEC Paris (Hautes Etudes Commerciales), has been
Vice President of Global Sustainability in the Procter & Gamble Group since 2016. She has been a
member of the Procter & Gamble Group Executive Committee since January 2020. She began her career
in 1988 in the same group, where she held various positions in France, the United States and Switzerland
in marketing, brand management, sales, innovation and digital, before taking over as Global
Sustainability Director in 2012.
José Arozamena, born in 1960, an industrial and systems engineer graduated from the University of
Southern California, Los Angeles, California, founded Cambium in 1996, a family investment vehicle
that has invested in various companies in the United States, Europe and Latin America. Mr. Arozamena
is also Chairman and CEO of Arglass Yamamura. Between 2005 and 2008, José Arozamena was an
operational partner of funds III and IV of the Lehman Brothers investment bank. From 2003 to 2005,
he led investments in American Rice and Mineraqua-Agua Castello. From 1995 to 2003, José
Arozamena was Chairman and Chief Executive Officer of Alpha Private Equity Group, a private
investment vehicle.
João Salles, born in 1981, holds a BA in Economics from INSPER, an MA in Economics and a
specialised post-graduate degree in finance from Columbia University, as well as a Ph.D. in economics
from the University of São Paulo. Mr Salles has been Managing Director of the holding BWSA and has
been a member since 2017 of the Investment Committee, Risk Committee and Management Committee
of BWGI, an asset manager. Mr Salles is currently a member of the Boards of Directors of Itaú
Unibanco, of IUPAR, an entity holding the control of Itaú Unibanco and a member of the Financial
Committee of Alpargatas. Between 2013 and 2018, Mr Salles was a partner, Investment Professional
and a member of the Cambuhy Investimentos Investment Committee. Previously, he worked in the
investment bank and acquisition mergers sector in New York, with J.P. Morgan.
Dieter Müller, born in 1958, has worked for Verallia Deutschland since 1988, where he began his career
as a sheet metal operator. He is a member of the Industriegewerkschaft Bergbau-Chemie-Energie (IG-
138
BCE) trade union. In 1993, Dieter Müller was elected as a member of the Essen Works Committee, of
which he became Secretary in 1996. In 2010, Dieter Müller was elected Secretary of the Verallia
Deutschland Central Works Committee. Since 2017, he was also a member of the Verallia European
Works Committee, of which he was elected Deputy Secretary. He resigned from these positions when
he was appointed by the Group’s European Works Committee. Dieter Müller has also been a member
of the Supervisory Board of Verallia Deutschland for almost 20 years and its Vice-President for more
than 10 years.
Sylvain Artigau, born in 1972, has worked in the shipping department of VOA – Verrerie d’Albi, a
subsidiary of Verallia France since 1997. He is a member of the Conféderation générale du travail
(CGT) trade union and has served as an employee representative on the VOA. He was a trade union
delegate from 2004 to 2016. From 2017 to 2019, Sylvain Artigau was seconded to the Departmental
Union of the CGT trade unions of the Tarn region to take up the position of Secretary-General. He
resigned from all these positions when he was elected by the employees of the Group companies that
have registered offices in France. Since January 2020, he has rejoined the shipping department of VOA
– Verrerire d’Albi.
Nationality of members of the Board of Directors
Seven members of the Board of Directors are foreign nationals.
Independent members of the Board of Directors
In light of the independence criteria set out in the AFEP-MEDEF Code, the Board of Directors
considered that five members of the Board of Directors, namely, Marie-José Donsion, Cécile Tandeau
de Marsac and Virginie Hélias, José Arozamena and Brasil Warrant Administração de Bens e Empresas
S.A., represented by Mr. João Salles, are independent members on the Board of Directors.
Balanced gender representation
The Board of Directors comprises four women, or 40% of the Board members. The composition of the
Board of Directors therefore complies with the provisions of Article L.225-18-1 of the French
Commercial Code, which requires a balanced representation of men and women on the boards of
companies whose shares are admitted to trading on a regulated market.
Non-voting members
Mr Guilherme Bottura and Mr Fabrice Nottin were appointed as non-voting members of the Board of
Directors of the Company for a period of four (4) years by a decision of the Board of Directors of 3
October 2019.
Guilherme Bottura, born in 1979, graduated from the Polytechnic School of the University of São
Paulo with a bachelor's degree in production engineering. Mr Bottura is Managing Director of BWGI,
the global asset management division of BWSA, and has been a member since 2018 of the BWGI
Investment Committee, Risk Committee and Management Committee. Mr Bottura is currently a
director, a member of the Finance Committee and the Audit Committee of Eneva SA and a member of
the Finance Committee of Alpargatas SA and a member of the Audit Committee of Fundo Patrimonial
Amigos da Poli, an endowment fund affiliated with the Polytechnic School of the University of São
Paulo. Between 2011 and 2018, Mr. Bottura was a partner and member of the Investment Committee
of Cambuhy Investimentos. Before that, he has been portfolio manager at Lanx Capital between 2009
and 2011 and was a Vice-President at Goldman Sachs between 2005 and 2009.
Fabrice Nottin, born in 1978, holds a degree in finance and strategy from the École supérieure des
sciences économiques et commerciales (ESSEC) in Paris. Prior to joining Apollo, Fabrice Nottin was a
senior partner at Lion Capital LLP from 2005 to 2011. Since 2011, he has been a partner at Apollo
Management International LLP.
139
12.2 Statements relating to administrative bodies
In addition, to the Company’s knowledge, over the past five years: (i) no member of the Board of
Directors or the Chairman and Chief Executive Officer of the Company has been convicted of fraud,
(ii) no member of the Board of Directors or the Chairman and Chief Executive Officer of the Company
has been involved in bankruptcy, receivership, liquidation or compulsory administration proceedings,
(iii) no member of the Board of Directors or the Chairman and Chief Executive Officer of the Company
has been charged and/or officially disciplined by judicial or administrative authorities (including
designated professional bodies), and (iv) no member of the Board of Directors or the Chairman and
Chief Executive Officer of the Company has been disqualified by a court from acting as a member of
an administrative, management or supervisory body of an issuer or from being involved in the
management or running of an issuer.
12.3 Conflicts of interest
To the Company’s knowledge, at the date of this Universal Registration Document, there are no
potential conflicts of interest between the duties of the members of the Board of Directors and the
Chairman and Chief Executive Officer to the Company and their private interests and/or other duties.
12.4 Information on services agreements between members of the board and the company
or any of its subsidiaries
To the knowledge of the Company, as of the date of this universal registration document, there are no
services agreements between members of the Board of directors and the Company or any of its
subsidiaries and providing for the granting of any advantages.
140
13. COMPENSATION AND BENEFITS
See Chapter 2, “Remuneration and Benefits to Corporate Officers” of the Corporate Governance Report
contained in Annex I to this Universal Registration Document.
141
14. OPERATION OF THE ADMINISTRATIVE AND MANAGEMENT BODIES
See Chapter 1 “Corporate Governance” of the Corporate Governance Report contained in Annex I to
this Universal Registration Document.
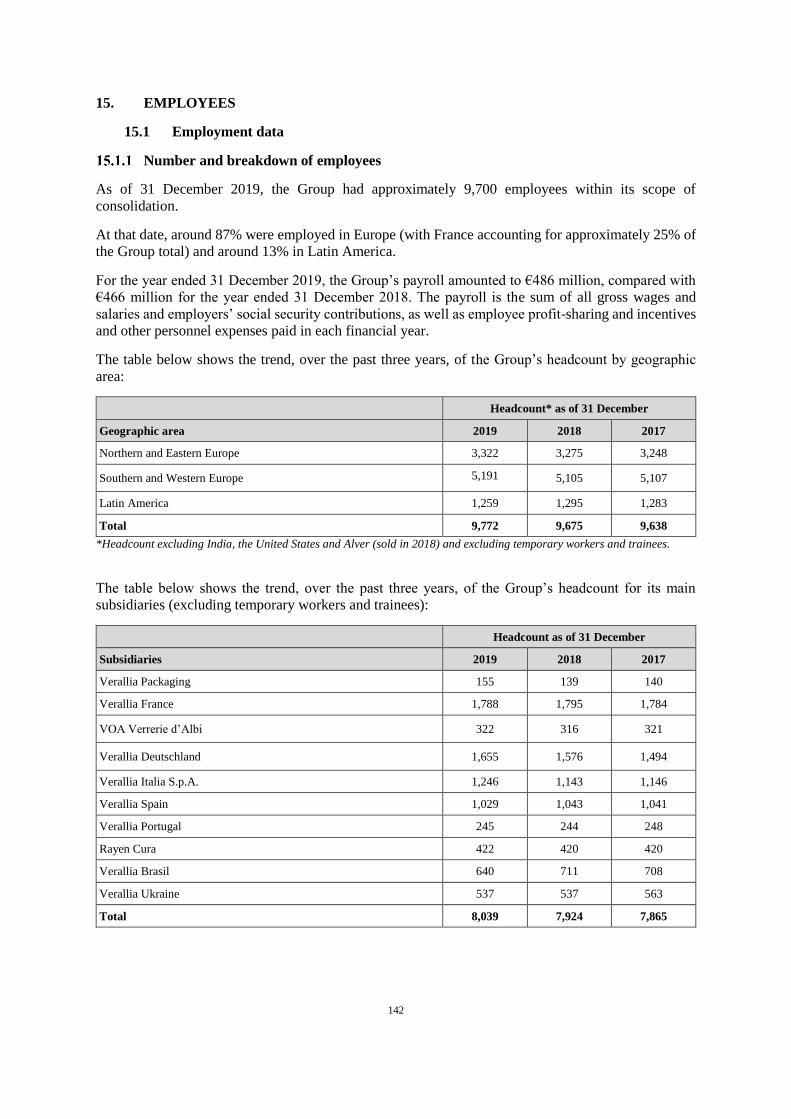
142
15. EMPLOYEES
15.1 Employment data
Number and breakdown of employees
As of 31 December 2019, the Group had approximately 9,700 employees within its scope of
consolidation.
At that date, around 87% were employed in Europe (with France accounting for approximately 25% of
the Group total) and around 13% in Latin America.
For the year ended 31 December 2019, the Group’s payroll amounted to €486 million, compared with
€466 million for the year ended 31 December 2018. The payroll is the sum of all gross wages and
salaries and employers’ social security contributions, as well as employee profit-sharing and incentives
and other personnel expenses paid in each financial year.
The table below shows the trend, over the past three years, of the Group’s headcount by geographic
area:
Headcount* as of 31 December
Geographic area 2019 2018 2017
Northern and Eastern Europe 3,322 3,275 3,248
Southern and Western Europe 5,191 5,105 5,107
Latin America 1,259 1,295 1,283
Total 9,772 9,675 9,638
*Headcount excluding India, the United States and Alver (sold in 2018) and excluding temporary workers and trainees.
The table below shows the trend, over the past three years, of the Group’s headcount for its main
subsidiaries (excluding temporary workers and trainees):
Headcount as of 31 December
Subsidiaries 2019 2018 2017
Verallia Packaging 155 139 140
Verallia France 1,788 1,795 1,784
VOA Verrerie d’Albi 322 316 321
Verallia Deutschland 1,655 1,576 1,494
Verallia Italia S.p.A. 1,246 1,143 1,146
Verallia Spain 1,029 1,043 1,041
Verallia Portugal 245 244 248
Rayen Cura 422 420 420
Verallia Brasil 640 711 708
Verallia Ukraine 537 537 563
Total 8,039 7,924 7,865
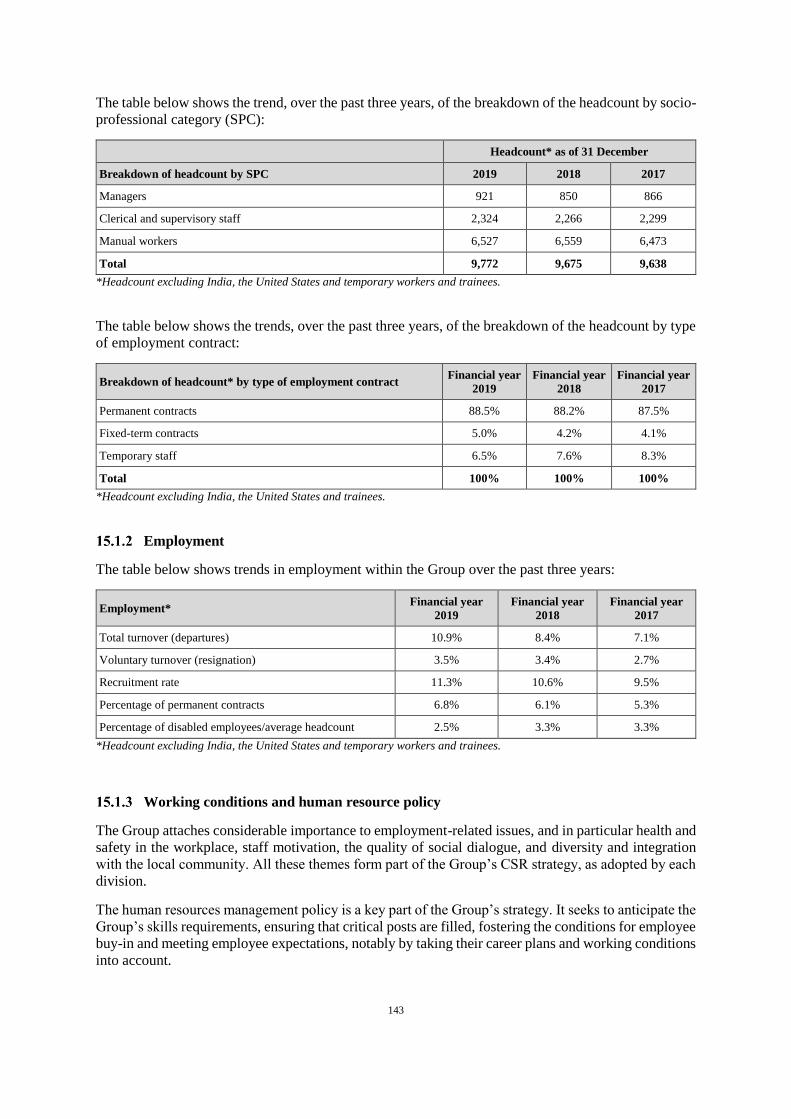
143
The table below shows the trend, over the past three years, of the breakdown of the headcount by socio-
professional category (SPC):
Headcount* as of 31 December
Breakdown of headcount by SPC 2019 2018 2017
Managers 921 850 866
Clerical and supervisory staff 2,324 2,266 2,299
Manual workers 6,527 6,559 6,473
Total 9,772 9,675 9,638
*Headcount excluding India, the United States and temporary workers and trainees.
The table below shows the trends, over the past three years, of the breakdown of the headcount by type
of employment contract:
Breakdown of headcount* by type of employment contract Financial year
2019
Financial year
2018
Financial year
2017
Permanent contracts 88.5% 88.2% 87.5%
Fixed-term contracts 5.0% 4.2% 4.1%
Temporary staff 6.5% 7.6% 8.3%
Total 100% 100% 100%
*Headcount excluding India, the United States and trainees.
Employment
The table below shows trends in employment within the Group over the past three years:
Employment* Financial year
2019
Financial year
2018
Financial year
2017
Total turnover (departures) 10.9% 8.4% 7.1%
Voluntary turnover (resignation) 3.5% 3.4% 2.7%
Recruitment rate 11.3% 10.6% 9.5%
Percentage of permanent contracts 6.8% 6.1% 5.3%
Percentage of disabled employees/average headcount 2.5% 3.3% 3.3%
*Headcount excluding India, the United States and temporary workers and trainees.
Working conditions and human resource policy
The Group attaches considerable importance to employment-related issues, and in particular health and
safety in the workplace, staff motivation, the quality of social dialogue, and diversity and integration
with the local community. All these themes form part of the Group’s CSR strategy, as adopted by each
division.
The human resources management policy is a key part of the Group’s strategy. It seeks to anticipate the
Group’s skills requirements, ensuring that critical posts are filled, fostering the conditions for employee
buy-in and meeting employee expectations, notably by taking their career plans and working conditions
into account.
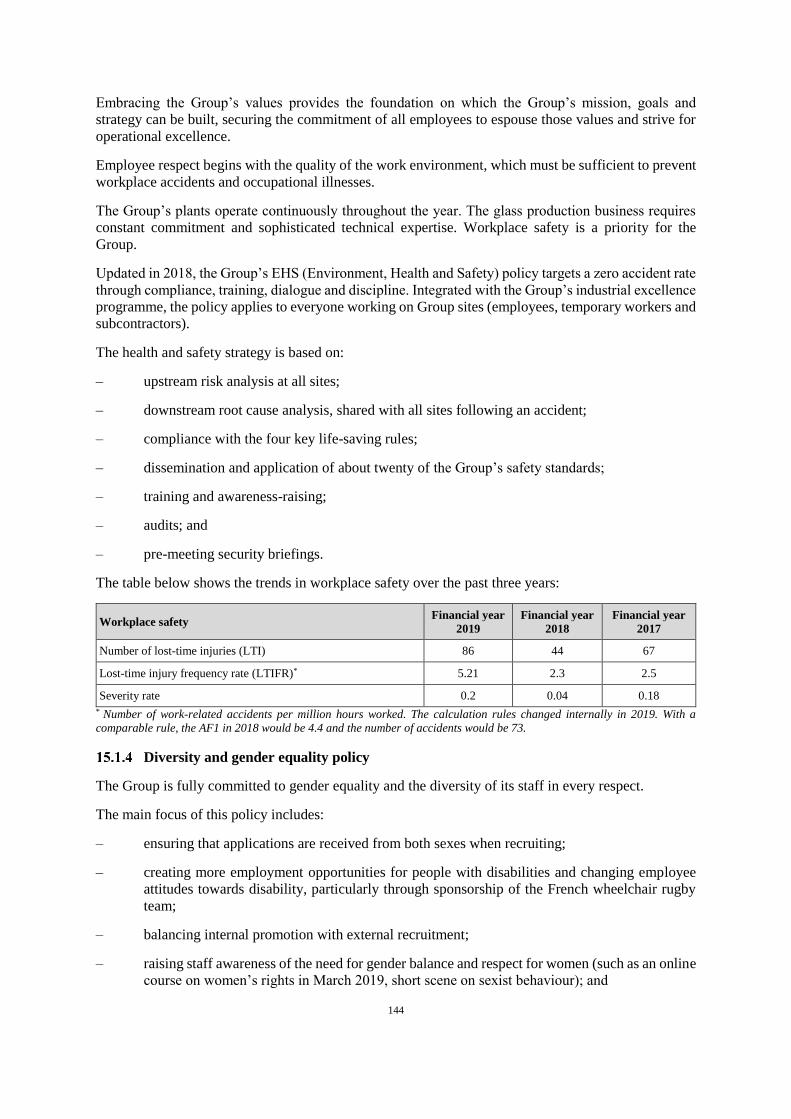
144
Embracing the Group’s values provides the foundation on which the Group’s mission, goals and
strategy can be built, securing the commitment of all employees to espouse those values and strive for
operational excellence.
Employee respect begins with the quality of the work environment, which must be sufficient to prevent
workplace accidents and occupational illnesses.
The Group’s plants operate continuously throughout the year. The glass production business requires
constant commitment and sophisticated technical expertise. Workplace safety is a priority for the
Group.
Updated in 2018, the Group’s EHS (Environment, Health and Safety) policy targets a zero accident rate
through compliance, training, dialogue and discipline. Integrated with the Group’s industrial excellence
programme, the policy applies to everyone working on Group sites (employees, temporary workers and
subcontractors).
The health and safety strategy is based on:
– upstream risk analysis at all sites;
– downstream root cause analysis, shared with all sites following an accident;
– compliance with the four key life-saving rules;
– dissemination and application of about twenty of the Group’s safety standards;
– training and awareness-raising;
– audits; and
– pre-meeting security briefings.
The table below shows the trends in workplace safety over the past three years:
Workplace safety Financial year
2019
Financial year
2018
Financial year
2017
Number of lost-time injuries (LTI) 86 44 67
Lost-time injury frequency rate (LTIFR)* 5.21 2.3 2.5
Severity rate 0.2 0.04 0.18
* Number of work-related accidents per million hours worked. The calculation rules changed internally in 2019. With a
comparable rule, the AF1 in 2018 would be 4.4 and the number of accidents would be 73.
Diversity and gender equality policy
The Group is fully committed to gender equality and the diversity of its staff in every respect.
The main focus of this policy includes:
– ensuring that applications are received from both sexes when recruiting;
– creating more employment opportunities for people with disabilities and changing employee
attitudes towards disability, particularly through sponsorship of the French wheelchair rugby
team;
– balancing internal promotion with external recruitment;
– raising staff awareness of the need for gender balance and respect for women (such as an online
course on women’s rights in March 2019, short scene on sexist behaviour); and

145
– coaching women in their careers: training, mentoring by members of Comex, exchange forum,
theatrical training on self-confidence and speech.
The Group has joined the United Nations Global Compact and is committed to advocating the principles
of human rights, environmental protection, international labour standards and anti-corruption.
Training
Each year, the Group defines the key areas of its training policy in line with the operational objectives
to be achieved. The Group’s general training programmes cover compliance (corruption, competition,
embargoes), leadership, commitment to values, business-specific training and EHS. The courses are
either attended in person or increasingly designed as online courses.
Other training courses are arranged locally based on the framework of the general training policy. They
are primarily aimed at developing employee skills either individually or collectively.
Training needs are identified during annual appraisals when employees and their line managers review
the achievement of performance targets (mid-year review). For non-executives, the appraisal is based
on the skills matrix associated with each job. These are subsequently collated by the heads of HR in
each division so that they can be implemented.
Each year, the Group carries out “people reviews”, which are an opportunity to validate the
organisational structure, as well as examine skills matching, promotions and succession plans. The
reviews are carried out in each country during budgeting and strategic planning, and are also organised
by major sector.
The table below presents trends in training over the past three years:
Training Financial year
2019
Financial year
2018
Financial year
2017
Percentage of workforce trained 80% 80% 81%
Proportion of managers and non-managers trained
Managers 82% 82% 81%
Senior technicians and supervisors(1) 73% 75% 79%
Operations, administrative and technical staff(2) 72% 73% 73%
Training costs as a % of total payroll 1% 1% 1%
Number of training hours per employee 37 45 37
Percentage per type of training:
Technical
EHS
Management
Language
Other
46%
19%
9%
9%
10%
38%
21%
7%
9%
25%
42%
17%
11%
9%
21%
1. Senior technicians and supervisors.
2. Shop floor workers, administrative staff and technicians.
15.2 Compensation policy
The Group’s compensation policy is intended, in accordance with the Company’s social interest, and in
line with market and industry practices, to ensure competitive compensation levels while maintaining a
strong link to company performance.
146
The Group has thus implemented a compensation policy consisting of (i) a basic salary, which
remunerates the position held and is attractive for recruiting and retaining talent, and for executives
concerned and (ii) a variable annual share, which remunerates individual and collective performance
based on the achievement of ambitious goals while capped at a maximum level to discourage excessive
risk-taking. A source of motivation for teams, this variable annual share is based on annual criteria
including safety, the environment, financial and operational performance, and personal goals.
In addition to this variable annual compensation, the Group intends to fully associate its employees with
its development by associating them with the capital; the employee share ownership policy is thus a
strategic pillar to support the Group’s profitable and sustainable growth, which the Group intends to
pursue actively (as at 31 December 2019, the Verallia employee investment fund (FCPE), which brings
together the Company’s employee share ownership, thus holds 2.6% of the Company’s capital). In
particular, the Company should offer in 2020 Group employees the possibility of subscribing to a
reserved capital increase via Verallia's corporate mutual fund, under the discount and employer
matching contribution conditions approved by the Board of Directors.
15.3 Stock options and free share grants
The Company has implemented a long-term incentive policy for senior executives, including its
Chairman and Chief Executive Officer, in line with market practices (see chapter 2 of Annex I of this
universal registration document).
15.4 Profit-sharing and incentive agreements
Profit-sharing agreements
In France, the Group’s companies benefit from profit-sharing, depending on performance, in
accordance with the statutory conditions.
Incentive agreements
In France, employees in most of the Group’s companies are eligible for a share of their company’s
profits, calculated according to performance indicators such as safety, quality, output and operating
income.
In Europe, Germany and Italy also have incentive agreements.
Employee savings plans and similar plans
The Group has a Group Savings Plan (“PEG”) for French companies and an International Group
Savings Plan (“PEGI”) for its foreign companies, allowing eligible employees to participate in offers
reserved for them through the Verallia employee investment fund or by direct shareholding for the offer
reserved for employees only in 2020 and invest their savings in diversified funds.
15.5 Employee share ownership
The Company has a Verallia corporate investment mutual fund, invested in Verallia securities (the
“FCPE”). The FCPE is an investment option for employees of Group companies participating in Group
savings plans, either through the Group Savings Plan (PEG) or through the International Group Savings
Plan (PEGI).
In 2019, the countries (other than France) participating in the PEGI were Spain, Germany, Portugal,
Poland and Brazil.
In this respect, as a result of plans launched by the Group between 2016 and 2019, more than 2,000
employees have become shareholders of the Company through FCPE Verallia. At the date of this
Universal Registration Document, the FCPE holds 2.6% of the capital of Company’s capital.
147
The Company’s shareholders, meeting on 20 September 2019 in a Combined Shareholders’ Meeting,
delegated to the Board of Directors in their 15th resolution the authority to decide to increase the
Company’s share capital in one or more times, up to a maximum nominal amount of €19,500,000, per
issue of new shares of the Company, reserved for eligible employees and corporate officers of the
Company and of French and foreign companies linked to it under the terms of Articles L. 225-180 of
the French Commercial Code and L. 3344-1 of the French Labour Code, members of a company savings
plan of the Group. On 3 December 2019, the Board of Directors of the Company decided to issue
common shares for employees who are members of a Group Corporate Savings Plan, the main features
of the transaction were laid down and delegated to the Chairman and CEO of the Company the powers
necessary to implement the transaction in 2020.
15.6 Social relations
The Group’s employees are represented at various levels by trade union representatives, through various
existing bodies, according to the regulations of the different countries, such as works committees and
committees for health, safety and working conditions.
In accordance with the applicable European regulations, a European works committee has been in place
since 2016. It is composed of 16 representatives who meet once a year. Its select committee meets two
to three times a year. The Agreement on the establishment and functioning of the European Committee
was renewed for a period of 3 years, until 31 December 2022.
In addition, elections were held in 2019 in the companies in France, which led to the establishment of
a Social and Economic Committee (ESC) in accordance with the regulations in force.
Each company in each country has established employee representative bodies in accordance with the
applicable law and maintains permanent social dialogue with employees and their representatives.
148
16. MAIN SHAREHOLDERS
16.1 Shareholders
The table below provides a breakdown of the Company’s share capital at 31 December 2019:
Shareholder Diluted number of
shares
% of capital and voting rights
Horizon Investment Holdings(1) 65,505,178 55.3%
Bpifrance Participations 8,861,539 7.5%
Brasil Warrant Administração de Bens e Empresas S.A.
(BWSA)(2) 10,185,185 8.6%
Managers 5,814,108 4.9%
Including Mr Michel Giannuzzi, Chairman – Chief Executive
Officer(3) 2,565,522 2.16%
FCPE Verallia 3,019,530 2.6%
Public 25,008,402 21.1%
Total 118,393,942 100%
(1) Company wholly owned by Horizon Parent Holdings S.à.r. LLP, which is wholly owned by AIF VIII Euro Laverage, L.P.,
an investment fund managed by an affiliate of Apollo Global Management, Inc.
(2) Acting through Lepton Fund Ltd., a fund managed by BW Gestão de Investimentos Ltda., a wholly owned subsidiary of
Brasil Warrant Administração de Bens e Empresas S.A. In addition, the Company has been informed on 5 March 2020 of
the acquisition by Brasil Warrant Administração de Bens e Empresas S.A. of 5,164 shares of the Company, on 2 March
2020 (see AMF declaration AMF2020DD671777).
(3) In the context of the initial public offering of the Company, Mr Michel Giannuzzi has undertaken, subject to certain
exceptions, not to sell Verallia shares for a period of 365 calendar days following the settlement of the initial public
offering on 7 October 2019 (see also section 7.4.2 of the securities note approved by the Financial and markets authority
on 20 September 2019).
Apollo Global Management
Apollo Global Management is a leading global alternative investment manager with offices in New
York, Los Angeles, San Diego, Houston, Bethesda, London, Frankfurt, Madrid, Luxembourg, Mumbai,
Delhi, Singapore, Hong Kong, Shanghai and Tokyo. As of 31 December 2018, Apollo had
approximately $280 billion in assets under management in private equity, credit and real estate funds,
invested through a core group of nine sectors in which Apollo has significant knowledge and resources.
Apollo Global Management shares are admitted to trading on the New York Stock Exchange.
Bpifrance Participations
A state-owned subsidiary of the Caisse des Dépôts et Consignations, Bpifrance SA provides credit and
equity for entrepreneurs and businesses from their start-up to their listing on the stock exchange.
Bpifrance Participations is a société anonyme, 100% of which is held by Bpifrance SA. Its objective is
to provide long-term support to mid-caps with potential in order to accelerate their growth, strengthen
their innovation capacity and promote their international development. The investments made by
Bpifrance Participations are made on its behalf by the management company Bpifrance Investissement.
Brasil Warrant Administração de Bens e Empresas S.A. (BWSA)
BWSA, a Brazilian investment company that has been operating for six decades, has successfully forged
partnerships around the world with leading companies in their sector, as well as their reference
shareholders and founders, in a variety of sectors, such as financial services, natural resources,
149
agriculture, consumer products, distribution and industry. BWSA now focuses its business in the
banking and mining sectors of Brazil. Recently, BWSA acquired a joint ownership interest in
Alpargatas, Latin America’s largest footwear manufacturer (including the manufacturer of the
“Havaianas” flip-flops). BWSA also manages the investments of the BWSA Group through BWGI, an
asset management entity, established in 2008.
16.2 Statement relating to control of the Company
At the date of this Universal Registration Document, the Company is controlled by Horizon Investment
Holdings S.à.r.l.
On the occasion of the Company’s initial public offering, Bpfrance Participations and AIF VIII Euro
Leverage, L.P., an investment fund managed by an affiliate of Apollo Global Management, Inc., on 8
October 2019, a shareholders’ agreement concerning their equity holdings in the capital of Horizon
Parent Holdings S.à.r.l66, which holds 55.3% of the share capital and voting rights thereof. In order for
such control not to be exercised in an abusive way, it is reminded that five members of the Board of
directors (i.e. almost half) are independent members, pursuant to the recommendations of the AFEP-
MEDEF Code applicable to controlled companies and three members (i.e. a quarter), are appointed
upon Apollo’s proposal.
In the context of the shareholder reorganisation implemented at Horizon Parent Holdings S.à.r. LLP,
this agreement was terminated on 18 December 2019 and a new shareholder agreement was concluded
between Bpfrance Participations and Horizon Investment Holdings S.à.r.l. The agreement, which has
been concluded for a period of 20 years from its signature and which will be terminated as of right, once
one of the parties ceases to hold direct or indirect shares in the Company, provides, inter alia:
Lack of concerted action: the parties to the agreement have stated that they do not intend to act
together with the Company and do not intend to exercise their voting rights within the Company to
implement a common policy.
Bpfrance Participations representation on the Board of Directors of the Company: as long as
Bpifrance Participations and its affiliates hold a stake representing at least 5% of the Company’s
share capital, Bpifrance Participations may propose the appointment of a director to the Company’s
Board of Directors, which will also be a member of the Company’s Sustainable Development
Committee. Horizon Investment Holdings S.à r.l committed to vote in favour of the above-
mentioned appointment to the Company’s Shareholders’ Meeting and to instruct its representatives
on the Board of Directors of the Company to propose and vote in favour of the above-mentioned
appointment to the Board of Directors of the Company (whether through the convening of a
Company’s Shareholders’ Meeting on this agenda or through the Board of Directors’ co-optation
process).
Right of information: As long as Bpfrance Participations and its affiliates hold a stake representing
at least 5% of the Company’s share capital, it will be provided, in compliance with the applicable
regulations, to Bpifrance Participations the same information and documents received by Horizon
Investments Holdings S.à.r.l and AP VIII Horizon Holdings L.P. or any other direct or indirect
partner of Horizon Investments Holdings S.à.r.l, including in connection with the preparation of the
Company’s budget, financial and operational information and strategic decisions.
66 A company held at 100% by Horizon Parent Holdings S.à.r.l., which is itself held at 100% by AIF VIII Euro Leverage, L.P.,
an investment fund managed by an affiliate of Apollo Global Management, Inc.
150
16.3 Agreements that could lead to a change of control
The Company has been informed of the implementation on 20 December 2019 by Horizon Investment
Holdings S.à.r.l. of a financing agreement secured by way of a pledge of part of the shares of the
Company held by Horizon Investment Holdings S.à.r.l.67
67 See in particular AMF decision 219C2898 dated 23 December 2019.
151
17. RELATED PARTY AGREEMENTS
17.1 Principal transactions with related parties
The Group’s related parties mainly include the Company’s shareholders, unconsolidated subsidiaries,
associates (companies accounted for by the equity method), and entities over which the various Group
executives exercise at least significant influence.
The figures for the relationships with these related parties are set out in Note 22 to the consolidated
financial statements for the financial year ended 31 December 2019 contained in Section 18.1.1 of this
Universal Registration Document.
The main related party agreement is a €10 million amortisable loan agreement signed on 11 December
2018, between Verallia Packaging, a subsidiary of the Company, and Bpifrance Financement, an
affiliate of the Company’s shareholder (see Chapter 16 of this Universal Registration Document), to
finance and refinance the cash flow requirements of Verallia Packaging and its subsidiaries. The loan
bears annual interest at a rate of 0.70%. The loan is repayable on 31 December 2021.
17.2 Statutory Auditors’ special report on related party agreements for the financial year
ended 31 December 2019
“This is a free translation into English of the Statutory Auditors’ special report on related party
agreements issued in French and is provided solely for the convenience of English speaking readers.
This report should be read in conjunction with, and construed in accordance with, French law and
professional auditing standards applicable in France.
Verallia SA
Tour Carpe Diem
31 Place des Corolles - Esplanade Nord
92400 Courbevoie, France
To the General annual meeting,
In our capacity as Statutory Auditors of Verallia SA (hereinafter the “Company”), we hereby report to
you on related party agreements.
It is our responsibility to report to shareholders, based on the information provided to us, on the main
terms and conditions of agreements that have been disclosed to us or that we may have identified as
part of our engagement, as well as the reasons given as to why they are beneficial for the Company,
without commenting on their relevance or substance or identifying any undisclosed agreements. Under
the provisions of Article R. 225-31 of the French Commercial Code (Code de commerce), it is the
responsibility of the shareholders to determine whether the agreements are appropriate and should be
approved.
Where applicable, it is also our responsibility to provide shareholders with the information required by
Article R. 225-31 of the French Commercial Code in relation to the implementation during the year of
agreements already approved by the General Shareholders’ Meeting.
We performed the procedures that we deemed necessary in accordance with professional standards
applicable in France to such engagements. These procedures consisted in verifying that the information
given to us is consistent with the underlying documents.
Agreements to be submitted for the approval of the General Shareholders’ Meeting
Agreements authorised and entered into during the year
152
In accordance with Article L. 225-40 of the French Commercial Code, we were informed of the
following agreements which were entered into during the year and authorised in advance by the Board
of Directors.
English-language Underwriting Agreement entered into on 3 October 2019
Party concerned:
Horizon Parent Holdings Sàrl, a company controlling a corporate shareholder of the Company owning
more than 10% of the voting rights, i.e., Horizon Intermediate Holdings SCA.
Purpose of the agreement:
In connection with the initial public offering of the Company, the public offering (offre à prix ouvert)
and the international private placement (placement global) were subject to an underwriting agreement
entered into on 3 October 2019 with a group of financial institutions (the “Guarantors”), covering the
total number of shares sold (the “Underwriting Agreement”). Pursuant to the Underwriting Agreement,
the Guarantors undertook, jointly but not severally, to organise for investors to purchase or, failing that,
to purchase themselves, the number of guaranteed shares subject to their respective underwriting
undertakings, in full at the settlement date and at the offering price.
The Underwriting Agreement was authorised by the Board of Directors on 3 October 2019.
Terms and conditions:
The remuneration due to the Guarantors in respect of the Underwriting Agreement was paid by the
selling shareholders, i.e., (i) Horizon Parent Holdings Sàrl, (ii) certain managers of the Verallia Group
and (iii) certain co-investors.
Reasons provided by the Company:
The Underwriting Agreement was consistent with market practices for this type of operation and was
in the interests of the Company by providing a guarantee of a successful initial public offering.
Neuilly-sur-Seine and Paris, 17 March 2020
The Statutory Auditors
PricewaterhouseCoopers Audit BM&A
Itto El Hariri Gilles Rabier
153
18. FINANCIAL INFORMATION CONCERNING THE ISSUER’S ASSETS,
LIABILITIES, FINANCIAL POSITION, PROFITS AND LOSSES
Pursuant to Article 19 of Regulation (EU) 2017/1129 of the European Parliament and of the Council of
14 June 2017, the financial statements for the years ended 31 December 2018, 2017 and 2016 as well
as the corresponding auditors’ report, set out in Chapter 18, “Financial information on assets and
liabilities, the Company’s financial position and results” from the Company’s Registration Document
approved by the AMF on 4 September 2019, under No. I. 19-031, are included by reference in this
Universal Registration Document.
18.1 Group’s consolidated accounts for the year ended 31 December 2019 and the
Auditors’ Report
Group consolidated financial statements for the year ended 31 December 2019
CONTENTS
STATEMENT OF CONSOLIDATED FINANCIAL POSITION .............................................. 156
CONSOLIDATED STATEMENT OF INCOME ....................................................................... 157
CONSOLIDATED STATEMENT OF COMPREHENSIVE INCOME ..................................... 158
CONSOLIDATED STATEMENT OF CASH FLOWS .............................................................. 159
CONSOLIDATED STATEMENT OF CHANGE IN EQUITY ................................................. 160
NOTE 1 – INFORMATION ON THE GROUP .......................................................................... 161
1.1 INCORPORATION AND CREATION ......................................................................... 161 1.2 HIGHLIGHTS ................................................................................................................ 161 1.3 OPERATIONS ................................................................................................................ 162
NOTE 2 – BASIS OF PREPARATION OF THE CONSOLIDATED FINANCIAL
STATEMENTS .............................................................................................................. 162
2.1 DECLARATION OF COMPLIANCE AND APPLICABLE FRAMEWORK ............. 162 2.2 FIRST TIME APPLICATION OF IFRS 16 ................................................................... 163 2.3 ESTIMATES AND JUDGEMENTS .............................................................................. 165 2.4 VALUATION PRINCIPLES .......................................................................................... 165 2.5 TRANSACTIONS IN FOREIGN CURRENCIES ......................................................... 166
NOTE 3 – CONSOLIDATION METHODS AND SCOPE OF CONSOLIDATION ................ 167
3.1 CHANGES IN THE SCOPE OF CONSOLIDATION ................................................... 167 3.2 LIST OF THE MAIN CONSOLIDATED COMPANIES .............................................. 170 3.3 INVESTMENTS IN EQUITY-ACCOUNTED COMPANIES ...................................... 170
NOTE 4 – SEGMENT INFORMATION .................................................................................... 172
4.1 BASIS FOR SEGMENTATION .................................................................................... 172 4.2 KEY PERFORMANCE INDICATORS ......................................................................... 172 4.3 SEGMENT INFORMATION ......................................................................................... 174 4.4 BREAKDOWN OF REVENUE BY “END MARKET” ................................................ 174 4.5 ENTITY-LEVEL INFORMATION ............................................................................... 175 4.6 INFORMATION ABOUT THE MAIN CUSTOMERS ................................................ 175
NOTE 5 – OPERATING INCOME AND EXPENSES .............................................................. 176
5.1 REVENUE ...................................................................................................................... 176 5.2 EXPENSES BY FUNCTION AND BY NATURE ........................................................ 176
154
NOTE 6 - OTHER OPERATING INCOME AND EXPENSES ................................................. 178
6.1 ACQUISITION-RELATED ITEMS .............................................................................. 178 6.2 OTHER OPERATING INCOME AND EXPENSES .................................................... 178
NOTE 7 – FINANCIAL INCOME AND EXPENSE.................................................................. 180
NOTE 8 – INCOME TAX ........................................................................................................... 181
8.1 INCOME TAX ............................................................................................................... 182 8.2 ANALYSIS OF DEFERRED TAXES ON THE BALANCE SHEET .......................... 182 8.3 TAX PROOF .................................................................................................................. 183 8.4 TAX CONSOLIDATION ............................................................................................... 183 8.5 UNCERTAINTY REGARDING TAX TREATMENT ................................................ 183
NOTE 9 – GOODWILL .............................................................................................................. 184
NOTE 10 – OTHER INTANGIBLE ASSETS ............................................................................ 185
NOTE 11 – PROPERTY, PLANT AND EQUIPMENT ............................................................. 185
NOTE 12 – IMPAIRMENT OF GOODWILL AND FIXED ASSETS ...................................... 189
NOTE 13 – OTHER NON-CURRENT ASSETS ........................................................................ 190
NOTE 14 – CHANGE IN NET WORKING CAPITAL ............................................................. 191
14.1 INVENTORIES .............................................................................................................. 192 14.2 TRADE RECEIVABLES AND OTHER CURRENT ASSETS .................................... 192 14.3 TRADE AND OTHER CURRENT LIABILITIES ........................................................ 193 14.4 FACTORING .................................................................................................................. 194
NOTE 15 – CASH AND CASH EQUIVALENTS ..................................................................... 195
NOTE 16 – EQUITY ................................................................................................................... 196
16.1 SHARE CAPITAL ......................................................................................................... 196 16.2 TRANSLATION RESERVE .......................................................................................... 197 16.3 EARNINGS PER SHARE .............................................................................................. 197
NOTE 17 – BORROWINGS AND FINANCIAL LIABILITIES ............................................... 197
17.1 NET FINANCIAL DEBT ............................................................................................... 197 17.2 CHANGE IN GROSS FINANCIAL DEBT ................................................................... 198 17.3 THE GROUP’S DEBT STRUCTURE ........................................................................... 202 17.4 DEBT REPAYMENT SCHEDULE ............................................................................... 202 17.5 LEASE LIABILITIES .................................................................................................... 202 17.6 COVENANTS ................................................................................................................ 203 17.7 CHANGE IN DEBT ....................................................................................................... 204
NOTE 18 – PROVISIONS AND OTHER NON-CURRENT FINANCIAL LIABILITIES ....... 205
18.1 PROVISIONS AND CONTINGENT LIABILITIES ..................................................... 206 18.2 OTHER NON-CURRENT FINANCIAL LIABILITIES ............................................... 209
NOTE 19 – PROVISIONS FOR PENSIONS AND OTHER EMPLOYEE BENEFITS ............ 210
19.1 PENSION LIABILITIES AND OTHER POST-EMPLOYMENT BENEFIT
LIABILITIES .................................................................................................................. 210 19.2 OTHER LONG-TERM BENEFITS ............................................................................... 213 19.3 MANAGEMENT SHARE OWNERSHIP PLAN .......................................................... 214 19.4 GROUP SAVINGS PLANS ........................................................................................... 215
155
NOTE 20 – FINANCIAL RISK MANAGEMENT .................................................................... 216
20.1 LIQUIDITY RISK .......................................................................................................... 216 20.2 MARKET RISKS ........................................................................................................... 216
NOTE 21 – FINANCIAL INSTRUMENTS ............................................................................... 220
NOTE 22 – RELATED PARTIES............................................................................................... 226
22.1 TRANSACTIONS WITH ASSOCIATES...................................................................... 226 22.2 TRANSACTIONS WITH SHAREHOLDERS .............................................................. 226 22.3 TRANSACTIONS WITH MANAGEMENT PERSONNEL ......................................... 228
NOTE 23 – CONTRACTUAL OBLIGATIONS AND OFF-BALANCE SHEET
COMMITMENTS .......................................................................................................... 228
23.1 COMMITMENTS OF OPERATING ACTIVITIES ...................................................... 228 23.2 FINANCING COMMITMENTS .................................................................................... 231
NOTE 24 – AUDIT FEES ........................................................................................................... 232
NOTE 25 – EVENTS AFTER THE CLOSING DATE .............................................................. 232
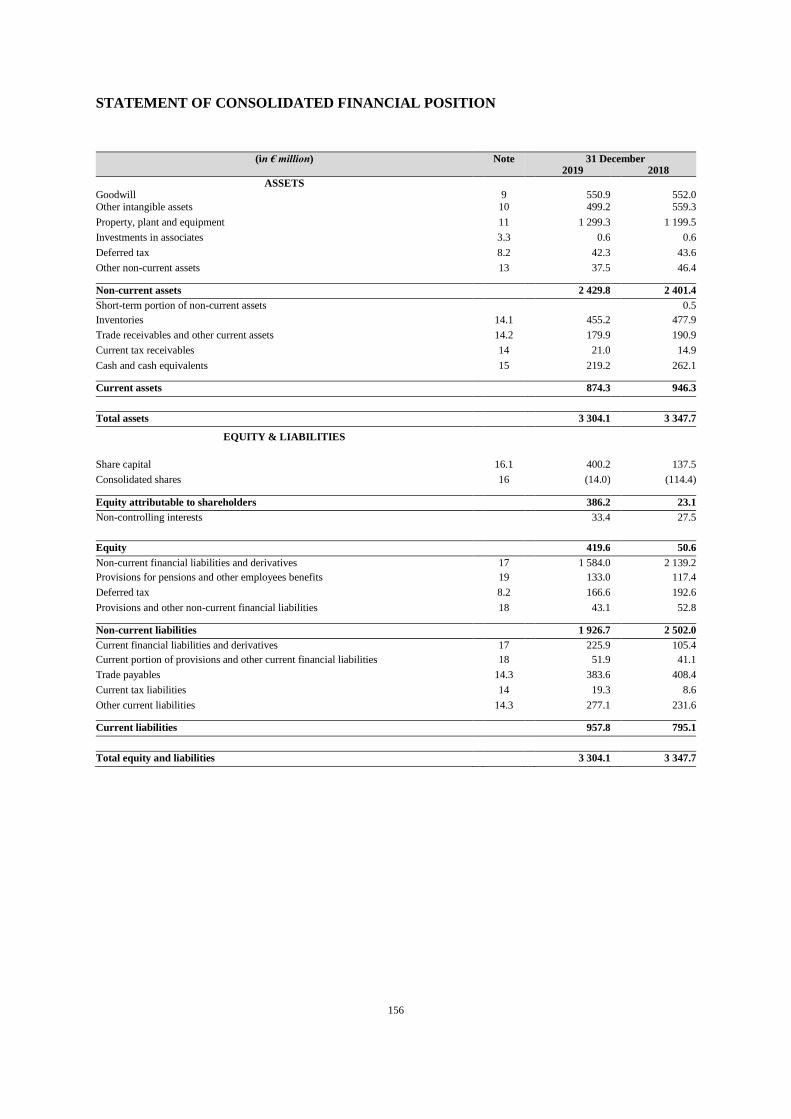
156
STATEMENT OF CONSOLIDATED FINANCIAL POSITION
(in € million) Note 31 December 2019 2018
ASSETS Goodwill 9 550.9 552.0 Other intangible assets 10 499.2 559.3
Property, plant and equipment 11 1 299.3 1 199.5
Investments in associates 3.3 0.6 0.6
Deferred tax 8.2 42.3 43.6
Other non-current assets 13 37.5 46.4
Non-current assets 2 429.8 2 401.4
Short-term portion of non-current assets 0.5
Inventories 14.1 455.2 477.9
Trade receivables and other current assets 14.2 179.9 190.9
Current tax receivables 14 21.0 14.9
Cash and cash equivalents 15 219.2 262.1
Current assets 874.3 946.3
Total assets 3 304.1 3 347.7
EQUITY & LIABILITIES
Share capital 16.1 400.2 137.5
Consolidated shares 16 (14.0) (114.4)
Equity attributable to shareholders 386.2 23.1
Non-controlling interests 33.4 27.5
Equity 419.6 50.6
Non-current financial liabilities and derivatives 17 1 584.0 2 139.2
Provisions for pensions and other employees benefits 19 133.0 117.4
Deferred tax 8.2 166.6 192.6
Provisions and other non-current financial liabilities 18 43.1 52.8
Non-current liabilities 1 926.7 2 502.0
Current financial liabilities and derivatives 17 225.9 105.4
Current portion of provisions and other current financial liabilities 18 51.9 41.1
Trade payables 14.3 383.6 408.4
Current tax liabilities 14 19.3 8.6
Other current liabilities 14.3 277.1 231.6
Current liabilities 957.8 795.1
Total equity and liabilities 3 304.1 3 347.7
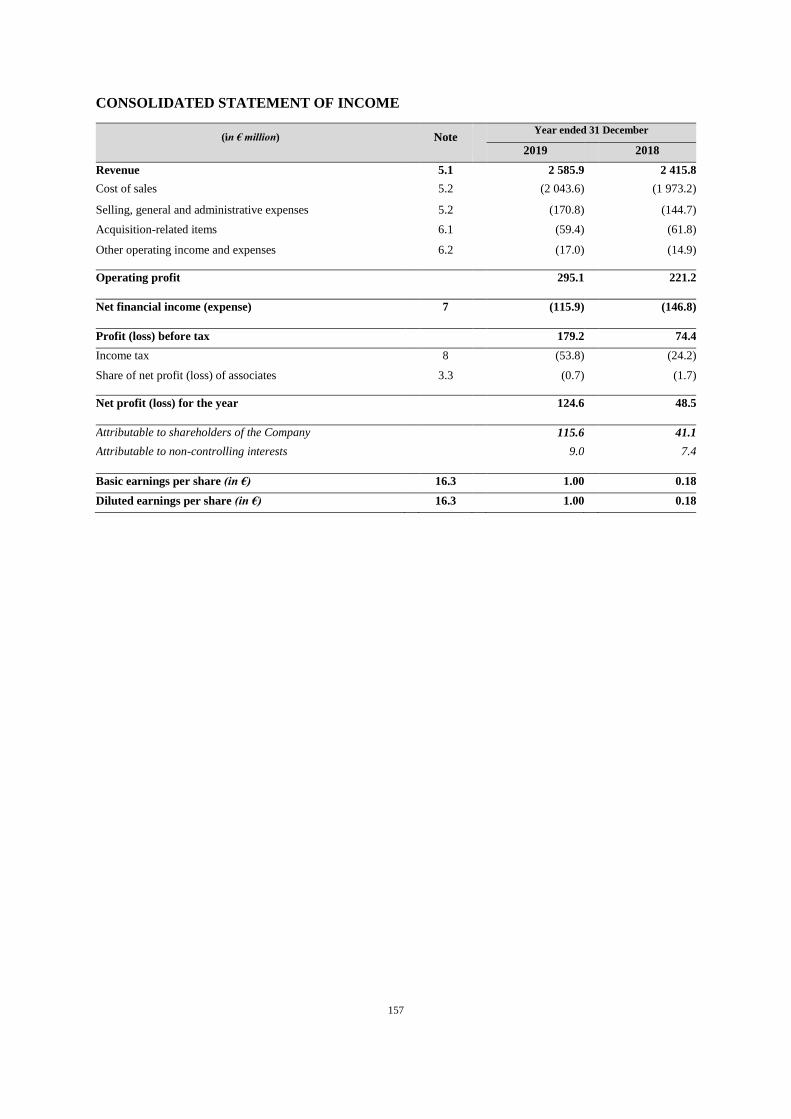
157
CONSOLIDATED STATEMENT OF INCOME
(in € million) Note Year ended 31 December
2019 2018
Revenue 5.1 2 585.9 2 415.8
Cost of sales 5.2 (2 043.6) (1 973.2)
Selling, general and administrative expenses 5.2 (170.8) (144.7)
Acquisition-related items 6.1 (59.4) (61.8)
Other operating income and expenses 6.2 (17.0) (14.9)
Operating profit 295.1 221.2
Net financial income (expense) 7 (115.9) (146.8)
Profit (loss) before tax 179.2 74.4
Income tax 8 (53.8) (24.2)
Share of net profit (loss) of associates 3.3 (0.7) (1.7)
Net profit (loss) for the year 124.6 48.5
Attributable to shareholders of the Company 115.6 41.1
Attributable to non-controlling interests 9.0 7.4
Basic earnings per share (in €) 16.3 1.00 0.18
Diluted earnings per share (in €) 16.3 1.00 0.18
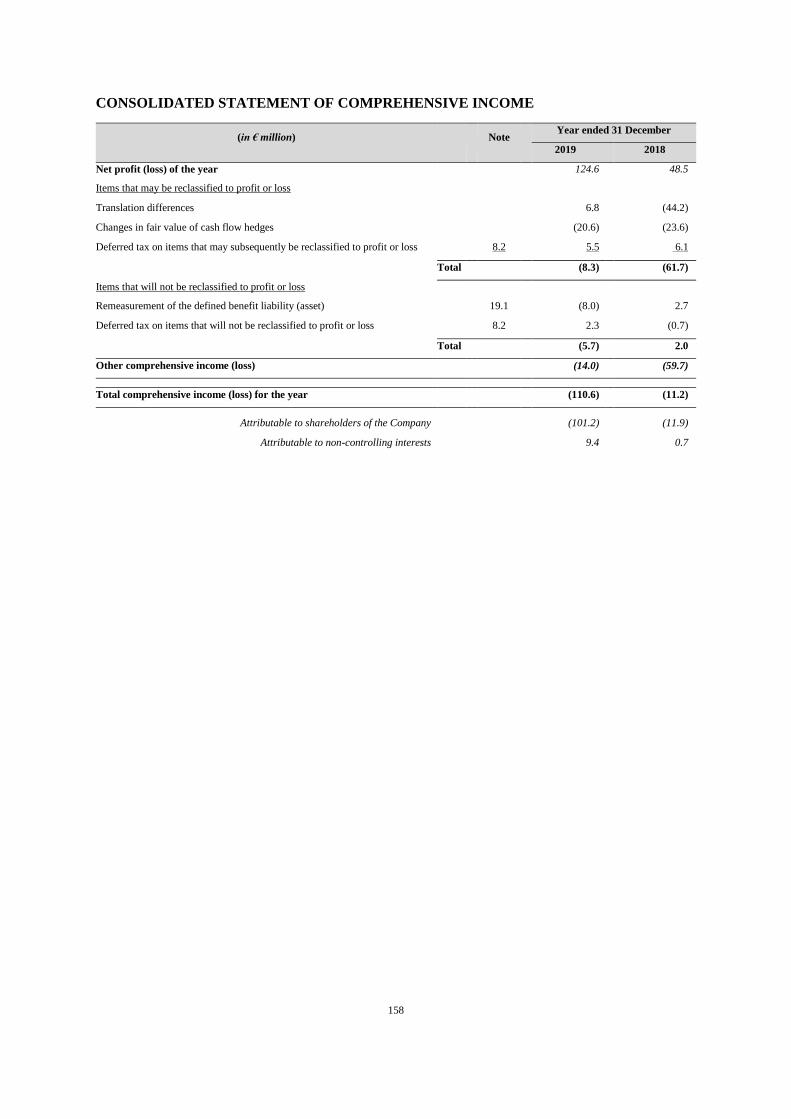
158
CONSOLIDATED STATEMENT OF COMPREHENSIVE INCOME
(in € million)
Note Year ended 31 December
2019 2018
Net profit (loss) of the year 124.6 48.5
Items that may be reclassified to profit or loss
Translation differences 6.8 (44.2)
Changes in fair value of cash flow hedges (20.6) (23.6)
Deferred tax on items that may subsequently be reclassified to profit or loss 8.2 5.5 6.1
Total (8.3) (61.7)
Items that will not be reclassified to profit or loss
Remeasurement of the defined benefit liability (asset) 19.1 (8.0) 2.7
Deferred tax on items that will not be reclassified to profit or loss 8.2 2.3 (0.7)
Total (5.7) 2.0
Other comprehensive income (loss) (14.0) (59.7)
Total comprehensive income (loss) for the year (110.6) (11.2)
Attributable to shareholders of the Company (101.2) (11.9)
Attributable to non-controlling interests 9.4 0.7
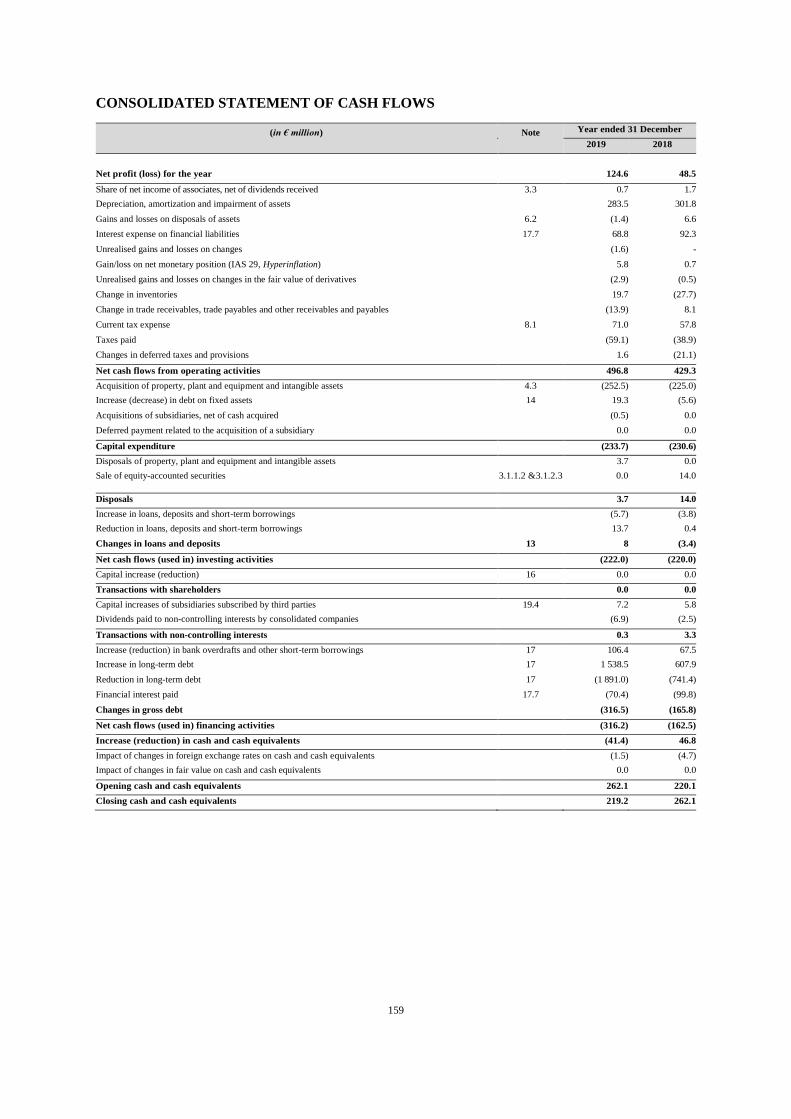
159
CONSOLIDATED STATEMENT OF CASH FLOWS
(in € million) Note Year ended 31 December
2019 2018
Net profit (loss) for the year 124.6 48.5
Share of net income of associates, net of dividends received 3.3 0.7 1.7
Depreciation, amortization and impairment of assets 283.5 301.8
Gains and losses on disposals of assets 6.2 (1.4) 6.6
Interest expense on financial liabilities 17.7 68.8 92.3
Unrealised gains and losses on changes (1.6) -
Gain/loss on net monetary position (IAS 29, Hyperinflation) 5.8 0.7
Unrealised gains and losses on changes in the fair value of derivatives (2.9) (0.5)
Change in inventories 19.7 (27.7)
Change in trade receivables, trade payables and other receivables and payables (13.9) 8.1
Current tax expense 8.1 71.0 57.8
Taxes paid (59.1) (38.9)
Changes in deferred taxes and provisions 1.6 (21.1)
Net cash flows from operating activities 496.8 429.3
Acquisition of property, plant and equipment and intangible assets 4.3 (252.5) (225.0)
Increase (decrease) in debt on fixed assets 14 19.3 (5.6)
Acquisitions of subsidiaries, net of cash acquired (0.5) 0.0
Deferred payment related to the acquisition of a subsidiary 0.0 0.0
Capital expenditure (233.7) (230.6)
Disposals of property, plant and equipment and intangible assets 3.7 0.0
Sale of equity-accounted securities 3.1.1.2 &3.1.2.3 0.0 14.0
Disposals 3.7 14.0
Increase in loans, deposits and short-term borrowings (5.7) (3.8)
Reduction in loans, deposits and short-term borrowings 13.7 0.4
Changes in loans and deposits 13 8 (3.4)
Net cash flows (used in) investing activities (222.0) (220.0)
Capital increase (reduction) 16 0.0 0.0
Transactions with shareholders 0.0 0.0
Capital increases of subsidiaries subscribed by third parties 19.4 7.2 5.8
Dividends paid to non-controlling interests by consolidated companies (6.9) (2.5)
Transactions with non-controlling interests 0.3 3.3
Increase (reduction) in bank overdrafts and other short-term borrowings 17 106.4 67.5
Increase in long-term debt 17 1 538.5 607.9
Reduction in long-term debt 17 (1 891.0) (741.4)
Financial interest paid 17.7 (70.4) (99.8)
Changes in gross debt (316.5) (165.8)
Net cash flows (used in) financing activities (316.2) (162.5)
Increase (reduction) in cash and cash equivalents (41.4) 46.8
Impact of changes in foreign exchange rates on cash and cash equivalents (1.5) (4.7)
Impact of changes in fair value on cash and cash equivalents 0.0 0.0
Opening cash and cash equivalents 262.1 220.1
Closing cash and cash equivalents 219.2 262.1
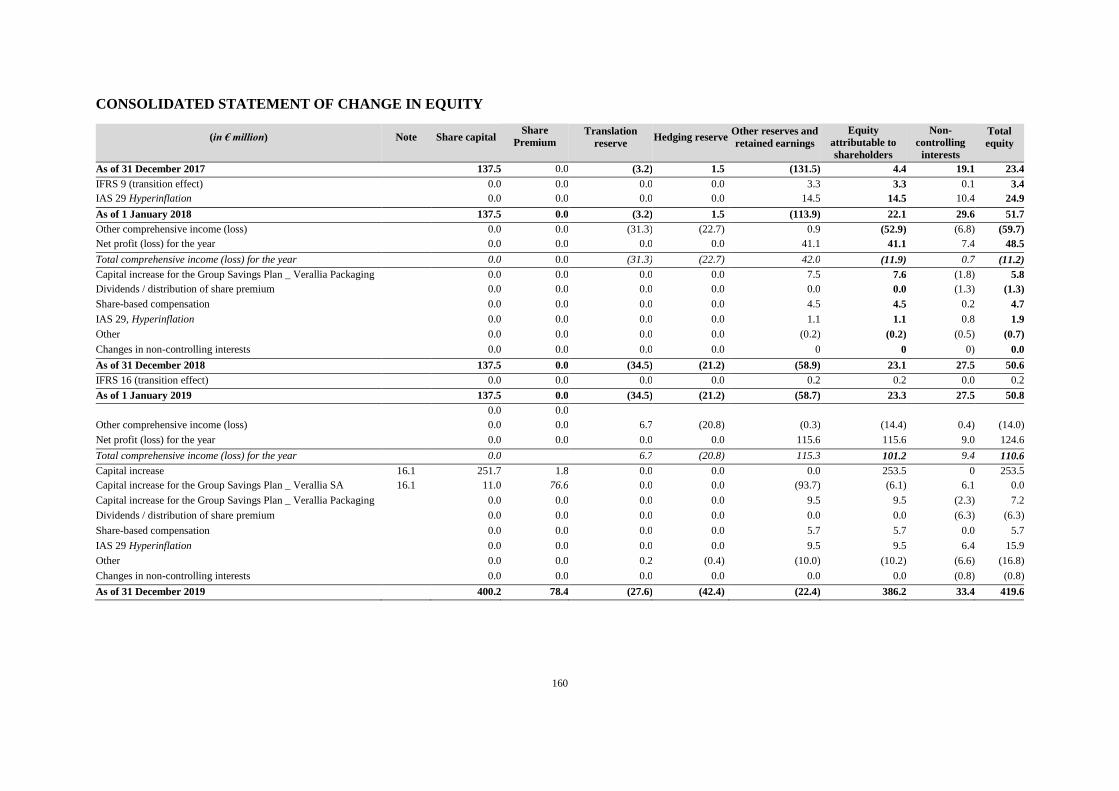
160
CONSOLIDATED STATEMENT OF CHANGE IN EQUITY
(in € million) Note Share capital Share
Premium Translation
reserve Hedging reserve
Other reserves and
retained earnings
Equity
attributable to
shareholders
Non-
controlling
interests
Total
equity
As of 31 December 2017 137.5 0.0 (3.2) 1.5 (131.5) 4.4 19.1 23.4
IFRS 9 (transition effect) 0.0 0.0 0.0 0.0 3.3 3.3 0.1 3.4
IAS 29 Hyperinflation 0.0 0.0 0.0 0.0 14.5 14.5 10.4 24.9
As of 1 January 2018 137.5 0.0 (3.2) 1.5 (113.9) 22.1 29.6 51.7
Other comprehensive income (loss) 0.0 0.0 (31.3) (22.7) 0.9 (52.9) (6.8) (59.7)
Net profit (loss) for the year 0.0 0.0 0.0 0.0 41.1 41.1 7.4 48.5
Total comprehensive income (loss) for the year 0.0 0.0 (31.3) (22.7) 42.0 (11.9) 0.7 (11.2)
Capital increase for the Group Savings Plan _ Verallia Packaging 0.0 0.0 0.0 0.0 7.5 7.6 (1.8) 5.8
Dividends / distribution of share premium 0.0 0.0 0.0 0.0 0.0 0.0 (1.3) (1.3)
Share-based compensation 0.0 0.0 0.0 0.0 4.5 4.5 0.2 4.7
IAS 29, Hyperinflation 0.0 0.0 0.0 0.0 1.1 1.1 0.8 1.9
Other 0.0 0.0 0.0 0.0 (0.2) (0.2) (0.5) (0.7)
Changes in non-controlling interests 0.0 0.0 0.0 0.0 0 0 0) 0.0
As of 31 December 2018 137.5 0.0 (34.5) (21.2) (58.9) 23.1 27.5 50.6
IFRS 16 (transition effect) 0.0 0.0 0.0 0.0 0.2 0.2 0.0 0.2
As of 1 January 2019 137.5 0.0 (34.5) (21.2) (58.7) 23.3 27.5 50.8
0.0 0.0
Other comprehensive income (loss) 0.0 0.0 6.7 (20.8) (0.3) (14.4) 0.4) (14.0)
Net profit (loss) for the year 0.0 0.0 0.0 0.0 115.6 115.6 9.0 124.6
Total comprehensive income (loss) for the year 0.0 6.7 (20.8) 115.3 101.2 9.4 110.6
Capital increase 16.1 251.7 1.8 0.0 0.0 0.0 253.5 0 253.5
Capital increase for the Group Savings Plan _ Verallia SA 16.1 11.0 76.6 0.0 0.0 (93.7) (6.1) 6.1 0.0
Capital increase for the Group Savings Plan _ Verallia Packaging 0.0 0.0 0.0 0.0 9.5 9.5 (2.3) 7.2
Dividends / distribution of share premium 0.0 0.0 0.0 0.0 0.0 0.0 (6.3) (6.3)
Share-based compensation 0.0 0.0 0.0 0.0 5.7 5.7 0.0 5.7
IAS 29 Hyperinflation 0.0 0.0 0.0 0.0 9.5 9.5 6.4 15.9
Other 0.0 0.0 0.2 (0.4) (10.0) (10.2) (6.6) (16.8)
Changes in non-controlling interests 0.0 0.0 0.0 0.0 0.0 0.0 (0.8) (0.8)
As of 31 December 2019 400.2 78.4 (27.6) (42.4) (22.4) 386.2 33.4 419.6
161
NOTE 1 – INFORMATION ON THE GROUP
1.1 INCORPORATION AND CREATION
1.1.1 CORPORATE NAME
At 31 December 2019, the Company’s corporate name is “Verallia” and has been since 20 June 2019.
1.1.2 PLACE OF REGISTRATION AND REGISTRATION NUMBER
The Company is registered in the Nanterre Trade and Companies Register under number 812 163 913.
LEI: 5299007YZU978DE0ZY32
1.1. 3 DATE OF INCORPORATION AND LENGTH OF LIFE OF THE COMPANY
The Company has been incorporated for a period of 99 years starting from its registration on 23 June
2015, unless it is dissolved early or extended on the joint decision of the shareholders in accordance
with the law and articles of association.
The financial year begins on 1 January and ends on 31 December of each year.
1.1.4 REGISTERED OFFICE, LEGAL FORM AND APPLICABLE LEGAL REGIME
The Company’s registered office is located at 31 Place des Corolles, Tour Carpe Diem, Esplanade Nord,
92400 Courbevoie, France.
At 31 December 2019, the Company is a société anonyme (limited company) governed by French law.
1.2 HIGHLIGHTS
Verallia SA listed on Euronext on 4 October 2019.
On 20 September 2019, prior to this IPO, the company incorporated into its capital the outstanding
amount (principal and interest) of the loan granted to it by its parent company, Luxembourg’s Horizon
Intermediate Holdings S.C.A., via a €251.4 million increase in the Company’s capital (Note 16).
While listing its shares for trading on the regulated market of Euronext, the Group also carried out a
number of transactions and reorganisation measures:
the merger-acquisition of Horizon Holdings II by Horizon Holdings I, both fully owned
subsidiaries of the Company, and then the merger-acquisition of Horizon Holdings I by the
Company; these transactions had no impact on the Group’s consolidated financial statements,
the merger-acquisition by the Company of Horizon Intermediate Holdings S.C.A., the
Company’s parent company with 100% of its capital,
the transfer by the Verallia FCPE (employee investment fund) to the Company of all ordinary
and preference shares corresponding to the 3.52% it owned at 7 October 2019 in the capital of
the Verallia Packaging subsidiary, in exchange for new ordinary shares in the Company. This
transaction resulted in the reclassification of non-controlling interests to attributable
shareholders’ equity,
the full repayment of Term Loan B of a nominal amount of €1,125 million and of Term Loan
C of a nominal amount of €550 million, together with the arrangement of a new Term Loan A
of a nominal amount of €1,500 million on 7 October 2019,
162
the arrangement of a new revolving credit facility of €500 million on 7 October 2019 to replace
the €325 million facility. This revolving credit facility provides the Group with a secure source
of funding (together with the potential support of its programme to issue Negotiable European
Commercial Paper (Neu CP)).
1.3 OPERATIONS
With industrial operations in 11 countries, Verallia is the world’s third-largest producer of glass
packaging for beverages and food products. In 2019, the Group produced approximately 16 billion
bottles and jars. The Group boasts a sound position in Western and Eastern Europe, as well as in Latin
America. Its main subsidiaries are located in the following countries: France, Italy, Germany, Spain,
Portugal, Argentina and Brazil. Verallia employs approximately 9,705 employees worldwide, spread
over 32 glass production sites with a total of 57 furnaces.
NOTE 2 – BASIS OF PREPARATION OF THE CONSOLIDATED FINANCIAL
STATEMENTS
2.1 DECLARATION OF COMPLIANCE AND APPLICABLE FRAMEWORK
The Verallia Group’s consolidated financial statements for the period ended 31 December 2019 have
been prepared in accordance with international accounting standards (IFRS) as published by the IASB
(International Accounting Standards Board) and adopted in the European Union in compliance with
European Regulation n°1606/2002 of 19 July 2002. They were approved by the Board of Directors on
20 February 2020.
International accounting standards include IFRS (International Financial Reporting Standards), IAS
(International Accounting Standards) and their interpretations. This reporting framework can be found
on the European Commission’s website68.
The consolidated financial statements are presented in millions of euros, with amounts rounded up or
down to the nearest million. So rounding differences may appear between different financial statements.
The accounting principles applied are identical to those applied to the consolidated financial statements
at 31 December 2018 except for the following standards, amendments and interpretations applied
starting from 1 January 2019:
IFRS 16, Leases 1 January 2019
IFRS 17, Insurance contracts 1 January 2021
Amendments to IAS 28, Long-term interests in Associates and Joint Ventures 1 January 2019
Amendments to IAS 19, Plan Amendment, Curtailment or Settlement 1 January 2019
IFRIC 23, Uncertainty over Income Tax Treatments 1 January 2019
Annual improvements to IFRS (2015-2017 cycle) 1 January 2019
These new texts had no material impact on the financial statements, except for IFRS 16. The resulting
changes to accounting policies are described in detail in Note 11.
IFRIC 23 was applied retrospectively without restating comparative periods and only had a presentation
impact corresponding to the reclassification of tax risk provisions to current tax liabilities at 1 January
2019 (Note 8.5 & Note 18).
The Group did not apply the following new standards, amendments and interpretations, which were not
yet effective:
NEW STANDARDS, AMENDMENTS AND INTERPRETATIONS PUBLISHED BUT NOT YET EFFECTIVE OR EARLY
ADOPTED BY THE GROUP
68 https://ec.europa.eu/info/index_en
163
Amendments to References to the Conceptual Framework in IFRS Standards 1 January 2020
Amendments to IFRS 3, Business Combinations 1 January 2020
Amendments to IAS 1 and IAS 8, Definition of Material 1 January 2020
Application of the Phase 1 amendments to IFRS 9/IAS 39 relating to the interest rate benchmark reform,
published in September 2019 and adopted by the European Union on 15 January 2020, will not
compromise interest rate hedging relations despite the reform.
The Group thus decided to apply the Phase 1 amendments early on 31 December 2019 and provide the
required information up until the end of the period of uncertainty, i.e. the date on which application of
these amendments ends.
The Group’s interest rate hedging relations subject to the interest rate benchmark reform are its interest
rate swaps, classified as cash flow hedges, and the cash flow hedging arranged for its new Term Loan
A.
Hedged financing and hedging instruments are indexed to the Euribor.
The Group expects the Euribor rate to be replaced by the hybrid Euribor rate simultaneously in both
hedging instrument contracts and hedged items, so it believes the corresponding cash flow hedging
relations will remain fully effective.
The Group therefore expects the interest rate benchmark reform to have no material impact on its
hedging relations.
2.2 FIRST TIME APPLICATION OF IFRS 16
The Group adopted IFRS 16 Leases for the first time on 1 January 2019.
On 13 January 2016, the IASB issued IFRS 16 Leases, which was adopted by the European Union on
31 October 2017. IFRS 16 replaces IAS 17 and the corresponding IFRIC and SIC interpretations. For
lessees, it removes the different accounting treatments previously applicable to operating leases and
finance leases.
Lessees are required to record all agreements (with exceptions) on terms similar to those currently
imposed by IAS 17 for finance leases, recognising a right-of-use asset (representing the right to use the
underlying leased asset) and a lease liability (representing the obligation to pay rent over the term of
the lease).
The standard does, however, provide exemptions for leases that are short term (12 months or less) or
for low-value assets. The Group made use of these two exemptions. The agreements in question mainly
concern light industrial equipment, photocopiers, water fountains and IT equipment.
The Group presents right-of-use assets as “property, plant and equipment” on the same line as
underlying assets of a similar nature over which it has full ownership, and it presents lease liabilities as
“financial liabilities and non-current derivatives” and “financial liabilities and current derivatives” in
the statement of financial position.
The new accounting policies applied in accordance with IFRS 16 are described in Note 11.
2.2.1 Method and transition impacts
The Group used the simplified retrospective approach to apply IFRS 16, which recommends
recognising the cumulative effects of initial application of IFRS 16 by adjusting the opening balance of
reserves at 1 January 2019. As a result, comparative information presented for 2018 was not restated
and is therefore presented, as previously, according to the principles of IAS 17 and its interpretations.
At the transition date, i.e. 1 January 2019, the lease liabilities of agreements qualified as operating leases
under IAS 17 were measured at the value of outstanding lease payments, discounted at a single discount
164
rate for each portfolio of similar leases. Discount rates are based on the incremental borrowing rate by
currency, taking into account the specific economic conditions in each country. In addition, discount
rates were determined based on remaining lease terms (rather than original terms).
Right-of-use assets are measured at an amount equal to that of lease liabilities, adjusted for lease
payments made in advance or outstanding recognised in the balance sheet as well as any incentives
received from lessors.
As a lessee, the Group rents certain equipment (primarily forklift trucks) under leases that were
previously qualified as finance leases under IAS 17. In the case of such finance leases, the carrying
amounts of the right-of-use asset and lease liability at 1 January 2019 were determined as being those
of the underlying leased asset and the lease liability hitherto calculated under IAS 17.
As part of the transition to IFRS 16, the Group recognised additional right-of-use assets and lease
liabilities in the balance sheet (in addition to the existing finance leases at 31 December 2018). The
transition impacts are summarised below.
(In € million) As of 1 January 2019
Right-of-use assets recorded in “Property, plant and equipment”* 60.0
Lease liabilities recorded in current and non-current “Financial liabilities and derivatives”** (60.4)
Balance sheet reclassification *** 0.4
* This item does not include assets under IAS 17 recognised in the amount of €1.7 million at 31 December 2018.
** This item does not include finance lease liabilities under IAS 17 recognised in the amount of €1.9 million at 31 December 2018.
*** Reclassification of accrued expenses relating to the staggering of the rent-free period as a reduction in the value of the right-of-use asset,
of which a €0.2 million impact on equity in the opening balance.
To measure these lease liabilities on agreements previously classified as operating leases, the Group
discounted the lease payments using the incremental borrowing rate at 1 January 2019. The weighted
average rate was 4.02%.
The reconciliation between off balance sheet commitments relating to leases recorded in the financial
statements at 31 December 2018 and lease liabilities under IFRS 16 is presented below:
(In € million) As of 1 January 2019
Operating lease commitments as of 31 December 2018 46.7
Commitments to purchase services as of 31 December 2018* 3.2
Finance lease liabilities under IAS 17 as of 31 December 2018 1.9
Impact of optional periods not included in off-balance sheet commitments** 16.2
Discounting effect (8.7)
Exemptions for low-value and short-term leases (0.6)
Others 3.7
Lease liabilities as of 1 January 2019 under IFRS 16*** 62.4
* Off balance sheet commitments recorded in the notes to the last annual financial statements (Note 23.1.2 - the “Non-cancellable purchase
commitments/Services” line relating mainly to logistics platforms).
** Mainly relating to warehouses in Italy.
*** This item includes finance lease liabilities under IAS 17 recognised in the amount of €1.9 million at 31 December 2018.
2.2.2 Impacts on the financial statements for 2019
On application of IFRS 16 to leases previously classified as operating leases, the Group recorded €52.3
million of right-of-use assets, €53.3 million of lease liabilities and €0.9 million of deferred tax assets at
31 December 2019.

165
Also with regard to these leases, the Group recognised depreciation costs and interest expenses instead
of the rental expenses associated with operating leases. It thus recognised €18.8 million of depreciation
costs and €2.1 million of interest expenses in respect of these leases.
The impact of IFRS 16 on information relating to operating segments is provided in Note 4.2 (Impact
on adjusted EBITDA).
2.3 ESTIMATES AND JUDGEMENTS
In preparing consolidated financial statements, Management relies on estimates and assumptions that
may affect the amounts of assets, liabilities, income and expenses, as well as the information presented
in the notes. These estimates and assumptions are reviewed on a regular basis to ensure that they are
reasonable in light of the Group’s history, economic conditions and the information available to the
Group. Actual results may differ from the estimates used. Major sources of estimation uncertainty may
result in significant adjustments to the amounts of assets and liabilities in the subsequent year. Besides
making use of estimates, the Group’s Management must exercise judgement in selecting and/or
applying the most appropriate accounting treatment for certain transactions and activities and in
defining the terms of its application.
Management’s main estimates and judgements in the preparation of these consolidated financial
statements were as follows:
Management’s main judgements and estimates Note
Assessment of the recoverable value of goodwill and fixed assets 9 & 12
Recoverability of deferred tax assets 8
Measurement of provisions and other financial liabilities 18.1
Measurement of the value of rights-of-use and finance leases 2.4
Measurement of defined benefit obligations and plan assets 19.1
Measurement of put liabilities on non-controlling interests 18.2
2.4 VALUATION PRINCIPLES
The consolidated financial statements were prepared on a historical cost basis with the exception of:
Certain financial assets and liabilities measured using the fair value model (Note 21);
Defined benefit plan assets (Note 19.1).
ACCOUNTING PRINCIPLES
Fair value is defined as the price that would be received to sell an asset or paid to transfer a liability in
an orderly transaction between market participants at the measurement date.
The methods used to measure the fair value of financial and non-financial assets and liabilities as
defined above are classified according to the following three fair value levels:
Level 1: fair value based on quoted prices (unadjusted) in active markets for identical assets or
liabilities.
Level 2: fair value measured using inputs other than quoted prices in active markets, which are
observable either directly (price) or indirectly (price-derived data);
Level 3: fair value inputs for the asset or liability that are not based on observable market data
(unobservable inputs).
166
2.5 TRANSACTIONS IN FOREIGN CURRENCIES
ACCOUNTING PRINCIPLES
The Group’s presentation currency is the euro, which is also the functional currency of the Group’s
parent company. Each Group entity determines its own functional currency, and all its financial
transactions are then measured in that currency.
The financial statements of subsidiaries that have a functional currency other than the presentation
currency are translated using the closing rate method:
Assets and liabilities, including goodwill and fair value adjustments in the context of acquisition
accounting, are translated into euros at the closing rate, i.e. the daily rate on the closing date;
Statement of income and cash flow items are translated into euros at the average rate for the
period, unless significant differences are recognised.
The resulting foreign currency translation differences are recognised in other comprehensive income,
with a corresponding entry in the translation reserve in shareholders’ equity. When a foreign entity is
sold, the cumulative amount of foreign currency translation differences in equity relating to that entity
is reclassified to profit or loss.
Transactions denominated in foreign currency are converted into euros at the exchange rate prevailing
on the date of the transaction. Monetary assets and liabilities denominated in foreign currencies are
converted at the closing rate, and the resulting translation differences are recognised in the statement of
income in financial income or expense. Non-monetary assets and liabilities denominated in foreign
currencies are translated at the exchange rate applicable on the day of the transaction.
Differences arising from the translation of borrowings, loans or advances that are substantially part of
the net investment in a foreign entity are recognised in other comprehensive income, with a
corresponding entry in the translation reserve in equity, and reclassified to profit or loss on disposal of
the net investment.
Hyperinflation in Argentina
In 2018, Argentina was considered a “hyperinflationary” economy within the meaning of IFRS,
rendering IAS 29 Financial Reporting in Hyperinflationary Economies applicable.
Accordingly, the Group has applied IAS 29 since 1 January 2018. Adoption of IAS 29 requires the
restatement of the non-monetary assets and liabilities, equity and statement of income of the Group’s
Argentine subsidiary in order to reflect the change in the purchasing power of its functional currency.
The gain or loss on the net monetary position is included in financial income or expense. Moreover, the
financial information of the Group’s Argentine subsidiary is converted into euros by applying the
exchange rate prevailing on the closing date of the relevant period.
The cumulative foreign currency translation differences relating to the Argentine subsidiary at 1 January
2018 have been transferred to the reserve since that date. The Group will apply the final position adopted
by the IASB’s Interpretations Committee once it has been published.
The rates selected for the main currencies were as follows:
2019 2018
Closing rate
Average
rate Closing rate Average rate
Brazilian real (EUR/BRL) 4.5 4.41 4.43 4.31
Argentine peso (EUR/ARS)* 67.14 53.76 43.13 32.89
Russian rouble (EUR/RUB) 69.48 72.46 79.56 74.02
Ukranian hryvnia (EUR/UAH) 26.71 28.93 31.69 32.1
167
* In accordance with IAS 29, all financial information is translated at the closing rate for subsidiaries located in a country considered to be
“hyperinflationary” (applicable to Argentina since 2018).
NOTE 3 – CONSOLIDATION METHODS AND SCOPE OF CONSOLIDATION
ACCOUNTING PRINCIPLES
Basis of consolidation
The consolidated financial statements include the assets and liabilities, income and cash flows of the
Company and its subsidiaries. All balances and reciprocal transactions between companies controlled
by the Group are eliminated.
Subsidiaries are entities over which the Group has control. The Group controls an entity when it is
exposed or entitled to variable returns because of its relationship with the entity and has the ability to
affect those returns because of the power it holds over it. The interests acquired in these entities are
consolidated from the date on which control is transferred to the Group. They are deconsolidated from
the date on which the control ceases to be exercised. See Note 3.3 for more information on associated
companies.
3.1 CHANGES IN THE SCOPE OF CONSOLIDATION
ACCOUNTING PRINCIPLES
Business combinations
Business combinations are accounted for in accordance with IFRS 3 Business Combinations using the
acquisition method.
Goodwill corresponds to:
the fair value of the consideration transferred; plus
the amount recognised for any non-controlling interests in the acquiree; plus
if the business combination is achieved in stages, the fair value of any pre-existing equity
interest in the acquired company; less
the net recognised amount (generally at fair value) of the identifiable assets acquired and
liabilities assumed.
When the difference is negative, a bargain purchase gain is recognised immediately in profit or loss.
The consideration for the acquisition is measured at fair value, which is the sum of the fair values, at
the acquisition date, of the assets transferred, the liabilities incurred or assumed, and the equity
securities issued in exchange for the acquisition of control of the acquired company. When the
consideration transferred by the Company in a business combination includes a contingent
consideration arrangement, the contingent consideration is measured at fair value. Subsequent changes
in the fair value of the contingent consideration corresponding to debt instruments are recognised in
profit or loss.
Acquisition-related costs are recorded as expenses when incurred and recognised in “Items related to
acquisitions” in the consolidated statement of income.
At the acquisition date, the Group recognises identifiable assets acquired and liabilities assumed
(identifiable net assets) in the subsidiary, based on their fair value at that date (with some exceptions).
The assets and liabilities recognised may be adjusted for a maximum of 12 months from the acquisition
date, based on new information gathered on the facts and circumstances existing at the acquisition date.
168
For business combinations resulting in less than a 100% interest, the non-controlling interest in the
acquired company (i.e. any interest that gives its holders the right to a share of the net assets of the
acquired company), as at the acquisition date, is measured:
either at fair value, so that a portion of the goodwill recognised at the time of the combination
is allocated to the non-controlling interest (the “full goodwill” method);
or based on the share of the identifiable net assets of the acquired company, so that only
goodwill attributable to the Group is recognised (the “partial goodwill” method).
The method applied is selected according to factors specific to each transaction.
In 2015, the Company, via its Verallia Packaging subsidiary, acquired substantially all the entities and
operations of the Saint-Gobain Group’s Packaging division; non-controlling interests acquired were
measured according to the “partial goodwill” method.
Changes in equity interests (%) in subsidiaries without change of control
Transactions with non-controlling interests that do not result in a gain or loss of control are accounted
for as equity transactions – in other words, as transactions with shareholders acting in that capacity. The
difference between the fair value of any consideration paid and the carrying amount of the share of the
subsidiary’s net assets acquired or disposed of is recorded in equity.
Commitments to purchase non-controlling interests
Commitments to purchase non-controlling interests result in the recognition in the financial statements
of a liability in “Provisions and other non-current financial liabilities”, which is the present value of the
estimated exercise price of the put option on non-controlling interests, with a corresponding reduction
in non-controlling interests and equity attributable to owners of the parent company for the balance, if
any. Any subsequent change in the fair value of the liability is recognised through an adjustment to
equity.
Assets and liabilities held for sale and discontinued operations
When the Group expects to recover the value of an asset or group of assets through its sale rather than
its use, the asset in question is presented separately on the “Assets held for sale” line in the statement
of financial position in accordance with IFRS 5 Non-current Assets Held for Sale and Discontinued
Operations. Liabilities related to such assets, if any, are also presented on a separate line of the statement
of financial position (“Liabilities related to assets held for sale”).
Assets classified as such are measured at the lesser of the carrying amount or the fair value, less the cost
of selling them. Assets classified as assets held for sale cease to be depreciated from the date they
qualify for classification as assets held for sale.
A discontinued operation is either a component of the Group from which it has separated or an activity
that is classified as held for sale and:
which represents a separate major line of business or geographical area of operations; and
is part of a single, coordinated plan to dispose of a separate line of business or geographical
area of operations; or
is an activity acquired exclusively for resale.
When an activity is classified as a discontinued operation, the comparative statement of income and
statement of cash flows are restated as if the activity had met the criteria for an activity that was
discontinued from the start of the comparative period.
169
In these financial statements, no non-current assets met the criteria for classification as assets held for
sale and none of the businesses sold during the year met the criteria for classification as a discontinued
operation.
ESTIMATES AND ASSUMPTIONS USED BY MANAGEMENT
Determination of the fair value of assets and liabilities at the acquisition date involves the Group making
estimates using several methods with the help of independent valuation experts. These estimates are
based on a number of assumptions and assessments.
The significant assumptions used to determine the allocation of fair value include the following
valuation methods: the cost approach, the revenue approach and the market approach. These methods
are based on cash flow projections and related discount rates, sector indices, market prices for
replacement cost and comparable market transactions.
3.1.1 Changes in 2019
There were no significant changes to the consolidation scope other than the reorganisation measures
taken relating to the initial public offering described in Note 1.2 “Highlights”.
3.1.2 Changes in 2018
3.1.2.1 Disposal of Alver
In May 2018, the disposal of the Group’s subsidiary in Algeria to a local industrialist was finalised for
a token price of 600,000 dinars (approximately €4,000). This resulted in a loss of €3.6 million
recognised in “Other operating income and expenses” in the year ended 31 December 2018, mainly
relating to the reclassification of the translation reserve to profit or loss (Note 6.2). For the record, the
subsidiary’s property, plant and equipment had been fully impaired in 2017 in the amount of €35 million
(Note 6.2).
3.1.2.2 Disposal of IVN
On 26 October 2018, the Group finalised the sale of its stake in the associated company IVN (Brazilian
company “Indústria Vidreira do Nordeste”). In 2018, a profit of €14 million was recorded as a result of
this sale (Note 18.1.5).
170
3.2 LIST OF THE MAIN CONSOLIDATED COMPANIES
*As mentioned in Note 1.2 “Highlights”, the companies Horizon Holdings I and Horizon Holdings II
were merged into Verallia SA on 7 October 2019.
Entity Country % interest as of 31 December
2019 2018 Consolidation method
Verallia SA France 100.0% 100.0% Parent Company
Horizon Holdings Germany Germany 100.0% 97.1%
97.1%
Full consolidation
Verallia Deutschland (ex SG Oberland Aktiengesellschaft) Germany 100.0% 97.1%
Full consolidation
Rayen-Cura SAIC Argentina 60.0% 58.2% Full consolidation
Verallia Brasil (ex SG Vidros SA) Brazil 100.0% 97.1%
Full consolidation
Inversiones Verallia Chile (ex Inversiones SG Chili) Chile 100.0% 97.1%
Full consolidation
Verallia Chile (ex SG Envases) Chile 100.0% 97.1%
Full consolidation
Horizon Holdings Vitrum Spain Spain 100.0% 97.1%
Full consolidation
Verallia Spain (ex SG Vicasa) Spain 99.9% 97.0% Full consolidation
Etablissements René Salomon France 100.0% 97.1%
Full consolidation
Everglass France 100.0% 97.1%
Full consolidation
Horizon Holdings I France Merged* 100.0% /
Horizon Holdings II France Merged* 100.0% /
Saga Décor France 100.0% 97.1%
Full consolidation
Société Charentaise de Décor France 100.0% 97.1%
Full consolidation
Verallia France (ex SG Emballage) France 100.0% 97.1%
Full consolidation
Verallia Packaging (Horizon Holdings III) France 100.0% 97.1%
Full consolidation
VOA Verrerie d’Albi France 100.0% 97.1%
Full consolidation
Verallia Italia (ex Saint-Gobain Vetri Spa) Italy 100.0% 97.1%
Full consolidation
Verallia Polska (ex Euroverlux Sp. Z.o.o) Poland 100.0% 97.1%
Full consolidation
Verallia Portugal (ex SG Mondego SA) Portugal 99.9% 97.0% Full consolidation
Kavminsteklo Zao Russia 98.6% 95.8% Full consolidation
Zao Kamyshinsky Steklotarny ZA Russia 96.5% 92.8% Full consolidation
Verallia Ukraine (ex Consumers SKLO Zorya) Ukraine 100.0% 93.9% Full consolidation
*As mentioned in Note 1.2 “Highlights”, the companies Horizon Holdings I and Horizon Holdings II were merged into Verallia SA on 7
October 2019.
3.3 INVESTMENTS IN EQUITY-ACCOUNTED COMPANIES
ACCOUNTING PRINCIPLES
Associates
Associated companies are companies over which the Group exercises significant influence, i.e. the
power to participate in financial and operating policy decisions, without exercising control or joint
control over such policies. They are recognised in the consolidated financial statements using the equity
method.
Equity method
Under the equity method, an investment in an associate must initially be recognised at the acquisition
cost and then adjusted based on the Group’s share of the profit or loss and, where applicable, other
comprehensive income of the associated company as well as dividends. Goodwill is included in the
carrying amount of the investment. Any losses or reversals of the value of investments and any gains
or losses on the sale of investments in companies accounted for under the equity method are presented
under “Share of net income of associates” in the statement of income.
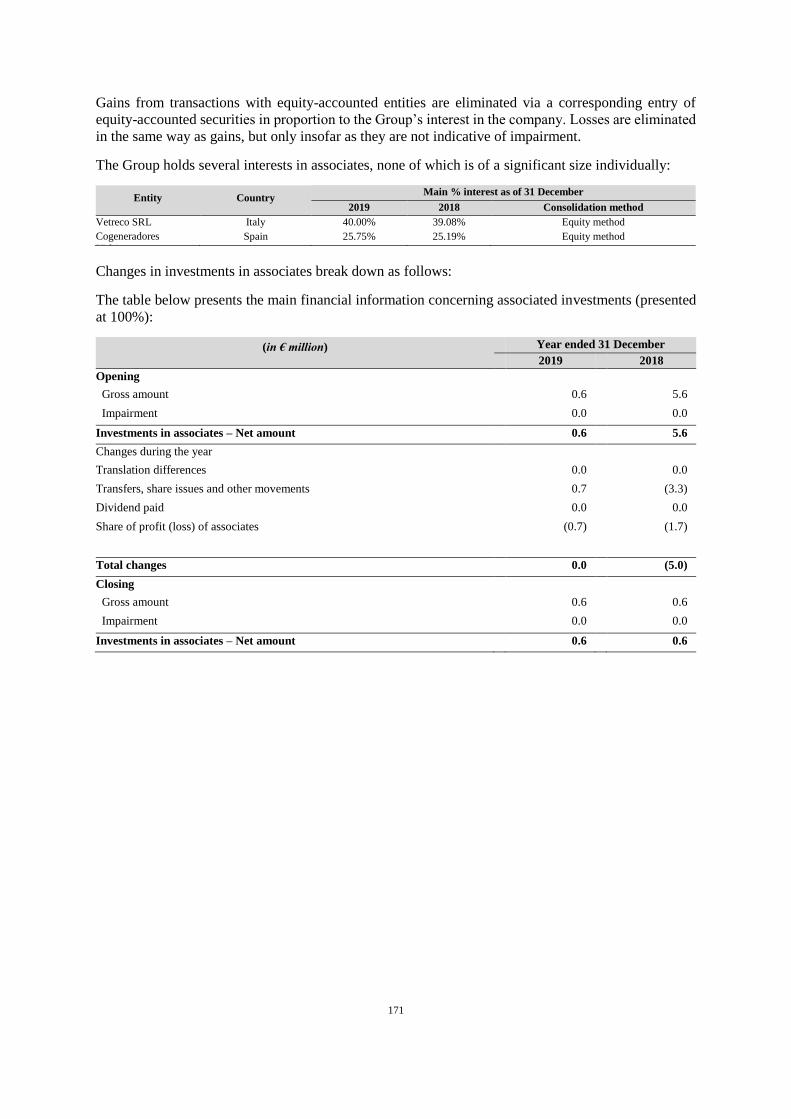
171
Gains from transactions with equity-accounted entities are eliminated via a corresponding entry of
equity-accounted securities in proportion to the Group’s interest in the company. Losses are eliminated
in the same way as gains, but only insofar as they are not indicative of impairment.
The Group holds several interests in associates, none of which is of a significant size individually:
Entity Country Main % interest as of 31 December
2019 2018 Consolidation method
Vetreco SRL Italy 40.00% 39.08% Equity method
Cogeneradores
Vidrieros Spain 25.75% 25.19% Equity method
Changes in investments in associates break down as follows:
The table below presents the main financial information concerning associated investments (presented
at 100%):
(in € million) Year ended 31 December
2019 2018
Opening
Gross amount 0.6 5.6
Impairment 0.0 0.0
Investments in associates – Net amount 0.6 5.6
Changes during the year
Translation differences 0.0 0.0
Transfers, share issues and other movements 0.7 (3.3)
Dividend paid 0.0 0.0
Share of profit (loss) of associates (0.7) (1.7)
Total changes 0.0 (5.0)
Closing
Gross amount 0.6 0.6
Impairment 0.0 0.0
Investments in associates – Net amount 0.6 0.6
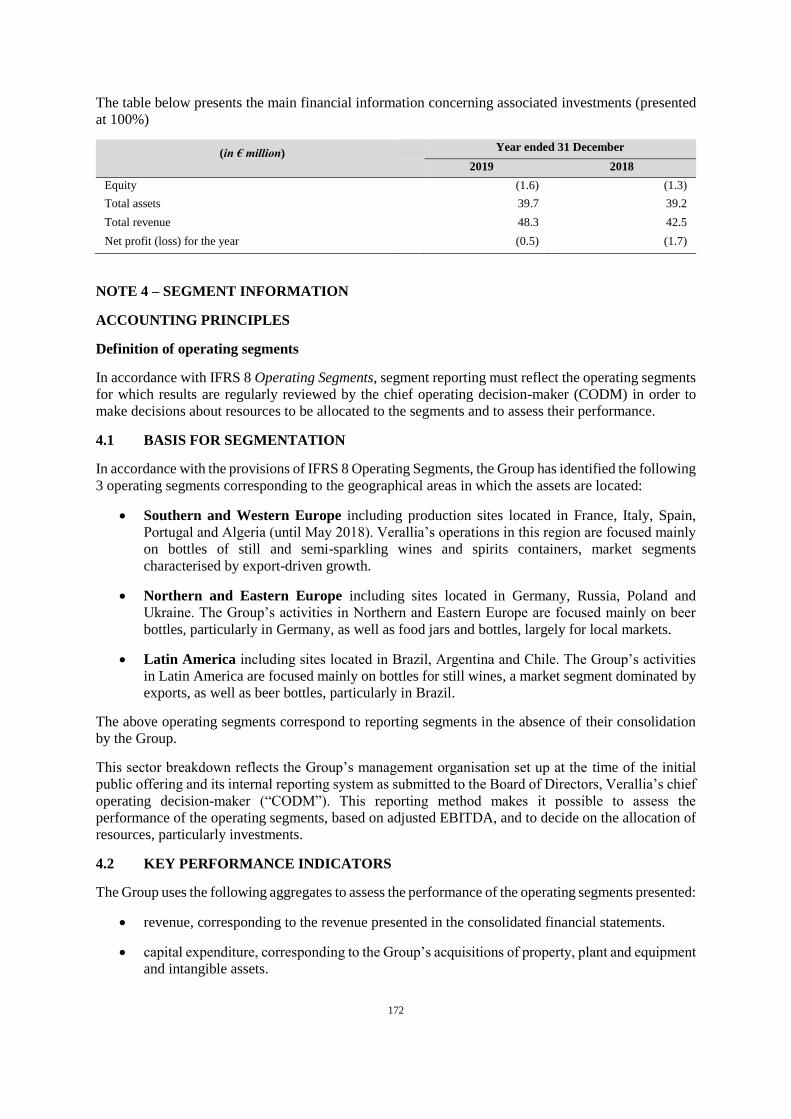
172
The table below presents the main financial information concerning associated investments (presented
at 100%)
(in € million) Year ended 31 December
2019 2018
Equity (1.6) (1.3)
Total assets 39.7 39.2
Total revenue 48.3 42.5
Net profit (loss) for the year (0.5) (1.7)
NOTE 4 – SEGMENT INFORMATION
ACCOUNTING PRINCIPLES
Definition of operating segments
In accordance with IFRS 8 Operating Segments, segment reporting must reflect the operating segments
for which results are regularly reviewed by the chief operating decision-maker (CODM) in order to
make decisions about resources to be allocated to the segments and to assess their performance.
4.1 BASIS FOR SEGMENTATION
In accordance with the provisions of IFRS 8 Operating Segments, the Group has identified the following
3 operating segments corresponding to the geographical areas in which the assets are located:
Southern and Western Europe including production sites located in France, Italy, Spain,
Portugal and Algeria (until May 2018). Verallia’s operations in this region are focused mainly
on bottles of still and semi-sparkling wines and spirits containers, market segments
characterised by export-driven growth.
Northern and Eastern Europe including sites located in Germany, Russia, Poland and
Ukraine. The Group’s activities in Northern and Eastern Europe are focused mainly on beer
bottles, particularly in Germany, as well as food jars and bottles, largely for local markets.
Latin America including sites located in Brazil, Argentina and Chile. The Group’s activities
in Latin America are focused mainly on bottles for still wines, a market segment dominated by
exports, as well as beer bottles, particularly in Brazil.
The above operating segments correspond to reporting segments in the absence of their consolidation
by the Group.
This sector breakdown reflects the Group’s management organisation set up at the time of the initial
public offering and its internal reporting system as submitted to the Board of Directors, Verallia’s chief
operating decision-maker (“CODM”). This reporting method makes it possible to assess the
performance of the operating segments, based on adjusted EBITDA, and to decide on the allocation of
resources, particularly investments.
4.2 KEY PERFORMANCE INDICATORS
The Group uses the following aggregates to assess the performance of the operating segments presented:
revenue, corresponding to the revenue presented in the consolidated financial statements.
capital expenditure, corresponding to the Group’s acquisitions of property, plant and equipment
and intangible assets.
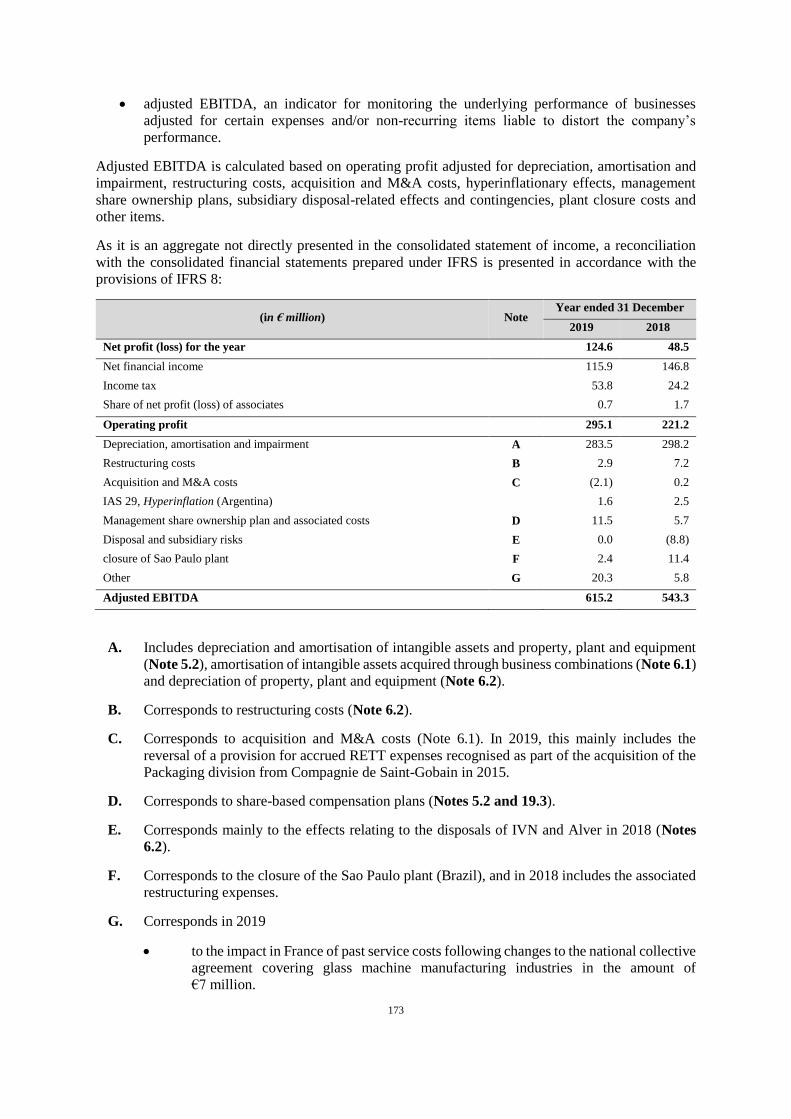
173
adjusted EBITDA, an indicator for monitoring the underlying performance of businesses
adjusted for certain expenses and/or non-recurring items liable to distort the company’s
performance.
Adjusted EBITDA is calculated based on operating profit adjusted for depreciation, amortisation and
impairment, restructuring costs, acquisition and M&A costs, hyperinflationary effects, management
share ownership plans, subsidiary disposal-related effects and contingencies, plant closure costs and
other items.
As it is an aggregate not directly presented in the consolidated statement of income, a reconciliation
with the consolidated financial statements prepared under IFRS is presented in accordance with the
provisions of IFRS 8:
(in € million) Note Year ended 31 December
2019 2018
Net profit (loss) for the year 124.6 48.5
Net financial income 115.9 146.8
Income tax 53.8 24.2
Share of net profit (loss) of associates 0.7 1.7
Operating profit 295.1 221.2
Depreciation, amortisation and impairment A 283.5 298.2
Restructuring costs B 2.9 7.2
Acquisition and M&A costs C (2.1) 0.2
IAS 29, Hyperinflation (Argentina) 1.6 2.5
Management share ownership plan and associated costs D 11.5 5.7
Disposal and subsidiary risks E 0.0 (8.8)
closure of Sao Paulo plant F 2.4 11.4
Other G 20.3 5.8
Adjusted EBITDA 615.2 543.3
A. Includes depreciation and amortisation of intangible assets and property, plant and equipment
(Note 5.2), amortisation of intangible assets acquired through business combinations (Note 6.1)
and depreciation of property, plant and equipment (Note 6.2).
B. Corresponds to restructuring costs (Note 6.2).
C. Corresponds to acquisition and M&A costs (Note 6.1). In 2019, this mainly includes the
reversal of a provision for accrued RETT expenses recognised as part of the acquisition of the
Packaging division from Compagnie de Saint-Gobain in 2015.
D. Corresponds to share-based compensation plans (Notes 5.2 and 19.3).
E. Corresponds mainly to the effects relating to the disposals of IVN and Alver in 2018 (Notes
6.2).
F. Corresponds to the closure of the Sao Paulo plant (Brazil), and in 2018 includes the associated
restructuring expenses.
G. Corresponds in 2019
to the impact in France of past service costs following changes to the national collective
agreement covering glass machine manufacturing industries in the amount of
€7 million.
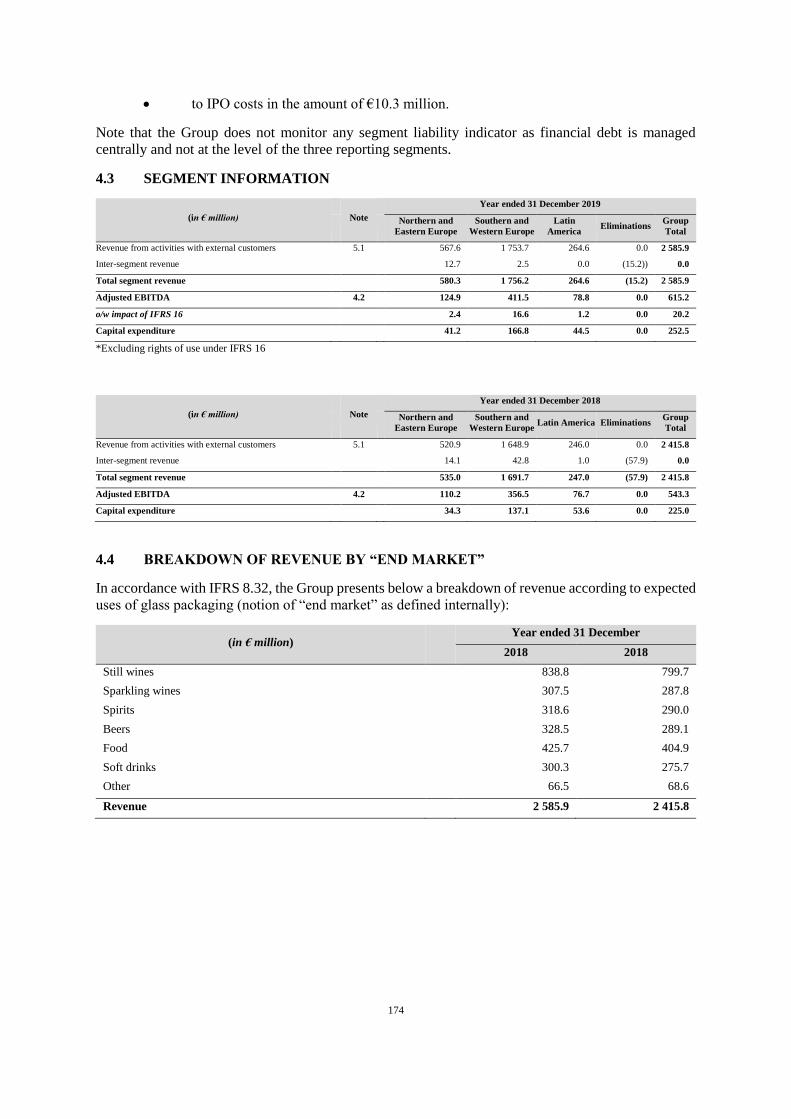
174
to IPO costs in the amount of €10.3 million.
Note that the Group does not monitor any segment liability indicator as financial debt is managed
centrally and not at the level of the three reporting segments.
4.3 SEGMENT INFORMATION
(in € million)
Note
Year ended 31 December 2019
Northern and
Eastern Europe
Southern and
Western Europe
Latin
America Eliminations
Group
Total
Revenue from activities with external customers 5.1 567.6 1 753.7 264.6 0.0 2 585.9
Inter-segment revenue 12.7 2.5 0.0 (15.2)) 0.0
Total segment revenue 580.3 1 756.2 264.6 (15.2) 2 585.9
Adjusted EBITDA 4.2 124.9 411.5 78.8 0.0 615.2
o/w impact of IFRS 16 2.4 16.6 1.2 0.0 20.2
Capital expenditure 41.2 166.8 44.5 0.0 252.5
*Excluding rights of use under IFRS 16
(in € million)
Note
Year ended 31 December 2018
Northern and
Eastern Europe
Southern and
Western Europe Latin America Eliminations
Group
Total
Revenue from activities with external customers 5.1 520.9 1 648.9 246.0 0.0 2 415.8
Inter-segment revenue 14.1 42.8 1.0 (57.9) 0.0
Total segment revenue 535.0 1 691.7 247.0 (57.9) 2 415.8
Adjusted EBITDA 4.2 110.2 356.5 76.7 0.0 543.3
Capital expenditure 34.3 137.1 53.6 0.0 225.0
4.4 BREAKDOWN OF REVENUE BY “END MARKET”
In accordance with IFRS 8.32, the Group presents below a breakdown of revenue according to expected
uses of glass packaging (notion of “end market” as defined internally):
(in € million) Year ended 31 December
2018 2018
Still wines 838.8 799.7
Sparkling wines 307.5 287.8
Spirits 318.6 290.0
Beers 328.5 289.1
Food 425.7 404.9
Soft drinks 300.3 275.7
Other 66.5 68.6
Revenue 2 585.9 2 415.8
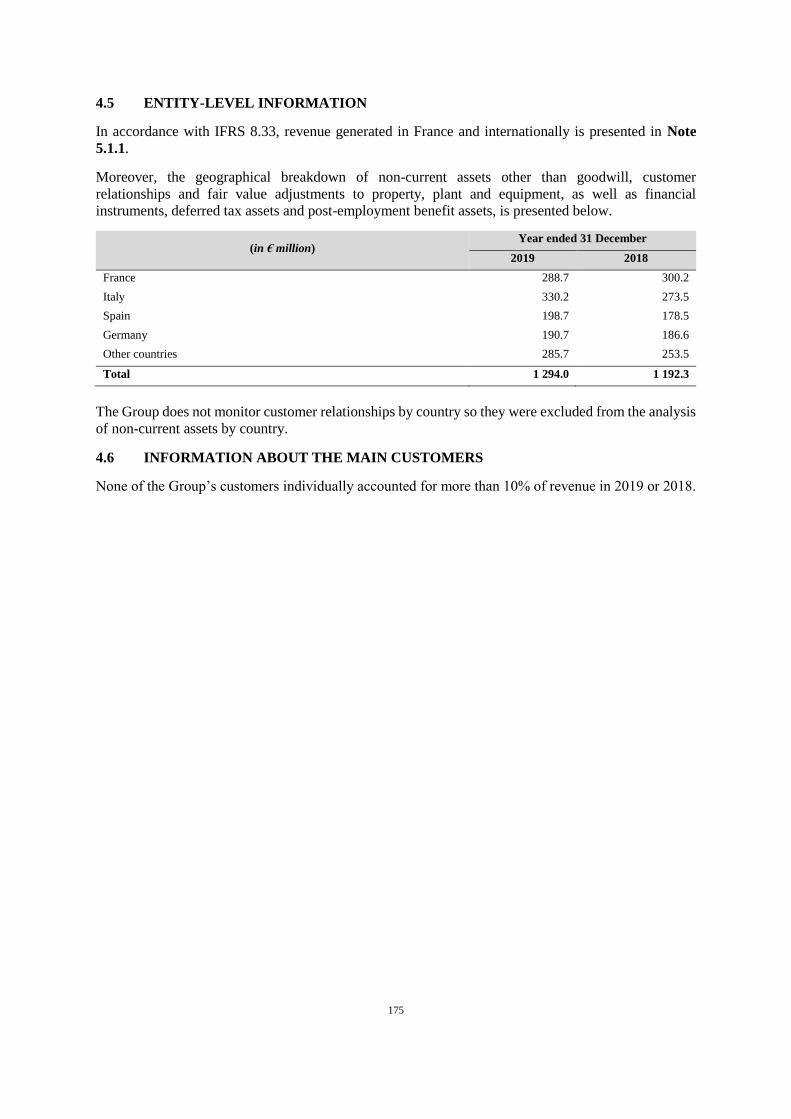
175
4.5 ENTITY-LEVEL INFORMATION
In accordance with IFRS 8.33, revenue generated in France and internationally is presented in Note
5.1.1.
Moreover, the geographical breakdown of non-current assets other than goodwill, customer
relationships and fair value adjustments to property, plant and equipment, as well as financial
instruments, deferred tax assets and post-employment benefit assets, is presented below.
(in € million) Year ended 31 December
2019 2018
France 288.7 300.2
Italy 330.2 273.5
Spain 198.7 178.5
Germany 190.7 186.6
Other countries 285.7 253.5
Total 1 294.0 1 192.3
The Group does not monitor customer relationships by country so they were excluded from the analysis
of non-current assets by country.
4.6 INFORMATION ABOUT THE MAIN CUSTOMERS
None of the Group’s customers individually accounted for more than 10% of revenue in 2019 or 2018.
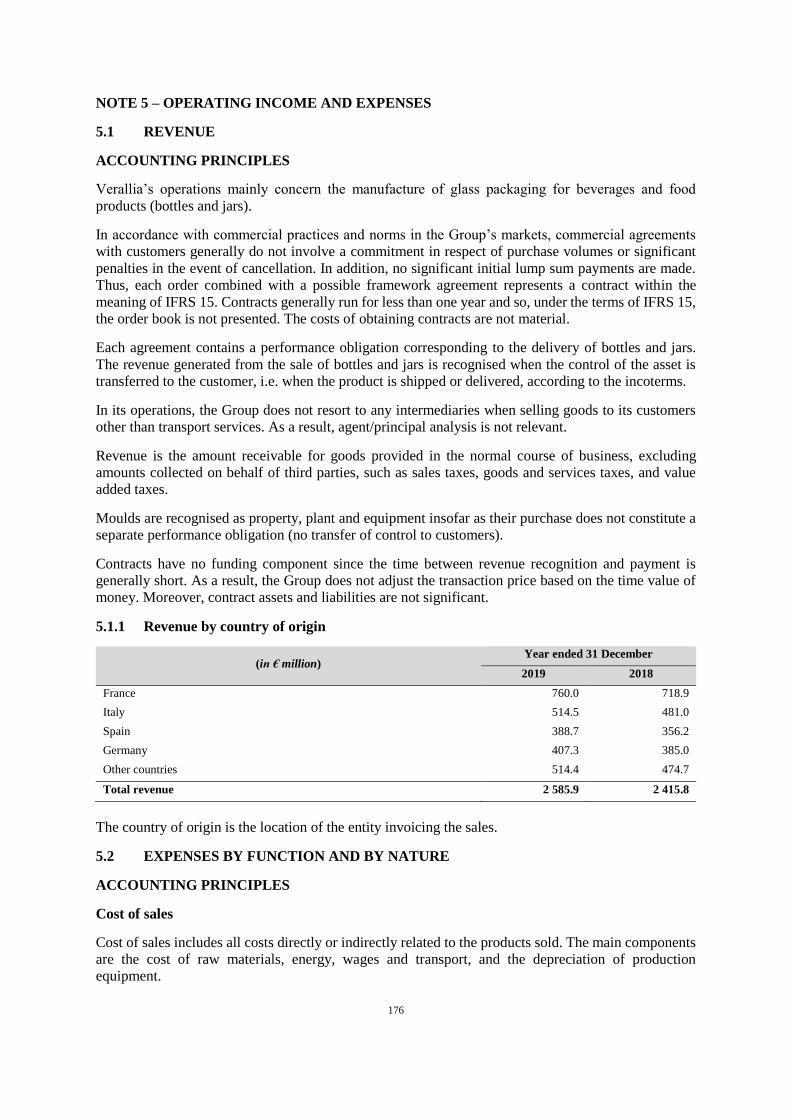
176
NOTE 5 – OPERATING INCOME AND EXPENSES
5.1 REVENUE
ACCOUNTING PRINCIPLES
Verallia’s operations mainly concern the manufacture of glass packaging for beverages and food
products (bottles and jars).
In accordance with commercial practices and norms in the Group’s markets, commercial agreements
with customers generally do not involve a commitment in respect of purchase volumes or significant
penalties in the event of cancellation. In addition, no significant initial lump sum payments are made.
Thus, each order combined with a possible framework agreement represents a contract within the
meaning of IFRS 15. Contracts generally run for less than one year and so, under the terms of IFRS 15,
the order book is not presented. The costs of obtaining contracts are not material.
Each agreement contains a performance obligation corresponding to the delivery of bottles and jars.
The revenue generated from the sale of bottles and jars is recognised when the control of the asset is
transferred to the customer, i.e. when the product is shipped or delivered, according to the incoterms.
In its operations, the Group does not resort to any intermediaries when selling goods to its customers
other than transport services. As a result, agent/principal analysis is not relevant.
Revenue is the amount receivable for goods provided in the normal course of business, excluding
amounts collected on behalf of third parties, such as sales taxes, goods and services taxes, and value
added taxes.
Moulds are recognised as property, plant and equipment insofar as their purchase does not constitute a
separate performance obligation (no transfer of control to customers).
Contracts have no funding component since the time between revenue recognition and payment is
generally short. As a result, the Group does not adjust the transaction price based on the time value of
money. Moreover, contract assets and liabilities are not significant.
5.1.1 Revenue by country of origin
(in € million) Year ended 31 December
2019 2018
France 760.0 718.9
Italy 514.5 481.0
Spain 388.7 356.2
Germany 407.3 385.0
Other countries 514.4 474.7
Total revenue 2 585.9 2 415.8
The country of origin is the location of the entity invoicing the sales.
5.2 EXPENSES BY FUNCTION AND BY NATURE
ACCOUNTING PRINCIPLES
Cost of sales
Cost of sales includes all costs directly or indirectly related to the products sold. The main components
are the cost of raw materials, energy, wages and transport, and the depreciation of production
equipment.
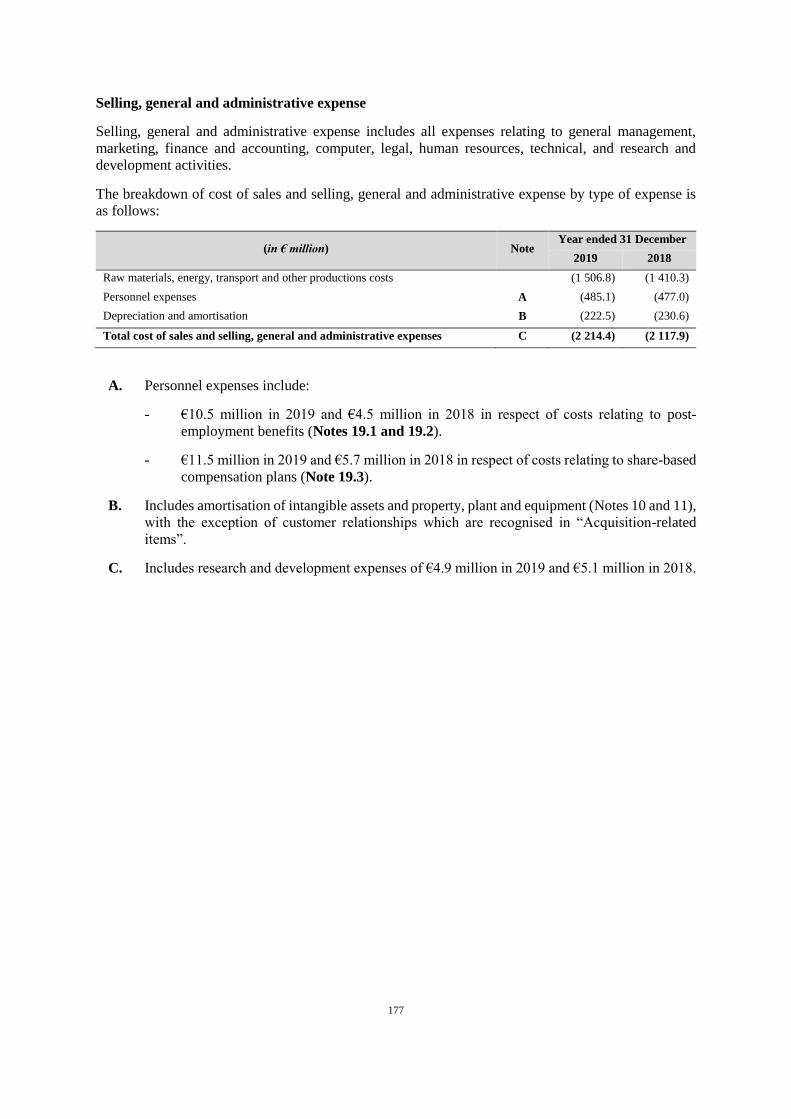
177
Selling, general and administrative expense
Selling, general and administrative expense includes all expenses relating to general management,
marketing, finance and accounting, computer, legal, human resources, technical, and research and
development activities.
The breakdown of cost of sales and selling, general and administrative expense by type of expense is
as follows:
(in € million) Note Year ended 31 December
2019 2018
Raw materials, energy, transport and other productions costs (1 506.8) (1 410.3)
Personnel expenses A (485.1) (477.0)
Depreciation and amortisation B (222.5) (230.6)
Total cost of sales and selling, general and administrative expenses C (2 214.4) (2 117.9)
A. Personnel expenses include:
- €10.5 million in 2019 and €4.5 million in 2018 in respect of costs relating to post-
employment benefits (Notes 19.1 and 19.2).
- €11.5 million in 2019 and €5.7 million in 2018 in respect of costs relating to share-based
compensation plans (Note 19.3).
B. Includes amortisation of intangible assets and property, plant and equipment (Notes 10 and 11),
with the exception of customer relationships which are recognised in “Acquisition-related
items”.
C. Includes research and development expenses of €4.9 million in 2019 and €5.1 million in 2018.
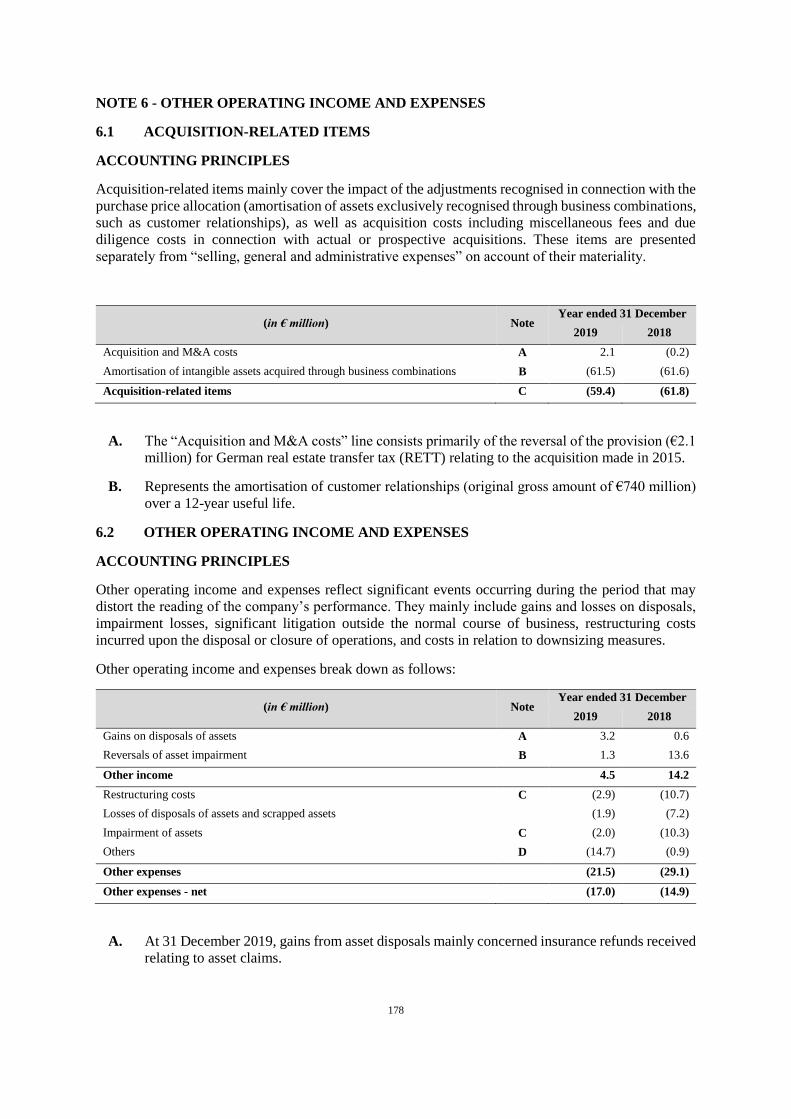
178
NOTE 6 - OTHER OPERATING INCOME AND EXPENSES
6.1 ACQUISITION-RELATED ITEMS
ACCOUNTING PRINCIPLES
Acquisition-related items mainly cover the impact of the adjustments recognised in connection with the
purchase price allocation (amortisation of assets exclusively recognised through business combinations,
such as customer relationships), as well as acquisition costs including miscellaneous fees and due
diligence costs in connection with actual or prospective acquisitions. These items are presented
separately from “selling, general and administrative expenses” on account of their materiality.
(in € million) Note Year ended 31 December
2019 2018
Acquisition and M&A costs A 2.1 (0.2)
Amortisation of intangible assets acquired through business combinations B (61.5) (61.6)
Acquisition-related items C (59.4) (61.8)
A. The “Acquisition and M&A costs” line consists primarily of the reversal of the provision (€2.1
million) for German real estate transfer tax (RETT) relating to the acquisition made in 2015.
B. Represents the amortisation of customer relationships (original gross amount of €740 million)
over a 12-year useful life.
6.2 OTHER OPERATING INCOME AND EXPENSES
ACCOUNTING PRINCIPLES
Other operating income and expenses reflect significant events occurring during the period that may
distort the reading of the company’s performance. They mainly include gains and losses on disposals,
impairment losses, significant litigation outside the normal course of business, restructuring costs
incurred upon the disposal or closure of operations, and costs in relation to downsizing measures.
Other operating income and expenses break down as follows:
(in € million) Note Year ended 31 December
2019 2018
Gains on disposals of assets A 3.2 0.6
Reversals of asset impairment B 1.3 13.6
Other income 4.5 14.2
Restructuring costs C (2.9) (10.7)
Losses of disposals of assets and scrapped assets (1.9) (7.2)
Impairment of assets C (2.0) (10.3)
Others D (14.7) (0.9)
Other expenses (21.5) (29.1)
Other expenses - net (17.0) (14.9)
A. At 31 December 2019, gains from asset disposals mainly concerned insurance refunds received
relating to asset claims.
179
B. In 2018: mainly relating to the sale of Brazilian associate IVN, which resulted in the reversal
of a loan impairment recorded in 2016 (Note 18.1.5).
C. In 2018: mainly relating to the costs of closing the Sao Paolo plant in Brazil.
D. For financial year 2019, “Others” corresponds mainly to €10.3 million of IPO costs.
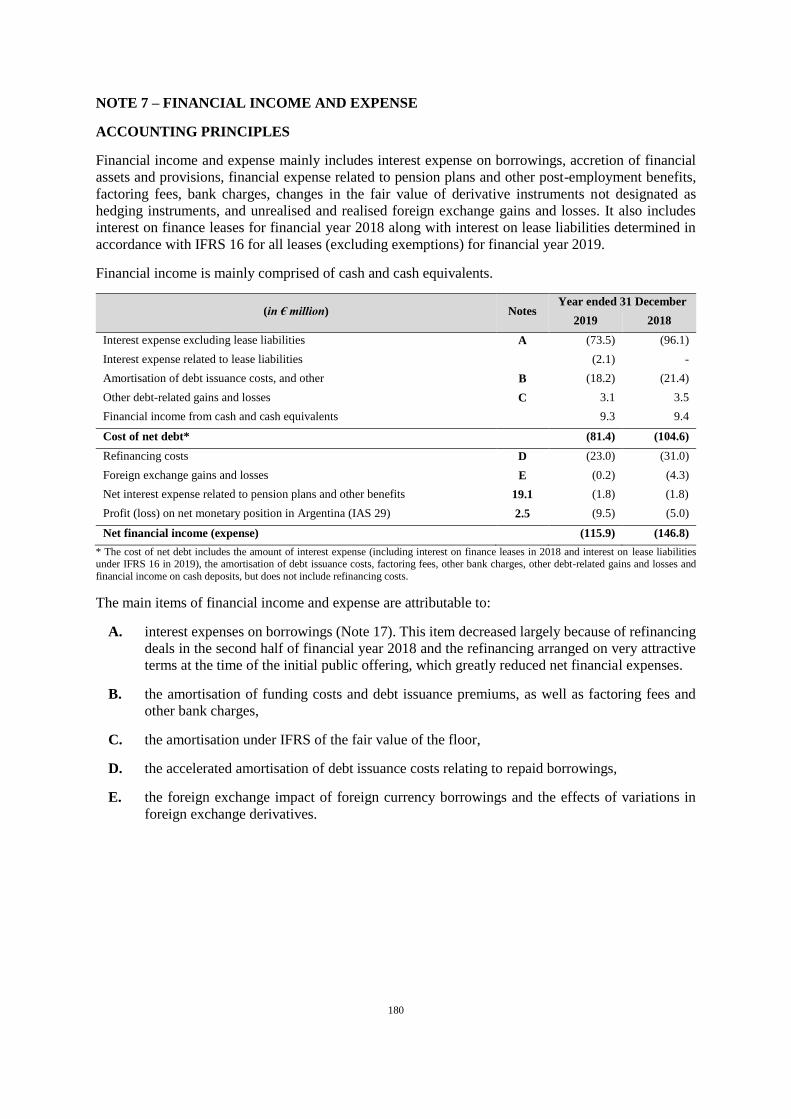
180
NOTE 7 – FINANCIAL INCOME AND EXPENSE
ACCOUNTING PRINCIPLES
Financial income and expense mainly includes interest expense on borrowings, accretion of financial
assets and provisions, financial expense related to pension plans and other post-employment benefits,
factoring fees, bank charges, changes in the fair value of derivative instruments not designated as
hedging instruments, and unrealised and realised foreign exchange gains and losses. It also includes
interest on finance leases for financial year 2018 along with interest on lease liabilities determined in
accordance with IFRS 16 for all leases (excluding exemptions) for financial year 2019.
Financial income is mainly comprised of cash and cash equivalents.
(in € million) Notes Year ended 31 December
2019 2018
Interest expense excluding lease liabilities A (73.5) (96.1)
Interest expense related to lease liabilities (2.1) -
Amortisation of debt issuance costs, and other B (18.2) (21.4)
Other debt-related gains and losses C 3.1 3.5
Financial income from cash and cash equivalents 9.3 9.4
Cost of net debt* (81.4) (104.6)
Refinancing costs D (23.0) (31.0)
Foreign exchange gains and losses E (0.2) (4.3)
Net interest expense related to pension plans and other benefits 19.1 (1.8) (1.8)
Profit (loss) on net monetary position in Argentina (IAS 29) 2.5 (9.5) (5.0)
Net financial income (expense) (115.9) (146.8)
* The cost of net debt includes the amount of interest expense (including interest on finance leases in 2018 and interest on lease liabilities under IFRS 16 in 2019), the amortisation of debt issuance costs, factoring fees, other bank charges, other debt-related gains and losses and
financial income on cash deposits, but does not include refinancing costs.
The main items of financial income and expense are attributable to:
A. interest expenses on borrowings (Note 17). This item decreased largely because of refinancing
deals in the second half of financial year 2018 and the refinancing arranged on very attractive
terms at the time of the initial public offering, which greatly reduced net financial expenses.
B. the amortisation of funding costs and debt issuance premiums, as well as factoring fees and
other bank charges,
C. the amortisation under IFRS of the fair value of the floor,
D. the accelerated amortisation of debt issuance costs relating to repaid borrowings,
E. the foreign exchange impact of foreign currency borrowings and the effects of variations in
foreign exchange derivatives.
181
NOTE 8 – INCOME TAX
ACCOUNTING PRINCIPLES
Income tax expense represents the sum of current tax and deferred tax.
Tax expense is calculated based on the tax laws in force or substantively in force as of the reporting
date in the countries where the Company and its subsidiaries operate.
The amount of current tax payable (or recoverable) is determined based on the best estimate of the
amount of tax that the Group expects to pay (or recover) and reflecting any potential associated
uncertainties.
The Group is subject to income tax in France, Spain, Germany, Italy and several other jurisdictions.
Current tax and deferred tax are recognised in profit or loss unless they relate to items that have been
recognised in other comprehensive income or directly in equity. If current tax or deferred tax arises
from the initial recognition of a business combination, the tax effect is included in the recognition of
the business combination.
Deferred tax assets and liabilities are recognised on the basis of temporary differences between the
carrying amounts of assets and liabilities on the balance sheet and their respective tax values (with some
exceptions).
The impact of a change in tax rates and tax laws on deferred income tax assets and liabilities is generally
recognised as tax income/expense over the period that the change was substantively in effect. Deferred
tax assets and liabilities are measured at the expected tax rates for the period of realisation of the asset
or settlement of the liability, based on tax rates and tax laws prevailing or substantively in force on the
reporting date.
Deferred tax assets are recognised in respect of deductible temporary differences, unused tax losses and
unused tax credits only if it is probable that the Group will have sufficient future taxable profits against
which they can be used. They are reviewed at each reporting date and are impaired if it no longer appears
likely that sufficient future taxable income will be available. To determine whether deferred tax assets
should be recognised in respect of tax loss carryforwards, the Group applies various criteria that take
into account the likely recovery period based on economic projections and the strategy for recovering
tax losses over the long term applied in each country.
ESTIMATES AND ASSUMPTIONS MADE BY MANAGEMENT
Management’s judgement is necessary to determine the extent to which tax losses can be recovered by
the Group, resulting in the recognition of a deferred tax asset. In assessing the recognition of deferred
tax assets, Management considers whether it is more likely than not that they will be used. Ultimately,
deferred tax assets will be used if sufficient taxable income is available during the periods in which the
temporary differences become deductible. Estimates of taxable profit and the use of tax loss
carryforwards are based on the earnings forecast in the budget, the medium-term plan and, if necessary,
supplementary estimates.
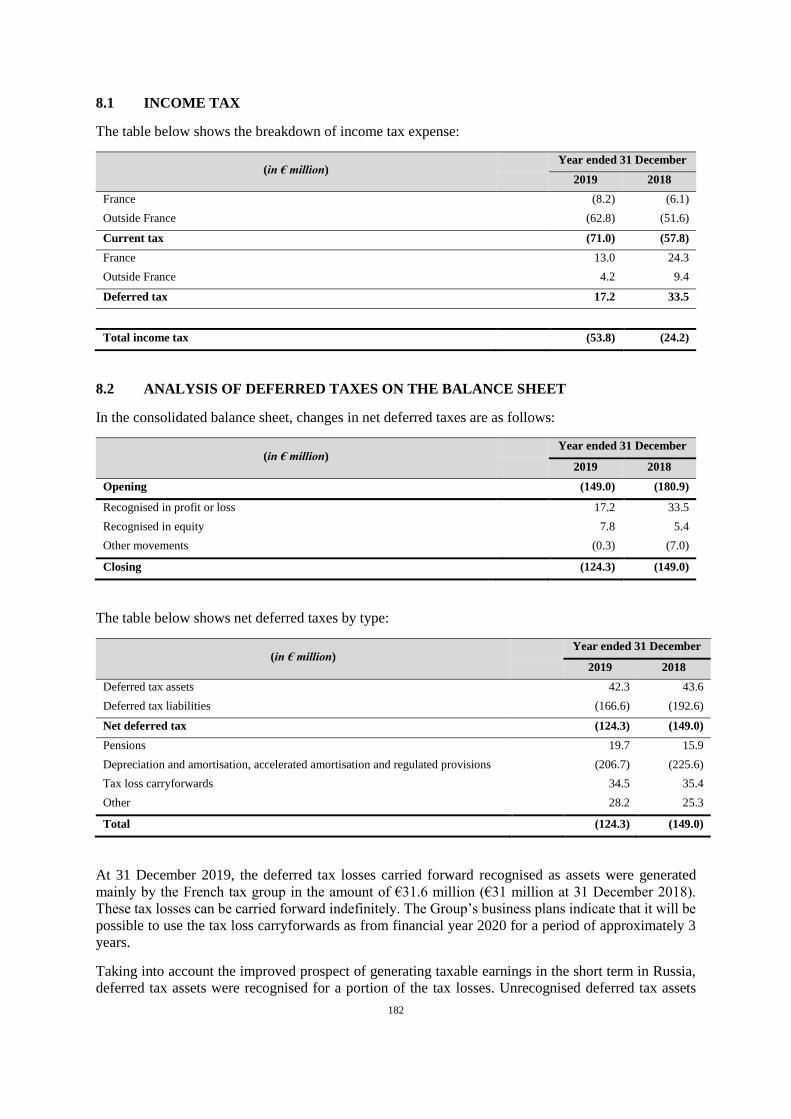
182
8.1 INCOME TAX
The table below shows the breakdown of income tax expense:
(in € million) Year ended 31 December
2019 2018
France (8.2) (6.1)
Outside France (62.8) (51.6)
Current tax (71.0) (57.8)
France 13.0 24.3
Outside France 4.2 9.4
Deferred tax 17.2 33.5
Total income tax (53.8) (24.2)
8.2 ANALYSIS OF DEFERRED TAXES ON THE BALANCE SHEET
In the consolidated balance sheet, changes in net deferred taxes are as follows:
(in € million) Year ended 31 December
2019 2018
Opening (149.0) (180.9)
Recognised in profit or loss 17.2 33.5
Recognised in equity 7.8 5.4
Other movements (0.3) (7.0)
Closing (124.3) (149.0)
The table below shows net deferred taxes by type:
(in € million) Year ended 31 December
2019 2018
Deferred tax assets 42.3 43.6
Deferred tax liabilities (166.6) (192.6)
Net deferred tax (124.3) (149.0)
Pensions 19.7 15.9
Depreciation and amortisation, accelerated amortisation and regulated provisions (206.7) (225.6)
Tax loss carryforwards 34.5 35.4
Other 28.2 25.3
Total (124.3) (149.0)
At 31 December 2019, the deferred tax losses carried forward recognised as assets were generated
mainly by the French tax group in the amount of €31.6 million (€31 million at 31 December 2018).
These tax losses can be carried forward indefinitely. The Group’s business plans indicate that it will be
possible to use the tax loss carryforwards as from financial year 2020 for a period of approximately 3
years.
Taking into account the improved prospect of generating taxable earnings in the short term in Russia,
deferred tax assets were recognised for a portion of the tax losses. Unrecognised deferred tax assets
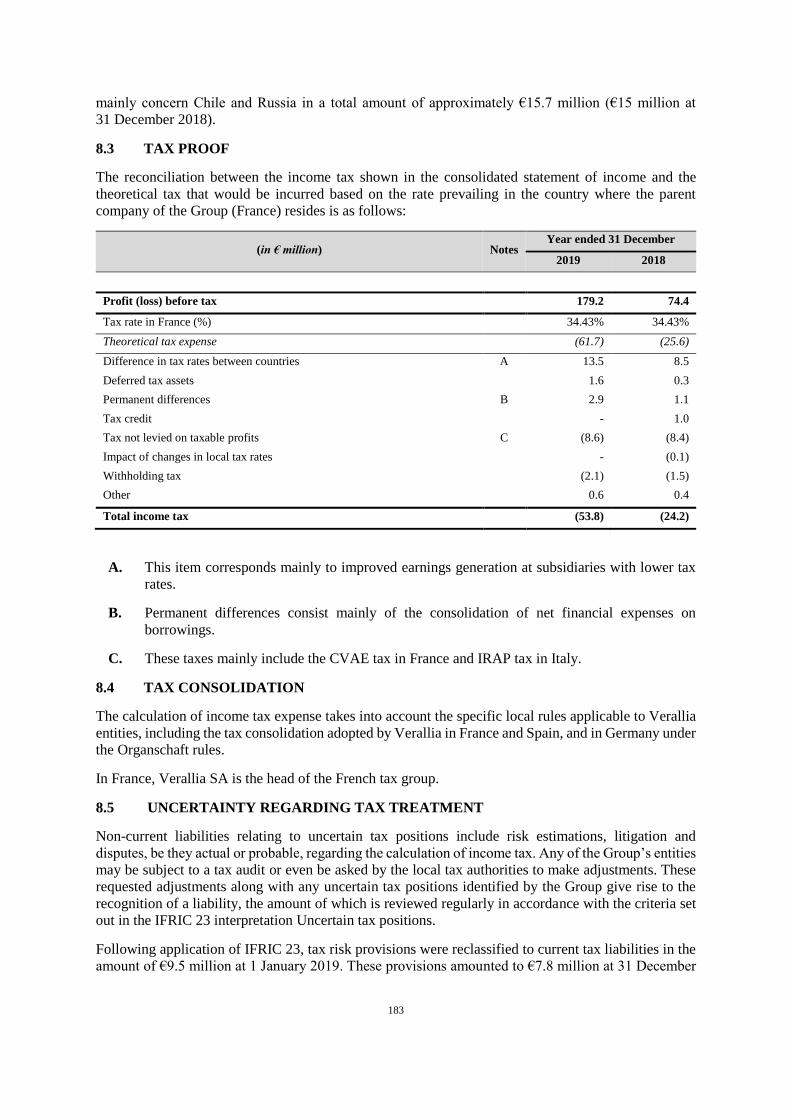
183
mainly concern Chile and Russia in a total amount of approximately €15.7 million (€15 million at
31 December 2018).
8.3 TAX PROOF
The reconciliation between the income tax shown in the consolidated statement of income and the
theoretical tax that would be incurred based on the rate prevailing in the country where the parent
company of the Group (France) resides is as follows:
(in € million) Notes Year ended 31 December
2019 2018
Profit (loss) before tax 179.2 74.4
Tax rate in France (%) 34.43% 34.43%
Theoretical tax expense (61.7) (25.6)
Difference in tax rates between countries A 13.5 8.5
Deferred tax assets 1.6 0.3
Permanent differences B 2.9 1.1
Tax credit - 1.0
Tax not levied on taxable profits C (8.6) (8.4)
Impact of changes in local tax rates - (0.1)
Withholding tax (2.1) (1.5)
Other 0.6 0.4
Total income tax (53.8) (24.2)
A. This item corresponds mainly to improved earnings generation at subsidiaries with lower tax
rates.
B. Permanent differences consist mainly of the consolidation of net financial expenses on
borrowings.
C. These taxes mainly include the CVAE tax in France and IRAP tax in Italy.
8.4 TAX CONSOLIDATION
The calculation of income tax expense takes into account the specific local rules applicable to Verallia
entities, including the tax consolidation adopted by Verallia in France and Spain, and in Germany under
the Organschaft rules.
In France, Verallia SA is the head of the French tax group.
8.5 UNCERTAINTY REGARDING TAX TREATMENT
Non-current liabilities relating to uncertain tax positions include risk estimations, litigation and
disputes, be they actual or probable, regarding the calculation of income tax. Any of the Group’s entities
may be subject to a tax audit or even be asked by the local tax authorities to make adjustments. These
requested adjustments along with any uncertain tax positions identified by the Group give rise to the
recognition of a liability, the amount of which is reviewed regularly in accordance with the criteria set
out in the IFRIC 23 interpretation Uncertain tax positions.
Following application of IFRIC 23, tax risk provisions were reclassified to current tax liabilities in the
amount of €9.5 million at 1 January 2019. These provisions amounted to €7.8 million at 31 December
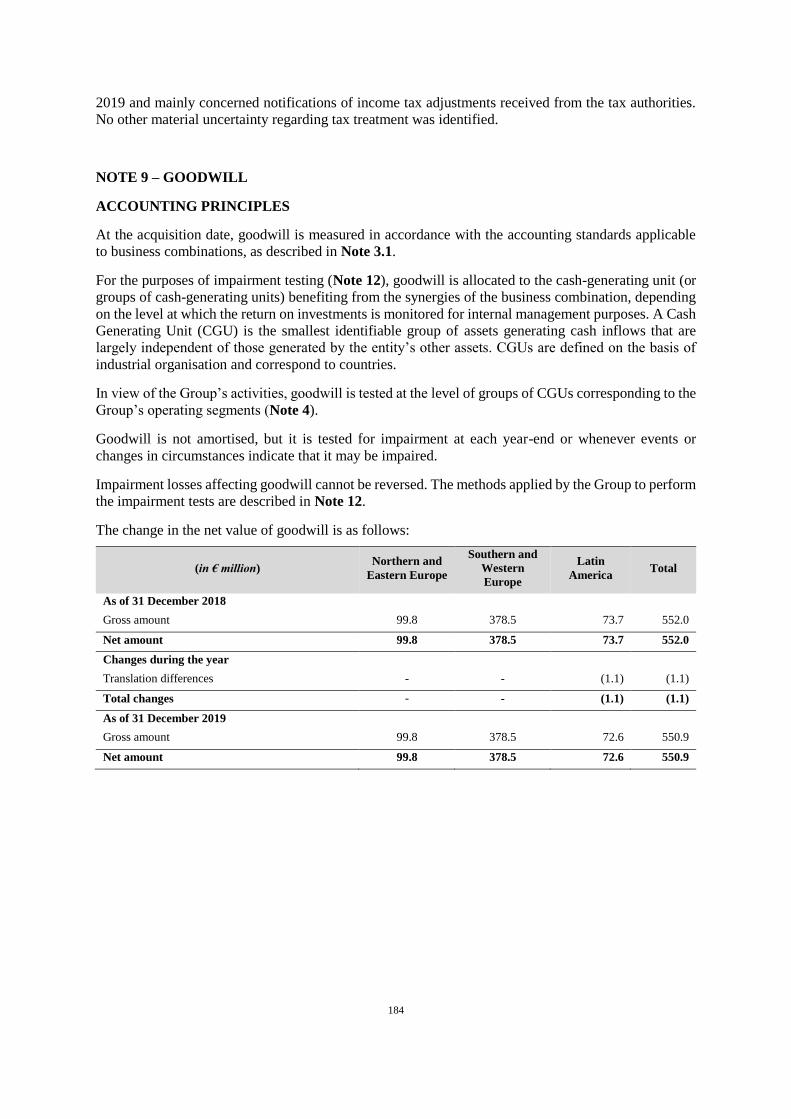
184
2019 and mainly concerned notifications of income tax adjustments received from the tax authorities.
No other material uncertainty regarding tax treatment was identified.
NOTE 9 – GOODWILL
ACCOUNTING PRINCIPLES
At the acquisition date, goodwill is measured in accordance with the accounting standards applicable
to business combinations, as described in Note 3.1.
For the purposes of impairment testing (Note 12), goodwill is allocated to the cash-generating unit (or
groups of cash-generating units) benefiting from the synergies of the business combination, depending
on the level at which the return on investments is monitored for internal management purposes. A Cash
Generating Unit (CGU) is the smallest identifiable group of assets generating cash inflows that are
largely independent of those generated by the entity’s other assets. CGUs are defined on the basis of
industrial organisation and correspond to countries.
In view of the Group’s activities, goodwill is tested at the level of groups of CGUs corresponding to the
Group’s operating segments (Note 4).
Goodwill is not amortised, but it is tested for impairment at each year-end or whenever events or
changes in circumstances indicate that it may be impaired.
Impairment losses affecting goodwill cannot be reversed. The methods applied by the Group to perform
the impairment tests are described in Note 12.
The change in the net value of goodwill is as follows:
(in € million) Northern and
Eastern Europe
Southern and
Western
Europe
Latin
America Total
As of 31 December 2018
Gross amount 99.8 378.5 73.7 552.0
Net amount 99.8 378.5 73.7 552.0
Changes during the year
Translation differences - - (1.1) (1.1)
Total changes - - (1.1) (1.1)
As of 31 December 2019
Gross amount 99.8 378.5 72.6 550.9
Net amount 99.8 378.5 72.6 550.9
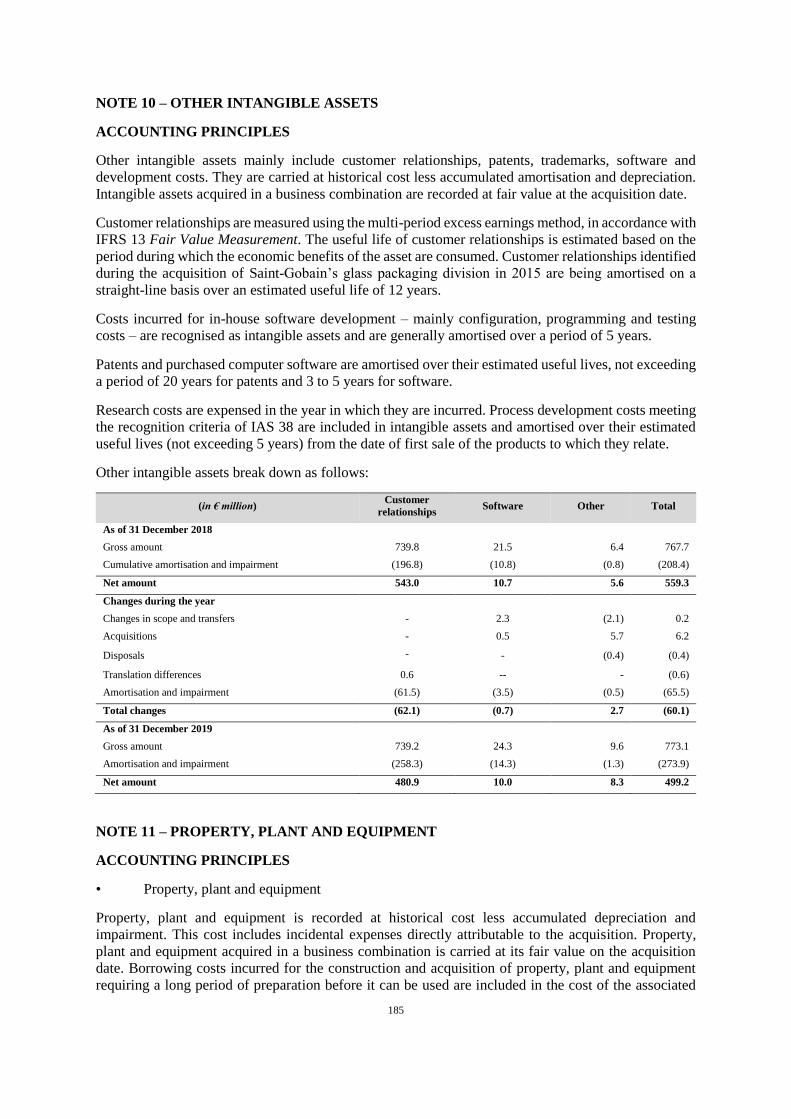
185
NOTE 10 – OTHER INTANGIBLE ASSETS
ACCOUNTING PRINCIPLES
Other intangible assets mainly include customer relationships, patents, trademarks, software and
development costs. They are carried at historical cost less accumulated amortisation and depreciation.
Intangible assets acquired in a business combination are recorded at fair value at the acquisition date.
Customer relationships are measured using the multi-period excess earnings method, in accordance with
IFRS 13 Fair Value Measurement. The useful life of customer relationships is estimated based on the
period during which the economic benefits of the asset are consumed. Customer relationships identified
during the acquisition of Saint-Gobain’s glass packaging division in 2015 are being amortised on a
straight-line basis over an estimated useful life of 12 years.
Costs incurred for in-house software development – mainly configuration, programming and testing
costs – are recognised as intangible assets and are generally amortised over a period of 5 years.
Patents and purchased computer software are amortised over their estimated useful lives, not exceeding
a period of 20 years for patents and 3 to 5 years for software.
Research costs are expensed in the year in which they are incurred. Process development costs meeting
the recognition criteria of IAS 38 are included in intangible assets and amortised over their estimated
useful lives (not exceeding 5 years) from the date of first sale of the products to which they relate.
Other intangible assets break down as follows:
(in € million) Customer
relationships Software Other Total
As of 31 December 2018
Gross amount 739.8 21.5 6.4 767.7
Cumulative amortisation and impairment (196.8) (10.8) (0.8) (208.4)
Net amount 543.0 10.7 5.6 559.3
Changes during the year
Changes in scope and transfers - 2.3 (2.1) 0.2
Acquisitions - 0.5 5.7 6.2
Disposals - - (0.4) (0.4)
Translation differences 0.6 -- - (0.6)
Amortisation and impairment (61.5) (3.5) (0.5) (65.5)
Total changes (62.1) (0.7) 2.7 (60.1)
As of 31 December 2019
Gross amount 739.2 24.3 9.6 773.1
Amortisation and impairment (258.3) (14.3) (1.3) (273.9)
Net amount 480.9 10.0 8.3 499.2
NOTE 11 – PROPERTY, PLANT AND EQUIPMENT
ACCOUNTING PRINCIPLES
• Property, plant and equipment
Property, plant and equipment is recorded at historical cost less accumulated depreciation and
impairment. This cost includes incidental expenses directly attributable to the acquisition. Property,
plant and equipment acquired in a business combination is carried at its fair value on the acquisition
date. Borrowing costs incurred for the construction and acquisition of property, plant and equipment
requiring a long period of preparation before it can be used are included in the cost of the associated
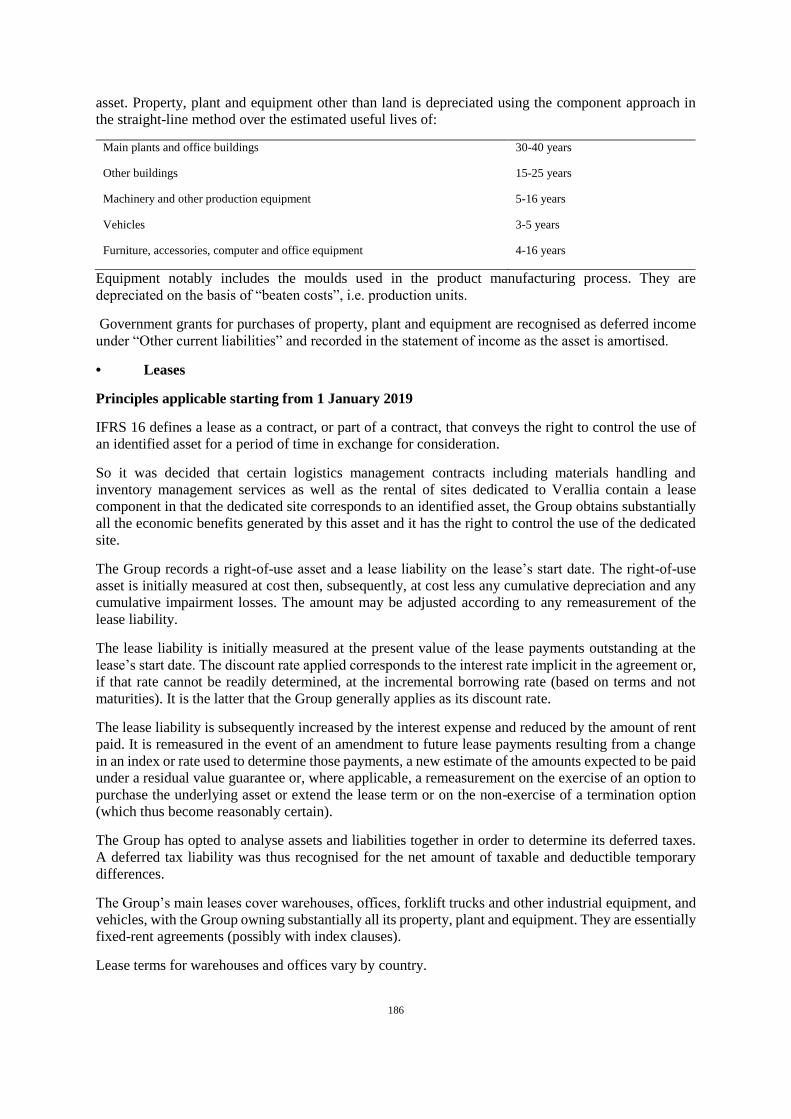
186
asset. Property, plant and equipment other than land is depreciated using the component approach in
the straight-line method over the estimated useful lives of:
Main plants and office buildings 30-40 years
Other buildings 15-25 years
Machinery and other production equipment 5-16 years
Vehicles 3-5 years
Furniture, accessories, computer and office equipment 4-16 years
Equipment notably includes the moulds used in the product manufacturing process. They are
depreciated on the basis of “beaten costs”, i.e. production units.
Government grants for purchases of property, plant and equipment are recognised as deferred income
under “Other current liabilities” and recorded in the statement of income as the asset is amortised.
• Leases
Principles applicable starting from 1 January 2019
IFRS 16 defines a lease as a contract, or part of a contract, that conveys the right to control the use of
an identified asset for a period of time in exchange for consideration.
So it was decided that certain logistics management contracts including materials handling and
inventory management services as well as the rental of sites dedicated to Verallia contain a lease
component in that the dedicated site corresponds to an identified asset, the Group obtains substantially
all the economic benefits generated by this asset and it has the right to control the use of the dedicated
site.
The Group records a right-of-use asset and a lease liability on the lease’s start date. The right-of-use
asset is initially measured at cost then, subsequently, at cost less any cumulative depreciation and any
cumulative impairment losses. The amount may be adjusted according to any remeasurement of the
lease liability.
The lease liability is initially measured at the present value of the lease payments outstanding at the
lease’s start date. The discount rate applied corresponds to the interest rate implicit in the agreement or,
if that rate cannot be readily determined, at the incremental borrowing rate (based on terms and not
maturities). It is the latter that the Group generally applies as its discount rate.
The lease liability is subsequently increased by the interest expense and reduced by the amount of rent
paid. It is remeasured in the event of an amendment to future lease payments resulting from a change
in an index or rate used to determine those payments, a new estimate of the amounts expected to be paid
under a residual value guarantee or, where applicable, a remeasurement on the exercise of an option to
purchase the underlying asset or extend the lease term or on the non-exercise of a termination option
(which thus become reasonably certain).
The Group has opted to analyse assets and liabilities together in order to determine its deferred taxes.
A deferred tax liability was thus recognised for the net amount of taxable and deductible temporary
differences.
The Group’s main leases cover warehouses, offices, forklift trucks and other industrial equipment, and
vehicles, with the Group owning substantially all its property, plant and equipment. They are essentially
fixed-rent agreements (possibly with index clauses).
Lease terms for warehouses and offices vary by country.
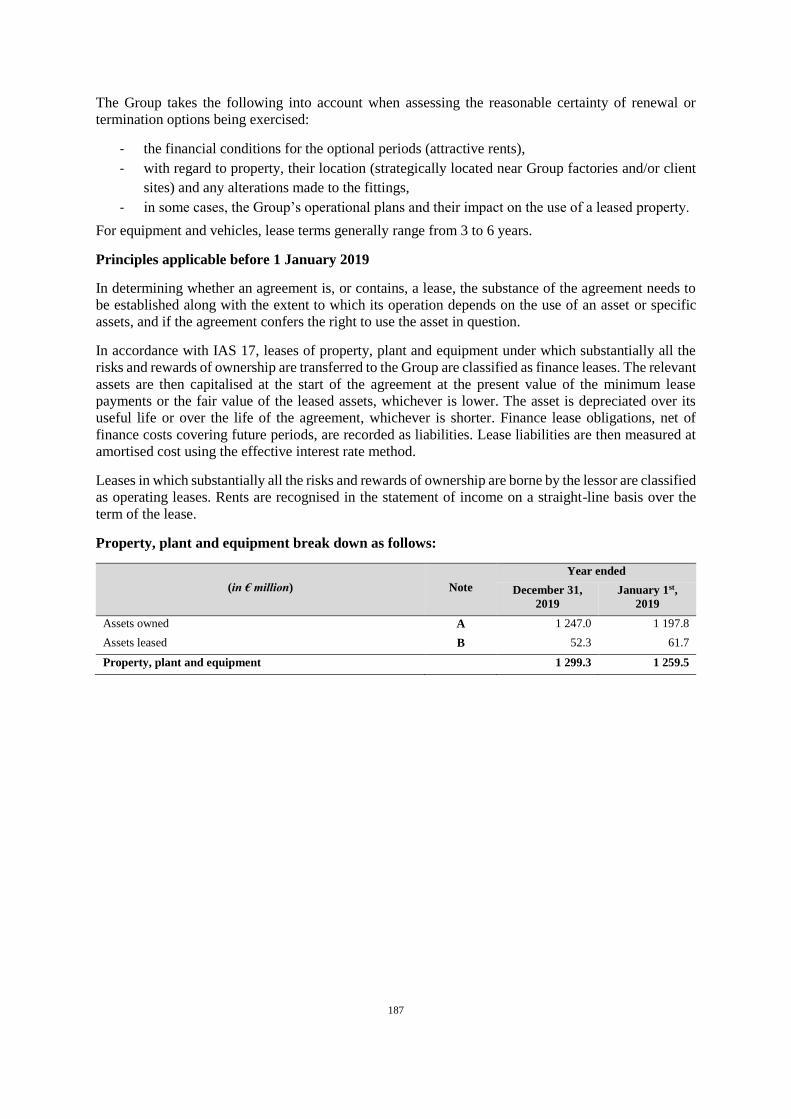
187
The Group takes the following into account when assessing the reasonable certainty of renewal or
termination options being exercised:
- the financial conditions for the optional periods (attractive rents),
- with regard to property, their location (strategically located near Group factories and/or client
sites) and any alterations made to the fittings,
- in some cases, the Group’s operational plans and their impact on the use of a leased property.
For equipment and vehicles, lease terms generally range from 3 to 6 years.
Principles applicable before 1 January 2019
In determining whether an agreement is, or contains, a lease, the substance of the agreement needs to
be established along with the extent to which its operation depends on the use of an asset or specific
assets, and if the agreement confers the right to use the asset in question.
In accordance with IAS 17, leases of property, plant and equipment under which substantially all the
risks and rewards of ownership are transferred to the Group are classified as finance leases. The relevant
assets are then capitalised at the start of the agreement at the present value of the minimum lease
payments or the fair value of the leased assets, whichever is lower. The asset is depreciated over its
useful life or over the life of the agreement, whichever is shorter. Finance lease obligations, net of
finance costs covering future periods, are recorded as liabilities. Lease liabilities are then measured at
amortised cost using the effective interest rate method.
Leases in which substantially all the risks and rewards of ownership are borne by the lessor are classified
as operating leases. Rents are recognised in the statement of income on a straight-line basis over the
term of the lease.
Property, plant and equipment break down as follows:
(in € million) Note
Year ended
December 31,
2019
January 1st,
2019
Assets owned A 1 247.0 1 197.8
Assets leased B 52.3 61.7
Property, plant and equipment 1 299.3 1 259.5
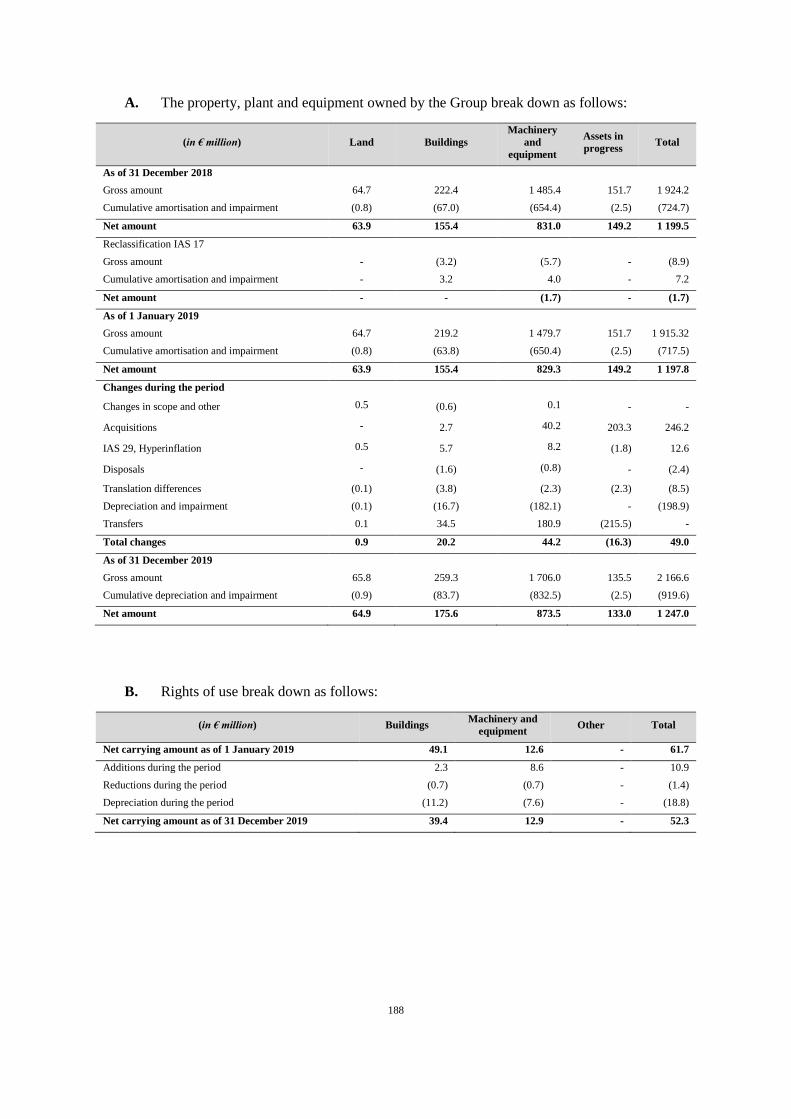
188
A. The property, plant and equipment owned by the Group break down as follows:
(in € million) Land Buildings
Machinery
and
equipment
Assets in
progress Total
As of 31 December 2018
Gross amount 64.7 222.4 1 485.4 151.7 1 924.2
Cumulative amortisation and impairment (0.8) (67.0) (654.4) (2.5) (724.7)
Net amount 63.9 155.4 831.0 149.2 1 199.5
Reclassification IAS 17
Gross amount - (3.2) (5.7) - (8.9)
Cumulative amortisation and impairment - 3.2 4.0 - 7.2
Net amount - - (1.7) - (1.7)
As of 1 January 2019
Gross amount 64.7 219.2 1 479.7 151.7 1 915.32
Cumulative amortisation and impairment (0.8) (63.8) (650.4) (2.5) (717.5)
Net amount 63.9 155.4 829.3 149.2 1 197.8
Changes during the period
Changes in scope and other 0.5 (0.6) 0.1 - -
Acquisitions - 2.7 40.2 203.3 246.2
IAS 29, Hyperinflation 0.5 5.7 8.2 (1.8) 12.6
Disposals - (1.6) (0.8) - (2.4)
Translation differences (0.1) (3.8) (2.3) (2.3) (8.5)
Depreciation and impairment (0.1) (16.7) (182.1) - (198.9)
Transfers 0.1 34.5 180.9 (215.5) -
Total changes 0.9 20.2 44.2 (16.3) 49.0
As of 31 December 2019
Gross amount 65.8 259.3 1 706.0 135.5 2 166.6
Cumulative depreciation and impairment (0.9) (83.7) (832.5) (2.5) (919.6)
Net amount 64.9 175.6 873.5 133.0 1 247.0
B. Rights of use break down as follows:
(in € million) Buildings Machinery and
equipment Other Total
Net carrying amount as of 1 January 2019 49.1 12.6 - 61.7
Additions during the period 2.3 8.6 - 10.9
Reductions during the period (0.7) (0.7) - (1.4)
Depreciation during the period (11.2) (7.6) - (18.8)
Net carrying amount as of 31 December 2019 39.4 12.9 - 52.3

189
NOTE 12 – IMPAIRMENT OF GOODWILL AND FIXED ASSETS
The carrying amounts of goodwill and intangible assets with indefinite useful lives are tested for
impairment at least annually and whenever events or changes in circumstances indicate that they may
be impaired. Other fixed assets are tested for impairment whenever events or changes in circumstances
indicate that they may be impaired. Such events or situations are related to material and adverse changes
affecting the economic environment and the assumptions or objectives identified at the time of
acquisition.
Fixed assets are tested at the level of the corresponding CGUs in general in the respective countries.
Goodwill is tested at the level of groups of CGUs corresponding to the various operating segments, i.e.
Southern and Western Europe, Northern and Eastern Europe, and Latin America. The breakdown of
goodwill generated at the time of the acquisition of Compagnie de Saint-Gobain’s packaging activities
in 2015 was based on the contribution of each group of CGUs to EBITDA.
When the carrying amount of CGUs or groups of CGUs exceeds their recoverable amount, an
impairment loss is recognised and allocated first to the carrying amount of any goodwill allocated to
groups of CGUs.
The recoverable amount of the CGUs or groups of CGUs is the greater of the fair value net of exit costs
and the value in use, which is measured against anticipated future discounted cash flow projections.
Impairment losses recorded against goodwill cannot be reversed through profit or loss. For property,
plant and equipment and other intangible assets, impairments recognised in previous periods may be
reversed, taking into account the depreciation adjustment, if there is an indication that the loss of value
no longer exists and that the recoverable amount of the asset is greater than its carrying amount.
ESTIMATES AND ASSUMPTIONS MADE BY MANAGEMENT
The assumptions, judgements and estimates on which the impairment tests are based are the main
assumptions used to estimate the recoverable amounts in the calculation of the value in use (discount
rate, perpetual growth rate, cash flow projections), all of which depend on an assessment of the
economic and financial environment.
At 31 December 2019 and 2018, the recoverable amount of the groups of CGUs was determined on the
basis of value in use. No goodwill impairment was recognised in financial years 2019 or 2018.
Cash flow projections
Projections of future cash flows correspond to the budget for the coming year, the strategic plan for the
following 2 years and an extrapolation for the fourth and fifth years.
The Group uses a number of macroeconomic assumptions to determine its cash flows: exchange rates,
GDP growth, inflation, variations in commodity, energy and packaging prices. As regards energy, the
Group establishes its assumptions based on expected variations in underlying energy price data (Brent,
TTF, NCG). These assumptions are determined using external data and by incorporating the hedging
arrangements made.
In addition, the Group takes into account the schedule for maintenance stoppages (furnaces and
machines) and for rolling out the Performance Action Plan.
The extrapolation carried out for the two test years (years 4 and 5) is based on growth and margin rates
and WCR that are relatively close to those of the last year of the Plan.
Cash flows beyond this five-year period are extrapolated using a constant perpetual growth rate
determined on the basis of past performance and market growth forecasts.
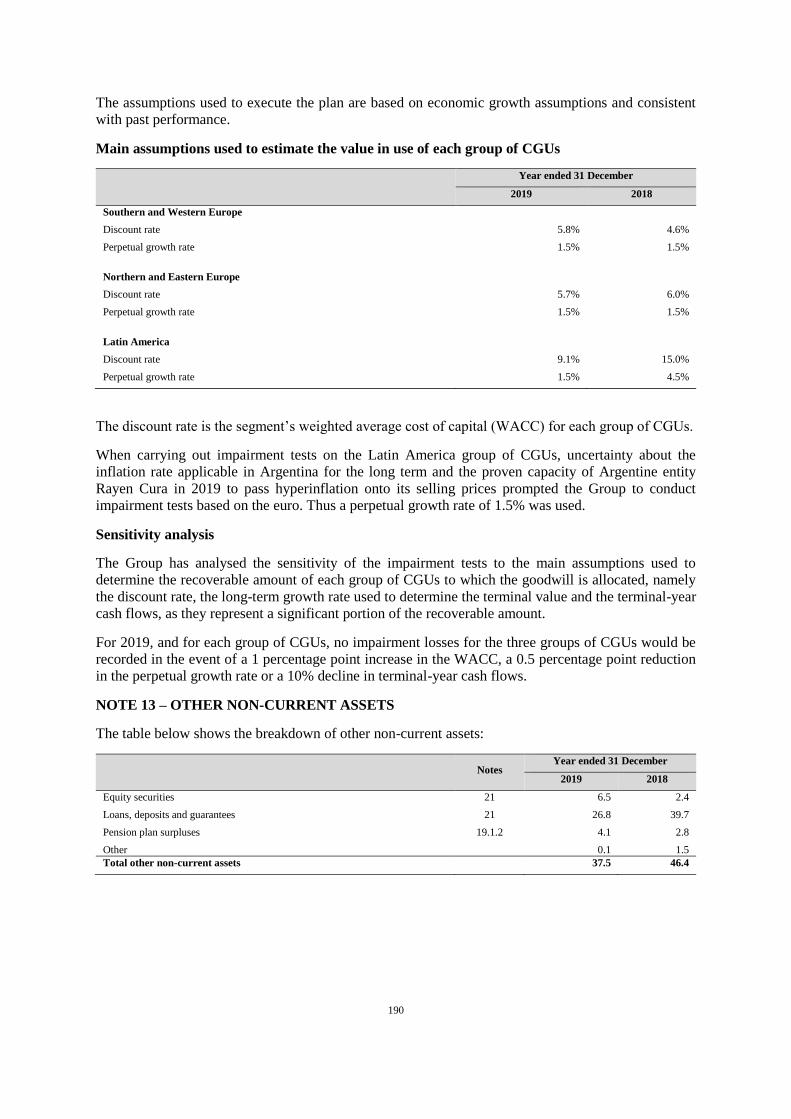
190
The assumptions used to execute the plan are based on economic growth assumptions and consistent
with past performance.
Main assumptions used to estimate the value in use of each group of CGUs
Year ended 31 December
2019 2018
Southern and Western Europe
Discount rate 5.8% 4.6%
Perpetual growth rate 1.5% 1.5%
Northern and Eastern Europe
Discount rate 5.7% 6.0%
Perpetual growth rate 1.5% 1.5%
Latin America
Discount rate 9.1% 15.0%
Perpetual growth rate 1.5% 4.5%
The discount rate is the segment’s weighted average cost of capital (WACC) for each group of CGUs.
When carrying out impairment tests on the Latin America group of CGUs, uncertainty about the
inflation rate applicable in Argentina for the long term and the proven capacity of Argentine entity
Rayen Cura in 2019 to pass hyperinflation onto its selling prices prompted the Group to conduct
impairment tests based on the euro. Thus a perpetual growth rate of 1.5% was used.
Sensitivity analysis
The Group has analysed the sensitivity of the impairment tests to the main assumptions used to
determine the recoverable amount of each group of CGUs to which the goodwill is allocated, namely
the discount rate, the long-term growth rate used to determine the terminal value and the terminal-year
cash flows, as they represent a significant portion of the recoverable amount.
For 2019, and for each group of CGUs, no impairment losses for the three groups of CGUs would be
recorded in the event of a 1 percentage point increase in the WACC, a 0.5 percentage point reduction
in the perpetual growth rate or a 10% decline in terminal-year cash flows.
NOTE 13 – OTHER NON-CURRENT ASSETS
The table below shows the breakdown of other non-current assets:
Notes Year ended 31 December
2019 2018
Equity securities 21 6.5 2.4
Loans, deposits and guarantees 21 26.8 39.7
Pension plan surpluses 19.1.2 4.1 2.8
Other 0.1 1.5
Total other non-current assets 37.5 46.4
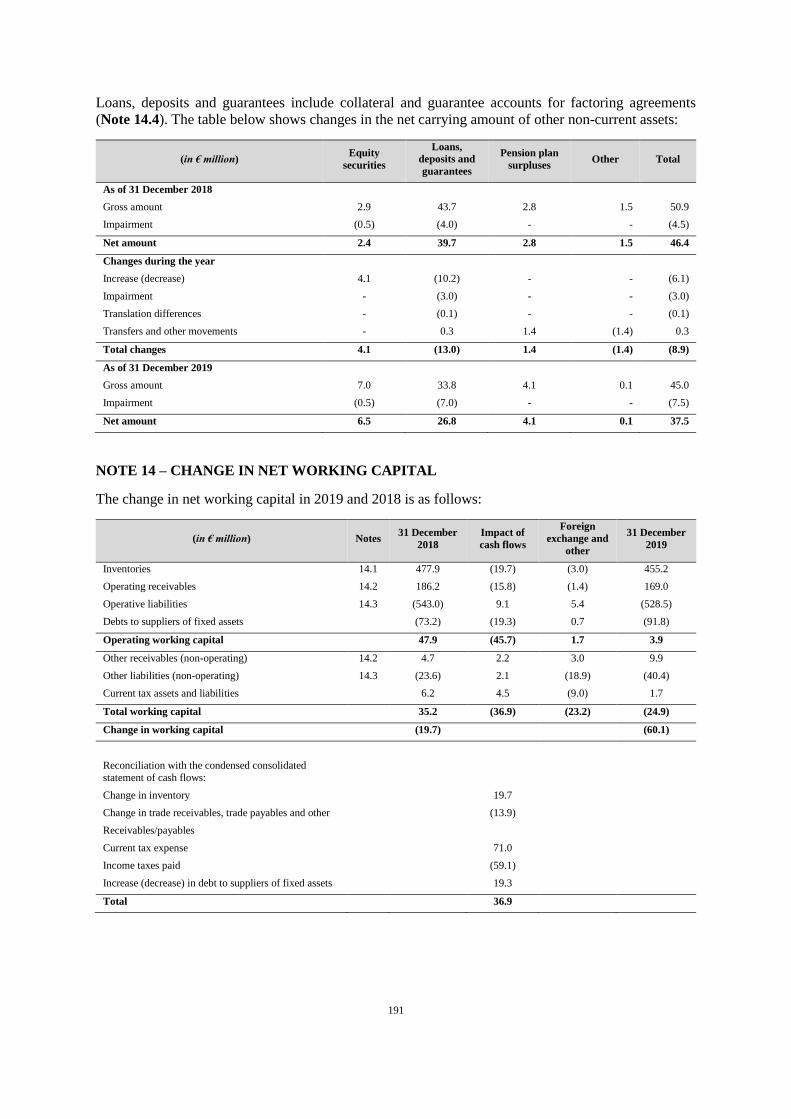
191
Loans, deposits and guarantees include collateral and guarantee accounts for factoring agreements
(Note 14.4). The table below shows changes in the net carrying amount of other non-current assets:
(in € million) Equity
securities
Loans,
deposits and
guarantees
Pension plan
surpluses Other Total
As of 31 December 2018
Gross amount 2.9 43.7 2.8 1.5 50.9
Impairment (0.5) (4.0) - - (4.5)
Net amount 2.4 39.7 2.8 1.5 46.4
Changes during the year
Increase (decrease) 4.1 (10.2) - - (6.1)
Impairment - (3.0) - - (3.0)
Translation differences - (0.1) - - (0.1)
Transfers and other movements - 0.3 1.4 (1.4) 0.3
Total changes 4.1 (13.0) 1.4 (1.4) (8.9)
As of 31 December 2019
Gross amount 7.0 33.8 4.1 0.1 45.0
Impairment (0.5) (7.0) - - (7.5)
Net amount 6.5 26.8 4.1 0.1 37.5
NOTE 14 – CHANGE IN NET WORKING CAPITAL
The change in net working capital in 2019 and 2018 is as follows:
(in € million) Notes 31 December
2018
Impact of
cash flows
Foreign
exchange and
other
31 December
2019
Inventories 14.1 477.9 (19.7) (3.0) 455.2
Operating receivables 14.2 186.2 (15.8) (1.4) 169.0
Operative liabilities 14.3 (543.0) 9.1 5.4 (528.5)
Debts to suppliers of fixed assets (73.2) (19.3) 0.7 (91.8)
Operating working capital 47.9 (45.7) 1.7 3.9
Other receivables (non-operating) 14.2 4.7 2.2 3.0 9.9
Other liabilities (non-operating) 14.3 (23.6) 2.1 (18.9) (40.4)
Current tax assets and liabilities 6.2 4.5 (9.0) 1.7
Total working capital 35.2 (36.9) (23.2) (24.9)
Change in working capital (19.7) (60.1)
Reconciliation with the condensed consolidated
statement of cash flows:
Change in inventory 19.7
Change in trade receivables, trade payables and other (13.9)
Receivables/payables
Current tax expense 71.0
Income taxes paid (59.1)
Increase (decrease) in debt to suppliers of fixed assets 19.3
Total 36.9
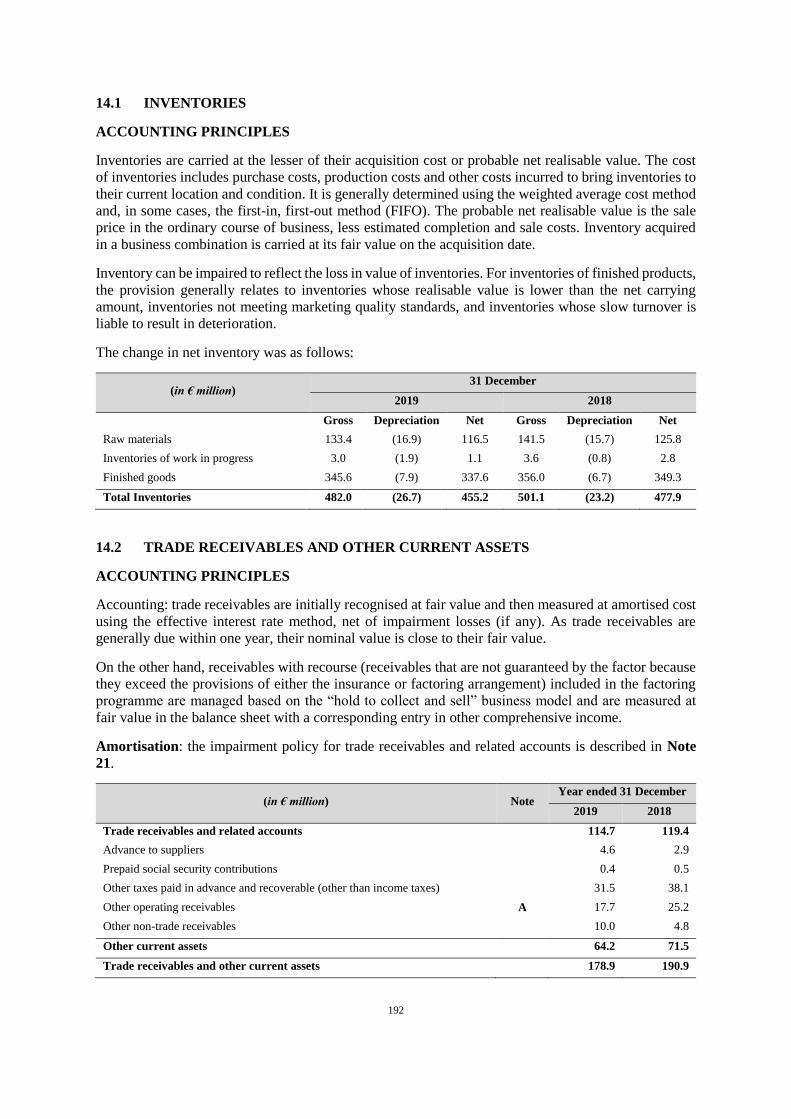
192
14.1 INVENTORIES
ACCOUNTING PRINCIPLES
Inventories are carried at the lesser of their acquisition cost or probable net realisable value. The cost
of inventories includes purchase costs, production costs and other costs incurred to bring inventories to
their current location and condition. It is generally determined using the weighted average cost method
and, in some cases, the first-in, first-out method (FIFO). The probable net realisable value is the sale
price in the ordinary course of business, less estimated completion and sale costs. Inventory acquired
in a business combination is carried at its fair value on the acquisition date.
Inventory can be impaired to reflect the loss in value of inventories. For inventories of finished products,
the provision generally relates to inventories whose realisable value is lower than the net carrying
amount, inventories not meeting marketing quality standards, and inventories whose slow turnover is
liable to result in deterioration.
The change in net inventory was as follows:
(in € million) 31 December
2019 2018
Gross Depreciation Net Gross Depreciation Net
Raw materials 133.4 (16.9) 116.5 141.5 (15.7) 125.8
Inventories of work in progress 3.0 (1.9) 1.1 3.6 (0.8) 2.8
Finished goods 345.6 (7.9) 337.6 356.0 (6.7) 349.3
Total Inventories 482.0 (26.7) 455.2 501.1 (23.2) 477.9
14.2 TRADE RECEIVABLES AND OTHER CURRENT ASSETS
ACCOUNTING PRINCIPLES
Accounting: trade receivables are initially recognised at fair value and then measured at amortised cost
using the effective interest rate method, net of impairment losses (if any). As trade receivables are
generally due within one year, their nominal value is close to their fair value.
On the other hand, receivables with recourse (receivables that are not guaranteed by the factor because
they exceed the provisions of either the insurance or factoring arrangement) included in the factoring
programme are managed based on the “hold to collect and sell” business model and are measured at
fair value in the balance sheet with a corresponding entry in other comprehensive income.
Amortisation: the impairment policy for trade receivables and related accounts is described in Note
21.
(in € million) Note Year ended 31 December
2019 2018
Trade receivables and related accounts 114.7 119.4
Advance to suppliers 4.6 2.9
Prepaid social security contributions 0.4 0.5
Other taxes paid in advance and recoverable (other than income taxes) 31.5 38.1
Other operating receivables A 17.7 25.2
Other non-trade receivables 10.0 4.8
Other current assets 64.2 71.5
Trade receivables and other current assets 178.9 190.9
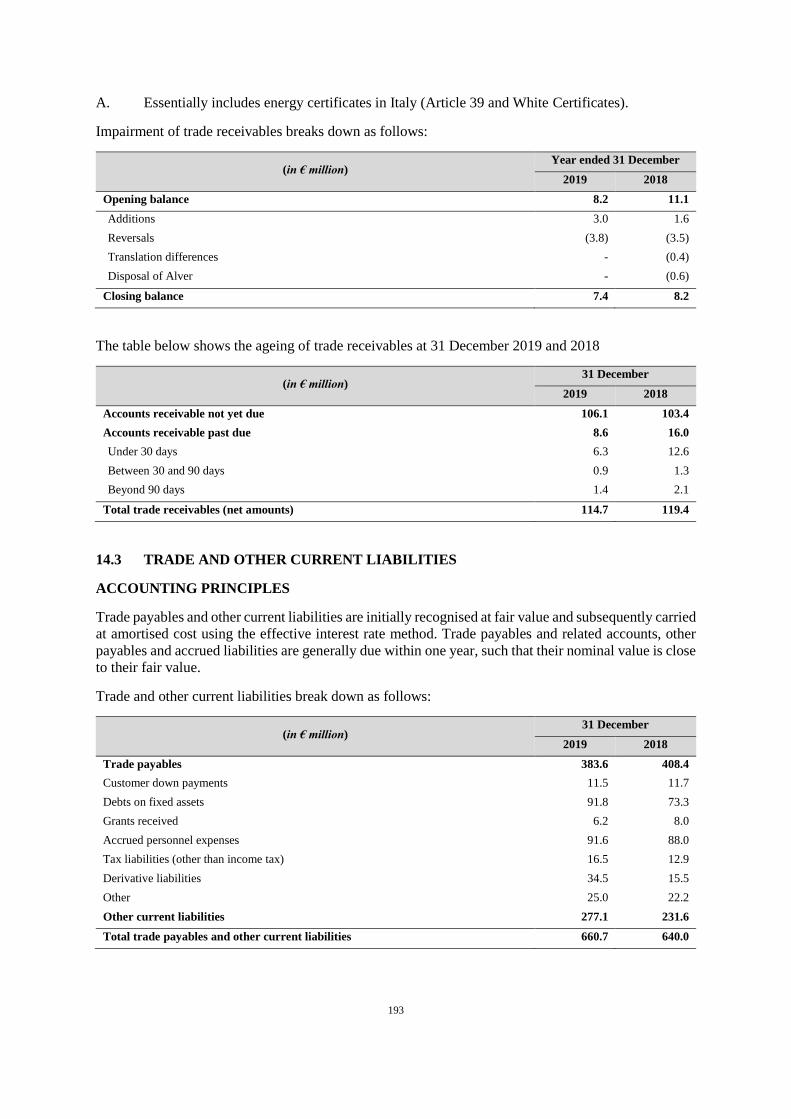
193
A. Essentially includes energy certificates in Italy (Article 39 and White Certificates).
Impairment of trade receivables breaks down as follows:
(in € million) Year ended 31 December
2019 2018
Opening balance 8.2 11.1
Additions 3.0 1.6
Reversals (3.8) (3.5)
Translation differences - (0.4)
Disposal of Alver - (0.6)
Closing balance 7.4 8.2
The table below shows the ageing of trade receivables at 31 December 2019 and 2018
(in € million) 31 December
2019 2018
Accounts receivable not yet due 106.1 103.4
Accounts receivable past due 8.6 16.0
Under 30 days 6.3 12.6
Between 30 and 90 days 0.9 1.3
Beyond 90 days 1.4 2.1
Total trade receivables (net amounts) 114.7 119.4
14.3 TRADE AND OTHER CURRENT LIABILITIES
ACCOUNTING PRINCIPLES
Trade payables and other current liabilities are initially recognised at fair value and subsequently carried
at amortised cost using the effective interest rate method. Trade payables and related accounts, other
payables and accrued liabilities are generally due within one year, such that their nominal value is close
to their fair value.
Trade and other current liabilities break down as follows:
(in € million) 31 December
2019 2018
Trade payables 383.6 408.4
Customer down payments 11.5 11.7
Debts on fixed assets 91.8 73.3
Grants received 6.2 8.0
Accrued personnel expenses 91.6 88.0
Tax liabilities (other than income tax) 16.5 12.9
Derivative liabilities 34.5 15.5
Other 25.0 22.2
Other current liabilities 277.1 231.6
Total trade payables and other current liabilities 660.7 640.0
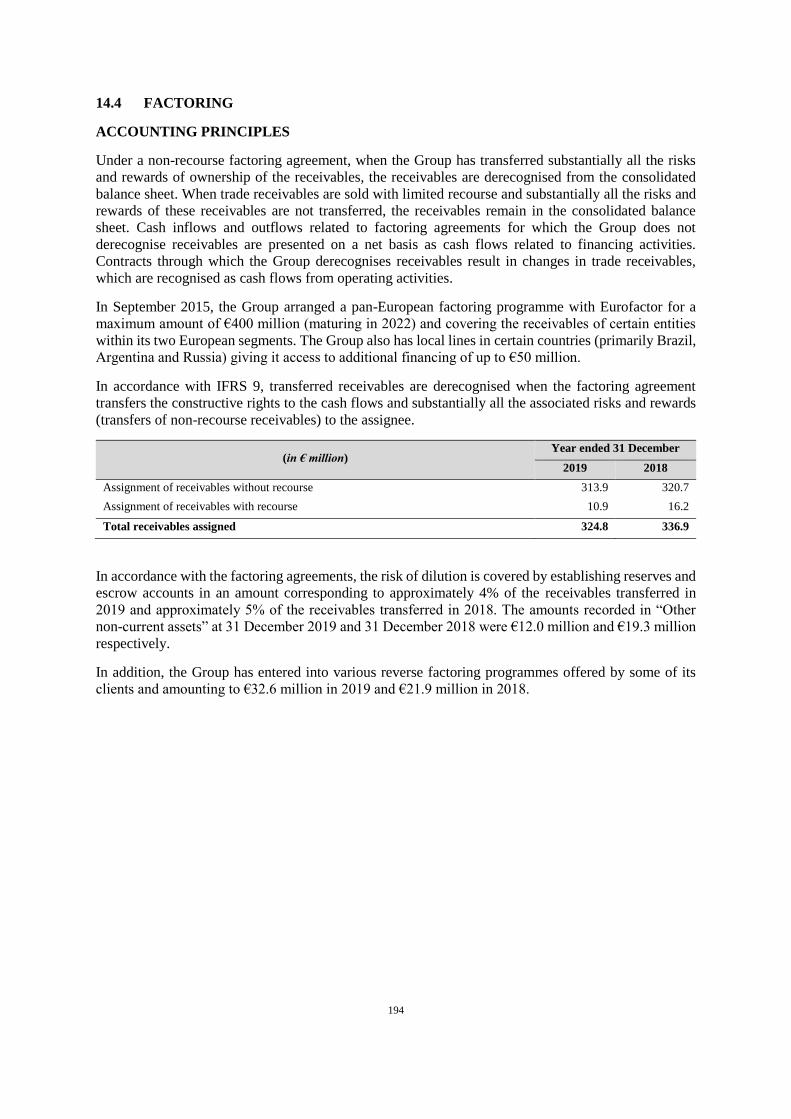
194
14.4 FACTORING
ACCOUNTING PRINCIPLES
Under a non-recourse factoring agreement, when the Group has transferred substantially all the risks
and rewards of ownership of the receivables, the receivables are derecognised from the consolidated
balance sheet. When trade receivables are sold with limited recourse and substantially all the risks and
rewards of these receivables are not transferred, the receivables remain in the consolidated balance
sheet. Cash inflows and outflows related to factoring agreements for which the Group does not
derecognise receivables are presented on a net basis as cash flows related to financing activities.
Contracts through which the Group derecognises receivables result in changes in trade receivables,
which are recognised as cash flows from operating activities.
In September 2015, the Group arranged a pan-European factoring programme with Eurofactor for a
maximum amount of €400 million (maturing in 2022) and covering the receivables of certain entities
within its two European segments. The Group also has local lines in certain countries (primarily Brazil,
Argentina and Russia) giving it access to additional financing of up to €50 million.
In accordance with IFRS 9, transferred receivables are derecognised when the factoring agreement
transfers the constructive rights to the cash flows and substantially all the associated risks and rewards
(transfers of non-recourse receivables) to the assignee.
(in € million) Year ended 31 December
2019 2018
Assignment of receivables without recourse 313.9 320.7
Assignment of receivables with recourse 10.9 16.2
Total receivables assigned 324.8 336.9
In accordance with the factoring agreements, the risk of dilution is covered by establishing reserves and
escrow accounts in an amount corresponding to approximately 4% of the receivables transferred in
2019 and approximately 5% of the receivables transferred in 2018. The amounts recorded in “Other
non-current assets” at 31 December 2019 and 31 December 2018 were €12.0 million and €19.3 million
respectively.
In addition, the Group has entered into various reverse factoring programmes offered by some of its
clients and amounting to €32.6 million in 2019 and €21.9 million in 2018.
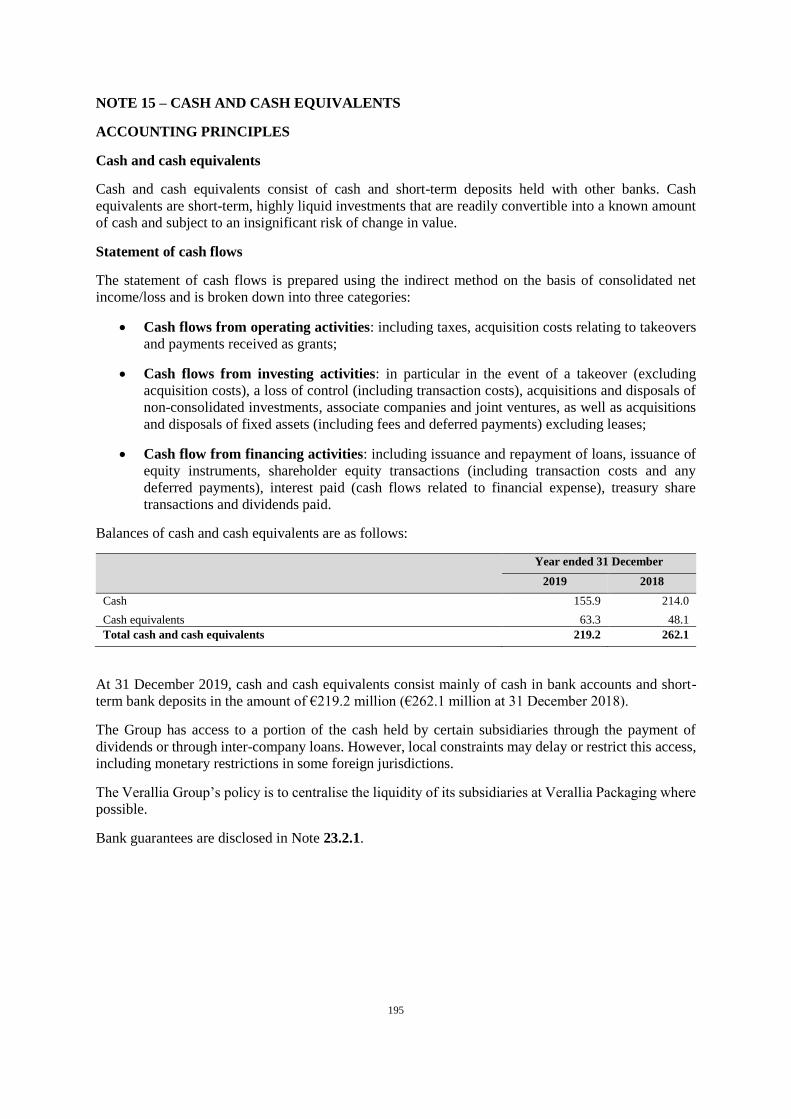
195
NOTE 15 – CASH AND CASH EQUIVALENTS
ACCOUNTING PRINCIPLES
Cash and cash equivalents
Cash and cash equivalents consist of cash and short-term deposits held with other banks. Cash
equivalents are short-term, highly liquid investments that are readily convertible into a known amount
of cash and subject to an insignificant risk of change in value.
Statement of cash flows
The statement of cash flows is prepared using the indirect method on the basis of consolidated net
income/loss and is broken down into three categories:
Cash flows from operating activities: including taxes, acquisition costs relating to takeovers
and payments received as grants;
Cash flows from investing activities: in particular in the event of a takeover (excluding
acquisition costs), a loss of control (including transaction costs), acquisitions and disposals of
non-consolidated investments, associate companies and joint ventures, as well as acquisitions
and disposals of fixed assets (including fees and deferred payments) excluding leases;
Cash flow from financing activities: including issuance and repayment of loans, issuance of
equity instruments, shareholder equity transactions (including transaction costs and any
deferred payments), interest paid (cash flows related to financial expense), treasury share
transactions and dividends paid.
Balances of cash and cash equivalents are as follows:
Year ended 31 December
2019 2018
Cash 155.9 214.0
Cash equivalents 63.3 48.1
Total cash and cash equivalents 219.2 262.1
At 31 December 2019, cash and cash equivalents consist mainly of cash in bank accounts and short-
term bank deposits in the amount of €219.2 million (€262.1 million at 31 December 2018).
The Group has access to a portion of the cash held by certain subsidiaries through the payment of
dividends or through inter-company loans. However, local constraints may delay or restrict this access,
including monetary restrictions in some foreign jurisdictions.
The Verallia Group’s policy is to centralise the liquidity of its subsidiaries at Verallia Packaging where
possible.
Bank guarantees are disclosed in Note 23.2.1.
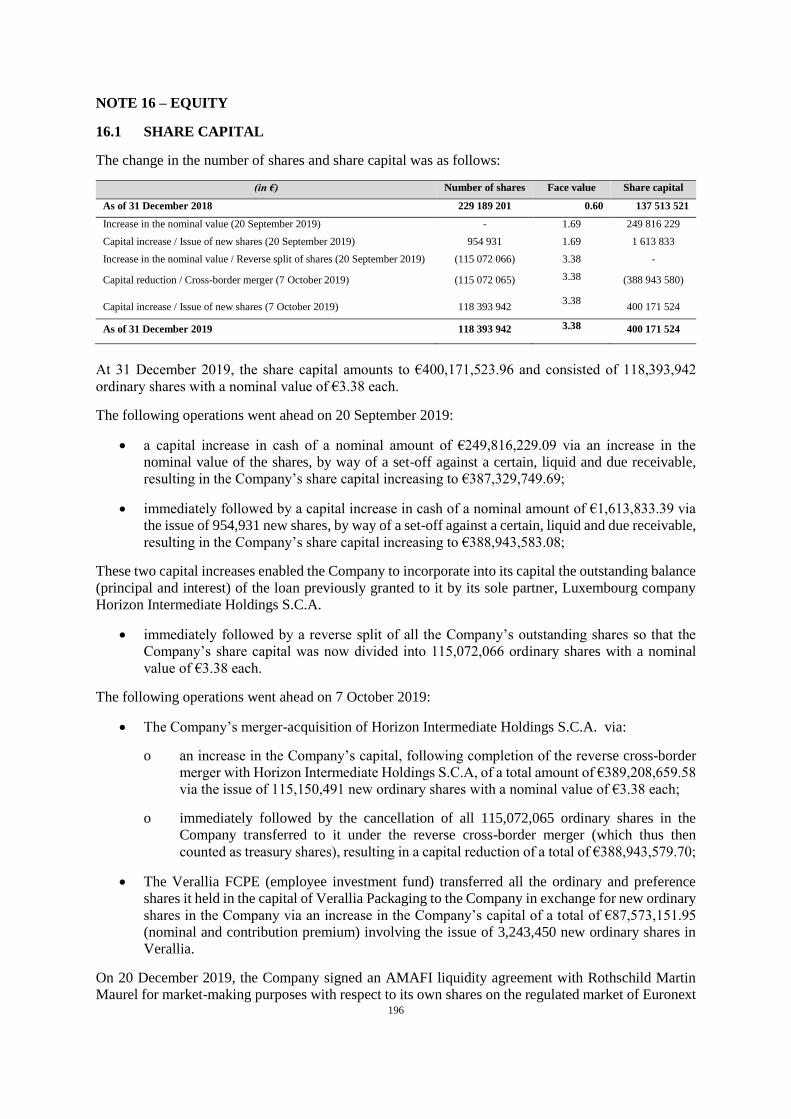
196
NOTE 16 – EQUITY
16.1 SHARE CAPITAL
The change in the number of shares and share capital was as follows:
(in €) Number of shares Face value Share capital
As of 31 December 2018 229 189 201 0.60 137 513 521
Increase in the nominal value (20 September 2019) - 1.69 249 816 229
Capital increase / Issue of new shares (20 September 2019) 954 931 1.69 1 613 833
Increase in the nominal value / Reverse split of shares (20 September 2019) (115 072 066) 3.38 -
Capital reduction / Cross-border merger (7 October 2019) (115 072 065) 3.38 (388 943 580)
Capital increase / Issue of new shares (7 October 2019) 118 393 942 3.38
400 171 524
As of 31 December 2019 118 393 942 3.38 400 171 524
At 31 December 2019, the share capital amounts to €400,171,523.96 and consisted of 118,393,942
ordinary shares with a nominal value of €3.38 each.
The following operations went ahead on 20 September 2019:
a capital increase in cash of a nominal amount of €249,816,229.09 via an increase in the
nominal value of the shares, by way of a set-off against a certain, liquid and due receivable,
resulting in the Company’s share capital increasing to €387,329,749.69;
immediately followed by a capital increase in cash of a nominal amount of €1,613,833.39 via
the issue of 954,931 new shares, by way of a set-off against a certain, liquid and due receivable,
resulting in the Company’s share capital increasing to €388,943,583.08;
These two capital increases enabled the Company to incorporate into its capital the outstanding balance
(principal and interest) of the loan previously granted to it by its sole partner, Luxembourg company
Horizon Intermediate Holdings S.C.A.
immediately followed by a reverse split of all the Company’s outstanding shares so that the
Company’s share capital was now divided into 115,072,066 ordinary shares with a nominal
value of €3.38 each.
The following operations went ahead on 7 October 2019:
The Company’s merger-acquisition of Horizon Intermediate Holdings S.C.A. via:
o an increase in the Company’s capital, following completion of the reverse cross-border
merger with Horizon Intermediate Holdings S.C.A, of a total amount of €389,208,659.58
via the issue of 115,150,491 new ordinary shares with a nominal value of €3.38 each;
o immediately followed by the cancellation of all 115,072,065 ordinary shares in the
Company transferred to it under the reverse cross-border merger (which thus then
counted as treasury shares), resulting in a capital reduction of a total of €388,943,579.70;
The Verallia FCPE (employee investment fund) transferred all the ordinary and preference
shares it held in the capital of Verallia Packaging to the Company in exchange for new ordinary
shares in the Company via an increase in the Company’s capital of a total of €87,573,151.95
(nominal and contribution premium) involving the issue of 3,243,450 new ordinary shares in
Verallia.
On 20 December 2019, the Company signed an AMAFI liquidity agreement with Rothschild Martin
Maurel for market-making purposes with respect to its own shares on the regulated market of Euronext
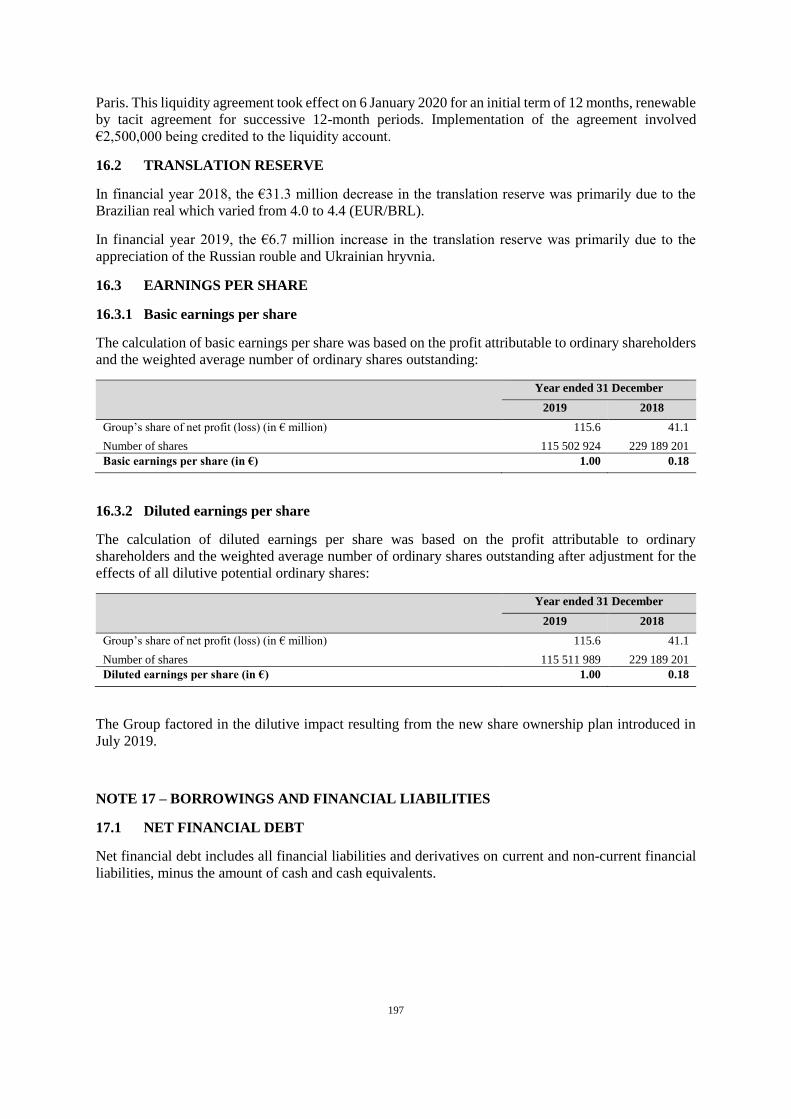
197
Paris. This liquidity agreement took effect on 6 January 2020 for an initial term of 12 months, renewable
by tacit agreement for successive 12-month periods. Implementation of the agreement involved
€2,500,000 being credited to the liquidity account.
16.2 TRANSLATION RESERVE
In financial year 2018, the €31.3 million decrease in the translation reserve was primarily due to the
Brazilian real which varied from 4.0 to 4.4 (EUR/BRL).
In financial year 2019, the €6.7 million increase in the translation reserve was primarily due to the
appreciation of the Russian rouble and Ukrainian hryvnia.
16.3 EARNINGS PER SHARE
16.3.1 Basic earnings per share
The calculation of basic earnings per share was based on the profit attributable to ordinary shareholders
and the weighted average number of ordinary shares outstanding:
Year ended 31 December
2019 2018
Group’s share of net profit (loss) (in € million) 115.6 41.1
Number of shares 115 502 924 229 189 201
Basic earnings per share (in €) 1.00 0.18
16.3.2 Diluted earnings per share
The calculation of diluted earnings per share was based on the profit attributable to ordinary
shareholders and the weighted average number of ordinary shares outstanding after adjustment for the
effects of all dilutive potential ordinary shares:
Year ended 31 December
2019 2018
Group’s share of net profit (loss) (in € million) 115.6 41.1
Number of shares 115 511 989 229 189 201
Diluted earnings per share (in €) 1.00 0.18
The Group factored in the dilutive impact resulting from the new share ownership plan introduced in
July 2019.
NOTE 17 – BORROWINGS AND FINANCIAL LIABILITIES
17.1 NET FINANCIAL DEBT
Net financial debt includes all financial liabilities and derivatives on current and non-current financial
liabilities, minus the amount of cash and cash equivalents.
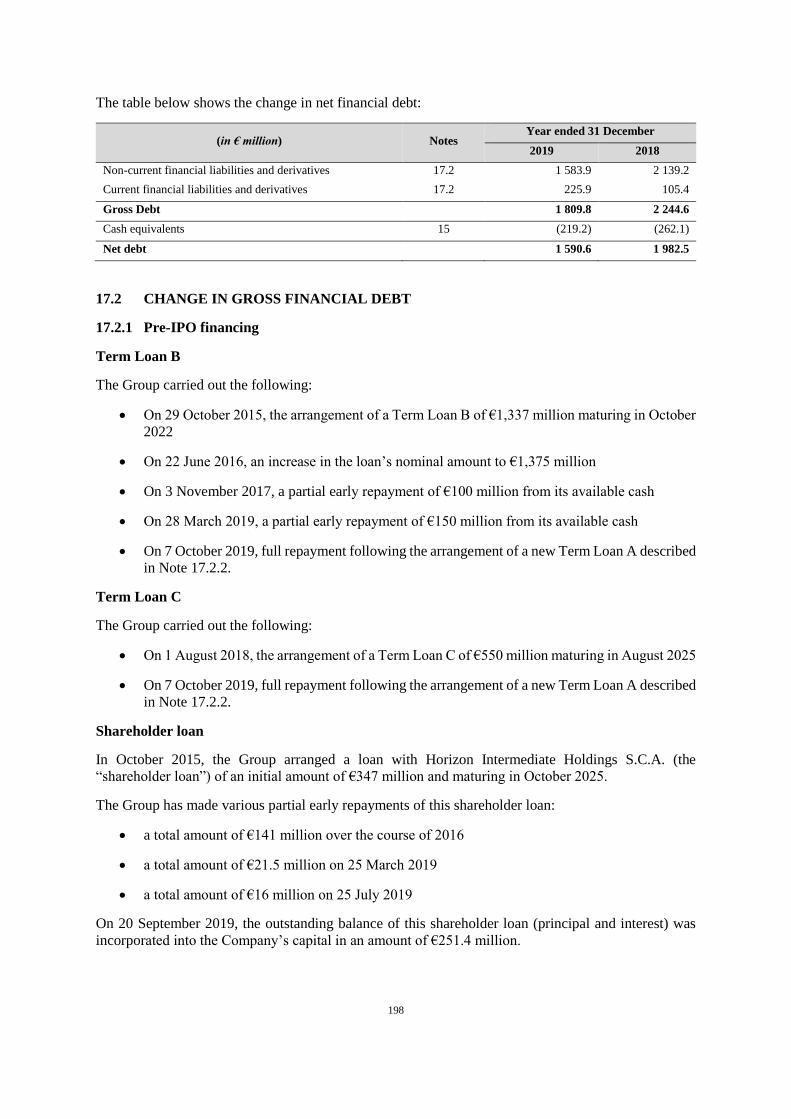
198
The table below shows the change in net financial debt:
(in € million) Notes Year ended 31 December
2019 2018
Non-current financial liabilities and derivatives 17.2 1 583.9 2 139.2
Current financial liabilities and derivatives 17.2 225.9 105.4
Gross Debt 1 809.8 2 244.6
Cash equivalents 15 (219.2) (262.1)
Net debt 1 590.6 1 982.5
17.2 CHANGE IN GROSS FINANCIAL DEBT
17.2.1 Pre-IPO financing
Term Loan B
The Group carried out the following:
On 29 October 2015, the arrangement of a Term Loan B of €1,337 million maturing in October
2022
On 22 June 2016, an increase in the loan’s nominal amount to €1,375 million
On 3 November 2017, a partial early repayment of €100 million from its available cash
On 28 March 2019, a partial early repayment of €150 million from its available cash
On 7 October 2019, full repayment following the arrangement of a new Term Loan A described
in Note 17.2.2.
Term Loan C
The Group carried out the following:
On 1 August 2018, the arrangement of a Term Loan C of €550 million maturing in August 2025
On 7 October 2019, full repayment following the arrangement of a new Term Loan A described
in Note 17.2.2.
Shareholder loan
In October 2015, the Group arranged a loan with Horizon Intermediate Holdings S.C.A. (the
“shareholder loan”) of an initial amount of €347 million and maturing in October 2025.
The Group has made various partial early repayments of this shareholder loan:
a total amount of €141 million over the course of 2016
a total amount of €21.5 million on 25 March 2019
a total amount of €16 million on 25 July 2019
On 20 September 2019, the outstanding balance of this shareholder loan (principal and interest) was
incorporated into the Company’s capital in an amount of €251.4 million.
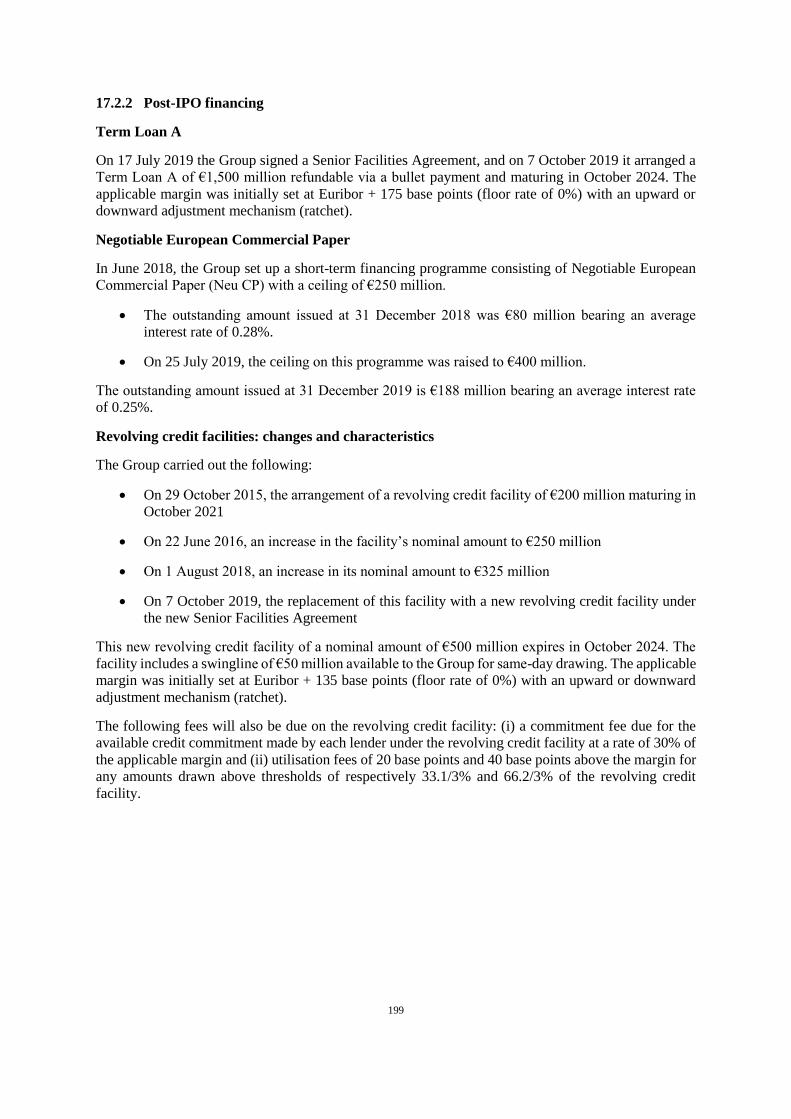
199
17.2.2 Post-IPO financing
Term Loan A
On 17 July 2019 the Group signed a Senior Facilities Agreement, and on 7 October 2019 it arranged a
Term Loan A of €1,500 million refundable via a bullet payment and maturing in October 2024. The
applicable margin was initially set at Euribor + 175 base points (floor rate of 0%) with an upward or
downward adjustment mechanism (ratchet).
Negotiable European Commercial Paper
In June 2018, the Group set up a short-term financing programme consisting of Negotiable European
Commercial Paper (Neu CP) with a ceiling of €250 million.
The outstanding amount issued at 31 December 2018 was €80 million bearing an average
interest rate of 0.28%.
On 25 July 2019, the ceiling on this programme was raised to €400 million.
The outstanding amount issued at 31 December 2019 is €188 million bearing an average interest rate
of 0.25%.
Revolving credit facilities: changes and characteristics
The Group carried out the following:
On 29 October 2015, the arrangement of a revolving credit facility of €200 million maturing in
October 2021
On 22 June 2016, an increase in the facility’s nominal amount to €250 million
On 1 August 2018, an increase in its nominal amount to €325 million
On 7 October 2019, the replacement of this facility with a new revolving credit facility under
the new Senior Facilities Agreement
This new revolving credit facility of a nominal amount of €500 million expires in October 2024. The
facility includes a swingline of €50 million available to the Group for same-day drawing. The applicable
margin was initially set at Euribor + 135 base points (floor rate of 0%) with an upward or downward
adjustment mechanism (ratchet).
The following fees will also be due on the revolving credit facility: (i) a commitment fee due for the
available credit commitment made by each lender under the revolving credit facility at a rate of 30% of
the applicable margin and (ii) utilisation fees of 20 base points and 40 base points above the margin for
any amounts drawn above thresholds of respectively 33.1/3% and 66.2/3% of the revolving credit
facility.
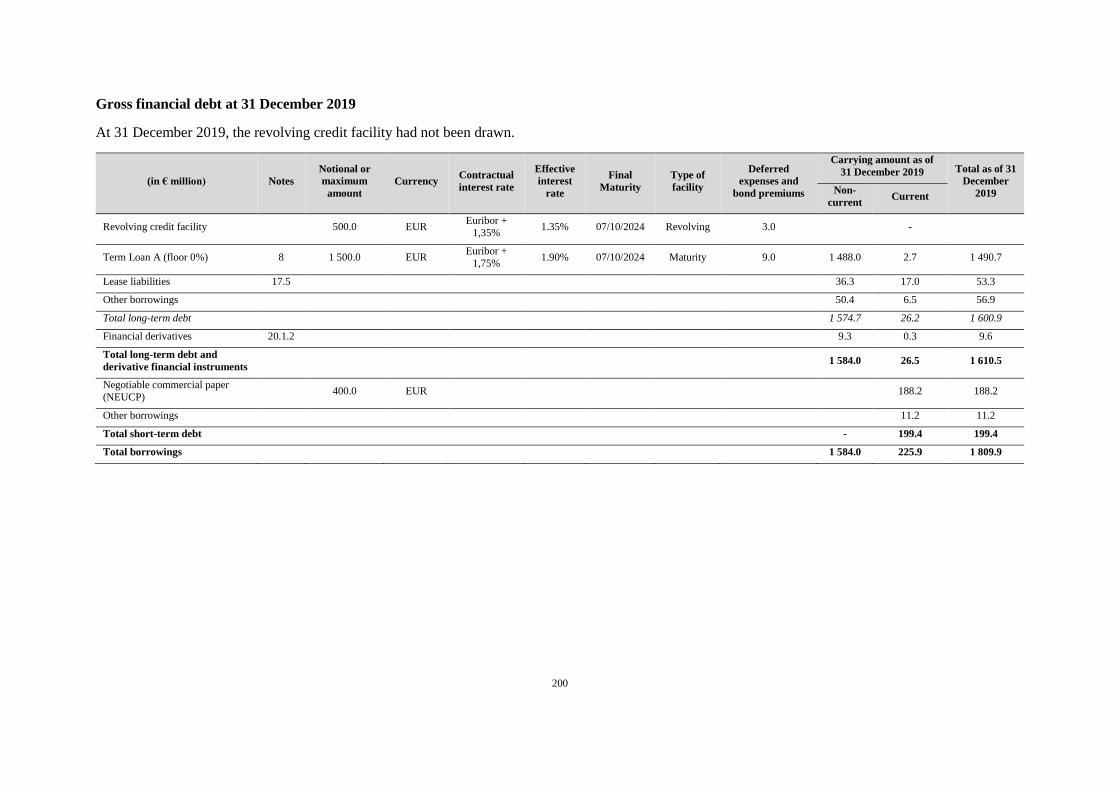
200
Gross financial debt at 31 December 2019
At 31 December 2019, the revolving credit facility had not been drawn.
(in € million) Notes
Notional or
maximum
amount
Currency Contractual
interest rate
Effective
interest
rate
Final
Maturity
Type of
facility
Deferred
expenses and
bond premiums
Carrying amount as of
31 December 2019 Total as of 31
December
2019 Non-
current Current
Revolving credit facility 500.0 EUR Euribor +
1,35% 1.35% 07/10/2024 Revolving 3.0 -
Term Loan A (floor 0%) 8 1 500.0 EUR Euribor +
1,75% 1.90% 07/10/2024 Maturity 9.0 1 488.0 2.7 1 490.7
Lease liabilities 17.5 36.3 17.0 53.3
Other borrowings 50.4 6.5 56.9
Total long-term debt 1 574.7 26.2 1 600.9
Financial derivatives 20.1.2 9.3 0.3 9.6
Total long-term debt and
derivative financial instruments 1 584.0 26.5 1 610.5
Negotiable commercial paper
(NEUCP) 400.0 EUR 188.2 188.2
Other borrowings 11.2 11.2
Total short-term debt - 199.4 199.4
Total borrowings 1 584.0 225.9 1 809.9
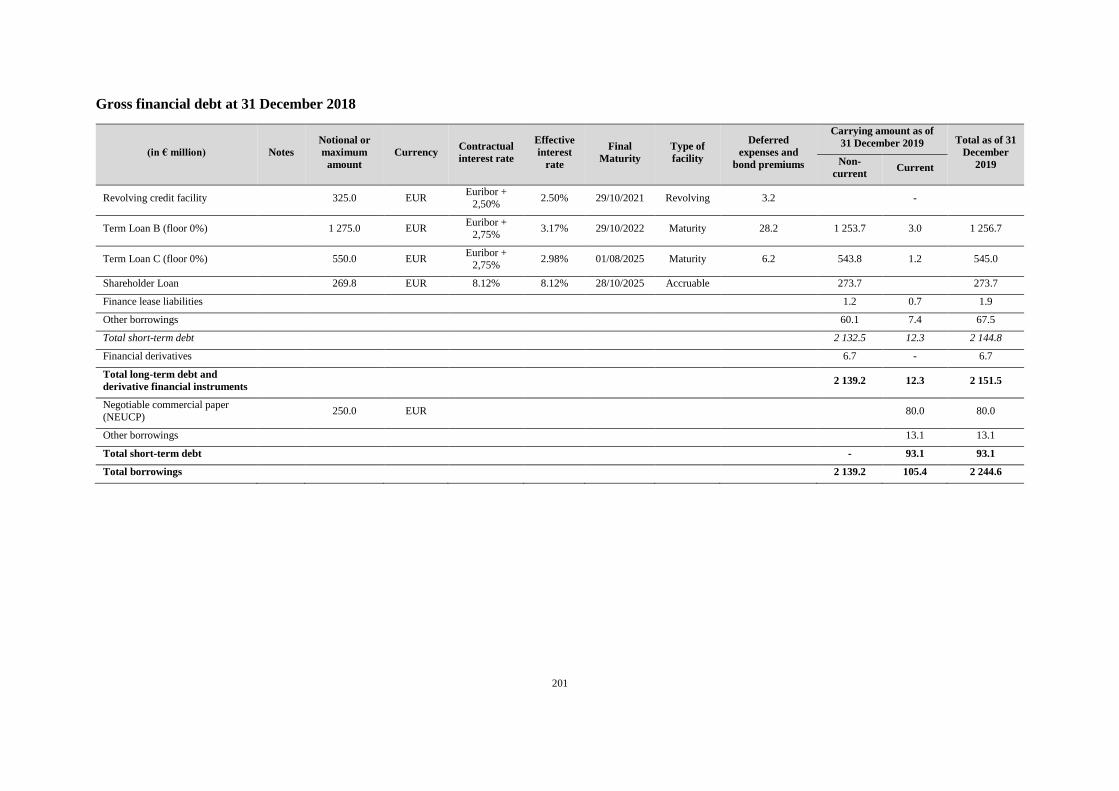
201
Gross financial debt at 31 December 2018
(in € million) Notes
Notional or
maximum
amount
Currency Contractual
interest rate
Effective
interest
rate
Final
Maturity
Type of
facility
Deferred
expenses and
bond premiums
Carrying amount as of
31 December 2019 Total as of 31
December
2019 Non-
current Current
Revolving credit facility 325.0 EUR Euribor +
2,50% 2.50% 29/10/2021 Revolving 3.2 -
Term Loan B (floor 0%) 1 275.0 EUR Euribor +
2,75% 3.17% 29/10/2022 Maturity 28.2 1 253.7 3.0 1 256.7
Term Loan C (floor 0%) 550.0 EUR Euribor +
2,75% 2.98% 01/08/2025 Maturity 6.2 543.8 1.2 545.0
Shareholder Loan 269.8 EUR 8.12% 8.12% 28/10/2025 Accruable 273.7 273.7
Finance lease liabilities 1.2 0.7 1.9
Other borrowings 60.1 7.4 67.5
Total short-term debt 2 132.5 12.3 2 144.8
Financial derivatives 6.7 - 6.7
Total long-term debt and
derivative financial instruments 2 139.2 12.3 2 151.5
Negotiable commercial paper
(NEUCP) 250.0 EUR 80.0 80.0
Other borrowings 13.1 13.1
Total short-term debt - 93.1 93.1
Total borrowings 2 139.2 105.4 2 244.6
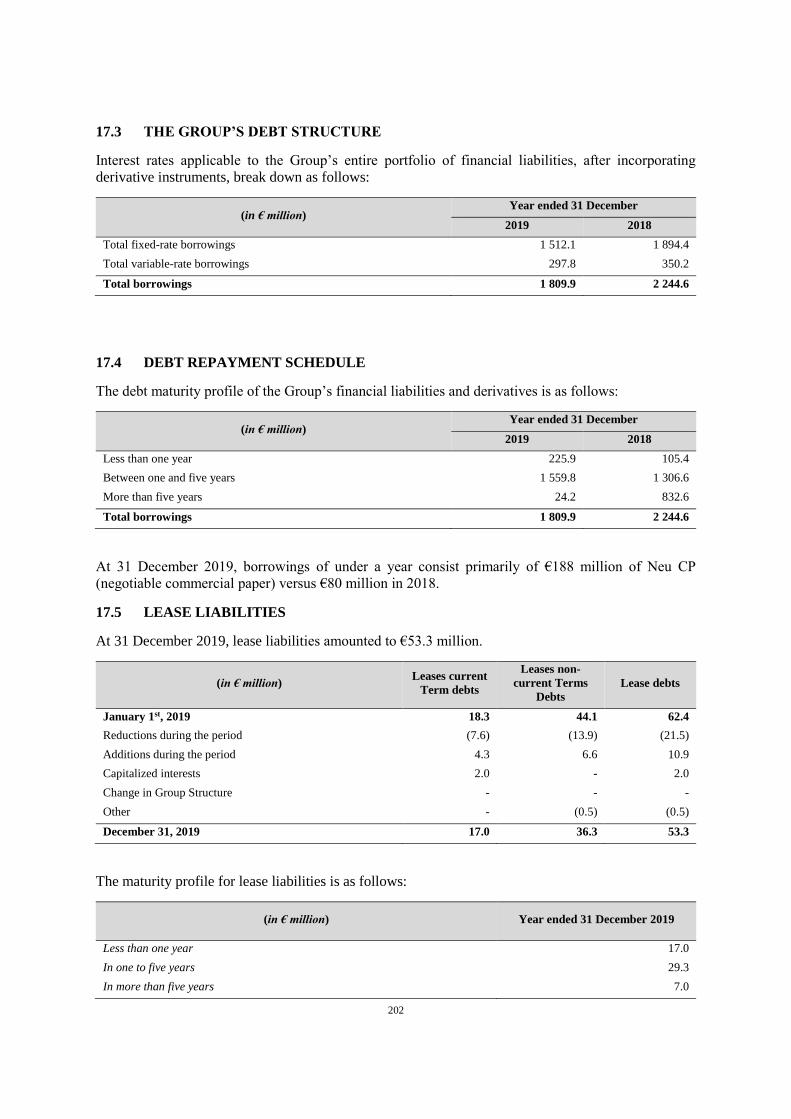
202
17.3 THE GROUP’S DEBT STRUCTURE
Interest rates applicable to the Group’s entire portfolio of financial liabilities, after incorporating
derivative instruments, break down as follows:
(in € million) Year ended 31 December
2019 2018
Total fixed-rate borrowings 1 512.1 1 894.4
Total variable-rate borrowings 297.8 350.2
Total borrowings 1 809.9 2 244.6
17.4 DEBT REPAYMENT SCHEDULE
The debt maturity profile of the Group’s financial liabilities and derivatives is as follows:
(in € million) Year ended 31 December
2019 2018
Less than one year 225.9 105.4
Between one and five years 1 559.8 1 306.6
More than five years 24.2 832.6
Total borrowings 1 809.9 2 244.6
At 31 December 2019, borrowings of under a year consist primarily of €188 million of Neu CP
(negotiable commercial paper) versus €80 million in 2018.
17.5 LEASE LIABILITIES
At 31 December 2019, lease liabilities amounted to €53.3 million.
(in € million) Leases current
Term debts
Leases non-
current Terms
Debts
Lease debts
January 1st, 2019 18.3 44.1 62.4
Reductions during the period (7.6) (13.9) (21.5)
Additions during the period 4.3 6.6 10.9
Capitalized interests 2.0 - 2.0
Change in Group Structure - - -
Other - (0.5) (0.5)
December 31, 2019 17.0 36.3 53.3
The maturity profile for lease liabilities is as follows:
(in € million) Year ended 31 December 2019
Less than one year 17.0
In one to five years 29.3
In more than five years 7.0
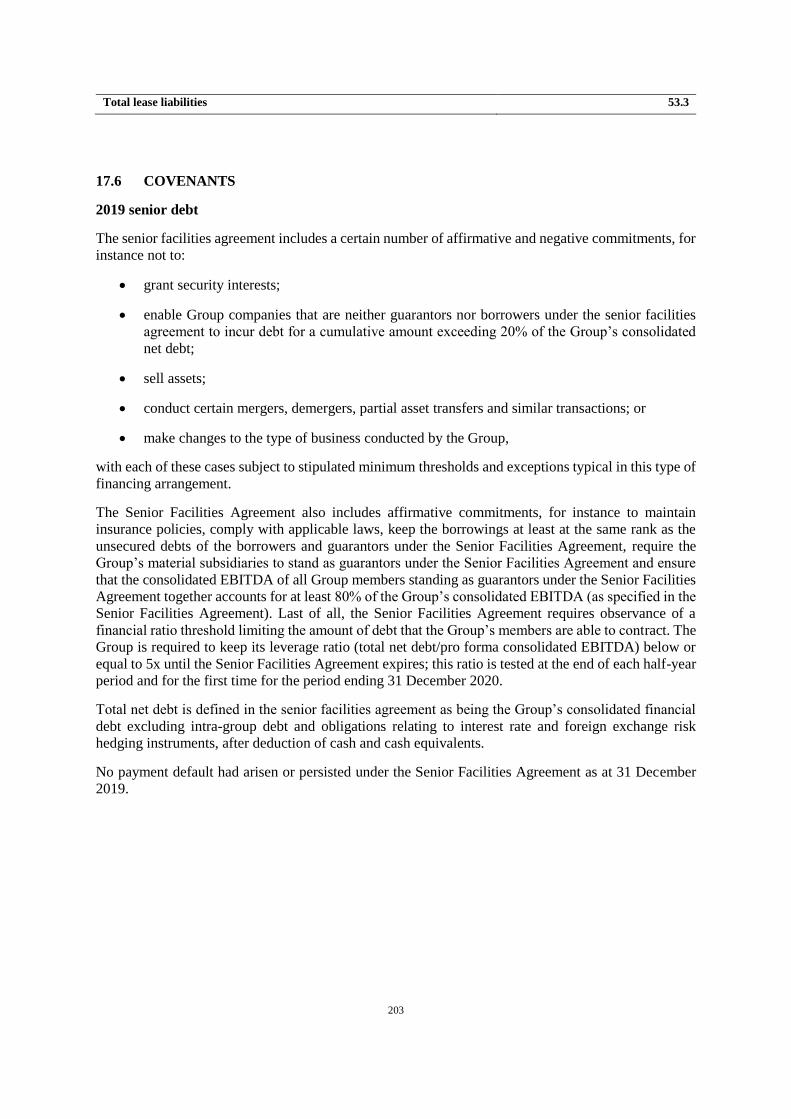
203
Total lease liabilities 53.3
17.6 COVENANTS
2019 senior debt
The senior facilities agreement includes a certain number of affirmative and negative commitments, for
instance not to:
grant security interests;
enable Group companies that are neither guarantors nor borrowers under the senior facilities
agreement to incur debt for a cumulative amount exceeding 20% of the Group’s consolidated
net debt;
sell assets;
conduct certain mergers, demergers, partial asset transfers and similar transactions; or
make changes to the type of business conducted by the Group,
with each of these cases subject to stipulated minimum thresholds and exceptions typical in this type of
financing arrangement.
The Senior Facilities Agreement also includes affirmative commitments, for instance to maintain
insurance policies, comply with applicable laws, keep the borrowings at least at the same rank as the
unsecured debts of the borrowers and guarantors under the Senior Facilities Agreement, require the
Group’s material subsidiaries to stand as guarantors under the Senior Facilities Agreement and ensure
that the consolidated EBITDA of all Group members standing as guarantors under the Senior Facilities
Agreement together accounts for at least 80% of the Group’s consolidated EBITDA (as specified in the
Senior Facilities Agreement). Last of all, the Senior Facilities Agreement requires observance of a
financial ratio threshold limiting the amount of debt that the Group’s members are able to contract. The
Group is required to keep its leverage ratio (total net debt/pro forma consolidated EBITDA) below or
equal to 5x until the Senior Facilities Agreement expires; this ratio is tested at the end of each half-year
period and for the first time for the period ending 31 December 2020.
Total net debt is defined in the senior facilities agreement as being the Group’s consolidated financial
debt excluding intra-group debt and obligations relating to interest rate and foreign exchange risk
hedging instruments, after deduction of cash and cash equivalents.
No payment default had arisen or persisted under the Senior Facilities Agreement as at 31 December
2019.
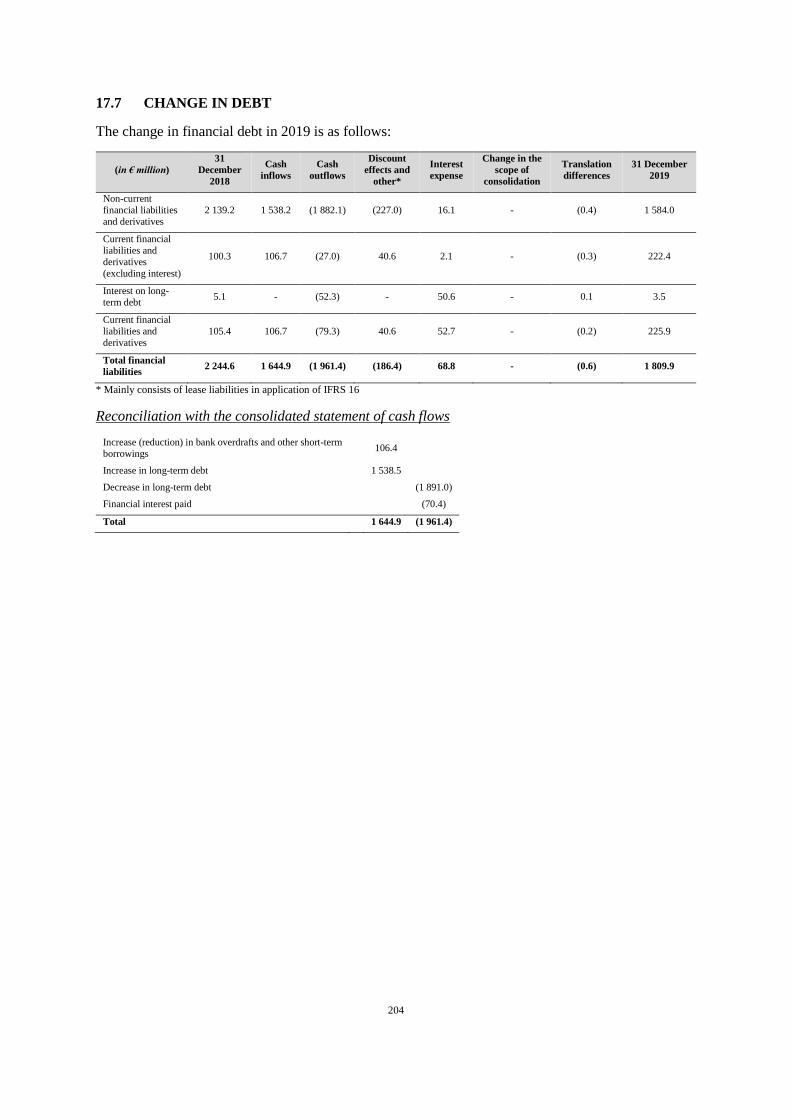
204
17.7 CHANGE IN DEBT
The change in financial debt in 2019 is as follows:
(in € million)
31
December
2018
Cash
inflows
Cash
outflows
Discount
effects and
other*
Interest
expense
Change in the
scope of
consolidation
Translation
differences
31 December
2019
Non-current
financial liabilities
and derivatives
2 139.2 1 538.2 (1 882.1) (227.0) 16.1 - (0.4) 1 584.0
Current financial
liabilities and
derivatives
(excluding interest)
100.3 106.7 (27.0) 40.6 2.1 - (0.3) 222.4
Interest on long-
term debt 5.1 - (52.3) - 50.6 - 0.1 3.5
Current financial
liabilities and
derivatives
105.4 106.7 (79.3) 40.6 52.7 - (0.2) 225.9
Total financial
liabilities 2 244.6 1 644.9 (1 961.4) (186.4) 68.8 - (0.6) 1 809.9
* Mainly consists of lease liabilities in application of IFRS 16
Reconciliation with the consolidated statement of cash flows
Increase (reduction) in bank overdrafts and other short-term
borrowings 106.4
Increase in long-term debt 1 538.5
Decrease in long-term debt (1 891.0)
Financial interest paid (70.4)
Total 1 644.9 (1 961.4)
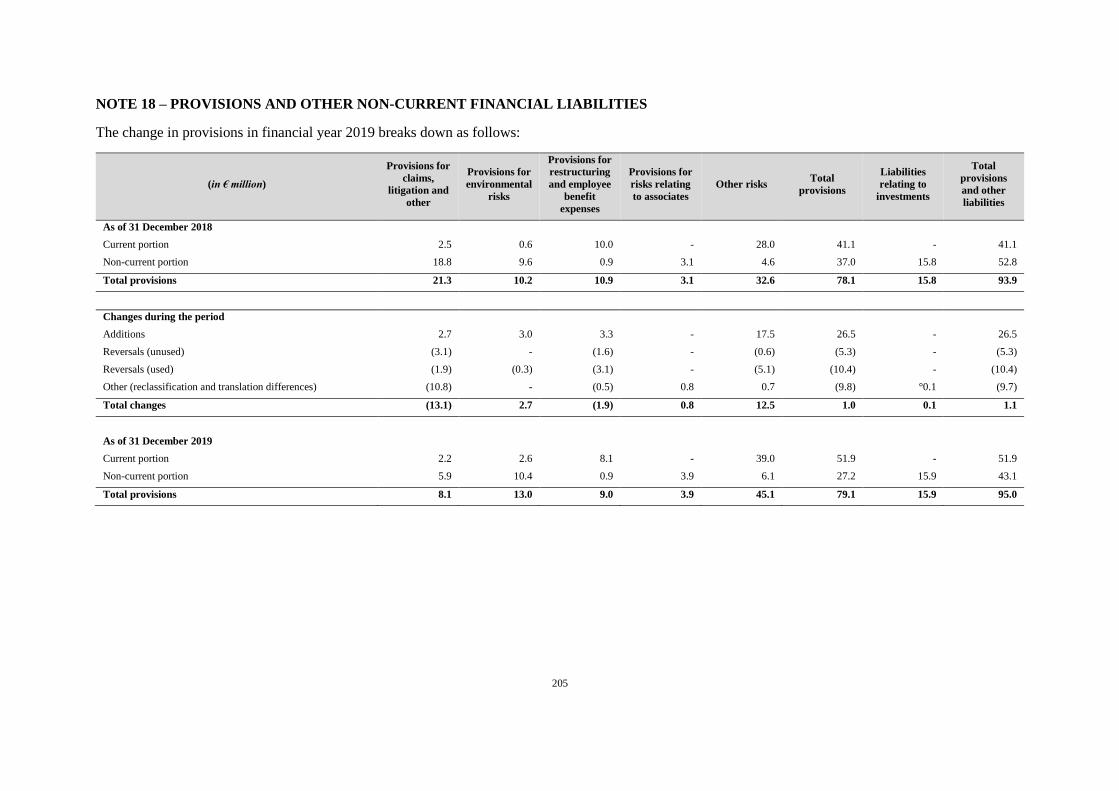
205
NOTE 18 – PROVISIONS AND OTHER NON-CURRENT FINANCIAL LIABILITIES
The change in provisions in financial year 2019 breaks down as follows:
(in € million)
Provisions for
claims,
litigation and
other
Provisions for
environmental
risks
Provisions for
restructuring
and employee
benefit
expenses
Provisions for
risks relating
to associates
Other risks Total
provisions
Liabilities
relating to
investments
Total
provisions
and other
liabilities
As of 31 December 2018
Current portion 2.5 0.6 10.0 - 28.0 41.1 - 41.1
Non-current portion 18.8 9.6 0.9 3.1 4.6 37.0 15.8 52.8
Total provisions 21.3 10.2 10.9 3.1 32.6 78.1 15.8 93.9
Changes during the period
Additions 2.7 3.0 3.3 - 17.5 26.5 - 26.5
Reversals (unused) (3.1) - (1.6) - (0.6) (5.3) - (5.3)
Reversals (used) (1.9) (0.3) (3.1) - (5.1) (10.4) - (10.4)
Other (reclassification and translation differences) (10.8) - (0.5) 0.8 0.7 (9.8) °0.1 (9.7)
Total changes (13.1) 2.7 (1.9) 0.8 12.5 1.0 0.1 1.1
As of 31 December 2019
Current portion 2.2 2.6 8.1 - 39.0 51.9 - 51.9
Non-current portion 5.9 10.4 0.9 3.9 6.1 27.2 15.9 43.1
Total provisions 8.1 13.0 9.0 3.9 45.1 79.1 15.9 95.0

206
On application of IFRIC 23, provisions for tax risks in an amount of €9.5 million were reclassified to
current tax liabilities.
18.1 PROVISIONS AND CONTINGENT LIABILITIES
ACCOUNTING PRINCIPLES
A provision is made when (i) the Group has a legal or current implicit obligation towards a third-party
resulting from a past event, (ii) an outflow of resources will probably be necessary for the Group to
extinguish the obligation, and (iii) the amount of the obligation can be reliably estimated.
Provisions primarily concern obligations associated with litigation, restructuring plans and other risks
identified with respect to the Group’s operations. Provisions with settlement dates that can be reliably
estimated are discounted.
When a current obligation is unlikely to exist, the Group recognises a contingent liability, unless there
is little likelihood of an outflow of resources embodying an economic benefit.
Contingent liabilities assumed during a business combination are recognised at their fair value on the
acquisition date.
Under applicable regulations on carbon dioxide (CO2) emission allowances, and in light of the Group’s
allowances deficit, the Group accordingly recorded provisions in financial years 2018 and 2019.
When the Group is in deficit (CO2 allowances to be surrendered for CO2 emitted during the year in
excess of the stock of CO2 emission allowances allocated free of charge and featuring in the securities
accounts at the closing date), it recognises a provision to cover the expected allowances deficit so as to
be able to surrender the allowances in April of the following year. Measurement of the provision takes
into account the price of forward purchases made for the following year and the spot price on
31 December of the current year for the balance not covered by forward purchases.
CO2 emission allowances allocated free of charge or purchased are recognised in the Group’s inventory
of raw materials.
ESTIMATES AND ASSUMPTIONS MADE BY MANAGEMENT
Estimates primarily concern valuations of liabilities and contingent liabilities, especially provisions for
litigation and other Group risks.
18.1.1 Provisions for claims, litigation and other
These provisions mainly concern provisions for claims, litigation and other commercial risks, primarily
in France and Italy.
Litigation between Verallia Italia and Nelson Servizi
In December 2014, Verallia Italia, as a supplier, and Nelson Servizi, as a distributor, renewed their
previously agreed distribution contract and established mutual undertakings to sell and buy standard
and customised bottles for the Cuban market for the years 2015, 2016 and 2017.
During the last few months of 2015, the Group decided to cease all commercial activity for the Cuban
market starting from the second half of 2016. Verallia Italia therefore offered Nelson Servizi an out-of-
court settlement to terminate their ongoing relationship. In response, Nelson Servizi suspended all
payments to Verallia Italia.
In February 2016, Verallia Italia informed Nelson Servizi that said distribution contract would be
cancelled if Nelson Servizi did not settle its debts towards it. That same month, Verallia Italia received
a summons from Nelson Servizi ordering it (i) to fulfil its obligations under the distribution contract
207
that was renewed in December 2014, (ii) to compensate Nelson Servizi for damages resulting from the
breach of the distribution contract and from Verallia Italia’s behaviour, and (iii) to compensate Nelson
Servizi for damages resulting from Nelson Servizi’s economic dependence on Verallia Italia. Nelson
Servizi thus requested that Verallia Italia be ordered to pay damages amounting to €11 million.
At the closing date, the litigation launched by Nelson Servizi remains under investigation.
A provision was recognised accordingly in the amount of €4.3 million at 31 December 2019 and 2018.
18.1.2 Provisions for environmental risks
Provisions for environmental risks cover the costs of environmental protection measures, asbestos-
related costs and the costs of waste disposal relating to the reconstruction of furnaces.
Asbestos-related litigation
Charges of gross negligence (inexcusable fault)
In France, since the late 1990s, several former and current employees of the Group or their assignees
have filed lawsuits against the Group’s French subsidiary, Verallia France, for gross negligence; their
aim has been to obtain damages, in addition to the compensation they received from the French social
security authorities, along with an increase in said compensation for occupational illnesses resulting
from their alleged exposure to asbestos-containing materials. In recent years, the French courts have
responded favourably to some of their demands. At 31 December 2019, the amount provisioned in
respect of these claims stand at €1.1 million.
Classification of the Cognac facility as an asbestos-contaminated site
On February 4, 2019, the Bordeaux Administrative Court of Appeal reiterated the ruling handed down
by the Administrative Court of Poitiers not to place the Cognac facility on the list for the period 1964-
1975. The time-limit to appeal against this decision has now expired and the case is closed.
The Cognac facility has therefore not been placed on the list of manufacturing, spraying and insulation
facilities involving asbestos.
Claims for compensation for anxiety
At 31 December 2019, 87 lawsuits had been filed by employees or former employees of the Group
claiming compensation for anxiety caused by their alleged exposure to asbestos-containing materials at
the Group’s French facilities.
At the closing date, none of the plaintiffs had claimed to have fallen ill as a result of exposure to
asbestos-containing materials.
A provision has been recognised for this risk in the amount of €1.5 million.
18.1.3 Provisions for restructuring and personnel expenses
Provisions for restructuring and personnel expenses amount to €9 million at 31 December 2019 and
€10.9 million at 31 December 2018.
They mainly concern Brazil (€6.3 million versus €8.1 million at 31 December 2018) following the
closure of the Sao Paolo production plant.
18.1.4 Provisions for other risks
Provisions for other risks mainly concern the provision relating to the Group’s deficit with respect to
its CO2 allowances for the period covering Phase III (2013-2020) of the “Quotas Directive”, amended
by Directive 29/2009/EC.

208
With respect to provisions for CO2 allowance deficits, emission projections were calculated for Phase
III of the European plan ending in 2020 and were based on the detailed estimates made periodically by
the Group’s industrial management. Management measures the Group’s capacity utilisation according
to energy prices (fuel and gas), the markets and any upgrades made to its production facilities.
In light of the Group’s allowances deficit, a provision was recognised in financial years 2019 and 2018
in the amounts of €37.7 million and €27.6 million.
Moreover, in order to secure the prices at which it will have to acquire allowances, and in preparation
for the end of Phase III, the Group has made forward purchases of carbon dioxide allowances on the
market for a total amount at 31 December 2019 of €34.9 million, corresponding to its expected deficit.
The settlement of forward purchases and delivery of allowances will result in a cash outflow for the
Group (it will accordingly record a reversal of the aforementioned provision corresponding to the
amount of said outflows), mainly in 2021.
Measurement of the provision takes into account the price of forward purchases made by the Group and
the spot price at the closing date for the balance not covered by forward purchases.
Under Phase IV (2021-2030), as defined by the Quotas Directive, the amount of allowances allocated
to the Group free of charge will not be known until the start of 2021 for the 2021-2025 period and the
start of 2026 for the 2026-2030 period. Despite the uncertainty surrounding the number of allowances
that will be allocated to it free of charge under Phase IV, the Group already expects the number allocated
to it free of charge to be slightly lower than under Phase III and, in any case, it believes it will probably
not be allocated enough to meet its allowance return obligations in respect of its carbon dioxide
emissions, which means it will have to continue purchasing large amounts of allowances on the market.
In preparation for Phase IV, the group has already made forward purchases of carbon dioxide
allowances on the market for a total amount at 31 December 2019 of €24.6 million.
18.1.5 Risks relating to associates
Context
In 2013, Verallia Brasil, a Company subsidiary, set up a joint venture governed by Brazilian law
(Industria Vidreira de Nordeste – “IVN”) with a local partner, Ipiaram Empreendimentos e
Participações Ltda (Ipiaram). Verallia Brasil held a majority stake in this joint venture, the purpose of
which was to build and operate a glass manufacturing facility in the Brazilian state of Sergipe. The plant
came onstream in 2015.
Verallia Brasil’s shareholding was equity-accounted and then sold in October 2018.
Bank guarantees / Shareholder loans
In addition, at 31 December 2016, the shareholder loans traditionally granted to IVN by Verallia Brasil
were fully impaired in the amount of 55.6 million Brazilian reals (corresponding to €15 million at the
average exchange rate in 2016). In 2018, this impairment loss was fully recovered following the disposal
of the shareholding to an amount of 55.6 million Brazilian reals (corresponding to €13 million at the
average exchange rate of 2018) (Note 6.2).
Disposal
In October 2018, the Group and Ipiaram completed the disposal of their shareholdings in IVN. A
€14 million gain was recognised in the financial year 2018 for this disposal.
Arbitration
In January 2017, Ipiaram launched arbitration proceedings with the International Chamber of
Commerce (ICC) against Verallia Brasil regarding the interpretation of certain provisions in the
209
partnership agreements signed by the two parties; Ipiaram felt entitled to exercise the undertakings to
purchase granted by Verallia Brasil under these partnership agreements.
At the closing date, these arbitration proceedings were still under way. At 31 December 2019, Ipiaram’s
claim is estimated at 104 million Brazilian reals in total damages (i.e. approximately €23 million at the
closing exchange rate on 31 December 2019); the Group, meanwhile, considers that there are no
grounds for the claim. No provisions have been recognised for this risk.
18.2 OTHER NON-CURRENT FINANCIAL LIABILITIES
ACCOUNTING PRINCIPLES
The other non-current financial liabilities primarily consist of put options granted to minority
shareholders in subsidiaries and liabilities relating to the acquisition of securities in the Group’s
companies, including additional considerations for acquisitions made. Liabilities relating to the put
options correspond to the present value of their estimated exercise price, with a corresponding decrease
in interests not conferring control and in equity attributable to owners of the parent company. Any
subsequent fair value adjustment of the liability is recognised through an adjustment to equity.
Verallia Deutschland AG
Other non-current financial liabilities include a liability towards Verallia Deutschland AG’s minority
shareholders.
In December 2016, Verallia Deutschland AG, as the controlled entity, and Horizon Holdings Germany
GmbH, as the controlling entity, signed a Domination and Profit & Loss Transfer Agreement
(“DPLTA”) approved by the local authorities.
At 31 December 2019, the Group held 96.74% of the capital and voting rights in Verallia Deutschland
AG, its German-listed subsidiary (96.73% at 31 December 2018).
After signing this agreement, and in accordance with applicable German law, Horizon Holdings
Germany GmbH agreed to purchase all the Verallia Deutschland AG shares it did not already own for
€433.02 per share. To date, this offer still applies, but some of Verallia Deutschland AG’s minority
shareholders dispute the valuation on which the price per share offered was based. A liability relating
to the obligation to buy out these minority shareholders was therefore recognised for a total present
value of €12.9 million at 31 December 2019 (€12.3 million at 31 December 2018). This amount is based
on the assumption that 100% of minority shareholders will tender their shares to the offer made by
Horizon Holdings Germany GmbH to purchase their shares for €433.02 per share as proposed in 2016.
Moreover, the Domination and Profit & Loss Transfer Agreement provides for annual flat-rate
compensation (in the form of dividends per share paid each year) payable to Verallia Deutschland AG’s
minority shareholders. A liability relating to the obligation to pay this compensation for 5 years was
therefore recognised for a total present value of €2.1 million at 31 December 2019 (€2.7 million at
31 December 2018). The minority shareholders also dispute the amount of annual flat-rate
compensation provided for in said agreement.
On September 24, 2018, the Stuttgart district court rejected the requests made by the minority
shareholders. The minority shareholders appealed, and the case was sent to the Stuttgart regional high
court where it is still pending.
Therefore, total liabilities relating to the DPLTA amounted to €15 million at 31 December 2019 versus
€15 million at 31 December 2018.

210
NOTE 19 – PROVISIONS FOR PENSIONS AND OTHER EMPLOYEE BENEFITS
Provisions for pensions and other employee benefits break down as follows:
(in € million) Note 31 December
2019 2018
Annuities payable to plan beneficiaries 80.8 77.3
Flat-rate compensation 42.1 31.5
Post-employment medical benefits 5.9 5.4
Provisions for pensions and other liabilities 19.1 128.8 114.2
Other long-term benefits 19.2 4.2 3.2
Trade receivables and other current assets 133.0 117.4
The Group’s workforce breaks down as follows:
31 December
2019 2018
Managers 903 869
Employees 2 207 2 252
Manual workers 6 595 6 629
Total 9 705 9 750
The workforce presented corresponds to the average number of people employed by the Group over the
year.
19.1 PENSION LIABILITIES AND OTHER POST-EMPLOYMENT BENEFIT
LIABILITIES
ACCOUNTING PRINCIPLES
Defined benefit plans
Defined benefit pension plans refer to plans where the Group is committed officially or through an
implicit obligation to an amount or level of benefits and therefore bears the associated medium- or long-
term risk.
After retiring, the Group’s former employees are entitled to pension benefits in accordance with
applicable laws and regulations in the respective countries in which the Group operates. Supplemental
pension liabilities also apply in some of the Group’s companies, in France and also in other countries.
The group’s liabilities with respect to pensions and retirement benefits are established at the end of the
reporting period with the assistance of independent actuaries, on an actuarial basis, using the projected
unit credit method which incorporates projected final salaries on retirement and economic conditions
in each country. These liabilities can be funded by pension funds or plan assets, and a provision is
recognised in the consolidated balance sheet for the portion not funded by assets.
The Group contributes to defined benefit plans which determine the level of retirement benefits an
employee will receive on their retirement. These plans mainly concern Germany, Spain, Italy and
France.
In France, employees receive retirement benefits depending on their years of service and their last salary
on the date of their retirement. This flat-rate amount is determined according to the applicable collective
agreement.
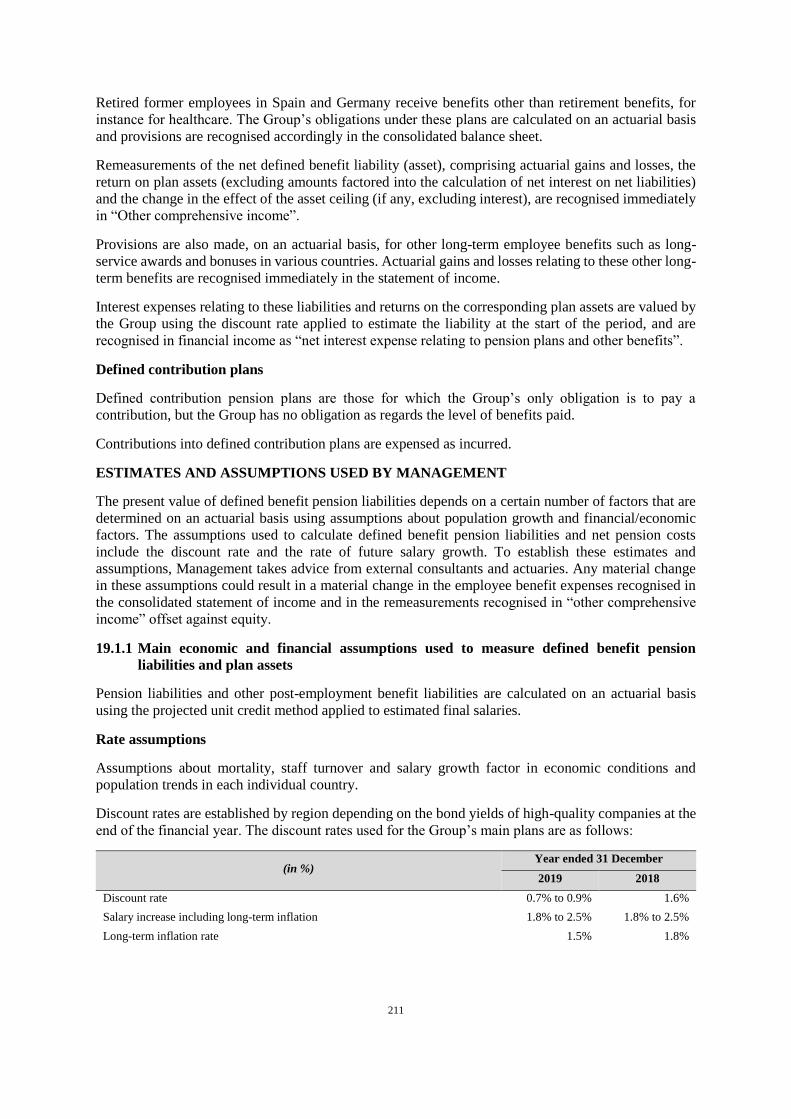
211
Retired former employees in Spain and Germany receive benefits other than retirement benefits, for
instance for healthcare. The Group’s obligations under these plans are calculated on an actuarial basis
and provisions are recognised accordingly in the consolidated balance sheet.
Remeasurements of the net defined benefit liability (asset), comprising actuarial gains and losses, the
return on plan assets (excluding amounts factored into the calculation of net interest on net liabilities)
and the change in the effect of the asset ceiling (if any, excluding interest), are recognised immediately
in “Other comprehensive income”.
Provisions are also made, on an actuarial basis, for other long-term employee benefits such as long-
service awards and bonuses in various countries. Actuarial gains and losses relating to these other long-
term benefits are recognised immediately in the statement of income.
Interest expenses relating to these liabilities and returns on the corresponding plan assets are valued by
the Group using the discount rate applied to estimate the liability at the start of the period, and are
recognised in financial income as “net interest expense relating to pension plans and other benefits”.
Defined contribution plans
Defined contribution pension plans are those for which the Group’s only obligation is to pay a
contribution, but the Group has no obligation as regards the level of benefits paid.
Contributions into defined contribution plans are expensed as incurred.
ESTIMATES AND ASSUMPTIONS USED BY MANAGEMENT
The present value of defined benefit pension liabilities depends on a certain number of factors that are
determined on an actuarial basis using assumptions about population growth and financial/economic
factors. The assumptions used to calculate defined benefit pension liabilities and net pension costs
include the discount rate and the rate of future salary growth. To establish these estimates and
assumptions, Management takes advice from external consultants and actuaries. Any material change
in these assumptions could result in a material change in the employee benefit expenses recognised in
the consolidated statement of income and in the remeasurements recognised in “other comprehensive
income” offset against equity.
19.1.1 Main economic and financial assumptions used to measure defined benefit pension
liabilities and plan assets
Pension liabilities and other post-employment benefit liabilities are calculated on an actuarial basis
using the projected unit credit method applied to estimated final salaries.
Rate assumptions
Assumptions about mortality, staff turnover and salary growth factor in economic conditions and
population trends in each individual country.
Discount rates are established by region depending on the bond yields of high-quality companies at the
end of the financial year. The discount rates used for the Group’s main plans are as follows:
(in %) Year ended 31 December
2019 2018
Discount rate 0.7% to 0.9% 1.6%
Salary increase including long-term inflation 1.8% to 2.5% 1.8% to 2.5%
Long-term inflation rate 1.5% 1.8%
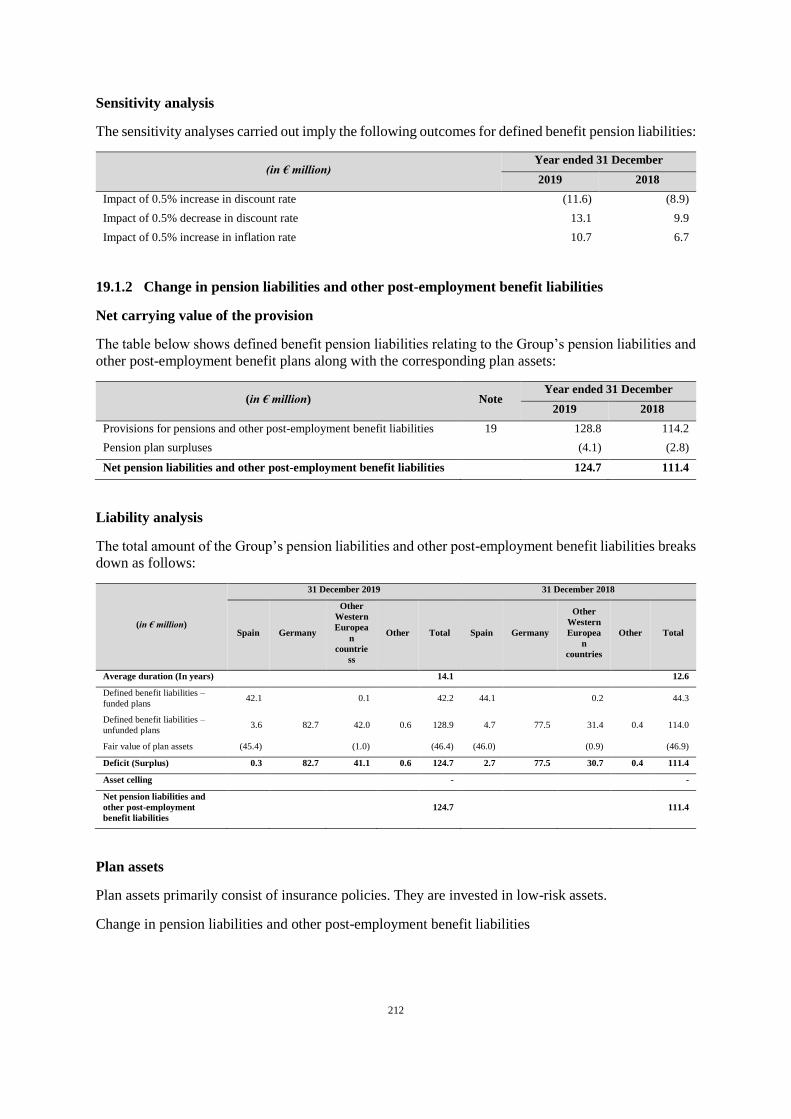
212
Sensitivity analysis
The sensitivity analyses carried out imply the following outcomes for defined benefit pension liabilities:
(in € million) Year ended 31 December
2019 2018
Impact of 0.5% increase in discount rate (11.6) (8.9)
Impact of 0.5% decrease in discount rate 13.1 9.9
Impact of 0.5% increase in inflation rate 10.7 6.7
19.1.2 Change in pension liabilities and other post-employment benefit liabilities
Net carrying value of the provision
The table below shows defined benefit pension liabilities relating to the Group’s pension liabilities and
other post-employment benefit plans along with the corresponding plan assets:
(in € million) Note Year ended 31 December
2019 2018
Provisions for pensions and other post-employment benefit liabilities 19 128.8 114.2
Pension plan surpluses (4.1) (2.8)
Net pension liabilities and other post-employment benefit liabilities 124.7 111.4
Liability analysis
The total amount of the Group’s pension liabilities and other post-employment benefit liabilities breaks
down as follows:
(in € million)
31 December 2019 31 December 2018
Spain Germany
Other
Western
Europea
n
countrie
ss
Other Total Spain Germany
Other
Western
Europea
n
countries
Other Total
Average duration (In years) 14.1 12.6
Defined benefit liabilities –
funded plans 42.1 0.1 42.2 44.1 0.2 44.3
Defined benefit liabilities –
unfunded plans 3.6 82.7 42.0 0.6 128.9 4.7 77.5 31.4 0.4 114.0
Fair value of plan assets (45.4) (1.0) (46.4) (46.0) (0.9) (46.9)
Deficit (Surplus) 0.3 82.7 41.1 0.6 124.7 2.7 77.5 30.7 0.4 111.4
Asset celling - -
Net pension liabilities and
other post-employment
benefit liabilities
124.7 111.4
Plan assets
Plan assets primarily consist of insurance policies. They are invested in low-risk assets.
Change in pension liabilities and other post-employment benefit liabilities
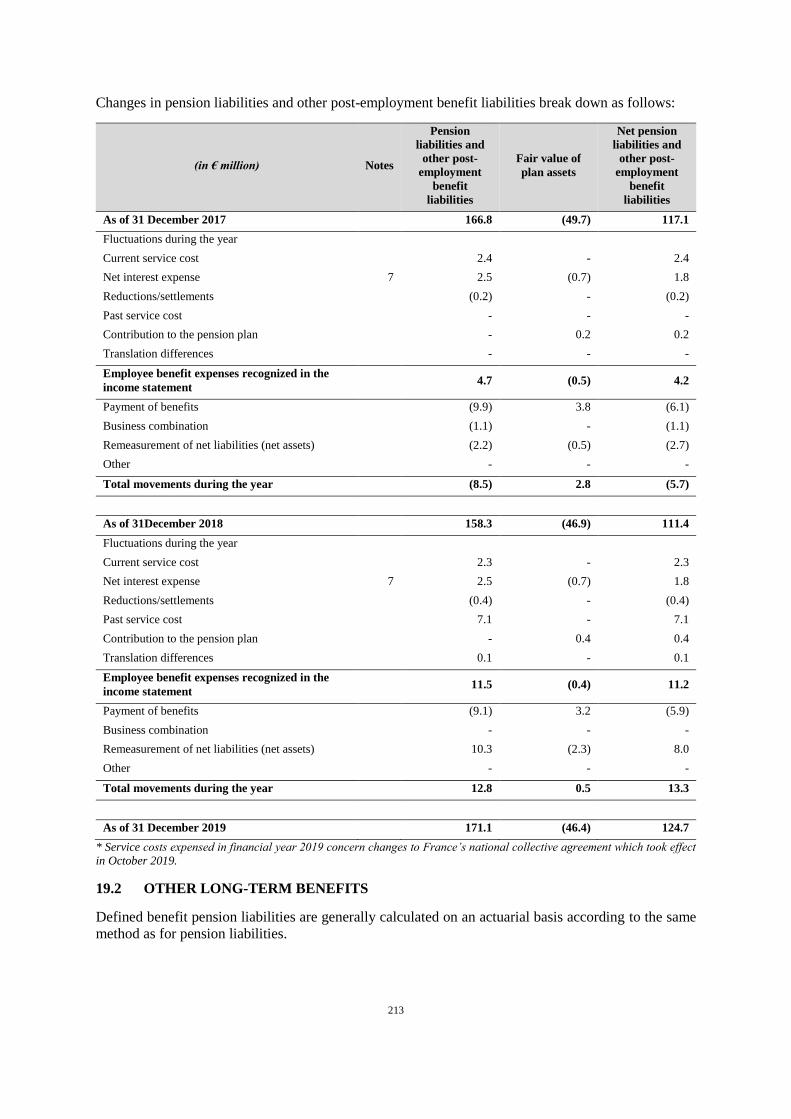
213
Changes in pension liabilities and other post-employment benefit liabilities break down as follows:
(in € million) Notes
Pension
liabilities and
other post-
employment
benefit
liabilities
Fair value of
plan assets
Net pension
liabilities and
other post-
employment
benefit
liabilities
As of 31 December 2017 166.8 (49.7) 117.1
Fluctuations during the year
Current service cost 2.4 - 2.4
Net interest expense 7 2.5 (0.7) 1.8
Reductions/settlements (0.2) - (0.2)
Past service cost - - -
Contribution to the pension plan - 0.2 0.2
Translation differences - - -
Employee benefit expenses recognized in the
income statement
4.7 (0.5) 4.2
Payment of benefits (9.9) 3.8 (6.1)
Business combination (1.1) - (1.1)
Remeasurement of net liabilities (net assets) (2.2) (0.5) (2.7)
Other - - -
Total movements during the year (8.5) 2.8 (5.7)
As of 31December 2018 158.3 (46.9) 111.4
Fluctuations during the year
Current service cost 2.3 - 2.3
Net interest expense 7 2.5 (0.7) 1.8
Reductions/settlements (0.4) - (0.4)
Past service cost 7.1 - 7.1
Contribution to the pension plan - 0.4 0.4
Translation differences 0.1 - 0.1
Employee benefit expenses recognized in the
income statement
11.5 (0.4) 11.2
Payment of benefits (9.1) 3.2 (5.9)
Business combination - - -
Remeasurement of net liabilities (net assets) 10.3 (2.3) 8.0
Other - - -
Total movements during the year 12.8 0.5 13.3
As of 31 December 2019 171.1 (46.4) 124.7
* Service costs expensed in financial year 2019 concern changes to France’s national collective agreement which took effect
in October 2019.
19.2 OTHER LONG-TERM BENEFITS
Defined benefit pension liabilities are generally calculated on an actuarial basis according to the same
method as for pension liabilities.
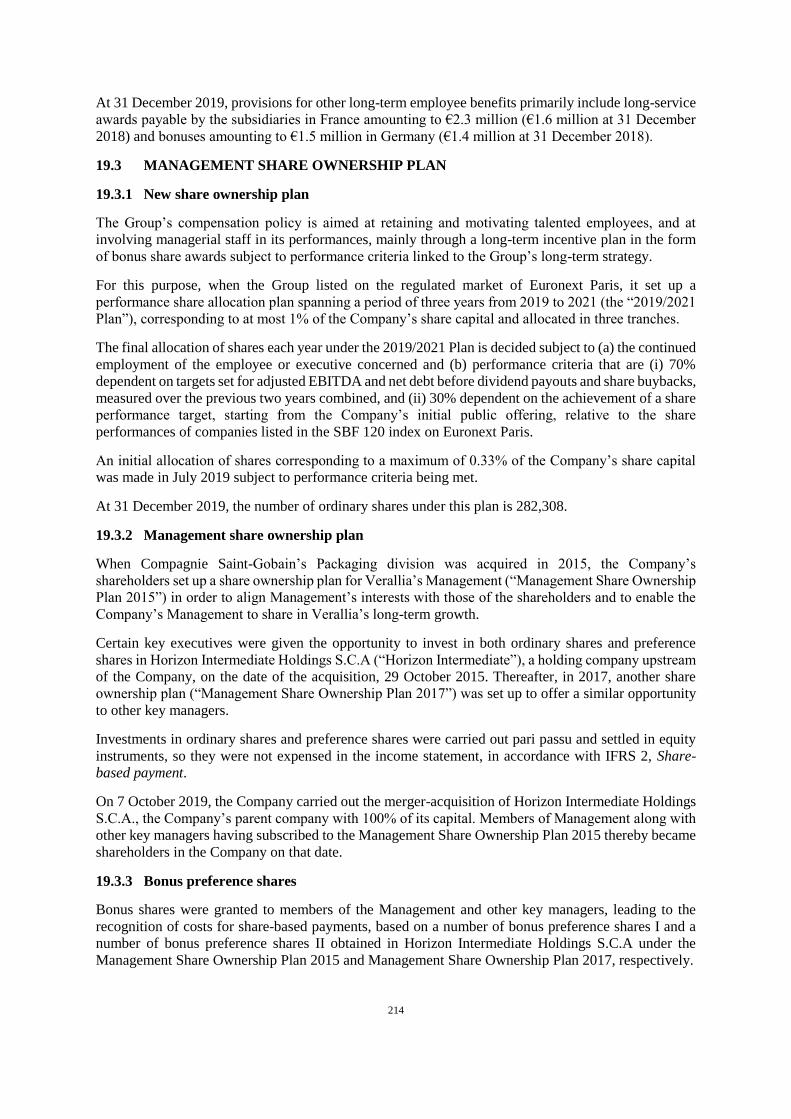
214
At 31 December 2019, provisions for other long-term employee benefits primarily include long-service
awards payable by the subsidiaries in France amounting to €2.3 million (€1.6 million at 31 December
2018) and bonuses amounting to €1.5 million in Germany (€1.4 million at 31 December 2018).
19.3 MANAGEMENT SHARE OWNERSHIP PLAN
19.3.1 New share ownership plan
The Group’s compensation policy is aimed at retaining and motivating talented employees, and at
involving managerial staff in its performances, mainly through a long-term incentive plan in the form
of bonus share awards subject to performance criteria linked to the Group’s long-term strategy.
For this purpose, when the Group listed on the regulated market of Euronext Paris, it set up a
performance share allocation plan spanning a period of three years from 2019 to 2021 (the “2019/2021
Plan”), corresponding to at most 1% of the Company’s share capital and allocated in three tranches.
The final allocation of shares each year under the 2019/2021 Plan is decided subject to (a) the continued
employment of the employee or executive concerned and (b) performance criteria that are (i) 70%
dependent on targets set for adjusted EBITDA and net debt before dividend payouts and share buybacks,
measured over the previous two years combined, and (ii) 30% dependent on the achievement of a share
performance target, starting from the Company’s initial public offering, relative to the share
performances of companies listed in the SBF 120 index on Euronext Paris.
An initial allocation of shares corresponding to a maximum of 0.33% of the Company’s share capital
was made in July 2019 subject to performance criteria being met.
At 31 December 2019, the number of ordinary shares under this plan is 282,308.
19.3.2 Management share ownership plan
When Compagnie Saint-Gobain’s Packaging division was acquired in 2015, the Company’s
shareholders set up a share ownership plan for Verallia’s Management (“Management Share Ownership
Plan 2015”) in order to align Management’s interests with those of the shareholders and to enable the
Company’s Management to share in Verallia’s long-term growth.
Certain key executives were given the opportunity to invest in both ordinary shares and preference
shares in Horizon Intermediate Holdings S.C.A (“Horizon Intermediate”), a holding company upstream
of the Company, on the date of the acquisition, 29 October 2015. Thereafter, in 2017, another share
ownership plan (“Management Share Ownership Plan 2017”) was set up to offer a similar opportunity
to other key managers.
Investments in ordinary shares and preference shares were carried out pari passu and settled in equity
instruments, so they were not expensed in the income statement, in accordance with IFRS 2, Share-
based payment.
On 7 October 2019, the Company carried out the merger-acquisition of Horizon Intermediate Holdings
S.C.A., the Company’s parent company with 100% of its capital. Members of Management along with
other key managers having subscribed to the Management Share Ownership Plan 2015 thereby became
shareholders in the Company on that date.
19.3.3 Bonus preference shares
Bonus shares were granted to members of the Management and other key managers, leading to the
recognition of costs for share-based payments, based on a number of bonus preference shares I and a
number of bonus preference shares II obtained in Horizon Intermediate Holdings S.C.A under the
Management Share Ownership Plan 2015 and Management Share Ownership Plan 2017, respectively.
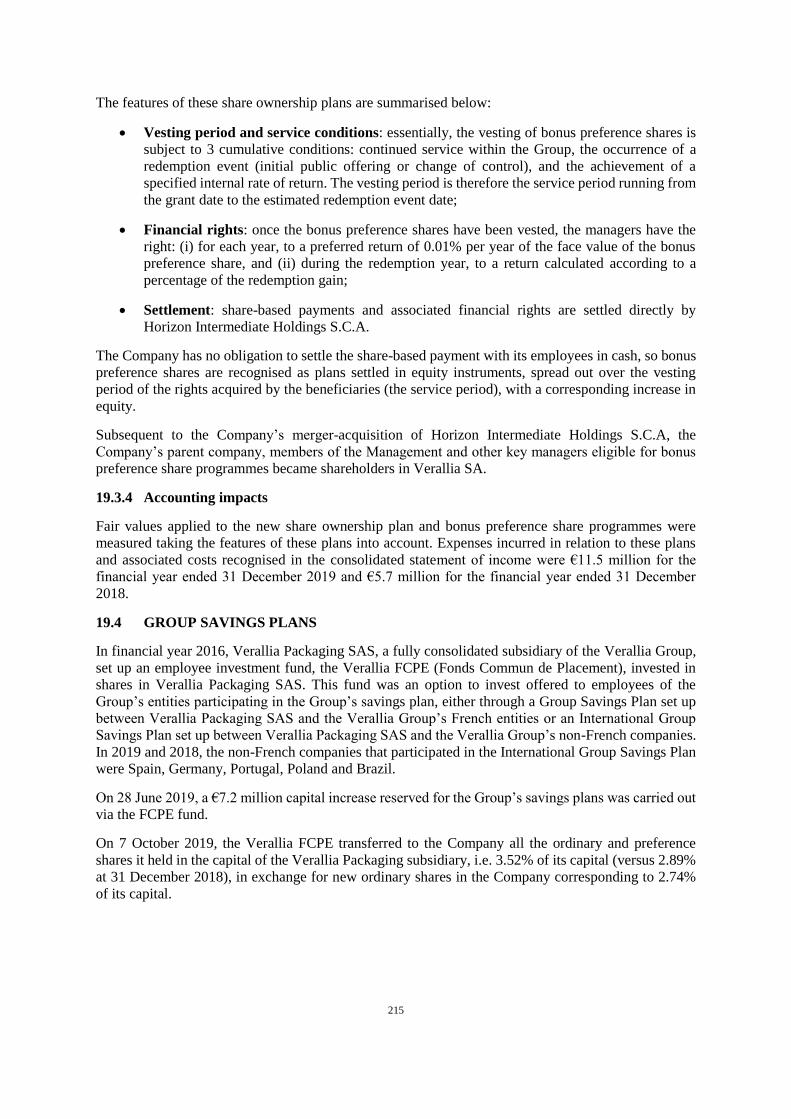
215
The features of these share ownership plans are summarised below:
Vesting period and service conditions: essentially, the vesting of bonus preference shares is
subject to 3 cumulative conditions: continued service within the Group, the occurrence of a
redemption event (initial public offering or change of control), and the achievement of a
specified internal rate of return. The vesting period is therefore the service period running from
the grant date to the estimated redemption event date;
Financial rights: once the bonus preference shares have been vested, the managers have the
right: (i) for each year, to a preferred return of 0.01% per year of the face value of the bonus
preference share, and (ii) during the redemption year, to a return calculated according to a
percentage of the redemption gain;
Settlement: share-based payments and associated financial rights are settled directly by
Horizon Intermediate Holdings S.C.A.
The Company has no obligation to settle the share-based payment with its employees in cash, so bonus
preference shares are recognised as plans settled in equity instruments, spread out over the vesting
period of the rights acquired by the beneficiaries (the service period), with a corresponding increase in
equity.
Subsequent to the Company’s merger-acquisition of Horizon Intermediate Holdings S.C.A, the
Company’s parent company, members of the Management and other key managers eligible for bonus
preference share programmes became shareholders in Verallia SA.
19.3.4 Accounting impacts
Fair values applied to the new share ownership plan and bonus preference share programmes were
measured taking the features of these plans into account. Expenses incurred in relation to these plans
and associated costs recognised in the consolidated statement of income were €11.5 million for the
financial year ended 31 December 2019 and €5.7 million for the financial year ended 31 December
2018.
19.4 GROUP SAVINGS PLANS
In financial year 2016, Verallia Packaging SAS, a fully consolidated subsidiary of the Verallia Group,
set up an employee investment fund, the Verallia FCPE (Fonds Commun de Placement), invested in
shares in Verallia Packaging SAS. This fund was an option to invest offered to employees of the
Group’s entities participating in the Group’s savings plan, either through a Group Savings Plan set up
between Verallia Packaging SAS and the Verallia Group’s French entities or an International Group
Savings Plan set up between Verallia Packaging SAS and the Verallia Group’s non-French companies.
In 2019 and 2018, the non-French companies that participated in the International Group Savings Plan
were Spain, Germany, Portugal, Poland and Brazil.
On 28 June 2019, a €7.2 million capital increase reserved for the Group’s savings plans was carried out
via the FCPE fund.
On 7 October 2019, the Verallia FCPE transferred to the Company all the ordinary and preference
shares it held in the capital of the Verallia Packaging subsidiary, i.e. 3.52% of its capital (versus 2.89%
at 31 December 2018), in exchange for new ordinary shares in the Company corresponding to 2.74%
of its capital.
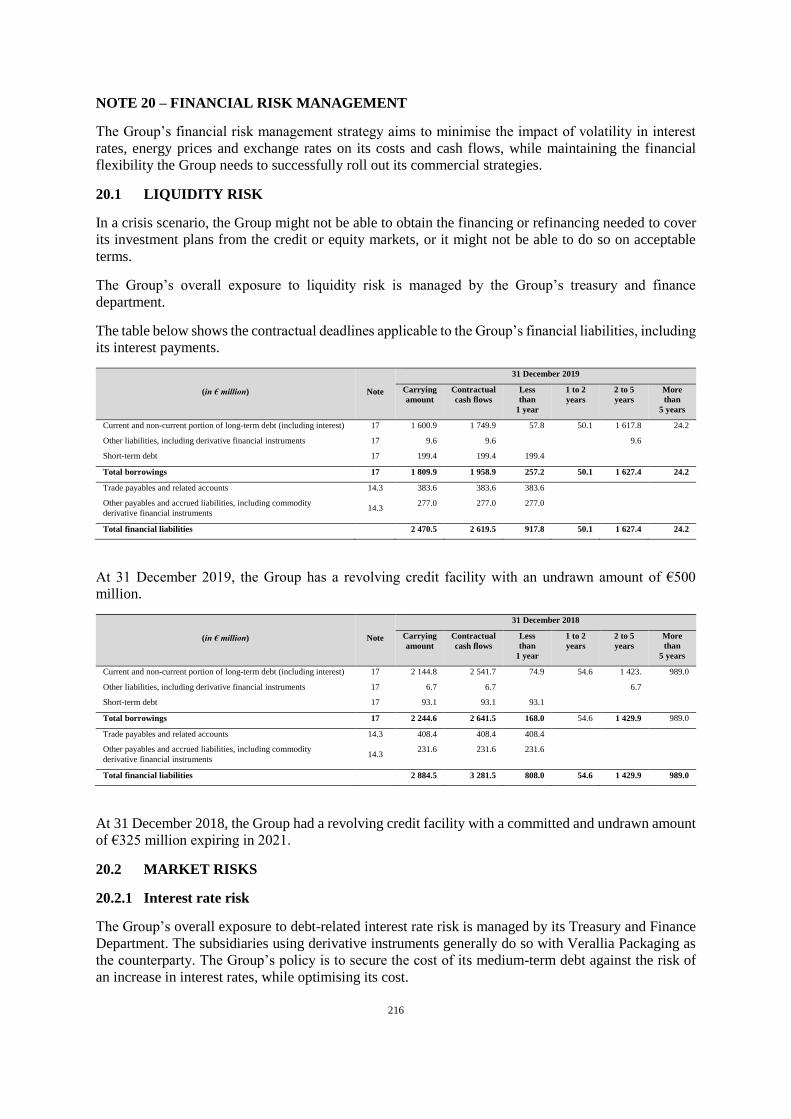
216
NOTE 20 – FINANCIAL RISK MANAGEMENT
The Group’s financial risk management strategy aims to minimise the impact of volatility in interest
rates, energy prices and exchange rates on its costs and cash flows, while maintaining the financial
flexibility the Group needs to successfully roll out its commercial strategies.
20.1 LIQUIDITY RISK
In a crisis scenario, the Group might not be able to obtain the financing or refinancing needed to cover
its investment plans from the credit or equity markets, or it might not be able to do so on acceptable
terms.
The Group’s overall exposure to liquidity risk is managed by the Group’s treasury and finance
department.
The table below shows the contractual deadlines applicable to the Group’s financial liabilities, including
its interest payments.
(in € million) Note
31 December 2019
Carrying
amount
Contractual
cash flows
Less
than
1 year
1 to 2
years
2 to 5
years
More
than
5 years
Current and non-current portion of long-term debt (including interest) 17 1 600.9 1 749.9 57.8 50.1 1 617.8 24.2
Other liabilities, including derivative financial instruments 17 9.6 9.6 9.6
Short-term debt 17 199.4 199.4 199.4
Total borrowings 17 1 809.9 1 958.9 257.2 50.1 1 627.4 24.2
Trade payables and related accounts 14.3 383.6 383.6 383.6
Other payables and accrued liabilities, including commodity
derivative financial instruments 14.3
277.0 277.0 277.0
Total financial liabilities 2 470.5 2 619.5 917.8 50.1 1 627.4 24.2
At 31 December 2019, the Group has a revolving credit facility with an undrawn amount of €500
million.
(in € million) Note
31 December 2018
Carrying
amount
Contractual
cash flows
Less
than
1 year
1 to 2
years
2 to 5
years
More
than
5 years
Current and non-current portion of long-term debt (including interest) 17 2 144.8 2 541.7 74.9 54.6 1 423. 989.0
Other liabilities, including derivative financial instruments 17 6.7 6.7 6.7
Short-term debt 17 93.1 93.1 93.1
Total borrowings 17 2 244.6 2 641.5 168.0 54.6 1 429.9 989.0
Trade payables and related accounts 14.3 408.4 408.4 408.4
Other payables and accrued liabilities, including commodity
derivative financial instruments 14.3
231.6 231.6 231.6
Total financial liabilities 2 884.5 3 281.5 808.0 54.6 1 429.9 989.0
At 31 December 2018, the Group had a revolving credit facility with a committed and undrawn amount
of €325 million expiring in 2021.
20.2 MARKET RISKS
20.2.1 Interest rate risk
The Group’s overall exposure to debt-related interest rate risk is managed by its Treasury and Finance
Department. The subsidiaries using derivative instruments generally do so with Verallia Packaging as
the counterparty. The Group’s policy is to secure the cost of its medium-term debt against the risk of
an increase in interest rates, while optimising its cost.
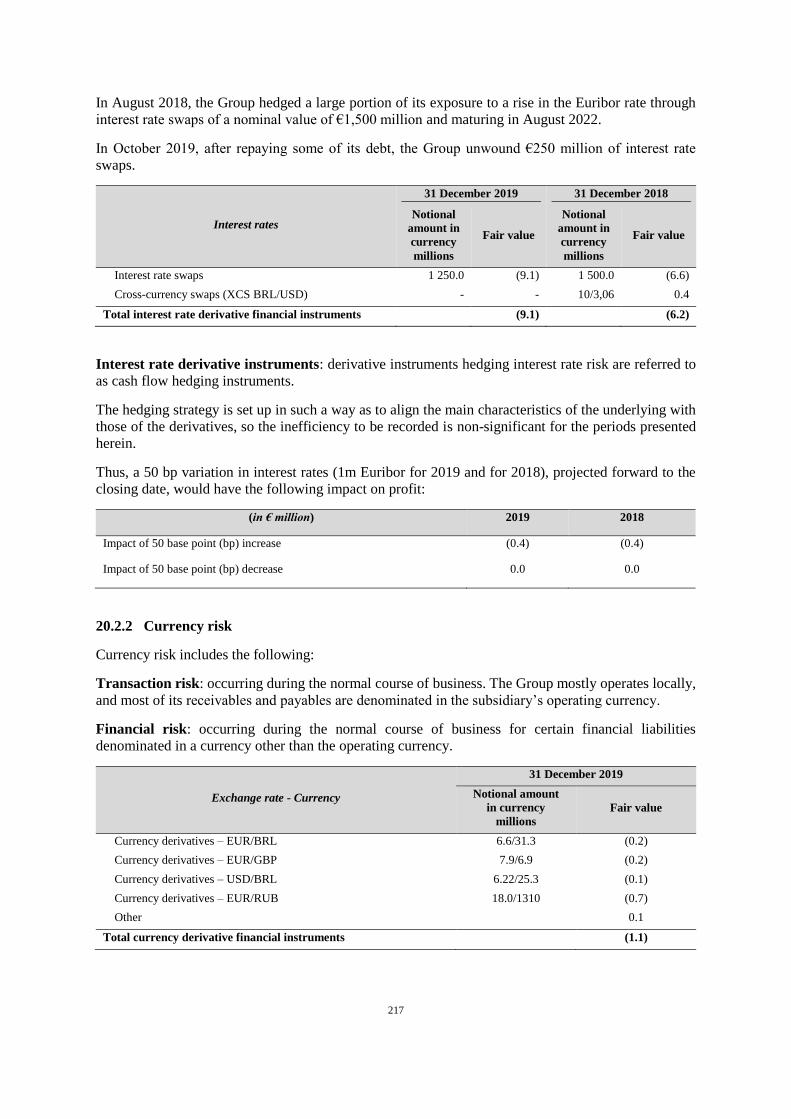
217
In August 2018, the Group hedged a large portion of its exposure to a rise in the Euribor rate through
interest rate swaps of a nominal value of €1,500 million and maturing in August 2022.
In October 2019, after repaying some of its debt, the Group unwound €250 million of interest rate
swaps.
Interest rates
31 December 2019 31 December 2018
Notional
amount in
currency
millions
Fair value
Notional
amount in
currency
millions
Fair value
Interest rate swaps 1 250.0 (9.1) 1 500.0 (6.6)
Cross-currency swaps (XCS BRL/USD) - - 10/3,06 0.4
Total interest rate derivative financial instruments (9.1) (6.2)
Interest rate derivative instruments: derivative instruments hedging interest rate risk are referred to
as cash flow hedging instruments.
The hedging strategy is set up in such a way as to align the main characteristics of the underlying with
those of the derivatives, so the inefficiency to be recorded is non-significant for the periods presented
herein.
Thus, a 50 bp variation in interest rates (1m Euribor for 2019 and for 2018), projected forward to the
closing date, would have the following impact on profit:
(in € million) 2019 2018
Impact of 50 base point (bp) increase (0.4) (0.4)
Impact of 50 base point (bp) decrease 0.0 0.0
20.2.2 Currency risk
Currency risk includes the following:
Transaction risk: occurring during the normal course of business. The Group mostly operates locally,
and most of its receivables and payables are denominated in the subsidiary’s operating currency.
Financial risk: occurring during the normal course of business for certain financial liabilities
denominated in a currency other than the operating currency.
Exchange rate - Currency
31 December 2019
Notional amount
in currency
millions
Fair value
Currency derivatives – EUR/BRL 6.6/31.3 (0.2)
Currency derivatives – EUR/GBP 7.9/6.9 (0.2)
Currency derivatives – USD/BRL 6.22/25.3 (0.1)
Currency derivatives – EUR/RUB 18.0/1310 (0.7)
Other 0.1
Total currency derivative financial instruments (1.1)

218
Exchange rate - Currency
31 December 2018
Notional amount
in currency
millions
Fair value
Currency derivatives – EUR/RUB 20.6/1557 1.1
Currency derivatives – EUR/USD 7.3/8.2 (0.1)
Currency derivatives – USD/ARS 5.2/248.7 (0.7)
Other 0.1
Total currency derivative financial instruments 0.4
Currency derivative instruments: derivative instruments hedging transaction and financial currency
risks are referred to as fair value hedging instruments.
Translation risk: occurring as a result of the consolidation in euros of the financial statements of
subsidiaries that have a different operating currency. Any fluctuation in the exchange rates of these
currencies against the euro has an impact on the Group’s equity. The Group’s main exposures are to the
Argentine peso, the Brazilian real and the Russian rouble.
2019 Group’s equity
(In € million)
Euro appreciation
+10%
Euro depreciation
-10%
Brazilian real (23.0) 19.0
Argentine peso (5.0) 4.0
Russian rouble (7.0) 5.0
2018 Group’s equity
(In € million)
Euro appreciation
+10%
Euro depreciation
-10%
Brazilian real (22.0) 18.0
Argentine peso (8.0) 7.0
Russian rouble (6.0) 5.0
20.2.3 Commodity risk
The Group is exposed to variations in the prices of the commodities and energy it uses in its operational
activities. The Group may sometimes limit its exposure to fluctuations in energy prices by using swaps
to hedge some of its energy purchases. Energy hedges (excluding purchases at fixed prices negotiated
directly with suppliers by the procurement department) are arranged, as far as possible, by the Group’s
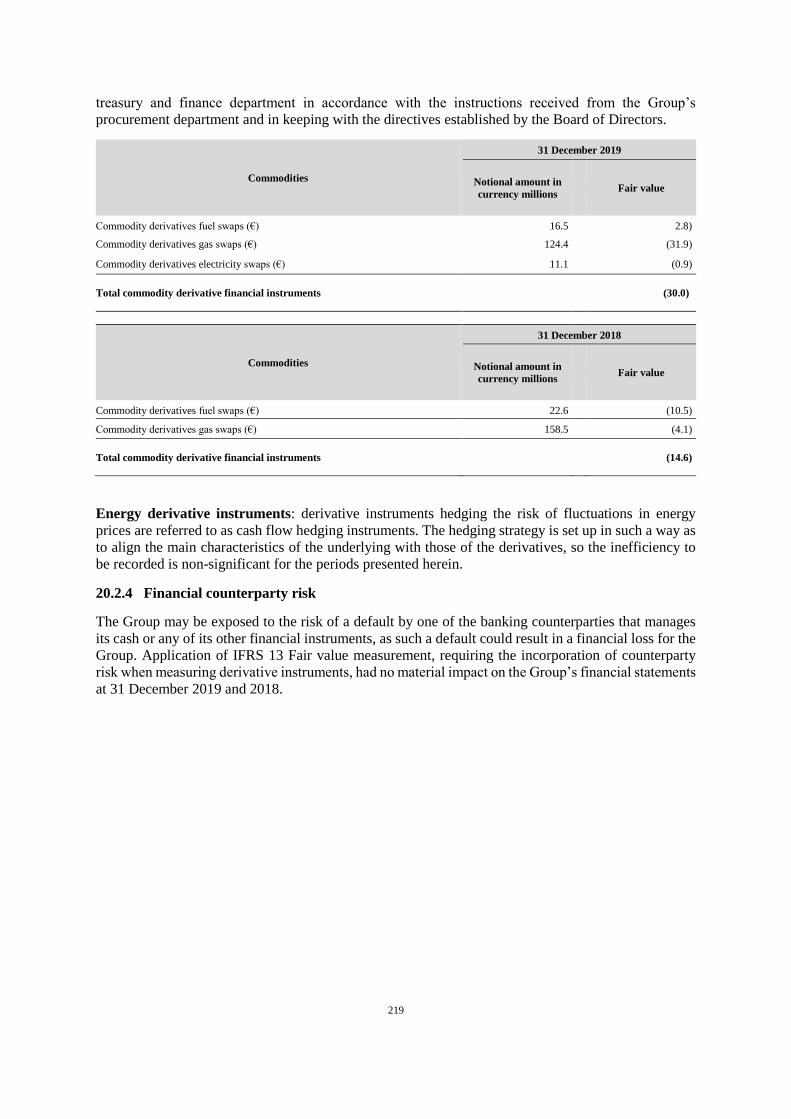
219
treasury and finance department in accordance with the instructions received from the Group’s
procurement department and in keeping with the directives established by the Board of Directors.
Commodities
31 December 2019
Notional amount in
currency millions Fair value
Commodity derivatives fuel swaps (€) 16.5 2.8)
Commodity derivatives gas swaps (€) 124.4 (31.9)
Commodity derivatives electricity swaps (€) 11.1 (0.9)
Total commodity derivative financial instruments
(30.0)
Commodities
31 December 2018
Notional amount in
currency millions Fair value
Commodity derivatives fuel swaps (€) 22.6 (10.5)
Commodity derivatives gas swaps (€) 158.5 (4.1)
Total commodity derivative financial instruments
(14.6)
Energy derivative instruments: derivative instruments hedging the risk of fluctuations in energy
prices are referred to as cash flow hedging instruments. The hedging strategy is set up in such a way as
to align the main characteristics of the underlying with those of the derivatives, so the inefficiency to
be recorded is non-significant for the periods presented herein.
20.2.4 Financial counterparty risk
The Group may be exposed to the risk of a default by one of the banking counterparties that manages
its cash or any of its other financial instruments, as such a default could result in a financial loss for the
Group. Application of IFRS 13 Fair value measurement, requiring the incorporation of counterparty
risk when measuring derivative instruments, had no material impact on the Group’s financial statements
at 31 December 2019 and 2018.
220
NOTE 21 – FINANCIAL INSTRUMENTS
ACCOUNTING PRINCIPLES
Initial recognition and measurement
Trade receivables are initially recognised when they are created. All other financial assets and liabilities
are initially recognised when the Group becomes a party to the contractual provisions of the instrument.
A financial asset or financial liability is initially measured at fair value plus, in the case of an item not
measured at fair value through profit or loss (“FVTPL”), the transaction costs that are directly
attributable to its acquisition or issue. A trade receivable with no significant financing component is
initially measured at its transaction price.
Classification and subsequent measurement
Financial assets
At initial recognition, a financial asset is classified as having been measured either at amortised cost, at
fair value through other comprehensive income (“FVOCI”) with a distinction made between debt
instruments and equity instruments, or at fair value through profit or loss (“FVTPL”).
Financial assets are not reclassified after initial recognition unless the Group changes its business model
for managing financial assets, in which case all financial assets affected are reclassified on the first day
of the first financial year following the change in business model.
A financial asset is measured at amortised cost if it meets the following two conditions and is not
designated as at FVTPL:
it is held as part of a business model whose objective is to hold assets in order to collect
contractual cash flows; and
its contractual terms give rise, on specified dates, to cash flows that are solely payment of
principal and interest on the principal amount outstanding.
A debt instrument is measured at FVOCI if it meets the following two conditions and is not designated
as at FVTPL:
it is held as part of a business model whose objective is achieved both by collecting contractual
cash flows and selling financial assets; and
its contractual terms give rise, on specified dates, to cash flows that are solely payment of
principal and interest on the principal amount outstanding.
At initial recognition of an equity instrument that is not held for trading, the Group has the irrevocable
option to present subsequent adjustments to the fair value of this instrument in other comprehensive
income. This choice is made for each instrument.
All financial assets not classified as being measured at amortised cost or at FVOCI using the method
described above are measured at FVTPL. This includes all derivative financial assets (see below). At
initial recognition, the Group has the irrevocable option to designate a financial asset that would
otherwise meet the conditions to be measured at amortised cost or at FVOCI as being at FVTPL, if this
designation makes it possible to eliminate or significantly reduce an accounting mismatch that would
otherwise have arisen.
221
Financial assets – assessing whether contractual cash flows are solely payment of principal and
interest
For the purposes of this assessment, the term “principal” is defined as being the fair value of the
financial asset at initial recognition. “Interest” is defined as being the consideration of the time value of
money, the credit risk associated with the principal amount outstanding during a particular period of
time, and other basic lending risks and costs (for example, liquidity risk and administrative expenses),
as well as the profit margin.
The Group takes into consideration the instrument’s contractual terms when assessing whether
contractual cash flows are solely payment of principal and interest.
Financial assets – subsequent measurement and gains and losses
Financial assets at
FVTPL
These assets are then measured at their fair value. Net gains and losses, including
any interest income or dividends, are recognised through profit or loss. However,
see Note 20 for derivative instruments designated as hedging instruments.
Financial assets at
amortised cost
These assets are then measured at amortised cost using the effective interest
method. Impairment losses are deducted from the amortised cost. Interest income,
currency gains and losses, and impairment losses are recognised through profit or
loss. Any gains or losses from derecognition are recognised through profit or loss.
Debt instruments at
FVOCI
These assets are then measured at their fair value. Interest income calculated using
the effective interest method, currency gains and losses, and impairment losses are
recognised through profit or loss. Other net gains and losses are recognised through
other comprehensive income. At derecognition, cumulative gains and losses in
other comprehensive income are reclassified to profit or loss.
Equity investments at
FVOCI
These assets are then measured at their fair value. Dividends are recognised as
income in profit or loss, unless the dividend clearly corresponds to the recovery of
some of the cost of the investment. Other net gains and losses are recognised in
other comprehensive income and are never reclassified to profit or loss.
Financial liabilities – classification, subsequent measurement and gains and losses
In accordance with IFRS 9, financial liabilities are classified as being measured at amortised cost or at
FVTPL. A financial liability is classified as being at FVTPL if it is considered to be held for trading,
whether it is a derivative or was designated as such at initial recognition. Financial liabilities at FVTPL
are measured at fair value and the resulting net gains and losses, including any interest expense, are
recognised through profit or loss. Other financial liabilities are subsequently measured at amortised cost
using the effective interest method. Interest expense and currency gains and losses are recognised
through profit or loss. Any gains or losses resulting from derecognition are also recognised through
profit or loss.
See Note 20 for financial liabilities designated as hedging instruments.
Derecognition –
Financial assets
The Group derecognises a financial asset when the contractual rights to the cash flows from the financial
asset expire, or it transfers the rights to receive the contractual cash flows in a transaction in which
substantially all the risks and rewards of ownership of the financial asset are transferred, or it neither
transfers nor retains substantially all the risks and rewards of ownership and does not retain control over
the financial asset.
222
The Group carries out transactions through which it transfers assets recognised in its balance sheet but
retains all or substantially all the risks and rewards of ownership of the transferred assets. In such cases,
the transferred assets are not derecognised.
Financial liabilities
The Group derecognises a financial liability when its contractual obligations are discharged or
cancelled, or they expire. The Group also derecognises a financial liability when its terms are modified
and the cash flows of the modified liability are substantially different, in which case a new financial
liability based on the modified terms is recognised at its fair value.
On derecognition of a financial liability, the difference between the carrying amount extinguished and
the consideration paid (including any non-cash assets transferred or liabilities assumed) is recognised
in profit or loss.
When a financial liability measured at amortised cost is modified without being derecognised, a gain or
loss is recognised through profit or loss. The calculated gain or loss corresponds to the difference
between the original contractual cash flows and the modified cash flows discounted at the original
effective interest rate.
Derivative financial instruments and hedge accounting under IFRS 9
The Group holds derivative financial instruments to hedge currency risk, interest rate risk, commodity
risk and energy risk. Embedded derivatives are separated from the host contract and considered
separately if the host contract is not a financial asset and if certain criteria are met.
Derivatives are first measured at their fair value. Subsequent to initial recognition, derivative
instruments are measured at their fair value and changes therein are generally recognised in profit or
loss.
The Group designates certain derivative instruments as being hedging instruments to hedge the
variability of cash flows relating to highly probable forecast transactions resulting from movements in
exchange rates, interest rates, commodity prices or energy prices. At inception of a designated hedging
relationship, the Group documents the risk management objective and the strategy for undertaking the
hedge. The Group also documents the economic relationship between the hedged item and the hedging
instrument, including whether variations in cash flows from the hedged item and hedging instrument
are expected to offset each other.
Cash flow hedges
When a derivative is designated as a cash flow hedging instrument, the effective portion of changes in
the fair value of the derivative is recognised in other comprehensive income and accumulated in the
hedging reserve. The effective portion of changes in the fair value of the derivative recognised in other
comprehensive income is limited to the cumulative change in the fair value of the hedged item,
determined using the present value, as from inception of the hedge. Any ineffective portion of changes
in the fair value of the derivative is recognised immediately in profit or loss.
If a hedged forecast transaction subsequently results in the recognition of a non-financial item, such as
inventory, the amount that has been accumulated in the hedging reserve is included directly in the initial
cost of the non-financial item when it is recognised.
For all other hedged forecast transactions, the amount that has been accumulated in the hedging reserve
is reclassified to profit or loss in the same period(s) as when the hedged forecast future cash flows affect
profit or loss.
If the hedge no longer meets hedge qualifying criteria or if the hedging instrument is sold, expires, is
terminated or exercised, hedge accounting is then discontinued prospectively. If hedge accounting of

223
cash flow hedges ceases to apply, the amount that has been accumulated in the hedging reserve remains
recognised in equity until, in the case of the hedging of a transaction giving rise to the recognition of a
non-financial item, it is included in the cost of the non-financial item on its initial recognition or, in the
case of other cash flow hedges, until it is reclassified in profit or loss in the same period(s) as when the
hedged forecast cash flows affect profit or loss.
If the hedged future cash flows are no longer expected to occur, the amounts that have been accumulated
in the hedging reserve are immediately reclassified to profit or loss.
Impairment of receivables
The Group recognises impairment losses for Expected Credit Losses (ECL) for:
financial assets measured at amortised cost; and
contract assets.
Impairments for losses on trade receivables and contract assets are measured at an amount equal to full
lifetime ECL.
To determine whether the credit risk of a financial asset has increased significantly since initial
recognition, and to estimate ECL, the Group considers reasonable and supportable information that is
relevant and available and does not involve undue cost or effort. This consists of quantitative and
qualitative information and analyses based on the Group’s past experience and on an informed credit
assessment, including prospective information.
Impairments for losses on financial assets measured at amortised cost are deducted from the gross
carrying amount of the assets.
The gross carrying amount of a financial asset is written off if the Group has no reasonable expectation
of recovering the financial asset in its entirety or a portion thereof. The Group individually makes an
assessment with respect to the timing and amount of write-off based on whether there is a reasonable
expectation of recovery. The Group expects no significant recovery from the amount written off.
However, financial assets that are written off could still be subject to recovery procedures in accordance
with the Group’s credit policy.
ESTIMATES AND ASSUMPTIONS USED BY MANAGEMENT
As indicated above, the Company uses estimates to determine impairments for trade receivables.
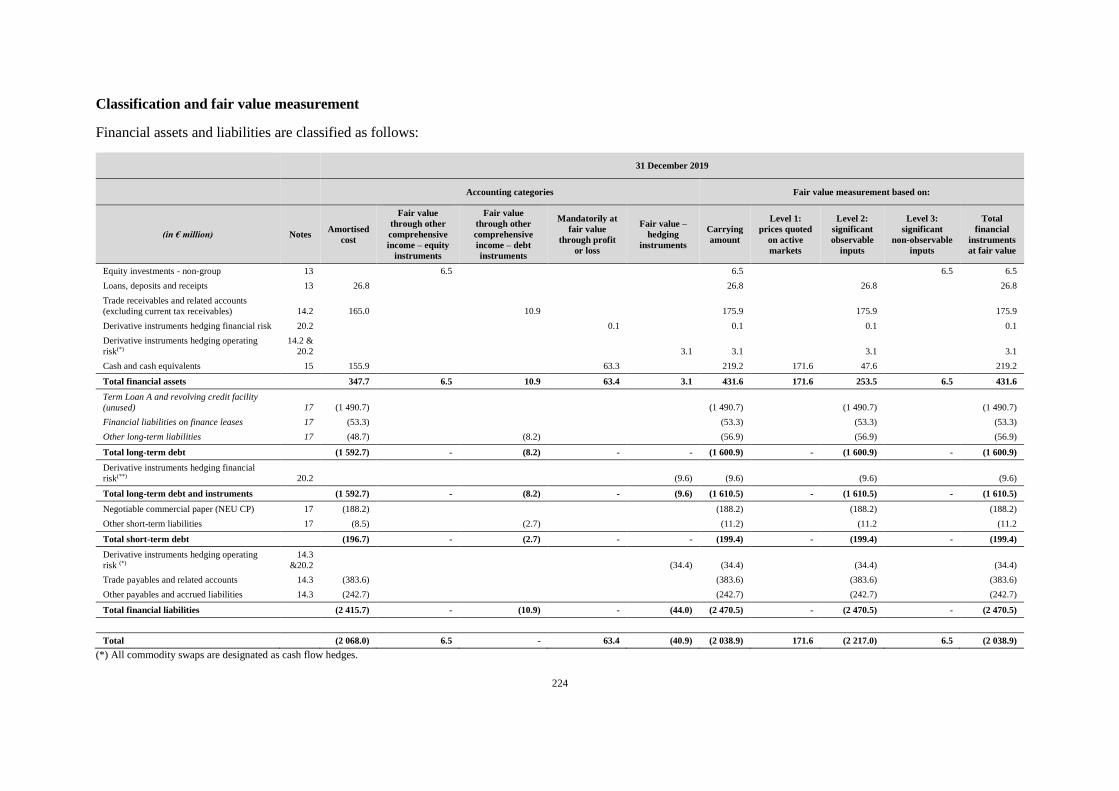
224
Classification and fair value measurement
Financial assets and liabilities are classified as follows:
31 December 2019
Accounting categories Fair value measurement based on:
(in € million) Notes Amortised
cost
Fair value
through other
comprehensive
income – equity
instruments
Fair value
through other
comprehensive
income – debt
instruments
Mandatorily at
fair value
through profit
or loss
Fair value –
hedging
instruments
Carrying
amount
Level 1:
prices quoted
on active
markets
Level 2:
significant
observable
inputs
Level 3:
significant
non-observable
inputs
Total
financial
instruments
at fair value
Equity investments - non-group 13 6.5 6.5 6.5 6.5
Loans, deposits and receipts 13 26.8 26.8 26.8 26.8
Trade receivables and related accounts
(excluding current tax receivables) 14.2 165.0 10.9 175.9 175.9 175.9
Derivative instruments hedging financial risk 20.2 0.1 0.1 0.1 0.1
Derivative instruments hedging operating
risk(*)
14.2 &
20.2 3.1 3.1 3.1 3.1
Cash and cash equivalents 15 155.9 63.3 219.2 171.6 47.6 219.2
Total financial assets 347.7 6.5 10.9 63.4 3.1 431.6 171.6 253.5 6.5 431.6
Term Loan A and revolving credit facility
(unused) 17 (1 490.7) (1 490.7) (1 490.7) (1 490.7)
Financial liabilities on finance leases 17 (53.3) (53.3) (53.3) (53.3)
Other long-term liabilities 17 (48.7) (8.2) (56.9) (56.9) (56.9)
Total long-term debt (1 592.7) - (8.2) - - (1 600.9) - (1 600.9) - (1 600.9)
Derivative instruments hedging financial
risk(**) 20.2 (9.6) (9.6) (9.6) (9.6)
Total long-term debt and instruments (1 592.7) - (8.2) - (9.6) (1 610.5) - (1 610.5) - (1 610.5)
Negotiable commercial paper (NEU CP) 17 (188.2) (188.2) (188.2) (188.2)
Other short-term liabilities 17 (8.5) (2.7) (11.2) (11.2 (11.2
Total short-term debt (196.7) - (2.7) - - (199.4) - (199.4) - (199.4)
Derivative instruments hedging operating
risk (*)
14.3
&20.2 (34.4) (34.4) (34.4) (34.4)
Trade payables and related accounts 14.3 (383.6) (383.6) (383.6) (383.6)
Other payables and accrued liabilities 14.3 (242.7) (242.7) (242.7) (242.7)
Total financial liabilities (2 415.7) - (10.9) - (44.0) (2 470.5) - (2 470.5) - (2 470.5)
Total (2 068.0) 6.5 - 63.4 (40.9) (2 038.9) 171.6 (2 217.0) 6.5 (2 038.9)
(*) All commodity swaps are designated as cash flow hedges.
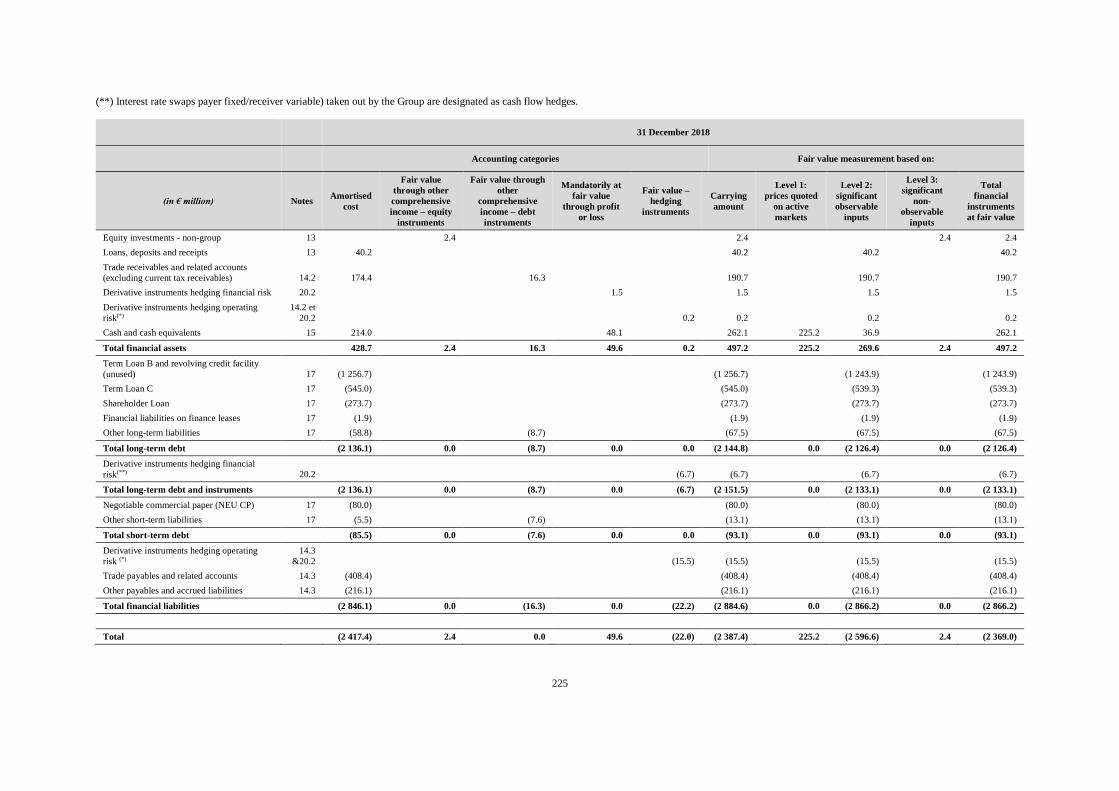
225
(**) Interest rate swaps payer fixed/receiver variable) taken out by the Group are designated as cash flow hedges.
31 December 2018
Accounting categories Fair value measurement based on:
(in € million) Notes Amortised
cost
Fair value
through other
comprehensive
income – equity
instruments
Fair value through
other
comprehensive
income – debt
instruments
Mandatorily at
fair value
through profit
or loss
Fair value –
hedging
instruments
Carrying
amount
Level 1:
prices quoted
on active
markets
Level 2:
significant
observable
inputs
Level 3:
significant
non-
observable
inputs
Total
financial
instruments
at fair value
Equity investments - non-group 13 2.4 2.4 2.4 2.4
Loans, deposits and receipts 13 40.2 40.2 40.2 40.2
Trade receivables and related accounts
(excluding current tax receivables) 14.2 174.4 16.3 190.7 190.7 190.7
Derivative instruments hedging financial risk 20.2 1.5 1.5 1.5 1.5
Derivative instruments hedging operating
risk(*)
14.2 et
20.2 0.2 0.2 0.2 0.2
Cash and cash equivalents 15 214.0 48.1 262.1 225.2 36.9 262.1
Total financial assets 428.7 2.4 16.3 49.6 0.2 497.2 225.2 269.6 2.4 497.2
Term Loan B and revolving credit facility
(unused) 17 (1 256.7) (1 256.7) (1 243.9) (1 243.9)
Term Loan C 17 (545.0) (545.0) (539.3) (539.3)
Shareholder Loan 17 (273.7) (273.7) (273.7) (273.7)
Financial liabilities on finance leases 17 (1.9) (1.9) (1.9) (1.9)
Other long-term liabilities 17 (58.8) (8.7) (67.5) (67.5) (67.5)
Total long-term debt (2 136.1) 0.0 (8.7) 0.0 0.0 (2 144.8) 0.0 (2 126.4) 0.0 (2 126.4)
Derivative instruments hedging financial
risk(**) 20.2 (6.7) (6.7) (6.7) (6.7)
Total long-term debt and instruments (2 136.1) 0.0 (8.7) 0.0 (6.7) (2 151.5) 0.0 (2 133.1) 0.0 (2 133.1)
Negotiable commercial paper (NEU CP) 17 (80.0) (80.0) (80.0) (80.0)
Other short-term liabilities 17 (5.5) (7.6) (13.1) (13.1) (13.1)
Total short-term debt (85.5) 0.0 (7.6) 0.0 0.0 (93.1) 0.0 (93.1) 0.0 (93.1)
Derivative instruments hedging operating
risk (*)
14.3
&20.2 (15.5) (15.5) (15.5) (15.5)
Trade payables and related accounts 14.3 (408.4) (408.4) (408.4) (408.4)
Other payables and accrued liabilities 14.3 (216.1) (216.1) (216.1) (216.1)
Total financial liabilities (2 846.1) 0.0 (16.3) 0.0 (22.2) (2 884.6) 0.0 (2 866.2) 0.0 (2 866.2)
Total (2 417.4) 2.4 0.0 49.6 (22.0) (2 387.4) 225.2 (2 596.6) 2.4 (2 369.0)
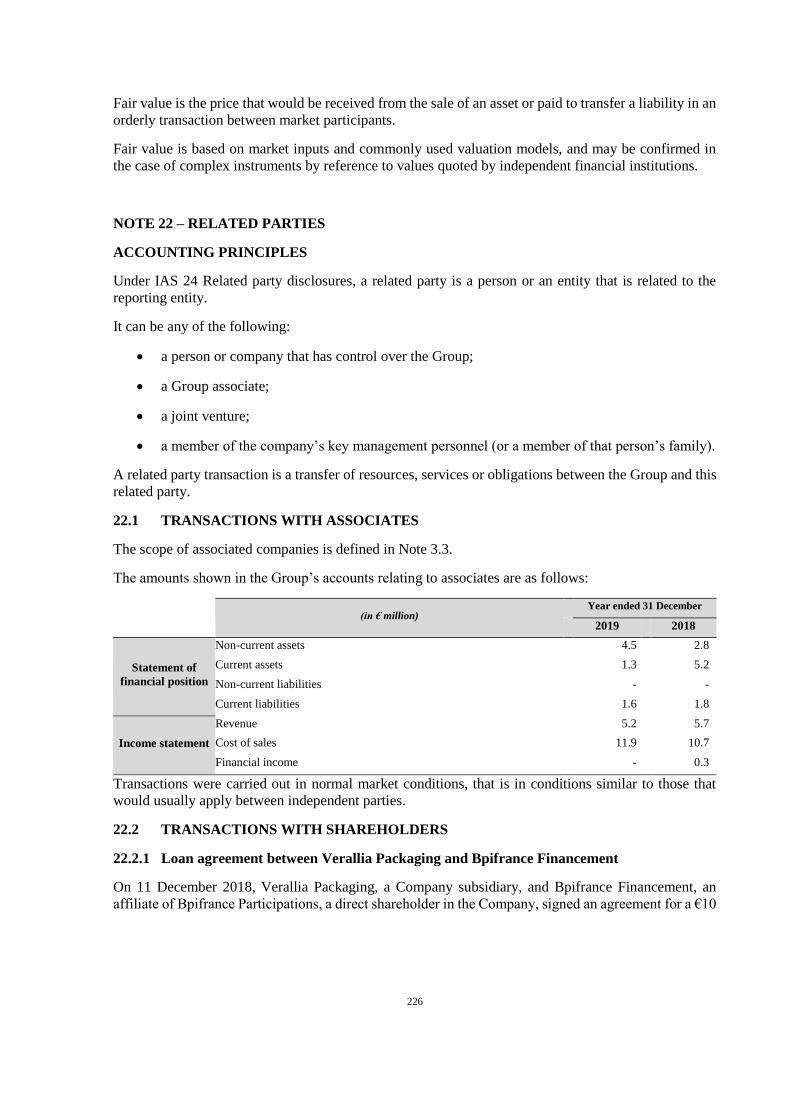
226
Fair value is the price that would be received from the sale of an asset or paid to transfer a liability in an
orderly transaction between market participants.
Fair value is based on market inputs and commonly used valuation models, and may be confirmed in
the case of complex instruments by reference to values quoted by independent financial institutions.
NOTE 22 – RELATED PARTIES
ACCOUNTING PRINCIPLES
Under IAS 24 Related party disclosures, a related party is a person or an entity that is related to the
reporting entity.
It can be any of the following:
a person or company that has control over the Group;
a Group associate;
a joint venture;
a member of the company’s key management personnel (or a member of that person’s family).
A related party transaction is a transfer of resources, services or obligations between the Group and this
related party.
22.1 TRANSACTIONS WITH ASSOCIATES
The scope of associated companies is defined in Note 3.3.
The amounts shown in the Group’s accounts relating to associates are as follows:
(in € million)
Year ended 31 December
2019 2018
Statement of
financial position
Non-current assets 4.5 2.8
Current assets 1.3 5.2
Non-current liabilities - -
Current liabilities 1.6 1.8
Income statement
Revenue 5.2 5.7
Cost of sales 11.9 10.7
Financial income - 0.3
Transactions were carried out in normal market conditions, that is in conditions similar to those that
would usually apply between independent parties.
22.2 TRANSACTIONS WITH SHAREHOLDERS
22.2.1 Loan agreement between Verallia Packaging and Bpifrance Financement
On 11 December 2018, Verallia Packaging, a Company subsidiary, and Bpifrance Financement, an
affiliate of Bpifrance Participations, a direct shareholder in the Company, signed an agreement for a €10
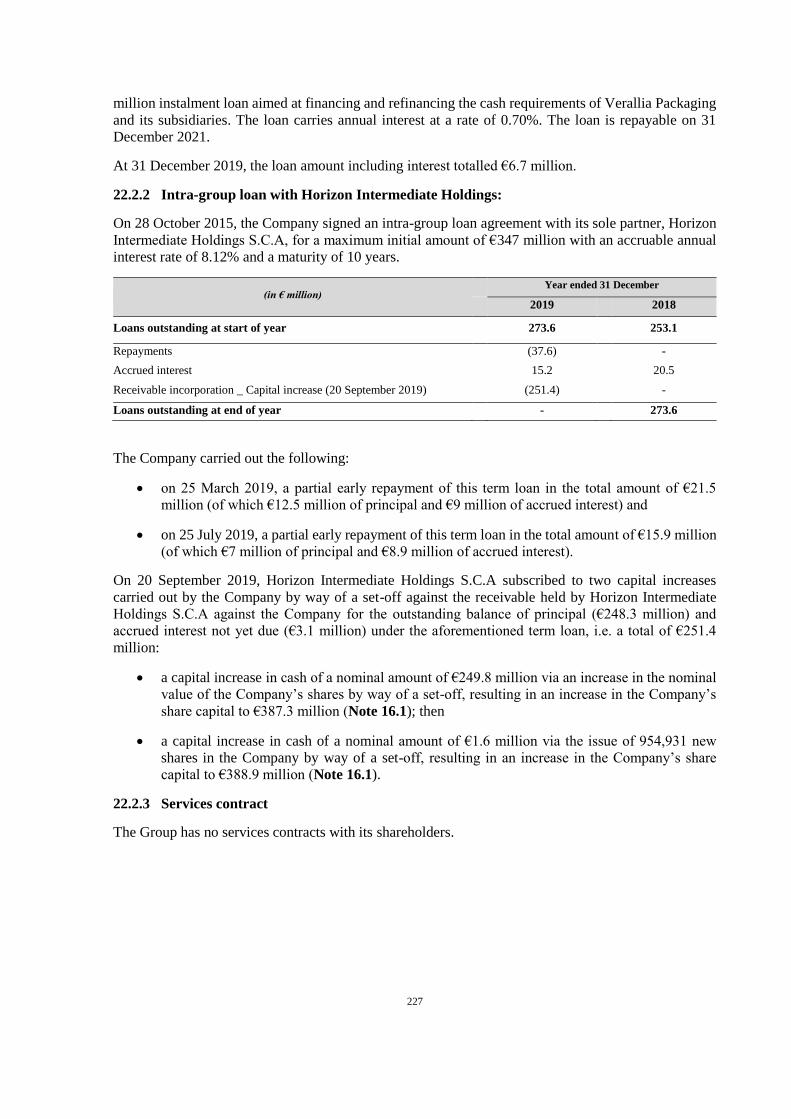
227
million instalment loan aimed at financing and refinancing the cash requirements of Verallia Packaging
and its subsidiaries. The loan carries annual interest at a rate of 0.70%. The loan is repayable on 31
December 2021.
At 31 December 2019, the loan amount including interest totalled €6.7 million.
22.2.2 Intra-group loan with Horizon Intermediate Holdings:
On 28 October 2015, the Company signed an intra-group loan agreement with its sole partner, Horizon
Intermediate Holdings S.C.A, for a maximum initial amount of €347 million with an accruable annual
interest rate of 8.12% and a maturity of 10 years.
(in € million) Year ended 31 December
2019 2018
Loans outstanding at start of year 273.6 253.1
Repayments (37.6) -
Accrued interest 15.2 20.5
Receivable incorporation _ Capital increase (20 September 2019) (251.4) -
Loans outstanding at end of year - 273.6
The Company carried out the following:
on 25 March 2019, a partial early repayment of this term loan in the total amount of €21.5
million (of which €12.5 million of principal and €9 million of accrued interest) and
on 25 July 2019, a partial early repayment of this term loan in the total amount of €15.9 million
(of which €7 million of principal and €8.9 million of accrued interest).
On 20 September 2019, Horizon Intermediate Holdings S.C.A subscribed to two capital increases
carried out by the Company by way of a set-off against the receivable held by Horizon Intermediate
Holdings S.C.A against the Company for the outstanding balance of principal (€248.3 million) and
accrued interest not yet due (€3.1 million) under the aforementioned term loan, i.e. a total of €251.4
million:
a capital increase in cash of a nominal amount of €249.8 million via an increase in the nominal
value of the Company’s shares by way of a set-off, resulting in an increase in the Company’s
share capital to €387.3 million (Note 16.1); then
a capital increase in cash of a nominal amount of €1.6 million via the issue of 954,931 new
shares in the Company by way of a set-off, resulting in an increase in the Company’s share
capital to €388.9 million (Note 16.1).
22.2.3 Services contract
The Group has no services contracts with its shareholders.
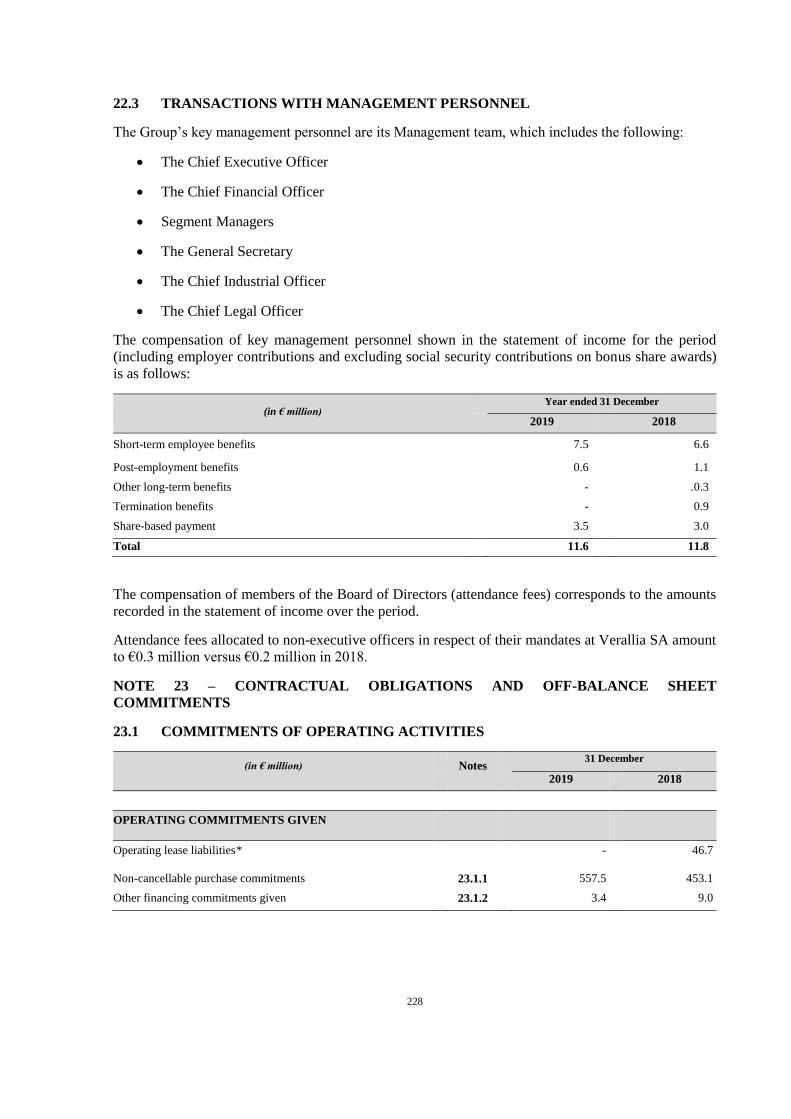
228
22.3 TRANSACTIONS WITH MANAGEMENT PERSONNEL
The Group’s key management personnel are its Management team, which includes the following:
The Chief Executive Officer
The Chief Financial Officer
Segment Managers
The General Secretary
The Chief Industrial Officer
The Chief Legal Officer
The compensation of key management personnel shown in the statement of income for the period
(including employer contributions and excluding social security contributions on bonus share awards)
is as follows:
(in € million) Year ended 31 December
2019 2018
Short-term employee benefits 7.5 6.6
Post-employment benefits 0.6 1.1
Other long-term benefits - .0.3
Termination benefits - 0.9
Share-based payment 3.5 3.0
Total 11.6 11.8
The compensation of members of the Board of Directors (attendance fees) corresponds to the amounts
recorded in the statement of income over the period.
Attendance fees allocated to non-executive officers in respect of their mandates at Verallia SA amount
to €0.3 million versus €0.2 million in 2018.
NOTE 23 – CONTRACTUAL OBLIGATIONS AND OFF-BALANCE SHEET
COMMITMENTS
23.1 COMMITMENTS OF OPERATING ACTIVITIES
(in € million)
Notes 31 December
2019 2018
OPERATING COMMITMENTS GIVEN
Operating lease liabilities* - 46.7
Non-cancellable purchase commitments 23.1.1 557.5 453.1
Other financing commitments given 23.1.2 3.4 9.0
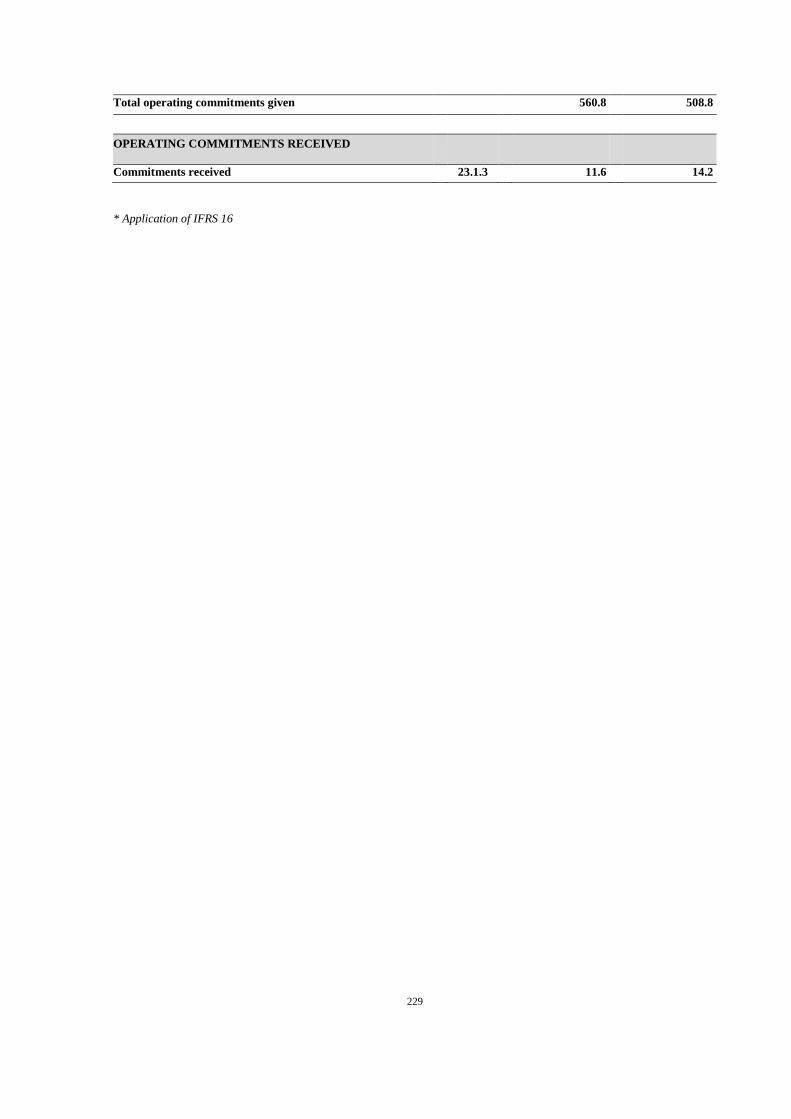
229
Total operating commitments given 560.8 508.8
OPERATING COMMITMENTS RECEIVED
Commitments received 23.1.3 11.6 14.2
* Application of IFRS 16
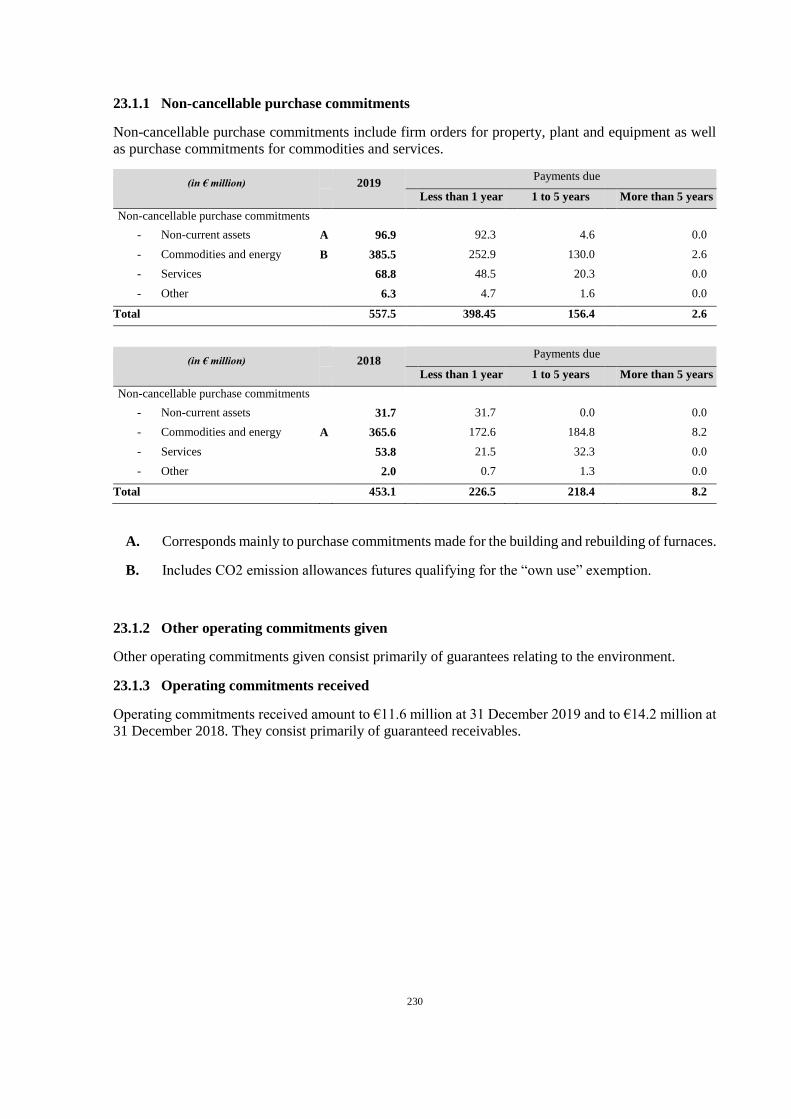
230
23.1.1 Non-cancellable purchase commitments
Non-cancellable purchase commitments include firm orders for property, plant and equipment as well
as purchase commitments for commodities and services.
(in € million)
2019 Payments due
Less than 1 year 1 to 5 years More than 5 years
Non-cancellable purchase commitments
- Non-current assets A 96.9 92.3 4.6 0.0
- Commodities and energy B 385.5 252.9 130.0 2.6
- Services 68.8 48.5 20.3 0.0
- Other 6.3 4.7 1.6 0.0
Total 557.5 398.45 156.4 2.6
(in € million)
2018 Payments due
Less than 1 year 1 to 5 years More than 5 years
Non-cancellable purchase commitments
- Non-current assets 31.7 31.7 0.0 0.0
- Commodities and energy A 365.6 172.6 184.8 8.2
- Services 53.8 21.5 32.3 0.0
- Other 2.0 0.7 1.3 0.0
Total 453.1 226.5 218.4 8.2
A. Corresponds mainly to purchase commitments made for the building and rebuilding of furnaces.
B. Includes CO2 emission allowances futures qualifying for the “own use” exemption.
23.1.2 Other operating commitments given
Other operating commitments given consist primarily of guarantees relating to the environment.
23.1.3 Operating commitments received
Operating commitments received amount to €11.6 million at 31 December 2019 and to €14.2 million at
31 December 2018. They consist primarily of guaranteed receivables.
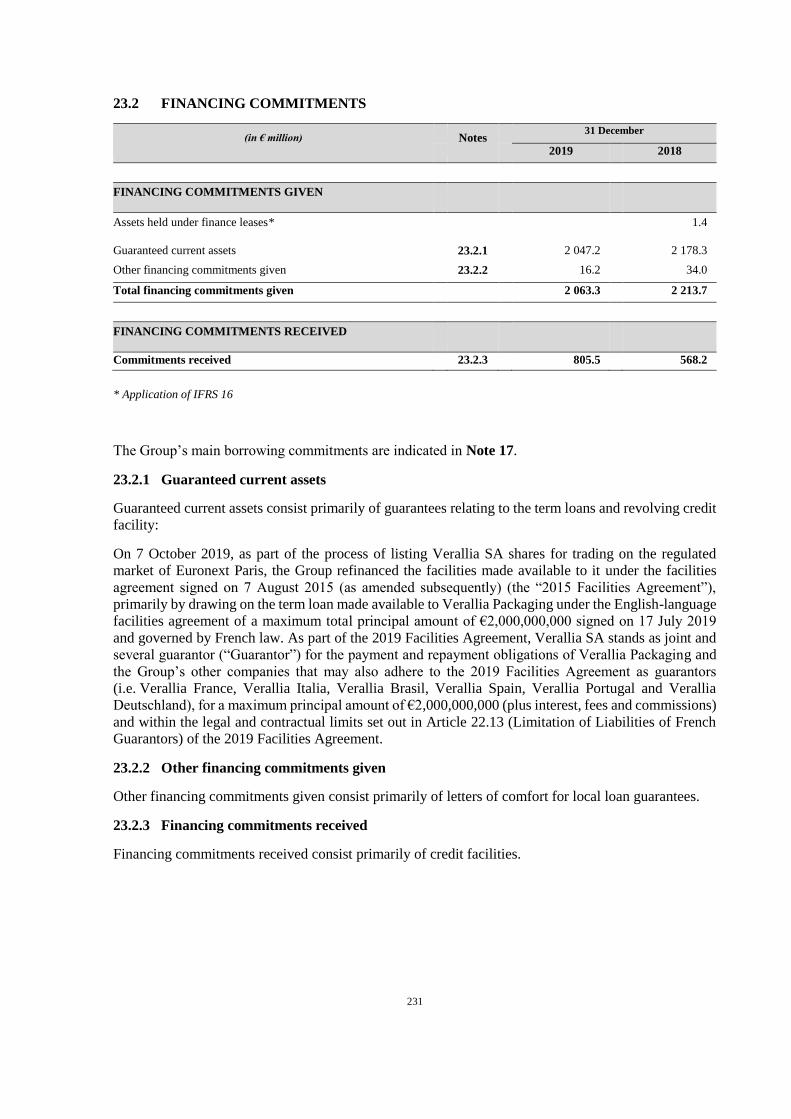
231
23.2 FINANCING COMMITMENTS
(in € million)
Notes 31 December
2019 2018
FINANCING COMMITMENTS GIVEN
Assets held under finance leases* 1.4
Guaranteed current assets 23.2.1 2 047.2 2 178.3
Other financing commitments given 23.2.2 16.2 34.0
Total financing commitments given 2 063.3 2 213.7
FINANCING COMMITMENTS RECEIVED
Commitments received 23.2.3 805.5 568.2
* Application of IFRS 16
The Group’s main borrowing commitments are indicated in Note 17.
23.2.1 Guaranteed current assets
Guaranteed current assets consist primarily of guarantees relating to the term loans and revolving credit
facility:
On 7 October 2019, as part of the process of listing Verallia SA shares for trading on the regulated
market of Euronext Paris, the Group refinanced the facilities made available to it under the facilities
agreement signed on 7 August 2015 (as amended subsequently) (the “2015 Facilities Agreement”),
primarily by drawing on the term loan made available to Verallia Packaging under the English-language
facilities agreement of a maximum total principal amount of €2,000,000,000 signed on 17 July 2019
and governed by French law. As part of the 2019 Facilities Agreement, Verallia SA stands as joint and
several guarantor (“Guarantor”) for the payment and repayment obligations of Verallia Packaging and
the Group’s other companies that may also adhere to the 2019 Facilities Agreement as guarantors
(i.e. Verallia France, Verallia Italia, Verallia Brasil, Verallia Spain, Verallia Portugal and Verallia
Deutschland), for a maximum principal amount of €2,000,000,000 (plus interest, fees and commissions)
and within the legal and contractual limits set out in Article 22.13 (Limitation of Liabilities of French
Guarantors) of the 2019 Facilities Agreement.
23.2.2 Other financing commitments given
Other financing commitments given consist primarily of letters of comfort for local loan guarantees.
23.2.3 Financing commitments received
Financing commitments received consist primarily of credit facilities.

232
NOTE 24 – AUDIT FEES
in € million)
PricewaterhouseCoopers BMA Other Total
Amount(before
tax) %
Amount(before
tax) %
Amount(before
tax) %
Amount(before
tax) %
2019 2018 2019 2018 2019 2018 2019 2018 2019 2018 2019 2018 2019 2018 2019 2018
Audit, certification and review of
parent company and consolidated
financial statements
1.2 1.2 49% 92% 0.3 - 71% - 0.2 0.5 56% 97% 1.6 1.7 52% 95%
Verallia SA 0.3 - 14% - 0.2 - 42% - - - - - 0.5 - 18%
Fully-consolidated subsidiaries 0.8 1.2 35% 92% 0.1 - 0% - 0.2 0.5 56% 97% 1.1 1.7 35% 89%
Services other than certification of
financial statements 1.2 0.1 51% 8% 0.1 - 29% - 0.1 0.0 44 3% 1.4 0.1 48% 6%
Verallia SA 0.7 - 31 - 0.1 - 29% - - - - - 0.8 - 25%
Fully-consolidated subsidiaries 0.5 0.1 20% 8% - - 0% - 0.1 0.0 44% 3% 0.6 0.1 25% 6%
Total 2.4 1.3 100% 100% 0.4 - 100% - 0.3 0.5 100% 100% 3.0 2.2 100% 100%
Services other than the certification of financial statements provided by the Statutory Auditors of
Verallia SA, the consolidating entity, and of its subsidiaries correspond primarily to due diligence
conducted for the Company’s initial public offering.
NOTE 25 – EVENTS AFTER THE CLOSING DATE
No significant events occurred after the close on 31 December 2019.
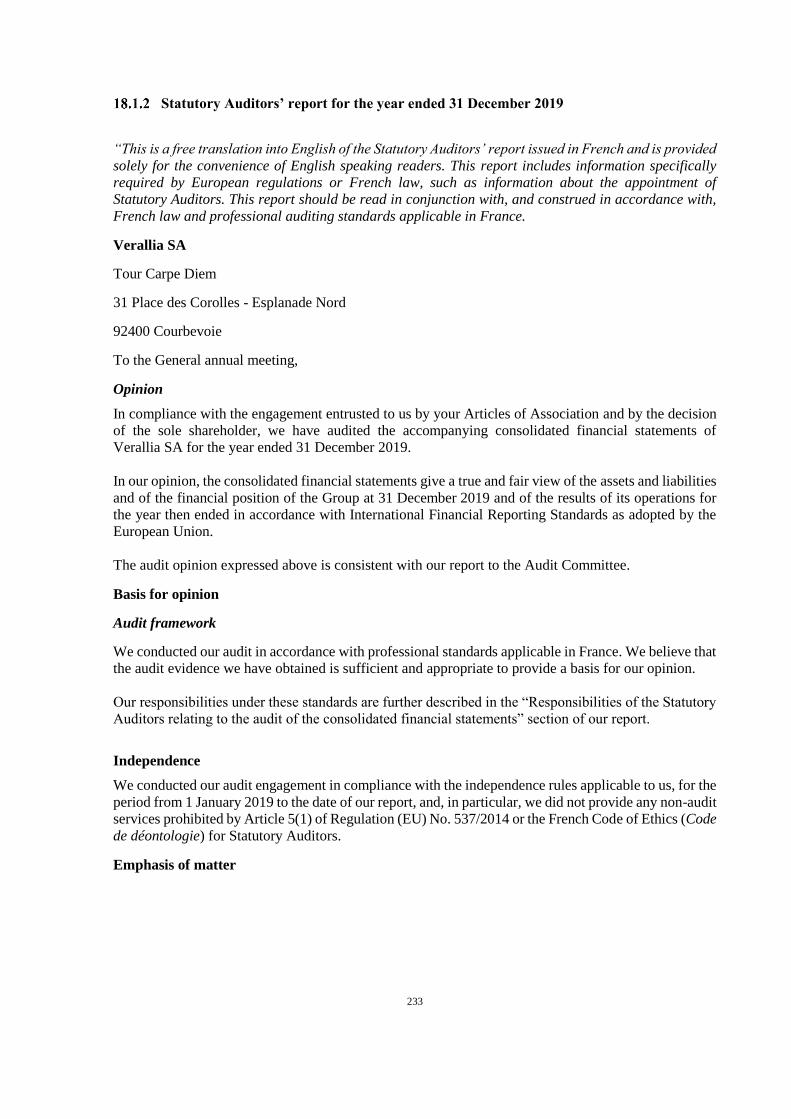
233
Statutory Auditors’ report for the year ended 31 December 2019
“This is a free translation into English of the Statutory Auditors’ report issued in French and is provided
solely for the convenience of English speaking readers. This report includes information specifically
required by European regulations or French law, such as information about the appointment of
Statutory Auditors. This report should be read in conjunction with, and construed in accordance with,
French law and professional auditing standards applicable in France.
Verallia SA
Tour Carpe Diem
31 Place des Corolles - Esplanade Nord
92400 Courbevoie
To the General annual meeting,
Opinion
In compliance with the engagement entrusted to us by your Articles of Association and by the decision
of the sole shareholder, we have audited the accompanying consolidated financial statements of
Verallia SA for the year ended 31 December 2019.
In our opinion, the consolidated financial statements give a true and fair view of the assets and liabilities
and of the financial position of the Group at 31 December 2019 and of the results of its operations for
the year then ended in accordance with International Financial Reporting Standards as adopted by the
European Union.
The audit opinion expressed above is consistent with our report to the Audit Committee.
Basis for opinion
Audit framework
We conducted our audit in accordance with professional standards applicable in France. We believe that
the audit evidence we have obtained is sufficient and appropriate to provide a basis for our opinion.
Our responsibilities under these standards are further described in the “Responsibilities of the Statutory
Auditors relating to the audit of the consolidated financial statements” section of our report.
Independence
We conducted our audit engagement in compliance with the independence rules applicable to us, for the
period from 1 January 2019 to the date of our report, and, in particular, we did not provide any non-audit
services prohibited by Article 5(1) of Regulation (EU) No. 537/2014 or the French Code of Ethics (Code
de déontologie) for Statutory Auditors.
Emphasis of matter

234
Without qualifying our opinion, we draw your attention to Note 2.2 to the consolidated financial
statements, which describes the impacts of the first-time application of IFRS 16 – Leases as from
1 January 2019.
Justification of assessments – Key audit matters
In accordance with the requirements of Articles L.823-9 and R.823-7 of the French Commercial Code
(Code de commerce) relating to the justification of our assessments, we inform you of the key audit
matters relating to the risks of material misstatement that, in our professional judgement, were the most
significant in our audit of the consolidated financial statements, as well as how we addressed those risks.
These matters were addressed as part of our audit of the consolidated financial statements as a whole,
and therefore contributed to the opinion we formed as expressed above. We do not provide a separate
opinion on specific items of the consolidated financial statements.
Measurement of the recoverable amount of goodwill
Description of risk
The carrying amount of goodwill at 31 December 2019 was €551 million and is recognised as indicated
in Note “3.1 - Changes in scope” and Note “9 - Goodwill”.
Management conducts impairment tests, as described in Note “12 - Impairment of goodwill and non-
current assets” at least once a year and whenever there is an indication of impairment. Impairment
indicators may correspond to events or situations related to material and adverse changes affecting the
economic environment and the assumptions or objectives identified at the time of acquisition.
Goodwill is tested at the level of groups of cash-generating units (CGUs) corresponding to the operating
segments as defined by the Group. An impairment loss is recognised when the carrying amount of a
group of CGUs exceeds its recoverable amount.
We deemed the measurement of the recoverable amount of these assets to be a key audit matter due to
the potentially significant nature of any impairment and the high level of judgement and estimation
required by management for this assessment. Management’s judgement is based on assumptions relating
to future trends in sales, renewal investments and changes in working capital requirements linked to the
operation of these assets, as well as the determination of an appropriate discount rate applied to future
cash flows.
How our audit addressed this risk
We assessed the appropriateness and pertinence of the approach used by management to determine the
groups of CGUs at the level of which goodwill impairment tests are performed.
We gained an understanding of and examined the procedure implemented by Group management to
conduct impairment tests.
We also assessed the appropriateness of the model used to calculate the value in use based on the
discounted cash flow method and reviewed, by sampling, the calculations made by management.
We verified the consistency of the cash flow projections by comparing them with:
management’s most recent estimates, as presented to the Board of Directors during the budget
process,
235
the cash flow projections used in the previous impairment tests for the years 2020 to 2023, and
historical projections for 2019 and the performance for that year.
We met with management to analyse the main assumptions used in the impairment tests and to obtain
explanations to enable us to corroborate these assumptions.
With the assistance of our valuation experts, we performed an independent analysis of certain key
assumptions used by management in its tests and analyses, including the discount rate and the perpetual
average annual growth rate of future cash flows, with reference to both external market data and analyses
of comparable companies.
We also compared sensitivity analyses to certain key variables in the valuation model to assess the
materiality of potential impacts on the assets’ recoverable amount.
We also examined the appropriateness of the disclosures provided in note “12 - Impairment of goodwill
and non-current assets” to the consolidated financial statements.
Specific verifications
As required by legal and regulatory provisions and in accordance with professional standards applicable
in France, we have also verified the information pertaining to the Group presented in the Board of
Directors’ management report.
We have no matters to report as to its fair presentation and its consistency with the consolidated financial
statements.
We attest that the information pertaining to the Group presented in the management report includes the
consolidated non-financial information statement required under Article L.225-102-1 of the French
Commercial Code. However, in accordance with Article L.823-10 of the French Commercial Code, we
have not verified the fair presentation and consistency with the consolidated financial statements of the
information given in that statement, which will be the subject of a report by an independent third party.
Report on other legal and regulatory requirements
Appointment of the Statutory Auditors
We were appointed Statutory Auditors of Verallia SA in the Articles of Association dated 18 June 2015
for PricewaterhouseCoopers Audit and by a decision of the sole shareholder of 24 July 2019 for BM&A.
At 31 December 2019, PricewaterhouseCoopers Audit and BM&A were in the fifth consecutive year
and the first year of their engagement, respectively, and the first year since the Company’s securities
were admitted to trading on a regulated market.
Responsibilities of management and those charged with governance for the consolidated financial
statements
Management is responsible for preparing consolidated financial statements giving a true and fair view
in accordance with International Financial Reporting Standards as adopted by the European Union and
for implementing the internal control procedures it deems necessary for the preparation of consolidated
financial statements that are free of material misstatement, whether due to fraud or error.
236
In preparing the consolidated financial statements, management is responsible for assessing the
Company’s ability to continue as a going concern, disclosing, as applicable, matters related to going
concern, and using the going concern basis of accounting, unless it expects to liquidate the Company or
to cease operations.
The Audit Committee is responsible for monitoring the financial reporting process and the effectiveness
of internal control and risk management systems, as well as, where applicable, any internal audit systems
relating to accounting and financial reporting procedures.
The consolidated financial statements were approved by the Board of Directors.
Responsibilities of the Statutory Auditors relating to the audit of the consolidated financial
statements
Objective and audit approach
Our role is to issue a report on the consolidated financial statements. Our objective is to obtain
reasonable assurance about whether the consolidated financial statements as a whole are free of material
misstatement. Reasonable assurance is a high level of assurance, but is not a guarantee that an audit
conducted in accordance with professional standards will always detect a material misstatement when it
exists. Misstatements can arise from fraud or error and are considered material if, individually or in the
aggregate, they could reasonably be expected to influence the economic decisions taken by users on the
basis of these consolidated financial statements.
As specified in Article L.823-10-1 of the French Commercial Code, our audit does not include assurance
on the viability or quality of the Company’s management.
As part of an audit conducted in accordance with professional standards applicable in France, the
Statutory Auditors exercise professional judgement throughout the audit.
They also:
identify and assess the risks of material misstatement in the consolidated financial statements,
whether due to fraud or error, design and perform audit procedures in response to those risks, and
obtain audit evidence considered to be sufficient and appropriate to provide a basis for their
opinion. The risk of not detecting a material misstatement resulting from fraud is higher than for
one resulting from error, as fraud may involve collusion, forgery, intentional omissions,
misrepresentations, or the override of internal control;
obtain an understanding of the internal control procedures relevant to the audit in order to design
audit procedures that are appropriate in the circumstances, but not for the purpose of expressing
an opinion on the effectiveness of the internal control;
evaluate the appropriateness of accounting policies used and the reasonableness of accounting
estimates made by management and the related disclosures in the notes to the consolidated
financial statements;
assess the appropriateness of management’s use of the going concern basis of accounting and,
based on the audit evidence obtained, whether a material uncertainty exists related to events or
237
conditions that may cast significant doubt on the Company’s ability to continue as a going
concern. This assessment is based on the audit evidence obtained up to the date of the audit report.
However, future events or conditions may cause the Company to cease to continue as a going
concern. If the Statutory Auditors conclude that a material uncertainty exists, they are required to
draw attention in the audit report to the related disclosures in the consolidated financial statements
or, if such disclosures are not provided or are inadequate, to issue a qualified opinion or a
disclaimer of opinion;
evaluate the overall presentation of the consolidated financial statements and assess whether these
statements represent the underlying transactions and events in a manner that achieves fair
presentation;
obtain sufficient appropriate audit evidence regarding the financial information of the entities or
business activities within the Group to express an opinion on the consolidated financial
statements. The Statutory Auditors are responsible for the management, supervision and
performance of the audit of the consolidated financial statements and for the opinion expressed
thereon.
Report to the Audit Committee
We submit a report to the Audit Committee which includes, in particular, a description of the scope of
the audit and the audit program implemented, as well as the results of our audit. We also report any
significant deficiencies in internal control that we have identified regarding the accounting and financial
reporting procedures.
Our report to the Audit Committee includes the risks of material misstatement that, in our professional
judgement, were the most significant for the audit of the consolidated financial statements and which
constitute the key audit matters that we are required to describe in this report.
We also provide the Audit Committee with the declaration provided for in Article 6 of Regulation (EU)
No 537-2014, confirming our independence within the meaning of the rules applicable in France, as
defined in particular in Articles L.822-10 to L.822-14 of the French Commercial Code and in the French
Code of Ethics for Statutory Auditors. Where appropriate, we discuss any risks to our independence and
the related safeguard measures with the Audit Committee.
Neuilly-sur-Seine and Paris, 17 March 2020
The Statutory Auditors
PricewaterhouseCoopers Audit BM&A
Itto El Hariri Gilles Rabier
238
18.2 Parent company annual financial statements for the year ended 31 December 2019
and Statutory Auditors’ report
Parent company annual financial statements for the year ended 31 December 2019
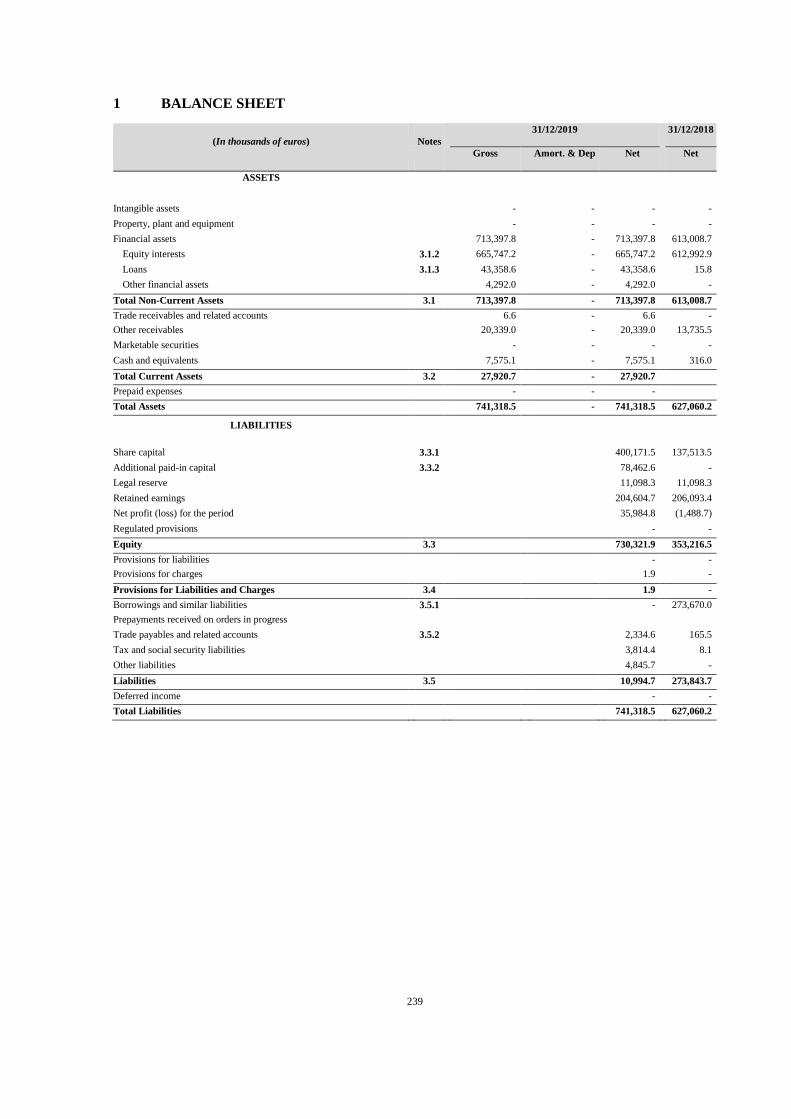
239
1 BALANCE SHEET
(In thousands of euros)
Notes
31/12/2019 31/12/2018
Gross Amort. & Dep Net Net
ASSETS
Intangible assets - - - -
Property, plant and equipment - - - -
Financial assets 713,397.8 - 713,397.8 613,008.7
Equity interests 3.1.2 665,747.2 - 665,747.2 612,992.9
Loans 3.1.3 43,358.6 - 43,358.6 15.8
Other financial assets 4,292.0 - 4,292.0 -
Total Non-Current Assets 3.1 713,397.8 - 713,397.8 613,008.7
Trade receivables and related accounts 6.6 - 6.6 -
Other receivables 20,339.0 - 20,339.0 13,735.5
Marketable securities - - - -
Cash and equivalents 7,575.1 - 7,575.1 316.0
Total Current Assets 3.2 27,920.7 - 27,920.7
Prepaid expenses - - -
Total Assets 741,318.5 - 741,318.5 627,060.2
LIABILITIES
Share capital 3.3.1 400,171.5 137,513.5
Additional paid-in capital 3.3.2 78,462.6 -
Legal reserve 11,098.3 11,098.3
Retained earnings 204,604.7 206,093.4
Net profit (loss) for the period 35,984.8 (1,488.7)
Regulated provisions - -
Equity 3.3 730,321.9 353,216.5
Provisions for liabilities - -
Provisions for charges 1.9 -
Provisions for Liabilities and Charges 3.4 1.9 -
Borrowings and similar liabilities 3.5.1 - 273,670.0
Prepayments received on orders in progress
Trade payables and related accounts 3.5.2 2,334.6 165.5
Tax and social security liabilities 3,814.4 8.1
Other liabilities 4,845.7 -
Liabilities 3.5 10,994.7 273,843.7
Deferred income - -
Total Liabilities 741,318.5 627,060.2

240
2 STATEMENT OF INCOME
(In thousands of euros)
Notes Year ended 31 December
2019 2018
Net revenue 4.1 2,509.5 -
Other income 5.4 -
Total operating income 2,514.9 -
Other purchases and external charges 11,095.5 8.2
Taxes and similar duties 45.2 0.4
Wages and salaries 3,113.8 -
Payroll taxes 1,127.5 -
Depreciation, amortisation and provisions 1.9 -
Other expenses 286.9 200.0
Total operating expenses 15,670.8 (208.6)
Operating profit 4.2 (13,155.9) (208.6)
Income from other securities and receivables 37,460.7 -
Other interest payable and similar income 1,108.8 35.5
Positive translation adjustment - 0.5
Total financial income 38,569.5 36.0
Depreciation, amortisation and provisions for financial items - -
Other interest payable and similar income 15,220.9 20,560.1
Negative translation adjustment 3.4 1.0
Total financial expenses 15,224.3 20,561.1
Financial result 4.3 23,345.2 (20,525.2)
Recurring profit before tax 10,189.3 (20,733.8)
Total non-recurring income - -
Total non-recurring expenses - -
Non-recurring profit/loss - -
Corporate tax (tax consolidation gains) 4.4 25,795.5 19,245.1
Total income 66,879.9 19,281.0
Total expenses
30,895.1 20,769.7
Net profit (loss) for the period 35,984.8 (1,488.7)
241
NOTES TO THE 2019 INDIVIDUAL FINANCIAL STATEMENTS
1. HIGHLIGHTS OF THE FINANCIAL YEAR ................................................................ 243
2. MAIN ACCOUNTING PRINCIPLES AND VALUATION METHODS ...................... 244
2.1. Accounting principles ...................................................................................................... 244
2.2. Main methods used .......................................................................................................... 244
2.2.1. Financial assets................................................................................................................. 244
2.2.2. Translation of receivables and liabilities denominated in foreign currencies .................. 245
2.2.3. Cash and equivalents and bank loans and overdrafts ....................................................... 245
2.2.4. Provisions for liabilities and charges ............................................................................... 245
2.2.5. Tax consolidation ............................................................................................................. 245
3. NOTES TO THE BALANCE SHEET ............................................................................. 246
3.1. Fixed assets ...................................................................................................................... 246
3.1.1. Table of changes in fixed assets ....................................................................................... 246
3.1.2. Table of subsidiaries and equity interests ........................................................................ 247
3.1.3. Receivables on non-current assets.................................................................................... 247
3.2. Current assets ................................................................................................................... 247
3.3. Equity ............................................................................................................................... 248
3.3.1. Composition of the share capital ...................................................................................... 248
3.3.2. Change in equity .............................................................................................................. 249
3.3.3. Liquidity agreement ......................................................................................................... 249
3.4. Provisions for liabilities and charges ............................................................................... 249
3.5. Liabilities ......................................................................................................................... 250
4. NOTES TO THE STATEMENT OF INCOME .............................................................. 250
4.1. Revenue ............................................................................................................................ 250
4.2. Operating profit ................................................................................................................ 251
4.3. Financial result ................................................................................................................. 251
4.4. Taxes ................................................................................................................................ 251
5. OFF-BALANCE SHEET COMMITMENTS .................................................................. 252
5.1. Pensions ........................................................................................................................... 252
5.2. Other commitments .......................................................................................................... 252
6. OTHER INFORMATION ............................................................................................... 252
6.1. Workforce ........................................................................................................................ 252
242
6.2. Compensation of board members ..................................................................................... 252
7. EVENTS AFTER THE CLOSING DATE ...................................................................... 252
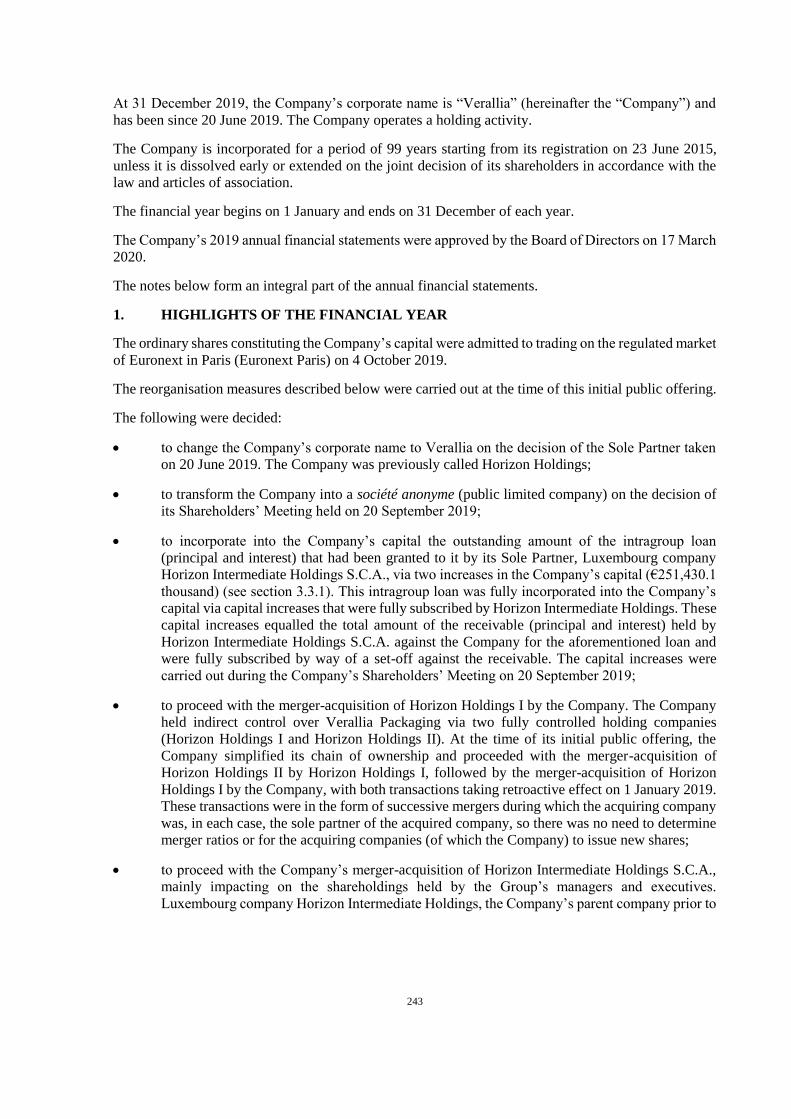
243
At 31 December 2019, the Company’s corporate name is “Verallia” (hereinafter the “Company”) and
has been since 20 June 2019. The Company operates a holding activity.
The Company is incorporated for a period of 99 years starting from its registration on 23 June 2015,
unless it is dissolved early or extended on the joint decision of its shareholders in accordance with the
law and articles of association.
The financial year begins on 1 January and ends on 31 December of each year.
The Company’s 2019 annual financial statements were approved by the Board of Directors on 17 March
2020.
The notes below form an integral part of the annual financial statements.
1. HIGHLIGHTS OF THE FINANCIAL YEAR
The ordinary shares constituting the Company’s capital were admitted to trading on the regulated market
of Euronext in Paris (Euronext Paris) on 4 October 2019.
The reorganisation measures described below were carried out at the time of this initial public offering.
The following were decided:
to change the Company’s corporate name to Verallia on the decision of the Sole Partner taken
on 20 June 2019. The Company was previously called Horizon Holdings;
to transform the Company into a société anonyme (public limited company) on the decision of
its Shareholders’ Meeting held on 20 September 2019;
to incorporate into the Company’s capital the outstanding amount of the intragroup loan
(principal and interest) that had been granted to it by its Sole Partner, Luxembourg company
Horizon Intermediate Holdings S.C.A., via two increases in the Company’s capital (€251,430.1
thousand) (see section 3.3.1). This intragroup loan was fully incorporated into the Company’s
capital via capital increases that were fully subscribed by Horizon Intermediate Holdings. These
capital increases equalled the total amount of the receivable (principal and interest) held by
Horizon Intermediate Holdings S.C.A. against the Company for the aforementioned loan and
were fully subscribed by way of a set-off against the receivable. The capital increases were
carried out during the Company’s Shareholders’ Meeting on 20 September 2019;
to proceed with the merger-acquisition of Horizon Holdings I by the Company. The Company
held indirect control over Verallia Packaging via two fully controlled holding companies
(Horizon Holdings I and Horizon Holdings II). At the time of its initial public offering, the
Company simplified its chain of ownership and proceeded with the merger-acquisition of
Horizon Holdings II by Horizon Holdings I, followed by the merger-acquisition of Horizon
Holdings I by the Company, with both transactions taking retroactive effect on 1 January 2019.
These transactions were in the form of successive mergers during which the acquiring company
was, in each case, the sole partner of the acquired company, so there was no need to determine
merger ratios or for the acquiring companies (of which the Company) to issue new shares;
to proceed with the Company’s merger-acquisition of Horizon Intermediate Holdings S.C.A.,
mainly impacting on the shareholdings held by the Group’s managers and executives.
Luxembourg company Horizon Intermediate Holdings, the Company’s parent company prior to
244
its initial public offering, chose to enable its shareholders to become direct shareholders in the
Company. For this purpose, Horizon Intermediate Holdings and the Company merged. This
reverse cross-border merger was submitted for the approval of the Shareholders’ Meetings of
each of the companies involved in this merger, with the Company’s Shareholders’ Meeting
being held on 20 September 2019, and the merger took effect on the day of settlement/delivery;
to proceed with the transfer by the Verallia FCPE (employee investment fund) to the Company
of all the ordinary and preference shares it held in the capital of Verallia Packaging, in exchange
for new ordinary shares in the Company (3,243,450 shares were issued amounting to a total of
€87,573.2 thousand).
2. MAIN ACCOUNTING PRINCIPLES AND VALUATION METHODS
2.1. Accounting principles
The financial statements were prepared according to the General Chart of Accounts in compliance with
Regulation ANC n°2014-03, the provisions set out in French law and generally accepted accounting
principles applied in France.
General accounting conventions were applied, with the principle of prudence being observed based on
the following core assumptions:
that the business is a going concern,
that accounting policies are consistent from one accounting period to the next,
that there is a clear cut-off between accounting periods,
and in accordance with the general rules for preparing and presenting annual financial statements.
The basic method used to evaluate accounting items is the historical cost method.
2.2. Main methods used
2.2.1. Financial assets
Equity interests are initially recognised at their acquisition cost or transfer value, excluding ancillary
expenses.
Periodically, such as at the end of each financial year, securities are valued at their value in use
corresponding to what the entity would be prepared to pay out to obtain the equity interest if it were to
acquire it at that time.
Estimates of value in use factor in various criteria including the share of company shareholders’ equity
and the share of consolidated net book value and future cash flows based on business plans (or projected
long-term budgets), excluding financial expenses but after tax.
An impairment charge is recognised when the value in use of the securities is below their net book value.
Unrealised capital gains are not recognised. However, any impairment charges recognised are adjusted.
245
2.2.2. Translation of receivables and liabilities denominated in foreign currencies
Liabilities and receivables not under any currency risk hedging arrangement appear in the balance sheet
at their counter-value during the course of the financial year.
The Company applies Regulation ANC n° 2015-05 relating to futures and hedging operations applicable
to financial years starting from 1 January 2017.
2.2.3. Cash and equivalents and bank loans and overdrafts
Cash and equivalents comprise securities immediately convertible into cash at their face value.
2.2.4. Provisions for liabilities and charges
Provisions for liabilities and charges (excluding retirement benefits and long-service awards)
A provision is recognised when the Company has an obligation (legal or implicit) towards a third party
resulting from past events that can be reliably estimated and that will probably lead to an outflow of
resources.
Retirement benefits and long-service awards
Retirement benefits are presented as off-balance sheet commitments.
Actuarial estimates of benefits granted are made using the projected unit credit method based on final
salaries and pension rights established on the valuation date.
Long-term service awards are provisioned in the financial statements.
2.2.5. Tax consolidation
Since 1 July 2015, the Company has been the parent company of a tax group. At 1 January 2019, this
group consisted of Verallia SA, Verallia Packaging, Verallia France, Everglass, Etablissements René
Salomon, Saga Décor, Obale, Société Charentaise de Décor and VOA Verrerie d’Albi.
The consolidation convention applies the principle of tax neutrality for consolidated subsidiaries. In
their relations with the consolidating parent company, subsidiaries pay their taxes as if they were taxed
individually.
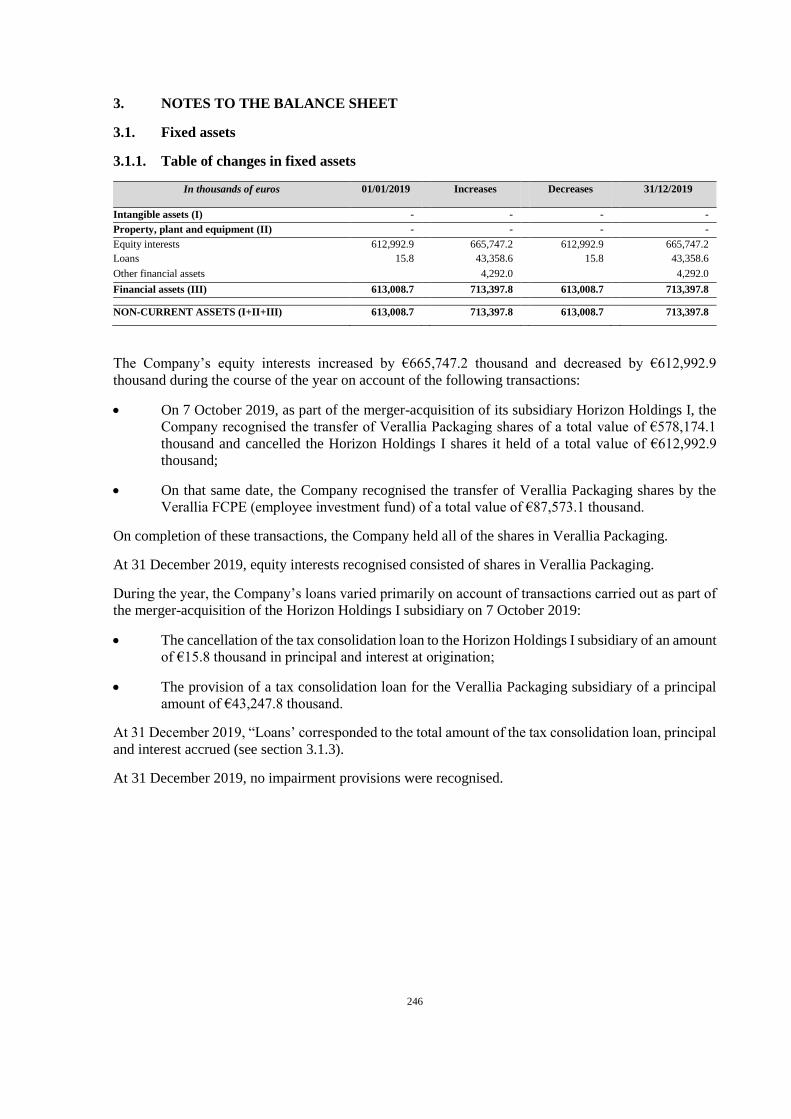
246
3. NOTES TO THE BALANCE SHEET
3.1. Fixed assets
3.1.1. Table of changes in fixed assets
In thousands of euros 01/01/2019 Increases Decreases 31/12/2019
Intangible assets (I) - - - -
Property, plant and equipment (II) - - - -
Equity interests 612,992.9 665,747.2 612,992.9 665,747.2
Loans 15.8 43,358.6 15.8 43,358.6
Other financial assets 4,292.0 4,292.0
Financial assets (III) 613,008.7 713,397.8 613,008.7 713,397.8
NON-CURRENT ASSETS (I+II+III) 613,008.7 713,397.8 613,008.7 713,397.8
The Company’s equity interests increased by €665,747.2 thousand and decreased by €612,992.9
thousand during the course of the year on account of the following transactions:
On 7 October 2019, as part of the merger-acquisition of its subsidiary Horizon Holdings I, the
Company recognised the transfer of Verallia Packaging shares of a total value of €578,174.1
thousand and cancelled the Horizon Holdings I shares it held of a total value of €612,992.9
thousand;
On that same date, the Company recognised the transfer of Verallia Packaging shares by the
Verallia FCPE (employee investment fund) of a total value of €87,573.1 thousand.
On completion of these transactions, the Company held all of the shares in Verallia Packaging.
At 31 December 2019, equity interests recognised consisted of shares in Verallia Packaging.
During the year, the Company’s loans varied primarily on account of transactions carried out as part of
the merger-acquisition of the Horizon Holdings I subsidiary on 7 October 2019:
The cancellation of the tax consolidation loan to the Horizon Holdings I subsidiary of an amount
of €15.8 thousand in principal and interest at origination;
The provision of a tax consolidation loan for the Verallia Packaging subsidiary of a principal
amount of €43,247.8 thousand.
At 31 December 2019, “Loans’ corresponded to the total amount of the tax consolidation loan, principal
and interest accrued (see section 3.1.3).
At 31 December 2019, no impairment provisions were recognised.
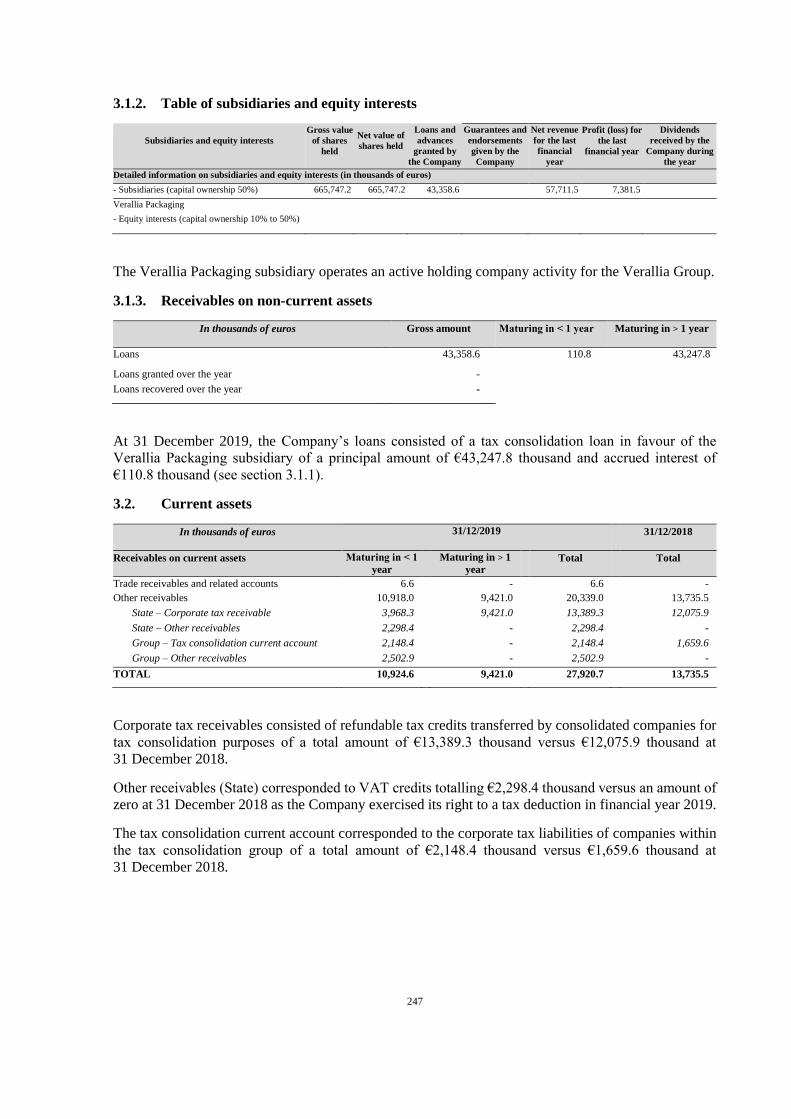
247
3.1.2. Table of subsidiaries and equity interests
Subsidiaries and equity interests
Gross value
of shares
held
Net value of
shares held
Loans and
advances
granted by
the Company
Guarantees and
endorsements
given by the
Company
Net revenue
for the last
financial
year
Profit (loss) for
the last
financial year
Dividends
received by the
Company during
the year
Detailed information on subsidiaries and equity interests (in thousands of euros)
- Subsidiaries (capital ownership 50%) 665,747.2 665,747.2 43,358.6
57,711.5 7,381.5
Verallia Packaging
- Equity interests (capital ownership 10% to 50%)
The Verallia Packaging subsidiary operates an active holding company activity for the Verallia Group.
3.1.3. Receivables on non-current assets
In thousands of euros Gross amount Maturing in ˂ 1 year Maturing in > 1 year
Loans 43,358.6 110.8 43,247.8
Loans granted over the year -
Loans recovered over the year -
At 31 December 2019, the Company’s loans consisted of a tax consolidation loan in favour of the
Verallia Packaging subsidiary of a principal amount of €43,247.8 thousand and accrued interest of
€110.8 thousand (see section 3.1.1).
3.2. Current assets
In thousands of euros 31/12/2019
Augmentations
Diminutions
31/12/2018
Receivables on current assets Maturing in ˂ 1
year Maturing in > 1
year Total Total
Trade receivables and related accounts 6.6 - 6.6 -
Other receivables 10,918.0 9,421.0 20,339.0 13,735.5
State – Corporate tax receivable 3,968.3 9,421.0 13,389.3 12,075.9
State – Other receivables 2,298.4 - 2,298.4 -
Group – Tax consolidation current account 2,148.4 - 2,148.4 1,659.6
Group – Other receivables 2,502.9 - 2,502.9 -
TOTAL 10,924.6 9,421.0 27,920.7 13,735.5
Corporate tax receivables consisted of refundable tax credits transferred by consolidated companies for
tax consolidation purposes of a total amount of €13,389.3 thousand versus €12,075.9 thousand at
31 December 2018.
Other receivables (State) corresponded to VAT credits totalling €2,298.4 thousand versus an amount of
zero at 31 December 2018 as the Company exercised its right to a tax deduction in financial year 2019.
The tax consolidation current account corresponded to the corporate tax liabilities of companies within
the tax consolidation group of a total amount of €2,148.4 thousand versus €1,659.6 thousand at
31 December 2018.
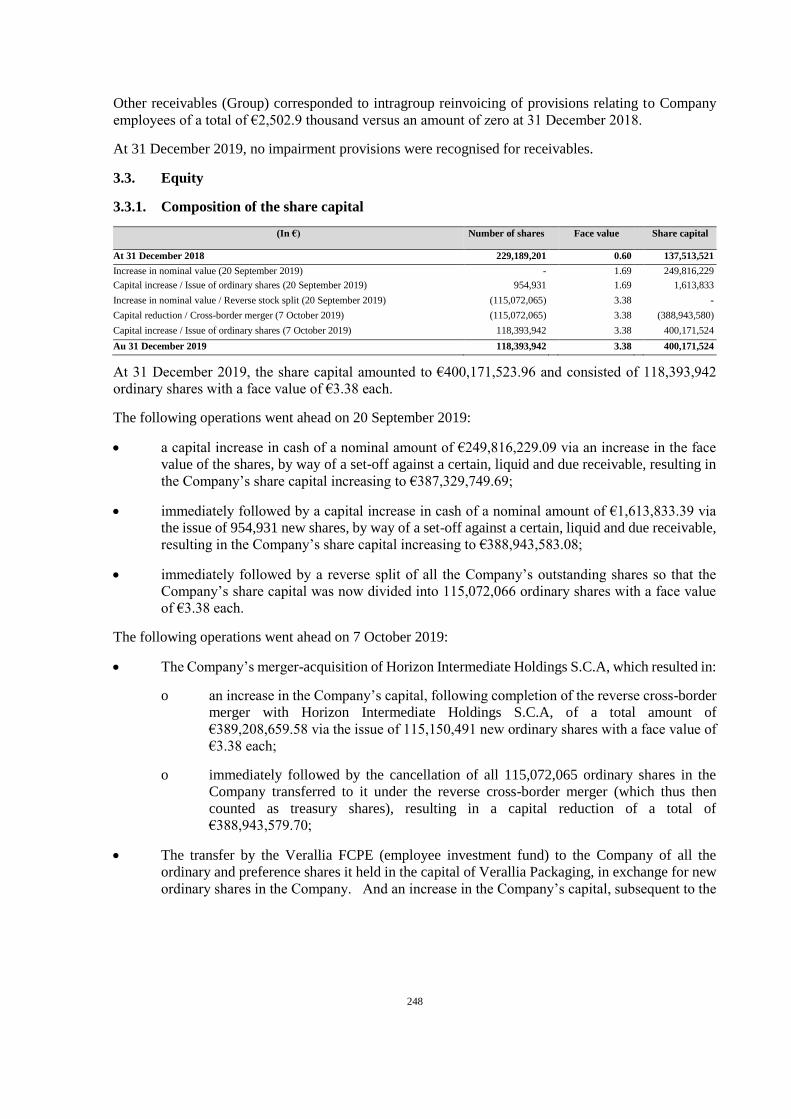
248
Other receivables (Group) corresponded to intragroup reinvoicing of provisions relating to Company
employees of a total of €2,502.9 thousand versus an amount of zero at 31 December 2018.
At 31 December 2019, no impairment provisions were recognised for receivables.
3.3. Equity
3.3.1. Composition of the share capital
(In €) Number of shares Face value Share capital
At 31 December 2018 229,189,201 0.60 137,513,521
Increase in nominal value (20 September 2019) - 1.69 249,816,229
Capital increase / Issue of ordinary shares (20 September 2019) 954,931 1.69 1,613,833
Increase in nominal value / Reverse stock split (20 September 2019) (115,072,065) 3.38 -
Capital reduction / Cross-border merger (7 October 2019) (115,072,065) 3.38 (388,943,580)
Capital increase / Issue of ordinary shares (7 October 2019) 118,393,942 3.38 400,171,524
Au 31 December 2019 118,393,942 3.38 400,171,524
At 31 December 2019, the share capital amounted to €400,171,523.96 and consisted of 118,393,942
ordinary shares with a face value of €3.38 each.
The following operations went ahead on 20 September 2019:
a capital increase in cash of a nominal amount of €249,816,229.09 via an increase in the face
value of the shares, by way of a set-off against a certain, liquid and due receivable, resulting in
the Company’s share capital increasing to €387,329,749.69;
immediately followed by a capital increase in cash of a nominal amount of €1,613,833.39 via
the issue of 954,931 new shares, by way of a set-off against a certain, liquid and due receivable,
resulting in the Company’s share capital increasing to €388,943,583.08;
immediately followed by a reverse split of all the Company’s outstanding shares so that the
Company’s share capital was now divided into 115,072,066 ordinary shares with a face value
of €3.38 each.
The following operations went ahead on 7 October 2019:
The Company’s merger-acquisition of Horizon Intermediate Holdings S.C.A, which resulted in:
o an increase in the Company’s capital, following completion of the reverse cross-border
merger with Horizon Intermediate Holdings S.C.A, of a total amount of
€389,208,659.58 via the issue of 115,150,491 new ordinary shares with a face value of
€3.38 each;
o immediately followed by the cancellation of all 115,072,065 ordinary shares in the
Company transferred to it under the reverse cross-border merger (which thus then
counted as treasury shares), resulting in a capital reduction of a total of
€388,943,579.70;
The transfer by the Verallia FCPE (employee investment fund) to the Company of all the
ordinary and preference shares it held in the capital of Verallia Packaging, in exchange for new
ordinary shares in the Company. And an increase in the Company’s capital, subsequent to the
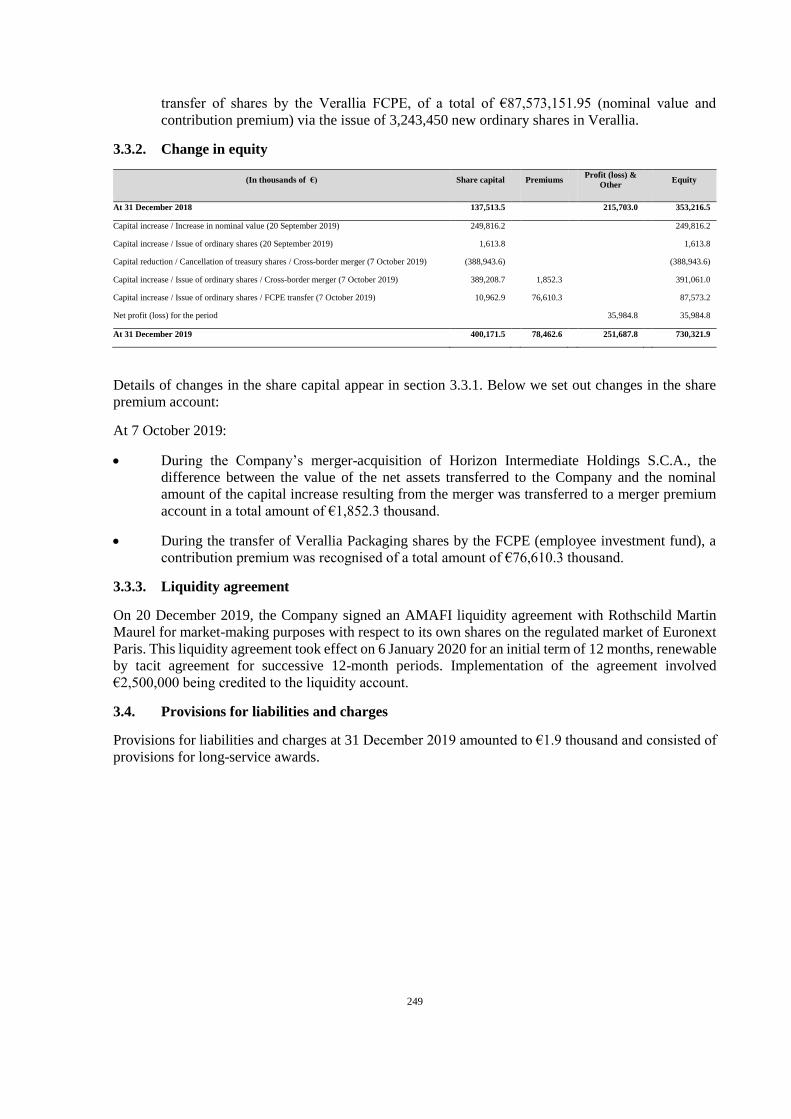
249
transfer of shares by the Verallia FCPE, of a total of €87,573,151.95 (nominal value and
contribution premium) via the issue of 3,243,450 new ordinary shares in Verallia.
3.3.2. Change in equity
(In thousands of €) Share capital Premiums Profit (loss) &
Other Equity
At 31 December 2018 137,513.5 215,703.0 353,216.5
Capital increase / Increase in nominal value (20 September 2019) 249,816.2 249,816.2
Capital increase / Issue of ordinary shares (20 September 2019) 1,613.8 1,613.8
Capital reduction / Cancellation of treasury shares / Cross-border merger (7 October 2019) (388,943.6) (388,943.6)
Capital increase / Issue of ordinary shares / Cross-border merger (7 October 2019) 389,208.7 1,852.3 391,061.0
Capital increase / Issue of ordinary shares / FCPE transfer (7 October 2019) 10,962.9 76,610.3 87,573.2
Net profit (loss) for the period 35,984.8 35,984.8
At 31 December 2019 400,171.5 78,462.6 251,687.8 730,321.9
Details of changes in the share capital appear in section 3.3.1. Below we set out changes in the share
premium account:
At 7 October 2019:
During the Company’s merger-acquisition of Horizon Intermediate Holdings S.C.A., the
difference between the value of the net assets transferred to the Company and the nominal
amount of the capital increase resulting from the merger was transferred to a merger premium
account in a total amount of €1,852.3 thousand.
During the transfer of Verallia Packaging shares by the FCPE (employee investment fund), a
contribution premium was recognised of a total amount of €76,610.3 thousand.
3.3.3. Liquidity agreement
On 20 December 2019, the Company signed an AMAFI liquidity agreement with Rothschild Martin
Maurel for market-making purposes with respect to its own shares on the regulated market of Euronext
Paris. This liquidity agreement took effect on 6 January 2020 for an initial term of 12 months, renewable
by tacit agreement for successive 12-month periods. Implementation of the agreement involved
€2,500,000 being credited to the liquidity account.
3.4. Provisions for liabilities and charges
Provisions for liabilities and charges at 31 December 2019 amounted to €1.9 thousand and consisted of
provisions for long-service awards.
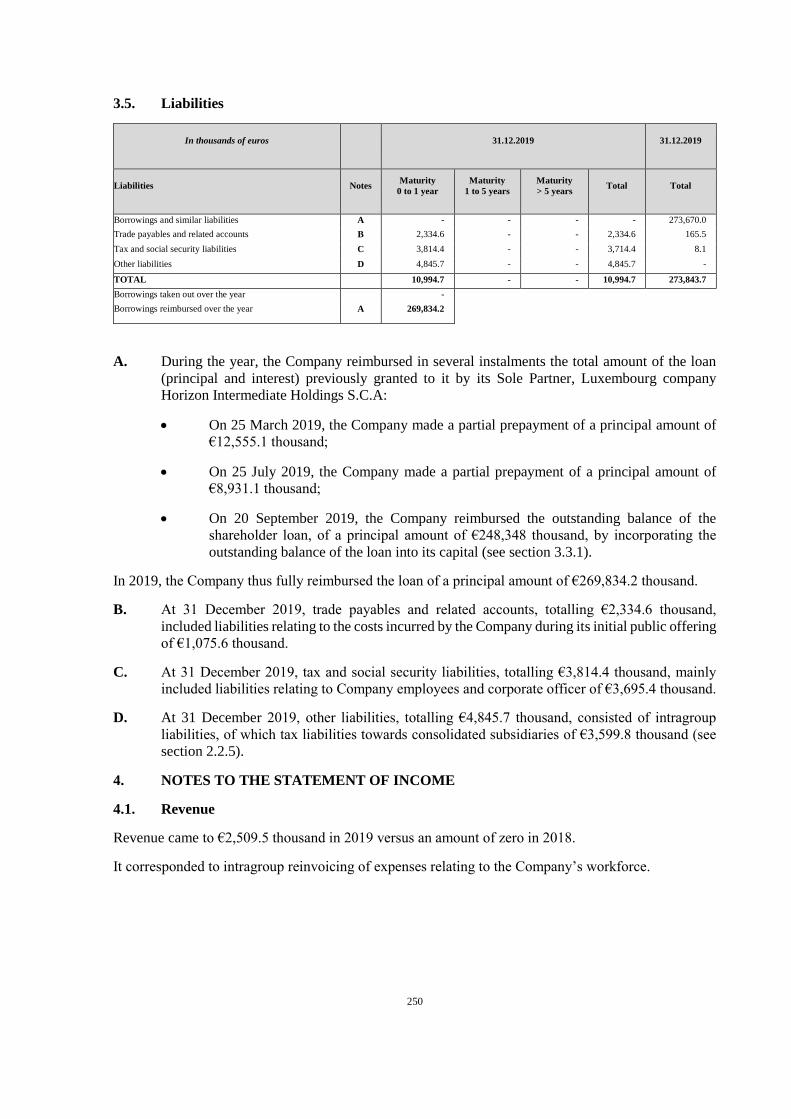
250
3.5. Liabilities
In thousands of euros 31.12.2019 31.12.2019
Liabilities Notes Maturity
0 to 1 year
Maturity
1 to 5 years
Maturity
> 5 years Total Total
Borrowings and similar liabilities A - - - - 273,670.0
Trade payables and related accounts B 2,334.6 - - 2,334.6 165.5
Tax and social security liabilities C 3,814.4 - - 3,714.4 8.1
Other liabilities D 4,845.7 - - 4,845.7 -
TOTAL 10,994.7 - - 10,994.7 273,843.7
Borrowings taken out over the year -
Borrowings reimbursed over the year A 269,834.2
A. During the year, the Company reimbursed in several instalments the total amount of the loan
(principal and interest) previously granted to it by its Sole Partner, Luxembourg company
Horizon Intermediate Holdings S.C.A:
On 25 March 2019, the Company made a partial prepayment of a principal amount of
€12,555.1 thousand;
On 25 July 2019, the Company made a partial prepayment of a principal amount of
€8,931.1 thousand;
On 20 September 2019, the Company reimbursed the outstanding balance of the
shareholder loan, of a principal amount of €248,348 thousand, by incorporating the
outstanding balance of the loan into its capital (see section 3.3.1).
In 2019, the Company thus fully reimbursed the loan of a principal amount of €269,834.2 thousand.
B. At 31 December 2019, trade payables and related accounts, totalling €2,334.6 thousand,
included liabilities relating to the costs incurred by the Company during its initial public offering
of €1,075.6 thousand.
C. At 31 December 2019, tax and social security liabilities, totalling €3,814.4 thousand, mainly
included liabilities relating to Company employees and corporate officer of €3,695.4 thousand.
D. At 31 December 2019, other liabilities, totalling €4,845.7 thousand, consisted of intragroup
liabilities, of which tax liabilities towards consolidated subsidiaries of €3,599.8 thousand (see
section 2.2.5).
4. NOTES TO THE STATEMENT OF INCOME
4.1. Revenue
Revenue came to €2,509.5 thousand in 2019 versus an amount of zero in 2018.
It corresponded to intragroup reinvoicing of expenses relating to the Company’s workforce.
251
4.2. Operating profit
Operating profit came out negative at €(13,155.9) thousand in 2019 versus €(208.6) thousand in 2018,
having fallen steeply on account of higher operating expenses.
It consisted mainly of the following:
External expenses of €11,095.5 thousand in 2019, of which €9,869 thousand in expenses
incurred during the preparation of the Company’s initial public offering; this is a much higher
figure than in 2018 (€8.2 thousand);
Wages and salaries of €3,113.8 thousand in 2019 versus an amount of zero in 2018.
4.3. Financial result
The financial result came to €23,345.2 thousand in 2019 versus €(20,525.2) thousand in 2018.
It consisted of:
Financial income of €38,569.5 thousand in 2019, of which €37,460.7 thousand of exceptional
dividends of share premium received from the Verallia Packaging subsidiary and €1,108.8
thousand of interest income relating to the loans contracted on behalf of the Verallia Packaging
subsidiary; this is a much higher figure than in 2018 (€36 thousand);
Financial expenses of €15,224,3 thousand in 2019, of which €15,220.9 thousand of interest
expenses relating to the loan contracted as part of the acquisition of Verallia investees; this is a
lower figure than in 2018 (€20,561.1 thousand).
4.4. Taxes
At 31 December 2019, Verallia SA recognised a net corporate tax gain of €25,854.5 thousand under the
French tax consolidation regime, of which a research tax credit of €910 thousand.
In the absence of any tax consolidation, the Company would have recognised corporate tax of zero.
252
5. OFF-BALANCE SHEET COMMITMENTS
5.1. Pensions
The Company’s commitments relating to retirement benefits are not provisioned.
At 31 December 2019, these commitments totalled €336.8 thousand.
5.2. Other commitments
On 7 October 2019, as part of the process of listing Verallia SA shares for trading on the regulated
market of Euronext Paris, the Group refinanced the facilities that had been made available to it under
the facilities agreement signed on 7 August 2015 (as amended subsequently) (the “2015 Facilities
Agreement”), primarily by drawing on the term loan made available to Verallia Packaging under the
English-language facilities agreement of a maximum total amount of €2,000,000,000 in principal,
governed by French law and signed on 17 July 2019 by Verallia SA in its capacity as the parent company
(Parent), Verallia Packaging in its capacity as the borrower (Borrower) and guarantor (Guarantor),
Banco Santander S.A., BNP Paribas, Citigroup Global Markets Limited, Crédit Agricole Corporate and
Investment Bank, Credit Suisse International, Deutsche Bank Luxembourg S.A., Société Générale,
Allied Irish Banks, p.l.c, Banco de Sabadell, S.A., Commerzbank Aktiengesellschaft, Filiale
Luxembourg, Cooperatieve Rabobank U.A., Crédit Industriel et Commercial, La Banque Postale,
Mediobanca – Banca di Credito Finanziario S.p.A. and Raiffeisen Bank International AG in their
capacity as arrangers (Arrangers), the financial institutions involved in their capacity as lenders
(Lenders), and Crédit Agricole Corporate and Investment Bank in its capacity as the agent (Agent) (as
each of these terms is defined in English in said agreement) (the “2019 Facilities Agreement”).
Under the 2019 Facilities Agreement, Verallia SA stands as joint and several guarantor (“Guarantor”)
for the payment and repayment obligations of Verallia Packaging and other Group companies that may
also adhere to the 2019 Facilities Agreement as guarantors (i.e. Verallia France, Verallia Italia, Verallia
Brasil, Verallia Spain, Verallia Portugal and Verallia Deutschland), for a maximum amount of
€2,000,000,000 in principal (plus interest, fees and commissions) and within the legal and contractual
limits set out in Article 22.13 (Limitation of Liabilities of French Guarantors) of the 2019 Facilities
Agreement.
6. OTHER INFORMATION
6.1. Workforce
The Company comprises two employees and one corporate officer at 31 December 2019.
6.2. Compensation of board members
The compensation of members of the Board of Directors (attendance fees) corresponds to the amounts
recorded in the statement of income over the period.
Attendance fees allocated to non-executive officers in respect of their mandates at Verallia SA amounted
to €267.9 thousand versus €200 thousand in 2018.
7. EVENTS AFTER THE CLOSING DATE
N/A.
253
Statutory Auditors’ report on the parent company financial statements for the year ended
31 December 2019
“This is a free translation into English of the Statutory Auditors’ report issued in French and is
provided solely for the convenience of English speaking readers. This report includes information
specifically required by European regulations or French law, such as information about the
appointment of Statutory Auditors. This report should be read in conjunction with, and construed in
accordance with, French law and professional auditing standards applicable in France.
Verallia SA
Tour Carpe Diem
31 Place des Corolles - Esplanade Nord
92400 Courbevoie
To the General annual meeting,
Opinion
In compliance with the engagement entrusted to us by your Articles of Association and by the decision
of the sole shareholder, we have audited the accompanying financial statements of Verallia SA for the
year ended 31 December 2019.
In our opinion, the financial statements give a true and fair view of the assets and liabilities and of the
financial position of the Company at 31 December 2019 and of the results of its operations for the year
then ended in accordance with French accounting principles.
The audit opinion expressed above is consistent with our report to the Audit Committee.
Basis for opinion
Audit framework
We conducted our audit in accordance with professional standards applicable in France. We believe that
the audit evidence we have obtained is sufficient and appropriate to provide a basis for our opinion.
Our responsibilities under these standards are further described in the “Responsibilities of the Statutory
Auditors relating to the audit of the financial statements” section of our report.
Independence
We conducted our audit engagement in compliance with the independence rules applicable to us, for the
period from 1 January 2019 to the date of our report, and, in particular, we did not provide any non-audit
services prohibited by Article 5 (1) of Regulation (EU) No 537/2014 or the French Code of Ethics (Code
de déontologie) for Statutory Auditors.
254
Justification of assessments – Key audit matters
In accordance with the requirements of Articles L.823-9 and R.823-7 of the French Commercial Code
(Code de commerce) relating to the justification of our assessments, we inform you of the key audit
matters relating to the risks of material misstatement that, in our professional judgement, were the most
significant in our audit of the financial statements, as well as how we addressed those risks.
These matters were addressed as part of our audit of the financial statements as a whole, and therefore
contributed to the opinion we formed as expressed above. We do not provide a separate opinion on
specific items of the financial statements.
Valuation of equity securities
Description of risk
Equity securities are initially recognised at cost or at their transfer value.
A provision for impairment is recognised when the value in use of the securities is less than their net
carrying amount. The estimate of value in use takes into account various criteria, including the
Company’s share of equity, consolidated net assets and discounted future cash flows on the basis of
business plans (or long-term forecast budgets) excluding interest and after tax, as described in note 2.2.1.
“Financial assets” to the financial statements.
At 31 December 2019, they comprise shares in Verallia Packaging SAS, which are recorded in the
balance sheet for an amount of €666 million, i.e. 90% of total assets, the other assets being mainly
receivables related to this investment.
The valuation of these equity securities, which requires management to exercise its judgement in
selecting the items to be considered and the assumptions used, is sensitive to the economic environment
and the uncertainty inherent in evaluating future prospects and is a determining factor in assessing
Verallia SA’s financial position, assets and liabilities.
We therefore deemed the measurement of equity securities to be a key audit matter.
How our audit addressed this risk
On the basis of the information provided to us, we verified that the estimated value of these equity
securities determined by management were based on an appropriate measurement method and
underlying data.
Our work consisted mainly in verifying that management’s estimate of value in use was based on
(i) enterprise values determined on the basis of the same assumptions as those used for the impairment
tests carried out by the Group within the scope of the operations of the subsidiary Verallia Packaging
SAS and the subsidiaries that it holds directly or indirectly, and (ii) consolidated net debt within this
scope.
We have assessed the appropriateness of the approach used by management to assess the value in use
of Verallia Packaging SAS shares.
255
We also ensured that the value in use was consistent with the Group’s stock market capitalisation.
Lastly, we examined the appropriateness of the disclosures in the notes to the financial statements.
Specific verifications
In accordance with professional standards applicable in France, we have also performed the specific
verifications required by French legal and regulatory provisions.
Information given in the management report and in the other documents provided to the shareholders
with respect to the Company’s financial position and the financial statements
We have no matters to report as to the fair presentation and the consistency with the financial statements
of the information given in the Board of Directors’ management report and in the other documents
provided to the shareholders with respect to the Company’s financial position and the financial
statements.
We attest to the fair presentation and the consistency with the financial statements of the information
about payment terms referred to in Article D.441-4 of the French Commercial Code.
Report on corporate governance
We attest that the Board of Directors’ report on corporate governance sets out the information required
by Articles L.225-37-3 and L.225-37-4 of the French Commercial Code.
Concerning the information given in accordance with the requirements of Article L.225-37-3 of the
French Commercial Code relating to remuneration and benefits received by corporate officers and any
other commitments made in their favour, we have verified its consistency with the financial statements
or with the underlying information used to prepare these financial statements, and, where applicable,
with the information obtained by the Company from companies controlling it or controlled by it. Based
on this work, we attest to the accuracy and fair presentation of this information.
Concerning the information given in accordance with the requirements of Article L.225-37-5 of the
French Commercial Code relating to those items the Company has deemed liable to have an impact in
the event of a takeover bid or exchange offer, we have verified its consistency with the underlying
documents that were disclosed to us. Based on this work, we have no matters to report with regard to
this information.
Other information
In accordance with French law, we have verified that the required information concerning the purchase
of investments and controlling interests and the identity of the shareholders and holders of the voting
rights has been properly disclosed in the management report.
Report on other legal and regulatory requirements
Appointment of the Statutory Auditors
256
We were appointed Statutory Auditors of Verallia SA in the Articles of Association dated 18 June 2015
for PricewaterhouseCoopers Audit and by a decision of the sole shareholder of 24 July 2019 for BM&A.
At 31 December 2019, PricewaterhouseCoopers Audit and BM&A were in the fifth consecutive year
and the first year of their engagement, respectively, and the first year since the Company’s securities
were admitted to trading on a regulated market.
Responsibilities of management and those charged with governance for the financial statements
Management is responsible for preparing financial statements giving a true and fair view in accordance
with French accounting principles, and for implementing the internal control procedures it deems
necessary for the preparation of financial statements that are free of material misstatement, whether due
to fraud or error.
In preparing the financial statements, management is responsible for assessing the Company’s ability to
continue as a going concern, disclosing, as applicable, matters related to going concern, and using the
going concern basis of accounting, unless it expects to liquidate the Company or to cease operations.
The Audit Committee is responsible for monitoring the financial reporting process and the effectiveness
of internal control and risk management systems, as well as, where applicable, any internal audit
systems, relating to accounting and financial reporting procedures.
The financial statements were approved by the Board of Directors.
Responsibilities of the Statutory Auditors relating to the audit of the financial statements
Objective and audit approach
Our role is to issue a report on the financial statements. Our objective is to obtain reasonable assurance
about whether the financial statements as a whole are free of material misstatement. Reasonable
assurance is a high level of assurance, but is not a guarantee that an audit conducted in accordance with
professional standards will always detect a material misstatement when it exists. Misstatements can arise
from fraud or error and are considered material if, individually or in the aggregate, they could reasonably
be expected to influence the economic decisions taken by users on the basis of these financial statements.
As specified in Article L.823-10-1 of the French Commercial Code, our audit does not include assurance
on the viability or quality of the Company’s management.
As part of an audit conducted in accordance with professional standards applicable in France, the
Statutory Auditors exercise professional judgement throughout the audit. They also:
identify and assess the risks of material misstatement in the financial statements, whether due to
fraud or error, design and perform audit procedures in response to those risks, and obtain audit
evidence considered to be sufficient and appropriate to provide a basis for their opinion. The risk
of not detecting a material misstatement resulting from fraud is higher than for one resulting from
error, as fraud may involve collusion, forgery, intentional omissions, misrepresentations, or the
override of internal control;
obtain an understanding of the internal control procedures relevant to the audit in order to design
audit procedures that are appropriate in the circumstances, but not for the purpose of expressing
an opinion on the effectiveness of the internal control;

257
evaluate the appropriateness of accounting policies used and the reasonableness of accounting
estimates made by management and the related disclosures in the notes to the financial statements;
assess the appropriateness of management’s use of the going concern basis of accounting and,
based on the audit evidence obtained, whether a material uncertainty exists related to events or
conditions that may cast significant doubt on the Company’s ability to continue as a going
concern. This assessment is based on the audit evidence obtained up to the date of the audit report.
However, future events or conditions may cause the Company to cease to continue as a going
concern. If the Statutory Auditors conclude that a material uncertainty exists, they are required to
draw attention in the audit report to the related disclosures in the financial statements or, if such
disclosures are not provided or are inadequate, to issue a qualified opinion or a disclaimer of
opinion;
evaluate the overall presentation of the financial statements and assess whether these statements
represent the underlying transactions and events in a manner that achieves fair presentation.
Report to the Audit Committee
We submit a report to the Audit Committee which includes, in particular, a description of the scope of
the audit and the audit programme implemented, as well as the results of our audit. We also report any
significant deficiencies in internal control that we have identified regarding the accounting and financial
reporting procedures.
Our report to the Audit Committee includes the risks of material misstatement that, in our professional
judgement, were the most significant for the audit of the financial statements and which constitute the
key audit matters that we are required to describe in this report.
We also provide the Audit Committee with the declaration provided for in Article 6 of
Regulation (EU) No 537/2014, confirming our independence within the meaning of the rules applicable
in France, as defined in particular in Articles L.822-10 to L.822-14 of the French Commercial Code and
in the French Code of Ethics for Statutory Auditors. Where appropriate, we discuss any risks to our
independence and the related safeguard measures with the Audit Committee.
Neuilly-sur-Seine and Paris, 17 March 2020
The Statutory Auditors PricewaterhouseCoopers Audit BM&A
Itto El Hariri Gilles Rabier

259
18.3 Date of the last financial information
31 December 2019
18.4 Dividend distribution policy
The Company made no dividend payments for the years ended 31 December 2017 and 2018.
For the year ended 31 December 2019, a proposal will be made at the Company’s General Shareholders’ Meeting
for the distribution of a dividend of €0.85 per share, with a payment scheduled for 9 July 2020. The shareholders will
have an option between the payment of the dividend in cash or new shares of the Company.
The Group’s dividend policy is described in Section 10.2 of this Universal Registration Document.
18.5 Judicial and arbitration proceedings
In the normal course of its business, the Group may be involved in legal, arbitration, administrative or regulatory
proceedings, which may notably include disputes with its customers, suppliers, competitors or employees, as well as
tax or other authorities. At the date of this Universal Registration Document, the Group is not aware of any
government, legal or arbitration proceedings (including any proceedings that to the Group’s knowledge are under
way or imminent), other than those mentioned below, that could have or have had, during the last 12 months, a
material impact on the financial position or profitability of the Company or the Group.
A provision is recorded by the Group if there is a sufficient likelihood that such proceeding will give rise to costs for
the Company or one of its subsidiaries and if the amount of such costs can be reasonably estimated. As of 31
December 2019, the Group’s total provisions for litigation amounted to €8.1 million (see Note 18 to the Group’s
consolidated financial statements for the financial year ended 31 December 2019, contained in Section 18.1.1 of this
Universal Registration Document).
Arbitration proceedings against Verallia Brasil, the Group’s Brazilian subsidiary, concerning the joint venture
Industria Vidreira do Nordeste LTDA (IVN)
In 2013, Verallia Brasil, a subsidiary of the Company, formed a joint venture with a local partner, Ipiaram
Empreendimentos e Participações Ltda. (Ipiaram) for the purpose of constructing and operating a glass production
facility in the State of Sergipe in Brazil. The plant was commissioned in 2015.
In January 2017, Ipiaram initiated an arbitration proceeding with the International Chamber of Commerce (ICC)
against Verallia Brazil concerning the interpretation of certain provisions of the shareholders’ agreement; Ipiaram
believes that it had the right to exercise the purchase commitments given under the partnership agreements and that
it no longer had to participate in the governance of IVN.
The arbitration proceedings were still ongoing at the date of this Universal Registration Document. As of 31
December 2019, Ipiaram’s loss is estimated at R$104 million Brazilian reals in principal and interest (equivalent to
about €23 million at the closing rate on 31 December 2019). The Group considers the claim unfounded. No provision
has therefore been recorded in this respect.
On 26 October 2018, Ipiaram and the Group sold their respective interests in the IVN joint venture to a Brazilian
glass manufacturer.
Proceedings brought against Verallia Deutschland AG and Horizon Holdings Germany GmbH in relation to the
Domination and Profit & Loss Transfer Agreement
At the date of this Universal Registration Document, the Group, through Horizon Holdings Germany GmbH and
Verallia France, held 96.73% of the capital and voting rights of Verallia Deutschland AG, a German subsidiary listed
on the Frankfurt, Munich and Stuttgart stock exchanges.
In December 2016, Verallia Deutschland AG, as the controlled entity, and Horizon Holdings Germany GmbH, as the
controlling entity, entered into a Domination and Profit & Loss Transfer Agreement approved by the local authorities.
Following the execution of this agreement and in accordance with applicable German law, Horizon Holdings
Germany GmbH offered to buy all the Verallia Deutschland AG shares that it did not already hold at the price of
260
€433.02 per share. This offer was still pending at the date of this Universal Registration Document. Certain minority
shareholders of Verallia Deutschland AG are disputing the valuation used to calculate the price per share offered. A
liability relating to the obligation to buy out the minority shareholders was recorded by the Company for a total
present value of €12.9 million as of 31 December 2019 (€12.3 million at 31 December 2018). The amount is based
on the assumption that 100% of the minority shareholders will tender their shares to the offer made by Horizon
Holdings Germany GmbH to purchase their shares for a price of €433.02 per share as proposed in 2016.
In addition, the Domination and Profit & Loss Transfer Agreement provides for annual flat-rate remuneration (in the
form of an annual dividend per share) during the term of the majority ownership and profit transfer agreement for
the minority shareholders of Verallia Deutschland AG, representing, over a five-year period, a total of €2.1 million
(discounted to present value) as of 31 December 2019. The minority shareholders also demanded an increase in the
annual flat-rate remuneration provided for in the agreement.
On 24 September 2018, the Stuttgart District Court rejected the requests made by the minority shareholders, who
have appealed. The minority shareholders appealed the decision and the case was referred to the Stuttgart Regional
High Court where it is still pending.
Dispute between Verallia Italia and Nelson Servizi
In December 2014, the companies Verallia Italia, as supplier, and Nelson Servizi, as distributor, renewed their
existing distribution agreement and defined their mutual commitments to sell and buy standard and customised bottles
for the Cuban market for the years 2015, 2016 and 2017.
Towards the latter part of 2015, the Group decided that it wanted to cease all commercial activity destined for Cuba
at the second half of 2016. Verallia Italia therefore proposed an amicable procedure to Nelson Servizi with a view to
ending their agreement. In response, Nelson Servizi suspended all payments to Verallia Italia.
In February 2016, Verallia Italia notified Nelson Servizi that the distribution agreement would be terminated if
Nelson Servizi failed to settle its debts. In the same month, Verallia Italia received a summons from Nelson Servizi,
which was seeking a court injunction so that Verallia Italia would be forced to (i) fulfil its obligations under the
distribution contract renewed in December 2014, (ii) compensate Nelson Servizi for the loss resulting from the
termination of the distribution agreement and Verallia Italia’s actions, and (iii) compensate Nelson Servizi for the
loss incurred as a result of its economic dependence on Verallia Italia. Nelson Servizi requested that Verallia Italia
be ordered to pay damages in the amount of €11 million.
At the date of this Universal Registration Document, the litigation proceedings initiated by Nelson Servizi were still
ongoing.
Accordingly, a provision was recognised for the amount of €4.3 million as of 31 December 2019.
Litigation relating to asbestos
At the date of this Universal Registration Document, the Group was involved in proceedings and litigation relating
to alleged exposure to asbestos-containing materials at some of the Group’s facilities in France.
Inexcusable misconduct
In France, since the late 1990s, several of the Group’s former employees and employees or beneficiaries have sued
Verallia France, the Group’s French subsidiary, for “inexcusable misconduct”, seeking damages for occupational
illnesses caused by alleged exposure to asbestos-containing materials, in addition to compensation they would have
received from social security agencies. In recent years, some of their claims have been granted by the French courts.
As at 31 December 2019, the amount provisioned for these claims amounted to €1.1 million.
Classification of the Cognac site as an asbestos site
For several years, the Group’s staff representatives have been lobbying the French Ministry of Labour, Health and
Employment to include the Cognac site in France on the list of establishments involved in asbestos manufacturing,
flocking and insulation activities. This would potentially entitle workers exposed to asbestos to qualify for an early
retirement benefit. After a survey carried out at the Cognac site, in January 2007 the Ministry declined to grant the
application for classification of the site. Following this refusal, a complaint was lodged with the administrative courts.
261
In 2013, the Council of State upheld the Ministry’s position and refused to include the Cognac site on the list for the
1976-1996 period.
Another investigation was then conducted for the 1964-1975 period, but the Ministry once again rejected the request
to place the Cognac facility on the above-mentioned list. Following this decision, a new complaint was lodged with
the administrative courts. On 4 February 2019, the Bordeaux Administrative Court of Appeal upheld the decision of
the Poitiers Administrative Court not to place the Cognac facility on the list for the 1964-1975 period. As the statute
of limitation has run off, the case is closed. The Cognac site was therefore not listed on the list of asbestos
manufacturing, flocking and insulation establishments.
If the Cognac site had been included on the list of asbestos manufacturing, flocking and insulation establishments,
Group employees present on the site between 1964 and 1975 would have been eligible for early retirement. In
addition, the Group’s employees and former employees allegedly exposed to asbestos-containing materials at the site
could have potentially obtained damages for emotional distress linked to the alleged exposure by benefiting from a
no-evidence required waiver, which exempts them from the need to prove their exposure to asbestos due to the
employer’s fault. This risk has been extinguished. However, a new case law of the French courts on the harm of
anxiety has led to an increase in the scope of these damages and possible claims (see below).
Claims for emotional distress damages
As of 31 December 2019, 87 lawsuits had been brought by employees or former employees of the Group seeking
compensation for emotional distress suffered as a result of their alleged exposure to asbestos-containing materials at
the Group’s French sites.
An amount of €1,479,000 has been recorded as provisions for this purpose.
As of the date of this Universal Registration Document, none of the complainants have declared a disease related to
exposure to asbestos-containing materials.
Since the end of 2019, a judgement of the Social Chamber of the French Court of Cassation has led to an expansion
of the scope of anxiety prejudice. In fact, employees who now no longer need to prove their employment by a listed
asbestos manufacturing, flocking and insulation facility, but exposure to a harmful or toxic substance that creates a
high risk of developing serious pathology and anxiety prejudice resulting from such exposure, can now seek remedy
on the basis of statutory law and the employer’s failure to fulfil its safety obligation. New legal actions could therefore
be taken on the basis of exposure to substances other than asbestos.
18.6 Significant change in the issuer’s financial position
On 28 April 2020, the Company has published the following press release relating to its results for the first quarter
2020 and provided an update on the Group’s activity in the current context of health crisis:
“2020 first quarter results
Good start of the year with limited impact from the COVID-19 epidemic:
1.9% growth in reported revenue
Organic revenue growth of 4.0%
23.5% adjusted EBITDA margin, up 103 basis points
Paris, April 28, 2020
Highlights
262
1.9% growth in reported revenue amounting to €645m compared to Q1 2019
Sustained organic revenue growth of 4.0% compared to Q1 2019
Adjusted EBITDA growth reaching €151m, up 6.5% compared to Q1 2019 (+9.6% at constant
exchange rates and scope)
Improvement in adjusted EBITDA margin at 23.5%, up 103 basis points compared to Q1 2019
Reduction in net debt leverage to 2.5x adjusted EBITDA for the last 12 months, compared to
2.6x as of December 31, 2019
Withdrawal of the 2020 guidance due to the limited visibility linked to the COVID-19 epidemic
Proposal to pay a dividend per share of €0.85, with payment in cash or in new shares(1)
(1) At shareholder’s option, subject to the June 10, 2020 Annual General Meeting’s approval.
“Verallia reports good results for the first quarter of 2020 with an increase in sales and an improvement in
profitability, despite the impact of the COVID-19 epidemic on March sales. From the onset of the current health
crisis, we were very prompt in our response to ensure the safety of our employees and guarantee business continuity
for our customers by keeping all our production sites up and running. I wish to acknowledge and warmly thank all
of our employees for their commitment and their spontaneous acts of solidarity. Even though it is now inevitable that
this crisis will have a significant impact on the results for the next quarter and the year 2020, our financial strength
and our resilient profile will enable us to address the situation with equanimity.” commented Michel Giannuzzi,
Chairman and CEO Verallia.
Adaptation plans to address the COVID-19 epidemic
Verallia reiterates that, from the outset of the COVID‐19 crisis, all necessary measures have been undertaken to
guarantee the safety and health of its employees worldwide and to ensure business continuity. Adaptation plans have
been implemented at Group and country level to ensure the following priorities are met:
Employee safety
Verallia immediately put in place all required health precautionary measures to prevent the spread of the virus
at its production sites. In addition, remote work has been swiftly rolled out in all possible cases.
Business continuity and production
As a key supplier to the food industry, the Group has managed to maintain all of its production sites running,
adapting its production volumes, and thus to serve its customers to the fullest extent possible. In Northern
Europe, Italy and Iberia, the plants continued to operate at a sustained level. France and Latin America have
been more affected.
2020 first quarter results
In the first quarter of the year, Verallia recorded a revenue of €645m, compared to €633m in the first quarter of
2019, an increase of 1.9% on a reported basis.
The impact of the exchange rates variation was -2.1% over the first quarter (-€13m), primarily linked to the currency
depreciation in Latin America, which was considerably more pronounced during the month of March.
At constant exchange rates and scope, revenue increased by 4.0% during the first quarter of the year (and by 2.0%
excluding Argentina), with a deceleration in March: organic growth at the end of February amounted to +5.9% while
it decreased to +0.4% in March, the initial impacts of the COVID-19 crisis only being felt at the end of the quarter.
The activity evolution has been slightly negative
(-€2.7m) on the quarter despite volumes sold showing a small increase. This can be explained by the higher decline
in French sales, where the selling prices and the sales mix are higher than the Group’s average.
The Group estimates that close to two-thirds of its consolidated sales are exposed to the off-trade channel, while one-
third to the on-trade channel. This percentage varies quite significantly depending on the country and product family.
By segment:
263
In Southern and Western Europe, demand levels remained dynamic, particularly for food jars and beer
bottles. Italy and Iberia posted positive growth over the quarter. At the beginning of the quarter, activities in
France were affected by the national strikes related to the pension reform and by a decline in demand from
customers exporting to China. This decline became more pronounced from mid-March onwards due to
COVID-19 impact.
The Northern and Eastern Europe region was driven by the food jars and mineral water markets. Germany,
Ukraine and Russia showed positive organic growth in Q1.
In Latin America, all countries reported positive growth for the quarter. The situation took a downturn from
mid-March onwards, particularly in Brazil which is going through a challenging political and health context.
In terms of pricing policy at Group level, sales price increases were more moderate at the start of the year than the
previous year and in line with expectations. The weight of Argentina, that is in hyperinflation, is noticeable as the
price / mix impact amounted to €11m over the quarter.
Adjusted EBITDA grew by 6.5% (+9.6% at constant exchange rates and scope) in the first quarter amounting to
€151m. Despite a slightly negative activity impact, the adjusted EBITDA improved thanks to a positive spread69 and
a net reduction in cash production costs (Performance Action Plan, PAP) of €8m in the first quarter of 2020. The first
operational impacts related to COVID-19 remain insignificant at the end of March. The adjusted EBITDA margin
increased by 103 basis points to 23.5%.
During the first quarter of the year, Verallia continued its deleveraging. Net debt thus reached €1,574m at the end
of March 2020, i.e. 2.5x adjusted EBITDA for the last 12 months, compared to 2.6x as of December 31, 2019.
This leverage ratio remains well below the maximum leverage ratio set out in Verallia’s Group financing
documentation, which is at 5.0x adjusted EBITDA. On March 20, 2020, the Group drew €200m from its €500m
Revolving Credit Facility ahead of the upcoming maturities of its “Neu Commercial Papers”, the market of which is
currently closed for non-investment grade companies in France. In addition, Verallia continues to benefit from strong
liquidity70 of €528m as of March 31, 2020.
In order to reinforce its liquidity, Verallia successfully set up an additional €250m Revolving Credit line with a
one-year maturity, extendable by six months at the Group’s discretion, on April 24, 2020. The syndicate of banks
that participated to this new source of financing includes Banco Santander, BNP Paribas, CACIB, CIC,
Commerzbank, La Banque Postale, Rabobank and Société Générale.
Verallia: united and responsible
Given its financial strength and its resilience, Verallia does not intend to apply for the financial support offered by
the French government (public loans or guarantees, deferrals of tax or social charges payments,…) in order to allow
businesses that need them the most to benefit from those financial measures. Only after having used employees’
holidays, banked hours or RTT (reduction of working hours) to the highest extent possible did Verallia implement
partial unemployment measures, in the most responsible and restricted manner possible.
The management recognizes the remarkable commitment and responsiveness of all the Group’s employees, as well
as the teams’ spontaneous movements of solidarity towards the local communities where the production sites are
located, such as donations of hospital equipment, hydroalcoholic gels, protective clothing or masks.
In addition, Michel Giannuzzi, Verallia’s CEO, has decided to contribute to the Group’s collective effort by foregoing
his 2020 variable compensation, which represents 50% of his total annual compensation. All other Executive
Committee members also participate in this joint effort by renouncing 15% of their total annual compensation. This
amount will be dedicated to additional donations at local level.
69 The spread represents the difference between (i) the increase in sales prices and mix applied by the Group after passing on to these prices
the increase in its production costs and (ii) the increase in its production costs. The spread is positive when the increase in sales prices
applied by the Group is greater than the increase in its production costs. The increase in production costs is recorded by the Group at
constant production volumes and before production gap and the impact of the Performance Action Plan (PAP).
70 Calculated as the Cash + Undrawn Revolving Credit Facility ‐ Outstanding Commercial Papers.
264
Outlook
In this critical context associated with the COVID‐19 epidemic, and as announced in the press release of April 7, the
Group considers that its financial guidance for 2020 is no longer valid, given the uncertainty resulting from the depth
of the crisis.
Verallia expects a significant impact of the COVID-19 crisis on its activities in the second quarter of 2020, resulting
in a significant drop in sales volumes. However, the scale and complexity of this unprecedented health crisis together
with the uncertainties concerning the end of such crisis do not, to date, enable the Group to precisely quantify the
impact on customers and its activities for the year 2020.
In order to address this situation, Verallia is implementing measures to variabilize costs, to follow very accurately
cash and supply chain, and proactively manage all investments. Recurring investments will be maintained at around
8% of annual consolidated revenue, which will be lower than expected, thus leading to an absolute amount of
recurring investments lower than forecast. The building of the two strategic investments (construction of a new
furnace with two production lines at the Villa Poma site in Italy and at the Azuqueca site in Spain) will be completed
by the end of the year and their start-up will take place depending on market needs.
2020 Annual General Shareholders’ Meeting and 2019 dividend
Verallia’s Board of Directors met on Tuesday, April 28, 2020 and has taken a decision regarding the organization of
the 2020 Annual General Shareholders’ Meeting, which was confirmed for Wednesday, June 10, 2020.
In the context of an exceptional health crisis, and in accordance with the provisions set out in ordinance 2020-321 of
March 25, 2020, it was decided to hold this Annual General Shareholders’ Meeting in closed session, with the
meeting being webcast on Verallia’s website: www.verallia.com.
Shareholders are thereby invited to cast their vote remotely (via the secure Voteaccess website or using a paper form),
and to submit their questions in writing in accordance with the procedures which will be detailed in the notice of
meeting.
The Board of Directors will submit for shareholder approval at the Annual General Shareholders’ Meeting the
payment of a dividend of €0.85 per share, with an option, for each shareholder, between the payment in cash or new
shares, to be paid out on July 9, 2020.”
On 7 April 2020, the Company has published the following press release, providing an update on the Group’s activity
in the current context of health crisis:
“COVID-19: Group activity update
Paris, 7 April 2020
Within the current context of the COVID-19 pandemic, Verallia today provides an update on its business activities
and reviews the measures implemented by the Group to address the situation. From the outset of the crisis, Verallia
has immediately undertaken all necessary measures to guarantee the safety and health of its employees worldwide
and ensure business continuity. Adaptation plans have been implemented at Group and country levels to ensure the
following priorities are met:
Employee safety
Verallia immediately put in place all required health precautionary initiatives to prevent the spread of the virus
at its production sites. In addition, remote work has been swiftly rolled out in all possible cases.
265
Business continuity and production
As a key supplier to the food industry, the Group has managed to maintain all of its production sites running,
adapting its production volumes, and thus serve its customers to the fullest extent possible. In Northern Europe,
Italy and Iberia, the plants continue to operate at a sustained level. France and Latin America are impacted the
most due to the number of workforce available on-site and the decline in demand from certain customers.
Strong financial structure
Verallia benefits from a very solid balance sheet structure: the leverage ratio at December 31, 2019 was 2.6x
adjusted EBITDA, a level far below the requirements of the bank covenants, which amount to 5x adjusted
EBITDA. The Group has no significant debt maturities before 2024 and enjoys strong liquidity.
The Group has drawn down 200 million euros of its 500 million euros Revolving Credit Facility on the 20th of
March 2020. As of Friday April 3rd, Verallia had 535 million euros in liquidity71
Verallia: united and responsible
Given its financial strength and resilience, Verallia does not intend to apply for the financial support offered by the
French government (public loans or guarantees, deferrals of tax or social charges payments,…) in order to allow
businesses that need them the most to benefit from those financial measures. Only after having used employees’
holidays, banked hours or RTT (Réduction du Temps de Travail, i.e. reduction of working hours) to the highest extent
possible did Verallia apply for partial unemployment, in the most responsible and restricted manner.
The management recognizes the remarkable commitment and responsiveness of all the Group’s employees, as well
as the teams’ spontaneous movements of solidarity towards the local communities where the production sites are
located, such as donations of hospital equipment, hydroalcoholic gels, protective clothing or masks.
In addition, Michel Giannuzzi, Verallia’s CEO, has decided to contribute to the Group’s collective effort by foregoing
his 2020 variable compensation, which represents 50% of his total annual compensation. All other Executive
Committee members also participate in this joint effort by renouncing 15% of their annual compensation. This
amount will be dedicated to additional donations at local level.
Outlook
Given the unprecedented nature of the situation caused by the COVID-19 pandemic and the corresponding lack of
visibility, the Group withdraws its 2020 annual guidance announced on February 20, 2020. Verallia will provide
further information at the time of its first quarter results announcement on April 28, 2020.”
71 Calculated as the Cash + Undrawn Revolving Credit Facility – Outstanding Commercial Papers.
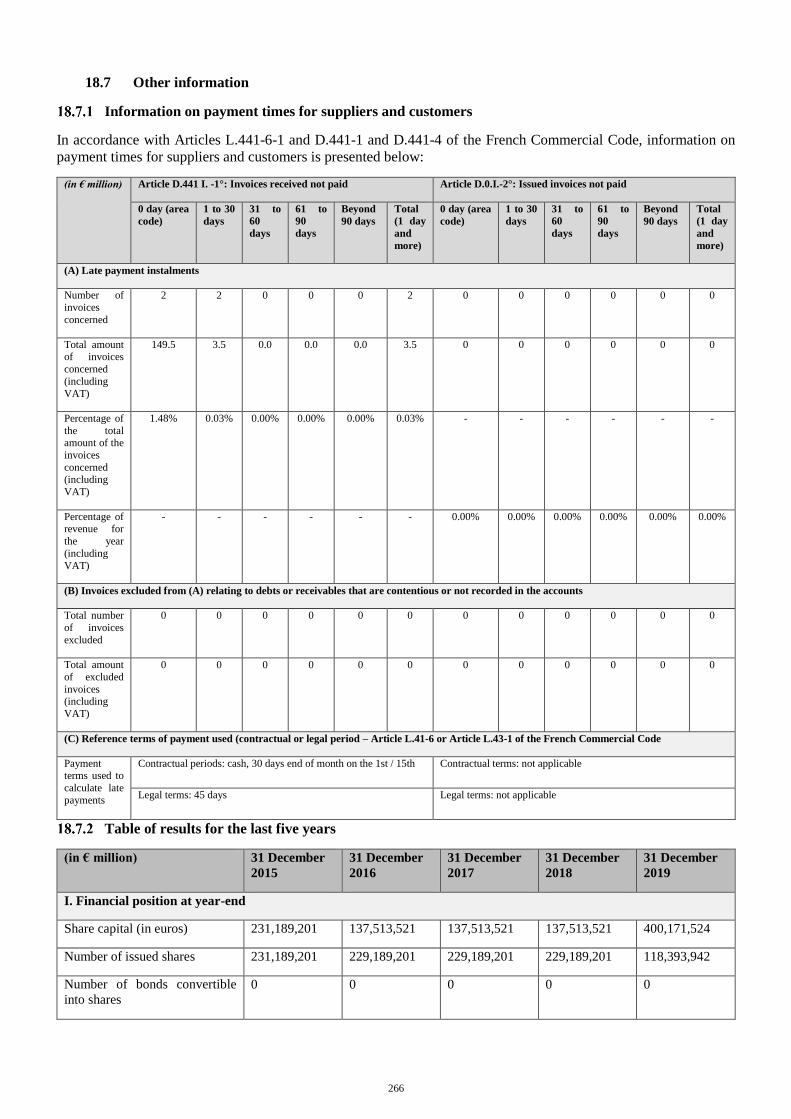
266
18.7 Other information
Information on payment times for suppliers and customers
In accordance with Articles L.441-6-1 and D.441-1 and D.441-4 of the French Commercial Code, information on
payment times for suppliers and customers is presented below:
(in € million) Article D.441 I. -1°: Invoices received not paid Article D.0.I.-2°: Issued invoices not paid
0 day (area
code)
1 to 30
days
31 to
60
days
61 to
90
days
Beyond
90 days
Total
(1 day
and
more)
0 day (area
code)
1 to 30
days
31 to
60
days
61 to
90
days
Beyond
90 days
Total
(1 day
and
more)
(A) Late payment instalments
Number of
invoices
concerned
2 2 0 0 0 2 0 0 0 0 0 0
Total amount of invoices
concerned
(including
VAT)
149.5 3.5 0.0 0.0 0.0 3.5 0 0 0 0 0 0
Percentage of
the total amount of the
invoices
concerned (including
VAT)
1.48% 0.03% 0.00% 0.00% 0.00% 0.03% - - - - - -
Percentage of revenue for
the year
(including
VAT)
- - - - - - 0.00% 0.00% 0.00% 0.00% 0.00% 0.00%
(B) Invoices excluded from (A) relating to debts or receivables that are contentious or not recorded in the accounts
Total number
of invoices
excluded
0 0 0 0 0 0 0 0 0 0 0 0
Total amount
of excluded
invoices (including
VAT)
0 0 0 0 0 0 0 0 0 0 0 0
(C) Reference terms of payment used (contractual or legal period – Article L.41-6 or Article L.43-1 of the French Commercial Code
Payment terms used to
calculate late
payments
Contractual periods: cash, 30 days end of month on the 1st / 15th Contractual terms: not applicable
Legal terms: 45 days Legal terms: not applicable
Table of results for the last five years
(in € million) 31 December
2015
31 December
2016
31 December
2017
31 December
2018
31 December
2019
I. Financial position at year-end
Share capital (in euros) 231,189,201 137,513,521 137,513,521 137,513,521 400,171,524
Number of issued shares 231,189,201 229,189,201 229,189,201 229,189,201 118,393,942
Number of bonds convertible
into shares
0 0 0 0 0
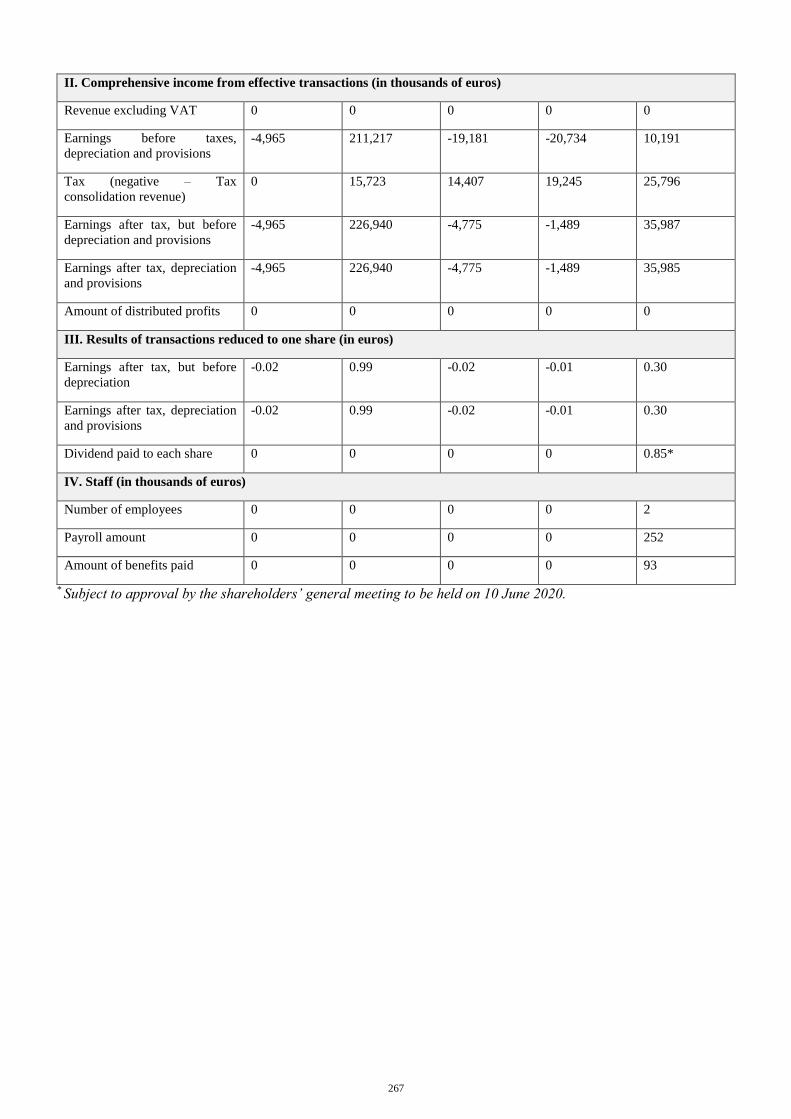
267
II. Comprehensive income from effective transactions (in thousands of euros)
Revenue excluding VAT 0 0 0 0 0
Earnings before taxes,
depreciation and provisions
-4,965 211,217 -19,181 -20,734 10,191
Tax (negative – Tax
consolidation revenue)
0 15,723 14,407 19,245 25,796
Earnings after tax, but before
depreciation and provisions
-4,965 226,940 -4,775 -1,489 35,987
Earnings after tax, depreciation
and provisions
-4,965 226,940 -4,775 -1,489 35,985
Amount of distributed profits 0 0 0 0 0
III. Results of transactions reduced to one share (in euros)
Earnings after tax, but before
depreciation
-0.02 0.99 -0.02 -0.01 0.30
Earnings after tax, depreciation
and provisions
-0.02 0.99 -0.02 -0.01 0.30
Dividend paid to each share 0 0 0 0 0.85*
IV. Staff (in thousands of euros)
Number of employees 0 0 0 0 2
Payroll amount 0 0 0 0 252
Amount of benefits paid 0 0 0 0 93
* Subject to approval by the shareholders’ general meeting to be held on 10 June 2020.
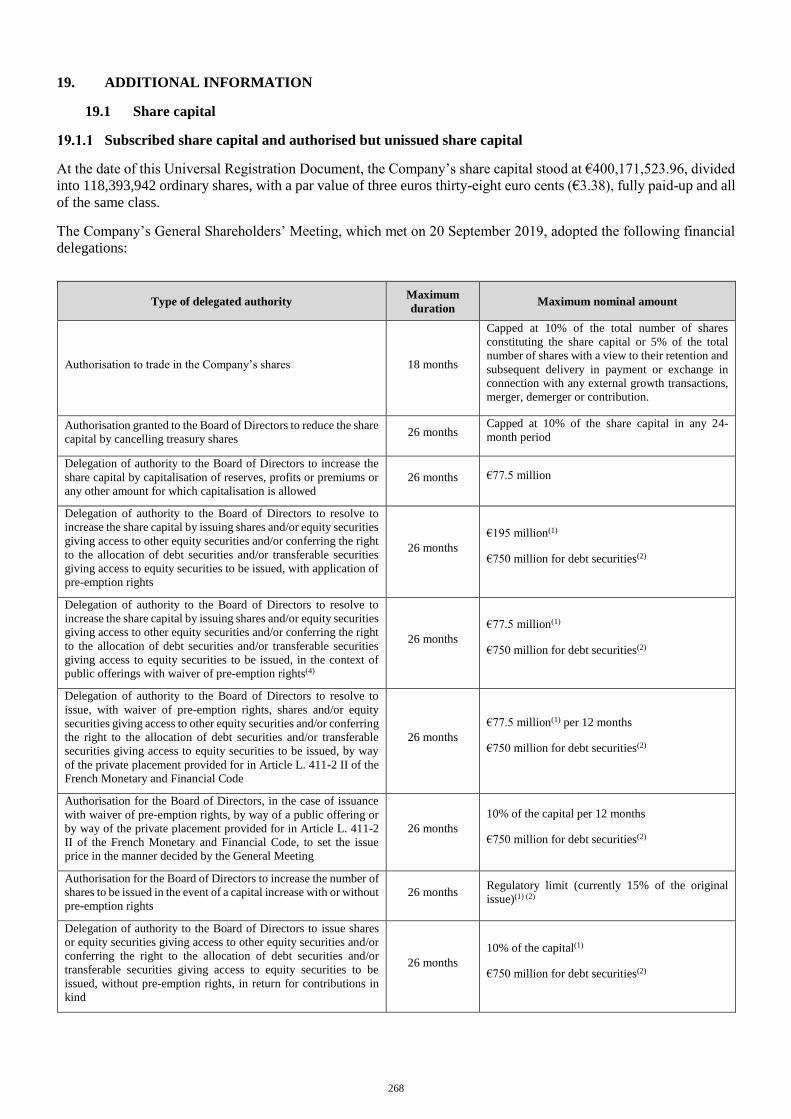
268
19. ADDITIONAL INFORMATION
19.1 Share capital
Subscribed share capital and authorised but unissued share capital
At the date of this Universal Registration Document, the Company’s share capital stood at €400,171,523.96, divided
into 118,393,942 ordinary shares, with a par value of three euros thirty-eight euro cents (€3.38), fully paid-up and all
of the same class.
The Company’s General Shareholders’ Meeting, which met on 20 September 2019, adopted the following financial
delegations:
Type of delegated authority Maximum
duration Maximum nominal amount
Authorisation to trade in the Company’s shares 18 months
Capped at 10% of the total number of shares
constituting the share capital or 5% of the total
number of shares with a view to their retention and
subsequent delivery in payment or exchange in
connection with any external growth transactions,
merger, demerger or contribution.
Authorisation granted to the Board of Directors to reduce the share
capital by cancelling treasury shares 26 months
Capped at 10% of the share capital in any 24-
month period
Delegation of authority to the Board of Directors to increase the
share capital by capitalisation of reserves, profits or premiums or
any other amount for which capitalisation is allowed
26 months €77.5 million
Delegation of authority to the Board of Directors to resolve to
increase the share capital by issuing shares and/or equity securities
giving access to other equity securities and/or conferring the right
to the allocation of debt securities and/or transferable securities
giving access to equity securities to be issued, with application of
pre-emption rights
26 months
€195 million(1)
€750 million for debt securities(2)
Delegation of authority to the Board of Directors to resolve to
increase the share capital by issuing shares and/or equity securities
giving access to other equity securities and/or conferring the right
to the allocation of debt securities and/or transferable securities
giving access to equity securities to be issued, in the context of
public offerings with waiver of pre-emption rights(4)
26 months
€77.5 million(1)
€750 million for debt securities(2)
Delegation of authority to the Board of Directors to resolve to
issue, with waiver of pre-emption rights, shares and/or equity
securities giving access to other equity securities and/or conferring
the right to the allocation of debt securities and/or transferable
securities giving access to equity securities to be issued, by way
of the private placement provided for in Article L. 411-2 II of the
French Monetary and Financial Code
26 months
€77.5 million(1) per 12 months
€750 million for debt securities(2)
Authorisation for the Board of Directors, in the case of issuance
with waiver of pre-emption rights, by way of a public offering or
by way of the private placement provided for in Article L. 411-2
II of the French Monetary and Financial Code, to set the issue
price in the manner decided by the General Meeting
26 months
10% of the capital per 12 months
€750 million for debt securities(2)
Authorisation for the Board of Directors to increase the number of
shares to be issued in the event of a capital increase with or without
pre-emption rights
26 months Regulatory limit (currently 15% of the original
issue)(1) (2)
Delegation of authority to the Board of Directors to issue shares
or equity securities giving access to other equity securities and/or
conferring the right to the allocation of debt securities and/or
transferable securities giving access to equity securities to be
issued, without pre-emption rights, in return for contributions in
kind
26 months
10% of the capital(1)
€750 million for debt securities(2)

269
Type of delegated authority Maximum
duration Maximum nominal amount
Delegation of authority to the Board of Directors to resolve to
issue shares reserved for members of an employee savings plan
with waiver of pre-emption rights in favour of those members
26 months €19.5 million(1)
Delegation of authority to the Board of Directors to increase the
share capital by issuing shares with waiver of pre-emption rights
in favour of a specific category of beneficiaries (particularly
employees and corporate officers of the Company and its affiliated
entities)
18 months €19.5 million (1)
Authorisation for the Board of Directors to grant new or existing
shares free of charge, with waiver of pre-emption rights, to some
employees and corporate officers of the Company and its affiliated
entities
38 months 3% of the capital(1) (3)
Authorisation for the Board of Directors to grant stock options to
eligible employees and corporate officers of the Group 38 months 3% of the capital(1) (3)
(1) The aggregate maximum nominal amount of capital increases that may be made pursuant to this delegation of authority shall count towards the overall limit
of €195 million for immediate and/or future capital increases.
(2) The aggregate maximum nominal amount of debt securities that may be issued pursuant to this delegation of authority shall count towards the overall limit
of €750 million applicable to the issuance of debt securities.
(3) The maximum nominal amount of capital increases that may be made pursuant to this delegation of authority shall count towards the general limit for grants
of free shares and stock options, set at 3% of the Company’s capital.
(4) Including as part of a public exchange offer initiated by the Company (Article L. 225-148 of the French Commercial Code).
Non-equity securities
At the date of this Universal Registration Document, the Company had not issued any non-equity securities.
Shares held in treasury by the Company or for its account
On 20 December 2019, the Company signed an AMAFI liquidity contract with Rothschild Martin Maurel to trade in
its own shares on the Euronext Paris regulated market. This liquidity contract became effective on 6 January 2020,
for an initial period of 12 months renewable by tacit agreement for successive 12-month periods. As part of the
implementation of this liquidity contract, an amount of €2.5 million has been credited to the liquidity account.
The Company’s General Shareholders’ Meeting of 20 September 2019 authorised the Board of Directors, for a period
of 18 months, with the right of delegation permitted by the law and regulations, in accordance with the provisions of
Articles L. 225-209 et seq. of the French Commercial Code, to purchase, in one or more instalments and at such times
as it shall determine, a number of shares of the Company not exceeding 10% of the total number of shares constituting
the share capital at any given time, or 5% of the total number of shares constituting the share capital if they are shares
acquired by the Company with a view to their retention and subsequent delivery in payment or exchange as part of a
merger, demerger or contribution. However, under no circumstances may the number of shares held by the Company
result in the Company holding more than 10% of the shares constituting its share capital at any time.
The Board of Directors may decide to acquire shares in order:
– to ensure the liquidity and stimulate the market for the Company’s securities through an investment service
provider acting independently under a liquidity contract in accordance with the market practice accepted by
the AMF on 2 July 2018;
– to allocate shares to corporate members and members of staff of the Company, and other Group entities, and
particularly in the context of (i) profit-sharing, (ii) any Company stock option plan under the provisions of
Articles L. 225-177 et seq. of the French Commercial Code, or (iii) any savings plan in accordance with
Articles L. 3331-1 et seq. of the French Labour Code or (iv) of any grant of free shares under the provisions
of Articles L. 225-197-1 et seq. of the French Commercial Code, and to carry out any hedging in relation to
such transactions, under the conditions laid down by the market authorities and at such times as the Board of
Directors or the person acting on behalf of the Board of Directors may determine;
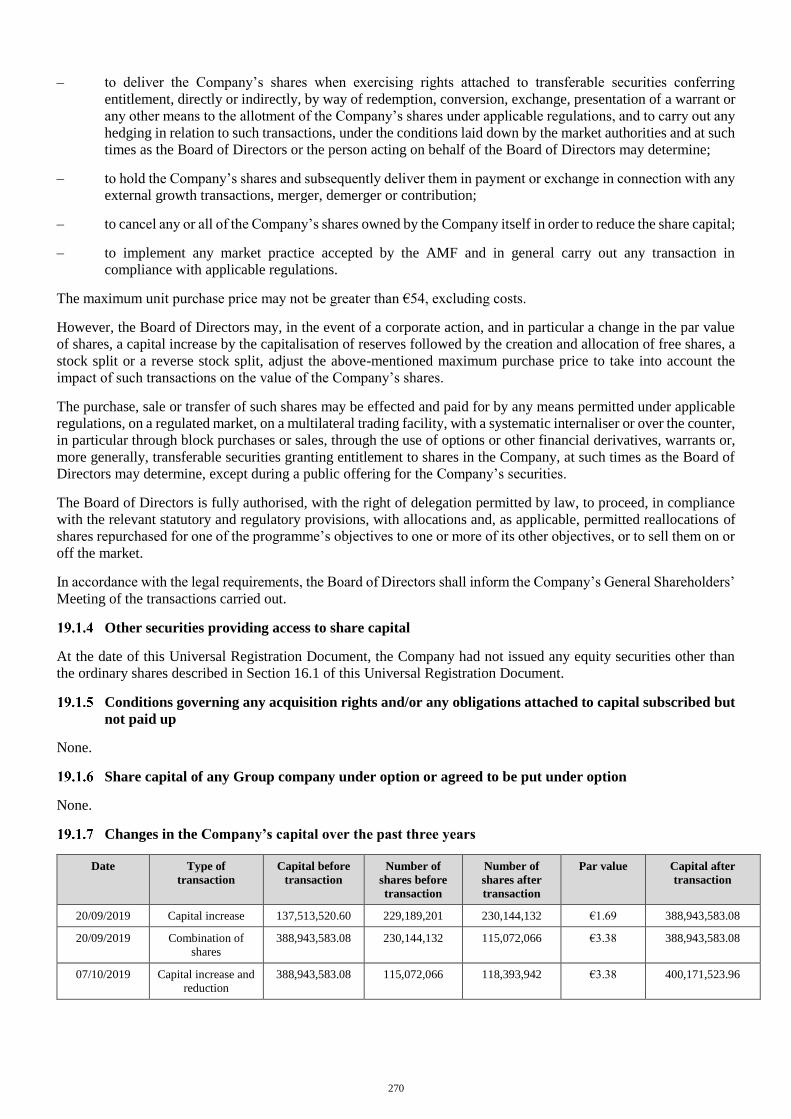
270
– to deliver the Company’s shares when exercising rights attached to transferable securities conferring
entitlement, directly or indirectly, by way of redemption, conversion, exchange, presentation of a warrant or
any other means to the allotment of the Company’s shares under applicable regulations, and to carry out any
hedging in relation to such transactions, under the conditions laid down by the market authorities and at such
times as the Board of Directors or the person acting on behalf of the Board of Directors may determine;
– to hold the Company’s shares and subsequently deliver them in payment or exchange in connection with any
external growth transactions, merger, demerger or contribution;
– to cancel any or all of the Company’s shares owned by the Company itself in order to reduce the share capital;
– to implement any market practice accepted by the AMF and in general carry out any transaction in
compliance with applicable regulations.
The maximum unit purchase price may not be greater than €54, excluding costs.
However, the Board of Directors may, in the event of a corporate action, and in particular a change in the par value
of shares, a capital increase by the capitalisation of reserves followed by the creation and allocation of free shares, a
stock split or a reverse stock split, adjust the above-mentioned maximum purchase price to take into account the
impact of such transactions on the value of the Company’s shares.
The purchase, sale or transfer of such shares may be effected and paid for by any means permitted under applicable
regulations, on a regulated market, on a multilateral trading facility, with a systematic internaliser or over the counter,
in particular through block purchases or sales, through the use of options or other financial derivatives, warrants or,
more generally, transferable securities granting entitlement to shares in the Company, at such times as the Board of
Directors may determine, except during a public offering for the Company’s securities.
The Board of Directors is fully authorised, with the right of delegation permitted by law, to proceed, in compliance
with the relevant statutory and regulatory provisions, with allocations and, as applicable, permitted reallocations of
shares repurchased for one of the programme’s objectives to one or more of its other objectives, or to sell them on or
off the market.
In accordance with the legal requirements, the Board of Directors shall inform the Company’s General Shareholders’
Meeting of the transactions carried out.
Other securities providing access to share capital
At the date of this Universal Registration Document, the Company had not issued any equity securities other than
the ordinary shares described in Section 16.1 of this Universal Registration Document.
Conditions governing any acquisition rights and/or any obligations attached to capital subscribed but
not paid up
None.
Share capital of any Group company under option or agreed to be put under option
None.
Changes in the Company’s capital over the past three years
Date Type of
transaction
Capital before
transaction
Number of
shares before
transaction
Number of
shares after
transaction
Par value Capital after
transaction
20/09/2019 Capital increase 137,513,520.60 229,189,201 230,144,132 €1.69 388,943,583.08
20/09/2019 Combination of
shares
388,943,583.08 230,144,132 115,072,066 €3.38 388,943,583.08
07/10/2019 Capital increase and
reduction
388,943,583.08 115,072,066 118,393,942 €3.38 400,171,523.96
271
19.2 Memorandum and Articles of Association
Corporate purpose
The Company’s corporate purpose, in France and other countries, is as follows:
– the purchase, subscription, holding, management, transfer or contribution of shares or other transferable
securities in all French and foreign companies;
– any provision of services and consulting in the fields of human resources, information technology,
management, communication, finance, law, marketing and purchasing for its subsidiaries and holdings;
– the ownership, management and disposition of the Company’s trademarks, patents and intellectual property
rights and those of its subsidiaries and holdings;
– the provision of any type of financial assistance as Group finance company to companies belonging to the
same corporate group as the Company;
– the granting of any surety bonds or guarantees for the benefit of any company in its group or within the
normal course of business of any company in its group;
– and in general, any transaction, whether financial, commercial, industrial, civil, of real estate or other, directly
or indirectly related to the above-mentioned corporate purpose and to any similar or connected purpose, and
able to facilitate, directly or indirectly, the object pursued by the Company, its expansion, development and
corporate assets.
Provisions of the Articles of Association relating to administrative and management bodies – Internal
Rules of the Board of Directors
The description below summarises the main provisions of the Articles of Association and internal rules relating to
the Board of Directors, in particular its mode of operation and powers.
In addition to the provisions relating to the Board of Directors mentioned below, the Internal Rules set out how the
Board’s committees are organised and run, as well as define their powers and responsibilities (see Section 14.3 of
this Universal Registration Document).
(a) Board of Directors (Articles 15, 16 and 17 of the Articles of Association and Articles 1, 2 and 5 of the Internal
Rules)
Composition
The Company shall be managed by a Board of Directors with at least three members and no more than eighteen
members, subject to the exceptions permitted by law.
The Board of Directors shall ensure that at least one third of its members are independent. It shall further ensure that
at least two thirds of the members of the Audit Committee and more than half of the members of the Appointments
and Compensation Committee are independent.
Directors representing employees do not count when determining the percentage of independent members.
Upon each re-election or appointment of a member of the Board of Directors, and at least once a year before the
Board prepares its report on corporate governance, the Board of Directors shall assess the independence of each of
its members (or candidates). During this assessment, the Board of Directors, after consulting the Appointments and
Compensation Committee, shall examine on a case-by-case basis the qualifications of each of its members (or
candidates) in light of the criteria referred to below, the specific circumstances and the position of the person
concerned in relation to the Company. The findings shall be disclosed to shareholders in the report on corporate
governance and, where appropriate, at the General Shareholders’ Meeting when members of the Board of Directors
are elected.
The Board of Directors may appoint one or more non-voting members; however, it may not have more than two non-
voting members. Non-voting members may be natural or legal persons, but need not be shareholders. The term of
272
office of non-voting members shall be four years, unless they resign or the Board decides to terminate the
appointment early. The duties of non-voting members, including any remuneration, shall be decided by the Board of
Directors. Non-voting members shall be eligible for re-election. They shall be invited to meetings of the Board of
Directors and shall participate in discussions in an advisory capacity.
Appointment
During the Company’s existence, directors shall be appointed, re-elected or removed from office under the conditions
laid down by applicable laws and regulations and by the Articles of Association.
Each member of the Board of Directors shall hold at least one hundred (100) shares throughout his or her term of
office and in any event within six (6) months of his or her appointment. This requirement does not apply to directors
representing employees of the Group or, following a decision of the Board of Directors, to directors representing
shareholders whose internal procedures prohibit the direct holding of shares by their representatives. Loans of shares
by the Company to members of the Board of Directors shall not be permitted. Upon assuming office, members of the
Board of Directors shall register the securities they hold. The same shall apply for any securities subsequently
acquired.
Duties
Directors shall serve a four-year term of office.
Directors shall be eligible for re-election. They may be removed at any time by the Ordinary General Meeting.
Directors shall not be more than 75 years of age (it being specified that the number of directors who are over the age
of 70 may not exceed one third of the directors in office) and shall be subject to applicable laws and regulations on
multiple appointments.
Identity of directors
Directors may be natural persons or legal persons. Upon being appointed, legal persons shall appoint a permanent
representative who shall be subject to the same conditions and requirements and have the same responsibilities as if
he or she were a director in his or her own right, without prejudice to the joint and several liability of the legal person
he or she represents.
The term of office of the permanent representative shall be the same as that of the legal person he or she represents.
If the legal person revokes the mandate of its permanent representative, it shall be required to inform the Company
of such revocation immediately by registered letter, together with the name of its new permanent representative. The
same shall apply in the event of the death, resignation or prolonged incapacity of the permanent representative.
Directors representing employees
In accordance with the provisions of Article L. 225-27-1 of the French Commercial Code, the Board of Directors
shall include a director representing employees. This director shall be elected from among the employees of the
Company and its direct or indirect subsidiaries whose registered office is in France, subject to the conditions laid
down in Article L. 225-28 of the French Commercial Code.
If the number of members of the Board of Directors exceeds the number of directors mentioned in the first paragraph
of Article L. 225-27-1-II of the French Commercial Code, and provided that this criterion is still met on the date of
the appointment, a second director representing employees shall be appointed by the European Works Committee.
Directors representing employees shall be appointed for a four-year term expiring at the end of the General
Shareholders’ Meeting approving the financial statements for the previous financial year, held in the year in which
their term of office expires. The term of office of directors representing employees shall be renewable.
Chairman of the Board of Directors
The Board of Directors shall elect one of its members as chairman, provided that member is a natural person.
The chairman shall be appointed for the duration of his or her term of office as director. He or she shall be eligible
for re-election.
273
Deliberations of the Board of Directors
The Board of Directors shall perform the duties and exercise the powers conferred on it by law, by the Company’s
Articles of Association and by the Internal Rules of the Board of Directors. The Board of Directors shall determine
and monitor the implementation of the Company’s overall business strategy. It shall examine any and all matters
pertaining to the efficient operation of the Company and make decisions about any and all issues concerning the
Company, within the limits of the Company’s corporate purpose and except for those issues that, by law, can only
be decided upon by shareholders at a General Meeting. The Board of Directors shall perform any inspections and
audits it deems necessary.
The Board of Directors shall be convened by the chairman or by one of its members as often as the interests of the
Company so require; the frequency and duration of meetings of the Board of Directors shall be such as to permit a
thorough examination and discussion of the matters within the Board’s remit. The Board of Directors shall meet at
least four times a year.
The Board of Directors may legitimately conduct business, even without being formally convened, if all members
are present or represented.
At least half of the Board members must be present for decisions taken at Board meetings to be valid. Decisions shall
be taken by a simple majority of directors present or represented. In the event of a tie, the chairman of the meeting
shall have the deciding vote.
The following shall be subject to prior authorisation by the Board of Directors acting by a simple majority of members
present or represented:
– approval and/or amendment of the Group’s medium-term business plan and annual budget (including the
Group’s hedging policy);
– any investment (excluding acquisitions) exceeding the Group’s annual budget, for a total amount in excess
of €10 million;
– any transaction involving the acquisition or disposal of assets or securities totalling more than €10 million
and the formation, modification or termination of joint ventures or partnerships representing more than €10
million in revenue or investments;
– any decision to participate in an operation outside the usual scope of the Group’s operations and any decision
to discontinue or significantly reduce the Group’s principal operations;
– the creation of security interests for the benefit of a third party (i.e., a company outside the Group), except
for security interests granted to authorities or public bodies in the normal course of business;
– any decision to participate in a project or to enter into any contract with a term of more than five years
(including contracts with guaranteed income) for a total amount in excess of €50 million;
– any decision to settle or initiate litigation with more than €5 million at stake or litigation that has a material
impact on the Group’s reputation;
– any additional debt transaction exceeding €50 million;
– any amendments to the Articles of Association of the Company or of Significant Subsidiaries (except
amendments of an administrative nature); the term “Significant Subsidiaries” means any subsidiary of the
Company whose consolidated revenue represented, in the previous financial year, more than 5% of the
Company’s consolidated annual revenue;
– any merger/demerger/liquidation of a Significant Subsidiary, except for intra-group restructuring;
– any issuance of shares or transferable securities giving immediate or deferred access to the Company’s
capital, as well as any issuance of shares or securities giving immediate or deferred access to the capital of a
Significant Subsidiary, in each case for the benefit of a third party to the Group;
– any purchase or sale of real estate assets for an amount in excess of €10 million;
274
– any distributions, excluding distributions between wholly owned subsidiaries;
– any recruitment, suspension or removal of members of the Group’s Executive Committee, any significant
change in their compensation (including with regard to retirement plans, incentive plans or specific severance
terms) and the conclusion, amendment or termination of an agreement with any of them;
– the introduction or amendment of stock option plans or free share plans for the Company or any Group
company (or any other similar instrument) for the benefit of the Group’s executives and/or employees or
certain categories of them;
– the conclusion or amendment of any pension plan or any restructuring of the workforce resulting in a total
cost to the Group of more than €10 million;
– any material change in the accounting policies applied by Group companies when preparing their financial
statements, except for changes required by law or under applicable accounting standards;
– the appointment, re-appointment or dismissal of the Company’s statutory auditors;
– the acquisition of treasury shares by the Company;
– the delisting of the Company and the listing of a Group company;
– the implementation of any insolvency, winding-up or liquidation proceedings (or similar proceedings in each
applicable jurisdiction) in respect of the Company or its Significant Subsidiaries.
Unless otherwise stated, the decisions referred to above relate to the Company and its controlled subsidiaries within
the meaning of Article L.233-3 of the French Commercial Code.
Compensation of members of the Board of Directors
On the recommendation of the Appointments and Compensation Committee, the Board of Directors:
– shall freely distribute among its members the remunerations allocated to the Board of Directors by the
General Shareholders’ Meeting, taking into account the actual participation of directors at Board and
committee meetings;
– shall determine the amount of the Chairman’s compensation;
– may, in addition, allocate special compensation to some of its members for specific duties or assignments
entrusted to them.
The Board of Directors shall examine whether the level of allocated remunerations is appropriate in view of the duties
and responsibilities of each director.
(b) Executive management (Article 18 of the Articles of Association)
Management model
The Company’s executive management shall be the responsibility either of the Chairman of the Board of Directors
or of another individual appointed by the Board of Directors (from among its members), who shall have the title of
Chief Executive Officer.
The Board of Directors may choose between these two executive management models at any time, and at least upon
the expiration of the term of office of the Chief Executive Officer or the term of office of the Chairman of the Board
of Directors, if the Chairman is also responsible for executive management of the Company.
Shareholders and third parties shall be informed of this choice in accordance with regulatory conditions.
If responsibility for the Company’s executive management is assumed by the Chairman of the Board of Directors,
the provisions that follow regarding the Chief Executive Officer shall also apply to the Chairman. He or she will then
have the title of Chairman and Chief Executive Officer.
275
Executive management
Following a proposal from the Chief Executive Officer, the Board of Directors may appoint one or more individuals
to assist the Chief Executive Officer, who shall have the title of Deputy Chief Executive Officer.
There may not be more than two Deputy Chief Executive Officers.
Age limit – Term of office – Compensation
The Chief Executive Officer and the Deputy Chief Executive Officers may not be more than 65 years of age.
The term of office of the Chief Executive Officer or Deputy Chief Executive Officers shall be determined upon their
appointment, but may not exceed their term of office as director, where applicable.
Removal from office
The Chief Executive Officer may be removed from office by the Board of Directors at any time. The same shall
apply, following a proposal from the Chief Executive Officer, to the Deputy Chief Executive Officers.
If the Chief Executive Officer ceases or becomes unable to perform his or her duties, the Deputy Chief Executive
Officers shall retain their duties and powers until the new Chief Executive Officer is appointed, unless otherwise
decided by the Board.
The Board of Directors shall determine the compensation of the Chief Executive Officer and the Deputy Chief
Executive Officers.
Powers of the Chief Executive Officer and Deputy Chief Executive Officers
The Chief Executive Officer shall be fully empowered to act on behalf of the Company in any and all circumstances.
The Chief Executive Officer shall exercise those powers within the scope of the corporate purpose and subject to the
powers expressly reserved by law for shareholder meetings and for the Board of Directors.
He or she represents the Company in its dealings with third parties. The Company shall be bound by the actions of
the Chief Executive Officer even if such actions are beyond the scope of the corporate purpose, unless the Company
can prove that a third party knew that the action concerned was beyond the scope of the corporate purpose or had
constructive knowledge thereof in view of the circumstances. The publication of the Articles of Association alone
may not be deemed to constitute evidence of such knowledge.
Decisions of the Board of Directors limiting the powers of the Chief Executive Officer shall not be binding on third
parties.
In agreement with the Chief Executive Officer, the Board of Directors shall determine the scope and duration of the
powers granted to Deputy Chief Executive Officers. The Deputy Chief Executive Officers shall have the same powers
with respect to third parties as the Chief Executive Officer.
The Chief Executive Officer or the Deputy Chief Executive Officers may, within the limits set by applicable
legislation, delegate such powers as they deem appropriate, for one or more specified purposes, to any representatives,
even outside the Company, individually or meeting as a committee or commission, with or without the possibility of
substitution, subject to the limitations provided by law. Such powers may be permanent or temporary, and may or
may not include the possibility of substitution. Any authority thus delegated shall remain in full effect
notwithstanding the expiration of the term of office of the person granting them.
Rights, privileges and restrictions attached to shares (Articles 10, 11, 12 and 13 of the Articles of
Association)
Fully paid-up shares shall be in registered or bearer form, at the shareholder’s option, under the conditions laid down
by applicable regulations.
Each share confers the right to a share of the Company’s profits and net assets in proportion to the percentage of the
share capital it represents. In addition, each share carries the right to vote and the right to representation at General
Shareholders’ Meetings, according to the statutory conditions and the Articles of Association.
276
A double voting right shall be established for fully paid-up registered shares that have been continuously held by the
same shareholder for a minimum period of two (2) years. For the purpose of calculating this period, any period during
which the Company’s shares were held prior to the date on which the Company’s shares are admitted to trading on
the regulated market of Euronext Paris shall not count.
In accordance with the provisions of the second paragraph of Article L. 225-123 of the French Commercial Code, in
the event of a capital increase by capitalisation of reserves, profits or issue premiums, a double voting right shall be
granted upon their issuance to new shares allocated free of charge to a shareholder on the basis of his or her existing
shares with a double voting right.
This double voting right may be exercised at any General Meeting.
The double voting right shall automatically lapse when the share is converted to bearer form or ownership is
transferred.
Shareholders shall only bear losses to the extent of their contributions.
The rights and obligations attaching to the share shall be transferred to the new owner in the event of a change of
ownership. Ownership of a share is deemed to imply acceptance of the Articles of Association and of the decisions
of General Shareholders’ Meetings.
Whenever it is necessary to hold several shares in order to exercise a particular right, holders of single shares or of
fewer shares than the required number shall have no rights in respect of the Company, the shareholders being
responsible in this case for arranging to group together the necessary number of shares.
The Company regards its shares as indivisible.
Co-owners of shares shall be represented at General Shareholders’ Meetings by one of the co-owners or by a sole
representative. In the event of disagreement, the representative shall be appointed by a court of law at the request of
the co-owner who first takes action.
If the shares are subject to usufruct, their book entry shall mention the existence of the usufruct. Unless otherwise
agreed and notified to the Company by registered letter with acknowledgement of receipt, the voting right shall
belong to the usufructuary at Ordinary General Meetings and to the bare owner at Extraordinary General Meetings.
Registered and bearer shares shall be freely negotiable, unless otherwise provided by laws or regulations. Shares
shall be recorded in book-entry form. The sale of shares involving the Company or third parties shall take place by
account transfer, in accordance with the terms defined by the applicable laws and regulations.
Changes in share capital and rights attached to shares
Unless otherwise stipulated in the Articles of Association, changes to the rights attached to shares shall be subject to
statutory provisions.
General Shareholders’ Meetings (Article 19 of the Articles of Association)
Notice of meeting and venue
General Shareholders’ Meetings shall be convened in accordance with the statutory conditions, forms and time
frames.
They shall be held at the registered office or at any other venue indicated in the notice of meeting.
Agenda
The General Meeting agenda shall be set out in the notice of meeting and shall be set by the person calling the
meeting.
The General Meeting may only deliberate upon matters included on the agenda; nevertheless, it may, in all
circumstances, remove one or more directors from office and replace them.
277
One or more shareholders, representing at least the percentage of the share capital required by law, and acting in
accordance with the statutory conditions and time frames, may request the inclusion of draft resolutions on the
agenda.
Access to General Meetings
All shareholders shall have the right to attend General Meetings and to participate in deliberations, either in person
or by proxy.
All shareholders may participate in General Meetings, in person or by proxy, in accordance with the regulatory
conditions, subject to proof of their identity and ownership of their securities in book-entry form under the conditions
laid down in the applicable laws and regulations.
If the Board of Directors authorises the use of means of telecommunication, as published in the notice of meeting,
shareholders who participate in the General Meeting by video-conference or by means of telecommunication or
remote transmission, including the internet, enabling them to be identified under the conditions laid down by
applicable regulations, shall be deemed present for the purpose of calculating the quorum and majority.
Any shareholder may vote by post or by proxy in accordance with applicable regulations using a form issued by the
Company and sent to the Company under the conditions laid down in applicable regulations, including by electronic
means or by means of remote transmission, if authorised by the Board of Directors. Said form must be received by
the Company in accordance with the regulatory conditions in order to be taken into account.
The minutes of General Meetings shall be drawn up and copies shall be certified and issued in accordance with
applicable regulations.
The legal representatives of shareholders without legal capacity and natural persons representing corporate
shareholders may take part in meetings, irrespective of whether or not they personally are shareholders.
Attendance register, officers, minutes
An attendance register shall be kept at each General Meeting containing the information required by law.
General Meetings shall be chaired by the Chairman of the Board of Directors or, in his/her absence, by a director
specially appointed for this purpose by the Board. Failing this, the meeting shall elect its own chairman.
The role of scrutineer shall be performed by the two members of the General Meeting, present and accepting this
role, who have the most votes either personally or as proxies.
The meeting officers shall appoint a secretary, who need not be a shareholder.
The meeting officers shall have the task of verifying, certifying and signing the attendance register, ensuring that the
meeting takes place in an orderly fashion, resolving matters that arise during the meeting, monitoring the voting
process, ensuring that it is properly applied, and overseeing the drafting of the minutes.
Minutes of Board meetings and copies or extracts of said minutes are prepared, and certified copies are made in
accordance with the applicable regulations.
Ordinary General Meeting
The Ordinary General Meeting is required to take all decisions that do not have the effect of amending the Articles
of Association. The Ordinary General Meeting shall be held at least once a year, within six months of each financial
year-end, to approve the financial statements for that financial year and the consolidated financial statements.
It shall only be deemed to be quorate when first called if the shareholders present or represented, or having voted by
post, possess at least one fifth of the shares with voting rights. No quorum is required when a meeting is convened
for a second time.
The meeting shall act by a majority of the votes of the shareholders present or represented or who voted by post.
278
Extraordinary General Meeting
The Extraordinary General Meeting alone is authorised to amend the provisions of the Articles of Association.
However, it may not increase the commitments of shareholders, except in the context of transactions resulting from
a reverse stock split lawfully carried out.
It shall only be quorate if the shareholders present, represented or having voted by post possess at least one quarter
of voting shares at first call and one fifth of voting shares at second call. In the absence of this second quorum, the
second meeting may be postponed until a later date, which may be no more than two months after the date on which
it was originally convened.
It shall act by a two-thirds majority of the votes of the shareholders present, represented or having voted by post.
However, the Extraordinary General Meeting may not under any circumstances, except by unanimous agreement of
the shareholders, increase the commitments of shareholders, nor interfere with the equality of their rights.
Provisions that delay, postpone or prevent a change of control of the Company
The Articles of Association contain no provisions that delay, postpone or prevent a change of control of the Company.
Ownership threshold disclosures and identification of shareholders (Article 14 of the Articles of
Association)
While the Company’s shares are admitted to trading on a regulated market, in addition to the ownership threshold
disclosures expressly provided for by applicable laws and regulations, any natural or legal person who directly or
indirectly holds, alone or in concert, a percentage of the capital or voting rights (calculated in accordance with the
provisions of Articles L. 233-7 and L. 233-9 of the French Commercial Code and the provisions of the AMF General
Regulation) equal to or greater than 1% of the capital or voting rights, or any multiple thereof, even if above the
thresholds stipulated in the statutory and regulatory provisions, shall notify the Company of the total number (i) of
shares and voting rights that he or she holds, directly or indirectly, alone or in concert, (ii) of securities giving access
in future to the Company’s capital that he or she owns, directly or indirectly, alone or in concert, and the voting rights
potentially attaching thereto, and (iii) of existing shares in issue that such person may acquire by virtue of an
agreement or financial instrument mentioned in Article L. 211-1 of the French Monetary and Financial Code. Said
notification shall be made by registered letter with acknowledgement of receipt within four trading days of breaching
the relevant threshold.
The requirement to inform the Company shall also apply, within the same time frame and under the same conditions,
if the shareholder’s interest in the capital or voting rights falls below one of the above-mentioned thresholds.
In the event of non-compliance with the threshold disclosure requirement referred to above and at the request,
recorded in the minutes of the General Shareholders’ Meeting, of one or more shareholders representing at least 3%
of the Company’s capital or voting rights, shares exceeding the percentage that should have been disclosed shall be
deprived of voting rights for a period of two years following the date of disclosure.
The Company reserves the right to inform the public and shareholders either of the information disclosed to it or of
the failure of the person concerned to comply with the above-mentioned requirement.
Identification of securities holders (Article 10 of the Articles of Association)
While the Company’s shares are admitted to trading on a regulated market, the Company is entitled to require the
identification of holders of securities conferring the right to vote immediately or in the future at its shareholders’
meetings, as well as the quantities of securities held, under the conditions provided for by the laws and regulations
in force.
In accordance with the provisions of Article L. 228-3-3 of the French Commercial Code, where the person who is
the subject of a request referred to above has not sent the information within the time provided for by the legislative
and regulatory provisions in force or has sent incomplete or erroneous information relating either to his or her
capacity, or to the owners of the securities, or to the quantity of securities held by each of them, the shares or securities
giving immediate or deferred access to the share capital and for which this person has been registered shall be
deprived of voting rights for any shareholders’ meeting held until the date of regularisation of the identification, and
the payment of the corresponding dividend shall be deferred until that date.
279
Special clauses governing changes in share capital
Regarding changes in share capital, the Company’s Articles of Association contain no specific provisions that are
more stringent than the statutory provisions.

280
20. IMPORTANT CONTRACTS
See Section 8.2.2 “Financial liabilities” of this Universal Registration Document.
281
21. DOCUMENTS AVAILABLE TO THE PUBLIC
The Company’s Articles of Association, minutes of General Shareholders’ Meetings and other statutory documents,
as well as any valuation or statement made by an independent expert at the Company’s request that must be made
available to shareholders in accordance with applicable regulations, may be consulted at the Company’s registered
office.
282
GLOSSARY
Latin America Includes production plants located in Brazil, Argentina and Chile.
Bag-in-box Means a supple pouch equipped with a tap and enclosed in a 3 to10 litter box ,
used for selling and conserving wine.
Cullet Means the crushed glass added to the raw materials used in the production of glass.
Capex Short for “capital expenditure”, represents purchases of property, plant and
equipment and intangible assets necessary to maintain the value of an asset and/or
adapt to market demand or to environmental and health and safety constraints, or
to increase the Group’s capacity. It excludes the purchase of securities. Capex
corresponds to the item “Purchases of property, plant and equipment and
intangible assets” in the consolidated statement of cash flows.
Operational
cash flows
Defined as cash flows plus the change in operational working capital requirement.
Cash flows Defined as (i) operating profit restated for depreciation, amortisation and
impairment, restructuring costs, acquisition and M&A costs, effects of
hyperinflation, costs related to management share plans, impacts of disposals and
subsidiary risks, site closure and carve-out costs, and other items (i.e., adjusted
EBITDA) less (ii) Capex.
Deposit Is an additional sum of money paid by the consumer for the packaging and
refunded upon return of the packaging to the store.
Organic
growth
Corresponds to revenue growth at constant exchange rates and scope.
Cash
conversion
Defined as the ratio between cash flows and adjusted EBITDA.
Carbon
leakage
A situation where a company, in order to avoid the costs of climate policies, moves
its production to another country with less stringent emissions rules.
Adjusted
EBITDA
Corresponds to operating profit adjusted for depreciation, amortisation and
impairment, restructuring costs, acquisition and M&A costs, hyperinflationary
effects, management share ownership plans, disposal-related effects and
subsidiary contingencies, closing and carve-out expenses, and other items.
EHS Refers to the “Environment, Hygiene and Safety” policy.
Northern and
Eastern
Europe
Includes production plants located in Germany, Russia, Ukraine and Poland.
Southern and
Western
Europe
Includes production plants located in France, Italy, Spain and Portugal.
Feeders Fireproof distribution channels that take glass from a furnace to forming machines.
Feeders allow conditioning of glass at the right temperature corresponding to the
viscosity level necessary to work with the glass.
283
Forming Means the technique through which a compact mass of molten glass (gob) is
transformed into a hollow shape using a metal plunger or blown air.
Melting Means the first step in the melting of glass in production furnaces.
kT Kilotonnes.
Adjusted
EBITDA
margin
The adjusted EBITDA margin corresponds to the amount of adjusted EBITDA in
relation to revenue.
IS machine An industry-standard hollow glass forming machine made up of “sections” that
work in parallel. An IS machine normally consists of between 6 and 16 sections
and can form 1, 2, 3 or 4 items simultaneously in each section – these are referred
to as “single, double, triple or quadruple gob”. A machine with 10 forming sections
that produces two gobs each is abbreviated as an IS 10 DG, and has 10 x 2 = 20
finishing moulds.
Blank mould Refers to the mould used in the production of hollow glass, which is used to
transform the material into a hollow partially formed container.
Finishing
mould
Refers to the mould used in the hollow glass manufacturing process to give the
final shape to the product.
New products Products that have been produced and marketed for a period of less than five years
at the date of this Universal Registration Document.
Finishing Means the decoration of glass using various techniques.
Gob Means a compact mass of molten glass.
PET Refers to polyethylene terephthalate, a rigid, transparent plastic used in packaging.
Net financial
debt/Adjusted
EBITDA ratio
Refers to the relationship between (i) net financial indebtedness as included in note
17.1 of the Group’s consolidated financial statements for the year ended 31
December 2019 and (ii) adjusted EBITDA.
Net external
financial
debt/Adjusted
EBITDA ratio
Refers to the relationship between (i) net financial indebtedness as included in note
17.1 of the Group’s consolidated accounts for the year ended 31 December 2019,
taking into account only debt incurred with third parties and (ii) adjusted EBITDA.
Satin-finishing Means a decoration technique that consists of making glass opaque via a chemical
treatment (acid bath) or an electrostatic and thermal treatment (sand blasting).
Screen-
printing
Refers to a decoration technique that uses ceramic enamels to vary the thickness,
colour and substance of the glass.
Spread Represents the difference between (i) the increase in selling prices applied by the
Group after, passing on any increases in its production costs, and (ii) the increase
in its production costs. The spread is positive when the increase in selling prices
applied by the Group is greater than the increase in its production costs.
CAGR Stands for “compound annual growth rate”.

ANNEXES

ANNEX I
Report of the Board of Directors on corporate governance (Articles L. 225-37 and following of the French
Commercial Code)
1
Verallia
A French joint-stock company (société anonyme) with capital of €400,171,523.96
Registered Office: 31 Place des Corolles, Carpe Diem Tower, North Esplanade, 92400 Courbevoie
Trade and Companies Register Nanterre 812 163 913
(The “Company”)
Board of Directors' Report on Corporate Governance
(Articles L. 225-37 et seq. of the French Commercial Code)
2
This report has been prepared in accordance with the provisions of Articles L. 225-37 et seq. of the French Commercial Code, to supplement
the management report. In addition, this report has been communicated to the Company's statutory auditors for the preparation of their report
on this report in accordance with the provisions of Article L.225-235 of the French Commercial Code.
TABLE OF CONTENTS
1. CORPORATE GOVERNANCE ................................................................................................ 3
1.1 Corporate Governance Code ......................................................................................................... 3
1.2 Board of Directors ......................................................................................................................... 3
1.3 Specialised Board committees .................................................................................................... 10
1.4 Procedures and operation of supervisory and management bodies ............................................ 12
2. COMPENSATION AND BENEFITS TO EXECUTIVE OFFICERS ................................. 14
2.1 Compensation policy for executive officers ............................................................................... 14
2.2 Compensation and benefits to executive officers during the year ended 31 December 2019 .... 18
2.3 Ratio of the Chairman and Chief Executive Officer's level of compensation to the average and
median compensation of the Group's employees ........................................................................ 26
2.4 Draft resolution prepared by the Board of Directors pursuant to Article L.225-100 II. of the
French Commercial Code submitted to the Combined General Shareholders' Meeting of 10
June 2020 .................................................................................................................................... 27
3. OTHER INFORMATION ........................................................................................................ 27
3.1 Related party transactions ........................................................................................................... 27
3.2 Procedures for participation in General Meetings ...................................................................... 27
3.3 Delegations and authorisations granted by the General Shareholders' Meetings in respect of
capital increase ............................................................................................................................ 28
3.4 Items that may have an impact in the event of a public offer ..................................................... 31
3
1. CORPORATE GOVERNANCE
1.1 Corporate Governance Code
Since the Company's shares were admitted to trading on the Euronext regulated market in Paris (“Euronext Paris”) in October 2019, the
Company refers to and, subject to the following, complies with the Corporate Governance Code of listed companies developed by the
Association française des entreprises privées (the “AFEP”) and the Mouvement des Enterprises de France (the “MEDEF”) in its version
updated in June 2018 (the “AFEP-MEDEF Code”).
The AFEP-MEDEF Code to which the Company refers is available online at http://www.medef.com. The Company keeps copies of this Code
at the permanent disposal of the members of its corporate bodies.
The Company applies the AFEP-MEDEF Code (as revised in June 2018) with the exception of the following recommendation:
Recommendation of the AFEP-MEDEF Code Comment from the Company
Recommendation 13.2 of the AFEP-MEDEF Code
“The timing of terms of office shall be organised in such a
way as to avoid block renewal and to promote a harmonious
renewal of directors.”
With the exception of the terms of office of directors representing
employees, the terms of office of other Company directors will all expire
at the General Shareholders' Meeting convened to approve the financial
statements for the year ended 31 December 2022. Therefore, the terms
of office will not be staggered in accordance with Recommendation 13.2
of the AFEP-MEDEF Code, which recommends avoiding a block
renewal of directors, as all directors were appointed simultaneously at
the time of the initial public offering. While considering that the absence
of phased renewal does not impede the proper functioning of the Board
of Directors, the Company expects the Board to review the term of the
next bulk renewals by possibly providing shorter term periods for some
directors.
The Board of Directors will meet during the financial year 2020 to review any adaptations that may be required within the company following
the update of the AFEP-MEDEF Code in January 2020.
1.2 Board of Directors
1.2.1 Rules for the composition of the Board of Directors
The Articles of Association provide that the Company's Board of Directors (the “Board” or the “Board of Directors”) shall consist of between
three and eighteen members, subject to the exceptions permitted by law. As of 31 December 2019, the Board was composed of 10 members.
In accordance with Article 15 of the Articles of Association, the term of office of director shall be four years renewable. This duration complies
with the recommendations of the AFEP-MEDEF Code. Directors shall not be older than 75 years of age (it being specified that the number of
directors over the age of 70 may not exceed one third of the directors in office) and shall be subject to applicable laws and regulations on
multiple appointments.
Directors are appointed by the General Shareholders' Meeting on the proposal of the Board of Directors, which itself receives proposals from
the Appointments and Compensation Committee. They may be removed from office at any time by the Ordinary General Shareholders'
Meeting. The term of office of each director shall expire at the end of the Ordinary General Shareholders' Meeting, called to approve the
financial statements for the past financial year and held in the year in which the term of office expires.
1.2.2 Internal Rules of the Board of Directors
The Board of Directors has Internal Rules to set out the operating procedures of the Board of Directors, in addition to the applicable legal and
regulatory provisions and the Company's Articles of Association. The provisions of the Internal Rules entered into force on 7 October 2019,
the date on which the Company's shares were admitted to trading on the Euronext Paris regulated market. The Internal Rules of the Audit
Committee, the Internal Rules of the Appointments and Compensation Committee and the Internal Rules of the Sustainable Development
Committee are also provided for in the annex to the Internal Rules of the Board of Directors.
The Internal Rules of the Board of Directors are in line with marketplace recommendations aimed at ensuring compliance with the fundamental
principles of corporate governance, and in particular those referred to in the AFEP-MEDEF Code. These Internal Rules describe the manner
of operation, powers and duties of the Board of Directors and specify the rules of ethics applicable to its members. It includes rules for the
holding of meetings of the Board of Directors, as well as provisions relating to the frequency of meetings, the attendance of directors and their
disclosure obligations with regard to the rules governing multiple appointments and conflict of interest.
The Company's Articles of Association and Internal Rules are available on the Company's website (www.verallia.com).

4
1.2.3 Duties of the Board of Directors
The Board of Directors shall determine and monitor the implementation of the Company's overall business strategy, in accordance with its
corporate interest. It examines and decides on important operations. Board members are informed of market developments, the competitive
environment and key issues, including the Company's social and environmental responsibility.
The Board of Directors shall perform the duties and exercise the powers conferred on it by law, the Company's Articles of Association and the
Internal Rules of the Board of Directors. The Board of Directors shall determine and monitor the implementation of the Company's orientations,
objectives and performances. It shall examine any and all matters pertaining to the efficient operation of the Company and make decisions
about any and all issues concerning the Company, within the limits of the Company's corporate purpose and except for those issues which, by
law, can only be decided upon by shareholders at a General Meeting.
The Board of Directors shall also carry out the controls and checks that it deems appropriate and may be provided with the documents it
considers useful for the performance of its duties.
The Board of Directors shall set the limitation of the powers of the Chairman and Chief Executive Officer, where appropriate, under its Internal
Rules, with regard to operations for which the prior authorisation of the Board of Directors is required (for further details, See paragraph 1.4.2
“Branch Mode of Practice – Power Limitations” of this report).
The Board of Directors shall ensure the good corporate governance of the Company and the Group as well as the quality of the information
given to shareholders and investors.
The Internal Rules define information procedures for directors. In particular, it states that the Chairman of the Board of Directors shall provide
to the members of the Board of Directors, within a sufficient period of time and except in emergencies, with the information or documents in
his or her possession to enable them to carry out their duties effectively. Any member of the Board of Directors who has not been able to
knowingly deliberate on an issue has a duty to inform the Board of Directors and to demand the information necessary for the performance of
his or her duties.
1.2.4 Meetings and deliberations of the Board of Directors
The Internal Rules of the Board of Directors provide for the terms and conditions of the Board of Directors' meetings. Thus, the Board of
Directors is called by its Chairman or one of its members, by any means, even orally. The person who convenes the meeting shall set the
agenda for the meeting.
The Board of Directors meets at least four (4) times a year and, at any other time, as often as the interests of the Company require. The
frequency and duration of the meetings should be such that they allow for a thorough review and discussion of matters within the competence
of the Board of Directors.
The Board of Directors' meetings shall be chaired by the Chairman. In the event of the absence of the Chairman, the meetings shall be chaired
by a member of the Board of Directors appointed by the Board of Directors.
At least half of the Board members must be present for decisions taken at Board meetings to be valid. Members participating in meetings shall
be deemed to be present, for the purposes of quorum and majority calculations, by means of video conferencing or telecommunications,
enabling their identification and ensuring their effective participation, under the conditions laid down in the applicable laws and regulations.
Each meeting of the Board of Directors and of the Committees set up by the Board of Directors must be long enough to allow productive and
thorough discussion of the agenda. Decisions shall be taken by a majority of directors present or represented. In the event of a tie, the chairman
of the meeting shall have the deciding vote.
The Internal Rules of the Board of Directors also recall the obligations of the members of the Board of Directors, as described in the AFEP-
MEDEF Code. The Internal Rules provide, in particular, that the members of the Board of Directors, upon appointment, may benefit from
additional training on the specific characteristics of the Company and the companies it controls, their business lines and their business sector,
and that they may occasionally receive reports from the Company's principal executives, who may be called upon to attend Board meetings.
Finally, the Board of Directors is required to be regularly informed of the financial situation of the Company and the Group and the Chairman-
CEO shall communicate on a permanent basis to the directors any information concerning the Company that he/she is aware of and deems
useful or relevant. The Board of Directors and the Committees also have the opportunity to hear experts in their respective areas of competence.
Under the Internal Rules, each member of the Board of Directors is required to inform the Board of any conflict of interest situation, even
potential, and must refrain from attending the debate and taking part in the vote on the corresponding deliberation.
1.2.5 Independence of directors
In accordance with the AFEP-MEDEF Code to which the Company refers, the Board of Directors examines the situation of each of its members
(or candidate) with regard to the independence criteria adopted by the Company at the time of each renewal or appointment of a member of
the Board of Directors and at least once a year before the publication of the Company’s corporate governance report. During this assessment,
the Board of Directors, after consulting the Appointments and Compensation Committee, shall examine on a case-by-case basis the
qualifications of each of its members (or candidates) with respect to the criteria of the AFEP-MEDEF Code, the specific circumstances and
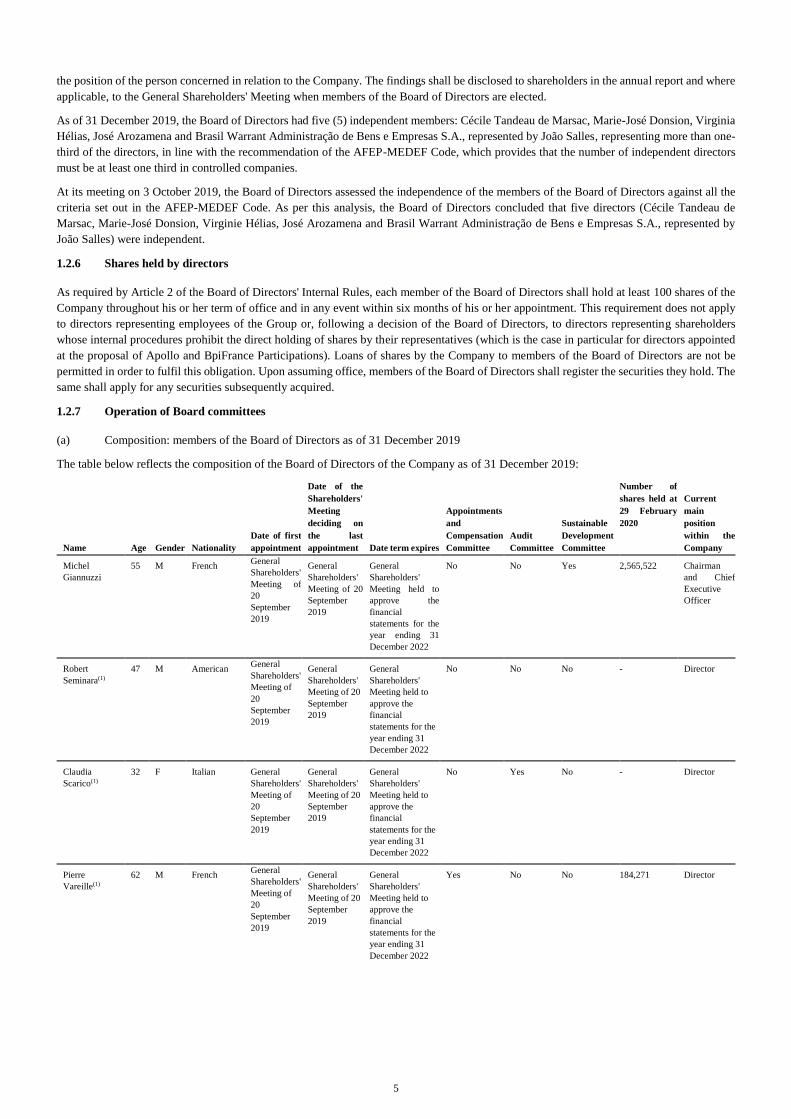
5
the position of the person concerned in relation to the Company. The findings shall be disclosed to shareholders in the annual report and where
applicable, to the General Shareholders' Meeting when members of the Board of Directors are elected.
As of 31 December 2019, the Board of Directors had five (5) independent members: Cécile Tandeau de Marsac, Marie-José Donsion, Virginia
Hélias, José Arozamena and Brasil Warrant Administração de Bens e Empresas S.A., represented by João Salles, representing more than one-
third of the directors, in line with the recommendation of the AFEP-MEDEF Code, which provides that the number of independent directors
must be at least one third in controlled companies.
At its meeting on 3 October 2019, the Board of Directors assessed the independence of the members of the Board of Directors against all the
criteria set out in the AFEP-MEDEF Code. As per this analysis, the Board of Directors concluded that five directors (Cécile Tandeau de
Marsac, Marie-José Donsion, Virginie Hélias, José Arozamena and Brasil Warrant Administração de Bens e Empresas S.A., represented by
João Salles) were independent.
1.2.6 Shares held by directors
As required by Article 2 of the Board of Directors' Internal Rules, each member of the Board of Directors shall hold at least 100 shares of the
Company throughout his or her term of office and in any event within six months of his or her appointment. This requirement does not apply
to directors representing employees of the Group or, following a decision of the Board of Directors, to directors representing shareholders
whose internal procedures prohibit the direct holding of shares by their representatives (which is the case in particular for directors appointed
at the proposal of Apollo and BpiFrance Participations). Loans of shares by the Company to members of the Board of Directors are not be
permitted in order to fulfil this obligation. Upon assuming office, members of the Board of Directors shall register the securities they hold. The
same shall apply for any securities subsequently acquired.
1.2.7 Operation of Board committees
(a) Composition: members of the Board of Directors as of 31 December 2019
The table below reflects the composition of the Board of Directors of the Company as of 31 December 2019:
Name Age Gender Nationality
Date of first
appointment
Date of the
Shareholders'
Meeting
deciding on
the last
appointment Date term expires
Appointments
and
Compensation
Committee
Audit
Committee
Sustainable
Development
Committee
Number of
shares held at
29 February
2020
Current
main
position
within the
Company
Michel
Giannuzzi
55 M French General
Shareholders'
Meeting of
20
September
2019
General
Shareholders'
Meeting of 20
September
2019
General
Shareholders'
Meeting held to
approve the
financial
statements for the
year ending 31
December 2022
No No Yes 2,565,522 Chairman
and Chief
Executive
Officer
Robert
Seminara(1)
47 M American General
Shareholders'
Meeting of
20
September
2019
General
Shareholders'
Meeting of 20
September
2019
General
Shareholders'
Meeting held to
approve the
financial
statements for the
year ending 31
December 2022
No No No - Director
Claudia
Scarico(1)
32 F Italian General
Shareholders'
Meeting of
20
September
2019
General
Shareholders'
Meeting of 20
September
2019
General
Shareholders'
Meeting held to
approve the
financial
statements for the
year ending 31
December 2022
No Yes No - Director
Pierre
Vareille(1)
62 M French General
Shareholders'
Meeting of
20
September
2019
General
Shareholders'
Meeting of 20
September
2019
General
Shareholders'
Meeting held to
approve the
financial
statements for the
year ending 31
December 2022
Yes No No 184,271 Director
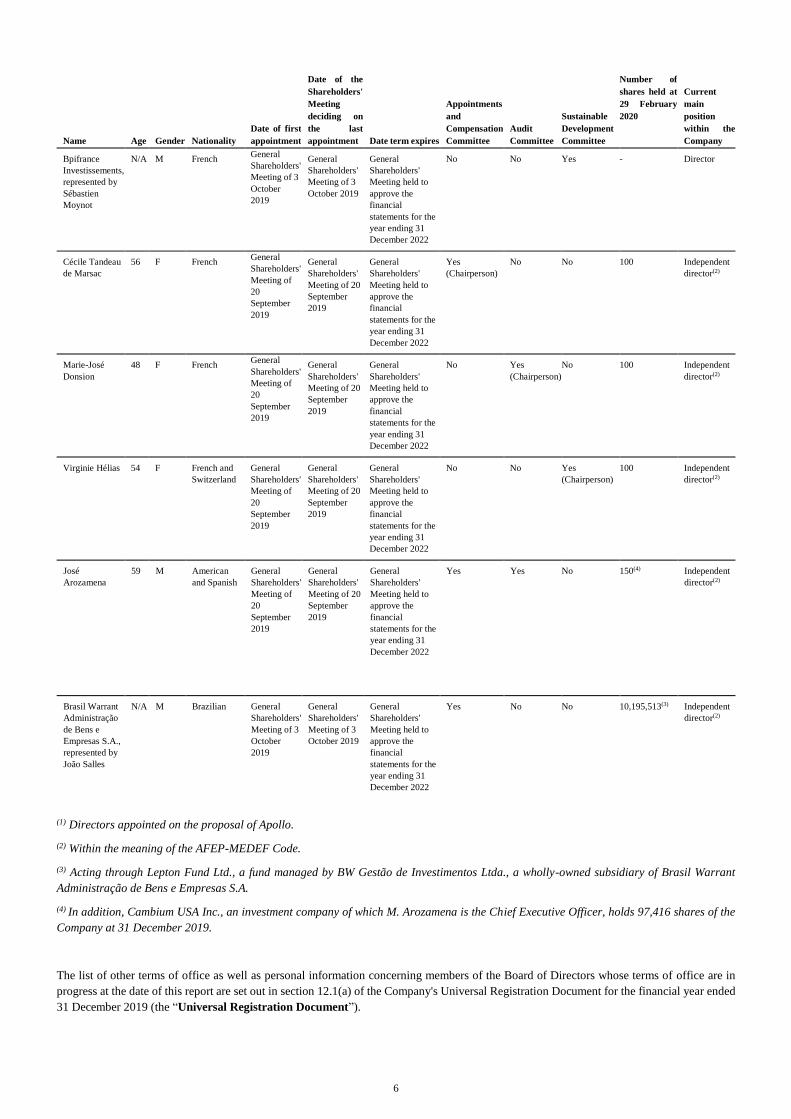
6
Name Age Gender Nationality
Date of first
appointment
Date of the
Shareholders'
Meeting
deciding on
the last
appointment Date term expires
Appointments
and
Compensation
Committee
Audit
Committee
Sustainable
Development
Committee
Number of
shares held at
29 February
2020
Current
main
position
within the
Company
Bpifrance
Investissements,
represented by
Sébastien
Moynot
N/A M French General
Shareholders'
Meeting of 3
October
2019
General
Shareholders'
Meeting of 3
October 2019
General
Shareholders'
Meeting held to
approve the
financial
statements for the
year ending 31
December 2022
No No Yes - Director
Cécile Tandeau
de Marsac
56 F French General
Shareholders'
Meeting of
20
September
2019
General
Shareholders'
Meeting of 20
September
2019
General
Shareholders'
Meeting held to
approve the
financial
statements for the
year ending 31
December 2022
Yes
(Chairperson)
No No 100 Independent
director(2)
Marie-José
Donsion
48 F French General
Shareholders'
Meeting of
20
September
2019
General
Shareholders'
Meeting of 20
September
2019
General
Shareholders'
Meeting held to
approve the
financial
statements for the
year ending 31
December 2022
No Yes
(Chairperson)
No 100 Independent
director(2)
Virginie Hélias 54 F French and
Switzerland
General
Shareholders'
Meeting of
20
September
2019
General
Shareholders'
Meeting of 20
September
2019
General
Shareholders'
Meeting held to
approve the
financial
statements for the
year ending 31
December 2022
No No Yes
(Chairperson)
100 Independent
director(2)
José
Arozamena
59 M American
and Spanish
General
Shareholders'
Meeting of
20
September
2019
General
Shareholders'
Meeting of 20
September
2019
General
Shareholders'
Meeting held to
approve the
financial
statements for the
year ending 31
December 2022
Yes Yes No 150(4) Independent
director(2)
Brasil Warrant
Administração
de Bens e
Empresas S.A.,
represented by
João Salles
N/A M Brazilian General
Shareholders'
Meeting of 3
October
2019
General
Shareholders'
Meeting of 3
October 2019
General
Shareholders'
Meeting held to
approve the
financial
statements for the
year ending 31
December 2022
Yes No No 10,195,513(3) Independent
director(2)
(1) Directors appointed on the proposal of Apollo.
(2) Within the meaning of the AFEP-MEDEF Code.
(3) Acting through Lepton Fund Ltd., a fund managed by BW Gestão de Investimentos Ltda., a wholly-owned subsidiary of Brasil Warrant
Administração de Bens e Empresas S.A.
(4) In addition, Cambium USA Inc., an investment company of which M. Arozamena is the Chief Executive Officer, holds 97,416 shares of the
Company at 31 December 2019.
The list of other terms of office as well as personal information concerning members of the Board of Directors whose terms of office are in
progress at the date of this report are set out in section 12.1(a) of the Company's Universal Registration Document for the financial year ended
31 December 2019 (the “Universal Registration Document”).
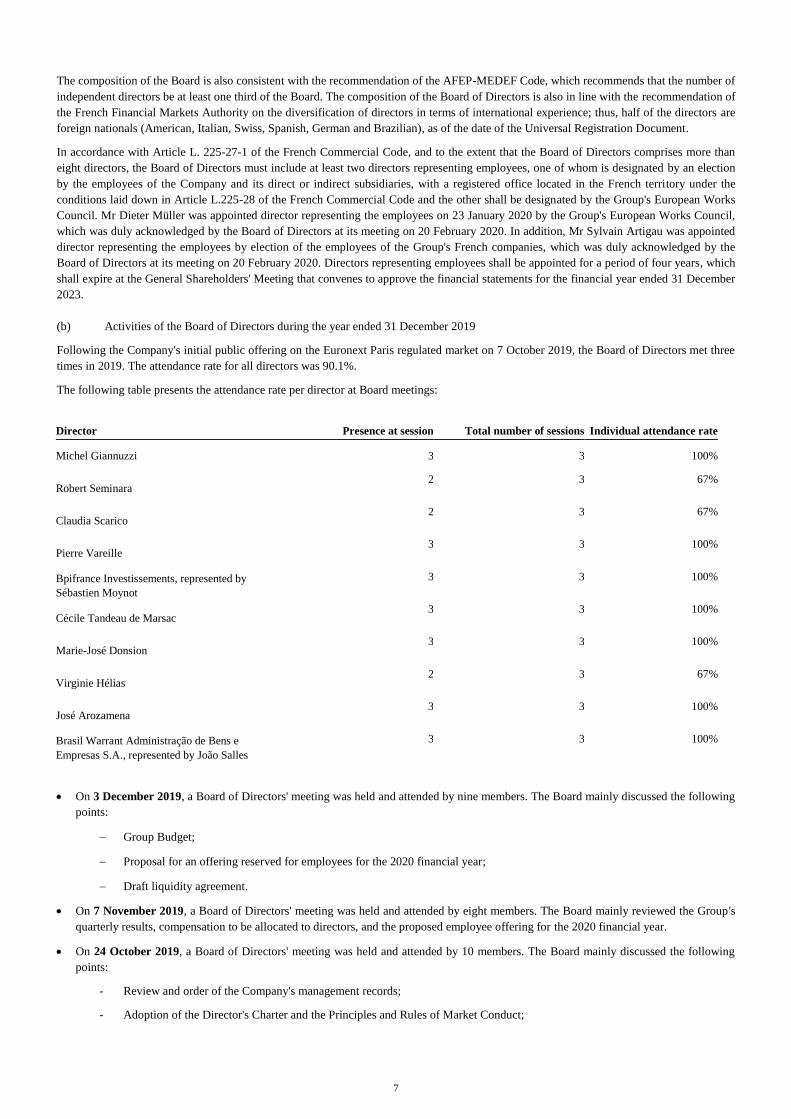
7
The composition of the Board is also consistent with the recommendation of the AFEP-MEDEF Code, which recommends that the number of
independent directors be at least one third of the Board. The composition of the Board of Directors is also in line with the recommendation of
the French Financial Markets Authority on the diversification of directors in terms of international experience; thus, half of the directors are
foreign nationals (American, Italian, Swiss, Spanish, German and Brazilian), as of the date of the Universal Registration Document.
In accordance with Article L. 225-27-1 of the French Commercial Code, and to the extent that the Board of Directors comprises more than
eight directors, the Board of Directors must include at least two directors representing employees, one of whom is designated by an election
by the employees of the Company and its direct or indirect subsidiaries, with a registered office located in the French territory under the
conditions laid down in Article L.225-28 of the French Commercial Code and the other shall be designated by the Group's European Works
Council. Mr Dieter Müller was appointed director representing the employees on 23 January 2020 by the Group's European Works Council,
which was duly acknowledged by the Board of Directors at its meeting on 20 February 2020. In addition, Mr Sylvain Artigau was appointed
director representing the employees by election of the employees of the Group's French companies, which was duly acknowledged by the
Board of Directors at its meeting on 20 February 2020. Directors representing employees shall be appointed for a period of four years, which
shall expire at the General Shareholders' Meeting that convenes to approve the financial statements for the financial year ended 31 December
2023.
(b) Activities of the Board of Directors during the year ended 31 December 2019
Following the Company's initial public offering on the Euronext Paris regulated market on 7 October 2019, the Board of Directors met three
times in 2019. The attendance rate for all directors was 90.1%.
The following table presents the attendance rate per director at Board meetings:
Director Presence at session Total number of sessions Individual attendance rate
Michel Giannuzzi 3 3 100%
Robert Seminara 2 3 67%
Claudia Scarico 2 3 67%
Pierre Vareille 3 3 100%
Bpifrance Investissements, represented by
Sébastien Moynot
3 3 100%
Cécile Tandeau de Marsac 3 3 100%
Marie-José Donsion 3 3 100%
Virginie Hélias 2 3 67%
José Arozamena 3 3 100%
Brasil Warrant Administração de Bens e
Empresas S.A., represented by João Salles
3 3 100%
On 3 December 2019, a Board of Directors' meeting was held and attended by nine members. The Board mainly discussed the following
points:
Group Budget;
Proposal for an offering reserved for employees for the 2020 financial year;
Draft liquidity agreement.
On 7 November 2019, a Board of Directors' meeting was held and attended by eight members. The Board mainly reviewed the Group's
quarterly results, compensation to be allocated to directors, and the proposed employee offering for the 2020 financial year.
On 24 October 2019, a Board of Directors' meeting was held and attended by 10 members. The Board mainly discussed the following
points:
- Review and order of the Company's management records;
- Adoption of the Director's Charter and the Principles and Rules of Market Conduct;
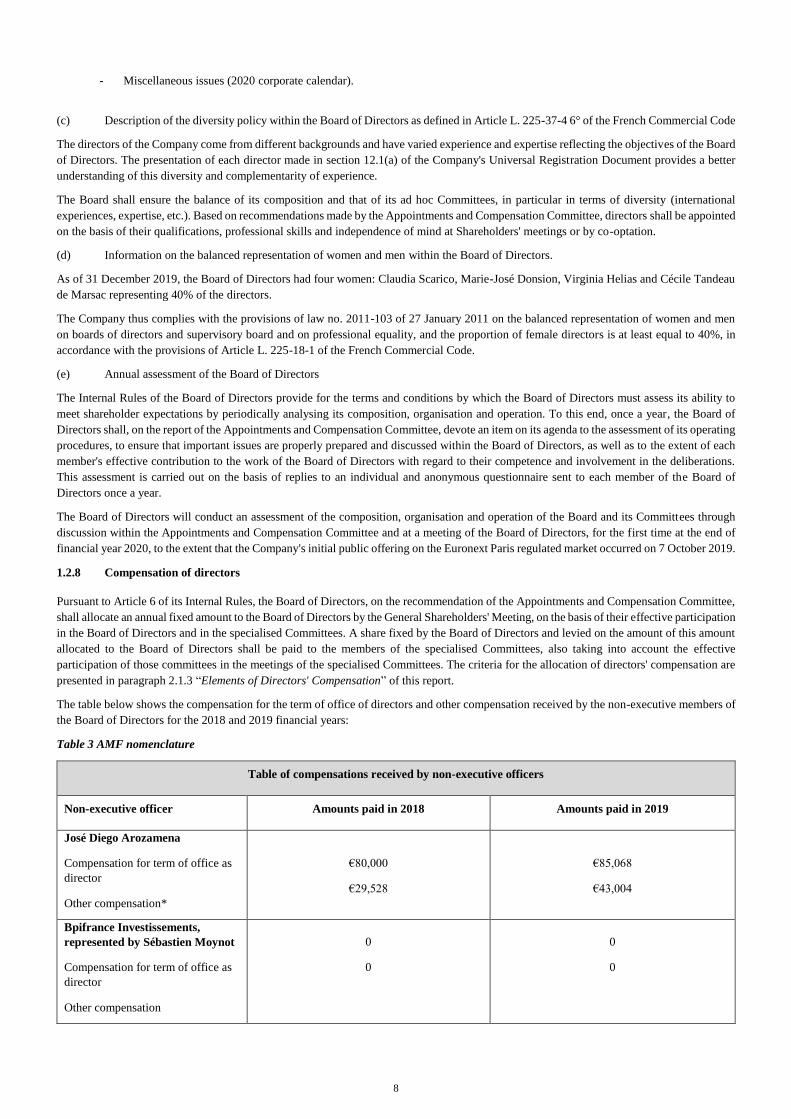
8
- Miscellaneous issues (2020 corporate calendar).
(c) Description of the diversity policy within the Board of Directors as defined in Article L. 225-37-4 6° of the French Commercial Code
The directors of the Company come from different backgrounds and have varied experience and expertise reflecting the objectives of the Board
of Directors. The presentation of each director made in section 12.1(a) of the Company's Universal Registration Document provides a better
understanding of this diversity and complementarity of experience.
The Board shall ensure the balance of its composition and that of its ad hoc Committees, in particular in terms of diversity (international
experiences, expertise, etc.). Based on recommendations made by the Appointments and Compensation Committee, directors shall be appointed
on the basis of their qualifications, professional skills and independence of mind at Shareholders' meetings or by co-optation.
(d) Information on the balanced representation of women and men within the Board of Directors.
As of 31 December 2019, the Board of Directors had four women: Claudia Scarico, Marie-José Donsion, Virginia Helias and Cécile Tandeau
de Marsac representing 40% of the directors.
The Company thus complies with the provisions of law no. 2011-103 of 27 January 2011 on the balanced representation of women and men
on boards of directors and supervisory board and on professional equality, and the proportion of female directors is at least equal to 40%, in
accordance with the provisions of Article L. 225-18-1 of the French Commercial Code.
(e) Annual assessment of the Board of Directors
The Internal Rules of the Board of Directors provide for the terms and conditions by which the Board of Directors must assess its ability to
meet shareholder expectations by periodically analysing its composition, organisation and operation. To this end, once a year, the Board of
Directors shall, on the report of the Appointments and Compensation Committee, devote an item on its agenda to the assessment of its operating
procedures, to ensure that important issues are properly prepared and discussed within the Board of Directors, as well as to the extent of each
member's effective contribution to the work of the Board of Directors with regard to their competence and involvement in the deliberations.
This assessment is carried out on the basis of replies to an individual and anonymous questionnaire sent to each member of the Board of
Directors once a year.
The Board of Directors will conduct an assessment of the composition, organisation and operation of the Board and its Committees through
discussion within the Appointments and Compensation Committee and at a meeting of the Board of Directors, for the first time at the end of
financial year 2020, to the extent that the Company's initial public offering on the Euronext Paris regulated market occurred on 7 October 2019.
1.2.8 Compensation of directors
Pursuant to Article 6 of its Internal Rules, the Board of Directors, on the recommendation of the Appointments and Compensation Committee,
shall allocate an annual fixed amount to the Board of Directors by the General Shareholders' Meeting, on the basis of their effective participation
in the Board of Directors and in the specialised Committees. A share fixed by the Board of Directors and levied on the amount of this amount
allocated to the Board of Directors shall be paid to the members of the specialised Committees, also taking into account the effective
participation of those committees in the meetings of the specialised Committees. The criteria for the allocation of directors' compensation are
presented in paragraph 2.1.3 “Elements of Directors' Compensation” of this report.
The table below shows the compensation for the term of office of directors and other compensation received by the non-executive members of
the Board of Directors for the 2018 and 2019 financial years:
Table 3 AMF nomenclature
Table of compensations received by non-executive officers
Non-executive officer Amounts paid in 2018 Amounts paid in 2019
José Diego Arozamena
Compensation for term of office as
director
Other compensation*
€80,000
€29,528
€85,068
€43,004
Bpifrance Investissements,
represented by Sébastien Moynot
Compensation for term of office as
director
Other compensation
0
0
0
0
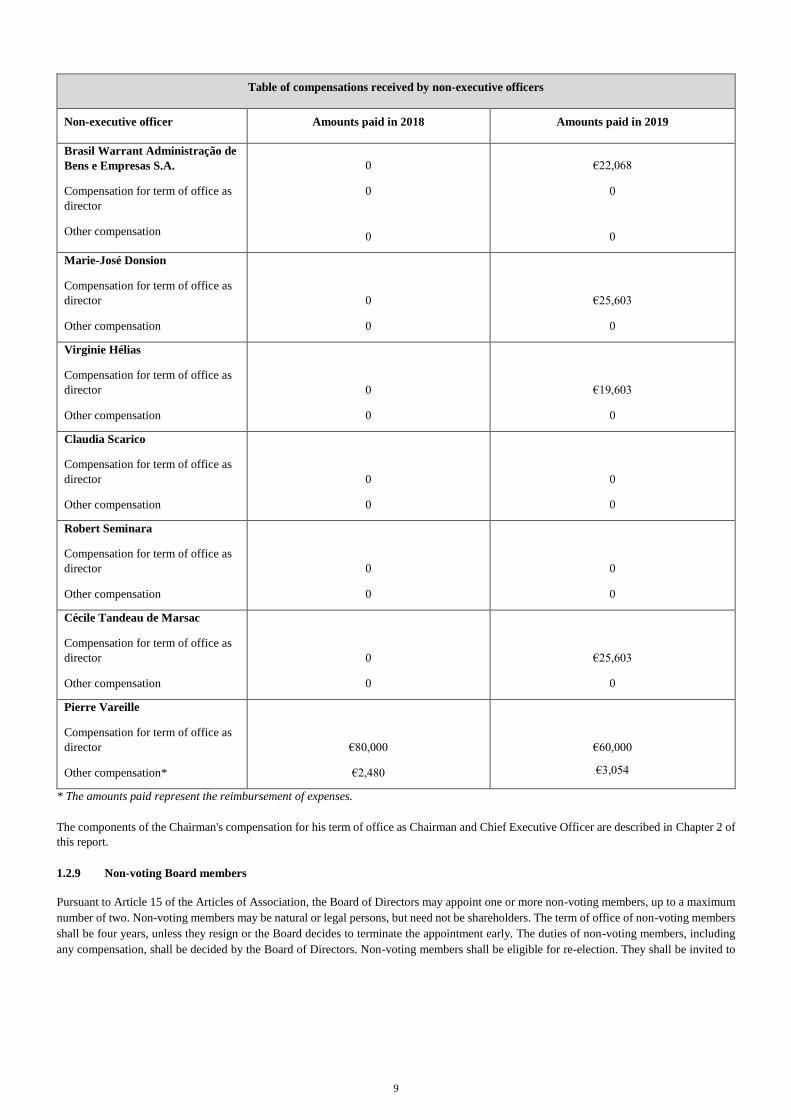
9
Table of compensations received by non-executive officers
Non-executive officer Amounts paid in 2018 Amounts paid in 2019
Brasil Warrant Administração de
Bens e Empresas S.A.
Compensation for term of office as
director
Other compensation
0
0
0
€22,068
0
0
Marie-José Donsion
Compensation for term of office as
director
Other compensation
0
0
€25,603
0
Virginie Hélias
Compensation for term of office as
director
Other compensation
0
0
€19,603
0
Claudia Scarico
Compensation for term of office as
director
Other compensation
0
0
0
0
Robert Seminara
Compensation for term of office as
director
Other compensation
0
0
0
0
Cécile Tandeau de Marsac
Compensation for term of office as
director
Other compensation
0
0
€25,603
0
Pierre Vareille
Compensation for term of office as
director
Other compensation*
€80,000
€2,480
€60,000
€3,054
* The amounts paid represent the reimbursement of expenses.
The components of the Chairman's compensation for his term of office as Chairman and Chief Executive Officer are described in Chapter 2 of
this report.
1.2.9 Non-voting Board members
Pursuant to Article 15 of the Articles of Association, the Board of Directors may appoint one or more non-voting members, up to a maximum
number of two. Non-voting members may be natural or legal persons, but need not be shareholders. The term of office of non-voting members
shall be four years, unless they resign or the Board decides to terminate the appointment early. The duties of non-voting members, including
any compensation, shall be decided by the Board of Directors. Non-voting members shall be eligible for re-election. They shall be invited to
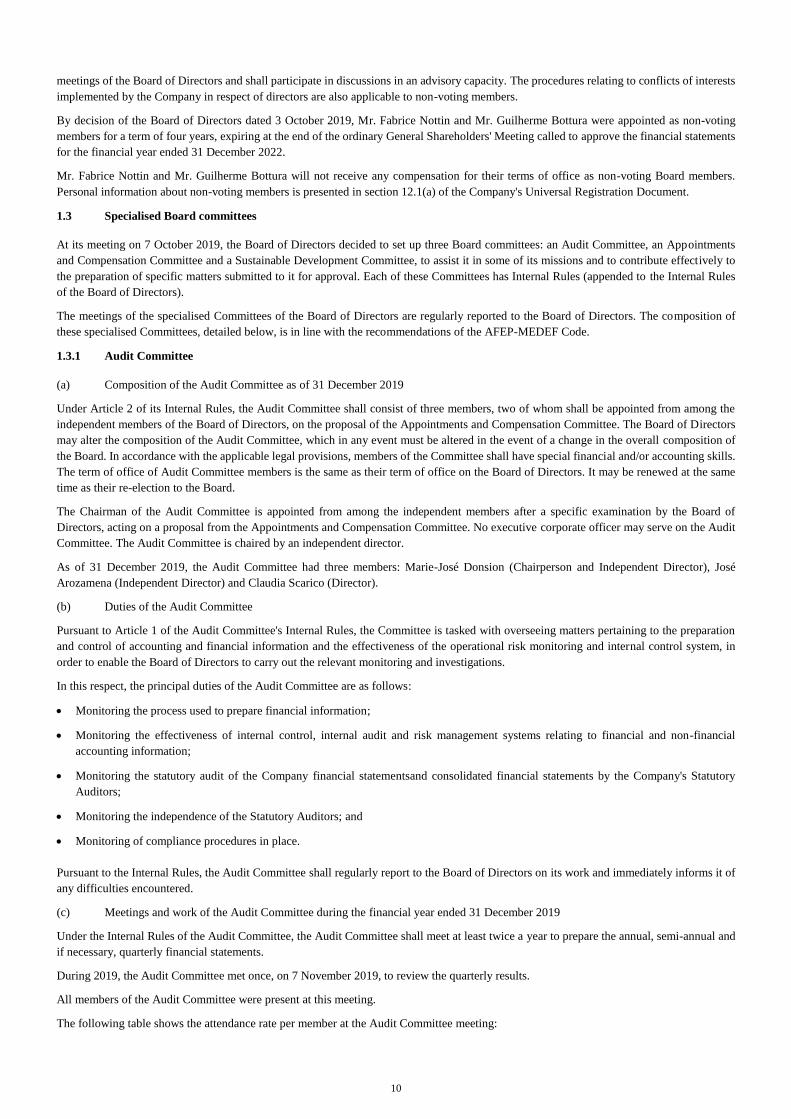
10
meetings of the Board of Directors and shall participate in discussions in an advisory capacity. The procedures relating to conflicts of interests
implemented by the Company in respect of directors are also applicable to non-voting members.
By decision of the Board of Directors dated 3 October 2019, Mr. Fabrice Nottin and Mr. Guilherme Bottura were appointed as non-voting
members for a term of four years, expiring at the end of the ordinary General Shareholders' Meeting called to approve the financial statements
for the financial year ended 31 December 2022.
Mr. Fabrice Nottin and Mr. Guilherme Bottura will not receive any compensation for their terms of office as non-voting Board members.
Personal information about non-voting members is presented in section 12.1(a) of the Company's Universal Registration Document.
1.3 Specialised Board committees
At its meeting on 7 October 2019, the Board of Directors decided to set up three Board committees: an Audit Committee, an Appointments
and Compensation Committee and a Sustainable Development Committee, to assist it in some of its missions and to contribute effectively to
the preparation of specific matters submitted to it for approval. Each of these Committees has Internal Rules (appended to the Internal Rules
of the Board of Directors).
The meetings of the specialised Committees of the Board of Directors are regularly reported to the Board of Directors. The composition of
these specialised Committees, detailed below, is in line with the recommendations of the AFEP-MEDEF Code.
1.3.1 Audit Committee
(a) Composition of the Audit Committee as of 31 December 2019
Under Article 2 of its Internal Rules, the Audit Committee shall consist of three members, two of whom shall be appointed from among the
independent members of the Board of Directors, on the proposal of the Appointments and Compensation Committee. The Board of Directors
may alter the composition of the Audit Committee, which in any event must be altered in the event of a change in the overall composition of
the Board. In accordance with the applicable legal provisions, members of the Committee shall have special financial and/or accounting skills.
The term of office of Audit Committee members is the same as their term of office on the Board of Directors. It may be renewed at the same
time as their re-election to the Board.
The Chairman of the Audit Committee is appointed from among the independent members after a specific examination by the Board of
Directors, acting on a proposal from the Appointments and Compensation Committee. No executive corporate officer may serve on the Audit
Committee. The Audit Committee is chaired by an independent director.
As of 31 December 2019, the Audit Committee had three members: Marie-José Donsion (Chairperson and Independent Director), José
Arozamena (Independent Director) and Claudia Scarico (Director).
(b) Duties of the Audit Committee
Pursuant to Article 1 of the Audit Committee's Internal Rules, the Committee is tasked with overseeing matters pertaining to the preparation
and control of accounting and financial information and the effectiveness of the operational risk monitoring and internal control system, in
order to enable the Board of Directors to carry out the relevant monitoring and investigations.
In this respect, the principal duties of the Audit Committee are as follows:
Monitoring the process used to prepare financial information;
Monitoring the effectiveness of internal control, internal audit and risk management systems relating to financial and non-financial
accounting information;
Monitoring the statutory audit of the Company financial statementsand consolidated financial statements by the Company's Statutory
Auditors;
Monitoring the independence of the Statutory Auditors; and
Monitoring of compliance procedures in place.
Pursuant to the Internal Rules, the Audit Committee shall regularly report to the Board of Directors on its work and immediately informs it of
any difficulties encountered.
(c) Meetings and work of the Audit Committee during the financial year ended 31 December 2019
Under the Internal Rules of the Audit Committee, the Audit Committee shall meet at least twice a year to prepare the annual, semi-annual and
if necessary, quarterly financial statements.
During 2019, the Audit Committee met once, on 7 November 2019, to review the quarterly results.
All members of the Audit Committee were present at this meeting.
The following table shows the attendance rate per member at the Audit Committee meeting:
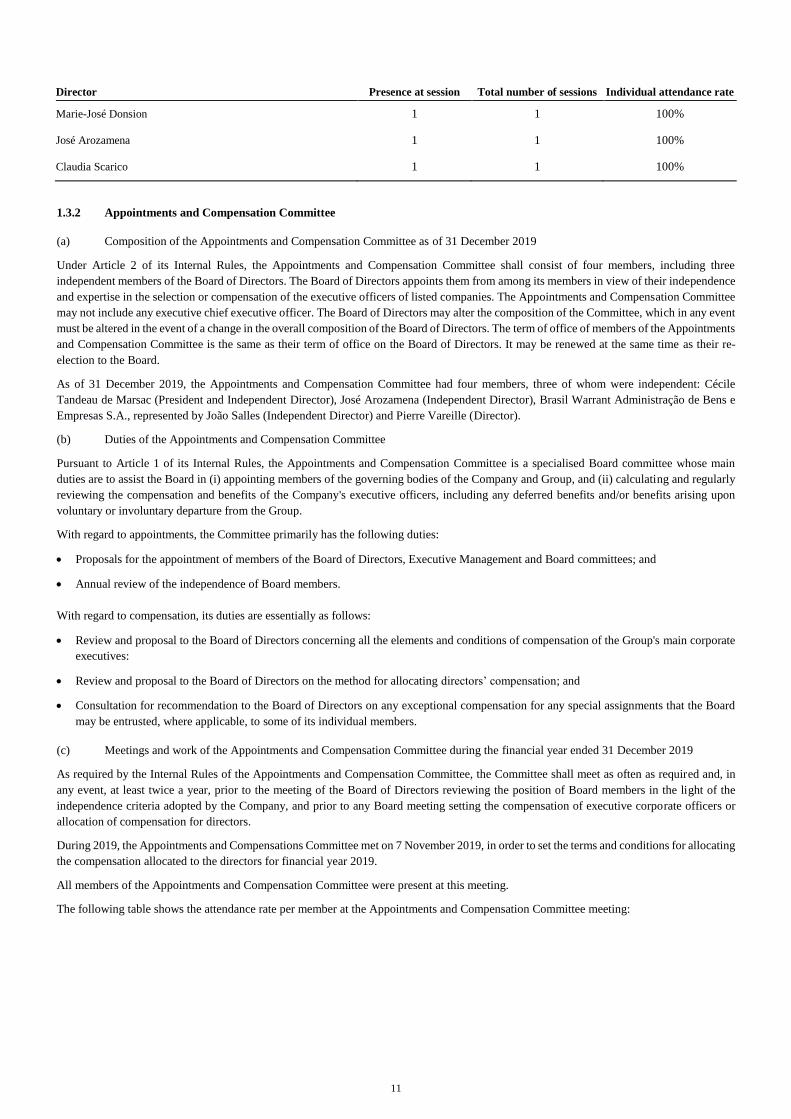
11
Director Presence at session Total number of sessions Individual attendance rate
Marie-José Donsion 1 1 100%
José Arozamena 1 1 100%
Claudia Scarico 1 1 100%
1.3.2 Appointments and Compensation Committee
(a) Composition of the Appointments and Compensation Committee as of 31 December 2019
Under Article 2 of its Internal Rules, the Appointments and Compensation Committee shall consist of four members, including three
independent members of the Board of Directors. The Board of Directors appoints them from among its members in view of their independence
and expertise in the selection or compensation of the executive officers of listed companies. The Appointments and Compensation Committee
may not include any executive chief executive officer. The Board of Directors may alter the composition of the Committee, which in any event
must be altered in the event of a change in the overall composition of the Board of Directors. The term of office of members of the Appointments
and Compensation Committee is the same as their term of office on the Board of Directors. It may be renewed at the same time as their re-
election to the Board.
As of 31 December 2019, the Appointments and Compensation Committee had four members, three of whom were independent: Cécile
Tandeau de Marsac (President and Independent Director), José Arozamena (Independent Director), Brasil Warrant Administração de Bens e
Empresas S.A., represented by João Salles (Independent Director) and Pierre Vareille (Director).
(b) Duties of the Appointments and Compensation Committee
Pursuant to Article 1 of its Internal Rules, the Appointments and Compensation Committee is a specialised Board committee whose main
duties are to assist the Board in (i) appointing members of the governing bodies of the Company and Group, and (ii) calculating and regularly
reviewing the compensation and benefits of the Company's executive officers, including any deferred benefits and/or benefits arising upon
voluntary or involuntary departure from the Group.
With regard to appointments, the Committee primarily has the following duties:
Proposals for the appointment of members of the Board of Directors, Executive Management and Board committees; and
Annual review of the independence of Board members.
With regard to compensation, its duties are essentially as follows:
Review and proposal to the Board of Directors concerning all the elements and conditions of compensation of the Group's main corporate
executives:
Review and proposal to the Board of Directors on the method for allocating directors’ compensation; and
Consultation for recommendation to the Board of Directors on any exceptional compensation for any special assignments that the Board
may be entrusted, where applicable, to some of its individual members.
(c) Meetings and work of the Appointments and Compensation Committee during the financial year ended 31 December 2019
As required by the Internal Rules of the Appointments and Compensation Committee, the Committee shall meet as often as required and, in
any event, at least twice a year, prior to the meeting of the Board of Directors reviewing the position of Board members in the light of the
independence criteria adopted by the Company, and prior to any Board meeting setting the compensation of executive corporate officers or
allocation of compensation for directors.
During 2019, the Appointments and Compensations Committee met on 7 November 2019, in order to set the terms and conditions for allocating
the compensation allocated to the directors for financial year 2019.
All members of the Appointments and Compensation Committee were present at this meeting.
The following table shows the attendance rate per member at the Appointments and Compensation Committee meeting:

12
Director Presence at session Total number of sessions Individual attendance rate
Cécile Tandeau de Marsac 1 1 100%
José Arozamena 1 1 100%
Brasil Warrant Administração de Bens e Empresas S.A.,
represented by João Salles 1 1 100%
Pierre Vareille 1 1 100%
1.3.3 Sustainable Development Committee
(a) Composition of the Sustainable Development Committee as of 31 December 2019
Pursuant to Article 2 of its Internal Rules, the Sustainable Development Committee is to be composed of five members, including the Chairman
of the Board of Directors, the two employee representatives sitting on the Board of Directors, and one member appointed from among the
independent members of the Board of Directors. The Board of Directors may alter the composition of the Committee, which in any event must
be altered in the event of a change in the overall composition of the Board of Directors. The term of office of Sustainable Development
Committee members is the same as their term of office on the Board of Directors. It may be renewed at the same time as their re-election to
the Board.
As of 31 December 2019, the Sustainable Development Committee had three members, including one independent: Virginie Hélias
(Chairperson and Independent Director), Michel Giannuzzi (Chairman of the Board of Directors) and Bpifrance Investissements, represented
by Sébastien Moynot (Director).
(b) Duties of the Sustainable Development Committee
Under Article 1 of its Internal Rules, the Sustainable Development Committee is a specialised committee of the Board of Directors whose main
tasks are (i) to ensure that social and environmental responsibility issues are taken into account in the Group's strategy and in its implementation,
(ii) consider the report provided for in Article L. 225-102-1 of the French Commercial Code on sustainable development and (iii) review the
Group's commitments on sustainable development, with regard to the issues specific to its activities and objectives.
(c) Meetings and work of the Sustainable Development Committee during the financial year ended 31 December 2019
Pursuant to the Internal Rules of the Sustainable Development Committee, the Committee meets as often as required, and in any event at least
once a year.
During 2019, the Sustainable Development Committee did not meet, as the Company's initial public offering on the Euronext Paris regulated
market occurred on 7 October 2019. The Sustainable Development Committee will meet in 2020 to review the Company's 2019 non-financial
performance statement (NFPS).
1.4 Procedures and operation of supervisory and management bodies
1.4.1 Mode of exercise of the Executive Management – Chairmanship of the Board of Directors
The positions of Chairman of the Board of Directors and Chief Executive Officer of the Company are combined.
At its meeting on 20 September 2019, the Board of Directors appointed Mr Michel Giannuzzi as Chairman of the Board of Directors and Chief
Executive Officer of the Company for a period equivalent to the duration of his term of office as director, until the end of the meeting of the
Company's ordinary General Shareholders' Meeting, which will be called upon to decide on the financial statements for the financial year
ended 31 December 2022, to be held in 2023.
1.4.2 Powers of the Chairman and Chief Executive Officer
The positions of Chairman of the Board of Directors and Chief Executive Officer of the Company are combined since the initial public offering
of the Company. In accordance with the law, the Company's Articles of Association and the Internal Rules of the Board of Directors, the
Chairman and CEO of the Company shall preside over the meetings of the Board of Directors and ensure the proper functioning of the
Company's bodies, in particular, ensuring that directors are able to fulfil their mission.
The Chairman and Chief Executive Officer shall be fully empowered to act on behalf of the Company in any and all circumstances. He or she
shall exercise those powers within the scope of the corporate purpose and subject to the powers expressly reserved by law for shareholder
meetings and for the Board of Directors.
He or she represents the Company in its dealings with third parties. The Company shall be bound by the actions of the Chairman and Chief
Executive Officer even if such actions are beyond the scope of the corporate purpose, unless the Company can prove that a third party knew
that the action concerned was beyond the scope of the corporate purpose or had constructive knowledge thereof in view of the circumstances.
The publication of the Articles of Association alone may not be deemed to constitute evidence of such knowledge.
13
Decisions of the Board of Directors limiting the powers of the Chairman and Chief Executive Officer shall not be binding on third parties.
The Chairman and Chief Executive Officer may, within the limits set by applicable legislation, delegate such powers as he or she deems
appropriate, for one or more specified purposes, to any representatives, even outside the Company, individually or meeting as a committee or
commission, with or without the possibility of substitution, subject to the limitations provided by law. Such powers may be permanent or
temporary, and may or may not include the possibility of substitution. Any authority thus delegated shall remain in full effect notwithstanding
the expiration of the term of office of the person granting them.
Under Article 3.2 of its Internal Rules, the Board of Directors shall give its prior approval, acting by a simple majority of its members present
or represented, for any act or decision of the Chairman and Chief Executive Officer concerning:
- Approval and/or amendment of the Group's medium-term business plan and annual budget (including the Group's hedging policy);
- Any investment (excluding acquisitions) exceeding the Group's annual budget, for a total amount in excess of €10 million;
- Any transaction involving the acquisition or disposal of assets or securities totalling more than €10 million and the formation,
modification or termination of joint ventures or partnerships representing more than €10 million in revenue or investments;
- Any decision to participate in an operation outside the usual scope of the Group's operations and any decision to discontinue or
significantly reduce the Group's principal operations;
- The creation of security interests for the benefit of a third party (i.e. a company outside the Group), except for security interests
granted to public administrations or public entitites in the normal course of business;
- Any decision to participate in a project or to enter into any contract with a term of more than five years (including contracts with
guaranteed income) for a total amount in excess of €50 million;
- Any decision to settle or engage in litigation with more than €5 million at stake or litigation that has a material impact on the Group's
reputation;
- Any additional debt transaction exceeding €50 million;
- Any amendments to the Articles of Association of the Company or of Significant Subsidiaries (except amendments of an
administrative nature); the term “Significant Subsidiaries” means any subsidiary of the Company whose consolidated revenue
represents, during the last financial year, more than 5% of the Company's consolidated annual revenue;
- Any merger/demerger/liquidation of a Significant Subsidiary, except for intra-group restructuring;
- Any issuance of shares or transferable securities giving immediate or deferred access to the Company's share capital, as well as any
issuance of shares or securities giving immediate or deferred access to the capital of a Significant Subsidiary, in each case for the
benefit of a third party to the Group;
- Any purchase or sale of real estate assets for an amount in excess of €10 million;
- Any distributions, excluding distributions between wholly owned subsidiaries;
- Any recruitment, suspension or removal of members of the Group's Executive Committee, any significant change in their
compensation (including with regard to retirement plans, incentive plans or specific severance terms) and the conclusion, amendment
or termination of an agreement with any of them;
- The implementation or amendment of stock option plans or free share plans for the Company or any Group company (or any other
similar instrument) for the benefit of the Group's executives and/or employees or certain categories of them;
- The conclusion or amendment of any pension plan or any restructuring of the workforce resulting in a total cost to the Group of more
than €10 million;
- Any material change in the accounting policies applied by Group companies when preparing their financial statements, except for
changes required by law or under applicable accounting standards;
- The appointment, re-appointment or dismissal of the Company's statutory auditors;
- The acquisition of treasury shares by the Company;
- The delisting of the Company and the listing of a Group company;
- The implementation of any insolvency, winding-up or liquidation proceedings (or similar proceedings in each applicable jurisdiction)
in respect of the Company or its Significant Subsidiaries.
14
2. COMPENSATION AND BENEFITS TO EXECUTIVE OFFICERS
2.1 Compensation policy for executive officers
The following developments constitute the compensation policy for the Company's executive officers, notably for 2020. They describe the
components of fixed and variable compensation and explain the decision-making process used to determine, review and implement it.
In accordance with the provisions of Article L. 225-37-2 of the French Commercial Code, the compensation policy presented below is subject
to approval by the Combined General Shareholders' Meeting of 10 June 2020. It is recalled that the last annual approval of the compensation
policy for the Chairman and Chief Executive Officer was by decision of the Company's sole shareholder (in its form of a simplified share
company) dated 27 August 2019.
It is reminded that, in a press release dated 7 April 2020, the Company has indicated that given the current health crisis, the Chairman
and Chief Executive Officer has decided to contribute to the Group’s collective effort by foregoing his variable compensation for the
financial year ending 31 December 2020. All others Executive Committee members also contribute to this collective effort by waiving
15% of their total annual compensation. This sum are donated at local level.
2.1.1 Principles and decision-making processes followed to identify, review and implement the Group's compensation policy
The Group's compensation policy, including the compensation of its corporate executive officer, is intended, in accordance with the Company's
social interest, and in accordance with market and industry practices, to ensure competitive compensation levels while maintaining a strong
link to company performance and maintaining the balance between short-term and medium/long-term performance in support of the Group's
business strategy and the sustainability of the Group.
The Group has thus implemented a compensation policy consisting of (i) a base salary, to compensate the position held, that is attractive for
recruiting and retaining talent, and for the relevant executives, and (ii) a variable annual portion, which compensates individual and collective
performance based on the achievement of ambitious objectives while being limited by a maximum level avoiding excessive risk-taking. This
variable annual share, a source of motivation for teams, is based on annual criteria, including safety, the environment, financial and operational
performance, and personal goals.
In addition to this variable annual compensation, the Group intends to fully associate its employees with its development by associating them
with the capital; the employee share ownership policy is thus a strategic pillar to support the Group's profitable and sustainable growth, which
the Group intends to pursue actively (as of 31 December 2019, the FCPE Verallia, which brings together employee ownership in the Company,
thus holds 2.6% of the Company's share capital). In particular, the Company intends to offer, during the first half of 2020, the Group employees
the possibility of subscribing to a capital increase that would be reserved for them, via the FCPE Verallia, under the conditions of discount and
employer matching contribution approved by the Board of Directors.
For its chief executive officer and senior managers, the Group has also implemented a long-term incentive plan, which involves them in the
creation of value over a period of three years and whose final vesting is subject to ambitious performance conditions, in accordance with the
principles of good governance and the recommendations of the AFEP-MEDEF code to which the Group refers.
Within the Group, the compensation policy for the Chief Executive Officer shall be set by the Board of Directors on the proposal of the
Appointments and Compensation Committee. The Appointments and Compensation Committee is chaired by an independent director and is
composed mainly of independent directors within the meaning of the AFEP-MEDEF Code. In the context of its considerations, it relies in
particular on benchmarking carried out on companies of similar size and industry, where appropriate with the assistance of one or more external
consultants. The members of the Appointments and Compensation Committee were selected for their technical skills, as well as for their
understanding of current standards and emerging trends. The Committee shall ensure at the beginning of the year the level of achievement of
the performance criteria set for the previous year, which conditions the granting of variable compensation. The Board of Directors and the
Appointments and Compensation Committee shall ensure that the compensation of corporate officers is consistent with the recommendations
of the AFEP-MEDEF Code.
Finally, as part of the so-called ‘say on pay’ arrangement, the compensation policy of the Company's executive corporate officer, as well as
the compensation elements and benefits that were allocated to them during the past financial year, described in this Chapter 2, are submitted
annually, in accordance with the provisions of Articles L.225-37-2 and L.225-100 of the French Commercial Code, to the approval of the
Company's General Shareholders' Meeting.
2.1.2 Elements that comprise the compensation of the Chairman and Chief Executive Officer
By a decision of the sole shareholder dated 27 August 2019, the compensation and benefits of the Chairman and Chief Executive Officer for
his duties as of the Company's Initial Public Offering, were set for the next three financial years, i.e. until December 2022.
15
In this context, the elements of the compensation of the Chairman and Chief Executive Officer for 2020 were confirmed by the Board of
Directors on 20 February 2020 as follows:
(a) A fixed compensation
The Board of Directors, on the proposal of the Appointments and Compensation Committee, shall determine the fixed annual compensation
of the Chairman and Chief Executive Officer, in particular with regard to a detailed study of the fixed and variable compensation of executives
of comparable listed companies carried out by an external firm.
On this basis, the gross annual fixed share of the compensation of the Chairman and Chief Executive Officer for 2020 was fixed by the Board
of Directors at an amount of €1,100,000, unchanged from the decision of the Company's single shareholder on 27 August 2019.
(b) Variable compensation
The Board of Directors, on the proposal of the Appointments and Compensation Committee, shall determine the variable annual compensation
of the Chairman and Chief Executive Officer on the basis of quantitative and qualitative criteria. For the 2020 financial year, the Board of
Directors of 20 February 2020 set the annual variable share at an amount equal to 100% of the fixed annual compensation, i.e. €1,100,000, in
the event of the achievement of the 100% targets, and, in the event that the targets set are exceeded, at a maximum amount equal to 140% of
the annual fixed compensation, i.e. €1,540,000.
The variable portion of the compensation is calculated for 80% of its amount from quantitative elements, each weighted, and for 20% from
qualitative elements.
In accordance with the provisions of Article L. 225-100 of the French Commercial Code, the payment of this variable compensation shall be
subject to the favourable vote of the ordinary General Shareholders' Meeting convened in 2021 to approve the financial statements for the
financial year ended 31 December 2020.
Quantitative criteria:
They are based on indicators that the Board of Directors, on the proposal of the Appointments and Compensation Committee, demmed most
relevant for assessing the Group's financial performance. For 2020, the quantitative criteria represent 80% of variable compensation, of which
55% are linked to the achievement of an adjusted EBITDA threshold1 and 45% are linked to the achievement of an operational cash flow
threshold2 for the financial year ended 31 December 2020.
If the stipulated quantitative criteria are exceeded, this annual variable compensation (i.e. €880,000 gross) will be increased on a linear basis
up to a maximum amount corresponding to 120% of the annual fixed compensation (i.e. €1,320,000 gross).
Qualitative criteria:
They are based on indicators that the Board of Directors, on the proposal of the Appointments and Compensation Committee, deemed most
relevant for assessing the Group's social and environmental performance. For 2020, qualitative criteria are linked to safety and sustainable
development objectives, including (i) up to 50%, a safety criterion, linked to the maintenance of a workplace accident frequency rate with or
without a lost days (known as AF2) below a pre-defined threshold and (ii) at 50%, a sustainable development criterion, namely the reduction
of the Group's carbon dioxide emissions3.
However, given the current health crisis, the Chairman and Chief Executive Officer has decided to contribute to the Group’s collective
effort by foregoing his annual variable compensation, which represents 50% of its total annual compensation, for the financial year
ending 31 December 2020. This sum will be donated at local level4.
(c) Allocation of performance shares
The Group conducts a compensation policy aimed at retaining and motivating the Group's talent and associating managers with its performance,
including through a long-term incentive plan in the form of free share grants subject to performance criteria related to the Group's long-term
strategy.
1 Adjusted EBITDA corresponds to operating profit adjusted for certain expenses and/or income of a non-recurring nature such as depreciation and
amortisation, restructuring costs, acquisition and M&A costs, hyperinflationary effects, management share ownership plans, disposal effects, closing
expenses, and other non-recurring items.
2 Operational cash flows represent increased cash flows from the change in operating working capital requirement (see section 8.5.1.4 of the Universal
Registration Document).
3 By 2020, the target is to reduce CO2 emissions per ton of packaged glass (scope 1 and 2) from glassmakers worldwide by 2%. Scope 1 is direct emissions,
i.e. CO2 emissions at the plant's physical perimeter, related to carbonated raw materials, heavy and domestic fuel, natural gas (fusion and non-fusion).
Scope 2 corresponds to indirect emissions, linked to the electricity consumption necessary to run the plant.
4 See the Company’s press release dated 7 April 2020.
16
To this end, the Company, during its Initial Public Offering on the Euronext Paris regulated market in October 2019, implemented a
performance share allocation plan over a three-year period from 2019 to 2021 (the “Plan 2019-2021”), representing a maximum of 0.99% of
the Company's share capital, granted in three instalments.
The executives and employees of the Company and its affiliates (within the meaning of Article L. 225-197-2 of the French Commercial Code)
will be eligible for the plan, including in particular the Chairman and Chief Executive Officer of the Company.
The definitive award of the shares granted each year under the 2019-2021 Plan will be (a) subject to the continued employment of the employee
or executive concerned and (b) subject to performance criteria linked (i) for 70%, to adjusted EBITDA and net debt targets before dividend
payments or share buybacks, measured over the last two previous years combined, and (ii) for 30%, to a target share price, after the Initial
Public Offering, relative to the share performance of companies in the SBF 120 index on Euronext Paris.
A first allocation of shares up to a maximum amount of €8,700,000, including a number of shares attributable to the Chairman and Chief
Executive Officer representing a maximum amount of €1,750,000, was carried out in July 2019, subject in particular to the achievement of the
above-mentioned performance conditions. The number of shares granted on their final grant date (i.e. after a two-year vesting period) will be
determined (subject to the achievement of the aforesaid performance conditions) by dividing the above amounts by the average stock market
price of the Company's shares on the Euronext Paris regulated market at the close of the 20 days preceding and following the publication of
the annual financial statements during the final award year, in view of the fact that the total definitive number of shares allocated may not
exceed 390,700, of which 78,140 shares may be awarded to the Chairman and Chief Executive Officer. For information, on the basis of the
above formula and the initial public offering price of €27, the total number of shares attributable to the first tranche of Plan 2019-2021 would
be 322,222, of which a maximum of 64,814 to the Chairman and CEO within the limit of 20% of the attributable shares (i.e. up to 20% of
0.33% of the Company's share capital), subject in particular to the attainment of the above-mentioned performance conditions.
The Board of Directors, acting pursuant to the authorisation conferred by the 17th resolution of the Company's Extraordinary General
Shareholders' Meeting of 20 September 2019, proceeded at its meeting of 20 February 2020, under the second tranche of Plan 2019-2021, to
the allocation of shares up to a maximum amount of €6,264,000 for the benefit of the corporate officer and employees of the Company and its
subsidiaries, including a number of shares attributable to the Chairman and Chief Executive Officer representing a maximum amount of
€1,650,000, subject in particular to the achievement of the above performance conditions and on the understanding that the total definitive
number of shares allocated may not exceed 390,700, of which 78,140 shares to the Chairman and Chief Executive Officer. For information,
on the basis of the formula referred to in the above paragraph and a closing price for the Verallia share of €34.40 as of 20 February 2020, the
total maximum number of shares attributable under the second tranche of Plan 2019-2021 would be 182,093, of which a maximum of 47,965
to the Chairman and Chief Executive Officer within the limit of 20% of the attributable shares (within the limit of 20% of 0.33% of the share
capital of the Company) and subject in particular to the attainment of the above performance conditions.
It is contemplated that the third tranche of performance shares will be allocated under Plan 2019-2021, by decision of the Board of Directors,
during the first quarter of 2021.
Shares granted under Plan 2019-2021 are subject to a two-year vesting period, without a retention period, except for the Chairman and Chief
Executive Officer, subject to a 30% retention obligation of shares vested, for the duration of his term of office, and for the members of the
Executive Committee of the Group, subject to an obligation to retain 20% of the vested shares, as long as they are members of the Executive
Committee.
If the maximum thresholds for the above-mentioned performance criteria are reached, the shares granted under Plan 2019-2021 may not
represent more than 0.99% of the share capital after the Company's Initial Public Offering, i.e. 1,172,100 shares with a maximum of 20% for
the free shares granted to Company officers.
(d) Benefits in kind
The Chairman and Chief Executive Officer benefits from a company car, an executive unemployment insurance scheme (GSC) and a
complementary health plan.
(e) Pension plan
The Company has not implemented a supplementary pension plan, preferring to give preference to the allocation of performance shares.
Therefore, the Chairman and CEO does not benefit from a supplementary pension plan.
(f) Severance and non-compete benefits
Severance pay
The Chairman and Chief Executive Officer shall receive a gross termination benefit of up to 150% of the amount of fixed and variable
compensation for the 12 months preceding the effective termination of his appointment. This would be due in the event of his removal from
office, unless he resigns or is dismissed for gross negligence or gross misconduct. No benefit will be due if the average amount of variable
compensation as referred to in section 2.1.2(b) during the two years preceding the termination of the Chief Executive Officer's appointment is
17
less than 30% of the target amount. If the average variable compensation paid is equal to 30% or more of the target amount, the termination
benefit will be paid in full.
Non-compete indemnity
The Chairman and Chief Executive Officer would be subject to a 12-month non-compete obligation and as such would receive a fixed monthly
benefit equal to 1/12th of 70% of the amount of his fixed and variable compensation for the last 12 months preceding the effective termination
of his appointment. In the event of the combined application of the termination benefit described above and the non-compete benefit, the
aggregate amount of the two benefits will be capped at an amount corresponding to the sum of the fixed and variable compensation received
by the Chairman and Chief Executive Officer during the two years preceding the effective termination of his appointment.
Summary table of fixed and variable items comprising the compensation of the Chairman and Chief Executive Officer
Compensation
Items Principle Criteria for determination
Fixed
compensation
The Chairman and Chief Executive
Officer shall receive a fixed
compensation in 12 monthly
instalments.
For the 2020 financial year, the gross annual amount is set at €1,100,000.
Annual
variable
compensation
The Chairman and Chief Executive
Officer shall receive a variable
compensation determined in view of the
Group's performance. This
compensation shall be paid during the
corporate financial year following that
in which performance has been
observed. In accordance with the
provisions of Article L. 225-37-2 of the
French Commercial Code, the payment
of variable compensation is conditional
on the approval by an ordinary General
Shareholders' Meeting of the
compensation items of the Chairman
and Chief Executive Officer under the
conditions laid down in Article L. 225-
100 of the French Commercial Code.
The annual variable share of the compensation of the Chairman and Chief Executive Officer
shall be €1,100,000 in the event of the achievement of the 100% objectives and, in the event
that the targets set are exceeded, a maximum amount equal to 140% of the annual fixed
compensation, i.e. €1,540,000. The variable share of the compensation is calculated for 80%
of its amount from quantitative items (55% related to the attainment of an adjusted EBITDA
threshold and 45% related to the achievement of an operational cash flow threshold) and 20%
of its amount from qualitative items related to safety and sustainable development objectives
and strategy (i.e. (i) up to 50%, a safety criterion, linked to maintaining a workplace accident
frequency rate below a pre-set threshold and (ii) at 50%, on a sustainable development criterion,
i.e. the reduction of the Group's carbon dioxide emissions.5
Long-term
compensation
(performance
shares)
The Chairman and Chief Executive
Officer is entitled to the Company' free
shares, subject to the achievement of
performance criteria.
The number of shares granted free of charge transferred to each beneficiary at the end of the
vesting period varies according to the level of achievement of the objectives detailed in section
2.1.2 (c) above.
Long-term
compensation
(stock options
or purchase
shares)
N/A N/A
Pension plan The Company has not implemented a
supplementary pension plan, preferring
to give preference to the allocation of
performance shares.
The Chairman and Chief Executive Officer does not benefit from any additional pension
scheme.
Severance and
no-compete
benefit
The Chairman and Chief Executive
Officer shall be entitled to a severance
pay in the event of the termination of his
duties.
The Chairman and Chief Executive Officer will also receive a gross termination benefit of up
to 150% of the amount of fixed and variable compensation for the twelve months preceding
the effective termination of his appointment. This would be due in the event of his removal
from office, unless he resigns or is dismissed for gross negligence or gross misconduct. No
benefit will be due if the average amount of variable compensation as referred to above during
the two years preceding the termination of the Chief Executive Officer's appointment is less
than 30% of the target amount. If the average variable compensation paid is equal to 30% or
more of the target amount, the termination benefit will be paid in full. In addition, the Chairman
5 Given the current health crisis, the Chairman and Chief Executive Officer has decided to contribute to the Group’s collective effort by
foregoing his annual variable compensation, which represents 50% of its total annual compensation, for the financial year ending 31
December 2020. This sum will be donated at local level (see press release of the Company dated 7 April 2020).

18
Compensation
Items Principle Criteria for determination
and Chief Executive Officer would be subject to a twelve-month non-compete obligation and
as such would receive a fixed monthly benefit equal to 1/12th of 70% of the amount of his fixed
and variable compensation for the twelve months preceding the effective termination of his
appointment. In the event of the combined application of the termination benefit described
above and the non-compete benefit, the aggregate amount of the two benefits will be capped at
an amount corresponding to the sum of the fixed and variable compensation received by the
Chairman and Chief Executive Officer during the two years preceding the effective termination
of his appointment.
Benefits in
kind
The Chairman and Chief Executive
Officer benefits from a company car, an
executive unemployment insurance
scheme (‘GSC’) and a complementary
health plan.
N/A
Draft resolution prepared by the Board of Directors pursuant to Article L.225-100 of the French Commercial Code submitted to the
Combined General Shareholders' Meeting of 10 June 2020
“SEVENTH RESOLUTION
(Approval of the compensation policy of the Chairman and Chief Executive Officer)
The General Shareholders' Meeting, voting under the conditions of quorum and majority required for ordinary General Shareholders'
Meetings, after reviewing the corporate governance report referred to in Article L.225-37 of the French Commercial Code, set out in Annex I
of the Company's 2019 Universal Registration Document, approves the compensation policy of Mr Michel Giannuzzi, the Chairman and CEO
of the Company, as presented in the aforementioned report.”
2.1.3 Items that make up the compensation of directors
The Company's General Shareholders' Meeting of 20 September 2019, in its 5th resolution, decided to set the total amount of compensation
allocated to the Board of Directors at €600,000 for the financial year 2019 as well as for subsequent financial years, until further decision of
the General Shareholders' Meeting.
On the recommendation of the Appointments and Compensation Committee, the Board of Directors freely distributes among its members the
compensation allocated to the Board by the General Shareholders' Meeting taking into account the effective participation of directors in Board
and Committee meetings. A share fixed by the Board and deducted from the amount of compensation allocated to the Board shall be paid to
the members of the Committees, also taking into account their effective participation in Committee meetings.
The basic compensation for 2019 and 2020 was fixed at €30,000 per year, calculated on a prorata temporis basis for the terms of office that
have ended or that became effective during the year. In addition, a fixed compensation of €15,000 per year shall be allocated to the Chairman
of each Committee, in compensation for his or her position.
In addition to these basic compensation, a variable amount of €3,000 is due for each Board and Committee meeting attended by the director
concerned.
Draft resolution prepared by the Board of Directors pursuant to Article L.225-100 of the French Commercial Code submitted to the
Combined General Shareholders' Meeting of 10 June 2020
“NINTH RESOLUTION
(Approval of directors compensation policy)
The General Assembly, voting under the conditions of quorum and majority required for ordinary general meetings, after reviewing the
corporate governance report referred to in Article L.225-37 of the French Commercial Code, set out in Annex I of the Company's 2019
Universal Registration Document, approves the directors' compensation policy, as presented in the aforementioned report.”
2.2 Compensation and benefits to executive officers during the year ended 31 December 2019
In accordance with Article L. 225-100, II of the French Commercial Code, the Annual General Shareholders' Meeting shall decide on a draft
resolution on the information referred to in Article L. 225-37-3 I of the French Commercial Code, to be included in the corporate governance
report, including compensation items paid for the term of office during the past financial year or allocated for the term of office for the same
financial year, that is, the financial year ended 31 December 2019. These items are presented in sections 2.2.1 and 2.2.2 below for the Chairman
and Chief Executive Officer and directors.
19
In addition, in accordance with Article L. 225-100, III of the French Commercial Code, the Annual General Shareholders' Meeting shall decide
on the fixed, variable and exceptional items making up the total compensation and benefits of any kind paid during the past financial year or
allocated for the same financial year, in a separate resolution for each executive officer. As regards the Company Chairman and Chief Executive
Officer, these elements are presented in section 2.2.1 below.
It will therefore be proposed to the Combined General Shareholders' Meeting of 10 June 2020 to decide, in separate resolutions, on the one
hand on the information referred to in Article L. 225-37-3 I of the French Commercial Code, including in particular the items presented in
sections 2.2.1 and 2.2.2 below, and on the other hand, on the compensation paid or allocated for the financial year ended 31 December 2019
to the Chairman and Chief Executive Officer, as set out in paragraph 2.2.1 below.
2.2.1 Chairman and Chief Executive Officer
(a) Fixed compensation
The fixed compensation paid to the Chairman and Chief Executive Officer during the 2019 financial year amounts to €875,000.
(b) Annual variable compensation
The Board of Directors of 20 February 2020, on the proposal of the Appointments and Compensation Committee which met on 19 February
2020, after having reviewed the results of the Company and the qualitative results of the Chairman and CEO during the year ended 31 December
2019, has fixed the quantitative portion of the variable compensation due to the Chairman and Chief Executive Officer for the financial year
ended 31 December 2019 at €1,162,615, i.e. 132.1% of the quantitative share target6, and the qualitative share of this compensation to 40% of
the target of the qualitative share7, i.e. €87,500 (a total of €1,250,115, or 113.6% of the target).
With regard to the quantitative portion, representing 80% of the variable compensation, the Board of Directors therefore noted that entitlement
to variable compensation rights follow the grid below:
Objective Weighting Achievement of the target (in % of the objective) during
the year ended 31 December 2019
Amount of variable compensation (in
% of target amount)
Adjusted
EBITDA
55% 102.2% 110.4%
Operating cash
flows
45% 112.5% 158.7%
The quantitative portion was thus reached at 106.8% of the objectives, giving entitlement to variable compensation of 132.1% of the amount
of the quantitative portion of the target, i.e. €1,162,615.
Regarding the qualitative portion, representing 20% of the variable compensation, the following qualitative objectives were reviewed by the
Committee on Appointments and Compensation, which estimated that they were met and gave entitlement toa bonus of 40% of the qualitative
share, i.e. €87,500: (i) for 50%, a safety criterion, relating to the accident rate being maintained below a predefined threshold, and (ii) for 50%,
sustainability criterion, such as the reduction of the Group's carbon dioxide emissions.
The payment of the variable compensation shall be conditional upon the approval by the Company's General Shareholders' Meeting to be held
on 10 June 2020 of the compensation items of the Chairman and Chief Executive Officer under the conditions laid down in Article L. 225-
100.
6 I.e. €880,000 (see section 13.1.4 of the Company's Universal Registration Document dated 4 September 2019).
7 I.e. €220,000 (see section 13.1.4 of the Company's Universal Registration Document dated 4 September 2019).
20
(c) Exceptional bonus
None.
(d) Compensation for term of office as director
None.
(e) Allocation of performance shares
Pursuant to an authorisation from the Company's single shareholder (in the form of a French simplified joint stock company) dated 24 July
2019, a number of shares attributable to a maximum amount of €1,750,000, i.e. for information purposes only, a maximum of 64,814 shares
on the basis of the €27 initial public offering stock price, were allocated to the Chairman and Chief Executive Officer, under the first tranche
of Plan 2019-2021 described in section 2.1.2.1(c) above. The shares shall be fully vested after a period of two years, i.e. on 24 July 2021 and
subject to (a) the continued employment of the Chairman and Chief Executive Officer and (b) subject to performance criteria linked (i) for
70%, to adjusted EBITDA and net debt targets before dividend payments or share buybacks, measured over the last two previous years
combined, and (ii) for 30%, to a target share price, after the initial public offering, relative to the share performance of companies in the SBF
120 index on Euronext Paris.
The Chairman and Chief Executive Officer is subject to a 30% retention obligation for vested shares, for a period expiring at the end of his
term of office.
(f) Severance and non-compete benefits
See subsection 2.1.2.1(f) above.
(g) Interest and employer matching contribution
For the year ended 31 December 2019, Michel Giannuzzi received a profit-sharing bonus of €4,667 and a matching contribution of 2,000, for
a total of €6,667.
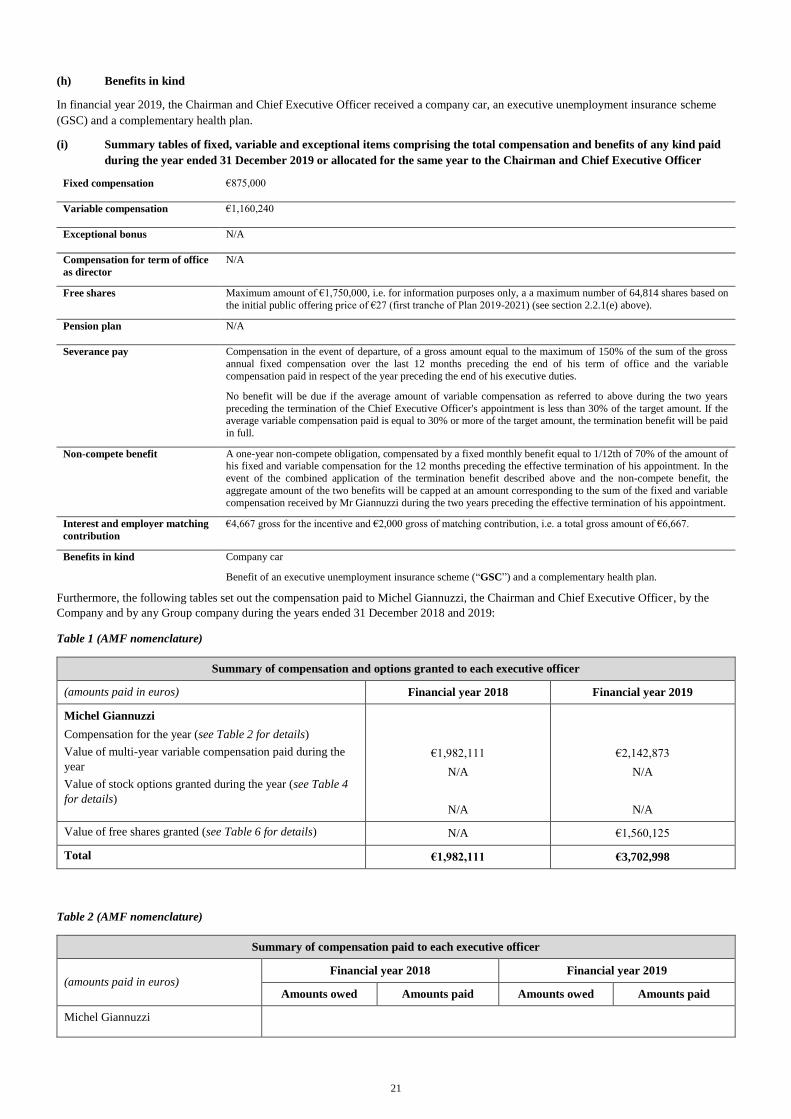
21
(h) Benefits in kind
In financial year 2019, the Chairman and Chief Executive Officer received a company car, an executive unemployment insurance scheme
(GSC) and a complementary health plan.
(i) Summary tables of fixed, variable and exceptional items comprising the total compensation and benefits of any kind paid
during the year ended 31 December 2019 or allocated for the same year to the Chairman and Chief Executive Officer
Fixed compensation €875,000
Variable compensation €1,160,240
Exceptional bonus N/A
Compensation for term of office
as director
N/A
Free shares Maximum amount of €1,750,000, i.e. for information purposes only, a a maximum number of 64,814 shares based on
the initial public offering price of €27 (first tranche of Plan 2019-2021) (see section 2.2.1(e) above).
Pension plan N/A
Severance pay Compensation in the event of departure, of a gross amount equal to the maximum of 150% of the sum of the gross
annual fixed compensation over the last 12 months preceding the end of his term of office and the variable
compensation paid in respect of the year preceding the end of his executive duties.
No benefit will be due if the average amount of variable compensation as referred to above during the two years
preceding the termination of the Chief Executive Officer's appointment is less than 30% of the target amount. If the average variable compensation paid is equal to 30% or more of the target amount, the termination benefit will be paid
in full.
Non-compete benefit A one-year non-compete obligation, compensated by a fixed monthly benefit equal to 1/12th of 70% of the amount of his fixed and variable compensation for the 12 months preceding the effective termination of his appointment. In the
event of the combined application of the termination benefit described above and the non-compete benefit, the
aggregate amount of the two benefits will be capped at an amount corresponding to the sum of the fixed and variable
compensation received by Mr Giannuzzi during the two years preceding the effective termination of his appointment.
Interest and employer matching
contribution
€4,667 gross for the incentive and €2,000 gross of matching contribution, i.e. a total gross amount of €6,667.
Benefits in kind Company car
Benefit of an executive unemployment insurance scheme (“GSC”) and a complementary health plan.
Furthermore, the following tables set out the compensation paid to Michel Giannuzzi, the Chairman and Chief Executive Officer, by the
Company and by any Group company during the years ended 31 December 2018 and 2019:
Table 1 (AMF nomenclature)
Summary of compensation and options granted to each executive officer
(amounts paid in euros) Financial year 2018 Financial year 2019
Michel Giannuzzi
Compensation for the year (see Table 2 for details)
Value of multi-year variable compensation paid during the
year
Value of stock options granted during the year (see Table 4
for details)
€1,982,111
N/A
N/A
€2,142,873
N/A
N/A
Value of free shares granted (see Table 6 for details) N/A €1,560,125
Total €1,982,111 €3,702,998
Table 2 (AMF nomenclature)
Summary of compensation paid to each executive officer
(amounts paid in euros) Financial year 2018 Financial year 2019
Amounts owed Amounts paid Amounts owed Amounts paid
Michel Giannuzzi
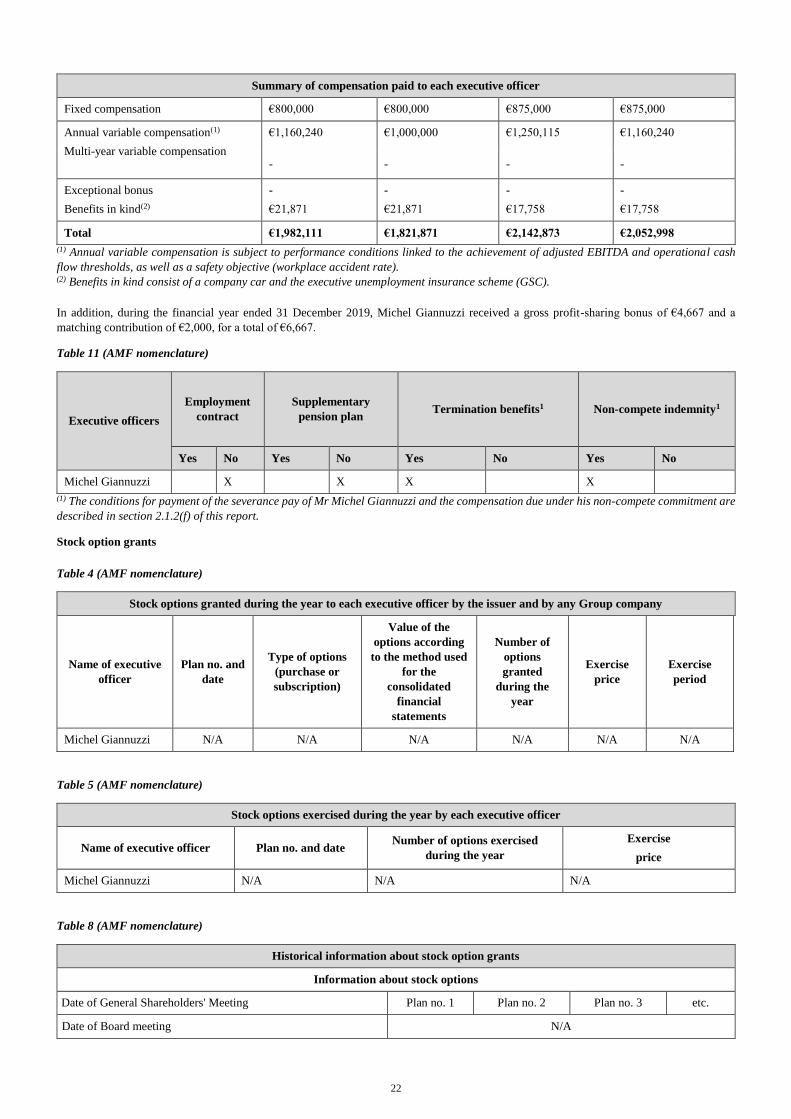
22
Summary of compensation paid to each executive officer
Fixed compensation €800,000 €800,000 €875,000 €875,000
Annual variable compensation(1)
Multi-year variable compensation
€1,160,240 €1,000,000 €1,250,115 €1,160,240
- - - -
Exceptional bonus
Benefits in kind(2)
-
€21,871
-
€21,871
-
€17,758
-
€17,758
Total €1,982,111 €1,821,871 €2,142,873 €2,052,998
(1) Annual variable compensation is subject to performance conditions linked to the achievement of adjusted EBITDA and operational cash
flow thresholds, as well as a safety objective (workplace accident rate). (2) Benefits in kind consist of a company car and the executive unemployment insurance scheme (GSC).
In addition, during the financial year ended 31 December 2019, Michel Giannuzzi received a gross profit-sharing bonus of €4,667 and a
matching contribution of €2,000, for a total of €6,667.
Table 11 (AMF nomenclature)
Executive officers
Employment
contract
Supplementary
pension plan Termination benefits1 Non-compete indemnity1
Yes No Yes No Yes No Yes No
Michel Giannuzzi X X X X
(1) The conditions for payment of the severance pay of Mr Michel Giannuzzi and the compensation due under his non-compete commitment are
described in section 2.1.2(f) of this report.
Stock option grants
Table 4 (AMF nomenclature)
Stock options granted during the year to each executive officer by the issuer and by any Group company
Name of executive
officer
Plan no. and
date
Type of options
(purchase or
subscription)
Value of the
options according
to the method used
for the
consolidated
financial
statements
Number of
options
granted
during the
year
Exercise
price
Exercise
period
Michel Giannuzzi N/A N/A N/A N/A N/A N/A
Table 5 (AMF nomenclature)
Stock options exercised during the year by each executive officer
Name of executive officer Plan no. and date Number of options exercised
during the year
Exercise
price
Michel Giannuzzi N/A N/A N/A
Table 8 (AMF nomenclature)
Historical information about stock option grants
Information about stock options
Date of General Shareholders' Meeting Plan no. 1 Plan no. 2 Plan no. 3 etc.
Date of Board meeting N/A
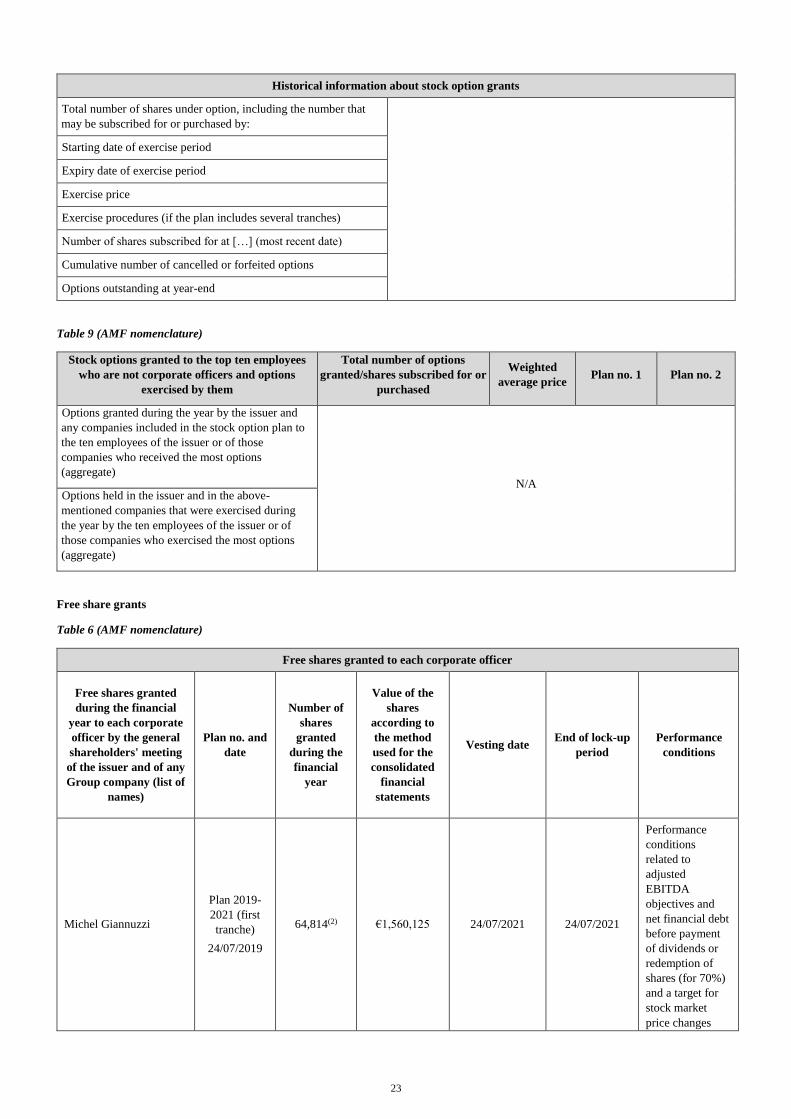
23
Historical information about stock option grants
Total number of shares under option, including the number that
may be subscribed for or purchased by:
Starting date of exercise period
Expiry date of exercise period
Exercise price
Exercise procedures (if the plan includes several tranches)
Number of shares subscribed for at […] (most recent date)
Cumulative number of cancelled or forfeited options
Options outstanding at year-end
Table 9 (AMF nomenclature)
Stock options granted to the top ten employees
who are not corporate officers and options
exercised by them
Total number of options
granted/shares subscribed for or
purchased
Weighted
average price Plan no. 1 Plan no. 2
Options granted during the year by the issuer and
any companies included in the stock option plan to
the ten employees of the issuer or of those
companies who received the most options
(aggregate) N/A
Options held in the issuer and in the above-
mentioned companies that were exercised during
the year by the ten employees of the issuer or of
those companies who exercised the most options
(aggregate)
Free share grants
Table 6 (AMF nomenclature)
Free shares granted to each corporate officer
Free shares granted
during the financial
year to each corporate
officer by the general
shareholders' meeting
of the issuer and of any
Group company (list of
names)
Plan no. and
date
Number of
shares
granted
during the
financial
year
Value of the
shares
according to
the method
used for the
consolidated
financial
statements
Vesting date End of lock-up
period
Performance
conditions
Michel Giannuzzi
Plan 2019-
2021 (first
tranche)
24/07/2019
64,814(2) €1,560,125 24/07/2021 24/07/2021
Performance
conditions
related to
adjusted
EBITDA
objectives and
net financial debt
before payment
of dividends or
redemption of
shares (for 70%)
and a target for
stock market
price changes
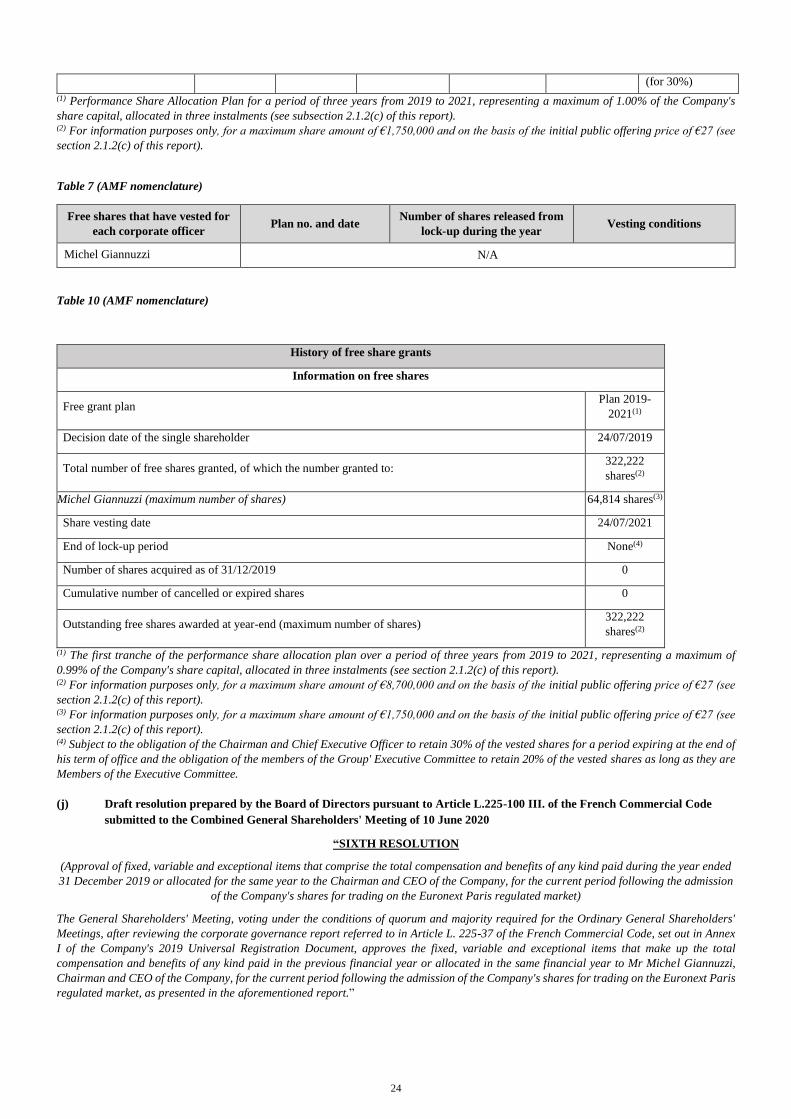
24
(for 30%)
(1) Performance Share Allocation Plan for a period of three years from 2019 to 2021, representing a maximum of 1.00% of the Company's
share capital, allocated in three instalments (see subsection 2.1.2(c) of this report). (2) For information purposes only, for a maximum share amount of €1,750,000 and on the basis of the initial public offering price of €27 (see
section 2.1.2(c) of this report).
Table 7 (AMF nomenclature)
Free shares that have vested for
each corporate officer Plan no. and date
Number of shares released from
lock-up during the year Vesting conditions
Michel Giannuzzi N/A
Table 10 (AMF nomenclature)
History of free share grants
Information on free shares
Free grant plan Plan 2019-
2021(1)
Decision date of the single shareholder 24/07/2019
Total number of free shares granted, of which the number granted to: 322,222
shares(2)
Michel Giannuzzi (maximum number of shares) 64,814 shares(3)
Share vesting date 24/07/2021
End of lock-up period None(4)
Number of shares acquired as of 31/12/2019 0
Cumulative number of cancelled or expired shares 0
Outstanding free shares awarded at year-end (maximum number of shares) 322,222
shares(2)
(1) The first tranche of the performance share allocation plan over a period of three years from 2019 to 2021, representing a maximum of
0.99% of the Company's share capital, allocated in three instalments (see section 2.1.2(c) of this report). (2) For information purposes only, for a maximum share amount of €8,700,000 and on the basis of the initial public offering price of €27 (see
section 2.1.2(c) of this report). (3) For information purposes only, for a maximum share amount of €1,750,000 and on the basis of the initial public offering price of €27 (see
section 2.1.2(c) of this report).
(4) Subject to the obligation of the Chairman and Chief Executive Officer to retain 30% of the vested shares for a period expiring at the end of
his term of office and the obligation of the members of the Group' Executive Committee to retain 20% of the vested shares as long as they are
Members of the Executive Committee.
(j) Draft resolution prepared by the Board of Directors pursuant to Article L.225-100 III. of the French Commercial Code
submitted to the Combined General Shareholders' Meeting of 10 June 2020
“SIXTH RESOLUTION
(Approval of fixed, variable and exceptional items that comprise the total compensation and benefits of any kind paid during the year ended
31 December 2019 or allocated for the same year to the Chairman and CEO of the Company, for the current period following the admission
of the Company's shares for trading on the Euronext Paris regulated market)
The General Shareholders' Meeting, voting under the conditions of quorum and majority required for the Ordinary General Shareholders'
Meetings, after reviewing the corporate governance report referred to in Article L. 225-37 of the French Commercial Code, set out in Annex
I of the Company's 2019 Universal Registration Document, approves the fixed, variable and exceptional items that make up the total
compensation and benefits of any kind paid in the previous financial year or allocated in the same financial year to Mr Michel Giannuzzi,
Chairman and CEO of the Company, for the current period following the admission of the Company's shares for trading on the Euronext Paris
regulated market, as presented in the aforementioned report.”
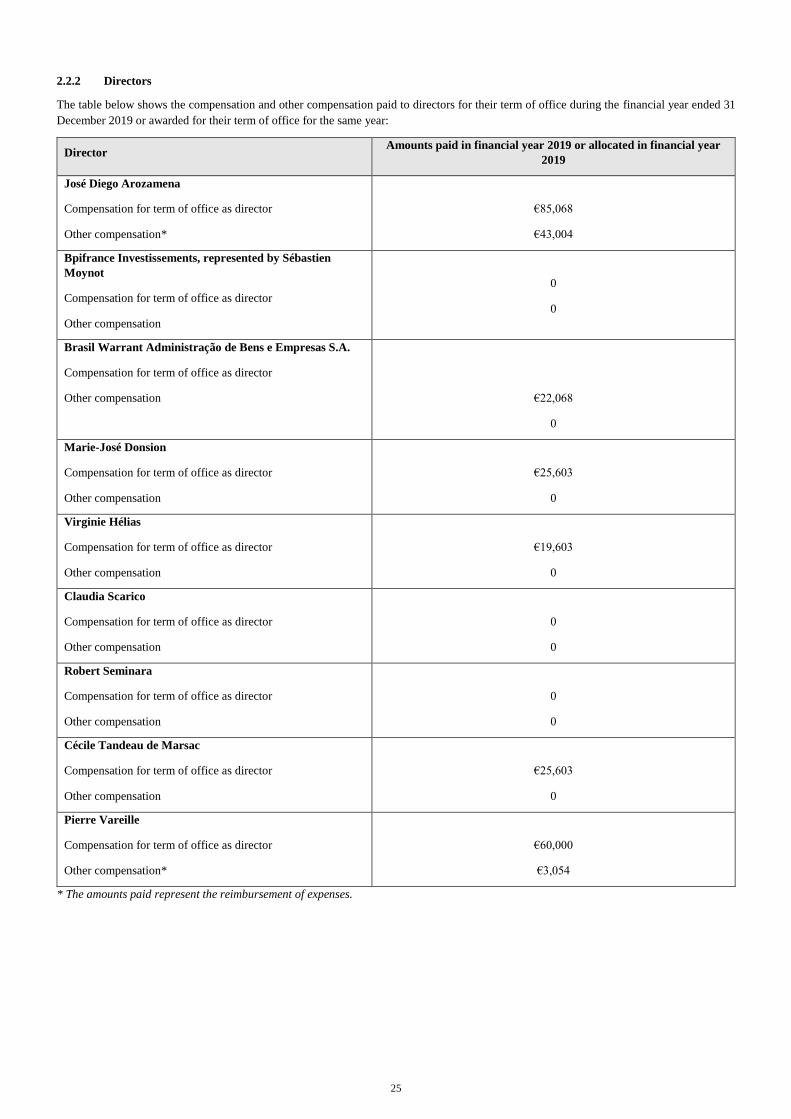
25
2.2.2 Directors
The table below shows the compensation and other compensation paid to directors for their term of office during the financial year ended 31
December 2019 or awarded for their term of office for the same year:
Director Amounts paid in financial year 2019 or allocated in financial year
2019
José Diego Arozamena
Compensation for term of office as director
Other compensation*
€85,068
€43,004
Bpifrance Investissements, represented by Sébastien
Moynot
Compensation for term of office as director
Other compensation
0
0
Brasil Warrant Administração de Bens e Empresas S.A.
Compensation for term of office as director
Other compensation
€22,068
0
Marie-José Donsion
Compensation for term of office as director
Other compensation
€25,603
0
Virginie Hélias
Compensation for term of office as director
Other compensation
€19,603
0
Claudia Scarico
Compensation for term of office as director
Other compensation
0
0
Robert Seminara
Compensation for term of office as director
Other compensation
0
0
Cécile Tandeau de Marsac
Compensation for term of office as director
Other compensation
€25,603
0
Pierre Vareille
Compensation for term of office as director
Other compensation*
€60,000
€3,054
* The amounts paid represent the reimbursement of expenses.
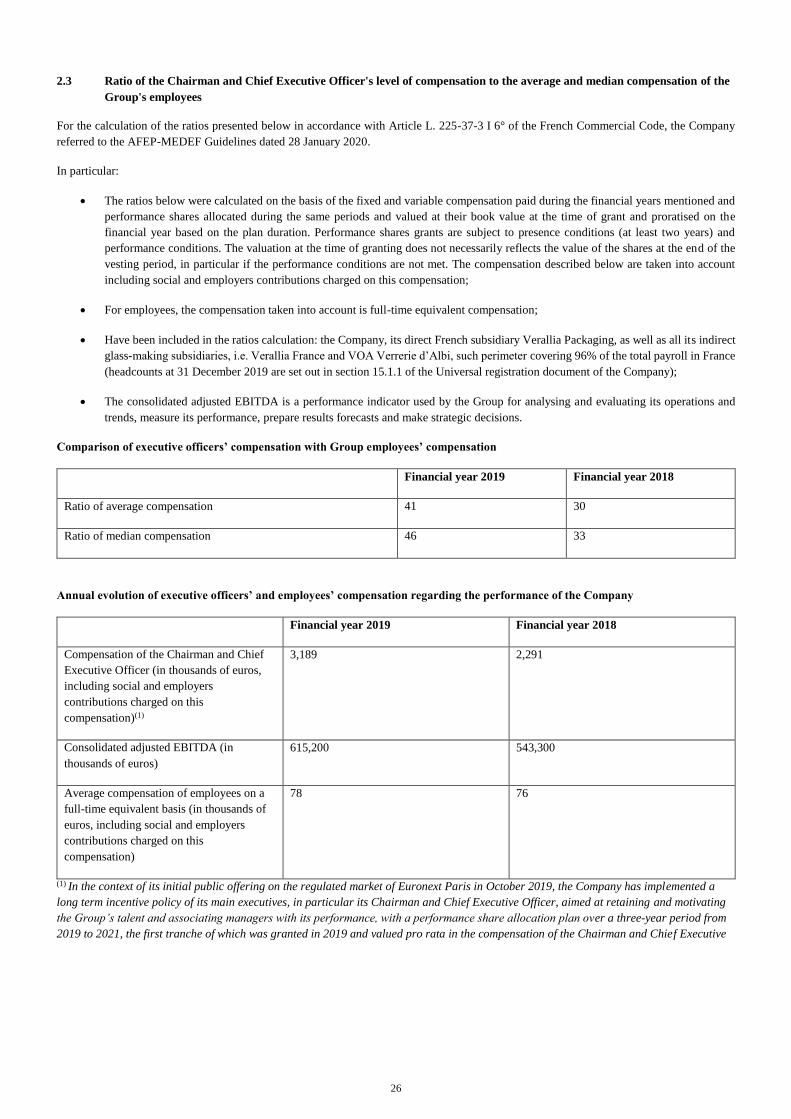
26
2.3 Ratio of the Chairman and Chief Executive Officer's level of compensation to the average and median compensation of the
Group's employees
For the calculation of the ratios presented below in accordance with Article L. 225-37-3 I 6° of the French Commercial Code, the Company
referred to the AFEP-MEDEF Guidelines dated 28 January 2020.
In particular:
The ratios below were calculated on the basis of the fixed and variable compensation paid during the financial years mentioned and
performance shares allocated during the same periods and valued at their book value at the time of grant and proratised on the
financial year based on the plan duration. Performance shares grants are subject to presence conditions (at least two years) and
performance conditions. The valuation at the time of granting does not necessarily reflects the value of the shares at the end of the
vesting period, in particular if the performance conditions are not met. The compensation described below are taken into account
including social and employers contributions charged on this compensation;
For employees, the compensation taken into account is full-time equivalent compensation;
Have been included in the ratios calculation: the Company, its direct French subsidiary Verallia Packaging, as well as all its indirect
glass-making subsidiaries, i.e. Verallia France and VOA Verrerie d’Albi, such perimeter covering 96% of the total payroll in France
(headcounts at 31 December 2019 are set out in section 15.1.1 of the Universal registration document of the Company);
The consolidated adjusted EBITDA is a performance indicator used by the Group for analysing and evaluating its operations and
trends, measure its performance, prepare results forecasts and make strategic decisions.
Comparison of executive officers’ compensation with Group employees’ compensation
Financial year 2019 Financial year 2018
Ratio of average compensation 41 30
Ratio of median compensation 46 33
Annual evolution of executive officers’ and employees’ compensation regarding the performance of the Company
Financial year 2019 Financial year 2018
Compensation of the Chairman and Chief
Executive Officer (in thousands of euros,
including social and employers
contributions charged on this
compensation)(1)
3,189 2,291
Consolidated adjusted EBITDA (in
thousands of euros)
615,200 543,300
Average compensation of employees on a
full-time equivalent basis (in thousands of
euros, including social and employers
contributions charged on this
compensation)
78 76
(1) In the context of its initial public offering on the regulated market of Euronext Paris in October 2019, the Company has implemented a
long term incentive policy of its main executives, in particular its Chairman and Chief Executive Officer, aimed at retaining and motivating
the Group’s talent and associating managers with its performance, with a performance share allocation plan over a three-year period from
2019 to 2021, the first tranche of which was granted in 2019 and valued pro rata in the compensation of the Chairman and Chief Executive
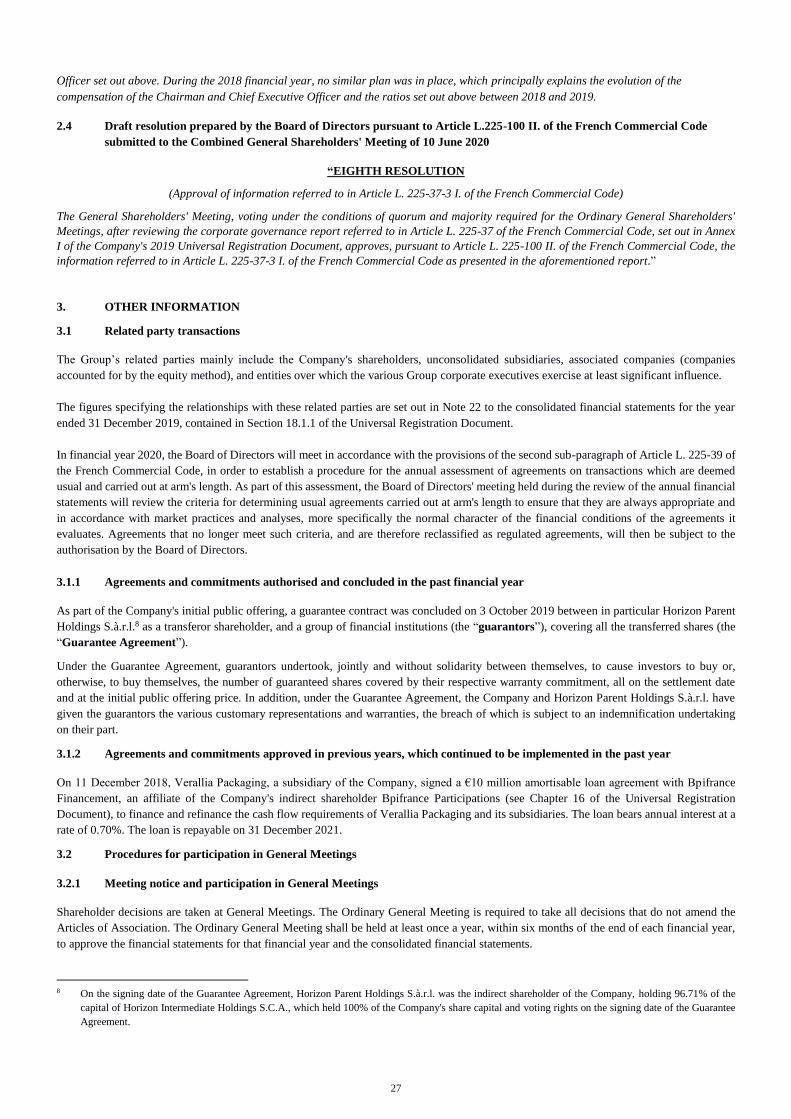
27
Officer set out above. During the 2018 financial year, no similar plan was in place, which principally explains the evolution of the
compensation of the Chairman and Chief Executive Officer and the ratios set out above between 2018 and 2019.
2.4 Draft resolution prepared by the Board of Directors pursuant to Article L.225-100 II. of the French Commercial Code
submitted to the Combined General Shareholders' Meeting of 10 June 2020
“EIGHTH RESOLUTION
(Approval of information referred to in Article L. 225-37-3 I. of the French Commercial Code)
The General Shareholders' Meeting, voting under the conditions of quorum and majority required for the Ordinary General Shareholders'
Meetings, after reviewing the corporate governance report referred to in Article L. 225-37 of the French Commercial Code, set out in Annex
I of the Company's 2019 Universal Registration Document, approves, pursuant to Article L. 225-100 II. of the French Commercial Code, the
information referred to in Article L. 225-37-3 I. of the French Commercial Code as presented in the aforementioned report.”
3. OTHER INFORMATION
3.1 Related party transactions
The Group’s related parties mainly include the Company's shareholders, unconsolidated subsidiaries, associated companies (companies
accounted for by the equity method), and entities over which the various Group corporate executives exercise at least significant influence.
The figures specifying the relationships with these related parties are set out in Note 22 to the consolidated financial statements for the year
ended 31 December 2019, contained in Section 18.1.1 of the Universal Registration Document.
In financial year 2020, the Board of Directors will meet in accordance with the provisions of the second sub-paragraph of Article L. 225-39 of
the French Commercial Code, in order to establish a procedure for the annual assessment of agreements on transactions which are deemed
usual and carried out at arm's length. As part of this assessment, the Board of Directors' meeting held during the review of the annual financial
statements will review the criteria for determining usual agreements carried out at arm's length to ensure that they are always appropriate and
in accordance with market practices and analyses, more specifically the normal character of the financial conditions of the agreements it
evaluates. Agreements that no longer meet such criteria, and are therefore reclassified as regulated agreements, will then be subject to the
authorisation by the Board of Directors.
3.1.1 Agreements and commitments authorised and concluded in the past financial year
As part of the Company's initial public offering, a guarantee contract was concluded on 3 October 2019 between in particular Horizon Parent
Holdings S.à.r.l.8 as a transferor shareholder, and a group of financial institutions (the “guarantors”), covering all the transferred shares (the
“Guarantee Agreement”).
Under the Guarantee Agreement, guarantors undertook, jointly and without solidarity between themselves, to cause investors to buy or,
otherwise, to buy themselves, the number of guaranteed shares covered by their respective warranty commitment, all on the settlement date
and at the initial public offering price. In addition, under the Guarantee Agreement, the Company and Horizon Parent Holdings S.à.r.l. have
given the guarantors the various customary representations and warranties, the breach of which is subject to an indemnification undertaking
on their part.
3.1.2 Agreements and commitments approved in previous years, which continued to be implemented in the past year
On 11 December 2018, Verallia Packaging, a subsidiary of the Company, signed a €10 million amortisable loan agreement with Bpifrance
Financement, an affiliate of the Company's indirect shareholder Bpifrance Participations (see Chapter 16 of the Universal Registration
Document), to finance and refinance the cash flow requirements of Verallia Packaging and its subsidiaries. The loan bears annual interest at a
rate of 0.70%. The loan is repayable on 31 December 2021.
3.2 Procedures for participation in General Meetings
3.2.1 Meeting notice and participation in General Meetings
Shareholder decisions are taken at General Meetings. The Ordinary General Meeting is required to take all decisions that do not amend the
Articles of Association. The Ordinary General Meeting shall be held at least once a year, within six months of the end of each financial year,
to approve the financial statements for that financial year and the consolidated financial statements.
8 On the signing date of the Guarantee Agreement, Horizon Parent Holdings S.à.r.l. was the indirect shareholder of the Company, holding 96.71% of the
capital of Horizon Intermediate Holdings S.C.A., which held 100% of the Company's share capital and voting rights on the signing date of the Guarantee
Agreement.
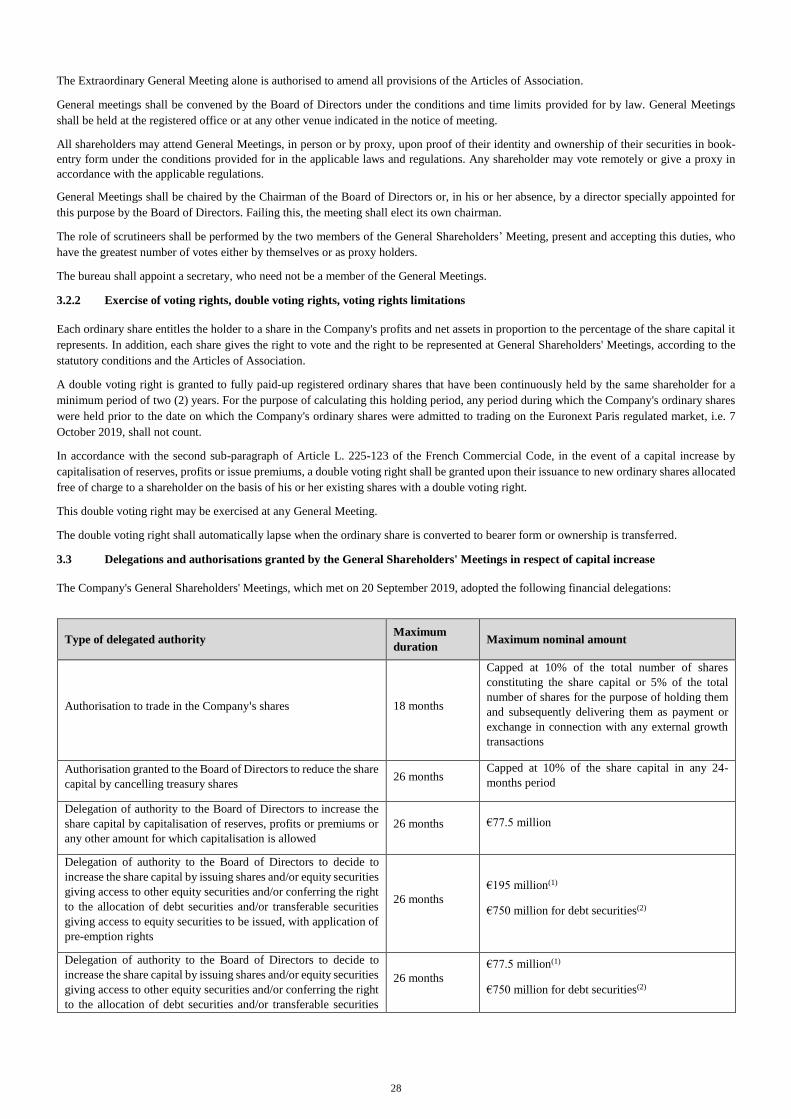
28
The Extraordinary General Meeting alone is authorised to amend all provisions of the Articles of Association.
General meetings shall be convened by the Board of Directors under the conditions and time limits provided for by law. General Meetings
shall be held at the registered office or at any other venue indicated in the notice of meeting.
All shareholders may attend General Meetings, in person or by proxy, upon proof of their identity and ownership of their securities in book-
entry form under the conditions provided for in the applicable laws and regulations. Any shareholder may vote remotely or give a proxy in
accordance with the applicable regulations.
General Meetings shall be chaired by the Chairman of the Board of Directors or, in his or her absence, by a director specially appointed for
this purpose by the Board of Directors. Failing this, the meeting shall elect its own chairman.
The role of scrutineers shall be performed by the two members of the General Shareholders’ Meeting, present and accepting this duties, who
have the greatest number of votes either by themselves or as proxy holders.
The bureau shall appoint a secretary, who need not be a member of the General Meetings.
3.2.2 Exercise of voting rights, double voting rights, voting rights limitations
Each ordinary share entitles the holder to a share in the Company's profits and net assets in proportion to the percentage of the share capital it
represents. In addition, each share gives the right to vote and the right to be represented at General Shareholders' Meetings, according to the
statutory conditions and the Articles of Association.
A double voting right is granted to fully paid-up registered ordinary shares that have been continuously held by the same shareholder for a
minimum period of two (2) years. For the purpose of calculating this holding period, any period during which the Company's ordinary shares
were held prior to the date on which the Company's ordinary shares were admitted to trading on the Euronext Paris regulated market, i.e. 7
October 2019, shall not count.
In accordance with the second sub-paragraph of Article L. 225-123 of the French Commercial Code, in the event of a capital increase by
capitalisation of reserves, profits or issue premiums, a double voting right shall be granted upon their issuance to new ordinary shares allocated
free of charge to a shareholder on the basis of his or her existing shares with a double voting right.
This double voting right may be exercised at any General Meeting.
The double voting right shall automatically lapse when the ordinary share is converted to bearer form or ownership is transferred.
3.3 Delegations and authorisations granted by the General Shareholders' Meetings in respect of capital increase
The Company's General Shareholders' Meetings, which met on 20 September 2019, adopted the following financial delegations:
Type of delegated authority Maximum
duration Maximum nominal amount
Authorisation to trade in the Company's shares 18 months
Capped at 10% of the total number of shares
constituting the share capital or 5% of the total
number of shares for the purpose of holding them
and subsequently delivering them as payment or
exchange in connection with any external growth
transactions
Authorisation granted to the Board of Directors to reduce the share
capital by cancelling treasury shares 26 months
Capped at 10% of the share capital in any 24-
months period
Delegation of authority to the Board of Directors to increase the
share capital by capitalisation of reserves, profits or premiums or
any other amount for which capitalisation is allowed
26 months €77.5 million
Delegation of authority to the Board of Directors to decide to
increase the share capital by issuing shares and/or equity securities
giving access to other equity securities and/or conferring the right
to the allocation of debt securities and/or transferable securities
giving access to equity securities to be issued, with application of
pre-emption rights
26 months
€195 million(1)
€750 million for debt securities(2)
Delegation of authority to the Board of Directors to decide to
increase the share capital by issuing shares and/or equity securities
giving access to other equity securities and/or conferring the right
to the allocation of debt securities and/or transferable securities
26 months
€77.5 million(1)
€750 million for debt securities(2)
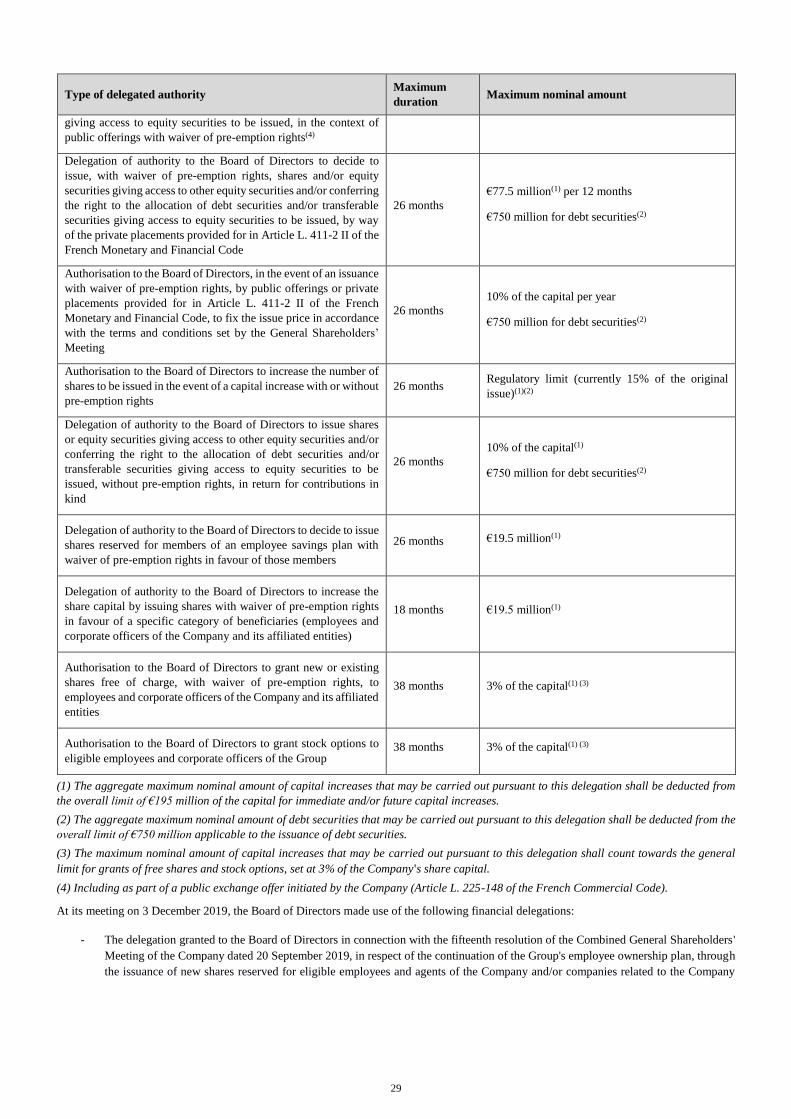
29
Type of delegated authority Maximum
duration Maximum nominal amount
giving access to equity securities to be issued, in the context of
public offerings with waiver of pre-emption rights(4)
Delegation of authority to the Board of Directors to decide to
issue, with waiver of pre-emption rights, shares and/or equity
securities giving access to other equity securities and/or conferring
the right to the allocation of debt securities and/or transferable
securities giving access to equity securities to be issued, by way
of the private placements provided for in Article L. 411-2 II of the
French Monetary and Financial Code
26 months
€77.5 million(1) per 12 months
€750 million for debt securities(2)
Authorisation to the Board of Directors, in the event of an issuance
with waiver of pre-emption rights, by public offerings or private
placements provided for in Article L. 411-2 II of the French
Monetary and Financial Code, to fix the issue price in accordance
with the terms and conditions set by the General Shareholders’
Meeting
26 months
10% of the capital per year
€750 million for debt securities(2)
Authorisation to the Board of Directors to increase the number of
shares to be issued in the event of a capital increase with or without
pre-emption rights
26 months Regulatory limit (currently 15% of the original
issue)(1)(2)
Delegation of authority to the Board of Directors to issue shares
or equity securities giving access to other equity securities and/or
conferring the right to the allocation of debt securities and/or
transferable securities giving access to equity securities to be
issued, without pre-emption rights, in return for contributions in
kind
26 months
10% of the capital(1)
€750 million for debt securities(2)
Delegation of authority to the Board of Directors to decide to issue
shares reserved for members of an employee savings plan with
waiver of pre-emption rights in favour of those members
26 months €19.5 million(1)
Delegation of authority to the Board of Directors to increase the
share capital by issuing shares with waiver of pre-emption rights
in favour of a specific category of beneficiaries (employees and
corporate officers of the Company and its affiliated entities)
18 months €19.5 million(1)
Authorisation to the Board of Directors to grant new or existing
shares free of charge, with waiver of pre-emption rights, to
employees and corporate officers of the Company and its affiliated
entities
38 months 3% of the capital(1) (3)
Authorisation to the Board of Directors to grant stock options to
eligible employees and corporate officers of the Group 38 months 3% of the capital(1) (3)
(1) The aggregate maximum nominal amount of capital increases that may be carried out pursuant to this delegation shall be deducted from
the overall limit of €195 million of the capital for immediate and/or future capital increases.
(2) The aggregate maximum nominal amount of debt securities that may be carried out pursuant to this delegation shall be deducted from the
overall limit of €750 million applicable to the issuance of debt securities.
(3) The maximum nominal amount of capital increases that may be carried out pursuant to this delegation shall count towards the general
limit for grants of free shares and stock options, set at 3% of the Company's share capital.
(4) Including as part of a public exchange offer initiated by the Company (Article L. 225-148 of the French Commercial Code).
At its meeting on 3 December 2019, the Board of Directors made use of the following financial delegations:
- The delegation granted to the Board of Directors in connection with the fifteenth resolution of the Combined General Shareholders'
Meeting of the Company dated 20 September 2019, in respect of the continuation of the Group's employee ownership plan, through
the issuance of new shares reserved for eligible employees and agents of the Company and/or companies related to the Company
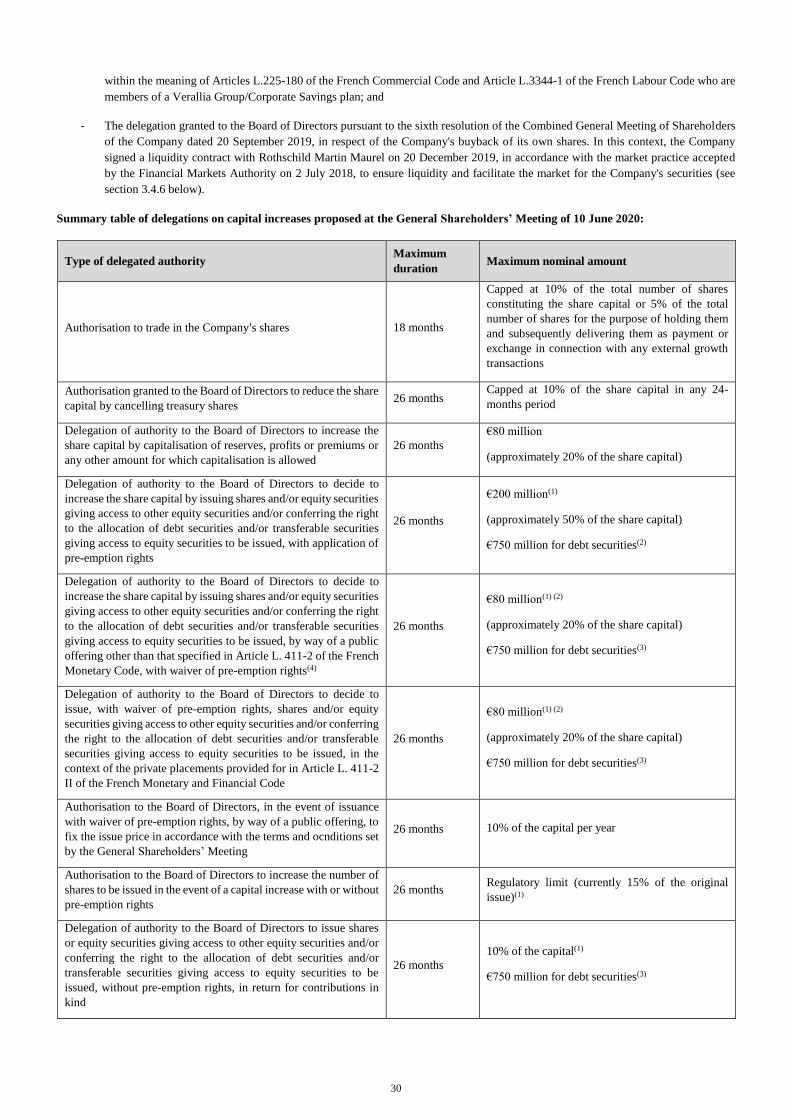
30
within the meaning of Articles L.225-180 of the French Commercial Code and Article L.3344-1 of the French Labour Code who are
members of a Verallia Group/Corporate Savings plan; and
- The delegation granted to the Board of Directors pursuant to the sixth resolution of the Combined General Meeting of Shareholders
of the Company dated 20 September 2019, in respect of the Company's buyback of its own shares. In this context, the Company
signed a liquidity contract with Rothschild Martin Maurel on 20 December 2019, in accordance with the market practice accepted
by the Financial Markets Authority on 2 July 2018, to ensure liquidity and facilitate the market for the Company's securities (see
section 3.4.6 below).
Summary table of delegations on capital increases proposed at the General Shareholders’ Meeting of 10 June 2020:
Type of delegated authority Maximum
duration Maximum nominal amount
Authorisation to trade in the Company's shares 18 months
Capped at 10% of the total number of shares
constituting the share capital or 5% of the total
number of shares for the purpose of holding them
and subsequently delivering them as payment or
exchange in connection with any external growth
transactions
Authorisation granted to the Board of Directors to reduce the share
capital by cancelling treasury shares 26 months
Capped at 10% of the share capital in any 24-
months period
Delegation of authority to the Board of Directors to increase the
share capital by capitalisation of reserves, profits or premiums or
any other amount for which capitalisation is allowed
26 months
€80 million
(approximately 20% of the share capital)
Delegation of authority to the Board of Directors to decide to
increase the share capital by issuing shares and/or equity securities
giving access to other equity securities and/or conferring the right
to the allocation of debt securities and/or transferable securities
giving access to equity securities to be issued, with application of
pre-emption rights
26 months
€200 million(1)
(approximately 50% of the share capital)
€750 million for debt securities(2)
Delegation of authority to the Board of Directors to decide to
increase the share capital by issuing shares and/or equity securities
giving access to other equity securities and/or conferring the right
to the allocation of debt securities and/or transferable securities
giving access to equity securities to be issued, by way of a public
offering other than that specified in Article L. 411-2 of the French
Monetary Code, with waiver of pre-emption rights(4)
26 months
€80 million(1) (2)
(approximately 20% of the share capital)
€750 million for debt securities(3)
Delegation of authority to the Board of Directors to decide to
issue, with waiver of pre-emption rights, shares and/or equity
securities giving access to other equity securities and/or conferring
the right to the allocation of debt securities and/or transferable
securities giving access to equity securities to be issued, in the
context of the private placements provided for in Article L. 411-2
II of the French Monetary and Financial Code
26 months
€80 million(1) (2)
(approximately 20% of the share capital)
€750 million for debt securities(3)
Authorisation to the Board of Directors, in the event of issuance
with waiver of pre-emption rights, by way of a public offering, to
fix the issue price in accordance with the terms and ocnditions set
by the General Shareholders’ Meeting
26 months 10% of the capital per year
Authorisation to the Board of Directors to increase the number of
shares to be issued in the event of a capital increase with or without
pre-emption rights
26 months Regulatory limit (currently 15% of the original
issue)(1)
Delegation of authority to the Board of Directors to issue shares
or equity securities giving access to other equity securities and/or
conferring the right to the allocation of debt securities and/or
transferable securities giving access to equity securities to be
issued, without pre-emption rights, in return for contributions in
kind
26 months
10% of the capital(1)
€750 million for debt securities(3)
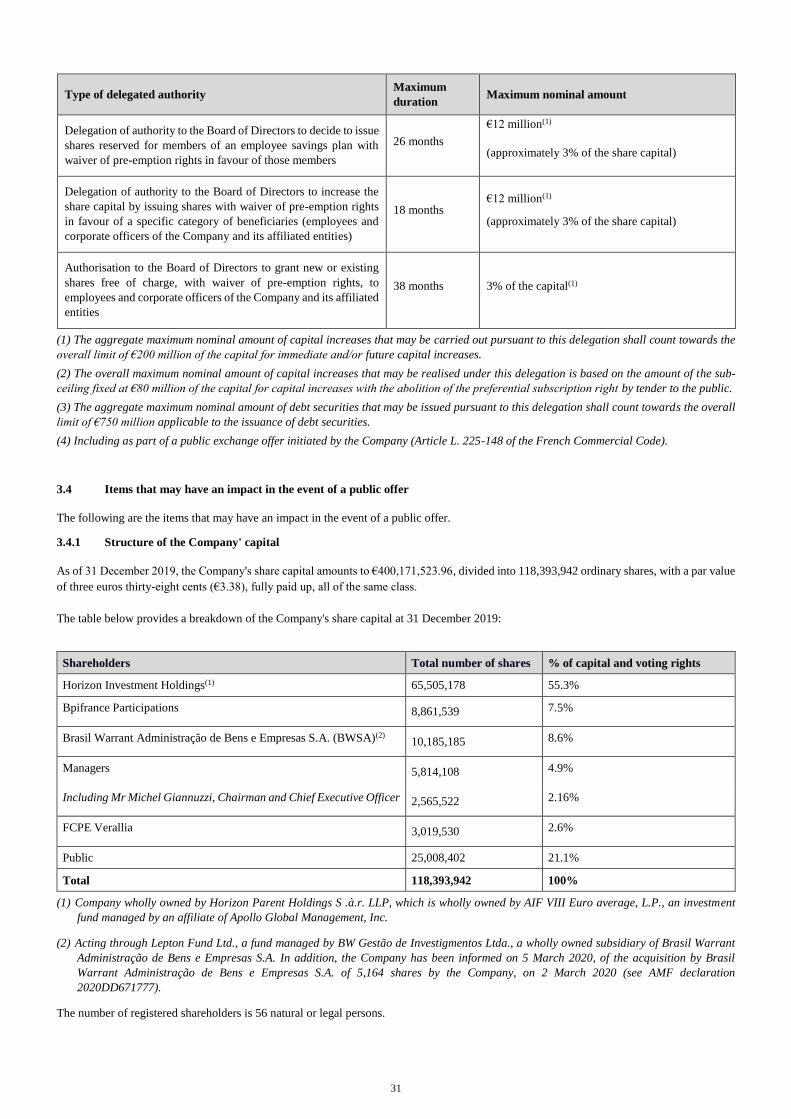
31
Type of delegated authority Maximum
duration Maximum nominal amount
Delegation of authority to the Board of Directors to decide to issue
shares reserved for members of an employee savings plan with
waiver of pre-emption rights in favour of those members
26 months
€12 million(1)
(approximately 3% of the share capital)
Delegation of authority to the Board of Directors to increase the
share capital by issuing shares with waiver of pre-emption rights
in favour of a specific category of beneficiaries (employees and
corporate officers of the Company and its affiliated entities)
18 months €12 million(1)
(approximately 3% of the share capital)
Authorisation to the Board of Directors to grant new or existing
shares free of charge, with waiver of pre-emption rights, to
employees and corporate officers of the Company and its affiliated
entities
38 months 3% of the capital(1)
(1) The aggregate maximum nominal amount of capital increases that may be carried out pursuant to this delegation shall count towards the
overall limit of €200 million of the capital for immediate and/or future capital increases.
(2) The overall maximum nominal amount of capital increases that may be realised under this delegation is based on the amount of the sub-
ceiling fixed at €80 million of the capital for capital increases with the abolition of the preferential subscription right by tender to the public.
(3) The aggregate maximum nominal amount of debt securities that may be issued pursuant to this delegation shall count towards the overall
limit of €750 million applicable to the issuance of debt securities.
(4) Including as part of a public exchange offer initiated by the Company (Article L. 225-148 of the French Commercial Code).
3.4 Items that may have an impact in the event of a public offer
The following are the items that may have an impact in the event of a public offer.
3.4.1 Structure of the Company' capital
As of 31 December 2019, the Company's share capital amounts to €400,171,523.96, divided into 118,393,942 ordinary shares, with a par value
of three euros thirty-eight cents (€3.38), fully paid up, all of the same class.
The table below provides a breakdown of the Company's share capital at 31 December 2019:
Shareholders Total number of shares % of capital and voting rights
Horizon Investment Holdings(1) 65,505,178 55.3%
Bpifrance Participations 8,861,539 7.5%
Brasil Warrant Administração de Bens e Empresas S.A. (BWSA)(2) 10,185,185 8.6%
Managers 5,814,108 4.9%
Including Mr Michel Giannuzzi, Chairman and Chief Executive Officer 2,565,522 2.16%
FCPE Verallia 3,019,530 2.6%
Public 25,008,402 21.1%
Total 118,393,942 100%
(1) Company wholly owned by Horizon Parent Holdings S .à.r. LLP, which is wholly owned by AIF VIII Euro average, L.P., an investment
fund managed by an affiliate of Apollo Global Management, Inc.
(2) Acting through Lepton Fund Ltd., a fund managed by BW Gestão de Investigmentos Ltda., a wholly owned subsidiary of Brasil Warrant
Administração de Bens e Empresas S.A. In addition, the Company has been informed on 5 March 2020, of the acquisition by Brasil
Warrant Administração de Bens e Empresas S.A. of 5,164 shares by the Company, on 2 March 2020 (see AMF declaration
2020DD671777).
The number of registered shareholders is 56 natural or legal persons.
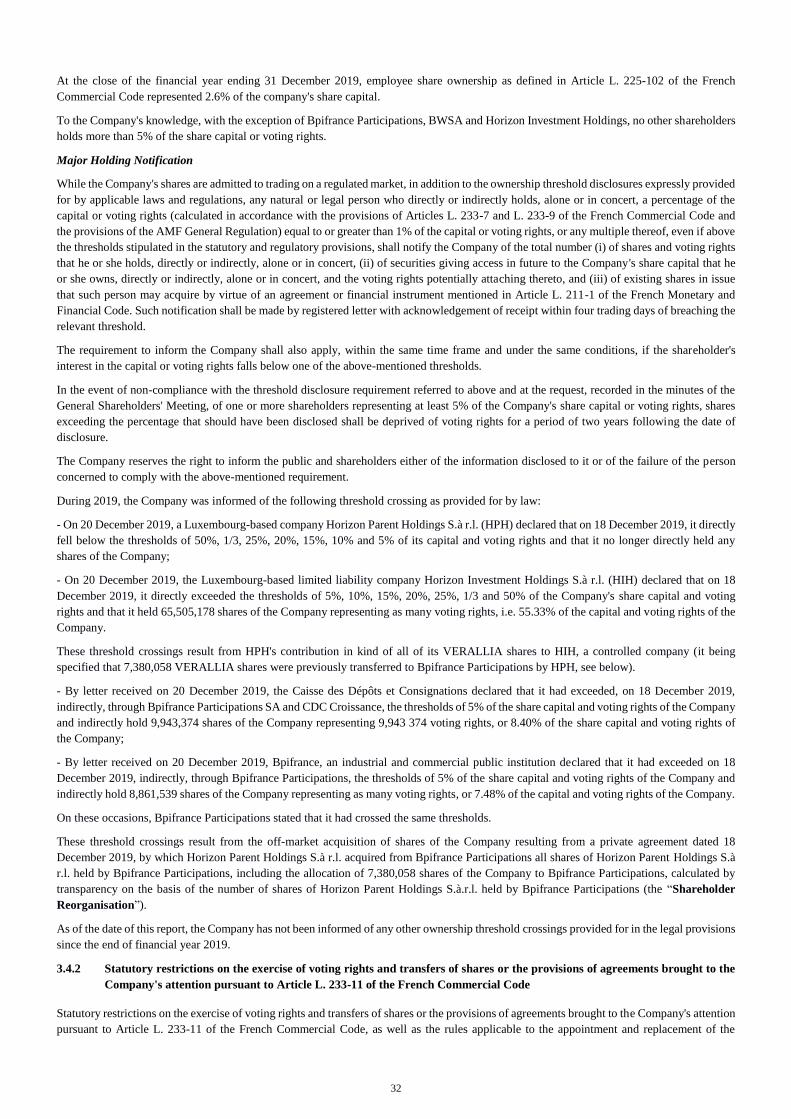
32
At the close of the financial year ending 31 December 2019, employee share ownership as defined in Article L. 225-102 of the French
Commercial Code represented 2.6% of the company's share capital.
To the Company's knowledge, with the exception of Bpifrance Participations, BWSA and Horizon Investment Holdings, no other shareholders
holds more than 5% of the share capital or voting rights.
Major Holding Notification
While the Company's shares are admitted to trading on a regulated market, in addition to the ownership threshold disclosures expressly provided
for by applicable laws and regulations, any natural or legal person who directly or indirectly holds, alone or in concert, a percentage of the
capital or voting rights (calculated in accordance with the provisions of Articles L. 233-7 and L. 233-9 of the French Commercial Code and
the provisions of the AMF General Regulation) equal to or greater than 1% of the capital or voting rights, or any multiple thereof, even if above
the thresholds stipulated in the statutory and regulatory provisions, shall notify the Company of the total number (i) of shares and voting rights
that he or she holds, directly or indirectly, alone or in concert, (ii) of securities giving access in future to the Company's share capital that he
or she owns, directly or indirectly, alone or in concert, and the voting rights potentially attaching thereto, and (iii) of existing shares in issue
that such person may acquire by virtue of an agreement or financial instrument mentioned in Article L. 211-1 of the French Monetary and
Financial Code. Such notification shall be made by registered letter with acknowledgement of receipt within four trading days of breaching the
relevant threshold.
The requirement to inform the Company shall also apply, within the same time frame and under the same conditions, if the shareholder's
interest in the capital or voting rights falls below one of the above-mentioned thresholds.
In the event of non-compliance with the threshold disclosure requirement referred to above and at the request, recorded in the minutes of the
General Shareholders' Meeting, of one or more shareholders representing at least 5% of the Company's share capital or voting rights, shares
exceeding the percentage that should have been disclosed shall be deprived of voting rights for a period of two years following the date of
disclosure.
The Company reserves the right to inform the public and shareholders either of the information disclosed to it or of the failure of the person
concerned to comply with the above-mentioned requirement.
During 2019, the Company was informed of the following threshold crossing as provided for by law:
- On 20 December 2019, a Luxembourg-based company Horizon Parent Holdings S.à r.l. (HPH) declared that on 18 December 2019, it directly
fell below the thresholds of 50%, 1/3, 25%, 20%, 15%, 10% and 5% of its capital and voting rights and that it no longer directly held any
shares of the Company;
- On 20 December 2019, the Luxembourg-based limited liability company Horizon Investment Holdings S.à r.l. (HIH) declared that on 18
December 2019, it directly exceeded the thresholds of 5%, 10%, 15%, 20%, 25%, 1/3 and 50% of the Company's share capital and voting
rights and that it held 65,505,178 shares of the Company representing as many voting rights, i.e. 55.33% of the capital and voting rights of the
Company.
These threshold crossings result from HPH's contribution in kind of all of its VERALLIA shares to HIH, a controlled company (it being
specified that 7,380,058 VERALLIA shares were previously transferred to Bpifrance Participations by HPH, see below).
- By letter received on 20 December 2019, the Caisse des Dépôts et Consignations declared that it had exceeded, on 18 December 2019,
indirectly, through Bpifrance Participations SA and CDC Croissance, the thresholds of 5% of the share capital and voting rights of the Company
and indirectly hold 9,943,374 shares of the Company representing 9,943 374 voting rights, or 8.40% of the share capital and voting rights of
the Company;
- By letter received on 20 December 2019, Bpifrance, an industrial and commercial public institution declared that it had exceeded on 18
December 2019, indirectly, through Bpifrance Participations, the thresholds of 5% of the share capital and voting rights of the Company and
indirectly hold 8,861,539 shares of the Company representing as many voting rights, or 7.48% of the capital and voting rights of the Company.
On these occasions, Bpifrance Participations stated that it had crossed the same thresholds.
These threshold crossings result from the off-market acquisition of shares of the Company resulting from a private agreement dated 18
December 2019, by which Horizon Parent Holdings S.à r.l. acquired from Bpifrance Participations all shares of Horizon Parent Holdings S.à
r.l. held by Bpifrance Participations, including the allocation of 7,380,058 shares of the Company to Bpifrance Participations, calculated by
transparency on the basis of the number of shares of Horizon Parent Holdings S.à.r.l. held by Bpifrance Participations (the “Shareholder
Reorganisation”).
As of the date of this report, the Company has not been informed of any other ownership threshold crossings provided for in the legal provisions
since the end of financial year 2019.
3.4.2 Statutory restrictions on the exercise of voting rights and transfers of shares or the provisions of agreements brought to the
Company's attention pursuant to Article L. 233-11 of the French Commercial Code
Statutory restrictions on the exercise of voting rights and transfers of shares or the provisions of agreements brought to the Company's attention
pursuant to Article L. 233-11 of the French Commercial Code, as well as the rules applicable to the appointment and replacement of the
33
members of the Board of Directors and the agreements between shareholders of which the Company is aware and which may result in
restrictions on the transfer of shares and the exercise of voting rights are described in sections 16.2 “Statement relating to control of the
Company”, 19.2.3 “Rights, privileges and restrictions attached to shares” and 19.2.7 “Ownership threshold disclosures and identification of
shareholders” of the Universal Registration Document. The powers of the Board of Directors in particular the issuance or buyback of shares
and agreements entered into by the Company that are amended or terminated in the event of a change in control of the Company are described
in sections 16.2 and 19.2.6 respectively of the Universal Registration Document.
3.4.3 Direct or indirect interests in the capital of the Company of which it is aware under Articles L. 233-7 and L. 233-12 of the
French Commercial Code
The direct or indirect interests in the share capital of the Company of which it is aware of under Articles L. 233-7 and L. 233-12 of the French
Commercial Code are described in the stock ownership table above (see paragraph 3.4.1 “Capital Structure” of this report).
3.4.4 List of holders of any security with special control rights and the description of those rights and control mechanisms provided
for in a potential employee ownership system, when the control rights are not exercised by the latter
There are no holders of securities with special control rights or control mechanisms provided for in any employee ownership system, when the
supervisory rights are not exercised by the latter.
3.4.5 Agreements between shareholders of which the Company is aware and which may result in restrictions on the transfer of
shares and the exercise of voting rights
On the occasion of the Company's initial public offering, Bpifrance Participations and AIF VIII Euro Leverage, L.P., an investment fund
managed by an affiliate of Apollo Global Management, Inc., entered into a a shareholders' agreement on 8 October 2019 relating to their equity
interest in the share capital of Horizon Parent Holdings S.à.r.l. As part of the shareholder reorganisation, this agreement was terminated on 18
December 2019 and a new shareholders’ agreement was concluded between Bpifrance Participations and Horizon Investment Holdings S.à.r.l.
A clause in the new shareholders' agreement provides, inter alia, that as long as Bpifrance Participations and its affiliates hold a stake
representing at least 5% of the company's share capital, Bpifrance Participations may propose the appointment of a director to the Company'
Board of Directors, who will also be a member of the Company's Sustainable Development Committee. Horizon Investment Holdings S.à.r.l.
undertakes to vote in favour of the above-mentioned appointment at the relevant General Meeting of the Company and to instruct its
representatives on the Board of Directors of the Company to propose and vote in favour of the above-mentioned appointment to the Board of
Directors of the Company (whether by convening a General Shareholders’ Meeting of the Company on this agenda or through the co-optation
process of the Board of Directors).
3.4.6 Powers of the Board of Directors in respect of capital increase and share buyback
Information on the powers of the Board of Directors with respect to capital increases is detailed in Section 3.3 “Delegations and current
authorisations granted by the General Shareholders' Meeting with respect to capital increases” of this report.
Share buyback programme
The General Shareholders' Meeting of 20 September 2019 authorised, for a period of 18 months from the date of the meeting, the Board of
Directors with the right to delegation as permitted by law, in accordance with the provisions of Articles L. 225-209 et seq. of the French
Commercial Code, to purchase, on one or more instalments and at such times as it shall determine, a number of shares of the Company not
exceeding 10% of the total number of shares constituting the share capital at any given time, or 5% of the total number of shares constituting
the share capital if they are shares acquired by the Company with a view to their retention and subsequent delivery in payment or exchange as
part of a merger, demerger or contribution. However, under no circumstances may the number of shares held by the Company result in the
Company holding at any time more than 10% of the shares constituting its share capital.
The Board of Directors may decide to acquire shares in order:
to ensure the liquidity and stimulate the market for the Company's securities through an investment service provider acting independently
under a liquidity contract in accordance with the market practice accepted by the French Financial Markets Authority, on 2 July 2018;
to allocate shares to members of staff of the Company and other Group entities, and particularly in the context of (i) profit-sharing, (ii) any
Company stock option plan under the provisions of Articles L. 225-177 et seq. of the French Commercial Code, or (iii) any savings plan
in accordance with Articles L. 3331-1 et seq. of the French Labour Code or (iv) any grant of free shares under the provisions of Articles L.
225-197-1 et seq. of the French Commercial Code, and to carry out any hedging in relation to such transactions, under the conditions laid
down by the market authorities and at such times as the Board of Directors or the person acting on behalf of the Board of Directors may
determine;
to deliver the Company's shares when exercising rights attached to transferable securities conferring entitlement by way of redemption,
conversion, exchange, presentation of a warrant or any other means to the allotment of the Company's shares under applicable regulations,
and to carry out any hedging in relation to such transactions, under the conditions laid down by the market authorities and at such times as
the Board of Directors or the person acting on behalf of the Board of Directors may determine;
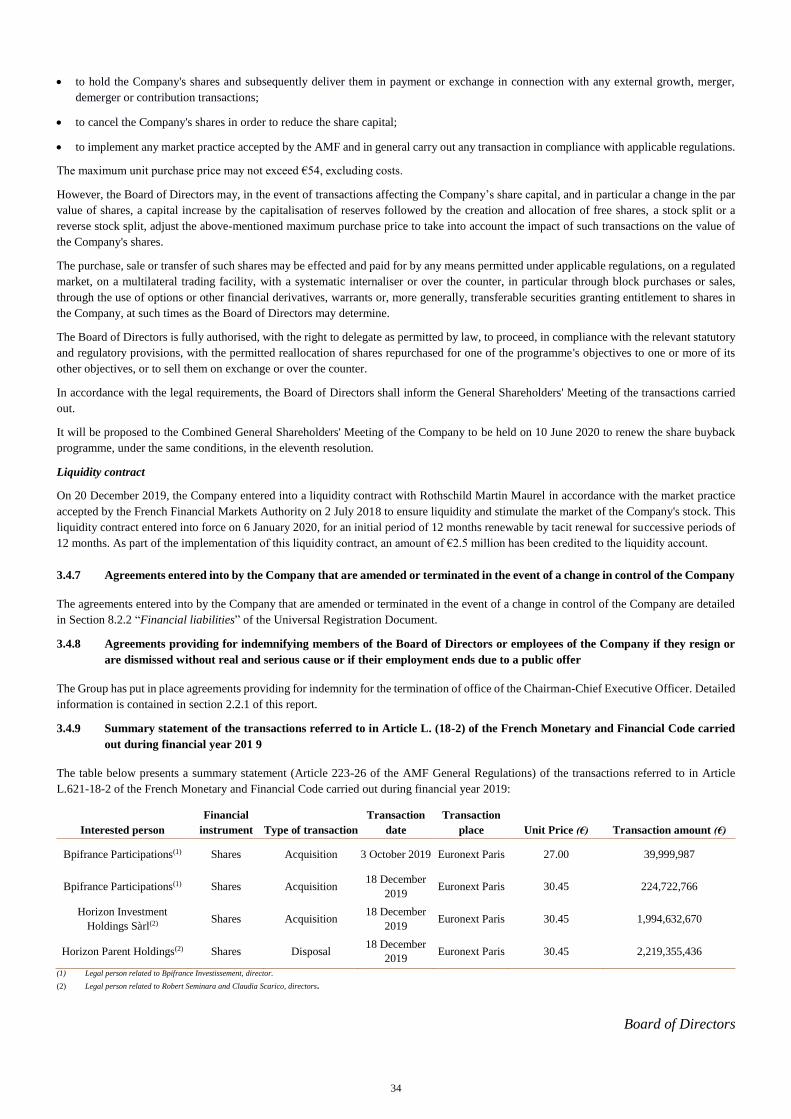
34
to hold the Company's shares and subsequently deliver them in payment or exchange in connection with any external growth, merger,
demerger or contribution transactions;
to cancel the Company's shares in order to reduce the share capital;
to implement any market practice accepted by the AMF and in general carry out any transaction in compliance with applicable regulations.
The maximum unit purchase price may not exceed €54, excluding costs.
However, the Board of Directors may, in the event of transactions affecting the Company’s share capital, and in particular a change in the par
value of shares, a capital increase by the capitalisation of reserves followed by the creation and allocation of free shares, a stock split or a
reverse stock split, adjust the above-mentioned maximum purchase price to take into account the impact of such transactions on the value of
the Company's shares.
The purchase, sale or transfer of such shares may be effected and paid for by any means permitted under applicable regulations, on a regulated
market, on a multilateral trading facility, with a systematic internaliser or over the counter, in particular through block purchases or sales,
through the use of options or other financial derivatives, warrants or, more generally, transferable securities granting entitlement to shares in
the Company, at such times as the Board of Directors may determine.
The Board of Directors is fully authorised, with the right to delegate as permitted by law, to proceed, in compliance with the relevant statutory
and regulatory provisions, with the permitted reallocation of shares repurchased for one of the programme's objectives to one or more of its
other objectives, or to sell them on exchange or over the counter.
In accordance with the legal requirements, the Board of Directors shall inform the General Shareholders' Meeting of the transactions carried
out.
It will be proposed to the Combined General Shareholders' Meeting of the Company to be held on 10 June 2020 to renew the share buyback
programme, under the same conditions, in the eleventh resolution.
Liquidity contract
On 20 December 2019, the Company entered into a liquidity contract with Rothschild Martin Maurel in accordance with the market practice
accepted by the French Financial Markets Authority on 2 July 2018 to ensure liquidity and stimulate the market of the Company's stock. This
liquidity contract entered into force on 6 January 2020, for an initial period of 12 months renewable by tacit renewal for successive periods of
12 months. As part of the implementation of this liquidity contract, an amount of €2.5 million has been credited to the liquidity account.
3.4.7 Agreements entered into by the Company that are amended or terminated in the event of a change in control of the Company
The agreements entered into by the Company that are amended or terminated in the event of a change in control of the Company are detailed
in Section 8.2.2 “Financial liabilities” of the Universal Registration Document.
3.4.8 Agreements providing for indemnifying members of the Board of Directors or employees of the Company if they resign or
are dismissed without real and serious cause or if their employment ends due to a public offer
The Group has put in place agreements providing for indemnity for the termination of office of the Chairman-Chief Executive Officer. Detailed
information is contained in section 2.2.1 of this report.
3.4.9 Summary statement of the transactions referred to in Article L. (18-2) of the French Monetary and Financial Code carried
out during financial year 201 9
The table below presents a summary statement (Article 223-26 of the AMF General Regulations) of the transactions referred to in Article
L.621-18-2 of the French Monetary and Financial Code carried out during financial year 2019:
Interested person
Financial
instrument Type of transaction
Transaction
date
Transaction
place Unit Price (€) Transaction amount (€)
Bpifrance Participations(1) Shares Acquisition 3 October 2019 Euronext Paris 27.00 39,999,987
Bpifrance Participations(1) Shares Acquisition 18 December
2019 Euronext Paris 30.45 224,722,766
Horizon Investment
Holdings Sàrl(2) Shares Acquisition 18 December
2019 Euronext Paris 30.45 1,994,632,670
Horizon Parent Holdings(2) Shares Disposal 18 December
2019 Euronext Paris 30.45 2,219,355,436
(1) Legal person related to Bpifrance Investissement, director.
(2) Legal person related to Robert Seminara and Claudia Scarico, directors.
Board of Directors

ANNEX II
Extra-financial performance statement 2019
Statement of Extra-Financial Performance
2019
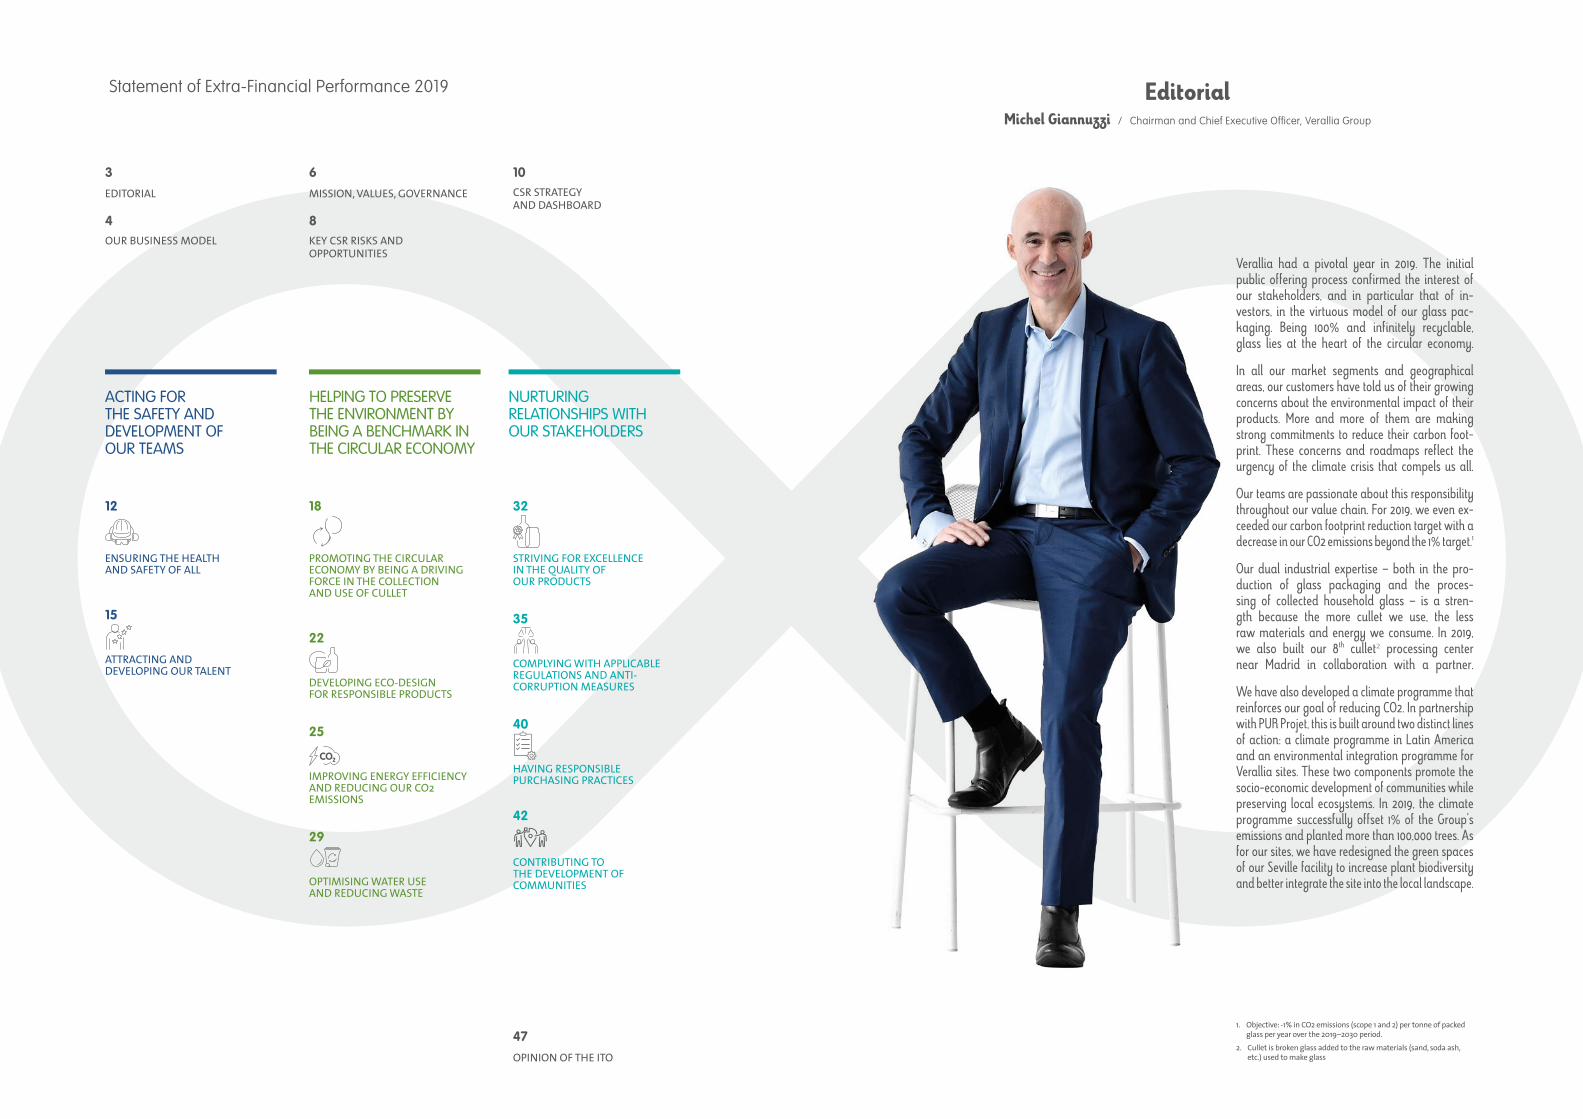
Verallia had a pivotal year in 2019. The initial public offering process confirmed the interest of our stakeholders, and in particular that of in-vestors, in the virtuous model of our glass pac-kaging. Being 100% and infinitely recyclable, glass lies at the heart of the circular economy.
In all our market segments and geographical areas, our customers have told us of their growing concerns about the environmental impact of their products. More and more of them are making strong commitments to reduce their carbon foot-print. These concerns and roadmaps reflect the urgency of the climate crisis that compels us all.
Our teams are passionate about this responsibility throughout our value chain. For 2019, we even ex-ceeded our carbon footprint reduction target with a decrease in our CO2 emissions beyond the 1% target.1
Our dual industrial expertise – both in the pro-duction of glass packaging and the proces-sing of collected household glass – is a stren-gth because the more cullet we use, the less raw materials and energy we consume. In 2019, we also built our 8th cullet2 processing center near Madrid in collaboration with a partner.
We have also developed a climate programme that reinforces our goal of reducing CO2. In partnership with PUR Projet, this is built around two distinct lines of action: a climate programme in Latin America and an environmental integration programme for Verallia sites. These two components promote the socio-economic development of communities while preserving local ecosystems. In 2019, the climate programme successfully offset 1% of the Group's emissions and planted more than 100,000 trees. As for our sites, we have redesigned the green spaces of our Seville facility to increase plant biodiversity and better integrate the site into the local landscape.
1. Objective: -1% in CO2 emissions (scope 1 and 2) per tonne of packed glass per year over the 2019–2030 period.
2. Cullet is broken glass added to the raw materials (sand, soda ash, etc.) used to make glass
EditorialMichel Giannuzzi / Chairman and Chief Executive Officer, Verallia Group
Statement of Extra-Financial Performance 2019
ACTING FOR THE SAFETY AND DEVELOPMENT OF OUR TEAMS
NURTURING RELATIONSHIPS WITH OUR STAKEHOLDERS
HELPING TO PRESERVE THE ENVIRONMENT BY BEING A BENCHMARK IN THE CIRCULAR ECONOMY
3EDITORIAL
4OUR BUSINESS MODEL
6MISSION, VALUES, GOVERNANCE
8KEY CSR RISKS AND OPPORTUNITIES
10CSR STRATEGY AND DASHBOARD
47OPINION OF THE ITO
12
ENSURING THE HEALTH AND SAFETY OF ALL
15
ATTRACTING AND DEVELOPING OUR TALENT
18
PROMOTING THE CIRCULAR ECONOMY BY BEING A DRIVING FORCE IN THE COLLECTION AND USE OF CULLET
22
DEVELOPING ECO-DESIGN FOR RESPONSIBLE PRODUCTS
25
IMPROVING ENERGY EFFICIENCY AND REDUCING OUR CO2 EMISSIONS
29
OPTIMISING WATER USE AND REDUCING WASTE
32
STRIVING FOR EXCELLENCE IN THE QUALITY OF OUR PRODUCTS
35
COMPLYING WITH APPLICABLE REGULATIONS AND ANTI-CORRUPTION MEASURES
40
HAVING RESPONSIBLE PURCHASING PRACTICES
42
CONTRIBUTING TO THE DEVELOPMENT OF COMMUNITIES
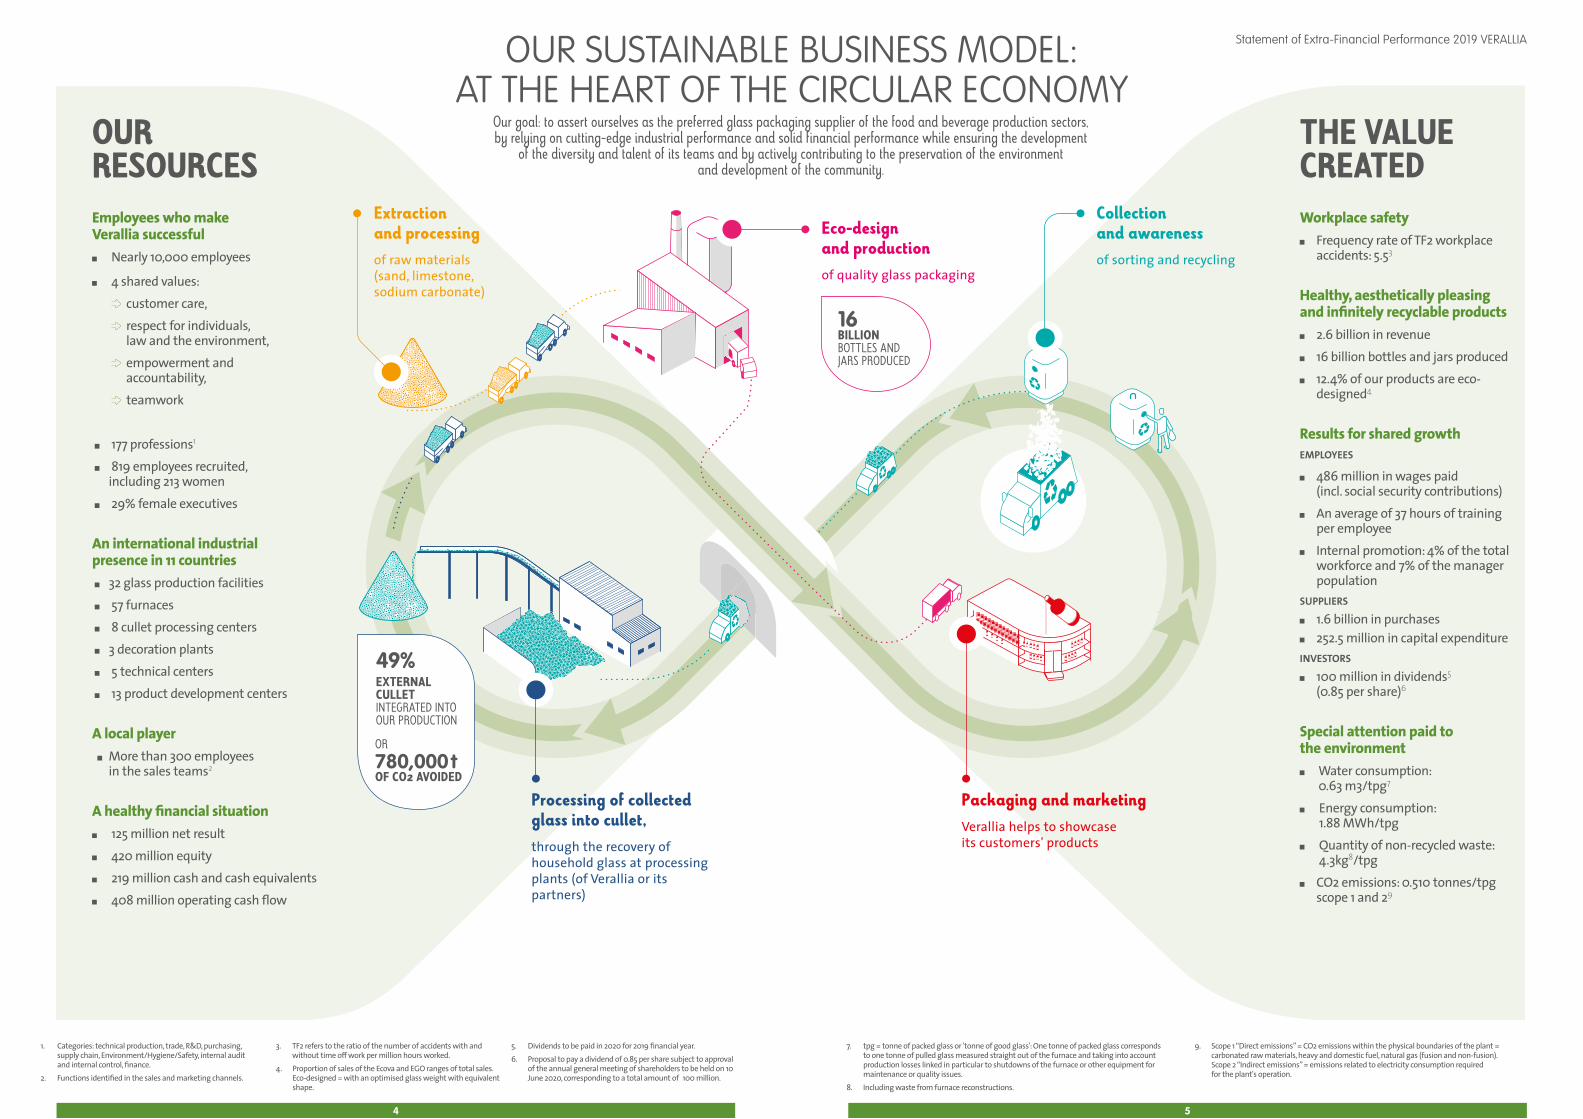
Statement of Extra-Financial Performance 2019 VERALLIA
OUR RESOURCESEmployees who make Verallia successful Nearly 10,000 employees
4 shared values: customer care, respect for individuals, law and the environment,
empowerment and accountability,
teamwork
177 professions1
819 employees recruited, including 213 women
29% female executives
An international industrial presence in 11 countries 32 glass production facilities 57 furnaces 8 cullet processing centers 3 decoration plants 5 technical centers 13 product development centers
A local player More than 300 employees
in the sales teams2
A healthy financial situation 125 million net result 420 million equity 219 million cash and cash equivalents 408 million operating cash flow
THE VALUE CREATEDWorkplace safety Frequency rate of TF2 workplace
accidents: 5.53
Healthy, aesthetically pleasing and infinitely recyclable products 2.6 billion in revenue 16 billion bottles and jars produced 12.4% of our products are eco-
designed4
Results for shared growthEMPLOYEES
486 million in wages paid (incl. social security contributions)
An average of 37 hours of training per employee
Internal promotion: 4% of the total workforce and 7% of the manager population
SUPPLIERS
1.6 billion in purchases 252.5 million in capital expenditureINVESTORS
100 million in dividends5 (0.85 per share)6
Special attention paid to the environment Water consumption:
0.63 m3/tpg7
Energy consumption: 1.88 MWh/tpg
Quantity of non-recycled waste: 4.3kg8/tpg
CO2 emissions: 0.510 tonnes/tpg scope 1 and 29
Extraction and processing of raw materials (sand, limestone, sodium carbonate)
Collection and awareness of sorting and recycling
Processing of collected glass into cullet, through the recovery of household glass at processing plants (of Verallia or its partners)
49%EXTERNAL CULLET INTEGRATED INTO OUR PRODUCTION
Packaging and marketingVerallia helps to showcase its customers' products
OUR SUSTAINABLE BUSINESS MODEL: AT THE HEART OF THE CIRCULAR ECONOMY
16 BILLIONBOTTLES AND JARS PRODUCED
Eco-design and production of quality glass packaging
1. Categories: technical production, trade, R&D, purchasing, supply chain, Environment/Hygiene/Safety, internal audit and internal control, finance.
2. Functions identified in the sales and marketing channels.
3. TF2 refers to the ratio of the number of accidents with and without time off work per million hours worked.
4. Proportion of sales of the Ecova and EGO ranges of total sales. Eco-designed = with an optimised glass weight with equivalent shape.
5. Dividends to be paid in 2020 for 2019 financial year.6. Proposal to pay a dividend of 0.85 per share subject to approval
of the annual general meeting of shareholders to be held on 10 June 2020, corresponding to a total amount of€100 million.
7. tpg = tonne of packed glass or 'tonne of good glass': One tonne of packed glass corresponds to one tonne of pulled glass measured straight out of the furnace and taking into account production losses linked in particular to shutdowns of the furnace or other equipment for maintenance or quality issues.
8. Including waste from furnace reconstructions.
9. Scope 1 “Direct emissions” = CO2 emissions within the physical boundaries of the plant = carbonated raw materials, heavy and domestic fuel, natural gas (fusion and non-fusion). Scope 2 “Indirect emissions” = emissions related to electricity consumption required for the plant's operation.
Our goal: to assert ourselves as the preferred glass packaging supplier of the food and beverage production sectors, by relying on cutting-edge industrial performance and solid financial performance while ensuring the development
of the diversity and talent of its teams and by actively contributing to the preservation of the environment and development of the community.
OR 780,000 t OF CO2 AVOIDED
54

Statement of Extra-Financial Performance 2019 VERALLIA
CERTIFICATION
In 2019, the Group's achievements in terms of sustai-nable development were assessed on the EcoVadis1 platform as being “Gold Medal” standard with a score of 62/100.
Teamwork
Empowerment and accountability
Care for customers
Respect for people, laws and the environment
Every day, Verallia enables people to enjoy beverages and food with healthy, attractive and sustainable glass packa-ging. This mission is consistent with the four values of Ve-rallia. In line with these values, the Group's commitment in terms of social responsibility is based on three pillars:
• Acting for the safety and development of our teams
• Helping to preserve the environment by being a benchmark in the circular economy
• Nurturing relationships with our stakeholders
As a member of the United Nations Global Compact, the Group has decided to focus particularly on the following five Sustainable Development Goals (SDGs).
THE MISSION OF VERALLIA
OUR 4 VALUES
General Secretary
THE EXECUTIVE COMMITTEE
is under the responsibility of the Chairman and Chief Executive Officer
Chief Legal Officer
Chief Financial Officer
Segment Managers
Chief Industrial Officer
BOARD OF DIRECTORS
SUSTAINABLE DEVELOPMENT COMMITTEE
Work in coordination
whose policy is validated and monitored by
CSR MANAGER
NETWORK OF CSR correspondents in each country
Its main mission is to ensure that the social and environmental responsibility issues are taken into account in the Group's strategy
and that the objectives set in this area are robust and in line with the company's overall strategy.
CSR GOVERNANCE
1. ECOVADIS is a platform for rating the social and environmental performance of global supply chains.
76
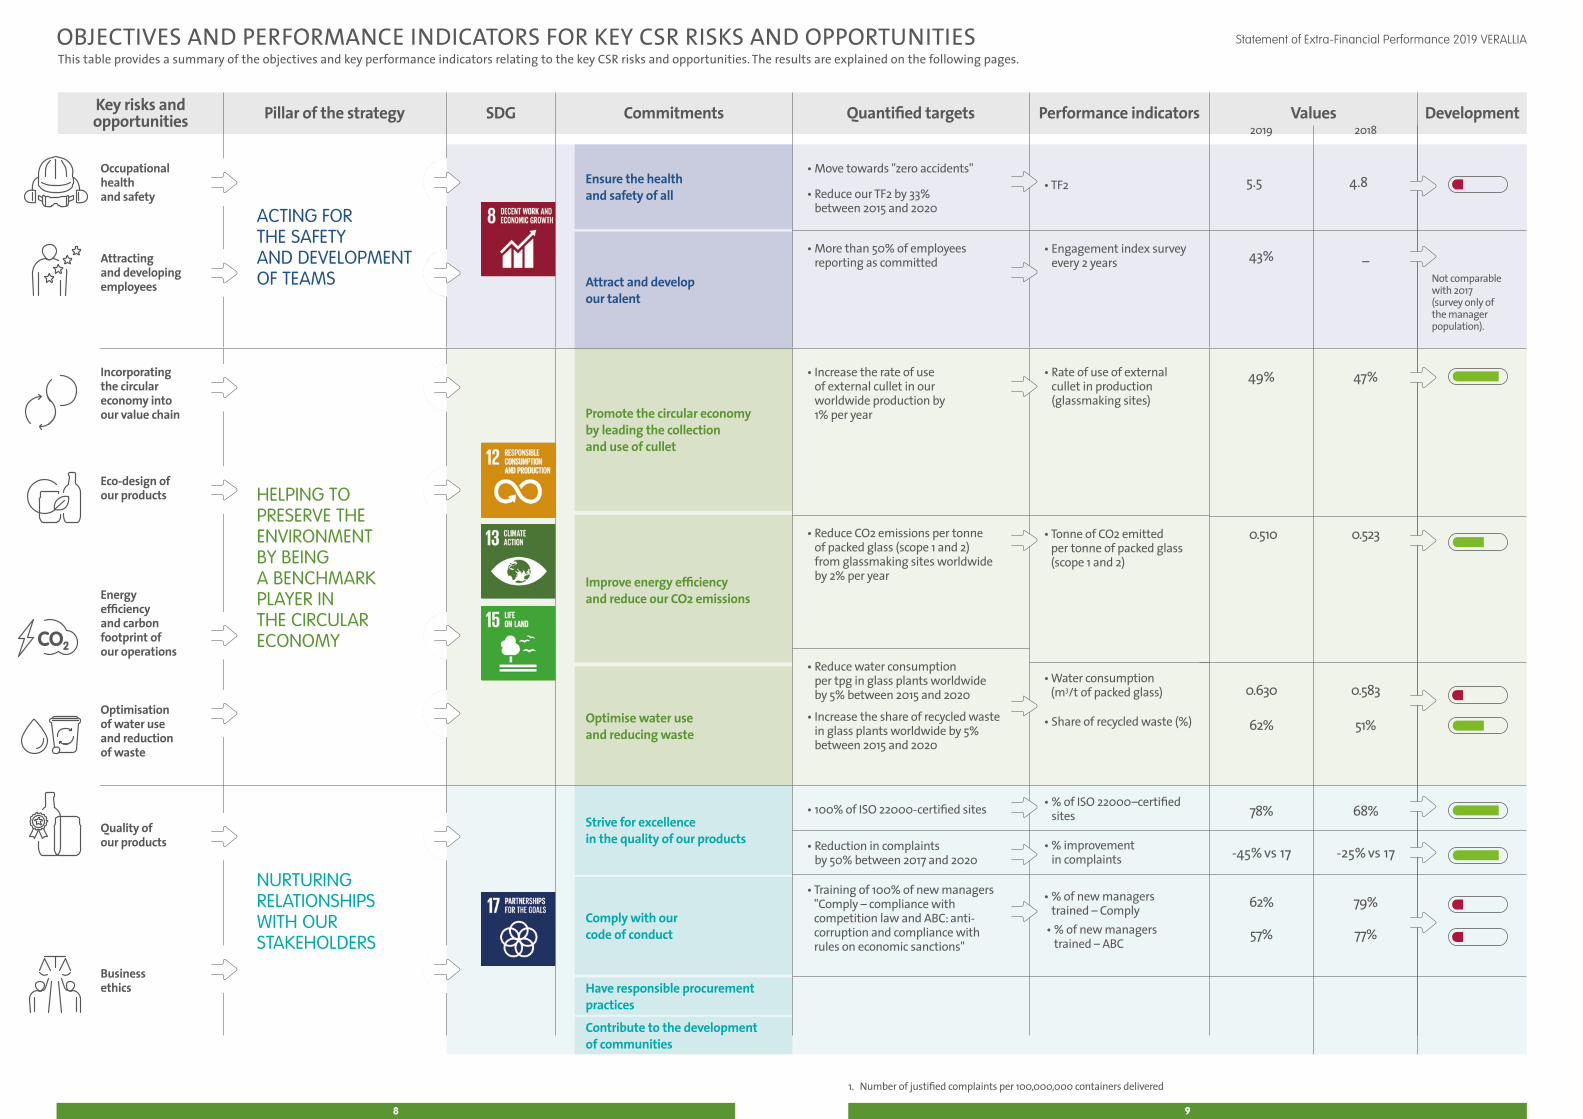
Statement of Extra-Financial Performance 2019 VERALLIA
This table provides a summary of the objectives and key performance indicators relating to the key CSR risks and opportunities. The results are explained on the following pages.OBJECTIVES AND PERFORMANCE INDICATORS FOR KEY CSR RISKS AND OPPORTUNITIES
2019 2018
5.5 4.8Ensure the health and safety of all
Attract and develop our talent
Promote the circular economy by leading the collection and use of cullet
Improve energy efficiency and reduce our CO2 emissions
Optimise water use and reducing waste
Strive for excellence in the quality of our products
Comply with our code of conduct
Have responsible procurement practices
Contribute to the development of communities
Key risks and opportunities Pillar of the strategy SDG Commitments Quantified targets Performance indicators Values Development
Occupational health and safety
Attracting and developing employees
ACTING FOR THE SAFETY AND DEVELOPMENT OF TEAMS
• Move towards "zero accidents"
• Reduce our TF2 by 33% between 2015 and 2020
• More than 50% of employees reporting as committed
• TF2
• Engagement index survey every 2 years
Incorporating the circular economy into our value chain
Eco-design of our products
Energy efficiency and carbon footprint of our operations
Optimisation of water use and reduction of waste
HELPING TO PRESERVE THE ENVIRONMENT BY BEING A BENCHMARK PLAYER IN THE CIRCULAR ECONOMY
• Increase the rate of use of external cullet in our worldwide production by 1% per year
• Reduce CO2 emissions per tonne of packed glass (scope 1 and 2) from glassmaking sites worldwide by 2% per year
• Reduce water consumption per tpg in glass plants worldwide by 5% between 2015 and 2020
• Increase the share of recycled waste in glass plants worldwide by 5% between 2015 and 2020
• Rate of use of external cullet in production (glassmaking sites)
• Tonne of CO2 emitted per tonne of packed glass (scope 1 and 2)
• Water consumption (m3/t of packed glass)
• Share of recycled waste (%)
Quality of our products
Business ethics
NURTURING RELATIONSHIPS WITH OUR STAKEHOLDERS
• 100% of ISO 22000-certified sites
• Reduction in complaints by 50% between 2017 and 2020
• Training of 100% of new managers "Comply – compliance with competition law and ABC: anti-corruption and compliance with rules on economic sanctions"
• % of ISO 22000–certified sites
• % improvement in complaints
• % of new managers trained – Comply
• % of new managers trained – ABC
43%
49%
0.630
62%
78%
62%
57%
79%
77%
-45% vs 17
47%
0.583
51%
0.5230.510
68%
-25% vs 17
–Not comparable with 2017 (survey only of the manager population).
1. Number of justified complaints per 100,000,000 containers delivered
98
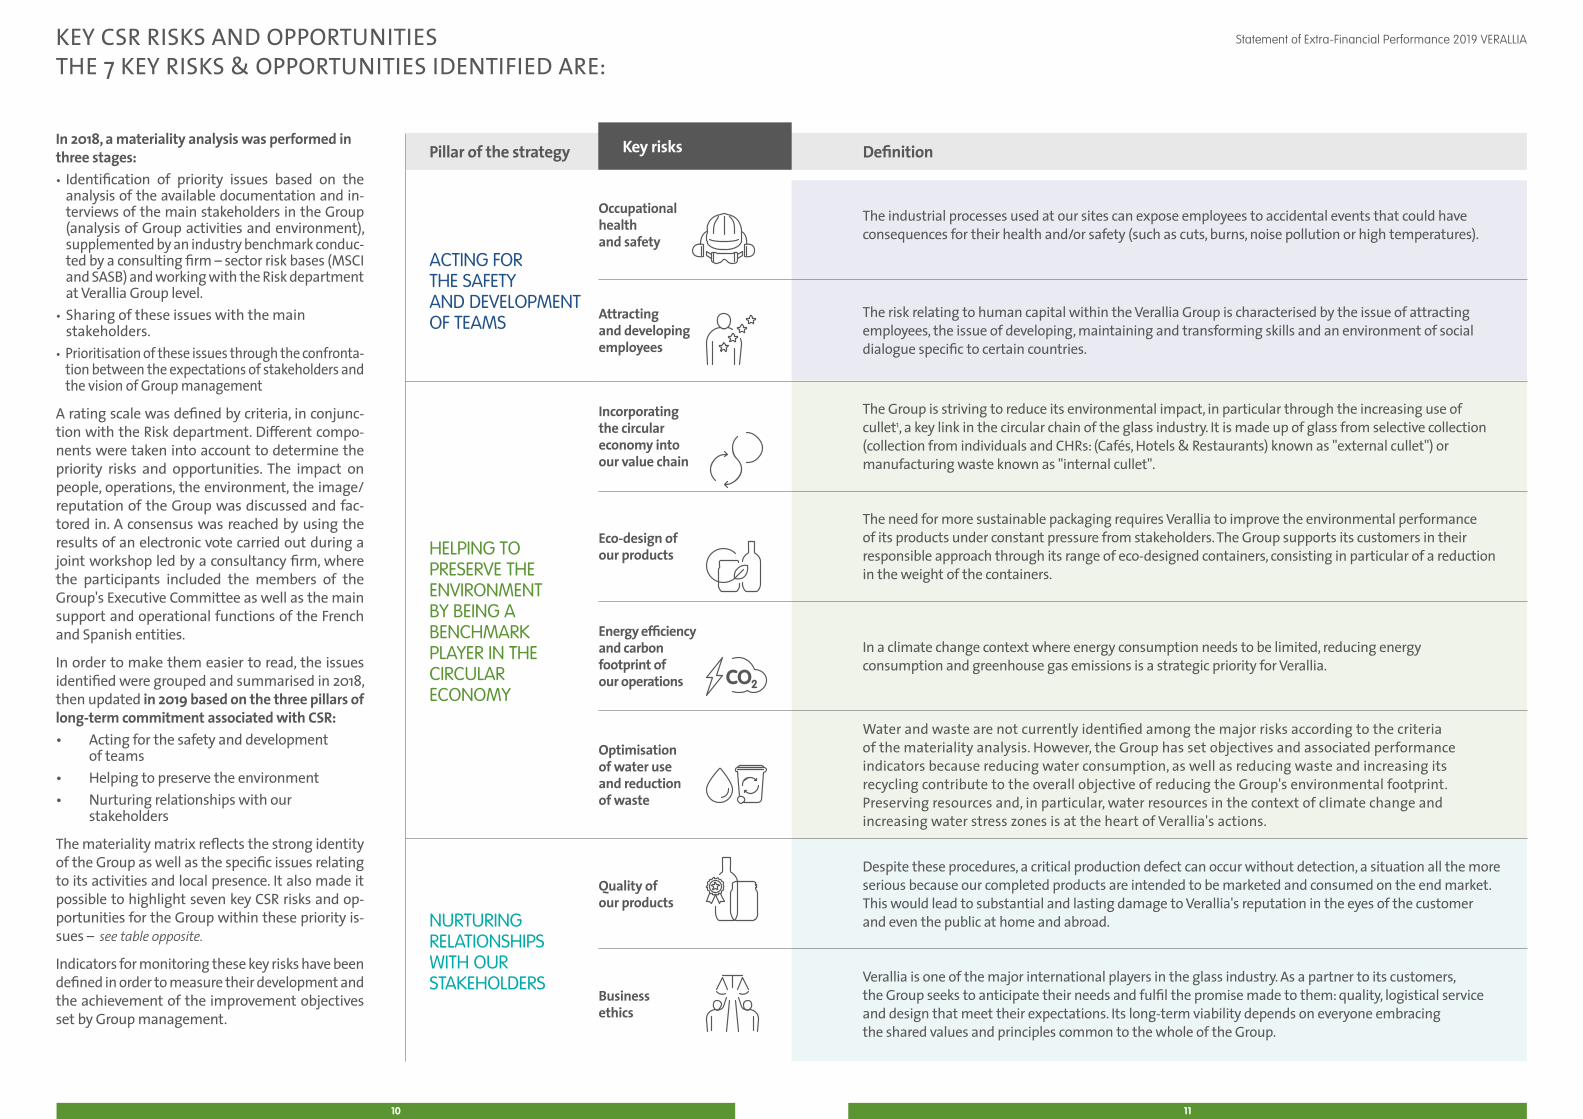
Statement of Extra-Financial Performance 2019 VERALLIA
ACTING FOR THE SAFETY AND DEVELOPMENT OF TEAMS
NURTURING RELATIONSHIPS WITH OUR STAKEHOLDERS
HELPING TO PRESERVE THE ENVIRONMENT BY BEING A BENCHMARK PLAYER IN THE CIRCULAR ECONOMY
Pillar of the strategy Key risks Definition
Occupational health and safety
The industrial processes used at our sites can expose employees to accidental events that could have consequences for their health and/or safety (such as cuts, burns, noise pollution or high temperatures).
Attracting and developing employees
The risk relating to human capital within the Verallia Group is characterised by the issue of attracting employees, the issue of developing, maintaining and transforming skills and an environment of social dialogue specific to certain countries.
Incorporating the circular economy into our value chain
The Group is striving to reduce its environmental impact, in particular through the increasing use of cullet1, a key link in the circular chain of the glass industry. It is made up of glass from selective collection (collection from individuals and CHRs: (Cafés, Hotels & Restaurants) known as "external cullet") or manufacturing waste known as "internal cullet".
Eco-design of our products
The need for more sustainable packaging requires Verallia to improve the environmental performance of its products under constant pressure from stakeholders. The Group supports its customers in their responsible approach through its range of eco-designed containers, consisting in particular of a reduction in the weight of the containers.
Energy efficiency and carbon footprint of our operations
In a climate change context where energy consumption needs to be limited, reducing energy consumption and greenhouse gas emissions is a strategic priority for Verallia.
Optimisation of water use and reduction of waste
Water and waste are not currently identified among the major risks according to the criteria of the materiality analysis. However, the Group has set objectives and associated performance indicators because reducing water consumption, as well as reducing waste and increasing its recycling contribute to the overall objective of reducing the Group's environmental footprint. Preserving resources and, in particular, water resources in the context of climate change and increasing water stress zones is at the heart of Verallia's actions.
Quality of our products
Despite these procedures, a critical production defect can occur without detection, a situation all the more serious because our completed products are intended to be marketed and consumed on the end market. This would lead to substantial and lasting damage to Verallia's reputation in the eyes of the customer and even the public at home and abroad.
Business ethics
Verallia is one of the major international players in the glass industry. As a partner to its customers, the Group seeks to anticipate their needs and fulfil the promise made to them: quality, logistical service and design that meet their expectations. Its long-term viability depends on everyone embracing the shared values and principles common to the whole of the Group.
In 2018, a materiality analysis was performed in three stages:• Identification of priority issues based on the
analysis of the available documentation and in-terviews of the main stakeholders in the Group (analysis of Group activities and environment), supplemented by an industry benchmark conduc-ted by a consulting firm – sector risk bases (MSCI and SASB) and working with the Risk department at Verallia Group level.
• Sharing of these issues with the main stakeholders.
• Prioritisation of these issues through the confronta-tion between the expectations of stakeholders and the vision of Group management
A rating scale was defined by criteria, in conjunc-tion with the Risk department. Different compo-nents were taken into account to determine the priority risks and opportunities. The impact on people, operations, the environment, the image/reputation of the Group was discussed and fac-tored in. A consensus was reached by using the results of an electronic vote carried out during a joint workshop led by a consultancy firm, where the participants included the members of the Group's Executive Committee as well as the main support and operational functions of the French and Spanish entities.
In order to make them easier to read, the issues identified were grouped and summarised in 2018, then updated in 2019 based on the three pillars of long-term commitment associated with CSR:• Acting for the safety and development
of teams• Helping to preserve the environment• Nurturing relationships with our
stakeholders
The materiality matrix reflects the strong identity of the Group as well as the specific issues relating to its activities and local presence. It also made it possible to highlight seven key CSR risks and op-portunities for the Group within these priority is-sues – see table opposite.
Indicators for monitoring these key risks have been defined in order to measure their development and the achievement of the improvement objectives set by Group management.
KEY CSR RISKS AND OPPORTUNITIES THE 7 KEY RISKS & OPPORTUNITIES IDENTIFIED ARE:
1110
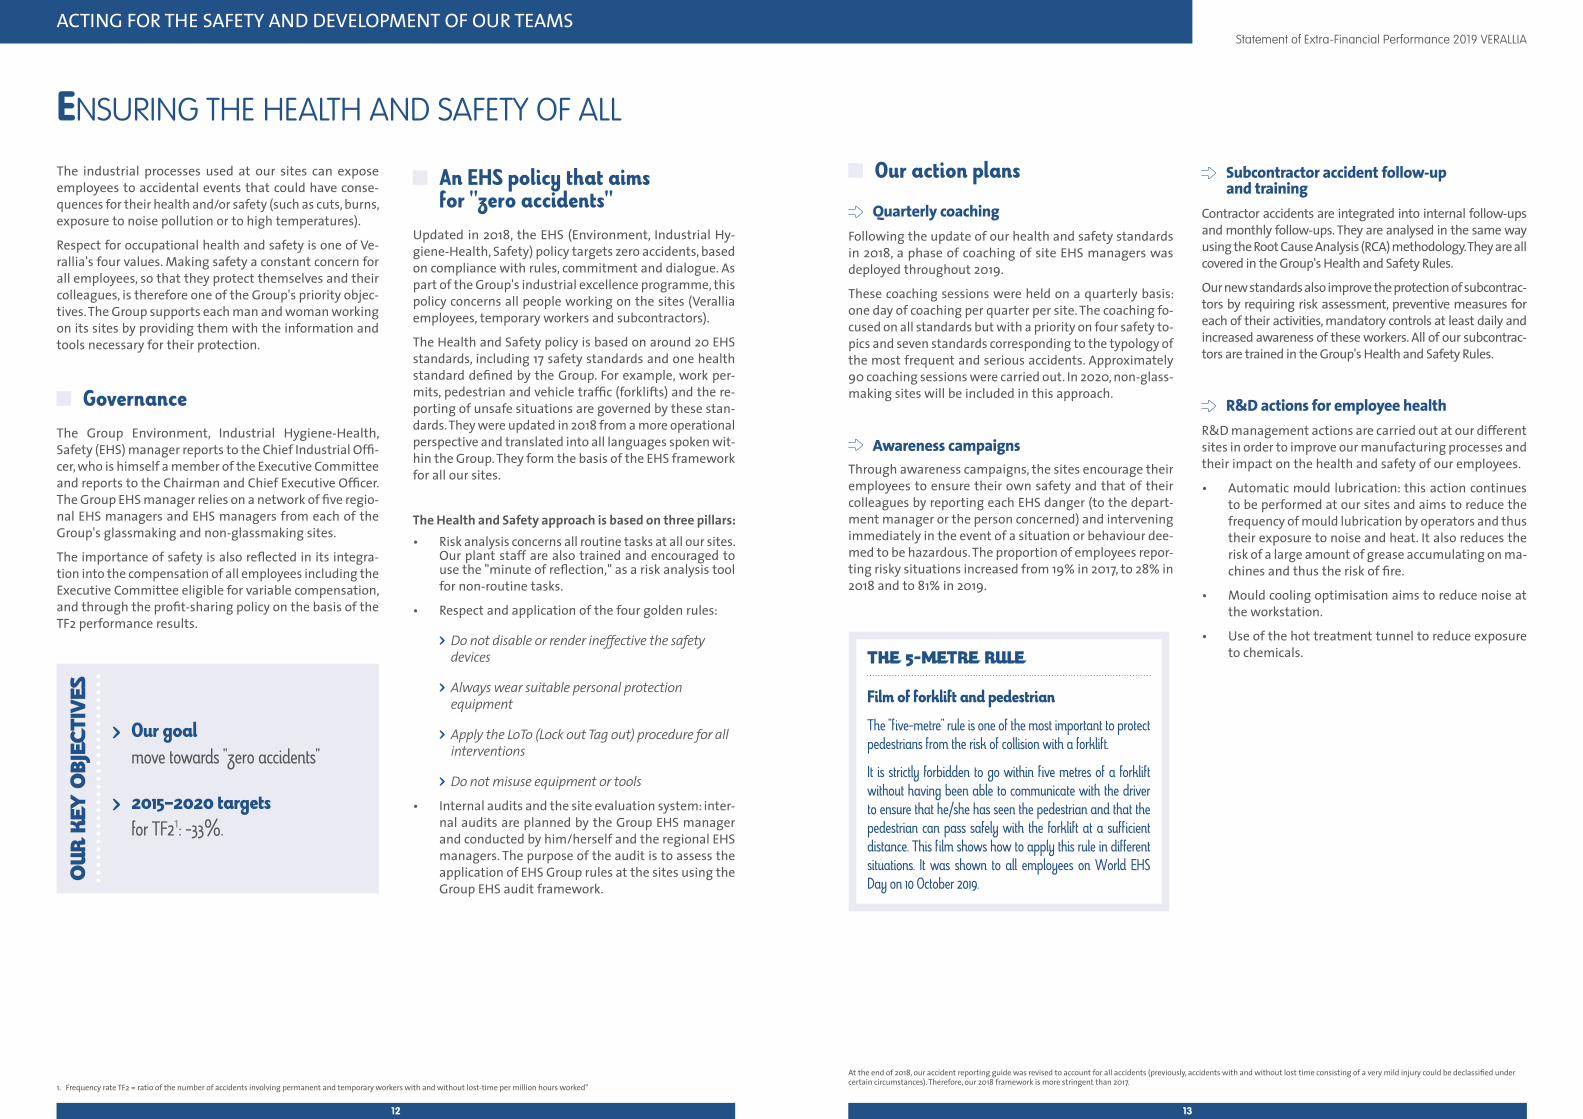
Statement of Extra-Financial Performance 2019 VERALLIAACTING FOR THE SAFETY AND DEVELOPMENT OF OUR TEAMS
The industrial processes used at our sites can expose employees to accidental events that could have conse-quences for their health and/or safety (such as cuts, burns, exposure to noise pollution or to high temperatures).
Respect for occupational health and safety is one of Ve-rallia's four values. Making safety a constant concern for all employees, so that they protect themselves and their colleagues, is therefore one of the Group's priority objec-tives. The Group supports each man and woman working on its sites by providing them with the information and tools necessary for their protection.
GovernanceThe Group Environment, Industrial Hygiene-Health, Safety (EHS) manager reports to the Chief Industrial Offi-cer, who is himself a member of the Executive Committee and reports to the Chairman and Chief Executive Officer. The Group EHS manager relies on a network of five regio-nal EHS managers and EHS managers from each of the Group's glassmaking and non-glassmaking sites.
The importance of safety is also reflected in its integra-tion into the compensation of all employees including the Executive Committee eligible for variable compensation, and through the profit-sharing policy on the basis of the TF2 performance results.
An EHS policy that aims for "zero accidents"
Updated in 2018, the EHS (Environment, Industrial Hy-giene-Health, Safety) policy targets zero accidents, based on compliance with rules, commitment and dialogue. As part of the Group's industrial excellence programme, this policy concerns all people working on the sites (Verallia employees, temporary workers and subcontractors).
The Health and Safety policy is based on around 20 EHS standards, including 17 safety standards and one health standard defined by the Group. For example, work per-mits, pedestrian and vehicle traffic (forklifts) and the re-porting of unsafe situations are governed by these stan-dards. They were updated in 2018 from a more operational perspective and translated into all languages spoken wit-hin the Group. They form the basis of the EHS framework for all our sites.
The Health and Safety approach is based on three pillars:• Risk analysis concerns all routine tasks at all our sites.
Our plant staff are also trained and encouraged to use the "minute of reflection," as a risk analysis tool for non-routine tasks.
• Respect and application of the four golden rules:
> Do not disable or render ineffective the safety devices
> Always wear suitable personal protection equipment
> Apply the LoTo (Lock out Tag out) procedure for all interventions
> Do not misuse equipment or tools
• Internal audits and the site evaluation system: inter-nal audits are planned by the Group EHS manager and conducted by him/herself and the regional EHS managers. The purpose of the audit is to assess the application of EHS Group rules at the sites using the Group EHS audit framework.
Our action plans
Quarterly coachingFollowing the update of our health and safety standards in 2018, a phase of coaching of site EHS managers was deployed throughout 2019.
These coaching sessions were held on a quarterly basis: one day of coaching per quarter per site. The coaching fo-cused on all standards but with a priority on four safety to-pics and seven standards corresponding to the typology of the most frequent and serious accidents. Approximately 90 coaching sessions were carried out. In 2020, non-glass-making sites will be included in this approach.
Awareness campaignsThrough awareness campaigns, the sites encourage their employees to ensure their own safety and that of their colleagues by reporting each EHS danger (to the depart-ment manager or the person concerned) and intervening immediately in the event of a situation or behaviour dee-med to be hazardous. The proportion of employees repor-ting risky situations increased from 19% in 2017, to 28% in 2018 and to 81% in 2019.
Subcontractor accident follow-up and training
Contractor accidents are integrated into internal follow-ups and monthly follow-ups. They are analysed in the same way using the Root Cause Analysis (RCA) methodology. They are all covered in the Group's Health and Safety Rules.
Our new standards also improve the protection of subcontrac-tors by requiring risk assessment, preventive measures for each of their activities, mandatory controls at least daily and increased awareness of these workers. All of our subcontrac-tors are trained in the Group's Health and Safety Rules.
R&D actions for employee healthR&D management actions are carried out at our different sites in order to improve our manufacturing processes and their impact on the health and safety of our employees.
• Automatic mould lubrication: this action continues to be performed at our sites and aims to reduce the frequency of mould lubrication by operators and thus their exposure to noise and heat. It also reduces the risk of a large amount of grease accumulating on ma-chines and thus the risk of fire.
• Mould cooling optimisation aims to reduce noise at the workstation.
• Use of the hot treatment tunnel to reduce exposure to chemicals.THE 5-METRE RULE
Film of forklift and pedestrian
The "five-metre" rule is one of the most important to protect pedestrians from the risk of collision with a forklift.
It is strictly forbidden to go within five metres of a forklift without having been able to communicate with the driver to ensure that he/she has seen the pedestrian and that the pedestrian can pass safely with the forklift at a sufficient distance. This film shows how to apply this rule in different situations. It was shown to all employees on World EHS Day on 10 October 2019.O
UR K
EY O
BJEC
TIVE
S
> Our goal move towards "zero accidents"
> 2015–2020 targets for TF21: -33%.
ENSURING THE HEALTH AND SAFETY OF ALL
1. Frequency rate TF2 = ratio of the number of accidents involving permanent and temporary workers with and without lost-time per million hours worked"
At the end of 2018, our accident reporting guide was revised to account for all accidents (previously, accidents with and without lost time consisting of a very mild injury could be declassified under certain circumstances). Therefore, our 2018 framework is more stringent than 2017.
1312
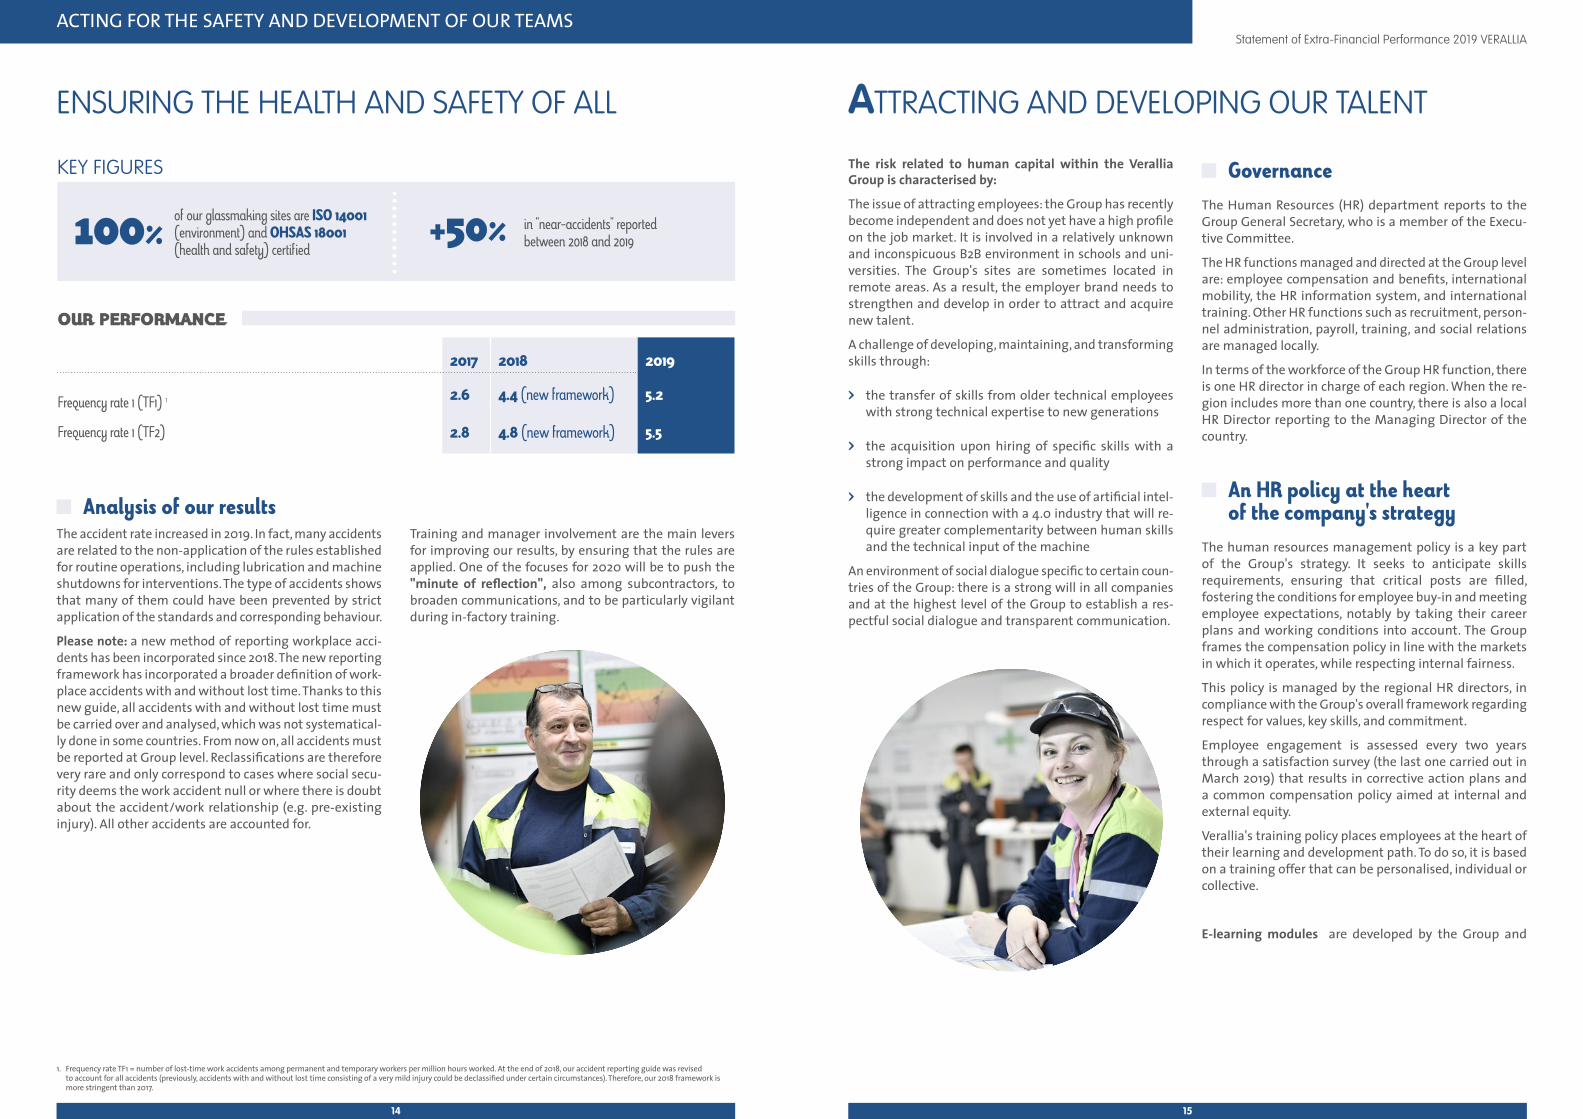
Statement of Extra-Financial Performance 2019 VERALLIAACTING FOR THE SAFETY AND DEVELOPMENT OF OUR TEAMS
2017 2018 2019
Frequency rate 1 (TF1) 1 2.6 4.4 (new framework) 5.2
Frequency rate 1 (TF2) 2.8 4.8 (new framework) 5.5
OUR PERFORMANCE
Analysis of our resultsThe accident rate increased in 2019. In fact, many accidents are related to the non-application of the rules established for routine operations, including lubrication and machine shutdowns for interventions. The type of accidents shows that many of them could have been prevented by strict application of the standards and corresponding behaviour.
Please note: a new method of reporting workplace acci-dents has been incorporated since 2018. The new reporting framework has incorporated a broader definition of work-place accidents with and without lost time. Thanks to this new guide, all accidents with and without lost time must be carried over and analysed, which was not systematical-ly done in some countries. From now on, all accidents must be reported at Group level. Reclassifications are therefore very rare and only correspond to cases where social secu-rity deems the work accident null or where there is doubt about the accident/work relationship (e.g. pre-existing injury). All other accidents are accounted for.
Training and manager involvement are the main levers for improving our results, by ensuring that the rules are applied. One of the focuses for 2020 will be to push the "minute of reflection", also among subcontractors, to broaden communications, and to be particularly vigilant during in-factory training.
The risk related to human capital within the Verallia Group is characterised by:
The issue of attracting employees: the Group has recently become independent and does not yet have a high profile on the job market. It is involved in a relatively unknown and inconspicuous B2B environment in schools and uni-versities. The Group's sites are sometimes located in remote areas. As a result, the employer brand needs to strengthen and develop in order to attract and acquire new talent.
A challenge of developing, maintaining, and transforming skills through:
> the transfer of skills from older technical employees with strong technical expertise to new generations
> the acquisition upon hiring of specific skills with a strong impact on performance and quality
> the development of skills and the use of artificial intel-ligence in connection with a 4.0 industry that will re-quire greater complementarity between human skills and the technical input of the machine
An environment of social dialogue specific to certain coun-tries of the Group: there is a strong will in all companies and at the highest level of the Group to establish a res-pectful social dialogue and transparent communication.
GovernanceThe Human Resources (HR) department reports to the Group General Secretary, who is a member of the Execu-tive Committee.
The HR functions managed and directed at the Group level are: employee compensation and benefits, international mobility, the HR information system, and international training. Other HR functions such as recruitment, person-nel administration, payroll, training, and social relations are managed locally.
In terms of the workforce of the Group HR function, there is one HR director in charge of each region. When the re-gion includes more than one country, there is also a local HR Director reporting to the Managing Director of the country.
An HR policy at the heart of the company's strategy
The human resources management policy is a key part of the Group's strategy. It seeks to anticipate skills requirements, ensuring that critical posts are filled, fostering the conditions for employee buy-in and meeting employee expectations, notably by taking their career plans and working conditions into account. The Group frames the compensation policy in line with the markets in which it operates, while respecting internal fairness.
This policy is managed by the regional HR directors, in compliance with the Group's overall framework regarding respect for values, key skills, and commitment.
Employee engagement is assessed every two years through a satisfaction survey (the last one carried out in March 2019) that results in corrective action plans and a common compensation policy aimed at internal and external equity.
Verallia's training policy places employees at the heart of their learning and development path. To do so, it is based on a training offer that can be personalised, individual or collective.
E-learning modules are developed by the Group and
ATTRACTING AND DEVELOPING OUR TALENTENSURING THE HEALTH AND SAFETY OF ALL
1. Frequency rate TF1 = number of lost-time work accidents among permanent and temporary workers per million hours worked. At the end of 2018, our accident reporting guide was revised to account for all accidents (previously, accidents with and without lost time consisting of a very mild injury could be declassified under certain circumstances). Therefore, our 2018 framework is more stringent than 2017.
KEY FIGURES
100% of our glassmaking sites are ISO 14001 (environment) and OHSAS 18001 (health and safety) certified
+50% in "near-accidents" reported between 2018 and 2019
1514
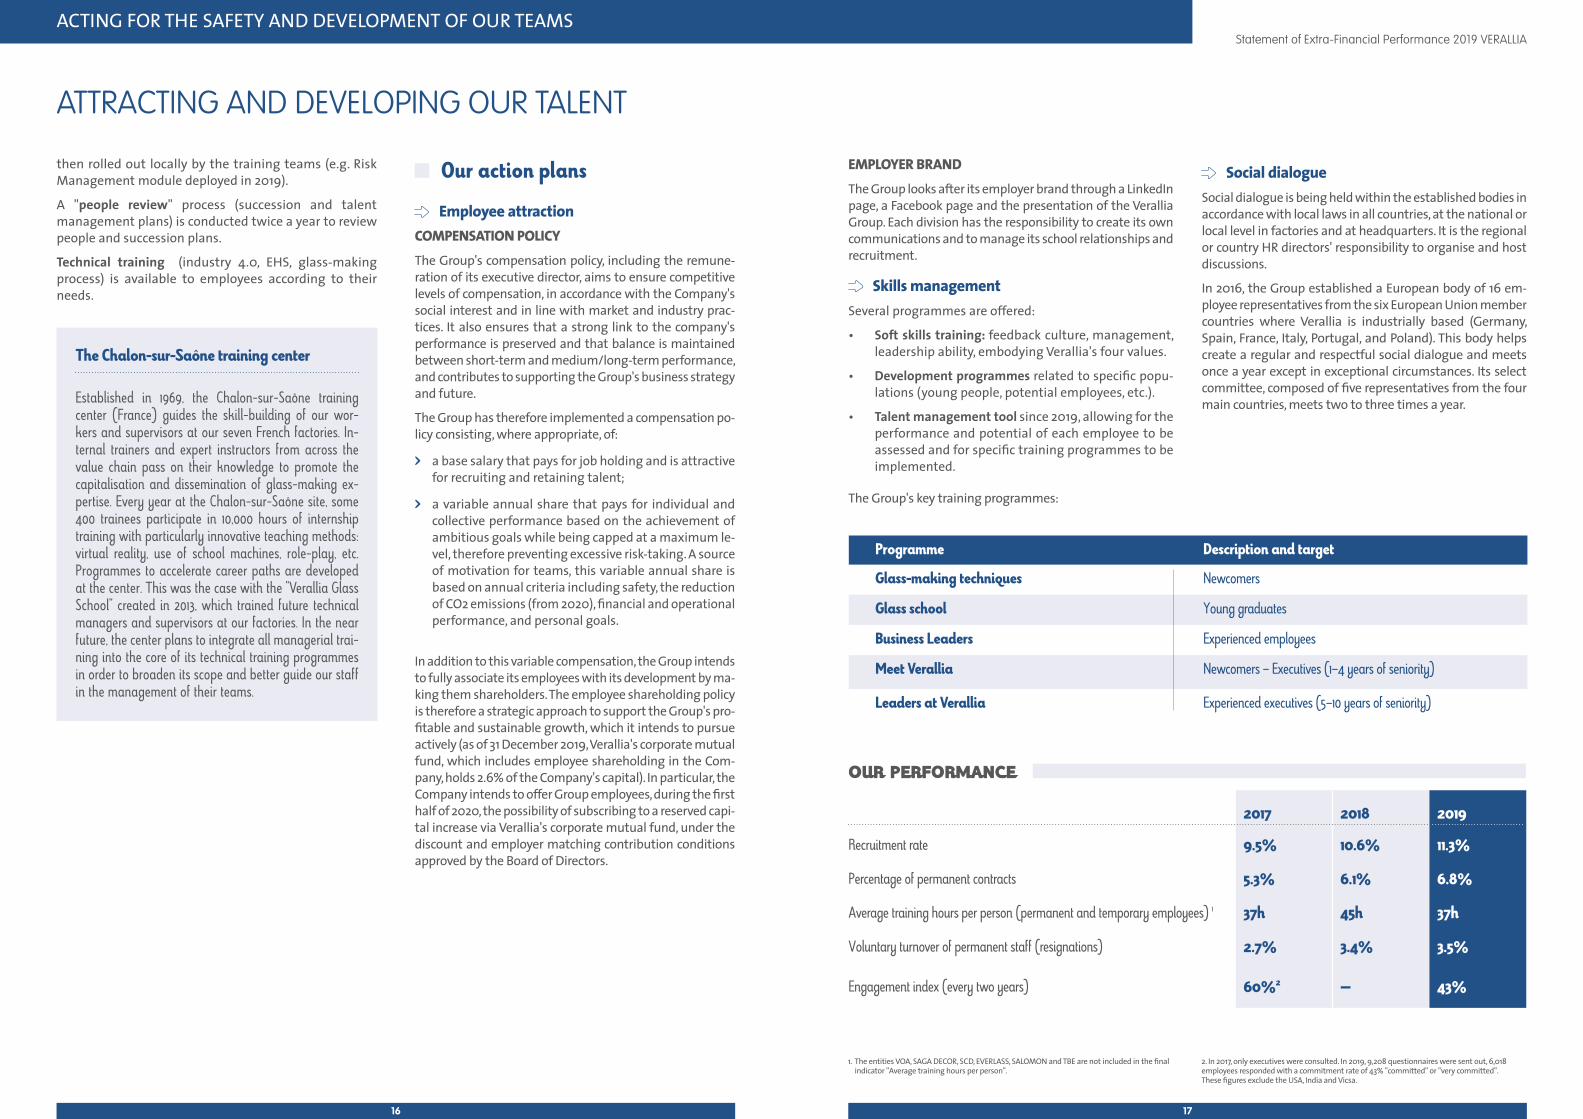
Statement of Extra-Financial Performance 2019 VERALLIAACTING FOR THE SAFETY AND DEVELOPMENT OF OUR TEAMS
then rolled out locally by the training teams (e.g. Risk Management module deployed in 2019).
A "people review" process (succession and talent management plans) is conducted twice a year to review people and succession plans.
Technical training (industry 4.0, EHS, glass-making process) is available to employees according to their needs.
Our action plans
Employee attractionCOMPENSATION POLICYThe Group's compensation policy, including the remune-ration of its executive director, aims to ensure competitive levels of compensation, in accordance with the Company's social interest and in line with market and industry prac-tices. It also ensures that a strong link to the company's performance is preserved and that balance is maintained between short-term and medium/long-term performance, and contributes to supporting the Group's business strategy and future.
The Group has therefore implemented a compensation po-licy consisting, where appropriate, of:
> a base salary that pays for job holding and is attractive for recruiting and retaining talent;
> a variable annual share that pays for individual and collective performance based on the achievement of ambitious goals while being capped at a maximum le-vel, therefore preventing excessive risk-taking. A source of motivation for teams, this variable annual share is based on annual criteria including safety, the reduction of CO2 emissions (from 2020), financial and operational performance, and personal goals.
In addition to this variable compensation, the Group intends to fully associate its employees with its development by ma-king them shareholders. The employee shareholding policy is therefore a strategic approach to support the Group's pro-fitable and sustainable growth, which it intends to pursue actively (as of 31 December 2019, Verallia's corporate mutual fund, which includes employee shareholding in the Com-pany, holds 2.6% of the Company's capital). In particular, the Company intends to offer Group employees, during the first half of 2020, the possibility of subscribing to a reserved capi-tal increase via Verallia's corporate mutual fund, under the discount and employer matching contribution conditions approved by the Board of Directors.
EMPLOYER BRANDThe Group looks after its employer brand through a LinkedIn page, a Facebook page and the presentation of the Verallia Group. Each division has the responsibility to create its own communications and to manage its school relationships and recruitment.
Skills managementSeveral programmes are offered:
• Soft skills training: feedback culture, management, leadership ability, embodying Verallia's four values.
• Development programmes related to specific popu-lations (young people, potential employees, etc.).
• Talent management tool since 2019, allowing for the performance and potential of each employee to be assessed and for specific training programmes to be implemented.
The Group's key training programmes:
Social dialogueSocial dialogue is being held within the established bodies in accordance with local laws in all countries, at the national or local level in factories and at headquarters. It is the regional or country HR directors' responsibility to organise and host discussions.
In 2016, the Group established a European body of 16 em-ployee representatives from the six European Union member countries where Verallia is industrially based (Germany, Spain, France, Italy, Portugal, and Poland). This body helps create a regular and respectful social dialogue and meets once a year except in exceptional circumstances. Its select committee, composed of five representatives from the four main countries, meets two to three times a year.
ATTRACTING AND DEVELOPING OUR TALENT
2017 2018 2019
Recruitment rate 9.5% 10.6% 11.3%
Percentage of permanent contracts 5.3% 6.1% 6.8%
Average training hours per person (permanent and temporary employees) 1 37h 45h 37h
Voluntary turnover of permanent staff (resignations) 2.7% 3.4% 3.5%
Engagement index (every two years) 60%2 — 43%
OUR PERFORMANCE
1. The entities VOA, SAGA DECOR, SCD, EVERLASS, SALOMON and TBE are not included in the final indicator "Average training hours per person".
2. In 2017, only executives were consulted. In 2019, 9,208 questionnaires were sent out, 6,018 employees responded with a commitment rate of 43% "committed" or "very committed". These figures exclude the USA, India and Vicsa.
Programme Description and target
Glass-making techniques Newcomers
Glass school Young graduates
Business Leaders Experienced employees
Meet Verallia Newcomers – Executives (1–4 years of seniority)
Leaders at Verallia Experienced executives (5–10 years of seniority)
The Chalon-sur-Saône training center
Established in 1969, the Chalon-sur-Saône training center (France) guides the skill-building of our wor-kers and supervisors at our seven French factories. In-ternal trainers and expert instructors from across the value chain pass on their knowledge to promote the capitalisation and dissemination of glass-making ex-pertise. Every year at the Chalon-sur-Saône site, some 400 trainees participate in 10,000 hours of internship training with particularly innovative teaching methods: virtual reality, use of school machines, role-play, etc. Programmes to accelerate career paths are developed at the center. This was the case with the "Verallia Glass School" created in 2013, which trained future technical managers and supervisors at our factories. In the near future, the center plans to integrate all managerial trai-ning into the core of its technical training programmes in order to broaden its scope and better guide our staff in the management of their teams.
1716
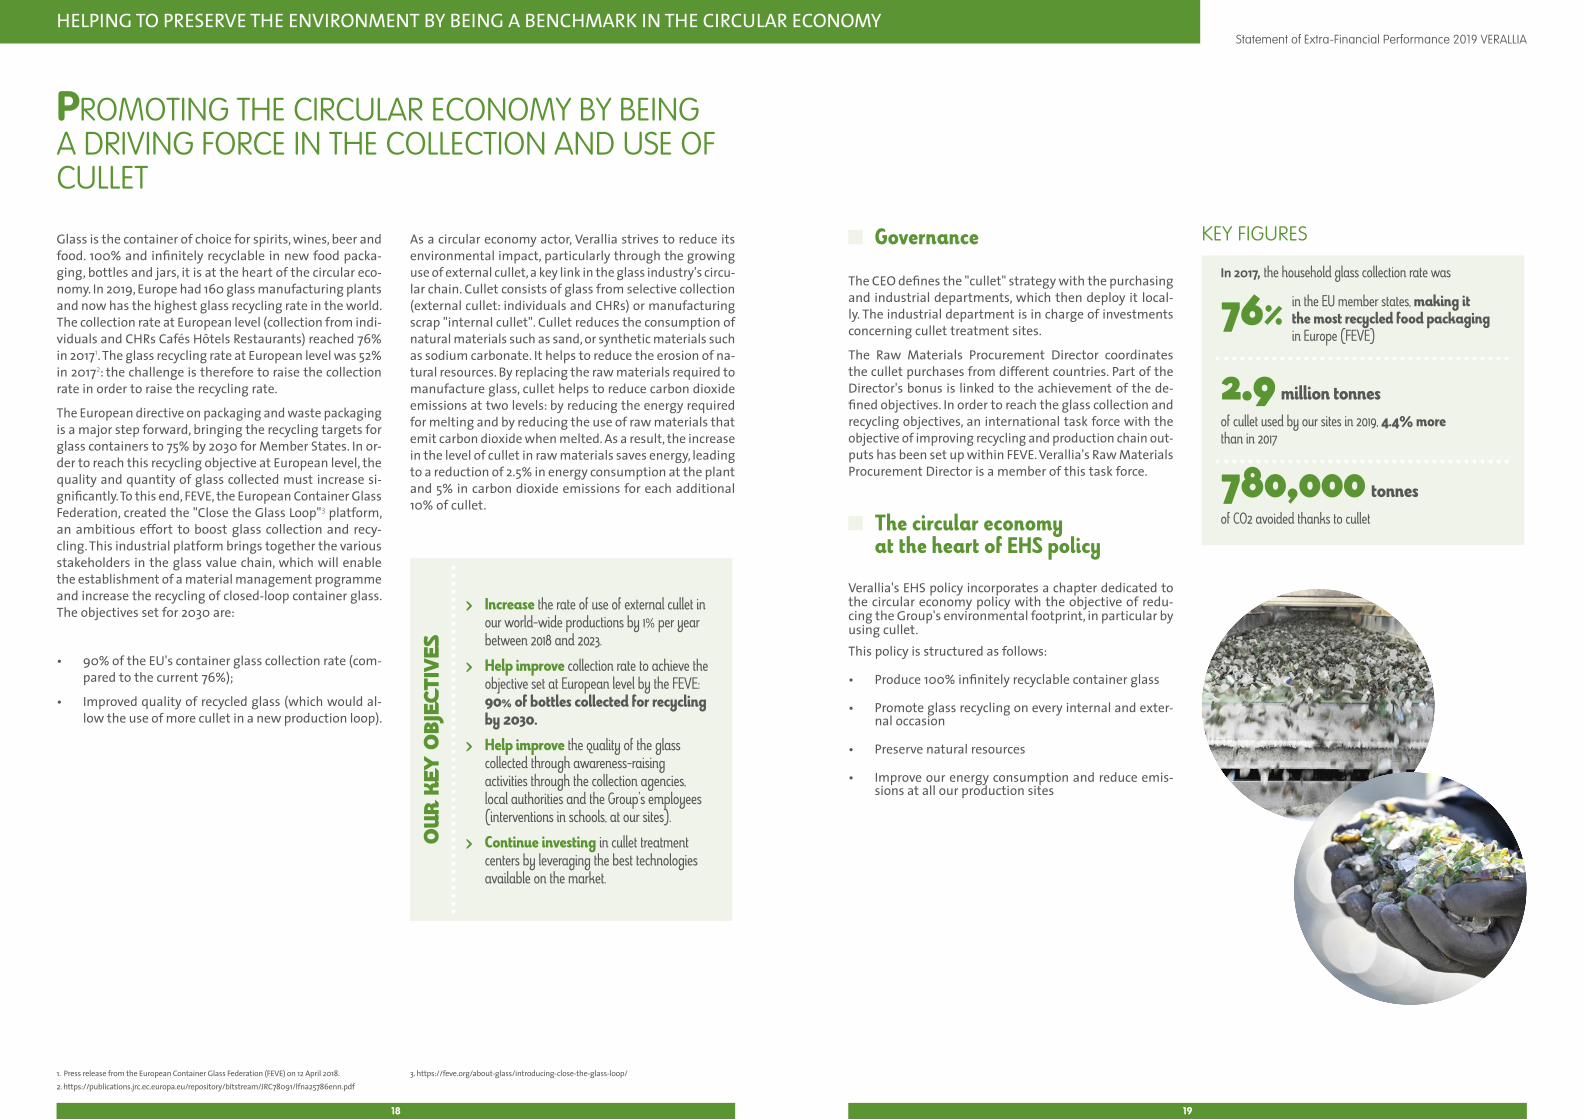
HELPING TO PRESERVE THE ENVIRONMENT BY BEING A BENCHMARK IN THE CIRCULAR ECONOMY Statement of Extra-Financial Performance 2019 VERALLIA
In 2017, the household glass collection rate was
76% in the EU member states, making it the most recycled food packaging in Europe (FEVE)
2.9 million tonnesof cullet used by our sites in 2019, 4.4% more than in 2017
780,000 tonnesof CO2 avoided thanks to cullet
KEY FIGURES
1. Press release from the European Container Glass Federation (FEVE) on 12 April 2018.2. https://publications.jrc.ec.europa.eu/repository/bitstream/JRC78091/lfna25786enn.pdf
3. https://feve.org/about-glass/introducing-close-the-glass-loop/
Glass is the container of choice for spirits, wines, beer and food. 100% and infinitely recyclable in new food packa-ging, bottles and jars, it is at the heart of the circular eco-nomy. In 2019, Europe had 160 glass manufacturing plants and now has the highest glass recycling rate in the world. The collection rate at European level (collection from indi-viduals and CHRs Cafés Hôtels Restaurants) reached 76% in 20171. The glass recycling rate at European level was 52% in 20172: the challenge is therefore to raise the collection rate in order to raise the recycling rate.
The European directive on packaging and waste packaging is a major step forward, bringing the recycling targets for glass containers to 75% by 2030 for Member States. In or-der to reach this recycling objective at European level, the quality and quantity of glass collected must increase si-gnificantly. To this end, FEVE, the European Container Glass Federation, created the "Close the Glass Loop"3 platform, an ambitious effort to boost glass collection and recy-cling. This industrial platform brings together the various stakeholders in the glass value chain, which will enable the establishment of a material management programme and increase the recycling of closed-loop container glass. The objectives set for 2030 are:
• 90% of the EU's container glass collection rate (com-pared to the current 76%);
• Improved quality of recycled glass (which would al-low the use of more cullet in a new production loop).
As a circular economy actor, Verallia strives to reduce its environmental impact, particularly through the growing use of external cullet, a key link in the glass industry's circu-lar chain. Cullet consists of glass from selective collection (external cullet: individuals and CHRs) or manufacturing scrap "internal cullet". Cullet reduces the consumption of natural materials such as sand, or synthetic materials such as sodium carbonate. It helps to reduce the erosion of na-tural resources. By replacing the raw materials required to manufacture glass, cullet helps to reduce carbon dioxide emissions at two levels: by reducing the energy required for melting and by reducing the use of raw materials that emit carbon dioxide when melted. As a result, the increase in the level of cullet in raw materials saves energy, leading to a reduction of 2.5% in energy consumption at the plant and 5% in carbon dioxide emissions for each additional 10% of cullet.
PROMOTING THE CIRCULAR ECONOMY BY BEING A DRIVING FORCE IN THE COLLECTION AND USE OF CULLET
Governance The CEO defines the "cullet" strategy with the purchasing and industrial departments, which then deploy it local-ly. The industrial department is in charge of investments concerning cullet treatment sites.
The Raw Materials Procurement Director coordinates the cullet purchases from different countries. Part of the Director's bonus is linked to the achievement of the de-fined objectives. In order to reach the glass collection and recycling objectives, an international task force with the objective of improving recycling and production chain out-puts has been set up within FEVE. Verallia's Raw Materials Procurement Director is a member of this task force.
The circular economy at the heart of EHS policy
Verallia's EHS policy incorporates a chapter dedicated to the circular economy policy with the objective of redu-cing the Group's environmental footprint, in particular by using cullet.This policy is structured as follows:
• Produce 100% infinitely recyclable container glass
• Promote glass recycling on every internal and exter-nal occasion
• Preserve natural resources
• Improve our energy consumption and reduce emis-sions at all our production sites
OUR
KEY
OBJ
ECTI
VES
> Increase the rate of use of external cullet in our world-wide productions by 1% per year between 2018 and 2023.
> Help improve collection rate to achieve the objective set at European level by the FEVE: 90% of bottles collected for recycling by 2030.
> Help improve the quality of the glass collected through awareness-raising activities through the collection agencies, local authorities and the Group's employees (interventions in schools, at our sites).
> Continue investing in cullet treatment centers by leveraging the best technologies available on the market.
1918
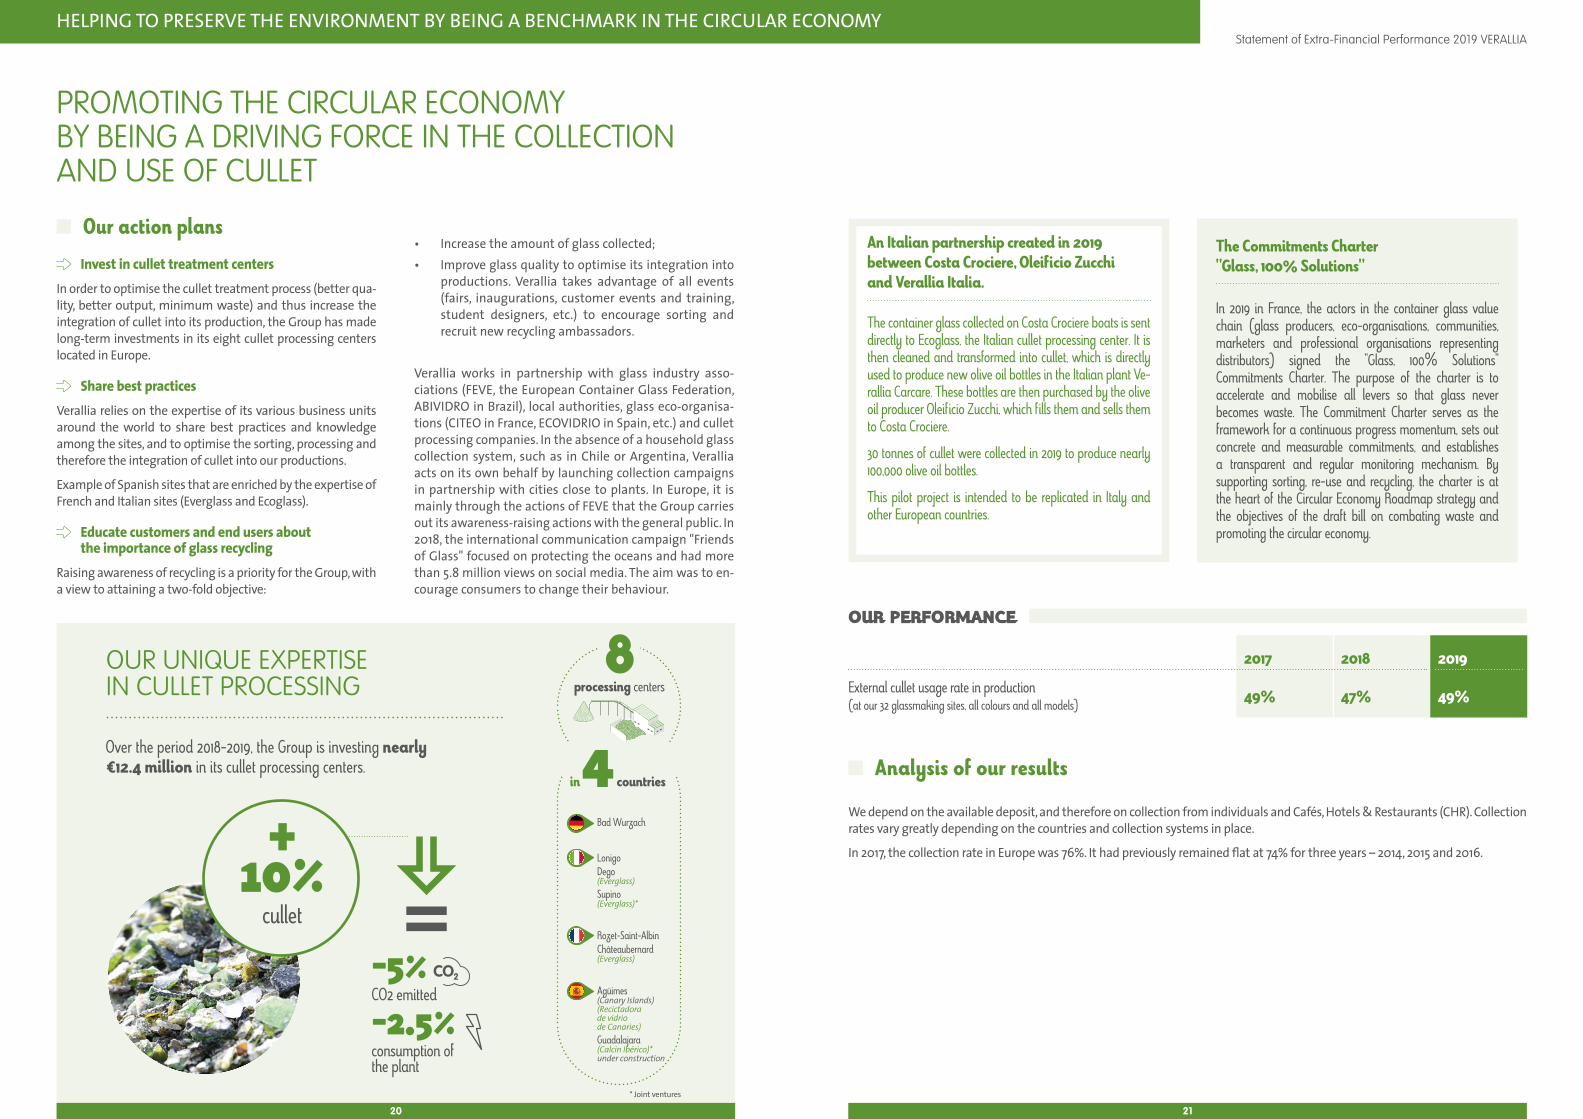
HELPING TO PRESERVE THE ENVIRONMENT BY BEING A BENCHMARK IN THE CIRCULAR ECONOMY Statement of Extra-Financial Performance 2019 VERALLIA
Our action plans
Invest in cullet treatment centersIn order to optimise the cullet treatment process (better qua-lity, better output, minimum waste) and thus increase the integration of cullet into its production, the Group has made long-term investments in its eight cullet processing centers located in Europe.
Share best practicesVerallia relies on the expertise of its various business units around the world to share best practices and knowledge among the sites, and to optimise the sorting, processing and therefore the integration of cullet into our productions.
Example of Spanish sites that are enriched by the expertise of French and Italian sites (Everglass and Ecoglass).
Educate customers and end users about the importance of glass recycling
Raising awareness of recycling is a priority for the Group, with a view to attaining a two-fold objective:
• Increase the amount of glass collected;• Improve glass quality to optimise its integration into
productions. Verallia takes advantage of all events (fairs, inaugurations, customer events and training, student designers, etc.) to encourage sorting and recruit new recycling ambassadors.
Verallia works in partnership with glass industry asso-ciations (FEVE, the European Container Glass Federation, ABIVIDRO in Brazil), local authorities, glass eco-organisa-tions (CITEO in France, ECOVIDRIO in Spain, etc.) and cullet processing companies. In the absence of a household glass collection system, such as in Chile or Argentina, Verallia acts on its own behalf by launching collection campaigns in partnership with cities close to plants. In Europe, it is mainly through the actions of FEVE that the Group carries out its awareness-raising actions with the general public. In 2018, the international communication campaign "Friends of Glass" focused on protecting the oceans and had more than 5.8 million views on social media. The aim was to en-courage consumers to change their behaviour.
The Commitments Charter "Glass, 100% Solutions"
In 2019 in France, the actors in the container glass value chain (glass producers, eco-organisations, communities, marketers and professional organisations representing distributors) signed the "Glass, 100% Solutions" Commitments Charter. The purpose of the charter is to accelerate and mobilise all levers so that glass never becomes waste. The Commitment Charter serves as the framework for a continuous progress momentum, sets out concrete and measurable commitments, and establishes a transparent and regular monitoring mechanism. By supporting sorting, re-use and recycling, the charter is at the heart of the Circular Economy Roadmap strategy and the objectives of the draft bill on combating waste and promoting the circular economy.
An Italian partnership created in 2019 between Costa Crociere, Oleificio Zucchi and Verallia Italia.
The container glass collected on Costa Crociere boats is sent directly to Ecoglass, the Italian cullet processing center. It is then cleaned and transformed into cullet, which is directly used to produce new olive oil bottles in the Italian plant Ve-rallia Carcare. These bottles are then purchased by the olive oil producer Oleificio Zucchi, which fills them and sells them to Costa Crociere.
30 tonnes of cullet were collected in 2019 to produce nearly 100,000 olive oil bottles.
This pilot project is intended to be replicated in Italy and other European countries.
2017 2018 2019
External cullet usage rate in production (at our 32 glassmaking sites, all colours and all models)
49% 47% 49%
OUR PERFORMANCE
PROMOTING THE CIRCULAR ECONOMY BY BEING A DRIVING FORCE IN THE COLLECTION AND USE OF CULLET
Analysis of our results We depend on the available deposit, and therefore on collection from individuals and Cafés, Hotels & Restaurants (CHR). Collection rates vary greatly depending on the countries and collection systems in place.
In 2017, the collection rate in Europe was 76%. It had previously remained flat at 74% for three years – 2014, 2015 and 2016.
OUR UNIQUE EXPERTISE IN CULLET PROCESSING
-2.5%consumption of the plant
8processing centers
in countries4LonigoDego(Everglass)Supino(Everglass)*
Bad Wurzach
Rozet-Saint-AlbinChâteaubernard(Everglass)
Agüimes(Canary Islands)(Recictadora de vidrio de Canaries)Guadalajara(Calcin Ibérico)*under construction
-5%CO2 emitted
+10%
cullet
Over the period 2018-2019, the Group is investing nearly €12.4 million in its cullet processing centers.
* Joint ventures
2120
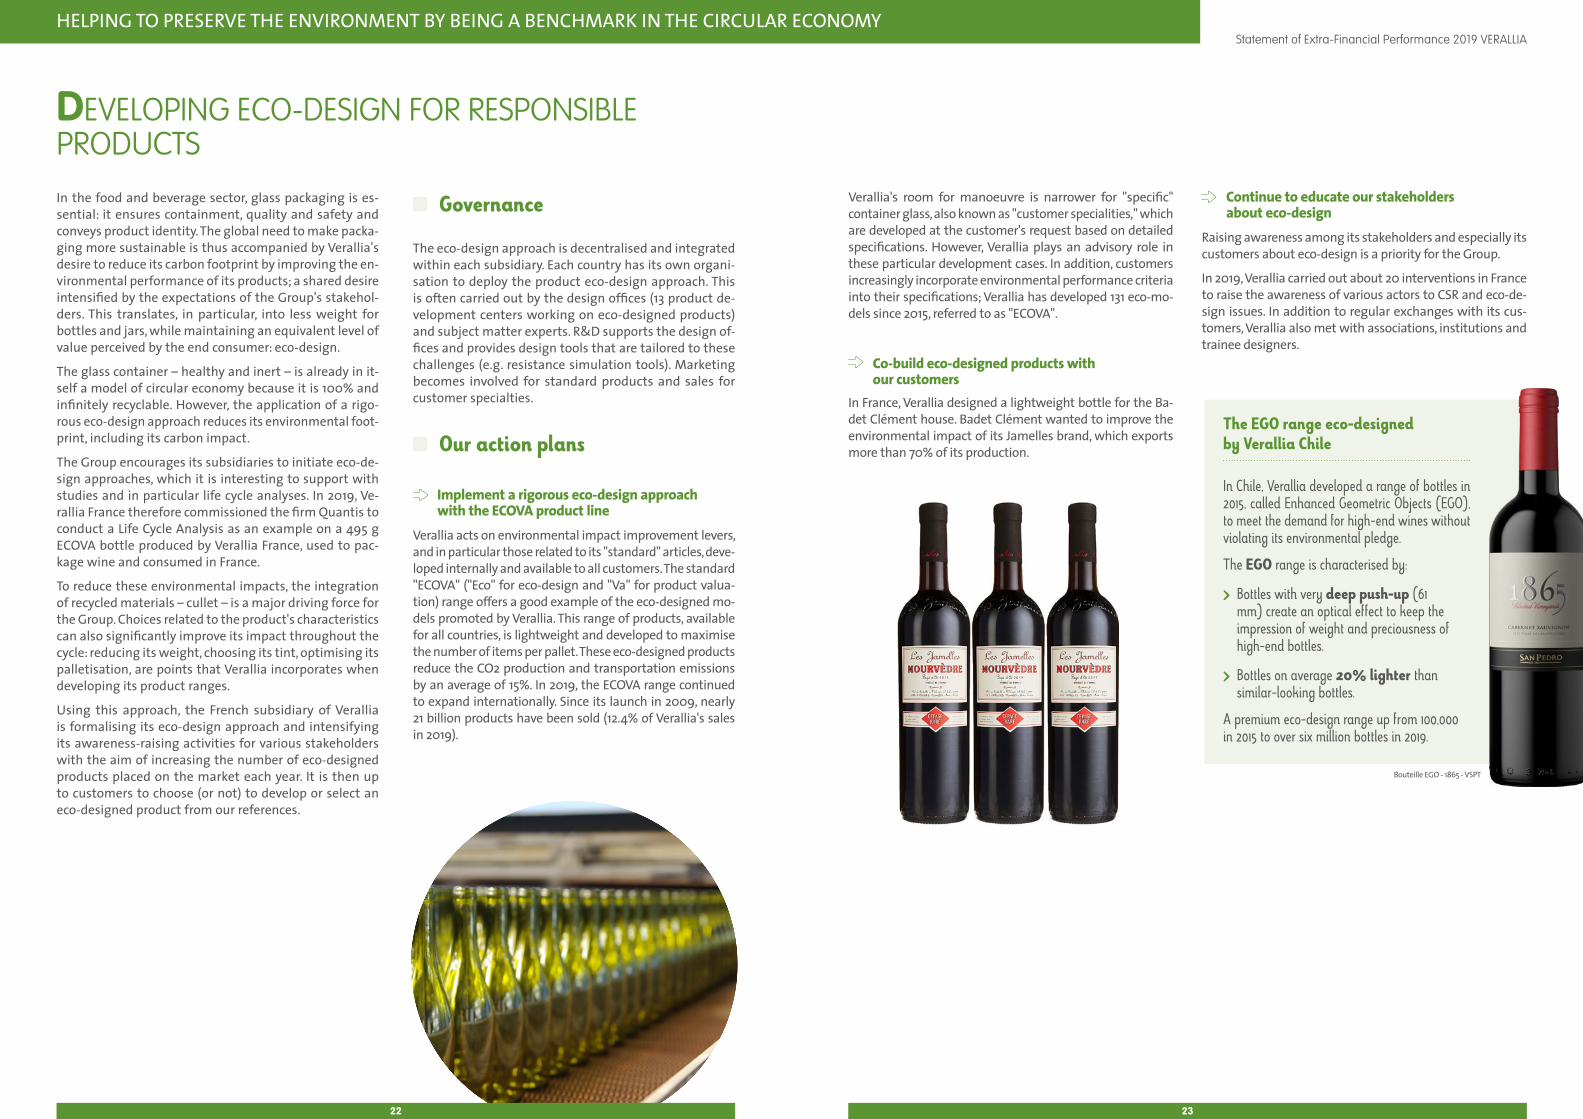
HELPING TO PRESERVE THE ENVIRONMENT BY BEING A BENCHMARK IN THE CIRCULAR ECONOMY Statement of Extra-Financial Performance 2019 VERALLIA
In the food and beverage sector, glass packaging is es-sential: it ensures containment, quality and safety and conveys product identity. The global need to make packa-ging more sustainable is thus accompanied by Verallia's desire to reduce its carbon footprint by improving the en-vironmental performance of its products; a shared desire intensified by the expectations of the Group's stakehol-ders. This translates, in particular, into less weight for bottles and jars, while maintaining an equivalent level of value perceived by the end consumer: eco-design.
The glass container – healthy and inert – is already in it-self a model of circular economy because it is 100% and infinitely recyclable. However, the application of a rigo-rous eco-design approach reduces its environmental foot-print, including its carbon impact.
The Group encourages its subsidiaries to initiate eco-de-sign approaches, which it is interesting to support with studies and in particular life cycle analyses. In 2019, Ve-rallia France therefore commissioned the firm Quantis to conduct a Life Cycle Analysis as an example on a 495 g ECOVA bottle produced by Verallia France, used to pac-kage wine and consumed in France.
To reduce these environmental impacts, the integration of recycled materials – cullet – is a major driving force for the Group. Choices related to the product's characteristics can also significantly improve its impact throughout the cycle: reducing its weight, choosing its tint, optimising its palletisation, are points that Verallia incorporates when developing its product ranges.
Using this approach, the French subsidiary of Verallia is formalising its eco-design approach and intensifying its awareness-raising activities for various stakeholders with the aim of increasing the number of eco-designed products placed on the market each year. It is then up to customers to choose (or not) to develop or select an eco-designed product from our references.
Governance The eco-design approach is decentralised and integrated within each subsidiary. Each country has its own organi-sation to deploy the product eco-design approach. This is often carried out by the design offices (13 product de-velopment centers working on eco-designed products) and subject matter experts. R&D supports the design of-fices and provides design tools that are tailored to these challenges (e.g. resistance simulation tools). Marketing becomes involved for standard products and sales for customer specialties.
Our action plans
Implement a rigorous eco-design approach with the ECOVA product line
Verallia acts on environmental impact improvement levers, and in particular those related to its "standard" articles, deve-loped internally and available to all customers. The standard "ECOVA" ("Eco" for eco-design and "Va" for product valua-tion) range offers a good example of the eco-designed mo-dels promoted by Verallia. This range of products, available for all countries, is lightweight and developed to maximise the number of items per pallet. These eco-designed products reduce the CO2 production and transportation emissions by an average of 15%. In 2019, the ECOVA range continued to expand internationally. Since its launch in 2009, nearly 21 billion products have been sold (12.4% of Verallia's sales in 2019).
DEVELOPING ECO-DESIGN FOR RESPONSIBLE PRODUCTS
Verallia's room for manoeuvre is narrower for "specific" container glass, also known as "customer specialities," which are developed at the customer's request based on detailed specifications. However, Verallia plays an advisory role in these particular development cases. In addition, customers increasingly incorporate environmental performance criteria into their specifications; Verallia has developed 131 eco-mo-dels since 2015, referred to as "ECOVA".
Co-build eco-designed products with our customers
In France, Verallia designed a lightweight bottle for the Ba-det Clément house. Badet Clément wanted to improve the environmental impact of its Jamelles brand, which exports more than 70% of its production.
Continue to educate our stakeholders about eco-design
Raising awareness among its stakeholders and especially its customers about eco-design is a priority for the Group.
In 2019, Verallia carried out about 20 interventions in France to raise the awareness of various actors to CSR and eco-de-sign issues. In addition to regular exchanges with its cus-tomers, Verallia also met with associations, institutions and trainee designers.
The EGO range eco-designed by Verallia Chile
In Chile, Verallia developed a range of bottles in 2015, called Enhanced Geometric Objects (EGO), to meet the demand for high-end wines without violating its environmental pledge.
The EGO range is characterised by:
> Bottles with very deep push-up (61 mm) create an optical effect to keep the impression of weight and preciousness of high-end bottles.
> Bottles on average 20% lighter than similar-looking bottles.
A premium eco-design range up from 100,000 in 2015 to over six million bottles in 2019.
Bouteille EGO - 1865 - VSPT
2322
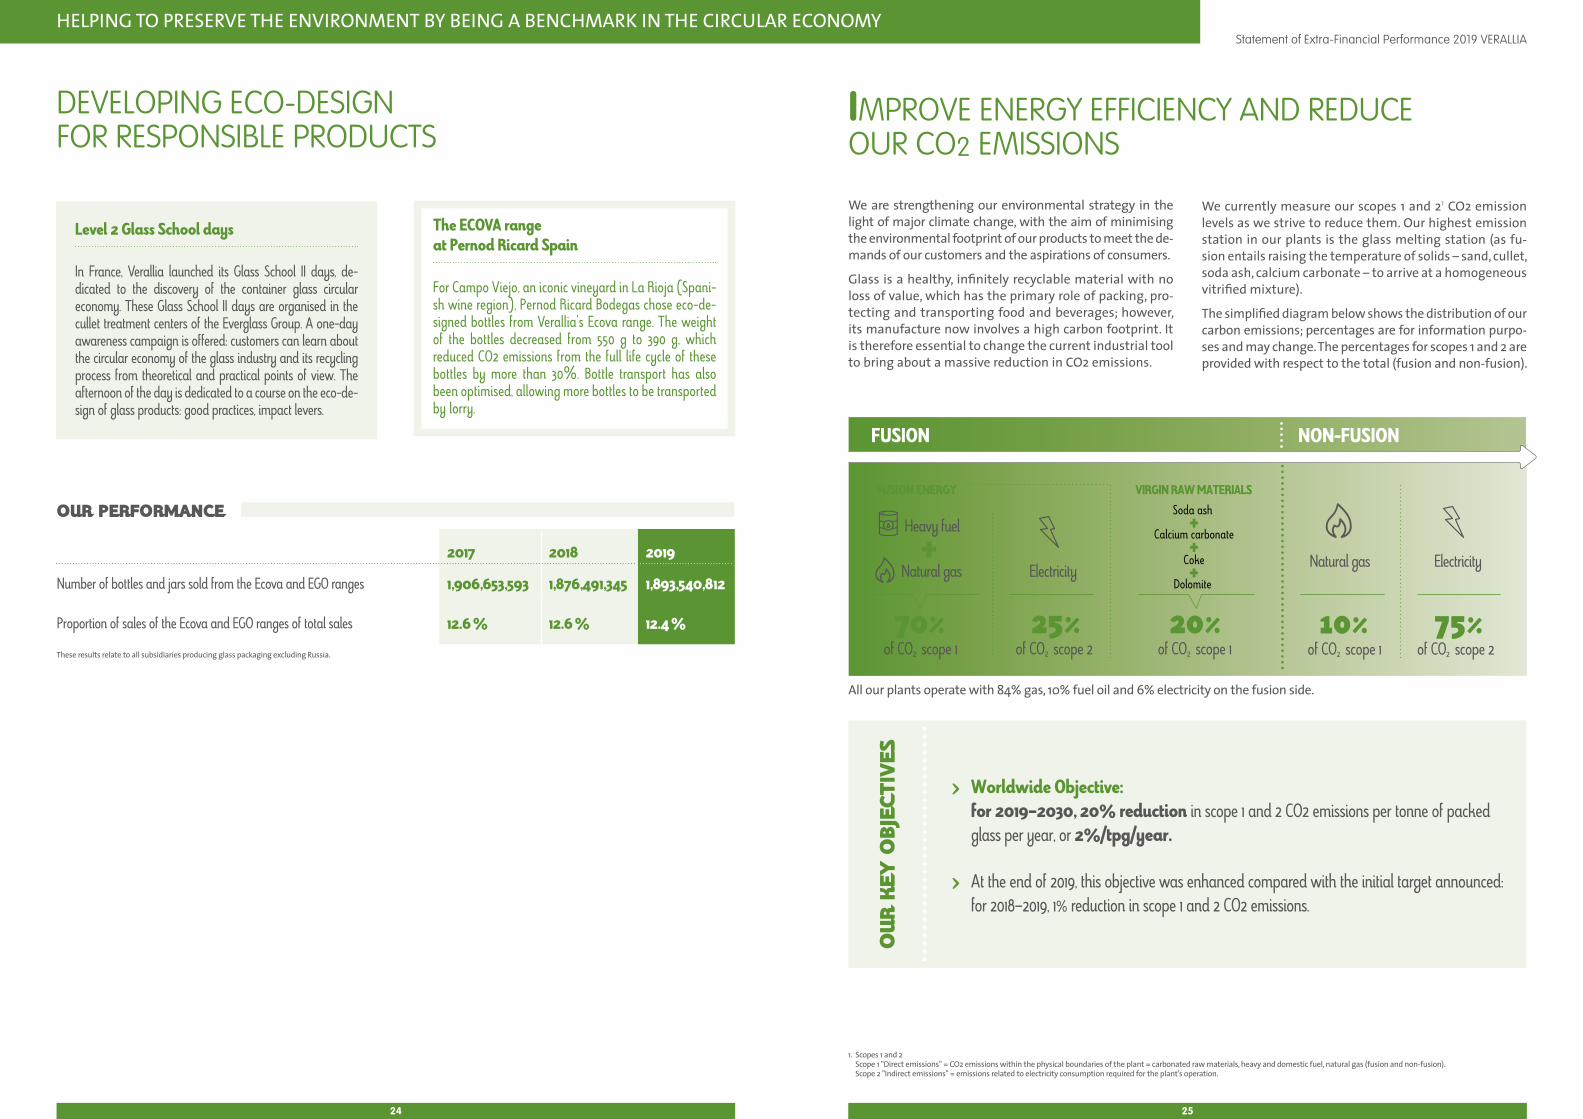
HELPING TO PRESERVE THE ENVIRONMENT BY BEING A BENCHMARK IN THE CIRCULAR ECONOMY Statement of Extra-Financial Performance 2019 VERALLIA
Level 2 Glass School days
In France, Verallia launched its Glass School II days, de-dicated to the discovery of the container glass circular economy. These Glass School II days are organised in the cullet treatment centers of the Everglass Group. A one-day awareness campaign is offered: customers can learn about the circular economy of the glass industry and its recycling process from theoretical and practical points of view. The afternoon of the day is dedicated to a course on the eco-de-sign of glass products: good practices, impact levers.
2017 2018 2019
Number of bottles and jars sold from the Ecova and EGO ranges 1,906,653,593 1,876,491,345 1,893,540,812
Proportion of sales of the Ecova and EGO ranges of total sales 12.6 % 12.6 % 12.4 %
OUR PERFORMANCE
The ECOVA range at Pernod Ricard Spain
For Campo Viejo, an iconic vineyard in La Rioja (Spani-sh wine region), Pernod Ricard Bodegas chose eco-de-signed bottles from Verallia's Ecova range. The weight of the bottles decreased from 550 g to 390 g, which reduced CO2 emissions from the full life cycle of these bottles by more than 30%. Bottle transport has also been optimised, allowing more bottles to be transported by lorry.
We are strengthening our environmental strategy in the light of major climate change, with the aim of minimising the environmental footprint of our products to meet the de-mands of our customers and the aspirations of consumers.
Glass is a healthy, infinitely recyclable material with no loss of value, which has the primary role of packing, pro-tecting and transporting food and beverages; however, its manufacture now involves a high carbon footprint. It is therefore essential to change the current industrial tool to bring about a massive reduction in CO2 emissions.
We currently measure our scopes 1 and 21 CO2 emission levels as we strive to reduce them. Our highest emission station in our plants is the glass melting station (as fu-sion entails raising the temperature of solids – sand, cullet, soda ash, calcium carbonate – to arrive at a homogeneous vitrified mixture).
The simplified diagram below shows the distribution of our carbon emissions; percentages are for information purpo-ses and may change. The percentages for scopes 1 and 2 are provided with respect to the total (fusion and non-fusion).
IMPROVE ENERGY EFFICIENCY AND REDUCE OUR CO2 EMISSIONS
1. Scopes 1 and 2 Scope 1 "Direct emissions" = CO2 emissions within the physical boundaries of the plant = carbonated raw materials, heavy and domestic fuel, natural gas (fusion and non-fusion). Scope 2 "Indirect emissions" = emissions related to electricity consumption required for the plant’s operation.
All our plants operate with 84% gas, 10% fuel oil and 6% electricity on the fusion side.
These results relate to all subsidiaries producing glass packaging excluding Russia.
DEVELOPING ECO-DESIGN FOR RESPONSIBLE PRODUCTS
FUSION ENERGY VIRGIN RAW MATERIALS
Électricité —> Co2scope 1 25%
70%Natural gas Natural gas
of CO2 scope 125%
of CO2 scope 220%
of CO2 scope 1
Heavy fuel
+Electricity
75%of CO2 scope 1
Electricity
of CO2 scope 2
Soda ash +
Calcium carbonate+
Coke+
Dolomite
10%
OUR
KEY
OBJ
ECTI
VES
> Worldwide Objective: for 2019–2030, 20% reduction in scope 1 and 2 CO2 emissions per tonne of packed glass per year, or 2%/tpg/year.
> At the end of 2019, this objective was enhanced compared with the initial target announced: for 2018–2019, 1% reduction in scope 1 and 2 CO2 emissions.
FUSION NON-FUSION
2524
HELPING TO PRESERVE THE ENVIRONMENT BY BEING A BENCHMARK IN THE CIRCULAR ECONOMY Statement of Extra-Financial Performance 2019 VERALLIA
1. Feeder = distribution channel that supplies glass to the machines from the front end of the furnace. Their role is to maintain the temperature and homogenise the glass until it arrives at the machine.
2. The waste heat is the residual heat produced by a process and not used by it.
GovernanceGlobal EHS policy is initiated by the Chairman and CEO and the CSR department, and then deployed and facilitated at the level of each department. See governance of the EHS function "Acting for the safety and development of our teams".
In 2019, the Group decided to strengthen its actions to re-duce its environmental footprint by giving priority to redu-cing CO2 emissions. The reduction target applicable from 2020 has become -2% for scope 1 and 2 per year between 2019 and 2030. Accordingly, the Group has set up a special organisation, defined in line with the various project ma-nagers. The global approach and objectives are determined by the CEO and are forwarded to all relevant departments: industrial, technical, R&D, EHS, procurement (in charge of renewable energy purchases), and finance. This steering committee meets every three months.
A specific "industrial excellence" network in the Technical Department is in place to ensure the deployment and im-plementation of projects and actions, including those with a direct impact on the reduction of energy consumption and CO2 emissions. This network is led by a manager on each region of the Group and by a coordinator at each plant. Mon-thly and quarterly reviews are performed by the Director of Industrial Excellence in order to attain the annual objectives.
Building on its new CO2 emission reduction objectives, the Group has stepped up its strategy through three key steps:
1/ Raise awareness,
2/ Measure,
3/ Reduce.
Raising awareness is the first step in the process of ensuring that each Verallia employee, including top management, shares a common level of knowledge on environmental is-sues and the acceleration of climate change. This first of all involves understanding the concept of CSR and the various lines of action during special meetings held in the Group. This presentation is relayed by each CSR expert worldwide to raise awareness among as many employees as possible.
The Climate Mural is another way of educating colleagues. This is a two-and-a-half hour workshop hosted by external consultants, which consists of three sequences: alignment of knowledge about the climate crisis and the need for ac-tion; presentation of the various driving forces for Verallia on these subjects; and collective reflection on concrete so-lutions to activate these forces. The 32 site managers have already participated in this mural. We have also organised workshops in four of our countries (Germany, France, Ita-ly and Spain), bringing together various functions of the Group (EHS, Purchasing, Marketing, Industrial, Manage-ment Control, etc.). These workshops have enabled us to raise awareness and examine 70 views, allowing us to align knowledge and identify actions to contribute to the objec-tive of reducing CO2 emissions. This workshop will also be offered to Executive Committee members in the first half of 2020.
To improve the measurement of our CO2 impacts and to communicate our "climate energy pledge" to our large-scale customers and investors, as of 2020, we will use the global benchmark for impact collection and assessment: The CDP (formerly the Carbon Disclosure Project1). The frequency of CO2 reporting will also be increased by 2020 through mon-thly versus quarterly reporting by EHS managers to the EHS Group Manager.
All Industrial, Technical, R&D and EHS departments strive daily to reduce the Group’s CO2 emissions. In 2019, this was reflected in a significant decrease in the share of fuel oil in the energy mix used.
All our plants operate with 84% gas, 10% fuel oil and 6% electricity on the fusion side. Five countries have completed their full conversion with furnaces operating with 95% gas and 5% electricity (Germany, Ukraine, Russia, Spain – exclu-ding the Canary Islands – and Portugal). 2019 also marked the worldwide deployment of industrial solutions described below in our policy. New actions will be added to attain the new objective of reducing CO2 emissions by at least 2% per tonne of packed glass from 2020.
A policy to adapt our different industrial tools to climate change
Today, only our scope 1 and scope 2 impact is measured. Our objectives and action plans are mainly established on the basis of scope 1 and 2 data.
The Group's approach to energy efficiency targets:
1. Eradicating all energy losses identifiedA structured method has been put in place to enable com-prehensive identification of energy losses. This programme uses different types of tools (energy auditing, equipment efficiency, leak detection, etc.).
The next step is to define projects to eradicate the iden-tified losses. A project is characterised by the definition of objectives, the creation of a team, work planning and industrial key performance indicators. Performance is mea-sured every month.
2. Improving existing industrial tools Throughout the service life of our furnaces (10 to 12 years, or even 14 years), the Group makes improvements to reduce energy consumption. This can be achieved through impro-vements in sealing and thermal insulation, glass tempera-ture optimisation, combustion settings, and adjustment of combustion air volume.
In regions with fluctuating Lower Calorific Value (LCV), the Group continued to deploy a real-time LCV regulation sys-tem, to optimise continuous combustion. Furnaces are thus less energy-intensive and more environmentally friendly.
By the end of 2019, 35% of Verallia furnaces had been fitted with this system. An identical programme will be deployed for feeders1 from 2020.
3. Research and development in a less energy-intensive 4.0 industry
As energy is mainly consumed during glass melting, each new furnace construction is an opportunity to improve the Group's performance in these areas.
The Group is investing to introduce artificial intelligence into its plants - Industry 4.0. Sensors progressively installed throughout the production line contribute to the regulation of production in real time. This approach makes it possible to stabilise production, quality and energy consumption.
Our specific action plansActions based on circular economy principles.
Initiatives based on circular economy principles enable the recovery of energy consumed, by extracting the waste heat2 from our installations to heat the buildings of the Group or neighbouring cities, as implemented in Germany a few years ago or in France recently.
First steps towards greener transportWith regard to commodity suppliers, Verallia always looks for local actors in order to reduce the impact of transport and thus minimise the environmental impact. For exa-mple, Italy's choice of multimodal transport allows the transfer of certain lorry flows to other transport modes, such as shipping and rail. This helps to reduce the carbon footprint of the Group, which also prioritises the use of a new generation of lorries powered by liquefied natural gas (LNG), less polluting than gasoline.
Waste heat recovery2
At the Neuburg (Germany) site, thanks to a heat exchan-ger set up in 2015, the heat from furnaces is recovered and used for the city's heat network.
Benefit for the city: 23.7 GWh in 2019 (about 7% of consumption of the plant)
On the site in Wirges, Germany, a waste heat recovery unit was installed on both furnaces of the plant in late 2013, hel-ping to drastically reduce gas consumption for heating the site (86% reduction corresponding to 10 GWh of natural gas and CO2 emissions reduced by 2000 tonnes per year).
At the Saint-Romain-Le-Puy site (France), thanks to the investment in 2018 of a system to recover waste heat from annealing arches to heat the plant and produce domes-tic hot water, the emission of almost 500t of CO2 could be avoided in 2019 (i.e. halving the natural gas consumption of these stations = -2500 MWh).
IMPROVE ENERGY EFFICIENCY AND REDUCE OUR CO2 EMISSIONS
1. https://www.cdp.net/fr
2726
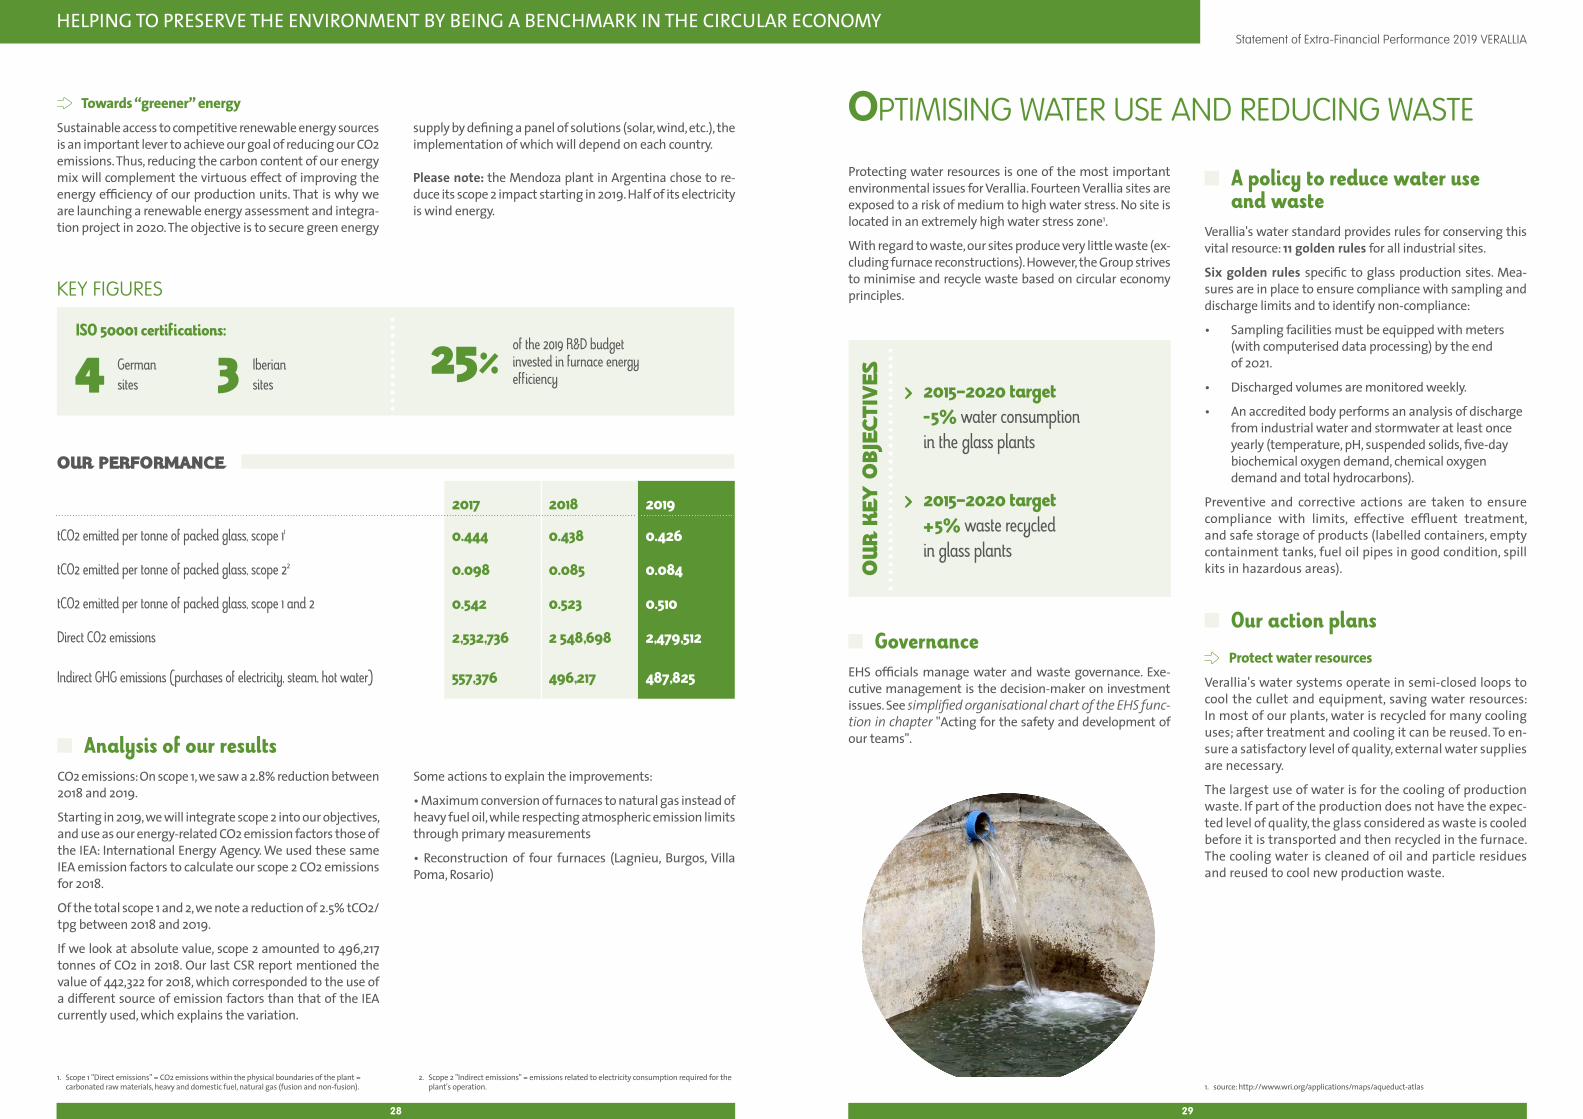
HELPING TO PRESERVE THE ENVIRONMENT BY BEING A BENCHMARK IN THE CIRCULAR ECONOMY Statement of Extra-Financial Performance 2019 VERALLIA
Towards “greener” energySustainable access to competitive renewable energy sources is an important lever to achieve our goal of reducing our CO2 emissions. Thus, reducing the carbon content of our energy mix will complement the virtuous effect of improving the energy efficiency of our production units. That is why we are launching a renewable energy assessment and integra-tion project in 2020. The objective is to secure green energy
supply by defining a panel of solutions (solar, wind, etc.), the implementation of which will depend on each country.
Please note: the Mendoza plant in Argentina chose to re-duce its scope 2 impact starting in 2019. Half of its electricity is wind energy.
2017 2018 2019
tCO2 emitted per tonne of packed glass, scope 11 0.444 0.438 0.426
tCO2 emitted per tonne of packed glass, scope 22 0.098 0.085 0.084
tCO2 emitted per tonne of packed glass, scope 1 and 2 0.542 0.523 0.510
Direct CO2 emissions 2,532,736 2 548,698 2,479,512
Indirect GHG emissions (purchases of electricity, steam, hot water) 557,376 496,217 487,825
OUR PERFORMANCE
1. Scope 1 "Direct emissions" = CO2 emissions within the physical boundaries of the plant = carbonated raw materials, heavy and domestic fuel, natural gas (fusion and non-fusion).
2. Scope 2 "Indirect emissions" = emissions related to electricity consumption required for the plant's operation. 1. source: http://www.wri.org/applications/maps/aqueduct-atlas
Protecting water resources is one of the most important environmental issues for Verallia. Fourteen Verallia sites are exposed to a risk of medium to high water stress. No site is located in an extremely high water stress zone1.
With regard to waste, our sites produce very little waste (ex-cluding furnace reconstructions). However, the Group strives to minimise and recycle waste based on circular economy principles.
GovernanceEHS officials manage water and waste governance. Exe-cutive management is the decision-maker on investment issues. See simplified organisational chart of the EHS func-tion in chapter "Acting for the safety and development of our teams".
A policy to reduce water use and waste
Verallia's water standard provides rules for conserving this vital resource: 11 golden rules for all industrial sites.
Six golden rules specific to glass production sites. Mea-sures are in place to ensure compliance with sampling and discharge limits and to identify non-compliance:
• Sampling facilities must be equipped with meters (with computerised data processing) by the end of 2021.
• Discharged volumes are monitored weekly.
• An accredited body performs an analysis of discharge from industrial water and stormwater at least once yearly (temperature, pH, suspended solids, five-day biochemical oxygen demand, chemical oxygen demand and total hydrocarbons).
Preventive and corrective actions are taken to ensure compliance with limits, effective effluent treatment, and safe storage of products (labelled containers, empty containment tanks, fuel oil pipes in good condition, spill kits in hazardous areas).
Our action plans
Protect water resourcesVerallia's water systems operate in semi-closed loops to cool the cullet and equipment, saving water resources: In most of our plants, water is recycled for many cooling uses; after treatment and cooling it can be reused. To en-sure a satisfactory level of quality, external water supplies are necessary.
The largest use of water is for the cooling of production waste. If part of the production does not have the expec-ted level of quality, the glass considered as waste is cooled before it is transported and then recycled in the furnace. The cooling water is cleaned of oil and particle residues and reused to cool new production waste.
OPTIMISING WATER USE AND REDUCING WASTE
ISO 50001 certifications:
KEY FIGURES
3 Iberian sites
25% of the 2019 R&D budget invested in furnace energy efficiency4
German sites
Analysis of our resultsCO2 emissions: On scope 1, we saw a 2.8% reduction between 2018 and 2019.
Starting in 2019, we will integrate scope 2 into our objectives, and use as our energy-related CO2 emission factors those of the IEA: International Energy Agency. We used these same IEA emission factors to calculate our scope 2 CO2 emissions for 2018.
Of the total scope 1 and 2, we note a reduction of 2.5% tCO2/tpg between 2018 and 2019.
If we look at absolute value, scope 2 amounted to 496,217 tonnes of CO2 in 2018. Our last CSR report mentioned the value of 442,322 for 2018, which corresponded to the use of a different source of emission factors than that of the IEA currently used, which explains the variation.
Some actions to explain the improvements:
• Maximum conversion of furnaces to natural gas instead of heavy fuel oil, while respecting atmospheric emission limits through primary measurements
• Reconstruction of four furnaces (Lagnieu, Burgos, Villa Poma, Rosario)
OUR
KEY
OBJ
ECTI
VES
> 2015–2020 target -5% water consumption in the glass plants
> 2015–2020 target +5% waste recycled in glass plants
2928

HELPING TO PRESERVE THE ENVIRONMENT BY BEING A BENCHMARK IN THE CIRCULAR ECONOMY Statement of Extra-Financial Performance 2019 VERALLIA
Cooling water from equipment (compressors, for example) is the second most important item of water consumption. These circuits operate in closed loops thanks to air cooling towers.
Other occasional water uses are intended for the reconstruc-tion of furnaces.
Monitoring of the implementation of the actions in the wa-ter standard has begun and will continue through coaching in environmental standards (as done for safety and health). Technical improvement actions are also in place: For exa-mple, for gob cutting water, the benchmark between sites has reduced water use by four to five times.
Reduce wasteSeveral actions have been taken to minimise waste, treat it and return it to the internal circuit; they are listed together in a catalogue of best practices.
Examples of best practices include the following:
• Organisation of storage areas
• Identification of waste collection containers with common colours
• Best methods of waste management, by waste type
• Reduction at source (sorting and washing soiled rags and gloves, replacing hazardous with non-hazardous materials)
Example: Waste disposal, Italy (Villa Poma site)
2017 2018 2019
Water consumption (m3/tonne of packed glass) 0.569 0.583 0.630
Percentage of our waste recycled 69% 51% 62%
Total water extractions (m3) 3,241,798 3,389,114 3,671,417
Quantity of waste produced (tonnes) 66,864 53,010 65,385
OUR PERFORMANCE
Analysis of our resultsWater use : In 2019, an average of 0.63 m3 of water was used per tonne of packaged glass. After several years of improvement (-5% between 2015 and 2018), use increased by 8% between 2018 and 2019. Specific issues in three plants contributed to more than 60% of the degradation:• At one site, pipes dating to 1970 and cooling towers
in poor condition were a source of major leaks, re-solved at the end of 2019 and early 2020. To address this issue, regular inspections are conducted and new cooling towers will be installed in 2020.
• Another site has encountered quality problems; the-refore, there is no internal cullet to cool.
• Finally, at one of our sites, end-of-life furnaces un-derwent hot repairs (six in one year for two furnaces) requiring large amounts of water.
• Some sites reduced consumption significantly in 2019 by implementing actions:
Chalon-sur-Saône (France) : -19%
> Cleaning of settling ponds and sludge removal
> Pipe cleaning
> Refurbishment of instrumentation for make-up water on IS machines
> Staff awareness buildingZorya (Ukraine): -11% thanks to more frequent checks of water volumes used.
WasteIn 2019, we recycled 62% of our waste, an increase of 11% compared with 2018. The Lagnieu plant particularly impro-ved, recycling 100% of its electrostatic precipitator dust. Another important performance indicator: The amount of non-recycled waste per tonne of packaged glass is 13% lower in 2019 than in 2018. This decrease demonstrates waste reduction at source, for example, by recycling cullet sludge, electrostatic precipitator dust and waste of various compositions in the furnace.
OPTIMISING WATER USE AND REDUCING WASTE
1. Including waste from furnace reconstructions
KEY FIGURES
4.31kg
of non-recycled waste per tonne of packed glass
3130
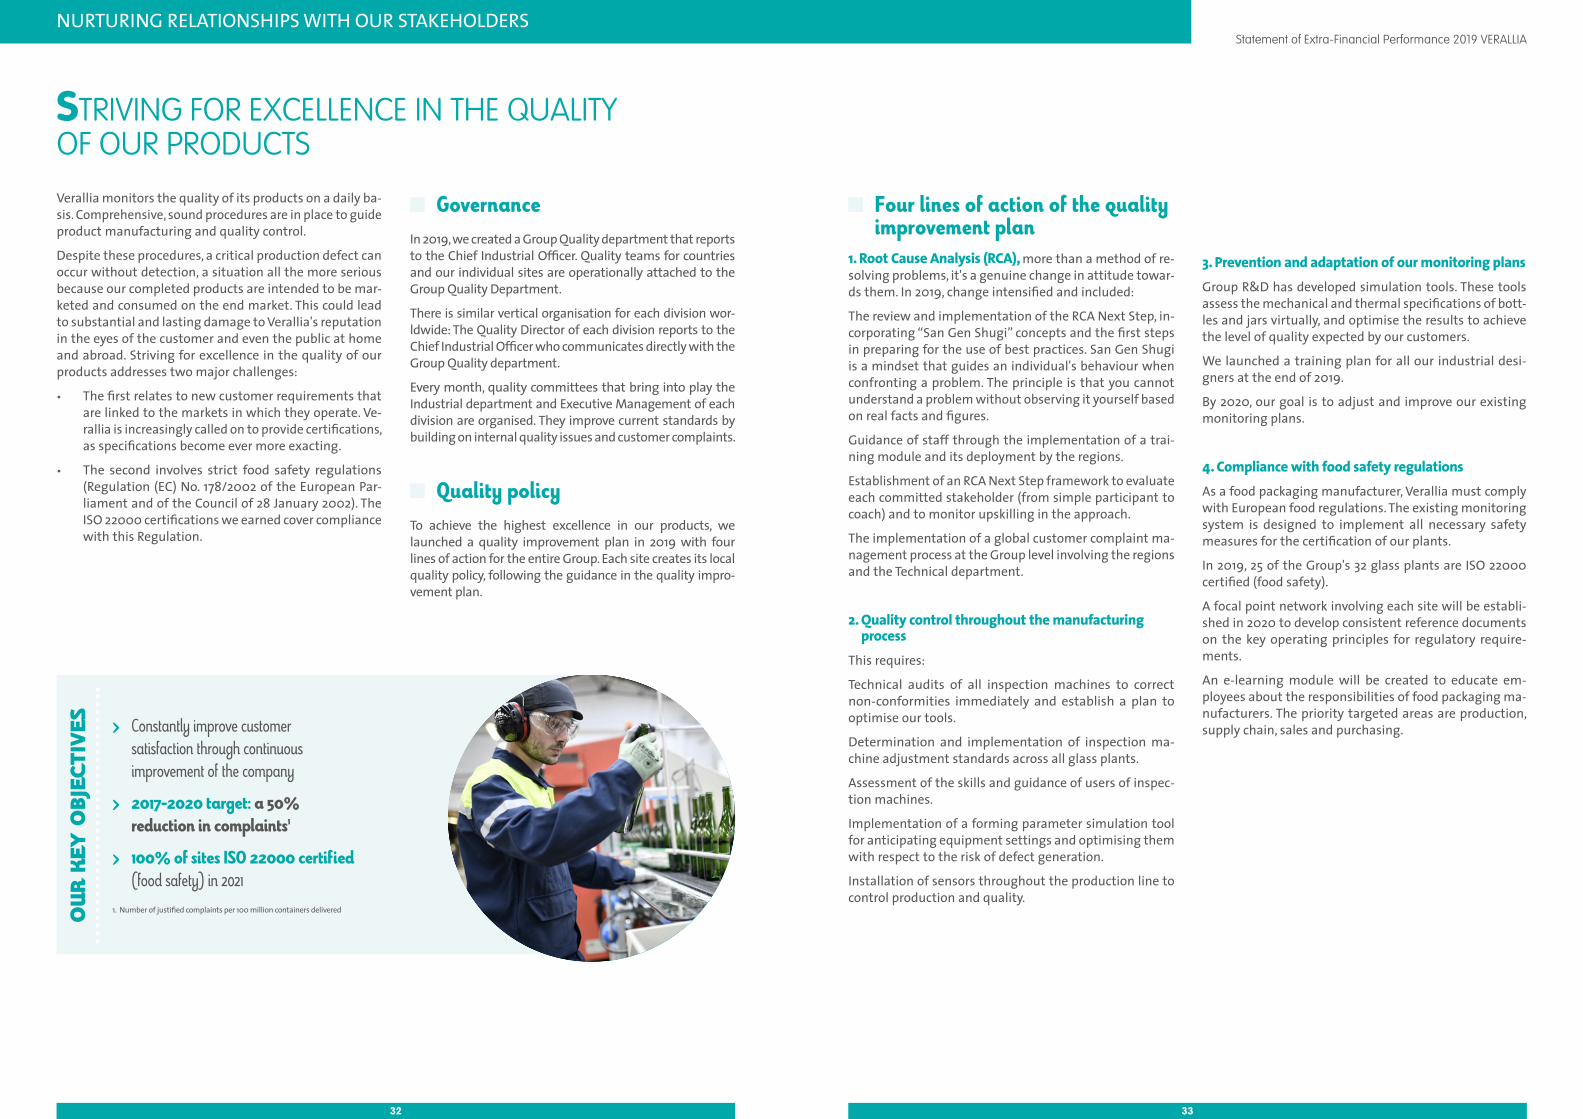
NURTURING RELATIONSHIPS WITH OUR STAKEHOLDERS Statement of Extra-Financial Performance 2019 VERALLIA
Verallia monitors the quality of its products on a daily ba-sis. Comprehensive, sound procedures are in place to guide product manufacturing and quality control.
Despite these procedures, a critical production defect can occur without detection, a situation all the more serious because our completed products are intended to be mar-keted and consumed on the end market. This could lead to substantial and lasting damage to Verallia's reputation in the eyes of the customer and even the public at home and abroad. Striving for excellence in the quality of our products addresses two major challenges:
• The first relates to new customer requirements that are linked to the markets in which they operate. Ve-rallia is increasingly called on to provide certifications, as specifications become ever more exacting.
• The second involves strict food safety regulations (Regulation (EC) No. 178/2002 of the European Par-liament and of the Council of 28 January 2002). The ISO 22000 certifications we earned cover compliance with this Regulation.
Governance In 2019, we created a Group Quality department that reports to the Chief Industrial Officer. Quality teams for countries and our individual sites are operationally attached to the Group Quality Department.
There is similar vertical organisation for each division wor-ldwide: The Quality Director of each division reports to the Chief Industrial Officer who communicates directly with the Group Quality department.
Every month, quality committees that bring into play the Industrial department and Executive Management of each division are organised. They improve current standards by building on internal quality issues and customer complaints.
Quality policyTo achieve the highest excellence in our products, we launched a quality improvement plan in 2019 with four lines of action for the entire Group. Each site creates its local quality policy, following the guidance in the quality impro-vement plan.
STRIVING FOR EXCELLENCE IN THE QUALITY OF OUR PRODUCTS
OUR
KEY
OBJ
ECTI
VES
> Constantly improve customer satisfaction through continuous improvement of the company
> 2017-2020 target: a 50% reduction in complaints1
> 100% of sites ISO 22000 certified (food safety) in 2021
1. Number of justified complaints per 100 million containers delivered
Four lines of action of the quality improvement plan
1. Root Cause Analysis (RCA), more than a method of re-solving problems, it's a genuine change in attitude towar-ds them. In 2019, change intensified and included:
The review and implementation of the RCA Next Step, in-corporating “San Gen Shugi” concepts and the first steps in preparing for the use of best practices. San Gen Shugi is a mindset that guides an individual's behaviour when confronting a problem. The principle is that you cannot understand a problem without observing it yourself based on real facts and figures.
Guidance of staff through the implementation of a trai-ning module and its deployment by the regions.
Establishment of an RCA Next Step framework to evaluate each committed stakeholder (from simple participant to coach) and to monitor upskilling in the approach.
The implementation of a global customer complaint ma-nagement process at the Group level involving the regions and the Technical department.
2. Quality control throughout the manufacturing process
This requires:
Technical audits of all inspection machines to correct non-conformities immediately and establish a plan to optimise our tools.
Determination and implementation of inspection ma-chine adjustment standards across all glass plants.
Assessment of the skills and guidance of users of inspec-tion machines.
Implementation of a forming parameter simulation tool for anticipating equipment settings and optimising them with respect to the risk of defect generation.
Installation of sensors throughout the production line to control production and quality.
3. Prevention and adaptation of our monitoring plansGroup R&D has developed simulation tools. These tools assess the mechanical and thermal specifications of bott-les and jars virtually, and optimise the results to achieve the level of quality expected by our customers.
We launched a training plan for all our industrial desi-gners at the end of 2019.
By 2020, our goal is to adjust and improve our existing monitoring plans.
4. Compliance with food safety regulationsAs a food packaging manufacturer, Verallia must comply with European food regulations. The existing monitoring system is designed to implement all necessary safety measures for the certification of our plants.
In 2019, 25 of the Group's 32 glass plants are ISO 22000 certified (food safety).
A focal point network involving each site will be establi-shed in 2020 to develop consistent reference documents on the key operating principles for regulatory require-ments.
An e-learning module will be created to educate em-ployees about the responsibilities of food packaging ma-nufacturers. The priority targeted areas are production, supply chain, sales and purchasing.
3332
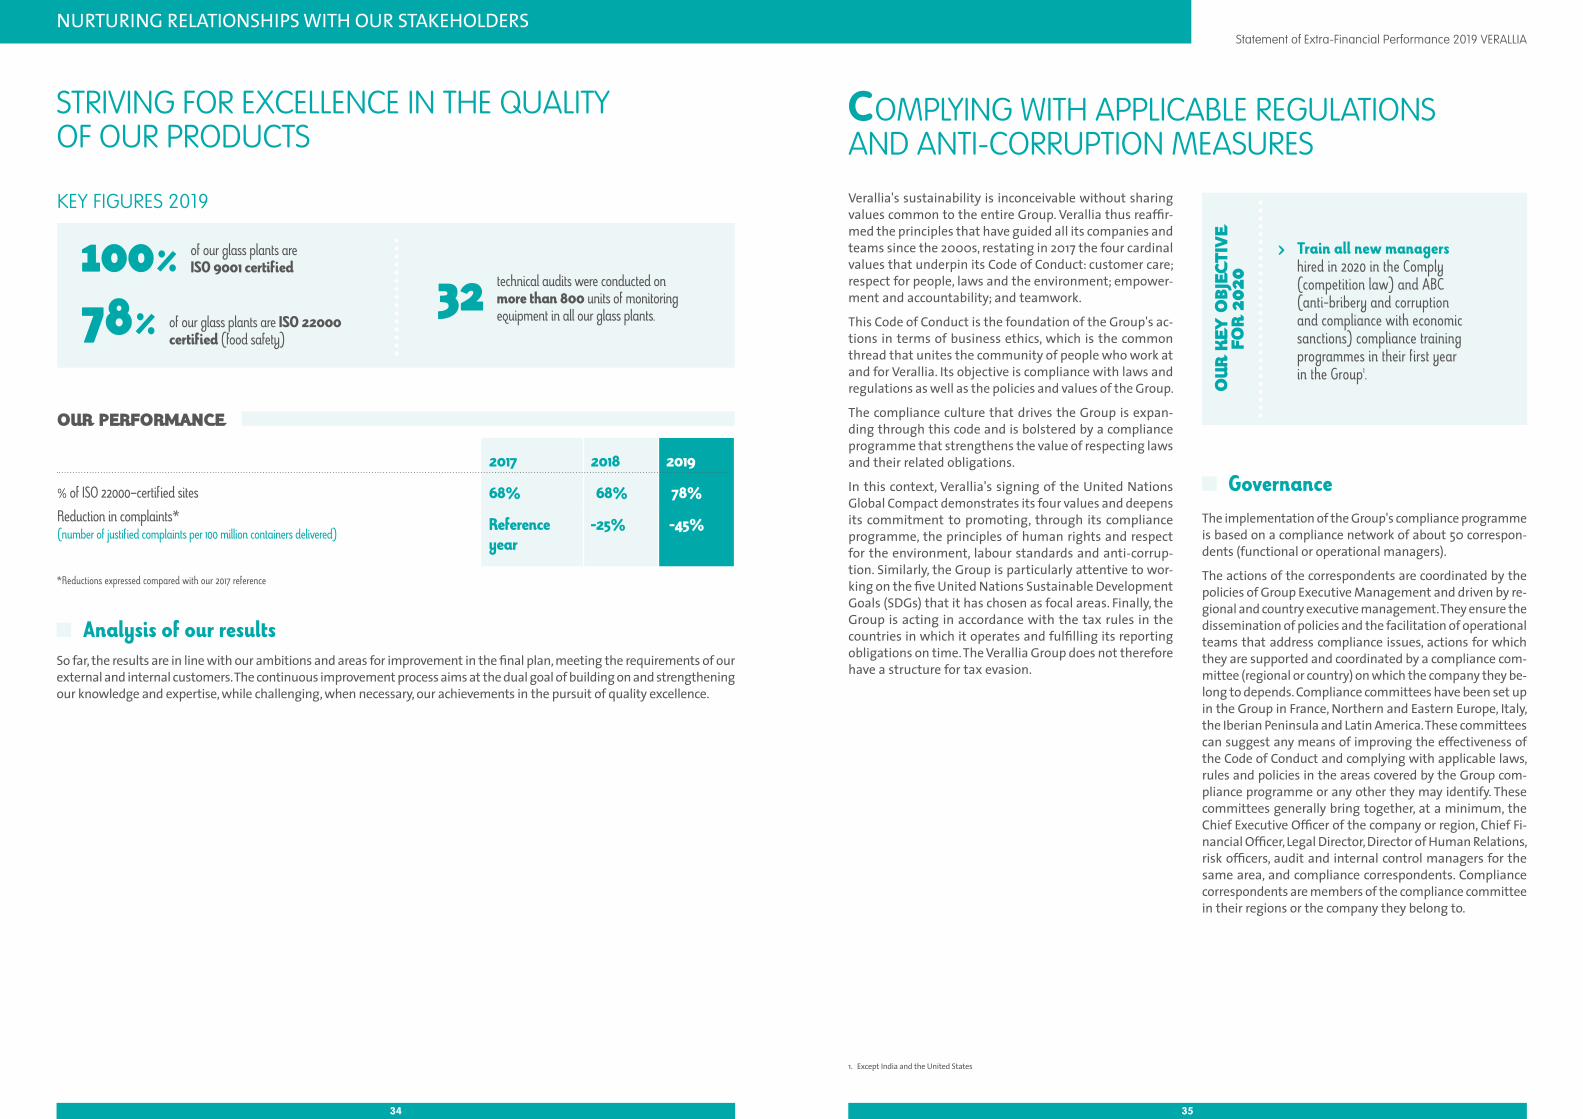
NURTURING RELATIONSHIPS WITH OUR STAKEHOLDERS Statement of Extra-Financial Performance 2019 VERALLIA
KEY FIGURES 2019
2017 2018 2019
% of ISO 22000–certified sites 68% 68% 78%Reduction in complaints* (number of justified complaints per 100 million containers delivered)
Reference year
-25% -45%
OUR PERFORMANCE
Analysis of our resultsSo far, the results are in line with our ambitions and areas for improvement in the final plan, meeting the requirements of our external and internal customers. The continuous improvement process aims at the dual goal of building on and strengthening our knowledge and expertise, while challenging, when necessary, our achievements in the pursuit of quality excellence.
Verallia's sustainability is inconceivable without sharing values common to the entire Group. Verallia thus reaffir-med the principles that have guided all its companies and teams since the 2000s, restating in 2017 the four cardinal values that underpin its Code of Conduct: customer care; respect for people, laws and the environment; empower-ment and accountability; and teamwork.
This Code of Conduct is the foundation of the Group's ac-tions in terms of business ethics, which is the common thread that unites the community of people who work at and for Verallia. Its objective is compliance with laws and regulations as well as the policies and values of the Group.
The compliance culture that drives the Group is expan-ding through this code and is bolstered by a compliance programme that strengthens the value of respecting laws and their related obligations.
In this context, Verallia's signing of the United Nations Global Compact demonstrates its four values and deepens its commitment to promoting, through its compliance programme, the principles of human rights and respect for the environment, labour standards and anti-corrup-tion. Similarly, the Group is particularly attentive to wor-king on the five United Nations Sustainable Development Goals (SDGs) that it has chosen as focal areas. Finally, the Group is acting in accordance with the tax rules in the countries in which it operates and fulfilling its reporting obligations on time. The Verallia Group does not therefore have a structure for tax evasion.
COMPLYING WITH APPLICABLE REGULATIONS AND ANTI-CORRUPTION MEASURES
Governance The implementation of the Group's compliance programme is based on a compliance network of about 50 correspon-dents (functional or operational managers).
The actions of the correspondents are coordinated by the policies of Group Executive Management and driven by re-gional and country executive management. They ensure the dissemination of policies and the facilitation of operational teams that address compliance issues, actions for which they are supported and coordinated by a compliance com-mittee (regional or country) on which the company they be-long to depends. Compliance committees have been set up in the Group in France, Northern and Eastern Europe, Italy, the Iberian Peninsula and Latin America. These committees can suggest any means of improving the effectiveness of the Code of Conduct and complying with applicable laws, rules and policies in the areas covered by the Group com-pliance programme or any other they may identify. These committees generally bring together, at a minimum, the Chief Executive Officer of the company or region, Chief Fi-nancial Officer, Legal Director, Director of Human Relations, risk officers, audit and internal control managers for the same area, and compliance correspondents. Compliance correspondents are members of the compliance committee in their regions or the company they belong to.
STRIVING FOR EXCELLENCE IN THE QUALITY OF OUR PRODUCTS
100 % of our glass plants are ISO 9001 certified
78 % of our glass plants are ISO 22000 certified (food safety)
32 technical audits were conducted on
more than 800 units of monitoring equipment in all our glass plants.
OUR
KEY
OBJ
ECTI
VE
FOR
2020
> Train all new managers hired in 2020 in the Comply (competition law) and ABC (anti-bribery and corruption and compliance with economic sanctions) compliance training programmes in their first year in the Group1.
1. Except India and the United States
*Reductions expressed compared with our 2017 reference
3534
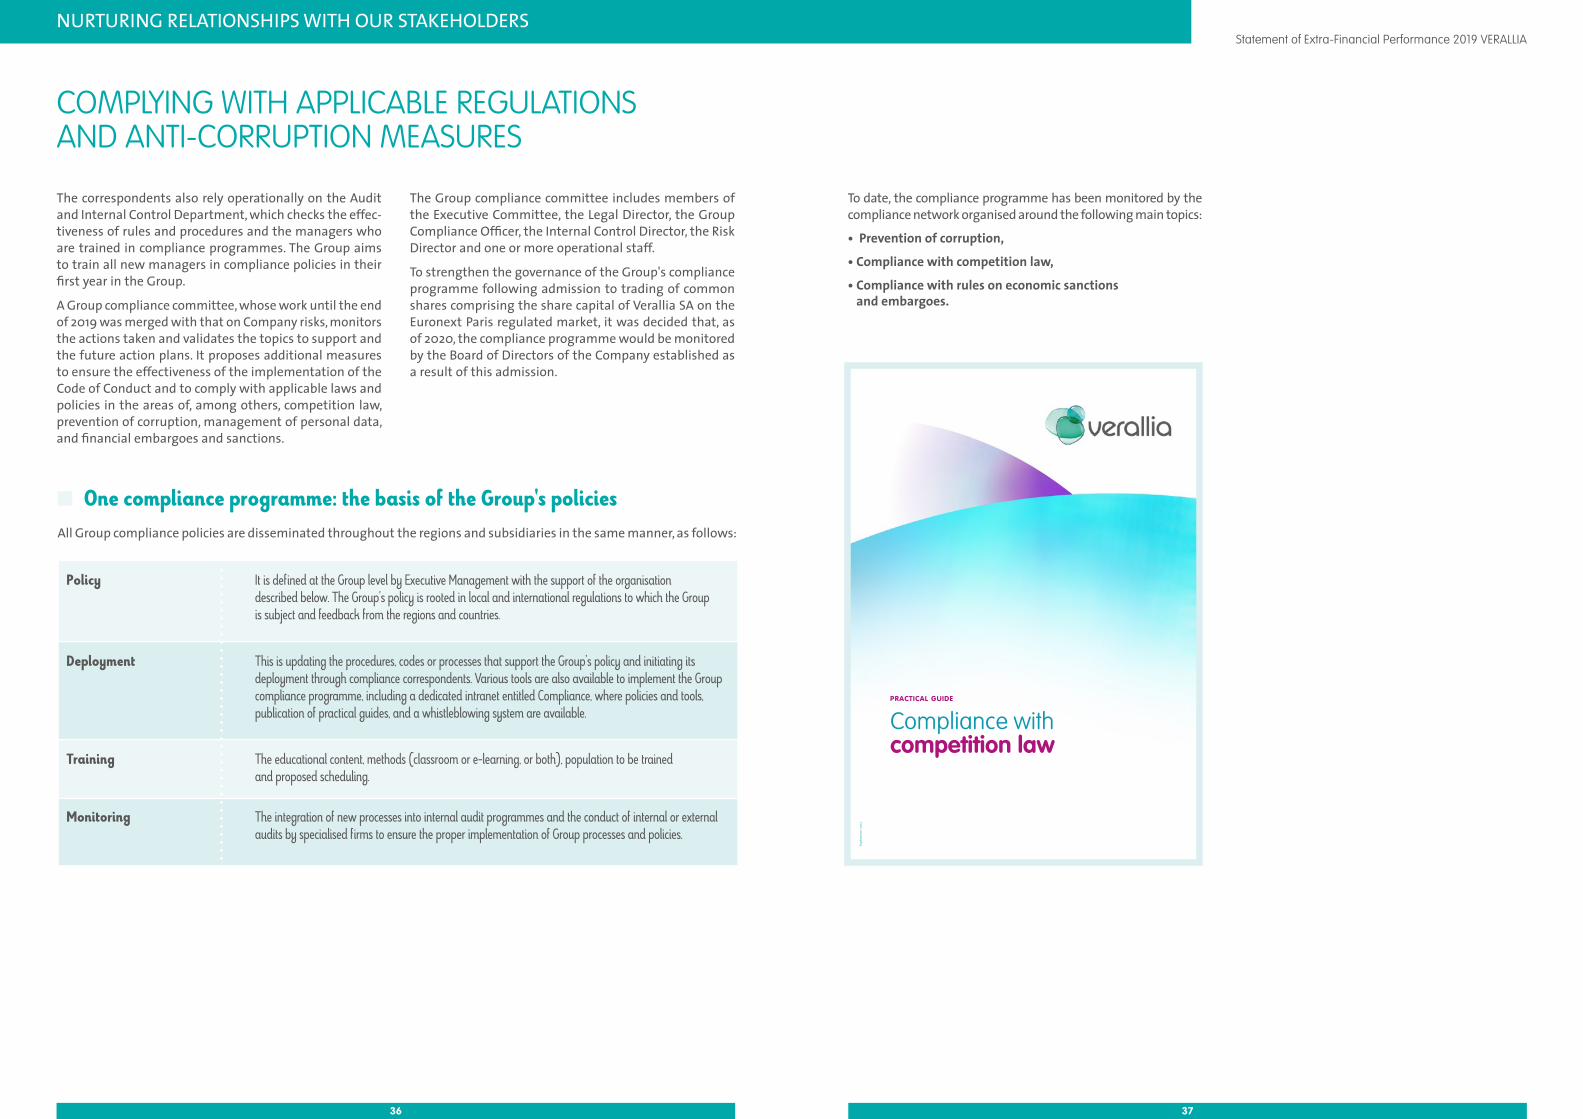
NURTURING RELATIONSHIPS WITH OUR STAKEHOLDERS Statement of Extra-Financial Performance 2019 VERALLIA
The correspondents also rely operationally on the Audit and Internal Control Department, which checks the effec-tiveness of rules and procedures and the managers who are trained in compliance programmes. The Group aims to train all new managers in compliance policies in their first year in the Group.
A Group compliance committee, whose work until the end of 2019 was merged with that on Company risks, monitors the actions taken and validates the topics to support and the future action plans. It proposes additional measures to ensure the effectiveness of the implementation of the Code of Conduct and to comply with applicable laws and policies in the areas of, among others, competition law, prevention of corruption, management of personal data, and financial embargoes and sanctions.
The Group compliance committee includes members of the Executive Committee, the Legal Director, the Group Compliance Officer, the Internal Control Director, the Risk Director and one or more operational staff.
To strengthen the governance of the Group's compliance programme following admission to trading of common shares comprising the share capital of Verallia SA on the Euronext Paris regulated market, it was decided that, as of 2020, the compliance programme would be monitored by the Board of Directors of the Company established as a result of this admission.
One compliance programme: the basis of the Group's policiesAll Group compliance policies are disseminated throughout the regions and subsidiaries in the same manner, as follows:
Policy It is defined at the Group level by Executive Management with the support of the organisation described below. The Group's policy is rooted in local and international regulations to which the Group is subject and feedback from the regions and countries.
Deployment This is updating the procedures, codes or processes that support the Group's policy and initiating its deployment through compliance correspondents. Various tools are also available to implement the Group compliance programme, including a dedicated intranet entitled Compliance, where policies and tools, publication of practical guides, and a whistleblowing system are available.
Training The educational content, methods (classroom or e-learning, or both), population to be trained and proposed scheduling.
Monitoring The integration of new processes into internal audit programmes and the conduct of internal or external audits by specialised firms to ensure the proper implementation of Group processes and policies.
To date, the compliance programme has been monitored by the compliance network organised around the following main topics:
• Prevention of corruption,
• Compliance with competition law,
• Compliance with rules on economic sanctions and embargoes.
COMPLYING WITH APPLICABLE REGULATIONS AND ANTI-CORRUPTION MEASURES
VERALLIA - Compliance with competit ion law - page 1
PRACTICAL GUIDE
Compliance with competition law
Sept
embe
r 201
7
3736
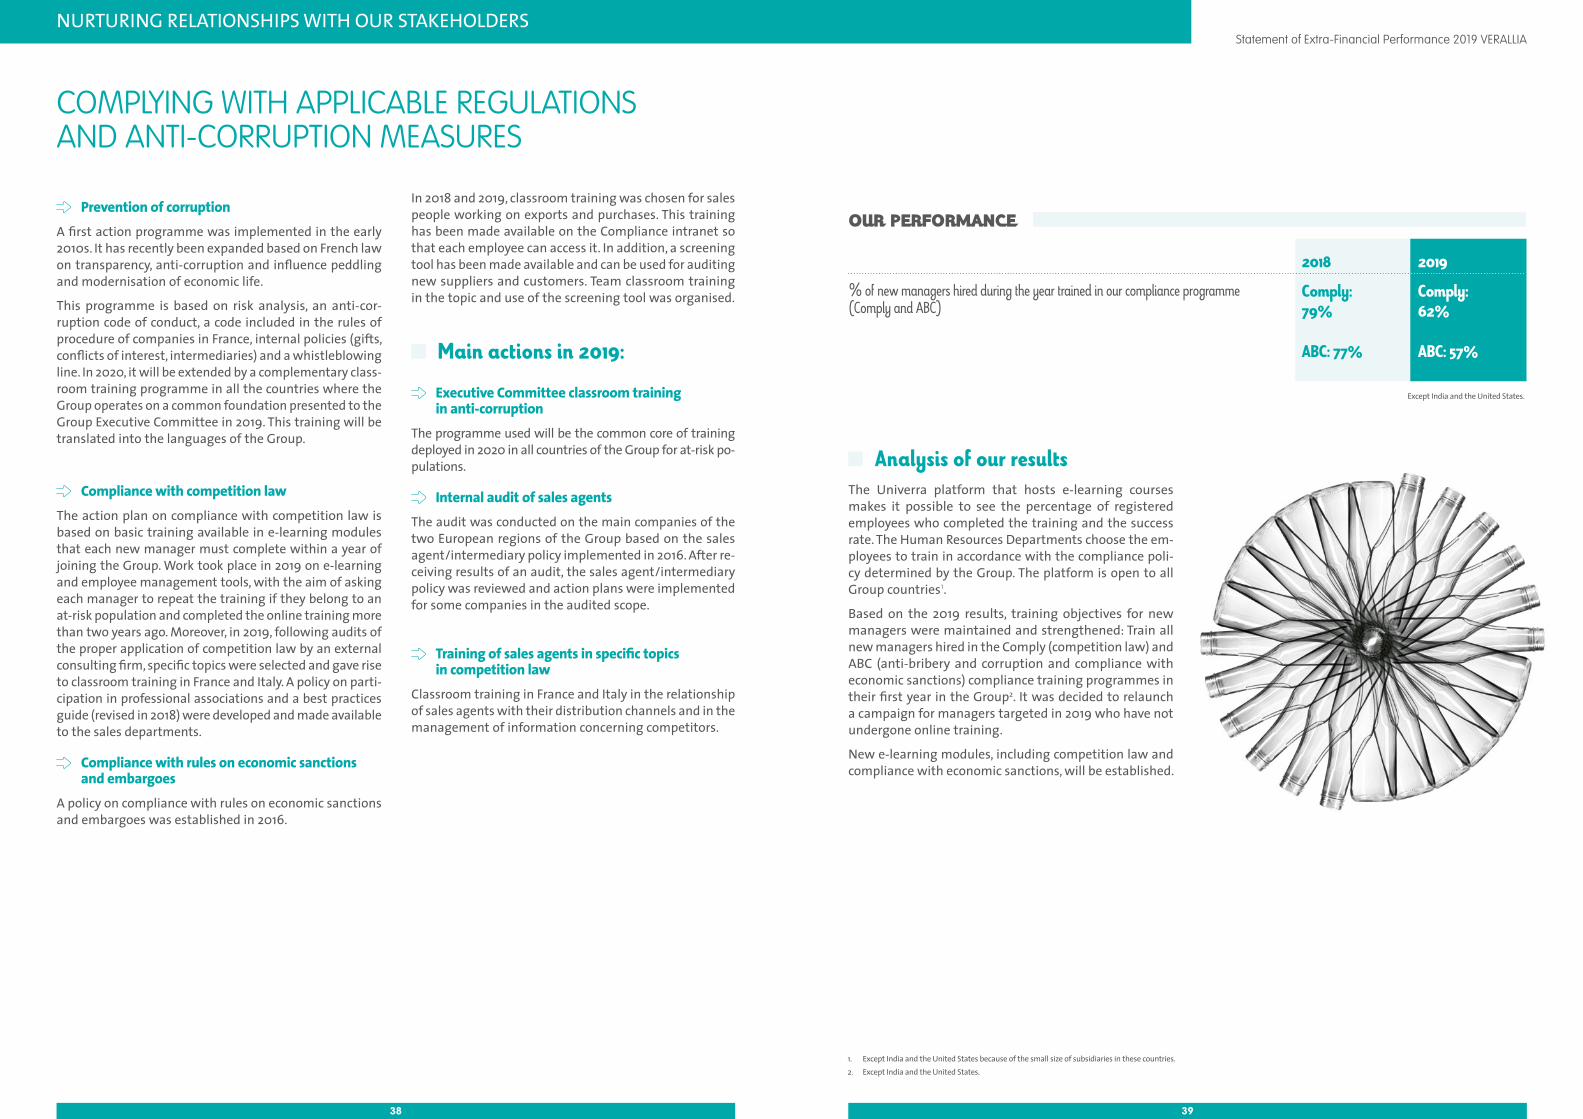
NURTURING RELATIONSHIPS WITH OUR STAKEHOLDERS Statement of Extra-Financial Performance 2019 VERALLIA
2018 2019
% of new managers hired during the year trained in our compliance programme (Comply and ABC)
Comply: 79%
Comply: 62%
ABC: 77% ABC: 57%
OUR PERFORMANCE Prevention of corruption
A first action programme was implemented in the early 2010s. It has recently been expanded based on French law on transparency, anti-corruption and influence peddling and modernisation of economic life.
This programme is based on risk analysis, an anti-cor-ruption code of conduct, a code included in the rules of procedure of companies in France, internal policies (gifts, conflicts of interest, intermediaries) and a whistleblowing line. In 2020, it will be extended by a complementary class-room training programme in all the countries where the Group operates on a common foundation presented to the Group Executive Committee in 2019. This training will be translated into the languages of the Group.
Compliance with competition lawThe action plan on compliance with competition law is based on basic training available in e-learning modules that each new manager must complete within a year of joining the Group. Work took place in 2019 on e-learning and employee management tools, with the aim of asking each manager to repeat the training if they belong to an at-risk population and completed the online training more than two years ago. Moreover, in 2019, following audits of the proper application of competition law by an external consulting firm, specific topics were selected and gave rise to classroom training in France and Italy. A policy on parti-cipation in professional associations and a best practices guide (revised in 2018) were developed and made available to the sales departments.
Compliance with rules on economic sanctions and embargoes
A policy on compliance with rules on economic sanctions and embargoes was established in 2016.
In 2018 and 2019, classroom training was chosen for sales people working on exports and purchases. This training has been made available on the Compliance intranet so that each employee can access it. In addition, a screening tool has been made available and can be used for auditing new suppliers and customers. Team classroom training in the topic and use of the screening tool was organised.
Main actions in 2019:
Executive Committee classroom training in anti-corruption
The programme used will be the common core of training deployed in 2020 in all countries of the Group for at-risk po-pulations.
Internal audit of sales agentsThe audit was conducted on the main companies of the two European regions of the Group based on the sales agent/intermediary policy implemented in 2016. After re-ceiving results of an audit, the sales agent/intermediary policy was reviewed and action plans were implemented for some companies in the audited scope.
Training of sales agents in specific topics in competition law
Classroom training in France and Italy in the relationship of sales agents with their distribution channels and in the management of information concerning competitors.
1. Except India and the United States because of the small size of subsidiaries in these countries.2. Except India and the United States.
Except India and the United States.
Analysis of our resultsThe Univerra platform that hosts e-learning courses makes it possible to see the percentage of registered employees who completed the training and the success rate. The Human Resources Departments choose the em-ployees to train in accordance with the compliance poli-cy determined by the Group. The platform is open to all Group countries1.
Based on the 2019 results, training objectives for new managers were maintained and strengthened: Train all new managers hired in the Comply (competition law) and ABC (anti-bribery and corruption and compliance with economic sanctions) compliance training programmes in their first year in the Group2. It was decided to relaunch a campaign for managers targeted in 2019 who have not undergone online training.
New e-learning modules, including competition law and compliance with economic sanctions, will be established.
COMPLYING WITH APPLICABLE REGULATIONS AND ANTI-CORRUPTION MEASURES
3938
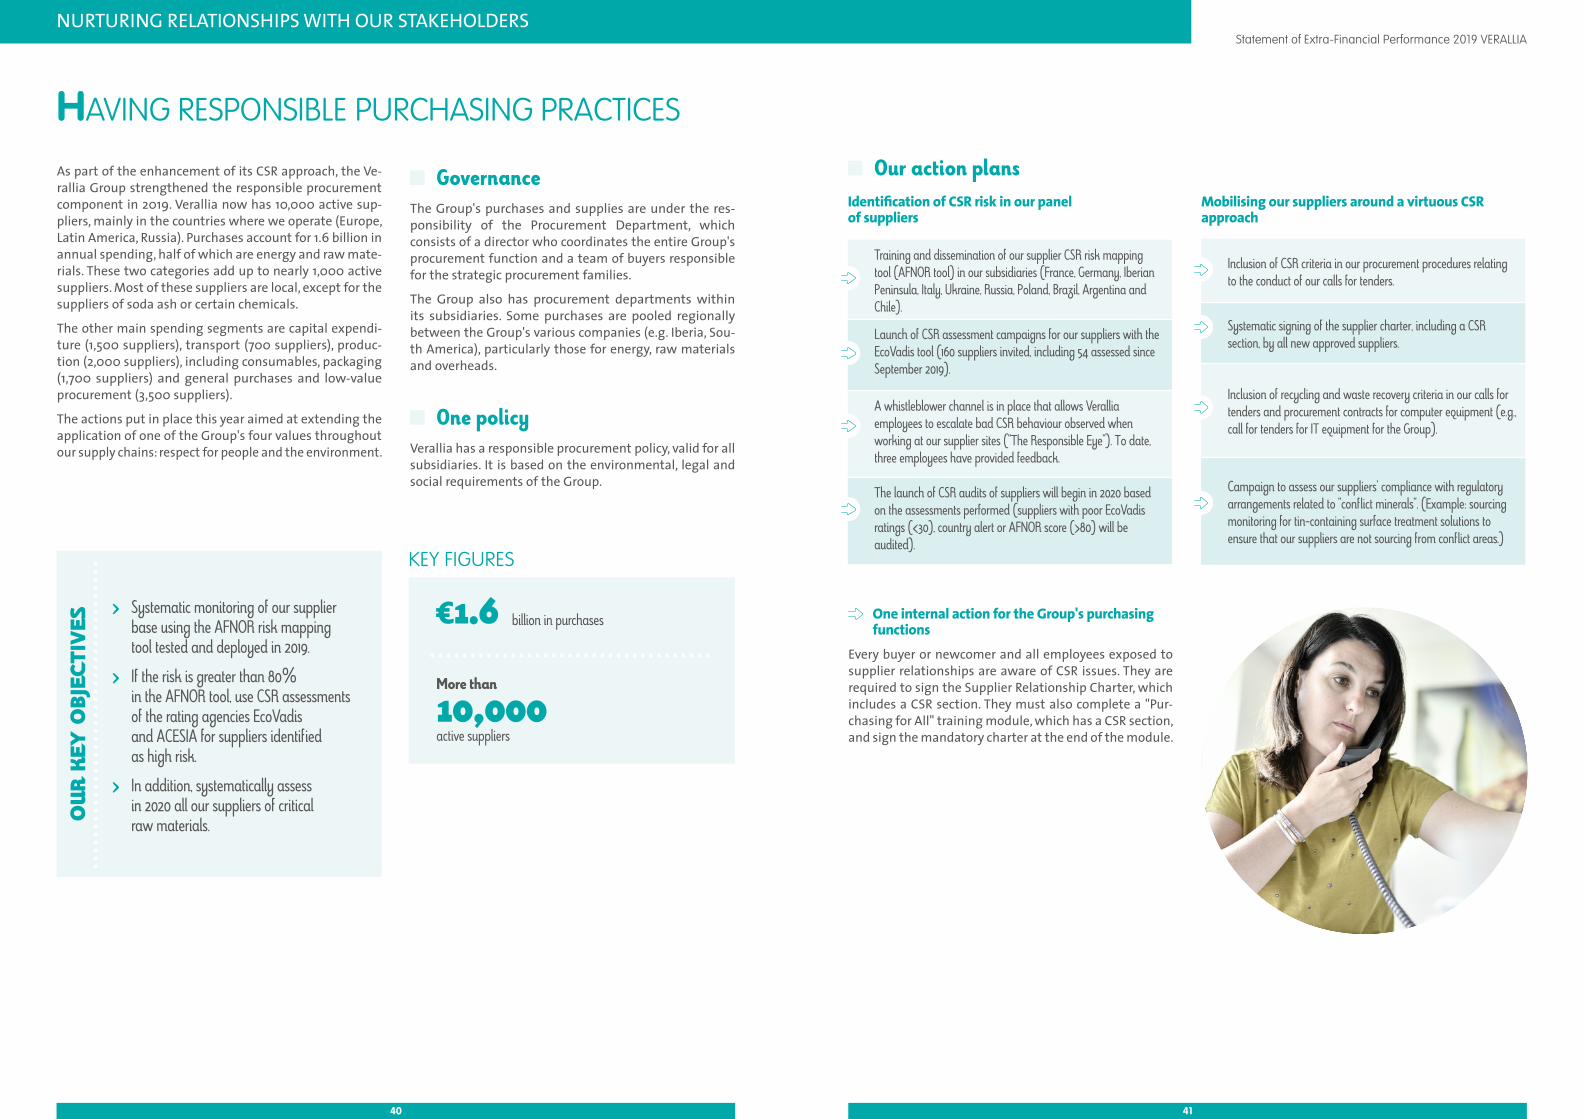
NURTURING RELATIONSHIPS WITH OUR STAKEHOLDERS Statement of Extra-Financial Performance 2019 VERALLIA
Our action plansIdentification of CSR risk in our panel of suppliers
Training and dissemination of our supplier CSR risk mapping tool (AFNOR tool) in our subsidiaries (France, Germany, Iberian Peninsula, Italy, Ukraine, Russia, Poland, Brazil, Argentina and Chile).
Launch of CSR assessment campaigns for our suppliers with the EcoVadis tool (160 suppliers invited, including 54 assessed since September 2019).
A whistleblower channel is in place that allows Verallia employees to escalate bad CSR behaviour observed when working at our supplier sites ("The Responsible Eye"). To date, three employees have provided feedback.
The launch of CSR audits of suppliers will begin in 2020 based on the assessments performed (suppliers with poor EcoVadis ratings (<30), country alert or AFNOR score (>80) will be audited).
Mobilising our suppliers around a virtuous CSR approach
Inclusion of CSR criteria in our procurement procedures relating to the conduct of our calls for tenders.
Systematic signing of the supplier charter, including a CSR section, by all new approved suppliers.
Inclusion of recycling and waste recovery criteria in our calls for tenders and procurement contracts for computer equipment (e.g., call for tenders for IT equipment for the Group).
Campaign to assess our suppliers' compliance with regulatory arrangements related to "conflict minerals". (Example: sourcing monitoring for tin-containing surface treatment solutions to ensure that our suppliers are not sourcing from conflict areas.)
KEY FIGURES
€1.6
More than
10,000 active suppliers
As part of the enhancement of its CSR approach, the Ve-rallia Group strengthened the responsible procurement component in 2019. Verallia now has 10,000 active sup-pliers, mainly in the countries where we operate (Europe, Latin America, Russia). Purchases account for 1.6 billion in annual spending, half of which are energy and raw mate-rials. These two categories add up to nearly 1,000 active suppliers. Most of these suppliers are local, except for the suppliers of soda ash or certain chemicals.
The other main spending segments are capital expendi-ture (1,500 suppliers), transport (700 suppliers), produc-tion (2,000 suppliers), including consumables, packaging (1,700 suppliers) and general purchases and low-value procurement (3,500 suppliers).
The actions put in place this year aimed at extending the application of one of the Group's four values throughout our supply chains: respect for people and the environment.
GovernanceThe Group's purchases and supplies are under the res-ponsibility of the Procurement Department, which consists of a director who coordinates the entire Group's procurement function and a team of buyers responsible for the strategic procurement families.
The Group also has procurement departments within its subsidiaries. Some purchases are pooled regionally between the Group's various companies (e.g. Iberia, Sou-th America), particularly those for energy, raw materials and overheads.
One policyVerallia has a responsible procurement policy, valid for all subsidiaries. It is based on the environmental, legal and social requirements of the Group.
HAVING RESPONSIBLE PURCHASING PRACTICESO
UR K
EY O
BJEC
TIVE
S > Systematic monitoring of our supplier base using the AFNOR risk mapping tool tested and deployed in 2019.
> If the risk is greater than 80% in the AFNOR tool, use CSR assessments of the rating agencies EcoVadis and ACESIA for suppliers identified as high risk.
> In addition, systematically assess in 2020 all our suppliers of critical raw materials.
billion in purchases One internal action for the Group's purchasing functions
Every buyer or newcomer and all employees exposed to supplier relationships are aware of CSR issues. They are required to sign the Supplier Relationship Charter, which includes a CSR section. They must also complete a "Pur-chasing for All" training module, which has a CSR section, and sign the mandatory charter at the end of the module.
4140
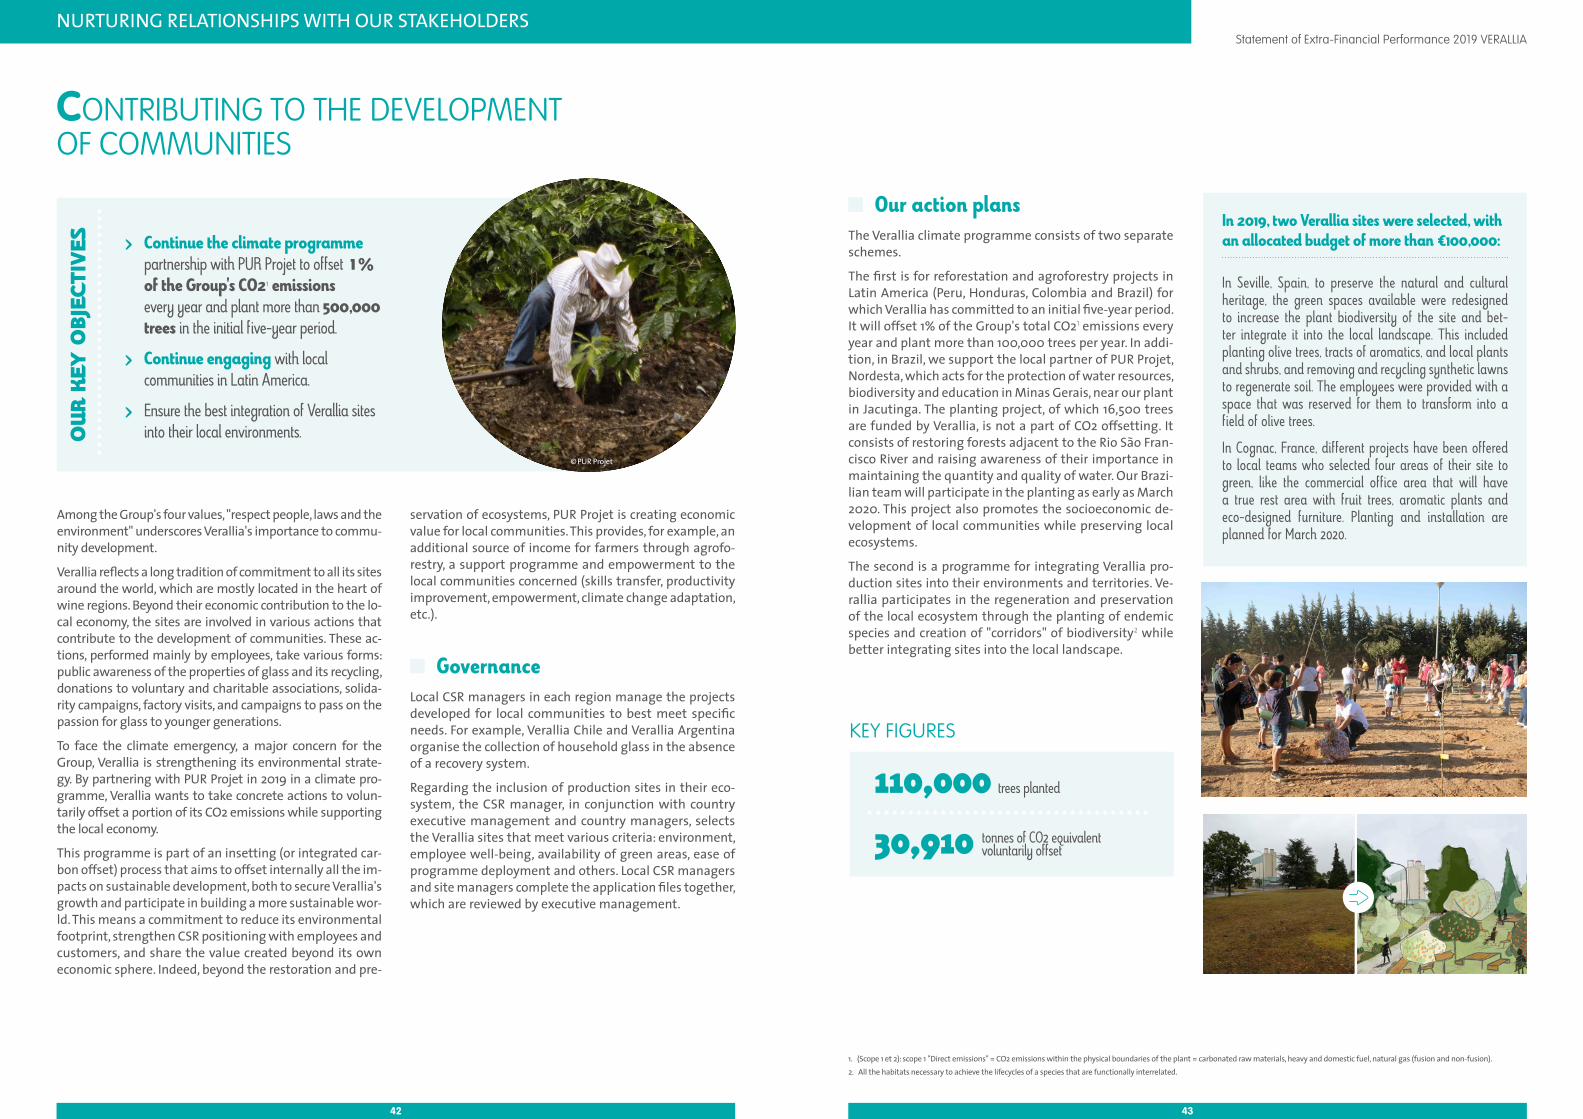
NURTURING RELATIONSHIPS WITH OUR STAKEHOLDERS Statement of Extra-Financial Performance 2019 VERALLIA
Among the Group's four values, "respect people, laws and the environment" underscores Verallia's importance to commu-nity development.
Verallia reflects a long tradition of commitment to all its sites around the world, which are mostly located in the heart of wine regions. Beyond their economic contribution to the lo-cal economy, the sites are involved in various actions that contribute to the development of communities. These ac-tions, performed mainly by employees, take various forms: public awareness of the properties of glass and its recycling, donations to voluntary and charitable associations, solida-rity campaigns, factory visits, and campaigns to pass on the passion for glass to younger generations.
To face the climate emergency, a major concern for the Group, Verallia is strengthening its environmental strate-gy. By partnering with PUR Projet in 2019 in a climate pro-gramme, Verallia wants to take concrete actions to volun-tarily offset a portion of its CO2 emissions while supporting the local economy.
This programme is part of an insetting (or integrated car-bon offset) process that aims to offset internally all the im-pacts on sustainable development, both to secure Verallia's growth and participate in building a more sustainable wor-ld. This means a commitment to reduce its environmental footprint, strengthen CSR positioning with employees and customers, and share the value created beyond its own economic sphere. Indeed, beyond the restoration and pre-
servation of ecosystems, PUR Projet is creating economic value for local communities. This provides, for example, an additional source of income for farmers through agrofo-restry, a support programme and empowerment to the local communities concerned (skills transfer, productivity improvement, empowerment, climate change adaptation, etc.).
GovernanceLocal CSR managers in each region manage the projects developed for local communities to best meet specific needs. For example, Verallia Chile and Verallia Argentina organise the collection of household glass in the absence of a recovery system.
Regarding the inclusion of production sites in their eco-system, the CSR manager, in conjunction with country executive management and country managers, selects the Verallia sites that meet various criteria: environment, employee well-being, availability of green areas, ease of programme deployment and others. Local CSR managers and site managers complete the application files together, which are reviewed by executive management.
Our action plansThe Verallia climate programme consists of two separate schemes.
The first is for reforestation and agroforestry projects in Latin America (Peru, Honduras, Colombia and Brazil) for which Verallia has committed to an initial five-year period. It will offset 1% of the Group's total CO21 emissions every year and plant more than 100,000 trees per year. In addi-tion, in Brazil, we support the local partner of PUR Projet, Nordesta, which acts for the protection of water resources, biodiversity and education in Minas Gerais, near our plant in Jacutinga. The planting project, of which 16,500 trees are funded by Verallia, is not a part of CO2 offsetting. It consists of restoring forests adjacent to the Rio São Fran-cisco River and raising awareness of their importance in maintaining the quantity and quality of water. Our Brazi-lian team will participate in the planting as early as March 2020. This project also promotes the socioeconomic de-velopment of local communities while preserving local ecosystems.
The second is a programme for integrating Verallia pro-duction sites into their environments and territories. Ve-rallia participates in the regeneration and preservation of the local ecosystem through the planting of endemic species and creation of "corridors" of biodiversity2 while better integrating sites into the local landscape.
1. (Scope 1 et 2): scope 1 "Direct emissions" = CO2 emissions within the physical boundaries of the plant = carbonated raw materials, heavy and domestic fuel, natural gas (fusion and non-fusion). 2. All the habitats necessary to achieve the lifecycles of a species that are functionally interrelated.
CONTRIBUTING TO THE DEVELOPMENT OF COMMUNITIES
OUR
KEY
OBJ
ECTI
VES > Continue the climate programme
partnership with PUR Projet to offset 1 % of the Group's CO21 emissions every year and plant more than 500,000 trees in the initial five-year period.
> Continue engaging with local communities in Latin America.
> Ensure the best integration of Verallia sites into their local environments.
KEY FIGURES
110,000 trees planted
30,910 tonnes of CO2 equivalent voluntarily offset
In 2019, two Verallia sites were selected, with an allocated budget of more than €100,000:
In Seville, Spain, to preserve the natural and cultural heritage, the green spaces available were redesigned to increase the plant biodiversity of the site and bet-ter integrate it into the local landscape. This included planting olive trees, tracts of aromatics, and local plants and shrubs, and removing and recycling synthetic lawns to regenerate soil. The employees were provided with a space that was reserved for them to transform into a field of olive trees.
In Cognac, France, different projects have been offered to local teams who selected four areas of their site to green, like the commercial office area that will have a true rest area with fruit trees, aromatic plants and eco-designed furniture. Planting and installation are planned for March 2020.
© PUR Projet
4342
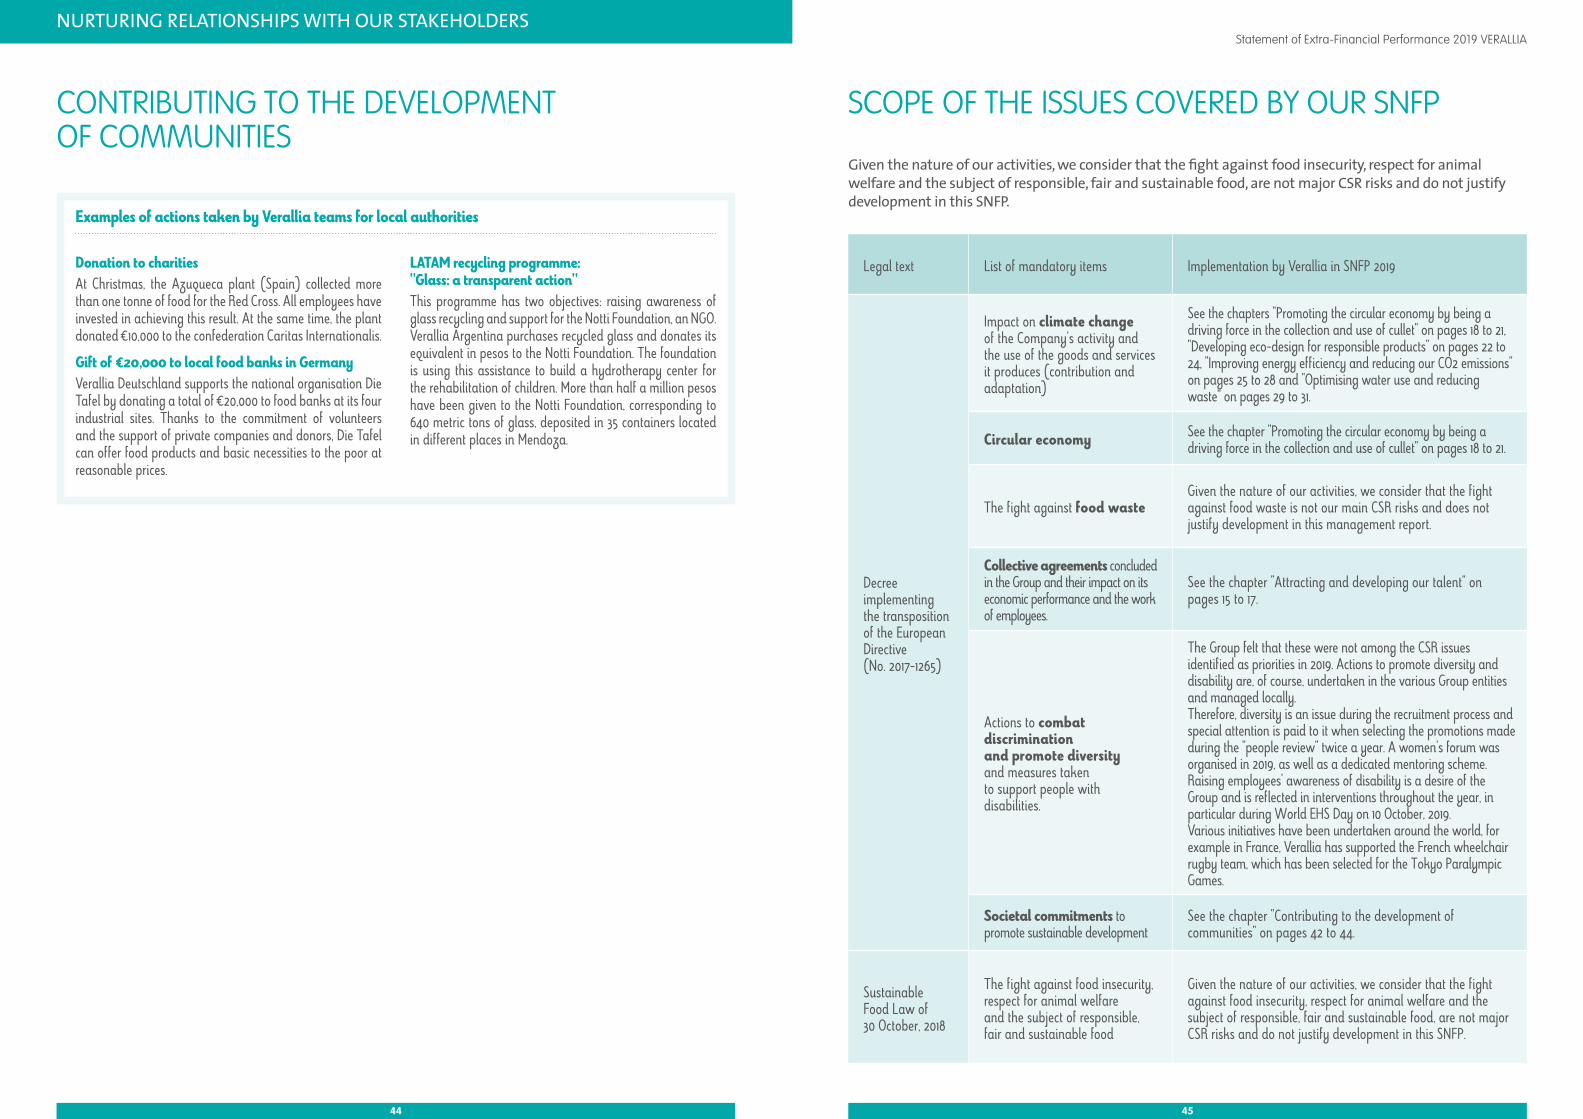
NURTURING RELATIONSHIPS WITH OUR STAKEHOLDERS Statement of Extra-Financial Performance 2019 VERALLIA
Examples of actions taken by Verallia teams for local authorities
Donation to charitiesAt Christmas, the Azuqueca plant (Spain) collected more than one tonne of food for the Red Cross. All employees have invested in achieving this result. At the same time, the plant donated €10,000 to the confederation Caritas Internationalis.
Gift of €20,000 to local food banks in GermanyVerallia Deutschland supports the national organisation Die Tafel by donating a total of €20,000 to food banks at its four industrial sites. Thanks to the commitment of volunteers and the support of private companies and donors, Die Tafel can offer food products and basic necessities to the poor at reasonable prices.
LATAM recycling programme: "Glass: a transparent action"This programme has two objectives: raising awareness of glass recycling and support for the Notti Foundation, an NGO. Verallia Argentina purchases recycled glass and donates its equivalent in pesos to the Notti Foundation. The foundation is using this assistance to build a hydrotherapy center for the rehabilitation of children. More than half a million pesos have been given to the Notti Foundation, corresponding to 640 metric tons of glass, deposited in 35 containers located in different places in Mendoza.
CONTRIBUTING TO THE DEVELOPMENT OF COMMUNITIES
SCOPE OF THE ISSUES COVERED BY OUR SNFP
Given the nature of our activities, we consider that the fight against food insecurity, respect for animal welfare and the subject of responsible, fair and sustainable food, are not major CSR risks and do not justify development in this SNFP.
Legal text List of mandatory items Implementation by Verallia in SNFP 2019
Decree implementing the transposition of the European Directive (No. 2017-1265)
Impact on climate change of the Company's activity and the use of the goods and services it produces (contribution and adaptation)
See the chapters "Promoting the circular economy by being a driving force in the collection and use of cullet" on pages 18 to 21, "Developing eco-design for responsible products" on pages 22 to 24, "Improving energy efficiency and reducing our CO2 emissions" on pages 25 to 28 and "Optimising water use and reducing waste" on pages 29 to 31.
Circular economy See the chapter "Promoting the circular economy by being a driving force in the collection and use of cullet" on pages 18 to 21.
The fight against food wasteGiven the nature of our activities, we consider that the fight against food waste is not our main CSR risks and does not justify development in this management report.
Collective agreements concluded in the Group and their impact on its economic performance and the work of employees.
See the chapter "Attracting and developing our talent" on pages 15 to 17.
Actions to combat discrimination and promote diversity and measures taken to support people with disabilities.
The Group felt that these were not among the CSR issues identified as priorities in 2019. Actions to promote diversity and disability are, of course, undertaken in the various Group entities and managed locally.Therefore, diversity is an issue during the recruitment process and special attention is paid to it when selecting the promotions made during the "people review" twice a year. A women's forum was organised in 2019, as well as a dedicated mentoring scheme.Raising employees' awareness of disability is a desire of the Group and is reflected in interventions throughout the year, in particular during World EHS Day on 10 October, 2019.Various initiatives have been undertaken around the world, for example in France, Verallia has supported the French wheelchair rugby team, which has been selected for the Tokyo Paralympic Games.
Societal commitments to promote sustainable development
See the chapter "Contributing to the development of communities" on pages 42 to 44.
Sustainable Food Law of 30 October, 2018
The fight against food insecurity, respect for animal welfare and the subject of responsible, fair and sustainable food
Given the nature of our activities, we consider that the fight against food insecurity, respect for animal welfare and the subject of responsible, fair and sustainable food, are not major CSR risks and do not justify development in this SNFP.
4544
Statement of Extra-Financial Performance 2019 VERALLIA Statement of Extra-Financial Performance 2019 VERALLIA
CORRIDOR OF BIODIVERSITYAll the habitats necessary for the functionally interrelated lifecycles of a species.
CULLETMeans the crushed glass added to the raw materials used in the production of glass.
ECOVARange of bottles – "Eco" for eco-design and "VA" for value added.
ECOVADISPlatform for rating the social and environmental performance of global supply chains.
EGO Range of Chilean eco-designed products, standing for "Enhanced Geometric Objects".
EHSRefers to the "Environment, Hygiene and Safety" policy.
EXTERNAL CULLETGlass collected from individuals and cafés, hotels and restaurants (CHR).
FEEDERDistribution channel that feeds glass to the machines from the front end of the furnace. Its role is to maintain the temperature and homogenise the glass until it arrives at the machine.
FEVEEuropean Container Glass Federation.
FUSIONMeans the first step in the melting of glass in production furnaces.Fusion entails raising the temperature of solids – sand, cullet, sodium carbonate, calcium carbonate – to arrive at a homogeneous vitrified mixture.
GLASS SANDVery small cullet (fraction 0–4 mm).
GOBMeans a compact mass of molten glass.
INSETTINGIdentifying business impacts (social, climate, water, biodiversity, etc.) and engaging in socio-economic and environmental projects that mitigate the impacts.
INTERNAL CULLETGlass from manufacturing scrap.
ISO 22000Standard that guarantees that food risk to consumers is considered throughout the entire production process.
LCVlower calorific value.
SALES TEAMSFunctions identified in the sales and marketing channels.
RCA Root Cause Analysis
SCOPE 1"Direct emissions" = CO2 emissions within the physical boundaries of the plant, meaning carbonated raw materials, heavy and domestic fuel, natural gas (fusion and non-fusion).
SCOPE 2"Indirect emissions" = emissions related to the electricity consumption necessary for the plant's operation.
TF1Number of accidents resulting in lost workdays, by millions of worked hours.
TF2Ratio of the number of accidents with and without lost workdays per million hours worked.
TPGTonne of packaged glass or tonne of good glass.
VERALLIA "DIVISIONS"There are three: • Southern and Western Europe,• Northern and Eastern Europe,• Latin America.
VERALLIA "REGIONS"There are five: France, Italy, Northern Europe, Iberian Peninsula, Latin America.
GLOSSARY
Verallia SAReport by one of the statutory auditors, appointed as an independent third-party body, on the consolidated statement of extra-financial performance contained in the Group's management report.Year ended 31 December 2019
46 47


ANNEX III
Report from one of the statutory auditors, designated as an independent third-party body, on the
consolidated statement of non-financial performance contained in the group management report
Verallia SA Rapport de l’un des commissaires aux comptes, désigné organisme tiers indépendant, sur la déclaration consolidée de performance extra-financière figurant dans le rapport de gestion du groupe
Exercice clos le 31 décembre 2019
PricewaterhouseCoopers Audit, 63, rue de Villiers, 92208 Neuilly-sur-Seine Cedex Téléphone: +33 (0)1 56 57 58 59, Fax: +33 (0)1 56 57 58 60, www.pwc.fr
Société d’expertise comptable inscrite au tableau de l’ordre de Paris - Ile de France. Société de commissariat aux comptes membre de la compagnie régionale deVersailles. Société par Actions Simplifiée au capital de 2 510 460 €. Siège social : 63, rue de Villiers 92200 Neuilly-sur-Seine. RCS Nanterre 672 006 483. TVA n° FR 76 672 006 483. Siret 672 006 483 00362. Code APE 6920 Z. Bureaux : Bordeaux, Grenoble, Lille, Lyon, Marseille, Metz, Nantes, Neuilly-Sur-
Seine, Nice, Poitiers, Rennes, Rouen, Strasbourg, Toulouse.
Rapport de l’un des commissaires aux comptes, désigné organisme tiers indépendant, sur la déclaration consolidée de performance extra-financière figurant dans le rapport de gestion du groupe
Exercice clos le 31 décembre 2019
A l’assemblée générale de la société Verallia SA
En notre qualité de commissaire aux comptes de la société Verallia SA (ci-après « l’entité ») désigné organisme tiers indépendant, accrédité par le COFRAC sous le numéro 3-1060 rév.2 (portée d’accréditation disponible sur le site www.cofrac.fr), nous vous présentons notre rapport sur la déclaration consolidée de performance extra-financière relative à l’exercice clos le 31 décembre 2019 (ci-après la « Déclaration »), présentée dans le rapport de gestion du groupe en application des dispositions légales et réglementaires des articles L. 225-102-1, R. 225-105 et R. 225-105-1 du code de commerce.
Responsabilité de l’entité
Il appartient au Conseil d’administration d’établir une Déclaration conforme aux dispositions légales et réglementaires, incluant une présentation du modèle d’affaires, une description des principaux risques extra-financiers, une présentation des politiques appliquées au regard de ces risques ainsi que les résultats de ces politiques, incluant des indicateurs clés de performance.
La Déclaration a été établie en appliquant les procédures de l’entité, (ci-après le « Référentiel ») dont les éléments significatifs sont disponibles sur demande au siège de la société.
Indépendance et contrôle qualité
Notre indépendance est définie par les dispositions prévues à l’article L. 822-11-3 du code de commerce et le code de déontologie de la profession. Par ailleurs, nous avons mis en place un système de contrôle qualité qui comprend des politiques et des procédures documentées visant à assurer le respect des règles déontologiques, de la doctrine professionnelle et des textes légaux et réglementaires applicables.
Responsabilité du commissaire aux comptes désigné OTI
Il nous appartient, sur la base de nos travaux, de formuler un avis motivé exprimant une conclusion d’assurance modérée sur :
- la conformité de la Déclaration aux dispositions prévues à l’article R. 225-105 du code de commerce ;
- la sincérité des informations fournies en application du 3° du I et du II de l’article R. 225-105 du code de commerce, à savoir les résultats des politiques, incluant des indicateurs clés de performance, et les actions, relatifs aux principaux risques, ci-après les « Informations ».
Verallia SA Rapport de l’un des commissaires aux comptes, désigné organisme tiers indépendant, sur la déclaration consolidée de performance extra-financière figurant dans le rapport de gestion du groupe Exercice clos le 31 décembre 2019 Page 3
Il ne nous appartient pas en revanche de nous prononcer sur :
- le respect par l’entité des autres dispositions légales et réglementaires applicables, notamment, en matière de plan de vigilance et de lutte contre la corruption et de fiscalité ;
- la conformité des produits et services aux réglementations applicables.
Nature et étendue des travaux
Nos travaux décrits ci-après ont été effectués conformément aux dispositions des articles A. 225-1 et suivants du code de commerce déterminant les modalités dans lesquelles l’organisme tiers indépendant conduit sa mission et selon la doctrine professionnelle de la Compagnie nationale des commissaires aux comptes relative à cette intervention ainsi qu’à la norme internationale ISAE 3000 - Assurance engagements other than audits or reviews of historical financial information.
Nous avons mené des travaux nous permettant d’apprécier la conformité de la Déclaration aux dispositions réglementaires et la sincérité des Informations :
− nous avons pris connaissance de l’activité de l’ensemble des entreprises incluses dans le périmètre de consolidation, de l’exposé des principaux risques sociaux et environnementaux liés à cette activité, et de ses effets quant au respect des droits de l’homme et à la lutte contre la corruption et l’évasion fiscale, ainsi que des politiques qui en découlent et de leurs résultats ;
− nous avons apprécié le caractère approprié du Référentiel au regard de sa pertinence, son exhaustivité, sa fiabilité, sa neutralité et son caractère compréhensible, en prenant en considération, le cas échéant, les bonnes pratiques du secteur ;
− nous avons vérifié que la Déclaration couvre chaque catégorie d’information prévue au III de l’article L. 225-102-1 en matière sociale et environnementale ainsi que de respect des droits de l’homme et de lutte contre la corruption et l’évasion fiscale ;
− nous avons vérifié que la Déclaration présente le modèle d’affaires et les principaux risques liés à l’activité de l’ensemble des entités incluses dans le périmètre de consolidation, y compris, lorsque cela s’avère pertinent et proportionné, les risques créés par ses relations d’affaires, ses produits ou ses services ainsi que les politiques, les actions et les résultats, incluant des indicateurs clés de performance ;
− nous avons vérifié, lorsqu’elles sont pertinentes au regard des principaux risques ou des politiques présentés, que la Déclaration présente les informations prévues au II de l’article R. 225-105 ;
− nous avons apprécié le processus de sélection et de validation des principaux risques ;
− nous nous sommes enquis de l’existence de procédures de contrôle interne et de gestion des risques mises en place par l’entité ;
− nous avons apprécié la cohérence des résultats et des indicateurs clés de performance retenus au regard des principaux risques et politiques présentés ;
− nous avons vérifié que la Déclaration couvre le périmètre consolidé, à savoir l’ensemble des entreprises incluses dans le périmètre de consolidation conformément à l’article L. 233-16 avec les limites précisées dans la Déclaration ;
Verallia SA Rapport de l’un des commissaires aux comptes, désigné organisme tiers indépendant, sur la déclaration consolidée de performance extra-financière figurant dans le rapport de gestion du groupe Exercice clos le 31 décembre 2019 Page 4
− nous avons apprécié le processus de collecte mis en place par l’entité visant à l’exhaustivité et à la sincérité des Informations ;
− nous avons mis en œuvre pour les indicateurs clés de performance et les autres résultats quantitatifs que nous avons considérés les plus importants et dont la liste est donnée en annexe :
o des procédures analytiques consistant à vérifier la correcte consolidation des données collectées ainsi que la cohérence de leurs évolutions ;
o des tests de détail sur la base de sondages, consistant à vérifier la correcte application des définitions et procédures et à rapprocher les données des pièces justificatives. Ces travaux ont été menés auprès d’une sélection d’entités contributrices, à savoir les sites de production de Azuqueca (Espagne), Bad Wurzach (Allemagne), Cognac (France), Dego (Italie), Figueira da Foz (Portugal), Lagnieu (France), Wirges (Allemagne), pour les informations environnementales et les sociétés Verallia Deutschland AG, Verallia France, Verallia Italia S.p.A., Verallia Portugal, Verallia Spain, pour les informations sociales, et couvrent entre 20% et 68% des données consolidées des indicateurs clés de performance et résultats sélectionnés pour ces tests ;
− nous avons consulté les sources documentaires et mené des entretiens pour corroborer les informations qualitatives (actions et résultats) que nous avons considérées les plus importantes et dont la liste est donnée en annexe ;
− nous avons apprécié la cohérence d’ensemble de la Déclaration par rapport à notre connaissance de l’ensemble des entreprises incluses dans le périmètre de consolidation.
Nous estimons que les travaux que nous avons menés en exerçant notre jugement professionnel nous permettent de formuler une conclusion d’assurance modérée ; une assurance de niveau supérieur aurait nécessité des travaux de vérification plus étendus.
Moyens et ressources
Nos travaux ont mobilisé les compétences de 6 personnes et se sont déroulés entre mi-février et mi-mars 2020 sur une durée totale d’intervention de 5 semaines.
Nous avons fait appel, pour nous assister dans la réalisation de nos travaux, à nos spécialistes en matière de développement durable et de responsabilité sociétale. Nous avons mené une dizaine d’entretiens avec les personnes responsables de la préparation de la Déclaration, représentant notamment le Secrétariat Général et les Directions des Ressources Humaines, des Achats, de la RSE, du Juridique et de la Concurrence, de la HSE, du Marketing, de la Qualité et de la Programmation, Logistique et Recyclage verre.
Verallia SA Rapport de l’un des commissaires aux comptes, désigné organisme tiers indépendant, sur la déclaration consolidée de performance extra-financière figurant dans le rapport de gestion du groupe Exercice clos le 31 décembre 2019 Page 5
Conclusion
Sur la base de nos travaux, nous n'avons pas relevé d'anomalie significative de nature à remettre en cause le fait que la déclaration consolidée de performance extra-financière est conforme aux dispositions réglementaires applicables et que les Informations, prises dans leur ensemble, sont présentées, de manière sincère, conformément au Référentiel.
Neuilly-sur-Seine, le 17 mars 2020
L’un des Commissaires aux comptes PricewaterhouseCoopers Audit
Itto El Hariri Associée
Émilie Bobin Associée du Département Développement Durable
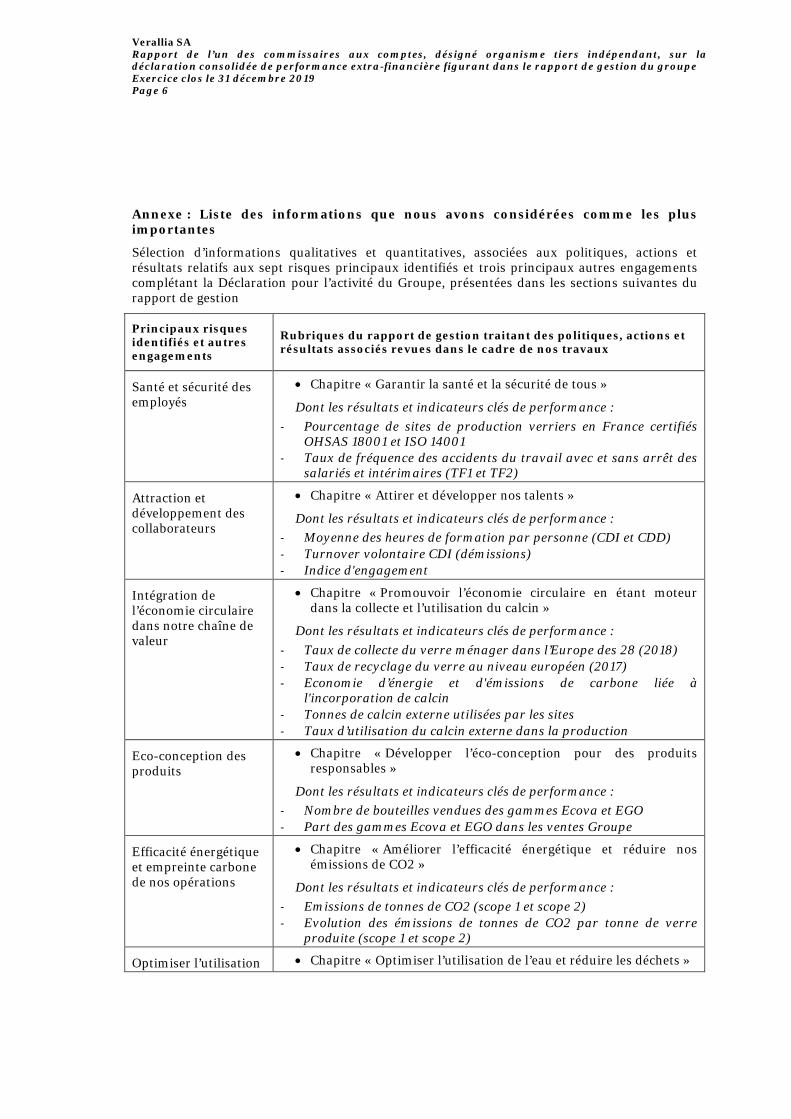
Verallia SA Rapport de l’un des commissaires aux comptes, désigné organisme tiers indépendant, sur la déclaration consolidée de performance extra-financière figurant dans le rapport de gestion du groupe Exercice clos le 31 décembre 2019 Page 6
Annexe : Liste des informations que nous avons considérées comme les plus importantes
Sélection d’informations qualitatives et quantitatives, associées aux politiques, actions et résultats relatifs aux sept risques principaux identifiés et trois principaux autres engagements complétant la Déclaration pour l’activité du Groupe, présentées dans les sections suivantes du rapport de gestion
Principaux risques identifiés et autres engagements
Rubriques du rapport de gestion traitant des politiques, actions et résultats associés revues dans le cadre de nos travaux
Santé et sécurité des employés
• Chapitre « Garantir la santé et la sécurité de tous »
Dont les résultats et indicateurs clés de performance : - Pourcentage de sites de production verriers en France certifiés
OHSAS 18001 et ISO 14001 - Taux de fréquence des accidents du travail avec et sans arrêt des
salariés et intérimaires (TF1 et TF2)
Attraction et développement des collaborateurs
• Chapitre « Attirer et développer nos talents »
Dont les résultats et indicateurs clés de performance : - Moyenne des heures de formation par personne (CDI et CDD) - Turnover volontaire CDI (démissions) - Indice d'engagement
Intégration de l’économie circulaire dans notre chaîne de valeur
• Chapitre « Promouvoir l’économie circulaire en étant moteur dans la collecte et l’utilisation du calcin »
Dont les résultats et indicateurs clés de performance : - Taux de collecte du verre ménager dans l’Europe des 28 (2018) - Taux de recyclage du verre au niveau européen (2017) - Economie d’énergie et d'émissions de carbone liée à
l'incorporation de calcin - Tonnes de calcin externe utilisées par les sites - Taux d’utilisation du calcin externe dans la production
Eco-conception des produits
• Chapitre « Développer l’éco-conception pour des produits responsables »
Dont les résultats et indicateurs clés de performance : - Nombre de bouteilles vendues des gammes Ecova et EGO - Part des gammes Ecova et EGO dans les ventes Groupe
Efficacité énergétique et empreinte carbone de nos opérations
• Chapitre « Améliorer l’efficacité énergétique et réduire nos émissions de CO2 »
Dont les résultats et indicateurs clés de performance : - Emissions de tonnes de CO2 (scope 1 et scope 2) - Evolution des émissions de tonnes de CO2 par tonne de verre
produite (scope 1 et scope 2)
Optimiser l’utilisation • Chapitre « Optimiser l’utilisation de l’eau et réduire les déchets »
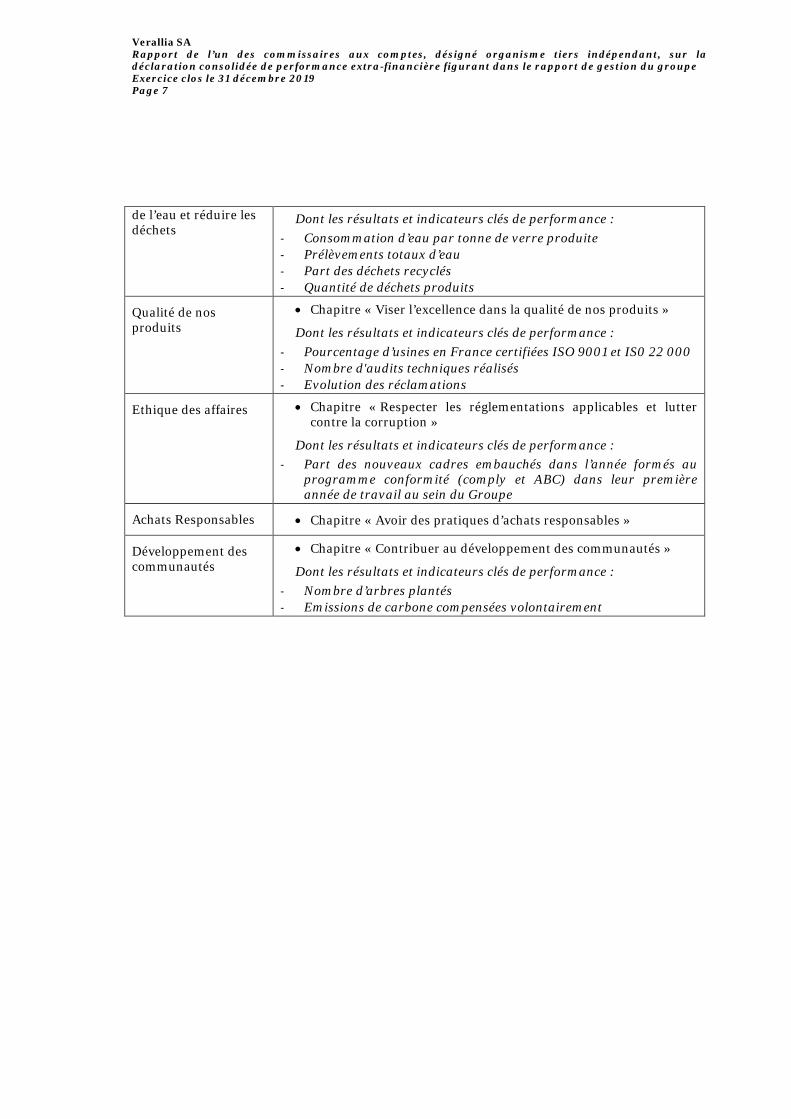
Verallia SA Rapport de l’un des commissaires aux comptes, désigné organisme tiers indépendant, sur la déclaration consolidée de performance extra-financière figurant dans le rapport de gestion du groupe Exercice clos le 31 décembre 2019 Page 7
de l’eau et réduire les déchets
Dont les résultats et indicateurs clés de performance : - Consommation d’eau par tonne de verre produite - Prélèvements totaux d’eau - Part des déchets recyclés - Quantité de déchets produits
Qualité de nos produits
• Chapitre « Viser l’excellence dans la qualité de nos produits »
Dont les résultats et indicateurs clés de performance : - Pourcentage d’usines en France certifiées ISO 9001 et IS0 22 000 - Nombre d'audits techniques réalisés - Evolution des réclamations
Ethique des affaires • Chapitre « Respecter les réglementations applicables et lutter contre la corruption »
Dont les résultats et indicateurs clés de performance : - Part des nouveaux cadres embauchés dans l’année formés au
programme conformité (comply et ABC) dans leur première année de travail au sein du Groupe
Achats Responsables • Chapitre « Avoir des pratiques d’achats responsables »
Développement des communautés
• Chapitre « Contribuer au développement des communautés »
Dont les résultats et indicateurs clés de performance : - Nombre d’arbres plantés - Emissions de carbone compensées volontairement
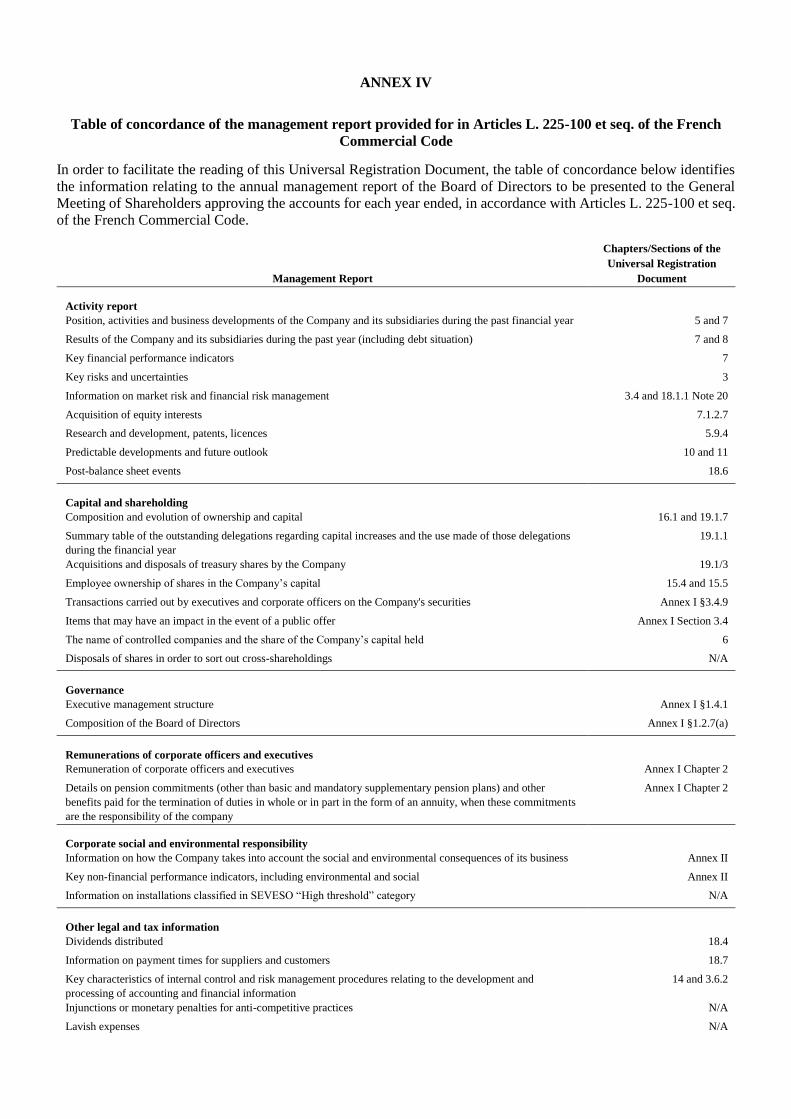
ANNEX IV
Table of concordance of the management report provided for in Articles L. 225-100 et seq. of the French
Commercial Code
In order to facilitate the reading of this Universal Registration Document, the table of concordance below identifies
the information relating to the annual management report of the Board of Directors to be presented to the General
Meeting of Shareholders approving the accounts for each year ended, in accordance with Articles L. 225-100 et seq.
of the French Commercial Code.
Management Report
Chapters/Sections of the
Universal Registration
Document
Activity report
Position, activities and business developments of the Company and its subsidiaries during the past financial year 5 and 7
Results of the Company and its subsidiaries during the past year (including debt situation) 7 and 8
Key financial performance indicators 7
Key risks and uncertainties 3
Information on market risk and financial risk management 3.4 and 18.1.1 Note 20
Acquisition of equity interests 7.1.2.7
Research and development, patents, licences 5.9.4
Predictable developments and future outlook 10 and 11
Post-balance sheet events 18.6
Capital and shareholding
Composition and evolution of ownership and capital 16.1 and 19.1.7
Summary table of the outstanding delegations regarding capital increases and the use made of those delegations
during the financial year
19.1.1
Acquisitions and disposals of treasury shares by the Company 19.1/3
Employee ownership of shares in the Company’s capital 15.4 and 15.5
Transactions carried out by executives and corporate officers on the Company's securities Annex I §3.4.9
Items that may have an impact in the event of a public offer Annex I Section 3.4
The name of controlled companies and the share of the Company’s capital held 6
Disposals of shares in order to sort out cross-shareholdings N/A
Governance
Executive management structure Annex I §1.4.1
Composition of the Board of Directors Annex I §1.2.7(a)
Remunerations of corporate officers and executives
Remuneration of corporate officers and executives Annex I Chapter 2
Details on pension commitments (other than basic and mandatory supplementary pension plans) and other
benefits paid for the termination of duties in whole or in part in the form of an annuity, when these commitments
are the responsibility of the company
Annex I Chapter 2
Corporate social and environmental responsibility
Information on how the Company takes into account the social and environmental consequences of its business Annex II
Key non-financial performance indicators, including environmental and social Annex II
Information on installations classified in SEVESO “High threshold” category N/A
Other legal and tax information
Dividends distributed 18.4
Information on payment times for suppliers and customers 18.7
Key characteristics of internal control and risk management procedures relating to the development and
processing of accounting and financial information
14 and 3.6.2
Injunctions or monetary penalties for anti-competitive practices N/A
Lavish expenses N/A
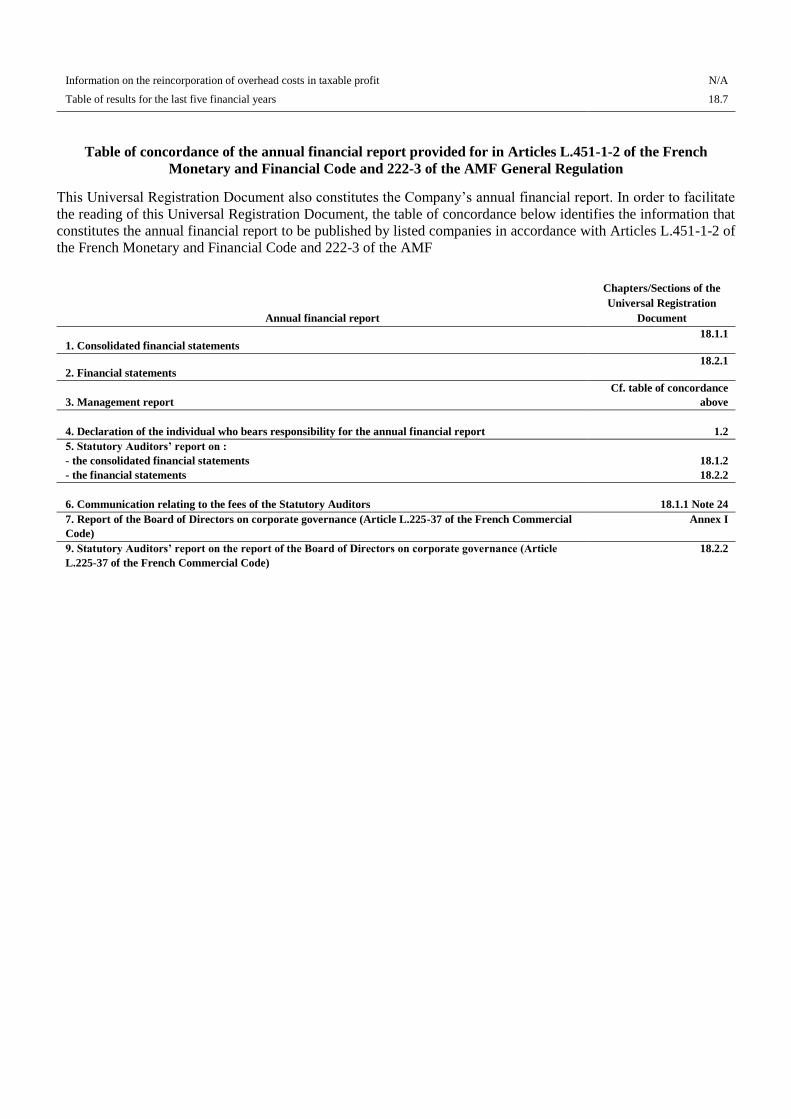
Table of concordance of the annual financial report provided for in Articles L.451-1-2 of the French
Monetary and Financial Code and 222-3 of the AMF General Regulation
This Universal Registration Document also constitutes the Company’s annual financial report. In order to facilitate
the reading of this Universal Registration Document, the table of concordance below identifies the information that
constitutes the annual financial report to be published by listed companies in accordance with Articles L.451-1-2 of
the French Monetary and Financial Code and 222-3 of the AMF
Information on the reincorporation of overhead costs in taxable profit N/A
Table of results for the last five financial years 18.7
Annual financial report
Chapters/Sections of the
Universal Registration
Document
1. Consolidated financial statements 18.1.1
2. Financial statements 18.2.1
3. Management report
Cf. table of concordance
above
4. Declaration of the individual who bears responsibility for the annual financial report
1.2
5. Statutory Auditors’ report on :
- the consolidated financial statements
- the financial statements
18.1.2
18.2.2
6. Communication relating to the fees of the Statutory Auditors
18.1.1 Note 24
7. Report of the Board of Directors on corporate governance (Article L.225-37 of the French Commercial
Code)
Annex I
9. Statutory Auditors’ report on the report of the Board of Directors on corporate governance (Article
L.225-37 of the French Commercial Code)
18.2.2