registration document - Total Energies
366
registration document 2015 EDITION
-
Upload
khangminh22 -
Category
Documents
-
view
0 -
download
0
Transcript of registration document - Total Energies
registrationdocument
2015 EDITION
couvertures_210*297 14/03/2016 15:44 Page2
Contents1. Key figures
1. Operating and market data . . . . . . . . . . . . . . . . . . . . .12. Selected financial information . . . . . . . . . . . . . . . . . . .2
2. Business overview1. History and strategy of TOTAL . . . . . . . . . . . . . . . . . .62. Upstream segment . . . . . . . . . . . . . . . . . . . . . . . . . . . .73. Refining & Chemicals segment . . . . . . . . . . . . . . . . .294. Marketing & Services segment . . . . . . . . . . . . . . . . .365. Investments . . . . . . . . . . . . . . . . . . . . . . . . . . . . . . . .416. Research & Development . . . . . . . . . . . . . . . . . . . . .437. Property, plant and equipment . . . . . . . . . . . . . . . . .468. Group organization . . . . . . . . . . . . . . . . . . . . . . . . . . .479. Organization chart as of December 31, 2015 . . . . . .48
3. 2015 Results and outlook1. Summary of results and financial position . . . . . . . .522. Liquidity and capital resources . . . . . . . . . . . . . . . . .563. Trends and outlook . . . . . . . . . . . . . . . . . . . . . . . . . . .584. Significant changes . . . . . . . . . . . . . . . . . . . . . . . . . .58
4. Risks and control1. Risk Factors . . . . . . . . . . . . . . . . . . . . . . . . . . . . . . . .602. Legal and arbitration proceedings . . . . . . . . . . . . . .693. Insurance and risk management . . . . . . . . . . . . . . . .714. Internal control and risk management procedures
(Article L. 225-37 of the French Commercial Code) . .725. Statutory auditors’ report (Article L. 225-235
of the French Commercial Code) . . . . . . . . . . . . . . . .78
5. Corporate governance1. Composition and practices of the Board of Directors . . .802. General Management . . . . . . . . . . . . . . . . . . . . . . . .1013. Shares held by the administration
and management bodies . . . . . . . . . . . . . . . . . . . . .1024. Statutory auditors . . . . . . . . . . . . . . . . . . . . . . . . . . .103
6. Compensation of the administrationand management bodies1. Board members’ compensation . . . . . . . . . . . . . . .1062. Executive directors’ compensation . . . . . . . . . . . . . .1083. Executive officers’ compensation . . . . . . . . . . . . . .1174. Stock option and free share grants policy . . . . . . .1175. Summary table of compensation elements
due or granted to the executive directors . . . . . . . . . .124
7. Social, environmental and societal information1. Social information . . . . . . . . . . . . . . . . . . . . . . . . . .1322. Safety, health and environment information . . . . . .1383. Societal information . . . . . . . . . . . . . . . . . . . . . . . . .1464. Reporting scopes and method . . . . . . . . . . . . . . . . . .1565. Independent verifier’s report . . . . . . . . . . . . . . . . . . .159
8. TOTAL and its shareholders1. Listing details . . . . . . . . . . . . . . . . . . . . . . . . . . . . . .1622. Dividend . . . . . . . . . . . . . . . . . . . . . . . . . . . . . . . . . .1653. Share buybacks . . . . . . . . . . . . . . . . . . . . . . . . . . . .1674. Shareholders . . . . . . . . . . . . . . . . . . . . . . . . . . . . . . .1715. Information for foreign shareholders . . . . . . . . . . . . . .1756. Investor Relations . . . . . . . . . . . . . . . . . . . . . . . . . . .176
9. General information1. Share capital . . . . . . . . . . . . . . . . . . . . . . . . . . . . . . .1802. Articles of incorporation and bylaws;
other information . . . . . . . . . . . . . . . . . . . . . . . . . . .1823. Historical financial information
and other information . . . . . . . . . . . . . . . . . . . . . . . .185
10. Consolidated Financial Statements1. Statutory auditors’ report on the Consolidated
Financial Statements . . . . . . . . . . . . . . . . . . . . . . . .1882. Consolidated statement of income . . . . . . . . . . . . .1893. Consolidated statement
of comprehensive income . . . . . . . . . . . . . . . . . . . .1904. Consolidated balance sheet . . . . . . . . . . . . . . . . . .1915. Consolidated statement of cash flow . . . . . . . . . . .1926. Consolidated statement of changes
in shareholders’ equity . . . . . . . . . . . . . . . . . . . . . . .1937. Notes to the Consolidated Financial Statements . . . .194
11. Supplemental oil and gas information(unaudited)1. Oil and gas information pursuant to FASB
Accounting Standards Codification 932 . . . . . . . . .2922. Other information . . . . . . . . . . . . . . . . . . . . . . . . . . .3093. Report on the payments made to governments . . . .311
12. TOTAL S.A.1. Statutory auditors’ report on regulated
agreements and commitments . . . . . . . . . . . . . . . .3262. Statutory auditors’ report on the annual
financial statements . . . . . . . . . . . . . . . . . . . . . . . . .3293. Statutory financial statements
of TOTAL S.A. as parent company . . . . . . . . . . . . .3304. Notes . . . . . . . . . . . . . . . . . . . . . . . . . . . . . . . . . . . .3345. Other financial information concerning
the parent company . . . . . . . . . . . . . . . . . . . . . . . . .346
Glossary 349
Cross-reference lists 353
Registration Document 2015including the annual financial report
This translation is a non binding translation into English of the Chairman and Chief Executive Officer’s certification issued in French and isprovided solely for the convenience of English-speaking readers.
“I certify, after having taken all reasonable measures to this purpose and to the best of my knowledge, that the information contained in thisDocument de référence (Registration Document) is in accordance with the facts and makes no omission likely to affect its import.
I certify, to the best of my knowledge, that the statutory and Consolidated Financial Statements of TOTAL S.A. (the Company) have beenprepared in accordance with applicable accounting standards and give a fair view of the assets, liabilities, financial position and results of theCompany and of all the entities included in the consolidation, and that the rapport de gestion (Management Report) of the Board of Directorsas referenced in the cross reference list included on page 357 of this Document de référence (Registration Document) presents a fair view ofthe development and performance of the business and financial position of the Company and of all the entities included in the consolidation,as well as a description of the main risks and uncertainties they are exposed to.
I have received a completion letter from the statutory auditors in which they state that they have audited the information related to the financialsituation and the financial statements included in this Document de référence (Registration Document), as well as read this Document deréférence (Registration Document) in its entirety.
The statutory auditors have reviewed the historical financial information contained in this Document de référence (Registration Document).The statutory auditors’ report on the Consolidated Financial Statements for the year ended December 31, 2015, is included on page 188 of this Document de référence (Registration Document). The statutory auditors’ report on the Consolidated Financial Statements for the yearended December 31, 2014, included on page 242 of the Registration Document 2014 filed on March 26, 2015, with the French FinancialMarkets Authority (AMF), contains a remark on the matter set out in the “Introduction” Note to the Consolidated Financial Statements whichsets out a change in accounting methods related to the change in the presentation currency of the Consolidated Financial Statements fromthe euro to the U.S. dollar.”
On March 15, 2016
Patrick PouyannéChairman and Chief Executive Officer
Registration Document 2015. TOTAL i
The French language version of this Document de référence (Registration Document) was filed with the French Financial Markets Authority(Autorité des marchés financiers) on March 16, 2016 pursuant to Article 212-13 of its general regulations. It may be used to support afinancial operation only if supplemented by a transaction note approved by the French Financial Markets Authority. This document wasprepared by the issuer and is binding for its signatories.
TOTAL. Registration Document 2015ii
Abbreviations
b: barrelcf: cubic feet / d: per day / y: per year€: euro$ and / or dollar: U.S. dollart: metric tonboe: barrel of oil equivalentkboe / d: thousand boe / dkb / d: thousand barrel / dBtu: British thermal unitM: millionB: billionMW: megawattMWp: megawatt peak (direct current)TWh: terawatt hourAMF: French Financial Markets AuthorityAPI: American Petroleum InstituteERMI: European Refining Margin Indicator. ERMI is an indicator intended to
represent the margin after variable costs for a hypothetical complexrefinery located around Rotterdam in Northern Europe. The indicatormargin may not be representative of the actual margins achieved byTOTAL in any period because of TOTAL’s particular refinery configurations,product mix effects or other company-specific operating conditions.
FEED: Front-End Engineering and DesignFPSO: Floating Production Storage and OffloadingIEA: International Energy AgencyIFRS: International Financial Reporting StandardsLNG: liquefied natural gasLPG: liquefied petroleum gasROE Return on EquityROACE: Return on Average Capital EmployedSAGD: Steam Assisted Gravity DrainageSEC: United States Securities and Exchange Commission
Conversion table
1 boe = 1 barrel of crude oil = approx. 5,390 cf of gas* in 2015.1 b / d = approx. 50 t / y1 t = approx. 7.5 b (for a gravity of 37° API)1 Bm³ / y = approx. 0.1 Bcf / d1 m³ = approx. 35.3 cf1 t of LNG = approx. 48 kcf of gas1 Mt / y of LNG = approx. 131 Mcf / d
* This ratio is calculated based on the actual average equivalent energy content of TOTAL’s natural gas reserves and is subject to change.
Définitions
The terms “TOTAL” and “Group” as used in this Registration Document refer toTOTAL S.A. collectively with all of its direct and indirect consolidated subsidiaries located in, or outside of France. The terms “Company” or “issues” as used in thisRegistration Document only refer to TOTAL S.A., parent company of the Group.
© TOTAL S.A. March 2016

Key figures
1. Operating and market data
2015 2014 2013
Brent ($ / b) 52.4 99.0 108.7Exchange rate (€-$) 1.11 1.33 1.33European Refining Margin Indicator (ERMI) ($ / t) 48.5 18.7 17.9
Hydrocarbon production (kboe / d) 2,347 2,146 2,299Liquids (kb / d) 1,237 1,034 1,167Gas (Mcf / d) 6,054 6,063 6,184
Refinery throughput (kb / d) 1,938 1,775 1,719Petroleum product sales (a) (kb / d) 4,005 3,769 3,521
(a) Including Trading.
Effective January 1, 2014, TOTAL changed the presentation currency of the Group’s Consolidated Financial Statements from the euro to the U.S. dollar. Comparative 2013 information has been restated.
Registration Document 2015. TOTAL 1
Key figures 1
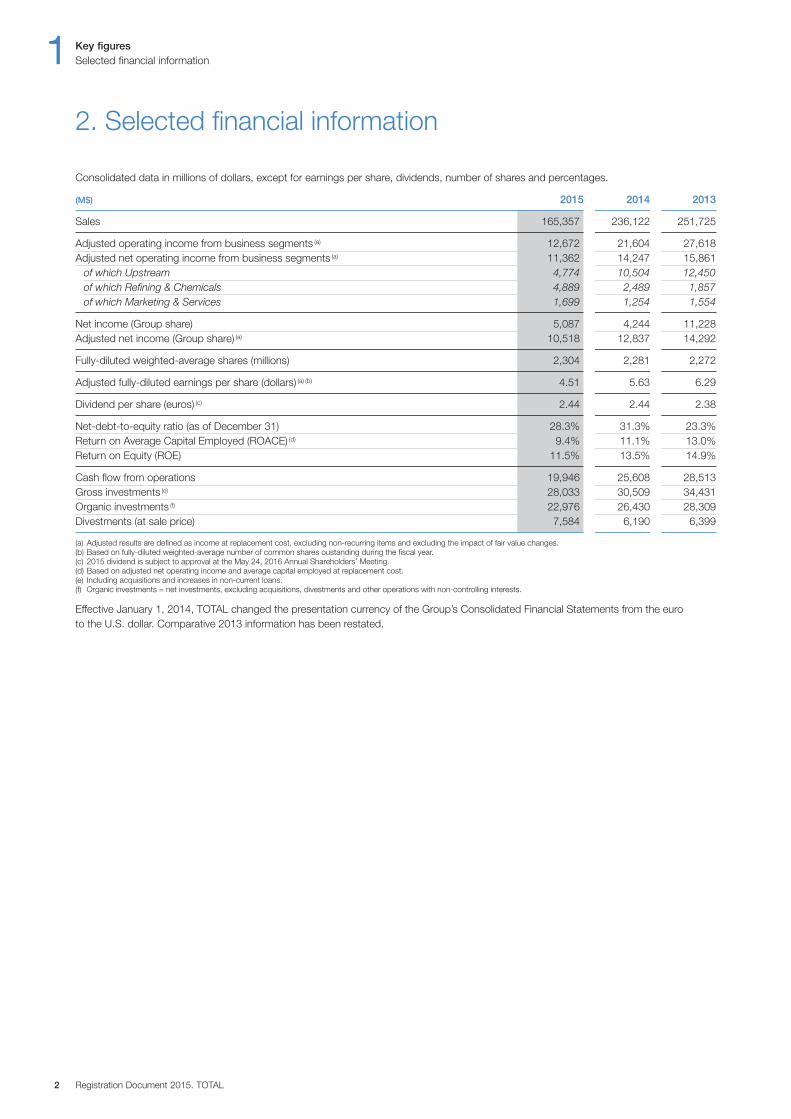
2. Selected financial information
Consolidated data in millions of dollars, except for earnings per share, dividends, number of shares and percentages.
(M$) 2015 2014 2013
Sales 165,357 236,122 251,725
Adjusted operating income from business segments (a) 12,672 21,604 27,618Adjusted net operating income from business segments (a) 11,362 14,247 15,861
of which Upstream 4,774 10,504 12,450of which Refining & Chemicals 4,889 2,489 1,857of which Marketing & Services 1,699 1,254 1,554
Net income (Group share) 5,087 4,244 11,228Adjusted net income (Group share) (a) 10,518 12,837 14,292
Fully-diluted weighted-average shares (millions) 2,304 2,281 2,272
Adjusted fully-diluted earnings per share (dollars) (a) (b) 4.51 5.63 6.29
Dividend per share (euros) (c) 2.44 2.44 2.38
Net-debt-to-equity ratio (as of December 31) 28.3% 31.3% 23.3%Return on Average Capital Employed (ROACE) (d) 9.4% 11.1% 13.0%Return on Equity (ROE) 11.5% 13.5% 14.9%
Cash flow from operations 19,946 25,608 28,513Gross investments (e) 28,033 30,509 34,431Organic investments (f) 22,976 26,430 28,309Divestments (at sale price) 7,584 6,190 6,399
(a) Adjusted results are defined as income at replacement cost, excluding non-recurring items and excluding the impact of fair value changes.(b) Based on fully-diluted weighted-average number of common shares oustanding during the fiscal year.(c) 2015 dividend is subject to approval at the May 24, 2016 Annual Shareholders’ Meeting.(d) Based on adjusted net operating income and average capital employed at replacement cost.(e) Including acquisitions and increases in non-current loans.(f) Organic investments = net investments, excluding acquisitions, divestments and other operations with non-controlling interests.
Effective January 1, 2014, TOTAL changed the presentation currency of the Group’s Consolidated Financial Statements from the euro to the U.S. dollar. Comparative 2013 information has been restated.
Registration Document 2015. TOTAL2
1 Key figuresSelected financial information
Registration Document 2015. TOTAL 3
Key figures 1Selected financial information
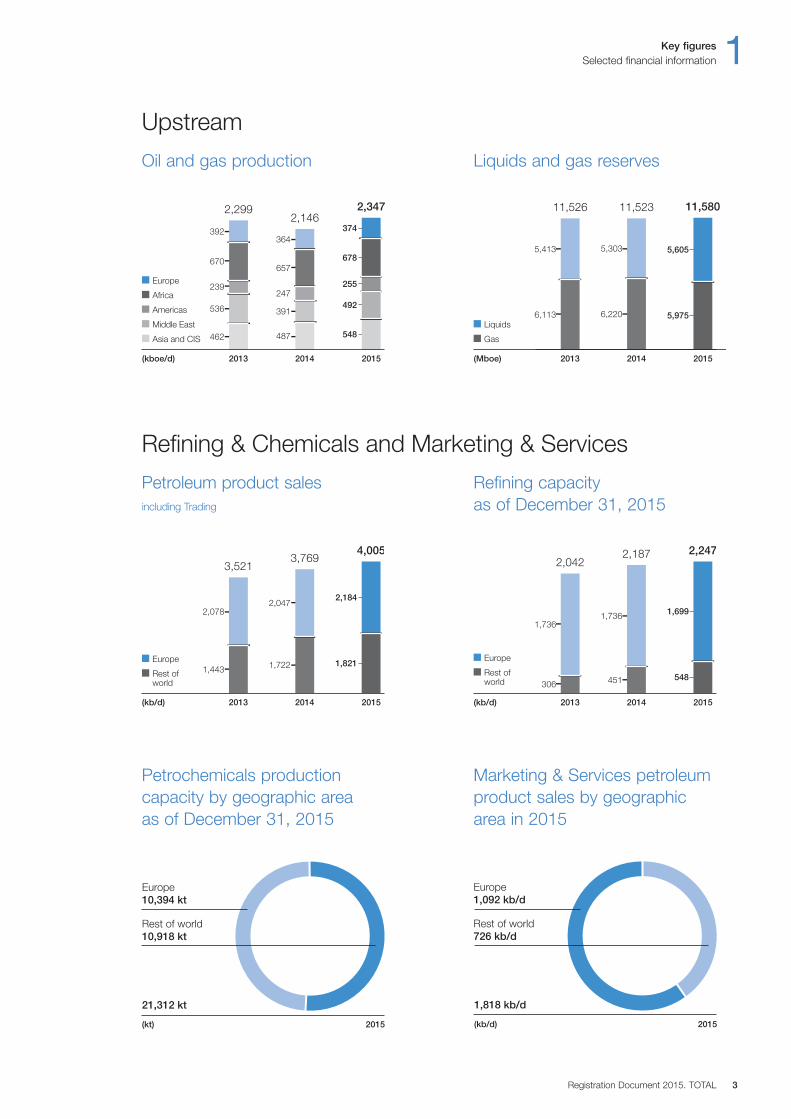
Refining capacity as of December 31, 2015
Liquids and gas reserves
Petroleum product salesincluding Trading
Oil and gas production
Petrochemicals production capacity by geographic area as of December 31, 2015
Marketing & Services petroleumproduct sales by geographicarea in 2015
Upstream
Refining & Chemicals and Marketing & Services
Asia and CIS
Middle East
Americas
Africa
Europe
2013(kboe/d) 2014 2015
374
678
255
492
548
364
657
247
391
487
392
670
239
536
462
2,2992,146
2,347
Rest ofworld
Europe
2013(kb/d) 2014 2015
2,078
1,443
2,184
1,821
2,047
1,722
3,5213,769
4,005
Rest ofworld
Europe
2013(kb/d) 2014 2015
1,736
306
1,699
548
1,736
451
2,0422,187 2,247
21,312 kt
Europe10,394 kt
Rest of world10,918 kt
(kt) 2015
Europe1,092 kb/d
Rest of world726 kb/d
1,818 kb/d
(kb/d) 2015
Gas
Liquids
2013(Mboe) 2014 2015
5,605
5,975
5,303
6,2206,113
5,413
11,58011,526 11,523
Registration Document 2015. TOTAL4
1 Key figuresSelected financial information
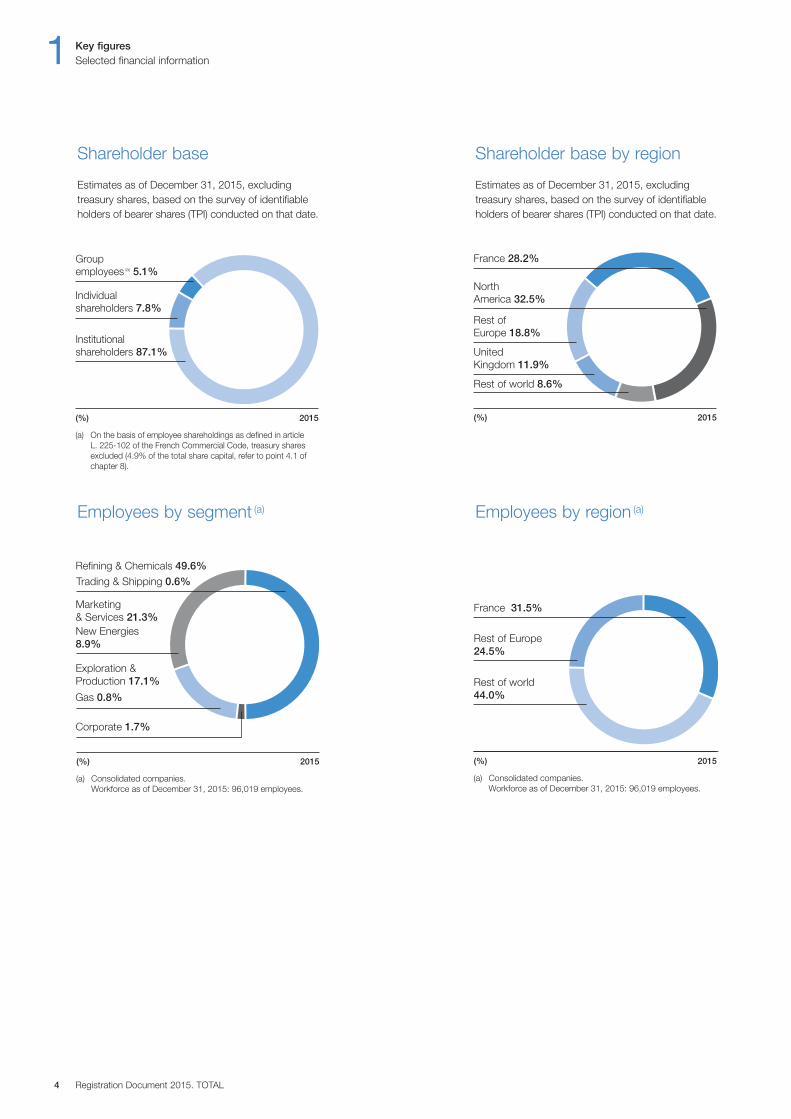
Shareholder base
Estimates as of December 31, 2015, excludingtreasury shares, based on the survey of identifiableholders of bearer shares (TPI) conducted on that date.
Shareholder base by region
Estimates as of December 31, 2015, excludingtreasury shares, based on the survey of identifiableholders of bearer shares (TPI) conducted on that date.
Employees by segment (a)
Refining & Chemicals 49.6%
Exploration &Production 17.1%
Gas 0.8%
Corporate 1.7%
Marketing& Services 21.3%
Trading & Shipping 0.6%
New Energies8.9%
(%) 2015
(a) Consolidated companies.Workforce as of December 31, 2015: 96,019 employees.
Employees by region (a)
Rest of Europe 24.5%
France 31.5%
Rest of world44.0%
(%) 2015
(a) Consolidated companies.Workforce as of December 31, 2015: 96,019 employees.
(%) 2015
Individual shareholders 7.8%
Group employees (a) 5.1%
Institutionalshareholders 87.1%
(a) On the basis of employee shareholdings as defined in article L. 225-102 of the French Commercial Code, treasury shares excluded (4.9% of the total share capital, refer to point 4.1 of chapter 8).
Rest of Europe 18.8%
United Kingdom 11.9%
France 28.2%
North America 32.5%
Rest of world 8.6%
(%) 2015
1. History and strategy of TOTAL 61.1. History and development . . . . . . . . . . . . . . . . . . . . . . . . . . . . . . . . . . . . . . . . . . . . . . . . . . . . . . . . . . . . . . . . . . . . . . . . . . . . . . . .61.2. Strategy . . . . . . . . . . . . . . . . . . . . . . . . . . . . . . . . . . . . . . . . . . . . . . . . . . . . . . . . . . . . . . . . . . . . . . . . . . . . . . . . . . . . . . . . . . . . . .6
2. Upstream segment 72.1. Exploration & Production . . . . . . . . . . . . . . . . . . . . . . . . . . . . . . . . . . . . . . . . . . . . . . . . . . . . . . . . . . . . . . . . . . . . . . . . . . . . . . . .92.2. Gas . . . . . . . . . . . . . . . . . . . . . . . . . . . . . . . . . . . . . . . . . . . . . . . . . . . . . . . . . . . . . . . . . . . . . . . . . . . . . . . . . . . . . . . . . . . . . . . .26
3. Refining & Chemicals segment 293.1. Refining & Chemicals . . . . . . . . . . . . . . . . . . . . . . . . . . . . . . . . . . . . . . . . . . . . . . . . . . . . . . . . . . . . . . . . . . . . . . . . . . . . . . . . . .303.2. Trading & Shipping . . . . . . . . . . . . . . . . . . . . . . . . . . . . . . . . . . . . . . . . . . . . . . . . . . . . . . . . . . . . . . . . . . . . . . . . . . . . . . . . . . . .34
4. Marketing & Services segment 364.1. Marketing & Services . . . . . . . . . . . . . . . . . . . . . . . . . . . . . . . . . . . . . . . . . . . . . . . . . . . . . . . . . . . . . . . . . . . . . . . . . . . . . . . . . .374.2. New Energies . . . . . . . . . . . . . . . . . . . . . . . . . . . . . . . . . . . . . . . . . . . . . . . . . . . . . . . . . . . . . . . . . . . . . . . . . . . . . . . . . . . . . . . .40
5. Investments 415.1. Major investments over the 2013-2015 period . . . . . . . . . . . . . . . . . . . . . . . . . . . . . . . . . . . . . . . . . . . . . . . . . . . . . . . . . . . . . .415.2. Major planned investments . . . . . . . . . . . . . . . . . . . . . . . . . . . . . . . . . . . . . . . . . . . . . . . . . . . . . . . . . . . . . . . . . . . . . . . . . . . . .42
6. Research & Development 436.1. Upstream . . . . . . . . . . . . . . . . . . . . . . . . . . . . . . . . . . . . . . . . . . . . . . . . . . . . . . . . . . . . . . . . . . . . . . . . . . . . . . . . . . . . . . . . . . . .436.2. Refining & Chemicals . . . . . . . . . . . . . . . . . . . . . . . . . . . . . . . . . . . . . . . . . . . . . . . . . . . . . . . . . . . . . . . . . . . . . . . . . . . . . . . . . .446.3. Marketing & Services . . . . . . . . . . . . . . . . . . . . . . . . . . . . . . . . . . . . . . . . . . . . . . . . . . . . . . . . . . . . . . . . . . . . . . . . . . . . . . . . . .446.4. Environment . . . . . . . . . . . . . . . . . . . . . . . . . . . . . . . . . . . . . . . . . . . . . . . . . . . . . . . . . . . . . . . . . . . . . . . . . . . . . . . . . . . . . . . . .456.5. R&D organization . . . . . . . . . . . . . . . . . . . . . . . . . . . . . . . . . . . . . . . . . . . . . . . . . . . . . . . . . . . . . . . . . . . . . . . . . . . . . . . . . . . . .46
7. Property, plant and equipment 46
8. Group organization 478.1. Position of the Company within the Group . . . . . . . . . . . . . . . . . . . . . . . . . . . . . . . . . . . . . . . . . . . . . . . . . . . . . . . . . . . . . . . . .478.2. Company subsidiaries . . . . . . . . . . . . . . . . . . . . . . . . . . . . . . . . . . . . . . . . . . . . . . . . . . . . . . . . . . . . . . . . . . . . . . . . . . . . . . . . .478.3. Group interests in publicly-traded companies . . . . . . . . . . . . . . . . . . . . . . . . . . . . . . . . . . . . . . . . . . . . . . . . . . . . . . . . . . . . . .47
9. Organization chart as of December 31, 2015 48
Business overview
Registration Document 2015. TOTAL 5
Business overview2.Présentation des activités 2
The Group’s goal is to be a global energy company. TOTAL is aleading international oil and gas company, and is active in newenergy sources, such as solar energy and biomass. To achieve thisgoal, TOTAL leverages its integrated business model, which enablesit to capture synergies between the different business segments ofthe Group. TOTAL stands out due to its operational excellence, itstechnological expertise and its capacity to manage complexprojects. The Group’s strategy is based on four main priorities:
– driving profitable, sustainable growth in Exploration & Production’shydrocarbon activities;
– developing competitive, top-tier refining and petrochemicalcomplexes;
– responding to its customer needs by delivering innovativesolutions and services that go beyond the supply of petroleumproducts; and
– consolidating its leadership in solar energy and continuing todevelop biomass in order to offer the most appropriate energysolutions.
This strategy incorporates the challenges of climate change, usingthe International Energy Agency 2°C scenario (450 ppm) as a pointof reference. TOTAL’s challenge is to contribute to satisfying thedemand for energy of the world’s growing population, while providingconcrete solutions to limit the effects of climate change. To do so,the Group focuses its actions around several key points, includingthe development of gas and renewable energies.
At the core of TOTAL’s strategy is a strong belief that energy is vital,drives progress and must be made available to everyone. Energy isa precious resource that must be used wisely. The Group is helpingto produce the energy that people around the planet need to liveand thrive, while ensuring that its operations deliver economic,societal and environmental benefits. TOTAL is meeting thischallenge with and for its employees, its stakeholders and localcommunities.
Beyond safety, the values of respect, responsibility and exemplaryconduct underpin TOTAL’s Code of Conduct and accompany prioritybusiness principles in the realms of safety / security / health / theenvironment, integrity (preventing corruption, fraud and anti-competitivepractices) and human rights. It is through strict adherence to thesevalues and principles that TOTAL will be able to build strong andsustainable growth for the Group and its stakeholders and fulfill itsmotto: committed to better energy.
1.2. Strategy
TOTAL S.A., a French société anonyme (limited company)incorporated on March 28, 1924 is, together with its subsidiariesand affiliates, the world’s fourth largest publicly-traded integrated oiland gas company (1).
With operations in more than 130 countries, TOTAL is engaged inevery sector of the oil industry, including upstream (hydrocarbonexploration, development and production) and downstream (refining,petrochemicals, specialty chemicals, trading and shipping of crudeoil and petroleum products and marketing). TOTAL also operates inthe renewable energies and power generation sectors.
TOTAL began its Upstream operations in the Middle East in 1924.Since then, the Company has grown and expanded its operationsworldwide. In early 1999, the Company acquired control ofPetroFina S.A. and in early 2000 it acquired control of Elf Aquitaine.Since the repeal in 2002 of the decree of December 13, 1993 thatestablished a golden share of Elf Aquitaine held by the Frenchgovernment, there are no longer any agreements or regulatoryprovisions governing shareholding relationships between TOTALand the French government. Information on TOTAL S.A.’sshareholding structure is presented in point 4.1 of chapter 8.
1. History and strategy of TOTAL
1.1. History and development
2 Business overviewHistory and strategy of TOTAL
TOTAL. Registration Document 20156
(1) Based on market capitalization (in dollars) as of December 31, 2015.
Upstream segment financial data
(M$) 2015 2014 2013
Non-Group sales 16,840 23,484 26,367Adjusted operating income (a) 4,925 17,156 23,700Adjusted net operating income (a) 4,774 10,504 12,450
(a) Adjusted results are defined as income using replacement cost, adjusted for special items, excluding the impact of changes for fair value.
Adjusted net operating income from the Upstream segment was $4,774 million in 2015 compared to $10,504 million in 2014, a decrease of55% which was due essentially to the decrease in the average realized price of hydrocarbons partially offset by production growth, costreduction and a lower average tax rate. The effective tax rate for the Upstream segment was 45.5% in 2015 compared to 57.1% in 2014.
Technical costs (3) for consolidated subsidiaries, in accordance with ASC 932 (4), were 23.0 $ / boe in 2015, compared to 28.3 $ / boe in 2014.
Price realizations (a) 2015 2014 2013
Average liquids price ($ / b) 47.4 89.4 103.3Average gas price ($ / Mbtu) 4.75 6.57 7.12
(a) Consolidated subsidiaries, excluding fixed margins.
Average liquids price decreased by 47% in 2015 compared to 2014 and average gas price decreased by 28% in 2015 compared to 2014.
2. Upstream segment
TOTAL’s Upstream segment includes the activities of Exploration & Production and Gas. The Group has exploration and production activitiesin more than 50 countries and produces oil or gas in approximately 30 countries. Gas conducts activities downstream from productionrelated to natural gas, liquefied natural gas (LNG) and liquefied petroleum gas (LPG), as well as power generation and trading, and otheractivities.
Business overview 2Upstream segment
Registration Document 2015. TOTAL 7
11.6 Bboeof proved reserves as ofDecember 31, 2015 (1)
2.35 Mboe / dof hydrocarbonsproduced in 2015
$20.5billionof organic investments (2)
in 2015
16,281employees present
(1) Based on a Brent crude price of $54.17/b (reference price in 2015), according to rules established by the Securities and Exchange Commission (refer to point 2.1.2).(2) Organic investments = net investments, excluding acquisitions, divestments and other operations with non-controlling interests (refer to point 5.1 of chapter 2).(3) (Production costs + exploration expenses + depreciation, depletion and amortization and valuation allowances)/production of the year.(4) FASB Accounting Standards Codification 932, Extractive industries – Oil and Gas.
Proved reserves based on SEC rules (based on Brent at 54.17 $ / b)were 11,580 Mboe at December 31, 2015.
Based on the 2015 average rate of production, the reserve life ismore than 13 years. The 2015 proved reserve replacement rate (1),based on SEC rules, was 107%.
At year-end 2015, TOTAL had a solid and diversified portfolio ofproved and probable reserves (2) representing more than 20 years ofreserve life based on the 2015 average production rate.
Reserves
As of December 31, 2015 2014 2013
Hydrocarbon reserves (Mboe) 11,580 11,523 11,526Liquids (Mb) 5,605 5,303 5,413Gas (Bcf) 32,206 33,590 33,026
In 2015, hydrocarbon production was 2,347 kboe / d, an increase of9.4% compared to 2014, due to the following:
• +6% for project start ups and ramp ups, notably CLOV, WestFranklin Phase 2, Eldfisk II and Termokarstovoye;
• +6% due to portfolio changes, mainly the extension of the ADCOconcession in the United Arab Emirates, partially offset by assetsales in the North Sea, Nigeria and Azerbaijan;
• -4% for productions stop in Yemen and Libya;• +1% for positive price effect and performance partially offset by
natural field decline.
Production
Hydrocarbon production 2015 2014 2013
Combined production (kboe / d) 2,347 2,146 2,299Liquids (kb / d) 1,237 1,034 1,167Gas (Mcf / d) 6,054 6,063 6,184
2 Business overviewUpstream segment
TOTAL. Registration Document 20158
Europe 1,272 Mboe
Americas 1,977 Mboe
Asia - CIS 3,811 Mboe
Africa 2,134 Mboe
Middle East 2,386 Mboe
Africa 678 kboe/d
North America 103 kboe/d
Asia Pacific 258 kboe/d
South America 152 kboe/d
Europe 374 kboe/d
CIS 290 kboe/d
Middle East 492 kboe/d
(1) Change in reserves excluding production (revisions + discoveries, extensions + acquisitions – divestments)/production for the period.(2) Limited to proved and probable reserves covered by Exploration & Production contracts on fields that have been drilled and for which technical studies have demonstrated economic
development in the price scenario retained by the Group, including projects developed by mining.
Exploration & Production’s mission is to discover and develop oiland gas fields in order to meet growing energy demand. Safety is acore value for that mission.
In an environment marked by the significant drop in hydrocarbonprices, Exploration & Production’s strategy is based on:
– developing its operational excellence (reduction of operatingcosts and development costs, and operational efficiencyimprovement) by drawing on its technological expertise and on innovation;
– maintaining a leading position in the Group’s technical areas of excellence, such as deep offshore and LNG;
– renewing reserves through exploration and access to alreadydiscovered but undeveloped resources.
This strategy aims at developing an oil and gas production modelthat is resilient (i.e., which can withstand a long period of lowhydrocarbon prices), profitable and sustainable.
Additionally, Exploration & Production thrives to minimize theenvironmental impact of its activities.
In 2015, the Group’s production grew 9.4% compared to 2014.Exploration & Production is exiting a heavy investments phase,which peaked in 2013, and which is expected to lead to a productionincrease of 5% per year over the period of 2014-2019. The maingrowth levers include, on the one hand, the start-up of 20 majorprojects between 2015 and 2019 and, on the other hand, theimprovement of the operational efficiency of the facilities. In 2015,nine projects were started up. After 2020, TOTAL’s objective for organic production growth of 1 to 2% is in line with worldwidegrowth in demand for hydrocarbons.
2.1.1. Exploration and development
TOTAL evaluates exploration opportunities based on a variety ofgeological, technical, political, economic (including taxes and licenseterms) environmental and societal factors.
The exploration strategy deployed since 2015 aims to prioritizedrilling that creates value and resources. The Group expects morebalanced exploration investments:
– 50% for core and emerging basins, where the presence ofhydrocarbons is already proven;
– 25% for near-field exploration around operated assets; and– 25% for high-potential frontier basins.
In April 2015, a new organization for the Group’s explorationactivities, adapted to the new strategy, was implemented with anew senior exploration management team. The organizationalchanges are focused notably on strengthening regional basinmastery and technical excellence.
In 2015, exploration expenditure from all Exploration & Productionsubsidiaries stood at $1.9 billion (excluding exploration bonuses),which were made mainly in the United States, Iraq, Norway, Brazil,Papua New Guinea, Nigeria and the United Kingdom, compared to$2.6 billion in 2014 and $2.9 billion in 2013. The 2016 explorationbudget is $1.5 billion.
Organic investments(1) from all Exploration & Production subsidiariesstood at $20.5 billion in 2015, compared to $23 billion in 2014
and $24 billion in 2013, and were mainly made in Angola, Nigeria,the Republic of the Congo, Norway, Canada, Australia, the UnitedKingdom, Russia, Kazakhstan, Indonesia, the United States and Argentina.
2.1.2. Reserves
The definitions used for proved, proved developed and provedundeveloped oil and gas reserves are in accordance with the UnitedStates Securities & Exchange Commission (SEC) Rule 4-10 ofRegulation S-X as amended by the SEC Modernization of Oil andGas Reporting release issued on December 31, 2008. Provedreserves are estimated using geological and engineering data todetermine with reasonable certainty whether the crude oil or naturalgas in known reservoirs is recoverable under existing regulatory,economic and operating conditions.
TOTAL’s oil and gas reserves are consolidated annually, taking into account, among other factors, levels of production, fieldreassessments, additional reserves from discoveries andacquisitions, disposal of reserves and other economic factors.
Unless otherwise indicated, any reference to TOTAL’s proved reserves,proved developed reserves, proved undeveloped reserves andproduction reflects the Group’s entire share of such reserves orsuch production. TOTAL’s worldwide proved reserves include theproved reserves of its consolidated subsidiaries as well as itsproportionate share of the proved reserves of equity affiliates. Thereserves estimation process involves making subjective judgments.Consequently, estimates of reserves are not exact measurementsand are subject to revision under well-established control procedures.
The reserves booking process requires, among other things:
– internal peer review of technical evaluations to ensure that theSEC definitions and guidance are followed; and
– that management makes significant funding commitmentstowards the development of the reserves prior to booking.
For further information concerning the reserves and their evaluationprocess, see points 1 and 2 of chapter 11.
Proved reserves for 2015, 2014 and 2013
In accordance with the amended Rule 4-10 of Regulation S-X,proved reserves at December 31 are calculated using a 12-monthaverage price determined as the unweighted arithmetic average ofthe first-day-of-the-month price for each month of the relevant yearunless prices are defined by contractual arrangements, excludingescalations based upon future conditions. The reference prices for2015, 2014 and 2013 were, respectively, $54.17 / b, $101.27 / b and$108.02 / b for Brent crude.
As of December 31, 2015, TOTAL’s combined proved reserves ofoil and gas were 11,580 Mboe (53% of which were proved developedreserves). Liquids (crude oil, condensates, natural gas liquids andbitumen) represented approximately 48% of these reserves andnatural gas the remaining 52%. These reserves were located inEurope (mainly in Norway and the United Kingdom), Africa (mainly inAngola, Gabon, Nigeria and the Republic of the Congo), the Americas(mainly in Canada, Argentina, the United States and Venezuela), theMiddle East (mainly in Qatar, the United Arab Emirates and Yemen),and Asia-Pacific (mainly in Australia) and in Kazakhstan and Russia.
2.1. Exploration & Production
Business overview 2Upstream segment
Registration Document 2015. TOTAL 9
(1) For Exploration & Production, organic investments include exploration investments, net development investments and net financial investments.

Discoveries of new fields and extensions of existing fields broughtan additional 2,762 Mboe to the Upstream segment’s proved reservesduring the 3-year period ended December 31, 2015 (beforededucting production and sales of reserves in place and adding anyacquisitions of reserves in place during this period). The net level ofreserve revisions during this 3-year period is +244 Mboe, whichwas due to the overall positive revisions in field behaviors, a scopechange in two projects in 2013, the impairment of two assets inLibya in 2015 due to the degradation of the security situation and to the positive impact of the decrease in hydrocarbon prices in 2015that led to a reserves increase on fields with production sharing orservice contracts and on Canadian bitumen fields (royalty effect),which was partially offset by the reserves decrease resulting from thesuspension or cancellation due to economic reasons of capitalexpenditures associated with, or from shorter producing life of,certain producing fields.
As of December 31, 2014, TOTAL’s combined proved reserves ofoil and gas were 11,523 Mboe (50% of which were proved developedreserves) compared to 11,526 Mboe (49% of which were proveddeveloped reserves) as of December 31, 2013. Liquids (crude oil,condensates, natural gas liquids and bitumen) at year-end 2014represented approximately 46% of these reserves and natural gasthe remaining 54% and, at year-end 2013, approximately 47% of these reserves and natural gas the remaining 53%.
Sensitivity to oil and gas prices
Changes in the price used as a reference for the proved reservesestimation result in non-proportionate inverse changes in provedreserves associated with production sharing and risked servicecontracts (which together represent approximately 20% of TOTAL’sreserves as of December 31, 2015). Under such contracts, TOTALis entitled to a portion of the production, the sale of which is meantto cover expenses incurred by the Group. As oil prices decrease,more barrels are necessary to cover the same amount of expenses.Moreover, the number of barrels recoverable under these contractsmay vary according to criteria such as cumulative production, therate of return on investment or the income-cumulative expensesratio. This increase is partly offset by a reduction of the duration overwhich fields can be produced economically. However, the decreasein reserves due to this reduction is generally less than the increasein reserves under production sharing or risked service contractsdue to such lower prices. As a result, lower prices usually lead to anincrease in TOTAL’s reserves. In Canada, a decrease in the referenceprice per barrel used as a reference for estimating proved reservesleads to a decrease in the volume of royalties and, therefore, anincrease of the proved reserves, and vice versa.
Lastly, for any type of contract, a significant decrease in thereference price of petroleum products that negatively impactsprojects profitability may lead to a reduction of proved reserves.
2.1.3. Production
The average daily production of liquids and natural gas was 2,347 kboe / d in 2015 compared to 2,146 kboe / d in 2014 and2,299 kboe / d in 2013. Liquids represented approximately 53% and natural gas approximately 47% of TOTAL’s overall production in 2015.
The tables on the following pages set forth TOTAL’s annual andaverage daily production of liquids and natural gas by geographicarea and for each of the last three fiscal years.
Consistent with industry practice, TOTAL often holds a percentageinterest in its fields rather than a 100% interest, with the balance beingheld by joint venture partners (which may include other internationaloil companies, state-owned oil companies or government entities).The Group’s entities may frequently act as operator (the partyresponsible for technical production) on acreage in which it holdsan interest. Refer to the table “Presentation of production activitiesby region” on the following pages for a presentation of the Group’sproducing assets.
As in 2014 and 2013, substantially all of the liquids production fromTOTAL’s Upstream segment in 2015 was marketed by the Trading &Shipping division of TOTAL’s Refining & Chemicals segment (refer totable “Trading’s crude oil sales and supply and petroleum productssales” in point 3.2.1 of this chapter).
2.1.4. Delivery commitments
The majority of TOTAL’s natural gas production is sold under long-term contracts. However, its North American production, and partof its production from the United Kingdom, the Netherlands andNorway, is sold on the spot market. The long-term contracts underwhich TOTAL sells its natural gas usually provide for a price relatedto, among other factors, average crude oil and other petroleumproduct prices, as well as, in some cases, a cost-of-living index.Though the price of natural gas tends to fluctuate in line with crudeoil prices, a slight delay may occur before changes in crude oilprices are reflected in long-term natural gas prices.
Some of TOTAL’s long-term contracts, notably in Bolivia, Indonesia,Nigeria, Norway, Thailand and Qatar, specify the delivery of quantitiesof natural gas that may or may not be fixed and determinable. Suchdelivery commitments vary substantially, both in duration and scope,from contract to contract throughout the world. For example, insome cases, contracts require delivery of natural gas on an as-needed basis, and, in other cases, contracts call for the delivery ofvaried amounts of natural gas over different periods of time.Nevertheless, TOTAL estimates the fixed and determinable quantityof gas to be delivered over the period 2016-2018 to be 3,591 Bcf.The Group expects to satisfy most of these obligations through theproduction of its proved reserves of natural gas, with, if needed,additional sourcing from spot market purchases (refer to points 1and 2 of chapter 11).
2.1.5. Contractual framework of activities
Licenses, permits and contracts governing the Group’s ownershipof oil and gas interests have terms that vary from country to countryand are generally granted by or entered into with a governmententity or a state-owned company and are sometimes entered intowith private owners. These agreements usually take the form ofconcessions or production sharing contracts.
In the framework of oil concession agreements, the oil company ownsthe assets and the facilities and is entitled to the entire production.In exchange, the operating risks, costs and investments are the oilcompany’s responsibility and it agrees to remit to the relevant hostcountry, usually the owner of the subsoil resources, a production-based royalty, income tax, and possibly other taxes that may applyunder local tax legislation.
The production sharing contract (“PSC”) involves a more complexlegal framework than the concession agreement: it defines the termsand conditions of production sharing and sets the rules governing
2 Business overviewUpstream segment
TOTAL. Registration Document 201510
the cooperation between the company or consortium in possessionof the license and the host country, which is generally representedby a state-owned company. The latter can thus be involved inoperating decisions, cost accounting and production allocation.The consortium agrees to undertake and finance all exploration,development and production activities at its own risk. In exchange,it is entitled to a portion of the production, known as “cost oil”, thesale of which is intended to cover its incurred expenses (capital andoperating costs). The balance of production, known as “profit oil”, is thenshared in varying proportions, between the company or consortium,on the one hand, and the host country or state-owned company,on the other hand.
Today, concession agreements and PSCs can coexist, sometimesin the same country or even on the same block. Even though thereare other contractual models, TOTAL’s license portfolio iscomprised mainly of concession agreements.
On most licenses, the partners and authorities of the host country,often assisted by international accounting firms, perform jointventure and PSC cost audits and ensure the observance ofcontractual obligations.
In some countries, TOTAL has also signed contracts called “riskedservice contracts”, which are similar to PSCs. However, the profit oilis replaced by a defined cash monetary remuneration, agreed bycontract, which depends notably on field performance parameterssuch as the amount of barrels produced.
Oil and gas exploration and production activities are subject toauthorization granted by public authorities (licenses), which aregranted for specific and limited periods of time and include anobligation to relinquish a large portion, or the entire portion in case of failure, of the area covered by the license at the end of the exploration period.
TOTAL pays taxes on income generated from its oil and gasproduction and sales activities under its concessions, PSCs andrisked service contracts, as provided for by local regulations. Inaddition, depending on the country, TOTAL’s production and salesactivities may be subject to a number of other taxes, fees andwithholdings, including special petroleum taxes and fees. The taxesimposed on oil and gas production and sales activities are generallysubstantially higher than those imposed on other industrial orcommercial businesses.
Business overview 2Upstream segment
Registration Document 2015. TOTAL 11
2 Business overviewUpstream segment
TOTAL. Registration Document 201512
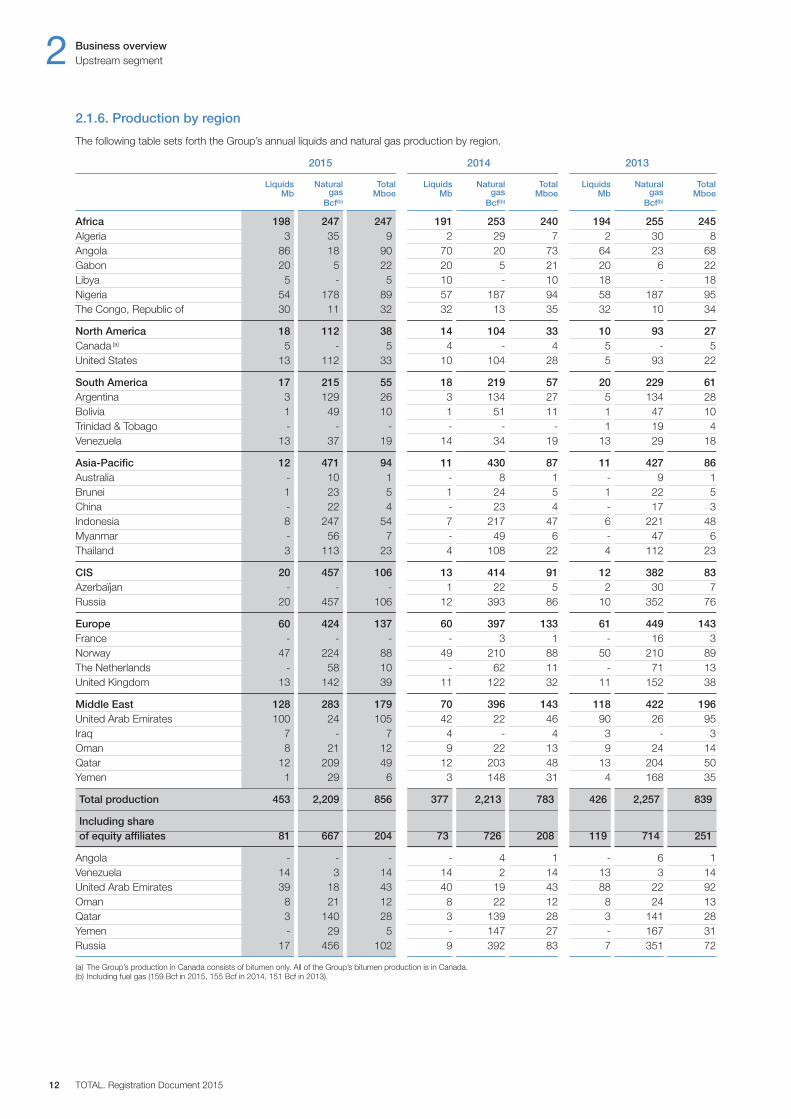
2.1.6. Production by region
The following table sets forth the Group’s annual liquids and natural gas production by region.
2015 2014 2013
Liquids Natural Total Liquids Natural Total Liquids Natural Total Mb gas Mboe Mb gas Mboe Mb gas Mboe Bcf(b) Bcf(b) Bcf(b)
Africa 198 247 247 191 253 240 194 255 245Algeria 3 35 9 2 29 7 2 30 8Angola 86 18 90 70 20 73 64 23 68Gabon 20 5 22 20 5 21 20 6 22Libya 5 - 5 10 - 10 18 - 18Nigeria 54 178 89 57 187 94 58 187 95The Congo, Republic of 30 11 32 32 13 35 32 10 34
North America 18 112 38 14 104 33 10 93 27Canada (a) 5 - 5 4 - 4 5 - 5United States 13 112 33 10 104 28 5 93 22
South America 17 215 55 18 219 57 20 229 61Argentina 3 129 26 3 134 27 5 134 28Bolivia 1 49 10 1 51 11 1 47 10Trinidad & Tobago - - - - - - 1 19 4Venezuela 13 37 19 14 34 19 13 29 18
Asia-Pacific 12 471 94 11 430 87 11 427 86Australia - 10 1 - 8 1 - 9 1Brunei 1 23 5 1 24 5 1 22 5China - 22 4 - 23 4 - 17 3Indonesia 8 247 54 7 217 47 6 221 48Myanmar - 56 7 - 49 6 - 47 6Thailand 3 113 23 4 108 22 4 112 23
CIS 20 457 106 13 414 91 12 382 83Azerbaïjan - - - 1 22 5 2 30 7Russia 20 457 106 12 393 86 10 352 76
Europe 60 424 137 60 397 133 61 449 143France - - - - 3 1 - 16 3Norway 47 224 88 49 210 88 50 210 89The Netherlands - 58 10 - 62 11 - 71 13United Kingdom 13 142 39 11 122 32 11 152 38
Middle East 128 283 179 70 396 143 118 422 196United Arab Emirates 100 24 105 42 22 46 90 26 95Iraq 7 - 7 4 - 4 3 - 3Oman 8 21 12 9 22 13 9 24 14Qatar 12 209 49 12 203 48 13 204 50Yemen 1 29 6 3 148 31 4 168 35
Total production 453 2,209 856 377 2,213 783 426 2,257 839
Including shareof equity affiliates 81 667 204 73 726 208 119 714 251
Angola - - - - 4 1 - 6 1Venezuela 14 3 14 14 2 14 13 3 14United Arab Emirates 39 18 43 40 19 43 88 22 92Oman 8 21 12 8 22 12 8 24 13Qatar 3 140 28 3 139 28 3 141 28Yemen - 29 5 - 147 27 - 167 31Russia 17 456 102 9 392 83 7 351 72
(a) The Group’s production in Canada consists of bitumen only. All of the Group’s bitumen production is in Canada.(b) Including fuel gas (159 Bcf in 2015, 155 Bcf in 2014, 151 Bcf in 2013).

Business overview 2Upstream segment
Registration Document 2015. TOTAL 13
The following table sets forth the Group’s average daily liquids and natural gas production by region.
2015 2014 2013
Liquids Natural Total Liquids Natural Total Liquids Natural Total kb/d gas kboe/d kb/d gas kboe/d kb/d gas kboe/d Mcf/d(b) Mcf/d(b) Mcf/d(b)
Africa 542 677 678 522 693 657 531 699 670Algeria 7 96 25 5 79 20 5 82 21Angola 238 49 248 191 54 200 175 62 186Gabon 55 15 59 55 14 58 55 16 59Libya 14 - 14 27 - 27 50 - 50Nigeria 147 487 245 156 511 257 158 511 261The Congo, Republic of 81 30 87 88 35 95 88 28 93
North America 48 308 103 39 285 90 28 256 73Canada (a) 14 - 14 12 - 12 13 - 13United States 34 308 89 27 285 78 15 256 60
South America 47 588 152 50 599 157 54 627 166Argentina 8 354 72 9 367 75 13 366 78Bolivia 3 133 28 4 139 30 4 129 28Trinidad & Tobago - - - - - - 2 52 12Venezuela 36 101 52 37 93 52 35 80 48
Asia-Pacific 34 1,290 258 30 1,178 238 30 1,170 235Australia - 28 4 - 23 4 - 25 4Brunei 3 62 15 2 66 15 2 59 13China - 59 11 - 63 12 - 46 8Indonesia 22 676 147 18 594 130 17 605 131Myanmar - 153 19 - 135 17 - 129 16Thailand 9 312 62 10 297 60 11 306 63
CIS 54 1,252 290 36 1,135 249 32 1,046 227Azerbaijan - - - 3 59 14 5 82 20Russia 54 1,252 290 33 1,076 235 27 964 207
Europe 161 1,161 374 165 1,089 364 168 1,231 392France - - - - 9 2 1 45 9Norway 125 614 239 135 576 242 136 575 243The Netherlands 1 158 28 1 171 31 1 195 35United Kingdom 35 389 107 29 333 89 30 416 105
Middle East 351 778 492 192 1,084 391 324 1,155 536United Arab Emirates 274 66 287 115 61 127 247 71 260Iraq 18 1 18 12 1 12 7 1 7Oman 25 58 36 24 61 36 24 66 37Qatar 32 573 134 32 555 132 36 558 137Yemen 2 80 17 9 406 84 10 459 95
Total production 1,237 6,054 2,347 1,034 6,063 2,146 1,167 6,184 2,299
Including share of equity affiliates 219 1,828 559 200 1,988 571 325 1,955 687
Angola - - - - 10 2 - 16 3Venezuela 36 7 37 37 6 38 35 7 37United Arab Emirates 107 50 116 109 51 118 240 61 253Oman 24 58 34 23 61 34 23 66 35Qatar 7 383 77 7 381 77 8 385 78Yemen - 80 15 - 404 75 - 458 84Russia 45 1,250 280 24 1,075 227 19 962 197
(a) The Group’s production in Canada consists of bitumen only. All of the Group’s bitumen production is in Canada.(b) Including fuel gas (435 Mcf / d in 2015, 426 Mcf / d in 2014, 415 Mcf / d in 2013).
2 Business overviewUpstream segment
TOTAL. Registration Document 201514
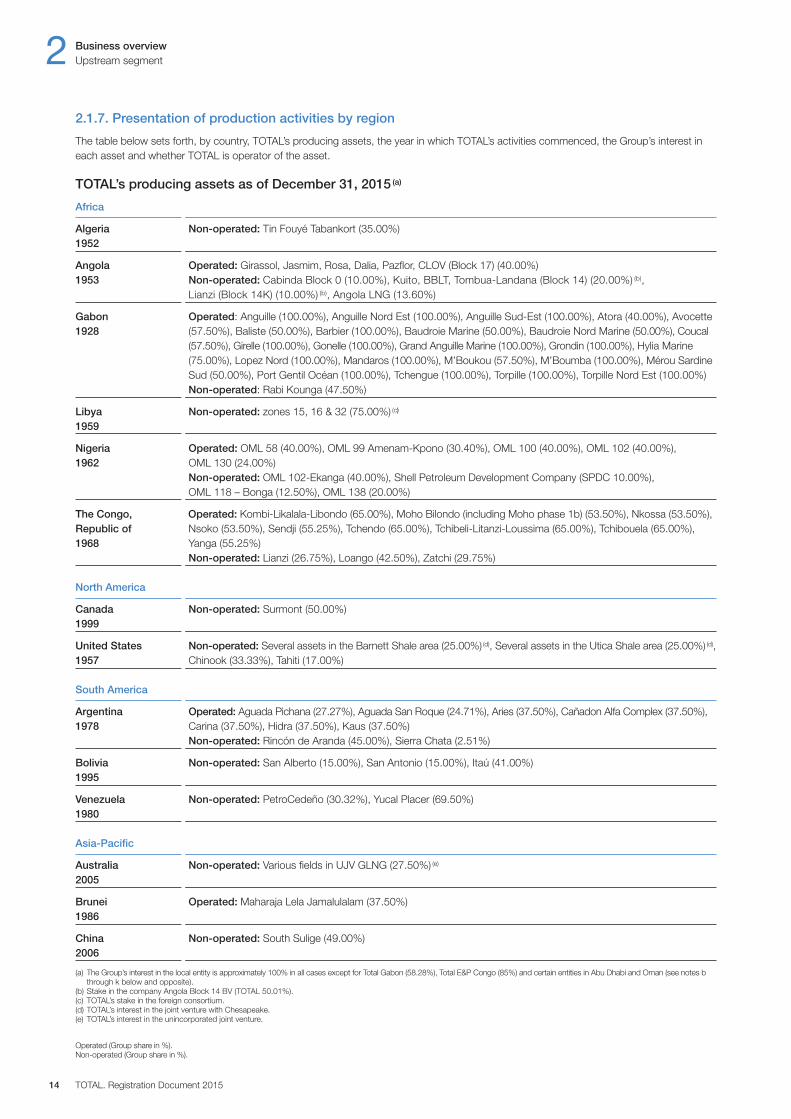
2.1.7. Presentation of production activities by region
The table below sets forth, by country, TOTAL’s producing assets, the year in which TOTAL’s activities commenced, the Group’s interest ineach asset and whether TOTAL is operator of the asset.
TOTAL’s producing assets as of December 31, 2015 (a)
Africa
Algeria Non-operated: Tin Fouyé Tabankort (35.00%)1952
Angola Operated: Girassol, Jasmim, Rosa, Dalia, Pazflor, CLOV (Block 17) (40.00%)1953 Non-operated: Cabinda Block 0 (10.00%), Kuito, BBLT, Tombua-Landana (Block 14) (20.00%) (b),
Lianzi (Block 14K) (10.00%) (b), Angola LNG (13.60%)
Gabon Operated: Anguille (100.00%), Anguille Nord Est (100.00%), Anguille Sud-Est (100.00%), Atora (40.00%), Avocette1928 (57.50%), Baliste (50.00%), Barbier (100.00%), Baudroie Marine (50.00%), Baudroie Nord Marine (50.00%), Coucal
(57.50%), Girelle (100.00%), Gonelle (100.00%), Grand Anguille Marine (100.00%), Grondin (100.00%), Hylia Marine(75.00%), Lopez Nord (100.00%), Mandaros (100.00%), M’Boukou (57.50%), M’Boumba (100.00%), Mérou SardineSud (50.00%), Port Gentil Océan (100.00%), Tchengue (100.00%), Torpille (100.00%), Torpille Nord Est (100.00%)Non-operated: Rabi Kounga (47.50%)
Libya Non-operated: zones 15, 16 & 32 (75.00%) (c)
1959
Nigeria Operated: OML 58 (40.00%), OML 99 Amenam-Kpono (30.40%), OML 100 (40.00%), OML 102 (40.00%), 1962 OML 130 (24.00%)
Non-operated: OML 102-Ekanga (40.00%), Shell Petroleum Development Company (SPDC 10.00%), OML 118 – Bonga (12.50%), OML 138 (20.00%)
The Congo, Operated: Kombi-Likalala-Libondo (65.00%), Moho Bilondo (including Moho phase 1b) (53.50%), Nkossa (53.50%), Republic of Nsoko (53.50%), Sendji (55.25%), Tchendo (65.00%), Tchibeli-Litanzi-Loussima (65.00%), Tchibouela (65.00%), 1968 Yanga (55.25%)
Non-operated: Lianzi (26.75%), Loango (42.50%), Zatchi (29.75%)
North America
Canada Non-operated: Surmont (50.00%)1999
United States Non-operated: Several assets in the Barnett Shale area (25.00%) (d), Several assets in the Utica Shale area (25.00%) (d),1957 Chinook (33.33%), Tahiti (17.00%)
South America
Argentina Operated: Aguada Pichana (27.27%), Aguada San Roque (24.71%), Aries (37.50%), Cañadon Alfa Complex (37.50%),1978 Carina (37.50%), Hidra (37.50%), Kaus (37.50%)
Non-operated: Rincón de Aranda (45.00%), Sierra Chata (2.51%)
Bolivia Non-operated: San Alberto (15.00%), San Antonio (15.00%), Itaú (41.00%)1995
Venezuela Non-operated: PetroCedeño (30.32%), Yucal Placer (69.50%)1980
Asia-Pacific
Australia Non-operated: Various fields in UJV GLNG (27.50%) (e)
2005
Brunei Operated: Maharaja Lela Jamalulalam (37.50%)1986
China Non-operated: South Sulige (49.00%)2006
(a) The Group’s interest in the local entity is approximately 100% in all cases except for Total Gabon (58.28%), Total E&P Congo (85%) and certain entities in Abu Dhabi and Oman (see notes bthrough k below and opposite).
(b) Stake in the company Angola Block 14 BV (TOTAL 50.01%).(c) TOTAL’s stake in the foreign consortium.(d) TOTAL’s interest in the joint venture with Chesapeake.(e) TOTAL’s interest in the unincorporated joint venture.
Operated (Group share in %).Non-operated (Group share in %).
Business overview 2Upstream segment
Registration Document 2015. TOTAL 15
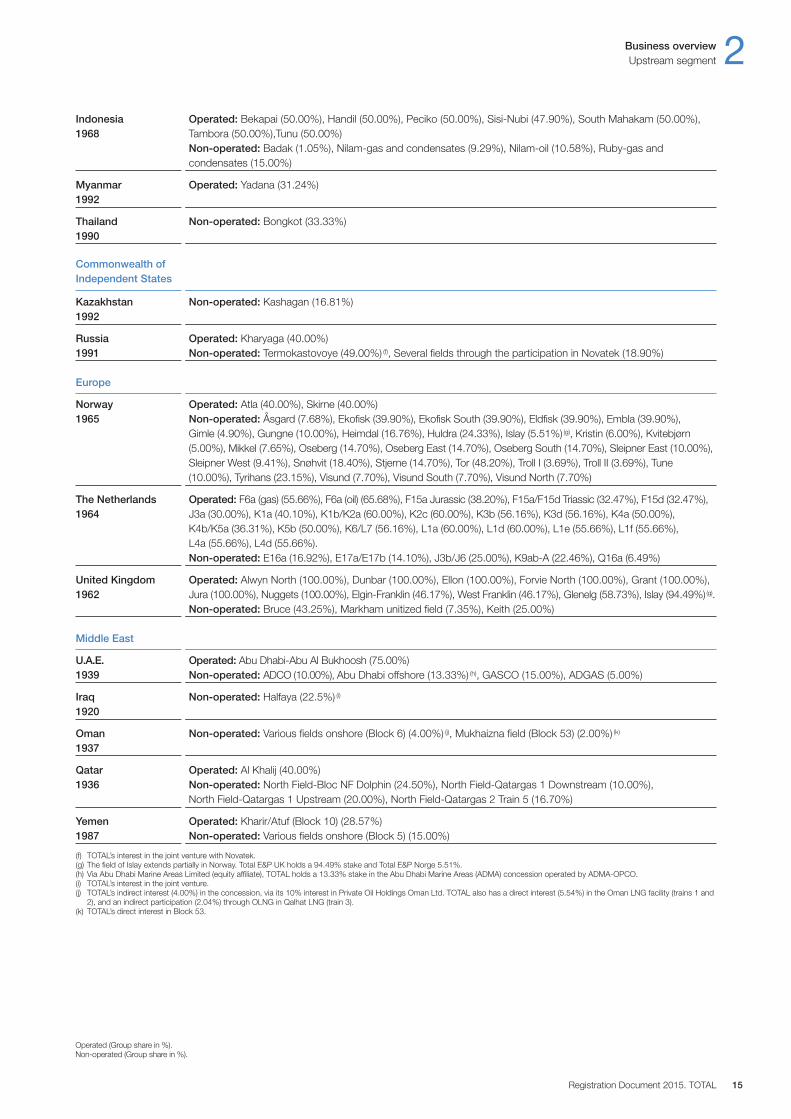
Indonesia Operated: Bekapai (50.00%), Handil (50.00%), Peciko (50.00%), Sisi-Nubi (47.90%), South Mahakam (50.00%), 1968 Tambora (50.00%),Tunu (50.00%)
Non-operated: Badak (1.05%), Nilam-gas and condensates (9.29%), Nilam-oil (10.58%), Ruby-gas and condensates (15.00%)
Myanmar Operated: Yadana (31.24%)1992
Thailand Non-operated: Bongkot (33.33%)1990
Commonwealth of Independent States
Kazakhstan Non-operated: Kashagan (16.81%)1992
Russia Operated: Kharyaga (40.00%)1991 Non-operated: Termokastovoye (49.00%) (f), Several fields through the participation in Novatek (18.90%)
Europe
Norway Operated: Atla (40.00%), Skirne (40.00%)1965 Non-operated: Åsgard (7.68%), Ekofisk (39.90%), Ekofisk South (39.90%), Eldfisk (39.90%), Embla (39.90%),
Gimle (4.90%), Gungne (10.00%), Heimdal (16.76%), Huldra (24.33%), Islay (5.51%) (g), Kristin (6.00%), Kvitebjørn(5.00%), Mikkel (7.65%), Oseberg (14.70%), Oseberg East (14.70%), Oseberg South (14.70%), Sleipner East (10.00%),Sleipner West (9.41%), Snøhvit (18.40%), Stjerne (14.70%), Tor (48.20%), Troll I (3.69%), Troll II (3.69%), Tune(10.00%), Tyrihans (23.15%), Visund (7.70%), Visund South (7.70%), Visund North (7.70%)
The Netherlands Operated: F6a (gas) (55.66%), F6a (oil) (65.68%), F15a Jurassic (38.20%), F15a / F15d Triassic (32.47%), F15d (32.47%),1964 J3a (30.00%), K1a (40.10%), K1b / K2a (60.00%), K2c (60.00%), K3b (56.16%), K3d (56.16%), K4a (50.00%),
K4b / K5a (36.31%), K5b (50.00%), K6 / L7 (56.16%), L1a (60.00%), L1d (60.00%), L1e (55.66%), L1f (55.66%),L4a (55.66%), L4d (55.66%).Non-operated: E16a (16.92%), E17a / E17b (14.10%), J3b / J6 (25.00%), K9ab-A (22.46%), Q16a (6.49%)
United Kingdom Operated: Alwyn North (100.00%), Dunbar (100.00%), Ellon (100.00%), Forvie North (100.00%), Grant (100.00%),1962 Jura (100.00%), Nuggets (100.00%), Elgin-Franklin (46.17%), West Franklin (46.17%), Glenelg (58.73%), Islay (94.49%)(g).
Non-operated: Bruce (43.25%), Markham unitized field (7.35%), Keith (25.00%)
Middle East
U.A.E. Operated: Abu Dhabi-Abu Al Bukhoosh (75.00%) 1939 Non-operated: ADCO (10.00%), Abu Dhabi offshore (13.33%) (h), GASCO (15.00%), ADGAS (5.00%)
Iraq Non-operated: Halfaya (22.5%) (i)
1920
Oman Non-operated: Various fields onshore (Block 6) (4.00%) (j), Mukhaizna field (Block 53) (2.00%) (k)
1937
Qatar Operated: Al Khalij (40.00%)1936 Non-operated: North Field-Bloc NF Dolphin (24.50%), North Field-Qatargas 1 Downstream (10.00%),
North Field-Qatargas 1 Upstream (20.00%), North Field-Qatargas 2 Train 5 (16.70%)
Yemen Operated: Kharir / Atuf (Block 10) (28.57%)1987 Non-operated: Various fields onshore (Block 5) (15.00%)
(f) TOTAL’s interest in the joint venture with Novatek.(g) The field of Islay extends partially in Norway. Total E&P UK holds a 94.49% stake and Total E&P Norge 5.51%.(h) Via Abu Dhabi Marine Areas Limited (equity affiliate), TOTAL holds a 13.33% stake in the Abu Dhabi Marine Areas (ADMA) concession operated by ADMA-OPCO.(i) TOTAL’s interest in the joint venture.(j) TOTAL’s indirect interest (4.00%) in the concession, via its 10% interest in Private Oil Holdings Oman Ltd. TOTAL also has a direct interest (5.54%) in the Oman LNG facility (trains 1 and
2), and an indirect participation (2.04%) through OLNG in Qalhat LNG (train 3).(k) TOTAL’s direct interest in Block 53.
Operated (Group share in %).Non-operated (Group share in %).

2 Business overviewUpstream segment
TOTAL. Registration Document 201516
2.1.8. Main activities by geographic area
The information presented below describes the Group’s mainexploration and production activities by geographic area, withoutdetailing all of the assets held by TOTAL. The mentioned capacitiesare expressed in 100%.
Africa
In 2015, TOTAL’s production in Africa was 678 kboe / d,representing 29% of the Group’s overall production, comparedto 657 kboe / d in 2014 and 670 kboe / d in 2013. The two mainproducing countries in Africa in 2015 were Angola and Nigeria.
In Algeria, TOTAL’s production was 25 kboe / d during 2015,compared to 20 kboe / d in 2014 and 21 kboe / d in 2013. All of theGroup’s production in Algeria comes from the Tin Fouyé Tabankort(TFT) field (35%). TOTAL also has a 37.75% stake in the Timimoungas development project.
The development of the Timimoun field continued in 2015 withengineering activities, the start of plant construction and drillingpreparation.
In Angola, where TOTAL is the leading oil operator in the country(1),the Group’s production was 248 kboe / d in 2015 compared to 200kboe / d in 2014 and 186 kboe / d in 2013. This production comesfrom blocks 17,14 and 0.
– Deep offshore Block 17 (40%, operator) is TOTAL’s main asset inAngola. It is composed of four major producing hubs: Girassol,Dalia, Pazflor and CLOV. The latest greenfield project, CLOV,started production in June 2014 and, since September 2014, its production plateau of 160 kboe / d has been maintained. InJuly 2015, Dalia Phase 1A, a new development in the Dalia field,started production.
– On the ultra-deep offshore Block 32 (30%, operator), theKaombo project was launched in April 2014 to develop thediscoveries in the southeast part of the block via two FPSOs(Floating Production Storage and Offloading facilities) with acapacity of 115 kb / d each. The drilling campaign of 59 wellsbegan in October 2015 and production start-up is planned for2017. The exploration and delineation of the center and northparts of the block (outside Kaombo) is ongoing.
– On Block 14 (20%)(2), production comes from the Tombua-Landana and Kuito fields as well as the BBLT project, comprisingthe Benguela, Belize, Lobito and Tomboco fields.
– Block 14K (36.75%) is the offshore unitization zone betweenAngola (Block 14) and the Republic of the Congo (Haute Merlicense). The Lianzi field, which was connected to the existingBBLT platform (Block 14), started production at the end ofOctober 2015. The project is expected to reach a productionplateau of 40 kb / d. TOTAL’s interest in the unitized zone is held10% through Angola Block 14 BV and 26.75% through TotalE&P Congo.
– On Block 0 (10%), the development of Mafumeira Sul wasapproved by the partners and authorities in 2012. This projectconstitutes the second development phase of the Mafumeirafield and is expected to start production by the end of 2016.
– In April 2014, TOTAL sold its entire stake in Block 15 / 06 (15%).
In the Bas-Congo basin, TOTAL is the operator of exploration Block17 / 06 (30%). The Group relinquished Block 33 (58.67%, operator)in November 2014.
In the Kwanza basin, deep offshore, TOTAL is also operator ofBlocks 25 (35%), 40 (40%) and 39 (7.5% following the finalization ofthe sale of half of its stake in March 2015). TOTAL is alsodeveloping its LNG activities through the Angola LNG project(13.6%), which includes a gas liquefaction plant near Soyo suppliedby gas associated with production from blocks 0, 14, 15, 17 and18. LNG production started in June 2013, but various technicalincidents required the extended shutdown of the plant. LNGproduction is expected to resume in 2016.
In Gabon, the Group’s production in 2015 was 59 kboe / dcompared to 58 kboe / d in 2014 and 59 kboe / d in 2013. TheGroup’s exploration and production activities in Gabon wereprimarily carried out by Total Gabon(3).
– On the Anguille field (100%, operator), production of phase 3 of the redevelopment project (production capacity estimated at20 kboe / d) from the AGM Nord platform started in 2013 and 18 wells are operational today.
– On the Torpille field (100%, operator), the data acquired duringthe 3D seismic survey performed in 2014 is now beingprocessed.
– On the deep-offshore Diaba license (42.5%, operator), anexploration well (Diaman-1B), drilled in 2013, showed anaccumulation of gas and condensates. Additional seismic dataacquired at the end of 2014 on the western part of the license isbeing processed and is expected to generate a full inventory ofthe license’s prospectivity.
– On the Nzeimbou (20%) license, the Igongo-1X well (which revealeda multilayer accumulation of oil and gas) was commissioned byconnecting to the facilities of the Echira field in June 2015.
In Libya, where the security context remains unstable, the Group’sproduction was 14 kb / d in 2015 compared to 27 kb / d in 2014 and50 kb / d in 2013. This production comes from blocks located onoffshore areas 15, 16 and 32 (Al Jurf, 75%(4)), which have not beenaffected by the security issues. Since the fourth quarter of 2014,production as well as exploration activities have been stopped onMabruk – onshore areas 70 and 87 (75%(4)) – and on El Sharara – onshore areas 129, 130 (30%(4)), and 130 and 131 (24%(4)). In thisenvironment of uncertainty, an impairment on the onshore assetswas booked in the 2015 Consolidated Financial Statements.
In Morocco, the 3D seismic processing and interpretation studiesacquired in 2013 in the south of the block continued in the scope ofthe reconnaissance authorization of Anzarane offshore, which coversan ocean region of 100,000 km² and was allocated in December 2011to TOTAL by the ONHYM (National Office of Hydrocarbons andMines). The results of geological studies having not been encouraging,the reconnaissance authorization, which had been extended untilDecember 2015, was not transformed into an exploration license.
In Nigeria, the Group’s production, primarily offshore, was 245 kboe / din 2015, compared to 257 kboe / d in 2014 and 261 kboe / d in 2013.This decrease is explained mainly by the sale of interests in certainlicenses of the Shell Petroleum Development Company (SPDC) jointventure as well as by an upsurge of oil bunkering activities since 2013.This has negatively affected onshore production and has had an
(1) Company data.(2) Stake held by the company Angola Block 14 BV (TOTAL 50.01%).(3) Total Gabon is a company under Gabonese law listed on Euronext Paris. TOTAL holds 58.28%, the Republic of Gabon holds 25% and the public float is 16.72%.(4) TOTAL’s stake in the foreign consortium.
Business overview 2Upstream segment
Registration Document 2015. TOTAL 17
impact on the integrity of the SPDC joint venture facilities as well ason the local environment.
TOTAL operates 5 of the 31 oil mining leases (OML) in which it hasinterests and also holds interests in 4 oil prospecting licenses (OPL).
Regarding the principal variations in TOTAL’s permits since 2013:
– TOTAL was granted approval by the authorities in 2013 to increaseits stake in OPL 285 from 26.67% to 60% and it drilled theEkpeyi-1 exploration well in 2015;
– In 2013, TOTAL was granted approval by the authorities for therenewal of OMLs 99, 100 and 102 for a period of 20 years;
– On OML 138 (20%), the production of the offshore field Usanreached 130 kboe / d in 2013. In 2014, two exploration wells,Ukot South-2B and Ukot South-3, and an exploration well in 2015,Ukot South-4, led to three oil discoveries. The sale process,launched in November 2012, could not be closed. This asset isno longer accounted under “assets classified as held for sale”(refer to Note 4D Additional Information on adjustments andimpairments point 7 of chapter 10). TOTAL has ceased to be theoperator of OML 138 since February 2014;
– TOTAL sold its 10% interest in OMLs 18 and 29 (in 2015) andOML 24 (in 2014), operated via the SPDC joint venture. Inaddition, the sale process is underway for OML 25.
TOTAL continues to develop its operated assets, in particular:
– OML 58 (40%, operator, onshore): in the scope of its jointventure with the Nigerian National Petroleum Corporation(NNPC), TOTAL has finalized the increase of gas productioncapacity from 370 Mcf / d to 550 Mcf / d;
– OML 102 (40%, operator): in December 2014, TOTAL stoppedroutine flaring on the Ofon field (Ofon phase 2 project). The gasassociated with the production of oil is now compressed andevacuated to shore and monetized via the Nigeria LNG plant;
– OML 130 (24%, operator): the development of the Egina field(200 kboe / d capacity) launched in 2013 is underway. The drillingcampaign for 44 wells started at the end of 2014;
– OML 99 (40%, operator): additional studies are underway for the development of the Ikike field.
TOTAL is also developing LNG activities with a 15% stake in theNigeria LNG Ltd company, which owns a liquefaction plant with a 22 Mt / year total capacity. Assessments are underway for theinstallation of an additional capacity of approximately 8.5 Mt / year.In an effort to focus its activities, TOTAL is currently re-evaluating its participation in the Brass LNG project, in which it holds a20.48% interest.
The Group’s non-operated production in Nigeria comes mostly fromthe SPDC joint venture in which TOTAL holds a 10% stake. TOTALalso holds an interest in deep offshore OML 118 (12.5%). On thislease in 2015, the Bonga field contributed 19 kboe / d to the Group’sproduction. A unitization agreement for the Bonga SouthWest / Aparo discovery (10%) was submitted to the authorities in 2015.
In Uganda, a growth area for the Group and where TOTAL hasbeen present in the upstream since 2012, the Group has a 33.33%stake in the EA-1, EA-1A and EA-2 licenses and 28.33% in the EA-3license located in the region of Lake Albert. TOTAL is the operatorof licenses EA-1 and EA-1A and partner on the other licenses.
– On the EA-1 license, a drilling campaign, production tests and3D seismic acquisition survey were carried out between 2012and mid-2014. As of the end of 2014, five development planshad been submitted to the authorities. In 2015, discussions for the obtaining of production licenses continued, anddevelopment optimization studies were conducted in order to start the project phase.
– The EA-1A license expired in 2013 at the end of a drillingcampaign that resulted in one discovery (Lyec). With theexception of the area relating to this discovery, the license wasrelinquished to the authorities.
– On the EA-2 license, the drilling campaign and production testsstarted in 2012 were completed in 2014. Two development planswere submitted to the authorities in 2013. In 2015, discussionscontinued for the obtaining of production licenses.
– The development plan for Kingfisher field, located on the EA-3production license, was approved by the authorities in 2013 and the work to develop the field continues.
– In 2015, discussions were continued with the authorities of Uganda in order to assess the best option for the layout for the crude oil export pipeline to the Indian Ocean.
In the Republic of the Congo, the Group’s production was 87 kboe / din 2015 compared to 95 kboe / d in 2014 and 93 kboe / d in 2013. In December 2013, Qatar Petroleum International Upstream (QPI)purchased a 15% stake in the capital of Total E&P Congo, via ashare capital increase of the subsidiary.
– On the offshore field Moho Bilondo (53.5%, operator), phase 1bproject (estimated capacity: 40 kboe / d) started production inDecember 2015. Production of the Moho Nord project (estimatedcapacity: 100 kboe / d) is expected to start by the first half of 2017.
– Block 14K (36.75%) corresponds to the offshore unitization areabetween the Republic of the Congo (Haute Mer license) andAngola (Block 14 located in Angola). The production of the Lianzifield started at the end of October 2015. TOTAL’s interests in theunitization area are held 26.75% by Total E&P Congo and 10%by Angola Block 14 BV.
– Since 2013, as part of the renewal of licenses, the stake held bythe Group has been 42.5% on the Loango license and 29.75%on the Zatchi license.
– Total E&P Congo is operator of Djéno (63%) the sole oil terminalin the country.
Rest of AfricaTOTAL also holds interests in exploration licenses in South Africa,Côte d’Ivoire, Egypt, Kenya, Madagascar, Mauritania, Mozambiqueand the Democratic Republic of the Congo, and is negotiating withthe authorities with the view to resume exploration activities in theRepublic of South Sudan.
North America
In 2015, TOTAL’s production in North America was 103 kboe / d,representing 4% of the Group’s total production, compared to90 kboe / d in 2014 and 73 kboe / d in 2013.
In Canada, the Group’s production was 14 kboe / d in 2015 comparedto 12 kboe / d in 2014 and 13 kboe / d in 2013. This production comesentirely from TOTAL’s 50% stake in the Surmont project developed bySAGD(1). Phase 2 of the project was commissioned in September 2015and at the end of the ramp-up in 2017, the project is expected to havea total capacity of approximately 150 kb / d (75 kb / d in Group share).
(1) Steam Assisted Gravity Drainage, production by injection of recycled water vapor.
2 Business overviewUpstream segment
TOTAL. Registration Document 201518
Construction of the second oil sands project in which TOTAL has a stake, the Fort Hills mining project, has progressed on time andwithin budget. At a more than 50% completion rate as at the end of 2015, production from Fort Hills is expected to start toward theend of 2017. As a result of a full comparative analysis of its globalasset portfolio in the context of lower oil prices, the Group decided in 2015 to reduce its exposure to Canadian oil sands. In November 2015,TOTAL sold 10% of its 39.2% stake in the FortHills project to the operator, reducing its interest to 29.2%.Following this divestment, an impairment on the part of the assetsold was booked in the 2015 Consolidated Financial Statements.
On the Joslyn (38.25%, operator) and Northern Lights (50% operator)oil sands licenses, the projects were suspended and works havebeen strictly limited to legal and contractual obligations, andmaintaining safety.
The Group booked an impairment of $2.2 billion on its oil sandsassets in its 2014 Consolidated Financial Statements.
In the United States, the Group’s production was 89 kboe / d in2015 compared to 78 kboe / d in 2014 and 60 kboe / d in 2013.
– In the Gulf of Mexico, TOTAL holds interests in the deep offshorefields Tahiti (17%) and Chinook (33.33%).In 2015, the TOTAL (40%) – Cobalt (60%, operator) alliance,formed in 2009 for exploration in the Gulf of Mexico, carried outfurther drilling to evaluate the size of the North Platte discovery.
– TOTAL is also present in shale gas production in the United Statesthrough its 25% stake in two joint ventures operated by Chesapeakein the Barnett (Texas) and Utica (Ohio) basins. Drilling activity inthese basins was greatly reduced in 2015 due to the decrease in the price of gas and related liquids. In Barnett, four wells weredrilled in 2015 compared to 40 in 2014 and approximately 60 in2013. In Utica, the number of drilling rigs employed has beenreduced from nine to one in 2015 and TOTAL participated ineight wells with Chesapeake. In 2014, approximately 170 wellswere drilled by the joint venture and over 200 were drilled in 2013.Following successive decreases in gas prices in the UnitedStates, impairments on shale gas assets were booked in the2013, 2014 and 2015 Consolidated Financial Statements.
The R&D stage oil shale projects (in situ and ex situ productiontechnology) in which the Group holds a stake (through AmericanShale Oil LLC, 55.7%, and the 50 / 50 joint venture with thecompany Red Leaf Resources) including the development of theRed Leaf pilot, have been deferred.
South America
In 2015, TOTAL’s production in South America was 152 kboe / d,representing 7% of the Group’s total production, compared to 157 kboe / d in 2014 and 166 kboe / d in 2013. The two mainproducing countries in South America in 2015 were Argentinaand Venezuela.
In Argentina, TOTAL operated approximately 30%(1) of thecountry’s gas production in 2015. The Group’s production was 72 kboe / d in 2015 compared to 75 kboe / d in 2014 and 78 kboe / din 2013. From 2012, the Argentinean government concluded gasprice agreements with various producers under which the governmentguarantees the price of gas for quantities above a fixed productionlevel in exchange for compliance with defined production targetsand applicable penalties (i.e., “deliver or pay”). In 2013, TOTAL
signed an agreement of this type for a period of five years withretroactive effect from December 1, 2012.
– In Tierra del Fuego, the Group operates the Carina and Ariesoffshore fields (37.5%). A drilling campaign for two additionalwells off the existing platform was completed in 2015. The VegaPleyade field (37.5%, operator), where development work waslaunched in 2013 (with a production capacity of 350 Mcf / d),started production in February 2016.
– In the Neuquén basin, two pilot projects were launched followingpositive initial results of the drilling campaign on its mininglicenses in order to assess its gas and shale oil potential: one onthe Aguada Pichana Block (27.3%, operator) where productionstarted mid-2015, and the other on the Rincón la Ceniza Block(42.5%, operator).
In Bolivia, the Group’s production, mainly gas, was 28 kboe / d in2015 compared to 30 kboe / d in 2014 and 28 kboe / d in 2013.TOTAL is active on seven licenses: three production licenses at SanAlberto (15%), San Antonio (15%) and Block XX Tarija Oeste (41%);two licenses in development phase, Aquio and Ipati (60%,operator); and two exploration phase licenses, Rio Hondo (50%)and Azero (50%, operator of the exploration phase).
– Following the discovery of the Incahuasi gas field, located in theIpati Block, TOTAL was granted approval by the authorities tolaunch the first development phase of the project, including theconnection of three wells already drilled in a 6.5 Mm³ / d capacityprocessing plant. The project is expected to start productionmid-2016. In mid-2014, TOTAL reduced its stake in Aquio andIpati from 80% to 60%.
– In 2013, TOTAL acquired a 50% stake in the Azero explorationlicense located in the Andean foothills, which extends over anarea of 7,800 km². The exploration period began in June 2014.
In Brazil, a growth area for the Group, TOTAL acquired in 2013 a20% stake in the Libra field, located in the Santos basin. The field islocated in the ultra-deep offshore (2,000 m) approximately 170 kmoff the coast of Rio de Janeiro and covers an area of 1,550 km². In 2014, a 50 kb / d capacity boat was reserved for long durationproduction testing. In 2015, the drilling of two wells was completedand one of two others started in the northwest and center of the field.
The Group also holds stakes in 18 exploration licenses, followingthe 2015 acquisition of a 50% stake in Blocks P-M 1269, 1271,1351 and 1353 in the Pelotas basin.
In Venezuela, where TOTAL has been active since 1980, the Group’sproduction was 52 kboe / d in 2015 as in 2014 and compared to 48 kboe / d in 2013. TOTAL has stakes in PetroCedeño (30.3%) and Yucal Placer (69.5%) as well as the offshore exploration Block 4of Plataforma Deltana (49%).
Development of the extra heavy oil field of PetroCedeño continuesin the southern area as in the main area (47 production wells weredrilled in 2015 compared to 86 in 2014 and 43 in 2013), as well asthe debottlenecking project for the water separation and treatmentfacilities.
In the Yucal Placer field, following the signature of an amendment tothe gas sale contract, a new development phase was launched in 2012.In April 2014, the field’s production increased following thecommissioning of new clusters and the debottlenecking of the existinggas processing train (production capacity of 150 Mcf / d in 2015).
(1) Source: Department of Federal Planning, Public Investment and Services, Energy Secretariat.
Business overview 2Upstream segment
Registration Document 2015. TOTAL 19
Rest of South AmericaTOTAL also holds interests in exploration licenses in Aruba,Colombia, French Guiana and Uruguay.
Asia-Pacific
In 2015, TOTAL’s production in Asia-Pacific was 258 kboe / d,representing 11% of the Group’s overall production, comparedto 238 kboe / d in 2014 and 235 kboe / d in 2013. The two mainproducing countries in Asia-Pacific in 2015 were Indonesia and Thailand.
In Australia, where TOTAL has had mining rights since 2005, theGroup’s production was 4 kboe / d in 2015, 2014 and 2013.
– The Ichthys project (30%) involves the development of a gas andcondensate field located in the Browse Basin. This development willinclude a floating platform designed for the production (CPF, CentralProcessing Facility), processing and exploration of gas, an FPSO(with condensate processing capacity of 100 kb / d) to stabilize andexport the condensate, an 889 km gas pipeline and an onshoreliquefaction plant (with 8.9 Mt / y LNG and 1.6 Mt / y LPG capacities) at Darwin. The LNG has already been sold mainly to Asian buyersunder long-term contracts. Production is expected to start in 2017.
– Gladstone LNG (GLNG) (27.5%) is an integrated gas production,transportation and liquefaction project of 7.2 Mt / y based on thedevelopment of coal seam gas from the Fairview, Roma, Scotiaand Arcadia fields. The development of a first upstream phasewas completed with the start of production of Fairview 3 and 4and Roma 2. Train 1 (3.6 Mt / y capacity) started production inSeptember 2015 and the first LNG cargo left GLNG for SouthKorea in October 2015. The development of the liquefactionplant continues with the construction of train 2, which isexpected to start production in 2016. An asset impairment ofapproximately $1.4 billion was booked in TOTAL’s 2015Consolidated Financial Statements.
– The WA-492 and WA-493 licenses, located in the Carnarvonbasin, were awarded to TOTAL (100%, operator) in 2013. A 2Dseismic regional campaign began in January 2015.
– In 2012, TOTAL signed an agreement to enter into three shalegas exploration licenses located in the South Georgina basin inthe center of the country. In 2013, a 2D seismic survey wasacquired on three licenses and a drilling campaign began in 2014with two wells. Technical studies are ongoing.
In Brunei, TOTAL operates the offshore Maharaja Lela Jamalulalamgas and condensate field located on Block B (37.5%). The Group’sproduction was 15 kboe / d in 2015 as in 2014 and compared to 13 kboe / d in 2013. The gas is delivered to the Brunei LNG liquefaction plant.
A study regarding the additional development of the southern partof the gas field (Maharaja Lela South) was completed in 2013. Theproject was launched in early 2014 with the signature of most of thecontracts and the 20-year extension on the existing license.Onshore, a first debottlenecking phase for the productionprocessing plant was completed in 2015, increasing production by20%. Offshore, the installation of a third platform was completed atthe end of 2015 and the drilling campaign started in February 2016.The first wells are expected to be put into production in 2016.
Studies are currently being conducted to reassess the potential ofthe deep offshore exploration Block CA1 (where TOTAL is operator),which includes the Jagus East discovery. Following the decision oftwo partners to sell their interest in the block, TOTAL decided toexercise its preemptive right, bringing its stake from 54% to 86.9%.
A well was drilled in November 2015, and has confirmed the connectionof the Jagus East field with the Gumusut-Kakap reservoirs in Malaysia.Discussions of the terms of the unitization are underway between thetwo countries and an agreement should be reached in 2016.
In China, TOTAL has been active since 2006 on the South SuligeBlock, located in the Ordos Basin in the Inner Mongolia province. TheGroup’s production was 11 kboe / d in 2015 compared to 12 kboe / din 2014 and 8 kboe / d in 2013. Following appraisal work by TOTAL,China National Petroleum Corporation (CNPC) and TOTAL agreedto a development plan under which CNPC is the operator and TOTALholds a 49% stake. This development plan was approved by theauthorities in 2014. The drilling of development wells is ongoing.
In 2013, TOTAL signed a joint study agreement with Sinopec forpotential shale gas on the Xuancheng license (4,000 km²) nearNanjing. A 2D seismic survey was performed in 2014 and thedrilling of an exploration well was completed in 2015.
In Indonesia, the Group’s production was 147 kboe / d in 2015compared to 130 kboe / d in 2014 and 131 kboe / d in 2013.
TOTAL’s operations in Indonesia are primarily concentrated on theMahakam license (50%, operator), which in particular includes thePeciko and Tunu gas fields. TOTAL also has a stake in the Sisi-Nubigas field (47.9%, operator). The Mahakam license expires in December2017. The Indonesian government has decided to allocate 100% ofthe participating interest to Pertamina (operator) from January 1, 2018onwards, while giving Pertamina the possibility to farm-out a maximuminterest of 30% to TOTAL and its current partner, INPEX. The Groupdelivers most of its natural gas production to the Bontang LNG plant.These volumes of gas represented approximately 80% of the Botangplant’s supply in 2015. To this gas production was added the operatedproduction of oil and condensates from the Handil and Bekapai fields.
– On the Mahakam license, the works aimed at maintainingproduction on the Tunu, Peciko, South Mahakam, Sisi-Nubi andBekapai fields are ongoing.
– On the Sebuku (15%) license, production startup of the Ruby gasfield took place in 2013, with a production capacity of approximately100 Mcf / d. Production is routed via pipeline for processing andseparation at the Senipah terminal (operated by TOTAL).
– TOTAL also holds stakes in two exploration blocks: Mentawai(80%, operator) and Telen (100%).
– In addition, the Group holds stakes in blocks with no activity :Sadang (30%), Sageri (50%), Arafura Sea (24.5%), Amborip VI(24.5%), South Mandar (49.3%), South West Bird’s Head (90%,operator) and South East Mahakam (50%, operator).
– Early in 2015, the Group sold its stake in the two coal bedmethane (CBM) blocks located in the East Kalimantan province,Kutai II (18.4%) and Kutai Timur (50%).
In Myanmar, the Group’s production was 19 kboe / d en 2015compared to 17 kboe / d in 2014 and 16 kboe / d in 2013.
The Yadana field (31.2%, operator), located on the offshore BlocksM5 and M6, primarily produces gas for delivery to PTT (Thai state-owned company) for use in Thai power plants. The Yadana fieldalso supplies the domestic market via two pipelines built andoperated by MOGE, a Myanmar state-owned company. The LCP-Badamyar project, which includes the installation of the Badamyarfield compression and development platform connected to theYadana facilities, was launched in September 2014.
In 2014, the Group was awarded the deep offshore Block YWB(100%, operator) during the offshore round launched by the localauthorities. The PSC was signed in February 2015.
2 Business overviewUpstream segment
TOTAL. Registration Document 201520
In October 2015, the Group sold its stake in the offshore BlockM11 (47.06%) and entered in exploration license A6 (40%) in thedeep offshore area west of Myanmar. A first well was drilled inDecember 2015 on which a natural gas discovery has been madeand is currently under evaluation.
In Papua New Guinea, where TOTAL has been active since 2012,the Group acquired in March 2014 a stake in Block PRL-15(40.1%). TOTAL became the operator in August 2015. The State ofPapua New Guinea retains the right to enter the license (when thefinal investment decision is made) at a maximum level of 22.5%. In this case, TOTAL’s stake would be reduced to 31.1%.
Block PRL-15 includes the two discoveries Elk and Antelope,growth areas for the Group. A delineation program of thesediscoveries is underway. The results of the first wells drilled haveconfirmed the level of resources in the Elk and Antelope fields.TOTAL has also started development studies in the Elk andAntelope fields, including on the construction of an onshore gasliquefaction plant. In July 2015, the location of the variousproduction sites was announced to the authorities.
In Thailand, the Group’s production was 62 kboe / d in 2015compared to 60 kboe / d in 2014 and 63 kboe / d in 2013. This comesfrom the offshore gas and condensate field of Bongkot (33.33%).PTT (Thai state-owned company) purchases all of the natural gasand condensate production. New investments are underway formaintaining the plateau and responding to gas demand.
Rest of AsiaTOTAL also holds interests in exploration licenses in Malaysia andthe Philippines.
Commonwealth of Independent States (CIS)
In 2015, TOTAL’s production in the CIS was 290 kboe / d,representing 12% of the Group’s total production, compared to 249 kboe / d in 2014 and 227 kboe / d in 2013. The mainproducing country in the CIS in 2015 was Russia.
In Kazakhstan, TOTAL holds a stake in the North Caspian license(16.81%), which covers the Kashagan field.
The production of the first phase of the Kashagan project (300 kb / d),started in September 2013, was halted in October 2013 due to leaksdetected in the gas export pipeline. The two gas and oil export pipelinesare being replaced by the operator. The works progress accordingto plan and production is expected to resume in December 2016.
TOTAL is the operator of the Nurmunaï North and South onshoreexploration licenses (51.1%, after the sale of 23.9% of interests inFebruary 2015) located in the southwest of the country. The drillingof two exploration wells (the first on the Nurmunaï North license andthe second on the Nurmunaï South license) was performed betweenFebruary and October 2015. The results are being analyzed.
In Russia, where, as of December 31, 2015, the Group holds 19%of its proved reserves, the Group’s production was 290 kboe / d in2015 compared to 235 kboe / d in 2014 and 207 kboe / d in 2013.This production comes from the Kharyaga and Termokarstovoyefields and TOTAL’s stake in OAO Novatek (18.9% as ofDecember 31, 2015). In 2015, Russia became the leadingcontributor to the Group’s production.
In 2014, international economic sanctions associated with the situationin Ukraine were adopted by the United States, the European Unionand other countries. TOTAL complies with sanctions applicable toits activities. For further information, refer to point 1.9 of chapter 4(Risk factors).
On the Kharyaga (40%, operator) project, the works relating to thedevelopment plan of phases 3 and 4 are ongoing though they slowedin 2015 after a dispute with the main contractor, which was settledat the end of 2015. In addition, in January 2016, TOTAL signed anagreement for the sale of a 20% interest and the transfer ofoperatorship of the field. This sale is expected to take effect in thesecond quarter of 2016, subject to the approval of the authorities.
In addition to its shareholding in Novatek, TOTAL currentlyparticipates via a direct stake in two projects with Novatek:
– Termokarstovoye (an onshore gas and condensates field, locatedin the Yamalo-Nenets region): the development and productionlicense of Termokarstovoye field is held by ZAO Terneftegas, ajoint venture between Novatek (51%) and TOTAL (49%). Thisfield, which started production in May 2015, reached its capacityof 65 kboe / d in September 2015; and
– Yamal LNG: in December 2013 the company OAO Yamal LNG(1)
launched the project, aimed at developing the onshore field ofSouth Tambey (gas and condensates) located on the Yamalpeninsula and at building a three-train gas liquefaction plant withtotal LNG capacity of 16.5 Mt / y. The financing plan for the YamalLNG project is being reviewed, and the project’s partners areengaged in efforts to develop a financing plan in compliance withthe applicable regulations. In 2015, the project advancedsatisfactorily according to schedule.
The exploration project on the Bazhenov field (shale oil) in the KanthyMansiysk region has been suspended since 2014. In 2015, TOTALtransferred all of its rights in the awarded licenses to a subsidiary ofthe partner of the project.
For further information on international economic sanctions, refer topoint 1.9 of chapter 4.
Rest of CISTOTAL also holds interests in exploration licenses in Azerbaijan andTajikistan.
Europe
In 2015, TOTAL’s production in Europe was 374 kboe / d,representing 16% of the Group’s total production, compared to 364 kboe / d in 2014 and 392 kboe / d in 2013. The two mainproducing countries in Europe in 2015 were Norway and theUnited Kingdom.
In Denmark, TOTAL (80%, operator) acquired in 2010 two shalegas exploration licenses in order to assess their potential. On the1 / 10 (Nordjylland) license, a vertical exploration well withouthydraulic fracturing drilled in 2015 revealed the presence of gas,but the quantities were not sufficient to consider economicallyviable production. The Group is moving forward with restorationworks on the drilling site, which will be rehabilitated in compliancewith environmental obligations as required by Danish law. The 2 / 10(Nordsjaelland) license was relinquished in July 2015 due to lowerthan expected estimated potential for the Group.
(1) The OAO Yamal LNG company is owned by Novatek (60%), Total E&P Yamal (20%), and CNODC (20%), a subsidiary of China National Petroleum Corporation. Novatek’s investment in the company OAO Yamal LNG is to be reduced to 50.1% following an agreement signed in September 2015 for the entry of the Silk Road Fund (9.9%). This agreement is expected to be approved by the authorities in 2016.
In France, the Group’s production ended with the sale inOctober 2014 of the Lacq concessions to Geopetrol. Production in2014 was 2 kboe / d compared to 9 kboe / d in 2013. The Montélimarexclusive research license granted to TOTAL in 2010 for evaluatingthe shale gas potential of this area was repealed by the government in 2011. In January 2016, further to the appeal filed in 2011, theadministrative court canceled the revocation of the license decidingthe Group had fulfilled its obligations.
In Italy, TOTAL holds a stake in two exploration licenses and in theTempa Rossa field (50%, operator), discovered in 1989 and locatedon the Gorgoglione concession (Basilicate region). Development of theTempa Rossa project is underway.
In Norway, TOTAL has equity stakes in 97 production licenses onthe Norwegian maritime continental shelf, 31 of which it operates.The Group’s production in 2015 was 239 kboe / d compared to 242 kboe / d in 2014 and 243 kboe / d in 2013.
– In the Greater Ekofisk area, the Group holds a 39.9% stake in theEkofisk and Eldfisk fields. Production at Ekofisk South started in2013 and at Eldfisk II in January 2015 (capacity of 70 kboe / d each).
– In the Sleipner area, development of the Gina Krog field locatedin the north of Sleipner and approved in 2013 is underway. The Group’s stake, currently 30% (after the sale of 8% in 2014),is expected to be reduced to 15% after the finalization of the saleof 15% announced in October 2015.
– In the Greater Hild area, the Martin Linge field (51%, operator,estimated capacity 80 kboe / d) is currently being developed.
– In the Haltenbanken region, the first sub-marine compressiontrain in the world was commissioned on the Åsgard project(7.7%) in September 2015.
– In the Barents Sea, the Group holds an 18.4% stake in the gasliquefaction plant of Snøhvit (capacity of 4.2 Mt / y). This plant issupplied with gas from the Snøhvit, Albatross and Askeladd fields.
In the Netherlands, TOTAL currently holds interests in 24 offshoreproduction licenses, including 20 that it operates, and 2 offshoreexploration licenses, E17c (16.92%) and K1c (30%). In 2015, theGroup’s production was 28 kboe / d compared to 31 kboe / d in 2014and 35 kboe / d in 2013.
In the United Kingdom, the Group’s production was 107 kboe / d in2015 compared to 89 kboe / d in 2014 and 105 kboe / d in 2013.Approximately 90% of this production comes from operated fieldsin two main areas: the Alwyn area in the northern North Sea, andthe Elgin / Frankin area in the Central Graben.
– In the Alwyn area (100%), production from the Alwyn and Dunbarfields represents 20% and 25% of production, respectively. Therest of the production comes from satellites:
1) linked to Alwyn by subsea tieback: the Forvie gas andcondensates field joined by the Jura and Islay fields and theNuggets gas field network, which started to produce in cyclicmode at the end of 2015;
2) linked to Dunbar : the Ellon (oil and gas) and the Grant (gas and condensates) fields.
The natural decline of the Alwyn field’s production was partiallycompensated by the start-up of new reservoir compartments. A system for improving recovery, the concentric gas lift, wasinstalled in three Alwyn wells in 2014.
On the Dunbar field (100%), a new development phase (Dunbarphase IV) is underway, which includes three well work-overs andthe drilling of six new wells. Drilling on the first well, D14, started inApril 2015.
– In Central Graben, TOTAL holds stakes in the Elgin, Franklin andWest Franklin fields (46.2%, operator). A redevelopment projectinvolving the drilling of five new infill wells on Elgin and Franklinstarted in July 2013. The first well is currently being drilled. Inaddition, the West Franklin Phase II development project continuedwith the start-up of production of two new wells in 2015.
– A third area, West of Shetland, is currently under development.This includes the fields of Laggan, Tormore, Edradour and Glenlivet(operator with 60%, following the sale of 20% of its interestscarried out in 2015) and the P967 license, including the discoveryof gas at Tobermory (30%, operator). Production of the Lagganand Tormore fields started in February 2016. Production of theEdradour and Glenlivet fields is expected to start in 2017 and2018, respectively, with an expected total capacity of 90 kboe / d.
An impairment on gas assets in the United Kingdom was booked inthe 2015 Consolidated Financial Statements.
In 2014, TOTAL acquired a 40% stake in two onshore shale gasexploration and production licenses (PEDL 139 and 140) located inthe Gainsborough Trough basin of the East Midlands, and signedan agreement enabling the Group to acquire a 50% stake in thePEDL 209 license located in the same area. A 3D seismic surveywas performed on the PEDL 139 and 140 licenses.
In August 2015, an agreement was signed for the sale of interestsheld by Total E&P UK in transport pipelines (FUKA and SIRGE) andthe St. Fergus terminal. The transfer is expected to take effect inthe first half of 2016.
Rest of EuropeTOTAL also holds interests in exploration licenses in Bulgaria andCyprus.
Middle East
In 2015, TOTAL’s production in the Middle East was 492 kboe / d,representing 21% of the Group’s total production, compared to391 kboe / d in 2014 and 536 kboe / d in 2013. The two mainproducing countries in the Middle East in 2015 were the UnitedArab Emirates and Qatar.
In the United Arab Emirates, the Group’s production was 287 kboe / din 2015 compared to 127 kboe / d in 2014 and 260 kboe / d in 2013.The Group holds, since January 1, 2015, a 10% stake in the AbuDhabi Company for Onshore Petroleum Operations Ltd. (ADCO)concession for a period of 40 years, which follows a previousonshore concession. This concession covers the 15 main onshorefields of Abu Dhabi and represents more than half of the Emirate’sproduction.
TOTAL holds a 75% stake (operator) in the Abu Al Bukhoosh fieldand a 13.3% stake in Abu Dhabi Marine Operating Company(ADMA-OPCO), which operates two fields offshore Abu Dhabi.TOTAL also holds a 15% stake in Abu Dhabi Gas Industries(GASCO), which produces NGL and condensates from theassociated gas produced by ADCO. In addition, TOTAL holds 5%of the Abu Dhabi Gas Liquefaction Company (ADGAS), whichprocesses the associated gas produced by ADMA-OPCO in orderto produce LNG, NGL and condensates, and 5% of National GasShipping Company (NGSCO), which owns eight LNG tankers andexports the LNG produced by ADGAS.
Business overview 2Upstream segment
Registration Document 2015. TOTAL 21
2 Business overviewUpstream segment
TOTAL. Registration Document 201522
The Group holds a 24.5% stake in Dolphin Energy Ltd. in partnershipwith Mubadala, a company owned by the government of Abu Dhabi,in order to market gas produced in Qatar primarily to the UnitedArab Emirates.
The Group also owns 33.33% of Ruwais Fertilizer Industries (FERTIL),which produces urea. The FERTIL 2 project commenced operationsin 2013, enabling FERTIL to increase its production capacity to 2 Mt / y.
In Iraq, the Group’s production in 2015 was 18 kboe / d comparedto 12 kboe / d in 2014 and 7 kboe / d in 2013.
On the Halfaya field in Missan province, following the completion ofa negotiation in October 2014, TOTAL’s stake increased from 18.75%to 22.5% in the consortium that was awarded the development andproduction contract. Production of phase 1 of the project started in2012 and phase 2 started in 2014, enabling production to reach200 kb / d in the second half of 2014. In 2015, amid low barrelprices, the commencement of EPCC contracts (engineering,procurement, construction and commissioning) of phase 3 of theproject (to increase production to 400 kb / d) was postponed.
In Iraqi Kurdistan, TOTAL holds stakes in several exploration blocks.
In Oman, the Group’s production in 2015 was 36 kboe / d, stablecompared to 2014 and 2013. TOTAL participates in the productionof oil principally in Block 6 (4%)(1), but also in Block 53 (2%). TheGroup also produces LNG through its investments in the OmanLNG (5.54%) / Qalhat LNG (2.04%)(2) liquefaction complex, with anoverall capacity of 10.5 Mt / y. The ultra-deep offshore Block 41license, obtained in 2013, was relinquished in February 2015following disappointing results.
In Qatar, the Group’s production was 134 kboe / d in 2015compared to 132 kboe / d in 2014 and 137 kboe / d in 2013.
The Group operates the Al Khalij field (40% operator) and participatesin the production, processing and exporting of gas from the NorthField due to investments in the Qatargas 1 and Qatargas 2 LNG plantsand in Dolphin Energy.
– Qatargas 2 (16.7%): the production capacity of train 5 ofQatargas 2 stood at 8 Mt / y. TOTAL offtakes part of the LNGproduced under the 2006 contracts that provide for the purchaseof 5.2 Mt / y of LNG by the Group. In addition, the Group holds astake in the Qatargas 1 liquefaction plant (10%) as well as astake in the corresponding upstream Block NFB (20%).
– Dolphin Energy (24.5%): the production contract for the Dolphingas project, signed in 2001 with Qatar Petroleum, provides forthe sale of 2 Bcf / d of gas from the North Field for a 25-year period.The gas is processed in the Dolphin plant in Ras Laffan and exportedto the United Arab Emirates through a 360 km gas pipeline.
In Syria, TOTAL has a 100% stake in the Deir Ez Zor license, whichis operated by the joint venture company DEZPC in which TOTALand the state-owned company SPC each have a 50% share.Additionally, TOTAL is holder of the Tabiyeh contract which cameinto effect in 2009. The Group has had no production in the countrysince December 2011, when TOTAL suspended its hydrocarbonproduction activities in Syria in compliance with the EU’s regulationsregarding this country. For further information regardinginternational economic sanctions, refer to point 1.9 of chapter 4.
In Yemen, the Group’s production was 17 kboe / d in 2015compared to 84 kboe / d in 2014 and 95 kboe / d in 2013.
Due to the further deterioration in the security situation in the vicinityof its Balhaf site, the company Yemen LNG, in which the Groupholds a 39.62% stake, decided to stop its commercial LNGproduction and export activities. The plant is in a preservationmode. As a consequence of this situation, Yemen LNG declaredforce majeure to its various stakeholders in early April 2015.
The PSA of Block 10 (Masila Basin, East Shabwa permit, 28.57%,operator) expired in late December 2015, and the license wasreturned to the Yemeni authorities. TOTAL is a partner in Block 5(Marib basin, Jannah license, 15%) and holds various stakes in fouronshore exploration licenses.
(1) TOTAL holds an indirect 4% stake in Petroleum Development Oman LLC, operator of Block 6, via its 10% stake in Private Oil Holdings Oman Ltd.(2) TOTAL has an indirect stake via Oman LNG’s stake in Qalhat LNG.
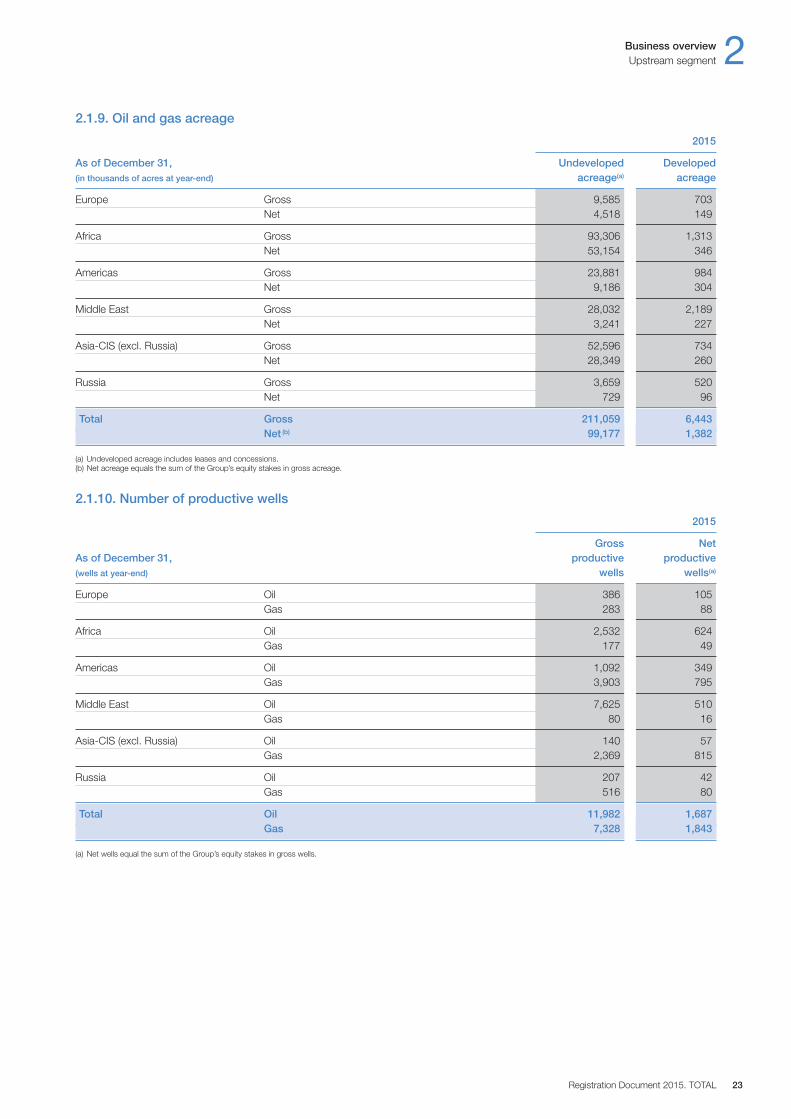
Business overview 2Upstream segment
Registration Document 2015. TOTAL 23
2.1.9. Oil and gas acreage
2015
As of December 31, Undeveloped Developed(in thousands of acres at year-end) acreage(a) acreage
Europe Gross 9,585 703 Net 4,518 149
Africa Gross 93,306 1,313 Net 53,154 346
Americas Gross 23,881 984 Net 9,186 304
Middle East Gross 28,032 2,189 Net 3,241 227
Asia-CIS (excl. Russia) Gross 52,596 734 Net 28,349 260
Russia Gross 3,659 520 Net 729 96
Total Gross 211,059 6,443 Net (b) 99,177 1,382
(a) Undeveloped acreage includes leases and concessions.(b) Net acreage equals the sum of the Group’s equity stakes in gross acreage.
2.1.10. Number of productive wells
2015
Gross NetAs of December 31, productive productive(wells at year-end) wells wells(a)
Europe Oil 386 105 Gas 283 88
Africa Oil 2,532 624 Gas 177 49
Americas Oil 1,092 349 Gas 3,903 795
Middle East Oil 7,625 510 Gas 80 16
Asia-CIS (excl. Russia) Oil 140 57 Gas 2,369 815
Russia Oil 207 42 Gas 516 80
Total Oil 11,982 1,687 Gas 7,328 1,843
(a) Net wells equal the sum of the Group’s equity stakes in gross wells.

2 Business overviewUpstream segment
TOTAL. Registration Document 201524
2.1.11. Number of net productive and dry wells drilled
As of December 31, 2015 2014 2013
(wells at year-end) Net Net dry Net total Net Net dry Net total Net Net dry Net total productive wells wells productive wells wells productive wells wells wells drilled(a)(c) drilled(a)(c) wells drilled(a)(c) drilled(a)(c) wells drilled(a)(c) drilled(a)(c)
drilled(a)(b) drilled(a)(b) drilled(a)(b)
ExploratoryEurope 1.0 3.6 4.6 1.4 0.2 1.6 1.5 0.2 1.7Africa 0.2 2.1 2.3 2.0 3.3 5.3 1.5 5.1 6.6Americas 1.4 0.6 2.0 2.1 0.3 2.4 2.9 1.4 4.3Middle East 0.3 0.5 0.8 0.3 0.3 0.6 0.6 0.7 1.3Asia-CIS (excl. Russia) 2.0 1.9 3.9 1.2 1.1 2.3 1.6 4.3 5.9Russia - - - - 0.3 0.3 - - -
Total 4.9 8.7 13.6 7.0 5.5 12.5 8.1 11.7 19.8
DevelopmentEurope 14.0 0.4 14.4 8.8 - 8.8 6.9 0.3 7.2Africa 21.4 - 21.4 24.6 1.0 25.6 19.7 0.4 20.1Americas 60.6 0.1 60.7 128.1 0.2 128.3 98.0 - 98.0Middle East 36.6 0.6 37.2 36.1 0.2 36.3 42.7 0.3 43.0Asia-CIS (excl. Russia) 88.6 - 88.6 106.2 0.5 106.7 184.2 - 184.2Russia 22.9 - 22.9 28.8 0.8 29.6 13.8 - 13.8
Total 244.1 1.1 245.2 332.6 2.7 335.3 365.3 1.0 366.3
Total 249.0 9.8 258.8 339.6 8.2 347.8 373.4 12.7 386.1
(a) Net wells equal the sum of the Company’s fractional interests in gross wells.(b) Includes certain exploratory wells that where abandoned, but which would have been capable of producing oil in sufficient quantities to justify completion.(c) For information: service wells and stratigraphic wells drilled within oil sands operations in Canada are not reported in this table (34.8 wells in 2015, 90.0 wells in 2014 and 86.2 wells in 2013).
For information on the accounting impacts in 2015 concerning dry wells drilled, refer to Note 4D of the Consolidated Financial Statements.
2.1.12. Wells in the process of being drilled (including wells temporarily suspended)
2015
As of December 31, (wells at year-end) Gross Net(a)
ExploratoryEurope 5 1.6Africa 25 7.3Americas 14 4.6Middle East 8 2.5Asia-CIS (excl. Russia) 11 3.4Russia - -
Total 63 19.4
Other wells (b)
Europe 38 13.6Africa 56 14.9Americas 63 22.4Middle East 158 20.5Asia-CIS (excl. Russia) 642 191.7Russia 113 17.4
Total 1,070 280.5
Total 1,133 299.9
(a) Net wells equal the sum of the Group’s equity stakes in gross wells. Includes wells for which surface facilities permitting production have not yet been constructed. Such wells are alsoreported in the table “Number of net productive and dry wells drilled”, above, for the year in which they were drilled.
(b) Other wells are developments wells, service wells, stratigraphic wells and extension wells.
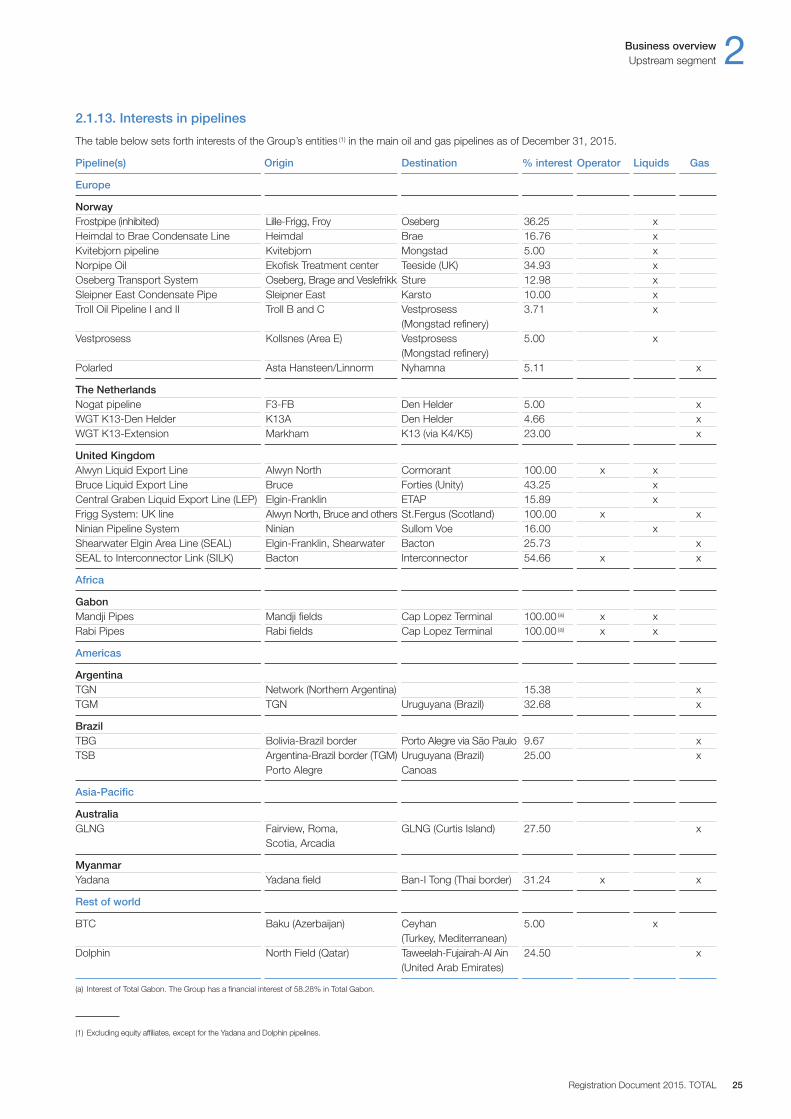
Business overview 2Upstream segment
Registration Document 2015. TOTAL 25
2.1.13. Interests in pipelines
The table below sets forth interests of the Group’s entities (1) in the main oil and gas pipelines as of December 31, 2015.
Pipeline(s) Origin Destination % interest Operator Liquids Gas
Europe
NorwayFrostpipe (inhibited) Lille-Frigg, Froy Oseberg 36.25 xHeimdal to Brae Condensate Line Heimdal Brae 16.76 xKvitebjorn pipeline Kvitebjorn Mongstad 5.00 xNorpipe Oil Ekofisk Treatment center Teeside (UK) 34.93 xOseberg Transport System Oseberg, Brage and Veslefrikk Sture 12.98 xSleipner East Condensate Pipe Sleipner East Karsto 10.00 xTroll Oil Pipeline I and II Troll B and C Vestprosess 3.71 x
(Mongstad refinery)Vestprosess Kollsnes (Area E) Vestprosess 5.00 x
(Mongstad refinery)Polarled Asta Hansteen / Linnorm Nyhamna 5.11 x
The NetherlandsNogat pipeline F3-FB Den Helder 5.00 xWGT K13-Den Helder K13A Den Helder 4.66 xWGT K13-Extension Markham K13 (via K4 / K5) 23.00 x
United KingdomAlwyn Liquid Export Line Alwyn North Cormorant 100.00 x xBruce Liquid Export Line Bruce Forties (Unity) 43.25 xCentral Graben Liquid Export Line (LEP) Elgin-Franklin ETAP 15.89 xFrigg System: UK line Alwyn North, Bruce and others St.Fergus (Scotland) 100.00 x xNinian Pipeline System Ninian Sullom Voe 16.00 xShearwater Elgin Area Line (SEAL) Elgin-Franklin, Shearwater Bacton 25.73 xSEAL to Interconnector Link (SILK) Bacton Interconnector 54.66 x x
Africa
GabonMandji Pipes Mandji fields Cap Lopez Terminal 100.00 (a) x xRabi Pipes Rabi fields Cap Lopez Terminal 100.00 (a) x x
Americas
ArgentinaTGN Network (Northern Argentina) 15.38 xTGM TGN Uruguyana (Brazil) 32.68 x
BrazilTBG Bolivia-Brazil border Porto Alegre via São Paulo 9.67 xTSB Argentina-Brazil border (TGM) Uruguyana (Brazil) 25.00 x
Porto Alegre Canoas
Asia-Pacific
AustraliaGLNG Fairview, Roma, GLNG (Curtis Island) 27.50 x
Scotia, Arcadia
MyanmarYadana Yadana field Ban-I Tong (Thai border) 31.24 x x
Rest of world
BTC Baku (Azerbaijan) Ceyhan 5.00 x(Turkey, Mediterranean)
Dolphin North Field (Qatar) Taweelah-Fujairah-Al Ain 24.50 x(United Arab Emirates)
(a) Interest of Total Gabon. The Group has a financial interest of 58.28% in Total Gabon.
(1) Excluding equity affiliates, except for the Yadana and Dolphin pipelines.

The activities of Gas, formerly known as Gas & Power, have aprimary objective of contributing to the growth of the Group byensuring sales outlets for TOTAL’s current and future natural gasproduction.
Beyond the production and liquefaction of natural gas (refer to point2.1 of this chapter), TOTAL actively markets natural gas, which issold either by pipeline or in the form of liquefied natural gas (LNG)and develops a downstream portfolio for its trading and shippingactivities, as well as regasification terminals.
In order to enhance the value of the Group’s gas resources, theactivities of Gas also include the trading and marketing of naturalgas, LNG, liquefied petroleum gas (LPG) and electricity as well asshipping of LNG and LPG. The Group also has stakes in infrastructurecompanies (including regasification terminals, natural gas transportationand storage, and power plants) necessary to implement its strategy.
2.2.1. Purchases, sales and shipping of liquefied natural gas (LNG)
A pioneer in the LNG industry, TOTAL is today one of the world‘sleading players (1) in the sector and has sound and diversifiedpositions both in the upstream and downstream portions of theLNG chain. LNG development is a key element of the Group’sstrategy, strengthening its positions in most major production zones and markets.
Through its stakes in liquefaction plants located in Qatar, the UnitedArab Emirates, Oman, Nigeria, Norway, Yemen, Angola and Australiaand its gas supply agreement with the Bontang LNG plant in Indonesia,the Group markets LNG in all global markets. In 2015, the share ofLNG production sold by TOTAL has decreased to 10.2 Mt,compared to 12.2 Mt in 2014 and 12.3 Mt in 2013. This reductionis connected to the force majeure declared in April 2015 for theYemen LNG joint venture due to the deterioration of securityconditions. The growth of LNG production sold by TOTAL over thecoming years is expected to be ensured by the Group’s liquefactionprojects under construction in Australia and Russia and by projectsbeing studied, including a new project in Papua New Guinea andthe expansion of the Nigeria LNG plant.
Long-term Group LNG purchases and sales
TOTAL acquires long-term LNG volumes mainly from liquefactionprojects in which the Group holds an interest, including Qatargas 2(Qatar), Yemen LNG (Yemen), Nigeria LNG (Nigeria) and Snøhvit(Norway). These volumes support the expansion of the Group’sworldwide LNG portfolio.
Since 2009, a growing portion of the long-term volume purchasedby the Group that was initially intended for delivery to North Americanand European markets has been diverted to more buoyant Asianmarkets.
New LNG sources are expected to support the growth of theGroup’s LNG portfolio, including Ichthys LNG (Australia), YamalLNG (2) (Russia), trains 3 and 5 of Sabine Pass LNG (United States)and Cameron LNG (United States).
TOTAL has entered into several significant long-term agreementsthroughout the world for the sale of LNG from the Group’s globalLNG portfolio, notably in China, Indonesia, Japan, Singapore,South Korea and Spain.
LNG shipping
As part of its LNG transport activities, TOTAL uses two long-termchartered LNG tankers: since 2006, the Arctic Lady, with a capacityof 145,000 m³; and since 2011, the Meridian Spirit, with a capacityof 165,000 m³, primarily for the transport of volumes from Snøhvitin Norway.
TOTAL continues to develop its fleet. The Group also signed a long-term charter agreement in 2013 with SK Shipping and Marubeni for two 180,000 m³ LNG tankers. The vessels will serve to fulfill thepurchase obligations of Total Gas & Power Limited, includingcommitments relating to the Ichthys and Sabine Pass projects.They will be among the largest LNG tankers to navigate thePanama Canal after the canal’s expansion and are expected to bedelivered in 2017.
2.2.2. Trading
In 2015, TOTAL continued its strategy downstream from naturalgas and LNG production by developing its trading, marketing andlogistics activities. The aim of this strategy is to optimize access forthe Group’s current and future production to markets suppliedbased on long-term contracts and to markets open to internationalcompetition (with short-term contracts and spot sales). The Groupalso has operations in electricity trading and the marketing of LPGand petcoke, and is disengaging from coal trading activities.
The trading teams, which are located in London, Houston, Genevaand Singapore, conduct their business, in particular, through theGroup’s wholly-owned subsidiaries Total Gas & Power Limited,Total Gas & Power North America and Total Gas & Power Asia.
Gas and electricity
TOTAL is pursuing gas and electricity trading operations in Europeand North America in order to sell the Group’s production, to supplyits marketing subsidiaries and to support other entities of the Group.
In Europe, TOTAL traded 849 Bcf (24.0 Bcm) of natural gas in2015, compared to 911 Bcf (25.8 Bcm) in 2014 and 1,194 Bcf(33.8 Bcm) in 2013. TOTAL also traded 41.1 TWh of electricity in2015, compared to 44.8 TWh in 2014 and 53.0 TWh in 2013,mainly from external resources.
In North America, TOTAL traded 441 Bcf (12.5 Bcm) of natural gasin 2015 from its own production or from external resources, comparedto 593 Bcf (16.8 Bcm) in 2014 and 938 Bcf (26.6 Bcm) in 2013.
LNG
TOTAL operates LNG trading activities through both spot sales andlong-term contracts such as those described in point 2.2.1 above.Significant sales and purchase agreements (SPAs) have permittedappreciable development of the Group’s activities in LNG trading,especially in the more buoyant markets in Asia (China, South Korea,
2 Business overviewUpstream segment
TOTAL. Registration Document 201526
2.2. Gas
(1) Company data, based on upstream and downstream LNG portfolios in 2015.(2) OAO Yamal LNG, which is developing the Yamal LNG project, is held by OAO Novatek (60%), Total E&P Yamal (20%) and CNODC (20%), a subsidiary of China National Petroleum
Corporation. Novatek’s investment in the company OAO Yamal LNG is to be reduced to 50.1% following an agreement signed in September 2015 for the entry of the Silk Road Fund (9.9%).This agreement is expected to be approved by the authorities in 2016. For information on international economic sanctions against Russia, refer to point 1.9 of chapter 4.

Business overview 2Upstream segment
Registration Document 2015. TOTAL 27
India and Japan). The spot and fixed-term LNG portfolio allowsTOTAL to supply gas to its main customers worldwide, whileretaining a sufficient degree of flexibility to react to marketopportunities.
In 2015, TOTAL purchased 64 contractual cargoes from Qatar,Yemen, Nigeria and Norway and 20 spot cargoes, compared to,respectively, 88 and 7 in 2014 and 89 and 9 in 2013. The interruptionof deliveries from Yemen LNG led to increased LNG trading activityon the spot market in 2015.
LPG
In 2015, TOTAL traded nearly 5.8 Mt of LPG (propane and butane)worldwide, compared to 5.5 Mt in 2014 and 5.6 Mt in 2013. Nearly20% of these quantities come from fields or refineries operated bythe Group. This trading activity was conducted by means of 7 time-chartered vessels. In 2015, 292 voyages were necessary fortransporting the negotiated quantities, including 196 journeyscarried out by TOTAL’s time-chartered vessels and 96 journeys by spot-chartered vessels.
Petcoke
TOTAL has been trading petcoke produced since 2011 by the PortArthur refinery in the United States. Nearly 1.1 Mt of petcoke weresold on the international market in 2015, compared to 1.3 Mt in2014 and 1.2 Mt in 2013.
In 2014, TOTAL began trading petcoke from the Jubail refinery in Saudi Arabia. In 2015, nearly 720 kt were sold, compared to100 kt in 2014.
Petcoke has been sold to cement plants and electricity producersmainly in India, as well as in Turkey, Mexico, Brazil and other LatinAmerican countries.
2.2.3. Marketing
To consolidate its position throughout the value chain and to leveragethe synergies from the Group’s other activities, TOTAL has beendeveloping the business of marketing natural gas and electricity toend users.
In the United Kingdom, TOTAL markets gas and electricity to theindustrial and commercial segments through its subsidiary TotalGas & Power Ltd. In 2015, the volumes of gas sold was 140 Bcf(4.0 Bcm), compared to 135 Bcf (3.8 Bcm) in 2014 and 142 Bcf(4.0 Bcm) in 2013. Electricity sales were 6.0 TWh in 2015,compared to 5.3 TWh in 2014 and 4.7 TWh in 2013.
In France, TOTAL operates in the natural gas market through itsmarketing subsidiary Total Energie Gaz, the sales of which were 84 Bcf (2.4 Bcm) in 2015, compared to 95 Bcf (2.7 Bcm) in 2014and 141 Bcf (4.0 Bcm) in 2013. This decrease in volumes is explainedby the strategic repositioning of the subsidiary on the small andmedium companies market.
In Germany, Total Energie Gas GmbH, a marketing subsidiary ofTOTAL, marketed 31 Bcf (0.9 Bcm) of gas in 2015 to industrial andcommercial customers, compared to 24 Bcf (0.7 Bcm) in 2014 and14 Bcf (0.4 Bcm) in 2013.
In 2015, the volumes of gas delivered to the industrial andcommercial segments were 2 Bcf (0.1 Bcm) in Belgium (TotalGas & Power Belgium) and 7 Bcf (0.2 Bcm) in the Netherlands(Total Gas & Power Nederland B.V.), an increase with respect to2014. These two subsidiaries started marketing gas in 2013.
In 2015, the natural gas marketing subsidiaries in France, Germany,Belgium and the Netherlands extended their activities to the marketingof electricity to industrial and commercial consumers.
In Spain, TOTAL markets natural gas to the industrial and commercialsegments through Cepsa Gas Comercializadora, in which it holds a35% stake. In 2015, the volume of gas sold was 105 Bcf (3.0 Bcm),compared to 94 Bcf (2.7 Bcm) in 2014 and 101 Bcf (2.9 Bcm) in 2013.
In Argentina, the subsidiary Total Gas Marketing Cono Sur overseesthe marketing of gas on behalf of Total Austral, the Group’sproduction subsidiary in Argentina.
The Group also holds stakes in the marketing companies that areassociated with the LNG regasification terminals located at Altamirain Mexico and Hazira in India.
2.2.4. Gas facilities
Downstream from its natural gas and LNG production activities,TOTAL holds stakes in natural gas transport networks, natural gasstorage facilities and LNG regasification terminals.
Transportation and storage of natural gas
The Group holds stakes in several natural gas transportationcompanies located in Brazil and Argentina. These companies arefacing a difficult operational and financial environment in Argentina.
In France, Géosud (TOTAL, 56.1%) is a joint venture that holds 50% ofGéométhane. Located in Manosque, Géométhane owns and operatesseveral natural gas storage caverns operating since 1983. Startingin April 2015, the shareholders of Géosud jointly developed aproposed sale covering 98% of the Company’s shares. The closingof this sale took place in the first quarter of 2016.
LNG regasification
TOTAL has entered into agreements to obtain long-term access to LNG regasifcation capacity on three continents that representthe largest consumers of natural gas: North America (United Statesand Mexico), Europe (France and the United Kingdom) and Asia(India). This diversified market presence allows the Group to accessnew liquefaction projects by becoming a long-term buyer of a portionof the LNG produced, thereby strengthening TOTAL’s LNG supplyportfolio.
In France, TOTAL holds a 27.5% stake in the company Fosmaxand has, through its subsidiary Total Gas & Power Limited., aregasifcation capacity of 78 Bcf / y (2.25 Bcm / y). The terminal received46 vessels in 2015, compared to 46 in 2014 and 53 in 2013.
In 2011, TOTAL acquired a 9.99% stake in Dunkerque LNG in order to develop an LNG receiving terminal with a capacity of 459 Bcf / y (13 Bcm / y). Trade agreements have also been signedthat allow TOTAL to reserve up to 2 Bcm / y of regasifcation capacityover a 20-year term. The project is underway and commissioning of the terminal is scheduled for 2016.
In the United Kingdom, through its equity interest in the Qatargas2 project, TOTAL holds an 8.35% stake in the South Hook LNGreceiving terminal with a total capacity of 742 Bcf / y (21 Bcm / y) andan equivalent access right to the regasifcation capacity. The terminalreceived 84 cargoes in 2015, compared to 68 in 2014 and 52 in 2013.
In Mexico, TOTAL has reserved 25% of the regasifcation capacityof the Altamira receiving terminal, i.e., 59 Bcf / y (1.7 Bcm / y), throughits 25% stake in Gas del Litoral.

2 Business overviewUpstream segment
TOTAL. Registration Document 201528
In the United States, TOTAL has reserved a regasification capacityof approximately 353 Bcf / y (10 Bcm / y) in the Sabine Pass terminal(Louisiana) for a 20-year period until 2029. In 2012, TOTAL andSabine Pass Liquefaction (SPL) signed agreements allowing SPL to gradually obtain access to TOTAL’s reserved capacity. Access to 38 Bcf / y commenced in 2012, growing to 195 Bcf / y from thestart-up of train 3 and plateauing at substantially all of TOTAL’scapacity from the start-up of train 5. In return, SPL will pay TOTAL a fee linked to the capacity assigned.
In India, TOTAL holds a 26% stake in the Hazira receiving terminal,the regasification capacity of which was increased to 244 Bcf / y (6.9 Bcm / y) in 2013. This terminal, located in the Gujarat state, is a merchant terminal with operations that cover both LNGregasification and gas marketing. Due to the Indian market’s strongprospects for growth, a potential expansion project is under studyto increase the terminal’s capacity to 343 Bcf / y (9.7 Bcm / y).
2.2.5. Electricity generation
In a context of increasing global demand for electricity, TOTAL hasdeveloped expertise in the power generation sector, especiallythrough cogeneration and combined-cycle power plant projects.
In Abu Dhabi, the Taweelah A1 gas-fired power plant, which isowned by Gulf Total Tractebel Power Company (TOTAL, 20%),combines electricity generation and water desalination. The plant, inoperation since 2003, currently has a net power generation capacityof 1,600 MW and a water desalination capacity of 385,000 m³ per day. The plant’s production is sold to Abu Dhabi Water andElectricity Company (ADWEC) as part of a long-term agreement.
In Nigeria, TOTAL holds a stake in the Afam VI gas-fired combinedcycle power plant through its 10% interest in the Shell PetroleumDevelopment Company (SPDC) joint venture. This plant is part ofthe government’s plan to develop power generation and increasethe share of natural gas production for domestic use.
In Thailand, TOTAL holds 28% of Eastern Power and ElectricCompany Ltd which operates the Bang Bo gas-fired combinedcycle power plant with a capacity of 350 MW, commissioned in2003. Production is sold to the Electricity Generating Authority ofThailand (EGAT) under a long-term contract.
2.2.6. Coal production and marketing
Following the completion of the sale, in August 2015, of itssubsidiary Total Coal South Africa, the Group ceased its coalproduction activities. In addition, the Group has announced thetermination of its coal marketing activities in 2016.
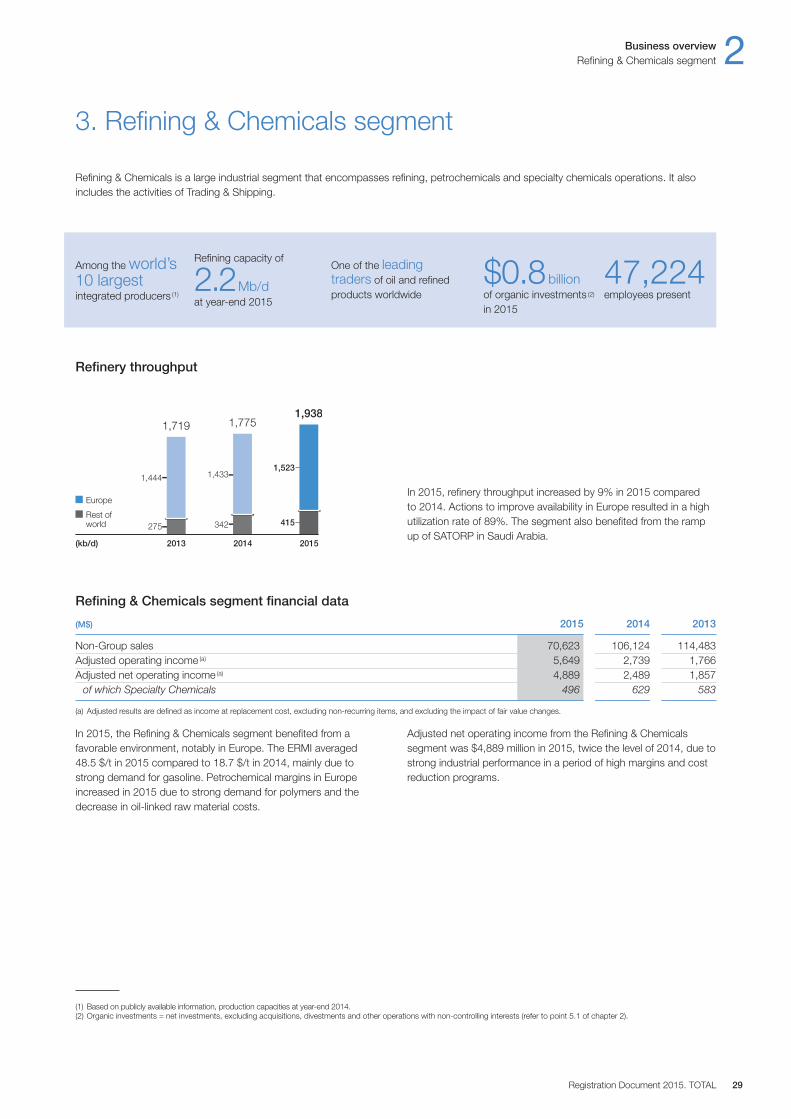
Refining & Chemicals segment financial data
(M$) 2015 2014 2013
Non-Group sales 70,623 106,124 114,483Adjusted operating income (a) 5,649 2,739 1,766Adjusted net operating income (a) 4,889 2,489 1,857
of which Specialty Chemicals 496 629 583
(a) Adjusted results are defined as income at replacement cost, excluding non-recurring items, and excluding the impact of fair value changes.
Business overview 2Refining & Chemicals segment
Registration Document 2015. TOTAL 29
In 2015, the Refining & Chemicals segment benefited from afavorable environment, notably in Europe. The ERMI averaged 48.5 $ / t in 2015 compared to 18.7 $ / t in 2014, mainly due tostrong demand for gasoline. Petrochemical margins in Europeincreased in 2015 due to strong demand for polymers and thedecrease in oil-linked raw material costs.
Adjusted net operating income from the Refining & Chemicalssegment was $4,889 million in 2015, twice the level of 2014, due tostrong industrial performance in a period of high margins and costreduction programs.
3. Refining & Chemicals segment
Refining & Chemicals is a large industrial segment that encompasses refining, petrochemicals and specialty chemicals operations. It alsoincludes the activities of Trading & Shipping.
Refinery throughput
In 2015, refinery throughput increased by 9% in 2015 compared to 2014. Actions to improve availability in Europe resulted in a highutilization rate of 89%. The segment also benefited from the rampup of SATORP in Saudi Arabia.
1,523
415Rest ofworld
Europe
(kb/d) 2013 2015
1,433
342
1,444
275
2014
1,9381,7751,719
(1) Based on publicly available information, production capacities at year-end 2014.(2) Organic investments = net investments, excluding acquisitions, divestments and other operations with non-controlling interests (refer to point 5.1 of chapter 2).
Refining capacity of
2.2Mb / dat year-end 2015
Among the world’s10 largestintegrated producers (1)
One of the leadingtraders of oil and refinedproducts worldwide
$0.8billionof organic investments (2)
in 2015
47,224employees present
2 Business overviewRefining & Chemicals segment
TOTAL. Registration Document 201530
Refining & Chemicals includes the Group’s refining, petrochemicalsand specialty chemicals businesses.
– the petrochemicals business includes base petrochemicals(olefins and aromatics) and polymer derivatives (polyethylene,polypropylene, polystyrene and hydrocarbon resins); and
– the specialty chemicals business includes elastomer processingand electroplating chemistry.
The volume of its Refining & Chemicals activities places TOTALamong the top ten integrated chemical producers in the world (1).
Against the backdrop of rising worldwide demand for oil andpetrochemicals driven by non-OECD countries and the entry of newcapacities into the market, the strategy of Refining & Chemicals, inaddition to the priority given to safety and environmental protection,involves:
– adapting production capacity to changes in demand in Europeby concentrating investments on large integrated platforms. TheGroup therefore plans to lower its capacity by 20% in Europe bythe end of 2016 in comparison with 2011;
– consolidating industrial means of production and searching foropportunities for growth in the United States; and
– strengthening TOTAL’s positions in Asia and the Middle East, inparticular to gain access to advantaged oil and gas feedstocksand to benefit from market growth.
This strategy is underpinned by an effort to differentiate through thetechnology used and innovation found in its products andprocesses.
3.1.1. Refining & Petrochemicals
TOTAL’s refining capacity was 2,247 kb / d as of December 31, 2015,compared to 2,187 kb / d at year-end 2014 and 2,042 kb / d at year-end 2013. TOTAL has equity stakes in 20 refineries (including 9operated by companies of the Group), located in Europe, theUnited States, Africa, the Middle East and Asia.
The Refining & Chemicals segment manages refining operationslocated in Europe (excluding TotalErg in Italy), the United States, theMiddle East and Asia, with a capacity of 2,168 kb / d at year-end2015 (96% of the Group’s total capacity (2)).
The petrochemicals businesses are located mainly in Europe, theUnited States, Qatar, South Korea and Saudi Arabia. Most of thesesites are either adjacent to or connected by pipelines to Group refineries.As a result, TOTAL’s petrochemical operations are integrated withinits refining operations, thereby maximizing synergies.
The year 2015 saw the launch of plans to adapt the Lindseyrefinery in the United Kingdom and the La Mède refinery in France,as well as the launch of a study to invest in the Donges refinery inFrance. As part of its European refining and petrochemicals capacityreduction and modernization plan, TOTAL ended steam crackingon the Carling site in France in October 2015. At the same time, theGroup began to develop new polymer and specialty resin activitieson the site. Finally, TOTAL continued to develop its major investmentproject launched in 2013 on the Antwerp platform in Belgium.
As part of the active management of its business portfolio, TOTALfinalized the sales of its stake in the Schwedt refinery (Germany) in November 2015 and its majority interest in the capital of thecompany Geosel (France) in December 2015. TOTAL completed inDecember 2014 the sale of its subsidiary CCP Composites (100%),which is active in the composite resins segment, and finalized in 2013the divestment of its Fertilizers activity (Base Chemicals) in Europe.
Activities by geographic area
EuropeTOTAL is the largest refiner in Western Europe (3).
Western Europe accounts for 76% of the Group’s refining capacity,i.e., 1,699 kb / d at year-end 2015, compared to 1,736 kb / d at year-end 2014 and at year-end 2013. The decrease observed in 2015 is attributable to the sale of the Group’s stake in the Schwedtrefinery in Germany.
The Group operates eight refineries in Western Europe (one inAntwerp, Belgium, five in France in Donges, Feyzin, Gonfreville,Grandpuits and La Mède, one in Immingham in the United Kingdomand one in Leuna, Germany) and owns stakes in the Zeelandrefinery in the Netherlands and the Trecate refinery in Italy throughits interest in TotalErg.
The Group’s main petrochemical sites in Europe are located inBelgium, in Antwerp (steam crackers, aromatics, polyethylene) andFeluy (polyolefins, polystyrene), and in France, in Carling (polyethylene,polystyrene), Feyzin (steam cracker, aromatics), Gonfreville (steamcrackers, aromatics, styrene, polyolefins, polystyrene) and Lavéra(steam cracker, aromatics, polypropylene). Europe accounts for49% of the Group’s petrochemicals capacity, i.e., 10,394 kt at year-end 2015, compared to 10,909 kt at year-end 2014 and 10,899 ktat year-end 2013.
– In France, the Group continues to adapt its refining capacity and to improve its operational efficiency against the backdrop of structural decline in the demand for petroleum products in Europe.In April 2015, TOTAL announced a significant modernization planfor its refining facilities in France, including:- in La Mède, a €200 million investment project to transform the
site and, in particular, to create the first bio-refinery in France,while stopping the treatment of crude oil at the end of 2016.The industrial transformation of La Mède will allow TOTAL torespond to the growing demand for biofuel in Europe. Otheractivities, such as a logistics and storage platform, a solar energyfarm, a training center and an AdBlue production plant (4), willalso be developed on the site,
- in Donges, a €400 million investment project for theconstruction of intermediate feedstock desulfurization units and hydrogen production units. The program, due to becommissioned in 2019, requires the rerouting of the railroadtrack that currently crosses the refinery. A three-partymemorandum of intent to fund this work between the state,local authorities and TOTAL was signed at the end of 2015.
3.1. Refining & Chemicals
(1) Based on publicly available information, production capacities at year-end 2014.(2) Earnings related to the refining assets in Africa, the French West Indies (up to mid-2015) and the TotalErg joint venture are reported in the results of the Marketing & Services segment.(3) Based on publicly available information, 2014 refining capacities.(4) Fuel additive intended for road transport and designed to lower nitrogen oxide (NOx) compound emissions.
Business overview 2Refining & Chemicals segment
Registration Document 2015. TOTAL 31
In 2014, the Group completed its industrial plan, launched in2009, to reconfigure the Gonfreville refinery in Normandy bystarting up a new diesel desulfurization unit. At the end of 2014,the Group launched a project to modernize the specialtiesproduction scheme of the Normandy complex, notably includinga decrease in base oil production capacity as of October 2015.In petrochemicals, the Group announced an investment plan in 2013 for the Carling platform in Lorraine, France, to adapt itscapacity and restore its competitiveness. As part of this project,steam cracking ended in October 2015. New hydrocarbon resinand compound polypropylene production units are in the processof being built and are expected to be commissioned in 2016.
– In Germany, TOTAL operates in the Leuna refinery (100%). In November 2015, the Group completed the sale of its stake in the Schwedt refinery (16.7%).In petrochemicals, in February 2015, the Group acquired amajority stake in Polyblend, a manufacturer of polyolefincompounds that are mainly used in the automotive industry.
– In Belgium, the Group launched a major project in 2013 tomodernize its Antwerp platform. This project consists of two parts:- the construction of new conversion units, which are expected
to be completed in 2016, in response to the shift in demandtowards lighter oil products with a very low sulfur content, and
- the construction of a new unit to convert part of the combustiblegases recovered from the refining process into raw materials forthe petrochemical units.
As part of this modernization plan, two of the site’s oldestproduction units were shut down: a steam cracker in 2013 and a polyethylene production line in 2014.In Feluy, TOTAL built a unit that produces latest-generation grayexpandable polystyrene for the fast-growing insulation market;the unit began production in 2014.
– In the United Kingdom, in February 2015, TOTAL launched aplan to adapt and secure the future of its Lindsey refinery. Inaddition to shutting down one of the two crude distillation unitsand associated units, which will reduce its capacity by 5 Mt / y,the plan aims to improve the conversion block, adapt logisticsoperations and simplify the refinery’s organization.In 2013, TOTAL shut down its 70 kt / y polystyrene production siteat Stalybridge, while continuing its commercial activity for polymers.
North AmericaThe Group’s main sites in North America are located in Texas, inPort Arthur (refinery, steam cracker), Bayport (polyethylene) and LaPorte (polypropylene), and in Louisiana, in Carville (styrene,polystyrene).
Located on the same site in Port Arthur, TOTAL wholly owns a 174 kb / dcapacity refinery as well as a 40% stake in a condensate splitterand a steam cracker (BASF Total Petrochemicals, BTP). The Groupis working to strengthen the synergies between these two plants.
The new pipeline connecting the Port Arthur refinery to the Sunterminal in Nederland was commissioned in 2014, facilitatingaccess to all domestic crudes, which are priced advantageouslycompared to the international market. Following investments toadapt its furnaces and the construction of a tenth ethane furnace,which was commissioned in March 2014, BTP’s cracker can nowproduce more than 1 Mt / year of ethylene, including more than 85%from advantaged feedstock (ethane, propane, butane). BTP thus
benefits from favorable market conditions in the United States. In addition, in September 2015, TOTAL launched detailed FEEDstudies for the construction of a new ethane steam cracker with anethylene production capacity of 1 Mt / year on the Port Arthur site, in synergy with the refinery and BTP steam cracker. The investmentdecision is expected to be made in 2016.
Asia and the Middle EastTOTAL is continuing to expand in growth areas and is developingsites in countries with favorable access to raw materials.
In Saudi Arabia, TOTAL has a 37.5% stake in the company,SATORP (Saudi Aramco Total Refining and PetrochemicalCompany), which operates the Jubail refinery. This refinery, fullyoperational since mid-2014, has a capacity of 400 kb / d and issituated close to Saudi Arabia’s heavy crude oil fields. The refinery’sconfiguration enables it to process these heavy crudes and sellfuels and other light products that meet strict specifications and aremainly intended for export. The refinery is also integrated withpetrochemical units: a 700 kt / y paraxylene unit, a 200 kt / ypropylene unit, and a 140 kt / y benzene unit.
In China, TOTAL holds a 22.4% stake in WEPEC, a company thatoperates a refinery located in Dalian.
The Group is also active through its 200 kt / y capacity polystyreneplant in Foshan in the Guangzhou region. In September 2014,TOTAL successfully began production on a new 200 kt / ypolystyrene plant in Ningbo in the Shanghai region.
Finally, TOTAL is continuing to study a project in Inner Mongolia to produce polyolefins from coal. This project, with a capacity of approximately 800 kt / y of olefins, would use the innovativemethanol-to-olefins / olefins cracking process (MTO / OCP), which theGroup confirmed in 2013 on a demonstration unit in Feluy, Belgium.The environmental impact assessment was submitted for approval to the Ministry of the Environment in 2015.
In South Korea, TOTAL has a 50% stake in Hanwha TotalPetrochemicals Co., Ltd. (HTC), which operates a petrochemicalcomplex in Daesan (condensate splitter, steam cracker, styrene,paraxylene, polyolefins). To keep up with growth in Asian markets,two major construction projects were completed in 2014, therebydoubling the site’s capacity compared to 2011. A new aromaticsunit (paraxlyne, benzene) supplied by a new condensate splitter, as well as a new EVA unit were successfully started up in 2014. The site’s paraxylene production capacity increased to 1.8 Mt / y as a result of these new units.
In Qatar, the Group holds interests (1) in two ethane-based steamcrackers (Qapco, Ras Laffan Olefin Cracker (RLOC)) and fourpolyethylene lines (Qapco, Qatofin), including the Qatofin linear low-density polyethylene plant in Messaied with a capacity of 550 kt / yand a 300 kt / y low-density polyethylene line operated by Qapco,which started up in 2012.
TOTAL holds a 10% stake in the Ras Laffan condensate refinery,which has a capacity of 146 kb / d. The construction project todouble the refinery’s capacity started in 2014 and is expected to becompleted by the end of 2016.
In Singapore, the Group sold its 95 kt / y capacity polystyreneproduction site in November 2014.
(1) TOTAL shareholdings: Qapco (20%); Qatofin (49%); RLOC (22.5%).
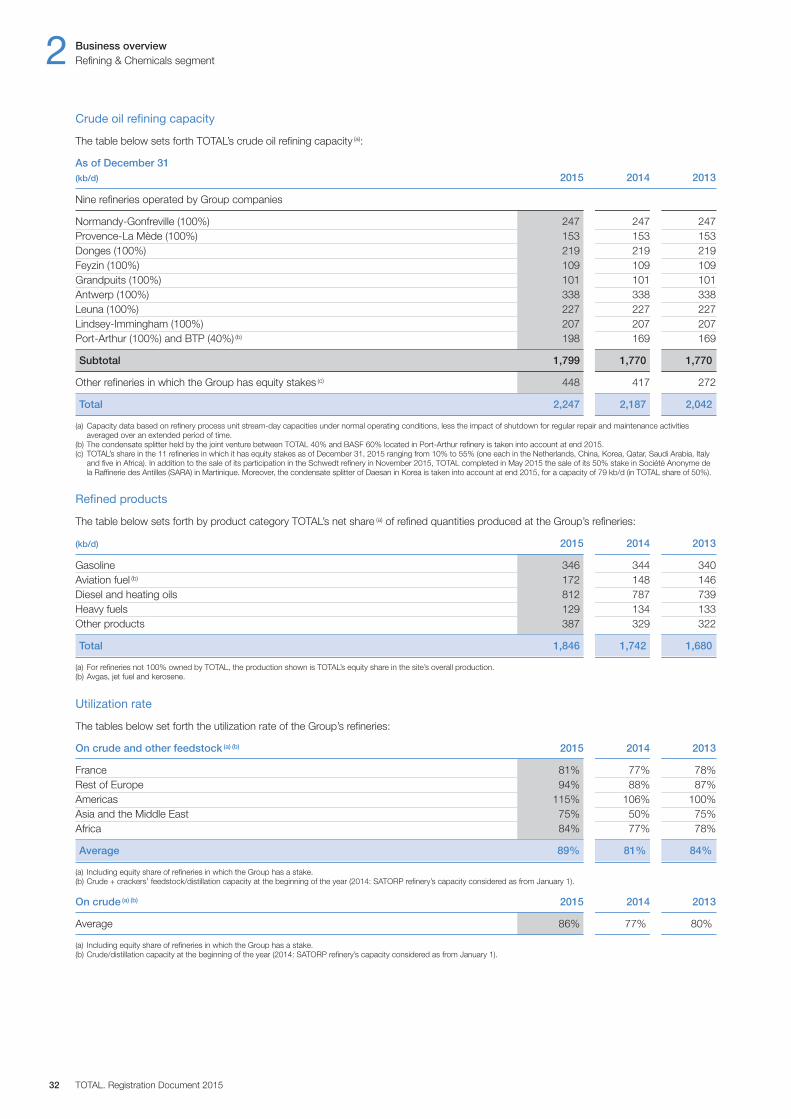
2 Business overviewRefining & Chemicals segment
TOTAL. Registration Document 201532
Crude oil refining capacity
The table below sets forth TOTAL’s crude oil refining capacity (a):
As of December 31(kb / d) 2015 2014 2013
Nine refineries operated by Group companies
Normandy-Gonfreville (100%) 247 247 247Provence-La Mède (100%) 153 153 153Donges (100%) 219 219 219Feyzin (100%) 109 109 109Grandpuits (100%) 101 101 101Antwerp (100%) 338 338 338Leuna (100%) 227 227 227Lindsey-Immingham (100%) 207 207 207Port-Arthur (100%) and BTP (40%) (b) 198 169 169
Subtotal 1,799 1,770 1,770
Other refineries in which the Group has equity stakes (c) 448 417 272
Total 2,247 2,187 2,042
(a) Capacity data based on refinery process unit stream-day capacities under normal operating conditions, less the impact of shutdown for regular repair and maintenance activitiesaveraged over an extended period of time.
(b) The condensate splitter held by the joint venture between TOTAL 40% and BASF 60% located in Port-Arthur refinery is taken into account at end 2015.(c) TOTAL’s share in the 11 refineries in which it has equity stakes as of December 31, 2015 ranging from 10% to 55% (one each in the Netherlands, China, Korea, Qatar, Saudi Arabia, Italy
and five in Africa). In addition to the sale of its participation in the Schwedt refinery in November 2015, TOTAL completed in May 2015 the sale of its 50% stake in Société Anonyme dela Raffinerie des Antilles (SARA) in Martinique. Moreover, the condensate splitter of Daesan in Korea is taken into account at end 2015, for a capacity of 79 kb/d (in TOTAL share of 50%).
Refined products
The table below sets forth by product category TOTAL’s net share (a) of refined quantities produced at the Group’s refineries:
(kb / d) 2015 2014 2013
Gasoline 346 344 340Aviation fuel (b) 172 148 146Diesel and heating oils 812 787 739Heavy fuels 129 134 133Other products 387 329 322
Total 1,846 1,742 1,680
(a) For refineries not 100% owned by TOTAL, the production shown is TOTAL’s equity share in the site’s overall production.(b) Avgas, jet fuel and kerosene.
Utilization rate
The tables below set forth the utilization rate of the Group’s refineries:
On crude and other feedstock (a) (b) 2015 2014 2013
France 81% 77% 78%Rest of Europe 94% 88% 87%Americas 115% 106% 100%Asia and the Middle East 75% 50% 75%Africa 84% 77% 78%
Average 89% 81% 84%
(a) Including equity share of refineries in which the Group has a stake.(b) Crude + crackers’ feedstock / distillation capacity at the beginning of the year (2014: SATORP refinery’s capacity considered as from January 1).
On crude (a) (b) 2015 2014 2013
Average 86% 77% 80%
(a) Including equity share of refineries in which the Group has a stake.(b) Crude / distillation capacity at the beginning of the year (2014: SATORP refinery’s capacity considered as from January 1).
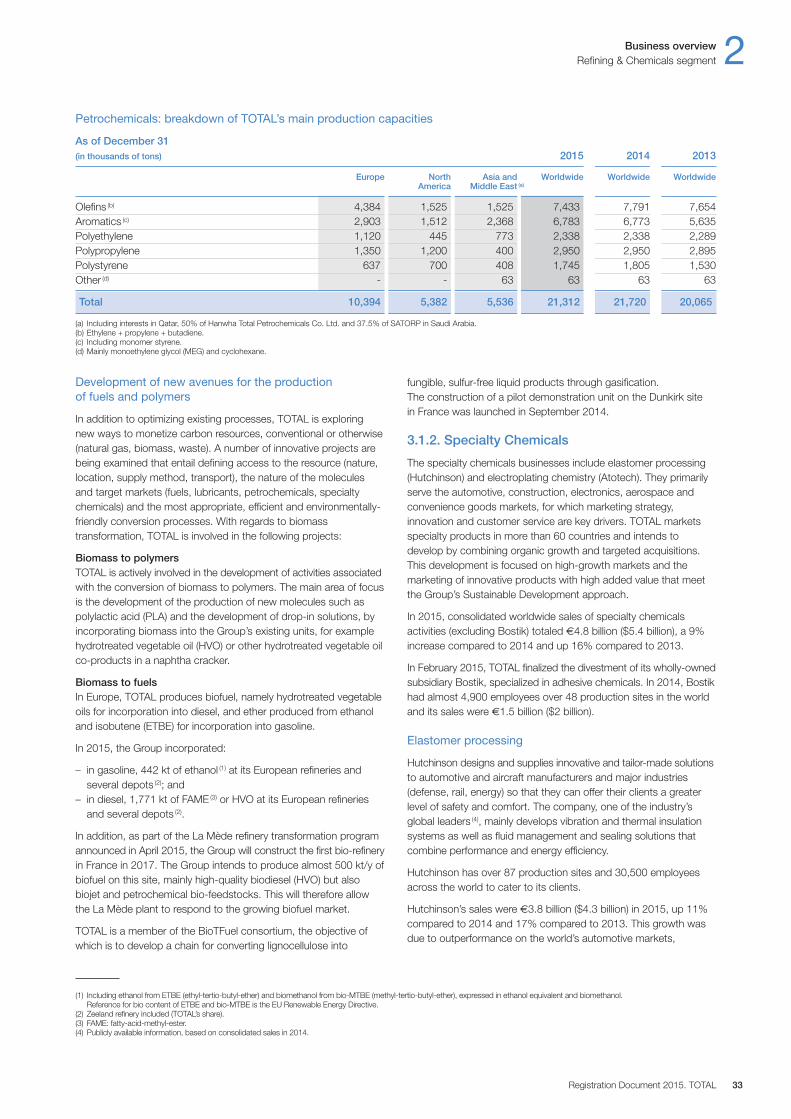
Business overview 2Refining & Chemicals segment
Registration Document 2015. TOTAL 33
(1) Including ethanol from ETBE (ethyl-tertio-butyl-ether) and biomethanol from bio-MTBE (methyl-tertio-butyl-ether), expressed in ethanol equivalent and biomethanol.Reference for bio content of ETBE and bio-MTBE is the EU Renewable Energy Directive.
(2) Zeeland refinery included (TOTAL’s share).(3) FAME: fatty-acid-methyl-ester.(4) Publicly available information, based on consolidated sales in 2014.
Development of new avenues for the production of fuels and polymers
In addition to optimizing existing processes, TOTAL is exploringnew ways to monetize carbon resources, conventional or otherwise(natural gas, biomass, waste). A number of innovative projects arebeing examined that entail defining access to the resource (nature,location, supply method, transport), the nature of the moleculesand target markets (fuels, lubricants, petrochemicals, specialtychemicals) and the most appropriate, efficient and environmentally-friendly conversion processes. With regards to biomasstransformation, TOTAL is involved in the following projects:
Biomass to polymersTOTAL is actively involved in the development of activities associatedwith the conversion of biomass to polymers. The main area of focusis the development of the production of new molecules such aspolylactic acid (PLA) and the development of drop-in solutions, byincorporating biomass into the Group’s existing units, for examplehydrotreated vegetable oil (HVO) or other hydrotreated vegetable oilco-products in a naphtha cracker.
Biomass to fuelsIn Europe, TOTAL produces biofuel, namely hydrotreated vegetableoils for incorporation into diesel, and ether produced from ethanoland isobutene (ETBE) for incorporation into gasoline.
In 2015, the Group incorporated:
– in gasoline, 442 kt of ethanol (1) at its European refineries andseveral depots (2); and
– in diesel, 1,771 kt of FAME (3) or HVO at its European refineriesand several depots (2).
In addition, as part of the La Mède refinery transformation programannounced in April 2015, the Group will construct the first bio-refineryin France in 2017. The Group intends to produce almost 500 kt / y ofbiofuel on this site, mainly high-quality biodiesel (HVO) but alsobiojet and petrochemical bio-feedstocks. This will therefore allowthe La Mède plant to respond to the growing biofuel market.
TOTAL is a member of the BioTFuel consortium, the objective ofwhich is to develop a chain for converting lignocellulose into
fungible, sulfur-free liquid products through gasification. The construction of a pilot demonstration unit on the Dunkirk site in France was launched in September 2014.
3.1.2. Specialty Chemicals
The specialty chemicals businesses include elastomer processing(Hutchinson) and electroplating chemistry (Atotech). They primarilyserve the automotive, construction, electronics, aerospace andconvenience goods markets, for which marketing strategy,innovation and customer service are key drivers. TOTAL marketsspecialty products in more than 60 countries and intends todevelop by combining organic growth and targeted acquisitions.This development is focused on high-growth markets and themarketing of innovative products with high added value that meetthe Group’s Sustainable Development approach.
In 2015, consolidated worldwide sales of specialty chemicalsactivities (excluding Bostik) totaled €4.8 billion ($5.4 billion), a 9%increase compared to 2014 and up 16% compared to 2013.
In February 2015, TOTAL finalized the divestment of its wholly-ownedsubsidiary Bostik, specialized in adhesive chemicals. In 2014, Bostikhad almost 4,900 employees over 48 production sites in the worldand its sales were €1.5 billion ($2 billion).
Elastomer processing
Hutchinson designs and supplies innovative and tailor-made solutionsto automotive and aircraft manufacturers and major industries(defense, rail, energy) so that they can offer their clients a greaterlevel of safety and comfort. The company, one of the industry’sglobal leaders (4), mainly develops vibration and thermal insulationsystems as well as fluid management and sealing solutions thatcombine performance and energy efficiency.
Hutchinson has over 87 production sites and 30,500 employeesacross the world to cater to its clients.
Hutchinson’s sales were €3.8 billion ($4.3 billion) in 2015, up 11%compared to 2014 and 17% compared to 2013. This growth wasdue to outperformance on the world’s automotive markets,
Petrochemicals: breakdown of TOTAL’s main production capacities
As of December 31(in thousands of tons) 2015 2014 2013
Europe North Asia and Worldwide Worldwide Worldwide America Middle East (a)
Olefins (b) 4,384 1,525 1,525 7,433 7,791 7,654Aromatics (c) 2,903 1,512 2,368 6,783 6,773 5,635Polyethylene 1,120 445 773 2,338 2,338 2,289Polypropylene 1,350 1,200 400 2,950 2,950 2,895Polystyrene 637 700 408 1,745 1,805 1,530Other (d) - - 63 63 63 63
Total 10,394 5,382 5,536 21,312 21,720 20,065
(a) Including interests in Qatar, 50% of Hanwha Total Petrochemicals Co. Ltd. and 37.5% of SATORP in Saudi Arabia.(b) Ethylene + propylene + butadiene.(c) Including monomer styrene.(d) Mainly monoethylene glycol (MEG) and cyclohexane.
2 Business overviewRefining & Chemicals segment
TOTAL. Registration Document 201534
Trading & Shipping focuses on serving the Group’s needs by:
– selling and marketing the Group’s crude oil production;– providing a supply of crude oil for the Group’s refineries;– importing and exporting the appropriate petroleum and refined
products for the Group’s refineries to be able to adjust theirproduction to the needs of local markets;
– chartering appropriate ships for these activities; and– undertaking Trading on various derivatives markets.
With its acquired expertise, Trading & Shipping is able to extend its scope beyond the aforementioned activities.
Trading & Shipping conducts its activities worldwide throughvarious wholly-owned subsidiaries (2) established on strategicallyimportant oil markets in Europe, Asia and North America.
3.2.1. Trading
In 2015, Trading benefited from oil price volatility and the contango (3)
situation of certain oil indexes (the opposite of the backwardationsituation observed in 2014) by better optimizing positions andarbitrage. Significant storage capacities in different parts of theworld, made available through leases, contributed to the strongperformance of these activities. The Group’s facilities in Houstonand Singapore also contributed to the growth of results byexpanding their respective activities.
TOTAL is one of the world’s largest traders of crude oil andpetroleum products on the basis of volumes traded. The tablebelow presents Trading’s worldwide crude oil sales and supplysources and petroleum product sales for each of the past threeyears. Trading of physical volumes of crude oil and petroleumproducts amounted to 5.2 Mb / d in 2015, compared to 4.9 Mb / d in 2014 and to 4.5 Mb / d in 2013.
3.2. Trading & Shipping
especially among German and Asian manufacturers. In 2015,Hutchinson also performed well on its other markets, particularlycivil aeronautics.
In addition, Hutchinson is pursuing the differentiation of its businessby investing in several R&D programs that focus on materialinnovations and solutions that incorporate mechatroniccomponents.
Since 2014, all Hutchinson entities that previously operated under26 different brand names have been marketed under a uniqueHutchinson brand name for greater consistency and visibility.
Electroplating
Atotech is one of the world’s leading companies in theelectroplating sector (1). It is active in the markets for electronics(printed circuits, semiconductors) and general surface treatments(automotive, construction, furnishing).
Atotech has 17 production sites worldwide, including seven in Asia,six in Europe, three in North America and one in South America.
The Company’s sales totaled €1.0 billion ($1.1 billion) in 2015, upby 4% compared to 2014 and 11% compared to 2013.
In 2015, Atotech successfully pursued its strategy to differentiate itsproducts by offering its customers a complete package in terms ofequipment, processes, facilities design and chemical products andby developing innovative technologies that have less of an impacton the environment. This strategy relies on global coverage providedby its technical centers located near customers.
Atotech intends to pursue its development in Asia, which alreadyrepresents approximately two-thirds of its global sales.
To strengthen its position in the electronics market, Atotech is increasingand modernizing its production capacity in Asia with two majorprojects in Malaysia and China (inaugurations planned in 2016 and2018 respectively). By relocating production as close to its marketsas possible, these two projects also adhere to its cost-cuttingstrategy. Furthermore, the new Atotech Development Center in Indiais planning to start its operations by 2017 in order to provide for afaster, more sustainable and higher-quality development of productsand processes and for a more cost-effective selection of raw materials.
(1) Publicaly available information, based on consolidated sales in 2014.(2) These subsidiaries include TOTSA Total Oil Trading S.A., Atlantic Trading & Marketing Inc., Total Trading Asia Pte, Total Trading and Marketing Canada L.P., Total European Trading S.A.S
and Chartering & Shipping Services S.A.(3) Contango is the price structure in which the prompt price of an index is lower than the future price. For example, the difference between the Brent ICE 1st line and the Brent ICE 12th line
was -$6.58 / b in 2015, compared with +$1.15 / b in 2014. The reverse situation is referred to as backwardation.
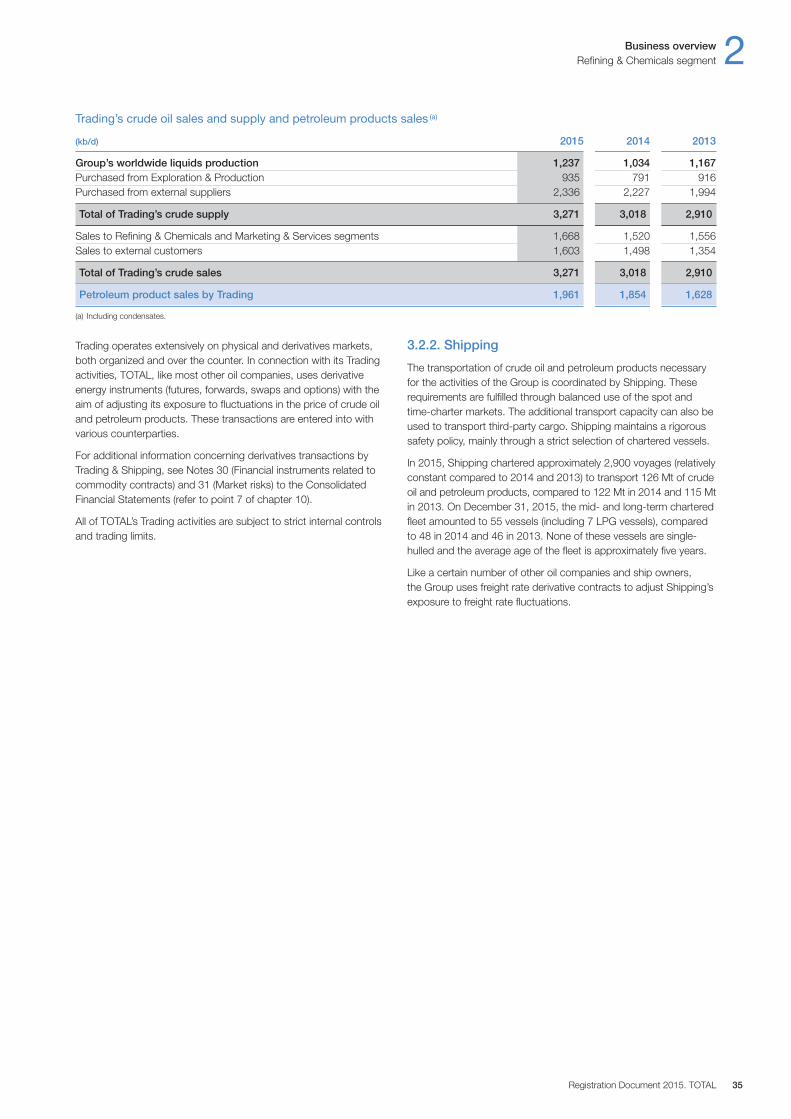
Business overview 2Refining & Chemicals segment
Registration Document 2015. TOTAL 35
Trading operates extensively on physical and derivatives markets,both organized and over the counter. In connection with its Tradingactivities, TOTAL, like most other oil companies, uses derivativeenergy instruments (futures, forwards, swaps and options) with theaim of adjusting its exposure to fluctuations in the price of crude oiland petroleum products. These transactions are entered into withvarious counterparties.
For additional information concerning derivatives transactions byTrading & Shipping, see Notes 30 (Financial instruments related tocommodity contracts) and 31 (Market risks) to the ConsolidatedFinancial Statements (refer to point 7 of chapter 10).
All of TOTAL’s Trading activities are subject to strict internal controlsand trading limits.
3.2.2. Shipping
The transportation of crude oil and petroleum products necessaryfor the activities of the Group is coordinated by Shipping. Theserequirements are fulfilled through balanced use of the spot andtime-charter markets. The additional transport capacity can also beused to transport third-party cargo. Shipping maintains a rigoroussafety policy, mainly through a strict selection of chartered vessels.
In 2015, Shipping chartered approximately 2,900 voyages (relativelyconstant compared to 2014 and 2013) to transport 126 Mt of crudeoil and petroleum products, compared to 122 Mt in 2014 and 115 Mtin 2013. On December 31, 2015, the mid- and long-term charteredfleet amounted to 55 vessels (including 7 LPG vessels), comparedto 48 in 2014 and 46 in 2013. None of these vessels are single-hulled and the average age of the fleet is approximately five years.
Like a certain number of other oil companies and ship owners, the Group uses freight rate derivative contracts to adjust Shipping’sexposure to freight rate fluctuations.
Trading’s crude oil sales and supply and petroleum products sales (a)
(kb / d) 2015 2014 2013
Group’s worldwide liquids production 1,237 1,034 1,167Purchased from Exploration & Production 935 791 916Purchased from external suppliers 2,336 2,227 1,994
Total of Trading’s crude supply 3,271 3,018 2,910
Sales to Refining & Chemicals and Marketing & Services segments 1,668 1,520 1,556Sales to external customers 1,603 1,498 1,354
Total of Trading’s crude sales 3,271 3,018 2,910
Petroleum product sales by Trading 1,961 1,854 1,628
(a) Including condensates.
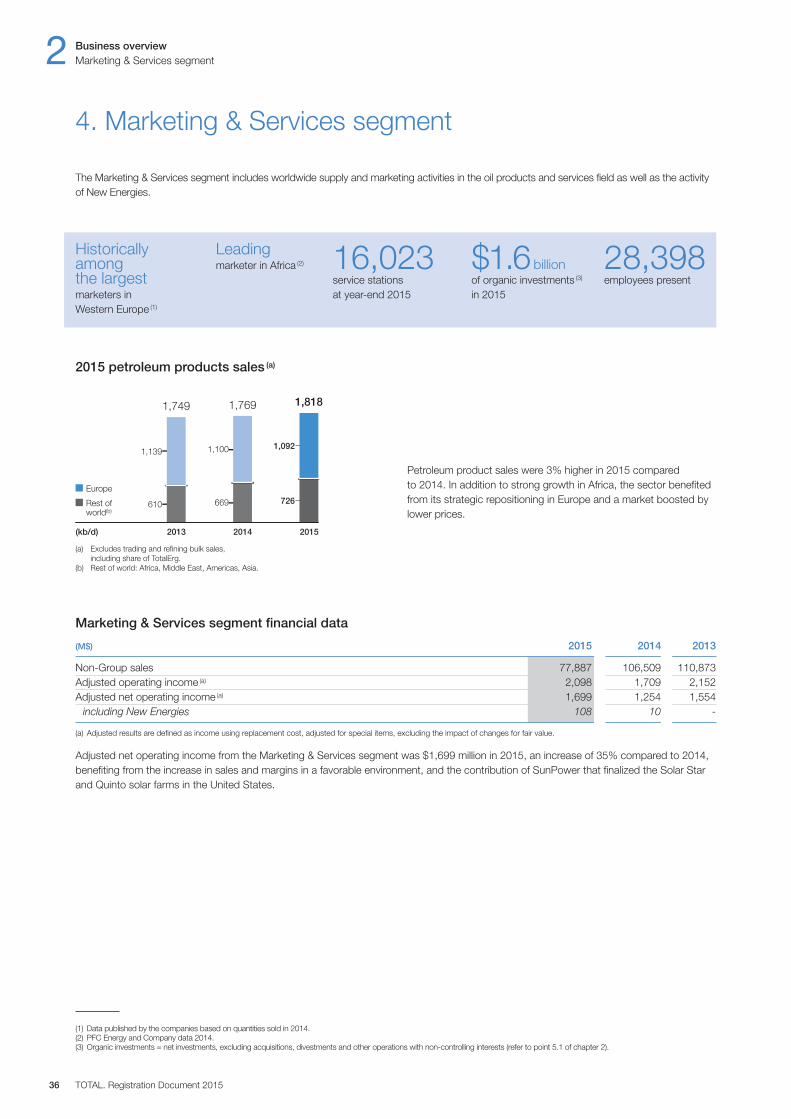
Marketing & Services segment financial data
(M$) 2015 2014 2013
Non-Group sales 77,887 106,509 110,873Adjusted operating income (a) 2,098 1,709 2,152Adjusted net operating income (a) 1,699 1,254 1,554
including New Energies 108 10 -
(a) Adjusted results are defined as income using replacement cost, adjusted for special items, excluding the impact of changes for fair value.
Adjusted net operating income from the Marketing & Services segment was $1,699 million in 2015, an increase of 35% compared to 2014,benefiting from the increase in sales and margins in a favorable environment, and the contribution of SunPower that finalized the Solar Starand Quinto solar farms in the United States.
2 Business overviewMarketing & Services segment
TOTAL. Registration Document 201536
Petroleum product sales were 3% higher in 2015 compared to 2014. In addition to strong growth in Africa, the sector benefitedfrom its strategic repositioning in Europe and a market boosted bylower prices.
2015 petroleum products sales (a)
1,092
726
1,100
669
1,139
610Rest ofworld(b)
Europe
2013(kb/d) 2014 2015
(a) Excludes trading and refining bulk sales, including share of TotalErg.
(b) Rest of world: Africa, Middle East, Americas, Asia.
1,8181,7691,749
Leadingmarketer in Africa (2)
Historicallyamong the largestmarketers in Western Europe (1)
16,023service stations at year-end 2015
$1.6billionof organic investments (3)
in 2015
4. Marketing & Services segment
The Marketing & Services segment includes worldwide supply and marketing activities in the oil products and services field as well as the activity of New Energies.
28,398employees present
(1) Data published by the companies based on quantities sold in 2014.(2) PFC Energy and Company data 2014.(3) Organic investments = net investments, excluding acquisitions, divestments and other operations with non-controlling interests (refer to point 5.1 of chapter 2).
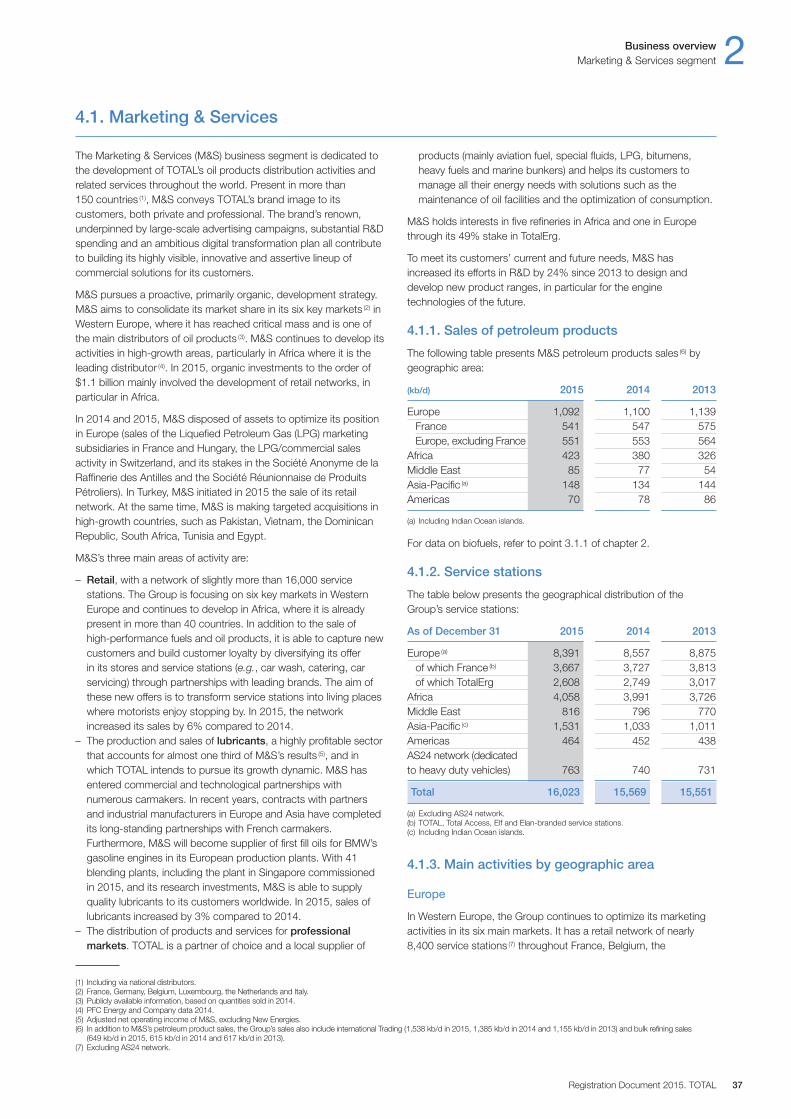
Business overview 2Marketing & Services segment
Registration Document 2015. TOTAL 37
The Marketing & Services (M&S) business segment is dedicated tothe development of TOTAL’s oil products distribution activities andrelated services throughout the world. Present in more than 150 countries (1), M&S conveys TOTAL’s brand image to itscustomers, both private and professional. The brand’s renown,underpinned by large-scale advertising campaigns, substantial R&Dspending and an ambitious digital transformation plan all contributeto building its highly visible, innovative and assertive lineup ofcommercial solutions for its customers.
M&S pursues a proactive, primarily organic, development strategy.M&S aims to consolidate its market share in its six key markets (2) inWestern Europe, where it has reached critical mass and is one ofthe main distributors of oil products (3). M&S continues to develop itsactivities in high-growth areas, particularly in Africa where it is theleading distributor (4). In 2015, organic investments to the order of$1.1 billion mainly involved the development of retail networks, inparticular in Africa.
In 2014 and 2015, M&S disposed of assets to optimize its positionin Europe (sales of the Liquefied Petroleum Gas (LPG) marketingsubsidiaries in France and Hungary, the LPG / commercial salesactivity in Switzerland, and its stakes in the Société Anonyme de laRaffinerie des Antilles and the Société Réunionnaise de ProduitsPétroliers). In Turkey, M&S initiated in 2015 the sale of its retailnetwork. At the same time, M&S is making targeted acquisitions inhigh-growth countries, such as Pakistan, Vietnam, the DominicanRepublic, South Africa, Tunisia and Egypt.
M&S’s three main areas of activity are:
– Retail, with a network of slightly more than 16,000 servicestations. The Group is focusing on six key markets in WesternEurope and continues to develop in Africa, where it is alreadypresent in more than 40 countries. In addition to the sale of high-performance fuels and oil products, it is able to capture newcustomers and build customer loyalty by diversifying its offer in its stores and service stations (e.g., car wash, catering, carservicing) through partnerships with leading brands. The aim ofthese new offers is to transform service stations into living placeswhere motorists enjoy stopping by. In 2015, the networkincreased its sales by 6% compared to 2014.
– The production and sales of lubricants, a highly profitable sectorthat accounts for almost one third of M&S’s results (5), and inwhich TOTAL intends to pursue its growth dynamic. M&S hasentered commercial and technological partnerships withnumerous carmakers. In recent years, contracts with partnersand industrial manufacturers in Europe and Asia have completedits long-standing partnerships with French carmakers.Furthermore, M&S will become supplier of first fill oils for BMW’sgasoline engines in its European production plants. With 41blending plants, including the plant in Singapore commissionedin 2015, and its research investments, M&S is able to supplyquality lubricants to its customers worldwide. In 2015, sales oflubricants increased by 3% compared to 2014.
– The distribution of products and services for professionalmarkets. TOTAL is a partner of choice and a local supplier of
products (mainly aviation fuel, special fluids, LPG, bitumens,heavy fuels and marine bunkers) and helps its customers tomanage all their energy needs with solutions such as themaintenance of oil facilities and the optimization of consumption.
M&S holds interests in five refineries in Africa and one in Europethrough its 49% stake in TotalErg.
To meet its customers’ current and future needs, M&S hasincreased its efforts in R&D by 24% since 2013 to design anddevelop new product ranges, in particular for the enginetechnologies of the future.
4.1.1. Sales of petroleum products
The following table presents M&S petroleum products sales (6) bygeographic area:
(kb / d) 2015 2014 2013
Europe 1,092 1,100 1,139France 541 547 575Europe, excluding France 551 553 564
Africa 423 380 326Middle East 85 77 54Asia-Pacific (a) 148 134 144Americas 70 78 86
(a) Including Indian Ocean islands.
For data on biofuels, refer to point 3.1.1 of chapter 2.
4.1.2. Service stations
The table below presents the geographical distribution of theGroup’s service stations:
As of December 31 2015 2014 2013
Europe (a) 8,391 8,557 8,875of which France (b) 3,667 3,727 3,813of which TotalErg 2,608 2,749 3,017
Africa 4,058 3,991 3,726Middle East 816 796 770Asia-Pacific (c) 1,531 1,033 1,011Americas 464 452 438AS24 network (dedicated to heavy duty vehicles) 763 740 731
Total 16,023 15,569 15,551
(a) Excluding AS24 network.(b) TOTAL, Total Access, Elf and Elan-branded service stations.(c) Including Indian Ocean islands.
4.1.3. Main activities by geographic area
Europe
In Western Europe, the Group continues to optimize its marketingactivities in its six main markets. It has a retail network of nearly8,400 service stations (7) throughout France, Belgium, the
4.1. Marketing & Services
(1) Including via national distributors.(2) France, Germany, Belgium, Luxembourg, the Netherlands and Italy.(3) Publicly available information, based on quantities sold in 2014.(4) PFC Energy and Company data 2014.(5) Adjusted net operating income of M&S, excluding New Energies.(6) In addition to M&S’s petroleum product sales, the Group’s sales also include international Trading (1,538 kb /d in 2015, 1,385 kb / d in 2014 and 1,155 kb /d in 2013) and bulk refining sales
(649 kb /d in 2015, 615 kb /d in 2014 and 617 kb / d in 2013).(7) Excluding AS24 network.
2 Business overviewMarketing & Services segment
TOTAL. Registration Document 201538
Netherlands, Luxembourg, Germany and Italy. TOTAL is regainingmarket shares in Western Europe by developing an innovative anddiversified line of products and services.
– In France, the dense retail network includes more than 1,530TOTAL-branded service stations, 670 Total Access stations(service station concept combining low prices and premiumTOTAL-branded fuels and services) and more than 1,300 Elanservice stations, which are mainly located in rural areas. Since itslaunch in 2011, Total Access has led to the Group regainingnearly 3% (1) market share. Developing the range of services in itsservice stations is one of M&S’s strategic priorities. In France,where new offers and services have been developed for vehiclemaintenance, catering and stores, the share of non-oil activitiesof the network’s income is increasing and already stands at 30%.
In addition, TOTAL promotes a large fuel and service offering to112,000 customer vehicle fleets. Fuel sales to consumers (B2C)reach more than one million customers.
TOTAL holds stakes in 28 depots in France, 7 of which are operatedby Group companies.
– In Germany, TOTAL is the country’s fourth largest operator (2) andcontinues to expand its network. With about 1,180 servicestations at year-end 2015, the Group has gained 1% in marketshare in two years.
– In Italy, TOTAL holds a 49% stake in TotalErg, which is the country’sfourth largest operator with more than 2,600 service stations(2).
To distribute its specialty products, the Group benefits from anextensive network in Europe and relies on numerous industrialfacilities to produce lubricants (mainly Rouen in France and Ertveldein Belgium), special fluids (Oudalle in France) and bitumen(Brunsbüttel in Germany).
TOTAL is pursuing its development in high-growth segmentsthroughout Europe, and in particular in lubricants and specialtybitumens on the growing markets in Eastern Europe.
TOTAL is also a major player in the market for fuel-payment cards,with nearly 3.3 million cards issued. With the AS24 card, TOTALhas a dedicated offering for the heavy-duty vehicles segment in 27European countries. Bolstered by a network of more than 760service stations, AS24 is expected to continue to grow primarilythrough expansion in the Mediterranean basin and Eastern Europe andthrough its toll payment card service, which covers nearly 20 countries.
Africa & the Middle East
TOTAL is the leading marketer of petroleum products in Africa andin certain countries in the Middle East, with a 16% (3) average marketshare in 2015, compared with 13% in 2013. In these regions, it ispursuing a strategy of profitable growth in all its operations.
As part of its dynamic asset management policy and afterconsidering that it would be difficult to reach a sufficient marketshare in Turkey to achieve the expected level of profitability, TOTALinitiated in 2015 the disposal of its network of 450 service stations.
On high-growth markets, the Group continues its developmentstrategy for its retail network, which grew from approximately 4,400service stations in 2012, to almost 5,000 in 2015, spread across
more than 40 countries. The Group operates major networks inSouth Africa, Nigeria, Egypt and Morocco.
In Egypt, TOTAL acquired the service station network andcommercial sales activities of Shell and Chevron in 2013. Theincorporation of these entities enabled the Group to increase itssize three-fold and to become the second private operator inAfrica’s largest market, with a 14% network market share (2).
Overall, M&S continues to gain market share in the countries whereit operates in Africa and the Middle East. On the one hand, M&Shas acquired independent petroleum networks in certain countriesor is expanding its specialty products portfolio, as illustrated by theacquisition of an LPG activity in Tunisia, and on the other hand,M&S is deploying a range of innovative products and servicesthrough partnerships in catering and stores, as well as in digitalsolutions. The retail networks in some 20 countries now offercustomers to use their smartphones for money transfer servicesand payments by smartphone are accepted in the service stationsof approximately 10 countries.
To strengthen its local presence, M&S began a process of openingup the share capital of select subsidiaries to regional investors,particularly in Morocco and Senegal in 2015. The opening up of thecapital resulted in the listing of these two entities, respectively, onthe Abidjan stock exchange in February and the Casablanca stockexchange in May.
TOTAL is pursuing a strategy for growth in specialty productsmarkets in Africa and the Middle East. M&S, which relies inparticular on lubricants blending plants in Dubai and Egypt, startedup a new plant of this type in Saudi Arabia in 2013.
Moreover, TOTAL acts as a leading partner for mining customers inAfrica by delivering complete supply chain and managementsolutions for fuels and lubricants.
Finally, TOTAL continued to develop its Awango by Total solar solutions,expanding this line to 10 new countries in Africa and the Middle East in2015 (for additional information, refer to point 3.4.5 of chapter 7).
Asia-Pacific
At year-end 2015, TOTAL was present in more than 20 countries inthe Asia-Pacific region and continues to strengthen its position inthe distribution of fuels and specialty products.
TOTAL operates service station networks in China, Pakistan, thePhilippines, Cambodia and Indonesia, and is a significant player inthe Pacific islands. The Group network continued to expand, andreached nearly 1,400 service stations at year-end 2015, an increaseof nearly 550 compared to 2014.
– In Pakistan, TOTAL, with its local partner PARCO, completed theacquisition of Chevron’s distribution network in 2015. This acquisitionwill expand TOTAL’s network by 500 service stations and strengthenthe Group’s distribution and logistics capacities in Pakistan.
– In the Philippines, TOTAL is pursuing its development, with thegoal of doubling its retail network market share.
– In China, the Group was operating more than 200 servicestations at year-end 2015 through two joint ventures withSinochem and a wholly-owned subsidiary.
(1) Company data.(2) Source: IHS 2014.(3) Market share in the countries where the Group operates, based on 2014 publicly available information on quantities sold.

Business overview 2Marketing & Services segment
Registration Document 2015. TOTAL 39
(1) For non-maritime transportation and industrial applications.(2) Company data.
TOTAL’s share of the inland lubricant (1) market reached 3.4% in2015 in this region. One of the Group’s largest lubricant productionplants started up in mid-2015 in Singapore in order to supportM&S’s ambitions for growth in the region. It boasts a capacity of310 kt / year. In China, a third lubricant production plant with acapacity of 200 kt / year was inaugurated in Tainjin in 2013. TOTALcontinues to strengthen its presence on the specialties market inthe region, in particular in Vietnam, where the Group becamenumber two (2) on the LPG market in 2015 following an acquisition,and in India, with the extension of its LPG distribution to 55 stations.
Americas
In the Americas, TOTAL is active directly in more than 20 countriesand indirectly (via distributors) in approximately 20 additionalcountries. TOTAL operates a large number of industrial units inthese countries including, in particular, the production of lubricantsand the storage and bottling of LPG. In addition, the Group hasopened new distribution subsidiaries in Peru and the DominicanRepublic, in 2013 and 2014, respectively.
In the Caribbean, the Group operates on several islands with morethan 450 service stations at year-end 2015. In January 2016,TOTAL strengthened its position with the acquisition of a majoritystake of 70% in the fuel marketing leader in the DominicanRepublic, which operates a network of 130 service stations,commercial sales and lubricants activities.
In Latin America, TOTAL continues to pursue its growth strategyfor specialty products (primarily lubricants and special fluids).
In the United States and Canada, TOTAL mainly markets specialtyproducts, particularly lubricants, jet fuels and special fluids. Tostrengthen its special fluids business, the Group is constructing aspecial fluids production plant near Houston, Texas, which isexpected to be operational in 2016.
4.1.4. Products and services developments
The Group develops technologically advanced products, some ofwhich are formulated for use in motor sports before being generallyreleased on the market. In 2015, TOTAL continued its technicalpartnerships, in particular with Renault Sport F1 (Formula 1) and thePSA Peugeot Citroën group (WRC, WTCC and Rallycross). Thesepartnerships demonstrate TOTAL’s technical excellence in theformulation of fuels and lubricants under extreme conditions andsubject to requirements to reduce fuel consumption. At year-end2014, TOTAL and Renault renewed their global partnership for thenext five years in the areas of R&D, business relations with Renaultafter-sales networks and Formula 1.
In order to respond to developments in world markets and preparetomorrow’s growth opportunities, TOTAL develops solutions incollaboration with its customers that optimize their energy bills suchas the Total Ecosolutions product and service label (refer to point2.3.4 of chapter 7). These solutions integrate a diversified range ofenergy supplies (fuels, gas, photovoltaics and wood pellets) as wellas consumption auditing, monitoring and management services. Inthe realm of consumption management, TOTAL draws on theknow-how of its Tenag joint venture in Germany (49% owned) andits 2014 acquisition BHC Energy in France, both of which specializein energy efficiency.
Looking beyond energy services, TOTAL also relies on digitalinnovations to develop new offers for its customers, such as moneytransfers and payment by smartphone in Africa, or online domesticheating oil orders in France. Total’s mobile application “Total Services”has been deployed in 42 countries. For its professional customers,M&S has launched Bitume Online in France, a platform that offersbitumens at fixed rates, and a portal for lubricant distributorsdeployed in 20 countries, among others. In addition to the offersdesigned by TOTAL, M&S also supports innovative start-ups inorder to encourage the development of new business models andto test the commercial and economic worth of innovative services.
In the longer term, TOTAL also supports the development ofalternatives to traditional fuels:
– Gas for transport: a segment in which M&S intends to grow:TOTAL has approximately 400 stations that deliver compressednatural gas in Asia, Africa and Europe. In 2015, TOTAL openedits first Liquefied Natural Gas (LNG) station for heavy dutyvehicles in the port of Antwerp (Kallo) in Belgium, and itsEuropean subsidiaries are keeping an active watch on thepotential of LNG as a fuel.
– Hydrogen: through its Clean Energy Partnership (CEP) inGermany, TOTAL is contributing to the development of a networkof hydrogen stations, with the target of opening 50 stations bythe end of 2016. In addition, with its partners Air Liquide,Daimler, Linde, OMV and Shell, TOTAL created in 2015 the “H2Mobility Germany” joint venture, which aims to deploy some 400hydrogen stations in Germany, with more than 250,000 fuel cellvehicles forecasted by 2023.
– Electro-mobility: The development and demonstration of thedistribution of electricity intended for electric vehicles continuedin 2015 in TOTAL’s European subsidiaries. TOTAL hasapproximately 20 prototype electric vehicle refueling stations inthe Netherlands, Belgium, Luxembourg and Germany. A partnership with Sodetrel (EDF) resulted in the installation of 10fast charging stations in motorway service stations in France in2015. Industrial partnership projects in France, Benelux andGermany are expected to allow for the installation of 110additional fast charging stations in 2016.
2 Business overviewMarketing & Services segment
TOTAL. Registration Document 201540
The Group, in addition to its activities in hydrocarbons, is active inthe development of renewable energies to build a diversified energymix while generating lower CO2 emissions as a response to thechallenge of climate change. To develop robust and profitable NewEnergies activities, the Group focuses on the following two themes:
– solar energy, a high-growth market in which the Group ispositioned among the leaders through SunPower;
– the transformation of biomass through biotechnology, a secondtheme of development over a longer term, which aims to developnew biosourced product solutions for transportation andchemicals.
TOTAL actively follows developments in other renewable energies.In this context, the Group owns a farm of four wind turbines (10 MW near Dunkirk, France) and a stake in marine energy (9.99%in the company Scotrenewables Tidal Power, Scotland).
The Group expects to dedicate to New Energies an annualinvestment budget of approximately $500 million for the comingyears.
4.2.1. Solar energy
TOTAL is mainly present in the photovoltaic sector based oncrystalline silicon technology through SunPower, in which the Groupacquired a majority stake in 2011. The Group is also pursuing R&Dinvestments in this field through several industrial and academicpartnerships.
The steady reduction in photovoltaic electricity costs is increasingsolar competitiveness in an ever-growing number of markets, insolar farms and residential and commercial applications.
SunPower
TOTAL holds 57.48% of SunPower as of December 31, 2015, anAmerican company listed on NASDAQ and based in California. Asan integrated player, SunPower operates over the entire solarpower value chain. On the one hand, it designs, manufactures andsupplies cells as well as the highest-efficiency crystalline silicon-based solar panels on the market. On the other hand, SunPower isactive in the design and construction of large turnkey power plantsand in the marketing of integrated solar solutions for decentralizedelectricity generation.
Upstream, SunPower manufactures all of its cells in Asia(Philippines, Malaysia) and has a total production capacity of 1,360MW / y. Through its significant R&D program, the company isconstantly optimizing its production process to reduce costs whilemaintaining its technological leadership. The cells are assembledinto modules, or solar panels, in plants located in Asia, the UnitedStates, Mexico, Europe and South Africa. A 350 MW / y expansion incapacity was approved at the end of 2013 for a production start-upin 2016.
To expand its product offering, SunPower launched at year-end2015 a module to target the most competitive market sectors whilecontinuing to hold a technical edge over its competitors.
Downstream, SunPower markets its panels worldwide forapplications ranging from residential and commercial roof tiles tolarge solar power plants. As of December 31, 2015, SunPowerholds a 40.7% stake in the company 8point3 Energy Partners,initially set up with First Solar. 8point3 Energy Partners, the purposeof which is to acquire and operate solar projects and to redistributefinancial flows to its shareholders in the form of a dividend, waslisted on NASDAQ in June 2015. Additionally, SunPower completedin 2015 the construction in the United States of the largest solarfarm in the world, Solar Star (709 MWc), and the Quinto farm (135MWc). SunPower continued to expand internationally with thecommissioning in Chile of the El Salvador plant (70 MWc) and thestarting of construction in South Africa of the Prieska solar powerplant (86 MWc).
SunPower is pursuing its development in residential andcommercial markets, in particular in the United States, byincreasing its service offerings for solar power production,management and financing. SunPower is also developing its SmartEnergy activity to permit its residential customers to optimize theirpower consumption. In 2015, SunPower signed severalagreements with companies developing solutions in the field ofconsumption and storage management.
Other solar assets
The Group holds a 20% stake in the solar power plant Shams 1,commissioned in 2013 in Abu Dhabi. With 109 MW of parabolicconcentrated solar power, Shams 1 is the largest thermal parabolicconcentrated solar power plant in the Middle East.
In line with its CSR approach, the Group continues to install solarsolutions through its decentralized rural electrification projects inseveral countries, especially in South Africa via KES (KwazuluEnergy Services Company), in which TOTAL holds a 35% stake.
New solar technologies
In order to strengthen its technological leadership in the crystallinesilicon value chain, and in addition to its cooperation withSunPower in the R&D field, New Energies partners with leadinglaboratories and international research institutes. This work consistsof developing and optimizing the photovoltaic solar power chain(from the silicon to the system passing through the wafers, cellsand modules) reducing production costs and increasing theefficiency and reliability of the components. The Group is alsostrengthening its expertise in solar resource evaluation and prediction.
Additionally, downstream, TOTAL is continuing its research effortson new generations of energy management, control and storagesystems for residential applications in order to differentiateSunPower’s offer on the electric market and to lower the cost ofenergy consumed.
4.2.2. Biotechnologies and the conversion ofbiomass
TOTAL is exploring a number of opportunities for developing biomassdepending on its nature, accessibility and sustainability. Theobjective is to sell high-performance molecules in targeted markets(e.g., fuel, lubricants, special polymers, chemicals). The Group isfocused on the biochemical conversion process of this biomass.
4.2. New Energies
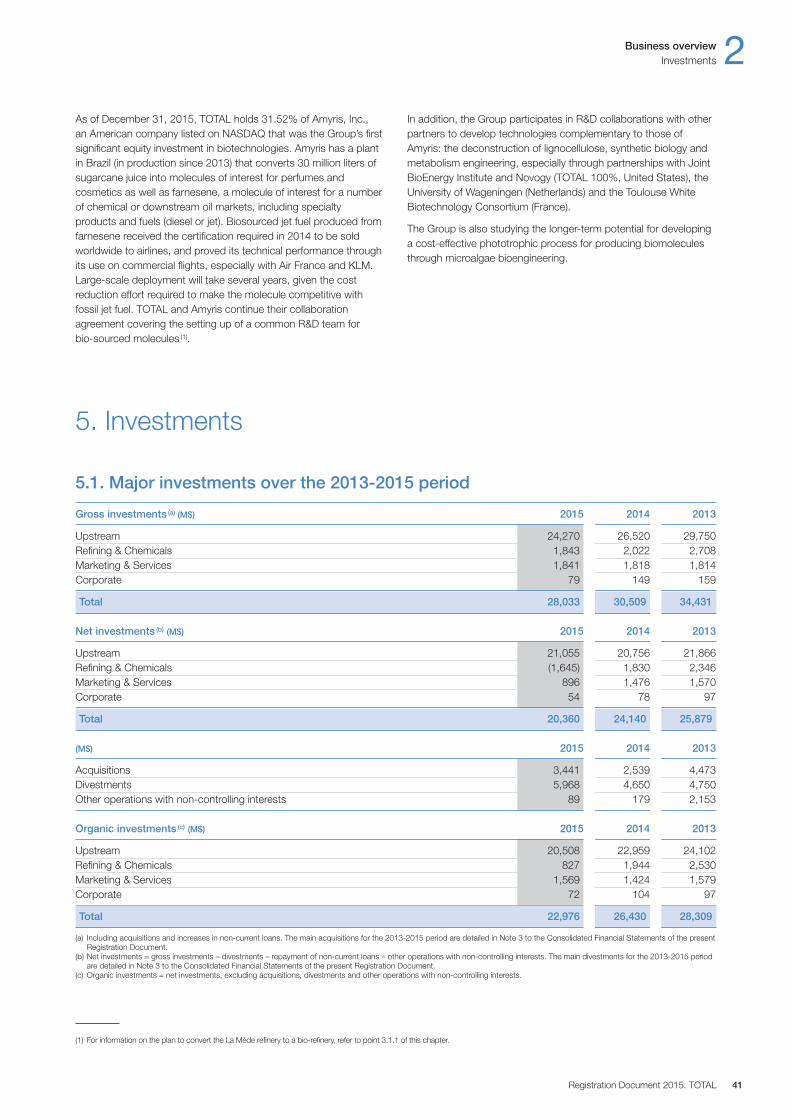
Business overview 2Investments
Registration Document 2015. TOTAL 41
5. Investments
5.1. Major investments over the 2013-2015 period
Gross investments (a) (M$) 2015 2014 2013
Upstream 24,270 26,520 29,750Refining & Chemicals 1,843 2,022 2,708Marketing & Services 1,841 1,818 1,814Corporate 79 149 159
Total 28,033 30,509 34,431
Net investments (b) (M$) 2015 2014 2013
Upstream 21,055 20,756 21,866Refining & Chemicals (1,645) 1,830 2,346Marketing & Services 896 1,476 1,570Corporate 54 78 97
Total 20,360 24,140 25,879
(M$) 2015 2014 2013
Acquisitions 3,441 2,539 4,473Divestments 5,968 4,650 4,750Other operations with non-controlling interests 89 179 2,153
Organic investments (c) (M$) 2015 2014 2013
Upstream 20,508 22,959 24,102Refining & Chemicals 827 1,944 2,530Marketing & Services 1,569 1,424 1,579Corporate 72 104 97
Total 22,976 26,430 28,309
(a) Including acquisitions and increases in non-current loans. The main acquisitions for the 2013-2015 period are detailed in Note 3 to the Consolidated Financial Statements of the presentRegistration Document.
(b) Net investments = gross investments – divestments – repayment of non-current loans – other operations with non-controlling interests. The main divestments for the 2013-2015 periodare detailed in Note 3 to the Consolidated Financial Statements of the present Registration Document.
(c) Organic investments = net investments, excluding acquisitions, divestments and other operations with non-controlling interests.
As of December 31, 2015, TOTAL holds 31.52% of Amyris, Inc., an American company listed on NASDAQ that was the Group’s firstsignificant equity investment in biotechnologies. Amyris has a plantin Brazil (in production since 2013) that converts 30 million liters ofsugarcane juice into molecules of interest for perfumes andcosmetics as well as farnesene, a molecule of interest for a numberof chemical or downstream oil markets, including specialtyproducts and fuels (diesel or jet). Biosourced jet fuel produced fromfarnesene received the certification required in 2014 to be soldworldwide to airlines, and proved its technical performance throughits use on commercial flights, especially with Air France and KLM.Large-scale deployment will take several years, given the costreduction effort required to make the molecule competitive withfossil jet fuel. TOTAL and Amyris continue their collaborationagreement covering the setting up of a common R&D team for bio-sourced molecules (1).
In addition, the Group participates in R&D collaborations with otherpartners to develop technologies complementary to those ofAmyris: the deconstruction of lignocellulose, synthetic biology andmetabolism engineering, especially through partnerships with JointBioEnergy Institute and Novogy (TOTAL 100%, United States), theUniversity of Wageningen (Netherlands) and the Toulouse WhiteBiotechnology Consortium (France).
The Group is also studying the longer-term potential for developinga cost-effective phototrophic process for producing biomoleculesthrough microalgae bioengineering.
(1) For information on the plan to convert the La Mède refinery to a bio-refinery, refer to point 3.1.1 of this chapter.
In response to the falling oil prices, TOTAL announced an organicinvestments budget for 2016 of approximately $19 billion.
Investments in the Upstream segment are expected to beapproximately $16 billion and will mainly be allocated to majordevelopment projects, including Vega Pleyade, Incahuasi, Angola LNGand Kashagan that are expected to start in 2016 as well as Ichthys inAustralia, Moho Nord in the Republic of the Congo, Egina in Nigeriaand Yamal in Russia that are expected to start from 2017. A little over$4 billion will also be allocated to assets already in production, inparticular for maintenance capital expenditures and in-fill wells.
The Refining & Chemicals segment has an investment budget of approximately $1.5 billion, which is expected to be allocated tothe refining, petrochemicals and specialty chemicals businesses.The modernization of the Antwerp integrated platform, the transformationof the La Mède refinery in a bio-refinery and the adaptation of theLindsey refinery are the three largest investments in the segment in2016. A significant portion of the segment’s budget will also beallocated to the maintenance and safety investments required forthese types of industrial activities.
The Marketing & Services segment has an investment budget ofapproximately $1.5 billion, which is expected to finance, inparticular, the service station network, logistics, specialty productsproduction and storage facilities, particularly lubricants, and the
development of its activities in New Energies. Most of theMarketing & Services budget will be allocated to growth areas(Africa, Middle East, Asia and Latin America).
After 2016, TOTAL expects investments to be in line with a $17-19 billion per year guideline and this level should allow theGroup to grow 1-2% per year over the long term, in line with oil and gas market growth.
TOTAL self-finances most of its investments from its excess cashfrom operations (refer to the consolidated statement of cash flows,point 5 of chapter 10), which is mainly supplemented by accessingthe bond market on a regular basis, when conditions on the financialmarkets are favorable (refer to Note 20 to the Consolidated FinancialStatements, point 7 of chapter 10). However, investments for jointventures between TOTAL and external partners are generallyfunded through specific project financing.
Active management of the asset portfolio, which is fully integratedinto the Group’s strategy, creates value and TOTAL has confirmedits 2015-17 asset sale program of $10 billion, including $4 billionannounced in 2015. In addition, the Group makes targetedacquisitions, notably to acquire resources discovered by other oilcompanies, with $2 billion planned in 2016.
As part of certain project financing arrangements, TOTAL S.A.
5.2. Major planned investments
2 Business overviewInvestments
TOTAL. Registration Document 201542
In 2015, the Group put in place a strong response to the falling Brentprice, based in particular on a reduction in organic investments.Including net investments in equity and non-consolidated affiliates,organic investments were $23.0 billion, in accordance with the $23-24billion objective. They were $26.4 billion in 2014 after reaching a peakof $28.3 billion in 2013, in line with the Group’s growth strategy. Majorprojects that will support a production growth of 5% per year on averageuntil 2019 (1) are launched, investments drop as they start and additionalsavings measures are implemented to accelerate this trend.
In the Upstream segment, most of the investments were gearedtoward the development of new hydrocarbon production facilities,the maintenance of existing facilities and exploration operations.Development expenditure mainly pertained to the nine projectsstarted in 2015 (Ofon 2, Eldfisk 2, West Franklin 2, Surmont,Termokarstovoye, GLNG, Dalia Phase 1a, Moho Phase 1b, Lianzi),the five projects that are expected to start in 2016 (Laggan-Tormore,Vega Pleyade, Incahuasi, Angola LNG and Kashagan) and to othermajor projects under construction like Moho North in the Republic ofthe Congo, Ichthys in Australia, Egina in Nigeria and Yamal in Russia.
In the Refining & Chemicals segment, investments were made infacilities maintenance and safety, as well as in projects aimed atimproving the plants’ competitiveness. In 2015, the Group completedthe Carling adaptation project, with the closure of the steamcracker inOctober and the modernization of the Antwerp refinery. The segmentalso announced in France the transformation of the La Mèderefinery into a bio-refinery and the modernization of the Dongesrefinery, and the 50% capacity reduction of the Lindsey oil refineryin the United Kingdom.
In the Marketing & Services segment, investments in 2015 mainlyconcerned the network (notably in Africa), logistics and specialtyproducts production and storage facilities, notably the new Singaporelubricant plant inaugurated in July.
While mobilizing its teams for future startups in Upstream and forcost reduction programs, the Group is preparing for the future byexpanding its acreage and acquiring stakes in new promising assets.Acquisitions were $3.4 billion, comprised principally of the ADCOlicense extension in Abu Dabi, the renewal of licenses in Nigeria, theacquisition of an additional stake in OAO Novatek (2) and the carryon the Utica gas and condensate field in the United States.
Gross investments (including acquisitions and changes in non-currentloans) fell by 8% to $28.0 billion in 2015 compared to $30.5 billionin 2014.
The Group also continued its asset sale program with the finalizationof sales totaling $6.0 billion in 2015, comprised essentially of thesale of a 20% interest in Laggan-Tormore in the United-Kingdom, a 10% interest in the Fort Hills project in Canada, the Group’s stakein the Schwedt refinery in Germany, a majority share in Geosel in Franceand the finalization in 2015 of the sales announced in 2014 (Bostik,participations in Nigerian onshore blocks, coal mines in South Africaand Totalgaz).
The Group confirmed an asset sale target of $10 billion for 2015-17.The sales of the FUKA pipeline system in the United-Kingdom, a15% in the Gina Krog project in Norway and the marketing activitiesin Turkey were announced in 2015.
Net investments were therefore $20.4 billion in 2015, compared to$24.1 billion in 2014, a decrease of 16%. This decrease was essentiallydue to the decrease in organic investments.
(1) Compared to 2014.(2) The Group held an 18.9% stake in OAO Novatek as of December 31, 2015.
In Exploration & Production, the project portfolio was reviewed in2015 according to what impact the projects have on reducingcosts and improving production. More than half the R&D budget isgiven to improving exploration, seismic acquisition and imagingtechnologies, appraisal of hydrocarbon reservoirs and simulation offield evolution during operations, especially for low-permeability orcarbonate reservoirs. Enhancing oil recovery from mature reservoirsremains an active area of research.
A new direction was taken to strengthen R&D activities in offshoreat greater distances for multiphase production transport, which isfully in line with the goals of Exploration & Production and supportsmajor technology-intensive assets such as Libra in Brazil.
The oxy-combustion CO2 capture and storage project in thedepleted Rousse reservoir in Lacq (France) is still in the monitoringphase, following the injection phase that ended in 2013. The Group
now has a strong command of the methods used to characterizereservoirs and their mechanical properties for this type of injection.New projects will look into new capturing solutions.
A sustained effort to adapt mature technologies in order to reducetheir costs has been implemented. In particular, new producedwater management technologies are now available for newdevelopments. This subject is part of a larger program dedicated tosustainable development.
Finally, R&D programs prepare for the more distant future, whetherfor developing technologies, such as robotics or high-performancecomputing, or for researching new exploration concepts.
Concerning the activities of Gas, the program to develop newtechnological LNG solutions is continuing.
6.1. Upstream
In 2015, TOTAL invested $1,068 million in Research andDevelopment (R&D), compared to $1,353 million in 2014 and$1,260 million in 2013. There were 4,498 people dedicated to R&Dactivities in 2015 compared to 4,840 in 2014 and 4,684 in 2013.The decrease in R&D budget and staff between 2014 and 2015was due to divestments during the year (notably Bostik, whichrepresented a R&D budget of $65 million in 2014). At a constantscope, the R&D budget has continuously increased since 2004.
R&D at TOTAL focuses on six major axes:
– developing knowledge, tools and technological expertise todiscover and profitably operate complex oil and gas resources ata reduced cost to help meet the global demand for energy;
– developing, industrializing and improving first-level competitiveprocesses for the conversion of oil, gas and biomass resourcesto adapt to changes in resources and markets, improve reliabilityand safety, achieve better energy efficiency, reduce theenvironmental footprint and maintain the Group’s economicmargins in the long term;
– developing and industrializing solar, biomass and carbon captureand storage technologies to help prepare for future energy needsin an economically competitive manner;
– developing practical, innovative and competitive materials andproducts that meet customers’ specific needs, contribute to the
emergence of new features and systems, enable currentmaterials to be replaced by materials delivering higherperformance to users, and address the challenges of improvedenergy efficiency, lower environmental impact and toxicity, bettermanagement of their life cycle and waste recovery;
– understanding and measuring the impacts of the Group’soperations and products on ecosystems (water, soil, air,biodiversity) and recovering waste to improve environmentalsafety, as part of the regulation in place, and reduce theirenvironmental footprint to endeavor to achieve sustainability inthe Group’s operations; and
– mastering and using innovative technologies such asbiotechnologies, materials sciences, nanotechnologies, high-performance computing, information and communicationtechnologies or new analytical techniques.
These issues are globally incorporated into the project portfolio todevelop synergies. Different aspects may be looked atindependently by different business segments.
The portfolio managed by Total Energy Ventures, in charge ofdevelopping SMEs specialized in innovative energy technologiesand cleantechs for the Group, has grown regularly since 2009. Inaddition, a loan facility was introduced for innovative SMEs thatdevelop technologies of interest for the Group.
6. Research & Development
has provided guarantees. These guarantees (“Guarantees given on borrowings”) as well as other information on the Group’s off-balance sheet commitments and contractual obligations appearin Note 23 to the Consolidated Financial Statements (point 7 ofchapter 10). The Group currently believes that neither these
guarantees nor the other off-balance sheet commitments ofTOTAL S.A. or of any other Group company have, or couldreasonably have in the future, a material effect on the Group’sfinancial position, income and expenses, liquidity, investments or financial resources.
Business overview 2Research & Development
Registration Document 2015. TOTAL 43
6.3.1. Marketing & Services
In 2015, the R&D of the Marketing & Services activities continued toroll out its new roadmap in line with its ambitions.
The roadmap features two focal points: reducing the environmentalfootprint of products and improving the durability of its end users’equipment. They include the following developments: energysavings for customers (fuels, lubricants, additives and bitumen),competitive advantage and new solutions (lubricants, bitumen andspecial fluids), anticipation of changes in legislation (marinelubricants and aviation fuel), and incorporation of bio-sourcedmolecules (lubricants and racing fuels).
Considerable efforts are therefore being made to develop digitaltools that can be used to provide a closer insight into how products
work, model their behavior, detect the performance of the differentcomponents available and ultimately determine targets for chemistsand formulators.
In 2015, a project aimed at pioneering new molecules for futurechanges to the Total Excellium fuel range was launched, with targetareas including chemicals and methods & measurements.Extensive work was also aimed at developing new products andadapting products to the range, mainly for Africa and the Middle East.
In the field of refinery additives, research continued intounderstanding and modeling the crystallization kinetics of paraffin.
The Fuel Economy range of lubricants continues to expand withmany new products designed to comply with the specifications ofmanufacturers targeted by the Total Lubricants business line in all
6.3. Marketing & Services
6.2.1. Refining & Chemicals (excluding Specialty Chemicals)
The aim of R&D is to support the medium and long-termdevelopment of Refining & Chemicals. In doing so, it contributes to the technological differentiation of this business through thedevelopment, implementation and promotion of effective R&Dprograms that pave the way for the industrialization of knowledge,processes and technologies.
In line with Refining & Chemicals’ strategy, R&D places specialemphasis on the following four major challenges: take advantage ofdifferent types of feedstock, maximize asset value, continuedeveloping innovative products, and develop bio-sourced products.The medium-term strategy of the project portfolio and its deploymentplan will facilitate Refining & Chemicals’ technological differentiation.
To take advantage of different types of feedstock, R&D activitiesrelated to the processing of more diversified crudes have increasedsignificantly through a clearer insight into the effect that feedstockshave on equipment and processes at the molecular level. R&D islaunching ambitious new programs to develop various technologiesfor producing liquid fuels, monomers and intermediates from gas.
R&D is developing expertise and technologies with a view tomaximizing asset value. Its efforts mainly involve programs focusingon the flexibility and availability of facilities. Advanced modeling offeedstocks and processes helps the units overcome theirprocessing-related constraints and operate while taking theseconstraints into account in real time. Research conducted oncatalysts is helping to increase their resistance, improve catalyticstability and extend the cycle time at a lower cost. Programs arebeing set up to maximize the value of heavy residues.
To address concerns related to social and environmentalacceptability in particular, R&D is focusing its efforts on reducingemissions to minimize facilities’ environmental footprint. Inanticipation of long-term challenges and the value of CO2, R&D ispioneering technologies to reduce GHG emissions through carboncapture and recovery by conversion.
Product innovation is a key aspect of research on polymers. R&Ddraws on its knowledge of metallocenes and bimodality to developdifferent types of mass consumption polymers that haveexceptional properties that allow them to replace heavier materials
and compete with technical polymers. Value-added niche polymersare also being developed, whether in the form of blends,compounds or composites. Efforts to diversify into “green”products are focused mainly on bioproducts endorsed by themarket: biomonomers, biointermediates and biopolymers. R&D isbanking on polylactic acid for the market launch of new polymersthat boast enhanced properties. In addition, the development ofblends, compounds and composites broadens the scope ofapplication of polylactic acid-based polymers.
With regard to biofuels, R&D has directed its efforts towardsgasification and coprocessing to produce liquid fuels from biomass.R&D is also particularly mindful of issues related to blends andproduct quality raised by the use of biomolecules.
Efficient resource use and end-of-life management for plastics aretopics of growing interest. R&D is therefore developing technologiesthat enable plastics to be used more efficiently as feedstock.
6.2.2. Specialty Chemicals
R&D is strategically important for specialty chemical products. It is closely linked to the needs of the subsidiaries and industrialcustomers.
Material innovation at Hutchinson is gaining pace for raisingperformance and increasing potential applications, with thedevelopment of advanced rubber or thermoplastic formulas, thedevelopment of new material formulations based on compositestructures, and the development of energy storage applications.
The aerospace and automotive industries face the samechallenges, namely mass reduction, energy efficiency, anddiagnostic and control functionality. In 2015, Hutchinson improvedits expertise in electronics and embedded systems. Hutchinson hasalso extended its network of partnerships across the Americancontinent and Asia.
Atotech is a global leader in integrated production systems(Chemicals, equipment, expertise and service) for industrial surfacefinishing and the manufacturing of integrated circuits. Given theenvironmental challenges related to electroplating, nearly half ofAtotech’s R&D projects are designed to develop ever cleanertechnologies and favor conditions for the Sustainable Developmentof these industries.
6.2. Refining & Chemicals
2 Business overviewResearch & Development
TOTAL. Registration Document 201544
Environmental issues are important throughout the Group and aretaken into account in all R&D projects. R&D’s effort is to manageenvironmental risks more effectively, particularly with regard to:
– water management, especially by reducing the use of water fromnatural environments and lowering emissions in compliance withlocal, national and international regulations;
– reduction of GHG emissions by improving energy efficiency andmonitoring carbon capture and storage and the potential effectsof CO2 on the natural environment;
– detection and reduction of discharges into the air and simulationof their dispersal;
– prevention of soil contamination and regulatory compliance withregard to historical aspects and the remediation of sites; and
– changes in the Group’s different products and management oftheir life cycle, in particular in compliance with the Registration,Evaluation, Authorisation and Restriction of Chemicals regulation(REACH).
6.4. Environment
fields of application (automotive, marine and manufacturing). Thekey work areas are focusing on the design of breakthroughcomponents used in formulations. Furthermore, new marinelubricants for two-stroke engines are being developed to anticipatechanges in fuel specifications (very low sulfur rate in coastal areas)and reduce emissions.
To meet the challenges of competitiveness, sustainable logistics andgeographic development in the bitumen sector, researchers mainlyconcentrated on the prospect of transporting bitumen in solid formand developing Styrelf formulas for the international market.
Cooperation with the Federal Aviation Administration (FAA)continued in the field of unleaded Avgas.
A greater understanding of the molecular composition of fluids,their applicative properties and their method of manufacture pavedthe way for new innovations, some of which in the field ofrenewable energy technologies.
In terms of Formula One racing, closer ties with manufacturers wereinstrumental in raising engine performance. This collaboration willhelp target future fuel developments more effectively.
In 2015, the Asia-Pacific Technical Center based in Bombay, India,continued to ramp up its activities and strengthen its skills, mainly inlubricants (including textile lubricants and engine lubricants) andspecial fluids, including drilling fluids.
French and international skills have been increasingly enlisted inrecent years, with a growing number of ties with academia,researchers seconded to universities, and international researchersrecruited for the Solaize Research Centre. Cooperation withacademia and secondments contribute to core research used toprovide scientific support for designing and developing breakthroughproducts, which is one of Marketing & Services’ objectives.
6.3.2. New Energies
New Energies’ R&D effort is focused on the solar value chain fromsilicon to photovoltaic electricity management systems and on thedevelopment of biotechnological methods of converting biomassinto products for the Group’s markets.
In the field of solar energy, R&D is striving to improve SunPower’s (1)
methods of producing cells and modules in order to drive downcosts while enhancing their efficiency and reliability. It is alsopreparing future generation photovoltaic cells within the frameworkof several strategic partnerships between TOTAL and renownedacademic research institutes. In particular, TOTAL is the foundingpartner of the Ile de France Photovoltaic Institute, an ambitiousproject set up in the Paris-Saclay campus.
Downstream in the solar value chain, R&D is monitoring thedevelopment of low-cost stationary storage technologies. It is alsopreparing solutions for supplying solar power and associatedservices to residential markets, by developing software tools andalgorithms for the intelligent management of domestic electricityproduction and consumption, but also by integrating and testingsystems combining photovoltaics, storage, control of demand aswell as pilots for assessing and improving systems and algorithmsin contact with customers.
With regard to biotechnologies, the Group is developing methodsfor converting sugars into biofuels and molecules of interest forchemicals, as well as processes for the deconstruction oflignocellulose into sugars. The Group has set up its own laboratories,including a competence center on fermentation and a laboratoryfocused on themes shared by New Energies and Marketing & Services(bio-sourced specialties in particular), and a dedicated researchteam. This research team manages a network of partnerships withresearch laboratories and startups in the United States and inEurope. The Group mainly works with Amyris (2), a companyspecializing in biotechnologies (refer to point 4.2.2 of chapter 2).
Business overview 2Research & Development
Registration Document 2015. TOTAL 45
(1) American company listed on NASDAQ in which the Group holds a 57.48% interest as of December 31, 2015.(2) American company listed on NASDAQ in which the Group holds a 31.52% interest as of December 31, 2015.

The companies of the Group have freehold and leasehold interestsin over 130 countries throughout the world. Operations inproperties, oil and gas fields or any other industrial, commercial oradministrative facility, as well as the production capacities andutilization rates of these facilities, are described in this chapter foreach business segment (Upstream, Refining & Chemicals andMarketing & Services).
A summary of the Group’s property, plant and equipment and theirmain related expenses (depreciation and impairment) is included inNote 11 to the Consolidated Financial Statements (point 7 ofchapter 10).
Minimum royalties from finance lease agreements regardingproperties, service stations, vessels and other equipment arepresented in Note 22 to the Consolidated Financial Statements(point 7 of chapter 10).
Information about the objectives of the Company’s environmentalpolicy, in particular those related to the Group’s industrial sites orfacilities, is presented in chapter 7.
7. Property, plant and equipment
The Group intends to increase R&D in all of its segments throughcross-functional themes and technologies. Constant attention ispaid to R&D synergies between business segments.
The Group has 18 R&D sites worldwide and has forgedapproximately 1,000 partnerships with other industrial groups andacademic or highly specialized research institutes. TOTAL also hasa permanently renewed network of scientific advisors worldwidethat monitor and consult on matters of interest to the Group’s R&D
activities. Long-term partnerships with universities and academiclaboratories considered to be of strategic importance in Europe, theUnited States, Japan and China, as well as innovative smallbusinesses, are part of the Group’s approach.
Each business segment is developing an active intellectual propertyactivity aimed at protecting its innovations, allowing its activity todevelop and promoting its technological assets among its partners.In 2015, more than 200 patent applications were issued by the Group.
6.5. R&D organization
2 Business overviewProperty, plant and equipment
TOTAL. Registration Document 201546
TOTAL holds stakes in a limited number of companies that issuepublicly-traded financial instruments in France or abroad. Thesecompanies are mainly the Group’s financing vehicles (Total Capital,Total Capital Canada Ltd., Total Capital International) or theoperational subsidiaries in its business segments, in particular inAfrica, such as Total Gabon (1).
TOTAL also holds a majority stake in SunPower (57.48% onDecember 31, 2015), an American company listed on NASDAQ,and minority interests in other companies, including OAO Novatek(18.9% on December 31, 2015), a Russian company listed on theMoscow Interbank Currency Exchange and the London StockExchange.
8.3. Group interests in publicly-traded companies
A list of the major subsidiaries directly or indirectly held by theCompany included in TOTAL S.A.’s scope of consolidation ispresented in Note 35 to the Consolidated Financial Statements(refer to point 7 of chapter 10).
As of December 31, 2015, there were 882 consolidatedcompanies, of which 789 were fully consolidated and 93 wereaccounted for under the equity method. The principles ofconsolidation are described in Note 1A to the ConsolidatedFinancial Statements.
In addition, the table of subsidiaries and affiliates in point 5.1 of chapter 12 presents the Company’s direct subsidiaries andshareholdings, and in particular those with a gross value exceeding1% of the Company’s share capital.
The decision of TOTAL S.A.’s subsidiaries to declare dividends ismade by their relevant Shareholders’ Meetings and is subject to theprovisions of applicable local laws and regulations. As ofDecember 31, 2015, there is no restriction under such provisionsthat would materially restrict the distribution to TOTAL S.A. of thedividends declared by those subsidiaries.
During fiscal year 2015, TOTAL S.A. neither acquired any stakes incompanies with registered offices in France representing more thanone twentieth, one tenth, one fifth, one third or one half of thecapital of these companies, nor took control of any suchcompanies.
8. Group organization
8.1. Position of the Company within the Group
TOTAL S.A. is the Group’s parent company.
The Group’s businesses are organized as indicated on the chart in point 9 of this chapter. The Group’s business segments receiveassistance from the corporate functional divisions grouped within TOTAL S.A.
8.2. Company subsidiaries
Business overview 2Group organization
Registration Document 2015. TOTAL 47
(1) Total Gabon is a company under Gabonese law listed on Euronext Paris. TOTAL holds 58.28%, the Republic of Gabon holds 25% and the public float is 16.72%.
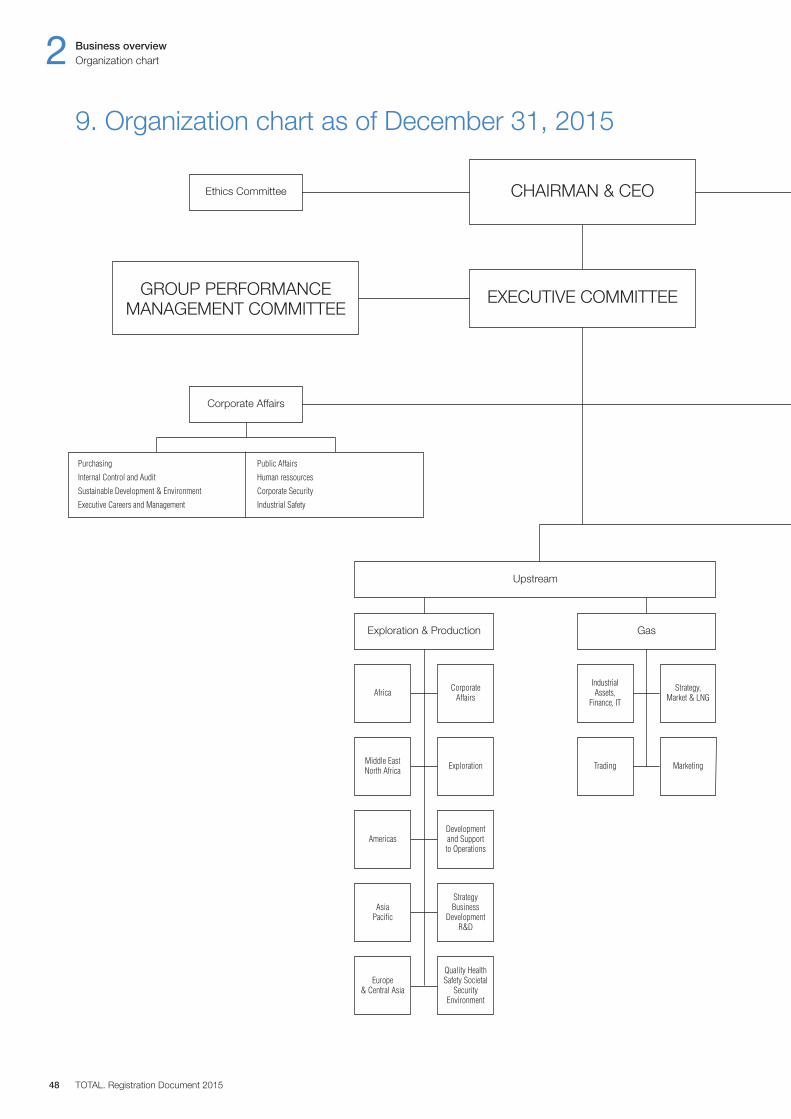
2 Business overview
TOTAL. Registration Document 201548
Organization chart
9. Organization chart as of December 31, 2015
Corporate Affairs
Purchasing Public Affairs
Internal Control and Audit Human ressources
Sustainable Development & Environment Corporate Security
Executive Careers and Management Industrial Safety
Industrial Assets,
Finance, IT
Strategy, Market & LNG
Trading Marketing
Africa CorporateAffairs
Middle EastNorth Africa Exploration
AmericasDevelopmentand Supportto Operations
StrategyBusiness
DevelopmentR&D
AsiaPacifi c
Quality HealthSafety Societal
SecurityEnvironment
Europe& Central Asia
Ethics Committee CHAIRMAN & CEO
EXECUTIVE COMMITTEEGROUP PERFORMANCEMANAGEMENT COMMITTEE
GasExploration & Production
Upstream
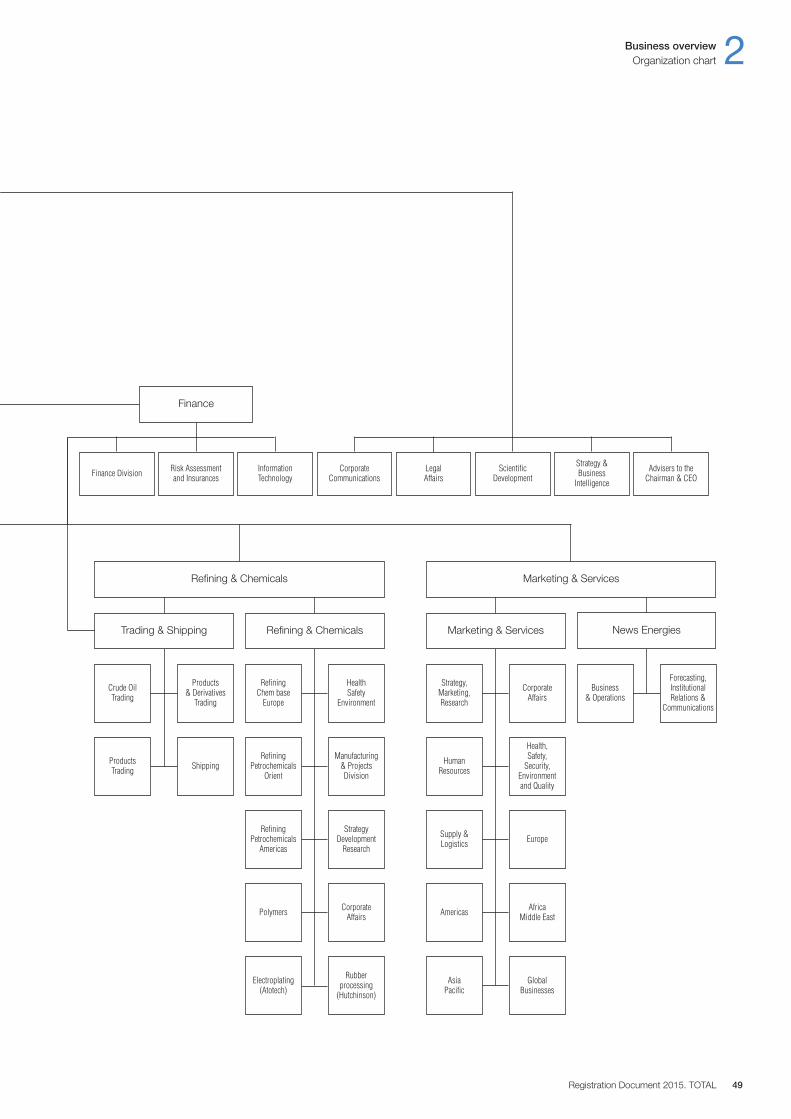
Business overview 2
Registration Document 2015. TOTAL 49
Organization chart
Risk Assessment and Insurances
InformationTechnology
CorporateCommunications
LegalAffairs
Strategy &Business
Intelligence
Scientific DevelopmentFinance Division
Finance
Advisers to theChairman & CEO
Crude Oil Trading
ProductsTrading
RefiningChem base
Europe
Strategy,Marketing,Research
Products& Derivatives
Trading
Health Safety
Environment
CorporateAffairs
RefiningPetrochemicals
Orient
HumanResourcesShipping
Manufacturing & Projects Division
RefiningPetrochemicals
Americas
StrategyDevelopment
Research
Polymers CorporateAffairs
Electroplating(Atotech)
Rubberprocessing
(Hutchinson)
Health,Safety,
Security,Environmentand Quality
Americas
EuropeSupply &Logistics
AfricaMiddle East
GlobalBusinesses
AsiaPaci fic
Business& Operations
Forecasting,InstitutionalRelations &
Communications
Trading & Shipping Refining & Chemicals Marketing & Services News Energies
Refining & Chemicals Marketing & Services

TOTAL. Registration Document 201550
Registration Document 2015. TOTAL 51
2015 Results and outlook3.Rapport de gestion 3
2015 Results and outlookThe items presented in points 1 to 3 were approved by the Board of Directors on February 10, 2016 and have not been updated with subsequent events.
1. Summary of results and financial position 521.1. Overview of the 2015 fiscal year for TOTAL . . . . . . . . . . . . . . . . . . . . . . . . . . . . . . . . . . . . . . . . . . . . . . . . . . . . . . . . . . . . . . . .521.2. 2015 Group results . . . . . . . . . . . . . . . . . . . . . . . . . . . . . . . . . . . . . . . . . . . . . . . . . . . . . . . . . . . . . . . . . . . . . . . . . . . . . . . . . . . .531.3. Upstream segment results . . . . . . . . . . . . . . . . . . . . . . . . . . . . . . . . . . . . . . . . . . . . . . . . . . . . . . . . . . . . . . . . . . . . . . . . . . . . . .541.4. Refining & Chemicals segment results . . . . . . . . . . . . . . . . . . . . . . . . . . . . . . . . . . . . . . . . . . . . . . . . . . . . . . . . . . . . . . . . . . . .551.5. Marketing & Services segment results . . . . . . . . . . . . . . . . . . . . . . . . . . . . . . . . . . . . . . . . . . . . . . . . . . . . . . . . . . . . . . . . . . . .551.6. TOTAL S.A. results in 2015 . . . . . . . . . . . . . . . . . . . . . . . . . . . . . . . . . . . . . . . . . . . . . . . . . . . . . . . . . . . . . . . . . . . . . . . . . . . . . .551.7. Proposed dividend . . . . . . . . . . . . . . . . . . . . . . . . . . . . . . . . . . . . . . . . . . . . . . . . . . . . . . . . . . . . . . . . . . . . . . . . . . . . . . . . . . . .56
2. Liquidity and capital resources 562.1. Long-term and short-term capital . . . . . . . . . . . . . . . . . . . . . . . . . . . . . . . . . . . . . . . . . . . . . . . . . . . . . . . . . . . . . . . . . . . . . . . .562.2. Cash flow . . . . . . . . . . . . . . . . . . . . . . . . . . . . . . . . . . . . . . . . . . . . . . . . . . . . . . . . . . . . . . . . . . . . . . . . . . . . . . . . . . . . . . . . . . . .562.3. Borrowing requirements and funding structure . . . . . . . . . . . . . . . . . . . . . . . . . . . . . . . . . . . . . . . . . . . . . . . . . . . . . . . . . . . . .572.4. External financing available . . . . . . . . . . . . . . . . . . . . . . . . . . . . . . . . . . . . . . . . . . . . . . . . . . . . . . . . . . . . . . . . . . . . . . . . . . . . .572.5. Anticipated sources of financing . . . . . . . . . . . . . . . . . . . . . . . . . . . . . . . . . . . . . . . . . . . . . . . . . . . . . . . . . . . . . . . . . . . . . . . . .57
3. Trends and outlook 583.1. Outlook . . . . . . . . . . . . . . . . . . . . . . . . . . . . . . . . . . . . . . . . . . . . . . . . . . . . . . . . . . . . . . . . . . . . . . . . . . . . . . . . . . . . . . . . . . . . .583.2. Risks and uncertainties . . . . . . . . . . . . . . . . . . . . . . . . . . . . . . . . . . . . . . . . . . . . . . . . . . . . . . . . . . . . . . . . . . . . . . . . . . . . . . . .58
4. Significant changes 58
The year 2015 was marked by the sharp decline of oil prices, in acontext of global abundance of supply. The Brent oil price averaged52 $ / b in 2015, almost 50% less than in 2014. In the downstream,the environment was favorable. Margins in refining, petrochemicalsand retail were sustained by strong demand. The competitivenessof European activities improved, notably due to the lower cost ofraw materials and a favorable euro-dollar exchange rate.
In this context, TOTAL generated adjusted net results of $10.5 billionin 2015, down 18% from 2014, the best performance among themajors. This resilience in a degraded environment demonstrates theefficiency of the Group’s integrated model and the full mobilization ofits teams.
Discipline on spending was reinforced in 2015. The cost reductionprogram allowed the Group to save $1.5 billion, above the objectiveof $1.2 billion. Organic investments (1) were $23 billion, a decreaseof close to 15% compared to 2014.
In the Upstream segment, adjusted net operating income was $4.8 billion in 2015, a decrease of 55% compared to 2014 essentiallydue to lower oil and gas prices. Upstream production increased bya record 9.4%. Nine projects were started up globally: Ofon 2 inNigeria, Eldfisk 2 in Norway, West Franklin 2 in the United Kingdom,Termokarstovoye in Russia, Dalia Phase 1a in Angola, Surmont 2 inCanada, GLNG in Australia, Lianzi located in the unitized zonebetween Congo and Angola, and Moho phase 1b in Congo.
The Group was able to prepare its future with a reservereplacement rate of 107%. It continued its exploration program andmade discoveries in Argentina, Myanmar, and Nigeria.
In the Refining & Chemicals segment, adjusted net operatingincome was $4.9 billion in 2015, almost twice the level of 2014.
Strong operational performance, with a utilization rate averaging89% for the year, enabled the segment to fully benefit from highmargins. The segment also benefited from the ramp-up of SATORPin Saudi Arabia. Modernization projects have been launched, withthe conversion of La Mède into a bio-refinery in France, the Lindseyrestructuring in the UK and the Antwerp refinery modernization.
In the Marketing & Services segment, adjusted net operatingincome was $1.7 billion in 2015, an increase of 35% compared to2014. This good performance was due to the growth in sales andmargins in a favorable environment and to the contribution of theSunPower affiliate with the finalization of the Quinto solar farm in theUnited States.
Divestments were $6 billion, essentially comprised of the finalizationof the Bostik disposal, onshore blocks in Nigeria, Totalgaz, theSchwedt refinery, Geosel oil storage facilities, coal productionactivities in South Africa and partial interests in Laggan-Tormoreand Fort Hills.
Acquisitions were $3.4 billion, essentially comprised of the ADCOlicense extension in the United Arab Emirates, the acquisition of an additional 0.7% interest in the capital of Novatek in Russia(increasing the Group’s interest to 18.9%), and the carry on theUtica field in the United States.
The net-debt-to-equity ratio at year-end decreased to 28% as aresult of a financial policy which is designed to maintain a strongbalance sheet through the cycle.
In the numerous countries where its projects are conducted, theGroup also places an emphasis on Corporate Social Responsibility(CSR) challenges and the development of local economies.
1. Summary of results and financial position
1.1. Overview of the 2015 fiscal year for TOTAL
3 2015 Results and outlookSummary of results and financial position
TOTAL. Registration Document 201552
(1) Organic investments = net investments, excluding acquisitions, divestments and other operations with non-controlling interests (refer to point 5.1 of chapter 2).
1.2.1. Sales
Consolidated sales in 2015 were $165,357 million compared to$236,122 million in 2014, a decrease of 30%, due mainly to thedecrease of oil and gas prices.
1.2.2. Operating income from business segments
The Brent oil price decreased by 47% to 52 $ / b in 2015. The Group’s ERMI was 48 $ / t in 2015 compared to 19 $ / t in 2014.The environment for petrochemicals also improved. The eurodepreciated compared to the U.S. Dollar, at 1.11 $ / € on average in2015 compared to 1.33 $ / € in 2014.
In this context, adjusted operating income from the businesssegments was $12,672 million, a decrease of 41% comparedto 2014.
The effective tax rate (1) for the business segments was 33.9% in2015 compared to 51.2% in 2014, essentially due to the decreaseof the average tax rate in the Upstream segment and the higherproportion of Downstream in the results.
1.2.3. Net income (Group share)
Adjusted net income was $10,518 million in 2015 compared to$12,837 million in 2014, a decrease of 18%.
1.2. 2015 Group results
Consolidated data in millions of dollars, except for earnings per share, dividends, number of shares and percentages.
(M$) 2015 2014 2013
Sales 165,357 236,122 251,725
Adjusted operating income from business segments (a) 12,672 21,604 27,618Adjusted net operating income from business segments (a) 11,362 14,247 15,861
Net income (Group share) 5,087 4,244 11,228Adjusted net income (Group share) (a) 10,518 12,837 14,292
Fully-diluted weighted-average shares (millions) 2,304 2,281 2,272
Adjusted fully-diluted earnings per share (dollars) (a) (b) 4.51 5.63 6.29
Dividend per share (euros) (c) 2.44 2.44 2.38
Net-debt-to-equity ratio (as of December 31) 28.3% 31.3% 23.3%Return on Average Capital Employed (ROACE) (d) 9.4% 11.1% 13.0%Return on Equity (ROE) 11.5% 13.5% 14.9%
Cash flow from operating activities 19,946 25,608 28,513Gross investments (e) 28,033 30,509 34,431Divestments (at sale price) 7,584 6,190 6,399
(a) Adjusted results are defined as income at replacement cost, excluding non-recurring items and excluding the impact of fair value changes.(b) Based on fully-diluted weighted-average number of common shares outstanding during the period.(c) The 2015 dividend is subject to approval at the May 24, 2016 Annual Shareholders’ Meeting.(d) Based on adjusted net operating income and average capital employed at replacement cost.(e) Including acquisitions and increases in non-current loans.
Market environment 2015 2014 2013
Exchange rate €-$ 1.11 1.33 1.33Brent ($ / b) 52.4 99.0 108.7European Refining Margin Indicator (ERMI) (a) ($ / t) 48.5 18.7 17.9
(a) ERMI is an indicator intended to represent the margin after variable costs for a hypothetical complex refinery located around Rotterdam in Northern Europe. The indicator margin maynot be representative of the actual margins achieved by TOTAL in any period because of TOTAL’s particular refinery configurations, product mix effects or other Company-specificoperating conditions.
Adjustments to net income (a) (Group share) (M$) 2015 2014 2013
Special items affecting net income (Group share) (4,675) (6,165) (2,278)Gain (loss) on asset sales 1,810 1,209 (117)
Restructuring charges (72) (20) (567)
Impairments (5,447) (7,063) (773)
Other (966) (291) (821)
Effect of changes in fair value (9) 25 (58)After-tax inventory effect (FIFO vs. replacement cost) (b) (747) (2,453) (728)
Total adjustments affecting net income (Group share) (5,431) (8,593) (3,064)
(a) For details of the adjustments to operational income, refer to Note 4D to the Consolidated Financial Statements.(b) Refer to Note 1N to the Consolidated Financial Statements.
2015 Results and outlook 3Summary of results and financial position
Registration Document 2015. TOTAL 53
(1) Defined as: (tax on adjusted net operating income) / (adjusted net operating income – income from equity affiliates – dividends received from investments + tax on adjusted net operating income).
Environment liquids and gas price realizations (a) 2015 2014 2013
Brent ($ / b) 52.4 99.0 108.7Average liquids price ($ / b) 47.4 89.4 103.3Average gas price ($ / Mbtu) 4.75 6.57 7.12Average hydrocarbon price ($ / boe) 39.2 66.2 74.8
(a) Consolidated subsidiaries, excluding fixed margins.
Market conditions were less favorable in 2015. The average realizedprice of liquids fell by 47% and the average realized price of gas by28% compared to 2014.
Hydrocarbon production 2015 2014 2013
Liquids (kb / d) 1,237 1,034 1,167Gas (Mcf / d) 6,054 6,063 6,184Combined production (kboe / d) 2,347 2,146 2,299
In 2015, hydrocarbon production was 2,347 kboe / d, an increase of9.4% compared to 2014, due to the following:
• +6% for new project start-ups and ramp-ups, notably CLOV,West Franklin Phase 2, Eldfisk II and Termokarstovoye;
• +6% due to portfolio changes, mainly the extension of the ADCOconcession in the United Arab Emirates, partially offset by assetsales in the North Sea, Nigeria and Azerbaijan;
• -4% due to shutdowns in Yemen and in Libya; and• +1% due to the price effect and field performance, net of natural
field decline.
Reserves As of December 31, 2015 2014 2013
Liquids (Mb) 5,605 5,303 5,413Gas (Bcf) 32,206 33,590 33,026Hydrocarbon reserves (Mboe) 11,580 11,523 11,526
Proved hydrocarbon reserves based on SEC rules (based on Brentat 54.17 $ / b) were 11,580 Mboe at December 31, 2015. Based onthe 2015 average rate of production, the reserve life is more than13 years.
In 2015, the proved reserve replacement rate(2), based on SEC rules,was 107%, notably due to the extension of the ADCO concession.
At year-end 2015, TOTAL had a solid and diversified portfolio ofproved and probable reserves(3) representing more than 20 years ofreserve life based on the 2015 average production rate.
Results (M$) 2015 2014 2013
Adjusted operating income 4,925 17,156 23,700Adjusted net operating income 4,774 10,504 12,450Cash flow from operations 11,182 16,666 21,857Adjusted cash flow from operations 11,179 18,667 22,011Investments 24,270 26,520 29,750Divestments (at sale price) 3,215 5,764 5,786ROACE 4.6% 10.7% 13.8%
Adjusted net operating income from the Upstream segment in 2015was $4,774 million, a decrease of 55% compared to 2014,essentially due to the lower price of hydrocarbons, partially offset byan increase in production, a decrease in operating costs and alower effective tax rate.
Technical costs for consolidated subsidiaries, calculated in accordancewith ASC 932 (4), were 23.0 $ / boe in 2015 compared to 28.3 $ / boein 2014. This reduction is essentially due to the execution of theGroup’s program to reduce operating costs (which decreased from9.9 $ / boe in 2014 to 7.4 $ / boe in 2015) and lower depreciation(portfolio effect).
1.3. Upstream segment results
3 2015 Results and outlookSummary of results and financial position
TOTAL. Registration Document 201554
Adjusted net income excludes the after-tax inventory effect, specialitems and the effect of changes in fair value.
Adjustment items had a negative impact on net income (Groupshare) of $5,431 million in 2015. This includes impairments on FortHills in Canada and Gladstone LNG in Australia as well as in Libya,an adjustment to depreciation on Usan in Nigeria following thecancellation of the sale process, the impairment of explorationprojects that will not be developed and a negative inventory effect.
In this context, net income (Group share) was $5,087 million in2015 compared to $4,244 million in 2014, an increase of 20%.
The number of fully-diluted shares was 2,336 million on December 31, 2015, compared to 2,285 million on December 31, 2014.
Adjusted fully-diluted earnings per share, based on 2,304 millionfully-diluted weighted-average shares, was $4.51 in 2015compared to $5.63 in 2014.
1.2.4. Divestments – acquisitions
Asset sales were $5,968 million in 2015, comprised mainly of thesales of Bostik, interests in onshore blocks in Nigeria, Totalgaz, theSchwedt Refinery, the Geosel oil storage facility, coal mining assetsin South Africa and partial interests in Laggan-Tormore and Fort Hills.
Acquisitions were $3,441 million in 2015, comprised mainly of therenewal of the ADCO license in the United Arab Emirates, theacquisition of a further 0.7% in the capital of Novatek in Russiabringing the Group participation to 18.9%, and the carry on theUtica gas and condensate field in the United States.
Net investments(1) were $20.4 billion in 2015 compared to $24.1 billionin 2014, a decrease of 16%.
1.2.5. Profitability
The ROACE in 2015 was 9.4% for the Group, a decrease of 1.7percentage points compared to 2014. The ROE was 11.5% in2015 compared to 13.5% in 2014.
(1) Net investments = investments including acquisitions and changes in non-current loans – sales – other transactions with non-controlling interests.(2) Change in reserves excluding production: (revisions + discoveries, extensions + acquisitions – divestments) / production for the period.(3) Limited to proved and probable reserves covered by Exploration & Production contracts on fields that have been drilled and for which technical studies have demonstrated economic
development in in the Group’s central price scenario, including projects developed by mining.(4) FASB Accounting Standards Codification Topic 932, Extractive industries – Oil and Gas.
1.5. Marketing & Services segment results
Operational data (a) 2015 2014 2013
Refined products sales (kb / d) 1,818 1,769 1,749
(a) Excludes trading and bulk Refining sales, includes share of TotalErg.
Petroleum product sales were 3% higher in 2015 compared to 2014. In addition to strong growth in Africa, the sector benefited from itsstrategic repositioning in Europe and demand stimulated by lower prices.
Results (M$) 2015 2014 2013
Non-Group sales 77,887 106,509 110,873Adjusted operating income 2,098 1,709 2,152Adjusted net operating income 1,699 1,254 1,554
including New Energies 108 10 -
Cash flow from operations 2,323 2,721 2,557Adjusted cash flow from operations 2,065 2,016 2,497
Investments 1,841 1,818 1,814Divestments 856 163 186
ROACE 19.7% 13.3% 16.1%
Adjusted net operating income from the Marketing & Services segment was $1,699 million in 2015, an increase of 35% compared to 2014,benefiting from an increase in sales and margins in a favorable environment, and the contribution of SunPower.
1.6. TOTAL S.A. results in 2015
Net income for TOTAL S.A., the parent company, was €11,067 million in 2015 compared to €6,045 million in 2014. During 2015, a largeamount of dividends was paid by affiliates of TOTAL S.A. to the parent company.
In 2015, the Refining & Chemicals segment benefited from afavorable environment, notably in Europe. The ERMI averaged 48.5 $ / t in 2015 compared to 18.7 $ / t in 2014, mainly due tostrong demand for gasoline. Petrochemical margins in Europeincreased in 2015 due to a strong demand for polymers and thedecrease in raw material costs.
Adjusted net operating income from the Refining & Chemicalssegment was $4,889 million in 2015, more than twice the level of2014, due to strong industrial performance in a period of highmargins and cost reduction programs.
1.4. Refining & Chemicals segment results
Operational data (a) 2015 2014 2013
Total refinery throughput (kb / d) 1,938 1,775 1,719
(a) Including share of TotalErg. Results for refineries in South Africa, French Antilles and Italy are reported in the Marketing & Services segment.
In 2015, refinery throughput increased by 9% compared to 2014. Actions to improve the availability in Europe resulted in a high utilizationrate of 89%. The segment also benefited from the ramp up of SATORP in Saudi Arabia.
Results (M$) 2015 2014 2013
Adjusted operating income 5,649 2,739 1,766Adjusted net operating income 4,889 2,489 1,857
including Specialty Chemicals 496 629 583
Cash flow from operations 6,432 6,302 4,260Adjusted cash flow from operations 5,785 4,028 2,974
Investments 1,843 2,022 2,708Divestments 3,488 192 365
ROACE 41.0% 15.0% 9.2%
2015 Results and outlook 3Summary of results and financial position
Registration Document 2015. TOTAL 55

The Group’s net cash flow was -$414 million in 2015 compared to$1,468 million in 2014. The decrease in net investments partiallyoffset the decrease in cash flow from operations in the context of a
47% lower Brent price. Despite this drop in the Brent price, the net-debt-to-equity ratio on December 31 decreased from 31% in2014 to 28% in 2015, confirming the Group’s financial strength.
2. Liquidity and capital resources
2.1. Long-term and short-term capital
Long-term capital As of December 31, (M$) 2015 2014 2013
Adjusted shareholders’ equity (a) 93,864 91,845 (b) 101,471Non-current financial debt 44,464 45,481 34,574Hedging instruments of non-current financial debt (1,219) (1,319) (1,418)
Total net non-current capital 137,109 136,007 134,627
(a) Based on a 2015 dividend of €2.44 per share.(b) The decline in adjusted shareholders’ equity in 2014 is mainly due to the recognition of $(6,315) million as currency translation adjustment, including $(2,608) million for the ruble and
$(2,438) million for the euro.
Short-term capital As of December 31, (M$) 2015 2014 2013
Current borrowings 12,488 10,942 11,193Net current financial assets (6,019) (1,113) (358)
Net current financial debt 6,469 9,829 10,835
Cash and cash equivalents (23,269) (25,181) (20,200)
2.2. Cash flow
(M$) 2015 2014 2013
Cash flow from operating activities 19,946 25,608 28,513Investments (28,033) (30,509) (34,431)Divestments 7,584 6,190 6,399Other transactions with non-controlling interests 89 179 2,153
Net cash flow (1) (414) 1,468 2,634
Dividends paid (2,945) (7,462) (7,284)Share buybacks (237) (289) (238)Net-debt-to-equity ratio at December 31 28% 31% 23%
After closing the 2015 accounts, the Board of Directors decided on February 10, 2016, to propose to the Annual Shareholders’Meeting on May 24, 2016 an annual dividend of 2.44 € / share for2015, stable compared to 2014. TOTAL’s dividend pay-out ratio,based on the adjusted net income for 2015, would be 60%.
Taking into account the interim dividends of 0.61 € / share for thefirst three quarters of 2015, a remaining dividend of the sameamount of 0.61 € / share is therefore proposed. The Board of
Directors will also propose to the Annual Shareholders’ Meetingthat shareholders have the option of receiving the remaining 2015dividend payment in cash or in new shares of the Company,benefiting from a 10% discount, consistent with the first three 2015interim dividends. Pending approval at the Annual Shareholders’Meeting, the ex-dividend date would be June 6, 2016, and thepayment date for the cash dividend or the delivery of the newshares, depending on the election of the shareholder, would be setfor June 23, 2016.
3 2015 Results and outlookLiquidity and capital resources
TOTAL. Registration Document 201556
1.7. Proposed dividend
(1) Net cash flow = cash flow from operations – net investments (including other transactions with non-controlling interests).
Investments, working capital and dividend payments are financedessentially by cash flow from operations, asset disposals and, ifnecessary, by net borrowings.
For the coming years and based on the current financingconditions, the Company intends to maintain this method offinancing the Group’s investments and activities.
2.5. Anticipated sources of financing
As of December 31, 2015, the aggregate amount of the majorconfirmed credit facilities granted by international banks to theGroup’s companies (including TOTAL S.A.) was $11,225 million(compared to $11,064 million on December 31, 2014), of which$11,225 million were unused ($10,764 million unused as ofDecember 31, 2014).
TOTAL S.A. has confirmed lines of credit granted by internationalbanks, which are calculated to allow it to manage its short-termliquidity needs as required. As of December 31, 2015, these creditfacilities amounted to $10,675 million (compared to $10,514 millionon December 31, 2014), of which $10,675 million were unused($10,514 million unused as of December 31, 2014).
The agreements for the lines of credit granted to TOTAL S.A. do not contain conditions related to the Company’s financial ratios,to its financial ratings from specialized agencies, or to theoccurrence of events that could have a material adverse effect onits financial position.
Credit facilities granted to Group companies other than TOTAL S.A.are not intended to finance the Group’s general needs; they areintended to finance either the general needs of the borrowingsubsidiary or a specific project.
As of December 31, 2015, no restrictions applied to the use of theGroup companies’ capital (including TOTAL S.A.) that couldsignificantly impact the Group’s activities, directly or indirectly.
2.4. External financing available
The Group’s policy consists of incurring non-current debt primarilyat a floating rate or, if the opportunity arises at the time of anissuance, at a fixed rate. Debt is incurred in dollars or eurosaccording to general corporate needs. Long-term interest rate andcurrency swaps may be used to hedge bonds at their issuance inorder to create a variable or fixed rate synthetic debt. In order topartially modify the interest rate structure of the long-term debt,TOTAL may also enter into long-term interest rate swaps.
The non-current debt is generally raised by the corporate treasuryentities either directly in dollars or euros or in other currencies whichare then exchanged for dollars or euros through swap issues toappropriately match general corporate needs.
In addition to its bond issuance programs, TOTAL S.A. issued, onFebruary 19, 2015, €5 billion of perpetual subordinated notes in twoinstallments. The nature of this debt means it is in accordance withIAS 32 and can be recognized as equity.
Furthermore, on November 25, 2015, TOTAL S.A. issued a $1.2 billion bond combining cash-settled convertible bonds
indexed to TOTAL’s share performance and the purchase of stockoptions to hedge the risk of additional costs related to this indexation.This combination creates a non-dilutive synthetic instrumentequivalent to a standard bond. At maturity all transactions are madein cash and limited to the nominal amount.
The Group has established standards for market transactions underwhich bank counterparties must be approved in advance, based onan assessment of the counterparty’s financial soundness (multi-criteria analysis including a review of the market capitalization andof the Credit Default Swap (CDS), its ratings with Standard & Poor’sand Moody’s, which must be of high quality, and its overall financialcondition).
An overall authorized credit limit is set for each bank and isallocated among the subsidiaries and the Group’s central treasuryentities according to their needs.
To reduce the market values risk on its commitments, in particularfor swaps set as part of bonds issuance, the Group also enteredinto margin call contracts with its significant counterparties.
2.3. Borrowing requirements and funding structure
2015 Results and outlook 3Liquidity and capital resources
Registration Document 2015. TOTAL 57
Except for the events mentioned above in the Management Report(chapter 3), in the Business overview (chapter 2), or in the descriptionof legal and arbitration procedures (point 2 of chapter 4), nosignificant changes in the Group’s financial or commercial position
have occurred since December 31, 2015, the end of the last fiscalyear for which audited financial statements have been published bythe Company.
4. Significant changes
Due to the nature of its business, the Group’s activities remainsubject to the usual market risks (sensitivity to the environmentalparameters of the oil and financial markets), industrial andenvironmental risks related to its operations, and to political orgeopolitical risks stemming from the global presence of most of its activities.
Detailed information is given in the Risk Factors section (point 1 ofchapter 4) of this Registration Document. For more information,also refer to the Chairman’s report in point 4 of chapter 4.
3.2. Risks and uncertainties
In 2015, the Return on Equity for the Group was 11.5%. TOTALresisted the drop in prices by leveraging the effectiveness of itsintegrated model and its strong operational performance. TheGroup will further pursue this strategy and all of the necessaryactions will continue to be implemented to reduce costs andmaintain a solid balance sheet, demonstrating once again theGroup’s capacity to adapt.
In 2016, the Group will reduce its organic investments (1) to around $19 billion, a reduction of more than 15% compared to 2015. This marks a transition to a sustainable level of investments of $17-19 billion from 2017 onwards. The cost reduction programlaunched in 2014 will be reinforced, enabling Opex savings of $2.4 billion in 2016 and underpinning the objective of more than $3 billion in 2017. The asset sales program will continue in line withthe plan, with $4 billion expected in 2016, the same level as 2015.
In the Upstream, five major start ups are planned in 2016. The firstof these, Laggan-Tormore, took place on February 8. Production isexpected to grow by 4% in 2016 compared to 2015, followingmore than 9% in 2015 compared to 2014, confirming the growthtarget of 5% per year on average between 2014 and 2019.
In the Downstream, the target to reduce European refining capacityby 20% will be achieved by end-2016, one year ahead of the initialplan announced in 2012. The cessation of traditional refiningactivities at La Mède in view of its conversion to a bio-refinery, the restructuring of the Lindsey refinery and the modernization of the Antwerp refinery will be finalized before the end of the year,with the first benefits expected from 2017.
The strategy implemented by the Group in 2015 based on its fourpriorities of Safety, Delivery, Costs and Cash, will continue in 2016,notably for the benefit of its shareholders.
3. Trends and outlook
3.1. Outlook
3 2015 Results and outlookTrends and outlook. Significant changes
TOTAL. Registration Document 201558
(1) Organic investments = net investments, excluding acquisitions, divestments and other operations with non-controlling interests (refer to point 5.1 of chapter 2).
Registration Document 2015. TOTAL 59
Risks and control4.Facteurs de risques 4
Risks and control1. Risk Factors 601.1. Risks related to market environment and other financial risks . . . . . . . . . . . . . . . . . . . . . . . . . . . . . . . . . . . . . . . . . . . . . . . . .601.2. Industrial and environmental risks and risks related to climate issues . . . . . . . . . . . . . . . . . . . . . . . . . . . . . . . . . . . . . . . . . . .611.3. Risks related to critical IT systems security . . . . . . . . . . . . . . . . . . . . . . . . . . . . . . . . . . . . . . . . . . . . . . . . . . . . . . . . . . . . . . . .631.4. Risks related to the development of major projects and reserves . . . . . . . . . . . . . . . . . . . . . . . . . . . . . . . . . . . . . . . . . . . . . . .631.5. Risks related to equity affiliates and management of assets operated by third parties . . . . . . . . . . . . . . . . . . . . . . . . . . . . . .641.6. Risks related to economic or political factors . . . . . . . . . . . . . . . . . . . . . . . . . . . . . . . . . . . . . . . . . . . . . . . . . . . . . . . . . . . . . . .641.7. Risks related to competition and lack of innovation . . . . . . . . . . . . . . . . . . . . . . . . . . . . . . . . . . . . . . . . . . . . . . . . . . . . . . . . . .651.8. Ethical misconduct and non-compliance risks . . . . . . . . . . . . . . . . . . . . . . . . . . . . . . . . . . . . . . . . . . . . . . . . . . . . . . . . . . . . . .651.9. Countries targeted by economic sanctions . . . . . . . . . . . . . . . . . . . . . . . . . . . . . . . . . . . . . . . . . . . . . . . . . . . . . . . . . . . . . . . .66
2. Legal and arbitration proceedings 69
3. Insurance and risk management 713.1. Organization . . . . . . . . . . . . . . . . . . . . . . . . . . . . . . . . . . . . . . . . . . . . . . . . . . . . . . . . . . . . . . . . . . . . . . . . . . . . . . . . . . . . . . . . .713.2. Risk and insurance management policy . . . . . . . . . . . . . . . . . . . . . . . . . . . . . . . . . . . . . . . . . . . . . . . . . . . . . . . . . . . . . . . . . . .713.3. Insurance policy . . . . . . . . . . . . . . . . . . . . . . . . . . . . . . . . . . . . . . . . . . . . . . . . . . . . . . . . . . . . . . . . . . . . . . . . . . . . . . . . . . . . . .71
4. Internal control and risk management procedures (Article L. 225-37 of the French Commercial Code) 72
4.1. Basic elements of internal control . . . . . . . . . . . . . . . . . . . . . . . . . . . . . . . . . . . . . . . . . . . . . . . . . . . . . . . . . . . . . . . . . . . . . . . .724.2. Control environment . . . . . . . . . . . . . . . . . . . . . . . . . . . . . . . . . . . . . . . . . . . . . . . . . . . . . . . . . . . . . . . . . . . . . . . . . . . . . . . . . . .734.3. Risk assessment and management . . . . . . . . . . . . . . . . . . . . . . . . . . . . . . . . . . . . . . . . . . . . . . . . . . . . . . . . . . . . . . . . . . . . . . .74
5. Statutory auditors’ report (Article L. 225-235 of the French Commercial Code) 78
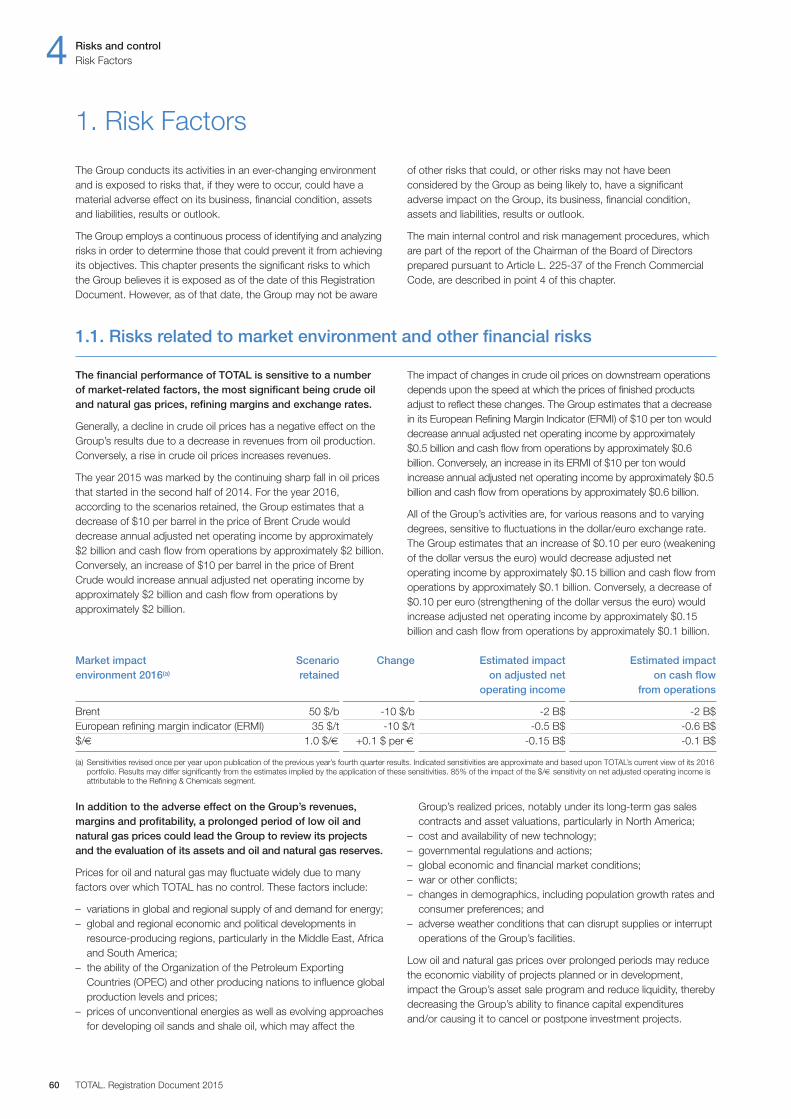
In addition to the adverse effect on the Group’s revenues,margins and profitability, a prolonged period of low oil andnatural gas prices could lead the Group to review its projectsand the evaluation of its assets and oil and natural gas reserves.
Prices for oil and natural gas may fluctuate widely due to manyfactors over which TOTAL has no control. These factors include:
– variations in global and regional supply of and demand for energy;– global and regional economic and political developments in
resource-producing regions, particularly in the Middle East, Africaand South America;
– the ability of the Organization of the Petroleum ExportingCountries (OPEC) and other producing nations to influence globalproduction levels and prices;
– prices of unconventional energies as well as evolving approachesfor developing oil sands and shale oil, which may affect the
Group’s realized prices, notably under its long-term gas salescontracts and asset valuations, particularly in North America;
– cost and availability of new technology;– governmental regulations and actions;– global economic and financial market conditions;– war or other conflicts;– changes in demographics, including population growth rates and
consumer preferences; and– adverse weather conditions that can disrupt supplies or interrupt
operations of the Group’s facilities.
Low oil and natural gas prices over prolonged periods may reducethe economic viability of projects planned or in development,impact the Group’s asset sale program and reduce liquidity, therebydecreasing the Group’s ability to finance capital expendituresand / or causing it to cancel or postpone investment projects.
Market impact Scenario Change Estimated impact Estimated impactenvironment 2016(a) retained on adjusted net on cash flow operating income from operations
Brent 50 $ / b -10 $ / b -2 B$ -2 B$European refining margin indicator (ERMI) 35 $ / t -10 $ / t -0.5 B$ -0.6 B$$ / € 1.0 $ / € +0.1 $ per € -0.15 B$ -0.1 B$
(a) Sensitivities revised once per year upon publication of the previous year’s fourth quarter results. Indicated sensitivities are approximate and based upon TOTAL’s current view of its 2016portfolio. Results may differ significantly from the estimates implied by the application of these sensitivities. 85% of the impact of the $ / € sensitivity on net adjusted operating income isattributable to the Refining & Chemicals segment.
The financial performance of TOTAL is sensitive to a number of market-related factors, the most significant being crude oiland natural gas prices, refining margins and exchange rates.
Generally, a decline in crude oil prices has a negative effect on theGroup’s results due to a decrease in revenues from oil production.Conversely, a rise in crude oil prices increases revenues.
The year 2015 was marked by the continuing sharp fall in oil pricesthat started in the second half of 2014. For the year 2016,according to the scenarios retained, the Group estimates that adecrease of $10 per barrel in the price of Brent Crude woulddecrease annual adjusted net operating income by approximately$2 billion and cash flow from operations by approximately $2 billion.Conversely, an increase of $10 per barrel in the price of BrentCrude would increase annual adjusted net operating income byapproximately $2 billion and cash flow from operations byapproximately $2 billion.
The impact of changes in crude oil prices on downstream operationsdepends upon the speed at which the prices of finished productsadjust to reflect these changes. The Group estimates that a decreasein its European Refining Margin Indicator (ERMI) of $10 per ton woulddecrease annual adjusted net operating income by approximately$0.5 billion and cash flow from operations by approximately $0.6billion. Conversely, an increase in its ERMI of $10 per ton wouldincrease annual adjusted net operating income by approximately $0.5billion and cash flow from operations by approximately $0.6 billion.
All of the Group’s activities are, for various reasons and to varyingdegrees, sensitive to fluctuations in the dollar / euro exchange rate.The Group estimates that an increase of $0.10 per euro (weakeningof the dollar versus the euro) would decrease adjusted netoperating income by approximately $0.15 billion and cash flow fromoperations by approximately $0.1 billion. Conversely, a decrease of$0.10 per euro (strengthening of the dollar versus the euro) wouldincrease adjusted net operating income by approximately $0.15billion and cash flow from operations by approximately $0.1 billion.
1.1. Risks related to market environment and other financial risks
The Group conducts its activities in an ever-changing environmentand is exposed to risks that, if they were to occur, could have amaterial adverse effect on its business, financial condition, assetsand liabilities, results or outlook.
The Group employs a continuous process of identifying and analyzingrisks in order to determine those that could prevent it from achievingits objectives. This chapter presents the significant risks to whichthe Group believes it is exposed as of the date of this RegistrationDocument. However, as of that date, the Group may not be aware
of other risks that could, or other risks may not have beenconsidered by the Group as being likely to, have a significantadverse impact on the Group, its business, financial condition,assets and liabilities, results or outlook.
The main internal control and risk management procedures, whichare part of the report of the Chairman of the Board of Directorsprepared pursuant to Article L. 225-37 of the French CommercialCode, are described in point 4 of this chapter.
4 Risks and controlRisk Factors
TOTAL. Registration Document 201560
1. Risk Factors
TOTAL is exposed to risks related to the safety and security of its operations.
The Group’s activities involve a wide range of operational risks,such as explosions, fires, accidents, equipment failures, leakage of toxic products, emissions or discharges into the air, water or soil,that can potentially cause death or injury, or impact naturalresources and ecosystems.
The industrial event that could have the most significant impact is amajor industrial accident (e.g., blow out, explosion, fire, leakage ofhighly toxic products resulting in the death or injury of one or severalpeople and / or accidental pollution on a large-scale or at anenvironmentally sensitive site).
Acts of terrorism against the Group’s plants and sites, pipelines,and transportation and computer systems could also disrupt itsbusiness activities and could cause harm to people, the environmentand property.
Certain activities of the Group face specific additional risks. TOTAL’sUpstream segment faces, notably, risks related to the physicalcharacteristics of oil and gas fields, particularly during explorationoperations that can cause blow outs, explosions and fires and harmthe environment as well as lead to a disruption of the Group’soperations or reduce its production. In addition to the risks ofexplosions and fires, the activities of the Refining & Chemicals andMarketing & Services business segments entail risks related to theoverall life cycle of the products manufactured, as well as thematerials used. With regard to transportation, the likelihood of anoperational accident depends not only on the hazardous nature ofthe products transported, but also on the volumes involved and thesensitivity of the regions through which they are transported (qualityof infrastructure, population density, environmental considerations).
TOTAL’s workforce and the public are exposed to risks inherent tothe Group’s operations (loss of life, injuries, property damage,environmental damage) that could result in regulatory action and
legal liability against the Group’s entities and senior management aswell as damage to the Group’s reputation. Like most industrialgroups, TOTAL is affected by reports of occupational illnesses,particularly those caused by past exposure of Group employees toasbestos.
To manage the operational risks to which it is exposed, the Groupmaintains worldwide third-party liability insurance coverage for all itssubsidiaries. TOTAL also has insurance to protect against the riskof damage to Group property and / or business interruption at itsmain refining and petrochemical sites. TOTAL’s insurance and riskmanagement policies are described in point 3 of this chapter.However, the Group is not insured against all potential risks. In certain cases, such as a major environmental disaster, TOTAL’sliability may exceed the maximum coverage provided by its third-party liability insurance. The Group cannot guarantee that it will notsuffer any uninsured loss and there can be no guarantee,particularly in the event of a major environmental disaster orindustrial accident, that such loss would not have a materialadverse effect on the Group.
Crisis management systems are necessary to effectivelyrespond to emergencies, avoid potential disruptions to TOTAL’sbusiness and operations and minimize impacts on third partiesand the environment.
TOTAL has crisis management plans in place to deal with emergencies(refer to point 4 of this chapter). However, these plans cannotexclude the risk that the Group’s business and operations may beseverely disrupted in a crisis situation or ensure the absence ofimpacts on third parties or the environment. TOTAL has alsoimplemented business continuity plans to continue or resumeoperations following a shutdown or incident. An inability to restoreor replace critical capacity in a timely manner could prolong theimpact of any disruption and could have a material adverse effecton the Group’s business and operations.
1.2. Industrial and environmental risks and risks related to climate issues
Risks and control 4Risk Factors
Registration Document 2015. TOTAL 61
If TOTAL is unable to follow through with investment projects, theGroup’s opportunities for future revenue and profitability growthwould be reduced, which could materially impact the Group’sfinancial condition.
Prolonged periods of low oil and natural gas prices may reduce theGroup’s reported reserves and / or result in impairment that could have asignificant effect on the Group’s results in the period in which it occurs.
Conversely, in a high oil and gas price environment, the Group canexperience significant increases in cost and government take, and,under some production-sharing contracts, the Group’s productionrights could be reduced. Higher prices can also reduce demand forthe Group’s products.
The Group’s earnings from its Refining & Chemicals andMarketing & Services segments are primarily dependent upon thesupply and demand for refined products and the associatedmargins on refined product sales, with the impact of changes in oiland gas prices on earnings on these segments being dependentupon the speed at which the prices of refined products adjust toreflect movements in oil and gas prices. In 2015, the negativeeffects of the decline of oil prices on the Group’s results werepartially offset by the results of Refining & Chemicals, which were
supported by high refining margins. In 2016, there can be noassurance that the refining margins will remain at such a high level.
The activities of Trading & Shipping (oil, gas and power trading andshipping activities) are particularly sensitive to market risk and morespecifically to price risk as a consequence of the volatility of oil andgas prices, to liquidity risk (inability to buy or sell cargoes at marketprices) and to counterparty risk (when a counterparty does not fulfillits contractual obligations). The Group uses various energy derivativeinstruments to adjust its exposure to price fluctuations of crude oil,refined products, natural gas, power and freight-rates. AlthoughTOTAL believes it has established appropriate risk managementprocedures, large market fluctuations may adversely affect theactivities and operating results of the Group.
Since the second half of 2014, oil prices have declined very significantly.For more detailed information on the impact of the sharp decline inoil prices on the Group’s 2015 results, financial condition (includingimpairments, significant reductions to capital expenditures andoperating costs, and divestments completed under the Group’sasset sale program) and outlook, refer to chapter 3.
Financial risks are detailed in Note 31 to the Consolidated FinancialStatements (point 7 of chapter 10).

4 Risks and controlRisk Factors
TOTAL. Registration Document 201562
TOTAL is subject to increasingly stringent environmental,health and safety laws and regulations in numerous countriesand may incur material related compliance costs.
The Group’s activities are subject to numerous laws and regulationspertaining to health, safety and the environment. In most countrieswhere the Group operates, particularly in Europe and the UnitedStates, sites and products are subject to increasingly strict lawsgoverning the protection of the environment (e.g., water, air, soil,noise, protection of nature, waste management, impact assessments),health (e.g., occupational safety, chemical product risk), and thesafety of personnel and residents (e.g., major risk facilities).
Product quality and consumer protection are also subject toregulations. The Group’s entities ensure that their products meetapplicable specifications and abide by all applicable consumerprotection laws. Failure to do so could lead to personal injury,environmental harm and loss of customers, which could negativelyimpact the Group’s operating results, financial position and reputation.
TOTAL incurs, and will continue to incur, substantial expenditures tocomply with increasingly complex laws and regulations aimed atprotecting health, safety and the environment. Such expenditurescould have a material adverse effect on the Group’s operatingresults and financial position.
As a further result of, notably, the introduction of new laws andregulations, the Group could also be compelled to curtail, modify orcease certain operations or implement temporary shutdowns offacilities, which could diminish the Group’s productivity and have amaterial adverse impact on its operating results.
Moreover, most of the Group’s activities will eventually, at site closure,require decommissioning followed by environmental remediationafter operations are discontinued, due to compliance with applicableregulations. Costs related to such activities may materially exceedthe Group’s provisions and adversely impact its operating results.With regard to the permanent shutdown of an activity, the Group’senvironmental contingencies and asset retirement obligations areaddressed in the “Asset retirement obligations” and “Provisions forenvironmental contingencies” sections of the Group’s consolidatedbalance sheet (refer to Note 19 to the Consolidated FinancialStatements, point 7 of chapter 10). Future expenditures related toasset retirement obligations are accounted for in accordance withthe accounting principles described in Note 1Q to the ConsolidatedFinancial Statements (point 7 of chapter 10).
Laws and regulations related to climate change may adverselyaffect the Group’s business.
Growing public concern in a number of countries over greenhousegas (GHG) emissions and climate change, as well as amultiplication of stricter regulations in this area, could adverselyaffect the Group’s businesses, increase its operating costs andreduce its profitability.
The scientific community has established a link between climatechange and increasing GHG emissions. The worldwide goal to limitglobal warming has led to the need to gradually reduce fossil fueluse notably through the diversification of the energy mix. The shareof natural gas, the least GHG-emitting fossil energy source,represented nearly 50% of TOTAL’s production in 2015, comparedto approximately 35% in 2005. The Group has ceased its coal
production activities and is developing its renewable energyproduction activities in solar and biomass. Regulations designed togradually limit fossil fuel use may, depending on the GHG emissionlimits and time horizons set, negatively and significantly affect thedevelopment of the most emitting projects, as well as the economicvalue of some of the Group’s assets.
In Europe, the regulations concerning the market for CO2 emissionallowances, the EU Emissions Trading System (EU-ETS), entered athird phase on January 1, 2013. This phase marks the end of theoverall free allocation of emission allowances: certain emissions,such as those related to electricity production, no longer benefitfrom free allowances, while for others free allowances have beensignificantly reduced. Free allocations are now established basedon the emission level of the top-performing plants (i.e., the leastGHG-emitting) within the same sector (“top 10 benchmark”).Lower-performing plants must purchase, at market price, thenecessary allowances to cover their emissions over these freeallocations. The plants also need to indirectly bear the cost ofallowances for all electricity consumed (including electricitygenerated internally at the facilities).
The European Commission’s decision to apply a “cross-sectoralcorrection factor” (CSCF) has reduced the total amount of freeallocations for all sectors combined by an average of 11.6% overphase 3 (2013-2020). However, the revision in 2014 of the list of“sectors exposed to carbon leakage” confirmed that the refiningsector in Europe is an exposed sector, which may continue tobenefit from free allowances that partially cover its deficits.
In this context, the Group estimates that approximately 30% of itsemissions subject to the EU-ETS will not be covered by freeallowances during the 2013-2020 period. The financial risk relatedto the foreseeable purchase of CO2 emission allowances on the marketshould remain low for the Group during this period. At year-end2015, the price of the EU allowances stood at approximately €8 / tCO2 and may reach approximately €20 / t(1) CO2 for 2020 due to thecombined effects of backloading(2), having removed 900 Mt fromphase 3 allowance auctions, and the establishment of a “marketstability reserve” at the end of this phase.
The physical effects of climate change may adversely affectthe Group’s business.
TOTAL’s businesses operate in varied locales where the potentialphysical impacts of climate change, including changes in weatherpatterns, are highly uncertain and may adversely impact the resultsof the Group’s operations.
Climate change potentially has multiple effects that could harm theGroup’s operations. The increasing scarcity of water resources maynegatively affect the Group’s operations in some regions of theworld, high sea levels may harm certain coastal activities, and themultiplication of extreme weather events may damage offshore andonshore facilities. These climate risk factors are continuallyassessed in TOTAL’s management and risk management plans.
The Group believes that it is impossible to guarantee that thecontingencies or liabilities related to the matters mentioned in point 1.2will not have a material adverse impact in the future on its business,assets and liabilities, consolidated financial situation, cash flow or income.
(1) Company data.(2) Backloading: authorization given to the European Commission to intervene at its own discretion in the CO2 allowance auction calendar.
The Group’s production growth and profitability depend on thedelivery of its major development projects.
Growth of production and profitability of the Group rely heavily onthe successful execution of its major development projects that areincreasingly complex and capital-intensive. These major projectsare subject to a number of challenges, including, in particular, thoserelated to:
– negotiations with partners, governments, suppliers, customersand others;
– obtaining project financing;– controlling operating costs;– earning an adequate return in a low oil price environment;– adhering to projects schedules; and– the timely issuance or renewal of permits and licenses by
government agencies.
Poor delivery of any major project that underpins production orproduction growth could adversely affect the Group’s financialperformance.
The Group’s long-term profitability depends on cost-effectivediscovery, acquisition and development of economically viablenew reserves; if the Group is unsuccessful, its operatingresults and financial condition would be materially andadversely affected.
A large portion of the Group’s revenues and operating results arederived from the sale of oil and gas that the Group extracts fromunderground reserves developed as part of its exploration andproduction activities. The development of oil and gas fields, theconstruction of facilities and the drilling of production or injectionwells is capital intensive and requires advanced technology. Due to constantly changing market conditions and environmentalchallenges, cost projections can be uncertain. For the Upstreamsegment to continue to be profitable, the Group needs to replaceits reserves with new proved reserves that can be developed andproduced in an economically viable manner.
In addition, TOTAL’s ability to discover or acquire and develop newreserves successfully is uncertain and can be negatively affected bya number of factors, including:
– the geological nature of oil and gas fields, notably unexpecteddrilling conditions including pressure or unexpectedheterogeneities in geological formations;
– the risk of dry holes or failure to find expected commercialquantities of hydrocarbons;
– the inability of service companies to deliver on contractedservices on time and on budget;
– the inability of the Group’s partners to execute or finance projectsin which the Group holds an interest;
– equipment failures, fires, blow-outs or accidents;– the Group’s inability to develop or implement new technologies
that enable access to previously inaccessible fields;– the Group’s inability to anticipate market changes in a timely manner;– adverse weather conditions;– compliance with both anticipated and unanticipated
governmental requirements, including U.S. and EU regulationsthat may give a competitive advantage to companies not subjectto such regulations;
– shortages or delays in the availability or delivery of appropriateequipment;
– industrial action;– competition from oil and gas companies for the acquisition and
development of assets and licenses (refer to point 1.7);– increased taxes and royalties, including retroactive claims; and– disputes related to property titles.
These factors could lead to cost overruns and could impair theGroup’s ability to complete a development project or makeproduction economical. Some of these factors may also affect theGroup’s projects and facilities further down the oil and gas chain.
If TOTAL fails to develop new reserves cost-effectively in sufficientquantities to replace the Group’s reserves currently being developed,produced and marketed, the Group’s financial condition, includingits results, would be materially and adversely affected.
The Group’s oil and gas reserves data are estimates only andsubsequent downward adjustments are possible. If actualproduction from such reserves proves to be lower than currentestimates indicate, the Group’s operating results and financialcondition would be negatively impacted.
The Group’s proved reserves figures are estimates prepared inaccordance with SEC rules. Proved reserves are those reserveswhich, by analysis of geoscience and engineering data, can beestimated with reasonable certainty to be economicallyrecoverable – from a given date forward, from known reservoirs andunder existing economic conditions, operating methods andgovernment regulations – prior to the time at which contractsproviding the right to operate expire, unless evidence indicates thatrenewal is reasonably certain, regardless of whether deterministic orprobabilistic methods are used for the estimation. Reserves areestimated by teams of qualified, experienced and trainedgeoscientists, petroleum engineers and project engineers, whorigorously review and analyze in detail all available geoscience andengineering data (e.g., seismic data, electrical logs, cores, fluids,pressures, flow rates, facilities parameters). This process involvesmaking subjective judgments, including with respect to the estimateof hydrocarbons initially in place, initial production rates andrecovery efficiency, based on available geological, technical and
1.4. Risks related to the development of major projects and reserves
Disruption to or breaches of TOTAL’s critical IT services orinformation security systems could adversely affect theGroup’s operations.
The Group’s activities depend heavily on the reliability and securityof its information technology (IT) systems. If the integrity of its ITsystems were compromised due to, for example, technical failure,
cyber attack, computer intrusions and viruses, power or networkoutages or natural disasters, the Group’s activities and assets couldsustain serious damage, material intellectual property could be divulgedand, in some cases, personal injury, environmental harm andregulatory violations could occur, potentially having a materialadverse effect on the Group’s financial condition, including its results.
1.3. Risks related to critical IT systems security
Risks and control 4Risk Factors
Registration Document 2015. TOTAL 63
TOTAL has significant production and reserves located inpolitically, economically and socially unstable areas, where thelikelihood of material disruption of the Group’s operations isrelatively high.
A significant portion of TOTAL’s oil and gas production and reservesis located in countries outside of the Organisation for Economic Co-operation and Development (OECD). In recent years, a number ofthese countries have experienced varying degrees of one or moreof the following: economic instability, political volatility, civil war,violent conflict, social unrest, actions of terrorist groups and theapplication of international economic sanctions. Any of theseconditions alone or in combination could disrupt the Group’soperations in any of these regions, causing substantial declines inproduction or revisions to reserves estimates. In Africa, whichrepresented 29% of the Group’s 2015 combined liquids and gasproduction, certain of the countries in which the Group hasproduction have recently suffered from some of these conditions,including Nigeria, which is one of the main contributing countries tothe Group’s production of hydrocarbons, and Libya. The Middle
East, which represented 21% of the Group’s 2015 combined liquidsand gas production, has in recent years suffered increased politicalvolatility in connection with violent conflict and social unrest,including Syria, where European Union (EU) and U.S. economicsanctions have prohibited TOTAL from producing oil and gas since2011. In Yemen, the deterioration of security conditions in thevicinity of Balhaf have lead the company Yemen LNG, in which theGroup holds a stake of 39.62%, to stop its commercial productionand export of LNG and to declare force majeure to its variousstakeholders. In South America, which represented 6% of theGroup’s 2015, combined liquids and gas production, certain of thecountries in which TOTAL has production have recently sufferedfrom some of the above-mentioned conditions, including Argentinaand Venezuela. In Russia, where, as of December 31, 2015, theGroup held 19% of its proved reserves, members of theinternational community have, since July 2014, adopted economicsanctions against certain Russian persons and entities, includingvarious entities operating in the financial, energy and defensesectors, in response to the situation in Ukraine (for additionalinformation, refer to point 1.9.1 of this chapter).
1.6. Risks related to economic or political factors
Many of the Group’s projects are conducted by equity affiliatesor are operated by third parties. For these projects, theGroup’s degree of control, as well as its ability to identify andmanage risks, may be reduced.
A significant number of the Group’s projects is conducted by equityaffiliates. In cases where the Group’s company is not the operator,such company may have limited influence over, and control of, thebehavior, performance and costs of the partnership, its ability tomanage risks may be limited and it may, nevertheless, beprosecuted by regulators or claimants in the event of an incident.
For additional information concerning equity affiliates, refer to Note12 (“Equity affiliates: investments and loans”) to the ConsolidatedFinancial Statements (point 7 of chapter 10).
Additionally, the partners of the Group may not be able to meet theirfinancial or other obligations to the projects, which may threaten theviability of a given project. These partners may also not have thefinancial capacity to fully indemnify the Group in the event of an incident.
Contracts signed by the Group’s entities may provide for indemnificationobligations either by TOTAL in favor of the contractor or third
parties or by the contractor or third parties in favor of TOTAL if, forexample, an event occurs leading to death, personal injury orproperty or environmental damage.
With respect to joint ventures, contractual terms generally providethat the operator, whether an entity of the Group or a third party,assumes full liability for damages caused by its gross negligence orwillful misconduct.
In the absence of the operator’s gross negligence or willfulmisconduct, other liabilities are generally borne by the joint ventureand the cost thereof is assumed by the partners of the joint venturein proportion to their respective ownership interests.
With respect to third-party providers of goods and services, theamount and nature of the liability assumed by the third partydepends on the context and may be limited by contract. Withrespect to their customers, the Group’s entities ensure that theirproducts meet applicable specifications and abide by all applicableconsumer protection laws. Failure to do so could lead to personalinjury, environmental harm and loss of customers, which couldnegatively impact the Group’s financial condition and reputation.
1.5. Risks related to equity affiliates and management of assets operated by third parties
4 Risks and controlRisk Factors
TOTAL. Registration Document 201564
economic data. Consequently, estimates of reserves are not exactmeasurements and are subject to revision.
A variety of factors that are beyond the Group’s control could causesuch estimates to be adjusted downward in the future, or cause theGroup’s actual production to be lower than its currently reportedproved reserves indicate. These main such factors include:
– a decline in the price of oil or gas, making reserves no longereconomically viable to exploit and therefore not classifiable as proved;
– an increase in the price of oil or gas, which may reduce thereserves to which the Group is entitled under production sharingand risked service contracts and other contractual terms;
– changes in tax rules and other government regulations that makereserves no longer economically viable to exploit; and
– the actual production performance of the Group’s deposits.
The Group’s reserves estimates may therefore require substantialdownward revisions should its subjective judgments prove not tohave been conservative enough based on the available geoscienceand engineering data, or the Group’s assumptions regarding factorsor variables that are beyond its control prove to be incorrect overtime. Any downward adjustment would indicate lower futureproduction amounts, which could adversely affect the Group’sfinancial condition, including its results.
Ethical misconduct or breaches of applicable laws by employeesof the Group could expose TOTAL to criminal and civil penaltiesand be damaging to TOTAL’s reputation and shareholder value.
The Group’s Code of Conduct, which applies to all of itsemployees, defines TOTAL’s commitment to business integrity andcompliance with all applicable legal requirements and high ethical
standards. This commitment is supported by a “zero tolerance”principle. Ethical misconduct or non-compliance with applicablelaws and regulations by TOTAL or any third party acting on itsbehalf could expose TOTAL and / or its employees to criminal andcivil penalties and could be damaging to TOTAL’s reputation andshareholder value.
1.8. Ethical misconduct and non-compliance risks
The Group operates in a highly competitive environment. Its competitiveness could be adversely impacted if the Group’slevel of innovation lagged behind its competitors.
TOTAL’s main competitors are comprised of national and internationaloil companies. The evolution of the energy sector has opened thedoor to new competitors and increased market price volatility.
TOTAL is subject to competition in the acquisition of assets andlicenses for the exploration and production of oil and natural gas aswell as for the sale of manufactured products based on crude andrefined oil. In the gas sector, major producers increasingly competein the downstream value chain with established distributioncompanies, including those that belong to the Group. Increasedcompetitive pressure could have a significant negative effect on theprices, margins and market shares of the Group’s companies.
The pursuit of unconventional gas development, particularly in theUnited States, has contributed to falling market prices and amarked difference between spot and long-term contract prices.The competitiveness of long-term contracts indexed to oil pricescould be affected if this discrepancy persists and if it should provedifficult to invoke price revision clauses.
The Group’s activities are carried out in a constantly changingenvironment with new products and technologies continuouslyemerging. The Group may not be able to anticipate these changes,identify and integrate technological developments in order tomaintain its competitiveness, maintain a high level of performanceand operational excellence, and best meet the needs and demandsof its customers. The Group’s innovation policy requires significantinvestment, notably in R&D, of which the expected impact cannotbe guaranteed.
1.7. Risks related to competition and lack of innovation
Furthermore, in addition to current production, TOTAL is alsoexploring for and developing new reserves in other regions of theworld that are historically characterized by political, social andeconomic instability, such as the Caspian Sea region where TOTALhas large projects currently underway.
The occurrence and magnitude of incidents related to economic,social and political instability are unpredictable. It is possible thatthey could have a material adverse impact on the Group’s productionand operations in the future and / or cause certain investors toreduce their holdings of TOTAL’s securities.
TOTAL, like other major international energy companies, has ageographically diverse portfolio of reserves and operational sites,which allows it to conduct its business and financial affairs so as to reduce its exposure to political and economic risks. However,there can be no assurance that such events will not have a materialadverse impact on the Group.
Intervention by host country authorities can adversely effectthe Group’s activities and its operating results.
TOTAL has significant exploration and production activities, and in some cases refining, marketing or chemicals operations, incountries whose governmental and regulatory framework is subjectto unexpected change and where the enforcement of contractualrights is uncertain. The legal framework of TOTAL’s exploration andproduction activities, established through concessions, licenses,permits and contracts granted by or entered into with a governmententity, a state-owned company or, sometimes, private owners, issubject to risks of renegotiation that, in certain cases, can reduceor challenge the protections offered by the initial legal framework.
In addition, the Group’s exploration and production activities in suchcountries are often undertaken in conjunction with state-owned
entities, for example as part of a joint venture where the state has asignificant degree of control. In recent years, in various regionsglobally, TOTAL has observed governments and state-ownedenterprises impose more stringent conditions on companiespursuing exploration and production activities in their respectivecountries, increasing the costs and uncertainties of the Group’sbusiness operations, which is a trend TOTAL expects to continue.
Potential increasing intervention by governments in such countriescan take a wide variety of forms, including:
– the award or denial of exploration and production interests;– the imposition of specific drilling obligations;– price and / or production quota controls and export limits;– nationalization or expropriation of assets;– unilateral cancellation or modification of license or contract rights;– increases in taxes and royalties, including retroactive claims;– the renegotiation of contracts;– the imposition of increased local content requirements;– payment delays; and– currency exchange restrictions or currency devaluation.
Imposition of any of these factors by a host government whereTOTAL has substantial operations, including exploration, couldcause the Group to incur material costs or cause the Group’sproduction or value of the Group’s assets to decrease, which couldpotentially have a material adverse effect on its results.
For example, the Nigerian government has been contemplatingnew legislation to govern the petroleum industry which, if passedinto law, could have an impact on the existing and future activitiesof the Group in that country through increased taxes and / oroperating costs and could adversely affect financial returns fromprojects in that country.
Risks and control 4Risk Factors
Registration Document 2015. TOTAL 65
TOTAL has activities in certain countries targeted by economicsanctions. If the Group’s activities are not conducted inaccordance with applicable laws and regulations, TOTAL couldbe sanctioned or otherwise penalized.
Various members of the international community have targetedcertain countries, including Iran, Syria and Russia, with economicsanctions and other restrictive measures. U.S. and Europeanrestrictions relevant to the Group and certain disclosure concerningthe Group’s limited activities or presence in certain targetedcountries are outlined below in points 1.9.1 and 1.9.2, respectively.
1.9.1. U.S. and European legal restrictions
TOTAL continues to closely monitor the possible impacts of internationaleconomic sanctions regimes on its activities. The Group does notbelieve that its activities in targeted countries are in violation ofapplicable international economic sanctions administered by theUnited States, the European Union (“EU”) and other members ofthe international community. However, the Group cannot assurethat current or future regulations or developments related to economicsanctions will not have a negative impact on its business orreputation. A violation by the Group of applicable laws or regulationscould result in criminal, civil and / or material financial penalties.
Restrictions against Iran
With respect to Iran, the United States has adopted a number ofmeasures since 1996 that provide for the possible imposition ofsanctions against non-U.S. companies engaged in certain activitiesin and with Iran. Pursuant to the Iran Sanctions Act (“ISA”), whichhas been amended and expanded on several occasions since1996, including by the Comprehensive Iran Sanctions,Accountability and Divestment Act of 2010 (“CISADA”), thePresident of the United States is authorized to initiate aninvestigation into the activities of non-U.S. companies in Iran’senergy sector and to impose sanctions against persons found,amongst other activities, to have knowingly made investments of$20 million or more in Iran’s petroleum sector in any 12-monthperiod. In May 1998, the U.S. government waived the application ofISA sanctions for TOTAL’s past investments in the South Pars gasfield. This waiver, which has not been modified since it was granted,does not address any of TOTAL’s other activities in Iran. Excludingthe investments made as part of the development of South Pars,TOTAL made investments in Iran in excess of $20 million in each ofthe years between 1996 and 2007.These investments are notsanctionable by the U.S. authorities pursuant to a determinationmade by the U.S. Department of State on September 30, 2010,under the “Special Rule” provision of ISA that allows it to avoidmaking a determination of sanctionability with respect to any partythat provides certain assurances. The U.S. Department of Statefurther indicated that, so long as TOTAL acts in accordance with its
commitments, it will not be regarded as a company of concern forits past Iran-related activities. Since 2008, TOTAL’s position in Iranessentially has consisted of being reimbursed for its pastinvestments as part of buyback contracts signed between 1995and 1999 with respect to permits on which the Group is no longerthe operator. Since 2011, TOTAL has had no production in Iran.Furthermore, since the applicability of the “Special Rule” to TOTALwas announced by the U.S. State Department, the United Statesimposed a number of additional restrictive measures targetingactivities in Iran. TOTAL does not conduct activities that it believeswould be sanctionable under these measures.
Many U.S. states have adopted legislation with respect to Iranrequiring, in certain conditions, state pension funds to divestthemselves of securities in any company with active businessoperations in Iran and state contracts not to be awarded to suchcompanies. State regulators have adopted similar initiatives relatingto investments by insurance companies. If TOTAL’s presence in Iranwere determined to fall within the prohibited scope of these laws,and TOTAL were not to qualify for any available exemptions, certainU.S. institutions holding interests in TOTAL may be required to selltheir interests. If significant, sales of securities resulting from suchlaws and / or regulatory initiatives could have an adverse effect onthe prices of TOTAL’s securities.
The EU has also adopted sanctions regimes with regard to Iran,including a set of restrictive measures adopted in July andOctober 2010 that prohibited, among other things, the supply ofkey equipment and technology in the refining, liquefied natural gas(LNG), and oil and gas exploration and production sectors in Iran,as well as technical assistance, training and financial assistance inconnection with such items. Extension of loans or credit to,acquisition of shares in, entry into joint ventures with or otherparticipation in enterprises in Iran (or Iranian-owned enterprisesoutside of Iran) engaged in any of the targeted sectors also isprohibited. Moreover, with respect to restrictions on transfers offunds and on financial services, any transfer of at least €400,000 orequivalent to or from an Iranian individual or entity shall require aprior authorization of the competent authorities of the EU MemberStates. TOTAL conducts its activities in compliance with these EUmeasures. On January 23, 2012, the Council of the EU prohibitedthe purchase, import and transport of Iranian oil and petroleum andpetrochemical products by European persons and by entitiesconstituted under the laws of an EU Member State. Prior to thatdate, TOTAL had ceased these activities.
On July 14, 2015, the EU, the P5+1 countries (China, France,Russia, the United Kingdom, the United States and Germany) andIran reached an agreement called the Joint Comprehensive Plan ofAction (the “JCPOA”) regarding limits on Iran’s nuclear activities andrelief under certain U.S., EU and UN sanctions regarding Iran. OnJanuary 16, 2016, in recognition of the International Atomic Energy
1.9. Countries targeted by economic sanctions
In addition, such misconduct or non-compliance may lead thecompetent authorities to impose other measures, such as theappointment of an independent monitor in charge of assessing theGroup’s compliance and internal control procedures and, if needbe, recommending improvements. For an overview of thesettlements between TOTAL, the SEC and the Department ofJustice (DoJ) providing for the appointment of an independentmonitor, refer to point 4.3 of this chapter and point 3.7 of chapter 7.
With respect to competition laws, which apply to the Group’scompanies in the vast majority of countries in which it does business,non-compliance may result in substantial fines and expose theGroup and its employees to criminal sanctions and civil suits.
Generally, entities of the Group could potentially be subject toadministrative, judicial or arbitration proceedings that could have amaterial adverse impact on the Group or its financial situation.
4 Risks and controlRisk Factors
TOTAL. Registration Document 201566
Agency (“IAEA”) having verified that Iran has met its initial nuclearcompliance commitments under the JCPOA, EU and UN andsecondary U.S. (i.e., those covering non-U.S. persons) economicand financial sanctions were suspended, but they could be re-imposedif there is a dispute over Iran’s compliance with its nuclear commitments.TOTAL is closely monitoring developments in this regard.
Restrictions against Syria
With respect to Syria, the EU adopted measures in May 2011 thatprohibit the supply of certain equipment to this country, as well ascertain financial and asset transactions with respect to a list ofnamed individuals and entities. These measures apply to Europeanpersons and to entities constituted under the laws of an EUMember State. In September 2011, the EU adopted furthermeasures, including, notably, a prohibition on the purchase, importor transportation from Syria of crude oil and petroleum products.Since early September 2011, the Group ceased to purchasehydrocarbons from Syria. On December 1, 2011, the EU extendedsanctions against, among others, three state-owned Syrian oilfirms, including General Petroleum Corporation, TOTAL’s co-contracting partner in the production sharing agreement signed in1988 (Deir Ez Zor licence) and the Tabiyeh contract. The UnitedStates also has various measures regarding Syria. Since earlyDecember 2011, the Group has ceased its activities thatcontributed to oil and gas production in Syria.
Restrictions against Russia
Since July 2014, members of the international community haveadopted economic sanctions against certain Russian persons andentities, including various entities operating in the financial, energyand defense sectors, in response to the situation in Ukraine.
Among other things, the United States has adopted economicsanctions targeting OAO Novatek(1) (“Novatek”), as well as entities inwhich Novatek (individually or with other similarly targeted personsor entities collectively) owns an interest of at least 50%, includingOAO Yamal LNG(2) (“Yamal LNG”). These sanctions prohibit U.S.persons from transacting in, providing financing for or otherwisedealing in debt issued by these entities after July 16, 2014 of greaterthan 90 days maturity. Consequently, the use of the U.S. dollar forsuch financing, including for Yamal LNG, is effectively prohibited.
As a result, the financing plan for the Yamal LNG project is beingreviewed, and the project’s partners are engaged in efforts todevelop a financing plan in compliance with the applicableregulations.
The economic sanctions initially adopted by the European Union in2014 and subsequently extended do not materially affect TOTAL’sactivities in Russia. TOTAL has been formally authorized to continueall its activities in Russia (in the Kharyaga field as operator, and inthe Termokarstovoye field and Yamal project in which the Groupholds interests) by the French government, which is the competentauthority for granting authorization under the EU sanctions regime.
TOTAL’s activities in Russia are also not materially affected byrestrictive measures adopted by the United States in August 2015imposing export controls and restrictions relating to the export ofcertain goods, services, and technologies destined for projectslocated in Russia in the field of oil exploration.
With respect to the exploration project in the Bazhenov play (tightoil) in western Siberia, which has been suspended since 2014,TOTAL signed in July 2015 an agreement to transfer the explorationlicenses it held in this play to OAO Lukoil. This agreement also setsout the conditions under which TOTAL and OAO Lukoil couldpotentially resume their joint activities in Russia. In January 2016,TOTAL signed an agreement to sell 50% of its interest in theKharyaga field and transfer the operatorship to Zarubezhneft. After the sale, which is expected to be completed in 2016, TOTAL’sinterest in the Kharyaga field will be 20%.
TOTAL continues to closely monitor the different internationaleconomic sanctions with respect to its activities in Russia.
As of December 31, 2015, the Group held 19% of its provedreserves in Russia.
1.9.2. Information concerning certain limitedactivities in Iran and Syria
Provided in this section is certain information concerning TOTAL’sactivities related to Iran that took place in 2015 that is required tobe disclosed pursuant to Section 13(r) of the Securities ExchangeAct of 1934, as amended (“U.S. Exchange Act”). In addition,information for 2015 is provided concerning the various types ofpayments made by Group affiliates to the government of anycountry identified by the United States as a state sponsor ofterrorism (currently, Iran, Syria and Sudan(3)) or any entity controlledby those governments. TOTAL believes that these activities are notsanctionable and has not been informed that it is at risk of possibleimposition of sanctions for activities previously disclosed. For moreinformation on certain U.S. and EU restrictions relevant to TOTAL inthese jurisdictions, see point 1.9.1 above.
Iran
The Iran Threat Reduction and Syria Human Rights Act of 2012(“ITRA”) added Section 13(r) to the U.S. Exchange Act, whichrequires TOTAL to disclose whether it or any of its affiliates hasengaged during the calendar year in certain Iran-related activities,including those targeted under ISA, without regard to whether suchactivities are sanctionable under ISA, and any transaction or dealingwith the Government of Iran that is not conducted pursuant to aspecific authorization of the U.S. government. While neither TOTAL S.A.nor any of its affiliates have engaged in any activity that would berequired to be disclosed pursuant to subparagraphs (A), (B) or (C)of Section 13(r)(1), affiliates of the Company may be deemed tohave engaged in certain transactions or dealings with the governmentof Iran that would require disclosure pursuant to Section 13(r)(1)(D),as discussed below.
UpstreamThe Group has no upstream activities in Iran and maintains a localoffice in Iran solely for non-operational functions. Some paymentsare yet to be reimbursed to the Group with respect to pastexpenditures and remuneration under buyback contracts enteredinto between 1997 and 1999 with the National Iranian Oil Company(“NIOC”) for the development of the South Pars 2&3 and Doroodfields. With respect to these contracts, development operationswere completed in 2010 and the Group is no longer involved in theoperation of these fields. In 2015, Total E&P Iran (100%), Elf PetroleumIran (99.8%), Total Sirri (100%) and Total South Pars (99.8%)
Risks and control 4Risk Factors
Registration Document 2015. TOTAL 67
(1) A Russian company listed on stock exchanges in Moscow and London and in which the Group held an interest of 18.9% as of December 31, 2015.(2) A company jointly owned by Novatek (60%), Total E&P Yamal (20%), and CNODC (20%), a subsidiary of China National Petroleum Corporation. Novatek’s investment in the company OAO Yamal
LNG is to be reduced to 50.1% following an agreement signed in September 2015 for the entry of the Silk Road Fund (9.9%). This agreement is expected to be approved by the authorities in 2016.(3) Since the independence of the Republic of South Sudan on July 9, 2011, TOTAL is no longer present in Sudan.
collectively made payments of approximately IRR 4 billion(approximately $0.1 million(1)) to (i) the Iranian administration fortaxes and social security contributions concerning the personnel ofthe aforementioned local office and residual buyback contract-relatedobligations, and (ii) Iranian public entities for payments with respectto the maintenance of the aforementioned local office (e.g., utilities,telecommunications). TOTAL expects similar or slightly higher paymentsto be made by these affiliates in 2016. Neither revenues nor profitswere recognized from the aforementioned activities in 2015.
In the context of the then-anticipated suspension of part of the sanctionstargeting Iran following the adoption of the JCPOA on July 14, 2015,there were contacts in 2015 between representatives of certainwholly-owned affiliates of TOTAL S.A and representatives of theIranian Government and NIOC within the framework of delegationsorganized by French authorities or during public internationalevents. During the course of these contacts, such affiliates receivedin 2015 verbal information of a general nature concerning certain oiland gas fields and projects in Iran and no information not permittedby applicable international economic sanctions was provided toIranian authorities for the development of Iranian hydrocarbons.Neither TOTAL S.A. nor any of its affiliates recognized any revenueor profit from this activity in 2015. Following the suspension of certaininternational economic sanctions against Iran on January 16, 2016(refer to point 1.9.1 above), TOTAL entered into a Memorandum ofUnderstanding (“MOU”) with NIOC and a framework agreement forthe purchase of crude oil for French and European refineries, inparticular. Pursuant to the MOU, NIOC will provide technical dataon certain oil and gas projects so that TOTAL can assess potentialdevelopments in Iran in compliance with the remaining applicableinternational economic sanctions.
Total E&P UK Limited (“TEP UK”), a wholly-owned affiliate ofTOTAL, holds a 43.25% interest in a joint venture at the Bruce fieldin the UK with BP Exploration Operating Company Limited (37.5%,operator), BHP Billiton Petroleum Great Britain Ltd (16%) andMarubeni Oil & Gas (North Sea) Limited (3.75%). This joint ventureis party to an agreement (the “Bruce Rhum Agreement”) governingcertain transportation, processing and operation services providedto a joint venture at the Rhum field in the UK that is co-owned byBP (50%, operator) and the Iranian Oil Company UK Ltd (“IOC”), asubsidiary of NIOC (50%) (together, the “Rhum Owners”). TEP UKowns and operates the Frigg UK Association pipeline and St FergusGas Terminal and is party to an agreement governing provision oftransportation and processing services to the Rhum Owners (the“Rhum FUKA Agreement”) (the Bruce Rhum Agreement and theRhum FUKA Agreement being referred to collectively as the “RhumAgreements”). To TOTAL’s knowledge, provision of all services underthe Rhum Agreements was initially suspended in November 2010,when the Rhum field stopped production following the adoption ofEU sanctions, other than critical safety-related services (i.e.,monitoring and marine inspection of the Rhum facilities), whichwere permitted by EU sanctions regulations. On October 22, 2013,the UK government notified IOC of its decision to apply a temporarymanagement scheme to IOC’s interest in the Rhum field within themeaning of UK Regulations 3 and 5 of the Hydrocarbons (TemporaryManagement Scheme) Regulations 2013 (the “HydrocarbonsRegulations”). Since that date all correspondence in respect ofIOC’s interest in the Rhum Agreements has been with the UKgovernment in its capacity as temporary manager of IOC’s interestsand TEP UK has had no contact with IOC in 2015 regarding the
Rhum Agreements. On December 6, 2013, the UK governmentauthorized TEP UK, among others, under Article 43a of EURegulation 267 / 2012, as amended by 1263 / 2012 and underRegulation 9 of the Hydrocarbons Regulations, to carry out activitiesin relation to the operation and production of the Rhum field. In addition,on September 4, 2013, the U.S. Treasury Department issued a licenseto BP authorizing BP and certain others to engage in variousactivities relating to the operation and production of the Rhum field.Following receipt of all necessary authorizations, the Rhum fieldresumed production on October 26, 2014 with IOC’s interest in theRhum field and the Rhum Agreements subject to the UK government’stemporary management pursuant to the Hydrocarbons Regulations.Services have been provided by TEP UK under the Rhum Agreementssince that date and TEP UK has received tariff income from BP andthe UK government (in its capacity as temporary manager of IOC’sinterest in the Rhum field) in accordance with the terms of theRhum Agreements. In 2015, these activities generated for TEP UKgross revenue of approximately £4.6 million (approximately$6.4 million) and net profit of approximately £1.4 million (approximately$2.0 million). On August 27, 2015, TEP UK signed a sale andpurchase agreement to divest its entire interest in the Frigg UKAssociation pipeline and St Fergus Gas Terminal to NSMPOperations Limited (“NSMP”). Upon completion of the divestment,TEP UK’s interest in the Rhum FUKA Agreement will be novated toNSMP whereupon TEP UK’s only interest in the Rhum FUKAAgreement will be in relation to the settlement of historical forcemajeure claims with the Rhum Owners relating to the period whenthe Rhum field was shut down. Subject to the foregoing, TEP UKintends to continue such activities so long as they continue to bepermissible under UK and EU law and not be in breach ofremaining applicable international economic sanctions.
DownstreamThe Group does not own or operate any refineries or chemicalsplants in Iran and did not purchase Iranian hydrocarbons whenprohibited by applicable EU and U.S. economic and financialsanctions (refer to point 1.9.1, above).
Hutchinson, a wholly-owned affiliate of TOTAL, conducted, inconjunction with a delegation of international companies (Fédérationdes Industries des Equipements pour Véhicules), two visits in Iran in2015 to discuss business opportunities in the Iranian car industrysector with several companies, including some having direct orindirect ties to the government of Iran. Hutchinson recognized norevenue or profit from this activity in 2015 and expects to continuesuch discussions in the future.
Until December 2012, at which time it sold its entire interest, the Groupheld a 50% interest in the lubricants retail company Beh Total (nownamed Beh Tam) along with Behran Oil (50%), a company controlledby entities with ties to the government of Iran. As part of the sale of theGroup’s interest in Beh Tam, TOTAL S.A. agreed to license thetrademark “Total” to Beh Tam for an initial 3-year period for the sale byBeh Tam of lubricants to domestic consumers in Iran. In 2014, TotalE&P Iran (“TEPI”), a wholly-owned affiliate of TOTAL S.A., received, onbehalf of TOTAL S.A., royalty payments of approximately IRR 24 billion(nearly $1 million(2)) from Beh Tam for such license. These paymentswere based on Beh Tam’s sales of lubricants during the previouscalendar year. In 2015, royalty payments were suspended due to anadjustment procedure concerning these payments brought by theIranian tax authorities against TEPI, which TEPI expects will be settled
4 Risks and controlRisk Factors
TOTAL. Registration Document 201568
(1) Unless otherwise indicated, all non-USD currencies presented in this point 1.9.2 were converted to USD using the prevailing exchange rates available on February 29, 2016.(2) Based on an average daily exchange rate of $1 = IRR 0.000039 during 2014, as published by Bloomberg.
There are no governmental, legal or arbitration proceedings,including any proceeding of which the Company is aware that arepending or threatened against the Company, that could have, orcould have had during the last 12 months, a material impact on theGroup’s financial situation or profitability.
Described below are the main administrative, legal and arbitrationproceedings in which the Company and the other entities of theGroup are involved.
AlitaliaIn the Marketing & Services segment, a civil proceeding wasinitiated in Italy, in 2013, against TOTAL S.A. and its subsidiary Total Aviazione Italia Srl before the competent Italian civil court. The plaintiff claims against TOTAL S.A., its subsidiary and otherthird parties, damages that it estimates to be nearly €908 million.This proceeding follows practices that had been condemned by theItalian competition authority in 2006. The parties have exchangedpreliminary findings. The existence and the assessment of thealleged damages in this procedure involving multiple defendantsremain contested.
Blue Rapid and the Russian Olympic Committee – Russianregions and InterneftBlue Rapid, a Panamanian company, and the Russian OlympicCommittee filed a claim for damages with the Paris CommercialCourt against Elf Aquitaine, alleging a so-called non-completion bya former subsidiary of Elf Aquitaine of a contract related to anexploration and production project in Russia negotiated in the early1990s. Elf Aquitaine believed this claim to be unfounded andopposed it. On January 12, 2009, the Commercial Court of Parisrejected Blue Rapid’s claim against Elf Aquitaine and found that theRussian Olympic Committee did not have standing in the matter.On June 30, 2011, the Court of Appeal of Paris dismissed asinadmissible the claim of Blue Rapid and the Russian OlympicCommittee against Elf Aquitaine, notably on the grounds of thecontract having lapsed. The judgment of the Court of Appeal ofParis is now final and binding following two decisions issued onFebruary 18, 2016 by the French Supreme Court to put an end tothis proceeding.
2. Legal and arbitration proceedings
in 2016. Therefore, TEPI expects royalty payments may resume in2016. In addition, representatives of the Group and Beh Tam metseveral times in 2015 to discuss the local lubricants market and furtherdiscussions are expected to take place in the future.
Total Liban, a Lebanese company wholly-owned by the Group, is amember of a consortium with five other companies for the purposeof providing services for fueling facilities at Beirut InternationalAirport (“BIA”) to the members of the consortium. The consortiummembers assume, on a rotating three-year term, ministerial andadministrative responsibilities (including supervision of fuel services)in connection with the consortium. Until October 2015, Total Libanserved in this capacity. During this period, another consortium memberhad a fuel supply contract with Iran Air. Total Liban did not receive,directly or indirectly, any profit or remuneration in connection withthe fuel sold to Iran Air by this other consortium member.
Total Marketing Middle East FZE (“TMME”), a wholly-owned affiliateof the Group, sold lubricants to Beh Tam in 2015. The sale in 2015of approximately 299 t of lubricants and special fluids generatedgross revenue of approximately AED 2 million (approximately $0.5 millionand net profit of approximately AED 1.7 million (approximately $0.5 million). TMME expects to continue this activity in 2016.
Total Marketing France (“TMF”), a French company wholly-ownedby Total Marketing Services (“TMS”), itself a French companywholly-owned by TOTAL S.A. and six Group employees, providedin 2015 fuel payment cards to the Iranian embassy in France for usein the Group’s service stations. In 2015, these activities generatedgross revenue of approximately €25,000 (approximately $27,200)and net profit of approximately €1,000 (approximately $1,100).TMF expects to continue this activity in 2016.
Total Belgium (“TB”), a Belgian company wholly-owned by theGroup, provided in 2015 fuel payment cards to the Iranian embassyin Brussels for use in the Group’s service stations. In 2015, these
activities generated gross revenue of approximately €23,100(approximately $25,100) and net profit of approximately €1,600(approximately $1,700). TB expects to continue this activity in 2016.
Proxifuel, a Belgian company wholly-owned by the Group, sold in2015 heating oil to the Iranian embassy in Brussels. In 2015, these activities generated gross revenue of approximately €2,400(approximately $2,600) and net profit of approximately €200(approximately $220). Proxifuel expects to continue this activity in 2016.
Caldeo, a French company wholly-owned by TMS, sold in 2015domestic heating oil to the Iranian embassy in France, whichgenerated gross revenue of nearly €3,500 (approximately $3,800)and net profit of approximately €700 (approximately $760). Caldeo expects to continue this activity in 2016.
Total Namibia (PTY) Ltd (“TN”), a wholly-owned affiliate of Total SouthAfrica (PTY) Ltd (of which the Group holds 50.1%), sold petroleumproducts and services during 2015 to Rössing Uranium Limited, acompany in which the Iranian Foreign Investment Co. holds aninterest of 15.3%. In 2015, these activities generated gross revenueof approximately N$115 million (approximately $7.3 million) and netprofit of nearly N$5 million (approximately $0.3 million). TN expectsto continue this activity in 2016.
Syria
Since early December 2011, TOTAL has ceased its activities thatcontribute to oil and gas production in Syria and maintains a localoffice solely for non-operational functions. In 2015, TOTAL madepayments of approximately SYP 37 million (approximately $0.2 million)to Syrian government agencies in the form of taxes and contributionsfor public services rendered in relation to the maintenance of theaforementioned office and its personnel. In late 2014, the Groupinitiated a downsizing of its Damascus office and reduced its staffto a few employees.
Risks and control 4Legal and arbitration proceedings
Registration Document 2015. TOTAL 69
In connection with the same facts, and 15 years after theaforementioned exploration and production contract was renderednull and void (“caduc”), a Russian company, which was held not tobe the contracting party to the contract, and two regions of theRussian Federation that were not even parties to the contract,launched an arbitration procedure against the aforementionedformer subsidiary of Elf Aquitaine that was liquidated in 2005,claiming alleged damages of $22.4 billion. For the same reasons asthose successfully adjudicated by Elf Aquitaine against Blue Rapidand the Russian Olympic Committee, the Group considers thisclaim to be unfounded as a matter of law and fact.
The Group has lodged a criminal complaint to denounce thefraudulent claim of which the Group believes it is a victim and, hastaken and reserved its rights to take all actions and measures todefend its interests.
FERCThe Office of Enforcement of the U.S. Federal Energy RegulatoryCommission (FERC) has begun an investigation in connection withthe natural gas trading activities of TOTAL Gas & Power NorthAmerica, Inc, an American subsidiary of the Group. The investigationcovers transactions made by the Group’s subsidiary betweenJune 2009 and June 2012 on the natural gas market. TOTALGas & Power North America, Inc received a Notice of AllegedViolations of the FERC on September 21, 2015
The Group’s subsidiary is cooperating in the investigation with theU.S. authorities, while contesting the claims brought against it.
Grande ParoisseOn September 21, 2001, an explosion occurred at the industrialsite of Grande Paroisse (a former subsidiary of Atofina which becamea subsidiary of Elf Aquitaine Fertilisants on December 31, 2004), in astockpile of ammonium nitrate pellets. The explosion caused thedeath of thirty-one people, including twenty-one workers at the site,injured many others and caused significant damage on the site andto property in the city of Toulouse.
Grande Paroisse donated the former site of the plant to the greateragglomeration of Toulouse. A €10 million endowment was alsogranted to the InNaBioSanté research foundation as part of thesetting up of a cancer research center at the site.
After many years, the investigating magistrate brought chargesagainst Grande Paroisse and the former Plant Manager before theToulouse Criminal Court. TOTAL S.A. and the CEO at the time ofthe event were summoned to appear in Court pursuant to a requestby a victims association.
On November 19, 2009, the Toulouse Criminal Court acquittedboth the former Plant Manager and Grande Paroisse due to thelack of reliable evidence for the explosion. The Court declaredGrande Paroisse civilly liable for the damages caused by the explosionto the victims in its capacity as custodian and operator of the plant.The Court also ruled that the summonses were inadmissible.
On September 24, 2012, the Court of Appeal convicted the formerPlant Manager and Grande Paroisse. The summonses weredetermined to be inadmissible.
On January 13, 2015, the French Supreme Court (Cour de cassation)fully quashed the decision of September 24, 2012. The FrenchSupreme Court ruled that the Court of Appeal impartiality wasquestionable and that the application of the law on which theconviction was partially based was improper. The case has beenreferred back to the Court of Appeal of Paris for a new criminal trialthat could be held in early 2017.
A compensation mechanism for victims was set up immediatelyfollowing the explosion. €2.3 billion was paid for the compensationof claims and related expenses amounts. A €7.3 million reserveremains booked in the Group’s Consolidated Financial Statementsas of December 31, 2015.
IranIn 2003, the Securities and Exchange Commission (SEC) followedby the Department of Justice (DoJ) issued a formal order directingan investigation against TOTAL, and others oil companies, for allegedviolations of the Foreign Corrupt Practices Act (FCPA) and theCompany’s accounting obligations in connection with the pursuit of business in Iran in the 1990s.
In late May 2013, and after several years of discussions, TOTALreached settlements with the U.S. authorities (a Deferred ProsecutionAgreement with the DoJ and a Cease and Desist Order with theSEC). These settlements, which put an end to these investigations,were concluded without admission of guilt and in exchange forTOTAL respecting a number of obligations, including the paymentof a fine and civil compensation for an aggregate amount of$398.2 million. By virtue of these settlements, TOTAL also acceptedthe appointment of a French independent compliance monitor toreview the Group’s compliance program and to recommendpossible improvements. For more information, refer to point 4.3 ofthis chapter and point 3.7 of chapter 7.
With respect to the same facts, TOTAL was placed under formalinvestigation in France in 2012. In October 2014, the investigatingmagistrate decided to refer the case to trial.
ItalyAs part of an investigation led by the Public Prosecutor of thePotenza Court in 2007, Total Italia and certain Group employeeswere the subjects of an investigation related to alleged irregularitiesin connection with the purchase of lands and the award of calls fortenders in relation to the preparation and development of an oil fieldlocated in the south of Italy.
In May 2012, the Judge of the preliminary hearing decided to sendTotal Italia and several employees for trial before the Criminal Court of Potenza. The trial started in September 2012 and is still ongoing. The judgment of the Court of Potenza is expected during the secondquarter of 2016.
Oil-for-Food ProgramSeveral countries have launched investigations concerning possibleviolations of the UN resolutions relating to the Iraqi Oil-for-FoodProgram implemented as from 1996.
Pursuant to a French criminal investigation, certain current orformer Group employees were placed under formal criminalinvestigation for possible charges as aiding and abetting themisappropriation of corporate assets and/or as aiding and abettingthe corruption of foreign public agents. In 2010, TOTAL S.A. wasindicted on bribery charges as well as aiding and abetting andconcealing the influence peddling.
On July 8, 2013, TOTAL S.A. and the persons who were prosecutedwere cleared of all charges by the Paris Criminal Court, which foundthat none of the offenses for which they had been prosecuted wasestablished. The Prosecutor’s office appealed the parts of the CriminalCourt’s decision acquitting TOTAL S.A. for corruption of foreign publicagents. On February 26, 2016, the Court of Appeal of Paris overturnedthe Criminal Court’s decision and TOTAL S.A. was convicted andordered to pay a fine of €750,000. The Company has decided to appealthis decision before the French Supreme Court (Cour de cassation).
4 Risks and controlLegal and arbitration proceedings
TOTAL. Registration Document 201570

The Group has worldwide property insurance and third-party liabilitycoverage for all its subsidiaries. These programs are contractedwith first-class insurers (or reinsurers and oil and gas industrymutual insurance companies through ORC).
The amounts insured depend on the financial risks defined in thedisaster scenarios and the coverage terms offered by the market(available capacities and price conditions).
More specifically for:
– third-party liability: since the maximum financial risk cannot beevaluated by a systematic approach, the amounts insured arebased on market conditions and oil and gas industry practice. In 2015, the Group’s third-party liability insurance for any liability(including potential accidental environmental liabilities) wascapped at $900 million (onshore) and $850 million (offshore). In addition, the Group adopts, where appropriate, the necessarymeans to manage the compensation of victims in the event of anindustrial accident for which it is liable; and
– property damage and business interruption: the amounts insuredvary by sector and by site and are based on the estimated costand scenarios of reconstruction under maximum loss situationsand on insurance market conditions. The Group subscribed forbusiness interruption coverage in 2015 for its main refining andpetrochemical sites.
For example, for the Group’s highest risks (North Sea platforms andmain refineries or petrochemical plants), in 2015 the insurance limit
for the Group share of the installations was approximately $1.75 billionfor the Refining & Chemicals segment and approximately $2.15 billionfor the Upstream segment.
Deductibles for property damage and third-party liability fluctuatebetween €0.1 and €10 million depending on the level of risk andliability, and are borne by the relevant subsidiaries. For businessinterruption, coverage is triggered 60 days after the occurrencegiving rise to the interruption. In addition, the main refineries andpetrochemical plants bear a combined retention for property damageand business interruption of $75 million per insurance claim.
Other insurance contracts are bought by the Group in addition toproperty damage and third-party liability coverage, mainly in connectionwith car fleets, credit insurance and employee benefits. These risksare mostly underwritten by outside insurance companies.
The above-described policy is given as an example of a situation asof a given date and cannot be considered as representative of futureconditions. The Group’s insurance policy may be changed at anytime depending on the market conditions, specific circumstancesand on the General Management’s assessment of the risks incurredand the adequacy of their coverage.
TOTAL believes that its insurance coverage is in line with industrypractice and sufficient to cover normal risks in its operations.However, the Group is not insured against all potential risks. In theevent of a major environmental disaster, for example, TOTAL’sliability may exceed the maximum coverage provided by its third-
3.3. Insurance policy
In this context, the Group risk and insurance management policy isto work with the relevant internal department of each subsidiary to:
– define scenarios of major disaster risks (estimated maximum loss);– assess the potential financial impact on the Group should a
catastrophic event occur;
– help implement measures to limit the probability that a catastrophicevent occurs and the financial consequences if such eventshould occur; and
– manage the level of financial risk from such events to be either coveredinternally by the Group or transferred to the insurance market.
3.2. Risk and insurance management policy
TOTAL has its own reinsurance company, Omnium ReinsuranceCompany (ORC). ORC is integrated within the Group’s insurancemanagement and is used as a centralized global operations tool forcovering the Group companies’ insurable risks. It allows theGroup’s worldwide insurance program to be implemented incompliance with the specific requirements of local regulationsapplicable in the countries where the Group operates.
Some countries may require the purchase of insurance from a localinsurance company. If the local insurer accepts to cover thesubsidiary of the Group in compliance with its worldwide insuranceprogram, ORC negotiates a retrocession of the covered risks fromthe local insurer. As a result, ORC enters into reinsurance contractswith the subsidiaries’ local insurance companies, which transfermost of the risk to ORC.
At the same time, ORC negotiates a reinsurance program at theGroup level with oil industry mutual insurance companies andcommercial reinsurance markets. ORC allows the Group to bettermanage price variations in the insurance market by taking on agreater or lesser amount of risk corresponding to the price trends inthe insurance market.
In 2015, the net amount of risk retained by ORC after reinsurancewas, on the one hand, a maximum of $53 million per onshore third-party liability insurance claim or $77 million per offshore third-partyliability insurance claim and, on the other hand, $75 million perproperty damage and / or business interruption insurance claim.Accordingly, in the event of any loss giving rise to an aggregateinsurance claim, the effect on ORC would be limited to itsmaximum retention of $152 million per occurrence.
3. Insurance and risk management
3.1. Organization
Risks and control 4Insurance and risk management
Registration Document 2015. TOTAL 71
The Group is structured around three business segments (Upstream,Refining & Chemicals, Marketing & Services) to which the Group’soperational entities report. Business segment management areresponsible, within their area of responsibility, for ensuring thatoperations are carried out in accordance with the strategic objectivesdefined by the Board of Directors and General Management. Thefunctional departments of the Holding level help General Managementdefine norms and standards, oversee their application and monitoractivities. They also lend their expertise to the operational divisions.
The functional departments of the Holding level include the FinanceDivision (to which the Group Risk Assessment and InsuranceDepartment and the Group Information Technology Departmentreport), the Legal Affairs Department (including the Compliance andSocial Responsibility Department) and Corporate Affairs (to whichthe following departments report: Corporate Internal Control andAudit, Sustainable Development and Environment, HumanResources, Security, Industrial Safety and Purchasing).
The Group’s internal control and risk management systems arestructured around this three-level organization – Holding level,business segments, operational entities – where each level isdirectly involved and accountable in line with the degree ofcentralization decided by General Management.
General Management constantly strives to maintain an efficientinternal control system across the Group, based on the frameworkof the Committee of Sponsoring Organizations of the TreadwayCommission (COSO). In this framework, internal control is a processintended to provide reasonable assurance that the objectivesrelated to operations, reporting and compliance with applicablelaws and regulations are achieved. As for any internal controlsystem, it cannot provide an absolute guarantee that all risks arecompletely controlled or eliminated. The COSO framework isconsidered equivalent to the reference framework of the French
Financial Markets Authority (Autorité des marchés financiers). TheGroup has also chosen to rely on this framework as part of itsobligations under the Sarbanes-Oxley Act.
The Group’s internal control and risk management systems aretherefore based on the five components of this framework: controlenvironment, risk assessment, control activities, monitoring andinformation, and communication.
The Group’s risk management system draws on the maininternational standards (COSO Enterprise Risk Managementintegrated framework, ISO 31000: 2009 – Risk management) aswell as on French standards (Reference framework of the FrenchFinancial Markets Authority). The internal Risk Management,Internal Control and Audit Charter forms the common frameworkon which the Group relies to ensure control of its activities.
The Group’s internal control and risk management systems coverthe processes of the fully consolidated entities and the mostimportant equity affiliates.
Under these internal control principles, which are part of thecorporate governance organization, the Audit Committee isresponsible for monitoring the efficiency of internal control and riskmanagement systems, assisted by the Corporate Internal Controland Audit Department and the internal control teams from thebusiness segments. These rules are particularly designed to allowthe Board of Directors to ensure that internal control is effective andthat published information available to shareholders and financialmarkets is reliable.
Approximately 400 employees monitor the internal control systemswithin the Group. The assessment of the internal control and riskmanagement system is mainly overseen by the Corporate InternalControl and Audit Department, which employed 79 people in 2015and carried out more than 180 internal audits.
4.1. Basic elements of internal control
Information related to the internal control and risk managementprocedures implemented within the Group presented hereafter arepart of the Report of the Chairman of the Board of Directors preparedpursuant to Article L. 225-37 of the French Commercial Code (referto the cross-reference list specific to the Report of the Chairman ofthe Board of Directors, page 359 of this Registration Document).
The information contained in the Report of the Chairman of theBoard of Directors was prepared with the assistance of several ofthe Company’s corporate functional departments, including inparticular the Legal, Finance and Group Internal Control and AuditDepartments. After the sections relevant to their respective dutieswere reviewed by the Governance and Ethics Committee, theCompensation Committee and the Audit Committee, theinformation was approved by the Board of Directors.
4. Internal control and risk management procedures(Article L. 225-37 of the French Commercial Code)
party liability insurance. The loss TOTAL could suffer in the event ofsuch disaster would depend on all the facts and circumstances ofthe event and would be subject to a whole range of uncertainties,including legal uncertainty as to the scope of liability forconsequential damages, which may include economic damage not
directly connected to the disaster. The Group cannot guaranteethat it will not suffer any uninsured loss and there can be noguarantee, particularly in the case of a major environmental disasteror industrial accident, that such loss would not have a materialadverse effect on the Group.
4 Risks and controlInternal control and risk management procedures
TOTAL. Registration Document 201572
The control environment is based primarily on the Group’s Code ofConduct, which, in addition to safety, sets forth its core values (respect,responsibility and exemplary conduct) and business principles interms of safety, security, health, protection of the environment,integrity and respect for human rights. This Code of Conduct buildstrust between TOTAL and both its employees and stakeholders.
Integrity and ethics
The Group’s values and business principles are set out in its Codeof Conduct (revised in 2014), its Business Integrity Guide and itsHuman Rights Guide. These documents are distributed to allemployees and are available on the intranet. They also set out therules of individual behavior expected of all employees in thecountries where the Group has a presence. The Group has pledgedits adherence to recognized international standards related tohuman rights and, in particular, the core conventions of theInternational Labour Organization (ILO), the “voluntary principles onsecurity and human rights” and the United Nations guidingprinciples on business and human rights.
The Financial Code of Ethics, which also refers to the Code of Conduct,sets forth specific rules for the Chairman and Chief Executive Officer,the Chief Financial Officer, the Senior Vice President Accounting andthe financial and accounting officers of the principal Group activities.
As a priority of General Management, the Group deploys ethics andcompliance policies and programs, including in particular anti-fraudprograms and programs for the prevention of corruption andcompetition law infringement. These include training programs aswell as compliance audits and ethical assessments (refer to point3.7 of chapter 7). The Group also relies on the Ethics Committee,whose role is to listen and provide assistance in these areas.
The relationship between the Group and its service providers is alsobased on adherence to the principles set forth in the Code of Conductand on the fundamental principles of purchasing attached to allcontracts. Suppliers and service providers are required to applystandards equivalent to those of the Group, particularly with respectto their employees, and to make every effort to encourage their ownsuppliers and subcontractors in turn to respect these principles (forfurther information about relations between the Group and itssuppliers, refer to point 3.6 of chapter 7).
Structure, authority and responsibility
General Management ensures that the organizational structure andreporting lines plan, execute, control and periodically assess theGroup’s activities. General Management regularly reviews therelevance of the organizational structures so as to be able to adaptthem quickly to changes in the activities and in the environment inwhich they are carried out.
The Group has also defined central responsibilities that cover thethree lines of defense of internal control: (1) operational management,which is responsible for implementing internal control, (2) supportfunctions (such as Finance, Legal, Human Resources, etc.), whichprescribe the internal control systems, verify their implementationand effectiveness and assist operational employees, and (3) internalauditors who, through their internal control reports, providerecommendations to improve the effectiveness of the system.
In addition, an accountability system is defined and formalized at alllevels of the organization, through organization notes, organizationcharts, appointment notes, job descriptions and delegations of
powers. Each business segment has established clear rules applicableto its specific scope by directly integrating the Group’s instructions.
Policies and procedures
TOTAL incorporates the values, fundamental principles, strategic optionsand respective requirements of the businesses, at all levels of theorganization, into a normative framework, supplemented by a set ofpractical recommendations and feedback. Like the Group’s organization,this framework has a three-level structure: a Group level, with theREFLEX Group framework and the technical framework set out by theCorporate Technology Group, frameworks for each business segment;and a specific framework for each significant operational entity.
A document known as the governance framework details therelationship between these frameworks and describes theirrespective scope, the way in which the standards differ from oneanother (by adaptation, clarification or stricter requirements relativeto higher level standards), exemption processes, if any, standardsdevelopment processes and the monitoring system put in place.
The main procedures regarding financial controls established at thecorporate level cover acquisitions and sales, capital expenditure,financing and cash management, budget control and financialreporting. Disclosure controls and procedures are in place (refer topoint 4.3.2 below). At the operating levels, these procedures mainlypertain to directives, rules and recommendations regarding health,general safety, industrial safety, IT security, the environment andSustainable Development, as well as integrity and fraud andcorruption prevention.
These documents, all of which are published on the intranet, arereviewed regularly and their implementation is monitored.
At the business segment or operational entity levels, control activitiesare organized around the main operational processes: explorationand reserves, procurement, capital expenditure, production, sales,oil and gas trading, inventories, human resources, financing andcash management, and account closing process.
Commitment to competence
The Group’s Human Resources policy, revised in 2014, sets outrules and practices that reflect its commitment in terms of socialresponsibility and its expectations of employees, particularly interms of competencies. Descriptions of jobs within the Group’svarious entities define the competencies and expertise required foremployees to carry out their functions effectively.
In addition, the Human Resources function shapes and regularlyupdates policies aimed at attracting new talents, includingemployee training, assessment and retention policies (annualappraisals, training programs, compensation policies and careermanagement – refer to point 1 of chapter 7).
Accountability
The Board of Directors, with the support of the Audit Committee,ensures that the internal control functions are operating properly.The Audit Committee ensures that General Managementimplements internal control and risk management procedures basedon the risks identified, such that the Group’s objectives are achieved.
The general managements of the business segments andoperational entities are responsible for designing and deployingspecific components of this internal control and risk management
Risks and control 4Internal control and risk management procedures
Registration Document 2015. TOTAL 73
4.2. Control environment
To implement its strategy, General Management ensures that clearand precise objectives are defined at the various levels of theorganization with regard to operations, reporting and compliance.
Operational objectives focus on the definition and efficient use ofhuman, financial and technical resources. In particular, they aredefined during the budgetary processes and in the long-term plan,and are monitored regularly as part of the self-assessment process.
The monitoring of operational objectives (financial and non-financial)helps in decision-making and monitoring performance of activitiesat each level of the organization.
TOTAL has set up an ongoing process to identify and analyze risksthat may preclude the achievement of its objectives. The Grouptakes into account risks at all levels of the organization and in all itsentities, and examines factors that influence the severity, probabilityof occurrence of risks or the loss of its assets and the potentialimpact on operations, reporting (financial and non-financial) andcompliance with applicable laws and regulations.
The Group has developed a control framework in line with the riskassessments performed and implements initiatives necessary foraddressing specific risks by enforcing Group-wide rules. Theseinitiatives must reduce the probability of occurrence of risks andtheir possible impact. They also cover the main processesoutsourced via subcontracting agreements.
TOTAL also identifies changes that could have a significant impacton its internal control system, particularly changes related to assets
consolidated by the business segments. To this end, the Grouprelies on governance bodies adapted to its various activities andcapable of making and implementing decisions necessary for quicklyresponding to material changes that the Group must deal with.
The risk-mapping activities carried out by the Group’s entities aspart of a regular risk assessment process help identify and analyzekey ongoing or foreseeable changes.
4.3.1. Monitoring of risk management systems
The Executive Committee, with the assistance of the Group RiskCommittee (GRC) created in 2011, is responsible for identifying andanalyzing internal and external risks that could impact TOTAL’sperformance. The GRC’s main function is to identify risks that couldprevent the Group from achieving its objectives and to ensure theexistence and effectiveness of risk management systems adaptedto the Group’s needs.
The GRC relies on the work carried out by the business segmentsand functional departments, which concurrently establish their ownrisk mapping. These maps are drawn up according to a methodologicalframework developed by the Group. The activities of the GRC, themajor risks identified by the Group and the risk mappings of thebusiness segments are regularly reported to the Audit Committee
The Group’s business segments and entities are responsible for definingand implementing a risk management policy suited to their specificactivities. However, today the handling of certain transverse risks ismore closely coordinated by the respective functional departments.
4.3. Risk assessment and management
system within their area of responsibility. A representation letterprocess regularly deployed at the various levels of the organizationreinforces the effectiveness of the internal control system,particularly over financial reporting.
The Internal Control Department has pursued a process aimed atstrengthening the assessment of the role and involvement of allemployees in terms of internal control. Training initiatives tailored tothe various stakeholders involved in the internal control process areregularly launched within the Group.
Control activities and assessment
The Group regularly examines and assesses the design andeffectiveness of the key operational, financial and informationtechnology controls related to internal control over financialreporting, pursuant to Section 404 of the Sarbanes-Oxley Act. In 2015, this assessment was performed with the assistance of the Group’s main entities and the Corporate Internal Control and Audit Department. The system used covers:
– the most significant entities, which assess the key operationalcontrols of their significant processes and respond to a Groupquestionnaire for assessing the internal control system;
– other less significant entities, which respond only to the Groupquestionnaire for assessing the internal control system.
These two categories of entities account for approximately 80%and 10%, respectively, of the financial aggregates in the Group’sConsolidated Financial Statements.
In addition, any activity, process or management system may bethe subject of an internal audit conducted by Group Audit, in
accordance with the international internal audit framework and itscode of ethics. The Corporate Internal Control and Audit Departmentalso conducts joint audits with third-party auditors and providesassistance (advice, analysis, input regarding methodology). The auditplan, which is based on an analysis of the risks and risk managementsystems, is submitted annually to the Executive Committee and theAudit Committee for approval. The statutory auditors also reviewthe internal controls that they deem necessary as part of theircertification of the financial statements. In 2015, they reviewed theimplementation of the Group’s internal control framework and thedesign and effectiveness of key internal controls at its main entitiesregarding financial reporting. Based on their work, the statutoryauditors declared that they had no comments on the informationand statements presented in this present Report of the Chairman of the Board on internal control and risk management procedures.
The reports on the work performed by the Group Audit andstatutory auditors are periodically summarized and presented to theAudit Committee and, thereby, to the Board of Directors. TheSenior Vice President, Corporate Internal Control and Auditattended all Audit Committee meetings held in 2015. The AuditCommittee also interviews the statutory auditors at least once ayear without any Company representatives present.
If areas of improvement are identified by these internal audits andoperational controls, then corrective action plans are drawn up andshared with operational management who, along with the CorporateInternal Control and Audit Department, monitor them closely.
Based on the internal reviews, General Management has reasonableassurance of the effectiveness of the Group’s internal control.
4 Risks and controlInternal control and risk management procedures
TOTAL. Registration Document 201574
General Management exercises operational control over TOTAL’sactivities through the Executive Committee’s approval of investmentsand commitments for projects based on defined thresholds. Theseprojects are subject to prior review by the Risk Committee (CORISK),whose conclusions are transmitted to the Executive Committee. As part of this review, the CORISK verifies the analysis of thevarious project-related risks.
The Group implements appropriate control systems for the mainrisks identified.
Financial risks
The management and conditions procedures for using financialinstruments are governed by strict rules that are defined by the Group’sGeneral Management, and which provide for centralization by theTreasury Department of liquidity, interest exchange rate positions,management of financial instruments and access to capital markets.
The Group’s financing policy consists of incurring long-term debtprimarily at a floating rate, or at a fixed rate when warranted byinterest rates. Debt is mainly incurred in U.S. dollars or eurosaccording to the Group’s general corporate needs.
The Group’s cash balances, which mainly consist of euros and U.S.dollars, are managed to maintain liquidity based on daily interestrates in the given currency. Maximum amounts are set fortransactions exceeding one month, with placements not to exceed12 months. TOTAL S.A. also has confirmed credit facilities grantedby international banks. These credit facilities, along with the Group’snet cash position, allow it to continually maintain a high level ofliquidity in accordance with targets set by General Management.
In terms of counterparty risk in financial transactions, the Groupadheres to a cautious policy, and only makes commitments withinstitutions featuring a high degree of financial soundness, as basedon a multi-criteria analysis. An overall credit limit is set for eachauthorized financial counterparty and allocated among the Group’ssubsidiaries. In addition, to reduce market value risk on itscommitments, the Treasury Department has entered into margincall contracts with its significant counterparties.
The Group seeks to minimize its currency exposure, on the one handby financing its long-term assets in the functional currency of theentity to which they belong and, on the other hand, by systematicallyhedging the currency exposure generated by commercial activity.These risks are managed centrally by the Treasury Department,which operates within a set of limits defined by General Management.
The policy for managing risks related to financing and cashmanagement activities as well as the Group’s currency exposureand interest rate risks is described in detail in Note 31 to theConsolidated Financial Statements (point 7 of chapter 10).
Industrial and environmental risks and risks related to climate issues
The Group has developed a Safety Health Environment QualityCharter that sets out the basic principles applicable to theprotection of people, property and the environment. This Charter isimplemented at several levels within the Group through itsmanagement systems.
Along these lines, TOTAL develops safety, environment and qualitymanagement systems such as MAESTRO (internal HSE managementsystem) and takes a targeted approach to certifying its activitiesbased on such standards as ISO 14001 and ISO 9001.
As part of its policy, the Group performs regular assessments,following various procedures, of the risks and impacts of itsactivities in the areas of industrial safety (particularly process safety),the environment and the protection of workers and local residents:
– prior to approving new projects, investments, acquisitions andassets disposal;
– during operations (safety studies, environmental impactassessments, health impact studies); and
– prior to releasing new substances on the market (toxicologicaland ecotoxicological studies and life cycle analyses).
These assessments incorporate the regulatory requirements of thecountries where the Group’s activities are carried out and generallyaccepted professional practices.
In countries where prior administrative authorization and supervisionis required, projects are not undertaken without the authorization ofthe relevant authorities based on the studies provided to the latter.
In particular, TOTAL has developed a common methodology foranalyzing technological risks that is being gradually applied to allactivities carried out by the companies of the Group (refer to point2.2.3 of chapter 7). TOTAL develops risk management measuresbased on risk and impact assessments. These measures involvefacility and structure design, the reinforcement of safety devicesand environmental remediation.
In addition to developing management systems as describedabove, the Group strives to minimize industrial and environmentalrisks inherent in its operations by conducting thorough inspectionsand audits, training personnel and raising awareness among allthose involved.
In addition, performance indicators (particularly in the areas of HSE)and risk monitoring have been put in place, objectives have beenset and action plans have been implemented to achieve theseobjectives (refer to point 2 of chapter 7).
Although the emphasis is on preventing risks, TOTAL takes regularsteps to prepare for crisis management based on identified riskscenarios. The Group has a crisis management process that relieson a permanent on-call system, regular drills, training courses incrisis management and a set of tools. The organization set up inthe event of a crisis is deployed at two closely-coordinated levels:
– at the local level (country, site or entities), a crisis unit isresponsible for ensuring operational management andimplementing emergency plans; and
– at the head office level, a crisis unit consisting of a multi-disciplinaryteam is tasked with assessing the situation and overseeing crisismanagement. This central unit provides the necessary expertiseand mobilizes additional resources to assist the local crisis unitwhen necessary.
In addition, TOTAL has developed emergency plans andprocedures to respond to an oil spill or leak. These plans andprocedures are specific to each subsidiary and adapted to itsorganization, activities and environment, and are consistent with theGroup’s anti-pollution plan. They are reviewed regularly and testedthrough drills (refer to point 2.2.3 of chapter 7).
At the Group level, TOTAL has set up an organization structuredaround the Plan to Mobilize Resources Against Pollution (PARAPOL)alert scheme to facilitate crisis management and provide assistanceregardless of geographical restrictions by mobilizing both internal andexternal resources in the event of pollution of marine, coastal or inlandwaters. Its main objective is to facilitate access to internal and externalexperts and physical response resources (FOST, Cedre, OSRL).
Risks and control 4Internal control and risk management procedures
Registration Document 2015. TOTAL 75
4 Risks and controlInternal control and risk management procedures
TOTAL. Registration Document 201576
With regard to risks related to climate issues, TOTAL is committed tomanaging its energy consumption and develops processes to improveits energy performance and that of its customers, in accordance withArticle 9 of its Safety Health Environment Quality Charter. In itsdecision-making process, the risks and associated climate issues(flaring, GHG emissions, CO2 price sensitivity) are assessed prior to the presentation of the projects to the Executive Committee.Climate hazards are taken into consideration and addressed eitherthrough environmental and safety assessments to ensure that theconsequences, and, in particular, possible changes to surfacewater levels, do not affect the integrity of the facilities, or throughprocedures that take into account local hazards in order to arrangefor the protection of people and facilities.
Risks related to information systems
TOTAL’s IT Department has developed and distributed governanceand security rules that describe the recommended infrastructure,organization and procedures in order to maintain information systemsthat are appropriate to the organization’s needs and to limit informationsecurity risks. These rules are implemented across the Group underthe responsibility of the various business segments.
The Group has also developed control activities at various levels ofthe organization in areas where information systems cover all orpart of the processes. A set of Information Technology GeneralControls (ITGC) aim to guarantee that information systems functionand are available as required, and that data integrity is guaranteedand changes controlled.
Information Technology Automated Controls (ITAC) aim to ensurethe integrity of data generated or supported by businessapplications, particularly those that impact financial flows.
The outsourcing of some components of the Group’s IT infrastructureto service providers poses specific risks and requires the selectionand development of additional controls of the completeness, accuracyand validity of the information supplied and received from such serviceproviders. Accordingly, to ensure continuous improvement, the Groupassesses whether suitable controls are implemented by the serviceproviders concerned and what controls are necessary within itsown organization to maintain these risks at an acceptable level.
In addition, in light of growing risks in legal (document retention,personal data protection, copyrights, etc.) and security (loss ofinformation, external and internal threats, fraud, etc.) areas, the Grouphas stepped up its deployment, including within subsidiaries, ofinformation protection, document retention and personal dataprotection policies (and, for the latter, in anticipation of complying withthe future European regulation scheduled to be adopted in 2016).
Ethical misconduct and non-compliance risks
Fraud preventionThe Group deploys an anti-fraud and fraud prevention program andhas implemented a range of procedures and programs that help toprevent, detect and limit different types of fraud. This effort is supportedby the business principles and values of individual behaviordescribed in the Group’s Code of Conduct and in the codes,charters and other standards applied by the business segments.
The Group has also issued a directive for handling incidents of fraudthat has been widely distributed to employees, and has created analert system that employees can use to report acts that may constitutefraud. In addition, a specific process is in place for reportingaccounting, internal control and auditing irregularities. This alertprocess, implemented at the request of the Audit Committee, is
monitored by the Audit Committee and may be used byshareholders, employees and third parties.
In 2015, a large campaign on fraud risks to raise awareness of allGroup employees has been launched. A guide “Prevention andfraud prevention the risks of fraud”, which highlights the differentactions conducted through the anti-fraud program was distributed.A mapping of fraud risks in the Group was finalized inDecember 2015, allowing defining priority actions for 2016.
The deployment of the anti-fraud and fraud prevention programrelies on the network of fraud risks coordinators within the businesssegments and operational entities.
Prevention of corruption risksGeneral Management constantly reiterates the principle of zerotolerance with regard to corruption. Internal rules have beenpublished since 2011 in this area. They cover various areas whereparticular risks of exposure to corruption may exist (businesspartnerships, representatives, procurement and sales, donations,acquisitions, joint ventures, human resources, gifts and invitations, etc.)in an effort to detect, assess and address risks at a very early stagethrough an appropriate due diligence process.
To support this program, in December 2015 TOTAL launched asecond e-learning module in 11 languages open to all employeesand mandatory for more than 30,000 of them.
In addition, 370 compliance officers were appointed and trainedwithin the business segments and operational entities. Their role isto ensure that the program is implemented at the local level.
Lastly, under the settlements reached in 2013 between TOTAL, theSecurities and Exchange Commission (SEC) and the Department ofJustice (DoJ), an independent monitor was appointed. His role is toconduct a 3-year assessment of the anti-corruption complianceand related internal control procedures implemented by the Groupand to recommend improvements, where necessary. The monitortook up the position at the end of 2013 and issued an initial reportto the authorities in July 2014. As the monitor was forced by healthreasons to abandon this role, a new monitor was appointed in early2015 to continue the review. A second report was issued inOctober 2015 in which the monitor stated that “TOTAL hasimproved its corruption prevention program considerably byimplementing the recommendations made in the first report.”
Prevention of competition law infringementA Group policy aimed at ensuring compliance with, and preventinginfringement of, competition law has been in place since 2014 andis a follow-up to the various measures previously implemented bythe business segments. Its deployment is based, in particular, onmanagement and staff involvement, training courses that include ane-learning module and an organization responsible forimplementing the program.
Prevention of insider trading and conflict of interestsThe Group’s Ethics Committee implements a policy to prevent insidertrading on the financial markets which is based, in particular, on theGroup’s internal ethics rules. These rules are updated on a regularbasis and widely distributed to employees who are permanently oroccasionally in possession of insider information. These ethical rulesrequire, in particular, that permanent insiders refrain from carryingout any transactions, including hedging transactions, in TOTALshares or ADRs and in shares in collective investment plans (FCPE)invested primarily in TOTAL shares (as well as derivatives related tosuch shares) on the day on which the Company discloses itsperiodic results publications (quarterly, interim and annual) as wellas during the 30 calendar days preceding such date.
To prevent conflicts of interest, each of the Group’s senior executivescompletes an annual statement declaring any conflicts of interest towhich he or she may be subject. By completing this declaration,each senior executive also agrees to report to his or her supervisorany conflict of interest that he or she has had or of which he or sheis aware in performing his or her duties.
4.3.2. Internal control procedures related to the preparation and processing of accountingand financial information
Accounting information
The Group’s Accounting Department, which reports to the Group’sChief Financial Officer, draws up the Group’s Consolidated FinancialStatements according to IFRS standards based on the reportingpackages prepared quarterly by the consolidated entities, as well asthe statutory financial statements of TOTAL S.A. as parent companyand those of certain French entities. Each quarter, the Consolidatedand statutory financial statements of TOTAL S.A. are reviewed bythe Audit Committee and the Board of Directors.
The Consolidated Financial Statements are prepared based on thefollowing principles:
– homogeneity of the accounting framework and standards; to thisend, the interpretation of accounting standards applicable to theConsolidated Financial Statements is centralized by the Group’sAccounting Department, which also distributes these standardsthrough formal procedures and an internal financial reportingmanual. The department monitors the effective implementation ofthese standards through periodic formal communication withmanagers of the business segments; and
– a supervised account closing process based mainly on formalizationof economic assumptions, judgments and estimates, treatmentof complex accounting transactions and on respect of establishedtimetables announced through Group instructions disclosed toeach entity.
Off-balance sheet commitments which are valued according to thefinancial reporting manual are reported on a quarterly basis to theAudit Committee.
Internal control of accounting information is mainly focused aroundthe following areas:
– a monthly financial report is formalized by Group and businesssegment control panels. This report and the Consolidated FinancialStatements use the same framework and standards. In addition,the quarterly closing schedule is the same for preparing theConsolidated Financial Statements and financial reporting;
– a detailed analysis of differences as part of the quarterly reconciliationbetween the Consolidated Financial Statements and financialreporting is supervised by the Accounting and Budget-ControllingDepartments, which are part of the Finance Division;
– a detailed analysis of differences between actual amounts andthe yearly budget established on a monthly basis is realized ateach level of the organization;
– an annual reconciliation between the parent company financialstatements and the financial statements based on IFRS standardsis performed by entity;
– periodic controls are designed to ensure the reliability of accountinginformation and mainly concern the processes for preparingaggregated financial items;
– a regular process for the signature of representation letters ateach level of the organization; and
– the Disclosure Committee ensures the application of theprocedures in place.
Because of the important contribution of the equity affiliates to theGroup’s aggregated financial items, an annual review of the controlon these companies’ financial statements is implemented based ona detailed questionnaire completed by each entity. This system isintegrated into the Group’s internal control framework.
Other financial information
Proved oil and gas reserves are evaluated annually by the relevantentities. They are reviewed by the Reserves Committee, approvedby Exploration & Production’s senior management and thenvalidated by the Group’s General Management. They are alsopresented to the Audit Committee each year.
The internal control process related to estimating reserves is formalizedin a special procedure described in detail in point 2.1.2 of chapter 2.The reserves evaluation and the related internal control processesare audited periodically.
The strategic outlook published by the Group is prepared, in particular,according to the long-term plans drawn up at the business segmentand Group levels, and on the work carried out at each relevant levelof the organization. The Board of Directors reviews the strategicoutlook each year.
Disclosure control
The external communication of material information concerning theGroup’s performance is prepared for shareholders, businesspartners, regulators, financial analysts, government entities andother stakeholders as part of formal internal procedures, includingin particular disclosure controls and procedures. The aim of theseprocedures is to confirm the quality and accuracy of externalcommunications intended for financial markets.
The Disclosure Committee ensures that these procedures arefollowed and meets before press releases on results are submittedto the Audit Committee and Board of Directors.
In addition, a specific process is in place for reporting any informationrelated to the Group’s accounting procedures, internal control andauditing. This process is available to any shareholder, employee orthird party.
The Group’s General Management is responsible for implementingand assessing the internal control system for financial disclosure. In this context, the implementation of the Group’s internal controlframework, based on the various components of the COSOframework, was assessed internally within the Group’s main entities.
Pursuant to the requirements introduced by Section 302 of theSarbanes-Oxley Act of July 30, 2002, the Chairman and Chief Executive Officer and the Chief Financial Officer of the Companyhave conducted, with the assistance of the General Management,an evaluation of the effectiveness of the disclosure controls andprocedures as defined by U.S. regulations, over the period coveredby the Form 20-F. For fiscal year 2015, the Chairman andChief Executive Officer and the Chief Financial Officer concludedthat the disclosure controls and procedures were effective.
The statutory auditors also perform those internal control auditsthat they deem necessary as part of their mission to certify theFinancial Statements.
Refer to point 4.2 above (Control activities and assessment).
Risks and control 4Internal control and risk management procedures
Registration Document 2015. TOTAL 77
5. Statutory auditors’ report(Article L. 225-235 of the French commercial code)
This is a free translation into English of a report issued in French and it is provided solely for the convenience of English-speaking users. This report should be read in conjunction with, and construed in accordance with, French law and professional standards applicable in France.
Year ended December 31, 2015
Statutory auditors’ report, prepared in accordance with Article L. 225-235 of the French commercial code(Code de commerce), on the report prepared by the Chairman of the Board of Directors of TOTAL S.A.
To the Shareholders,
In our capacity as statutory auditors of TOTAL S.A., and in accordance with Article L. 225-235 of the French Commercial Code (Code decommerce), we hereby report on the report prepared by the Chairman of your Company in accordance with Article L. 225-37 of the FrenchCommercial Code (Code de commerce) for the year ended December 31, 2015.
It is the Chairman’s responsibility to prepare and submit for the Board of Directors’ approval a report on the internal control and riskmanagement procedures implemented by the Company and to provide the other information required by Article L. 225-37 of the FrenchCommercial Code (Code de commerce) relating to matters such as corporate governance.
Our role is to:
– report on any matters as to the information contained in the Chairman’s report in respect of the internal control and risk managementprocedures relating to the preparation and processing of the accounting and financial information, and
– confirm that the report also includes the other information required by Article L. 225-37 of the French Commercial Code (Code decommerce). It should be noted that our role is not to verify the fairness of this other information.
We conducted our work in accordance with professional standards applicable in France.
Information on internal control and risk management procedures relating to the preparation and processing of accounting and financial information
The professional standards require that we perform the necessary procedures to assess the fairness of the information provided in theChairman’s report in respect of the internal control and risk management procedures relating to the preparation and processing of theaccounting and financial information. These procedures consist mainly in:
– obtaining an understanding of the internal control and risk management procedures relating to the preparation and processing of theaccounting and financial information on which the information presented in the Chairman’s report is based and of the existingdocumentation;
– obtaining an understanding of the work involved in the preparation of this information and of the existing documentation;– obtaining an understanding of the evaluation process implemented and assessing the quality and adequacy of the documentation in
respect of the information relating to the evaluation of the internal control and risk management procedures;– determining if any material weaknesses in the internal control procedures relating to the preparation and processing of the accounting and
financial information that we would have noted in the course of our work are properly disclosed in the Chairman’s report.
On the basis of our work, we have no matters to report on the information relating to the Company’s internal control and risk managementprocedures relating to the preparation and processing of the accounting and financial information contained in the report prepared by theChairman of the Board of Directors in accordance with Article L. 225-37 of the French Commercial Code (Code de commerce).
Other information
We confirm that the report prepared by the Chairman of the Board of Directors also contains the other information required by Article L. 225-37 of the French Commercial Code (Code de commerce).
Paris-La Défense, March 15, 2016
The statutory auditors French original signed by
KPMG Audit ERNST & YOUNG AuditA division of KPMG S.A. Yvon Salaün PartnerMichel Piette Partner Laurent Miannay PartnerValérie Besson Partner
TOTAL. Registration Document 201578
4 Risks and controlStatutory auditors’ report
Corporate governance1. Composition and practices of the Board of Directors 801.1. Composition of the Board of Directors . . . . . . . . . . . . . . . . . . . . . . . . . . . . . . . . . . . . . . . . . . . . . . . . . . . . . . . . . . . . . . . . . . . .801.2. Practices of the Board of Directors . . . . . . . . . . . . . . . . . . . . . . . . . . . . . . . . . . . . . . . . . . . . . . . . . . . . . . . . . . . . . . . . . . . . . . .881.3. Statement regarding corporate governance . . . . . . . . . . . . . . . . . . . . . . . . . . . . . . . . . . . . . . . . . . . . . . . . . . . . . . . . . . . . . . .100
2. General Management 1012.1. The Executive Committee . . . . . . . . . . . . . . . . . . . . . . . . . . . . . . . . . . . . . . . . . . . . . . . . . . . . . . . . . . . . . . . . . . . . . . . . . . . . .1012.2. The Group Performance Management Committee . . . . . . . . . . . . . . . . . . . . . . . . . . . . . . . . . . . . . . . . . . . . . . . . . . . . . . . . . .101
3. Shares held by the administration and management bodies 102
4. Statutory auditors 1034.1. Auditor’s term of office . . . . . . . . . . . . . . . . . . . . . . . . . . . . . . . . . . . . . . . . . . . . . . . . . . . . . . . . . . . . . . . . . . . . . . . . . . . . . . . .1034.2. Fees received by the statutory auditors (including members of their networks) . . . . . . . . . . . . . . . . . . . . . . . . . . . . . . . . . .103
5Corporate governance
79Registration Document 2015. TOTAL
The Company is administered by a Board of Directors composed of12 members. The members of the Board of Directors include adirector representing employee shareholders and a director representingemployees pursuant to French law.
Directors are appointed for a 3-year term (Article 11 of the Company’sbylaws) by the Shareholders’ Meeting, with the exception of thedirector representing employees who is appointed by the CentralWorks Council.
The terms of office of the members of the Board are staggered tomore evenly space the renewal of appointments and to ensure thecontinuity of the work of the Board of Directors and its Committees,in accordance with the recommendations made in the AFEP-MEDEF Code, which the Company uses as a reference.
As of February 10, 2016, the Board of Directors had seven independentdirectors, i.e., 70%(1) of the directors (refer to point 1.1.3).
Mr. Patrick Pouyanné has served as Chairman of the Board ofDirectors since December 19, 2015, the date on which thefunctions of Chairman of the Board of Directors and Chief Executive Officer were combined following the decision made by the Board ofDirectors at its meeting on December 16, 2015 (refer to point1.2.1). Since December 19, 2015, Mr. Pouyanné has thereforebeen Chairman and Chief Executive Officer of TOTAL S.A.
At its meeting on December 16, 2015, the Board of Directors alsoappointed Ms. Patricia Barbizet as Lead Independent Director forthe duration of her term of office as director. Her duties took effecton December 19, 2015 and are described in point 1.2.2 below.
The profiles, experience and expertise of the directors are detailedin the biographies below.
1. Composition and practices of the Board of Directors
1.1. Composition of the Board of Directors
Report of the Chairman of the Board of Directors (article L. 225-37 of the French Commercial Code)Pursuant to Article L. 225-37 of the French Commercial Code, theReport of the Chairman of the Board of Directors must includeinformation related to corporate governance, in particular thecomposition of the Board of Directors, the Board of Directors’application of the principle of balanced representation of men andwomen, the preparation and organization of the work of the Boardof Directors, internal control and risk management proceduresimplemented by the Company, any limits set by the Board ofDirectors concerning the powers of the Chief Executive Officer,bylaws concerning participation in Shareholders’ Meetings, theprinciples and rules applied to determine the compensation andother benefits granted to the executive and non-executive directors(mandataires sociaux), and the information required by ArticleL. 225-100-3 of the French Commercial Code.
The information related to the composition of the Board of Directors,the Board of Directors’ application of the principle of balancedrepresentation of men and women, the preparation and organizationof the work of the Board of Directors and any limits set by theBoard of Directors concerning the powers of the Chief Executive Officeris presented below in point 1.
Information related to the internal control and risk managementprocedures implemented within the Group is presented in chapter4, point 4; information related to bylaws concerning participation inShareholders’ Meetings is presented in chapter 9, point 2.4;information related to the principles and rules applied to determine thecompensation and other benefits granted to the executive andnon-executive directors (mandataires sociaux) is presented inchapter 6, point 2.1, and information likely to have an impact in theevent of a public offering and required by Article L. 225-100-3 ofthe French Commercial Code is presented in chapter 8, point 4.5.
This information collectively forms the Report of the Chairman ofthe Board of Directors prepared pursuant to Article L. 225-37 of theFrench Commercial Code (refer to the cross-reference list specificto the Report of the Chairman of the Board of Directors, page 359of this Registration Document).
The information contained in the Report of the Chairman of theBoard of Directors was prepared with the assistance of several of theCompany’s corporate functional divisions, including in particular theLegal, Finance and Corporate Internal Control and Audit Departments.After the sections relevant to their respective duties were reviewedby the Governance and Ethics Committee, the CompensationCommittee and the Audit Committee, the information was approvedby the Board of Directors at its meeting on February 10, 2016.
5 Corporate governanceComposition and practices of the Board of Directors
TOTAL. Registration Document 201580
(1) Excluding the director representing employee shareholders and the director representing employees, in accordance with recommendations of the AFEP-MEDEF Code (point 9.2).
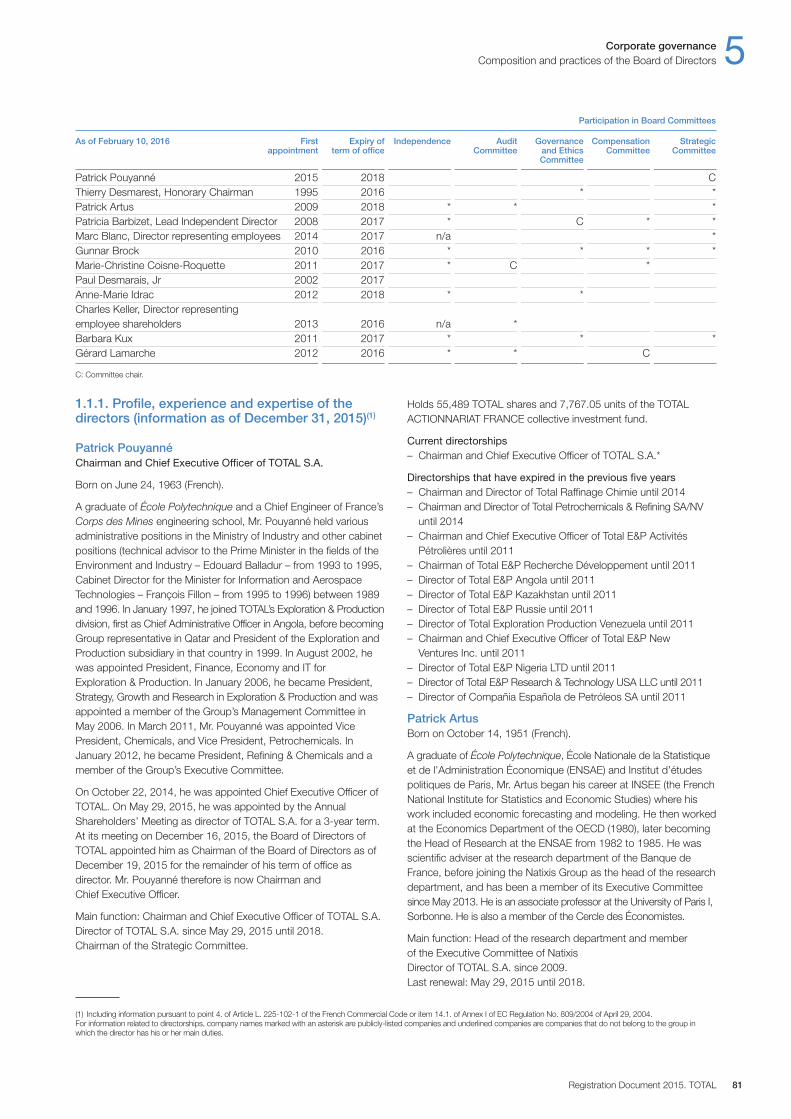
1.1.1. Profile, experience and expertise of thedirectors (information as of December 31, 2015)(1)
Patrick PouyannéChairman and Chief Executive Officer of TOTAL S.A.
Born on June 24, 1963 (French).
A graduate of École Polytechnique and a Chief Engineer of France’sCorps des Mines engineering school, Mr. Pouyanné held variousadministrative positions in the Ministry of Industry and other cabinetpositions (technical advisor to the Prime Minister in the fields of theEnvironment and Industry – Edouard Balladur – from 1993 to 1995,Cabinet Director for the Minister for Information and AerospaceTechnologies – François Fillon – from 1995 to 1996) between 1989and 1996. In January 1997, he joined TOTAL’s Exploration & Productiondivision, first as Chief Administrative Officer in Angola, before becomingGroup representative in Qatar and President of the Exploration andProduction subsidiary in that country in 1999. In August 2002, hewas appointed President, Finance, Economy and IT forExploration & Production. In January 2006, he became President,Strategy, Growth and Research in Exploration & Production and wasappointed a member of the Group’s Management Committee inMay 2006. In March 2011, Mr. Pouyanné was appointed VicePresident, Chemicals, and Vice President, Petrochemicals. InJanuary 2012, he became President, Refining & Chemicals and amember of the Group’s Executive Committee.
On October 22, 2014, he was appointed Chief Executive Officer ofTOTAL. On May 29, 2015, he was appointed by the AnnualShareholders’ Meeting as director of TOTAL S.A. for a 3-year term.At its meeting on December 16, 2015, the Board of Directors ofTOTAL appointed him as Chairman of the Board of Directors as ofDecember 19, 2015 for the remainder of his term of office asdirector. Mr. Pouyanné therefore is now Chairman andChief Executive Officer.
Main function: Chairman and Chief Executive Officer of TOTAL S.A.Director of TOTAL S.A. since May 29, 2015 until 2018. Chairman of the Strategic Committee.
Holds 55,489 TOTAL shares and 7,767.05 units of the TOTALACTIONNARIAT FRANCE collective investment fund.
Current directorships– Chairman and Chief Executive Officer of TOTAL S.A.*
Directorships that have expired in the previous five years– Chairman and Director of Total Raffinage Chimie until 2014– Chairman and Director of Total Petrochemicals & Refining SA / NV
until 2014– Chairman and Chief Executive Officer of Total E&P Activités
Pétrolières until 2011– Chairman of Total E&P Recherche Développement until 2011– Director of Total E&P Angola until 2011– Director of Total E&P Kazakhstan until 2011– Director of Total E&P Russie until 2011– Director of Total Exploration Production Venezuela until 2011– Chairman and Chief Executive Officer of Total E&P New
Ventures Inc. until 2011– Director of Total E&P Nigeria LTD until 2011– Director of Total E&P Research & Technology USA LLC until 2011– Director of Compañia Española de Petróleos SA until 2011
Patrick ArtusBorn on October 14, 1951 (French).
A graduate of École Polytechnique, École Nationale de la Statistiqueet de l’Administration Économique (ENSAE) and Institut d’étudespolitiques de Paris, Mr. Artus began his career at INSEE (the FrenchNational Institute for Statistics and Economic Studies) where hiswork included economic forecasting and modeling. He then workedat the Economics Department of the OECD (1980), later becomingthe Head of Research at the ENSAE from 1982 to 1985. He wasscientific adviser at the research department of the Banque deFrance, before joining the Natixis Group as the head of the researchdepartment, and has been a member of its Executive Committeesince May 2013. He is an associate professor at the University of Paris I,Sorbonne. He is also a member of the Cercle des Économistes.
Main function: Head of the research department and member of the Executive Committee of NatixisDirector of TOTAL S.A. since 2009. Last renewal: May 29, 2015 until 2018.
Participation in Board Committees
As of February 10, 2016 First Expiry of Independence Audit Governance Compensation Strategic appointment term of office Committee and Ethics Committee Committee Committee
Patrick Pouyanné 2015 2018 CThierry Desmarest, Honorary Chairman 1995 2016 * *Patrick Artus 2009 2018 * * *Patricia Barbizet, Lead Independent Director 2008 2017 * C * *Marc Blanc, Director representing employees 2014 2017 n / a *Gunnar Brock 2010 2016 * * * *Marie-Christine Coisne-Roquette 2011 2017 * C *Paul Desmarais, Jr 2002 2017Anne-Marie Idrac 2012 2018 * *Charles Keller, Director representing employee shareholders 2013 2016 n / a *Barbara Kux 2011 2017 * * *Gérard Lamarche 2012 2016 * * C
C: Committee chair.
Corporate governance 5Composition and practices of the Board of Directors
Registration Document 2015. TOTAL 81
(1) Including information pursuant to point 4. of Article L. 225-102-1 of the French Commercial Code or item 14.1. of Annex I of EC Regulation No. 809 / 2004 of April 29, 2004. For information related to directorships, company names marked with an asterisk are publicly-listed companies and underlined companies are companies that do not belong to the group inwhich the director has his or her main duties.
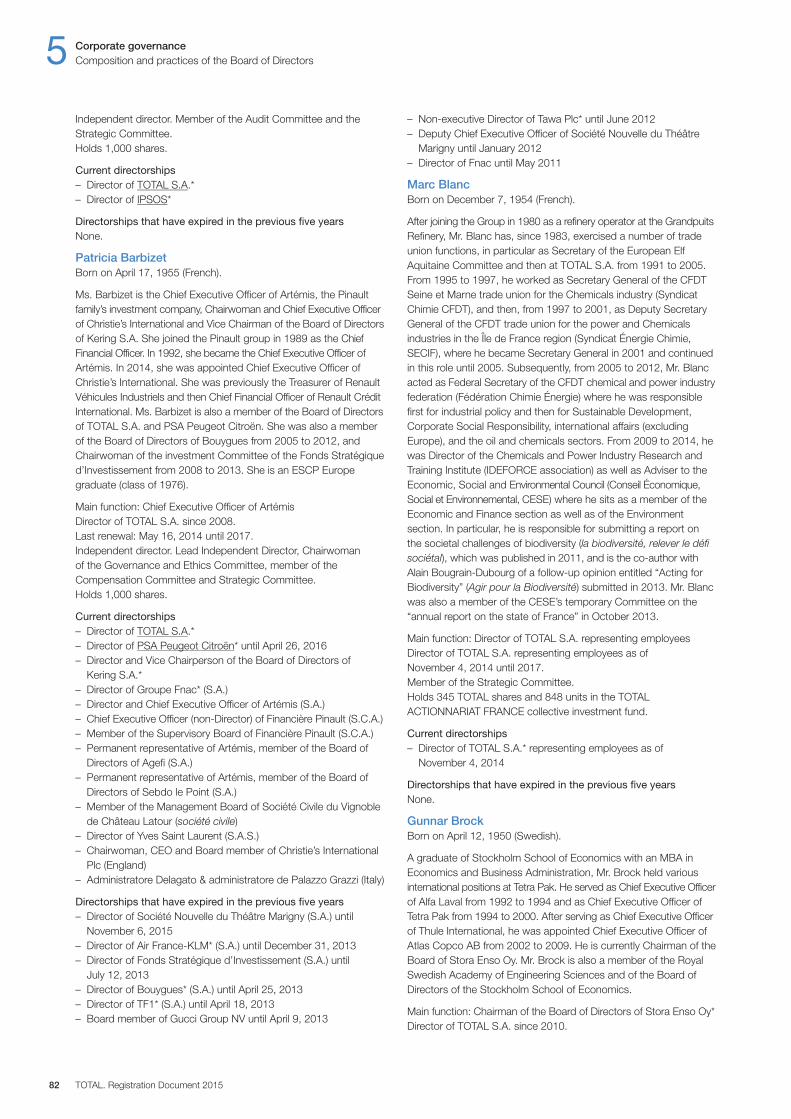
Independent director. Member of the Audit Committee and theStrategic Committee. Holds 1,000 shares.
Current directorships– Director of TOTAL S.A.*– Director of IPSOS*
Directorships that have expired in the previous five yearsNone.
Patricia BarbizetBorn on April 17, 1955 (French).
Ms. Barbizet is the Chief Executive Officer of Artémis, the Pinaultfamily’s investment company, Chairwoman and Chief Executive Officer of Christie’s International and Vice Chairman of the Board of Directorsof Kering S.A. She joined the Pinault group in 1989 as the ChiefFinancial Officer. In 1992, she became the Chief Executive Officer ofArtémis. In 2014, she was appointed Chief Executive Officer ofChristie’s International. She was previously the Treasurer of RenaultVéhicules Industriels and then Chief Financial Officer of Renault CréditInternational. Ms. Barbizet is also a member of the Board of Directorsof TOTAL S.A. and PSA Peugeot Citroën. She was also a memberof the Board of Directors of Bouygues from 2005 to 2012, andChairwoman of the investment Committee of the Fonds Stratégiqued’Investissement from 2008 to 2013. She is an ESCP Europegraduate (class of 1976).
Main function: Chief Executive Officer of ArtémisDirector of TOTAL S.A. since 2008. Last renewal: May 16, 2014 until 2017. Independent director. Lead Independent Director, Chairwoman of the Governance and Ethics Committee, member of theCompensation Committee and Strategic Committee. Holds 1,000 shares.
Current directorships– Director of TOTAL S.A.*– Director of PSA Peugeot Citroën* until April 26, 2016– Director and Vice Chairperson of the Board of Directors of
Kering S.A.*– Director of Groupe Fnac* (S.A.)– Director and Chief Executive Officer of Artémis (S.A.)– Chief Executive Officer (non-Director) of Financière Pinault (S.C.A.)– Member of the Supervisory Board of Financière Pinault (S.C.A.)– Permanent representative of Artémis, member of the Board of
Directors of Agefi (S.A.)– Permanent representative of Artémis, member of the Board of
Directors of Sebdo le Point (S.A.)– Member of the Management Board of Société Civile du Vignoble
de Château Latour (société civile)– Director of Yves Saint Laurent (S.A.S.)– Chairwoman, CEO and Board member of Christie’s International
Plc (England)– Administratore Delagato & administratore de Palazzo Grazzi (Italy)
Directorships that have expired in the previous five years– Director of Société Nouvelle du Théâtre Marigny (S.A.) until
November 6, 2015– Director of Air France-KLM* (S.A.) until December 31, 2013– Director of Fonds Stratégique d’Investissement (S.A.) until
July 12, 2013– Director of Bouygues* (S.A.) until April 25, 2013– Director of TF1* (S.A.) until April 18, 2013– Board member of Gucci Group NV until April 9, 2013
– Non-executive Director of Tawa Plc* until June 2012– Deputy Chief Executive Officer of Société Nouvelle du Théâtre
Marigny until January 2012– Director of Fnac until May 2011
Marc BlancBorn on December 7, 1954 (French).
After joining the Group in 1980 as a refinery operator at the GrandpuitsRefinery, Mr. Blanc has, since 1983, exercised a number of tradeunion functions, in particular as Secretary of the European ElfAquitaine Committee and then at TOTAL S.A. from 1991 to 2005.From 1995 to 1997, he worked as Secretary General of the CFDTSeine et Marne trade union for the Chemicals industry (SyndicatChimie CFDT), and then, from 1997 to 2001, as Deputy SecretaryGeneral of the CFDT trade union for the power and Chemicalsindustries in the Île de France region (Syndicat Énergie Chimie,SECIF), where he became Secretary General in 2001 and continuedin this role until 2005. Subsequently, from 2005 to 2012, Mr. Blancacted as Federal Secretary of the CFDT chemical and power industryfederation (Fédération Chimie Énergie) where he was responsiblefirst for industrial policy and then for Sustainable Development,Corporate Social Responsibility, international affairs (excludingEurope), and the oil and chemicals sectors. From 2009 to 2014, hewas Director of the Chemicals and Power Industry Research andTraining Institute (IDEFORCE association) as well as Adviser to theEconomic, Social and Environmental Council (Conseil Économique,Social et Environnemental, CESE) where he sits as a member of theEconomic and Finance section as well as of the Environmentsection. In particular, he is responsible for submitting a report onthe societal challenges of biodiversity (la biodiversité, relever le défisociétal), which was published in 2011, and is the co-author withAlain Bougrain-Dubourg of a follow-up opinion entitled “Acting forBiodiversity” (Agir pour la Biodiversité) submitted in 2013. Mr. Blancwas also a member of the CESE’s temporary Committee on the“annual report on the state of France” in October 2013.
Main function: Director of TOTAL S.A. representing employeesDirector of TOTAL S.A. representing employees as of November 4, 2014 until 2017.Member of the Strategic Committee. Holds 345 TOTAL shares and 848 units in the TOTALACTIONNARIAT FRANCE collective investment fund.
Current directorships– Director of TOTAL S.A.* representing employees as of
November 4, 2014
Directorships that have expired in the previous five yearsNone.
Gunnar BrockBorn on April 12, 1950 (Swedish).
A graduate of Stockholm School of Economics with an MBA inEconomics and Business Administration, Mr. Brock held variousinternational positions at Tetra Pak. He served as Chief Executive Officerof Alfa Laval from 1992 to 1994 and as Chief Executive Officer ofTetra Pak from 1994 to 2000. After serving as Chief Executive Officerof Thule International, he was appointed Chief Executive Officer ofAtlas Copco AB from 2002 to 2009. He is currently Chairman of theBoard of Stora Enso Oy. Mr. Brock is also a member of the RoyalSwedish Academy of Engineering Sciences and of the Board ofDirectors of the Stockholm School of Economics.
Main function: Chairman of the Board of Directors of Stora Enso Oy*Director of TOTAL S.A. since 2010.
5 Corporate governanceComposition and practices of the Board of Directors
TOTAL. Registration Document 201582
Corporate governance 5Composition and practices of the Board of Directors
Registration Document 2015. TOTAL 83
Last renewal: May 17, 2013 until 2016. Independent director. Member of the Compensation Committee,the Governance and Ethics Committee and the Strategic Committee.Holds 1,000 shares.
Current directorships– Director of TOTAL S.A.*– Chairman of the Board of Directors of Stora Enso Oy*– Member of the Board of Investor AB*– Member of the Board of Syngenta AG*– Chairman of the Board of Mölnlycke Health Care Group– Chairman of the Board of Rolling Optics– Member of the Board of Stena AB
Directorships that have expired in the previous five years– Member of the Supervisory Board of Spencer Stuart Scandinavia
until 2011
Marie-Christine Coisne-RoquetteBorn on November 4, 1956 (French).
Ms. Coisne-Roquette has a Bachelor’s Degree in English. Lawyerby training, with a French Masters’ Law and a Specialized LawCertificate from the New York bar, she started a career as anattorney in 1981 at the Paris and New York bars, as an associate ofCabinet Sonier & Associés in Paris. In 1984, she joined the Boardof Sonepar as a director and gave up her law career in 1988 towork full time for the family group. As Chairwoman of the familyholding company, Colam Entreprendre, and later of the SoneparSupervisory Board, she consolidated family ownership, reorganizedthe Group structures and reinforced the shareholders’ Group tosustain its long-term strategy. Chairwoman and CEO of Soneparfrom early 2002 until end 2012, Ms. Coisne-Roquette handed overthe operational management of the Group to the ManagingDirector, and is now Chairwoman of the Board of Sonepar. She heads also Colam Entreprendre as its Chairwoman and CEO.Formerly a member of the Young Presidents’ Organization (YPO),she served the MEDEF (France’s main employers’ association) asExecutive Committee member from 2000 to 2013 and Chairwomanof the Tax Commission the last eight years. She was member of theEconomic, Social and Environmental Council from 2013 and 2015and is currently a Director of TOTAL S.A.
Main function: Chairwoman of the Board of Directors of SoneparDirector of TOTAL S.A. since 2011. Last renewal: May 16, 2014 until 2017. Independent director. Chairwoman of the Audit Committee andmember of the Compensation Committee. Holds 3,718 shares.
Current directorships– Director of TOTAL S.A.*– Chairwoman of the Board of Directors of Sonepar S.A.– Chairwoman and Chief Executive Officer of Colam Entreprendre– Permanent representative of Colam Entreprendre, co-manager of
Sonedis (société civile)– Permanent representative of Colam Entreprendre, Director of
Sovemarco Europe (S.A.)– Chief Executive Officer of Sonepack S.A.S.– Co-manager of Développement Mobilier & Industriel (D.M.I.)
(société civile)– Manager of Ker Coro (société civile immobilière)
Directorships that have expired in the previous five years– Permanent representative of Sonepar, Director of Sonepar
France until 2014
– Director of Hagemeyer Canada, Inc. until 2013– Chairwoman of the Supervisory Board of Otra N.V. until 2013– Director of Sonepar Canada, Inc. until 2013– Chairwoman of the Supervisory Board of Sonepar Deutschland
GmbH until 2013– Director of Sonepar Ibérica until 2013– Director of Sonepar Italia Holding until 2013– Director of Sonepar Mexico until 2013– Member of the Supervisory Board of Sonepar Nederland B.V.
until 2013– Director of Sonepar USA Holdings, Inc. until 2013– Director of Feljas et Masson SAS until 2013– Permanent representative of Colam Entreprendre, member of the
Board of Directors at Cabus & Raulot (S.A.S.) until 2013– Chief Executive Officer of Sonepar S.A. until 2012– Permanent representative of Sonepar S.A., co-manager of
Sonedis (société civile) until 2012– Permanent representative of Sonepar International (S.A.S.) until 2012– Chairwoman of the Board of Directors of Sonepar Mexico until 2012
Paul Desmarais, JrBorn on July 3, 1954 (Canadian).
A graduate of McGill University in Montreal and Institut européend’administration des affaires (INSEAD) in Fontainebleau, Mr. Desmaraiswas first appointed as Vice Chairman (1984), and then as Chairmanand Chief Executive Officer (1986), Executive Vice Chairman of theBoard (1989), Executive Chairman of the Board (1990), Chairman ofthe Executive Committee (2006) and Executive Co-Chairman of theBoard (2008) of Power Financial Corporation, a company he helpedfound. Since 1996, he has also served as Chairman of the Boardand Co-Chief Executive Officer of Power Corporation of Canada.
Main function: Chairman of the Board & Co-Chief Executive Officerof Power Corporation of Canada*Director of TOTAL S.A. since 2002. Last renewal: May 16, 2014 until 2017. Holds 2,000 ADRs (corresponding to 2,000 shares).
Current directorships– Director of TOTAL S.A.*– Chairman of the Board & Co-Chief Executive Officer of Power
Corporation of Canada*– Executive Co-Chairman of the Board of Power Financial
Corporation* (Canada)– Executive Chairman of the Board of Directors and Co-Chief Executive
Officer of Pargesa Holding SA* (Switzerland)– Director and member of the Executive Committee of Great-West
Lifeco Inc.* (Canada)– Director and member of the Executive Committee of Great-West
Life Assurance Company (Canada)– Director and member of the Executive Committee of Great-West
Life & Annuity Insurance Company (United States of America)– Director of Great-West Financial (Canada) Inc. (Canada)– Vice Chairman of the Board, Director and member of the
Standing Committee of Groupe Bruxelles Lambert S.A.* (Belgium)– Director and member of the Executive Committee of Investors
Group Inc. (Canada)– Director and member of the Executive Committee of London
Insurance Group Inc. (Canada)– Director and member of the Executive Committee of London Life
Insurance Company (Canada)– Director and member of the Executive Committee of Mackenzie Inc.– Director and Deputy Chairman of the Board of La Presse, ltée
(Canada)
84 TOTAL. Registration Document 2015
Composition and practices of the Board of DirectorsCorporate governance5
– Director and Deputy Chairman of Gesca ltée (Canada)– Director of LafargeHolcim Ltd* (Switzerland)– Director and member of the Executive Committee of The Canada
Life Assurance Company (Canada)– Director and member of the Executive Committee of The Canada
Life Financial Corporation (Canada)– Director and member of the Executive Committee of IGM
Financial Inc.* (Canada)– Director and Chairman of the Board of 171263 Canada Inc.
(Canada)– Director of 152245 Canada Inc. (Canada)– Director of GWL&A Financial Inc. (United States of America)– Director of Great-West Financial (Nova Scotia) Co. (Canada)– Director of Great-West Life & Annuity Insurance Company of
New York (United States of America)– Director of Power Communications Inc. (Canada)– Director and Chairman of the Board of Power Corporation
International (Canada)– Director and member of the Executive Committee of Putnam
Investments, LLC (United States of America)– Member of the Supervisory Board of Power Financial Europe B.V.
(Netherlands)– Director and member of the Executive Committee of The Canada
Life Insurance Company of Canada (Canada)– Director and Deputy Chairman of the Board of Groupe de
Communications Square Victoria Inc. (Canada)– Member of the Supervisory Board of Parjointco N.V.
(Netherlands)– Director of SGS S.A.* (Switzerland)
Directorships that have expired in the previous five years– Director of Canada Life Capital Corporation Inc. (Canada) until 2015– Director of Lafarge* (France) until 2015– Director of GDF Suez* (France) until 2013– Director and member of the Executive Committee of Crown Life
Insurance Company (Canada) until 2012
Thierry DesmarestBorn on December 18, 1945 (French).
A graduate of École Polytechnique and an Engineer of France’sCorps des Mines engineering school, Mr. Desmarest served asDirector of Mines and Geology in New Caledonia, then as technicaladvisor at the Offices of the Minister of Industry and the Minister ofEconomy. He joined TOTAL in 1981, where he held various managementpositions, then served as President of Exploration & Production until1995. He served as Chairman and Chief Executive Officer of TOTALfrom May 1995 until February 2007, and then as Chairman of theBoard of TOTAL until May 21, 2010. He was then appointedHonorary Chairman of TOTAL where he remains a director, and was Chairman of the TOTAL Foundation until January 2015. On October 22, 2014, he was again appointed as Chairman of the Board of Directors for a term of office that expired on December 18, 2015.
Main function: Honorary Chairman of TOTAL S.A.*Director of TOTAL S.A. since 1995. Last renewal: May 17, 2013 until 2016. Member of the Governance and Ethics Committee and theStrategic Committee. Holds 186,576 shares.
Current directorships– Director of TOTAL S.A.*– Director of Air Liquide*
– Director of Renault S.A.*– Director of Renault S.A.S.
Directorships that have expired in the previous five years– Chairman of the Board of Directors of TOTAL S.A.* until
December 18, 2015– Director of Bombardier Inc.* (Canada) until October 29, 2014– Director of Sanofi* until October 23, 2014
Anne-Marie IdracBorn on July 27, 1951 (French).
A graduate of Institut d’Etudes Politiques de Paris and formerly astudent at École Nationale d’Administration (ENA -1974), Ms. Idracbegan her career holding various positions as a senior civil servantat the Ministry of Infrastructure (Ministère de l’Équipement) in thefields of environment, housing, urban planning and transportation.She served as Executive Director of the public institution in chargeof the development of Cergy-Pontoise (Établissement publicd’Aménagement de Cergy-Pontoise) from 1990 to 1993 andDirector of land transport from 1993 to 1995. Ms. Idrac was StateSecretary for Transport from May 1995 to June 1997, electedmember of Parliament for Yvelines from 1997 to 2002, regionalcouncilor for Île-de-France from 1998 to 2002 and State Secretaryfor Foreign Trade from March 2008 to November 2010. She alsoserved as Chairwoman and Chief Executive Officer of RATP from2002 to 2006 and then as Chairwoman of SNCF from 2006 to 2008.
Main function: Chairwoman of the Supervisory Board of Toulouse-Blagnac AirportDirector of TOTAL S.A. since 2012. Last renewal: May 29, 2015 until 2018. Independent director. Member of the Governance and Ethics Committee.Holds 1,195 shares.
Current directorships– Director of TOTAL S.A.*– Director of Bouygues*– Director of Saint Gobain*– Chairwoman of the Supervisory Board of Toulouse-Blagnac Airport
Directorships that have expired in the previous five years– Member of the Supervisory Board of Vallourec* until May 28, 2015– Director of Mediobanca S.p.A.* (Italy) until October 28, 2014
Charles KellerBorn on November 15, 1980 (French).
A graduate of École Polytechnique and École des Hautes ÉtudesCommerciales (HEC), Mr. Keller joined the Group in 2005 at therefinery in Normandy as a performance auditor. In 2008, he wasnamed Project Manager at the Grandpuits refinery to improve thesite’s energy efficiency and oversee its reliability plan. In 2010, hejoined Exploration & Production and Yemen LNG as head of theProduction Support department in charge of optimizing the plant.Since February 2014, he has been a reservoir engineer at the headoffice in La Défense. While performing his duties in the refiningsector, Mr. Keller sat on the Works Committees of the two refineriesand contributed to the activities of the Central Works Council of UES Aval, first as an elected member and then as a union representative.Mr. Keller has been an elected member, representing holders of fundunits, of the Supervisory Board of the TOTAL ACTIONNARIATFRANCE collective investment fund since November 2012.
Main function: EngineerDirector of TOTAL S.A. representing employee shareholders sinceMay 17, 2013 and until 2016.
85Registration Document 2015. TOTAL
Composition and practices of the Board of Directors 5Corporate governance
Member of the Audit Committee. Holds 754 TOTAL shares and 543 units of the TOTAL ACTIONNARIATFRANCE collective investment fund.
Current directorshipsDirector of TOTAL S.A.* representing employee shareholders.
Directorships that have expired in the previous five yearsNone.
Barbara KuxBorn on February 26, 1954 (Swiss).
Holder of an MBA (with honors) from INSEAD in Fontainebleau, Ms. Kux joined McKinsey & Company in 1984 as a ManagementConsultant, where she was responsible for strategic assignments forinternational groups. After serving as manager for development ofemerging markets at ABB and then at Nestlé between 1989 and1999, she was appointed Executive Director of Ford in Europe from1999 to 2003. In 2003, Ms. Kux became a member of the ExecutiveCommittee of the Philips group and, starting in 2005, was in chargeof the supply chain and Sustainable Development. From 2008 to2013, she was a member of the Executive Board of Siemens AG, aglobal leader in high technology present in the energy and renewableenergies sector. She has been responsible for sustainable developmentand the supply chain of the group. Since 2013, she has been adirector of various world-class international companies and is also amember of the Advisory Board of INSEAD.
Main function: Independent directorDirector of TOTAL S.A. since 2011. Last renewal: May 16, 2014 until 2017. Independent director. Member of the Governance and EthicsCommittee and the Strategic Committee. Holds 1,000 shares.
Current directorships– Director of TOTAL S.A.*– Director of Engie S.A.*– Director of Pargesa Holding S.A.*– Member of the Supervisory Board of Henkel*– Director of Umicore*– Member of the Board of Directors of Firmenich S.A.
Directorships that have expired in the previous five years– Member of the Management Board of Siemens AG* until 2013– Member of the Board of Directors of INSEAD until 2011– Member of the Board of Directors of ZF Friedrichshafen AG until 2011
Gérard LamarcheBorn on July 15, 1961 (Belgian).
Mr. Lamarche graduated in economic science from Louvain-la-NeuveUniversity and is also a graduate of INSEAD business school(Advanced Management Program for Suez Group Executives). He also followed the Global Leadership Series training course atthe Wharton International Forum in 1998-99. He started his careerin 1983 at Deloitte Haskins & Sells in Belgium, before becoming aconsultant in mergers and acquisitions in the Netherlands in 1987.In 1988, Mr. Lamarche joined Société Générale de Belgique as aninvestment manager and management controller between 1989and 1991, then as a consultant in strategic operations from 1992to 1995. He joined Compagnie Financière de Suez as a projectmanager for the Chairman and Secretary of the ExecutiveCommittee (1995-1997), before taking part in the merger betweenCompagnie de Suez and Lyonnaise des Eaux, which became SuezLyonnaise des Eaux (1997), and then being appointed as theacting Managing Director in charge of Planning, Management
Control and Accounts. In 2000, Mr. Lamarche pursued his careerby branching into the industrial sector, joining NALCO (theAmerican subsidiary of the Suez group and the world leader in the treatment of industrial water) as the Director andChief Executive Officer. In January 2003, he was appointed ChiefFinancial Officer of the Suez group. In April 2011, Mr. Lamarche became a director on the Board ofDirectors of Groupe Bruxelles Lambert (GBL). He has been theDeputy Managing Director since January 2012. Mr. Lamarche iscurrently a director of LafargeHolcim Ltd (Switzerland), Legrand,TOTAL S.A. and SGS S.A.
Main function: Deputy Managing Director of Groupe Bruxelles Lambert*Director of TOTAL S.A. since 2012. Last renewal: May 17, 2013 until 2016. Independent director. Chairman of the Compensation Committeeand member of the Audit Committee. Holds 2,836 shares.
Current directorships– Deputy Managing Director and Director of Groupe Bruxelles
Lambert*– Director of TOTAL S.A.*– Director and Chairman of the Audit Committee of Legrand*– Director of Lafarge– Director of LafargeHolcim Ltd* (Switzerland)– Director of SGS S.A.* (Switzerland)
Directorships that have expired in the previous five years– Director of Electrabel until 2011– Director of Suez Environnement Company until 2011– Director of International Power Plc until 2011– Director of Europalia International until 2011– Director of GDF Suez Belgium until 2011– Director of Sociedad General de Agua de Barcelona until 2011– Director of GDF Suez E.S. until 2011– Director of Suez Tractebel until 2011– Non-voting member (censeur) of Engie* until 2015
Expired directorships of TOTAL S.A. in 2015
Bertrand CollombBorn on August 14, 1942 (French).
A graduate of École Polytechnique and an Engineer of France’sCorps des Mines engineering school, Mr. Collomb held a number ofpositions within the Ministry of Industry and other cabinet positionsfrom 1966 to 1975. In 1975, he joined the Lafarge group, where heserved in various management positions. He served as Chairmanand Chief Executive Officer of Lafarge from 1989 to 2003, then asChairman of the Board of Directors from 2003 to 2007, and hasbeen the Honorary Chairman since 2007.
Director of TOTAL S.A. since 2000. Last renewal: May 11, 2012 until May 29, 2015. Member of the Governance and Ethics Committee until May 29, 2015.
Anne LauvergeonBorn on August 2, 1959 (French).
A Chief Engineer of France’s Corps des Mines engineering schooland a graduate of École Normale Supérieure with a doctorate inphysical science, Ms. Lauvergeon held various positions in industrybefore becoming Deputy Chief of Staff in the Office of the Presidentof the Republic in 1990. She joined Lazard Frères et Cie asManaging Partner in 1995. From 1997 to 1999, she was ExecutiveVice President and member of the Executive Committee of Alcatel,
where she was responsible for industrial partnerships and internationalaffairs. Ms. Lauvergeon was Chairwoman of the Management Board ofthe Areva Group from July 2001 to June 2011 and Chairwoman andChief Executive Officer of Areva NC (formerly Cogema) from June 1999to June 2011. Since 2011, Ms. Lauvergeon has been ChairwomanandChief Executive Officer of ALP and, since April 2014, Chairwoman ofthe Board of Directors of SIGFOX.
Director of TOTAL S.A. since 2000. Last renewal: May 11, 2012 until May 29, 2015. Member of the Strategic Committee until May 29, 2015.
Michel PébereauBorn on January 23, 1942 (French).
Honorary Inspector General of Finance, Mr. Pébereau held variouspositions in the Ministry of Economy and Finance before serving, from1982 to 1993, as Chief Executive Officer and then as Chairman andChief Executive Officer of Crédit Commercial de France (CCF). He wasChairman and Chief Executive Officer of BNP and then of BNP Paribasfrom 1993 to 2003, Chairman of the Board of Directors from 2003 to2011, and is currently Honorary Chairman of BNP Paribas, Chairmanof the BNP Paribas Foundation, and Chairman of the Centre desprofessions financières. He is also a member of the Académie desSciences Morales et Politiques, a member of the Policy Board ofthe Institut de l’Entreprise, Honorary Chairman of the SupervisoryBoard of the Institut Aspen and Chairman of the ARC Foundation.
Director of TOTAL S.A. since 2000. Last renewal: May 11, 2012 until May 29, 2015. Chairman of the Compensation Committee until May 29, 2015.
1.1.2. Absence of conflicts of interest or convictions
The Board of Directors noted the absence of potential conflicts ofinterest between the directors’ duties with respect to the Companyand their private interests. To the Company’s knowledge, there isno family relationship among the members of the Board of Directorsof TOTAL S.A., there is no arrangement or agreement with customersor suppliers under which a director was selected, and there is noservice agreement that binds a director to TOTAL S.A. or to any of itssubsidiaries and provides for special benefits under the terms thereof.
The current members of the Board of Directors of the Companyhave informed the Company that they have not been convicted,have not been associated with a bankruptcy, receivership orliquidation, and have not been incriminated or publicly sanctionedor disqualified, as stipulated in item 14.1 of Annex I of EC Regulation809 / 2004 of April 29, 2004.
1.1.3. Director independence
At its meeting on February 10, 2016, the Board of Directors, on therecommendation of the Governance and Ethics Committee,reviewed the independence of the Company’s directors as ofDecember 31, 2015. At the Committee’s proposal, the Boardconsidered that, pursuant to the AFEP-MEDEF Code, a director isindependent when “he or she has no relationship of any kind withthe Company, its Group or its Management, that may compromisethe exercise of his or her freedom of judgment”.
For each director, this assessment relies on the independencecriteria set forth in the AFEP-MEDEF Code, revised inNovember 2015, as outlined below, as well as on the analysis of
the High Committee for Corporate Governance (Haut Comité deGouvernement d’Entreprise) set out in the AFEP-MEDEF CodeApplication Guide, revised in December 2015:
– not to be an employee or executive director of the Company, oran employee or director of its parent company or of a companyconsolidated by its parent company, and not having been in sucha position for the previous five years;
– not to be an executive director of a company in which theCompany holds a directorship, directly or indirectly, or in whichan employee appointed as such or an executive director of theCompany (currently in office or having held such office for lessthan five years) is a director;
– not to be a significant customer, supplier, investment banker orcommercial banker of the Company or Group or for which theCompany or the Group represents a material part of theirbusiness (the assessment of the materiality or non-materiality ofthe relationship must be discussed by the Board and the criteriaon which this assessment was based must be explained in theRegistration Document);
– not to be related by close family ties to a corporate executivedirector;
– not have been a statutory auditor of the Company within theprevious five years; and
– not have been a director of the Company for more than 12 years(upon expiry of the term of office during which the 12-year limitwas reached).
The AFEP-MEDEF Code expressly stipulates that the Board candecide that the implementation of certain defined criteria is notrelevant or induces an interpretation that is particular to the Company.
At its meeting on February 10, 2016, based on the proposals of theGovernance and Ethics Committee, the Board of Directorsobserved that Mr. Desmarest, a director since May 30, 1995 andChairman of the Board of Directors between October 22, 2014 andDecember 18, 2015, was a former executive director within themeaning of the Code and therefore could not be considered asindependent.
With regard to the criterion of 12 years of service, the Board ofDirectors, at its meeting on February 10, 2016 and based on theproposals of the Governance and Ethics Committee, observed thatas of December 31, 2015, the more than 12 years of service of Mr. Desmarais, Jr disqualified him from being considered asindependent within the meaning of the AFEP-MEDEF Code.
In addition, the Board deemed that the level of activity between theGroup’s companies and Stena AB, of which Mr. Brock is a director,which accounted for less than 0.05% of Stena AB’s sales (1) andless than 0.05% of the Group’s purchases in 2015, representedneither a material portion of this supplier’s overall activity nor amaterial portion of the Group’s purchases. The Board concludedthat Mr. Brock could be considered as being independent.
The Board also deemed that the level of activity between theGroup’s companies and Engie, of which Ms. Kux is a director,which accounted for less than 0.05% of Engie’s sales (2) and lessthan 0.3% of the Group’s purchases in 2015, represented neither a material portion of this supplier’s overall activity nor a materialportion of the Group’s purchases. The Board concluded that Ms. Kux could be considered as being independent.
5 Corporate governanceComposition and practices of the Board of Directors
TOTAL. Registration Document 201586
(1) Based on the 2014 consolidated sales published by Stena AB.(2) Based on the 2014 consolidated sales published by GDF Suez.
Accordingly, Mses. Barbizet, Coisne-Roquette, Idrac and Kux and Messrs. Artus, Brock and Lamarche were deemed to beindependent directors.
The percentage of independent directors on the Board based on itscomposition as of December 31, 2015 was 70% (1).
The rate of independence of the Board of Directors is higher thanthat recommended by the AFEP-MEDEF Code, which specifies thatat least one-half of Board members at widely held companies withno controlling shareholders must be independent.
1.1.4. Diversity policy of the Board of Directors
The Board of Directors places a great deal of importance on itscomposition and that of its Committees’ composition. In particular,it relies on the work of the Governance and Ethics Committee,which reviews annually and proposes, as circumstances mayrequire, desirable changes to the composition of the Board ofDirectors and Committees based on the Group’s strategy.
The Governance and Ethics Committee conducts its work withinthe context of a formal procedure so as to ensure the complementarityof the directors’ competencies and the diversity of their profiles,maintain a rate of independence for the Board as a whole that isrelevant to the Company’s governance structure and shareholderbase, strive for a balanced representation of men and women onthe Board, and promote an appropriate representation of directorsof different nationalities.
As part of an effort that began several years ago, the compositionof the Board of Directors has changed significantly since 2010 toachieve a more balanced representation of men and women and anopenness to more international profiles.
As of February 10, 2016, the Board of Directors had four women(36.4%(2) of the directors) and four members of foreign nationality(36.4%(3) of the directors).
According to the recommendations introduced in April 2010 in theAFEP-MEDEF Code regarding balanced representation of men andwomen on boards, the proportion of women on boards of directorsshould be at least 20% within three years of the 2010 Shareholders’Meeting and should be at least 40% within six years of that sameShareholders’ Meeting (4). These requirements were also stipulatedin the French law of January 27, 2011 regarding balancedrepresentation of men and women on boards of directors andsupervisory boards and equal treatment of men and women.Pursuant to this law, the 20% target must be reached by the end ofthe 2014 Shareholders’ Meeting and the 40% target must bereached by the end of the 2017 Shareholders’ Meeting (5).
Given the appointment proposals presented to the nextShareholders’ Meeting (refer to point 1.1.6 of this chapter), if theproposed resolutions are approved, the composition of the Boardof Directors, following the Meeting, will include six women, i.e., aproportion of 54.54% (2), above the level of 40% set out by law andin the AFEP-MEDEF Code.
The Board of Directors will continue its reflections on diversifying itscomposition in the coming years.
1.1.5. Training of directors
Directors may ask to receive training in the specifics of theCompany, its businesses and its business sector, as well as anytraining that may help them perform their duties as directors.
The director representing employees also receives 20 hours oftraining per year, which covers in-house training at the Companyand / or training in economics offered by an outside companychosen by the director, after the Board Secretary has accepted thecompany and the training program.
Since 2013, the Board of Directors has met once a year at aproduction or industrial site. In October 2015, the Board ofDirectors met in Abu Dhabi. On-site Board meetings contribute tothe integration of new directors.
1.1.6. Appointment and renewal of directorshipsproposed to the Shareholders’ Meeting of May 24, 2016
Renewal of the directorship of Mr. Gérard LamarcheAt its meeting of February 10, 2016, and further to a proposal bythe Governance and Ethics Committee, the Board of Directorsdecided to propose to the Annual Shareholders’ Meeting of May 24, 2016 the renewal of the directorship of Mr. GérardLamarche for a 3-year term to expire at the end of the AnnualShareholders’ Meeting held to approve the 2018 financialstatements. Messrs. Desmarest and Brock have not requested the renewal of their directorships.
Proposal to appoint Ms. Maria Van der Hoeven and Mr. Jean LemierreAt its meeting of March 15, 2016, and further to a proposal by theGovernance and Ethics Committee, the Board of Directors decidedto propose to this same Shareholders’ Meeting the appointment ofMs. Maria Van der Hoeven and Mr. Jean Lemierre as directors for a3-year term to expire at the end of the Shareholders’ Meeting heldto approve the 2018 financial statements.
Ms. Van der Hoeven, former Executive Director of the InternationalEnergy Agency (IEA), will, in particular, bring to the Board herknowledge and her expertise in the energy sector.
Mr. Lemierre, Chairman of the Board of Directors of BNP Paribas,will bring to the Board his knowledge and his expertise in thefinancial sector at an international level.
The Board considered that Ms. Van der Hoeven and Mr. Lemierrecould be deemed as being independent, after having assessedtheir independence based on the independence criteria set forth in the AFEP-MEDEF Code. Concerning “significant relationships” asa customer, supplier, investment banker or finance banker, betweena director whose appointment is proposed and the Company, theBoard deemed that the level of activity between Group companiesand BNP Paribas at which Mr. Lemierre is the Chairman of theBoard, which is less than 0.1% of its net banking income(6) and lessthan 5% of the Group’s overall assets, represents neither asignificant portion of the overall activity of such bank nor a materialportion of the Group’s external financing.
Corporate governance 5Composition and practices of the Board of Directors
Registration Document 2015. TOTAL 87
(1) Excluding the director representing employee shareholders and the director representing employees, in accordance with the recommendations of the AFEP-MEDEF Code (point 9.2).(2) Excluding the director representing employees, in accordance with the recommendations of the AFEP-MEDEF Code (point 6.4).(3) Excluding the director representing employees.(4) According to the AFEP-MEDEF Code (point 6.4), directors representing employees are not considered for the purposes of calculating this percentage.(5) According to Article L. 225-27-1 of the French Commercial Code, directors representing employees are not taken into consideration for the application of these provisions.(6) 2015 net banking income estimated based on BNP Paribas accounts as of September 30, 2015.
1.2.1. Governance structure
Combination of the management positions
At its meeting on December 16, 2015, the Board of Directorsdecided to reunify the positions of Chairman and Chief ExecutiveOfficer of TOTAL S.A. as of December 19, 2015. Since that date,Mr. Pouyanné has therefore held the position of Chairman andChief Executive Officer of TOTAL S.A.
Following the death of TOTAL’s former Chairman and ChiefExecutive Officer, Mr. de Margerie, the Board of Directors haddecided, at its meeting on October 22, 2014, to separate thefunctions of Chairman and Chief Executive Officer in order toensure the greatest possible continuity in the transition of theGeneral Management. The Board of Directors had thereforeappointed Mr. Pouyanné as Chief Executive Officer for a term of
office expiring at the end of the Annual Shareholders’ Meetingcalled in 2017 (2) to approve the 2016 financial statements, and Mr. Desmarest as Chairman of the Board of Directors for a term of office expiring on December 18, 2015, in accordance with theage limits set out in the bylaws. It was announced that, on thatdate, the functions of Chairman and Chief Executive Officer ofTOTAL S.A. would be combined.
The decision to reunify the positions of Chairman of the Board ofDirectors and Chief Executive Officer was made further to workdone by the Governance and Ethics Committee and in the bestinterests of the Company. The Board of Directors had deemed thata unified Management Form was most appropriate to the Group’sorganization, modus operandi and business, and to the specificitiesof the oil and gas sector. In its decision, the Board in particularnoted the advantage for the Group of having a unified managementin strategic negotiations with governments and the Group’s partners.
1.2. Practices of the Board of Directors
5 Corporate governanceComposition and practices of the Board of Directors
TOTAL. Registration Document 201588
Proposals to appoint the director representing employeeshareholdersIn addition, the term of office of Mr. Keller, the director representingemployee shareholders, is due to expire at the end of the AnnualShareholders’ Meeting on May 24, 2016. Pursuant to the provisionsof Article 11 of the bylaws of TOTAL S.A., which specify theprocedure for nominating candidates for the position of directorrepresenting employees of the Group who are shareholders ofTOTAL S.A., a process to elect candidates for this position waslaunched at the end of 2015. At the end of this process, threeapplications for the position of director representing employeeshareholders were submitted to the shareholders for voting:
– Mr. Charles Keller, nominated by the Supervisory Board of theTOTAL ACTIONNARIAT FRANCE collective investment fund,which, as of December 31, 2015, held 84.4 million shares of theCompany, and by the Supervisory Board of the TOTAL FRANCECAPITAL + collective investment fund, which, as ofDecember 31, 2015 held 4.8 million shares of the Company.The biography of Mr. Keller is presented in point 1.1.1 above.
– Ms. Renata Perycz, nominated by the Supervisory Board of theTOTAL ACTIONNARIAT INTERNATIONAL CAPITALISATIONcollective investment fund, which, as of December 31, 2015,held 23.7 million Company shares, and by the Supervisory Boardof the TOTAL INTERNATIONAL CAPITAL collective investmentfund, which, as of December 31, 2015 held 2.0 million shares of the Company.Ms. Perycz, born on November 5, 1963 (Polish), is a graduate of the University of Warsaw, the Ecole des Hautes EtudesCommerciales (HEC) and the SGH Warsaw School ofEconomics. Ms. Perycz entered the Group in 1993 as a logisticsand sales manager for Total Polska. In 2000, she became asupplies and logistics manager before becoming head of thesubsidiary’s purchasing department in 2003. In 2007, shebecame Total Polska’s Human Resources and Purchasingdirector. Since 2013, Ms. Perycz has been the subsidiary’sHuman Resources and Internal Communications director. She has also been an elected member, representing unit-holders,
of Supervisory Board of FCPE TOTAL ACTIONNARIATINTERNATIONAL CAPITALISATION since 2012.
– Mr. Werner Guyot, elected, after the counting of votes, by theemployee shareholders having the right to vote on an individualbasis (who, as of December 31, 2015, together held 2.3 millionshares of the Company).Mr. Guyot, born on September 10, 1955 (German nationality),holds a master’s degree in business administration (MBA). Mr. Guyot entered the Group in 1989 as Head of the DepartmentControlling, Budgeting, Back Office for the network in Düsseldorf.In 1994, he became Head of the Mülheim blending plant(lubricants). From 1996 to 2000, he was Head of Controlling andStrategy Department of Total Deutschland, then in 2000, hebecame Head of Controlling, Business Support, Pricing for thenetwork. From 2004 to 2006, he was in charge of implementingthe Template Europe project for Germany. In 2006, he joinedCentralized Purchasing of Total Deutschland, then Finance in2010 as Head of Management Information.
The candidate receiving the largest number of votes (and at least amajority of the votes) cast by the shareholders present andrepresented at the Annual Shareholders’ Meeting on May 24, 2016will be appointed as the director representing employee shareholdersand will sit on the Board of Directors for the 3-year term set out inthe bylaws.
After reviewing the applications, based on the proposal of theGovernance and Ethics Committee, the Board of Directors, at itsmeeting on March 15, 2016, decided to approve the resolutionproposing the appointment of Ms. Renata Perycz, nominated by theSupervisory Boards of the TOTAL ACTIONNARIAT INTERNATIONALCAPITALISATION and TOTAL INTERNATIONAL CAPITAL collectiveinvestment funds, to promote the international representation withinthe Board, due to the presence of a director representing theFrench employees, pursuant to the law of June 14, 2013.
Following the Shareholders’ Meeting of May 24, 2016, if theproposed resolutions were approved, the Board of Directors wouldhave 12 members (as before). The number of women on the Boardwould be six (i.e., 54.54% (1)).
(1) Excluding the director representing employees, in accordance with the recommendations of the AFEP-MEDEF Code (point 6.4).(2) The Board of Directors of December 16, 2015 decided to prorogate the term of this office to the end of the 2018 Annual Shareholders’meeting, date of expiry of the term of office of
Mr. Pouyanné as Director.
The Board of Directors of TOTAL S.A.(1) approved the following Rules of Procedure.
1. ROLE OF THE BOARD OF DIRECTORS
The Board of Directors is a collegial body that determines the strategic direction of the Company and supervises the implementation of thisvision. With the exception of the powers and authority expressly reserved for shareholders and within the limits of the Company’s legalpurpose, the Board may address any issue related to the Company’s operation and make any decision concerning the matters falling withinits purview. Within this framework, the Board’s duties and responsibilities include, but are not limited to, the following:
– appointing the executive directors(2) and supervising the handling of their responsibilities;– defining the Company’s strategic orientation and, more generally, that of the Group;– approving investments or divestments being considered by the Group that exceed 3% of shareholders’ equity;– reviewing information on significant events related to the Company’s operations, in particular for investments and divestments involving
amounts exceeding 1% of shareholders’ equity;– conducting any audits and investigations it deems appropriate. In particular, the Board, with the assistance of the Audit Committee,
ensures that:- authority has been properly defined and that the various corporate bodies of the Company make proper use of their powers and
responsibilities,- no individual is authorized to commit to pay or to make payments, on behalf of the Company, without proper supervision and control,
The Board also wanted the Group’s governance structure to ensurea balanced distribution of powers. To this end, at its meeting onDecember 16, 2015, the Board amended the provisions of its rulesof procedure to provide for the appointment of a Lead IndependentDirector in case of the combination of the positions of Chairman of the Board of Directors and Chief Executive Officer. The LeadIndependent Director’s duties, resources and rights are described in the rules of procedure of the Board of Directors.
The balance of powers within the Company’s bodies is also ensuredby the composition of the Board of Directors and that of its fourCommittees, particularly given the high proportion of members whoare independent directors. It is further ensured by the directors’ fullinvolvement in the work of the Board and the Committees, and by theirdiverse profiles, competencies and expertise (refer to point 1.1 above).
In addition, the Board’s rules of procedure state that investmentsand divestments considered by the Group exceeding 3% of equitymust be approved by the Board, which is also informed of anysignificant events related to the Company’s operations, particularlyinvestments and divestments in amounts exceeding 1% of equity.
Finally, the Company’s bylaws also offer the necessary guaranteesto ensure compliance with best governance practices under aunified Management Form. In particular, they stipulate that a Boardmeeting may be convened by any means, including verbally, and atshort notice depending on the urgency, by the Chairman, a ViceChairman, or by a third of its members, at any time and as often asrequired to ensure the best interests of the Company. The rules ofprocedure of the Board of Directors also state that each directormust notify the Board of Directors of any existing or potential conflictof interest with the Company or any Group company and mustrefrain from participating in the vote related to the correspondingresolution as well as in any discussion preceding such vote.
Lead Independent Director
At its meeting on December 16, 2015, the Board of Directorsappointed Ms. Barbizet as Lead Independent Director as ofDecember 19, 2015. Pursuant to the provisions of the rules of
procedure of the Board of Directors, she therefore chairs theGovernance and Ethics Committee.
The duties of the Lead Independent Director are described in detailin the rules of procedure of the Board of Directors, the full version ofwhich is provided in point 1.2.2 below.
1.2.2. Working procedures of the Board of Directors
The working procedures of the Board of Directors are set out in itsrules of procedure, which set forth the mission of the Board ofDirectors and the rules related to the organization of its work. The Board’s rules of procedure also specify the obligations of eachdirector, as well as the role and powers of the Chairman and theChief Executive Officer.
Mr. Charles Paris de Bollardière has served as Secretary of theBoard of Directors since September 15, 2009, the date on whichthe Board of Directors decided to appoint him to this position.
As of November 4, 2014, date of the appointment of the directorrepresenting employees on the Board of Directors, a member of theCentral Works Council attends Board meetings in an advisorycapacity, pursuant to Article L. 2323-65 of the French Labor Code.
The rules of procedure of the Board of Directors are reviewed on aregular basis to adapt them to changes in governance rules andpractices. In 2014, changes were made to include, in particular, newprovisions relating to information of the Board of Directors in the eventof new directorships being assumed by the directors or changesbeing made to existing directorships, together with a reminder of theobligations of confidentiality inherent to the work of the Board. InDecember 2015, changes were made to provide for the appointmentof a Lead Independent Director in the event of the combination of themanagement positions and to define his or her duties.
The latest unabridged version of the rules of procedure of theBoard of Directors, approved by the Board of Directors at itsmeeting on December 16, 2015, is provided below. It is also availableon the Company’s website under “Our Group / Governance”.
Corporate governance 5Composition and practices of the Board of Directors
Registration Document 2015. TOTAL 89
(1) TOTAL S.A. is referred to in these rules of procedure as the “Company” and collectively with all its direct and indirect subsidiaries as the “Group”.(2) The term “executive director” refers to the Chairman and Chief Executive Officer, if the Chairman of the Board of Directors is also responsible for the management of the Company; the Chairman
of the Board of Directors and the Chief Executive Officer, if the two roles are carried out separately; and, where applicable, any Deputy Chief Executive Officers or Chief Operating Officers,depending on the organizational structure adopted by the Board of Directors.
5 Corporate governanceComposition and practices of the Board of Directors
TOTAL. Registration Document 201590
- the internal control function operates properly and the statutory auditors are able to perform their mission satisfactorily, and- the Committees it has created duly perform their responsibilities;
– ensuring the quality of the information provided to shareholders and financial markets through the financial statements that it approves aswell as the annual reports, or when major transactions are conducted;
– convening and setting the agenda for Shareholders’ Meetings or meetings of bond holders; and– preparing on an annual basis the list of directors it deems to be independent according to generally accepted corporate governance criteria.– appointing a Lead Independent Director under the conditions set out in article 7, when the Chairman of the Board of Directors is also the
Chief Executive Officer pursuant to a decision by the Board of Directors.
2. OBLIGATIONS OF THE DIRECTORS OF TOTAL S.A.
Before accepting a directorship, all candidates receive a copy of TOTAL S.A.’s bylaws and these rules of procedure. They must ensure thatthey have broad knowledge of the general and particular obligations related to their duty, especially the laws and regulations governingdirectorships in French limited liability companies (sociétés anonymes) whose shares are listed in one or several regulated markets. Theymust also ensure that they are familiar with the guidelines set out in the Corporate Governance Code to which the Company refers.
Accepting a directorship creates an obligation to comply with applicable regulations relating in particular to the functioning of the Board ofDirectors, and with the ethical rules of professional conduct for directors as described in the Corporate Governance Code to which theCompany refers. It also creates an obligation to comply with these rules of rrocedure and to uphold the Group’s values as described in itsCode of Conduct.
When directors participate in and vote at meetings of the Board of Directors, they are required to represent all of the Company’s shareholdersand to act in the interest of the Company as a whole.
2.1. INDEPENDENCE OF JUDGMENT
Directors undertake to maintain, in all circumstances, the independence of their analysis, judgment, decision-making and actions as well asnot to be unduly influenced, directly or indirectly, by other directors, particular groups of shareholders, creditors, suppliers or, more generally,any third party.
2.2. OTHER DIRECTORSHIPS OR FUNCTIONS
Directors must keep the Board of Directors informed of any position they hold on the management team, Board of Directors or SupervisoryBoard of any other company, whether French or foreign, listed or unlisted. This includes any positions as a non-voting member (censeur) of aboard. To this end, directors expressly undertake to promptly notify the Chairman of the Board of Directors, and the Lead Independent Directorif one has been appointed, of any changes to the positions held, for any reason, whether appointment, resignation, termination or non-renewal.
2.3. PARTICIPATION IN THE BOARD’S WORK
Directors undertake to devote the amount of time required to duly consider the information they are given and otherwise prepare for meetingsof the Board of Directors and of the Committees of the Board of Directors on which they sit. They may request from the executive directorsany additional information they deem necessary or useful to their duties. If they consider it necessary, they may request training on the Company’sspecificities, businesses and industry sector, and any other training that may be of use to the effective exercise of their duties as directors.
Unless unable, in which case the Chairman of the Board shall be provided advance notice, directors are to attend all meetings of the Boardof Directors, meetings of Committees of the Board of Directors on which they serve and Shareholders’ Meetings.
The Chairman of the Board ensures that directors receive all relevant information concerning the Company, including that of a negativenature, particularly analyst reports, press releases and the most important media articles.
2.4. CONFIDENTIALITY
Directors and any other person who attends all or part of any meeting of the Board of Directors or its Committees are under the strictobligation not to disclose any details of the proceedings.
All documents reviewed at meetings of the Board of Directors, as well as information conveyed prior to or during the meetings, are strictly confidential.
With respect to all non-public information acquired during the exercise of their functions, directors are bound by professional secrecy not to divulgesuch information to employees of the Group or to outside parties. This obligation goes beyond the mere duty of discretion provided for by law.
Directors must not use confidential information obtained prior to or during meetings for their own personal benefit or for the benefit ofanyone else, for whatever reason. They must take all necessary steps to ensure that the information remains confidential. Confidentiality andprivacy are lifted when such information is made publicly available by the Company.
2.5. DUTY OF LOYALTY
Directors must not take advantage of their office or duties to gain, for themselves or a third party, any monetary or non-monetary benefit.
They must notify the Chairman of the Board of Directors and the Lead Independent Director, if one has been appointed, of any existing orpotential conflict of interest with the Company or any Group company, and they must refrain from participating in the vote relating to thecorresponding resolution as well as in any discussion preceding such vote.
Directors must inform the Board of Directors of their participation in any transaction that directly involves the Company, or any Groupcompany, before such transaction is finalized.
Directors must not assume personal responsibilities in companies or businesses having activities in competition with those of the Companyor any Group company without first having informed the Board of Directors.
Directors undertake not to seek or accept from the Company, or from companies directly or indirectly connected to the Company, anyadvantages liable to be considered as being of a nature that may compromise their independence.
2.6. DUTY OF EXPRESSION
Directors undertake to clearly express their opposition if they deem a decision being considered by the Board of Directors is contrary to theCompany’s corporate interest and they must endeavor to convince the Board of Directors of the pertinence of their position.
2.7. TRANSACTIONS IN THE COMPANY’S SECURITIES AND STOCK EXCHANGE RULES
While in office, directors are required to hold the minimum number of registered shares of the Company as set by the bylaws.
Generally speaking, directors must act with the highest degree of prudence and vigilance when completing any personal transactioninvolving the financial instruments of the Company, its subsidiaries or affiliates that are listed or that issue listed financial instruments.
To that end, directors must comply with the following requirements:
1. Any shares or ADRs of TOTAL S.A. or its listed subsidiaries are to be held in registered form, either with the Company or its agent, or asadministered registered shares with a French broker (or North American broker for ADRs), whose contact details are communicated bythe director to the Secretary of the Board of Directors.
2. Directors shall refrain from directly or indirectly engaging in (or recommending engagement in) transactions involving the financialinstruments (shares, ADRs or any other securities related to such financial instruments) of the Company or its listed subsidiaries, or anylisted financial instruments for which the director has insider information.Insider information is specific information that has not yet been made public and that directly or indirectly concerns one or more issuers offinancial instruments or one or more financial instruments and which, if it were made public, could have a significant impact on the price ofthe financial instruments concerned or on the price of financial instruments related to them.
3. Any transaction in the Company’s financial instruments (shares, ADRs or related financial instruments) is strictly prohibited during the thirty calendardays preceding the publication by the Company of its periodic results (quarterly, half-year or annual) as well as on the day of any suchannouncement.
4. Moreover, directors shall comply, where applicable, with the provisions of Article L. 255-197-1 of the French Commercial Code, whichstipulates that free shares may not be sold:– during the ten trading days preceding and the three trading days following the date on which the Consolidated Financial Statements or,
failing that, the annual financial statements, are made public; and– during the period from the date on which the Company’s corporate bodies become aware of information that, if it were made public,
could have a significant impact on the Company’s share price, until ten trading days after such information is made public.5. Directors are prohibited from carrying out transactions on any financial instruments related to the Company’s share (Paris option market
(MONEP), warrants, exchangeable bonds, etc.) and from buying on margin or short selling such financial instruments.6. Directors are also prohibited from hedging the shares of the Company and any financial instruments related to them, and in particular:
– Company shares that they hold; and, where applicable;– Company share subscription or purchase options;– rights to Company shares that may be awarded free of charge; and– Company shares obtained from the exercise of options or granted free of charge.
7. Directors must make all necessary arrangements to declare, pursuant to the form and timeframe provided by applicable law, to the Frenchsecurities regulator (Autorité des marchés financiers), as well as to the Secretary of the Board of Directors, any transaction involving theCompany’s securities conducted by themselves or by any other person to whom they are closely related.
3. FUNCTIONING OF THE BOARD OF DIRECTORS
3.1. BOARD MEETINGS
The Board of Directors meets at least four times a year and whenever circumstances require.
Prior to each Board meeting, the directors receive the agenda and, whenever possible, all other materials necessary to consider for the session.
Directors may be represented by another director at a meeting of the Board, provided that no director holds more than one proxy at anysingle meeting.
Whenever authorized by law, directors are considered present for quorum and majority purposes who attend Board meetings through videoconferencing or other audiovisual means that are compliant with the technical requirements set by applicable regulations.
3.2. DIRECTORS’ FEES
The Board of Directors allocates annual directors’ fees within the total amount authorized by the Annual Shareholders’ Meeting.Compensation includes a fixed portion and a variable portion that takes into account each directors’ actual participation in the work of the
Corporate governance 5Composition and practices of the Board of Directors
Registration Document 2015. TOTAL 91

Board of Directors and its Committees together with, if applicable, the duties of the Lead Independent Director.
The Chief Executive Officer or, if the functions are combined, the Chairman and Chief Executive Officer, does not receive any director’s feesfor his participation in the work of the Board and its Committees.
3.3. SECRETARY OF THE BOARD OF DIRECTORS
The Board of Directors, based on the recommendation of its Chairman, appoints a Secretary of the Board who assists the Chairman inorganizing the Board’s activities, and particularly in preparing the annual work program and the schedule of Board meetings.
The Secretary drafts the minutes of Board meetings, which are then submitted to the Board for approval. The Secretary is authorized todispatch Board meeting minutes and to certify copies and excerpts of the minutes.
The Secretary is responsible for all procedures pertaining to the functioning of the Board of Directors. These procedures are reviewedperiodically by the Board.
All Board members may ask the Secretary for information or assistance.
3.4. EVALUATION OF THE FUNCTIONING OF THE BOARD
The Board evaluates its functioning at regular intervals not exceeding three years. The evaluation is carried out under the supervision of theLead Independent Director, if one has been appointed, or under the supervision of the Governance and Ethics Committee, with theassistance of an outside consultant. The Board of Directors also conducts an annual review of its practices.
4. ROLE AND AUTHORITY OF THE CHAIRMAN
The Chairman represents the Board of Directors and, except under exceptional circumstances, has sole authority to act and speak on behalfof the Board of Directors.
The Chairman organizes and oversees the work of the Board of Directors and ensures that the Company’s corporate bodies operateeffectively and in compliance with good governance principles. The Chairman coordinates the work of the Board of Directors and itsCommittees. The Chairman establishes the agenda for each Board meeting, including items suggested by the Chief Executive Officer.
The Chairman ensures that directors receive, in a timely manner and in a clear and appropriate format, the information they need toeffectively carry out their duties.
In liaison with the Group’s General Management, the Chairman is responsible for maintaining relations between the Board of Directors andthe Company’s shareholders. The Chairman monitors the quality of information disclosed by the Company.
In close cooperation with the Group’s General Management, the Chairman may represent the Company in high-level discussions withgovernment authorities and major partners, both at a national and international level.
The Chairman is regularly informed by the Chief Executive Officer of significant events and situations relating to the Group, particularly withregard to strategy, organization, monthly financial reporting, major investment and divestment projects and key financial transactions. TheChairman may ask the Chief Executive Officer or other senior executives of the Company, provided that the Chief Executive Officer isinformed, to supply any information that may help the Board or its Committees to carry out their duties.
The Chairman may meet with the statutory auditors in order to prepare the work of the Board of Directors and the Audit Committee.
Every year, the Chairman presents a report to the Annual Shareholders’ Meeting describing the preparation and organization of the Board ofDirectors’ work, any limits set by the Board of Directors concerning the powers of the Chief Executive Officer, and the internal controlprocedures implemented by the Company. To this end, the Chairman obtains the necessary information from the Chief Executive Officer.
5. AUTHORITY OF THE CHIEF EXECUTIVE OFFICER
The Chief Executive Officer is responsible for the Company’s overall management. He represents the Company in its relationships with thirdparties and chairs the Executive Committee. The Chief Executive Officer is vested with the broadest powers to act on behalf of the Companyin all circumstances, subject to the powers that are, by law, restricted to the Board of Directors and to the Annual Shareholders’ Meeting, aswell as to the Company’s corporate governance rules and in particular these rules of procedure of the Board of Directors.
The Chief Executive Officer is responsible for presenting the Group’s results and prospects to shareholders and the financial community on aregular basis.
At each meeting of the Board of Directors, the Chief Executive Officer presents an overview of significant Group events.
6. BOARD COMMITTEES
The Board of Directors approved the creation of:
– an Audit Committee;– a Governance and Ethics Committee;
5 Corporate governanceComposition and practices of the Board of Directors
TOTAL. Registration Document 201592
– a Compensation Committee; and– a Strategic Committee.
The roles and composition of each Committee are set forth in their respective rules of procedure, which have been approved by the Board ofDirectors.
The Committees perform their duties under the authority and for the benefit of the Board of Directors.
Each Committee reports on its activities to the Board of Directors.
7. LEAD INDEPENDENT DIRECTOR
7.1. APPOINTMENT OF THE LEAD INDEPENDENT DIRECTOR
When the functions of the Chairman of the Board and Chief Executive Officer are combined, the Board of Directors appoints a LeadIndependent Director, on the recommendation of the Governance and Ethics Committee, among the directors considered to be independentby the Board of Directors.
The appointed Lead Independent Director holds this position while in office as director, unless otherwise decided by the Board of Directors,which may choose to terminate his duties at any time. If for any reason the director is no longer deemed to be independent, his or herposition as Lead Independent Director will be terminated.
The Lead Independent Director, if one is appointed, chairs the Governance and Ethics Committee.
7.2. DUTIES OF THE LEAD INDEPENDENT DIRECTOR
The Lead Independent Director’s duties include:
1. Convening meetings of the Board of Directors – Meeting AgendaThe Lead Independent Director may request that the Chairman and Chief Executive Officer call a meeting of the Board of Directors todiscuss a given agenda.He may request that the Chairman and Chief Executive Officer include additional items on the agenda of any meeting of the Board of Directors.
2. Participation in the work of the CommitteesIf not a member of the Compensation Committee, the Lead Independent Director is invited to attend meetings and participates in thework of the Compensation Committee relating to the annual review of the executive directors’ performance and recommendationsregarding their compensation.
3. Acting as Chairperson of Board of Directors’ meetingsWhen the Chairman and Chief Executive Officer is unable to attend all or part of a meeting of the Board of Directors, the LeadIndependent Director chairs the meeting. In particular, he or she chairs those Board meetings the proceedings of which relate to theevaluation of the performance of the executive directors and the determination of their compensation, which take place in their absence.
4. Evaluation of the functioning of the Board of DirectorsThe Lead Independent Director manages the evaluation process relating to the functioning of the Board of Directors and reports on thisevaluation to the Board of Directors.
5. Prevention of conflicts of interestWithin the Governance and Ethics Committee, the Lead Independent Director organizes the performance of due diligence in order toidentify and analyze potential conflicts of interest within the Board of Directors. He informs the Chairman and Chief Executive Officer of anyconflicts of interest identified as a result and reports to the Board of Directors on these activities.Pursuant to the obligation to declare conflicts of interest set out in article 2.5 of these Rules, any director affected by an existing orpotential conflict of interest must inform the Chairman and Chief Executive Officer and the Lead Independent Director.
6. Monitoring of the satisfactory functioning of the Board and compliance with the Rules of ProcedureThe Lead Independent Director ensures compliance with the rules of the Corporate Governance Code to which TOTAL S.A. refers andwith the Rules of Procedure of the Board of Directors. He or she may make any suggestions or recommendations that he deemsappropriate to this end.He or she ensures that the directors are in a position to carry out their tasks under optimal conditions and that they have sufficientinformation to perform their duties.With the agreement of the Governance and Ethics Committee, the Lead Independent Director may hold meetings of the directors who donot hold executive or salaried positions on the Board of Directors. He reports to the Board of Directors on the conclusions of such meetings.
7. Relationships with ShareholdersThe Chairman and Chief Executive Officer and the Lead Independent Director are the shareholders’ dedicated contacts on issues that fallwithin the remit of the Board.When a shareholder approaches the Chairman and Chief Executive Officer in relation to such issues, they may seek the opinion of theLead Independent Director before responding appropriately to the shareholder’s request.When the Lead Independent Director is approached by a shareholder in relation to such issues, he or she must inform the Chairman and
Corporate governance 5Composition and practices of the Board of Directors
Registration Document 2015. TOTAL 93
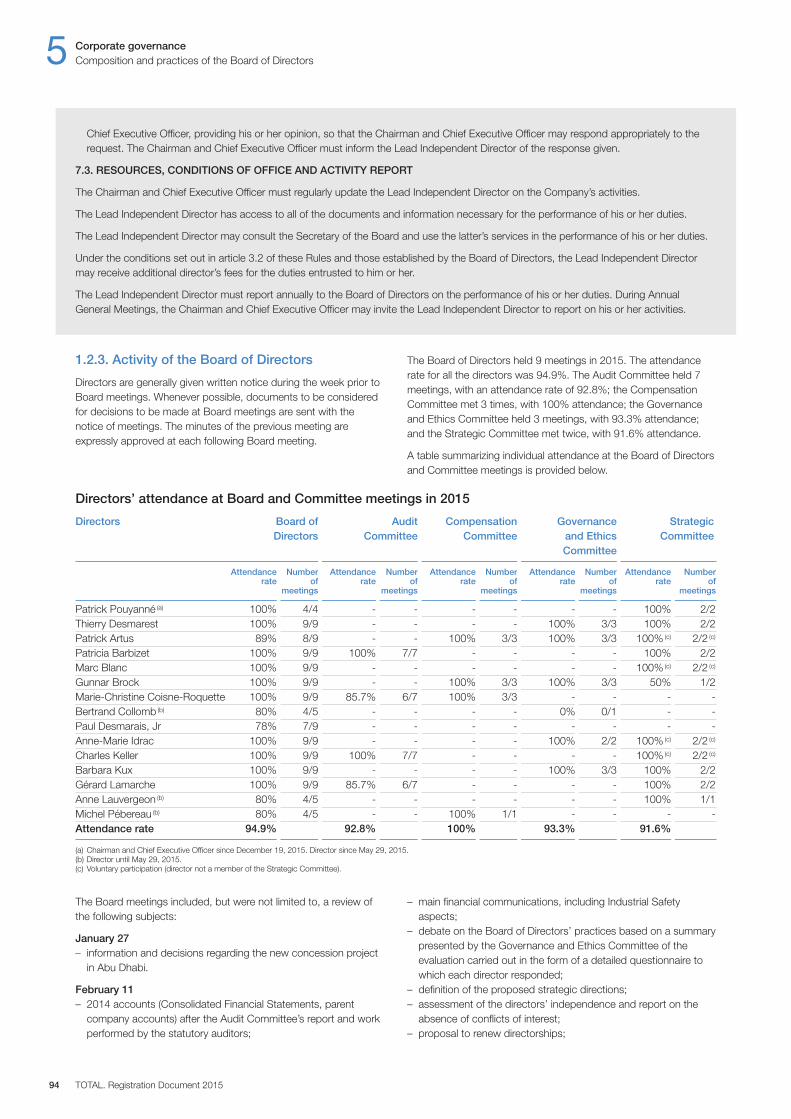
The Board meetings included, but were not limited to, a review ofthe following subjects:
January 27– information and decisions regarding the new concession project
in Abu Dhabi.
February 11– 2014 accounts (Consolidated Financial Statements, parent
company accounts) after the Audit Committee’s report and workperformed by the statutory auditors;
– main financial communications, including Industrial Safetyaspects;
– debate on the Board of Directors’ practices based on a summarypresented by the Governance and Ethics Committee of theevaluation carried out in the form of a detailed questionnaire towhich each director responded;
– definition of the proposed strategic directions;– assessment of the directors’ independence and report on the
absence of conflicts of interest;– proposal to renew directorships;
Directors’ attendance at Board and Committee meetings in 2015
Directors Board of Audit Compensation Governance Strategic Directors Committee Committee and Ethics Committee Committee
Attendance Number Attendance Number Attendance Number Attendance Number Attendance Number rate of rate of rate of rate of rate of
meetings meetings meetings meetings meetings
Patrick Pouyanné (a) 100% 4 / 4 - - - - - - 100% 2 / 2Thierry Desmarest 100% 9 / 9 - - - - 100% 3 / 3 100% 2 / 2Patrick Artus 89% 8 / 9 - - 100% 3 / 3 100% 3 / 3 100% (c) 2 / 2 (c)
Patricia Barbizet 100% 9 / 9 100% 7 / 7 - - - - 100% 2 / 2Marc Blanc 100% 9 / 9 - - - - - - 100% (c) 2 / 2 (c)
Gunnar Brock 100% 9 / 9 - - 100% 3 / 3 100% 3 / 3 50% 1 / 2Marie-Christine Coisne-Roquette 100% 9 / 9 85.7% 6 / 7 100% 3 / 3 - - - -Bertrand Collomb (b) 80% 4 / 5 - - - - 0% 0 / 1 - -Paul Desmarais, Jr 78% 7 / 9 - - - - - - - -Anne-Marie Idrac 100% 9 / 9 - - - - 100% 2 / 2 100% (c) 2 / 2 (c)
Charles Keller 100% 9 / 9 100% 7 / 7 - - - - 100% (c) 2 / 2 (c)
Barbara Kux 100% 9 / 9 - - - - 100% 3 / 3 100% 2 / 2Gérard Lamarche 100% 9 / 9 85.7% 6 / 7 - - - - 100% 2 / 2Anne Lauvergeon (b) 80% 4 / 5 - - - - - - 100% 1 / 1Michel Pébereau (b) 80% 4 / 5 - - 100% 1 / 1 - - - -Attendance rate 94.9% 92.8% 100% 93.3% 91.6%
(a) Chairman and Chief Executive Officer since December 19, 2015. Director since May 29, 2015.(b) Director until May 29, 2015.(c) Voluntary participation (director not a member of the Strategic Committee).
1.2.3. Activity of the Board of Directors
Directors are generally given written notice during the week prior toBoard meetings. Whenever possible, documents to be consideredfor decisions to be made at Board meetings are sent with thenotice of meetings. The minutes of the previous meeting areexpressly approved at each following Board meeting.
The Board of Directors held 9 meetings in 2015. The attendancerate for all the directors was 94.9%. The Audit Committee held 7meetings, with an attendance rate of 92.8%; the CompensationCommittee met 3 times, with 100% attendance; the Governanceand Ethics Committee held 3 meetings, with 93.3% attendance;and the Strategic Committee met twice, with 91.6% attendance.
A table summarizing individual attendance at the Board of Directorsand Committee meetings is provided below.
Chief Executive Officer, providing his or her opinion, so that the Chairman and Chief Executive Officer may respond appropriately to therequest. The Chairman and Chief Executive Officer must inform the Lead Independent Director of the response given.
7.3. RESOURCES, CONDITIONS OF OFFICE AND ACTIVITY REPORT
The Chairman and Chief Executive Officer must regularly update the Lead Independent Director on the Company’s activities.
The Lead Independent Director has access to all of the documents and information necessary for the performance of his or her duties.
The Lead Independent Director may consult the Secretary of the Board and use the latter’s services in the performance of his or her duties.
Under the conditions set out in article 3.2 of these Rules and those established by the Board of Directors, the Lead Independent Directormay receive additional director’s fees for the duties entrusted to him or her.
The Lead Independent Director must report annually to the Board of Directors on the performance of his or her duties. During AnnualGeneral Meetings, the Chairman and Chief Executive Officer may invite the Lead Independent Director to report on his or her activities.
5 Corporate governanceComposition and practices of the Board of Directors
TOTAL. Registration Document 201594
– determination of the amount of directors’ fees due for fiscal year2014;
– the Chief Executive Officer’s compensation (in the absence of theChief Executive Officer); and
– review of the possibility of granting the Company’s performanceshares and stock options.
March 25– summary of the Strategic Committee meeting of February 11, 2015;– presentation to the Board of the work of the Audit Committee at
its meeting on March 23, 2015;– presentation to the Board of the Group’s R&D activities and the
major issues it faces;– preparation of the Annual Shareholders’ Meeting: agenda,
resolutions and reports;– review of various chapters of the Registration Document forming
the Management Report within the meaning of the FrenchCommercial Code (risk factors and social, environmental andsocietal information); and
– setting the schedule related to the payment of interim dividendsand the balance of the dividend for 2016.
April 27– results for the first quarter of 2015 after the Audit Committee’s
report and work performed by the statutory auditors;– payment of an interim dividend;– preparation of the Annual Shareholders’ Meeting: review of
requests made by the Central Works Council to include a draftresolution on the Annual Shareholders’ Meeting agenda; the Board of Directors’ position on this request;
– information about the share capital increase reserved foremployees and additional decisions; establishment of the Boardof Directors’ additional report on this operation; and
– French Labor Code procedure relating to the Company’sstrategic directions: communication of the Central WorksCouncil’s response to the Board of Directors’ response given onDecember 16, 2014.
May 29 – pre-Shareholders’ Meeting– review of the draft responses to the written questions submitted
by a shareholder; and– setting of the share issue price for the payment of the balance of
the 2014 dividend in shares, subject to the adoption of theresolution by the Annual Shareholders’ Meeting immediatelyfollowing the Board meeting.
July 28– strategic perspectives of the Refining & Chemicals segment
including safety and energy efficiency aspects and prevention ofmajor environmental risks;
– results for the second quarter 2015 and the first half of 2015after the Audit Committee’s report and work performed by thestatutory auditors;
– payment of a second interim dividend;– approval of the resources made available and training program
for the director representing employees on recommendation ofthe Governance and Ethics Committee;
– performance share grants on the recommendation of theCompensation Committee;
– presentation of the Company’s equal opportunity and salaryequality policy and comparative status of overall employment andtraining conditions for women and men in the Company; and
– information about the results of the votes on the resolutions atthe Annual Shareholders’ Meeting held on May 29, 2015, theresults of the option to receive the payment of the remainingbalance of the dividend for fiscal year 2014 in shares.
September 22– strategic perspectives of Exploration & Production activities with
a presentation of safety indicators and environmental objectives;– mid-2015 financial communications: presentation of the outlook
and objectives for the coming years;– the Company’s strategic directions;– comparison of the results of international oil companies; and– distribution of the first interim dividend for the 2015 fiscal year
and setting of the new share issue price for the option to receivethe interim dividend in shares.
October 28 – meeting held in Abu Dhabi– summary of the Strategic Committee meeting of September 22,
2015;– strategic perspectives of Marketing & Services activities,
including the operational safety, technological risk andenvironmental aspects, and strategic perspectives of NewEnergies (solar and biotechnology) activities;
– results for the third quarter of 2015 after the Audit Committee’sreport and work performed by the statutory auditors;
– payment of a third interim dividend;– information about the results of the option to receive the payment
of the first interim dividend for fiscal year 2015 in shares.
December 16– decision to reunify the positions of Chairman and
Chief Executive Officer and appointment of the Chairmanfollowing the Governance and Ethics Committee’s report;
– amendment of the Board of Directors’ Rules of Procedure tointroduce the option of appointing a Lead Independent Directorand define their duties;
– appointment of a Lead Independent Director;– amendment of the Rules of Procedure of the Governance and
Ethics Committee; – approval of the change in the composition of the Committees;– examination of the allocation of the directors’ fees in particular in
light of the a appointment of a Lead Independent Director;– the Chairman and Chief Executive Officer’s compensation (in the
absence of the Chief Executive Officer);– determination of the commitments made to the Chairman and
Chief Executive Officer (supplementary pension plan, retirementbenefits, severance pay and life insurance plan) (in the absenceof the Chief Executive Officer);
– the Group’s 5-year plan: outlook of the Group and businesssegments and financial summary of the long-term plan;
– 2016 budget review;– Board of Directors’ response to the Central Works Council’s
opinion on the strategic directions presented to the Board onSeptember 22, 2015;
– distribution of the second interim dividend for the 2015 fiscal yearand setting of the new share issue price for the option to receivethe interim dividend in shares; and
– information about the regulated agreements authorized duringthe fiscal year and the regulated agreements concluded andauthorized during previous fiscal years that have remainedapplicable during fiscal year 2015.
1.2.4. Audit Committee
Composition
The Committee has four members. It is chaired by Ms. Coisne-Roquetteand its members also include Messrs. Artus, Keller and Lamarche.Ms. Coisne-Roquette was appointed “financial expert” of theCommittee by the Board at its meeting of December 16, 2015.
Corporate governance 5Composition and practices of the Board of Directors
Registration Document 2015. TOTAL 95
5 Corporate governanceComposition and practices of the Board of Directors
TOTAL. Registration Document 201596
The Committee members are all independent directors (refer topoint 1.1.3 above), with the exception of the director representingemployee shareholders (Mr. Keller). The careers of all of theCommittee members attest to their possession of acknowledgedexpertise in the financial and accounting or economic fields (refer topoint 1.1.1 above).
Duties
The rules of procedure of the Audit Committee define the Committee’sduties and working procedures. They were last amended in 2014 to permit the appointment of a director representing employeeshareholders or employees. The unabridged version of the rules ofprocedure approved by the Board of Directors on July 29, 2014 isavailable on the Company’s website under “Our Group / CorporateGovernance”.
To allow the Board of Directors of TOTAL S.A. to ensure thatinternal control is effective and that published information availableto shareholders and financial markets is reliable, the duties of theCommittee include:
– recommending the appointment of statutory auditors and theircompensation, ensuring their independence and monitoring theirwork;
– establishing the rules for the use of statutory auditors for non-audit services and verifying their implementation;
– supervising the audit by the statutory auditors of theConsolidated Financial Statements and the parent companyfinancial statements;
– examining the assumptions used to prepare the financialstatements, assessing the validity of the methods used to handlesignificant transactions and examining the parent companyfinancial statements and annual, half-yearly, and quarterlyConsolidated Financial Statements prior to their examination bythe Board of Directors, after regularly monitoring the financialsituation, cash position and commitments included in the annualfinancial statements of the Company;
– supervising the implementation of internal control and riskmanagement procedures and their effective application, with the assistance of the internal audit department;
– supervising procedures for preparing financial information;– monitoring the implementation and activities of the disclosure
Committee, including reviewing the conclusions of thisCommittee;
– reviewing the annual work program of internal and externalauditors;
– receiving information periodically on completed audits andexamining annual internal audit reports and other reports(statutory auditors, annual report, etc.);
– reviewing the choice of appropriate accounting policies andprinciples used to prepare the Consolidated Financial Statementsand parent company financial statements and ensuring thecontinuity of the principles;
– reviewing the Group’s policy for the use of derivative instruments;– reviewing, if requested by the Board of Directors, major transactions
contemplated by the Group;– reviewing significant litigation annually;– implementing and monitoring compliance with the Group’s
Financial Code of Ethics;– proposing to the Board of Directors, for implementation, a
procedure for complaints or concerns of employees,shareholders and others, related to accounting, internal controlor auditing matters, and monitoring the implementation of thisprocedure;
– where applicable, reviewing significant transactions of the Groupduring which a conflict of interest may have occurred; and
– reviewing the procedure for booking the Group’s proved reserves.
Organization of activities
The Committee meets at least seven times each year: each quarterto review the statutory financial statements of TOTAL S.A. as parentcompany and the annual and quarterly Consolidated FinancialStatements, and at least three other times a year to review mattersnot directly related to the review of the quarterly financial statements.
At each Committee meeting where the quarterly financialstatements are reviewed, the Group’s Chief Financial Officerpresents the Consolidated Financial Statements and the statutoryfinancial statements of TOTAL S.A. as parent company, as well asthe Group’s financial position and, in particular, its liquidity, cashflow and debt situation. A memo describing the Company’s riskexposure and off-balance sheet commitments is communicated tothe Audit Committee. This review of the financial statementsincludes a presentation by the statutory auditors underscoring thekey points observed.
As part of monitoring the efficiency of the internal control and riskmanagement systems, the Committee is informed of the workprogram of the Corporate Internal Control and Audit Departmentand its organization, on which it may issue an opinion. TheCommittee also receives a summary of the internal audit reports,which is presented at each Committee meeting where the quarterlyfinancial statements are reviewed. The risk management processesimplemented within the Group and updates to them are presentedregularly to the Audit Committee.
The Committee may meet with the Chairman and Chief ExecutiveOfficer or, if the functions are separate, the Chairman of the Boardof Directors, the Chief Executive Officer and, if applicable, anyDeputy Chief Executive Officer of the Company, and performinspections and consult with managers of operating or non-operatingdepartments, as may be useful in performing its duties. TheChairperson of the Committee gives prior notice of such meeting tothe Chairman and Chief Executive Officer or, if the functions areseparate, both the Chairman of the Board of Directors and theChief Executive Officer. The Committee is authorized to consult withthose involved in preparing or auditing the financial statements(Chief Financial Officer and principal Finance Departmentmanagers, Audit Department, Legal Department) by asking theCompany’s Chief Financial Officer to call them to a meeting.
The Committee consults with the statutory auditors and, at leastonce a year, without any Company representative being present. If it is informed of a substantial irregularity, it recommends that theBoard of Directors take all appropriate action.
Audit Committee activity
In 2015, the Audit Committee held 7 meetings, with 92.8%attendance. Its work was focused on the following areas:
February 9– review of the accounts for the fourth quarter of 2014, the Group’s
consolidated results and the statutory financial statements ofTOTAL S.A. as parent company for 2014. Presentation by thestatutory auditors of a summary of their work performed inaccordance with French and American professional audit standards,in particular on the Group’s positions in terms of valuing assetsand assessing country risk;
– review of the Group’s financial position;
Corporate governance 5Composition and practices of the Board of Directors
Registration Document 2015. TOTAL 97
– presentation of the preparation process and key validation stagesof the Management Report forming chapter 3 of the RegistrationDocument;
– update on internal audit: presentation of the 2014 mainaccomplishments and key topics of the audit plan for 2015.Comments on the results of the assessment of internal controlon financial reporting conducted for fiscal year 2014 as part ofthe implementation of the Sarbanes-Oxley Act (SOX), along witha summary of the statutory auditors’ assessments of internalcontrol related to financial reporting as part of the SOX 404process;
– review of the draft of the Chairman’s report on internal controland risk management procedures; and
– update on unvalued guarantees given by TOTAL S.A. in 2014.
March 23– presentation of certain parts of the Registration Document: risk
factors and legal proceedings;– update on compliance procedures: 2014 results and
implementation of programs;– environmental and societal reporting: analysis of environmental
risks, key indicators and action plans. Presentation of theGroup’s societal policy. Presentation by the statutory auditors oftheir procedures and the conclusions of their review of theseissues;
– review of the hydrocarbon reserves evaluation process at year-end2014; and
– presentation of the Group’s insurance policy: coverage for 2015against property damage, business interruption and civil liability.Update on the main pending claims.
April 23– compliance: information about the new independent monitor
appointed by the U.S. authorities (the monitor originallyappointed having relinquished his assignment for health reasons);presentation of the monitor’s work schedule;
– review of the consolidated and statutory financial statements ofTOTAL S.A. as parent company for the first quarter of 2015, with a presentation by the statutory auditors of a summary oftheir work;
– presentation of the Group’s financial position at the end of thequarter; and
– update on the internal audits conducted in the first quarter of2015.
June 10– presentation of the topics covered by the Group Risk Committee
in 2014, including “partner” risks for assets operated by thirdparties, tax risks, major accident and pollution risks, andenvironmental risks;
– approval of the new version of the Risk Management, InternalControl and Audit Charter;
– presentation of the main potential risks for the growth ofExploration & Production;
– presentation of the updated Trading & Shipping risk map;– presentation of the Group’s financial position: map of taxes paid
worldwide, tax risk map; main inspections and tax-related legalproceedings; main changes and anticipated risks; and
– review of the Consolidation Department’s functions in terms ofaccounting standards and its organization within the Group;presentation of the main proposed changes in standards inprogress.
July 24– update on the statutory auditors panel (in the absence of the
statutory auditors) in light of the European Regulation on statutoryaudit that will come into effect on June 17, 2016 and the end ofthe terms of office of the current statutory auditors at the 2016Annual Shareholders’ Meeting. After analysis, the Audit Committeewill recommend that the Board propose to the Annual Shareholders’Meeting of May 24, 2016 that the terms of office of the statutoryauditors be renewed for a period of six fiscal years;
– review of the Consolidated Financial Statements for the secondquarter and first half of 2015 and the statutory financialstatements of TOTAL S.A.as parent company. Presentation bythe statutory auditors of a summary of their work;
– presentation of the Group’s financial position at the end of thequarter; and
– update on the internal audits conducted in the second quarter of 2015.
October 7– statutory auditors’ analysis of the main transverse risks that will
be addressed as important points in their audit plan for theclosing of the 2015 accounts;
– review of significant litigation and status update on the mainpending proceedings involving the Group;
– presentation by the independent monitor of the aims of hismission and the actions taken since his appointment;
– presentation on social commitments and managed assets:control and management; and
– statutory auditors: update on fees followed by review of the rulesfor pre-approval of audit and non-audit services and approval,without changes, of the policy implemented.
The members of the Committee then met with the statutoryauditors without management being present.
October 26– review of the consolidated and the statutory financial statements
of TOTAL S.A. as parent company for the third quarter of 2015and the first nine months of 2015. Presentation by the statutoryauditors of a summary of their work;
– presentation of the Group’s financial position at the end of thequarter;
– update on the internal audits conducted in the third quarter of2015;
– the Committee was informed that the relevant employees actedin compliance with the provisions of the Financial Code of Ethics;and
– presentation of the supervision of the audit of the equity affiliates’financial statements.
At each meeting related to the quarterly financial statements, theCommittee reviewed the Group’s financial position in terms ofliquidity, cash flow and debt, as well as its significant risks and off-balance sheet commitments. The Audit Committee wasperiodically informed of the risk management processes implementedwithin the Group and the work carried out by the Corporate InternalControl and Audit Department which was presented at eachCommittee meeting where the quarterly financial statements were reviewed.
The Audit Committee reviewed the accounts within the time limitsrequired by the AFEP-MEDEF Code, namely at least two days priorto their review by the Board of Directors.
The statutory auditors attended all Audit Committee meetings heldin 2015.

The Chief Financial Officer, the Vice President Accounting and theVice President Corporate Internal Control and Audit attended allAudit Committee meetings, and the Treasurer attended all meetingsrelated to his area.
The Chairman of the Committee reported to the Board of Directorson the Committee’s activities.
1.2.5. Governance and Ethics Committee
Composition
The Governance and Ethics Committee has five members. It ischaired by Ms. Barbizet, Lead Independent Director, and itsmembers also include Mses. Kux and Idrac and Messrs. Brock andDesmarest. 80% of the Committee members are independentdirectors (refer to point 1.1.3 above).
Duties
The rules of procedure of the Governance and Ethics Committeedefine the Committee’s duties and working procedures. Theunabridged version of the rules of procedure approved by the Boardof Directors on December 16, 2015 is available on the Company’swebsite under “Our Group / Corporate Governance”.
The Governance and Ethics Committee is focused on:
– recommending to the Board of Directors the persons who arequalified to be appointed as directors, so as to guarantee thescope of coverage of the Directors’ competencies and the diversityof their profiles;
– recommending to the Board of Directors the persons who arequalified to be appointed as executive directors;
– preparing the Company’s corporate governance rules andsupervising their implementation; and
– ensuring compliance with ethics rules and examining anyquestions related to ethics and conflicts of interest.
Its duties include:
– presenting recommendations to the Board for its membershipand the membership of its Committees, and the qualification interms of independence of each candidate for directors’ positionson the Board of Directors;
– proposing annually to the Board of Directors the list of directorswho may be considered as “independent directors”;
– examining, for the parts within its remit, reports to be sent by theBoard of Directors or its Chairman to shareholders;
– assisting the Board of Directors in the selection and evaluation ofthe executive directors and examining the preparation of theirpossible successors, including cases of unforeseeable absence;
– recommending to the Board of Directors the persons who arequalified to be appointed as directors;
– recommending to the Board of Directors the persons who arequalified to be appointed as members of a Committee of theBoard of Directors;
– proposing methods for the Board of Directors to evaluate itsperformance, and in particular preparing means of regular self-assessment of the practices of the Board of Directors, and thepossible assessment thereof by an external consultant;
– proposing to the Board of Directors the terms and conditions forallocating directors’ fees and the conditions under which expensesincurred by the directors are reimbursed;
– developing and recommending to the Board of Directors thecorporate governance principles applicable to the Company;
– preparing recommendations requested at any time by the Boardof Directors or the Management of the Company regardingappointments or governance;
– examining the conformity of the Company’s governance practiceswith the recommendations of the Corporate Governance Codeadopted by the Company;
– supervising and monitoring implementation of the Company’sethics and compliance program and, in this respect, ensuring thatthe necessary procedures for updating the Group’s Code of Conductare put in place and that this Code is disseminated and applied;
– examining any questions related to ethics and conflicts ofinterest; and
– examining changes in the duties of the Board of Directors.
Governance and Ethics Committee activity
In 2015, the Governance and Ethics Committee held 3 meetings,with 93.3% attendance. Its work was focused on the following areas:
February 10– results of the formal self-assessment of the Board’s practices
conducted in the form of a detailed questionnaire, prepared withthe assistance of an external consultant, to which the directorsresponded. The Committee stated that it was in favor of theproposed improvements, which will be submitted to the Board ofDirectors and notably concern the accentuating of the progressmade to the time allotted to the most important issues andsubstantive debates;
– proposals to the Board of Directors regarding the assessment ofthe independence of the directors based on the independencecriteria specified in the AFEP-MEDEF Code and after reviewingthe level of activity between certain directors and the Group’ssuppliers;
– proposals to the Board of Directors regarding the list of directorswhose appointment will be voted on by the 2015 AnnualShareholders’ Meeting;
– proposals regarding changes to the composition of theCommittees, subject to approval of the resolutions voted on bythe Annual Shareholders’ Meeting;
– review of the terms and conditions for allocating directors’ fees todirectors and Committee members. After noting the criteria used,the Committee proposed setting the fees to be paid to directorsfor 2014 based on the number of Board and Committeemeetings in which they participated at €1.34 million; and
– review, for the parts within its remit, of the reports that must besent to shareholders by the Board of Directors or its Chairman.
July 28– presentation by the Chairman of the Ethics Committee of a review
of the ethics program for 2014 (information and training campaigns,changes in the matters and cases reviewed, ethical assessmentsconducted within the Group’s entities, actions related to humanrights) and presentation of the priorities for 2015;
– discussion of changes to the composition of the Board ofDirectors; and
– establishment of the conditions for the performance of the dutiesof the director representing employees on the Board of Directors:resources made available and training program.
December 15– review of the General Management form and proposal to
combine the positions of Chairman and Chief Executive Officer;– proposed appointment of the Chairman and
Chief Executive Officer;– proposal to amend the Board of Directors’ Rules of Procedure to
5 Corporate governanceComposition and practices of the Board of Directors
TOTAL. Registration Document 201598
Corporate governance 5Composition and practices of the Board of Directors
Registration Document 2015. TOTAL 99
include provision for the appointment of a Lead IndependentDirector if the positions of Chairman and Chief Executive Officerare combined, and setting out of his or her duties, proposal toamend the rules of procedures of the Governance and EthicsCommittee;
– proposal regarding the appointment of a Lead Independent Director;– proposals regarding changes in the composition of the
Committees; and– proposal regarding change in the directors’ fees to be allocated to
the directors and the members of the Committees, in the eventof the combination of the positions of Chairman andChief Executive Officer.
1.2.6. Compensation Committee
Composition
The Compensation Committee is made up of four members. It is chaired by Mr. Lamarche and its members also include Mses.Barbizet and Coisne-Roquette and Mr. Brock. 100% of theCommittee members are independent directors (refer to point 1.1.3 above).
Duties
The rules of procedure of the Compensation Committee define theCommittee’s duties and working procedures. The unabridgedversion of the rules of procedure approved by the Board ofDirectors on February 9, 2012 is available on the Company’swebsite under “Our Group / Corporate Governance”.
The Committee is focused on:
– examining the executive compensation policies implemented bythe Group and the compensation of members of the ExecutiveCommittee;
– evaluating the performance and recommending thecompensation of each executive director; and
– preparing reports which the Company must present in these areas.
Its duties include:
– reviewing the main objectives proposed by the GeneralManagement of the Company regarding compensation of theGroup’s executive directors, including stock option plans, freeshare plans and equity-based plans, and advising on this subject;
– making recommendations and proposals to the Board ofDirectors concerning:- compensation, pension and life insurance plans, in-kind
benefits and other compensation (including severance benefits)for the executive directors of the Company; in particular, theCommittee proposes compensation structures that take intoaccount the Company’s strategy, objectives and earnings aswell as market practices,
- grants of stock options and free shares, particularly grants ofregistered shares to the executive directors;
– reviewing the compensation of the members of the ExecutiveCommittee, including stock option plans, free share plans andequity-based plans, pension and insurance plans and in-kindbenefits;
– preparing and presenting reports in accordance with its rules ofprocedure;
– examining, for the parts within its remit, reports to be sent by theBoard of Directors or its Chairman to shareholders; and
– preparing recommendations requested at any time by theChairman of the Board of Directors or the General Managementof the Company regarding compensation.
Work of the Compensation Committee
In 2015, the Compensation Committee held 3 meetings, with 100%attendance. Neither the Chairman nor the Chief Executive Officermay be present during the Committee’s deliberations regarding hisown situation.
Its work was focused on the following areas:
February 10– determination of the variable portion of the compensation to be
paid to the former Chairman and Chief Executive Officer for hisperformance in 2014;
– proposed compensation for the Chief Executive Officer (fixedportion for 2015 and variable portion for his duties in 2014) andproposals regarding the variable portion for 2015;
– review of compliance with the restrictions on share transfers bythe Chairman and by the Chief Executive Officer;
– information regarding the compensation policy for the membersof the Executive Committee;
– review of the performance share and stock option grant policy for2015; and
– for the parts within its remit, provision of the information andreports that must be sent to shareholders by the Board ofDirectors or its Chairman.
July 28– appointment of the new Chairman of the Committee; and– proposals regarding the 2015 performance share plan: number
of beneficiaries, length of the acquisition period (three years) andretention period (two years), performance conditions for final grant;
– proposals regarding the grant of performance shares to theChief Executive Officer.
December 15– proposals regarding the compensation of the Chairman and
Chief Executive Officer; and– proposals regarding the commitments to be made to the
Chairman and Chief Executive Officer.
1.2.7. Strategic Committee
Composition
The Strategic Committee is made up of seven members. It is chaired by Mr. Pouyanné and its members also include Mses. Barbizet and Kux and Messrs. Artus, Blanc, Brock andDesmarest. 66.7% (1) of the Committee members are independentdirectors (refer to point 1.1.3 above).
Duties
The rules of procedure of the Strategic Committee define theCommittee’s duties and working procedures. The unabridgedversion of the rules of procedure approved by the Board ofDirectors on April 25, 2013 is available on the Company’s websiteunder “Our Group / Corporate Governance”.
(1) Excluding the director representing employees.
For many years, TOTAL has taken an active approach to corporategovernance and at its meeting on November 4, 2008, the Board ofDirectors confirmed its decision to refer to the AFEP-MEDEF Codeof Corporate Governance for publicly-traded companies.
The AFEP-MEDEF Code is available on the Internet websites of theMEDEF and AFEP.
The AFEP-MEDEF Code was revised in June 2013 to introducenew changes regarding, in particular, a consultation procedure inwhich shareholders can express an opinion on the individualcompensation of the executive directors (say on pay), as well as the
establishment of a High Committee for corporate governance, anindependent structure in charge of monitoring implementation ofthe Code. It was also revised in November 2015 to introduce theprinciple of consultation of the Annual Shareholders’ Meeting incase of the sale of at least one-half of the Company’s assets and tobring the Code in line with new laws regarding supplementarypensions of executive directors.
Pursuant to Article L. 225-37 of the French Commercial Code, the following table sets forth the recommendations made in theAFEP-MEDEF Code that the Company has not followed and thereasons for such decision.
1.3. Statement regarding corporate governance
5 Corporate governanceComposition and practices of the Board of Directors
TOTAL. Registration Document 2015100
To allow the Board of Directors of TOTAL S.A. to ensure theGroup’s development, the Strategic Committee’s duties include:
– examining the Group’s overall strategy proposed by theCompany’s Chief Executive Officer;
– examining operations that are of particular strategic importance; and– reviewing competition and the resulting medium and long-term
outlook for the Group.
Work of the Strategic Committee
In 2015, the Strategic Committee held 2 meetings, with 91.6%attendance. Its work was focused on the following areas:
February 11– analysis of the status of the oil markets and the positions of
market players, in the context of the drop in oil prices in thesecond half of 2014.
September 22– analysis of long-term demand on the oil and gas markets.
1.2.8. Evaluation of the Board’s practices
Once a year, the Board of Directors adds a discussion of its practicesto its agenda. It also conducts a formal evaluation of its ownpractices at regular intervals of up to three years. This evaluation iscarried out under the supervision of the Governance and EthicsCommittee with the help of an outside consultant. When a LeadIndependent Director is appointed, he or she oversees this
evaluation process and reports on it to the Board of Directors.
At its meeting on February 10, 2016, the Board of Directors discussedits practices on the basis of a formal self-evaluation carried out byan external consultant in the form of interviews with each directorbased on a detailed questionnaire. The evaluation was carried outunder the supervision of Ms. Barbizet, Lead Independent Director.The responses given by the directors were then presented to theGovernance and Ethics Committee to be reviewed and summarized.This summary was then discussed by the Board of Directors. Thisprocess made it possible to confirm the quality of each director’scontribution to the work of the Board and its Committees.
This formal evaluation showed a positive opinion of the practices of theBoard of Directors and the Committees. In particular, it was noted thatthe suggestions for improvement made by the directors in recent yearshad generally been taken into account. During the Board of Directors’meetings, some of which were held at certain of the Group’s sites,special attention was paid at the start of each meeting to the review ofthe main points to be examined by the Board (financial statements,large-scale investment and divestment projects, etc.).
To further improve its performance, the Board retained the mainsuggestions made by the directors in the 2016 self-assessment,which notably concerned to continue its reflections on themonitoring of risks at the Board level and changes to the Board’scomposition, as well as the holding of executive sessions inapplication of the Board’s rules of procedures and the examinationof creating a secured-access platform for Board documents.
Recommendations not followed Explanation – Practice followed by TOTAL
The Board of Directors’ assessment (paragraph 10.4 of the Code)
– It is recommended that non-executive directors meet periodicallywithout the participation of the executive or “in house” directors. The rules of procedure of the Board of Directors should provide for one meeting of this kind per year, during which the performance of the Chairman, the Chief Executive Officer and the DeputyChief Executive Officer(s) would be evaluated, and which would be an opportunity to reflect periodically on the future of theCompany’s management.
At its meeting held each year in February, the Board of Directors evaluatesthe performance of the executive directors and, where applicable,reflects as necessary on the future of the Company’s management.When these particular matters are reviewed, the Chairman andChief Executive Officer and the members of the Executive Committeein attendance (who are not directors) leave the Board meeting.
Since December 16, 2015, the rules of procedure of the Board of Directorsprovide that, with the agreement of the Governance and Ethics Committee,the Lead Independent Director may hold meetings of the directors whodo not hold executive or salaried positions on the Board of Directors. He orshe reports to the Board of Directors on the conclusions of such meetings.
In February 2016, the part of the meeting during which the Boarddiscussed the evaluation of the performance of the Chairman andChief Executive Officer and the determination of his compensation waschaired by the Lead Independent Director. Thus, the Board ofDirectors’ practice constitutes a mechanism that has the same effectas the recommendation made in the AFEP-MEDEF Code.
The mission of the Group Performance Management Committee isto examine, analyze and monitor the safety, financial andoperational results of the Group. It meets once a month.
In addition to the members of the Executive Committee, thisCommittee, chaired by the Chairman and Chief Executive Officer, ismade up of the head of the Group’s main business units, as well asa limited number of Senior Vice Presidents of functions at theGroup and business segment levels:
– for central corporate functions, the Senior Vice Presidents incharge of Corporate Communication, Human Resources, Legal,Safety and Strategy;
– for Exploration & Production, the Senior Vice Presidents incharge of the Africa, Americas, Asia-Pacific, Europe and CentralAsia, Middle East / North Africa and Exploration business units,
and any of the functional divisions designated by the ExecutiveCommittee;
– for Gas, the President, Gas;– for Refining & Chemicals, the Senior Vice Presidents in charge of
the Refining & Base Chemicals Europe,Refining & Petrochemicals Orient, Refining & PetrochemicalsAmericas and Hutchinson business units, and any of thefunctional divisions designated by the Executive Committee;
– for Trading & Shipping, the Senior Vice President,Trading & Shipping;
– for Marketing & Services, the Senior Vice Presidents of theEurope, Africa-Middle East and Global Operations andBusinesses business units, and any of the functional divisionsdesignated by the Executive Committee; and
– for New Energies, the President, New Energies.
2.2. The Group Performance Management Committee
The Executive Committee, under the responsibility of the Chairmanand Chief Executive Officer, is the decision-making body of the Group.
It implements the strategy formulated by the Board of Directors andauthorizes related investments, subject to the approval of the Boardof Directors for investments exceeding 3% of the Group’s equity ornotification of the Board for investments exceeding 1% of equity.
In 2015, the Executive Committee met at least twice a month,except in August when it met once.
As of December 31, 2015, the members of TOTAL’s ExecutiveCommittee were as follows:
– Patrick Pouyanné, Chairman and Chief Executive Officer andPresident of the Executive Committee;
– Philippe Boisseau, President, Marketing & Services andPresident New Energies;
– Arnaud Breuillac, President, Exploration & Production;– Jean-Jacques Guilbaud, Chief Administrative Officer;– Patrick de La Chevardière, Chief Financial Officer; and– Philippe Sauquet, President, Refining & Chemicals.
2. General Management
2.1. The Executive Committee
Corporate governance 5General Management
Registration Document 2015. TOTAL 101
Compensation Committee (point 18.1 of the Code)
– It is recommended that one member of the Committee should be an employee director.
Given that the Compensation Committee is made up exclusively ofindependent directors and that the Lead Independent Director is amember of this Committee, the Board of Directors determined that itwas appropriate that the director representing employees be amember of the Strategic Committee to allow him or her to be moreinvolved in reviewing the overall strategy of the Group and operationsthat are of particular strategic importance, and in reviewing competitionand the resulting medium and long-term outlook for the Group.
Supplementary pension plan (point 23.2.6 of the Code)
– Supplementary pension schemes with defined benefits must besubject to the condition that the beneficiary must be a director oremployee of the Company when claiming his or her pension rightspursuant to the applicable rules.
It appeared justified not to deprive the concerned beneficiaries of thebenefit of the pension commitments made by the Company in specialcases of the disability or departure of a beneficiary over 55 years ofage at the initiative of the Group.In addition, it should be noted that the supplementary pension planset up by the Company was declared to URSSAF in 2004, inaccordance with Articles L. 137-11 and R. 137-16 of the FrenchSocial Security Code.
Recommendations not followed Explanation – Practice followed by TOTAL
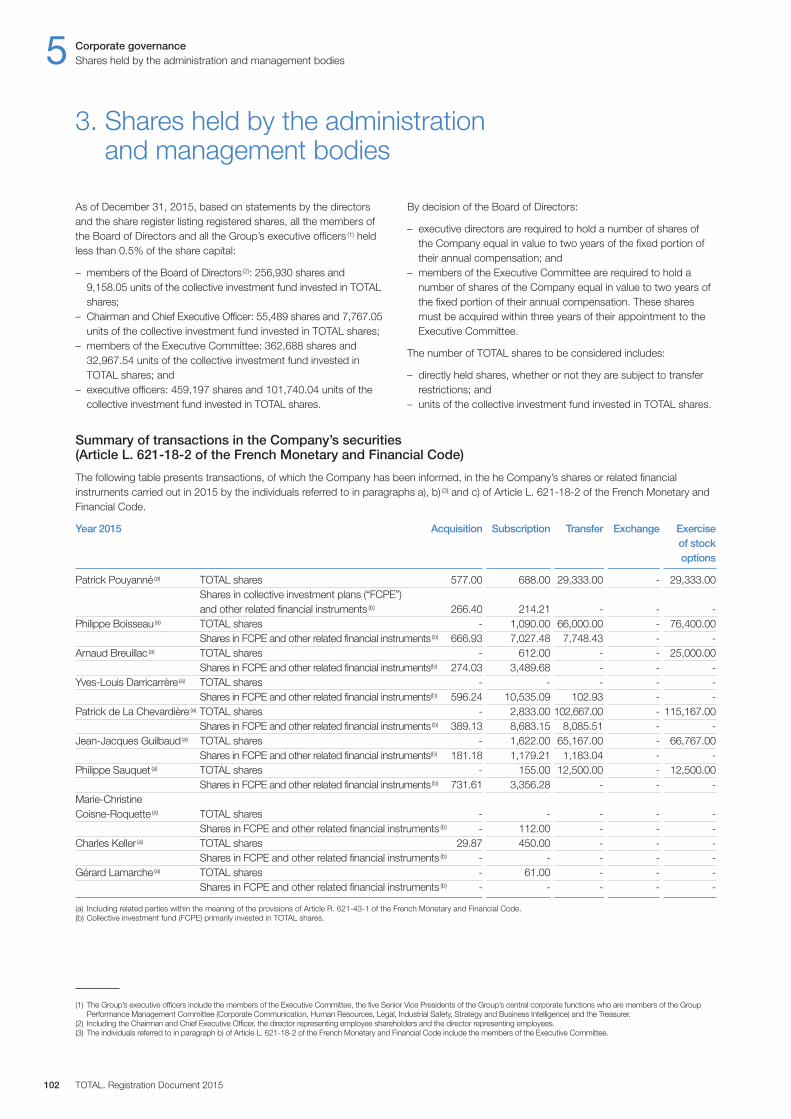
(1) The Group’s executive officers include the members of the Executive Committee, the five Senior Vice Presidents of the Group’s central corporate functions who are members of the GroupPerformance Management Committee (Corporate Communication, Human Resources, Legal, Industrial Safety, Strategy and Business Intelligence) and the Treasurer.
(2) Including the Chairman and Chief Executive Officer, the director representing employee shareholders and the director representing employees.(3) The individuals referred to in paragraph b) of Article L. 621-18-2 of the French Monetary and Financial Code include the members of the Executive Committee.
Summary of transactions in the Company’s securities (Article L. 621-18-2 of the French Monetary and Financial Code)
The following table presents transactions, of which the Company has been informed, in the he Company’s shares or related financialinstruments carried out in 2015 by the individuals referred to in paragraphs a), b) (3) and c) of Article L. 621-18-2 of the French Monetary andFinancial Code.
Year 2015 Acquisition Subscription Transfer Exchange Exercise of stock options
Patrick Pouyanné(a) TOTAL shares 577.00 688.00 29,333.00 - 29,333.00 Shares in collective investment plans (“FCPE”) and other related financial instruments (b) 266.40 214.21 - - -Philippe Boisseau(a) TOTAL shares - 1,090.00 66,000.00 - 76,400.00 Shares in FCPE and other related financial instruments (b) 666.93 7,027.48 7,748.43 - -
Arnaud Breuillac (a) TOTAL shares - 612.00 - - 25,000.00 Shares in FCPE and other related financial instruments(b) 274.03 3,489.68 - - -Yves-Louis Darricarrère (a) TOTAL shares - - - - - Shares in FCPE and other related financial instruments(b) 596.24 10,535.09 102.93 - -Patrick de La Chevardière (a) TOTAL shares - 2,833.00 102,667.00 - 115,167.00 Shares in FCPE and other related financial instruments (b) 389.13 8,683.15 8,085.51 - -Jean-Jacques Guilbaud(a) TOTAL shares - 1,622.00 65,167.00 - 66,767.00 Shares in FCPE and other related financial instruments(b) 181.18 1,179.21 1,183.04 - -Philippe Sauquet (a) TOTAL shares - 155.00 12,500.00 - 12,500.00 Shares in FCPE and other related financial instruments (b) 731.61 3,356.28 - - -Marie-Christine Coisne-Roquette (a) TOTAL shares - - - - - Shares in FCPE and other related financial instruments (b) - 112.00 - - -Charles Keller (a) TOTAL shares 29.87 450.00 - - - Shares in FCPE and other related financial instruments (b) - - - - -Gérard Lamarche(a) TOTAL shares - 61.00 - - - Shares in FCPE and other related financial instruments (b) - - - - -
(a) Including related parties within the meaning of the provisions of Article R. 621-43-1 of the French Monetary and Financial Code.(b) Collective investment fund (FCPE) primarily invested in TOTAL shares.
As of December 31, 2015, based on statements by the directorsand the share register listing registered shares, all the members ofthe Board of Directors and all the Group’s executive officers (1) heldless than 0.5% of the share capital:
– members of the Board of Directors (2): 256,930 shares and9,158.05 units of the collective investment fund invested in TOTALshares;
– Chairman and Chief Executive Officer: 55,489 shares and 7,767.05units of the collective investment fund invested in TOTAL shares;
– members of the Executive Committee: 362,688 shares and32,967.54 units of the collective investment fund invested inTOTAL shares; and
– executive officers: 459,197 shares and 101,740.04 units of thecollective investment fund invested in TOTAL shares.
By decision of the Board of Directors:
– executive directors are required to hold a number of shares ofthe Company equal in value to two years of the fixed portion oftheir annual compensation; and
– members of the Executive Committee are required to hold anumber of shares of the Company equal in value to two years ofthe fixed portion of their annual compensation. These sharesmust be acquired within three years of their appointment to theExecutive Committee.
The number of TOTAL shares to be considered includes:
– directly held shares, whether or not they are subject to transferrestrictions; and
– units of the collective investment fund invested in TOTAL shares.
3. Shares held by the administration and management bodies
5 Corporate governanceShares held by the administration and management bodies
TOTAL. Registration Document 2015102
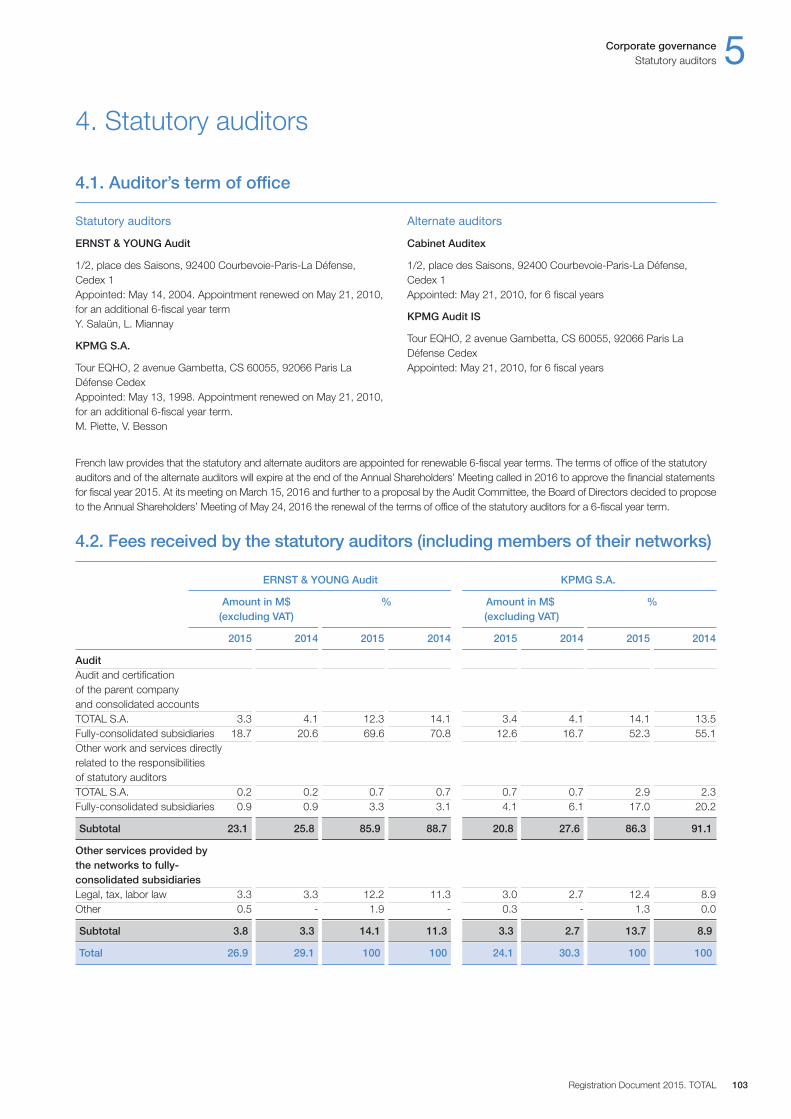
French law provides that the statutory and alternate auditors are appointed for renewable 6-fiscal year terms. The terms of office of the statutoryauditors and of the alternate auditors will expire at the end of the Annual Shareholders’ Meeting called in 2016 to approve the financial statementsfor fiscal year 2015. At its meeting on March 15, 2016 and further to a proposal by the Audit Committee, the Board of Directors decided to proposeto the Annual Shareholders’ Meeting of May 24, 2016 the renewal of the terms of office of the statutory auditors for a 6-fiscal year term.
4.2. Fees received by the statutory auditors (including members of their networks)
ERNST & YOUNG Audit KPMG S.A.
Amount in M$ % Amount in M$ % (excluding VAT) (excluding VAT)
2015 2014 2015 2014 2015 2014 2015 2014
AuditAudit and certification of the parent company and consolidated accountsTOTAL S.A. 3.3 4.1 12.3 14.1 3.4 4.1 14.1 13.5Fully-consolidated subsidiaries 18.7 20.6 69.6 70.8 12.6 16.7 52.3 55.1Other work and services directly related to the responsibilities of statutory auditorsTOTAL S.A. 0.2 0.2 0.7 0.7 0.7 0.7 2.9 2.3Fully-consolidated subsidiaries 0.9 0.9 3.3 3.1 4.1 6.1 17.0 20.2
Subtotal 23.1 25.8 85.9 88.7 20.8 27.6 86.3 91.1
Other services provided bythe networks to fully-consolidated subsidiariesLegal, tax, labor law 3.3 3.3 12.2 11.3 3.0 2.7 12.4 8.9Other 0.5 - 1.9 - 0.3 - 1.3 0.0
Subtotal 3.8 3.3 14.1 11.3 3.3 2.7 13.7 8.9
Total 26.9 29.1 100 100 24.1 30.3 100 100
Statutory auditors
ERNST & YOUNG Audit
1 / 2, place des Saisons, 92400 Courbevoie-Paris-La Défense,Cedex 1Appointed: May 14, 2004. Appointment renewed on May 21, 2010,for an additional 6-fiscal year termY. Salaün, L. Miannay
KPMG S.A.
Tour EQHO, 2 avenue Gambetta, CS 60055, 92066 Paris LaDéfense CedexAppointed: May 13, 1998. Appointment renewed on May 21, 2010,for an additional 6-fiscal year term.M. Piette, V. Besson
Alternate auditors
Cabinet Auditex
1 / 2, place des Saisons, 92400 Courbevoie-Paris-La Défense,Cedex 1Appointed: May 21, 2010, for 6 fiscal years
KPMG Audit IS
Tour EQHO, 2 avenue Gambetta, CS 60055, 92066 Paris LaDéfense CedexAppointed: May 21, 2010, for 6 fiscal years
Corporate governance 5Statutory auditors
Registration Document 2015. TOTAL 103
4. Statutory auditors
4.1. Auditor’s term of office

TOTAL. Registration Document 2015104
12. Responsabilité sociale, environ-nementale et sociétale
Registration Document 2015. TOTAL 105
Compensation of the administration and management bodies 6
Compensation of the administrationand management bodies
1. Board members’ compensation 106
2. Executive directors’ compensation 1082.1. General principles for determining the compensation of the executive directors . . . . . . . . . . . . . . . . . . . . . . . . . . . . . . . . .1082.2. Compensation of the Chairman and Chief Executive Officer . . . . . . . . . . . . . . . . . . . . . . . . . . . . . . . . . . . . . . . . . . . . . . . . . .1082.3. Compensation of the former Chairman of the Board . . . . . . . . . . . . . . . . . . . . . . . . . . . . . . . . . . . . . . . . . . . . . . . . . . . . . . . .1132.4. Summary tables (AFEP-MEDEF Code / AMF position-recommendations No. 2009-16) . . . . . . . . . . . . . . . . . . . . . . . . . . . . .114
3. Executive officers’ compensation 117
4. Stock option and free share grants policy 1174.1. General policy . . . . . . . . . . . . . . . . . . . . . . . . . . . . . . . . . . . . . . . . . . . . . . . . . . . . . . . . . . . . . . . . . . . . . . . . . . . . . . . . . . . . . . .1174.2. Follow up of the grants to executive directors . . . . . . . . . . . . . . . . . . . . . . . . . . . . . . . . . . . . . . . . . . . . . . . . . . . . . . . . . . . . .1184.3. Grants to employees . . . . . . . . . . . . . . . . . . . . . . . . . . . . . . . . . . . . . . . . . . . . . . . . . . . . . . . . . . . . . . . . . . . . . . . . . . . . . . . . .1204.4. Follow up of TOTAL stock option plans as of December 31, 2015 . . . . . . . . . . . . . . . . . . . . . . . . . . . . . . . . . . . . . . . . . . . . .1204.5. Follow up of TOTAL free share grants as of December 31, 2015 . . . . . . . . . . . . . . . . . . . . . . . . . . . . . . . . . . . . . . . . . . . . . . .122
5. Summary table of compensation elements due or granted to the executive directors for fiscal year 2015, as submitted to the Shareholder’s Meeting for advisory vote 124
6 Compensation of the administration and management bodiesBoard members’ compensation
TOTAL. Registration Document 2015106
The conditions applicable to Board members’ compensation aredefined by the Board of Directors on the proposal of the CompensationCommittee, subject to the overall maximum amount of directors’fees authorized by the Shareholders’ Meeting of May 17, 2013 and set at €1.4 million per fiscal year.
In 2015, the overall amount of directors’ fees due to the membersof the Board of Directors was €1.21 million, noting that there were12 directors as of December 31, 2015.
The directors’ fees for fiscal year 2015 are allocated according to a formula comprised of fixed compensation and variablecompensation based on fixed amounts per meeting, which makesit possible to take into account each director’s actual attendance atthe meetings of the Board of Directors and its Committees, subjectto the conditions below:
– a fixed annual amount of €20,000 is to be paid to each director(calculated on a prorata basis in case of a change during theyear), apart from the Chairperson of the Audit Committee, who isto be paid €30,000 and the other Audit Committee members,who are to be paid €25,000;
– an amount of €5,000 per director for each Board of Directors’meeting actually attended;
– an amount of €3,500 per director for each Governance andEthics Committee, Compensation Committee or StrategicCommittee meeting actually attended;
– an amount of €7,000 per director for each Audit Committeemeeting actually attended;
– a premium of €2,000 for travel from a country outside France toattend a Board of Directors’ or Committee meeting;
– the Chief Executive Officer, or the Chairman and Chief Executive Officer if the positions are unified, does not receive directors’ feesfor his work on the Board and Committees of TOTAL S.A.; and
– the total amount paid to each director is determined after takinginto consideration the director’s actual presence at each Board ofDirectors’ or Committee meeting and, if appropriate, afterprorating the amount set for each director, such that the overallamount paid remains within the maximum limit set by theShareholders’ Meeting.
Directors’ fees for a fiscal year are paid on the decision of theBoard of Directors, following a proposal of the Governance andEthics Committee, at the beginning of the next fiscal year.
The director representing employee shareholders and the directorrepresenting employees receive directors’ fees according to thesame terms and conditions as any other director.
At its meeting of December 16, 2015, the Board of Directorsmaintained the rules for allocating directors’ fees for fiscal year2016; after deciding, however, to increase the annual fixed portionfor the Chairperson of the Governance and Ethics Committee andthe Chairperson of the Compensation Committee to €25,000 andset the additional annual fixed portion for the Lead IndependentDirector at €15,000.
The table below presents the total compensation (including in-kindbenefits) due and paid to each director and non-executive director(mandataires sociaux) during the previous two fiscal years (ArticleL. 225-102-1 of the French Commercial Code, 1st and 2nd paragraphs).
Messrs. Marc Blanc and Charles Keller participate in the internaldefined contribution pension plan applicable to all TOTAL S.A.employees, known as RECOSUP (Régime collectif et obligatoire deretraite supplémentaire à cotisations définies), covered by ArticleL. 242-1 of the French Social Security Code. The Company’scommitment is limited to its share of the payment to the insurancecompany that manages the plan. For fiscal year 2015, this pensionplan represented a booked expense to TOTAL S.A. in favor ofMessrs. Marc Blanc and Charles Keller of €761 and €920, respectively.
Mr. Marc Blanc, who joined the Elf Aquitaine Group in 1980, alsoparticipates in a supplementary defined benefit pension plan,known as CREA, set up and financed by the Company. This plancovers former employees of the Elf Aquitaine Group and wasclosed on December 31, 1994. It does not require a presencecondition within the Group at the time of retirement. Commitmentsmade by the Group in favor of Mr. Marc Blanc under this planrepresent, at December 31, 2015, a gross annual pension, payableto his spouse within a limit of 60% in case of death of thebeneficiary, estimated at €4,848. The Group’s commitments underthe CREA plan are outsourced to an insurance company for almosttheir entire amount, the remaining balance being evaluated on anannual basis and adjusted through a provision in the accounts. Theamount of these commitments of the Group at December 31, 2015in favor of Mr. Marc Blanc is €129.4 thousand. This amountrepresents the gross value of the Group’s commitments to thisbeneficiary based on the gross annual pension estimated as ofDecember 31, 2015, as well as a statistical life expectancy of thebeneficiary and his spouse.
Over the past two years, the directors currently in office have notreceived any compensation or in-kind benefits from companiescontrolled by TOTAL S.A.
Moreover, there is no service contract linking a director toTOTAL S.A. or any of its controlled companies that provide forbenefits under such contract.
1. Board members’ compensation
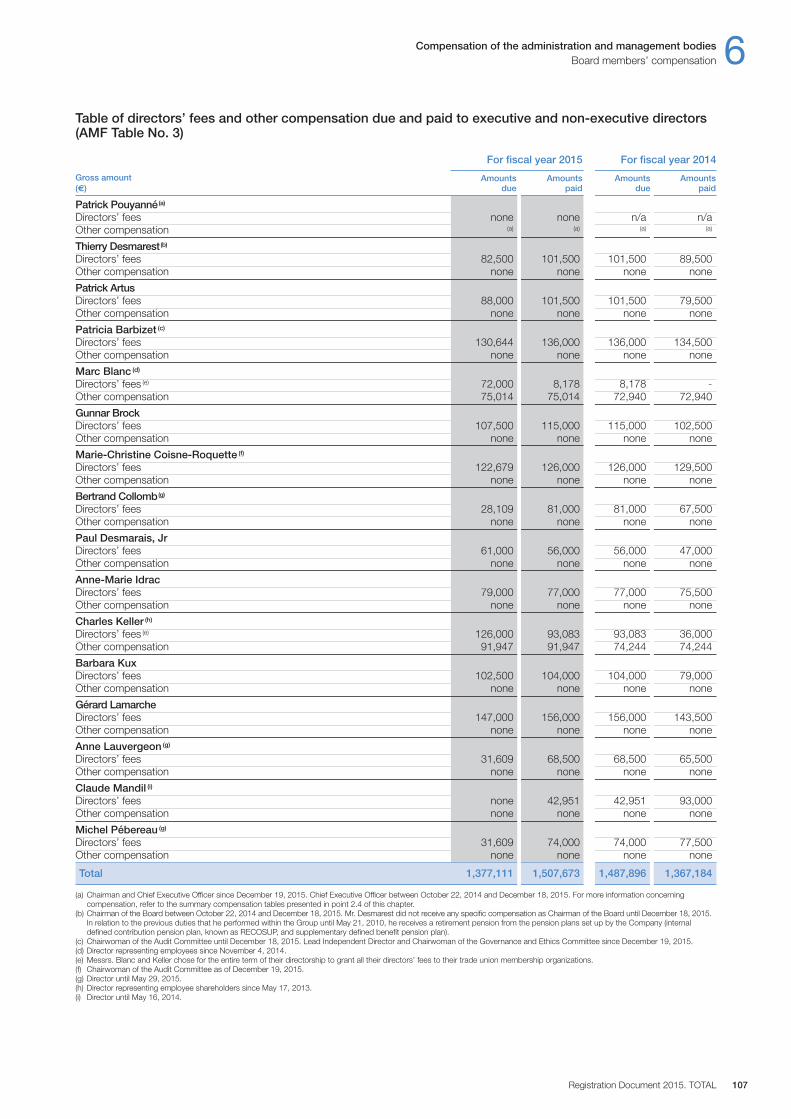
Table of directors’ fees and other compensation due and paid to executive and non-executive directors (AMF Table No. 3)
For fiscal year 2015 For fiscal year 20 14
Gross amount Amounts Amounts Amounts Amounts (€) due paid due paid
Patrick Pouyanné(a)
Directors’ fees none none n / a n / aOther compensation (a) (a) (a) (a)
Thierry Desmarest(b)
Directors’ fees 82,500 101,500 101,500 89,500Other compensation none none none none
Patrick ArtusDirectors’ fees 88,000 101,500 101,500 79,500Other compensation none none none none
Patricia Barbizet (c)
Directors’ fees 130,644 136,000 136,000 134,500Other compensation none none none none
Marc Blanc (d)
Directors’ fees (e) 72,000 8,178 8,178 -Other compensation 75,014 75,014 72,940 72,940
Gunnar BrockDirectors’ fees 107,500 115,000 115,000 102,500Other compensation none none none none
Marie-Christine Coisne-Roquette (f)
Directors’ fees 122,679 126,000 126,000 129,500Other compensation none none none none
Bertrand Collomb(g)
Directors’ fees 28,109 81,000 81,000 67,500Other compensation none none none none
Paul Desmarais, JrDirectors’ fees 61,000 56,000 56,000 47,000Other compensation none none none none
Anne-Marie IdracDirectors’ fees 79,000 77,000 77,000 75,500Other compensation none none none none
Charles Keller (h)
Directors’ fees (e) 126,000 93,083 93,083 36,000Other compensation 91,947 91,947 74,244 74,244
Barbara KuxDirectors’ fees 102,500 104,000 104,000 79,000Other compensation none none none none
Gérard LamarcheDirectors’ fees 147,000 156,000 156,000 143,500Other compensation none none none none
Anne Lauvergeon (g)
Directors’ fees 31,609 68,500 68,500 65,500Other compensation none none none none
Claude Mandil (i)
Directors’ fees none 42,951 42,951 93,000Other compensation none none none none
Michel Pébereau (g)
Directors’ fees 31,609 74,000 74,000 77,500Other compensation none none none none
Total 1,377,111 1,507,673 1,487,896 1,367,184
(a) Chairman and Chief Executive Officer since December 19, 2015. Chief Executive Officer between October 22, 2014 and December 18, 2015. For more information concerningcompensation, refer to the summary compensation tables presented in point 2.4 of this chapter.
(b) Chairman of the Board between October 22, 2014 and December 18, 2015. Mr. Desmarest did not receive any specific compensation as Chairman of the Board until December 18, 2015.In relation to the previous duties that he performed within the Group until May 21, 2010, he receives a retirement pension from the pension plans set up by the Company (internaldefined contribution pension plan, known as RECOSUP, and supplementary defined benefit pension plan).
(c) Chairwoman of the Audit Committee until December 18, 2015. Lead Independent Director and Chairwoman of the Governance and Ethics Committee since December 19, 2015.(d) Director representing employees since November 4, 2014.(e) Messrs. Blanc and Keller chose for the entire term of their directorship to grant all their directors’ fees to their trade union membership organizations.(f) Chairwoman of the Audit Committee as of December 19, 2015.(g) Director until May 29, 2015.(h) Director representing employee shareholders since May 17, 2013.(i) Director until May 16, 2014.
Compensation of the administration and management bodies 6Board members’ compensation
Registration Document 2015. TOTAL 107
The compensation structure for Mr. Pouyanné (1) consists of a fixedcompensation, an annual variable compensation calculated on thebasis of predefined criteria and a long-term component in the formof the allocation of performance shares.
Performance shares are allocated as part of plans that are notspecific to the Chairman and Chief Executive Officer and which arestructured over a 5-year term with a 3-year vesting period followedby a mandatory 2-year holding period. The final grant of shares is
2.2. Compensation of the Chairman and Chief Executive Officer
The compensation policy for the executive directors is approvedand reviewed every year by the Board of Directors on the proposalof the Compensation Committee. It is determined in accordancewith the principles and rules approved by the Board of Directors atits meeting on February 9, 2012, which have not since beenamended and are set out below.
Based on a proposal by the Compensation Committee, the Boardadopted the following principles for determining the compensationand other benefits of the executive directors:
– Compensation and benefits for the executive directors are set by the Board of Directors after considering proposals from the Compensation Committee. Such compensation must bereasonable and fair, in a context that values both teamwork andmotivation within the Company. Compensation for the executivedirectors is related to market practice, work performed, resultsobtained and responsibilities held.
– Compensation for the executive directors includes both a fixedportion and a variable portion. The fixed portion is reviewed atleast every two years.
– The amount of variable compensation is reviewed each year and may not exceed a stated percentage of fixed compensation.Variable compensation is determined based on pre-definedquantitative and qualitative criteria that are periodically reviewed by the Board of Directors. Quantitative criteria are limited in number, objective, measurable and adapted to the Company’s strategy.
– Variable compensation is designed to reward short-termperformance and progress towards medium-term objectives. The compensation is determined in line with the annualassessment of the performance of the executive directors and the Company’s medium-term strategy.
The Board of Directors monitors the evolution of the fixed andvariable portions of the compensation of the executive directorsover several years and in light of the Company’s performance.
– The Group does not have a specific pension plan for theexecutive directors. They are eligible for retirement benefits andpensions plans available to certain employee categories in theGroup under conditions determined by the Board.
– Stock options and performance shares are designed to align thelong-term interests of the executive directors with those of theshareholders. The allocation of options and performance sharesto the executive directors is examined in light of all forms ofcompensation for each person. The exercise price for stockoptions awarded is not discounted compared with the marketprice, at the time of the grant, for the underlying share.
Stock options and performance shares are awarded at regularintervals to prevent any opportunistic behavior.
The exercise of options and the definitive allocation of performanceshares to which the executive directors are entitled are subject toperformance criteria that must be met over several years.
The Board puts in place restrictions on the transfer of a portion of shares held upon the exercise of options and the definitiveallocation of performance shares, applicable to the executivedirectors until the end of their term of office.
The executive directors may not be granted stock options orperformance shares when they leave office.
– After three years in office, the executive directors are required tohold at least the number of Company shares set by the Board.
– The components of the compensation of the executive directorsare made public after the Board of Directors’ meeting at whichthey are approved.
The executive directors do not take part in any discussions ordeliberations of the corporate bodies regarding items on theagenda of Board of Directors’ meetings related to the assessmentof their performance or the determination of the componentscomprising their compensation.
2. Executive directors’ compensation
2.1. General principles for determining the compensation of the executive directors
6 Compensation of the administration and management bodiesExecutive directors’ compensation
TOTAL. Registration Document 2015108
(1) Chairman and Chief Executive Officer since December 19, 2015. Chief Executive Officer between October 22, 2014 and December 18, 2015.
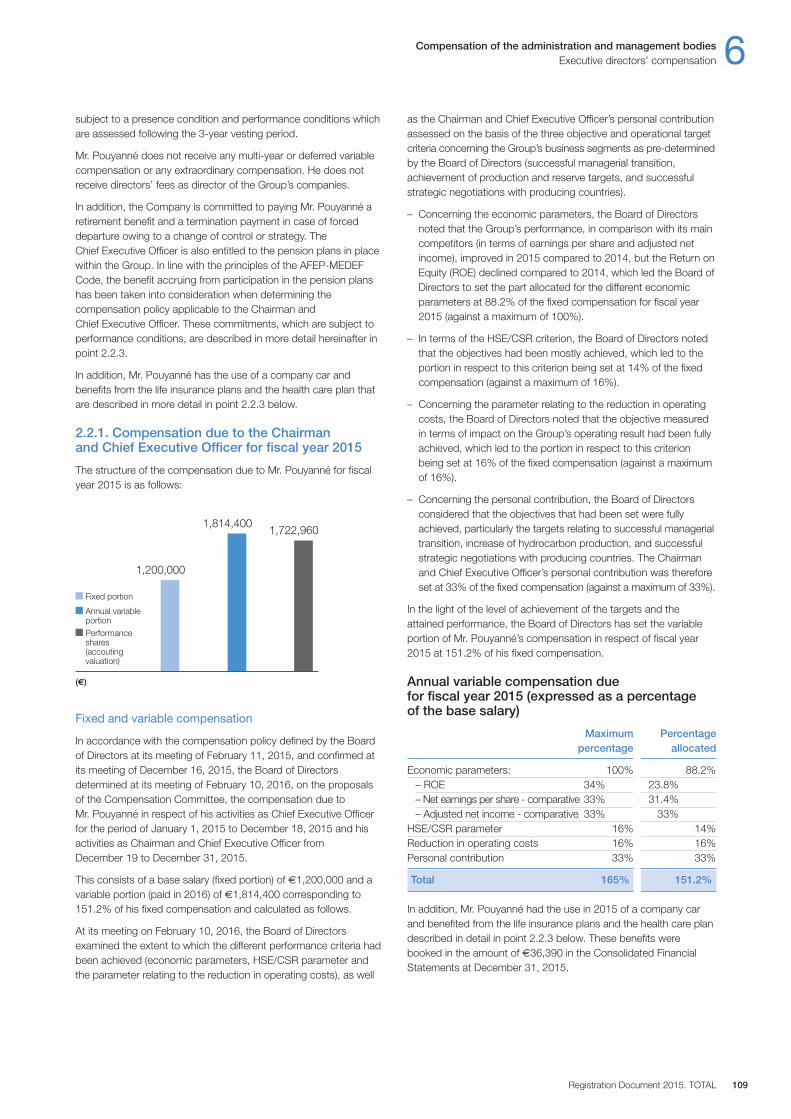
subject to a presence condition and performance conditions whichare assessed following the 3-year vesting period.
Mr. Pouyanné does not receive any multi-year or deferred variablecompensation or any extraordinary compensation. He does notreceive directors’ fees as director of the Group’s companies.
In addition, the Company is committed to paying Mr. Pouyanné aretirement benefit and a termination payment in case of forceddeparture owing to a change of control or strategy. TheChief Executive Officer is also entitled to the pension plans in placewithin the Group. In line with the principles of the AFEP-MEDEFCode, the benefit accruing from participation in the pension planshas been taken into consideration when determining thecompensation policy applicable to the Chairman andChief Executive Officer. These commitments, which are subject toperformance conditions, are described in more detail hereinafter inpoint 2.2.3.
In addition, Mr. Pouyanné has the use of a company car andbenefits from the life insurance plans and the health care plan thatare described in more detail in point 2.2.3 below.
2.2.1. Compensation due to the Chairman and Chief Executive Officer for fiscal year 2015
The structure of the compensation due to Mr. Pouyanné for fiscalyear 2015 is as follows:
Fixed and variable compensation
In accordance with the compensation policy defined by the Boardof Directors at its meeting of February 11, 2015, and confirmed atits meeting of December 16, 2015, the Board of Directorsdetermined at its meeting of February 10, 2016, on the proposalsof the Compensation Committee, the compensation due to Mr. Pouyanné in respect of his activities as Chief Executive Officerfor the period of January 1, 2015 to December 18, 2015 and hisactivities as Chairman and Chief Executive Officer fromDecember 19 to December 31, 2015.
This consists of a base salary (fixed portion) of €1,200,000 and avariable portion (paid in 2016) of €1,814,400 corresponding to151.2% of his fixed compensation and calculated as follows.
At its meeting on February 10, 2016, the Board of Directorsexamined the extent to which the different performance criteria hadbeen achieved (economic parameters, HSE / CSR parameter andthe parameter relating to the reduction in operating costs), as well
as the Chairman and Chief Executive Officer’s personal contributionassessed on the basis of the three objective and operational targetcriteria concerning the Group’s business segments as pre-determinedby the Board of Directors (successful managerial transition,achievement of production and reserve targets, and successfulstrategic negotiations with producing countries).
– Concerning the economic parameters, the Board of Directorsnoted that the Group’s performance, in comparison with its maincompetitors (in terms of earnings per share and adjusted netincome), improved in 2015 compared to 2014, but the Return onEquity (ROE) declined compared to 2014, which led the Board ofDirectors to set the part allocated for the different economicparameters at 88.2% of the fixed compensation for fiscal year2015 (against a maximum of 100%).
– In terms of the HSE / CSR criterion, the Board of Directors notedthat the objectives had been mostly achieved, which led to theportion in respect to this criterion being set at 14% of the fixedcompensation (against a maximum of 16%).
– Concerning the parameter relating to the reduction in operatingcosts, the Board of Directors noted that the objective measuredin terms of impact on the Group’s operating result had been fullyachieved, which led to the portion in respect to this criterionbeing set at 16% of the fixed compensation (against a maximumof 16%).
– Concerning the personal contribution, the Board of Directorsconsidered that the objectives that had been set were fullyachieved, particularly the targets relating to successful managerialtransition, increase of hydrocarbon production, and successfulstrategic negotiations with producing countries. The Chairmanand Chief Executive Officer’s personal contribution was thereforeset at 33% of the fixed compensation (against a maximum of 33%).
In the light of the level of achievement of the targets and theattained performance, the Board of Directors has set the variableportion of Mr. Pouyanné’s compensation in respect of fiscal year2015 at 151.2% of his fixed compensation.
Annual variable compensation due for fiscal year 2015 (expressed as a percentage of the base salary)
Maximum Percentagepercentage allocated
Economic parameters: 100% 88.2%– ROE 34% 23.8%– Net earnings per share - comparative 33% 31.4%– Adjusted net income - comparative 33% 33%
HSE / CSR parameter 16% 14%Reduction in operating costs 16% 16%Personal contribution 33% 33%
Total 165% 151.2%
In addition, Mr. Pouyanné had the use in 2015 of a company carand benefited from the life insurance plans and the health care plandescribed in detail in point 2.2.3 below. These benefits werebooked in the amount of €36,390 in the Consolidated FinancialStatements at December 31, 2015.
Compensation of the administration and management bodies 6Executive directors’ compensation
Registration Document 2015. TOTAL 109
1,200,000
1,722,9601,814,400
(€)
Fixed portion
Annual variable portionPerformance shares (accouting valuation)
Mr. Pouyanné did not benefit from any other forms of compensationdue or granted for fiscal year 2015. No multi-year or deferredvariable compensation or any extraordinary compensation wasawarded for fiscal year 2015.
Grant of performance shares
At its meeting of July 28, 2015, the Board of Directors, on theproposal of the Compensation Committee and pursuant to theauthorization of the Company’s Combined Shareholders’ Meetingof May 16, 2014 (sixteenth resolution), decided to grant Mr. Pouyanné, who was at that time Chief Executive Officer ofTOTAL S.A., 48,000 existing shares of the Company(corresponding to 0.002% of the share capital) subject to theconditions set out below. These shares were awarded as part of abroader share grant plan approved by the Board of Directors onJuly 28, 2015 relating to 0.20% of the share capital for more than10,000 beneficiaries.
The definitive award of the totality of the shares is subject to thebeneficiary’s continued presence within the Group during thevesting period and to performance conditions, according to which40% of the awarded shares are subject to the Group’s Return onEquity (ROE) and Return on Average Capital Employed (ROACE)during the fiscal years 2015, 2016 and 2017 (internal criteria) and60% are dependent on a performance condition that is based onadjusted net income (ANI) (external criterion).
The number of performance shares definitively awarded to Mr. Pouyanné will therefore depend, with regard to 20% of theawarded performance shares, on the average ROE, and, withregard to a further 20%, on the average ROACE. The ROE andROACE values adopted for the assessment of attainment of theperformance conditions shall be those published by the Group inthe first quarter of 2016, the first quarter of 2017 and the firstquarter of 2018, based on the Group’s balance sheet andconsolidated statement of income for fiscal years 2015, 2016 and 2017.
In the case of the ROE criterion, the acquisition rate will be zero ifthe average ROE is less than 6.5%, will vary on a straight-line basisfrom 0% to 50% if the average ROE is greater than or equal to6.5% and less than or equal to 9.5%, will vary on a straight-linebasis from 50% to 100% if the average ROE is greater than orequal to 9.5% and less than or equal to 14.5%, and will be equal to100% if the average ROE is greater than 14.5%.
In the case of the ROACE criterion, the acquisition rate will be zeroif the average ROACE is less than 6.5%, will vary on a straight-linebasis from 0% to 50% if the average ROACE is greater than orequal to 6.5% and less than or equal to 9%, will vary on a straight-line basis from 50% to 100% if the average ROACE is greater thanor equal to 9% and less than or equal to 13%, and will be equal to100% if the average ROACE is greater than 13%.
The number of performance shares definitively awarded to Mr. Pouyanné will also depend, for 60% of the awarded performanceshares, on a performance condition defined in relation to changesin the Group’s published 3-yearly average ANI compared to that ofa set of four other international oil companies (1) during the threeyears of acquisition (2015, 2016 and 2017).
In the case of the ANI criterion, by comparison, the acquisition ratewill be zero if the relative difference in this change is less than -12%,will be equal to 60% if the relative difference in this change is zeroand will be equal to 100% if the relative difference in this change isgreater than 12%, with intermediate values between these anchorpoints being calculated on a straight-line basis.
In accordance with the provisions of the French Commercial Code,Mr. Pouyanné will be required, until the end of his functions, toretain in the form of registered shares 50% of the gains on theacquired shares net of tax and national insurance contributions on the awarded shares. When Mr. Pouyanné holds a volume ofshares (2) representing five times the fixed portion of his gross annualcompensation, this percentage will be equal to 10%. If thiscondition is no longer fulfilled, the 50% holding requirement statedabove will again apply. Given this holding requirement, theavailability of the performance shares is not dependent on thepurchase of further shares in the Company.
In addition, the Board of Directors has noted that, pursuant to theBoard of Directors’ rules of procedure applicable to all directors, theChairman and Chief Executive Officer may not hedge the shares ofthe Company or any related financial instruments and has takennote of Mr. Pouyanné’s commitment to abstain from any suchhedging operations with regard to the awarded performance shares.
Subject to the specific provisions set out above, the award ofperformance shares to Mr. Pouyanné is subject to the sameprovisions as those that apply to the other beneficiaries of theperformance share plan approved by the Board at its meeting ofJuly 28, 2015. In particular, these provisions require that the sharesthat are definitively awarded following the 3-year vesting periodshall, following confirmation of fulfillment of the presence andperformance conditions, be automatically recorded as pureregistered shares on the date of the start of the 2-year holdingperiod and will remain non-transferable and unavailable through tothe end of the holding period.
2.2.2. Compensation policy for the Chairman andChief Executive Officer for fiscal year 2016
The Board of Directors defined the compensation elements for theChairman and Chief Executive Officer for fiscal year 2016 during itsmeeting on December 16, 2015, as follows:
Base salary
In the light of his appointment as Chairman and Chief Executive Officer,the Board of Directors set Mr. Pouyanné’s base salary (fixedcompensation) at €1,400,000 with effect from January 1, 2016.
The positioning of the Chairman and Chief Executive Officer’s fixedcompensation was set in relation to the responsibilities held and taking account of the compensation practices for executivedirectors of comparable companies (in particular, CAC 40 companiesand issuers operating in the energy sectors).
6 Compensation of the administration and management bodiesExecutive directors’ compensation
TOTAL. Registration Document 2015110
(1) ExxonMobil, Royal Dutch Shell, BP and Chevron.(2) In the form of shares or holdings in mutual funds invested in shares of the Company.
Compensation of the administration and management bodies 6Executive directors’ compensation
Registration Document 2015. TOTAL 111
Annual variable portion
The Board of Directors also decided to fix the maximum amount ofthe variable portion potentially payable to the Chairman andChief Executive Officer in respect of fiscal year 2016 at 180% of hisbase salary. This ceiling was fixed in the light of the levels adopted bya reference sample including companies operating in the energy sectors.
The formula used to calculate the variable portion of the Chairmanand Chief Executive Officer’s compensation for fiscal year 2016involves parameters that refer to quantitative targets that reflect theGroup’s performance as well as the Chairman and Chief Executive Officer’s personal contribution that permits a qualitative assessmentof his management.
The Board of Directors has defined the respective weightings of thevarious criteria used to calculate the variable portion of theChairman and Chief Executive Officer’s compensation for fiscal year2016 as follows:
Annual variable compensation for fiscal year 2016(expressed as a percentage of the base salary)
Maximum percentage
Safety – comparative 20%ROE 30%Net-debt-to-equity ratio 40%ANI – comparative 50%Personal contribution: 40%
– successful managerial transition 10%– achievement of production
and reserve targets 10%– successful strategic negotiations
with producing countries 10%– Corporate Social Responsibility
(CSR) performance 10%
Total 180%
The chosen parameters include:
– changes in safety-related values, to account for a maximum of20%, assessed in particular through the achievement of anannual TRIR target (Total Recordable Injury Rate) and the numberof accidental deaths per million hours worked, FIR (FatalityIncident Rate). Safety performance is more specifically assessedby comparison with the corresponding performance of the fourlarge competitor oil companies (1);
– Return on Equity (ROE) as published by the Group on the basisof its balance sheet and consolidated statement of income, toaccount for a maximum amount equal to 30% of the base salary;
– net-debt-to-equity ratio as published by the Group on the basisof its balance sheet and consolidated statement of income, toaccount for a maximum amount equal to 40% of the base salary;
– the change in the adjusted net income (ANI), to account for amaximum amount equal to 50% of the base salary, determinedon the basis of the financial statements published by the Group(in accordance with the accounting standards applicable at thetime of the closure of the accounts for the fiscal years inquestion) and compared with the ANI values of peers (1) drawn upon the basis of estimates calculated by a group of leadingfinancial analysts.
The expected levels of attainment of the quantitative targets fordetermining the variable portion of the Chairman andChief Executive Officer’s compensation have been clearly definedbut have not been made public for reasons of confidentiality.
The Chairman and Chief Executive Officer’s personal contribution,which may represent a maximum of 40% of the base salary, isevaluated based on the following criteria:
– successful managerial transition, accounting for a maximum of 10%;– achievement of production and reserve targets, accounting for a
maximum of 10%;– successful strategic negotiations with producing countries,
accounting for a maximum of 10%; and– CSR performance, accounting for a maximum of 10%, measured
in particular in the light of the achievement of targets relating toCO2 emissions, energy efficiency, and the Group’s position in therankings published by non-financial rating agencies.
2.2.3. Commitments made by the Company to the Chairman and Chief Executive Officer(Article L. 225-102-1, paragraph 3, of the FrenchCommercial Code)
The commitments made to the Chairman and Chief Executive Officerwith regard to pension plans, retirement benefits and the terminationpayment to be paid in the event of a forced departure owing to achange of control or strategy, as well as the life insurance and healthcare plans set out below, were approved by the Board of Directorson December 16, 2015. They will be presented to the AnnualShareholders’ Meeting of May 24, 2016 in accordance with theprovisions of Article L. 225-42-1 of the French Commercial Code.
It should be noted that Mr. Pouyanné was already entitled to allthese provisions when he was an employee of the Company,except for the commitment to be granted a termination payment incase of forced departure owing to a change of control or strategy. It should also be noted that Mr. Pouyanné joined the Group onJanuary 1, 1997, and terminated the employment contract thatpreviously bound him to TOTAL S.A. by resignation when he wasappointed Chief Executive Officer on October 22, 2014.
Pension plans
Pursuant to law, the Chairman and Chief Executive Officer is eligiblefor the basic French social security pension and for pension benefitsunder the government-sponsored supplementary pension plans ARRCO(Association pour le régime de retraite complémentaire des salariés) andAGIRC (Association générale des institutions de retraite des cadres).
He also participates in the internal defined contribution pension planapplicable to all TOTAL S.A. employees, known as RECOSUP(Régime collectif et obligatoire de retraite supplémentaire à cotisationsdéfinies), covered by Article L. 242-1 of the French Social Security Code.The Company’s commitment is limited to its share of the paymentto the insurance company that manages the plan. For fiscal year 2015,this pension plan represented a booked expense to the Companyin favor of the Chairman and Chief Executive Officer of €2,282.
The Chairman and Chief Executive Officer also participates in asupplementary defined benefit pension plan, covered by Article L. 137-11 of the French Social Security Code, set up and financedby the Company, which was approved by the Board of Directors at itsmeeting on March 13, 2001, for which management is outsourced to
(1) ExxonMobil, Royal Dutch Shell, BP and Chevron.
two insurance companies and which is effective as of January 1, 2012.This plan is applicable to all employees of TOTAL S.A. whoseannual compensation is greater than eight times the ceiling forcalculating French social security contributions (Plafond annuel dela sécurité sociale, PASS), set at €38,616 for 2016, and abovewhich there is no conventional pension plan.
To be eligible for this supplementary pension plan, participantsmust have a length of service of at least five years and must still beemployed at the time of their retirement. However, in the event of abeneficiary leaving the Company at the Company’s initiative as ofthe age of 55 or in the event of invalidity, then the beneficiary’srights will be maintained provided that the 5-year length of servicecondition is met. The length of service acquired by Mr. Pouyanné asa result of his previous salaried duties within the Group exercised asof January 1, 1997 has been maintained for the benefit of this plan.The compensation taken into account to calculate the supplementarypension is the retiree’s last 3-year average gross compensation(fixed and variable portions). The amount paid under this plan isequal to 1.8% of the compensation falling between 8 and 40 timesthe PASS and 1% for the portion of the compensation fallingbetween 40 and 60 times this ceiling, multiplied by the number ofyears of service up to a maximum of 20 years, subject to theperformance condition set out below applicable to the Chairmanand Chief Executive Officer.
The sum of the annual supplementary pension plan benefits andother pension plan benefits (other than those constitutedindividually and on a voluntary basis) may not exceed 45% of theaverage gross compensation (fixed and variable portions) for thelast three years. In the event that this percentage is exceeded, thesupplementary pension is reduced accordingly. The amount of thesupplementary pension determined in this way is indexed to theARRCO pension point.
The supplementary pension includes a clause whereby up to 60%of the amount will be paid to beneficiaries in the event of death afterretirement.
To ensure that the acquisition of additional pension rights under thisdefined benefit pension plan is subject to performance conditionsto be defined pursuant to the provisions of Article L. 225-42-1 ofthe French Commercial Code amended by law No. 2015-990 ofAugust 6, 2015, the Board of Directors noted the existence of theChief Executive Officer’s pension rights under the abovementionedpension plan immediately before his appointment as Chairman,from the period from January 1, 1997 to December 18, 2015.
The conditional rights awarded for the period from January 1, 1997to December 18, 2015 (inclusive) (1) acquired free of performanceconditions correspond to a substitution rate equal to 34.14% (2) inrespect of the portion of the reference compensation containedbetween 8 and 40 times the PASS, and a substitution rate of18.96% (3) in respect of the portion of the reference compensationcontained between 40 and 60 times the PASS.
The conditional rights awarded for the period from December 19, 2015to December 31, 2016 that are subject to the performancecondition described below correspond to a maximum substitutionrate equal to 1.86% (4) in respect of the portion of the referencecompensation contained between 8 and 40 times the PASS, and a
substitution rate of 1.04% (5) in respect of the portion of the referencecompensation contained between 40 and 60 times the PASS.
Pursuant to the provisions of Article L. 225-42-1 of the FrenchCommercial Code, the Board of Directors decided that theacquisition of these conditional rights for the period fromDecember 19, 2015 to December 31, 2016 is to be subject to aperformance-related condition applicable to the beneficiary, whichshall be considered to be fulfilled if the variable portion of theChairman and Chief Executive Officer’s compensation paid in 2017in respect of fiscal year 2016 reaches 100% of the base salary due in respect of fiscal year 2016. Should the variable portion notreach 100% of the base salary, the awarded rights will becalculated on a prorata basis.
The commitments made by TOTAL S.A. in favor of the Chairman andChief Executive Officer with regard to the supplementary defined benefitand similar pension plans therefore represent, at December 31, 2015,a gross annual pension estimated at €560,862, based on the lengthof service acquired as of December 31, 2015, i.e., 18.61% of Mr. Pouyanné’s gross annual compensation, consisting of theannual fixed portion for 2015 (i.e., €1,200,000) and the variableportion paid in 2016 in respect of fiscal year 2015 (i.e., €1,814,400).
The commitments of TOTAL S.A. related to these supplementarydefined benefit and similar plans (including the retirement benefit)are outsourced to insurance companies for almost their entireamount, the remaining balance being evaluated on an annual basisand adjusted through a provision in the accounts. The Group’scommitments amount, as of December 31, 2015, to €14.1 millionfor the Chairman and Chief Executive Officer (€26.5 million for theChairman and Chief Executive Officer, non-executive directors andthe concerned former non-executive directors). These amountsrepresent the gross value of the commitments of TOTAL S.A. tothese beneficiaries based on the gross annual pensions estimatedas of December 31, 2015 as well as a statistical life expectancy ofthe beneficiaries.
The sum of all the pension plans in which Mr. Pouyanné participateswould, as of December 31, 2015, represent a gross annual retirementpension estimated at €647,407, based on the length of serviceacquired as of December 31, 2015, i.e., 21.48% of Mr. Pouyanné’sgross annual compensation defined above (fixed annual portion for2015 and variable portion paid in 2016 in respect of fiscal year 2015).
In line with the principles used to determine the compensation ofthe executive directors as set out in the AFEP-MEDEF Code whichthe Company uses as a reference, the Board of Directors has takenaccount of the advantage conferred through participation in thepension plans when determining the Chairman and Chief ExecutiveOfficer’s compensation.
Retirement benefit
The Chairman and Chief Executive Officer is entitled to a retirementbenefit equal to those available to eligible members of the Groupunder the French National Collective Bargaining Agreement for thePetroleum Industry. This benefit amounts to 25% of the annualcompensation (both fixed and variable portions) of the 12-monthperiod preceding retirement.
6 Compensation of the administration and management bodiesExecutive directors’ compensation
TOTAL. Registration Document 2015112
(1) The period that elapsed from January 1, 1997 to December 18, 2015 (inclusive) is equal to 18 years and 352 days in 2015 (out of 365).(2) 1.8%*(18+352 / 365) = 1.8%* (18+0.9643) = 34.14%.(3) 1%*(18+352 / 365) = 1%*(18+0.9643) = 18.96%.(4) 1.8%*(1+13 / 365) = 1.8%*(1+0.0356) = 1.86%.(5) 1%*(1+13 / 365) = 1%*(1+0.0356) = 1.04%.
For fiscal year 2015, Mr. Desmarest did not receive anycompensation in his role as Chairman of the Board for the periodfrom January 1 to December 18, 2015, other than his directors’
fees. In relation to the previous duties that he performed within theGroup until May 21, 2010, Mr. Desmarest receives a retirementpension from the pension plans set up by the Company.
2.3. Compensation of the former Chairman of the Board
Pursuant to the provisions of Article L. 225-42-1 of the FrenchCommercial Code, receipt of this retirement benefit is contingentupon a performance-related condition applicable to the beneficiary,which is deemed to be fulfilled if at least two of the following criteriaare met:
– the average ROE (Return on Equity) over the three yearspreceding the year in which the Chairman andChief Executive Officer retires is at least 10%;
– the average debt-to-equity ratio for the three years preceding theyear in which the Chairman and Chief Executive Officer retires isless than or equal to 30%; and
– growth in TOTAL’s oil and gas production is greater than or equalto the average of the rates of growth of four oil companies (1)
during the three years preceding the year in which the Chairmanand Chief Executive Officer retires.
The retirement benefit cannot be combined with the terminationpayment described below.
Termination payment
The Chairman and Chief Executive Officer is entitled to a benefitequal to two years’ gross compensation in the event of a forceddeparture owing to a change of control or strategy. The calculationis based on the gross compensation (both fixed and variableportions) for the 12-month period preceding the date of terminationor non-renewal of his term of office.
The termination payment will only be paid in the event of forceddeparture owing to a change of control or strategy. It will not be duein cases of gross negligence or willful misconduct or if theChairman and Chief Executive Officer leaves the Company of hisown volition, accepts new responsibilities within the Group, or mayclaim full retirement benefits within a short time period.
Pursuant to the provisions of Article L. 225-42-1 of the FrenchCommercial Code, receipt of this termination benefit is contingentupon a performance-related condition applicable to the beneficiary,which is considered to be fulfilled if at least two of the criteria setout below are met:
– the average ROE (Return on Equity) over the three yearspreceding the year in which the Chairman and
Chief Executive Officer retires is at least 10%;– the average debt-to-equity ratio for the three years preceding the
year in which the Chairman and Chief Executive Officer retires isless than or equal to 30%; and
– growth in TOTAL’s oil and gas production is greater than or equalto the average of the rates of growth of four oil companies (1)
during the three years preceding the year in which the Chairmanand Chief Executive Officer retires.
Life insurance and health care plans
The Chairman and Chief Executive Officer is covered by the lifeinsurance plans described below, which are taken out from variouslife insurance companies.
– an “incapacity, disability, life insurance” plan applicable to allemployees, partially at the expense of the Company, thatprovides for two options in the event of the death of a marriedemployee: either the payment of a sum equal to five times theannual compensation, subject to a maximum of 16 times thePASS (and therefore corresponding to a maximum of€3,089,280 in 2016). This amount is increased if there is adependent child or children; alternatively, the beneficiary mayreceive three times the annual compensation, subject to amaximum of 16 times the PASS, complemented by a spouse’spension and education allowance;
– a second “disability and life insurance” plan, entirely at the expenseof the Company, applicable to senior executives whose annualgross compensation is greater than 16 times the PASS. Thiscontract, which was signed on October 17, 2002, guaranteesbeneficiaries the payment, in the event of death, of an amountcorresponding to two years of compensation, which is increased to three years in the event of accidental death. In the event ofaccidental permanent disability, the beneficiary receives a paymentproportional to the degree of disability. The payment made in theevent of death is increased by 15% for each dependent child.
Any payment due under the terms of this contract is paid followingdeduction of any amount paid under the above-mentioned planapplicable to all employees.
The Chairman and Chief Executive Officer also benefits from ahealth care plan available to all employees.
Compensation of the administration and management bodies 6Executive directors’ compensation
Registration Document 2015. TOTAL 113
(1) ExxonMobil, Royal Dutch Shell, BP and Chevron.
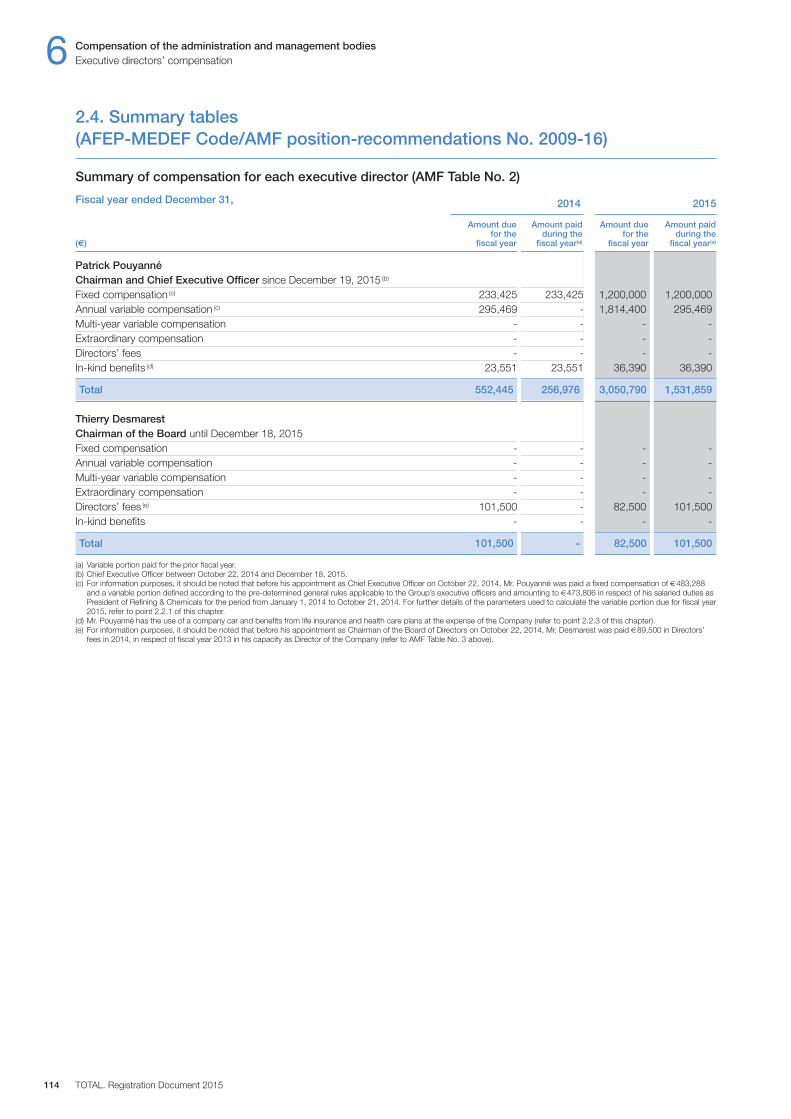
6 Compensation of the administration and management bodies
TOTAL. Registration Document 2015114
2.4. Summary tables (AFEP-MEDEF Code / AMF position-recommendations No. 2009-16)
Summary of compensation for each executive director (AMF Table No. 2)
Fiscal year ended December 31, 2014 2015
Amount due Amount paid Amount due Amount paid for the during the for the during the
(€) fiscal year fiscal year(a) fiscal year fiscal year(a)
Patrick PouyannéChairman and Chief Executive Officer since December 19, 2015 (b)
Fixed compensation (c) 233,425 233,425 1,200,000 1,200,000Annual variable compensation (c) 295,469 - 1,814,400 295,469Multi-year variable compensation - - - -Extraordinary compensation - - - -Directors’ fees - - - -In-kind benefits (d) 23,551 23,551 36,390 36,390
Total 552,445 256,976 3,050,790 1,531,859
Thierry DesmarestChairman of the Board until December 18, 2015Fixed compensation - - - -Annual variable compensation - - - -Multi-year variable compensation - - - -Extraordinary compensation - - - -Directors’ fees (e) 101,500 - 82,500 101,500In-kind benefits - - - -
Total 101,500 - 82,500 101,500
(a) Variable portion paid for the prior fiscal year.(b) Chief Executive Officer between October 22, 2014 and December 18, 2015.(c) For information purposes, it should be noted that before his appointment as Chief Executive Officer on October 22, 2014, Mr. Pouyanné was paid a fixed compensation of €483,288
and a variable portion defined according to the pre-determined general rules applicable to the Group’s executive officers and amounting to €473,806 in respect of his salaried duties asPresident of Refining & Chemicals for the period from January 1, 2014 to October 21, 2014. For further details of the parameters used to calculate the variable portion due for fiscal year2015, refer to point 2.2.1 of this chapter.
(d) Mr. Pouyanné has the use of a company car and benefits from life insurance and health care plans at the expense of the Company (refer to point 2.2.3 of this chapter).(e) For information purposes, it should be noted that before his appointment as Chairman of the Board of Directors on October 22, 2014, Mr. Desmarest was paid €89,500 in Directors’
fees in 2014, in respect of fiscal year 2013 in his capacity as Director of the Company (refer to AMF Table No. 3 above).
Executive directors’ compensation

Compensation of the administration and management bodies 6
Registration Document 2015. TOTAL 115
Summary of compensation, stock options and performance shares awarded to each executive director(AMF Table No. 1)
(in €, except for numbers of shares) For fiscal For fiscal year 2014 year 2015
Patrick Pouyanné Chairman and Chief Executive Officer since December 19, 2015 (a)
Compensation due in respect of the fiscal year (detailed in AMF Table No. 2 above) 552,445 3,050,790Valuation of multi-year variable compensation awarded during the fiscal year - -Accounting valuation of the stock options awarded during the fiscal year - -Accounting valuation of performance shares awarded during the fiscal year (b) 1,116,500 (c) 1,722,960
Number of performance shares awarded during the fiscal year 25,000 (c) 48,000
Total 1,668,945 4,773,750
Thierry Desmarest Chairman of the Board until December 18, 2015Compensation due in respect of the fiscal year (detailed in AMF Table No. 2 above) 101,500 82,500Valuation of multi-year variable compensation awarded during the fiscal year - -Accounting valuation of the stock options awarded during the fiscal year - -Accounting valuation of performance shares awarded during the fiscal year (b) - -
Number of performance shares awarded during the fiscal year - -
Total 101,500 82,500
Note: The valuation of the options and performance shares awarded corresponds to a valuation performed in accordance with IFRS 2 (see Notes 1E and 25 to the Consolidated FinancialStatements) and not to any compensation actually received during the fiscal year. Entitlement to performance shares is subject to fulfillment of performance conditions assessed overa 3-year period.
(a) Chief Executive Officer between October 22, 2014 and December 18, 2015.(b) For detailed information, refer to AMF Table No. 6 below. The valuation of performance shares awarded was calculated on the day they were awarded (see Note 1E to the Consolidated
Financial Statements).(c) Performance shares were granted prior to Mr. Pouyanné’s appointment as Chief Executive Officer and related to his previous salaried duties.
Stock options awarded in 2015 to each executive director by the issuer and by any Group company(AMF Table No. 4)
Executive directors Plan Nature Valuation Number Exercise Exercisedate of options of options of options price period
and No. (purchase or (€)(a) awarded duringsubscription) fiscal year
Patrick Pouyanné, Chairman and Chief Executive Officer since December 19, 2015 (b) - - - - - -Thierry Desmarest, Chairman of the Board until December 18, 2015 - - - - - -
(a) According to the method used for the Consolidated Financial Statements.(b) Chief Executive Officer between October 22, 2014 and December 18, 2015.
Executive directors’ compensation
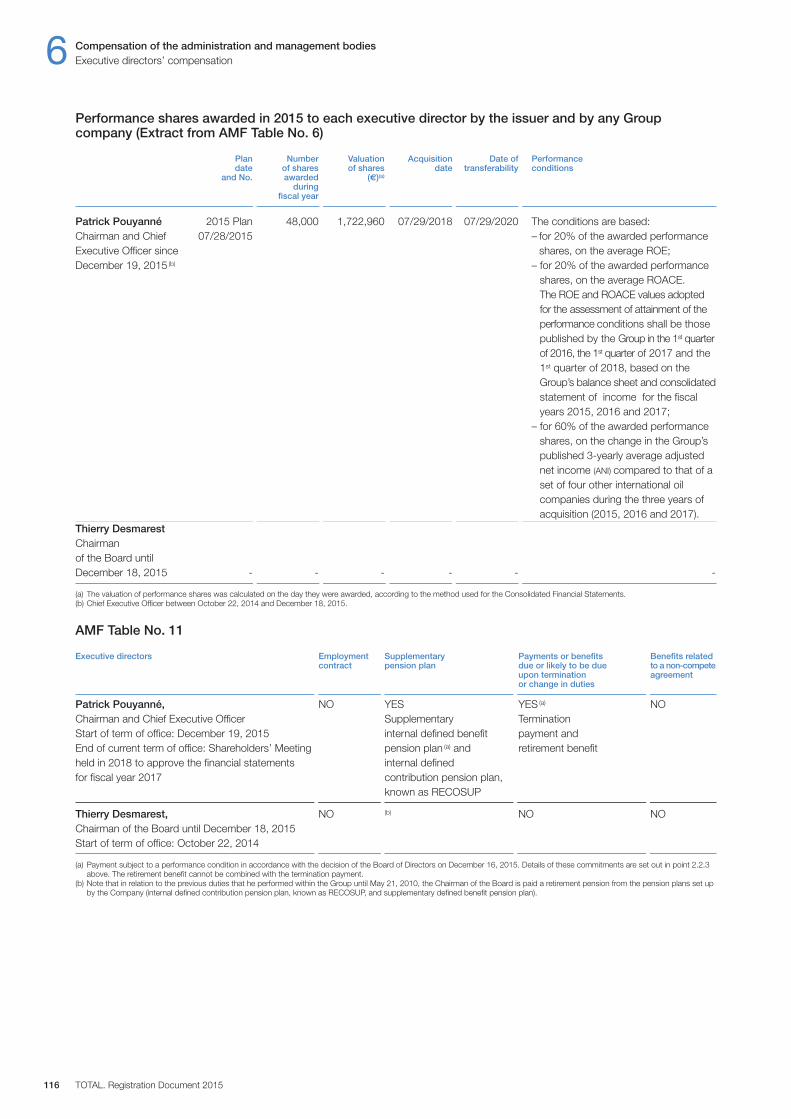
6 Compensation of the administration and management bodiesExecutive directors’ compensation
TOTAL. Registration Document 2015116
Performance shares awarded in 2015 to each executive director by the issuer and by any Groupcompany (Extract from AMF Table No. 6)
Plan Number Valuation Acquisition Date of Performance date of shares of shares date transferability conditions and No. awarded (€)(a)
during fiscal year
Patrick Pouyanné 2015 Plan 48,000 1,722,960 07 / 29 / 2018 07 / 29 / 2020 The conditions are based:Chairman and Chief 07 / 28 / 2015 – for 20% of the awarded performanceExecutive Officer since shares, on the average ROE;December 19, 2015 (b) – for 20% of the awarded performance
shares, on the average ROACE. The ROE and ROACE values adoptedfor the assessment of attainment of theperformance conditions shall be thosepublished by the Group in the 1st quarterof 2016, the 1st quarter of 2017 and the1st quarter of 2018, based on theGroup’s balance sheet and consolidatedstatement of income for the fiscalyears 2015, 2016 and 2017;
– for 60% of the awarded performance shares, on the change in the Group’spublished 3-yearly average adjustednet income (ANI) compared to that of aset of four other international oilcompanies during the three years ofacquisition (2015, 2016 and 2017).
Thierry Desmarest Chairman of the Board until December 18, 2015 - - - - - -
(a) The valuation of performance shares was calculated on the day they were awarded, according to the method used for the Consolidated Financial Statements.(b) Chief Executive Officer between October 22, 2014 and December 18, 2015.
AMF Table No. 11
Executive directors Employment Supplementary Payments or benefits Benefits related contract pension plan due or likely to be due to a non-compete upon termination agreement or change in duties
Patrick Pouyanné, NO YES YES (a) NOChairman and Chief Executive Officer Supplementary Termination Start of term of office: December 19, 2015 internal defined benefit payment and End of current term of office: Shareholders’ Meeting pension plan (a) and retirement benefitheld in 2018 to approve the financial statements internal defined for fiscal year 2017 contribution pension plan, known as RECOSUP
Thierry Desmarest, NO (b) NO NOChairman of the Board until December 18, 2015 Start of term of office: October 22, 2014
(a) Payment subject to a performance condition in accordance with the decision of the Board of Directors on December 16, 2015. Details of these commitments are set out in point 2.2.3above. The retirement benefit cannot be combined with the termination payment.
(b) Note that in relation to the previous duties that he performed within the Group until May 21, 2010, the Chairman of the Board is paid a retirement pension from the pension plans set upby the Company (internal defined contribution pension plan, known as RECOSUP, and supplementary defined benefit pension plan).
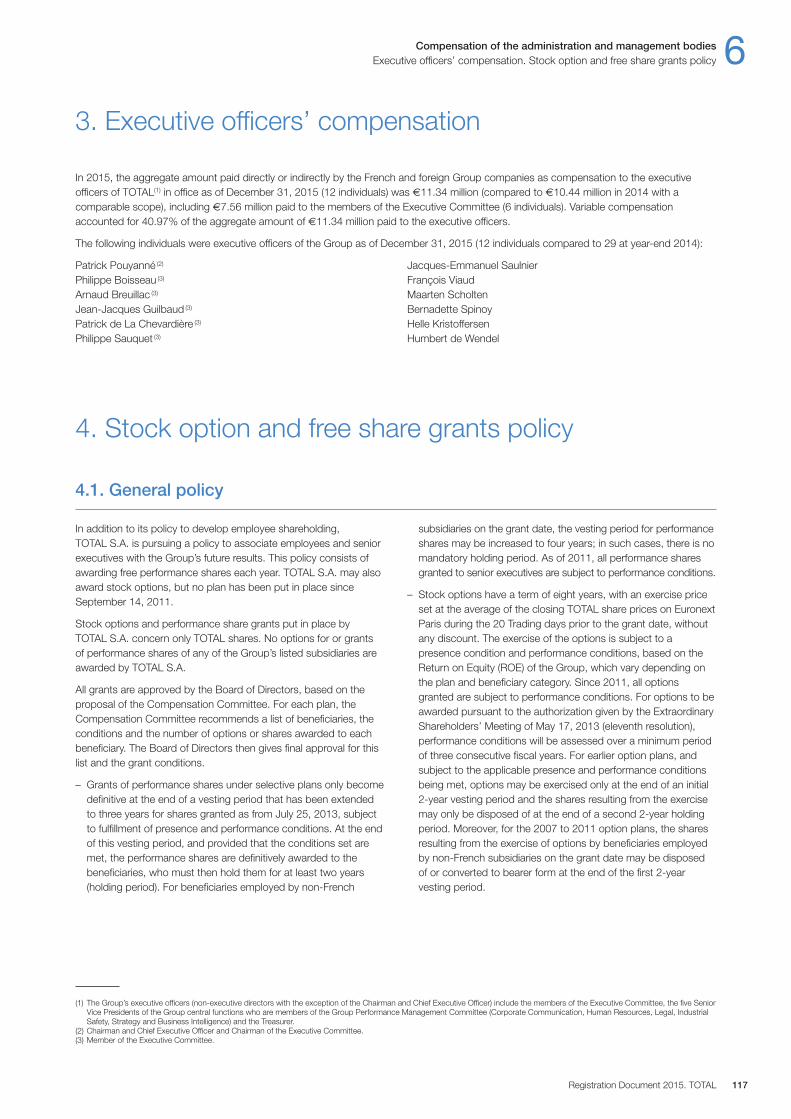
Compensation of the administration and management bodies 6Executive officers’ compensation. Stock option and free share grants policy
Registration Document 2015. TOTAL 117
In addition to its policy to develop employee shareholding,TOTAL S.A. is pursuing a policy to associate employees and seniorexecutives with the Group’s future results. This policy consists ofawarding free performance shares each year. TOTAL S.A. may alsoaward stock options, but no plan has been put in place sinceSeptember 14, 2011.
Stock options and performance share grants put in place byTOTAL S.A. concern only TOTAL shares. No options for or grantsof performance shares of any of the Group’s listed subsidiaries areawarded by TOTAL S.A.
All grants are approved by the Board of Directors, based on theproposal of the Compensation Committee. For each plan, theCompensation Committee recommends a list of beneficiaries, theconditions and the number of options or shares awarded to eachbeneficiary. The Board of Directors then gives final approval for thislist and the grant conditions.
– Grants of performance shares under selective plans only becomedefinitive at the end of a vesting period that has been extendedto three years for shares granted as from July 25, 2013, subjectto fulfillment of presence and performance conditions. At the endof this vesting period, and provided that the conditions set aremet, the performance shares are definitively awarded to thebeneficiaries, who must then hold them for at least two years(holding period). For beneficiaries employed by non-French
subsidiaries on the grant date, the vesting period for performanceshares may be increased to four years; in such cases, there is nomandatory holding period. As of 2011, all performance sharesgranted to senior executives are subject to performance conditions.
– Stock options have a term of eight years, with an exercise priceset at the average of the closing TOTAL share prices on EuronextParis during the 20 Trading days prior to the grant date, withoutany discount. The exercise of the options is subject to apresence condition and performance conditions, based on theReturn on Equity (ROE) of the Group, which vary depending onthe plan and beneficiary category. Since 2011, all optionsgranted are subject to performance conditions. For options to beawarded pursuant to the authorization given by the ExtraordinaryShareholders’ Meeting of May 17, 2013 (eleventh resolution),performance conditions will be assessed over a minimum periodof three consecutive fiscal years. For earlier option plans, andsubject to the applicable presence and performance conditionsbeing met, options may be exercised only at the end of an initial2-year vesting period and the shares resulting from the exercisemay only be disposed of at the end of a second 2-year holdingperiod. Moreover, for the 2007 to 2011 option plans, the sharesresulting from the exercise of options by beneficiaries employedby non-French subsidiaries on the grant date may be disposedof or converted to bearer form at the end of the first 2-yearvesting period.
4. Stock option and free share grants policy
4.1. General policy
(1) The Group’s executive officers (non-executive directors with the exception of the Chairman and Chief Executive Officer) include the members of the Executive Committee, the five SeniorVice Presidents of the Group central functions who are members of the Group Performance Management Committee (Corporate Communication, Human Resources, Legal, IndustrialSafety, Strategy and Business Intelligence) and the Treasurer.
(2) Chairman and Chief Executive Officer and Chairman of the Executive Committee.(3) Member of the Executive Committee.
Patrick Pouyanné (2)
Philippe Boisseau (3)
Arnaud Breuillac (3)
Jean-Jacques Guilbaud (3)
Patrick de La Chevardière (3)
Philippe Sauquet (3)
Jacques-Emmanuel SaulnierFrançois ViaudMaarten ScholtenBernadette SpinoyHelle KristoffersenHumbert de Wendel
3. Executive officers’ compensation
In 2015, the aggregate amount paid directly or indirectly by the French and foreign Group companies as compensation to the executiveofficers of TOTAL(1) in office as of December 31, 2015 (12 individuals) was €11.34 million (compared to €10.44 million in 2014 with acomparable scope), including €7.56 million paid to the members of the Executive Committee (6 individuals). Variable compensationaccounted for 40.97% of the aggregate amount of €11.34 million paid to the executive officers.
The following individuals were executive officers of the Group as of December 31, 2015 (12 individuals compared to 29 at year-end 2014):
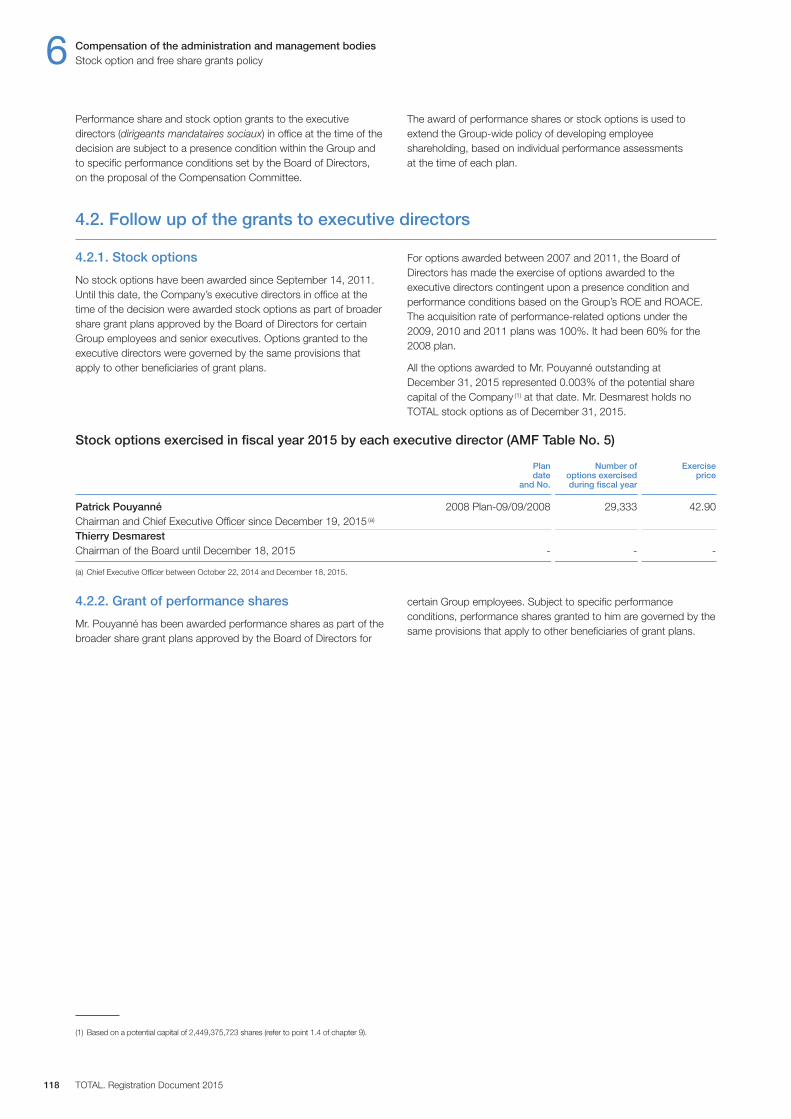
6 Compensation of the administration and management bodiesStock option and free share grants policy
TOTAL. Registration Document 2015118
4.2.2. Grant of performance shares
Mr. Pouyanné has been awarded performance shares as part of thebroader share grant plans approved by the Board of Directors for
certain Group employees. Subject to specific performanceconditions, performance shares granted to him are governed by thesame provisions that apply to other beneficiaries of grant plans.
Stock options exercised in fiscal year 2015 by each executive director (AMF Table No. 5)
Plan Number of Exercise date options exercised price and No. during fiscal year
Patrick Pouyanné 2008 Plan-09 / 09 / 2008 29,333 42.90Chairman and Chief Executive Officer since December 19, 2015 (a)
Thierry Desmarest Chairman of the Board until December 18, 2015 - - -
(a) Chief Executive Officer between October 22, 2014 and December 18, 2015.
4.2.1. Stock options
No stock options have been awarded since September 14, 2011.Until this date, the Company’s executive directors in office at thetime of the decision were awarded stock options as part of broadershare grant plans approved by the Board of Directors for certainGroup employees and senior executives. Options granted to theexecutive directors were governed by the same provisions thatapply to other beneficiaries of grant plans.
For options awarded between 2007 and 2011, the Board ofDirectors has made the exercise of options awarded to theexecutive directors contingent upon a presence condition andperformance conditions based on the Group’s ROE and ROACE.The acquisition rate of performance-related options under the2009, 2010 and 2011 plans was 100%. It had been 60% for the2008 plan.
All the options awarded to Mr. Pouyanné outstanding atDecember 31, 2015 represented 0.003% of the potential sharecapital of the Company (1) at that date. Mr. Desmarest holds noTOTAL stock options as of December 31, 2015.
4.2. Follow up of the grants to executive directors
Performance share and stock option grants to the executivedirectors (dirigeants mandataires sociaux) in office at the time of thedecision are subject to a presence condition within the Group andto specific performance conditions set by the Board of Directors,on the proposal of the Compensation Committee.
The award of performance shares or stock options is used toextend the Group-wide policy of developing employeeshareholding, based on individual performance assessments at the time of each plan.
(1) Based on a potential capital of 2,449,375,723 shares (refer to point 1.4 of chapter 9).

Compensation of the administration and management bodies 6Stock option and free share grants policy
Registration Document 2015. TOTAL 119
Summary tables
Free shares awarded to each executive and non-executive director in fiscal year 2015 by the issuer and by any Group company (AMF Table No. 6)
Plan Number Valuation Acquisition Date of Performance date of shares of shares date trans- conditions and No. awarded (€)(a) ferability during fiscal year
Patrick Pouyanné 2015 Plan 48,000 1,722,960 07 / 29 / 2018 07 / 29 / 2020 The conditions are based:Chairman and Chief 07 / 28 / 2015 – for 20% of the awardedExecutive Officer since on the average ROE; December 19, 2015 (b) – for 20% of the awarded performance
shares, on the average ROACE. TheROE and ROACE values adopted forthe assessment of attainment of theperformance conditions shall be thosepublished by the Group in the1st quarter of 2016, the 1st quarter of2017 and the 1st quarter of 2018,based on the Group’s balance sheetand consolidated statement of incomefor the fiscal years 2015, 2016 and 2017;
– for 60% of the awarded performanceshares, on the change in the Group’spublished 3-yearly average adjustednet income (ANI) compared to that of a set of four other international oilcompanies during the three years ofacquisition (2015, 2016 and 2017).
Thierry DesmarestChairman of the Board since December 18, 2015 - none - - - -
Marc Blanc Director representing employees since November 4, 2014 - none - - - -
Charles Keller Director representing employee shareholders since May 17, 2013 - none - - - -
Total 48,000 1,722,960
(a) The valuation of performance shares was calculated on the day they were awarded, according to the method used for the Consolidated Financial Statements.(b) Chief Executive Officer between October 22, 2014 and December 18, 2015.
Free shares that have become available for each executive and non-executive director (AMF Table No. 7)
Plan Number of shares Acquisition date that have become conditions and No. available during the fiscal year
Patrick Pouyanné Chairman and Chief Executive Officer since December 19, 2015 (a) - - -
Thierry Desmarest Chairman of the Board until December 18, 2015 - - -
Marc Blanc Director representing employees since November 4, 2014 - - -
Charles Keller Director representing employee shareholders since May 17, 2013 - - -
(a) Chief Executive Officer between October 22, 2014 and December 18, 2015.
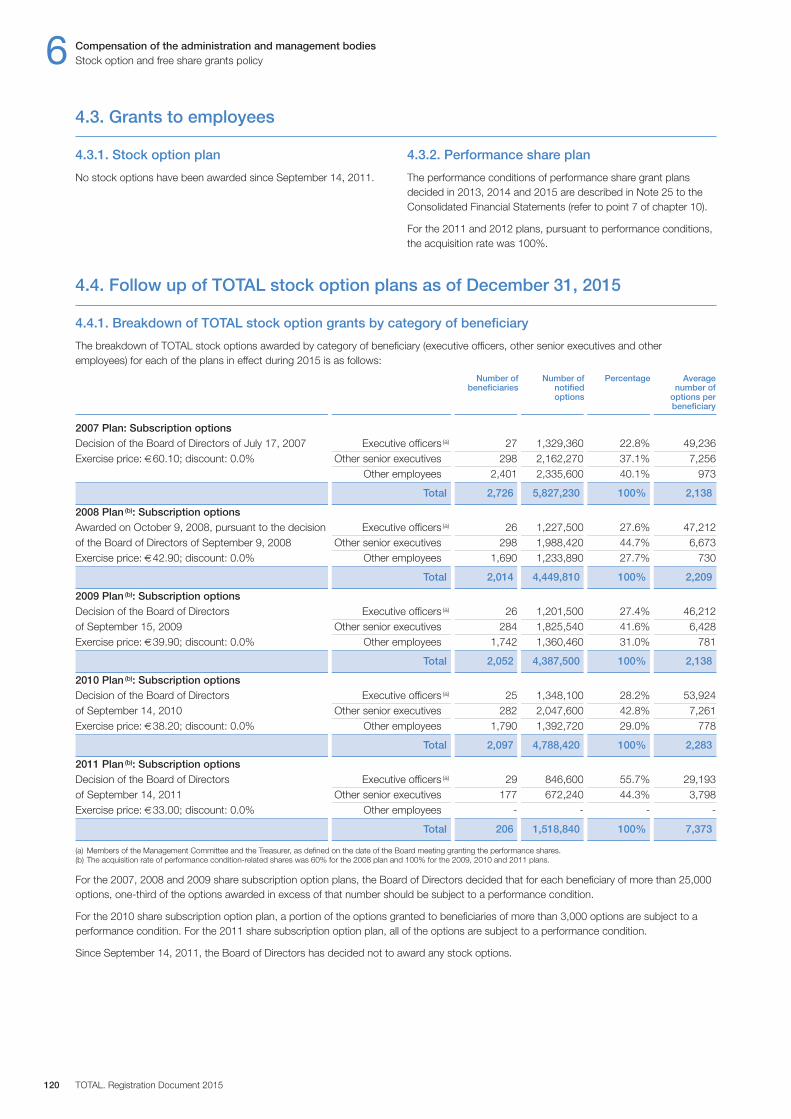
4.4. Follow up of TOTAL stock option plans as of December 31, 2015
4.4.1. Breakdown of TOTAL stock option grants by category of beneficiary
The breakdown of TOTAL stock options awarded by category of beneficiary (executive officers, other senior executives and otheremployees) for each of the plans in effect during 2015 is as follows:
Number of Number of Percentage Averagebeneficiaries notified number of
options options perbeneficiary
2007 Plan: Subscription optionsDecision of the Board of Directors of July 17, 2007 Executive officers (a) 27 1,329,360 22.8% 49,236Exercise price: €60.10; discount: 0.0% Other senior executives 298 2,162,270 37.1% 7,256 Other employees 2,401 2,335,600 40.1% 973
Total 2,726 5,827,230 100% 2,138
2008 Plan (b): Subscription options Awarded on October 9, 2008, pursuant to the decision Executive officers (a) 26 1,227,500 27.6% 47,212of the Board of Directors of September 9, 2008 Other senior executives 298 1,988,420 44.7% 6,673Exercise price: €42.90; discount: 0.0% Other employees 1,690 1,233,890 27.7% 730
Total 2,014 4,449,810 100% 2,209
2009 Plan (b): Subscription options Decision of the Board of Directors Executive officers (a) 26 1,201,500 27.4% 46,212of September 15, 2009 Other senior executives 284 1,825,540 41.6% 6,428Exercise price: €39.90; discount: 0.0% Other employees 1,742 1,360,460 31.0% 781
Total 2,052 4,387,500 100% 2,138
2010 Plan (b): Subscription options Decision of the Board of Directors Executive officers (a) 25 1,348,100 28.2% 53,924of September 14, 2010 Other senior executives 282 2,047,600 42.8% 7,261Exercise price: €38.20; discount: 0.0% Other employees 1,790 1,392,720 29.0% 778
Total 2,097 4,788,420 100% 2,283
2011 Plan (b): Subscription options Decision of the Board of Directors Executive officers (a) 29 846,600 55.7% 29,193of September 14, 2011 Other senior executives 177 672,240 44.3% 3,798Exercise price: €33.00; discount: 0.0% Other employees - - - -
Total 206 1,518,840 100% 7,373
(a) Members of the Management Committee and the Treasurer, as defined on the date of the Board meeting granting the performance shares.(b) The acquisition rate of performance condition-related shares was 60% for the 2008 plan and 100% for the 2009, 2010 and 2011 plans.
For the 2007, 2008 and 2009 share subscription option plans, the Board of Directors decided that for each beneficiary of more than 25,000options, one-third of the options awarded in excess of that number should be subject to a performance condition.
For the 2010 share subscription option plan, a portion of the options granted to beneficiaries of more than 3,000 options are subject to aperformance condition. For the 2011 share subscription option plan, all of the options are subject to a performance condition.
Since September 14, 2011, the Board of Directors has decided not to award any stock options.
4.3.1. Stock option plan
No stock options have been awarded since September 14, 2011.
4.3.2. Performance share plan
The performance conditions of performance share grant plansdecided in 2013, 2014 and 2015 are described in Note 25 to theConsolidated Financial Statements (refer to point 7 of chapter 10).
For the 2011 and 2012 plans, pursuant to performance conditions,the acquisition rate was 100%.
4.3. Grants to employees
6 Compensation of the administration and management bodiesStock option and free share grants policy
TOTAL. Registration Document 2015120
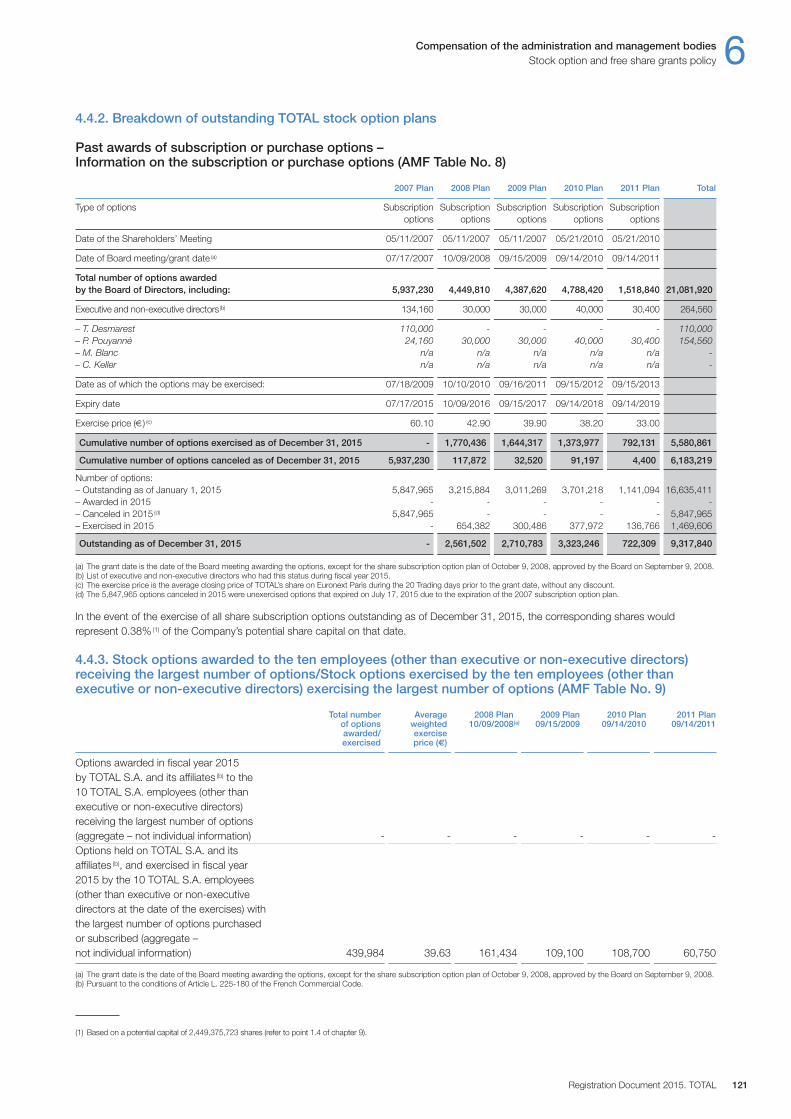
Compensation of the administration and management bodies 6Stock option and free share grants policy
Registration Document 2015. TOTAL 121
4.4.2. Breakdown of outstanding TOTAL stock option plans
Past awards of subscription or purchase options – Information on the subscription or purchase options (AMF Table No. 8)
2007 Plan 2008 Plan 2009 Plan 2010 Plan 2011 Plan Total
Type of options Subscription Subscription Subscription Subscription Subscription options options options options options
Date of the Shareholders’ Meeting 05 / 11 / 2007 05 / 11 / 2007 05 / 11 / 2007 05 / 21 / 2010 05 / 21 / 2010
Date of Board meeting / grant date (a) 07 / 17 / 2007 10 / 09 / 2008 09 / 15 / 2009 09 / 14 / 2010 09 / 14 / 2011
Total number of options awarded by the Board of Directors, including: 5,937,230 4,449,810 4,387,620 4,788,420 1,518,840 21,081,920
Executive and non-executive directors(b) 134,160 30,000 30,000 40,000 30,400 264,560
– T. Desmarest 110,000 - - - - 110,000– P. Pouyanné 24,160 30,000 30,000 40,000 30,400 154,560– M. Blanc n / a n / a n / a n / a n / a -– C. Keller n / a n / a n / a n / a n / a -
Date as of which the options may be exercised: 07 / 18 / 2009 10 / 10 / 2010 09 / 16 / 2011 09 / 15 / 2012 09 / 15 / 2013
Expiry date 07 / 17 / 2015 10 / 09 / 2016 09 / 15 / 2017 09 / 14 / 2018 09 / 14 / 2019
Exercise price (€) (c) 60.10 42.90 39.90 38.20 33.00
Cumulative number of options exercised as of December 31, 2015 - 1,770,436 1,644,317 1,373,977 792,131 5,580,861
Cumulative number of options canceled as of December 31, 2015 5,937,230 117,872 32,520 91,197 4,400 6,183,219
Number of options:– Outstanding as of January 1, 2015 5,847,965 3,215,884 3,011,269 3,701,218 1,141,094 16,635,411– Awarded in 2015 - - - - - -– Canceled in 2015 (d) 5,847,965 - - - - 5,847,965– Exercised in 2015 - 654,382 300,486 377,972 136,766 1,469,606
Outstanding as of December 31, 2015 - 2,561,502 2,710,783 3,323,246 722,309 9,317,840
(a) The grant date is the date of the Board meeting awarding the options, except for the share subscription option plan of October 9, 2008, approved by the Board on September 9, 2008.(b) List of executive and non-executive directors who had this status during fiscal year 2015.(c) The exercise price is the average closing price of TOTAL’s share on Euronext Paris during the 20 Trading days prior to the grant date, without any discount.(d) The 5,847,965 options canceled in 2015 were unexercised options that expired on July 17, 2015 due to the expiration of the 2007 subscription option plan.
In the event of the exercise of all share subscription options outstanding as of December 31, 2015, the corresponding shares wouldrepresent 0.38% (1) of the Company’s potential share capital on that date.
4.4.3. Stock options awarded to the ten employees (other than executive or non-executive directors)receiving the largest number of options / Stock options exercised by the ten employees (other thanexecutive or non-executive directors) exercising the largest number of options (AMF Table No. 9)
Total number Average 2008 Plan 2009 Plan 2010 Plan 2011 Plan of options weighted 10 / 09 / 2008(a) 09/15/2009 09/14/2010 09/14/2011 awarded / exercise exercised price (€)
Options awarded in fiscal year 2015 by TOTAL S.A. and its affiliates (b) to the 10 TOTAL S.A. employees (other than executive or non-executive directors) receiving the largest number of options (aggregate – not individual information) - - - - - -Options held on TOTAL S.A. and its affiliates (b), and exercised in fiscal year 2015 by the 10 TOTAL S.A. employees (other than executive or non-executive directors at the date of the exercises) with the largest number of options purchased or subscribed (aggregate – not individual information) 439,984 39.63 161,434 109,100 108,700 60,750
(a) The grant date is the date of the Board meeting awarding the options, except for the share subscription option plan of October 9, 2008, approved by the Board on September 9, 2008.(b) Pursuant to the conditions of Article L. 225-180 of the French Commercial Code.
(1) Based on a potential capital of 2,449,375,723 shares (refer to point 1.4 of chapter 9).

6 Compensation of the administration and management bodiesStock option and free share grants policy
TOTAL. Registration Document 2015122
These performance shares, which were previously bought back bythe Company on the market, are definitively awarded at the end ofa 2-year vesting period. In the case of shares awarded as ofJuly 25, 2013, the vesting period has been extended to three years.The definitive grant of all performance shares is subject to a
continued employment condition and a performance condition(refer to Note 25 to the Consolidated Financial Statements, point 7of chapter 10). In addition, the disposal of shares that have beendefinitively awarded cannot occur until the end of a 2-yearmandatory holding period.
4.5. Follow up of TOTAL free share grants as of December 31, 2015
4.5.1. Breakdown of TOTAL performance share grants by category of beneficiary
The following table gives a breakdown of TOTAL performance share grants by category of beneficiary (executive officers, other seniorexecutives and other employees):
Number of Number of Percentage Averagebeneficiaries notified number of
shares shares perbeneficiary
2011 Plan (a)
Decision of the Board of Directors Executive officers (b) 29 184,900 5.1% 6,376of September 14, 2011 Other senior executives 274 624,000 17.1% 2,277 Other employees 9,658 2,840,870 77.8% 294
Total 9,961 3,649,770 100% 366
2012 Plan (a)
Decision of the Board of Directors Executive officers (b) 33 416,100 9.7% 12,609of July 26, 2012 Other senior executives 274 873,000 20.3% 3,186 Other employees 9,698 3,006,830 70.0% 310
Total 10,005 4,295,930 100% 429
2013 Plan Decision of the Board Executive officers (b) 32 422,600 9.5% 13,206of Directors of July 25, 2013 Other senior executives 277 934,500 20.9% 3,374 Other employees (c) 9,625 3,107,100 69.6% 323
Total 9,934 4,464,200 100% 449
2014 Plan Decision of the Board Executive officers (b) 32 421,200 9.4% 13,163of Directors of July 29, 2014 Other senior executives 281 975,300 21.7% 3,471 Other employees (c) 9,624 3,089,800 68.9% 321
Total 9,937 4,486,300 100% 451
2015 Plan Decision of the Board Executive officers (d) 13 264,600 5.6% 20,354of Directors of July 28, 2015 Other senior executives 290 1,132,750 23.8% 3,906 Other employees (c) 10,012 3,364,585 70.6% 336
Total 10,315 4,761,935 100% 462
(a) For the 2011 and 2012 plans, the share acquisition rate deriving from the ROE performance condition was 100%.(b) Members of the Management Committee and the Treasurer such as defined on the date of the Board meeting granting the performance shares.(c) Mr. Keller, who is an employee of TOTAL S.A. and TOTAL S.A. director representing employee shareholders as of May 17, 2013, was awarded 400 performance shares under the 2013
plan, 400 performance shares under the 2014 plan and was not awarded any share under the 2015 plan. Mr. Blanc, who is an employee of TOTAL S.A. and TOTAL S.A. directorrepresenting employees as of November 4, 2014, was not awarded any shares under the 2014 and 2015 plan.
(d) Group executive officers as defined on the date of the Board meeting granting the performance shares. The Group’s executive officers include the members of the ExecutiveCommittee, the five Senior Vice Presidents of the Group functions (Corporate Communications, Human Resources, Legal, Safety and Strategy) and the Treasurer.
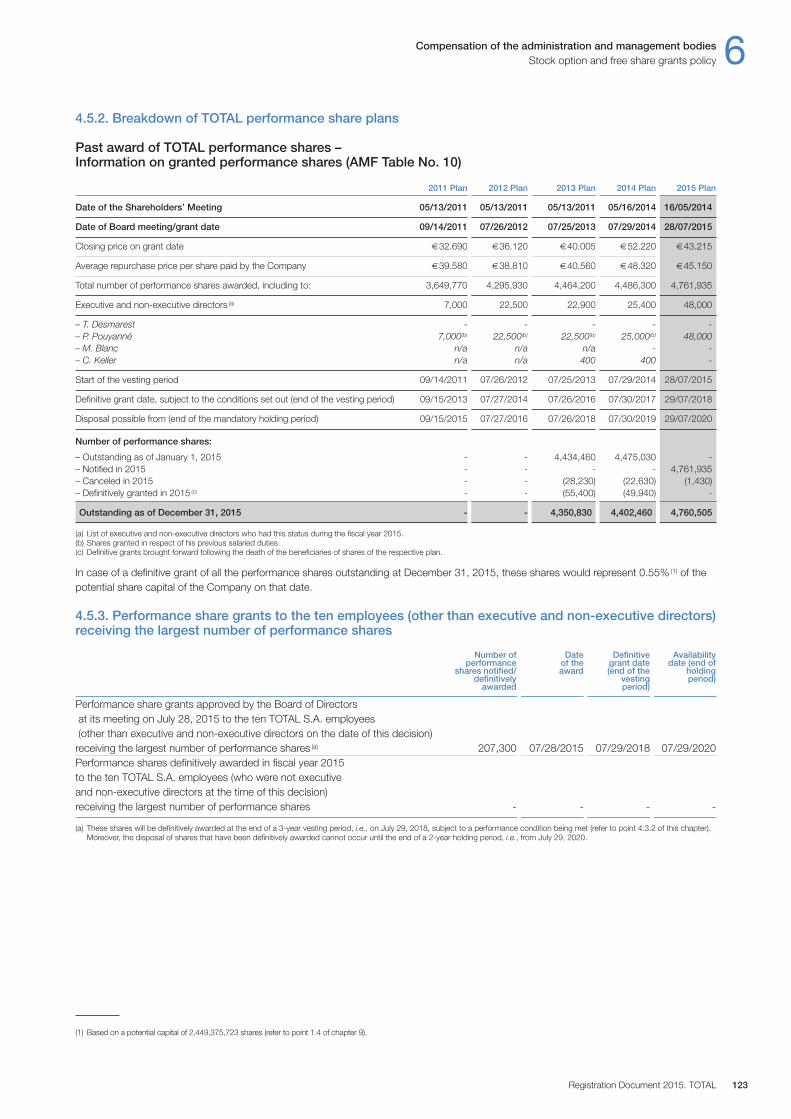
Compensation of the administration and management bodies 6Stock option and free share grants policy
Registration Document 2015. TOTAL 123
4.5.2. Breakdown of TOTAL performance share plans
Past award of TOTAL performance shares – Information on granted performance shares (AMF Table No. 10)
20 11 Plan 20 12 Plan 20 13 Plan 20 14 Plan 20 15 Plan
Date of the Shareholders’ Meeting 05 / 13 / 2011 05 / 13 / 2011 05 / 13 / 2011 05 / 16 / 2014 16 / 05 / 2014
Date of Board meeting / grant date 09 / 14 / 2011 07 / 26 / 2012 07 / 25 / 2013 07 / 29 / 2014 28 / 07 / 2015
Closing price on grant date €32.690 €36.120 €40.005 €52.220 €43.215
Average repurchase price per share paid by the Company €39.580 €38.810 €40.560 €48.320 €45.150
Total number of performance shares awarded, including to: 3,649,770 4,295,930 4,464,200 4,486,300 4,761,935
Executive and non-executive directors (a) 7,000 22,500 22,900 25,400 48,000
– T. Desmarest - - - - -– P. Pouyanné 7,000(b) 22,500(b) 22,500(b) 25,000(b) 48,000– M. Blanc n / a n / a n / a - -– C. Keller n / a n / a 400 400 -
Start of the vesting period 09 / 14 / 2011 07 / 26 / 2012 07 / 25 / 2013 07 / 29 / 2014 28 / 07 / 2015
Definitive grant date, subject to the conditions set out (end of the vesting period) 09 / 15 / 2013 07 / 27 / 2014 07 / 26 / 2016 07 / 30 / 2017 29 / 07 / 2018
Disposal possible from (end of the mandatory holding period) 09 / 15 / 2015 07 / 27 / 2016 07 / 26 / 2018 07 / 30 / 2019 29 / 07 / 2020
Number of performance shares:
– Outstanding as of January 1, 2015 - - 4,434,460 4,475,030 -– Notified in 2015 - - - - 4,761,935– Canceled in 2015 - - (28,230) (22,630) (1,430)– Definitively granted in 2015 (c) - - (55,400) (49,940) -
Outstanding as of December 31, 2015 - - 4,350,830 4,402,460 4,760,505
(a) List of executive and non-executive directors who had this status during the fiscal year 2015.(b) Shares granted in respect of his previous salaried duties.(c) Definitive grants brought forward following the death of the beneficiaries of shares of the respective plan.
In case of a definitive grant of all the performance shares outstanding at December 31, 2015, these shares would represent 0.55% (1) of thepotential share capital of the Company on that date.
4.5.3. Performance share grants to the ten employees (other than executive and non-executive directors)receiving the largest number of performance shares
Number of Date Definitive Availability performance of the grant date date (end of shares notified/ award (end of the holding definitively vesting period) awarded period)
Performance share grants approved by the Board of Directorsat its meeting on July 28, 2015 to the ten TOTAL S.A. employees(other than executive and non-executive directors on the date of this decision) receiving the largest number of performance shares (a) 207,300 07 / 28 / 2015 07 / 29 / 2018 07 / 29 / 2020Performance shares definitively awarded in fiscal year 2015 to the ten TOTAL S.A. employees (who were not executive and non-executive directors at the time of this decision) receiving the largest number of performance shares - - - -
(a) These shares will be definitively awarded at the end of a 3-year vesting period, i.e., on July 29, 2018, subject to a performance condition being met (refer to point 4.3.2 of this chapter).Moreover, the disposal of shares that have been definitively awarded cannot occur until the end of a 2-year holding period, i.e., from July 29, 2020.
(1) Based on a potential capital of 2,449,375,723 shares (refer to point 1.4 of chapter 9).
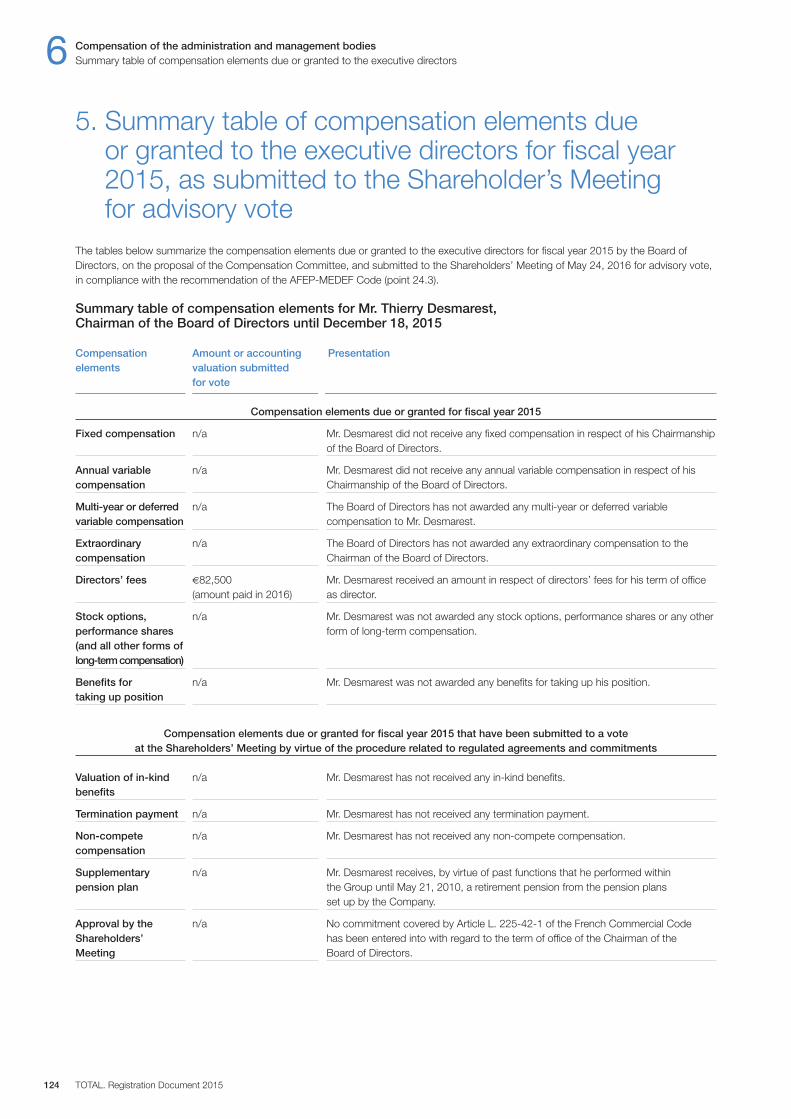
6 Compensation of the administration and management bodiesSummary table of compensation elements due or granted to the executive directors
TOTAL. Registration Document 2015124
5. Summary table of compensation elements due or granted to the executive directors for fiscal year2015, as submitted to the Shareholder’s Meeting for advisory vote
The tables below summarize the compensation elements due or granted to the executive directors for fiscal year 2015 by the Board ofDirectors, on the proposal of the Compensation Committee, and submitted to the Shareholders’ Meeting of May 24, 2016 for advisory vote,in compliance with the recommendation of the AFEP-MEDEF Code (point 24.3).
Summary table of compensation elements for Mr. Thierry Desmarest, Chairman of the Board of Directors until December 18, 2015
Compensation Amount or accounting Presentationelements valuation submitted for vote
Compensation elements due or granted for fiscal year 2015
Fixed compensation
n / a
Mr. Desmarest did not receive any fixed compensation in respect of his Chairmanshipof the Board of Directors.
Annual variablecompensation
n / a Mr. Desmarest did not receive any annual variable compensation in respect of hisChairmanship of the Board of Directors.
Multi-year or deferredvariable compensation
n / a The Board of Directors has not awarded any multi-year or deferred variablecompensation to Mr. Desmarest.
Extraordinarycompensation
n / a The Board of Directors has not awarded any extraordinary compensation to theChairman of the Board of Directors.
Directors’ fees €82,500 (amount paid in 2016)
Mr. Desmarest received an amount in respect of directors’ fees for his term of officeas director.
Stock options,performance shares(and all other forms oflong-term compensation)
n / a Mr. Desmarest was not awarded any stock options, performance shares or any otherform of long-term compensation.
Benefits for taking up position
n / a Mr. Desmarest was not awarded any benefits for taking up his position.
Valuation of in-kindbenefits
n / a Mr. Desmarest has not received any in-kind benefits.
Termination payment n / a Mr. Desmarest has not received any termination payment.
Non-competecompensation
n / a Mr. Desmarest has not received any non-compete compensation.
Supplementary pension plan
n / a Mr. Desmarest receives, by virtue of past functions that he performed within the Group until May 21, 2010, a retirement pension from the pension plans set up by the Company.
Approval by theShareholders’Meeting
n / a No commitment covered by Article L. 225-42-1 of the French Commercial Code has been entered into with regard to the term of office of the Chairman of the Board of Directors.
Compensation elements due or granted for fiscal year 2015 that have been submitted to a vote at the Shareholders’ Meeting by virtue of the procedure related to regulated agreements and commitments
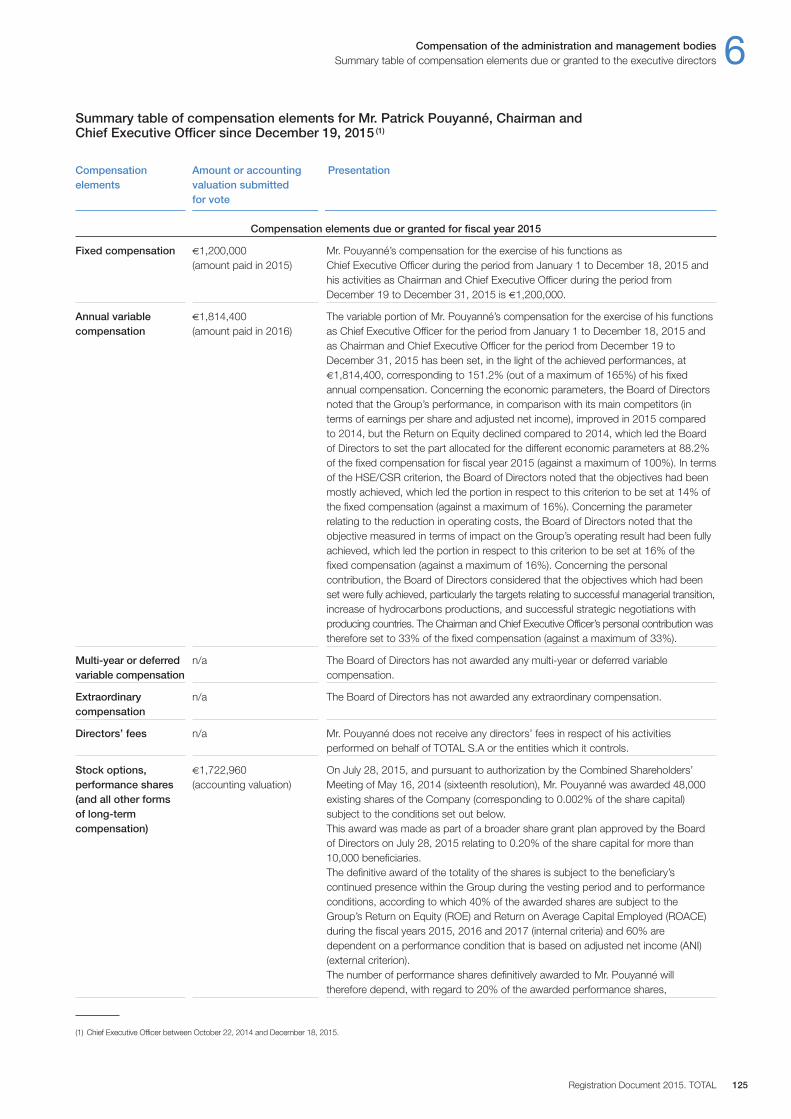
Compensation of the administration and management bodies 6Summary table of compensation elements due or granted to the executive directors
Registration Document 2015. TOTAL 125
Summary table of compensation elements for Mr. Patrick Pouyanné, Chairman andChief Executive Officer since December 19, 2015 (1)
Fixed compensation €1,200,000 (amount paid in 2015)
Mr. Pouyanné’s compensation for the exercise of his functions asChief Executive Officer during the period from January 1 to December 18, 2015 andhis activities as Chairman and Chief Executive Officer during the period fromDecember 19 to December 31, 2015 is €1,200,000.
Annual variablecompensation
€1,814,400(amount paid in 2016)
The variable portion of Mr. Pouyanné’s compensation for the exercise of his functionsas Chief Executive Officer for the period from January 1 to December 18, 2015 andas Chairman and Chief Executive Officer for the period from December 19 toDecember 31, 2015 has been set, in the light of the achieved performances, at€1,814,400, corresponding to 151.2% (out of a maximum of 165%) of his fixedannual compensation. Concerning the economic parameters, the Board of Directorsnoted that the Group’s performance, in comparison with its main competitors (interms of earnings per share and adjusted net income), improved in 2015 comparedto 2014, but the Return on Equity declined compared to 2014, which led the Boardof Directors to set the part allocated for the different economic parameters at 88.2%of the fixed compensation for fiscal year 2015 (against a maximum of 100%). In termsof the HSE / CSR criterion, the Board of Directors noted that the objectives had beenmostly achieved, which led the portion in respect to this criterion to be set at 14% ofthe fixed compensation (against a maximum of 16%). Concerning the parameterrelating to the reduction in operating costs, the Board of Directors noted that theobjective measured in terms of impact on the Group’s operating result had been fullyachieved, which led the portion in respect to this criterion to be set at 16% of thefixed compensation (against a maximum of 16%). Concerning the personalcontribution, the Board of Directors considered that the objectives which had beenset were fully achieved, particularly the targets relating to successful managerial transition,increase of hydrocarbons productions, and successful strategic negotiations withproducing countries. The Chairman and Chief Executive Officer’s personal contribution wastherefore set to 33% of the fixed compensation (against a maximum of 33%).
Multi-year or deferredvariable compensation
n / a The Board of Directors has not awarded any multi-year or deferred variablecompensation.
Extraordinarycompensation
n / a The Board of Directors has not awarded any extraordinary compensation.
Directors’ fees n / a Mr. Pouyanné does not receive any directors’ fees in respect of his activitiesperformed on behalf of TOTAL S.A or the entities which it controls.
Stock options,performance shares(and all other forms of long-termcompensation)
€1,722,960 (accounting valuation)
On July 28, 2015, and pursuant to authorization by the Combined Shareholders’Meeting of May 16, 2014 (sixteenth resolution), Mr. Pouyanné was awarded 48,000existing shares of the Company (corresponding to 0.002% of the share capital)subject to the conditions set out below. This award was made as part of a broader share grant plan approved by the Boardof Directors on July 28, 2015 relating to 0.20% of the share capital for more than10,000 beneficiaries. The definitive award of the totality of the shares is subject to the beneficiary’scontinued presence within the Group during the vesting period and to performanceconditions, according to which 40% of the awarded shares are subject to theGroup’s Return on Equity (ROE) and Return on Average Capital Employed (ROACE)during the fiscal years 2015, 2016 and 2017 (internal criteria) and 60% aredependent on a performance condition that is based on adjusted net income (ANI)(external criterion). The number of performance shares definitively awarded to Mr. Pouyanné willtherefore depend, with regard to 20% of the awarded performance shares,
Compensation Amount or accounting Presentationelements valuation submitted for vote
Compensation elements due or granted for fiscal year 2015
(1) Chief Executive Officer between October 22, 2014 and December 18, 2015.
6 Compensation of the administration and management bodiesSummary table of compensation elements due or granted to the executive directors
TOTAL. Registration Document 2015126
Stock options,performance shares(and all other forms of long-termcompensation)(continued)
€1,722,960 (accounting valuation)
on the Group’s average Return on Equity (ROE), and, with regard to a further 20%,on the Group’s average Return on Average Capital Employed (ROACE). The ROE andROACE values adopted for the assessment of attainment of the performanceconditions shall be those published by the Group in the 1st quarter of 2016, the1st quarter of 2017 and the 1st quarter of 2018, based on the Group’s balance sheetand consolidated statement of income for the fiscal years 2015, 2016 and 2017. In the case of the ROE criterion, the acquisition rate will be zero if the average ROE isless than 6.5%, will vary on a straight-line basis from 0% to 50% if the average ROEis greater than or equal to 6.5% and less than or equal to 9.5%, will vary on astraight-line basis from 50% to 100% if the average ROE is greater than or equal to9.5% and less than or equal to 14.5%, and will be equal to 100% if the average ROEis greater than 14.5%. In the case of the ROACE criterion, the acquisition rate will bezero if the average ROACE is less than 6.5%, will vary on a straight-line basis from0% to 50% if the average ROACE is greater than or equal to 6.5% and less than orequal to 9%, will vary on a straight-line basis from 50% to 100% if the averageROACE is greater than or equal to 9% and less than or equal to 13%, and will beequal to 100% if the average ROACE is greater than 13%. The number ofperformance shares definitively awarded to Mr. Pouyanné will also depend, for 60%of the awarded performance shares, on a performance condition defined in relation tochanges in the Group’s published 3-yearly average ANI compared to that of a set offour other international oil companies (ExxonMobil, Royal Dutch Shell, BP andChevron) during the three years of acquisition (2015, 2016 and 2017). In the case of the ANI criterion, by comparison, the acquisition rate will be zero if therelative difference in this change is less than -12%, will be equal to 60% if the relativedifference in this change is zero and will be equal to 100% if the relative difference inthis change is greater than 12%, with intermediate values between these anchorpoints being calculated on a straight-line basis.In accordance with the provisions of the French Commercial Code, Mr. Pouyanné willbe required, until the end of his functions, to retain in the form of registered shares50% of the gains on the acquired shares net of tax and national insurancecontributions on the awarded shares. When Mr. Pouyanné holds a volume of shares (1)
representing five times the fixed portion of his gross annual compensation, thispercentage will be equal to 10%. If this condition is no longer fulfilled, the 50%holding requirement stated above will again apply. Given this holding requirement, theavailability of the performance shares is not dependent on the purchase of furthershares in the Company. In addition, the Board of Directors has noted that, pursuant to the Board of Directors’rules of procedure applicable to all directors, the Chairman andChief Executive Officer may not hedge the shares of the Company or any relatedfinancial instruments and has taken note of Mr. Pouyanné’s commitment to abstainfrom any such hedging operations with regard to the awarded performance shares.Subject to the specific provisions set out above, the award of performance shares toMr. Pouyanné is subject to the same provisions as those that apply to the otherbeneficiaries of the performance share plan that was approved by the Board at itsmeeting of July 28, 2015. In particular, these provisions require that the shares thatare definitively awarded following the 3-year vesting period shall, following confirmationof fulfillment of the presence and performance conditions, be automatically recordedas pure registered shares on the date of the start of the 2-year holding period and willremain non-transferable and unavailable until the end of the holding period.
Compensation Amount or accounting Presentationelements valuation submitted for vote
Benefits for taking up position
n / a Mr. Pouyanné was not awarded any benefits for taking up his position.
(1) In the form of shares or holdings in mutual funds invested in shares of the Company.

Compensation of the administration and management bodies 6Summary table of compensation elements due or granted to the executive directors
Registration Document 2015. TOTAL 127
Compensation Amount or accounting Presentationelements valuation submitted for vote
Valuation of in-kindbenefits
€36,390 (accounting valuation)
The Chairman and Chief Executive Officer has the use of a company and is coveredby the life insurance plans and the health care plan at the expense of the Company.
Termination payment None The Chairman and Chief Executive Officer is entitled to a benefit equal to two years’gross compensation in the event of a forced departure owing to a change of controlor strategy. The calculation is based on the gross compensation (both fixed andvariable portions) for the 12-month period preceding the date of termination or non-renewal of his term of office. The termination payment will only be paid in the event of a forced departure owing toa change of control or strategy. It will not be due in cases of gross negligence orwillful misconduct or if the Chairman and Chief Executive Officer leaves the Companyof his own volition, accepts new responsibilities within the Group, or may claim fullretirement benefits within a short time period. Pursuant to the provisions of Article L. 225-42-1 of the French Commercial Code,receipt of this termination benefit is contingent upon a performance-related conditionapplicable to the beneficiary, which is deemed to be fulfilled if at least two of thefollowing criteria are met: – the average ROE (Return on Equity) over the three years preceding the year in
which the Chairman and Chief Executive Officer retires is at least 10%; – the average debt-to-equity ratio for the three years preceding the year in which the
Chairman and Chief Executive Officer retires is less than or equal to 30%; and – growth in TOTAL’s oil and gas production is greater than or equal to the average of
the rates of growth of four oil companies (ExxonMobil, Royal Dutch Shell, BP,Chevron) during the three years preceding the year in which the Chairman andChief Executive Officer retires.
Retirement benefit None The Chairman and Chief Executive Officer is entitled to a retirement benefit equal tothose available to eligible members of the Group under the French National CollectiveBargaining Agreement for the Petroleum Industry. This benefit amounts to 25% of theannual compensation (both fixed and variable portions) of the 12-month periodpreceding retirement. Pursuant to the provisions of Article L. 225-42-1 of the French Commercial Code,receipt of this retirement benefit is contingent upon a performance-related conditionapplicable to the beneficiary, which is deemed to be fulfilled if at least two of thefollowing criteria set are met: – the average ROE (Return on Equity) over the three years preceding the year in
which the Chairman and Chief Executive Officer retires is at least 10%; – the average debt-to-equity ratio for the three years preceding the year in which the
Chairman and Chief Executive Officer retires is less than or equal to 30%; and – growth in TOTAL’s oil and gas production is greater than or equal to the average of
the rates of growth of four oil companies (ExxonMobil, Royal Dutch Shell, BP,Chevron) during the three years preceding the year in which the Chairman andChief Executive Officer retires.
The retirement benefit cannot be combined with the termination payment described above.
Non-competecompensation
n / a Mr. Pouyanné has not received any non-compete compensation.
Compensation elements due or granted for fiscal year 2015 submitted to a vote at the Shareholders’ Meeting by virtue of the procedure related to regulated agreements and commitments
6 Compensation of the administration and management bodiesSummary table of compensation elements due or granted to the executive directors
TOTAL. Registration Document 2015128
Compensation Amount or accounting Presentationelements valuation submitted for vote
Supplementarypension plan
None Pursuant to law, the Chairman and Chief Executive Officer is eligible for the basicFrench social security pension and for pension benefits under the ARRCO(Association pour le régime de retraite complémentaire des salariés) and AGIRC(Association générale des institutions de retraite des cadres) government-sponsoredsupplementary pension plans.He also participates in the internal defined contribution pension plan applicable to allTOTAL S.A. employees, known as RECOSUP (Régime collectif et obligatoire de retraitesupplémentaire à cotisations définies), covered by Article L. 242-1 of the French SocialSecurity Code. The Company’s commitment is limited to its share of the payment tothe insurance company that manages the plan. For fiscal year 2015, this pension planrepresented a booked expense to the Company in favor of the Chairman and Chief Executive Officer of €2,282. The Chairman and Chief Executive Officer also participates in a supplementarydefined benefit pension plan, covered by Article L. 137-11 of the French SocialSecurity Code, set up and financed by the Company, which was approved by theBoard of Directors on March 13, 2001, for which management is outsourced to twoinsurance companies and which is effective as of January 1, 2012. This plan isapplicable to all employees of TOTAL S.A. whose annual compensation is greaterthan eight times the ceiling for calculating French social security contributions(Plafond annuel de la sécurité sociale, PASS), set at €38,616 for 2016. To be eligible for this supplementary pension plan, participants must have a length ofservice of at least five years and must still be employed at the time of their retirement.However, in the event of a beneficiary leaving the Company at the Company’sinitiative as of the age of 55 or in the event of invalidity, then the beneficiary’s rightswill be maintained provided that the 5-year length of service condition is met. The lengthof service acquired by Mr. Pouyanné as a result of his previous salaried duties withinthe Group exercised as of January 1, 1997 has been maintained for the benefit of thisplan. The compensation taken into account to calculate the supplementary pensionis the retiree’s last 3-year average gross compensation (fixed and variable portions).The amount paid under this plan is equal to 1.8% of the compensation fallingbetween 8 and 40 times the PASS and 1% for the portion of the compensation fallingbetween 40 and 60 times this ceiling, multiplied by the number of years of service upto a maximum of 20 years, subject to the performance condition set out belowapplicable to the Chairman and Chief Executive Officer. The sum of the annual supplementary pension plan benefits and other pension planbenefits (other than those constituted individually and on a voluntary basis) may notexceed 45% of the average gross compensation (fixed and variable portion) for thelast three years. In the event that this percentage is exceeded, the supplementarypension is reduced accordingly. The amount of the supplementary pensiondetermined in this way is indexed to the ARRCO pension point. The supplementarypension includes a clause whereby up to 60% of the amount will be paid tobeneficiaries in the event of death after retirement. To ensure that the acquisition of additional pension rights under this defined-benefitpension plan is subject to performance conditions that are to be defined pursuant tothe provisions of Article L. 225-42-1 of the French Commercial Code amended bylaw No. 2015-990 of August 6, 2015, the Board of Directors noted the existence ofthe Chief Executive Officer’s pension rights under the above-mentioned pension planimmediately before his appointment as Chairman from the period from January 1,1997 to December 18, 2015. The conditional rights awarded for the period fromJanuary 1, 1997 to December 18, 2015 (inclusive) (1) acquired free of performanceconditions correspond to a substitution rate equal to 34.14% (2) in respect of theportion of the reference compensation contained between 8 and 40 times the PASS,and a substitution rate of 18.96% (3) in respect of the portion of the referencecompensation contained between 40 and 60 times the PASS.
(1) The period that elapsed from January 1, 1997 to December 18, 2015 (inclusive) is equal to 18 years and 352 days in 2015 (out of 365).(2) 1.8%*(18+352/365) = 1.8%* (18+0.9643) = 34.14%.(3) 1%*(18+352/365) = 1%*(18+0.9643) = 18.96%.

Compensation of the administration and management bodies 6Summary table of compensation elements due or granted to the executive directors
Registration Document 2015. TOTAL 129
Supplementarypension plan(continued)
None The conditional rights awarded for the period from December 19, 2015 toDecember 31, 2016 that are subject to the performance condition described below correspond to a maximum substitution rate equal to 1.86% (1) in respect of the portionof the reference compensation contained between 8 and 40 times the PASS, and asubstitution rate of 1.04% (2) in respect of the portion of the reference compensationcontained between 40 and 60 times the PASS. Pursuant to the provisions of Article L. 225-42-1 of the French Commercial Code, theBoard of Directors decided that the acquisition of these conditional rights for theperiod from December 19, 2015 to December 31, 2016, is to be subject to aperformance-related condition applicable to the beneficiary, which shall beconsidered to be fulfilled if the variable portion of the Chairman andChief Executive Officer’s compensation paid in 2017 in respect of fiscal year 2016reaches 100% of the base salary due in respect of fiscal year 2016. Should thevariable portion not reach 100% of the base salary then the awarded rights will becalculated on a prorata basis. The commitments made by TOTAL S.A. in favor of its Chairman andChief Executive Officer with regard to the supplementary defined benefit and similarpension plans similar plans therefore represent, at December 31, 2015, a grossannual pension estimated at €560,862, based on the length of service acquired as ofDecember 31, 2015, i.e., 18.61% of Mr. Pouyanné’s gross annual compensation,consisting of the annual fixed portion for 2015 (i.e., €1,200,000) and the variableportion paid in 2016 in respect of fiscal year 2015 (i.e., €1,814,400). The commitments of TOTAL S.A. related to these supplementary defined benefitpension plans and similar plans (including the retirement benefit) are outsourced toinsurance companies for almost their entire amount, the remaining balance beingevaluated on an annual basis and adjusted through a provision in the accounts. Thecommitments amount, as of December 31, 2015, to €14.1 million for the Chairmanand Chief Executive Officer (€26.5 million for the Chairman and Chief Executive Officer, non-executive directors and the concerned former non-executive directors).These amounts represent the gross value of the commitments of TOTAL S.A. tothese beneficiaries based on the gross annual pensions estimated as ofDecember 31, 2015 as well as a statistical life expectancy of the beneficiaries. The sum of all the pension plans in which Mr. Pouyanné participates would, as ofDecember 31, 2015, represent a gross annual retirement pension estimated at€647,407, based on the length of service acquired as of December 31, 2015, i.e.,21.48% of Mr. Pouyanné’s gross annual compensation defined above (fixed annualportion for 2015 and variable portion paid in 2016 in respect of fiscal year 2015). In line with the principles used to determine the compensation of the executivedirectors as set out in the AFEP-MEDEF Code which the Company uses as areference, the Board of Directors has taken account of the advantage conferredthrough participation in the pension plans when determining the Chairman andChief Executive Officer’s compensation.
Approval by theShareholders’Meeting
- The commitments made to the Chairman and Chief Executive Officer regardingpension and life insurance plans, retirement benefit and termination payment (in theevent of with a forced departure owing to a change of control or strategy) wereapproved on December 16, 2015 by the Board of Directors and will be submitted tothe Shareholders’ Meeting of May 24, 2016.
Compensation Amount or accounting Presentationelements valuation submitted for vote
(1) 1.8%*(1+13/365) = 1.8%*(1+0.0356) = 1.86%.(2) 1%*(1+13/365) = 1%*(1+0.0356) = 1.04%.

TOTAL. Registration Document 2015130
12. Responsabilité sociale, environ-nementale et sociétale
Registration Document 2015. TOTAL 131
Social, environmental and societal information 7
Social, environmental and societal information
1. Social information 1321.1. Employment . . . . . . . . . . . . . . . . . . . . . . . . . . . . . . . . . . . . . . . . . . . . . . . . . . . . . . . . . . . . . . . . . . . . . . . . . . . . . . . . . . . . . . . .1321.2. Organization of work . . . . . . . . . . . . . . . . . . . . . . . . . . . . . . . . . . . . . . . . . . . . . . . . . . . . . . . . . . . . . . . . . . . . . . . . . . . . . . . . .1341.3. Dialogue with employees . . . . . . . . . . . . . . . . . . . . . . . . . . . . . . . . . . . . . . . . . . . . . . . . . . . . . . . . . . . . . . . . . . . . . . . . . . . . . .1351.4. Training . . . . . . . . . . . . . . . . . . . . . . . . . . . . . . . . . . . . . . . . . . . . . . . . . . . . . . . . . . . . . . . . . . . . . . . . . . . . . . . . . . . . . . . . . . . .1351.5. Equal opportunity . . . . . . . . . . . . . . . . . . . . . . . . . . . . . . . . . . . . . . . . . . . . . . . . . . . . . . . . . . . . . . . . . . . . . . . . . . . . . . . . . . . .136
2. Safety, health and environment information 1382.1. Occupational health and safety . . . . . . . . . . . . . . . . . . . . . . . . . . . . . . . . . . . . . . . . . . . . . . . . . . . . . . . . . . . . . . . . . . . . . . . . .1382.2. Environmental protection . . . . . . . . . . . . . . . . . . . . . . . . . . . . . . . . . . . . . . . . . . . . . . . . . . . . . . . . . . . . . . . . . . . . . . . . . . . . . .1392.3. Climate change . . . . . . . . . . . . . . . . . . . . . . . . . . . . . . . . . . . . . . . . . . . . . . . . . . . . . . . . . . . . . . . . . . . . . . . . . . . . . . . . . . . . . .144
3. Societal information 1463.1. TOTAL’s societal approach . . . . . . . . . . . . . . . . . . . . . . . . . . . . . . . . . . . . . . . . . . . . . . . . . . . . . . . . . . . . . . . . . . . . . . . . . . . . .1463.2. Dialogue and involvement with stakeholders . . . . . . . . . . . . . . . . . . . . . . . . . . . . . . . . . . . . . . . . . . . . . . . . . . . . . . . . . . . . . .1473.3. Controlling the impact of the Group’s activities . . . . . . . . . . . . . . . . . . . . . . . . . . . . . . . . . . . . . . . . . . . . . . . . . . . . . . . . . . . .1483.4. Creating local value . . . . . . . . . . . . . . . . . . . . . . . . . . . . . . . . . . . . . . . . . . . . . . . . . . . . . . . . . . . . . . . . . . . . . . . . . . . . . . . . . .1493.5. Partnerships and philanthropy . . . . . . . . . . . . . . . . . . . . . . . . . . . . . . . . . . . . . . . . . . . . . . . . . . . . . . . . . . . . . . . . . . . . . . . . . .1513.6. Contractors and suppliers . . . . . . . . . . . . . . . . . . . . . . . . . . . . . . . . . . . . . . . . . . . . . . . . . . . . . . . . . . . . . . . . . . . . . . . . . . . . .1523.7. Fair operating practices . . . . . . . . . . . . . . . . . . . . . . . . . . . . . . . . . . . . . . . . . . . . . . . . . . . . . . . . . . . . . . . . . . . . . . . . . . . . . . .154
4. Reporting scopes and method 1564.1. Reporting guidance . . . . . . . . . . . . . . . . . . . . . . . . . . . . . . . . . . . . . . . . . . . . . . . . . . . . . . . . . . . . . . . . . . . . . . . . . . . . . . . . . .1564.2. Scopes . . . . . . . . . . . . . . . . . . . . . . . . . . . . . . . . . . . . . . . . . . . . . . . . . . . . . . . . . . . . . . . . . . . . . . . . . . . . . . . . . . . . . . . . . . . .1564.3. Principles . . . . . . . . . . . . . . . . . . . . . . . . . . . . . . . . . . . . . . . . . . . . . . . . . . . . . . . . . . . . . . . . . . . . . . . . . . . . . . . . . . . . . . . . . . .1574.4. Details of certain indicators . . . . . . . . . . . . . . . . . . . . . . . . . . . . . . . . . . . . . . . . . . . . . . . . . . . . . . . . . . . . . . . . . . . . . . . . . . . .158
5. Independent verifier’s report 1595.1. Attestation of presence of CSR Information . . . . . . . . . . . . . . . . . . . . . . . . . . . . . . . . . . . . . . . . . . . . . . . . . . . . . . . . . . . . . . .1595.2. Limited assurance on CSR Information . . . . . . . . . . . . . . . . . . . . . . . . . . . . . . . . . . . . . . . . . . . . . . . . . . . . . . . . . . . . . . . . . . .160
1.1.1. Group employees
As of December 31, 2015, the Group had 96,019 employeesbelonging to 314 employing companies and subsidiaries located in102 countries. The tables below present the breakdown ofemployees by the following categories: gender, nationality, businesssegment, region and age bracket.
Group employees as of December 31, 2015 2014 2013
Total number of employees 96,019 100,307 98,799
Women 32.0% 31.1% 30.8%Men 68.0% 68.9% 69.2%French 31.2% 32.2% 33.4%Other nationalities 68.8% 67.8% 66.6%
Breakdown by business segmentUpstream
Exploration & Production 17.1% 17.2% 17.1%Gas 0.8% 1.1% 1.1%
Refining & Chemicals Refining & Chemicals 49.6% 50.9% 51.5%Trading & Shipping 0.6% 0.6% 0.6%
Marketing & Services Marketing & Services 21.3% 21.2% 21.5%New Energies 8.9% 7.4% 6.7%
Corporate 1.7% 1.6% 1.5%
Group employees as of December 31, 2015 2014 2013
Breakdown by region France 31.5% 32.5% 33.6%French overseas departments and territories 0.4% 0.3% 0.4%Rest of Europe 24.5% 23.9% 23.4%Africa 10.5% 10.2% 10.0%North America 6.4% 6.6% 6.6%Latin America 10.5% 9.7% 9.6%Asia 14.8% 15.0% 14.6%Middle East 1.3% 1.3% 1.3%Oceania 0.1% 0.5% 0.5%
Breakdown by age bracket < 25 years 6.6% 6.3% 6.5%25 to 34 years 28.8% 29.0% 29.1%35 to 44 years 29.1% 29.1% 28.8%45 to 54 years 22.6% 22.7% 23.1%> 55 years 12.9% 12.9% 12.5%
At year-end 2015, the country with the most employees after Francewas the United States, followed by Mexico, Poland and the Philippines.The decrease in the number of employees in 2015 was, on the onehand, due to divestments made during the year (refer to Note 3 to theConsolidated Financial Statements, point 7 of chapter 10) and, on theother hand, due to the recruitment reduction policy in the Group’s oil-related sector to face the decrease in the price of hydrocarbons.
7 Social, environmental and societal informationSocial information
TOTAL. Registration Document 2015132
1. Social informationThe quantitative information set out below regarding the Group’s employees worldwide covers all the entities that are fully consolidated in theGroup’s financial statements (1). However, some of the data comes from the Group’s Worldwide Human Resources Survey (WHRS), whichgathers approximately 100 indicators measuring important aspects of TOTAL’s Human Resources policy. The WHRS is performed on a sampleof employees from representative consolidated companies at the business segment and regional levels; when WHRS is mentioned in thisdocument, reference is made to data related to this sample, which represents 91% of the Group’s employees at 134 subsidiaries in 2015,stable compared to 2014 (91%) and 2013 (90%) despite a decrease in consolidated companies’ payrolls.
1.1. Employment
TOTAL puts Corporate Social Responsibility (CSR) at the heart of itsactivities and conducts its operations according to the followingprinciples of:
– protecting the safety and security of people and its facilities;– limiting its environmental footprint;– ensuring that its Code of Conduct is applied in its sphere of
operations;– incorporating the challenges of sustainable development in the
exercise of its activities;– increasing its local integration by placing dialogue with its stakeholders
at the heart of its policy and contributing to the economic and socialdevelopment of the regions where the Group has operations; and
– promoting equal opportunities and fostering diversity and culturalmix among its personnel.
The Group’s CSR performance is measured by non-financial ratingagencies. TOTAL has been included continuously in the FTSE4Goodindex (London Stock Exchange) since 2001 and in the Dow JonesSustainability World Index (DJSI World – New York Stock Exchange)since 2004. TOTAL was listed in the DJSI Europe from 2005 to 2014.
In terms of reporting, TOTAL refers to the IPIECA (global oil and gasindustry association for environmental and social issues) guidanceand to the Global Reporting Initiative (GRI). Detailed information onthese reporting guidelines is available on the Group’s website(analystes-csr.total.com).
On September 25, 2015, the United Nations adopted the 17 SustainableDevelopment Goals (SDGs). These goals acknowledge thedetermining role corporations play in economic development andgrowth and ask of them to show creativity and innovation in findingsolutions to global sustainable development challenges. TOTAL iscontinuing its analysis on how to better report, as of 2016, on itscontribution toward achieving these SDGs. Detailed information onTOTAL’s implementation of these goals is provided in this chapter,particularly with regard to Goal 7 – affordable and clean energy (seepoint 3.4.5 below) and Goal 13 – climate action (see point 2.3 below).
The reporting scopes and method concerning the information inthis chapter is presented in point 4 below. The data presented inthis section are provided on a current-scope basis.
(1) Refer to point 4.3.2 of this chapter.
The breakdown by gender and nationality of managers orequivalent positions (≥ 300 Hay points (1)) is as follows:
Breakdown of managers or equivalent as of December 31, 2015 2014 2013
Total number of managers 27,624 29,271 28,527
Women 25.1% 24.5% 23.9%Men 74.9% 75.5% 76.1%French 39.1% 38.8% 39.1%Other nationalities 60.9% 61.2% 60.9%
The table below presents the breakdown by business segment ofthe Group employees present (2).
Breakdown by business segment of the Group employees present as of December 31, 2015 2014
Upstream Exploration & Production 15,366 16,157Gas 915 1,111
Refining & Chemicals Refining & Chemicals 46,661 49,967Trading & Shipping 563 567
Marketing & Services Marketing & Services 19,923 20,682New Energies 8,475 7,425
Corporate 1,568 1,551
1.1.2. Employees joining and leaving TOTAL
As of December 31, 2015 2014 2013
Total number hired on open-ended contracts(a) 9,022 10,771 10,649
Women 34.9% 33.2% 35.9%Men 65.1% 66.8% 64.1%French 6.5% 9.5% 10.0%Other nationalities 93.5% 90.5% 90.0%
(a) Recruitments in China, which represent 9.2% of 2015 recruitments, are long-termcontracts as defined by local law.
The number of employees hired under open-ended contracts in2015 in the fully-consolidated companies decreased by 16.2%compared to 2014, due to the very significant decrease in the priceof oil since the second half of 2014. The regions or businesssegments in which the largest number of employees were hiredwere Latin America (37.8%), Asia (24.3%) and Europe (20%), on theone hand, and Refining & Chemicals (53%), on the other hand.
In 2015, the fully-consolidated Group companies also hired 2,666employees on fixed-term contracts. Close to 600,000 job applicationswere received by the companies covered by the WHRS.
As of December 31, 2015 2014 2013
Total number of departures (a) 7,724 7,195 6,779
Deaths 128 108 106Resignations 4,719 4,545 4,040Dismissals / negotiated departures 2,754 2,413 2,495Ruptures conventionnelles (specific negotiated departure in France) 123 129 138
Total departures / total employees 8% 7.2% 6.9%
(a) Excluding retirements, transfers, early retirements, voluntary departures and expiry ofshort-term contracts.
1.1.3. Compensation
The Group’s Human Resources policy formalized at the end of2014 applies to all companies in which TOTAL S.A. holds themajority of voting rights. In terms of compensation, the aim of thispolicy is to ensure external competitiveness and internal fairness,reinforce the link to individual performance, increase employeeshare ownership and fulfill the Group’s CSR commitments.
A large majority of employees benefit from laws that guarantee aminimum wage, and, whenever this is not the case, the Group’spolicy ensures that compensation is above the minimum wageobserved locally. Regular benchmarking is used to assesscompensation based on the external market and the entity’scompetitive environment. Each entity’s positioning relative to itsreference market is approved by the Human Resources departmentof each business segment, which monitors evolutions in payroll,turnover and consistency with the market.
Fair treatment is ensured within the Group through the widespreadimplementation of a job level evaluation using a common method(the Hay method), which associates a salary range to each job level.Performance of the Group’s employees (attainment of set targets,skills assessment, overall evaluation of job performance) isevaluated during an annual individual review and formalized inaccordance with principles common to the entire Group.
The compensation structure of the Group’s employees is based onthe following components, depending on the country:
– A base salary, which each year, in addition to a general salary-raise campaign, is subject to a merit-based salary-raisecampaign intended to compensate employees’ individualperformance according to the targets set during the annualindividual review, including at least one HSE (Health, Safety,Environment) target;
– Individual variable compensation, starting at a certain level ofresponsibility, which is intended to compensate individualperformance (quantitative and qualitative attainment of previouslyset targets) and the employee’s contribution to collectiveperformance evaluated among others according to HSE targetsset for each business segment, which represent up to 10% ofthe variable portion. In 2015, 87.3% of the Group’s entities(WHRS scope) included HSE criteria in the variable compensation.
Complementary collective variable compensation programsare implemented in some countries, such as France via incentivesand profit-sharing that also incorporates HSE criteria. According tothe agreement signed for 2015-2017 applicable to the oil andpetrochemicals (3) (nearly 19,000 employees) sector in France, the amount available for employee incentive is determined based
Social, environmental and societal information 7Social information
Registration Document 2015. TOTAL 133
(1) The Hay method is a unique reference framework used to classify and assess jobs.(2) Employees present as defined in point 4.3.2 of this chapter.(3) It includes the following Upstream, Refining & Chemicals and Marketing & Services companies in France: TOTAL S.A., Elf Exploration Production, Total Exploration Production France, CDF Énergie,
Total Marketing Services, Total Marketing France, Total Additifs et Carburants Spéciaux, Total Lubrifiants, Total Fluides, Total Raffinage-Chimie, Total Petrochemicals France, Total RaffinageFrance and Total Global Services.
The average work week is determined by applicable local law. It isless than 40 hours in most subsidiaries located in Europe, Japanand Qatar. It is 40 hours in most Asian and African countries, and inNorth America. It is longer in Latin America (Argentina, Mexico,Brazil) and a few Asian (India) and African (South Africa, EquatorialGuinea, Morocco) countries.
In addition, there are two specific employment regimes within the Group, the “shift” (2) regime and the “rotational” (3) regime. Most shift workers are employed in the Refining & Chemicals and Marketing & Services business segments, while the rotationalregime concerns the Upstream segment. New indicators wereestablished in 2015 to monitor these regimes.
Depending on local law, there are several programs that aim tocreate a better balance between work and private life and / orencourage equal career opportunities. In France, teleworking wasintroduced in 2012. As of December 31, 2015, there were 454teleworkers in France (WHRS scope), 27.1% of whom were men,compared to 346 in 2014.
WHRS WHRS WHRS 2015 2014 2013
% of companies offering the option of teleworking 17.2% 16% 22%% of employees involved in teleworking of those given the option 2.5% 2.1% 2.3%
The sickness absenteeism rate is one of the indicators monitored inthe WHRS:
WHRS WHRS WHRS 2015 2014 2013
Sickness absenteeism rate 2.1% 2.3% 2.5%
1.2. Organization of work
7 Social, environmental and societal informationSocial information
TOTAL. Registration Document 2015134
(1) TOTAL ACTIONNARIAT FRANCE, TOTAL FRANCE CAPITAL+, TOTAL ACTIONNARIAT INTERNATIONAL CAPITALISATION, TOTAL INTERNATIONAL CAPITAL.(2) For employees providing a continual activity with relays between alternating teams to maintain production (two or three 8-hour shifts), for example in plants or refineries.(3) For employees working at a location (town or worksite) far from their place of residence with alternating periods of work and rest.
on financial parameters (the Group’s return on equity and theevolution of the net adjusted income in comparison) and theattainment of safety targets (injury rate and accidental deaths).
The Group also offers employee benefit and pension programs(health, death and pension) based on a single standard of coverageat the Group level. These programs, which supplement those thatmay be provided by local regulations, allow each employee to:benefit, in case of illness, from coverage that is at least equal to themedian amount for the national industrial market; save or accumulateincome substitution benefits for retirement; and arrange for theprotection of family members in case of the employee’s death viainsurance that provides for the payment of a benefit recommendedto equal two years’ gross salary. This program was made availableto 91% of the workforce in 2015 (WHRS scope). These programsare reviewed on a regular basis and adjusted when necessary.
Employee shareholding, one of the pillars of the Group’s policy, isextended via three main mechanisms: the grant of performanceshares, share capital increases reserved for employees, andemployee savings. In this way, TOTAL wishes to encourageemployee shareholding, strengthen their sense of belonging to theGroup and give them a stake in the Group’s performance byallowing them to benefit from their involvement.
Each year since 2005, TOTAL has granted performance shares tomany of its employees (approximately 10,000). The definitive grantingof these shares depends on the fulfillment of performance conditionsassessed at the end of a vesting period extended to three years in2013 (refer to point 4 of chapter 6). The last performance share planapproved by the Board of Directors of TOTAL S.A. in July 2015ensured a significant replenishment rate: 39% of plan beneficiarieshad not received performance shares the previous year. More than10,000 non-senior executive employees were concerned by thisplan, namely 97% of the beneficiaries.
The Group also regularly invites its employees to subscribe tocapital increases reserved for employees. The latest capitalincrease was completed in 2015. Like the previous operation in2013, it included a classic offering and a leveraged offering. For thefirst time, this operation included a matching contribution for thefirst five shares subscribed aimed at encouraging subscribers withmodest saving capacity. Approximately 42,000 employees in 102countries decided to participate in this capital increase, whichresulted in the subscription of 10,108,918 shares at a price of€37.50. This operation was completed, based on the offeringchosen and the employees’ location, via the Shareholder GroupSavings Plan (PEG-A), created in 1999 for this purpose, eitherthrough Company Savings Plans (1) or by subscribing directly forshares or for American Depositary Shares (ADSs).
Finally, employee savings are also developed via the “TOTALGroup Savings Plan” (PEGT) and the “Complementary CompanySavings Plan” (PEC), both open to employees of the Group’sFrench companies that have subscribed to the plans under theagreements signed in 2002 and 2004 and their amendments.These plans allow investments in a number of mutual funds,including the TOTAL ACTIONNARIAT FRANCE fund that is mostlyinvested in TOTAL shares. Employees can make discretionarycontributions to these funds, which the Group’s companies maysupplement under certain conditions (abondement). The Group’scompanies made gross supplementary contributions (abondement)that totaled €68 million in 2015. A Collective Retirement SavingsPlan (PERCO) set up under the 2004 Group agreement onprovisions for retirement savings is open to employees of theGroup’s French companies covered by the French CollectiveBargaining Agreement for the Petroleum Industry.
The Group has four priorities in the field of training:
– sharing TOTAL’s corporate values, particularly with respect toHSE and ethics;
– increasing key skills in all business areas to maintain a high levelof operating performance;
– promoting employees’ integration and career developmentthrough Group induction and training on management andpersonal development; and
– supporting the policy of diversity and mobility within the Groupthrough language and inter-cultural training.
The Group’s efforts in the field of training were still siginificant in2015 with 71% of employees having followed at least one trainingcourse during the year. Within the scope of the WHRS, 289,000days of training were followed onsite, compared to 380,000 days in
2014, for a total training budget of approximately €170 million,compared to €235 million in 2014. This decrease from 2014 to 2015 is due to three main factors: firstly, the divestments of Totalgaz and Bostik in 2015 (which represented in 2014 12,000 training days for approximately €2 million) and thecompletion of specific training sessions in certain subsidiaries ofExploration & Production combined with a decrease in activity(Yemen and Canada); secondly, the increase in at-distance trainingcourses (26,000 days in 2015 compared to 19,000 in 2014), whichare gradually being combined with or are replacing on-site coursesas part of the Group’s digitalization program; and lastly, the combinedeffect of optimizing the length of training courses and betterselecting these to manage costs.
This shift towards e-learning programs within the Groupaccelerated in 2015 with the aim to improve the effectiveness of
1.4. Training
The Group’s employees and their representatives have a privilegedposition and role among the numerous stakeholders with whichTOTAL has regular dialogue (refer also to point 3.2 of this chapter).In countries where employee representation is not required by law(for example in Myanmar and Brunei), TOTAL strives to set up suchrepresentation. There are therefore employee representatives in themajority of Group companies, most of whom are elected. Thesubjects covered by dialogue with employees vary from companyto company, but some are shared throughout, such as health andsafety, work time, compensation, training and equal opportunity.
Within the Group, organizational changes are made in consultationwith the employee representatives, such as the creation of a newentity in 2014 (Total Global Services) dedicated to shared IT andtelecommunications services, and, in 2015, the sale of Totalgaz toAntargaz or the industrial project for the Donges (Loire-Atlantique)and La Mède (Bouches-du-Rhône) refineries to secure the future ofoperations at these industrial sites. This constructive social dialoguehas led to various agreements, for example an agreement regardingcommitments in the context of the disposal of Totalgaz and anotheron employee support measures for the project relating to the futureof La Mède (refer to point 3.1.1 of chapter 2). In 2015, 153 agreementswere signed with employee representatives around the world,including 63 (1) in France, covering in particular supplemental healthinsurance, life insurance, teleworking and compensation systems.
WHRS WHRS WHRS 2015 2014 2013
Percentage of companies with employee representation 76.9% 75.5% 71.6%Percentage of employees coveredby collective agreements 65.5% 67.8% 67.0%
TOTAL maintains an ongoing dialogue with employees in Europe vianegotiations with European trade union federations.
Several agreements have been signed, including, for example, theconvention on labor relations and equal opportunities that aims toset up a common social platform applicable to all the Group’sEuropean entities.
A European Committee (single representative body for theemployees at the group level) has been set up in order to informemployees and hold discussions on the Group’s strategy, its social,economic and financial situation, as well as questions of sustainabledevelopment, environmental and societal responsibility, and safetyon a European scale. It also examines any significant proposedorganizational change concerning at least two companies in twoEuropean countries, to express its opinion, in addition to theprocedures initiated before the national representative bodies.
In addition, every other year, TOTAL carries out an internal survey(Total Survey) amongst its employees to gather their views andexpectations with regard to their work situation and perception ofthe Company, locally and as a Group. The results of the surveyconducted in 2015 among 65,000 employees at 508 entities in 115countries demonstrated that employees have a commitment rate of75% and that 87% of them are proud to work for TOTAL.
In January 2015, TOTAL signed a global agreement with the worldwidetrade union federation, IndustriALL Global Union, which represents50 million employees in 140 countries. Under this agreement, theGroup made a commitment to maintain minimum Corporate SocialResponsibility (CSR) standards and guarantees worldwide forsubsidiaries in which it has more than a 50% stake, in the areas ofoccupational health and safety, human rights in the workplace,enhancement of the dialogue with employees, life insurance,professional equality, social responsibility and assistance withorganizational changes. The Group also ensures that the principlesof the agreement on health, safety and human rights are disclosedto and promoted among its service providers and suppliers. Theimplementation of this agreement will be monitored annually withrepresentatives who are members of trade unions affiliated with theIndustriALL Global Union and appointed by this federation.
1.3. Dialogue with employees
Social, environmental and societal information 7Social information
Registration Document 2015. TOTAL 135
(1) Some agreements cover several companies at once (for example, agreements in the Social and Economic Units or group of companies).

TOTAL is an international Group in terms of both its operations andits team members. The diversity of its employees and managementis crucial to the Group’s competitiveness, innovative capacity,attractiveness and acceptability.
For this reason, TOTAL develops its employees’ skills and careerswhile both prohibiting any discrimination related to origin, gender,sexual orientation or identity, disability, age or affiliation with apolitical, labor or religious organization, and promoting proactivebehaviors that allow everyone to feel integrated into the Company.This policy is upheld by the Diversity Council, which is chaired by amember of the Group Performance Management Committee.
Each entity is responsible for defining its own areas of focus basedon the legal context and its challenges and for creating a suitablework environment in which it can fully benefit from all the skills anddiverse approaches. Two areas are managed at the global level:
gender diversity and internationalization, so as to offer allemployees, regardless of their gender or nationality, the samecareer opportunities.
To this end, the Group’s target for 2020 is to have:
– women represent 25% of senior executives (having representedapproximately 5% in 2004 and 19% in 2015);
– non-French nationals represent 40% of senior executives (havingrepresented approximately 19% in 2004 and 28% in 2015);
– women represent more than 20% of Management Committeemembers (head office and subsidiaries); and
– local managers represent 50% to 75% of the subsidiaries’Management Committee members.
In addition to the Group’s targets, each business segment also setstargets for its senior management.
1.5. Equal opportunity
Average number of training days / year per employee(a)
(excluding “Companion” apprenticeships and e-learning) WHRS 2015 WHRS 2014 WHRS 2013
Group average 3.3 4.2 4.0
By segment (b)
Upstream 7.0 9.2 9.1Exploration & Production 7.2 9.5 9.5Gas 4.2 2.7 2.4
Refining & Chemicals 2.3 3.5 2.9Refining & Chemicals 2.3 3.6 2.9Trading & Shipping 1.4 2.0 1.8
Marketing & Services 2.8 2.2 2.7Marketing & Services 2.4 2.9 3.4New Energies 3.8 0.3 0.6
Corporate 2.6 3.0 3.3
By regionAfrica 5.5 7.6 8.6Asia-Pacific 4.9 4.6 4.1Europe 2.7 3.5 3.2Latin America 3.7 5.3 4.1Middle East 2.9 6.9 9.4North America 1.1 3.1 3.0Oceania 0.7 0.1 2.3French overseas departments and territories 3.2 1.6 2.2
Breakdown by type of training givenTechnical 37% 35% 34%Health, Safety, Environment, Quality (HSEQ) 22% 21% 22%Language 11% 14% 16%Other (management, personal development, inter-cultural, etc.) 30% 30% 28%
(a) This number is calculated using the number of training hours, where 7.6 hours equal one day.(b) 2014 and 2013 data by sector was restated to allocate TOTAL S.A. data into the business segments to ensure consistency with the activities.
7 Social, environmental and societal informationSocial information
TOTAL. Registration Document 2015136
training and reaching the largest number of people as quickly aspossible. It has been accompanied by the launch of a digitalawareness program in 2015 to support the Group’s goals in thisarea. As a result, 42,000 people received distance training coursesin 2015, compared to 30,000 in 2014.
In addition, Total University offers Group integration programs aswell as courses aimed specifically at developing leadership amongmanagers and executive officers. Furthermore, Total Universityoffers specific theme-based conferences, some of which are opento external audiences. These conferences cover strategic topics inthe field of energy ranging from technology to geopolitics andsocietal matters.
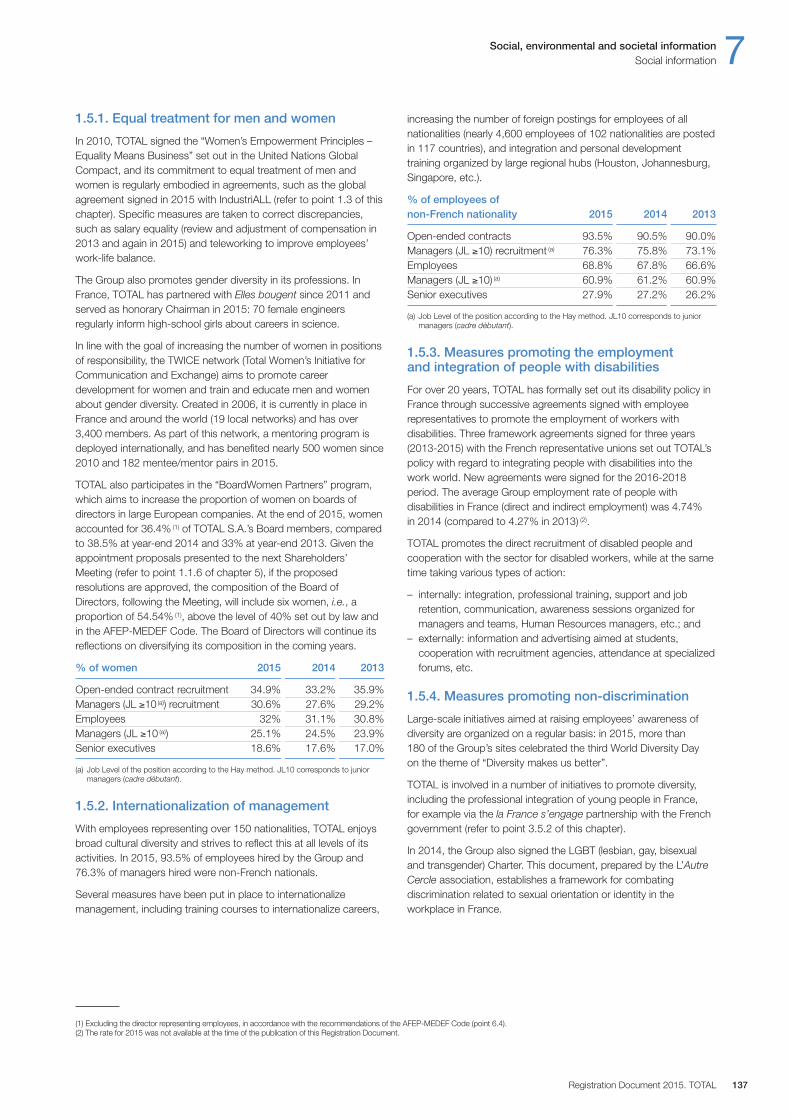
Social, environmental and societal information 7Social information
Registration Document 2015. TOTAL 137
1.5.1. Equal treatment for men and women
In 2010, TOTAL signed the “Women’s Empowerment Principles – Equality Means Business” set out in the United Nations GlobalCompact, and its commitment to equal treatment of men andwomen is regularly embodied in agreements, such as the globalagreement signed in 2015 with IndustriALL (refer to point 1.3 of thischapter). Specific measures are taken to correct discrepancies,such as salary equality (review and adjustment of compensation in2013 and again in 2015) and teleworking to improve employees’work-life balance.
The Group also promotes gender diversity in its professions. InFrance, TOTAL has partnered with Elles bougent since 2011 andserved as honorary Chairman in 2015: 70 female engineersregularly inform high-school girls about careers in science.
In line with the goal of increasing the number of women in positionsof responsibility, the TWICE network (Total Women’s Initiative forCommunication and Exchange) aims to promote careerdevelopment for women and train and educate men and womenabout gender diversity. Created in 2006, it is currently in place inFrance and around the world (19 local networks) and has over3,400 members. As part of this network, a mentoring program isdeployed internationally, and has benefited nearly 500 women since2010 and 182 mentee / mentor pairs in 2015.
TOTAL also participates in the “BoardWomen Partners” program,which aims to increase the proportion of women on boards ofdirectors in large European companies. At the end of 2015, womenaccounted for 36.4% (1) of TOTAL S.A.’s Board members, comparedto 38.5% at year-end 2014 and 33% at year-end 2013. Given theappointment proposals presented to the next Shareholders’Meeting (refer to point 1.1.6 of chapter 5), if the proposedresolutions are approved, the composition of the Board ofDirectors, following the Meeting, will include six women, i.e., aproportion of 54.54% (1), above the level of 40% set out by law andin the AFEP-MEDEF Code. The Board of Directors will continue itsreflections on diversifying its composition in the coming years.
% of women 2015 2014 2013
Open-ended contract recruitment 34.9% 33.2% 35.9%Managers (JL ≥10(a)) recruitment 30.6% 27.6% 29.2%Employees 32% 31.1% 30.8%Managers (JL ≥10 (a)) 25.1% 24.5% 23.9%Senior executives 18.6% 17.6% 17.0%
(a) Job Level of the position according to the Hay method. JL10 corresponds to juniormanagers (cadre débutant).
1.5.2. Internationalization of management
With employees representing over 150 nationalities, TOTAL enjoysbroad cultural diversity and strives to reflect this at all levels of itsactivities. In 2015, 93.5% of employees hired by the Group and76.3% of managers hired were non-French nationals.
Several measures have been put in place to internationalizemanagement, including training courses to internationalize careers,
increasing the number of foreign postings for employees of allnationalities (nearly 4,600 employees of 102 nationalities are postedin 117 countries), and integration and personal developmenttraining organized by large regional hubs (Houston, Johannesburg,Singapore, etc.).
% of employees of non-French nationality 2015 2014 2013
Open-ended contracts 93.5% 90.5% 90.0%Managers (JL ≥10) recruitment (a) 76.3% 75.8% 73.1%Employees 68.8% 67.8% 66.6%Managers (JL ≥10) (a) 60.9% 61.2% 60.9%Senior executives 27.9% 27.2% 26.2%
(a) Job Level of the position according to the Hay method. JL10 corresponds to juniormanagers (cadre débutant).
1.5.3. Measures promoting the employment and integration of people with disabilities
For over 20 years, TOTAL has formally set out its disability policy inFrance through successive agreements signed with employeerepresentatives to promote the employment of workers withdisabilities. Three framework agreements signed for three years(2013-2015) with the French representative unions set out TOTAL’spolicy with regard to integrating people with disabilities into thework world. New agreements were signed for the 2016-2018period. The average Group employment rate of people withdisabilities in France (direct and indirect employment) was 4.74% in 2014 (compared to 4.27% in 2013) (2).
TOTAL promotes the direct recruitment of disabled people andcooperation with the sector for disabled workers, while at the sametime taking various types of action:
– internally: integration, professional training, support and jobretention, communication, awareness sessions organized formanagers and teams, Human Resources managers, etc.; and
– externally: information and advertising aimed at students,cooperation with recruitment agencies, attendance at specializedforums, etc.
1.5.4. Measures promoting non-discrimination
Large-scale initiatives aimed at raising employees’ awareness ofdiversity are organized on a regular basis: in 2015, more than 180 of the Group’s sites celebrated the third World Diversity Day on the theme of “Diversity makes us better”.
TOTAL is involved in a number of initiatives to promote diversity,including the professional integration of young people in France, for example via the la France s’engage partnership with the Frenchgovernment (refer to point 3.5.2 of this chapter).
In 2014, the Group also signed the LGBT (lesbian, gay, bisexualand transgender) Charter. This document, prepared by the L’AutreCercle association, establishes a framework for combatingdiscrimination related to sexual orientation or identity in theworkplace in France.
(1) Excluding the director representing employees, in accordance with the recommendations of the AFEP-MEDEF Code (point 6.4).(2) The rate for 2015 was not available at the time of the publication of this Registration Document.
For many years, the Group has been developing a normativeframework related to occupational health and safety, security,societal commitment and the environment (H3SE). In this respect,directives have been drawn up for occupational health and safety.These directives set out TOTAL’s requirements in these areas forpersonnel working on its sites. Since 2013, the three businesssegments have increased their efforts regarding the frameworks ofthe H3SE management systems in order to provide greater overallconsistency, while at the same time respecting the businesses’specific characteristics.
Indicators are used to measure the main results in these areas.Monthly reporting of occupational accidents is used to monitorperformance at both the global and site levels.
Safety indicators 2015 2014 2013
TRIR (a): number of recorded injuries per million hours worked 1.17 1.30 1.55
Employees of TOTAL 0.92 1.06 1.34Employees of external contractors(b) 1.38 1.51 1.72
LTIR (c): number of lost time injuries per million hours worked 0.66 0.74 0.91SIR (d): average number of days lost per lost time injury 30.11 29.74 32.04Number of fatalities 9 9 15
(a) TRIR: Total Recordable Injury Rate.(b) As defined in point 4.4.1 of this chapter.(c) LTIR: Lost Time Injury Rate.(d) SIR: Severity Injury Rate.
For more than 10 years, the TRIR and the LTIR have declinedcontinuously. In 2015, the Group regrettably recorded nineaccidents that led to nine fatalities. A series of measures wasadopted in 2015. These are intended, in particular, to strengthensafety monitoring of external contractor staff, who are the primaryvictims of fatal accidents. These measures will be gradually rolledout throughout 2016.
The Group’s safety efforts are focused on preventing major accidentsand accidental spills (refer to point 2.2.3 of this chapter and point 4of chapter 4), occupational accidents and transport accidents. Theycover both TOTAL employees and employees of externalcontractors. The external contractors’ safety results are monitored asclosely as those for TOTAL employees. These efforts are coordinated
by the Group’s Industrial Safety Division and put into practice by theGroup’s entities with the support of the HSE departments.
Safety is the subject of regular training activities, in particular atmanagement level (refer to point 2.2.1 below), as well as of a policythat recognizes HSE performance, in particular by taking account ofsafety-related criteria for the calculation of compensation (refer topoint 1.1.3 above).
Since 2010, the basic rules to be scrupulously followed by allpersonnel, employees and contractors alike, in all of the Group’sbusinesses worldwide, have been set out in a safety documententitled “Safety at Work: TOTAL’s Twelve Golden Rules”. Accordingto the Group’s internal statistics, in more than 85% of severeincidents or near misses with high severity potential in theworkplace, at least one of the golden rules had not been followed.The proper application of these golden rules, and more generally ofall occupational safety procedures, is verified through site visits andinternal audits. The World Day for Safety at Work on April 28, 2015,was dedicated to the golden rules and provided an opportunity toassess how well they have been disseminated and understood inthe field five years after being introduced. Consequently, so thatthese rules are better assimilated by all of the Group’s employeesas well as by those working for external contractors, and to ensurethey are implemented correctly, additional obligations andprohibitions were added to these golden rules. An e-learningprogram has been developed to train all personnel in the 12 goldenrules and will be rolled out in 2016.
Moreover, the reporting of anomalies (770,000 in 2015) and nearmisses is strongly encouraged and monitored. The ability of eachemployee to identify anomalies or dangerous situations is one of themeasures of the personnel’s involvement and vigilance in accidentprevention and reflects the safety culture within the Group. In late2015, a “stop card” mechanism was implemented throughout theGroup. The stop card is the concrete expression of the authoritygiven to any Group employee or employee of an external contractorto stop work in progress if he or she perceives there to be anuncontrolled risk, and guarantees that no sanctions will be appliedeven if the assessment of the situation proves to be incorrect.
An investigation is generally launched in response to any type ofaccident whatsoever. The method and scope of investigationdepend on the actual or potential severity of the event.
2. Safety, health and environment information
In line with its Code of Conduct, TOTAL has adopted a Safety Health Environment Quality Charter, updated in 2014, covering the areas ofsafety, security, health, the environment, quality and societal commitment, and on which the Group relies for the conduct of its operations (available on total.com). This Charter represents the common framework of the Group’s management systems. Group directives define theminimum requirements expected in these areas and are designed to be implemented in the business segments, which subsequently factorin the specific characteristics of their operations. Recommendations, guides and manuals, which are the primary documents used forimplementing and managing the Group’s policies, are regularly distributed within the different business segments. The Industrial Safetydepartment and the Sustainable Development and Environment department, as well as the Security department, which report to CorporateAffairs, provide support to the segments and oversee the implementation by the segments of policies that reflect the principles of the charterin a concrete, effective manner.
In accordance with oil and gas industry best practices (set out in the IPIECA reporting guidance), the following safety, health andenvironment information relates to the activities, sites and industrial assets for which TOTAL S.A. or one of the companies it controls is theoperator (i.e., operates or has contractual responsibility for managing operations). An exception is made for information related to greenhousegases, which is also expressed as a Group share of all assets in which TOTAL has a stake.
2.1. Occupational health and safety
7 Social, environmental and societal informationSafety, health and environment information
TOTAL. Registration Document 2015138
2.2.1. General policy and environmental targets
The HSE departments and services within the Group’s entities seekto ensure that both applicable local regulations and internal minimumrequirements are being met. The Group steering bodies, led by theSustainable Development and Environment department, have athreefold task:
– monitoring TOTAL’s environmental performance, which isreviewed annually by the Executive Committee, for which multi-annual improvement targets are set;
– handling, in conjunction with the business segments, the variousenvironment-related subjects under their responsibility; and
– promoting the internal standards to be applied by the Group’sbusiness units as set out in the Safety Health EnvironmentQuality Charter.
The Group’s environmental targets, which were redefined in part atthe beginning of 2013 for the period up to 2017, were as follows:
– decrease flaring by 50% from 2005 to 2014 (excluding start-ups);– improve the energy efficiency of Group facilities by 1.5% on
average per year from 2012 to 2017;– decrease greenhouse gas emissions (GHG) by 15% from 2008
to 2015;– obtain the “Total Ecosolutions” label for more than 50 products
or services by 2015;
2.2. Environmental protection
For example, a near miss with a high severity potential level istreated in the same way as a severe incident: its analysis isconsidered to be a key driving force for progress and, dependingon its relevance to the Group’s other entities, triggers a safety alertand even the dissemination of a feedback report.
Traffic risk management is an important component of the Group’ssafety policy. An extensive transporter assessment program, launchedin 2012 in Africa and the Middle East, revealed a 40% decrease inthe number of serious accidents (roll-overs and collisions) between2013 and 2015. This program, which includes assistance providedto transporters to help them improve their professional skills, hasenabled them to achieve, in particular, higher levels of profitabilitythrough the optimization of truck rotation. As a result, transportershave been able to modernize their fleets and ensure their compliancewith TOTAL’s safety requirements. Between 2012 and 2015, 98% ofthe transporters with contracts with Marketing & Services subsidiariesin Africa and the Middle East were inspected and 28% of the contractswere terminated due to proven non-compliance. In 2015, 172 initialand 35 follow-up inspections were performed. Given these results,this program is to be extended to Marketing & Services’ Latin Americaand Asia-Pacific regions. Within the more general framework of roadvehicle handling, and given that driver behavior is a key safetyconsideration, TOTAL is pursuing its policy of training drivers anddemanding that they adhere strictly to the Group’s rules. Building onthe approach adopted for assessing transporters, the Africa-MiddleEast region of Marketing & Services has, as of 2015, introduced asimilar process to improve the selection and monitoring of externalcontractors that perform operations at its sites.
With regard to health, the Group has drawn up a policy to defineTOTAL’s minimum requirements in terms of incident prevention andthe protection of health. In particular, based on the IndustrialHygiene and Health at the Workplace directive, the Group’s companiesare expected to prepare and carry out a formal risk assessment(chemical, physical, biological, ergonomic or psychosocial), create arisk management action plan and provide medical monitoring ofstaff in line with the risks to which they are exposed.
Health indicators 2015 2014 2013
Percentage of companies includedin the WHRS offering employees regular medical monitoring 99.3% 97% 95%
Number of occupational illnesses recorded in the year (in accordance with local regulations) per million hours worked 0.63 0.81 0.68
In 2015, there was a 27.5% decrease in recorded illnessescompared to 2014 with respect to the main occupational illnessesidentified at TOTAL:
– musculoskeletal disorders, the main cause of occupationalillnesses, representing 63% of all recorded illnesses in 2015.Following the 65% increase between 2013 and 2014, the 20%decrease recorded in 2015 proves that specific action plans tocontrol risk and improve working conditions must be maintainedover the long-term;
– illnesses related to asbestos exposure decreased by 16%compared to 2014, in line with the continuous decline overseveral years due to the absence of recent exposure.
A Medical Advisory Committee meets regularly to discuss keyhealth issues that may affect the Group’s employees. It consists ofexternal scientific experts and brings together TOTAL’smanagement team and the relevant members of the Group. ThisCommittee provides scientific monitoring of health problems thatcould impact the Group, thus enabling the best health protectionstrategies to be put in place when necessary.
In support of the Group’s health policy and to complement theperiodic medical surveillance program currently in place andorganized by the Group’s medical staff, an employee healthobservatory has also been set up. This observatory aims atestablishing health indicators for keeping track over the long term ofany medical conditions that could affect employees using apopulation-based approach. This program can be used to quicklyidentify the emergence of certain illnesses and, if applicable,suggest and oversee appropriate preventive measures.Approximately 13% of the Group’s employees worldwide, whatevertheir position, age or horizon, took part anonymously in thisprogram, thereby providing a representative sample of the Group’sdifferent business segments and professions, including administrativeas much as operational staff. Based on the results, actions weretaken, particularly in the field of nutrition and quality of sleep.
On a broader level, TOTAL is associated with promoting individualand collective health in the countries where it operates, including fluvaccination campaigns and prevention and screening programs forcertain diseases (AIDS, cancer, malaria, Ebola, etc.) for employees,their families and local communities. For several years, awarenesscampaigns have also been in place concerning, for example,musculoskeletal disorder prevention and lifestyle risks (anti-smokingand anti-drinking campaigns).
Social, environmental and societal information 7Safety, health and environment information
Registration Document 2015. TOTAL 139

– develop a Biodiversity Action Plan by 2015 for all Group industrialsites (1) located in a IUCN (2) I to IV or Ramsar conventionprotected area;
– decrease by 40% the volume of hydrocarbons discharged in theGroup’s onshore and coastal wastewater from 2011 to 2017;
– decrease Group SO2 emissions by 20% between 2010 and2017; and
– obtain ISO 14001 certification for 100% of the production sites (3)
by 2017.
At year-end 2015, TOTAL had reached, ahead of or on time, all of theenvironmental targets it had set for 2014 and 2015: reduction ofGHG emissions and associated gas flaring; certification of its mainoperated sites; obtaining the “Total Ecosolutions” label for productsand services; and development of a Biodiversity Action Plan forsensitive sites. In addition, the Group is on track for reaching theabove-mentioned environmental targets set for 2017 on improving itsfacilities’ energy efficiency, obtaining ISO14001 certification for itsmain production sites and reducing SO2 emissions. The 2017 targetfor the reduction of hydrocarbons discharged into water may not bemet until 2018.
In order to pursue its progressive approach, the Group defined inearly 2016 a new set of coherent environmental targets aligned withthe 2010-2020 period:
– continue its efforts to reduce GHG emissions, particularly through:1. an 80% reduction of routine flaring (4) with the aim to eliminateit by 2030, and2. an average 1% improvement per year in the energy efficiencyof the Group’s operated facilities;
– decrease SO2 air emissions by 50%; and– maintain hydrocarbon content of water discharges below 30 mg/l
for offshore sites and below 15 mg/l for onshore and coastal sites.
In addition, the Group:
– develops Biodiversity Action Plans for production sites located inprotected areas (5);
– does not conduct oil and gas exploration or production operationsat natural sites included on the UNESCO World Heritage List (6)
or in oil fields under sea ice in polar areas; and– reclaims more than half of its waste and will continue its efforts in
this area.
TOTAL is developing a policy to decrease the carbon intensity ofthe Group’s productions (oil, gas, renewable energies) so as tocontribute to the evolution towards a lower carbon energy mix.
With regard more specifically to the certification objective, 100% ofthe 71 production sites emitting more than 10 kt / year of GHG haveISO 14001 certification since 2013. Overall, at year-end 2015, 290sites had ISO 14001 certification. In addition, 2 sites in the processof starting up are concerned by the Group’s policy and have beenallowed two years to obtain certification. These are CLOV (Angola),which started up in June 2015, and Laggan-Tormorre (UnitedKingdom), which started up in February 2016.
The environmental risks and impacts of any planned investment,disposal or acquisition subject to Executive Committee approval are
assessed and reviewed before the final decision is made (also referto point 4 of chapter 4).
TOTAL seeks to ensure that all employees share its environmentalprotection requirements. Employees receive training in the requiredskills. TOTAL also raises employee awareness through internalcommunication campaigns (e.g., in-house magazines, intranet,posters) and provides annual information about the Group’senvironmental performance.
H3SE training courses are organized for managers and seniorexecutives. In 2015, 48 training sessions were attended by 864participations in 1,957 training days across 20 countries. ThreeHSE training courses are made available to the business units:“HSE for Managers”, “HSE Implementation” and “HSE Leadershipfor Group Senior Executives”. The training session “HSE forManagers” is aimed at senior managers and operational orfunctional managers who are currently or will in the future beresponsible for one of the Group’s business units (four sessionswere held in 2015 with 214 participants). “HSE Implementation”sessions are aimed at employees whose job is specifically to handleone or more HSE or operational areas within a business unit (onesession was held in 2015 with 17 participants). This offer, recentlyredesigned and presented to Oléum Dunkerque, completes anexisting course for the same target population provided by theGroup’s business segments. In addition, the “HSE Leadership forGroup Senior Executives” course focusing on management styleshas been organized since 2012 (two sessions were held in 2015with 29 participants). Since 2012, close to 260 senior executiveshave taken part in this program.
2.2.2. Environmental footprint
TOTAL implements an active policy of monitoring, managing andreducing the environmental footprint of its operations. As part ofthis policy, emissions are identified and quantified by environment(water, air and soil) so that appropriate measures can be taken tobetter control them.
Water, air
The Group’s operations generate emissions such as fumes atcombustion plants, emissions into the atmosphere from the variousconversion processes and discharges into wastewater. In additionto complying with applicable legislation, the Group’s companiesactively pursue a policy aimed at reducing emissions. Sites usevarious treatment systems that include organizational measures(such as using predictive models to control peaks in SO2 emissionsbased on weather forecast data and the improvement of combustionprocesses management) and technical measures (such as settingup wastewater treatment plants, using low NOx burners and thebiological treatment of processed water).
The Refining & Chemicals segment has partnered with OndeoIndustrial Solutions (Suez group) for an ambitious European projectlaunched in June 2013 called “E4Water” aimed at saving largequantities of drinking water and reducing discharges of effluents.Seven pilot research projects are being conducted at thepetrochemicals plant on the Normandy platform. A €1.2 million
7 Social, environmental and societal informationSafety, health and environment information
TOTAL. Registration Document 2015140
(1) Excluding exploration wells, seismic survey areas and sites for the distribution and storage of products.(2) International Union for the Conservation of Nature.(3) Defined as sites emitting more than 10 kt / year of GHG, with a 2-year tolerance for sites in the process of starting up or recently acquired.(4) Operated routine flaring, in accordance with the World Bank’s Zero Routine Flaring initiative. (5) Sites located in a IUCN I to IV or Ramsar convention protected area.(6) Natural sites included on the UNESCO World Heritage List of June 4, 2013.
The amount of hydrocarbons discharged in rivers, waterways andcoasts increased in 2015.This increase, despite good performancesin Gabon, is mainly due to the increase in treated water volumesdue to the aging of the field in Indonesia and a deterioration in the Republic of the Congo, which led to the decision to commissionfloaters on the Djeno site. This implementation, planned in 2016,should enable to reduce the quantity of hydrocarbons discharged.
Below are the Group’s achievements at year-end 2015 based onthe objectives for air and water set at the beginning of 2013:
– 16% reduction in hydrocarbon discharges in water (rivers,waterways and coasts) since 2011, down from the -40% targetset for 2017; this target may not be reached until 2018;
– 40% reduction in SO2 emissions compared to 2010,considerably above the -20% target set for 2017.
Soil
The risks of soil pollution related to TOTAL’s operations comemainly from accidental spills (refer to point 2.2.3 of this chapter) andwaste storage (see below).
The Group’s approach to preventing and controlling these types ofpollution is based on four cornerstones:
– preventing leaks, by implementing industry best practices inengineering, operations and transport;
– carrying out maintenance at appropriate intervals to minimize therisk of leaks;
– overall monitoring of the environment to identify any soil andgroundwater pollution; and
– controlling pollution from previous activities by means ofcontainment or reduction operations.
In addition, a Group directive published in 2014 defines thefollowing minimum requirements:
– systematic identification of each site’s environmental and healthimpacts related to possible soil and groundwater contamination;
– assessment of soil and groundwater contamination based onvarious factors (extent of pollution inside or outside the site’sboundaries, nature and concentrations of pollutants, presence ofa vector that could allow the pollution to migrate, use of the landand groundwater in and around the site); and
– management of health or environmental impacts identified basedon the use of the site (current or future, if any) and the riskacceptability criteria recommended by the World HealthOrganization (WHO) and the Group.
Lastly, decommissioned Group facilities (i.e., chemical plants,service stations, mud pits or lagoons resulting from hydrocarbonextraction operations, wasteland on the site of decommissioned
refinery units, etc.) impact the landscape and may, despite all theprecautions taken, be sources of chronic or accidental pollution.TOTAL has a site remediation policy with the aim to, in agreementwith the authorities, allow new operations to be set up once thefuture use of the land has been determined. These remediationoperations are conducted by the Group’s specialized entities. The Group’s provisions for the protection of the environment andsite remediation are detailed in Note 19 to the ConsolidatedFinancial Statements (point 7 of chapter 10).
Waste
The Group’s companies are focused on controlling the wasteproduced at every stage in their operations. This commitment isbased on the following four principles, listed in decreasing order ofpriority:
1. reducing waste at source by designing products and processesthat generate as little waste as possible, as well as minimizing thequantity of waste produced by the Group’s operations;
2. reusing products for a similar purpose in order to prevent themfrom becoming waste;
3. recycling residual waste; and4. recovering energy, wherever possible, from non-recycled
products.
A Group directive revised in 2014 sets out the minimum requirementsrelated to waste management. It is carried out in four basic stages:waste identification (technical and regulatory); waste storage (soilprotection and discharge management); waste traceability, fromproduction through to disposal (e.g., notes, logs, statements); andwaste treatment, with technical and regulatory knowledge of therelevant processes, under the site’s responsibility.
TOTAL is especially committed to managing and treating wasteclassified as hazardous. Due to its nature, hazardous waste ismainly treated outside the Group by specialized companies (202 ktin 2015 compared with 223 kt in 2014 and 232 kt in 2013).
Waste treatment processes 2015 2014 2013
Recycling 42% 47% 37%Waste-to-energy recovery 13% 9% 7%Incineration 7% 8% 12%Landfill 14% 20% 23%
Environmental nuisance
The environmental nuisances resulting from TOTAL’s operations,which may be sound or odor nuisances or the result of vibrations orroad, sea or river traffic, are monitored at the Group’s mainindustrial sites.
Chronic emissions into the atmosphere (excluding GHG) and discharged water quality 2015 2014 2013
SO2 emissions (kt) 59 65 75NOx emissions (kt) 82 93 91Hydrocarbons in discharged water (rivers, waterways and coasts) (t) 324 295 306
N.B.: Because of the divestures made in the Specialty Chemicals activity over the past years, it has been decided that the chemical oxygen demand in discharged water will no longer bemeasured as of 2015.
budget was allocated to test three water treatment processes(wastewater from the site’s water treatment plant, cooling waterand cooling blowdown). The pertinent technical knowledgeidentified by this research could be used to reduce the waterfootprint of facilities.
To ensure the quality of its wastewater discharge, TOTAL has set,for all of its offshore exploration and production operations, a targetof complying with the hydrocarbon concentration requirements setout in the OSPAR standard (less than 30 mg / l), which is onlymandatory in the North Sea. The Group has achieved this goal forthe past six years based on yearly averages.
Social, environmental and societal information 7Safety, health and environment information
Registration Document 2015. TOTAL 141
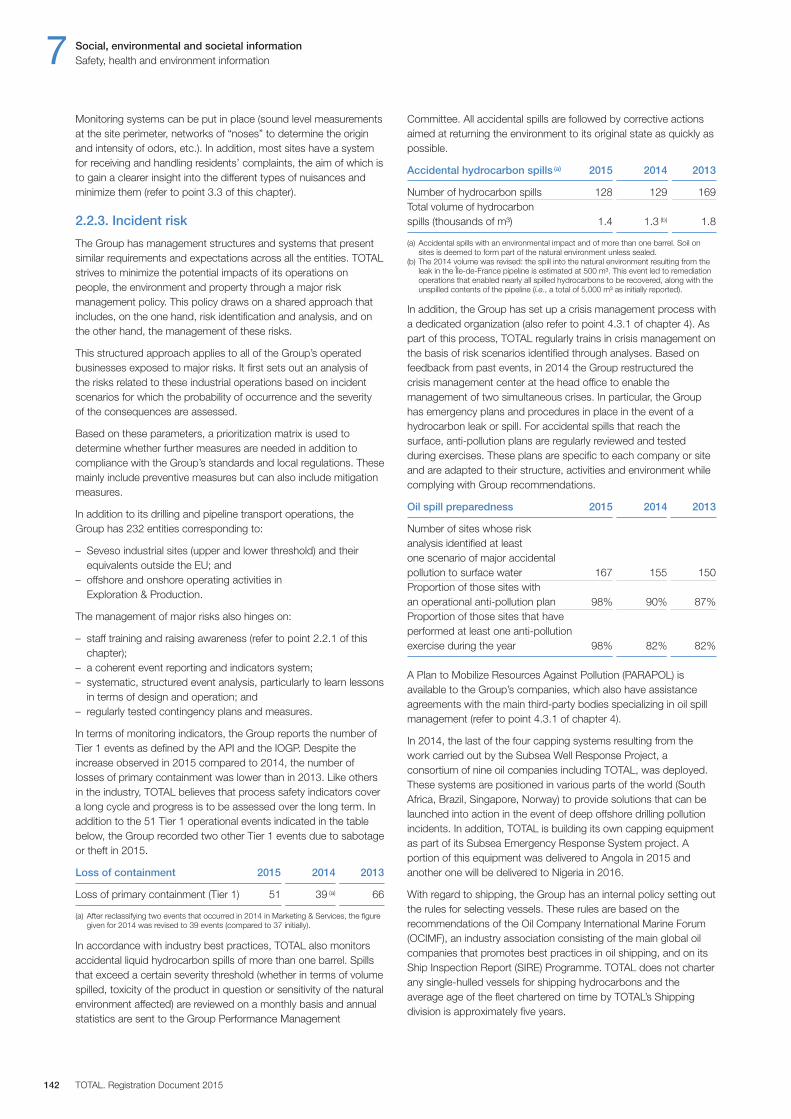
Monitoring systems can be put in place (sound level measurementsat the site perimeter, networks of “noses” to determine the originand intensity of odors, etc.). In addition, most sites have a systemfor receiving and handling residents’ complaints, the aim of which isto gain a clearer insight into the different types of nuisances andminimize them (refer to point 3.3 of this chapter).
2.2.3. Incident risk
The Group has management structures and systems that presentsimilar requirements and expectations across all the entities. TOTALstrives to minimize the potential impacts of its operations onpeople, the environment and property through a major riskmanagement policy. This policy draws on a shared approach thatincludes, on the one hand, risk identification and analysis, and onthe other hand, the management of these risks.
This structured approach applies to all of the Group’s operatedbusinesses exposed to major risks. It first sets out an analysis ofthe risks related to these industrial operations based on incidentscenarios for which the probability of occurrence and the severity of the consequences are assessed.
Based on these parameters, a prioritization matrix is used todetermine whether further measures are needed in addition tocompliance with the Group’s standards and local regulations. Thesemainly include preventive measures but can also include mitigationmeasures.
In addition to its drilling and pipeline transport operations, theGroup has 232 entities corresponding to:
– Seveso industrial sites (upper and lower threshold) and theirequivalents outside the EU; and
– offshore and onshore operating activities inExploration & Production.
The management of major risks also hinges on:
– staff training and raising awareness (refer to point 2.2.1 of thischapter);
– a coherent event reporting and indicators system;– systematic, structured event analysis, particularly to learn lessons
in terms of design and operation; and– regularly tested contingency plans and measures.
In terms of monitoring indicators, the Group reports the number ofTier 1 events as defined by the API and the IOGP. Despite theincrease observed in 2015 compared to 2014, the number oflosses of primary containment was lower than in 2013. Like othersin the industry, TOTAL believes that process safety indicators covera long cycle and progress is to be assessed over the long term. Inaddition to the 51 Tier 1 operational events indicated in the tablebelow, the Group recorded two other Tier 1 events due to sabotageor theft in 2015.
Loss of containment 2015 2014 2013
Loss of primary containment (Tier 1) 51 39 (a) 66
(a) After reclassifying two events that occurred in 2014 in Marketing & Services, the figuregiven for 2014 was revised to 39 events (compared to 37 initially).
In accordance with industry best practices, TOTAL also monitorsaccidental liquid hydrocarbon spills of more than one barrel. Spillsthat exceed a certain severity threshold (whether in terms of volumespilled, toxicity of the product in question or sensitivity of the naturalenvironment affected) are reviewed on a monthly basis and annualstatistics are sent to the Group Performance Management
Committee. All accidental spills are followed by corrective actionsaimed at returning the environment to its original state as quickly aspossible.
Accidental hydrocarbon spills (a) 2015 2014 2013
Number of hydrocarbon spills 128 129 169Total volume of hydrocarbon spills (thousands of m³) 1.4 1.3 (b) 1.8
(a) Accidental spills with an environmental impact and of more than one barrel. Soil onsites is deemed to form part of the natural environment unless sealed.
(b) The 2014 volume was revised: the spill into the natural environment resulting from theleak in the Île-de-France pipeline is estimated at 500 m³. This event led to remediationoperations that enabled nearly all spilled hydrocarbons to be recovered, along with theunspilled contents of the pipeline (i.e., a total of 5,000 m³ as initially reported).
In addition, the Group has set up a crisis management process witha dedicated organization (also refer to point 4.3.1 of chapter 4). Aspart of this process, TOTAL regularly trains in crisis management onthe basis of risk scenarios identified through analyses. Based onfeedback from past events, in 2014 the Group restructured thecrisis management center at the head office to enable themanagement of two simultaneous crises. In particular, the Grouphas emergency plans and procedures in place in the event of ahydrocarbon leak or spill. For accidental spills that reach thesurface, anti-pollution plans are regularly reviewed and testedduring exercises. These plans are specific to each company or siteand are adapted to their structure, activities and environment whilecomplying with Group recommendations.
Oil spill preparedness 2015 2014 2013
Number of sites whose risk analysis identified at least one scenario of major accidental pollution to surface water 167 155 150Proportion of those sites with an operational anti-pollution plan 98% 90% 87%Proportion of those sites that have performed at least one anti-pollution exercise during the year 98% 82% 82%
A Plan to Mobilize Resources Against Pollution (PARAPOL) isavailable to the Group’s companies, which also have assistanceagreements with the main third-party bodies specializing in oil spillmanagement (refer to point 4.3.1 of chapter 4).
In 2014, the last of the four capping systems resulting from thework carried out by the Subsea Well Response Project, aconsortium of nine oil companies including TOTAL, was deployed.These systems are positioned in various parts of the world (SouthAfrica, Brazil, Singapore, Norway) to provide solutions that can belaunched into action in the event of deep offshore drilling pollutionincidents. In addition, TOTAL is building its own capping equipmentas part of its Subsea Emergency Response System project. Aportion of this equipment was delivered to Angola in 2015 andanother one will be delivered to Nigeria in 2016.
With regard to shipping, the Group has an internal policy setting outthe rules for selecting vessels. These rules are based on therecommendations of the Oil Company International Marine Forum(OCIMF), an industry association consisting of the main global oilcompanies that promotes best practices in oil shipping, and on itsShip Inspection Report (SIRE) Programme. TOTAL does not charterany single-hulled vessels for shipping hydrocarbons and theaverage age of the fleet chartered on time by TOTAL’s Shippingdivision is approximately five years.
7 Social, environmental and societal informationSafety, health and environment information
TOTAL. Registration Document 2015142
Social, environmental and societal information 7
Registration Document 2015. TOTAL 143
Safety, health and environment information
2.2.4. Sustainable use of resources
Water
To determine which facilities are most affected by the availability offresh water, TOTAL conducts identification procedures of waterwithdrawals and discharges across all of its sites.
Water-related indicator 2015 2014 2013
Fresh water withdrawals excluding cooling water (million m³) 118 112 126
The increase in water withdrawals between 2014 and 2015 is duemainly to the increase in activity of certain refineries in maintenanceshutdown in 2014, the consolidation of Sobegi (France) within theoperated scope of Exploration & Production and, to a lesserdegree, the increase in New Energies’ solar business.
From 2012 to 2015, TOTAL used the World Resource Institute’sGlobal Water Tool, WRI Acqueduct and, since 2013, has beenidentifying the risk levels of its sites with withdrawals of more than500,000 m³ / year located in areas of potential risk to the waterresource. The Local Water Tool (LWT) developed by the GlobalEnvironmental Management Initiative (GEMI) is more suitable and isnow used to perform these water risk assessments and to guidethe actions needed to reduce these risks in order to optimize theuse of water resources at these sites.
At year-end 2015, 10 of the Group’s sites (8 in Refining & Chemicalsand 2 in Exploration & Production) were assessed for their level ofwater risk. These assessments will be progressively extended topriority sites and accompanied by an action plan to reduce risk andoptimize water resource use at these sites.
In Exploration & Production operations, reinjecting water extractedalong with hydrocarbons (known as produced water) back into theoriginal reservoir is one of the methods used to maintain reservoirpressure. The technical specifications in force in the Group stipulatethat this option be prioritized over other methods. The Group’s R&Dprograms make it possible to examine the best techniques fortreating this produced water so as to facilitate its reinjection orconsider its recovery and otherwise discharge it into the naturalenvironment while respecting natural and regulatory constraints.
Efforts to optimize water risk management tools are being madeboth internally, with the LWT (used as a multi-site notice board), andexternally, via the IPIECA, which is developing an e-learning moduleto extend and facilitate access to these tools.
Approximately 83% of the fresh water withdrawals were taken fromthe Refining & Chemicals segment in 2015. At refineries andpetrochemicals sites, water is mainly used to produce steam andfor cooling units. Increasing recycling and replacing water coolingwith air cooling, such as at the Normandy (France) and Antwerp(Belgium) refineries, are TOTAL’s preferred approaches for reducingfresh water withdrawals.
Soil
TOTAL uses the ground surface that it needs to safely conduct itsindustrial operations and, to date, does not make extensive use ofground surfaces that could substantially conflict with various naturalecosystems or agriculture.
For open-pit oil sands mining projects, TOTAL strives to ensure thatenvironmental issues are managed by the operator, in particularwith regard to the remediation of affected soils.
Raw materials
Hydrocarbons, an energetic material, are the Group’s main rawmaterial. Optimum use of hydrocarbons therefore lies in what isknown as “energy efficiency”, as described in point 2.3.4 below.
Raw material loss rate 2015 2014 2013
Hydrocarbon production business 2.5% 2.4% 2.5%Refining business 0.5% 0.5% 0.5%
2.2.5. Protecting biodiversity and ecosystem services
Given their nature, the Group’s projects, and particularlyExploration & Production projects, may be located in sensitivenatural environments. TOTAL’s operations can therefore have animpact on ecosystems and their biodiversity.
TOTAL is aware of these challenges and takes biodiversity andecosystem services into account in its guidelines and operations:
– in the Safety Health Environment Quality Charter, which specifiesthat TOTAL “is committed to managing (…) its use of naturalresources and its impact on biodiversity” and, therefore,supports ecosystem services; and
– in the biodiversity approach, set within the Group’s environmentalframework, which incorporates the following core principles foraction:
1. Deploy the “avoid – mitigate – compensate” hierarchy:TOTAL applies this approach for the duration of its projects’lifecycle to minimize the impact of its activities on biodiversity.
2. Take into account environmental sensitivity of ecosystems:as part of the course of its business, TOTAL identifies and takesinto account the diversity and sensitivity of various environmentsin terms of biodiversity.
3. Manage biodiversity: TOTAL incorporates the biodiversityimpact and risk management into its environmental managementsystems and refers to good practices within the industry.
4. Report: TOTAL reports to its stakeholders on its biodiversityperformance.
5. Improve knowledge of biodiversity: TOTAL participates in the improvement of knowledge of biodiversity and ecosystemservices as well as managing the stakes involved, through R&D initiatives taken with local and international partners,professional associations and the Total Foundation.
The Group made a commitment not to engage in oil and gasexploration or extraction operations at natural sites included on theUNESCO World Heritage List of June 4, 2013; in addition, TOTALcurrently does not conduct any exploration activities in oil fieldsunder sea ice in polar areas. In the Democratic Republic of theCongo, TOTAL made the commitment to not carry out anyexploration activity in the Virunga National Park, partly located inBlock III of the Graben Albertine.
To develop its projects located in sensitive habitats, TOTALdeveloped, based on the sensitivity and impact analysis, aBiodiversity Action Plan for Group operated sites located in themost sensitive protected areas corresponding to IUCN I to IV orRamsar categories. Two biodiversity action plans were developed in2015, in Gabon (Atora) and the Republic of the Congo (Djeno);other plans are expected to be developed, such as in Uganda andPapua-New-Guinea.
The Group’s strategy incorporates the challenges of climate changeusing the International Energy Agency 2°C scenario (450 ppm) as a point of reference. TOTAL’s challenge is to contribute to satisfyingthe demand for energy of the world’s growing population whileproviding concrete solutions to limit the effects of climate change.
To do so, the Group focuses its actions around the following key points:
– developing natural gas as the primary fossil energy source due toits lower carbon intensity;
– selecting and developing hydrocarbon projects based on theireconomic merit order, which incorporates their resistance to lowprice scenarios;
– developing the solar energy offer as the renewable energy ofchoice in the evolution of the energy mix, as well as the productionof biofuels from biomass;
– improving the energy efficiency of the Group’s facilities, productsand services, and maintaining efforts to reduce direct emissionsof greenhouse gases (GHG);
– increasing access to more sustainable energy, for as manypeople as possible, particularly by means of an innovative solarenergy solution; and
– stimulating initiatives in the oil and gas sector and supporting theimplementation of an international framework on climate.
To ensure that investment projects are as profitable as anticipatedin the desirable event that the international community agrees toput a cost on CO2 emissions, investments have been valued since2008 generally based on a cost of €25 per ton of CO2 emitted. As of 2016, new investments projects presented to the ExecutiveCommittee are evaluated using a cost of $30 to $40 per ton of CO2
emitted depending on the price scenario retained. This cost bracketis consistent with the prices generally required to favor, on the one hand, gas over coal for producing electricity and, on the otherhand, R&D in new low-carbon technologies.
2.3.1. The role of gas
Natural gas rose from 35% in 2005 to nearly 50% of TOTAL’sproduction in 2015 and is expected to contribute to approximatelyhalf of the Group’s production in the coming years.
The Group believes in the essential role of natural gas as one of thesolutions to climate change issues. Indeed, replacing coal withnatural gas at power plants could help reduce worldwide CO2
emissions by 5 Bt / y, i.e., approximately 10% of worldwide emissions(1).The reduction of GHG emissions linked to the use of gas requireslimiting methane losses to less than 3% throughout the entire productionvalue chain. Since methane’s global warming potential is 25 timeshigher than CO2
(2) and given its short life span in the atmosphere, a reduction in methane emissions is expected to play a significantrole in the fight against climate change.
Due to the nature of its activities, the Group’s methane losses arestructurally less than 1%. The Group strengthened its commitmenton this theme of methane losses in 2014 by becoming one of thefirst members of the partnership between governments and industrycompanies regarding the improvement of tools to measure andcontrol methane emissions set up by the Climate and Clean AirCoalition and promoted by the UN Environment Programme andthe non-profit organization Environmental Defense Fund.
2.3.2. Project selection
Particular care is taken when selecting and developing the Group’soil projects, based on their economic merit incorporating theirresistance to low price scenarios. This notably involves givingpriority to low cost oil projects.
In Canada, in the context of the lower oil prices, the Group decidedto limit its exposure to oil sands and reduced its interest in the FortHills project from 39.2% to 29.2% in November 2015. On the Joslyn(38.25%, operator) and Northern Lights (50% operator) oil sandslicenses, the projects were suspended and works have been strictlylimited to legal and contractual obligations, and maintaining safety.
In the United-States, R&D-stage oil shale projects (in situ and ex-situ production technology) in which the Group holds a stake(through American Shale Oil LLC, 55.7%, and the 50 / 50 jointventure with the company Red Leaf Resources), including thedevelopment of the Red Leaf pilot, have been deferred.
Beyond its oil projects, the Group has ceased its coal productionactivities following the sale in August 2015 of its subsidiary TotalCoal South Africa and, in addition, has announced the terminationof its coal marketing activities by year-end 2016.
2.3.3. Developing renewable energies
For some 15 years, TOTAL has been committed to developingrenewable energies. The Group’s activities in this area are set out in point 4.2 of chapter 2. The Group’s priority strategic development issolar energy through its interest in SunPower (57.48% owned by theGroup as of December 31, 2015).
In addition to solar energy, biomass is TOTAL’s second strategicdevelopment area in the field of renewable energies. In general,biomass represents approximately 10% of worldwide energyconsumption and is mostly used for heating or cooking purposes.Biomass is the only renewable alternative to fossil resources for theprovision of liquid fuel for transport (biodiesel, bioethanol, biokerosene),lubricants and base molecules for chemicals (solvents or polymers).
2.3. Climate change
The Group actively contributes to the development of best practicesrelated to biodiversity and ecosystem services management in theextractive industry through its partnerships with IPIECA, the Cross-Sector Biodiversity Initiative (which brings together the EquatorPrinciples signatory banks and the mining and oil industries), the UnitedNation Environment Programme’s World Conservation Monitoring
(UNEP-WCMC) and other work groups on biodiversity bringing togetherstakeholders from the private sector (international NGOs, governments,universities, the World Bank, etc.). In France, TOTAL continues itspartnership with the Fondation pour la Recherche sur la Biodiversité(Foundation for biodiversity research) and the Centre Vétérinaire de laFaune Sauvage et des Ecosystèmes des Pays de la Loire.
7 Social, environmental and societal informationSafety, health and environment information
TOTAL. Registration Document 2015144
(1) Source: IEA.(2) Source: fifth assessment report of the Intergovernmental Panel on Climate Change (IPCC).
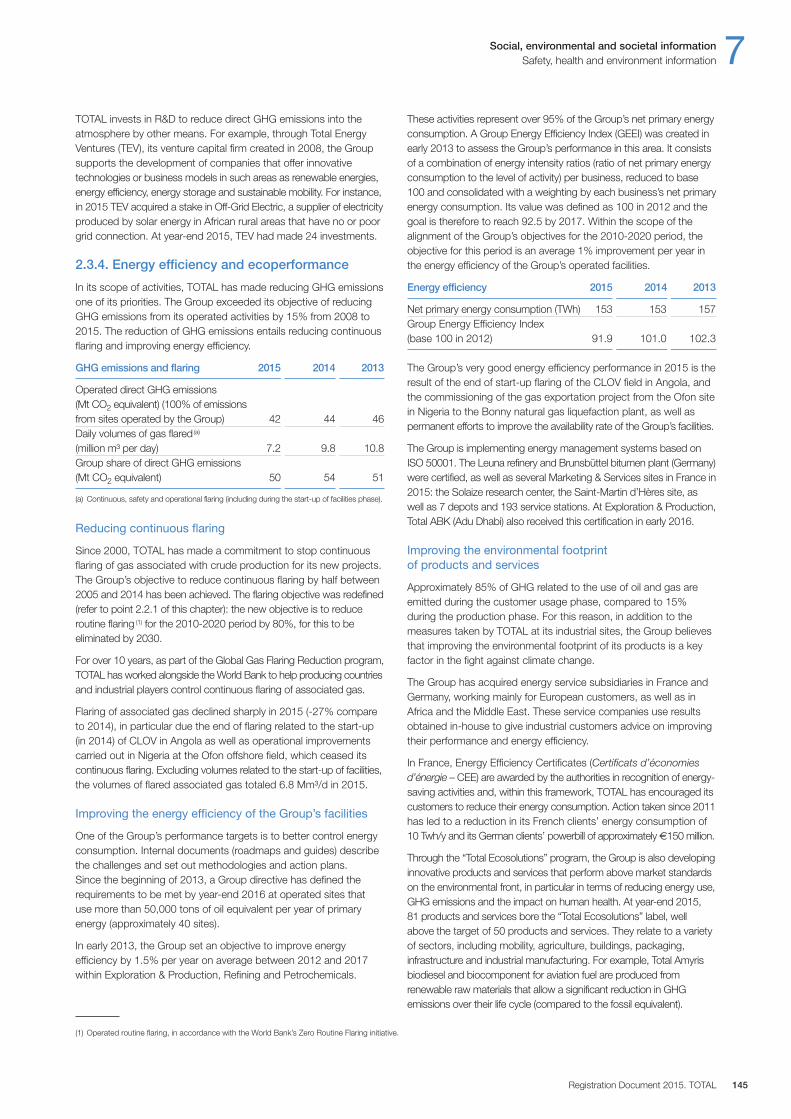
(1) Operated routine flaring, in accordance with the World Bank’s Zero Routine Flaring initiative.
TOTAL invests in R&D to reduce direct GHG emissions into theatmosphere by other means. For example, through Total EnergyVentures (TEV), its venture capital firm created in 2008, the Groupsupports the development of companies that offer innovativetechnologies or business models in such areas as renewable energies,energy efficiency, energy storage and sustainable mobility. For instance,in 2015 TEV acquired a stake in Off-Grid Electric, a supplier of electricityproduced by solar energy in African rural areas that have no or poorgrid connection. At year-end 2015, TEV had made 24 investments.
2.3.4. Energy efficiency and ecoperformance
In its scope of activities, TOTAL has made reducing GHG emissionsone of its priorities. The Group exceeded its objective of reducingGHG emissions from its operated activities by 15% from 2008 to2015. The reduction of GHG emissions entails reducing continuousflaring and improving energy efficiency.
GHG emissions and flaring 2015 2014 2013
Operated direct GHG emissions (Mt CO2 equivalent) (100% of emissionsfrom sites operated by the Group) 42 44 46Daily volumes of gas flared(a)
(million m³ per day) 7.2 9.8 10.8Group share of direct GHG emissions (Mt CO2 equivalent) 50 54 51
(a) Continuous, safety and operational flaring (including during the start-up of facilities phase).
Reducing continuous flaring
Since 2000, TOTAL has made a commitment to stop continuousflaring of gas associated with crude production for its new projects.The Group’s objective to reduce continuous flaring by half between2005 and 2014 has been achieved. The flaring objective was redefined(refer to point 2.2.1 of this chapter): the new objective is to reduceroutine flaring (1) for the 2010-2020 period by 80%, for this to beeliminated by 2030.
For over 10 years, as part of the Global Gas Flaring Reduction program,TOTAL has worked alongside the World Bank to help producing countriesand industrial players control continuous flaring of associated gas.
Flaring of associated gas declined sharply in 2015 (-27% compareto 2014), in particular due the end of flaring related to the start-up(in 2014) of CLOV in Angola as well as operational improvementscarried out in Nigeria at the Ofon offshore field, which ceased itscontinuous flaring. Excluding volumes related to the start-up of facilities,the volumes of flared associated gas totaled 6.8 Mm³ / d in 2015.
Improving the energy efficiency of the Group’s facilities
One of the Group’s performance targets is to better control energyconsumption. Internal documents (roadmaps and guides) describethe challenges and set out methodologies and action plans. Since the beginning of 2013, a Group directive has defined therequirements to be met by year-end 2016 at operated sites thatuse more than 50,000 tons of oil equivalent per year of primaryenergy (approximately 40 sites).
In early 2013, the Group set an objective to improve energyefficiency by 1.5% per year on average between 2012 and 2017within Exploration & Production, Refining and Petrochemicals.
These activities represent over 95% of the Group’s net primary energyconsumption. A Group Energy Efficiency Index (GEEI) was created inearly 2013 to assess the Group’s performance in this area. It consistsof a combination of energy intensity ratios (ratio of net primary energyconsumption to the level of activity) per business, reduced to base100 and consolidated with a weighting by each business’s net primaryenergy consumption. Its value was defined as 100 in 2012 and thegoal is therefore to reach 92.5 by 2017. Within the scope of thealignment of the Group’s objectives for the 2010-2020 period, theobjective for this period is an average 1% improvement per year inthe energy efficiency of the Group’s operated facilities.
Energy efficiency 2015 2014 2013
Net primary energy consumption (TWh) 153 153 157Group Energy Efficiency Index (base 100 in 2012) 91.9 101.0 102.3
The Group’s very good energy efficiency performance in 2015 is theresult of the end of start-up flaring of the CLOV field in Angola, andthe commissioning of the gas exportation project from the Ofon sitein Nigeria to the Bonny natural gas liquefaction plant, as well aspermanent efforts to improve the availability rate of the Group’s facilities.
The Group is implementing energy management systems based onISO 50001. The Leuna refinery and Brunsbüttel bitumen plant (Germany)were certified, as well as several Marketing & Services sites in France in2015: the Solaize research center, the Saint-Martin d’Hères site, aswell as 7 depots and 193 service stations. At Exploration & Production,Total ABK (Adu Dhabi) also received this certification in early 2016.
Improving the environmental footprint of products and services
Approximately 85% of GHG related to the use of oil and gas areemitted during the customer usage phase, compared to 15%during the production phase. For this reason, in addition to themeasures taken by TOTAL at its industrial sites, the Group believesthat improving the environmental footprint of its products is a keyfactor in the fight against climate change.
The Group has acquired energy service subsidiaries in France andGermany, working mainly for European customers, as well as inAfrica and the Middle East. These service companies use resultsobtained in-house to give industrial customers advice on improvingtheir performance and energy efficiency.
In France, Energy Efficiency Certificates (Certificats d’économiesd’énergie – CEE) are awarded by the authorities in recognition of energy-saving activities and, within this framework, TOTAL has encouraged itscustomers to reduce their energy consumption. Action taken since 2011has led to a reduction in its French clients’ energy consumption of10 Twh/y and its German clients’ powerbill of approximately €150 million.
Through the “Total Ecosolutions” program, the Group is also developinginnovative products and services that perform above market standardson the environmental front, in particular in terms of reducing energy use,GHG emissions and the impact on human health. At year-end 2015, 81 products and services bore the “Total Ecosolutions” label, wellabove the target of 50 products and services. They relate to a varietyof sectors, including mobility, agriculture, buildings, packaging,infrastructure and industrial manufacturing. For example, Total Amyrisbiodiesel and biocomponent for aviation fuel are produced fromrenewable raw materials that allow a significant reduction in GHGemissions over their life cycle (compared to the fossil equivalent).
Social, environmental and societal information 7Safety, health and environment information
Registration Document 2015. TOTAL 145
In line with the values and principles set out in its Code of Conductand Safety Health Environment and Quality Charter, TOTAL placesits commitment to community development at the heart of itscorporate responsibility in order to create shared value with peopleliving near its facilities, its customers and suppliers, and its employees.Dialogue with stakeholders, impact management and the creationof shared value are the pillars of the Group’s societal policy.
This approach, which is deployed in direct relation with operations,encompasses all actions taken by the Group to improve the way itis integrated in the countries where it operates. In line with thestrategic priorities defined by senior management, reporting toolsare used to track and monitor overall societal performance. Eightindicators, which are based on the societal policy, cover the qualityof dialogue with stakeholders, the management of the impact of theGroup’s activities, socioeconomic development projects andaccess to energy. Four topics have been identified as “GroupPriorities”: education, employment, road safety, and access to energy.
3. Societal information
3.1. TOTAL’s societal approach
7 Social, environmental and societal informationSocietal information
TOTAL. Registration Document 2015146
Some of the products result in reduced energy consumption, such asTotal Excellium fuel, Total Quartz Fuel Economy lubricant, and theAzalt® ECO2 and Styrelf® ECO2 bitumen ranges.
The CO2 eq emissions avoided throughout the life cycle by the useof “Total Ecosolutions” products and services, compared to the useof benchmark products on the market and for an equivalent level ofservice, are measured annually based on sales volumes. This represented 1.7 Mt CO2 eq in 2015.
2.3.5. Access to energy
The World Bank estimate for the number of people without accessto electricity has exceeded 1.3 billion. In 2011, TOTAL thereforelaunched a range of innovative solar energy solutions, accessible tothe greatest number of people, led by its flagship project Awangoby Total (refer to point 3.4.5 of this chapter).
2.3.6. Sector initiatives and internationalframework
In 2014, TOTAL decided to join the call of the UN Global Compact,which encourages companies to consider a CO2 price internallyand publicly support the importance of such a price via regulationmechanisms suited to the local context. TOTAL also works alongsidethe World Bank as part of the Carbon Pricing Leadership Coalition.In particular, TOTAL advocates the emergence of a balanced,progressive international agreement that prevents the distortion ofcompetition between industries or regions of the world. Drawingattention to future constraints on GHG emissions is crucial to changingthe energy mix. TOTAL therefore encourages the setting of a worldwideprice for each ton of carbon emitted, provided that great care istaken to protect “sectors exposed to carbon leakage” (as definedby the EU). To this end, six oil industry leaders, including that of theGroup, called for the setting up of carbon pricing mechanisms atthe UN Framework Convention on Climate Change in June 2015.
According to the IEA, the electricity-generating sector is the sectorthat must contribute most to the decrease of CO2 emissions in the
world by 2035 in order to remain within the 450 ppm of CO2
scenario (electricity generation contributes more than 65% to theemission reduction effort, compared to 11% for the industrialsector, 16% for transport and 4% for the construction sector).Substituting coal for gas in the electricity-generating sector iscurrently the fastest and cheapest way to reduce worldwide CO2
emissions. This solution is immediately available and offers thenecessary flexibility to electric networks, which supplementsintermittent energies. As a result, TOTAL supports standards thatimpose emission ceilings on electricity generation. Such standardsare being discussed in the United States and the United Kingdom.
In 2014, TOTAL was actively involved in launching and developing theOil and Gas Climate Initiative (OGCI), a global industry partnershipannounced at the UN Climate Summit in New York on September 23,2014. The aim of this initiative, which at year-end 2015 included 10 major international energy players, is to share experiences, advancetechnological solutions and catalyze meaningful action in order to assistthe evolution of the energy mix in a manner compatible with climatechange issues. In September 2015, the executives of the membercompanies published the first OGCI report, accompanied by a jointdeclaration of their support for an ambitious climate agreement, duringa debate on energy and climate issues with international experts.
TOTAL actively followed the deliberations of the United NationsFramework Convention on Climate Change during the COP21conference held in Paris, which, on December 12, 2015, resulted inthe Paris Agreement, the first universal agreement on climate change.
TOTAL also actively participates in the debate on climate issuesand has long-term partnerships with key stakeholders. For example,TOTAL funds research programs in France conducted by the ADEME,Paris-Saclay and the Climate Economics Chair at Paris-DauphineUniversity, as well as the Massachusetts Institute of Technology(MIT) in the United States. TOTAL has also been an active memberof the World Business Council for Sustainable Development since2014. Lastly, TOTAL offers training and makes presentations atseveral universities, thereby taking part in the debate.
Openness, dialogue and engagement are essential for developinglong-term, constructive and transparent relations with stakeholders.For the past 20 years or so, changes in the regulatory frameworkhave promoted information, consultation and dialogue prior to high-impact decisions being made.
In addition to complying with regulations, TOTAL encouragesdialogue at every level of its organization. The foremost requirementof the societal directive is that “each asset must consult itsstakeholders regularly to gain a clearer understanding of theirexpectations and concerns, measure their level of satisfactionregarding the Group and identify avenues of improvement for itssocietal strategy”.
3.2.1. Stakeholder consultation
In Exploration & Production, dialogue is initiated within the frameworkof societal baseline studies carried out to identify at a very early stage,even before the start of operational activities, stakeholders that maypotentially be affected and to understand the human socioeconomiccontext of the area in question. The Community Liaison Officer(CLO) maintains a dialogue between the subsidiary and the localcommunities. CLOs, who are employees of TOTAL, are members ofthe local community and therefore speak the local language andunderstand local customs; as such they often play a key role infacilitating the Company’s integration into the local context. Toformalize and organize relations with stakeholders, agreements mayalso be signed and meetings held, such as public consultations.
In the Democratic Republic of the Congo, a ConsultationCommittee composed of 10 members (5 women and 5 men)elected from among those living in the permit area was set up. Thefirst Committee meeting was held in the presence of the TerritoryAdministrator and representatives of the Ministry of Hydrocarbons.
In Azerbaijan, the consultation of local stakeholders (administration,nearby industrial players, the public, existing training centers, localNGOs, etc.) continued in 2015 in preparation for the developmentof the deep offshore discovery in the Absheron Block, whichincludes the construction of an onshore terminal.
In addition to holding regulatory forums for dialogue,Refining & Chemicals has voluntarily set up structures for dialoguewith local stakeholders (such as Community Advisory Panels in theUnited States and special commissions for some Europeanplatforms). In 2015, Refining & Chemicals signed the ResponsibleCare® Global Charter for its worldwide operated petrochemicalactivities, thereby reaffirming its commitment to the safe handling ofchemicals. One of the principles of this Charter is to engagestakeholders in order to understand and respond to their concernson improving operational and product safety.
3.2.2. Implementation of the SRM+ tool
To put its societal approach on a professional footing, TOTAL hasapplied its internal Stakeholder Relationship Management (SRM+)methodology since 2006. The aim of this methodology is to identifyand map the main stakeholders, schedule meetings with them,understand their views and issues, and then define an action planfor building a long-term relationship. It makes it possible toestablish a trust-based relationship and work with complete
transparency. These discussions allow the Group to identifyexpectations to which it can respond and consolidate the societalstrategy of the subsidiaries and sites. Since 2006, SRM+ has beenimplemented in over 100 entities.
In 2015, in Exploration & Production, this was the case in PapuaNew Guinea, where the methodology was adapted to carry out duediligence in order to better understand the societal practices of theformer operator and to consult with those living around the site.
In Refining & Chemicals, the methodology was implemented inFrance on the Donges platform in the Loire-Atlantique region.
In Marketing & Services, a specific module was set up for smallsites, allowing 11 subsidiaries of the Africa-Middle East division tobegin a consultation process with stakeholders in 2015 at 33 sites(service stations, depots and head offices). Four countries (Algeria,Lebanon, Democratic Republic of the Congo and Mauritania)launched this initiative for the first time, while others areimplementing it for new sites or have relaunched a consultationprocedure after several years. A total of 39 countries haveimplemented SRM+ in this region.
In 2015, a new and more streamlined SRM+ guide and manual formanagers and operational staff was drawn up to include newdevelopments made since the tool was first launched in 2007.
3.2.3. Respecting the rights of indigenous peoples
TOTAL is aware of the specificities of indigenous and tribal peoples(as referred to in International Labour Organization’s ConventionNo. 169) and has developed a Charter of Principles and GuidelinesRegarding Indigenous and Tribal Peoples to be followed withcommunities that are in contact with its subsidiaries. This Charterencourages the use of experts in order to identify and understandthese peoples’ expectations and specificities, consult with themand contribute to their socioeconomic development.
Convinced that respect for the human rights of local populations isa cornerstone of its industrial projects, TOTAL participated in thework of IPIECA (the global oil and gas industry association forenvironmental and social issues) to develop the guide entitled“Indigenous peoples and the oil and gas industry: context, issuesand emerging good practices”. The Group thus shared itsexperience with the Guarani people in Bolivia. Partnerships havebeen forged with institutions known to be experts in their field inorder to enhance the societal team’s professionalism in implementingprojects and allow for benefits to be shared equitably andtransparently. A number of socioeconomic development initiativeshave been launched to support the fight against discrimination,especially gender discrimination.
A chance archaeological discovery (bones, ceramic fragments, etc.)made by Total E&P Bolivia at the Incahuasi field during constructionwork was managed in collaboration with the Bolivian authoritiesand the local Guarani communities. Social and environmentalmonitors from these communities provided oversight of thearchaeological site. At the request of the Guarani communities,TOTAL changed the architecture of its construction project andagreed to re-bury the remains in the same place where they werefound and ensure communities retained access to this sacred place.
3.2. Dialogue and involvement with stakeholders
Social, environmental and societal information 7Societal information
Registration Document 2015. TOTAL 147

To better control the impact of its operations, the Group hasintegrated its societal approach into its operational processes viathe Group’s H3SE (industrial hygiene, safety, security, societal andenvironment) management system, known as MAESTRO(Management And Expectations Standards Towards RobustOperations). Audits conducted with MAESTRO give rise torecommendations and strengthen efforts in order to better managethe societal impacts of the Group’s operations.
3.3.1. Conducting impact assessments
An understanding of the socioeconomic context is gained througha baseline study, which is generally accompanied by a consultationphase involving local stakeholders.
In Exploration & Production, impact assessments are carried outbefore any operation to avoid, reduce and compensate for negativeimpacts. In 2015, a team of some 20 people in Papua New Guineawas recruited to prepare geotechnical studies and undertakesocietal and environmental assessments of the potential PapuaLNG project sites. The technical team used the results of theassessment to minimize the potential impacts on the local population.
In Uganda, the results of the societal and health baseline studywere incorporated into an Environmental, Social and Health ImpactAssessment and specifications were submitted to the governmentfor approval. A Preliminary Resettlement Action Plan wasdeveloped along with a risk identification methodology. Followingthe exploration phase, the subsidiary commissioned a consultant(ASLO) and an international NGO (International Alert) to conduct anex-post assessment of its societal performance with an analysisbased on consultation of the local populations.
In addition, to assess the impact of its operations in host countries,the Group regularly works with CDA, an independent non-profitorganization. In 2015, CDA conducted an assessment in Argentinaand a number of recommendations were made in a report to betterintegrate operations into the local socioeconomic fabric. CDAimpact assessments systematically produce reports, which areavailable online on the organization’s website.
Finally, the MOST (Management Operational Societal Tool) nowoffers a standard version that allows users to manage stakeholderrelations, site-related grievances and societal projects. Specificmodules (access to land, compensation and employment) can beadded to this common framework. Societal data is geo-referenced,with automatic display in a geographic information system. MOSTgenerates reports that serve as a basis for the analysis of societalperformance. This tool is used as part of the professionalization oflocal teams. In 2015, this tool was used in 13 countries and will beimplemented more widely in 2016.
3.3.2. Handling grievances from local communities
A grievance mechanism is gradually being introduced at all theGroup’s subsidiaries and sites. These systems are already in placeat all Refining & Chemicals platforms.
In Exploration & Production, a guide on the handling of grievances,inspired by the UN Guiding Principles on Business & Human Rights,was drawn up in 2013. In Denmark, for example, grievances
received during the drilling of an exploration well were recorded inMOST and follow-up action was taken by the CLO. This grievancemechanism was also implemented in 2015 in Papua New Guineaand the Democratic Republic of the Congo. The Group’s expertisecontributed to the development by IPIECA of a CommunityGrievance Mechanism Toolbox that is now available on its website.In 2014, Marketing & Services published a brochure to raiseawareness of grievance management to allow the segment’ssubsidiaries and operating sites to become familiar with this subjectand introduce a dedicated system separate from the one used tohandle commercial complaints. This mechanism was incorporatedinto Marketing & Service’s societal framework.
3.3.3. Improving road safety
Road safety is one of the Group’s priorities (also refer to point 2.1above), particularly in terms of societal matters.
To mobilize the public and private sectors, TOTAL created in 2012an independent organization known as Safe Way Right Way with aview to mobilize partners, raise funds, set up training and awarenessinitiatives and improve regulations and their implementation.
TOTAL is a member of the Global Road Safety Partnership (GRSP).The aim of this public-private partnership is to improve road safetyand share expertise in this area. In this context, the Group haspartnered with Toyota to help implement the “Safe to school – Safeto home” program developed by the GRSP in Zambia. TOTAL alsoco-financed the African Road Safety 2015 conference organized bythe GRSP in Lusaka, during which public authorities, internationalinstitutions and the private sector were able to discuss their policiesregarding road safety in Africa.
The “Safety Cube”, a box containing fun educational materials,supports road safety awareness campaigns in schools. Madeavailable by the subsidiaries in 37 countries in the Africa-MiddleEast region in partnership with education and transport ministriesand local NGOs and through the active involvement of employees,this program has grown and supports such initiatives as theopening of the Children’s Road Safety Education Center in Senegal.This program was also deployed in Asia, where 3,000 children havealready been made aware of road safety issues in around 10countries over the past two years. In total, nearly 440,000 childrenwere made aware of the dangers of the road.
A qualitative study was carried out in 2015 by the GRSP with foursubsidiaries (South Africa, Kenya, Morocco and Zambia) on the useof the Cube. The purpose of this study was to receive feedback onhow the project is perceived by the schools in which the programwas deployed. The large majority of teachers stated they weresatisfied and felt that the educational content was pertinent andeffective. One suggested area for improvement is to integrate thisproject into a wider road safety strategy that includes action onschools surroundings and involves local communities more.
In France, TOTAL has, since 1995, contributed to the 10 deConduite Jeune training operation for young drivers in cooperationwith the French national police, Groupama and Renault. Each year,this initiative raises awareness among more than 10,000 junior andsecondary school students.
3.3. Controlling the impact of the Group’s activities
7 Social, environmental and societal informationSocietal information
TOTAL. Registration Document 2015148

TOTAL’s goal is to act and be recognized both as a partner in thelong-term economic and social development of the communitiesand regions in which the Group operates, and as a key player inaccess to energy. The Group has a special responsibility to thecommunities living close to its facilities and endeavors to make itsactivities a source of value and opportunity for them.
TOTAL is building a global, integrated local development approach(“In-Country Value”) that creates synergies among all the value-creating elements for host countries (infrastructures, support forlocal industries, employment, subcontracting, socioeconomicdevelopment projects, education, access to energy, etc.) bypromoting the Group’s industrial know-how. This approach isreflected in two key strategies: on the one hand, the Group’scommitment to local content and, on the other hand, support forthe implementation of socioeconomic programs, including inparticular the implementation of access-to-energy programs.
3.4.1. Committing to local content
TOTAL is committed to: employing more local staff and subcontractingmore work to local businesses wherever the operating constraintsof its activities allow, particularly through training and supportprograms intended for small and medium-size enterprises (SME)and companies that shape the local economy; helping to diversifythe economies of the regions in which it operates by supportinglocal initiatives; and contributing to human development, mainly byfocusing on education and strengthening local development skillsand capacities.
To this end, Exploration & Production is shifting from a local contentapproach (focused mainly on direct and indirect local employment)to an In-Country Value approach geared toward local value creation.It has also developed a roadmap centered on four main areas:publishing future industrial and manpower needs; using a uniquesupplier database for each subsidiary; developing a large-scaleprogram for training technicians; and comprehensively studyinglocal value creation. TOTAL participated in the development of theIPIECA “Local content strategy guide” and helped update thisdocument in 2015.
In Papua New Guinea, where TOTAL opened a subsidiary in 2014,the Elk-Antelope project team is working on a local value creationstrategy aimed at integrating local businesses and professionals fromthe facilities construction phase. To this end, TOTAL conducted anational industrial survey in 2015 that enabled it to identify avenuesfor developing the country’s industrial fabric and the skills of itsworkforce.
Training and education are the key pillars of the In-Country Valueapproach. For instance, in Marketing & Services in Africa and theMiddle East, the “Young Dealers” program aims to help youngservice station employees gain promotion to management positions.Approximately 20% of the service stations in Africa-Middle East aremanaged by young dealers. Another program launched in 2014,the “Young Graduate” program, is intended for young graduatesfrom Africa or the Middle East with five years of higher educationand less than one year of professional experience. This careertrajectory strengthens their skills and makes it easier to recruityoung people with high potential. Currently, 140 “Young Graduates”are working in retail, operations or finance. More than 40 of themhave taken up a position outside their country of origin.
3.4.2. Boosting regional development and supporting industrial restructuring
TOTAL has set up a program to pre-qualify and certify FrenchSMEs, in line with Group standards, in order to work with morelocal suppliers. In addition to the jobs generated by its activities, the Group, as a responsible company, supports SMEs, mainly inFrance, through its Total Développement Régional (TDR) entity. The Group relies on TDR for the local implementation ofagreements signed with the French government and local publicplayers in connection with its industrial conversion projects. Theseincluded, for example, the conversion of the ICD platform in Dunkirkand the future Carling Saint-Avold and La Mède platform projects.
This support is a major element in TOTAL’s commitment to itsindustrial and economic responsibilities and takes a number ofdifferent forms within TDR. These include financial assistance forthe setting up, development or takeover of SMEs in the form ofloans, industrial conversion assistance alongside local developmentbodies, assistance in the development of export activities andinternational trade, and help for innovative SMEs. These programshelp create long-term jobs. Over the past three years (2013-2015),TDR has issued a total of €21.2 million in loans to 419 SME projects,thereby supporting nearly 8,000 jobs.
To maintain industrial activities and jobs once refining operations atthe Flanders facility end, two industrial projects are underway:construction of a dietary phosphate production plant by 2017(Ecophos), and construction of a pilot biodiesel and biofuelproduction plant in which the Group has a stake (BioTfueL). Theactivities maintained at the Flanders facility currently provide 260positions and 130 subcontracting jobs.
In Carling, the steam cracker was permanently shut down inOctober 2015. To adapt the platform and ensure its future byrestoring its competitiveness, TOTAL expects to invest €180 millionby the end of 2016 to develop new activities in the growinghydrocarbon resins (Cray Valley) and polymers markets. TOTAL has made a commitment to implement this industrialconversion without any lay-offs and to fulfill all of its contractualobligations with its clients and partner companies, particularlythrough a support fund. In addition, TOTAL commits to improvingthe industrial platform’s attractiveness by developing a sharedservices offer, with the aim to help new economic stakeholdersestablish in the area. In this way, TOTAL confirms its responsibilitytowards the employment areas in which the Group operates as wellas its commitment to maintain a strong and sustainable industrialpresence in the Lorraine region. A framework agreement signed inearly 2015 between the Chairman of the Lorraine region and TOTAL aims to leverage the Group’s expertise and financial meansto develop the area’s industrial fabric.
In 2015, TOTAL announced its plan to adapt its operations in LaMède by stopping refining activities and investing in converting theplatform to renewable energies and high value-added products.This project will be completed without any lay-offs. TDR will beinvolved to help minimize the impact on subcontractors.
3.4. Creating local value
Social, environmental and societal information 7Societal information
149Registration Document 2015. TOTAL
3.4.3. Acting as a partner for human, social and economic development
TOTAL’s contribution to the socioeconomic and humandevelopment of the countries in which the Group operates isreflected in its involvement in local development programs.
In 2015, €384 million ($426 million) was spent on societal projects,compared to €459 million in 2014 and €357 million in 2013.Certain expenses are managed directly by host countries inapplication of contractual provisions, for example in Nigeria (NigerDelta Development Committee) or the Republic of the Congo(Provisions d’investissements diversifiés). In 2015, 3,063 societalactions were reported. These programs support local populationsand fall into three main categories: local economic development,human and social development, and citizenship. Approximately85% of expenditure for societal projects goes to countries outsidethe OECD.
Two cross-functional priorities underlie these projects: partnershipsand skills development. Built on constructive dialogue and thedetermination to forge long-term relationships of trust withstakeholders, partnerships with local institutions and organizationsguarantee the long-term success of projects. In all its actions,TOTAL ensures that it does not take the place of local authoritiesand teams up with NGOs that have solid field experience. In thesame vein, TOTAL promotes actions that help strengthen the abilityof individuals and local bodies to organize their own developmentindependently in order to ensure sustainability.
The Group’s expertise is based on the continued professionalizationof its societal teams through structuring projects, setting goals and monitoring performance indicators. At the Group’s head office,an individual is dedicated to relations with NGOs. In Exploration &Production, more than 400 people are involved in societal matters,with over 360 involved on a full-time basis. In 2015, some 100employees involved in societal projects from many of the Group’sentities attended a Group Societal Seminar to share experiences,followed by a training session on human rights presented by theDanish Institute of Human Rights. Several in-house trainingmodules have been created for all Group employees, including ane-learning launched in 2015 on the Group’s societal commitment.
3.4.4. Supporting education
Education is key to creating shared value by helping host countriesdevelop the skills of their young people and training the futureemployees that industry will need. TOTAL’s contributions toeducation are framed within existing local systems, adapted to localrealities and always undertaken in the form of partnerships. In addition to support for primary and secondary education whereneeds have been identified, the Group’s educational initiatives arebuilt around four core international programs: scholarships,partnerships with universities, teaching and research chairs, andprofessional training.
TOTAL promotes the internationalization of its management, therecruitment of local personnel and their access to positions ofresponsibility, particularly within their original subsidiaries. To achievethis, the Group offers local, regional and international scholarshipsprior to recruitment. Each year, these scholarships enable several thousand young people to pursue their studies throughout theworld and, since 2004, over 1,000 students from the Group’s hostcountries have been able to prepare for qualifications (doctorates,MBAs, Master’s degrees, engineering schools, bachelor’s degrees
and university institutes of technology) at the best institutions, mainlyin France or other European countries.
To help the companies recruit qualified local staff, TOTAL helps tostrengthen the African continent’s universities by making theGroup’s technical and scientific expertise available to them. Twenty-nine framework agreements have been signed with leadinginstitutes of higher education, such as the 2IE Institute in BurkinaFaso and the universities of Cape Town and Witwatersrand inSouth Africa. The university partnership program launched in Africain 2010 has been extended to all of Europe, Asia and the MiddleEast and now includes 80 establishments that maintain a regulardialogue with TOTAL. In addition, professional training programsadapted to the needs of each country are organized in cooperationwith local actors and allow trainees to obtain diplomas andrecognized professional qualifications. Thus, the Group’s entitieshave introduced a large number of training schemes adapted tomeet the specific local context, particularly in Africa.
TOTAL supports teaching and research chairs, and in particularresearch and innovation at 32 institutions, to address the needs ofthe business world.
These programs are complemented by “TOTAL associate teachers”(TOTAL professeurs associés). This original initiative is a non-profitassociation run by current or retired employees of the Group whoteach courses free of charge in schools and universities. Over 250teachers give courses and lectures in oil-related fields. Since 2001,more than 160,000 students throughout the world have benefitedfrom this expertise.
Finally, to help provide access to education to as many people aspossible, TOTAL broke new ground in 2015 by contributing to thecreation of a free massive open online course (MOOC) on the oilchain entitled “Oil & Gas: from Exploration to Distribution”, a four-week online course taken by more than 21,800 learners worldwide,half of whom were from the African continent.
3.4.5. Giving the most disadvantaged populationsgreater access to energy
For more than 10 years, several Group subsidiaries have beenengaged in various one-off access-to-energy projects, usually incooperation with neighboring communities and local authorities inhost countries, without always aiming to economic viability andsustainability objective. To improve its societal performance andstructure its approach, TOTAL aims to develop models that areboth profitable and sustainable. For this reason, in 2010 the Grouplaunched the “Total Access to Energy” program, a source ofinitiatives for identifying and testing solutions that facilitate accessto energy for the poorest populations.
Awango by Total, a new business model
The first large-scale achievement to come out of this program,Awango by Total is a business response to a societal problem. This innovative, sustainable and reproducible business model offersa range of solar solutions for lighting and recharging small electricalappliances such as mobile phones.
Launched in 2011 in four pilot countries, this offer was sold in over30 countries in 2015, including 6 where it is currently beinglaunched. At the end of 2015, 1.3 million lamps have been sold,improving the day-to-day lives of six million people and exceedingthe target set in 2012 at the Rio+20 conference. The distributionnetworks used are both TOTAL’s traditional networks (service
7 Social, environmental and societal information
TOTAL. Registration Document 2015150
Societal information
In addition to the societal initiatives that are directly related to theGroup’s industrial activities, TOTAL has also been committed forover 20 years to taking general-interest measures in the countrieswhere it has operations. These actions are essentially conducted by the Total Corporate Foundation and the PhilanthropyDepartment of TOTAL S.A.
3.5.1. Total Corporate Foundation
For the period of 2013-2017, the Group has renewed itscommitment to its Corporate Foundation, which has a 5-yearbudget of €50 million. The Foundation is active in four fields: health,solidarity, oceans and marine biodiversity, culture and heritage.
In the health field, the Group has been a partner of the PasteurInstitute since 2005. The aim of this partnership, renewed for 2015to 2017, is to support projects to combat childhood diseases aswell as research programs and field actions in partnership with theGroup’s subsidiaries, mainly in Africa and South-East Asia.
In the field of solidarity, the Foundation encourages Groupemployees to engage with the community through support forprojects championed by non-profit organizations with which theyvolunteer on a personal basis. In 2015, the Foundation supported42 employee projects in 33 countries.
With regard to marine biodiversity, the Foundation funds researchprograms undertaken to improve knowledge about marine speciesand ecosystems and challenges related to their protection andenhancement. For the 51 projects supported in 2015, theFoundation ensures the sharing of knowledge through awarenessand education campaigns. In particular, it backed the Lengguruscientific expedition in West Papua. Led by the Institute ofResearch for Development, the Indonesian Institute of Sciencesand the Sorong Fisheries Academy, this project mobilized morethan 70 European and Indonesian researchers.
In the culture and heritage field, the Total Foundation partly funded12 exhibitions in 2015 that helped to showcase the cultures of thecountries in which the Group operates. In 2015, the Total
3.5. Partnerships and philanthropy
Social, environmental and societal information 7Societal information
Registration Document 2015. TOTAL 151
stations) and “last mile” networks built with local partners to bringthese solutions to isolated areas. Reseller networks are then set upand programs developed with the support of external partners torecruit and train “Young Solar Resellers”.
This model is based on innovative partnerships with variousstakeholders: development experts, NGOs, manufacturers,institutional bodies and associations, microfinancing institutes, etc.In 2014, TOTAL and the IFC entered into a 3-year partnership tosupport the Lighting Global program. On the ground in Uganda,Awango by Total lamps have been sold since 2013 in the LakeAlbert region through partnerships with local villager associationsand the Caritas Arua NGO.
In Haiti, a partnership with Entrepreneurs du Monde led to thedevelopment of a social business (Palmis Eneji) through the use ofmicrofinance mechanisms. A pilot project is also underway in thePhilippines with Entrepreneurs du Monde to measure the societalimpact of solar solutions on populations that use them (e.g., health,education, savings, revenue generated).
The Group’s goal is to further develop this program with a target offive million lamps sold in Africa by 2020, benefiting 25 million peopleon a continent that is at the core of TOTAL’s global strategy.
In 2015, Babyloan, a European leader in crowdfunding, and TOTALteamed up to develop the first crowdfunding platform dedicated toaccess to energy. This partnership aims to accelerate access toenergy and related financing solutions, particularly in Africa, Asia and Latin America, where the need is greatest. This bringstogether Babyloan and TOTAL’s complementary expertise: incrowdfunding and microfinance for Babyloan, and in access toenergy for TOTAL. This collaboration aims to support the creationof local microbusinesses that will develop distribution networkstowards isolated communities and better face of last miledistribution challenges.
Fighting fuel poverty and developing more inclusive mobility
The aim of the “fuel poverty and inclusive mobility” project in Franceis to reduce heating costs (via thermal renovation) and enhancemobility for low-income households.
To respond to the issue of fuel poverty, the Group is workingalongside the French government and other energy producers inthe “Living Better” program, which has allowed 150,000 low-incomehouseholds(1) to benefit from thermal renovation since its creation in2011. In addition, the 90 energy efficiency ambassadors at PACTand FACE (agreement signed in 2014 with the French Ministry forthe City, Youth and Sport) have helped to identify and supporthouseholds affected by energy poverty in 30 departments in France(assistance with building renovation formalities, financing solutions,training in eco-friendly behaviors).
The Wimoov association provided mobility advice and solutions to7,500 people (1) in 2015, 50% of whom found jobs or newemployment. As a result of TOTAL’s support, new mobility platformswere opened and developed. In 2015, the Inclusive MobilityLaboratory created by TOTAL and Wimoov welcomed five newmembers – the Red Cross, FARE (French federation of roadassociations for education), Michelin, Keolis and Transdev – andworked on the global recognition of mobility advisors and innovativeservices available to vulnerable groups, including local support viacommunity services and tailored digital solutions that bring togethertransport operators and players in the social economy. The call forprojects issued in partnership with the French Ministry for the City,Youth and Sport (Experimental Youth Development Fund) has madeit possible to fund and support, via the Agence Nationale desSolidarités Actives (national agency for active inclusion), 16innovative youth initiatives throughout France until the end of 2016.
Finally, TOTAL launched a social business model involving servicestations with reduced investment and operating costs formunicipalities (two openings in 2015) to facilitate access to fuel in rural areas in France.
(1) Source: Wimoov, which accompanies audiences from difficult situations (people with disabilities, people needing integration into the professional world, the elderly, etc.) to give themmore mobility.
TOTAL’s activities generate hundreds of thousands of direct andindirect jobs worldwide. The Group’s purchases alone representedapproximately $40 billion worldwide in 2015. The averagebreakdown, at the Group level, of expenditure for purchases ofgoods (products, materials, etc.) is approximately 25% and ofservices (including consulting services, work with supply ofmaterials, transport, etc.) is approximately 75%, excluding crude oilmaterials. The number of hours worked by subcontractors ismonitored for large projects. This involves a range of environmental,social and societal impact concerns addressed by TOTAL whendealing with its suppliers via its principles, purchasing commitmentsand sustainable procurement initiatives.
TOTAL’s societal commitment is shared by the Group’s employees,partners, customers and suppliers, in particular by employing morelocal staff and subcontracting more work to local businesseswherever the operating constraints of its activities allow. TheGroup’s societal directive stipulates that purchasing processesmust be adapted as required in cases where a societal action planhas been implemented.
TOTAL has created a map of the CSR risks and opportunities in theGroup’s main purchasing categories to identify key issues in threeareas: ethics and human rights, environmental impact and thecreation of value with local communities. Pilot projects wereimplemented in certain purchasing categories to integrate themonitoring of CSR aspects into the purchasing process throughconcrete measures (e.g., specific questionnaire focusing on theFundamental Principles of Purchasing, drafting of suitable contractclauses, good practices guide for purchases from the disabled andsheltered employment sectors). For example, for a multi-country“car wash” call for tenders, typical of Marketing & Services’ activities,the map encouraged the buyer / internal client team to take a “totalcost of ownership” approach (calculated by adding to the initialpurchase price costs incurred by the client when using and disposingof the product: power and water consumption, end-of-life processingcosts, etc.) and incorporate environmental criteria into the specificationsand then into the contract. The map was updated in 2015 to reflectthe Group’s main purchasing categories and presented to the buyers,the Group Purchasing Committee and the Ethics Department.
3.6.1. Monitoring responsible practices amongsuppliers
In its Code of Conduct, TOTAL states that it works with its suppliersto ensure the protection of the interests of both parties on the basisof clear and fairly negotiated contractual conditions. Thisrelationship is founded on three key principles: dialogue,professionalism and adherence to commitments.
TOTAL expects its suppliers to:
– adhere to principles equivalent to those in its own Code ofConduct, such as those set out in the Fundamental Principles ofPurchasing directive; and
– agree to be audited, be particularly attentive to the human rights-related aspects of their standards and procedures, inparticular their employees’ working conditions, and ensure thattheir own suppliers and contractors respect equivalent principles.
The Fundamental Principles of Purchasing, launched in 2010 andformally set out in a Group directive in 2014, specify thecommitments that TOTAL expects of its suppliers in the followingareas: respect for human rights at work, health protection,assurance of safety and security, preservation of the environment,prevention of corruption, conflicts of interest and fraud, respect forcompetition law, as well as the promotion of economic and socialdevelopment. TOTAL’s suppliers must be made aware of the rules itcontains, which apply to all the Group’s companies, by includingthem, suitably transposed if necessary, into the agreementsconcluded with these suppliers. These principles are available forconsultation by all suppliers in both French and English on TOTAL’swebsite (under “Suppliers”).
Questionnaires focused on environmental and societal issues areused to gather more in-depth information from suppliers about theirapproach to these subjects, either during pre-qualification or aspart of an audit. Supplier relations are also considered from anenvironmental and societal perspective on occasion as part ofethical assessments of Group subsidiaries and entities undertakenby GoodCorporation (refer to point 3.7.2 of this chapter) in allcontinents in which the Group is present.
3.6. Contractors and suppliers
7 Social, environmental and societal information
TOTAL. Registration Document 2015152
Societal information
Foundation and the Fondation du Patrimoine (heritage foundation)renewed their partnership for the fourth time for the 2015-2017period. The partnership primarily focuses its activities on therehabilitation of the country’s industrial, craft, port and maritimeheritage converted for sociocultural purposes and on work sitesdesigned to further professional training and social integration.Since 2006, more than 155 projects, including 29 worksites foremployment integration, spread across France, have receivednearly €21 million in funding from this partnership.
3.5.2. TOTAL S.A. philanthropy
In the field of solidarity, the Philanthropy Department has forged anumber of major institutional partnerships in France. Since 2009, it has worked with the French government and the ministryresponsible for youth to promote the social, professional and civicintegration of young people through programs that have alreadybenefited over 200,000 people. This partnership, with an overallbudget of €60 million and the experimental youth development
fund as its primary technical and financial tool, has enabled thefinancing of more than 260 projects since its creation. In 2014, the program was renamed “La France s’engage”.
In the field of marine biodiversity, the Group has been a partner ofthe French Society of Sea Rescuers (SNSM) since 2008. Throughits funding and expertise, it plays a role in improving the safety ofrescue operations and training volunteers. Thanks to its support,the Sea Rescuers have a center equipped with a state-of-the-artnavigation and vessel handling simulator. Each year, more than 300 rescuers have access to this training.
In the field of culture, convinced that access to culture from a veryyoung age is key to self-confidence and respect for others, theGroup supports numerous initiatives designed to instruct youngpeople in the worlds of art and culture. In total, nearly 75,000children from metropolitan France and the Overseas Departmentshave benefited from these projects.
In 2015, TOTAL signed an agreement with the worldwide tradeunion federation, IndustriALL Global Union, which marks a majorstep in TOTAL’s commitment as a responsible employer (refer topoint 1.3 of this chapter). In addition, TOTAL is committed todisclosing and promoting the principles of this agreement to itsservice providers and suppliers.
Despite a difficult economic environment, certain one-off initiativeswere launched. In October 2015, a suppliers day atExploration & Production, which brought together 300 people,including 200 representatives of approximately 100 suppliers, wasfocused around two main themes: HSE and economicperformance. Also in October 2015, a suppliers day atRefining & Chemicals, which brought together over 250representatives from its main European suppliers, was held topresent them with Refining & Chemicals’ strategy and safety,availability and cost-cutting goals.
The deployment of the anti-corruption policy in purchasingcontinued in 2015 with the dispatching of specific questionnaires toselect service providers and, in some cases, external controls. Aninitiative was launched in 2014 in which service providers workingon Group sites were asked to take a training module similar to theGroup’s anti-corruption e-learning module. CDs of this e-learningcourse were also distributed by several entities to their suppliers.
In addition, pursuant to Rule 13p-1 of the Securities Exchange Actof 1934, as amended, which implemented certain provisions of theDodd-Frank Wall Street Reform and Consumer Protection Act of2010, TOTAL has submitted since 2014 to the SEC an annualdocument relating to certain minerals (deemed “conflict minerals” (1)
by this Rule) sourced from the Democratic Republic of the Congoor a neighboring country. The document indicates whetherTOTAL S.A. or one of its affiliates had, during the precedingcalendar year, used any such minerals that were necessary to thefunctionality or production of a product manufactured or contractedto be manufactured by the Group. In addition, the document stateswhether such minerals were sourced from the Democratic Republicof the Congo or a neighboring country. The main objective of therule’s obligation to publish this information is to prevent the direct orindirect funding of armed groups in central Africa. For moreinformation, refer to TOTAL’s most recent publication available at:http: / / csr-analysts.total.com or http: / / www.sec.gov / .
3.6.2. Promoting sustainable procurement
An interdisciplinary working group dedicated to the issue ofsustainable procurement and representing the various businesssegments as well as the Purchasing, Legal and SustainableDevelopment Departments is tasked with strengthening TOTAL’spolicy in this area based on initiatives developed by each segment.
The Group’s buyers take part in international working groups onsustainable procurement. TOTAL is an active member of IPIECA’sSupply Chain Task Force. In 2015, TOTAL participated in the twospecial workshops on Operationalization of the UN GuidingPrinciples organized by the IPIECA, aimed at both oil and gascompanies and engineering, procurement, construction (EPC)contractors. TOTAL is also represented in the French delegation tothe international group that is considering the forthcoming ISO20400 standard on sustainable procurement. The aim of this
standard is to transpose the concept of social responsibility – asdefined in ISO 26000 – to purchasing activities. Forty-one countriesfrom every continent, as well as international organizations such asthe OECD, the UN and the International Labour Organization, areinvolved in drafting this standard.
Sustainable procurement targets are integrated into the centralbuyers’ annual appraisals. Twelve sustainable procurement trainingsessions have been held in France since 2013, with a total of 130Group employees receiving training. Half of buyers responsible for acategory at the head offices of the various business segments tookpart in this training and have been able to apply the correspondinggood practices to their categories. To accompany these trainingevents, practical tools (country factsheets including local laws andregulations, internal feedback and methodology sheets) weredeveloped and used both before and after the learning phases.
As part of the new Corporate Purchasing training program, aninduction e-learning course entitled “Purchasing at TOTAL” hasbeen made available to all buyers and is mandatory for all newbuyers. This module covers, in particular, the Group’s ethicalcommitments and the Fundamental Principles of Purchasing.
In France, the Group’s purchases from the disabled and protectedemployment sectors enabled the achievement of an indirectemployment rate of nearly 1% in 2015. TOTAL is a member of thePas@Pas association and provides its buyers with an onlinedirectory that can be used to identify potential suppliers and serviceproviders from the disabled or protected employment sectors bygeographical area and by category. A new training course onpurchasing from the disabled and protected employment sectorswas launched in 2015 and attended by nearly 100 people,including the Group’s Chief Purchasing Officer. Courses in theregions of France where TOTAL operates (Pau, Lyon, Nantes andLe Havre) were held throughout the year. These sessions form part of TOTAL’s sustainable procurement approach and furtherreflect its focus on regional development. In addition, in Belgium,Refining & Chemicals uses the services of companies that givepriority to the employment of disabled individuals.
3.6.3. Acting as a responsible partner in relation with suppliers
TOTAL received the “Responsible supplier relationships” label in2014 for its Holding and Marketing & Services activities in France.This label, awarded by the French authorities, recognizescompanies that maintain sustainable and balanced relationshipswith their suppliers. Eligibility for this label is reviewed every yearand was confirmed in 2015.
The general terms and conditions of purchase were updated in2014 to ensure a sharper focus on balanced contractual relations.This balance is monitored in particular by an interdisciplinaryworking group dedicated to the issue of payment terms, set up in2014. It involves the Purchasing and Finance departments at theFrench head offices of all the Group’s business segments and hasthe aim of monitoring payment terms, reporting and improving theprocessing of invoices.
Social, environmental and societal information 7
Registration Document 2015. TOTAL 153
Societal information
(1) Rule 13p-1 defines “conflict minerals” as follows (irrespective of their geographical origin): columbite-tantalite (coltan), cassiterite, gold, wolframite and their derivatives, which are limited to tantalum, tin and tungsten.

3.7.1. Preventing corruption
The oil industry must be particularly vigilant concerning the risk ofcorruption, especially given the scale of investments and the numberof countries in which operations are conducted. Preventingcorruption is therefore a major challenge for the Group and all itsemployees.
TOTAL’s stance on the issue of corruption is based on clearprinciples set out in its Code of Conduct: “The Group adopts azero tolerance’ approach to corruption and adheres to the strictestintegrity standards”. This Code sets out the principles governingthe actions and individual behavior of each person, both in theirday-to-day decisions and in their relations with the Company’sstakeholders. In it, TOTAL also reiterates its support for the OECDGuidelines and the Tenth Principle of the United Nations GlobalCompact, which urges businesses to work against corruption in allits forms.
The Group’s commitment has led to a number of actions, including:
– the adoption by the Executive Committee in 2009 of a corruptionprevention policy and the implementation of a dedicatedcompliance program; and
– the establishment of a specific organization including, inparticular, a Compliance and Social Responsibility Department,which is responsible for rolling out a robust anti-corruptioncompliance program via a network of 370 Compliance Officerswherever TOTAL operates.
The corruption prevention program is based on the very higheststandards including, in particular:
– a framework of internal rules that allow employees, with thesupport of their Compliance Officer, to identify risk situations,conduct due diligence and implement appropriate actions,particularly in the cases of: representatives dealing with publicofficials, purchasing / sales, gifts / invitations,donations / philanthropy, acquisitions, joint ventures, conflicts ofinterest and Human Resources;
– activities designed to raise awareness among all employees: aninitial e-learning course was rolled out in 2011 in 12 languages,followed by a more in-depth e-learning module inDecember 2015. This module is accessible to all employees andmandatory for the target groups (approximately 30,000employees);
– more targeted training activities intended for the most highlyexposed positions (particularly for implementation of new rules)and in-depth training for all Compliance Officers;
– the prohibition of “facilitation payments”;– regular reporting and incident feedback mechanisms, including
an ethics alert system;– audits dedicated to compliance (six to eight per year) covering all
the Group’s activities. These audits are followed up the next yearto verify that the recommendations have been implemented. Inaddition, missions carried out by the Group Audit Departmentinclude, depending on their purpose, controls to ensurecompliance processes are being followed; and
– the application of suitable sanctions.
3.7. Fair operating practices
Regarding the support given to French SMEs, TOTAL is a memberof the “Pacte PME” association and was positively rated by itsMonitoring Committee in 2015. One example is the support theGroup gives to the international development of SMEs, including anumber of its own suppliers, through TDR. More than 150 SMEswere thus able to take advantage of a range of programs in 2015:temporary reception of a Volunteer for International Experience (VIE)to represent them in one of the Group’s subsidiaries, access to anetwork of contacts consisting of Group employees at overseassubsidiaries, and the organization of joint operations in countries inwhich the Group is present in order to gain a better understandingof the local economic context (refer to point 3.4.2 of this chapter).Finally, the identification of innovative SME suppliers takes placethrough the appointment of innovation correspondents within eachPurchasing department of TOTAL’s business segments.
Together with GEP-AFTP, TOTAL was involved in the creation ofOG2P (Oil and Gas Partnering Platform). This is an online In-CountryValue partnering platform launched in October 2015. It allows SMEs
in France and other European countries to build relationships withSMEs in producing countries.
To contribute toward the development of good practices in businessrelations, TOTAL launched an initiative to raise its employees’awareness of mediation as an alternative method for resolvingdisputes with suppliers. Each year since 2013, a training day toraise awareness of mediation has been organized, and in 2015 twoevents were held. Each session brings together employees of theGroup, lawyers and suppliers. This day enables employees to gainan understanding of mediation and its advantages, in particular incementing long-term business relations, and includes practicalexercises. A brochure designed to increase awareness of themediation process is also made available to all employees. In addition,an e-mail address is available on the Group website (under “Suppliers”).It can be used to contact the Group’s internal mediator, whose taskis to facilitate relations between the Group and its French andinternational suppliers. Finally, the general purchase terms andconditions also mention the possibility of recourse to mediation.
The breakdown of TOTAL S.A.’s accounts payable as of December 31, 2015 and December 31, 2014, in application of the provisions of Article D. 144-4 of the French Commercial Code, is as follows:
(in M€) 2014 2015
Group non-Group Total Group non-Group Total
Balance 286 1,101 1,387 307 930 1,237Overdue as of Dec. 31 3 1 4 3 1 40 to 30 days 281 309 590 228 177 405Over 30 days 0 302 302 0 348 348Not yet received 2 489 491 76 404 480
7 Social, environmental and societal information
TOTAL. Registration Document 2015154
Societal information

In 2015, significant internal communications took place toemphasize once again the importance the Group attaches to theseissues. For the UN’s International Anti-Corruption Day andInternational Human Rights Day (both observed annually inDecember), TOTAL held its first Business Ethics Day, which focusedon these two themes. This event was organized at Group level andrelayed locally by the subsidiaries to remind employees how toreact appropriately and to encourage dialogue.
Under the settlements reached in 2013 between TOTAL, the U.S.Securities and Exchange Commission and the U.S. Department ofJustice, an independent monitor was appointed for three years toconduct a review of anti-corruption compliance and related internalcontrol procedures implemented by the Group and to recommendimprovements, when necessary. The monitor assumed his positionat the end of 2013 (refer to point 4.3 of chapter 4) and issued aninitial report to the authorities in July 2014. As the monitor had torelinquish his duties for health reasons, a new monitor wasappointed in early 2015 to continue the review. A second reportwas issued in October 2015, in which the monitor completed hisrecommendations and indicated that “TOTAL has considerablyimproved its anti-corruption program by implementing therecommendations outlined in the first report”.
3.7.2. Respect for human rights
Activities of companies can affect the human rights of employees,partners and local communities in numerous ways. TOTAL’sproactive approach to human rights reflects its ethical commitmentand helps to establish and maintain successful relationships with allstakeholders, which is essential for the Group to operate effectively.
TOTAL’s approach to respect for human rights is based on severalpillars, described below.
Written commitments
The Group’s Code of Conduct was revised in 2014 to reinforceTOTAL’s commitments in terms of respect for human rights. It setsout the Group’s adherence to international standards such as theUN Guiding Principles on Business and Human Rights and theVoluntary Principles on Security and Human Rights (VPSHR). In the event of any discrepancy between legal provisions and theCode of Conduct, the highest standard of protection of humanrights is applied.
Human rights are now one of the priority business principles,alongside integrity (preventing corruption and fraud and anti-competitive practices) and HSE standards (health, safety / securityand environment). The Group ensures that employees’ rights areprotected and prohibits any form of discrimination against them,including due to sexual orientation or identity. It demands that theythemselves respect human rights. TOTAL also expects its suppliersto respect standards equivalent to its own and pay particularattention to their employees’ working conditions. In addition, whilerespecting the sovereignty of the host countries in which it operates,the Group reserves the right to express its conviction on theimportance of respecting human rights in matters concerning it.Finally, TOTAL respects the rights of local communities by identifying,preventing and limiting the impacts of its activities on their way oflife and remediating them.
Some of these principles are set out in the “To find out more”section of the Code of Conduct and are detailed in TOTAL’s HumanRights Guide, as updated in December 2015 (available in English,French, Spanish and Chinese at total.com).
In 2013, the Group developed a strategic human rights roadmap tobetter integrate respect for human rights into its various risk andimpact management systems. This roadmap, approved by theExecutive Committee, is implemented by various Group entities (inparticular the Legal, Ethics, Sustainable Development, Purchasingand Safety Departments). For example, a practical guide waspublished in 2015 to help the Group’s teams responsible forbusiness acquisitions and disposals better incorporate humanrights into the various due diligence processes that apply.
A dedicated organization
The Ethics Committee and the “Ethics and Human Rights” unitwithin the Compliance and Social Responsibility Department adviseemployees, help operatives and monitor efforts to promote respectfor human rights. In particular, they run a human rights Committeethat coordinates the actions taken internally and externally by thevarious Group entities. The Ethics Committee is a central, independentstructure that represents all of TOTAL’s business segments. Its roleis to listen and support. Both employees and people outside theGroup can refer matters to it by email at [email protected]. The Committee maintains confidentiality with regard to referrals,which can only be lifted with the agreement of the person inquestion. At the local level, mechanisms for handling grievancesraised by local communities are also implemented by subsidiariesexposed to societal risks.
Awareness and training
To ensure its adopted principles are disseminated in-house, TOTALraises employee awareness via corporate communications channelssuch as the Ethics and Security intranet site and through eventssuch as the Business Ethics Day (refer to point 3.7.1 of thischapter) at which a new version of the Group’s Human RightsGuide was released. The Group has also produced several videoson three human rights topics that are key for TOTAL: responsiblesecurity, prevention of societal impacts on local communities, andworking conditions, both for its own employees and within itssupply chain. The Group also offers some employees specialtraining tailored to the challenges faced in the field, such as theResponsible Leadership for a Sustainable Business program.Finally, actions are taken to raise awareness among the Group’sexternal stakeholders, such as training related to the VPSHR for itssecurity providers.
Assessments and reporting
Tools are used to regularly assess the subsidiaries’ human rightspractices and the risks they may have to face. Their objective is toanalyze the societal impacts of a project at the local level or to verifythat the subsidiaries’ practices are in line with the Group’s ethicalstandards. TOTAL commissions approximately 10 ethical assessmentsper year, with more than 120 subsidiaries evaluated since 2002.These assessments are undertaken by GoodCorporation (GoodCorp),a qualified ethics expert. Certain assessments are also conductedin partnership with the Danish Institute for Human Rights, a Danishpublic non-profit organization. A reference catalog containingapproximately 90 questions relating to human rights, labor law andrules on competition, is used on site, and numerous internal andexternal stakeholders are interviewed by GoodCorp over the courseof several weeks. GoodCorp then issues a final report identifyingpoints requiring improvement and good practices. The entity is thengiven several months to correct any issues that have been identified.A follow-up report is issued by GoodCorp for the subsidiaries that
Social, environmental and societal information 7Societal information
Registration Document 2015. TOTAL 155
In 2015, environmental reporting covered all activities, sites andindustrial assets in which TOTAL S.A., or one of its companies itcontrols, is the operator (i.e., either operates or contractuallymanages the operations): 803 sites as of December 31, 2015.Greenhouse gas (GHG) emissions “based on the Group’s equityinterest” are the only data which are published for the “equityinterest” scope. This scope, which is different from the “operateddomain” mentioned above, includes all the assets in which TOTALhas a financial interest with rights over all or part of the production(financial interest without operational responsibility nor rights on allor part of the production do not lead to the incorporation of GHGemissions).
Safety reporting covers all TOTAL employees, employees ofcontractors working at Group-operated sites and employees oftransport companies under long-term contracts. Each site submitsits safety reporting to the relevant business unit. The data is thenconsolidated at the business level and every month at the Group
level. In 2015, the Group safety reporting scope covered 508 millionhours worked, equivalent to approximately 283,000 people.
Reporting on occupational illnesses covers only the Group’spersonnel and illnesses reported according to the regulationsapplicable in the country of operation of each entity. Each sitesends its reporting on occupational illnesses to the operationalentity it reports to. Statistics are consolidated at business segmentlevel and reported to the Group once a year.
Social reporting is based on two resources – the Global WorkforceAnalysis and the Worldwide Human Resources Survey.
The Global Workforce Analysis is conducted twice a year, onJune 30 and December 31, in all fully consolidated companies atleast 50% owned and consolidated by the global integrationmethod. The survey mainly covers worldwide workforces, hiringunder permanent and fixed-term contracts (non-French equivalentsof contrats à durée déterminée or indéterminée) as well as
4.2. Scopes
The Group’s reporting is based:
– for social indicators, on a practical handbook titled “CorporateSocial Reporting Protocol and Method”;
– for Industrial Safety indicators, on the Corporate Guidance onEvent and Statistical Reporting; and
– for environmental indicators, on a Group reporting procedure,together with segment-specific instructions.
These documents are available to all TOTAL companies. Theenvironmental and social reporting handbooks can be consulted atCorporate headquarters, in the relevant departments.
4. Reporting scopes and method
4.1. Reporting guidance
were assessed. Other non-profit partner organizations, such as theCDA Corporate Engagement Project, also contribute by evaluatingthe societal impact of the Group’s activities on nearby localcommunities, for example by surveying the populations in question.CDA’s reports are published online on their website.
At end-2013, the Group also commissioned the British NGOInternational Alert to conduct an impact study focusing on humanrights in the Democratic Republic of the Congo. Even though theGroup had not yet conducted any operations nor had anysubsidiaries in the area in question at that time, more than 300people – a quarter of whom were women – were consulted by theNGO. The aim of this study was to enable the Group to betterunderstand the country’s complex dynamics in order to limit anynegative impact and maximize any positive impact the Group’sexploration activities may have on this sensitive environment. TheNGO’s report is available online. Action based on the NGO’srecommendations were carried out by Total E&P RDC before thestart-up of the seismic campaign.
Participation in external initiatives
TOTAL is actively involved in numerous initiatives and workinggroups on human rights that bring together various stakeholders,
including Global Compact, Global Compact LEAD (initiative forsustainable leadership), Global Business Initiative on Human Rights,IPIECA and non-profit organizations such as Shift.
3.7.3. Consumer health and safety
Many of the products that TOTAL markets pose potential risks; for example, if they are used incorrectly. The Group therefore aimsto meet its current and future obligations with regard to informationand prevention in order to minimize the risks throughout its product’slife cycle. TOTAL’s health and products directive sets outs the minimumrequirements for marketing the Group’s products worldwide in orderto reduce potential risks to consumer health and the environment.
TOTAL identifies and assesses the risks inherent to its products andtheir use, and then informs customers and users of these risks andthe applicable prevention and protection measures. The materialsafety data sheets (MSDS) that accompany all products marketedby the Group (in at least one of the languages used in the country)and product labels are two key sources of information in this regard.All new products comply fully with the regulatory requirements inthe countries and markets for which they are intended.
7 Social, environmental and societal informationSocietal information. Reporting scopes and method
TOTAL. Registration Document 2015156
4.3.1. Indicator selection and relevance
The data published in the Registration Document are intended toinform stakeholders about TOTAL’s Corporate Social Responsibilityperformance for the year in question. The environmental indicatorsinclude Group performance indicators in line with the IPIECAreporting guidance, updated in 2015. The indicators have beenselected in order to monitor:
– TOTAL’s commitments and policies, and their effects in thesafety, environment, social, etc., domains;
– performance relative to TOTAL’s main challenges and impacts; and– information required by legislative and regulatory obligations
(Article L. 225-102-1 of the French Commercial Law).
4.3.2. Terminology used in social reporting
Outside of France, management staff refers to any employee whosejob level is the equivalent of 300 or more Hay points. Permanentcontracts correspond to contrats à durée indéterminée (CDI) andfixed-term contracts to contrats à durée déterminée (CDD),according to the terminology used in the Group’s social reporting.
Managed scope: all subsidiaries in which one or more Groupcompanies own a stake of 50% or more, i.e., 453 companies in123 countries as of December 31, 2015.
Consolidated scope: all companies fully consolidated by theglobal integration method, i.e., 314 companies having employees in102 countries as of December 31, 2015.
Employees present: employees present are employees on thepayroll of the consolidated scope, less employees who are notpresent, i.e., persons who are under suspended contract(sabbatical, business development leave, etc.), absent on long-termsick leave (more than six months), assigned to a company outsidethe Group, etc.
4.3.3. Methods
The methods may be adjusted to reflect the diversity of TOTAL’sactivities, recent integration of subsidiaries, lack of regulations orstandardized international definitions, practical procedures forcollecting data, or changes in methods.
4.3.4. Consolidation and internal controls
Environmental, social and industrial safety data are consolidatedand checked by each business unit and business segment, andthen at Group level. Data pertaining to certain specific indicators arecalculated directly by the business segments. These processesundergo regular internal audits.
4.3.5. External verification
The verification scope covers the forty-two quantitative and / orqualitative information categories as stated by Article R. 225-105-1of the French Commercial Law. The external verification isperformed at Group and business levels, as well as in a sample ofbusiness units in and outside France, selected each year in line withtheir relative contribution to the Group totals, previous years’ resultsand a risk analysis. The auditor’s independence is defined byregulations and the professions’ Rules of Professional Conductand / or an impartiality Committee.
Since 2005, the Group has its main environmental and socialperformance indicators externally verified. The units with the largestworkforces and that contribute significantly to environmentalindicators have been audited several times since this verificationprocess has been implemented.
4.3. Principles
employee turnover. This survey produces a breakdown of theworkforce by gender, professional category (managers and otheremployees), age and nationality.
The Worldwide Human Resources Survey is an annual surveywhich comprises approximately 100 indicators in addition to thoseused in the Global Workforce Analysis. The indicators are selectedin cooperation with the business segments and cover major componentsof the Group Human Resources policy, such as mobility, careermanagement, training, work conditions, employee dialogue, Codeof Conduct application, human rights, health, compensation,retirement benefits and insurance. The survey covers a representativesample of the consolidated scope. The data published in thisRegistration Document are extracted from the most recent survey,carried out in December 2015 and January 2016; 134 companiesin 54 countries, representing 91% of the consolidated Groupworkforce (87,341 employees) replied to the survey. With regard totraining only, this scope covers 90.5% of the Group’s consolidatedworkforce and 133 companies.
Both surveys are conducted using a new information systemimplemented at TOTAL in 2015, which strengthens coherencycontrols and develops the internal control process by adding levelsof validation.
4.2.1. Consolidation method
For the scopes defined above, safety indicators and social data arefully consolidated. Environmental indicators consolidate 100% ofthe emissions of Group operated sites for the “operated” indicators.GHG emissions are also published on an equity interest basis, i.e.by consolidating the Group share of the emissions of all assets inwhich the Group has a financial interest or rights to production.
4.2.2. Changes in scope
For social and environmental indicators, the indicators arecalculated on the basis of the perimeter of the Group as ofDecember 31, 2015. For safety indicators, acquisitions are takeninto account as soon as possible and at the latest on January 1 ofthe following year, and divestments are taken into account at theend of the quarter preceding their effective date of implementation.Restatement of previous years published data, unless there is aspecific statement, is now limited to changes of methodology.
Social, environmental and societal information 7Reporting scopes and method
Registration Document 2015. TOTAL 157
4.4.1. Industrial Safety definitions and indicators
TRIR (Total Recordable Injury Rate): number of recorded injuriesper million hours worked.
LTIR (Lost Time Injury Rate): number of lost time injuries per millionhours worked.
SIR (Severity Injury Rate): average number of days lost per lost timeinjury.
Employees of external contractors: any employee of a serviceprovider working at a Group-operated site or assigned by atransport company under a long-term contract.
Tier 1: indicator of the number of loss of primary containment asdefined in standards API 754 (for downstream) and IOGP 456 (for upstream).
Near miss: event which, under slightly different circumstances,could have resulted in a serious accident. The term “potentialseverity” is used for near misses.
Incidents and near misses are assessed in terms of actual or potentialseverity based on a scale that consists of six levels. Events with anactual or potential severity level of four or more are considered serious.
4.4.2. Environmental indicators
ISO sites: sites covered by an ISO 14001 certificate that is valid,some certificates may cover several sites.
Fresh water: water with salinity below 1.5 g / l.
Hydrocarbon spills: spills with a volume greater than 1 barrel (159 liters) are counted. These are accidental spills of which at leastpart of the volume spilled reaches the natural environment (includingnon-waterproof ground). Spills resulting from sabotage or maliciousacts are included. Spills which remain in a confined watertightcontainment system are excluded.
Waste: the contaminated soil excavated and removed from activesites to be treated externally is counted as waste. However, drillingdebris, mining cuttings or soil polluted in inactive sites are notcounted as waste.
GHG: the six gases of the Kyoto protocol, which are CO2, CH4, N2O,HFCs, PFCs and SF6, with their respective GWP (Global WarmingPotential) as described in the 2007 GIEC report.
GHG based on the Group’s equity interest: GHG emissions of non-significant assets are excluded, i.e. assets in which the Group’sequity interest is less than 10% and for which the Group share ofemissions are less than 50 kt CO2 eq / year. TOTAL relies on theinformation provided by its partners who operate its non-operatedassets. In cases where this information is not available, estimatesare made based on past data, budget data or by pro rata withsimilar assets.
Material loss rate: this rate corresponds to the net sum ofmaterials extracted or consumed which are neither auto-consumedenergy nor sold to a client, divided by the sum of transformedmaterial. This rate is only significant for hydrocarbon exploration,production and refinery activities.
Oil spill preparedness:
– an oil spill scenario is deemed “important” as soon as itsconsequences are on a small scale and with limited impacts onthe environment (orders of magnitude of several hundred metersof beaches impacted, and several tons of hydrocarbons);
– an oil spill preparedness plan is deemed operational if itdescribes the alert mechanisms, if it is based on pollutionscenarios that stem from risk analyses and if it describesmitigation strategies that are adapted to each scenario, if itdefines the technical and organizational means, internal andexternal, to be implemented and, lastly, if it mentions elements to be taken into account to implement a follow-up of theenvironmental impacts of the pollution; and
– oil spill preparedness exercise: only exercises conducted on thebasis of one of the scenarios identified in the oil spillpreparedness plan and which are played out until the stage ofequipment deployment are included for this indicator.
4.4. Details of certain indicators
7 Social, environmental and societal informationReporting scopes and method
TOTAL. Registration Document 2015158

5. Independent verifier’s report
Independent verifier’s report on consolidated social, environmental and societal information presented in the Management Report
This is a free translation into English of the original report issued in the French language and it is provided solely for the convenience ofEnglish speaking users. This report should be read in conjunction with, and construed in accordance with, French law and professionalstandards applicable in France.
To the shareholders,
In our quality as an independent verifier accredited by the COFRAC (1), under the number n° 3-1050, and as a member of the network of oneof the statutory auditors of the Company Total, we present our report on the consolidated social, environmental and societal informationestablished for the year ended on the December 31st 2015, presented in chapter 7 of the Registration Document, hereafter referred to as the“CSR Information,” pursuant to the provisions of article L. 225-102-1 of the French Commercial Code (Code de commerce).
Responsibility of the Company
It is the responsibility of the executive board to establish a Management Report including CSR Information referred to in Article R. 225-105-1 ofthe French Commercial Code (Code de commerce), in accordance with Human Resources and environment, health and safety protocols usedby the Company in their version updated in autumn 2015 (hereafter referred to as the “Criteria”), and of which a summary is included in the Management Report (chapter 7.4 of the Registration Document) and available on request at the Company’s headquarters.
Independence and quality control
Our independence is defined by regulatory requirements, the Code of Ethics of our profession as well as the provisions in Article L. 822-11 of the French Commercial Code (Code de commerce). In addition, we have implemented a quality control system, including documentedpolicies and procedures to ensure compliance with ethical standards, professional standards and applicable laws and regulations.
Responsibility of the independent verifier
It is our role, based on our work:
– to attest whether the required CSR Information is present in the Management Report or, in the case of its omission, that an appropriateexplanation has been provided, in accordance with the third paragraph of R. 225-105 of the French Commercial Code (Code de commerce)(Attestation of presence of CSR Information);
– to express a limited assurance conclusion, that the CSR Information, overall, is fairly presented, in all material aspects, in accordance withthe Criteria.
Our verification work was undertaken by a team of eight people between September 2015 and the date of signature of our report for anestimated duration of thirty weeks.
We conducted the work described below in accordance with the professional standards applicable in France and the Order of 13 May 2013determining the conditions under which an independent third-party verifier conducts its mission, and in relation to the opinion of fairness andthe reasonable assurance report, in accordance with the international standard ISAE 3000 (2).
5.1. Attestation of presence of CSR Information
We obtained an understanding of the Company’s CSR issues, based on interviews with the management of relevant departments, a presentation of the Company’s strategy on Sustainable Development based on the social and environmental consequences linked to the activities of the Company and its societal commitments, as well as, where appropriate, resulting actions or programmes.
We have compared the information presented in the Management Report with the list as provided for in the Article R. 225-105-1 of theFrench Commercial Code (Code de commerce).
In the absence of certain consolidated information, we have verified that the explanations were provided in accordance with the provisions inArticle R. 225-105, paragraph 3, of the French Commercial Code (Code de commerce).
We verified that the information covers the consolidated perimeter, namely the entity and its subsidiaries, as aligned with the meaning of theArticle L. 233-1 and the entities which it controls, as aligned with the meaning of the Article L. 233-3 of the French Commercial Code (Codede commerce) with the limitations specified in the Methodological Note of the Management Report (chapter 7.4 of the RegistrationDocument), and notably the Worldwide Human Resources Survey which covers 91% of the employees.
Based on this work, and given the limitations mentioned above, we confirm the presence in the Management Report of the required CSR information.
Social, environmental and societal information 7Independent verifier’s report
Registration Document 2015. TOTAL 159
(1) Scope available at www.cofrac.fr.(2) ISAE 3000 – Assurance engagements other than audits or reviews of historical information.
5.2. Limited assurance on CSR Information
Nature and scope of the work
We undertook interviews with about ten people responsible for the preparation of the CSR Information in the Sustainable Development andEnvironment Division, Industrial Safety Division and Human Resources Division, in charge of the data collection process and, if applicable,the people responsible for internal control processes and risk management, in order to:
– Assess the suitability of the Criteria for reporting, in relation to their relevance, completeness, reliability, neutrality, and understandability,taking into consideration, if relevant, industry standards;
– Verify the implementation of the process for the collection, compilation, processing and control for completeness and consistency of theCSR Information and identify the procedures for internal control and risk management related to the preparation of the CSR Information.
We determined the nature and extent of our tests and inspections based on the nature and importance of the CSR Information, in relation tothe characteristics of the Company, its social and environmental issues, its strategy in relation to Sustainable Development and industry bestpractices.
For the CSR Information which we considered the most important (1):
– At the level of the consolidated entity and the three segments, we consulted documentary sources and conducted interviews tocorroborate the qualitative information (organisation, policies, actions, etc.), we implemented analytical procedures on the quantitativeinformation and verified, on a test basis, the calculations and the compilation of the information, and also verified their coherence andconsistency with the other information presented in the management report-;
– At the level of the representative selection of sites that we selected (2), based on their activity, their contribution to the consolidated indicators,their location and a risk analysis, we undertook interviews to verify the correct application of the procedures and undertook detailed testson the basis of samples, consisting in verifying the calculations made and linking them with supporting documentation. The sampleselected therefore represented on average 15% of the total workforce and between 15% and 18% of the environmental information (3).
For the other consolidated CSR information, we assessed their consistency in relation to our knowledge of the Company.
Finally, we assessed the relevance of the explanations provided, if appropriate, in the partial or total absence of certain information.
We consider that the sample methods and sizes of the samples that we considered by exercising our professional judgment allow us toexpress a limited assurance conclusion; an assurance of a higher level would have required more extensive verification work. Due to thenecessary use of sampling techniques and other limitations inherent in the functioning of any information and internal control system, the riskof non-detection of a significant anomaly in the CSR Information cannot be entirely eliminated.
Conclusion
Based on our work, we have not identified any significant misstatement that causes us to believe that the CSR Information, taken together,has not been fairly presented, in compliance with the Criteria.
Paris-La Défense, March 4, 2016
French original signed by:
Independent VerifierERNST & YOUNG et Associés Christophe Schmeitzky Partner
Sustainable DevelopmentBruno Perrin Partner
TOTAL. Registration Document 2015160
7 Social, environmental and societal informationIndependent verifier’s report
(1) With respect to TOTAL Group’s activities, size of the Company and affiliates locations, we have considered as important:Environmental information: ISO 14001 certifications, SOx and NOx emissions, hazardous waste, oil spills, antipollution plans, freshwater withdrawals excluding once-through cooling water, flaring,greenhouse gases (operated and equity share).HR information: headcount, hiring and departures, training hours, social protection systems, compensation, organization of working time, social dialogue, diversity, accidents (frequency and severity),occupational diseases.Social information: relationships with stakeholders, relationships with suppliers, ethics, human rights.
(2) HR and environmental data verification: Total E&P Nederland BV, Total E&P Indonesia, Total E&P Congo, Raffinerie de Feyzin, Raffinerie de Grandpuits, Total Petrochemicals France (Carling site),Hutchinson Autopartes Mexico S.A., Servauto Nederland BV, Total Maroc, SunPower Corp. Mexico.HR data verification: Total Oil Asia Pacific Pte Ltd (documentary review).
(3) Coverage of the main environmental indicators: 18% of the greenhouse gases for operated sites, 14% of hazardous waste, 17% of freshwater withdrawals excluding once-through cooling water.
Registration Document 2015. TOTAL 161
TOTAL and its shareholders6.TOTAL et ses actionnaires 8
TOTAL and its shareholders1. Listing details 1621.1. Listing . . . . . . . . . . . . . . . . . . . . . . . . . . . . . . . . . . . . . . . . . . . . . . . . . . . . . . . . . . . . . . . . . . . . . . . . . . . . . . . . . . . . . . . . . . . . .1621.2. Share performance . . . . . . . . . . . . . . . . . . . . . . . . . . . . . . . . . . . . . . . . . . . . . . . . . . . . . . . . . . . . . . . . . . . . . . . . . . . . . . . . . . .163
2. Dividend 1652.1. Dividend policy . . . . . . . . . . . . . . . . . . . . . . . . . . . . . . . . . . . . . . . . . . . . . . . . . . . . . . . . . . . . . . . . . . . . . . . . . . . . . . . . . . . . . .1652.2. Dividend payment . . . . . . . . . . . . . . . . . . . . . . . . . . . . . . . . . . . . . . . . . . . . . . . . . . . . . . . . . . . . . . . . . . . . . . . . . . . . . . . . . . . .1662.3. Coupons . . . . . . . . . . . . . . . . . . . . . . . . . . . . . . . . . . . . . . . . . . . . . . . . . . . . . . . . . . . . . . . . . . . . . . . . . . . . . . . . . . . . . . . . . . .166
3. Share buybacks 1673.1. Share buybacks and cancellations in 2015 . . . . . . . . . . . . . . . . . . . . . . . . . . . . . . . . . . . . . . . . . . . . . . . . . . . . . . . . . . . . . . . .1673.2. Board’s report on share buybacks and sales . . . . . . . . . . . . . . . . . . . . . . . . . . . . . . . . . . . . . . . . . . . . . . . . . . . . . . . . . . . . . .1673.3. 2015-2016 share buyback program . . . . . . . . . . . . . . . . . . . . . . . . . . . . . . . . . . . . . . . . . . . . . . . . . . . . . . . . . . . . . . . . . . . . . .169
4. Shareholders 1714.1. Major shareholders . . . . . . . . . . . . . . . . . . . . . . . . . . . . . . . . . . . . . . . . . . . . . . . . . . . . . . . . . . . . . . . . . . . . . . . . . . . . . . . . . . .1714.2. Employee shareholding . . . . . . . . . . . . . . . . . . . . . . . . . . . . . . . . . . . . . . . . . . . . . . . . . . . . . . . . . . . . . . . . . . . . . . . . . . . . . . .1734.3. Shareholding structure . . . . . . . . . . . . . . . . . . . . . . . . . . . . . . . . . . . . . . . . . . . . . . . . . . . . . . . . . . . . . . . . . . . . . . . . . . . . . . . .1734.4. Regulated agreements and undertakings and related-party transactions . . . . . . . . . . . . . . . . . . . . . . . . . . . . . . . . . . . . . . .1744.5. Factors likely to have an impact in the event of a public offering . . . . . . . . . . . . . . . . . . . . . . . . . . . . . . . . . . . . . . . . . . . . . .174
5. Information for foreign shareholders 1755.1. American holders of ADRs . . . . . . . . . . . . . . . . . . . . . . . . . . . . . . . . . . . . . . . . . . . . . . . . . . . . . . . . . . . . . . . . . . . . . . . . . . . . .1755.2. Non-resident shareholders (other than American shareholders) . . . . . . . . . . . . . . . . . . . . . . . . . . . . . . . . . . . . . . . . . . . . . . .175
6. Investor Relations 1766.1. Documents on display . . . . . . . . . . . . . . . . . . . . . . . . . . . . . . . . . . . . . . . . . . . . . . . . . . . . . . . . . . . . . . . . . . . . . . . . . . . . . . . .1766.2. Relationships with institutional investors, financial analysts and individual shareholders . . . . . . . . . . . . . . . . . . . . . . . . . . .1766.3. Registered shareholding . . . . . . . . . . . . . . . . . . . . . . . . . . . . . . . . . . . . . . . . . . . . . . . . . . . . . . . . . . . . . . . . . . . . . . . . . . . . . .1776.4. 2016 calendar . . . . . . . . . . . . . . . . . . . . . . . . . . . . . . . . . . . . . . . . . . . . . . . . . . . . . . . . . . . . . . . . . . . . . . . . . . . . . . . . . . . . . . .1776.5. 2017 calendar . . . . . . . . . . . . . . . . . . . . . . . . . . . . . . . . . . . . . . . . . . . . . . . . . . . . . . . . . . . . . . . . . . . . . . . . . . . . . . . . . . . . . . .1786.6. Investor Relations contacts . . . . . . . . . . . . . . . . . . . . . . . . . . . . . . . . . . . . . . . . . . . . . . . . . . . . . . . . . . . . . . . . . . . . . . . . . . . .178
1.1.1. Stock Exchanges
Paris, New York, London and Brussels
1.1.2. Codes
ISIN FR0000120271Reuters TOTF.PABloomberg FP FPDatastream F: TALMnémo FP
1.1.3. Included in the following stock indexes
CAC 40, Euro Stoxx 50, Stoxx Europe 50, DJ Global Titans
1.1.4. Included in the following ESG (Environment, Social, Governance) indexes
DJSI World, FTSE4Good, Ethibel Excellence and, since 2015,Nasdaq Global Sustainability
1.1.5. Weighting in the main stock indexes as of December 31, 2015
CAC 40 9.3% 2nd largest component in the indexEURO STOXX 50 4.7% the largest component in the indexSTOXX EUROPE 50 2.9% 6th largest component in the indexDJ GLOBAL TITANS 1.2% 37th largest component in the index
1.1.6. Market capitalization on Euronext Paris and in the euro zone as of December 31, 2015
TOTAL has the second largest capitalization on the Euronext Parisregulated market. Based on the market capitalization of thecompanies that make up the Euro Stoxx 50, the largest marketcapitalizations in the euro zone are as follows (a):
As of December 31, 2015(€B)
AB InBev 183.9Unilever 119.7Sanofi 102.6TOTAL (b) 100.7Industria de Diseno Textil 98.7Bayer 95.8
(a) Source: Bloomberg for companies other than TOTAL.(b) Shares outstanding on December 31, 2015: 2,440,057,883. TOTAL closing share
price in Paris on December 31, 2015: €41.27.
1.1.7. Market capitalization as of December 31, 2015 (1)
€100.7 billion (2)
$109.7 billion (3)
1.1.8. Percentage of free float
As of December 31, 2015, the free float factor determined byEuronext for calculating TOTAL’s weight in the CAC 40 was 90%.The free float factor determined by Stoxx for calculating TOTAL’sweight in the Euro Stoxx 50 was 100%.
1.1.9. Par value
€2.50
1.1.10. Credit ratings of the long-term and short-term debt (long-term / outlook / short-term)
As of December 31 2015 2014
Standard & Poor’s AA- / Neg / A-1+ AA- / Neg / A-1+Moody’s Aa1 / Stable / P-1 Aa1 / Stable / P-1
On February 22, 2016, Standard & Poor’s downgraded TOTAL’slong term credit rating from AA- to A+ with a negative outlook. The short term credit rating was also downgraded from A-1+ to A-1.
1. Listing details
1.1. Listing
8 TOTAL and its shareholdersListing details
TOTAL. Registration Document 2015162
(1) Shares outstanding on December 31, 2015: 2,440,057,883.(2) TOTAL closing share price in Paris on December 31, 2015: €41.27.(3) TOTAL closing ADR price in New York on December 31, 2015: $44.95.
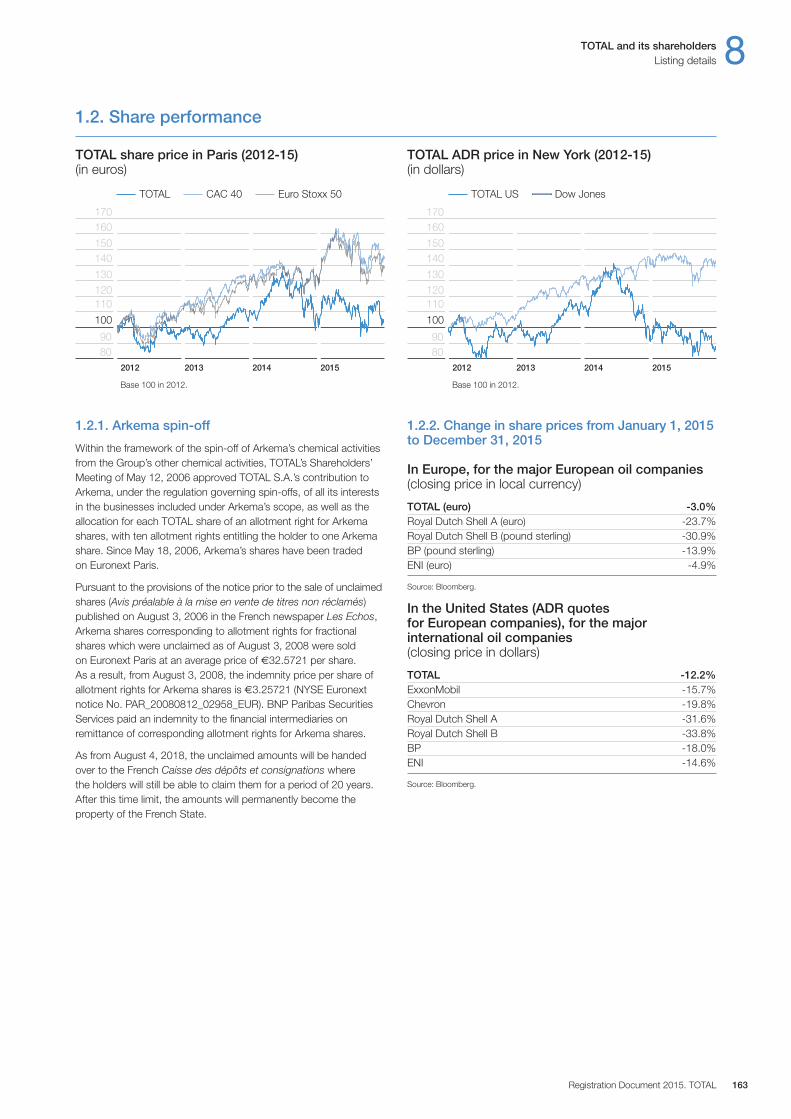
1.2.1. Arkema spin-off
Within the framework of the spin-off of Arkema’s chemical activitiesfrom the Group’s other chemical activities, TOTAL’s Shareholders’Meeting of May 12, 2006 approved TOTAL S.A.’s contribution toArkema, under the regulation governing spin-offs, of all its interestsin the businesses included under Arkema’s scope, as well as theallocation for each TOTAL share of an allotment right for Arkemashares, with ten allotment rights entitling the holder to one Arkemashare. Since May 18, 2006, Arkema’s shares have been traded on Euronext Paris.
Pursuant to the provisions of the notice prior to the sale of unclaimedshares (Avis préalable à la mise en vente de titres non réclamés)published on August 3, 2006 in the French newspaper Les Echos,Arkema shares corresponding to allotment rights for fractionalshares which were unclaimed as of August 3, 2008 were sold on Euronext Paris at an average price of €32.5721 per share. As a result, from August 3, 2008, the indemnity price per share ofallotment rights for Arkema shares is €3.25721 (NYSE Euronextnotice No. PAR_20080812_02958_EUR). BNP Paribas SecuritiesServices paid an indemnity to the financial intermediaries onremittance of corresponding allotment rights for Arkema shares.
As from August 4, 2018, the unclaimed amounts will be handedover to the French Caisse des dépôts et consignations where the holders will still be able to claim them for a period of 20 years.After this time limit, the amounts will permanently become theproperty of the French State.
1.2.2. Change in share prices from January 1, 2015to December 31, 2015
In Europe, for the major European oil companies(closing price in local currency)
TOTAL (euro) -3.0%Royal Dutch Shell A (euro) -23.7%Royal Dutch Shell B (pound sterling) -30.9%BP (pound sterling) -13.9%ENI (euro) -4.9%
Source: Bloomberg.
In the United States (ADR quotes for European companies), for the major international oil companies (closing price in dollars)
TOTAL -12.2%ExxonMobil -15.7%Chevron -19.8%Royal Dutch Shell A -31.6%Royal Dutch Shell B -33.8%BP -18.0%ENI -14.6%
Source: Bloomberg.
TOTAL share price in Paris (2012-15)(in euros)
TOTAL ADR price in New York (2012-15)(in dollars)
2012 2013 2014 2015
80
140
130120110
100
160
150
TOTAL CAC 40 Euro Stoxx 50
170
90
Base 100 in 2012.
TOTAL and its shareholders 8Listing details
Registration Document 2015. TOTAL 163
2012 2013 2014 2015
80
140
130120110
100
160
150
TOTAL US Dow Jones
170
90
Base 100 in 2012.
1.2. Share performance
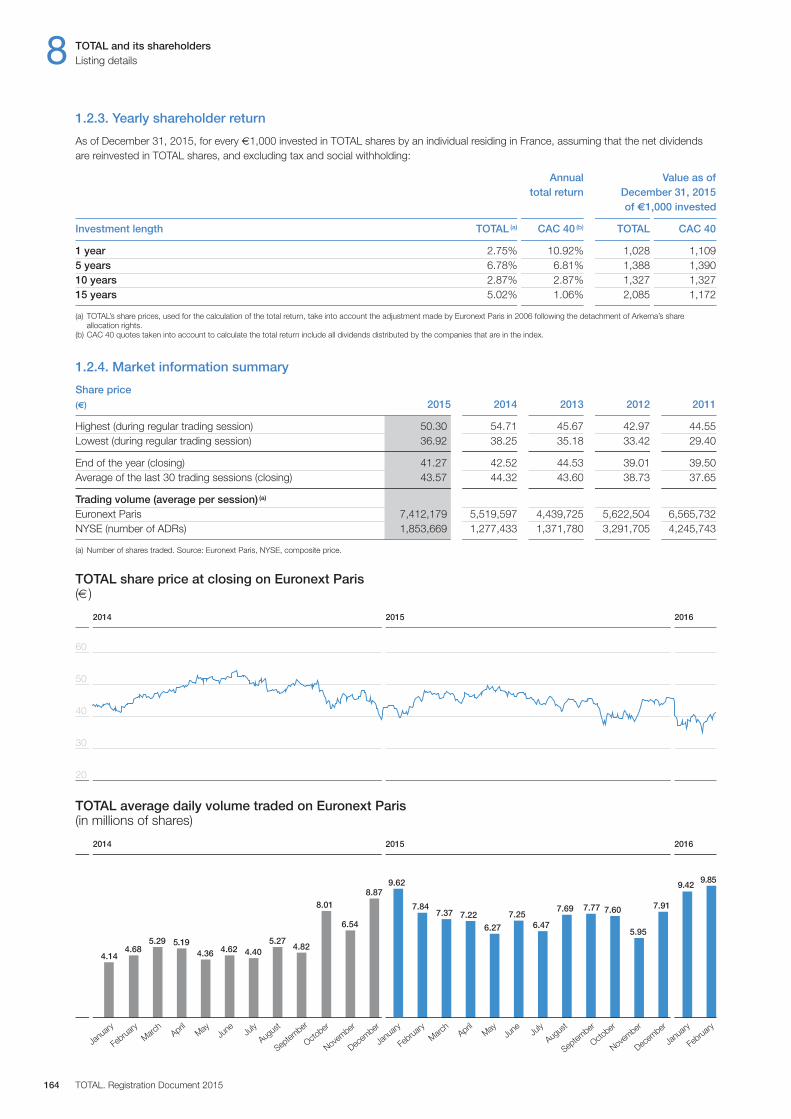
TOTAL average daily volume traded on Euronext Paris(in millions of shares)
2014 2015
20
30
40
50
60
2016
1.2.3. Yearly shareholder return
As of December 31, 2015, for every €1,000 invested in TOTAL shares by an individual residing in France, assuming that the net dividendsare reinvested in TOTAL shares, and excluding tax and social withholding:
Annual Value as of total return December 31, 20 15
of €1,000 invested
Investment length TOTAL (a) CAC 40 (b) TOTAL CAC 40
1 year 2.75% 10.92% 1,028 1,1095 years 6.78% 6.81% 1,388 1,39010 years 2.87% 2.87% 1,327 1,32715 years 5.02% 1.06% 2,085 1,172
(a) TOTAL’s share prices, used for the calculation of the total return, take into account the adjustment made by Euronext Paris in 2006 following the detachment of Arkema’s shareallocation rights.
(b) CAC 40 quotes taken into account to calculate the total return include all dividends distributed by the companies that are in the index.
1.2.4. Market information summary
Share price(€) 2015 2014 2013 2012 2011
Highest (during regular trading session) 50.30 54.71 45.67 42.97 44.55Lowest (during regular trading session) 36.92 38.25 35.18 33.42 29.40
End of the year (closing) 41.27 42.52 44.53 39.01 39.50Average of the last 30 trading sessions (closing) 43.57 44.32 43.60 38.73 37.65
Trading volume (average per session) (a)
Euronext Paris 7,412,179 5,519,597 4,439,725 5,622,504 6,565,732NYSE (number of ADRs) 1,853,669 1,277,433 1,371,780 3,291,705 4,245,743
(a) Number of shares traded. Source: Euronext Paris, NYSE, composite price.
TOTAL share price at closing on Euronext Paris(€)
8 TOTAL and its shareholdersListing details
TOTAL. Registration Document 2015164
2014 2015
Februa
ry
7.84
March
7.37
April
7.22
May
6.27
June
7.25
July
6.47
Augus
t
7.69
Septem
ber
7.77
October
7.60
November
5.95
Decem
ber
7.91
Februa
ry
Februa
ry
4.68
March
5.29
April
5.19
May
4.36
June
4.62
July
4.40
Augus
t
5.27
Septem
ber
4.82
October
8.01
November
6.54
Decem
ber
8.87
Janu
ary
9.62
Janu
ary
4.14
2016
Janu
ary
9.859.42

2.1.1. Dividend payment policy
On October 28, 2010, TOTAL S.A.’s Board of Directors adopted a policy based on quarterly dividend payments starting in fiscal year 2011.
2.1.2. Fiscal years 2015 and 2016 dividends
TOTAL has paid the following quarterly interim dividends with respectto fiscal year 2015:
– the first quarterly interim dividend for the fiscal year 2015 of €0.61per share, decided by the Board of Directors on September 22,2015, was paid in cash or in shares on October 21, 2015 (theex-dividend date was September 28, 2015). The number of sharesissued in lieu of the cash dividend was based on the dividendamount divided by €35.63 per share, equal to 90% of the averageEuronext Paris opening price of the shares for the 20 tradingdays preceding the Board of Directors meeting, reduced by theamount of the first interim dividend; and
– the second quarterly interim dividend for the fiscal year 2015 of €0.61 per share, decided by the Board of Directors onDecember 16, 2015, was paid in cash or in shares on January 14,2016 (the ex-dividend date was December 21, 2015). Thenumber of shares issued in lieu of the cash dividend was basedon the dividend amount divided by €39.77 per share, equal to90% of the average Euronext Paris opening price of the sharesfor the 20 trading days preceding the Board of Directors meeting,reduced by the amount of the second interim dividend.
The third quarterly interim dividend of €0.61 per share for fiscalyear 2015, approved by the Board of Directors on March 15, 2016,will be paid in cash or in shares on April 12, 2016 (the ex-dividenddate will be March 21, 2016).
After closing the 2015 accounts, the Board of Directors decided onFebruary 10, 2016, to propose to the Annual Shareholders’ Meetingon May 24, 2016 an annual dividend of €2.44 per share for fiscalyear 2015. Taking into account the interim dividends for the first threequarters of 2015 decided by the Board of Directors, the remaining2015 dividend is €0.61 per share, equal to the three 2015 interimdividends.
The Board of Directors also decided to propose to the shareholdersthe option of receiving the remaining 2015 dividend payment in newshares benefiting from a discount of 10% (1). Pending the approval at the Annual Shareholders’ Meeting, the ex-dividend date wouldbe June 6, 2016, and the payment date for the cash dividend or the delivery of the new shares, depending on the election of theshareholder, would be set for June 23, 2016.
Subject to the applicable legislative and regulatory provisions, andpending the approval by the Board of Directors and the shareholdersat the Shareholders’ Meeting for the accounts and the remainingdividend, the ex-date calendar for the interim quarterly dividends andthe final dividend for fiscal year 2016 is expected to be as follows:
– 1st interim dividend: September 27, 2016;– 2nd interim dividend: December 21, 2016;– 3rd interim dividend: March 20, 2017; and– remaining dividend: June 5, 2017.
The provisional ex-dividend dates above relate to the TOTAL sharestraded on Euronext Paris.
Dividends for the last five fiscal years (2)
(€)
In 2015, TOTAL’s pay-out ratio was 60% (3). Changes in the pay-outratio (4) over the past five fiscal years are as follows:
2. Dividend
2.1. Dividend policy
TOTAL and its shareholders 8Dividend
Registration Document 2015. TOTAL 165
20122011 2013 2014
2.28 € 2.34 € 2.38 €
2015Interim dividendRemainder
2.44 € 2.44 €
58% 60%
50%45% 43%
20122011 2013 2014 2015
(1) The issuance price of each new share will be equal to 90% of the average opening price of TOTAL S.A.’s shares on Euronext Paris over the 20 trading days preceding the Annual Shareholders’Meeting, reduced by the amount of the remaining dividend, and rounded up to the nearest euro centime.
(2) Pending approval at the May 24, 2016 Shareholders’ Meeting. Dividends are eligible for the 40% rebate applicable to individuals residing in France for tax purposes, as stipulated in Article 158of the French General Tax Code.
(3) Based on adjusted fully-diluted earnings per share of €4.07 and a dividend of €2.44 per share pending approval at the May 24, 2016 Shareholders’ Meeting.(4) Based on adjusted fully-diluted earnings for the relevant year.
2.2. Dividend payment
BNP Paribas Securities Services manages the payment of the dividend, which is made through financial intermediaries using the EuroclearFrance direct payment system.
JP Morgan Chase Bank (4 New York Plaza, New York, NY 10005-1401, USA) manages the payment of dividends to holders of AmericanDepositary Receipts (ADRs).
2.2.1. Dividend payment on stock certificates
TOTAL issued stock certificates (certificats représentatifs d’actions, CRs) as part of the public exchange offer for Total Petrochemicals & RefiningSA / NV (formerly PetroFina) shares.
The CR is a stock certificate provided for by French rules, issued by Euroclear France, intended to circulate exclusively outside of France,and which may not be held by French residents. The CR is freely convertible from a physical certificate into a security registered on a custodyaccount and vice-versa. However, in compliance with the Belgian law of December 14, 2005 on the dematerialization of securities in Belgium,CRs may only be delivered in the form of a dematerialized certificate as of January 1, 2008. In addition, ING Belgique is the bank handlingthe payment of all coupons detached from outstanding CRs.
No fees are applicable to the payment of coupons detached from CRs, except for any income or withholding taxes; the payment may bereceived on request at the following bank branches:ING Belgique Avenue Marnix 24, 1000 Brussels, BelgiumBNP Paribas Fortis Avenue des Arts 45, 1040 Brussels, BelgiumKBC BANK N.V. Avenue du Port 2, 1080 Brussels, Belgium
2.3. Coupons
For the year ended Ex-dividend Payment Expiration Nature of Net amount date date date the coupon (€)
2009 11 / 13 / 2009 11 / 18 / 2009 11 / 18 / 2014 Interim dividend 1.145 / 27 / 2010 6 / 1 / 2010 6 / 1 / 2015 Remaining dividend 1.14
2010 11 / 12 / 2010 11 / 17 / 2010 11 / 17 / 2015 Interim dividend 1.145 / 23 / 2011 5 / 26 / 2011 5 / 26 / 2016 Remaining dividend 1.14
2011 9 / 19 / 2011 9 / 22 / 2011 9 / 22 / 2016 Interim dividend 0.5712 / 19 / 2011 12 / 22 / 2011 12 / 22 / 2016 Interim dividend 0.573 / 19 / 2012 3 / 22 / 2012 3 / 22 / 2017 Interim dividend 0.576 / 18 / 2012 6 / 21 / 2012 6 / 21 / 2017 Remaining dividend 0.57
2012 9 / 24 / 2012 9 / 27 / 2012 9 / 27 / 2017 Interim dividend 0.5712 / 17 / 2012 12 / 20 / 2012 12 / 20 / 2017 Interim dividend 0.593 / 18 / 2013 3 / 21 / 2013 3 / 21 / 2018 Interim dividend 0.596 / 24 / 2013 6 / 27 / 2013 6 / 27 / 2018 Remaining dividend 0.59
2013 9 / 24 / 2013 9 / 27 / 2013 9 / 27 / 2018 Interim dividend 0.5912 / 16 / 2013 12 / 19 / 2013 12 / 19 / 2018 Interim dividend 0.593 / 24 / 2014 3 / 27 / 2014 3 / 27 / 2019 Interim dividend 0.596 / 2 / 2014 6 / 5 / 2014 6 / 5 / 2019 Remaining dividend 0.61
2014 9 / 23 / 2014 9 / 26 / 2014 9 / 26 / 2019 Interim dividend 0.6112 / 15 / 2014 12 / 17/2014 12 / 17 / 2019 Interim dividend 0.613 / 23 / 2015 3 / 25 / 2015 3 / 25 / 2020 Interim dividend 0.616 / 8 / 2015 7 / 1 / 2015 7 / 1 / 2020 Remaining dividend 0.61
2015 (a) 9 / 28 / 2015 10 / 21 / 2015 10 / 21 / 2020 Interim dividend 0.6112 / 21 / 2015 1 / 14 / 2016 1 / 14 / 2021 Interim dividend 0.613 / 21 / 2016 4 / 12 / 2016 4 / 12 / 2021 Interim dividend 0.616 / 6 / 2016 6 / 23 / 2016 6 / 23 / 2021 Remaining dividend 0.61
(a) A resolution will be submitted to the Shareholders’ Meeting on May 24, 2016 to pay a dividend of €2.44 per share for fiscal year 2015, including a remaining dividend of €0.61 pershare, with an ex-dividend date on June 6, 2016 and a payment date set for June 23, 2016, in cash or in new shares.
8 TOTAL and its shareholdersDividend
TOTAL. Registration Document 2015166
3.2.1. Share buybacks during 2015
Under the authorization granted by the Shareholders’ Meeting ofMay 29, 2015, 4,711,935 TOTAL shares, each with a par value of €2.50, were bought back by TOTAL S.A. in 2015, i.e., 0.20% (1)
of the share capital as of December 31, 2015. These buybackswere completed at an average price of €45.22 per share, for a totalcost of approximately €213 million, excluding transaction fees.These buybacks are intended to cover the performance share grantplan approved by the Board of Directors on July 28, 2015.
3.2.2. Shares held in the name of the Companyand its subsidiaries as of December 31, 2015
As of December 31, 2015, the Company held 13,636,490 treasuryshares, representing 0.56% of TOTAL’s share capital, including13,603,525 shares held to cover the performance share grant plansand 32,965 shares to be awarded under new share purchase optionplans or new restricted share grant plans. Pursuant to French law,the voting rights and dividend rights of these shares are suspended.
As of December 31, 2015, the Group’s subsidiaries held 100,331,268treasury shares, representing 4.11% of TOTAL’s share capital.Pursuant to French law, the shares are entitled to a dividend butdeprived of voting rights.
The total number of TOTAL shares held by the Group as ofDecember 31, 2015 was 113,967,758, representing 4.67% ofTOTAL’s share capital.
For shares bought back to be allocated to Company or Groupemployees pursuant to the objectives referred to in Article 3 of ECRegulation 2273 / 2003 of December 22, 2003, note that, whensuch shares are held to cover share purchase option plans thathave expired or performance share grants that have not beenawarded at the end of the vesting period, they will be allocated tonew TOTAL share purchase option plans or restricted share grantplans that may be approved by the Board of Directors.
3.1. Share buybacks and cancellations in 2015
In 2015, TOTAL S.A. bought back 4,711,935 of its own shares to cover commitments made in connection with performance share grantplans, i.e., 0.20% of the share capital (1).
Percentage of share capital bought back
In addition, TOTAL S.A. did not cancel any shares in 2015.
3.2. Board’s report on share buybacks and sales
The Shareholders’ Meeting of May 29, 2015, after acknowledgingthe report of the Board of Directors, authorized the Board ofDirectors, in accordance with the provisions of Article L. 225-209 ofthe French Commercial Code and of EC Regulation 2273 / 2003 ofDecember 22, 2003, to buy and sell the Company’s shares as partof a share buyback program. The maximum purchase price was setat €70 per share. The number of shares acquired may not exceed10% of the share capital. This authorization was granted for aperiod of 18 months and replaced the previous authorizationgranted by the Shareholders’ Meeting of May 16, 2014.
A resolution will be submitted to the Shareholders’ Meeting on May 24, 2016 to authorize trading in TOTAL shares under a sharebuyback program carried out in accordance with Article L. 225-209of the French Commercial Code and European Regulation 2273 / 2003of December 22, 2003. The specificities of this program aredescribed in point 3.3 of this chapter.
3. Share buybacks
TOTAL and its shareholders 8Share buybacks
Registration Document 2015. TOTAL 167
0.20%0.08%
0.18%
0.0%
0.19%
20122011 2013 2014 2015
(1) Average share capital of year N = (share capital at December 31 N-1 + share capital at December 31 N)/2.
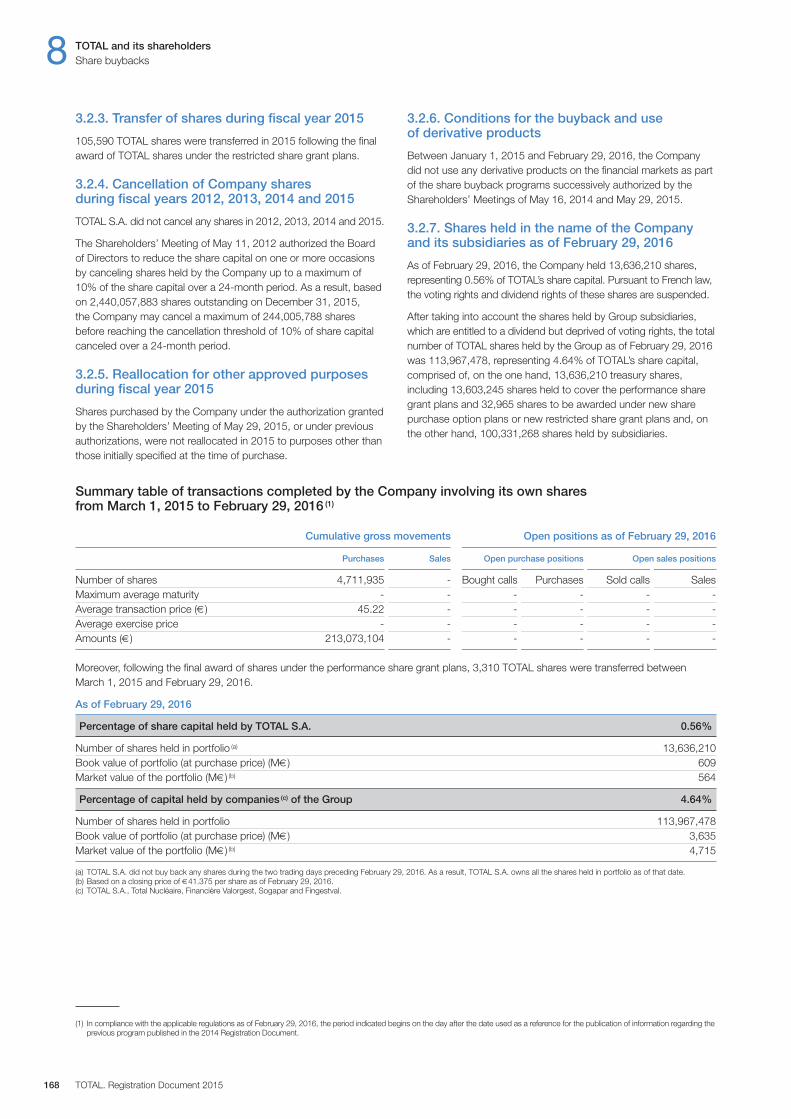
Summary table of transactions completed by the Company involving its own shares from March 1, 2015 to February 29, 2016 (1)
Cumulative gross movements Open positions as of February 29, 2016
Purchases Sales Open purchase positions Open sales positions
Number of shares 4,711,935 - Bought calls Purchases Sold calls SalesMaximum average maturity - - - - - -Average transaction price (€) 45.22 - - - - -Average exercise price - - - - - -Amounts (€) 213,073,104 - - - - -
Moreover, following the final award of shares under the performance share grant plans, 3,310 TOTAL shares were transferred between March 1, 2015 and February 29, 2016.
As of February 29, 2016
Percentage of share capital held by TOTAL S.A. 0.56%
Number of shares held in portfolio (a) 13,636,210Book value of portfolio (at purchase price) (M€) 609Market value of the portfolio (M€) (b) 564
Percentage of capital held by companies (c) of the Group 4.64%
Number of shares held in portfolio 113,967,478Book value of portfolio (at purchase price) (M€) 3,635Market value of the portfolio (M€) (b) 4,715
(a) TOTAL S.A. did not buy back any shares during the two trading days preceding February 29, 2016. As a result, TOTAL S.A. owns all the shares held in portfolio as of that date.(b) Based on a closing price of €41.375 per share as of February 29, 2016.(c) TOTAL S.A., Total Nucléaire, Financière Valorgest, Sogapar and Fingestval.
3.2.3. Transfer of shares during fiscal year 2015
105,590 TOTAL shares were transferred in 2015 following the finalaward of TOTAL shares under the restricted share grant plans.
3.2.4. Cancellation of Company shares during fiscal years 2012, 2013, 2014 and 2015
TOTAL S.A. did not cancel any shares in 2012, 2013, 2014 and 2015.
The Shareholders’ Meeting of May 11, 2012 authorized the Boardof Directors to reduce the share capital on one or more occasionsby canceling shares held by the Company up to a maximum of10% of the share capital over a 24-month period. As a result, basedon 2,440,057,883 shares outstanding on December 31, 2015,the Company may cancel a maximum of 244,005,788 sharesbefore reaching the cancellation threshold of 10% of share capitalcanceled over a 24-month period.
3.2.5. Reallocation for other approved purposesduring fiscal year 2015
Shares purchased by the Company under the authorization grantedby the Shareholders’ Meeting of May 29, 2015, or under previousauthorizations, were not reallocated in 2015 to purposes other thanthose initially specified at the time of purchase.
3.2.6. Conditions for the buyback and use of derivative products
Between January 1, 2015 and February 29, 2016, the Companydid not use any derivative products on the financial markets as partof the share buyback programs successively authorized by theShareholders’ Meetings of May 16, 2014 and May 29, 2015.
3.2.7. Shares held in the name of the Companyand its subsidiaries as of February 29, 2016
As of February 29, 2016, the Company held 13,636,210 shares,representing 0.56% of TOTAL’s share capital. Pursuant to French law,the voting rights and dividend rights of these shares are suspended.
After taking into account the shares held by Group subsidiaries,which are entitled to a dividend but deprived of voting rights, the totalnumber of TOTAL shares held by the Group as of February 29, 2016was 113,967,478, representing 4.64% of TOTAL’s share capital,comprised of, on the one hand, 13,636,210 treasury shares,including 13,603,245 shares held to cover the performance sharegrant plans and 32,965 shares to be awarded under new sharepurchase option plans or new restricted share grant plans and, onthe other hand, 100,331,268 shares held by subsidiaries.
8 TOTAL and its shareholdersShare buybacks
TOTAL. Registration Document 2015168
(1) In compliance with the applicable regulations as of February 29, 2016, the period indicated begins on the day after the date used as a reference for the publication of information regarding theprevious program published in the 2014 Registration Document.
3.3.1. Description of the share buyback programunder Article 241-1 et seq. of the GeneralRegulation of the French Financial MarketsAuthority
The objectives of the share buyback program are as follows:– reduce the Company’s capital through the cancellation of shares;– honor the Company’s obligations related to securities convertible
or exchangeable into Company shares;– honor the Company’s obligations related to stock option programs
or other share grants to the Company’s executive directors or to employees of the Company or a Group subsidiary;
– deliver shares (by exchange, payment or otherwise) in connectionwith external growth operations; and
– stimulate the secondary market or the liquidity of the TOTALshare under a liquidity agreement.
3.3.2. Legal framework
Implementation of this share buyback program, which is covered byArticle L. 225-209 et seq. of the French Commercial Code, Article241-1 et seq. of the General Regulation of the French FinancialMarkets Authority (Autorité des marchés financiers – AMF), and theprovisions of EC Regulation 2273 / 2003 of December 22, 2003,is subject to approval by the TOTAL S.A. Shareholders’ Meeting of May 24, 2016 through the 5th resolution that reads as follows:
“Upon presentation of the report by the Board of Directors andinformation appearing in the description of the program preparedpursuant to Articles 241-1 and thereafter of the General Regulation(Règlement général) of the French Financial Markets Authority(Autorité des marchés financiers, AMF), and voting under theconditions of quorum and majority required for Ordinary GeneralMeetings, the shareholders hereby authorize the Board of Directors,with the possibility to sub-delegate such authority under the termsprovided for by French law, pursuant to the provisions of ArticleL. 225-209 of the French Commercial Code, of Council RegulationNo. 2273 / 2003 dated December 22, 2003 and of the GeneralRegulation of the AMF, to buy or sell shares of the Company withinthe framework of a share buyback program.
The purchase, sale or transfer of such shares may be transacted byany means on regulated markets, multilateral trading facilities orover the counter, including the purchase or sale by block-trades, in accordance with the regulations of the relevant market authorities.Such transactions may include the use of any financial derivativeinstrument traded on regulated markets, multilateral trading facilitiesor over the counter, and implementing option strategies.
These transactions may be carried out at any time, in accordancewith the applicable rules and regulations, except during any publicoffering periods applying to the Company’s share capital.
The maximum purchase price is set at €70 per share.
In the case of a capital increase by incorporation of reserves orshare grants for no consideration and in the case of a stock-split ora reverse-stock-split, this maximum price shall be adjusted byapplying the ratio of the number of shares outstanding before thetransaction to the number of shares outstanding after the transaction.
Pursuant to the provisions of Article L. 225-209 of the FrenchCommercial Code, the maximum number of shares that may bebought back under this authorization may not exceed 10% of thetotal number of shares outstanding as of the date on which thisauthorization is used. This limit of 10% is applicable to a capital ofthe Company which may be adjusted from time to time as a resultof transactions after the date of the present Meeting. Purchasesmade by the Company may under no circumstances result in theCompany holding more than 10% of the share capital, eitherdirectly or indirectly through indirect subsidiaries.
As of December 31, 2015, out of the 2,440,057,883 sharesoutstanding at this date, the Company held 13,636,490 sharesdirectly and 100,331,268 shares indirectly through its subsidiaries,for a total of 113,967,758 shares. Under these circumstances, themaximum number of shares that the Company could buy back is130,038,030 shares and the maximum amount that the Companymay spend to acquire such shares is €9,101,662,100.
The purpose of this share buyback program is to reduce thenumber of shares outstanding or to allow the Company to fulfill itsengagements in connection with:
– convertible or exchangeable securities that may give holdersrights to receive shares of the Company upon conversion orexchange; or
– share purchase option plans, employee shareholding plans,Company savings plans or other share allocation programs formanagement or employees of the Company or Group companies.
The purpose of the buybacks may also be one of the marketpractices accepted by the AMF, i.e.,:
– delivery of shares (by exchange, payment or otherwise) in casesof external growth transactions, mergers, spin-offs or contributions,not exceeding the limit set forth in Article L. 225-209, 6th paragraphof the French Commercial Code in cases of mergers, spin-offs or contributions; or
– support the secondary market or the liquidity of TOTAL shares byan investment services provider by means of a liquidity agreementcompliant with the Code of ethics recognized by the AMF.
This program may also be used by the Company to trade in its ownshares, either on or off the market, for any other purpose that isauthorized or any permitted market practice, or any other purposethat may be authorized or any other market practice that may bepermitted under the applicable law or regulation. In case oftransactions other than the above-mentioned intended purposes,the Company will inform its shareholders in a press release.
3.3. 2015-2016 share buyback program
TOTAL and its shareholders 8Share buybacks
Registration Document 2015. TOTAL 169
According to the intended purposes, the treasury shares that areacquired by the Company through this program may, in particular, be:
– cancelled, up to the maximum legal limit of 10% of the totalnumber of shares outstanding on the date of the operation, pereach 24-month period;
– granted for no consideration to the employees of the Group andto the management of the Company or of other companies ofthe Group;
– delivered to the holders of Company’s shares purchase optionshaving exercised such options;
– sold to employees, either directly or through the intermediary of Company savings funds;
– delivered to the holders of securities that grant such rights to receive such shares, either through redemption, conversion,exchange, presentation of a warrant or in any other manner; or
– used in any other way consistent with the purposes stated in thisresolution.
While they are bought back and held by the Company, such shareswill be deprived of voting rights and dividend rights.
This authorization is granted for a period of eighteen months fromthe date of this Meeting. It renders ineffective up to the unusedportion, the previous authorization granted by the OrdinaryShareholders’ Meeting held on May 29, 2015.
The Board of Directors is hereby granted full authority, with the rightto delegate such authority, to undertake all actions authorized bythis resolution.”
In addition, the Annual Shareholders’ Meeting of May 11, 2012authorized the Board of Directors to reduce the Company capitalby canceling shares within a 10% limit of the share capital per 24-month period. This authorization was granted for five years and will expire at the conclusion of the Shareholders’ Meetingcalled to approve the financial statements for fiscal year endingDecember 31, 2016. This authorization reads as follows: “Uponpresentation of the report of the Board of Directors and theauditors’ special report, and voting under the conditions of quorumand majority required for Extraordinary General Meetings, theshareholders hereby authorize the Board of Directors, in accordancewith Article L. 225-209 and following of the French CommercialCode and Article L. 225-213 of the same Code, to reduce theCompany’s capital on one or more occasions by canceling shares,in the limits authorized by law.
The maximum number of Company shares that can be canceleddue to this authorization is set at 10% of the shares comprising the Company capital, per twenty-four month period, specifying that this limit applies to the number of shares that will be adjusted, if necessary, to take into account transactions affecting the sharecapital after this meeting.
The Shareholders’ Meeting grants all authority to the Board ofDirectors, with the option to sub-delegate within the conditions setforth by the law, to perform the share capital reduction transactionsat its sole option, decide on the number of shares to be canceledwithin a 10% limit per twenty-four month period, of the totalnumber of shares comprising the existing share capital on the dateof the transaction, determine the terms and condition of the capital
reduction and record the completion, allocate, if necessary, thedifference between the purchase value of the shares to be canceledand their par value in a reserve or premium account, then modifythe Articles of Association and carry out any necessary formalities.
This authorization is granted for five years and expires at theconclusion of the Shareholders’ Meeting called to approve thefinancial statements for fiscal year ending December 31, 2016.”
3.3.3. Conditions
Maximum share capital to be purchased and maximum fundsallocated to the transaction
The maximum number of shares that may be purchased under theauthorization proposed to the Shareholders’ Meeting of May 24, 2016may not exceed 10% of the total number of shares outstanding,with this limit applying to an amount of the Company’s share capitalthat will be adjusted, if necessary, to include transactions affectingthe share capital subsequent to this Meeting. Purchases made bythe Company may under no circumstances result in the Companyholding more than 10% of the share capital, either directly orindirectly through subsidiaries.
Before any share cancellation under the authorization given bythe Shareholders’ Meeting of May 29, 2015, based on the numberof shares outstanding as of February 29, 2016 (2,454,012,342 shares),and given the 113,967,478 shares held by the Group as ofFebruary 29, 2016, i.e., 4.64% of the share capital, the maximumnumber of shares that may be purchased would be 131,433,756,representing a theoretical maximum investment of €9,200,362,920based on the maximum purchase price of €70.
Conditions for buybacks
Such shares may be bought back by any means on regulatedmarkets, multilateral trading facilities or over the counter, includingthrough the purchase or sale of blocks of shares, under theconditions authorized by the relevant market authorities. Thesemeans include the use of any financial derivative instrument tradedon a regulated market or over the counter and the implementationof option strategies, with the Company taking measures, however,to avoid increasing the volatility of its stock. The portion of theprogram carried out through the purchase of blocks of shares willnot be subject to quota allocation, up to the limit set by thisresolution. These shares may be bought back at any time inaccordance with current regulations, except during public offeringsfor the Company’s shares.
Duration and schedule of the share buyback program
In accordance with the 5th resolution, which will be subject to approval by the Shareholders’ Meeting of May 24, 2016, theshare buyback program may be implemented over an 18-monthperiod following the date of this Meeting, and therefore expireson November 23, 2017.
Transactions carried out under the previous program
Transactions carried out under the previous program are listed inthe special report of the Board of Directors on share buybacks(refer to point 3.2 of this chapter).
8 TOTAL and its shareholdersShare buybacks
TOTAL. Registration Document 2015170
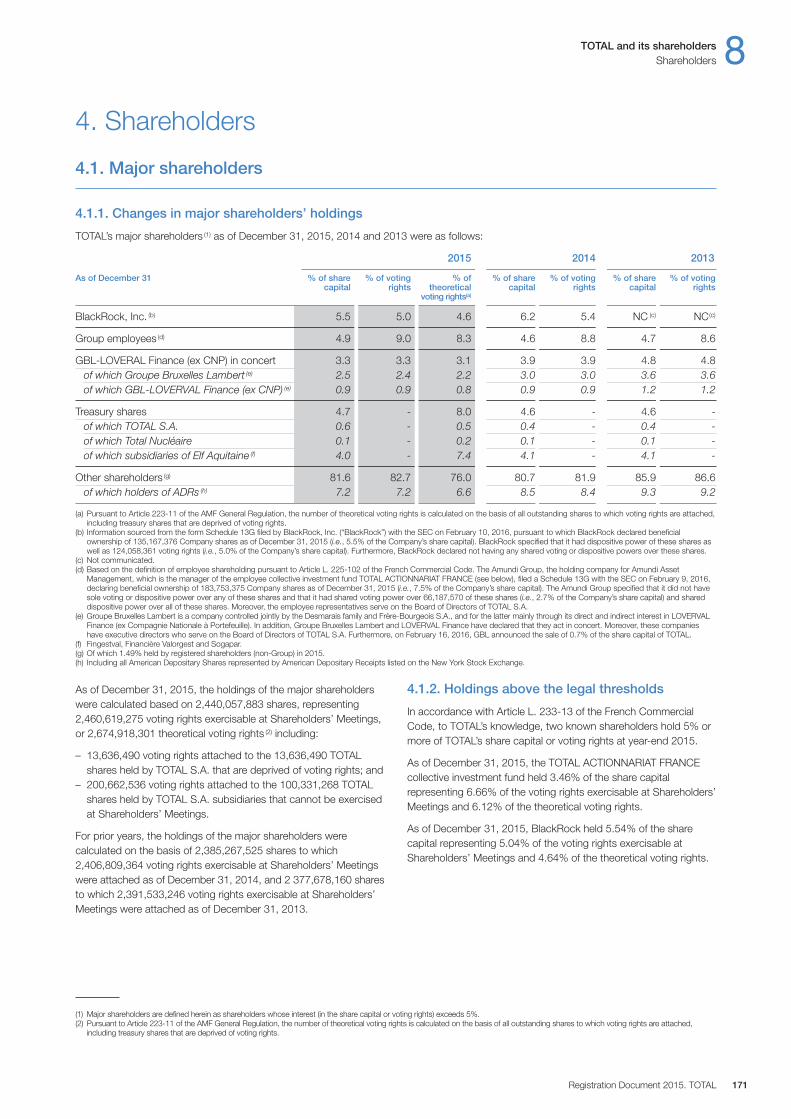
As of December 31, 2015, the holdings of the major shareholderswere calculated based on 2,440,057,883 shares, representing2,460,619,275 voting rights exercisable at Shareholders’ Meetings,or 2,674,918,301 theoretical voting rights (2) including:
– 13,636,490 voting rights attached to the 13,636,490 TOTALshares held by TOTAL S.A. that are deprived of voting rights; and
– 200,662,536 voting rights attached to the 100,331,268 TOTALshares held by TOTAL S.A. subsidiaries that cannot be exercisedat Shareholders’ Meetings.
For prior years, the holdings of the major shareholders werecalculated on the basis of 2,385,267,525 shares to which2,406,809,364 voting rights exercisable at Shareholders’ Meetingswere attached as of December 31, 2014, and 2 377,678,160 sharesto which 2,391,533,246 voting rights exercisable at Shareholders’Meetings were attached as of December 31, 2013.
4.1.2. Holdings above the legal thresholds
In accordance with Article L. 233-13 of the French CommercialCode, to TOTAL’s knowledge, two known shareholders hold 5% ormore of TOTAL’s share capital or voting rights at year-end 2015.
As of December 31, 2015, the TOTAL ACTIONNARIAT FRANCEcollective investment fund held 3.46% of the share capitalrepresenting 6.66% of the voting rights exercisable at Shareholders’Meetings and 6.12% of the theoretical voting rights.
As of December 31, 2015, BlackRock held 5.54% of the sharecapital representing 5.04% of the voting rights exercisable atShareholders’ Meetings and 4.64% of the theoretical voting rights.
4. Shareholders
4.1. Major shareholders
4.1.1. Changes in major shareholders’ holdings
TOTAL’s major shareholders (1) as of December 31, 2015, 2014 and 2013 were as follows:
2015 2014 2013
As of December 31 % of share % of voting % of % of share % of voting % of share % of voting capital rights theoretical capital rights capital rights
voting rights(a)
BlackRock, Inc. (b) 5.5 5.0 4.6 6.2 5.4 NC (c) NC(c)
Group employees (d) 4.9 9.0 8.3 4.6 8.8 4.7 8.6
GBL-LOVERAL Finance (ex CNP) in concert 3.3 3.3 3.1 3.9 3.9 4.8 4.8of which Groupe Bruxelles Lambert (e) 2.5 2.4 2.2 3.0 3.0 3.6 3.6of which GBL-LOVERVAL Finance (ex CNP) (e) 0.9 0.9 0.8 0.9 0.9 1.2 1.2
Treasury shares 4.7 - 8.0 4.6 - 4.6 -of which TOTAL S.A. 0.6 - 0.5 0.4 - 0.4 -of which Total Nucléaire 0.1 - 0.2 0.1 - 0.1 -of which subsidiaries of Elf Aquitaine (f) 4.0 - 7.4 4.1 - 4.1 -
Other shareholders (g) 81.6 82.7 76.0 80.7 81.9 85.9 86.6of which holders of ADRs (h) 7.2 7.2 6.6 8.5 8.4 9.3 9.2
(a) Pursuant to Article 223-11 of the AMF General Regulation, the number of theoretical voting rights is calculated on the basis of all outstanding shares to which voting rights are attached,including treasury shares that are deprived of voting rights.
(b) Information sourced from the form Schedule 13G filed by BlackRock, Inc. (“BlackRock”) with the SEC on February 10, 2016, pursuant to which BlackRock declared beneficialownership of 135,167,376 Company shares as of December 31, 2015 (i.e., 5.5% of the Company’s share capital). BlackRock specified that it had dispositive power of these shares aswell as 124,058,361 voting rights (i.e., 5.0% of the Company’s share capital). Furthermore, BlackRock declared not having any shared voting or dispositive powers over these shares.
(c) Not communicated.(d) Based on the definition of employee shareholding pursuant to Article L. 225-102 of the French Commercial Code. The Amundi Group, the holding company for Amundi Asset
Management, which is the manager of the employee collective investment fund TOTAL ACTIONNARIAT FRANCE (see below), filed a Schedule 13G with the SEC on February 9, 2016,declaring beneficial ownership of 183,753,375 Company shares as of December 31, 2015 (i.e., 7.5% of the Company’s share capital). The Amundi Group specified that it did not havesole voting or dispositive power over any of these shares and that it had shared voting power over 66,187,570 of these shares (i.e., 2.7% of the Company’s share capital) and shareddispositive power over all of these shares. Moreover, the employee representatives serve on the Board of Directors of TOTAL S.A.
(e) Groupe Bruxelles Lambert is a company controlled jointly by the Desmarais family and Frère-Bourgeois S.A., and for the latter mainly through its direct and indirect interest in LOVERVALFinance (ex Compagnie Nationale à Portefeuille). In addition, Groupe Bruxelles Lambert and LOVERVAL Finance have declared that they act in concert. Moreover, these companieshave executive directors who serve on the Board of Directors of TOTAL S.A. Furthermore, on February 16, 2016, GBL announced the sale of 0.7% of the share capital of TOTAL.
(f) Fingestval, Financière Valorgest and Sogapar.(g) Of which 1.49% held by registered shareholders (non-Group) in 2015.(h) Including all American Depositary Shares represented by American Depositary Receipts listed on the New York Stock Exchange.
TOTAL and its shareholders 8Shareholders
Registration Document 2015. TOTAL 171
(1) Major shareholders are defined herein as shareholders whose interest (in the share capital or voting rights) exceeds 5%.(2) Pursuant to Article 223-11 of the AMF General Regulation, the number of theoretical voting rights is calculated on the basis of all outstanding shares to which voting rights are attached,
including treasury shares that are deprived of voting rights.
4.1.3. Legal threshold notifications in fiscal year 2015
In AMF notice No. 215C0524 dated April 24, 2015, BlackRock, Inc.stated that, as of April 22, 2015, they had fallen below the 5% sharecapital threshold and that they held 119,087,683 TOTAL sharesrepresenting as many voting rights, i.e., 4.99% of the share capitaland 4.95% of the theoretical voting rights (based on share capital of2,385,555,871 shares representing 2,406,776,372 voting rights).
In AMF notice No. 215C0941 dated June 30, 2015, BlackRock, Inc.stated that, as of June 26, 2015, they had risen above the 5%share capital threshold and that they held 119,829,183 TOTALshares representing as many voting rights, i.e., 5.0005% of theshare capital and 4.56% of the theoretical voting rights (based onshare capital of 2,396,322,481 shares representing 2,627,688,781voting rights).
In AMF notice No. 215C0971 dated July 3, 2015, BlackRock, Inc.stated that, as of June 29, 2015, they had fallen below the 5% sharecapital threshold and that they held 119,757,351 TOTAL sharesrepresenting as many voting rights, i.e., 4.99% of the share capitaland 4.56% of the theoretical voting rights (based on share capital of 2,396,322,481 shares representing 2,627,688,781 voting rights).
In AMF notice No. 215C1371 dated October 5, 2015, BlackRock, Inc.stated that, as of September 30, 2015, they had risen above the5% share capital threshold and that they held 120,847,773 TOTALshares representing as many voting rights, i.e., 5.004% of the sharecapital and 4.57% of the theoretical voting rights (based on sharecapital of 2,415,073,561 shares representing 2,646,761,359 votingrights).
In AMF notice No. 215C1395 dated October 9, 2015, BlackRock, Inc.stated that, as of October 5, 2015, they had fallen below the 5%share capital threshold and that they held 120,602,086 TOTALshares representing as many voting rights, i.e., 4.99% of the sharecapital and 4.56% of the theoretical voting rights (based on sharecapital of 2,415,073,561 shares representing 2,646,761,359 votingrights).
In AMF notice No. 215C1413 dated October 13, 2015, BlackRock, Inc.stated that, as of October 7, 2015, they had risen above the 5%share capital threshold and that they held 121,653,868 TOTAL sharesrepresenting as many voting rights, i.e., 5.04% of the share capitaland 4.60% of the theoretical voting rights (based on share capital of2,415,073,561 shares representing 2,646,761,359 voting rights).
4.1.4. Threshold notifications
In addition to the legal obligation to inform the Company and theFrench Financial Markets Authority within four trading days of thedate on which the number of shares (or securities similar to sharesor voting rights pursuant to Article L. 233-9 of the French CommercialCode) held represents more than 5%, 10%, 15%, 20%, 25%, 30%,one-third, 50%, two-thirds, 90% or 95% of the share capital ortheoretical voting rights (Article L. 233-7 of the French CommercialCode), any individual or legal entity who directly or indirectly comesto hold a percentage of the share capital, voting rights or rightsgiving future access to the Company’s share capital that is equal toor greater than 1%, or a multiple of this percentage, is required tonotify the Company, within 15 days of the date on which each of theabove thresholds is exceeded, by registered mail with return receiptrequested, and indicate the number of shares held.
In case the shares above these thresholds are not declared, anyshares held in excess of the threshold that should have beendeclared will be deprived of voting rights at Shareholders’ Meetingsif, at a Shareholders’ Meeting, the failure to make a declaration isacknowledged and if one or more shareholders holding collectivelyat least 3% of the Company’s share capital or voting rights sorequest at that meeting.
Any individual or legal entity is also required to notify the Company indue form and within the time limits stated above when their direct orindirect holdings fall below each of the aforementioned thresholds.
Notifications must be sent to the Senior Vice President of InvestorRelations in London (contact details in point 6.6 of this chapter).
4.1.5. Temporary transfer of securities
Pursuant to legal provisions, any legal entity or individual (with theexception of those described in paragraph IV-3 of Article L. 233-7of the French Commercial Code) holding alone or in concert anumber of shares representing more than 0.5% of the Company’svoting rights pursuant to one or more temporary transfers or similaroperations as described in Article L. 225-126 of the aforementionedCode is required to notify the Company and the French FinancialMarkets Authority of the number of shares temporarily owned nolater than the second business day preceding the Shareholders’Meeting at midnight.
Notifications must be e-mailed to the Company at the followingaddress: [email protected]
If no notification is sent, any shares acquired under any of the abovetemporary transfer operations will be deprived of voting rights at the relevant Shareholders’ Meeting and at any Shareholders’ Meetingthat may be held until such shares are transferred again or returned.
4.1.6. Shareholders’ agreements
TOTAL is not aware of any agreements among its shareholders.
8 TOTAL and its shareholdersShareholders
TOTAL. Registration Document 2015172
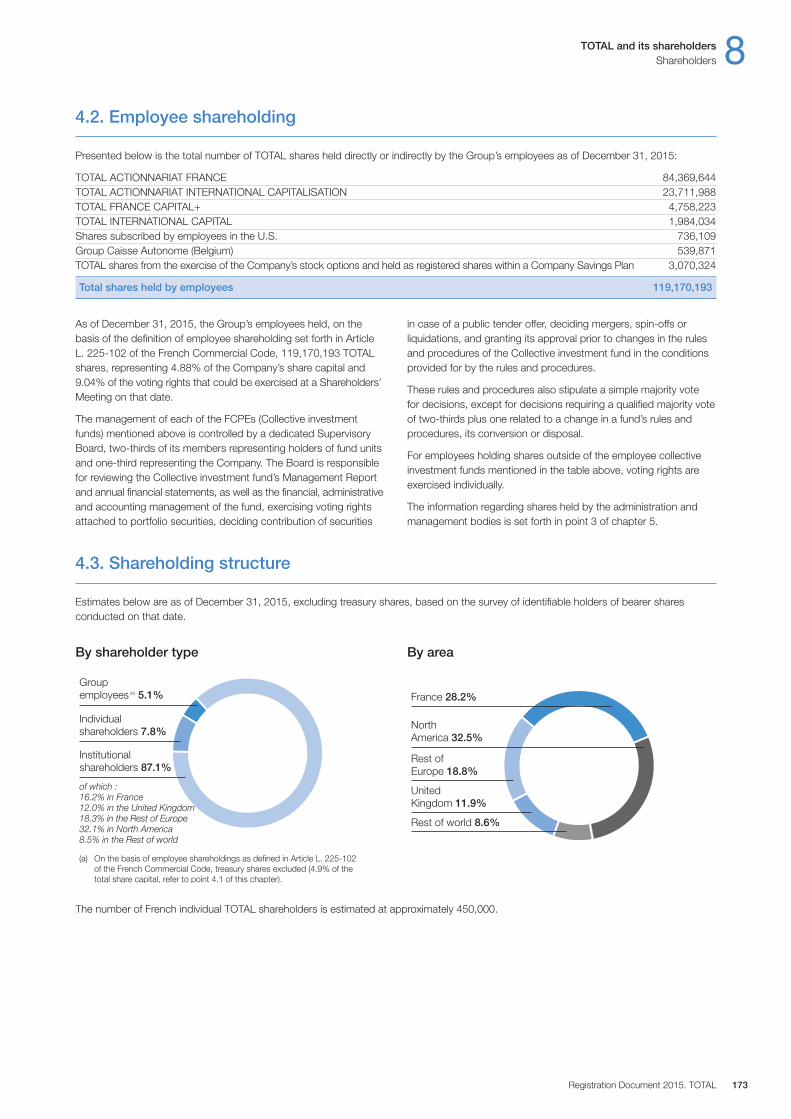
The number of French individual TOTAL shareholders is estimated at approximately 450,000.
By shareholder type By area
4.3. Shareholding structure
Estimates below are as of December 31, 2015, excluding treasury shares, based on the survey of identifiable holders of bearer sharesconducted on that date.
As of December 31, 2015, the Group’s employees held, on thebasis of the definition of employee shareholding set forth in ArticleL. 225-102 of the French Commercial Code, 119,170,193 TOTALshares, representing 4.88% of the Company’s share capital and9.04% of the voting rights that could be exercised at a Shareholders’Meeting on that date.
The management of each of the FCPEs (Collective investmentfunds) mentioned above is controlled by a dedicated SupervisoryBoard, two-thirds of its members representing holders of fund unitsand one-third representing the Company. The Board is responsiblefor reviewing the Collective investment fund’s Management Reportand annual financial statements, as well as the financial, administrativeand accounting management of the fund, exercising voting rightsattached to portfolio securities, deciding contribution of securities
in case of a public tender offer, deciding mergers, spin-offs orliquidations, and granting its approval prior to changes in the rulesand procedures of the Collective investment fund in the conditionsprovided for by the rules and procedures.
These rules and procedures also stipulate a simple majority vote for decisions, except for decisions requiring a qualified majority voteof two-thirds plus one related to a change in a fund’s rules andprocedures, its conversion or disposal.
For employees holding shares outside of the employee collectiveinvestment funds mentioned in the table above, voting rights areexercised individually.
The information regarding shares held by the administration andmanagement bodies is set forth in point 3 of chapter 5.
TOTAL and its shareholders 8Shareholders
Registration Document 2015. TOTAL 173
4.2. Employee shareholding
Presented below is the total number of TOTAL shares held directly or indirectly by the Group’s employees as of December 31, 2015:
TOTAL ACTIONNARIAT FRANCE 84,369,644TOTAL ACTIONNARIAT INTERNATIONAL CAPITALISATION 23,711,988TOTAL FRANCE CAPITAL+ 4,758,223TOTAL INTERNATIONAL CAPITAL 1,984,034Shares subscribed by employees in the U.S. 736,109Group Caisse Autonome (Belgium) 539,871TOTAL shares from the exercise of the Company’s stock options and held as registered shares within a Company Savings Plan 3,070,324
Total shares held by employees 119,170,193
Individual shareholders 7.8%
Group employees (a) 5.1%
Institutional shareholders 87.1%
of which :16.2% in France12.0% in the United Kingdom18.3% in the Rest of Europe32.1% in North America8.5% in the Rest of world
(a) On the basis of employee shareholdings as defined in Article L. 225-102of the French Commercial Code, treasury shares excluded (4.9% of the total share capital, refer to point 4.1 of this chapter).
Rest of Europe 18.8%
United Kingdom 11.9%
France 28.2%
North America 32.5%
Rest of world 8.6%
In accordance with Article L. 225-100-3 of the French CommercialCode, information relating to factors likely to have an impact in theevent of a public offering is provided below.
• Structure of the share capital and direct or indirect interests of which the Company is aware pursuant to Articles L. 233-7and L. 233-12 of the French Commercial CodeThe structure of the Company’s share capital and the intereststhat the Company is aware of pursuant to Articles L. 233-7 andL. 233-12 of the French Commercial Code are presented in point4.1 to 4.3 of chapter 8.
• Restrictions on the exercise of voting rights and transfers of shares provided in the bylaws – Clauses of the agreementsof which the Company has been informed in accordance withArticle L. 233-11 of the French Commercial CodeThe provisions of the bylaws relating to shareholders’ votingrights are mentioned in point 2.4 of chapter 9. The Company has not been informed of any clauses as specified in paragraph 2of Article L. 225-100-3 of the French Commercial Code.
• Holders of securities conferring special control rightsArticle 18 of the bylaws stipulates that double voting rights aregranted to all the shares held in the name of the same shareholderfor at least two years. Subject to this condition, there are nosecurities conferring special control rights as specified in paragraph 4of Article L. 225-100-3 of the French Commercial Code.
• Control mechanisms specified in an employee shareholdingsystemThe rules relating to the exercise of voting rights within theCompany collective investment funds are presented in point 4.2of this chapter 8.
• Shareholder agreements of which the company is aware and that could restrict share transfers and the exercise of voting rightsThe Company is not aware of any agreements betweenshareholders as specified in paragraph 6 of Article L. 225-100-3of the French Commercial Code which could result in restrictionson the transfer of shares and exercise of the voting rights of theCompany.
• Rules applicable to the appointment and replacement ofmembers of the Company’s Board of Directors and amendmentof the bylawsNo provision of the bylaws or an agreement made between theCompany and a third party contains a specific provision relatingto the appointment and / or replacement of the Company’s directorsthat is likely to have an impact in the event of a public offering.
• Powers of the Board of Directors in the event of a public offeringNo delegation of authority or authorization granted by theShareholders’ Meeting that is currently in effect limits the powersof the Board of Directors over the Company’s shares during apublic offering, except for the authorization for the Board to tradein shares of the Company.
• Agreements to which the Company is party and which arealtered or terminated in the event of a change of control of the Company – Agreements providing for the payment of compensation to members of the Board of Directors or employees in the event of their resignation or dismissalwithout real and serious cause or if their employment were to be terminated as a result of a tender offerAlthough a number of agreements made by the Company containa change in control clause, the Company believes that there areno agreements as specified in paragraph 9 or 10 of ArticleL. 225-100-3 of the French Commercial Code. The Company alsobelieves that there are no agreements as specified in paragraph10 of Article L. 225-100-3 of the French Commercial Code. Forcommitments made for the Chairman and Chief Executive Officerin the event of a forced departure owing to a change of control or strategy, refer to point 2.2.3 of chapter 6.
4.5. Factors likely to have an impact in the event of a public offering
4.4.1. Regulated agreements and undertakings
The special report of the statutory auditors of TOTAL S.A. onregulated agreements and undertakings referred to in ArticleL. 225-38 et seq. of the French Commercial Code for fiscal year2015 is provided in point 1 of chapter 12.
In addition, to TOTAL’s knowledge there exists no agreement, other than the agreements related to its ordinary course of businessand signed under normal conditions, engaged, directly or through anintermediary, between, on the one hand, any director or shareholderholding more than 10% of TOTAL S.A.’s voting rights and, on theother hand, a company of which TOTAL S.A. directly or indirectlyowns more than half the capital.
4.4.2. Related-party transactions
Details of transactions with related parties as specified by theregulations adopted under EC regulation 1606 / 2002, entered intoby the Group companies during fiscal years 2013, 2014 or 2015,are provided in Note 24 to the Consolidated Financial Statements(refer to point 7 of chapter 10).
These transactions primarily concern equity affiliates and non-consolidated companies.
4.4. Regulated agreements and undertakings and related-party transactions
8 TOTAL and its shareholdersShareholders
TOTAL. Registration Document 2015174

The information set forth below is a general overview. Shareholdersare invited to consult their own tax advisor to determine theapplicable procedures, the effect of tax treaties and, more generally,the tax impacts applicable to their particular situation.
Dividends
Dividends distributed by TOTAL to shareholders not residing inFrance are generally subject to French withholding tax at a rate of30%. This rate is increased to 75% for income paid outside Francein a non-cooperative country or territory (NCCT), as defined by the French General Tax Code (Article 238-0 A). This withholding taxis reduced to 21% for dividends received by individuals residing in a Member State of the European Union or in certain countries inEurope such as Iceland and Liechtenstein.
Under numerous bilateral international tax treaties signed betweenFrance and other countries for the purpose of avoiding doubletaxation (“Tax Treaties”), the withholding tax rate is reduced in caseswhere dividends are paid to a shareholder residing in one of thecountries that signed such Tax Treaties, provided that certainconditions are met. Countries with which France has signed a TaxTreaty providing for a reduced withholding tax rate of 15% on Frenchdividends include: Austria, Belgium, Canada, Germany, Ireland, Italy,Luxembourg, the Netherlands, Norway, Singapore, South Africa,Spain, Switzerland and the United Kingdom.
Taxation of dividends outside France varies according to eachcountry’s respective tax legislation. In most countries, the grossamount of dividends is included in the shareholder’s taxableincome. Based on certain conditions and limitations, the Frenchwithholding tax on dividends may result in a tax credit being appliedto the foreign tax payable by the shareholder. However, there aresome exceptions, as in Belgium where a 25% withholding taxapplies to net dividends received by an individual shareholder.
Dividends received in shares and dividends paid in cash are widelyand generally taxed under the same regime.
Taxation on sales of shares
Capital gains on sales of shares realized by taxpayers residingoutside France are, in principle, exempt from income tax in France.However, there are two exceptions to this rule: one for sales of holdings where the seller owns a permanent establishment or a fixed place of business in France to which his or her shares areattached, and the other for sales carried out by individuals ororganizations residing or established in a NCCT.
The shareholder may, nevertheless, be taxed on the capital gain or loss on the sale of shares in his or her country of tax residence.
A financial transaction tax (FTT) was instituted by the law ofMarch 14, 2012. This tax applies to all purchases of shares ofcompanies listed on a French, European or foreign regulatedmarket, provided that the purchase results in a transfer ofownership and that the securities are issued by a French companywhose market capitalization exceeds €1 billion as of December 1of the year preceding the year of taxation.
The FTT also applies to securities representing shares of stockissued by a company, regardless of the place of establishment of itshead office. Transactions carried out on certificates representingshares, such as ADRs and European Depositary Receipts, aretherefore subject to this tax.
The FTT is equal to 0.2% of the share purchase price.
In principle, sales of shares of French companies are also subject toa French transfer duty (droit d’enregistrement). However, Frenchlaw stipulates that transfer duties are not applicable to transactionsthat are subject to the FTT.
TOTAL and its shareholders 8Information for foreign shareholders
Registration Document 2015. TOTAL 175
5. Information for foreign shareholders
5.1. American holders of ADRs
Information for holders of TOTAL American Depositary Receipts (ADRs), representing American Depositary Shares (ADSs), is provided onTOTAL’s annual report on Form 20-F filed with the SEC for the fiscal year ended December 31, 2015.
5.2. Non-resident shareholders (other than American shareholders)
Members of the Group’s General Management and InvestorRelations regularly meet with institutional investors and financialanalysts in the leading financial centers throughout the world. In 2015, the Group organized more than 1,000 meetings.
Each year, two main presentations are given to the financialcommunity: one in February following the publication of the resultsfor the previous fiscal year, and one in September to present theGroup’s outlook and objectives. A series of meetings is held aftereach of these presentations. In addition, each year the ChiefFinancial Officer hosts three conference calls to discuss results forthe first, second and third quarters of the year.
The information presented and broadcast at these events is availableon the Group’s website total.com (under “Investors / InstitutionalInvestors / Presentations” or “Investors / Results”).
With a dedicated team, the Group maintains an active dialogue withshareholders in the field of Corporate Social Responsibility (CSR)and governance. Meetings covering these themes are organized inFrance and worldwide. More than 70 meetings were held in 2015.In addition, chapter 7 of this Registration Document focuses onsocial and environmental information.
The Group also has a team dedicated to relationships with individualshareholders. This department, which is the only shareholderservice in France to have received ISO 9001 certification, offers a comprehensive communication package, featuring:
– a direct line, email address, and postal address (refer to point 6.6of this chapter);
– documentation and material provided for individual shareholders(i.e., the shareholders’ newsletter, individual shareholders pagesavailable on the Company’s website, and a Total Investors mobileapp for digital tablets and smartphones);
– shareholder meetings and investor fairs held in France andworldwide;
– the Shareholders’ Club, which organizes visits to industrial facilities,visits to natural sites and cultural events sponsored by the TotalFoundation, and conferences about the Group; and
– the Shareholders’ e-Advisory Committee, which expresses itsviews on the communication service as a whole.
This team also organizes the Annual Shareholders’ Meeting, whichwas held on May 29, 2015 at the Palais des Congrès in Paris andattended by 3,400 people.
The documentation on relationships with individual shareholders is available on the Company’s website total.com (under“Investors / Individual shareholders”).
6.2. Relationships with institutional investors, financial analysts and individual shareholders
Information and documents regarding TOTAL S.A., its bylaws andthe Company’s statutory and Consolidated Financial Statements forthe year ended December 31, 2015 or previous fiscal years, maybe consulted at its registered office pursuant to the legal andregulatory provisions in force.
In addition, the French version of TOTAL S.A.’s RegistrationDocument filed with the French Financial Markets Authority (Autoritédes marchés financiers) for each of the past 10 financial years isavailable on its website total.com (under “Investors / Regulatedinformation in France”), as is the French version of TOTAL S.A.’s
mid-year financial reports filed with the French Financial MarketsAuthority since 2007. The Group’s bi-annual presentations of itsresults and outlook, as well as the quarterly financial information arealso available on its website. This English version of the Document de référence (Registration Document) is provided for informationpurposes only.
In addition, in order to meet its obligations related to the listing of itsshares in the United States, the Company also files an annualreport on Form 20-F, in English, with the SEC.
8 TOTAL and its shareholdersInvestor Relations
TOTAL. Registration Document 2015176
6. Investor Relations
6.1. Documents on display

The full calendar including shareholder meetings and investor fairs is available on the Company’s website total.com (under “Investors / Calendar”).
February 11 Results of the fourth quarter and full year 2015, and Investors’ Day – London
March 21 Ex-dividend date for the 2015 third interim dividend
April 27 Results of the first quarter 2016
May 24 2016 Annual Shareholders’ Meeting in Paris (Palais des Congrès)
June 6 Ex-dividend date for the 2015 remaining dividend (2)
July 28 Results of the second quarter and first half 2016
September 22 Investors’ Day (outlook and objectives) – London
September 27 Ex-dividend date for the 2016 first interim dividend (3)
October 28 Results of the third quarter and first nine months of 2016
December 21 Ex-dividend date for the 2016 second interim dividend (3)
TOTAL and its shareholders 8Investor Relations
Registration Document 2015. TOTAL 177
6.4. 2016 calendar
TOTAL S.A. shares can be held in bearer form or registered form. In the latter case, shareholders are identified by TOTAL S.A., in itscapacity as the issuer, or by its agent, BNP Paribas SecuritiesServices, which is responsible for keeping the register of shareholders’registered shares.
6.3.1. Registered shares
There are two forms of registration:
– administered registered shares: shares are registered withTOTAL through BNP Paribas Securities Services, but the holder’sfinancial intermediary continues to administer them with regard tosales, purchases, coupons, etc.; and
– pure registered shares: TOTAL holds and directly administersshares on behalf of the holder through BNP Paribas SecuritiesServices, which administers sales, purchases, coupons,Shareholders’ Meeting notices, etc., so that the shareholderdoes not need to appoint a financial intermediary.
6.3.2. Main advantages of registered shares
The advantages of registered shares include:
– double voting rights if the shares are held continuously for twosuccessive years (refer to point 2.4.1 of chapter 9);
– a number for all contacts with BNP Paribas Securities Services (a toll-free call within France from a landline): 0 800 117 000 or +33 1 40 14 80 61 (from outside France); from Monday to Friday (business days), 8:45 a.m. to 6:00 p.m., GMT+1 (fax: +33 1 55 77 34 17);
– registration as a recipient of all information published by the Groupfor its shareholders; and
– the ability to join the TOTAL Shareholders’ Club by holding atleast 50 shares.
The advantages of pure registered shares, in addition to those ofadministered registered shares, include:
– no custodial fees;– easier placement of market orders (1) (phone, mail, fax, internet);– brokerage fees of 0.20% (before tax) of the gross amount of the
trade, with no minimum charge and up to €1,000 per trade; and– the option to view and manage shareholdings online and via the
Planetshares app for digital tablets.
To convert TOTAL shares into pure registered shares, shareholdersmust fill out a form that can be obtained upon request from theIndividual Shareholder Relations Department and send it to theirfinancial intermediary.
6.3. Registered shareholding
(1) Provided the subscriber has signed the market service agreement. Signing this agreement is free of charge.(2) Subject to approval at the May 24, 2016 Annual Shareholders’ Meeting.(3) Subject to the Board of Directors’ decision.
Mr. Mike Sangster, Senior Vice President, Investor RelationsTOTAL S.A.10 Upper Bank StreetCanary WharfLondon E14 5BFUnited KingdomPhone: +44 (0)207 7197 962Email: [email protected]
Mr. Robert Hammond, Director of Investor Relations North AmericaTOTAL American Services Inc.1201 Louisiana Street, Suite 1800Houston, TX 77002United StatesPhone: +1 (713) 483-5070Email: [email protected]
Ms. Nathalie Portes-Laville, Head of Individual Shareholder RelationsTOTAL S.A.Individual Shareholder Relations DepartmentTour Coupole2, place Jean Millier92078 Paris La Défense CedexFrancePhone (Monday to Friday from 9:30 a.m. to 12:30 p.m. and from1:30 p.m. to 5:30 p.m., GMT+1):– from France: 0 800 039 039 (toll-free number from a landline); and– outside France: +33 1 47 44 24 02.Email: [email protected]
6.6. Investor Relations contacts
8 TOTAL and its shareholdersInvestor Relations
TOTAL. Registration Document 2015178
(1) Subject to the Board of Directors’ decision.(2) Subject to approval at the May 26, 2017 Annual Shareholders’ Meeting.
March 20 Ex-dividend date for the 2016 third interim dividend (1)
May 26 Shareholders’ Meeting in Paris (Palais des Congrès)
June 5 Ex-dividend date for the 2016 remaining dividend (2)
6.5. 2017 calendar
1. Share capital 1801.1. Share capital as of December 31, 2015 . . . . . . . . . . . . . . . . . . . . . . . . . . . . . . . . . . . . . . . . . . . . . . . . . . . . . . . . . . . . . . . . . . .1801.2. Features of the shares . . . . . . . . . . . . . . . . . . . . . . . . . . . . . . . . . . . . . . . . . . . . . . . . . . . . . . . . . . . . . . . . . . . . . . . . . . . . . . . .1801.3. Authorized share capital not issued as of December 31, 2015 . . . . . . . . . . . . . . . . . . . . . . . . . . . . . . . . . . . . . . . . . . . . . . . .1801.4. Potential share capital as of December 31, 2015 . . . . . . . . . . . . . . . . . . . . . . . . . . . . . . . . . . . . . . . . . . . . . . . . . . . . . . . . . . .1811.5. TOTAL shares held by the Company or its subsidiaries . . . . . . . . . . . . . . . . . . . . . . . . . . . . . . . . . . . . . . . . . . . . . . . . . . . . . .1811.6. Share capital history (since January 1, 2013) . . . . . . . . . . . . . . . . . . . . . . . . . . . . . . . . . . . . . . . . . . . . . . . . . . . . . . . . . . . . . .181
2. Articles of incorporation and bylaws; other information 1822.1. General information concerning the Company . . . . . . . . . . . . . . . . . . . . . . . . . . . . . . . . . . . . . . . . . . . . . . . . . . . . . . . . . . . . .1822.2. Summary of the Company’s corporate purpose . . . . . . . . . . . . . . . . . . . . . . . . . . . . . . . . . . . . . . . . . . . . . . . . . . . . . . . . . . . .1822.3. Provisions of the bylaws governing the administration and management bodies . . . . . . . . . . . . . . . . . . . . . . . . . . . . . . . . .1822.4. Rights, privileges and restrictions attached to the shares . . . . . . . . . . . . . . . . . . . . . . . . . . . . . . . . . . . . . . . . . . . . . . . . . . . .1832.5. Amending shareholders’ rights . . . . . . . . . . . . . . . . . . . . . . . . . . . . . . . . . . . . . . . . . . . . . . . . . . . . . . . . . . . . . . . . . . . . . . . . .1842.6. Shareholders’ Meetings . . . . . . . . . . . . . . . . . . . . . . . . . . . . . . . . . . . . . . . . . . . . . . . . . . . . . . . . . . . . . . . . . . . . . . . . . . . . . . .1842.7. Identification of the holders of bearer shares . . . . . . . . . . . . . . . . . . . . . . . . . . . . . . . . . . . . . . . . . . . . . . . . . . . . . . . . . . . . . .1852.8. Thresholds to be declared according to the bylaws . . . . . . . . . . . . . . . . . . . . . . . . . . . . . . . . . . . . . . . . . . . . . . . . . . . . . . . . .1852.9. Changes in the share capital . . . . . . . . . . . . . . . . . . . . . . . . . . . . . . . . . . . . . . . . . . . . . . . . . . . . . . . . . . . . . . . . . . . . . . . . . . .185
3. Historical financial information and other information 1853.1. 2015, 2014 and 2013 Consolidated Financial Statements . . . . . . . . . . . . . . . . . . . . . . . . . . . . . . . . . . . . . . . . . . . . . . . . . . . .1853.2. Statutory financial statements of TOTAL S.A. . . . . . . . . . . . . . . . . . . . . . . . . . . . . . . . . . . . . . . . . . . . . . . . . . . . . . . . . . . . . . .1863.3. Audit of the historical financial information . . . . . . . . . . . . . . . . . . . . . . . . . . . . . . . . . . . . . . . . . . . . . . . . . . . . . . . . . . . . . . . .1863.4. Other information . . . . . . . . . . . . . . . . . . . . . . . . . . . . . . . . . . . . . . . . . . . . . . . . . . . . . . . . . . . . . . . . . . . . . . . . . . . . . . . . . . . .186
Registration Document 2015. TOTAL 179
General information8.Renseignements généraux 9
General information
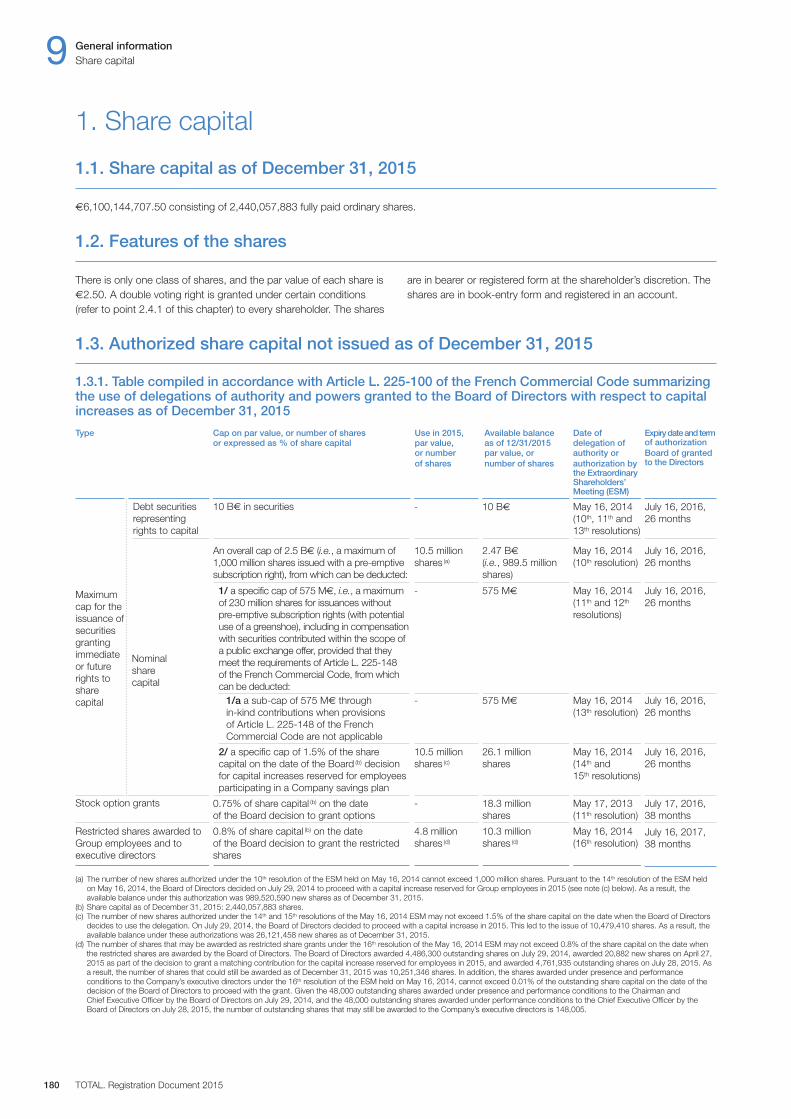
1.3. Authorized share capital not issued as of December 31, 2015
1.3.1. Table compiled in accordance with Article L. 225-100 of the French Commercial Code summarizingthe use of delegations of authority and powers granted to the Board of Directors with respect to capitalincreases as of December 31, 2015
Type Cap on par value, or number of shares Use in 20 15, Available balance Date of Expiry date and term or expressed as % of share capital par value, as of 12/31/2015 delegation of of authorization or number par value, or authority or Board of granted of shares number of shares authorization by to the Directors the Extraordinary Shareholders’ Meeting (ESM)
There is only one class of shares, and the par value of each share is€2.50. A double voting right is granted under certain conditions(refer to point 2.4.1 of this chapter) to every shareholder. The shares
are in bearer or registered form at the shareholder’s discretion. Theshares are in book-entry form and registered in an account.
1. Share capital
1.1. Share capital as of December 31, 2015
€6,100,144,707.50 consisting of 2,440,057,883 fully paid ordinary shares.
1.2. Features of the shares
9 General informationShare capital
TOTAL. Registration Document 2015180
May 16, 2014(10th, 11th and13th resolutions)
Maximumcap for theissuance ofsecuritiesgrantingimmediateor futurerights tosharecapital
Debt securitiesrepresenting rights to capital
Nominal share capital
10 B€ in securities - 10 B€ July 16, 2016,26 months
An overall cap of 2.5 B€ (i.e., a maximum of1,000 million shares issued with a pre-emptivesubscription right), from which can be deducted:
1 / a specific cap of 575 M€, i.e., a maximumof 230 million shares for issuances withoutpre-emptive subscription rights (with potentialuse of a greenshoe), including in compensationwith securities contributed within the scope ofa public exchange offer, provided that theymeet the requirements of Article L. 225-148 of the French Commercial Code, from whichcan be deducted:
1 / a a sub-cap of 575 M€ through in-kind contributions when provisionsof Article L. 225-148 of the FrenchCommercial Code are not applicable
2 / a specific cap of 1.5% of the sharecapital on the date of the Board (b) decisionfor capital increases reserved for employeesparticipating in a Company savings plan
10.5 million shares (a)
2.47 B€
(i.e., 989.5 millionshares)
May 16, 2014(10th resolution)
July 16, 2016,26 months
- 575 M€ May 16, 2014(11th and 12th
resolutions)
July 16, 2016,26 months
- 575 M€ May 16, 2014 (13th resolution)
July 16, 2016,26 months
10.5 million shares (c)
26.1 million shares
May 16, 2014(14th and15th resolutions)
July 16, 2016,26 months
Stock option grants
- 18.3 millionshares
May 17, 2013 (11th resolution)
July 17, 2016,38 months
Restricted shares awarded toGroup employees and toexecutive directors
4.8 million shares (d)
10.3 million shares (d)
May 16, 2014(16th resolution)
July 16, 2017,38 months
0.75% of share capital (b) on the date of the Board decision to grant options
0.8% of share capital (b) on the date of the Board decision to grant the restrictedshares
(a) The number of new shares authorized under the 10th resolution of the ESM held on May 16, 2014 cannot exceed 1,000 million shares. Pursuant to the 14th resolution of the ESM heldon May 16, 2014, the Board of Directors decided on July 29, 2014 to proceed with a capital increase reserved for Group employees in 2015 (see note (c) below). As a result, theavailable balance under this authorization was 989,520,590 new shares as of December 31, 2015.
(b) Share capital as of December 31, 2015: 2,440,057,883 shares.(c) The number of new shares authorized under the 14th and 15th resolutions of the May 16, 2014 ESM may not exceed 1.5% of the share capital on the date when the Board of Directors
decides to use the delegation. On July 29, 2014, the Board of Directors decided to proceed with a capital increase in 2015. This led to the issue of 10,479,410 shares. As a result, theavailable balance under these authorizations was 26,121,458 new shares as of December 31, 2015.
(d) The number of shares that may be awarded as restricted share grants under the 16th resolution of the May 16, 2014 ESM may not exceed 0.8% of the share capital on the date whenthe restricted shares are awarded by the Board of Directors. The Board of Directors awarded 4,486,300 outstanding shares on July 29, 2014, awarded 20,882 new shares on April 27,2015 as part of the decision to grant a matching contribution for the capital increase reserved for employees in 2015, and awarded 4,761,935 outstanding shares on July 28, 2015. Asa result, the number of shares that could still be awarded as of December 31, 2015 was 10,251,346 shares. In addition, the shares awarded under presence and performanceconditions to the Company’s executive directors under the 16th resolution of the ESM held on May 16, 2014, cannot exceed 0.01% of the outstanding share capital on the date of thedecision of the Board of Directors to proceed with the grant. Given the 48,000 outstanding shares awarded under presence and performance conditions to the Chairman andChief Executive Officer by the Board of Directors on July 29, 2014, and the 48,000 outstanding shares awarded under performance conditions to the Chief Executive Officer by theBoard of Directors on July 28, 2015, the number of outstanding shares that may still be awarded to the Company’s executive directors is 148,005.
1.5. TOTAL shares held by the Company or its subsidiaries
As of December 31, 2015
Percentage of share capital held by TOTAL S.A. 0.56%
Number of shares held in portfolio 13,636,490Book value of portfolio (at purchase price) (M€) 609Market value of portfolio (M€) (a) 563
Percentage of capital held by companies (b) of the Group 4.67%
Number of shares held in portfolio 113,967,758Book value of portfolio (at purchase price) (M€) 3,635Market value of portfolio (M€) (a) 4,703
(a) Based on a market price of €41.265 per share as of December 31, 2015.(b) TOTAL S.A., Total Nucléaire, Financière Valorgest, Sogapar and Fingestval.
1.6. Share capital history (since January 1, 2013)
1.6.1. For fiscal year 2013
April 25, 2013 Acknowledgement of the issuance of 10,802,215 new shares, par value €2.50 per share, as part of the capital increasereserved for Group employees approved by the Board of Directors on September 18, 2012, raising the share capital by€27,005,537.50 from €5,914,832,865 to €5,941,838,402.50.
January 8, 2014 Acknowledgement of the issuance of 942,799 new shares, par value €2.50 per share, through the exercise of stockoptions between January 1 and December 31, 2013, raising the share capital by €2,356,997.50 from €5,941,838,402.50to €5,944,195,400.
1.6.2. For fiscal year 2014
July 1, 2014 Acknowledgement of the issuance of 666,575 new shares, par value €2.50 per share, as part of the global free TOTAL share plan to Group employees decided by the Board of Directors on May 21, 2010, raising the share capital by €1,666,437.50 from €5,944,195,400 to €5,945,861,837.50.
January 12, 2015 Acknowledgement of the issuance of 6,922,790 new shares, par value €2.50 per share, through the exercise of stockoptions between January 1 and December 31, 2014, raising the share capital by €17,306,975 from €5,945,861,837.50to €5,963,168,812.50.
Securities granting rights to TOTAL shares through exercise areTOTAL share subscription options amounting to 9,317,840 as ofDecember 31, 2015, divided into:
– 2,561,502 options awarded on October 9, 2008 under the plandecided by the Board of Directors on September 9, 2008;
– 2,710,783 options awarded on September 15, 2009 under theplan decided by the Board of Directors;
– 3,323,246 options awarded on September 14, 2010 under theplan decided by the Board of Directors; and
– 722,309 options awarded on September 14, 2011 under theplan decided by the Board of Directors.
The potential share capital (i.e., the existing share capital plus rightsand securities that could result in the issuance of new TOTALshares through exercise), i.e., 2,449,375,723 shares, represents100.38% of the share capital as of December 31, 2015, on thebasis of 2,440,057,883 TOTAL shares constituting the share capitalas of December 31, 2015, and 9,317,840 TOTAL shares that couldbe issued upon the exercise of TOTAL options.
General information 9Share capital
Registration Document 2015. TOTAL 181
1.4. Potential share capital as of December 31, 2015
1.3.2. Authorization to cancel shares of the Company
Pursuant to the terms of the 19th resolution of the Shareholders’Meeting held on May 11, 2012, the Board of Directors is authorizedto cancel shares up to a maximum of 10% of the share capital of theCompany existing as of the date of the operation within a 24-monthperiod. This authorization is effective until the Shareholders’ Meetingheld to approve the financial statements for the year ending
December 31, 2016. The Board has not made use of thisauthorization since the 2012 Shareholders’ Meeting.
Based on 2,440,057,883 shares outstanding on December 31, 2015,the Company may, up until the conclusion of the Shareholders’Meeting called to approve the financial statements for the fiscalyear ending on December 31, 2016, cancel a maximum of244,005,788 shares before reaching the cancellation threshold of10% of share capital canceled over a 24-month period.
2.3.1. Election of directors and term of office
Directors are elected by the Shareholders’ Meeting for a 3-yearterm up to a maximum number of directors authorized by law(currently 18), subject to the legal provisions that allow the term tobe extended until the next Shareholders’ Meeting called to approvethe financial statements for the previous fiscal year.
In addition, one director representing the employee shareholders isalso elected by the Shareholders’ Meeting for a 3-year term from a
list of at least two candidates pre-selected by the employeeshareholders under the conditions provided for by the laws, regulationsand bylaws in force. However, his or her term shall expire automaticallyonce this Director is no longer an employee or a shareholder. TheBoard of Directors may meet and conduct valid deliberations untilthe date his or her replacement is named.
Furthermore, a director representing the employees is designatedby the Company’s Central Works Council. Where the number of
2.3. Provisions of the bylaws governing the administration and management bodies
The direct and indirect purpose of the Company is to search forand extract mining deposits in all countries, particularlyhydrocarbons in all forms, and to perform industrial refining,processing and trading in said materials as well as their derivativesand by-products, as well as all activities relating to production and
distribution of all forms of energy, as well as the chemicals sector inall of its forms and to the rubber and health sectors. The completedetails of the Company’s corporate purpose are set forth in Article 3of the bylaws.
2.2. Summary of the Company’s corporate purpose
The Company’s name is TOTAL S.A.
TOTAL S.A. is a French limited liability company (société anonyme)headquartered at 2, place Jean Millier, La Défense 6, 92400 Courbevoie,France. It is registered in the French trade registry in Nanterre underNo. 542 051 180 RCS. The Company’s term was extended for 99years from March 22, 2000, to expire on March 22, 2099, unlessdissolved prior to this date or extended.
Fiscal year: from January 1 to December 31 of each yearEC Registration Number: FR 59 542 051 180APE Code (NAF): 111Z until January 7, 2008; 7010Z sinceJanuary 8, 2008.The Company’s bylaws are on file with K.L. Associés, Notaries in Paris.
Its telephone number is +33 (0)1 47 44 45 46 and its internetaddress is total.com.
1.6.3. For fiscal year 2015
April 27, 2015 Acknowledgement of the issuance of 10,479,410 new shares, par value €2.50 per share, as part of the capital increasereserved for Group employees approved by the Board of Directors on July 29, 2014, raising the share capital by€26,198,525 from €5,963,168,812.50 to €5,989,367,337.50.
July 1, 2015 Acknowledgement of the issuance of 18,609,466 new shares, par value €2.50 per share and a share price of €42.02(i.e., a par value of €2.50 value and issue premium of €39.52) for the payment of the 2014 fourth quarter dividend inshares, raising the share capital by €46,523,665 from €5,989,367,337.50 to €6,035,891,002.50.
October 21, 2015 Acknowledgement of the issuance of 24,231,876 new shares, par value €2.50 per share and a share price of €35.63(i.e., a par value of €2.50 value and issue premium of €33.13) for the payment of the first quarterly interim dividend forfiscal year 2015 in shares, raising the share capital by €60,579,690 from €6,035,891,002.50 to €6,096,470,692.50.
January 14, 2016 Acknowledgement of the issuance of 1,469,606 new shares, par value €2.50 per share, through the exercise of stockoptions between January 1 and December 31, 2015, raising the share capital by €3,674,015 from €6,096,470,692.50to €6,100,144,707.50.
Acknowledgement of the issuance of 13,945,709 new shares, par value €2.50 per share and a share price of €39.77(i.e., a par value of €2.50 value and issue premium of €37.27) for the payment of the second quarterly interim dividendfor fiscal year 2015 in shares, raising the share capital by €34,864,272.50 from €6,100,144,707.50 to €6,135,008,980.
2. Articles of incorporation and bylaws; other information
2.1. General information concerning the Company
9 General informationArticles of incorporation and bylaws; other information
TOTAL. Registration Document 2015182
In addition to the right to vote, each share entitles the holder to aportion of the corporate assets, distributions of profits and liquidationdividend that is proportional to the number of shares issued,subject to the laws and regulations in force and the bylaws.
With the exception of double voting rights, no privilege is attachedto a specific class of shares or to a specific class of shareholders.
2.4.1. Double voting rights
Double voting rights, in relation to the portion of share capital theyrepresent, are granted to all fully paid-up registered shares heldcontinuously in the name of the same shareholder for at least two
years(2), and to additional registered shares allotted to a shareholderin connection with a capital increase by capitalization of reserves,profits or premiums on the basis of the existing shares which entitlethe shareholder to a double voting right.
2.4.2. Limitation of voting rights
Article 18 of the Company’s bylaws provides that at Shareholders’Meetings, no shareholder may cast, by himself or through hisagent, on the basis of the single voting rights attached to theshares he holds directly or indirectly and the shares for which heholds powers, more than 10% of the total number of voting rightsattached to the Company’s shares. In the case of double voting
2.4. Rights, privileges and restrictions attached to the shares
General information 9Articles of incorporation and bylaws; other information
Registration Document 2015. TOTAL 183
directors appointed by the Shareholders’ Meeting is greater than12(1), a second director representing the employees is designatedby the Company’s European Works Council. In accordance withapplicable legal provisions, the director elected by the CentralWorks Council must have held an employment contract with theCompany or one of its direct or indirect subsidiaries, whoseregistered office is based in mainland France, for at least two yearsprior to appointment. The second director elected by the EuropeanWorks Council must have held an employment contract with theCompany or one of its direct or indirect subsidiaries for at least twoyears prior to appointment. The term of office for a directorrepresenting the employees is three years. However, the term ofoffice ends following the Shareholders’ Meeting called to approvethe financial statements for the last fiscal year and held in the yearduring which the said director’s term of office expires.
2.3.2. Age limit of directors
On the closing date of each fiscal year, the number of individualdirectors over the age of 70 may not be greater than one-third ofthe directors in office. If this percentage is exceeded, the oldestBoard member is automatically considered to have resigned. Thedirector permanent representative of a legal entity must be under70 years old.
2.3.3. Age limit of the Chairman of the Board and the Chief Executive Officer
The duties of the Chairman of the Board automatically cease on hisor her 70th birthday at the latest.
To hold this office, the Chief Executive Officer must be under theage of 67. When the age limit is reached during his or her duties,such duties automatically cease, and the Board of Directors electsa new Chief Executive Officer. However, his or her duties asChief Executive Officer will continue until the date of the Board ofDirectors’ meeting aimed at electing his or her successor. Subjectto the age limit specified above, the Chief Executive Officer canalways be re-elected.
The age limits specified above are stipulated in the Company’sbylaws and were approved by the Shareholders’ Meeting held onMay 16, 2014.
2.3.4. Minimum interest in the Company held by directors
Each director (other than the director representing the employeeshareholders or the director representing the employees) must ownat least 1,000 shares of stock during his or her term of office. If,however, any director ceases to own the required number ofshares, they may adjust their position subject to the conditions setby law. The director representing employee shareholders must hold,during his or her term of office, either individually or through aCompany Savings Plan (Fonds Commun de Placement d’Entreprise,FCPE) governed by Article L. 214-165 of the French Monetary andFinance Code, at least one share or a number of units in said fundequivalent to at least one share. The director representing theemployees is not bound to be a shareholder.
2.3.5. Majority rules for Board meetings
Decisions are adopted by a majority vote of the directors present orrepresented. In the event of a tie vote, the person chairing themeeting shall cast the deciding vote.
2.3.6. Rules of procedure of the Board andCommittees of the Board of Directors
Refer to point 1 of chapter 5 of this Registration Document.
2.3.7. Form of management
Management of the Company is assumed either by the Chairmanof the Board (who then holds the title of the Chairman andChief Executive Officer), or by another person appointed by theBoard of Directors with the title of Chief Executive Officer. It is theresponsibility of the Board of Directors to choose between thesetwo forms of management under the majority rules describedabove.
At its meeting on December 16, 2015, the Board of Directorsdecided to reunify, as of December 19, 2015, the functions ofChairman and Chief Executive Officer of TOTAL S.A. As of suchdate, Mr. Pouyanné was appointed Chairman andChief Executive Officer of TOTAL S.A. For further information ongovernance structure refer to point 1.2.1 of chapter 5.
(1) Neither the director representing employee shareholders, elected by the Shareholders’ Meeting, nor the director(s) representing employees are taken into consideration when calculating the12-member threshold, which is assessed on the date on which the employee director(s) is / are elected.
(2) This term is not interrupted and the right acquired is retained in case of a conversion of bearer to bearer pursuant to intestate or testamentary succession, share of community propertybetween spouses or donation to the spouse or relatives entitled to inherit (Article 18 § 6 of the bylaws).

2.6.1. Notice of meetings
Shareholders’ Meetings are convened and conducted under theconditions provided for by law.
The Ordinary Shareholders’ Meeting is called to take any decisionsthat do not modify the Company’s bylaws. It is held at least once ayear within six months of the closing date of each fiscal year toapprove the financial statements of that year. It may only deliberate,at its first meeting, if the shareholders present, represented orparticipating by remote voting hold at least one fifth of the sharesthat confer voting rights. No quorum is required at its second meeting.Ordinary Shareholders’ Meeting decisions are made with the majorityof votes of shareholders present, represented or participating byremote voting.
Only the Extraordinary Shareholders’ Meeting is authorized to modifythe bylaws. It may not, however, increase shareholders’ commitments.It may only deliberate, at its first meeting, if the shareholderspresent, represented or participating by remote voting hold at leastone quarter, and, at the second meeting, one fifth, of the sharesthat confer voting rights. Decisions of Extraordinary Shareholders’Meetings are made with a two-thirds majority of votes of
shareholders present, represented or participating by remote voting.
One or several shareholders holding a certain percentage of theCompany’s share capital (calculated using a decreasing scalebased on the share capital) may ask for items or resolution drafts tobe added to the agenda of a Shareholders’ Meeting under theforms, terms and deadlines set forth by the French CommercialCode. Requests to add items or resolution drafts to the agendamust be sent no later than 20 days after the publication of thenotice of meeting that the Company must publish in the Frenchofficial journal of legal notices (Bulletin des Annonces LégalesObligatoires, BALO). Any request to add an item to the agendamust be justified. Any request to add a draft resolution must beaccompanied by the draft resolution text and brief summary of thegrounds for this request. Requests made by shareholders must beaccompanied by a proof of their share ownership and theirownership of the portion of capital as required by the regulations.Review of the item or draft resolution filed pursuant to regulatoryconditions is subject to those making the request providing a newattestation justifying the shares being recorded in a book-entry formin the same accounts on the second working date preceding thedate of the meeting.
2.6. Shareholders’ Meetings
Any amendment to the bylaws must be approved or authorized bythe Shareholders’ Meeting voting with the quorum and majority
required by the laws and regulations governing ExtraordinaryShareholders’ Meetings.
2.5. Amending shareholders’ rights
9 General informationArticles of incorporation and bylaws; other information
TOTAL. Registration Document 2015184
rights, by himself or through his agent, this limit may be exceeded,taking only the resulting additional voting rights into account, providedthat the total voting rights that he exercises do not exceed 20% ofthe total voting rights associated with the shares in the Company.
Moreover, Article 18 of the bylaws also provides that the limitationon voting rights no longer applies, absent any decision of theShareholders’ Meeting, if an individual or a legal entity acting solelyor together with one or more individuals or entities acquires at leasttwo-thirds of the Company’s shares following a public tender offerfor all the Company’s shares. In that case, the Board of Directorsacknowledges that the limitation no longer applies and carries outthe necessary procedure to modify the Company’s bylaws accordingly.
Once acknowledged, the fact that the limitation no longer applies isfinal and applies to all Shareholders’ Meetings following the publictender offer under which the acquisition of at least two-thirds of theoverall number of shares of the Company was made possible, andnot solely to the first meeting following that public tender offer.
Since in such circumstances the limitation no longer applies, suchlimitation on voting rights cannot prevent or delay any takeover ofthe Company, except in case of a public tender offer where thebidder does not acquire at least two-thirds of the Company’s shares.
2.4.3. Fractional rights
Whenever it is necessary to own several shares in order to exercisea right, a number of shares less than the number required does notgive the owners any right with respect to the Company; in suchcase, the shareholders are responsible for aggregating the requirednumber of shares.
2.4.4. Statutory allocation of profits
The Company may distribute dividends under the conditions providedfor by the French Commercial Code and the Company’s bylaws.
The net profit for the period is equal to the net income minusgeneral expenses and other personnel expenses, all amortizationand depreciation of the assets, and all provisions for commercialand industrial contingencies.
From this profit, minus prior losses, if any, the following items arededucted in the order indicated:
1) 5% to constitute the legal reserve fund, until said fund reaches10% of the share capital;
2) the amounts set by the Shareholders’ Meeting to fund reservesfor which it determines the allocation or use; and
3) the amounts that the Shareholders’ Meeting decides to retain.
The remainder is paid to the shareholders as dividends.
The Board of Directors may pay interim dividends.
The Shareholders’ Meeting held to approve the financial statementsfor the fiscal year may decide to grant shareholders an option, forall or part of the dividend or interim dividends, between payment ofthe dividend in cash or in shares.
The Shareholders’ Meeting may decide at any time, but only basedon a proposal by the Board of Directors, to make a full or partialdistribution of the amounts in the reserve accounts, either in cashor in Company shares.
Dividends that have not been claimed at the end of a 5-year periodare forfeited to the French State.
The Consolidated Financial Statements of TOTAL S.A. and itsconsolidated companies for the years ended December 31, 2015,2014 and 2013 were prepared in accordance with International
Financial Reporting Standards (IFRS) as issued by the InternationalAccounting Standards Board (IASB) and as adopted by theEuropean Union as of December 31, 2015.
3. Historical financial information and other information
3.1. 2015, 2014 and 2013 Consolidated Financial Statements
The Company’s share capital may be changed only under theconditions stipulated by the legal and regulatory provisions in force.No provision of the bylaws, charter, or internal regulations providefor more stringent conditions than the law governing changes in theCompany’s share capital.
The French Commercial Code stipulates that shareholders hold, inproportion to their number of shares, a pre-emptive subscription rightto shares issued for cash to increase the share capital. The ExtraordinaryShareholders’ Meeting can decide, under the conditions providedfor by law, to remove this pre-emptive subscription right.
2.9. Changes in the share capital
Any individual or entity who directly or indirectly acquires a percentageof the share capital, voting rights or rights giving future access tothe share capital of the Company that is equal to or greater than1%, or a multiple of this percentage, is required to notify theCompany within 15 days by registered mail with return receiptrequested, and declare the number of securities held.
In case the shares above these thresholds are not declared, asspecified in the preceding paragraph, any shares held in excess of,
the threshold that should have been declared will be deprived ofvoting rights at Shareholders’ Meetings if, at a Shareholders’Meeting, the failure to make a declaration is acknowledged and ifone or more shareholders holding collectively at least 3% of theCompany’s share capital or voting rights so request at that meeting.
All individuals and entities are also required to notify the Companyin due form and within the time limits stated above when their director indirect holdings fall below each of the thresholds mentioned inthe first paragraph.
2.8. Thresholds to be declared according to the bylaws
In accordance with Article 9 of its bylaws, TOTAL S.A. is authorized,to the extent permitted under applicable law, to identify the holders
of securities that grant immediate or future voting rights at theCompany’s Shareholders’ Meetings.
2.7. Identification of the holders of bearer shares
The Central Works Committee may also request the addition ofdraft resolutions to the meeting agendas under the forms, termsand deadlines set by the French Labor Code. In particular, requeststo add draft resolutions must be sent within 10 business daysfollowing the date the notice of meeting was published.
2.6.2. Admission to meetings
Participation in any form in Shareholders’ Meetings is subject toregistration of participating shares, either in the registered accountmaintained by the Company (or its securities agent) or recorded inbearer form in a securities account maintained by a financial
intermediary. Proof of this registration is obtained under a certificateof participation (attestation de participation) delivered to theshareholder. Registration of the shares must be effective no laterthan midnight (Paris time) on the second business day precedingthe date of the Shareholders’ Meeting. If, after having received sucha certificate, shares are sold or transferred prior to this record date,the certificate of participation will be canceled and the votes sent bymail or proxies granted to the Company for such shares will becanceled accordingly. If shares are sold or transferred after thisrecord date, the certificate of participation will remain valid andvotes cast or proxies granted will be taken into account.
General information 9Historical financial information and other information
Registration Document 2015. TOTAL 185
Financial information other than that contained in chapters 10 or 12of the Registration Document, in particular ratios, statistical data orother calculated data, which are used to describe the Group or itsbusiness performance, is not extracted from the audited financialstatements of the issuer. Except where otherwise stated, thisadditional information is based on internal Company data.
In particular, the supplemental oil and gas information provided inchapter 11 of the Registration Document is not extracted from theaudited financial statements of the issuer and was not audited bythe Company’s statutory auditors.
This supplemental information was prepared by the Companybased on information available to it, using its own calculations orestimates and taking into account the U.S. standards to which theCompany is subject for this kind of information as a result of thelisting of its shares (in the form of ADRs) on the New York StockExchange.
This Registration Document does not include profit forecasts orestimates, under the meaning given to such terms by EC RegulationNo. 809 / 2004 dated April 29, 2004, for the period afterDecember 31, 2015.
3.4. Other information
The Consolidated Financial Statements for the fiscal year 2015presented in chapter 10 of this Registration Document were certifiedby the Company’s statutory auditors. A translation into English forinformation purposes only of the statutory auditors’ report on theConsolidated Financial Statements is provided in point 1 of chapter 10.
TOTAL S.A.’s statutory financial statements for the fiscal year 2015presented in chapter 12 of this Registration Document were alsocertified by the Company’s statutory auditors. A translation intoEnglish for information purposes only of the statutory auditors’report on the 2015 statutory financial statements is provided inpoint 2 of chapter 12.
Pursuant to Article 28 of EC Regulation No 809 / 2004 datedApril 29, 2004, the following are incorporated by reference in thisRegistration Document:
– the consolidated and statutory financial statements for fiscal year2014, together with the statutory auditors’ reports on the
Consolidated Financial Statements and the statutory financialstatements presented on pages 250 and 380 of the Frenchversion of the Registration Document for fiscal year 2014 whichwas filed with the French Financial Markets Authority onMarch 26, 2015 (and a translation for information purposes onlyis reproduced on pages 242 and 370 of the English version ofsuch Registration Document).
– the consolidated and statutory financial statements for fiscal year2013, together with the statutory auditors’ reports on theConsolidated Financial Statements and the statutory financialstatements presented on pages 238 and 358 of the Frenchversion of the Registration Document for fiscal year 2013 whichwas filed with the French Financial Markets Authority onMarch 27, 2014 (and a translation for information purposes onlyis reproduced on pages 234 and 352 of the English version ofsuch Registration Document).
3.3. Audit of the historical financial information
The statutory financial statements of TOTAL S.A., the parentcompany of the Group, for the years ended December 31, 2015,
2014 and 2013 were prepared in accordance with Frenchaccounting standards as applicable on December 31, 2015.
3.2. Statutory financial statements of TOTAL S.A.
9 General informationHistorical financial information and other information
TOTAL. Registration Document 2015186

Registration Document 2015. TOTAL 187
Consolidated Financial Statements9.Comptes consolidés 10
Consolidated Financial StatementsThe management report was approved by the Board of Directors on February 10, 2016, and has not been updated with subsequent events.
1. Statutory auditors’ report on the Consolidated Financial Statements 188
2. Consolidated statement of income 189
3. Consolidated statement of comprehensive income 190
4. Consolidated balance sheet 191
5. Consolidated statement of cash flow 192
6. Consolidated statement of changes in shareholders’ equity 193
7. Notes to the Consolidated Financial Statements 194Basis of preparation of the Consolidated Financial Statements . . . . . . . . . . . . . . . . . . . . . . . . . . . . . . . . . . . . . . . . . . . . . . .194Major judgments and accounting estimates . . . . . . . . . . . . . . . . . . . . . . . . . . . . . . . . . . . . . . . . . . . . . . . . . . . . . . . . . . . . . . .194
1) Accounting policies . . . . . . . . . . . . . . . . . . . . . . . . . . . . . . . . . . . . . . . . . . . . . . . . . . . . . . . . . . . . . . . . . . . . . . . . . . . . . . . . . .1952) Main indicators – information by business segment . . . . . . . . . . . . . . . . . . . . . . . . . . . . . . . . . . . . . . . . . . . . . . . . . . . . . . . .2023) Changes in the Group structure, main acquisitions and divestments . . . . . . . . . . . . . . . . . . . . . . . . . . . . . . . . . . . . . . . . . . .2034) Business segment information . . . . . . . . . . . . . . . . . . . . . . . . . . . . . . . . . . . . . . . . . . . . . . . . . . . . . . . . . . . . . . . . . . . . . . . . . .2035) Information by geographical area . . . . . . . . . . . . . . . . . . . . . . . . . . . . . . . . . . . . . . . . . . . . . . . . . . . . . . . . . . . . . . . . . . . . . . .2156) Operating expenses . . . . . . . . . . . . . . . . . . . . . . . . . . . . . . . . . . . . . . . . . . . . . . . . . . . . . . . . . . . . . . . . . . . . . . . . . . . . . . . . . .2157) Other income and other expense . . . . . . . . . . . . . . . . . . . . . . . . . . . . . . . . . . . . . . . . . . . . . . . . . . . . . . . . . . . . . . . . . . . . . . .2158) Other financial income and expense . . . . . . . . . . . . . . . . . . . . . . . . . . . . . . . . . . . . . . . . . . . . . . . . . . . . . . . . . . . . . . . . . . . . .2169) Income taxes . . . . . . . . . . . . . . . . . . . . . . . . . . . . . . . . . . . . . . . . . . . . . . . . . . . . . . . . . . . . . . . . . . . . . . . . . . . . . . . . . . . . . . . .21610) Intangible assets . . . . . . . . . . . . . . . . . . . . . . . . . . . . . . . . . . . . . . . . . . . . . . . . . . . . . . . . . . . . . . . . . . . . . . . . . . . . . . . . . . . . .21811) Property, plant and equipment . . . . . . . . . . . . . . . . . . . . . . . . . . . . . . . . . . . . . . . . . . . . . . . . . . . . . . . . . . . . . . . . . . . . . . . . . .21912) Equity affiliates: investments and loans . . . . . . . . . . . . . . . . . . . . . . . . . . . . . . . . . . . . . . . . . . . . . . . . . . . . . . . . . . . . . . . . . .22113) Other investments . . . . . . . . . . . . . . . . . . . . . . . . . . . . . . . . . . . . . . . . . . . . . . . . . . . . . . . . . . . . . . . . . . . . . . . . . . . . . . . . . . . .22414) Other non-current assets . . . . . . . . . . . . . . . . . . . . . . . . . . . . . . . . . . . . . . . . . . . . . . . . . . . . . . . . . . . . . . . . . . . . . . . . . . . . . .22515) Inventories . . . . . . . . . . . . . . . . . . . . . . . . . . . . . . . . . . . . . . . . . . . . . . . . . . . . . . . . . . . . . . . . . . . . . . . . . . . . . . . . . . . . . . . . . .22616) Accounts receivable and other current assets . . . . . . . . . . . . . . . . . . . . . . . . . . . . . . . . . . . . . . . . . . . . . . . . . . . . . . . . . . . . .22717) Shareholders’ equity . . . . . . . . . . . . . . . . . . . . . . . . . . . . . . . . . . . . . . . . . . . . . . . . . . . . . . . . . . . . . . . . . . . . . . . . . . . . . . . . . .22818) Employee benefits obligations . . . . . . . . . . . . . . . . . . . . . . . . . . . . . . . . . . . . . . . . . . . . . . . . . . . . . . . . . . . . . . . . . . . . . . . . . .23219) Provisions and other non-current liabilities . . . . . . . . . . . . . . . . . . . . . . . . . . . . . . . . . . . . . . . . . . . . . . . . . . . . . . . . . . . . . . . .23520) Financial debt and related financial instruments . . . . . . . . . . . . . . . . . . . . . . . . . . . . . . . . . . . . . . . . . . . . . . . . . . . . . . . . . . .23721) Other creditors and accrued liabilities . . . . . . . . . . . . . . . . . . . . . . . . . . . . . . . . . . . . . . . . . . . . . . . . . . . . . . . . . . . . . . . . . . . .24122) Lease contracts . . . . . . . . . . . . . . . . . . . . . . . . . . . . . . . . . . . . . . . . . . . . . . . . . . . . . . . . . . . . . . . . . . . . . . . . . . . . . . . . . . . . .24223) Commitments and contingencies . . . . . . . . . . . . . . . . . . . . . . . . . . . . . . . . . . . . . . . . . . . . . . . . . . . . . . . . . . . . . . . . . . . . . . .24324) Related parties . . . . . . . . . . . . . . . . . . . . . . . . . . . . . . . . . . . . . . . . . . . . . . . . . . . . . . . . . . . . . . . . . . . . . . . . . . . . . . . . . . . . . .24625) Share-based payments . . . . . . . . . . . . . . . . . . . . . . . . . . . . . . . . . . . . . . . . . . . . . . . . . . . . . . . . . . . . . . . . . . . . . . . . . . . . . . .24726) Payroll and staff . . . . . . . . . . . . . . . . . . . . . . . . . . . . . . . . . . . . . . . . . . . . . . . . . . . . . . . . . . . . . . . . . . . . . . . . . . . . . . . . . . . . .25227) Statement of cash flows . . . . . . . . . . . . . . . . . . . . . . . . . . . . . . . . . . . . . . . . . . . . . . . . . . . . . . . . . . . . . . . . . . . . . . . . . . . . . . .25228) Financial assets and liabilities analysis per instrument class and strategy . . . . . . . . . . . . . . . . . . . . . . . . . . . . . . . . . . . . . .25429) Fair value of financial instruments (excluding commodity contracts) . . . . . . . . . . . . . . . . . . . . . . . . . . . . . . . . . . . . . . . . . . .25630) Financial instruments related to commodity contracts . . . . . . . . . . . . . . . . . . . . . . . . . . . . . . . . . . . . . . . . . . . . . . . . . . . . . .26231) Financial risks management . . . . . . . . . . . . . . . . . . . . . . . . . . . . . . . . . . . . . . . . . . . . . . . . . . . . . . . . . . . . . . . . . . . . . . . . . . . .26532) Other risks and contingent liabilities . . . . . . . . . . . . . . . . . . . . . . . . . . . . . . . . . . . . . . . . . . . . . . . . . . . . . . . . . . . . . . . . . . . . .27233) Other information . . . . . . . . . . . . . . . . . . . . . . . . . . . . . . . . . . . . . . . . . . . . . . . . . . . . . . . . . . . . . . . . . . . . . . . . . . . . . . . . . . . .27334) Changes in progress in the Group structure . . . . . . . . . . . . . . . . . . . . . . . . . . . . . . . . . . . . . . . . . . . . . . . . . . . . . . . . . . . . . . .27335) Consolidation scope . . . . . . . . . . . . . . . . . . . . . . . . . . . . . . . . . . . . . . . . . . . . . . . . . . . . . . . . . . . . . . . . . . . . . . . . . . . . . . . . . .274
1. Statutory auditors’ report on the Consolidated Financial Statements
This is a free translation into English of the statutory auditors’ report on the Consolidated Financial Statements issued in French and it isprovided solely for the convenience of English-speaking users. The statutory auditors’ report includes information specifically required byFrench law in such reports, whether modified or not. This information is presented below the audit opinion on the Consolidated FinancialStatements and includes an explanatory paragraph discussing the auditors’ assessments of certain significant accounting and auditingmatters. These assessments were considered for the purpose of issuing an audit opinion on the Consolidated Financial Statements taken as a whole and not to provide separate assurance on individual account balances, transactions or disclosures. This report also includesinformation relating to the specific verification of information given in the Group’s Management Report. This report should be read inconjunction with and construed in accordance with French law and professional auditing standards applicable in France.
To the Shareholders,
In compliance with the assignment entrusted to us by your general annual meeting, we hereby report to you, for the year endedDecember 31, 2015, on:
– the audit of the accompanying Consolidated Financial Statements of TOTAL S.A.;– the justification of our assessments;– the specific verification required by law.
These Consolidated Financial Statements have been approved by the Board of Directors. Our role is to express an opinion on theseConsolidated Financial Statements based on our audit.
I. Opinion on the Consolidated Financial Statements
We conducted our audit in accordance with professional standards applicable in France; those standards require that we plan and performthe audit to obtain reasonable assurance about whether the Consolidated Financial Statements are free of material misstatement. An auditinvolves performing procedures, using sampling techniques or other methods of selection, to obtain audit evidence about the amounts anddisclosures in the Consolidated Financial Statements. An audit also includes evaluating the appropriateness of accounting policies used andthe reasonableness of accounting estimates made, as well as the overall presentation of the Consolidated Financial Statements. We believethat the audit evidence we have obtained is sufficient and appropriate to provide a basis for our audit opinion.
In our opinion, the Consolidated Financial Statements give a true and fair view of the assets and liabilities and of the financial position of theGroup as at December 31, 2015 and of the results of its operations for the year then ended in accordance with International FinancialReporting Standards as adopted by the European Union.
II. Justification of our assessments
In accordance with the requirements of Article L. 823-9 of the French commercial code (Code de commerce) relating to the justification ofour assessments, we bring to your attention the following matters:
As stated in the introduction to the Consolidated Financial Statements, in paragraph “Major judgments and accounting estimates”, someaccounting principles applied by TOTAL S.A. involve a significant amount of estimates, judgments and assumptions. Management reviewsthese estimates, judgments and assumptions on a regular basis, if circumstances change or as a result of new information or changes inyour Group’s experience. Different estimates, assumptions and judgments could have significant impacts on the Consolidated FinancialStatements and their notes and consequently the final achievements could also be different from the amounts included in the ConsolidatedFinancial Statements. These estimates, assumptions and judgments relate principally to the application of the successful efforts method forthe oil and gas activities, the valuation of long-lived assets, the provisions for asset retirement obligations, the employee benefits and thecurrent and differed tax computation. Detailed information relating to the application of these accounting principles is given in the Notes tothe Consolidated Financial Statements.
In order to assess the reasonableness of management’s estimates, we performed audit procedures, using sampling techniques, that entailedthe review of the assumptions and calculations on which these estimates are based, the comparison of prior years’ actual results to theirrelated estimates and the review of management’s process for approving these estimates. Additionally, the introductory Note to the financialstatements was reviewed to ensure that appropriate information regarding the estimates used by management had been disclosed.
In addition, regarding the impairment of long-lived assets described in Note 4.E to the Consolidated Financial Statements, we reviewed themanner in which impairment tests were performed and the key assumptions that led to the determination of recoverable amounts. We alsoassessed the sensitivity of the valuation to possible changes in these assumptions and the management’s process for approving theseestimates.
These audit procedures support our assessment of the reasonableness of these estimates.
These assessments were made as part of our audit of the Consolidated Financial Statements taken as a whole, and therefore contributed tothe opinion we formed which is expressed in the first part of this report.
III. Specific verification
As required by law we have also verified, in accordance with professional standards applicable in France, the information related to theGroup, presented in the Management Report.
We have no matters to report as to its fair presentation and its consistency with the Consolidated Financial Statements.
Paris-La Défense, March 15, 2016
The statutory auditorsFrench original signed by
KPMG Audit ERNST & YOUNG AuditA division of KPMG S.A. Yvon Salaün PartnerMichel Piette Partner Laurent Miannay PartnerValérie Besson Partner
10 Consolidated Financial StatementsStatutory auditors’ report on the Consolidated Financial Statements
TOTAL. Registration Document 2015188
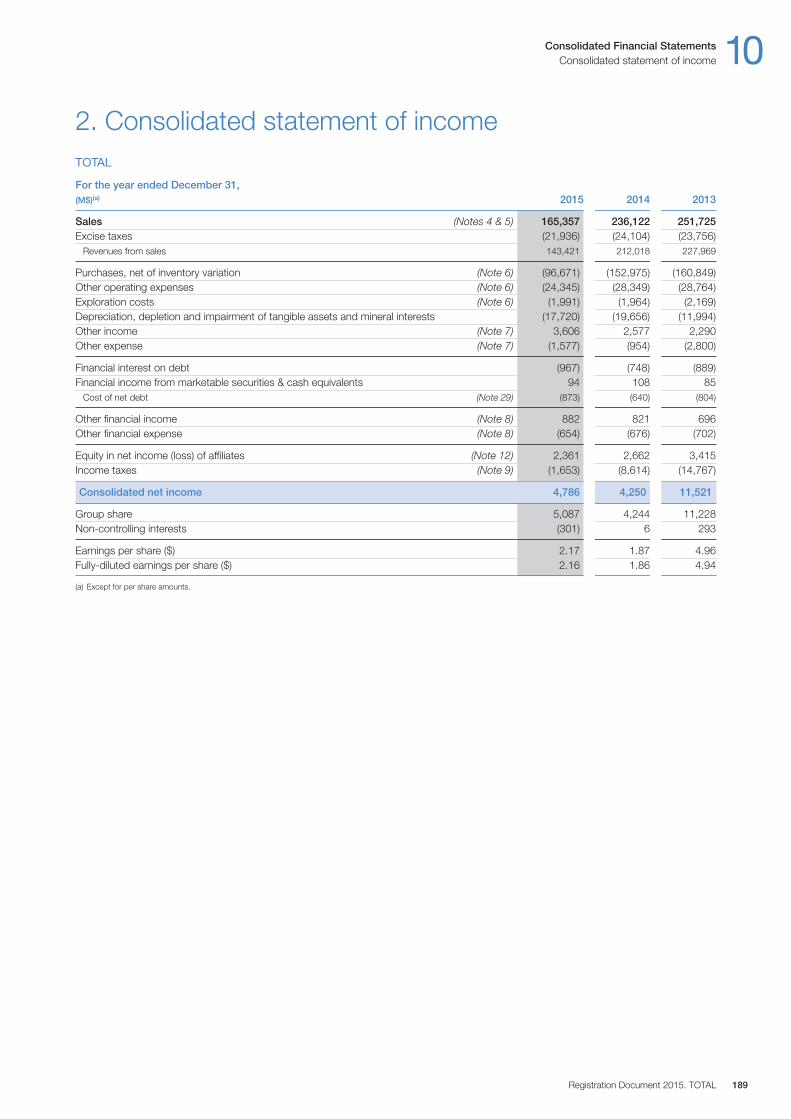
2. Consolidated statement of incomeTOTAL
For the year ended December 31,(M$)(a) 2015 2014 2013
Sales (Notes 4 & 5) 165,357 236,122 251,725Excise taxes (21,936) (24,104) (23,756)
Revenues from sales 143,421 212,018 227,969
Purchases, net of inventory variation (Note 6) (96,671) (152,975) (160,849)Other operating expenses (Note 6) (24,345) (28,349) (28,764)Exploration costs (Note 6) (1,991) (1,964) (2,169)Depreciation, depletion and impairment of tangible assets and mineral interests (17,720) (19,656) (11,994)Other income (Note 7) 3,606 2,577 2,290Other expense (Note 7) (1,577) (954) (2,800)
Financial interest on debt (967) (748) (889)Financial income from marketable securities & cash equivalents 94 108 85
Cost of net debt (Note 29) (873) (640) (804)
Other financial income (Note 8) 882 821 696Other financial expense (Note 8) (654) (676) (702)
Equity in net income (loss) of affiliates (Note 12) 2,361 2,662 3,415Income taxes (Note 9) (1,653) (8,614) (14,767)
Consolidated net income 4,786 4,250 11,521
Group share 5,087 4,244 11,228Non-controlling interests (301) 6 293
Earnings per share ($) 2.17 1.87 4.96Fully-diluted earnings per share ($) 2.16 1.86 4.94
(a) Except for per share amounts.
Consolidated Financial Statements 10Consolidated statement of income
Registration Document 2015. TOTAL 189

3. Consolidated statement of comprehensive incomeTOTAL
For the year ended December 31,(M$) 2015 2014 2013
Consolidated net income 4,786 4,250 11,521
Other comprehensive incomeActuarial gains and losses 557 (1,526) 682Tax effect (278) 580 (287)Currency translation adjustment generated by the parent company (7,268) (9,039) 3,129
Items not potentially reclassifiable to profit and loss (6,989) (9,985) 3,524
Currency translation adjustment 2,456 4,245 (1,925)Available for sale financial assets 9 (29) 33Cash flow hedge (185) 97 156Share of other comprehensive income of equity affiliates, net amount 120 (1,538) (805)Other 1 3 (12)Tax effect 53 (18) (62)
Items potentially reclassifiable to profit and loss 2,454 2,760 (2,615)
Total other comprehensive income (net amount) (Note 17) (4,535) (7,225) 909
Comprehensive income 251 (2,975) 12,430
Group share 633 (2,938) 12,193Non-controlling interests (382) (37) 237
10 Consolidated Financial StatementsConsolidated statement of comprehensive income
TOTAL. Registration Document 2015190

4. Consolidated balance sheetTOTAL
As of December 31,(M$)
ASSETS 2015 2014 2013
Non-current assetsIntangible assets, net (Notes 5 & 10) 14,549 14,682 18,395Property, plant and equipment, net (Notes 5 & 11) 109,518 106,876 104,480Equity affiliates: investments and loans (Note 12) 19,384 19,274 20,417Other investments (Note 13) 1,241 1,399 1,666Hedging instruments of non-current financial debt (Note 20) 1,219 1,319 1,418Deferred income taxes (Note 9) 3,982 4,079 3,838Other non-current assets (Note 14) 4,355 4,192 4,406
Total non-current assets 154,248 151,821 154,620
Current assetsInventories, net (Note 15) 13,116 15,196 22,097Accounts receivable, net (Note 16) 10,629 15,704 23,422Other current assets (Note 16) 15,843 15,702 14,892Current financial assets (Note 20) 6,190 1,293 739Cash and cash equivalents (Note 27) 23,269 25,181 20,200Assets classified as held for sale (Note 34) 1,189 4,901 3,253
Total current assets 70,236 77,977 84,603
Total assets 224,484 229,798 239,223
LIABILITIES & SHAREHOLDERS’ EQUITY 2015 2014 2013
Shareholders’ equityCommon shares 7,670 7,518 7,493Paid-in surplus and retained earnings 101,528 94,646 98,254Currency translation adjustment (12,119) (7,480) (1,203)Treasury shares (4,585) (4,354) (4,303)
Total shareholders’ equity – Group share (Note 17) 92,494 90,330 100,241
Non-controlling interests 2,915 3,201 3,138
Total shareholders’ equity 95,409 93,531 103,379
Non-current liabilitiesDeferred income taxes (Note 9) 12,360 14,810 17,850Employee benefits (Note 18) 3,774 4,758 4,235Provisions and other non-current liabilities (Note 19) 17,502 17,545 17,517Non-current financial debt (Note 20) 44,464 45,481 34,574
Total non-current liabilities 78,100 82,594 74,176
Current liabilitiesAccounts payable 20,928 24,150 30,282Other creditors and accrued liabilities (Note 21) 16,884 16,641 18,948Current borrowings (Note 20) 12,488 10,942 11,193Other current financial liabilities (Note 20) 171 180 381Liabilities directly associated with the assets classified as held for sale (Note 34) 504 1,760 864
Total current liabilities 50,975 53,673 61,668
Total liabilities & shareholders’ equity 224,484 229,798 239,223
Consolidated Financial Statements 10Consolidated balance sheet
Registration Document 2015. TOTAL 191
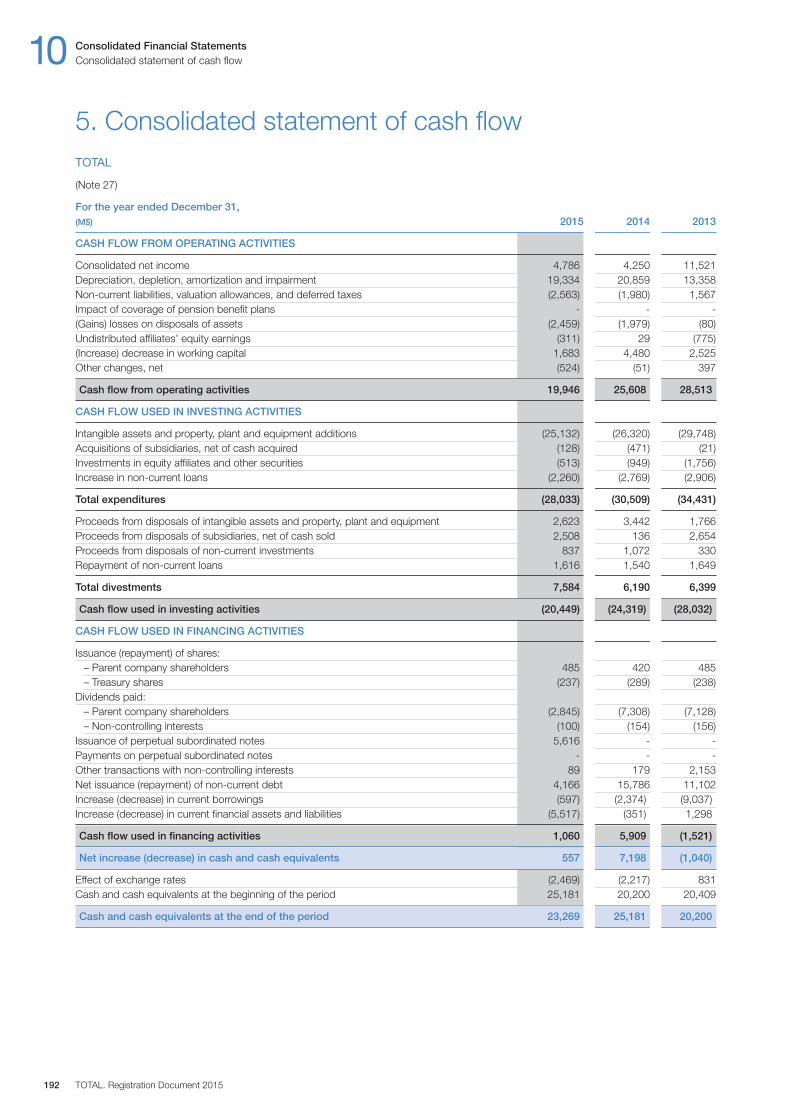
5. Consolidated statement of cash flowTOTAL
(Note 27)
For the year ended December 31,(M$) 2015 2014 2013
CASH FLOW FROM OPERATING ACTIVITIES
Consolidated net income 4,786 4,250 11,521Depreciation, depletion, amortization and impairment 19,334 20,859 13,358Non-current liabilities, valuation allowances, and deferred taxes (2,563) (1,980) 1,567Impact of coverage of pension benefit plans - - -(Gains) losses on disposals of assets (2,459) (1,979) (80)Undistributed affiliates’ equity earnings (311) 29 (775)(Increase) decrease in working capital 1,683 4,480 2,525Other changes, net (524) (51) 397
Cash flow from operating activities 19,946 25,608 28,513
CASH FLOW USED IN INVESTING ACTIVITIES
Intangible assets and property, plant and equipment additions (25,132) (26,320) (29,748)Acquisitions of subsidiaries, net of cash acquired (128) (471) (21)Investments in equity affiliates and other securities (513) (949) (1,756)Increase in non-current loans (2,260) (2,769) (2,906)
Total expenditures (28,033) (30,509) (34,431)
Proceeds from disposals of intangible assets and property, plant and equipment 2,623 3,442 1,766Proceeds from disposals of subsidiaries, net of cash sold 2,508 136 2,654Proceeds from disposals of non-current investments 837 1,072 330Repayment of non-current loans 1,616 1,540 1,649
Total divestments 7,584 6,190 6,399
Cash flow used in investing activities (20,449) (24,319) (28,032)
CASH FLOW USED IN FINANCING ACTIVITIES
Issuance (repayment) of shares:– Parent company shareholders 485 420 485– Treasury shares (237) (289) (238)
Dividends paid:– Parent company shareholders (2,845) (7,308) (7,128)– Non-controlling interests (100) (154) (156)
Issuance of perpetual subordinated notes 5,616 - -Payments on perpetual subordinated notes - - -Other transactions with non-controlling interests 89 179 2,153Net issuance (repayment) of non-current debt 4,166 15,786 11,102Increase (decrease) in current borrowings (597) (2,374) (9,037)Increase (decrease) in current financial assets and liabilities (5,517) (351) 1,298
Cash flow used in financing activities 1,060 5,909 (1,521)
Net increase (decrease) in cash and cash equivalents 557 7,198 (1,040)
Effect of exchange rates (2,469) (2,217) 831Cash and cash equivalents at the beginning of the period 25,181 20,200 20,409
Cash and cash equivalents at the end of the period 23,269 25,181 20,200
10 Consolidated Financial StatementsConsolidated statement of cash flow
TOTAL. Registration Document 2015192
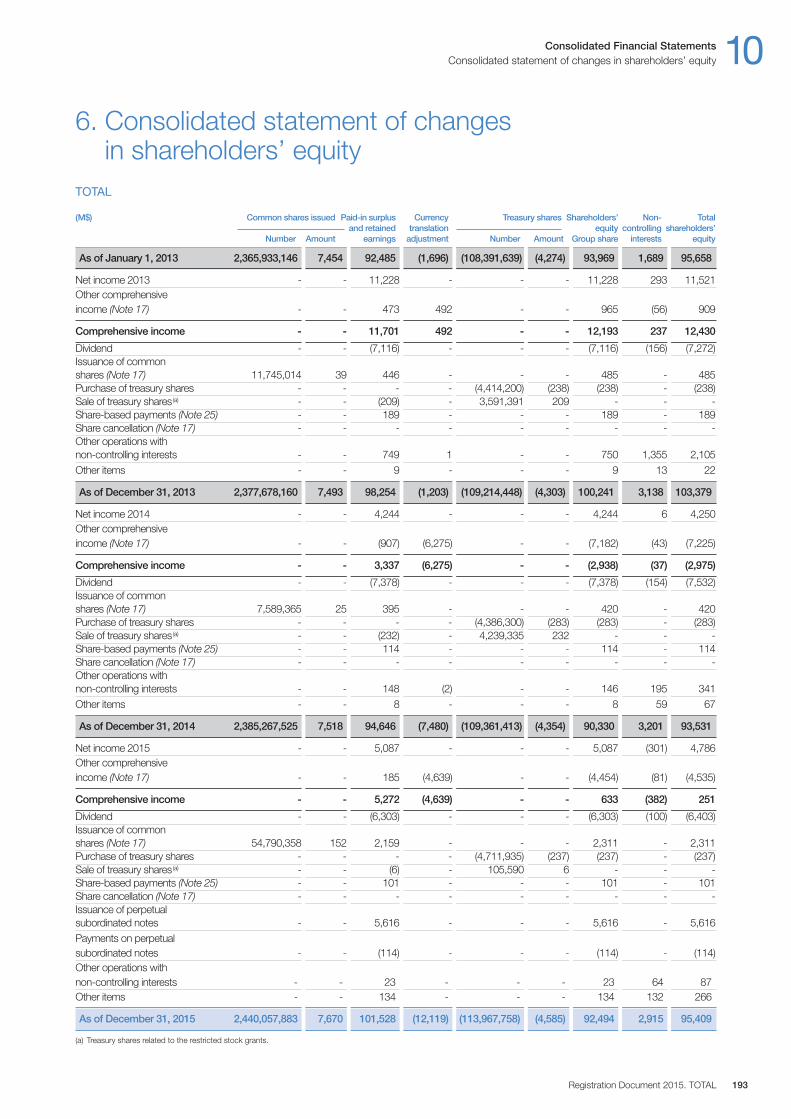
6. Consolidated statement of changes in shareholders’ equity
TOTAL
(M$) Common shares issued Paid-in surplus Currency Treasury shares Shareholders’ Non- Totaland retained translation equity controlling shareholders’
Number Amount earnings adjustment Number Amount Group share interests equity
As of January 1, 2013 2,365,933,146 7,454 92,485 (1,696) (108,391,639) (4,274) 93,969 1,689 95,658
Net income 2013 - - 11,228 - - - 11,228 293 11,521Other comprehensive income (Note 17) - - 473 492 - - 965 (56) 909
Comprehensive income - - 11,701 492 - - 12,193 237 12,430
Dividend - - (7,116) - - - (7,116) (156) (7,272)Issuance of common shares (Note 17) 11,745,014 39 446 - - - 485 - 485Purchase of treasury shares - - - - (4,414,200) (238) (238) - (238)Sale of treasury shares(a) - - (209) - 3,591,391 209 - - -Share-based payments (Note 25) - - 189 - - - 189 - 189Share cancellation (Note 17) - - - - - - - - -Other operations with non-controlling interests - - 749 1 - - 750 1,355 2,105Other items - - 9 - - - 9 13 22
As of December 31, 2013 2,377,678,160 7,493 98,254 (1,203) (109,214,448) (4,303) 100,241 3,138 103,379
Net income 2014 - - 4,244 - - - 4,244 6 4,250Other comprehensive income (Note 17) - - (907) (6,275) - - (7,182) (43) (7,225)
Comprehensive income - - 3,337 (6,275) - - (2,938) (37) (2,975)
Dividend - - (7,378) - - - (7,378) (154) (7,532)Issuance of common shares (Note 17) 7,589,365 25 395 - - - 420 - 420Purchase of treasury shares - - - - (4,386,300) (283) (283) - (283)Sale of treasury shares(a) - - (232) - 4,239,335 232 - - -Share-based payments (Note 25) - - 114 - - - 114 - 114Share cancellation (Note 17) - - - - - - - - -Other operations with non-controlling interests - - 148 (2) - - 146 195 341Other items - - 8 - - - 8 59 67
As of December 31, 2014 2,385,267,525 7,518 94,646 (7,480) (109,361,413) (4,354) 90,330 3,201 93,531
Net income 2015 - - 5,087 - - - 5,087 (301) 4,786Other comprehensive income (Note 17) - - 185 (4,639) - - (4,454) (81) (4,535)
Comprehensive income - - 5,272 (4,639) - - 633 (382) 251
Dividend - - (6,303) - - - (6,303) (100) (6,403)Issuance of common shares (Note 17) 54,790,358 152 2,159 - - - 2,311 - 2,311Purchase of treasury shares - - - - (4,711,935) (237) (237) - (237)Sale of treasury shares(a) - - (6) - 105,590 6 - - -Share-based payments (Note 25) - - 101 - - - 101 - 101Share cancellation (Note 17) - - - - - - - - -Issuance of perpetual subordinated notes - - 5,616 - - - 5,616 - 5,616Payments on perpetual subordinated notes - - (114) - - - (114) - (114)Other operations with non-controlling interests - - 23 - - - 23 64 87Other items - - 134 - - - 134 132 266
As of December 31, 2015 2,440,057,883 7,670 101,528 (12,119) (113,967,758) (4,585) 92,494 2,915 95,409
(a) Treasury shares related to the restricted stock grants.
Consolidated Financial Statements 10Consolidated statement of changes in shareholders’ equity
Registration Document 2015. TOTAL 193
The preparation of financial statements in accordance with IFRS forthe closing as of December 31, 2015 requires the executivemanagement to make estimates, judgments and assumptionsconsidered reasonable, which affect the Consolidated FinancialStatements and their notes. Different estimates, assumptions andjudgments could have significant impacts on the ConsolidatedFinancial Statements and their notes and consequently the finalachievements could also be different from the amounts included inthe Consolidated Financial Statements.
These estimates, assumptions and judgments are regularly reviewedif circumstances change or as a result of new information or changesin the Group’s experience; they could therefore be significantlychanged later.
The main estimates, judgments and assumptions can have asignificant impact in the following cases:
Estimation of hydrocarbon reserves
The estimation of oil and gas reserves is a key factor in theSuccessful Efforts method used by the Group to account for its oiland gas activities.
The Group’s oil and gas reserves are estimated by the Group’spetroleum engineers in accordance with industry standards andSEC (U.S. Securities and Exchange Commission) regulations.
Proved oil and gas reserves are those quantities of oil and gas,which, by analysis of geosciences and engineering data, can bedetermined with reasonable certainty to be recoverable (from agiven date forward, from known reservoirs, and under existingeconomic conditions, operating methods, and governmentregulations), prior to the time at which contracts providing the rightsto operate expire, unless evidence indicates that renewal isreasonably certain, regardless of whether deterministic orprobabilistic methods are used for the estimation.
Proved oil and gas reserves are calculated using a 12-monthaverage price determined as the unweighted arithmetic average ofthe first-day-of-the-month price for each month of the relevant yearunless prices are defined by contractual arrangements, excluding
escalations based upon future conditions. The Group reassessesits oil and gas reserves at least once a year on all its properties.
The Successful Efforts method of accounting is presented in Note 1“Accounting principles” section H.
For mineral interests and property and equipment of explorationand production, see notes 10 and 11.
Impairment of assets
As part of the determination of the recoverable value of assets forimpairment (IAS36), the estimates, assumptions and judgments mainlyconcern hydrocarbon prices scenarios, operating costs, productionvolumes and oil and gas proved reserves, refining margins and productmarketing conditions (mainly petroleum, petrochemical and chemicalproducts as well as solar industry products). The estimates andassumptions used by the executive management are determined inspecialized internal departments in light of economic conditions andexternal expert analysis. The discount rate is reviewed annually.
The paragraph L of Note 1 “Accounting principles” describes themethod applied for the impairment of fixed assets.
For asset impairment, see section D of Note 4 “Information bybusiness segment”.
Employee benefits
The benefit obligations and plan assets can be subject to significantvolatility due in part to changes in market values and actuarialassumptions. These assumptions vary between different pensionplans and thus take into account local conditions. They aredetermined following a formal process involving expertise andGroup internal judgments, in financial and actuarial terms, and alsoin consultation with actuaries and independent experts.
The assumptions for each plan are reviewed annually and adjusted ifnecessary to reflect changes from the experience and actuarial advices.
The section R of Note 1 “Accounting principles” describes themethods applied for employee benefits accounting.
For employee benefits, see Note 18.
Major judgments and accounting estimates
The Consolidated Financial Statements of TOTAL S.A. and itssubsidiaries (the Group) are presented in U.S. dollars and havebeen prepared on the basis of IFRS (International FinancialReporting Standards) as adopted by the European Union andIFRS as issued by the IASB (International Accounting StandardBoard) as of December 31, 2015.
The accounting policies and principles applied in the ConsolidatedFinancial Statements as of December 31, 2015 were the same asthose that were used as of December 31, 2014 except for standards,amendments and interpretations of IFRS which were mandatory forthe periods beginning after January 1, 2015 (and not early adopted).Their application did not have a significant impact on the financialstatements as of December 31, 2015.
7. Notes to the Consolidated Financial StatementsOn February 10, 2016, the Board of Directors established and authorized the publication of the Consolidated Financial Statements of TOTAL S.A.for the year ended December 31, 2015, which will be submitted for approval to the Shareholders’ Meeting to be held on May 24, 2016.
Basis of preparation of the Consolidated Financial Statements
10 Consolidated Financial StatementsNotes to the Consolidated Financial Statements
TOTAL. Registration Document 2015194

Pursuant to the accrual basis of accounting followed by the Group,the financial statements reflect the effects of transactions and otherevents when they occur. Assets and liabilities such as property,plant and equipment and intangible assets are usually measured atcost. Assets and liabilities are measured at fair value when requiredby the standards.
Accounting policies used by the Group are described below:
A) Principles of consolidation
Entities that are directly controlled by the parent company or indirectlycontrolled by other consolidated entities are fully consolidated.
Investments in joint ventures are consolidated under the equitymethod. The Group accounts for joint operations by recognizing itsshare of assets, liabilities, income and expenses.
Investments in associates, in which the Group has significantinfluence, are accounted for by the equity method. Significantinfluence is presumed when the Group holds, directly or indirectly(e.g. through subsidiaries), 20% or more of the voting rights.Companies in which ownership interest is less than 20%, but overwhich the Company is deemed to exercise significant influence, arealso accounted for by the equity method.
All internal balances, transactions and income are eliminated.
B) Business combinations
Business combinations are accounted for using the acquisitionmethod. This method requires the recognition of the acquiredidentifiable assets, assumed liabilities and any non-controllinginterest in the companies acquired by the Group at their fair value.
The value of the purchase price is finalized up to a maximum of oneyear from the acquisition date.
The acquirer shall recognize goodwill at the acquisition date, beingthe excess of:
– the consideration transferred, the amount of non-controllinginterests and, in business combinations achieved in stages, thefair value at the acquisition date of the investment previously heldin the acquired company;
– over the fair value at the acquisition date of acquired identifiableassets and assumed liabilities.
If the consideration transferred is lower than the fair value of acquiredidentifiable assets and assumed liabilities, an additional analysis isperformed on the identification and valuation of the identifiable elementsof the assets and liabilities. After having completed such additionalanalysis any residual negative goodwill is recorded as income.
In transactions with non-controlling interests, the differencebetween the price paid (received) and the book value of non-controlling interests acquired (sold) is recognized directly in equity.
C) Foreign currency translation
The presentation currency of the Group’s Consolidated FinancialStatements is the U.S. dollar. However the functional currency ofthe parent company is the euro. The resulting currency translationadjustments are presented on the line “currency translationadjustment generated by the parent company” of the consolidatedstatement of comprehensive income, within “items not potentiallyreclassifiable to profit and loss”. In the balance sheet, they arerecorded in “currency translation adjustment”.
1) Accounting policies
Asset retirement obligations
Asset retirement obligations, which result from a legal orconstructive obligation, are recognized based on a reasonableestimate in the period in which the obligation arises.
This estimate is based on information available in terms of costsand work program. It is regularly reviewed to take into account thechanges in laws and regulations, the estimates of reserves andproduction, the analysis of site conditions and technologies.
The discount rate is reviewed annually.
Section Q of Note 1 “Accounting policies” describes the methodsused to account for asset retirement obligations.
For asset retirement obligations, see Note 19 “Provisions and othernon-current liabilities”.
Income Taxes
A tax liability is recognized when a future payment, in application ofa tax regulation, is considered probable and can be reasonablyestimated. The exercise of judgment is required to assess the impactof new events on the amount of the liability.
Deferred tax assets are recognized in the accounts to the extentthat their recovery is considered probable. The amount of theseassets is determined based on future taxable profits estimatedinherently uncertain and subject to change over time. The exerciseof judgment is required to assess the impact of new events on thevalue of these assets and including changes in estimates of futuretaxable profits and the deadlines for their use.
In addition, these tax positions may depend on interpretations oftax laws and regulations in the countries where the Group operates.These interpretations may have uncertain nature. Depending on thecircumstances, they are final only after negotiations or resolution ofdisputes with authorities that can last several years.
Section F of Note 1 “Accounting policies” describes the accountingmethods for income taxes. For the income tax, see Note 9.
Transactions not addressed by any accounting standard or interpretation
Furthermore, when the accounting treatment of a specific transactionis not addressed by any accounting standard or interpretation, themanagement applies its judgment to define and apply accountingpolicies that provide information consistent with the generalIFRS concepts: faithful representation, relevance and materiality.
Consolidated Financial Statements 10Note 1 – Notes to the Consolidated Financial Statements
Registration Document 2015. TOTAL 195

The financial statements of subsidiaries are prepared in the currencythat most clearly reflects their business environment. This is referredto as their functional currency.
(i) Monetary transactionsTransactions denominated in foreign currencies other than thefunctional currency of the entity are translated at the exchange rate onthe transaction date. At each balance sheet date, monetary assetsand liabilities are translated at the closing rate and the resultingexchange differences are recognized in the statement of income.
(ii) Translation of financial statements denominated in foreign currenciesAssets and liabilities of foreign entities are translated into dollars onthe basis of the exchange rates at the end of the period. The incomeand cash flow statements are translated using the average exchangerates for the period. Foreign exchange differences resulting fromsuch translations are either recorded in shareholders’ equity under“Currency translation adjustments” (for the Group share) or under“Non-controlling interests” (for the share of non-controlling interests)as deemed appropriate.
D) Sales and revenues from sales
Sales figures include excise taxes collected by the Group within thecourse of its oil distribution operations. Excise taxes are deductedfrom sales in order to obtain the “Revenues from sales” indicator.
(i) Sales of goodsRevenues from sales are recognized when the significant risks andrewards of ownership have been passed to the buyer and when theamount is recoverable and can be reasonably measured.
Revenues from sales of crude oil, natural gas and coal are recordedupon transfer of title, according to the terms of the sales contracts.
Revenues from the production of crude oil and natural gas properties,in which the Group has an interest with other producers, are recognizedbased on actual volumes sold during the period. Any differencebetween volumes sold and entitlement volumes, based on theGroup net working interest, is recognized as “Crude oil and naturalgas inventories” or “Other current assets” or “Other creditors andaccrued liabilities”, as appropriate.
Quantities delivered that represent production royalties and taxes,when paid in cash, are included in oil and gas sales, except for theUnited States and Canada.
Certain transactions within the trading activities (contracts involvingquantities that are purchased from third parties then resold to thirdparties) are shown at their net value in sales.
Exchanges of crude oil and petroleum products within normaltrading activities do not generate any income and therefore theseflows are shown at their net value in both the statement of incomeand the balance sheet.
(ii) Sales of servicesRevenues from services are recognized when the services havebeen rendered.
Revenues from gas transport are recognized when services arerendered. These revenues are based on the quantities transported andmeasured according to procedures defined in each service contract.
Shipping revenues and expenses from time-charter activities arerecognized on a pro rata basis over a period that commences uponthe unloading of the previous voyage and terminates upon theunloading of the current voyage. Shipping revenue recognition
starts only when a charter has been agreed to by both the Groupand the customer.
(iii) Solar Farm Development ProjectsSunPower develops and sells solar farm projects. This activitygenerally contains a property component (land ownership or aninterest in land rights). The revenue associated with the developmentof these projects is recognized when the project-entities and landrights are irrevocably sold.
Revenues under contracts for construction of solar systems arerecognized based on the progress of construction works, measuredaccording to the percentage of costs incurred relative to totalforecast costs.
E) Share-based payments
The Group may grant employees stock options, create employeeshare purchase plans and offer its employees the opportunity tosubscribe to reserved capital increases. These employee benefitsare recognized as expenses with a corresponding credit toshareholders’ equity.
The expense is equal to the fair value of the instruments granted.The expense is recognized on a straight-line basis over the periodin which the advantages are acquired.
The fair value of the options is calculated using the Black-Scholesmodel at the grant date.
For restricted share plans, the fair value is calculated using themarket price at the grant date after deducting the expected distributionrate during the vesting period. The number of allocated equityinstruments can be revised during the vesting period in cases of non compliance with performance conditions, with the exceptionof those related to the market, or according to the rate of turnoverof the beneficiaries.
The cost of employee-reserved capital increases is immediatelyexpensed. A discount reduces the expense in order to account forthe non-transferability of the shares awarded to the employees overa period of five years.
F) Income taxes
Income taxes disclosed in the statement of income include the currenttax expenses (or income) and the deferred tax expenses (or income).
The expense (or income) of current tax is the estimated amount ofthe tax due for the taxable income of the period.
The Group uses the method whereby deferred income taxes arerecorded based on the temporary differences between the carryingamounts of assets and liabilities recorded in the balance sheet and theirtax bases, and on carry-forwards of unused tax losses and tax credits.
Deferred tax assets and liabilities are measured using the tax ratesthat have been enacted or substantially enacted at the balancesheet date. The tax rates used depend on the timing of reversals oftemporary differences, tax losses and other tax credits. The effectof a change in tax rate is recognized either in the Consolidatedstatement of income or in shareholders’ equity depending on theitem it relates to.
Deferred tax resulting from temporary differences between thecarrying amounts of equity-method investments and their tax basesare recognized. The deferred tax calculation is based on theexpected future tax effect (dividend distribution rate or tax rate oncapital gains).
10 Consolidated Financial StatementsNotes to the Consolidated Financial Statements – Note 1
TOTAL. Registration Document 2015196
G) Earnings per share
Earnings per share is calculated by dividing net income (Group share)by the weighted-average number of common shares outstandingduring the period, excluding TOTAL shares held by TOTAL S.A.(Treasury shares) and TOTAL shares held by the Group subsidiarieswhich are deducted from consolidated shareholders’ equity.
Diluted earnings per share is calculated by dividing net income(Group share) by the fully-diluted weighted-average number ofcommon shares outstanding during the period. Treasury sharesheld by the parent company, TOTAL S.A., and TOTAL shares heldby the Group subsidiaries are deducted from consolidatedshareholders’ equity. These shares are not considered outstandingfor purposes of this calculation which also takes into account thedilutive effect of stock options, share grants and capital increaseswith a subscription period closing after the end of the fiscal year.
The weighted-average number of fully-diluted shares is calculatedin accordance with the treasury stock method provided for by IAS33. The proceeds, which would be recovered in the event of anexercise of rights related to dilutive instruments, are presumed tobe a share buyback at the average market price over the period.The number of shares thereby obtained leads to a reduction in thetotal number of shares that would result from the exercise of rights.
In compliance with IAS 33, earnings per share and diluted earningsper share are based on the net income after deduction of theremuneration due to the holders of deeply subordinated notes.
H) Oil and gas exploration and producing properties
The Group applies IFRS 6 “Exploration for and Evaluation of MineralResources”. Oil and gas exploration and production properties andassets are accounted for in accordance with the Successful Effortsmethod.
(i) Exploration costsGeological and geophysical costs, including seismic surveys forexploration purposes are expensed as incurred.
Mineral interests are capitalized as intangible assets when acquired.These acquired interests are tested for impairment on a regularbasis, property-by-property, based on the results of the exploratoryactivity and the management’s evaluation.
In the event of a discovery, the unproved mineral interests aretransferred to proved mineral interests at their net book value assoon as proved reserves are booked.
Exploratory wells are tested for impairment on a well-by-well basisand accounted for as follows:
– costs of exploratory wells which result in proved reserves arecapitalized and then depreciated using the unit-of-productionmethod based on proved developed reserves;
– costs of dry wells and wells that have not found proved reservesare charged to expense;
– costs of exploratory wells are temporarily capitalized until adetermination is made as to whether the well has found provedreserves if both of the following conditions are met:- the well has found a sufficient quantity of reserves to justify, if
appropriate, its completion as a producing well, assuming thatthe required capital expenditures are made,
- the Group is making sufficient progress assessing the reservesand the economic and operating viability of the project. Thisprogress is evaluated on the basis of indicators such as whether
additional exploratory works are under way or firmly planned(wells, seismic or significant studies), whether costs are beingincurred for development studies and whether the Group iswaiting for governmental or other third-party authorization of aproposed project, or availability of capacity on an existingtransport or processing facility.
Costs of exploratory wells not meeting these conditions are chargedto expense.
(ii) Oil and Gas producing assetsDevelopment costs incurred for the drilling of development wellsand for the construction of production facilities are capitalized,together with borrowing costs incurred during the period ofconstruction and the present value of estimated future costs ofasset retirement obligations. The depletion rate is equal to the ratioof oil and gas production for the period to proved developedreserves (unit-of-production method).
With respect to phased development projects or projects subject toprogressive well production start-up, the fixed assets’ depreciableamount, excluding production or service wells, is adjusted to excludethe portion of development costs attributable to the undevelopedreserves of these projects.
With respect to production sharing contracts, this computation isbased on the portion of production and reserves assigned to theGroup taking into account estimates based on the contractualclauses regarding the reimbursement of exploration, developmentand production costs (cost oil / gas) as well as the sharing ofhydrocarbon rights (profit oil / gas).
Hydrocarbon transportation and processing assets are depreciatedusing the unit-of-production method based on throughput or byusing the straight-line method whichever best reflects the durationof use of the economic life of the asset.
Proved mineral interests are depreciated using the unit-of-productionmethod based on proved reserves.
I) Goodwill and other intangible assets excluding mineral interests
Other intangible assets include goodwill, patents, trademarks, andlease rights.
Intangible assets are carried at cost, after deducting any accumulateddepreciation and accumulated impairment losses.
Guidance for calculating goodwill is presented in Note 1 paragraph Bto the Consolidated Financial Statements. Goodwill is not amortizedbut is tested for impairment annually or as soon as there is anyindication of impairment (see Note 1 paragraph L to the ConsolidatedFinancial Statements).
In equity affiliates, goodwill is included in the investment book value.
Other intangible assets (except goodwill) have a finite useful life andare amortized on a straight-line basis over between three to twentyyears depending on the useful life of the assets.
Research and development
Research costs are charged to expense as incurred.
Development expenses are capitalized when the criteria of IAS38are met.
Advertising costs are charged to expense as incurred.
Consolidated Financial Statements 10Note 1 – Notes to the Consolidated Financial Statements
Registration Document 2015. TOTAL 197
J) Other property, plant and equipment
Other property, plant and equipment are carried at cost, afterdeducting any accumulated depreciation and accumulatedimpairment losses. This cost includes borrowing costs directlyattributable to the acquisition or production of a qualifying assetincurred until assets are placed in service. Borrowing costs arecapitalized as follows:
– if the project benefits from a specific funding, the capitalization ofborrowing costs is based on the borrowing rate;
– if the project is financed by all the Group’s debt, the capitalizationof borrowing costs is based on the weighted average borrowingcost for the period.
Routine maintenance and repairs are charged to expense as incurred.The costs of major turnarounds of refineries and large petrochemicalunits are capitalized as incurred and depreciated over the period oftime between two consecutive major turnarounds.
Other property, plant and equipment are depreciated using thestraight-line method over their useful lives, which are as follows:
Furniture, office equipment, machinery and tools 3-12 yearsTransportation equipment 5-20 yearsStorage tanks and related equipment 10-15 yearsSpecialized complex installations and pipelines 10-30 yearsBuildings 10-50 years
K) Leases
A finance lease transfers substantially all the risks and rewardsincidental to ownership from the lessor to the lessee. These contractsare capitalized as assets at fair value or, if lower, at the presentvalue of the minimum lease payments according to the contract. A corresponding financial debt is recognized as a financial liability.These assets are depreciated over the corresponding useful lifeused by the Group.
Leases that are not finance leases as defined above are recordedas operating leases.
Certain arrangements do not take the legal form of a lease butconvey the right to use an asset or a group of assets in return forfixed payments. Such arrangements are accounted for as leasesand are analyzed to determine whether they should be classified asoperating leases or as finance leases.
L) Impairment of long-lived assets
The recoverable amounts of intangible assets and property, plantand equipment are tested for impairment as soon as any indication ofimpairment exists. This test is performed at least annually for goodwill.
The recoverable amount is the higher of the fair value (less costs to sell)or its value in use.
Assets are grouped into cash-generating units (or CGUs) and tested.A CGU is a homogeneous group of assets that generates cashinflows that are largely independent of the cash inflows from othergroups of assets.
The value in use of a CGU is determined by reference to the discountedexpected future cash flows, based upon the management’sexpectation of future economic and operating conditions. When thisvalue is less than the carrying amount of the CGU, an impairmentloss is recorded. It is allocated first to goodwill with a correspondingamount in “Other expenses”. These impairment losses are thenallocated to property, plant and mineral interests with a corresponding
amount in “Depreciation, depletion and impairment of tangibleassets and mineral interests” and to other intangible assets with acorresponding amount in “Other expenses”.
Impairment losses recognized in prior periods can be reversed upto the original carrying amount, had the impairment loss not beenrecognized. Impairment losses recognized for goodwill cannot bereversed.
M) Financial assets and liabilities
Financial assets and liabilities are financial loans and receivables,investments in non-consolidated companies, publicly traded equitysecurities, derivatives instruments and current and non-currentfinancial liabilities.
The accounting treatment of these financial assets and liabilities isas follows:
(i) Loans and receivablesFinancial loans and receivables are recognized at amortized cost.They are tested for impairment, by comparing the carrying amountof the assets to estimates of the discounted future recoverable cashflows. These tests are conducted as soon as there is any evidencethat their fair value is less than their carrying amount, and at leastannually. Any impairment loss is recorded in the statement of income.
(ii) Other investmentsThese assets are classified as financial assets available for sale andtherefore measured at their fair value. For listed securities, this fair valueis equal to the market price. For unlisted securities, if the fair value isnot reliably determinable, the securities are recorded at their historicalvalue. Changes in fair value are recorded in other comprehensiveincome. If there is any evidence of a significant or long-lastingimpairment loss, a loss is recorded in the statement of income. This impairment is irreversible.
(iii) Derivative instrumentsThe Group uses derivative instruments to manage its exposure torisks of changes in interest rates, foreign exchange rates andcommodity prices. Changes in fair value of derivative instruments arerecognized in the statement of income or in other comprehensiveincome and are recognized in the balance sheet in the accountscorresponding to their nature, according to the risk managementstrategy described in Note 31 to the Consolidated FinancialStatements. The derivative instruments used by the Group are the following:
• Cash managementFinancial instruments used for cash management purposes are partof a hedging strategy of currency and interest rate risks withinglobal limits set by the Group and are considered to be used fortransactions (held for trading). Changes in fair value are systematicallyrecorded in the statement of income. The balance sheet value ofthose instruments is included in “Current financial assets” or “Othercurrent financial liabilities”.
• Long-term financingWhen an external long-term financing is set up, specifically tofinance subsidiaries, and when this financing involves currency andinterest rate derivatives, these instruments are qualified as:
1) Fair value hedge of the interest rate risk on the external debt andof the currency risk of the loans to subsidiaries. Changes in fairvalue of derivatives are recognized in the statement of income asare changes in fair value of underlying financial debts and loansto subsidiaries.
10 Consolidated Financial StatementsNotes to the Consolidated Financial Statements – Note 1
TOTAL. Registration Document 2015198

The fair value of those hedging instruments of long-termfinancing is included in assets under “Hedging instruments onnon-current financial debt” or in liabilities under “Non-currentfinancial debt “for the non-current portion. The current portion(less than one year) is accounted for in “Current financial assets”or “Other current financial liabilities”.
In case of the anticipated termination of derivative instrumentsaccounted for as fair value hedges, the amount paid or receivedis recognized in the statement of income and:
– if this termination is due to an early cancellation of the hedgeditems, the adjustment previously recorded as revaluation of thosehedged items is also recognized in the statement of income;
– if the hedged items remain in the balance sheet, the adjustmentpreviously recorded as a revaluation of those hedged items isspread over the remaining life of those items.
2) Cash flow hedge of the currency risk of the external debt.Changes in fair value are recorded in Other comprehensiveIncome for the effective portion of the hedging and in thestatement of income for the ineffective portion of the hedging.Amounts recorded in equity are transferred to the incomestatement when the hedged transaction affects profit or loss.
The fair value of those hedging instruments of long-term financing isincluded in assets under “Hedging instruments on non-currentfinancial debt” or in liabilities under “Non-current financial debt” forthe non-current portion. The current portion (less than one year) isaccounted for in “Current financial assets” or “Other currentfinancial liabilities”.
If the hedging instrument expires, is sold or terminated byanticipation, gains or losses previously recognized in equity remainin equity. Amounts are recycled to the income statement only whenthe hedged transaction affects profit or loss.
• Foreign subsidiaries’ equity hedgeCertain financial instruments hedge against risks related to theequity of foreign subsidiaries whose functional currency is notthe euro (mainly the dollar). These instruments qualify as “netinvestment hedges” and changes in fair value are recorded in othercomprehensive income for the effective portion of the hedging andin the statement of income for the ineffective portion of the hedging.Gains or losses on hedging instruments previously recorded inequity, are reclassified to the statement of income in the sameperiod as the total or partial disposal of the foreign activity.
The fair value of these instruments is recorded under “Currentfinancial assets” or “Other current financial liabilities”.
• Financial instruments related to commodity contracts, forward freight agreementsFinancial instruments related to commodity contracts, includingcrude oil, petroleum products, gas, power and coal purchase / salescontracts within the trading activities, together with the commoditycontract derivative instruments such as energy contracts andforward freight agreements, are used to adjust the Group’sexposure to price fluctuations within global trading limits. Accordingto the industry practice, these instruments are considered as heldfor trading. Changes in fair value are recorded in the statement ofincome. The fair value of these instruments is recorded in “Othercurrent assets” or “Other creditors and accrued liabilities”depending on whether they are assets or liabilities.
Detailed information about derivatives positions is disclosed inNotes 20, 28, 29, 30 and 31 to the Consolidated FinancialStatements.
(iv) Current and non-current financial liabilitiesCurrent and non-current financial liabilities (excluding derivatives)are recognized at amortized cost, except those for which hedgeaccounting can be applied as described in the previous paragraph(iii) Derivative instruments.
(v) Fair value of financial instrumentsFair values are estimated for the majority of the Group’s financialinstruments, with the exception of publicly traded equity securitiesand marketable securities for which the market price is used.
Estimations of fair value, which are based on principles such asdiscounting future cash flows to present value, must be weightedby the fact that the value of a financial instrument at a given timemay be influenced by the market environment (liquidity especially),and also the fact that subsequent changes in interest rates andexchange rates are not taken into account.
As a consequence, the use of different estimates, methodologiesand assumptions could have a material effect on the estimated fairvalue amounts.
The methods used are as follows:
• Financial debts, swapsThe market value of swaps and of bonds that are hedged by thoseswaps has been determined on an individual basis by discountingfuture cash flows with the zero coupon interest rate curves existingat year-end.
• Financial instruments related to commodity contractsThe valuation methodology is to mark-to-market all open positionsfor both physical and paper transactions. The valuations aredetermined on a daily basis using observable market data based onorganized and over the counter (OTC) markets. In particular caseswhen market data is not directly available, the valuations arederived from observable data such as arbitrages, freight or spreadsand market corroboration. For valuation of risks which are the resultof a calculation, such as options for example, commonly knownmodels are used to compute the fair value.
• Other financial instrumentsThe fair value of the interest rate swaps and of FRA’s (Forward RateAgreements) are calculated by discounting future cash flows on thebasis of zero coupon interest rate curves existing at year-end afteradjustment for interest accrued but unpaid. Forward exchangecontracts and currency swaps are valued on the basis of acomparison of the negotiated forward rates with the rates in effecton the financial markets at year-end for similar maturities.
Exchange options are valued based on the Garman-Kohlhagenmodel including market quotations at year-end.
(vi) Commitments to purchase shares held by non-controllinginterests (put options written on minority interests)Put options granted to non-controlling-interest shareholders areinitially recognized as financial liabilities at the present value of theexercise price of the options with a corresponding reduction inshareholders’ equity. The financial liability is subsequently measuredat fair value at each balance sheet date in accordance withcontractual clauses and any variation is recorded in the statementof income (cost of debt).
Consolidated Financial Statements 10Note 1 – Notes to the Consolidated Financial Statements
Registration Document 2015. TOTAL 199
N) Inventories
Inventories are measured in the Consolidated Financial Statementsat the lower of historical cost or market value. Costs for petroleumand petrochemical products are determined according to the FIFO(First-In, First-Out) method and other inventories are measuredusing the weighted-average cost method.
In addition stocks held for trading are measured at fair value lesscosts of sale.
Refining & Chemicals
Petroleum product inventories are mainly comprised of crude oiland refined products. Refined products principally consist of gasoline,kerosene, diesel, fuel oil and heating oil produced by the Group’srefineries. The turnover of petroleum products does not exceedmore than two months on average.
Crude oil costs include raw material and receiving costs. Refiningcosts principally include crude oil costs, production costs (energy,labor, depreciation of producing assets) and an allocation ofproduction overheads (taxes, maintenance, insurance, etc.).
Costs of chemical product inventories consist of raw material costs,direct labor costs and an allocation of production overheads. Start-up costs, general administrative costs and financing costs areexcluded from the cost price of refined and chemicals products.
Marketing & Services
The costs of refined products include mainly crude oil costs,production costs (energy, labor, depreciation of producing assets)and an allocation of production overheads (taxes, maintenance,insurance, etc.).
Start-up costs, general administrative costs and financing costs areexcluded from the cost price of refined products.
Product inventories purchased from entities external to the Groupare valued at their purchase cost plus primary costs of transport.
O) Treasury shares
Treasury shares of the parent company held by its subsidiaries oritself are deducted from consolidated shareholders’ equity. Gains orlosses on sales of treasury shares are excluded from the determinationof net income and are recognized in shareholders’ equity.
P) Provisions and other non-current liabilities
A provision is recognized when the Group has a present obligation(legal or constructive) as a result of a past event for which it isprobable that an outflow of resources will be required and when areliable estimate can be made regarding the amount of the obligation.The amount of the liability corresponds to the best possible estimate.
Provisions and non-current liabilities are comprised of liabilities forwhich the amount and the timing are uncertain. They arise fromenvironmental risks, legal and tax risks, litigation and other risks.
Q) Asset retirement obligations
Asset retirement obligations, which result from a legal or constructiveobligation, are recognized based on a reasonable estimate in theperiod in which the obligation arises.
The associated asset retirement costs are capitalized as part of thecarrying amount of the underlying asset and depreciated over theuseful life of this asset.
An entity is required to measure changes in the liability for an assetretirement obligation due to the passage of time (accretion) by applyinga risk-free discount rate to the amount of the liability. Given the longterm nature of expenditures related to our asset retirementobligations, the rate is determined by reference to the high qualityrates for AA-rated Corporate bonds on the USD area for a long-term horizon. The increase of the provision due to the passage oftime is recognized as “Other financial expense”.
R) Employee benefits
In accordance with the laws and practices of each country, theGroup participates in employee benefit plans offering retirement,death and disability, healthcare and special termination benefits.These plans provide benefits based on various factors such aslength of service, salaries, and contributions made to thegovernmental bodies responsible for the payment of benefits.
These plans can be either defined contribution or defined benefitpension plans and may be entirely or partially funded with investmentsmade in various non-Group instruments such as mutual funds,insurance contracts, and other instruments.
For defined contribution plans, expenses correspond to thecontributions paid.
Defined benefit obligations are determined according to theProjected Unit Method. Actuarial gains and losses may arise fromdifferences between actuarial valuation and projected commitments(depending on new calculations or assumptions) and betweenprojected and actual return of plan assets. Such gains and lossesare recognized in the statement of comprehensive income, with nopossibility to subsequently recycle them to the income statement.
The past service cost is recorded immediately in the statement ofincome, whether vested or unvested.
The net periodic pension cost is recognized under “Other operatingexpenses”.
S) Consolidated Statement of Cash Flows
The Consolidated Statement of Cash Flows prepared in foreigncurrencies has been translated into dollars using the exchange rateon the transaction date or the average exchange rate for the period.Currency translation differences arising from the translation of monetaryassets and liabilities denominated in foreign currency into dollarsusing the closing exchange rates are shown in the ConsolidatedStatement of Cash Flows under “Effect of exchange rates”.Therefore, the Consolidated Statement of Cash Flows will not agreewith the figures derived from the consolidated balance sheet.
Cash and cash equivalents
Cash and cash equivalents are comprised of cash on hand andhighly liquid short-term investments that are easily convertible intoknown amounts of cash and are subject to insignificant risks ofchanges in value.
Investments with maturity greater than three months and less thantwelve months are shown under “Current financial assets”.
Changes in current financial assets and liabilities are included in thefinancing activities section of the Consolidated Statement of Cash Flows.
10 Consolidated Financial StatementsNotes to the Consolidated Financial Statements – Note 1
TOTAL. Registration Document 2015200
Non-current financial debt
Changes in non-current financial debt are presented as the netvariation to reflect significant changes mainly related to revolvingcredit agreements.
T) Carbon dioxide emission rights
In the absence of a current IFRS standard or interpretation onaccounting for emission rights of carbon dioxide, the followingprinciples are applied:
– Emission rights are managed as a cost of production and assuch are recognized in inventories:- emission rights allocated for free are booked in inventories with
a nil carrying amount,- purchased emission rights are booked at acquisition cost,- sales or annual restorations of emission rights consist of decreases
in inventories recognized based on a weighted average cost,- if the carrying amount of inventories at closing date is higher
than the market value, an impairment loss is recorded.
– At each closing, a provision is recorded in order to materialize theobligation to surrender emission rights related to the emissions ofthe period. This provision is calculated based on estimatedemissions of the period, valued at weighted average cost of theinventories at the end of the period. It is reversed when theemission rights are surrendered.
– If emission rights to be surrendered at the end of the complianceperiod are higher than emission rights recorded in inventories,the shortage is accounted for as a liability at market value.
– Forward transactions are recognized at their fair market value inthe balance sheet. Changes in the fair value of such forwardtransactions are recognized in the statement of income.
U) Energy savings certificates
In the absence of current IFRS standards or interpretations onaccounting for energy savings certificates (ESC), the followingprinciples are applied:
– If the obligations linked to the sales of energy are greater than thenumber of ESC’s held then a liability is recorded. These liabilitiesare valued based on the price of the last transactions.
– In the event that the number of ESC’s held exceeds the obligationat the balance sheet date this is accounted for as inventory.
– ESC inventories are valued at weighted average cost (acquisitioncost for those ESC’s acquired or cost incurred for those ESC’sgenerated internally).
If the carrying value of the inventory of certificates at the balance sheetdate is higher than the market value, an impairment loss is recorded.
V) Non-current assets held for sale and discontinued operations
Pursuant to IFRS 5 “Non-current assets held for sale and discontinuedoperations”, assets and liabilities of affiliates that are held for saleare presented separately on the face of the balance sheet.Depreciation of assets ceases from the date of classification in“Non-current assets held for sale”.
Net income from discontinued operations is presented separatelyon the face of the statement of income. Therefore, the notes to theConsolidated Financial Statements related to the statement ofincome only refer to continuing operations.
A discontinued operation is a component of the Group for whichcash flows are independent. It represents a major line of businessor geographical area of operations which has been disposed of oris currently being held for sale.
W) New accounting texts not yet in effect
The standards or interpretations published respectively by theInternational Accounting Standards Board (IASB) and the InternationalFinancial Reporting Interpretations Committee (IFRIC) which werenot yet in effect at December 31, 2015, are as follows:
Standards not yet adopted by the European Union at December 31, 2015
– In May 2014, the IASB issued standard IFRS 15 that includesrequirements for the recognition of revenue from contracts withcustomers. The standard is applicable for annual periods startingon or after January 1, 2018. The impacts of the application ofthis standard are under analysis.
– In July 2014, the IASB issued standard IFRS 9 “Financial Instruments”that includes requirements for the recognition and measurementof financial instruments. This standard brings together threephases: classification and measurement, impairment of financialassets and hedge accounting excluding macro-hedging. Thestandard is applicable for annual periods starting on or afterJanuary 1, 2018. The impacts of the application of this standardare under analysis.
– In addition, in January 2016, the IASB issued standard IFRS 16,which sets out the principles for recognition of leases contracts.The standard is applicable for annual periods starting on or afterJanuary 1, 2019. The impacts of the application of this standardare under analysis.
Consolidated Financial Statements 10Note 1 – Notes to the Consolidated Financial Statements
Registration Document 2015. TOTAL 201
Performance indicators excluding the adjustment items, such asadjusted operating income, adjusted net operating income, andadjusted net income are meant to facilitate the analysis of the financialperformance and the comparison of income between periods.
Adjustment items
The detail of these adjustment items is presented in Note 4 to theConsolidated Financial Statements.
Adjustment items include:
(i) Special itemsDue to their unusual nature or particular significance, certaintransactions qualified as “special items” are excluded from the businesssegment figures. In general, special items relate to transactions that aresignificant, infrequent or unusual. However, in certain instances,transactions such as restructuring costs or assets disposals, whichare not considered to be representative of the normal course ofbusiness, may be qualified as special items although they may haveoccurred within prior years or are likely to occur again within thecoming years.
(ii) The inventory valuation effectThe adjusted results of the Refining & Chemicals and Marketing & Services segments are presented according to the replacementcost method. This method is used to assess the segments’performance and facilitate the comparability of the segments’performance with those of its competitors.
In the replacement cost method, which approximates the LIFO(Last-In, First-Out) method, the variation of inventory values in thestatement of income is, depending on the nature of the inventory,determined using either the month-end prices differential betweenone period and another or the average prices of the period ratherthan the historical value. The inventory valuation effect is thedifference between the results according to the FIFO (First-In, First-Out) and the replacement cost.
(iii) Effect of changes in fair valueThe effect of changes in fair value presented as adjustment itemsreflects for some transactions differences between internal measureof performance used by TOTAL’s management and the accountingfor these transactions under IFRS.
IFRS requires that trading inventories be recorded at their fair valueusing period end spot prices. In order to best reflect themanagement of economic exposure through derivativetransactions, internal indicators used to measure performanceinclude valuations of trading inventories based on forward prices.
Furthermore, TOTAL, in its trading activities, enters into storagecontracts, which future effects are recorded at fair value in Group’sinternal economic performance. IFRS precludes recognition of thisfair value effect.
Main indicators
(i) Operating income (measure used to evaluate operatingperformance)Revenue from sales after deducting cost of goods sold andinventory variations, other operating expenses, explorationexpenses and depreciation, depletion, and impairment of tangibleassets and mineral interests.
Operating income excludes the amortization of intangible assetsother than mineral interests, currency translation adjustments andgains or losses on the disposal of assets.
(ii) Net operating income (measure used to evaluate the returnon capital employed)Operating income after taking into account the amortization ofintangible assets other than mineral interests, currency translationadjustments, gains or losses on the disposal of assets, as well asall other income and expenses related to capital employed(dividends from non-consolidated companies, equity in income ofaffiliates, capitalized interest expenses), and after income taxesapplicable to the above.
The only income and expense not included in net operating incomebut included in net income are interest expenses related to netfinancial debt, after applicable income taxes (net cost of net debt)and non-controlling interests.
(iii) Adjusted incomeOperating income, net operating income, or net income excludingthe effect of adjustment items described above.
(iv) Fully-diluted adjusted earnings per shareAdjusted net income divided by the fully-diluted weighted-averagenumber of common shares.
(v) Capital employedNon-current assets and working capital, at replacement cost, net ofdeferred income taxes and non-current liabilities.
(vi) ROACE (Return on Average Capital Employed)Ratio of adjusted net operating income to average capital employedbetween the beginning and the end of the period.
(vii) ROE (Return on Equity)Ratio of adjusted consolidated net income to average adjustedshareholders’ equity (after distribution) between the beginning andthe end of the period.
(viii) Net debtNon-current debt, including current portion, current borrowings,other current financial liabilities less cash and cash equivalents andother current financial assets.
2) Main indicators – information by business segment
10 Consolidated Financial StatementsNotes to the Consolidated Financial Statements – Note 2
TOTAL. Registration Document 2015202
Financial information by business segment is reported inaccordance with the internal reporting system and shows internalsegment information that is used to manage and measure theperformance of TOTAL and which is reviewed by the mainoperational decision-making body of the Group, namely theExecutive Committee.
The operational profit and assets are broken down by businesssegment prior to the consolidation and inter-segment adjustments.
Sales prices between business segments approximate market prices.
The Group’s activities are divided into three business segments asfollows:
– an Upstream segment including, alongside the activities of theExploration & Production of hydrocarbons, the activities of Gas;
– a Refining & Chemicals segment constituting a major industrialhub comprising the activities of refining, petrochemicals andspecialty chemicals. This segment also includes the activities ofoil Trading & Shipping; and marine shipping;
– a Marketing & Services segment including the global activities ofsupply and marketing in the field of petroleum products as wellas the activity of New Energies.
In addition the Corporate segment includes holdings operating andfinancial activities.
4) Business segment information
In 2015, the main changes in the Group structure and mainacquisitions and divestments were as follows:
Upstream
– In January 2015, TOTAL was granted a 10% interest in the newADCO concession in Abu Dhabi (United Arab Emirates) for aduration of 40 years, effective January 1, 2015.
– TOTAL completed in March 2015 the sale of its entire stake inonshore Oil Mining Lease (OML) 29 to Aiteo Eastern E&P, aNigerian company, for an amount of $569 million.
– In August 2015, TOTAL finalized the sale of its 100% stake inTotal Coal South Africa, its coal-producing affiliate in SouthAfrica.
– In September 2015, TOTAL sold 20% of its interests in theLaggan, Tormore, Edradour and Glenlivet fields, located in theWest of Shetland area in the United Kingdom, to SSE E&P UKLimited.
– In November 2015, TOTAL finalized the sale to Suncor Energy ofa 10% interest in the Fort Hills oil sands mining project, in Canada.
Refining & Chemicals
– In February 2015, TOTAL sold its Bostik adhesives activity toArkema.
– In November 2015, TOTAL sold its 16.67% interest in theSchwedt refinery in northeastern Germany (Brandenburg) toRosneft.
– In December 2015, TOTAL sold an interest of 50% plus oneshare in Géosel Manosque to a 50-50 consortium composed ofEDF Invest and Ardian.
Marketing & Services
– In May 2015, TOTAL sold 100% of Totalgaz, distributor ofLiquefied Petroleum Gas (LPG) in France to the U.S. companyUGI Corporation, the parent company of Antargaz.
Information relating to sales in progress is presented in accordancewith IFRS 5 “Non-current assets held for sale and discontinuedoperations” in Note 34.
3) Changes in the Group structure, main acquisitions and divestments
Consolidated Financial Statements 10Notes 3, 4 – Notes to the Consolidated Financial Statements
Registration Document 2015. TOTAL 203
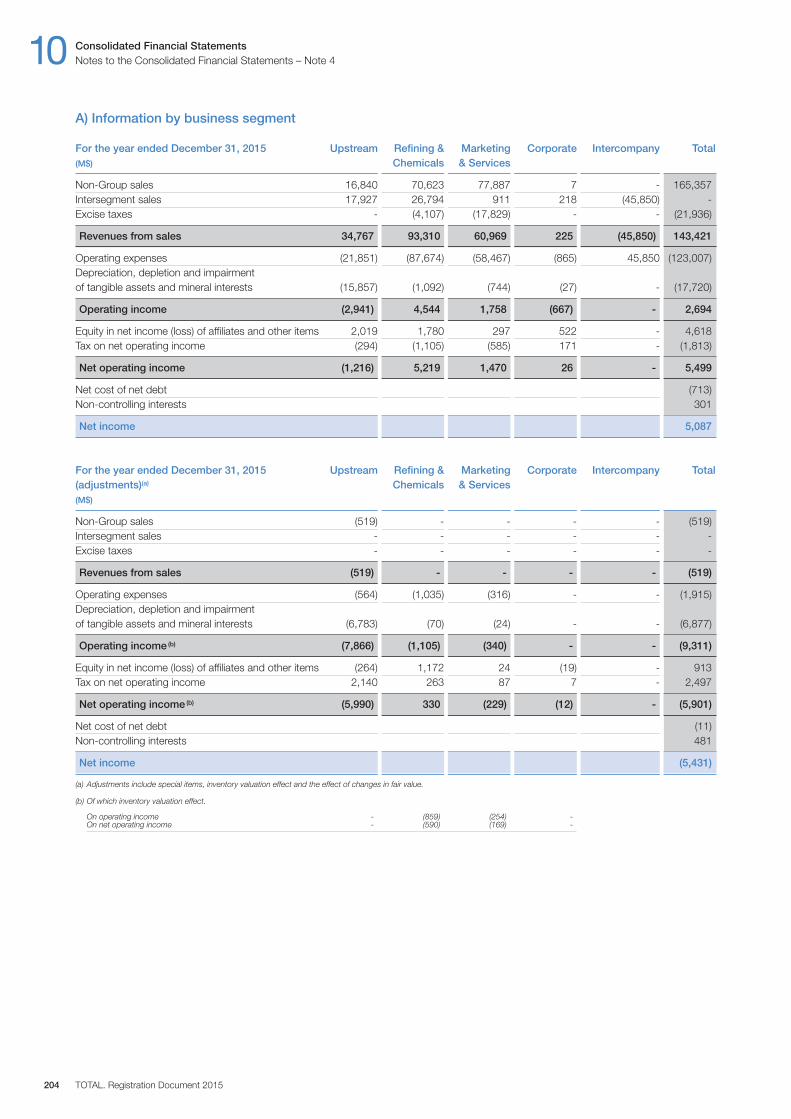
A) Information by business segment
For the year ended December 31, 2015 Upstream Refining & Marketing Corporate Intercompany Total(M$) Chemicals & Services
Non-Group sales 16,840 70,623 77,887 7 - 165,357Intersegment sales 17,927 26,794 911 218 (45,850) -Excise taxes - (4,107) (17,829) - - (21,936)
Revenues from sales 34,767 93,310 60,969 225 (45,850) 143,421
Operating expenses (21,851) (87,674) (58,467) (865) 45,850 (123,007)Depreciation, depletion and impairment of tangible assets and mineral interests (15,857) (1,092) (744) (27) - (17,720)
Operating income (2,941) 4,544 1,758 (667) - 2,694
Equity in net income (loss) of affiliates and other items 2,019 1,780 297 522 - 4,618Tax on net operating income (294) (1,105) (585) 171 - (1,813)
Net operating income (1,216) 5,219 1,470 26 - 5,499
Net cost of net debt (713)Non-controlling interests 301
Net income 5,087
For the year ended December 31, 2015 Upstream Refining & Marketing Corporate Intercompany Total(adjustments)(a) Chemicals & Services(M$)
Non-Group sales (519) - - - - (519)Intersegment sales - - - - - -Excise taxes - - - - - -
Revenues from sales (519) - - - - (519)
Operating expenses (564) (1,035) (316) - - (1,915)Depreciation, depletion and impairment of tangible assets and mineral interests (6,783) (70) (24) - - (6,877)
Operating income (b) (7,866) (1,105) (340) - - (9,311)
Equity in net income (loss) of affiliates and other items (264) 1,172 24 (19) - 913Tax on net operating income 2,140 263 87 7 - 2,497
Net operating income (b) (5,990) 330 (229) (12) - (5,901)
Net cost of net debt (11)Non-controlling interests 481
Net income (5,431)
(a) Adjustments include special items, inventory valuation effect and the effect of changes in fair value.
(b) Of which inventory valuation effect.
On operating income - (859) (254) -On net operating income - (590) (169) -
10 Consolidated Financial StatementsNotes to the Consolidated Financial Statements – Note 4
TOTAL. Registration Document 2015204
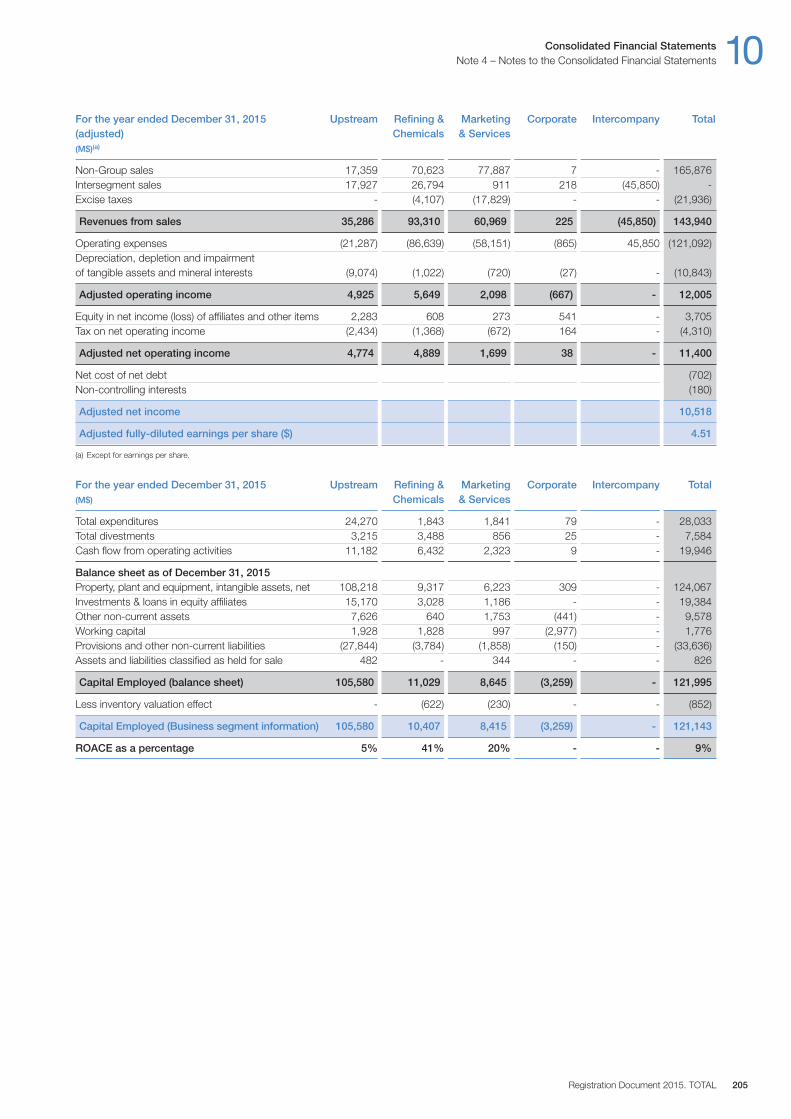
Consolidated Financial Statements 10Note 4 – Notes to the Consolidated Financial Statements
Registration Document 2015. TOTAL 205
For the year ended December 31, 2015 Upstream Refining & Marketing Corporate Intercompany Total(adjusted) Chemicals & Services(M$)(a)
Non-Group sales 17,359 70,623 77,887 7 - 165,876Intersegment sales 17,927 26,794 911 218 (45,850) -Excise taxes - (4,107) (17,829) - - (21,936)
Revenues from sales 35,286 93,310 60,969 225 (45,850) 143,940
Operating expenses (21,287) (86,639) (58,151) (865) 45,850 (121,092)Depreciation, depletion and impairment of tangible assets and mineral interests (9,074) (1,022) (720) (27) - (10,843)
Adjusted operating income 4,925 5,649 2,098 (667) - 12,005
Equity in net income (loss) of affiliates and other items 2,283 608 273 541 - 3,705Tax on net operating income (2,434) (1,368) (672) 164 - (4,310)
Adjusted net operating income 4,774 4,889 1,699 38 - 11,400
Net cost of net debt (702)Non-controlling interests (180)
Adjusted net income 10,518
Adjusted fully-diluted earnings per share ($) 4.51
(a) Except for earnings per share.
For the year ended December 31, 2015 Upstream Refining & Marketing Corporate Intercompany Total(M$) Chemicals & Services
Total expenditures 24,270 1,843 1,841 79 - 28,033Total divestments 3,215 3,488 856 25 - 7,584Cash flow from operating activities 11,182 6,432 2,323 9 - 19,946
Balance sheet as of December 31, 2015Property, plant and equipment, intangible assets, net 108,218 9,317 6,223 309 - 124,067Investments & loans in equity affiliates 15,170 3,028 1,186 - - 19,384Other non-current assets 7,626 640 1,753 (441) - 9,578Working capital 1,928 1,828 997 (2,977) - 1,776Provisions and other non-current liabilities (27,844) (3,784) (1,858) (150) - (33,636)Assets and liabilities classified as held for sale 482 - 344 - - 826
Capital Employed (balance sheet) 105,580 11,029 8,645 (3,259) - 121,995
Less inventory valuation effect - (622) (230) - - (852)
Capital Employed (Business segment information) 105,580 10,407 8,415 (3,259) - 121,143
ROACE as a percentage 5% 41% 20% - - 9%
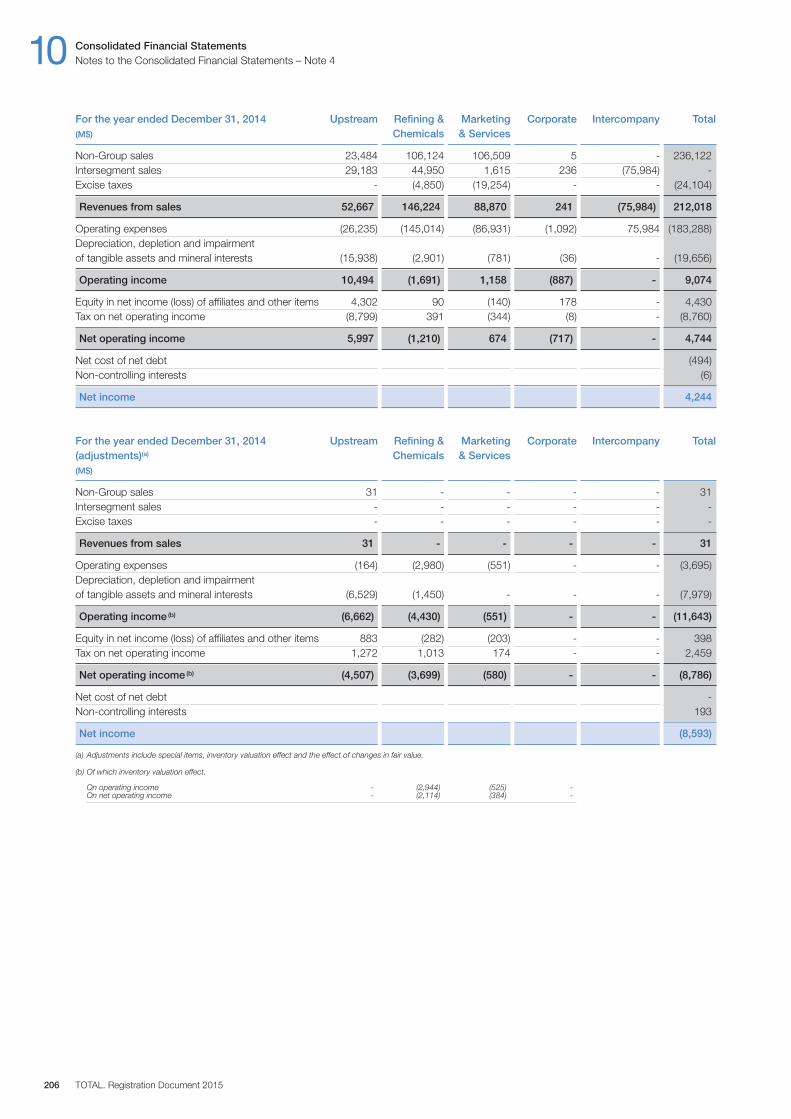
10 Consolidated Financial StatementsNotes to the Consolidated Financial Statements – Note 4
TOTAL. Registration Document 2015206
For the year ended December 31, 2014 Upstream Refining & Marketing Corporate Intercompany Total(M$) Chemicals & Services
Non-Group sales 23,484 106,124 106,509 5 - 236,122Intersegment sales 29,183 44,950 1,615 236 (75,984) -Excise taxes - (4,850) (19,254) - - (24,104)
Revenues from sales 52,667 146,224 88,870 241 (75,984) 212,018
Operating expenses (26,235) (145,014) (86,931) (1,092) 75,984 (183,288)Depreciation, depletion and impairment of tangible assets and mineral interests (15,938) (2,901) (781) (36) - (19,656)
Operating income 10,494 (1,691) 1,158 (887) - 9,074
Equity in net income (loss) of affiliates and other items 4,302 90 (140) 178 - 4,430Tax on net operating income (8,799) 391 (344) (8) - (8,760)
Net operating income 5,997 (1,210) 674 (717) - 4,744
Net cost of net debt (494)Non-controlling interests (6)
Net income 4,244
For the year ended December 31, 2014 Upstream Refining & Marketing Corporate Intercompany Total(adjustments)(a) Chemicals & Services(M$)
Non-Group sales 31 - - - - 31Intersegment sales - - - - - -Excise taxes - - - - - -
Revenues from sales 31 - - - - 31
Operating expenses (164) (2,980) (551) - - (3,695)Depreciation, depletion and impairment of tangible assets and mineral interests (6,529) (1,450) - - - (7,979)
Operating income (b) (6,662) (4,430) (551) - - (11,643)
Equity in net income (loss) of affiliates and other items 883 (282) (203) - - 398Tax on net operating income 1,272 1,013 174 - - 2,459
Net operating income (b) (4,507) (3,699) (580) - - (8,786)
Net cost of net debt -Non-controlling interests 193
Net income (8,593)
(a) Adjustments include special items, inventory valuation effect and the effect of changes in fair value.
(b) Of which inventory valuation effect.
On operating income - (2,944) (525) -On net operating income - (2,114) (384) -

Consolidated Financial Statements 10Note 4 – Notes to the Consolidated Financial Statements
Registration Document 2015. TOTAL 207
For the year ended December 31, 2014 Upstream Refining & Marketing Corporate Intercompany Total(adjusted) Chemicals & Services(M$)(a)
Non-Group sales 23,453 106,124 106,509 5 - 236,091Intersegment sales 29,183 44,950 1,615 236 (75,984) -Excise taxes - (4,850) (19,254) - - (24,104)
Revenues from sales 52,636 146,224 88,870 241 (75,984) 211,987
Operating expenses (26,071) (142,034) (86,380) (1,092) 75,984 (179,593)Depreciation, depletion and impairment of tangible assets and mineral interests (9,409) (1,451) (781) (36) - (11,677)
Adjusted operating income 17,156 2,739 1,709 (887) - 20,717
Equity in net income (loss) of affiliates and other items 3,419 372 63 178 - 4,032Tax on net operating income (10,071) (622) (518) (8) - (11,219)
Adjusted net operating income 10,504 2,489 1,254 (717) - 13,530
Net cost of net debt (494)Non-controlling interests (199)
Ajusted net income 12,837
Adjusted fully-diluted earnings per share ($) 5.63
(a) Except for earnings per share.
For the year ended December 31, 2014 Upstream Refining & Marketing Corporate Intercompany Total(M$) Chemicals & Services
Total expenditures 26,520 2,022 1,818 149 - 30,509Total divestments 5,764 192 163 71 - 6,190Cash flow from operating activities 16,666 6,302 2,721 (81) - 25,608
Balance sheet as of December 31, 2014Property, plant and equipment, intangible assets, net 105,273 9,512 6,443 330 - 121,558Investments & loans in equity affiliates 14,921 3,516 837 - - 19,274Other non-current assets 6,711 959 1,849 151 - 9,670Working capital 2,015 4,041 2,141 (2,386) - 5,811Provisions and other non-current liabilities (30,385) (4,290) (2,097) (341) - (37,113)Assets and liabilities classified as held for sale 1,962 1,032 91 - - 3,085
Capital Employed (balance sheet) 100,497 14,770 9,264 (2,246) - 122,285
Less inventory valuation effect - (1,319) (439) (1) - (1,759)
Capital Employed (Business segment information) 100,497 13,451 8,825 (2,247) - 120,526
ROACE as a percentage 11% 15% 13% - - 11%

10 Consolidated Financial StatementsNotes to the Consolidated Financial Statements – Note 4
TOTAL. Registration Document 2015208
For the year ended December 31, 2013 Upstream Refining & Marketing Corporate Intercompany Total(M$) Chemicals & Services
Non-Group sales 26,367 114,483 110,873 2 - 251,725Intersegment sales 37,650 52,275 2,159 177 (92,261) -Excise taxes - (4,814) (18,942) - - (23,756)
Revenues from sales 64,017 161,944 94,090 179 (92,261) 227,969
Operating expenses (31,875) (160,031) (91,343) (794) 92,261 (191,782)Depreciation, depletion and impairment of tangible assets and mineral interests (9,484) (1,736) (733) (41) - (11,994)
Operating income 22,658 177 2,014 (656) - 24,193
Equity in net income (loss) of affiliates and other items 2,688 181 55 (25) - 2,899Tax on net operating income (13,706) (612) (560) (29) - (14,907)
Net operating income 11,640 (254) 1,509 (710) - 12,185
Net cost of net debt (664)Non-controlling interests (293)
Net income 11,228
For the year ended December 31, 2013 Upstream Refining & Marketing Corporate Intercompany Total(adjustments)(a) Chemicals & Services(M$)
Non-Group sales (74) - - - - (74)Intersegment sales - - - - - -Excise taxes - - - - - -
Revenues from sales (74) - - - - (74)
Operating expenses (113) (1,405) (134) - - (1,652)Depreciation, depletion and impairment of tangible assets and mineral interests (855) (184) (4) - - (1,043)
Operating income (b) (1,042) (1,589) (138) - - (2,769)
Equity in net income (loss) of affiliates and other items (305) (268) 4 (34) - (603)Tax on net operating income 537 (254) 89 (45) - 327
Net operating income (b) (810) (2,111) (45) (79) - (3,045)
Net cost of net debt -Non-controlling interests (19)
Net income (3,064)
(a) Adjustments include special items, inventory valuation effect and the effect of changes in fair value.
(b) Of which inventory valuation effect.
On operating income - (978) (87) -On net operating income - (656) (63) -
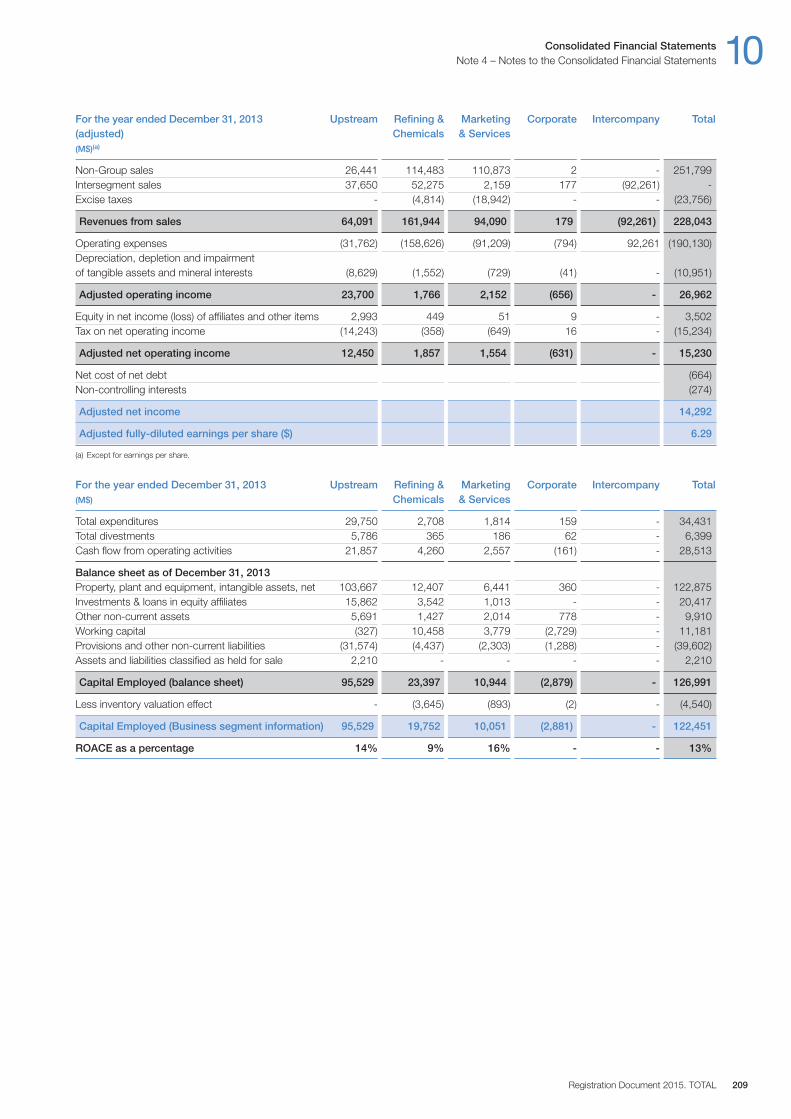
Consolidated Financial Statements 10Note 4 – Notes to the Consolidated Financial Statements
Registration Document 2015. TOTAL 209
For the year ended December 31, 2013 Upstream Refining & Marketing Corporate Intercompany Total(adjusted) Chemicals & Services(M$)(a)
Non-Group sales 26,441 114,483 110,873 2 - 251,799Intersegment sales 37,650 52,275 2,159 177 (92,261) -Excise taxes - (4,814) (18,942) - - (23,756)
Revenues from sales 64,091 161,944 94,090 179 (92,261) 228,043
Operating expenses (31,762) (158,626) (91,209) (794) 92,261 (190,130)Depreciation, depletion and impairment of tangible assets and mineral interests (8,629) (1,552) (729) (41) - (10,951)
Adjusted operating income 23,700 1,766 2,152 (656) - 26,962
Equity in net income (loss) of affiliates and other items 2,993 449 51 9 - 3,502Tax on net operating income (14,243) (358) (649) 16 - (15,234)
Adjusted net operating income 12,450 1,857 1,554 (631) - 15,230
Net cost of net debt (664)Non-controlling interests (274)
Adjusted net income 14,292
Adjusted fully-diluted earnings per share ($) 6.29
(a) Except for earnings per share.
For the year ended December 31, 2013 Upstream Refining & Marketing Corporate Intercompany Total(M$) Chemicals & Services
Total expenditures 29,750 2,708 1,814 159 - 34,431Total divestments 5,786 365 186 62 - 6,399Cash flow from operating activities 21,857 4,260 2,557 (161) - 28,513
Balance sheet as of December 31, 2013Property, plant and equipment, intangible assets, net 103,667 12,407 6,441 360 - 122,875Investments & loans in equity affiliates 15,862 3,542 1,013 - - 20,417Other non-current assets 5,691 1,427 2,014 778 - 9,910Working capital (327) 10,458 3,779 (2,729) - 11,181Provisions and other non-current liabilities (31,574) (4,437) (2,303) (1,288) - (39,602)Assets and liabilities classified as held for sale 2,210 - - - - 2,210
Capital Employed (balance sheet) 95,529 23,397 10,944 (2,879) - 126,991
Less inventory valuation effect - (3,645) (893) (2) - (4,540)
Capital Employed (Business segment information) 95,529 19,752 10,051 (2,881) - 122,451
ROACE as a percentage 14% 9% 16% - - 13%
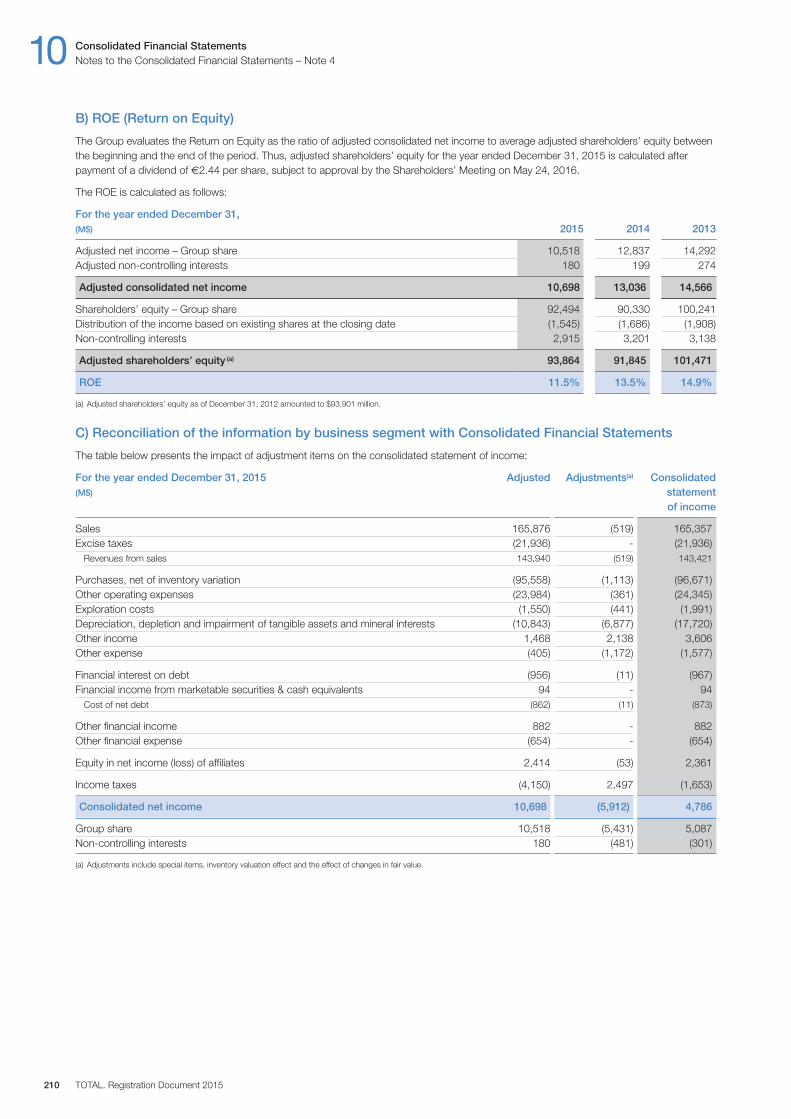
10 Consolidated Financial StatementsNotes to the Consolidated Financial Statements – Note 4
TOTAL. Registration Document 2015210
B) ROE (Return on Equity)
The Group evaluates the Return on Equity as the ratio of adjusted consolidated net income to average adjusted shareholders’ equity betweenthe beginning and the end of the period. Thus, adjusted shareholders’ equity for the year ended December 31, 2015 is calculated afterpayment of a dividend of €2.44 per share, subject to approval by the Shareholders’ Meeting on May 24, 2016.
The ROE is calculated as follows:
For the year ended December 31,(M$) 2015 2014 2013
Adjusted net income – Group share 10,518 12,837 14,292Adjusted non-controlling interests 180 199 274
Adjusted consolidated net income 10,698 13,036 14,566
Shareholders’ equity – Group share 92,494 90,330 100,241Distribution of the income based on existing shares at the closing date (1,545) (1,686) (1,908)Non-controlling interests 2,915 3,201 3,138
Adjusted shareholders’ equity (a) 93,864 91,845 101,471
ROE 11.5% 13.5% 14.9%
(a) Adjusted shareholders’ equity as of December 31, 2012 amounted to $93,901 million.
C) Reconciliation of the information by business segment with Consolidated Financial Statements
The table below presents the impact of adjustment items on the consolidated statement of income:
For the year ended December 31, 2015 Adjusted Adjustments(a) Consolidated(M$) statement
of income
Sales 165,876 (519) 165,357Excise taxes (21,936) - (21,936)
Revenues from sales 143,940 (519) 143,421
Purchases, net of inventory variation (95,558) (1,113) (96,671)Other operating expenses (23,984) (361) (24,345)Exploration costs (1,550) (441) (1,991)Depreciation, depletion and impairment of tangible assets and mineral interests (10,843) (6,877) (17,720)Other income 1,468 2,138 3,606Other expense (405) (1,172) (1,577)
Financial interest on debt (956) (11) (967)Financial income from marketable securities & cash equivalents 94 - 94
Cost of net debt (862) (11) (873)
Other financial income 882 - 882Other financial expense (654) - (654)
Equity in net income (loss) of affiliates 2,414 (53) 2,361
Income taxes (4,150) 2,497 (1,653)
Consolidated net income 10,698 (5,912) 4,786
Group share 10,518 (5,431) 5,087Non-controlling interests 180 (481) (301)
(a) Adjustments include special items, inventory valuation effect and the effect of changes in fair value.
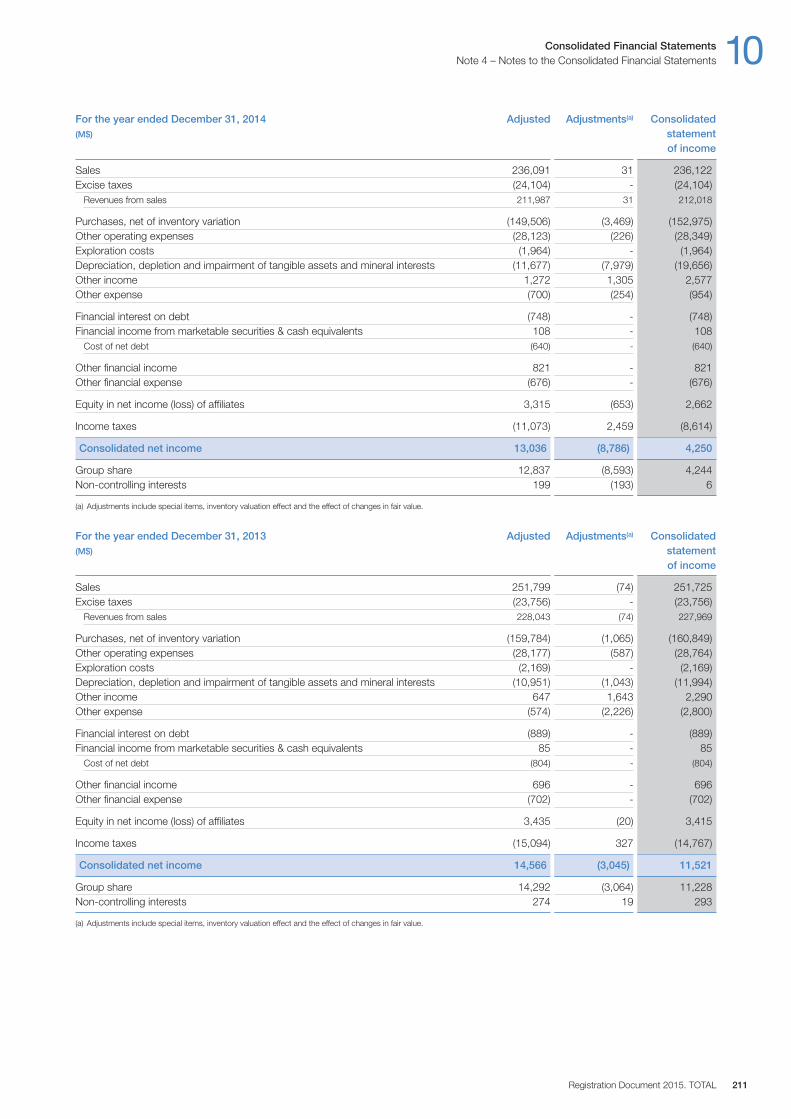
Consolidated Financial Statements 10Note 4 – Notes to the Consolidated Financial Statements
Registration Document 2015. TOTAL 211
For the year ended December 31, 2014 Adjusted Adjustments(a) Consolidated(M$) statement
of income
Sales 236,091 31 236,122Excise taxes (24,104) - (24,104)
Revenues from sales 211,987 31 212,018
Purchases, net of inventory variation (149,506) (3,469) (152,975)Other operating expenses (28,123) (226) (28,349)Exploration costs (1,964) - (1,964)Depreciation, depletion and impairment of tangible assets and mineral interests (11,677) (7,979) (19,656)Other income 1,272 1,305 2,577Other expense (700) (254) (954)
Financial interest on debt (748) - (748)Financial income from marketable securities & cash equivalents 108 - 108
Cost of net debt (640) - (640)
Other financial income 821 - 821Other financial expense (676) - (676)
Equity in net income (loss) of affiliates 3,315 (653) 2,662
Income taxes (11,073) 2,459 (8,614)
Consolidated net income 13,036 (8,786) 4,250
Group share 12,837 (8,593) 4,244Non-controlling interests 199 (193) 6
(a) Adjustments include special items, inventory valuation effect and the effect of changes in fair value.
For the year ended December 31, 2013 Adjusted Adjustments(a) Consolidated(M$) statement
of income
Sales 251,799 (74) 251,725Excise taxes (23,756) - (23,756)
Revenues from sales 228,043 (74) 227,969
Purchases, net of inventory variation (159,784) (1,065) (160,849)Other operating expenses (28,177) (587) (28,764)Exploration costs (2,169) - (2,169)Depreciation, depletion and impairment of tangible assets and mineral interests (10,951) (1,043) (11,994)Other income 647 1,643 2,290Other expense (574) (2,226) (2,800)
Financial interest on debt (889) - (889)Financial income from marketable securities & cash equivalents 85 - 85
Cost of net debt (804) - (804)
Other financial income 696 - 696Other financial expense (702) - (702)
Equity in net income (loss) of affiliates 3,435 (20) 3,415
Income taxes (15,094) 327 (14,767)
Consolidated net income 14,566 (3,045) 11,521
Group share 14,292 (3,064) 11,228Non-controlling interests 274 19 293
(a) Adjustments include special items, inventory valuation effect and the effect of changes in fair value.

10 Consolidated Financial StatementsNotes to the Consolidated Financial Statements – Note 4
TOTAL. Registration Document 2015212
D) Additional information on adjustment items and impairments
The adjustment items to income as per Note 2 to the Consolidated Financial Statements are detailed as follows:
Adjustments to operating income
For the year ended December 31, 2015 Upstream Refining & Marketing & Corporate Total(M$) Chemicals Services
Inventory valuation effect - (859) (254) - (1,113)Effect of changes in fair value (16) - - - (16)Restructuring charges (43) - (5) - (48)Asset impairment charges (6,783) (70) (24) - (6,877)Other items (1,024) (176) (57) - (1,257)
Total (7,866) (1,105) (340) - (9,311)
Adjustments to net income, Group share
For the year ended December 31, 2015 Upstream Refining & Marketing & Corporate Total(M$) Chemicals Services
Inventory valuation effect - (590) (157) - (747)Effect of changes in fair value (9) - - - (9)Restructuring charges (10) (52) (10) - (72)Asset impairment charges (5,249) (59) (127) (12) (5,447)Gains (losses) on disposals of assets 162 1,288 360 - 1,810Other items (516) (257) (193) - (966)
Total (5,622) 330 (127) (12) (5,431)
Adjustments to operating income
For the year ended December 31, 2014 Upstream Refining & Marketing & Corporate Total(M$) Chemicals Services
Inventory valuation effect - (2,944) (525) - (3,469)Effect of changes in fair value 31 - - - 31Restructuring charges - - - - -Asset impairment charges (6,529) (1,450) - - (7,979)Other items (164) (36) (26) - (226)
Total (6,662) (4,430) (551) - (11,643)
Adjustments to net income, Group share
For the year ended December 31, 2014 Upstream Refining & Marketing & Corporate Total(M$) Chemicals Services
Inventory valuation effect - (2,114) (339) - (2,453)Effect of changes in fair value 25 - - - 25Restructuring charges - (13) (7) - (20)Asset impairment charges (5,514) (1,409) (140) - (7,063)Gains (losses) on disposals of assets 1,314 (105) - - 1,209Other items (193) (58) (40) - (291)
Total (4,368) (3,699) (526) - (8,593)
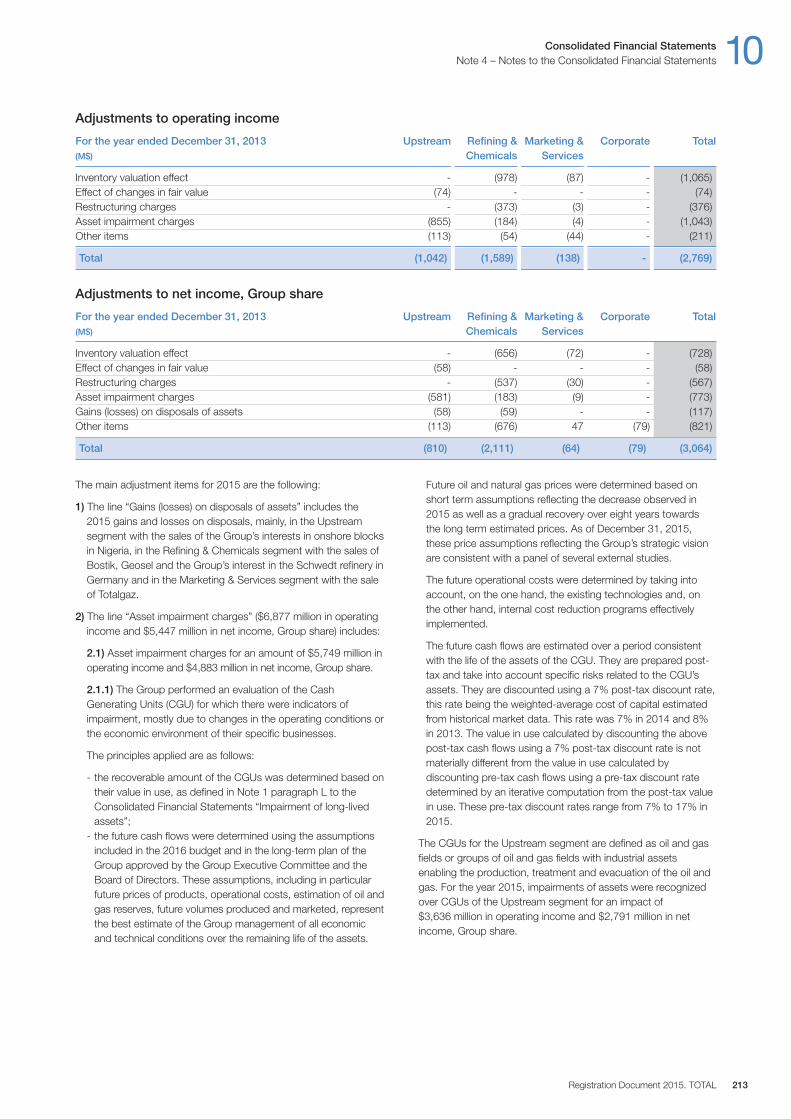
The main adjustment items for 2015 are the following:
1) The line “Gains (losses) on disposals of assets” includes the2015 gains and losses on disposals, mainly, in the Upstreamsegment with the sales of the Group’s interests in onshore blocksin Nigeria, in the Refining & Chemicals segment with the sales ofBostik, Geosel and the Group’s interest in the Schwedt refinery inGermany and in the Marketing & Services segment with the saleof Totalgaz.
2) The line “Asset impairment charges” ($6,877 million in operatingincome and $5,447 million in net income, Group share) includes:
2.1) Asset impairment charges for an amount of $5,749 million inoperating income and $4,883 million in net income, Group share.
2.1.1) The Group performed an evaluation of the CashGenerating Units (CGU) for which there were indicators ofimpairment, mostly due to changes in the operating conditions orthe economic environment of their specific businesses.
The principles applied are as follows:
- the recoverable amount of the CGUs was determined based ontheir value in use, as defined in Note 1 paragraph L to theConsolidated Financial Statements “Impairment of long-livedassets”;
- the future cash flows were determined using the assumptionsincluded in the 2016 budget and in the long-term plan of theGroup approved by the Group Executive Committee and theBoard of Directors. These assumptions, including in particularfuture prices of products, operational costs, estimation of oil andgas reserves, future volumes produced and marketed, representthe best estimate of the Group management of all economicand technical conditions over the remaining life of the assets.
Future oil and natural gas prices were determined based onshort term assumptions reflecting the decrease observed in2015 as well as a gradual recovery over eight years towardsthe long term estimated prices. As of December 31, 2015,these price assumptions reflecting the Group’s strategic visionare consistent with a panel of several external studies.
The future operational costs were determined by taking intoaccount, on the one hand, the existing technologies and, onthe other hand, internal cost reduction programs effectivelyimplemented.
The future cash flows are estimated over a period consistentwith the life of the assets of the CGU. They are prepared post-tax and take into account specific risks related to the CGU’sassets. They are discounted using a 7% post-tax discount rate,this rate being the weighted-average cost of capital estimatedfrom historical market data. This rate was 7% in 2014 and 8%in 2013. The value in use calculated by discounting the abovepost-tax cash flows using a 7% post-tax discount rate is notmaterially different from the value in use calculated bydiscounting pre-tax cash flows using a pre-tax discount ratedetermined by an iterative computation from the post-tax valuein use. These pre-tax discount rates range from 7% to 17% in2015.
The CGUs for the Upstream segment are defined as oil and gasfields or groups of oil and gas fields with industrial assetsenabling the production, treatment and evacuation of the oil andgas. For the year 2015, impairments of assets were recognizedover CGUs of the Upstream segment for an impact of$3,636 million in operating income and $2,791 million in netincome, Group share.
Consolidated Financial Statements 10Note 4 – Notes to the Consolidated Financial Statements
Registration Document 2015. TOTAL 213
Adjustments to operating income
For the year ended December 31, 2013 Upstream Refining & Marketing & Corporate Total(M$) Chemicals Services
Inventory valuation effect - (978) (87) - (1,065)Effect of changes in fair value (74) - - - (74)Restructuring charges - (373) (3) - (376)Asset impairment charges (855) (184) (4) - (1,043)Other items (113) (54) (44) - (211)
Total (1,042) (1,589) (138) - (2,769)
Adjustments to net income, Group share
For the year ended December 31, 2013 Upstream Refining & Marketing & Corporate Total(M$) Chemicals Services
Inventory valuation effect - (656) (72) - (728)Effect of changes in fair value (58) - - - (58)Restructuring charges - (537) (30) - (567)Asset impairment charges (581) (183) (9) - (773)Gains (losses) on disposals of assets (58) (59) - - (117)Other items (113) (676) 47 (79) (821)
Total (810) (2,111) (64) (79) (3,064)
10 Consolidated Financial StatementsNotes to the Consolidated Financial Statements – Note 4
TOTAL. Registration Document 2015214
These impairments were mainly recognized on the following items:
− assets related to the GLNG project in Australia, for an amountof $1,491 million in operating income and $1,356 million in netincome, Group share;
− gas assets in the United Kingdom, for an amount of$584 million in operating income and $292 million in netincome, Group share;
− assets in the United States of America, for an amount of$413 million in operating income and $267 million in netincome, Group share;
– various assets, for an amount of $1,148 million in operatingincome and $876 million in net income, Group share (mainly inAngola, Gabon, Bolivia, Nigeria).
As for the sensitivity analysis:
– a decrease by one point in the discount rate would have apositive impact of approximately $0.8 billion in operating incomeand approximately $0.5 billion in net income, Group share;
– an increase by one point in the discount rate would have anegative impact of approximately $1.3 billion in operating incomeand approximately $0.8 billion in net income, Group share;
– a variation of (10)% of the oil and gas prices would have anadditional negative impact of approximately $3.1 billion in operatingincome and approximately $2.1 billion in net income, Group share.
The most sensitive assets would be:
– the assets already impaired (impact of approximately $1.7 billionin operating income and $1.1 billion in net income, Groupshare), including GLNG in Australia, gas assets in the UnitedKingdom and assets in the United States of America;
– other assets under construction (impact of approximately $1.4 billionin operating income and $1.0 billion in net income, Groupshare), including projects in Canada and Kazakhstan.
The CGUs for the Refining & Chemicals segment are defined bythe legal entities having the operating activities for the refiningand petrochemical activities. The cash flows of these CGUs aredetermined using the gross contribution margin (calculated basedon sales minus purchases of crude oil and refined products, theeffect of inventory valuation and variable costs). The CGUs forthe other activities of the segment are global divisions, each divisiongathering a set of businesses or homogeneous products forstrategic, commercial and industrial plans. In 2015, there was noindicator of impairment for this segment, therefore, no impairmentswere recognized by the Group.
The CGUs of the Marketing & Services segment are subsidiariesor groups of subsidiaries organized by relevant geographicalzone. For the year 2015 the Group recognized impairments onCGUs of the Marketing & Services segment for an amount of$92 million in net income, Group share.
These impairments relate mainly to the intangible assets ofSunPower, following the deterioration of the economicenvironment of the solar activity.
2.1.2) Additional impairments were recognized in 2015 for anamount of $2,113 million in operating income and $2,000 millionin net income, Group share on the following assets:
– Assets, that, prior to their sale, were classified, at the end ofeach concerned quarter, in “assets held for sale”:
- the oil sands assets of the Fort Hills project in Canada. In order to limit its exposure in the oil sands in Canada and toreduce the future investments in the project, the Groupdecided to sell 10% of its interests in the project.
- the Coal assets in South Africa, following the Group’s decisionto withdraw from the coal activity.
- assets in Russia.
– Assets located in countries with geopolitical instability, such asin Libya and Yemen. In these two countries, production isstopped since the first quarter of 2015 following a significantdeterioration in the safety conditions.
– Exploration assets (mineral interests). Because of the currenteconomic environment, the Group decided to stop somepotential development projects, rendering the associatedmineral interests worthless.
– In the Refining & Chemicals and Marketing & Servicessegments, the Group decided to discontinue somedevelopment and production projects because of a lack offuture profitability.
2.1.3) In 2014, the Group recognized impairments of assets inthe Upstream, Refining & Chemicals and Marketing & Servicessegments for an impact of $7,979 million in operating incomeand of $7,063 million in net income, Group share. Theseimpairments were qualified as adjustments items of the operatingincome and net income, Group share.
In 2013, the Group recognized impairments of assets in theUpstream, Refining & Chemicals and Marketing & Servicessegments for an impact of $1,043 million in operating incomeand of $773 million in net income, Group share. These impairmentswere qualified as adjustments items of the operating income and net income, Group share.
No reversal of impairment was accounted for in respect of theyears 2013, 2014 and 2015.
2.2) Regarding the USAN assets in Nigeria (impact of$1,128 million in operating income and $564 million in netincome, Group share), given the negotiations with the potentialacquirer were unsuccessful, the Group decided to reclassifythem from “assets classified as held for sale” to tangible assets,taking into account a catch-up depreciation charge for thedepreciation previously not recognized in accordance with theIFRS 5 standard.
3) “Other elements” amount to $1,257 million in operating incomeand $966 million in net income, Group share, and mainly include:
– The write-off of some exploratory drilling costs previouslycapitalized, in relation with potential development projects thatthe Group decided to discontinue due to the current economicenvironment;
– Charges related to assets in Yemen and Libya following theshutdown of production in relation with the significantdeterioration of the safety conditions;
– A charge following the resolution of a dispute in Qatar and of agas transportation contract in the United States of America;
– Gains from the impact of changes in the tax regime in the UK and Canada on the deferred tax position.
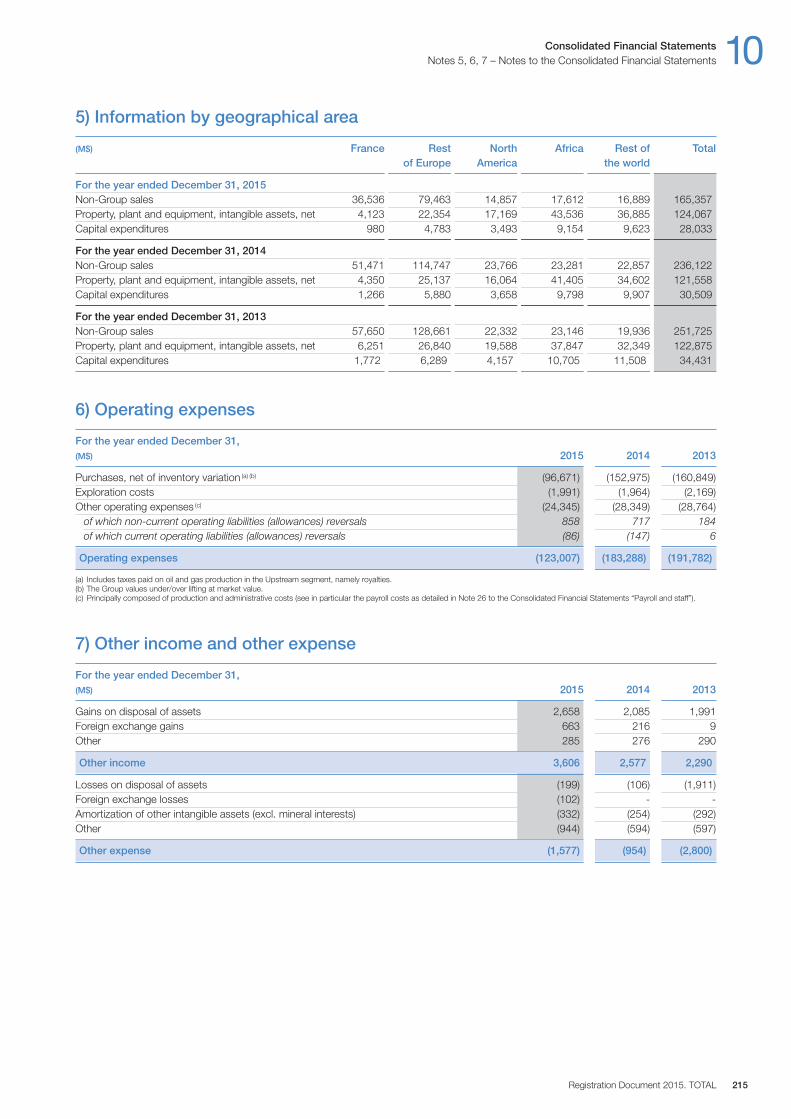
5) Information by geographical area
(M$) France Rest North Africa Rest of Totalof Europe America the world
For the year ended December 31, 2015Non-Group sales 36,536 79,463 14,857 17,612 16,889 165,357Property, plant and equipment, intangible assets, net 4,123 22,354 17,169 43,536 36,885 124,067Capital expenditures 980 4,783 3,493 9,154 9,623 28,033
For the year ended December 31, 2014Non-Group sales 51,471 114,747 23,766 23,281 22,857 236,122Property, plant and equipment, intangible assets, net 4,350 25,137 16,064 41,405 34,602 121,558Capital expenditures 1,266 5,880 3,658 9,798 9,907 30,509
For the year ended December 31, 2013Non-Group sales 57,650 128,661 22,332 23,146 19,936 251,725Property, plant and equipment, intangible assets, net 6,251 26,840 19,588 37,847 32,349 122,875Capital expenditures 1,772 6,289 4,157 10,705 11,508 34,431
6) Operating expenses
For the year ended December 31,(M$) 2015 2014 2013
Purchases, net of inventory variation (a) (b) (96,671) (152,975) (160,849)Exploration costs (1,991) (1,964) (2,169)Other operating expenses (c) (24,345) (28,349) (28,764)
of which non-current operating liabilities (allowances) reversals 858 717 184of which current operating liabilities (allowances) reversals (86) (147) 6
Operating expenses (123,007) (183,288) (191,782)
(a) Includes taxes paid on oil and gas production in the Upstream segment, namely royalties.(b) The Group values under / over lifting at market value.(c) Principally composed of production and administrative costs (see in particular the payroll costs as detailed in Note 26 to the Consolidated Financial Statements “Payroll and staff”).
7) Other income and other expense
For the year ended December 31,(M$) 2015 2014 2013
Gains on disposal of assets 2,658 2,085 1,991Foreign exchange gains 663 216 9Other 285 276 290
Other income 3,606 2,577 2,290
Losses on disposal of assets (199) (106) (1,911)Foreign exchange losses (102) - -Amortization of other intangible assets (excl. mineral interests) (332) (254) (292)Other (944) (594) (597)
Other expense (1,577) (954) (2,800)
Consolidated Financial Statements 10Notes 5, 6, 7 – Notes to the Consolidated Financial Statements
Registration Document 2015. TOTAL 215
10 Consolidated Financial StatementsNotes to the Consolidated Financial Statements – Notes 8, 9
TOTAL. Registration Document 2015216
8) Other financial income and expense
As of December 31,(M$) 2015 2014 2013
Dividend income on non-consolidated subsidiaries 267 282 202Capitalized financial expenses 364 348 343Other 251 191 151
Other financial income 882 821 696
Accretion of asset retirement obligations (513) (543) (584)Other (141) (133) (118)
Other financial expense (654) (676) (702)
9) Income taxes
TOTAL S.A. is taxed in accordance with the common French tax regime.
For the year ended December 31,(M$) 2015 2014 2013
Current income taxes (4,552) (10,904) (13,607)Deferred income taxes 2,899 2,290 (1,160)
Total income taxes (1,653) (8,614) (14,767)
Before netting deferred tax assets and liabilities by fiscal entity, the components of deferred tax balances are as follows:
As of December 31,(M$) 2015 2014 2013
Net operating losses and tax carry forwards 4,849 5,213 4,586Employee benefits 1,260 1,770 1,641Other temporary non-deductible provisions 6,481 6,258 5,992Differences in depreciations (15,932) (18,129) (20,948)Other temporary tax deductions (1,795) (2,542) (3,267)
Valuation allowance (3,241) (3,301) (2,016)
Net deferred tax liability (8,378) (10,731) (14,012)
Other income
In 2015, gains on disposal of assets are mainly related to sales ofassets in Nigeria in the Upstream segment, to sales of interests inGeosel and the Schwedt refinery in the Refining & Chemicalssegment, to the sale of the Bostik adhesives activity, also in theRefining & Chemicals segment, and to the sale of 100% of Totalgazin the Marketing & Services segment (see Note 3 to theConsolidated Financial Statements).
In 2014, gains on disposal of assets mainly related to sales ofassets in the Upstream segment in Angola and the United-Statesand to sales of interests, also in the Upstream segment in: thecompany GTT (GazTransport et Technigaz), the Shah Deniz fieldand the South Caucasus pipeline.
In 2013, gains on disposals were mainly related to the sale ofTransport et Infrastructures Gaz France (TIGF) and the sales ofinterests in the Upstream segment: 25% interest in the TempaRossa field in Italy and all interests in Trinidad & Tobago.
Other expense
In 2015, the loss on disposals is mainly related to the sale of 20%of interests in fields in the United Kingdom (see Note 3 to theConsolidated Financial Statements). The heading “Other” mainlyconsists of the impairment of non-consolidated shares and loansgranted to non-consolidated subsidiaries and equity affiliates for anamount of $409 million, $180 million of restructuring charges in theUpstream, Refining & Chemicals and Marketing & Services segmentsas well as $162 million for expenses relating to a litigation in Qatar.
In 2014, the loss on disposals is mainly related to the sale ofCCP Composites to Polynt Group. The heading “Other” mainlyconsists of the impairment of shares and loans of non-consolidatedsubsidiaries for an amount of $88 million, $43 million of restructuringcharges as well as $34 million for expenses relating to sales.
In 2013, the loss on disposals is mainly related to the sale to SuncorEnergy Inc. of TOTAL’s 49% interest in the Voyageur upgrader projectin Canada. The heading “Other” mainly consists of $281 million of restructuring charges in the Upstream, Refining & Chemicals andMarketing & Services segments.
Consolidated Financial Statements 10Note 9 – Notes to the Consolidated Financial Statements
Registration Document 2015. TOTAL 217
The reserves of TOTAL subsidiaries that would be taxable if distributed but for which no distribution is planned, and for which no deferredtax liability has therefore been recognized, totaled $10,596 million as of December 31, 2015.
The impairment of deferred tax assets in the table above for $3,241 million as of December 31, 2015, relates notably to Congo for anamount of $1,034 million, to France for an amount of $607 million, to Canada for an amount of $324 million, to Australia for an amount of$312 million and to Belgium for an amount of $263 million.
After netting deferred tax assets and liabilities by fiscal entity, deferred taxes are presented on the balance sheet as follows:
As of December 31,(M$) 2015 2014 2013
Deferred tax assets, non-current 3,982 4,079 3,838Deferred tax liabilities, non-current (12,360) (14,810) (17,850)
Net amount (8,378) (10,731) (14,012)
The net deferred tax variation in the balance sheet is analyzed as follows:
As of December 31,(M$) 2015 2014 2013
Opening balance (10,731) (14,012) (13,024)
Deferred tax on income 2,899 2,290 (1,160)Deferred tax on shareholders’ equity (a) (225) 562 (349)Changes in scope of consolidation (b) (552) 356 153Currency translation adjustment 231 73 368
Closing balance (8,378) (10,731) (14,012)
(a) This amount includes mainly deferred taxes on actuarial gains and losses, current income taxes and deferred taxes for changes in fair value of listed securities classified as financialassets available for sale, as well as deferred taxes related to the cash flow hedge (see Note 17 to the Consolidated Financial Statements).
(b) Changes in scope of consolidation include, as of December 31, 2015 the impact of reclassifications in assets classified as held for sale and liabilities directly associated with the assetsclassified as held for sale for $(565) million.
Reconciliation between provision for income taxes and pre-tax income
For the year ended December 31,(M$) 2015 2014 2013
Consolidated net income 4,786 4,250 11,521Provision for income taxes 1,653 8,614 14,767
Pre-tax income 6,439 12,864 26,288
French statutory tax rate 38.00% 38.00% 38.00%
Theoretical tax charge (2,447) (4,888) (9,989)
Difference between French and foreign income tax rates (6) (4,256) (6,131)Tax effect of equity in income (loss) of affiliates 897 1,012 1,298Permanent differences (371) 833 1,130Adjustments on prior years income taxes 100 33 -Adjustments on deferred tax related to changes in tax rates 483 (1) 3Changes in valuation allowance of deferred tax assets (309) (1,347) (1,078)
Net provision for income taxes (1,653) (8,614) (14,767)
The difference between the French tax rate and the tax rates of foreign subsidiaries is mainly due to the taxation of profits made by theGroup in countries where it conducts its exploration and production activities at higher tax rates than French tax rates.
The French statutory tax rate includes the standard corporate tax rate (33.33%) and additional applicable taxes that bring the overall tax rateto 38% (versus 38% in 2014 and 38% in 2013).
Permanent differences are mainly due to impairment of goodwill and to dividends from non-consolidated companies as well as the specifictaxation rules applicable to certain activities.
Net operating losses and carried forward tax credits
Deferred tax assets related to carried forward tax credits on net operating losses expire in the following years:
As of December 31, 2015 2014 2013(M$)
Basis Tax Basis Tax Basis Tax
2014 - - - - 491 2362015 - - 443 218 372 1782016 396 193 306 151 226 1052017 617 248 623 229 565 1852018 (a) 489 182 424 143 4,435 1,3322019 (b) 15 3 3,313 899 - -2020 and after 3,289 948 - - - -Unlimited 9,656 3,275 9,906 3,573 7,593 2,550
Total 14,462 4,849 15,015 5,213 13,682 4,586
(a) Net operating losses and carried forward tax credits in 2018 and after for 2013.(b) Net operating losses and carried forward tax credits in 2019 and after for 2014.
As of December 31, 2015 the schedule of the net operating losses and the carried forward tax credits for the main countries is as follows:
As of December 31, 2015 Tax(M$)
United Kingdom France Canada Australia Belgium
2016 - - - - 52017 - - - - 1342018 - - - - 1262019 - - - - -2020 and after - - 649 - 9Unlimited 1,019 864 215 684 235
Total 1,019 864 864 684 509
The Group has unused tax losses for which deferred tax has not been recognized for an amount of $1,283 million as of December 31, 2015,mainly in the Upstream segment when the affiliate or the field concerned is in its exploration phase. The net operating losses created duringthis exploration phase will be useable only if a final investment and development decision is made. Accordingly, the time limit for theutilization of these net operating losses is not known.
10) Intangible assets
As of December 31, 2015 Cost Amortization Net(M$) and impairment
Goodwill 1,597 (971) 626Proved mineral interests 12,800 (6,436) 6,364Unproved mineral interests 11,751 (5,082) 6,669Other intangible assets 4,059 (3,169) 890
Total intangible assets 30,207 (15,658) 14,549
As of December 31, 2014 Cost Amortization Net(M$) and impairment
Goodwill 1,639 (1,020) 619Proved mineral interests 12,215 (5,514) 6,701Unproved mineral interests 10,673 (4,498) 6,175Other intangible assets 4,387 (3,200) 1,187
Total intangible assets 28,914 (14,232) 14,682
10 Consolidated Financial StatementsNotes to the Consolidated Financial Statements – Notes 9, 10
TOTAL. Registration Document 2015218
A summary of changes in the carrying amount of goodwill by business segment for the year ended December 31, 2015 is as follows:
(M$) Net goodwill Increases Impairments Other Net goodwill as of as of
January 1, 2015 December 31, 2015
Upstream - - - - -Refining & Chemicals 485 10 - (25) 470Marketing & Services 104 37 - (12) 129Corporate 30 - - (3) 27
Total 619 47 - (40) 626
11) Property, plant and equipment
As of December 31, 2015 Cost Depreciation Net(M$) and impairment
Upstream propertiesProved properties 153,530 (94,843) 58,687Unproved properties 2,423 - 2,423Work in progress 36,246 (2,284) 33,962
Subtotal 192,199 (97,127) 95,072
Other property, plant and equipmentLand 1,551 (581) 970Machinery, plant and equipment (including transportation equipment) 28,723 (22,975) 5,748Buildings 7,655 (5,018) 2,637Work in progress 2,705 (128) 2,577Other 8,182 (5,668) 2,514
Subtotal 48,816 (34,370) 14,446
Total property, plant and equipment 241,015 (131,497) 109,518
In 2015, the heading “Amortization and impairment” includes theaccounting impact of exceptional asset impairments for an amountof $1,482 million (see Note 4D to the Consolidated FinancialStatements).
In 2014, the heading “Amortization and impairment” included theaccounting impact of exceptional asset impairments for an amountof $3,177 million (see Note 4D to the Consolidated FinancialStatements).
In 2014, the heading “Other” mainly included mineral interests inUtica reclassified into acquisitions for $(524) million, the recognition
of mineral interests in Papua New Guinea for $429 million, thereclassification of assets in accordance with IFRS 5 “Non-currentassets held for sale and discontinued operations” for $(561) millionand the reversal of the reclassification under IFRS 5 as atDecember 31, 2013 for $96 million corresponding to disposals.
In 2013, the heading “Other” mainly included mineral interests inUtica reclassified into acquisitions for $(604) million, thereclassification of assets in accordance with IFRS 5 “Non-currentassets held for sale and discontinued operations” for $(93) millionand the reversal of the reclassification under IFRS 5 as atDecember 31, 2012 for $331 million corresponding to disposals.
Consolidated Financial Statements 10Notes 10, 11 – Notes to the Consolidated Financial Statements
Registration Document 2015. TOTAL 219
As of December 31, 2013 Cost Amortization Net(M$) and impairment
Goodwill 2,512 (1,263) 1,249Proved mineral interests 12,309 (5,003) 7,306Unproved mineral interests 10,430 (1,785) 8,645Other intangible assets 4,978 (3,783) 1,195
Total intangible assets 30,229 (11,834) 18,395
Changes in net intangible assets are analyzed in the following table:
(M$) Net amount Acquisitions Disposals Amortization Currency Other Net amount as of and impairment translation as of January 1, adjustment December 31,
2015 14,682 2,750 (343) (2,324) (200) (16) 14,549
2014 18,395 1,000 (178) (3,920) (276) (339) 14,6822013 16,965 3,648 (388) (1,527) (10) (293) 18,395

In 2015, the heading “Disposals” mainly includes the impact of salesin the Upstream segment (sale of 4 blocks in Nigeria, West ofShetland fields in United Kingdom and a part of Fort Hills in Canada).
In 2015, the heading “Depreciation and impairment” includes theimpact of impairments of assets recognized for an amount of$5,544 million (see Note 4D to the Consolidated FinancialStatements).
In 2015, the heading “Other” principally corresponds to theincrease of the asset for site restitution for an amount of$956 million and the reclassification of assets classified inaccordance with IFRS 5 “Non-current assets held for sale anddiscontinued operations” for $1,128 million, primarily related to theUsan field in Nigeria.
In 2014, the heading “Disposals” mainly included the impact ofsales in the Upstream segment (sale of block 15 / 06 in Angola andthe Shah Deniz field in Azerbaijan).
In 2014, the heading “Depreciation and impairment” included theimpact of impairments of assets recognized for an amount of$4,802 million (see Note 4D to the Consolidated FinancialStatements).
In 2014, the heading “Other” principally corresponded to theincrease of the asset for site restitution for an amount of$1,366 million. It also includes $(466) million related to thereclassification of assets classified in accordance with IFRS 5 “Non-current assets held for sale and discontinued operations” primarilyrelated to the sales of Total Coal South Africa and Bostik.
10 Consolidated Financial StatementsNotes to the Consolidated Financial Statements – Note 11
TOTAL. Registration Document 2015220
As of December 31, 2014 Cost Depreciation Net(M$) and impairment
Upstream propertiesProved properties 139,294 (86,326) 52,968Unproved properties 2,153 - 2,153Work in progress 38,698 (1,574) 37,124
Subtotal 180,145 (87,900) 92,245
Other property, plant and equipmentLand 1,683 (613) 1,070Machinery, plant and equipment (including transportation equipment) 30,966 (24,874) 6,092Buildings 8,141 (5,291) 2,850Work in progress 2,367 (324) 2,043Other 8,673 (6,097) 2,576
Subtotal 51,830 (37,199) 14,631
Total property, plant and equipment 231,975 (125,099) 106,876
As of December 31, 2013 Cost Depreciation Net(M$) and impairment
Upstream propertiesProved properties 134,512 (83,423) 51,089Unproved properties 1,432 - 1,432Work in progress 34,668 (56) 34,612
Subtotal 170,612 (83,479) 87,133
Other property, plant and equipmentLand 1,846 (582) 1,264Machinery, plant and equipment (including transportation equipment) 35,215 (26,903) 8,312Buildings 9,050 (5,870) 3,180Work in progress 2,318 (465) 1,853Other 9,717 (6,979) 2,738
Subtotal 58,146 (40,799) 17,347
Total property, plant and equipment 228,758 (124,278) 104,480
Changes in net property, plant and equipment are analyzed in the following table:
(M$) Net amount Acquisitions Disposals Depreciation Currency Other Net amount as of and impairment translation as of
January 1, adjustment December 31,
2015 106,876 22,382 (1,842) (17,010) (3,449) 2,561 109,518
2014 104,480 25,320 (2,211) (16,939) (4,438) 664 106,8762013 91,477 26,100 (2,828) (11,831) (361) 1,923 104,480
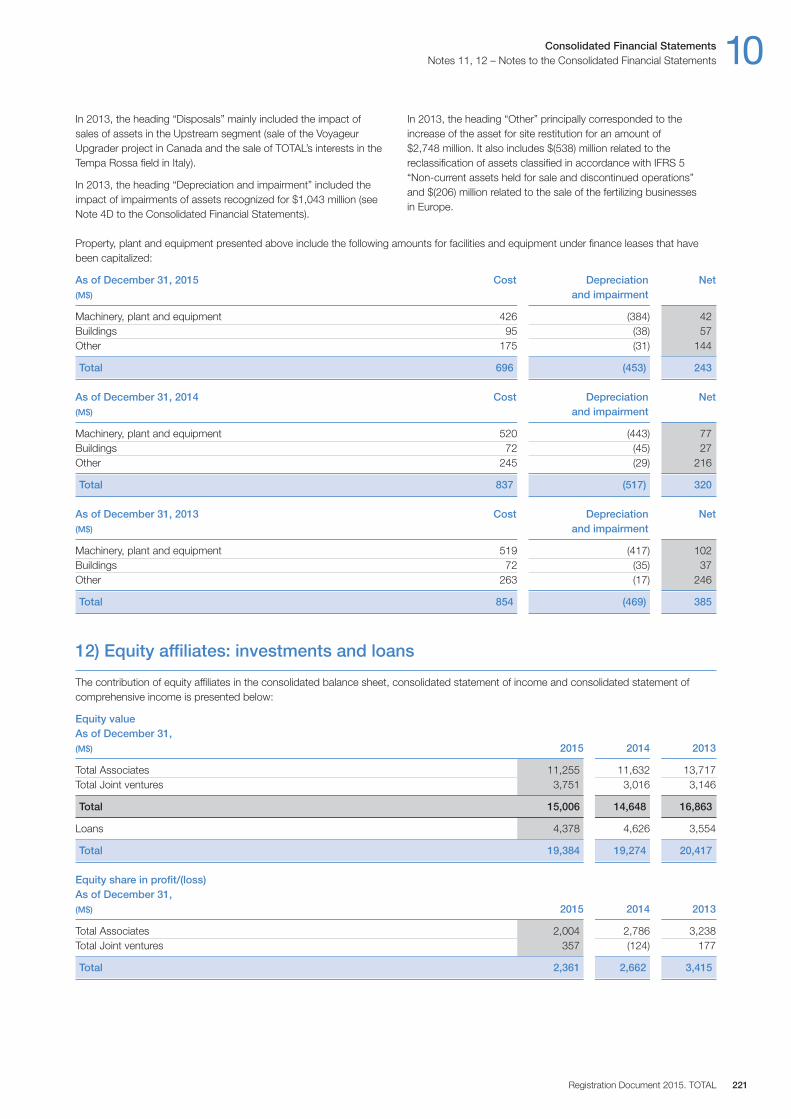
Property, plant and equipment presented above include the following amounts for facilities and equipment under finance leases that havebeen capitalized:
As of December 31, 2015 Cost Depreciation Net(M$) and impairment
Machinery, plant and equipment 426 (384) 42Buildings 95 (38) 57Other 175 (31) 144
Total 696 (453) 243
As of December 31, 2014 Cost Depreciation Net(M$) and impairment
Machinery, plant and equipment 520 (443) 77Buildings 72 (45) 27Other 245 (29) 216
Total 837 (517) 320
As of December 31, 2013 Cost Depreciation Net(M$) and impairment
Machinery, plant and equipment 519 (417) 102Buildings 72 (35) 37Other 263 (17) 246
Total 854 (469) 385
12) Equity affiliates: investments and loans
The contribution of equity affiliates in the consolidated balance sheet, consolidated statement of income and consolidated statement ofcomprehensive income is presented below:
Equity valueAs of December 31, (M$) 2015 2014 2013
Total Associates 11,255 11,632 13,717Total Joint ventures 3,751 3,016 3,146
Total 15,006 14,648 16,863
Loans 4,378 4,626 3,554
Total 19,384 19,274 20,417
Equity share in profit/(loss)As of December 31,(M$) 2015 2014 2013
Total Associates 2,004 2,786 3,238Total Joint ventures 357 (124) 177
Total 2,361 2,662 3,415
Consolidated Financial Statements 10Notes 11, 12 – Notes to the Consolidated Financial Statements
Registration Document 2015. TOTAL 221
In 2013, the heading “Disposals” mainly included the impact ofsales of assets in the Upstream segment (sale of the VoyageurUpgrader project in Canada and the sale of TOTAL’s interests in theTempa Rossa field in Italy).
In 2013, the heading “Depreciation and impairment” included theimpact of impairments of assets recognized for $1,043 million (seeNote 4D to the Consolidated Financial Statements).
In 2013, the heading “Other” principally corresponded to theincrease of the asset for site restitution for an amount of$2,748 million. It also includes $(538) million related to thereclassification of assets classified in accordance with IFRS 5 “Non-current assets held for sale and discontinued operations” and $(206) million related to the sale of the fertilizing businesses in Europe.

Other comprehensive incomeAs of December 31, (M$) 2015 2014 2013
Total Associates 139 (1,532) (669)Total Joint ventures (19) (6) (136)
Total 120 (1,538) (805)
In cases where the Group holds less than 20% of the voting rights in another entity, the determination of whether the Group exercisessignificant influence is also based on other facts and circumstances: representation on the Board of Directors or an equivalent governingbody of the entity, participation in policy-making processes, including participation in decisions relating to dividends or other distributions,significant transactions between the investor and the entity, exchange of management personnel, or provision of essential technicalinformation.
Information (100% gross) relating to significant associates is as follows:
Upstream
(M$) Novatek(a) Liquefaction entities PetroCedeño
2015 2014 2013 2015 2014 2013 2015 2014 2013
Non current assets 9,768 9,551 13,617 33,294 33,909 31,680 6,916 6,458 6,263Current assets 2,237 1,648 2,829 7,427 9,007 7,684 3,437 10,033 5,059
Total Assets 12,005 11,199 16,446 40,721 42,916 39,364 10,353 16,491 11,322
Shareholder’s equity 6,745 7,135 10,683 25,941 25,090 23,256 5,538 5,597 5,581Non current liabilities 3,014 3,352 4,934 9,373 10,876 11,474 10 274 186Current liabilities 2,246 712 829 5,407 6,950 4,634 4,805 10,620 5,555
Total Liabilities 12,005 11,199 16,446 40,721 42,916 39,364 10,353 16,491 11,322
Revenue from sales 7,130 9,222 9,355 22,731 39,502 38,728 1,840 3,644 4,117
Net income 1,755 2,759 2,647 7,720 14,269 14,381 399 343 600
Other comprehensive income (1,682) (5,431) (697) - - - - - -
% owned 18.90% 18.24% 16.96% 30.32% 30.32% 30.32%Revaluation identifiable assets on equity afiliates 1,580 1,944 3,545 - - - - - -Equity value 2,855 3,245 5,357 4,183 4,130 3,625 1,679 1,697 1,692Equity share in profit / (loss) 229 193 221 978 2,125 2,027 121 104 182Equity other comprehensive income (135) (1,844) (621) 156 200 (21) - - -Dividends paid to the Group 102 126 102 1,072 1,687 1,579 139 99 182
(a) Information includes estimates at the date of TOTAL’s financial statements.
Novatek, listed in Moscow and London, is the 2nd largest producer of natural gas in Russia. The Group share of Novatek’s market valueamounted to $ 4,577 million as at December 31, 2015. Novatek is consolidated by the equity method. TOTAL considers, in fact, that itexercises significant influence particularly via its representation on the Board of Directors of Novatek and its interest in the major project ofYamal LNG.
The Group is not aware of significant restrictions limiting the ability of OAO Novatek to transfer funds to its shareholder, be it under the formof dividends, repayment of advances or loans made.
The Group’s interests in associates operating liquefaction plants are combined. The amounts include investments in: Nigeria LNG (15.00%),Angola LNG (13.60%), Yemen LNG (39.62%), Qatargas (10.00%), Qatar Liquefied Gas Company Limited II – Train B (16.70%), Oman LNG(5.54%), Brass LNG (20.48%) and Abu Dhabi Gas Lc (5.00%).
PetroCedeño produces and upgrades extra-heavy crude oil in Venezuela.
10 Consolidated Financial StatementsNotes to the Consolidated Financial Statements – Note 12
TOTAL. Registration Document 2015222
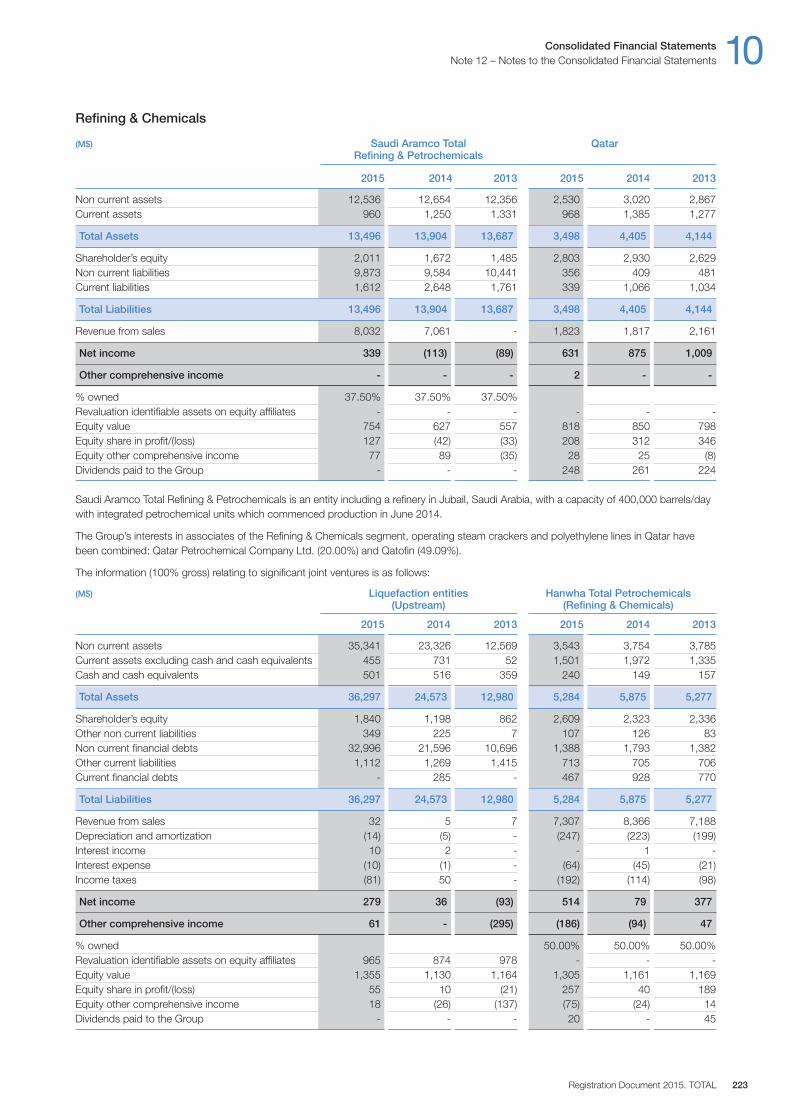
Refining & Chemicals
(M$) Saudi Aramco Total QatarRefining & Petrochemicals
2015 2014 2013 2015 2014 2013
Non current assets 12,536 12,654 12,356 2,530 3,020 2,867Current assets 960 1,250 1,331 968 1,385 1,277
Total Assets 13,496 13,904 13,687 3,498 4,405 4,144
Shareholder’s equity 2,011 1,672 1,485 2,803 2,930 2,629Non current liabilities 9,873 9,584 10,441 356 409 481Current liabilities 1,612 2,648 1,761 339 1,066 1,034
Total Liabilities 13,496 13,904 13,687 3,498 4,405 4,144
Revenue from sales 8,032 7,061 - 1,823 1,817 2,161
Net income 339 (113) (89) 631 875 1,009
Other comprehensive income - - - 2 - -
% owned 37.50% 37.50% 37.50% Revaluation identifiable assets on equity affiliates - - - - - -Equity value 754 627 557 818 850 798Equity share in profit / (loss) 127 (42) (33) 208 312 346Equity other comprehensive income 77 89 (35) 28 25 (8)Dividends paid to the Group - - - 248 261 224
Saudi Aramco Total Refining & Petrochemicals is an entity including a refinery in Jubail, Saudi Arabia, with a capacity of 400,000 barrels / daywith integrated petrochemical units which commenced production in June 2014.
The Group’s interests in associates of the Refining & Chemicals segment, operating steam crackers and polyethylene lines in Qatar havebeen combined: Qatar Petrochemical Company Ltd. (20.00%) and Qatofin (49.09%).
The information (100% gross) relating to significant joint ventures is as follows:
(M$) Liquefaction entities Hanwha Total Petrochemicals(Upstream) (Refining & Chemicals)
2015 2014 2013 2015 2014 2013
Non current assets 35,341 23,326 12,569 3,543 3,754 3,785Current assets excluding cash and cash equivalents 455 731 52 1,501 1,972 1,335Cash and cash equivalents 501 516 359 240 149 157
Total Assets 36,297 24,573 12,980 5,284 5,875 5,277
Shareholder’s equity 1,840 1,198 862 2,609 2,323 2,336Other non current liabilities 349 225 7 107 126 83Non current financial debts 32,996 21,596 10,696 1,388 1,793 1,382Other current liabilities 1,112 1,269 1,415 713 705 706Current financial debts - 285 - 467 928 770
Total Liabilities 36,297 24,573 12,980 5,284 5,875 5,277
Revenue from sales 32 5 7 7,307 8,366 7,188Depreciation and amortization (14) (5) - (247) (223) (199)Interest income 10 2 - - 1 -Interest expense (10) (1) - (64) (45) (21)Income taxes (81) 50 - (192) (114) (98)
Net income 279 36 (93) 514 79 377
Other comprehensive income 61 - (295) (186) (94) 47
% owned 50.00% 50.00% 50.00%Revaluation identifiable assets on equity affiliates 965 874 978 - - -Equity value 1,355 1,130 1,164 1,305 1,161 1,169Equity share in profit / (loss) 55 10 (21) 257 40 189Equity other comprehensive income 18 (26) (137) (75) (24) 14Dividends paid to the Group - - - 20 - 45
Consolidated Financial Statements 10Note 12 – Notes to the Consolidated Financial Statements
Registration Document 2015. TOTAL 223
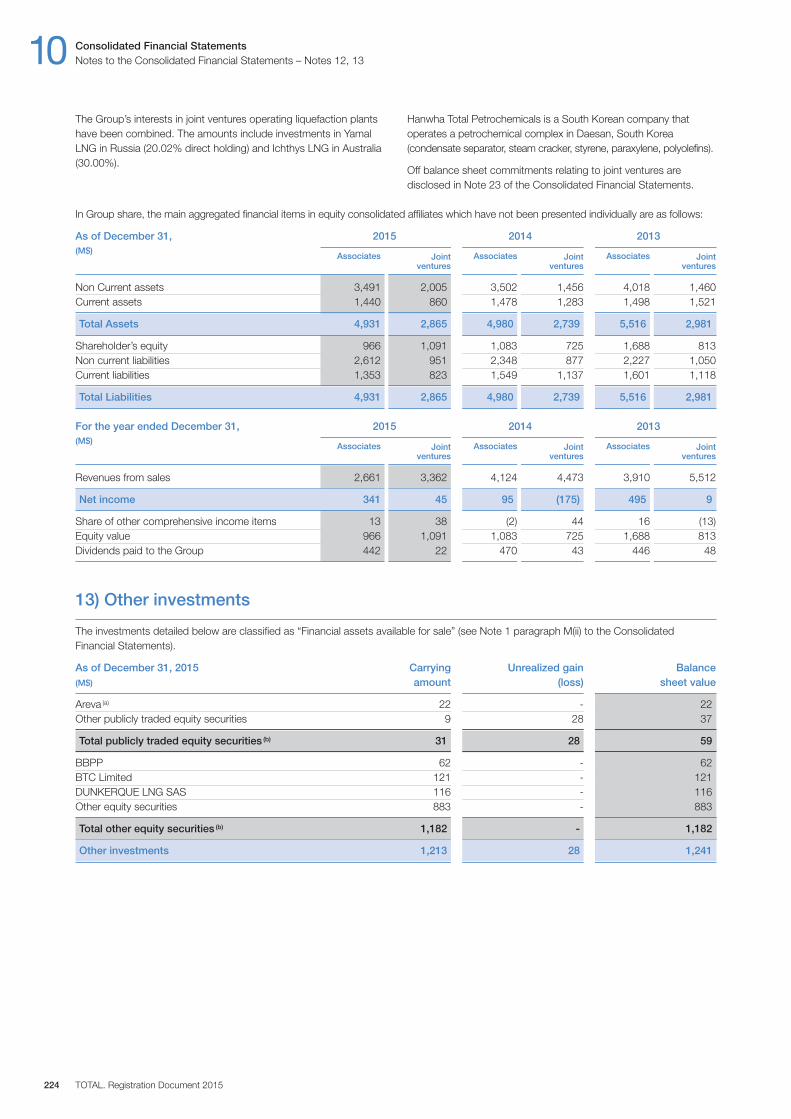
In Group share, the main aggregated financial items in equity consolidated affiliates which have not been presented individually are as follows:
As of December 31, 2015 2014 2013(M$)
Associates Joint Associates Joint Associates Joint ventures ventures ventures
Non Current assets 3,491 2,005 3,502 1,456 4,018 1,460Current assets 1,440 860 1,478 1,283 1,498 1,521
Total Assets 4,931 2,865 4,980 2,739 5,516 2,981
Shareholder’s equity 966 1,091 1,083 725 1,688 813Non current liabilities 2,612 951 2,348 877 2,227 1,050Current liabilities 1,353 823 1,549 1,137 1,601 1,118
Total Liabilities 4,931 2,865 4,980 2,739 5,516 2,981
For the year ended December 31, 2015 2014 2013(M$)
Associates Joint Associates Joint Associates Joint ventures ventures ventures
Revenues from sales 2,661 3,362 4,124 4,473 3,910 5,512
Net income 341 45 95 (175) 495 9
Share of other comprehensive income items 13 38 (2) 44 16 (13)Equity value 966 1,091 1,083 725 1,688 813Dividends paid to the Group 442 22 470 43 446 48
13) Other investments
The investments detailed below are classified as “Financial assets available for sale” (see Note 1 paragraph M(ii) to the ConsolidatedFinancial Statements).
As of December 31, 2015 Carrying Unrealized gain Balance(M$) amount (loss) sheet value
Areva (a) 22 - 22Other publicly traded equity securities 9 28 37
Total publicly traded equity securities (b) 31 28 59
BBPP 62 - 62BTC Limited 121 - 121DUNKERQUE LNG SAS 116 - 116Other equity securities 883 - 883
Total other equity securities (b) 1,182 - 1,182
Other investments 1,213 28 1,241
10 Consolidated Financial StatementsNotes to the Consolidated Financial Statements – Notes 12, 13
224
The Group’s interests in joint ventures operating liquefaction plantshave been combined. The amounts include investments in YamalLNG in Russia (20.02% direct holding) and Ichthys LNG in Australia(30.00%).
Hanwha Total Petrochemicals is a South Korean company thatoperates a petrochemical complex in Daesan, South Korea(condensate separator, steam cracker, styrene, paraxylene, polyolefins).
Off balance sheet commitments relating to joint ventures aredisclosed in Note 23 of the Consolidated Financial Statements.
TOTAL. Registration Document 2015
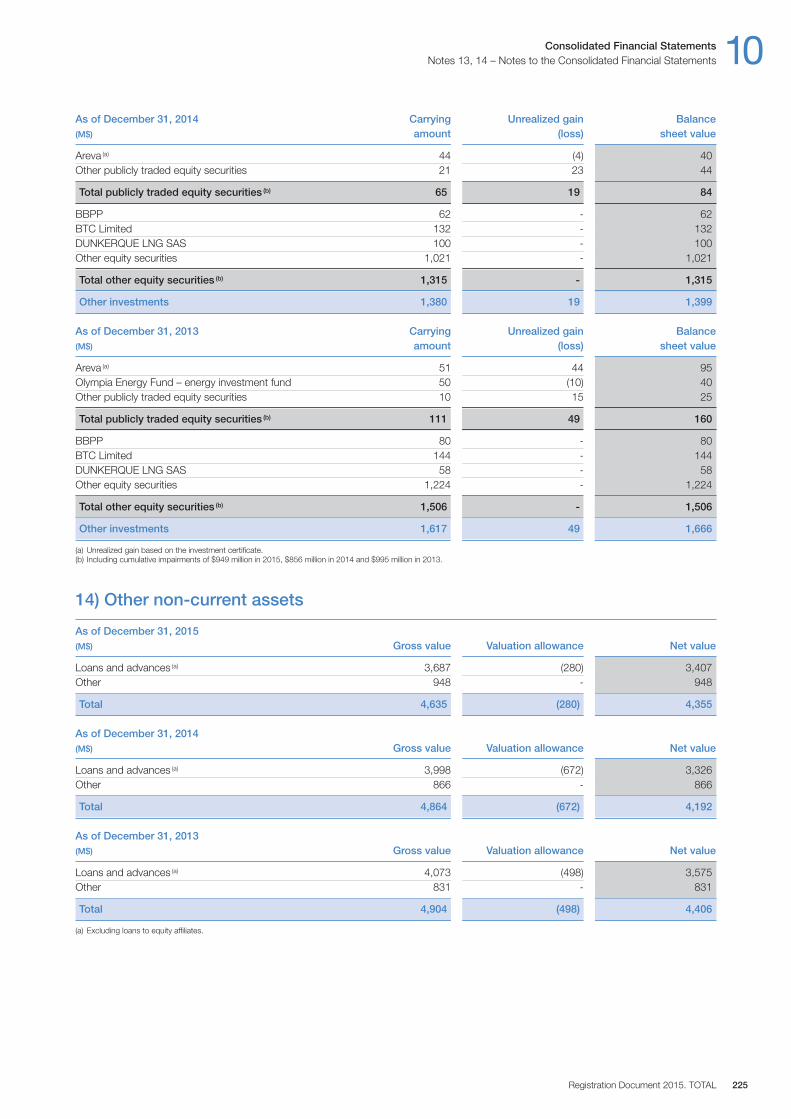
Consolidated Financial Statements 10Notes 13, 14 – Notes to the Consolidated Financial Statements
Registration Document 2015. TOTAL 225
As of December 31, 2014 Carrying Unrealized gain Balance(M$) amount (loss) sheet value
Areva (a) 44 (4) 40Other publicly traded equity securities 21 23 44
Total publicly traded equity securities (b) 65 19 84
BBPP 62 - 62BTC Limited 132 - 132DUNKERQUE LNG SAS 100 - 100Other equity securities 1,021 - 1,021
Total other equity securities (b) 1,315 - 1,315
Other investments 1,380 19 1,399
As of December 31, 2013 Carrying Unrealized gain Balance(M$) amount (loss) sheet value
Areva (a) 51 44 95Olympia Energy Fund – energy investment fund 50 (10) 40Other publicly traded equity securities 10 15 25
Total publicly traded equity securities (b) 111 49 160
BBPP 80 - 80BTC Limited 144 - 144DUNKERQUE LNG SAS 58 - 58Other equity securities 1,224 - 1,224
Total other equity securities (b) 1,506 - 1,506
Other investments 1,617 49 1,666
(a) Unrealized gain based on the investment certificate.(b) Including cumulative impairments of $949 million in 2015, $856 million in 2014 and $995 million in 2013.
14) Other non-current assets
As of December 31, 2015(M$) Gross value Valuation allowance Net value
Loans and advances (a) 3,687 (280) 3,407Other 948 - 948
Total 4,635 (280) 4,355
As of December 31, 2014(M$) Gross value Valuation allowance Net value
Loans and advances (a) 3,998 (672) 3,326Other 866 - 866
Total 4,864 (672) 4,192
As of December 31, 2013(M$) Gross value Valuation allowance Net value
Loans and advances (a) 4,073 (498) 3,575Other 831 - 831
Total 4,904 (498) 4,406
(a) Excluding loans to equity affiliates.
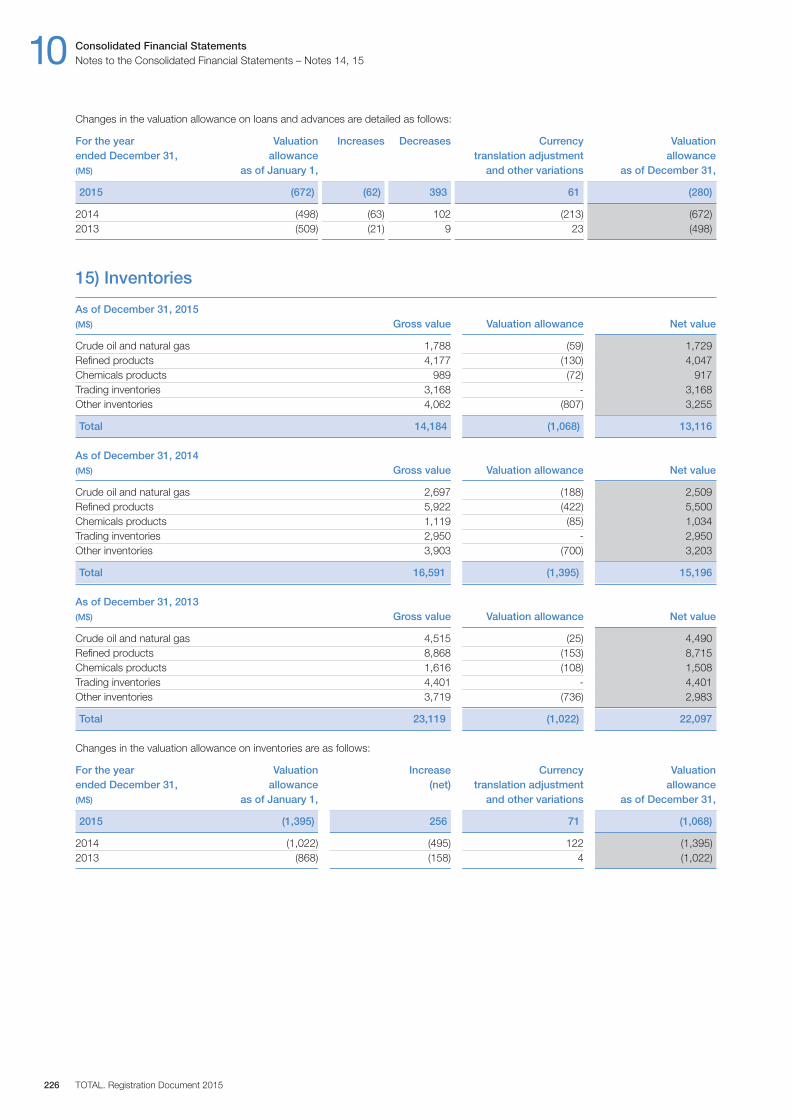
Changes in the valuation allowance on loans and advances are detailed as follows:
For the year Valuation Increases Decreases Currency Valuationended December 31, allowance translation adjustment allowance(M$) as of January 1, and other variations as of December 31,
2015 (672) (62) 393 61 (280)
2014 (498) (63) 102 (213) (672)2013 (509) (21) 9 23 (498)
15) Inventories
As of December 31, 2015(M$) Gross value Valuation allowance Net value
Crude oil and natural gas 1,788 (59) 1,729Refined products 4,177 (130) 4,047Chemicals products 989 (72) 917Trading inventories 3,168 - 3,168Other inventories 4,062 (807) 3,255
Total 14,184 (1,068) 13,116
As of December 31, 2014(M$) Gross value Valuation allowance Net value
Crude oil and natural gas 2,697 (188) 2,509Refined products 5,922 (422) 5,500Chemicals products 1,119 (85) 1,034Trading inventories 2,950 - 2,950Other inventories 3,903 (700) 3,203
Total 16,591 (1,395) 15,196
As of December 31, 2013(M$) Gross value Valuation allowance Net value
Crude oil and natural gas 4,515 (25) 4,490Refined products 8,868 (153) 8,715Chemicals products 1,616 (108) 1,508Trading inventories 4,401 - 4,401Other inventories 3,719 (736) 2,983
Total 23,119 (1,022) 22,097
Changes in the valuation allowance on inventories are as follows:
For the year Valuation Increase Currency Valuationended December 31, allowance (net) translation adjustment allowance(M$) as of January 1, and other variations as of December 31,
2015 (1,395) 256 71 (1,068)
2014 (1,022) (495) 122 (1,395)2013 (868) (158) 4 (1,022)
10 Consolidated Financial StatementsNotes to the Consolidated Financial Statements – Notes 14, 15
TOTAL. Registration Document 2015226
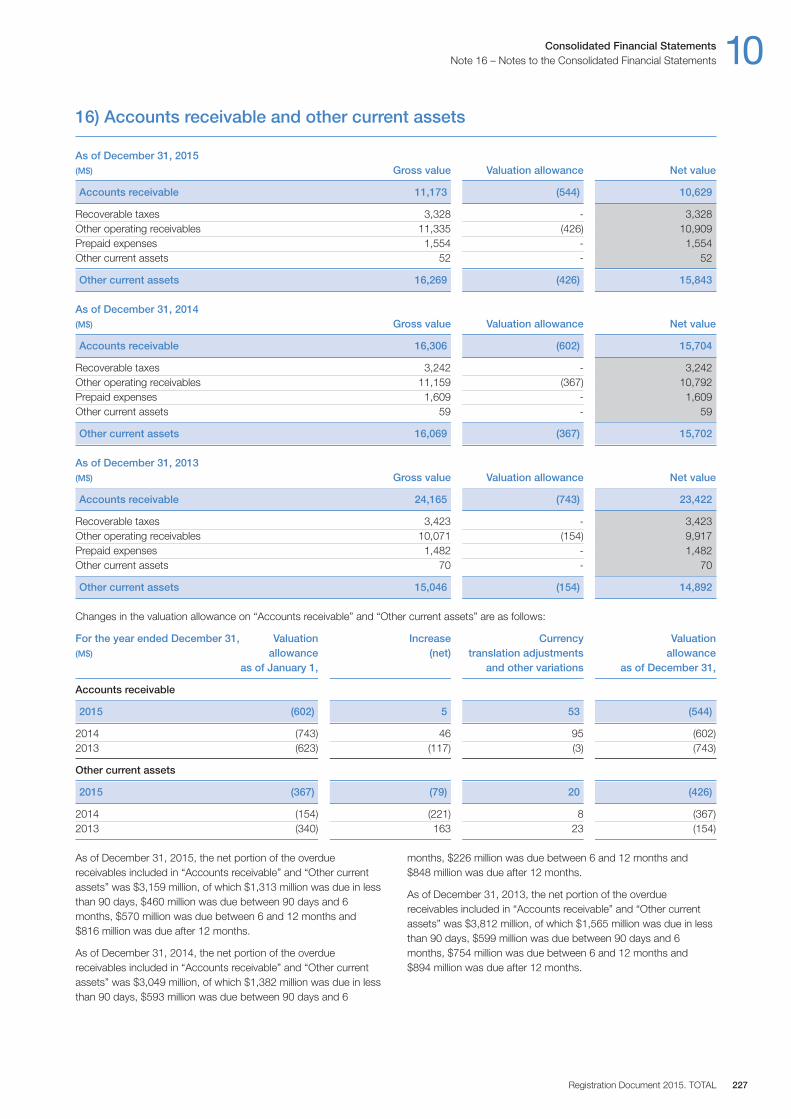
16) Accounts receivable and other current assets
As of December 31, 2015(M$) Gross value Valuation allowance Net value
Accounts receivable 11,173 (544) 10,629
Recoverable taxes 3,328 - 3,328Other operating receivables 11,335 (426) 10,909Prepaid expenses 1,554 - 1,554Other current assets 52 - 52
Other current assets 16,269 (426) 15,843
As of December 31, 2014(M$) Gross value Valuation allowance Net value
Accounts receivable 16,306 (602) 15,704
Recoverable taxes 3,242 - 3,242Other operating receivables 11,159 (367) 10,792Prepaid expenses 1,609 - 1,609Other current assets 59 - 59
Other current assets 16,069 (367) 15,702
As of December 31, 2013(M$) Gross value Valuation allowance Net value
Accounts receivable 24,165 (743) 23,422
Recoverable taxes 3,423 - 3,423Other operating receivables 10,071 (154) 9,917Prepaid expenses 1,482 - 1,482Other current assets 70 - 70
Other current assets 15,046 (154) 14,892
Changes in the valuation allowance on “Accounts receivable” and “Other current assets” are as follows:
For the year ended December 31, Valuation Increase Currency Valuation (M$) allowance (net) translation adjustments allowance
as of January 1, and other variations as of December 31,
Accounts receivable
2015 (602) 5 53 (544)
2014 (743) 46 95 (602)2013 (623) (117) (3) (743)
Other current assets
2015 (367) (79) 20 (426)
2014 (154) (221) 8 (367)2013 (340) 163 23 (154)
As of December 31, 2015, the net portion of the overduereceivables included in “Accounts receivable” and “Other currentassets” was $3,159 million, of which $1,313 million was due in lessthan 90 days, $460 million was due between 90 days and 6months, $570 million was due between 6 and 12 months and$816 million was due after 12 months.
As of December 31, 2014, the net portion of the overduereceivables included in “Accounts receivable” and “Other currentassets” was $3,049 million, of which $1,382 million was due in lessthan 90 days, $593 million was due between 90 days and 6
months, $226 million was due between 6 and 12 months and$848 million was due after 12 months.
As of December 31, 2013, the net portion of the overduereceivables included in “Accounts receivable” and “Other currentassets” was $3,812 million, of which $1,565 million was due in lessthan 90 days, $599 million was due between 90 days and 6months, $754 million was due between 6 and 12 months and$894 million was due after 12 months.
Consolidated Financial Statements 10Note 16 – Notes to the Consolidated Financial Statements
Registration Document 2015. TOTAL 227
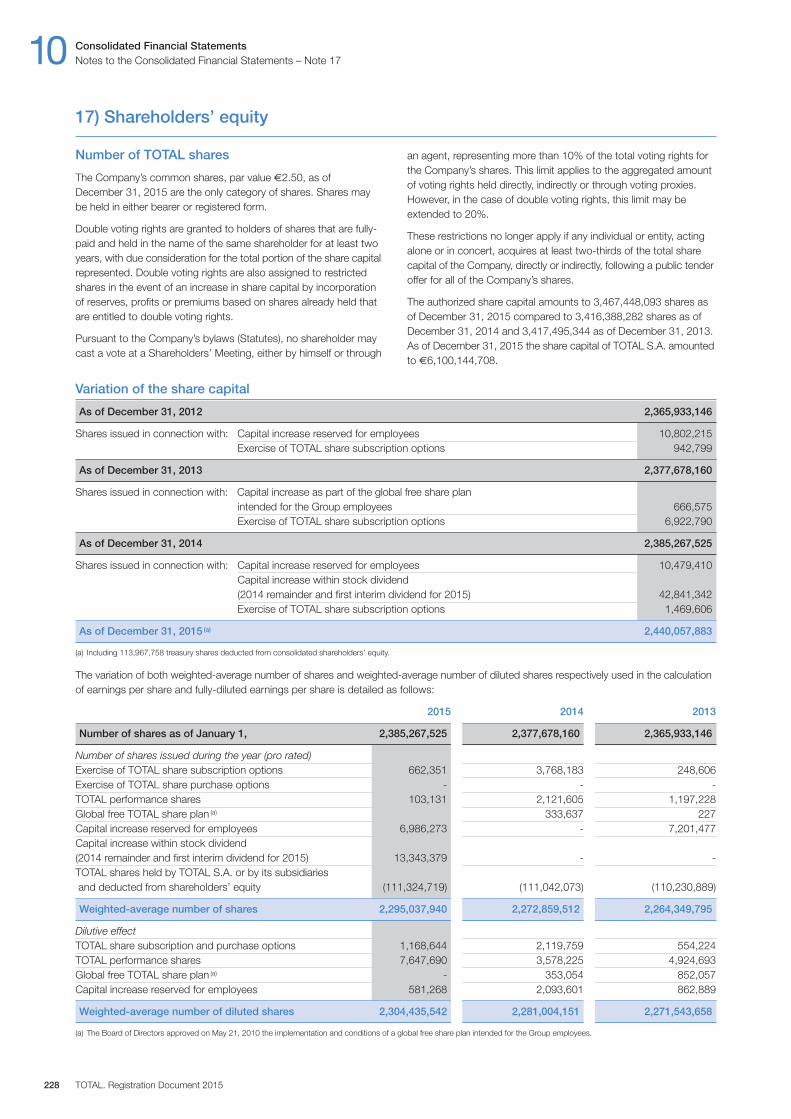
Variation of the share capital
As of December 31, 2012 2,365,933,146
Shares issued in connection with: Capital increase reserved for employees 10,802,215 Exercise of TOTAL share subscription options 942,799
As of December 31, 2013 2,377,678,160
Shares issued in connection with: Capital increase as part of the global free share plan intended for the Group employees 666,575 Exercise of TOTAL share subscription options 6,922,790
As of December 31, 2014 2,385,267,525
Shares issued in connection with: Capital increase reserved for employees 10,479,410 Capital increase within stock dividend (2014 remainder and first interim dividend for 2015) 42,841,342 Exercise of TOTAL share subscription options 1,469,606
As of December 31, 2015 (a) 2,440,057,883
(a) Including 113,967,758 treasury shares deducted from consolidated shareholders’ equity.
The variation of both weighted-average number of shares and weighted-average number of diluted shares respectively used in the calculationof earnings per share and fully-diluted earnings per share is detailed as follows:
2015 2014 2013
Number of shares as of January 1, 2,385,267,525 2,377,678,160 2,365,933,146
Number of shares issued during the year (pro rated)Exercise of TOTAL share subscription options 662,351 3,768,183 248,606Exercise of TOTAL share purchase options - - -TOTAL performance shares 103,131 2,121,605 1,197,228Global free TOTAL share plan (a) 333,637 227Capital increase reserved for employees 6,986,273 - 7,201,477Capital increase within stock dividend (2014 remainder and first interim dividend for 2015) 13,343,379 - -TOTAL shares held by TOTAL S.A. or by its subsidiariesand deducted from shareholders’ equity (111,324,719) (111,042,073) (110,230,889)
Weighted-average number of shares 2,295,037,940 2,272,859,512 2,264,349,795
Dilutive effectTOTAL share subscription and purchase options 1,168,644 2,119,759 554,224TOTAL performance shares 7,647,690 3,578,225 4,924,693Global free TOTAL share plan (a) - 353,054 852,057Capital increase reserved for employees 581,268 2,093,601 862,889
Weighted-average number of diluted shares 2,304,435,542 2,281,004,151 2,271,543,658
(a) The Board of Directors approved on May 21, 2010 the implementation and conditions of a global free share plan intended for the Group employees.
Number of TOTAL shares
The Company’s common shares, par value €2.50, as ofDecember 31, 2015 are the only category of shares. Shares maybe held in either bearer or registered form.
Double voting rights are granted to holders of shares that are fully-paid and held in the name of the same shareholder for at least twoyears, with due consideration for the total portion of the share capitalrepresented. Double voting rights are also assigned to restrictedshares in the event of an increase in share capital by incorporationof reserves, profits or premiums based on shares already held thatare entitled to double voting rights.
Pursuant to the Company’s bylaws (Statutes), no shareholder maycast a vote at a Shareholders’ Meeting, either by himself or through
an agent, representing more than 10% of the total voting rights forthe Company’s shares. This limit applies to the aggregated amountof voting rights held directly, indirectly or through voting proxies.However, in the case of double voting rights, this limit may beextended to 20%.
These restrictions no longer apply if any individual or entity, actingalone or in concert, acquires at least two-thirds of the total sharecapital of the Company, directly or indirectly, following a public tenderoffer for all of the Company’s shares.
The authorized share capital amounts to 3,467,448,093 shares asof December 31, 2015 compared to 3,416,388,282 shares as ofDecember 31, 2014 and 3,417,495,344 as of December 31, 2013.As of December 31, 2015 the share capital of TOTAL S.A. amountedto €6,100,144,708.
17) Shareholders’ equity
10 Consolidated Financial StatementsNotes to the Consolidated Financial Statements – Note 17
TOTAL. Registration Document 2015228
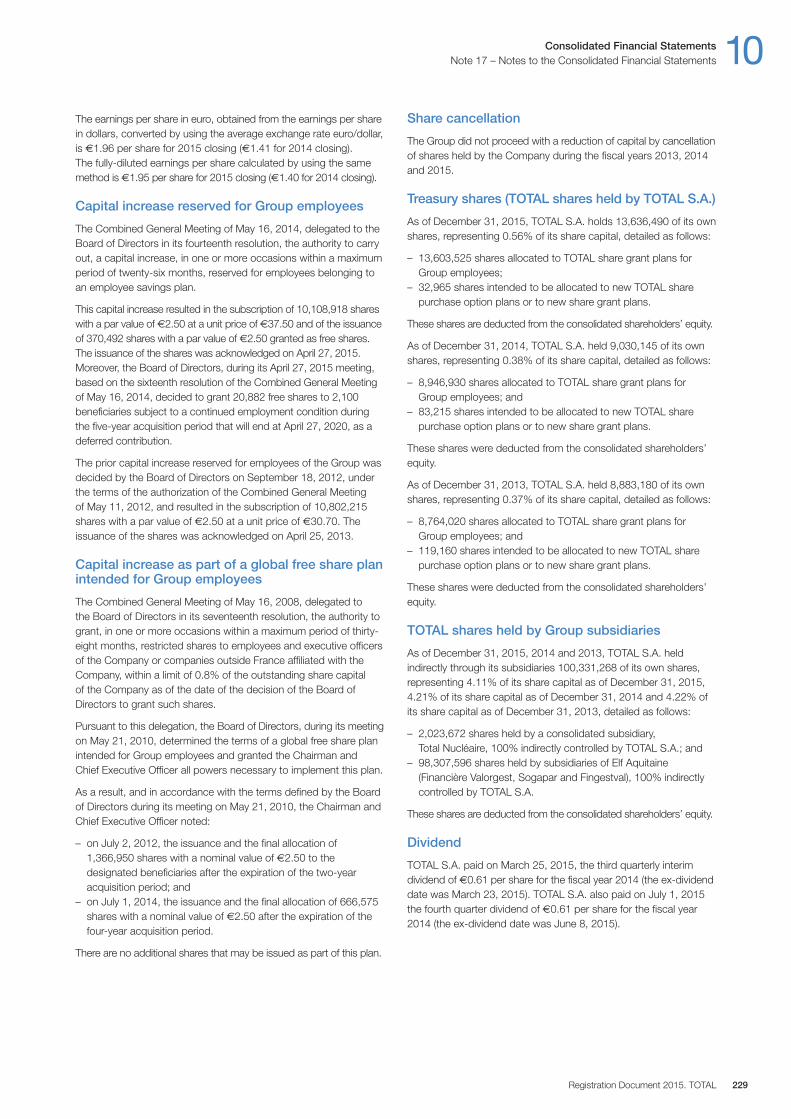
The earnings per share in euro, obtained from the earnings per sharein dollars, converted by using the average exchange rate euro / dollar,is €1.96 per share for 2015 closing (€1.41 for 2014 closing). The fully-diluted earnings per share calculated by using the samemethod is €1.95 per share for 2015 closing (€1.40 for 2014 closing).
Capital increase reserved for Group employees
The Combined General Meeting of May 16, 2014, delegated to theBoard of Directors in its fourteenth resolution, the authority to carryout, a capital increase, in one or more occasions within a maximumperiod of twenty-six months, reserved for employees belonging toan employee savings plan.
This capital increase resulted in the subscription of 10,108,918 shareswith a par value of €2.50 at a unit price of €37.50 and of the issuanceof 370,492 shares with a par value of €2.50 granted as free shares.The issuance of the shares was acknowledged on April 27, 2015.Moreover, the Board of Directors, during its April 27, 2015 meeting,based on the sixteenth resolution of the Combined General Meetingof May 16, 2014, decided to grant 20,882 free shares to 2,100beneficiaries subject to a continued employment condition duringthe five-year acquisition period that will end at April 27, 2020, as adeferred contribution.
The prior capital increase reserved for employees of the Group wasdecided by the Board of Directors on September 18, 2012, underthe terms of the authorization of the Combined General Meeting of May 11, 2012, and resulted in the subscription of 10,802,215shares with a par value of €2.50 at a unit price of €30.70. Theissuance of the shares was acknowledged on April 25, 2013.
Capital increase as part of a global free share planintended for Group employees
The Combined General Meeting of May 16, 2008, delegated to the Board of Directors in its seventeenth resolution, the authority togrant, in one or more occasions within a maximum period of thirty-eight months, restricted shares to employees and executive officersof the Company or companies outside France affiliated with theCompany, within a limit of 0.8% of the outstanding share capital of the Company as of the date of the decision of the Board ofDirectors to grant such shares.
Pursuant to this delegation, the Board of Directors, during its meetingon May 21, 2010, determined the terms of a global free share planintended for Group employees and granted the Chairman andChief Executive Officer all powers necessary to implement this plan.
As a result, and in accordance with the terms defined by the Boardof Directors during its meeting on May 21, 2010, the Chairman andChief Executive Officer noted:
– on July 2, 2012, the issuance and the final allocation of1,366,950 shares with a nominal value of €2.50 to thedesignated beneficiaries after the expiration of the two-yearacquisition period; and
– on July 1, 2014, the issuance and the final allocation of 666,575shares with a nominal value of €2.50 after the expiration of thefour-year acquisition period.
There are no additional shares that may be issued as part of this plan.
Share cancellation
The Group did not proceed with a reduction of capital by cancellationof shares held by the Company during the fiscal years 2013, 2014and 2015.
Treasury shares (TOTAL shares held by TOTAL S.A.)
As of December 31, 2015, TOTAL S.A. holds 13,636,490 of its ownshares, representing 0.56% of its share capital, detailed as follows:
– 13,603,525 shares allocated to TOTAL share grant plans forGroup employees;
– 32,965 shares intended to be allocated to new TOTAL sharepurchase option plans or to new share grant plans.
These shares are deducted from the consolidated shareholders’ equity.
As of December 31, 2014, TOTAL S.A. held 9,030,145 of its ownshares, representing 0.38% of its share capital, detailed as follows:
– 8,946,930 shares allocated to TOTAL share grant plans forGroup employees; and
– 83,215 shares intended to be allocated to new TOTAL sharepurchase option plans or to new share grant plans.
These shares were deducted from the consolidated shareholders’equity.
As of December 31, 2013, TOTAL S.A. held 8,883,180 of its ownshares, representing 0.37% of its share capital, detailed as follows:
– 8,764,020 shares allocated to TOTAL share grant plans forGroup employees; and
– 119,160 shares intended to be allocated to new TOTAL sharepurchase option plans or to new share grant plans.
These shares were deducted from the consolidated shareholders’equity.
TOTAL shares held by Group subsidiaries
As of December 31, 2015, 2014 and 2013, TOTAL S.A. heldindirectly through its subsidiaries 100,331,268 of its own shares,representing 4.11% of its share capital as of December 31, 2015,4.21% of its share capital as of December 31, 2014 and 4.22% ofits share capital as of December 31, 2013, detailed as follows:
– 2,023,672 shares held by a consolidated subsidiary,Total Nucléaire, 100% indirectly controlled by TOTAL S.A.; and
– 98,307,596 shares held by subsidiaries of Elf Aquitaine(Financière Valorgest, Sogapar and Fingestval), 100% indirectlycontrolled by TOTAL S.A.
These shares are deducted from the consolidated shareholders’ equity.
Dividend
TOTAL S.A. paid on March 25, 2015, the third quarterly interimdividend of €0.61 per share for the fiscal year 2014 (the ex-dividenddate was March 23, 2015). TOTAL S.A. also paid on July 1, 2015the fourth quarter dividend of €0.61 per share for the fiscal year2014 (the ex-dividend date was June 8, 2015).
Consolidated Financial Statements 10Note 17 – Notes to the Consolidated Financial Statements
Registration Document 2015. TOTAL 229
The Shareholders’ Meeting on May 29, 2015, approved the optionfor shareholders to receive the fourth quarter dividend in shares orin cash. The number of shares issued in lieu of the cash dividendhas been based on the dividend amount divided by €42.02 pershare, equal to 90% of the average Euronext Paris opening price ofthe shares for the 20 trading days preceding the shareholders meetingreduced by the amount of the dividend remainder. On July 1, 2015,18 609 466 shares have been issued at a price of €42,02 per share.
Another resolution has been approved at the Shareholders’ Meetingon May 29, 2015, being that if one or more interim dividends aredecided by the Board of Directors for the fiscal year 2015, thenshareholders would have the option to receive each of this or theseinterim dividends in shares or in cash.
For the fiscal year 2015, TOTAL S.A. already paid two quarterlyinterim dividends:
– Payment of the first interim dividend for the fiscal year 2015 of €0.61 per share, decided by the Board of Directors onSeptember 22, 2015 has been done in cash or in shares onOctober 21, 2015 (the ex-dividend date was September 28, 2015).The number of shares issued in lieu of the cash dividend wasbased on the dividend amount divided by €35.63 per share,equal to 90% of the average Euronext Paris opening price of theshares for the 20 trading days preceding the Board of Directorsmeeting, reduced by the amount of the first interim dividend. On October 21, 2015, 24,231,876 shares have been issued at a price of €35.63 per share.
– Payment of the second interim dividend for the fiscal year 2015of €0.61 per share, decided by the Board of Directors onDecember 16, 2015 has been done in cash or in shares onJanuary 14, 2016 (the ex-dividend date was December 21,2015). The number of shares issued in lieu of the cash dividendwas based on the dividend amount divided by €39.77 per share,equal to 90% of the average Euronext Paris opening price of theshares for the 20 trading days preceding the Board of Directorsmeeting, reduced by the amount of the second interim dividend.On January 14, 2016, 13,945,709 shares have been issued at aprice of €39.77 per share.
The Board of Directors, during its October 28, 2015 meeting, decidedto set the third quarterly interim dividend for the fiscal year 2015 at€0.61 per share. This interim dividend will be paid on April 12, 2016(the ex-dividend date will be March 21, 2016).
A resolution will be submitted at the Shareholders’ Meeting on May24, 2016 to pay a dividend of €2.44 per share for the 2015 fiscalyear, i.e. a balance of €0.61 per share to be distributed after deductingthe three quarterly interim dividends of €0.61 per share that willhave already been paid.
Issuance of perpetual subordinated notes
In 2015, the Group issued two tranches of perpetual subordinatednotes in EUR through Total S.A.:
– Deeply subordinated note 2.250% perpetual maturity callableafter 6 years (2,500 million EUR);
– Deeply subordinated note 2.625% perpetual maturity callableafter 10 years (2,500 million EUR).
Based on their characteristics and in compliance with the IAS 32standard – Financial Instruments – Presentation, these notes wererecorded in equity.
As of December 31, 2015, the amount of the perpetual deeplysubordinated note booked in the Group shareholders’ equity is$5,616 million. The coupons attributable to the holders of thesesecurities are booked in deduction of the Group shareholders’equity for an amount of $114 million for fiscal year 2015 closing.The tax saving due to these coupons is booked in the statement of income.
Paid-in surplus
In accordance with French law, the paid-in surplus corresponds topremiums related to shares, contributions or mergers of the parentcompany which can be capitalized or used to offset losses if thelegal reserve has reached its minimum required level. The amountof the paid-in surplus may also be distributed subject to taxationexcept in cases of a refund of shareholder contributions to.
As of December 31, 2015, paid-in surplus relating to TOTAL S.A.amounted to €30,265 million (€28,319 million as of December 31, 2014and €28,020 million as of December 31, 2013).
Reserves
Under French law, 5% of net income must be transferred to the legalreserve until the legal reserve reaches 10% of the nominal value of theshare capital. This reserve cannot be distributed to the shareholdersother than upon liquidation but can be used to offset losses.
If wholly distributed, the unrestricted reserves of the parent companywould be taxed for an approximate amount of $630 million as ofDecember 31, 2015 ($755 million as of December 31, 2014 and$754 million as of December 31, 2013) with regards to additionalcorporation tax to be applied on regulatory reserves so that theybecome distributable.
Futhermore, the additional tax to corporate income tax of 3%, dueon dividends distributed by French companies or foreign organizationssubject to corporate income in France, established by the secondcorrective finance act for 2012 would be payable for an amount of $450 million as of December 31, 2015, ($553 million as ofDecember 31, 2014 and $538 million as of December 31, 2013).
10 Consolidated Financial StatementsNotes to the Consolidated Financial Statements – Note 17
TOTAL. Registration Document 2015230
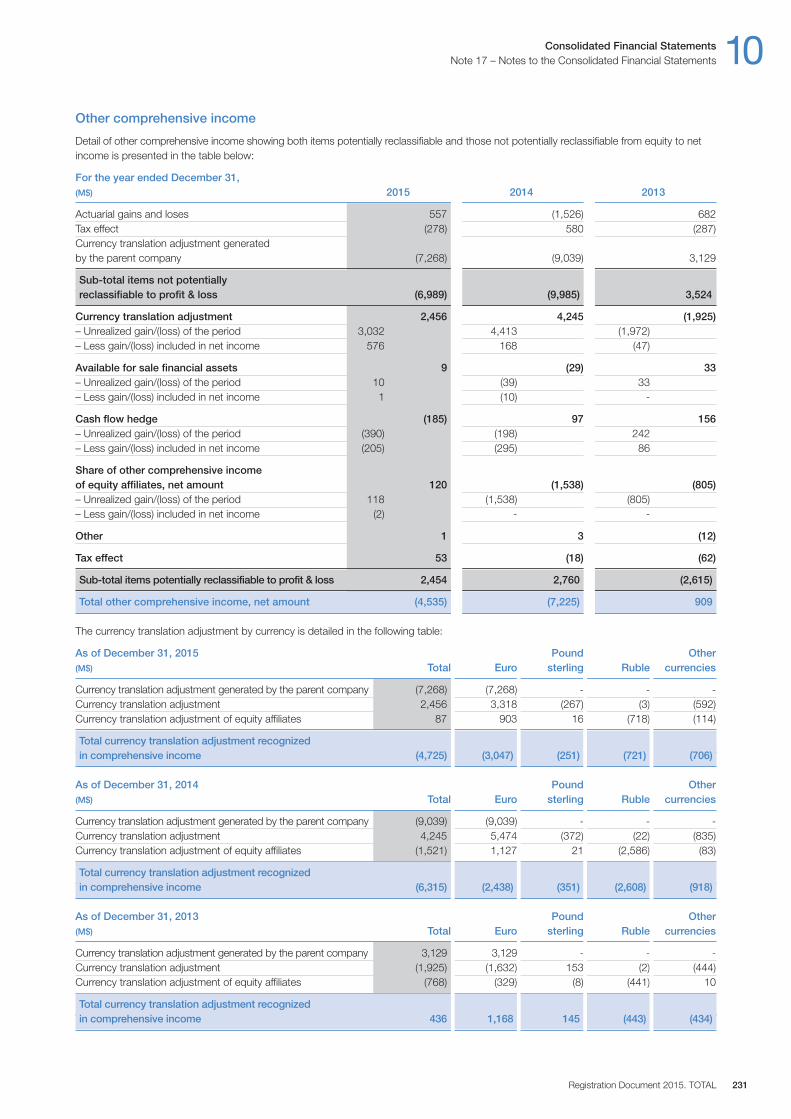
Other comprehensive income
Detail of other comprehensive income showing both items potentially reclassifiable and those not potentially reclassifiable from equity to netincome is presented in the table below:
For the year ended December 31,(M$) 2015 2014 2013
Actuarial gains and loses 557 (1,526) 682Tax effect (278) 580 (287)Currency translation adjustment generated by the parent company (7,268) (9,039) 3,129
Sub-total items not potentially reclassifiable to profit & loss (6,989) (9,985) 3,524
Currency translation adjustment 2,456 4,245 (1,925)– Unrealized gain / (loss) of the period 3,032 4,413 (1,972)– Less gain / (loss) included in net income 576 168 (47)
Available for sale financial assets 9 (29) 33– Unrealized gain / (loss) of the period 10 (39) 33– Less gain / (loss) included in net income 1 (10) -
Cash flow hedge (185) 97 156– Unrealized gain / (loss) of the period (390) (198) 242– Less gain / (loss) included in net income (205) (295) 86
Share of other comprehensive income of equity affiliates, net amount 120 (1,538) (805)– Unrealized gain / (loss) of the period 118 (1,538) (805)– Less gain / (loss) included in net income (2) - -
Other 1 3 (12)
Tax effect 53 (18) (62)
Sub-total items potentially reclassifiable to profit & loss 2,454 2,760 (2,615)
Total other comprehensive income, net amount (4,535) (7,225) 909
The currency translation adjustment by currency is detailed in the following table:
As of December 31, 2015 Pound Other(M$) Total Euro sterling Ruble currencies
Currency translation adjustment generated by the parent company (7,268) (7,268) - - -Currency translation adjustment 2,456 3,318 (267) (3) (592)Currency translation adjustment of equity affiliates 87 903 16 (718) (114)
Total currency translation adjustment recognizedin comprehensive income (4,725) (3,047) (251) (721) (706)
As of December 31, 2014 Pound Other(M$) Total Euro sterling Ruble currencies
Currency translation adjustment generated by the parent company (9,039) (9,039) - - -Currency translation adjustment 4,245 5,474 (372) (22) (835)Currency translation adjustment of equity affiliates (1,521) 1,127 21 (2,586) (83)
Total currency translation adjustment recognized in comprehensive income (6,315) (2,438) (351) (2,608) (918)
As of December 31, 2013 Pound Other(M$) Total Euro sterling Ruble currencies
Currency translation adjustment generated by the parent company 3,129 3,129 - - -Currency translation adjustment (1,925) (1,632) 153 (2) (444)Currency translation adjustment of equity affiliates (768) (329) (8) (441) 10
Total currency translation adjustment recognized in comprehensive income 436 1,168 145 (443) (434)
Consolidated Financial Statements 10Note 17 – Notes to the Consolidated Financial Statements
Registration Document 2015. TOTAL 231
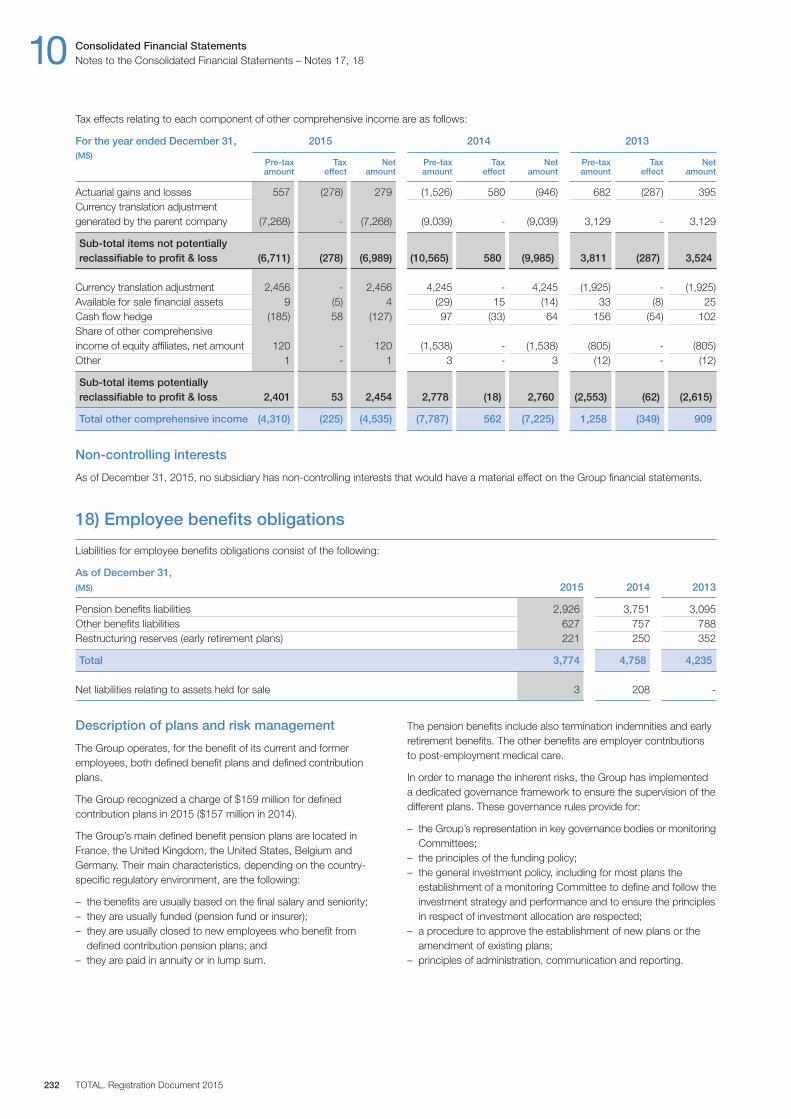
Description of plans and risk management
The Group operates, for the benefit of its current and formeremployees, both defined benefit plans and defined contributionplans.
The Group recognized a charge of $159 million for definedcontribution plans in 2015 ($157 million in 2014).
The Group’s main defined benefit pension plans are located inFrance, the United Kingdom, the United States, Belgium andGermany. Their main characteristics, depending on the country-specific regulatory environment, are the following:
– the benefits are usually based on the final salary and seniority;– they are usually funded (pension fund or insurer);– they are usually closed to new employees who benefit from
defined contribution pension plans; and– they are paid in annuity or in lump sum.
The pension benefits include also termination indemnities and earlyretirement benefits. The other benefits are employer contributionsto post-employment medical care.
In order to manage the inherent risks, the Group has implementeda dedicated governance framework to ensure the supervision of thedifferent plans. These governance rules provide for:
– the Group’s representation in key governance bodies or monitoringCommittees;
– the principles of the funding policy;– the general investment policy, including for most plans the
establishment of a monitoring Committee to define and follow theinvestment strategy and performance and to ensure the principlesin respect of investment allocation are respected;
– a procedure to approve the establishment of new plans or theamendment of existing plans;
– principles of administration, communication and reporting.
Tax effects relating to each component of other comprehensive income are as follows:
For the year ended December 31, 2015 2014 2013(M$)
Pre-tax Tax Net Pre-tax Tax Net Pre-tax Tax Net amount effect amount amount effect amount amount effect amount
Actuarial gains and losses 557 (278) 279 (1,526) 580 (946) 682 (287) 395Currency translation adjustment generated by the parent company (7,268) - (7,268) (9,039) - (9,039) 3,129 - 3,129
Sub-total items not potentially reclassifiable to profit & loss (6,711) (278) (6,989) (10,565) 580 (9,985) 3,811 (287) 3,524
Currency translation adjustment 2,456 - 2,456 4,245 - 4,245 (1,925) - (1,925)Available for sale financial assets 9 (5) 4 (29) 15 (14) 33 (8) 25Cash flow hedge (185) 58 (127) 97 (33) 64 156 (54) 102Share of other comprehensive income of equity affiliates, net amount 120 - 120 (1,538) - (1,538) (805) - (805)Other 1 - 1 3 - 3 (12) - (12)
Sub-total items potentially reclassifiable to profit & loss 2,401 53 2,454 2,778 (18) 2,760 (2,553) (62) (2,615)
Total other comprehensive income (4,310) (225) (4,535) (7,787) 562 (7,225) 1,258 (349) 909
Non-controlling interests
As of December 31, 2015, no subsidiary has non-controlling interests that would have a material effect on the Group financial statements.
18) Employee benefits obligations
Liabilities for employee benefits obligations consist of the following:
As of December 31,(M$) 2015 2014 2013
Pension benefits liabilities 2,926 3,751 3,095Other benefits liabilities 627 757 788Restructuring reserves (early retirement plans) 221 250 352
Total 3,774 4,758 4,235
Net liabilities relating to assets held for sale 3 208 -
10 Consolidated Financial StatementsNotes to the Consolidated Financial Statements – Notes 17, 18
TOTAL. Registration Document 2015232
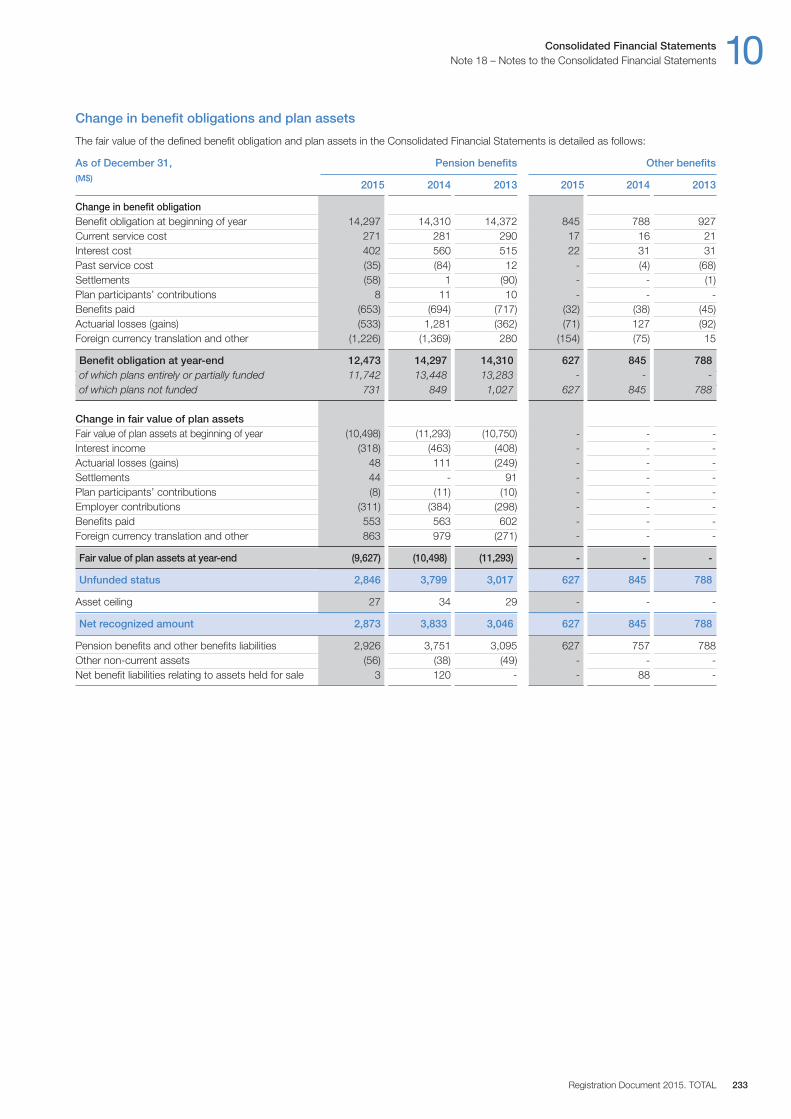
Consolidated Financial Statements 10Note 18 – Notes to the Consolidated Financial Statements
Registration Document 2015. TOTAL 233
Change in benefit obligations and plan assets
The fair value of the defined benefit obligation and plan assets in the Consolidated Financial Statements is detailed as follows:
As of December 31, Pension benefits Other benefits(M$)
2015 2014 2013 2015 2014 2013
Change in benefit obligationBenefit obligation at beginning of year 14,297 14,310 14,372 845 788 927Current service cost 271 281 290 17 16 21Interest cost 402 560 515 22 31 31Past service cost (35) (84) 12 - (4) (68)Settlements (58) 1 (90) - - (1)Plan participants’ contributions 8 11 10 - - -Benefits paid (653) (694) (717) (32) (38) (45)Actuarial losses (gains) (533) 1,281 (362) (71) 127 (92)Foreign currency translation and other (1,226) (1,369) 280 (154) (75) 15
Benefit obligation at year-end 12,473 14,297 14,310 627 845 788of which plans entirely or partially funded 11,742 13,448 13,283 - - -of which plans not funded 731 849 1,027 627 845 788
Change in fair value of plan assetsFair value of plan assets at beginning of year (10,498) (11,293) (10,750) - - -Interest income (318) (463) (408) - - -Actuarial losses (gains) 48 111 (249) - - -Settlements 44 - 91 - - -Plan participants’ contributions (8) (11) (10) - - -Employer contributions (311) (384) (298) - - -Benefits paid 553 563 602 - - -Foreign currency translation and other 863 979 (271) - - -
Fair value of plan assets at year-end (9,627) (10,498) (11,293) - - -
Unfunded status 2,846 3,799 3,017 627 845 788
Asset ceiling 27 34 29 - - -
Net recognized amount 2,873 3,833 3,046 627 845 788
Pension benefits and other benefits liabilities 2,926 3,751 3,095 627 757 788Other non-current assets (56) (38) (49) - - -Net benefit liabilities relating to assets held for sale 3 120 - - 88 -
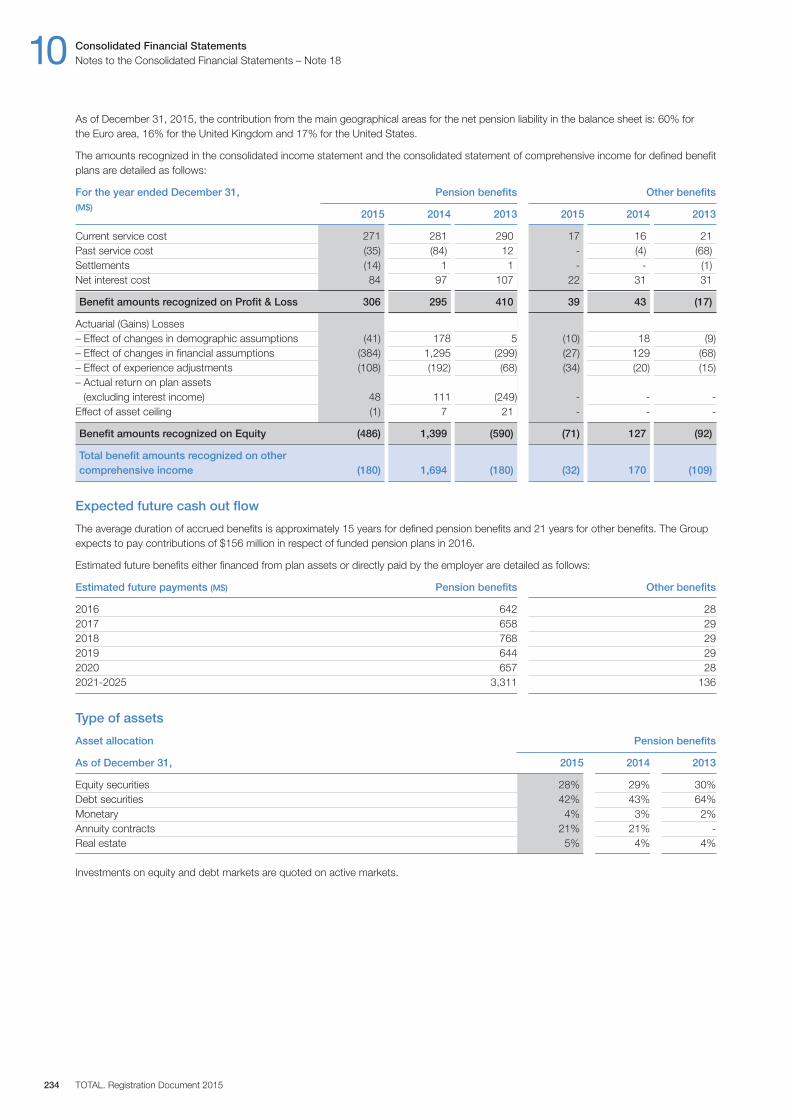
As of December 31, 2015, the contribution from the main geographical areas for the net pension liability in the balance sheet is: 60% forthe Euro area, 16% for the United Kingdom and 17% for the United States.
The amounts recognized in the consolidated income statement and the consolidated statement of comprehensive income for defined benefitplans are detailed as follows:
For the year ended December 31, Pension benefits Other benefits(M$)
2015 2014 2013 2015 2014 2013
Current service cost 271 281 290 17 16 21Past service cost (35) (84) 12 - (4) (68)Settlements (14) 1 1 - - (1)Net interest cost 84 97 107 22 31 31
Benefit amounts recognized on Profit & Loss 306 295 410 39 43 (17)
Actuarial (Gains) Losses– Effect of changes in demographic assumptions (41) 178 5 (10) 18 (9)– Effect of changes in financial assumptions (384) 1,295 (299) (27) 129 (68)– Effect of experience adjustments (108) (192) (68) (34) (20) (15)– Actual return on plan assets
(excluding interest income) 48 111 (249) - - -Effect of asset ceiling (1) 7 21 - - -
Benefit amounts recognized on Equity (486) 1,399 (590) (71) 127 (92)
Total benefit amounts recognized on other comprehensive income (180) 1,694 (180) (32) 170 (109)
Expected future cash out flow
The average duration of accrued benefits is approximately 15 years for defined pension benefits and 21 years for other benefits. The Groupexpects to pay contributions of $156 million in respect of funded pension plans in 2016.
Estimated future benefits either financed from plan assets or directly paid by the employer are detailed as follows:
Estimated future payments (M$) Pension benefits Other benefits
2016 642 282017 658 292018 768 292019 644 292020 657 282021-2025 3,311 136
Type of assets
Asset allocation Pension benefits
As of December 31, 2015 2014 2013
Equity securities 28% 29% 30%Debt securities 42% 43% 64%Monetary 4% 3% 2%Annuity contracts 21% 21% -Real estate 5% 4% 4%
Investments on equity and debt markets are quoted on active markets.
10 Consolidated Financial StatementsNotes to the Consolidated Financial Statements – Note 18
TOTAL. Registration Document 2015234
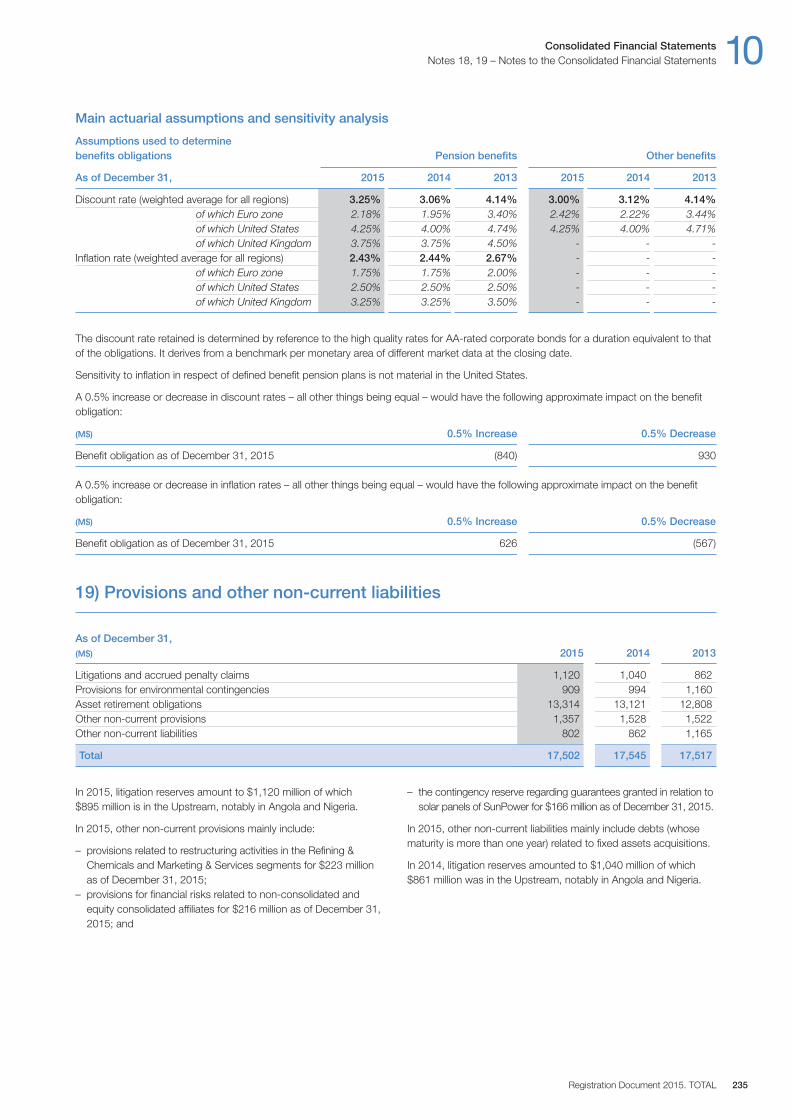
In 2015, litigation reserves amount to $1,120 million of which$895 million is in the Upstream, notably in Angola and Nigeria.
In 2015, other non-current provisions mainly include:
– provisions related to restructuring activities in the Refining & Chemicals and Marketing & Services segments for $223 millionas of December 31, 2015;
– provisions for financial risks related to non-consolidated andequity consolidated affiliates for $216 million as of December 31,2015; and
– the contingency reserve regarding guarantees granted in relation tosolar panels of SunPower for $166 million as of December 31, 2015.
In 2015, other non-current liabilities mainly include debts (whosematurity is more than one year) related to fixed assets acquisitions.
In 2014, litigation reserves amounted to $1,040 million of which$861 million was in the Upstream, notably in Angola and Nigeria.
The discount rate retained is determined by reference to the high quality rates for AA-rated corporate bonds for a duration equivalent to thatof the obligations. It derives from a benchmark per monetary area of different market data at the closing date.
Sensitivity to inflation in respect of defined benefit pension plans is not material in the United States.
A 0.5% increase or decrease in discount rates – all other things being equal – would have the following approximate impact on the benefitobligation:
(M$) 0.5% Increase 0.5% Decrease
Benefit obligation as of December 31, 2015 (840) 930
A 0.5% increase or decrease in inflation rates – all other things being equal – would have the following approximate impact on the benefitobligation:
(M$) 0.5% Increase 0.5% Decrease
Benefit obligation as of December 31, 2015 626 (567)
19) Provisions and other non-current liabilities
As of December 31,(M$) 2015 2014 2013
Litigations and accrued penalty claims 1,120 1,040 862Provisions for environmental contingencies 909 994 1,160Asset retirement obligations 13,314 13,121 12,808Other non-current provisions 1,357 1,528 1,522Other non-current liabilities 802 862 1,165
Total 17,502 17,545 17,517
Main actuarial assumptions and sensitivity analysis
Assumptions used to determinebenefits obligations Pension benefits Other benefits
As of December 31, 2015 2014 2013 2015 2014 2013
Discount rate (weighted average for all regions) 3.25% 3.06% 4.14% 3.00% 3.12% 4.14%of which Euro zone 2.18% 1.95% 3.40% 2.42% 2.22% 3.44%of which United States 4.25% 4.00% 4.74% 4.25% 4.00% 4.71%of which United Kingdom 3.75% 3.75% 4.50% - - -
Inflation rate (weighted average for all regions) 2.43% 2.44% 2.67% - - -of which Euro zone 1.75% 1.75% 2.00% - - -of which United States 2.50% 2.50% 2.50% - - -of which United Kingdom 3.25% 3.25% 3.50% - - -
Consolidated Financial Statements 10Notes 18, 19 – Notes to the Consolidated Financial Statements
Registration Document 2015. TOTAL 235
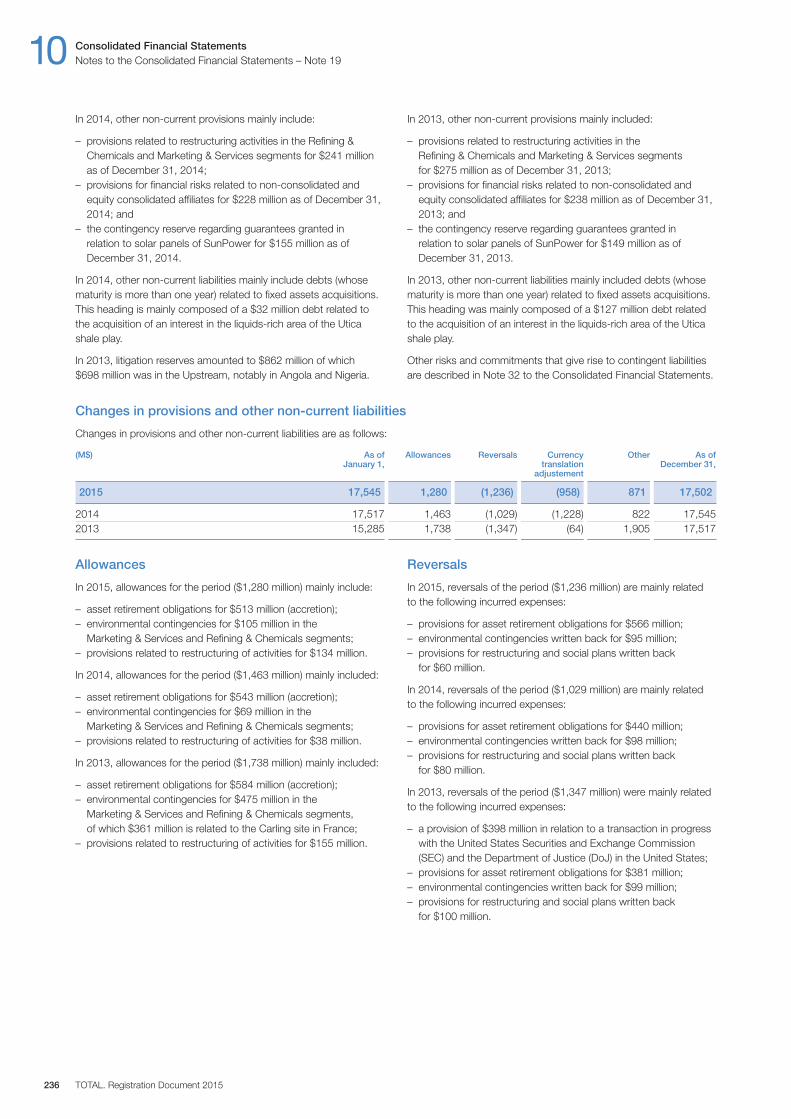
Allowances
In 2015, allowances for the period ($1,280 million) mainly include:
– asset retirement obligations for $513 million (accretion);– environmental contingencies for $105 million in the
Marketing & Services and Refining & Chemicals segments;– provisions related to restructuring of activities for $134 million.
In 2014, allowances for the period ($1,463 million) mainly included:
– asset retirement obligations for $543 million (accretion);– environmental contingencies for $69 million in the
Marketing & Services and Refining & Chemicals segments;– provisions related to restructuring of activities for $38 million.
In 2013, allowances for the period ($1,738 million) mainly included:
– asset retirement obligations for $584 million (accretion);– environmental contingencies for $475 million in the
Marketing & Services and Refining & Chemicals segments, of which $361 million is related to the Carling site in France;
– provisions related to restructuring of activities for $155 million.
Reversals
In 2015, reversals of the period ($1,236 million) are mainly related to the following incurred expenses:
– provisions for asset retirement obligations for $566 million;– environmental contingencies written back for $95 million;– provisions for restructuring and social plans written back
for $60 million.
In 2014, reversals of the period ($1,029 million) are mainly related to the following incurred expenses:
– provisions for asset retirement obligations for $440 million;– environmental contingencies written back for $98 million;– provisions for restructuring and social plans written back
for $80 million.
In 2013, reversals of the period ($1,347 million) were mainly relatedto the following incurred expenses:
– a provision of $398 million in relation to a transaction in progresswith the United States Securities and Exchange Commission(SEC) and the Department of Justice (DoJ) in the United States;
– provisions for asset retirement obligations for $381 million;– environmental contingencies written back for $99 million;– provisions for restructuring and social plans written back
for $100 million.
Changes in provisions and other non-current liabilities
Changes in provisions and other non-current liabilities are as follows:
(M$) As of Allowances Reversals Currency Other As of January 1, translation December 31, adjustement
2015 17,545 1,280 (1,236) (958) 871 17,502
2014 17,517 1,463 (1,029) (1,228) 822 17,5452013 15,285 1,738 (1,347) (64) 1,905 17,517
In 2014, other non-current provisions mainly include:
– provisions related to restructuring activities in the Refining & Chemicals and Marketing & Services segments for $241 millionas of December 31, 2014;
– provisions for financial risks related to non-consolidated andequity consolidated affiliates for $228 million as of December 31,2014; and
– the contingency reserve regarding guarantees granted in relation to solar panels of SunPower for $155 million as ofDecember 31, 2014.
In 2014, other non-current liabilities mainly include debts (whosematurity is more than one year) related to fixed assets acquisitions.This heading is mainly composed of a $32 million debt related tothe acquisition of an interest in the liquids-rich area of the Uticashale play.
In 2013, litigation reserves amounted to $862 million of which$698 million was in the Upstream, notably in Angola and Nigeria.
In 2013, other non-current provisions mainly included:
– provisions related to restructuring activities in theRefining & Chemicals and Marketing & Services segments for $275 million as of December 31, 2013;
– provisions for financial risks related to non-consolidated andequity consolidated affiliates for $238 million as of December 31,2013; and
– the contingency reserve regarding guarantees granted in relation to solar panels of SunPower for $149 million as ofDecember 31, 2013.
In 2013, other non-current liabilities mainly included debts (whosematurity is more than one year) related to fixed assets acquisitions.This heading was mainly composed of a $127 million debt relatedto the acquisition of an interest in the liquids-rich area of the Uticashale play.
Other risks and commitments that give rise to contingent liabilitiesare described in Note 32 to the Consolidated Financial Statements.
10 Consolidated Financial StatementsNotes to the Consolidated Financial Statements – Note 19
TOTAL. Registration Document 2015236

Changes in the asset retirement obligation
The discount rate used in 2015 for the valuation of asset retirement obligation is 4.5% as in 2014 and 2013 (the expenses are estimated at currentcurrency values with an inflation rate of 2%). A decrease of 0.5% of this rate would increase the asset retirement obligation by $860 million,with a corresponding impact in tangible assets, and with a negative impact of approximately $50 million on the following years net income.Conversely, an increase of 0.5% of this rate would decrease the asset retirement obligation by $860 million and have a positive impact ofapproximately $50 million on the following years net income.
Changes in the asset retirement obligation are as follows:
(M$) As of Accretion Revision in New Spending on Currency Other As of January 1, estimates obligations existing translation December 31, obligations adjustment
2015 13,121 513 685 271 (566) (676) (34) 13,314
2014 12,808 543 1,007 359 (440) (902) (254) 13,1212013 10,059 584 2,196 552 (381) (156) (46) 12,808
In 2015 and in 2014 the heading “Revision in estimates” includes additional provisions in respect of asset restitution costs.
In 2013 the heading “Revision in estimates” included additional provisions in respect of asset restitution costs and the impact of the revisionof the discount rate.
20) Financial debt and related financial instruments
A) Non-current financial debt and related financial instruments
As of December 31, 2015(M$) Secured Unsecured Total(Assets)/ Liabilities
Non-current financial debt 655 43,809 44,464of which hedging instruments of non-current financial debt (liabilities) - 2,891 2,891
Hedging instruments of non-current financial debt (assets) (a) - (1,219) (1,219)
Non-current financial debt – net of hedging instruments 655 42,590 43,245
Bonds after fair value hedge - 34,435 34,435Fixed rate bonds and bonds after cash flow hedge - 6,494 6,494Bank and other, floating rate 34 1,110 1,144Bank and other, fixed rate 326 551 877Financial lease obligations 295 - 295
Non-current financial debt – net of hedging instruments 655 42,590 43,245
(a) See the description of these hedging instruments in Notes 1 paragraph M(iii) “Long-term financing”, 28 and 29 to the Consolidated Financial Statements.
As of December 31, 2014(M$) Secured Unsecured Total(Assets)/ Liabilities
Non-current financial debt 798 44,683 45,481of which hedging instruments of non-current financial debt (liabilities) - 944 944
Hedging instruments of non-current financial debt (assets) (a) - (1,319) (1,319)
Non-current financial debt – net of hedging instruments 798 43,364 44,162
Bonds after fair value hedge - 36,558 36,558Fixed rate bonds and bonds after cash flow hedge - 6,155 6,155Bank and other, floating rate 265 395 660Bank and other, fixed rate 215 256 471Financial lease obligations 318 - 318
Non-current financial debt – net of hedging instruments 798 43,364 44,162
(a) See the description of these hedging instruments in Notes 1 paragraph M(iii) “Long-term financing”, 28 and 29 to the Consolidated Financial Statements.
Consolidated Financial Statements 10Notes 19, 20 – Notes to the Consolidated Financial Statements
Registration Document 2015. TOTAL 237

As of December 31, 2013(M$) Secured Unsecured Total(Assets)/ Liabilities
Non-current financial debt 717 33,857 34,574of which hedging instruments of non-current financial debt (liabilities) - 325 325
Hedging instruments of non-current financial debt (assets) (a) - (1,418) (1,418)
Non-current financial debt – net of hedging instruments 717 32,439 33,156
Bonds after fair value hedge - 25,965 25,965Fixed rate bonds and bonds after cash flow hedge - 6,079 6,079Bank and other, floating rate 173 247 420Bank and other, fixed rate 158 148 306Financial lease obligations 386 - 386
Non-current financial debt – net of hedging instruments 717 32,439 33,156
(a) See the description of these hedging instruments in Notes 1 paragraph M(iii) “Long-term financing”, 28 and 29 to the Consolidated Financial Statements.
The fair value of bonds, as of December 31, 2015, after taking into account currency and interest rates swaps, is detailed as follows:
Bonds after fair Currency of Fair value Fair value Fair value Range Range of initial value hedge issuance after after after of current current rate before hedging as of hedging as of hedging as of maturities hedging instruments December 31, December 31, December 31,
(M$) 2015 2014 2013
Bond USD 13,754 16,385 12,733 2016 to 2024 0.750% to 3.750%Bond USD 2,385 2,385 2,553 2016 to 2020 USLIBOR 3 month +0.03% to USLIBOR 3 month +0.75%Bond CHF 1,910 2,161 2,234 2016 to 2027 0.510% to 3.135%Bond NZD 251 251 138 2019 to 2020 4.750% to 5.000%Bond AUD 1,360 1,689 1,309 2016 to 2025 3.750% to 6.500%Bond EUR 11,365 12,127 7,956 2017 to 2044 1.125% to 4.875%Bond EUR 1,638 1,638 390 2020 EURIBOR 3 month +0.30% to EURIBOR 3 month +0.31%Bond CAD 289 288 339 2017 to 2020 2.000% to 2.375%Bond GBP 2,225 1,662 1,241 2017 to 2022 2.250% to 4.250%Bond GBP 469 468 - 2019 GBLIB 3 month +0.30%Bond JPY - - 110Bond NOK 566 566 565 2016 to 2018 2.250% to 4.000%Bond HKD 394 213 150 2019 to 2026 2.920% to 4.180%Bond SEK 95 95 94 2016 3.625%Current portion (less than one year) (4,164) (4,068) (4,545)
Total Principal Financing Entities (a) + (b) + (c) 32,537 35,860 25,267
TOTAL S.A. (d) 1,200 - - 2022 0.500%Other Consolidated Subsidiaries 698 698 698
Total bonds after fair value hedge 34,435 36,558 25,965
Bonds after cash flow hedge Currency of Fair value Fair value Fair value Range Range of initial and fixed rate bonds issuance after after after of current current rate before hedging as of hedging as of hedging as of maturities hedging instruments December 31, December 31, December 31,
(M$) 2015 2014 2013
Bond EUR 2,077 1,986 2,007 2019 to 2024 4.875% to 5.125%Bond USD 3,750 3,750 3,749 2020 to 2023 2.750% to 4.450%Bond CNY 164 172 177 2018 3.750%Current portion (less than one year) - - -
Total Principal Financing Entities (a) + (b) + (c) 5,991 5,908 5,933
Other Consolidated Subsidiaries 503 247 146
Total bonds after cash flow hedge and fixed rate bonds 6,494 6,155 6,079
All debt securities issued through the following subsidiaries are fully and unconditionally guaranteed by TOTAL S.A. as to payment of principal, premium, if any, interest and any other amounts due:(a) TOTAL CAPITAL is a wholly-owned subsidiary of TOTAL S.A. It acts as a financing vehicle for the Group.(b) TOTAL CAPITAL CANADA Ltd. is a wholly-owned subsidiary of TOTAL S.A. It acts as a financing vehicle for the activities of the Group in Canada.(c) TOTAL CAPITAL INTERNATIONAL is a wholly-owned subsidiary of TOTAL S.A. It acts as a financing vehicle for the Group.(d) New debt financing of $1.2 billion through a structure combining the issue of cash-settled convertible bonds with the purchase of cash-settled call options to hedge Total’s exposure
to the exercise of the conversion rights under the bonds.
10 Consolidated Financial StatementsNotes to the Consolidated Financial Statements – Note 20
TOTAL. Registration Document 2015238
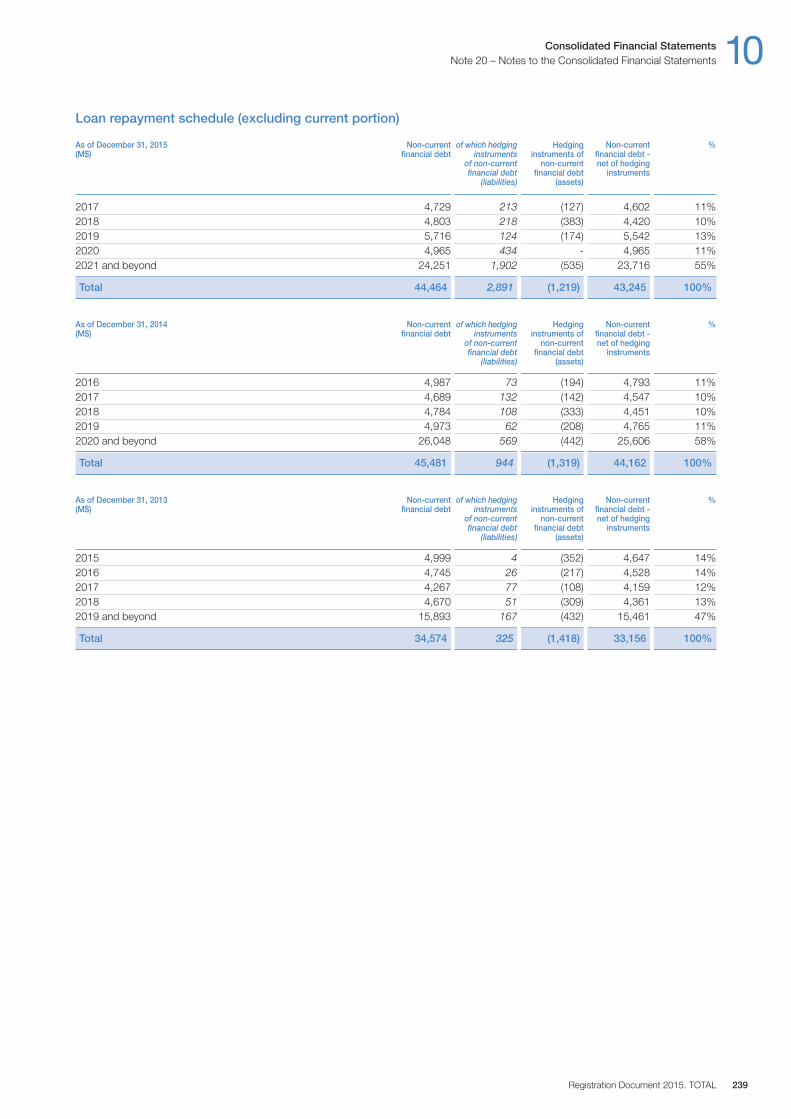
Loan repayment schedule (excluding current portion)
As of December 31, 2015 Non-current of which hedging Hedging Non-current %(M$) financial debt instruments instruments of financial debt - of non-current non-current net of hedging financial debt financial debt instruments (liabilities) (assets)
2017 4,729 213 (127) 4,602 11%2018 4,803 218 (383) 4,420 10%2019 5,716 124 (174) 5,542 13%2020 4,965 434 - 4,965 11%2021 and beyond 24,251 1,902 (535) 23,716 55%
Total 44,464 2,891 (1,219) 43,245 100%
As of December 31, 2014 Non-current of which hedging Hedging Non-current %(M$) financial debt instruments instruments of financial debt - of non-current non-current net of hedging financial debt financial debt instruments (liabilities) (assets)
2016 4,987 73 (194) 4,793 11%2017 4,689 132 (142) 4,547 10%2018 4,784 108 (333) 4,451 10%2019 4,973 62 (208) 4,765 11%2020 and beyond 26,048 569 (442) 25,606 58%
Total 45,481 944 (1,319) 44,162 100%
As of December 31, 2013 Non-current of which hedging Hedging Non-current %(M$) financial debt instruments instruments of financial debt - of non-current non-current net of hedging financial debt financial debt instruments (liabilities) (assets)
2015 4,999 4 (352) 4,647 14%2016 4,745 26 (217) 4,528 14%2017 4,267 77 (108) 4,159 12%2018 4,670 51 (309) 4,361 13%2019 and beyond 15,893 167 (432) 15,461 47%
Total 34,574 325 (1,418) 33,156 100%
Consolidated Financial Statements 10Note 20 – Notes to the Consolidated Financial Statements
Registration Document 2015. TOTAL 239
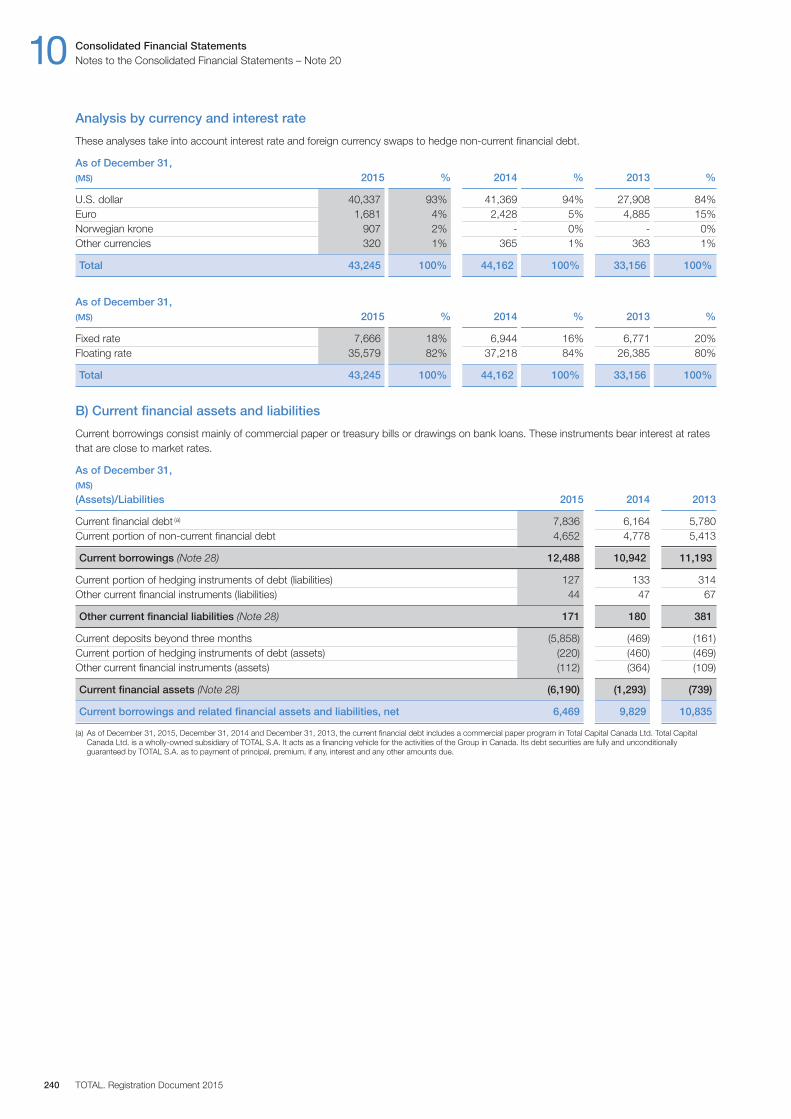
10 Consolidated Financial StatementsNotes to the Consolidated Financial Statements – Note 20
TOTAL. Registration Document 2015240
Analysis by currency and interest rate
These analyses take into account interest rate and foreign currency swaps to hedge non-current financial debt.
As of December 31,(M$) 2015 % 2014 % 2013 %
U.S. dollar 40,337 93% 41,369 94% 27,908 84%Euro 1,681 4% 2,428 5% 4,885 15%Norwegian krone 907 2% - 0% - 0%Other currencies 320 1% 365 1% 363 1%
Total 43,245 100% 44,162 100% 33,156 100%
As of December 31,(M$) 2015 % 2014 % 2013 %
Fixed rate 7,666 18% 6,944 16% 6,771 20%Floating rate 35,579 82% 37,218 84% 26,385 80%
Total 43,245 100% 44,162 100% 33,156 100%
B) Current financial assets and liabilities
Current borrowings consist mainly of commercial paper or treasury bills or drawings on bank loans. These instruments bear interest at ratesthat are close to market rates.
As of December 31,(M$)
(Assets)/ Liabilities 2015 2014 2013
Current financial debt (a) 7,836 6,164 5,780Current portion of non-current financial debt 4,652 4,778 5,413
Current borrowings (Note 28) 12,488 10,942 11,193
Current portion of hedging instruments of debt (liabilities) 127 133 314Other current financial instruments (liabilities) 44 47 67
Other current financial liabilities (Note 28) 171 180 381
Current deposits beyond three months (5,858) (469) (161)Current portion of hedging instruments of debt (assets) (220) (460) (469)Other current financial instruments (assets) (112) (364) (109)
Current financial assets (Note 28) (6,190) (1,293) (739)
Current borrowings and related financial assets and liabilities, net 6,469 9,829 10,835
(a) As of December 31, 2015, December 31, 2014 and December 31, 2013, the current financial debt includes a commercial paper program in Total Capital Canada Ltd. Total CapitalCanada Ltd. is a wholly-owned subsidiary of TOTAL S.A. It acts as a financing vehicle for the activities of the Group in Canada. Its debt securities are fully and unconditionallyguaranteed by TOTAL S.A. as to payment of principal, premium, if any, interest and any other amounts due.
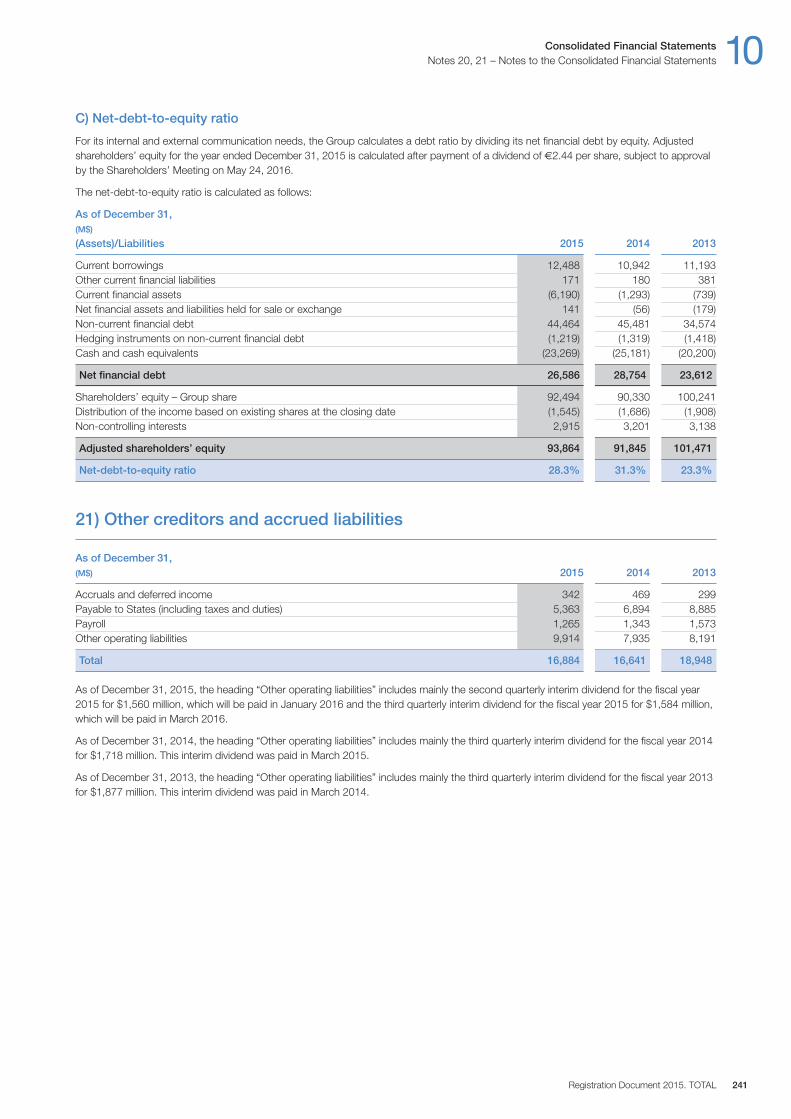
C) Net-debt-to-equity ratio
For its internal and external communication needs, the Group calculates a debt ratio by dividing its net financial debt by equity. Adjustedshareholders’ equity for the year ended December 31, 2015 is calculated after payment of a dividend of €2.44 per share, subject to approvalby the Shareholders’ Meeting on May 24, 2016.
The net-debt-to-equity ratio is calculated as follows:
As of December 31,(M$)
(Assets)/ Liabilities 2015 2014 2013
Current borrowings 12,488 10,942 11,193Other current financial liabilities 171 180 381Current financial assets (6,190) (1,293) (739)Net financial assets and liabilities held for sale or exchange 141 (56) (179)Non-current financial debt 44,464 45,481 34,574Hedging instruments on non-current financial debt (1,219) (1,319) (1,418)Cash and cash equivalents (23,269) (25,181) (20,200)
Net financial debt 26,586 28,754 23,612
Shareholders’ equity – Group share 92,494 90,330 100,241Distribution of the income based on existing shares at the closing date (1,545) (1,686) (1,908)Non-controlling interests 2,915 3,201 3,138
Adjusted shareholders’ equity 93,864 91,845 101,471
Net-debt-to-equity ratio 28.3% 31.3% 23.3%
21) Other creditors and accrued liabilities
As of December 31,(M$) 2015 2014 2013
Accruals and deferred income 342 469 299Payable to States (including taxes and duties) 5,363 6,894 8,885Payroll 1,265 1,343 1,573Other operating liabilities 9,914 7,935 8,191
Total 16,884 16,641 18,948
As of December 31, 2015, the heading “Other operating liabilities” includes mainly the second quarterly interim dividend for the fiscal year2015 for $1,560 million, which will be paid in January 2016 and the third quarterly interim dividend for the fiscal year 2015 for $1,584 million,which will be paid in March 2016.
As of December 31, 2014, the heading “Other operating liabilities” includes mainly the third quarterly interim dividend for the fiscal year 2014for $1,718 million. This interim dividend was paid in March 2015.
As of December 31, 2013, the heading “Other operating liabilities” includes mainly the third quarterly interim dividend for the fiscal year 2013for $1,877 million. This interim dividend was paid in March 2014.
Consolidated Financial Statements 10Notes 20, 21 – Notes to the Consolidated Financial Statements
Registration Document 2015. TOTAL 241
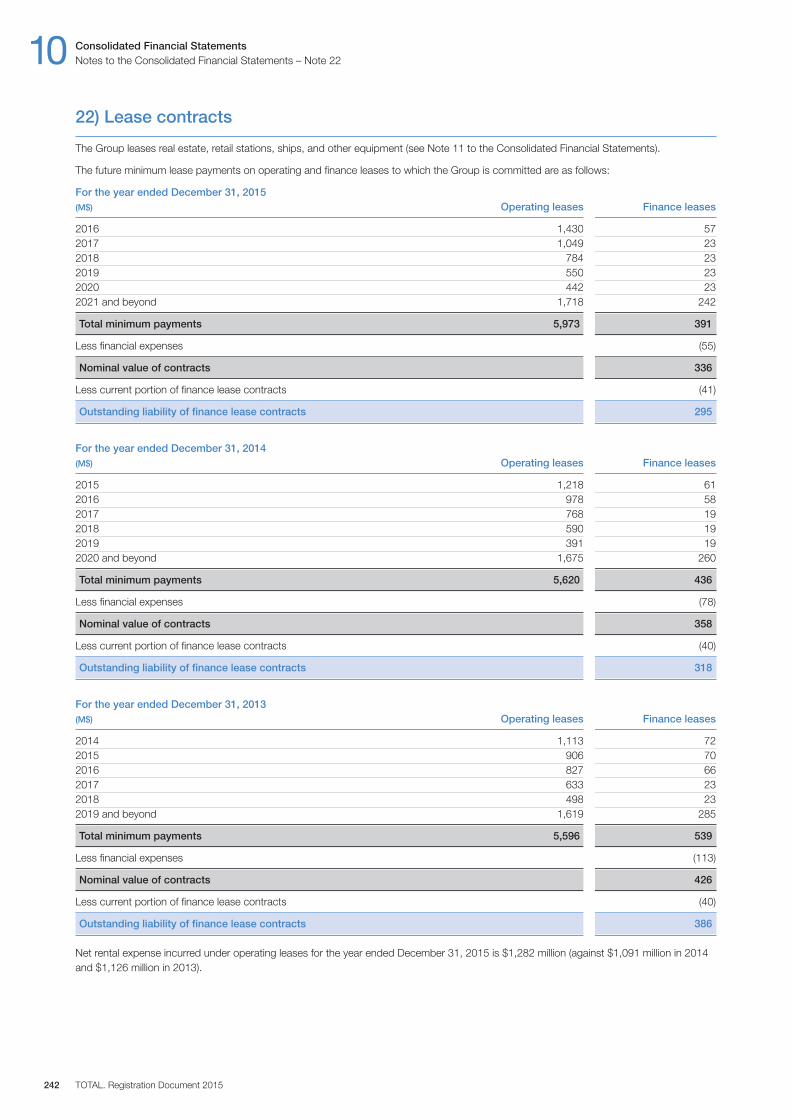
22) Lease contracts
The Group leases real estate, retail stations, ships, and other equipment (see Note 11 to the Consolidated Financial Statements).
The future minimum lease payments on operating and finance leases to which the Group is committed are as follows:
For the year ended December 31, 2015(M$) Operating leases Finance leases
2016 1,430 572017 1,049 232018 784 232019 550 232020 442 232021 and beyond 1,718 242
Total minimum payments 5,973 391
Less financial expenses (55)
Nominal value of contracts 336
Less current portion of finance lease contracts (41)
Outstanding liability of finance lease contracts 295
For the year ended December 31, 2014(M$) Operating leases Finance leases
2015 1,218 612016 978 582017 768 192018 590 192019 391 192020 and beyond 1,675 260
Total minimum payments 5,620 436
Less financial expenses (78)
Nominal value of contracts 358
Less current portion of finance lease contracts (40)
Outstanding liability of finance lease contracts 318
For the year ended December 31, 2013(M$) Operating leases Finance leases
2014 1,113 722015 906 702016 827 662017 633 232018 498 232019 and beyond 1,619 285
Total minimum payments 5,596 539
Less financial expenses (113)
Nominal value of contracts 426
Less current portion of finance lease contracts (40)
Outstanding liability of finance lease contracts 386
Net rental expense incurred under operating leases for the year ended December 31, 2015 is $1,282 million (against $1,091 million in 2014and $1,126 million in 2013).
10 Consolidated Financial StatementsNotes to the Consolidated Financial Statements – Note 22
TOTAL. Registration Document 2015242
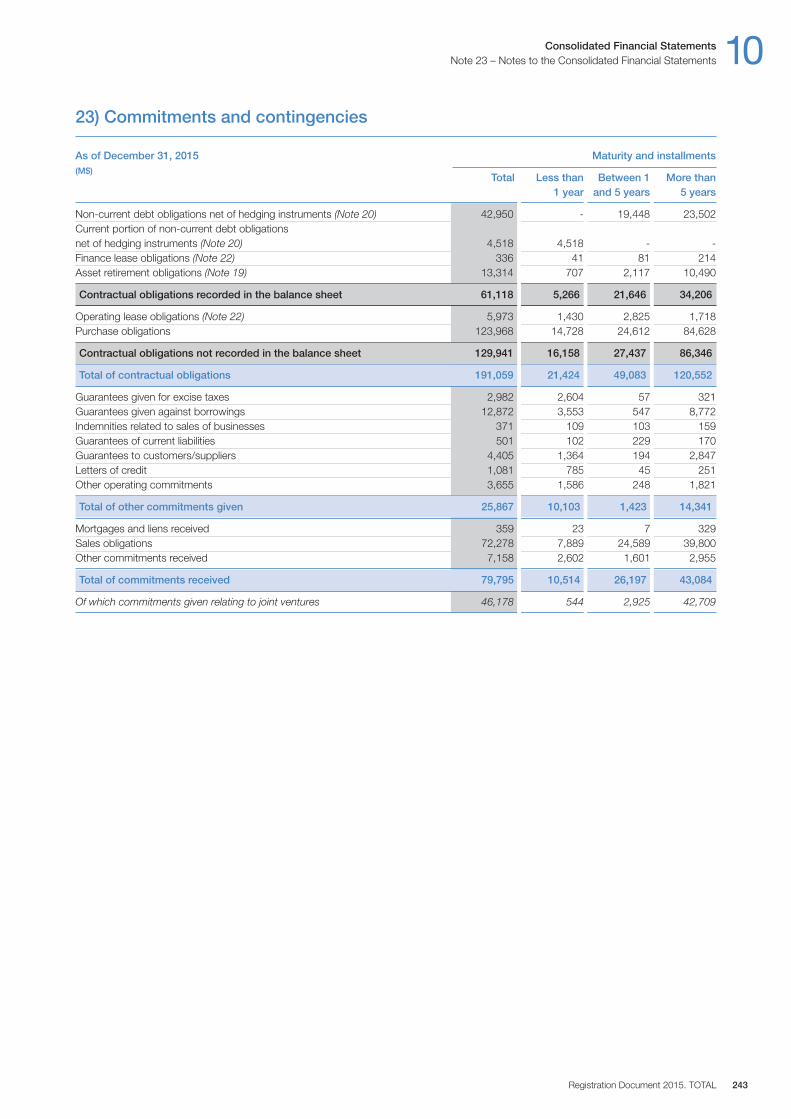
23) Commitments and contingencies
As of December 31, 2015 Maturity and installments(M$)
Total Less than Between 1 More than1 year and 5 years 5 years
Non-current debt obligations net of hedging instruments (Note 20) 42,950 - 19,448 23,502Current portion of non-current debt obligations net of hedging instruments (Note 20) 4,518 4,518 - -Finance lease obligations (Note 22) 336 41 81 214Asset retirement obligations (Note 19) 13,314 707 2,117 10,490
Contractual obligations recorded in the balance sheet 61,118 5,266 21,646 34,206
Operating lease obligations (Note 22) 5,973 1,430 2,825 1,718Purchase obligations 123,968 14,728 24,612 84,628
Contractual obligations not recorded in the balance sheet 129,941 16,158 27,437 86,346
Total of contractual obligations 191,059 21,424 49,083 120,552
Guarantees given for excise taxes 2,982 2,604 57 321Guarantees given against borrowings 12,872 3,553 547 8,772Indemnities related to sales of businesses 371 109 103 159Guarantees of current liabilities 501 102 229 170Guarantees to customers / suppliers 4,405 1,364 194 2,847Letters of credit 1,081 785 45 251Other operating commitments 3,655 1,586 248 1,821
Total of other commitments given 25,867 10,103 1,423 14,341
Mortgages and liens received 359 23 7 329Sales obligations 72,278 7,889 24,589 39,800Other commitments received 7,158 2,602 1,601 2,955
Total of commitments received 79,795 10,514 26,197 43,084
Of which commitments given relating to joint ventures 46,178 544 2,925 42,709
Consolidated Financial Statements 10Note 23 – Notes to the Consolidated Financial Statements
Registration Document 2015. TOTAL 243

As of December 31, 2014 Maturity and installments(M$)
Total Less than Between 1 More than1 year and 5 years 5 years
Non-current debt obligations net of hedging instruments (Note 20) 43,844 - 18,458 25,386Current portion of non-current debt obligations net of hedging instruments (Note 20) 4,411 4,411 - -Finance lease obligations (Note 22) 358 40 98 220Asset retirement obligations (Note 19) 13,121 651 2,430 10,040
Contractual obligations recorded in the balance sheet 61,734 5,102 20,986 35,646
Operating lease obligations (Note 22) 5,620 1,218 2,727 1,675Purchase obligations 160,837 19,987 33,908 106,942
Contractual obligations not recorded in the balance sheet 166,457 21,205 36,635 108,617
Total of contractual obligations 228,191 26,307 57,621 144,263
Guarantees given for excise taxes 2,382 1,855 91 436Guarantees given against borrowings 10,192 140 3,784 6,268Indemnities related to sales of businesses 396 121 110 165Guarantees of current liabilities 635 144 165 326Guarantees to customers / suppliers 5,599 2,564 168 2,867Letters of credit 1,552 1,138 3 411Other operating commitments 4,762 1,455 2,700 607
Total of other commitments given 25,518 7,417 7,021 11,080
Mortgages and liens received 418 17 4 397Sales obligations 110,949 9,287 33,629 68,033Other commitments received 7,081 3,321 1,388 2,372
Total of commitments received 118,448 12,625 35,021 70,802
Of which commitments given relating to joint ventures 57,439 298 1,915 55,226
As of December 31, 2013 Maturity and installments(M$)
Total Less than Between 1 More than1 year and 5 years 5 years
Non-current debt obligations net of hedging instruments (Note 20) 32,770 - 17,545 15,225Current portion of non-current debt obligations net of hedging instruments (Note 20) 5,218 5,218 - -Finance lease obligations (Note 22) 426 40 150 236Asset retirement obligations (Note 19) 12,808 735 2,368 9,705
Contractual obligations recorded in the balance sheet 51,222 5,993 20,063 25,166
Operating lease obligations (Note 22) 5,596 1,113 2,864 1,619Purchase obligations 118,982 20,060 34,013 64,909
Contractual obligations not recorded in the balance sheet 124,578 21,173 36,877 66,528
Total of contractual obligations 175,800 27,166 56,940 91,694
Guarantees given for excise taxes 2,444 2,048 102 294Guarantees given against borrowings 8,276 110 3,706 4,460Indemnities related to sales of businesses 320 7 135 178Guarantees of current liabilities 724 123 233 368Guarantees to customers / suppliers 4,865 2,120 190 2,555Letters of credit 2,360 1,863 225 272Other operating commitments 4,197 1,364 960 1,873
Total of other commitments given 23,186 7,635 5,551 10,000
Mortgages and liens received 389 21 1 367Sales obligations 135,463 10,515 38,702 86,246Other commitments received 8,193 4,428 1,750 2,015
Total of commitments received 144,045 14,964 40,453 88,628
Of which commitments given relating to joint ventures 11,151 98 553 10,500
10 Consolidated Financial StatementsNotes to the Consolidated Financial Statements – Note 23
TOTAL. Registration Document 2015244
A) Contractual obligations
Debt obligations
“Non-current debt obligations” are included in the items “Non-current financial debt” and “Hedging instruments of non-currentfinancial debt” of the consolidated balance sheet. It includes thenon-current portion of swaps hedging bonds, and excludes non-current finance lease obligations of $295 million.
The current portion of non-current debt is included in the items“Current borrowings”, “Current financial assets” and “Other currentfinancial liabilities” of the consolidated balance sheet. It includes thecurrent portion of swaps hedging bonds, and excludes the currentportion of finance lease obligations of $41 million.
The information regarding contractual obligations linked toindebtedness is presented in Note 20 to the Consolidated FinancialStatements.
Lease contracts
The information regarding operating and finance leases is presentedin Note 22 to the Consolidated Financial Statements.
Asset retirement obligations
This item represents the discounted present value of Upstreamasset retirement obligations, primarily asset removal costs at thecompletion date. The information regarding contractual obligationslinked to asset retirement obligations is presented in Notes 1Q and19 to the Consolidated Financial Statements.
Purchase obligations
Purchase obligations are obligations under contractual agreementsto purchase goods or services, including capital projects. Theseobligations are enforceable and legally binding on the company andspecify all significant terms, including the amount and the timing ofthe payments.
These obligations mainly include: unconditional hydrocarbonpurchase contracts (except where an active, highly-liquid marketexists and when the hydrocarbons are expected to be re-sold shortlyafter purchase), reservation of transport capacities in pipelines,unconditional exploration works and development works in theUpstream segment, and contracts for capital investment projects in the Refining & Chemicals segment.
B) Other commitments given
Guarantees given for excise taxes
These consist of guarantees given by the Group to customs authoritiesin order to guarantee the payments of taxes and excise duties onthe importation of oil and gas products, mostly in France.
Guarantees given against borrowings
The Group guarantees bank debt and finance lease obligations of certain non-consolidated subsidiaries and equity affiliates.Maturity dates vary, and guarantees will terminate on paymentand / or cancellation of the obligation. A payment would be triggeredby failure of the guaranteed party to fulfill its obligation covered by the guarantee, and no assets are held as collateral for theseguarantees. As of December 31, 2015, the maturities of theseguarantees are up to 2028.
Guarantees given against borrowings include the guarantee given in2008 by TOTAL S.A. in connection with the financing of the YemenLNG project for an amount of $551 million.
In 2010, TOTAL S.A. provided guarantees in connection with the financing of the Jubail project (operated by SAUDI ARAMCOTOTAL Refining and Petrochemical Company (SATORP)) of up to$3,188 million, proportional to TOTAL’s share in the project (37.5%).In addition, in 2015, TOTAL S.A has confirmed and extendedguarantees for TOTAL Refining SAUDI ARABIA SAS shareholders’advances for an amount of $1,013 million.
As of December 31, 2015, the guarantees provided by TOTAL S.A.in connection with the financing of the Ichthys LNG project amountedto $6,580 million.
Indemnities related to sales of businesses
In the ordinary course of business, the Group executes contractsinvolving standard indemnities for the oil industry and indemnitiesspecific to transactions such as sales of businesses. Theseindemnities might include claims against any of the following:environmental, tax and shareholder matters, intellectual propertyrights, governmental regulations and employment-related matters,dealer, supplier, and other commercial contractual relationships.Performance under these indemnities would generally be triggeredby a breach of terms of the contract or by a third party claim. TheGroup regularly evaluates the probability of having to incur costsassociated with these indemnities.
Other guarantees given
Non-consolidated subsidiariesThe Group also guarantees the current liabilities of certain non-consolidated subsidiaries. Performance under these guaranteeswould be triggered by a financial default of the entity.
Operating agreementsAs part of normal ongoing business operations and consistent with generally accepted and recognized industry practices, the Group enters into numerous agreements with other parties. These commitments are often entered into for commercial purposes,for regulatory purposes or for other operating agreements.
C) Commitments received
Sales obligations
These amounts represent binding obligations under contractualagreements to sell goods, including in particular unconditionalhydrocarbon sales contracts (except where an active, highly-liquidmarket exists and when the volumes are expected to be re-soldshortly after purchase).
Consolidated Financial Statements 10Note 23 – Notes to the Consolidated Financial Statements
Registration Document 2015. TOTAL 245
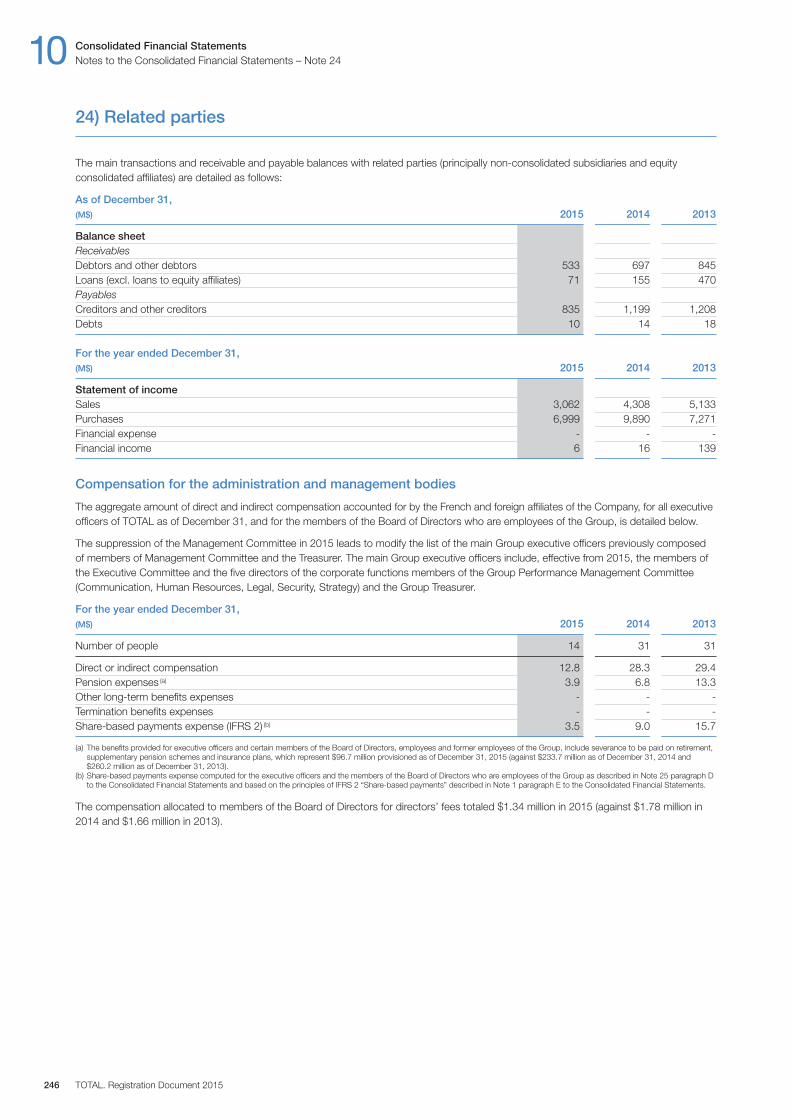
24) Related parties
The main transactions and receivable and payable balances with related parties (principally non-consolidated subsidiaries and equityconsolidated affiliates) are detailed as follows:
As of December 31,(M$) 2015 2014 2013
Balance sheetReceivablesDebtors and other debtors 533 697 845Loans (excl. loans to equity affiliates) 71 155 470PayablesCreditors and other creditors 835 1,199 1,208Debts 10 14 18
For the year ended December 31,(M$) 2015 2014 2013
Statement of incomeSales 3,062 4,308 5,133Purchases 6,999 9,890 7,271Financial expense - - -Financial income 6 16 139
Compensation for the administration and management bodies
The aggregate amount of direct and indirect compensation accounted for by the French and foreign affiliates of the Company, for all executiveofficers of TOTAL as of December 31, and for the members of the Board of Directors who are employees of the Group, is detailed below.
The suppression of the Management Committee in 2015 leads to modify the list of the main Group executive officers previously composedof members of Management Committee and the Treasurer. The main Group executive officers include, effective from 2015, the members ofthe Executive Committee and the five directors of the corporate functions members of the Group Performance Management Committee(Communication, Human Resources, Legal, Security, Strategy) and the Group Treasurer.
For the year ended December 31,(M$) 2015 2014 2013
Number of people 14 31 31
Direct or indirect compensation 12.8 28.3 29.4Pension expenses (a) 3.9 6.8 13.3Other long-term benefits expenses - - -Termination benefits expenses - - -Share-based payments expense (IFRS 2) (b) 3.5 9.0 15.7
(a) The benefits provided for executive officers and certain members of the Board of Directors, employees and former employees of the Group, include severance to be paid on retirement,supplementary pension schemes and insurance plans, which represent $96.7 million provisioned as of December 31, 2015 (against $233.7 million as of December 31, 2014 and$260.2 million as of December 31, 2013).
(b) Share-based payments expense computed for the executive officers and the members of the Board of Directors who are employees of the Group as described in Note 25 paragraph Dto the Consolidated Financial Statements and based on the principles of IFRS 2 “Share-based payments” described in Note 1 paragraph E to the Consolidated Financial Statements.
The compensation allocated to members of the Board of Directors for directors’ fees totaled $1.34 million in 2015 (against $1.78 million in2014 and $1.66 million in 2013).
10 Consolidated Financial StatementsNotes to the Consolidated Financial Statements – Note 24
TOTAL. Registration Document 2015246
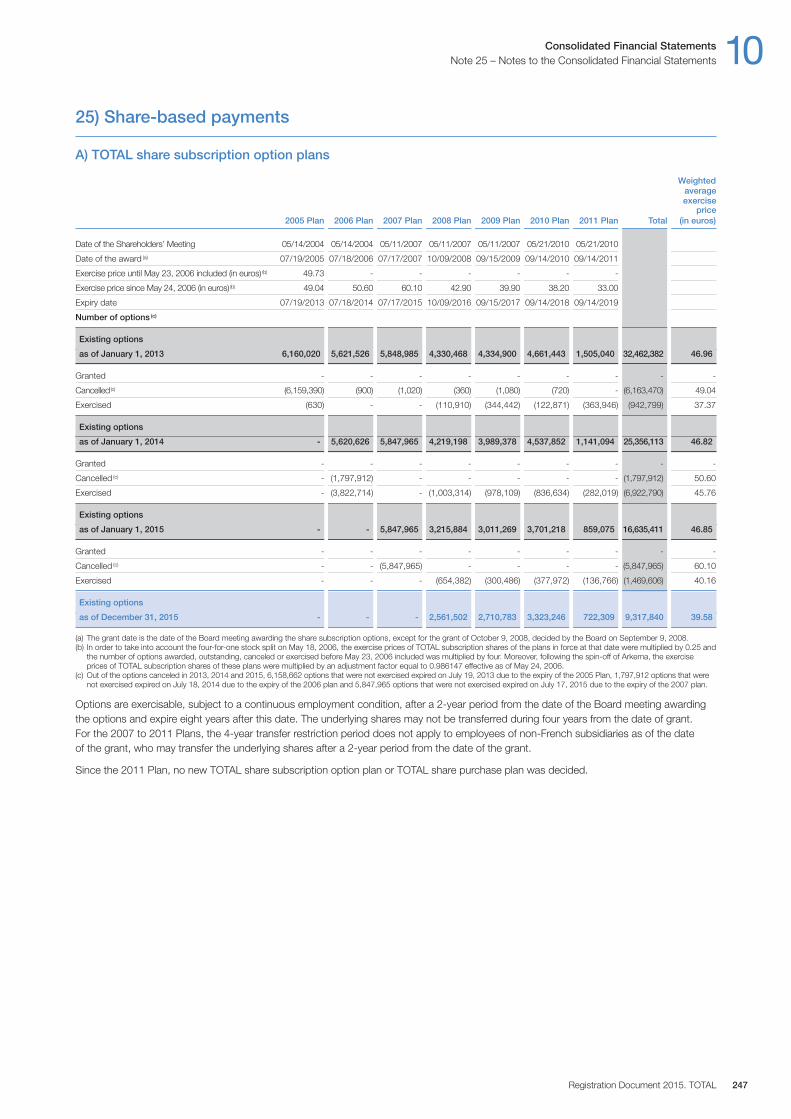
25) Share-based payments
A) TOTAL share subscription option plans
Weighted average exercise
price2005 Plan 2006 Plan 2007 Plan 2008 Plan 2009 Plan 2010 Plan 2011 Plan Total (in euros)
Date of the Shareholders’ Meeting 05 / 14 / 2004 05 / 14 / 2004 05 / 11 / 2007 05 / 11 / 2007 05 / 11 / 2007 05 / 21 / 2010 05 / 21 / 2010
Date of the award (a) 07 / 19 / 2005 07 / 18 / 2006 07 / 17 / 2007 10 / 09 / 2008 09 / 15 / 2009 09 / 14 / 2010 09 / 14 / 2011
Exercise price until May 23, 2006 included (in euros) (b) 49.73 - - - - - -
Exercise price since May 24, 2006 (in euros)(b) 49.04 50.60 60.10 42.90 39.90 38.20 33.00
Expiry date 07 / 19 / 2013 07 / 18 / 2014 07 / 17 / 2015 10 / 09 / 2016 09 / 15 / 2017 09 / 14 / 2018 09 / 14 / 2019
Number of options (c)
Existing options
as of January 1, 2013 6,160,020 5,621,526 5,848,985 4,330,468 4,334,900 4,661,443 1,505,040 32,462,382 46.96
Granted - - - - - - - - -
Cancelled(c) (6,159,390) (900) (1,020) (360) (1,080) (720) - (6,163,470) 49.04
Exercised (630) - - (110,910) (344,442) (122,871) (363,946) (942,799) 37.37
Existing options
as of January 1, 2014 - 5,620,626 5,847,965 4,219,198 3,989,378 4,537,852 1,141,094 25,356,113 46.82
Granted - - - - - - - - -
Cancelled (c) - (1,797,912) - - - - - (1,797,912) 50.60
Exercised - (3,822,714) - (1,003,314) (978,109) (836,634) (282,019) (6,922,790) 45.76
Existing options
as of January 1, 2015 - - 5,847,965 3,215,884 3,011,269 3,701,218 859,075 16,635,411 46.85
Granted - - - - - - - - -
Cancelled (c) - - (5,847,965) - - - - (5,847,965) 60.10
Exercised - - - (654,382) (300,486) (377,972) (136,766) (1,469,606) 40.16
Existing options
as of December 31, 2015 - - - 2,561,502 2,710,783 3,323,246 722,309 9,317,840 39.58
(a) The grant date is the date of the Board meeting awarding the share subscription options, except for the grant of October 9, 2008, decided by the Board on September 9, 2008.(b) In order to take into account the four-for-one stock split on May 18, 2006, the exercise prices of TOTAL subscription shares of the plans in force at that date were multiplied by 0.25 and
the number of options awarded, outstanding, canceled or exercised before May 23, 2006 included was multiplied by four. Moreover, following the spin-off of Arkema, the exerciseprices of TOTAL subscription shares of these plans were multiplied by an adjustment factor equal to 0.986147 effective as of May 24, 2006.
(c) Out of the options canceled in 2013, 2014 and 2015, 6,158,662 options that were not exercised expired on July 19, 2013 due to the expiry of the 2005 Plan, 1,797,912 options that werenot exercised expired on July 18, 2014 due to the expiry of the 2006 plan and 5,847,965 options that were not exercised expired on July 17, 2015 due to the expiry of the 2007 plan.
Options are exercisable, subject to a continuous employment condition, after a 2-year period from the date of the Board meeting awardingthe options and expire eight years after this date. The underlying shares may not be transferred during four years from the date of grant. For the 2007 to 2011 Plans, the 4-year transfer restriction period does not apply to employees of non-French subsidiaries as of the date of the grant, who may transfer the underlying shares after a 2-year period from the date of the grant.
Since the 2011 Plan, no new TOTAL share subscription option plan or TOTAL share purchase plan was decided.
Consolidated Financial Statements 10Note 25 – Notes to the Consolidated Financial Statements
Registration Document 2015. TOTAL 247
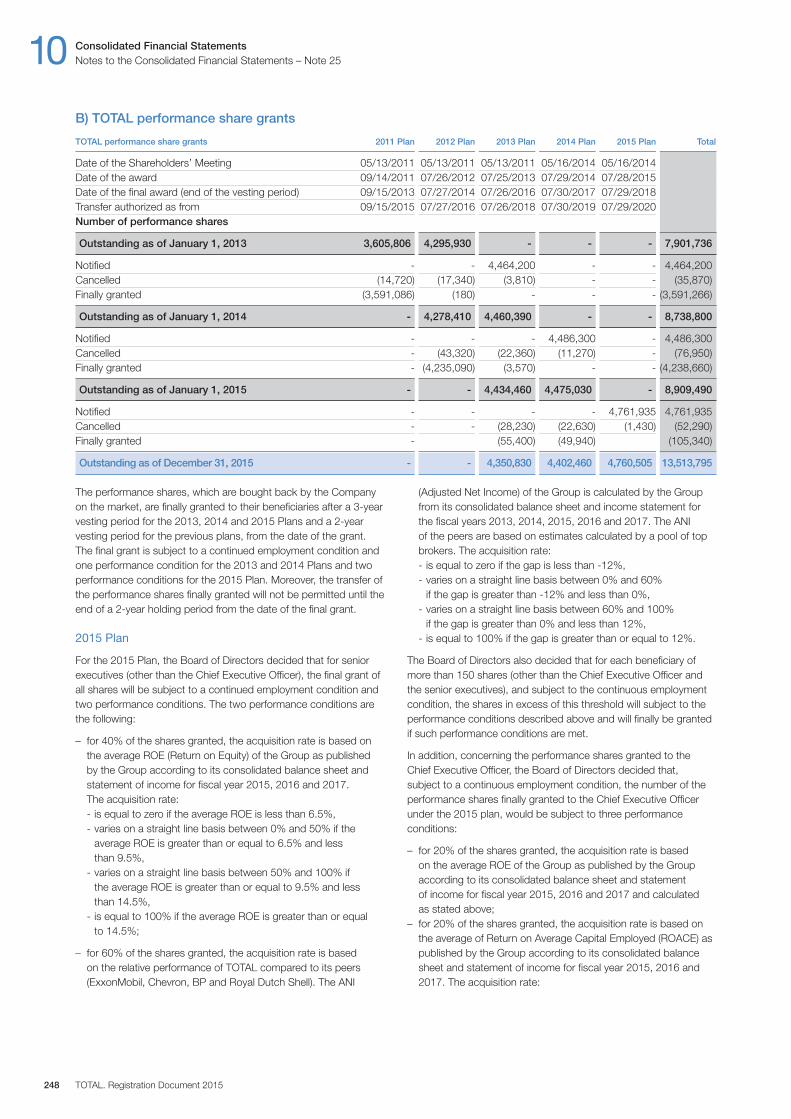
The performance shares, which are bought back by the Companyon the market, are finally granted to their beneficiaries after a 3-yearvesting period for the 2013, 2014 and 2015 Plans and a 2-yearvesting period for the previous plans, from the date of the grant.The final grant is subject to a continued employment condition andone performance condition for the 2013 and 2014 Plans and twoperformance conditions for the 2015 Plan. Moreover, the transfer ofthe performance shares finally granted will not be permitted until theend of a 2-year holding period from the date of the final grant.
2015 Plan
For the 2015 Plan, the Board of Directors decided that for seniorexecutives (other than the Chief Executive Officer), the final grant ofall shares will be subject to a continued employment condition andtwo performance conditions. The two performance conditions arethe following:
– for 40% of the shares granted, the acquisition rate is based onthe average ROE (Return on Equity) of the Group as published by the Group according to its consolidated balance sheet andstatement of income for fiscal year 2015, 2016 and 2017. The acquisition rate:- is equal to zero if the average ROE is less than 6.5%,- varies on a straight line basis between 0% and 50% if the
average ROE is greater than or equal to 6.5% and less than 9.5%,
- varies on a straight line basis between 50% and 100% if the average ROE is greater than or equal to 9.5% and less than 14.5%,
- is equal to 100% if the average ROE is greater than or equal to 14.5%;
– for 60% of the shares granted, the acquisition rate is based on the relative performance of TOTAL compared to its peers(ExxonMobil, Chevron, BP and Royal Dutch Shell). The ANI
(Adjusted Net Income) of the Group is calculated by the Groupfrom its consolidated balance sheet and income statement forthe fiscal years 2013, 2014, 2015, 2016 and 2017. The ANI of the peers are based on estimates calculated by a pool of topbrokers. The acquisition rate:- is equal to zero if the gap is less than -12%,- varies on a straight line basis between 0% and 60%
if the gap is greater than -12% and less than 0%,- varies on a straight line basis between 60% and 100%
if the gap is greater than 0% and less than 12%,- is equal to 100% if the gap is greater than or equal to 12%.
The Board of Directors also decided that for each beneficiary ofmore than 150 shares (other than the Chief Executive Officer andthe senior executives), and subject to the continuous employmentcondition, the shares in excess of this threshold will subject to theperformance conditions described above and will finally be grantedif such performance conditions are met.
In addition, concerning the performance shares granted to theChief Executive Officer, the Board of Directors decided that, subject to a continuous employment condition, the number of theperformance shares finally granted to the Chief Executive Officerunder the 2015 plan, would be subject to three performanceconditions:
– for 20% of the shares granted, the acquisition rate is based on the average ROE of the Group as published by the Groupaccording to its consolidated balance sheet and statement of income for fiscal year 2015, 2016 and 2017 and calculated as stated above;
– for 20% of the shares granted, the acquisition rate is based onthe average of Return on Average Capital Employed (ROACE) aspublished by the Group according to its consolidated balancesheet and statement of income for fiscal year 2015, 2016 and2017. The acquisition rate:
B) TOTAL performance share grants
TOTAL performance share grants 2011 Plan 2012 Plan 2013 Plan 2014 Plan 2015 Plan Total
Date of the Shareholders’ Meeting 05 / 13 / 2011 05 / 13 / 2011 05 / 13 / 2011 05 / 16 / 2014 05 / 16 / 2014Date of the award 09 / 14 / 2011 07 / 26 / 2012 07 / 25 / 2013 07 / 29 / 2014 07 / 28 / 2015Date of the final award (end of the vesting period) 09 / 15 / 2013 07 / 27 / 2014 07 / 26 / 2016 07 / 30 / 2017 07 / 29 / 2018Transfer authorized as from 09 / 15 / 2015 07 / 27 / 2016 07 / 26 / 2018 07 / 30 / 2019 07 / 29 / 2020Number of performance shares
Outstanding as of January 1, 2013 3,605,806 4,295,930 - - - 7,901,736
Notified - - 4,464,200 - - 4,464,200Cancelled (14,720) (17,340) (3,810) - - (35,870)Finally granted (3,591,086) (180) - - - (3,591,266)
Outstanding as of January 1, 2014 - 4,278,410 4,460,390 - - 8,738,800
Notified - - - 4,486,300 - 4,486,300Cancelled - (43,320) (22,360) (11,270) - (76,950)Finally granted - (4,235,090) (3,570) - - (4,238,660)
Outstanding as of January 1, 2015 - - 4,434,460 4,475,030 - 8,909,490
Notified - - - - 4,761,935 4,761,935Cancelled - - (28,230) (22,630) (1,430) (52,290)Finally granted - (55,400) (49,940) (105,340)
Outstanding as of December 31, 2015 - - 4,350,830 4,402,460 4,760,505 13,513,795
10 Consolidated Financial StatementsNotes to the Consolidated Financial Statements – Note 25
TOTAL. Registration Document 2015248

- is equal to zero if the average ROACE is less than 6.5%,- varies on a straight line basis between 0% and 50% if the
average ROACE is greater than or equal to 6.5% and less than or equal to 9%,
- varies on a straight line basis between 50% and 100% if theaverage ROACE is greater than or equal to 9% and less than orequal to 13%,
- is equal to 100% if the average ROACE is greater than 13%;
– for 60% of the shares granted, the number of shares is based onthe evolution of the ANI (adjusted net income) of TOTAL,compared to a panel of four other oil and gas companies, asstated above.
2013 and 2014 Plans
For the 2013 and 2014 Plans, the Board of Directors decided that for senior executives (other than the late Chairman andChief Executive Officer), the final grant of all shares will be subject to a continued employment condition and a performance condition.
The performance condition states that the number of shares finallygranted is based on the average ROE of the Group as published by the Group according to its consolidated balance sheet andstatement of income for fiscal years 2013, 2014 and 2015 for the2013 Plan and for fiscal years 2014, 2015 and 2016 for the 2014Plan. The acquisition rate:
– is equal to zero if the average ROE is less than or equal to 8%;– varies on a straight-line basis between 0% and 100% if the
average ROE is greater than 8% and less than 16%; and– is equal to 100% if the average ROE is greater than or equal
to 16%.
The Board of Directors also decided that for each beneficiary of more than 100 shares (other than the late Chairman andChief Executive Officer and the senior executives), and subject tothe continuous employment condition, the shares in excess of thisthreshold will be subject to the performance condition describedabove and will be finally granted provided such performancecondition is met.
In addition, the Board of Directors had decided that, subject to a continuous employment condition, the number of performanceshares finally granted to the late Chairman and Chief Executive Officerwould be subject to two performance conditions:
– For 50% of the shares granted, the performance condition statedthat the acquisition rate would have been based on the averageROE of the Group as published by the Group according to itsconsolidated balance sheet and statement of income for thethree reference fiscal years as defined above.
– For 50% of the shares granted, the performance condition statedthat the acquisition rate would have been based on the averageROACE of the Group as published by the Group according to itsconsolidated balance sheet and statement of income for thethree reference fiscal years. The acquisition rate would have beenequal to zero if the average ROACE had been less than or equalto 7%; would have varied on a straight-line basis between 0%and 100% if the average ROACE had been more than 7% andless than 15%; and would have been equal to 100% if theaverage ROACE had been more than or equal to 15%.
C) SunPower plans
SunPower has three stock incentive plans: the 1996 Stock Plan(“1996 Plan”), the Third Amended and Restated 2005 SunPowerCorporation Stock Incentive Plan (“2005 Plan”) and the PowerLightCorporation Common Stock Option and Common Stock PurchasePlan (“PowerLight Plan”). The PowerLight Plan was assumed bySunPower by way of the acquisition of PowerLight in fiscal 2007.Under the terms of all three plans, SunPower may issue incentive or non-statutory stock options or stock purchase rights to directors,employees and consultants to purchase common stock. The 2005Plan was adopted by SunPower’s Board of Directors in August 2005,and was approved by shareholders in November 2005. The 2005Plan replaced the 1996 Plan and allows not only for the grant ofoptions, but also for the grant of stock appreciation rights,restricted stock grants, restricted stock units and other equityrights. The 2005 Plan also allows for tax withholding obligationsrelated to stock option exercises or restricted stock awards to besatisfied through the retention of shares otherwise released uponvesting. The PowerLight Plan was adopted by PowerLight’s Boardof Directors in October 2000.
In May 2008, SunPower’s stockholders approved an automaticannual increase available for grant under the 2005 Plan, beginningin fiscal 2009. The automatic annual increase is equal to the lowerof three percent of the outstanding shares of all classes ofSunPower’s common stock measured on the last day of theimmediately preceding fiscal quarter, 6.0 million shares, or suchother number of shares as determined by SunPower’s Board ofDirectors. As of January 3, 2016, approximately 7.2 million shareswere available for grant under the 2005 Plan. In fiscal 2014,SunPower’s Board of Directors voted not to add the three percentannual increase at the beginning of fiscal 2015. In fiscal 2015,SunPower’s Board of Directors voted to reduce the stock incentiveplan’s automatic increase from 3% to 2% for 2016. No new awardsare being granted under the 1996 Plan or the PowerLight Plan.
Incentive stock options may be granted at no less than the fairvalue of the common stock on the date of grant. Non-statutorystock options and stock purchase rights may be granted at no lessthan 85% of the fair value of the common stock at the date ofgrant. The options and rights become exercisable when and asdetermined by SunPower’s Board of Directors, although theseterms generally do not exceed ten years for stock options. Underthe 1996 and 2005 Plans, the options typically vest over five yearswith a one-year cliff and monthly vesting thereafter. Under thePowerLight Plan, the options typically vest over five years withyearly cliff vesting. Under the 2005 Plan, the restricted stock grantsand restricted stock units typically vest in three equal installmentsannually over three years.
The majority of shares issued are net of the minimum statutorywithholding requirements that SunPower pays on behalf of itsemployees. During fiscal 2015, 2014, and 2013, SunPowerwithheld 1,380,891 shares, 1,738,625 shares and 1,329,140shares, respectively, to satisfy the employees’ tax obligations. SunPower pays such withholding requirements in cash to the appropriate taxing authorities. Shares withheld are treated ascommon stock repurchases for accounting and disclosure purposesand reduce the number of shares outstanding upon vesting.
Consolidated Financial Statements 10Note 25 – Notes to the Consolidated Financial Statements
Registration Document 2015. TOTAL 249
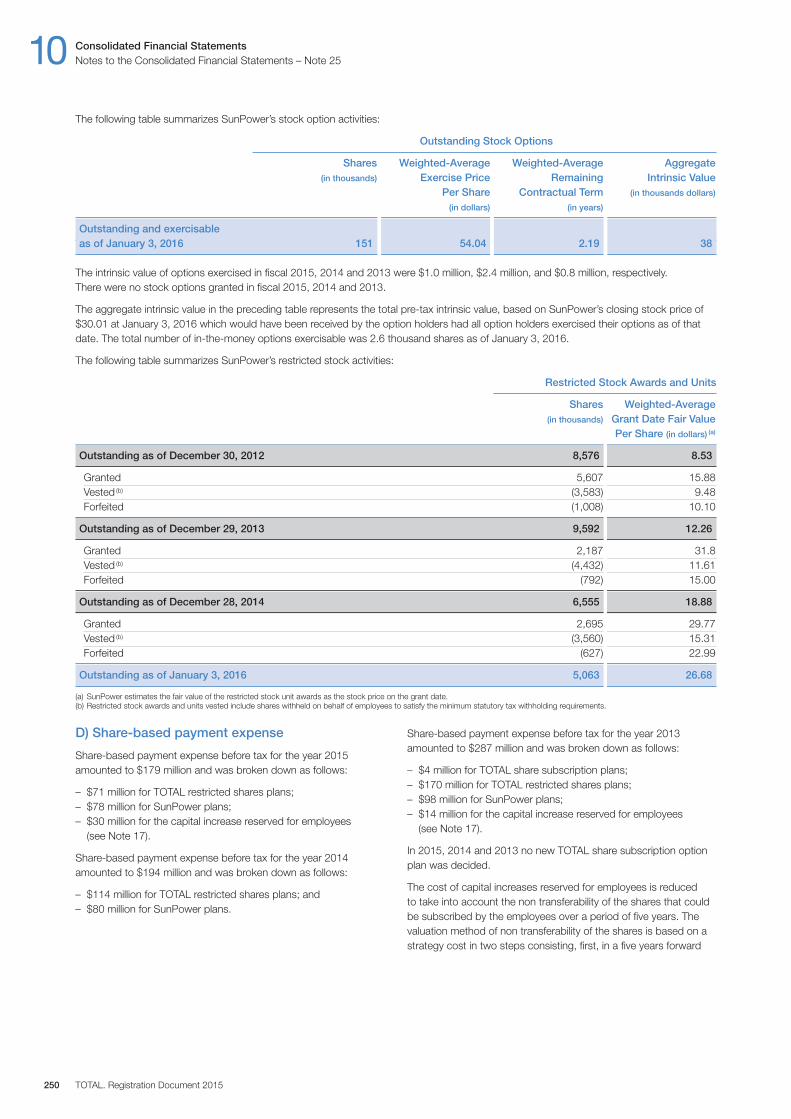
D) Share-based payment expense
Share-based payment expense before tax for the year 2015amounted to $179 million and was broken down as follows:
– $71 million for TOTAL restricted shares plans;– $78 million for SunPower plans;– $30 million for the capital increase reserved for employees
(see Note 17).
Share-based payment expense before tax for the year 2014amounted to $194 million and was broken down as follows:
– $114 million for TOTAL restricted shares plans; and– $80 million for SunPower plans.
Share-based payment expense before tax for the year 2013amounted to $287 million and was broken down as follows:
– $4 million for TOTAL share subscription plans;– $170 million for TOTAL restricted shares plans;– $98 million for SunPower plans;– $14 million for the capital increase reserved for employees
(see Note 17).
In 2015, 2014 and 2013 no new TOTAL share subscription optionplan was decided.
The cost of capital increases reserved for employees is reduced to take into account the non transferability of the shares that couldbe subscribed by the employees over a period of five years. Thevaluation method of non transferability of the shares is based on astrategy cost in two steps consisting, first, in a five years forward
The following table summarizes SunPower’s stock option activities:
Outstanding Stock Options
Shares Weighted-Average Weighted-Average Aggregate(in thousands) Exercise Price Remaining Intrinsic Value
Per Share Contractual Term (in thousands dollars)
(in dollars) (in years)
Outstanding and exercisable as of January 3, 2016 151 54.04 2.19 38
The intrinsic value of options exercised in fiscal 2015, 2014 and 2013 were $1.0 million, $2.4 million, and $0.8 million, respectively. There were no stock options granted in fiscal 2015, 2014 and 2013.
The aggregate intrinsic value in the preceding table represents the total pre-tax intrinsic value, based on SunPower’s closing stock price of$30.01 at January 3, 2016 which would have been received by the option holders had all option holders exercised their options as of thatdate. The total number of in-the-money options exercisable was 2.6 thousand shares as of January 3, 2016.
The following table summarizes SunPower’s restricted stock activities:
Restricted Stock Awards and Units
Shares Weighted-Average (in thousands) Grant Date Fair Value
Per Share (in dollars) (a)
Outstanding as of December 30, 2012 8,576 8.53
Granted 5,607 15.88Vested (b) (3,583) 9.48Forfeited (1,008) 10.10
Outstanding as of December 29, 2013 9,592 12.26
Granted 2,187 31.8Vested (b) (4,432) 11.61Forfeited (792) 15.00
Outstanding as of December 28, 2014 6,555 18.88
Granted 2,695 29.77Vested (b) (3,560) 15.31Forfeited (627) 22.99
Outstanding as of January 3, 2016 5,063 26.68
(a) SunPower estimates the fair value of the restricted stock unit awards as the stock price on the grant date.(b) Restricted stock awards and units vested include shares withheld on behalf of employees to satisfy the minimum statutory tax withholding requirements.
10 Consolidated Financial StatementsNotes to the Consolidated Financial Statements – Note 25
TOTAL. Registration Document 2015250
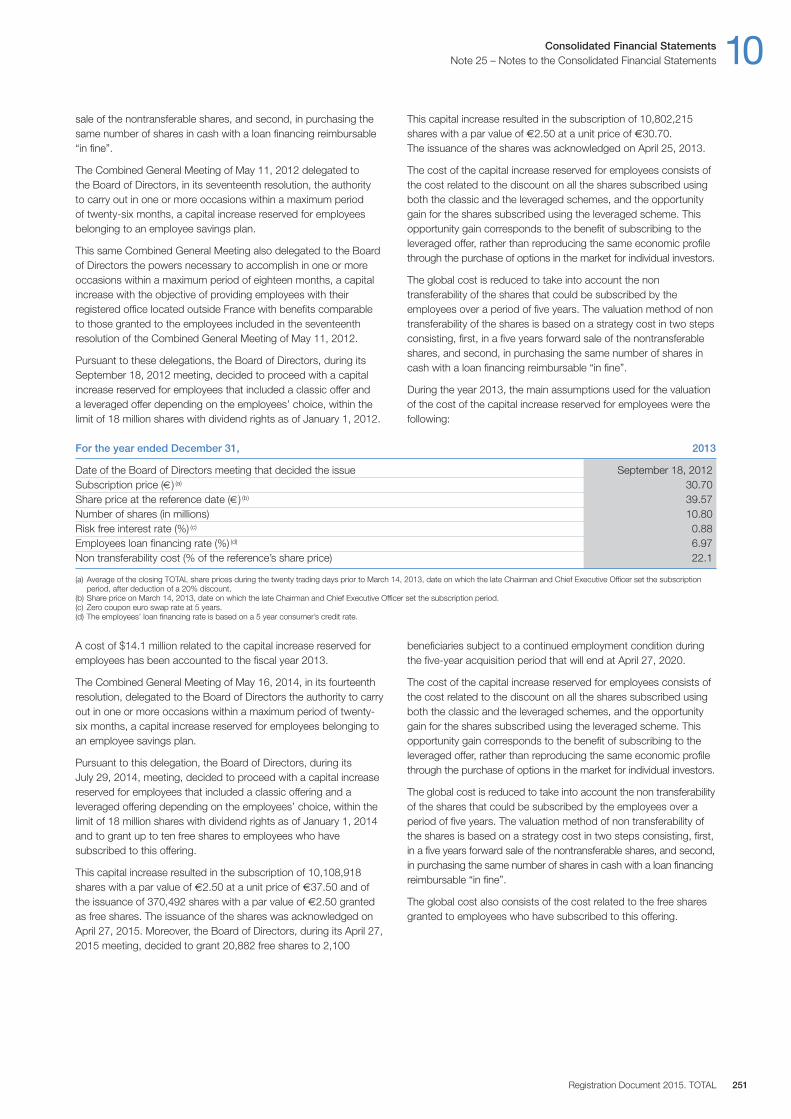
A cost of $14.1 million related to the capital increase reserved foremployees has been accounted to the fiscal year 2013.
The Combined General Meeting of May 16, 2014, in its fourteenthresolution, delegated to the Board of Directors the authority to carryout in one or more occasions within a maximum period of twenty-six months, a capital increase reserved for employees belonging toan employee savings plan.
Pursuant to this delegation, the Board of Directors, during itsJuly 29, 2014, meeting, decided to proceed with a capital increasereserved for employees that included a classic offering and aleveraged offering depending on the employees’ choice, within thelimit of 18 million shares with dividend rights as of January 1, 2014and to grant up to ten free shares to employees who havesubscribed to this offering.
This capital increase resulted in the subscription of 10,108,918shares with a par value of €2.50 at a unit price of €37.50 and ofthe issuance of 370,492 shares with a par value of €2.50 grantedas free shares. The issuance of the shares was acknowledged onApril 27, 2015. Moreover, the Board of Directors, during its April 27,2015 meeting, decided to grant 20,882 free shares to 2,100
beneficiaries subject to a continued employment condition duringthe five-year acquisition period that will end at April 27, 2020.
The cost of the capital increase reserved for employees consists ofthe cost related to the discount on all the shares subscribed usingboth the classic and the leveraged schemes, and the opportunitygain for the shares subscribed using the leveraged scheme. Thisopportunity gain corresponds to the benefit of subscribing to theleveraged offer, rather than reproducing the same economic profilethrough the purchase of options in the market for individual investors.
The global cost is reduced to take into account the non transferabilityof the shares that could be subscribed by the employees over aperiod of five years. The valuation method of non transferability ofthe shares is based on a strategy cost in two steps consisting, first,in a five years forward sale of the nontransferable shares, and second,in purchasing the same number of shares in cash with a loan financingreimbursable “in fine”.
The global cost also consists of the cost related to the free sharesgranted to employees who have subscribed to this offering.
For the year ended December 31, 2013
Date of the Board of Directors meeting that decided the issue September 18, 2012Subscription price (€) (a) 30.70Share price at the reference date (€) (b) 39.57Number of shares (in millions) 10.80Risk free interest rate (%) (c) 0.88Employees loan financing rate (%) (d) 6.97Non transferability cost (% of the reference’s share price) 22.1
(a) Average of the closing TOTAL share prices during the twenty trading days prior to March 14, 2013, date on which the late Chairman and Chief Executive Officer set the subscriptionperiod, after deduction of a 20% discount.
(b) Share price on March 14, 2013, date on which the late Chairman and Chief Executive Officer set the subscription period.(c) Zero coupon euro swap rate at 5 years.(d) The employees’ loan financing rate is based on a 5 year consumer’s credit rate.
sale of the nontransferable shares, and second, in purchasing thesame number of shares in cash with a loan financing reimbursable“in fine”.
The Combined General Meeting of May 11, 2012 delegated to the Board of Directors, in its seventeenth resolution, the authority to carry out in one or more occasions within a maximum period of twenty-six months, a capital increase reserved for employeesbelonging to an employee savings plan.
This same Combined General Meeting also delegated to the Boardof Directors the powers necessary to accomplish in one or moreoccasions within a maximum period of eighteen months, a capitalincrease with the objective of providing employees with theirregistered office located outside France with benefits comparableto those granted to the employees included in the seventeenthresolution of the Combined General Meeting of May 11, 2012.
Pursuant to these delegations, the Board of Directors, during itsSeptember 18, 2012 meeting, decided to proceed with a capitalincrease reserved for employees that included a classic offer and a leveraged offer depending on the employees’ choice, within thelimit of 18 million shares with dividend rights as of January 1, 2012.
This capital increase resulted in the subscription of 10,802,215shares with a par value of €2.50 at a unit price of €30.70. The issuance of the shares was acknowledged on April 25, 2013.
The cost of the capital increase reserved for employees consists ofthe cost related to the discount on all the shares subscribed usingboth the classic and the leveraged schemes, and the opportunitygain for the shares subscribed using the leveraged scheme. Thisopportunity gain corresponds to the benefit of subscribing to theleveraged offer, rather than reproducing the same economic profilethrough the purchase of options in the market for individual investors.
The global cost is reduced to take into account the nontransferability of the shares that could be subscribed by theemployees over a period of five years. The valuation method of nontransferability of the shares is based on a strategy cost in two stepsconsisting, first, in a five years forward sale of the nontransferableshares, and second, in purchasing the same number of shares incash with a loan financing reimbursable “in fine”.
During the year 2013, the main assumptions used for the valuationof the cost of the capital increase reserved for employees were thefollowing:
Consolidated Financial Statements 10Note 25 – Notes to the Consolidated Financial Statements
Registration Document 2015. TOTAL 251
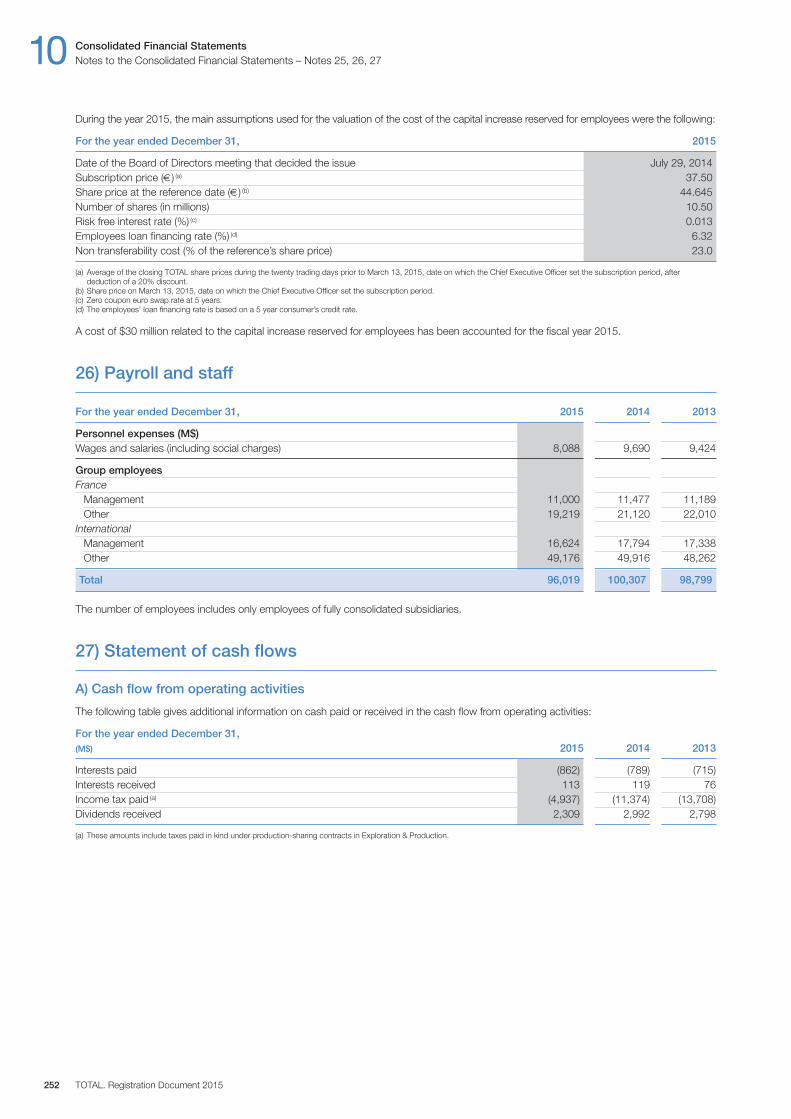
During the year 2015, the main assumptions used for the valuation of the cost of the capital increase reserved for employees were the following:
For the year ended December 31, 2015
Date of the Board of Directors meeting that decided the issue July 29, 2014Subscription price (€) (a) 37.50Share price at the reference date (€) (b) 44.645Number of shares (in millions) 10.50Risk free interest rate (%) (c) 0.013Employees loan financing rate (%) (d) 6.32Non transferability cost (% of the reference’s share price) 23.0
(a) Average of the closing TOTAL share prices during the twenty trading days prior to March 13, 2015, date on which the Chief Executive Officer set the subscription period, afterdeduction of a 20% discount.
(b) Share price on March 13, 2015, date on which the Chief Executive Officer set the subscription period.(c) Zero coupon euro swap rate at 5 years.(d) The employees’ loan financing rate is based on a 5 year consumer’s credit rate.
A cost of $30 million related to the capital increase reserved for employees has been accounted for the fiscal year 2015.
26) Payroll and staff
For the year ended December 31, 2015 2014 2013
Personnel expenses (M$)Wages and salaries (including social charges) 8,088 9,690 9,424
Group employeesFrance
Management 11,000 11,477 11,189Other 19,219 21,120 22,010
InternationalManagement 16,624 17,794 17,338Other 49,176 49,916 48,262
Total 96,019 100,307 98,799
The number of employees includes only employees of fully consolidated subsidiaries.
27) Statement of cash flows
A) Cash flow from operating activities
The following table gives additional information on cash paid or received in the cash flow from operating activities:
For the year ended December 31,(M$) 2015 2014 2013
Interests paid (862) (789) (715)Interests received 113 119 76Income tax paid (a) (4,937) (11,374) (13,708)Dividends received 2,309 2,992 2,798
(a) These amounts include taxes paid in kind under production-sharing contracts in Exploration & Production.
10 Consolidated Financial StatementsNotes to the Consolidated Financial Statements – Notes 25, 26, 27
TOTAL. Registration Document 2015252
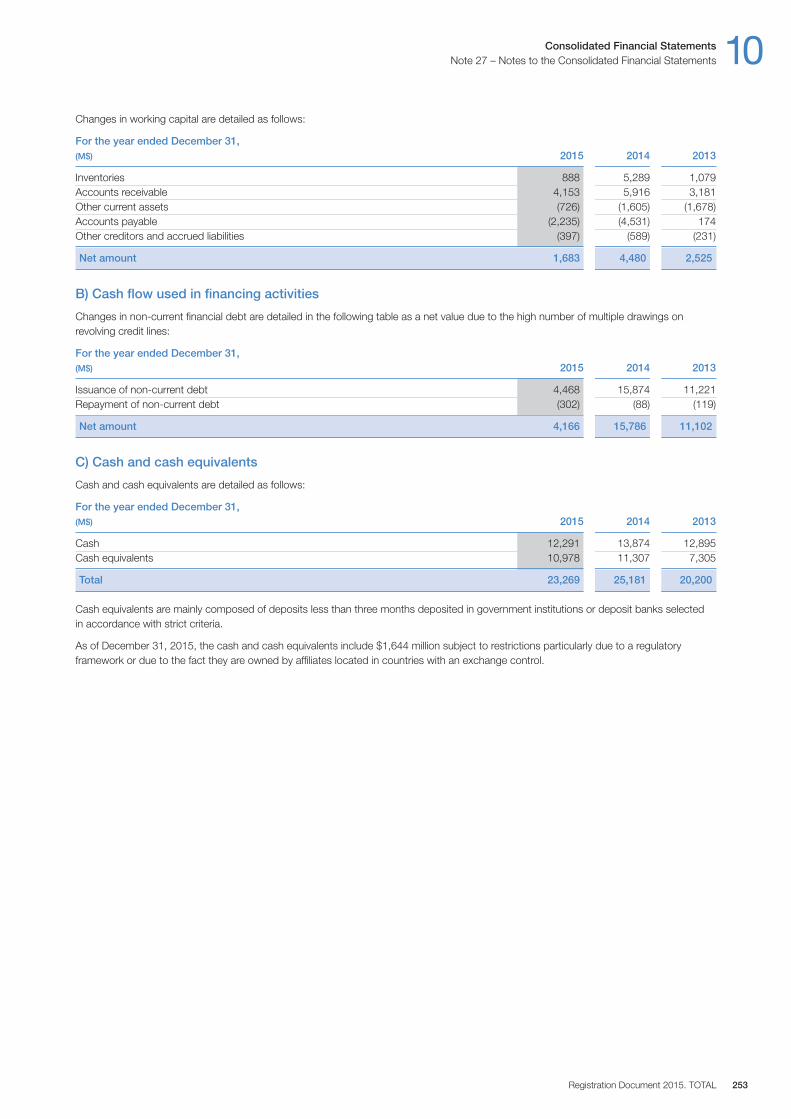
Changes in working capital are detailed as follows:
For the year ended December 31,(M$) 2015 2014 2013
Inventories 888 5,289 1,079Accounts receivable 4,153 5,916 3,181Other current assets (726) (1,605) (1,678)Accounts payable (2,235) (4,531) 174Other creditors and accrued liabilities (397) (589) (231)
Net amount 1,683 4,480 2,525
B) Cash flow used in financing activities
Changes in non-current financial debt are detailed in the following table as a net value due to the high number of multiple drawings onrevolving credit lines:
For the year ended December 31,(M$) 2015 2014 2013
Issuance of non-current debt 4,468 15,874 11,221Repayment of non-current debt (302) (88) (119)
Net amount 4,166 15,786 11,102
C) Cash and cash equivalents
Cash and cash equivalents are detailed as follows:
For the year ended December 31,(M$) 2015 2014 2013
Cash 12,291 13,874 12,895Cash equivalents 10,978 11,307 7,305
Total 23,269 25,181 20,200
Cash equivalents are mainly composed of deposits less than three months deposited in government institutions or deposit banks selected in accordance with strict criteria.
As of December 31, 2015, the cash and cash equivalents include $1,644 million subject to restrictions particularly due to a regulatoryframework or due to the fact they are owned by affiliates located in countries with an exchange control.
Consolidated Financial Statements 10Note 27 – Notes to the Consolidated Financial Statements
Registration Document 2015. TOTAL 253

28) Financial assets and liabilities analysis per instrument class and strategy
The financial assets and liabilities disclosed in the balance sheet are detailed as follows:
As of December 31, 2015 Financial instruments related to financing and operational activities Other Total Fair value(M$) financial
instruments
Amortized Fair value Amortized cost cost
Available Held for Financial Hedging of Cash flow Net for sale (a) trading debt (b) financial hedge investment
debt hedge andAssets / (Liabilities) other
Equity affiliates: loans 4,378 - - - - - - - 4,378 4,378Other investments - 1,241 - - - - - - 1,241 1,241
Hedging instruments of
non-current financial debt - - - - 1,075 144 - - 1,219 1,219Other non-current assets 3,407 - - - - - - - 3,407 3,407
Accounts receivable, net (c) - - - - - - - 10,629 10,629 10,629
Other operating receivables - - 3,379 - - 9 - 7,521 10,909 10,909
Current financial assets 5,858 - 112 - 220 - - - 6,190 6,190
Cash and cash equivalents - - - - - - - 23,269 23,269 23,269
Total financial assets 13,643 1,241 3,491 - 1,295 153 - 41,419 61,242 61,242
Total non-financial assets - - - - - - - - 163,242 -
Total assets - - - - - - - - 224,484 -
Non-current financial debt (7,810) - - (33,762) (2,891) (1) - - (44,464) (45,294)
Accounts payable(c) - - - - - - - (20,928) (20,928) (20,928)
Other operating liabilities - - (1,609) - - (103) - (8,202) (9,914) (9,914)
Current borrowings (8,230) - - (4,258) - - - - (12,488) (12,488)
Other current financial liabilities - - (44) - (127) - - - (171) (171)
Total financial liabilities (16,040) - (1,653) (38,020) (3,018) (104) - (29,130) (87,965) (88,795)
Total non-financial liabilities - - - - - - - - (136,519) -
Total liabilities - - - - - - - - (224,484) -
(a) Financial assets available for sale are measured at their fair value except for unlisted securities (see Note 1 paragraph M(ii) and Note 13 to the Consolidated Financial Statements).(b) The financial debt is adjusted to the hedged risks value (currency and interest rate) as part of hedge accounting (see Note 1 paragraph M(iii) to the Consolidated Financial Statements).(c) The impact of offsetting on accounts receivable, net is $(1,044) million and $+1,044 million on accounts payable.
10 Consolidated Financial StatementsNotes to the Consolidated Financial Statements – Note 28
TOTAL. Registration Document 2015254
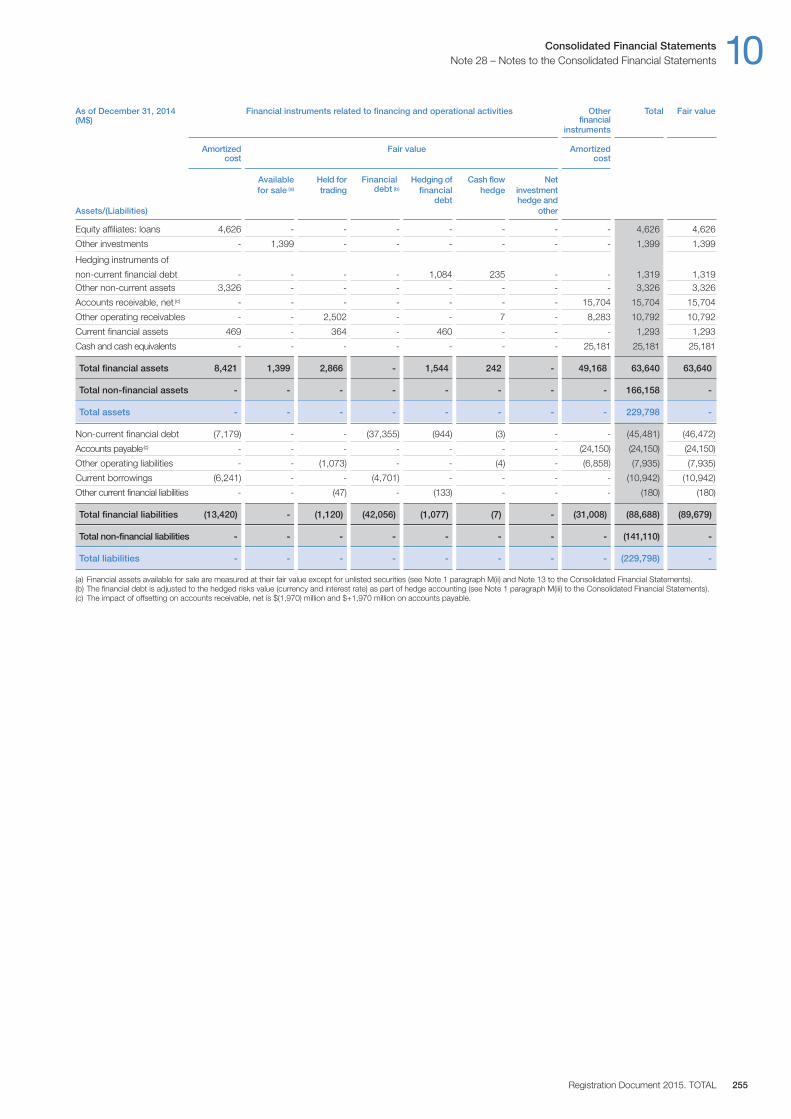
As of December 31, 2014 Financial instruments related to financing and operational activities Other Total Fair value(M$) financial
instruments
Amortized Fair value Amortized cost cost
Available Held for Financial Hedging of Cash flow Net for sale (a) trading debt (b) financial hedge investment
debt hedge andAssets / (Liabilities) other
Equity affiliates: loans 4,626 - - - - - - - 4,626 4,626
Other investments - 1,399 - - - - - - 1,399 1,399
Hedging instruments of
non-current financial debt - - - - 1,084 235 - - 1,319 1,319Other non-current assets 3,326 - - - - - - - 3,326 3,326
Accounts receivable, net (c) - - - - - - - 15,704 15,704 15,704
Other operating receivables - - 2,502 - - 7 - 8,283 10,792 10,792
Current financial assets 469 - 364 - 460 - - - 1,293 1,293
Cash and cash equivalents - - - - - - - 25,181 25,181 25,181
Total financial assets 8,421 1,399 2,866 - 1,544 242 - 49,168 63,640 63,640
Total non-financial assets - - - - - - - - 166,158 -
Total assets - - - - - - - - 229,798 -
Non-current financial debt (7,179) - - (37,355) (944) (3) - - (45,481) (46,472)
Accounts payable(c) - - - - - - - (24,150) (24,150) (24,150)
Other operating liabilities - - (1,073) - - (4) - (6,858) (7,935) (7,935)
Current borrowings (6,241) - - (4,701) - - - - (10,942) (10,942)
Other current financial liabilities - - (47) - (133) - - - (180) (180)
Total financial liabilities (13,420) - (1,120) (42,056) (1,077) (7) - (31,008) (88,688) (89,679)
Total non-financial liabilities - - - - - - - - (141,110) -
Total liabilities - - - - - - - - (229,798) -
(a) Financial assets available for sale are measured at their fair value except for unlisted securities (see Note 1 paragraph M(ii) and Note 13 to the Consolidated Financial Statements).(b) The financial debt is adjusted to the hedged risks value (currency and interest rate) as part of hedge accounting (see Note 1 paragraph M(iii) to the Consolidated Financial Statements).(c) The impact of offsetting on accounts receivable, net is $(1,970) million and $+1,970 million on accounts payable.
Consolidated Financial Statements 10Note 28 – Notes to the Consolidated Financial Statements
Registration Document 2015. TOTAL 255
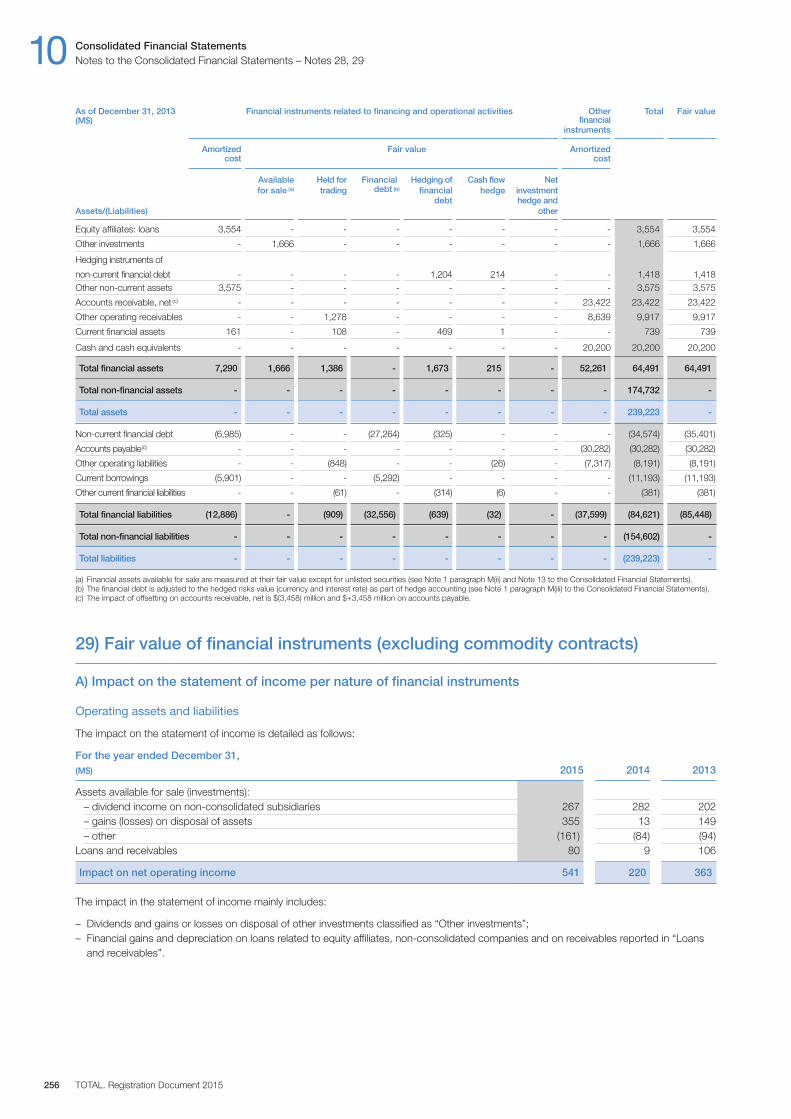
As of December 31, 2013 Financial instruments related to financing and operational activities Other Total Fair value(M$) financial
instruments
Amortized Fair value Amortized cost cost
Available Held for Financial Hedging of Cash flow Net for sale (a) trading debt (b) financial hedge investment
debt hedge andAssets / (Liabilities) other
Equity affiliates: loans 3,554 - - - - - - - 3,554 3,554
Other investments - 1,666 - - - - - - 1,666 1,666
Hedging instruments of
non-current financial debt - - - - 1,204 214 - - 1,418 1,418Other non-current assets 3,575 - - - - - - - 3,575 3,575
Accounts receivable, net (c) - - - - - - - 23,422 23,422 23,422
Other operating receivables - - 1,278 - - - - 8,639 9,917 9,917
Current financial assets 161 - 108 - 469 1 - - 739 739
Cash and cash equivalents - - - - - - - 20,200 20,200 20,200
Total financial assets 7,290 1,666 1,386 - 1,673 215 - 52,261 64,491 64,491
Total non-financial assets - - - - - - - - 174,732 -
Total assets - - - - - - - - 239,223 -
Non-current financial debt (6,985) - - (27,264) (325) - - - (34,574) (35,401)
Accounts payable(c) - - - - - - - (30,282) (30,282) (30,282)
Other operating liabilities - - (848) - - (26) - (7,317) (8,191) (8,191)
Current borrowings (5,901) - - (5,292) - - - - (11,193) (11,193)
Other current financial liabilities - - (61) - (314) (6) - - (381) (381)
Total financial liabilities (12,886) - (909) (32,556) (639) (32) - (37,599) (84,621) (85,448)
Total non-financial liabilities - - - - - - - - (154,602) -
Total liabilities - - - - - - - - (239,223) -
(a) Financial assets available for sale are measured at their fair value except for unlisted securities (see Note 1 paragraph M(ii) and Note 13 to the Consolidated Financial Statements).(b) The financial debt is adjusted to the hedged risks value (currency and interest rate) as part of hedge accounting (see Note 1 paragraph M(iii) to the Consolidated Financial Statements).(c) The impact of offsetting on accounts receivable, net is $(3,458) million and $+3,458 million on accounts payable.
29) Fair value of financial instruments (excluding commodity contracts)
A) Impact on the statement of income per nature of financial instruments
Operating assets and liabilities
The impact on the statement of income is detailed as follows:
For the year ended December 31,(M$) 2015 2014 2013
Assets available for sale (investments):– dividend income on non-consolidated subsidiaries 267 282 202– gains (losses) on disposal of assets 355 13 149– other (161) (84) (94)
Loans and receivables 80 9 106
Impact on net operating income 541 220 363
The impact in the statement of income mainly includes:
– Dividends and gains or losses on disposal of other investments classified as “Other investments”;– Financial gains and depreciation on loans related to equity affiliates, non-consolidated companies and on receivables reported in “Loans
and receivables”.
10 Consolidated Financial StatementsNotes to the Consolidated Financial Statements – Notes 28, 29
TOTAL. Registration Document 2015256
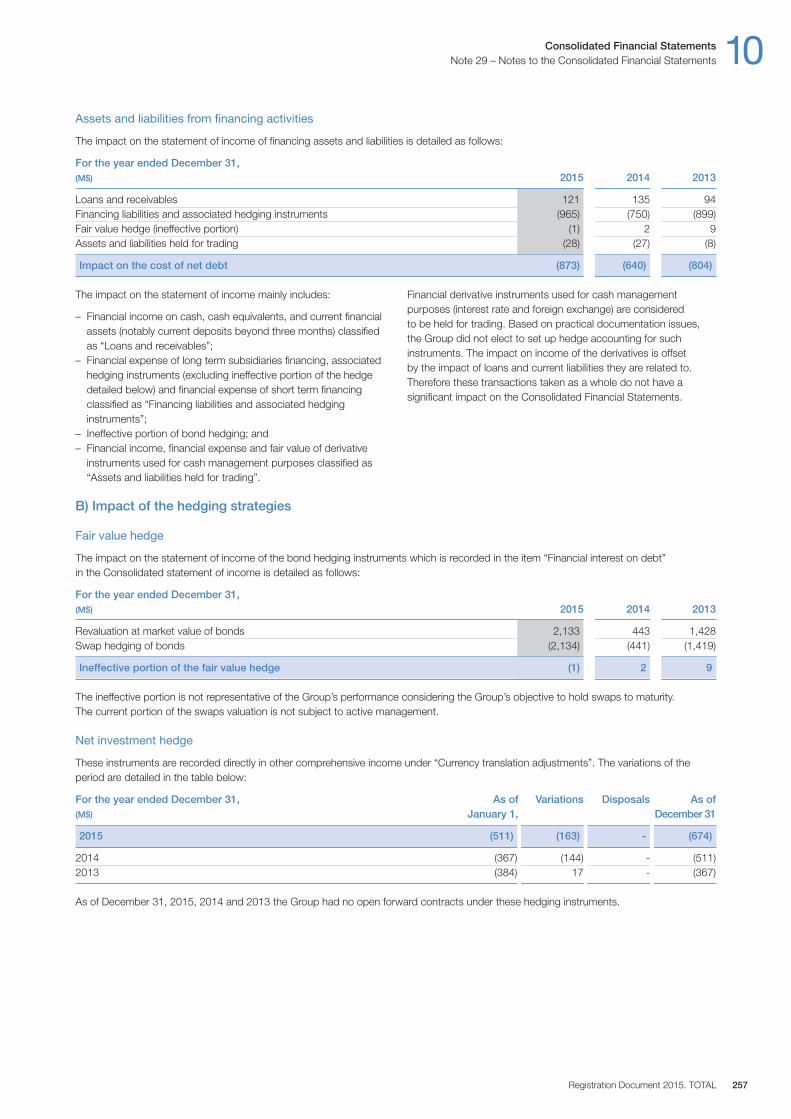
B) Impact of the hedging strategies
Fair value hedge
The impact on the statement of income of the bond hedging instruments which is recorded in the item “Financial interest on debt” in the Consolidated statement of income is detailed as follows:
For the year ended December 31,(M$) 2015 2014 2013
Revaluation at market value of bonds 2,133 443 1,428Swap hedging of bonds (2,134) (441) (1,419)
Ineffective portion of the fair value hedge (1) 2 9
The ineffective portion is not representative of the Group’s performance considering the Group’s objective to hold swaps to maturity. The current portion of the swaps valuation is not subject to active management.
Net investment hedge
These instruments are recorded directly in other comprehensive income under “Currency translation adjustments”. The variations of theperiod are detailed in the table below:
For the year ended December 31, As of Variations Disposals As of(M$) January 1, December 31
2015 (511) (163) - (674)
2014 (367) (144) - (511)2013 (384) 17 - (367)
As of December 31, 2015, 2014 and 2013 the Group had no open forward contracts under these hedging instruments.
The impact on the statement of income mainly includes:
– Financial income on cash, cash equivalents, and current financialassets (notably current deposits beyond three months) classifiedas “Loans and receivables”;
– Financial expense of long term subsidiaries financing, associatedhedging instruments (excluding ineffective portion of the hedgedetailed below) and financial expense of short term financingclassified as “Financing liabilities and associated hedginginstruments”;
– Ineffective portion of bond hedging; and– Financial income, financial expense and fair value of derivative
instruments used for cash management purposes classified as“Assets and liabilities held for trading”.
Financial derivative instruments used for cash managementpurposes (interest rate and foreign exchange) are considered to be held for trading. Based on practical documentation issues, the Group did not elect to set up hedge accounting for suchinstruments. The impact on income of the derivatives is offset by the impact of loans and current liabilities they are related to.Therefore these transactions taken as a whole do not have asignificant impact on the Consolidated Financial Statements.
Assets and liabilities from financing activities
The impact on the statement of income of financing assets and liabilities is detailed as follows:
For the year ended December 31,(M$) 2015 2014 2013
Loans and receivables 121 135 94Financing liabilities and associated hedging instruments (965) (750) (899)Fair value hedge (ineffective portion) (1) 2 9Assets and liabilities held for trading (28) (27) (8)
Impact on the cost of net debt (873) (640) (804)
Consolidated Financial Statements 10Note 29 – Notes to the Consolidated Financial Statements
Registration Document 2015. TOTAL 257
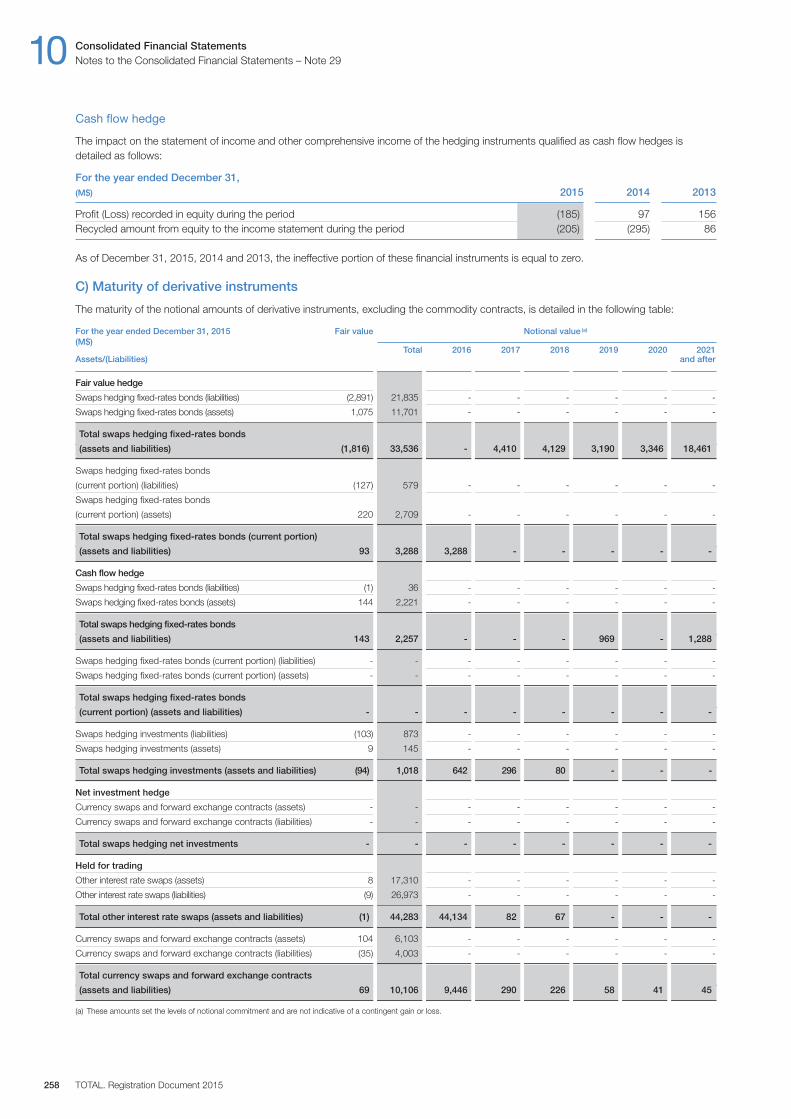
Cash flow hedge
The impact on the statement of income and other comprehensive income of the hedging instruments qualified as cash flow hedges isdetailed as follows:
For the year ended December 31,(M$) 2015 2014 2013
Profit (Loss) recorded in equity during the period (185) 97 156Recycled amount from equity to the income statement during the period (205) (295) 86
As of December 31, 2015, 2014 and 2013, the ineffective portion of these financial instruments is equal to zero.
C) Maturity of derivative instruments
The maturity of the notional amounts of derivative instruments, excluding the commodity contracts, is detailed in the following table:
For the year ended December 31, 2015 Fair value Notional value (a)
(M$)Total 2016 2017 2018 2019 2020 2021
Assets / (Liabilities) and after
Fair value hedge
Swaps hedging fixed-rates bonds (liabilities) (2,891) 21,835 - - - - - -
Swaps hedging fixed-rates bonds (assets) 1,075 11,701 - - - - - -
Total swaps hedging fixed-rates bonds
(assets and liabilities) (1,816) 33,536 - 4,410 4,129 3,190 3,346 18,461
Swaps hedging fixed-rates bonds
(current portion) (liabilities) (127) 579 - - - - - -
Swaps hedging fixed-rates bonds
(current portion) (assets) 220 2,709 - - - - - -
Total swaps hedging fixed-rates bonds (current portion)
(assets and liabilities) 93 3,288 3,288 - - - - -
Cash flow hedge
Swaps hedging fixed-rates bonds (liabilities) (1) 36 - - - - - -
Swaps hedging fixed-rates bonds (assets) 144 2,221 - - - - - -
Total swaps hedging fixed-rates bonds
(assets and liabilities) 143 2,257 - - - 969 - 1,288
Swaps hedging fixed-rates bonds (current portion) (liabilities) - - - - - - - -
Swaps hedging fixed-rates bonds (current portion) (assets) - - - - - - - -
Total swaps hedging fixed-rates bonds
(current portion) (assets and liabilities) - - - - - - - -
Swaps hedging investments (liabilities) (103) 873 - - - - - -
Swaps hedging investments (assets) 9 145 - - - - - -
Total swaps hedging investments (assets and liabilities) (94) 1,018 642 296 80 - - -
Net investment hedge
Currency swaps and forward exchange contracts (assets) - - - - - - - -
Currency swaps and forward exchange contracts (liabilities) - - - - - - - -
Total swaps hedging net investments - - - - - - - -
Held for trading
Other interest rate swaps (assets) 8 17,310 - - - - - -
Other interest rate swaps (liabilities) (9) 26,973 - - - - - -
Total other interest rate swaps (assets and liabilities) (1) 44,283 44,134 82 67 - - -
Currency swaps and forward exchange contracts (assets) 104 6,103 - - - - - -
Currency swaps and forward exchange contracts (liabilities) (35) 4,003 - - - - - -
Total currency swaps and forward exchange contracts
(assets and liabilities) 69 10,106 9,446 290 226 58 41 45
(a) These amounts set the levels of notional commitment and are not indicative of a contingent gain or loss.
10 Consolidated Financial StatementsNotes to the Consolidated Financial Statements – Note 29
TOTAL. Registration Document 2015258
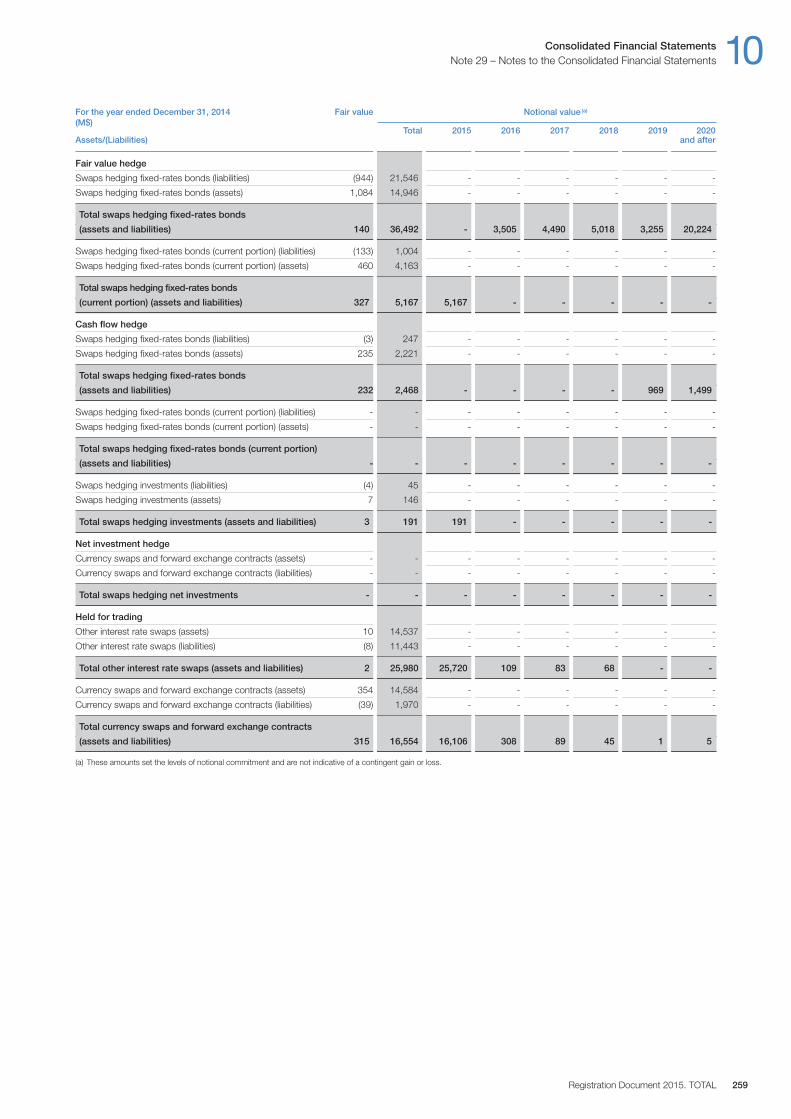
For the year ended December 31, 2014 Fair value Notional value (a)
(M$)Total 2015 2016 2017 2018 2019 2020
Assets / (Liabilities) and after
Fair value hedge
Swaps hedging fixed-rates bonds (liabilities) (944) 21,546 - - - - - -
Swaps hedging fixed-rates bonds (assets) 1,084 14,946 - - - - - -
Total swaps hedging fixed-rates bonds
(assets and liabilities) 140 36,492 - 3,505 4,490 5,018 3,255 20,224
Swaps hedging fixed-rates bonds (current portion) (liabilities) (133) 1,004 - - - - - -
Swaps hedging fixed-rates bonds (current portion) (assets) 460 4,163 - - - - - -
Total swaps hedging fixed-rates bonds
(current portion) (assets and liabilities) 327 5,167 5,167 - - - - -
Cash flow hedge
Swaps hedging fixed-rates bonds (liabilities) (3) 247 - - - - - -
Swaps hedging fixed-rates bonds (assets) 235 2,221 - - - - - -
Total swaps hedging fixed-rates bonds
(assets and liabilities) 232 2,468 - - - - 969 1,499
Swaps hedging fixed-rates bonds (current portion) (liabilities) - - - - - - - -
Swaps hedging fixed-rates bonds (current portion) (assets) - - - - - - - -
Total swaps hedging fixed-rates bonds (current portion)
(assets and liabilities) - - - - - - - -
Swaps hedging investments (liabilities) (4) 45 - - - - - -
Swaps hedging investments (assets) 7 146 - - - - - -
Total swaps hedging investments (assets and liabilities) 3 191 191 - - - - -
Net investment hedge
Currency swaps and forward exchange contracts (assets) - - - - - - - -
Currency swaps and forward exchange contracts (liabilities) - - - - - - - -
Total swaps hedging net investments - - - - - - - -
Held for trading
Other interest rate swaps (assets) 10 14,537 - - - - - -
Other interest rate swaps (liabilities) (8) 11,443 - - - - - -
Total other interest rate swaps (assets and liabilities) 2 25,980 25,720 109 83 68 - -
Currency swaps and forward exchange contracts (assets) 354 14,584 - - - - - -
Currency swaps and forward exchange contracts (liabilities) (39) 1,970 - - - - - -
Total currency swaps and forward exchange contracts
(assets and liabilities) 315 16,554 16,106 308 89 45 1 5
(a) These amounts set the levels of notional commitment and are not indicative of a contingent gain or loss.
Consolidated Financial Statements 10Note 29 – Notes to the Consolidated Financial Statements
Registration Document 2015. TOTAL 259
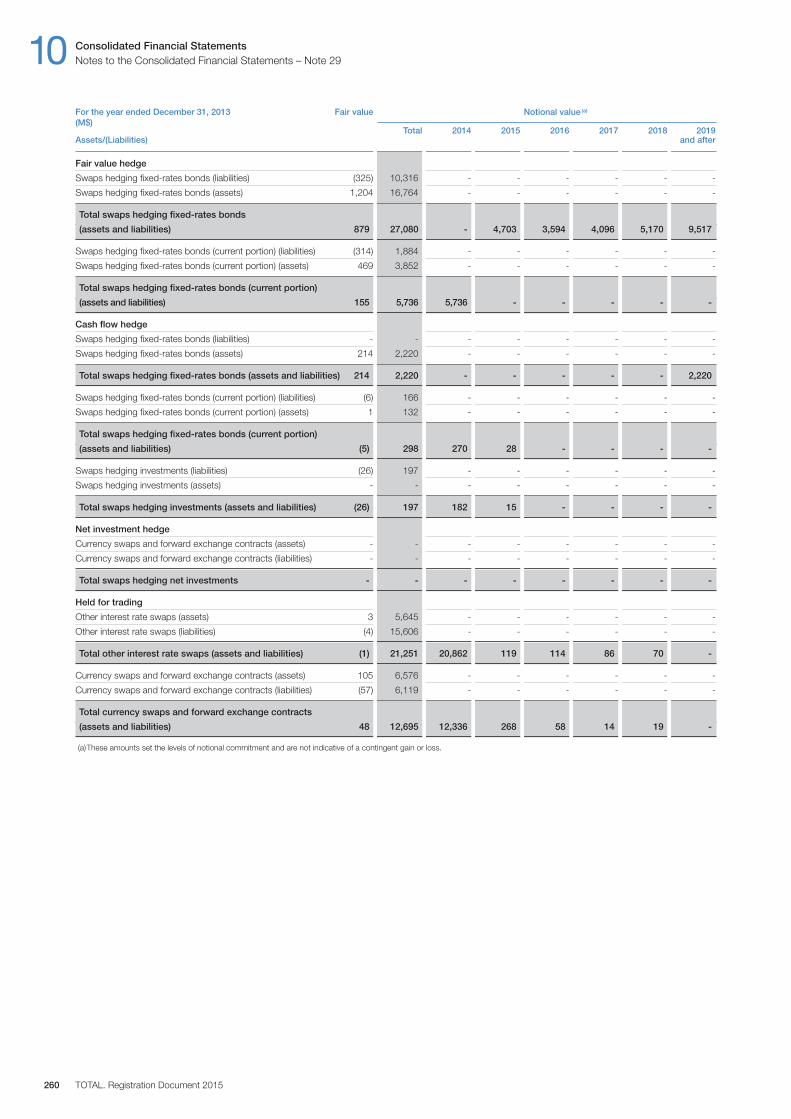
For the year ended December 31, 2013 Fair value Notional value (a)
(M$)Total 2014 2015 2016 2017 2018 2019
Assets / (Liabilities) and after
Fair value hedge
Swaps hedging fixed-rates bonds (liabilities) (325) 10,316 - - - - - -
Swaps hedging fixed-rates bonds (assets) 1,204 16,764 - - - - - -
Total swaps hedging fixed-rates bonds
(assets and liabilities) 879 27,080 - 4,703 3,594 4,096 5,170 9,517
Swaps hedging fixed-rates bonds (current portion) (liabilities) (314) 1,884 - - - - - -
Swaps hedging fixed-rates bonds (current portion) (assets) 469 3,852 - - - - - -
Total swaps hedging fixed-rates bonds (current portion)
(assets and liabilities) 155 5,736 5,736 - - - - -
Cash flow hedge
Swaps hedging fixed-rates bonds (liabilities) - - - - - - - -
Swaps hedging fixed-rates bonds (assets) 214 2,220 - - - - - -
Total swaps hedging fixed-rates bonds (assets and liabilities) 214 2,220 - - - - - 2,220
Swaps hedging fixed-rates bonds (current portion) (liabilities) (6) 166 - - - - - -
Swaps hedging fixed-rates bonds (current portion) (assets) 1 132 - - - - - -
Total swaps hedging fixed-rates bonds (current portion)
(assets and liabilities) (5) 298 270 28 - - - -
Swaps hedging investments (liabilities) (26) 197 - - - - - -
Swaps hedging investments (assets) - - - - - - - -
Total swaps hedging investments (assets and liabilities) (26) 197 182 15 - - - -
Net investment hedge
Currency swaps and forward exchange contracts (assets) - - - - - - - -
Currency swaps and forward exchange contracts (liabilities) - - - - - - - -
Total swaps hedging net investments - - - - - - - -
Held for trading
Other interest rate swaps (assets) 3 5,645 - - - - - -
Other interest rate swaps (liabilities) (4) 15,606 - - - - - -
Total other interest rate swaps (assets and liabilities) (1) 21,251 20,862 119 114 86 70 -
Currency swaps and forward exchange contracts (assets) 105 6,576 - - - - - -
Currency swaps and forward exchange contracts (liabilities) (57) 6,119 - - - - - -
Total currency swaps and forward exchange contracts
(assets and liabilities) 48 12,695 12,336 268 58 14 19 -
(a)These amounts set the levels of notional commitment and are not indicative of a contingent gain or loss.
10 Consolidated Financial StatementsNotes to the Consolidated Financial Statements – Note 29
TOTAL. Registration Document 2015260
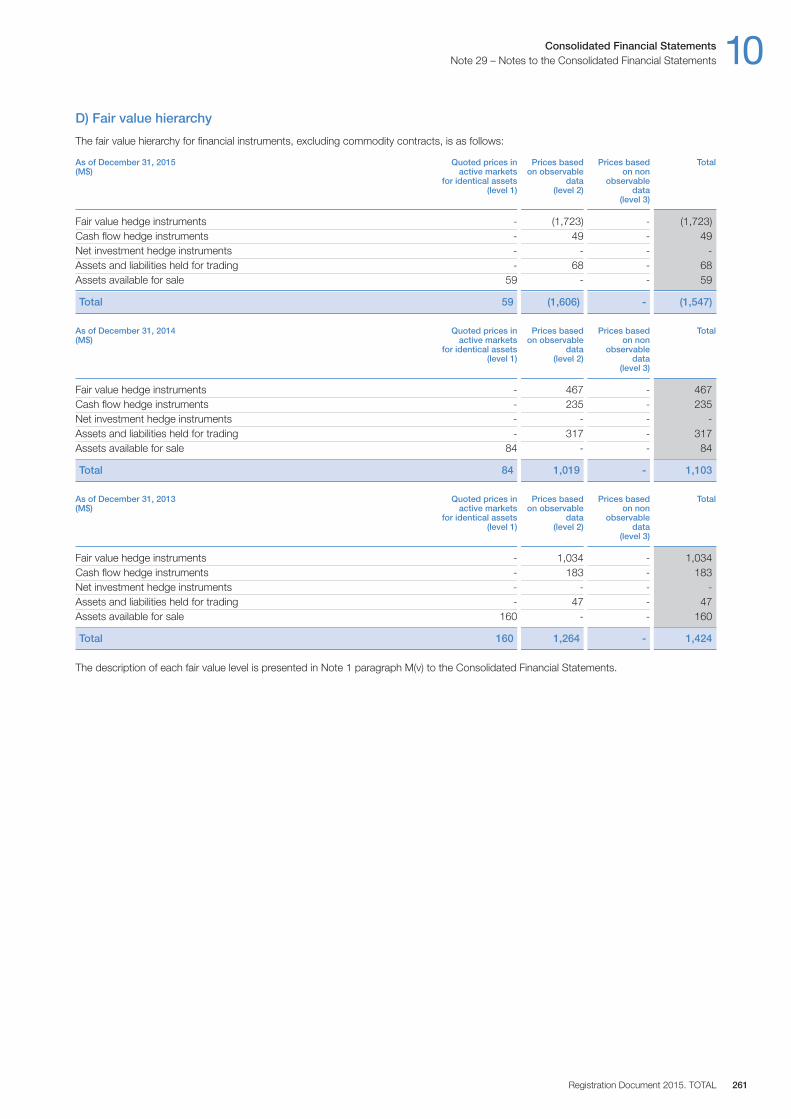
D) Fair value hierarchy
The fair value hierarchy for financial instruments, excluding commodity contracts, is as follows:
As of December 31, 2015 Quoted prices in Prices based Prices based Total(M$) active markets on observable on non for identical assets data observable (level 1) (level 2) data (level 3)
Fair value hedge instruments - (1,723) - (1,723)Cash flow hedge instruments - 49 - 49Net investment hedge instruments - - - -Assets and liabilities held for trading - 68 - 68Assets available for sale 59 - - 59
Total 59 (1,606) - (1,547)
As of December 31, 2014 Quoted prices in Prices based Prices based Total(M$) active markets on observable on non for identical assets data observable (level 1) (level 2) data (level 3)
Fair value hedge instruments - 467 - 467Cash flow hedge instruments - 235 - 235Net investment hedge instruments - - - -Assets and liabilities held for trading - 317 - 317Assets available for sale 84 - - 84
Total 84 1,019 - 1,103
As of December 31, 2013 Quoted prices in Prices based Prices based Total(M$) active markets on observable on non for identical assets data observable (level 1) (level 2) data (level 3)
Fair value hedge instruments - 1,034 - 1,034Cash flow hedge instruments - 183 - 183Net investment hedge instruments - - - -Assets and liabilities held for trading - 47 - 47Assets available for sale 160 - - 160
Total 160 1,264 - 1,424
The description of each fair value level is presented in Note 1 paragraph M(v) to the Consolidated Financial Statements.
Consolidated Financial Statements 10Note 29 – Notes to the Consolidated Financial Statements
Registration Document 2015. TOTAL 261
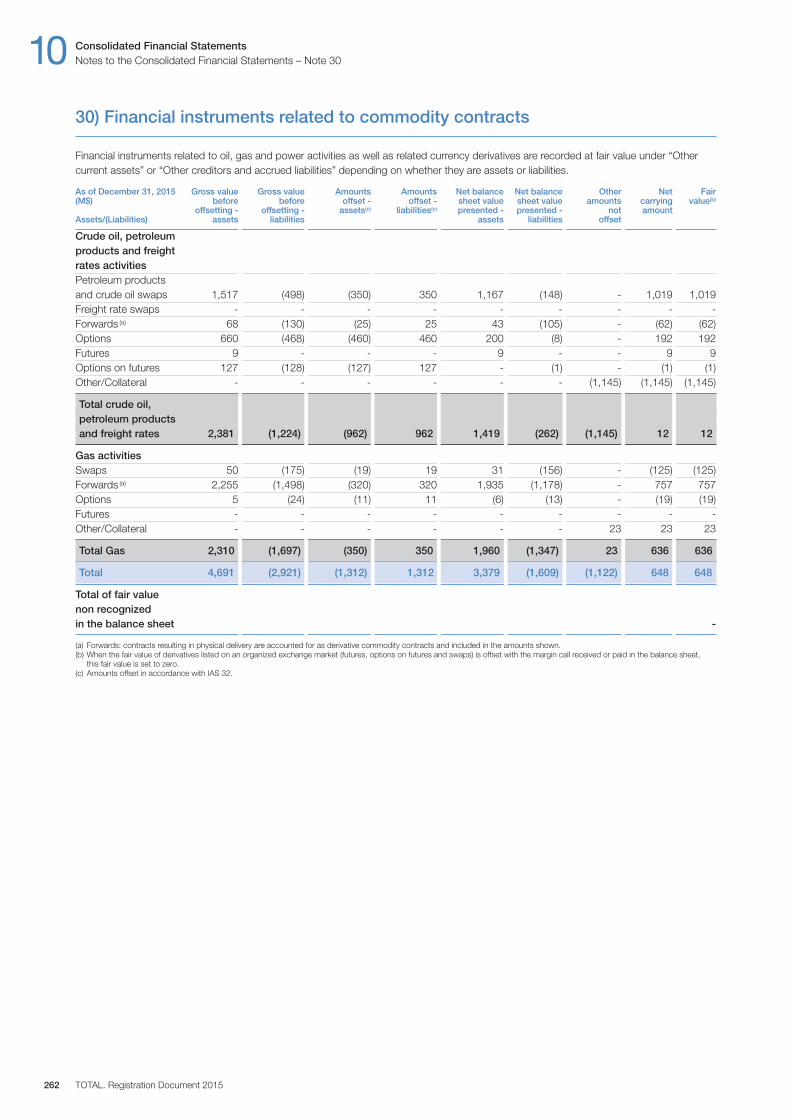
10 Consolidated Financial StatementsNotes to the Consolidated Financial Statements – Note 30
TOTAL. Registration Document 2015262
30) Financial instruments related to commodity contracts
Financial instruments related to oil, gas and power activities as well as related currency derivatives are recorded at fair value under “Othercurrent assets” or “Other creditors and accrued liabilities” depending on whether they are assets or liabilities.
As of December 31, 2015 Gross value Gross value Amounts Amounts Net balance Net balance Other Net Fair(M$) before before offset - offset - sheet value sheet value amounts carrying value(b)
offsetting - offsetting - assets(c) liabilities(c) presented - presented - not amountAssets/(Liabilities) assets liabilities assets liabilities offset
Crude oil, petroleum products and freight rates activitiesPetroleum products and crude oil swaps 1,517 (498) (350) 350 1,167 (148) - 1,019 1,019Freight rate swaps - - - - - - - - -Forwards (a) 68 (130) (25) 25 43 (105) - (62) (62)Options 660 (468) (460) 460 200 (8) - 192 192Futures 9 - - - 9 - - 9 9Options on futures 127 (128) (127) 127 - (1) - (1) (1)Other / Collateral - - - - - - (1,145) (1,145) (1,145)
Total crude oil, petroleum products and freight rates 2,381 (1,224) (962) 962 1,419 (262) (1,145) 12 12
Gas activitiesSwaps 50 (175) (19) 19 31 (156) - (125) (125)Forwards (a) 2,255 (1,498) (320) 320 1,935 (1,178) - 757 757Options 5 (24) (11) 11 (6) (13) - (19) (19)Futures - - - - - - - - -Other / Collateral - - - - - - 23 23 23
Total Gas 2,310 (1,697) (350) 350 1,960 (1,347) 23 636 636
Total 4,691 (2,921) (1,312) 1,312 3,379 (1,609) (1,122) 648 648
Total of fair value non recognized in the balance sheet -
(a) Forwards: contracts resulting in physical delivery are accounted for as derivative commodity contracts and included in the amounts shown.(b) When the fair value of derivatives listed on an organized exchange market (futures, options on futures and swaps) is offset with the margin call received or paid in the balance sheet,
this fair value is set to zero.(c) Amounts offset in accordance with IAS 32.

Consolidated Financial Statements 10Note 30 – Notes to the Consolidated Financial Statements
Registration Document 2015. TOTAL 263
As of December 31, 2014 Gross value Gross value Amounts Amounts Net balance Net balance Other Net Fair(M$) before before offset - offset - sheet value sheet value amounts carrying value(b)
offsetting - offsetting - assets(c) liabilities(c) presented - presented - not amountAssets/(Liabilities) assets liabilities assets liabilities offset
Crude oil, petroleum products and freight rates activitiesPetroleum products and crude oil swaps 1,505 (465) (384) 384 1,121 (81) - 1,040 1,040Freight rate swaps - - - - - - - - -Forwards (a) 168 (197) (56) 56 112 (141) - (29) (29)Options 928 (1,224) (790) 790 138 (434) - (296) (296)Futures 5 - - - 5 - - 5 5Options on futures 307 (130) (130) 130 177 - - 177 177Other / Collateral - - - - - - (505) (505) (505)
Total crude oil, petroleum products and freight rates 2,913 (2,016) (1,360) 1,360 1,553 (656) (505) 392 392
Gas activitiesSwaps 138 (41) (19) 19 119 (22) - 97 97Forwards (a) 1,110 (671) (278) 278 832 (393) - 439 439Options 5 (9) (7) 7 (2) (2) - (4) (4)Futures - - - - - - - - -Other / Collateral - - - - - - (89) (89) (89)
Total Gas 1,253 (721) (304) 304 949 (417) (89) 443 443
Total 4,166 (2,737) (1,664) 1,664 2,502 (1,073) (594) 835 835
Total of fair value non recognized in the balance sheet -
(a) Forwards: contracts resulting in physical delivery are accounted for as derivative commodity contracts and included in the amounts shown.(b) When the fair value of derivatives listed on an organized exchange market (futures, options on futures and swaps) is offset with the margin call received or paid in the balance sheet,
this fair value is set to zero.(c) Amounts offset in accordance with IAS 32.

As of December 31, 2013 Gross value Gross value Amounts Amounts Net balance Net balance Other Net Fair(M$) before before offset - offset - sheet value sheet value amounts carrying value(b)
offsetting - offsetting - assets(c) liabilities(c) presented - presented - not amountAssets/(Liabilities) assets liabilities assets liabilities offset
Crude oil, petroleum products and freight rates activitiesPetroleum products and crude oil swaps 94 (204) (79) 79 15 (125) - (110) (110)Freight rate swaps - - - - - - - - -Forwards (a) 58 (57) (8) 8 50 (49) - 1 1Options 198 (234) (62) 62 136 (172) - (36) (36)Futures 7 (1) - - 7 (1) - 6 6Options on futures 68 (57) (57) 57 11 - - 11 11Other / Collateral - - - - - - 96 96 96
Total crude oil, petroleum products and freight rates 425 (553) (206) 206 219 (347) 96 (32) (32)
Gas activitiesSwaps 69 (21) (11) 11 58 (10) - 48 48Forwards (a) 1,052 (530) (40) 40 1,012 (490) - 522 522Options - (12) (11) 11 (11) (1) - (12) (12)Futures - - - - - - - - -Other / Collateral - - - - - - 16 16 16
Total Gas 1,121 (563) (62) 62 1,059 (501) 16 574 574
Total 1,546 (1,116) (268) 268 1,278 (848) 112 542 542
Total of fair value non recognized in the balance sheet -
(a) Forwards: contracts resulting in physical delivery are accounted for as derivative commodity contracts and included in the amounts shown.(b) When the fair value of derivatives listed on an organized exchange market (futures, options on futures and swaps) is offset with the margin call received or paid in the balance sheet,
this fair value is set to zero.(c) Amounts offset in accordance with IAS 32.
Most commitments on crude oil and refined products have a short term maturity (less than one year). The maturity of most Gas divisionderivatives is less than three years forward.
The changes in fair value of financial instruments related to commodity contracts are detailed as follows:
For the year ended December 31, Fair value Impact on Settled Other Fair value as of (M$) as of January 1, income contracts December 31,
Crude oil, petroleum products and freight rates activities
2015 897 3,318 (3,058) - 1,157
2014 (128) 2,471 (1,445) (1) 8972013 (62) 2,266 (2,330) (2) (128)Gas activities
2015 532 113 3 (35) 613
2014 558 922 (909) (39) 5322013 359 624 (375) (50) 558
The fair value hierarchy for financial instruments related to commodity contracts is as follows:
As of December 31, 2015 Quoted prices Prices based Prices based Total(M$) in active markets on observable on non
for identical data observableassets (level 2) data
(level 1) (level 3)
Crude oil, petroleum products and freight rates activities 15 1,142 - 1,157Gas activities 79 534 - 613
Total 94 1,676 - 1,770
10 Consolidated Financial StatementsNotes to the Consolidated Financial Statements – Note 30
TOTAL. Registration Document 2015264
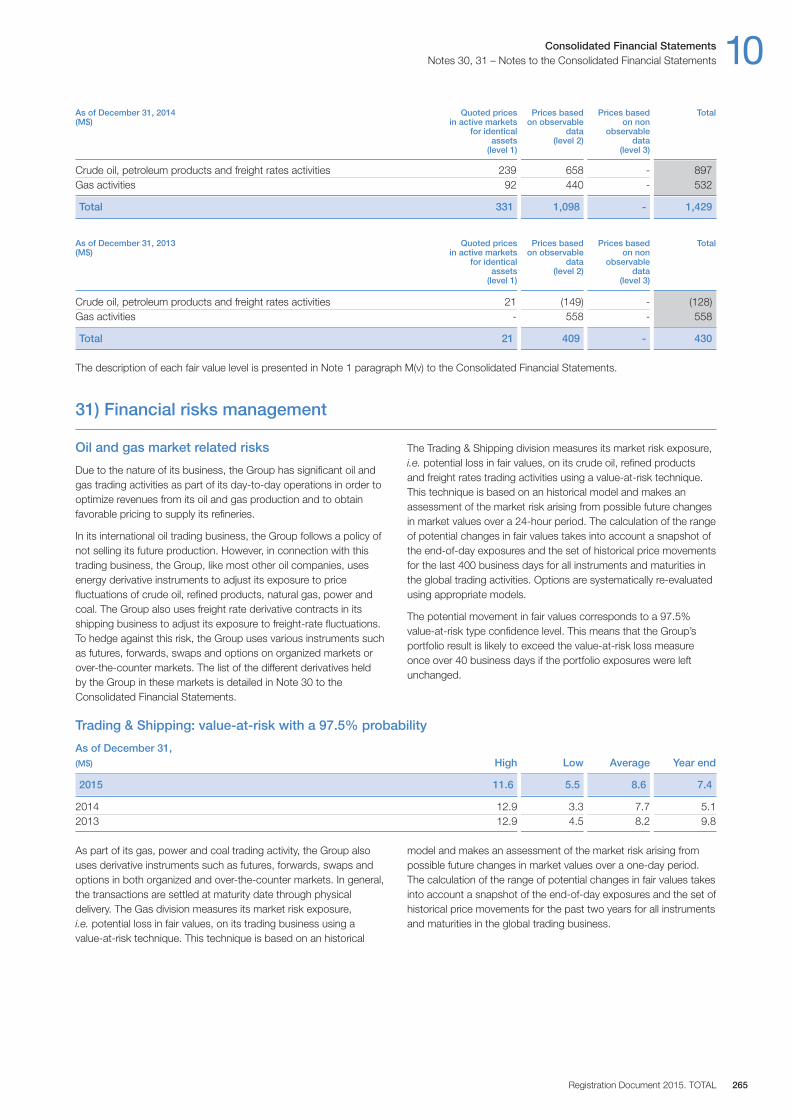
As part of its gas, power and coal trading activity, the Group alsouses derivative instruments such as futures, forwards, swaps andoptions in both organized and over-the-counter markets. In general,the transactions are settled at maturity date through physicaldelivery. The Gas division measures its market risk exposure,i.e. potential loss in fair values, on its trading business using avalue-at-risk technique. This technique is based on an historical
model and makes an assessment of the market risk arising frompossible future changes in market values over a one-day period.The calculation of the range of potential changes in fair values takesinto account a snapshot of the end-of-day exposures and the set ofhistorical price movements for the past two years for all instrumentsand maturities in the global trading business.
Trading & Shipping: value-at-risk with a 97.5% probability
As of December 31,(M$) High Low Average Year end
2015 11.6 5.5 8.6 7.4
2014 12.9 3.3 7.7 5.12013 12.9 4.5 8.2 9.8
Consolidated Financial Statements 10Notes 30, 31 – Notes to the Consolidated Financial Statements
Registration Document 2015. TOTAL 265
Oil and gas market related risks
Due to the nature of its business, the Group has significant oil andgas trading activities as part of its day-to-day operations in order tooptimize revenues from its oil and gas production and to obtainfavorable pricing to supply its refineries.
In its international oil trading business, the Group follows a policy ofnot selling its future production. However, in connection with thistrading business, the Group, like most other oil companies, usesenergy derivative instruments to adjust its exposure to pricefluctuations of crude oil, refined products, natural gas, power andcoal. The Group also uses freight rate derivative contracts in itsshipping business to adjust its exposure to freight-rate fluctuations.To hedge against this risk, the Group uses various instruments suchas futures, forwards, swaps and options on organized markets orover-the-counter markets. The list of the different derivatives heldby the Group in these markets is detailed in Note 30 to theConsolidated Financial Statements.
The Trading & Shipping division measures its market risk exposure,i.e. potential loss in fair values, on its crude oil, refined products and freight rates trading activities using a value-at-risk technique.This technique is based on an historical model and makes anassessment of the market risk arising from possible future changesin market values over a 24-hour period. The calculation of the rangeof potential changes in fair values takes into account a snapshot ofthe end-of-day exposures and the set of historical price movementsfor the last 400 business days for all instruments and maturities inthe global trading activities. Options are systematically re-evaluatedusing appropriate models.
The potential movement in fair values corresponds to a 97.5%value-at-risk type confidence level. This means that the Group’sportfolio result is likely to exceed the value-at-risk loss measureonce over 40 business days if the portfolio exposures were leftunchanged.
As of December 31, 2014 Quoted prices Prices based Prices based Total(M$) in active markets on observable on non
for identical data observableassets (level 2) data
(level 1) (level 3)
Crude oil, petroleum products and freight rates activities 239 658 - 897Gas activities 92 440 - 532
Total 331 1,098 - 1,429
As of December 31, 2013 Quoted prices Prices based Prices based Total(M$) in active markets on observable on non
for identical data observableassets (level 2) data
(level 1) (level 3)
Crude oil, petroleum products and freight rates activities 21 (149) - (128)Gas activities - 558 - 558
Total 21 409 - 430
The description of each fair value level is presented in Note 1 paragraph M(v) to the Consolidated Financial Statements.
31) Financial risks management
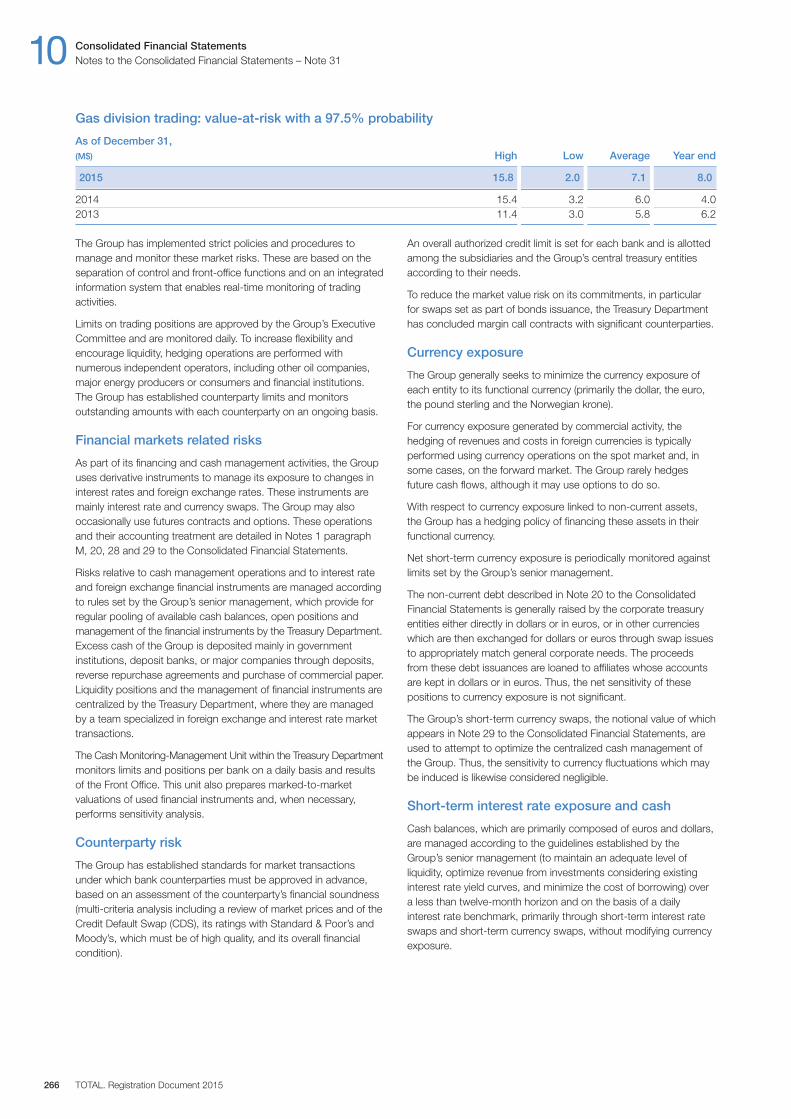
10 Consolidated Financial StatementsNotes to the Consolidated Financial Statements – Note 31
TOTAL. Registration Document 2015266
The Group has implemented strict policies and procedures tomanage and monitor these market risks. These are based on theseparation of control and front-office functions and on an integratedinformation system that enables real-time monitoring of tradingactivities.
Limits on trading positions are approved by the Group’s ExecutiveCommittee and are monitored daily. To increase flexibility andencourage liquidity, hedging operations are performed withnumerous independent operators, including other oil companies,major energy producers or consumers and financial institutions.The Group has established counterparty limits and monitorsoutstanding amounts with each counterparty on an ongoing basis.
Financial markets related risks
As part of its financing and cash management activities, the Groupuses derivative instruments to manage its exposure to changes ininterest rates and foreign exchange rates. These instruments aremainly interest rate and currency swaps. The Group may alsooccasionally use futures contracts and options. These operationsand their accounting treatment are detailed in Notes 1 paragraphM, 20, 28 and 29 to the Consolidated Financial Statements.
Risks relative to cash management operations and to interest rateand foreign exchange financial instruments are managed accordingto rules set by the Group’s senior management, which provide forregular pooling of available cash balances, open positions andmanagement of the financial instruments by the Treasury Department.Excess cash of the Group is deposited mainly in governmentinstitutions, deposit banks, or major companies through deposits,reverse repurchase agreements and purchase of commercial paper.Liquidity positions and the management of financial instruments arecentralized by the Treasury Department, where they are managedby a team specialized in foreign exchange and interest rate markettransactions.
The Cash Monitoring-Management Unit within the Treasury Departmentmonitors limits and positions per bank on a daily basis and resultsof the Front Office. This unit also prepares marked-to-marketvaluations of used financial instruments and, when necessary,performs sensitivity analysis.
Counterparty risk
The Group has established standards for market transactions under which bank counterparties must be approved in advance,based on an assessment of the counterparty’s financial soundness(multi-criteria analysis including a review of market prices and of theCredit Default Swap (CDS), its ratings with Standard & Poor’s andMoody’s, which must be of high quality, and its overall financialcondition).
An overall authorized credit limit is set for each bank and is allottedamong the subsidiaries and the Group’s central treasury entitiesaccording to their needs.
To reduce the market value risk on its commitments, in particularfor swaps set as part of bonds issuance, the Treasury Departmenthas concluded margin call contracts with significant counterparties.
Currency exposure
The Group generally seeks to minimize the currency exposure ofeach entity to its functional currency (primarily the dollar, the euro,the pound sterling and the Norwegian krone).
For currency exposure generated by commercial activity, thehedging of revenues and costs in foreign currencies is typicallyperformed using currency operations on the spot market and, insome cases, on the forward market. The Group rarely hedgesfuture cash flows, although it may use options to do so.
With respect to currency exposure linked to non-current assets, the Group has a hedging policy of financing these assets in theirfunctional currency.
Net short-term currency exposure is periodically monitored againstlimits set by the Group’s senior management.
The non-current debt described in Note 20 to the ConsolidatedFinancial Statements is generally raised by the corporate treasuryentities either directly in dollars or in euros, or in other currencieswhich are then exchanged for dollars or euros through swap issuesto appropriately match general corporate needs. The proceedsfrom these debt issuances are loaned to affiliates whose accountsare kept in dollars or in euros. Thus, the net sensitivity of thesepositions to currency exposure is not significant.
The Group’s short-term currency swaps, the notional value of whichappears in Note 29 to the Consolidated Financial Statements, areused to attempt to optimize the centralized cash management ofthe Group. Thus, the sensitivity to currency fluctuations which maybe induced is likewise considered negligible.
Short-term interest rate exposure and cash
Cash balances, which are primarily composed of euros and dollars,are managed according to the guidelines established by theGroup’s senior management (to maintain an adequate level ofliquidity, optimize revenue from investments considering existinginterest rate yield curves, and minimize the cost of borrowing) overa less than twelve-month horizon and on the basis of a dailyinterest rate benchmark, primarily through short-term interest rateswaps and short-term currency swaps, without modifying currencyexposure.
Gas division trading: value-at-risk with a 97.5% probability
As of December 31,(M$) High Low Average Year end
2015 15.8 2.0 7.1 8.0
2014 15.4 3.2 6.0 4.02013 11.4 3.0 5.8 6.2
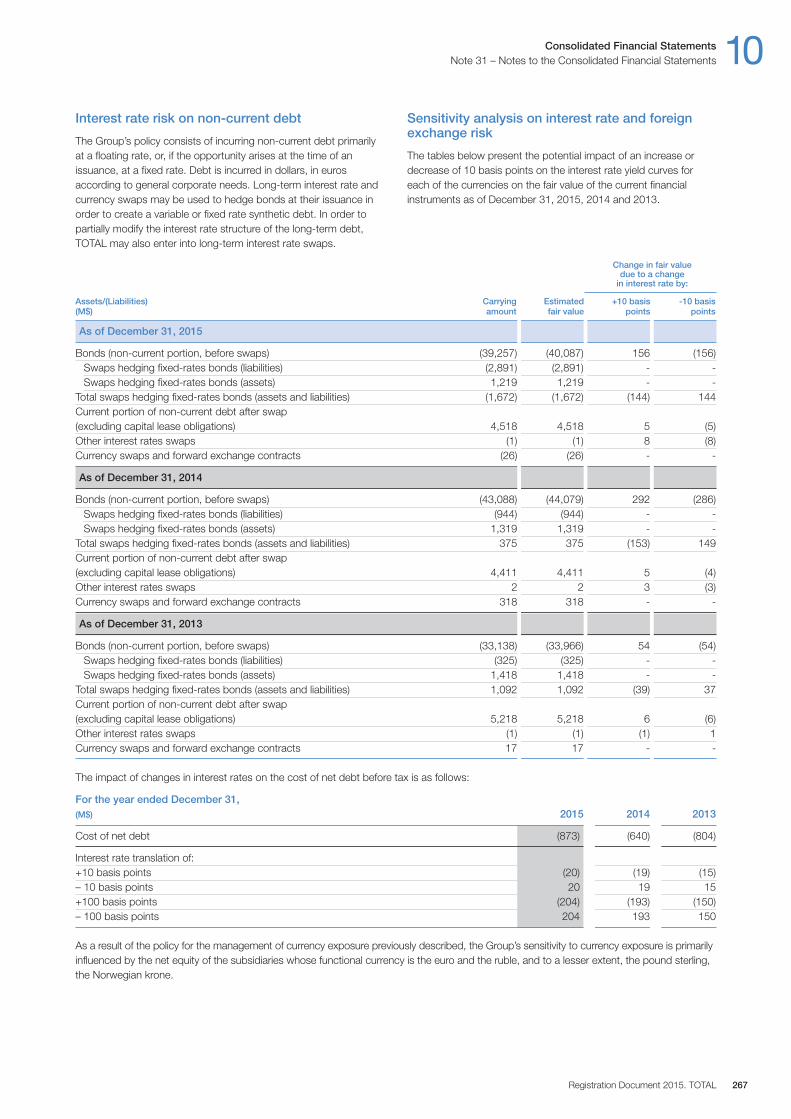
Change in fair value due to a change
in interest rate by:
Assets/(Liabilities) Carrying Estimated +10 basis -10 basis(M$) amount fair value points points
As of December 31, 2015
Bonds (non-current portion, before swaps) (39,257) (40,087) 156 (156)Swaps hedging fixed-rates bonds (liabilities) (2,891) (2,891) - -Swaps hedging fixed-rates bonds (assets) 1,219 1,219 - -
Total swaps hedging fixed-rates bonds (assets and liabilities) (1,672) (1,672) (144) 144Current portion of non-current debt after swap (excluding capital lease obligations) 4,518 4,518 5 (5)Other interest rates swaps (1) (1) 8 (8)Currency swaps and forward exchange contracts (26) (26) - -
As of December 31, 2014
Bonds (non-current portion, before swaps) (43,088) (44,079) 292 (286)Swaps hedging fixed-rates bonds (liabilities) (944) (944) - -Swaps hedging fixed-rates bonds (assets) 1,319 1,319 - -
Total swaps hedging fixed-rates bonds (assets and liabilities) 375 375 (153) 149Current portion of non-current debt after swap (excluding capital lease obligations) 4,411 4,411 5 (4)Other interest rates swaps 2 2 3 (3)Currency swaps and forward exchange contracts 318 318 - -
As of December 31, 2013
Bonds (non-current portion, before swaps) (33,138) (33,966) 54 (54)Swaps hedging fixed-rates bonds (liabilities) (325) (325) - -Swaps hedging fixed-rates bonds (assets) 1,418 1,418 - -
Total swaps hedging fixed-rates bonds (assets and liabilities) 1,092 1,092 (39) 37Current portion of non-current debt after swap (excluding capital lease obligations) 5,218 5,218 6 (6)Other interest rates swaps (1) (1) (1) 1Currency swaps and forward exchange contracts 17 17 - -
The impact of changes in interest rates on the cost of net debt before tax is as follows:
For the year ended December 31, (M$) 2015 2014 2013
Cost of net debt (873) (640) (804)
Interest rate translation of:+10 basis points (20) (19) (15)– 10 basis points 20 19 15+100 basis points (204) (193) (150)– 100 basis points 204 193 150
As a result of the policy for the management of currency exposure previously described, the Group’s sensitivity to currency exposure is primarilyinfluenced by the net equity of the subsidiaries whose functional currency is the euro and the ruble, and to a lesser extent, the pound sterling,the Norwegian krone.
Consolidated Financial Statements 10Note 31 – Notes to the Consolidated Financial Statements
Registration Document 2015. TOTAL 267
Interest rate risk on non-current debt
The Group’s policy consists of incurring non-current debt primarilyat a floating rate, or, if the opportunity arises at the time of anissuance, at a fixed rate. Debt is incurred in dollars, in eurosaccording to general corporate needs. Long-term interest rate andcurrency swaps may be used to hedge bonds at their issuance inorder to create a variable or fixed rate synthetic debt. In order topartially modify the interest rate structure of the long-term debt,TOTAL may also enter into long-term interest rate swaps.
Sensitivity analysis on interest rate and foreignexchange risk
The tables below present the potential impact of an increase ordecrease of 10 basis points on the interest rate yield curves foreach of the currencies on the fair value of the current financialinstruments as of December 31, 2015, 2014 and 2013.
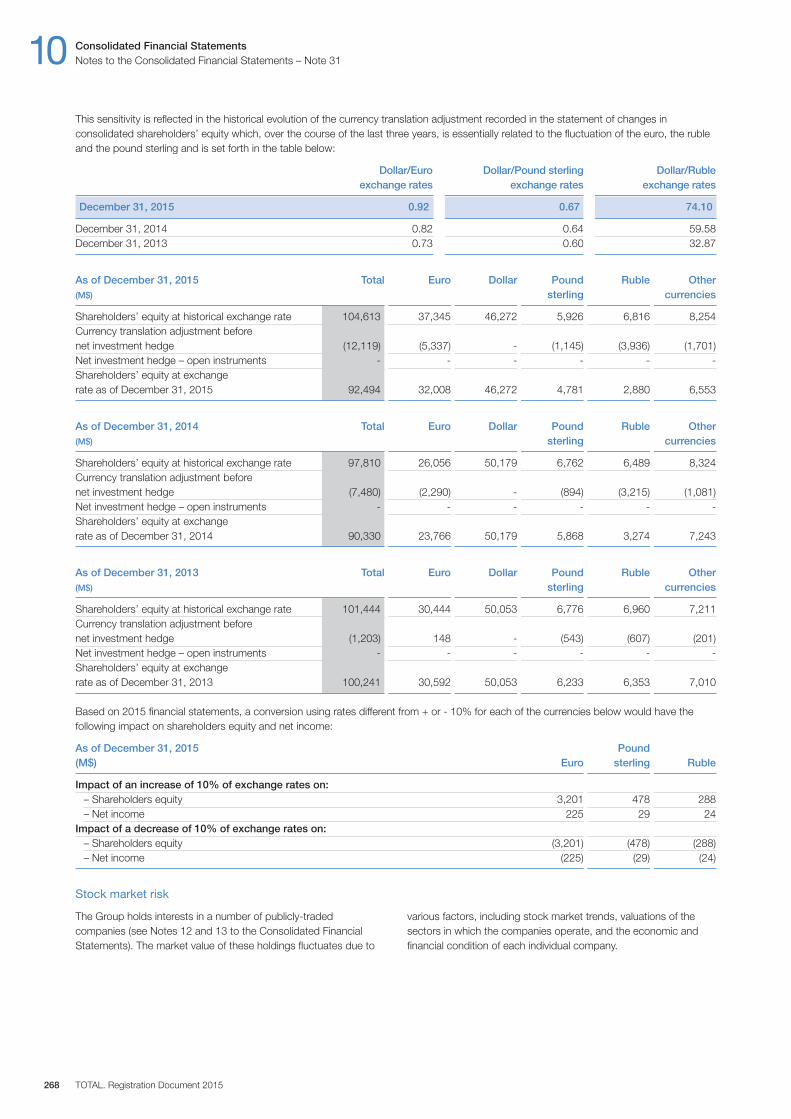
Stock market risk
The Group holds interests in a number of publicly-tradedcompanies (see Notes 12 and 13 to the Consolidated FinancialStatements). The market value of these holdings fluctuates due to
various factors, including stock market trends, valuations of thesectors in which the companies operate, and the economic andfinancial condition of each individual company.
10 Consolidated Financial StatementsNotes to the Consolidated Financial Statements – Note 31
TOTAL. Registration Document 2015268
This sensitivity is reflected in the historical evolution of the currency translation adjustment recorded in the statement of changes inconsolidated shareholders’ equity which, over the course of the last three years, is essentially related to the fluctuation of the euro, the rubleand the pound sterling and is set forth in the table below:
Dollar/Euro Dollar/Pound sterling Dollar/Ruble exchange rates exchange rates exchange rates
December 31, 2015 0.92 0.67 74.10
December 31, 2014 0.82 0.64 59.58December 31, 2013 0.73 0.60 32.87
As of December 31, 2015 Total Euro Dollar Pound Ruble Other (M$) sterling currencies
Shareholders’ equity at historical exchange rate 104,613 37,345 46,272 5,926 6,816 8,254Currency translation adjustment before net investment hedge (12,119) (5,337) - (1,145) (3,936) (1,701)Net investment hedge – open instruments - - - - - -Shareholders’ equity at exchange rate as of December 31, 2015 92,494 32,008 46,272 4,781 2,880 6,553
As of December 31, 2014 Total Euro Dollar Pound Ruble Other (M$) sterling currencies
Shareholders’ equity at historical exchange rate 97,810 26,056 50,179 6,762 6,489 8,324Currency translation adjustment before net investment hedge (7,480) (2,290) - (894) (3,215) (1,081)Net investment hedge – open instruments - - - - - -Shareholders’ equity at exchange rate as of December 31, 2014 90,330 23,766 50,179 5,868 3,274 7,243
As of December 31, 2013 Total Euro Dollar Pound Ruble Other (M$) sterling currencies
Shareholders’ equity at historical exchange rate 101,444 30,444 50,053 6,776 6,960 7,211Currency translation adjustment before net investment hedge (1,203) 148 - (543) (607) (201)Net investment hedge – open instruments - - - - - -Shareholders’ equity at exchange rate as of December 31, 2013 100,241 30,592 50,053 6,233 6,353 7,010
Based on 2015 financial statements, a conversion using rates different from + or - 10% for each of the currencies below would have thefollowing impact on shareholders equity and net income:
As of December 31, 2015 Pound(M$) Euro sterling Ruble
Impact of an increase of 10% of exchange rates on:– Shareholders equity 3,201 478 288– Net income 225 29 24
Impact of a decrease of 10% of exchange rates on:– Shareholders equity (3,201) (478) (288)– Net income (225) (29) (24)
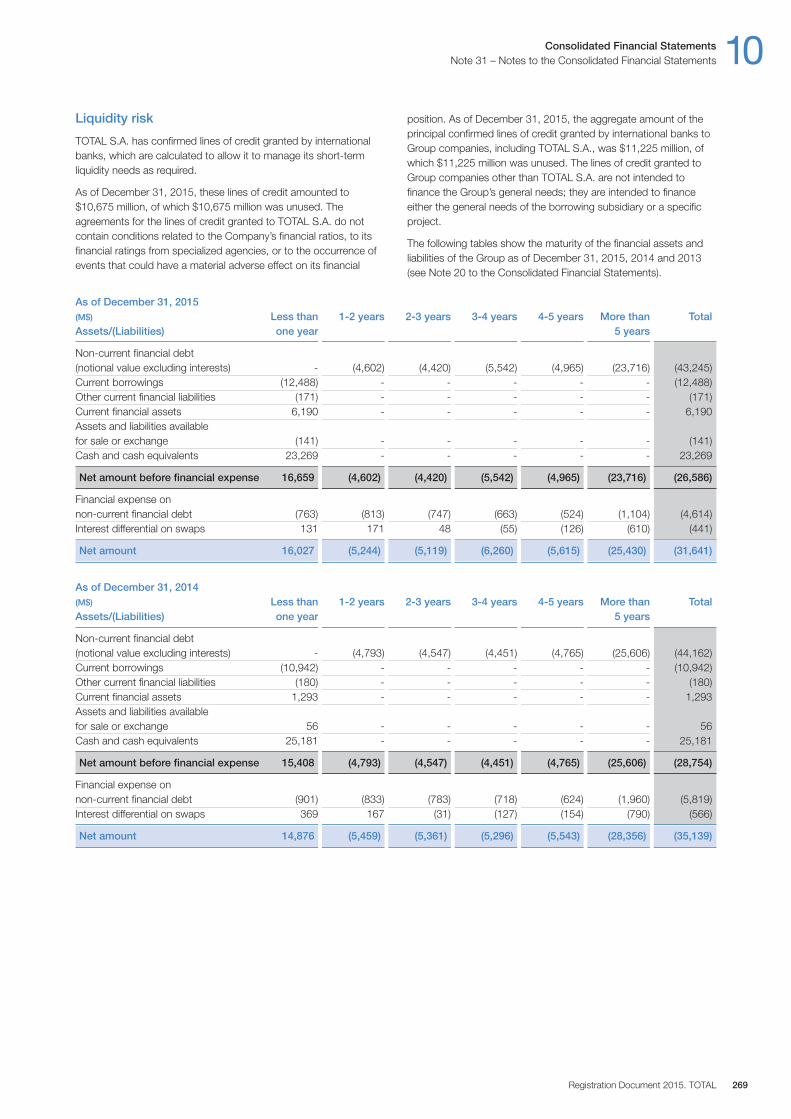
As of December 31, 2015(M$) Less than 1-2 years 2-3 years 3-4 years 4-5 years More than TotalAssets/(Liabilities) one year 5 years
Non-current financial debt (notional value excluding interests) - (4,602) (4,420) (5,542) (4,965) (23,716) (43,245)Current borrowings (12,488) - - - - - (12,488)Other current financial liabilities (171) - - - - - (171)Current financial assets 6,190 - - - - - 6,190Assets and liabilities available for sale or exchange (141) - - - - - (141)Cash and cash equivalents 23,269 - - - - - 23,269
Net amount before financial expense 16,659 (4,602) (4,420) (5,542) (4,965) (23,716) (26,586)
Financial expense on non-current financial debt (763) (813) (747) (663) (524) (1,104) (4,614)Interest differential on swaps 131 171 48 (55) (126) (610) (441)
Net amount 16,027 (5,244) (5,119) (6,260) (5,615) (25,430) (31,641)
As of December 31, 2014(M$) Less than 1-2 years 2-3 years 3-4 years 4-5 years More than TotalAssets/(Liabilities) one year 5 years
Non-current financial debt (notional value excluding interests) - (4,793) (4,547) (4,451) (4,765) (25,606) (44,162)Current borrowings (10,942) - - - - - (10,942)Other current financial liabilities (180) - - - - - (180)Current financial assets 1,293 - - - - - 1,293Assets and liabilities available for sale or exchange 56 - - - - - 56Cash and cash equivalents 25,181 - - - - - 25,181
Net amount before financial expense 15,408 (4,793) (4,547) (4,451) (4,765) (25,606) (28,754)
Financial expense on non-current financial debt (901) (833) (783) (718) (624) (1,960) (5,819)Interest differential on swaps 369 167 (31) (127) (154) (790) (566)
Net amount 14,876 (5,459) (5,361) (5,296) (5,543) (28,356) (35,139)
Liquidity risk
TOTAL S.A. has confirmed lines of credit granted by internationalbanks, which are calculated to allow it to manage its short-termliquidity needs as required.
As of December 31, 2015, these lines of credit amounted to$10,675 million, of which $10,675 million was unused. Theagreements for the lines of credit granted to TOTAL S.A. do notcontain conditions related to the Company’s financial ratios, to itsfinancial ratings from specialized agencies, or to the occurrence ofevents that could have a material adverse effect on its financial
position. As of December 31, 2015, the aggregate amount of theprincipal confirmed lines of credit granted by international banks toGroup companies, including TOTAL S.A., was $11,225 million, ofwhich $11,225 million was unused. The lines of credit granted toGroup companies other than TOTAL S.A. are not intended tofinance the Group’s general needs; they are intended to financeeither the general needs of the borrowing subsidiary or a specificproject.
The following tables show the maturity of the financial assets andliabilities of the Group as of December 31, 2015, 2014 and 2013(see Note 20 to the Consolidated Financial Statements).
Consolidated Financial Statements 10Note 31 – Notes to the Consolidated Financial Statements
Registration Document 2015. TOTAL 269

As of December 31, 2013(M$) Less than 1-2 years 2-3 years 3-4 years 4-5 years More than TotalAssets/(Liabilities) one year 5 years
Non-current financial debt (notional value excluding interests) - (4,647) (4,528) (4,159) (4,361) (15,461) (33,156)Current borrowings (11,193) - - - - - (11,193)Other current financial liabilities (381) - - - - - (381)Current financial assets 739 - - - - - 739Assets and liabilities available for sale or exchange 179 - - - - - 179Cash and cash equivalents 20,200 - - - - - 20,200
Net amount before financial expense 9,544 (4,647) (4,528) (4,159) (4,361) (15,461) (23,612)
Financial expense on non-current financial debt (1,005) (912) (764) (701) (616) (1,783) (5,781)Interest differential on swaps 483 392 138 (33) (110) (710) 160
Net amount 9,022 (5,167) (5,154) (4,893) (5,087) (17,954) (29,233)
The following table sets forth financial assets and liabilities related to operating activities as of December 31, 2015, 2014 and 2013 (see Note 28to the Consolidated Financial Statements).
As of December 31(M$)
Assets/(Liabilities) 2015 2014 2013
Accounts payable (20,928) (24,150) (30,282)Other operating liabilities (9,914) (7,935) (8,191)
including financial instruments related to commodity contracts (1,609) (1,073) (848)Accounts receivable, net 10,629 15,704 23,422Other operating receivables 10,909 10,792 9,917
including financial instruments related to commodity contracts 3,379 2,502 1,278
Total (9,304) (5,589) (5,134)
These financial assets and liabilities mainly have a maturity date below one year.
Credit risk
Credit risk is defined as the risk of the counterparty to a contract failing to perform or pay the amounts due.
The Group is exposed to credit risks in its operating and financing activities. The Group's maximum exposure to credit risk is partially relatedto financial assets recorded on its balance sheet, including energy derivative instruments that have a positive market value.
The following table presents the Group's maximum credit risk exposure:
As of December 31(M$)
Assets/(Liabilities) 2015 2014 2013
Loans to equity affiliates (Note 12) 4,378 4,626 3,554Loans and advances (Note 14) 3,407 3,326 3,575Hedging instruments of non-current financial debt (Note 20) 1,219 1,319 1,418Accounts receivable (Note 16) 10,629 15,704 23,422Other operating receivables (Note 16) 10,909 10,792 9,917Current financial assets (Note 20) 6,190 1,293 739Cash and cash equivalents (Note 27) 23,269 25,181 20,200
Total 60,001 62,241 62,825
10 Consolidated Financial StatementsNotes to the Consolidated Financial Statements – Note 31
TOTAL. Registration Document 2015270

Consolidated Financial Statements 10Note 31 – Notes to the Consolidated Financial Statements
Registration Document 2015. TOTAL 271
The valuation allowance on loans and advances and on accountsreceivable and other operating receivables is detailed respectively inNotes 14 and 16 to the Consolidated Financial Statements.
As part of its credit risk management related to operating andfinancing activities, the Group has developed margin call contractswith certain counterparties. As of December 31, 2015, the netamount paid as part of these margin calls was $124 million (against$1,437 million received as of December 31, 2014 and$1,105 million received as of December 31, 2013).
The Group has established a number of programs for the sale ofreceivables, without recourse, with various banks, primarily toreduce its exposure to such receivables. As a result of theseprograms the Group retains no risk of payment default after thesale, but may continue to service the customer accounts as part ofa service arrangement on behalf of the buyer and is required to payto the buyer payments it receives from the customers relating to thereceivables sold. As of December 31, 2015, the net value ofreceivables sold amounted to $4,274 million. The Group hassubstantially transferred all the risks and rewards related toreceivables. No financial asset or liability remains recognized in theconsolidated balance sheet after the date of sale.
Credit risk is managed by the Group’s business segments as follows:
Upstream segment
– Exploration & ProductionRisks arising under contracts with government authorities orother oil companies or under long-term supply contractsnecessary for the development of projects are evaluated duringthe project approval process. The long-term aspect of thesecontracts and the high-quality of the other parties lead to a lowlevel of credit risk.
Risks related to commercial operations, other than thosedescribed above (which are, in practice, directly monitored bysubsidiaries), are subject to procedures for establishing andreviewing credit.
Customer receivables are subject to provisions on a case-by-case basis, based on prior history and management’sassessment of the facts and circumstances.
– Gas activitiesGas activities deal with counterparties in the energy, industrialand financial sectors throughout the world. Financial institutionsproviding credit risk coverage are highly rated international bankand insurance groups.
Potential counterparties are subject to credit assessment andapproval before concluding transactions and are thereaftersubject to regular review, including re-appraisal and approval ofthe limits previously granted.
The creditworthiness of counterparties is assessed based on ananalysis of quantitative and qualitative data regarding financialstanding and business risks, together with the review of anyrelevant third party and market information, such as datapublished by rating agencies. On this basis, credit limits aredefined for each potential counterparty and, where appropriate,transactions are subject to specific authorizations.
Credit exposure, which is essentially an economic exposure oran expected future physical exposure, is permanently monitoredand subject to sensitivity measures.
Credit risk is mitigated by the systematic use of industry standardcontractual frameworks that permit netting, enable requiringadded security in case of adverse change in the counterpartyrisk, and allow for termination of the contract upon occurrence ofcertain events of default.
Refining & Chemicals segment
– Refining & ChemicalsCredit risk is primarily related to commercial receivables. Internalprocedures of Refining & Chemicals include rules for themanagement of credit describing the fundamentals of internalcontrol in this domain. Each division implements procedures formanaging and provisioning credit risk that differ based on thesize of the subsidiary and the market in which it operates. Theprincipal elements of these procedures are:
- implementation of credit limits with different authorizationprocedures for possible credit overruns;
- use of insurance policies or specific guarantees (letters of credit);- regular monitoring and assessment of overdue accounts (aging
balance), including collection procedures; and- provisioning of bad debts on a customer-by-customer basis,
according to payment delays and local payment practices(provisions may also be calculated based on statistics).
Counterparties are subject to credit assessment and approval priorto any transaction being concluded. Regular reviews are made forall active counterparties including a re-appraisal and renewing ofthe granted credit limits. The limits of the counterparties areassessed based on quantitative and qualitative data regardingfinancial standing, together with the review of any relevant thirdparty and market information, such as that provided by ratingagencies and insurance companies.
– Trading & ShippingTrading & Shipping deals with commercial counterparties andfinancial institutions located throughout the world. Counterpartiesto physical and derivative transactions are primarily entitiesinvolved in the oil and gas industry or in the trading of energycommodities, or financial institutions. Credit risk coverage isconcluded with financial institutions, international banks andinsurance groups selected in accordance with strict criteria.
The Trading & Shipping division has a strict policy of internaldelegation of authority governing establishment of country andcounterparty credit limits and approval of specific transactions.Credit exposures contracted under these limits and approvalsare monitored on a daily basis.
Potential counterparties are subject to credit assessment and approval prior to any transaction being concluded and allactive counterparties are subject to regular reviews, including re-appraisal and approval of granted limits. The creditworthinessof counterparties is assessed based on an analysis of quantitativeand qualitative data regarding financial standing and businessrisks, together with the review of any relevant third party andmarket information, such as ratings published byStandard & Poor’s, Moody’s Investors Service and other agencies.
Contractual arrangements are structured so as to maximize therisk mitigation benefits of netting between transactions whereverpossible and additional protective terms providing for theprovision of security in the event of financial deterioration and thetermination of transactions on the occurrence of defined defaultevents are used to the greatest permitted extent.

TOTAL is not currently aware of any exceptional event, dispute,risks or contingent liabilities that could have a material impact onthe assets and liabilities, results, financial position or operations ofthe Group.
Alitalia
In the Marketing & Services segment, a civil proceeding wasinitiated in Italy, in 2013, against TOTAL S.A. and its subsidiary TotalAviazione Italia Srl before the competent Italian civil court. Theplaintiff claims against TOTAL S.A., its subsidiary and other thirdparties, damages that it estimates to be nearly €908 million. Thisproceeding follows practices that had been condemned by theItalian competition authority in 2006. The parties have exchangedpreliminary findings. The existence and the assessment of thealleged damages in this procedure involving multiple defendantsremain contested.
Blue Rapid and the Russian OlympicCommittee – Russian regions and Interneft
Blue Rapid, a Panamanian company, and the Russian OlympicCommittee filed a claim for damages with the Paris CommercialCourt against Elf Aquitaine, alleging a so-called non-completion bya former subsidiary of Elf Aquitaine of a contract related to anexploration and production project in Russia negotiated in the early1990s. Elf Aquitaine believed this claim to be unfounded andopposed it. On January 12, 2009, the Commercial Court of Parisrejected Blue Rapid’s claim against Elf Aquitaine and found that theRussian Olympic Committee did not have standing in the matter.Blue Rapid and the Russian Olympic Committee appealed thisdecision. On June 30, 2011, the Court of Appeal of Paris dismissedas inadmissible the claim of Blue Rapid and the Russian OlympicCommittee against Elf Aquitaine, notably on the grounds of thecontract having lapsed. Blue Rapid and the Russian OlympicCommittee appealed this decision to the French Supreme Court.
In connection with the same facts, and fifteen years after theaforementioned exploration and production contract was renderednull and void (“caduc”), a Russian company, which was held not tobe the contracting party to the contract, and two regions of theRussian Federation that were not even parties to the contract,launched an arbitration procedure against the aforementionedformer subsidiary of Elf Aquitaine that was liquidated in 2005,claiming alleged damages of $22.4 billion. For the same reasons asthose successfully adjudicated by Elf Aquitaine against Blue Rapidand the Russian Olympic Committee, the Group considers thisclaim to be unfounded as a matter of law and fact.
The Group has lodged a criminal complaint to denounce thefraudulent claim of which the Group believes it is a victim and, hastaken and reserved its rights to take other actions and measures todefend its interests.
FERC
The Office of Enforcement of the U.S. Federal Energy RegulatoryCommission (FERC) has begun investigation in connection with thenatural gas trading activities of TOTAL Gas & Power North America,Inc, an American subsidiary of the Group. The investigation coverstransactions made by the Group’s subsidiary between June 2009and June 2012 on the natural gas market. TOTAL Gas & PowerNorth America, Inc received a Notice of Alleged Violations of theFERC on September 21, 2015.
The Group’s subsidiary is cooperating in the investigation with theU.S. authorities, while contesting the claims brought against it.
Russia
Since July 2014, the United States of America and the Europeancommunity have adopted economic sanctions against certainRussian persons and entities, including various entities operating inthe financial, energy and defense sectors, in response to thesituation in Ukraine.
32) Other risks and contingent liabilities
Credit risks in excess of approved levels are secured by meansof letters of credit and other guarantees, cash deposits andinsurance arrangements. In respect of derivative transactions,risks are secured by margin call contracts wherever possible.
Marketing & Services segment
– Marketing & ServicesInternal procedures for the Marketing & Services division includerules on credit risk that describe the basis of internal control inthis domain, including the separation of authority betweencommercial and financial operations.
Credit policies are defined at the local level and procedures tomonitor customer risk are implemented (credit Committees at thesubsidiary level, the creation of credit limits for corporate
customers, etc.). Each entity also implements monitoring of itsoutstanding receivables. Risks related to credit may be mitigatedor limited by subscription of credit insurance and / or requiringsecurity or guarantees.
Bad debts are provisioned on a case-by-case basis at a ratedetermined by management based on an assessment of the riskof credit loss.
– New EnergiesInternal procedures for the New Energies division include ruleson credit risk management. Procedures to monitor customerrisk are defined at the local level, especially for SunPower (rulesfor the approval of credit limits, use of guarantees, monitoringand assessment of the receivables portfolio, provisioning ofdoubtful debts…).
272 TOTAL. Registration Document 2015
Notes to the Consolidated Financial Statements – Notes 31, 32Consolidated Financial Statements10
Upstream
– In August 2015, Total has signed an agreement to sell all of itsinterests in the FUKA and SIRGE gas pipelines and the St.Fergus Gas Terminal to North Sea Midstream Partners.Completion of the sale is subject to approval by the relevantauthorities. At December 31, 2015 the assets and liabilities havebeen respectively classified in the consolidated balance sheet in“assets classified as held for sale” for an amount of $497 millionand “liabilities directly associated with the assets classified asheld for sale” for an amount of $82 million. The assets concernedmainly include tangible assets for an amount of $497 million.
– TOTAL has signed in January 2016 an agreement for the sale toZarubezhneft of a 20% stake in Kharyaga, Russia. Completion ofthe sale is subject to approval by the relevant authorities. AtDecember 31, 2015 the assets and liabilities have beenrespectively classified in the consolidated balance sheet in“assets classified as held for sale” for an amount of $234 millionand “liabilities directly associated with the assets classified as
held for sale” for an amount of $164 million. The assets andliabilities concerned mainly include tangible assets for an amountof $178 million and deferred tax liabilities for an amount of$90 million.
Marketing & Services
– TOTAL has signed in September 2015 an agreement for the saleto Demirören Group of its service station network andcommercial sales, supply and logistics assets located in Turkey.Completion of the sale is subject to approval by the relevantauthorities. At December 31, 2015, the assets and liabilities havebeen respectively classified in the consolidated balance sheet in“assets classified as held for sale” for an amount of $458 millionand “liabilities directly associated with the assets classified asheld for sale” for an amount of $258 million. The assets andliabilities concerned mainly include intangible and tangible assetsfor an amount of $127 million, trade receivables for an amount of$146 million and current bank debt for an amount of $161 million.
34) Changes in progress in the Group structure
Research and development costs incurred by the Group in 2015amounted to $1,068 million ($1,353 million in 2014 and$1,260 million in 2013), corresponding to 0.65% of the sales.
The staff dedicated in 2015 to these research and developmentactivities are estimated at 4,498 people (4,840 in 2014 and 4,684 in 2013).
33) Other information
Among other things, the United States has adopted economicsanctions targeting OAO Novatek (1) (“Novatek”), as well as entities inwhich Novatek (individually or with other similarly targeted persons orentities collectively) owns an interest of at least 50%, including OAOYamal LNG(2) (“Yamal LNG”). These sanctions prohibit U.S. personsfrom transacting in, providing financing for or otherwise dealing indebt issued by these entities after July 16, 2014 of greater than 90days maturity. Consequently, the use of the U.S. dollar for suchfinancing, including for Yamal LNG, is effectively prohibited.
As a result, the financing plan for the Yamal LNG project is beingreviewed, and the project’s partners are engaged in efforts todevelop a financing plan in compliance with the applicableregulations.
The economic sanctions initially adopted by the European Union in2014 and subsequently extended do not materially affect TOTAL’sactivities in Russia. TOTAL has been formally authorized to continueall its activities in Russia (in the Kharyaga field as operator, and inthe Termokarstovoye field and Yamal project in which the Groupholds interests) by the French government that is the competentauthorities for granting authorization under EU sanctions regime.
TOTAL’s activities in Russia are also not materially affected byrestrictive measures adopted by the United States in August 2015imposing export controls and restrictions relating to the export ofcertain goods, services, and technologies destined for projectslocated in Russia in the field of oil exploration.
With respect to the exploration project in the Bazhenov play (tightoil) in western Siberia, which has been suspended since 2014,TOTAL signed in July 2015 an agreement to transfer the explorationlicenses it held in this play to OAO Lukoil. This agreement also setsout the conditions under which TOTAL and OAO Lukoil couldpotentially resume their joint activities in Russia. In January 2016,TOTAL signed an agreement to sell 50% of its interest in theKharyaga field and transfer the operatorship to Zarubezhneft. Afterthe sale, which is expected to be completed in 2016, TOTAL’sinterest in the Kharyaga field will be 20%.
TOTAL continues to closely monitor the different internationaleconomic sanctions with respect to its activities in Russia.
As of December 31, 2015, the Group held 19% of its provedreserves in Russia.
Yemen
Due to the further deterioration in the security situation in the vicinityof its Balhaf site, the company Yemen LNG, in which the Groupholds a 39.62% stake, decided to stop its commercial LNGproduction and export activities. The plant is in a preservation modeand no expatriate personnel remain on site. As a consequence ofthis situation, Yemen LNG declared Force Majeure to its variousstakeholders in early April 2015.
273Registration Document 2015. TOTAL
Notes 33, 34 – Notes to the Consolidated Financial Statements 10Consolidated Financial Statements
(1) A Russian company listed on stock exchanges in Moscow and London and in which the Group held an interest of 18.9% as of December 31, 2015.(2) A company jointly owned by Novatek (60%), Total E&P Yamal (20%), CNODC (20%), a subsidiary of China National Petroleum Corporation ("CNPC") and Silk Road Fund (9.9%). Novatek’s
investment in the company OAO Yamal LNG is to be reduced to 50.1% following an agreement signed in September 2015 for the entry of the Silk Road Fund (9.9%). This agreement isexpected to be approved by the authorities in 2016.
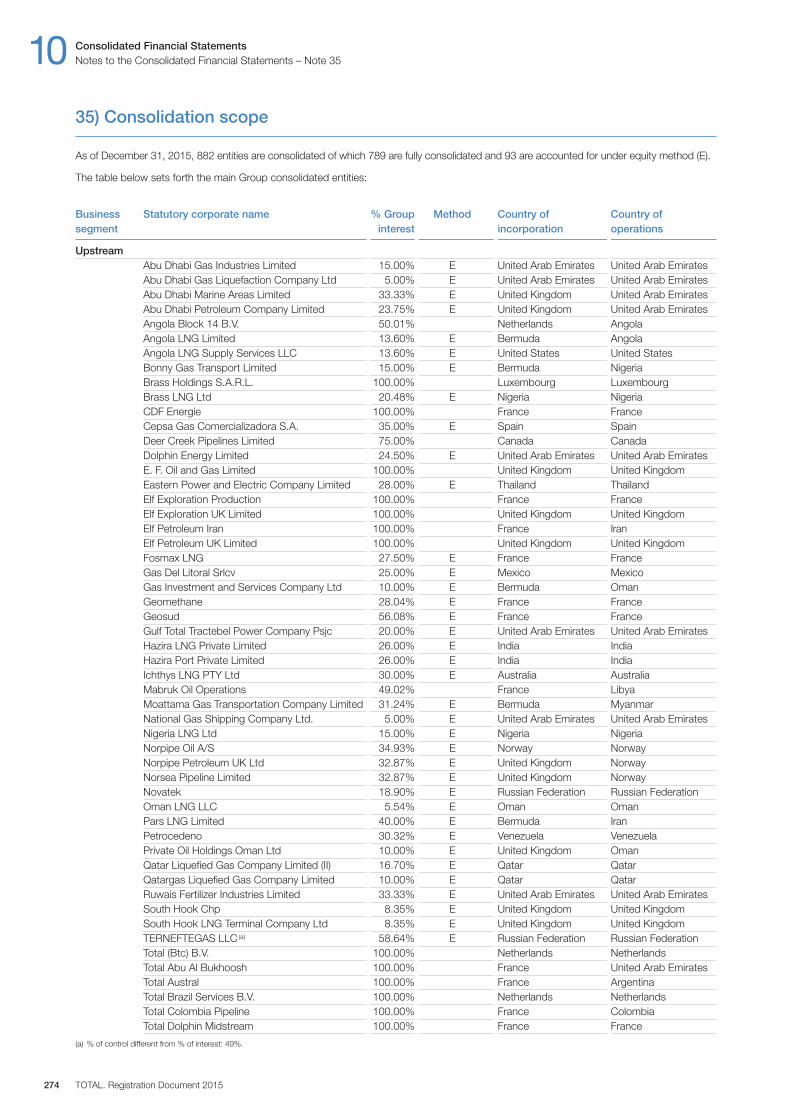
Business Statutory corporate name % Group Method Country of Country ofsegment interest incorporation operations
UpstreamAbu Dhabi Gas Industries Limited 15.00% E United Arab Emirates United Arab EmiratesAbu Dhabi Gas Liquefaction Company Ltd 5.00% E United Arab Emirates United Arab EmiratesAbu Dhabi Marine Areas Limited 33.33% E United Kingdom United Arab EmiratesAbu Dhabi Petroleum Company Limited 23.75% E United Kingdom United Arab EmiratesAngola Block 14 B.V. 50.01% Netherlands AngolaAngola LNG Limited 13.60% E Bermuda AngolaAngola LNG Supply Services LLC 13.60% E United States United StatesBonny Gas Transport Limited 15.00% E Bermuda NigeriaBrass Holdings S.A.R.L. 100.00% Luxembourg LuxembourgBrass LNG Ltd 20.48% E Nigeria NigeriaCDF Energie 100.00% France FranceCepsa Gas Comercializadora S.A. 35.00% E Spain SpainDeer Creek Pipelines Limited 75.00% Canada CanadaDolphin Energy Limited 24.50% E United Arab Emirates United Arab EmiratesE. F. Oil and Gas Limited 100.00% United Kingdom United KingdomEastern Power and Electric Company Limited 28.00% E Thailand ThailandElf Exploration Production 100.00% France FranceElf Exploration UK Limited 100.00% United Kingdom United KingdomElf Petroleum Iran 100.00% France IranElf Petroleum UK Limited 100.00% United Kingdom United KingdomFosmax LNG 27.50% E France FranceGas Del Litoral Srlcv 25.00% E Mexico MexicoGas Investment and Services Company Ltd 10.00% E Bermuda OmanGeomethane 28.04% E France FranceGeosud 56.08% E France FranceGulf Total Tractebel Power Company Psjc 20.00% E United Arab Emirates United Arab EmiratesHazira LNG Private Limited 26.00% E India IndiaHazira Port Private Limited 26.00% E India IndiaIchthys LNG PTY Ltd 30.00% E Australia AustraliaMabruk Oil Operations 49.02% France LibyaMoattama Gas Transportation Company Limited 31.24% E Bermuda MyanmarNational Gas Shipping Company Ltd. 5.00% E United Arab Emirates United Arab EmiratesNigeria LNG Ltd 15.00% E Nigeria NigeriaNorpipe Oil A / S 34.93% E Norway NorwayNorpipe Petroleum UK Ltd 32.87% E United Kingdom NorwayNorsea Pipeline Limited 32.87% E United Kingdom NorwayNovatek 18.90% E Russian Federation Russian FederationOman LNG LLC 5.54% E Oman OmanPars LNG Limited 40.00% E Bermuda IranPetrocedeno 30.32% E Venezuela VenezuelaPrivate Oil Holdings Oman Ltd 10.00% E United Kingdom OmanQatar Liquefied Gas Company Limited (II) 16.70% E Qatar QatarQatargas Liquefied Gas Company Limited 10.00% E Qatar QatarRuwais Fertilizer Industries Limited 33.33% E United Arab Emirates United Arab EmiratesSouth Hook Chp 8.35% E United Kingdom United KingdomSouth Hook LNG Terminal Company Ltd 8.35% E United Kingdom United KingdomTERNEFTEGAS LLC (a) 58.64% E Russian Federation Russian FederationTotal (Btc) B.V. 100.00% Netherlands NetherlandsTotal Abu Al Bukhoosh 100.00% France United Arab EmiratesTotal Austral 100.00% France ArgentinaTotal Brazil Services B.V. 100.00% Netherlands NetherlandsTotal Colombia Pipeline 100.00% France ColombiaTotal Dolphin Midstream 100.00% France France
(a) % of control different from % of interest: 49%.
35) Consolidation scope
As of December 31, 2015, 882 entities are consolidated of which 789 are fully consolidated and 93 are accounted for under equity method (E).
The table below sets forth the main Group consolidated entities:
10 Consolidated Financial StatementsNotes to the Consolidated Financial Statements – Note 35
TOTAL. Registration Document 2015274
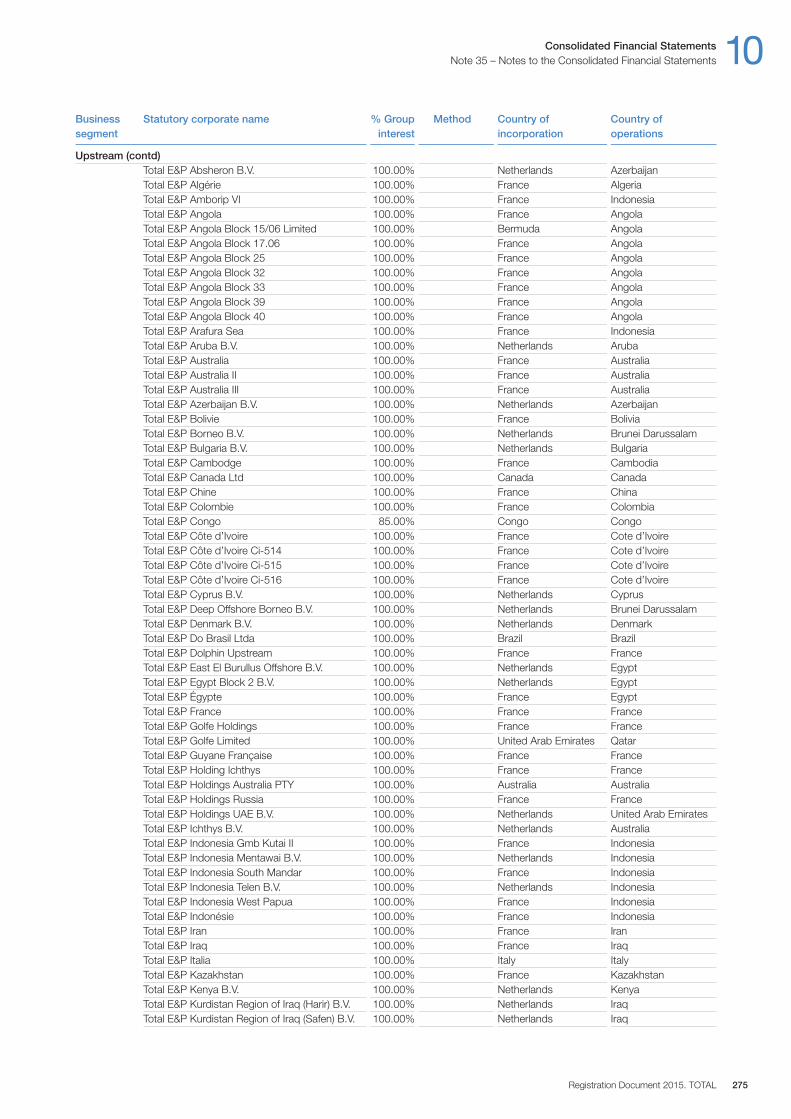
Business Statutory corporate name % Group Method Country of Country ofsegment interest incorporation operations
Upstream (contd)Total E&P Absheron B.V. 100.00% Netherlands AzerbaijanTotal E&P Algérie 100.00% France AlgeriaTotal E&P Amborip VI 100.00% France IndonesiaTotal E&P Angola 100.00% France AngolaTotal E&P Angola Block 15 / 06 Limited 100.00% Bermuda AngolaTotal E&P Angola Block 17.06 100.00% France AngolaTotal E&P Angola Block 25 100.00% France AngolaTotal E&P Angola Block 32 100.00% France AngolaTotal E&P Angola Block 33 100.00% France AngolaTotal E&P Angola Block 39 100.00% France AngolaTotal E&P Angola Block 40 100.00% France AngolaTotal E&P Arafura Sea 100.00% France IndonesiaTotal E&P Aruba B.V. 100.00% Netherlands ArubaTotal E&P Australia 100.00% France AustraliaTotal E&P Australia II 100.00% France AustraliaTotal E&P Australia III 100.00% France AustraliaTotal E&P Azerbaijan B.V. 100.00% Netherlands AzerbaijanTotal E&P Bolivie 100.00% France BoliviaTotal E&P Borneo B.V. 100.00% Netherlands Brunei DarussalamTotal E&P Bulgaria B.V. 100.00% Netherlands BulgariaTotal E&P Cambodge 100.00% France CambodiaTotal E&P Canada Ltd 100.00% Canada CanadaTotal E&P Chine 100.00% France ChinaTotal E&P Colombie 100.00% France ColombiaTotal E&P Congo 85.00% Congo CongoTotal E&P Côte d’Ivoire 100.00% France Cote d’IvoireTotal E&P Côte d’Ivoire Ci-514 100.00% France Cote d’IvoireTotal E&P Côte d’Ivoire Ci-515 100.00% France Cote d’IvoireTotal E&P Côte d’Ivoire Ci-516 100.00% France Cote d’IvoireTotal E&P Cyprus B.V. 100.00% Netherlands CyprusTotal E&P Deep Offshore Borneo B.V. 100.00% Netherlands Brunei DarussalamTotal E&P Denmark B.V. 100.00% Netherlands DenmarkTotal E&P Do Brasil Ltda 100.00% Brazil BrazilTotal E&P Dolphin Upstream 100.00% France FranceTotal E&P East El Burullus Offshore B.V. 100.00% Netherlands EgyptTotal E&P Egypt Block 2 B.V. 100.00% Netherlands EgyptTotal E&P Égypte 100.00% France EgyptTotal E&P France 100.00% France FranceTotal E&P Golfe Holdings 100.00% France FranceTotal E&P Golfe Limited 100.00% United Arab Emirates QatarTotal E&P Guyane Française 100.00% France FranceTotal E&P Holding Ichthys 100.00% France FranceTotal E&P Holdings Australia PTY 100.00% Australia AustraliaTotal E&P Holdings Russia 100.00% France FranceTotal E&P Holdings UAE B.V. 100.00% Netherlands United Arab EmiratesTotal E&P Ichthys B.V. 100.00% Netherlands AustraliaTotal E&P Indonesia Gmb Kutai II 100.00% France IndonesiaTotal E&P Indonesia Mentawai B.V. 100.00% Netherlands IndonesiaTotal E&P Indonesia South Mandar 100.00% France IndonesiaTotal E&P Indonesia Telen B.V. 100.00% Netherlands IndonesiaTotal E&P Indonesia West Papua 100.00% France IndonesiaTotal E&P Indonésie 100.00% France IndonesiaTotal E&P Iran 100.00% France IranTotal E&P Iraq 100.00% France IraqTotal E&P Italia 100.00% Italy ItalyTotal E&P Kazakhstan 100.00% France KazakhstanTotal E&P Kenya B.V. 100.00% Netherlands KenyaTotal E&P Kurdistan Region of Iraq (Harir) B.V. 100.00% Netherlands IraqTotal E&P Kurdistan Region of Iraq (Safen) B.V. 100.00% Netherlands Iraq
Consolidated Financial Statements 10Note 35 – Notes to the Consolidated Financial Statements
Registration Document 2015. TOTAL 275
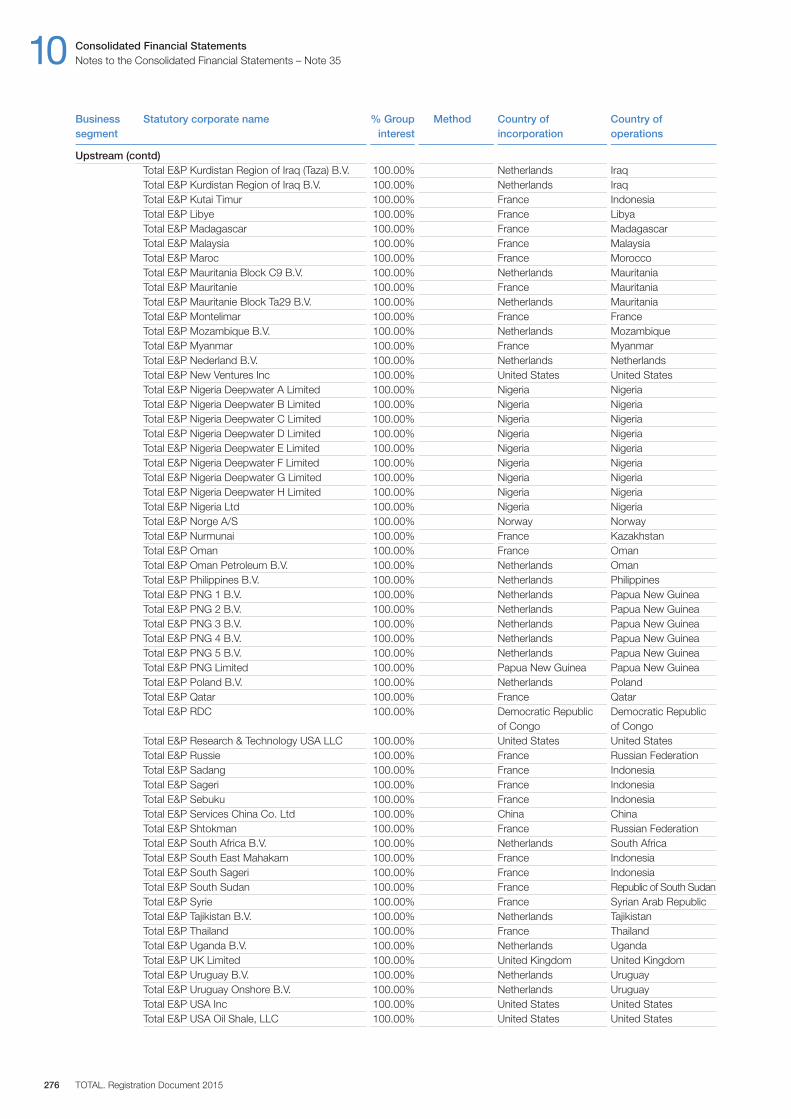
Total E&P Kurdistan Region of Iraq (Taza) B.V. 100.00% Netherlands IraqTotal E&P Kurdistan Region of Iraq B.V. 100.00% Netherlands IraqTotal E&P Kutai Timur 100.00% France IndonesiaTotal E&P Libye 100.00% France LibyaTotal E&P Madagascar 100.00% France MadagascarTotal E&P Malaysia 100.00% France MalaysiaTotal E&P Maroc 100.00% France MoroccoTotal E&P Mauritania Block C9 B.V. 100.00% Netherlands MauritaniaTotal E&P Mauritanie 100.00% France MauritaniaTotal E&P Mauritanie Block Ta29 B.V. 100.00% Netherlands MauritaniaTotal E&P Montelimar 100.00% France FranceTotal E&P Mozambique B.V. 100.00% Netherlands MozambiqueTotal E&P Myanmar 100.00% France MyanmarTotal E&P Nederland B.V. 100.00% Netherlands NetherlandsTotal E&P New Ventures Inc 100.00% United States United StatesTotal E&P Nigeria Deepwater A Limited 100.00% Nigeria NigeriaTotal E&P Nigeria Deepwater B Limited 100.00% Nigeria NigeriaTotal E&P Nigeria Deepwater C Limited 100.00% Nigeria NigeriaTotal E&P Nigeria Deepwater D Limited 100.00% Nigeria NigeriaTotal E&P Nigeria Deepwater E Limited 100.00% Nigeria NigeriaTotal E&P Nigeria Deepwater F Limited 100.00% Nigeria NigeriaTotal E&P Nigeria Deepwater G Limited 100.00% Nigeria NigeriaTotal E&P Nigeria Deepwater H Limited 100.00% Nigeria NigeriaTotal E&P Nigeria Ltd 100.00% Nigeria NigeriaTotal E&P Norge A/S 100.00% Norway NorwayTotal E&P Nurmunai 100.00% France KazakhstanTotal E&P Oman 100.00% France OmanTotal E&P Oman Petroleum B.V. 100.00% Netherlands OmanTotal E&P Philippines B.V. 100.00% Netherlands PhilippinesTotal E&P PNG 1 B.V. 100.00% Netherlands Papua New GuineaTotal E&P PNG 2 B.V. 100.00% Netherlands Papua New GuineaTotal E&P PNG 3 B.V. 100.00% Netherlands Papua New GuineaTotal E&P PNG 4 B.V. 100.00% Netherlands Papua New GuineaTotal E&P PNG 5 B.V. 100.00% Netherlands Papua New GuineaTotal E&P PNG Limited 100.00% Papua New Guinea Papua New GuineaTotal E&P Poland B.V. 100.00% Netherlands PolandTotal E&P Qatar 100.00% France QatarTotal E&P RDC 100.00% Democratic Republic Democratic Republic
of Congo of CongoTotal E&P Research & Technology USA LLC 100.00% United States United StatesTotal E&P Russie 100.00% France Russian FederationTotal E&P Sadang 100.00% France IndonesiaTotal E&P Sageri 100.00% France IndonesiaTotal E&P Sebuku 100.00% France IndonesiaTotal E&P Services China Co. Ltd 100.00% China ChinaTotal E&P Shtokman 100.00% France Russian FederationTotal E&P South Africa B.V. 100.00% Netherlands South AfricaTotal E&P South East Mahakam 100.00% France IndonesiaTotal E&P South Sageri 100.00% France IndonesiaTotal E&P South Sudan 100.00% France Republic of South SudanTotal E&P Syrie 100.00% France Syrian Arab RepublicTotal E&P Tajikistan B.V. 100.00% Netherlands TajikistanTotal E&P Thailand 100.00% France ThailandTotal E&P Uganda B.V. 100.00% Netherlands UgandaTotal E&P UK Limited 100.00% United Kingdom United KingdomTotal E&P Uruguay B.V. 100.00% Netherlands UruguayTotal E&P Uruguay Onshore B.V. 100.00% Netherlands UruguayTotal E&P USA Inc 100.00% United States United StatesTotal E&P USA Oil Shale, LLC 100.00% United States United States
10 Consolidated Financial StatementsNotes to the Consolidated Financial Statements – Note 35
TOTAL. Registration Document 2015276
Business Statutory corporate name % Group Method Country of Country ofsegment interest incorporation operations
Upstream (contd)

Total E&P Well Response 100.00% France FranceTotal E&P Yamal 100.00% France FranceTotal E&P Yemen 100.00% France YemenTotal E&P Yemen Block 3 B.V. 100.00% Netherlands YemenTotal Energie Gaz 100.00% France FranceTotal Exploration M’bridge 100.00% Netherlands AngolaTotal Exploration Production Nigeria 100.00% France FranceTotal Exploration Production Timan-Pechora LLC 100.00% Russian Federation Russian FederationTotal Facilities Management B.V. 100.00% Netherlands NetherlandsTotal Gabon 58.28% Gabon GabonTotal Gas & Power Actifs Industriels 100.00% France FranceTotal Gas & Power Asia Private Limited 100.00% Singapore SingaporeTotal Gas & Power Brazil 100.00% France FranceTotal Gas & Power Chartering Limited 100.00% United Kingdom United KingdomTotal Gas & Power Limited 100.00% United Kingdom United KingdomTotal Gas & Power North America Inc 100.00% United States United StatesTotal Gas & Power Services Limited 100.00% United Kingdom United KingdomTotal Gas & Power Thailand 100.00% France FranceTotal Gas Contracts Limited 100.00% United Kingdom United KingdomTotal Gas Pipeline USA Inc 100.00% United States United StatesTotal Gas Shale Europe 100.00% France FranceTotal Gas Y Electricidad Argentina S.A. 100.00% Argentina ArgentinaTotal Gasandes 100.00% France FranceTotal Gass Handel Norge AS 100.00% Norway NorwayTotal Gastransport Nederland B.V. 100.00% Netherlands NetherlandsTotal Gaz Electricite Holdings France 100.00% France FranceTotal GLNG Australia 100.00% France AustraliaTotal Holding Dolphin Amont 100.00% France FranceTotal Holdings International B.V. 100.00% Netherlands NetherlandsTotal Holdings Nederland B.V. 100.00% Netherlands NetherlandsTotal LNG Angola 100.00% France FranceTotal LNG Nigeria Limited 100.00% France FranceTotal LNG Supply Services USA Inc 100.00% United States United StatesTotal Midstream Holdings UK Limited 100.00% United Kingdom United KingdomTotal NNS LLC 100.00% United States United KingdomTotal Oil and Gas South America 100.00% France FranceTotal Oil and Gas Venezuela B.V. 100.00% Netherlands VenezuelaTotal Pars LNG 100.00% France IranTotal Participations Petrolieres Gabon 100.00% Gabon GabonTotal Petroleum Angola 100.00% France AngolaTotal Profils Petroliers 100.00% France FranceTotal Qatar Oil And Gas 100.00% France FranceTotal Shtokman B.V. 100.00% Netherlands NetherlandsTotal South Pars 100.00% France IranTotal Tengah 100.00% France IndonesiaTotal Termokarstovoye B.V. 100.00% Netherlands Russian FederationTotal Tractebel Emirates O & M Company 50.00% E France United Arab EmiratesTotal Tractebel Emirates Power Company 50.00% E France United Arab EmiratesTotal Upstream Nigeria Limited 100.00% Nigeria NigeriaTotal Upstream UK Limited 100.00% United Kingdom United KingdomTotal Venezuela 100.00% France FranceTotal Yemen LNG Company Ltd. 100.00% Bermuda BermudaTransportadora De Gas Del Mercosur S.A. 32.68% E Argentina ArgentinaUnitah Colorado Resources II, LLC 100.00% United States United StatesYamal LNG (b) 31.35% E Russian Federation Russian FederationYemen LNG Company Ltd 39.62% E Bermuda YemenYpergas S.A. 37.33% Venezuela Venezuela
(b) % of control different from % of interest: 20.02%.
Consolidated Financial Statements 10Note 35 – Notes to the Consolidated Financial Statements
Registration Document 2015. TOTAL 277
Business Statutory corporate name % Group Method Country of Country ofsegment interest incorporation operations
Upstream (contd)
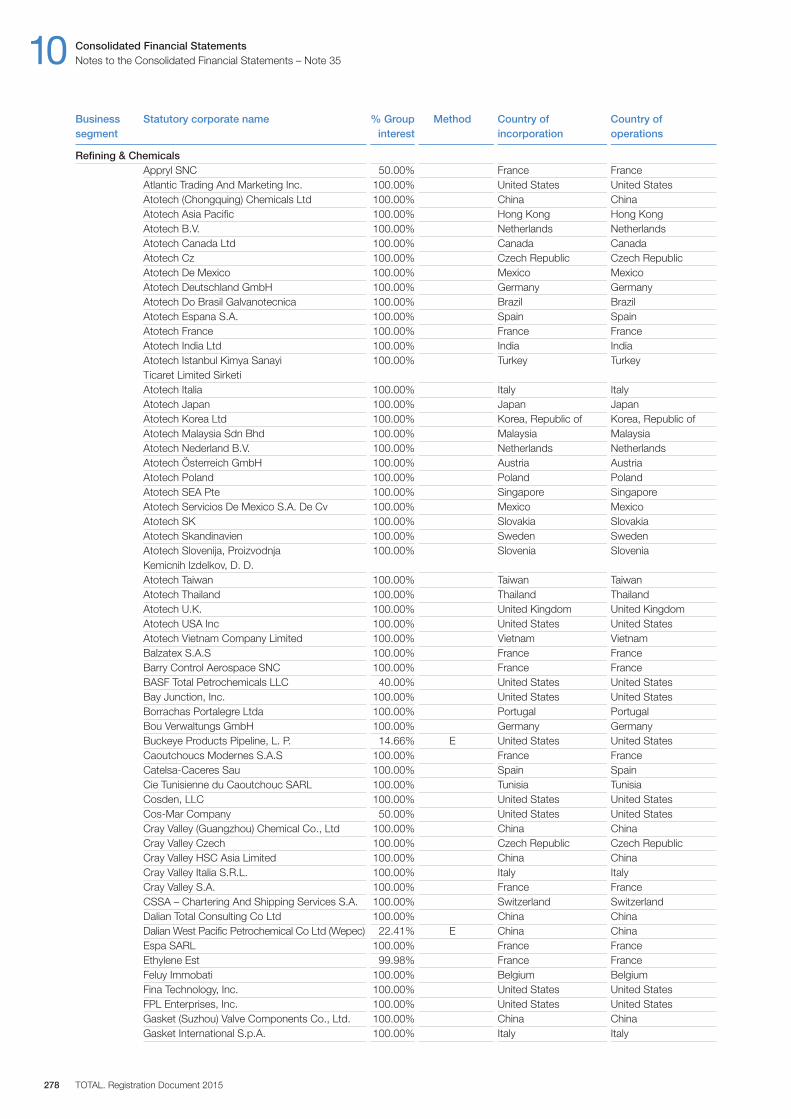
Refining & ChemicalsAppryl SNC 50.00% France FranceAtlantic Trading And Marketing Inc. 100.00% United States United StatesAtotech (Chongquing) Chemicals Ltd 100.00% China ChinaAtotech Asia Pacific 100.00% Hong Kong Hong KongAtotech B.V. 100.00% Netherlands NetherlandsAtotech Canada Ltd 100.00% Canada CanadaAtotech Cz 100.00% Czech Republic Czech RepublicAtotech De Mexico 100.00% Mexico MexicoAtotech Deutschland GmbH 100.00% Germany GermanyAtotech Do Brasil Galvanotecnica 100.00% Brazil BrazilAtotech Espana S.A. 100.00% Spain SpainAtotech France 100.00% France FranceAtotech India Ltd 100.00% India IndiaAtotech Istanbul Kimya Sanayi 100.00% Turkey TurkeyTicaret Limited SirketiAtotech Italia 100.00% Italy ItalyAtotech Japan 100.00% Japan JapanAtotech Korea Ltd 100.00% Korea, Republic of Korea, Republic of Atotech Malaysia Sdn Bhd 100.00% Malaysia MalaysiaAtotech Nederland B.V. 100.00% Netherlands NetherlandsAtotech Österreich GmbH 100.00% Austria AustriaAtotech Poland 100.00% Poland PolandAtotech SEA Pte 100.00% Singapore SingaporeAtotech Servicios De Mexico S.A. De Cv 100.00% Mexico MexicoAtotech SK 100.00% Slovakia SlovakiaAtotech Skandinavien 100.00% Sweden SwedenAtotech Slovenija, Proizvodnja 100.00% Slovenia SloveniaKemicnih Izdelkov, D. D. Atotech Taiwan 100.00% Taiwan TaiwanAtotech Thailand 100.00% Thailand ThailandAtotech U.K. 100.00% United Kingdom United KingdomAtotech USA Inc 100.00% United States United StatesAtotech Vietnam Company Limited 100.00% Vietnam VietnamBalzatex S.A.S 100.00% France FranceBarry Control Aerospace SNC 100.00% France FranceBASF Total Petrochemicals LLC 40.00% United States United StatesBay Junction, Inc. 100.00% United States United StatesBorrachas Portalegre Ltda 100.00% Portugal PortugalBou Verwaltungs GmbH 100.00% Germany GermanyBuckeye Products Pipeline, L. P. 14.66% E United States United StatesCaoutchoucs Modernes S.A.S 100.00% France FranceCatelsa-Caceres Sau 100.00% Spain SpainCie Tunisienne du Caoutchouc SARL 100.00% Tunisia TunisiaCosden, LLC 100.00% United States United StatesCos-Mar Company 50.00% United States United StatesCray Valley (Guangzhou) Chemical Co., Ltd 100.00% China ChinaCray Valley Czech 100.00% Czech Republic Czech RepublicCray Valley HSC Asia Limited 100.00% China ChinaCray Valley Italia S.R.L. 100.00% Italy ItalyCray Valley S.A. 100.00% France FranceCSSA – Chartering And Shipping Services S.A. 100.00% Switzerland SwitzerlandDalian Total Consulting Co Ltd 100.00% China ChinaDalian West Pacific Petrochemical Co Ltd (Wepec) 22.41% E China ChinaEspa SARL 100.00% France FranceEthylene Est 99.98% France FranceFeluy Immobati 100.00% Belgium BelgiumFina Technology, Inc. 100.00% United States United StatesFPL Enterprises, Inc. 100.00% United States United StatesGasket (Suzhou) Valve Components Co., Ltd. 100.00% China ChinaGasket International S.p.A. 100.00% Italy Italy
10 Consolidated Financial StatementsNotes to the Consolidated Financial Statements – Note 35
TOTAL. Registration Document 2015278
Business Statutory corporate name % Group Method Country of Country ofsegment interest incorporation operations
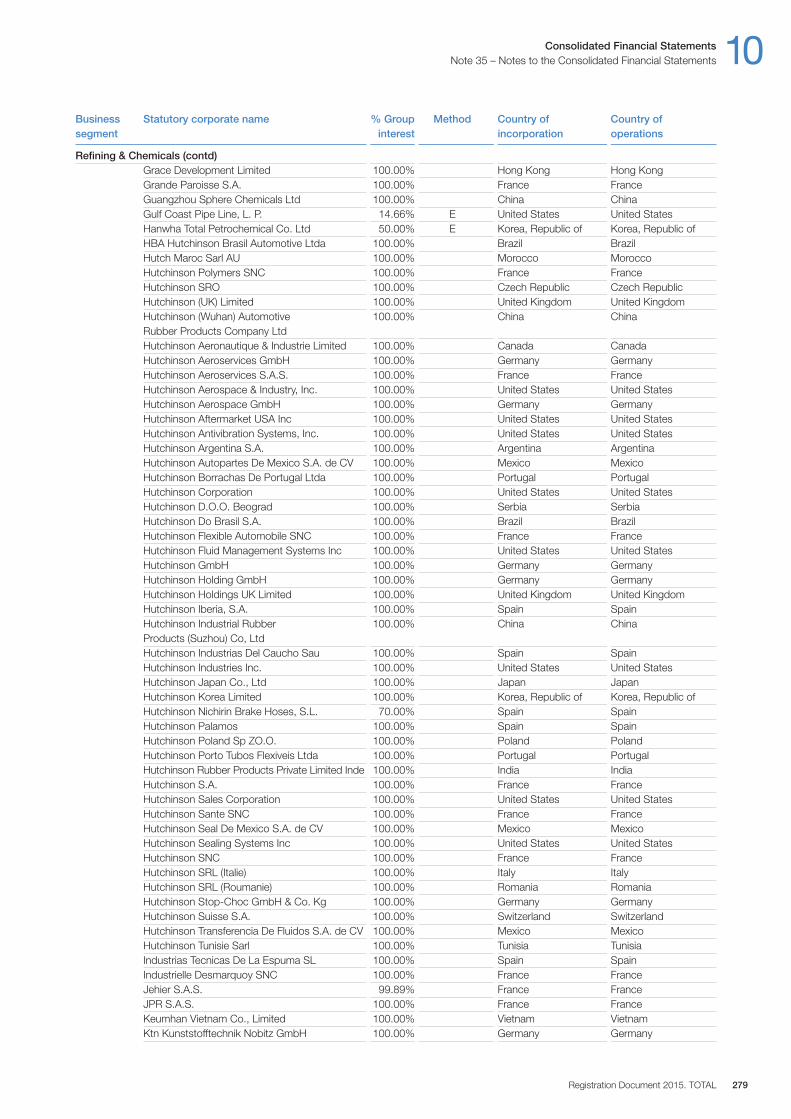
Grace Development Limited 100.00% Hong Kong Hong KongGrande Paroisse S.A. 100.00% France FranceGuangzhou Sphere Chemicals Ltd 100.00% China ChinaGulf Coast Pipe Line, L. P. 14.66% E United States United StatesHanwha Total Petrochemical Co. Ltd 50.00% E Korea, Republic of Korea, Republic of HBA Hutchinson Brasil Automotive Ltda 100.00% Brazil BrazilHutch Maroc Sarl AU 100.00% Morocco MoroccoHutchinson Polymers SNC 100.00% France FranceHutchinson SRO 100.00% Czech Republic Czech RepublicHutchinson (UK) Limited 100.00% United Kingdom United KingdomHutchinson (Wuhan) Automotive 100.00% China ChinaRubber Products Company LtdHutchinson Aeronautique & Industrie Limited 100.00% Canada CanadaHutchinson Aeroservices GmbH 100.00% Germany GermanyHutchinson Aeroservices S.A.S. 100.00% France FranceHutchinson Aerospace & Industry, Inc. 100.00% United States United StatesHutchinson Aerospace GmbH 100.00% Germany GermanyHutchinson Aftermarket USA Inc 100.00% United States United StatesHutchinson Antivibration Systems, Inc. 100.00% United States United StatesHutchinson Argentina S.A. 100.00% Argentina ArgentinaHutchinson Autopartes De Mexico S.A. de CV 100.00% Mexico MexicoHutchinson Borrachas De Portugal Ltda 100.00% Portugal PortugalHutchinson Corporation 100.00% United States United StatesHutchinson D.O.O. Beograd 100.00% Serbia SerbiaHutchinson Do Brasil S.A. 100.00% Brazil BrazilHutchinson Flexible Automobile SNC 100.00% France FranceHutchinson Fluid Management Systems Inc 100.00% United States United StatesHutchinson GmbH 100.00% Germany GermanyHutchinson Holding GmbH 100.00% Germany GermanyHutchinson Holdings UK Limited 100.00% United Kingdom United KingdomHutchinson Iberia, S.A. 100.00% Spain SpainHutchinson Industrial Rubber 100.00% China ChinaProducts (Suzhou) Co, LtdHutchinson Industrias Del Caucho Sau 100.00% Spain SpainHutchinson Industries Inc. 100.00% United States United StatesHutchinson Japan Co., Ltd 100.00% Japan JapanHutchinson Korea Limited 100.00% Korea, Republic of Korea, Republic of Hutchinson Nichirin Brake Hoses, S.L. 70.00% Spain SpainHutchinson Palamos 100.00% Spain SpainHutchinson Poland Sp ZO.O. 100.00% Poland PolandHutchinson Porto Tubos Flexiveis Ltda 100.00% Portugal PortugalHutchinson Rubber Products Private Limited Inde 100.00% India IndiaHutchinson S.A. 100.00% France FranceHutchinson Sales Corporation 100.00% United States United StatesHutchinson Sante SNC 100.00% France FranceHutchinson Seal De Mexico S.A. de CV 100.00% Mexico MexicoHutchinson Sealing Systems Inc 100.00% United States United StatesHutchinson SNC 100.00% France FranceHutchinson SRL (Italie) 100.00% Italy ItalyHutchinson SRL (Roumanie) 100.00% Romania RomaniaHutchinson Stop-Choc GmbH & Co. Kg 100.00% Germany GermanyHutchinson Suisse S.A. 100.00% Switzerland SwitzerlandHutchinson Transferencia De Fluidos S.A. de CV 100.00% Mexico MexicoHutchinson Tunisie Sarl 100.00% Tunisia TunisiaIndustrias Tecnicas De La Espuma SL 100.00% Spain SpainIndustrielle Desmarquoy SNC 100.00% France FranceJehier S.A.S. 99.89% France FranceJPR S.A.S. 100.00% France FranceKeumhan Vietnam Co., Limited 100.00% Vietnam VietnamKtn Kunststofftechnik Nobitz GmbH 100.00% Germany Germany
Consolidated Financial Statements 10Note 35 – Notes to the Consolidated Financial Statements
Registration Document 2015. TOTAL 279
Business Statutory corporate name % Group Method Country of Country ofsegment interest incorporation operations
Refining & Chemicals (contd)
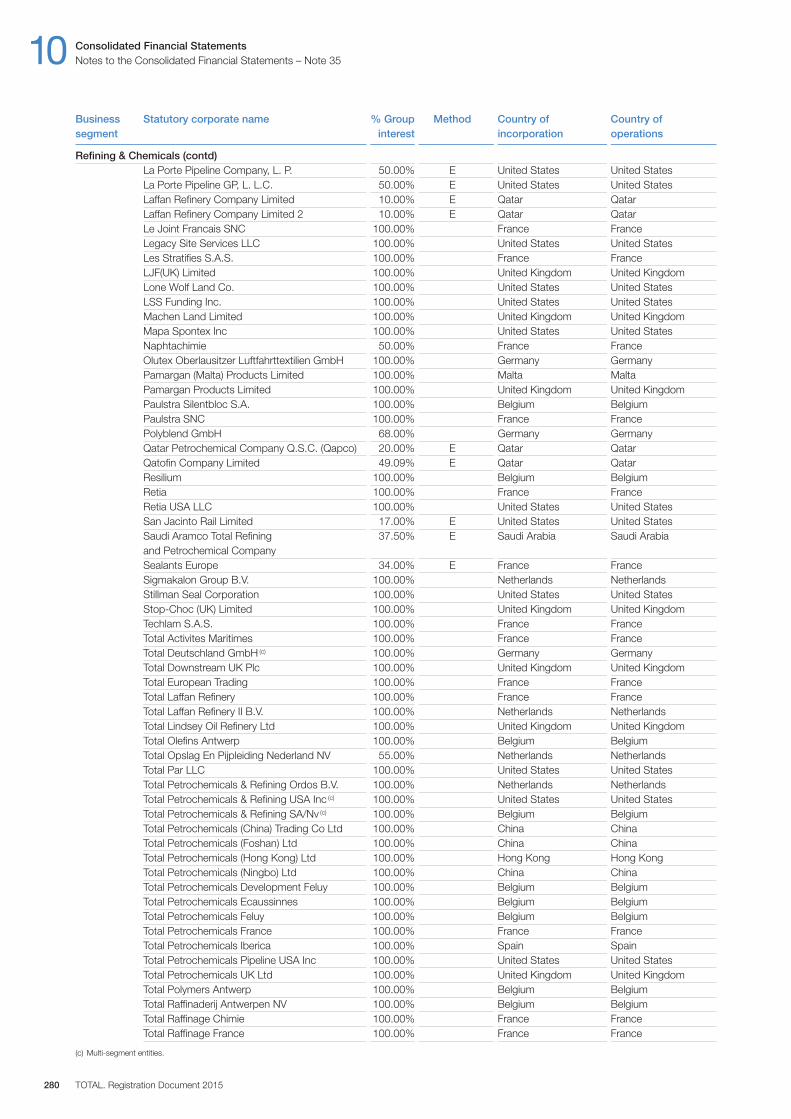
La Porte Pipeline Company, L. P. 50.00% E United States United StatesLa Porte Pipeline GP, L. L.C. 50.00% E United States United StatesLaffan Refinery Company Limited 10.00% E Qatar QatarLaffan Refinery Company Limited 2 10.00% E Qatar QatarLe Joint Francais SNC 100.00% France FranceLegacy Site Services LLC 100.00% United States United StatesLes Stratifies S.A.S. 100.00% France FranceLJF(UK) Limited 100.00% United Kingdom United KingdomLone Wolf Land Co. 100.00% United States United StatesLSS Funding Inc. 100.00% United States United StatesMachen Land Limited 100.00% United Kingdom United KingdomMapa Spontex Inc 100.00% United States United StatesNaphtachimie 50.00% France FranceOlutex Oberlausitzer Luftfahrttextilien GmbH 100.00% Germany GermanyPamargan (Malta) Products Limited 100.00% Malta MaltaPamargan Products Limited 100.00% United Kingdom United KingdomPaulstra Silentbloc S.A. 100.00% Belgium BelgiumPaulstra SNC 100.00% France FrancePolyblend GmbH 68.00% Germany GermanyQatar Petrochemical Company Q.S.C. (Qapco) 20.00% E Qatar QatarQatofin Company Limited 49.09% E Qatar QatarResilium 100.00% Belgium BelgiumRetia 100.00% France FranceRetia USA LLC 100.00% United States United StatesSan Jacinto Rail Limited 17.00% E United States United StatesSaudi Aramco Total Refining 37.50% E Saudi Arabia Saudi Arabiaand Petrochemical CompanySealants Europe 34.00% E France FranceSigmakalon Group B.V. 100.00% Netherlands NetherlandsStillman Seal Corporation 100.00% United States United StatesStop-Choc (UK) Limited 100.00% United Kingdom United KingdomTechlam S.A.S. 100.00% France FranceTotal Activites Maritimes 100.00% France FranceTotal Deutschland GmbH (c) 100.00% Germany GermanyTotal Downstream UK Plc 100.00% United Kingdom United KingdomTotal European Trading 100.00% France FranceTotal Laffan Refinery 100.00% France FranceTotal Laffan Refinery II B.V. 100.00% Netherlands NetherlandsTotal Lindsey Oil Refinery Ltd 100.00% United Kingdom United KingdomTotal Olefins Antwerp 100.00% Belgium BelgiumTotal Opslag En Pijpleiding Nederland NV 55.00% Netherlands NetherlandsTotal Par LLC 100.00% United States United StatesTotal Petrochemicals & Refining Ordos B.V. 100.00% Netherlands NetherlandsTotal Petrochemicals & Refining USA Inc (c) 100.00% United States United StatesTotal Petrochemicals & Refining SA / Nv (c) 100.00% Belgium BelgiumTotal Petrochemicals (China) Trading Co Ltd 100.00% China ChinaTotal Petrochemicals (Foshan) Ltd 100.00% China ChinaTotal Petrochemicals (Hong Kong) Ltd 100.00% Hong Kong Hong KongTotal Petrochemicals (Ningbo) Ltd 100.00% China ChinaTotal Petrochemicals Development Feluy 100.00% Belgium BelgiumTotal Petrochemicals Ecaussinnes 100.00% Belgium BelgiumTotal Petrochemicals Feluy 100.00% Belgium BelgiumTotal Petrochemicals France 100.00% France FranceTotal Petrochemicals Iberica 100.00% Spain SpainTotal Petrochemicals Pipeline USA Inc 100.00% United States United StatesTotal Petrochemicals UK Ltd 100.00% United Kingdom United KingdomTotal Polymers Antwerp 100.00% Belgium BelgiumTotal Raffinaderij Antwerpen NV 100.00% Belgium BelgiumTotal Raffinage Chimie 100.00% France FranceTotal Raffinage France 100.00% France France
(c) Multi-segment entities.
10 Consolidated Financial StatementsNotes to the Consolidated Financial Statements – Note 35
TOTAL. Registration Document 2015280
Business Statutory corporate name % Group Method Country of Country ofsegment interest incorporation operations
Refining & Chemicals (contd)
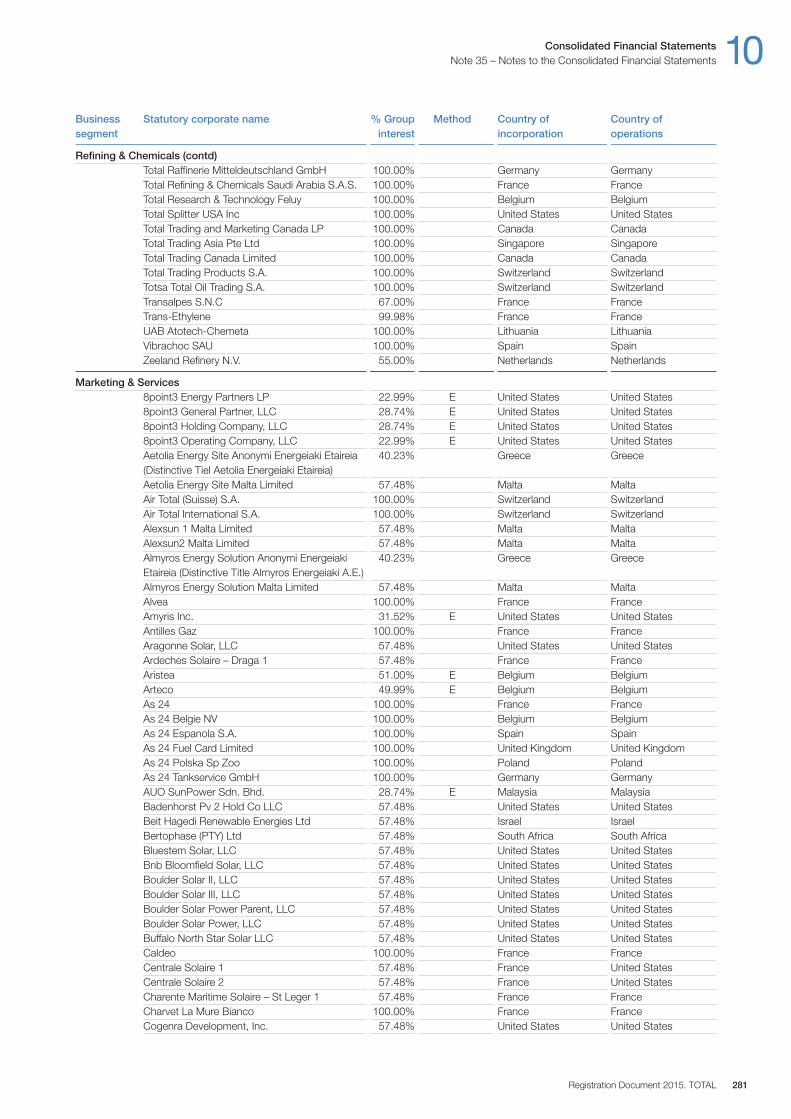
Total Raffinerie Mitteldeutschland GmbH 100.00% Germany GermanyTotal Refining & Chemicals Saudi Arabia S.A.S. 100.00% France FranceTotal Research & Technology Feluy 100.00% Belgium BelgiumTotal Splitter USA Inc 100.00% United States United StatesTotal Trading and Marketing Canada LP 100.00% Canada CanadaTotal Trading Asia Pte Ltd 100.00% Singapore SingaporeTotal Trading Canada Limited 100.00% Canada CanadaTotal Trading Products S.A. 100.00% Switzerland SwitzerlandTotsa Total Oil Trading S.A. 100.00% Switzerland SwitzerlandTransalpes S.N.C 67.00% France FranceTrans-Ethylene 99.98% France FranceUAB Atotech-Chemeta 100.00% Lithuania LithuaniaVibrachoc SAU 100.00% Spain SpainZeeland Refinery N.V. 55.00% Netherlands Netherlands
Marketing & Services8point3 Energy Partners LP 22.99% E United States United States8point3 General Partner, LLC 28.74% E United States United States8point3 Holding Company, LLC 28.74% E United States United States8point3 Operating Company, LLC 22.99% E United States United StatesAetolia Energy Site Anonymi Energeiaki Etaireia 40.23% Greece Greece(Distinctive Tiel Aetolia Energeiaki Etaireia)Aetolia Energy Site Malta Limited 57.48% Malta MaltaAir Total (Suisse) S.A. 100.00% Switzerland SwitzerlandAir Total International S.A. 100.00% Switzerland SwitzerlandAlexsun 1 Malta Limited 57.48% Malta MaltaAlexsun2 Malta Limited 57.48% Malta MaltaAlmyros Energy Solution Anonymi Energeiaki 40.23% Greece GreeceEtaireia (Distinctive Title Almyros Energeiaki A.E.)Almyros Energy Solution Malta Limited 57.48% Malta MaltaAlvea 100.00% France FranceAmyris Inc. 31.52% E United States United StatesAntilles Gaz 100.00% France FranceAragonne Solar, LLC 57.48% United States United StatesArdeches Solaire – Draga 1 57.48% France FranceAristea 51.00% E Belgium BelgiumArteco 49.99% E Belgium BelgiumAs 24 100.00% France FranceAs 24 Belgie NV 100.00% Belgium BelgiumAs 24 Espanola S.A. 100.00% Spain SpainAs 24 Fuel Card Limited 100.00% United Kingdom United KingdomAs 24 Polska Sp Zoo 100.00% Poland PolandAs 24 Tankservice GmbH 100.00% Germany GermanyAUO SunPower Sdn. Bhd. 28.74% E Malaysia MalaysiaBadenhorst Pv 2 Hold Co LLC 57.48% United States United StatesBeit Hagedi Renewable Energies Ltd 57.48% Israel IsraelBertophase (PTY) Ltd 57.48% South Africa South AfricaBluestem Solar, LLC 57.48% United States United StatesBnb Bloomfield Solar, LLC 57.48% United States United StatesBoulder Solar II, LLC 57.48% United States United StatesBoulder Solar III, LLC 57.48% United States United StatesBoulder Solar Power Parent, LLC 57.48% United States United StatesBoulder Solar Power, LLC 57.48% United States United StatesBuffalo North Star Solar LLC 57.48% United States United StatesCaldeo 100.00% France FranceCentrale Solaire 1 57.48% France United StatesCentrale Solaire 2 57.48% France United StatesCharente Maritime Solaire – St Leger 1 57.48% France FranceCharvet La Mure Bianco 100.00% France FranceCogenra Development, Inc. 57.48% United States United States
Consolidated Financial Statements 10Note 35 – Notes to the Consolidated Financial Statements
Registration Document 2015. TOTAL 281
Business Statutory corporate name % Group Method Country of Country ofsegment interest incorporation operations
Refining & Chemicals (contd)
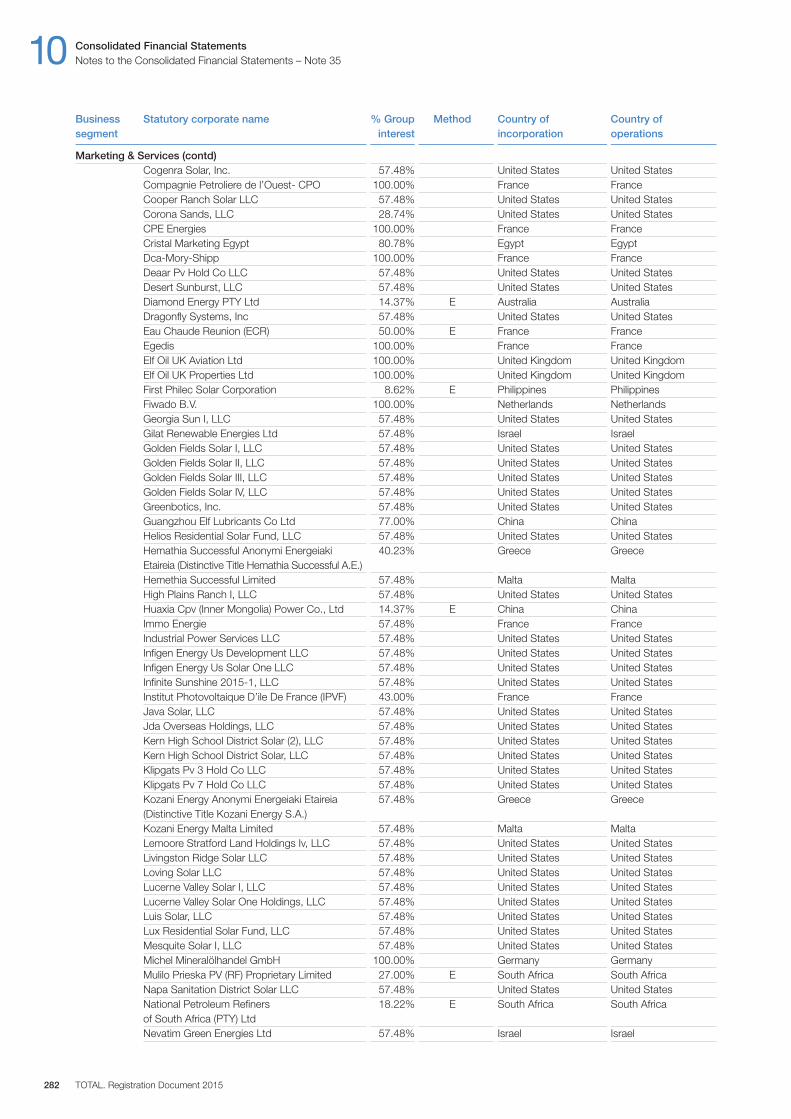
Cogenra Solar, Inc. 57.48% United States United StatesCompagnie Petroliere de l’Ouest- CPO 100.00% France FranceCooper Ranch Solar LLC 57.48% United States United StatesCorona Sands, LLC 28.74% United States United StatesCPE Energies 100.00% France FranceCristal Marketing Egypt 80.78% Egypt EgyptDca-Mory-Shipp 100.00% France FranceDeaar Pv Hold Co LLC 57.48% United States United StatesDesert Sunburst, LLC 57.48% United States United StatesDiamond Energy PTY Ltd 14.37% E Australia AustraliaDragonfly Systems, Inc 57.48% United States United StatesEau Chaude Reunion (ECR) 50.00% E France FranceEgedis 100.00% France FranceElf Oil UK Aviation Ltd 100.00% United Kingdom United KingdomElf Oil UK Properties Ltd 100.00% United Kingdom United KingdomFirst Philec Solar Corporation 8.62% E Philippines PhilippinesFiwado B.V. 100.00% Netherlands NetherlandsGeorgia Sun I, LLC 57.48% United States United StatesGilat Renewable Energies Ltd 57.48% Israel IsraelGolden Fields Solar I, LLC 57.48% United States United StatesGolden Fields Solar II, LLC 57.48% United States United StatesGolden Fields Solar III, LLC 57.48% United States United StatesGolden Fields Solar IV, LLC 57.48% United States United StatesGreenbotics, Inc. 57.48% United States United StatesGuangzhou Elf Lubricants Co Ltd 77.00% China ChinaHelios Residential Solar Fund, LLC 57.48% United States United StatesHemathia Successful Anonymi Energeiaki 40.23% Greece GreeceEtaireia (Distinctive Title Hemathia Successful A.E.)Hemethia Successful Limited 57.48% Malta MaltaHigh Plains Ranch I, LLC 57.48% United States United StatesHuaxia Cpv (Inner Mongolia) Power Co., Ltd 14.37% E China ChinaImmo Energie 57.48% France FranceIndustrial Power Services LLC 57.48% United States United StatesInfigen Energy Us Development LLC 57.48% United States United StatesInfigen Energy Us Solar One LLC 57.48% United States United StatesInfinite Sunshine 2015-1, LLC 57.48% United States United StatesInstitut Photovoltaique D’ile De France (IPVF) 43.00% France FranceJava Solar, LLC 57.48% United States United StatesJda Overseas Holdings, LLC 57.48% United States United StatesKern High School District Solar (2), LLC 57.48% United States United StatesKern High School District Solar, LLC 57.48% United States United StatesKlipgats Pv 3 Hold Co LLC 57.48% United States United StatesKlipgats Pv 7 Hold Co LLC 57.48% United States United StatesKozani Energy Anonymi Energeiaki Etaireia 57.48% Greece Greece(Distinctive Title Kozani Energy S.A.)Kozani Energy Malta Limited 57.48% Malta MaltaLemoore Stratford Land Holdings Iv, LLC 57.48% United States United StatesLivingston Ridge Solar LLC 57.48% United States United StatesLoving Solar LLC 57.48% United States United StatesLucerne Valley Solar I, LLC 57.48% United States United StatesLucerne Valley Solar One Holdings, LLC 57.48% United States United StatesLuis Solar, LLC 57.48% United States United StatesLux Residential Solar Fund, LLC 57.48% United States United StatesMesquite Solar I, LLC 57.48% United States United StatesMichel Mineralölhandel GmbH 100.00% Germany GermanyMulilo Prieska PV (RF) Proprietary Limited 27.00% E South Africa South AfricaNapa Sanitation District Solar LLC 57.48% United States United StatesNational Petroleum Refiners 18.22% E South Africa South Africaof South Africa (PTY) LtdNevatim Green Energies Ltd 57.48% Israel Israel
10 Consolidated Financial StatementsNotes to the Consolidated Financial Statements – Note 35
TOTAL. Registration Document 2015282
Business Statutory corporate name % Group Method Country of Country ofsegment interest incorporation operations
Marketing & Services (contd)
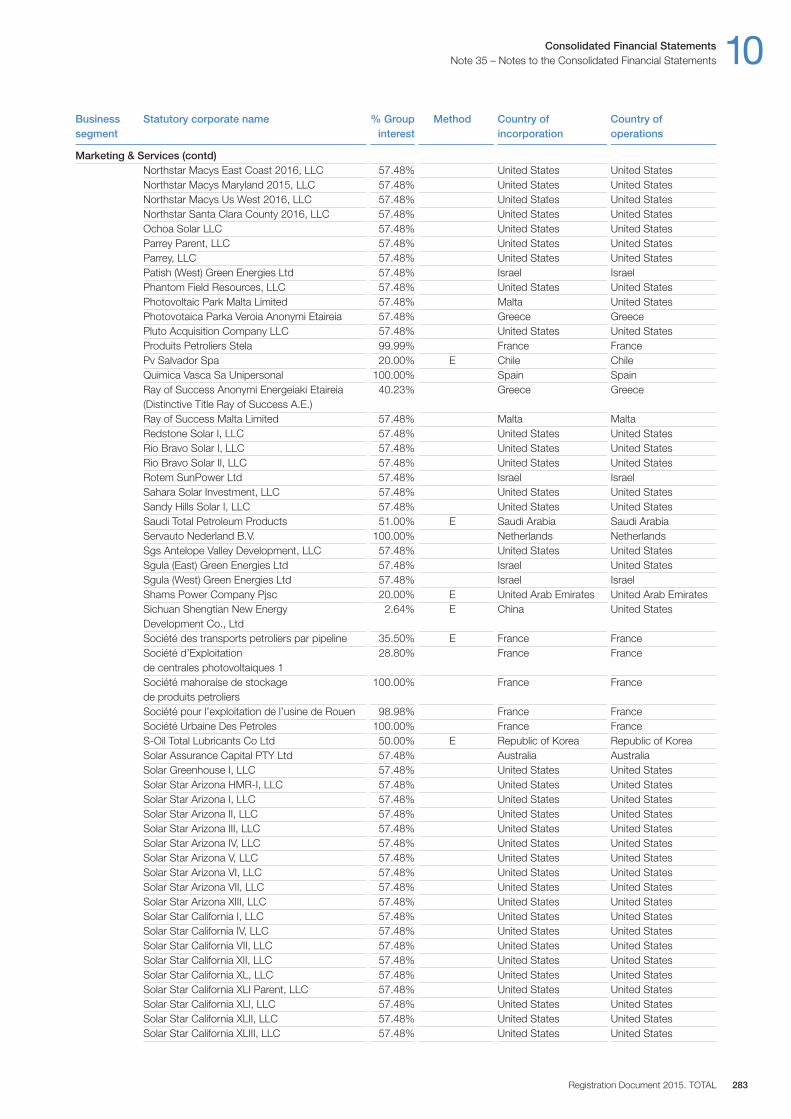
Northstar Macys East Coast 2016, LLC 57.48% United States United StatesNorthstar Macys Maryland 2015, LLC 57.48% United States United StatesNorthstar Macys Us West 2016, LLC 57.48% United States United StatesNorthstar Santa Clara County 2016, LLC 57.48% United States United StatesOchoa Solar LLC 57.48% United States United StatesParrey Parent, LLC 57.48% United States United StatesParrey, LLC 57.48% United States United StatesPatish (West) Green Energies Ltd 57.48% Israel IsraelPhantom Field Resources, LLC 57.48% United States United StatesPhotovoltaic Park Malta Limited 57.48% Malta United StatesPhotovotaica Parka Veroia Anonymi Etaireia 57.48% Greece GreecePluto Acquisition Company LLC 57.48% United States United StatesProduits Petroliers Stela 99.99% France FrancePv Salvador Spa 20.00% E Chile ChileQuimica Vasca Sa Unipersonal 100.00% Spain SpainRay of Success Anonymi Energeiaki Etaireia 40.23% Greece Greece(Distinctive Title Ray of Success A.E.)Ray of Success Malta Limited 57.48% Malta MaltaRedstone Solar I, LLC 57.48% United States United StatesRio Bravo Solar I, LLC 57.48% United States United StatesRio Bravo Solar II, LLC 57.48% United States United StatesRotem SunPower Ltd 57.48% Israel IsraelSahara Solar Investment, LLC 57.48% United States United StatesSandy Hills Solar I, LLC 57.48% United States United StatesSaudi Total Petroleum Products 51.00% E Saudi Arabia Saudi ArabiaServauto Nederland B.V. 100.00% Netherlands NetherlandsSgs Antelope Valley Development, LLC 57.48% United States United StatesSgula (East) Green Energies Ltd 57.48% Israel United StatesSgula (West) Green Energies Ltd 57.48% Israel IsraelShams Power Company Pjsc 20.00% E United Arab Emirates United Arab EmiratesSichuan Shengtian New Energy 2.64% E China United StatesDevelopment Co., LtdSociété des transports petroliers par pipeline 35.50% E France FranceSociété d’Exploitation 28.80% France Francede centrales photovoltaiques 1Société mahoraise de stockage 100.00% France Francede produits petroliersSociété pour l’exploitation de l’usine de Rouen 98.98% France FranceSociété Urbaine Des Petroles 100.00% France FranceS-Oil Total Lubricants Co Ltd 50.00% E Republic of Korea Republic of KoreaSolar Assurance Capital PTY Ltd 57.48% Australia AustraliaSolar Greenhouse I, LLC 57.48% United States United StatesSolar Star Arizona HMR-I, LLC 57.48% United States United StatesSolar Star Arizona I, LLC 57.48% United States United StatesSolar Star Arizona II, LLC 57.48% United States United StatesSolar Star Arizona III, LLC 57.48% United States United StatesSolar Star Arizona IV, LLC 57.48% United States United StatesSolar Star Arizona V, LLC 57.48% United States United StatesSolar Star Arizona VI, LLC 57.48% United States United StatesSolar Star Arizona VII, LLC 57.48% United States United StatesSolar Star Arizona XIII, LLC 57.48% United States United StatesSolar Star California I, LLC 57.48% United States United StatesSolar Star California IV, LLC 57.48% United States United StatesSolar Star California VII, LLC 57.48% United States United StatesSolar Star California XII, LLC 57.48% United States United StatesSolar Star California XL, LLC 57.48% United States United StatesSolar Star California XLI Parent, LLC 57.48% United States United StatesSolar Star California XLI, LLC 57.48% United States United StatesSolar Star California XLII, LLC 57.48% United States United StatesSolar Star California XLIII, LLC 57.48% United States United States
Consolidated Financial Statements 10Note 35 – Notes to the Consolidated Financial Statements
Registration Document 2015. TOTAL 283
Business Statutory corporate name % Group Method Country of Country ofsegment interest incorporation operations
Marketing & Services (contd)
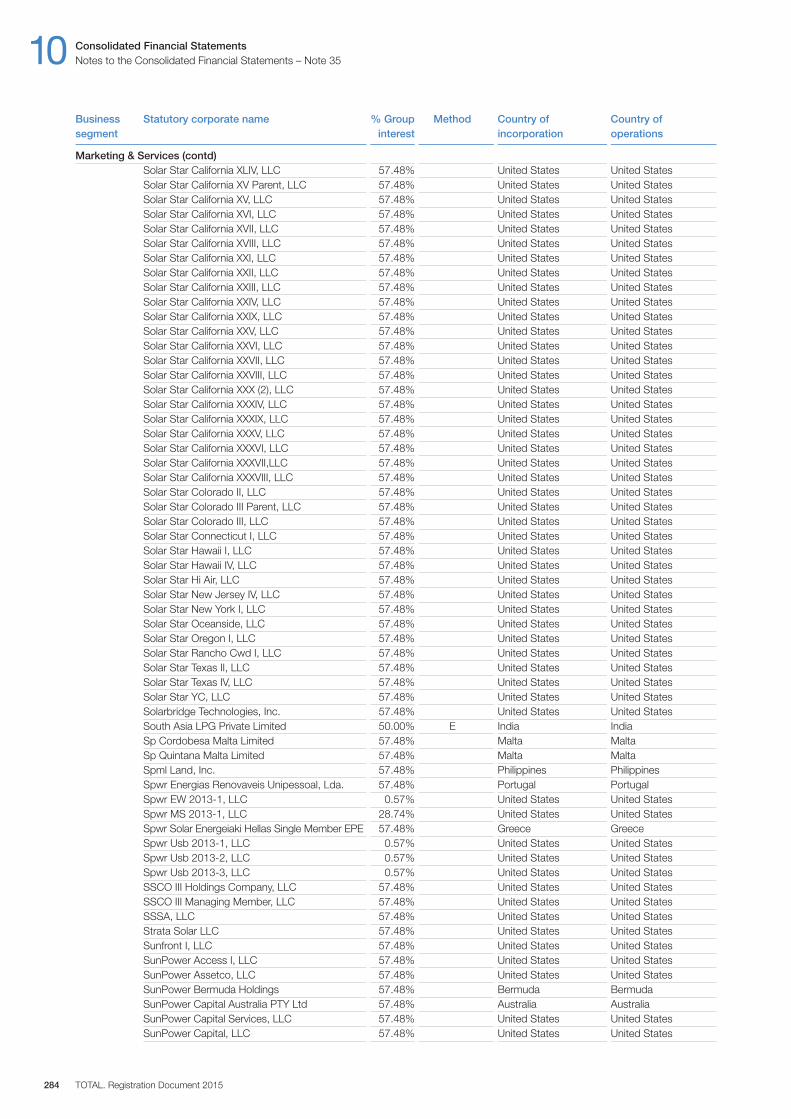
Solar Star California XLIV, LLC 57.48% United States United StatesSolar Star California XV Parent, LLC 57.48% United States United StatesSolar Star California XV, LLC 57.48% United States United StatesSolar Star California XVI, LLC 57.48% United States United StatesSolar Star California XVII, LLC 57.48% United States United StatesSolar Star California XVIII, LLC 57.48% United States United StatesSolar Star California XXI, LLC 57.48% United States United StatesSolar Star California XXII, LLC 57.48% United States United StatesSolar Star California XXIII, LLC 57.48% United States United StatesSolar Star California XXIV, LLC 57.48% United States United StatesSolar Star California XXIX, LLC 57.48% United States United StatesSolar Star California XXV, LLC 57.48% United States United StatesSolar Star California XXVI, LLC 57.48% United States United StatesSolar Star California XXVII, LLC 57.48% United States United StatesSolar Star California XXVIII, LLC 57.48% United States United StatesSolar Star California XXX (2), LLC 57.48% United States United StatesSolar Star California XXXIV, LLC 57.48% United States United StatesSolar Star California XXXIX, LLC 57.48% United States United StatesSolar Star California XXXV, LLC 57.48% United States United StatesSolar Star California XXXVI, LLC 57.48% United States United StatesSolar Star California XXXVII,LLC 57.48% United States United StatesSolar Star California XXXVIII, LLC 57.48% United States United StatesSolar Star Colorado II, LLC 57.48% United States United StatesSolar Star Colorado III Parent, LLC 57.48% United States United StatesSolar Star Colorado III, LLC 57.48% United States United StatesSolar Star Connecticut I, LLC 57.48% United States United StatesSolar Star Hawaii I, LLC 57.48% United States United StatesSolar Star Hawaii IV, LLC 57.48% United States United StatesSolar Star Hi Air, LLC 57.48% United States United StatesSolar Star New Jersey IV, LLC 57.48% United States United StatesSolar Star New York I, LLC 57.48% United States United StatesSolar Star Oceanside, LLC 57.48% United States United StatesSolar Star Oregon I, LLC 57.48% United States United StatesSolar Star Rancho Cwd I, LLC 57.48% United States United StatesSolar Star Texas II, LLC 57.48% United States United StatesSolar Star Texas IV, LLC 57.48% United States United StatesSolar Star YC, LLC 57.48% United States United StatesSolarbridge Technologies, Inc. 57.48% United States United StatesSouth Asia LPG Private Limited 50.00% E India IndiaSp Cordobesa Malta Limited 57.48% Malta MaltaSp Quintana Malta Limited 57.48% Malta MaltaSpml Land, Inc. 57.48% Philippines PhilippinesSpwr Energias Renovaveis Unipessoal, Lda. 57.48% Portugal PortugalSpwr EW 2013-1, LLC 0.57% United States United StatesSpwr MS 2013-1, LLC 28.74% United States United StatesSpwr Solar Energeiaki Hellas Single Member EPE 57.48% Greece GreeceSpwr Usb 2013-1, LLC 0.57% United States United StatesSpwr Usb 2013-2, LLC 0.57% United States United StatesSpwr Usb 2013-3, LLC 0.57% United States United StatesSSCO III Holdings Company, LLC 57.48% United States United StatesSSCO III Managing Member, LLC 57.48% United States United StatesSSSA, LLC 57.48% United States United StatesStrata Solar LLC 57.48% United States United StatesSunfront I, LLC 57.48% United States United StatesSunPower Access I, LLC 57.48% United States United StatesSunPower Assetco, LLC 57.48% United States United StatesSunPower Bermuda Holdings 57.48% Bermuda BermudaSunPower Capital Australia PTY Ltd 57.48% Australia AustraliaSunPower Capital Services, LLC 57.48% United States United StatesSunPower Capital, LLC 57.48% United States United States
10 Consolidated Financial StatementsNotes to the Consolidated Financial Statements – Note 35
TOTAL. Registration Document 2015284
Business Statutory corporate name % Group Method Country of Country ofsegment interest incorporation operations
Marketing & Services (contd)
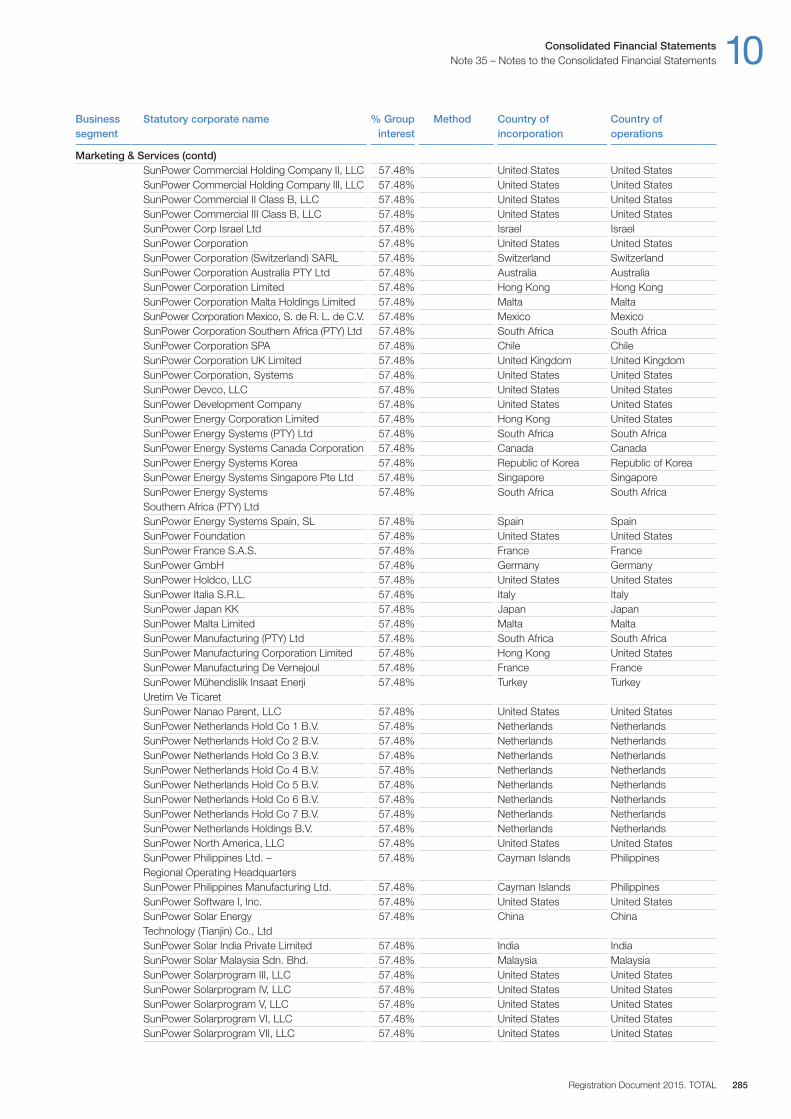
SunPower Commercial Holding Company II, LLC 57.48% United States United StatesSunPower Commercial Holding Company III, LLC 57.48% United States United StatesSunPower Commercial II Class B, LLC 57.48% United States United StatesSunPower Commercial III Class B, LLC 57.48% United States United StatesSunPower Corp Israel Ltd 57.48% Israel IsraelSunPower Corporation 57.48% United States United StatesSunPower Corporation (Switzerland) SARL 57.48% Switzerland SwitzerlandSunPower Corporation Australia PTY Ltd 57.48% Australia AustraliaSunPower Corporation Limited 57.48% Hong Kong Hong KongSunPower Corporation Malta Holdings Limited 57.48% Malta MaltaSunPower Corporation Mexico, S. de R. L. de C.V. 57.48% Mexico MexicoSunPower Corporation Southern Africa (PTY) Ltd 57.48% South Africa South AfricaSunPower Corporation SPA 57.48% Chile ChileSunPower Corporation UK Limited 57.48% United Kingdom United KingdomSunPower Corporation, Systems 57.48% United States United StatesSunPower Devco, LLC 57.48% United States United StatesSunPower Development Company 57.48% United States United StatesSunPower Energy Corporation Limited 57.48% Hong Kong United StatesSunPower Energy Systems (PTY) Ltd 57.48% South Africa South AfricaSunPower Energy Systems Canada Corporation 57.48% Canada CanadaSunPower Energy Systems Korea 57.48% Republic of Korea Republic of KoreaSunPower Energy Systems Singapore Pte Ltd 57.48% Singapore SingaporeSunPower Energy Systems 57.48% South Africa South AfricaSouthern Africa (PTY) LtdSunPower Energy Systems Spain, SL 57.48% Spain SpainSunPower Foundation 57.48% United States United StatesSunPower France S.A.S. 57.48% France FranceSunPower GmbH 57.48% Germany GermanySunPower Holdco, LLC 57.48% United States United StatesSunPower Italia S.R.L. 57.48% Italy ItalySunPower Japan KK 57.48% Japan JapanSunPower Malta Limited 57.48% Malta MaltaSunPower Manufacturing (PTY) Ltd 57.48% South Africa South AfricaSunPower Manufacturing Corporation Limited 57.48% Hong Kong United StatesSunPower Manufacturing De Vernejoul 57.48% France FranceSunPower Mühendislik Insaat Enerji 57.48% Turkey TurkeyUretim Ve TicaretSunPower Nanao Parent, LLC 57.48% United States United StatesSunPower Netherlands Hold Co 1 B.V. 57.48% Netherlands NetherlandsSunPower Netherlands Hold Co 2 B.V. 57.48% Netherlands NetherlandsSunPower Netherlands Hold Co 3 B.V. 57.48% Netherlands NetherlandsSunPower Netherlands Hold Co 4 B.V. 57.48% Netherlands NetherlandsSunPower Netherlands Hold Co 5 B.V. 57.48% Netherlands NetherlandsSunPower Netherlands Hold Co 6 B.V. 57.48% Netherlands NetherlandsSunPower Netherlands Hold Co 7 B.V. 57.48% Netherlands NetherlandsSunPower Netherlands Holdings B.V. 57.48% Netherlands NetherlandsSunPower North America, LLC 57.48% United States United StatesSunPower Philippines Ltd. – 57.48% Cayman Islands PhilippinesRegional Operating HeadquartersSunPower Philippines Manufacturing Ltd. 57.48% Cayman Islands PhilippinesSunPower Software I, Inc. 57.48% United States United StatesSunPower Solar Energy 57.48% China ChinaTechnology (Tianjin) Co., LtdSunPower Solar India Private Limited 57.48% India IndiaSunPower Solar Malaysia Sdn. Bhd. 57.48% Malaysia MalaysiaSunPower Solarprogram III, LLC 57.48% United States United StatesSunPower Solarprogram IV, LLC 57.48% United States United StatesSunPower Solarprogram V, LLC 57.48% United States United StatesSunPower Solarprogram VI, LLC 57.48% United States United StatesSunPower Solarprogram VII, LLC 57.48% United States United States
Consolidated Financial Statements 10Note 35 – Notes to the Consolidated Financial Statements
Registration Document 2015. TOTAL 285
Business Statutory corporate name % Group Method Country of Country ofsegment interest incorporation operations
Marketing & Services (contd)
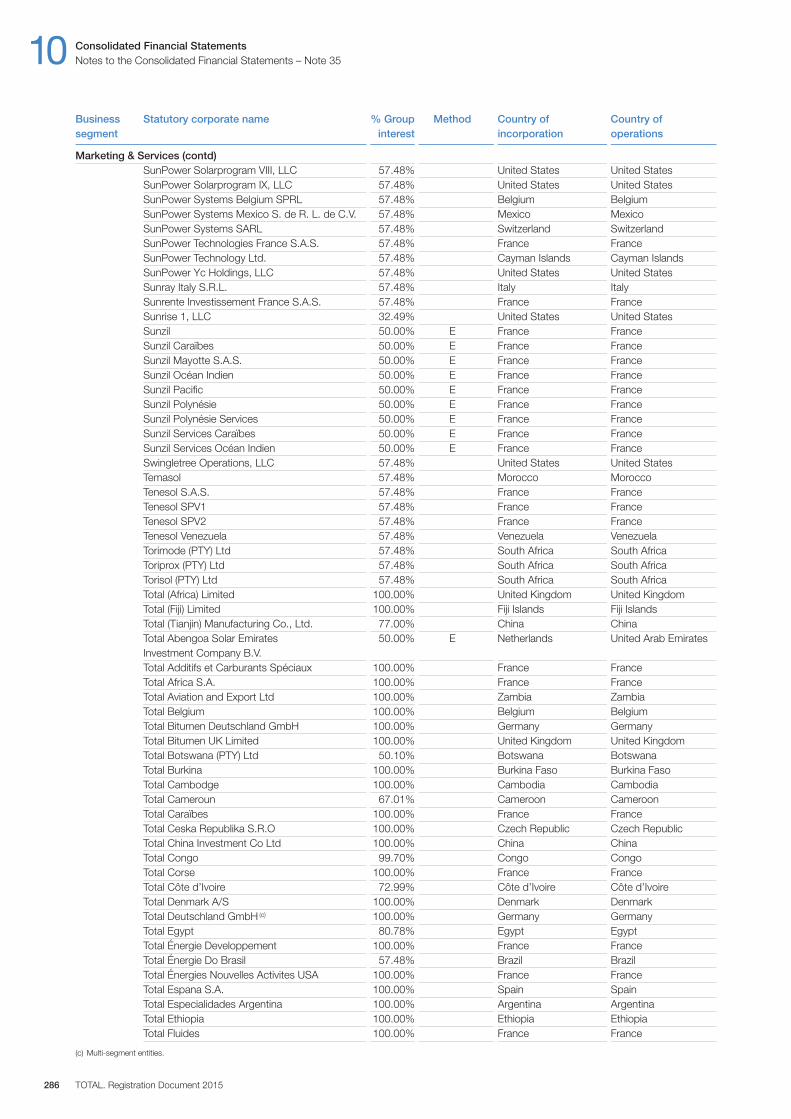
SunPower Solarprogram VIII, LLC 57.48% United States United StatesSunPower Solarprogram IX, LLC 57.48% United States United StatesSunPower Systems Belgium SPRL 57.48% Belgium BelgiumSunPower Systems Mexico S. de R. L. de C.V. 57.48% Mexico MexicoSunPower Systems SARL 57.48% Switzerland SwitzerlandSunPower Technologies France S.A.S. 57.48% France FranceSunPower Technology Ltd. 57.48% Cayman Islands Cayman IslandsSunPower Yc Holdings, LLC 57.48% United States United StatesSunray Italy S.R.L. 57.48% Italy ItalySunrente Investissement France S.A.S. 57.48% France FranceSunrise 1, LLC 32.49% United States United StatesSunzil 50.00% E France FranceSunzil Caraïbes 50.00% E France FranceSunzil Mayotte S.A.S. 50.00% E France FranceSunzil Océan Indien 50.00% E France FranceSunzil Pacific 50.00% E France FranceSunzil Polynésie 50.00% E France FranceSunzil Polynésie Services 50.00% E France FranceSunzil Services Caraïbes 50.00% E France FranceSunzil Services Océan Indien 50.00% E France FranceSwingletree Operations, LLC 57.48% United States United StatesTemasol 57.48% Morocco MoroccoTenesol S.A.S. 57.48% France FranceTenesol SPV1 57.48% France FranceTenesol SPV2 57.48% France FranceTenesol Venezuela 57.48% Venezuela VenezuelaTorimode (PTY) Ltd 57.48% South Africa South AfricaToriprox (PTY) Ltd 57.48% South Africa South AfricaTorisol (PTY) Ltd 57.48% South Africa South AfricaTotal (Africa) Limited 100.00% United Kingdom United KingdomTotal (Fiji) Limited 100.00% Fiji Islands Fiji IslandsTotal (Tianjin) Manufacturing Co., Ltd. 77.00% China ChinaTotal Abengoa Solar Emirates 50.00% E Netherlands United Arab EmiratesInvestment Company B.V. Total Additifs et Carburants Spéciaux 100.00% France FranceTotal Africa S.A. 100.00% France FranceTotal Aviation and Export Ltd 100.00% Zambia ZambiaTotal Belgium 100.00% Belgium BelgiumTotal Bitumen Deutschland GmbH 100.00% Germany GermanyTotal Bitumen UK Limited 100.00% United Kingdom United KingdomTotal Botswana (PTY) Ltd 50.10% Botswana BotswanaTotal Burkina 100.00% Burkina Faso Burkina FasoTotal Cambodge 100.00% Cambodia CambodiaTotal Cameroun 67.01% Cameroon CameroonTotal Caraïbes 100.00% France FranceTotal Ceska Republika S.R.O 100.00% Czech Republic Czech RepublicTotal China Investment Co Ltd 100.00% China ChinaTotal Congo 99.70% Congo CongoTotal Corse 100.00% France FranceTotal Côte d’Ivoire 72.99% Côte d’Ivoire Côte d’IvoireTotal Denmark A / S 100.00% Denmark DenmarkTotal Deutschland GmbH (c) 100.00% Germany GermanyTotal Egypt 80.78% Egypt EgyptTotal Énergie Developpement 100.00% France FranceTotal Énergie Do Brasil 57.48% Brazil BrazilTotal Énergies Nouvelles Activites USA 100.00% France FranceTotal Espana S.A. 100.00% Spain SpainTotal Especialidades Argentina 100.00% Argentina ArgentinaTotal Ethiopia 100.00% Ethiopia EthiopiaTotal Fluides 100.00% France France
(c) Multi-segment entities.
10 Consolidated Financial StatementsNotes to the Consolidated Financial Statements – Note 35
TOTAL. Registration Document 2015286
Business Statutory corporate name % Group Method Country of Country ofsegment interest incorporation operations
Marketing & Services (contd)
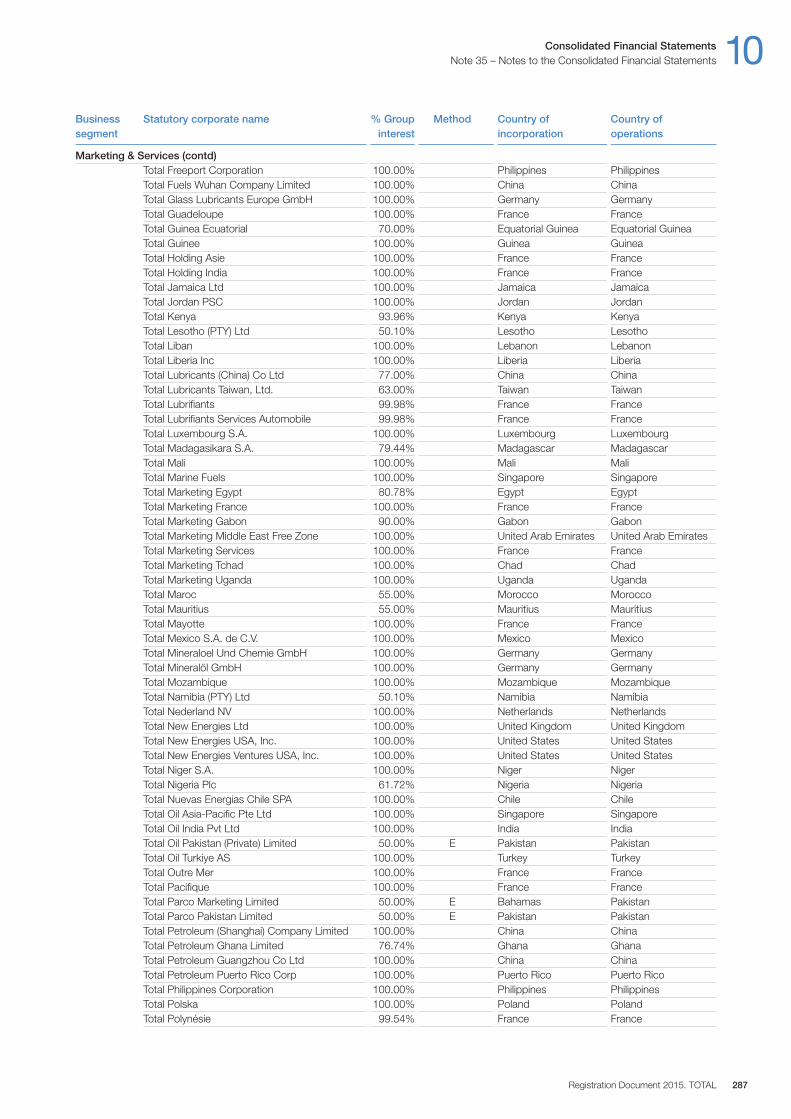
Total Freeport Corporation 100.00% Philippines PhilippinesTotal Fuels Wuhan Company Limited 100.00% China ChinaTotal Glass Lubricants Europe GmbH 100.00% Germany GermanyTotal Guadeloupe 100.00% France FranceTotal Guinea Ecuatorial 70.00% Equatorial Guinea Equatorial GuineaTotal Guinee 100.00% Guinea GuineaTotal Holding Asie 100.00% France FranceTotal Holding India 100.00% France FranceTotal Jamaica Ltd 100.00% Jamaica JamaicaTotal Jordan PSC 100.00% Jordan JordanTotal Kenya 93.96% Kenya KenyaTotal Lesotho (PTY) Ltd 50.10% Lesotho LesothoTotal Liban 100.00% Lebanon LebanonTotal Liberia Inc 100.00% Liberia LiberiaTotal Lubricants (China) Co Ltd 77.00% China ChinaTotal Lubricants Taiwan, Ltd. 63.00% Taiwan TaiwanTotal Lubrifiants 99.98% France FranceTotal Lubrifiants Services Automobile 99.98% France FranceTotal Luxembourg S.A. 100.00% Luxembourg LuxembourgTotal Madagasikara S.A. 79.44% Madagascar MadagascarTotal Mali 100.00% Mali MaliTotal Marine Fuels 100.00% Singapore SingaporeTotal Marketing Egypt 80.78% Egypt EgyptTotal Marketing France 100.00% France FranceTotal Marketing Gabon 90.00% Gabon GabonTotal Marketing Middle East Free Zone 100.00% United Arab Emirates United Arab EmiratesTotal Marketing Services 100.00% France FranceTotal Marketing Tchad 100.00% Chad ChadTotal Marketing Uganda 100.00% Uganda UgandaTotal Maroc 55.00% Morocco MoroccoTotal Mauritius 55.00% Mauritius MauritiusTotal Mayotte 100.00% France FranceTotal Mexico S.A. de C.V. 100.00% Mexico MexicoTotal Mineraloel Und Chemie GmbH 100.00% Germany GermanyTotal Mineralöl GmbH 100.00% Germany GermanyTotal Mozambique 100.00% Mozambique MozambiqueTotal Namibia (PTY) Ltd 50.10% Namibia NamibiaTotal Nederland NV 100.00% Netherlands NetherlandsTotal New Energies Ltd 100.00% United Kingdom United KingdomTotal New Energies USA, Inc. 100.00% United States United StatesTotal New Energies Ventures USA, Inc. 100.00% United States United StatesTotal Niger S.A. 100.00% Niger NigerTotal Nigeria Plc 61.72% Nigeria NigeriaTotal Nuevas Energias Chile SPA 100.00% Chile ChileTotal Oil Asia-Pacific Pte Ltd 100.00% Singapore SingaporeTotal Oil India Pvt Ltd 100.00% India IndiaTotal Oil Pakistan (Private) Limited 50.00% E Pakistan PakistanTotal Oil Turkiye AS 100.00% Turkey TurkeyTotal Outre Mer 100.00% France FranceTotal Pacifique 100.00% France FranceTotal Parco Marketing Limited 50.00% E Bahamas PakistanTotal Parco Pakistan Limited 50.00% E Pakistan PakistanTotal Petroleum (Shanghai) Company Limited 100.00% China ChinaTotal Petroleum Ghana Limited 76.74% Ghana GhanaTotal Petroleum Guangzhou Co Ltd 100.00% China ChinaTotal Petroleum Puerto Rico Corp 100.00% Puerto Rico Puerto RicoTotal Philippines Corporation 100.00% Philippines PhilippinesTotal Polska 100.00% Poland PolandTotal Polynésie 99.54% France France
Consolidated Financial Statements 10Note 35 – Notes to the Consolidated Financial Statements
Registration Document 2015. TOTAL 287
Business Statutory corporate name % Group Method Country of Country ofsegment interest incorporation operations
Marketing & Services (contd)
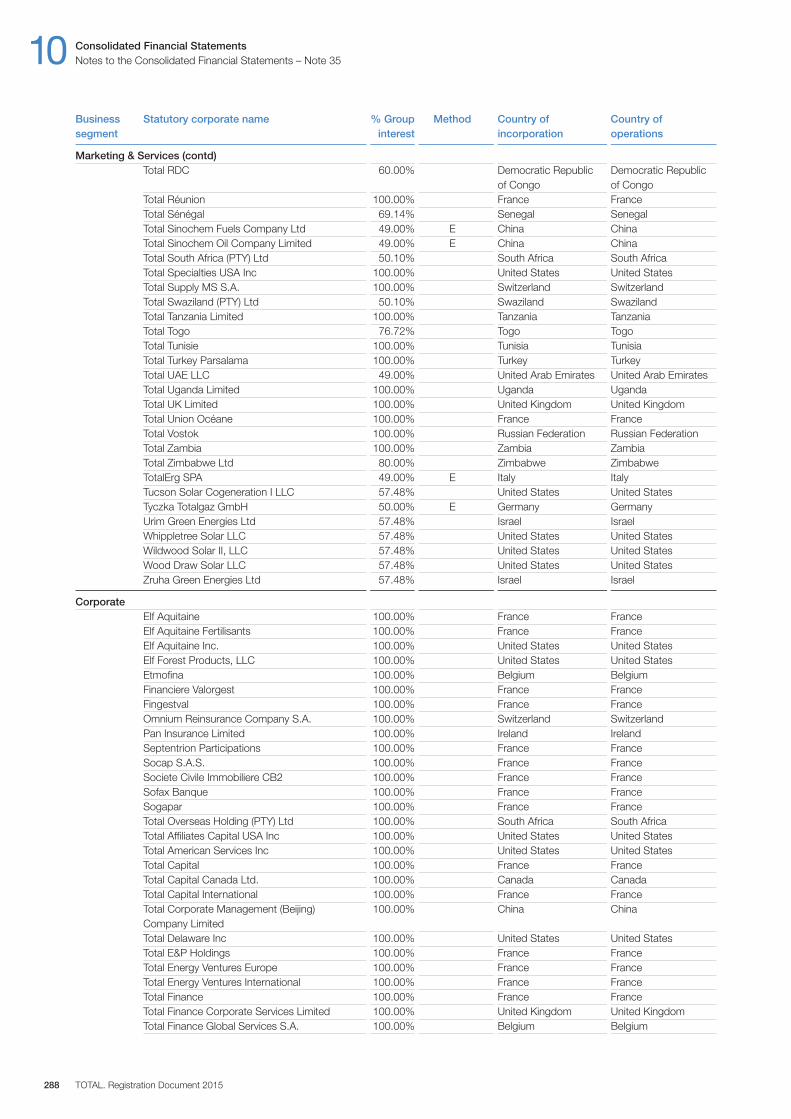
Total RDC 60.00% Democratic Republic Democratic Republicof Congo of Congo
Total Réunion 100.00% France FranceTotal Sénégal 69.14% Senegal SenegalTotal Sinochem Fuels Company Ltd 49.00% E China ChinaTotal Sinochem Oil Company Limited 49.00% E China ChinaTotal South Africa (PTY) Ltd 50.10% South Africa South AfricaTotal Specialties USA Inc 100.00% United States United StatesTotal Supply MS S.A. 100.00% Switzerland SwitzerlandTotal Swaziland (PTY) Ltd 50.10% Swaziland SwazilandTotal Tanzania Limited 100.00% Tanzania TanzaniaTotal Togo 76.72% Togo TogoTotal Tunisie 100.00% Tunisia TunisiaTotal Turkey Parsalama 100.00% Turkey TurkeyTotal UAE LLC 49.00% United Arab Emirates United Arab EmiratesTotal Uganda Limited 100.00% Uganda UgandaTotal UK Limited 100.00% United Kingdom United KingdomTotal Union Océane 100.00% France FranceTotal Vostok 100.00% Russian Federation Russian FederationTotal Zambia 100.00% Zambia ZambiaTotal Zimbabwe Ltd 80.00% Zimbabwe ZimbabweTotalErg SPA 49.00% E Italy ItalyTucson Solar Cogeneration I LLC 57.48% United States United StatesTyczka Totalgaz GmbH 50.00% E Germany GermanyUrim Green Energies Ltd 57.48% Israel IsraelWhippletree Solar LLC 57.48% United States United StatesWildwood Solar II, LLC 57.48% United States United StatesWood Draw Solar LLC 57.48% United States United StatesZruha Green Energies Ltd 57.48% Israel Israel
CorporateElf Aquitaine 100.00% France FranceElf Aquitaine Fertilisants 100.00% France FranceElf Aquitaine Inc. 100.00% United States United StatesElf Forest Products, LLC 100.00% United States United StatesEtmofina 100.00% Belgium BelgiumFinanciere Valorgest 100.00% France FranceFingestval 100.00% France FranceOmnium Reinsurance Company S.A. 100.00% Switzerland SwitzerlandPan Insurance Limited 100.00% Ireland IrelandSeptentrion Participations 100.00% France FranceSocap S.A.S. 100.00% France FranceSociete Civile Immobiliere CB2 100.00% France FranceSofax Banque 100.00% France FranceSogapar 100.00% France FranceTotal Overseas Holding (PTY) Ltd 100.00% South Africa South AfricaTotal Affiliates Capital USA Inc 100.00% United States United StatesTotal American Services Inc 100.00% United States United StatesTotal Capital 100.00% France FranceTotal Capital Canada Ltd. 100.00% Canada CanadaTotal Capital International 100.00% France FranceTotal Corporate Management (Beijing) 100.00% China ChinaCompany LimitedTotal Delaware Inc 100.00% United States United StatesTotal E&P Holdings 100.00% France FranceTotal Energy Ventures Europe 100.00% France FranceTotal Energy Ventures International 100.00% France FranceTotal Finance 100.00% France FranceTotal Finance Corporate Services Limited 100.00% United Kingdom United KingdomTotal Finance Global Services S.A. 100.00% Belgium Belgium
10 Consolidated Financial StatementsNotes to the Consolidated Financial Statements – Note 35
TOTAL. Registration Document 2015288
Business Statutory corporate name % Group Method Country of Country ofsegment interest incorporation operations
Marketing & Services (contd)

Total Finance International B.V. 100.00% Netherlands NetherlandsTotal Finance Nederland B.V. 100.00% Netherlands NetherlandsTotal Finance USA Inc 100.00% United States United StatesTotal Funding Nederland B.V. 100.00% Netherlands NetherlandsTotal Funding Nederland International B.V. 100.00% Netherlands NetherlandsTotal Gestion Filiales 100.00% France FranceTotal Gestion USA 100.00% France FranceTotal Global Services 100.00% France FranceTotal Global Services Belgium S.A. 99.80% Belgium BelgiumTotal Holding Allemagne 100.00% France FranceTotal Holdings Europe 100.00% France FranceTotal Holdings UK Limited 100.00% United Kingdom United KingdomTotal Holdings USA Inc 100.00% United States United StatesTotal International NV 100.00% Netherlands NetherlandsTotal Nucléaire 100.00% France FranceTotal Operations Canada Ltd 100.00% Canada CanadaTotal Participations 100.00% France FranceTotal Petrochemicals & Refining USA Inc (c) 100.00% United States United StatesTotal Petrochemicals & Refining S.A. / NV (c) 100.00% Belgium BelgiumTotal Petrochemicals Security USA Inc 100.00% United States United StatesTotal Resources (Canada) Limited 100.00% Canada CanadaTOTAL S.A. France FranceTotal Treasury 100.00% France FranceTotal UK Finance Limited 100.00% United Kingdom United Kingdom
(c) Multi-segment entities.
Consolidated Financial Statements 10Note 35 – Notes to the Consolidated Financial Statements
Registration Document 2015. TOTAL 289
Business Statutory corporate name % Group Method Country of Country ofsegment interest incorporation operations
Corporate (contd)

TOTAL. Registration Document 2015290
Registration Document 2015. TOTAL 291
Supplemental oil and gas information (unaudited) 11
1. Oil and gas information pursuant to FASB Accounting Standards Codification 932 292
1.1. Assessment process for reserves . . . . . . . . . . . . . . . . . . . . . . . . . . . . . . . . . . . . . . . . . . . . . . . . . . . . . . . . . . . . . . . . . . . . . . .2921.2. Proved developed reserves . . . . . . . . . . . . . . . . . . . . . . . . . . . . . . . . . . . . . . . . . . . . . . . . . . . . . . . . . . . . . . . . . . . . . . . . . . . .2931.3. Proved undeveloped reserves . . . . . . . . . . . . . . . . . . . . . . . . . . . . . . . . . . . . . . . . . . . . . . . . . . . . . . . . . . . . . . . . . . . . . . . . . .2931.4. Estimated proved reserves of oil, bitumen and gas . . . . . . . . . . . . . . . . . . . . . . . . . . . . . . . . . . . . . . . . . . . . . . . . . . . . . . . . .2931.5. Results of operations for oil and gas producing activities . . . . . . . . . . . . . . . . . . . . . . . . . . . . . . . . . . . . . . . . . . . . . . . . . . . .3011.6. Cost incurred . . . . . . . . . . . . . . . . . . . . . . . . . . . . . . . . . . . . . . . . . . . . . . . . . . . . . . . . . . . . . . . . . . . . . . . . . . . . . . . . . . . . . . . .3031.7. Capitalized costs related to oil and gas producing activities . . . . . . . . . . . . . . . . . . . . . . . . . . . . . . . . . . . . . . . . . . . . . . . . . .3041.8. Standardized measure of discounted future net cash flows (excluding transportation) . . . . . . . . . . . . . . . . . . . . . . . . . . . .3051.9. Changes in the standardized measure of discounted future net cash flows . . . . . . . . . . . . . . . . . . . . . . . . . . . . . . . . . . . . .308
2. Other information 3092.1. Net gas production, production prices and production costs . . . . . . . . . . . . . . . . . . . . . . . . . . . . . . . . . . . . . . . . . . . . . . . . .309
3. Report on the payments made to governments (Article L. 225-102-3 of the French Commercial Code) 311
3.1. Reporting by country and type of Payment . . . . . . . . . . . . . . . . . . . . . . . . . . . . . . . . . . . . . . . . . . . . . . . . . . . . . . . . . . . . . . .3123.2. Reporting of Payments by Project and by type of Payment, and by Government and by type of Payment . . . . . . . . . . . . .313
Supplemental oil and gas information (unaudited)
11 Supplemental oil and gas informationOil and gas information pursuant to FASB Accounting Standards Codification 932
TOTAL. Registration Document 2015292
The estimation of reserves is an ongoing process that is done withinaffiliates by experienced geoscientists, engineers and economistsunder the supervision of each affiliate’s General Management. Staffinvolved in reserves evaluation are trained to follow SEC-compliantinternal guidelines and policies regarding criteria that must be metbefore reserves can be considered as proved. All of the Group’sproved reserves held in subsidiaries and equity affiliates are estimatedwithin the affiliates of the Group with the exception of the provedreserves held by the Russian equity affiliate OAO Novatek. The assessment of the net proved liquids and natural gas reservesof certain properties owned by OAO Novatek was completed as of December 31, 2015, in accordance with the standards appliedby the Group, based on an independent third-party report fromDeGolyer & MacNaughton. These independently assessed reservesaccount for 51% of OAO Novatek’s net proved reserves and 58% of the total net proved reserves TOTAL held in Russia as ofDecember 31, 2015.
The technical validation process relies on a Technical ReservesCommittee that is responsible for approving proved reserves changesabove a certain threshold and technical evaluations of reservesassociated with an investment decision that requires approval fromthe Exploration & Production Executive Committee. The Chairmanof the Technical Reserves Committee is appointed by the SeniorManagement of Exploration & Production and its members representexpertise in reservoir engineering, production geology, productiongeophysics, drilling and development studies.
An internal control process related to reserves estimation isformalized and involves the following elements:
– A central Reserve Entity whose responsibility is to consolidate,document and archive the Group’s reserves; to ensure coherenceof evaluations worldwide; to maintain the Corporate ReservesGuidelines Standards in line with SEC guidelines and policies; to deliver training on reserves evaluation and classification; and to conduct periodically in-depth technical review of reservesfor each affiliate.
– An annual review of affiliates reserves conducted by an internalgroup of specialists selected for their expertise in geosciencesand engineering or their knowledge of the affiliate. All members ofthis group, chaired by the Reserves Vice-President (RVP) of the
Development and Support to Operations division and composedof at least three Technical Reserves Committee members, areknowledgeable in the SEC guidelines for proved reserves evaluation.Their responsibility is to provide an independent review of reserveschanges proposed by affiliates and ensure that reserves areestimated using appropriate standards and procedures.
– At the end of the annual review carried out by the Developmentdivision and Support to Operations, an SEC Reserves Committeechaired by the Exploration & Production Senior Vice PresidentCorporate Affairs and comprised of the Development and Support toOperations, Exploration, Strategy and Legal Senior Vice Presidents,or their representatives, as well as the Chairman of the TechnicalReserves Committee and the RVP, approves the elements of the SEC reserve booking proposals concerning criteria that arenot dependent upon reservoir and geosciences techniques.The results of the annual review and the proposals for includingrevisions or additions of SEC Proved Reserves are presented tothe Exploration & Production Executive Committee for approvalbefore final validation by the Group’s General Management andChief Financial Officer.
The reserves evaluation and control process is audited periodicallyby the Group’s internal auditors.
The RVP of the Development and Support to Operations division isthe technical person responsible for preparing the reserves estimatesfor the Group. Appointed by the President of Exploration & Production,the RVP supervises the Reserve Entity, chairs the annual review ofreserves, and is a member of the Technical Reserves Committeeand the SEC Reserves Committee. The current RVP has over thirtyyears of experience in the oil and gas industry. He previously heldseveral management positions in the Group in reservoir engineeringand geosciences, and has more than fifteen years of experience in the field of reserves evaluation and control process. He holds anengineering degree from Institut National des Sciences Appliquées,Lyon, France, and a petroleum engineering degree from ÉcoleNationale Supérieure du Pétrole et des Moteurs (IFP School), France.He is the current Chairman of the Society of Petroleum EngineersOil and Gas Reserves Committee and a member of the UNECE(United Nations Economic Commission for Europe) Expert Groupon Resource Classification.
1.1. Assessment process for reserves
Proved reserves estimates are calculated according to the Securitiesand Exchange Commission (SEC) Rule 4-10 of Regulation S-X set forth in the “Modernization of Oil and Gas Reporting” release(SEC Release n° 33-8995) and the Financial Accounting Standard
Board (FASB) Accounting Standards Update regarding ExtractiveActivities – Oil and Gas (ASC 932), which provide definitions anddisclosure requirements.
1. Oil and gas information pursuant to FASB Accounting Standards Codification 932
Supplemental oil and gas information 11Oil and gas information pursuant to FASB Accounting Standards Codification 932
Registration Document 2015. TOTAL 293
The following tables present, for oil, bitumen and gas reserves, anestimate of the Group’s oil, bitumen and gas quantities by geographicareas as of December 31, 2015, 2014 and 2013.
Quantities shown correspond to proved developed and undevelopedreserves together with changes in quantities for 2015, 2014, and 2013.
The definitions used for proved, proved developed and provedundeveloped oil and gas reserves are in accordance with therevised Rule 4-10 of SEC Regulation S-X.
All references in the following tables to reserves or production are tothe Group’s entire share of such reserves or production. TOTAL’sworldwide proved reserves include the proved reserves of itsconsolidated subsidiaries as well as its proportionate share of theproved reserves of equity affiliates.
1.4. Estimated proved reserves of oil, bitumen and gas
As of December 31, 2015, TOTAL’s combined proved undevelopedreserves of oil and gas were 5,394 Mboe as compared to 5,817 Mboeat the end of 2014. The net decrease of 423 Mboe of provedundeveloped reserves is due to the addition of 152 Mboe ofundeveloped reserves related to extensions and discoveries, therevision of +57 Mboe of previous estimates, a net decrease of 204Mboe due to acquisitions / divestitures, and the booking of 428 Mboeproved undeveloped reserves to proved developed reserves. In 2015,the cost incurred to develop proved undeveloped reserves (PUDs)was $15.3 billion, which represents 79% of 2015 developmentcosts incurred, and was related to projects located for the mostpart in Norway, Canada, Angola, Nigeria, Australia, the Republic of the Congo and the United Kingdom.
Approximately 51% of the Group’s proved undeveloped reservesare associated with producing projects and are located for the mostpart in Canada, Kazakhstan, Nigeria, Norway, Russia, and Venezuela.These reserves are expected to be developed over time as part of initial field development plans or additional development phases.
The timing to bring these proved reserves into production will dependupon several factors including reservoir performance, surface facilitiesor plant capacity constraints and contractual limitations on productionlevels. The remaining proved undeveloped reserves correspond to undeveloped fields or assets for which a development has beensanctioned or is in progress.
The Group’s portfolio of projects includes a few large scale andcomplex developments for which reserves have remained provedundeveloped for more than five years or the Group anticipates thatit may take more than five years from the time of recording proved
reserves to the start of production. These specific projects representapproximately 26% of the Group’s proved undeveloped reservesand include deep offshore developments in Nigeria, offshoredevelopment in Australia, Argentina, Norway and the United Kingdomand development of oil sands in Canada.
These projects are highly complex to develop due to a combinationof factors that include, among others, the nature of the reservoirrock and fluid properties, challenging market and operatingenvironments, and the size of the projects. In addition, some ofthese projects are generally designed and optimized for a givenproduction capacity that controls the pace at which the field isdeveloped and the wells are drilled. At production start-up, only a portion of the proved reserves are developed in order to deliversufficient production potential to meet capacity constraints andcontractual obligations. Under these specific circumstances, the Group believes that it is justified to report as proved reservesthe level of reserves used in connection with the approved project,despite the fact that some of these PUDs may remain undevelopedfor more than five years. In addition, TOTAL has demonstrated inrecent years the Group’s ability to develop and bring into productionsimilar large scale and complex projects, including the developmentof deep-offshore fields in Angola, Nigeria, the Republic of the Congo,HP / HT fields in the United Kingdom, heavy oil projects in Venezuelaand LNG projects in Qatar, Yemen, Nigeria and Indonesia.
The tables provided below are presented by the followinggeographic areas: Europe, Africa, the Americas, Middle East andAsia-CIS (with figures shown for Russia separately).
1.3. Proved undeveloped reserves
As of December 31, 2015, proved developed reserves of oil andgas were 6,186 Mboe and represented 53% of the proved reserves.As of December 31, 2014, proved developed reserves of oil andgas were 5,706 Mboe and represented 50% of the proved reserves.As of December 31, 2013, proved developed reserves of oil and
gas were 5,674 Mboe and represented 49% of the proved reserves.Over the past three years, the average of proved developed reservesrenewal has remained above 900 Mboe per year, illustrating TOTAL’sability to consistently transfer proved undeveloped reserves intodeveloped status.
1.2. Proved developed reserves
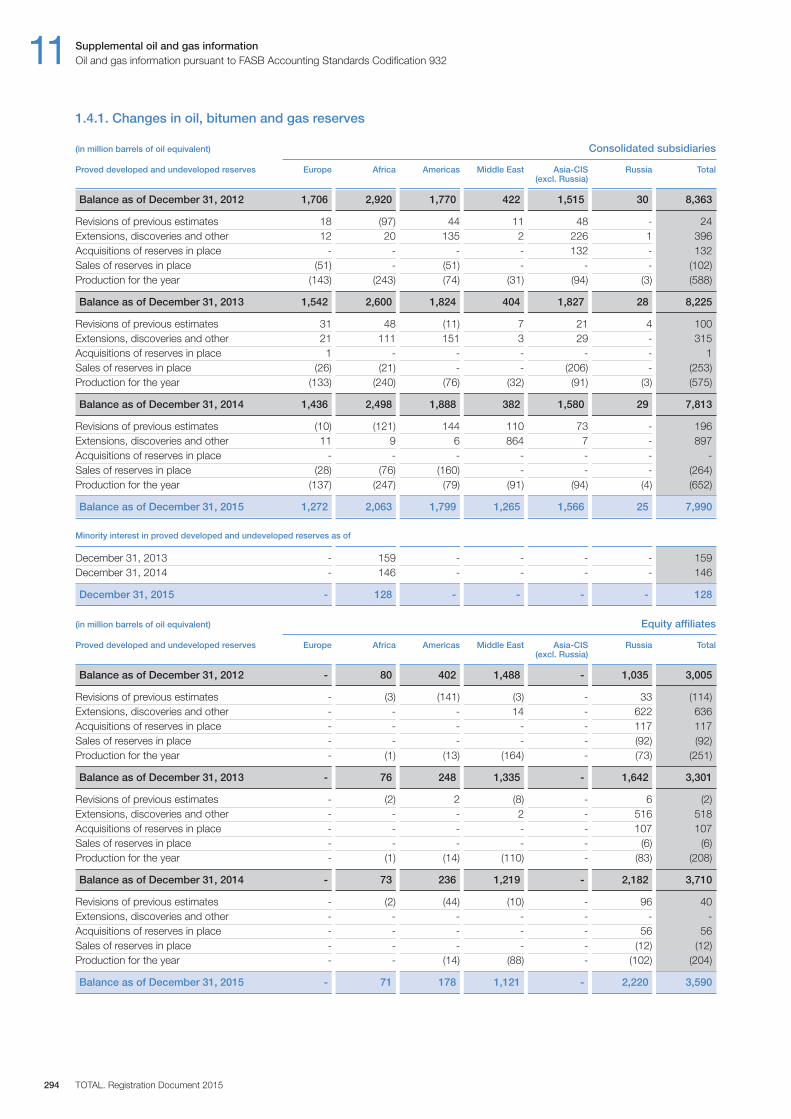
11 Supplemental oil and gas informationOil and gas information pursuant to FASB Accounting Standards Codification 932
TOTAL. Registration Document 2015294
1.4.1. Changes in oil, bitumen and gas reserves
(in million barrels of oil equivalent) Consolidated subsidiaries
Proved developed and undeveloped reserves Europe Africa Americas Middle East Asia-CIS Russia Total (excl. Russia)
Balance as of December 31, 2012 1,706 2,920 1,770 422 1,515 30 8,363
Revisions of previous estimates 18 (97) 44 11 48 - 24Extensions, discoveries and other 12 20 135 2 226 1 396Acquisitions of reserves in place - - - - 132 - 132Sales of reserves in place (51) - (51) - - - (102)Production for the year (143) (243) (74) (31) (94) (3) (588)
Balance as of December 31, 2013 1,542 2,600 1,824 404 1,827 28 8,225
Revisions of previous estimates 31 48 (11) 7 21 4 100Extensions, discoveries and other 21 111 151 3 29 - 315Acquisitions of reserves in place 1 - - - - - 1Sales of reserves in place (26) (21) - - (206) - (253)Production for the year (133) (240) (76) (32) (91) (3) (575)
Balance as of December 31, 2014 1,436 2,498 1,888 382 1,580 29 7,813
Revisions of previous estimates (10) (121) 144 110 73 - 196Extensions, discoveries and other 11 9 6 864 7 - 897Acquisitions of reserves in place - - - - - - -Sales of reserves in place (28) (76) (160) - - - (264)Production for the year (137) (247) (79) (91) (94) (4) (652)
Balance as of December 31, 2015 1,272 2,063 1,799 1,265 1,566 25 7,990
Minority interest in proved developed and undeveloped reserves as of
December 31, 2013 - 159 - - - - 159December 31, 2014 - 146 - - - - 146
December 31, 2015 - 128 - - - - 128
(in million barrels of oil equivalent) Equity affiliates
Proved developed and undeveloped reserves Europe Africa Americas Middle East Asia-CIS Russia Total (excl. Russia)
Balance as of December 31, 2012 - 80 402 1,488 - 1,035 3,005
Revisions of previous estimates - (3) (141) (3) - 33 (114)Extensions, discoveries and other - - - 14 - 622 636Acquisitions of reserves in place - - - - - 117 117Sales of reserves in place - - - - - (92) (92)Production for the year - (1) (13) (164) - (73) (251)
Balance as of December 31, 2013 - 76 248 1,335 - 1,642 3,301
Revisions of previous estimates - (2) 2 (8) - 6 (2)Extensions, discoveries and other - - - 2 - 516 518Acquisitions of reserves in place - - - - - 107 107Sales of reserves in place - - - - - (6) (6)Production for the year - (1) (14) (110) - (83) (208)
Balance as of December 31, 2014 - 73 236 1,219 - 2,182 3,710
Revisions of previous estimates - (2) (44) (10) - 96 40Extensions, discoveries and other - - - - - - -Acquisitions of reserves in place - - - - - 56 56Sales of reserves in place - - - - - (12) (12)Production for the year - - (14) (88) - (102) (204)
Balance as of December 31, 2015 - 71 178 1,121 - 2,220 3,590
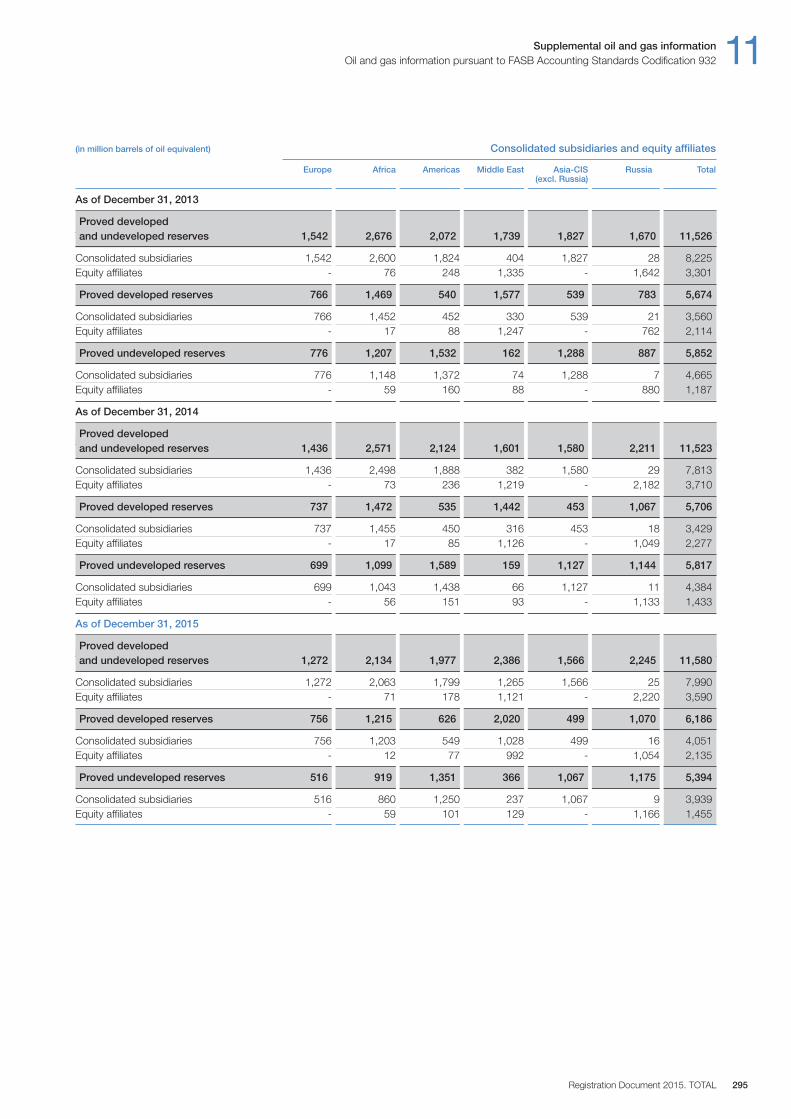
Supplemental oil and gas information 11Oil and gas information pursuant to FASB Accounting Standards Codification 932
Registration Document 2015. TOTAL 295
(in million barrels of oil equivalent) Consolidated subsidiaries and equity affiliates
Europe Africa Americas Middle East Asia-CIS Russia Total (excl. Russia)
As of December 31, 2013
Proved developed and undeveloped reserves 1,542 2,676 2,072 1,739 1,827 1,670 11,526
Consolidated subsidiaries 1,542 2,600 1,824 404 1,827 28 8,225Equity affiliates - 76 248 1,335 - 1,642 3,301
Proved developed reserves 766 1,469 540 1,577 539 783 5,674
Consolidated subsidiaries 766 1,452 452 330 539 21 3,560Equity affiliates - 17 88 1,247 - 762 2,114
Proved undeveloped reserves 776 1,207 1,532 162 1,288 887 5,852
Consolidated subsidiaries 776 1,148 1,372 74 1,288 7 4,665Equity affiliates - 59 160 88 - 880 1,187
As of December 31, 2014
Proved developed and undeveloped reserves 1,436 2,571 2,124 1,601 1,580 2,211 11,523
Consolidated subsidiaries 1,436 2,498 1,888 382 1,580 29 7,813Equity affiliates - 73 236 1,219 - 2,182 3,710
Proved developed reserves 737 1,472 535 1,442 453 1,067 5,706
Consolidated subsidiaries 737 1,455 450 316 453 18 3,429Equity affiliates - 17 85 1,126 - 1,049 2,277
Proved undeveloped reserves 699 1,099 1,589 159 1,127 1,144 5,817
Consolidated subsidiaries 699 1,043 1,438 66 1,127 11 4,384Equity affiliates - 56 151 93 - 1,133 1,433
As of December 31, 2015
Proved developed and undeveloped reserves 1,272 2,134 1,977 2,386 1,566 2,245 11,580
Consolidated subsidiaries 1,272 2,063 1,799 1,265 1,566 25 7,990Equity affiliates - 71 178 1,121 - 2,220 3,590
Proved developed reserves 756 1,215 626 2,020 499 1,070 6,186
Consolidated subsidiaries 756 1,203 549 1,028 499 16 4,051Equity affiliates - 12 77 992 - 1,054 2,135
Proved undeveloped reserves 516 919 1,351 366 1,067 1,175 5,394
Consolidated subsidiaries 516 860 1,250 237 1,067 9 3,939Equity affiliates - 59 101 129 - 1,166 1,455
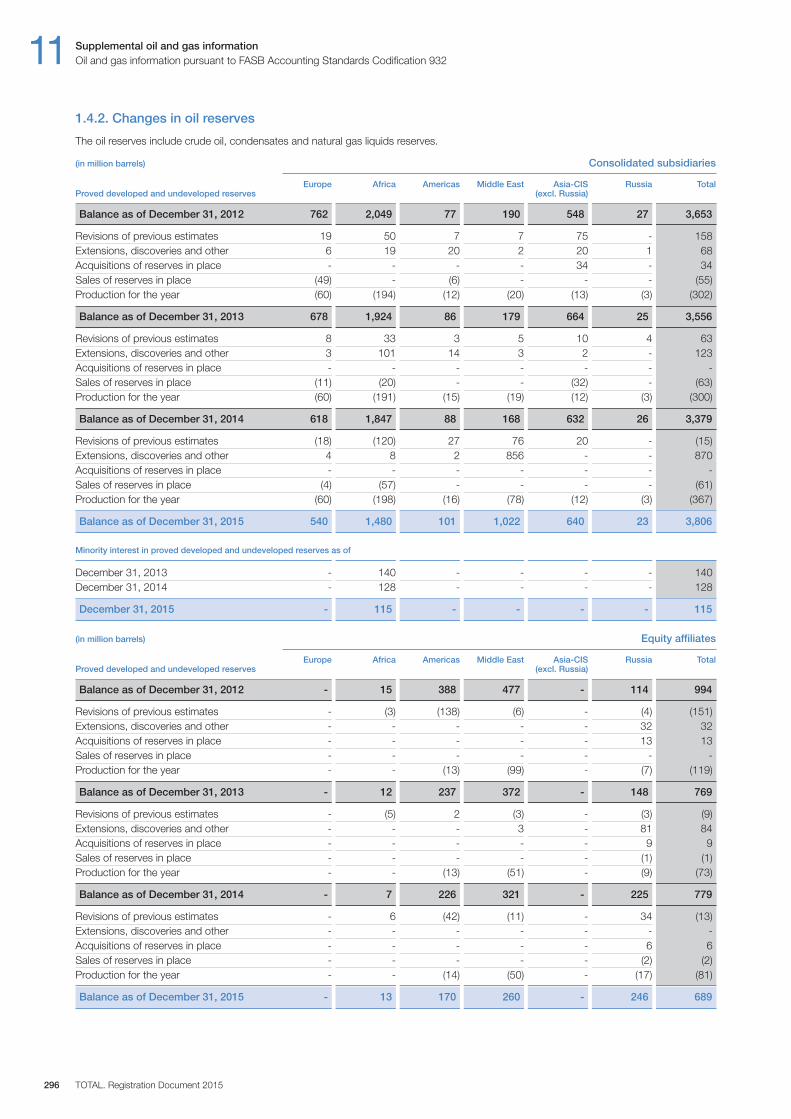
11 Supplemental oil and gas informationOil and gas information pursuant to FASB Accounting Standards Codification 932
TOTAL. Registration Document 2015296
1.4.2. Changes in oil reserves
The oil reserves include crude oil, condensates and natural gas liquids reserves.
(in million barrels) Consolidated subsidiaries
Europe Africa Americas Middle East Asia-CIS Russia TotalProved developed and undeveloped reserves (excl. Russia)
Balance as of December 31, 2012 762 2,049 77 190 548 27 3,653
Revisions of previous estimates 19 50 7 7 75 - 158Extensions, discoveries and other 6 19 20 2 20 1 68Acquisitions of reserves in place - - - - 34 - 34Sales of reserves in place (49) - (6) - - - (55)Production for the year (60) (194) (12) (20) (13) (3) (302)
Balance as of December 31, 2013 678 1,924 86 179 664 25 3,556
Revisions of previous estimates 8 33 3 5 10 4 63Extensions, discoveries and other 3 101 14 3 2 - 123Acquisitions of reserves in place - - - - - - -Sales of reserves in place (11) (20) - - (32) - (63)Production for the year (60) (191) (15) (19) (12) (3) (300)
Balance as of December 31, 2014 618 1,847 88 168 632 26 3,379
Revisions of previous estimates (18) (120) 27 76 20 - (15)Extensions, discoveries and other 4 8 2 856 - - 870Acquisitions of reserves in place - - - - - - -Sales of reserves in place (4) (57) - - - - (61)Production for the year (60) (198) (16) (78) (12) (3) (367)
Balance as of December 31, 2015 540 1,480 101 1,022 640 23 3,806
Minority interest in proved developed and undeveloped reserves as of
December 31, 2013 - 140 - - - - 140December 31, 2014 - 128 - - - - 128
December 31, 2015 - 115 - - - - 115
(in million barrels) Equity affiliates
Europe Africa Americas Middle East Asia-CIS Russia TotalProved developed and undeveloped reserves (excl. Russia)
Balance as of December 31, 2012 - 15 388 477 - 114 994
Revisions of previous estimates - (3) (138) (6) - (4) (151)Extensions, discoveries and other - - - - - 32 32Acquisitions of reserves in place - - - - - 13 13Sales of reserves in place - - - - - - -Production for the year - - (13) (99) - (7) (119)
Balance as of December 31, 2013 - 12 237 372 - 148 769
Revisions of previous estimates - (5) 2 (3) - (3) (9)Extensions, discoveries and other - - - 3 - 81 84Acquisitions of reserves in place - - - - - 9 9Sales of reserves in place - - - - - (1) (1)Production for the year - - (13) (51) - (9) (73)
Balance as of December 31, 2014 - 7 226 321 - 225 779
Revisions of previous estimates - 6 (42) (11) - 34 (13)Extensions, discoveries and other - - - - - - -Acquisitions of reserves in place - - - - - 6 6Sales of reserves in place - - - - - (2) (2)Production for the year - - (14) (50) - (17) (81)
Balance as of December 31, 2015 - 13 170 260 - 246 689
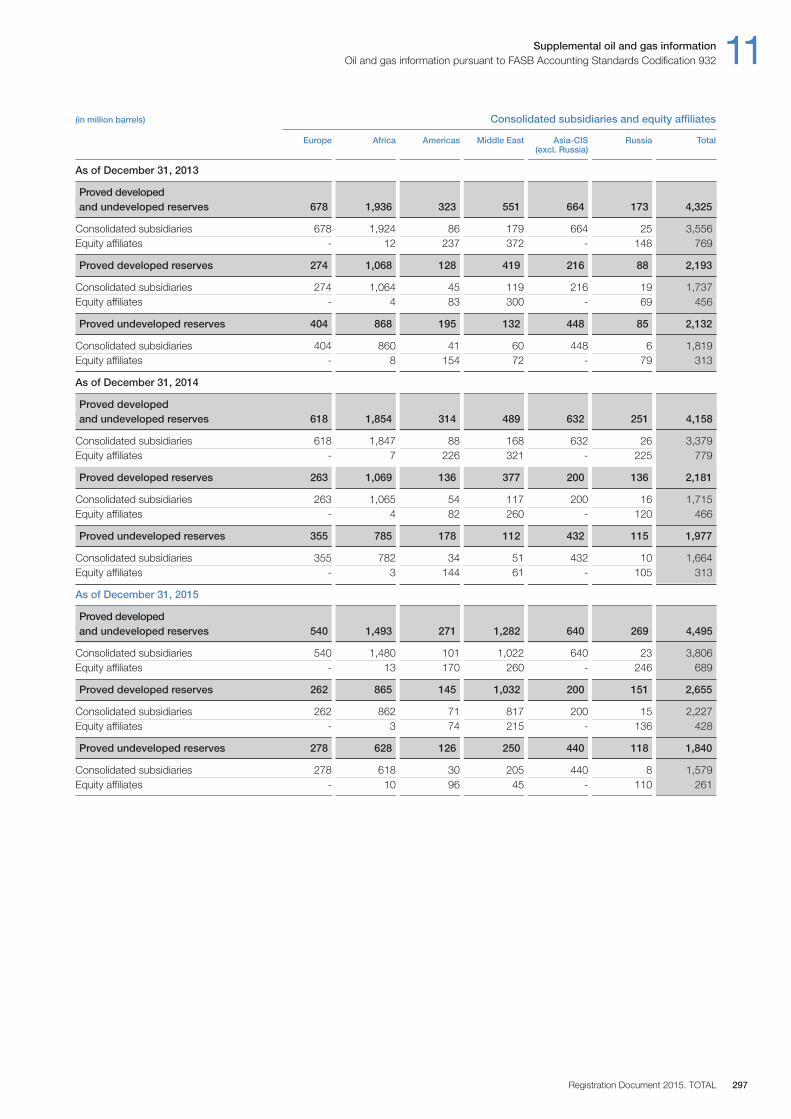
Supplemental oil and gas information 11Oil and gas information pursuant to FASB Accounting Standards Codification 932
Registration Document 2015. TOTAL 297
(in million barrels) Consolidated subsidiaries and equity affiliates
Europe Africa Americas Middle East Asia-CIS Russia Total (excl. Russia)
As of December 31, 2013
Proved developed and undeveloped reserves 678 1,936 323 551 664 173 4,325
Consolidated subsidiaries 678 1,924 86 179 664 25 3,556Equity affiliates - 12 237 372 - 148 769
Proved developed reserves 274 1,068 128 419 216 88 2,193
Consolidated subsidiaries 274 1,064 45 119 216 19 1,737Equity affiliates - 4 83 300 - 69 456
Proved undeveloped reserves 404 868 195 132 448 85 2,132
Consolidated subsidiaries 404 860 41 60 448 6 1,819Equity affiliates - 8 154 72 - 79 313
As of December 31, 2014
Proved developed and undeveloped reserves 618 1,854 314 489 632 251 4,158
Consolidated subsidiaries 618 1,847 88 168 632 26 3,379Equity affiliates - 7 226 321 - 225 779
Proved developed reserves 263 1,069 136 377 200 136 2,181
Consolidated subsidiaries 263 1,065 54 117 200 16 1,715Equity affiliates - 4 82 260 - 120 466
Proved undeveloped reserves 355 785 178 112 432 115 1,977
Consolidated subsidiaries 355 782 34 51 432 10 1,664Equity affiliates - 3 144 61 - 105 313
As of December 31, 2015
Proved developed and undeveloped reserves 540 1,493 271 1,282 640 269 4,495
Consolidated subsidiaries 540 1,480 101 1,022 640 23 3,806Equity affiliates - 13 170 260 - 246 689
Proved developed reserves 262 865 145 1,032 200 151 2,655
Consolidated subsidiaries 262 862 71 817 200 15 2,227Equity affiliates - 3 74 215 - 136 428
Proved undeveloped reserves 278 628 126 250 440 118 1,840
Consolidated subsidiaries 278 618 30 205 440 8 1,579Equity affiliates - 10 96 45 - 110 261
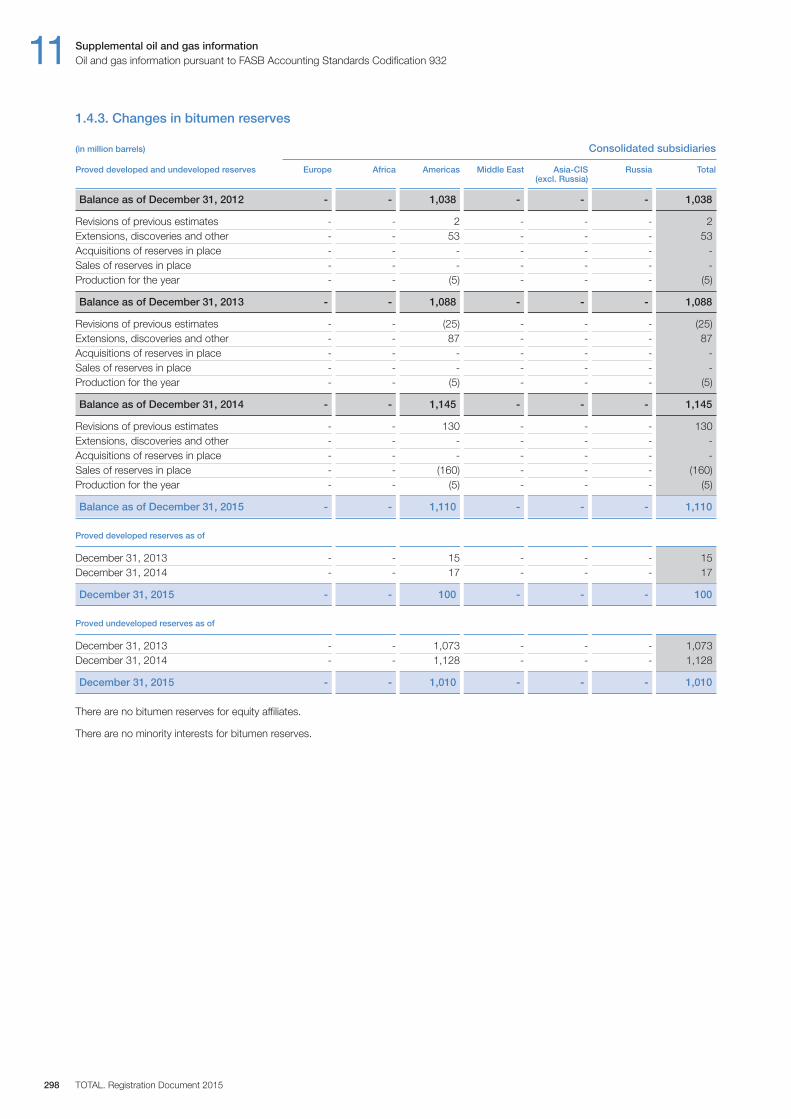
11 Supplemental oil and gas informationOil and gas information pursuant to FASB Accounting Standards Codification 932
TOTAL. Registration Document 2015298
1.4.3. Changes in bitumen reserves
(in million barrels) Consolidated subsidiaries
Proved developed and undeveloped reserves Europe Africa Americas Middle East Asia-CIS Russia Total (excl. Russia)
Balance as of December 31, 2012 - - 1,038 - - - 1,038
Revisions of previous estimates - - 2 - - - 2Extensions, discoveries and other - - 53 - - - 53Acquisitions of reserves in place - - - - - - -Sales of reserves in place - - - - - - -Production for the year - - (5) - - - (5)
Balance as of December 31, 2013 - - 1,088 - - - 1,088
Revisions of previous estimates - - (25) - - - (25)Extensions, discoveries and other - - 87 - - - 87Acquisitions of reserves in place - - - - - - -Sales of reserves in place - - - - - - -Production for the year - - (5) - - - (5)
Balance as of December 31, 2014 - - 1,145 - - - 1,145
Revisions of previous estimates - - 130 - - - 130Extensions, discoveries and other - - - - - - -Acquisitions of reserves in place - - - - - - -Sales of reserves in place - - (160) - - - (160)Production for the year - - (5) - - - (5)
Balance as of December 31, 2015 - - 1,110 - - - 1,110
Proved developed reserves as of
December 31, 2013 - - 15 - - - 15December 31, 2014 - - 17 - - - 17
December 31, 2015 - - 100 - - - 100
Proved undeveloped reserves as of
December 31, 2013 - - 1,073 - - - 1,073December 31, 2014 - - 1,128 - - - 1,128
December 31, 2015 - - 1,010 - - - 1,010
There are no bitumen reserves for equity affiliates.
There are no minority interests for bitumen reserves.
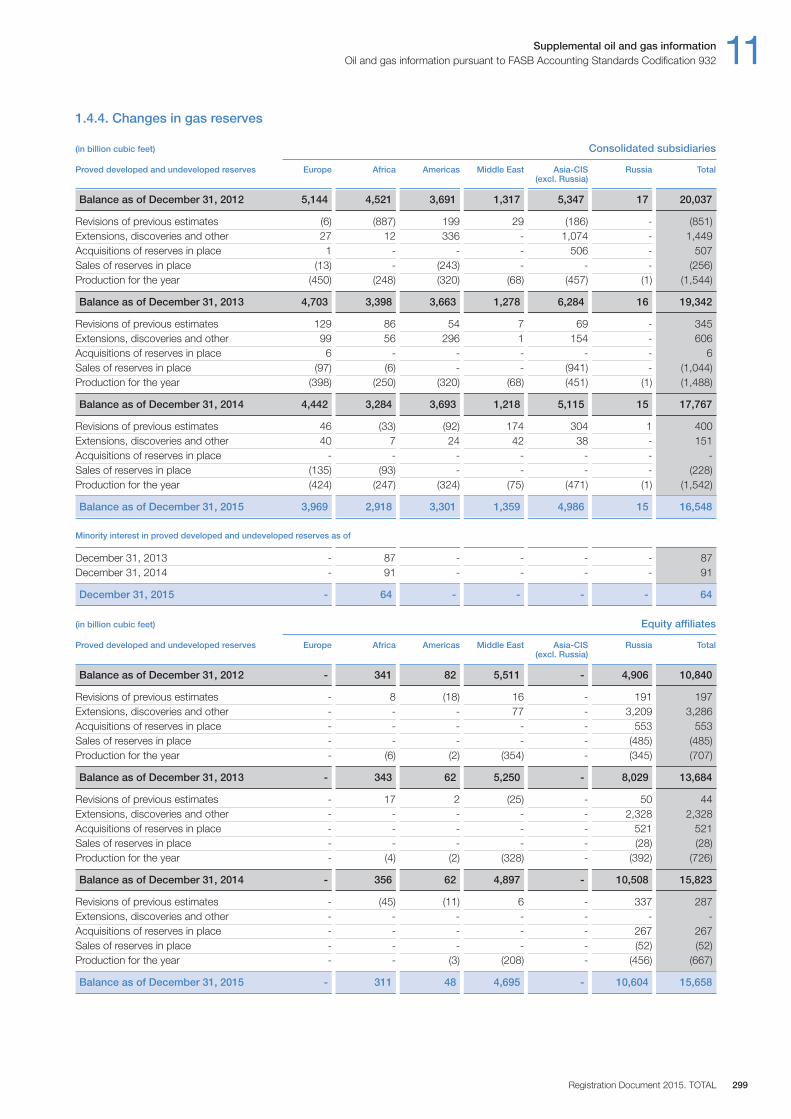
Supplemental oil and gas information 11Oil and gas information pursuant to FASB Accounting Standards Codification 932
Registration Document 2015. TOTAL 299
1.4.4. Changes in gas reserves
(in billion cubic feet) Consolidated subsidiaries
Proved developed and undeveloped reserves Europe Africa Americas Middle East Asia-CIS Russia Total (excl. Russia)
Balance as of December 31, 2012 5,144 4,521 3,691 1,317 5,347 17 20,037
Revisions of previous estimates (6) (887) 199 29 (186) - (851)Extensions, discoveries and other 27 12 336 - 1,074 - 1,449Acquisitions of reserves in place 1 - - - 506 - 507Sales of reserves in place (13) - (243) - - - (256)Production for the year (450) (248) (320) (68) (457) (1) (1,544)
Balance as of December 31, 2013 4,703 3,398 3,663 1,278 6,284 16 19,342
Revisions of previous estimates 129 86 54 7 69 - 345Extensions, discoveries and other 99 56 296 1 154 - 606Acquisitions of reserves in place 6 - - - - - 6Sales of reserves in place (97) (6) - - (941) - (1,044)Production for the year (398) (250) (320) (68) (451) (1) (1,488)
Balance as of December 31, 2014 4,442 3,284 3,693 1,218 5,115 15 17,767
Revisions of previous estimates 46 (33) (92) 174 304 1 400Extensions, discoveries and other 40 7 24 42 38 - 151Acquisitions of reserves in place - - - - - - -Sales of reserves in place (135) (93) - - - - (228)Production for the year (424) (247) (324) (75) (471) (1) (1,542)
Balance as of December 31, 2015 3,969 2,918 3,301 1,359 4,986 15 16,548
Minority interest in proved developed and undeveloped reserves as of
December 31, 2013 - 87 - - - - 87December 31, 2014 - 91 - - - - 91
December 31, 2015 - 64 - - - - 64
(in billion cubic feet) Equity affiliates
Proved developed and undeveloped reserves Europe Africa Americas Middle East Asia-CIS Russia Total (excl. Russia)
Balance as of December 31, 2012 - 341 82 5,511 - 4,906 10,840
Revisions of previous estimates - 8 (18) 16 - 191 197Extensions, discoveries and other - - - 77 - 3,209 3,286Acquisitions of reserves in place - - - - - 553 553Sales of reserves in place - - - - - (485) (485)Production for the year - (6) (2) (354) - (345) (707)
Balance as of December 31, 2013 - 343 62 5,250 - 8,029 13,684
Revisions of previous estimates - 17 2 (25) - 50 44Extensions, discoveries and other - - - - - 2,328 2,328Acquisitions of reserves in place - - - - - 521 521Sales of reserves in place - - - - - (28) (28)Production for the year - (4) (2) (328) - (392) (726)
Balance as of December 31, 2014 - 356 62 4,897 - 10,508 15,823
Revisions of previous estimates - (45) (11) 6 - 337 287Extensions, discoveries and other - - - - - - -Acquisitions of reserves in place - - - - - 267 267Sales of reserves in place - - - - - (52) (52)Production for the year - - (3) (208) - (456) (667)
Balance as of December 31, 2015 - 311 48 4,695 - 10,604 15,658

11 Supplemental oil and gas informationOil and gas information pursuant to FASB Accounting Standards Codification 932
TOTAL. Registration Document 2015300
(in billion cubic feet) Consolidated subsidiaries and equity affiliates
Europe Africa Americas Middle East Asia-CIS Russia Total (excl. Russia)
As of December 31, 2013
Proved developed and undeveloped reserves 4,703 3,741 3,725 6,528 6,284 8,045 33,026
Consolidated subsidiaries 4,703 3,398 3,663 1,278 6,284 16 19,342Equity affiliates - 343 62 5,250 - 8,029 13,684
Proved developed reserves 2,687 2,009 2,240 6,366 1,821 3,693 18,816
Consolidated subsidiaries 2,687 1,937 2,210 1,210 1,821 13 9,878Equity affiliates - 72 30 5,156 - 3,680 8,938
Proved undeveloped reserves 2,016 1,732 1,485 162 4,463 4,352 14,210
Consolidated subsidiaries 2,016 1,461 1,453 68 4,463 3 9,464Equity affiliates - 271 32 94 - 4,349 4,746
As of December 31, 2014
Proved developed and undeveloped reserves 4,442 3,640 3,755 6,115 5,115 10,523 33,590
Consolidated subsidiaries 4,442 3,284 3,693 1,218 5,115 15 17,767Equity affiliates - 356 62 4,897 - 10,508 15,823
Proved developed reserves 2,578 2,019 2,167 5,866 1,444 4,959 19,033
Consolidated subsidiaries 2,578 1,952 2,145 1,144 1,444 9 9,272Equity affiliates - 67 22 4,722 - 4,950 9,761
Proved undeveloped reserves 1,864 1,621 1,588 249 3,671 5,564 14,557
Consolidated subsidiaries 1,864 1,332 1,548 74 3,671 6 8,495Equity affiliates - 289 40 175 - 5,558 6,062
As of December 31, 2015
Proved developed and undeveloped reserves 3,969 3,229 3,349 6,054 4,986 10,619 32,206
Consolidated subsidiaries 3,969 2,918 3,301 1,359 4,986 15 16,548Equity affiliates - 311 48 4,695 - 10,604 15,658
Proved developed reserves 2,682 1,726 2,153 5,442 1,717 4,890 18,610
Consolidated subsidiaries 2,682 1,680 2,133 1,207 1,717 6 9,425Equity affiliates - 46 20 4,235 - 4,884 9,185
Proved undeveloped reserves 1,287 1,503 1,196 612 3,269 5,729 13,596
Consolidated subsidiaries 1,287 1,238 1,168 152 3,269 9 7,123Equity affiliates - 265 28 460 - 5,720 6,473
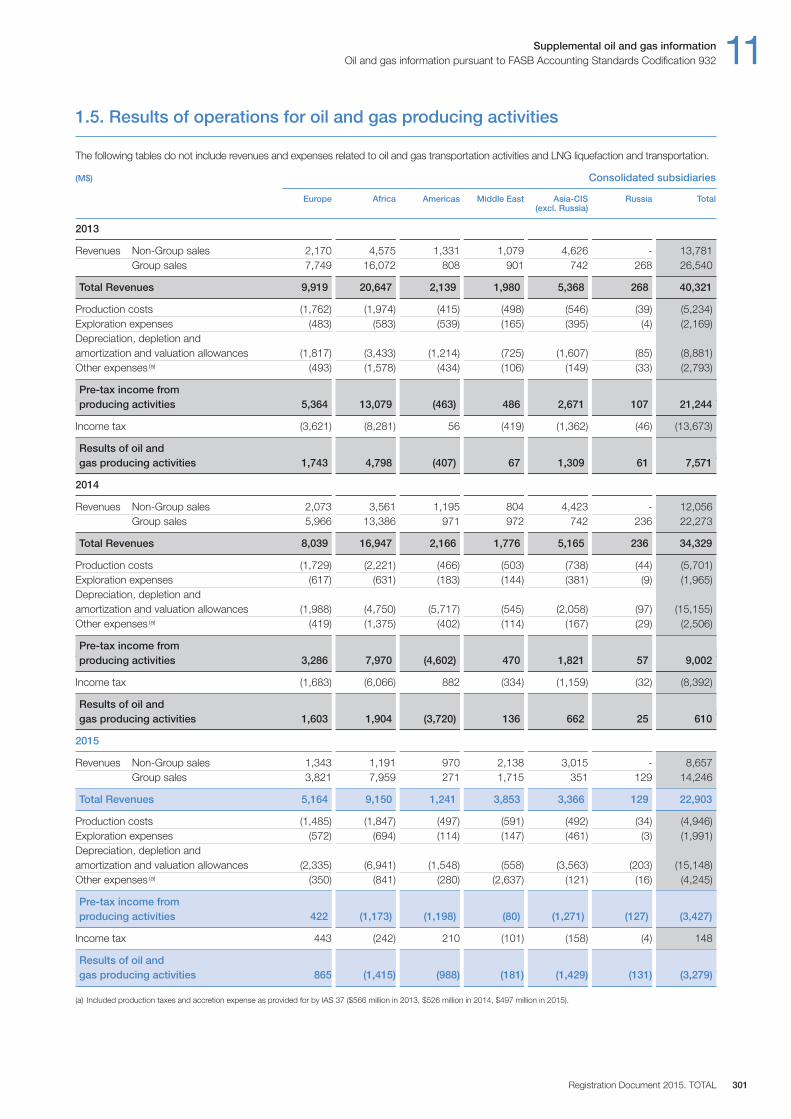
Supplemental oil and gas information 11Oil and gas information pursuant to FASB Accounting Standards Codification 932
Registration Document 2015. TOTAL 301
1.5. Results of operations for oil and gas producing activities
The following tables do not include revenues and expenses related to oil and gas transportation activities and LNG liquefaction and transportation.
(M$) Consolidated subsidiaries
Europe Africa Americas Middle East Asia-CIS Russia Total (excl. Russia)
2013
Revenues Non-Group sales 2,170 4,575 1,331 1,079 4,626 - 13,781Group sales 7,749 16,072 808 901 742 268 26,540
Total Revenues 9,919 20,647 2,139 1,980 5,368 268 40,321
Production costs (1,762) (1,974) (415) (498) (546) (39) (5,234)Exploration expenses (483) (583) (539) (165) (395) (4) (2,169)Depreciation, depletion and amortization and valuation allowances (1,817) (3,433) (1,214) (725) (1,607) (85) (8,881)Other expenses (a) (493) (1,578) (434) (106) (149) (33) (2,793)
Pre-tax income from producing activities 5,364 13,079 (463) 486 2,671 107 21,244
Income tax (3,621) (8,281) 56 (419) (1,362) (46) (13,673)
Results of oil and gas producing activities 1,743 4,798 (407) 67 1,309 61 7,571
2014
Revenues Non-Group sales 2,073 3,561 1,195 804 4,423 - 12,056Group sales 5,966 13,386 971 972 742 236 22,273
Total Revenues 8,039 16,947 2,166 1,776 5,165 236 34,329
Production costs (1,729) (2,221) (466) (503) (738) (44) (5,701)Exploration expenses (617) (631) (183) (144) (381) (9) (1,965)Depreciation, depletion and amortization and valuation allowances (1,988) (4,750) (5,717) (545) (2,058) (97) (15,155)Other expenses (a) (419) (1,375) (402) (114) (167) (29) (2,506)
Pre-tax income from producing activities 3,286 7,970 (4,602) 470 1,821 57 9,002
Income tax (1,683) (6,066) 882 (334) (1,159) (32) (8,392)
Results of oil and gas producing activities 1,603 1,904 (3,720) 136 662 25 610
2015
Revenues Non-Group sales 1,343 1,191 970 2,138 3,015 - 8,657Group sales 3,821 7,959 271 1,715 351 129 14,246
Total Revenues 5,164 9,150 1,241 3,853 3,366 129 22,903
Production costs (1,485) (1,847) (497) (591) (492) (34) (4,946)Exploration expenses (572) (694) (114) (147) (461) (3) (1,991)Depreciation, depletion and amortization and valuation allowances (2,335) (6,941) (1,548) (558) (3,563) (203) (15,148)Other expenses (a) (350) (841) (280) (2,637) (121) (16) (4,245)
Pre-tax income from producing activities 422 (1,173) (1,198) (80) (1,271) (127) (3,427)
Income tax 443 (242) 210 (101) (158) (4) 148
Results of oil and gas producing activities 865 (1,415) (988) (181) (1,429) (131) (3,279)
(a) Included production taxes and accretion expense as provided for by IAS 37 ($566 million in 2013, $526 million in 2014, $497 million in 2015).
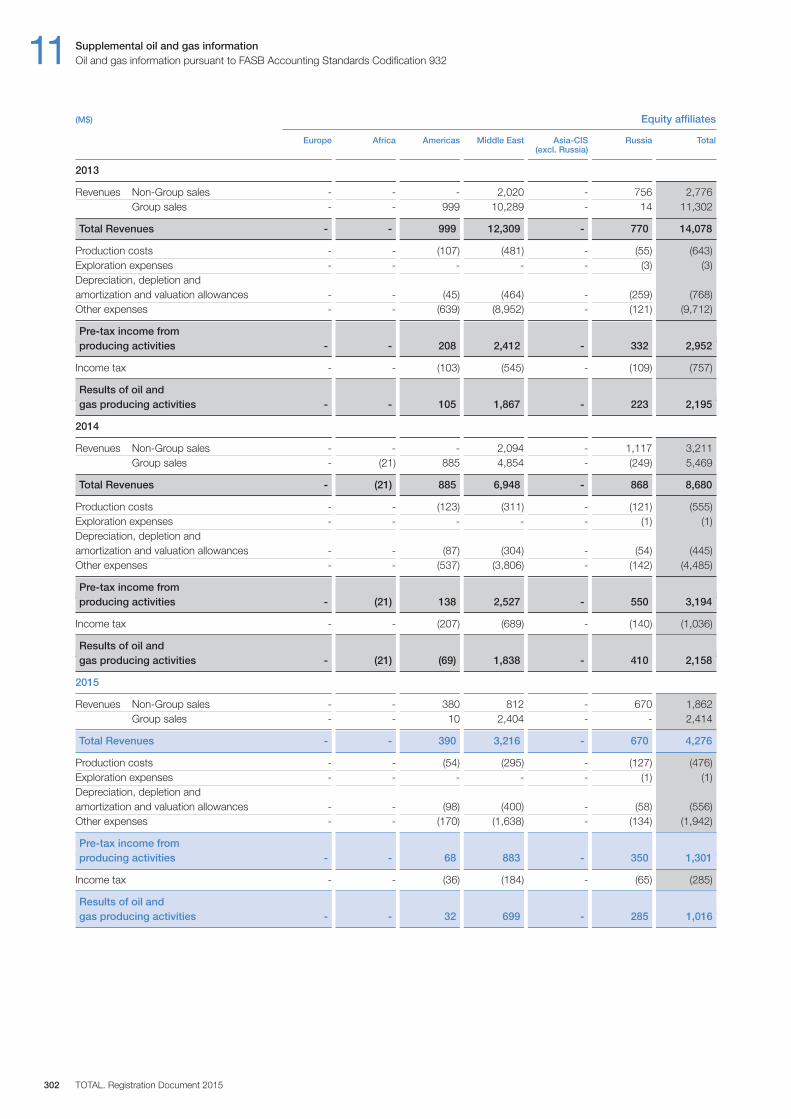
11 Supplemental oil and gas informationOil and gas information pursuant to FASB Accounting Standards Codification 932
TOTAL. Registration Document 2015302
(M$) Equity affiliates
Europe Africa Americas Middle East Asia-CIS Russia Total (excl. Russia)
2013
Revenues Non-Group sales - - - 2,020 - 756 2,776Group sales - - 999 10,289 - 14 11,302
Total Revenues - - 999 12,309 - 770 14,078
Production costs - - (107) (481) - (55) (643)Exploration expenses - - - - - (3) (3)Depreciation, depletion and amortization and valuation allowances - - (45) (464) - (259) (768)Other expenses - - (639) (8,952) - (121) (9,712)
Pre-tax income from producing activities - - 208 2,412 - 332 2,952
Income tax - - (103) (545) - (109) (757)
Results of oil and gas producing activities - - 105 1,867 - 223 2,195
2014
Revenues Non-Group sales - - - 2,094 - 1,117 3,211Group sales - (21) 885 4,854 - (249) 5,469
Total Revenues - (21) 885 6,948 - 868 8,680
Production costs - - (123) (311) - (121) (555)Exploration expenses - - - - - (1) (1)Depreciation, depletion and amortization and valuation allowances - - (87) (304) - (54) (445)Other expenses - - (537) (3,806) - (142) (4,485)
Pre-tax income from producing activities - (21) 138 2,527 - 550 3,194
Income tax - - (207) (689) - (140) (1,036)
Results of oil and gas producing activities - (21) (69) 1,838 - 410 2,158
2015
Revenues Non-Group sales - - 380 812 - 670 1,862Group sales - - 10 2,404 - - 2,414
Total Revenues - - 390 3,216 - 670 4,276
Production costs - - (54) (295) - (127) (476)Exploration expenses - - - - - (1) (1)Depreciation, depletion and amortization and valuation allowances - - (98) (400) - (58) (556)Other expenses - - (170) (1,638) - (134) (1,942)
Pre-tax income from producing activities - - 68 883 - 350 1,301
Income tax - - (36) (184) - (65) (285)
Results of oil and gas producing activities - - 32 699 - 285 1,016
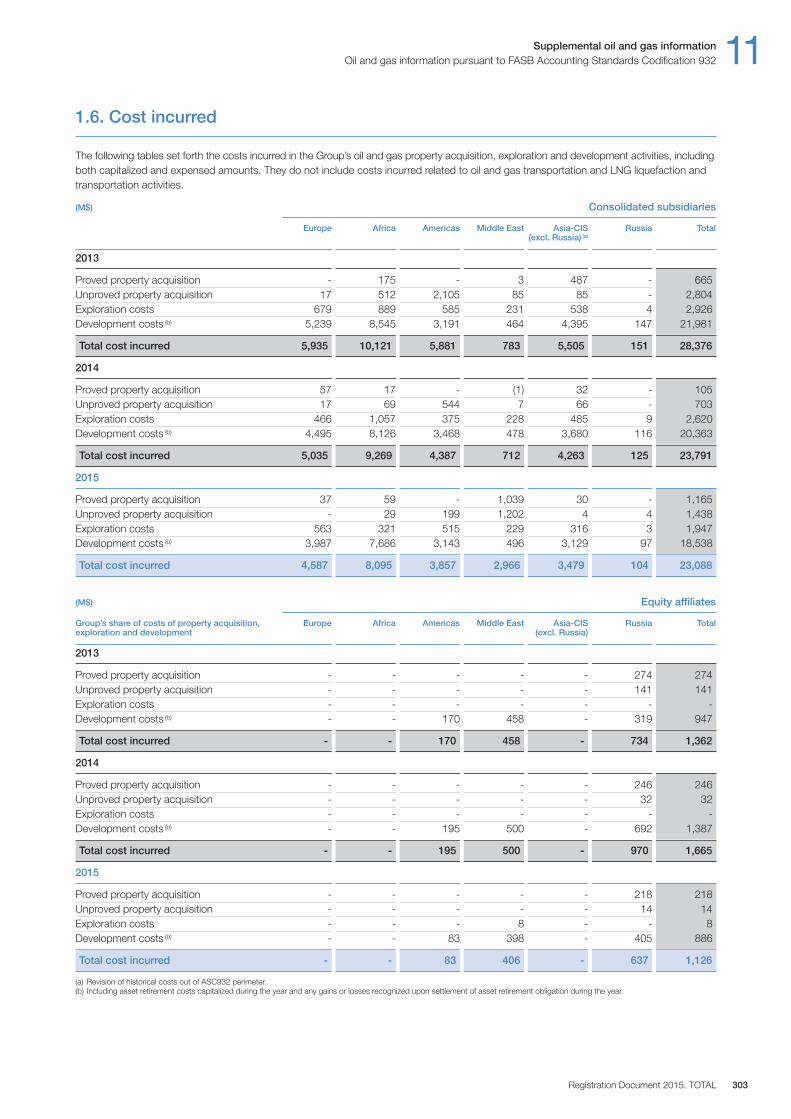
Supplemental oil and gas information 11Oil and gas information pursuant to FASB Accounting Standards Codification 932
Registration Document 2015. TOTAL 303
1.6. Cost incurred
The following tables set forth the costs incurred in the Group’s oil and gas property acquisition, exploration and development activities, includingboth capitalized and expensed amounts. They do not include costs incurred related to oil and gas transportation and LNG liquefaction andtransportation activities.
(M$) Consolidated subsidiaries
Europe Africa Americas Middle East Asia-CIS Russia Total (excl. Russia) (a)
2013
Proved property acquisition - 175 - 3 487 - 665Unproved property acquisition 17 512 2,105 85 85 - 2,804Exploration costs 679 889 585 231 538 4 2,926Development costs (b) 5,239 8,545 3,191 464 4,395 147 21,981
Total cost incurred 5,935 10,121 5,881 783 5,505 151 28,376
2014
Proved property acquisition 57 17 - (1) 32 - 105Unproved property acquisition 17 69 544 7 66 - 703Exploration costs 466 1,057 375 228 485 9 2,620Development costs (b) 4,495 8,126 3,468 478 3,680 116 20,363
Total cost incurred 5,035 9,269 4,387 712 4,263 125 23,791
2015
Proved property acquisition 37 59 - 1,039 30 - 1,165Unproved property acquisition - 29 199 1,202 4 4 1,438Exploration costs 563 321 515 229 316 3 1,947Development costs (b) 3,987 7,686 3,143 496 3,129 97 18,538
Total cost incurred 4,587 8,095 3,857 2,966 3,479 104 23,088
(M$) Equity affiliates
Group’s share of costs of property acquisition, Europe Africa Americas Middle East Asia-CIS Russia Totalexploration and development (excl. Russia)
2013
Proved property acquisition - - - - - 274 274Unproved property acquisition - - - - - 141 141Exploration costs - - - - - - -Development costs (b) - - 170 458 - 319 947
Total cost incurred - - 170 458 - 734 1,362
2014
Proved property acquisition - - - - - 246 246Unproved property acquisition - - - - - 32 32Exploration costs - - - - - - -Development costs (b) - - 195 500 - 692 1,387
Total cost incurred - - 195 500 - 970 1,665
2015
Proved property acquisition - - - - - 218 218Unproved property acquisition - - - - - 14 14Exploration costs - - - 8 - - 8Development costs (b) - - 83 398 - 405 886
Total cost incurred - - 83 406 - 637 1,126
(a) Revision of historical costs out of ASC932 perimeter.(b) Including asset retirement costs capitalized during the year and any gains or losses recognized upon settlement of asset retirement obligation during the year.
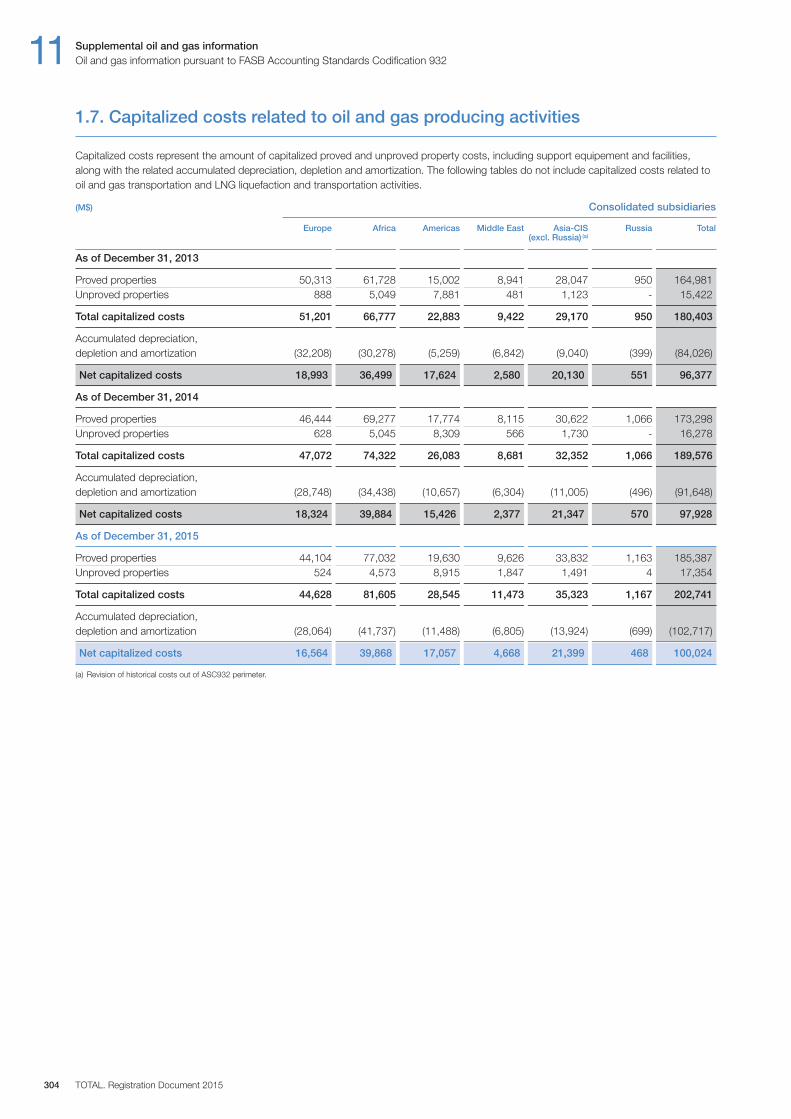
11 Supplemental oil and gas informationOil and gas information pursuant to FASB Accounting Standards Codification 932
TOTAL. Registration Document 2015304
1.7. Capitalized costs related to oil and gas producing activities
Capitalized costs represent the amount of capitalized proved and unproved property costs, including support equipement and facilities,along with the related accumulated depreciation, depletion and amortization. The following tables do not include capitalized costs related tooil and gas transportation and LNG liquefaction and transportation activities.
(M$) Consolidated subsidiaries
Europe Africa Americas Middle East Asia-CIS Russia Total (excl. Russia) (a)
As of December 31, 2013
Proved properties 50,313 61,728 15,002 8,941 28,047 950 164,981Unproved properties 888 5,049 7,881 481 1,123 - 15,422
Total capitalized costs 51,201 66,777 22,883 9,422 29,170 950 180,403
Accumulated depreciation, depletion and amortization (32,208) (30,278) (5,259) (6,842) (9,040) (399) (84,026)
Net capitalized costs 18,993 36,499 17,624 2,580 20,130 551 96,377
As of December 31, 2014
Proved properties 46,444 69,277 17,774 8,115 30,622 1,066 173,298Unproved properties 628 5,045 8,309 566 1,730 - 16,278
Total capitalized costs 47,072 74,322 26,083 8,681 32,352 1,066 189,576
Accumulated depreciation, depletion and amortization (28,748) (34,438) (10,657) (6,304) (11,005) (496) (91,648)
Net capitalized costs 18,324 39,884 15,426 2,377 21,347 570 97,928
As of December 31, 2015
Proved properties 44,104 77,032 19,630 9,626 33,832 1,163 185,387Unproved properties 524 4,573 8,915 1,847 1,491 4 17,354
Total capitalized costs 44,628 81,605 28,545 11,473 35,323 1,167 202,741
Accumulated depreciation, depletion and amortization (28,064) (41,737) (11,488) (6,805) (13,924) (699) (102,717)
Net capitalized costs 16,564 39,868 17,057 4,668 21,399 468 100,024
(a) Revision of historical costs out of ASC932 perimeter.
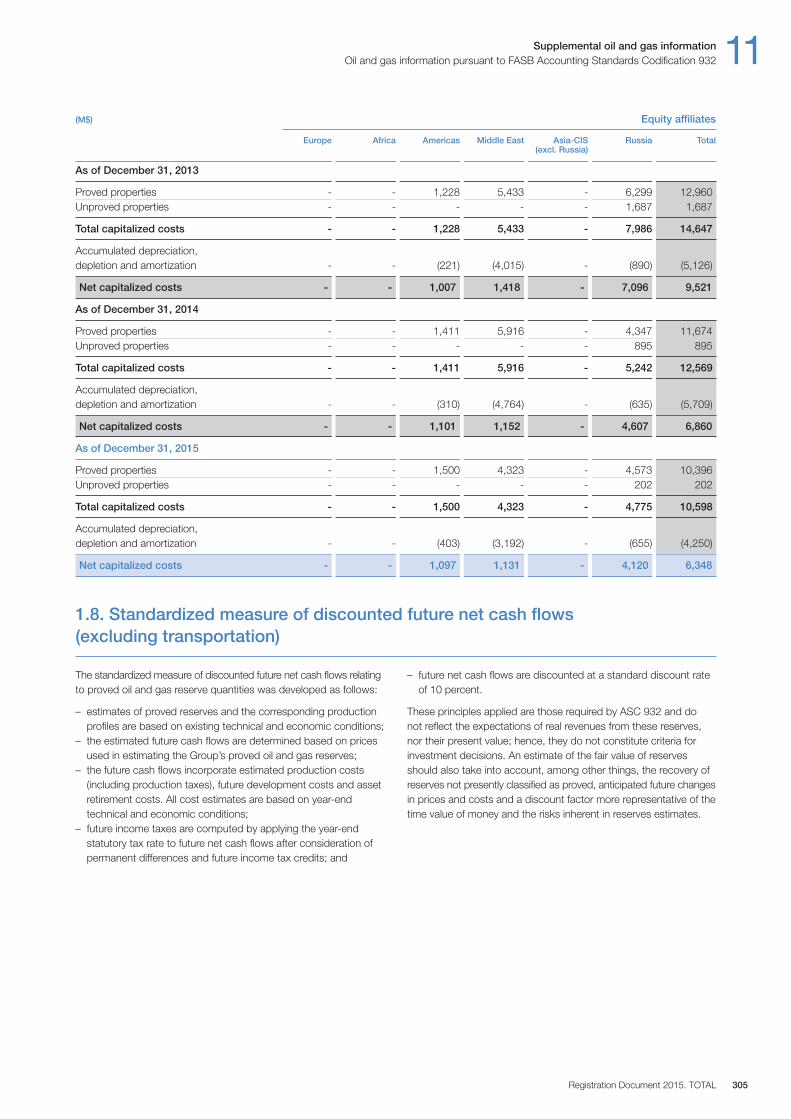
Supplemental oil and gas information 11Oil and gas information pursuant to FASB Accounting Standards Codification 932
Registration Document 2015. TOTAL 305
The standardized measure of discounted future net cash flows relatingto proved oil and gas reserve quantities was developed as follows:
– estimates of proved reserves and the corresponding productionprofiles are based on existing technical and economic conditions;
– the estimated future cash flows are determined based on pricesused in estimating the Group’s proved oil and gas reserves;
– the future cash flows incorporate estimated production costs(including production taxes), future development costs and assetretirement costs. All cost estimates are based on year-endtechnical and economic conditions;
– future income taxes are computed by applying the year-endstatutory tax rate to future net cash flows after consideration ofpermanent differences and future income tax credits; and
– future net cash flows are discounted at a standard discount rateof 10 percent.
These principles applied are those required by ASC 932 and do not reflect the expectations of real revenues from these reserves,nor their present value; hence, they do not constitute criteria forinvestment decisions. An estimate of the fair value of reservesshould also take into account, among other things, the recovery ofreserves not presently classified as proved, anticipated future changesin prices and costs and a discount factor more representative of thetime value of money and the risks inherent in reserves estimates.
(M$) Equity affiliates
Europe Africa Americas Middle East Asia-CIS Russia Total (excl. Russia)
As of December 31, 2013
Proved properties - - 1,228 5,433 - 6,299 12,960Unproved properties - - - - - 1,687 1,687
Total capitalized costs - - 1,228 5,433 - 7,986 14,647
Accumulated depreciation, depletion and amortization - - (221) (4,015) - (890) (5,126)
Net capitalized costs - - 1,007 1,418 - 7,096 9,521
As of December 31, 2014
Proved properties - - 1,411 5,916 - 4,347 11,674Unproved properties - - - - - 895 895
Total capitalized costs - - 1,411 5,916 - 5,242 12,569
Accumulated depreciation, depletion and amortization - - (310) (4,764) - (635) (5,709)
Net capitalized costs - - 1,101 1,152 - 4,607 6,860
As of December 31, 2015
Proved properties - - 1,500 4,323 - 4,573 10,396Unproved properties - - - - - 202 202
Total capitalized costs - - 1,500 4,323 - 4,775 10,598
Accumulated depreciation, depletion and amortization - - (403) (3,192) - (655) (4,250)
Net capitalized costs - - 1,097 1,131 - 4,120 6,348
1.8. Standardized measure of discounted future net cash flows (excluding transportation)
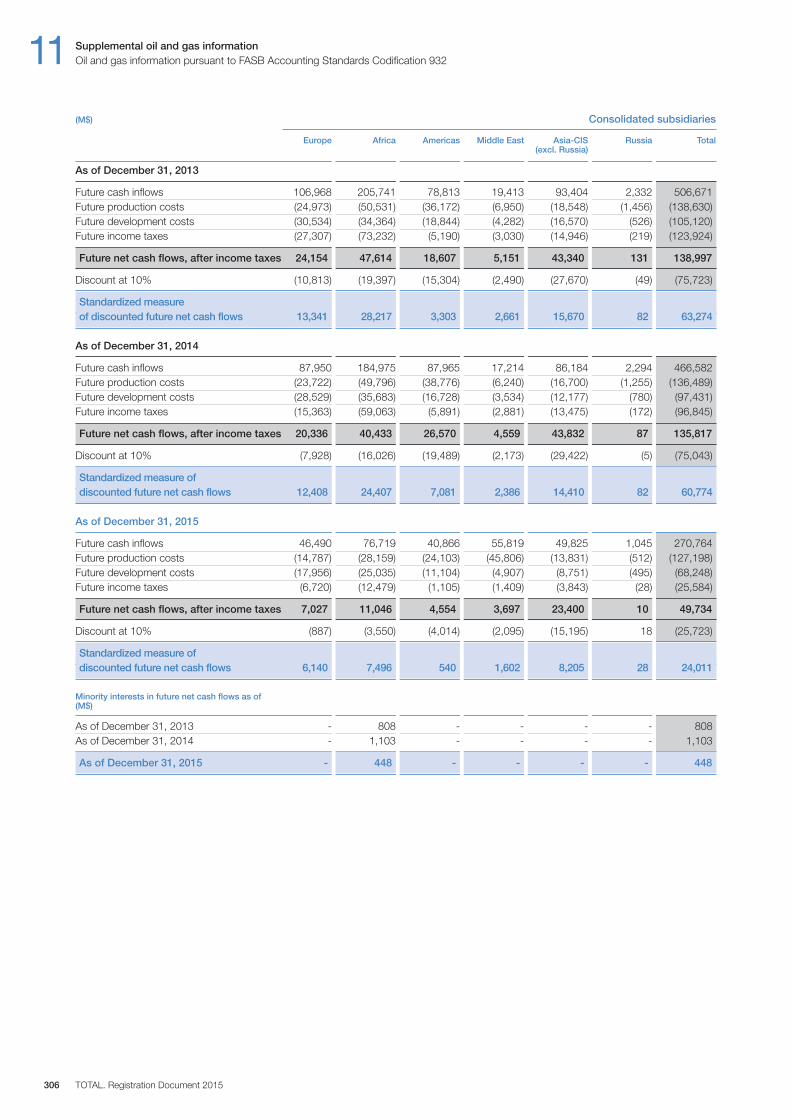
11 Supplemental oil and gas informationOil and gas information pursuant to FASB Accounting Standards Codification 932
TOTAL. Registration Document 2015306
(M$) Consolidated subsidiaries
Europe Africa Americas Middle East Asia-CIS Russia Total (excl. Russia)
As of December 31, 2013
Future cash inflows 106,968 205,741 78,813 19,413 93,404 2,332 506,671Future production costs (24,973) (50,531) (36,172) (6,950) (18,548) (1,456) (138,630)Future development costs (30,534) (34,364) (18,844) (4,282) (16,570) (526) (105,120)Future income taxes (27,307) (73,232) (5,190) (3,030) (14,946) (219) (123,924)
Future net cash flows, after income taxes 24,154 47,614 18,607 5,151 43,340 131 138,997
Discount at 10% (10,813) (19,397) (15,304) (2,490) (27,670) (49) (75,723)
Standardized measure of discounted future net cash flows 13,341 28,217 3,303 2,661 15,670 82 63,274
As of December 31, 2014
Future cash inflows 87,950 184,975 87,965 17,214 86,184 2,294 466,582Future production costs (23,722) (49,796) (38,776) (6,240) (16,700) (1,255) (136,489)Future development costs (28,529) (35,683) (16,728) (3,534) (12,177) (780) (97,431)Future income taxes (15,363) (59,063) (5,891) (2,881) (13,475) (172) (96,845)
Future net cash flows, after income taxes 20,336 40,433 26,570 4,559 43,832 87 135,817
Discount at 10% (7,928) (16,026) (19,489) (2,173) (29,422) (5) (75,043)
Standardized measure of discounted future net cash flows 12,408 24,407 7,081 2,386 14,410 82 60,774
As of December 31, 2015
Future cash inflows 46,490 76,719 40,866 55,819 49,825 1,045 270,764Future production costs (14,787) (28,159) (24,103) (45,806) (13,831) (512) (127,198)Future development costs (17,956) (25,035) (11,104) (4,907) (8,751) (495) (68,248)Future income taxes (6,720) (12,479) (1,105) (1,409) (3,843) (28) (25,584)
Future net cash flows, after income taxes 7,027 11,046 4,554 3,697 23,400 10 49,734
Discount at 10% (887) (3,550) (4,014) (2,095) (15,195) 18 (25,723)
Standardized measure of discounted future net cash flows 6,140 7,496 540 1,602 8,205 28 24,011
Minority interests in future net cash flows as of(M$)
As of December 31, 2013 - 808 - - - - 808As of December 31, 2014 - 1,103 - - - - 1,103
As of December 31, 2015 - 448 - - - - 448
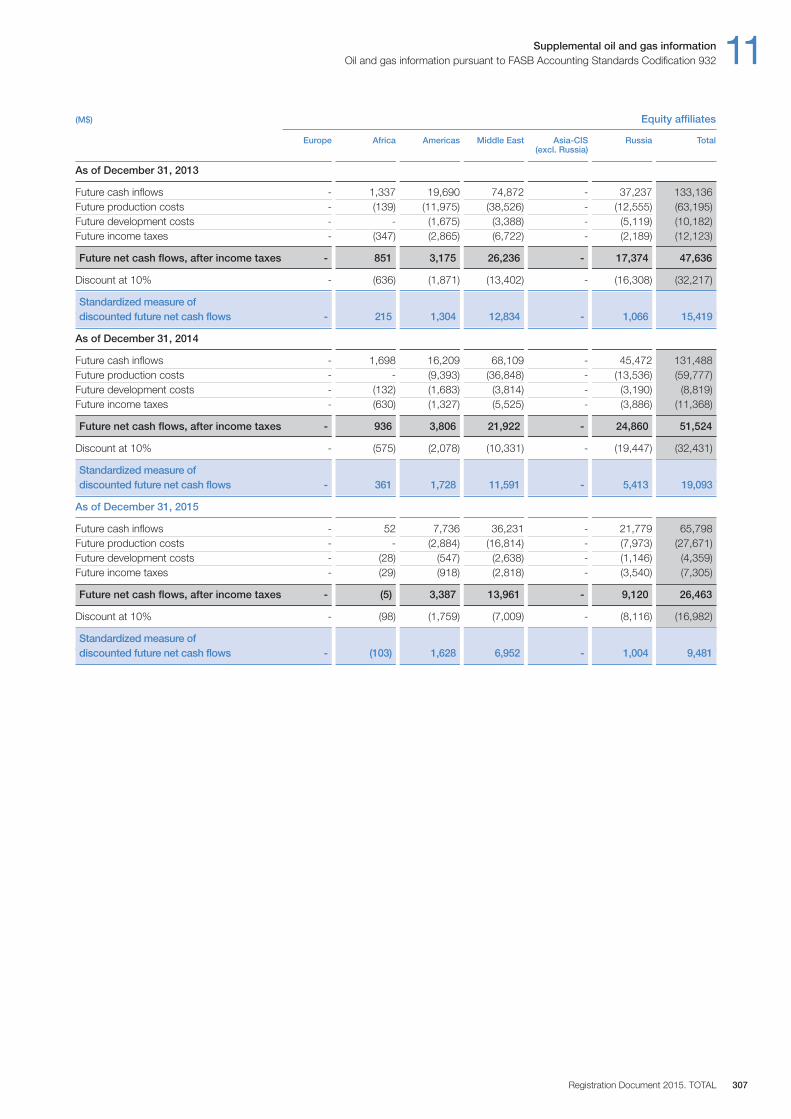
Supplemental oil and gas information 11Oil and gas information pursuant to FASB Accounting Standards Codification 932
Registration Document 2015. TOTAL 307
(M$) Equity affiliates
Europe Africa Americas Middle East Asia-CIS Russia Total (excl. Russia)
As of December 31, 2013
Future cash inflows - 1,337 19,690 74,872 - 37,237 133,136Future production costs - (139) (11,975) (38,526) - (12,555) (63,195)Future development costs - - (1,675) (3,388) - (5,119) (10,182)Future income taxes - (347) (2,865) (6,722) - (2,189) (12,123)
Future net cash flows, after income taxes - 851 3,175 26,236 - 17,374 47,636
Discount at 10% - (636) (1,871) (13,402) - (16,308) (32,217)
Standardized measure of discounted future net cash flows - 215 1,304 12,834 - 1,066 15,419
As of December 31, 2014
Future cash inflows - 1,698 16,209 68,109 - 45,472 131,488Future production costs - - (9,393) (36,848) - (13,536) (59,777)Future development costs - (132) (1,683) (3,814) - (3,190) (8,819)Future income taxes - (630) (1,327) (5,525) - (3,886) (11,368)
Future net cash flows, after income taxes - 936 3,806 21,922 - 24,860 51,524
Discount at 10% - (575) (2,078) (10,331) - (19,447) (32,431)
Standardized measure of discounted future net cash flows - 361 1,728 11,591 - 5,413 19,093
As of December 31, 2015
Future cash inflows - 52 7,736 36,231 - 21,779 65,798Future production costs - - (2,884) (16,814) - (7,973) (27,671)Future development costs - (28) (547) (2,638) - (1,146) (4,359)Future income taxes - (29) (918) (2,818) - (3,540) (7,305)
Future net cash flows, after income taxes - (5) 3,387 13,961 - 9,120 26,463
Discount at 10% - (98) (1,759) (7,009) - (8,116) (16,982)
Standardized measure of discounted future net cash flows - (103) 1,628 6,952 - 1,004 9,481
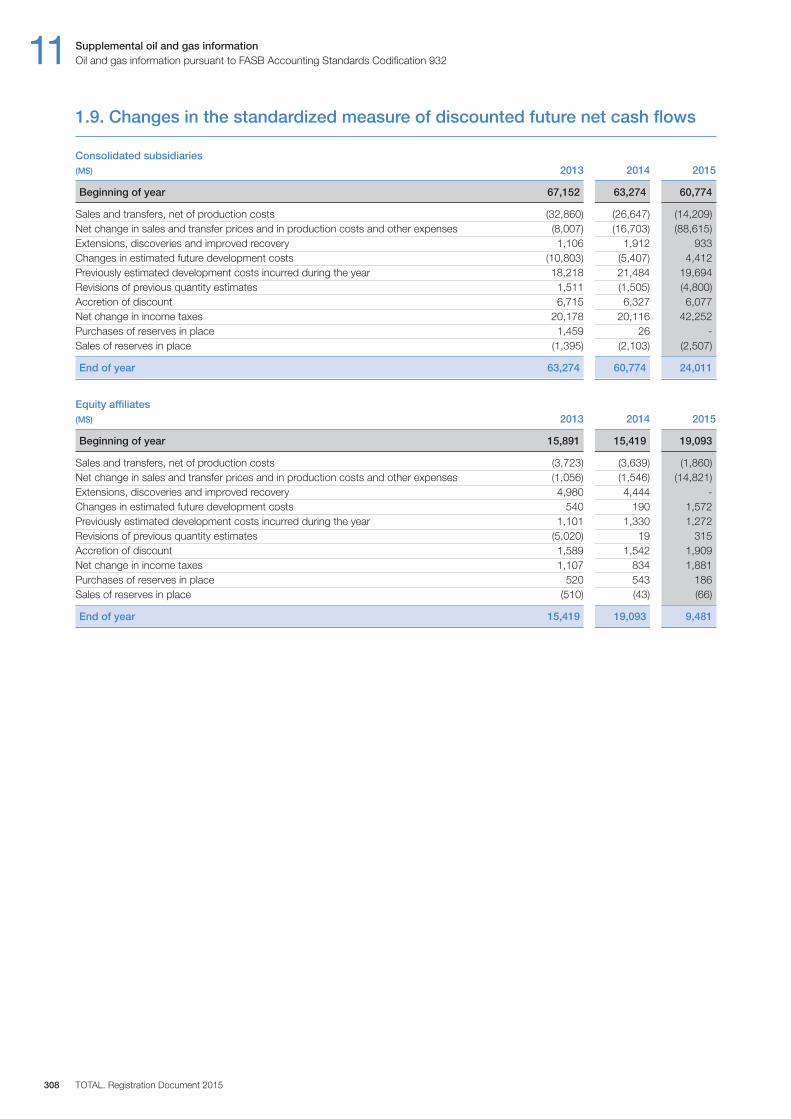
11 Supplemental oil and gas informationOil and gas information pursuant to FASB Accounting Standards Codification 932
TOTAL. Registration Document 2015308
1.9. Changes in the standardized measure of discounted future net cash flows
Consolidated subsidiaries(M$) 20 13 20 14 2015
Beginning of year 67,152 63,274 60,774
Sales and transfers, net of production costs (32,860) (26,647) (14,209)Net change in sales and transfer prices and in production costs and other expenses (8,007) (16,703) (88,615)Extensions, discoveries and improved recovery 1,106 1,912 933Changes in estimated future development costs (10,803) (5,407) 4,412Previously estimated development costs incurred during the year 18,218 21,484 19,694Revisions of previous quantity estimates 1,511 (1,505) (4,800)Accretion of discount 6,715 6,327 6,077Net change in income taxes 20,178 20,116 42,252Purchases of reserves in place 1,459 26 -Sales of reserves in place (1,395) (2,103) (2,507)
End of year 63,274 60,774 24,011
Equity affiliates(M$) 2013 2014 2015
Beginning of year 15,891 15,419 19,093
Sales and transfers, net of production costs (3,723) (3,639) (1,860)Net change in sales and transfer prices and in production costs and other expenses (1,056) (1,546) (14,821)Extensions, discoveries and improved recovery 4,980 4,444 -Changes in estimated future development costs 540 190 1,572Previously estimated development costs incurred during the year 1,101 1,330 1,272Revisions of previous quantity estimates (5,020) 19 315Accretion of discount 1,589 1,542 1,909Net change in income taxes 1,107 834 1,881Purchases of reserves in place 520 543 186Sales of reserves in place (510) (43) (66)
End of year 15,419 19,093 9,481
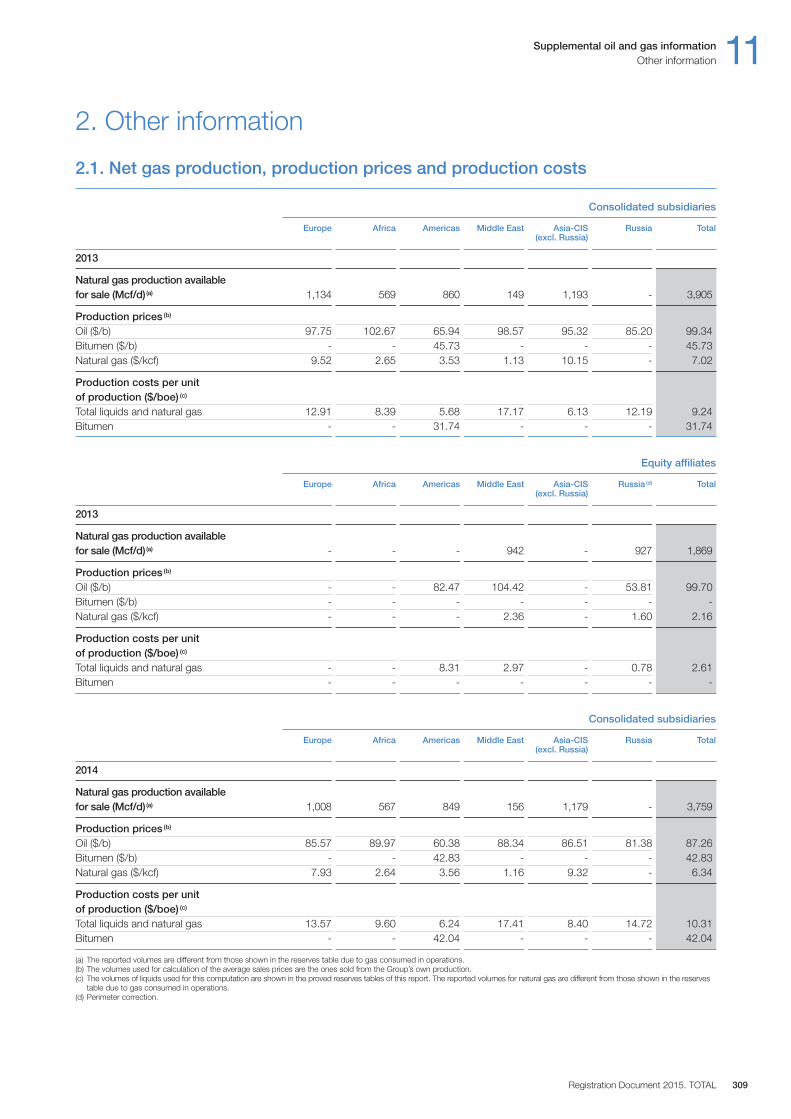
Supplemental oil and gas information 11Other information
Registration Document 2015. TOTAL 309
2. Other information
2.1. Net gas production, production prices and production costs
Consolidated subsidiaries
Europe Africa Americas Middle East Asia-CIS Russia Total (excl. Russia)
2013
Natural gas production available for sale (Mcf / d)(a) 1,134 569 860 149 1,193 - 3,905
Production prices (b)
Oil ($ / b) 97.75 102.67 65.94 98.57 95.32 85.20 99.34Bitumen ($ / b) - - 45.73 - - - 45.73Natural gas ($ / kcf) 9.52 2.65 3.53 1.13 10.15 - 7.02
Production costs per unit of production ($ / boe) (c)
Total liquids and natural gas 12.91 8.39 5.68 17.17 6.13 12.19 9.24Bitumen - - 31.74 - - - 31.74
Equity affiliates
Europe Africa Americas Middle East Asia-CIS Russia (d) Total (excl. Russia)
2013
Natural gas production available for sale (Mcf / d)(a) - - - 942 - 927 1,869
Production prices (b)
Oil ($ / b) - - 82.47 104.42 - 53.81 99.70Bitumen ($ / b) - - - - - - -Natural gas ($ / kcf) - - - 2.36 - 1.60 2.16
Production costs per unit of production ($ / boe) (c)
Total liquids and natural gas - - 8.31 2.97 - 0.78 2.61Bitumen - - - - - - -
Consolidated subsidiaries
Europe Africa Americas Middle East Asia-CIS Russia Total (excl. Russia)
2014
Natural gas production available for sale (Mcf / d)(a) 1,008 567 849 156 1,179 - 3,759
Production prices (b)
Oil ($ / b) 85.57 89.97 60.38 88.34 86.51 81.38 87.26Bitumen ($ / b) - - 42.83 - - - 42.83Natural gas ($ / kcf) 7.93 2.64 3.56 1.16 9.32 - 6.34
Production costs per unit of production ($ / boe) (c)
Total liquids and natural gas 13.57 9.60 6.24 17.41 8.40 14.72 10.31Bitumen - - 42.04 - - - 42.04
(a) The reported volumes are different from those shown in the reserves table due to gas consumed in operations.(b) The volumes used for calculation of the average sales prices are the ones sold from the Group’s own production.(c) The volumes of liquids used for this computation are shown in the proved reserves tables of this report. The reported volumes for natural gas are different from those shown in the reserves
table due to gas consumed in operations.(d) Perimeter correction.

11 Supplemental oil and gas informationOther information
TOTAL. Registration Document 2015310
Equity affiliates
Europe Africa Americas Middle East Asia-CIS Russia (d) Total (excl. Russia)
2014
Natural gas production available for sale (Mcf / d)(a) - - - 872 - 1,059 1,931
Production prices (b)
Oil ($ / b) - - 85.72 88.92 - 54.19 87.51Bitumen ($ / b) - - - - - - -Natural gas ($ / kcf) - - - 3.37 - 2.35 3.02
Production costs per unit of production ($ / boe) (c)
Total liquids and natural gas - - 9.19 2.86 - 1.48 2.72Bitumen - - - - - - -
Consolidated subsidiaries
Europe Africa Americas Middle East Asia-CIS Russia Total (excl. Russia)
2015
Natural gas production availablefor sale (Mcf / d)(a) 1,091 557 872 166 1,230 - 3,916
Production prices (b)
Oil ($ / b) 45.90 44.71 25.68 49.65 47.43 39.83 45.12Bitumen ($ / b) - - 12.16 - - - 12.16Natural gas ($ / kcf) 6.00 1.97 2.53 1.16 6.62 - 4.65
Production costs per unit of production ($ / boe) (c)
Total liquids and natural gas 11.25 7.74 6.35 6.67 5.45 9.77 7.84Bitumen - - 37.92 - - - 37.92
Equity affiliates
Europe Africa Americas Middle East Asia-CIS Russia Total (excl. Russia)
2015
Natural gas production available for sale (Mcf / d)(a) - - - 548 - 1,228 1,776
Production prices (b)
Oil ($ / b) - - 32.20 50.33 - 25.37 43.92Bitumen ($ / b) - - - - - - -Natural gas ($ / kcf) - - - 1.00 - 1.23 1.08
Production costs per unit of production ($ / boe) (c)
Total liquids and natural gas - - 4.05 3.40 - 1.26 2.37Bitumen - - - - - - -
(a) The reported volumes are different from those shown in the reserves table due to gas consumed in operations.(b) The volumes used for calculation of the average sales prices are the ones sold from the Group’s own production.(c) The volumes of liquids used for this computation are shown in the proved reserves tables of this report. The reported volumes for natural gas are different from those shown in the reserves
table due to gas consumed in operations.(d) Perimeter correction.
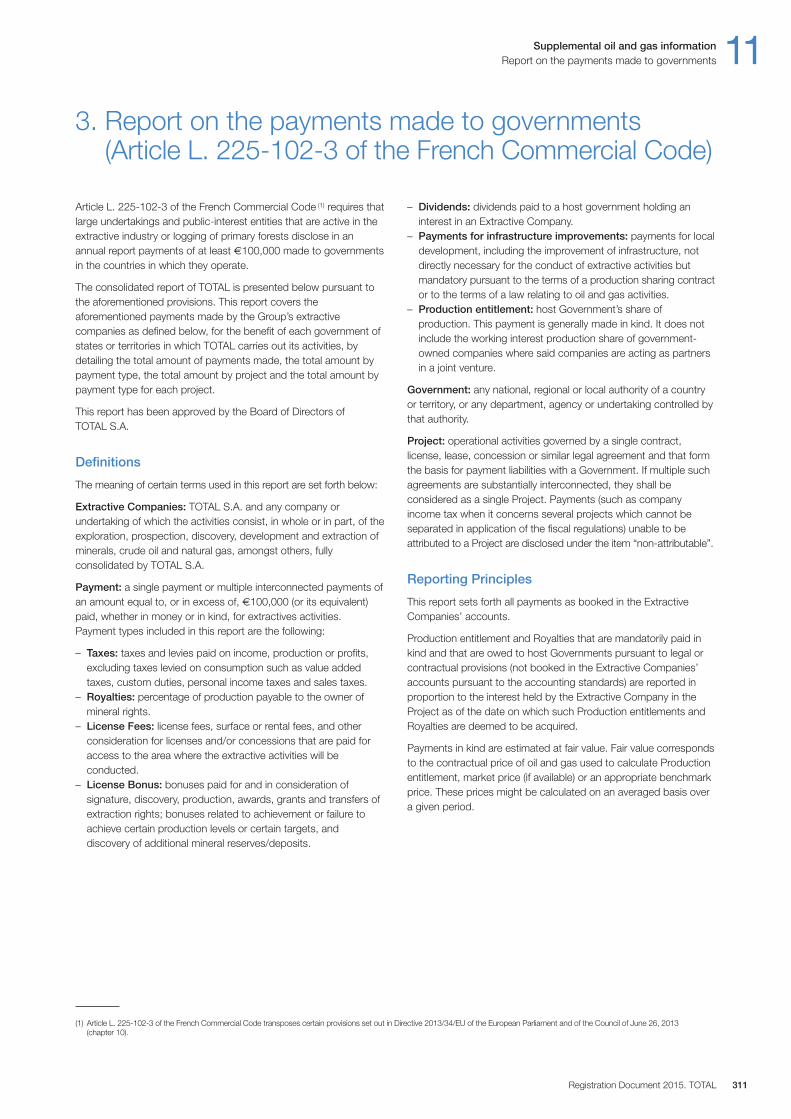
Supplemental oil and gas information 11Report on the payments made to governments
Registration Document 2015. TOTAL 311
Article L. 225-102-3 of the French Commercial Code (1) requires thatlarge undertakings and public-interest entities that are active in theextractive industry or logging of primary forests disclose in anannual report payments of at least €100,000 made to governmentsin the countries in which they operate.
The consolidated report of TOTAL is presented below pursuant tothe aforementioned provisions. This report covers theaforementioned payments made by the Group’s extractivecompanies as defined below, for the benefit of each government ofstates or territories in which TOTAL carries out its activities, bydetailing the total amount of payments made, the total amount bypayment type, the total amount by project and the total amount bypayment type for each project.
This report has been approved by the Board of Directors ofTOTAL S.A.
Definitions
The meaning of certain terms used in this report are set forth below:
Extractive Companies: TOTAL S.A. and any company orundertaking of which the activities consist, in whole or in part, of theexploration, prospection, discovery, development and extraction ofminerals, crude oil and natural gas, amongst others, fullyconsolidated by TOTAL S.A.
Payment: a single payment or multiple interconnected payments ofan amount equal to, or in excess of, €100,000 (or its equivalent)paid, whether in money or in kind, for extractives activities.Payment types included in this report are the following:
– Taxes: taxes and levies paid on income, production or profits,excluding taxes levied on consumption such as value addedtaxes, custom duties, personal income taxes and sales taxes.
– Royalties: percentage of production payable to the owner ofmineral rights.
– License Fees: license fees, surface or rental fees, and otherconsideration for licenses and / or concessions that are paid foraccess to the area where the extractive activities will beconducted.
– License Bonus: bonuses paid for and in consideration ofsignature, discovery, production, awards, grants and transfers ofextraction rights; bonuses related to achievement or failure toachieve certain production levels or certain targets, anddiscovery of additional mineral reserves / deposits.
– Dividends: dividends paid to a host government holding aninterest in an Extractive Company.
– Payments for infrastructure improvements: payments for localdevelopment, including the improvement of infrastructure, notdirectly necessary for the conduct of extractive activities butmandatory pursuant to the terms of a production sharing contractor to the terms of a law relating to oil and gas activities.
– Production entitlement: host Government’s share ofproduction. This payment is generally made in kind. It does notinclude the working interest production share of government-owned companies where said companies are acting as partnersin a joint venture.
Government: any national, regional or local authority of a countryor territory, or any department, agency or undertaking controlled bythat authority.
Project: operational activities governed by a single contract,license, lease, concession or similar legal agreement and that formthe basis for payment liabilities with a Government. If multiple suchagreements are substantially interconnected, they shall beconsidered as a single Project. Payments (such as companyincome tax when it concerns several projects which cannot beseparated in application of the fiscal regulations) unable to beattributed to a Project are disclosed under the item “non-attributable”.
Reporting Principles
This report sets forth all payments as booked in the ExtractiveCompanies’ accounts.
Production entitlement and Royalties that are mandatorily paid inkind and that are owed to host Governments pursuant to legal orcontractual provisions (not booked in the Extractive Companies’accounts pursuant to the accounting standards) are reported inproportion to the interest held by the Extractive Company in theProject as of the date on which such Production entitlements andRoyalties are deemed to be acquired.
Payments in kind are estimated at fair value. Fair value correspondsto the contractual price of oil and gas used to calculate Productionentitlement, market price (if available) or an appropriate benchmarkprice. These prices might be calculated on an averaged basis overa given period.
3. Report on the payments made to governments(Article L. 225-102-3 of the French Commercial Code)
(1) Article L. 225-102-3 of the French Commercial Code transposes certain provisions set out in Directive 2013/34/EU of the European Parliament and of the Council of June 26, 2013 (chapter 10).
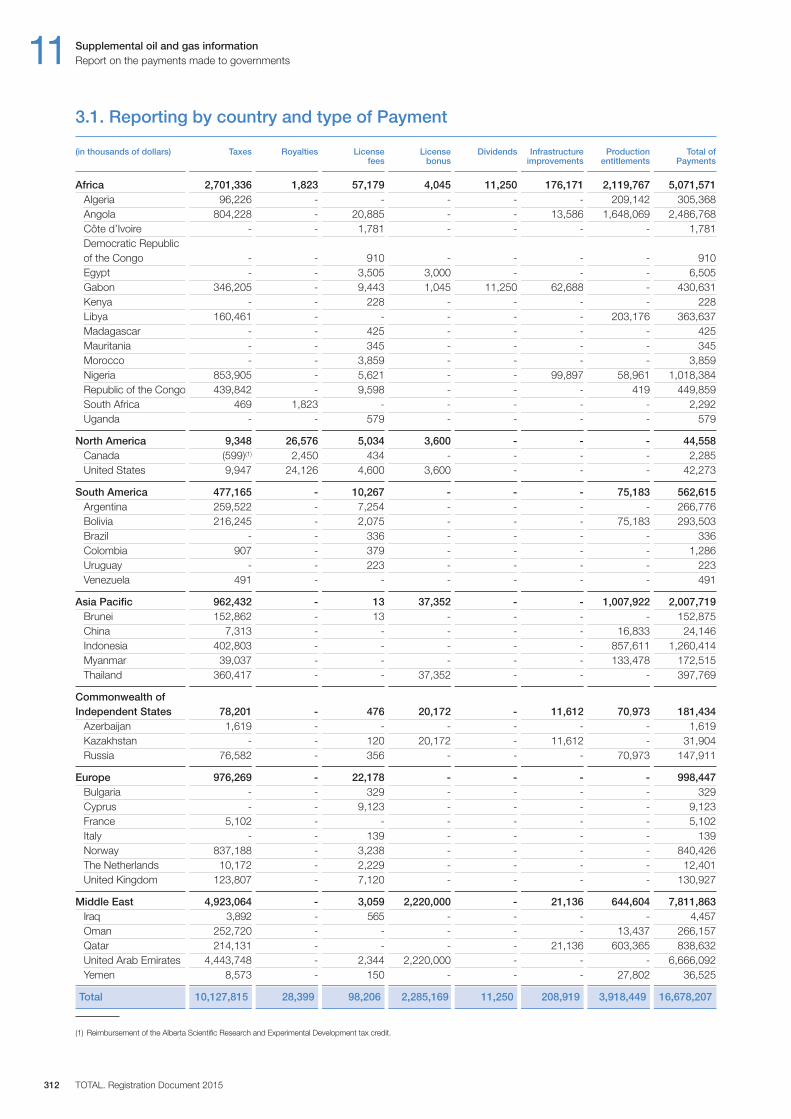
11 Supplemental oil and gas informationReport on the payments made to governments
TOTAL. Registration Document 2015312
3.1. Reporting by country and type of Payment
(in thousands of dollars) Taxes Royalties License License Dividends Infrastructure Production Total of fees bonus improvements entitlements Payments
Africa 2,701,336 1,823 57,179 4,045 11,250 176,171 2,119,767 5,071,571Algeria 96,226 - - - - - 209,142 305,368Angola 804,228 - 20,885 - - 13,586 1,648,069 2,486,768Côte d’Ivoire - - 1,781 - - - - 1,781Democratic Republic of the Congo - - 910 - - - - 910Egypt - - 3,505 3,000 - - - 6,505Gabon 346,205 - 9,443 1,045 11,250 62,688 - 430,631Kenya - - 228 - - - - 228Libya 160,461 - - - - - 203,176 363,637Madagascar - - 425 - - - - 425Mauritania - - 345 - - - - 345Morocco - - 3,859 - - - - 3,859Nigeria 853,905 - 5,621 - - 99,897 58,961 1,018,384Republic of the Congo 439,842 - 9,598 - - - 419 449,859 South Africa 469 1,823 - - - - - 2,292Uganda - - 579 - - - - 579
North America 9,348 26,576 5,034 3,600 - - - 44,558Canada (599)(1) 2,450 434 - - - - 2,285United States 9,947 24,126 4,600 3,600 - - - 42,273
South America 477,165 - 10,267 - - - 75,183 562,615Argentina 259,522 - 7,254 - - - - 266,776Bolivia 216,245 - 2,075 - - - 75,183 293,503Brazil - - 336 - - - - 336Colombia 907 - 379 - - - - 1,286Uruguay - - 223 - - - - 223Venezuela 491 - - - - - - 491
Asia Pacific 962,432 - 13 37,352 - - 1,007,922 2,007,719Brunei 152,862 - 13 - - - - 152,875China 7,313 - - - - - 16,833 24,146Indonesia 402,803 - - - - - 857,611 1,260,414Myanmar 39,037 - - - - - 133,478 172,515Thailand 360,417 - - 37,352 - - - 397,769
Commonwealth ofIndependent States 78,201 - 476 20,172 - 11,612 70,973 181,434
Azerbaijan 1,619 - - - - - - 1,619Kazakhstan - - 120 20,172 - 11,612 - 31,904Russia 76,582 - 356 - - - 70,973 147,911
Europe 976,269 - 22,178 - - - - 998,447Bulgaria - - 329 - - - - 329Cyprus - - 9,123 - - - - 9,123France 5,102 - - - - - - 5,102Italy - - 139 - - - - 139Norway 837,188 - 3,238 - - - - 840,426The Netherlands 10,172 - 2,229 - - - - 12,401United Kingdom 123,807 - 7,120 - - - - 130,927
Middle East 4,923,064 - 3,059 2,220,000 - 21,136 644,604 7,811,863Iraq 3,892 - 565 - - - - 4,457Oman 252,720 - - - - - 13,437 266,157Qatar 214,131 - - - - 21,136 603,365 838,632United Arab Emirates 4,443,748 - 2,344 2,220,000 - - - 6,666,092Yemen 8,573 - 150 - - - 27,802 36,525
Total 10,127,815 28,399 98,206 2,285,169 11,250 208,919 3,918,449 16,678,207
(1) Reimbursement of the Alberta Scientific Research and Experimental Development tax credit.

Supplemental oil and gas information 11Report on the payments made to governments
Registration Document 2015. TOTAL 313
3.2. Reporting of Payments by Project and by type of Payment, and by Government and by type of Payment
(in thousands of dollars) Taxes Royalties License License Dividends Infrastructure Production Total of fees bonus improvements entitlements Payments
Algeria
Payments per ProjectTin Fouyé Tabenkort 96,226 - - - - - 209,142 305,368
Total 96,226 - - - - - 209,142 305,368
Payments per Government Direction Générale des Impôts, Direction des Grandes Entreprises c / o Sonatrach 96,226 - - - - - - 96,226Sonatrach - - - - - - 209,142 209,142
Total 96,226 - - - - - 209,142 305,368
Angola
Payments per Project Block 17 660,639 - 19,476 - - - 1,535,173 2,215,288Block 0 116,489 - - - - - - 116,489Block 14 27,100 - - - - - 112,476 139,576Block 14k - - - - - - 420 420Block 32 - - 616 - - - - 616Block 33 - - 38 - - - - 38Block 17 / 06 - - 163 - - - - 163Block 25 - - 171 - - 5,000 - 5,171Block 39 - - 214 - - 2,872 - 3,086Block 40 - - 207 - - 5,714 - 5,921
Total 804,228 - 20,885 - - 13,586 1,648,069 2,486,768
Payments per Government Caixa do Tesouro Nacional 804,228 - 1,058 - - - - 805,286Ministério dos Petróleos - - 19,260 - - - - 19,260Sonangol, E.P. - - 567 - - 13,586 1,648,069 1,662,222
Total 804,228 - 20,885 - - 13,586 1,648,069 2,486,768
Argentina
Payments per Project Neuquen 25,310 - 1,290 - - - - 26,600Tierra del Fuego 45,704 - 5,964 - - - - 51,668Non-attributable 188,508 - - - - - - 188,508
Total 259,522 - 7,254 - - - - 266,776
Payments per Government Administracion Federal de Ingresos Publicos 188,508 - - - - - - 188,508Secretaria de Energia, Republica Argentina 27,328 - 2,826 - - - - 30,154Provincia del Neuquen 25,310 - 1,290 - - - - 26,600Provincia del Tierra del Fuego 18,376 - 3,138 - - - - 21,514
Total 259,522 - 7,254 - - - - 266,776
Azerbaijan
Payments per Project Shah Deniz 1,619 - - - - - - 1,619
Total 1,619 - - - - - - 1,619

11 Supplemental oil and gas informationReport on the payments made to governments
TOTAL. Registration Document 2015314
(in thousands of dollars) Taxes Royalties License License Dividends Infrastructure Production Total of fees bonus improvements entitlements Payments
Payments per Government Ministry of Taxes of the Republic of Azerbaijan 1,619 - - - - - - 1,619
Total 1,619 - - - - - - 1,619
Bolivia
Payments per Project Ipati - - 464 - - - - 464Azero - - 1,330 - - - - 1,330Aquio - - 281 - - - - 281Itau 43,005 - - - - - 43 43,048San Alberto 35,401 - - - - - 11,442 46,843San Antonio 113,375 - - - - - 63,698 177,073Non-attributable 24,464 - - - - - - 24,464
Total 216,245 - 2,075 - - - 75,183 293,503
Payments per Government Yacimientos Petroliferos Fiscales Bolivianos (YPFB) - - 2,075 - - - 75,183 77,258Servicio de Impuestos Nacionales (SIN) 24,464 - - - - - - 24,464Servicio de Impuestos Nacionales (SIN) c / o YPFB 122,740 - - - - - - 122,740Departamentos c / o YPFB 69,041 - - - - - - 69,041
Total 216,245 - 2,075 - - - 75,183 293,503
Brazil
Payments per Project Foz de Amazonas - - 95 - - - - 95Ceara (CE-M-661) - - 192 - - - - 192Xerelete (BC-2) - - 49 - - - - 49
Total - - 336 - - - - 336
Payments per Government Agencia National de Petroleo, Gas Natural e Biocombustiveis - - 336 - - - - 336
Total - - 336 - - - - 336
Brunei
Payments per Project Block B 152,862 - 13 - - - - 152,875
Total 152,862 - 13 - - - - 152,875
Payments per Government Brunei Government 152,862 - 13 - - - - 152,875
Total 152,862 - 13 - - - - 152,875
Bulgaria
Payments per Project Khan Asparuh - - 323 - - - - 323Silistar - - 6 - - - - 6
Total - - 329 - - - - 329
Payments per Government Ministry of Energy of Bulgaria - - 329 - - - - 329
Total - - 329 - - - - 329
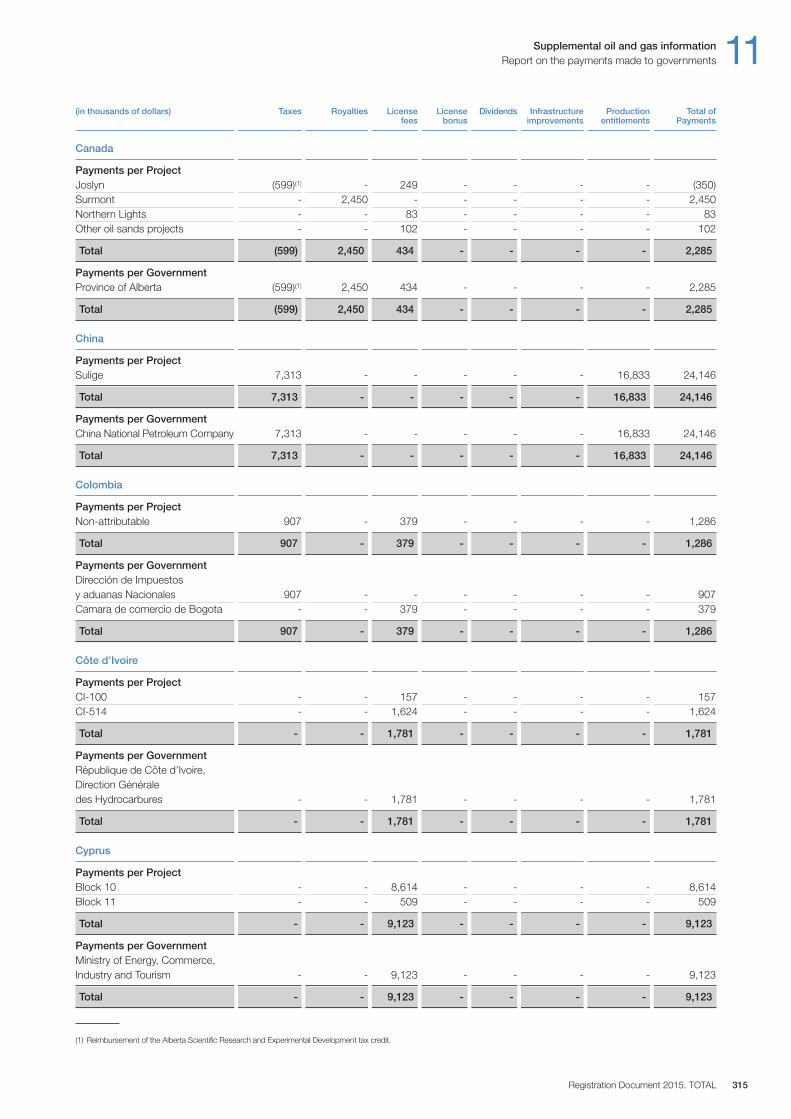
Supplemental oil and gas information 11Report on the payments made to governments
Registration Document 2015. TOTAL 315
Canada
Payments per Project Joslyn (599)(1) - 249 - - - - (350)Surmont - 2,450 - - - - - 2,450Northern Lights - - 83 - - - - 83Other oil sands projects - - 102 - - - - 102
Total (599) 2,450 434 - - - - 2,285
Payments per Government Province of Alberta (599)(1) 2,450 434 - - - - 2,285
Total (599) 2,450 434 - - - - 2,285
China
Payments per Project Sulige 7,313 - - - - - 16,833 24,146
Total 7,313 - - - - - 16,833 24,146
Payments per Government China National Petroleum Company 7,313 - - - - - 16,833 24,146
Total 7,313 - - - - - 16,833 24,146
Colombia
Payments per Project Non-attributable 907 - 379 - - - - 1,286
Total 907 - 379 - - - - 1,286
Payments per Government Dirección de Impuestos y aduanas Nacionales 907 - - - - - - 907Camara de comercio de Bogota - - 379 - - - - 379
Total 907 - 379 - - - - 1,286
Côte d’Ivoire
Payments per Project CI-100 - - 157 - - - - 157CI-514 - - 1,624 - - - - 1,624
Total - - 1,781 - - - - 1,781
Payments per Government République de Côte d’Ivoire, Direction Générale des Hydrocarbures - - 1,781 - - - - 1,781
Total - - 1,781 - - - - 1,781
Cyprus
Payments per Project Block 10 - - 8,614 - - - - 8,614Block 11 - - 509 - - - - 509
Total - - 9,123 - - - - 9,123
Payments per Government Ministry of Energy, Commerce, Industry and Tourism - - 9,123 - - - - 9,123
Total - - 9,123 - - - - 9,123
(in thousands of dollars) Taxes Royalties License License Dividends Infrastructure Production Total of fees bonus improvements entitlements Payments
(1) Reimbursement of the Alberta Scientific Research and Experimental Development tax credit.
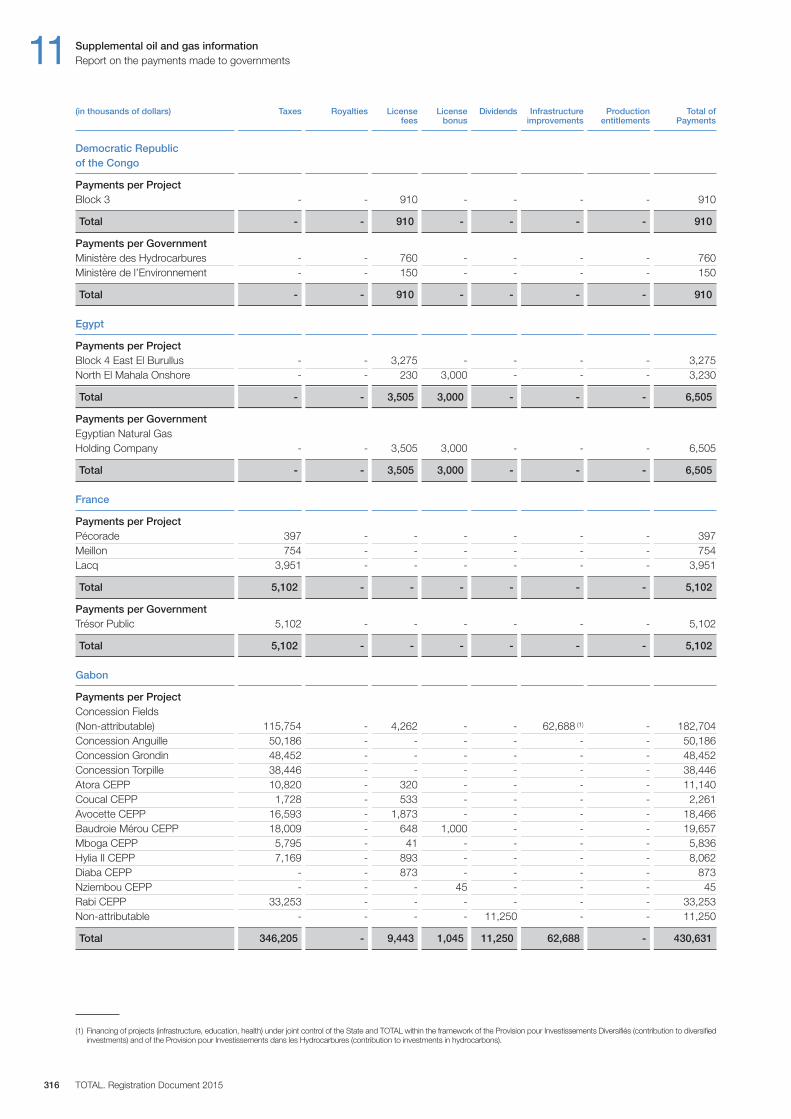
11 Supplemental oil and gas informationReport on the payments made to governments
TOTAL. Registration Document 2015316
Democratic Republic of the Congo
Payments per Project Block 3 - - 910 - - - - 910
Total - - 910 - - - - 910
Payments per Government Ministère des Hydrocarbures - - 760 - - - - 760Ministère de l’Environnement - - 150 - - - - 150
Total - - 910 - - - - 910
Egypt
Payments per Project Block 4 East El Burullus - - 3,275 - - - - 3,275North El Mahala Onshore - - 230 3,000 - - - 3,230
Total - - 3,505 3,000 - - - 6,505
Payments per Government Egyptian Natural Gas Holding Company - - 3,505 3,000 - - - 6,505
Total - - 3,505 3,000 - - - 6,505
France
Payments per Project Pécorade 397 - - - - - - 397Meillon 754 - - - - - - 754Lacq 3,951 - - - - - - 3,951
Total 5,102 - - - - - - 5,102
Payments per Government Trésor Public 5,102 - - - - - - 5,102
Total 5,102 - - - - - - 5,102
Gabon
Payments per Project Concession Fields (Non-attributable) 115,754 - 4,262 - - 62,688 (1) - 182,704Concession Anguille 50,186 - - - - - - 50,186Concession Grondin 48,452 - - - - - - 48,452Concession Torpille 38,446 - - - - - - 38,446Atora CEPP 10,820 - 320 - - - - 11,140Coucal CEPP 1,728 - 533 - - - - 2,261Avocette CEPP 16,593 - 1,873 - - - - 18,466Baudroie Mérou CEPP 18,009 - 648 1,000 - - - 19,657Mboga CEPP 5,795 - 41 - - - - 5,836Hylia II CEPP 7,169 - 893 - - - - 8,062Diaba CEPP - - 873 - - - - 873Nziembou CEPP - - - 45 - - - 45Rabi CEPP 33,253 - - - - - - 33,253Non-attributable - - - - 11,250 - - 11,250
Total 346,205 - 9,443 1,045 11,250 62,688 - 430,631
(in thousands of dollars) Taxes Royalties License License Dividends Infrastructure Production Total of fees bonus improvements entitlements Payments
(1) Financing of projects (infrastructure, education, health) under joint control of the State and TOTAL within the framework of the Provision pour Investissements Diversifiés (contribution to diversifiedinvestments) and of the Provision pour Investissements dans les Hydrocarbures (contribution to investments in hydrocarbons).
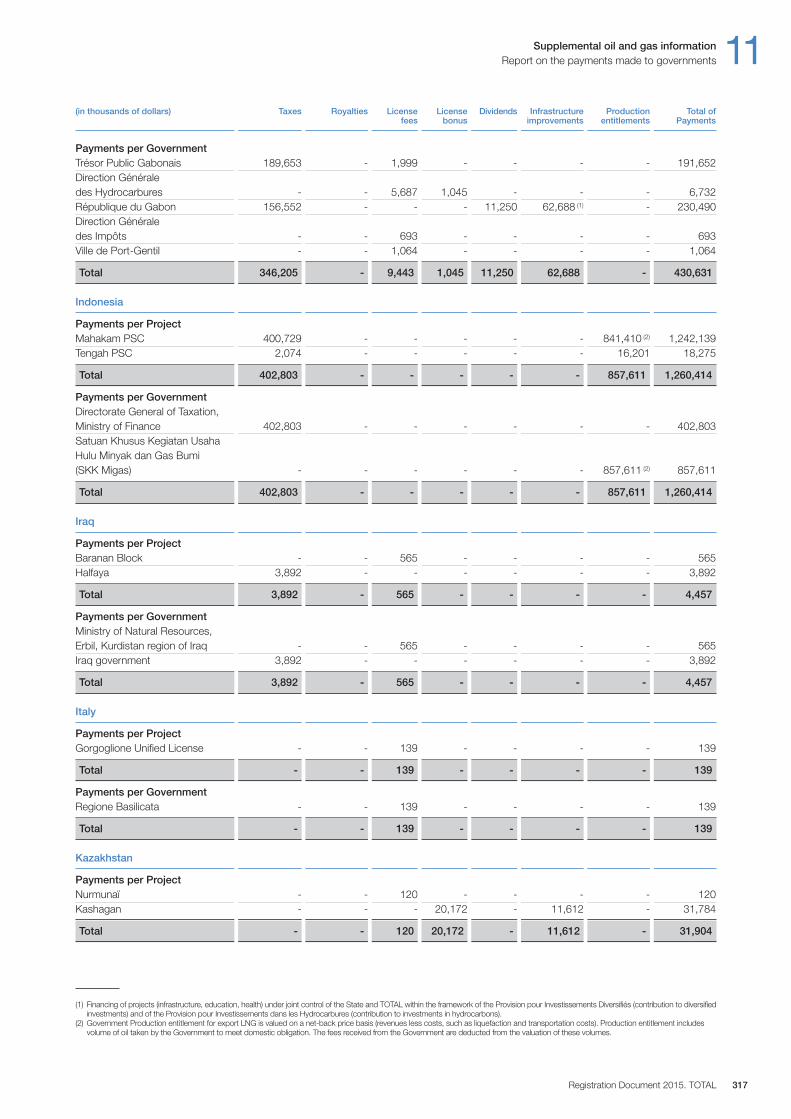
Supplemental oil and gas information 11Report on the payments made to governments
Registration Document 2015. TOTAL 317
Payments per Government Trésor Public Gabonais 189,653 - 1,999 - - - - 191,652Direction Générale des Hydrocarbures - - 5,687 1,045 - - - 6,732République du Gabon 156,552 - - - 11,250 62,688 (1) - 230,490Direction Générale des Impôts - - 693 - - - - 693Ville de Port-Gentil - - 1,064 - - - - 1,064
Total 346,205 - 9,443 1,045 11,250 62,688 - 430,631
Indonesia
Payments per Project Mahakam PSC 400,729 - - - - - 841,410 (2) 1,242,139Tengah PSC 2,074 - - - - - 16,201 18,275
Total 402,803 - - - - - 857,611 1,260,414
Payments per Government Directorate General of Taxation, Ministry of Finance 402,803 - - - - - - 402,803Satuan Khusus Kegiatan Usaha Hulu Minyak dan Gas Bumi (SKK Migas) - - - - - - 857,611 (2) 857,611
Total 402,803 - - - - - 857,611 1,260,414
Iraq
Payments per Project Baranan Block - - 565 - - - - 565Halfaya 3,892 - - - - - - 3,892
Total 3,892 - 565 - - - - 4,457
Payments per Government Ministry of Natural Resources, Erbil, Kurdistan region of Iraq - - 565 - - - - 565Iraq government 3,892 - - - - - - 3,892
Total 3,892 - 565 - - - - 4,457
Italy
Payments per Project Gorgoglione Unified License - - 139 - - - - 139
Total - - 139 - - - - 139
Payments per Government Regione Basilicata - - 139 - - - - 139
Total - - 139 - - - - 139
Kazakhstan
Payments per Project Nurmunaï - - 120 - - - - 120Kashagan - - - 20,172 - 11,612 - 31,784
Total - - 120 20,172 - 11,612 - 31,904
(1) Financing of projects (infrastructure, education, health) under joint control of the State and TOTAL within the framework of the Provision pour Investissements Diversifiés (contribution to diversifiedinvestments) and of the Provision pour Investissements dans les Hydrocarbures (contribution to investments in hydrocarbons).
(2) Government Production entitlement for export LNG is valued on a net-back price basis (revenues less costs, such as liquefaction and transportation costs). Production entitlement includesvolume of oil taken by the Government to meet domestic obligation. The fees received from the Government are deducted from the valuation of these volumes.
(in thousands of dollars) Taxes Royalties License License Dividends Infrastructure Production Total of fees bonus improvements entitlements Payments
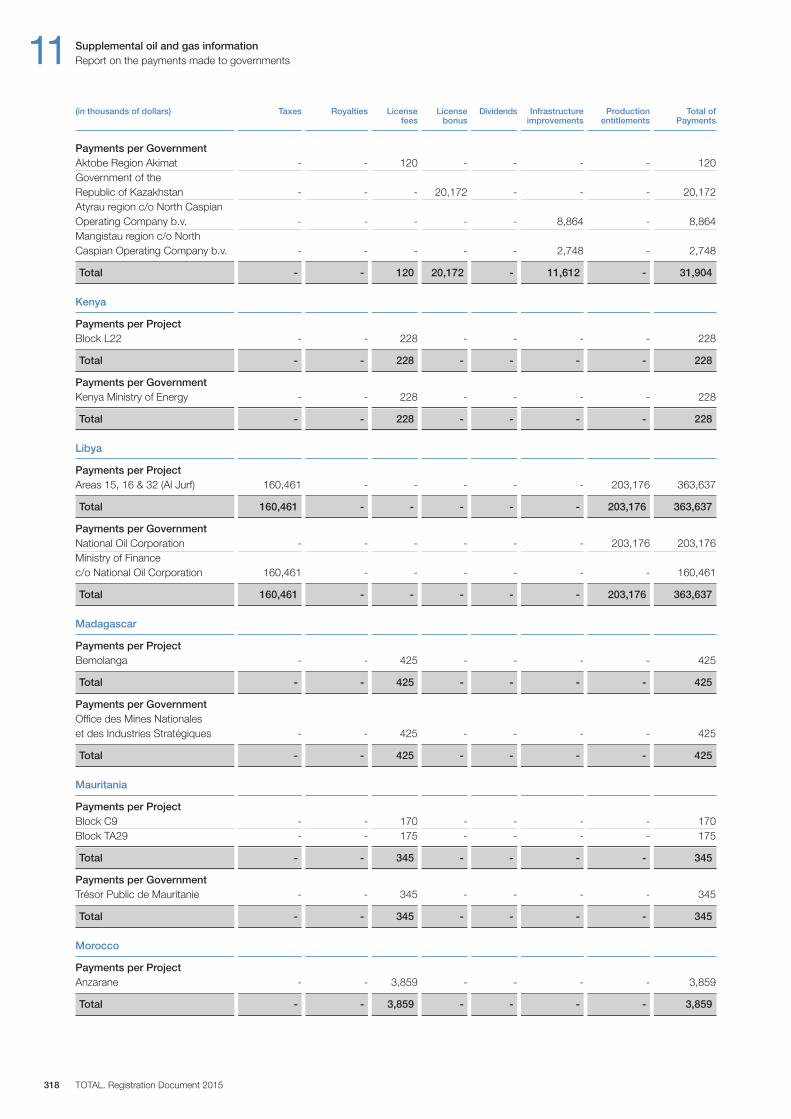
11 Supplemental oil and gas informationReport on the payments made to governments
TOTAL. Registration Document 2015318
Payments per Government Aktobe Region Akimat - - 120 - - - - 120Government of the Republic of Kazakhstan - - - 20,172 - - - 20,172Atyrau region c / o North Caspian Operating Company b.v. - - - - - 8,864 - 8,864Mangistau region c / o North Caspian Operating Company b.v. - - - - - 2,748 - 2,748
Total - - 120 20,172 - 11,612 - 31,904
Kenya
Payments per Project Block L22 - - 228 - - - - 228
Total - - 228 - - - - 228
Payments per Government Kenya Ministry of Energy - - 228 - - - - 228
Total - - 228 - - - - 228
Libya
Payments per Project Areas 15, 16 & 32 (Al Jurf) 160,461 - - - - - 203,176 363,637
Total 160,461 - - - - - 203,176 363,637
Payments per Government National Oil Corporation - - - - - - 203,176 203,176Ministry of Finance c / o National Oil Corporation 160,461 - - - - - - 160,461
Total 160,461 - - - - - 203,176 363,637
Madagascar
Payments per Project Bemolanga - - 425 - - - - 425
Total - - 425 - - - - 425
Payments per Government Office des Mines Nationales et des Industries Stratégiques - - 425 - - - - 425
Total - - 425 - - - - 425
Mauritania
Payments per Project Block C9 - - 170 - - - - 170Block TA29 - - 175 - - - - 175
Total - - 345 - - - - 345
Payments per Government Trésor Public de Mauritanie - - 345 - - - - 345
Total - - 345 - - - - 345
Morocco
Payments per Project Anzarane - - 3,859 - - - - 3,859
Total - - 3,859 - - - - 3,859
(in thousands of dollars) Taxes Royalties License License Dividends Infrastructure Production Total of fees bonus improvements entitlements Payments
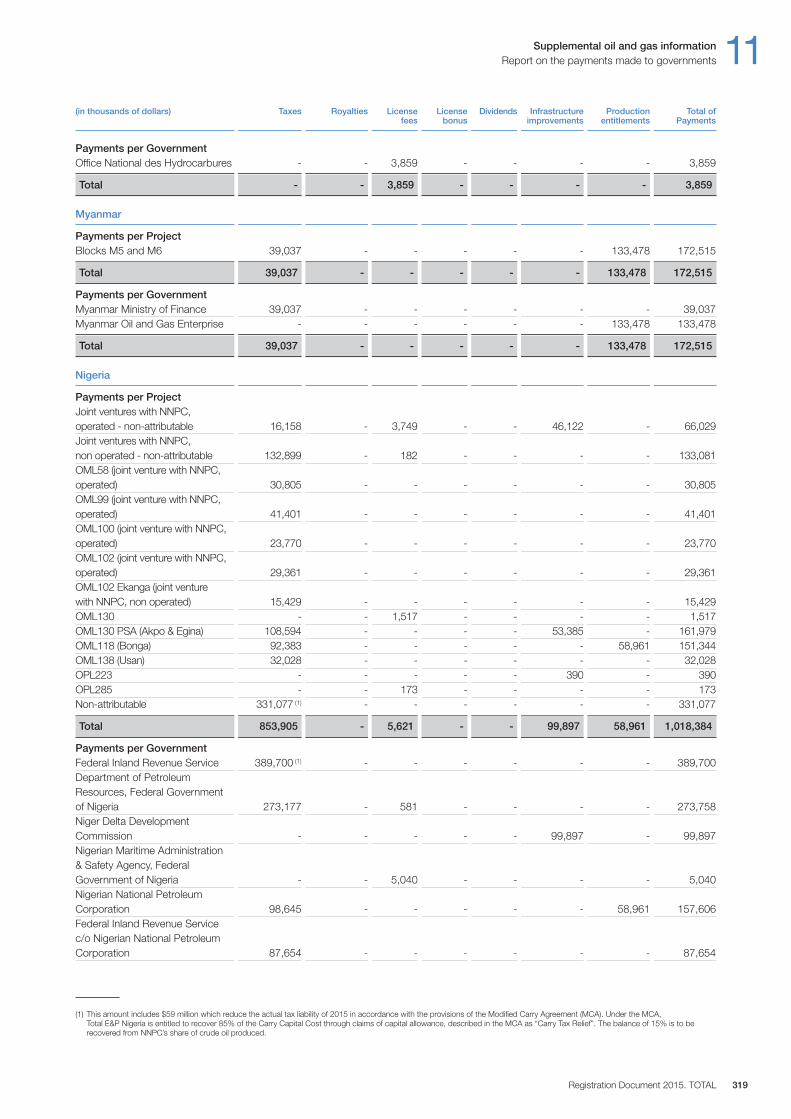
Supplemental oil and gas information 11Report on the payments made to governments
Registration Document 2015. TOTAL 319
Payments per Government Office National des Hydrocarbures - - 3,859 - - - - 3,859
Total - - 3,859 - - - - 3,859
Myanmar
Payments per Project Blocks M5 and M6 39,037 - - - - - 133,478 172,515
Total 39,037 - - - - - 133,478 172,515
Payments per Government Myanmar Ministry of Finance 39,037 - - - - - - 39,037Myanmar Oil and Gas Enterprise - - - - - - 133,478 133,478
Total 39,037 - - - - - 133,478 172,515
Nigeria
Payments per Project Joint ventures with NNPC, operated - non-attributable 16,158 - 3,749 - - 46,122 - 66,029Joint ventures with NNPC, non operated - non-attributable 132,899 - 182 - - - - 133,081OML58 (joint venture with NNPC, operated) 30,805 - - - - - - 30,805OML99 (joint venture with NNPC, operated) 41,401 - - - - - - 41,401OML100 (joint venture with NNPC, operated) 23,770 - - - - - - 23,770OML102 (joint venture with NNPC, operated) 29,361 - - - - - - 29,361OML102 Ekanga (joint venture with NNPC, non operated) 15,429 - - - - - - 15,429OML130 - - 1,517 - - - - 1,517OML130 PSA (Akpo & Egina) 108,594 - - - - 53,385 - 161,979OML118 (Bonga) 92,383 - - - - - 58,961 151,344OML138 (Usan) 32,028 - - - - - - 32,028OPL223 - - - - - 390 - 390OPL285 - - 173 - - - - 173Non-attributable 331,077 (1) - - - - - - 331,077
Total 853,905 - 5,621 - - 99,897 58,961 1,018,384
Payments per Government Federal Inland Revenue Service 389,700 (1) - - - - - - 389,700Department of Petroleum Resources, Federal Government of Nigeria 273,177 - 581 - - - - 273,758Niger Delta Development Commission - - - - - 99,897 - 99,897Nigerian Maritime Administration & Safety Agency, FederalGovernment of Nigeria - - 5,040 - - - - 5,040Nigerian National Petroleum Corporation 98,645 - - - - - 58,961 157,606Federal Inland Revenue Service c / o Nigerian National Petroleum Corporation 87,654 - - - - - - 87,654
(1) This amount includes $59 million which reduce the actual tax liability of 2015 in accordance with the provisions of the Modified Carry Agreement (MCA). Under the MCA, Total E&P Nigeria is entitled to recover 85% of the Carry Capital Cost through claims of capital allowance, described in the MCA as “Carry Tax Relief”. The balance of 15% is to berecovered from NNPC’s share of crude oil produced.
(in thousands of dollars) Taxes Royalties License License Dividends Infrastructure Production Total of fees bonus improvements entitlements Payments
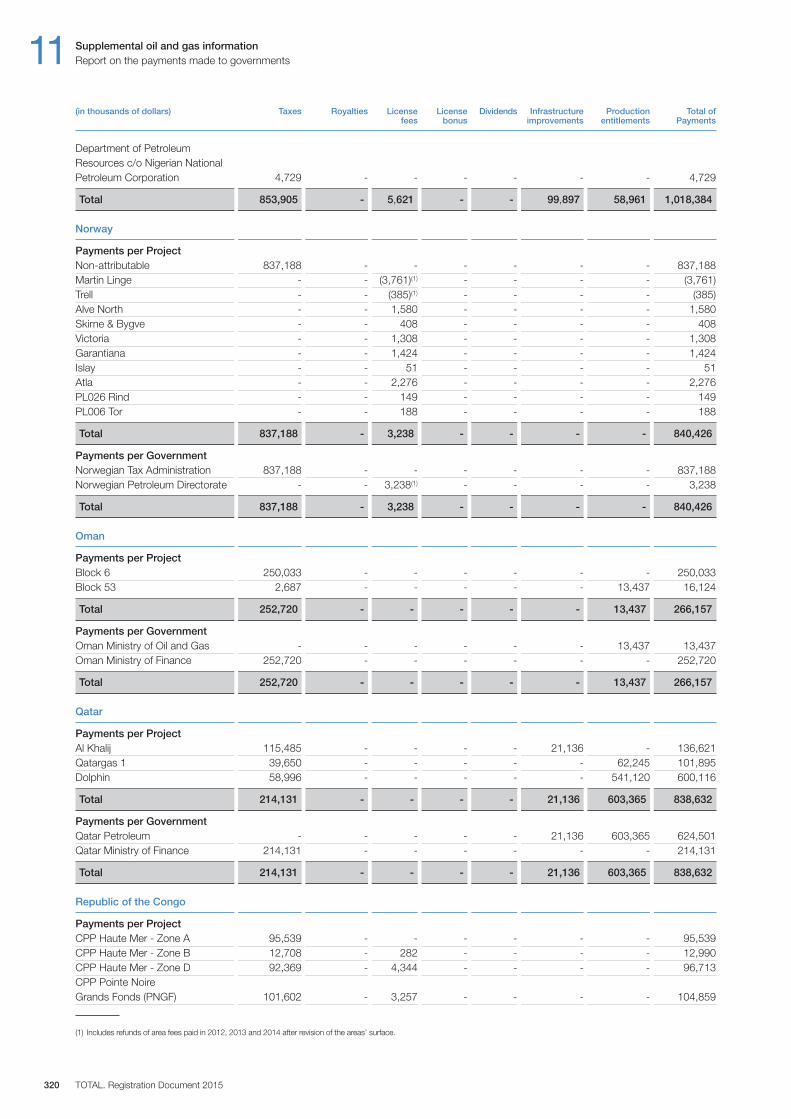
11 Supplemental oil and gas informationReport on the payments made to governments
TOTAL. Registration Document 2015320
Department of Petroleum Resources c / o Nigerian National Petroleum Corporation 4,729 - - - - - - 4,729
Total 853,905 - 5,621 - - 99,897 58,961 1,018,384
Norway
Payments per Project Non-attributable 837,188 - - - - - - 837,188Martin Linge - - (3,761)(1) - - - - (3,761)Trell - - (385)(1) - - - - (385)Alve North - - 1,580 - - - - 1,580Skirne & Bygve - - 408 - - - - 408Victoria - - 1,308 - - - - 1,308Garantiana - - 1,424 - - - - 1,424Islay - - 51 - - - - 51Atla - - 2,276 - - - - 2,276PL026 Rind - - 149 - - - - 149PL006 Tor - - 188 - - - - 188
Total 837,188 - 3,238 - - - - 840,426
Payments per Government Norwegian Tax Administration 837,188 - - - - - - 837,188Norwegian Petroleum Directorate - - 3,238(1) - - - - 3,238
Total 837,188 - 3,238 - - - - 840,426
Oman
Payments per Project Block 6 250,033 - - - - - - 250,033Block 53 2,687 - - - - - 13,437 16,124
Total 252,720 - - - - - 13,437 266,157
Payments per Government Oman Ministry of Oil and Gas - - - - - - 13,437 13,437Oman Ministry of Finance 252,720 - - - - - - 252,720
Total 252,720 - - - - - 13,437 266,157
Qatar
Payments per Project Al Khalij 115,485 - - - - 21,136 - 136,621Qatargas 1 39,650 - - - - - 62,245 101,895Dolphin 58,996 - - - - - 541,120 600,116
Total 214,131 - - - - 21,136 603,365 838,632
Payments per Government Qatar Petroleum - - - - - 21,136 603,365 624,501Qatar Ministry of Finance 214,131 - - - - - - 214,131
Total 214,131 - - - - 21,136 603,365 838,632
Republic of the Congo
Payments per Project CPP Haute Mer - Zone A 95,539 - - - - - - 95,539CPP Haute Mer - Zone B 12,708 - 282 - - - - 12,990 CPP Haute Mer - Zone D 92,369 - 4,344 - - - - 96,713CPP Pointe Noire Grands Fonds (PNGF) 101,602 - 3,257 - - - - 104,859
(in thousands of dollars) Taxes Royalties License License Dividends Infrastructure Production Total of fees bonus improvements entitlements Payments
(1) Includes refunds of area fees paid in 2012, 2013 and 2014 after revision of the areas’ surface.
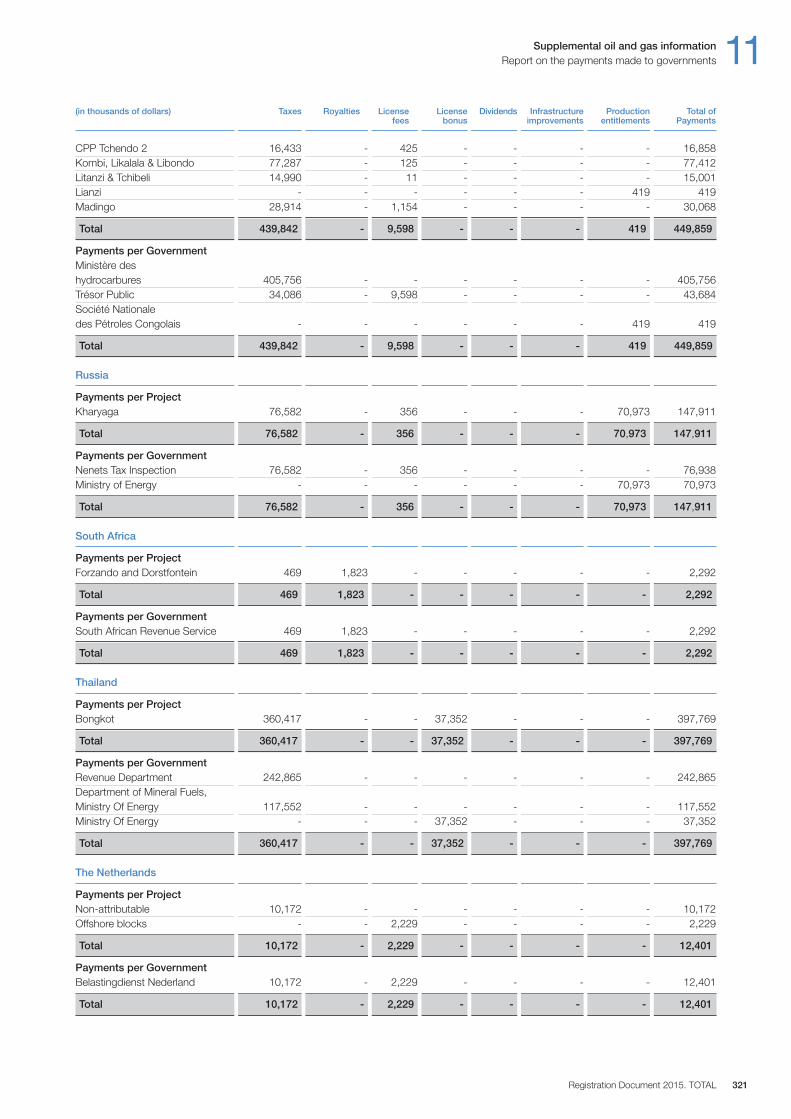
Supplemental oil and gas information 11Report on the payments made to governments
Registration Document 2015. TOTAL 321
CPP Tchendo 2 16,433 - 425 - - - - 16,858Kombi, Likalala & Libondo 77,287 - 125 - - - - 77,412Litanzi & Tchibeli 14,990 - 11 - - - - 15,001Lianzi - - - - - - 419 419Madingo 28,914 - 1,154 - - - - 30,068
Total 439,842 - 9,598 - - - 419 449,859
Payments per Government Ministère des hydrocarbures 405,756 - - - - - - 405,756Trésor Public 34,086 - 9,598 - - - - 43,684Société Nationale des Pétroles Congolais - - - - - - 419 419
Total 439,842 - 9,598 - - - 419 449,859
Russia
Payments per Project Kharyaga 76,582 - 356 - - - 70,973 147,911
Total 76,582 - 356 - - - 70,973 147,911
Payments per Government Nenets Tax Inspection 76,582 - 356 - - - - 76,938Ministry of Energy - - - - - - 70,973 70,973
Total 76,582 - 356 - - - 70,973 147,911
South Africa
Payments per Project Forzando and Dorstfontein 469 1,823 - - - - - 2,292
Total 469 1,823 - - - - - 2,292
Payments per Government South African Revenue Service 469 1,823 - - - - - 2,292
Total 469 1,823 - - - - - 2,292
Thailand
Payments per Project Bongkot 360,417 - - 37,352 - - - 397,769
Total 360,417 - - 37,352 - - - 397,769
Payments per Government Revenue Department 242,865 - - - - - - 242,865Department of Mineral Fuels, Ministry Of Energy 117,552 - - - - - - 117,552Ministry Of Energy - - - 37,352 - - - 37,352
Total 360,417 - - 37,352 - - - 397,769
The Netherlands
Payments per Project Non-attributable 10,172 - - - - - - 10,172Offshore blocks - - 2,229 - - - - 2,229
Total 10,172 - 2,229 - - - - 12,401
Payments per Government Belastingdienst Nederland 10,172 - 2,229 - - - - 12,401
Total 10,172 - 2,229 - - - - 12,401
(in thousands of dollars) Taxes Royalties License License Dividends Infrastructure Production Total of fees bonus improvements entitlements Payments
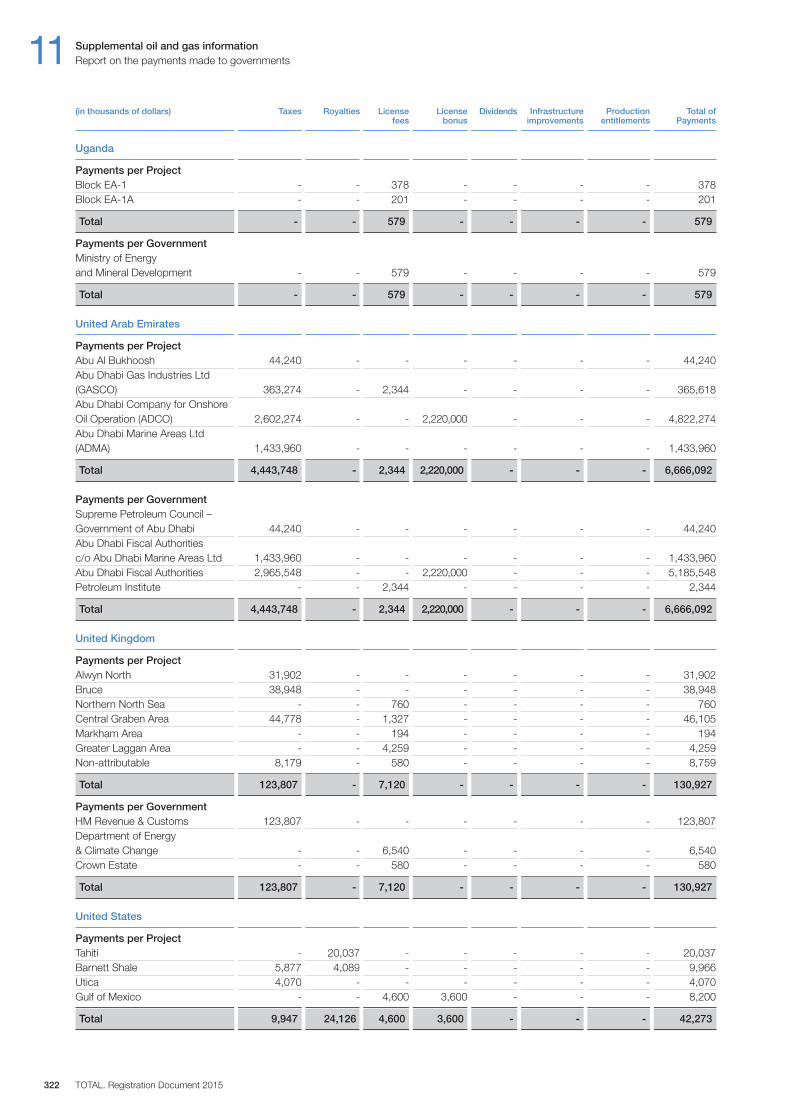
11 Supplemental oil and gas informationReport on the payments made to governments
TOTAL. Registration Document 2015322
Uganda
Payments per Project Block EA-1 - - 378 - - - - 378Block EA-1A - - 201 - - - - 201
Total - - 579 - - - - 579
Payments per Government Ministry of Energy and Mineral Development - - 579 - - - - 579
Total - - 579 - - - - 579
United Arab Emirates
Payments per Project Abu Al Bukhoosh 44,240 - - - - - - 44,240Abu Dhabi Gas Industries Ltd (GASCO) 363,274 - 2,344 - - - - 365,618Abu Dhabi Company for Onshore Oil Operation (ADCO) 2,602,274 - - 2,220,000 - - - 4,822,274Abu Dhabi Marine Areas Ltd (ADMA) 1,433,960 - - - - - - 1,433,960
Total 4,443,748 - 2,344 2,220,000 - - - 6,666,092
Payments per Government Supreme Petroleum Council – Government of Abu Dhabi 44,240 - - - - - - 44,240Abu Dhabi Fiscal Authorities c / o Abu Dhabi Marine Areas Ltd 1,433,960 - - - - - - 1,433,960Abu Dhabi Fiscal Authorities 2,965,548 - - 2,220,000 - - - 5,185,548Petroleum Institute - - 2,344 - - - - 2,344
Total 4,443,748 - 2,344 2,220,000 - - - 6,666,092
United Kingdom
Payments per Project Alwyn North 31,902 - - - - - - 31,902Bruce 38,948 - - - - - - 38,948Northern North Sea - - 760 - - - - 760Central Graben Area 44,778 - 1,327 - - - - 46,105Markham Area - - 194 - - - - 194Greater Laggan Area - - 4,259 - - - - 4,259Non-attributable 8,179 - 580 - - - - 8,759
Total 123,807 - 7,120 - - - - 130,927
Payments per Government HM Revenue & Customs 123,807 - - - - - - 123,807Department of Energy & Climate Change - - 6,540 - - - - 6,540Crown Estate - - 580 - - - - 580
Total 123,807 - 7,120 - - - - 130,927
United States
Payments per Project Tahiti - 20,037 - - - - - 20,037Barnett Shale 5,877 4,089 - - - - - 9,966Utica 4,070 - - - - - - 4,070Gulf of Mexico - - 4,600 3,600 - - - 8,200
Total 9,947 24,126 4,600 3,600 - - - 42,273
(in thousands of dollars) Taxes Royalties License License Dividends Infrastructure Production Total of fees bonus improvements entitlements Payments
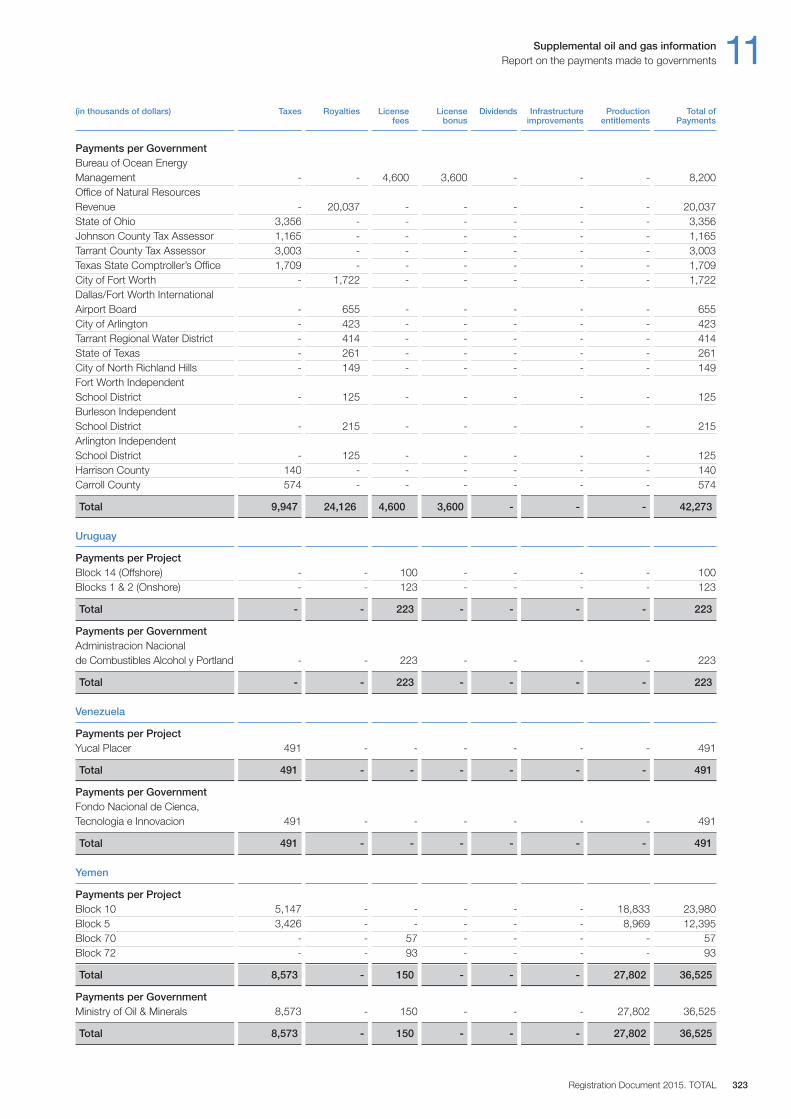
Supplemental oil and gas information 11Report on the payments made to governments
Registration Document 2015. TOTAL 323
Payments per Government Bureau of Ocean Energy Management - - 4,600 3,600 - - - 8,200Office of Natural Resources Revenue - 20,037 - - - - - 20,037State of Ohio 3,356 - - - - - - 3,356Johnson County Tax Assessor 1,165 - - - - - - 1,165Tarrant County Tax Assessor 3,003 - - - - - - 3,003Texas State Comptroller’s Office 1,709 - - - - - - 1,709City of Fort Worth - 1,722 - - - - - 1,722Dallas / Fort Worth International Airport Board - 655 - - - - - 655City of Arlington - 423 - - - - - 423Tarrant Regional Water District - 414 - - - - - 414State of Texas - 261 - - - - - 261City of North Richland Hills - 149 - - - - - 149Fort Worth Independent School District - 125 - - - - - 125Burleson Independent School District - 215 - - - - - 215Arlington Independent School District - 125 - - - - - 125Harrison County 140 - - - - - - 140Carroll County 574 - - - - - - 574
Total 9,947 24,126 4,600 3,600 - - - 42,273
Uruguay
Payments per Project Block 14 (Offshore) - - 100 - - - - 100Blocks 1 & 2 (Onshore) - - 123 - - - - 123
Total - - 223 - - - - 223
Payments per Government Administracion Nacional de Combustibles Alcohol y Portland - - 223 - - - - 223
Total - - 223 - - - - 223
Venezuela
Payments per Project Yucal Placer 491 - - - - - - 491
Total 491 - - - - - - 491
Payments per Government Fondo Nacional de Cienca, Tecnologia e Innovacion 491 - - - - - - 491
Total 491 - - - - - - 491
Yemen
Payments per Project Block 10 5,147 - - - - - 18,833 23,980Block 5 3,426 - - - - - 8,969 12,395Block 70 - - 57 - - - - 57Block 72 - - 93 - - - - 93
Total 8,573 - 150 - - - 27,802 36,525
Payments per Government Ministry of Oil & Minerals 8,573 - 150 - - - 27,802 36,525
Total 8,573 - 150 - - - 27,802 36,525
(in thousands of dollars) Taxes Royalties License License Dividends Infrastructure Production Total of fees bonus improvements entitlements Payments

TOTAL. Registration Document 2015324
Registration Document 2015. TOTAL 325
TOTAL S.A.11. TOTAL S.A. 12
TOTAL S.A.The Statutory Financial Statements were approved by the Board of Directors on February 10, 2016 and have not been updatedwith subsequent events.
1. Statutory auditors’ report on regulated agreements and commitments 326
2. Statutory auditors’ report on the financial statements 329
3. Statutory financial statements of TOTAL S.A. as parent company 3303.1. Statement of income . . . . . . . . . . . . . . . . . . . . . . . . . . . . . . . . . . . . . . . . . . . . . . . . . . . . . . . . . . . . . . . . . . . . . . . . . . . . . . . . .3303.2. Balance sheet . . . . . . . . . . . . . . . . . . . . . . . . . . . . . . . . . . . . . . . . . . . . . . . . . . . . . . . . . . . . . . . . . . . . . . . . . . . . . . . . . . . . . . .3313.3. Statement of cash flow . . . . . . . . . . . . . . . . . . . . . . . . . . . . . . . . . . . . . . . . . . . . . . . . . . . . . . . . . . . . . . . . . . . . . . . . . . . . . . . .3323.4. Statement of changes in shareholders’ equity . . . . . . . . . . . . . . . . . . . . . . . . . . . . . . . . . . . . . . . . . . . . . . . . . . . . . . . . . . . . .333
4. Notes 3341) Accounting policies . . . . . . . . . . . . . . . . . . . . . . . . . . . . . . . . . . . . . . . . . . . . . . . . . . . . . . . . . . . . . . . . . . . . . . . . . . . . . . . . . .3342) Intangible assets and property, plant and equipment . . . . . . . . . . . . . . . . . . . . . . . . . . . . . . . . . . . . . . . . . . . . . . . . . . . . . . .3353) Subsidiaries and affiliates: investments and loans . . . . . . . . . . . . . . . . . . . . . . . . . . . . . . . . . . . . . . . . . . . . . . . . . . . . . . . . . .3354) Other non-current assets . . . . . . . . . . . . . . . . . . . . . . . . . . . . . . . . . . . . . . . . . . . . . . . . . . . . . . . . . . . . . . . . . . . . . . . . . . . . . .3365) Accounts receivable . . . . . . . . . . . . . . . . . . . . . . . . . . . . . . . . . . . . . . . . . . . . . . . . . . . . . . . . . . . . . . . . . . . . . . . . . . . . . . . . . .3366) Shareholders’ equity . . . . . . . . . . . . . . . . . . . . . . . . . . . . . . . . . . . . . . . . . . . . . . . . . . . . . . . . . . . . . . . . . . . . . . . . . . . . . . . . . .3367) Contingency reserves . . . . . . . . . . . . . . . . . . . . . . . . . . . . . . . . . . . . . . . . . . . . . . . . . . . . . . . . . . . . . . . . . . . . . . . . . . . . . . . . .3388) Employee benefits obligations . . . . . . . . . . . . . . . . . . . . . . . . . . . . . . . . . . . . . . . . . . . . . . . . . . . . . . . . . . . . . . . . . . . . . . . . . .3389) Loans . . . . . . . . . . . . . . . . . . . . . . . . . . . . . . . . . . . . . . . . . . . . . . . . . . . . . . . . . . . . . . . . . . . . . . . . . . . . . . . . . . . . . . . . . . . . . .33910) Liabilities . . . . . . . . . . . . . . . . . . . . . . . . . . . . . . . . . . . . . . . . . . . . . . . . . . . . . . . . . . . . . . . . . . . . . . . . . . . . . . . . . . . . . . . . . . .33911) Currency translation adjustments . . . . . . . . . . . . . . . . . . . . . . . . . . . . . . . . . . . . . . . . . . . . . . . . . . . . . . . . . . . . . . . . . . . . . . .34012) Sales . . . . . . . . . . . . . . . . . . . . . . . . . . . . . . . . . . . . . . . . . . . . . . . . . . . . . . . . . . . . . . . . . . . . . . . . . . . . . . . . . . . . . . . . . . . . . .34013) Net operating expenses . . . . . . . . . . . . . . . . . . . . . . . . . . . . . . . . . . . . . . . . . . . . . . . . . . . . . . . . . . . . . . . . . . . . . . . . . . . . . . .34014) Operating depreciation, amortization and allowances . . . . . . . . . . . . . . . . . . . . . . . . . . . . . . . . . . . . . . . . . . . . . . . . . . . . . . .34015) Financial expenses and income . . . . . . . . . . . . . . . . . . . . . . . . . . . . . . . . . . . . . . . . . . . . . . . . . . . . . . . . . . . . . . . . . . . . . . . . .34016) Dividends . . . . . . . . . . . . . . . . . . . . . . . . . . . . . . . . . . . . . . . . . . . . . . . . . . . . . . . . . . . . . . . . . . . . . . . . . . . . . . . . . . . . . . . . . .34117) Other financial income and expenses . . . . . . . . . . . . . . . . . . . . . . . . . . . . . . . . . . . . . . . . . . . . . . . . . . . . . . . . . . . . . . . . . . . .34118) Non-recurring income . . . . . . . . . . . . . . . . . . . . . . . . . . . . . . . . . . . . . . . . . . . . . . . . . . . . . . . . . . . . . . . . . . . . . . . . . . . . . . . . .34119) Basis of taxation . . . . . . . . . . . . . . . . . . . . . . . . . . . . . . . . . . . . . . . . . . . . . . . . . . . . . . . . . . . . . . . . . . . . . . . . . . . . . . . . . . . . .34120) Foreign exchange and counterparty risk . . . . . . . . . . . . . . . . . . . . . . . . . . . . . . . . . . . . . . . . . . . . . . . . . . . . . . . . . . . . . . . . . .34221) Commitments . . . . . . . . . . . . . . . . . . . . . . . . . . . . . . . . . . . . . . . . . . . . . . . . . . . . . . . . . . . . . . . . . . . . . . . . . . . . . . . . . . . . . . .34222) Average number of employees . . . . . . . . . . . . . . . . . . . . . . . . . . . . . . . . . . . . . . . . . . . . . . . . . . . . . . . . . . . . . . . . . . . . . . . . .34223) Stock option, restricted share and free share plans . . . . . . . . . . . . . . . . . . . . . . . . . . . . . . . . . . . . . . . . . . . . . . . . . . . . . . . . .34324) Others . . . . . . . . . . . . . . . . . . . . . . . . . . . . . . . . . . . . . . . . . . . . . . . . . . . . . . . . . . . . . . . . . . . . . . . . . . . . . . . . . . . . . . . . . . . . .345
5. Other financial information concerning the parent company 3465.1. Subsidiaries and affiliates . . . . . . . . . . . . . . . . . . . . . . . . . . . . . . . . . . . . . . . . . . . . . . . . . . . . . . . . . . . . . . . . . . . . . . . . . . . . .3465.2. Five-year financial data . . . . . . . . . . . . . . . . . . . . . . . . . . . . . . . . . . . . . . . . . . . . . . . . . . . . . . . . . . . . . . . . . . . . . . . . . . . . . . .3475.3. Proposed allocation of 2015 income . . . . . . . . . . . . . . . . . . . . . . . . . . . . . . . . . . . . . . . . . . . . . . . . . . . . . . . . . . . . . . . . . . . . .3475.4. Statement of changes in share capital for the past five years . . . . . . . . . . . . . . . . . . . . . . . . . . . . . . . . . . . . . . . . . . . . . . . . .348

1. Statutory auditors’ report on regulated agreements and commitments
General Meeting of Shareholders held to approve the financial statements for the year ended December 31, 2015
To the Shareholders,
As statutory auditors of your Company, we hereby present our report on regulated agreements and commitments.
It is our responsibility to inform you, on the basis of the information provided to us, of the terms and conditions, the purpose, and thebenefits to the Company of the agreements and commitments of which we were informed or became aware during our engagement. It isnot our role to determine whether they are beneficial or appropriate or to ascertain whether any other agreements and commitments exist. Itis your responsibility, in accordance with Article R. 225-31 of the French Commercial Code (Code de Commerce), to assess the merit ofthese agreements and commitments with a view to approving them.
In addition, it is our responsibility to inform you, where appropriate, in accordance with Article R. 225-31 of the French Commercial Code, ofthe agreements and commitments that were approved in prior years and continued to apply during the period.
We performed the procedures that we deemed necessary in accordance with the professional guidance issued by the French institute ofstatutory auditors (Compagnie nationale des commissaires aux comptes) for such engagements. Our work entailed verifying that theinformation provided is consistent with the documents from which it was derived.
1. Agreements and commitments submitted for the approval of the general meeting of shareholders
Agreements and commitments approved during the period
In accordance with Article L. 225-40 of the French Commercial Code, we have been informed of the following agreements andcommitments previously approved by the Board of Directors.
Commitments concerning the pension plan
– Director concerned:Mr Patrick Pouyanné, Chairman and Chief Executive Officer.
– Nature and purpose:Following the appointment of Mr Patrick Pouyanné as Chairman and Chief Executive Officer of your Company, with effect as of December 19,2015, the Board of Directors, at its meeting on December 16, 2015, confirmed the commitments entered into previously by TOTAL S.A. in favorof Mr Pouyanné with regard to retirement benefits and the supplementary pension plan, in accordance with the following terms and conditions.
– Terms and conditions:- Retirement benefitsThe Chairman and Chief Executive Officer is entitled to receive a benefit at retirement equal to that available to eligible members of the Totalgroup under the French Collective Bargaining Agreement for the Petroleum Industry. The benefit amounts to 25% of annual compensation (bothfixed and variable portions) for the twelve-month period preceding the retirement of the person concerned.
Payment of this benefit is subject to performance conditions. The performance conditions are deemed to be met if at least two of the followingthree criteria are satisfied:
- the average Return on Equity (ROE) over the three years preceding the year of retirement is at least 10%; - the average debt-to-equity ratio for the three years preceding the year of retirement is less than or equal to 30%; - the Total Group’s oil and gas production growth rate over the three years preceding the year of retirement is greater than or equal to the
average growth rate of the following four oil companies: ExxonMobil, Royal Dutch Shell, BP and Chevron.
- Purpose and benefits to the Company of the commitment:The Board of Directors decided that it was in the Company’s interest to grant Mr Patrick Pouyanné the same retirement benefits as the formerChairman and Chief Executive Officer.
– Supplementary defined benefit pension planThe Chairman and Chief Executive Officer also benefits from a supplementary defined benefit pension plan, which was approved by the Board ofDirectors in a prior year. The plan is applicable to all corporate officers and employees whose annual compensation is greater than eight timesthe ceiling for calculating French social security contributions (Plafond annuel de la sécurité sociale, PASS), set at €304,320 for 2015, and abovewhich there is no conventional pension plan.
To be eligible for the supplementary pension plan, set up and financed by TOTAL S.A., members must be at least 60 years of age and haveserved the Company for at least five years. In addition, they must still be employed by the Company at the time of their retirement, unless theyretire due to disability or take early retirement at your Company’s initiative after the age of 55. They must also have claimed their basic pensionfrom the French social security.
The Board of Directors points out that, during its meeting on December 16, 2014, it decided to maintain the seniority vested by Mr PatrickPouyanné in respect of his previous salaried positions with the Group since January 1, 1997.
12 TOTAL S.A.Statutory auditors’ report on regulated agreements and commitments
TOTAL. Registration Document 2015326
Average gross annual compensation (fixed and variable portions) over the retiree’s last three years of employment are taken into accountto calculate the supplementary benefits.
The plan provides beneficiaries with a pension equal to the sum of 1.8% of the portion of reference compensation between eight and 40 times the annual ceiling for calculating French social security contributions, and 1% of the reference compensation between 40 and 60 times the annual ceiling for calculating French social security contributions, multiplied by the number of years of employment (up to 20 years). The assessment basis for this supplementary plan is indexed to changes in the French Association for Supplementary PensionsSchemes (ARRCO) index.
Aggregate supplementary and other pension plan benefits (other than those funded personally on a voluntary basis) may not exceed 45%of average gross compensation (fixed and variable portions) for the last three years of employment. In the event that this percentage isexceeded, the supplementary is reduced accordingly.
At the date of his appointment as Chairman and Chief Executive Officer, Mr Patrick Pouyanné had served the Company for 18 years and352 days. Pursuant to the new provisions of Article L. 225-42-1 of the French Commercial Code, the performance conditions to bedefined by the Board of Directors may only be taken into account to calculate the Chairman and Chief Executive Officer’s additionalpension rights for one year and 13 days as the current scheme limits the reference period to 20 years.
The conditional rights awarded for the period from January 1, 1997 to December 18, 2015 inclusive correspond to a replacement rate of34.14% of the portion of compensation that is between eight and 40 times the ceiling for calculating French social security contributions(Plafond annuel de la sécurité sociale, PASS), and 18.96% of the portion of compensation that is between 40 and 60 times the ceiling forcalculating French social security contributions (Plafond annuel de la sécurité sociale, PASS). These conditional rights are not subject toperformance conditions.
The conditional rights awarded to the Chairman and Chief Executive Officer for the period from December 19, 2015 to December 31, 2016correspond to a maximum replacement rate of 1.86% of the portion of compensation that is between eight and 40 times the PASS, and1.04% of the portion of compensation that is between 40 and 60 times the PASS. These additional rights are awarded subject tofulfilment by the Chairman and Chief Executive Officer of a performance condition, determined on the basis of the Company’s financialposition. The performance condition will be deemed to be fulfilled if the variable portion of the Chairman and Chief Executive Officer’scompensation paid in 2017 for financial year 2016 is 100% of his base compensation due for financial year 2016. Should the variableportion not reach 100% of his base compensation, the rights will be awarded on a pro rata basis.
Consequently, at December 31, 2015, the commitments made by TOTAL S.A. to the Chairman and Chief Executive Officer in terms ofsupplementary defined benefit and similar pension plans represented a gross annual retirement pension estimated at €560,862, based onthe length of service acquired as of December 31, 2015, which is 18.61% of Mr Pouyanné’s gross annual compensation, comprising theannual fixed portion for 2015 (€1,200,000) and the variable portion paid in 2016 for financial year 2015 (€1,814,400).
The supplementary pension includes a clause whereby up to 60% of the amount will be paid to beneficiaries in the event of death afterretirement.
– Purpose and benefits to the Company of the commitment:The Board of Directors decided that it was in the Company’s interest to grant Mr Patrick Pouyanné the same supplementary pensionplans as the former Chairman and Chief Executive Officer.
Commitments relating to insurance and health care plans
– Director concerned:Mr Patrick Pouyanné, Chairman and Chief Executive Officer.
– Nature and purpose:The Chairman and Chief Executive Officer is covered by the insurance plans described below, taken out from life insurance companies.
– Terms and conditions:The Chairman and Chief Executive Officer is covered by:
- an incapacity, disability and life insurance plan for all employees, partially at the expense of the Company, with two options in the event ofdeath of a married employee. The first option entails a death benefit payment equal to five times the deceased’s annual compensationwithin the limit of 16 times the annual social security threshold, corresponding to a maximum of €3,043,200 in 2015. The amount isincreased if there is a dependent child or children. The second option entails a death benefit payment equal to three times the deceased’sannual compensation within the limit of 16 times the annual social security threshold, in addition to survivor benefits (for the spouse andchildren’s education).
- a disability and life insurance plan, entirely at the expense of the Company, for senior executives whose annual gross compensation is greater than 16 times the social security threshold (Plafond annuel de la sécurité sociale, PASS). The contract, which was signed on October 17, 2002, guarantees beneficiaries a death benefit payment corresponding to two years’ compensation. The amount is increased to three years in the event of accidental death. In the event of accidental permanent disability, the beneficiary receives a payment proportional to the degree of disability. Death benefits are increased by 15% for each dependent child. Payments due underthis contract are made after the deduction of amounts paid under the above-mentioned plan for all employees.
- the health care plan applicable to all employees.
- Purpose and benefits to the Company of the agreement and commitment:The Board of Directors decided that it was in the Company’s interest to grant Mr. Patrick Pouyanné the same insurance and additional healthcare cover as the former Chairman and Chief Executive Officer.
TOTAL S.A. 12Statutory auditors’ report on regulated agreements and commitments
Registration Document 2015. TOTAL 327
Commitments concerning the provisions applicable in the event that the Chairman and Chief Executive Officer is removed from office or his term of office is not renewed
– Director concerned:Mr Patrick Pouyanné, Chairman and Chief Executive Officer.
– Nature and purpose:Following the appointment of Mr Patrick Pouyanné as Chairman and Chief Executive Officer of your Company, with effect as of December 19, 2015,the Board of Directors, at its meeting on December 16, 2015, confirmed TOTAL S.A.’s prior commitments on severance benefits in favor of MrPatrick Pouyanné. The commitments will apply if he is removed from office or his term of office is not renewed, in accordance with the followingterms and conditions.
– Terms and conditions:The severance benefit is equal to two years’ gross compensation.The severance benefit is calculated based on gross compensation (fixed and variable) for the twelve-month period preceding the date oftermination or non-renewal of the Chairman and Chief Executive Officer’s term of office.The severance benefit is only paid if termination is imposed due to a change in control or strategy. It is not due in the case of gross negligence orwilful misconduct or if the Chairman and Chief Executive Officer leaves the Company of his own will, accepts new responsibilities within theGroup, or may claim full retirement benefits in the short term.Payment of the benefit is subject to performance conditions, which are deemed to be met if at least two of the following three criteria are met:
- the average Return on Equity (ROE) for the three years preceding the year of retirement is at least 10%; - the average debt-to-equity ratio for the three years preceding the year of retirement is less than or equal to 30%; - the Total Group’s oil and gas production growth rate for the three years preceding the year of retirement is greater than or equal to the
average production growth rate of the following four oil companies: ExxonMobil, Royal Dutch Shell, BP and Chevron.
- Purpose and benefits to the Company of the commitment:The Board of Directors decided that it was in the Company’s interest to grant Mr Patrick Pouyanné the same severance benefits as the formerChairman and Chief Executive Officer.
Agreement concerning specific resources made available to the Honorary Chairman
– Director concerned:Mr Thierry Desmarest, Director and Honorary Chairman of your Company.
– Nature and purpose:Company resources made available to the Honorary Chairman.
– Terms and conditions:In consideration of the assignments entrusted to the Honorary Chairman to represent the Total group, the following company resources aremade available to him: an office, an administrative assistant, and a company vehicle with driver.
Mr Thierry Desmarest’s term of office as Chairman of the Board ended on December 18, 2015. As Honorary Chairman, Mr Thierry Desmarest isprovided, as of December 19, 2015 and for the duration of his term of office as Director, with the same company resources as were available tohim prior to his appointment as Chairman of the Board on October 22, 2014.
- Purpose and benefits to the Company of the agreement:After reviewing the benefit of renewing your Honorary Chairman’s corporate officer duties (representing the company on certain occasions), the Board of Directors agreed to provide him with the company resources specific to his role.
2. Agreements and commitments approved in prior financial years that continued to apply during the period
We hereby inform you that, to our knowledge, no agreements or commitments approved in prior financial years continued to apply during theperiod.
Paris La Défense, March 15, 2016
The statutory auditorsKPMG Audit ERNST & YOUNG AuditA division of KPMG S.A. Yvon Salaün PartnerMichel Piette Partner Laurent Miannay PartnerValérie Besson Partner
12 TOTAL S.A.Statutory auditors’ report on regulated agreements and commitments
TOTAL. Registration Document 2015328
TOTAL S.A. 12Statutory auditor’s report on the annual financial statements
Registration Document 2015. TOTAL 329
2. Statutory auditors’ report on the financial statementsThis is a free translation into English of the statutory auditors’ report on the financial statements issued in French and it is provided solely forthe convenience of English-speaking users. The statutory auditors’ report includes information specifically required by French law in suchreports, whether modified or not. This information is presented below the audit opinion on the financial statements and includes an explanatoryparagraph discussing the auditors’ assessments of certain significant accounting and auditing matters. These assessments were consideredfor the purpose of issuing an audit opinion on the financial statements taken as a whole and not to provide separate assurance on individualaccount balances, transactions or disclosures. This report also includes information relating to the specific verification of information given inthe Management Report and in the documents addressed to the shareholders. This report should be read in conjunction with and construedin accordance with French law and professional auditing standards applicable in France.
To the Shareholders,
In compliance with the assignment entrusted to us by your annual general meeting, we hereby report to you, for the year endedDecember 31, 2015 on:
– the audit of the accompanying financial statements of TOTAL S.A.;– the justification of our assessments;– the specific verifications and information required by law.
These financial statements have been approved by the Board of Directors. Our role is to express an opinion on these financial statementsbased on our audit.
I. Opinion on the financial statements
We conducted our audit in accordance with professional standards applicable in France; those standards require that we plan and performthe audit to obtain reasonable assurance about whether the financial statements are free of material misstatement. An audit involves performingprocedures, using sampling techniques or other methods of selection, to obtain audit evidence about the amounts and disclosures in thefinancial statements. An audit also includes evaluating the appropriateness of accounting policies used and the reasonableness of accountingestimates made, as well as the overall presentation of the financial statements. We believe that the audit evidence we have obtained is sufficientand appropriate to provide a basis for our audit opinion.
In our opinion, the financial statements give a true and fair view of the assets and liabilities and of the financial position of the Company as atDecember 31, 2015 and of the results of its operations for the year then ended in accordance with French accounting principles.
II. Justification of our assessments
In accordance with the requirements of article L. 823-9 of the French Commercial Code (Code de commerce) relating to the justification ofour assessments, we bring to your attention the following matters:
We assessed the methods adopted by your Company to value investment in subsidiaries and affiliates as described in Note 1 to the financialstatements and performed tests using sampling techniques to verify the application of these methods. Within the framework of our assessmentsand based on the information available to date, we also verified the reasonable nature of the estimates derived from these methods.
These assessments were made as part of our audit of the financial statements, taken as a whole, and therefore contributed to the opinionwe formed which is expressed in the first part of this report.
III. Specific verifications and information
We have also performed, in accordance with professional standards applicable in France, the specific verifications required by French law.
We have no matters to report as to the fair presentation and the consistency with the financial statements of the information given in theManagement Report of the Board of Directors, and in the documents addressed to the shareholders with respect to the financial positionand the financial statements.
Concerning the information given in accordance with the requirements of Article L. 225-102-1 of the French Commercial Code (Code decommerce) relating to remunerations and benefits received by the directors and any other commitments made in their favour, we haveverified its consistency with the financial statements or with the underlying information used to prepare these financial statements and, whereapplicable, with the information obtained by your Company from companies controlling your Company or controlled by it. Based on thiswork, we attest the accuracy and fair presentation of this information.
In accordance with French law, we have verified that the required information concerning the purchase of investments and controllinginterests and the identity of the shareholders or holders of the voting rights has been properly disclosed in the Management Report.
Paris-La-Défense, March 15, 2016
The statutory auditors KPMG Audit ERNST & YOUNG AuditA division of KPMG S.A. Yvon Salaün PartnerMichel Piette Partner Laurent Miannay PartnerValérie Besson Partner
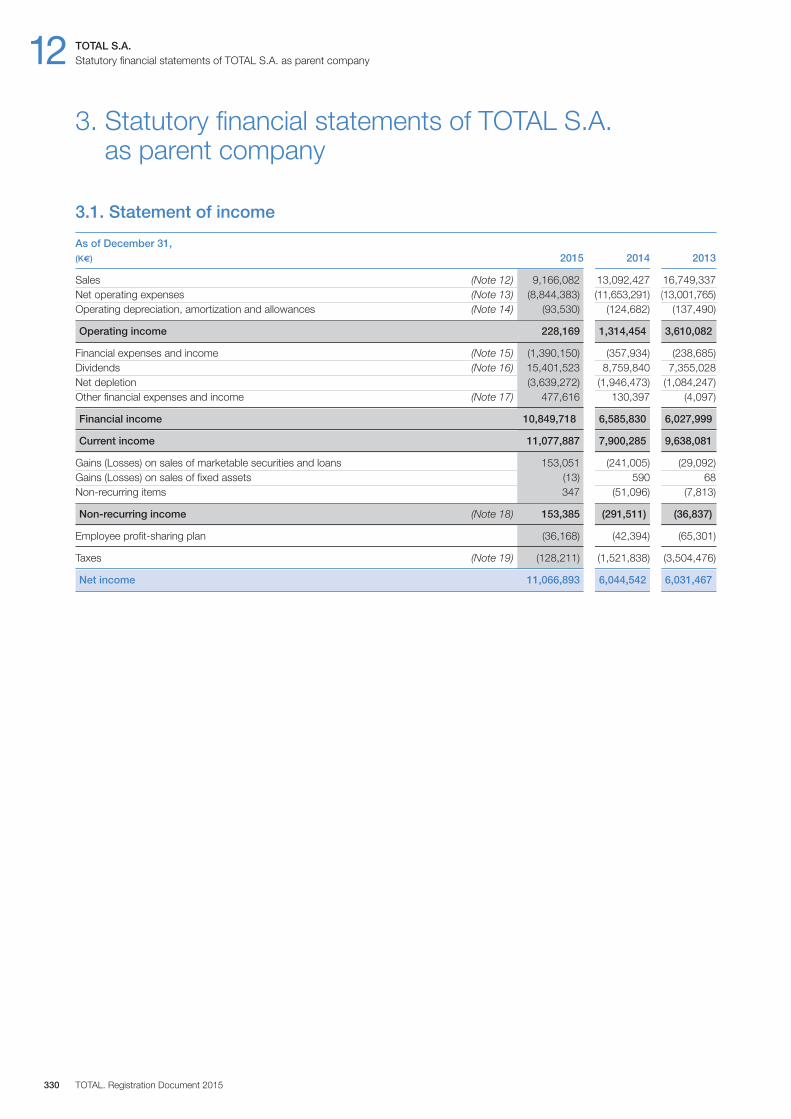
12 TOTAL S.A.Statutory financial statements of TOTAL S.A. as parent company
TOTAL. Registration Document 2015330
3. Statutory financial statements of TOTAL S.A. as parent company
3.1. Statement of income
As of December 31, (K€) 2015 2014 2013
Sales (Note 12) 9,166,082 13,092,427 16,749,337Net operating expenses (Note 13) (8,844,383) (11,653,291) (13,001,765)Operating depreciation, amortization and allowances (Note 14) (93,530) (124,682) (137,490)
Operating income 228,169 1,314,454 3,610,082
Financial expenses and income (Note 15) (1,390,150) (357,934) (238,685)Dividends (Note 16) 15,401,523 8,759,840 7,355,028Net depletion (3,639,272) (1,946,473) (1,084,247)Other financial expenses and income (Note 17) 477,616 130,397 (4,097)
Financial income 10,849,718 6,585,830 6,027,999
Current income 11,077,887 7,900,285 9,638,081
Gains (Losses) on sales of marketable securities and loans 153,051 (241,005) (29,092)Gains (Losses) on sales of fixed assets (13) 590 68Non-recurring items 347 (51,096) (7,813)
Non-recurring income (Note 18) 153,385 (291,511) (36,837)
Employee profit-sharing plan (36,168) (42,394) (65,301)
Taxes (Note 19) (128,211) (1,521,838) (3,504,476)
Net income 11,066,893 6,044,542 6,031,467
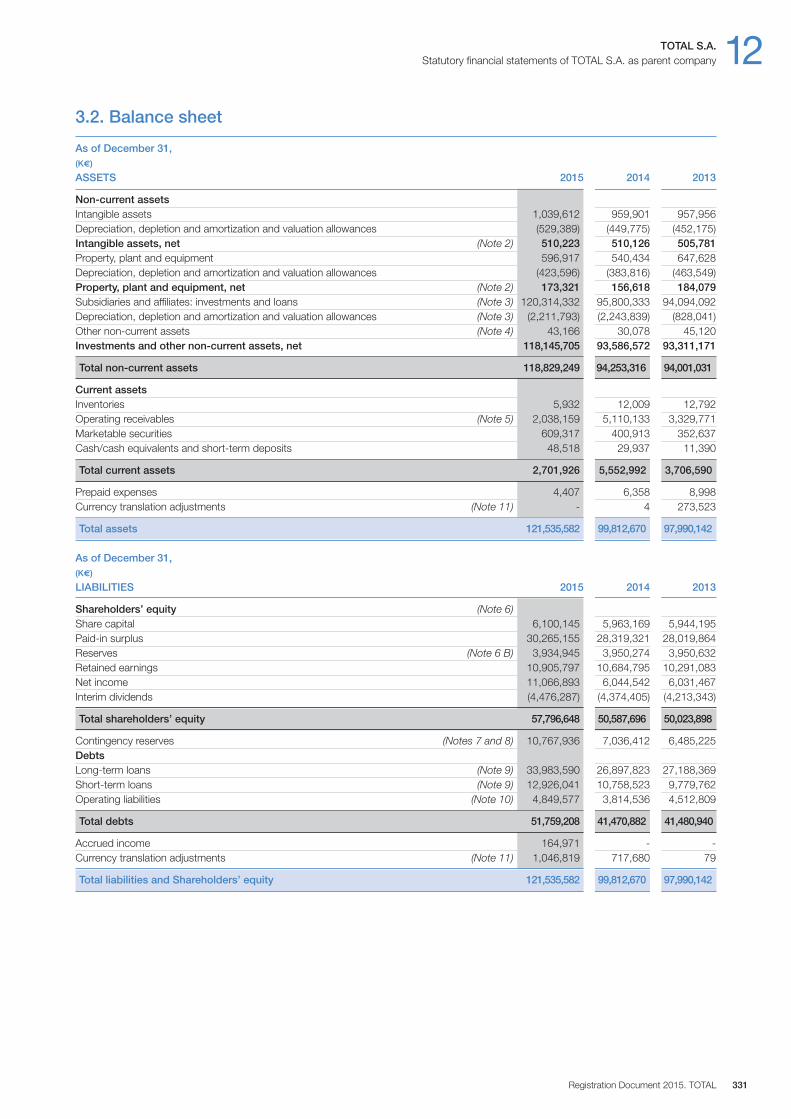
TOTAL S.A. 12Statutory financial statements of TOTAL S.A. as parent company
Registration Document 2015. TOTAL 331
3.2. Balance sheet
As of December 31,(K€)
ASSETS 2015 2014 2013
Non-current assetsIntangible assets 1,039,612 959,901 957,956Depreciation, depletion and amortization and valuation allowances (529,389) (449,775) (452,175)Intangible assets, net (Note 2) 510,223 510,126 505,781Property, plant and equipment 596,917 540,434 647,628Depreciation, depletion and amortization and valuation allowances (423,596) (383,816) (463,549)Property, plant and equipment, net (Note 2) 173,321 156,618 184,079Subsidiaries and affiliates: investments and loans (Note 3) 120,314,332 95,800,333 94,094,092Depreciation, depletion and amortization and valuation allowances (Note 3) (2,211,793) (2,243,839) (828,041)Other non-current assets (Note 4) 43,166 30,078 45,120Investments and other non-current assets, net 118,145,705 93,586,572 93,311,171
Total non-current assets 118,829,249 94,253,316 94,001,031
Current assetsInventories 5,932 12,009 12,792Operating receivables (Note 5) 2,038,159 5,110,133 3,329,771Marketable securities 609,317 400,913 352,637Cash / cash equivalents and short-term deposits 48,518 29,937 11,390
Total current assets 2,701,926 5,552,992 3,706,590
Prepaid expenses 4,407 6,358 8,998Currency translation adjustments (Note 11) - 4 273,523
Total assets 121,535,582 99,812,670 97,990,142
As of December 31,(K€)
LIABILITIES 2015 2014 2013
Shareholders’ equity (Note 6) Share capital 6,100,145 5,963,169 5,944,195Paid-in surplus 30,265,155 28,319,321 28,019,864Reserves (Note 6 B) 3,934,945 3,950,274 3,950,632Retained earnings 10,905,797 10,684,795 10,291,083Net income 11,066,893 6,044,542 6,031,467Interim dividends (4,476,287) (4,374,405) (4,213,343)
Total shareholders’ equity 57,796,648 50,587,696 50,023,898
Contingency reserves (Notes 7 and 8) 10,767,936 7,036,412 6,485,225DebtsLong-term loans (Note 9) 33,983,590 26,897,823 27,188,369Short-term loans (Note 9) 12,926,041 10,758,523 9,779,762Operating liabilities (Note 10) 4,849,577 3,814,536 4,512,809
Total debts 51,759,208 41,470,882 41,480,940
Accrued income 164,971 - -Currency translation adjustments (Note 11) 1,046,819 717,680 79
Total liabilities and Shareholders’ equity 121,535,582 99,812,670 97,990,142
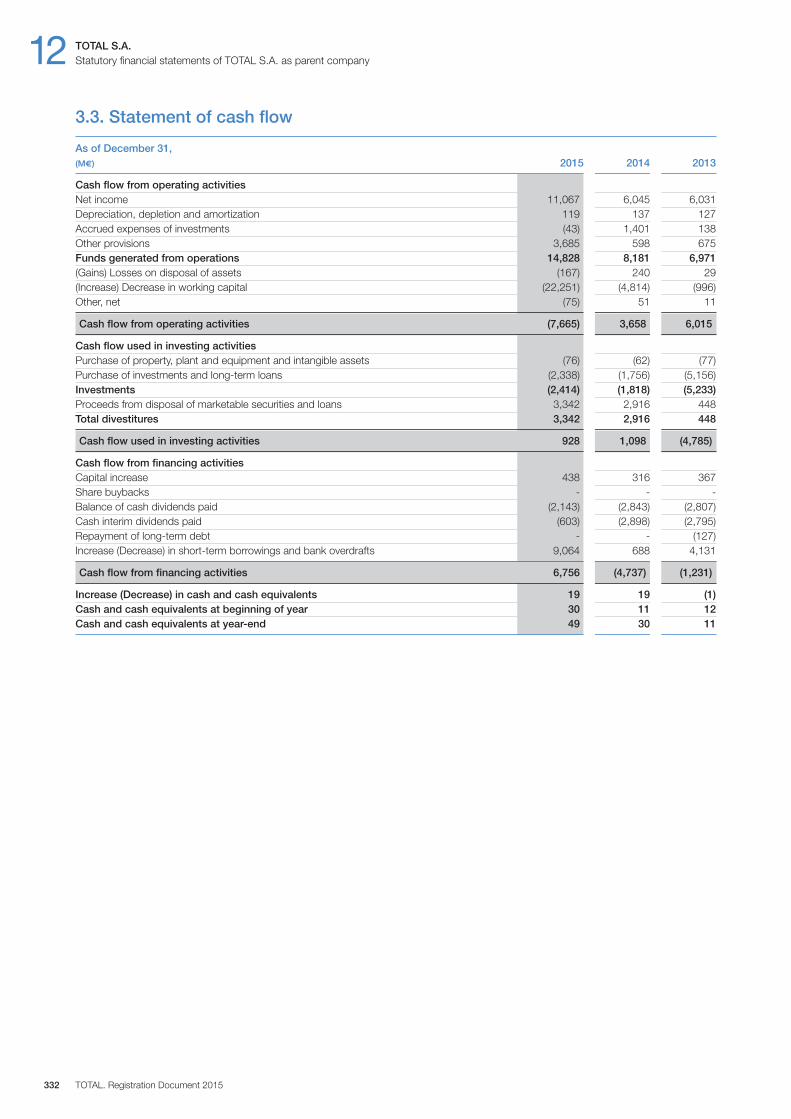
12 TOTAL S.A.Statutory financial statements of TOTAL S.A. as parent company
TOTAL. Registration Document 2015332
3.3. Statement of cash flow
As of December 31, (M€) 2015 2014 2013
Cash flow from operating activitiesNet income 11,067 6,045 6,031Depreciation, depletion and amortization 119 137 127Accrued expenses of investments (43) 1,401 138Other provisions 3,685 598 675Funds generated from operations 14,828 8,181 6,971(Gains) Losses on disposal of assets (167) 240 29(Increase) Decrease in working capital (22,251) (4,814) (996)Other, net (75) 51 11
Cash flow from operating activities (7,665) 3,658 6,015
Cash flow used in investing activitiesPurchase of property, plant and equipment and intangible assets (76) (62) (77)Purchase of investments and long-term loans (2,338) (1,756) (5,156)Investments (2,414) (1,818) (5,233)Proceeds from disposal of marketable securities and loans 3,342 2,916 448Total divestitures 3,342 2,916 448
Cash flow used in investing activities 928 1,098 (4,785)
Cash flow from financing activitiesCapital increase 438 316 367Share buybacks - - -Balance of cash dividends paid (2,143) (2,843) (2,807)Cash interim dividends paid (603) (2,898) (2,795)Repayment of long-term debt - - (127)Increase (Decrease) in short-term borrowings and bank overdrafts 9,064 688 4,131
Cash flow from financing activities 6,756 (4,737) (1,231)
Increase (Decrease) in cash and cash equivalents 19 19 (1)Cash and cash equivalents at beginning of year 30 11 12Cash and cash equivalents at year-end 49 30 11

TOTAL S.A. 12Statutory financial statements of TOTAL S.A. as parent company
Registration Document 2015. TOTAL 333
3.4. Statement of changes in shareholders’ equity
(M€) Common shares issued General Revaluation Totalreserves reserve
Number Amount Issue and retained premiums earnings
As of January 1, 2013 2,365,933,146 5,915 27,684 15,607 24 49,230
Balance of cash dividends paid (a) - - - (1,381) - (1,381)Net income 2013 - - - 6,031 - 6,031Cash interim dividends paid for 2013 (b)(b’) - - - (4,213) - (4,213)Issuance of common shares 942,799 2 33 - - 35Capital increase reserved for Group employees 10,802,215 27 305 - - 332Changes in revaluation differences - - - - (8) (8)Expenses related to the capital increase reserved for employees - - (2) - - (2)
As of December 31, 2013 2,377,678,160 5,944 28,020 16,044 16 50,024
Balance of cash dividends paid (c) - - - (1,424) - (1,424)Net income 2014 - - - 6,045 - 6,045Cash interim dividends paid for 2014 (d)(d’) - - - (4,374) - (4,374)Issuance of common shares 6,922,790 17 299 - - 316Capital increase reserved for Group employees 666,575 2 - (2) - -Changes in revaluation differences - - - - 1 1Expenses related to the capital increase reserved for employees - - - - - -
As of December 31, 2014 2,385,267,525 5,963 28,319 16,289 17 50,588
Balance of cash dividends paid (e) - - (674) - (674)Capital increase by final dividend paid in shares 18,609,466 47 735 (775) - 7Net income 2015 - - - 11,067 - 11,067Cash interim dividends paid for 2015 (f)(f’) - - - (4,476) - (4,476)Issuance of common shares 1,469,606 4 55 - - 59Capital increase reserved for Group employees 10,479,410 26 354 (1) - 379Changes in revaluation differences - - - - (14) (14)Expenses related to the capital increase reserved for employees - - (2) - - (2)Capital increase by dividend paid in shares 24,231,876 60 803 - - 863
As of December 31, 2015 2,440,057,883 6,100 30,264 21,430 3 57,797
(a) Balance of the 2012 dividend paid in 2013: €1,398 million (€0.59 per share) reduced by €17 million for accounting adjustment, according to the Shareholders’ Meeting on May 17, 2013.(b) Interim dividend paid in 2013 for the 1st and 2nd quarters 2013: €2,795 million (€0.59 per share).(b’) Interim dividend not paid in 2013 for the 3rd quarter 2013: €1,418 million (€0.59 per share).(c) Balance of the 2013 dividend paid in 2014: €1,445 million (€0.61 per share) reduced by €21 million for accounting adjustment, according to the Shareholders’ Meeting on May 16, 2014.(d) Interim dividend paid in 2014 for the 1st and 2nd quarters 2014: €2,898 million (€0.61 per share).(d’) Interim dividend not paid in 2014 for the 3rd quarter 2014: €1,476 million (€0.61 per share).(e) Balance of the 2014 dividend paid in 2015: €674 million (€0.61 per share) paid in cash and €782 million paid in shares reduced by €7 million for accounting adjustment, according to
the Shareholders’ Meeting on May 29, 2015.(f) Interim dividend paid in 2015 for the 1st quarter 2015: €591 million (€0.61 per share) paid in cash and €874 million paid in shares.(f’) Interim dividend not paid in 2015 for the 2nd and 3rd quarters 2015: €3,011 million (€0.61 per share) with the option to receive dividend in shares.
12 TOTAL S.A.Notes to the statutory financial statements
TOTAL. Registration Document 2015334
The 2015 financial statements have been prepared in accordancewith French Generally Accepted Accounting Principles (“FrenchGAAP”) in force.
Property, plant and equipment
Property, plant and equipment are carried at cost except thoseassets that were acquired before 1976 for which the basis has beenrevalued pursuant to French regulations. They are depreciatedaccording to the straight-line method over their estimated useful life,as follows:
Buildings 20-30 yearsFurniture and fixtures 5-10 yearsTransportation equipment 2-5 yearsOffice equipment and furniture 5-10 yearsComputer equipment 3-5 years
Investments and loans to consolidatedsubsidiaries and equity affiliates
Investments in consolidated subsidiaries and equity affiliates areaccounted for at the acquisition cost, or the appraised value forinvestments affected by the 1976 legal revaluation.
Loans to consolidated subsidiaries and equity affiliates are stated attheir nominal value.
In the Upstream segment, in the absence of a developmentdecision, allowances are recorded against investments and loansfor an amount corresponding to the exploration costs incurred.When the existence of proved reserves is established, the value ofthe investments and loans is limited to the subsidiary expected pay-back evaluated at year-end.
For other segments, allowances for impairment in value arecalculated by reference to the Company’s equity in the underlyingnet assets, the fair value and usefulness of the investment.
Inventories
Cost for crude oil and refined product inventories are determinedaccording to the First-In, First-Out (FIFO) method.
Inventories are valued at either the historical cost or the marketvalue, whichever is lower.
Receivables and payables
Receivables and payables are stated at nominal value. Allowancesfor doubtful debts are recorded when the actual value is inferior tothe book value.
Foreign currency transactions
Receivables and payables denominated in foreign currencies aretranslated into euros at the year-end exchange rate. Translationdifferences for non-hedged items are recorded under “CurrencyTranslation adjustment” on the assets or liabilities side of thebalance sheet. Unrealized exchange losses are recorded asprovisions.
Translation differences related to other foreign receivables andpayables are recorded in the statement of income and offset byunrealized gains or losses from off-balance sheet hedging.
Financial instruments
TOTAL S.A. uses financial instruments for hedging purposes only inorder to manage its exposure to changes in interest rates andforeign exchange rates.
As part of this policy, the Company may use interest rate swapagreements and forward transactions. The difference betweeninterest to be paid and interest to be received on these swaps orpremiums and discounts on these forward transactions isrecognized as interest expense or interest income on a proratedbasis, over the life of the instruments.
4. Notes
1) Accounting policies
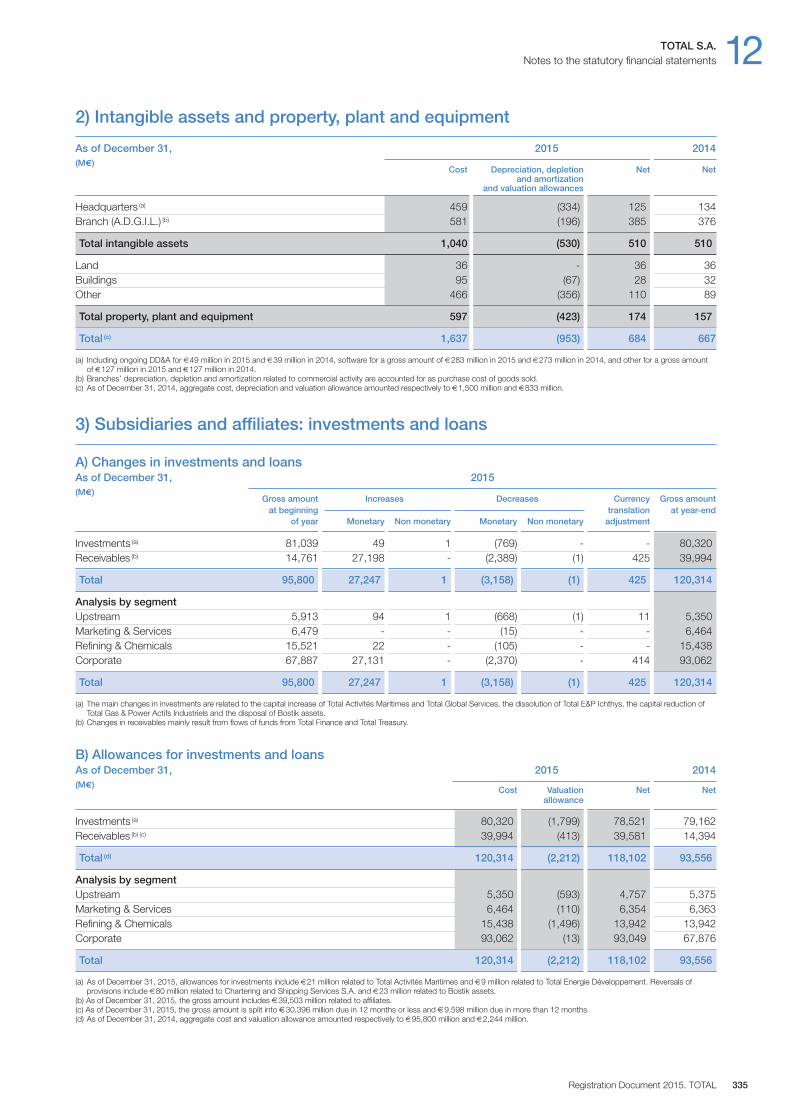
TOTAL S.A. 12Notes to the statutory financial statements
Registration Document 2015. TOTAL 335
2) Intangible assets and property, plant and equipment
As of December 31, 2015 2014(M€) Cost Depreciation, depletion Net Net and amortization
and valuation allowances
Headquarters (a) 459 (334) 125 134Branch (A.D.G.I.L.) (b) 581 (196) 385 376
Total intangible assets 1,040 (530) 510 510
Land 36 - 36 36Buildings 95 (67) 28 32Other 466 (356) 110 89
Total property, plant and equipment 597 (423) 174 157
Total (c) 1,637 (953) 684 667
(a) Including ongoing DD&A for €49 million in 2015 and €39 million in 2014, software for a gross amount of €283 million in 2015 and €273 million in 2014, and other for a gross amountof €127 million in 2015 and €127 million in 2014.
(b) Branches’ depreciation, depletion and amortization related to commercial activity are accounted for as purchase cost of goods sold.(c) As of December 31, 2014, aggregate cost, depreciation and valuation allowance amounted respectively to €1,500 million and €833 million.
3) Subsidiaries and affiliates: investments and loans
A) Changes in investments and loansAs of December 31, 2015(M€)
Gross amount Increases Decreases Currency Gross amount at beginning translation at year-end of year Monetary Non monetary Monetary Non monetary adjustment
Investments (a) 81,039 49 1 (769) - - 80,320Receivables (b) 14,761 27,198 - (2,389) (1) 425 39,994
Total 95,800 27,247 1 (3,158) (1) 425 120,314
Analysis by segmentUpstream 5,913 94 1 (668) (1) 11 5,350Marketing & Services 6,479 - - (15) - - 6,464Refining & Chemicals 15,521 22 - (105) - - 15,438Corporate 67,887 27,131 - (2,370) - 414 93,062
Total 95,800 27,247 1 (3,158) (1) 425 120,314
(a) The main changes in investments are related to the capital increase of Total Activités Maritimes and Total Global Services, the dissolution of Total E&P Ichthys, the capital reduction ofTotal Gas & Power Actifs Industriels and the disposal of Bostik assets.
(b) Changes in receivables mainly result from flows of funds from Total Finance and Total Treasury.
B) Allowances for investments and loansAs of December 31, 2015 2014(M€) Cost Valuation Net Net allowance
Investments (a) 80,320 (1,799) 78,521 79,162Receivables (b) (c) 39,994 (413) 39,581 14,394
Total (d) 120,314 (2,212) 118,102 93,556
Analysis by segmentUpstream 5,350 (593) 4,757 5,375Marketing & Services 6,464 (110) 6,354 6,363Refining & Chemicals 15,438 (1,496) 13,942 13,942Corporate 93,062 (13) 93,049 67,876
Total 120,314 (2,212) 118,102 93,556
(a) As of December 31, 2015, allowances for investments include €21 million related to Total Activités Maritimes and €9 million related to Total Energie Développement. Reversals ofprovisions include €80 million related to Chartering and Shipping Services S.A. and €23 million related to Bostik assets.
(b) As of December 31, 2015, the gross amount includes €39,503 million related to affiliates.(c) As of December 31, 2015, the gross amount is split into €30,396 million due in 12 months or less and €9,598 million due in more than 12 months.(d) As of December 31, 2014, aggregate cost and valuation allowance amounted respectively to €95,800 million and €2,244 million.
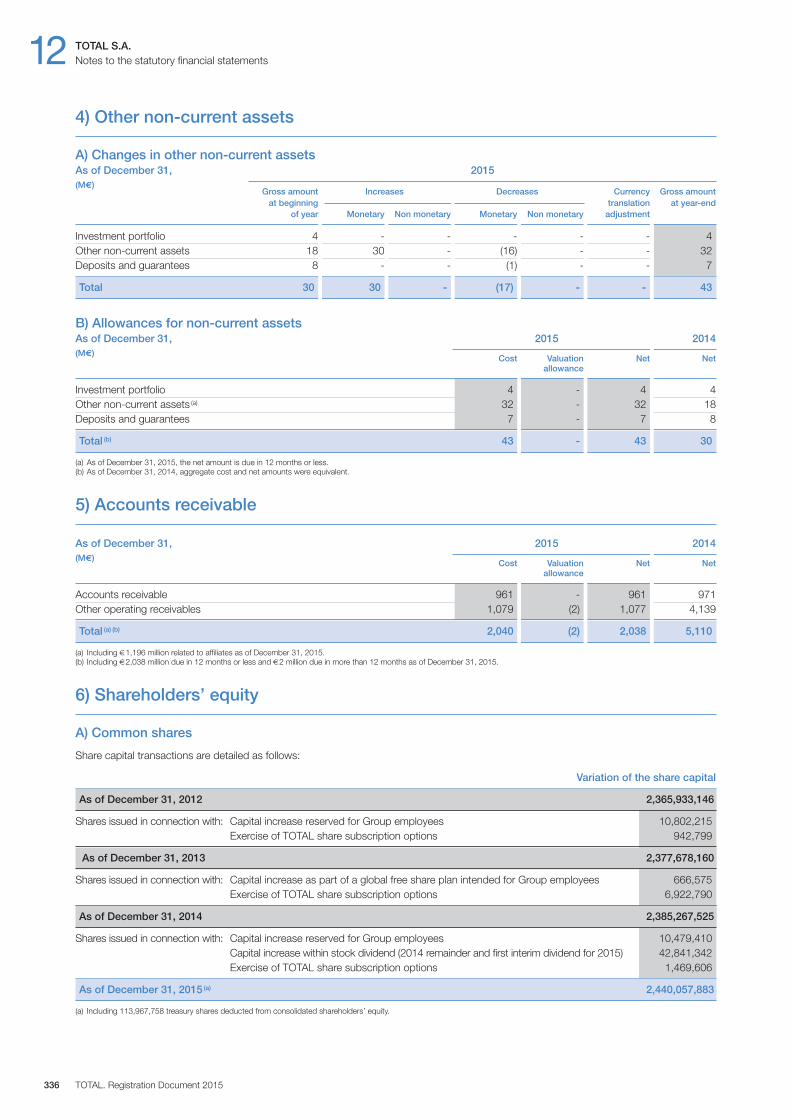
12 TOTAL S.A.Notes to the statutory financial statements
TOTAL. Registration Document 2015336
4) Other non-current assets
A) Changes in other non-current assetsAs of December 31, 2015(M€)
Gross amount Increases Decreases Currency Gross amount at beginning translation at year-end of year Monetary Non monetary Monetary Non monetary adjustment
Investment portfolio 4 - - - - - 4Other non-current assets 18 30 - (16) - - 32Deposits and guarantees 8 - - (1) - - 7
Total 30 30 - (17) - - 43
B) Allowances for non-current assetsAs of December 31, 2015 2014(M€) Cost Valuation Net Net allowance
Investment portfolio 4 - 4 4Other non-current assets (a) 32 - 32 18Deposits and guarantees 7 - 7 8
Total (b) 43 - 43 30
(a) As of December 31, 2015, the net amount is due in 12 months or less.(b) As of December 31, 2014, aggregate cost and net amounts were equivalent.
5) Accounts receivable
As of December 31, 2015 2014(M€) Cost Valuation Net Net allowance
Accounts receivable 961 - 961 971Other operating receivables 1,079 (2) 1,077 4,139
Total (a) (b) 2,040 (2) 2,038 5,110
(a) Including €1,196 million related to affiliates as of December 31, 2015.(b) Including €2,038 million due in 12 months or less and €2 million due in more than 12 months as of December 31, 2015.
6) Shareholders’ equity
A) Common shares
Share capital transactions are detailed as follows:
Variation of the share capital
As of December 31, 2012 2,365,933,146
Shares issued in connection with: Capital increase reserved for Group employees 10,802,215Exercise of TOTAL share subscription options 942,799
As of December 31, 2013 2,377,678,160
Shares issued in connection with: Capital increase as part of a global free share plan intended for Group employees 666,575Exercise of TOTAL share subscription options 6,922,790
As of December 31, 2014 2,385,267,525
Shares issued in connection with: Capital increase reserved for Group employees 10,479,410 Capital increase within stock dividend (2014 remainder and first interim dividend for 2015) 42,841,342 Exercise of TOTAL share subscription options 1,469,606
As of December 31, 2015 (a) 2,440,057,883
(a) Including 113,967,758 treasury shares deducted from consolidated shareholders’ equity.

TOTAL S.A. 12Notes to the statutory financial statements
Registration Document 2015. TOTAL 337
Capital increase reserved for Group employees
The Combined General Meeting of May 16, 2014, delegated to theBoard of Directors in its fourteenth resolution, the authority to carryout, a capital increase, in one or more occasions within a maximumperiod of twenty-six months, reserved for employees belonging toan employee savings plan.
This capital increase resulted in the subscription of 10,108,918shares with a par value of €2.50 at a unit price of €37.50 and ofthe issuance of 370,492 shares with a par value of €2.50 grantedas free shares. The issuance of the shares was acknowledged onApril 27, 2015. Moreover, the Board of Directors, during its April 27, 2015meeting, based on the sixteenth resolution of the Combined GeneralMeeting of May 16, 2014, decided to grant 20,882 free shares to2,100 beneficiaries subject to a continued employment conditionduring the 5-year acquisition period that will end at April 27, 2020,as a deferred contribution.
The prior capital increase reserved for employees of the Group wasdecided by the Board of Directors on September 18, 2012, underthe terms of the authorization of the Combined General Meeting ofMay 11, 2012, and resulted in the subscription of 10,802,215shares with a par value of €2.50 at a unit price of €30.70. The issuanceof the shares was acknowledged on April 25, 2013.
Capital increase as part of a global free share plan intended for Group employees
The Combined General Meeting of May 16, 2008, delegated to theBoard of Directors in its seventeenth resolution, the authority togrant, in one or more occasions within a maximum period of thirty-eight months, restricted shares to employees and executive officersof the Company or companies outside France affiliated with theCompany, within a limit of 0.8% of the outstanding share capital ofthe Company as of the date of the decision of the Board ofDirectors to grant such shares.
Pursuant to this delegation, the Board of Directors, during its meetingon May 21, 2010, determined the terms of a global free share planintended for Group employees and granted the Chairman andChief Executive Officer all powers necessary to implement this plan.
As a result, and in accordance with the terms defined by the Boardof Directors during its meeting on May 21, 2010, the Chairman andChief Executive Officer noted:
– on July 2, 2012, the issuance and the final allocation of 1,366,950shares with a nominal value of €2.50 to the designatedbeneficiaries after the expiration of the two-year acquisitionperiod; and
– on July 1, 2014, the issuance and the final allocation of 666,575shares with a nominal value of €2.50 after the expiration of thefour-year acquisition period.
There are no additional shares that may be issued as part of this plan.
Capital increase by dividend paid in shares
The Shareholders’ Meeting on May 29, 2015, approved the optionfor shareholders to receive the fourth quarter dividend in shares orin cash.
Another resolution has been approved at the Shareholders’ Meetingon May 29, 2015, being that if one or more interim dividends are
decided by the Board of Directors for the fiscal year 2015, thenshareholders would have the option to receive each of this or theseinterim dividends in shares or in cash.
Terms of these operations are included in Note 17 – Shareholders’equity – to the Consolidated Financial Statements attached in theRegistration Document.
Share cancellation
The Group did not proceed with a reduction of capital by cancellationof shares held by the Company during the fiscal years 2013, 2014 and 2015.
Treasury shares (TOTAL shares held by TOTAL S.A.)
As of December 31, 2015, TOTAL S.A. holds 13,636,490 of its ownshares, representing 0.56% of its share capital, detailed as follows:
– 13,603,525 shares allocated to TOTAL share grant plans forGroup employees; and
– 32,965 shares intended to be allocated to new TOTAL sharepurchase option plans or to new share grant plans.
These shares are deducted from the consolidated shareholders’ equity.
As of December 31, 2014, TOTAL S.A. held 9,030,145 of its ownshares, representing 0.38% of its share capital, detailed as follows:
– 8,946,930 shares allocated to TOTAL share grant plans for Groupemployees; and
– 83,215 shares intended to be allocated to new TOTAL sharepurchase option plans or to new share grant plans.
These shares were deducted from the consolidated shareholders’ equity.
As of December 31, 2013, TOTAL S.A. held 8,883,180 of its ownshares, representing 0.37% of its share capital, detailed as follows:
– 8,764,020 shares allocated to TOTAL share grant plans for Groupemployees; and
– 119,160 shares intended to be allocated to new TOTAL sharepurchase option plans or to new share grant plans.
These shares were deducted from the consolidated shareholders’ equity.
TOTAL shares held by Group subsidiaries
As of December 31, 2015, 2014 and 2013, TOTAL S.A. heldindirectly through its subsidiaries 100,331,268 of its own shares,representing 4.11% of its share capital as of December 31, 2015,4.21% of its share capital as of December 31, 2014 and 4.22% ofits share capital as of December 31, 2013, detailed as follows:
– 2,023,672 shares held by a consolidated subsidiary,Total Nucléaire, 100% indirectly controlled by TOTAL S.A.; and
– 98,307,596 shares held by subsidiaries of Elf Aquitaine(Financière Valorgest, Sogapar and Fingestval), 100% indirectlycontrolled by TOTAL S.A.
These shares are deducted from the consolidated shareholders’ equity.
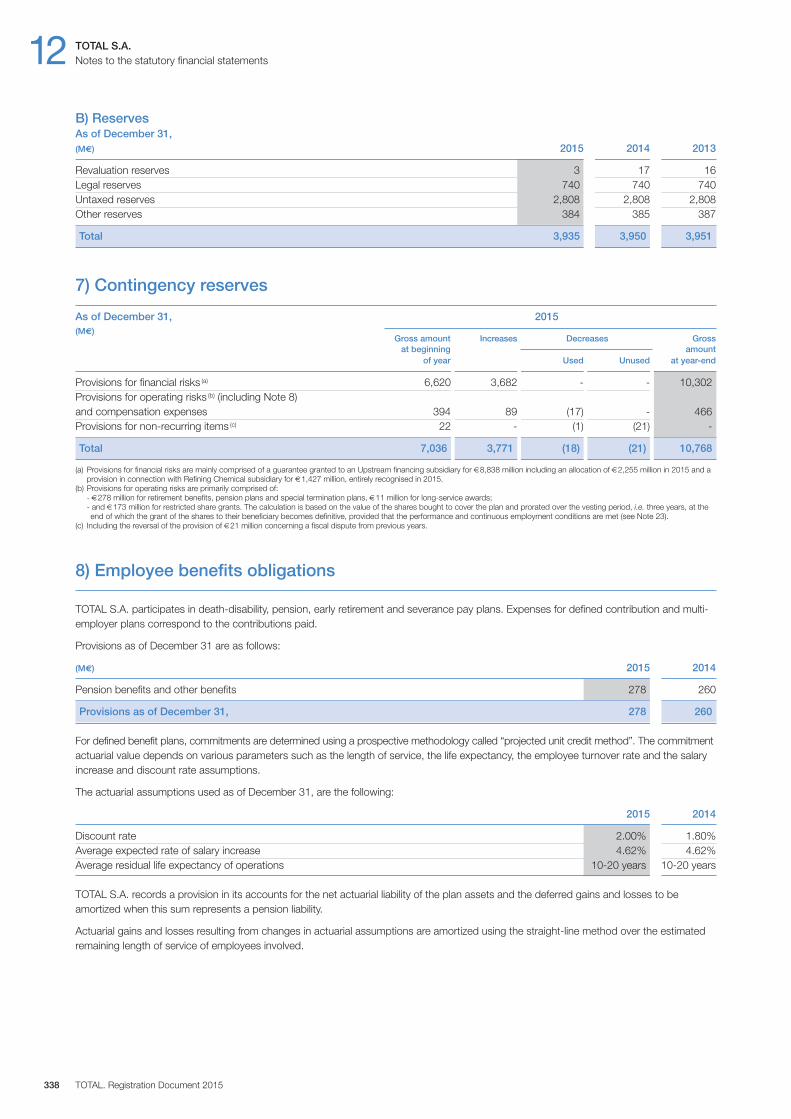
12 TOTAL S.A.Notes to the statutory financial statements
TOTAL. Registration Document 2015338
B) ReservesAs of December 31, (M€) 2015 2014 2013
Revaluation reserves 3 17 16Legal reserves 740 740 740Untaxed reserves 2,808 2,808 2,808Other reserves 384 385 387
Total 3,935 3,950 3,951
7) Contingency reserves
As of December 31, 2015(M€) Gross amount Increases Decreases Gross at beginning amount of year Used Unused at year-end
Provisions for financial risks (a) 6,620 3,682 - - 10,302Provisions for operating risks (b) (including Note 8)and compensation expenses 394 89 (17) - 466Provisions for non-recurring items (c) 22 - (1) (21) -
Total 7,036 3,771 (18) (21) 10,768
(a) Provisions for financial risks are mainly comprised of a guarantee granted to an Upstream financing subsidiary for €8,838 million including an allocation of €2,255 million in 2015 and aprovision in connection with Refining Chemical subsidiary for €1,427 million, entirely recognised in 2015.
(b) Provisions for operating risks are primarily comprised of:- €278 million for retirement benefits, pension plans and special termination plans, €11 million for long-service awards;- and €173 million for restricted share grants. The calculation is based on the value of the shares bought to cover the plan and prorated over the vesting period, i.e. three years, at the end of which the grant of the shares to their beneficiary becomes definitive, provided that the performance and continuous employment conditions are met (see Note 23).
(c) Including the reversal of the provision of €21 million concerning a fiscal dispute from previous years.
8) Employee benefits obligations
TOTAL S.A. participates in death-disability, pension, early retirement and severance pay plans. Expenses for defined contribution and multi-employer plans correspond to the contributions paid.
Provisions as of December 31 are as follows:
(M€) 2015 2014
Pension benefits and other benefits 278 260
Provisions as of December 31, 278 260
For defined benefit plans, commitments are determined using a prospective methodology called “projected unit credit method”. The commitmentactuarial value depends on various parameters such as the length of service, the life expectancy, the employee turnover rate and the salaryincrease and discount rate assumptions.
The actuarial assumptions used as of December 31, are the following:
2015 2014
Discount rate 2.00% 1.80%Average expected rate of salary increase 4.62% 4.62%Average residual life expectancy of operations 10-20 years 10-20 years
TOTAL S.A. records a provision in its accounts for the net actuarial liability of the plan assets and the deferred gains and losses to beamortized when this sum represents a pension liability.
Actuarial gains and losses resulting from changes in actuarial assumptions are amortized using the straight-line method over the estimatedremaining length of service of employees involved.
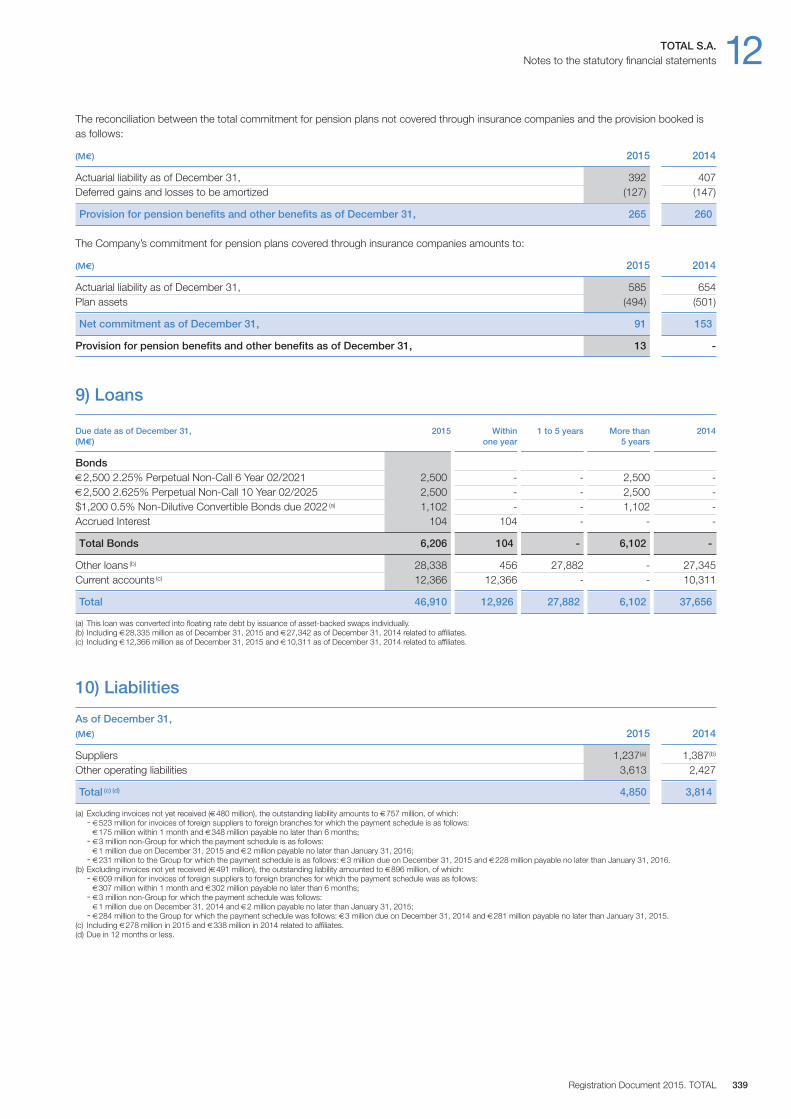
TOTAL S.A. 12Notes to the statutory financial statements
Registration Document 2015. TOTAL 339
The reconciliation between the total commitment for pension plans not covered through insurance companies and the provision booked isas follows:
(M€) 2015 2014
Actuarial liability as of December 31, 392 407Deferred gains and losses to be amortized (127) (147)
Provision for pension benefits and other benefits as of December 31, 265 260
The Company’s commitment for pension plans covered through insurance companies amounts to:
(M€) 2015 2014
Actuarial liability as of December 31, 585 654Plan assets (494) (501)
Net commitment as of December 31, 91 153
Provision for pension benefits and other benefits as of December 31, 13 -
9) Loans
Due date as of December 31, 2015 Within 1 to 5 years More than 2014(M€) one year 5 years
Bonds€2,500 2.25% Perpetual Non-Call 6 Year 02 / 2021 2,500 - - 2,500 -€2,500 2.625% Perpetual Non-Call 10 Year 02 / 2025 2,500 - - 2,500 -$1,200 0.5% Non-Dilutive Convertible Bonds due 2022 (a) 1,102 - - 1,102 -Accrued Interest 104 104 - - -
Total Bonds 6,206 104 - 6,102 -
Other loans (b) 28,338 456 27,882 - 27,345Current accounts (c) 12,366 12,366 - - 10,311
Total 46,910 12,926 27,882 6,102 37,656
(a) This loan was converted into floating rate debt by issuance of asset-backed swaps individually.(b) Including €28,335 million as of December 31, 2015 and €27,342 as of December 31, 2014 related to affiliates.(c) Including €12,366 million as of December 31, 2015 and €10,311 as of December 31, 2014 related to affiliates.
10) Liabilities
As of December 31, (M€) 2015 2014
Suppliers 1,237(a) 1,387(b)
Other operating liabilities 3,613 2,427
Total (c) (d) 4,850 3,814
(a) Excluding invoices not yet received (€480 million), the outstanding liability amounts to €757 million, of which:- €523 million for invoices of foreign suppliers to foreign branches for which the payment schedule is as follows:€175 million within 1 month and €348 million payable no later than 6 months;
- €3 million non-Group for which the payment schedule is as follows:€1 million due on December 31, 2015 and €2 million payable no later than January 31, 2016;
- €231 million to the Group for which the payment schedule is as follows: €3 million due on December 31, 2015 and €228 million payable no later than January 31, 2016.(b) Excluding invoices not yet received (€491 million), the outstanding liability amounted to €896 million, of which:
- €609 million for invoices of foreign suppliers to foreign branches for which the payment schedule was as follows:€307 million within 1 month and €302 million payable no later than 6 months;
- €3 million non-Group for which the payment schedule was follows:€1 million due on December 31, 2014 and €2 million payable no later than January 31, 2015;
- €284 million to the Group for which the payment schedule was follows: €3 million due on December 31, 2014 and €281 million payable no later than January 31, 2015.(c) Including €278 million in 2015 and €338 million in 2014 related to affiliates.(d) Due in 12 months or less.
12 TOTAL S.A.Notes to the statutory financial statements
TOTAL. Registration Document 2015340
11) Currency translation adjustments
The application of the foreign currency translation method outlined in Note 1 resulted in a net currency translation adjustment of €1,047 millionas of December 31, 2015, mainly due to dollar-denominated loans, thanks to the appreciation of this currency.
12) Sales
(M€) France Rest of North Africa Middle East Total Europe America & Rest of world
Fiscal year ended December 31, 2015 223 6,999 22 970 952 9,166
Hydrocarbon and oil products - 6,701 - - 175 6,876Technical support fees 223 298 22 970 777 2,290
Fiscal year ended December 31, 2014 293 10,755 36 1,119 889 13,092
Hydrocarbon and oil products - 10,455 - - 177 10,632Technical support fees 293 300 36 1,119 712 2,460
13) Net operating expenses
(M€) 2015 2014
Purchase cost of goods sold (5,891) (8,461)Other purchases and external expenses (1,664) (1,713)Taxes (61) (60)Personnel expenses (1,228) (1,419)
Total (8,844) (11,653)
14) Operating depreciation, amortization and allowances
(M€) 2015 2014
Depreciation, valuation allowance and amortization on- Property, plant and equipment and intangible assets (68) (93)- Employee benefits (89) (127)- Current assets - (47)
Subtotal 1 (157) (267)
Reversals- Property, plant and equipment and intangible assets 48 -- Employee benefits 15 143
Subtotal 2 63 143
Total (1+2) (94) (124)
15) Financial expenses and income
(M€) 2015 2014
Financial expenses (a)
Interest expenses and other (339) (273)Depreciation on investments and loans to subsidiaries and affiliates (1,137) (114)
Subtotal 1 (1,476) (387)
Financial income (b)
Net gain on sales of marketable securities and interest on loans to subsidiaries and affiliates 1 -Interest on short-term deposits and other 85 29
Subtotal 2 86 29
Total (1+2) (1,390) (358)
(a) Including, related to affiliates: 1,146 380(b) Including, related to affiliates: 81 28
TOTAL S.A. 12Notes to the statutory financial statements
Registration Document 2015. TOTAL 341
As of December 31, (M€) 2015 2014
Pension, benefits and other benefits 278 260Net currency translation adjustment 1,047 718Other, net 59 60
TOTAL NET ASSETS 1,384 1,038
TOTAL S.A. is subject to French corporation tax according to theordinary rules of law, i.e. based on the principle of territoriality of taxstipulated in the French Tax Code (Article 209-I). It is also taxedoutside France on income from its direct operations abroad.
Moreover, since January 1, 1992, TOTAL S.A. has elected the95% -owned French subsidiaries tax regime provided for by Articles223 A et seq. of the French Tax Code (Régime de l’intégrationfiscale). In accordance with the integration agreement signedbetween TOTAL S.A. and its consolidated subsidiaries, the lossesrealized by these subsidiaries during the consolidation period aredefinitively acquired by the parent company.
The tax group consists of 184 subsidiaries owned by 95% whosemain contributors to the consolidated taxable income atDecember 31, 2015 are:
– Total S.A;– Total Petrochemicals France;
– Total Treasury;– Elf Aquitaine;– Total Lubrifiants;– Total Marketing Services.
The French tax rate consists of the standard corporation tax rate(33.33%), plus additional contributions in effect in 2015, whichbrings the overall income tax rate to 38%.
For the fiscal year 2015, TOTAL S.A. recorded a net tax expense of€128 million, which is broken down into net tax income of€866 million received primarily from the subsidiaries under the taxconsolidation scheme, a tax expense of €923 million paid by theforeign branches and the additional tax contribution of €71 million.
TOTAL S.A. does not record deferred tax in its statutory financialstatements; however, the main temporary differences are as follows:
19) Basis of taxation
Non-recurring income is a profit of €153 million, it is mainlycomprised of:
– gain on disposals of assets amounting to €153 million detailedas follows:- €129 million with Total Coal South Africa Pty Ltd,- €8 million with Bostik assets,
- €8 million with Total International Ltd,- €8 million with Total Holding India;
– scholarships and grants payment for €36 million;– reversals of provisions for €36 million detailed as follows:
- €21 million for taxes due regarding prior years,- €15 million resulting from the reevaluation on disposals.
16) Dividends
(M€) 2015 2014
Upstream 1,742 417Marketing & Services 889 801Refining & Chemicals 656 23Corporate 12,115 7,519
Total 15,402 8,760
17) Other financial income and expenses
This net profit of €478 million is comprised entirely of foreign exchange profits.
18) Non-recurring income
12 TOTAL S.A.Notes to the statutory financial statements
TOTAL. Registration Document 2015342
21) Commitments
As of December 31, (M€) 2015 2014
Commitments givenGuarantees on custom duties 1,820 921Bank guarantees 11,874 9,507Guarantees given on other commitments (a) 12,093 10,902Guarantees related to confirmed lines of credit 78 75Short-term financing plan (b) 20,378 18,820Bond issue plan (b) 47,432 45,120
Total commitments given 93,675 85,345
Commitments receivedGuarantees related to confirmed lines of credit 9,805 8,660Guarantees on confirmed authorized bank overdrafts - -Other commitments received 462 607
Total of commitments received 10,267 9,267
(a) This item mainly includes the following commitments: shareholder agreements, financing guarantees, payment guarantees, and reservation of oil and gas transport and storage capacity guarantees.(b) Guarantees of bond issues and short-term financing plans incurred by Total Capital. On the overall plan amount of €67,810 million, €48,836 million were incurred as of December 31, 2015
compared with €39,343 million as of December 31, 2014.
Portfolio of financial derivative instruments
The off-balance sheet commitments related to financial derivative instruments are set forth below.
As of December 31, (M€) 2015 2014
Issue swapsNotional value, accrued coupon interest (a) 1,102 -Market value, accrued coupon interest (b) (169) -Forward contracts of currenciesNotional value (a) 79 410Market value (b) - 17
(a) These amounts set the levels of notional commitment and are not indicative of a contingent gain or loss.(b) This value was determined by estimating future cash flows on a borrowing-by-borrowing basis and discounting these future cash flows using the zero coupon interest rate curves at year-end
and taking into account a spread that corresponds to the average risk classification of the Company.
22) Average number of employees
As of December 31, (M€) 2015 2014
Managers 5,317 5,403Supervisors 1,326 1,386Technical and administrative staff 433 472
Total 7,076 7,261
The commercial foreign exchange positions are systematicallycovered by the purchase or sale of the corresponding currencies,mainly with cash transactions and sometimes on forward market.Regarding long-term assets in foreign currencies, the Companytries to reduce the corresponding exchange risk by associatingthem, as far as possible, with financing in the same currency.
An independent department from the dealing room monitors thestatus of the financial instruments, especially through marked-to-market valuations and sensitivity estimations. Counterparty risk ismonitored on a regular basis against limits set by the Group’s seniormanagement.
20) Foreign exchange and counterparty risk
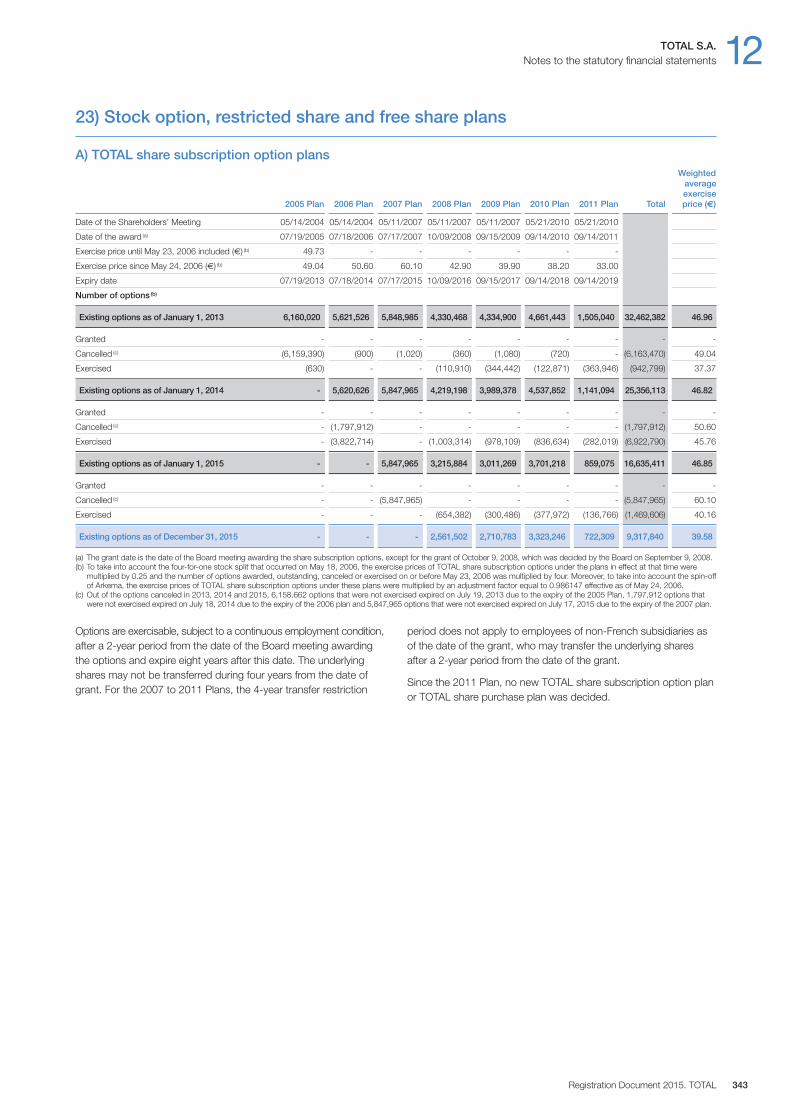
TOTAL S.A. 12Notes to the statutory financial statements
Registration Document 2015. TOTAL 343
Options are exercisable, subject to a continuous employment condition,after a 2-year period from the date of the Board meeting awardingthe options and expire eight years after this date. The underlyingshares may not be transferred during four years from the date ofgrant. For the 2007 to 2011 Plans, the 4-year transfer restriction
period does not apply to employees of non-French subsidiaries asof the date of the grant, who may transfer the underlying sharesafter a 2-year period from the date of the grant.
Since the 2011 Plan, no new TOTAL share subscription option planor TOTAL share purchase plan was decided.
23) Stock option, restricted share and free share plans
A) TOTAL share subscription option plans Weighted
averageexercise
20 05 Plan 20 06 Plan 20 07 Plan 20 08 Plan 20 09 Plan 20 10 Plan 20 11 Plan Total price (€)
Date of the Shareholders’ Meeting 05 / 14 / 2004 05 / 14 / 2004 05 / 11 / 2007 05 / 11 / 2007 05 / 11 / 2007 05 / 21 / 2010 05 / 21 / 2010
Date of the award (a) 07 / 19 / 2005 07 / 18 / 2006 07 / 17 / 2007 10 / 09 / 2008 09 / 15 / 2009 09 / 14 / 2010 09 / 14 / 2011
Exercise price until May 23, 2006 included (€) (b) 49.73 - - - - - -
Exercise price since May 24, 2006 (€) (b) 49.04 50.60 60.10 42.90 39.90 38.20 33.00
Expiry date 07 / 19 / 2013 07 / 18 / 2014 07 / 17 / 2015 10 / 09 / 2016 09 / 15 / 2017 09 / 14 / 2018 09 / 14 / 2019
Number of options (b)
Existing options as of January 1, 2013 6,160,020 5,621,526 5,848,985 4,330,468 4,334,900 4,661,443 1,505,040 32,462,382 46.96
Granted - - - - - - - - -
Cancelled (c) (6,159,390) (900) (1,020) (360) (1,080) (720) - (6,163,470) 49.04
Exercised (630) - - (110,910) (344,442) (122,871) (363,946) (942,799) 37.37
Existing options as of January 1, 2014 - 5,620,626 5,847,965 4,219,198 3,989,378 4,537,852 1,141,094 25,356,113 46.82
Granted - - - - - - - - -
Cancelled (c) - (1,797,912) - - - - - (1,797,912) 50.60
Exercised - (3,822,714) - (1,003,314) (978,109) (836,634) (282,019) (6,922,790) 45.76
Existing options as of January 1, 2015 - - 5,847,965 3,215,884 3,011,269 3,701,218 859,075 16,635,411 46.85
Granted - - - - - - - - -
Cancelled (c) - - (5,847,965) - - - - (5,847,965) 60.10
Exercised - - - (654,382) (300,486) (377,972) (136,766) (1,469,606) 40.16
Existing options as of December 31, 2015 - - - 2,561,502 2,710,783 3,323,246 722,309 9,317,840 39.58
(a) The grant date is the date of the Board meeting awarding the share subscription options, except for the grant of October 9, 2008, which was decided by the Board on September 9, 2008.(b) To take into account the four-for-one stock split that occurred on May 18, 2006, the exercise prices of TOTAL share subscription options under the plans in effect at that time were
multiplied by 0.25 and the number of options awarded, outstanding, canceled or exercised on or before May 23, 2006 was multiplied by four. Moreover, to take into account the spin-offof Arkema, the exercise prices of TOTAL share subscription options under these plans were multiplied by an adjustment factor equal to 0.986147 effective as of May 24, 2006.
(c) Out of the options canceled in 2013, 2014 and 2015, 6,158,662 options that were not exercised expired on July 19, 2013 due to the expiry of the 2005 Plan, 1,797,912 options thatwere not exercised expired on July 18, 2014 due to the expiry of the 2006 plan and 5,847,965 options that were not exercised expired on July 17, 2015 due to the expiry of the 2007 plan.

12 TOTAL S.A.Notes to the statutory financial statements
TOTAL. Registration Document 2015344
The performance shares, which are bought back by the Companyon the market, are finally granted to their beneficiaries after a 3-yearvesting period for the 2013, 2014 and 2015 Plans and a 2-yearvesting period for the previous plans, from the date of the grant.The final grant is subject to a continued employment condition andone performance condition for the 2013 and 2014 Plans, and twoperformance conditions for the 2015 Plan. Moreover, the transfer ofthe performance shares finally granted will not be permitted until theend of a 2-year holding period from the date of the final grant.
2015 Plan
For the 2015 Plan, the Board of Directors decided that for seniorexecutives (other than the Chief Executive Officer), the final grant ofall shares will be subject to a continued employment condition andtwo performance conditions. The two performance conditions arethe following:
– for 40% of the shares granted, the acquisition rate is based onthe average ROE (Return on Equity) of the Group as published bythe Group according to its consolidated balance sheet andstatement of income for fiscal years 2015, 2016 and 2017. The acquisition rate:- is equal to zero if the average ROE is less than 6.5%,- varies on a straight line basis between 0% and 50% if the
average ROE is greater than or equal to 6.5% and less than9.5%,
- varies on a straight line basis between 50% and 100% if theaverage ROE is greater than or equal to 9.5% and less than14.5%, and
- is equal to 100% if the average ROE is greater than or equal to14.5%;
– for 60% of the shares granted, the acquisition rate is based onthe relative performance of TOTAL’s adjusted net income (ANI)compared to its peers (ExxonMobil, Chevron, BP and Royal DutchShell). The ANI of the Group is calculated on the consolidatedfinancial statements published by the Group for the fiscal years
2013, 2014, 2015, 2016 and 2017. The ANI of the peers arebased on estimates calculated by a pool of top brokers. The acquisition rate:
– is equal to zero if the gap is less than -12%;– varies on a straight line basis between 0% and 60% if the gap is
greater than -12% and less than 0%;– varies on a straight line basis between 60% and 100% if the gap
is greater than 0% and less than 12%; and– is equal to 100% if the gap is greater than or equal to 12%.
The Board of Directors also decided that for each beneficiary ofmore than 150 shares (other than the Chief Executive Officer andthe senior executives), and subject to the continuous employmentcondition, the shares in excess of this threshold will be subject tothe performance conditions described above and will finally begranted if such performance conditions are met.
In addition, concerning the performance shares granted to theChief Executive Officer, the Board of Directors decided that, subject toa continuous employment condition, the number of the performanceshares finally granted to the Chief Executive Officer under the 2015plan, would be subject to three performance conditions:
– for 20% of the shares granted, the acquisition rate is based onthe average ROE of the Group as published by the Groupaccording to its consolidated balance sheet and statement ofincome for fiscal years 2015, 2016 and 2017 and calculated asstated above;
– for 20% of the shares granted, the acquisition rate is based onthe average of Return on Average Capital Employed (ROACE) aspublished by the Group according to its consolidated balance sheetand statement of income for fiscal years 2015, 2016 and 2017. Theacquisition rate:- is equal to zero if the average ROACE is less than 6.5%,- varies on a straight line basis between 0% and 50% if the
average ROACE is greater than or equal to 6.5% and less thanor equal to 9%,
- varies on a straight line basis between 50% and 100% if the
B) TOTAL performance shares grants 2011 Plan 2012 Plan 2013 Plan 2014 Plan 2015 Plan Total
Date of the Shareholders’ Meeting 05 / 13 / 2011 05 / 13 / 2011 05 / 13 / 2011 05 / 16 / 2014 05 / 16 / 2014Date of the award 09 / 14 / 2011 07 / 26 / 2012 07 / 25 / 2013 07 / 29 / 2014 07 / 28 / 2015Date of the final award (end of the vesting period) 09 / 15 / 2013 07 / 27 / 2014 07 / 26 / 2016 07 / 30 / 2017 07 / 29 / 2018Transfer authorized as from 09 / 15 / 2015 07 / 27 / 2016 07 / 26 / 2018 07 / 30 / 2019 07 / 29 / 2020
Number of performance shares
Outstanding as of January 1, 2013 3,605,806 4,295,930 - - - 7,901,736
Notified - - 4,464,200 - - 4,464,200Cancelled (14,720) (17,340) (3,810) - - (35,870)Finally granted (3,591,086) (180) - - - (3,591,266)
Outstanding as of January 1, 2014 - 4,278,410 4,460,390 - - 8,738,800
Notified - - - 4,486,300 - 4,486,300Cancelled - (43,320) (22,360) (11,270) - (76,950)Finally granted - (4,235,090) (3,570) - - (4,238,660)
Outstanding as of January 1, 2015 - - 4,434,460 4,475,030 - 8,909,490
Notified - - - - 4,761,935 4,761,935Cancelled - - (28,230) (22,630) (1,430) (52,290)Finally granted - - (55,400) (49,940) - (105,340)
Outstanding as of December 31, 2015 - - 4,350,830 4,402,460 4,760,505 13,513,795
TOTAL S.A. 12Notes to the statutory financial statements
Registration Document 2015. TOTAL 345
Compensation for the administration and management bodies
The aggregate amount of direct and indirect compensation paid bythe French and foreign affiliates of the Company to the executiveofficers of TOTAL as of December 31 and to the members of theBoard of Directors who are employees of the Group was€11.5 million in 2015 (€21.3 million in 2014).
The suppression of the Management Committee in 2015 leads tomodify the list of the main Group executive officers previouslycomposed of the members of the Management Committee and theTreasurer. The main Group executive officers include, effective from2015, the members of the Executive Committee and the fivedirectors of the corporate functions members of the GroupPerformance Management Committee (communication, HumanResources, legal, security, strategy) and the Group Treasurer.
The compensation paid to the members of the Board of Directors fordirectors’ fees amount to €1.21 million in 2015 (€1.34 million in 2014).
Pension benefits for the Group’s executive officers and somemembers of the Board of Directors, employees and former employeesof the Group totaled €88.8 million as of December 31, 2015(€192.5 millions as of December 31, 2014). They include severanceto be paid on retirement, supplementary pension schemes anddeath-disability plans.
Legal proceedings
All legal proceedings involving TOTAL S.A. are included in Note 32 – Other risks and commitments – to the Consolidated FinancialStatements attached to the Registration Document.
24) Others
average ROACE is greater than or equal to 9% and less than orequal to 13%, and
- is equal to 100% if the average ROACE is greater than 13%;
– for 60% of the shares granted, the acquisition rate is based on therelative performance of TOTAL’s ANI compared to its peers(ExxonMobil, Chevron, BP and Royal Dutch Shell), as stated above.
2013 and 2014 Plans
For the 2013 and 2014 Plans, the Board of Directors decided that forsenior executives (other than the former Chairman and Chief Executive Officer), the final grant of all shares will be subject to a continuedemployment condition and a performance condition.
The performance condition states that the number of shares finallygranted is based on the average ROE of the Group as published bythe Group according to its consolidated balance sheet and statementof income for fiscal years 2013, 2014 and 2015 for the 2013 Planand for fiscal years 2014, 2015 and 2016 for the 2014 Plan.
The acquisition rate:
– is equal to zero if the average ROE is less than or equal to 8%;– varies on a straight-line basis between 0% and 100% if the
average ROE is greater than 8% and less than 16%; and– is equal to 100% if the average ROE is greater than or equal to 16%.
The Board of Directors also decided that for each beneficiary of more than 100 shares (other than the former Chairman andChief Executive Officer and the senior executives), and subject tothe continuous employment condition, the shares in excess of thisthreshold will be subject to the performance condition describedabove and will be finally granted provided such performancecondition is met.
In addition, the Board of Directors had decided that, subject to acontinuous employment condition, the number of performanceshares finally granted to the former Chairman and Chief Executive Officer would be subject to two performance conditions:
– for 50% of the shares granted, the performance condition statedthat the number of shares finally granted would have been basedon the average ROE of the Group as published by the Groupaccording to its consolidated balance sheet and statement ofincome for the three reference fiscal years as defined above;
– for 50% of the shares granted, the performance condition statedthat the number of shares finally granted would have been basedon the average ROACE of the Group as published by the Groupaccording to its consolidated balance sheet and statement ofincome for the three reference fiscal years. The acquisition ratewould have been equal to zero if the average ROACE had beenless than or equal to 7%; would have varied on a straight-line basisbetween 0% and 100% if the average ROACE had been more than7% and less than 15%; and would have been equal to 100% if theaverage ROACE had been more than or equal to 15%.

12 TOTAL S.A.Other financial information concerning the parent company
TOTAL. Registration Document 2015346
5. Other financial information concerning the parent company
5.1. Subsidiaries and affiliates
As of December 31, 2015 % of share Share Other Book value Loans & Sales Net Dividends Commitments(M€) capital capital sharehoders’ of investments advances income allocated &
owned by equity
gross net the Company
contingencies
Subsidiaries
Chartering and Shipping Services S.A. 100.0 13 169 92 85 - 1,836 159 - -Elf Aquitaine 100.0 2,166 28,939 45,787 45,787 - - 8,264 5,000 -Omnium Reinsurance Company S.A. 100.0 37 1,190 114 114 - - 222 - -Total China Investment Co Ltd 100.0 183 160 140 140 - 501 62 82 -Total E&P Golfe Holdings 100.0 - 220 2,855 2,855 - - (1) 866 -Total E&P Holdings 65.8 6 5,651 1,118 1,118 - - 1,785 3,291 -Total E&P Holding Ichthys 100.0 84 (9) 84 84 - - (2) - -Total E&P Iraq 100.0 13 (19) 67 67 - 220 5 - -Total Energie Développement 100.0 1 8 110 10 - 3 (2) - -Total Gasandes 100.0 - 9 148 6 - - (3) 23 -Total Gestion USA 100.0 3,969 1,237 3,969 3,969 - - 1,237 - -Total Holdings Europe 53.2 65 6,300 4,446 4,446 - - 2,405 3,038 -Total Marketing Services 100.0 324 3,702 6,204 6,204 - - 1,381 801 700Total Raffinage Chimie 100.0 934 12,196 13,171 13,171 - - 585 601 -Total Raffinage France 95.2 414 (2,270) 1,288 - - 19,842 328 - 200Total Refining & Chemicals Saudi Arabia S.A.S 100.0 80 6 80 80 538 1 (3) - -Other (c) - - - 651 389 39,456(a) - - 1,700 80,682(b)
Total 80,324 78,525 39,994 15,402 81,582
(a) Including Total Finance for €8,190 million and Total Treasury for €30,396 million.(b) Including €67,810 million concerning Total Capital, for bond issue and short-term financing plans.(c) This item covers subsidiaries and affiliates whose gross value does not exceed 1% of the share capital.

TOTAL S.A. 12Other financial information concerning the parent company
Registration Document 2015. TOTAL 347
5.2. Five-year financial data
Share capital at year-end(K€) 2015 2014 2013 20 12 20 11
Share capital 6,100,145 5,963,169 5,944,195 5,914,833 5,909,418Number of common shares outstanding 2,440,057,883 2,385,267,525 2,377,678,160 2,365,933,146 2,363,767,313Number of future shares to issue:– share subscription options 9,317,840 16,635,411 25,356,113 32,462,382 44,632,912– global free share plan - - 873,475 974,900 2,494,525
Operation and income for the year(K€) 2015 2014 2013 20 12 20 11
Net commercial sales 6,876,418 10,632,425 14,295,556 14,127,247 12,102,415Employee profit sharing 43,000 49,600 61,000 55,000 51,000Net income 11,066,894 6,044,542 6,031,467 6,519,782 9,766,284Retained earnings before appropriation 10,905,797 10,684,795 10,291,083 9,314,000 4,916,078Income available for appropriation 21,972,691 16,729,337 16,322,550 15,833,782 14,682,362Dividends (including interim dividends) 6,080,872 5,866,069 5,661,590 5,581,925 5,392,829Retained earnings 15,891,819 10,863,268 10,660,960 10,251,857 9,289,533
Earnings per share(€) 2015 2014 2013 20 12 20 11
Income after tax, before depreciation, amortization and provisions (a) 6.41 3.57 3.06 3.44 4.80Income after tax and depreciation, amortization and provisions (a) 4.80 2.65 2.66 2.88 4.33Net dividend per share 2.44 2.44 2.38 2.34 2,28
Employees(K€) 2015 2014 2013 20 12 20 11
Average number of employees during the year (b) 7,076 7,261 7,193 7,076 7,001Total payroll for the year 863,280 1,045,114 1,007,778 954,487 910,707Social security and other staff benefits 394,346 389,799 374,378 383,844 331,248
(a) Earnings per share are calculated based on the fully-diluted weighted-average number of common shares outstanding during the year, excluding treasury shares and shares held by subsidiaries.(b) Including employees on end-of-career leave or taking early retirement (dispensations from work, 89 people in 2011, 96 people in 2012, 89 people in 2013, 89 people in 2014 and 106 people
in 2015).
5.3. Proposed allocation of 2015 income
(Net dividend proposed: €2.44 per share)(€)
Income for the year 11,066,893,360Retained earnings before appropriation 10,905,797,224
Total available for allocation 21,972,690,584
2015 dividends: €2.44 per share (a) 6,080,871,547Retained earnings 15,891,819,037
Total allocated 21,972,690,584
(a) The total dividend amount would be €6,080,871,547 based on a maximum number of shares entitled to a dividend for fiscal year 2015, i.e., 2,492,160,470.
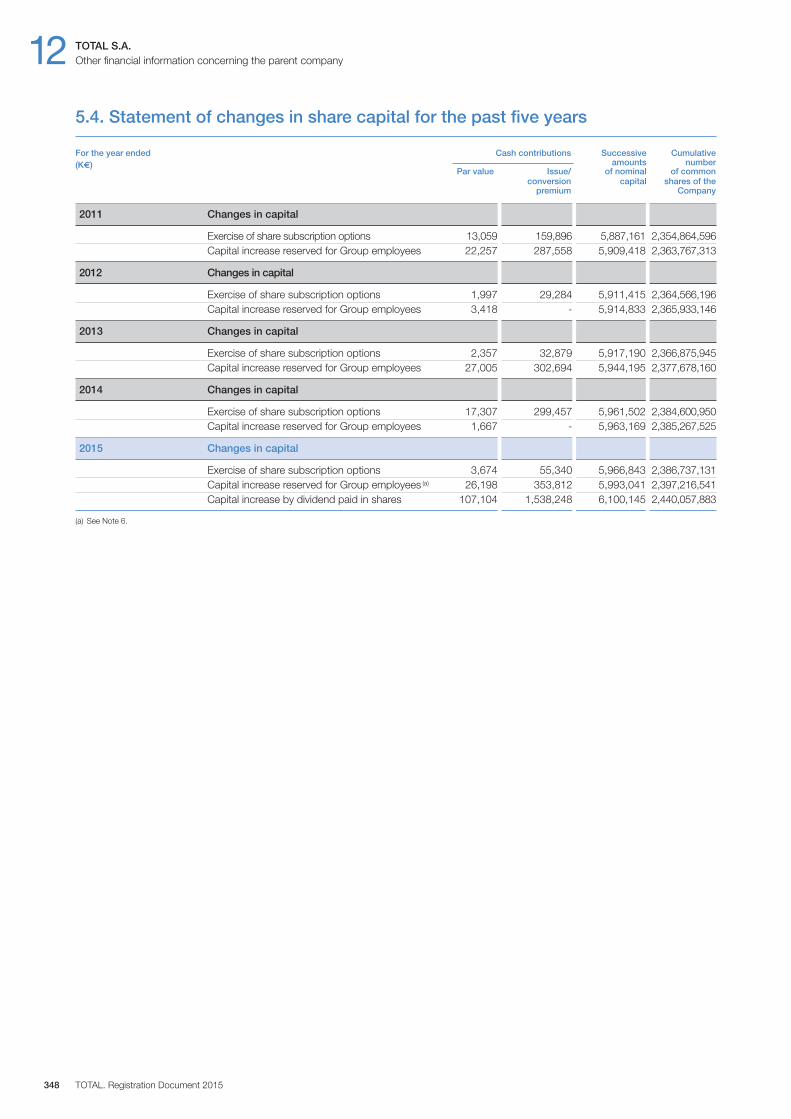
12 TOTAL S.A.Other financial information concerning the parent company
TOTAL. Registration Document 2015348
5.4. Statement of changes in share capital for the past five years
For the year ended Cash contributions Successive Cumulative (K€) amounts number Par value Issue/ of nominal of common conversion capital shares of the premium Company
2011 Changes in capital
Exercise of share subscription options 13,059 159,896 5,887,161 2,354,864,596Capital increase reserved for Group employees 22,257 287,558 5,909,418 2,363,767,313
2012 Changes in capital
Exercise of share subscription options 1,997 29,284 5,911,415 2,364,566,196Capital increase reserved for Group employees 3,418 - 5,914,833 2,365,933,146
2013 Changes in capital
Exercise of share subscription options 2,357 32,879 5,917,190 2,366,875,945Capital increase reserved for Group employees 27,005 302,694 5,944,195 2,377,678,160
2014 Changes in capital
Exercise of share subscription options 17,307 299,457 5,961,502 2,384,600,950Capital increase reserved for Group employees 1,667 - 5,963,169 2,385,267,525
2015 Changes in capital
Exercise of share subscription options 3,674 55,340 5,966,843 2,386,737,131Capital increase reserved for Group employees (a) 26,198 353,812 5,993,041 2,397,216,541
Capital increase by dividend paid in shares 107,104 1,538,248 6,100,145 2,440,057,883
(a) See Note 6.
AAcreageAreas in which mining rights are exercised.
API degreesScale established by the American Petroleum Institute (API) tomeasure oil density. A high API degree indicates light oil from whicha high yield of gasoline can be refined.
Appraisal (delineation)Work performed after a discovery for the purpose of determiningthe boundaries or extent of an oil or gas field or assessing itsreserves and production potential.
Associated gasGas released during oil production.
Association / consortium / joint ventureTerms used to generally describe a project in which two or more entitiesparticipate. For the principles and methods of consolidation applicableto different types of joint arrangements according to IFRS, refer toNote 1 to the Consolidated Financial Statements (point 7 of chapter 10).
BBarrelUnit of measurement of volume of crude oil equal to 42 U.S. gallonsor 158.9 liters. Quantities of liquid hydrocarbons in barrels areexpressed at 60°F.
Barrel of Oil Equivalent (boe)Conventional unit for measuring the energy released by a quantityof fuel by relating it to the energy released by the combustion of abarrel of oil.
Biochemical conversionConversion of energy sources (usually biomass) through biologicaltransformation (reactions in living organisms). Examples includefermentation (in the presence of enzymes).
BiofuelLiquid or gaseous fuel used for transport and produced from biomass.
BiomassBiodegradable fraction of products, waste and residues ofbiological origin from agriculture (including plant and animalsubstances), forestry and related industries, including fisheries andaquaculture which, through chemical transformation, can becomebeneficial molecules (carbon molecules) for the production of fuelsand Specialty Chemicals.
BrentQuality of crude (38° API) produced in the North Sea, at the Brentfields.
Brownfield ProjectProject concerning developed existing fields.
BuybackRisk services agreement (the investments and risks are undertakenby the contractor) combined with an offset mechanism that allowsthe contractor to receive a portion of the production equivalent tothe monetary value, with interest, of its investments and a return onits investment.
CCapacity of treatmentAnnual crude oil treatment capacity of the atmospheric distillationunits of a refinery.
Carbon Capture and Storage (CCS)Technology designed to reduce greenhouse gas emissions in theatmosphere during the combustion of fossil materials by capturing,compressing, transporting and injecting carbon dioxide (CO2) intodeep geological formations for permanent storage. The use ofoxygen instead of air in CO2 production is called oxy-combustion.
CatalystsSubstances that facilitate chemical reactions during the refiningprocess used in conversion units (reformer, hydrocracker, catalyticcracker) and desulphurization units.
Principal catalysts are precious metals (platinum) or other metalssuch as nickel and cobalt. There are some catalysts that regeneratethemselves and others that are consumable.
Coal bed methaneNatural gas present in coal seams.
CogenerationSimultaneous generation of electrical and thermal energies from acombustible source (gas, fuel oil or coal).
Commercial salesCommercial sales’ main activity is the sale of oil, fuel and combustibleproducts to professional customers (resellers and / or end-users)and private customers, outside of the Network’s sale channels.
Concentrating solar power plantThe most advanced form of solar steam plant which concentratessunlight using mirrors to heat a liquid and produce electricity. Thistechnology consists mainly of tower power plants and cylindrical-parabolic plants.
Concession contractExploration and production contract under which a host countrygrants to an oil & gas company (or joint venture) the right to explorea geographic area and develop and produce potential reserves. Theoil and gas company (or joint venture) undertakes the executionand financing, at its own risk, of all operations. In return, it is entitledto the entire production.
CondensateLight hydrocarbon substances produced with natural gas thatexist – either in a gaseous phase or in solution – in the crude oilunder the initial pressure and temperature conditions in thereservoir, and which are recovered in a liquid state in separators,on-site facilities or gas treatment units.
ConversionRefining operation aimed at transforming heavy products (heavyfuel oil) into lighter or less viscous products (gasoline, jet fuels, etc.)
Cost oil / gasIn a production sharing contract, portion of the oil and gas productionmade available to the contractor (contractor group) and contractuallyreserved for reimbursement of exploration, development, operationand site reclamation costs (“recoverable” costs).
349Registration Document 2015. Total
Glossary
CrackingRefining process that entails converting the molecules of large,complex, heavy hydrocarbons into simpler, lighter molecules usingheat, pressure and, in some cases, a catalyst. A distinction is madebetween catalytic cracking and steam cracking, which uses heatinstead of a catalyst. Cracking then produces ethylene andpropylene, in particular.
DDated BrentDated Brent is a market term representing the minimum value ofphysical cargoes of Brent, Forties, Oseberg, or Ekofisk crude oil,loading between the 10th and the 25th day forward.
Dated Brent prices are used, directly and indirectly, as a benchmarkfor a large proportion of the crude oil that is traded internationally.
DebottleneckingChange made to a facility to increase its production capacity.
Deep conversion unit (coker)Unit that produces light products (gas, gasoline, diesel) and cokethrough the cracking of distillation residues.
Desulphurization unitUnit in which sulphur and sulphur compounds are eliminated frommixtures of gaseous or liquid hydrocarbons.
Developed reservesReserves that are expected to be recovered from existing wells andinstallations or for which the cost of the required equipment isrelatively minor. This applies to both proved reserves and provedand probable reserves.
DevelopmentOperations carried out to bring an oil or gas field on stream,including in particular construction of the necessary infrastructuresfor oil and gas production.
DistillatesProducts obtained through the atmospheric distillation of crude oilor through vacuum distillation. Includes medium distillate such asaviation fuel, diesel fuel and heating oil.
EEcosystem servicesBenefits humans derive from ecosystems without having to takeaction. These services include the production of oxygen, naturalwater purification, biomass that feeds domestic, hunted and fishedanimals, the contribution of pollinators towards agriculture, etc.
Energy mixThe various energy sources used to meet the demand for energy.
EthaneA colorless, odorless combustible gas found in natural gas andpetroleum gas.
EthanolAlso commonly called ethyl alcohol or alcohol, ethanol is obtainedthrough the fermentation of sugar (beetroot, sugarcane) or starch(grains, etc.). Ethanol has numerous food, chemical and energy(biofuel) applications.
Ethylene / PropylenePetrochemical products derived from cracking and essential to theproduction of polyethylene and polypropylene, two plastics
frequently used in packaging, the automotive industry, householdappliances, healthcare and textiles.
Ex situ oil shale production technology (Red Leaf: EcoShaleTM In-Capsule Technology)Ex situ production technology is used for shallow oil shaleformations. Shale is extracted using a mining method and thenheated in large sealed capsules. Heating triggers a pyrolysisreaction that produces high-quality liquid hydrocarbons and gas.
FFarmoutSale of all or part of an asset to a third-party.
FarnesaneFarnesane is obtained through the hydrogenation of farnesene, asaturated hydrocarbon (alkane) that can be added to diesel fuel.
FarneseneA hydrocarbon molecule (iso-olefin containing 15 carbon atoms),farnesene is a molecule that is very similar to fossil hydrocarbonsand can therefore be used to produce fuel or chemical compounds.The Amyris company has developed a process to producefarnesene through the fermentation of sugar.
FEED studies (Front-End Engineering Design)Studies aimed at defining the project and preparing for itsexecution. In the TOTAL process, this covers the pre-project andbasic engineering phases.
Fossil energiesEnergies produced from oil, natural gas and coal.
FPSO (Floating production, storage and offloading)Floating integrated offshore unit comprising the equipment used toproduce, process and store hydrocarbons and offload them directlyto an offshore oil tanker.
GGreenfield ProjectProject concerning fields that have never been developed.
HHydraulic fracturingTechnique that involves fracturing rock to improve its permeability.
HydrocarbonsMolecules composed principally of carbon and hydrogen atoms.They can be solid such as asphalt, liquid such as crude oil orgaseous such as natural gas. They may also include compoundswith sulphur, nitrogen, metals, etc.
HydrocrackingCatalytic refining process that uses hydrogen to convert heavy oilsinto lighter fractions.
IIn situ oil shale production technology (American ShaleOil, LLC (AMSO) Technology)In an in situ process, oil shale is heated in place underground inorder to trigger an in situ pyrolysis reaction. The very high-qualityliquid and gaseous hydrocarbons produced through this reactionare then extracted from the reservoir by gas lift and / or pumping,which are traditional production techniques.
TOTAL. Registration Document 2015350

JJoint ventureRefer to Association/consortium/joint venture.
LLignocelluloseLignocellulose makes up the wall of plant cells. In the biofuel sector,this term is used to designate wood and straw, two resources thatcan be used for biofuel production. Lignocellulose can be gasified(thermochemical conversion) or split into its basic components(sugars from cellulose and lignin) in order to transform them throughbiochemical conversion.
Liquefied Natural Gas (LNG)Natural gas, primarily methane, that has been liquefied by cooling inorder to transport it.
Liquefied Petroleum Gas (LPG)Light hydrocarbons (comprised principally of butane and propane)that are gaseous under normal temperature and pressureconditions and that are kept in liquid state by increasing thepressure or reducing the temperature. LPG is included in NGL.
MMineral interestsRights to explore for and / or produce oil and gas in a specific areafor a fixed period. Covers the concepts of “permit”, “license”,“title”, etc.
MTO / OCPMTO (Methanol to Olefins) involves the conversion of methanol intoolefins. OCP (Olefin Cracking Process) is then used to convertthese olefins into plastics.
NNaphthaHeavy gasoline used as a base in petrochemicals.
Natural gasMixture of gaseous hydrocarbons, composed mainly of methane.
Natural Gas Liquids (NGL)A mixture of light hydrocarbons that exist in the gaseous phase atatmospheric pressure and are recovered as liquid in gas processingplants. NGL include very light hydrocarbons (ethane, propane andbutane).
OOil and gas explorationAll operations carried out to reveal the existence of oil and gasfields.
OlefinsProducts (gas) obtained after cracking of petroleum streams.Olefins are ethylene, propylene and butadiene. These products areused in the production of large plastics (polyethylene,polypropylene, PVC, etc.), elastomers (polybutadiene, etc.) andlarge chemical intermediates.
Operated productionTotal quantity of oil and gas produced on fields operated by an oiland gas company.
OperatorPartner of an oil and gas joint venture in charge of carrying out theoperations on a specific area on behalf of the joint venture.
A refinery is also said to be operated by a specific partner when theoperations are carried out by the partner on behalf of the jointventure that owns the refinery.
PPermitArea contractually granted to an oil and gas company (or a jointventure) by the host country for a defined period. The permit grantsthe oil and gas company (or joint venture) the exclusive right tocarry out exploration work (“exploration” permit) or to exploit a field(“exploitation” permit).
Petcoke (or petroleum coke)Residual product remaining after the improvement of very heavypetroleum cuts. This solid black product consists mainly of carbonand can be used as fuel in a manner similar to steam coal.
PolymersMolecule composed of monomers bonded together by covalentbonds, such as starch and proteins. They are generally organic(DNA), artificial or synthetic (such as polystyrene). Polyolefinsrepresent the largest family of polymers.
Production plateauExpected average stabilized level of production for a field followingthe production build-up.
Production Sharing Contract (PSA, PSC)Exploration and production contract under which a host country or,more frequently, its national company, transfers to an oil and gascompany (the contractor) or a joint venture (the contractor group)the right to explore a geographic area and develop and produce thereserves of the fields discovered. The contractor (or contractorgroup) undertakes the execution and financing, as its own risk, ofall operations. In return, it is entitled to a portion of the production,called cost oil / gas, to recover its costs and investment. Theremaining production, called profit oil / gas, is then shared betweenthe contractor (contractor group), and the national company and / orhost country.
ProjectAs used in this document, “project” may encompass differentmeanings, such as properties, agreements, investments,developments, phases, activities or components, each of whichmay also informally be described as a “project”. Such use is forconvenience only and is not intended as a precise description ofthe term “project” as it relates to any specific governmental law orregulation.
Proved and probable reserves (2P reserves)Sum of proved reserves and probable reserves. 2P reserves are themedian quantities of oil and gas recoverable from fields that havealready been drilled, covered by E&P contracts and for whichtechnical studies have demonstrated economic development in along-term price environment. They include projects developed bymining.
Proved permitPermit for which there are proved reserves.
Registration Document 2015. Total 351
Proved reserves (1P reserves)Estimated quantities of crude oil and natural gas that geologicaland engineering data show, with reasonable certainty (90%), to berecoverable in the coming years from known reservoirs and underexisting contractual, economic and operating conditions:
– proved developed reserves are those that can be recovered fromexisting facilities and without significant additional investment;
– proved undeveloped reserves are those that are expected to berecovered with new investments (surface facilities, wells, etc.).
RRefiningThe various processes used to produce petroleum products fromcrude oil (distillation, reforming, desulphurization, cracking, etc.).
Renewable energiesAn energy source whose inventories can be renewed or areinexhaustible, such as solar, wind, hydraulic, biomass andgeothermal energy.
Reserve lifeRatio of reserves at the end of the year to the production soldduring the past year.
ReservesEstimated remaining quantities of oil and gas and relatedsubstances expected to be economically producible, as of a givendate, by application of development projects to knownaccumulations.
ReservoirsPorous, permeable underground rock formation that contains oil ornatural gas.
ResourcesSum of proved and probable reserves and contingent resources(average quantities potentially recoverable from knownaccumulations)(1).
SSeismicMethod of exploring the subsoil that entails methodically sendingvibration or sound waves and recording their reflections to assessthe type, size, shape and depth of subsurface layers.
Shale gasNatural gas trapped in very compact, low-permeable rock.
Shale oilOil in a source rock that hasn’t migrated to a reservoir.
SidetrackWell drilled from a portion of an existing well (and not by startingfrom the surface). It is used to get around an obstruction in theoriginal well or resume drilling in a new direction or to explore anearby geological area.
SiliconThe most abundant element in the earth’s crust after oxygen. Itdoes not exist in a free state but in the form of compounds such assilica, which has long been used as an essential element of glass.Polysilicon (or crystalline silicon), which is obtained by purifyingsilicon and consists of metal-like crystals, is used in theconstruction of photovoltaic solar panels.
Site abandonmentOil companies may have to incur expenses related to theabandonment of production sites at the end of exploitation of adeposit. This definitive shutdown of the production on a field or partof a site’s production capacity (a well, a group of wells, etc.)generally involves the dismantling of production, transport andstorage facilities and the restoration of the sites.
Steam Assisted Gravity Drainage (SAGD)Technique used in in situ production of bitumen from oil sandswhich entails injecting water vapor to increase the temperature ofthe bitumen and reduce its viscosity, making it easier to extract.
TThermochemical conversionConversion of energy sources (gas, coal, biomass) through thermaltransformation (chemical reactions from heat). Examples includegasification, combustion and photosynthesis (solar energy).
Tower / cylindrical-parabolic collector power plantType of solar steam plant consisting of a field of solarmirrors – heliostats – which concentrate sunlight toward a boilerlocated at the top of a tower. At a cylindrical-parabolic collectorplant (a reference to its shape), the mirrors follow the sunautomatically as it rises.
UUnconventional hydrocarbonsOil and gas hydrocarbons that cannot be produced or extractedusing conventional methods. These hydrocarbons generally includeshale gas, coal bed methane, gas located in very low-permeablereservoirs, methane hydrates, extra heavy oil, bitumen and liquid orgaseous hydrocarbons generated during pyrolysis of oil shale.
UnitizationCreation of a new joint venture and appointment of a singleoperator for the development and production as single unit of an oilor gas field involving several permits / licenses or countries.
Unproved permitPermit for which there are no proved reserves.
UpgraderRefining unit where petroleum products, such as heavy oils, areupgraded through cracking and hydrogenation.
TOTAL. Registration Document 2015352
(1) Society of Petroleum Engineers - 03 / 07.
Cross-reference listsRegistration Document concordance tables, for use in identifying the information required by Annex 1 of Regulation 809 / 2004 / EC of 29 April 2004
Information required by Annex 1 Registration Document 2015of Regulation 809 / 2004 / EC Relevant Chapters Relevant paragraphs
1. Persons responsible p i p i
2. Statutory auditors 5 4.1. to 4.2.
3. Selected financial information 1 2.
4. Risk factors 4 1.
5. Information about the issuer
5.1. History and development 2 1.1.5.1.1. Legal and commercial name 9 2.1.5.1.2. Place of registration and registration number 9 2.1.5.1.3. Date of incorporation and length of life 9 2.1.5.1.4. Domicile, legal form, applicable legislation, country of incorporation 9 2.1.
address and telephone number of registered office5.1.5. Important events in the development of the business 2 2. to 6.
3 1.5.2. Investments 2 5.1. and 5.2.5.2.1. Principal investments over the last three fiscal years 2 5.1.5.2.2. Principal investments in progress 2 5.1.5.2.3. Principal future investments 2 5.2.
6. Business overview
6.1. Principal activities 1 2.2 2. to 5.
6.2. Principal markets 1 2.2 2. to 5.
6.3. Exceptional factors that have influenced 2 2. to 5. the principal activities or principal markets 3 1.1. to 1.5.
6.4. Dependence on certain contracts 2 2.1.5. 4 1.4.
6.5. Competitive position 2 1.1., 2., 3., 4.4 1.7.
7. Organizational structure 2 8.
7.1. Issuer’s position within the Group 2 8.1.7.2. Significant subsidiaries 2 8.2.
10 7. (Note 35)
8. Property, plant and equipment
8.1. Most significant tangible fixed assets 2 2. to 4., 7.10 7. (Note 11)
8.2. Environmental issues affecting the most significant 4 4. tangible fixed assets 7 2.2. and 2.3.
Registration Document 2015. TOTAL 353
9. Operating and financial review
9.1. Financial condition 1 2.3 1.
9.2. Operating results 3 1.9.2.1. Significant factors materially affecting income from operations 3 1. and 4.9.2.2. Narrative description of changes in net sales or revenues 3 1.9.2.3. External factors that have materially affected, or could materially affect operations 1. and 4.
10. Capital resources
10.1. Information concerning capital resources (both short and long term) 3 2.1.10.2. Source, amounts and narrative description of cash flows 3 2.2.
10 5.10.3. Borrowing requirements and funding structure 3 2.3.10.4. Restrictions on the use of capital resources that have 3 2.4.
materially affected, or could materially affect, operations10.5. Anticipated sources of funds needed for the principal future investments 2 5.2.
and major encumbrances on the most significant tangible fixed assets 3 2.5.10 5.10 7. (Note 11)
11. Research and development, patents and licenses 2 6.
12. Trend information
12.1. Most significant trends in production, sales and inventory, 3 1.1. and costs and selling prices since the end of the last fiscal year 3 4.
12.2. Known trends, uncertainties, demands, commitments or events that are 2 5.2. likely to have a material effect on prospects for the current fiscal year 3 3. and 4.
4 1. to 3.
13. Profit forecasts or estimates n / a n / a
14. Administrative, management and supervisory bodies and Senior Management
14.1. Information about members of the administrative and management bodies 5 1.1.1.14.2. Conflicts of interests, understandings relating to nominations, 5 1.1.2.
restrictions on the disposal of holdings in the issuer’s securities 5 3.
15. Remuneration and benefits
15.1. Remuneration paid and benefits in kind granted by the issuer and its subsidiaries 6 1. to 5.15.2. Amounts set aside or accrued to provide pension, 6 2. and 5.
and 5. retirement or similar benefits 10 7. (Notes 24 and 25)
16. Board practices
16.1. Date of expiration of the current term of office, and date of commencement in office 5 1.1.1.16.2. Contracts with the issuer or any of its subsidiaries providing 6 2.2.3.
for benefits upon termination of such contracts16.3. Information about the issuer’s Audit Committee 5 1.2.4.
and remuneration Committee 5 1.2.6.16.4. Compliance with the Corporate Governance regime in force in France 5 1.3.
TOTAL. Registration Document 2015354
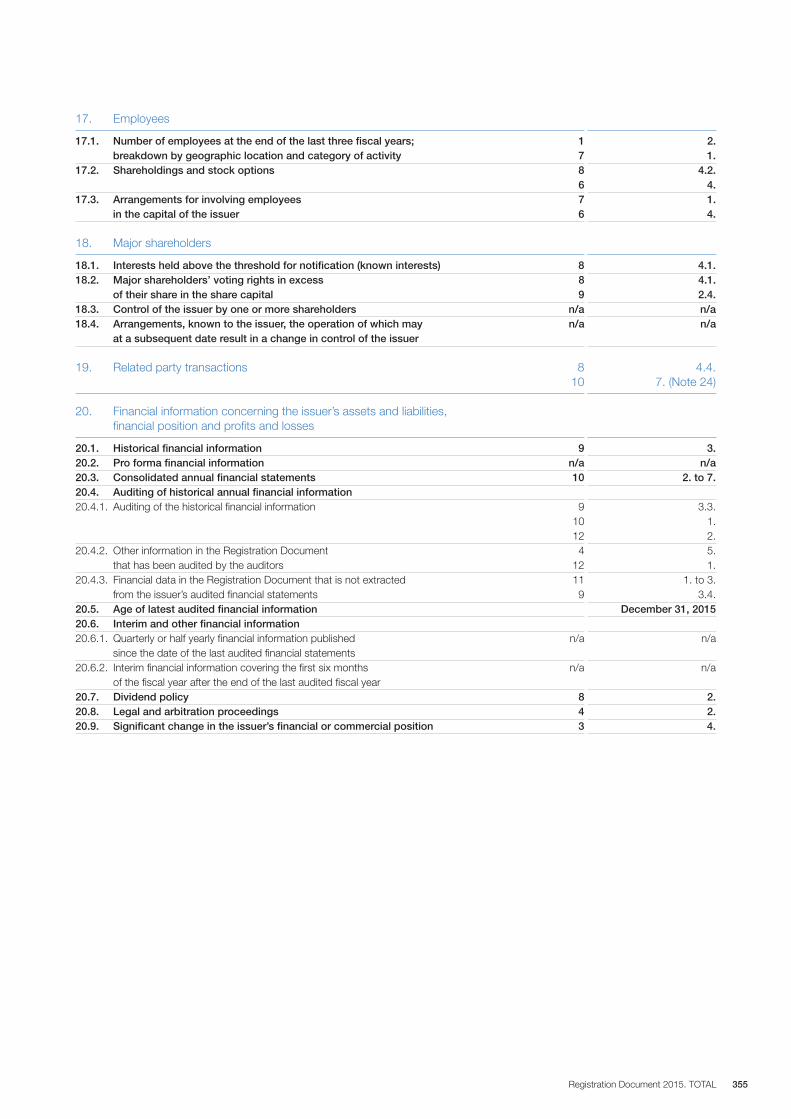
17. Employees
17.1. Number of employees at the end of the last three fiscal years; 1 2. breakdown by geographic location and category of activity 7 1.
17.2. Shareholdings and stock options 8 4.2.6 4.
17.3. Arrangements for involving employees 7 1. in the capital of the issuer 6 4.
18. Major shareholders
18.1. Interests held above the threshold for notification (known interests) 8 4.1.18.2. Major shareholders’ voting rights in excess 8 4.1.
of their share in the share capital 9 2.4.18.3. Control of the issuer by one or more shareholders n / a n / a18.4. Arrangements, known to the issuer, the operation of which may n / a n / a
at a subsequent date result in a change in control of the issuer
19. Related party transactions 8 4.4.10 7. (Note 24)
20. Financial information concerning the issuer’s assets and liabilities,financial position and profits and losses
20.1. Historical financial information 9 3.20.2. Pro forma financial information n / a n / a20.3. Consolidated annual financial statements 10 2. to 7.20.4. Auditing of historical annual financial information 20.4.1. Auditing of the historical financial information 9 3.3.
10 1.12 2.
20.4.2. Other information in the Registration Document 4 5. that has been audited by the auditors 12 1.
20.4.3. Financial data in the Registration Document that is not extracted 11 1. to 3. from the issuer’s audited financial statements 9 3.4.
20.5. Age of latest audited financial information December 31, 201520.6. Interim and other financial information 20.6.1. Quarterly or half yearly financial information published n / a n / a
since the date of the last audited financial statements20.6.2. Interim financial information covering the first six months n / a n / a
of the fiscal year after the end of the last audited fiscal year20.7. Dividend policy 8 2.20.8. Legal and arbitration proceedings 4 2.20.9. Significant change in the issuer’s financial or commercial position 3 4.
Registration Document 2015. TOTAL 355
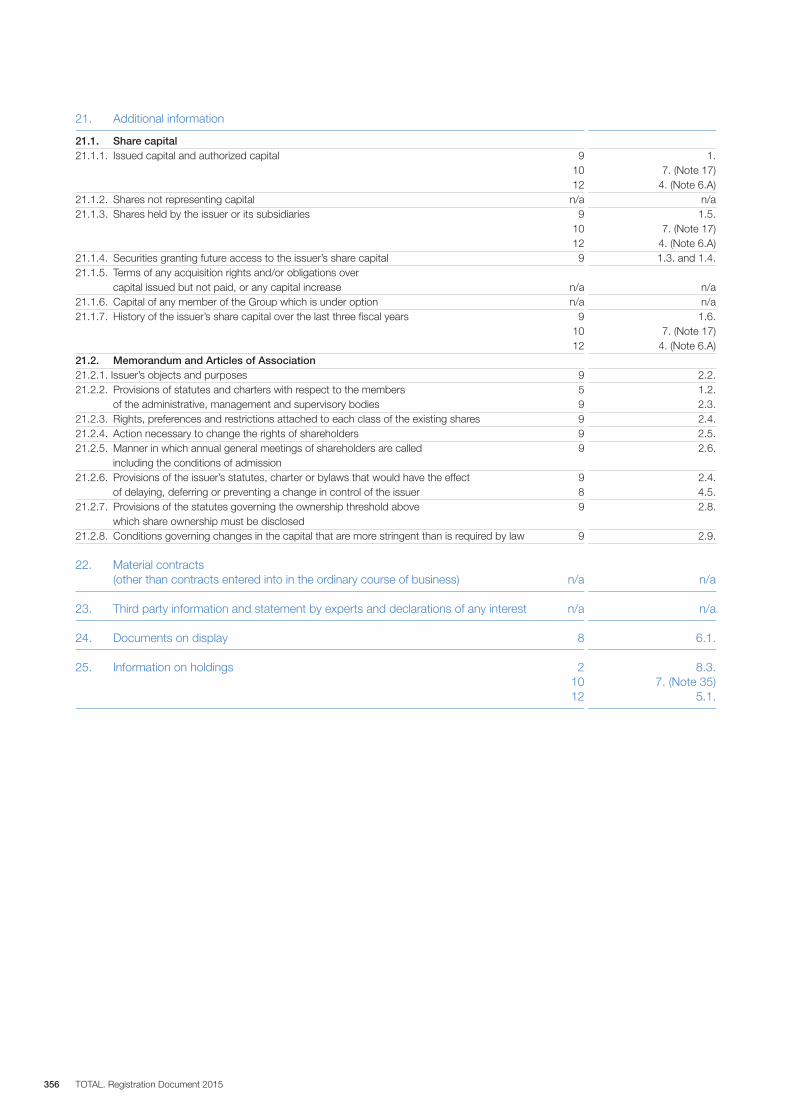
21. Additional information
21.1. Share capital 21.1.1. Issued capital and authorized capital 9 1.
10 7. (Note 17)12 4. (Note 6.A)
21.1.2. Shares not representing capital n / a n / a21.1.3. Shares held by the issuer or its subsidiaries 9 1.5.
10 7. (Note 17)12 4. (Note 6.A)
21.1.4. Securities granting future access to the issuer’s share capital 9 1.3. and 1.4.21.1.5. Terms of any acquisition rights and / or obligations over
capital issued but not paid, or any capital increase n / a n / a21.1.6. Capital of any member of the Group which is under option n / a n / a21.1.7. History of the issuer’s share capital over the last three fiscal years 9 1.6.
10 7. (Note 17)12 4. (Note 6.A)
21.2. Memorandum and Articles of Association 21.2.1. Issuer’s objects and purposes 9 2.2.21.2.2. Provisions of statutes and charters with respect to the members 5 1.2.
of the administrative, management and supervisory bodies 9 2.3.21.2.3. Rights, preferences and restrictions attached to each class of the existing shares 9 2.4.21.2.4. Action necessary to change the rights of shareholders 9 2.5.21.2.5. Manner in which annual general meetings of shareholders are called 9 2.6.
including the conditions of admission21.2.6. Provisions of the issuer’s statutes, charter or bylaws that would have the effect 9 2.4.
of delaying, deferring or preventing a change in control of the issuer 8 4.5.21.2.7. Provisions of the statutes governing the ownership threshold above 9 2.8.
which share ownership must be disclosed21.2.8. Conditions governing changes in the capital that are more stringent than is required by law 9 2.9.
22. Material contracts (other than contracts entered into in the ordinary course of business) n / a n / a
23. Third party information and statement by experts and declarations of any interest n / a n / a
24. Documents on display 8 6.1.
25. Information on holdings 2 8.3.10 7. (Note 35)12 5.1.
TOTAL. Registration Document 2015356
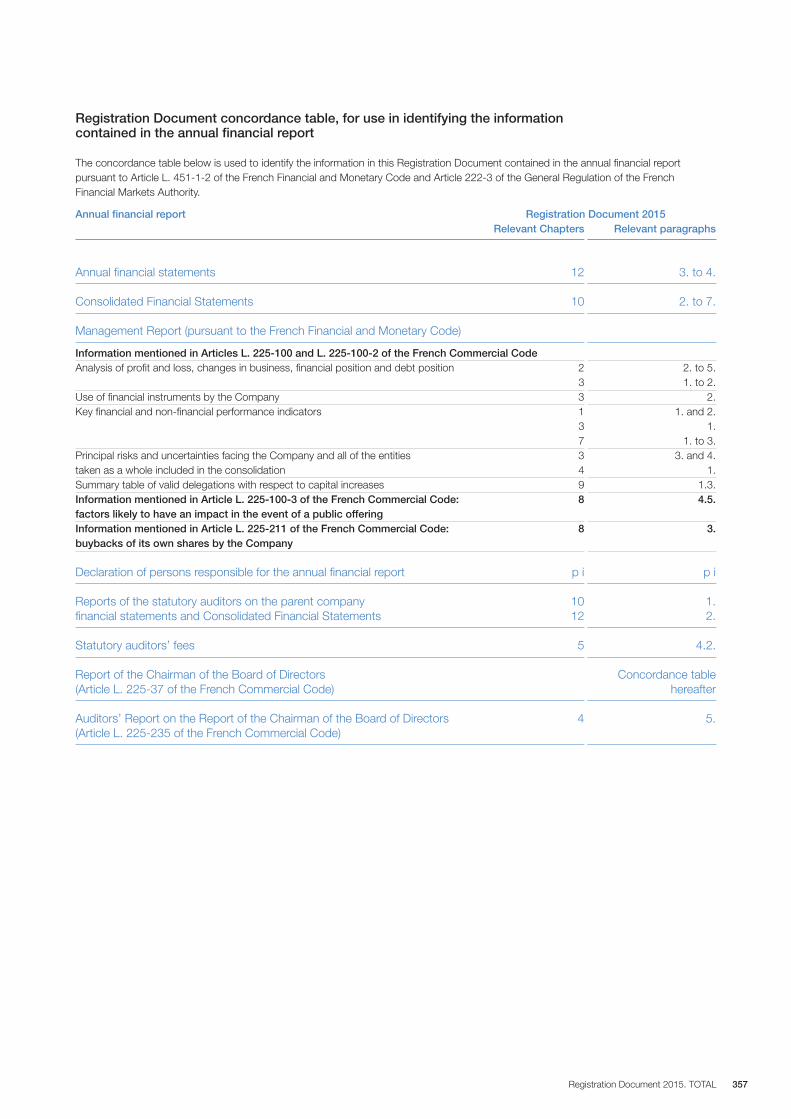
Registration Document concordance table, for use in identifying the information contained in the annual financial report
The concordance table below is used to identify the information in this Registration Document contained in the annual financial reportpursuant to Article L. 451-1-2 of the French Financial and Monetary Code and Article 222-3 of the General Regulation of the FrenchFinancial Markets Authority.
Annual financial report Registration Document 2015Relevant Chapters Relevant paragraphs
Annual financial statements 12 3. to 4.
Consolidated Financial Statements 10 2. to 7.
Management Report (pursuant to the French Financial and Monetary Code)
Information mentioned in Articles L. 225-100 and L. 225-100-2 of the French Commercial Code Analysis of profit and loss, changes in business, financial position and debt position 2 2. to 5.
3 1. to 2.Use of financial instruments by the Company 3 2.Key financial and non-financial performance indicators 1 1. and 2.
3 1.7 1. to 3.
Principal risks and uncertainties facing the Company and all of the entities 3 3. and 4.taken as a whole included in the consolidation 4 1.Summary table of valid delegations with respect to capital increases 9 1.3.Information mentioned in Article L. 225-100-3 of the French Commercial Code: 8 4.5. factors likely to have an impact in the event of a public offeringInformation mentioned in Article L. 225-211 of the French Commercial Code: 8 3. buybacks of its own shares by the Company
Declaration of persons responsible for the annual financial report p i p i
Reports of the statutory auditors on the parent company 10 1. financial statements and Consolidated Financial Statements 12 2.
Statutory auditors’ fees 5 4.2.
Report of the Chairman of the Board of Directors Concordance table(Article L. 225-37 of the French Commercial Code) hereafter
Auditors’ Report on the Report of the Chairman of the Board of Directors 4 5.(Article L. 225-235 of the French Commercial Code)
Registration Document 2015. TOTAL 357
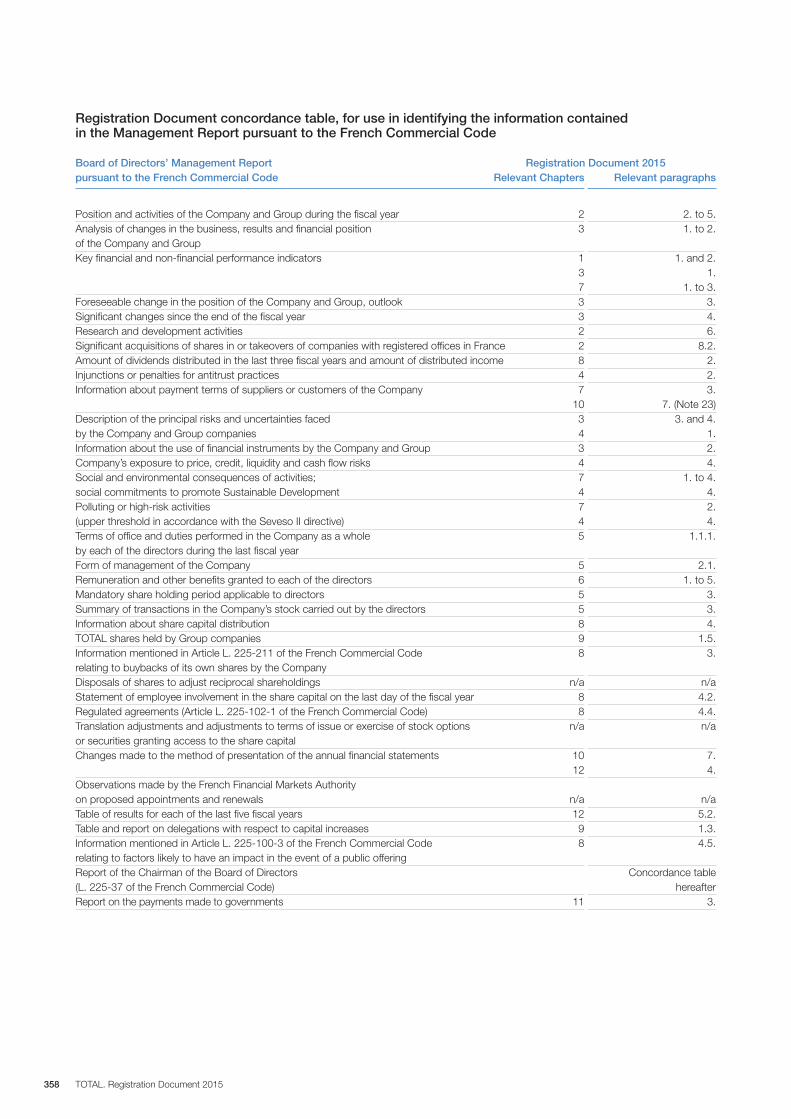
Registration Document concordance table, for use in identifying the information contained in the Management Report pursuant to the French Commercial Code
Board of Directors’ Management Report Registration Document 2015pursuant to the French Commercial Code Relevant Chapters Relevant paragraphs
Position and activities of the Company and Group during the fiscal year 2 2. to 5.Analysis of changes in the business, results and financial position 3 1. to 2. of the Company and GroupKey financial and non-financial performance indicators 1 1. and 2.
3 1.7 1. to 3.
Foreseeable change in the position of the Company and Group, outlook 3 3.Significant changes since the end of the fiscal year 3 4.Research and development activities 2 6.Significant acquisitions of shares in or takeovers of companies with registered offices in France 2 8.2.Amount of dividends distributed in the last three fiscal years and amount of distributed income 8 2.Injunctions or penalties for antitrust practices 4 2.Information about payment terms of suppliers or customers of the Company 7 3.
10 7. (Note 23)Description of the principal risks and uncertainties faced 3 3. and 4. by the Company and Group companies 4 1.Information about the use of financial instruments by the Company and Group 3 2.Company’s exposure to price, credit, liquidity and cash flow risks 4 4.Social and environmental consequences of activities; 7 1. to 4. social commitments to promote Sustainable Development 4 4.Polluting or high-risk activities 7 2. (upper threshold in accordance with the Seveso II directive) 4 4.Terms of office and duties performed in the Company as a whole 5 1.1.1. by each of the directors during the last fiscal year Form of management of the Company 5 2.1.Remuneration and other benefits granted to each of the directors 6 1. to 5.Mandatory share holding period applicable to directors 5 3.Summary of transactions in the Company’s stock carried out by the directors 5 3.Information about share capital distribution 8 4.TOTAL shares held by Group companies 9 1.5.Information mentioned in Article L. 225-211 of the French Commercial Code 8 3. relating to buybacks of its own shares by the Company Disposals of shares to adjust reciprocal shareholdings n / a n / aStatement of employee involvement in the share capital on the last day of the fiscal year 8 4.2.Regulated agreements (Article L. 225-102-1 of the French Commercial Code) 8 4.4.Translation adjustments and adjustments to terms of issue or exercise of stock options n / a n / a or securities granting access to the share capital Changes made to the method of presentation of the annual financial statements 10 7.
12 4.Observations made by the French Financial Markets Authority on proposed appointments and renewals n / a n / aTable of results for each of the last five fiscal years 12 5.2.Table and report on delegations with respect to capital increases 9 1.3.Information mentioned in Article L. 225-100-3 of the French Commercial Code 8 4.5. relating to factors likely to have an impact in the event of a public offeringReport of the Chairman of the Board of Directors Concordance table (L. 225-37 of the French Commercial Code) hereafterReport on the payments made to governments 11 3.
TOTAL. Registration Document 2015358

Registration Document concordance table, for use in identifying the information contained in the Report of the Chairman of the Board of Directors pursuant to Article L. 225-37 of the French Commercial Code.
Chairman of the Board of Directors’ Report pursuant Registration Document 2015to Article L. 225-37 of French Commercial Code Relevant Chapters Relevant paragraphs
Information related to corporate governance 5 1.Internal control and risk management procedures 4 4.Limits set by the Board of Directors concerning the powers of the Chief Executive Officer 5 1.Provisions of the bylaws governing shareholders’ participation to Annual General Meetings 9 2.4.Principles and rules applied to determine the compensation 6 2.1.and other benefits granted to the executive and non executive directorsInformation mentioned in Article L. 225-100-3 of the French Commercial Code 8 4.5.
Registration Document 2015. TOTAL 359

TOTAL. Registration Document 2015360

This brochure is printed on 100% recyclable and biodegradable coated paper, manufactured from ECF (Elemental Chlorine Free) bleached pulp in a European factory certified ISO 9001 (for its quality management), ISO 14001 (for its environmental management), CoC FSC (for the use of paper from sustainably managed forests) and is EMAS-accredited(for its environmental performance).
Cover photography: CAPA/M. Roussel © TOTAL
Design and production: Agence Marc Praquin
TOTAL S.A.Registered Office:2, place Jean Millier - La Défense 692400 Courbevoie - FranceShare capital: 6,135,008,980 euros 542 051 180 RCS Nanterretotal.com
Reception : +33 (0)1 47 44 45 46Investor Relations: +44 (0)207 719 7962North American Investor Relations: +1 (713) 483-5070
see you on
total.com