Sanlam Universal Funds Plc
576
SANLAM UNIVERSAL FUNDS PLC Unaudited condensed interim financial statements for the six months ended 30 June 2017
-
Upload
khangminh22 -
Category
Documents
-
view
3 -
download
0
Transcript of Sanlam Universal Funds Plc

SANLAM UNIVERSAL FUNDS PLC
SANLAM UNIVERSAL FUNDS PLC Unaudited condensed interim financial statements for the six months ended 30 June 2017

SANLAM UNIVERSAL FUNDS PLC
UNAUDITED CONDENSED INTERIM FINANCIAL STATEMENTS for the six months ended 30 June 2017 Contents Page(s) Company information 1 - 6 Directors’ report 7 - 12 Economic & market review 13 - 18 Investment Manager’s reports 19 - 87 Statement of comprehensive income
of the Company 88 of the Funds 89 - 104
Statement of financial position of the Company 105 of the Funds 106 - 122
Statement of changes in net assets attributable to holders of redeemable participating shares
of the Company 123 of the Funds 124 - 139
Statement of cash flows of the Company 140 of the Funds 141 - 156
Portfolio of investments 157 - 368
Bridge Global Property Income Fund 157 - 159 P-Solve Inflation Plus Fund 160 - 161 Sanlam African Frontier Markets Fund 162 - 164 Sanlam Global Best Ideas Fund 165 - 168 Sanlam Global Bond Fund 169 - 185 Sanlam Global Financial Fund 186 - 189 Sanlam Global Property Fund 190 - 195 Sanlam World Equity Fund 196 - 212 Satrix World Equity Tracker Fund 213- 237 SIIP India Opportunities Fund 238 - 240 SIM Global Equity Income Fund 241 - 243 Sanlam Strategic Bond Fund 244 - 249 Sanlam Accel Income Fund 250 - 251 Satrix North America Equity Tracker Fund 252 - 263 Satrix UK Equity Tracker Fund 264 - 267 Satrix Europe (ex UK) Equity Tracker Fund 268 - 277 Sanlam Equity Allocation Fund 278 - 285 Satrix Emerging Market Equity Tracker Fund 286 - 306 Sanlam Managed Risk Fund 307 - 308

SANLAM UNIVERSAL FUNDS PLC
UNAUDITED CONDENSED INTERIM FINANCIAL STATEMENTS (CONTINUED) for the six months ended 30 June 2017 Contents (continued) Page(s) Portfolio of investments (continued)
Sanlam Private Wealth Global High Quality Fund 309 - 311 Sanlam FOUR US Dividend Income Fund 312 - 314 High Street Global Balanced Fund 315 - 318 Sanlam FOUR Global Equity Fund 319 - 322 Sanlam FOUR Stable Global Equity Fund 323 - 324 Sanlam FOUR Active UK Equity Fund 325 - 327 Sanlam FOUR Multi-Strategy Fund 328 - 332 Anchor Global Capital Plus Fund 333 - 336 Bridge Global Equity Income Growth Fund 337 - 339 Anchor Global Equity Fund 340 - 342 Bridge Global Managed Growth Fund 343 - 345 SIM Global Emerging Markets Fund 346 - 349 ABSA Africa Equity Fund 350 - 352 Sanlam Centre American Select Equity Fund 353 - 355 Sanlam Global Convertible Securities Fund 356 - 359 Sanlam Japan Equity Fund 360 - 363 Sanlam Centre Active US Treasury Fund 364 - 365 Autus Global Equity Fund 366 - 368
Notes to and forming part of the unaudited condensed interim financial statements 369 - 496 Securities Financing Transactions Regulation Disclosures 497 - 520 Purchases and Sales for the period ended 30 June 2017 521 - 572

SANLAM UNIVERSAL FUNDS PLC
1
COMPANY INFORMATION
Directors of Sanlam Ùniversal Paul Dobbyn – Irish
1
Funds Plc (the “Company”) Thomas Murray – Irish1
Haydn Franckeiss – South African Richard Aslett – British
All Directors are non-executive
Registered number 267451
Funds of the Company Sanlam Centre Global Select Equity Fund2
Bridge Global Property Income Fund3
P-Solve Inflation Plus Fund Sanlam African Frontier Markets Fund Sanlam Global Best Ideas Fund Sanlam Global Bond Fund Sanlam Global Financial Fund Sanlam Global Property Fund Sanlam World Equity Fund Satrix World Equity Tracker Fund SIIP India Opportunities Fund SIM Global Equity Income Fund Sanlam Strategic Bond Fund
Sanlam Accel Income Fund Satrix North America Equity Tracker Fund
Satrix UK Equity Tracker Fund Satrix Europe (ex UK) Equity Tracker Fund Sanlam Equity Allocation Fund Satrix Emerging Market Equity Tracker Fund
Sanlam Managed Risk Fund Sanlam Private Wealth Global High Quality Fund Sanlam FOUR US Dividend Income Fund High Street Global Balanced Fund Sanlam FOUR Active European (ex UK) Equity Fund
2
Sanlam FOUR Global Equity Fund Sanlam FOUR Stable Global Equity Fund Sanlam FOUR Active UK Equity Fund Sanlam FOUR Multi-Strategy Fund Anchor Global Capital Plus Fund Bridge Global Equity Income Growth Fund
3
Anchor Global Equity Fund Bridge Global Managed Growth Fund
3
SIM Global Emerging Markets Fund Absa Africa Equity Fund
Sanlam Centre American Select Equity Fund
Sanlam Global Convertible Securities Fund Sanlam Japan Equity Fund Sanlam Centre Active US Treasury Fund Autus Global Equity Fund Wisian Capital South African Equity Fund
4
1Paul Dobbyn is considered an independent Director by the Central Bank of Ireland and the Irish Stock Exchange. Thomas Murray is
considered an independent Director by the Irish Stock Exchange only. 2Sanlam Centre Global Select Equities Fund and Sanlam FOUR Active European (ex UK) Equity Fund were closed with effect from
22 June 2017 and 30 June 2017, respectively. 3During the period ended 30 June 2017, effective from 13 June 2017, the Funds were renamed. The previous names of these Funds
were Grindrod Global Property Income Fund, Grindrod Global Equity Income Growth Fund and Grindrod Global Managed Growth Fund, respectively. 4Wisian Capital South African Equity Fund was approved by the Central Bank of Ireland as an authorised designated sub-fund of the
Company on 17 January 2017. As of the date of these financial statements, the Fund has not yet launched.

SANLAM UNIVERSAL FUNDS PLC
2
COMPANY INFORMATION (CONTINUED)
Registered office of the Company Beech House Beech Hill Road Dublin 4 Ireland
Manager, Securities Lending Agent Sanlam Asset Management (Ireland) Limited & Secretary Beech House Beech Hill Road Dublin 4 Ireland Administrator Sanlam Asset Management (Ireland) Limited Beech House Beech Hill Road Dublin 4 Ireland Registrar & Transfer Agent Brown Brothers Harriman Fund Administration Services (Ireland) Limited 30 Herbert Street Dublin 2 Ireland
Investment Managers Sanlam Investment Management (Pty) Limited1
55 Willie Van Schoor Avenue Bellville 7530 South Africa Sanlam FOUR Investments UK Limited
2
1 Ely Place London, EC1N 6RY United Kingdom Investment Manager – Sanlam Centre Centre Asset Management LLC American Select Equity Fund, Sanlam 48 Wall Street Centre Active US Treasury Fund Suite 1100 New York, N.Y. 10005 United States of America
Investment Manager – Sanlam Private Sanlam Private Investments (UK) Limited Wealth Global High Quality Fund 16 South Park Sevenoaks Kent TN13 1AN United Kingdom Investment Manager – Sanlam AllianceBernstein Limited Global Property Fund 50 Berkeley Street London W1J 8HA United Kingdom 1Satrix World Equity Tracker Fund, SIIP India Opportunities Fund, Sanlam African Frontier Markets Fund, Sanlam Global Financial
Fund, Sanlam Global Best Ideas Fund, Satrix North America Equity Tracker Fund, Satrix UK Equity Tracker Fund, Satrix Europe (ex UK) Equity Tracker Fund, Satrix Emerging Market Equity Tracker Fund, Sanlam Managed Risk Fund, SIM Global Equity Income Fund and SIM Global Emerging Markets Fund are managed by Sanlam Investment Management (Pty) Limited. 2Sanlam Strategic Bond Fund, Sanlam Equity Allocation Fund, Sanlam Accel Income Fund, Sanlam FOUR US Dividend Income
Fund, Sanlam FOUR Active European (ex UK) Equity Fund, Sanlam FOUR Global Equity Fund, Sanlam FOUR Stable Global Equity Fund, Sanlam FOUR Active UK Equity Fund and Sanlam FOUR Multi-Strategy Fund are managed by Sanlam FOUR Investments UK Limited.

SANLAM UNIVERSAL FUNDS PLC
3
COMPANY INFORMATION (CONTINUED) Investment Manager – Bridge Bridge Fund Managers (Proprietary) Limited Global Property Income Fund, Bridge 5 Arundel Close Global Equity Income Growth Fund, Kingsmead Office Park Bridge Global Managed Growth Fund PO Box 3211 Durban, KwaZulu Natal, 4001 South Africa Investment Manager – P-Solve P-Solve Investments Limited Inflation Plus Fund 11 Strand London WC2N 5HR United Kingdom Investment Manager – Sanlam Cameron Hume Limited Global Bond Fund Exchange Place 1 1 Temple Street Edinburgh, EH13 0JB United Kingdom Investment Managers – Sanlam Sanlam FOUR Investments UK Limited World Equity Fund 1 Ely Place London, EC1N 6RY United Kingdom Sanlam Investment Management (Pty) Limited
55 Willie Van Schoor Avenue Bellville 7530 South Africa Centre Asset Management LLC 48 Wall Street Suite 1100 New York N.Y. 10005 United States of America AllianceBernstein Limited 50 Berkeley Street London W1J 8HA United Kingdom DIAM International Limited ` Bracken House One Friday Street London, EC4M 9JA United Kingdom Investment Manager – High Street Global High Street Asset Management (Pty) Limited Balanced Fund The Offices of Hyde Park Block B, 1 Strouthos Road Hyde Park, Sandton Gauteng 2196 South Africa

SANLAM UNIVERSAL FUNDS PLC
4
COMPANY INFORMATION (CONTINUED)
Investment Manager – Anchor Global Anchor Capital (Pty) Limited Capital Plus Fund, Anchor Global 25 Culross Road Equity Fund Bryanston Sandton 2191 South Africa
Investment Manager – Absa Africa Absa Asset Management (Pty) Limited Equity Fund Barclays Sandton South Campus 15 Alice Lane 2
nd Floor
South Africa
Investment Manager – Sanlam Global Zazove Associates, LLC Convertible Securities Fund 1001 Tahoe Boulevard Incline Village NV89451 Unites States of America
Investment Manager – Sanlam Japan Asset Management One Ltd Equity Fund Mizuho House 30 Old Bailey London EC4M 7AU United Kingdom
Investment Manager – Autus Global Autus Fund Managers (Pty) Limited Equity Fund Pointbreak Building The Vineyards Office Estate 99 Jip De Jager Avenue Bellville 7530 South Africa
Investment Allocation Manager Sanlam FOUR Investments UK Limited1
1 Ely Place London, EC1N 6RY United Kingdom
Investment Transition Managers Morgan Stanley & Co. International Limited 25 Cabot Square Canary Wharf London E14 4QA United Kingdom
State Street Bank Europe Limited 20 Churchill Place Canary Wharf London E14 5HJ United Kingdom
Investment Advisors Sanlam FOUR Investments UK Limited 1 Ely Place London EC1N 6RY United Kingdom
High Street Global Ltd OMC Chambers Roadtown Tortola British Virgin Islands 1Sanlam FOUR Investments UK Limited is the investment allocation manager to Sanlam Centre Global Select Equity Fund, Sanlam
Global Bond Fund, Sanlam Global Property Fund, Sanlam World Equity Fund, Satrix World Equity Tracker Fund, SIIP India Opportunities Fund, Satrix North America Equity Tracker Fund, Satrix UK Equity Tracker Fund, Satrix Europe (ex UK) Equity Tracker Fund, Satrix Emerging Markets Equity Tracker Fund, Sanlam Equity Allocation Fund and Sanlam Japan Equity Fund.

SANLAM UNIVERSAL FUNDS PLC
5
COMPANY INFORMATION (CONTINUED) Depositary Brown Brothers Harriman Trustee Services (Ireland) Limited 30 Herbert Street Dublin 2 Ireland Listing Broker Maples and Calder 75 St. Stephens Green Dublin 2 Ireland
Auditor Ernst & Young
1
Harcourt Centre Harcourt Street Dublin 2 Ireland Legal Adviser Maples and Calder 75 St. Stephens Green Dublin 2 Ireland
Distributors Sanlam FOUR Investments UK Limited 55 Willie van Schoor Avenue Bellville 7530 South Africa
P-Solve Investments Limited 11 Strand London WC2N 5HR United Kingdom Bridge Fund Managers (Proprietary) Limited 5 Arundel Close Kingsmead Office Park PO Box 3211 Durban, KwaZulu Natal, 4001 South Africa Anchor Capital (Pty) Limited 25 Culross Road Bryanston Sandton 2191 South Africa High Street Asset Management (Pty) Limited The Offices of Hyde Park Block B, 1 Strouthos Road Hyde Park, Sandton Gauteng 2196 South Africa Sanlam Global Investment Solutions Ltd Canon’s Court 22 Victoria Street Hamilton HM12 Bermuda 1The auditor has not expressed an opinion nor have they reviewed the unaudited condensed interim financial statements for the six
months ended 30 June 2017.

SANLAM UNIVERSAL FUNDS PLC
6
COMPANY INFORMATION (CONTINUED) Distributors (continued) Absa Asset Management (Pty) Limited Barclays Sandton South Campus 15 Alice Lane 2nd Floor South Africa Autus Fund Managers (Pty) Limited Pointbreak Building The Vineyards Office Estate 99 Jip De Jager Avenue Bellville 7530 South Africa

SANLAM UNIVERSAL FUNDS PLC
7
DIRECTORS’ REPORT
The Directors of Sanlam Universal Funds plc (the “Company”) present herewith their unaudited condensed interim financial statements for the period ended 30 June 2017.
RESULTS AND BUSINESS ACTIVITIES Detailed investment reviews are included in the Reports of the Investment Managers on pages 19 to 87. The results of operations are set out in the Statement of Comprehensive Income on pages 88 to 104. The Directors also draw your attention to the significant events during the period disclosed in Note 16 on page 494. PRINCIPAL RISKS AND UNCERTAINTIES The Company is exposed to the risks associated with the financial instruments and markets in which they invest. There has been no significant change to the principal risks and uncertainties to which the Company is exposed since the most recent annual financial statements of the Company. A further comprehensive summary of the risk factors that investors should consider is included in the prospectus of the Company and the offering supplement of each Fund. DIVIDENDS The present intention of the Directors is to distribute sufficient surplus net income of specific share classes, currently:
Fund Name Classes
Distribution
Frequency
P-Solve Inflation Plus Fund A (GBP) / B (GBP) / C (GBP) Annual
Sanlam Global Best Ideas Fund A (GBP) / C (GBP) Annual
Sanlam Global Financial Fund A (GBP) / C (GBP) Annual
Sanlam African Frontier Markets Fund A (GBP) / C (GBP) Annual
Satrix World Equity Tracker Fund I (GBP) Annual
SIM Global Equity Income Fund
A (USD) / A (GBP / B (USD) / C (USD)
/ I (USD) Semi-Annual
Sanlam Strategic Bond Fund A Income (GBP) / I Income (GBP)/
P Income (GBP)
Monthly
Sanlam Accel Income Fund Class A Net Income Monthly
Satrix North America Equity Tracker Fund I (GBP) Annual
Satrix UK Equity Tracker Fund I (GBP) Annual
Satrix Europe (ex UK) Equity Tracker Fund I (GBP) Annual
Satrix Emerging Markets Equity Tracker Fund I (GBP) Annual
Sanlam Managed Risk Fund
A (GBP) / I (GBP) / N (GBP) / D(GBP)
/ L(GBP / N2 (GBP) Annual
Sanlam Private Wealth Global High Quality Fund
C Income (GBP) / D Income (USD) /
E Income (USD) / F Income (GBP) /
G Income (USD) Semi-Annual
Sanlam FOUR US Dividend Income Fund Distribution A (GBP) / Distribution A
(USD) / Distribution A (EUR)
Quarterly
Sanlam FOUR Active European (ex UK) Equity
Fund A (GBP) / C (GBP) Annual
Sanlam FOUR Global Equity Fund Distribution A (GBP) Quarterly
Sanlam FOUR Stable Global Equity Fund Distribution A (GBP) Quarterly
Sanlam FOUR Active UK Equity Fund C (GBP) Annual
I (GBP) Semi-Annual
Sanlam FOUR Multi-Strategy Fund
Income Distribution A (GBP) / Income
Distribution B (GBP) / Income
Distribution Founder (GBP) Monthly
Absa Africa Equity Fund A (USD) / A (EUR) / A (USD) Monthly
Sanlam Centre Active US Treasury Fund A (USD) / B (USD) / D(USD) / E(USD) Semi-Annual

SANLAM UNIVERSAL FUNDS PLC
8
DIRECTORS’ REPORT (CONTINUED)
DIVIDENDS (CONTINUED) For those Funds which distribute annually, dividends (if any) will be declared and paid following the completion of the annual audits for the year ended 31 December in each calendar year. Sanlam Accel Income Fund, Sanlam Strategic Bond Fund, Sanlam FOUR Multi-Strategy Fund and Sanlam Centre Active US Treasury Fund will distribute on a monthly basis and for those Funds that distribute on a semi-annual or quarterly basis, the dates for the distributions will be as stated in the Fund supplement. All dividends will be subject to the discretion of the Directors.
Payment will be made in cash unless the payment is for an amount less than USD100, EUR100 or GBP100 (depending on the functional currency of each Fund) in which case such payment will be automatically reinvested in the purchase of shares of the relevant class, for the account of the relevant shareholder.
The Directors reserve the right to change the dividend policy of the Fund to reflect changes that may occur from time to time in the requirements for qualifying as a reporting Fund for the purposes of United Kingdom taxation.
With reference to the Statement of Comprehensive Income on pages 88 to 104, Shareholders should note that surplus net income for the year ended 31 December 2016 was distributed during the course of 2017 as follows: P-Solve Inflation Plus Fund distributed GBP 287,842 (2016: GBP 420,663), Sanlam African Frontier Markets Fund distributed USD Nil (2016: USD 1,713), Sanlam Global Best Ideas Fund distributed USD 1,191 (2016: USD 1,777), Sanlam Global Financial Fund distributed USD 34,372 (2016: USD 35,054), Sanlam World Equity Tracker Fund distributed USD 12,928 (2016: USD 13,268), SIM Global Equity Income Fund distributed USD 215,961 (2016: USD 239,760), Sanlam Strategic Bond Fund distributed GBP 2,015,923 (2016: GBP 1,775,999), Sanlam Accel Income Fund distributed GBP 428,077 (2016: GBP 486,992), Sanlam North America Equity Tracker Fund distributed USD 8,813 (2016: USD 15,333), Sanlam UK Equity Tracker Fund distributed GBP 24,783 (2016: GBP 35,254), Sanlam Europe (ex UK) Equity Tracker Fund distributed EUR 12,478 (2016: EUR 15,801), Sanlam Emerging Market Equity Tracker Fund distributed USD 173,598 (2016: USD 186,084), Sanlam Private Wealth Global High Quality Fund distributed GBP 85,040 (2016: GBP 100,384); Sanlam FOUR US Dividend Income Fund distributed USD 42,134 (2016: USD 44); Sanlam FOUR Stable Global Equity Fund distributed GBP 27 (2016: GBP 20); Sanlam FOUR Active UK Equity Fund distributed GBP 4,523 (2016: GBP 1,189,207); Sanlam FOUR Multi-Strategy Fund distributed GBP 13,530 (2016: GBP 6,776), Sanlam FOUR UK Income Opportunities Fund distributed GBP Nil (2016: GBP 6,916) and Sanlam Centre Active US Treasury Fund distributed GBP 175,663 (2016: n/a). During the period ended 30 June 2017, only Sanlam FOUR Active UK Equity Fund made distributions out of capital, distributing an amount of GBP£ 1,908 out of capital at the end of April 2017. No other Funds of the Company made distributions out of capital during the period ended 30 June 2017. DIRECTORS The Directors of the Company during the period were as follows:
Paul Dobbyn (Irish)
Thomas Murray (Irish)
Haydn Franckeiss (South African)
Richard Aslett (British)
Paul Dobbyn is a Director of Sanlam Global Funds Plc and Sanlam Qualifying Investors Funds Plc.
Thomas Murray is a Director of Sanlam Global Funds Plc and Sanlam Qualifying Investors Funds Plc. Thomas Murray is also a Director of Sanlam Asset Management (Ireland) Ltd. (“SAMI”).
Haydn Franckeiss is a Director of Sanlam Global Funds Plc and Sanlam Qualifying Investors Funds Plc. Richard Aslett is the Chief Executive Officer of SAMI. Richard Aslett is also a Director of Sanlam Global Funds Plc, Sanlam Qualifying Investors Funds Plc and SAMI.

SANLAM UNIVERSAL FUNDS PLC
9
DIRECTORS’ REPORT (CONTINUED) DIRECTORS’ AND SECRETARY’S INTEREST IN SHARES AND CONTRACTS At 31 December 2016, Haydn Franckeiss had an interest of 60,604 shares in Sanlam Global Best Ideas Fund. During the period these shares were switched for shares in SIM Global Equity Income Fund. At 30 June 2017, Haydn Franckeiss had an interest of 60,123 shares in SIM Global Equity Income Fund. During the period Richard Aslett disposed of 20,403 shares in Sanlam Strategic Bond Fund. At 30 June 2017, Richard Aslett does not have a beneficial interest in any shares of the Company’s Funds. The other Directors who held office on 30 June 2017 had no interest in the shares of the Company or Funds at that date or at any time during the financial period. None of the Directors has a service contract with the Company. The Manager holds non-participating shares of the Company as explained in the notes to the Financial Statements. RELATED PARTIES Disclosures in respect of related parties are contained in note 8 to the financial statements. CONNECTED PERSONS Part 2, Chapter 10 of the Central Bank (Supervision and Enforcement) Act 2013 (Section 48(1)) (Undertakings for Collective Investment in Transferable Securities) Regulations 2015 (the “CBI UCITS Regulations”) on transactions involving connected persons states that any transactions between a UCITS and a Connected Person must be carried out as if negotiated at arm’s length. Transactions must be in the best interests of the shareholders.
A ‘Connected Person’ is defined as the Management Company or Depositary to a UCITS; and the delegates or sub-delegates of such a Management Company or Depositary (excluding non-group company sub-custodians appointed by a Depositary); and any associated or group company of such a Management Company, Depositary, delegate or sub-delegate. The Directors are satisfied that there are arrangements (evidenced by written procedures) in place, to ensure that the obligations set out above are applied to all transactions with Connected Persons entered into during the period and that all such transactions have complied with these obligations. SUBSEQUENT EVENTS Other than as disclosed in note 18, up to the date of the approval of these financial statements there were no events subsequent to the period end, which, in the opinion of the Directors of the Company, may have had an impact on the unaudited condensed interim financial statements for the period ended 30 June 2017. ACCOUNTING RECORDS The measures taken by the Directors to ensure compliance with the Company’s obligation to keep proper accounting records are the use of appropriate systems and procedures which are carefully implemented by the Administrator. The accounting records of the Company are kept at Beech House, Beech Hill Road, Dublin 4, Ireland.

SANLAM UNIVERSAL FUNDS PLC
10
DIRECTORS’ REPORT (CONTINUED) STATEMENT OF DIRECTORS’ RESPONSIBILITIES Irish company law requires the Directors to prepare financial statements for each financial period which give a true and fair view of the state of affairs of the Company and of the results of the Company for that period.
In preparing those financial statements, the Directors are required to:
Select suitable accounting policies and then apply them consistently; Make judgements and estimates that are reasonable and prudent; Follow applicable accounting standards or disclose or explain material departures from them in the
financial statements; Ensure that financial statements comply with the Memorandum and Articles of Association; Provide a fair review of the development and performance of the Company; Give a description of principal risks and uncertainties that they may face; and Prepare the financial statements on the going concern basis, unless it is inappropriate to presume that
the Company will continue in business.
The Directors are responsible for keeping proper books of account which disclose with reasonable accuracy, at any time, the financial position of the Company and to enable them to ensure that the financial statements are prepared in accordance with International Financial Reporting Standards (“IFRS”) as adopted by the EU and comply with the Irish Companies Act 2014 and the European Communities (Undertakings for Collective Investment in Transferable Securities) Regulations, 2011 (as amended) (the “UCITS Regulations”). They are also responsible for safeguarding the assets of the Company and in fulfilment of this responsibility, they have entrusted the assets of the Company to the Depositary for safekeeping, in accordance with the Memorandum and Articles of Association of the Company. The Directors are responsible for taking reasonable steps for the prevention and detection of fraud and other irregularities. CORPORATE GOVERNANCE CODE The European Communities (Directive 2006/46/EC) Regulations (S.I. 450 of 2009 and S.I.83 of 2010) (the “Regulations”) require the inclusion of a corporate governance statement in the Director’s Report.
Although there is no specific statutory corporate governance code applicable to Irish collective investment schemes whose shares are admitted to trading on the Irish Stock Exchange (“ISE”), the Irish Funds (“IF”) has published a corporate governance code (“IF Code”) that may be adopted on a voluntary basis by Irish authorised collective investments schemes. This code became effective from 1 January 2012, with a twelve month transitional period. It should be noted that the IF Code reflects existing corporate governance practises imposed on Irish authorised collective investment schemes, as noted above. On 19 December 2012, the Board of Directors voluntarily adopted the IF Code as the Company’s corporate governance code.
The Board of Directors has assessed the measures included in the IF Code as being consistent with its corporate governance practises and procedures for the financial period. The code is available at www.sanlam.ie.
In addition to the IF Code, the Company is subject to corporate governance practices imposed by:
i) The Irish Companies Act 2014, which is available for inspection at the registered office of the Company. It may also be obtained at http://www.irishstatutebook.ie/eli/2014/act/38/enacted/en/html.
ii) The Articles of Association of the Company which are available for inspection at the registered office of the Company at Beech House, Beech Hill Road, Dublin 4, Ireland and the Companies Registration Office in Ireland.
iii) The CBI UCITS Regulations and related Guidance Notes of the Central Bank of Ireland which can be obtained from the Central Bank of Ireland website at http://www.centralbank.ie/regulation/industry-sectors/funds/Pages/default.aspx and are available for inspection at the registered Office of the Company.
iv) The ISE through the ISE Code of Listing Requirements and Procedures which can be obtained from the ISE’s website at http://www.ise.ie/Products-Services/Investment%20Funds/List-a-Fund/Open%20ended%20rules.pdf?v=1032015.

SANLAM UNIVERSAL FUNDS PLC
11
DIRECTORS’ REPORT (CONTINUED)
CORPORATE GOVERNANCE CODE (CONTINUED) v) SAMI's Programme of Activity, Business Plan and Code of Conduct, which are available for
inspection at the registered office of SAMI at Beech House, Beech Hill Road, Dublin 4, Ireland. vi) SAMI is also subject to the Corporate Governance Code of the Sanlam Group.
The Board of Directors is responsible for establishing and maintaining internal control and risk management systems of the Company in relation to the financial reporting process. Such systems are designed to manage rather than eliminate the risk of error or fraud in achieving the Company’s financial reporting objectives and can only provide reasonable and not absolute assurance against material misstatement and loss. The Board of Directors has delegated this duty to SAMI.
SAMI is appointed as administrator to maintain the books and records of the Company. SAMI is authorised and regulated by the Central Bank of Ireland and must comply with the rules imposed by the Central Bank of Ireland. SAMI also monitors and evaluates the external auditor’s performance, qualifications and independence.
The Company has procedures in place to ensure all relevant books of accounts are properly maintained and are readily available, including production of annual and half-yearly financial statements. The annual financial statements of the Company are required to be approved by the Board of Directors of the Company and the annual and half yearly financial statements are required to be filed with the Central Bank of Ireland and the ISE.
The statutory financial statements are required to be audited by the independent auditors who report annually to the Board on their findings.
The Board evaluates and discusses significant accounting and reporting issues as the need arises.
Shareholders’ meetings The convening and conduct of shareholders’ meetings are governed by the Articles of Association of the Company and the Companies Acts. Although the Directors may convene an extraordinary general meeting of the Company at any time, the Directors of the Company are required to convene a general meeting within eighteen months of incorporation and fifteen months of the previous annual general meeting thereafter. Shareholders representing not less than one-tenth of the paid up share capital of the Company may also request to convene a shareholders meeting. Not less than twenty one days notice of every annual general meeting and any meeting for the passing of a special resolution must be given to shareholders and fourteen days’ notice must be given in the case of any other general meeting unless the auditors of the Company and all the shareholders entitled to attend and vote agree to shorter notice. Two members present either in person or by proxy constitutes a quorum at a general meeting provided that the quorum for a general meeting convened to consider any alteration to the class rights of shares is two shareholders holding or representing by proxy at least one third of the issued shares of the relevant Funds or class. Every holder of participating shares or non-participating shares present in person or by proxy who votes on a show of hands is entitled to one vote. On a poll, every holder of participating shares present in person or by proxy is entitled to one vote in respect of each share held by him and every holder of non-participating shares is entitled to one vote in respect of all non-participating shares held by him. The chairman of a general meeting of the Company, or at least two members present in person or by proxy, or any holder or holders of participating shares present in person or by proxy representing at least one-tenth of the shares in issue having the right to vote at such meeting, may demand a poll. Shareholders may decide to sanction an ordinary resolution or special resolution at a shareholder’s meeting. An ordinary resolution of the Company (or of the shareholders of a particular Funds or class) requires a simple majority vote cast by the shareholders voting in person or by proxy at the meeting at which the resolution is proposed. A special resolution of the Company (or of the shareholders of a particular Fund or class) requires a majority vote of not less than 75% of the shareholders present in person or by proxy and voting in general meeting in order to pass a special resolution including a resolution to amend the Articles of Association.

SANLAM UNIVERSAL FUNDS PLC
12
DIRECTORS’ REPORT (CONTINUED) Composition and Operation of the Board Unless otherwise determined by an ordinary resolution of the Company in a general meeting, the number of Directors may not be less than two. Currently the Board of Directors of the Company is composed of four Non-Executive Directors, being those listed on page 3 of these financial statements with Paul Dobbyn, Thomas Murray and Richard Aslett being Irish residents. None of the Company’s Directors hold directorships with the Depositary. The business of the Company is managed by the Directors, who exercise all such powers of the Company as are not required by the Companies Acts or the Articles of Association to be exercised by the Company in a general meeting. A Director may, and the company secretary of the Company on the requisition of a Director will, at any time summon a meeting of Directors. Questions arising at any meeting of Directors are determined by a majority of votes. In the case of quality of votes, the chairman has a second or casting vote. The quorum necessary for the transaction of business at a meeting of the Directors is two. All key management functions of the Company have been delegated to SAMI. SAMI will manage these in terms of their Programme of Activity and Business Plan. SAMI is approved by the Central Bank of Ireland, and is authorised as a UCITS Management Company and an Alternative Investment Fund Manager. VALUATION OF INVESTMENTS As at 30 June 2017, the following delisted securities were held by the Company:
- Accident Exchange Group Plc (Sanlam Global Best Ideas Fund; Sanlam Global Financial Fund) - African Bank Investments Limited (Satrix Emerging Markets Equity Tracker Fund) - Banco Espirito Santo SA (Satrix Europe (ex-UK) Equity Tracker Fund)
- DBA Telecommunications Asia (Sanlam Global Best Ideas Fund; Sanlam Global Financial Fund) - Hanergy Thin Film Power Group Limited (Satrix Emerging Markets Equity Tracker Fund) As at 30 June 2017, the following thinly traded securities were held by the Company: - Du Pont ‘S’ Fractional Shares (Sanlam World Equity Fund) - Stanbic IBTC Holding Co. Rights (Sanlam African Frontiers Market Fund)
The fair value of those securities listed above and used in preparing these financial statements may differ significantly from the values that would have been used had those securities had readily available market prices at 30 June 2017. All other investments in 2017 have readily available market prices.
Approved by the Board of Directors on 30 August 2017

SANLAM UNIVERSAL FUNDS PLC
13
ECONOMIC & MARKET REVIEW
for the six months ended 30 June 2017
Global Economics Review Global economic conditions lifted towards the end of 2016 and remained relatively buoyant in the first half of 2017. Real GDP trended at close to an estimated 3%. Amongst the developed economies (DM) an upturn in corporate profits growth supported a welcome lift in investment spending, amidst elevated levels of business and consumer confidence. An increase in the global manufacturing purchasing managers’ index (PMI), relative to its 2016 level, was reflected in firmer global industrial production growth. This supported metals prices. The increase in commodity prices since 2016 and easing financial conditions, amidst firm foreign capital inflows into emerging market (“EM”) countries offering attractive yields, lent considerable support to economic activity in EM economies in 1H17. India and China continued to deliver the world’s strongest economic growth. China’s policymakers are targeting 6.5 per cent growth per year for the five year period ending 2020 although President Xi Jinping did indicate early in 2017 that real GDP growth should not be pursued at the expense of financial stability. Amongst DM economies, US President Trump’s reform agenda, including the widely publicised fiscal policy reform initiative, failed to gather momentum, although the withdrawal of the US from the Trans-Pacific Partnership trade deal signalled a shift towards a less open foreign trade regime. Although US real GDP advanced by a moderate 1.2% seasonally adjusted and annualised in 1Q17, growth lifted to 2.6% in 2Q17. And, although declining to a degree, the share of corporate profits in GDP, as measured in the US national accounts, remained elevated through the first two quarters of the year. Also, employment growth remained relatively firm and the unemployment rate continued to decline, reaching 4.4% in June 2017. This level is close to historic lows for this series and is far below the peak of 10.0% recorded in October 2009. Meanwhile, the US housing market remained stable with low housing inventory levels supporting house prices. The decline in vacancy rates, nonetheless, appeared to bottom in the second quarter. News flow in Europe was dominated by coverage of the elections in The Netherlands and France. In the former, the Euro-sceptic Party for Freedom (PVV), which had seemingly been gathering momentum amongst voters early in the year, lost ground as the mainstream People’s Party for Freedom and Democracy (VVD) secured the most votes in the March 2017 general election. In France, Emmanuel Macron (an independent reformist) defeated Marine Le Pen, a Euro-sceptic, from the National Front in the second round run-off for the Presidency in May 2017. Subsequently, in an alliance with the Democratic Movement, Macron’s La République En Marche! secured a majority in France’s National Assembly following the June 2017 legislative election. Macron’s promised reform agenda includes restricting government spending and labour market reform. The election results in the Netherlands and France sparked a marked appreciation of the euro against the US$ as concerns over possible disintegration of the Euro project eased – at least for now. Political developments aside, the euro, which was materially undervalued at the beginning of the year, was supported by the lift in Euro area real GDP, which advanced 2.3% seasonally adjusted and annualised in 2Q17 and closed the real GDP growth gap between the euro area and the US. In addition, the economies of the Eurozone, in aggregate, continued to record a large current account surplus, reflecting not only Germany’s enormous surplus, but also surpluses in other countries such as The Netherlands, Italy and Spain. The UK is one notable exception to the generally satisfactory growth outcomes recorded in DM. The sharp depreciation of sterling, following last year’s EU membership referendum, fueled an increase in UK CPI, which increased 2.6% in the year to June 2017. The weakness of sterling, against the backdrop of a wide current account deficit, implies significant downside risk to UK final domestic demand. Indeed, despite a relatively buoyant labour market real GDP growth moderated in 1H17, as higher inflation constrained real income growth and household consumption spending.

SANLAM UNIVERSAL FUNDS PLC
14
ECONOMIC & MARKET REVIEW (CONTINUED) for the six months ended 30 June 2017 Global Economics Review (continued) Prime Minister Theresa May’s attempt to obtain a stronger mandate to negotiate a “hard Brexit” (which could end UK membership of the EU single market) by calling a general election in June 2017, failed as the Conservative Party lost its majority in the UK parliament. This entrenched uncertainty around the likely final outcome of the negotiation process. This outcome is not ideal, especially since there is limited time left to determine the future of migrants in both the UK and the EU, in addition to negotiating a UK-EU trade agreement before the “Brexit” deadline on 29th March 2019. As regards inflation, DM headline consumer price inflation (CPI) lifted a little in 1H17. In the Euro area, the increase in the annual advance in CPI, albeit modest, was welcomed as it eased the deflation concerns of the European Central Bank. At the same time, core CPI remained low and stable, on aggregate, in DM. This backdrop assisted DM central banks in maintaining loose monetary policy stances. Accordingly, the US Federal Open Market Committee (FOMC) proceeded cautiously in shifting towards a less accommodative policy stance. It increased the target range for the Federal Funds Rate by 0.25% in March 2017, followed by an additional increase of 0.25% in July 2017, which left the target range at 1.0% to 1.25%. At the conclusion of its June 2017 meeting the FOMC continued to signal a gradual pace of interest rate “normalization”. According to the FOMC Monetary Policy Statement, the Committee expects that through gradual adjustments in the stance of monetary policy, economic activity will expand at a moderate pace, and labour market conditions will strengthen somewhat further.” In Europe, the ECB expressed confidence that its loose monetary policy stance has helped stabilise the Euro area economy. At the conclusion of its Governing Council meeting in June 2017, the Bank signalled it is still too early to end its support measures, indicating that it expected its key interest rates to remain unchanged for “an extended period of time, and well past the horizon of (its) net asset purchases”. Its net asset purchases (currently €60 billion per month) are expected to continue until end December 2017 “or beyond, if necessary, and in any case until the Governing Council sees a sustained adjustment in the path of inflation consistent with its inflation aim”. Even so, given the improvement in Euro area real GDP growth and receding deflation concerns, expectations of a shift towards a less accommodative monetary policy stance by the ECB have been building. Global Economic Outlook If history is a trustworthy guide, the June 2017 global all-industry PMI should be consistent with continued decent real GDP and industrial production growth. Global unemployment has also declined substantially from its “Great Recession” level and employment growth is supporting retail sales. Encouragingly, too, global trade activity has gathered momentum, following an extended lull in the post-recession period. The current economic expansion amongst the DM economies is, nonetheless, long in the tooth when compared with the average length of previous expansions. Ultimately, it is likely to be difficult to maintain growth momentum if productivity trends remain as soft as in the first half of this year – especially if there is a decisive shift towards less trade liberalization or even protectionism. Still, following years of deleveraging there is no excessive growth evident in private sector credit extension, on aggregate, in DM economies. Inflation does not appear to be a threat either at present. Indeed, income growth in current prices is trending at a relatively low level. Accordingly, there is no need for DM central banks to act aggressively on monetary policy. Even so, real interest rates remain extraordinarily low and it is apparent that central banks are likely to shift towards “normalization” of monetary policy, led by the US Federal Reserve. In particular, attention is being focused on likely changes in the balance sheets of the G4 central banks over the next few years. The US FOMC has already signalled its intention to reduce the size of its balance sheet. In time, the European Central Bank, the Bank of England and the Bank of Japan are expected to follow, although in the case of the Bank of Japan, action is probably some way off considering the Bank’s commitment to its bond yield target.

SANLAM UNIVERSAL FUNDS PLC
15
ECONOMIC & MARKET REVIEW (CONTINUED)
for the six months ended 30 June 2017
Global Economic Outlook (continued) Still, the pace of DM monetary policy normalization is expected to be gradual, especially since any sharp increase in real interest rates would expose countries with high government debt levels to potentially unmanageable increases in their debt servicing burdens. In Europe, in particular, there is risk to long-term fiscal sustainability, since the implementation of economic reforms needed to lift income growth is likely to be slow in countries such as Italy (and possibly France despite President Macron’s best efforts). This continues to hold material risk to debt dynamics – especially in the absence of a decisive shift towards a fiscal union in Europe. Renewed focus on political risk could also emerge ahead of Italy’s general election (which may take place before its scheduled date in 2018), given concerns that a Euro-sceptic coalition could emerge. Polls have indicated similar levels of support for Prime Minister Renzi’s Democratic Party (PD) and the Euro-sceptic Five Star Movement (5SM). The concern is that the possible formation of unstable political party coalitions could scupper economic reform, which would heighten long-term fiscal risk in the country. A shift to a less accommodative monetary policy stance amongst the large G4 central banks in the years ahead and the implied tightening of global financial conditions, would be a concern to indebted EM economies with significant macroeconomic imbalances. At least, however, EM real interest rates, in aggregate, have increased substantially relative to real DM interest rates, following the 2013 “taper tantrum” (when former US Federal Reserve Chairman Bernanke announced the arrival of US Federal Reserve balance sheet “tapering” in May 2013). This should, ostensibly, ease the risk to EM to some extent. That said continued optimism in EM would partially depend on the absence of renewed weakness in commodity prices or sharper than expected increases in global risk-free interest rates, which could expose debt vulnerabilities. Meanwhile, China’s economy continues to deliver. But, it does appear “over-indebted” and “over-invested”. Much of China’s debt is in local currency and the bank system is largely state-owned. Further, the country saves more than it invests and despite large capital outflows last year, the level of China’s reserves remains substantial. Still, China’s real GDP growth may disappoint, accompanied by a falling share of investment in GDP in the years ahead. And, despite the mitigating factors noted, the risk of a disorderly adjustment to a lower investment ratio amidst accelerated deleveraging is probably not nil. Market Review The first quarter of 2017 contained a lot of news (as well as noise) around Donald Trump and how he is fairing as a president. Markets continued in a positive manner on the back of his campaign rhetoric regarding tax reforms and deregulation. However, towards the end of the quarter doubts started to form amongst investors - relating to the efficacy which Trump would be able to deliver on his promises. Very little has in fact been implemented to date and the jury is still out. As a result the reflation trade lost momentum towards the end of the quarter, specifically in Europe. Economic data from across the globe had been improving over the quarter; “soft data” had seen significant improvement whereas the hard data had been lagging and was much more moderate in magnitude. Going into the second quarter investors were eagerly waiting for the hard data to confirm the recovery. While it is widely acknowledged that the economy is showing signs of improvements, risks to the global economy have not disappeared. One of these risks for equity markets going forward is a significant increase in inflation without the accompanying earnings growth. It seems that recently perceived market shocks, those events which were perceived as a negative at the time, namely BREXIT and the Trump victory, has sent equities to all-time highs while volatility has descended to all-time lows. That being said, the bond markets did not agree with the rosy picture that equities painted in the first quarter of 2017, and also advanced over the same period.

SANLAM UNIVERSAL FUNDS PLC
16
ECONOMIC & MARKET REVIEW (CONTINUED) for the six months ended 30 June 2017 Market Review (continued) During the first quarter global equity markets, as measured by the MSCI World Index rose 6.38%
1. For the
calendar months over the quarter, the MSCI World returned 2.41%, 2.77% and 1.07% respectively. Most major regions produced positive returns; Asia Pacific ex Japan led the charge rising 11.76% while Europe followed with a positive 7.44%, North America and Japan followed with returns of 5.88% and 4.49% respectively. As noted above, risks very much remain and not the least in Europe going forward. That being said the region did avoid perceived market risk events during the first quarter. In Europe, the risks that were averted were namely the Dutch elections, where voters remained in the moderate category and did not move towards a more right leaning stance; while in Germany Angela Merkel has fared respectably in the state elections - removing some fears of a similar shake-up in political stance as in the Netherlands. Looking at markets from a regional perspective: over the quarter China performed better than investors expected and this has been a boon to the Asian markets. With no other negative surprises of significance, at least for investors, combined with improving fundamentals across the region - Asia was the star performer both in dollar and local currency terms. There was some rerating in Asia, however this was in line with improvements in fundaments and therefore the region remained cheap. In local currency terms the US, Eurozone and UK equities rose strongly during the quarter with returns of 5.84%, 6.02% and 7.93% respectively. Japan declined only marginally with a return of -0.17% in local currency terms. From a sector perspective, it was clear to see a strong quarter for equity markets with only the energy sector posting a negative return. Oil sold off strongly after experiencing range bound trading for an extended period of time resulting in the energy sector posting a return of -4.95% over the period. Information technology posted the strongest returns by rising 12.25%. Virtually all sectors produced a return between 6.5 and 8.5%, those sectors being, from largest to smallest in return; heath care, consumer discretionary, consumer staples, materials, industrials and utilities. Financials lagged somewhat but that did not come as a big surprise after the strong returns the sector posted post the US elections. The sector returned 4.72% while telecommunications services lagged all the rest significantly with a return of only 1.09%. For the first quarter of 2017, global bonds, as measured by the Barclays Capital Global Aggregate Bond Index, rose 1.76%. The bond markets lost significant ground in the latter part of 2016 due to the risk on sentiment that ensued post the US elections; the strong equity market continued, although the correlation between equity markets and bond markets during this quarter reversed. Even though it is a fairly short time period being only three months, the magnitude of the swing in performance correlation of the bond markets has been very interesting with some investors surely shaking their heads. Over the quarter the index produced returns of 1.13%, 0.47% and 0.15%. In the corporate bond market, the Barclays Capital Global Aggregate Corporate Bond Index rose 1.59% for the quarter. The returns for the Corporate Bond Index over the past six months have been more muted versus the Global Index, albeit it has followed the general bond market returns fairly consistently. For the calendar months of January, February and March the index returned 0.88%, 0.73% and -0.02% respectively.
1
All performance numbers are in US dollars unless stated otherwise.

SANLAM UNIVERSAL FUNDS PLC
17
ECONOMIC & MARKET REVIEW (CONTINUED) for the six months ended 30 June 2017 Market Review (continued) In the second quarter of 2017, the stock market got off to a weak start on concerns over Trump’s policy implementation, the French Presidential election and geopolitical risks surrounding North Korea. The market turned risk on after some of these uncertainties receded. In June, the stock market traded in a narrower range after lower than expected US jobs data and a wait-and-see attitude ahead of important events during the month; the UK general election and FOMC meeting being the most notable. The FOMC decision on 15th June was a significant event reaffirming the tightening policy direction by the US Federal Reserve Bank. The market is currently pricing in a further two hikes whilst the Fed’s rhetoric is implying another five. Market volatility is currently about as low as it has been in the last 20 years while equity and bond markets remain in conflict regarding the health of the economy. In the UK, political risk remains elevated following the “failed” general election Theresa May called – the outcome of which clearly not what she had in mind. A global improving market outlook should however help the UK see modest economic growth continuing forwards. Over the quarter there were some positive signs elsewhere in Europe; better inflation data out of Spain and Germany and Macron’s victory in France was part of the reason why Draghi hinted towards tightening conditions. Macron’s rhetoric is pro-business and with a strong government France has a good chance to change restrictive policies such as sticky labour conditions which are not helpful to productivity. In the USA the employment picture keeps on improving and the benign recovery continues. Earnings in 2015 and 2016 were weak in the USA whilst in 2017 it has grown fairly well. Corporate profitability has also picked up year to date. That being said, valuations versus the rest of the world remain rich and investors should take that into account. Globally there is a lot of political uncertainty, though this is not evident in equity markets. A risk factor that remains is a derailing of China. Another would be the US Fed tightening in an aggressive and too fast manner – however we believe that is unlikely. Italian elections could possibly be a surprise later in 2017, but for the market at least it has not surfaced as a real concern. During the quarter global equity markets, as measured by the MSCI World Index rose 4.03%
2. Since the
US elections the index has only posted gains on a calendar month basis – that is now eight straight consecutive months of positive returns. For the calendar months over the second quarter the MSCI World returned 1.48%, 2.12% and 0.38% respectively. All major regions produced positive returns; Europe produced the strongest results by rising 7.37% while Japan followed with a positive 5.19%. North America followed with a return of 2.82% whilst Asia ex Japan rose 1.54% over the quarter. Looking at regional markets in local currency; Japan outperformed significantly by posting a return of 6.07% over the quarter. Versus Japan the other major regions produced muted numbers, the strongest being North America with a return of 2.67%. Europe followed with a return of 1.79% whilst Pacific ex Japan rose 1.14%. From a sector perspective, the big outlier in performance was the energy sector that posted a negative return of -8.98% over the second quarter. Oil continued selling off after a weak first quarter where it sold off more than 11%. The only other sector to post a significant negative number over the period was Telecommunication Services with a decline of -4.88%. Materials also fell producing a return of -1.34% whilst Consumer Staples only fell marginally by declining -0.42%. The strongest sector was Health Care with a return of 2.91%, followed by Industrials and Financials with returns of 1.62% and 1.23% respectively. For the first quarter of 2017, global bonds, as measured by the Barclays Capital Global Aggregate Bond Index rose 2.60%. The bond markets gained significant ground in the first ten weeks of the quarter but then lost significant ground post the Fed’s decision to raise interest rates. This is already the second time this has happened in 2017. During the final month of the quarter treasuries were detractors whilst investment grade credit continued to advance. Over the quarter the index produced returns of 1.13%, 1.55% and -0.09%.
2 All performance numbers are in US dollars unless stated otherwise.

SANLAM UNIVERSAL FUNDS PLC
18
ECONOMIC & MARKET REVIEW (CONTINUED) for the six months ended 30 June 2017 Market Review (continued) In the corporate bond market, the Barclays Capital Global Aggregate Corporate Bond Index rose 3.53% for the quarter. After following the general bond market during the first quarter of the year, the corporate index has outperformed notably in the second. For the calendar months of April, May and June the index returned 1.40%, 1.67% and 0.42% respectively.

SANLAM UNIVERSAL FUNDS PLC
19
BRIDGE GLOBAL PROPERTY INCOME FUND Investment Objective The Bridge Global Property Income Fund (the “Fund”) aims to provide investors with a high level of current income, as well as long-term income and capital growth, by investing primarily in a global range of transferable securities of real estate companies and real estate related companies, or in companies which own significant real estate assets at the time of investment or in Real Estate Investment Trusts (REITS) including publicly traded closed-ended real estate funds listed or traded on a regulated stock exchange or market. The Fund’s name was changed this year from Grindrod Global Property Income Fund to Bridge Global Property Income Fund to reflect the fact that the Investment Manager of the Fund changed its name from Grindrod Asset Management (Pty) Limited to Bridge Fund Managers (Pty) Limited. Fund Performance
Note: The Fund is benchmarked against the GPR 250 REIT Index. Performance figures longer than 12 months are annualised. Figures are quoted gross of Investment Manager and Manager fees.
The US Federal Reserve (“Fed”) increased their US target interest rate by 25bps at both their March and June meetings, with the current rate now at 1.25%. According to the Fed, the US labour market has continued to strengthen and the latest batch of US economic data shows that economic activity has been rising moderately in 2017. The US unemployment rate has fallen to the lowest level in 16 years following 80 consecutive months of jobs growth. The Fed also announced that the US$4.5 trillion bond portfolio it had acquired through a series of quantitative easing programmes would be sold gradually. While the Fed appears committed to a further rate hike this year, current economic data suggests that economic activity has slowed, which may push the next hike into 2018. The expected increase in fiscal stimulus from President Trump’s economic policies, while good for economic growth, will also be inflationary and take some of the pressure off the US Federal Reserve to keep interest rates lower for longer. A combination of higher official interests and higher inflation should lead to higher bond yields and higher borrowing costs for listed property companies. Market sentiment to US mall REITs continues to be negative as the outlook for their trading metrics continue to be questioned by investors. Analysts have lowered their expectations for 2017 and 2018. The threat of online shopping and the vast improvements made in home entertainment systems has seen a decline in the number of mall visits. These issues are impacting mall owners in most developed nations, where online shopping is growing well in excess of 20% per annum. The number of announcements from US retailers looking to close stores has increased during the year.
-6%
-4%
-2%
0%
2%
4%
6%
8%
10%
1st Qtr 2017 2nd Qtr 2017 YTD Inception
Fund USD-terms 0.00% -2.07% -2.07% 4.86%
Benchmark 1.24% 1.29% 2.53% 9.92%
Excess return -1.24% -3.36% -4.60% -5.06%

SANLAM UNIVERSAL FUNDS PLC
20
BRIDGE GLOBAL PROPERTY INCOME FUND (CONTINUED)
Fund Performance (continued) Against this backdrop, the global listed property markets were moderately positive during the first half of the year, with the GPR 250 REIT index up by 2.53%. The index was supported by positive performance from the US and European regions, while Africa was slightly positive, Asia and Oceania returns were negative. The Fund was down 2.07%, underperforming its benchmark by 4.60% year to date. The underperformance came about as a result of the Fund’s underweight position in the US and overweight position in South Africa. The US and European components of the GPR 250 REIT index increased by 1.8% and 2.1% respectively. The underperformance to its benchmark can also be attributed to the Fund’s service fee and the payment of dividend withholdings tax, neither of which are adjusted for when comparing the Fund’s performance to the benchmark. Fund Outlook There is still significant political uncertainty which is likely to influence the direction of financial markets in the second half of 2017. The election of Emmanuel Macron as the next French president over Marine Le Pen in May did dampen the wave of anti-EU populism that had started to gain momentum last year. The German federal elections are scheduled to occur later this year, where we may see Angela Merkel’s leadership being challenged, increasing uncertainty for financial markets in the short-term. While the Fed appears committed to a further rate hike this year, current economic data suggests that economic activity has slowed, which may push the next hike into 2018. If Donald Trump and his administration get their way, US economic growth will accelerate in 2017 and 2018 and the Fed will raise interest rates as inflation moves beyond the 2% target rate. Bond yields will rise and the US dollar is likely to strengthen, given limited scope in other developed markets to raise interest rates in 2017. The Fed continues to suggest that they wish to normalise rates in the US and unwind their balance sheet. While increased economic growth should support higher occupancies and market rental growth, higher bond yields will lead to higher borrowing costs and higher capitalisation rates (i.e. lower property values) in the short-term. Although prices are likely to be volatile in the short-term, the current one year forward income yield on the portfolio has increased to 4.86% following price weakness in the second quarter. This relatively high yield should provide some downside protection. At the same time, the Fund’s investments are focussed on high-quality REITs with strong balance sheets that should be able to weather a more difficult operating environment throughout 2017. Investment Manager
Bridge Fund Managers (Pty) Limited

SANLAM UNIVERSAL FUNDS PLC
21
P-SOLVE INFLATION PLUS FUND Investment Objective The investment objective of the P-Solve Inflation Plus Fund (the “Fund”) is to grow capital by delivering a return in excess of UK inflation as measured by the Retail Price Index. This is achieved by diversifying investments across various asset classes and providing the opportunity for real capital growth. The reduction of risk will be accomplished through the diversification and tactical rotation of assets, rather than through the targeting of risk using a static allocation.
The Fund may offer downside capital preservation during adverse market conditions, however, this is not guaranteed.
Fund Performance
Note: The Fund is bench marked against Retail Price Index. Performance figures longer than 12 months are annualised. Figures are quoted gross of Investment Manager and Manager fees.
The Fund size as of 30 June 2017 was £52.8m and the Fund returned 2.51% over the first half of 2017, outperforming its benchmark which returned 1.95% for the same period. Equity slightly underperformed over this period as Emerging markets and Asia Pacific ex Japan dragged. European equities were also boosted by Emmanuel Macron’s election as French President.
Economics led the way over the first quarter of this year, but political developments put a few bumps in the road.
Over the course of the first quarter it became clear that economic activity is expanding in all of the major economic regions, and doing so at an accelerating rate. By the end of March inflation was at or above 2%, a target for central banks, in three of the G7 leading economies.
The exception to this good news was a fall in copper and oil prices. These hinted at the possibility of falling industrial demand, although the fall in the oil price also reflected a resurgence in US shale oil production.
Significantly, the US Federal Reserve had enough confidence in the US economy to raise the Federal funds target rate, in March – for the second time in four months – to 1%. But US financial markets were affected by political events, in particular the impact of Donald Trump as incoming US President.
Rising corporate earnings and expanding economic activity assisted return-seeking assets in the second quarter, although the shine was taken off a little in the final 10 days when markets overreacted to the remarks of central bankers. Political and geopolitical developments acted as a brake from time to time but the effect was generally slight, apart from in the US, where growing question marks against the Trump administration had a cooling effect on equities.
0%
2%
4%
6%
8%
1st Qtr 2017 2nd Qtr 2017 YTD Inception
Fund GBP-terms 2.34% 0.17% 2.51% 7.18%
Benchmark 0.84% 1.11% 1.95% 2.99%
Excess return 1.50% -0.94% 0.56% 4.19%

SANLAM UNIVERSAL FUNDS PLC
22
P-SOLVE INFLATION PLUS FUND (CONTINUED) Fund Performance (continued) There were plenty of political developments outside the US – a presidential election in France, an unexpected general election in the UK, with an even more unexpected result – and there were unsettling geopolitical events in Syria and North Korea. But the progress of corporate earnings across the developed market economies proved more important, with improvements in the US, eurozone, UK and Japan pushing up equity prices in all of those regions.
Fund Outlook Looking ahead, the second round of Brexit negotiations began on 17 July, with citizen’s rights, exit bill and Ireland among the main talking points. The Bank of England’s August 3rd meeting will be closely watched with the potential talks of a rate hike to combat inflation. Markets will also be closely watching the German federal election in September to see if it will follow the same direction as recent French and Dutch elections in rejecting populist candidates. Elsewhere, Libya and Nigeria may be asked to join the other members of the Organisation for Petroleum Exporting Countries (OPEC) in cutting output in order to combat low oil prices. ECB President Mario Draghi is attending the Fed’s Jackson Hole meeting in August and could potentially outline his plans for the tapering of the ECB’s QE program.
Investment Manager
P-Solve Investments Limited

SANLAM UNIVERSAL FUNDS PLC
23
SANLAM AFRICAN FRONTIER MARKETS FUND
Investment Objective The investment objective of the Sanlam African Frontier Markets Fund (the “Fund”) is to achieve long-term capital growth by investing in listed African equities (ex-South Africa) that offer above average growth potential. Fund Performance
Note: The Fund is bench marked against MSCI EFM Africa ex ZA Daily Net TR Index (MSEIAZUN). Performance figures longer than 12 months are annualised. Figures are quoted gross of Investment Manager and Manager fees.
The 6 month period to 30 June 2017 saw the Sanlam African Frontier Markets Fund advance 24.33%, outperforming its benchmark, the MSCI Africa ex-South Africa TR Index, by 794bps. Over a one-year period, the Fund is ahead of its benchmark by 804bps, and the 5 year alpha is +149bps. The Fund was launched in March 2010, which makes it 7 years old, and the since inception annualised alpha is +113bps. The Fund’s strong performance to the end of June 2017 was driven by our concentrated positions in a few Nigerian banks that we consider to be high quality and our holdings in Zimbabwe. Over a one-year period, our Egyptian holdings have been a key driver of outperformance - we have been overweight Egypt for quite some time. Fund Outlook
Zimbabwe: Although a driver of the strong performance to date, Zimbabwe is still experiencing significant foreign currency liquidity issues with foreign investors unable to move money out. The introduction of bond notes has to some extent helped the local population to transact on a day-to-day basis but most Zimbabweans remain skeptical about the long-term value of these bond notes. This has forced locals to preserve their wealth by investing on the Harare Stock Exchange. This demand for shares has to some extent contributed to the recent stock market rally, and to the Fund’s performance to date. In the second quarter, the Harare Stock Exchange rallied 41% and the 1 year return of the All Share Index is 95%. The Fund has been invested in Zimbabwe for almost 5 years and we continue to hold our investments which now make up 11% of the Fund.
-2%
0%
2%
4%
6%
8%
10%
12%
14%
16%
18%
20%
22%
24%
26%
1st Qtr 2017 2nd Qtr 2017 YTD Inception
Fund USD-terms 5.40% 17.96% 24.33% 1.52%
Benchmark -0.49% 16.97% 16.39% 0.39%
Excess return 5.89% 0.99% 7.94% 1.13%

SANLAM UNIVERSAL FUNDS PLC
24
SANLAM AFRICAN FRONTIER MARKETS FUND (CONTINUED) Fund Outlook (continued) Zimbabwe (continued): Subsequent to the period end, we took a deliberate decision to apply a 35% write down to Zimbabwean securities in recognition of the foreign currency liquidity issues noted above. This write down was equivalent to the Old Mutual Implied Rate (OMIR) - the exchange rate implied from the differing value of Old Mutual shares listed on the London, Johannesburg and Harare exchanges. It remains difficult to ascertain when things could improve in terms of USD liquidity in Zimbabwe however, it should be noted there was an announcement that the government is setting up a sinking fund to start addressing investors FX repatriation backlog. We wouldn’t expect any significant changes soon, but if it works with time, we may see the liquidity crunch in Zimbabwe for foreign investors being alleviated. If this happens, and we are able to freely trade in and out of Zimbabwe, then we would write up our Zimbabwe holdings to reflect the traded market value. Nigeria: Recent FX policy changes created some optimism in the FX, Equities and Fixed Income markets, and that has led to some improvement in capital inflows. The Nigerian All Share Index went up by 26% in dollar terms in 2Q17. The rally was mainly driven by investors’ optimism following the Central Bank’s introduction of an exchange rate for foreign investors which seems to be working well so far. The recent rally has not been strong enough to recoup losses incurred on the stock market over the last three years. Over a 1 year period the Nigerian All Share Index is down 2.5% and the 3 year return is still a negative 27% in dollars. While the recent developments in the FX market provide some hope that the Central Bank of Nigeria may be considering a move towards a more flexible Naira exchange rate, it is important for the Central Bank to remove the current multiple exchange rate system which is causing a few distortions in the economy. During the second quarter we took a deliberate decision to price our Nigerian holdings using the NAFEX rate which is 20% weaker compared to the official interbank exchange rate of around USDNGN 315. At present foreign portfolio investors are able to access some FX liquidity on the NAFEX window at ex-change rates between USDNGN 380 – USDNGN 400. Given that the NAFEX window reflects an exchange rate that equity investors can transact on, we are valuing our Nigerian holdings using an exchange rate of USDNGN 380. However, our index provider, MSCI, is still valuing Nigeria using the overvalued exchange rate of USDNGN 315. Investment Manager
Sanlam Investment Management (Pty) Limited

SANLAM UNIVERSAL FUNDS PLC
25
SANLAM GLOBAL BEST IDEAS FUND
Investment Objective The investment objective of the Sanlam Global Best Ideas Fund (the “Fund”) is to provide above average long-term capital growth by investing primarily in global equities which the Investment Manager has identified as being undervalued and as offering above average growth potential. Fund Performance
Note: The Fund is bench marked against the MSCI World Index. Performance figures longer than 12 months are annualised. Figures are quoted gross of Investment Manager and Manager fees.
In the first two months of 2017, the “Trump reflation trade” added to the rally in world equity markets that
started in November of last year. This buoyancy was halted in March as it became increasingly clear that
a business-friendly promise made by the Trump campaign was not the same thing as a business-friendly
policy implemented by the Trump administration. It is not unusual to see markets rally after a US election,
but this breathless run left markets looking increasingly pricey.
In the second quarter, most of the world’s respected geopolitical commentators expressed grave
reservations about the apparent intent of the Trump administration to abdicate the US’s traditional
leadership of the Western alliance and turn itself inward to “make America great again”. That this should
take the form of trashing trade agreements and building walls augurs poorly for the US economy and the
very people of middle America the administration is purporting to help. Yet, markets were reassured by the
surprisingly easy wins for president Macron and his party in France in the face of a well-organised right
wing challenge, boosting that country’s equity market by 9% in the quarter. This was in contrast to the UK,
where Theresa May’s ill-timed election call weakened her and her party considerably. We doubt that she
will survive as the leader of the Conservative party, thus impairing Britain’s position at the Brexit
negotiating table considerably and making the business climate in the UK riskier for all, in our opinion.
For the first quarter, the Fund’s holdings in Consumer Staples were the largest contributors to
outperformance. The Fund’s Industrial sector holdings detracted the most from performance. From a
country perspective, the Fund benefitted from good stockpicking in the US and the UK, producing excess
returns in both these geographies.
For the second quarter, Financials contributed the most to outperformance. The Fund’s information
technology holdings detracted most from performance for the period.
0%
2%
4%
6%
8%
10%
12%
14%
1st Qtr 2017 2nd Qtr 2017 YTD Inception
Fund USD-terms 7.68% 4.58% 12.61% 6.84%
Benchmark 6.38% 4.03% 10.66% 7.00%
Excess return 1.30% 0.55% 1.95% -0.16%

SANLAM UNIVERSAL FUNDS PLC
26
SANLAM GLOBAL BEST IDEAS FUND (CONTINUED) Fund Performance (continued) As at 30 June 2017, the Fund is in the top half of performance in the Morningstar global peer group ranking over one, two and three years.
Fund Outlook Based on current consensus expectations the Fund has a forward P/E of 14.9 versus 17.2 for the MSCI World index and a dividend yield of 2.6% versus 2.4%. The Fund ROE is 20% compared to 16% for the above benchmark and has superior profitability (operating margin: 23% versus 19%). The Fund has an active share of 87%. Investment Manager Sanlam Investment Management (Pty) Limited

SANLAM UNIVERSAL FUNDS PLC
27
SANLAM GLOBAL BOND FUND
Investment Objective The Sanlam Global Bond Fund (the “Fund”) aims to provide income with the possibility of long-term growth from capital appreciation. Fund Performance
Note: The Fund’s benchmark is the Barclays Capital Global Aggregate Bond Index. Performance figures longer than 12 months are annualised. Figures are quoted gross of Investment Manager and Manager fees.
The Fund outperformed its benchmark, the Bloomberg Barclays Global Aggregate Index, by +0.07% over
the first half of 2017. The Fund and benchmark climbed 4.48% and 4.41% respectively. The Fund and its
benchmark returned 1.77% and 1.76% respectively over the first quarter. The Fund advanced 2.66%
whilst the benchmark managed 2.60% in Q2. Since inception, the Fund and the benchmark have returned
an annualized 3.18% and 3.66% respectively.
Fund Outlook
The current global economic expansion is long by historic standards and, ultimately, it is likely to be
difficult to maintain growth momentum if productivity trends remain weak – especially considering the shift
towards less trade liberalization (or even protectionism despite the recent EU-Japan trade agreement?).
Numerous risks linger, including the potential for a more rapid and impactful adjustment in China,
heightened geopolitical risk and ongoing policy uncertainty in the US. China remains a particular concern
– credit extension has been excessive and the country’s high capital to labour ratio precludes ongoing
robust productivity gains. There are numerous mitigating factors though, including China’s high level of
foreign exchange reserves and its excess of savings over investment. Looking ahead, the US FOMC is
likely to stick with its interest rate hiking path, supplemented by a reduction of its balance sheet (possibly
from late 2017). The market is currently pricing in a further two hikes whilst the Fed’s rhetoric is implying
another five. There should be one more hike in 2017 and then another two or potentially three in 2018. A
risk here is that the US tightens too fast – although we believe that is unlikely. The Fed will also be aware
of the possible inflation risk posed by fiscal expansion, especially if also accompanied by an increase in
trade protectionist measures. Valuations in North America are rich versus the rest of the world and
investors should take this into account going forward. In general though, as one portfolio manager noted,
“it is hard to find people excited about equity markets lately” – the US is no exception and if anything the
leader of the pack.
-2%
0%
2%
4%
6%
1st Qtr 2017 2nd Qtr 2017 YTD Inception
Fund USD-terms 1.77% 2.66% 4.48% 3.18%
Benchmark 1.76% 2.60% 4.41% 3.66%
Excess return 0.01% 0.06% 0.07% -0.48%

SANLAM UNIVERSAL FUNDS PLC
28
SANLAM GLOBAL BOND FUND (CONTINUED)
Fund Outlook (continued)
In terms of yields, investors should be more bearish on the long end going forward. The Fed’s unwinding
of their balance sheet by the end of the year will particularly have an effect in the longer end of the curve,
as well as in core rates. In the UK, the BOE has implied more hawkishness which translates more risk to
that space as well, while the ECB should add to their rhetoric to remove stimulus going forward – which
should end around the middle of 2018. Therefore, we expect the rates market to be whipsawed out of
Washington and other political centres for the foreseeable short term future.
Investment Manager
Cameron Hume Limited

SANLAM UNIVERSAL FUNDS PLC
29
SANLAM GLOBAL FINANCIAL FUND
Investment Objective The investment objective of the Sanlam Global Financial Fund (the “Fund”) is to achieve steady growth in the US Dollar value of investments primarily through global investment in securities of companies of which the principle operations specifically focus on, and derive benefit from or pertain to, the provision of banking, insurance and other financial services. Fund Performance
Note: The Fund’s benchmark is the MSCI World Financials Index. Performance figures longer than 12 months are annualised. Figures are quoted gross of Investment Manager and Manager fees.
The Fund had a good first half of 2017.
Since the crisis it’s paid to ignore seemingly attractive valuations, and our stance of investing in banks and
insurers that are on the front foot and growing shareholder value (and are attractively valued) has helped
performance tremendously. The compounding of shareholder value at higher and predictable rates is
always important, but in tough and low growth periods like the current one compounding at a high rate is
scarce and adds considerable value. But it is not only avoiding value traps that is important, not
overpaying for compounders is just as important.
We’ve continued to do that in the spaces avoided by most competitors and not represented in the index:
Emerging markets and small and medium sized banks and insurers. In the first quarter, a few of them
came through strongly in terms of results and also higher share prices. The good news is that the share
price gains have generally only kept pace with the growth in shareholder value, hence they have not really
re-rated to being expensive and we expect these shares to continue to generate good returns. At the
same time, European banks and insurers are lagging and getting cheaper (but bear in mind their
shareholder value is only growing at 7%-10% per annum) and US financials stood still during the quarter
after their strong rally in Q4 2016.
For the second quarter, most of the Fund’s US investments reported good results and the share prices
reacted favourably to this and the SEC’s capital audits. In Europe and Asia there were winners and losers.
Generally, in each case the banks and insurers reported good results helped by their strong franchise on
the back of a gradually improving macro environment.
0%
2%
4%
6%
8%
10%
12%
14%
16%
1st Qtr 2017 2nd Qtr 2017 YTD Inception
Fund USD-terms 7.72% 6.96% 15.22% 10.39%
Benchmark 4.72% 5.26% 10.23% 2.92%
Excess return 3.00% 1.70% 4.99% 7.47%

SANLAM UNIVERSAL FUNDS PLC
30
SANLAM GLOBAL FINANCIAL FUND (CONTINUED)
Fund Performance (continued)
The environment remains supportive of financials and the Fund has good diversification amongst US,
Europe, UK and emerging markets. Within those geographies the Fund has good diversification amongst
banks, insurers, exchanges and asset managers. Fund Outlook
We expect good performance:
- Indications are that the probability is high that the global low growth, low inflation, low interest rate environment has ended.
- This is good for confidence (increased financial activity in terms of investment, lending and M&A). - The upswing will start (and we think it already has started) from a very healthy and low base, within a
financial sector which generally has strong and clean balance sheets (with a few exceptions in Greece, Italy and Spain).
- Because it starts from such a low base, the wave should last a number of years and should result in higher net interest margins and improved cost-to-income ratios leading to a period of sustained and above average shareholder value growth.
- The regulatory headwind seems to have peaked and automation of the additional information requirements means cost savings by banks and insurers going forward.
- Finally, the financial sector is undervalued in absolute terms and relative to the MSCI World index. The benefit from higher interest rates should see both insurers and banks re-rate and outperform.
- In short – we think the driving forces behind the rally could continue anything from four to ten years, helping financials to be an outperforming sector over that period.
Based on our experience of the past 30 years, the probability is high that next few years could see a
golden period for financials. The investment philosophy, as highlighted in the track record, means that the
probability is high that the Fund will generate good returns over the next 10 years.
Investment Manager Sanlam Investment Management (Pty) Limited

SANLAM UNIVERSAL FUNDS PLC
31
SANLAM GLOBAL PROPERTY FUND Investment Objective
The Sanlam Global Property Fund (the “Fund”) aims to provide long-term capital growth.
Fund Performance
Note: The Fund’s benchmark is the FTSE EPRA/NAREIT Developed Index. Performance figures longer than 12 months are annualised. Figures are quoted gross of Investment Manager and Manager fees.
The Fund has enjoyed a very pleasing start to 2017, adding 7.70% over the first six months and has
outperformed the FTSE EPRA/NAREIT Developed Index by +2.86% over this period. The Fund gained
3.12% whilst the benchmark gained 2.07% in the first quarter. In absolute terms, the Fund gained 4.44%
in the second quarter whilst the benchmark gained 2.71% and hence an outperformance of +1.73%. Since
inception, the Fund has annualized returns of 11.09%, having outperformed by +0.99% annualized.
Fund Outlook
The current global economic expansion is long by historic standards and, ultimately, it is likely to be
difficult to maintain growth momentum if productivity trends remain weak – especially considering the shift
towards less trade. Numerous risks linger, including the potential for a more rapid and impactful
adjustment in China, heightened geopolitical risk and ongoing policy uncertainty in the US. China remains
a particular concern – credit extension has been excessive and the country’s high capital to labour ratio
precludes ongoing robust productivity gains. There are numerous mitigating factors though, including
China’s high level of foreign exchange reserves and its excess of savings over investment. Looking
ahead, the US FOMC is likely to stick with its interest rate hiking path, supplemented by a reduction of its
balance sheet (possibly from late 2017). The market is currently pricing in a further two hikes whilst the
Fed’s rhetoric is implying another five. A risk here is that the US tightens too fast – although we believe
that is unlikely. The Fed will also be aware of the possible inflation risk posed by fiscal expansion,
especially if also accompanied by an increase in trade protectionist measures. Valuations in North
America are rich versus the rest of the world and investors should take this into account going forward.
Further political risk in the Eurozone is the Italian elections later this year. German elections are also due
in September; Angela Merkel’s popularity has recovered and there should be no surprises. The UK’s
political climate is expected to remain volatile for the foreseeable future – the BREXIT negotiations are a
first in history and have seemingly endless complications.
0%
2%
4%
6%
8%
10%
12%
1st Qtr 2017 2nd Qtr 2017 YTD Inception
Fund USD-terms 3.12% 4.44% 7.70% 11.09%
Benchmark 2.07% 2.71% 4.84% 10.10%
Excess return 1.05% 1.73% 2.86% 0.99%

SANLAM UNIVERSAL FUNDS PLC
32
SANLAM GLOBAL PROPERTY FUND (CONTINUED)
Fund Outlook (continued)
On the equity side, the UK has seen a decent run since BREXIT, boosted by the weak currency, so a
consolidation is definitely possible. In terms of Asia; a rising concern with several market participants is
Australia’s economic outlook – their mining industry is under pressure which constitutes a large part of
their GDP, as well as a housing and debt bubble being discussed. Specific to listed equities, the price to
cash flow multiple has reacted in the short term to changing interest rates but has not moved in the
medium to long term. This means that returns from listed property have come from yield and growth and
not from multiple expansions. This points to listed equities being more fairly valued than the broader
equity market and should protect relative to equities in turbulent markets. Investment Manager
AllianceBernstein Limited

SANLAM UNIVERSAL FUNDS PLC
33
SANLAM WORLD EQUITY FUND
Investment Objective The Sanlam World Equity Fund (the “Fund”) aims to provide above average long-term capital growth by investing primarily in global equities. Fund Performance
Note: The Fund‘s benchmark is the MSCI World Index. Performance figures longer than 12 months are annualised. Figures are quoted gross of Investment Manager and Manager fees.
The Fund had a difficult six months in relative terms as indicated by the Fund returning 10.43% whilst its
benchmark, the MSCI World Index, returned 10.66% and hence the Fund underperformed by -0.23%. Q1
saw the Fund gain 6.98% and the benchmark 6.38% and hence a relative outperformance of +0.60%. In
absolute terms the Fund and the benchmark advanced 3.22% and 4.03% respectively during Q2. Since
inception, the Fund and the benchmark have returned 6.12% and 7.11% annualized respectively. Fund Outlook
The current global economic expansion is long by historic standards and, ultimately, it is likely to be
difficult to maintain growth momentum if productivity trends remain weak – especially considering the shift
towards less trade. Numerous risks linger, including the potential for a more rapid and impactful
adjustment in China, heightened geopolitical risk and ongoing policy uncertainty in the US. China remains
a particular concern – credit extension has been excessive and the country’s high capital to labour ratio
precludes ongoing robust productivity gains. There are numerous mitigating factors though, including
China’s high level of foreign exchange reserves and its excess of savings over investment. Looking
ahead, the US FOMC is likely to stick with its interest rate hiking path, supplemented by a reduction of its
balance sheet (possibly from late 2017). The market is currently pricing in a further two hikes whilst the
Fed’s rhetoric is implying another five. A risk here is that the US tightens too fast – although we believe
that is unlikely. The Fed will also be aware of the possible inflation risk posed by fiscal expansion,
especially if also accompanied by an increase in trade protectionist measures. Valuations in North
America are rich versus the rest of the world and investors should take this into account going forward.
-2%
0%
2%
4%
6%
8%
10%
12%
1st Qtr 2017 2nd Qtr 2017 YTD Inception
Fund USD-terms 6.98% 3.22% 10.43% 6.12%
Benchmark 6.38% 4.03% 10.66% 7.11%
Excess return 0.60% -0.81% -0.23% -0.99%

SANLAM UNIVERSAL FUNDS PLC
34
SANLAM WORLD EQUITY FUND (CONTINUED) Fund Outlook (continued)
Further political risk in the Eurozone is the Italian elections later this year. German elections are also due
in September; Angela Merkel’s popularity has recovered and there should be no surprises. The UK’s
political climate is expected to remain volatile for the foreseeable future – the BREXIT negotiations are a
first in history and have seemingly endless complications. On the equity side, the UK has seen a decent
run since BREXIT, boosted by the weak currency, so a consolidation is definitely possible. In terms of
Asia, a rising concern with several market participants is Australia’s economic outlook – their mining
industry is under pressure which constitutes a large part of their GDP, as well as a housing and debt
bubble being discussed. In summary, we remain cautious. Investment Managers AllianceBernstein Limited Centre Asset Management LLC DIAM International Limited Sanlam FOUR Investments UK Limited Sanlam Investment Management (Pty) Limited

SANLAM UNIVERSAL FUNDS PLC
35
SATRIX WORLD EQUITY TRACKER FUND Investment Objective The investment objective of the Satrix World Equity Tracker Fund (the “Fund”) is to provide capital growth equivalent to that gained from investment in world equity markets.
Fund Performance
Note: The Fund‘s benchmark is the MSCI World Index. Performance figures longer than 12 months are annualised. Figures are quoted gross of Investment Manager and Manager fees.
The Fund performed fairly in tracking the MSCI World Index in the first six months of 2017. The Fund
gained 10.81% whilst the benchmark returned 10.66% and hence the Fund deviated from its benchmark
by +0.15%. The Fund returned 6.37% whilst the benchmark climbed 6.38% and hence the Fund’s
performance deviated by -0.01% in Q1. The Fund gained 4.18% in absolute terms and deviated by
+0.15% from the benchmark’s returns over the second quarter. Since inception, the Fund and the
benchmark have annualized 6.74% and 7.11% respectively. Fund Outlook
The current global economic expansion is long by historic standards and, ultimately, it is likely to be
difficult to maintain growth momentum if productivity trends remain weak – especially considering the shift
towards less trade. Numerous risks linger, including the potential for a more rapid and impactful
adjustment in China, heightened geopolitical risk and ongoing policy uncertainty in the US. China remains
a particular concern – credit extension has been excessive and the country’s high capital to labour ratio
precludes ongoing robust productivity gains. There are numerous mitigating factors though, including
China’s high level of foreign exchange reserves and its excess of savings over investment. Looking
ahead, the US FOMC is likely to stick with its interest rate hiking path, supplemented by a reduction of its
balance sheet (possibly from late 2017). The market is currently pricing in a further two hikes whilst the
Fed’s rhetoric is implying another five. A risk here is that the US tightens too fast – although we believe
that is unlikely. The Fed will also be aware of the possible inflation risk posed by fiscal expansion,
especially if also accompanied by an increase in trade protectionist measures. Valuations in North
America are rich versus the rest of the world and investors should take this into account going forward.
-2%
0%
2%
4%
6%
8%
10%
12%
1st Qtr 2017 2nd Qtr 2017 YTD Inception
Fund USD-terms 6.37% 4.18% 10.81% 6.74%
Benchmark 6.38% 4.03% 10.66% 7.11%
Excess return -0.01% 0.15% 0.15% -0.37%

SANLAM UNIVERSAL FUNDS PLC
36
SATRIX WORLD EQUITY TRACKER FUND (CONTINUED) Fund Outlook (continued)
Further political risk in the Eurozone is the Italian elections later this year. German elections are also due
in September; Angela Merkel’s popularity has recovered and there should be no surprises. The UK’s
political climate is expected to remain volatile for the foreseeable future – the BREXIT negotiations are a
first in history and have seemingly endless complications. On the equity side, the UK has seen a decent
run since BREXIT, boosted by the weak currency, so a consolidation is definitely possible. In terms of
Asia, a rising concern with several market participants is Australia’s economic outlook – their mining
industry is under pressure which constitutes a large part of their GDP, as well as a housing and debt
bubble being discussed. In summary, we remain cautious. Investment Manager
Sanlam Investment Management (Pty) Limited

SANLAM UNIVERSAL FUNDS PLC
37
SIIP INDIA OPPORTUNITIES FUND
Investment Objective The investment objective of the SIIP India Opportunities Fund (the “Fund”) is to provide long-term capital growth.
Fund Performance
Note: The Fund’s benchmark is the Bombay Stock Exchange 500 Index. Performance figures longer than 12 months are annualised.
Figures are quoted gross of Investment Manager and Manager fees.
The Fund has experienced a good first six months of the year, adding 26.06% outperforming the Bombay
Stock Exchange 500 Index by +0.52%. The Fund gained strongly in absolute terms over the first quarter
but lagged in relative terms, returning 19.58% to its investors whilst the benchmark gained 19.88%. The
Fund managed to outperform the Bombay Stock Exchange 500 Index by +0.70% over the second quarter,
gaining 5.42% in absolute terms. Since inception, the Fund and the benchmark have gained 2.64% and
3.33% annualized respectively.
Fund Outlook
The equity market was supported by the RBI keeping interest rates unchanged and maintained a hawkish
tone in spite of a weakening currency. More importantly, corporate earnings during the 4th quarter of the
Indian financial calendar (which runs from January to March) beat estimates broadly sustaining growth
momentum and margins. Although the so called “unorganized” sectors continue to struggle due to last
year’s demonetization scheme, currency circulation is now at pre-demonetization levels. The largest driver
of performance for the equity market as a whole however, was due to the anticipation of the Goods and
Services Tax (GST) reforms which are due to be implemented starting 1 July. Seen as India’s largest tax
reforms to date and is premised around the idea of one nation one tax system which will free up interstate
goods movements and accountability. It is believed that the GST reforms will be to the benefit of all
stakeholders. The consumer will benefit as it aims to remove cascading taxes, industry stands to benefit
as they will now only be subject to a single, uniform indirect tax nationwide. Government will ultimately see
an improvement in tax collection. It is expected that inflation will continue to drift downwards in part due to
the good monsoon season, stronger rupee and better control on deficit. Expect a 25 bps cut over the
quarter due to the easing inflation. Despite the neutral stance from the RBI, markets are continuously
seeing strong inflow resulting in stretched valuations and P/E expansion. We expect the inflow to be
moderate with Fed taking a hawkish stance. However, markets are expected to move sideways with a
positive bias.
Investment Manager Sanlam Investment Management (Pty) Limited
-2%
0%
2%
4%
6%
8%
10%
12%
14%
16%
18%
20%
22%
24%
26%
1st Qtr 2017 2nd Qtr 2017 YTD Inception
Fund USD-terms 19.58% 5.42% 26.06% 2.64%
Benchmark 19.88% 4.72% 25.54% 3.33%
Excess return -0.30% 0.70% 0.52% -0.69%

SANLAM UNIVERSAL FUNDS PLC
38
SIM GLOBAL EQUITY INCOME FUND
Investment Objective The investment objective of the SIM Global Equity Income Fund (the “Fund”) is to provide a regular income stream for investors with the potential for capital growth. It aims to provide a regular income which will be in line with the annual average dividend yield of the MSCI World High Dividend Yield NTR Index as well as provide capital growth exceeding inflation. Fund Performance
Note: The Fund is bench marked against a composite index (USA CPI + Yield of the MSCI World High Dividend Yield Index). Performance figures longer than 12 months are annualised. Figures are quoted gross of Investment Manager and Manager fees.
The Fund experienced somewhat of a rollercoaster ride in the first half of the year. The Fund benefited from the growing realisation that President Trump would not easily deliver on his election promises. Then the better-than-hoped-for result achieved by President Macron in the French general election provided a significant boost to that market and the markets of continental Europe in general. During the final few weeks of the last quarter, the messy outcome of the British general election weighed on the Fund as the currency weakened and the UK market retreated. Having seen her attempt to achieve a greater majority and a stronger hand in the Brexit negotiations fail spectacularly, Prime Minister May has been forced into an unpopular coalition and appears politically vulnerable. Instead of improving their position in the recently commenced Brexit negotiations, May’s gamble has weakened it significantly. Finally, in June, Governor Yellen’s comments regarding the robustness of the US economic recovery when announcing the Federal Reserve’s decision to raise US interest rates sparked a renewed bout of switching from shares perceived to be defensive in favour of those perceived to be more likely to benefit from a cyclical recovery and higher interest rates. Financial shares, in particular, benefited from this switch. In the first quarter, the Fund’s largest contributors to performance were British American Tobacco, Philip Morris International, Taylor Wimpey, Unilever and HP Inc. Notable detractors from its performance were Verizon Communications, General Electric and BP. The Fund declared a distribution of 15.87 cents per unit (Class A) for the six month period to the end of March 2017. This reflects a 9.4% decline, compared to the corresponding period of the previous year, in the aggregate dividends received from its investee companies. Most of this decline was due to the effect of the roughly 15% depreciation of the UK pound versus the US dollar exchange rate during the respective periods. Combined with the 26.05 cents per unit distribution paid during October 2016, it denotes a yield of 3.7% (net of withholding taxes paid by the Fund) on capital invested twelve months ago. This compared favourably to the 3.7% yield (gross) of the benchmark MSCI World High Dividend Index during the same period.
0%
2%
4%
6%
8%
10%
12%
1st Qtr 2017 2nd Qtr 2017 YTD Inception
Fund USD-terms 7.76% 3.77% 11.82% 8.78%
Benchmark 1.19% 1.00% 2.20% 4.41%
Excess return 6.57% 2.77% 9.62% 4.37%

SANLAM UNIVERSAL FUNDS PLC
39
SIM GLOBAL EQUITY INCOME FUND (CONTINUED)
Fund Performance (continued) In the second quarter, the performers were McDonald’s Corporation, Legal & General Group, Mitie Group, IG Group and Boeing Company. Underperformers were Cisco Systems, International Business Machines and General Electric. Fund Outlook Based on current consensus expectations, the Fund offers a significantly better yield than the overall market (dividend yield of 4.0% versus 2.4%), while trading on a lower valuation (forward P/E of 14.5x versus 16.4x) and producing a substantially better return (ROE of 20.7% versus 16.2%). When compared to the MSCI World index the Fund displays an active share of 91%. We believe that this positions the Fund well for the future and, based on our current projections, expect it to deliver a yield greater than that of its benchmark during the next 12 months. Investment Manager Sanlam Investment Management (Pty) Limited

SANLAM UNIVERSAL FUNDS PLC
40
SANLAM STRATEGIC BOND FUND
Investment Objective Total return: The objective of the Sanlam Strategic Bond Fund (the “Fund”) is to provide a total return for investors, with an attractive monthly income and capital growth potential. The Fund is not designed to track a reference benchmark or peer group. Value driven credit approach: Investing in undervalued credit sectors and specific bond issues primarily in the investment grade/crossover area. Active macro tactical overlay: Seeks to actively enhance total returns by allocating to government bonds on either an FX hedged/unhedged basis.
Fund Performance
Note: The Fund is bench marked against IA £ Strategic Bond Sector Index. Performance figures longer than 12 months are annualised. Figures are quoted gross of Investment Manager and Manager fees.
The Fund has had an excellent first and second quarter, putting the Fund’s performance near the top of its
sector. Credit selection, duration management and careful risk control all played their part in contributing
to the performance of the portfolio, in addition to an underlying environment of tightening credit spreads.
Fund Outlook
The Fund maintains a balanced allocation between investment grade credit, high yield and government
bonds. We view the outlook for credit as generally positive and expect defaults to stay extremely low due
to expansionary monetary policy. The Fund continues to actively look for opportunities to add value by
tactically adding to risk off assets.
Investment Manager
Sanlam FOUR Investments UK Limited
0%
2%
4%
6%
8%
10%
1st Qtr 2017 2nd Qtr 2017 YTD Inception
Fund USD-terms 4.14% 3.92% 8.23% 8.27%
Benchmark 1.86% 1.26% 3.14% 5.07%
Excess return 2.28% 2.66% 5.09% 3.20%

SANLAM UNIVERSAL FUNDS PLC
41
SANLAM ACCEL INCOME FUND
Investment Objective
The investment objective of the Sanlam Accel Income Fund (the “Fund”) is to provide income to investors
and capital growth over the long-term.
Fund Performance
Note: The Fund’s benchmark is the Accel Green Benchmark. Performance figures longer than 12 months are annualised. Figures are quoted gross of Investment Manager and Manager fees.
The Fund produced a healthy absolute return of 5.89%, gross of fees, for the first half of 2017. In relative
terms, the Fund ended the period 2.14% ahead of the benchmark which was up 3.75%. On an asset
allocation level, the underweight to US equities, one of the weakest markets over the period, aided relative
performance. In addition, the Fund’s small allocation to UK government bonds also helped relative
performance. In terms of Fund selection, the biggest contributors to performance, in the equity space,
were the Fund’s UK small cap, European and Asian managers. In the UK, Unicorn UK Income and
Chelverton UK Equity Income delivered returns of 13.4% and 12.2%, respectively. BlackRock European
Continental Income gained 13.4%, partly driven by stronger stock markets in the region, whilst Guinness
Asian Equity Income rallied 13.9%. On a slightly more negative note, Sanlam FOUR US Dividend Income
produced a negative return of -2.1% as its value style struggled. That being said, we are not concerned
about the Fund’s poor performance over the first half of the year, especially following a very strong 2016
for the Fund. In the bond space, Sanlam Strategic Bond was the best performer with a return of 8%.
Elsewhere, Kames High Yield delivered a return of 3.8%, aided by further narrowing in credit spreads.
Similarly, those strategic bond managers seeking higher returns down the credit quality spectrum
performed well. Twenty Four Dynamic Bond gained 5.9%, Artemis Strategic Bond 4.8% and Henderson
Strategic Bond 4.6%. UK Gilts sold off aggressively in the last few days of June following comments from
Mark Carney which suggested interest rates may rise sooner than expected, erasing almost all of the
gains made through the period.
-2%
0%
2%
4%
6%
8%
1st Qtr 2017 2nd Qtr 2017 YTD Inception
Fund GBP-terms 3.74% 2.07% 5.89% 7.27%
Benchmark 3.34% 0.39% 3.75% 7.61%
Excess return 0.40% 1.68% 2.14% -0.34%

SANLAM UNIVERSAL FUNDS PLC
42
SANLAM ACCEL INCOME FUND (CONTINUED) Fund Outlook
The current global economic expansion is long by historic standards and, ultimately, it is likely to be
difficult to maintain growth momentum if productivity trends remain weak – especially considering the shift
towards less trade. Numerous risks linger, including the potential for a more rapid and impactful
adjustment in China, heightened geopolitical risk and ongoing policy uncertainty in the US. China remains
a particular concern – credit extension has been excessive and the country’s high capital to labour ratio
precludes ongoing robust productivity gains. There are numerous mitigating factors though, including
China’s high level of foreign exchange reserves and its excess of savings over investment. Looking
ahead, the US FOMC is likely to stick with its interest rate hiking path, supplemented by a reduction of its
balance sheet (possibly from late 2017). The market is currently pricing in a further two hikes whilst the
Fed’s rhetoric is implying another five. A risk here is that the US tightens too fast – although we believe
that is unlikely. The Fed will also be aware of the possible inflation risk posed by fiscal expansion,
especially if also accompanied by an increase in trade protectionist measures. Valuations in North
America are rich versus the rest of the world and investors should take this into account going forward.
Further political risk in the Eurozone is the Italian elections later this year. German elections are also due
in September; Angela Merkel’s popularity has recovered and there should be no surprises. The UK’s
political climate is expected to remain volatile for the foreseeable future – the BREXIT negotiations are a
first in history and have seemingly endless complications. On the equity side the UK has seen a decent
run since BREXIT, boosted by the weak currency, so a consolidation is definitely possible. In terms of
Asia; a rising concern with several market participants is Australia’s economic outlook – their mining
industry is under pressure which constitutes a large part of their GDP, as well as a housing and debt
bubble being discussed. In summary, we remain cautious. Investment Manager
Sanlam FOUR Investments UK Limited

SANLAM UNIVERSAL FUNDS PLC
43
SATRIX NORTH AMERICA EQUITY TRACKER FUND
Investment Objective The investment objective of the Satrix North America Equity Tracker Fund (the “Fund”) is to provide capital growth equivalent to that gained from investment in the North American equity markets by tracking the performance of the MSCI North America Index.
Fund Performance
Note: The Fund’s benchmark is the MSCI North America Index. Performance figures longer than 12 months are annualised. Figures are quoted gross of Investment Manager and Manager fees.
The Fund experienced a difficult period in replicating the performance of the MSCI North America Index
but this must be seen in the context of very large inflows into the Fund in the first quarter. The Fund
gained 8.50% and deviated from the benchmark by -0.36% over the six month period. The Fund gained
5.41% in the first quarter, a deviation of -0.47% from the benchmark’s performance. The Fund returned
2.93% over the second quarter to its investors. This figure deviated by +0.11% from the returns of the
Fund’s benchmark. Since inception the Fund and the benchmark have annualized 10.29% and 10.63%
and hence a deviation of -0.34%.
Fund Outlook
The current global economic expansion is long by historic standards and, ultimately, it is likely to be
difficult to maintain growth momentum if productivity trends remain weak – especially considering the shift
towards less trade. Numerous risks linger, including the potential for a more rapid and impactful
adjustment in China, heightened geopolitical risk and ongoing policy uncertainty in the US. China remains
a particular concern – credit extension has been excessive and the country’s high capital to labour ratio
precludes ongoing robust productivity gains. There are numerous mitigating factors though, including
China’s high level of foreign exchange reserves and its excess of savings over investment. Looking
ahead, the US FOMC is likely to stick with its interest rate hiking path, supplemented by a reduction of its
balance sheet (possibly from late 2017). The market is currently pricing in a further two hikes whilst the
Fed’s rhetoric is implying another five. A risk here is that the US tightens too fast – although we believe
that is unlikely. The Fed will also be aware of the possible inflation risk posed by fiscal expansion,
especially if also accompanied by an increase in trade protectionist measures. Valuations in North
America are rich versus the rest of the world and investors should take this into account going forward. In
general, as one portfolio manager noted, “it is hard to find people excited about equity markets lately” –
the US is no exception and if anything, the leader of the pack.
Investment Manager
Sanlam Investment Management (Pty) Limited
-2%
0%
2%
4%
6%
8%
10%
12%
1st Qtr 2017 2nd Qtr 2017 YTD Inception
Fund USD-terms 5.41% 2.93% 8.50% 10.29%
Benchmark 5.88% 2.82% 8.86% 10.63%
Excess return -0.47% 0.11% -0.36% -0.34%

SANLAM UNIVERSAL FUNDS PLC
44
SATRIX UK EQUITY TRACKER FUND
Investment Objective The investment objective of the Satrix UK Equity Tracker Fund (the “Fund”) is to provide capital growth equivalent to that gained from investment in the UK equity markets by tracking the performance of the MSCI UK Daily Net Total Return Index. Fund Performance
Note: The Fund’s benchmark is the MSCI UK Daily Net Total Return Index. Performance figures longer than 12 months are annualised. Figures are quoted gross of Investment Manager and Manager fees.
The Fund performed fairly in tracking the performance of the MSCI UK Index over the first six months of
2017. The Fund advanced 4.40% whilst the benchmark gained 4.64% and hence a deviation of -0.24%.
The performance of the Fund deviated from the MSCI UK index by -0.16% over the first quarter. The Fund
gained 3.63% whilst the aforementioned index gained 3.79% in the first three months of 2017. The Fund
advanced 0.74% over the second quarter and the performance deviated from that of the MSCI UK Index
by -0.07%. Since inception, the Fund and the benchmark have gained 4.81% and 5.35% respectively on
an annualized basis. Fund Outlook
The current global economic expansion is long by historic standards and, ultimately, it is likely to be
difficult to maintain growth momentum if productivity trends remain weak – especially considering the shift
towards less trade liberalization. Numerous risks linger, including the potential for a more rapid and
impactful adjustment in China, heightened geopolitical risk and ongoing policy uncertainty in the US.
China remains a particular concern – credit extension has been excessive and the country’s high capital
to labour ratio precludes ongoing robust productivity gains. There are numerous mitigating factors though,
including China’s high level of foreign exchange reserves and its excess of savings over investment. The
UK’s political climate is expected to remain volatile for the foreseeable future – the BREXIT negotiations
are a first in history and have seemingly endless complications. We should see modest economic growth
going forward though. Global improving market outlook should help the UK even with its current problems
– the economy is still “ok”. Inflation in the UK should not be as aggressive as some market participants
assume and at least it is not the worse alternative of being deflationary. On the equity side the UK has
seen a decent run since BREXIT, boosted by the weak currency, so a consolidation is definitely possible.
Investment Manager Sanlam Investment Management (Pty) Limited
-2%
0%
2%
4%
6%
1st Qtr 2017 2nd Qtr 2017 YTD Inception
Fund GBP-terms 3.63% 0.74% 4.40% 4.81%
Benchmark 3.79% 0.81% 4.64% 5.35%
Excess return -0.16% -0.07% -0.24% -0.54%

SANLAM UNIVERSAL FUNDS PLC
45
SATRIX EUROPE (EX UK) EQUITY TRACKER FUND Investment Objective The investment objective of the Satrix Europe (ex-UK) Equity Tracker Fund (the “Fund”) is to provide capital growth equivalent to that gained from investment in the European equity markets, excluding the UK, by tracking the performance of the MSCI Europe (ex UK) Index. Fund Performance
Note: The Fund’s benchmark is the MSCI Europe (ex UK) Index. Performance figures longer than 12 months are annualised. Figures are quoted gross of Investment Manager and Manager fees.
The Fund had a fair period in tracking the MSCI Europe ex UK Index, gaining 8.88% in absolute terms
which is a deviation of +0.19% from the benchmark. The Fund gained 6.91% over the first quarter, the
absolute performance only deviating by -0.01% from that of the benchmark. The Fund gained 1.84% over
the second quarter, the absolute performance deviating by +0.18% from that of the benchmark. Since
inception, the Fund and the benchmark have gained 8.96% and 8.89% respectively on an annualized
basis. Fund Outlook
The current global economic expansion is long by historic standards and, ultimately, it is likely to be
difficult to maintain growth momentum if productivity trends remain weak – especially considering the shift
towards less trade liberalization. Numerous risks linger, including the potential for a more rapid and
impactful adjustment in China, heightened geopolitical risk and ongoing policy uncertainty in the US.
China remains a particular concern – credit extension has been excessive and the country’s high capital
to labour ratio precludes ongoing robust productivity gains. There are numerous mitigating factors though,
including China’s high level of foreign exchange reserves and its excess of savings over investment.
Further political risk in the Eurozone is the Italian elections later this year. German elections are also due
in September; Angela Merkel’s popularity has recovered and there should be no surprises. Even if there
were to be a surprise in the elected winner, the main opposition has a very similar agenda as Merkel and
her party, thus we are confident Germany’s election will be a non-event. We cannot say the same about
the Italian elections. In general the outlook for Europe looks fine at the moment.
Investment Manager
Sanlam Investment Management (Pty) Limited
0%
2%
4%
6%
8%
10%
1st Qtr 2017 2nd Qtr 2017 YTD Inception
Fund EUR-terms 6.91% 1.84% 8.88% 8.96%
Benchmark 6.92% 1.66% 8.69% 8.89%
Excess return -0.01% 0.18% 0.19% 0.07%

SANLAM UNIVERSAL FUNDS PLC
46
SANLAM EQUITY ALLOCATION FUND
Investment Objective The investment objective of the Sanlam Equity Allocation Fund (the “Fund”) is to provide capital growth over the long-term.
Fund Performance
Note: The Fund’s benchmark is the MSCI Europe Index. Performance figures longer than 12 months are annualised. Figures are quoted gross of Investment Manager and Manager fees.
The Fund had another disappointing period, underperforming the MSCI Europe Index by -0.62% but
added 14.74% in absolute terms. The Fund and the benchmark gained 7.09% and 7.44% respectively
over the first quarter. In Q2, the Fund advanced 7.14% but still lagged its benchmark, the MSCI Europe
Index by -0.23%. Since inception, the Fund and the benchmark have annualized returns of 3.68% and
4.42% respectively.
Fund Outlook
The current global economic expansion is long by historic standards and, ultimately, it is likely to be
difficult to maintain growth momentum if productivity trends remain weak – especially considering the shift
towards less trade liberalization. Numerous risks linger, including the potential for a more rapid and
impactful adjustment in China, heightened geopolitical risk and ongoing policy uncertainty in the US.
China remains a particular concern – credit extension has been excessive and the country’s high capital
to labour ratio precludes ongoing robust productivity gains. There are numerous mitigating factors though,
including China’s high level of foreign exchange reserves and its excess of savings over investment.
Further political risk in the Eurozone is the Italian elections later this year. German elections are also due
in September; Angela Merkel’s popularity has recovered and there should be no surprises. Even if there
were to be a surprise in the elected winner, the main opposition has a very similar agenda as Merkel and
her party, thus we are confident Germany’s election will be a non-event. We cannot say the same about
the Italian elections. The UK’s political climate is expected to remain volatile for the foreseeable future –
the BREXIT negotiations are a first in history and have seemingly endless complications. We should see
modest economic growth going forward though. Global improving market outlook should help the UK even
with its current problems – the economy is still “ok”. Inflation in the UK should not be as aggressive as
some market participants assume and at least it is not the worse alternative of being deflationary. On the
equity side, the UK has seen a decent run since BREXIT, boosted by the weak currency, so a
consolidation is definitely possible. In general, the outlook for Europe looks fine at the moment.
Investment Manager Sanlam FOUR Investments UK Limited
-2%
0%
2%
4%
6%
8%
10%
12%
14%
16%
1st Qtr 2017 2nd Qtr 2017 YTD Inception
Fund USD-terms 7.09% 7.14% 14.74% 3.68%
Benchmark 7.44% 7.37% 15.36% 4.42%
Excess return -0.35% -0.23% -0.62% -0.74%

SANLAM UNIVERSAL FUNDS PLC
47
SATRIX EMERGING MARKETS EQUITY TRACKER FUND
Investment Objective The investment objective of the Satrix Emerging Markets Equity Tracker Fund (the “Fund”) is to provide capital growth equivalent to that gained from investment in the emerging equity markets by tracking the performance of the MSCI Emerging Markets Index.
Fund Performance
Note: The Fund’s benchmark is the MSCI Emerging Markets Index. Performance figures longer than 12 months are annualised. Figures are quoted gross of Investment Manager and Manager fees.
The Fund’s performance deviated from that of the MSCI Emerging Markets Index by +0.25% over the
course of the first half of 2017, gaining 18.68% in absolute terms. In Q1 the Fund’s performance deviated
from that of the benchmarks by +0.08% and the Fund gained 11.53% in absolute terms. The Fund
advanced 6.41% over the second quarter and the performance deviated from that of the benchmark by
+0.14%. Since inception, the Fund lags its benchmark by -0.29% on an annualized basis.
Fund Outlook
The current global economic expansion is long by historic standards and, ultimately, it is likely to be
difficult to maintain growth momentum if productivity trends remain weak – especially considering the shift
towards less trade. Numerous risks linger, including the potential for a more rapid and impactful
adjustment in China, heightened geopolitical risk and ongoing policy uncertainty in the US. China remains
a particular concern – credit extension has been excessive and the country’s high capital to labour ratio
precludes ongoing robust productivity gains. There are numerous mitigating factors though, including
China’s high level of foreign exchange reserves and its excess of savings over investment. Looking
ahead, the US FOMC is likely to stick with its interest rate hiking path, supplemented by a reduction of its
balance sheet (possibly from late 2017). The market is currently pricing in a further two hikes whilst the
Fed’s rhetoric is implying another five. A risk here is that the US tightens too fast – that is unlikely. The
Fed will also be aware of the possible inflation risk posed by fiscal expansion, especially if also
accompanied by an increase in trade protectionist measures.
0%
2%
4%
6%
8%
10%
12%
14%
16%
18%
20%
1st Qtr 2017 2nd Qtr 2017 YTD Inception
Fund USD-terms 11.53% 6.41% 18.68% 1.79%
Benchmark 11.45% 6.27% 18.43% 2.08%
Excess return 0.08% 0.14% 0.25% -0.29%

SANLAM UNIVERSAL FUNDS PLC
48
SATRIX EMERGING MARKETS EQUITY TRACKER FUND (CONTINUED) Fund Outlook (continued)
In terms of Asia; a rising concern with several market participants is Australia’s economic outlook – their
mining industry is under pressure which constitutes a large part of their GDP, as well as a housing and
debt bubble being discussed. In general, the country is struggling with moving away from their commodity
driven economy. The big driver in the region is China which remains on a “cautious watch” with investors;
that said, supply side reform is going ahead, which bodes well. Another boon for China is the global
growth engine recovery – for Chinese exports this is a big tailwind. In summary, it is reasonable to expect
the G4 balance sheets to stop expanding by 2018, followed by possible net shrinkage in 2019. This will
usher in a materially different environment from the one financial markets have become used to in the
years following the global financial crisis to date. This shift to being less accommodative in monetary
policy and the implied tightening of global financial conditions would be a concern to indebted EM
economies with significant macroeconomic imbalances specifically. Though a greater concern will be the
litmus test of whether the world economy has recovered sufficiently enough for this, or not, and just how
organic the benign, but gaining recovery has been. We remain cautious.
Investment Manager
Sanlam Investment Management (Pty) Limited

SANLAM UNIVERSAL FUNDS PLC
49
SANLAM MANAGED RISK FUND Investment Objective
The investment objective of the Sanlam Managed Risk Fund (the “Fund”) is to provide long-term capital
growth through exposure to world equity markets. The Fund utilises a risk management strategy designed
to reduce volatility and minimise losses in declining markets. Income will not be a consideration.
On 12 June 2017, Sanlam Investment Management (Pty) Limited replaced Sanlam FOUR Investments UK
Limited and Milliman Financial Strategies Limited as Investment Manager of the Fund. As a result of the
change, the Fund went from utilizing a systematic risk management strategy to one driven by an artificial
intelligence machine learning investment engine with the same objective, to reduce volatility and minimise
losses in declining markets. Fund Performance
Note: The Fund’s long-term benchmark is 60% Sanlam World Equity Tracker - E Class; 40% USD Libor 3 Month. Performance figures longer than 12 months are annualised. Figures are quoted gross of Investment Manager and Manager fees.
For the last 6 months or year to date, the Fund outperformed the benchmark by 2.00%. The Fund
returned 8.62% versus the benchmark of 6.62%.
Starting off the year, the Fund had a market exposure of roughly 82% and volatility forecast of 8.4%. The
target volatility remained firmly below the targets of 15% and later 10%, which resulted in high market
exposure throughout the first half of the year. Market exposure reached a maximum level of 87% and was
at 81% at the end of June. The AI and ML engine produces weekly signals, dictating the level of market
exposure required. Since the change in Investment Manager, the level of market exposure has remained
unchanged at 80%.
Given the high exposure to the market over the last 6 months the Fund participated to a large degree in
the strong performance of the underlying index tracker, which returned 10.81% year to date.
The benchmark is a long-term return benchmark and is intended to provide the client an expectation of the
average market exposure they should expect over a full market cycle. We believe that a static equity
allocation benchmark of 60% does not provide an accurate comparison over the shorter term and we are
investigating more appropriate alternatives.
-2%
0%
2%
4%
6%
8%
10%
1st Qtr 2017 2nd Qtr 2017 YTD Inception
Fund USD-terms 5.16% 3.29% 8.62% 5.14%
Benchmark 3.90% 2.62% 6.62% 6.11%
Excess return 1.26% 0.67% 2.00% -0.97%

SANLAM UNIVERSAL FUNDS PLC
50
SANLAM MANAGED RISK FUND (CONTINUED) Fund Performance (continued)
The Fund ended the period to 30 June 2017 with effective cash of 18% of which 8% was actual cash and
5% was short futures exposure.
As per the investment objective, the volatility of the Fund was 26% lower than an investment in the
underlying index tracker since inception and maximum drawdown was also lower. Fund Outlook
The Fund does not take a forward-looking view of the equity markets due to the nature of the investment
strategy. However, an outlook of the underlying index tracker fund used in that fund’s investment outlook.
Below illustrates the intended behaviour of the Fund in different market conditions.
Performance in rising markets:
The Fund will rise, albeit not to the same degree as the markets. The reason for this is that during a rising
market a proportion of the investment will be invested in assets that fall in value as markets rise. It is these
assets that provide the “smoothing” effect.
Performance in falling markets:
It is anticipated that the Fund will most likely outperform from a return perspective versus the naked index,
as the SMR AI strategy will cushion the decline. The overall value of the investment is likely to fall, but not
by as much as would have been the case without the cushioning effect of the Fund’s AI strategy. Please
note that the Fund’s strategy is not intended to provide a cushion against sudden and extreme market falls
(for example, those brought about by a catastrophic event such as 9/11).
It is anticipated that over the long-term the Fund’s strategy will “smooth” the investment experience, and
provide better risk-adjusted returns over multiple market cycles.
Investment Managers
Sanlam Investment Management (Pty) Limited

SANLAM UNIVERSAL FUNDS PLC
51
SANLAM PRIVATE WEALTH GLOBAL HIGH QUALITY FUND
Investment Objective The Sanlam Private Wealth Global High Quality Fund (the “Fund”) aims to produce compounded total returns in excess of the MSCI World index over the medium to long term, through a concentrated portfolio of high quality stocks, using our proprietary quantitative screening process combined with rigorous fundamental research.
Fund Performance
Note: The Fund is bench marked against MSCI World Total Return Index (NDDUWI). Performance figures longer than 12 months
are annualised. Figures are quoted gross of Investment Manager and Manager fees. Sector is the IA Global in GBP.
The Fund has outperformed the market since inception with the net asset value increasing by 81.40% compared to a gain of 57.39% for the comparative benchmark, the MSCI World Total Return Index. During the first six months of 2017 the Fund outperformed the benchmark by 6.43%. During the first half of 2017, we initiated positions in Fresenius Medical Care, Edwards Lifesciences and Altria, and reinitated positions in Yum China, Philip Morris, Priceline, Automatic Data Processing and NetEase. We exited our position in Amgen. Fund Outlook
Over the last few years, the US has offered a welcome source of growth and stability to investors, and has consequently benefitted from significant investment inflows, which have steadily inflated prices. So far this year, we’ve been enjoying something of a global resurgence, especially in Europe and across emerging markets. We’ve been well positioned to take advantage of this, while moving away from the more expensive US. Despite this optimism, we’re still in a low-return environment and, as a result, we remain cautious about the future. The US: awaiting clarity on policy To achieve the highly anticipated economic expansion in the US, the Trump administration needs to turn the promise of tax reform and government infrastructure plans into reality. If it can do this, it will deliver immediate results for company bottom lines, helping to justify current stock prices. But if the tax cuts are not realised, it may take longer than the market expects for the company earnings to get to this point. With valuations high, we are selective in our exposure to this region, preferring to own US businesses that are exposed to global markets and operate in attractive industries.
0%
5%
10%
15%
20%
25%
30%
35%
40%
45%
50%
55%
60%
65%
70%
75%
80%
85%
1st Qtr 2017 2nd Qtr 2017 YTD Inception
Fund GBP-terms 7.21% 4.23% 11.44% 81.40%
Benchmark 4.71% 0.30% 5.01% 57.39%
Excess return 2.50% 3.93% 6.43% 24.01%

SANLAM UNIVERSAL FUNDS PLC
52
SANLAM PRIVATE WEALTH GLOBAL HIGH QUALITY FUND (CONTINUED) Fund Outlook (continued) The UK: disappointing economic performance The UK’s economic performance has been disappointing, given that the weakness of sterling should have supported export-oriented manufacturers and those locally focussed businesses that compete with imports. Despite low interest rates, businesses continue to be reluctant to invest in growth (which is understandable, given Brexit uncertainty), and the government is holding back on infrastructure spending in an attempt to control the budget deficit. The general election in June was a further set-back for sterling, with rumours of an interest rate rise in the offing, something we think is unlikely unless the economy finds itself on surer footing. Europe: improving fundamentals 2017 has been a year of steadily improving fundamentals for Europe. Economic performance has been good, and all indications are that this will continue, prompting the European Central Bank (ECB) to begin preparing the market for an end to its massive stimulus package. Improvements in company earnings and the outlook for inflation are positive indicators for Europe. As money has flowed back into the region the euro has been strong, and European stocks have outperformed global markets by about 6% so far this year. Emerging markets: stabilisation and attractive valuations The longer-term outlook for emerging markets is positive, with valuations appearing cheap enough to compensate for the additional risk, and growth rates generally good. The Asian region is particularly exciting, with the emergence of the Chinese consumer, and reforms in economies like India. While a cautious approach is necessary, there are some excellent companies in these regions, experiencing better growth and trading at more attractive prices than their developed-market peers. A great example is the growth in mobile payments in India, where the population is moving from cash to cashless without using banks.
Investment Manager Sanlam Private Investments (UK) Limited

SANLAM UNIVERSAL FUNDS PLC
53
SANLAM FOUR US DIVIDEND INCOME FUND Investment Objective The Sanlam FOUR US Dividend Income Fund (the “Fund”) aims to target capital growth over the longer- term.
Fund Performance
Note: The Fund is bench marked against MSCI North America Index. Performance figures longer than 12 months are annualised. Figures are quoted gross of Investment Manager and Manager fees.
Following a very strong year for the Fund in 2016, in a rising market, 2017 year-to-date has seen the
momentum trade take over. The markets have continued to rise in a strong fashion; however the high-
growth style took the leap significantly, leaving the value style out of the rally.
In this environment, the Fund naturally underperformed. However, it managed to perform in-line with the
value indices. This comes on the heels of a significant outperformance of the value style, when the style
led the markets in 2016.The year-to-date outperformance of the growth style, has already exceeded all of
its underperformance of 2016. Thus the value style is now back into underperformance mode over one,
three, five, and up to eight years. It remains to be seen how long this market aberration will continue.
In the meantime the 10-yield US treasury yields fell again this year, while most strategists were calling for
it to rise, retracting back from the mid-2 to the low-2 levels. Gold advanced, commodities weakened, and
the USD weakened.
The Fund had a number of successful stock picks in the first half. Mead Johnson and Whole Foods, both
in Consumer staples, were acquired with significant premiums. Top fund holding Best Buy also had a
significant re-rating. However, it was what the Fund did not and could not own, that accounted for most of
the underperformance. Not being able to own a few names like Amazon, Facebook or Netflix, which rallied
an average of 35%, and where valuation levels gave full way to momentum had an outsized effect. Our
analysis shows all these names to be significantly overvalued. As such, being structurally underweight the
high-growth new technology proved to be a major detriment vs. markets year-to-date. Currency allocation
acted as a positive.
-6%
-4%
-2%
0%
2%
4%
6%
8%
10%
12%
1st Qtr 2017 2nd Qtr 2017 YTD Inception
Fund GBP-terms 2.71% 0.89% 3.63% 11.19%
Benchmark 5.88% 2.82% 8.86% 9.62%
Excess return -3.17% -1.93% -5.23% 1.57%

SANLAM UNIVERSAL FUNDS PLC
54
SANLAM FOUR US DIVIDEND INCOME FUND (CONTINUED) Fund Outlook
The marked underperformance of the value style witnessed year-to-date, which exacerbated in the
second quarter, had one beneficial effect of entrenching the Fund further into value territory, thus
increasing its attractiveness to the market. The Fund’s dividend yield hit 3.5% again, right before exiting
the quarter, a relatively attractive entry point over the history for the Fund and one we had not been seen
since the market lows of 2016. This level is as much as 150bps higher than the market’s average yield, as
well as higher than other us dividend fund peers.
The underperformance of value also deepened the portfolio’s valuation discount vs. the market, to well
north of 30%; the Fund is now trading at an average price-to-earnings ratio of less than 15; as opposed to
22 times for the broader market. So while one will argue markets are expensive, here is the cheap option
still available. We believe this should make it a great long-term entry point for the Fund versus market.
It should also be noted that this valuation discount has come coupled with higher quality metrics for the
portfolio, such as total leverage or return on equity, than the market. The Fund also exhibits significantly
less risk than the market, creating a further attractive risk-reward profile.
It remains to be seen when the style will turn back in favour, but the year-to-date underperformance has
put the differential between value and growth to levels not seen since the dot com bubble. In the
meantime, the Fund continues to provide best-in-class exposure to the US value and dividend equities
space.
Over the longer-term, US equity markets are now in their ninth year of strong positive returns, driven
largely by low interest rates. Growth has been massively outperforming value over this period, reaching a
cumulative 80% of excess returns since 2009.
There are many wild cards that make 2017 another highly interesting year, and we will stay closely tuned.
As always, we continue all of our research efforts on detecting, analysing, and investing in undervalued
opportunities with strong dividends in North America.
Investment Manager
Sanlam FOUR Investments UK Limited

SANLAM UNIVERSAL FUNDS PLC
55
HIGH STREET GLOBAL BALANCED FUND
Investment Objective The High Street Global Balanced Fund (the “Fund”) aims to provide a high level of income and the potential for capital growth. Fund Performance
Note: The Fund’s benchmark against 50% USD 3 Month LIBOR, 50% EUR 3 Month LIBOR, + 2.5% Per Annum. Performance figures longer than 12 months are annualised. Figures are quoted gross of Investment Manager and Manager fees.
The Fund’s AUM has shown good growth in the first 6 months of 2017, up 30% to $19.24m. This was attributable to both inflows from our South African client base and solid performance of 7.61% for the six months, versus 1.45% for its benchmark, an outperformance of 6.16%. With the prospect of a slow but sustained rise in interest rates in the US and further down the line in Europe, we have decreased the interest rate sensitive investments in our portfolio. This includes our bonds where we have shortened duration significantly by selling off some bonds and investing our maturing assets in US short dated treasuries. At the same time, we have increased our weighting in equities and in particular banks and commodity focused stocks that should perform well in this environment. Our levels of cash and near cash remain high to take advantage of a pullback in the market which we feel could happen in the near term. Fund Outlook
World equity markets continue to reach all-time highs as a result of improving world economies despite
expectation of rising interest rates. We feel that these will be slow for some time.
We are encouraged by a medium-term bull market in commodities which bodes well for markets. Despite
this we could see some shocks to the market which will provide opportunities to invest our cash war chest.
Investment Manager High Street Asset Management (Pty) Limited
-4%
-2%
0%
2%
4%
6%
8%
1st Qtr 2017 2nd Qtr 2017 YTD Inception
Fund USD-terms 5.52% 1.98% 7.61% 3.63%
Benchmark 0.71% 0.73% 1.45% 7.00%
Excess return 4.81% 1.25% 6.16% -3.37%

SANLAM UNIVERSAL FUNDS PLC
56
SANLAM FOUR GLOBAL EQUITY FUND Investment Objective The Sanlam FOUR Global Equity Fund (the “Fund”) aims to deliver attractive real returns, and superior investment returns to the wider equity market over time. This goal is achieved by investing in a disciplined manner to buy strong companies (which generate above average cash returns on capital over an economic cycle), at times when they are out of favour in the market and trading at a significant discount to their intrinsic value. We focus our research on unloved and out of favour stocks. Our investment research focuses on the medium term strengths and cash generation of these companies underlying business models, rather than trying to outguess near term results. Our time horizon in both assessing companies and intended holding period is measured in years rather than months or quarters. We maintain a strict valuation discipline to only buy shares at a significant discount to our estimate of the Intrinsic Value of future cash flow.
Fund Performance
Note: The Fund is bench marked against MSCI World Index. Performance figures longer than 12 months are annualised. Figures are
quoted gross of Investment Manager and Manager fees.
For the first half of 2017, the Fund gained 2.39% in GBP terms, underperforming the benchmark by 2.88%, which rose to 5.27%. During the period, the largest detractors from performance were our Energy holdings such as Cobalt International Energy, Ezion Holdings and Anadarko Petroleum, which more than offset positive contributions generated by good performance in Information Technology, namely Oracle, Western Digital and Samsung Electronics. Q1 was a strong quarter for Information Technology as many of the names in the sector delivered better than expected operating results. On the back of the solid momentum in the memory market, our holdings in Samsung Electronics and Western Digital continued to perform strongly, while Oracle announced a better than expected set of quarterly results during the period. The company’s Cloud business continued to expand and was supportive to software revenue growth. Outside the IT sector, the Media Company Viacom announced a positive set of quarterly results, which highlighted improving operating momentum within both Media Networks and Paramount studios. The market also positively received the management’s strategic plan to focus programming investment on the flagship networks in order to drive advertising revenue growth.
-4%
-2%
0%
2%
4%
6%
8%
10%
12%
14%
1st Qtr 2017 2nd Qtr 2017 YTD Inception
Fund GBP-terms 4.03% -1.58% 2.39% 9.10%
Benchmark 5.12% 0.14% 5.27% 12.05%
Excess return -1.09% -1.72% -2.88% -2.95%

SANLAM UNIVERSAL FUNDS PLC
57
SANLAM FOUR GLOBAL EQUITY FUND (CONTINUED)
Fund Performance (continued) Detractors during the period were Cobalt International Energy that recorded an impairment on its assets in Angola, for which it is still awaiting a buyer despite having marketed those in the second half of 2016. The process has been further complicated by an arbitration dispute with the oil company’s Angolan partner. The Fund’s exposure to the financial sector was a further detractor, as relatively poor operating performance of NN Group and AIG, due to weaker underwriting period towards the end of 2016, reduced the benefit generated by our exposure to other financial institutions and banks. In Q2, the Fund suffered again from the holdings in the Energy sector. Ezion Holdings was the most notable detractor. The Singapore-listed oil services company was negatively impacted by an increase in competitive forces and an increase in its balance sheet leverage. This was accompanied by a decline in the oil price during the second quarter, which then led to a weakness in our other Energy-related holdings, namely Anadarko Petroleum, Cobalt International Energy as well as ENI. Additionally, Viacom share price gave back some of the gains recorded in the previous quarter as the business continued its strategic plan implementation. SJM Holdings, the Macau casino operator led the positive contributors with operational improvements as a result from a continued recovery in gaming trends. The positive operating momentum continued in Oracle as well as Western Digital and Samsung Electronics, all reporting strong financial results, particularly driven by sustained pricing trends in the memory market for the latter two names. Furthermore, UnitedHealth Group was another notable performer in the quarter. The US-listed managed care company reported good results that were well received by the market as the management remains confident on the outlook for 2018, with OptumCare (IT-enabled health care services) remaining a key focal point of future growth for the company. Fund Outlook Markets have enjoyed their longest winning streak since the 2003-2004 rally on expectations of stronger economic growth, the promise of business-friendly political reforms and a gradual reduction in monetary stimulus. These factors, combined with a recovering European economy and strong US consumer spending, have pushed stock valuation to decade high multiples, comparable to 2004 levels. While there are no signs of overheating, our cautious nature encourages us to pay attention to the fact that growth rates are a third of what they were in 2004, inflation and ISM have disappointed recently and the Trump administration still needs to prove its ability to implement reforms. Operating conditions for many US and European companies are clearly improving but we do not believe we, or anyone else for that matter, have a consistent competitive advantage in making macro predictions. Therefore, we continue investing fundamentally with a margin of safety and stick to our principles of valuation and quality. In spite of elevated market levels, we continue to find good investment opportunities across a variety of companies, with the best value found amongst Healthcare, Technology, Financials, Energy and Industrials. As always, we expect that markets will eventually recognise the true long-term earnings power of our companies and reward them with higher ratings and higher share prices. For Healthcare companies, we see the more strident rhetoric of the election campaigns starting to shift as the complexity of policy in this area becomes more apparent, giving some respite to the sector. The failure of the GOP to repeal Obamacare is the latest reminder of how hard it will be for Trump to deliver on campaign promise. This is why we remain invested in resilient businesses that can grow their earnings in a variety of conditions. In some cases, our companies are part of the solution to reduce the cost of US Healthcare. We expect our IT holdings to remain immune from political machinations and enter periods of accelerated growth as they transition from investment/restructuring to execution. In the case of Oracle and Microsoft we expect fast growth of their cloud businesses. eBay is likely to accelerate their GMV driven by improved search results, traffic conversion and overall user experience. HP should continue generating cash and win share in personal systems and printers, with 3D printing growing quickly into a profitable industry leader.

SANLAM UNIVERSAL FUNDS PLC
58
SANLAM FOUR GLOBAL EQUITY FUND (CONTINUED) Fund Outlook (continued) Financials should benefit from a multi-year improvement in returns, on the back of higher interest rates and regulation. As banks are passing liquidity tests with flying colours, we expect to benefit from increasingly generous capital return policies. The improvement in European economies is giving our European bank investments a chance to close the valuation gap with their US peers. The best predictor of future returns is valuation, and while the Fund is invested in superior ROIC companies, our estimate shows it remains undervalued in absolute terms and against market averages. The best predictor of future returns is valuation, and while the Fund is invested in superior ROIC companies, it remains undervalued both in absolute terms, as assessed by our intrinsic value estimates, and in relation to market averages. Investment Manager Sanlam FOUR Investments UK Limited

SANLAM UNIVERSAL FUNDS PLC
59
SANLAM FOUR STABLE GLOBAL EQUITY FUND
Investment Objective The Global Stable Equity Fund (the”Fund”) aims to offer an attractive and differentiated investment proposition to clients. We aim to deliver attractive real returns, CPI+6%, comparable to the long run returns from equities, but with significantly less volatility and lower downside risks than the wider equity market. These goals are achieved by a portfolio that is focused solely on cash generative, non-cyclical companies. Only 30-35% of the market will meet these criteria. These are approached with a highly disciplined approach to valuation, purchasing these stocks only at prices which will allow us to achieve return objectives. This combination creates a portfolio, which is intended to provide resilience during tougher economic and stock market periods, whilst remaining invested to deliver strong long run returns.
Fund Performance
Note: The Fund is bench marked against MSCI ACWI. Performance figures longer than 12 months are annualised. Figures are
quoted gross of Investment Manager and Manager fees.
For the first half of 2017, the Fund gained 4.97% in GBP terms to stay ahead of the CPI+6% target by 0.15%, but behind the overall equity market. During the period, the Fund benefitted from strong performance in the Information Technology sector and an underweight position in the Energy sector as the oil price continued to slide. This underweight is in line with our stated investment objective, and the Fund will never hold equities in the more cyclical and capital-intensive areas of the market. Shares in Oracle, Tupperware and Medtronic were amongst the best-performing holdings during the period, while Healthcare names such as Express Scripts and Gilead Sciences were large detractors to performance alongside WPP and Verizon Communications. During Q1, the Fund produced strong performance on the back of stock selection in the Consumer Discretionary and Information Technology sectors. Our underweight allocation to Energy and Financials was also beneficial to the Fund’s performance. On the other hand, stock selection within the Healthcare sector was the main detractor to performance.
-2%
0%
2%
4%
6%
8%
10%
12%
14%
16%
18%
1st Qtr 2017 2nd Qtr 2017 YTD Inception
Fund GBP-terms 6.62% -1.55% 4.97% 17.31%
Benchmark 5.64% 0.38% 6.04% 14.49%
Excess return 0.98% -1.93% -1.07% 2.82%

SANLAM UNIVERSAL FUNDS PLC
60
SANLAM FOUR STABLE GLOBAL EQUITY FUND (CONTINUED) Fund Performance (continued) At the stock level, Viacom announced a positive set of quarterly results, which highlighted improving operating momentum within both Media Networks and Paramount studios. The market also positively received the management’s strategic plan to focus programming investment on the flagship networks in order to drive advertising revenue growth. Oracle reported a better than expected set of quarterly results during the period. The company’s Cloud business continued to expand and was supportive to software revenue growth. Computershare announced a solid set of financial results in the quarter. The Australian Registry business raised its full year outlook, highlighting strong growth in the UK and United States mortgage servicing markets. Moreover, the company has been successful in addressing the cost base in the core registry business, as it looks to offset the decline in organic revenue. Gilead Sciences and Express Scripts were notable decliners during the period under review. Gilead Sciences provided lower than expected guidance for its Hepatitis C franchise, with the number of patients expected to commence treatment in 2017 lower than 2016. Despite the market concerns over the sustainability of the HCV franchise, the Gilead’s HIV business is set to continue its strong momentum. Sentiment around Express Scripts has been negatively influenced by the noise around the desire to repeal the Affordable Care act and control drug price inflation, however, we believe that the current valuation fully reflects these concerns and offers an attractive risk-reward. In Q2, the positive stock selection in the Financials sector was offset by currency weakness, but our underweight allocation to Energy was beneficial to Fund performance during the quarter. Despite weak stock selection in Healthcare, our large allocation here was also a notable contributor to performance. Stock selection in Consumer Staples and Consumer Discretionary were the primary detractors to performance. UnitedHealth Group was the most significant stock contributor. The US-listed managed care company reported good results that were well received by the market as the management remains confident on the outlook for 2018, with OptumCare (IT-enabled health care services) remaining a key focal point of future growth for the company. The positive operating momentum continued in Oracle, which continued to report strong financial results and improved revenue and earnings outlook. Other notable contributors were Tupperware, AON, Medtronic and Japan Tobacco. Sentiment towards Imperial Brands has been negative due to weaker than expected organic revenue growth, concerns around the competitive threat from next generation products, and comments from Japan Tobacco regarding the lack of desire to engage in large scale M&A. The company is targeting a return to growth in the second half of 2017 as it aims to reduce cost and complexity within its business. The most notable decliner during the period was Viacom, whose share price gave back some of the gains recorded in the previous quarter as the business continued its strategic plan implementation. Fund Outlook Markets have enjoyed their longest winning streak since the 2003-2004 rally on expectations of stronger economic growth, the promise of business-friendly political reforms and a gradual reduction in monetary stimulus. These factors, combined with a recovering European economy and strong US consumer spending, have pushed stock valuation to decade high multiples, comparable to 2004 levels. While there are no signs of overheating, our cautious nature encourages us to pay attention to the fact that growth rates are a third of what they were in 2004, inflation and ISM have disappointed recently and the Trump administration still needs to prove its ability to implement reforms. While we do not dispute that operating conditions for many US and European companies are improving, we do not believe we, or anyone else for that matter, have a consistent competitive advantage in making macro predictions. Therefore, we will continue investing fundamentally with a margin of safety and stick to our principles of valuation and quality.

SANLAM UNIVERSAL FUNDS PLC
61
SANLAM FOUR STABLE GLOBAL EQUITY FUND (CONTINUED)
Fund Outlook (continued) In spite of elevated market levels, we continue to find good investment opportunities across a variety of companies with the best values found amongst Healthcare and Information Technology. As always, we expect that the markets will eventually recognise the true resilience and long-term earnings power of our companies and reward them with higher ratings and higher share prices. For healthcare companies, we see the more strident rhetoric of the election campaigns starting to shift as the complexity of policy becomes more apparent, giving some respite to the sector. The failure of the GOP to repeal Obamacare is the latest reminder of how hard it will be for Trump to deliver on campaign promise, which is why we remain invested in resilient businesses that can grow their earnings in a variety of political or economic conditions. In some cases, our companies are part of the solution to reduce the cost of healthcare in the US. In IT, we expect our holdings to remain immune from political machinations and enter periods of accelerated growth as they transition from investment or restructuring phases to execution. In the case of Oracle and Microsoft we expect fast growth of their cloud businesses. In the case of eBay, we expect an acceleration of their GMV, driven by improved search results, traffic conversion and overall user experience. We expect HP to continue generating cash and win a share in personal systems and printers, with 3D printing growing quickly into a profitable industry leader. These attractive valuations are for a group of companies which have excellent returns on equity (an average of 28%) and are steadily growing earnings and cash flows. We believe that these offer a strong prospective return over the next few years, with significantly less sensitivity to uncertain economic outcomes. Investment Manager
Sanlam FOUR Investments UK Limited

SANLAM UNIVERSAL FUNDS PLC
62
SANLAM FOUR ACTIVE UK EQUITY FUND
Investment Objective The Sanlam FOUR Active UK Equity Fund (the “Fund”) aims to target capital growth over the longer-term.
Fund Performance
Note: The Fund is bench marked against FTSE All Share Index. Performance figures longer than 12 months are annualised. Figures
are quoted gross of Investment Manager and Manager fees.
The Fund has performed respectably over the six months to end June 2017, returning +7.2% compared
with the benchmark FT All Share Index of +5.5%.
All of the out-performance has come from stock-selection, and, furthermore, this was dominated by
positive selection in the Technology sector.
Having seen performance suffer from the Brexit vote last year, and then partially recover in H2, the first
half of 2017 has witnessed a return to more traditional drivers of performance, although Brexit is clearly
still an issue amongst several. More important, however, has been the fading of hopes for US economic
stimulus from the Trump administration, thus leading to a reversal of the US dollar and a return to lower
bond yields. Global growth has held up well, however, as the European economy has gathered
momentum, while China, Japan, and Emerging Markets more generally, have all surprised positively.
Against this backdrop Consumer Goods sectors have been strong as their “bond proxy” characteristics
have returned to favour, but so too have Industrials and Technology on global growth optimism. In
contrast, the worst sector has been Oils, as the supply agreement established last year has so far failed to
bring down the large excess of oil stocks, and the oil price has therefore weakened following earlier
optimism.
Our largest positive performance contributors have been IQE (+121%) and Sophos, (+60.0%), the latter a
new holding at the start of the year. In both cases positive trading updates have drawn investor’s
attention to the acceleration in sales growth now underway at these companies. Also significant have
been First Derivatives (+35%), International Consolidated Airlines (+40.9%) and Market Tech Holdings
(+35%), the latter having benefitted from a takeover bid from majority shareholder Terry Sagi.
0%
2%
4%
6%
8%
1st Qtr 2017 2nd Qtr 2017 YTD Inception
Fund GBP-terms 5.29% 1.85% 7.24% 6.03%
Benchmark 4.04% 1.40% 5.49% 5.70%
Excess return 1.25% 0.45% 1.75% 0.33%

SANLAM UNIVERSAL FUNDS PLC
63
SANLAM FOUR ACTIVE UK EQUITY FUND (CONTINUED) Fund Performance (continued)
Partially offsetting these positive factors was negative drag from a varied array of holdings, the most
significant being domestic UK situations, including Pets at Home (-25.4%, sold in the period), BT Group (-
19.7%, impacted by significant losses and right-downs in Italy) and ITV (-8.0%, on downgrades to
advertising spend expectations).
Several new holdings were established in the early part of the period, namely HSBC, GlaxoSmithKline,
Sainsbury, Sophos and Great Portland Estates, with Imperial Brands being purchased at the end of the
period. Stocks sold out from the portfolio were Tullow Oil, Pets at Home, Equiniti, Mears, WPP, Watkin
Jones and OPG Power Ventures.
Fund Outlook
The net effect of portfolio changes has been to increase the average market capitalisation, further reduce
the portfolio tracking error, and raise the overall dividend yield. Sector risks have been reduced rather
than stock risk, and it is therefore expected that stock selection, as evident in the current period, will
continue to be the main driver of performance.
The broader UK economic backdrop has deteriorated somewhat as Brexit uncertainty is weighing on
confidence and consumer incomes are falling in real terms. However, from a stock-market standpoint,
sterling weakness is good for international competitiveness and the translation of overseas profits, which
account for a majority of total profits for listed UK companies.
The positive international outlook should therefor continue to be supportive for the UK market, and our
portfolio is well placed to benefit from this.
Investment Manager
Sanlam FOUR Investments UK Limited

SANLAM UNIVERSAL FUNDS PLC
64
SANLAM FOUR MULTI-STRATEGY FUND Investment Objective The Sanlam FOUR Multi-Strategy Fund (the “Fund”) aims to seek to outperform the Consumer Price Index by 4% per annum over five-year periods with a target of generating a positive absolute return on a rolling 3 year basis.
Fund Performance
Note: The Fund is bench marked against the Consumer Price Index plus 4%. Performance figures longer than 12 months are
annualised. Figures are quoted gross of Investment Manager and Manager fees.
H1 - The momentum strategy has seen the allocation to equities ranging between 24% and 42% over the
period under review, and where possible we have continued to take exposure through index options. In
the period we reinvested proceeds from maturing bonds and we added to real assets predominantly
through placings.
We also added the aviation sector to the infrastructure satellite. Midcap alpha exposure was reduced via
our risk control process and futures positions were rolled forward. Option positions were reset to reflect
current market levels.
0%
2%
4%
6%
1st Qtr 2017 2nd Qtr 2017 YTD Inception
Fund GBP-terms 2.31% 2.13% 4.49% 3.63%
Benchmark 0.69% 1.18% 1.87% 1.29%
Excess return 1.62% 0.95% 2.62% 2.34%

SANLAM UNIVERSAL FUNDS PLC
65
SANLAM FOUR MULTI-STRATEGY FUND (CONTINUED) Fund Performance (continued) The table below show the allocation of the underlying investment strategy for the year H1 2017:
Exposure Jan %
Feb %
Mar %
Apr %
May %
Jun %
Momentum Strategy
UK 6 6 6 6 0 6
US 6 6 6 6 6 6
Europe ex UK 6 6 6 6 6 6
Japan 6 6 6 6 0 6
Asia ex Japan 0 6 6 6 6 6
Emerging Markets 0 6 6 6 6 6
BRICs 0 0 0 0 0 0
Global 0 6 6 6 6 6
Sub-total 24 42 42 42 30 42
Satellite Strategies
Property 5 5 6 6 6 6
Infrastructure 9 10 10 10 10 10.5
EM vs. DM 0 0 0 0 0 0
Mid-cap vs Large-cap 15
(Long Mid) 15
(Long Mid) 7.5
(Long Mid) 7.5
(Long Mid) 7.5
(Long Mid) 7.5
(Long Mid)
High Yield 12 12 12 12 12 12
Investment Grade 9 10 12 12 13 11.5
Synthetic Option 20 22 19 19 20 21
Renewable Energy 9 9 9 9 9 9
Commodities 0 0 0 0 0 0
Opportunistic 0 0 0 0 0 0
Hedge 1 1 2 2 1 3
Sub-total 64 68 68 77.5 78.5 80.5
Source: Sanlam FOUR Investments UK Limited
Fund Outlook Brexit negotiations began with the recent election result pointing the government towards a "soft exit". Whilst "soft Brexit" sounds better than "hard Brexit" what either actually mean in practice remains a mystery. Hawkish tones from the Bank of England have pushed the UK 10 year to levels last seen in November 2016. On the horizon, you also have the uncertainty of an election in Germany and simmering tensions in the Middle East and the potential removal of stimulus by major central banks making the markets nervous. The Fund continues to employ a “barbell” combining diversified long-term income producing investments with option based equity exposure which allows us to participate in the positive moves but prepared to defend if negative moves occur.
Positioning
We continue to favour structured options for equity exposure as volatility is currently at quite low levels.
These positions sit alongside stable cash generative assets such as infrastructure, renewable energy and
property securities. A quarter of the portfolio is currently invested in these real assets which have a strong
link to inflation and yields in excess of 4%. Our risk to interest rates is relatively low due to a weighted
duration of 1.5 years in fixed income portfolio.
Investment Manager
Sanlam FOUR Investments UK Limited

SANLAM UNIVERSAL FUNDS PLC
66
ANCHOR GLOBAL CAPITAL PLUS FUND
Investment Objective The Anchor Global Capital Plus Fund (the “Fund”) aims to provide capital growth over the long-term.
Fund Performance
Note: The Fund is bench marked against 50% 3 Month US Libor +.50% 3 Month Euribor + 2.5% p.a. Performance figures longer
than 12 months are annualised. Figures are quoted gross of Investment Manager and Manager fees.
The 1st quarter of 2017 saw the continuation of the rally of risk assets which started with the election of Donald Trump as US president late in 2016. The rally did stutter into the end of the quarter as doubts began to creep in about Trump’s ability to fulfill his market-friendly campaign promises, as he stumbled at the 1st hurdle with his failure to get Obama’s affordable care act repealed by congress. That wasn’t enough to prevent the MSCI World Equity Index from delivering its best quarterly return since 2013. Bonds also posted a decent gain, having recovered from a 4th quarter sell off on the back of heighted expectations around the return of inflation. The Fund was up 1.67% in the quarter with contributions from all asset classes.
The 2nd
quarter of 2017 saw a shakey start as the market became concerned about the prospect of a Marine Le Pen victory in French elections causing ructions in the European Unition. The eventual victory of Emmanuel Macron, seen as a more market and EU friendly candidate, brought some relief and coincided with a pick up in European economic data resulting in strong gains for the Euro and European stocks. Lack of inflation has kept a lid on bond yields and while central banks in Europe and the US are now latking about removing the extraordinary levels of monetary stimulus, the lack of inflation and the apparent inability of US president Donald Trump to enact any meaningfully pro growth policies is keeping bond yields low and equity markets supported.
Fund Outlook With moderately higher bond yields globally, the Fund has been able to add to bond exposures, though is still cautiously positioned with low duration as the prospect of tighter monetary conditions could still push yields off their historically low levels. The Fund’s property exposure has edged slightly higher, but is cautiously positioned away from US retail property, where an oversupply of malls and a structural shift of shopping to online is creating major problems for the sector. In equities, the Fund has been conservatively positioned, and while the opportunity cost of that has been high, with rampant equity markets, now doesn’t seem like the appropriate time to be increasing exposure.
Investment Manager Anchor Capital (Pty) Limited
-4%
-2%
0%
2%
4%
1st Qtr 2017 2nd Qtr 2017 YTD Inception (ann.)
Fund USD-terms 1.67% 1.00% 2.68% -0.10%
Benchmark 0.72% 0.73% 1.45% 2.74%
Excess return 0.95% 0.27% 1.23% -2.84%

SANLAM UNIVERSAL FUNDS PLC
67
BRIDGE GLOBAL EQUITY INCOME GROWTH FUND
Investment Objective The Bridge Global Equity Income Growth Fund (the “Fund”) aims to seek income (more in the form of dividends) and capital growth over the long term. Income (which will be reinvested in the portfolio) will be a key component of the portfolio return. The Fund’s name was changed this year from Grindrod Global Equity Income Growth Fund to Bridge Global Equity Income Growth Fund to reflect the fact that the Investment Manager of the Fund changed its name from Grindrod Asset Management (Pty) Limited to Bridge Fund Managers (Pty) Limited.
Fund Performance
Note: The Fund is benchmarked against US Consumer Price Index plus 5%. Performance figures longer than 12 months are
annualised. Figures are quoted gross of Investment Manager and Manager fees.
The US Federal Reserve (“Fed”) increased their US target interest rate by 25bps at both their March and June meetings, with the current rate now at 1.25%. According to the Fed, the US labour market has continued to strengthen and the latest batch of US economic data shows that economic activity has been rising moderately in 2017. The US unemployment rate has fallen to the lowest level in 16 years following 80 consecutive months of jobs growth. The Fed also announced that the US$4.5 trillion bond portfolio it had acquired through a series of quantitative easing programmes would be sold gradually. Central bankers took centre stage in the UK and Eurozone during June. Governor of the Bank of England, Mark Carney, suggested that interest rates in the UK may need to be raised soon. He did qualify his statement by adding that any upward move in official interest rates would depend on several factors, including how the UK economy responds to tighter financial conditions and the reality of Brexit negotiations. Carney’s comments followed a statement from the European Central Bank (“ECB”) that it was considering removing some stimulus as the European economic recovery continued to gather momentum. On the back of these hawkish comments, the yield on US 10-year Treasuries rose, while the yield on German 10-year bunds increased to their highest monthly close since December 2015. The Dow Jones Industrial Average, S&P 500 Index and NASDAQ Composite Index rose by 9.3%, 9.3% and 14.7% during the first half of 2017. The NASDAQ Composite Index is dominated by heavyweight tech-stocks like Apple, Amazon, Alphabet (Google’s parent) and Facebook which have all posted strong gains during 2017. Many investors have now started to question the lofty valuations of the world’s leading tech stocks. The NASDAQ Composite Index lost more than 2% of its value in the final week of June and 3% since rising to a record high on 8 June. Equity markets in the UK and Europe declined as both pound sterling and the euro appreciated against the US dollar. Despite the increase in global bond yields, the GPR 250 REIT Index has increased 2.55% year to date on the back of a rally in US and European REITs.
0%
2%
4%
6%
8%
10%
12%
14%
16%
1st Qtr 2017 2nd Qtr 2017 YTD Inception
Fund USD-terms 4.50% 3.96% 8.46% 15.48%
Benchmark 2.13% 1.00% 3.13% 10.09%
Excess return 2.37% 2.96% 5.33% 5.39%

SANLAM UNIVERSAL FUNDS PLC
68
BRIDGE GLOBAL EQUITY INCOME GROWTH FUND (CONTINUED) Fund Performance (continued) The Fund has advanced 8.46% year to date on the strong returns from equities together with moderate returns from listed property markets. As the Fund’s benchmark is inflation and not market-linked, the Fund outperformed the benchmark by 5.33% over this period. Fund Outlook There is still significant political uncertainty which is likely to influence the direction of financial markets in the second half of 2017. The election of Emmanuel Macron as the next French president over Marine Le Pen in May did dampen the wave of anti-EU populism that had started to gain momentum last year. The German federal elections are scheduled to occur later this year, where we may see Angela Merkel’s leadership being challenged, increasing uncertainty for financial markets in the short-term. While the Fed appears committed to a further rate hike this year, current economic data suggests that economic activity has slowed, which may push the next hike into 2018. If Donald Trump and his administration get their way, US economic growth will accelerate in 2017 and 2018 and the Fed will raise interest rates as inflation moves beyond the 2% target rate. Bond yields will rise and the US dollar is likely to strengthen, given limited scope in other developed markets to raise interest rates in 2017. While this may potentially be supportive of the US equity market, it will provide a difficult backdrop for global listed property markets as well as equity markets outside the US. The Fund allocates 90% of the portfolio to high quality businesses that are expected to deliver inflation-beating earnings growth over the medium and long term and reward shareholders with above-average dividend yields. The Fund also allocates 10% of the portfolio to listed property companies that offer the highest possible combination of income yield and income growth, while at the same time providing an acceptable level of property and geographic diversification. As a result, the Fund is expected to exhibit lower price volatility in the short-term, without compromising the potential to deliver on the Fund’s long-term objective of providing returns in excess of US CPI+5%. Investment Manager
Bridge Fund Managers (Pty) Limited

SANLAM UNIVERSAL FUNDS PLC
69
ANCHOR GLOBAL EQUITY FUND Investment Objective The Anchor Global Equity Fund (the “Fund”) aims to provide capital growth over the long-term.
Fund Performance
Note: The Fund is benchmarked against MSCI World All Country Total Return Net USD Index. Performance figures longer than 12
months are annualised. Figures are quoted gross of Investment Manager and Manager fees.
The Fund enjoyed a solid first half of 2017. The majority of the Fund’s holdings have executed well operationally and their share prices have been rewarded accordingly. Merger and acquisition activity has picked up recently, with one of our top 10 holdings, medical device manufacturer Becton Dickinson, bidding for another, CR Bard. We remain bullish on Becton’s prospects following the deal, which is expected to conclude by the end of the year. The Fund’s cash balance has been rising over the last several months, primarily as a function of client inflows. In addition, we have gradually trimmed our Technology sector exposure as valuations have risen and investor sentiment and positioning have become stretched. As long term investors our bias is to avoid selling out entirely, which is usually a mistake for best-in-class businesses. It’s hard to know when to buy back in as, more often than not, one’s repurchase price target is never reached. Our strategy is therefore somewhat ‘hedged’: if the shares continue to rise we still participate; if they fall we can increase our holding at better prices. As such, we are content to wait for an opportunity to add meaningfully to these positions. This could arrive in the form of a broad market correction, or sector rotation as enthusiasm for the Technology sector inevitably wanes. Fund Outlook Global equity markets have had a strong start to the year, buoyed by a weak US dollar and abundant liquidity. Volatility has been virtually non-existent. We suspect that this benign environment will become more challenging as the year progresses, although timing is, as always, uncertain. We look forward to the return of volatility as this will provide an opportunity to load up on high quality businesses at attractive prices. If anything, we believe a market correction could set the stage for improved absolute and relative returns. Investment Manager
Anchor Capital (Pty) Limited
0%
2%
4%
6%
8%
10%
12%
14%
16%
18%
1st Qtr 2017 2nd Qtr 2017 YTD Inception
Fund USD-terms 10.17% 6.32% 17.12% 7.45%
Benchmark 6.91% 4.27% 11.48% 6.89%
Excess return 3.26% 2.05% 5.64% 0.56%

SANLAM UNIVERSAL FUNDS PLC
70
BRIDGE GLOBAL MANAGED GROWTH FUND
Investment Objective The Bridge Global Managed Growth Fund (the “Fund”) aims to seek income and moderate capital growth over the long term. Income (which will be reinvested in the portfolio) will be a key component of the portfolio return. The Fund’s name was changed this year from Grindrod Global Managed Growth Fund to Bridge Global Managed Growth Fund to reflect the fact that the Investment Manager of the Fund changed its name from Grindrod Asset Management (Pty) Limited to Bridge Fund Managers (Pty) Limited.
Fund Performance
Note: The Fund is benchmarked against US Consumer Price Index plus 3%. Performance figures longer than 12 months are
annualised. Figures are quoted gross of Investment Manager and Manager fees.
The US Federal Reserve (“Fed”) increased their US target interest rate by 25bps at both their March and June meetings, with the current rate now at 1.25%. According to the Fed, the US labour market has continued to strengthen and the latest batch of US economic data shows that economic activity has been rising moderately in 2017. The US unemployment rate has fallen to the lowest level in 16 years following 80 consecutive months of jobs growth. The Fed also announced that the US$4.5 trillion bond portfolio it had acquired through a series of quantitative easing programmes would be sold gradually.
Central bankers took centre stage in the UK and Eurozone during June. Governor of the Bank of England, Mark Carney, suggested that interest rates in the UK may need to be raised soon. He did qualify his statement by adding that any upward move in official interest rates would depend on several factors, including how the UK economy responds to tighter financial conditions and the reality of Brexit negotiations. Carney’s comments followed a statement from the European Central Bank (“ECB”) that it was considering removing some stimulus as the European economic recovery continued to gather momentum.
On the back of these hawkish comments, the yield on US 10-year Treasuries rose, while the yield on German 10-year bunds increased to their highest monthly close since December 2015. The Dow Jones Industrial Average, S&P 500 Index and NASDAQ Composite Index rose by 9.3%, 9.3% and 14.7% during the first half of 2017. The NASDAQ Composite Index is dominated by heavyweight tech-stocks like Apple, Amazon, Alphabet (Google’s parent) and Facebook which have all posted strong gains during 2017. Many investors have now started to question the lofty valuations of the world’s leading tech stocks. The NASDAQ Composite Index lost more than 2% of its value in the final week of June and 3% since rising to a record high on 8 June. Equity markets in the UK and Europe declined as both pound sterling and the euro appreciated against the US dollar. Despite the increase in global bond yields, the GPR 250 REIT Index has increased 2.55% year to date on the back of a rally in US and European REITs.
-2%
0%
2%
4%
6%
8%
1st Qtr 2017 2nd Qtr 2017 YTD Inception
Fund USD-terms 3.40% 3.49% 6.89% 3.97%
Benchmark 1.63% 0.50% 2.13% 4.94%
Excess return 1.77% 2.99% 4.76% -0.97%

SANLAM UNIVERSAL FUNDS PLC
71
BRIDGE GLOBAL MANAGED GROWTH FUND (CONTINUED) Fund Performance (continued) The Fund has advanced 6.89% year to date on the strong returns from equities together with moderate returns from listed property markets and its allocation to bonds. As the Fund’s benchmark is inflation and not market-linked, the Fund outperformed the benchmark by 4.76% over this period. Fund Outlook
There is still significant political uncertainty which is likely to influence the direction of financial markets in the second half of 2017. The election of Emmanuel Macron as the next French president over Marine Le Pen in May did dampen the wave of anti-EU populism that had started to gain momentum last year. The German federal elections are scheduled to occur later this year, where we may see Angela Merkel’s leadership being challenged, increasing uncertainty for financial markets in the short-term. While the Fed appears committed to a further rate hike this year, current economic data suggests that economic activity has slowed, which may push the next hike into 2018. If Donald Trump and his administration get their way, US economic growth will accelerate in 2017 and 2018 and the Fed will raise interest rates as inflation moves beyond the 2% target rate. Bond yields will rise and the US dollar is likely to strengthen, given limited scope in other developed markets to raise interest rates in 2017. While this may potentially be supportive of the US equity market, it will provide a difficult backdrop for global listed property markets as well as equity markets outside the US. The Fund allocates 65% of the portfolio to high quality businesses that are expected to deliver inflation-beating earnings growth over the medium and long term and reward shareholders with above-average dividend yields. The Fund also allocates 25% of the portfolio to listed property companies that offer the highest possible combination of income yield and income growth, while at the same time providing an acceptable level of property and geographic diversification. The balance of the portfolio comprises short and medium-dated government and corporate debt. As a result, the Fund is expected to exhibit lower price volatility in the short-term, without compromising the potential to deliver on the Fund’s long-term objective of providing returns in excess of US CPI+3%.
Investment Manager
Bridge Fund Managers (Pty) Limited

SANLAM UNIVERSAL FUNDS PLC
72
SIM GLOBAL EMERGING MARKETS FUND Investment Objective The investment objective of the SIM Global Emerging Markets Fund (the “Fund”) is to provide a regular income stream for investors with the potential for capital growth. It aims to provide a regular income which will be in line with the annual average dividend yield of the MSCI World High Dividend Yield NTR Index (Bloomberg Code: MHDYWOUN) as well as provide capital growth exceeding inflation.
Fund Performance
Note: The Fund is bench marked against the MSCI World High Dividend Yield NTR Index. Performance figures longer than 12
months are annualised. Figures are quoted gross of Investment Manager and Manager fees.
For the six months ending 30 June 2017, the MSCI Emerging Market Index outperformed the MSCI World
Index by 7.7%. News flow within emerging markets was diverse. Some of the headlines reflected issues
that created significant volatility in portfolios but at the same time they created opportunities for investors.
Although the election of Trump as the US President caused concerns for investors, towards those
emerging markets with high amount of trade with the US, the first quarter saw EM perform strongly on the
back of stabilising commodity prices, inflows of capital, improving earnings and a slow rate rising trajectory
from the Federal Reserve.
In the second quarter, Brazil was thrown back into turmoil as President Temer was implicated in the
Brazilian corruption saga. Russia continues to be reliant on the oil price which looks likely to stay weak.
While growth is slow, Russian producers remain profitable at these oil price levels, unlike many other
regions. India saw the implementation of the Goods and Services Tax (GST), which will be positive for
growth in the medium term and disruptive in the shorter term. China saw the MSCI announce the inclusion
of 222 China A-share companies to the MSCI Emerging Markets index. After the removal of Pravin
Gordhan, we have seen two rating agencies downgrade South Africa’s foreign currency credit rating to
sub-investment grade. South Africa’s local currency debt has retained its investment grade rating from
Standard & Poor's and Moody’s in the short term, but its inclusion in the World Government Bond Index
(WGBI) is looking unlikely if the ANC do not improve soon.
-4%
-2%
0%
2%
4%
6%
8%
10%
12%
14%
16%
18%
1st Qtr 2017 2nd Qtr 2017 YTD Inception
Fund USD-terms 13.24% 3.48% 16.72% 14.64%
Benchmark 11.45% 6.27% 17.72% 8.74%
Excess return 1.79% -2.79% -1.00% 5.90%

SANLAM UNIVERSAL FUNDS PLC
73
SIM GLOBAL EMERGING MARKETS FUND (CONTINUED) Fund Performance (continued)
Emerging market countries that performed strongly during the first quarter were Poland, India and Korea.
Those countries that underperformed were Russia, Greece and Qatar. Strong performing countries in the
second quarter were Greece, Turkey and Poland and underperformers were Qatar, Russia and Brazil.
For the first and second quarter, Information Technology and Consumer Discretionary were outperformers
while Energy underperformed for both periods. While many EM currencies weakened against the US
Dollar post the US presidential outcome, the first quarter saw many of them reverse that trend. The
second quarter saw emerging market currencies move based on their unique macro factors, such as
political risks and commodity price weaknesses. Outperformance within the portfolio was driven by
NetEase, Sun TV Network and Arcos Dorados in the first quarter with Magnit, Matahari and TSKB
detracting from performance. The portfolio underperformed its benchmark in the second quarter - driven
by Esprit, Sberbank and Magnit with contributors to the performance being Alibaba, Samsung and Bank
Rakayat.
Fund Outlook
Emerging markets continue to benefit from a combination of low valuations, relatively stable political
climates, improving business sentiment, and central banks that in most cases have room to reduce
interest rates to stimulate growth if needed. Investing is a long term endeavour and we are confident that our bottom up approach of constructing the portfolio will see the patient investor richly rewarded. We focus on companies:
with strong sustainable competitive advantages;
which generate returns well above their cost of capital;
which generate significant free cash flow; and
which are trading at significant discounts to their intrinsic value.
Investment Manager Sanlam Investment Management (Pty) Limited

SANLAM UNIVERSAL FUNDS PLC
74
ABSA AFRICA EQUITY FUND Investment Objective The ABSA Africa Equity Fund (the “Fund”) aims to provide long-term capital growth through exposure to African equity securities by investing in equity securities listed on recognised stock exchanges across the African continent as well as equities that may be listed and/or traded in recognised exchanges outside of Africa. Fund Performance
Note: The Fund is bench marked against the MSCI Africa ex South Africa Index. Performance figures longer than 12 months are
annualised. Figures are quoted gross of Investment Manager and Manager fees.
The Fund was launched on 21 November 2016. Its seed funding included a transfer of cash and securities from all markets that the legacy fund was invested in with the exception of Egypt. The process of moving assets from Egypt was only fully completed in January 2017 which resulted in a significant underweight positioning in Egypt, a market which rallied 6% in December 2016, driving a 4% rally in the benchmark. In the first quarter of 2017, our immediate objective was to rebalance the Fund’s positioning to reflect our views on stocks within our opportunity set. The Fund aims to be overweight North and East Africa and underweight commodity exporters in particular oil exporting Nigeria. The Fund returned 18.8% for the 6 month period to 30 June 2017 versus a return of 16.7% for the benchmark, an outperformance of 2.1% over the period. The 2nd quarter saw the Fund underperform its benchmark by 4.6% which was disappointing and attributable mainly to the Fund’s benchmark not discounting the Nigerian official FX rate to reflect the actual FX rate available to market participants. In our view, commodity/resource countries can no longer rely on global demand tailwinds for their primary exports to drive economic growth and corporate earnings. Instead they must formulate and deliver on economic policies that will foster sustainable improvement in productivity and economic growth. We will maintain our underweight in Nigeria until such a time as we see such a policy tilt emerge. In contrast to Nigeria, we aim to be overweight East Africa. Unlike resource/commodity dependent countries East African economies continue to experience a high rate of growth in per capita income driven by public and private investment programs particularly in the rail, road, port and power sectors of the economy. The high growth economies of tomorrow are the ones investing today. More importantly, we see significant under-pricing of that growth in high quality listed companies in the consumer goods and utility sectors.
-6%
-4%
-2%
0%
2%
4%
6%
8%
10%
12%
14%
16%
18%
20%
22%
1st Qtr 2017 2nd Qtr 2017 YTD Inception
Fund USD-terms 5.5% 12.6% 18.8% 20.5%
Benchmark -0.4% 17.2% 16.7% 21.6%
Excess return 5.9% -4.6% 2.1% -1.1%

SANLAM UNIVERSAL FUNDS PLC
75
ABSA AFRICA EQUITY FUND (CONTINUED)
Fund Performance (continued)
In the case of Egypt, we see the seeds of an investment-lead economic boom over a medium term as well
as one of the most compelling long term emerging consumer themes on the continent. The Fund aims to
be well positioned to participate in targeted growth sectors such as power, construction, healthcare
consumer goods and financial services.
Fund Outlook
We expect a cooling of sentiment in the third quarter on the back of such an aggressive rally in the
second. Any dips in the market may present opportunities to buy particularly in Kenya and Nigeria. The
risk of a major drawdown are low in our view given the current environment of improved reform credibility
in Egypt and Nigeria coupled with emerging and frontier market inflows globally.
Investment Manager
Absa Asset Management (Pty) Limited

SANLAM UNIVERSAL FUNDS PLC
76
SANLAM CENTRE AMERICAN SELECT EQUITY FUND Investment Objective The Sanlam Centre American Select Equity Fund (the “Fund”) aims to achieve long-term capital growth. Fund Performance
Note: The Fund is bench marked against MSCI North America Index. Performance figures longer than 12 months are annualised. Figures are quoted gross of Investment Manager and Manager fees.
For the six month period ended 30 June 2017, the Fund delivered a total return of 11.71%.
The Fund benefited from positive alpha across Information Technology due to allocation and stock
selection (Activision Blizzard, NVidia, Alphabet, Corning); Consumer Discretionary due to stock selection
(Amazon.com, Coach, Ralph Lauren, Wyndham, Carnival); Consumer Staples due to allocation and stock
selection (Altria, Whole Foods); Energy due to allocation and stock selection (Cabot Oil & Gas, Williams
Cos.) and Health Care due to stock selection (C.R. Bard, Johnson & Johnson, UnitedHealth).
Performance was negatively impacted from a total return perspective by the amortization costs of certain
hedges and other investments that we deemed to be capital protective in nature. Given the continued
presence of certain potentially de‐stabilizing factors that we believe could negatively impact the value of
underlying equity securities held in the Fund at this current stage of the stock market and economic cycle,
as of 30 June 2017, the Fund continued to hold capital protection hedges, namely put options on the S&P
500 Index, as a potential “tail hedge” against its underlying stock holdings in the event of a material
correction.
Fund Outlook
It’s tough to remember a period of time other than the election of Ronald Reagan in 1980 when a change
in the U.S. presidency ushered in such a change in hope, at least in terms of expression by financial
markets. Perhaps it is due to the shift in near-consensus thinking that Hillary Clinton would win and that
the general prevailing environment characterized by low growth, low interest rates, and company earnings
driven almost solely from either innovation, cost-cutting or, more ominously, financial engineering, would
continue indefinitely, leaving those geared toward an improving economy languishing with near nil top-line
growth and deteriorating profit margin.
0%
2%
4%
6%
8%
10%
12%
14%
1st Qtr 2017 2nd Qtr 2017 YTD Inception
Fund USD-terms 8.16% 3.55% 11.71% 12.03%
Benchmark 5.88% 2.82% 8.70% 10.88%
Excess return 2.28% 0.73% 3.01% 1.15%

SANLAM UNIVERSAL FUNDS PLC
77
SANLAM CENTRE AMERICAN SELECT EQUITY FUND (CONTINUED)
Fund Outlook (continued)
With low interest rates leaving little alternative for investors, the flow into equities, particularly from early
2015, narrowed towards those companies that genuinely could distinguish themselves with innovative
growth or stable earnings and, hence, were afforded valuation multiples only seen at other prior market
cycle peaks or reminiscent of the original Nifty-Fifty1 era. This all seemed to change the day after the
election. Namely, the narrative for owning stocks shifted from the “stick” of low interest rates to the “carrot”
of better economic growth, with the hope that this would lead to an acceleration of profits after a more
than two year period of broad based profits and margin decline. Although profits did begin to turn in the
summer prior to the election due to stability of commodity prices mainly, forward looking and long term
expectations across all sectors took on an incredibly robust tone afterwards. The important point to make
in all this is that the election of Donald Trump is potentially a move away from the status quo and, if the
Republican primary contest illustrated anything, he has little to gain in an about face and become a
product of the establishment. If he was genuine and pushes for real change and satisfies his electorate,
Middle America, we should move to a market environment that is much different from the one that we
have been in since 2014, which is reflected in the stock market’s performance since the election. Thus far
however, it seems that Trump is being consumed by the Washington Swamp rather than enforcing his
stated populist goal to drain it so investors find themselves facing greater uncertainty which should by
itself increase risk premiums and lower valuation multiples across all financial assets.
It cannot be stressed enough that the support for Trump in the recent U.S. Presidential election came
principally from the U.S. industrial and agricultural heartlands. The blue-collar workers in these States
such as Pennsylvania, Michigan, and Ohio have had to contend with the loss of higher-paying
manufacturing jobs and increased benefit and retirement uncertainty. The steady offshoring of American
manufacturing jobs to lower cost countries, most notably Mexico and China, has come about through the
implementation of the North American Free Trade Agreement (“NAFTA’) and China’s entry into the World
Trade Organization (‘WTO”) under currency conditions that tremendously benefitted China in its
mercantilist trade pursued since. In the meantime, U.S. corporations have benefited from much lower
input costs without having to face any costs on importation of their products as well as being able to
subordinate their traditional pension obligations to the government or domestic workforce. Candidate
Trump effectively blamed the political class and promised to introduce measures to make American great
again. Furthermore, his celebrity and showmanship allowed him to be perceived as the only person who
could take decisive action, even though his policies for doing so were somewhat incoherent and voters
relied on the hope that he actually believed in what he espoused on the campaign trail.
1 Nifty-Fifty is the 50 stocks that were most favored by institutional investors in the 1960s and 1970s. Companies in this group were
usually characterized by consistent earnings growth and high price-to-earnings ratios. Price-to-earnings ratio is a ratio for valuing a
company that measures its current share price relative to its per-share earnings.

SANLAM UNIVERSAL FUNDS PLC
78
SANLAM CENTRE AMERICAN SELECT EQUITY FUND (CONTINUED)
Fund Outlook (continued)
From an economic perspective, Trump has advocated tax and trade measures that will address the
problems created by free trade or what he calls, “bad trade deals.” Trump also expressed an America-first
policy, which would result in a retreat from America’s role as a global policeman that’s been in place since
the 1950’s and a re-focus of the White House’s energy on domestic problems, particularly America’s
ageing infrastructure. In sum, the top priority for Trump is to come up with a plan for economic growth that
will actually benefit his core constituencies in industrial America. Extending the impact of his pro-growth
priorities makes a strong case for better domestic economic growth but it also creates an environment of
higher inflation and interest rates as well as higher compensation and input costs, which historically have
been bad for the stock market. In essence, President Trump is in a quandary, implement measures that
satisfy his voter base and increase economic growth but, at the same time, contribute to what may be a
very poor stock market as profit margins and valuations compress. We don’t see how he can accomplish
both, particularly since broad market valuation measures that we deem important indicate that U.S.
stocks, on a median basis, are the most expensively valued ever, even more so than in 2000 or in 2008
prior to the start of severe market declines. Furthermore, the degree of financial engineering – stock
buybacks financed with debt, etc. – are dependent on an environment of low interest rates and vulnerable
to increases in inflation and debt risk premiums.
Unfortunately, the Reaganesque hope parallel that surrounds financial markets today has several
potential problems, and the challenges that Trump faces are relatively daunting, maybe because of very
unequal starting points between 1980 and today. Firstly, on a macro basis the U.S. has a debt to GDP
ratio of over 100% and U.S. corporations have the highest debt to assets ratios ever seen, both of which
are only serviceable due to extraordinary low interest rates. This leaves little room to undertake the
massive capital investment and infrastructure plans, public and private, without jeopardizing the existing
serviceability of debt as interest rates would be expected to rise, perhaps significantly. Rates are already
too low and are rising, suggesting an economic headwind rather than support. Second, the growth of
developing countries as manufacturing destinations as a lower-cost alternative is somewhat entrenched
due to the incredible transfer of knowledge and intellectual property overseas and the fact that significant
wage differentials still exist between the U.S. and the developing world, even for skilled labor. Thirdly,
recent geopolitical and military actions show how difficult it will be for the U.S. to withdraw from its role as
a global policeman and focus instead on its domestic priorities. It seems that President Trump has already
flipped on his beliefs in stressing his America-first program and the wholesale cut to U.S. defense
expenditures that would be required to fund domestic stimulus, tax cuts and infrastructure and, at the
same time, maintain entitlements which seem extinguished even before his first one hundred days in
office, and it seems very unlikely that he seeks a conflict with the so-called military-industrial complex and
the Washington political class given his fascination with selecting flag level officers as his confidants.
Fourthly, Trump’s proposed ban on immigration, legal and illegal, contributes to the secular headwinds
against growth. There are two key drivers of economic activity, and one is population growth, and the
second is productivity growth. The reason population growth is so important is that population is the labor
force that potentially produces things. Without people to produce things, you also don't have as many
people to spend on things. Also, from 1982 through 2002, the number of people entering their peak
savings years was increasing every year as the baby boomers were in their peak earnings and savings
years, resulting in a continuously increasing demand for securities. Since the native-born population is not
growing as fast as it used to, barring an unprecedented increase in productivity, and the fact that baby
boomers will now be divesting securities, the secular headwinds seem as strong as ever and the opposite
of when Ronald Reagan took office. Last and perhaps most importantly, the stock market as a whole is in
our opinion overvalued by about 30% and, after having driven valuations to their current extremes on the
basis of ultra-low interest rates, the Wall Street consensus script has been replaced and it’s now higher
growth that will enable valuations to be extended further, despite rising interest rates. With the
financialization of the U.S. economy over the past two decades, we cannot conceive that a poor stock
market will not impact and have a tautological impact on confidence and the economy, even though the
policies geared to improving the domestic economy by nature have historically contributed to a poor stock
market.

SANLAM UNIVERSAL FUNDS PLC
79
SANLAM CENTRE AMERICAN SELECT EQUITY FUND (CONTINUED)
Fund Outlook (continued)
So, given the above and our intermediate-term expectations of difficult conditions for financial assets in
general, what are the investment opportunities for capital growth aside from focusing solely on protection
of capital?
We continue to trim and eliminate stock positions within the “stable growth” area of the market,
namely consumer staples and healthcare. To us, summer of 2016 represented the euphoric top
in these types of stocks and the nadir of bond yields that contributed to their extended valuations.
Our portfolio sales of General Mills, Phillip Morris, Nike, Colgate, SJ Smucker, and other similar
companies on valuation concerns seem prescient in hindsight and, as with the original Nifty-Fifty,
stable growth loses its luster in an environment of rising growth, inflation, and interest rates which
we expect.
Our significant exposure to “innovation,” namely NVidia, Alphabet, Facebook, and Amazon,
remains intact and has been and will likely continue to be supplemented with more cyclical
technology companies such as KLA-Tencor, Corning, Adobe, and Applied Materials.
After getting caught flat footed on “financials” at the time of the election, we see some
fundamental improvement in the domestically focused regional banks as net interest rate margins
improve and some alleviation of regulatory burdens will accrue to them and more so than to
money center and more financial market sensitive investment banks.
Within the “resource” industries, including energy, we have lessened our hard negative posture
that was based on undisciplined capital spending and production but believe that more measured
future production increases will benefit workers and debtholders over shareholders in these
industries mainly but certain companies, such as Noble and Williams hold unique assets or
attributes making them attractive investments in an area otherwise dependent upon a steep
increase in oil prices, which we do not foresee.
Within traditional “cyclical” areas of the market, our current preference is towards the consumer
and we prefer to be exposed positively to the quality of employment and wages derived from an
improved economic environment and Trump’s growth agenda. Also, we’ve witnessed many
companies in the consumer cyclical sector undertake far reaching and efficacious restructurings
of their operations during the growth slowdown over the past two years, examples being Coach,
Whole Foods, Carnival, and Nordstrom, with ample room for margins to expand further and
attractive valuations relative to other areas of the market.
As we progress further into 2017 and beyond, despite our bottom‐up optimism for the companies owned
currently by the Fund, we are less enthusiastic about the prospects for capital gains in U.S. stocks as a
whole. We forecast that fiscal policy potentially will replace monetary policy as the favored means of
economic stimulus but are by no means assured that the transition will be a smooth one or helpful for
investment securities. Also, with capital protection from traditional diversification ebbing, we believe that
our pragmatic large capitalization valuation sensitive growth and concentrated approach to stock
selection, with a cognizance of risk management that includes tactically implementing capital protective
investments, seems positioned to perform well relative to less risk aware strategies within a balanced
overall portfolio.
Investment Manager
Centre Asset Management, LLC

SANLAM UNIVERSAL FUNDS PLC
80
SANLAM GLOBAL CONVERTIBLE SECURITIES FUND Investment Objective
The investment objective of the Sanlam Global Convertible Securities Fund (the “Fund”) is to provide
global equity-like returns with significantly less risk. The objective is achieved by seeking to capture the
majority of stock market advances while simultaneously providing downside protection during market
declines. Statistical focus on convertible structure is used to create a balanced, diversified portfolio that
optimizes the asymmetrical risk/reward characteristics of convertibles. The investment approach is not
reliant on forecasting or market timing. The Fund strives for a consistent risk/reward profile at all times. Fund Performance
Note: The Fund is bench marked against the JP Morgan 3m USD LIBOR +3% p.a. Index. Performance figures longer than 12 months are annualised. Figures are quoted gross of Investment Manager and Manager fees.
The Fund moved significantly higher in the first half of 2017 driven primarily by the ongoing rally in global equity markets. Large cap generally outperformed small cap with Technology names particularly strong. The impact of changes in interest rates and credit was relatively modest. The Fund displayed the projected convexity versus the underlying equities, capturing the majority of the upside when stocks moved higher and providing significant downside protection in instances when they declined. Regionally, the Americas was the top contributor, followed by Europe and Asia. Japan and Africa/Middle East were minor detractors weighed down by relatively weak equity markets. Returns were positive in virtually all sectors with Technology, Media, and Capital Goods the top performers. Energy was the only sector that posted a negative return but the impact on performance was minimal. Activity focused on selling names that had either become too bond-like or too equity sensitive and buying balanced names with attractive asymmetrical risk/reward profiles. New convertible issuance was strong with US$ 41.2 billion added to the market in the first half of 2017. The US was the top issuer followed by Europe. The large volume of new paper served to refresh the market and help moderate valuations. Fund Outlook The outlook for new issuance remains favorable and the convertible market is projected to grow in 2017. This should support liquidity and result in buying opportunities not only in the primary market, but also in the secondary market as investors make room for new paper. With a conversion premium of 21.9% and an investment value premium of 20.1%, the Fund is well-structured to both meaningfully participate should equities continue to advance and provide protection should equity markets reverse. A low duration of 1.87 years should help cushion the Fund from a rise in interest rates. Investment Manager
Zazove Associates, LLC
0%
2%
4%
6%
1st Qtr 2017 2nd Qtr 2017 YTD Inception
Fund USD-terms 3.62% 1.09% 4.71% 5.62%
Benchmark 1.10% 1.07% 2.17% 2.60%
Excess return 2.52% 0.02% 2.54% 3.02%
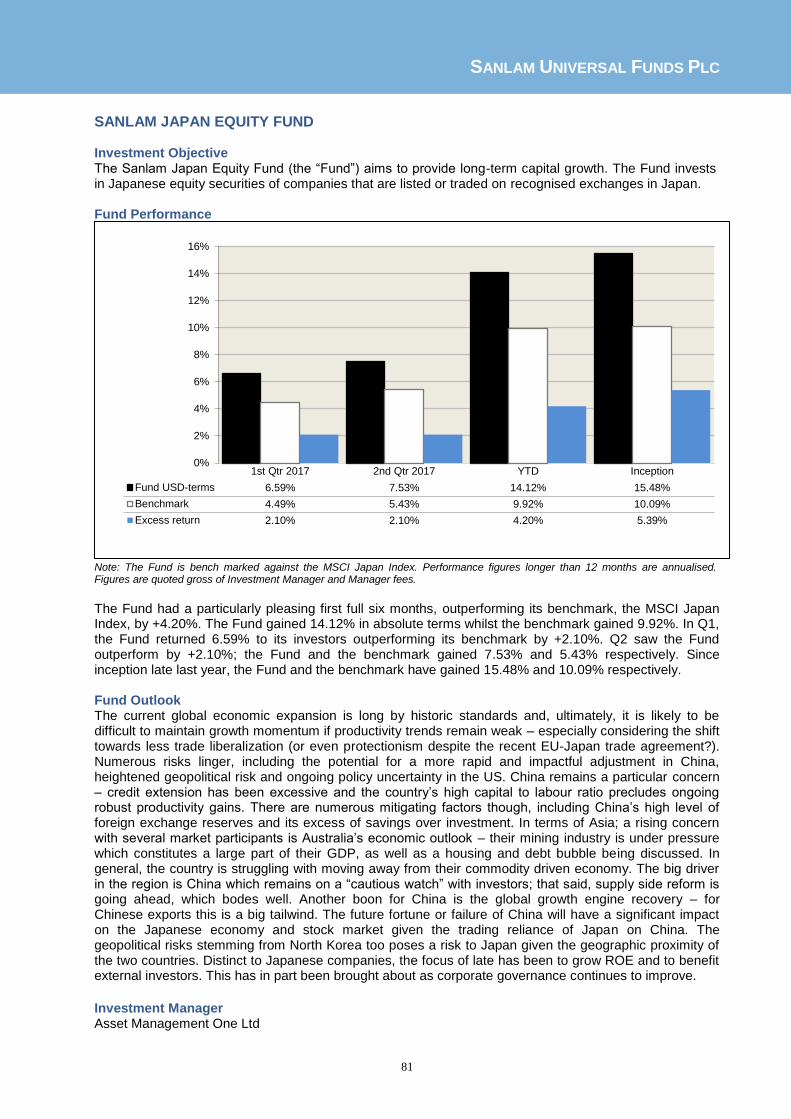
SANLAM UNIVERSAL FUNDS PLC
81
SANLAM JAPAN EQUITY FUND Investment Objective The Sanlam Japan Equity Fund (the “Fund”) aims to provide long-term capital growth. The Fund invests in Japanese equity securities of companies that are listed or traded on recognised exchanges in Japan. Fund Performance
Note: The Fund is bench marked against the MSCI Japan Index. Performance figures longer than 12 months are annualised. Figures are quoted gross of Investment Manager and Manager fees.
The Fund had a particularly pleasing first full six months, outperforming its benchmark, the MSCI Japan Index, by +4.20%. The Fund gained 14.12% in absolute terms whilst the benchmark gained 9.92%. In Q1, the Fund returned 6.59% to its investors outperforming its benchmark by +2.10%. Q2 saw the Fund outperform by +2.10%; the Fund and the benchmark gained 7.53% and 5.43% respectively. Since inception late last year, the Fund and the benchmark have gained 15.48% and 10.09% respectively. Fund Outlook The current global economic expansion is long by historic standards and, ultimately, it is likely to be difficult to maintain growth momentum if productivity trends remain weak – especially considering the shift towards less trade liberalization (or even protectionism despite the recent EU-Japan trade agreement?). Numerous risks linger, including the potential for a more rapid and impactful adjustment in China, heightened geopolitical risk and ongoing policy uncertainty in the US. China remains a particular concern – credit extension has been excessive and the country’s high capital to labour ratio precludes ongoing robust productivity gains. There are numerous mitigating factors though, including China’s high level of foreign exchange reserves and its excess of savings over investment. In terms of Asia; a rising concern with several market participants is Australia’s economic outlook – their mining industry is under pressure which constitutes a large part of their GDP, as well as a housing and debt bubble being discussed. In general, the country is struggling with moving away from their commodity driven economy. The big driver in the region is China which remains on a “cautious watch” with investors; that said, supply side reform is going ahead, which bodes well. Another boon for China is the global growth engine recovery – for Chinese exports this is a big tailwind. The future fortune or failure of China will have a significant impact on the Japanese economy and stock market given the trading reliance of Japan on China. The geopolitical risks stemming from North Korea too poses a risk to Japan given the geographic proximity of the two countries. Distinct to Japanese companies, the focus of late has been to grow ROE and to benefit external investors. This has in part been brought about as corporate governance continues to improve.
Investment Manager
Asset Management One Ltd
0%
2%
4%
6%
8%
10%
12%
14%
16%
1st Qtr 2017 2nd Qtr 2017 YTD Inception
Fund USD-terms 6.59% 7.53% 14.12% 15.48%
Benchmark 4.49% 5.43% 9.92% 10.09%
Excess return 2.10% 2.10% 4.20% 5.39%

SANLAM UNIVERSAL FUNDS PLC
82
SANLAM CENTRE ACTIVE US TREASURY FUND
Investment Objective The Sanlam Centre Active US Treasury Fund (the “Fund”) aims to maximize investors' total return through capital appreciation and current income.
Fund Performance
Note: The Fund is bench marked against Bloomberg Barclays U.S. Treasury Total Return Unhedged USD. Performance figures longer than 12 months are annualised. Figures are quoted gross of Investment Manager and Manager fees.
Since its inception in January of this year, the Fund has returned 0.24%. As described below this performance reflects the Fund’s generally Bearish posture, targeted duration of zero, during most of the period in view of the U.S. economy’s continuing expansion and, as a consequence, the likelihood that rates would move higher harming bond market valuation. Performance attribution in the Fund’s portfolio reflects interest income combined with our active duration management decisions that impact capital gain or loss capture. As there are no corporate or mortgage related securities in the portfolio, there are no “spread” components to performance. Performance since inception through 30 June 2017, reflects our investment discipline’s (the Interest Rate Scorecard) monthly review and adjustments of the portfolio’s targeted duration in the period in light of changing economic conditions, bond market valuations, and the uncertainty of the likely speed at which monetary policy normalization, as well as its form, would occur. Over this period, the Scorecard generally targeted duration at zero (Bearish), and for one month at half the duration of the U.S. Treasury Market or about 3 years (Moderately Bearish). Fund Outlook
Our discipline’s potential for providing value to our investors from actively managing interest rate risk
through the duration positioning of the portfolio clearly depends on the future behavior of interest rates,
both their cyclical path as well as deviations from the general direction dictated by that path. Interest rate
behavior is determined by the strength of economic growth and the inflation premium based on their
inflation expectations that investors demand from nominal interest rates to hedge against future inflation.
Over long periods of time there is a strong and positive correlation between the rate of nominal growth in
the economy and the yield on the 10-year U.S. Treasury note, the benchmark yield for the U.S. fixed
income marketplace. Nominal economic growth is of course comprised of real growth and inflation. So, the
outlook for rates and hence the potential for value added from our investment strategy rests on the future
courses of real growth and inflation.
-2%
0%
2%
1st Qtr 2017 2nd Qtr 2017 YTD Inception
Fund USD-terms 0.04% 0.20% 0.24% 0.24%
Benchmark 0.19% 1.19% 1.38% 1.38%
Excess return -0.15% -0.99% -1.14% -1.14%

SANLAM UNIVERSAL FUNDS PLC
83
SANLAM CENTRE ACTIVE US TREASURY FUND (CONTINUED)
Fund Outlook (continued)
Despite some “softening” in reported economic data in May (the reason for our Moderately Bearish
stance) real growth in the second quarter in the U.S. economy appears to be rebounding from the
disappointing 1.5% annual rate reported for the first quarter. It should be pointed out, however, that first
quarter growth data continue to be plagued by a downward bias due to “residual seasonality”. Estimates
place this downward bias at about -0.8% on average so real growth in the first quarter could actually have
been slightly above current estimates of the economy’s potential. Presently, estimates for second quarter
real growth based on “hard data”, monthly reports on statistics like retail sales which are actually used in
the construction of GDP (source data) range between 2.4% from the Atlanta Federal Reserve Bank to
1.9% from the Federal Reserve Bank of New York. An approach that uses “soft data”, monthly reports on
statistics that don’t necessarily feed directly into the GDP calculation like employment and also take into
consideration announcement “surprises”, indicate growth of 2.5% (from the St. Louis Federal Reserve
Bank). So, it appears, that the expansion phase of the U.S. economic cycle continues and at a pace at or
slightly above that of the economy’s growth potential. Forecasts for full year growth in 2017 are generally
at 2-2.1%.
Forecasts for a second quarter rebound and continued expansion in 2017 reflect reports on both business
and labor market activity. The ISM Reports on Business for both the Manufacturing and Non-
Manufacturing sectors have shown increasing improvement with respect to overall conditions and key
components like New Orders, Production, Employment and Delivery Times. Labor force activity, both the
level and momentum, suggest strength and perhaps some “overheating”. New hires based on
establishment data have averaged around 180,000 over the last six months. This rate of hiring is well
above the pace that Federal Reserve Economists estimate would be sufficient to provide jobs for new
entrants to the labor force. In her recent testimony before the Committee on Financial Services Chair
Janet Yellen noted that at 4.4% the unemployment rate is “below the median of Federal Open Market
Committee (FOMC) participants’ assessments of its longer-run normal level”. Additionally, she noted that
the labor force participation rate is little changed on net this year despite “the demographically driven
downward trend in this series”. Further, a broad measure of unemployment U6 which includes those
marginally attached to the labor force as well as those who can only find part-time work “is now nearly as
low as it was just before the recession”.
Beyond 2017 it seems likely that the U.S. economy will continue to grow or expand through next year.
Research focused on the relation between the likelihood of a recession and the length of the preceding
recovery is consistent with the view that no relationship exists. Economic research over the years has
offered many explanations as to why a business cycle recession might occur but the length of the prior
recovery is not one of them as recoveries don’t wear out or die of old age.
On the inflation front, the Federal Reserve’s preferred gauge, the price deflator for personal consumption
expenditures (“PCE”) less food and energy (defined as “Core” inflation), is now at an annualized run rate
below the FOMC’s 2 percent target. Additionally, inflation expectations, both survey and market-price
based, have recently declined. Expectations which drive both pricing decisions and wage demands have
to be in line with the Fed’s goal, away from their “well anchored state” at a rate below 2% in order to reach
the targeted rate. Analysis of the PCE data suggests that recent readings likely reflect some remaining
impact on prices from previous increases in the value of the dollar, other transitory factors and exceptional
one-time price reductions for some Core items.

SANLAM UNIVERSAL FUNDS PLC
84
SANLAM CENTRE ACTIVE US TREASURY FUND (CONTINUED)
Fund Outlook (continued)
As the dollar is no longer strengthening, import prices have begun to increase and the Atlanta Fed’s
“sticky price” CPI has recently increased modestly as well and is at a run rate slightly above 2%. Given
weak productivity growth, the Atlanta’s Fed’s “wage tracker” also supports the view that inflation is roughly
consistent with the Fed’s target. As stated in the remarks following the June FOMC policy meeting, policy
makers are monitoring the inflation data closely. Currently, the expectation is that monetary policy
normalization with respect to increasing the federal funds rate target and the beginning of reducing the
Fed’s balance sheet will proceed as planned. The FOMC is likely to increase the target for the funds rate
twice (probably ¼ point moves) before yearend and perhaps three times if the forecast risks prove to be to
the upside. The Taylor Rule Facility provided by the Atlanta Federal Reserve Bank suggests that the
FOMC is at least one move behind in its normalization process.
The normalization process may be drawn out through the end of 2018 as there continue to be supporters
of overshooting the 2% inflation target in order to make sure that all resources are fully employed--
capacity utilization continues to be below its long term average. And, chairwoman Yellen has indicated a
willingness to let the labor market remain “overheated” and to have inflation slightly above 2% for a
temporary period. The problem with such remarks of course is the failure to define “overheated” (are we
there at 4.4%), slightly and temporary. Drawing out the tightening cycle could result in interest rates
“overshooting” their ultimate equilibrium point if investors come to believe that the Fed has been overly
accommodative. The Fed can control the front end of the Treasury yield curve, rates on securities of less
than one year in maturity, but beginning at the two year maturity rates reflect investors’ expectations for
real growth and concerns about future inflation.
Longer term the economy’s potential for growth is determined by the growth of the labor force and the
productivity of the labor force in producing goods and services. On the pessimistic side, demographics are
consistent with domestic population growth of 0.5% per year. Assuming no change in the labor force
participation rate, the percentage of the population seeking employment, this implies labor force growth of
similar magnitude. Over the past 40 years productivity has grown at between 1 and 1.25%. So, that would
mean real growth of 1.5-1.75% per year in real terms. These calculations suggest a limit to growth from
the “supply side” as we are already at full employment as a starting point from the “demand side”.
So, the question is: what can be done to increase our capacity to grow? Many economists have laid out
the basic game plan for improved growth and it boils down to incentives. A growth plan must increase the
incentive to work, to invest in both physical and human capital and to innovate and create new
businesses. The plan should target removing excessive regulations, create a simple tax structure which is
competitive globally, focus government outlays on infrastructure which facilitates private enterprise and
seek to eliminate “crony capitalism”. It is interesting that the Koch brothers found common ground with
Bernie Sanders on the last factor.
“Soft data” forecasts of future real growth suggest expectations that the economy could approach its 20th
century mean of 3-3.25%. These forecasts reflect surveys on anticipated business spending and
household employment expectations that likely build on many of President Trump’s pro-growth policies.
Actual results, will, of course, depend on the ability to define these policies and get the needed legislation
passed by Congress. He is already making some headway on rolling back regulations which have been
viewed as anti-business or growth.

SANLAM UNIVERSAL FUNDS PLC
85
SANLAM CENTRE ACTIVE US TREASURY FUND (CONTINUED)
Fund Outlook (continued)
A real wrinkle to understanding/predicting the future course of inflation could come from attempts by
Congress to reduce the independence of the Federal Reserve in setting monetary policy. History has
adequately demonstrated that an independent Central Bank is key for price stability. However, as
Friedrich Hegel said, “the only thing we learn from history is that we learn nothing from history”. Currently,
there is a proposal, though not yet in the form of legislation, to subject monetary policy to the
Congressional Budget Authority. Support for this effort is from both the “right” and “left”. President Trump
may well support such efforts in order to limit the extent to which government budget outlays are
increasingly accounted for by interest expense. Such outlays are projected to be the third largest category
in the federal budget by 2028 and could reduce the funds available for infrastructure spending and tax
cuts. Even if such legislation does not come to fruition Janet Yellen’s tenure as Chairman is up in 2018
and there will also be at least two additional Federal Reserve Board of Governors’ seats open and
requiring presidential appointments.
As stated above, interest rates over time exhibit a significant and positive correlation with the economy’s
nominal growth. Again, this is explained by the fact that rates have a real and inflation premium
component just as nominal growth has a real and inflation component. Using the current real potential
growth estimate from the Congressional Budget Office of 1.8% and the Fed’s 2% inflation target would
imply a yield on the benchmark 10-year U.S. Treasury note of 3.8% eventually. This level serves as a
baseline forecast. In all likelihood, rates will go even higher by a little or by a lot. Rates have a tendency
to overshoot at both peaks and troughs so this factor alone would lead to a level above 3.8%. But the rate
could be even higher if President Trump’s programs lead to higher growth. A return to 3% potential growth
would imply a 10-year yield of 5%.
Estimates from the San Francisco Fed put the longer term growth impact of his proposed tax policies
alone at 0.4% overtime and 0.1-0.2% over the next few years as it takes time for incentives to alter
behavior. If we allow for inflation slightly above 2% temporarily, that could lead to 5% or higher depending
on slightly and temporary. Additionally, research on the impact of the asset purchases conducted during
the Fed’s various QE efforts has demonstrated that the effect on rates of allowing balance sheet runoff
while increasing the target for the federal funds rate could have a double impact. For the 10-year Treasury
note that would imply an increase of 0.9% for every 1% increase in the federal funds’ rate target.
Finally, if the independence of the Federal Reserve in setting monetary policy objectives were lost, rates
could balloon upwards. The policy norm could revert to the period before the 1951 Treasury Accord when
the Fed was subservient to the needs of debt financed fiscal policy. Assuming a reluctance to force a
trade-off between entitlement programs and infrastructure and defense spending and tax cuts, the deficit
could increase beyond current estimates. If the Fed is required to help finance butter and butter and
guns, inflation could go beyond slightly above target for more than a temporary period as it is unclear how
quickly the tax revenue benefits of stronger growth would become available to reduce the deficit and debt
outstanding.
Assuming continued economic expansion and higher inflation an upward trajectory in rates is to be
expected. However, the trend will not be smooth. In the 105 months between January1973 and
September 1981, the yield on the 10-year note increased roughly 10%, from about 5% to almost 16%.
However, rates increased in only about 60% of the months. As a result, there are opportunities to profit
from neutral as well as bullish calls even in a rising rate environment. Our investment discipline is
designed to identify the risks and opportunities of both any trend and short term deviations in rate
behavior utilizing measures of real growth, of inflation expectations, of current market valuation and of the
course of Fed policy. It is intended to preserve capital in periods of significant rate increases by
decreasing duration but with the flexibility to extend duration or re-enter the market when our discipline
suggests lower rates are likely. What is relevant to the potential success of our discipline for our Fund is
that interest rates continue to exhibit cyclical volatility, that the business cycle is not dead. While panic
buying can move rates dramatically for short time periods, rate behavior over time in driven by the
business cycle.

SANLAM UNIVERSAL FUNDS PLC
86
SANLAM CENTRE ACTIVE US TREASURY FUND (CONTINUED)
Fund Outlook (continued)
The Fund is intended to serve as a tactical fixed income investment by managing market exposure to
achieve performance (e.g. managing beta to achieve alpha). Over time, it is intended to provide the same
yield as the Treasury market with attractive diversification benefits. In addition to its wealth accumulation
and diversification objectives, the strategy readily accommodates both systematic and unforeseen cash
needs, given the liquidity of the Treasury market. Furthermore, the utilization of Treasury securities within
asset allocation provides attractive diversification properties, as the correlation between Treasury market
returns and those of the U.S. equity market is, historically, negative during recession related “bear” equity
markets.
Investment Manager
Centre Asset Management, LLC

SANLAM UNIVERSAL FUNDS PLC
87
AUTUS GLOBAL EQUITY FUND
Investment Objective The Autus Global Equity Fund (the “Fund”) aims to provide capital growth over the long-term.
Fund Performance
Note: The Fund is benchmarked against the MSCI ACWI Net Total Return USD Index. Performance figures longer than 12 months are annualised. Figures are quoted gross of Investment Manager and Manager fees.
The Fund was launched in March 2017 with 19 holdings and equity exposure of 95% at inception.
Subsequent to launch, the Fund’s holdings have been diversified during the quarter two of 2017 to now
include 39 holdings and an overall equity exposure of 81% of Fund AUM towards the end of the quarter.
The first half of 2017 exhibited signs that the global economy is strengthening. Year-on-year inflation in
the US hit a five-year high of 2.7% in February, while UK inflation was up to 2.3% and Eurozone inflation
at 2% in the same month. This is positive news for policy makers who were recently still warding off
threats of deflation in their economies. Economic indicators in developed nations (especially PMI and
labour statistics) further suggest that the global economy is expanding at a steady rate. The US Federal
Reserve’s rate hike in December 2016 was followed by two more hikes in March and June 2017. The
European Central Bank has announced that it is slowly beginning to scale back its asset-purchasing
programme. At the end of March, British Prime Minister Theresa May triggered Article 50 of the Lisbon
Treaty, allowing for the potentially long and drawn-out Brexit negotiations to proceed. International
markets remained volatile on the back of events such as the North Korean missile tests, the accusations
of Russian interference in the US election, China’s South Sea activities, ISIS taking responsibility for
various civilian attacks and Brexit uncertainty.
Fund Outlook
The global economy is expected to continue its growth acceleration despite the political uncertainty, in
particular in the US and the UK. Oil prices are expected to remain relatively low in the absence of
cooperation between producers. The situation in the Middle East is monitored closely, specifically with
regards to diplomatic relationships between Qatar and its neighbours. The conflict in Syria remains a
significant risk to stability in the region. There is a chance that equity markets will slow somewhat after
strong performances in the first half of the year. We do, however, see opportunities in technology
companies, particularly in the ecommerce and cloud sectors. We expect to maintain our equity exposure
at between 80% and 90%.
Investment Manager
Autus Fund Managers (Pty) Limited
0%
2%
4%
6%
2nd Qtr 2017 YTD Inception
Fund USD-terms 4.70% 4.70% 5.90%
Benchmark 4.30% 4.30% 5.80%
Excess return 0.40% 0.40% 0.10%

SANLAM UNIVERSAL FUNDS PLC
88
STATEMENT OF COMPREHENSIVE INCOME OF THE COMPANY for the six months ended 30 June 2017
Six months ended
30 June 2017 Six months ended
30 June 2016
USD USD
Investment income
Net gains/(losses) on financial assets and liabilities at fair value through profit or loss – held for trading 312,552,445 (62,118,385) Income from securities lending 223,004 405,854 Income from financial assets at fair value through profit or loss 72,196,677 70,003,224 Bank interest 206,905 45,579 Other income 390,024 414,931
Net investment income/(deficit) 385,569,055 8,751,203
Operating expenses Management and investment management fees (8,056,277) (6,895,730) Other operating expenses (1,117,483) (783,535) Custody fees (736,761) (854,650) Administration fees (437,503) (412,160) Performance fee (122,821) (117,298) Directors’ fees (36,431) (34,676)
Total operating expenses (10,507,276) 9,098,049
Operating profit/(loss) 375,061,779 (346,846)
Finance costs Distribution to shareholders (4,272,412) (6,271,014) Interest expense (54,224) (28,944) Income equalisation (35,644,329) (14,282,388)
Total finance costs (39,970,965) (20,582,346)
Profit/(loss) before tax 335,090,814 (20,929,192)
Withholding tax (9,347,664) (9,431,085)
Change in net assets attributable to holders of redeemable participating shares 325,743,150 (30,360,277)
The accompanying notes form an integral part of these unaudited condensed interim financial statements.

SANLAM UNIVERSAL FUNDS PLC
89
STATEMENTS OF COMPREHENSIVE INCOME OF THE FUNDS for the six months ended 30 June 2017
1During the period ended 30 June 2017, effective from 13 June 2017, the name of this Fund was changed. The previous name of this Fund was Grindrod Global Property Income Fund.
Sanlam Centre Global Select
Equity Fund
Bridge Global Property Income
Fund1
P-Solve Inflation Plus Fund
Sanlam African Frontier Markets
Fund Sanlam Global Best
Ideas Fund USD USD GBP USD USD Investment income
Net gains/(losses) on financial assets and liabilities at fair value through profit or loss – held for trading 2,353,937 (1,157,906) 1,263,475 12,810,625 11,483,140 Income from securities lending 1,419 - 1,165 444 14,534 Income from financial assets at fair value through profit or loss 145,370 847,170 293,566 1,903,273 1,715,709 Bank interest 1,716 416 56 4,054 2,921 Other income 265 272 4,131 463 803
Net investment income/(deficit) 2,502,707 (310,048) 1,562,393 14,718,859 13,217,107
Operating expenses Management and investment management fees (25,344) (312,614) (23,947) (293,390) (350,929) Performance fee - - - - - Administration fees (3,611) (7,603) (9,000) (12,258) (15,159) Directors’ fees (395) (322) (445) (556) (867) Custody fees (15,953) (3,554) (4,000) (84,740) (11,175) Other operating expenses (30,979) (12,935) (12,164) (19,599) (27,083)
Total operating expenses (76,282) (337,028) (49,556) (410,543) (405,213)
Operating profit/(loss) 2,426,425 (647,076) 1,512,837 14,308,316 12,811,894
Finance costs
Distribution to shareholders - - (287,842) - (1,191)
Interest expense - - (27,132) - - Income equalization (2,332,557) (154,640) 271 (982,998) (210,576)
Profit/(loss) before tax 93,868 (801,716) 1,198,134 13,325,318 12,600,127
Withholding tax (14,006) (124,510) (32,158) (176,163) (238,604) Change in net assets attributable to
holders of redeemable participating shares 79,862 (926,226) 1,165,976 13,149,155 12,361,523

SANLAM UNIVERSAL FUNDS PLC
90
STATEMENTS OF COMPREHENSIVE INCOME OF THE FUNDS (CONTINUED) for the six months ended 30 June 2017
Sanlam Global
Bond Fund Sanlam Global Financial Fund
Sanlam Global Property Fund
Sanlam World Equity Fund
Satrix World Equity Tracker Fund
USD USD USD USD USD Investment income
Net gains/(losses) on financial assets and liabilities at fair value through profit or loss – held for trading 12,914,495 17,521,348 7,018,772 55,622,753 51,810,320 Income from securities lending - 27 1,847 70,691 35,714 Income from financial assets fair value through profit or loss 5,525,549 3,058,546 2,510,135 7,615,534 9,039,851 Bank interest 13,225 8,126 7,924 24,306 8,333 Other income 200,945 993 1,553 40,875 71,560
Net investment income/(deficit) 18,654,214 20,589,040 9,540,231 63,374,159 60,965,778
Operating expenses Management and investment management fees (263,102) (569,492) (235,159) (1,289,515) (900,936) Performance fee - (1,300) - - - Administration fees (15,125) (21,959) (12,716) (53,761) (23,331) Directors’ fees (2,923) (1,200) (946) (7,541) (4,189) Custody fees (63,326) (28,531) (30,183) (104,008) (32,857) Other operating expenses (52,418) (30,154) (22,453) (101,615) (68,835)
Total operating expenses (396,894) (652,636) (301,457) (1,556,440) (1,030,148)
Operating profit/(loss) 18,257,320 19,936,404 9,238,774 61,817,719 59,935,630
Finance costs Distribution to shareholders - (34,372) - - (12,928) Interest expense - - - - - Income equalisation 6,122,255 (1,637,296) (32,477) (49,323,892) (1,169,522)
Profit/(loss) before tax 24,379,575 18,264,736 9,206,297 12,493,827 58,753,180
Withholding tax (10,578) (369,443) (420,185) (1,388,944) (1,772,848) Change in net assets attributable to
holders of redeemable participating shares 24,368,997 17,895,293 8,786,112 11,104,883 56,980,332

SANLAM UNIVERSAL FUNDS PLC
91
STATEMENTS OF COMPREHENSIVE INCOME OF THE FUNDS (CONTINUED)
for the six months ended 30 June 2017
SIIP India Opportunities
Fund
SIM Global Equity Income Fund
Sanlam Strategic Bond Fund
Sanlam Accel Income Fund
Satrix North America Equity Tracker Fund
USD USD GBP GBP USD Investment income
Net gains/(losses) on financial assets and liabilities at fair value through profit or loss – held for trading 7,348,025 9,763,883 3,575,904 1,444,860 2,362,872 Income from securities lending - 12,966 - - 673 Income from financial assets at fair value through profit or loss 226,386 2,740,817 3,566,769 798,844 378,944 Bank interest 1,047 3,878 13,458 39 737 Other income 203 704 563 289 13,374
Net investment income/(deficit) 7,575,661 12,522,248 7,156,694 2,244,032 2,756,600
Operating expenses Management and investment management fees (69,226) (448,922) (176,248) (58,769) (4,807) Performance fee - - - - - Administration fees (4,738) (20,387) (2,429) (7,675) (1,997) Directors’ fees (247) (862) (707) (371) (52) Custody fees (14,567) (5,644) (9,859) (3,880) (9,506) Other operating expenses (112,806) (24,569) (18,975) (13,043) (16,571)
Total operating expenses (201,584) (500,384) (208,218) (83,738) (32,933)
Operating profit/(loss) 7,374,077 12,021,864 6,948,476 2,160,294 2,723,667
Finance costs Distribution to shareholders - (215,961) (2,015,923) (428,077) (8,813) Interest expense - - - - - Income equalisation (27,988) (57,282) 1,939,659 (348,328) 3,223,579
Profit/(loss) before tax 7,346,089 11,748,621 6,872,212 1,383,889 5,938,433
Withholding tax (161) (303,688) (12,146) - (105,997) Change in net assets attributable to
holders of redeemable participating shares 7,345,928 11,444,933 6,860,066 1,383,889 5,832,436

SANLAM UNIVERSAL FUNDS PLC
92
STATEMENTS OF COMPREHENSIVE INCOME OF THE FUNDS (CONTINUED) for the six months ended 30 June 2017
Satrix UK Equity Tracker Fund
Satrix Europe (ex UK) Equity Tracker Fund
Sanlam Equity Allocation Fund
Satrix Emerging Market Equity Tracker Fund
Sanlam Managed Risk Fund
GBP EUR USD USD USD Investment income
Net gains/(losses) on financial assets and liabilities at fair value through profit or loss – held for trading 607,139 6,890,330 11,933,271 6,747,844 4,898,948 Income from securities lending 4,084 35,710 31,663 897 - Income from financial assets at fair value through profit or loss 1,137,662 3,633,899 2,657,735 591,693 - Bank interest - - 2,285 231 - Other income 5,364 20,680 682 34,226 -
Net investment income/(deficit) 1,754,249 10,580,619 14,625,636 7,374,891 4,898,948
Operating expenses
Management and investment management fees (15,097) (99,759) - (94,998) (196,050) Performance fee - - - - -
Administration fees (2,431) (4,003) (1,488) (5,021) - Directors’ fees (296) (994) (800) (328) - Custody fees (4,944) (26,590) (43,366) (28,037) (37,666) Other operating expenses (14,713) (28,769) (19,443) (18,906) (7,726)
Total operating expenses (37,481) (160,115) (65,097) (147,290) (241,442)
Operating profit/(loss) 1,716,768 10,420,504 14,560,539 7,227,601 4,657,506
Finance costs Distribution to shareholders (24,783) (12,478) - (173,598) - Interest expense (1,620) (4,760) - - (6,413) Income equalisation 1,299,575 9,938,132 - (40,481) 209,555
Profit/(loss) before tax 2,989,940 20,341,398 14,560,539 7,013,522 203,142
Withholding tax (17,662) (565,517) (311,063) (75,608) (886) Change in net assets attributable to
holders of redeemable participating shares 2,972,278 19,775,881 14,249,476 6,937,914 4,861,534

SANLAM UNIVERSAL FUNDS PLC
93
STATEMENTS OF COMPREHENSIVE INCOME OF THE FUNDS (CONTINUED)
for the six months ended 30 June 2017
Sanlam Private Wealth Global
High Quality Fund
Sanlam FOUR US Dividend Income
Fund
High Street Global Balanced Fund
Sanlam FOUR Active European (ex
UK) Equity Fund
Sanlam FOUR Global Equity Fund
GBP USD USD GBP GBP Investment income
Net gains/(losses) on financial assets and liabilities at fair value through profit or loss – held for trading 13,141,906 5,383,767 1,100,214 9,065,455 2,304,553 Income from securities lending 5,100 - - - - Income from financial assets at fair value through profit or loss 1,066,554 2,968,016 293,212 2,351,031 2,740,167 Bank interest 39,017 25,400 4,524 - 5,845 Other income 689 1,177 124 599 1,188
Net investment income/(deficit) 14,253,266 8,378,360 1,398,074 11,417,085 5,051,753
Operating expenses
Management and investment management fees (560,674) (218,133) (102,273) (94,553) (133,733) Performance fee - - - - -
Administration fees (4,452) (29,382) (4,653) (13,918) (28,872)
Directors’ fees (870) (1,488) (116) (1,819) (666)
Custody fees (4,937) (10,028) (1,007) (22,933) (9,360)
Other operating expenses (23,966) (31,219) (12,130) (36,321) (53,411)
Total operating expenses (594,899) (290,250) (120,179) (169,544) (226,042)
Operating profit/(loss) 13,658,367 8,088,110 1,277,895 11,247,541 4,825,711
Finance costs
Distribution to shareholders (85,040) (42,134) - - - Interest expense - - - (3,831) - Income equalisation 542,997 394,527 130,021 (3,669,312) (362,241)
Profit/(loss) before tax 14,116,324 8,440,503 1,407,916 7,574,398 4,463,470
Withholding tax (210,087) (861,990) (31,325) (436,957) (371,091)
Change in net assets attributable to
holders of redeemable participating shares 13,906,237 7,578,513 1,376,591 7,137,441 4,092,379

SANLAM UNIVERSAL FUNDS PLC
94
STATEMENTS OF COMPREHENSIVE INCOME OF THE FUNDS (CONTINUED)
for the six months ended 30 June 2017
1During the period ended 30 June 2017, effective from 13 June 2017, the name of this Fund was changed. The previous name of this Fund was Grindrod Global Equity Income Growth Fund.
Sanlam FOUR Stable Global
Equity Fund
Sanlam FOUR Active UK Equity
Fund
Sanlam FOUR Multi-Strategy
Fund
Anchor Global Capital Plus Fund
Bridge Global Equity Income Growth Fund
1
GBP GBP GBP USD USD Investment income
Net gains/(losses) on financial assets and liabilities at fair value through profit or loss – held for trading 4,605,748 3,979,063 2,725,388 360,849 404,885 Income from securities lending - - - 400 - Income from financial assets at fair value through profit or loss 1,942,960 1,503,919 2,361,618 56,916 111,480 Bank interest 7,641 261 1,104 10,253 183 Other income 839 1,389 734 98 38
Net investment income/(deficit) 6,557,188 5,484,632 5,088,844 428,516 516,586
Operating expenses Management and investment management fees (153,390) (56,763) (97,054) (81,138) (32,075) Performance fee - - - - - Administration fees (22,591) (11,588) (18,068) (3,798) (2,786) Directors’ fees (1,072) (688) (992) (101) (43) Custody fees (4,227) (10,058) (9,731) (1,404) (1,236) Other operating expenses (27,156) (16,359) (21,709) (12,386) (11,417)
Total operating expenses (208,436) (95,456) (147,554) (98,827) (47,557)
Operating profit/(loss) 6,348,752 5,389,176 4,941,290 329,689 469,029
Finance costs
Distribution to shareholders (27) (4,523) (13,530) - - Interest expense - - - (1,248) - Income equalisation 1,446,682 (1,687,455) 267,390 (17,851) 1,329
Profit/(loss) before tax 7,795,407 3,697,198 5,195,150 310,590 470,358
Withholding tax (395,591) (37,923) (13,012) (956) (22,097)
Change in net assets attributable to
holders of redeemable participating shares 7,399,816 3,659,275 5,182,138 309,634 448,261

SANLAM UNIVERSAL FUNDS PLC
95
STATEMENTS OF COMPREHENSIVE INCOME OF THE FUNDS (CONTINUED) for the six months ended 30 June 2017
1During the period ended 30 June 2017, effective from 13 June 2017, the name of this Fund was changed. The previous name of this Fund was Grindrod Global Managed Growth Fund.
Anchor Global Equity Fund
Bridge Global Managed Growth
Fund1
SIM Global Emerging Markets
Fund
ABSA Africa Equity Fund
Sanlam Centre American Select
Equity Fund USD USD USD USD USD Investment income
Net gains/(losses) on financial assets and liabilities at fair value through profit or loss – held for trading 3,796,566 598,328 3,818,800 3,805,831 14,736,542 Income from securities lending 47 - - - - Income from financial assets at fair value through profit or loss 136,025 212,426 534,994 579,465 1,121,453 Bank interest 3,957 - 2,700 3,924 4,464 Other income 150 74 264 140 809
Net investment income/(deficit) 3,936,745 810,828 4,356,758 4,389,360 15,863,268
Operating expenses Management and investment management fees (157,528) (60,832) (150,206) (238,099) (35) Performance fee (150,349) - (2,404) - - Administration fees (5,487) (3,505) (9,795) (7,651) (1,488) Directors’ fees (171) (84) (120) (248) (1,043) Custody fees (4,052) (1,653) (3,553) (48,890) (7,272) Other operating expenses (13,427) (11,873) (31,643) (25,370) (23,689)
Total operating expenses (331,014) (77,947) (197,721) (320,258) (33,527)
Operating profit/(loss) 3,605,731 732,881 4,159,037 4,069,102 15,829,741
Finance costs
Distribution to shareholders - - - - - Interest expense - (56) - - - Income equalisation (9,503) (18,686) 45,464 (11,401) 27,015
Profit/(loss) before tax 3,596,228 714,139 4,204,501 4,057,701 15,856,756
Withholding tax (25,033) (35,347) (61,514) (54,089) (323,094)
Change in net assets attributable to
holders of redeemable participating shares 3,571,195 678,792 4,142,987 4,003,612 15,533,662

SANLAM UNIVERSAL FUNDS PLC
96
STATEMENTS OF COMPREHENSIVE INCOME OF THE FUNDS (CONTINUED) for the six months ended 30 June 2017
Sanlam Global Convertible
Securities Fund
Sanlam Japan Equity Fund
Sanlam Centre Active US
Treasury Fund
Autus Global Equity Fund
USD USD USD USD Investment income
Net gains/(losses) on financial assets and liabilities at fair value through profit or loss – held for trading 928,615 6,721,745 (191,447) 964,754 Income from securities lending - - - - Income from financial assets at fair value through profit or loss 195,266 471,263 226,957 71,575 Bank interest 747 - 1,582 2,149 Other income 129 220 - -
Net investment income/(deficit) 1,124,757 7,193,228 37,092 1,038,478
Operating expenses
Management and investment management fees (74,056) - (9) (57,213)
Performance fee (103,862) - - (15,255)
Administration fees (6,434) (1,488) (2,553) (2,886)
Directors’ fees (223) (274) (161) (93)
Custody fees (2,680) (4,852) (2,096) (642)
Other operating expenses (18,506) (14,459) (8,873) (12,256)
Total operating expenses (205,761) (21,073) (13,692) (88,345)
Operating profit/(loss) 918,996 7,172,155 23,400 950,133
Finance costs Distribution to shareholders - - (175,663) - Interest expense - (400) - - Income equalisation (61) 178,755 76 4,490
Profit/(loss) before tax 918,935 7,350,510 (152,187) 954,623
Withholding tax (1,703) (70,687) - (17,728)
Change in net assets attributable to
holders of redeemable participating shares 917,232 7,279,823 (152,187) 936,895

SANLAM UNIVERSAL FUNDS PLC
97
STATEMENTS OF COMPREHENSIVE INCOME OF THE FUNDS for the six months ended 30 June 2016
1During the period ended 30 June 2017, effective from 13 June 2017, the name of this Fund was changed. The previous name of this Fund was Grindrod Global Property Income Fund.
Sanlam Centre Global Select
Equity Fund
Bridge Global Property Income
Fund1
P-Solve Inflation Plus Fund
Sanlam African Frontier Markets
Fund Sanlam Global Best
Ideas Fund USD USD GBP USD USD Investment income
Net gains/(losses) on financial assets and liabilities at fair value through profit or loss – held for trading (2,088,183) 3,083,146 2,710,321 (6,802,995) (8,954,945) Income from securities lending 3,609 - 1,212 - 30,427 Income from financial assets at fair value through profit or loss 855,523 902,633 308,779 2,253,003 3,329,240 Bank interest 1,214 123 524 1,601 2,639 Other income 2,600 1,203 5,266 2,909 4,805
Net investment income/(deficit) (1,225,237) 3,987,105 3,026,102 (4,545,482) (5,587,834)
Operating expenses Management and investment management fees (94,675) (332,755) (24,894) (327,174) (500,260) Performance fee - - - - - Administration fees (4,232) (9,189) (8,269) (14,019) (21,562) Directors’ fees (118) (298) (380) (623) (2,141) Custody fees (7,460) (4,973) (3,232) (99,454) (24,864) Other operating expenses (20,426) (11,749) (9,308) (19,643) (31,636)
Total operating expenses (126,911) (358,964) (46,083) (460,913) (580,463)
Operating profit/(loss) (1,352,148) 3,628,141 2,980,019 (5,006,395) (6,168,297)
Finance costs
Distribution to shareholders - - (420,663) (1,713) (1,777)
Interest expense - - - - - Income equalization (5,775) 120,128 (1,151) (28,829) (1,995,701)
Profit/(loss) before tax (1,357,923) 3,748,269 2,558,205 (5,036,937) (8,165,775)
Withholding tax (144,405) (145,994) (31,335) (194,329) (410,396) Change in net assets attributable to
holders of redeemable participating shares (1,502,328) 3,602,275 2,526,870 (5,231,266) (8,576,171)

SANLAM UNIVERSAL FUNDS PLC
98
STATEMENTS OF COMPREHENSIVE INCOME OF THE FUNDS (CONTINUED)for the six months ended 30 June 2016
Sanlam Global
Bond Fund Sanlam Global Financial Fund
Sanlam Global Property Fund
Sanlam Strategic Cash Fund
Sanlam World Equity Fund
USD USD USD USD USD Investment income
Net gains/(losses) on financial assets and liabilities at fair value through profit or loss – held for trading 23,235,607 (8,599,791) 4,808,692 (8,299) (52,920,390) Income from securities lending - 17,082 3,352 - 279,068 Income from financial assets fair value through profit or loss 4,329,301 3,655,782 2,375,308 19,865 18,745,968 Bank interest 2 2,380 1,602 18 10,767 Other income 3,674 3,821 1,890 14,563 40,742
Net investment income/(deficit) 27,568,584 (4,920,726) 7,190,844 26,147 (33,843,845)
Operating expenses Management and investment management fees (237,465) (660,562) (202,451) (6,822) (1,127,472) Performance fee - - - - - Administration fees (14,829) (36,133) (11,795) (5,395) (54,401) Directors’ fees (2,527) (1,646) (951) (31) (11,321) Custody fees (59,672) (39,781) (29,836) (1,653) (149,179) Other operating expenses (38,823) (29,326) (22,537) (14,094) (102,424)
Total operating expenses (353,316) (767,448) (267,570) (27,995) (1,444,797)
Operating profit/(loss) 27,215,268 (5,688,174) 6,923,274 (1,848) (35,288,642)
Finance costs Distribution to shareholders - (35,054) - - - Interest expense (11,070) - - - - Income equalisation 99,848 (2,637,597) 217,523 (333,703) (7,334,293)
Profit/(loss) before tax 27,304,046 (8,360,825) 7,140,797 (335,551) (42,622,935)
Withholding tax (13,399) (540,064) (360,422) - (3,461,933) Change in net assets attributable to
holders of redeemable participating shares 27,290,647 (8,900,889) 6,780,375 (335,551) (46,084,868)

SANLAM UNIVERSAL FUNDS PLC
99
STATEMENTS OF COMPREHENSIVE INCOME OF THE FUNDS (CONTINUED) for the six months ended 30 June 2016
Satrix World Equity Tracker
Fund
SIIP India Opportunities
Fund
SIM Global Equity Income Fund
Sanlam Strategic Bond Fund
Sanlam Accel Income Fund
USD USD USD GBP GBP Investment income
Net gains/(losses) on financial assets and liabilities at fair value through profit or loss – held for trading (6,700,128) (21,338) (545,756) 632,830 224,327 Income from securities lending 29,526 - 2,773 - Income from financial assets at fair value through profit or loss 8,036,618 183,138 897,281 2,071,320 943,149 Bank interest 3,640 - 1,194 - 379 Other income 64,566 107 1,615 2,165 1,146
Net investment income/(deficit) 1,434,222 161,907 357,107 2,706,315 1,169,001
Operating expenses Management and investment management fees (868,046) (62,333) (160,746) (131,385) (71,479) Performance fee - - - - - Administration fees (31,060) (5,467) (10,098) (9,945) (10,176) Directors’ fees (4,472) (275) (233) (582) (370) Custody fees (34,809) (55,806) (4,973) (14,919) (3,729) Other operating expenses (48,310) (13,331) (14,678) (14,712) (10,881)
Total operating expenses (986,697) (137,212) (190,728) (171,543) (96,635)
Operating profit/(loss) 447,525 24,695 166,379 2,534,772 1,072,366
Finance costs Distribution to shareholders (13,268) - (239,760) (1,775,999) (486,992) Interest expense - (5) - (3,602) - Income equalisation (4,611,145) 11,253 282,491 (90,579) (122,459)
Profit/(loss) before tax (4,176,888) 35,943 209,110 664,592 462,915
Withholding tax (1,581,991) (162) (90,054) (1,844) (44,114) Change in net assets attributable to
holders of redeemable participating shares (5,758,879) 35,781 119,056 662,748 418,801

SANLAM UNIVERSAL FUNDS PLC
100
STATEMENTS OF COMPREHENSIVE INCOME OF THE FUNDS (CONTINUED) for the six months ended 30 June 2016
Satrix North America Equity
Tracker Fund
Satrix UK Equity Tracker Fund
Satrix Europe (ex UK) Equity Tracker
Fund
Sanlam Equity Allocation Fund
Satrix Emerging Market Equity Tracker Fund
USD GBP EUR USD USD Investment income
Net gains/(losses) on financial assets and liabilities at fair value through profit or loss – held for trading 450,613 1,188,920 (10,607,272) (8,668,013) 2,011,704 Income from securities lending 357 2,852 18,512 9,376 1,453 Income from financial assets at fair value through profit or loss 212,527 887,174 2,749,207 2,481,583 558,305 Bank interest 45 123 - 715 - Other income 16,909 6,491 18,814 1,309 58,455
Net investment income/(deficit) 680,451 2,085,560 (7,820,739) (6,175,030) 2,629,917
Operating expenses
Management and investment management fees (10,907) (12,284) (61,394) - (64,659) Performance fee - - - - -
Administration fees (3,988) (3,732) (5,461) (1,492) (8,766) Directors’ fees (202) (321) (906) (847) (301) Custody fees (9,945) (3,979) (22,377) (49,727) (59,672) Other operating expenses (15,324) (12,179) (19,296) (16,258) (17,171)
Total operating expenses (40,366) (32,495) (109,434) (68,324) (150,569)
Operating profit/(loss) 640,085 2,053,065 (7,930,173) (6,243,354) 2,479,348
Finance costs Distribution to shareholders (15,333) (35,254) (15,801) - (186,084) Interest expense - (1,874) - (151) Income equalisation (674,597) (872,814) (42,678) - (217,426)
Profit/(loss) before tax (49,845) 1,144,997 (7,990,526) (6,243,354) 2,075,687
Withholding tax (59,033) (31,906) (455,413) (324,652) (69,741) Change in net assets attributable to
holders of redeemable participating shares (108,878) 1,113,091 (8,445,939) (6,568,006) 2,005,946

SANLAM UNIVERSAL FUNDS PLC
101
STATEMENTS OF COMPREHENSIVE INCOME OF THE FUNDS (CONTINUED)for the six months ended 30 June 2016
Sanlam Managed Risk Fund
Sanlam P2strategies UK Fund
Sanlam P2strategies North
America Fund
Sanlam P2strategies Emerging Market
Fund
Sanlam P2strategies Europe (ex UK) Fund
USD GBP USD USD EUR Investment income
Net gains/(losses) on financial assets and liabilities at fair value through profit or loss – held for trading (1,946,528) (9,882) 101,640 (36,956) (608,128) Income from securities lending - - - - - Income from financial assets at fair value through profit or loss 138,731 - - - - Bank interest - - - - - Other income 510 - 2 366 25
Net investment income/(deficit) (1,807,287) (9,882) 101,642 (36,590) (608,103)
Operating expenses Management and investment management fees (181,179) (18,449) (43,216) (15,002) (19,919) Performance fee - - - - - Administration fees - - - - - Directors’ fees - - - - - Custody fees (38,919) (9,472) (11,243) (11,634) (10,711)
Other operating expenses (13,950) (7,584) (12,485) (12,505) (11,528)
Total operating expenses (206,148) (35,505) (66,944) (39,141) (42,158)
Operating profit/(loss) (2,013,435) (45,387) 34,698 (75,731) (650,261)
Finance costs Distribution to shareholders - - - - - Interest expense (8,452) (519) (40) (928) (1,823) Income equalisation (663,700) 222,223 417,567 195,707 180,538
Profit/(loss)before tax (2,685,587) 176,317 452,225 119,048 (471,546)
Withholding tax (12,143) - - - -
Change in net assets attributable to holders of
redeemable participating shares (2,697,730) 176,317 452,225 119,048 (471,546)

SANLAM UNIVERSAL FUNDS PLC
102
STATEMENTS OF COMPREHENSIVE INCOME OF THE FUNDS (CONTINUED)for the six months ended 30 June 2016
Sanlam Private Wealth Global
High Quality Fund
Sanlam FOUR US Dividend Income
Fund
High Street Global Balanced Fund
Sanlam FOUR Active European (ex
UK) Equity Fund
Sanlam FOUR Global Equity Fund
GBP USD USD GBP GBP Investment income
Net gains/(losses) on financial assets and liabilities at fair value through profit or loss – held for trading 8,312,986 8,612,959 (449,951) (1,234,002) 725,560 Income from securities lending 390 - - - - Income from financial assets at fair value through profit or loss 509,536 759,502 256,205 926,074 925,141 Bank interest 3,874 2,858 1,349 - - Other income 1,336 1,574 277 578 1,437
Net investment income/(deficit) 8,828,122 9,376,893 (192,120) (307,350) 1,652,138
Operating expenses
Management and investment management fees (198,543) (64,794) (65,759) (69,709) (60,719) Performance fee - - - - -
Administration fees (9,945) (7,293) (4,202) (5,238) (9,223)
Directors’ fees (341) (196) (85) (196) (468) Custody fees (3,481) (4,987) (2,486) (4,974) (8,206) Other operating expenses (13,501) (14,851) (13,492) (12,614) (15,129)
Total operating expenses (225,811) (92,121) (86,024) (92,731) (93,745)
Operating profit/(loss) 8,602,311 9,284,772 (278,144) (400,081) 1,558,393
Finance costs
Distribution to shareholders (100,384) (44) - - - Interest expense - - - (728) (3) Income equalisation 162,498 508,850 38,554 708,082 656,400
Profit/(loss) before tax 8,664,425 9,793,578 (239,590) 307,273 2,214,790
Withholding tax (115,708) (211,923) (22,175) (174,237) (120,947)
Change in net assets attributable to
holders of redeemable participating shares 8,548,717 9,581,655 (261,765) 133,036 2,093,843

SANLAM UNIVERSAL FUNDS PLC
103
STATEMENTS OF COMPREHENSIVE INCOME OF THE FUNDS (CONTINUED) for the six months ended 30 June 2016
1During the period ended 30 June 2017, effective from 13 June 2017, the name of this Fund was changed. The previous name of this Fund was Grindrod Global Equity Income Growth Fund.
Sanlam FOUR Stable Global
Equity Fund
Sanlam FOUR Active UK Equity
Fund
Sanlam FOUR Multi-Strategy
Fund
Anchor Global Capital Plus Fund
Bridge Global Equity Income Growth Fund
1
GBP GBP GBP USD USD Investment income
Net gains/(losses) on financial assets and liabilities at fair value through profit or loss – held for trading 8,003,786 (18,094,305) 817,664 (181,440) 140,303 Income from securities lending - - 1,718 - Income from financial assets at fair value through profit or loss 1,040,773 2,321,790 1,377,629 44,148 101,339 Bank interest 1,387 739 526 3,914 108 Other income 756 107,373 6,779 921 297
Net investment income/(deficit) 9,046,702 (15,664,403) 2,202,598 (130,739) 242,047
Operating expenses Management and investment management fees (60,108) (317,647) (64,363) (71,377) (29,547) Performance fee - - - - - Administration fees (11,534) (20,869) (10,665) (3,392) (2,231) Directors’ fees (568) (1,016) (537) (63) (29) Custody fees (1,989) (8,206) (8,204) (1,989) (1,989) Other operating expenses (14,808) (15,922) (12,946) (13,306) (11,938)
Total operating expenses (89,007) (363,660) (96,715) (90,127) (45,734)
Operating profit/(loss) 8,957,695 (16,028,063) 2,105,883 (220,866) 196,313
Finance costs
Distribution to shareholders (20) (1,189,207) (6,776) - - Interest expense - - - - - Income equalisation 625,384 262,657 (29,178) (25,017) 1,790
Profit/(loss) before tax 9,583,059 (16,954,613) 2,070,929 (245,883) 198,103
Withholding tax (213,073) (60,433) - (5,090) (18,557)
Change in net assets attributable to
holders of redeemable participating shares 9,369,986 (17,015,046) 2,070,929 (250,973) 179,546

SANLAM UNIVERSAL FUNDS PLC
104
STATEMENTS OF COMPREHENSIVE INCOME OF THE FUNDS (CONTINUED) for the six months ended 30 June 2016
1During the period ended 30 June 2017, effective from 13 June 2017, the name of this Fund was changed. The previous name of this Fund was Grindrod Global Managed Growth Fund.
Anchor Global Equity Fund
Bridge Global Managed Growth
Fund1
SIM Global Emerging Markets
Fund
Sanlam FOUR UK Income
Opportunities Fund USD USD USD GBP Investment income
Net gains/(losses) on financial assets and liabilities at fair value through profit or loss – held for trading
(274,571) 397,943 1,102,649 (143,079)
Income from securities lending 82 - - - Income from financial assets at fair value through profit or loss
268,807 193,256 115,148 13,770
Bank interest 479 121 161 5 Other income 389 1,902 3,102 -
Net investment income/(deficit) (4,814) 593,222 1,221,060 (129,304)
Operating expenses
Management and investment management fees (115,342) (58,153) (26,703) (1,925) Performance fee - - (117,298) -
Administration fees (4,243) (2,946) (6,029) (444) Directors’ fees (129) (85) (57) (132) Custody fees (1,989) (2,984) (4,973) (1,332) Other operating expenses (15,124) (13,290) (19,266) (14,771)
Total operating expenses (136,827) (77,458) (174,326) (18,604)
Operating profit/(loss) (141,641) 515,764 1,046,734 (147,908)
Finance costs Distribution to shareholders - - - (6,916) Interest expense - - - - Income equalisation 17,386 616 (412) 974
Profit/(loss) before tax (124,255) 516,380 1,046,322 (153,850)
Withholding tax (73,174) (38,331) (7,725) (377)
Change in net assets attributable to
holders of redeemable participating shares (197,429) 478,049 1,038,597 (154,227)

SANLAM UNIVERSAL FUNDS PLC
105
STATEMENT OF FINANCIAL POSITION OF THE COMPANY as at 30 June 2017
30 June 2017 31 December 2016
USD USD
Assets
Cash and cash equivalents 186,638,236 171,189,783
Margin accounts 12,240,890 15,062,061
Accrued income 14,727,359 10,184,349
Amounts receivable on sale of securities 6,048,930 972,172
Amounts receivable on issue of shares 2,500,315 17,716,670
Other debtors 984,629 675,490
Financial assets at fair value through profit or loss
- Transferable securities 4,301,517,233 3,832,094,932
- Collective investment schemes 45,265,850 89,562,744
- Derivative financial assets 10,464,406 8,868,281
Total assets 4,580,387,848 4,146,326,482
Liabilities
Amounts payable on repurchases of shares (33,591,036) (1,843,994)
Amounts payable on purchases of securities (9,716,198) (38,745,430)
Financial liabilities at fair value through profit or loss
- Derivative financial liabilities (8,577,868) (8,179,706)
Accrued expenses (4,237,848) (3,018,533)
Bank overdraft (865,444) -
Administration fees accrued (314,177) (161,000)
Liabilities (excluding net assets attributable to
holders of redeemable participating shares) (57,302,571) (51,948,663)
Net assets attributable to holder of redeemable
participating shares 4,523,085,277 4,094,377,819
The unaudited condensed interim financial statements were approved by the Board of Directors on 30 August 2017. The accompanying notes form an integral part of these unaudited condensed interim financial statements.

SANLAM UNIVERSAL FUNDS PLC
106
STATEMENTS OF FINANCIAL POSITION OF THE FUNDS as at 30 June 2017
Sanlam Centre Global Select
Equity Fund
Bridge Global Property Income
Fund1
P-Solve Inflation Plus Fund
Sanlam African Frontier Markets
Fund
Sanlam Global Best Ideas Fund
USD USD GBP USD USD Assets
Cash and cash equivalents 43,748 930,262 941,630 3,367,440 1,088,375 Margin accounts - - - - - Accrued income - 138,030 119,541 134,098 300,976 Amounts receivable on sale of securities - - - - - Amounts receivable on issue of shares - - - - - Other debtors 35 4,643 528 2,697 1,401 Financial assets at fair value through profit or loss
- Transferable securities - 35,223,034 34,909,070 68,529,489 111,376,061 - Investment funds - - 16,886,262 - - - FDI assets - - - - -
Total assets 43,783 36,295,969 52,857,031 72,033,724 112,766,813
Liabilities
Bank overdraft - - - - - Financial liabilities at fair value through profit or loss
- FDI liabilities - - - - - Accrued expenses (40,702) (73,497) (25,143) (232,249) (136,078) Administration fees accrued (3,081) (5,226) (4,914) (7,157) (895) Amounts payable on purchases of securities - - - - - Amounts payable on repurchases of shares - (10,000) - - -
(8,114)
Liabilities (excluding net assets attributable to
holders of redeemable participating shares) (43,783) (88,723) (30,057) (239,406) (145,087)
Net assets attributable to holder of redeemable
participating shares - 36,207,246 52,826,974 71,794,318 112,621,726
1During the period ended 30 June 2017, effective from 13 June 2017, the name of this Fund was changed. The previous name of this Fund was Grindrod Global Property Income Fund.

SANLAM UNIVERSAL FUNDS PLC
107
STATEMENTS OF FINANCIAL POSITION OF THE FUNDS (CONTINUED)as at 30 June 2017
Sanlam Global Bond Fund
Sanlam Global Financial Fund
Sanlam Global Property Fund
Sanlam World Equity Fund
Satrix World Equity Tracker Fund
USD USD USD USD USD Assets
Cash and cash equivalents 17,705,497 4,656,968 1,744,788 7,105,267 5,763,534 Margin accounts 865,507 - - - - Accrued income 3,830,824 540,195 401,534 515,291 831,550 Amounts receivable on sale of securities - - 533,695 - - Amounts receivable on issue of shares - - - - 315,144 Other debtors 5,129 3,293 882 33,108 212,541
Financial assets at fair value through profit or loss
- Transferable securities 457,417,022 114,058,348 124,807,901 334,689,074 671,267,712
- Investment funds - - - 11,088,620 -
- FDI assets 5,703,441 - 88,410 - -
Total assets 485,527,420 119,258,804 127,577,210 353,431,360 678,390,481
Liabilities
Bank overdraft - - - - - Financial liabilities at fair value through profit or loss
- FDI liabilities (5,369,453) - (92,632) - - Accrued expenses (233,489) (155,908) (112,869) (592,506) (249,334) Administration fees accrued (10,572) (16,218) (6,073) (51,634) - Amounts payable on purchases of securities (695,771) (1,288,224) (1,000,894) (60,811) (999,750) Amounts payable on repurchases of shares (233,391) (5,290) (4,450) (365,646) -
Liabilities (excluding net assets attributable to
holders of redeemable participating shares) (6,542,676) (1,465,640) (1,216,918) (1,070,597) (1,249,084)
Net assets attributable to holder of redeemable
participating shares 478,984,744 117,793,164 126,360,292 352,360,763 677,141,397

SANLAM UNIVERSAL FUNDS PLC
108
STATEMENTS OF FINANCIAL POSITION OF THE FUNDS (CONTINUED)as at 30 June 2017
SIIP India Opportunities
Fund
SIM Global Equity Income Fund
Sanlam Strategic Bond Fund
Sanlam Accel Income Fund
Satrix North America Equity
Tracker Fund USD USD GBP GBP USD
Assets
Cash and cash equivalents 133,795 2,112,877 - 1,320,213 293,901 Margin accounts - - - - -
Accrued income 69,281 398,151 1,706,965 121,438 57,783
Amounts receivable on sale of securities - - - - -
Amounts receivable on issue of shares - 46,188 815,469 - 28,517
Other debtors 79,737 381 33,981 6,574 47,136
Financial assets at fair value through profit or loss
- Transferable securities 37,899,273 111,382,168 114,840,276 - 71,791,726
- Investment funds - - - 38,198,816 -
- FDI assets - - 1,285,125 - -
Total assets 38,182,086 113,939,765 118,681,816 39,647,041 72,219,063
Liabilities
Bank overdraft - - (69,651) - - Financial liabilities at fair value through profit or loss
- FDI liabilities - - (1,911,698) - - Accrued expenses (135,100) (117,630) (111,816) (52,730) (39,542) Administration fees accrued (4,196) (9,371) - - - Amounts payable on purchases of securities - - - - - Amounts payable on repurchases of shares - - - (78,261) -
Liabilities (excluding net assets attributable to
holders of redeemable participating shares) (139,296) (127,001) (2,093,165) (130,991) (39,542)
Net assets attributable to holder of redeemable
participating shares 38,042,790 113,812,764 116,588,651 39,516,050 72,179,521

SANLAM UNIVERSAL FUNDS PLC
109
STATEMENTS OF FINANCIAL POSITION OF THE FUNDS (CONTINUED) as at 30 June 2017
Satrix UK Equity Tracker Fund
2
Satrix Europe (ex-UK) Equity Tracker Fund
3
Sanlam Equity Allocation Fund
Satrix Emerging Markets Equity Tracker Fund
4
Sanlam Managed Risk Fund
GBP EUR USD USD USD Assets
Cash and cash equivalents 323,619 19,111,343 1,653,076 339,395 219,744
Margin accounts - - - - 3,738,194
Accrued income 250,962 50,768 149,146 166,317 -
Amounts receivable on sale of securities - - - - 66,809
Amounts receivable on issue of shares - - - 6,178 19,322
Other debtors 13,822 44,941 - 110,941 95,173
Financial assets at fair value through profit or loss
- Transferable securities 48,168,217 236,396,335 109,218,687 45,366,604 40,191,010
- Investment funds - - - - -
- FDI assets - - - - 356,052
Total assets 48,756,620 255,603,387 111,020,909 45,989,435 44,686,304
Liabilities
Bank overdraft - - - - -
Financial liabilities at fair value through profit or loss
- FDI liabilities - - - - (3,908)
Accrued expenses (24,575) (76,881) (119,690) (127,262) (99,863)
Administration fees accrued - - (2,079) - -
Amounts payable on purchases of securities (104,810) (1,118,125) - (80,636) -
Amounts payable on repurchases of shares - (954,599) - - -
Liabilities (excluding net assets attributable to
holders of redeemable participating shares) (129,385) (2,149,605) (121,769) (207,898) (103,771)
Net assets attributable to holder of redeemable
participating shares 48,627,235 253,453,782 110,899,140 45,781,537 44,582,533

SANLAM UNIVERSAL FUNDS PLC
110
STATEMENTS OF FINANCIAL POSITION OF THE FUNDS (CONTINUED) as at 30 June 2017
Sanlam Private Wealth Global
High Quality Fund
Sanlam FOUR US Dividend Income
Fund
High Street Global Balanced Fund
Sanlam FOUR Active European (ex-UK)
Equity Fund
Sanlam FOUR Global Equity Fund
GBP USD USD GBP GBP Assets
Cash and cash equivalents 27,759,101 23,479,910 914,774 10,711,096 2,446,111
Margin accounts - - 398,235 - -
Accrued income 24,317 366,507 53,696 - 275,609
Amounts receivable on sale of securities - 651,210 - - 130,815
Amounts receivable on issue of shares 691,917 - - - -
Other debtors 38,911 12,299 13,315 - 1,273
Financial assets at fair value through profit or loss
- Transferable securities 124,215,123 211,959,621 18,181,839 - 184,938,248
- Investment funds 4,555,742 - - - -
- FDI assets - - 148,349 - -
Total assets 157,285,111 236,469,547 19,710,208 10,711,096 187,792,056
Liabilities
Bank overdraft - - - - -
Financial liabilities at fair value through profit or loss
- FDI liabilities - - (105,177) - -
Accrued expenses (152,242) (117,919) (41,135) (109,708) (105,528)
Administration fees accrued - (8,732) (4,035) (8,182) (13,734)
Amounts payable on purchases of securities (1,026,139) (425,891) (314,925) - -
Amounts payable on repurchases of shares - (6,001,597) - (10,593,206) (1,542,494)
Liabilities (excluding net assets attributable to
holders of redeemable participating shares) (1,178,381) (6,554,139) (465,272) (10,711,096) (1,661,756)
Net assets attributable to holder of redeemable
participating shares 156,106,730 229,915,408 19,244,936 - 186,130,300

SANLAM UNIVERSAL FUNDS PLC
111
STATEMENTS OF FINANCIAL POSITION OF THE FUNDS (CONTINUED) as at 30 June 2017
Sanlam FOUR Stable Global
Equity Fund
Sanlam FOUR Active UK Equity
Fund
Sanlam FOUR Multi-Strategy
Fund
Anchor Global Capital Plus Fund
Bridge Global Equity Income Growth
Fund1
GBP GBP GBP USD USD Assets
Cash and cash equivalents 5,908,379 2,503,185 8,139,190 3,014,986 139,209 Margin accounts - - 4,728,167 816,051 - Accrued income 381,521 185,472 1,637,524 11,779 15,443 Amounts receivable on sale of securities - 7,499 - 513,651 - Amounts receivable on issue of shares - - - - - Other debtors 1,549 12,727 9,255 27,459 11,195 Financial assets at fair value through profit or loss
- Transferable securities 158,934,834 59,272,314 106,717,202 8,807,675 5,491,030
- Investment funds - - - - -
- FDI assets - - 917,923 13,073 -
Total assets 165,226,283 61,981,197 122,149,261 13,204,674 5,656,877
Liabilities
Bank overdraft - - - - -
Financial liabilities at fair value through profit or loss
- FDI liabilities - - (323,228) (14,084) - Accrued expenses (99,549) (47,550) (61,552) (36,563) (27,462) Administration fees accrued (12,286) - (3,093) (1,259) (2,443) Amounts payable on purchases of securities - - - (321,929) -
Amounts payable on repurchases of shares (2,313,742) - - - -
Liabilities (excluding net assets attributable to
holders of redeemable participating shares) (2,425,577) (47,550) (387,873) (373,835) (29,905)
Net assets attributable to holder of redeemable
participating shares 162,800,706 61,933,647 121,761,388 12,830,839 5,626,972
1During the period ended 30 June 2017, effective from 13 June 2017, the name of this Fund was changed. The previous name of this Fund was Grindrod Global Equity Income Growth Fund.

SANLAM UNIVERSAL FUNDS PLC
112
STATEMENTS OF FINANCIAL POSITION OF THE FUNDS (CONTINUED) as at 30 June 2017
Anchor Global Equity Fund
Bridge Global Managed Growth
Fund1
SIM Global Emerging Markets
Fund
ABSA Africa Equity Fund
Sanlam Centre American Select
Equity Fund USD USD USD USD USD
Assets
Cash and cash equivalents 3,813,034 126,391 929,723 832,376 1,791,500
Margin accounts - - - - 2,993
Accrued income 17,022 26,596 37,378 30,729 112,894
Amounts receivable on sale of securities - - 328,136 - -
Amounts receivable on issue of shares - - 126,948 - -
Other debtors 18,939 12,834 16,902 18,099 20,368
Financial assets at fair value through profit or loss
- Transferable securities 23,102,971 9,765,178 46,206,231 30,341,444 156,354,804
- Investment funds - - - - -
- FDI assets - - - - 1,486,850
Total assets 26,951,966 9,930,999 47,645,318 31,222,648 159,769,508
Liabilities
Bank overdraft - - - - -
Financial liabilities at fair value through profit or loss
- FDI liabilities - - - - (1)
Accrued expenses (199,083) (36,003) (62,949) (112,890) (50,353)
Administration fees accrued - (2,712) (14,426) - - Amounts payable on purchases of securities - - (758,693) - -
Amounts payable on repurchases of shares (4,627) - - - (10,000,000)
Liabilities (excluding net assets attributable to
holders of redeemable participating shares) (203,710) (38,715) (836,068) (112,890) (10,050,354)
Net assets attributable to holder of redeemable
participating shares 26,748,256 9,892,284 46,809,250 31,109,758 149,719,154
1During the period ended 30 June 2017, effective from 13 June 2017, the name of this Fund was changed. The previous name of this Fund was Grindrod Global Managed Growth Fund.

SANLAM UNIVERSAL FUNDS PLC
113
STATEMENTS OF FINANCIAL POSITION OF THE FUNDS (CONTINUED) as at 30 June 2017
Sanlam Global Convertible
Securities Fund
Sanlam Japan Equity Fund
Salam Centre Active US
Treasury Fund
Autus Global Equity Fund
USD USD USD USD Assets
Cash and cash equivalents 128,314 420,352 642,866 2,668,538
Margin accounts - - 278,261 -
Accrued income 86,681 79,583 175,825 12,735
Amounts receivable on sale of securities - 3,775,766 - -
Amounts receivable on issue of shares - - - -
Other debtors 4,987 3,566 971 21,259
Financial assets at fair value through profit or loss
- Transferable securities 20,230,026 67,489,611 8,930,332 10,877,497
- Investment funds - - - 1,093,185
- FDI assets 13,261 - 12,579 -
Total assets 20,463,269 71,768,878 10,040,834 14,673,214
Liabilities
Bank overdraft - - - - Financial liabilities at fair value through profit or loss
- FDI liabilities (89,369) - (188) -
Accrued expenses (135,565) (37,412) (10,235) (40,405)
Administration fees accrued (4,980) (2,485) (1,913) -
Amounts payable on purchases of securities (112,957) (911,394) - -
Amounts payable on repurchases of shares - (3,000,000) - -
Liabilities (excluding net assets attributable to
holders of redeemable participating shares) (342,871) (3,951,291) (12,336) (40,405)
Net assets attributable to holder of redeemable
participating shares 20,120,398 67,817,587 10,028,498 14,632,809

SANLAM UNIVERSAL FUNDS PLC
114
STATEMENTS OF FINANCIAL POSITION OF THE FUNDS as at 31 December 2016
Sanlam Centre Global Select
Equity Fund
Bridge Global Property Income
Fund1
P-Solve Inflation Plus Fund
Sanlam African Frontier Markets
Fund
Sanlam Global Best Ideas Fund
USD USD GBP USD USD Assets
Cash and cash equivalents 746,067 196,811 852,633 1,583,458 1,597,539 Margin accounts - - - - - Accrued income 34,681 162,684 66,443 - 208,439 Amounts receivable on sale of securities - - - - - Amounts receivable on issue of shares - 11,897 - - - Other debtors 872 89 710 4,345 2,405 Financial assets at fair value through profit or loss
- Transferable securities 34,977,241 38,122,913 31,109,402 64,278,749 100,991,007 - Investment funds - - 19,118,399 - - - FDI assets - - - - -
Total assets 35,758,861 38,494,394 51,147,587 65,866,552 102,799,390
Liabilities
Bank overdraft - - - - - Financial liabilities at fair value through profit or loss
- FDI liabilities - - - - - Accrued expenses (32,732) (72,184) (16,997) (167,911) (129,265) Administration fees accrued (1,664) (4,597) (4,200) (6,187) (4,014)
Amounts payable on purchases of securities - - - - -
Amounts payable on repurchases of shares - - - - (11,971)
Liabilities (excluding net assets attributable to
holders of redeemable participating shares) (34,396) (76,781) (21,197) (174,098) (145,250)
Net assets attributable to holder of redeemable
participating shares 35,724,465 38,417,613 51,126,390 65,692,454 102,654,140
1During the period ended 30 June 2017, effective from 13 June 2017, the name of this Fund was changed. The previous name of this Fund was Grindrod Global Property Income Fund.

SANLAM UNIVERSAL FUNDS PLC
115
STATEMENTS OF FINANCIAL POSITION OF THE FUNDS (CONTINUED) as at 31 December 2016
Sanlam Global
Bond Fund Sanlam Global Financial Fund
Sanlam Global Property Fund
Sanlam Strategic Cash Fund
Sanlam World Equity Fund
USD USD USD USD USD Assets
Cash and cash equivalents 27,315,533 1,471,095 3,275,100 9,022 17,035,493 Margin accounts 1,420,949 - - - - Accrued income 3,139,880 32,965 282,354 - 656,978 Amounts receivable on sale of securities - 98,118 134,697 - 244,617 Amounts receivable on issue of shares - - - - - Other debtors 3,742 4,393 1,413 - 28,259
Financial assets at fair value through profit or loss
- Transferable securities 332,972,344 138,115,927 113,703,510 - 739,524,549
- Investment funds - - - - -
- FDI assets 5,318,331 - - - -
Total assets 370,170,779 139,722,498 117,397,074 9,022 757,489,896
Liabilities
Bank overdraft - - - - - Financial liabilities at fair value through profit or loss
- FDI liabilities (6,133,748) - (351,139) - - Accrued expenses (138,162) (157,798) (77,854) (4,970) (489,131) Administration fees accrued (8,246) (17,010) (4,569) (4,052) (47,237) Amounts payable on purchases of securities (3,990,254) (505,086) (885,461) - (1,307,793) Amounts payable on repurchases of shares (2) (156) (269) - -
Liabilities (excluding net assets attributable to
holders of redeemable participating shares) (10,270,412) (680,050) (1,319,292) (9,022) (1,844,161)
Net assets attributable to holder of redeemable
participating shares 359,900,367 139,042,448 116,077,782 - 755,645,735

SANLAM UNIVERSAL FUNDS PLC
116
STATEMENTS OF FINANCIAL POSITION OF THE FUNDS (CONTINUED) as at 31 December 2016
Satrix World Equity Tracker
Fund1
SIIP India Opportunities
Fund
SIM Global Equity Income Fund
Sanlam Strategic Bond Fund
2
Sanlam Accel Income Fund
USD USD USD GBP GBP Assets
Cash and cash equivalents 14,605,551 1,003,929 2,995,062 1,120,395 879,378 Margin accounts - - - - -
Accrued income 480,486 2,364 328,378 1,451,103 69,198
Amounts receivable on sale of securities 1,835 - - - -
Amounts receivable on issue of shares - - - 91,007 -
Other debtors 117,255 44 1,834 32,363 5,796
Financial assets at fair value through profit or loss
- Transferable securities 491,925,995 27,651,801 101,926,904 80,386,490 -
- Investment funds - - - - 40,983,966
- FDI assets - - - 178,853 -
Total assets 507,131,122 28,658,138 105,252,178 83,260,211 41,938,338
Liabilities
Bank overdraft - - - - - Financial liabilities at fair value through profit or loss
- FDI liabilities - - - (361,120) -
Accrued expenses (185,738) (56,201) (92,556) (56,396) (48,113) Administration fees accrued - (2,743) (3,687) - - Amounts payable on purchases of securities (8,523,928) - - - - Amounts payable on repurchases of shares (842,080) - (126,102) - (63,977)
Liabilities (excluding net assets attributable to
holders of redeemable participating shares) (9,551,746) (58,944) (222,345) (417,516) (112,090)
Net assets attributable to holder of redeemable
participating shares 497,579,376 28,599,194 105,029,833 82,842,695 41,826,248

SANLAM UNIVERSAL FUNDS PLC
117
STATEMENTS OF FINANCIAL POSITION OF THE FUNDS (CONTINUED) as at 31 December 2016
Satrix North America Equity
Tracker Fund1
Satrix UK Equity Tracker Fund
2
Satrix Europe (ex-UK) Equity Tracker Fund
3
Sanlam Equity Allocation Fund
Satrix Emerging Markets Equity Tracker Fund
4
USD GBP EUR USD USD Assets
Cash and cash equivalents 7,508 1,412,568 536,625 932,444 176,318
Margin accounts - - - - -
Accrued income 6,286 79,142 35,628 71,980 20,412
Amounts receivable on sale of securities - 1,648 187,877 1,907 -
Amounts receivable on issue of shares 19,830 - - - 14,959
Other debtors 35,198 9,672 28,727 1,312 77,901
Financial assets at fair value through profit or loss
- Transferable securities 6,291,476 35,904,967 118,641,933 95,720,423 38,243,018
- Investment funds - - - - -
- FDI assets - - - - -
Total assets 6,360,298 37,407,997 119,430,790 96,728,066 38,532,608
Liabilities
Bank overdraft - - - - -
Financial liabilities at fair value through profit or loss
- FDI liabilities - - - - -
Accrued expenses (29,755) (16,331) (44,946) (77,315) (108,320)
Administration fees accrued - - - (1,087) -
Amounts payable on purchases of securities (6,390) (1,206,863) - - -
Amounts payable on repurchases of shares - (12) - - -
Liabilities (excluding net assets attributable to
holders of redeemable participating shares) (36,145) (1,223,206) (44,946) (78,402) (108,320)
Net assets attributable to holder of redeemable
participating shares 6,324,153 36,184,791 119,385,844 96,649,664 38,424,288

SANLAM UNIVERSAL FUNDS PLC
118
STATEMENTS OF FINANCIAL POSITION OF THE FUNDS (CONTINUED) as at 31 December 2016
Sanlam Managed Risk Fund
Sanlam P2strategies UK
Fund
Sanlam P2strategies North
America Fund
Sanlam P2strategies Emerging
Market Fund
Sanlam P2strategies Europe (ex-UK)
Fund USD GBP USD USD EUR Assets
Cash and cash equivalents 387,495 - - - -
Margin accounts 4,109,324 - - - -
Accrued income - - - - -
Amounts receivable on sale of securities 110,767 - - - -
Amounts receivable on issue of shares - - - - -
Other debtors 91,053 - - - -
Financial assets at fair value through profit or loss
- Transferable securities - - - - -
- Investment funds 41,784,642 - - - -
- FDI assets 48,952 - - - -
Total assets 46,532,233 - - - -
Liabilities
Bank overdraft - - - - -
Financial liabilities at fair value through profit or loss
- FDI liabilities (262,268) - - - -
Accrued expenses (124,700) - - - -
Administration fees accrued - - - - -
Amounts payable on purchases of securities - - - - -
Amounts payable on repurchases of shares (133,995) - - - -
Liabilities (excluding net assets attributable to
holders of redeemable participating shares) (520,963) - - - -
Net assets attributable to holder of redeemable
participating shares 46,011,270 - - - -

SANLAM UNIVERSAL FUNDS PLC
119
STATEMENTS OF FINANCIAL POSITION OF THE FUNDS (CONTINUED) as at 31 December 2016
Sanlam Private Wealth Global
High Quality Fund
Sanlam FOUR US Dividend Income
Fund
High Street Global Balanced Fund
Sanlam FOUR Active European (ex-UK)
Equity Fund
Sanlam FOUR Global Equity Fund
GBP USD USD GBP GBP Assets
Cash and cash equivalents 16,903,453 17,646,671 2,513,759 1,167,680 1,862,359
Margin accounts - - 226,451 - -
Accrued income 48,417 146,633 93,016 - 171,843
Amounts receivable on sale of securities - - - 28,051 -
Amounts receivable on issue of shares 470,468 5,100,437 - 3,043,562 2,382,936
Other debtors 34,134 17,256 15,100 2,050 499
Financial assets at fair value through profit or loss
- Transferable securities 84,418,600 163,095,507 11,787,512 77,255,020 183,053,772
- Investment funds 4,762,956 - - - -
- FDI assets - - 253,131 - -
Total assets 106,638,028 186,006,504 14,888,969 81,496,363 187,471,409
Liabilities
Bank overdraft - - - - -
Financial liabilities at fair value through profit or loss
- FDI liabilities - - - - -
Accrued expenses (100,502) (51,859) (36,683) (39,825) (52,140)
Administration fees accrued - (5,610) (2,304) (4,344) (6,623)
Amounts payable on purchases of securities - (4,699,400) - (3,893,775) (646,444)
Amounts payable on repurchases of shares - - - - -
Liabilities (excluding net assets attributable to
holders of redeemable participating shares) (100,502) (4,756,869) (38,987) (3,937,944) (705,207)
Net assets attributable to holder of redeemable
participating shares 106,537,526 181,249,635 14,849,982 77,558,419 186,766,202

SANLAM UNIVERSAL FUNDS PLC
120
STATEMENTS OF FINANCIAL POSITION OF THE FUNDS (CONTINUED) as at 31 December 2016
Sanlam FOUR Stable Global
Equity Fund
Sanlam FOUR Active UK Equity
Fund
Sanlam FOUR Multi-Strategy
Fund
Anchor Global Capital Plus Fund
Bridge Global Equity Income Growth
Fund1
GBP GBP GBP USD USD Assets
Cash and cash equivalents 5,466,247 1,576,761 8,144,068 6,144,175 8,740
Margin accounts - - 6,579,538 789,415 -
Accrued income 152,236 74,914 1,289,835 3,368 11,161
Amounts receivable on sale of securities - 6,454 - - -
Amounts receivable on issue of shares 3,348,304 - 826,665 - -
Other debtors 6,509 9,007 5,950 28,349 12,431
Financial assets at fair value through profit or loss
- Transferable securities 119,308,944 76,465,493 86,141,130 5,087,300 5,093,511
- Investment funds - - 10,309,484 - -
- FDI assets - - 1,078,734 - -
Total assets 128,282,240 78,132,629 114,375,404 12,052,607 5,125,843
Liabilities
Bank overdraft - - - - -
Financial liabilities at fair value through profit or loss
- FDI liabilities - - (742,629) (47,482) -
Accrued expenses (61,883) (35,316) (41,376) (34,075) (24,996)
Administration fees accrued (8,887) - (2,833) (138) (1,001) Amounts payable on purchases of securities - - - - -
Amounts payable on repurchases of shares (525,740) (33) - - -
Liabilities (excluding net assets attributable to
holders of redeemable participating shares) (596,510) (35,349) (786,838) (81,695) (25,997)
Net assets attributable to holder of redeemable
participating shares 127,685,730 78,097,280 113,588,566 11,970,912 5,099,846
1During the period ended 30 June 2017, effective from 13 June 2017, the name of this Fund was changed. The previous name of this Fund was Grindrod Global Equity Income Growth Fund.

SANLAM UNIVERSAL FUNDS PLC
121
STATEMENTS OF FINANCIAL POSITION OF THE FUNDS (CONTINUED) as at 31 December 2016
Anchor Global Equity Fund
Bridge Global Managed Growth
Fund1
SIM Global Emerging Markets
Fund
Sanlam FOUR UK Income
Opportunities Fund
ABSA Africa Equity Fund
USD USD USD GBP USD Assets
Cash and cash equivalents 221,781 138,468 527,344 17,924 4,971,532
Margin accounts - - - - -
Accrued income 16,507 21,677 17,872 - -
Amounts receivable on sale of securities - - - - -
Amounts receivable on issue of shares - - - - -
Other debtors 23,508 14,085 18,096 428 4,178
Financial assets at fair value through profit or loss
- Transferable securities 19,956,796 9,916,735 16,212,028 - 17,467,102
- Investment funds - - - - -
- FDI assets - - - - -
Total assets 20,218,592 10,090,965 16,775,340 18,352 22,442,812
Liabilities
Bank overdraft - - - - -
Financial liabilities at fair value through profit or loss
- FDI liabilities - - - - -
Accrued expenses (44,097) (33,946) (92,265) (18,174) (31,450)
Administration fees accrued - (1,272) (8,737) (178) (805) Amounts payable on purchases of securities (1) - (641,874) - -
Amounts payable on repurchases of shares - - - - -
Liabilities (excluding net assets attributable to
holders of redeemable participating shares) (44,098) (35,218) (742,876) (18,352) (32,255)
Net assets attributable to holder of redeemable
participating shares 20,174,494 10,055,747 16,032,464 - 22,410,557
1During the period ended 30 June 2017, effective from 13 June 2017, the name of this Fund was changed. The previous name of this Fund was Grindrod Global Managed Growth Fund.

SANLAM UNIVERSAL FUNDS PLC
122
STATEMENTS OF FINANCIAL POSITION OF THE FUNDS (CONTINUED) as at 31 December 2016
Sanlam Centre American Select
Equity Fund
Sanlam Global Convertible
Securities Fund
Sanlam Japan Equity Fund
USD USD USD Assets
Cash and cash equivalents 7,763,087 5,584,192 3,031,311
Margin accounts 378,336 - -
Accrued income 112,193 58,404 29,053
Amounts receivable on sale of securities - - 137,351
Amounts receivable on issue of shares - - -
Other debtors 4,178 4,397 1,013
Financial assets at fair value through profit or loss
- Transferable securities 126,745,195 15,342,045 34,467,387
- Investment funds - - -
- FDI assets 1,670,400 22,081 -
Total assets 136,673,389 21,011,119 37,666,115
Liabilities
Bank overdraft - - -
Financial liabilities at fair value through profit or loss
- FDI liabilities - (19,950) -
Accrued expenses (23,562) (30,598) (20,615)
Administration fees accrued (997) (572) (997)
Amounts payable on purchases of securities
(6,946,460) (1,786,592) (2,344,188)
Amounts payable on repurchases of shares
- - -
Liabilities (excluding net assets attributable to
holders of redeemable participating shares) (6,971,019) (1,837,712) (2,365,800)
Net assets attributable to holder of redeemable
participating shares 129,702,370 19,173,407 35,300,315

SANLAM UNIVERSAL FUNDS PLC
123
STATEMENT OF CHANGES IN NET ASSETS ATTRIBUTABLE TO HOLDERS OF REDEEMABLE PARTICIPATING SHARES OF THE COMPANY for the six months ended 30 June 2017
Six months ended
30 June 2017 Six months ended
30 June 2016
USD USD
Operating activities
Change in net assets attributable to
participating shareholders from operations 325,743,150 (30,360,277)
Capital transactions
Issue of shares during the period 945,903,348 399,121,643
Redemption of shares during the period (924,664,052) (486,755,583)
Net increase in net assets attributable to holders of redeemable participating shares from capital transactions
21,239,296 (87,633,940)
Net increase in net assets attributable to holders of redeemable participating shares in the period
346,982,446 (117,994,217)
Net assets attributable to holders of redeemable participating
shares at the beginning of the period 4,094,377,819 4,054,858,943
Exchange differences due to presentation of these financial statements in USD
81,725,012 (83,434,869)
Net assets attributable to holders of redeemable
participating shares at the end of the period 4,523,085,277 3,853,429,857
The accompanying notes form an integral part of these unaudited condensed interim financial statements.

SANLAM UNIVERSAL FUNDS PLC
124
STATEMENTS OF CHANGES IN NET ASSETS ATTRIBUTABLE TO PARTICIPATING SHAREHOLDERS OF THE FUNDS for the six months ended 30 June 2017
Sanlam Centre Global Select Equity Fund
Bridge Global Property Income
Fund1
P-Solve Inflation Plus Fund
Sanlam African Frontier Markets Fund
Sanlam Global Best Ideas Fund
USD USD GBP USD USD Operating activities
Change in net assets attributable to
participating shareholders from operations 79,862 (926,226) 1,165,976 13,149,155 12,361,523
Capital transactions
Issue of shares during the period 18,985 161,430 751,787 2,719,397 1,567,947 Redemption of shares during the period (35,823,312) (1,445,570) (217,178) (9,766,688) (3,961,884)
Net increase/(decrease) in net assets attributable to holders of redeemable participating shares from capital transactions
(35,804,327) (1,284,141) 534,608 (7,047,291) (2,393,937)
Net increase/(decrease) in net assets attributable to holders of redeemable participating shares in the period
(35,724,465) (2,210,367) (1,700,584) 6,101,864 9,967,586
Net assets attributable to holders of redeemable participating shares at the beginning of the period
35,724,465 38,417,613 51,126,390 65,692,454 102,654,140
Net assets attributable to holders of redeemable participating shares at the end of the period - 36,207,246 52,826,974 71,794,318 112,621,726
1During the period ended 30 June 2017, effective from 13 June 2017, the name of this Fund was changed. The previous name of this Fund was Grindrod Global Property Income Fund.

SANLAM UNIVERSAL FUNDS PLC
125
STATEMENTS OF CHANGES IN NET ASSETS ATTRIBUTABLE TO PARTICIPATING SHAREHOLDERS OF THE FUNDS (CONTINUED) for the six months ended 30 June 2017
Sanlam Global Bond Fund
Sanlam Global Financial Fund
Sanlam Global Property Fund
Sanlam World Equity Fund
Satrix World Equity Tracker Fund
USD USD USD USD USD Operating activities
Change in net assets attributable to
participating shareholders from operations 23,351,595 17,895,293 8,786,112 11,104,883 56,980,332
Capital transactions
Issue of shares during the period 101,881,324 10,359,099 4,252,155 48,193,483 168,039,998 Redemption of shares during the period (7,165,943) (49,503,676) (2,755,757) (462,583,338)
1 (45,458,309)
Net increase/(decrease) in net assets attributable to holders of redeemable participating shares from capital transactions 94,715,381 (39,144,577) 1,496,398 (414,389,855) 122,581,689
Net increase/(decrease) in net assets attributable to holders of redeemable participating shares in the period 119,084,378 (21,249,284) 10,282,510 (403,284,972) 179,562,021
Net assets attributable to holders of redeemable participating shares at the beginning of the period 359,900,367 139,042,448 116,077,782 755,645,735 497,579,376
Net assets attributable to holders of redeemable participating shares at the end of the period 478,984,745 117,793,164 126,360,292 352,360,763 677,141,397
1During the period Sanlam Global Equity Fund, a sub-fund of Sanlam Global Funds Plc, redeemed shares in Sanlam World Equity Fund in the amount of USD 379,145,744. This redemption was made by
means of an in specie transfer of equity securities held by the Sanlam World Equity Fund to Sanlam Global Equity Fund.

SANLAM UNIVERSAL FUNDS PLC
126
STATEMENTS OF CHANGES IN NET ASSETS ATTRIBUTABLE TO PARTICIPATING SHAREHOLDERS OF THE FUNDS (CONTINUED) for the six months ended 30 June 2017
SIIP India Opportunities Fund
SIM Global Equity Income Fund
Sanlam Strategic Bond Fund
Sanlam Accel Income Fund
Satrix North America Equity Tracker Fund
USD USD GBP GBP USD Operating activities
Change in net assets attributable to
participating shareholders from operations 7,345,928 11,444,933 6,860,066 1,383,899 5,832,436
Capital transactions
Issue of shares during the period 3,947,182 1,108,943 35,135,229 1,946,422 75,408,501 Redemption of shares during the period (1,849,514) (3,770,946) (8,249,339) (5,640,509) (15,385,569)
Net increase/(decrease) in net assets attributable to holders of redeemable participating shares from capital transactions 2,097,668 (2,662,002) 26,885,890 (3,694,087) 60,022,932
Net increase/(decrease) in net assets attributable to holders of redeemable participating shares in the period 9,443,596 8,782,931 33,745,956 (2,310,198) 65,855,368
Net assets attributable to holders of redeemable participating shares at the beginning of the period 28,599,194 105,029,833 82,842,695 41,826,248 6,324,153
Net assets attributable to holders of redeemable participating shares at the end of the period 38,042,790 113,812,764 116,588,651 39,516,050 72,179,521

SANLAM UNIVERSAL FUNDS PLC
127
STATEMENTS OF CHANGES IN NET ASSETS ATTRIBUTABLE TO PARTICIPATING SHAREHOLDERS OF THE FUNDS (CONTINUED) for the six months ended 30 June 2017
Satrix UK Equity Tracker Fund
Satrix Europe (ex UK) Equity Tracker Fund
Sanlam Equity Allocation Fund
Satrix Emerging Market Equity Tracker Fund
Sanlam Managed Risk Fund
GBP EUR USD USD USD Operating activities
Change in net assets attributable to
participating shareholders from operations 2,972,278 19,775,881 14,249,476 6,937,914 4,861,534
Capital transactions
Issue of shares during the period 9,490,856 116,674,852 - 2,681,323 5,830,902 Redemption of shares during the period (20,690) (2,382,795) - (2,261,988) (12,121,172)
Net increase/(decrease) in net assets attributable to holders of redeemable participating shares from capital transactions 9,470,166 114,292,057 - 419,335 (6,290,271)
Net increase/(decrease) in net assets attributable to holders of redeemable participating shares in the period 12,442,444 134,067,938 14,249,476 7,357,249 (1,428,737)
Net assets attributable to holders of redeemable participating shares at the beginning of the period 36,184,791 119,385,844 96,649,664 38,424,288 46,011,270
Net assets attributable to holders of redeemable participating shares at the end of the period 48,627,235 253,453,782 110,899,140 45,781,537 44,582,533

SANLAM UNIVERSAL FUNDS PLC
128
STATEMENTS OF CHANGES IN NET ASSETS ATTRIBUTABLE TO PARTICIPATING SHAREHOLDERS OF THE FUNDS (CONTINUED) for the six months ended 30 June 2017
Sanlam Private Wealth Global High
Quality Fund
Sanlam FOUR US Dividend Income
Fund
High Street Global Balanced Fund
Sanlam FOUR Active European (ex UK)
Equity Fund
Sanlam FOUR Global Equity Fund
GBP USD USD GBP GBP Operating activities
Change in net assets attributable to
participating shareholders from operations 13,906,237 7,578,513 1,376,591 7,137,441 4,092,379
Capital transactions
Issue of shares during the period 43,768,144 52,594,370 3,320,357 42,139,642 1,287,742 Redemption of shares during the period (8,105,177) (11,507,110) (301,994) (126,835,502) (6,016,023)
Net increase/(decrease) in net assets attributable to holders of redeemable participating shares from capital transactions 35,662,967 41,087,260 3,018,363 (84,695,860) (4,728,281)
Net increase/(decrease) in net assets attributable to holders of redeemable participating shares in the period 49,569,204 48,665,773 4,394,954 (77,558,419) (635,902)
Net assets attributable to holders of redeemable participating shares at the beginning of the period 106,537,526 181,249,635 14,849,982 77,558,419 186,766,202
Net assets attributable to holders of redeemable participating shares at the end of the period 156,106,730 229,915,408 19,244,936 - 186,130,300

SANLAM UNIVERSAL FUNDS PLC
129
STATEMENTS OF CHANGES IN NET ASSETS ATTRIBUTABLE TO PARTICIPATING SHAREHOLDERS OF THE FUNDS (CONTINUED) for the six months ended 30 June 2017
Sanlam FOUR Stable Global Equity Fund
Sanlam FOUR Active UK Equity
Fund
Sanlam FOUR Multi-Strategy Fund
Anchor Global Capital Plus Fund
Bridge Global Equity Income Growth
Fund1
GBP GBP GBP USD USD Operating activities
Change in net assets attributable to
participating shareholders from operations 7,399,816 3,659,275 5,182,138 309,634 448,261
Capital transactions
Issue of shares during the period 32,383,718 8,391,055 3,490,617 1,580,051 180,337 Redemption of shares during the period (4,668,558) (28,213,963) (499,932) (1,029,759) (101,473)
Net increase/(decrease) in net assets attributable to holders of redeemable participating shares from capital transactions 27,715,160 (19,822,908) 2,990,684 550,293 78,865
Net increase/(decrease) in net assets attributable to holders of redeemable participating shares in the period 35,114,976 (16,163,633) 8,172,822 859,927 527,126
Net assets attributable to holders of redeemable participating shares at the beginning of the period 127,685,730 78,097,280 113,588,566 11,970,912 5,099,846
Net assets attributable to holders of redeemable participating shares at the end of the period 162,800,706 61,933,647 121,761,388 12,830,839 5,626,972
1During the period ended 30 June 2017, effective from 13 June 2017, the name of this Fund was changed. The previous name of this Fund was Grindrod Global Equity Income Growth Fund.

SANLAM UNIVERSAL FUNDS PLC
130
STATEMENTS OF CHANGES IN NET ASSETS ATTRIBUTABLE TO PARTICIPATING SHAREHOLDERS OF THE FUNDS (CONTINUED) for the six months ended 30 June 2017
Anchor Global Equity Fund
Bridge Global Managed Growth
Fund1
SIM Global Emerging Markets
Fund
ABSA Africa Equity Fund
Sanlam Centre American Select
Equity Fund USD USD USD USD USD Operating activities
Change in net assets attributable to
participating shareholders from operations 3,571,195 678,792 4,142,987 4,003,612 15,533,662
Capital transactions
Issue of shares during the period 4,252,325 41,420 26,849,788 4,695,589 19,005,161 Redemption of shares during the period (1,249,758) (883,675) (215,989) - (14,522,039)
Net increase/(decrease) in net assets attributable to holders of redeemable participating shares from capital transactions 3,002,567 (842,255) 26,633,799 4,695,589 4,483,122
Net increase/(decrease) in net assets attributable to holders of redeemable participating shares in the period 6,573,762 (163,463) 30,776,786 8,699,201 20,016,784
Net assets attributable to holders of redeemable participating shares at the beginning of the period 20,174,494 10,055,747 16,032,464 22,410,557 129,702,370
Net assets attributable to holders of redeemable participating shares at the end of the period 26,748,256 9,892,284 46,809,250 31,109,758 149,719,154
1During the period ended 30 June 2017, effective from 13 June 2017, the name of this Fund was changed. The previous name of this Fund was Grindrod Global Managed Growth Fund.

SANLAM UNIVERSAL FUNDS PLC
131
STATEMENTS OF CHANGES IN NET ASSETS ATTRIBUTABLE TO PARTICIPATING SHAREHOLDERS OF THE FUNDS (CONTINUED) for the six months ended 30 June 2017
Sanlam Global Convertible Securities
Fund
Sanlam Japan Equity Fund
Sanlam Centre Active US Treasury
Fund
Autus Global Equity Fund
USD USD USD USD Operating activities
Change in net assets attributable to
participating shareholders from operations 917,232 7,279,823 (152,187) 936,895
Capital transactions
Issue of shares during the period 29,759 34,196,252 10,180,685 16,950,4051
Redemption of shares during the period - (8,958,803) - (3,254,490)
Net increase/(decrease) in net assets attributable to holders of redeemable participating shares from capital transactions 29,759 25,237,449 10,180,685 13,695,914
Net increase/(decrease) in net assets attributable to holders of redeemable participating shares in the period 946,991 32,517,272 10,028,498 14,632,809
Net assets attributable to holders of redeemable participating shares at the beginning of the period 19,173,407 35,300,315 - -
Net assets attributable to holders of redeemable participating shares at the end of the period 20,120,398 67,817,587 10,028,498 14,632,809
1Subscriptions include in specie transfers from SBSA ITF Autus BCI Global Equity Fund during the period in exchange for assets with a fair value at date of transfer of USD 16,950,405.

SANLAM UNIVERSAL FUNDS PLC
132
STATEMENTS OF CHANGES IN NET ASSETS ATTRIBUTABLE TO PARTICIPATING SHAREHOLDERS OF THE FUNDS for the six months ended 30 June 2016
Sanlam Centre Global Select Equity Fund
Bridge Global Property Income
Fund1
P-Solve Inflation Plus Fund
Sanlam African Frontier Markets Fund
Sanlam Global Best Ideas Fund
USD USD GBP USD USD Operating activities
Change in net assets attributable to
participating shareholders from operations (1,502,328) 3,602,275 2,526,870 (5,231,266) (8,576,171)
Capital transactions
Issue of shares during the period - 1,815,616 822,705 3,667,156 79,817 Redemption of shares during the period (454,112) (623,216) (501,940) (5,013,561) (18,453,608)
Net increase/(decrease) in net assets attributable to holders of redeemable participating shares from capital transactions
(454,112) 1,192,400 320,765 (1,346,406) (18,373,791)
Net increase/(decrease) in net assets attributable to holders of redeemable participating shares in the period
(1,956,440) 4,794,675 2,847,635 (6,577,672) (26,949,962)
Net assets attributable to holders of redeemable participating shares at the beginning of the period
54,565,133 36,453,509 45,363,781 73,380,397 194,452,035
Net assets attributable to holders of redeemable participating shares at the end of the period 52,608,693 41,248,184 48,211,416 66,802,725 167,502,073
1During the period ended 30 June 2017, effective from 13 June 2017, the name of this Fund was changed. The previous name of this Fund was Grindrod Global Property Income Fund.

SANLAM UNIVERSAL FUNDS PLC
133
STATEMENTS OF CHANGES IN NET ASSETS ATTRIBUTABLE TO PARTICIPATING SHAREHOLDERS OF THE FUNDS (CONTINUED) for the six months ended 30 June 2016
Sanlam Global Bond Fund
Sanlam Global Financial Fund
Sanlam Global Property Fund
Sanlam Strategic Cash Fund
Sanlam World Equity Fund
USD USD USD USD USD Operating activities
Change in net assets attributable to
participating shareholders from operations 27,290,647 (8,900,889) 6,780,375 (335,551) (46,084,868)
Capital transactions
Issue of shares during the period 27,627,869 3,792,344 6,528,582 967,627 49,366,113 Redemption of shares during the period (27,580,771) (52,745,987) (4,683,261) (5,548,489) (109,031,563)*
Net increase/(decrease) in net assets attributable to holders of redeemable participating shares from capital transactions 47,098 (48,953,643) 1,845,321 (4,580,862) (59,665,450)
Net increase/(decrease) in net assets attributable to holders of redeemable participating shares in the period 27,337,745 (57,854,532) 8,625,696 (4,916,413) (105,750,318)
Net assets attributable to holders of redeemable participating shares at the beginning of the period 319,962,145 175,093,943 116,859,654 4,916,413 1,263,780,701
Net assets attributable to holders of redeemable participating shares at the end of the period 347,299,890 117,239,411 125,485,350 - 1,158,030,383
* A shareholder’s redemption from Sanlam World Equity Fund was made by means of an in-specie transfer of securities with a total fair value of USD 15,172,255 at the date of transfer. The in-specie assets were used as part of the shareholders subscription into Sanlam FOUR US Dividend Income Fund.

SANLAM UNIVERSAL FUNDS PLC
134
STATEMENTS OF CHANGES IN NET ASSETS ATTRIBUTABLE TO PARTICIPATING SHAREHOLDERS OF THE FUNDS (CONTINUED) for the six months ended 30 June 2016
Satrix World Equity Tracker Fund
SIIP India Opportunities Fund
SIM Global Equity Income Fund
Sanlam Strategic Bond Fund
Sanlam Accel Income Fund
USD USD USD GBP GBP Operating activities
Change in net assets attributable to
participating shareholders from operations (5,758,879) 35,781 119,056 662,748 418,801
Capital transactions
Issue of shares during the period 95,792,488 445,465 10,449,718 9,669,531 3,261,328 Redemption of shares during the period (123,773,045) * (1,523,215) (590,714) (8,241,599) (4,269,285)
Net increase/(decrease) in net assets attributable to holders of redeemable participating shares from capital transactions (27,980,557) (1,077,750) 9,859,004 1,427,932 (1,007,957)
Net increase/(decrease) in net assets attributable to holders of redeemable participating shares in the period (33,739,436) (1,041,969) 9,978,060 2,090,680 (589,156)
Net assets attributable to holders of redeemable participating shares at the beginning of the period 525,541,583 31,876,924 31,120,186 68,920,223 45,354,512
Net assets attributable to holders of redeemable participating shares at the end of the period 491,802,147 30,834,955 41,098,246 71,010,903 44,765,356
* Redemptions from Satrix World Equity Tracker Fund included an in-specie transfer of securities to Sanlam Managed Risk Fund with a total fair value of USD 14,964,304 at the date of transfer.

SANLAM UNIVERSAL FUNDS PLC
135
STATEMENTS OF CHANGES IN NET ASSETS ATTRIBUTABLE TO PARTICIPATING SHAREHOLDERS OF THE FUNDS (CONTINUED) for the six months ended 30 June 2016
Satrix North America Equity Tracker Fund
Satrix UK Equity Tracker Fund
Satrix Europe (ex UK) Equity Tracker Fund
Sanlam Equity Allocation Fund
Satrix Emerging Market Equity Tracker Fund
USD GBP EUR USD USD Operating activities
Change in net assets attributable to
participating shareholders from operations (108,878) 1,113,091 (8,445,939) (6,568,006) 2,005,946
Capital transactions
Issue of shares during the period 2,536,505 1,306,486 9,225,303 - 5,932,396 Redemption of shares during the period (19,398,200)* (8,470,975) (9,087,263)** - (8,613,529)
Net increase/(decrease) in net assets attributable to holders of redeemable participating shares from capital transactions (16,861,695) (7,164,489) 138,040 - (2,681,143)
Net increase/(decrease) in net assets attributable to holders of redeemable participating shares in the period (16,970,573) (6,051,398) (8,307,899) (6,568,006) (675,197)
Net assets attributable to holders of redeemable participating shares at the beginning of the period 23,813,295 36,969,550 108,504,444 98,299,746 34,979,885
Net assets attributable to holders of redeemable participating shares at the end of the period 6,842,722 30,918,152 100,196,545 91,731,740 34,304,688
* Redemptions from Satrix North America Tracker Fund included an in-specie transfer of securities to Sanlam Managed Risk Fund with a total fair value of USD 10,066,045 at the date of transfer. ** Redemptions from Satrix Europe Ex UK Tracker Fund included an in-specie transfer of securities to Sanlam Managed Risk Fund with a total fair value of EUR 4,285,235 at the date of transfer.

SANLAM UNIVERSAL FUNDS PLC
136
STATEMENTS OF CHANGES IN NET ASSETS ATTRIBUTABLE TO PARTICIPATING SHAREHOLDERS OF THE FUNDS (CONTINUED) for the six months ended 30 June 2016
Sanlam Managed Risk Fund
Sanlam P2strategies UK Fund
Sanlam P2strategies North America Fund
Sanlam P2strategies Emerging Market
Fund
Sanlam P2strategies Europe (ex UK) Fund
USD GBP USD USD EUR Operating activities
Change in net assets attributable to
participating shareholders from operations (2,697,730) 176,317 452,225 119,048 (471,546)
Capital transactions
Issue of shares during the period 42,066,112* 458,159 1,845,037 710,792 957,437 Redemption of shares during the period (15,019,396) (9,012,845) (19,320,521)* (7,848,656) (9,675,144)*
Net increase/(decrease) in net assets attributable to holders of redeemable participating shares from capital transactions 27,046,716 (8,554,686) (17,475,484) (7,137,864) (8,717,707)
Net increase/(decrease) in net assets attributable to holders of redeemable participating shares in the period 24,358,986 (8,378,369) (17,023,259) (7,018,816) (9,189,253)
Net assets attributable to holders of redeemable participating shares at the beginning of the period 37,516,662 8,378,369 17,023,259 7,018,816 9,189,253
Net assets attributable to holders of redeemable participating shares at the end of the period 61,865,648 - - - -
* The merger of Sanlam P2strategies Europe (ex UK) Fund and Sanlam P2strategies UK Fund and Sanlam P2strategies North America Fund (the “Merging Funds”) into Sanlam Managed Risk Fund was achieved partially by an in-specie transfer from Sanlam P2strategies North America Fund of cash and Satrix North America Tracker Fund units with a value of USD 10,946,941 at the date of transfer and an in-speie transfer Sanlam P2strategies Europe (ex UK) Fund of cash and Satrix Europe Ex UK Tracker Fund units with a value of EUR 4,534,507 at the date of transfer

SANLAM UNIVERSAL FUNDS PLC
137
STATEMENTS OF CHANGES IN NET ASSETS ATTRIBUTABLE TO PARTICIPATING SHAREHOLDERS OF THE FUNDS (CONTINUED) for the six months ended 30 June 2016
Sanlam Private Wealth Global High
Quality Fund
Sanlam FOUR US Dividend Income
Fund
High Street Global Balanced Fund
Sanlam FOUR Active European (ex UK)
Equity Fund
Sanlam FOUR Global Equity Fund
GBP USD USD GBP GBP Operating activities
Change in net assets attributable to
participating shareholders from operations 8,548,717 9,581,655 (261,765) 133,036 2,093,843
Capital transactions
Issue of shares during the period 16,735,451 21,643,407* 1,514,825 10,687,119 17,917,536 Redemption of shares during the period (6,365,394) (1,039,861) (229,030) (198,150) (8,576,912)
Net increase/(decrease) in net assets attributable to holders of redeemable participating shares from capital transactions 10,370,057 20,306,546 1,285,795 10,488,969 9,340,624
Net increase/(decrease) in net assets attributable to holders of redeemable participating shares in the period 18,918,774 30,185,201 1,024,030 10,622,005 11,434,467
Net assets attributable to holders of redeemable participating shares at the beginning of the period 45,464,636 32,319,697 11,335,910 25,469,217 52,147,922 Exchange Difference - (4,478,695) - - -
Net assets attributable to holders of redeemable participating shares at the end of the period 64,383,410 58,026,202 12,359,940 36,091,222 63,582,389
* A shareholder’s subscription into Sanlam FOUR US Dividend Income Fund was made by means of an in-specie transfer of securities with a total fair value of USD 15,172,255 at the date of transfer. The in-specie assets arose from the shareholders redemption from Sanlam World Equity Fund.

SANLAM UNIVERSAL FUNDS PLC
138
STATEMENTS OF CHANGES IN NET ASSETS ATTRIBUTABLE TO PARTICIPATING SHAREHOLDERS OF THE FUNDS (CONTINUED) for the six months ended 30 June 2016
Sanlam FOUR Stable Global Equity Fund
Sanlam FOUR Active UK Equity
Fund
Sanlam FOUR Multi-Strategy Fund
Anchor Global Capital Plus Fund
Bridge Global Equity Income Growth
Fund1
GBP GBP GBP USD USD Operating activities
Change in net assets attributable to
participating shareholders from operations 9,369,986 (17,015,046) 2,070,929 (250,973) 179,546
Capital transactions
Issue of shares during the period 13,639,135 20,856,766 562,754 5,825,850 142,270 Redemption of shares during the period (395,493) (17,484,095) (1,122,490) (3,047,830) (2,285)
Net increase/(decrease) in net assets attributable to holders of redeemable participating shares from capital transactions 13,243,642 3,372,671 (559,736) 2,778,020 139,985
Net increase/(decrease) in net assets attributable to holders of redeemable participating shares in the period 22,613,628 (13,642,375) 1,511,193 2,527,047 319,531
Net assets attributable to holders of redeemable participating shares at the beginning of the period 70,953,588 122,921,209 65,614,192 9,419,223 4,940,543
Net assets attributable to holders of redeemable participating shares at the end of the period 93,567,216 109,278,834 67,125,385 11,946,270 5,260,074
1During the period ended 30 June 2017, effective from 13 June 2017, the name of this Fund was changed. The previous name of this Fund was Grindrod Global Equity Income Growth Fund.

SANLAM UNIVERSAL FUNDS PLC
139
STATEMENTS OF CHANGES IN NET ASSETS ATTRIBUTABLE TO PARTICIPATING SHAREHOLDERS OF THE FUNDS (CONTINUED) for the six months ended 30 June 2016
Anchor Global Equity Fund
Bridge Global Managed Growth
Fund1
SIM Global Emerging Markets
Fund
Sanlam FOUR UK Income
Opportunities Fund USD USD USD GBP Operating activities
Change in net assets attributable to
participating shareholders from operations (197,429) 478,049 1,038,597 (154,227)
Capital transactions
Issue of shares during the period 4,971,705 144,691 62,559 358,621 Redemption of shares during the period (5,611,315) (17,136) - -
Net increase/(decrease) in net assets attributable to holders of redeemable participating shares from capital transactions
(639,610) 127,555
62,559 358,621
Net increase/(decrease) in net assets attributable to holders of redeemable participating shares in the period
(837,039) 605,604
1,101,156 204,394
Net assets attributable to holders of redeemable participating shares at the beginning of the period
18,789,944 9,609,524 6,911,951 504,053
Net assets attributable to holders of redeemable participating shares at the end of the period 17,952,905 10,215,128 8,013,107 708,447
1During the period ended 30 June 2017, effective from 13 June 2017, the name of this Fund was changed. The previous name of this Fund was Grindrod Global Managed Growth Fund.

SANLAM UNIVERSAL FUNDS PLC
140
STATEMENT OF CASH FLOWS OF THE COMPANY for the six months ended 30 June 2017
Six months ended 30 June
2017
Six months ended 30 June
2016
USD USD
Cash flows from operating activities
Purchases of financial assets and settlement of financial liabilities (2,585,423,676) (1,704,583,460)
Proceeds from sale of investments (including realised gains) 2,502,071,217 1,833,486,737
Dividends received 48,484,347 49,508,252
Income from financial assets through profit or loss 10,642,873 9,154,964
Interest received 524,597 13,621
Income from securities lending received 225,651 405,349
Other income received 275,974 (89,483)
Operating expenses paid (9,549,301) (8,392,104)
Net cash inflow from operating activities (32,748,318) 179,503,876
Cash flows from financing activities
Distributions paid to holders of redeemable participating shares (4,455,290) (5,891,641)
Proceeds from redeemable participating shares issued 976,207,070 348,503,624
Payments on redemption of redeemable participating shares (894,216,646) (477,876,073)
Income equalisation (35,096,600) (14,455,825)
Net cash used in financing activities 42,438,534 (149,719,915)
Net increase in cash and cash equivalents 9,690,216 29,783,961
Cash and cash equivalents at the start of the period 186,251,844 100,443,399
Exchange gains on cash and cash equivalents 2,071,622 1,082,093
Cash and cash equivalents at the end of the period 198,013,682 131,309,453
The accompanying notes form an integral part of these unaudited condensed interim financial statements.

SANLAM UNIVERSAL FUNDS PLC
141
STATEMENTS OF CASH FLOWS OF THE FUNDS for the six months ended 30 June 2017
Sanlam Centre Global Select
Equity Fund
Bridge Global Property Income
Fund1
P-Solve Inflation Plus Fund
Sanlam African Frontier Markets
Fund
Sanlam Global Best Ideas Fund
USD USD GBP USD USD
Cash flows from operating activities
Purchases of financial assets and settlement of financial liabilities - (4,428,928) (20,098,303) (10,699,316) (7,911,570)
Proceeds from sale of investments (including realised gains) 37,328,454 6,166,886 19,811,464 19,039,922 8,995,094
Dividends received 166,045 747,314 111,840 1,593,012 1,384,568
Income from financial assets through profit of loss - - 96,470 - -
Interest received 1,716 416 (27,076) 4,054 2,921
Income from securities lending received 1,419 - 1,165 444 14,534
Other income 265 272 4,131 463 803
Operating expenses paid (66,058) (339,640) (40,514) (343,587) (400,515)
Net cash inflow/(outflow) from operating activities 37,431,841 2,146,320 (140,823) 9,594,992 2,085,835
Cash flows from financing activities
Distributions paid to holders of redeemable participating shares - - (287,842) - (1,191)
Proceeds from redeemable participating shares issued 18,985 173,327 751,787 2,719,397 1,567,947
Payment on redemption of redeemable participating shares (35,823,312) (1,435,570) (217,178) (9,766,688) (3,965,741)
Income equalization (2,332,557) (154,640) 271 (982,998) (210,576)
Net cash provided/(used in) by financing activities (38,136,884) (1,416,883) 247,038 (8,030,289) (2,609,562)
Net increase/(decrease) in cash and cash equivalents (705,043) 729,437 106,215 1,564,703 (523,727)
Cash and cash equivalents at the start of the period 746,067 196,811 852,633 1,583,458 1,597,539
Exchange gains/(losses) on cash and cash equivalents 2,724 4,014 (17,218) 219,279 14,563
Cash and cash equivalents at the end of the period 43,748 930,262 941,630 3,367,440 1,088,375
1During the period ended 30 June 2017, effective from 13 June 2017, the name of this Fund was changed. The previous name of this Fund was Grindrod Global Property Income Fund.

SANLAM UNIVERSAL FUNDS PLC
142
STATEMENTS OF CASH FLOWS OF THE FUNDS (CONTINUED) for the six months ended 30 June 2017
Sanlam Global Bond Fund
Sanlam Global Financial Fund
Sanlam Global Property Fund
Sanlam World Equity Fund
Satrix World Equity Tracker Fund
USD USD USD USD USD
Cash flows from operating activities
Purchases of financial assets and settlement of financial liabilities (129,809,645) (29,841,109) (61,174,608) (685,210,064) (157,229,484)
Proceeds from sale of investments (including realised gains) 13,318,515 72,289,001 56,614,650 1,133,634,889 22,148,341
Dividends received - 2,181,873 1,970,770 6,368,277 6,915,939
Income from financial assets through profit of loss 4,824,027 - - - -
Interest received 13,225 8,126 7,924 24,306 8,333
Income from securities lending received - 27 1,847 70,691 35,714
Other income 200,945 993 1,553 40,875 5,803
Operating expenses paid (300,628) (654,218) (264,407) (1,453,517) (996,081)
Net cash inflow/(outflow) from operating activities (111,753,561) 43,984,693 (2,842,271) 453,475,457 (129,111,435)
Cash flows from financing activities
Distributions paid to holders of redeemable participating shares - (34,372) - - (12,928)
Proceeds from redeemable participating shares issued 101,881,324 10,359,099 4,252,155 48,193,483 167,724,854
Payment on redemption of redeemable participating shares (6,932,554) (49,498,542) (2,751,576) (462,217,692) (46,300,389)
Income equalisation 6,122,255 (1,637,296) (32,477) (49,323,892) (1,169,522)
Net cash provided by/(used in) financing activities 101,071,025 (40,811,111) 1,468,102 (463,348,101) 120,242,015
Net increase/(decrease) in cash and cash equivalents (10,682,536) 3,173,582 (1,374,169) (9,872,644) (8,869,420)
Cash and cash equivalents at the start of the period 28,736,482 1,471,095 3,275,100 17,035,493 14,605,551
Exchange gains/(losses) on cash and cash equivalents 517,058 12,291 (156,143) (57,582) 27,403
Cash and cash equivalents at the end of the period 18,571,004 4,656,968 1,744,788 7,105,267 5,763,534

SANLAM UNIVERSAL FUNDS PLC
143
STATEMENTS OF CASH FLOWS OF THE FUNDS (CONTINUED) for the six months ended 30 June 2017
SIIP India Opportunities
Fund
SIM Global Equity Income Fund
Sanlam Strategic Bond Fund
Sanlam Accel Income Fund
Satrix North America Equity
Tracker Fund USD USD GBP GBP USD
Cash flows from operating activities
Purchases of financial assets and settlement of financial liabilities (8,829,060) (8,372,884) (407,803,255) (1,500,000) (68,281,830)
Proceeds from sale of investments (including realised gains) 5,923,500 8,679,049 377,388,573 5,730,001 5,141,479
Dividends received 156,185 2,367,356 239,077 746,604 221,450
Income from financial assets through profit of loss 3,123 - 3,059,684 - -
Interest received 1,047 3,878 13,458 39 737
Income from securities lending received - 12,966 - - 673
Other income 203 704 563 289 989
Operating expenses paid (200,925) (594,274) (154,416) (79,899) (22,700)
Net cash inflow/(outflow) from operating activities (2,945,927) 2,096,795 (27,256,316) 4,897,034 (62,939,201)
Cash flows from financing activities
Distributions paid to holders of redeemable participating shares - (215,961) (2,015,923) (428,077) (8,813)
Proceeds from redeemable participating shares issued 3,947,182 1,062,755 34,410,767 1,946,422 75,399,814
Payment on redemption of redeemable participating shares (1,849,514) (3,770,946) (8,249,339) (5,626,225) (15,385,569)
Income equalization (27,988) (57,282) 1,939,659 (348,328) 3,223,579
Net cash provided by/(used in) financing activities 2,069,680 (2,981,434) 26,085,164 (4,456,208) 63,229,011
Net increase/(decrease) in cash and cash equivalents (876,247) (884,639) (1,171,152) 440,826 289,810
Cash and cash equivalents at the start of the period 1,003,929 2,995,062 1,120,395 879,378 7,508
Exchange gains/(losses) on cash and cash equivalents 6,113 2,454 (18,894) 9 (3,417)
Cash and cash equivalents at the end of the period 133,795 2,112,877 (69,651) 1,320,213 293,901

SANLAM UNIVERSAL FUNDS PLC
144
STATEMENTS OF CASH FLOWS OF THE FUNDS (CONTINUED) for the six months ended 30 June 2017
Satrix UK Equity Tracker Fund
Satrix Europe (ex UK) Equity Tracker Fund
Sanlam Equity Allocation Fund
Satrix Emerging Market Equity Tracker Fund
Sanlam Managed Risk Fund
GBP EUR USD USD USD
Cash flows from operating activities
Purchases of financial assets and settlement of financial liabilities (13,031,630) (111,906,936) (13,938,236) (1,605,132) (4,722,579)
Proceeds from sale of investments (including realised gains) 275,521 2,482,299 12,384,112 1,306,245 10,460,372
Dividends received 948,180 3,053,242 2,269,506 370,180 (886)
Income from financial assets through profit of loss - - - - -
Interest received (1,620) (4,760) 2,285 231 (6,413)
Income from securities lending received 4,084 35,710 31,663 897 -
Other income 242 3,717 682 267 -
Operating expenses paid (28,265) (127,431) (20,418) (127,429) (270,399)
Net cash inflow/(outflow) from operating activities (11,833,488) (106,464,159) 729,594 (54,741) 5,460,095
Cash flows from financing activities
Distributions paid to holders of redeemable participating shares (24,783) (12,478) - (173,598) -
Proceeds from redeemable participating shares issued 9,490,856 116,862,729 - 2,690,104 5,811,580
Payment on redemption of redeemable participating shares (20,702) (1,428,196) - (2,261,988) (12,255,167)
Income equalisation 1,299,575 9,938,132 - (40,481) 209,555
Net cash provided by/(used in) financing activities 10,744,946 125,360,187 - 214,037 (6,234,032)
Net increase/(decrease) in cash and cash equivalents (1,088,542) 18,896,028 729,594 159,296 (773,937)
Cash and cash equivalents at the start of the period 1,412,568 536,625 932,444 176,318 4,496,819
Exchange gains/(losses) on cash and cash equivalents (407) (321,310) (8,962) 3,781 235,056
Cash and cash equivalents at the end of the period 323,619 19,111,343 1,653,076 339,395 3,957,938

SANLAM UNIVERSAL FUNDS PLC
145
STATEMENTS OF CASH FLOWS OF THE FUNDS (CONTINUED) for the six months ended 30 June 2017
Sanlam Private Wealth Global High
Quality Fund
Sanlam FOUR US Dividend Income
Fund
High Street Global Balanced Fund
Sanlam FOUR Active European (ex
UK) Equity Fund
Sanlam FOUR Global Equity Fund
GBP USD USD GBP GBP
Cash flows from operating activities
Purchases of financial assets and settlement of financial liabilities (40,587,873) (189,324,891) (7,792,616) (45,414,901) (28,247,466)
Proceeds from sale of investments (including realised gains) 16,265,814 140,802,465 3,362,666 126,886,076 27,994,484
Dividends received 880,567 1,886,152 164,035 1,914,074 2,265,310
Income from financial assets through profit of loss - - - -
Interest received 39,017 25,400 141,696 (3,831) 5,845
Income from securities lending received 5,100 - - - -
Other income 689 1,177 124 599 1,188
Operating expenses paid (547,936) (216,112) (112,211) (93,773) (166,317)
Net cash inflow/(outflow) from operating activities (23,944,622) (46,825,809) (4,236,306) 83,288,244 1,853,044
Cash flows from financing activities
Distributions paid to holders of redeemable participating shares (85,040) (42,134) - - -
Proceeds from redeemable participating shares issued 43,546,695 57,694,807 3,320,357 45,183,204 3,670,678
Payment on redemption of redeemable participating shares (8,105,177) (5,505,513) (301,994) (116,242,296) (4,473,529)
Income equalisation 542,997 394,527 130,021 (3,669,312) (362,241)
Net cash provided by/(used in) financing activities 35,899,475 52,541,687 3,148,384 (74,728,404) (1,165,092)
Net increase/(decrease) in cash and cash equivalents 11,954,853 5,715,878 (1,087,921) 8,559,840 687,952
Cash and cash equivalents at the start of the period 16,903,453 17,646,671 2,740,210 1,167,680 1,862,359
Exchange gains/(losses) on cash and cash equivalents (1,099,205) 117,361 (339,279) 983,576 (104,200)
Cash and cash equivalents at the end of the period 27,759,101 23,479,910 1,313,009 10,711,096 2,446,111

SANLAM UNIVERSAL FUNDS PLC
146
STATEMENTS OF CASH FLOWS OF THE FUNDS (CONTINUED) for the six months ended 30 June 2017
Sanlam FOUR Stable Global
Equity Fund
Sanlam FOUR Active UK Equity
Fund
Sanlam FOUR Multi-Strategy
Fund
Anchor Global Capital Plus Fund
Bridge Global Equity Income Growth Fund
1
GBP GBP GBP USD USD Cash flows from operating activities
Purchases of financial assets and settlement of financial liabilities (48,836,592) (15,757,871) (30,022,290) (6,019,192) -
Proceeds from sale of investments (including realised gains) 13,584,878 36,869,100 22,232,657 2,435,211 7,243
Dividends received 1,318,084 1,355,438 679,819 47,549 85,101
Income from financial assets through profit of loss - - 1,321,098 - -
Interest received 7,641 261 1,104 9,005 183
Income from securities lending received - - - 400 -
Other income 839 1,389 734 98 38
Operating expenses paid (162,411) (86,942) (130,423) (94,328) (42,413)
Net cash inflow/(outflow) from operating activities (34,087,561) 22,381,375 (5,917,301) (3,621,257) 50,152
Cash flows from financing activities
Distributions paid to holders of redeemable participating shares (27) (4,523) (13,530) - -
Proceeds from redeemable participating shares issued 35,732,022 8,391,055 4,317,282 1,580,051 180,337
Payment on redemption of redeemable participating shares (2,354,816) (28,213,996) (499,932) (1,029,759) (101,473)
Income equalisation 1,446,682 (1,687,455) 267,390 (17,851) 1,329
Net cash provided by/(used in) financing activities 34,823,861 (21,514,919) 4,071,210 532,441 80,195
Net increase/(decrease) in cash and cash equivalents 736,300 866,456 (1,846,091) (3,088,816) 130,345
Cash and cash equivalents at the start of the period 5,466,247 1,576,761 14,723,606 6,933,590 8,740
Exchange gains/(losses) on cash and cash equivalents (294,168) 59,968 (10,158) (13,737) 124
Cash and cash equivalents at the end of the period 5,908,378 2,503,185 12,867,357 3,831,037 139,209
1During the period ended 30 June 2017, effective from 13 June 2017, the name of this Fund was changed. The previous name of this Fund was Grindrod Global Equity Income Growth Fund.

SANLAM UNIVERSAL FUNDS PLC
147
STATEMENTS OF CASH FLOWS OF THE FUNDS (CONTINUED) for the six months ended 30 June 2017
Anchor Global Equity Fund
Bridge Global Managed Growth
Fund1
SIM Global Emerging Markets
Fund
ABSA Africa Equity Fund
Sanlam Centre American Select
Equity Fund USD USD USD USD USD Cash flows from operating activities
Purchases of financial assets and settlement of financial liabilities (4,145,651) (104,360) (28,319,467) (18,550,136) (76,202,004)
Proceeds from sale of investments (including realised gains) 4,802,083 854,420 1,952,387 9,661,098 54,568,659
Dividends received 110,477 172,160 453,974 494,647 797,658
Income from financial assets through profit of loss - - - - -
Interest received 3,957 (56) 2,700 3,924 4,464
Income from securities lending received 47 - 157 - -
Other income 150 74 107 140 809
Operating expenses paid (171,459) (73,199) (220,154) (253,544) (23,924)
Net cash inflow/(outflow) from operating activities 599,604 849,039 (26,130,296) (8,643,871) (20,854,338)
Cash flows from financing activities
Distributions paid to holders of redeemable participating shares - - - - -
Proceeds from redeemable participating shares issued 4,252,325 41,420 26,722,840 - 19,005,331
Payment on redemption of redeemable participating shares (1,245,131) (883,675) (215,989) 4,695,589 (4,522,106)
Income equalisation (9,503) (18,686) 45,464 (11,401) 27,015
Net cash provided by/(used in) financing activities 2,997,691 (860,941) 26,552,315 4,684,188 14,510,240
Net increase/(decrease) in cash and cash equivalents 3,597,295 (11,902) 422,019 (3,959,683) (6,344,098)
Cash and cash equivalents at the start of the period 221,781 138,468 527,344 4,971,532 8,141,423
Exchange gains/(losses) on cash and cash equivalents (6,042) (175) (19,640) (179,473) (2,832)
Cash and cash equivalents at the end of the period 3,813,034 126,391 929,723 832,376 1,794,493
1During the period ended 30 June 2017, effective from 13 June 2017, the name of this Fund was changed. The previous name of this Fund was Grindrod Global Managed Growth Fund.

SANLAM UNIVERSAL FUNDS PLC
148
STATEMENTS OF CASH FLOWS OF THE FUNDS (CONTINUED) for the six months ended 30 June 2017
Sanlam Global Convertible
Securities Equity Fund
Sanlam Japan Equity Fund
Sanlam Centre Active US
Treasury Fund
Autus Global Equity Fund
USD USD USD USD Cash flows from operating activities
Purchases of financial assets and settlement of financial liabilities (9,101,223) (49,284,392) (9,133,781) (26,959,091)
Proceeds from sale of investments (including realised gains) 3,757,409 17,887,855 - 15,915,528
Dividends received 40,001 350,046 - 41,112
Income from financial assets through profit of loss 125,285 - - -
Interest received 747 (400) 52,714 2,149
Income from securities lending received - - - -
Other income 129 220 - -
Operating expenses paid (96,976) (5,341) (2,515) (69,199)
Net cash inflow/(outflow) from operating activities (5,274,628) (31,052,012) (9,083,582) (11,069,501)
Cash flows from financing activities
Distributions paid to holders of redeemable participating shares - - (175,663) -
Proceeds from redeemable participating shares issued 29,759 34,196,252 10,180,685 16,950,405
Payment on redemption of redeemable participating shares - (5,958,803) - (3,254,490)
Income equalisation (61) 178,755 76 4,490
Net cash provided by/(used in) financing activities 29,698 28,416,204 10,005,098 13,700,405
Net increase/(decrease) in cash and cash equivalents (5,244,930) (2,635,808) 921,516 2,630,904
Cash and cash equivalents at the start of the period 5,584,192 3,031,311 - -
Exchange gains/(losses) on cash and cash equivalents (210,948) 24,849 (389) 37,634
Cash and cash equivalents at the end of the period 128,314 420,352 921,127 2,668,538

SANLAM UNIVERSAL FUNDS PLC
149
STATEMENTS OF CASH FLOWS OF THE FUNDS for the six months ended 30 June 2016
Sanlam Centre Global Select
Equity Fund
Bridge Global Property Income
Fund1
P-Solve Inflation Plus Fund
Sanlam African Frontier Markets
Fund
Sanlam Global Best Ideas Fund
USD USD GBP USD USD
Cash flows from operating activities
Purchases of financial assets and settlement of financial liabilities (24,648,550) (8,780,833) (14,922,665) (12,112,637) (55,558,131)
Proceeds from sale of investments (including realised gains) 26,161,498 6,886,407 16,888,662 10,052,028 72,802,869
Dividends received 710,621 791,867 154,506 1,761,977 2,787,361
Income from financial assets through profit of loss - - 139,764 - -
Interest received 1,214 123 524 1,601 2,639
Income from securities lending received 3,609 - 1,212 - 30,427
Other income 2,600 1,203 5,266 2,909 4,805
Operating expenses paid (136,252) (356,807) (48,849) (466,127) (619,934)
Net cash inflow/(outflow) from operating activities 2,094,740 (1,458,040) 2,218,420 (760,249) 19,450,036
Cash flows from financing activities
Distributions paid to holders of redeemable participating shares - - (420,663) (1,713) (1,777)
Proceeds from redeemable participating shares issued - 1,815,616 822,706 3,667,156 79,817
Payment on redemption of redeemable participating shares (588,530) (623,216) (502,169) (5,001,606) (18,369,069)
Income equalization (5,775) 120,128 (1,151) (28,829) (1,995,701)
Net cash provided/(used in) by financing activities (594,305) 1,312,528 (101,277) (1,364,992) (20,286,730)
Net increase/(decrease) in cash and cash equivalents 1,500,435 (145,512) 2,117,143 (2,125,241) (836,694)
Cash and cash equivalents at the start of the period 1,581,765 318,694 636,581 3,422,371 3,288,445
Exchange gains/(losses) on cash and cash equivalents (96,149) 1,272 (69,442) (154,692) (91,932)
Cash and cash equivalents at the end of the period 2,986,051 174,454 2,684,282 1,153,438 2,359,819
1During the period ended 30 June 2017, effective from 13 June 2017, the name of this Fund was changed. The previous name of this Fund was Grindrod Global Property Income Fund.

SANLAM UNIVERSAL FUNDS PLC
150
STATEMENTS OF CASH FLOWS OF THE FUNDS (CONTINUED) for the six months ended 30 June 2016
Sanlam Global Bond Fund
Sanlam Global Financial Fund
Sanlam Global Property Fund
Sanlam Strategic Cash Fund
Sanlam World Equity Fund
USD USD USD USD USD
Cash flows from operating activities
Purchases of financial assets and settlement of financial liabilities (213,021,070) (52,676,503) (49,746,559) (2,549,966) (472,282,193)
Proceeds from sale of investments (including realised gains) 216,496,561 98,126,997 45,840,528 7,307,809 534,864,828
Dividends received - 3,460,942 1,943,182 - 14,972,629
Income from financial assets through profit of loss 4,621,831 - - 40,262 -
Interest received (11,068) 2,380 1,602 18 10,767
Income from securities lending received - 17,082 3,352 - 279,068
Other income 3,674 3,821 1,890 56,644 40,742
Operating expenses paid (333,809) (822,687) (266,297) (29,981) (1,496,552)
Net cash inflow/(outflow) from operating activities 7,756,119 48,112,032 (2,222,302) 4,824,786 76,389,289
Cash flows from financing activities
Distributions paid to holders of redeemable participating shares - (35,054) - - -
Proceeds from redeemable participating shares issued 27,627,869 3,792,344 6,528,582 967,627 49,366,113
Payment on redemption of redeemable participating shares (27,580,771) (53,011,073) (4,691,498) (5,547,160) (109,024,062)
Income equalisation 99,848 (2,637,597) 217,523 (333,703) (7,334,293)
Net cash provided by/(used in) financing activities 146,946 (51,891,380) 2,054,607 (4,913,236) (66,992,242)
Net increase/(decrease) in cash and cash equivalents 7,903,065 (3,779,348) (167,695) (88,450) 9,397,047
Cash and cash equivalents at the start of the period 22,549,930 3,879,585 2,125,628 109,839 15,627,127
Exchange gains/(losses) on cash and cash equivalents (16,767) (77,226) 123,603 - (9,494)
Cash and cash equivalents at the end of the period 30,436,228 23,011 2,081,536 21,389 25,014,680

SANLAM UNIVERSAL FUNDS PLC
151
STATEMENTS OF CASH FLOWS OF THE FUNDS (CONTINUED) for the six months ended 30 June 2016
Satrix World Equity Tracker
Fund
SIIP India Opportunities Fund
SIM Global Equity Income Fund
Sanlam Strategic Bond Fund
Sanlam Accel Income Fund
USD USD USD GBP GBP
Cash flows from operating activities
Purchases of financial assets and settlement of financial liabilities (76,539,518) (1,481,449) (13,764,893) (323,318,516) (6,212,155)
Proceeds from sale of investments (including realised gains) 105,336,713 3,059,455 2,999,225 328,978,825 6,779,092
Dividends received 6,311,028 115,256 748,589 79,759 897,038
Income from financial assets through profit of loss - 3,143 - 2,280,628 -
Interest received 3,640 (5) 1,194 (3,602) 379
Income from securities lending received 29,526 - 2,773 - -
Other income (156,554) 107 1,615 2,165 1,146
Operating expenses paid (902,539) (166,607) (185,475) (168,284) (99,739)
Net cash inflow/(outflow) from operating activities 34,082,296 1,529,900 (10,196,972) 7,850,975 1,365,761
Cash flows from financing activities
Distributions paid to holders of redeemable participating shares (13,268) - (239,760) (1,775,999) (486,992)
Proceeds from redeemable participating shares issued 92,312,143 445,465 10,530,801 9,688,448 3,261,328
Payment on redemption of redeemable participating shares (123,773,045) (1,969,172) (590,715) (8,241,599) (4,046,704)
Income equalization (4,611,145) 11,253 282,491 (90,579) (122,459)
Net cash provided by/(used in) financing activities (36,085,315) (1,512,454) 9,982,817 (419,729) (1,394,827)
Net increase/(decrease) in cash and cash equivalents (2,003,019) 17,446 (214,155) 7,431,246 (29,066)
Cash and cash equivalents at the start of the period 4,284,180 17,037 1,659,647 222,737 747,084
Exchange gains/(losses) on cash and cash equivalents (29,264) (5,417) (2,031) (281,955) 264
Cash and cash equivalents at the end of the period 2,251,897 29,066 1,443,461 7,372,028 718,282

SANLAM UNIVERSAL FUNDS PLC
152
STATEMENTS OF CASH FLOWS OF THE FUNDS (CONTINUED) for the six months ended 30 June 2016
Satrix North America Equity
Tracker Fund
Satrix UK Equity Tracker Fund
Satrix Europe (ex UK) Equity Tracker Fund
Sanlam Equity Allocation Fund
Satrix Emerging Market Equity Tracker Fund
USD GBP EUR USD USD
Cash flows from operating activities
Purchases of financial assets and settlement of financial liabilities (1,204,975) (1,607,110) (9,876,412) (16,911,008) (4,784,489)
Proceeds from sale of investments (including realised gains) 18,129,901 8,980,618 7,285,674 14,503,822 7,815,973
Dividends received 171,611 797,087 2,276,637 2,093,140 314,200
Income from financial assets through profit of loss - - - - -
Interest received 45 123 (1,874) 715 (151)
Income from securities lending received 357 2,852 18,512 9,376 1,453
Other income 13,075 (17,085) (45,816) 1,309 (172,836)
Operating expenses paid (21,861) (14,969) (66,278) (66,921) 259,380
Net cash inflow/(outflow) from operating activities 17,088,153 8,141,516 (409,557) (369,567) 3,433,530
Cash flows from financing activities
Distributions paid to holders of redeemable participating shares (15,333) (35,254) (15,801) - (186,084)
Proceeds from redeemable participating shares issued 2,536,505 1,305,866 9,225,303 - 5,932,385
Payment on redemption of redeemable participating shares (19,030,288) (8,490,272) (9,130,967) - (8,625,991)
Income equalisation (674,597) (872,814) (42,678) - (217,426)
Net cash provided by/(used in) financing activities (17,183,713) (8,092,474) 35,857 - (3,097,116)
Net increase/(decrease) in cash and cash equivalents (95,560) 49,042 (373,700) (369,567) 336,414
Cash and cash equivalents at the start of the period 186,985 162,357 498,844 1,376,953 185,114
Exchange gains/(losses) on cash and cash equivalents (2,490) 7,715 (14,385) (29,126) 2,114
Cash and cash equivalents at the end of the period 88,935 219,114 110,759 978,260 523,642

SANLAM UNIVERSAL FUNDS PLC
153
STATEMENTS OF CASH FLOWS OF THE FUNDS (CONTINUED) for the six months ended 30 June 2016
Sanlam Managed Risk Fund
Sanlam P2strategies UK
Fund
Sanlam P2strategies North
America Fund
Sanlam P2strategies
Emerging Market Fund
Sanlam P2strategies
Europe (ex UK) Fund
USD GBP USD USD EUR
Cash flows from operating activities
Purchases of financial assets and settlement of financial liabilities (74,411,490) (738,208) (1,710,657) (1,222,046) (670,500)
Proceeds from sale of investments (including realised gains) 53,679,491 8,030,289 17,675,274 7,367,843 8,404,085
Dividends received 126,588 - - - -
Income from financial assets through profit of loss - - - - -
Interest received (8,452) (519) (40) (928) (1,823)
Income from securities lending received - - - - -
Other income 510 - 2 366 25
Operating expenses paid (175,652) (35,373) (67,055) (34,342) (39,766)
Net cash inflow/(outflow) from operating activities (20,789,005) 7,256,189 15,897,524 6,110,893 7,692,021
Cash flows from financing activities
Distributions paid to holders of redeemable participating shares - - - - -
Proceeds from redeemable participating shares issued 41,855,385 458,159 1,902,801 725,679 957,438
Payment on redemption of redeemable participating shares (15,008,050) (9,037,226) (19,320,521) (7,848,656) (9,677,827)
Income equalisation (663,700) 222,223 417,567 195,707 180,538
Net cash provided by/(used in) financing activities 26,183,635 (8,356,844) (17,000,153) (6,927,270) (8,539,851)
Net increase/(decrease) in cash and cash equivalents 5,394,630 (1,100,655) (1,102,629) (816,377) (847,830)
Cash and cash equivalents at the start of the period 2,728,681 1,014,874 1,124,761 936,867 809,094
Exchange gains/(losses) on cash and cash equivalents (1,456,715) 85,781 (22,132) (120,490) 38,736
Cash and cash equivalents at the end of the period 6,666,596 - - - -

SANLAM UNIVERSAL FUNDS PLC
154
STATEMENTS OF CASH FLOWS OF THE FUNDS (CONTINUED) for the six months ended 30 June 2016
Sanlam Private Wealth Global High
Quality Fund
Sanlam FOUR US Dividend Income
Fund
High Street Global Balanced Fund
Sanlam FOUR Active European (ex
UK) Equity Fund
Sanlam FOUR Global Equity Fund
GBP USD USD GBP GBP
Cash flows from operating activities
Purchases of financial assets and settlement of financial liabilities (15,297,101) (47,414,815) (1,235,847) (17,642,150) (18,750,346)
Proceeds from sale of investments (including realised gains) 8,478,016 29,563,320 408,212 6,115,769 9,189,668
Dividends received 414,626 476,217 118,770 704,930 761,281
Income from financial assets through profit of loss - - 115,918 - -
Interest received 3,874 2,674 1,349 (728) (3)
Income from securities lending received 390 - - - -
Other income 1,336 1,473 277 578 1,437
Operating expenses paid (216,067) (81,723) (85,591) (88,656) (91,341)
Net cash inflow/(outflow) from operating activities (6,614,926) (17,452,854) (676,912) (10,910,257) (8,889,304)
Cash flows from financing activities
Distributions paid to holders of redeemable participating shares (100,384) (42) - - -
Proceeds from redeemable participating shares issued 16,536,566 20,253,239 1,514,825 10,687,119 17,917,537
Payment on redemption of redeemable participating shares (6,365,394) (953,957) (229,030) (159,635) (8,591,912)
Income equalisation 162,498 476,166 38,554 708,082 656,400
Net cash provided by/(used in) financing activities 10,233,286 19,775,406 1,324,349 11,235,566 9,982,025
Net increase/(decrease) in cash and cash equivalents 3,618,360 2,322,552 647,437 325,309 1,092,721
Cash and cash equivalents at the start of the period 4,111,773 3,243,446 1,655,423 25,777 158,821
Exchange gains/(losses) on cash and cash equivalents 663,288 149,489 (8,173) 52,772 138,808
Cash and cash equivalents at the end of the period 8,393,421 5,715,487 2,294,687 403,858 1,390,350

SANLAM UNIVERSAL FUNDS PLC
155
STATEMENTS OF CASH FLOWS OF THE FUNDS (CONTINUED) for the six months ended 30 June 2016
Sanlam FOUR Stable Global
Equity Fund
Sanlam FOUR Active UK Equity
Fund
Sanlam FOUR Multi-Strategy
Fund
Anchor Global Capital Plus Fund
Bridge Global Equity Income Growth Fund
1
GBP GBP GBP USD USD Cash flows from operating activities
Purchases of financial assets and settlement of financial liabilities (9,616,491) (31,679,099) (13,330,859) (2,310,011) (425,386)
Proceeds from sale of investments (including realised gains) 3,676,132 25,860,388 11,171,471 2,225,084 310,398
Dividends received 798,444 2,163,126 305,982 39,970 82,363
Income from financial assets through profit of loss - - 842,470 - -
Interest received 1,387 739 526 3,914 108
Income from securities lending received - - - 1,718 -
Other income 756 107,373 6,779 921 297
Operating expenses paid (87,572) (374,497) (104,452) (88,394) (46,861)
Net cash inflow/(outflow) from operating activities (5,227,344) (3,921,970) (1,108,083) (126,798) (79,081)
Cash flows from financing activities
Distributions paid to holders of redeemable participating shares (20) (1,189,207) (5,776) - -
Proceeds from redeemable participating shares issued 3,893,274 20,856,767 467,674 5,825,850 142,270
Payment on redemption of redeemable participating shares (410,530) (16,946,087) (1,122,490) (3,016,940) (2,285)
Income equalisation 625,384 262,657 (29,178) (25,017) 1,790
Net cash provided by/(used in) financing activities 4,108,108 2,984,130 (689,770) 2,783,893 141,775
Net increase/(decrease) in cash and cash equivalents (1,119,236) (937,840) (1,797,853) 2,657,095 62,694
Cash and cash equivalents at the start of the period 2,013,571 1,180,549 5,339,165 4,734,455 128,883
Exchange gains/(losses) on cash and cash equivalents 277,692 (952) 2,846,405 (1,394) (246)
Cash and cash equivalents at the end of the period 1,172,027 241,757 6,387,717 7,390,156 191,331
1During the period ended 30 June 2017, effective from 13 June 2017, the name of this Fund was changed. The previous name of this Fund was Grindrod Global Equity Income Growth Fund.

SANLAM UNIVERSAL FUNDS PLC
156
STATEMENTS OF CASH FLOWS OF THE FUNDS (CONTINUED) for the six months ended 30 June 2016
Anchor Global Equity Fund
Bridge Global Managed Growth
Fund1
SIM Global Emerging Markets
Fund
Sanlam FOUR UK Income
Opportunities Fund USD USD USD GBP Cash flows from operating activities
Purchases of financial assets and settlement of financial liabilities (9,235,737) (782,507) (1,348,845) (556,883)
Proceeds from sale of investments (including realised gains) 9,266,788 661,707 1,336,739 202,502
Dividends received 191,274 160,245 100,680 11,572
Income from financial assets through profit of loss - - - -
Interest received 479 121 161 5
Income from securities lending received 82 - - -
Other income 389 1,902 3,102 -
Operating expenses paid (172,644) (77,370) (51,085) 1,047
Net cash inflow/(outflow) from operating activities 50,631 (35,902) 40,752 (341,757)
Cash flows from financing activities
Distributions paid to holders of redeemable participating shares - - - (1,385)
Proceeds from redeemable participating shares issued 4,971,705 144,691 62,559 358,621
Payment on redemption of redeemable participating shares (5,572,179) (17,136) - -
Income equalisation 17,386 616 (412) 974
Net cash provided by/(used in) financing activities (583,088) 128,171 62,147 358,210
Net increase/(decrease) in cash and cash equivalents (532,457) 92,269 102,899 16,453
Cash and cash equivalents at the start of the period 668,280 61,578 106,054 9,213
Exchange gains/(losses) on cash and cash equivalents (18,628) (1,588) (1,748) 220
Cash and cash equivalents at the end of the period 117,195 152,259 207,205 25,886
1During the period ended 30 June 2017, effective from 13 June 2017, the name of this Fund was changed. The previous name of this Fund was Grindrod Global Managed Growth Fund.

SANLAM UNIVERSAL FUNDS PLC
157
PORTFOLIO OF INVESTMENTS OF BRIDGE GLOBAL PROPERTY INCOME FUND as at 30 June 2017
Equities - 97.28%
Australia - 8.58%
279,865 General Property Group 1,029,276 2.84%
425,526 Growthpoint Properties Australia 1,025,897 2.84%
170,410 Westfield Corp 1,050,651 2.90%
Total Australia 3,105,824 8.58%
Canada - 3.01%
58,863 RioCan Real Estate Investment Trust 1,090,626 3.01%
Total Canada 1,090,626 3.01%
France - 2.96%
4,256 Unibail Rodamco 1,071,780 2.96%
Total France 1,071,780 2.96%
Great Britain - 10.94%
126,900 British Land 999,508 2.76%
28,000 Derwent London Plc 966,650 2.67%
134,400 Hammerson Plc 1,004,384 2.77%
75,300 Land Securities Group Plc 992,236 2.74%
Total Great Britain 3,962,778 10.94%
Mauritius - 2.31%
661,215 Mara Delta Property Holdings Limited 835,641 2.31%
Total Mauritius 835,641 2.31%
South Africa - 6.58%
1,208,100 Delta Property Fund Ltd 677,341 1.87%
1,431,359 Safari Investments RSA Limited 723,579 2.00%
1,731,754 Tower Property Fund 981,547 2.71%
Total South Africa 2,382,467 6.58%
United States - 62.90%
32,500 Acadia Realty Trust 903,500 2.49%
4,500 AvalonBay Communities Inc. 864,765 2.39%
7,000 Boston Properties Inc 861,140 2.38%
40,100 Columbia Property Trust Inc 897,438 2.48%
36,100 Cubesmart 867,844 2.40%
16,200 DCT Industrial Trust Inc 865,728 2.39%
100,500 DDR Corp 911,535 2.52%
7,600 Digital Realty Trust Inc 858,420 2.37%
Nominal Security Classification Fair Value
USD
% of
Net Assets
Financial assets at fair value through profit or loss

SANLAM UNIVERSAL FUNDS PLC
158
PORTFOLIO OF INVESTMENTS OF BRIDGE GLOBAL PROPERTY INCOME FUND (CONTINUED)
as at 30 June 2017
Equities - 97.28% (continued)
United States - 62.90% (continued)
30,700 Duke Realty Corp 858,065 2.37%
22,600 Education Realty Trust Inc 875,750 2.42%
13,000 Equity Residential 855,790 2.36%
7,100 Federal Realty Inv Trust 897,369 2.48%
25,000 Healthcare Realty Trust Inc 853,750 2.36%
25,100 Hudson Pacific Properties Inc 858,169 2.37%
41,000 Invitation Homes Inc 886,830 2.45%
49,600 Kimco Realty Corp 910,160 2.51%
21,000 Liberty Property Trust 854,910 2.36%
15,400 Macerich Co 894,124 2.47%
8,000 Mid-America Apartments 843,040 2.33%
15,100 Prologis Inc 885,464 2.45%
4,165 Public Storage Inc 868,527 2.40%
5,600 Simon Property Group Inc 905,856 2.50%
8,469 SL Green Realty Corp 896,020 2.47%
114,700 Spirit Realty Cap Inc 849,927 2.35%
9,700 Sun Communities Inc 850,593 2.35%
15,100 Taubman Centers Inc 899,205 2.48%
Total United States 22,773,919 62.90%
Total Equities 35,223,034 97.28%
Total financial assets at fair value through profit or loss 35,223,034 97.28%
Cash and cash equivalents 930,262 2.57%
Other net assets and liabilities 53,950 0.15%
Net assets attributable to holders of redeemable participating shares 36,207,246 100.00%
Nominal Security Classification Fair Value
USD
% of
Net Assets
Financial assets at fair value through profit or loss (continued)

SANLAM UNIVERSAL FUNDS PLC
159
PORTFOLIO OF INVESTMENTS OF BRIDGE GLOBAL PROPERTY INCOME FUND (CONTINUED)
as at 30 June 2017 Bridge Global Property Income Fund
Summary
Classification Description
Fair Value % of % of
USD Net
Assets Total
Assets
Transferable securities and money market instruments admitted to official stock exchange listing or traded on regulated market 35,223,034 97.28% 97.04%
A Transferable securities and money market instruments other than those referred above - - -
B UCITS and AIFs
- - -
C Financial derivative instruments dealt in on a regulated market - - -
D Over the counter financial derivative instruments - - -
Cash and cash equivalents
930,262 2.57% 2.56%
Other net assets and liabilities
53,950 0.15% 0.15%
Net assets attributable to holders of redeemable participating shares 36,207,246 100.00%

SANLAM UNIVERSAL FUNDS PLC
160
PORTFOLIO OF INVESTMENTS OF P-SOLVE INFLATION PLUS FUND
as at 30 June 2017
SANLAM RSALUNDS PLCCollective Investment Schemes – 31.95%
100,800 Blackrock Developed Real Estate Index Sub Fun 882,164 1.67%
1,796 Finsbury High Income Fund 1,479,362 2.80%
327,666 First State Investments ICVC - Asia Pacific 2,205,683 4.18%
41,766 GLG Treasury Plus Fund 662,857 1.25%
3,974 IFDC - Japan Dynamic Fund 662,943 1.25%
392,178 Institutional Sterling Liquidity Fund - Class A 392,178 0.74%
11,264 Marshall Wace UCIT Funds Plc 1,175,531 2.22%
28,647 Nomura US Higher Yield Bond Fund 3,651,495 6.91%
49,464 PIMCO Global Investors 962,569 1.82%
143,912 Pimco-Hi Yield Bond 2,941,565 5.57%
90,230 T Rowe Price fund Global Unconstrained Bond f 889,668 1.68%
81,961 T.Rowe Price Funds SICAV- Global Emerging Market 980,249 1.86%
Total Collective Investment Schemes 16,886,262 31.95%
Exchange Traded Funds – 49.55%
195,540 db x-trackes S&P 500 UCITS ETF 7,996,608 15.14%
28,401 ETFS Brent 1Mth Oil Security 442,090 0.84%
60,260 iShares Core S&P Small Cap ETF 3,257,485 6.17%
35,600 iShares Euro Stoxx UCITS ETF (DE) 1,183,921 2.24%
23,432 iShares MSCI Japan Monthly GBP Hedged 1,270,249 2.41%
50,722 iShares MSCI World Islamic 1,185,120 2.24%
2,090 SPDR Trust Series 1 388,704 0.74%
14,151 Vanguard Emerging Market ETF 441,748 0.84%
20,970 Vanguard FTSE 250 645,457 1.22%
113,110 Vanguard FTSE Developed ETF 3,594,556 6.80%
6,383 Vanguard Global ex- US Real Estate ETF 276,480 0.52%
4,868 Vanguard Reit Exchange Traded Fund 312,217 0.59%
8,828 Vanguard S&P 500 ETF 1,081,129 2.05%
11,860 Vanguard Small Cap Value ETF 1,122,756 2.13%
6,500 Vanguard Total Stock Market ETF 622,501 1.18%
228,980 WisdomTree Germany Equity UCITS ETF 2,345,328 4.44%
Total Exchange Traded Funds 26,166,349 49.55%
Nominal Security Classification Fair Value
GBP
% of
Net Assets
Financial assets at fair value through profit or loss

SANLAM UNIVERSAL FUNDS PLC
161
PORTFOLIO OF INVESTMENTS OF P-SOLVE INFLATION PLUS FUND (CONTINUED)
as at 30 June 2017
Nominal Security Coupon Maturity Classification Fair Value % of
GBP Net Assets
Financial assets at fair value through profit or loss (continued) Government Debt – 16.55%
Great Britain – 16.55%
503,438 UK Gilt 1.250% 22/07/2018 508,369 0.96%
1,988,370 UK Treasury 4.500% 07/09/2034 2,809,676 5.32%
1,304,500 UK Treasury 0.500% 22/07/2022 1,292,994 2.45%
2,770,900 UK Treasury 1.500% 22/07/2026 2,849,510 5.39%
990,935 UK Treasury 4.250% 07/12/2027 1,282,171 2.43%
Total Great Britain 8,742,721 16.55%
Total Government Debt 8,742,721 16.55%
Total financial assets at fair value through profit or loss 51,795,333 98.05%
Cash and cash equivalents 1,538,244 2.91%
Other net assets and liabilities (506,603) (0.96)%
Net assets attributable to holders of redeemable participating shares 52,826,974 100.00%
P-Solve Inflation Plus Fund
Summary
Classification Description
Fair Value % of % of
GBP Net
Assets Total
Assets
Transferable securities and money market instruments admitted to official stock exchange listing or traded on regulated market 34,909,070 66.08% 66.04%
A Transferable securities and money market instruments other than those referred above - - -
B UCITS and AIFs
16,886,262 31.97% 31.95%
C Financial derivative instruments dealt in on a regulated market - - -
D Over the counter financial derivative instruments - - -
Cash and cash equivalents
1,538,244 2.91% 2.88%
Other net assets and liabilities
(506,602) (0.96)% (0.95)%
Net assets attributable to holders of redeemable participating shares 52,826,974 100.00%

SANLAM UNIVERSAL FUNDS PLC
162
UNIVER PORTFOLIO OF INVESTMENTS OF SANLAM AFRICAN FRONTIERS MARKETS FUND as at 30 June 2017
Equities - 94.74%
Egypt - 16.76%
1,395,000 Commercial International Bank Egypt SAE (CIB) 6,277,500 8.72%
350,952 Credit Agricole Egypt 861,787 1.20%
179,404 Eastern Tobacco 2,798,001 3.89%
3,900,000 Global Telecom Holding 1,493,874 2.07%
273,942 National Societe Generale Bank 635,337 0.88%
Total Egypt 12,066,499 16.76%
Jersey Channel Islands - 2.25%
805,000 Centamin PLC 1,620,978 2.25%
Total Jersey Channel Islands 1,620,978 2.25%
Kenya - 13.71%
1 Co-operative Bank of Kenya Ltd - 0.00%
1,000,000 East African Breweries Ltd 2,496,386 3.47%
5,000,000 Equity Bank Ltd 1,819,277 2.53%
5,273,000 Kenya Commercial Bank Ltd 1,918,610 2.66%
16,583,304 Safaricom Ltd 3,636,339 5.05%
Total Kenya 9,870,612 13.71%
Mauritius - 7.36%
288,475 MCB Group Ltd 2,275,673 3.16%
1,105,617 Rockcastle Global Real Estate Company Limited 3,021,501 4.20%
Total Mauritius 5,297,174 7.36%
Morocco - 17.69%
72,849 Attijariwafa Bank 3,319,341 4.61%
23,599 Banque Centrale Populaire 708,749 0.98%
153,486 Douja Prom Addoha 773,970 1.07%
4,200 LafargeHolcim Maroc SA 908,912 1.26%
312,656 Maroc Telecom 4,546,894 6.32%
11,227 Societe des Brasseries du Maroc 2,483,083 3.45%
Total Morocco 12,740,949 17.69%
Nigeria - 22.18%
45,527,952 Guaranty Trust Bank 4,317,691 6.00%
582,174 Guinness Nigeria Plc 113,371 0.16%
777,829 Nestle Foods Nigeria Plc 1,908,770 2.65%
7,378,747 Nigerian Breweries Plc 3,235,587 4.49%
990,337 Seplat Petroleum Development 1,326,877 1.89%
10,348,285 Stanbic IBTC Holding Co 930,094 1.29%
Nominal Security Classification Fair Value
USD
% of
Net Assets
Financial assets at fair value through profit or loss

SANLAM UNIVERSAL FUNDS PLC
163
SANLAM PORTFOLIO OF INVESTMENTS OF SANLAM AFRICAN FRONTIERS MARKETS FUND (CONTINUED)
as at 30 June 2017
Equities - 94.74% (continued)
Nigeria – 22.18% (continued)
46,314,427 United Bank for Africa Plc 1,105,007 1.54%
52,619,115 Zenith Bank Ltd 2,993,826 4.16%
Total Nigeria 4,098,833 22.18%
Senegal - 3.74%
64,843 Sonatel 2,692,044 3.74%
Total Senegal 2,692,044 3.74%
Zimbabwe - 11.05%
2,427,796 Delta Corporation Ltd 3,083,301 4.28%
13,535,392 Econet Wireless Zimbambwe Ltd 4,872,741 6.77%
Total Zimbabwe 7,956,042 11.05%
Total Equities 68,175,522 94.74%
Nominal Security Coupon Maturity Classification Fair Value % of
USD Net Assets
Corporate Debt - 0.44%
Zimbabwe – 0.44%
6,820,155 Econet Wireless Debenture 0.000% 31/12/2049 318,160 0.44%
Total Zimbabwe 318,160 0.44%
Total Corporate Debt 318,160 0.44%
Derivative Financial Instruments Rights - 0.05%
Nigeria – 0.05%
1,752,903 Stanbic IBTC Holding Co 35,807 0.05%
Total Nigeria 35,807 0.05%
Total Rights 35,807 0.05%
Total financial assets at fair value through profit or loss 68,529,489 95.18%
Cash and cash equivalents 3,367,440 4.68%
Other net assets and liabilities 102,611 0.14%
Net assets attributable to holders of redeemable participating shares 71,999,540 100.00%
Nominal Security Classification Fair Value
USD
% of
Net Assets
Financial assets at fair value through profit or loss (continued)

SANLAM UNIVERSAL FUNDS PLC
164
PORTFOLIO OF INVESTMENTS OF SANLAM AFRICAN FRONTIERS MARKETS FUND (CONTINUED)
as at 30 June 2017 Sanlam African Frontier Markets Fund
Summary
Classification Description
Fair Value % of % of
USD Net
Assets Total
Assets
Transferable securities and money market instruments admitted to official stock exchange listing or traded on regulated market 68,493,682 95.18% 95.14%
A Transferable securities and money market instruments other than those referred above 35,807 0.00% 0.00%
B UCITS and AIFs
- - -
C Financial derivative instruments dealt in on a regulated market - - -
D Over the counter financial derivative instruments - - -
Cash and cash equivalents
3,367,440 4.68% 4.67%
Other net assets and liabilities
102,611 0.14% 0.14%
Net assets attributable to holders of redeemable participating shares 71,999,540 100.00%

SANLAM UNIVERSAL FUNDS PLC
165
PORTFOLIO OF INVESTMENTS OF SANLAM GLOBAL BEST IDEAS FUND as at 30 June 2017
SANLAM UNIVERSAL FUEquities - 98.89%
Bermuda - 1.20%
36,500 Essent Group Ltd 1,355,610 1.20%
Total Bermuda 1,355,610 1.20%
Canada - 2.12%
87,776 Lions Gate Entertainment Corporation 2,391,896 2.12%
Total Canada 2,391,896 2.12%
Cayman Islands - 0.00%
28,882,799 DBA Telecommunication Asia - 0.00%
Total Cayman Islands - 0.00%
France - 3.79%
49,564 AXA SA 1,354,789 1.21%
21,656 Scor SE 857,892 0.76%
41,554 Total SA 2,052,816 1.82%
Total France 4,265,497 3.79%
Great Britain - 20.19%
4,700,000 Accident Exchange Group Plc - 0.00%
342,984 Countrywide Plc 747,307 0.66%
108,390 GlaxoSmithKline Plc 2,305,951 2.05%
529,873 Howden Joinery Group PLC 2,805,971 2.49%
197,335 IG Group Holdings Plc 1,458,018 1.29%
47,006 Imperial Brands Plc 2,108,598 1.87%
681,727 Legal & General Group Plc 2,290,579 2.03%
58,326 Micro Focus International Plc 1,723,017 1.53%
53,231 Nielsen Holdings Plc 2,057,910 1.83%
200,000 OneSavings Bank Plc 975,600 0.87%
95,894 Royal Dutch Shell PLC 2,542,927 2.26%
1,052,471 Taylor Wimpey Plc 2,412,273 2.14%
63,700 TBC Bank Group Plc 1,312,517 1.17%
Total Great Britain 22,740,668 20.19%
Hong Kong - 0.84%
1,783,224 Esprit Holdings Ltd 950,249 0.84%
Total Hong Kong 950,249 0.84%
India - 1.27%
124,460 LIC Housing Finance Ltd 1,429,501 1.27%
Total India 1,429,501 1.27%
Nominal Security Classification Fair Value
USD
% of
Net Assets
Financial assets at fair value through profit or loss

SANLAM UNIVERSAL FUNDS PLC
166
PORTFOLIO OF INVESTMENTS OF SANLAM GLOBAL BEST IDEAS FUND (CONTINUED)
as at 30 June 2017
Equities - 98.89% (continued)
Ireland - 3.82%
48,509 Medtronic Plc 4,305,174 3.82%
Total Ireland 4,305,174 3.82%
Netherlands - 3.95%
12,600 ASML Holding NV 1,640,801 1.45%
51,017 Unilever NV 2,813,465 2.50%
Total Netherlands 4,454,266 3.95%
Portugal - 0.99%
4,130,000 Banco Commercial Portugues SA 1,110,988 0.99%
Total Portugal 1,110,988 0.99%
Russia - 1.71%
459,800 Moscow Exchange Micex 811,191 0.72%
107,500 Sberbank of Russia 1,112,625 0.99%
Total Russia 1,923,816 1.71%
Singapore - 1.90%
756,826 Singapore Telecommunications Ltd 2,138,641 1.90%
Total Singapore 2,138,641 1.90%
Switzerland - 5.03%
29,653 Novartis AG 2,467,476 2.19%
9,213 Roche Holding AG 2,346,001 2.09%
50,000 UBS Group AG 846,715 0.75%
Total Switzerland 5,660,192 5.03%
Turkey - 0.83%
2,318,049 Turkiye Sinai Kalkin 936,079 0.83%
Total Turkey 936,079 0.83%
United States - 51.25%
31,682 Altria Group Inc 2,359,359 2.10%
25,939 American International Group 1,621,706 1.44%
22,747 Apple Inc 3,276,023 2.91%
82,809 Bank of America Corp 2,008,946 1.78%
12,040 Bard CR Inc 3,805,964 3.38%
13,776 Berkshire Hathaway Inc. 2,333,241 2.07%
10,046 Boeing Com 1,986,597 1.76%
118,399 Cisco Systems Inc 3,705,889 3.29%
25,941 Citigroup Inc 1,734,934 1.54%
Nominal Security Classification Fair Value
USD
% of
Net Assets
Financial assets at fair value through profit or loss (continued)

SANLAM UNIVERSAL FUNDS PLC
167
PORTFOLIO OF INVESTMENTS OF SANLAM GLOBAL BEST IDEAS FUND (CONTINUED)
as at 30 June 2017
Equities - 98.89% (continued)
United States - 51.25% (continued)
8,630 Credicorp 1,548,136 1.37%
119,103 HP Inc 2,081,920 1.85%
8,302 Illinois Tool Works 1,189,262 1.06%
36,632 JP Morgan Chase & Co 3,348,165 2.97%
140,780 MGIC Investment Corp 1,576,736 1.40%
58,899 Microsoft Corp 4,059,908 3.60%
1,260 NVR Inc 3,037,369 2.70%
77,228 Oracle Corp 3,872,212 3.44%
20,120 Pepsico Inc 2,323,659 2.06%
24,039 Philip Morris International Inc 2,823,381 2.51%
21,165 Time Warner Inc 2,125,178 1.89%
4,067 Transdigm Group Incorporated 1,093,494 0.97%
35,328 Twenty First Century Fox Inc. 1,001,196 0.89%
59,930 Verizon Communications Inc 2,676,474 2.38%
18,820 Wells Fargo & Co 1,042,816 0.93%
99,624 Wesco Aircraft Holdings Inc 1,080,920 0.96%
Total United States 57,713,485 51.25%
Total Equities 111,376,061 98.89%
Total financial assets at fair value through profit or loss 111,376,061 98.89%
Cash and cash equivalents 1,088,375 0.97%
Other net assets and liabilities 157,290 0.14%
Net assets attributable to holders of redeemable participating shares 112,621,726 100.00%
Nominal Security Classification Fair Value
USD
% of
Net Assets
Financial assets at fair value through profit or loss

SANLAM UNIVERSAL FUNDS PLC
168
PORTFOLIO OF INVESTMENTS OF SANLAM GLOBAL BEST IDEAS FUND (CONTINUED)
as at 30 June 2017
Sanlam Global Best Ideas Fund
Summary
Classification Description
Fair Value % of % of
USD Net
Assets Total
Assets
Transferable securities and money market instruments admitted to official stock exchange listing or traded on regulated market 111,376,061 98.89% 98.77%
A Transferable securities and money market instruments other than those referred above - - -
B UCITS and AIFs
- - -
C Financial derivative instruments dealt in on a regulated market - - -
D Over the counter financial derivative instruments - - -
Cash and cash equivalents
1,088,375 0.97% 0.97%
Other net assets and liabilities
157,290 0.14% 0.14%
Net assets attributable to holders of redeemable participating shares 112,621,726 100.00%

SANLAM UNIVERSAL FUNDS PLC
169
PORTFOLIO OF INVESTMENTS OF SANLAM GLOBAL BOND FUND as at 30 June 2017
Nominal Security Coupon Maturity Classification Fair Value % of
USD Net Assets
Financial assets at fair value through profit or loss
Debt – 95.50%
Corporate Debt – 38.72%
Australia - 0.87%
882,000 Queensland Treasury Corp 3.250 21/07/2026
687,940 0.14%
1,750,000 Westpac Banking Corp 3.350 08/03/2027
1,762,338 0.37%
800,000 Westpac Banking Corp 7.250 11/02/2020
685,246 0.14%
1,000,000 Westpac Banking Corp 4.322 23/11/2031
1,027,600 0.21%
Total Australia
4,163,123 0.87%
Austria - 0.06%
131,000 Autobahn Schnell AG 4.500 16/10/2017
151,656 0.03%
83,000 Energie Oberoesterreich 4.500 04/03/2025
119,231 0.02%
Total Austria
270,887 0.06%
Canada - 0.57%
1,274,000 CDP Financial 4.600 15/07/2020
1,063,311 0.22%
113,000 General Elec Cap Canada 5.730 22/10/2037
114,966 0.02%
1,613,000 Royal Bank of Canada 4.930 16/07/2025
1,456,530 0.30%
100,000 Toronto Dominion Bank 3.226 24/07/2024
80,988 0.02%
Total Canada
2,715,794 0.57%
European Union - 0.15%
500,000 Caja Ahorro Monte Madrid 4.000 03/02/2025
700,433 0.15%
Total European Union
700,433 0.15%
Finland - 0.14%
600,000 Finnvera Plc 0.500 13/04/2026
675,330 0.14%
Total Finland
675,330 0.14%
France - 2.13%
1,117,000 Caisse D'Amort Dette Soc 4.375 25/10/2021
1,521,830 0.32%
1,276,000 Caisse Francaise De Fin 4.250 07/02/2019
1,563,817 0.33%
420,000 CIE Financement Foncier 4.000 24/10/2025
605,428 0.13%
1,600,000 Credit Agricole London 1.750 12/03/2018
1,851,243 0.39%
900,000 Credit Agricole Public 1.875 07/06/2023
1,122,676 0.23%
100,000 Credit Agricole SA London 5.500 17/12/2021
154,371 0.03%
300,000 Electricite De France 6.125 02/06/2034
531,741 0.11%
180,000 GDF Suez 2.875 10/10/2022
182,014 0.04%
731,000 GDF Suez 6.375 18/01/2021
1,018,209 0.21%
130,000 GDF Suez 6.375 18/01/2021
181,077 0.04%
1,000,000 Reseau Ferre de France 4.250 07/10/2026
1,488,015 0.31%
Total France
10,220,422 2.13%
Germany - 1.20%
502,000 Ewe Ag 4.875 14/10/2019
635,365 0.13%
657,000 Hypothekenbank Frankfurt 4.375 02/07/2019
819,681 0.17%
160,000 KFW 0.000 29/06/2037
88,802 0.02%
541,000 KFW 2.250 21/09/2017
621,271 0.13%

SANLAM UNIVERSAL FUNDS PLC
170
PORTFOLIO OF INVESTMENTS OF SANLAM GLOBAL BOND FUND (CONTINUED) as at 30 June 2017
Nominal Security Coupon Maturity Classification Fair Value % of
USD Net Assets
Financial assets at fair value through profit or loss (continued)
Debt – 95.50% (continued)
Corporate Debt – 38.72% (continued) Germany - 1.20% (continued) 771,000 KFW 2.000 02/05/2025
753,907 0.16%
1,200,000 Land Nordrhein - Westfalen 1.250 16/09/2019
1,187,688 0.25%
66,000 Land Nordrhein - Westfalen 2.000 15/10/2025
84,391 0.02%
1,000,000 Landwirtsch Rentenbank 2.700 05/09/2022
766,610 0.16%
379,000 NRW Bank 3.875 27/01/2020
478,836 0.10%
188,000 RWE AG 5.750 14/02/2033
316,967 0.07%
Total Germany
5,753,518 1.20%
Great Britain 3.41%
202,000
Abbey National Treasury Services Plc 4.125 14/09/2017
264,519 0.06%
600,000 Bank of Scotland Plc 9.375 15/05/2021
1,006,077 0.21%
1,970,000 BG Energy Capital Plc 6.500 30/11/2072
2,003,195 0.42%
700,000 BP Capital Markets Plc 4.742 11/03/2021
762,083 0.16%
1,400,000 BP Capital Markets Plc 2.518 16/01/2020
1,413,986 0.30%
1,770,000 British Telecommunications 1.125 10/03/2023
2,044,483 0.43%
510,000 Centrica Plc 4.375 13/03/2029
779,152 0.16%
590,000 FCE Bank Plc 1.750 21/05/2018
684,107 0.14%
140,000 Glaxo Smith Kline Capital 5.250 10/04/2042
263,494 0.06%
210,000 HSBC Plc 6.000 29/03/2040
362,770 0.08%
1,775,000 Lloyd Bank Plc 6.500 24/03/2020
2,353,988 0.49%
710,000 Lloyds Bank Plc 1.000 19/11/2021
834,989 0.17%
400,000 National Grid Electricity Transmission 4.000 08/06/2027
610,314 0.13%
600,000 Nationwide Plc 0.625 25/03/2027
657,998 0.14%
609,000 Network Rail Infra Finance 4.750 22/01/2024
971,673 0.20%
283,000 Vodafone Group Plc 5.375 05/12/2017
375,297 0.08%
690,000 Vodafone Group Plc 7.875 15/02/2030
939,890 0.20%
Total Great Britain
16,328,016 3.41%
Hong Kong - 0.16%
665,000 AIA Group 4.875 11/03/2044
749,954 0.16%
Total Hong Kong
749,954 0.16%
Jersey Channel Islands - 0.26%
350,000 Annington Repack 5.324 10/01/2023
541,587 0.11%
100,000 Heathrow Funding Ltd 4.625 31/10/2048
171,564 0.04%
300,000 Heathrow Funding Ltd 4.625 31/10/2048
514,691 0.11%
Total Jersey Channel Islands
1,227,842 0.26%
Korea (South) - 0.27%
1,316,000 Export-Import Bank of Korea 1.750 26/05/2019
1,308,157 0.27%
Total Korea (South)
1,308,157 0.27%

SANLAM UNIVERSAL FUNDS PLC
171
PORTFOLIO OF INVESTMENTS OF SANLAM GLOBAL BOND FUND (CONTINUED) as at 30 June 2017
Nominal Security Coupon Maturity Classification Fair Value % of
USD Net Assets
Financial assets at fair value through profit or loss (continued)
Debt – 95.50% (continued)
Corporate Debt – 38.72% (continued)
Malaysia - 0.08%
400,000
Export Import Bank of Malaysia 2.875 14/12/2017
401,216 0.08%
Total Malaysia
401,216 0.08%
Mexico - 0.33%
982,000 America Movil SAB 6.125 30/03/2040
1,204,069 0.25%
391,000 Petroleos Mexicanos 4.875 18/01/2024
396,720 0.08%
Total Mexico
1,600,790 0.33%
Netherlands – 2.28%
800,000 ABN Amro Bank NV 1.000 13/04/2031
881,613 0.18%
700,000 Cooperatieve Rabobank UA 1.375 03/02/2027
814,433 0.17%
253,000 ENBW International Finance BV 6.125 07/07/2039
471,261 0.10%
775,000 Enel Finance International NV 4.875 17/04/2023
1,096,329 0.23%
300,000 Iberdrola 4.250 11/10/2018
361,143 0.08%
2,086,000 Nederlandse Gasunie NV 2.625 13/07/2022
2,645,705 0.55%
34,000 Rabobank Nederland 3.250 01/11/2017
44,615 0.01%
376,000 Rabobank Nederland 4.125 14/07/2025
534,969 0.11%
188,000 RWE Finance BV 1.875 30/01/2020
224,220 0.05%
980,000 Shell International Finance 4.375 11/05/2045
1,029,137 0.21%
1,392,000 Shell International Finance 6.375 15/12/2038
1,860,547 0.39%
850,000 Unilever NV 1.125 29/04/2028
966,855 0.20%
Total Netherlands
10,930,827 2.28%
New Zealand - 0.17%
715,000
BNZ International Funding London 0.125 17/06/2021
814,438 0.17%
Total New Zealand
814,438 0.17%
Spain - 0.48%
900,000 Banco Bilbao Vizcaya ARG 3.875 30/01/2023
1,233,980 0.26%
200,000 Banco Santander SA 2.000 27/11/2034
242,074 0.05%
500,000 Fondo De Amortizacion Del Defi 5.600 17/09/2018
611,035 0.13%
200,000 Gas Natural Capital 4.125 26/01/2018
233,772 0.05%
Total Spain
2,320,862 0.48%
Supra-National - 0.56%
236,000 Asian Development Bank 5.820 16/06/2028
289,721 0.06%
525,000 Eurofima 2.875 04/02/2030
715,861 0.15%
279,000 Inter - American Development Bank 4.375 24/01/2044
337,808 0.07%
1,275,000 International Bank Recon & Development 0.000 26/11/2021
1,356,592 0.28%
Total Supra-National
2,699,982 0.56%

SANLAM UNIVERSAL FUNDS PLC
172
PORTFOLIO OF INVESTMENTS OF SANLAM GLOBAL BOND FUND (CONTINUED) as at 30 June 2017
Nominal Security Coupon Maturity Classification Fair Value % of
USD Net Assets
Financial assets at fair value through profit or loss (continued)
Debt – 95.50% (continued)
Corporate Debt – 38.72% (continued)
Sweden - 0.43%
560,000 Skandinaviska Enskilda 2.000 19/02/2021
679,649 0.14%
1,400,000 Swedish Export Credit 1.750 18/05/2020
1,399,748 0.29%
Total Sweden
2,079,397 0.43%
Switzerland - 0.09%
360,000 Pfandbrief Schweiz Hypo 1.625 15/03/2022
407,896 0.09%
Total Switzerland
407,896 0.09%
United States – 25.07%
1,433,000
American International Group Inc 4.125 15/02/2024
1,512,933 0.32%
1,104,000 Amgen Inc 2.125 13/09/2019
1,315,372 0.27%
1,976,000 Amgen Inc 3.625 15/05/2022
2,065,414 0.43%
570,000 Anadarko Petroluem Corp 3.450 15/07/2024
561,137 0.12%
1,408,000 Anheuser Busch Inbev 4.000 17/01/2043
1,403,494 0.29%
870,000 Anheuser Busch Inbev 3.750 15/01/2022
917,615 0.19%
920,000 AT&T Inc 2.500 15/03/2023
1,130,919 0.24%
2,120,000 AT&T Inc 4.450 15/05/2021
2,256,952 0.47%
700,000 AT&T Inc 5.000 01/03/2021
756,735 0.16%
614,000 Bank of America Corp 4.875 01/04/2044
688,902 0.14%
1,000,000 Bank of America Corp 1.375 10/09/2021
1,179,727 0.25%
780,000 Bank of America Corp 4.000 01/04/2024
817,144 0.17%
50,000 Bank of America Corp 7.750 30/04/2018
68,671 0.01%
447,000 Bank One Corp 7.625 15/10/2026
574,226 0.12%
775,000 Caterpillar Financial SE 3.250 01/12/2024
796,840 0.17%
2,262,000 Caterpillar Financial SE 7.150 15/02/2019
2,451,352 0.51%
431,000 Caterpillar Financial SE 7.150 15/02/2019
467,079 0.10%
1,140,000 Caterpillar Inc 3.400 15/05/2024
1,187,093 0.25%
1,143,000 Citigroup Inc 2.125 10/09/2026
1,386,885 0.29%
230,000 Citigroup Inc 5.150 21/05/2026
366,910 0.08%
1,911,000 Daimler Finance NA LLC 1.875 11/01/2018
1,913,656 0.40%
872,000 Dominion Resources Inc 4.900 01/08/2041
956,863 0.20%
1,230,000 Dow Chemical Co 3.000 15/11/2022
1,251,697 0.26%
473,021 Fannie Mae 3.000 01/11/2034
480,681 0.10%
1,259,870 Fannie Mae 3.000 01/07/2043
1,260,080 0.26%
1,145,740 Fannie Mae 3.500 01/03/2040
1,185,606 0.25%
882,441 Fannie Mae 3.500 01/05/2042
906,737 0.19%
4,361 Fannie Mae 4.500 01/03/2018
4,386 0.00%
1,820,021 Fannie Mae 4.500 01/05/2040
1,961,523 0.41%
18,101 Fannie Mae 5.500 01/03/2023
19,988 0.00%
1,662,831 Fannie Mae 5.500 01/11/2035
1,849,492 0.39%
2,800,507 Federal Home Loan Mortgage 3.000 01/09/2027
2,877,167 0.60%
2,854,353 Federal Home Loan Mortgage 4.000 01/10/2044
3,024,616 0.63%
800,000 Federal Home Loan Mortgage 3.000 10/09/2021
835,672 0.17%

SANLAM UNIVERSAL FUNDS PLC
173
PORTFOLIO OF INVESTMENTS OF SANLAM GLOBAL BOND FUND (CONTINUED) as at 30 June 2017
Nominal Security Coupon Maturity Classification Fair Value % of
USD Net Assets
Financial assets at fair value through profit or loss (continued)
Debt – 95.50% (continued)
Corporate Debt – 38.72% (continued)
United States – 25.07% (continued)
1,303,173 Federal Home Loan Mortgage 3.500 01/04/2046
1,339,421 0.28%
309,601 Federal Home Loan Mortgage 3.500 01/12/2044
318,363 0.07%
389,000 Florida Power & Light Co 4.125% 01022042 4.125 01/02/2042
414,553 0.09%
1,963,446 Fannie Mae 3.000 01/06/2042
1,963,772 0.41%
2,990,801 Fannie Mae 3.000 01/11/2042
2,998,704 0.63%
312,733 Fannie Mae 3.000 01/09/2027
321,287 0.07%
230,537 Fannie Mae 3.000 01/09/2034
234,265 0.05%
253,680 Fannie Mae 3.500 01/06/2039
262,732 0.05%
2,033,200 Fannie Mae 4.500 01/02/2045
2,190,601 0.46%
293,595 Fannie Mae 4.500 01/08/2040
316,013 0.07%
388,701 Fannie Mae 5.500 01/12/2038
431,109 0.09%
921,000 Freddie Mac 2.375 13/01/2022
940,184 0.20%
1,036,764 Freddie Mac 3.000 01/04/2028
1,066,123 0.22%
2,295,000 Freddie Mac 3.375 12/06/2020
2,407,960 0.50%
136,075 Freddie Mac 3.500 01/10/2041
140,292 0.03%
1,137,000 Freddie Mac 6.250 15/07/2032
1,616,496 0.34%
6,828,871 Freddie Mac 2.500 01/01/2029
6,937,062 1.45%
1,866,007 Freddie Mac 3.000 01/07/2045
1,873,275 0.39%
3,910,402 Freddie Mac 3.000 01/01/2047
3,920,715 0.82%
5,734,363 Ginnie Mae 3.500 15/12/2041
5,970,648 1.25%
971,161 Ginnie Mae 4.000 20/02/2041
1,022,400 0.21%
241,701 Ginnie Mae 2.500 15/09/2042
236,257 0.05%
256,554 Ginnie Mae 2.500 20/01/2045
253,009 0.05%
1,771,232 Ginnie Mae 4.000 15/08/2041
1,872,307 0.39%
1,037,282 Ginnie Mae 4.000 15/10/2044
1,108,183 0.23%
141,411 Ginnie Mae 4.000 15/03/2044
149,185 0.03%
778,852 Ginnie Mae 4.000 15/04/2044
831,495 0.17%
87,953 Ginnie Mae 4.000 20/11/2044
92,916 0.02%
1,139,227 Ginnie Mae 4.500 20/03/2046
1,217,503 0.25%
862,223 Ginnie Mae 4.500 20/08/2043
939,203 0.20%
764,863 Ginnie Mae 4.500 20/08/2043
829,146 0.17%
857,000 JP Morgan Chase & Co 4.850 01/02/2044
994,154 0.21%
2,000,000 JP Morgan Chase & Co 3.200 25/01/2023
2,038,400 0.43%
500,000 JPM Chase Commercial Mortgage 3.143 15/12/2047
511,645 0.11%
1,415,000 Kinder Morgan Ener Part 5.000 15/08/2042
1,385,695 0.29%
1,712,000 McDonald's Corp 3.250 10/06/2024
1,757,556 0.37%
600,000 McDonald's Corp 1.750 03/05/2028
700,722 0.15%
3,339,000 McDonald's Corp 2.750 09/12/2020
3,409,286 0.71%
1,000,000 Microsoft Corp 2.400 08/08/2026
961,780 0.20%
650,000 Microsoft Corp 4.100 06/02/2037
701,740 0.15%
2,290,000 Morgan Stanley 2.500 24/01/2019
2,308,228 0.48%
1,500,000 Morgan Stanley 2.800 16/06/2020
1,521,630 0.32%

SANLAM UNIVERSAL FUNDS PLC
174
PORTFOLIO OF INVESTMENTS OF SANLAM GLOBAL BOND FUND (CONTINUED) as at 30 June 2017
Nominal Security Coupon Maturity Classification Fair Value % of
USD Net Assets
Financial assets at fair value through profit or loss (continued)
Debt – 95.50% (continued)
Corporate Debt – 38.72% (continued)
United States – 25.07% (continued) 1,682,000 Morgan Stanley 3.625 20/01/2027
1,694,699 0.35%
200,000 New York NY 5.206 01/10/2031
232,678 0.05%
240,000 Oncor Electric Delivery Co 7.000 01/09/2022
289,104 0.06%
523,000 Oncor Electric Delivery Co 4.550 01/12/2041
573,574 0.12%
978,000 Pacific Gas & Electric 4.750 15/02/2044
1,115,957 0.23%
1,250,000 Philip Morris International Inc 2.875 03/03/2026
1,619,633 0.34%
350,000 Philip Morris International Inc 3.125 03/06/2033
468,453 0.10%
1,330,000 Philip Morris International Inc 4.500 20/03/2042
1,416,078 0.30%
1,088,000 Tennessee Valley Authority 5.500 18/07/2017
1,090,007 0.23%
2,936,000 Time Warner Inc 2.100 01/06/2019
2,939,787 0.61%
1,230,000 Verizon Communications 4.150 15/03/2024
1,294,575 0.27%
1,200,000 Verizon Communications 3.500 01/11/2021
1,242,564 0.26%
2,180,000 Wal-Mart Stores Inc 3.300 22/04/2024
2,280,302 0.48%
151,000 Wal-Mart Stores Inc 5.250 28/09/2035
279,357 0.06%
2,540,000 Wells Fargo & Company 3.000 22/01/2021
2,595,474 0.54%
Total United States
120,071,821 25.07%
Total Corporate Debt
185,440,704 38.72%
Government Debt – 56.78%
Australia - 0.92%
233,000 Australia (Commonwealth) 4.500 15/04/2020
191,409 0.04%
1,196,000 Australia (Commonwealth) 4.750 21/04/2027
1,088,236 0.23%
700,000 Australia (Commonwealth) 3.750 18/10/2019
551,482 0.12%
67,000 Australian Government 2.750 21/04/2024
52,558 0.01%
898,000 Australian Government 2.750 21/04/2024
704,439 0.15%
193,000 Australian Government 3.250 21/04/2029
155,695 0.03%
350,000 Australian Government 3.750 21/04/2037
290,849 0.06%
487,000 Australian Government 4.250 21/07/2017
374,382 0.08%
416,000 Australian Government 5.750 15/05/2021
363,048 0.08%
546,000 Australian Government 5.750 15/07/2022
490,113 0.10%
185,000 Australian Government 5.750 15/07/2022
166,064 0.03%
Total Australia
4,428,276 0.92%
Austria - 0.44%
380,133 Republic of Austria 6.250 15/07/2027
674,227 0.14%
87,000 Republic of Austria 3.650 20/04/2022
117,251 0.02%
30,000 Republic of Austria 3.650 20/04/2022
40,431 0.01%
629,000 Republic of Austria 1.950 18/06/2019
752,221 0.16%
322,000 Republic of Austria 3.150 20/06/2044
503,017 0.11%
Total Austria
2,087,147 0.44%

SANLAM UNIVERSAL FUNDS PLC
175
PORTFOLIO OF INVESTMENTS OF SANLAM GLOBAL BOND FUND (CONTINUED) as at 30 June 2017
Nominal Security Coupon Maturity Classification Fair Value % of
USD Net Assets
Financial assets at fair value through profit or loss (continued)
Debt – 95.50% (continued)
Government Debt – 56.78% (continued)
Belgium – 1.11%
560,428 Belgium 5.500 28/03/2028
954,090 0.20%
470,331 Belgium 4.000 28/03/2022
642,896 0.13%
110,000 Belgium 4.500 28/03/2026
168,565 0.04%
593,660 Belgium 3.000 28/09/2019
730,860 0.15%
1,049,000 Belgium 4.500 28/03/2026
1,607,500 0.34%
262,128 Belgium 3.000 28/09/2019
322,708 0.07%
546,328 Belgium 3.750 22/06/2045
909,073 0.19%
Total Belgium
5,335,693 1.11%
Canada - 2.28%
350,000 British Columbia Province 5.750 01/06/2029
379,781 0.08%
730,000 British Columbia Province 6.200 02/06/2031
786,035 0.16%
1,755,000 Canada Government 4.700 02/06/2037
1,718,862 0.36%
1,337,000 Canada Government 4.700 18/06/2037
1,317,343 0.28%
186,000 Canada Government 3.750 01/06/2019
150,239 0.03%
457,000 Canada Government 9.000 23/08/2024
507,154 0.11%
221,000 Canada Government 2.750 01/06/2022
180,891 0.04%
629,000 Canada Government 3.500 01/12/2045
620,449 0.13%
190,000 Canada Government 1.500 01/09/2017
146,423 0.03%
815,000 Manitoba Province 2.500 01/06/2024
665,551 0.14%
1,420,000 Ontario Province 2.500 20/04/2026
1,398,373 0.29%
400,000 Ontario Province 0.750 15/12/2021
514,534 0.11%
700,000 Ontario Province 1.875 21/05/2024
870,564 0.18%
628,000 Ontario Province 1.500 01/03/2020
487,400 0.10%
1,523,000 Quebec Province 2.100 08/09/2019
1,190,850 0.25%
Total Canada
10,934,450 2.28%
Czechoslovakia - 0.07%
7,120,000 Czech Republic 2.500 25/08/2028
357,680 0.07%
Total Czechoslovakia
357,680 0.07%
Denmark - 0.30%
860,000 Denmark 4.500 15/11/2039
219,450 0.05%
7,273,763 Denmark 1.500 15/11/2023
1,215,911 0.25%
Total Denmark
1,435,362 0.30%
France - 3.55%
2,239,324 France Government 8.500 25/04/2023
3,808,487 0.80%
1,661,848 France Government 4.000 25/10/2038
2,764,904 0.58%
143,120 France Government 4.000 25/04/2060
260,656 0.05%
1,778,806 France Government 3.750 25/10/2019
2,229,735 0.47%
2,819,370 France Government 3.500 25/04/2026
4,020,124 0.84%
169,808 France Government 3.500 25/04/2026
242,128 0.05%
889,087 France Government 3.250 25/10/2021
1,165,562 0.24%
1,000,000 France Government 2.250 25/05/2024
1,296,608 0.27%

SANLAM UNIVERSAL FUNDS PLC
176
PORTFOLIO OF INVESTMENTS OF SANLAM GLOBAL BOND FUND (CONTINUED) as at 30 June 2017
Nominal Security Coupon Maturity Classification Fair Value % of
USD Net Assets
Financial assets at fair value through profit or loss (continued)
Debt – 95.50% (continued)
Government Debt – 56.78% (continued) France - 3.55% (continued) 909,918 France Government 2.500 25/05/2030
1,215,147 0.25%
Total France
17,003,350 3.55%
Germany – 1.96%
1,322,075 Germany Government 1.000 15/08/2024
1,606,916 0.34%
238,974 Germany Government 5.500 04/01/2031
439,860 0.09%
561,123 Germany Government 5.625 04/01/2028
974,972 0.20%
1,103,342 Germany Government 4.000 04/01/2037
1,930,296 0.40%
855,736 Germany Government 4.750 04/07/2040
1,707,469 0.36%
1,288,539 Germany Government 3.250 04/01/2020
1,612,552 0.34%
873,539 Germany Government 2.000 04/01/2022
1,100,665 0.23%
Total Germany
9,372,730 1.96%
Great Britain 3.80%
1,148,188 UK Gilt 5.000 07/03/2025
1,939,242 0.40%
230,000 UK Government 4.750 07/12/2038
453,781 0.09%
1,538,750 UK Government 4.250 07/12/2027
2,585,734 0.54%
2,213,359 UK Government 4.500 07/12/2042
4,402,026 0.92%
120,000 UK Government 4.750 07/12/2030
217,524 0.05%
943,000 UK Treasury 4.250 07/12/2049
1,949,202 0.41%
675,000 UK Treasury 4.000 07/03/2022
1,017,709 0.21%
646,556 UK Treasury 3.750 07/09/2019
903,680 0.19%
86,000 UK Treasury 4.500 07/09/2034
157,842 0.03%
408,211 UK Treasury 4.000 22/01/2060
897,035 0.19%
641,091 UK Treasury 1.000 07/09/2017
835,223 0.17%
184,007 UK Treasury 1.750 07/09/2022
252,511 0.05%
500,000 UK Treasury 2.250 07/09/2023
706,341 0.15%
450,000 UK Treasury 2.750 07/09/2024
659,279 0.14%
894,092 UK Treasury 1.500 22/01/2021
1,204,951 0.25%
Total Great Britain
18,182,081 3.80%
Ireland - 0.54%
2,195,839 Irish Treasury 0.800 15/03/2022
2,601,292 0.54%
Total Ireland
2,601,292 0.54%
Israel - 0.08%
1,400,000 Israel Fixed Bond 1.750 31/08/2025
399,963 0.08%
Total Israel
399,963 0.08%
Italy - 3.32%
1,169,000 Buoni Poliennali Del Tes 5.000 01/08/2034
1,738,156 0.36%
2,663,000 Buoni Poliennali Del Tes 4.250 01/09/2019
3,316,768 0.69%
2,396,000 Buoni Poliennali Del Tes 4.500 01/03/2026
3,300,416 0.69%
154,000 Buoni Poliennali Del Tes 5.500 01/11/2022
216,248 0.05%
669,000 Buoni Poliennali Del Tes 4.750 01/09/2044
965,170 0.20%

SANLAM UNIVERSAL FUNDS PLC
177
PORTFOLIO OF INVESTMENTS OF SANLAM GLOBAL BOND FUND (CONTINUED) as at 30 June 2017
Nominal Security Coupon Maturity Classification Fair Value % of
USD Net Assets
Financial assets at fair value through profit or loss (continued)
Debt – 95.50% (continued)
Government Debt – 56.78% (continued) Italy - 3.32% (continued) 1,754,000 Buoni Poliennali Del Tes 4.500 01/03/2024
2,384,672 0.50%
1,340,000 Buoni Poliennali Del Tes 3.500 01/03/2030
1,697,309 0.35%
622,000 Buoni Poliennali Del Tes 2.150 15/12/2021
754,455 0.16%
1,343,000 Buoni Poliennali Del Tes 0.650 01/11/2020
1,550,745 0.32%
Total Italy
15,923,938 3.32%
Japan – 16.50%
165,750,000 Japan Government 3.000 20/09/2017
1,485,377 0.31%
498,400,000 Japan Government 1.900 20/06/2022
4,868,794 1.02%
419,900,000 Japan Government 2.200 20/09/2026
4,472,318 0.93%
699,850,000 Japan Government 2.500 20/09/2036
8,435,264 1.76%
535,400,000 Japan Government 2.400 20/06/2028
5,946,157 1.24%
227,800,000 Japan Government 1.500 20/09/2018
2,067,759 0.43%
670,750,000 Japan Government 1.400 20/09/2019
6,169,646 1.29%
306,000,000 Japan Government 1.900 20/03/2031
3,327,679 0.69%
679,650,000 Japan Government 0.800 20/09/2020
6,222,473 1.30%
847,500,000 Japan Government 1.000 20/09/2021
7,888,501 1.65%
290,150,000 Japan Government 0.800 20/06/2023 2,712,819 0.57%
900,000 Japan Bank 2.375 20/04/2026
875,610 0.18%
1,410,000 Japan Financial Organisation 2.125 13/04/2021
1,394,603 0.29%
2,000,000 Japan Financial Organisation 2.125 12/02/2021
1,979,200 0.41%
302,000,000 Japan Government 0.100 20/03/2027
2,696,576 0.56%
1,800,000 Tokyo Metropolitan Government 2.125 20/05/2019
1,802,124 0.38%
263,450,000 Japan Government 1.700 20/03/2054
2,878,393 0.60%
630,700,000 Japan Government 0.500 20/09/2024
5,819,955 1.22%
218,350,000 Japan Government 0.400 20/09/2025
2,004,039 0.42%
674,100,000 Japan Government 0.800 20/03/2046
5,980,440 1.25%
Total Japan
79,027,725 16.50%
Korea (South) - 0.28%
270,000,000 Korea Treasury 5.500 10/12/2029
319,469 0.07%
378,930,000 Korea Treasury 3.000 10/12/2042
376,701 0.08%
707,610,000 Korea Treasury 3.000 10/09/2024
654,158 0.14%
Total Korea (South)
1,350,327 0.28%
Luxembourg - 0.28%
1,058,000
European Financial Stability Facility Bond 1.750 27/06/2024
1,322,352 0.28%
Total Luxembourg
1,322,352 0.28%
Malaysia - 0.19%
525,000 Malaysia Government 5.734 30/07/2019
127,872 0.03%
1,648,000 Malaysia Government 4.709 15/09/2026
402,827 0.08%

SANLAM UNIVERSAL FUNDS PLC
178
PORTFOLIO OF INVESTMENTS OF SANLAM GLOBAL BOND FUND (CONTINUED) as at 30 June 2017
Nominal Security Coupon Maturity Classification Fair Value % of
USD Net Assets
Financial assets at fair value through profit or loss (continued)
Debt – 95.50% (continued)
Government Debt – 56.78% (continued) Malaysia - 0.19% (continued) 711,000 Malaysia Government 4.012 15/09/2017
165,706 0.03%
540,000 Malaysia Government 3.418 15/08/2022
123,647 0.03%
419,000 Malaysia Government 4.127 15/04/2032
93,816 0.02%
Total Malaysia
913,868 0.19%
Mexico - 0.53%
23,377,900 Mexico Government 6.500 10/06/2021
1,289,397 0.27%
572,000 Mexico Government 4.750 08/03/2044
579,453 0.12%
13,000,000 Mexico Government 5.750 05/03/2026
671,869 0.14%
Total Mexico
2,540,718 0.53%
Netherlands - 0.88%
617,938 Netherlands Government 5.500 15/01/2028
1,057,195 0.22%
345 Netherlands Government 4.500 15/07/2017
394 0.00%
601,131 Netherlands Government 3.750 15/01/2042
1,059,437 0.22%
1,092,295 Netherlands Government 4.000 15/07/2019
1,363,471 0.28%
578,081 Netherlands Government 2.250 15/07/2022
739,410 0.15%
Total Netherlands
4,219,907 0.88%
New Zealand - 0.45%
2,539,000 New Zealand Government 5.500 15/04/2023
2,140,185 0.45%
Total New Zealand
2,140,185 0.45%
Norway - 0.21%
7,447,000 Norwegian Government 3.000 14/03/2024
983,366 0.21%
Total Norway
983,366 0.21%
Philippines - 0.19%
800,000 Republic of Philippines 8.375 17/06/2019
901,928 0.19%
Total Philippines
901,928 0.19%
Poland - 0.36%
3,146,000 Poland Government 5.750 23/09/2022
974,519 0.20%
685,000 Poland Government 4.000 22/01/2024
734,094 0.15%
Total Poland
1,708,613 0.36%
Spain - 2.66%
383,426 Spain Government 6.000 31/01/2029
633,130 0.13%
364,000 Spain Government 5.500 30/07/2017
417,195 0.09%
761,000 Spain Government 4.200 31/01/2037
1,109,225 0.23%
450,000 Spain Government 4.800 31/01/2024
645,925 0.13%
1,901,000 Spain Government 4.650 30/07/2025
2,750,372 0.57%
669,000 Spain Government 5.500 30/04/2021
923,352 0.19%
2,461,000 Spain Government 4.850 31/10/2020
3,267,912 0.68%
856,000 Spain Government 4.300 31/10/2019
1,079,562 0.23%

SANLAM UNIVERSAL FUNDS PLC
179
PORTFOLIO OF INVESTMENTS OF SANLAM GLOBAL BOND FUND (CONTINUED) as at 30 June 2017
Nominal Security Coupon Maturity Classification Fair Value % of
USD Net Assets
Financial assets at fair value through profit or loss (continued)
Debt – 95.50% (continued)
Government Debt – 56.78% (continued) Spain - 2.66% (continued) 412,000 Spain Government 5.850 31/01/2022
591,423 0.12%
59,000 Spain Government 4.300 31/10/2019
74,409 0.02%
1,050,000 Spain Government 2.750 30/04/2019
1,264,682 0.26%
Total Spain
12,757,186 2.66%
Supra-National - 1.74%
251,040
European Financial Stability Facility Bond 5.625 15/02/2028
425,462 0.09%
448,000 European Financial Stability Facility Bond 4.000 15/10/2037
762,070 0.16%
850,000 European Investment Bank 4.875 15/02/2036
1,097,206 0.23%
1,134,000 European Investment Bank 6.500 07/08/2019
946,765 0.20%
571,000 European Investment Bank 2.500 16/09/2019
693,696 0.14%
1,618,000 European Investment Bank 3.500 04/02/2022
2,152,756 0.45%
472,000 European Investment Bank 2.750 03/12/2029
647,402 0.14%
471,000 European Investment Bank 1.000 14/03/2031
535,552 0.11%
310,000 European Investment Bank 0.875 13/09/2024
369,328 0.08%
590,000 European Investment Bank 1.625 17/11/2036
715,843 0.15%
Total Supra-National
8,346,080 1.74%
Sweden - 0.12%
4,245,000 Sweden Government 2.250 01/06/2032
566,849 0.12%
Total Sweden
566,849 0.12%
Thailand - 0.35%
15,000,000 Thailand Government 5.125 13/03/2018
453,153 0.09%
17,000,000 Thailand Government 3.875 13/06/2019
523,510 0.11%
21,902,000 Thailand Government 3.625 16/06/2023
698,249 0.15%
Total Thailand
1,674,912 0.35%
Turkey - 0.28%
1,324,000 Republic of Turkey 7.500 14/07/2017
1,326,118 0.28%
Total Turkey
1,326,118 0.28%
United States – 13.39%
400,000 US Treasury 1.125 28/02/2021
391,891 0.08%
5,240,500 US Treasury 1.375 31/08/2020
5,204,267 1.09%
695,000 US Treasury 1.500 31/05/2019
696,683 0.15%
4,314,000 US Treasury 1.750 31/01/2023
4,259,569 0.89%
410,000 US Treasury 2.000 31/05/2021
414,164 0.09%
1,651,300 US Treasury 2.250 15/11/2025
1,651,300 0.34%
2,979,300 US Treasury 2.500 15/02/2046
2,776,335 0.58%
2,990,000 US Treasury 2.750 15/02/2024
3,110,067 0.65%
839,000 US Treasury 5.250 15/02/2029
1,083,621 0.23%
2,369,800 US Treasury 6.750 15/08/2026
3,250,514 0.68%

SANLAM UNIVERSAL FUNDS PLC
180
PORTFOLIO OF INVESTMENTS OF SANLAM GLOBAL BOND FUND (CONTINUED) as at 30 June 2017
Nominal Security Coupon Maturity Classification Fair Value % of
USD Net Assets
Financial assets at fair value through profit or loss (continued)
Debt – 95.50% (continued)
Government Debt – 56.78% (continued)
United States – 13.39% (continued) 5,026,900 US Treasury 1.250 31/01/2019
5,018,849 1.05%
6,593,600 US Treasury 2.000 15/02/2022
6,643,052 1.39%
5,925,700 US Treasury 2.125 31/12/2021
6,001,623 1.25%
4,683,500 US Treasury 2.250 15/11/2024
4,708,381 0.98%
7,552,300 US Treasury 3.750 15/08/2041
8,849,172 1.85%
9,553,400 US Treasury 3.625 15/02/2020
10,074,732 2.10%
Total United States
64,134,220 13.39%
Total Government Debt
271,976,318 56.78%
Total Debt
457,417,022 95.50%
Derivative Financial Instruments
Buy Currency Buy Amount Sell currency Sell Amount Maturity Fair Value % of
USD Net Assets
Forward Contracts - 0.34%1,2
GBP 40,215,322 USD (51,420,115) 20/07/2017 926,262 0.19%
CHF 3,660,000 USD (3,712,043) 20/10/2017 132,311 0.03%
MXN 41,000,000 USD (2,160,631) 20/10/2017 67,831 0.01%
MXN 20,500,000 USD (1,079,948) 20/10/2017 34,283 0.01%
SEK 4,680,000 USD (524,605) 20/10/2017 33,101 0.01%
SEK 4,680,000 USD (524,605) 20/10/2017 33,101 0.01%
INR 246,000,000 USD (3,726,708) 23/10/2017 29,525 0.01%
EUR 493,000 USD (542,856) 20/10/2017 23,194 0.00%
EUR 1,025,000 USD (1,154,537) 20/10/2017 22,340 0.00%
PLN 1,100,000 USD (274,512) 20/10/2017 22,252 0.00%
PLN 1,100,000 USD (274,512) 20/10/2017 22,252 0.00%
EUR 965,000 USD (1,086,955) 20/10/2017 21,032 0.00%
CAD 738,000 USD (548,165) 20/10/2017 20,850 0.00%
MXN 20,500,000 USD (1,099,956) 20/10/2017 14,275 0.00%
CAD 502,000 USD (372,871) 20/10/2017 14,182 0.00%
USD 593,562 JPY (65,000,000) 20/10/2017 12,053 0.00%
USD 593,562 JPY (65,000,000) 20/10/2017 12,053 0.00%
USD 583,205 JPY (63,900,000) 20/10/2017 11,537 0.00%
EUR 135,000 USD (144,248) 20/10/2017 10,755 0.00%
EUR 135,000 USD (144,248) 20/10/2017 10,755 0.00%
EUR 135,000 USD (144,335) 20/10/2017 10,669 0.00%
USD 501,976 JPY (55,000,000) 20/10/2017 9,930 0.00%
HUF 44,000,000 USD (153,553) 20/10/2017 9,739 0.00%
HUF 44,000,000 USD (153,553) 20/10/2017 9,739 0.00%
CHF 251,000 USD (254,569) 20/10/2017 9,074 0.00%
ILS 700,000 USD (192,939) 20/10/2017 8,623 0.00%
CAD 295,000 USD (218,923) 20/10/2017 8,529 0.00%
EUR 100,000 USD (106,915) 20/10/2017 7,903 0.00%

SANLAM UNIVERSAL FUNDS PLC
181
PORTFOLIO OF INVESTMENTS OF SANLAM GLOBAL BOND FUND (CONTINUED) as at 30 June 2017
Buy Currency Buy Amount Sell currency Sell Amount Maturity Fair Value % of
USD Net Assets
Financial assets at fair value through profit or loss (continued)
Derivative Financial Instruments (continued)
Forward Contracts - 0.34% (continued)
SGD 535,000 USD (382,471) 20/10/2017 6,833 0.00%
SGD 535,000 USD (382,471) 20/10/2017 6,833 0.00%
USD 1,775,044 KRW (2,020,000,000) 20/10/2017 6,235 0.00%
USD 194,059 JPY (21,000,000) 20/10/2017 6,187 0.00%
USD 194,059 JPY (21,000,000) 20/10/2017 6,187 0.00%
CAD 305,000 USD (229,522) 20/10/2017 5,640 0.00%
AUD 383,000 USD (288,192) 20/10/2017 5,462 0.00%
GBP 185,000 USD (236,747) 20/10/2017 4,742 0.00%
SEK 955,000 USD (110,036) 20/10/2017 3,769 0.00%
SEK 955,000 USD (110,036) 20/10/2017 3,769 0.00%
AUD 255,000 USD (191,877) 20/10/2017 3,637 0.00%
SEK 840,000 USD (97,131) 20/10/2017 2,970 0.00%
EUR 135,000 USD (152,530) 20/10/2017 2,473 0.00%
CHF 150,000 USD (155,186) 20/10/2017 2,369 0.00%
CHF 150,000 USD (155,186) 20/10/2017 2,369 0.00%
EUR 121,500 USD (137,336) 20/10/2017 2,167 0.00%
EUR 121,500 USD (137,336) 20/10/2017 2,167 0.00%
EUR 115,000 USD (129,933) 20/10/2017 2,107 0.00%
SEK 340,000 USD (38,826) 20/10/2017 1,691 0.00%
SEK 340,000 USD (38,826) 20/10/2017 1,691 0.00%
DKK 440,000 USD (66,641) 20/10/2017 1,324 0.00%
DKK 440,000 USD (66,641) 20/10/2017 1,324 0.00%
DKK 478,000 USD (72,633) 20/10/2017 1,202 0.00%
DKK 478,000 USD (72,633) 20/10/2017 1,202 0.00%
CZK 1,000,000 USD (42,967) 20/10/2017 1,024 0.00%
CZK 1,000,000 USD (42,967) 20/10/2017 1,024 0.00%
CHF 116,000 USD (120,966) 20/10/2017 877 0.00%
CHF 116,000 USD (120,966) 20/10/2017 877 0.00%
SEK 210,000 USD (24,283) 20/10/2017 742 0.00%
ILS 170,000 USD (48,366) 20/10/2017 585 0.00%
ILS 170,000 USD (48,366) 20/10/2017 585 0.00%
GBP 18,600 USD (23,803) 20/10/2017 477 0.00%
NOK 370,000 USD (43,927) 20/10/2017 332 0.00%
NOK 370,000 USD (43,927) 20/10/2017 332 0.00%
THB 2,500,000 USD (73,370) 20/10/2017 314 0.00%
THB 2,500,000 USD (73,370) 20/10/2017 314 0.00%
SGD 100,000 USD (72,460) 20/10/2017 307 0.00%
SGD 100,000 USD (72,460) 20/10/2017 307 0.00%
USD 223,946 JPY (25,000,000) 20/10/2017 289 0.00%
THB 2,250,000 USD (66,086) 20/10/2017 230 0.00%
THB 2,250,000 USD (66,086) 20/10/2017 230 0.00%
USD 170,199 JPY (19,000,000) 20/10/2017 219 0.00%
PLN 164,000 USD (44,062) 20/10/2017 183 0.00%
PLN 45,000 USD (12,090) 20/10/2017 50 0.00%
Total Forward Contracts
1,641,794 0.34%

SANLAM UNIVERSAL FUNDS PLC
182
PORTFOLIO OF INVESTMENTS OF SANLAM GLOBAL BOND FUND (CONTINUED) as at 30 June 2017
Nominal Security Maturity Classification Fair Value % of
USD Net Assets
Financial assets at fair value through profit or loss (continued)
Derivative Financial Instruments (continued)
Futures Contracts - 0.04%2,4
(148) OATU7 - Euro-OAT Future Sep 17 07/09/2017 190,825 0.04%
Total Futures Contracts
190,825 0.04%
Interest Rate Swaps- 0.81%2,3
110,000,000 IRS SWAP USD
13/09/2021 836,803 0.17%
7,500,000 IRS SWAP EUR
12/09/2046 755,274 0.16%
10,500,000 IRS SWAP EUR
20/01/2047 307,837 0.06%
175,000,000 IRS SWAP NZD
27/02/2020 275,398 0.06%
13,500,000 IRS SWAP AUD
26/05/2029 236,847 0.05%
16,000,000 IRS SWAP GBP
01/06/2027 185,288 0.04%
16,000,000 IRS SWAP GBP
23/05/2027 168,690 0.04%
135,340,000 IRS SWAP JPY
13/11/2031 129,984 0.03%
1,300,000,000 IRS SWAP JPY
16/09/2031 117,864 0.02%
110,000,000 IRS SWAP EUR
27/02/2020 111,809 0.02%
2,250,000,000 IRS SWAP JPY
14/09/2026 103,548 0.02%
6,750,000 IRS SWAP USD
17/11/2026 96,614 0.02%
95,000,000 IRS SWAP PLN
11/04/2019 93,280 0.02%
33,000,000 IRS SWAP USD
04/02/2020 92,021 0.02%
6,750,000 IRS SWAP USD
23/11/2026 88,504 0.02%
4,050,000 IRS SWAP EUR
21/01/2026 70,802 0.01%
20,000,000 IRS SWAP AUD
15/12/2021 42,849 0.01%
1,790,000 IRS SWAP EUR
22/01/2046 32,658 0.01%
6,800,000 IRS SWAP USD
14/12/2026 29,579 0.01%
38,000,000 IRS SWAP USD
12/06/2020 29,237 0.01%
38,000,000 IRS SWAP USD
12/06/2020 26,136 0.01%
40,000,000 IRS SWAP PLN
11/04/2022 20,207 0.00%
38,000,000 IRS SWAP USD
13/06/2020 15,618 0.00%
167,000 IRS SWAP EUR
18/01/2021 2,981 0.00%
300,000 IRS SWAP EUR
12/03/2018 993 0.00%
Total Interest Rate Swaps
3,870,821 0.81%
Total financial assets at fair value through profit or loss 463,120,463 96.69%
Buy Currency Buy Amount Sell currency Sell Amount Maturity Fair Value % of
USD Net Assets
Financial liabilities at fair value through profit or loss
Derivative Financial Instruments Forward Contracts - (0.21)%
1,2
JPY 432,000,000 CHF (3,803,497) 20/10/2017 (130,276) (0.03)%
USD 2,120,679 EUR (1,960,000) 20/10/2017 (129,741) (0.03)%
USD 1,612,149 EUR (1,490,000) 20/10/2017 (98,629) (0.02)%
USD 2,863,278 CNY (20,000,000) 20/10/2017 (66,557) (0.01)%
USD 828,099 GBP (660,000) 20/10/2017 (33,431) (0.01)%
USD 2,186,092 CLP (1,475,000,000) 20/10/2017 (28,035) (0.01)%
JPY 213,000,000 USD (1,932,299) 20/10/2017 (26,736) (0.01)%

SANLAM UNIVERSAL FUNDS PLC
183
PORTFOLIO OF INVESTMENTS OF SANLAM GLOBAL BOND FUND (CONTINUED) as at 30 June 2017
Buy Currency Buy Amount Sell currency Sell Amount Maturity Fair Value % of
USD Net Assets
Financial liabilities at fair value through profit or loss
Derivative Financial Instruments (continued) Forward Contracts - (0.21)% (continued)
USD 1,376,015 EUR (1,220,000) 20/10/2017 (24,756) (0.01)%
USD 400,877 NZD (575,000) 20/10/2017 (19,450) (0.00)%
USD 291,541 EUR (270,000) 20/10/2017 (18,465) (0.00)%
USD 291,541 EUR (270,000) 20/10/2017 (18,465) (0.00)%
JPY 146,500,000 USD (1,329,022) 20/10/2017 (18,389) (0.00)%
USD 647,276 AUD (867,000) 20/10/2017 (17,471) (0.00)%
USD 1,090,976 CLP (737,500,000) 20/10/2017 (16,087) (0.00)%
USD 363,926 GBP (291,000) 20/10/2017 (15,931) (0.00)%
USD 571,873 AUD (766,000) 20/10/2017 (15,436) (0.00)%
JPY 46,500,000 USD (430,475) 20/10/2017 (14,472) (0.00)%
USD 250,000 NZD (361,786) 20/10/2017 (14,466) (0.00)%
USD 798,540 EUR (708,000) 20/10/2017 (14,367) (0.00)%
USD 388,087 NZD (550,000) 20/10/2017 (13,965) (0.00)%
USD 275,385 NZD (395,000) 20/10/2017 (13,361) (0.00)%
USD 370,447 NZD (525,000) 20/10/2017 (13,330) (0.00)%
USD 194,083 EUR (180,000) 20/10/2017 (12,588) (0.00)%
JPY 84,400,000 USD (767,250) 20/10/2017 (12,182) (0.00)%
USD 592,751 THB (20,500,000) 20/10/2017 (11,452) (0.00)%
USD 1,096,654 CLP (737,500,000) 20/10/2017 (10,409) (0.00)%
USD 259,784 CAD (350,000) 20/10/2017 (10,074) (0.00)%
USD 205,000 EUR (187,043) 20/10/2017 (9,757) (0.00)%
USD 205,000 EUR (187,043) 20/10/2017 (9,757) (0.00)%
USD 135,593 DKK (940,000) 20/10/2017 (9,605) (0.00)%
USD 135,593 DKK (940,000) 20/10/2017 (9,605) (0.00)%
USD 214,747 EUR (195,000) 20/10/2017 (9,147) (0.00)%
USD 172,583 GBP (138,000) 20/10/2017 (7,555) (0.00)%
USD 289,687 CAD (385,000) 20/10/2017 (7,157) (0.00)%
USD 197,000 MXN (3,751,634) 20/10/2017 (6,912) (0.00)%
USD 197,000 MXN (3,751,634) 20/10/2017 (6,912) (0.00)%
USD 350,000 EUR (310,816) 20/10/2017 (6,870) (0.00)%
USD 270,850 MYR (1,200,000) 23/10/2017 (6,626) (0.00)%
USD 299,364 GBP (234,639) 20/07/2017 (6,054) (0.00)%
USD 197,000 AUD (264,680) 20/10/2017 (5,936) (0.00)%
RUB 11,200,000 USD (190,996) 20/10/2017 (5,881) (0.00)%
RUB 11,200,000 USD (190,996) 20/10/2017 (5,881) (0.00)%
USD 269,405 NOK (2,300,000) 20/10/2017 (5,721) (0.00)%
USD 269,405 NOK (2,300,000) 20/10/2017 (5,721) (0.00)%
USD 93,307 NZD (135,000) 20/10/2017 (5,378) (0.00)%
USD 76,920 EUR (71,500) 20/10/2017 (5,175) (0.00)%
JPY 34,300,000 USD (311,809) 20/10/2017 (4,951) (0.00)%
KRW 1,480,000,000 USD (1,300,527) 20/10/2017 (4,568) (0.00)%
USD 96,265 ILS (350,000) 20/10/2017 (4,517) (0.00)%
KRW 352,000,000 USD (312,057) 20/10/2017 (3,829) (0.00)%
KRW 352,000,000 USD (312,057) 20/10/2017 (3,829) (0.00)%
USD 304,000 JPY (34,281,472) 20/10/2017 (2,692) (0.00)%
USD 285,993 PLN (1,070,000) 20/10/2017 (2,678) (0.00)%
USD 285,993 PLN (1,070,000) 20/10/2017 (2,678) (0.00)%

SANLAM UNIVERSAL FUNDS PLC
184
PORTFOLIO OF INVESTMENTS OF SANLAM GLOBAL BOND FUND (CONTINUED) as at 30 June 2017
Buy Currency Buy Amount Sell currency Sell Amount Maturity Fair Value % of
USD Net Assets
Financial liabilities at fair value through profit or loss
Derivative Financial Instruments (continued) Forward Contracts - (0.21)% (continued)
USD 57,000 AUD (77,452) 20/10/2017 (2,384) (0.00)%
USD 143,905 NZD (200,000) 20/10/2017 (2,295) (0.00)%
USD 36,172 MXN (700,000) 20/10/2017 (1,875) (0.00)%
USD 95,418 THB (3,300,000) 20/10/2017 (1,844) (0.00)%
USD 38,000 AUD (51,635) 20/10/2017 (1,589) (0.00)%
USD 96,416 NZD (134,000) 20/10/2017 (1,538) (0.00)%
USD 171,000 JPY (19,283,328) 20/10/2017 (1,515) (0.00)%
JPY 26,000,000 USD (234,094) 20/10/2017 (1,490) (0.00)%
RUB 2,700,000 USD (46,067) 20/10/2017 (1,441) (0.00)%
RUB 2,700,000 USD (46,067) 20/10/2017 (1,441) (0.00)%
USD 56,427 MYR (250,000) 23/10/2017 (1,381) (0.00)%
JPY 4,229,869 USD (39,158) 20/10/2017 (1,316) (0.00)%
USD 228,567 EUR (200,000) 20/10/2017 (1,067) (0.00)%
JPY 25,800,000 USD (231,783) 20/10/2017 (968) (0.00)%
JPY 9,750,000 USD (87,949) 20/10/2017 (723) (0.00)%
USD 22,000 AUD (29,558) 20/10/2017 (663) (0.00)%
USD 137,140 EUR (120,000) 20/10/2017 (640) (0.00)%
JPY 10,800,000 USD (97,239) 20/10/2017 (619) (0.00)%
MYR 205,000 USD (48,009) 19/10/2017 (601) (0.00)%
MYR 205,000 USD (48,009) 19/10/2017 (601) (0.00)%
JPY 4,900,000 USD (44,200) 20/10/2017 (363) (0.00)%
USD 57,000 GBP (43,829) 20/10/2017 (213) (0.00)%
USD 57,000 GBP (43,829) 20/10/2017 (213) (0.00)%
Total Forward Contracts
(1,010,694) (0.21)%
Nominal Security Maturity Classification Fair Value % of
USD Net Assets
Futures Contracts - (0.07)%
2,4
115 RXU7-Euro-Bund Future Sep17 07/09/2017 (341,249) (0.07)%
39 TYU7-US 10YR Note Future Sep17 20/09/2017 (17,063) (0.00)%
Total Futures Contracts
(358,311) (0.07)%
Interest Rate Swaps - (0.84)%2,3
100,000 IRS SWAP GBP
30/04/2018 (573) (0.00)%
167,000 IRS SWAP USD
10/10/2022 (1,563) (0.00)%
100,000 IRS SWAP GBP
17/12/2021 (2,729) (0.00)%
526,000,000 IRS SWAP JPY
02/03/2026 (11,008) (0.00)%
1,500,000,000 IRS SWAP JPY
06/04/2026 (20,246) (0.00)%
7,500,000 IRS SWAP AUD
15/12/2031 (34,752) (0.01)%
4,400,000 IRS SWAP EUR
02/03/2026 (46,081) (0.01)%
11,500,000 IRS SWAP USD
25/05/2027 (48,992) (0.01)%
11,500,000 IRS SWAP USD
07/06/2027 (49,325) (0.01)%
13,000,000 IRS SWAP USD
13/12/2021 (53,958) (0.01)%
90,000,000 IRS SWAP SEK
27/05/2027 (61,220) (0.01)%
12,750,000 IRS SWAP EUR
06/04/2026 (78,695) (0.02)%
315,000,000 IRS SWAP SEK
12/06/2020 (89,612) (0.02)%

SANLAM UNIVERSAL FUNDS PLC
185
PORTFOLIO OF INVESTMENTS OF SANLAM GLOBAL BOND FUND (CONTINUED) as at 30 June 2017
Buy Currency Buy Amount Sell currency Sell Amount Maturity Fair Value % of
USD Net Assets
Financial liabilities at fair value through profit or loss (continued)
Derivative Financial Instruments (continued) Interest Rate Swaps - (0.84)% (continued)
90,000,000 IRS SWAP SEK
07/06/2027 (89,674) (0.02)%
315,000,000 IRS SWAP SEK
12/06/2020 (94,333) (0.02)%
32,500,000 IRS SWAP USD
05/02/2019 (100,675) (0.02)%
320,000,000 IRS SWAP SEK
14/06/2020 (106,004) (0.02)%
13,000,000 IRS SWAP USD
22/11/2021 (109,460) (0.02)%
13,000,000 IRS SWAP USD
17/11/2021 (124,345) (0.03)%
21,000,000 IRS SWAP EUR
20/01/2027 (162,007) (0.03)%
4,000,000,000 IRS SWAP JPY
16/09/2021 (243,139) (0.05)%
31,000,000 IRS SWAP AUD
26/05/2022 (309,042) (0.06)%
21,000,000 IRS SWAP EUR
14/09/2026 (607,008) (0.13)%
19,800,000 IRS SWAP EUR
14/09/2026 (776,031) (0.16)%
110,000,000 IRS SWAP USD
14/09/2020 (779,977) (0.16)%
Total Interest Rate Swaps
(4,000,447) (0.84)%
Total financial liabilities at fair value through profit or loss (5,369,453) (1.12)%
Cash and cash equivalents
18,571,004 3.88%
Other net assets and liabilities
2,662,730 0.56%
Net assets attributable to holders of redeemable participating shares 478,984,744 100.00%
Sanlam Global Bond Fund
Summary
Classification Description
Fair Value % of % of
USD Net
Assets Total
Assets
Transferable securities and money market instruments admitted to official stock exchange listing or traded on regulated market 457,417,022 95.50% 94.21%
A Transferable securities and money market instruments other than those referred above - - -
B UCITS and AIFs
- - -
C Financial derivative instruments dealt in on a regulated market (167,486) (0.03)% (0.03)%
D Over the counter financial derivative instruments 501,473 0.10% 0.10%
Cash and cash equivalents
18,571,004 3.88% 3.82%
Other net assets and liabilities
2,662,730 0.56% 0.55%
Net assets attributable to holders of redeemable participating shares 478,984,744 100.00%
The following entities act as counterparty or clearing broker to the open derivative positions at 30 June 2017: Statestreet1, JP Morgan
2,
Morgan Stanley3 and
BNP Paribas
4.

SANLAM UNIVERSAL FUNDS PLC
186
PORTFOLIO OF INVESTMENTS OF SANLAM GLOBAL FINANCIAL FUND as at 30 June 2017
Nominal Security Classification Fair Value
USD
% of
Net Assets
Financial assets at fair value through profit or loss
Equities – 96.83%
Austria – 1.11%
34,203 Erste Group Bank AG 1,308,678 1.11%
Total Austria 1,308,678 1.11%
Belgium – 1.22%
35,738 Ageas
1,438,177
1.22%
Total Belgium 1,438,177 1.22%
Bermuda – 8.68%
22,337 Credicorp
4,007,034
3.40%
75,092 Essent Group Ltd 2,788,917 2.37%
8,527 Renaissancere Holdings Ltd 1,185,679 1.01%
51,183 XL Group Limited 2,241,815 1.90%
Total Bermuda 10,223,446 8.68%
Brazil – 0.44%
46,600 Itau Unibanco Holding SA
514,930
0.44%
Total Brazil 514,930 0.44%
Cayman Islands - 0.00%
4,000,000 DBA Telecommunication Asia
-
0.00%
Total Cayman Islands - 0.00%
Cyprus - 4.53%
463,676 TCS Group Holding - Reg S
5,332,274
4.53%
Total Cyprus 5,332,274 4.53%
France – 3.00%
80,037 AXA SA
2,187,742
1.86%
34,092 Scor SE 1,350,538 1.15%
Total France 3,538,280 3.00%
Great Britain – 15.83% 2,215,749 AccidentExchangeGroupPLC - 0.00%
283,220 AldermoreGroupPlc 800,560 0.68%
338,991 ArrowGlobalGroupPLC 1,786,988 1.52%
29,985 BankofGeorgiaHoldingsPlc 1,362,816 1.16%
91,741 IGGroupHoldingsPlc 677,832 0.58%
788,112 Legal&GeneralGroupPLC 2,648,029 2.25%
867,626 OneSavingsBankPlc 4,232,278 3.59%
308,155 ShawbrookGroupPlcLtd 1,358,874 1.15%
280,549 TBCBankGroupPlc 5,780,618 4.91%
Total Great Britain 18,647,995 15.83%

SANLAM UNIVERSAL FUNDS PLC
187
PORTFOLIO OF INVESTMENTS OF SANLAM GLOBAL FINANCIAL FUND as at 30 June 2017
Nominal Security Classification Fair Value
USD
% of
Net Assets
Financial assets at fair value through profit or loss (continued)
Equities – 96.83% (continued)
Hungary – 1.19%
42,050 OTPBankNyrt 1,405,342 1.19%
Total Hungary 1,405,342 1.19%
India – 5.11%
232,080 LICHousingFinanceLtd 2,665,584 2.26%
633,708 PowerFinanceCorporation 1,203,282 1.02%
5,150 ShriramCityUnionFinance 189,989 0.16%
26,422 UjjivanFinancialServicesLtd 126,570 0.11%
80,957 YesBank 1,833,500 1.56%
Total India 6,018,925 5.11%
Indonesia – 11.41%
7,342,000 AdiraDinamikaMultiFinance 3,742,829 3.18%
4,880,232 BankNegaraIndonesia 2,414,689 2.05%
2,671,000 BankRakyatIndonesa 3,053,658 2.59%
20,008,000 PaninSekuritasTBKPT 4,229,894 3.59%
Total Indonesia 13,441,071 11.41%
Ireland – 1.61%
25,000 AlliedIrishBanksPLC 141,236 0.12%
6,689,489 BankofIrelandOrd 1,755,984 1.49%
Total Ireland 1,897,220 1.61%
Luxembourg – 0.14%
Norway – 2.18%
379,630 Sparebank1Nord-Norge 2,571,528 2.18%
Total Norway 2,571,528 2.18%
Portugal – 2.57%
11,267,840 BancoCommercialPortuguesSA 3,031,098 2.57%
Total Portugal 3,031,098 2.57%
Russia – 2.98%
896,808 MoscowExchangeMicex 1,582,172 1.34%
185,850 SberbankofRussiaADR 1,923,548 1.63%
Total Russia 3,505,720 2.98%
Switzerland – 2.22%
154,754 UBSGroupAG 2,620,652 2.22%
Total Switzerland 2,620,652 2.22%
20,602 IdBHoldingsSA 164,591 0.14% Total Luxembourg 164,591 0.14%

SANLAM UNIVERSAL FUNDS PLC
188
PORTFOLIO OF INVESTMENTS OF SANLAM GLOBAL FINANCIAL FUND (CONTINUED) as at 30 June 2017
Nominal Security Classification Fair Value
USD
% of
Net Assets
Financial assets at fair value through profit or loss (continued)
Equities – 96.83% (continued)
Turkey – 5.10%
5,523,455 ISYatirimMenkul 2,418,986 2.05%
8,893,997 TurkiyeSinaiKalkin 3,591,592 3.05%
Total Turkey 6,010,578 5.10%
United States – 27.50%
42,794 AmericanInternationalGroup 2,675,481 2.27%
112,598 BankofAmericaCorp 2,731,627 2.32%
12,515 BerkshireHathawayInc. 2,119,666 1.80%
68,016 CitigroupInc 4,548,910 3.86%
46,113 ENCORECAPITALGROUPINC 1,851,437 1.57%
32,603 IntercontinentalExchangeInc 2,149,190 1.82%
82,888 JPMorganChase&Co 7,575,963 6.43%
225,287 MGICInvestmentCorp. 2,523,214 2.14%
6,834 SignatureBank 980,884 0.83%
54,253 USBancorp 2,816,816 2.39%
43,578 WellsFargo&Co 2,414,657 2.05%
Total United States 32,387,845 27.50%
Total Equities
114,058,348 96.83%
Total financial assets at fair value through profit or loss 114,058,348 96.83%
Cash and cash equivalents
4,656,968 3.95%
Other net assets and liabilities
(920,852) (0.78)%
Net assets attributable to holders of redeemable participating shares 117,794,464 100.00%

SANLAM UNIVERSAL FUNDS PLC
189
PORTFOLIO OF INVESTMENTS OF SANLAM GLOBAL FINANCIAL FUND (CONTINUED) as at 30 June 2017
Sanlam Global Financial Fund
Summary
Classification Description
Fair Value % of % of
USD Net
Assets Total
Assets
Transferable securities and money market instruments admitted to official stock exchange listing or traded on regulated market 114,058,348 96.83% 95.64%
A Transferable securities and money market instruments other than those referred above - - -
B UCITS and AIFs
- - -
C Financial derivative instruments dealt in on a regulated market - - -
D Over the counter financial derivative instruments - - -
Cash and cash equivalents
4,656,968 3.95% 3.90%
Other net assets and liabilities
(920,852) (0.78)% (0.77)%
Net assets attributable to holders of redeemable participating shares 117,794,464 100.00%

SANLAM UNIVERSAL FUNDS PLC
190
PORTFOLIO OF INVESTMENTS OF SANLAM GLOBAL PROPERTY FUND
as at 30 June 2017
Equities - 96.86%
Australia - 5.01%
326,770 General Property Group 1,201,782 0.95%
109,730 Goodman Group 663,053 0.52%
222,988 ING Office Fund 751,612 0.60%
79,340 Lend Lease Group 1,014,272 0.80%
562,160 Mirvac Group 919,364 0.73%
111,680 Sydney Airport 607,952 0.48%
128,670 Transurban Group 1,170,695 0.93%
Total Australia 6,328,730 5.01%
Austria - 1.58%
29,587 Buwog AG 849,425 0.67%
46,958 CA Immobilien Anlagen AG 1,144,750 0.91%
Total Austria 1,994,175 1.58%
Canada - 2.48%
29,410 Allied Properties Real Estate Investment Trust 881,100 0.70%
47,680 H&R Real Estate Investment Trust 808,185 0.64%
71,510 Killam Apartment Real Estate Investment trust 701,284 0.55%
140,960 Pure Industry Real Estate 746,521 0.59%
Total Canada 3,137,090 2.48%
Cayman Islands - 2.14%
339,000 Cheung Kong Property Holdings Ltd 2,655,426 2.10%
136,000 Kaisa Group Holdings Limited 43,030 0.04%
Total Cayman Islands 2,698,456 2.14%
Chile - 0.28%
139,951 Parque Arauco SA 352,270 0.28%
Total Chile 352,270 0.28%
China - 0.56%
204,000 Anhui Conch Cement Company Limited 709,477 0.56%
Total China 709,477 0.56%
France - 2.50%
20,250 Icade 1,698,682 1.34%
35,810 Klepierre 1,466,618 1.16%
Total France 3,165,300 2.50%
Germany - 3.85%
21,230 Aareal Bank AG 841,016 0.67%
Nominal Security Classification Fair Value
USD
% of
Net Assets
Financial assets at fair value through profit or loss

SANLAM UNIVERSAL FUNDS PLC
191
PORTFOLIO OF INVESTMENTS OF SANLAM GLOBAL PROPERTY FUND (CONTINUED)
as at 30 June 2017
Equities - 96.86% (continued)
Germany - 3.85% (continued)
33,160 Deutsche Wohnen AG 1,267,446 1.00%
40,787 Tag Immobilien AG 640,763 0.51%
53,224 Vonovia Se 2,111,784 1.67%
Total Germany 4,861,009 3.85%
Great Britain - 3.48%
33,960 Derwent London Plc 1,172,408 0.93%
172,140 Segro Plc 1,095,415 0.87%
127,517 Unite Group Plc 1,076,523 0.85%
90,860 Workspace Group Plc 1,052,488 0.83%
Total Great Britain 4,396,834 3.48%
Hong Kong - 3.98%
381,500 Link Reit 2,902,813 2.30%
203,000 Wharf Holdings 1,682,435 1.33%
59,000 Wheelock & Co Ltd 445,149 0.35%
Total Hong Kong 5,030,397 3.98%
Japan - 10.02%
136 Daiwa Office Investment Corp 686,355 0.54%
8,300 East Japan Railway Co 793,801 0.63%
168 Frontier Real Estate Invest 693,084 0.55%
455 Fukuoka REIT Corporation 700,218 0.55%
449 Heiwa Real Estate Reit Inc 349,289 0.28%
348 Hulic REIT Inc 543,605 0.43%
100 Japan Real Estate 497,552 0.39%
934 Japan Rental Housing Investment Inc 690,004 0.55%
273 Kenedix Retail REIT Corporation 576,860 0.46%
595 Lasalle Logiport REIT 600,031 0.47%
51,500 Leopalace21 Corporation 319,956 0.25%
199 MCUBS MidCity Investment Corporation 596,026 0.47%
40,000 Mitsubishi Estate 745,349 0.59%
131,700 Mitsui Fudosan Co Ltd 3,142,162 2.49%
253 Premier Investment Corporation 247,258 0.20%
48,000 Sumitomo Realty Develop. 1,480,374 1.17%
Total Japan 12,661,924 10.02%
Mexico - 0.64%
156,400 Grupo Cementos De Chihuahua Sab De Cv 808,889 0.64%
Total Mexico 808,889 0.64%
Nominal Security Classification Fair Value
USD
% of
Net Assets
Financial assets at fair value through profit or loss (continued)

SANLAM UNIVERSAL FUNDS PLC
192
PORTFOLIO OF INVESTMENTS OF SANLAM GLOBAL PROPERTY FUND (CONTINUED)
as at 30 June 2017
Equities - 96.86% (continued)
Netherlands - 0.66%
20,900 Eurocommercial Properties NV 834,503 0.66%
Total Netherlands 834,503 0.66%
New Zealand - 0.53%
114,560 Fletcher Building Ltd 670,482 0.53%
Total New Zealand 670,482 0.53%
Norway - 0.85%
86,405 Entra ASA 1,072,598 0.85%
Total Norway 1,072,598 0.85%
Singapore - 1.70%
160,400 City Developments 1,250,248 0.99%
1,029,300 Mapletree Logistics Trust 893,516 0.71%
Total Singapore 2,143,764 1.70%
Spain - 2.88%
45,860 Axiare Patrimonio SOCIMI SA 783,007 0.62%
50,190 Hispania Activos Inmobiliarios Socimi Sa 829,155 0.66%
77,617 Inmobiliaria Colonial SA 675,721 0.53%
107,095 Merlin Properties Socimi SA 1,351,836 1.07%
Total Spain 3,639,719 2.88%
Sweden - 0.96%
63,050 Fabege AB 1,209,356 0.96%
Total Sweden 1,209,356 0.96%
United States – 53.19%
18,520 Alexandria Real Estate Equit 2,231,104 1.77%
86,460 Armada Hoffler Properties Inc 1,119,657 0.89%
14,980 AvalonBay Communities Inc. 2,878,707 2.28%
19,880 Boston Properties Inc 2,445,638 1.93%
50,630 Brandywine Realty Trust 887,544 0.70%
102,610 Brixmor Property Group Inc 1,834,667 1.45%
11,920 Camden Property Trust 1,019,279 0.81%
74,310 Columbia Property Trust Inc 1,663,058 1.32%
34,890 Corporate Office Properties 1,222,197 0.97%
22,130 Digital Realty Trust Inc 2,499,584 1.98%
23,180 Education Realty Trust Inc 898,225 0.71%
76,880 Empire State Realty Trust Inc 1,596,798 1.26%
22,240 Epr Properties 1,598,389 1.26%
3,020 Equinix Inc 1,296,063 1.03%
Nominal Security Classification Fair Value
USD
% of
Net Assets
Financial assets at fair value through profit or loss (continued)

SANLAM UNIVERSAL FUNDS PLC
193
PORTFOLIO OF INVESTMENTS OF SANLAM GLOBAL PROPERTY FUND (CONTINUED)
as at 30 June 2017
Equities - 96.86% (continued)
United States – 53.19% (continued)
7,970 Essex Property Trust Inc 2,050,442 1.62%
101,430 GGP Inc 2,389,691 1.89%
53,848 Gramercy Property Trust 1,599,824 1.27%
37,790 Healthcare Realty Trust Inc 1,290,529 1.02%
176,900 Hong Kong Land Hldgs 1,301,984 1.03%
49,910 Hudson Pacific Properties Inc 1,706,423 1.35%
126,860 Independence Realty Trust Inc 1,252,108 0.99%
33,740 Liberty Property Trust 1,373,555 1.09%
91,140 Medical Properties Trust Inc 1,172,972 0.93%
27,720 Mid-America Apartments 2,921,134 2.31%
61,880 Monmouth Real Estate Investment Corporation 931,294 0.74%
29,090 National Retail Properties Inc 1,137,419 0.90%
62,310 National Storage Affiliates Trust 1,439,984 1.14%
41,880 Park Hotels & Resorts Inc 1,129,085 0.89%
29,730 Parkway Inc 680,520 0.54%
5,460 Public Storage Inc 1,138,574 0.90%
47,170 Realty Income Corp 2,602,841 2.06%
30,430 Regal Entertainment Group 622,598 0.49%
52,540 Retail Opportunity Investments Corp 1,008,243 0.80%
60,080 Rexford Industrial Realty Inc. 1,648,595 1.30%
42,230 Sabra Health Care REIT Inc 1,017,743 0.80%
17,550 Simon Property Group Inc 2,838,888 2.25%
62,780 STAG Industrial Inc 1,732,728 1.37%
65,914 Summit Hotel Properties Inc 1,229,296 0.97%
19,820 Sun Communities Inc 1,738,016 1.37%
53,740 Urban Edge Properties 1,275,250 1.01%
43,890 Washington REIT 1,400,091 1.11%
45,350 Welltower Inc 3,394,448 2.69%
Total United States 67,215,185 53.19%
Virgin Islands - 1.49%
1,043,222 Mas Real Estate Inc 1,877,750 1.49%
Total Virgin Islands 1,877,750 1.49%
Total Equities 124,807,901 96.86%
Nominal Security Classification Fair Value
USD
% of
Net Assets
Financial assets at fair value through profit or loss (continued)

SANLAM UNIVERSAL FUNDS PLC
194
PORTFOLIO OF INVESTMENTS OF SANLAM GLOBAL PROPERTY FUND (CONTINUED)
as at 30 June 2017
Buy Currency Buy Amount Sell currency Sell Amount Maturity Fair Value % of
USD Net Assets
Financial assets at fair value through profit or loss (continued)
Derivative Financial Instruments
Forward Contracts - 0.07%
GBP 1,068,640 USD (1,366,385) 20/07/2017 24,614 0.02%5
SEK 3,691,000 USD (425,160) 15/09/2017 13,749 0.01%4
GBP 1,091,000 USD (1,414,286) 15/09/2017 8,309 0.01%2
CAD 429,000 USD (323,847) 15/09/2017 6,785 0.01%4
CHF 1,053,000 USD (1,096,740) 15/09/2017 6,601 0.01%3
AUD 470,000 USD (354,436) 15/09/2017 6,082 0.00%4
USD 569,578 JPY (63,152,000) 15/09/2017 5,603 0.00%2
GBP 197,000 USD (251,453) 15/09/2017 5,423 0.00%4
AUD 414,000 USD (313,166) 15/09/2017 4,397 0.00%4
JPY 63,152,000 USD (559,928) 15/09/2017 4,048 0.00%4
SGD 416,000 USD (300,567) 15/09/2017 1,978 0.00%4
USD 322,647 MXN (5,889,000) 15/09/2017 824 0.00%4
Total Forward Contracts 88,410 0.07%
Total financial assets at fair value through profit or loss 124,896,311 98.77%
Financial liabilities at fair value through profit or loss
Derivative Financial Instruments
Forward Contracts – (0.07)%
USD 1,040,021 EUR (951,000) 15/09/2017 (49,730) (0.04)%2
USD 959,798 EUR (848,000) 15/09/2017 (11,925) (0.01)%1
USD 246,038 EUR (225,000) 15/09/2017 (11,790) (0.01)%4
USD 869,872 NOK (7,344,000) 15/09/2017 (8,045) (0.01)%2
USD 416,237 NZD (580,000) 15/09/2017 (8,029) (0.01)%4
USD 155,687 MXN (2,887,000) 15/09/2017 (2,082) (0.00)%4
USD 13,166 GBP (10,320) 20/07/2017 (266) (0.00)%5
USD 13,166 GBP (10,320) 20/07/2017 (266) (0.00)% 5
GBP 1,068,640 USD (1,366,385) 20/07/2017 (266) (0.00)% 5
USD 285,946 CLP (190,397,000) 15/09/2017 (232) (0.00)%2
Total Forward Contracts (92,632) (0.07)%
Total financial liabilities at fair value through profit or loss (92,632) (0.07)%
Cash and cash equivalents 1,744,788 1.38%
Other net assets and liabilities (188,175) (0.15)%
Net assets attributable to holders of redeemable participating shares 126,360,292 100.00%

SANLAM UNIVERSAL FUNDS PLC
195
PORTFOLIO OF INVESTMENTS OF SANLAM GLOBAL PROPERTY FUND (CONTINUED)
as at 30 June 2017
Sanlam Global Property Fund
Summary
Classification Description
Fair Value % of % of
USD Net
Assets Total
Assets
Transferable securities and money market instruments admitted to official stock exchange listing or traded on regulated market 124,807,901 98.77% 97.83%
A Transferable securities and money market instruments other than those referred above - - -
B UCITS and AIFs
- - -
C Financial derivative instruments dealt in on a regulated market - - -
D Over the counter financial derivative instruments (4,222) 0.00% 0.00%
Cash and cash equivalents
1,744,788 1.38% 1.37%
Other net assets and liabilities
(188,175) (0.15)% (0.15)%
Net assets attributable to holders of redeemable participating shares 126,360,292 100.00%
The following entities act as counterparty to the open derivative positions at 30 June 2017: BNP Paribas
1, Citi
2, Standard
Chartered3, UBS
4 and Brown Brothers Harriman
5.

SANLAM UNIVERSAL FUNDS PLC
196
PORTFOLIO OF INVESTMENTS OF SANLAM WORLD EQUITY FUND
as at 30 June 2017
Equities - 94.98%
Australia - 1.00%
18,150 Aristocrat Leisure Ltd 314,386 0.09%
11,655 BHP Billiton Limited 208,326 0.06%
30,577 Challenger Financial Service 313,183 0.09%
2,961 Cochlear Ltd 353,409 0.10%
3,293 Common wealth Bank of Australia 209,374 0.06%
96,051 Fortescue Metals Group Ltd 384,964 0.11%
22,150 Orica Limited 351,700 0.10%
83,230 Qantas Airways 365,531 0.11%
6,980 Rea Group Limited 355,854 0.10%
47,810 Scentre Group 148,669 0.04%
20,581 Transurban Group 187,255 0.05%
7,769 Westpac Banking Corp Ltd 181,993 0.05%
64,800 Whitehaven Coal Limited 142,792 0.04%
Total Australia 3,517,436 1.00%
Austria - 0.09%
12,800 Raiffeisen Intl Bank 322,851 0.09%
Total Austria 322,851 0.09%
Belgium - 0.27%
1,493 Anheuser Busch InBev SA NV 164,790 0.05%
54,036 Euronav SA 427,135 0.12%
4,742 KBC Bankverzekeringsholding 359,414 0.10%
Total Belgium 951,339 0.27%
Bermuda - 0.39%
95,500 Kerry Properties Ltd 324,181 0.09%
10,682 Norwegian Cruise line Holdings Ltd 579,926 0.16%
7,643 Signet Jewelers Ltd 483,343 0.14%
Total Bermuda 1,387,450 0.39%
Brazil - 0.20%
217,513 Via Varejo SA 715,724 0.20%
Total Brazil 715,724 0.20%
Canada - 3.64%
10,530 Air Canada 140,876 0.04%
5,800 Bank of Montreal 425,122 0.12%
8,500 Bank of Nova Scotia 510,419 0.14%
26,016 BCE Inc 1,169,528 0.33%
Nominal Security Classification Fair Value
USD
% of
Net Assets
Financial assets at fair value through profit or loss

SANLAM UNIVERSAL FUNDS PLC
197
PORTFOLIO OF INVESTMENTS OF SANLAM WORLD EQUITY FUND (CONTINUED)
as at 30 June 2017
Equities - 94.98% (continued)
Canada - 3.64% (continued)
9,239 Brookfield Asset Management 361,922 0.10%
4,591 Canadian National Railway Co. 371,846 0.11%
14,981 Canadian Western Bank 315,742 0.09%
6,720 CCL Industries Inc 339,388 0.10%
187 Constellation Software Inc 97,654 0.03%
24,350 CRH Medical Corporation 138,329 0.04%
72,100 Empire Company ltd 1,227,659 0.35%
9,500 Enbridge Inc 377,777 0.11%
16,570 Enerplus Corp 134,182 0.04%
43,940 Ivanhoe Mines Ltd 141,044 0.04%
47,000 Labrador Iron Ore Royalty Corp 568,732 0.16%
7,120 Linamar Corp 350,327 0.10%
28,327 Loblaw Companies Ltd. 1,573,020 0.45%
7,800 Magna International Inc 360,670 0.10%
21,230 Manulife Financial Corp 397,276 0.11%
4,123 Metro Inc 135,455 0.04%
20,200 Mullen Group Ltd 248,788 0.07%
8,870 Paramount Resources Ltd 130,343 0.04%
54,800 Power Corp. Of Canada 1,247,775 0.35%
3,660 Royal Bank of Canada 265,280 0.07%
23,904 Shaw Communications Inc. 520,548 0.15%
46,260 Silvercorp Metals Inc 147,778 0.04%
20,350 Suncor Energy Inc 594,045 0.17
21,000 Teck Resources Ltd 363,390 0.10%
12,340 Veresen Inc 174,210 0.05%
Total Canada 12,829,125 3.64%
Denmark - 0.28%
2,937 DSV A/S 180,320 0.05%
10,340 Novo Nordisk AS 442,479 0.13%
3,940 Vestas Wind Systems AS 363,454 0.10%
Total Denmark 986,253 0.28%
European Union - 0.41%
10,240 MTU Aero Engines Holding AG 1,443,333 0.41%
Total European Union 1,443,333 0.41%
Nominal Security Classification Fair Value
USD
% of
Net Assets
Financial assets at fair value through profit or loss (continued)

SANLAM UNIVERSAL FUNDS PLC
198
PORTFOLIO OF INVESTMENTS OF SANLAM WORLD EQUITY FUND (CONTINUED)
as at 30 June 2017
Equities - 94.98% (continued)
Finland - 0.43%
5,399 Orion OYJ/New 344,449 0.10%
22,577 Sampo Oyj 1,156,171 0.33%
Total Finland 1,500,620 0.43%
France - 3.03%
19,394 Airbus Group SE 1,593,674 0.45%
4,488 AtoS 629,513 0.18%
17,916 BNP Paribas SA 1,289,421 0.37%
1,930 Danone 144,960 0.04%
6,609 L’Oreal SA 1,375,816 0.39%
41,094 Orange 651,449 0.19%
82,976 Peugeot SA 1,653,944 0.47%
3,374 Saint-Gobain SA 180,138 0.05%
1,586 Sanofi 151,614 0.04%
2,305 Schneider Electric SE 176,967 0.05%
19,800 Societe Generale SA 1,064,579 0.30%
2,210 Sodexo 285,521 0.08%
22,100 Stmicroelectronic 317,050 0.09%
19,862 Total SA 981,206 0.28%
1,963 Vinci SA 167,423 0.05%
Total France 10,663,275 3.03%
Germany - 2.17%
2,017 Basf SE 186,669 0.05%
8,852 Bayer AG 1,143,635 0.32%
1,506 Bayerische Motoren Werke 139,704 0.04%
4,733 Covestro AG 341,446 0.10%
1,930 Daimler AG 139,586 0.04%
8,207 Deutsche Telekom 147,244 0.04%
3,845 Deutsche Wohnen AG 146,964 0.04%
9,898 Henkel KGAA-VORZUG 1,361,238 0.39%
294 Hochtief AG 53,821 0.02%
4,430 Osram Licht AG 352,653 0.10%
22,216 Prosieben Sat 1 Media AG 929,011 0.26%
10,602 SAP SE 1,106,550 0.31%
1,296 Siemens AG 178,013 0.05%
21,420 Software AG 937,529 0.27%
33,830 Tui Ag 492,428 0.14%
Total Germany 7,656,491 2.17%
Nominal Security Classification Fair Value
USD
% of
Net Assets
Financial assets at fair value through profit or loss (continued)

SANLAM UNIVERSAL FUNDS PLC
199
PORTFOLIO OF INVESTMENTS OF SANLAM WORLD EQUITY FUND (CONTINUED)
as at 30 June 2017
Equities - 94.98% (continued)
Gibraltar - 0.04%
41,430 888 Holdings Plc 137,560 0.04%
Total Gibraltar 137,560 0.04%
Great Britain - 6.69%
30,600 3I Group Plc 359,235 0.10%
26,490 AA Plc 78,565 0.02%
48,964 Aggreko Plc 586,288 0.17%
18,803 Anglo American PLC 250,459 0.07%
17,783 Aon Plc 2,364,250 0.67%
197,887 Barclays Plc 521,901 0.15%
77,863 BBA Aviation Plc 311,347 0.09%
186,044 BP Plc 1,071,602 0.30%
24,597 Brewin Dolphin Holdings Plc 109,649 0.03%
12,200 British American Tobacco Plc 830,623 0.24%
85,727 BT Group Plc 328,686 0.09%
141,490 Centrica Plc 368,468 0.10%
5,873 Compass Group PLC 123,761 0.04%
34,458 Crest Nicholson Holdings 234,648 0.07%
4,505 Diageo 132,936 0.04%
56,880 Ferrexpo PLC 153,454 0.04%
90,430 GKN Plc 383,478 0.11%
37,233 GlaxoSmithKline Plc 792,116 0.23%
37,180 Great Portland Estates PLC 288,731 0.08%
211,013 HSBC Holdings 1,953,514 0.55%
79,086 Imperial Brands Plc 3,547,645 1.01%
192,603 ITV PLC 454,476 0.13%
75,654 John Laing Group Plc 298,184 0.09%
20,770 Kazakhmys PLC 139,816 0.04%
87,437 Legal & General Group Plc 293,785 0.08%
628,511 Lloyds Bank Plc 540,820 0.15%
25,762 Novae Group Plc 191,014 0.05%
51,576 OneSavings Bank Plc 251,588 0.07%
37,130 Petrofac Ltd 213,480 0.06%
39,044 Prudential Corp 894,384 0.25%
1,828 Reckitt Benckiser Group Plc 185,093 0.05%
14,098 Reed Elsevier plc 304,422 0.09%
9,425 Rio Tinto Plc 397,470 0.11%
14,767 Rolls-Royce Holdings Plc 171,151 0.05%
109,410 Royal Bank of Scotland Group 351,816 0.10%
35,848 Royal Dutch Shell Plc 949,518 0.27
Nominal Security Classification Fair Value
USD
% of
Net Assets
Financial assets at fair value through profit or loss (continued)

SANLAM UNIVERSAL FUNDS PLC
200
PORTFOLIO OF INVESTMENTS OF SANLAM WORLD EQUITY FUND (CONTINUED)
as at 30 June 2017
Equities - 94.98% (continued)
Great Britain - 6.69% (continued)
163,580 Sainsbury (J) Plc 535,579 0.15%
8,226 Shire Plc 453,482 0.13%
25,431 Smart Metering Systems Plc 174,500 0.05% 43,044 Sophos Group Plc 248,267 0.07%
16,738 Standard Chartered Plc 169,218 0.05%
6,447 Technipfmc Plc 175,358 0.05%
169,525 Tungsten Corp Plc 146,645 0.04%
3,798 Unilever Plc 205,275 0.06%
190,424 Vodafone Group PLC 539,374 0.15%
4,500 Whitbread Plc 232,212 0.07%
65,003 Worldpay Group Plc 266,182 0.08%
Total Great Britain 23,574,465 6.69%
Hong Kong - 0.52%
19,555 AIA Group Ltd 142,906 0.04%
25,200 ASM Pacific Technology 340,558 0.10%
72,000 Boc Hong Kong Holdings Ltd 344,478 0.10%
87,000 Citic Pacific 130,835 0.04%
79,000 Hang Lung Group Ltd 326,864 0.09%
519,218 SJM Holdings Ltd 547,378 0.15%
Total Hong Kong 1,833,019 0.52%
Ireland - 2.34%
2,937 Accenture PLC 363,248 0.10%
8,222 Allergan Plc 1,998,686 0.57%
10,485 CRH Plc 372,887 0.11%
2,316 Ingersoll-Rand Plc 211,659 0.06%
35,160 Kenmare Resources Plc 116,513 0.03%
38,520 Medtronic Plc 3,418,650 0.97%
2,308 Paddy Power Betfair PLC 245,584 0.07%
2,890 Ryanair Holdings Plc 310,993 0.09%
8,205 Willis Towers Watson PLC 1,193,910 0.34%
Total Ireland 8,232,130 2.34%
Israel - 0.10%
3,140 Taro Pharmaceutical Industries 351,868 0.10%
Total Israel 351,868 0.10%
Italy - 2.00%
73,223 Azimut Holding Spa 1,466,643 0.42%
79,798 ENI-Ente Nazionale Idrocarburi SpA 1,198,526 0.34%
995,794 Intesa Sanpaolo SpA 3,154,922 0.89%
Nominal Security Classification Fair Value
USD
% of
Net Assets
Financial assets at fair value through profit or loss (continued)

SANLAM UNIVERSAL FUNDS PLC
201
PORTFOLIO OF INVESTMENTS OF SANLAM WORLD EQUITY FUND (CONTINUED)
as at 30 June 2017
Equities - 94.98% (continued)
Italy - 2.00% (continued)
96,558 Mediobanca SpA 952,142 0.27%
55,570 Saras SPA 129,254 0.04%
28,619 Terna Spa 154,365 0.04% Total Italy 7,055,852 2.00%
Japan - 9.25%
18,900 Adeka Corporation 287,664 0.08%
2,400 Aisin Seiki Co Ltd 122,830 0.04%
3,700 Alps Electric Co Ltd 106,702 0.03%
2,900 Asahi Breweries 109,134 0.03%
14,289 Astellas Pharma Inc 174,813 0.05%
3,300 Benesse Holdings Inc 124,539 0.04%
14,400 Calbee Inc 332,347 0.10%
4,800 Central Japan Railway Co 782,270 0.22%
3,000 Daikin Industries Ltd 306,275 0.09%
1,600 Dainippon Screen Manufacturing Co Ltd 106,809 0.03%
3,800 Daiwa House Industry Co 129,812 0.04%
11,900 DIC Corporation 427,383 0.12%
65,000 Fuji Electric Holdings Co Ltd 342,501 0.10%
8,200 Fuji Heavy Industries 276,326 0.08%
26,200 Fujikura JPY 50 219,441 0.06%
39,000 Fujitsu 287,354 0.08%
6,400 Furukawa Electric Co Ltd 284,824 0.08%
62,000 Furukawa-Sky Alluminium Corp 169,969 0.05%
4,757 Hankyu Holdings Inc 171,057 0.05%
24,400 Hazama Ando Corp 153,762 0.04%
115,587 Hitachi 709,263 0.20%
6,000 Hitachi Chemical Company ltd 178,905 0.05%
8,200 Hitachi High-Technologies Corp 318,220 0.09%
28,315 Honda Motor Co 772,204 0.22%
2,500 Horiba Ltd 151,980 0.04%
6,300 Hoya Pentax HD Corporation 327,084 0.09%
5,500 Idemitsu Kosan Co Ltd 156,164 0.04%
5,200 Iida Group Holdings Co Ltd 86,597 0.03%
19,000 Inpex Holdings Inc 182,813 0.05%
5,100 Izumi Co Ltd 289,613 0.08%
27,400 Japan Post Holdings Co Ltd 339,970 0.10%
65,193 Japan Tobacco Inc 2,290,314 0.65%
2,200 JCU Corp 78,131 0.02%
9,700 JFE Holdings Inc 168,401 0.05%
1,200 Jowa Holdings Co Ltd 33,271 0.01%
31,000 JX Holdings Inc 135,396 0.04%
Nominal Security Classification Fair Value
USD
% of
Net Assets
Financial assets at fair value through profit or loss (continued)

SANLAM UNIVERSAL FUNDS PLC
202
PORTFOLIO OF INVESTMENTS OF SANLAM WORLD EQUITY FUND (CONTINUED)
as at 30 June 2017
Equities - 94.98% (continued)
Japan - 9.25% (continued)
5,000 Kajima Corp 42,190 0.01%
2,058 Kao Corp 122,216 0.04%
6,500 KDDI Corp 172,118 0.05%
8,400 Keisei Electric Railway Co 224,299 0.06%
341 Keyence Corp 149,755 0.04%
15,200 KH Neochem Co Ltd 291,012 0.08%
50,644 Kinki Nippon Railway Co Ltd 195,183 0.06%
7,400 Kirin Holdings Company Limited 150,766 0.04%
2,400 Kohnan Shoji Co Ltd 44,710 0.01%
9,000 Kyudenko Corporation 322,430 0.09%
2,400 Maruha Nichiro Corporation 63,402 0.02%
33,600 Minebea Co Ltd 539,813 0.15%
14,600 Mitsubishi Chemical Holdings Corporation 120,867 0.03%
1,500 Mitsubishi Corp 31,455 0.01%
3,200 Mitsubishi Electric Corp 46,013 0.01%
152,909 Mitsubishi UFJ Holdings Inc 1,027,287 0.29%
56,000 Mitsui Mining & Smelting Co Ltd 218,816 0.06%
5,700 Mixi Inc 317,089 0.09%
3,000 Morinaga & Co Ltd 170,360 0.05%
11,000 Morinaga Milk Industry Co 83,810 0.02%
34,900 MS&AD Insurance Group Holdings 1,172,342 0.33%
2,300 Murata Manufacturing 349,453 0.10%
3,000 Namco Bandai Hldgs Inc 102,270 0.03%
6,200 Nichiha Corp 218,531 0.06%
54,000 Nippon Express Co 337,891 0.10%
30,600 Nippon Light Metal Holdings Co Ltd 72,721 0.02%
5,000 Nippon Meat Packers Inc 151,980 0.04%
5,200 Nippon Shinyaku Co Ltd 332,781 0.10%
13,000 Nippon Telegraph and Telephone Company 614,419 0.18%
6,800 Nippon Television Network Corp 114,271 0.03%
27,000 Nipro Corporation 352,069 0.10%
800 Nitori Holdings Co Ltd 107,094 0.03%
2,400 Nitto Denko Corp 197,383 0.06%
85,700 Nomura Securities 513,666 0.15%
8,100 NSK Ltd 101,151 0.03%
3,500 Obayashi Corp 41,153 0.01%
4,000 Omron Tateisi Electronics Co 173,565 0.05%
20,000 Orix Corporation 309,746 0.09%
5,000 Otsuka Holdings KK 213,173 0.06%
Nominal Security Classification Fair Value
USD
% of
Net Assets
Financial assets at fair value through profit or loss (continued)

SANLAM UNIVERSAL FUNDS PLC
203
PORTFOLIO OF INVESTMENTS OF SANLAM WORLD EQUITY FUND (CONTINUED)
as at 30 June 2017
Equities - 94.98% (continued)
Japan - 9.25% (continued)
31,000 Prima Meat Packers Ltd 182,109 0.05%
2,000 Rohm Co. 153,627 0.04%
10,000 Sakata INX Corp 159,324 0.05%
9,800 Sankyo Co Ltd Gunma 332,336 0.09%
22,000 Sanyo Special Steel Co Ltd 124,539 0.04%
7,300 Sekisui Chemical Co Ltd 130,666 0.04%
16,000 Sekisui House Ltd 281,905 0.08%
2,946 Seven & I Holdings 121,354 0.04%
18,000 Shimizu Corporation 190,814 0.05%
8,900 Shin-Etsu Chemical Co 806,822 0.23%
1,500 Shionogi & Co Ltd 83,565 0.02%
16,500 Showa Denko K K 382,724 0.11%
500 SMC Corp 151,980 0.04%
7,500 Softbank Corp 607,276 0.17%
1,500 Sogho Security Services 67,557 0.02%
10,500 Sompo Japan Nipponkoa Holdings Inc 405,514 0.12%
13,700 Sony Corp 522,636 0.15%
2,600 Sony Financial Holdings Inc 44,294 0.01%
32,400 Sumitomo Corp 421,618 0.12%
14,600 Sumitomo Electric 224,815 0.06%
37,000 Sumitomo Heavy Ind 244,032 0.07%
3,000 Sumitomo Mitsui Financial 116,929 0.03%
18,700 Suzuki Motor Corp 887,147 0.25%
3,000 Taiyo Yuden Co Ltd 47,049 0.01%
13,400 Temp Holdings Co Ltd 251,183 0.07%
27,100 The Kysh Electric Power Co 329,011 0.09%
2,900 THK Co Ltd 82,083 0.02%
30,000 Tokuyama Corporation 144,459 0.04%
82,600 Tokyo Electric Power 340,399 0.10%
1,900 Tokyo Electron 256,377 0.07%
1,300 Tokyo Ohka Kogyo Co Ltd 43,333 0.01%
5,000 Tokyo Seimitsu Co Ltd 160,881 0.05%
28,000 Tokyo Tatemono Co Ltd 366,854 0.10%
15,000 TOPPAN PRINTING 164,486 0.05%
70,000 Tosoh Corp 717,134 0.20%
25,200 Toyo Tire & Rubber Co Ltd 513,421 0.15%
5,000 Toyoda Automat Loom 263,017 0.08%
6,021 Toyota Motor Co 315,814 0.09%
3,900 TV Asahi Corp 70,294 0.02%
3,000 Ut Group Co Ltd 48,198 0.01%
25,900 Yahoo Japan Corporation 112,729 0.03%
Nominal Security Classification Fair Value
USD
% of
Net Assets
Financial assets at fair value through profit or loss (continued)

SANLAM UNIVERSAL FUNDS PLC
204
PORTFOLIO OF INVESTMENTS OF SANLAM WORLD EQUITY FUND (CONTINUED)
as at 30 June 2017
Equities - 94.98% (continued)
Japan - 9.25% (continued)
3,700 Yakuodo Co Ltd 108,349 0.03%
16,500 Yamaha Motor Co Ltd 425,607 0.12%
6,500 Zenkoku Hosho Co Ltd 265,843 0.08%
Total Japan 32,613,492 9.25%
Jersey Channel Islands - 0.92%
69,076 Glencore Plc 258,061 0.08%
4,190 Wolseley Plc 256,875 0.07%
129,649 WPP Plc 2,721,968 0.77%
Total Jersey Channel Islands 3,236,904 0.92%
Korea (South) - 0.36%
770 Samsung Electronics Ltd 1,253,510 0.36%
Total Korea (South) 1,253,510 0.36%
Marshall Islands - 0.05%
115,342 Navios Maritime Acquisition Corporation 169,553 0.05%
Total Marshall Islands 169,553 0.05%
Netherlands - 1.56%
15,732 ASML Holding NV 2,048,657 0.58%
3,940 Ferrari NV 337,929 0.10%
31,460 Fiat Chrysler Automobiles NV 331,406 0.09%
78,824 Ing Groep NV 1,358,423 0.39%
34,618 NN Group NV 1,229,536 0.35%
490 Schlumberger Ltd 32,262 0.01%
2,703 Unilever NV 149,064 0.04%
Total Netherlands 5,487,277 1.56%
New Zealand - 0.04%
50,680 a2 Milk Company Limited 148,492 0.04%
Total New Zealand 148,492 0.04%
Philippines - 0.11%
3,248,681 Vista Land & Lifescapes Inc 374,248 0.11%
Total Philippines 374,248 0.11%
Portugal - 0.09%
17,106 Jeronimo Martin 333,649 0.09%
Total Portugal 333,649 0.09%
Nominal Security Classification Fair Value
USD
% of
Net Assets
Financial assets at fair value through profit or loss (continued)

SANLAM UNIVERSAL FUNDS PLC
205
PORTFOLIO OF INVESTMENTS OF SANLAM WORLD EQUITY FUND (CONTINUED)
as at 30 June 2017
Equities - 94.98% (continued)
Singapore - 0.86%
126,500 Best World International Limited 130,488 0.04%
531 Broadcom Limited Designs 123,750 0.03%
3,487,782 Cambridge Industrial Trust 1,494,836 0.42%
57,000 China Aviation Oil Singapore Corporation Limi 69,149 0.02%
12,682 DBS Bank Ltd 191,068 0.05%
3,694,178 Ezion Holdings Ltd 630,635 0.18%
131,000 Global Logistic Properties Limited 272,163 0.08%
103,100 Yanlord Land Group Ltd 131,440 0.04%
Total Singapore 3,043,529 0.86%
Spain - 0.63%
30,631 Banco Santander SA 202,483 0.06%
54,060 Distribuidora Interncional de Alimentacion SA 336,319 0.10%
13,160 Grifols SA 366,251 0.10%
24,250 Industria de Diseno Textil SA 930,208 0.27%
28,359 Int Consol Airlines Group SA 225,025 0.06%
7,340 Red Electrica Corporacion SA 153,260 0.04%
Total Spain 2,213,546 0.63%
Sweden - 1.10%
14,861 Atlas Copco AB 568,335 0.16%
136,200 Elekta AB 1,287,674 0.36%
6,660 Industrivarden AB 159,287 0.04%
10,324 Sandvik AB 161,964 0.05%
115,574 Skandinaviska Enskilda Banken SEB 1,394,403 0.40%
8,640 Swedish Match AB 303,519 0.09%
Total Sweden 3,875,182 1.10%
Switzerland - 2.94%
1,244 Baloise Holding 192,243 0.05%
9,653 Dufry AG 1,581,320 0.45%
1,352 Idorsia Ltd 25,517 0.01%
27,038 Nestle SA 2,352,785 0.67%
3,862 Novartis AG 321,364 0.09%
90 Partners Group Holding AG 55,792 0.02%
19,797 Roche Holding AG 5,041,113 1.43%
448 Swiss Life Holding Ag 151,171 0.04%
37,286 UBS Group AG 631,413 0.18%
Total Switzerland 10,352,718 2.94%
Nominal Security Classification Fair Value
USD
% of
Net Assets
Financial assets at fair value through profit or loss (continued)

SANLAM UNIVERSAL FUNDS PLC
206
PORTFOLIO OF INVESTMENTS OF SANLAM WORLD EQUITY FUND (CONTINUED)
as at 30 June 2017
Equities - 94.98% (continued)
United States - 53.23%
2,269 3M Company 472,383 0.13%
4,200 Abbott Labs 204,162 0.06%
2,600 AbbVie Inc 188,526 0.05%
11,310 Activision Blizzard Inc 651,117 0.18%
9,440 Adobe Systems Inc 1,335,194 0.38%
2,796 Aetna Inc-New 424,517 0.12%
2,610 Air Products & Chemicals Inc 373,387 0.11%
400 Alleghany Corp 237,920 0.07%
800 Allegiant Travel Company 108,480 0.03%
6,700 Alliant Energy Corp 269,139 0.08%
4,671 Alphabet Inc 4,296,759 1.22%
4,777 Altria Group Inc 355,743 0.10%
3,363 Amazon.Com Inc 3,255,384 0.92%
39,300 American Eagle Outfitters 473,565 0.13%
3,443 American Financial Corp 342,131 0.10%
20,732 American International Group 1,296,165 0.37%
975 Ameriprise Financial 124,108 0.03%
24,646 Amerisourcebergen Corp 2,329,786 0.66%
2,530 Ametek Inc 153,242 0.04%
5,545 Amgen Corp 955,015 0.27%
5,800 Amphenol Corp 428,156 0.12%
22,211 Anadarko Petroleum Corp 1,007,047 0.29%
4,610 Analog Devices Inc. 358,658 0.10%
37,660 Apple Inc 5,423,793 1.54%
10,940 Applied Material Inc 451,931 0.13%
16,619 Arrow Electronics Inc 1,303,262 0.37%
3,373 Assurant Inc 349,746 0.10%
43,936 AT & T Inc 1,657,705 0.47%
17,219 Autoliv Inc 1,883,796 0.53%
538 Autozone 306,907 0.09%
17,800 Avnet Inc 692,064 0.20%
110,071 Bank of America Corp 2,670,322 0.76%
551 Bard CR Inc 174,177 0.05%
6,502 Baxter International 393,631 0.11%
800 Becton Dickinson & Co 156,088 0.04%
4,970 Berkshire Hathaway Inc. 841,769 0.24%
14,499 Best Buy Co Inc 831,228 0.24%
5,109 Boeing Com 1,010,305 0.29%
27,400 Bristol-Myrs Squib 1,526,728 0.43%
27,650 Cabot Oil & Gas Corp 693,462 0.20%
Nominal Security Classification Fair Value
USD
% of
Net Assets
Financial assets at fair value through profit or loss (continued)

SANLAM UNIVERSAL FUNDS PLC
207
PORTFOLIO OF INVESTMENTS OF SANLAM WORLD EQUITY FUND (CONTINUED)
as at 30 June 2017
Equities - 94.98% (continued)
United States - 53.23% (continued)
20,738 Campbell Soup 1,081,487 0.31%
4,200 Capital One Financial Corp 347,004 0.10%
3,388 Caterpillar Inc 364,074 0.10%
13,290 CBRE Group Inc 483,756 0.14%
14,262 CBS Corp 909,630 0.26%
2,684 CDW Corporation of Delaware 167,831 0.05%
16,452 Celgene Corp 2,136,621 0.61%
4,536 Centene Corp 362,336 0.10%
12,492 Centerpoint Energy Inc 342,031 0.10%
500 Charter Communication Inc 168,425 0.05%
6,661 Chevron Corp 694,942 0.20%
1,150 Chipotle Mexican Grill Inc 478,515 0.14%
2,607 Church&Dwight Co Inc 135,251 0.04%
51,748 Cisco Systems Inc 1,619,712 0.46%
11,481 Citigroup Inc 767,849 0.22%
4,688 Clorox Company 624,629 0.18%
3,610 CMS Energy Corporation 166,963 0.05%
16,120 Coach Inc 763,121 0.22%
17,583 Cobalt International Energy 43,430 0.01%
43,670 Coca-Cola Co. 1,958,600 0.56%
2,300 Colgate-Palmolive Co 170,499 0.05%
29,963 Comcast Corp 1,166,160 0.33%
9,226 Conagra Foods Inc 329,922 0.09%
6,381 Conocophillips Co 280,509 0.08%
1,841 Constellation Brands 356,657 0.10%
23,320 Corning Inc 700,766 0.20%
1,575 Costco Wholesale Corp 251,890 0.07%
11,800 CSG Systems International Inc 478,844 0.14%
15,409 CSX Corp 840,715 0.24%
2,320 Cummins Inc 376,350 0.11%
21,073 CVS Health Corporation 1,695,534 0.48%
29,900 Delta Air Lines INC 1,606,826 0.46%
6,025 Discover Financial Services 374,695 0.11%
5,420 Dollar Tree Stores Inc 378,966 0.11%
4,256 Dominion Resources Inc 326,137 0.09%
19,300 DOMTAR CORP 741,506 0.21%
2,100 Dow Chemical Co 132,447 0.04%
10,200 Dr Pepper Snapple Group 929,322 0.26%
3,536 DTE Energy Co 374,073 0.11%
50,380 Du Pont - 0.00%
Nominal Security Classification Fair Value
USD
% of
Net Assets
Financial assets at fair value through profit or loss (continued)

SANLAM UNIVERSAL FUNDS PLC
208
PORTFOLIO OF INVESTMENTS OF SANLAM WORLD EQUITY FUND (CONTINUED)
as at 30 June 2017
Equities - 94.98% (continued)
United States - 53.23% (continued)
16,167 Dun & Bradsheet Corp 1,748,461 0.50%
49,586 eBay Inc. 1,731,543 0.49%
3,500 Electronic Arts Inc 370,020 0.10%
3,000 Emerson Electric Co 178,860 0.05%
1,873 Entergy Corp. 143,790 0.04%
3,829 Eog Resources Inc 346,601 0.10%
12,200 Equitable Resources Inc 714,798 0.20%
44,619 Express Scripts Holdings Inc 2,848,477 0.81%
16,797 Exxon Corp 1,356,022 0.38%
16,989 Facebook Inc 2,564,999 0.73%
53,200 Federated Investors Inc 1,502,900 0.43%
3,800 Fidelity National Information 324,520 0.09%
12,738 Fifth Third Bancorp 330,678 0.09%
18,100 First American Financial Corporation 808,889 0.23%
2,700 Fiserv Inc 330,318 0.09%
20,600 Flowers Foods Inc. 356,586 0.10%
44,870 Gap Inc 986,691 0.28%
2,410 General Dynanics Corp 477,421 0.14%
72,030 General Electric Co 1,945,530 0.55%
21,200 General Mills Inc 1,174,480 0.33%
9,700 General Motors Co 338,821 0.10%
50,937 Gilead Sciences Inc 3,605,321 1.02%
3,339 Goldman Sachs Group 740,924 0.21%
13,344 Halliburton Co 569,922 0.16%
37,643 Hewlett Packard Enterprise 624,497 0.18%
10,183 Home Depot 1,562,072 0.44%
133,882 HP Inc 2,340,257 0.66%
1,670 Humana Inc 401,835 0.11%
26,000 Huntington Bancshares Inc 351,520 0.10%
56,131 Intel Corp 1,893,860 0.54%
10,600 International Business Machine Corp 1,630,598 0.46%
2,757 Intuit Inc 366,157 0.10%
27,976 Johnson & Johnson 3,700,945 1.05%
36,170 JP Morgan Chase & Co 3,305,938 0.94%
9,600 Keycorp 179,904 0.05%
15,000 Kforce Inc 294,000 0.08%
3,110 Kimberley Clark Corp 401,532 0.11%
10,000 Kimco Realty Corp 183,500 0.05%
5,920 Kla-Tencor Corp. 541,739 0.15%
1,700 Laboratory CRP of Amer Hldgs 262,038 0.07%
Nominal Security Classification Fair Value
USD
% of
Net Assets
Financial assets at fair value through profit or loss (continued)

SANLAM UNIVERSAL FUNDS PLC
209
PORTFOLIO OF INVESTMENTS OF SANLAM WORLD EQUITY FUND (CONTINUED)
as at 30 June 2017
Equities - 94.98% (continued)
United States - 53.23% (continued)
2,400 LAM Research Corporation 339,432 0.10%
2,309 Lennar Corp 123,116 0.03%
3,540 Liberty Sirius Group 147,618 0.04%
5,700 Lilly (Eli) & Co 469,110 0.13%
4,840 Lincoln National Corp. 327,087 0.09%
1,145 Lockheed Martin Corp 317,863 0.09%
6,008 Loews Corp 281,234 0.08%
4,000 Lowes Com 310,120 0.09%
3,270 Manpower Inc. 365,096 0.10%
3,830 Marathon Petroleum Corp 200,424 0.06%
3,500 Mastercard Inc 425,075 0.12%
54,000 Mattel Inc 1,162,620 0.33%
5,710 McDonald’s Corp 874,544 0.25%
1,290 MercadoLibre Inc 323,635 0.09%
7,685 Merck & Co’ 492,532 0.14%
12,734 MGE Energy Inc 819,433 0.23%
31,200 MGM Resorts International 491,400 0.14%
11,344 Microchip Technology Inc 875,530 0.25%
93,744 Microsoft Corp 6,461,774 1.83%
1,400 Mohawk Industries Inc 338,366 0.10%
3,900 Mondelez International Inc 168,441 0.05%
2,200 Monsanto Co 260,392 0.07%
8,600 Morgan Stanley 383,216 0.11%
4,131 Motorola Solutions Inc 358,323 0.10%
2,918 MSCI Inc 300,525 0.09%
18,363 Nasdaq OMX Group Inc 1,312,771 0.37%
31,100 National-Oilwell Inc 1,024,434 0.29%
29,700 Netapp Inc 1,189,485 0.34%
4,400 Netflix Inc 657,404 0.19%
18,630 Noble Energy Inc 527,229 0.15%
7,880 Nordstrom Inc. 376,900 0.11%
2,045 Northrop Grumman Corp 524,972 0.15%
4,200 Northwest Natural Gas Co 251,370 0.07%
6,038 Nucor Corp. 349,419 0.10%
7,300 Nvidia Corp 1,055,288 0.30%
17,100 Occidental Petroleum Corp 1,023,777 0.29%
66,300 Office Depot Inc 373,932 0.11%
25,800 Oge Energy Corp 897,582 0.25%
85,635 Oracle Corp 4,293,739 1.22%
1,100 O’Reilly Automotive Inc 240,614 0.07%
Nominal Security Classification Fair Value
USD
% of
Net Assets
Financial assets at fair value through profit or loss (continued)

SANLAM UNIVERSAL FUNDS PLC
210
PORTFOLIO OF INVESTMENTS OF SANLAM WORLD EQUITY FUND (CONTINUED)
as at 30 June 2017
Equities - 94.98% (continued)
United States - 53.23% (continued)
25,200 Owens & Minor Inc 811,188 0.23%
4,800 Paccar Inc 316,992 0.09%
5,964 Parker Hannifin Corp 953,166 0.27%
21,470 People’s United Financial 379,160 0.11%
5,632 Pepsico Inc 650,440 0.18%
92,497 Pfizer Inc 3,106,974 0.88%
6,439 Philip Morris International Inc 756,261 0.21%
5,000 Pinnacle West Capital 425,800 0.12%
2,000 PPG Industries Inc 219,920 0.06%
3,184 Praxair Inc 422,039 0.12%
238 Priceline Group Incorporated 445,184 0.13%
26,795 Procter & Gamble 2,335,184 0.66%
5,034 Prudential Financial 544,377 0.15%
2,900 Qualcomm Inc 160,138 0.05%
18,560 Quanta Services 610,995 0.17%
3,292 Quest Diagnostics Inc. 365,939 0.10%
9,800 Ralph Lauren Corp 723,240 0.20%
4,430 Raymond James Financial Inc 355,375 0.10%
3,490 Raytheon Company 563,565 0.16%
2,890 Realty Income Corp 159,470 0.05%
8,500 Regency Centers Corp 532,440 0.15%
710 Regeneron Pharmaceuticals 348,709 0.10%
55,925 Regions Financial Corp 818,742 0.23%
5,262 Republic Serv Inc 335,347 0.09%
7,320 Robert Half International Inc. 350,848 0.10%
6,400 Safety Insurance Group Inc 437,120 0.12%
4,100 Salesforce Com Inc 355,060 0.10%
1,770 Sba Communications Corporation 238,773 0.07%
2,800 Scana Corp 187,628 0.05%
12,400 Schweitzer-Mauduit International Inc 461,652 0.13%
2,413 Simon Property Group Inc 390,327 0.11%
8,500 Sonoco Products Co 437,070 0.12%
13,800 SpartanNash Co 358,248 0.10%
2,290 Stanley Black & Decker Inc 322,272 0.09%
37,500 Staples Inc. 377,625 0.11%
16,040 Starbucks Corp. 935,292 0.27%
1,614 State Street Corp 144,824 0.04%
2,300 Synopsys Inc 167,739 0.05%
5,122 Texas Instruments 394,035 0.11%
16,800 The Mosiac Company 383,544 0.11%
Nominal Security Classification Fair Value
USD
% of
Net Assets
Financial assets at fair value through profit or loss (continued)

SANLAM UNIVERSAL FUNDS PLC
211
PORTFOLIO OF INVESTMENTS OF SANLAM WORLD EQUITY FUND (CONTINUED)
as at 30 June 2017
Equities - 94.98% (continued)
United States - 53.23% (continued)
2,100 Thermo Fisher Scientific Inc 366,387 0.10%
2,300 TJX Cos Inc 165,991 0.05%
22,495 Tupperware Brands Corp 1,579,824 0.45%
9,500 Twenty First Century Fox Inc. 269,230 0.08%
6,137 UGI Corp 297,092 0.08%
680 United Continental Holdings 51,170 0.01%
30,318 United Healthcare Corp 5,621,564 1.60%
6,100 United Parcel Service Inc 674,599 0.19%
23,500 Universal Insurance Holdings Inc 592,200 0.17%
3,190 Valero Energy Corp 215,197 0.06%
3,420 Varian Medical Systems 352,910 0.10%
23,588 VeriFone Holdings Inc 426,943 0.12%
53,278 Verizon Communications Inc 2,379,395 0.68%
8,613 VF Corporation 496,109 0.14%
69,299 Viacom Inc 2,326,367 0.66%
10,737 Visa Inc 1,006,916 0.29%
18,017 Wal-Mart Stores Inc 1,363,527 0.39%
7,479 Walt Disney Co 794,644 0.23%
23,870 Welbilt Inc 449,950 0.13%
1,906 Wellcare Health Plans INC 342,241 0.10%
28,901 Wells Fargo & Co 1,601,404 0.45%
11,012 Western Digital Corporation 975,663 0.28%
6,189 Westrock Company 350,669 0.10%
14,400 Whole Foods Market Inc 606,384 0.17%
11,640 Williams Companies 352,459 0.10%
26,500 Wisdom Tree Investments Inc 269,505 0.08%
4,460 Wyndham Worldwide Corp 447,829 0.13%
12,400 Xilinx Inc 797,568 0.23%
5,101 Yum Brands Inc 376,250 0.11%
8,200 Zions Bancorporation 360,062 0.10%
Total United States 187,581,060 53.23%
Virgin Islands - 0.24%
22,912 Michael Kors Holdings Ltd 830,560 0.24%
Total Virgin Islands 830,560 0.24%
Total Equities 334,672,530 94.98%
Nominal Security Classification Fair Value
USD
% of
Net Assets
Financial assets at fair value through profit or loss (continued)

SANLAM UNIVERSAL FUNDS PLC
212
PORTFOLIO OF INVESTMENTS OF SANLAM WORLD EQUITY FUND (CONTINUED)
as at 30 June 2017
Collective Investment Schemes - 3.15%
553,877 BlackRock Global Funds 11,088,620 3.15%
Total Collective Investment Schemes 11,088,620 3.15%
Derivative Financial Instruments
Warrants - 0.00%
Ireland - 0.00%
5,402 Kenmare Warrants - 0.00%
Total Ireland - 0.00%
Singapore - 0.00%
690,139 Ezion Holdings Ltd Call Warrant 16,544 0.00%
Total Singapore 16,544 0.00%
Total Warrants 16,544 0.00%
Total financial assets at fair value through profit or loss 345,777,674 98.13%
Cash and cash equivalents 7,105,267 2.02%
Other net assets and liabilities (522,198) (0.15)%
Net assets attributable to holders of redeemable participating shares 352,360,763 100.00%
Sanlam World Equity Fund
Summary
Classification Description
Fair Value % of % of
USD Net
Assets Total
Assets
Transferable securities and money market instruments admitted to official stock exchange listing or traded on regulated market 334,672,530 94.98% 94.69%
A Transferable securities and money market instruments other than those referred above 16,544 0.00% 0.00%
B UCITS and AIFs
11,088,620 3.15% 3.14%
C Financial derivative instruments dealt in on a regulated market - - -
D Over the counter financial derivative instruments - - -
Cash and cash equivalents
7,105,267 2.02% 2.01%
Other net assets and liabilities
(522,198) (0.15)% (0.15)%
Net assets attributable to holders of redeemable participating shares 352,360,763 100.00%
Nominal Security Classification Fair Value
USD
% of
Net Assets
Financial assets at fair value through profit or loss (continued)

SANLAM UNIVERSAL FUNDS PLC
213
PORTFOLIO OF INVESTMENTS OF SATRIX WORLD EQUITY TRACKER FUND as at 30 June 2017
Equities - 94.03%
Australia - 2.55%
32,021 Amcor Limited 398,534 0.06%
66,479 AMP Limited 264,911 0.04%
50,267 Australia and New Zealand Banking Group Ltd 1,108,448 0.16%
53,143 BHP Billiton Limited 949,898 0.14%
33,425 Brambles Ltd 249,708 0.04%
6,400 Caltex Australia Limited 155,329 0.02%
28,511 Common wealth Bank of Australia 1,812,772 0.27%
27,609 Crown Resorts Limited 260,314 0.04%
10,810 CSL Ltd 1,145,637 0.17%
49,448 Dexus Property Group 359,919 0.05%
94,967 Insurance Australia Group 494,368 0.07%
28,613 Lend Lease Group 365,785 0.05%
8,296 Macquarie Group Limited 563,715 0.08%
190,939 Mirvac Group 312,264 0.05%
43,602 National Australia Bank Ltd 990,602 0.15%
19,250 Newcrest Mining Ltd 297,968 0.04%
16,112 Orica Limited 255,828 0.04%
28,244 Origin Energy Limited 148,764 0.02%
40,149 Q.B.E. Insurance Group 364,060 0.05%
9,674 Rio Tinto Limited 469,950 0.07%
18,449 Santos Ltd 42,920 0.01%
185,663 Scentre Group 577,336 0.09%
146,951 South32 Limited 302,382 0.04%
40,142 Suncorp Group Ltd 456,767 0.07%
79,140 Sydney Airport 430,814 0.06%
76,181 Tabcorp Hldgs Ltd 255,609 0.04%
85,807 Telstra Corporation 283,295 0.04%
60,894 Transurban Group 554,040 0.08%
21,582 Wesfarmers Ltd 664,815 0.10%
51,150 Westfield Corp 315,362 0.05%
54,020 Westpac Banking Corp Ltd 1,265,449 0.19%
20,244 Woodside Petroleum Ltd 464,279 0.07%
33,612 Woolworths Limited 659,118 0.10%
Total Australia 17,240,960 2.55%
Austria - 0.12%
9,922 Erste Group Bank AG 379,636 0.06%
8,350 OMV AG 432,989 0.06%
Total Austria 812,625 0.12%
Nominal Security Classification Fair Value
USD
% of
Net Assets
Financial assets at fair value through profit or loss

SANLAM UNIVERSAL FUNDS PLC
214
SANLAM PORTFOLIO OF INVESTMENTS OF SATRIX WORLD EQUITY TRACKER FUND (CONTINUED) as at 30 June 2017
Equities - 94.03% (continued)
Belgium - 0.49%
11,314 Ageas 455,301 0.07%
13,058 Anheuser Busch InBev SA NV 1,441,278 0.21%
9,456 Groupe Bruxelles Lambert SA 909,669 0.13%
6,903 KBC Bankverzekeringsholding 523,204 0.08%
Total Belgium 3,329,452 0.49%
Bermuda - 0.21%
6,257 Bunge Limited 466,772 0.07%
10,490 Invesco Ltd 369,143 0.05%
35,033 Marvell Technology Group Ltd 578,745 0.09%
Total Bermuda 1,414,660 0.21%
Canada - 3.33%
8,520 Agnico-Eagle Mines 383,534 0.06%
4,300 Agrium Inc 389,022 0.06%
13,337 Bank of Montreal 977,561 0.14%
21,746 Bank of Nova Scotia 1,305,831 0.19%
16,670 Barrick Gold Corp. 264,723 0.04%
27,450 BlackBerry Ltd 273,845 0.04%
19,621 Brookfield Asset Management 768,619 0.11%
6,232 Cameco Corp. 56,655 0.01%
7,053 Can Imperial Bk of Commerce 572,177 0.08%
16,210 Canadian National Railway Co. 1,312,921 0.19%
21,179 Canadian Natural Resources Ltd 610,052 0.09%
3,153 Canadian Pacific Railway Ltd 506,407 0.08%
28,088 Cenovus Energy Inc 206,698 0.03%
9,504 Crescent Point Energy Corp 72,573 0.01%
33,474 Enbridge Inc 1,331,127 0.20%
20,382 Encana Corp 179,015 0.03%
18,799 Fortis Inc 659,578 0.10%
5,400 Franco-Nevada Corporation 388,945 0.06%
9,597 Goldcorp Inc 123,518 0.02%
10,625 Husky Energy Inc 120,391 0.02%
5,743 Imperial Oil Ltd 167,104 0.03%
7,084 Intact Financial Corporation 534,176 0.08%
13,629 Kinross Gold Corp 55,288 0.01%
7,635 Loblaw Companies Ltd. 423,977 0.06%
10,878 Magna International Inc 502,996 0.07%
42,927 Manulife Financial Corp 803,291 0.12%
Nominal Security Classification Fair Value
USD
% of
Net Assets
Financial assets at fair value through profit or loss (continued)

SANLAM UNIVERSAL FUNDS PLC
215
UN PORTFOLIO OF INVESTMENTS OF SATRIX WORLD EQUITY TRACKER FUND (CONTINUED) as at 30 June 2017
Equities - 94.03% (continued)
Canada - 3.33% (continued)
9,735 Metro Inc 319,829 0.05%
12,007 National Bank Of Canada 503,996 0.07%
16,635 Potash Corp of Saskatchewan 270,826 0.04%
8,089 PrairieSky Royalty Ltd 183,872 0.03%
12,493 Rogers Communications Inc 589,020 0.09%
26,468 Royal Bank of Canada 1,918,426 0.28%
19,495 Shaw Communications Inc. 424,535 0.06%
14,132 Sun Life Financial Inc 504,318 0.07%
34,809 Suncor Energy Inc 1,015,251 0.15%
9,564 Teck Resources Ltd 165,498 0.02%
9,087 Telus Corporation Com NPV (Non Canadian) 313,159 0.05%
9,107 Thomson Reuters Corporation 420,895 0.06%
33,040 Toronto-Dominion Bank 1,662,046 0.25%
21,186 Transcanada Corp 1,008,174 0.15%
10,286 Turquoise Hill Resources Ltd 27,316 0.00%
5,500 Valeant Pharmaceuticals International 95,428 0.01%
6,497 Wheaton Precious Metals Corp 128,830 0.02%
11,498 Yamana Gold Inc 27,703 0.00%
Total Canada 22,569,146 3.33%
Cayman Islands - 0.25%
70,381 Cheung Kong Property Holdings Ltd 551,303 0.08%
49,881 CK Hutchison Holdings Limited 626,180 0.09%
66,400 Sands China Ltd 304,076 0.05%
5,913 Seagate Technology 229,129 0.03%
Total Cayman Islands 1,710,688 0.25%
Denmark - 0.69%
257 AP Moller - Maersk A/S 516,359 0.08%
7,956 Coloplast A/S 664,313 0.10%
21,310 Danske Bank A/S 819,024 0.12%
1,925 Genmab A/S 410,404 0.06%
Nominal Security Classification Fair Value
USD
% of
Net Assets
Financial assets at fair value through profit or loss (continued)

SANLAM UNIVERSAL FUNDS PLC
216
UN PORTFOLIO OF INVESTMENTS OF SATRIX WORLD EQUITY TRACKER FUND (CONTINUED) as at 30 June 2017
Equities - 94.03% (continued)
Denmark - 0.69% (continued)
34,211 Novo Nordisk AS 1,463,988 0.22%
10,134 Novozymes AS 443,152 0.06%
12,415 William Demant Holdings 321,089 0.05%
Total Denmark 4,638,329 0.69%
Finland - 0.27%
10,321 Elisa Corporation 399,674 0.06%
5,786 Fortum Oyj 90,667 0.01%
4,551 Metso Oyj 157,692 0.02%
113,790 Nokia OYJ 695,446 0.10%
17,551 Upm-Kymmene Oy 499,973 0.08%
Total Finland 1,843,452 0.27%
France - 3.51%
9,503 Accor SA 445,165 0.07%
8,199 Air Liquide 1,012,483 0.15%
10,986 Airbus Group SE 902,759 0.13%
7,639 Alstom 266,870 0.04%
3,426 AtoS 480,550 0.07%
32,001 AXA SA 874,719 0.13%
16,358 BNP Paribas SA 1,177,291 0.17%
6,371 Bouygues 268,453 0.04%
5,424 Cap Gemini 560,108 0.08%
12,795 Carrefour SA 323,455 0.05%
843 Casino Guichard 49,895 0.01%
5,330 Cie Generale D’Optique Essilor International 677,660 0.10%
23,919 Credit Agricole SA 384,503 0.06%
11,606 Danone 871,714 0.13%
6,403 Edenred 166,836 0.03%
1,128 Electricite De France 12,207 0.00%
14,646 Engie 220,895 0.03%
1,284 Hermes International 634,018 0.09%
3,975 L’Oreal SA 827,488 0.12%
4,815 LVMH Moet Hennessy Louis Vuitton SA 1,199,637 0.18%
5,436 Michelin 722,158 0.11%
35,603 Orange 564,402 0.08%
5,051 Pernod-Ricard 675,912 0.10%
1,683 Pinault-Printemps 572,785 0.08%
3,372 Renault SA 304,991 0.05%
Nominal Security Classification Fair Value
USD
% of
Net Assets
Financial assets at fair value through profit or loss (continued)

SANLAM UNIVERSAL FUNDS PLC
217
I PORTFOLIO OF INVESTMENTS OF SATRIX WORLD EQUITY TRACKER FUND (CONTINUED) as at 30 June 2017
Equities - 94.03% (continued)
France - 3.51% (continued)
13,242 Saint-Gobain SA 706,990 0.10%
19,999 Sanofi 1,911,810 0.28%
11,693 Schneider Electric SE 897,733 0.13%
7,750 Scor SE 307,012 0.05%
12,915 Societe Generale SA 694,396 0.10%
3,738 Sodexo 482,931 0.07%
13,163 Stmicroelectronic 188,838 0.03%
14,027 Suez Environment SA 259,586 0.04%
33,919 Total SA 1,675,638 0.25%
3,143 Unibail Rodamco 791,495 0.12%
13,790 Veolia Environnement 291,163 0.04%
9,703 Vinci SA 827,562 0.12%
24,066 Vivendi SA 535,322 0.08%
Total France 23,767,430 3.51%
Germany - 3.25%
3,817 Adidas AG 730,776 0.11%
8,277 Allianz SE 1,628,583 0.24%
17,255 Basf SE 1,596,916 0.24%
14,078 Bayer AG 1,818,809 0.27%
7,035 Bayerische Motoren Werke 652,601 0.10%
27,852 Commerzbank AG 331,543 0.05%
16,715 Daimler AG 1,208,898 0.18%
47,886 Deutsche Bank AG 848,477 0.12%
5,233 Deutsche Boerse AG 551,971 0.08%
25,664 Deutsche Post AG 961,308 0.14%
65,104 Deutsche Telekom 1,168,046 0.17%
35,154 E.ON AG 330,920 0.05%
6,980 Henkel AG & Co KGAA 843,628 0.12%
9,452 K+S AG 241,857 0.04%
4,506 Linde AG 852,659 0.13%
7,765 MAN SE 831,894 0.12%
4,500 Merck KGAA 543,116 0.08%
9,399 Metro AG 317,039 0.05%
4,070 Muenchener Rueckversicherungs AG 820,091 0.12%
4,877 Osram Licht AG 388,237 0.06%
6,995 Porsche Ag 392,703 0.06%
8,665 RWE AG 172,520 0.02%
19,373 SAP SE 2,021,996 0.30%
Nominal Security Classification Fair Value
USD
% of
Net Assets
Financial assets at fair value through profit or loss (continued)

SANLAM UNIVERSAL FUNDS PLC
218
PORTFOLIO OF INVESTMENTS OF SATRIX WORLD EQUITY TRACKER FUND (CONTINUED) as at 30 June 2017
Equities - 94.03% (continued)
Germany - 3.25% (continued)
14,068 Siemens AG 1,932,316 0.28%
7,649 ThyssenKrupp AG 217,154 0.03%
3,942 Volkswagen 599,942 0.09%
Total Germany 22,004,000 3.25%
Great Britain - 6.14%
34,773 3I Group Plc 408,225 0.06%
23,251 Anglo American PLC 309,708 0.05%
5,985 Aon Plc 795,706 0.12%
21,826 Astrazeneca Plc 1,457,891 0.22%
89,163 Aviva Plc 610,072 0.09%
329,864 Barclays Plc 869,974 0.13%
33,071 Bhp Billiton Plc 505,900 0.07%
321,914 BP Plc 1,854,205 0.27%
66,997 British Aerospace Plc 552,093 0.08%
32,953 British American Tobacco Plc 2,243,567 0.33%
48,495 British Land 381,963 0.06%
183,228 BT Group Plc 702,516 0.10%
37,149 Capita Group Plc 334,156 0.05%
116,559 Centrica Plc 303,543 0.04%
51,951 Compass Group PLC 1,094,761 0.16%
48,270 Diageo 1,424,382 0.21%
30,222 Experian Group Ltd 619,176 0.09%
322,063 Genting Singapore Plc 253,842 0.04%
79,922 GlaxoSmithKline Plc 1,700,307 0.25%
335,347 HSBC Holdings 3,104,572 0.46%
18,215 Imperial Brands Plc 817,090 0.12%
8,665 InterContinental Hotels Group PLC 480,952 0.07%
48,136 Kingfisher Plc 188,284 0.03%
33,987 Land Securities Group Plc 447,850 0.07%
116,310 Legal & General Group Plc 390,798 0.06%
14,823 Liberty Global Plc 476,115 0.07%
9,661 Liberty Global Plc - Series C 301,230 0.04%
1,410,818 Lloyds Bank Plc 1,213,979 0.18%
4,886 London Stock Exchange Group Plc 231,729 0.03%
67,676 Marks & Spencer Plc 293,414 0.04%
96,274 Morrison Supermarkets Plc 302,062 0.04%
53,820 National Grid Plc 666,346 0.10%
4,749 Next PLC 238,204 0.04%
Nominal Security Classification Fair Value
USD
% of
Net Assets
Financial assets at fair value through profit or loss (continued)

SANLAM UNIVERSAL FUNDS PLC
219
PORTFOLIO OF INVESTMENTS OF SATRIX WORLD EQUITY TRACKER FUND (CONTINUED) as at 30 June 2017
Equities - 94.03% (continued)
Great Britain - 6.14% (continued)
140,335 Old Mutual Plc 353,047 0.05%
18,327 Pearson 164,852 0.02%
46,465 Prudential Corp 1,064,377 0.16%
12,576 Reckitt Benckiser Group Plc 1,273,373 0.19%
26,088 Reed Elsevier plc 563,325 0.08%
24,614 Rio Tinto Plc 1,038,020 0.15%
45,707 Rolls-Royce Holdings Plc 529,750 0.08%
96,809 Royal Bank of Scotland Group 311,297 0.05%
136,778 Royal Dutch Shell Plc 3,644,357 0.54%
20,585 Scottish & Southern Energy 389,069 0.06%
17,917 Shire Plc 987,726 0.15%
28,925 Sky Plc 373,999 0.06%
25,070 Smith & Nephew plc 432,096 0.06%
21,718 Smiths Group Plc 451,165 0.07%
59,495 Standard Chartered Plc 601,483 0.09%
251,474 Taylor Wimpey Plc 576,381 0.09%
10,387 Technipfmc Plc 282,526 0.04%
131,519 Tesco Plc 288,783 0.04%
21,080 Unilever Plc 1,139,336 0.17%
20,605 United Utilities Group Plc 232,516 0.03%
452,713 Vodafone Group PLC 1,282,305 0.19%
Total Great Britain 41,554,395 6.14%
Hong Kong - 0.85%
223,225 AIA Group Ltd 1,631,310 0.24%
18,601 Bank of East Asia 79,941 0.01%
82,600 Boc Hong Kong Holdings Ltd 395,193 0.06%
41,100 CLP Holdings Ltd 434,870 0.06%
62,000 Galaxy Entertainment Group Ltd 376,451 0.06%
16,639 Hang Seng Bank 348,058 0.05%
164,227 Hong Kong & China Gas Co 308,822 0.05%
24,659 Hong Kong Exchanges and Clearing Ltd 637,433 0.09%
169,000 Li & Fung Ltd 61,481 0.01%
51,000 Link Reit 388,056 0.06%
33,855 Power Assets Holdings Limited 299,017 0.04%
30,242 Sun Hung Kai Properties 444,337 0.07%
14,500 Swire Pacific 141,627 0.02%
24,817 Wharf Holdings 205,680 0.03%
Total Hong Kong 5,752,276 0.85%
Nominal Security Classification Fair Value
USD
% of
Net Assets
Financial assets at fair value through profit or loss (continued)

SANLAM UNIVERSAL FUNDS PLC
220
PORTFOLIO OF INVESTMENTS OF SATRIX WORLD EQUITY TRACKER FUND (CONTINUED) as at 30 June 2017
Equities - 94.03% (continued)
Ireland - 1.38%
11,078 Accenture PLC 1,370,127 0.20%
7,221 Allergan Plc 1,755,353 0.26%
19,643 CRH Plc 694,415 0.10%
8,334 Eaton Corp Plc 648,635 0.10%
6,873 Ingersoll-Rand Plc 628,123 0.09%
19,285 Johnson Controls International PLC 836,198 0.12%
5,650 Kerry Group 485,754 0.07%
24,317 Medtronic Plc 2,158,134 0.32%
4,801 Pentair Plc 319,459 0.05%
4,300 Perrigo Company Plc 324,736 0.05%
28,890 Weatherford International Plc 111,804 0.02%
Total Ireland 9,332,738 1.38%
Israel - 0.19%
122,190 Bank Leumi Le-Israel 594,417 0.09%
20,975 Teva Pharmaceutical Industries Ltd 696,790 0.10%
Total Israel 1,291,207 0.19%
Italy - 0.70%
23,259 Assicurazioni Generali 382,521 0.06%
18,430 Atlantia SPA 518,282 0.08%
120,368 Enel SpA 644,843 0.09%
54,674 ENI-Ente Nazionale Idrocarburi SpA 821,176 0.12%
11,212 Finmeccanica Spa 186,185 0.03%
220,523 Intesa Sanpaolo SpA 698,672 0.10%
29,708 Mediobanca SpA 292,946 0.04%
28,633 Saipem SpA 105,683 0.02%
42,534 Telecom Italia RNC 31,311 0.00%
279,919 Telecom Italis Spa 258,133 0.04%
44,033 Unicredit SpA 821,667 0.12%
Total Italy 4,761,419 0.70%
Japan - 8.21%
16,900 Aeon Co Ltd 256,772 0.04%
7,900 Aisin Seiki Co Ltd 404,317 0.06%
17,000 Ajinomoto Co Inc 367,161 0.05%
31,000 Asahi Chemical Ind 333,178 0.05%
6,560 Asahi Glass Co 276,180 0.04%
42,800 Astellas Pharma Inc 523,619 0.08%
Nominal Security Classification Fair Value
USD
% of
Net Assets
Financial assets at fair value through profit or loss (continued)

SANLAM UNIVERSAL FUNDS PLC
221
PORTFOLIO OF INVESTMENTS OF SATRIX WORLD EQUITY TRACKER FUND (CONTINUED) as at 30 June 2017
Equities - 94.03% (continued)
Japan - 8.21% (continued)
12,314 Bridgestone Corp 530,483 0.08%
15,146 Canon Inc 514,438 0.08%
2,700 Central Japan Railway Co 440,027 0.07%
29,350 Chiba Bank 212,647 0.03%
11,400 Chubu Electric Power Co Inc 151,442 0.02%
7,739 Chuo Mitsui Trust Holdings Inc 276,841 0.04%
22,000 Concordia Financial Group Ltd 110,950 0.02%
11,100 Credit Saison 216,764 0.03%
25,000 Dai Nippon Printing Co 277,704 0.04%
12,800 Daiichi Sankyo Co 301,572 0.04%
4,000 Daito TST & Construction 622,875 0.09%
17,351 Daiwa House Industry Co 592,729 0.09%
27,824 Daiwa Securities 164,888 0.02%
9,777 Denso Corp 412,662 0.06%
5,600 East Japan Railway Co 535,576 0.08%
5,200 Eisai Co 287,192 0.04%
3,800 Fanuc Ltd 732,434 0.11%
1,400 Fast Retailing Co Ltd 466,293 0.07%
12,800 Fuji Heavy Industries 431,338 0.06%
10,300 Fuji Photo Film Co 370,378 0.05%
59,721 Fujitsu 440,027 0.07%
97,000 Hitachi 595,210 0.09%
28,500 Honda Motor Co 777,250 0.11%
13,900 Hoya Pentax HD Corporation 721,662 0.11%
15,880 Isetan Mitsukoshi Holdings 159,153 0.02%
25,200 Itochu Corporation 374,355 0.06%
17,400 Japan Tobacco Inc 611,284 0.09%
13,656 JFE Holdings Inc 237,081 0.04%
77,140 JX Holdings Inc 336,917 0.05%
20,700 Kamigumi Company 217,041 0.03%
11,100 Kansai Electric Power Co 152,841 0.02%
16,381 Kansai Paint Co Ltd 376,902 0.06%
11,458 Kao Corp 680,443 0.10%
36,100 KDDI Corp 955,919 0.14%
33,411 Keikyu Corp 402,359 0.06%
10,600 Keisei Electric Railway Co 283,044 0.04%
2,280 Keyence Corp 1,001,292 0.15%
132,000 Kinki Nippon Railway Co Ltd 508,732 0.08%
21,000 Kirin Holdings Company Limited 427,850 0.06%
Nominal Security Classification Fair Value
USD
% of
Net Assets
Financial assets at fair value through profit or loss (continued)

SANLAM UNIVERSAL FUNDS PLC
222
PORTFOLIO OF INVESTMENTS OF SATRIX WORLD EQUITY TRACKER FUND (CONTINUED) as at 30 June 2017
Equities - 94.03% (continued)
Japan - 8.21% (continued)
13,400 Kobe Steel Ltd 137,638 0.02%
18,000 Komatsu Ltd 457,330 0.07%
12,800 Konica Minolta Inc 106,182 0.02%
25,000 Kubota Corp. 420,004 0.06%
12,155 Kurita Water Industries Ltd 331,057 0.05%
7,500 Kyocera Corp 434,312 0.06%
44,400 Marubeni Corp 286,832 0.04%
9,493 Mazda Motor Corp 132,488 0.02%
57,833 Mebuki Financial Group Inc 215,169 0.03%
38,800 Mitsubishi Chemical Holdings Corporation 321,209 0.05%
24,900 Mitsubishi Corp 522,158 0.08%
39,741 Mitsubishi Electric Corp 571,443 0.08%
27,550 Mitsubishi Estate 513,359 0.08%
11,500 Mitsubishi Gas 243,102 0.04%
74,700 Mitsubishi Heavy Industries 305,715 0.05%
21,931 Mitsubishi Motor 144,450 0.02%
17,400 Mitsubishi Tanabe Pharma 402,051 0.06%
216,299 Mitsubishi UFJ Holdings Inc 1,453,160 0.21%
32,300 Mitsui & Co 461,572 0.07%
18,100 Mitsui Fudosan Co Ltd 431,838 0.06%
42,000 Mitsui O.S.K. Lines Ltd 123,364 0.02%
360,800 Mizuho Financial Group Inc 659,620 0.10%
12,500 MS&AD Insurance Group Holdings 419,893 0.06%
4,500 Murata Manufacturing 683,712 0.10%
102,798 Nec Corp 272,664 0.04%
8,000 NGK Spark Plug Co Ltd 170,111 0.03%
6,782 Nidec Corp 694,800 0.10%
6,100 Nikon Corp 97,513 0.01%
2,600 Nintendo Co 871,989 0.13%
12,669 Nippon Steel Corp 286,194 0.04%
12,400 Nippon Telegraph and Telephone Company 586,061 0.09%
36,500 Nissan Motor Co Ltd 363,213 0.05%
3,400 Nitori Holdings Co Ltd 455,149 0.07%
5,100 Nitto Denko Corp 419,439 0.06%
67,300 Nomura Securities 403,381 0.06%
28,200 NTT Mobile Communications 665,656 0.10%
37,620 Obayashi Corp 442,332 0.07%
15,300 Ono Pharmaceutical 333,781 0.05%
42,500 Orix Corporation 658,211 0.10%
Nominal Security Classification Fair Value
USD
% of
Net Assets
Financial assets at fair value through profit or loss (continued)

SANLAM UNIVERSAL FUNDS PLC
223
PORTFOLIO OF INVESTMENTS OF SATRIX WORLD EQUITY TRACKER FUND (CONTINUED) as at 30 June 2017
Equities - 94.03% (continued)
Japan - 8.21% (continued)
10,900 Otsuka Holdings KK 464,717 0.07%
37,461 Panasonic Corp 508,149 0.08%
21,000 Recruit Holdings Co Ltd 360,935 0.05%
69,633 Resona Holdings Inc 383,338 0.06%
15,000 Ricoh Company Ltd 132,443 0.02%
5,300 Secom Co 402,158 0.06%
19,300 Sega Sammy Holdings Inc. 259,738 0.04%
13,360 Seven & I Holdings 550,334 0.08%
2,900 Shimano Inc. 458,941 0.07%
7,700 Shin-Etsu Chemical Co 698,037 0.10%
7,800 Shionogi & Co Ltd 434,537 0.06%
13,000 Shiseido 462,145 0.07%
18,000 Shizuoka Bank 162,617 0.02%
15,400 Softbank Corp 1,246,941 0.18%
9,850 Sompo Japan Nipponkoa Holdings Inc 380,411 0.06%
18,200 SO-NET M3 INC 501,371 0.07%
23,070 Sony Corp 880,089 0.13%
50,000 Sumitomo Chemical Co 287,494 0.04%
25,800 Sumitomo Corp 335,733 0.05%
22,000 Sumitomo Electric 338,763 0.05%
32,000 Sumitomo Heavy Ind 211,055 0.03%
22,700 Sumitomo Mitsui Financial 884,765 0.13%
12,000 Sumitomo Realty Develop. 370,093 0.05%
8,900 Suzuki Motor Corp 422,225 0.06%
19,700 T&D Holdings Inc 299,752 0.04%
12,656 Takeda Pharmaceutical Co Ltd 643,107 0.10%
10,800 Terumo Corp 425,367 0.06%
8,300 Toho Co (Film) 255,612 0.04%
22,100 Tohoku Electric Power 305,879 0.05%
11,200 Tokio Marine Holdings 463,651 0.07%
24,600 Tokyo Electric Power 101,378 0.01%
4,400 Tokyo Electron 593,716 0.09%
68,755 Tokyo Gas Co 357,575 0.05%
34,000 Tokyu Corp 259,350 0.04%
27,000 Tokyu Fudosan Holdings Corp 159,573 0.02%
39,000 Toray Inds Inc 326,406 0.05%
125,800 Toshiba Corp 304,339 0.04%
43,510 Toyota Motor Co 2,282,193 0.34%
11,860 Toyota Tsusho Corp 355,219 0.05%
Nominal Security Classification Fair Value
USD
% of
Net Assets
Financial assets at fair value through profit or loss (continued)

SANLAM UNIVERSAL FUNDS PLC
224
PORTFOLIO OF INVESTMENTS OF SATRIX WORLD EQUITY TRACKER FUND (CONTINUED) as at 30 June 2017
Equities - 94.03% (continued)
Japan - 8.21% (continued)
7,900 Trend Micro Inc 407,130 0.06%
5,100 West Japan Railway Co 360,246 0.05%
72,706 Yahoo Japan Corporation 316,451 0.05%
62,424 Yamada Denki Co Ltd 310,036 0.05%
8,500 Yamaha Motor Co Ltd 219,252 0.03%
6,300 Yamato Holdings Co Ltd 127,766 0.02%
Total Japan 55,579,001 8.21%
Jersey Channel Islands - 0.39%
7,700 Delphi Automotive Plc 674,905 0.10%
235,176 Glencore Plc 878,593 0.13%
9,212 Wolseley Plc 564,757 0.08%
24,508 WPP Plc 514,543 0.08%
Total Jersey Channel Islands 2,632,798 0.39%
Luxembourg - 0.04%
11,007 ArcelorMittal 249,487 0.04%
Total Luxembourg 249,487 0.04%
Netherlands - 1.76%
39,314 Aegon NV 200,610 0.03%
7,770 Akzo Nobel NV 674,758 0.10%
7,715 ASML Holding NV 1,004,665 0.15%
30,832 CNH Industrial NV 348,895 0.05%
4,819 Ferrari NV 413,319 0.06%
30,300 Fiat Chrysler Automobiles NV 319,186 0.05%
5,203 Heineken Holding NV 505,517 0.07%
60,923 Ing Groep NV 1,049,924 0.16%
26,849 Koninklijke Ahold Delhaize NV 512,960 0.08%
22,471 Koninklijke Philips NV 797,467 0.12%
6,000 LyondellBasell Industries NV 506,340 0.07%
5,300 Mobileye NV 332,840 0.05%
10,000 Mylan NV 388,200 0.06%
5,154 NXP Semiconductors NV 564,105 0.08%
3,726 Randstad Holdings NV 217,387 0.03%
28,909 Relx NV 593,889 0.09%
114,146 Royal KPN NV 364,900 0.05%
23,255 Schlumberger Ltd 1,531,109 0.23%
28,504 Unilever NV 1,571,927 0.23%
Total Netherlands 11,897,998 1.76%
Nominal Security Classification Fair Value
USD
% of
Net Assets
Financial assets at fair value through profit or loss (continued)

SANLAM UNIVERSAL FUNDS PLC
225
PORTFOLIO OF INVESTMENTS OF SATRIX WORLD EQUITY TRACKER FUND (CONTINUED) as at 30 June 2017
Equities - 94.03% (continued)
New Zealand - 0.04%
88,314 Spark New Zealand Limited 244,528 0.04%
Total New Zealand 244,528 0.04%
Norway - 0.21%
34,950 Norsk Hydro Asa 193,066 0.03%
56,537 Orkla ASA 572,597 0.08%
25,877 Statoil ASA 427,479 0.06%
15,861 Telenor ASA 262,208 0.04%
Total Norway 1,455,350 0.21%
Portugal - 0.06%
123,193 Energias De Portugal SA 402,538 0.06%
Total Portugal 402,538 0.06%
Singapore - 0.90%
7,864 Broadcom Limited Designs 1,832,705 0.27%
146,250 CapitaLand Limited 371,840 0.05%
48,562 DBS Bank Ltd 731,640 0.11%
36,091 Flextronics International Ltd 588,644 0.09%
38,400 Keppel Corp Ltd 175,458 0.03%
94,884 Oversea-Chinese Bank 743,715 0.11%
74,000 Singapore Press Holdings Ltd 173,631 0.02%
196,900 Singapore Telecommunications Ltd 556,401 0.08%
38,891 United Overseas Bank Ltd 653,174 0.10%
106,000 Wilmar International Ltd 257,954 0.04%
Total Singapore 6,085,162 0.90%
Spain - 1.14%
4,765 ACS Actividades Cons Y Serv 183,950 0.03%
13,163 Amadeus IT Holding SA 786,450 0.11%
116,764 Banco Bilbao Viscaya 968,154 0.14%
238,744 Banco Santander SA 1,578,195 0.23%
51,323 Bankia SA 247,889 0.04%
19,632 Distribuidora Interncional de Alimentacion SA 122,135 0.02%
100,990 Iberdrola SA 799,097 0.12%
23,507 Industria de Diseno Textil SA 901,707 0.13%
39,500 International Consolidated Airlines Group SA 313,270 0.05%
36,155 Red Electrica Corporacion SA 754,919 0.11%
23,997 Repsol SA 366,996 0.05%
70,097 Telefonica SA 723,055 0.11%
Total Spain 7,745,817 1.14%
Nominal Security Classification Fair Value
USD
% of
Net Assets
Financial assets at fair value through profit or loss (continued)

SANLAM UNIVERSAL FUNDS PLC
226
PORTFOLIO OF INVESTMENTS OF SATRIX WORLD EQUITY TRACKER FUND (CONTINUED) as at 30 June 2017
Equities - 94.03% (continued)
Sweden - 1.00%
25,400 Atlas Copco AB 875,447 0.13%
8,120 Getinge AB 158,537 0.02%
19,228 Hennes & Mauritz AB 477,860 0.07%
55,021 Nordea Bank AB 698,357 0.10%
29,088 Sandvik AB 456,335 0.07%
20,140 Securitas AB 338,612 0.05%
33,600 Skandinaviska Enskilda Banken SEB 405,385 0.06%
18,274 Skanska AB 432,514 0.07%
10,900 SKF AB-B 220,300 0.03%
34,685 Svenska Handelsbanken AB 495,271 0.07%
23,492 Swedbank AB 571,035 0.09%
15,999 Swedish Match AB 562,036 0.08%
48,941 Telefonaktiebolaget LM Ericsson 349,127 0.05%
50,960 Teliasonera 234,047 0.04%
29,135 Volvo AB 495,363 0.07%
Total Sweden 6,770,226 1.00%
Switzerland - 3.29%
35,823 ABB Ltd 884,555 0.13%
8,344 ACE Limited 1,213,051 0.18%
1,350 Actelion Ltd 376,916 0.06%
9,952 Compagnie Financiere Richemont SA 819,821 0.12%
32,118 Credit Suisse Group AG 464,187 0.07%
2,019 Geberit AG-Reg 941,498 0.14%
250 Givaudan 500,000 0.07%
8,201 Holcim Ltd 469,484 0.07%
7,080 Julius Baer Group Ltd 372,457 0.05%
51,834 Nestle SA 4,510,477 0.67%
37,823 Novartis AG 3,147,315 0.46%
11,956 Roche Holding AG 3,044,479 0.45%
2,451 Schindler Holding 518,569 0.08%
288 SGS SA 697,326 0.10%
3,298 Sonova Holdings AG 535,452 0.08%
954 Swatch Group AG 352,254 0.05%
8,041 Swiss RE AG 734,926 0.11%
816 Swisscom 393,705 0.06%
7,769 TE Connectivity Ltd 611,265 0.09%
57,063 UBS Group AG 966,322 0.14%
2,507 Zurich Financial Services AG 729,618 0.11%
Total Switzerland 22,283,677 3.29%
Nominal Security Classification Fair Value
USD
% of
Net Assets
Financial assets at fair value through profit or loss (continued)

SANLAM UNIVERSAL FUNDS PLC
227
PORTFOLIO OF INVESTMENTS OF SATRIX WORLD EQUITY TRACKER FUND (CONTINUED) as at 30 June 2017
Equities - 94.03% (continued)
United States - 53.03%
9,498 3M Company 1,977,389 0.29%
28,850 Abbott Labs 1,402,399 0.21%
28,660 AbbVie Inc 2,078,137 0.31%
13,400 Activision Blizzard Inc 771,438 0.11%
9,816 Adobe Systems Inc 1,388,375 0.21%
23,610 AES Corp 262,307 0.04%
6,412 Aetna Inc-New 973,534 0.14%
5,837 Aflac Inc. 453,418 0.07%
8,865 Agilent Technologies Inc. 525,783 0.08%
4,149 Air Products & Chemicals Inc 593,556 0.09%
4,700 Alexion Pharmaceuticals Inc 571,849 0.08%
10,400 Alliant Energy Corp 417,768 0.06%
8,161 Allstate Corp 721,759 0.11%
10,451 Alphabet Inc 9,586,238 1.41%
32,933 Altria Group Inc 2,452,521 0.36%
7,157 Amazon.Com Inc 6,927,976 1.02%
5,200 Amerada Hess Corp 228,124 0.03%
6,500 Ameren Corporation 355,355 0.05%
3,200 American Airlines Group Inc 161,024 0.02%
7,049 American Electric Power 489,694 0.07%
14,226 American Express 1,198,398 0.18%
16,521 American International Group 1,032,893 0.15%
10,051 American Tower Corp 1,329,948 0.20%
3,532 Ameriprise Financial 449,588 0.07%
4,930 Amerisourcebergen Corp 466,033 0.07%
12,815 Amgen Corp 2,207,127 0.33%
8,808 Amphenol Corp 650,207 0.10%
10,793 Anadarko Petroleum Corp 489,355 0.07%
8,175 Analog Devices Inc. 636,015 0.09%
36,200 Annaly Mortgage Management 436,210 0.06%
4,580 Anthem Inc 861,635 0.13%
8,974 Apache Corp 430,124 0.06%
90,351 Apple Inc 13,012,351 1.92%
11,740 Archer-Daniels-Midland Co. 485,801 0.07%
8,825 ARCONIC INC 199,886 0.03%
Nominal Security Classification Fair Value
USD
% of
Net Assets
Financial assets at fair value through profit or loss (continued)

SANLAM UNIVERSAL FUNDS PLC
228
PORTFOLIO OF INVESTMENTS OF SATRIX WORLD EQUITY TRACKER FUND (CONTINUED) as at 30 June 2017
Equities - 94.03% (continued)
United States - 53.03% (continued)
103,834 AT & T Inc 3,917,657 0.58%
5,981 Autodesk Inc 603,004 0.09%
8,951 Automatic Data Processing Inc 917,119 0.14%
790 Autozone 450,663 0.07%
4,383 AvalonBay Communities Inc. 842,281 0.12%
6,218 Avery Dennison Corp. 549,485 0.08%
7,498 Baker Hughes 408,716 0.06%
9,920 Ball Corp 418,723 0.06%
18,154 Bank New York Mellon 926,217 0.14%
173,175 Bank of America Corp 4,201,226 0.62%
2,000 Bard CR Inc 632,220 0.09%
11,640 Baxter International 704,686 0.10%
14,470 BB&T Corporation 657,083 0.10%
4,615 Becton Dickinson & Co 900,433 0.13%
12,262 Bed Bath & Beyond Inc. 372,765 0.06%
19,006 Berkshire Hathaway Inc. 3,219,046 0.48%
8,012 Best Buy Co Inc 459,328 0.07%
4,033 Biogen Inc 1,094,395 0.16%
4,500 Biomarin Pharmaceutical inc 408,690 0.06%
1,979 Blackrock Inc 835,949 0.12%
10,061 Boeing Com 1,989,563 0.29%
5,875 Boston Properties Inc 722,743 0.11%
27,628 Boston Scientific Corp 765,848 0.11%
28,667 Bristol-Myrs Squib 1,597,325 0.24%
5,100 C.H.Robinson Worldwide Inc 350,268 0.05%
12,729 CA Inc 438,769 0.06%
6,400 Campbell Soup 333,760 0.05%
9,128 Capital One Financial Corp 754,155 0.11%
6,626 Cardinal Health 516,298 0.08%
8,761 Carnival Corp 574,459 0.08%
10,343 Caterpillar Inc 1,111,459 0.16%
9,826 CBS Corp 626,702 0.09%
13,762 Celgene Corp 1,787,271 0.26%
12,204 Centerpoint Energy Inc 334,146 0.05%
23,215 CenturyLink Inc 554,374 0.08%
7,400 Cerner Corp 491,878 0.07%
23,491 Charles Schwab Corp 1,009,173 0.15%
4,346 Charter Communication Inc 1,463,950 0.22%
7,400 Cheniere Energy Inc 360,454 0.05%
Nominal Security Classification Fair Value
USD
% of
Net Assets
Financial assets at fair value through profit or loss (continued)

SANLAM UNIVERSAL FUNDS PLC
229
PORTFOLIO OF INVESTMENTS OF SATRIX WORLD EQUITY TRACKER FUND (CONTINUED) as at 30 June 2017
Equities - 94.03% (continued)
United States - 53.03% (continued)
30,306 Chevron Corp 3,161,825 0.47%
800 Chipotle Mexican Grill Inc 332,880 0.05%
5,086 Cigna Corp 851,346 0.13%
6,619 Cincinnati Financial Corp. 479,547 0.07%
84,046 Cisco Systems Inc 2,630,640 0.39%
48,088 Citigroup Inc 3,216,125 0.48%
5,786 Citrix Systems Inc 460,450 0.07%
3,349 Clorox Company 446,221 0.07%
6,535 CME Group Inc 818,443 0.12%
9,603 Coach Inc 454,606 0.07%
65,124 Coca-Cola Co. 2,920,811 0.43%
12,172 Cognizant Tech Solutions CRP 808,221 0.12%
15,050 Colgate-Palmolive Co 1,115,657 0.16%
81,030 Comcast Corp 3,153,688 0.47%
8,554 Comerica Inc 626,495 0.09%
12,894 Conagra Foods Inc 461,089 0.07%
3,954 Concho Resources Inc 480,530 0.07%
22,420 Conocophillips Co 985,583 0.15%
6,019 Consolidated Edison Inc 486,456 0.07%
4,199 Constellation Brands 813,472 0.12%
19,623 Corning Inc 589,671 0.09%
7,224 Costco Wholesale Corp 1,155,334 0.17%
9,712 Crown Castle International Corporation 972,948 0.14%
17,116 CSX Corp 933,849 0.14%
3,900 Cummins Inc 632,658 0.09%
18,728 CVS Health Corporation 1,506,855 0.22%
11,492 Danaher Corp 969,810 0.14%
4,581 Darden Restuarants Inc 414,306 0.06%
6,574 Deere & Co 812,481 0.12%
5,547 Dell Technologies Inc 338,977 0.05%
6,808 Dentsply Sirona Inc 441,431 0.07%
12,697 Devon Energy Corporation 405,923 0.06%
8,868 Discover Financial Services 551,501 0.08%
10,300 Dominion Resources Inc 789,289 0.12%
4,964 Dover Corp. 398,212 0.06%
20,132 Dow Chemical Co 1,269,725 0.19%
10,349 DR Horton Inc 357,765 0.05%
5,514 Dr Pepper Snapple Group 502,381 0.07%
3,965 DTE Energy Co 419,457 0.06%
Nominal Security Classification Fair Value
USD
% of
Net Assets
Financial assets at fair value through profit or loss (continued)

SANLAM UNIVERSAL FUNDS PLC
230
PORTFOLIO OF INVESTMENTS OF SATRIX WORLD EQUITY TRACKER FUND (CONTINUED) as at 30 June 2017
Equities - 94.03% (continued)
United States - 53.03% (continued)
15,736 Du Pont De Nemours 1,270,053 0.19%
10,646 Duke Energy Corp 889,899 0.13%
4,184 Dxc Technology Co 320,996 0.05%
19,681 eBay Inc. 687,261 0.10%
5,300 Ecolab Inc 703,575 0.10%
5,900 Edison International 461,321 0.07%
4,800 Edwards Lifesciences Corp 567,552 0.08%
8,346 Electronic Arts Inc 882,339 0.13%
10,946 Emerson Electric Co 652,601 0.10%
5,879 Entergy Corp. 451,331 0.07%
10,921 Eog Resources Inc 988,569 0.15%
3,920 Equifax Inc 538,686 0.08%
11,517 Equity Residential 758,164 0.11%
5,590 Estee Lauder Cos 536,528 0.08%
16,226 Exelon Corp 585,272 0.09%
5,646 Expditors Intl Wash 318,886 0.05%
12,668 Express Scripts Holdings Inc 808,725 0.12%
67,062 Exxon Corp 5,413,915 0.80%
41,142 Facebook Inc 6,211,619 0.92%
6,844 Fastenal Co 297,919 0.04%
4,850 FDX Corp 1,054,051 0.16%
8,237 Fidelity National Information 703,440 0.10%
21,348 Fifth Third Bancorp 554,194 0.08%
10,303 FirstEnergy Corp 300,435 0.04%
5,917 Fiserv Inc 723,886 0.11%
6,428 Fluor Corp 294,274 0.04%
10,970 FNF Group 491,785 0.07%
64,015 Ford Motor Co 716,328 0.11%
7,696 Fortive Corporation 487,542 0.07%
10,120 Franklin Resources Inc 453,275 0.07%
25,996 Freeport-Mcmoran Inc 312,212 0.05%
6,590 Gap Inc 144,914 0.02%
4,669 General Dynanics Corp 924,929 0.14%
145,740 General Electric Co 3,936,437 0.58%
11,733 General Mills Inc 650,008 0.10%
27,400 General Motors Co 957,082 0.14%
18,517 GGP Inc 436,261 0.06%
23,038 Gilead Sciences Inc 1,630,630 0.24%
6,280 Goldman Sachs Group 1,393,532 0.21%
Nominal Security Classification Fair Value
USD
% of
Net Assets
Financial assets at fair value through profit or loss (continued)

SANLAM UNIVERSAL FUNDS PLC
231
PORTFOLIO OF INVESTMENTS OF SATRIX WORLD EQUITY TRACKER FUND (CONTINUED) as at 30 June 2017
Equities - 94.03% (continued)
United States - 53.03% (continued)
9,700 Goodyear Tire Co 339,112 0.05%
1,440 Grainger (W.W.) Inc. 259,963 0.04%
10,859 H&R Block Inc 335,652 0.05%
16,820 Halliburton Co 718,382 0.11%
5,000 Harley Davidson 270,100 0.04%
9,609 Hartford Finl Serv 505,145 0.07%
7,600 HCA Holdings Inc 662,720 0.10%
19,000 HCP INC 607,240 0.09%
4,330 Hershey Foods Corp 464,912 0.07%
34,661 Hewlett Packard Enterprise 575,026 0.08%
20,915 Home Depot 3,208,361 0.47%
11,899 Honeywell International Inc 1,586,018 0.23%
29,649 Host Hotels & Resorts Inc 541,687 0.08%
34,661 HP Inc 605,874 0.09%
3,315 Humana Inc 797,655 0.12%
5,305 Illinois Tool Works 759,941 0.11%
3,195 Illumina Inc 554,396 0.08%
3,459 Incyte Corp 435,523 0.06%
80,659 Intel Corp 2,721,435 0.40%
12,575 Intercontinental Exchange Inc 828,944 0.12%
15,010 International Business Machine Corp 2,308,988 0.34%
2,363 International Flavors & Fragrances 319,005 0.05%
7,356 International Paper Co 416,423 0.06%
7,022 Intuit Inc 932,592 0.14%
911 Intuitive Surgery Inc 852,122 0.13%
7,050 Jacobs Engineering Group Inc 383,450 0.06%
44,007 Johnson & Johnson 5,821,686 0.86%
58,483 JP Morgan Chase & Co 5,345,346 0.79%
11,042 Juniper Networks Inc 307,851 0.05%
6,720 Kellogg Co 466,771 0.07%
34,725 Keycorp 650,747 0.10%
6,160 Kimberley Clark Corp 795,318 0.12%
14,500 Kimco Realty Corp 266,075 0.04%
37,712 Kinder Morgan Inc 722,562 0.11%
4,943 Kla-Tencor Corp. 452,334 0.07%
6,468 Kohls Corporation 250,118 0.04%
11,804 Kraft Heinz Company 1,010,895 0.15%
14,886 Kroger Co 347,142 0.05%
5,228 L Brands Inc 281,737 0.04%
Nominal Security Classification Fair Value
USD
% of
Net Assets
Financial assets at fair value through profit or loss (continued)

SANLAM UNIVERSAL FUNDS PLC
232
PORTFOLIO OF INVESTMENTS OF SATRIX WORLD EQUITY TRACKER FUND (CONTINUED) as at 30 June 2017
Equities - 94.03% (continued)
United States - 53.03% (continued)
2,065 L3 Technologies Inc 345,020 0.05%
4,935 LAM Research Corporation 697,957 0.10%
9,330 Las Vegas Sands Corp 596,094 0.09%
11,900 Leucadia National Corp 311,304 0.05%
13,313 Liberty Media-Interactive 326,701 0.05%
17,380 Lilly (Eli) & Co 1,430,374 0.21%
5,821 Lincoln National Corp. 393,383 0.06%
4,431 Lockheed Martin Corp 1,230,090 0.18%
11,500 Loews Corp 538,315 0.08%
15,839 Lowes Com 1,227,998 0.18%
3,747 M&TBankCorp 606,827 0.09%
8,125 Macy’s Inc 188,825 0.03%
3,590 Manpower Inc. 400,824 0.06%
22,101 Marathon Oil Corporation 261,897 0.04%
11,500 Marathon Petroleum Corp 601,795 0.09%
9,156 Marriott International Inc. 918,438 0.14%
10,211 Marsh & McLennan Cos 796,050 0.12%
12,928 Masco Corp 493,979 0.07%
17,400 Mastercard Inc 2,113,230 0.31%
21,075 Mattel Inc 453,745 0.07%
13,838 McDonald’s Corp 2,119,428 0.31%
4,841 Mckesson Corp 796,538 0.12%
45,889 Merck & Co’ 2,941,026 0.43%
14,311 Metlife Inc 786,246 0.12%
6,841 Microchip Technology Inc 527,988 0.08%
22,463 Micron Technology Inc 670,745 0.10%
125,225 Microsoft Corp 8,631,759 1.27%
2,433 Mohawk Industries Inc 588,032 0.09%
26,371 Mondelez International Inc 1,138,963 0.17%
8,707 Monsanto Co 1,030,561 0.15%
10,439 Monster Beverage Corporation 518,610 0.08%
5,270 Moody’s Corp 641,254 0.09%
26,033 Morgan Stanley 1,160,030 0.17%
4,671 Motorola Solutions Inc 405,163 0.06%
9,373 Murphy Oil Corp 240,230 0.04%
7,714 National-Oilwell Inc 254,099 0.04%
9,891 Navient Corporation 164,685 0.02%
9,560 Netapp Inc 382,878 0.06%
8,099 Netflix Inc 1,210,072 0.18%
Nominal Security Classification Fair Value
USD
% of
Net Assets
Financial assets at fair value through profit or loss (continued)

SANLAM UNIVERSAL FUNDS PLC
233
PORTFOLIO OF INVESTMENTS OF SATRIX WORLD EQUITY TRACKER FUND (CONTINUED) as at 30 June 2017
Equities - 94.03% (continued)
United States - 53.03% (continued)
11,127 Newell 596,630 0.09%
8,088 Newmont Mining Corp 261,970 0.04%
31,375 News Corporation 429,838 0.06%
7,666 NextEra Energy Inc 1,074,237 0.16%
24,464 Nike Inc 1,443,376 0.21%
10,700 Noble Energy Inc 302,810 0.04%
5,606 Norfolk Southern Corp 682,250 0.10%
5,870 Northern Trust Corp 570,623 0.08%
3,393 Northrop Grumman Corp 871,017 0.13%
6,731 Nucor Corp. 389,523 0.06%
10,210 Nvidia Corp 1,475,958 0.22%
13,075 Occidental Petroleum Corp 782,800 0.12%
6,022 Omnicom Group 499,224 0.07%
6,500 Oneok Inc New 339,040 0.05%
53,060 Oracle Corp 2,660,428 0.39%
2,440 O’Reilly Automotive Inc 533,726 0.08%
8,644 Paccar Inc 570,850 0.08%
2,200 Palo Alto Networks Inc 294,382 0.04%
3,900 Parker Hannifin Corp 623,298 0.09%
12,200 Parsley Energy Inc 338,550 0.05%
5,882 Patterson Cos Inc 276,160 0.04%
8,248 Paychex Inc 469,641 0.07%
22,081 Paypal Holidings Inc 1,185,087 0.18%
23,131 Pepsico Inc 2,671,399 0.39%
98,391 Pfizer Inc 3,304,954 0.49%
9,998 PG&E Corp 663,567 0.10%
26,405 Philip Morris International Inc 3,101,267 0.46%
8,850 Phillips 66 731,807 0.11%
5,374 Pinnacle West Capital 457,650 0.07%
4,000 Pioneer Natural Resources Co 638,320 0.09%
7,956 PNC Financial Services Group Inc 993,466 0.15%
6,382 PPG Industries Inc 701,765 0.10%
11,978 PPL Corporation 463,069 0.07%
5,506 Praxair Inc 729,820 0.11%
911 Priceline Group Incorporated 1,704,044 0.25%
7,500 Principal Financial Group 480,525 0.07%
40,624 Procter & Gamble 3,540,382 0.52%
17,013 Progressive Corp-Ohio 750,103 0.11%
16,538 Prologis Inc 969,788 0.14%
Nominal Security Classification Fair Value
USD
% of
Net Assets
Financial assets at fair value through profit or loss (continued)

SANLAM UNIVERSAL FUNDS PLC
234
PORTFOLIO OF INVESTMENTS OF SATRIX WORLD EQUITY TRACKER FUND (CONTINUED) as at 30 June 2017
Equities - 94.03% (continued)
United States - 53.03% (continued)
7,327 Prudential Financial 792,342 0.12%
8,534 Public Service Enterprise Group 367,047 0.05%
3,408 Public Storage Inc 710,670 0.10%
25,942 Qualcomm Inc 1,432,517 0.21%
6,245 Quest Diagnostics Inc. 694,194 0.10%
5,363 Raytheon Company 866,017 0.13%
1,600 Regeneron Pharmaceuticals 785,824 0.12%
39,737 Regions Financial Corp 581,750 0.09%
6,687 Republic Serv Inc 426,163 0.06%
16,688 Reynolds American Inc 1,085,388 0.16%
6,045 Robert Half International Inc. 289,737 0.04%
5,347 Rockwell Collins 561,863 0.08%
3,289 Rockwell International Corp 532,686 0.08%
2,770 Roper Technologies Inc 641,338 0.09%
5,776 S&P Global Inc 843,238 0.12%
13,360 Salesforce Com Inc 1,156,976 0.17%
7,015 Sealed Air Corp. 313,991 0.05%
4,903 Sempra Energy 552,813 0.08%
5,400 Servicenow Inc 572,400 0.08%
2,540 Sherwin-Williams Co. 891,438 0.13%
6,200 Simon Property Group Inc 1,002,912 0.15%
15,328 Southern Co/The 733,905 0.11%
20,849 Sprint Corp 171,170 0.03%
3,872 Stanley Black & Decker Inc 544,907 0.08%
24,147 Staples Inc. 243,160 0.04%
25,866 Starbucks Corp. 1,508,246 0.22%
8,424 State Street Corp 755,886 0.11%
6,208 Stryker Corp. 861,546 0.13%
13,223 Suntrust Banks Inc 750,009 0.11%
18,030 Symantec Corp 509,348 0.08%
18,977 Synchrony Financial 565,894 0.08%
11,300 Sysco Corp 568,729 0.08%
6,516 T Rowe Price Group 483,552 0.07%
10,053 Target Corp 525,671 0.08%
2,827 Tesla Motors Inc 1,022,271 0.15%
5,329 Tesoro Petroleum Crp 498,794 0.07%
18,647 Texas Instruments 1,434,514 0.21%
9,119 Textron Inc 429,505 0.06%
Nominal Security Classification Fair Value
USD
% of
Net Assets
Financial assets at fair value through profit or loss (continued)

SANLAM UNIVERSAL FUNDS PLC
235
PORTFOLIO OF INVESTMENTS OF SATRIX WORLD EQUITY TRACKER FUND (CONTINUED) as at 30 June 2017
Equities - 94.03% (continued)
United States - 53.03% (continued)
10,000 The Mosiac Company 228,300 0.03%
7,322 Thermo Fisher Scientific Inc 1,277,469 0.19%
13,877 Time Warner Inc 1,393,390 0.21%
14,020 TJX Cos Inc 1,011,823 0.15%
6,100 T-Mobile US Inc 369,782 0.05%
5,715 Travelers Cos Inc 723,119 0.11%
6,000 Twenty First Century Fox Inc. 170,040 0.03%
27,180 Twenty-First Cent Fox 757,507 0.11%
18,900 Twitter Inc 337,743 0.05%
14,328 Union Pacific Corp 1,560,462 0.23%
15,731 United Healthcare Corp 2,916,842 0.43%
10,608 United Parcel Service Inc 1,173,139 0.17%
7,468 Unum Group 348,233 0.05%
27,540 US Bancorp 1,429,877 0.21%
10,315 USD Waste Services 756,605 0.11%
12,145 UTD Technologies 1,483,026 0.22%
8,193 Valero Energy Corp 552,700 0.08%
4,512 Varian Medical Systems 465,593 0.07%
11,605 Ventas Inc 806,315 0.12%
3,122 VeriSign Inc 290,221 0.04%
68,863 Verizon Communications Inc 3,075,422 0.45%
5,500 Vertex Pharmaceuticals Inc 708,785 0.10%
9,100 VF Corporation 524,160 0.08%
9,030 Viacom Inc 303,137 0.04%
32,440 Visa Inc 3,042,223 0.45%
6,065 Vornado Realty Trust 569,504 0.08%
4,081 Vulcan Materials Co. 516,981 0.08%
16,476 Walgreens Boots Alliance Inc 1,290,236 0.19%
24,634 Wal-Mart Stores Inc 1,864,301 0.28%
25,586 Walt Disney Co 2,718,513 0.40%
2,808 Waters Corp. 516,223 0.08%
75,247 Wells Fargo & Co 4,169,436 0.62%
6,072 Western Digital Corporation 537,979 0.08%
18,333 Western Union Co 349,244 0.05%
7,897 Westrock Company 447,444 0.07%
15,878 Weyerhaeuser Co 531,913 0.08%
2,059 Whirlpool Corp 394,546 0.06%
10,350 Whole Foods Market Inc 435,839 0.06%
17,204 Williams Companies 520,937 0.08%
Nominal Security Classification Fair Value
USD
% of
Net Assets
Financial assets at fair value through profit or loss (continued)

SANLAM UNIVERSAL FUNDS PLC
236
PORTFOLIO OF INVESTMENTS OF SATRIX WORLD EQUITY TRACKER FUND (CONTINUED) as at 30 June 2017
Equities - 94.03% (continued)
United States - 53.03% (continued)
9,300 WR Berkley Corp 643,281 0.10%
10,400 Xcel Energy Inc 477,152 0.07%
8,410 Xerox Corporation 241,619 0.04%
7,369 Xilinx Inc 473,974 0.07%
9,649 Xylem Inc 534,844 0.08%
8,090 Yum Brands Inc 596,718 0.09%
4,084 Zimmer Biomet Holdings Inc 524,386 0.08%
11,100 Zoetis Inc. 692,418 0.10%
Total United States 359,089,137 53.03%
Virgin Islands - 0.03%
6,000 Michael Kors Holdings Ltd 217,500 0.03%
Total Virgin Islands 217,500 0.03%
Total Equities 636,675,995 94.03%
Exchange Traded Funds - 5.10%
45,304 Ishares MSCI Canada 1,212,335 0.18%
84,283 Ishares S&P 500 Index Fund 20,515,325 3.03%
196,987 Ishares MSCI EAFE Index Fund 12,843,552 1.89%
Total Exchange Traded Funds 34,571,212 5.10%
Derivative Financial Instruments
Rights - 0.00%
Spain - 0.00%
23,997 Repsol SA 10,955 0.00%
Total Spain 10,955 0.00%
United States - 0.00%
17,956 Safeway Stores Inc 9,550 0.00%
Total United States 9,550 0.00%
Total Rights 20,505 0.00%
Total financial assets at fair value through profit or loss 671,267,712 99.13%
Cash and cash equivalents 5,763,534 0.85%
Other net assets and liabilities 110,151 0.02%
Net assets attributable to holders of redeemable participating shares 677,141,397 100.00%
Nominal Security Classification Fair Value
USD
% of
Net Assets
Financial assets at fair value through profit or loss (continued)

SANLAM UNIVERSAL FUNDS PLC
237
PORTFOLIO OF INVESTMENTS OF SATRIX WORLD EQUITY TRACKER FUND (CONTINUED) as at 30 June 2017
Satrix World Equity Tracker Fund
Summary
Classification Description
Fair Value % of % of
USD Net
Assets Total
Assets
Transferable securities and money market instruments admitted to official stock exchange listing or traded on regulated market 671,247,207 99.13% 98.95%
A Transferable securities and money market instruments other than those referred above 20,505 0.00% 0.00%
B UCITS and AIFs
- - -
C Financial derivative instruments dealt in on a regulated market - - -
D Over the counter financial derivative instruments - - -
Cash and cash equivalents
5,763,534 0.85% 0.85%
Other net assets and liabilities
110,151 0.02% 0.02%
Net assets attributable to holders of redeemable participating shares 677,141,397 100.00%

SANLAM UNIVERSAL FUNDS PLC
238
PORTFOLIO OF INVESTMENTS OF SIIP INDIA OPPORTUNITIES FUND as at 30 June 2017
Equities - 99.51%
India - 99.51%
17,376 Aarti Industries Limited 246,523 0.65%
9,669 APL Apollo Tubes Ltd 231,790 0.61%
35,389 Asian Paints Ltd 604,029 1.59%
41,330 Aurobindo Pharma Ltd 437,861 1.15%
25,841 Bajaj Finance Limited 549,092 1.44%
3,670 Bajaj Finserv Ltd 233,916 0.61%
122,385 Bank of Baroda 306,152 0.80%
91,378 Berger Paints India Limited 348,218 0.92%
325,885 Bharat Electronics Ltd 814,714 2.14%
51,420 Bharat Petroleum Corporation Ltd 508,790 1.34%
782 Bosch Limited 282,296 0.74%
21,729 Britannia Industries Ltd 1,240,811 3.26%
28,383 Cadila Healthcare Ltd 230,662 0.61%
43,359 Century Plyboards India Ltd 197,437 0.52%
2,900 Cera Sanitaryware Ltd 129,885 0.34%
82,500 Edelweiss Capital Limited 244,424 0.64%
3,450 Eicher Motors Ltd 1,443,610 3.79%
21,647 Finolex Cables Ltd 152,856 0.40%
42,173 HCL Technololgies Ltd 555,324 1.46%
109,852 HDFC Bank Ltd 2,808,438 7.38%
77,261 HealthCare Global Enterprise Limited 301,416 0.79%
132,066 Hindalco Industries Limited 390,251 1.03%
33,288 Hindustan Petroluem Corporation Limited 262,899 0.69%
24,748 Hindustan Zinc Ltd 100,972 0.27%
80,329 Housing Development Finance Corporation Ltd 2,007,544 5.28%
339,498 Icici Bank Ltd 1,524,381 4.01%
39,859 Indusind Bank Limited 912,249 2.40%
80,724 Infosys Ltd 1,168,701 3.07%
402,906 ITC Ltd 2,017,962 5.30%
16,570 Jk Lakshmi Cement Ltd 124,339 0.33%
94,777 Kotak Mahindra Bank Ltd 1,401,784 3.68%
43,059 Larsen & Toubro Ltd 1,124,520 2.96%
79,247 LIC Housing Finance Ltd 910,201 2.39%
39,137 Mahanagar Gas Limited 598,745 1.57%
51,790 Marico Ltd 251,938 0.66%
18,242 Maruti Suziki India Ltd 2,037,506 5.36%
66,902 Natco Pharma Limited 1,037,076 2.73%
135,982 Oil & Natural Gas Corp 331,012 0.87%
603 Page Industries Ltd 156,179 0.41%
22,000 Petronet LNG Ltd 147,092 0.39%
Nominal Security Classification Fair Value
USD
% of
Net Assets
Financial assets at fair value through profit or loss

SANLAM UNIVERSAL FUNDS PLC
239
PORTFOLIO OF INVESTMENTS OF SIIP INDIA OPPORTUNITIES FUND (CONTINUED) as at 30 June 2017
Equities - 99.51% (continued)
India - 99.51% (continued)
14,056 Pidilite Industries Ltd 175,233 0.46%
161,071 Power Grid Corporation of India Ltd 524,815 1.38%
82,562 Punjab National Bank 175,422 0.46%
32,881 Pvr Ltd 716,722 1.88%
63,907 Rbl Bank Ltd 502,148 1.32%
93,145 Reliance Industries Ltd 1,989,172 5.23%
1,299 Shree Cement Ltd 340,798 0.90%
176,027 State Bank of India 745,433 1.96%
9,453 Supreme Industries Limited 179,610 0.47%
13,468 Syngene International Ltd 98,051 0.26%
22,720 Tata Consultancy Services Ltd 830,589 2.18%
91,799 Tata Motors Ltd 614,480 1.62%
29,059 Tech Mahindra Ltd 171,782 0.45%
34,305 Techno Electric & Engineering Company Ltd 199,157 0.52%
8,618 Ultratech Cement Ltd 528,003 1.39%
43,277 United Phosphorus Ltd 562,830 1.48%
37,493 Yes Bank 849,135 2.23%
37,050 Zee Entertainment Enterprises Ltd 281,721 0.74%
Total India 37,858,696 99.51%
Total Equities 37,858,696 99.51%
Nominal Security Coupon Maturity Classification Fair Value % of
USD Net Assets
Corporate Debt - 0.11%
India – 0.11%
2,455,138 NTPC Ltd 8.490% 25/03/2025 40,577 0.11%
Total India 40,577 0.11%
Total Corporate Debt 40,577 0.11%
Total financial assets at fair value through profit or loss 37,899,273 99.62%
Cash and cash equivalents 133,795 0.35%
Other net assets and liabilities 9,722 0.03%
Net assets attributable to holders of redeemable participating shares 38,042,790 100.00%
Nominal Security Classification Fair Value
USD
% of
Net Assets
Financial assets at fair value through profit or loss (continued)

SANLAM UNIVERSAL FUNDS PLC
240
PORTFOLIO OF INVESTMENTS OF SIIP INDIA OPPORTUNITIES FUND (CONTINUED) as at 30 June 2017
SIIP India Opportunities Fund
Summary
Classification Description
Fair Value % of % of
USD Net
Assets Total
Assets
Transferable securities and money market instruments admitted to official stock exchange listing or traded on regulated market 37,899,273 99.62% 99.26%
A Transferable securities and money market instruments other than those referred above - - -
B UCITS and AIFs
- - -
C Financial derivative instruments dealt in on a regulated market - - -
D Over the counter financial derivative instruments - - -
Cash and cash equivalents
133,795 0.35% 0.35%
Other net assets and liabilities
9,722 0.03% 0.03%
Net assets attributable to holders of redeemable participating shares 38,042,790 100.00%

SANLAM UNIVERSAL FUNDS PLC
241
PORTFOLIO OF INVESTMENTS OF SIM GLOBAL EQUITY INCOME FUND
as at 30 June 2017
Equities - 97.86%
Belgium - 2.40%
67,790 Ageas 2,728,021 2.40%
Total Belgium 2,728,021 2.40%
France - 9.78%
108,566 AXA SA 2,967,557 2.61%
26,786 Sanofi 2,560,615 2.25%
80,296 Scor SE 3,180,887 2.79%
49,086 Total SA 2,424,905 2.13%
Total France 11,133,964 9.78%
Germany - 1.97%
24,218 Bayerische Motoren Werke 2,246,579 1.97%
Total Germany 2,246,579 1.97%
Great Britain - 36.81%
316,383 Aberdeen Asset Management Plc 1,242,884 1.09%
33,763 Astrazeneca Plc 2,255,235 1.98%
471,924 BP Plc 2,718,254 2.39%
68,317 British American Tobacco Plc 4,651,284 4.09%
192,764 GlaxoSmithKline Plc 4,100,972 3.60%
342,706 IG Group Holdings Plc 2,532,097 2.22%
36,012 Imperial Brands Plc 1,615,429 1.42%
1,245,374 Legal & General Group Plc 4,184,413 3.68%
79,032 Micro Focus International Plc 2,334,697 2.05%
462,102 Mitie Group Plc 1,662,648 1.46%
134,586 Royal Dutch Shell Plc 3,610,806 3.17%
355,415 Sainsbury (J) Plc 1,163,669 1.02%
1,111,863 Taylor Wimpey Plc 2,548,400 2.24%
93,638 Unilever Plc 5,060,967 4.45%
782,046 Vodafone Group PLC 2,215,138 1.95%
Total Great Britain 41,896,893 36.81%
Netherlands - 1.33%
79,485 Koninklijke Ahold Delhaize NV 1,518,589 1.33%
Total Netherlands 1,518,589 1.33%
Norway - 1.46%
245,000 Sparebank 1 Nord-Norge 1,659,575 1.46%
Total Norway 1,659,575 1.46%
Nominal Security Classification Fair Value
USD
% of
Net Assets
Financial assets at fair value through profit or loss

SANLAM UNIVERSAL FUNDS PLC
242
PORTFOLIO OF INVESTMENTS OF SIM GLOBAL EQUITY INCOME FUND (CONTINUED)
as at 30 June 2017
Equities - 97.86% (continued)
Singapore - 3.17%
1,277,156 Singapore Telecommunications Ltd 3,608,991 3.17%
Total Singapore 3,608,991 3.17%
Switzerland - 5.25%
37,669 Novartis AG 3,134,501 2.76%
11,132 Roche Holding AG 2,834,655 2.49%
Total Switzerland 5,969,156 5.25%
United States - 35.69%
40,346 Altria Group Inc 3,004,567 2.64%
15,100 Boeing Com 2,986,025 2.62%
137,511 Cisco Systems Inc 4,304,094 3.78%
108,559 General Electric Co 2,932,179 2.58%
140,565 HP Inc 2,457,076 2.16%
15,070 International Business Machine Corp 2,318,218 2.04%
8,300 Lockheed Martin Corp 2,304,163 2.02%
24,887 McDonald’s Corp 3,811,693 3.35%
26,858 Pepsico Inc 3,101,830 2.73%
35,640 Philip Morris International Inc 4,185,918 3.68%
39,603 Procter & Gamble 3,451,401 3.03%
43,906 Reynolds American Inc 2,855,646 2.51%
65,105 Verizon Communications Inc 2,907,589 2.55%
Total United States 40,620,399 35.69%
Total Equities 111,382,168 97.86%
Total financial assets at fair value through profit or loss 111,382,168 97.86%
Cash and cash equivalents 2,112,877 1.86%
Other net assets and liabilities 317,719 0.28%
Net assets attributable to holders of redeemable participating shares 113,812,764 100.00%
Nominal Security Classification Fair Value
USD
% of
Net Assets
Financial assets at fair value through profit or loss (continued)

SANLAM UNIVERSAL FUNDS PLC
243
PORTFOLIO OF INVESTMENTS OF SIM GLOBAL EQUITY INCOME FUND (CONTINUED)
as at 30 June 2017
SIM Global Equity Income Fund
Summary
Classification Description
Fair Value % of % of
USD Net
Assets Total
Assets
Transferable securities and money market instruments admitted to official stock exchange listing or traded on regulated market 111,382,168 97.86% 97.76%
A Transferable securities and money market instruments other than those referred above - - -
B UCITS and AIFs
- - -
C Financial derivative instruments dealt in on a regulated market - - -
D Over the counter financial derivative instruments - - -
Cash and cash equivalents
2,112,677 1.86% 1.85%
Other net assets and liabilities
317,719 0.28% 0.28%
Net assets attributable to holders of redeemable participating shares 113,812,764 100.00%

SANLAM UNIVERSAL FUNDS PLC
244
PORTFOLIO OF SANLAM STRATEGIC BOND FUND as at 30 June 2017
Nominal Security Classification Fair Value
GBP
% of
Net Assets
Financial assets at fair value through profit or loss
Equities – 10.26%
Great Britain – 10.26%
450,000 Aviva Plc
694,000 0.60%
250,000 Ecclesiastical Insurance
360,625 0.31%
1,100,000 General Accident Plc
1,633,125 1.40%
646,500 Lloyds Banking Group Plc
1,020,773 0.88%
385,000 National Westminster Bank Plc
573,650 0.49%
605,000 RSA Insurance Group Plc
807,675 0.69%
1,749,000 Santander Uk Plc
2,999,005 2.57%
2,943,000 Standard Chartered Plc
3,868,589 3.32%
Total Great Britain
11,957,442 10.26%
Total Equity
11,957,442 10.26%
Nominal Security Coupon Maturity Classification Fair Value % of
GBP Net Assets
Corporate Debt – 62.24%
Brazil - 0.83%
700,000 Vale SA 5.625 11/09/2042
515,245 0.44%
600,000 Votorantim Cimentos SA 7.250 05/04/2041
454,450 0.39%
Total Brazil
969,695 0.83%
Columbia - 0.43%
600,000 Ecopetrol SA 7.375 18/09/2043
499,632 0.43%
Total Columbia
499,632 0.43%
France - 4.70%
1,800,000 AXA SA 6.686 06/07/2049
2,112,651 1.81%
1,500,000 Electricite De France 6.000 29/07/2049
1,579,253 1.35%
1,000,000 Electricite De France 5.875 22/07/2049
1,021,930 0.88%
715,000 Societe Generale 8.875 16/06/2050
762,683 0.65%
Total France
5,476,517 4.70%
Great Britain – 41.10%
900,000 Aviva Plc 6.125 29/09/2050
1,013,670 0.87%
200,000 Bank of Scotland Plc 12.000 30/01/2049
260,000 0.22%
150,000 Bank of Scotland Plc 13.625 10/06/2049
337,500 0.29%
700,000 Barclays Bank Plc 6.000 15/06/2049
703,462 0.60%
350,000 Barclays Bank Plc 6.369 15/12/2049
366,746 0.31%
1,350,000 Barclays Bank Plc 14.000 15/09/2049
1,643,443 1.41%
26,000 British Telecom Plc 3.500 25/04/2025
54,593 0.05%
2,471 Canary Wharf Finance 6.455 22/10/2033
4,361 0.00%

SANLAM UNIVERSAL FUNDS PLC
245
PORTFOLIO OF SANLAM STRATEGIC BOND FUND (CONTINUED) as at 30 June 2017
Nominal Security Coupon Maturity Classification Fair Value % of
GBP Net Assets
Financial assets at fair value through profit or loss (continued)
Corporate Debt – 62.24% (continued)
Great Britain – 41.10% (continued) 2,392,864 Co-Operative Group Ltd 11.000 20/12/2025
3,029,186 2.60%
330,000 Coventry Building 12.125 01/09/2049
678,150 0.58%
150,000 CYBG Plc 5.000 09/02/2026
152,041 0.13%
1,350,000 Direct Line Insurance 9.250 27/04/2042
1,742,472 1.49%
235,000 Friends Life Holdings Plc 6.875 21/11/2050
259,675 0.22%
8,000 Hammerson Plc 6.000 23/02/2026
10,077 0.01%
10,000 HSBC Bank Plc 6.500 07/07/2023
12,439 0.01%
1,798,000 Investec Bank Plc 9.625 17/02/2022
2,279,585 1.96%
500,000 Legal & General 5.875 01/10/2048
531,795 0.46%
3,097,000 Liverpool Friendly Society Ltd 6.500 22/05/2043
3,318,590 2.85%
2,100,000 Lloyds Bank Plc 11.750 28/10/2049
4,263,000 3.66%
1,100,000 Lloyds Bank Plc 13.000 22/01/2049
2,072,279 1.78%
433,000 Nationwide Building Society 6.250 22/10/2049
491,455 0.42%
500,000 Nationwide Building Society 10.250 20/06/2050
752,663 0.65%
38,000 National Westminster Bank 11.500 17/12/2052
64,220 0.06%
998,000 National Westminster Bank 11.500 17/12/2052
1,686,620 1.45%
1,700,000 Old Mutual Plc 7.875 03/11/2025
2,006,859 1.72%
500,000 Paragon Group Comapanies 7.250 09/09/2026
538,223 0.46%
650,000 Paragon Group Companies 6.125 30/01/2022
696,345 0.60%
1,000,000 Paragon Group Companies 6.000 28/08/2024
1,068,670 0.92%
260,000 Pension Insurance 6.500 03/07/2024
278,599 0.24%
136,000 Principality Building Society 7.000 01/06/2045
146,078 0.13%
11,000 Prudent 6.875 20/01/2023
14,034 0.01%
2,800,000 RL Finance Bonds 6.125 30/11/2043
3,122,182 2.68%
900,000 Santander UK Plc 5.875 14/08/2031
1,081,643 0.93%
2,632,000 Scottish Widows Plc 7.000 16/06/2043
3,361,340 2.88%
2,453,000 SL Finance 6.750 12/07/2027
2,895,938 2.48%
200,000 Standard Chartered Bank Plc 5.375 14/07/2049
210,612 0.18%
1,880,000 Standard Chartered Bank Plc 7.750 31/01/2090
2,183,601 1.87%
200,000 Standard Chartered Bank Plc 5.125 06/06/2034
216,620 0.19%
500,000 Standard Life 6.546 06/01/2050
549,155 0.47%
500,000 Tesco Plc 4.875 24/03/2042
492,275 0.42%
500,000 Tesco Plc 5.200 05/03/2057
495,775 0.43%
500,000 Tesco Property Finance Plc 7.623 13/07/2039
589,171 0.51%
1,000,000 TSB Banking Group Plc 5.750 06/05/2026
1,083,220 0.93%
1,000,000 Virgin Money Holding 7.875 31/10/2165
1,010,870 0.87%
100,000 Yorkshire Building Society 13.500 01/04/2025
145,711 0.12%
Total Great Britain
47,914,941 41.10%
Ireland - 2.68%
402,000 Bank of Ireland 13.375 07/11/2049
837,165 0.72%
1,991,000 PGH Capital Ltd 6.625 18/12/2025
2,288,396 1.96%
Total Ireland
3,125,561 2.68%

SANLAM UNIVERSAL FUNDS PLC
246
PORTFOLIO OF SANLAM STRATEGIC BOND FUND (CONTINUED) as at 30 June 2017
Nominal Security Coupon Maturity Classification Fair Value % of
GBP Net Assets
Financial assets at fair value through profit or loss (continued)
Corporate Debt – 62.24% (continued)
Italy – 0.87%
550,000 Assicurazioni 6.269 16/06/2049
597,218 0.51%
500,000 Telecom Italia Spa 5.303 30/05/2024
413,312 0.35%
Total Italy
1,010,529 0.87%
Jersey Channel Islands- 1.58%
1,511,000 HSBC Bank Plc 5.844 05/11/2094
1,846,714 1.58%
Total Jersey Channel Islands
1,846,714 1.58%
Luxembourg - 0.40%
500,000 Telecom Italia Capital 7.721 04/06/2038
466,597 0.40%
Total Luxembourg
466,597 0.40%
Mexico - 1.57%
600,000 ALFA SA 6.875 25/03/2044
503,252 0.43%
600,000 Petroleos Mexicanos 6.750 21/09/2047
467,391 0.40%
1,000,000 Petroleos Mexicanos 6.875 04/08/2026
855,602 0.73%
Total Mexico
1,826,245 1.57%
Netherlands - 3.49%
1,570,000 Brit Insurance Holdings 6.625 09/12/2030
1,657,794 1.42%
1,300,000 Rabobank Nederland 6.910 10/12/2055
1,685,288 1.45%
700,000 Rabobank Stichting AK 6.500 29/12/2049
729,098 0.63%
Total Netherlands
4,072,180 3.49%
Russia - 0.44%
500,000 Gazprom (Gaz capital SA) 4.250 06/04/2024
517,310 0.44%
Total Russia
517,310 0.44%
United States - 3.76%
2,770,000 Cheniere Energy Inc 4.250 15/03/2045
1,475,387 1.27%
600,000 Comision Federal De Electricity 6.125 16/06/2045
495,852 0.43%
785,000 DB Cap Fin Trust 1.750 27/06/2049
609,631 0.52%
2,500,000 Mellon Capital IV 4.000 20/12/2049
1,721,025 1.48%
100,000 Och Ziff Finance Co LLC 4.500 20/11/2019
72,532 0.06%
8,000 Wal-Mart Stores Inc 5.250 28/09/2035
11,396 0.01%
Total United States
4,385,824 3.76%
Virgin Islands - 0.39%
600,000 GTL Trade Finance Inc 7.250 16/04/2044
453,461 0.39%
Total Virgin Islands
453,461 0.39%
Total Corporate Debt
72,565,204 62.24%

SANLAM UNIVERSAL FUNDS PLC
247
PORTFOLIO OF SANLAM STRATEGIC BOND FUND (CONTINUED) as at 30 June 2017
Nominal Security Coupon Maturity Classification Fair Value % of
GBP Net Assets
Financial assets at fair value through profit or loss (continued)
Government Debt – 26.00%
Europe - 0.01%
9,000 European Investment Bank 5.375 07/06/2021
10,584 0.01%
Total Europe
10,584 0.01%
Great Britain - 10.29%
1,500,000 UK Gilt 2.500 17/07/2024
5,490,638 4.71%
2,670,000 UK Government 1.250 22/11/2027
5,008,427 4.30%
590,000 UK Treasury 0.125 22/03/2068
1,491,942 1.28%
113 UK Treasury 5.000 07/03/2025
147 0.00%
Total Great Britain
11,991,153 10.29%
United States - 15.71%
2,700,000 UK Gilt 2.000 26/01/2035
7,162,628 6.14%
14,000,000 US Treasury 3.000 15/11/2045
11,153,265 9.57%
Total United States
18,315,892 15.71%
Total Government Debt
30,317,630 26.00%
Total Debt
102,882,834 88.24%
Buy Currency Buy Amount Sell currency Sell Amount Maturity Fair Value % of
GBP Net Assets
Derivative Financial Instruments
Forward Contracts – 1.10%1
GBP 529 USD (670) 20/07/2017 12 0.00%
GBP 19,980,000 JPY (2,839,713,444) 24/07/2017 443,654 0.38%
GBP 575,000 JPY (80,957,930) 21/09/2017 18,035 0.02%
JPY 602,431,390 USD (5,300,000) 24/07/2017 63,415 0.05%
JPY 591,848,400 USD (5,200,000) 24/07/2017 67,609 0.06%
GBP 10,509,000 USD (13,577,355) 16/08/2017 61,843 0.05%
EUR 1,755,244 GBP (1,530,109) 16/08/2017 12,103 0.01%
GBP 15,900,000 USD (19,833,660) 06/07/2017 618,454 0.53%
Total Forward Contracts
1,285,125 1.10%
Total financial assets at fair value through profit or loss 116,125,401 99.60%

SANLAM UNIVERSAL FUNDS PLC
248
PORTFOLIO OF SANLAM STRATEGIC BOND FUND (CONTINUED) as at 30 June 2017
Buy Currency Buy Amount Sell currency Sell Amount Maturity Fair Value % of
GBP Net Assets
Financial liabilities at fair value through profit or loss
Derivative Financial Instruments Forward Contracts - (1.64)%
1
USD 64,661 GBP (50,552) 20/07/2017 (759) (0.00)%
USD 255,494 GBP (200,121) 20/07/2017 (3,372) (0.00)%
USD 128 GBP (100) 20/07/2017 (2) (0.00)%
USD 8,940,666 GBP (6,992,434) 20/07/2017 (107,468) (0.09)%
USD 85,515 GBP (67,026) 20/07/2017 (1,173) (0.00)%
USD 9,334 GBP (67,026) 20/07/2017 (172) (0.00)%
USD 3,194 GBP (2,505) 20/07/2017 (45) (0.00)%
USD 36,400 GBP (28,522) 20/07/2017 (491) (0.00)%
USD 6,483 GBP (4,998) 20/07/2017 (5) (0.00)%
GBP 2,193,000 EUR (2,584,183) 16/08/2017 (77,545) (0.07)%
USD 792,242 EUR (707,000) 22/09/2017 (12,290) (0.01)%
JPY 662,845,400 GBP (4,750,000) 24/07/2017 (189,830) (0.16)%
JPY 59,414,000 GBP (4,000,000) 24/07/2017 (151,405) (0.13)%
USD 21,289,000 JPY (2,402,027,226) 24/07/2017 (132,165) (0.11)%
USD 6,668,506 GBP (5,200,000) 25/07/2017 (65,261) (0.06)%
USD 26,861,940 GBP (21,000,000) 13/09/2017 (348,836) (0.30)%
USD 1,277,970 GBP (1,000,000) 13/09/2017 (17,511) (0.02)%
JPY 162,877,605 GBP (1,150,000) 21/09/2017 (29,453) (0.03)%
USD 13,544,797 GBP (10,600,000) 22/09/2017 (189,713) (0.16)%
JPY 2,881,684,000 USD (26,000,000) 22/08/2017 (176,915) (0.15)%
JPY 2,903,671,250 USD (26,500,000) 15/09/2017 (395,333) (0.34)%
USD 1,060,325 USD (1,074,692) 21/09/2017 (11,956) (0.01)%
Total Forward Contracts
(1,911,698) (1.64)%
Total financial liabilities at fair value through profit or loss (1,911,698) (1.64)%
Cash and cash equivalents
(69,651) (0.06)%
Other net assets and liabilities
2,444,599 2.10%
Net assets attributable to holders of redeemable participating shares 116,588,651 100.00%

SANLAM UNIVERSAL FUNDS PLC
249
PORTFOLIO OF SANLAM STRATEGIC BOND FUND (CONTINUED) as at 30 June 2017 Sanlam Strategic Bond Fund
Summary
Classification Description
Fair Value % of % of
GBP Net
Assets Total
Assets
Transferable securities and money market instruments admitted to official stock exchange listing or traded on regulated market 114,840,276 98.50% 96.76%
A Transferable securities and money market instruments other than those referred above - - -
B UCITS and AIFs
- - -
C Financial derivative instruments dealt in on a regulated market - - -
D Over the counter financial derivative instruments (626,573) (0.54)% (0.53)%
Cash and cash equivalents
(69,651) (0.06)% (0.06)%
Other net assets and liabilities
2,444,599 2.10% 2.06%
Net assets attributable to holders of redeemable participating shares 116,588,651 100.00%
1Brown Brothers Harriman acts as counterparty to the open derivative positions at 30 June 2017.

SANLAM UNIVERSAL FUNDS PLC
250
UNI PORTFOLIO OF INVESTMENTS OF SANLAM ACCEL INCOME FUND as at 30 June 2017
Collective Investment Schemes - 96.67%
1,263,932 Fidelity Institutional Funds ICVC - UK Corporate Bond Fund 1,672,182 4.23%
160,449 Henderson UK & Europe Funds - UK Equity Income Fund 1,180,265 2.99%
454,473 Henderson UK & Europe Funds - Strategic Bond Fund 626,718 1.59%
634,127 Unicorn Investment Funds - UK Income Fund 1,742,516 4.41%
211,346 Trojan Investment Funds - Trojan Income Fund 408,786 1.04%
825,121 Schroder UK Alpha Fund 1,534,725 3.88%
2,659 Vanguard Investment Series - UK Government Bond Index Fund 349,686 0.89%
1,534,888 JPMorgan Fund ICVC - Sterling Corporate Bond Fund 1,958,518 4.96%
818,263 Blackrock Continental European Income Fund 1,280,581 3.24%
1,436,538 Artemis Global Income Fund 1,415,564 3.58%
188,210 M&G Short Dated Coporrate Bond Fund 1,956,090 4.95%
614,406 Kames ICVC - High Yield Bond Fund 603,715 1.53%
1,435,959 PFS Chelverton UK Equity Fund 1,771,788 4.48%
1,385,425 Invesco Perpetual Fixed Interest - Corporate Bond Fund 1,669,853 4.23%
313,735 Artemis Income Fund 767,428 1.94%
1,272,131 Artemis Strategic Bond Fund 731,348 1.85%
4,486,600 Schroder Income Maximiser Fund 2,373,412 6.01%
1,218,933 Jupiter Strategic Bond - II 814,247 2.06%
6,364 Veritas Funds Plc - Global Equity Income Fund 1,324,319 3.35%
1,537,268 Lazard Global Equity Income Fund 1,684,846 4.26%
1,662,514 Kames ICVC - Sterling Corporate Bond Fund 1,850,379 4.68%
20,006 Muzinich Emerging Markets Short Duration Fund 1,876,136 4.75%
1,484,081 Cazenove Strategic Bond Fund 1,479,184 3.74%
5,324 PFS Twenty Four Dynamic Bond Fund 604,918 1.53%
85,471 Guinness Asset Management Fund Plc 1,338,496 3.39%
1,878,192 Fidelity Enhanced Income Fund 1,953,320 4.94%
94,549 Sanlam FOUR US Dividend Income Fund Class A G 1,348,918 3.41%
1,679,358 Sanlam Strategic Bond Fund 1,880,881 4.76%
Total Collective Investment Schemes 38,198,816 96.67%
Total financial assets at fair value through profit or loss 38,198,816 96.67%
Cash and cash equivalents 1,320,213 3.34%
Other net assets and liabilities (2,979) (0.01)%
Net assets attributable to holders of redeemable participating shares 39,516,050 100.00%
Nominal Security Classification Fair Value
GBP
% of
Net Assets
Financial assets at fair value through profit or loss

SANLAM UNIVERSAL FUNDS PLC
251
PORTFOLIO OF INVESTMENTS OF SANLAM ACCEL INCOME FUND (CONTINUED) as at 30 June 2017
Sanlam Accel Income Fund
Summary
Classification Description
Fair Value % of % of
GBP Net
Assets Total
Assets
Transferable securities and money market instruments admitted to official stock exchange listing or traded on regulated market - - -
A Transferable securities and money market instruments other than those referred above - - -
B UCITS and AIFs
38,198,816 96.67% 96.35%
C Financial derivative instruments dealt in on a regulated market - - -
D Over the counter financial derivative instruments - - -
Cash and cash equivalents
1,320,213 3.34% 3.33%
Other net assets and liabilities
(2,979) (0.01)% (0.01)%
Net assets attributable to holders of redeemable participating shares 39,516,050 100.00%

SANLAM UNIVERSAL FUNDS PLC
252
PORTFOLIO OF INVESTMENTS OF SATRIX NORTH AMERICA EQUITY TRACKER FUND as at 30 June 2017
Equities – 99.46%
Bermuda – 0.53%
1,583 ArchCapitalGroupLtd 147,678 0.20%
671 BungeLimited 50,057 0.07%
1,606 InvescoLtd 56,515 0.08%
2,760 MarvellTechnologyGroupLtd 45,595 0.06%
1,941 XLGroupLimited 85,016 0.12%
Total Bermuda 384,861 0.53%
Canada – 5.48%
910 Agnico-EagleMines 40,964 0.06%
516 AgriumInc 46,683 0.06%
2,239 AlimentationCouche-TardInc 107,133 0.15%
1,674 ARCResourcesLtd 21,854 0.03%
2,217 BankofMontreal 162,499 0.23%
3,826 BankofNovaScotia 229,748 0.32%
3,590 BarrickGoldCorp. 57,010 0.08%
949 BCEInc 42,662 0.06%
2,525 BlackBerryLtd 25,190 0.03%
11,044 BombardierInc 20,063 0.03%
3,512 BrookfieldAssetManage-ClA 137,577 0.19%
1,571 CamecoCorp. 14,282 0.02%
1,331 CanImperialBkofCommerce 107,978 0.15%
2,741 CanadianNationalRailwayCo. 222,006 0.31%
3,791 CanadianNaturalResources 109,198 0.15%
534 CanadianPacificRailwayLtd 85,766 0.12%
2,679 CenovusEnergyInc 19,715 0.03%
1,091 CGIGroupInc. 55,646 0.08%
2,110 CrescentPointEnergyCorp 16,112 0.02%
5,408 EnbridgeInc 215,054 0.30%
3,778 EncanaCorp 33,182 0.05%
2,198 FirstQuantumMinerals 18,561 0.03%
2,750 FortisInc 96,486 0.13%
680 Franco-NevadaCorporation 48,978 0.07%
2,312 GoldcorpInc 29,756 0.04%
1,231 HuskyEnergyInc 13,948 0.02%
1,017 ImperialOilLtd 29,592 0.04%
942 IntactFinancialCorporation 71,033 0.10%
1,073 LoblawCompaniesLtd. 59,585 0.08%
1,695 MagnaInternationalInc-CLA 78,376 0.11%
6,925 ManulifeFinancialCorp 129,587 0.18%
502 MethanexCorp 22,123 0.03%
1,781 NationalBankOfCanada 74,758 0.10%
1,724 PembinaPipelineCorporation 56,998 0.08%
2,884 PotashCorpofSaskatchewan 46,953 0.07%
1,561 PowerCorp.OfCanada 35,543 0.05%
1,171 PrairieSkyRoyaltyLtd 26,618 0.04%
1,696 RogersCommunicationsInc 79,963 0.11%
Nominal Security Classification Fair Value
USD
% of
Net Assets
Financial assets at fair value through profit or loss

SANLAM UNIVERSAL FUNDS PLC
253
PORTFOLIO OF INVESTMENTS OF SATRIX NORTH AMERICA EQUITY TRACKER FUND (CONTINUED)
as at 30 June 2017
Equities – 99.46% (continued)
Canada – 5.48% (continued)
4,737 RoyalBankofCanada 343,342 0.48%
2,520 ShawCommunicationsInc. 54,877 0.08%
2,443 SunLifeFinancialInc 87,181 0.12%
5,494 SuncorEnergyInc 160,240 0.22%
1,722 TeckResourcesLtd 29,798 0.04%
1,707 ThomsonReutersCorporation 78,892 0.11%
5,838 Toronto-DominionBank 293,675 0.41%
3,256 TranscanadaCorp 154,943 0.21%
1,321 ValeantPharmaceuticalsInternational 22,920 0.03%
1,345 WheatonPreciousMetalsCorp 26,670 0.04%
5,102 YamanaGoldInc 12,293 0.02%
Total Canada 3,954,011 5.48%
Great Britain – 0.45%
1,045 Aon Plc 138,933 0.19%
2,202 Liberty Global Plc 70,728 0.10%
783 Liberty Global Plc - Series C 24,414 0.03%
1,314 Nielsen Holdings Plc 50,799 0.07%
1,440 Technipfmc Plc 39,168 0.05%
Total Great Britain 324,042 0.45%
Ireland – 2.19%
1,996 Accenture PLC 246,865 0.34%
1,193 Allergan Plc 290,006 0.40%
1,575 Eaton Corp Plc 122,582 0.17%
1,188 Ingersoll-Rand Plc 108,571 0.15%
3,256 Johnson Controls International PLC 141,180 0.20%
499 Mallinckrodt PLC 22,360 0.03%
4,499 Medtronic Plc 399,286 0.55%
899 Pentair Plc 59,819 0.08%
536 Perrigo Company Plc 40,479 0.06%
1,165 Seagate Technology 45,144 0.06%
4,149 Weatherford International Plc 16,057 0.02%
627 Willis Towers Watson PLC 91,235 0.13%
Total Ireland 1,583,585 2.19%
Jersey Channel Islands – 0.13%
1,074 Delphi Automotive Plc 94,136 0.13%
Total Jersey Channel Islands 94,136 0.13%
Liberia – 0.10%
658 Royal Caribbean Cruises Ltd 71,873 0.10%
Total Liberia 71,873 0.10%
Nominal Security Classification Fair Value
USD
% of
Net Assets
Financial assets at fair value through profit or loss (continued)

SANLAM UNIVERSAL FUNDS PLC
254
PORTFOLIO OF INVESTMENTS OF SATRIX NORTH AMERICA EQUITY TRACKER FUND (CONTINUED)
as at 30 June 2017
Equities – 99.46% (continued)
Netherlands – 0.22%
1,166 LyondellBasell Industries NV 98,399 0.14%
1,578 Mylan NV 61,258 0.08%
Total Netherlands 428,877 0.22%
Singapore – 0.43%
1,325 Broadcom Limited Designs 308,791 0.43%
Total Singapore 308,791 0.43%
Switzerland – 0.14%
1,330 TE Connectivity Ltd 104,644 0.14%
Total Switzerland 104,644 0.14%
United States – 89.64%
1,848 3MCompany 384,735 0.53%
5,420 AbbottLabs 263,466 0.37%
5,144 AbbVieInc 372,991 0.52%
2,230 ActivisionBlizzardInc 128,381 0.18%
1,726 AdobeSystemsInc 244,125 0.34%
2,949 AESCorp 32,763 0.05%
1,177 AetnaInc-New 178,704 0.25%
273 AffiliatedManagersGroup 45,280 0.06%
1,159 AflacInc. 90,031 0.12%
1,591 AgilentTechnologiesInc. 94,362 0.13%
2,388 AGNCInvestmentCorp 50,841 0.07%
671 AirProducts&ChemicalsInc 95,993 0.13%
771 AkamaiTechnologiesInc 38,404 0.05%
786 AlexionPharmaceuticalsInc 95,633 0.13%
261 AllianceDataSystemsCorp 66,996 0.09%
1,487 AllstateCorp 131,510 0.18%
795 AlphabetIncClA 739,096 1.02%
1,063 AlphabetIncClC 965,980 1.34%
6,084 AltriaGroupInc 453,075 0.63%
1,268 Amazon.ComInc 1,227,424 1.70%
1,044 AmeradaHessCorp 45,800 0.06%
1,440 AmerenCorporation 78,725 0.11%
826 AmericanAirlinesGroupInc 41,564 0.06%
1,599 AmericanElectricPower 111,083 0.15%
2,499 AmericanExpress 210,516 0.29%
3,155 AmericanInternationalGroup 197,251 0.27%
1,493 AmericanTowerCorp 197,554 0.27%
657 AmeripriseFinancial 83,630 0.12%
657 AmerisourcebergenCorp 62,106 0.09%
1,046 AmetekInc 63,356 0.09%
2,370 AmgenCorpComNpv 408,185 0.57%
1,436 AmphenolCorp-CLA 106,006 0.15%
Nominal Security Classification Fair Value
USD
% of
Net Assets
Financial assets at fair value through profit or loss (continued)

SANLAM UNIVERSAL FUNDS PLC
255
PORTFOLIO OF INVESTMENTS OF SATRIX NORTH AMERICA EQUITY TRACKER FUND (CONTINUED)
as at 30 June 2017
Equities – 99.46% (continued)
United States – 89.64% (continued)
1,849 AnadarkoPetroleumCorp 83,834 0.12%
1,330 AnalogDevicesInc. 103,474 0.14%
5,189 AnnalyMortgageManagement 62,527 0.09%
804 AnthemInc 151,257 0.21%
1,297 ApacheCorp 62,165 0.09%
16,504 AppleInc 2,376,906 3.29%
3,834 AppliedMaterialIncComStkNPV 158,383 0.22%
1,983 Archer-Daniels-MidlandCo. 82,057 0.11%
1,544 ARCONICINC 34,972 0.05%
19,306 AT&TInc 728,415 1.01%
925 AutodeskInc 93,259 0.13%
1,595 AutomaticDataProcessing 163,424 0.23%
124 Autozone 70,737 0.10%
541 AvalonBayCommunitiesInc. 103,964 0.14%
1,284 BakerHughes 69,991 0.10%
1,266 BallCorp 53,438 0.07%
3,407 BankNewYorkMellon 173,825 0.24%
31,731 BankofAmericaCorp 769,794 1.07%
1,972 BaxterInternational 119,385 0.17%
2,901 BB&TCorporation 131,734 0.18%
802 BectonDickinson&Co 156,478 0.22%
644 BedBath&BeyondInc. 19,578 0.03%
3,685 BerkshireHathawayInc. 624,128 0.86%
1,165 BestBuyCoInc 66,789 0.09%
677 BiogenInc 183,711 0.25%
792 BiomarinPharmaceuticalinc 71,929 0.10%
397 BlackrockInc 167,697 0.23%
1,867 BoeingComUSD5 369,199 0.51%
1,179 BorgwarnerIncorporated 49,942 0.07%
689 BostonPropertiesInc 84,761 0.12%
5,284 BostonScientificCorp 146,472 0.20%
5,269 Bristol-MyrsSquib 293,589 0.41%
793 C.H.RobinsonWorldwideInc 54,463 0.08%
1,453 CAInc 50,085 0.07%
1,836 CABOTOIL&GASCORP 46,047 0.06%
1,564 CapitalOneFinancialCorp 129,218 0.18%
1,189 CardinalHealth 92,647 0.13%
789 CarmaxInc 49,754 0.07%
1,837 CaterpillarInc 197,404 0.27%
1,601 CBREGroupInc 58,276 0.08%
1,325 CBSCorp-CLB 84,509 0.12%
658 CelaneseCorp-Series 62,471 0.09%
2,505 CelgeneCorp 325,324 0.45%
2,898 CenterpointEnergyInc 79,347 0.11%
1,615 CenturyLinkInc 38,566 0.05%
1,181 CernerCorp 78,501 0.11%
1,016 CFIndustriesHoldingsInc 28,407 0.04%
Nominal Security Classification Fair Value
USD
% of
Net Assets
Financial assets at fair value through profit or loss (continued)

SANLAM UNIVERSAL FUNDS PLC
256
PORTFOLIO OF INVESTMENTS OF SATRIX NORTH AMERICA EQUITY TRACKER FUND (CONTINUED)
as at 30 June 2017
Equities – 99.46% (continued)
United States – 89.64% (continued)
4,116 CharlesSchwabCorp 176,823 0.24%
679 CharterCommunicationInc 228,721 0.32%
1,027 CheniereEnergyInc 50,025 0.07%
5,560 ChevronCorp 580,075 0.80%
127 ChipotleMexicanGrillInc 52,845 0.07%
1,317 Church&DwightCoInc 68,326 0.09%
915 CignaCorp 153,162 0.21%
397 CimarexEnergyCo 37,322 0.05%
15,463 CiscoSystems 483,992 0.67%
1,244 CITGroupInc 60,583 0.08%
8,738 CitigroupInc 584,397 0.81%
790 CitrixSystemsInc 62,868 0.09%
533 CloroxCompany 71,017 0.10%
1,318 CMEGroupInc 165,066 0.23%
1,146 CoachInc 54,252 0.08%
12,019 Coca-ColaCo. 539,052 0.75%
2,084 CognizantTechSolutionsCRP 138,378 0.19%
2,650 Colgate-PalmoliveCom 196,445 0.27%
14,424 ComcastCorp-CLA 561,382 0.78%
1,869 ConagraBrandsInc 66,835 0.09%
534 ConchoResourcesInc 64,897 0.09%
3,950 Conocophillips 173,642 0.24%
1,075 ConsolidatedEdisonInc 86,882 0.12%
662 ConstellationBrands 128,249 0.18%
3,573 CorningInc 107,369 0.15%
1,335 CostcoWholesaleCorp 213,507 0.30%
1,452 CrownCastleInternationalCorporation 145,461 0.20%
477 CrownHoldingsInc 28,458 0.04%
3,168 CSXCorp 172,846 0.24%
649 CumminsInc 105,281 0.15%
3,165 CVSHealthCorporation 254,656 0.35%
2,114 DanaherCorp 178,400 0.25%
792 DavitaInc 51,290 0.07%
1,031 Deere&Co 127,421 0.18%
795 DellTechnologiesInc 48,582 0.07%
1,624 DevonEnergyCorporation 51,919 0.07%
1,442 DiscoverFinancialServices 89,678 0.12%
1,807 DiscoveryCommunicationsInc 45,559 0.06%
1,023 DISHNetworkCorporation 64,203 0.09%
929 DollarGeneralCorp 66,972 0.09%
915 DollarTreeStoresInc 63,977 0.09%
2,005 DominionEnergyInc 153,643 0.21%
661 DoverCorp. 53,025 0.07%
3,544 DowChemicalCo 223,520 0.31%
1,565 DRHortonInc 54,102 0.07%
901 DrPepperSnappleGroup 82,090 0.11%
920 DTEEnergyCo 97,327 0.13%
Nominal Security Classification Fair Value
USD
% of
Net Assets
Financial assets at fair value through profit or loss (continued)

SANLAM UNIVERSAL FUNDS PLC
257
PORTFOLIO OF INVESTMENTS OF SATRIX NORTH AMERICA EQUITY TRACKER FUND (CONTINUED)
as at 30 June 2017
Equities – 99.46% (continued)
United States – 89.64% (continued)
2,766 DuPontDeNemours 223,244 0.31%
2,109 DukeEnergyCorp 176,291 0.24%
1,130 DxcTechnologyCo 86,694 0.12%
664 EastmanChemicalCo 55,769 0.08%
3,449 eBayInc. 120,439 0.17%
921 EcolabInc 122,263 0.17%
1,220 EdisonInternational 95,392 0.13%
797 EdwardsLifesciencesCorp 94,237 0.13%
1,304 ElectronicArtsInc 137,859 0.19%
1,989 EmersonElectricCo 118,584 0.16%
884 EntergyCorp. 67,865 0.09%
1,964 EogResourcesInc 177,781 0.25%
291 EquinixInc 124,886 0.17%
782 EquitableResourcesInc 45,817 0.06%
1,324 EquityResidential 87,159 0.12%
787 EsteeLauderCos 75,536 0.10%
1,453 EversourceEnergy 88,212 0.12%
2,917 ExelonCorp 105,216 0.15%
1,584 ExpditorsIntlWash 89,464 0.12%
1,954 ExpressScriptsHoldingsInc 124,743 0.17%
12,257 ExxonCorp 989,508 1.37%
385 F5Networks 48,918 0.07%
7,396 FacebookInc 1,116,648 1.55%
1,165 FastenalCo 50,712 0.07%
804 FDXCorp 174,733 0.24%
1,351 FidelityNationalInformation 115,375 0.16%
3,813 FifthThirdBancorp 98,985 0.14%
1,816 FirstEnergyCorp 52,955 0.07%
942 FiservInc 115,244 0.16%
689 FluorCorp(New) 31,542 0.04%
785 FMCCorporation 57,344 0.08%
10,836 FordMotorCo 121,255 0.17%
1,444 FortiveCorporation 91,477 0.13%
1,531 FranklinResourcesInc 68,573 0.10%
4,213 Freeport-McmoranInc 50,598 0.07%
919 GeneralDynamicsCorporation 182,054 0.25%
26,558 GeneralElectricCo 717,332 0.99%
1,967 GeneralMillsInc 108,972 0.15%
4,279 GeneralMotorsCo 149,465 0.21%
1,135 GenuinePartsCo. 105,283 0.15%
2,175 GGPInc 51,243 0.07%
4,091 GileadSciencesInc 289,561 0.40%
1,173 GoldmanSachsGroup 260,289 0.36%
264 Grainger(W.W.)Inc. 47,660 0.07%
1,302 H&RBlockInc 40,245 0.06%
2,791 HalliburtonCo 119,204 0.17%
914 HarleyDavidson 49,374 0.07%
Nominal Security Classification Fair Value
USD
% of
Net Assets
Financial assets at fair value through profit or loss (continued)

SANLAM UNIVERSAL FUNDS PLC
258
PORTFOLIO OF INVESTMENTS OF SATRIX NORTH AMERICA EQUITY TRACKER FUND (CONTINUED)
as at 30 June 2017
Equities – 99.46% (continued)
United States – 89.64% (continued)
1,562 HartfordFinlServ 82,114 0.11%
1,072 HCAHealthcareInc 93,478 0.13%
2,574 HCPINC 82,265 0.11%
445 Helmerich&PayneInc 24,181 0.03%
506 HenryScheinInc 92,608 0.13%
771 HersheyFoodsCorp 82,782 0.11%
4,789 HewlettPackardEnterprise 79,450 0.11%
840 HollyFrontierCorporation 23,075 0.03%
3,711 HomeDepot 569,267 0.79%
2,254 HoneywellInternationalINC 300,436 0.42%
3,433 HostHotels&ResortsInc 62,721 0.09%
5,800 HPInc 101,384 0.14%
528 HumanaInc 127,047 0.18%
1,078 IllinoisToolWorks 154,424 0.21%
526 IlluminaInc 91,272 0.13%
663 IncyteCorp 83,478 0.12%
14,162 IntelCorp 477,826 0.66%
2,229 IntercontinentalExchangeInc 146,936 0.20%
1,449 InternationalPaperCo 82,028 0.11%
2,450 InterpublicGroupCos.Inc. 60,270 0.08%
2,671 IntlBusinessMachine 410,880 0.57%
952 IntuitInc 126,435 0.18%
139 INTUITIVESURGICALINC 130,016 0.18%
789 JacobsEngineeringGroupInc 42,914 0.06%
529 JMSmuckerCo/The-NewCom 62,597 0.09%
8,223 Johnson&Johnson 1,087,821 1.51%
10,264 JPMorganChase&Co 938,130 1.30%
1,344 JuniperNetworksInc 37,471 0.05%
413 KansasCitySouthern 43,220 0.06%
1,035 KelloggCo 71,891 0.10%
5,492 Keycorp 102,920 0.14%
1,067 KimberleyClarkCorpCOMUSD1.25 137,760 0.19%
2,000 KIMCOREALTYCORP 36,700 0.05%
6,289 KinderMorganInc 120,497 0.17%
650 Kla-TencorCorp. 59,482 0.08%
746 KohlsCorporation 28,848 0.04%
2,113 KraftHeinzCompany 180,957 0.25%
2,880 KrogerCo 67,162 0.09%
801 LBrandsInc 43,166 0.06%
528 LaboratoryCRPofAmerHldgs 81,386 0.11%
667 LAMResearchCorporation 94,334 0.13%
1,309 LasVegasSandsCorp 83,632 0.12%
1,017 LennarCorp-ClA 54,226 0.08%
1,195 Level3CommunicationInc 70,864 0.10%
1,688 LibertyMedia-InteractiveA 41,424 0.06%
1,695 LibertySiriusGroup 70,982 0.10%
3,175 Lilly(Eli)&Co 261,303 0.36%
Nominal Security Classification Fair Value
USD
% of
Net Assets
Financial assets at fair value through profit or loss (continued)

SANLAM UNIVERSAL FUNDS PLC
259
PORTFOLIO OF INVESTMENTS OF SATRIX NORTH AMERICA EQUITY TRACKER FUND (CONTINUED)
as at 30 June 2017
Equities – 99.46% (continued)
United States – 89.64% (continued)
967 LincolnNationalCorp. 65,350 0.09%
1,647 LKQCorp 54,269 0.08%
753 LockheedMartinCorpCOMSTKUSD0.01 209,040 0.29%
1,584 LoewsCorp 74,147 0.10%
2,761 LowesCom 214,060 0.30%
683 M&TBankCorp 110,612 0.15%
754 MacerichCo/The 43,777 0.06%
1,033 Macy'sInc 24,007 0.03%
520 ManpowerInc. 58,058 0.08%
3,149 MarathonOilCorporation 37,316 0.05%
1,950 MarathonPetroleumCorp 102,044 0.14%
1,295 MarriottInternationalInc. 129,901 0.18%
1,872 Marsh&McLennanCos 145,941 0.20%
1,823 MascoCorp 69,657 0.10%
3,055 MastercardIncorporated 371,030 0.51%
1,475 MattelInc 31,757 0.04%
1,287 MaximIntegratedProducts 57,786 0.08%
2,630 McDonald'sCorpNPV 402,811 0.56%
779 MckessonCorp 128,177 0.18%
8,590 Merck&Co 550,533 0.76%
2,739 MetlifeInc 150,481 0.21%
1,796 MGMResortsInternational 56,197 0.08%
3,673 MicronTechnologyInc 109,676 0.15%
22,977 MicrosoftCorp 1,583,805 2.19%
384 MohawkIndustriesInc 92,809 0.13%
665 MolsonCoorsBrewingCo-B 57,416 0.08%
4,739 MondelezInternationalInc 204,677 0.28%
1,455 MonsantoCo 172,214 0.24%
1,588 MonsterBeverageCorporation 78,892 0.11%
786 Moody'sCorp 95,640 0.13%
4,633 MorganStanley 206,446 0.29%
652 MotorolaSolutionsInc 56,554 0.08%
848 MurphyOilCorp 21,734 0.03%
1,275 National-OilwellInc 41,999 0.06%
1,552 NavientCorporation-WhenDistribute 25,841 0.04%
1,309 NetappInc 52,425 0.07%
1,446 NetflixInc 216,047 0.30%
1,735 NewellBrandsInc 93,031 0.13%
1,503 NewmontMiningCorp 48,682 0.07%
1,904 NewsCorporation 26,085 0.04%
1,470 NextEraEnergyInc 205,991 0.29%
4,237 NikeInc 249,983 0.35%
1,559 NobleEnergyInc 44,120 0.06%
615 NordstromInc. 29,415 0.04%
951 NorfolkSouthernCorp 115,737 0.16%
1,060 NorthernTrustCorp 103,043 0.14%
Nominal Security Classification Fair Value
USD
% of
Net Assets
Financial assets at fair value through profit or loss (continued)

SANLAM UNIVERSAL FUNDS PLC
260
PORTFOLIO OF INVESTMENTS OF SATRIX NORTH AMERICA EQUITY TRACKER FUND (CONTINUED)
as at 30 June 2017
Equities – 99.46% (continued)
United States – 89.64% (continued)
659 NorthropGrummanCorp 169,172 0.23%
1,067 NucorCorp. 61,747 0.09%
1,842 NvidiaCorp 266,280 0.37%
5,917 NYComBancorp 77,690 0.11%
2,230 OccidentalPetroleumCorp 133,510 0.18%
934 OmnicomGroup 77,429 0.11%
1,193 OneokIncNew 62,227 0.09%
9,495 OracleCorpComStkUSD0.01 476,079 0.66%
383 O'ReillyAutomotiveInc 83,777 0.12%
1,449 PaccarInc 95,692 0.13%
647 ParkerHannifinCorp 103,404 0.14%
1,475 PaychexIncComSTKUSD0.01 83,987 0.12%
3,782 PaypalHolidingsInc 202,980 0.28%
4,355 PepsicoIncCom 502,959 0.70%
18,634 PfizerInc 625,916 0.87%
1,853 PG&ECorp 122,984 0.17%
4,758 PhilipMorrisInternational 558,827 0.77%
1,550 Phillips66 128,170 0.18%
651 PioneerNatRes 103,887 0.14%
1,591 PNCFinancialServicesGroupInc 198,668 0.28%
915 PPGIndustriesInc 100,613 0.14%
2,216 PPLCorporation 85,671 0.12%
921 PraxairInc 122,079 0.17%
139 PricelineGroupIncorporated 260,002 0.36%
1,316 PrincipalFinancialGroup 84,316 0.12%
7,647 Procter&Gamble 666,436 0.92%
3,032 ProgressiveCorp-Ohio 133,681 0.19%
2,269 PrologisInc 133,054 0.18%
1,442 PrudentialFinancial 155,938 0.22%
1,734 PublicServiceEnterpriseGroup 74,579 0.10%
522 PublicStorageInc 108,853 0.15%
1,829 PulteGroupInc 44,865 0.06%
395 PVHCorp 45,228 0.06%
4,587 QualcommInc 253,294 0.35%
804 QuestDiagnosticsInc. 89,373 0.12%
826 RangeResourcesCorporation 19,138 0.03%
1,065 RaytheonCompany 171,976 0.24%
1,572 RealtyIncomeCorp 86,743 0.12%
796 RedHatInc 76,217 0.11%
266 RegeneronPharmaceuticals 130,643 0.18%
6,707 RegionsFinancialCorp 98,190 0.14%
1,306 RepublicServInc 83,231 0.12%
2,920 ReynoldsAmericanINC 189,917 0.26%
770 RockwellCollins 80,912 0.11%
524 RockwellInternationalCorp 84,867 0.12%
421 RoperTechnologiesInc 97,474 0.14%
1,557 RossStoresInc 89,886 0.12%
Nominal Security Classification Fair Value
USD
% of
Net Assets
Financial assets at fair value through profit or loss (continued)

SANLAM UNIVERSAL FUNDS PLC
261
PORTFOLIO OF INVESTMENTS OF SATRIX NORTH AMERICA EQUITY TRACKER FUND (CONTINUED)
as at 30 June 2017
Equities – 99.46% (continued)
United States – 89.64% (continued)
933 S&PGlobalInc 136,209 0.19%
2,234 SALESFORCECOMINC 193,464 0.27%
654 SbaCommunicationsCorporation 88,225 0.12%
4,089 Schlumberger 269,220 0.37%
918 SempraEnergy 103,505 0.14%
272 Sherwin-WilliamsCo. 95,461 0.13%
930 SimonPropertyGroupInc 150,437 0.21%
8,288 SiriusXMHoldingsInc 45,335 0.06%
679 SkyworksSolutionsInc 65,150 0.09%
3,024 SouthernCo/The 144,789 0.20%
4,809 SprintCorp 39,482 0.05%
648 StanleyBlack&DeckerInc 91,193 0.13%
2,751 StaplesInc. 27,703 0.04%
4,760 StarbucksCorp. 277,556 0.38%
1,455 StateStreetCorp 130,557 0.18%
1,317 StrykerCorp. 182,773 0.25%
2,248 SuntrustBanksInc 127,507 0.18%
2,795 SymantecCorp 78,959 0.11%
1,972 SyscoCorp 99,251 0.14%
927 TRowePriceGroup 68,793 0.10%
1,662 TargetCorp 86,906 0.12%
414 TeslaInc 149,707 0.21%
518 TesoroPetroleumCrp 48,485 0.07%
2,650 TexasInstruments 203,865 0.28%
1,303 TextronInc 61,371 0.09%
1,342 TheMosiacCompany 30,638 0.04%
1,321 ThermoFisherScientificInc 230,475 0.32%
522 Tiffany&Co. 49,000 0.07%
2,391 TimeWarnerInc 240,080 0.33%
2,109 TJXCosIncNew 152,207 0.21%
538 TractorSupplyCompany 29,165 0.04%
1,041 TravelersCosInc/The 131,718 0.18%
1,421 TrimbleNavigationLtd 50,687 0.07%
526 TripadvisorInc. 20,093 0.03%
1,533 TwentyFirstCenturyFoxInc. 43,445 0.06%
3,444 Twenty-FirstCentFox-ClassB 95,984 0.13%
2,353 TwitterInc 42,048 0.06%
1,065 TysonFoodsInc-CLA 66,701 0.09%
271 UltaSalonCosmetics&FragrancesInc 77,869 0.11%
39 UnderArmourInc 786 0.00%
1,515 UnderArmourIncClassA 32,966 0.05%
2,515 UnionPacificCorp 273,909 0.38%
544 UnitedContinentalHoldings 40,936 0.06%
2,946 UnitedHealthcareCorp 546,247 0.76%
1,967 UnitedParcelServiceInc 217,531 0.30%
1,343 UnumGroup 62,624 0.09%
5,294 USBancorp 274,864 0.38%
Nominal Security Classification Fair Value
USD
% of
Net Assets
Financial assets at fair value through profit or loss (continued)

SANLAM UNIVERSAL FUNDS PLC
262
PORTFOLIO OF INVESTMENTS OF SATRIX NORTH AMERICA EQUITY TRACKER FUND (CONTINUED)
as at 30 June 2017
Equities – 99.46% (continued)
United States – 89.64% (continued)
1,723 USDWasteServices 126,382 0.18%
2,350 UTDTechnologies 286,959 0.40%
1,457 ValeroEnergyCorp 98,289 0.14%
661 VarianMedicalSystems 68,209 0.09%
1,615 VentasInc 112,210 0.16%
509 VeriSignInc 47,317 0.07%
920 VeriskAnalyticsInc 77,620 0.11%
12,705 VerizonCommunicationsInc 567,405 0.79%
922 VertexPharmaceuticalsInc 118,818 0.16%
1,168 VFCorporation 67,277 0.09%
1,167 ViacomInc-ClassB 39,176 0.05%
5,834 VisaINC-ClassAShares 547,113 0.76%
523 VMWareInc-ClassA 45,726 0.06%
715 VornadoRealtyTrust 67,139 0.09%
649 VulcanMaterialsCo. 82,215 0.11%
2,895 WalgreensBootsAllianceInc 226,707 0.31%
4,480 Wal-MartStoresInc 339,046 0.47%
4,493 WaltDisneyCo 477,381 0.66%
395 WatersCorp. 72,617 0.10%
14,222 WellsFargo&Co 788,041 1.09%
1,591 WelltowerInc 119,086 0.16%
1,035 WesternDigitalCorporation 91,701 0.13%
2,302 WesternUnionCo 43,853 0.06%
1,325 WestrockCompany 75,075 0.10%
2,781 WeyerhaeuserCo 93,164 0.13%
282 WhirlpoolCorp 54,037 0.07%
1,435 WholeFoodsMarketInc 60,428 0.08%
3,161 WilliamsCompanies 95,715 0.13%
537 WorkdayIncClassA 52,089 0.07%
1,604 WRBerkleyCorp 110,949 0.15%
619 WyndhamWorldwideCorp 62,154 0.09%
280 WynnResortsLtd 37,554 0.05%
2,229 XcelEnergyInc 102,267 0.14%
913 XeroxCorporation 26,230 0.04%
1,034 XilinxInc 66,507 0.09%
1,456 YumBrandsInc 107,395 0.15%
883 ZillowGroupInc 43,276 0.06%
787 ZimmerBiometHoldingsInc 101,051 0.14%
1,717 ZoetisInc. 107,106 0.15%
Total United States 64,509,798 89.64%
Virgin Islands – 0.04%
748 Michael Kors Holdings Ltd 27,115 0.04%
Total Virgin Islands 27,115 0.04%
Total Equities 71,791,210 99.46%
Nominal Security Classification Fair Value
USD
% of
Net Assets
Financial assets at fair value through profit or loss (continued)

SANLAM UNIVERSAL FUNDS PLC
263
PORTFOLIO OF INVESTMENTS OF SATRIX NORTH AMERICA EQUITY TRACKER FUND (CONTINUED)
as at 30 June 2017
Derivative Financial Instruments Rights – 0.00% United States – 0.00%
970 Safeway Stores Inc 516 0.00%
Total United States 516 0.00%
Total Rights 516 0.00%
Total financial assets at fair value through profit or loss 71,791,726 99.46%
Cash and cash equivalents 293,901 0.41%
Other net assets and liabilities 93,894 0.13%
Net assets attributable to holders of redeemable participating shares 72,179,521 100.00%
Satrix North America Equity Tracker Fund
Summary
Classification Description
Fair Value % of % of
USD Net
Assets Total
Assets
Transferable securities and money market instruments admitted to official stock exchange listing or traded on regulated market 71,791,210 99.46% 99.41%
A Transferable securities and money market instruments other than those referred above 516 0.00% 0.00%
B UCITS and AIFs
- - -
C Financial derivative instruments dealt in on a regulated market - - -
D Over the counter financial derivative instruments - - -
Cash and cash equivalents
293,901 0.41% 0.41%
Other net assets and liabilities
93,894 0.13% 0.13%
Net assets attributable to holders of redeemable participating shares 72,179,521 100.00%
Nominal Security Classification Fair Value
USD
% of
Net Assets
Financial assets at fair value through profit or loss (continued)

SANLAM UNIVERSAL FUNDS PLC
264
PORTFOLIO OF INVESTMENTS OF SATRIX UK EQUITY TRACKER FUND as at 30 June 2017
Equities - 99.06%
Germany - 0.26%
11,322 Tui Ag 126,693 0.26%
Total Germany 126,693 0.26%
Great Britain - 94.28%
26,020 3I Group Plc 234,831 0.48%
23,658 Aberdeen Asset Management Plc 71,447 0.15%
5,711 Admiral Group Plc 114,391 0.23%
34,278 Anglo American PLC 351,007 0.72%
10,386 Antofagasta Plc 83,036 0.17%
13,055 Ashtead Group Plc 207,444 0.43%
9,241 Associated British Foods Plc 271,316 0.56%
32,775 Astrazeneca Plc 1,682,996 3.46%
26,863 Auto Trader Group Plc 102,079 0.21%
105,525 Aviva Plc 555,062 1.14%
6,515 Babcock Intl Group Plc 57,365 0.12%
438,944 Barclays Plc 889,959 1.83%
24,498 Barratt Development 138,046 0.28%
54,604 Bhp Billiton Plc 642,143 1.32%
503,221 BP Plc 2,228,263 4.58%
81,960 British Aerospace Plc 519,217 1.07%
48,378 British American Tobacco Plc 2,532,105 5.21%
26,619 British Land 161,178 0.33%
219,440 BT Group Plc 646,799 1.33%
8,886 Bunzl Plc 203,312 0.42%
11,861 Burberry Group Plc 197,011 0.40%
18,292 Capita Group Plc 126,489 0.26%
4,745 Carnival Plc 241,046 0.50%
24,483 Carphone Warehouse Group Plc 69,434 0.14%
138,551 Centrica Plc 277,379 0.57%
63,354 Cobham Plc 82,107 0.17%
40,987 Compass Group PLC 663,989 1.37%
30,133 Convatec Group Plc 96,185 0.20%
3,414 Croda International Plc 132,634 0.27%
65,154 Diageo 1,478,018 3.04%
35,653 Direct Line Insurance Group Plc 126,711 0.26%
4,145 Easyjet Plc 56,331 0.12%
24,056 Experian Group Ltd 378,882 0.78%
6,342 Fresnillo Plc 94,242 0.19%
Nominal Security Classification Fair Value
GBP
% of
Net Assets
Financial assets at fair value through profit or loss

SANLAM UNIVERSAL FUNDS PLC
265
SANLAM PORTFOLIO OF INVESTMENTS OF SATRIX UK EQUITY TRACKER FUND (CONTINUED)
as at 30 June 2017
Equities - 99.06% (continued)
Great Britain - 94.28% (continued)
41,593 G4S PLC 135,760 0.28%
47,414 GKN Plc 154,570 0.32%
127,816 GlaxoSmithKline Plc 2,090,431 4.30%
20,905 Hammerson Plc 120,099 0.25%
6,298 Hargreaves Lansdowne Plc 82,000 0.17%
3,304 Hikma Pharmaceuticals Plc 48,569 0.10%
512,454 HSBC Holdings 3,647,135 7.50%
6,612 IMI Plc 79,013 0.16%
24,789 Imperial Brands Plc 854,849 1.76%
11,178 Inmarsat Plc 86,015 0.18%
4,743 InterContinental Hotels Group PLC 202,384 0.42%
4,032 Intertek Group Plc 170,029 0.35%
23,667 Intu Properties Plc 63,688 0.13%
16,066 Investec PLC 92,139 0.19%
94,872 ITV PLC 172,098 0.35%
4,836 Johnson Matthey PLC 138,842 0.29%
60,791 Kingfisher Plc 182,799 0.38%
20,813 Land Securities Group Plc 210,836 0.43%
155,580 Legal & General Group Plc 401,863 0.83%
1,838,436 Lloyds Bank Plc 1,216,125 2.50%
8,134 London Stock Exchange Group Plc 296,566 0.61%
40,312 Marks & Spencer Plc 134,360 0.28%
9,326 Mediclinic International Plc 69,152 0.14%
19,483 Meggitt Plc 92,914 0.19%
16,459 Merlin Entertainments Plc 79,086 0.16%
9,965 Mondi Plc 200,695 0.41%
53,496 Morrison Supermarkets Plc 129,032 0.26%
89,534 National Grid Plc 852,185 1.75%
3,784 Next PLC 145,911 0.30%
124,756 Old Mutual Plc 241,278 0.50%
20,606 Pearson 142,490 0.29%
8,363 Persimmon Plc 187,498 0.39%
6,714 Petrofac Ltd 29,676 0.06%
3,872 Provident Financial Plc 94,206 0.19%
66,846 Prudential Corp 1,177,158 2.42%
17,109 Reckitt Benckiser Group Plc 1,331,765 2.74%
28,393 Reed Elsevier plc 471,324 0.97%
31,968 Rio Tinto Plc 1,036,403 2.13%
42,578 Rolls-Royce Holdings Plc 379,370 0.78%
91,600 Royal Bank of Scotland Group 226,435 0.47%
Nominal Security Classification Fair Value
GBP
% of
Net Assets
Financial assets at fair value through profit or loss (continued)

SANLAM UNIVERSAL FUNDS PLC
266
UNI PORTFOLIO OF INVESTMENTS OF SATRIX UK EQUITY TRACKER FUND (CONTINUED)
as at 30 June 2017
Equities - 99.06% (continued)
Great Britain - 94.28% (continued)
211,248 Royal Dutch Shell Plc 4,325,403 8.90
25,644 Royal Mail Plc 108,013 0.22%
25,822 RSA Insurance Group Plc 158,934 0.33%
44,272 Sainsbury (J) Plc 111,433 0.23%
3,221 Schroders Plc 99,980 0.21%
26,548 Scottish & Southern Energy 385,742 0.79%
25,376 Segro Plc 124,139 0.25%
6,106 Severn Trent Plc 133,233 0.27%
23,419 Shire Plc 992,497 2.04%
26,378 Sky Plc 262,197 0.54%
22,952 Smith & Nephew plc 304,114 0.63%
9,959 Smiths Group Plc 159,045 0.33%
12,967 St James Place Plc 153,270 0.31%
84,994 Standard Chartered Plc 660,573 1.36%
53,005 Standard Life Plc 211,543 0.43%
13,521 Tate & Lyle 89,509 0.18%
80,871 Taylor Wimpey Plc 142,495 0.29%
216,954 Tesco Plc 366,218 0.75%
3,573 The Berkeley Group Holdings PLC 115,301 0.24%
28,742 The Sage Group plc 197,745 0.41%
6,357 Travis Perkins Plc 92,494 0.19%
33,165 Unilever Plc 1,378,006 2.83%
17,155 United Utilities Group Plc 148,820 0.31%
688,765 Vodafone Group PLC 1,499,786 3.08%
5,263 Weir Group Plc 91,103 0.19%
4,920 Whitbread Plc 195,176 0.40%
24 William Hill Plc 61 0.00%
51,471 Worldpay Group Plc 162,031 0.33%
Total Great Britain 45,848,063 94.28%
Ireland - 0.33%
2,260 DCC Plc 157,974 0.33%
Total Ireland 157,974 0.33%
Jersey Channel Islands - 3.63%
316,674 Glencore Plc 909,488 1.87%
6,772 Wolseley Plc 319,164 0.66%
33,141 WPP Plc 534,896 1.10%
Total Jersey Channel Islands 1,763,548 3.63%
Nominal Security Classification Fair Value
GBP
% of
Net Assets
Financial assets at fair value through profit or loss (continued)

SANLAM UNIVERSAL FUNDS PLC
267
PORTFOLIO OF INVESTMENTS OF SATRIX UK EQUITY TRACKER FUND (CONTINUED)
as at 30 June 2017
Equities - 99.06% (continued)
Switzerland - 0.21%
4,458 Coca-Cola HBC AG 100,662 0.21%
Total Switzerland 100,662 0.21%
United States - 0.35%
2,517 Randgold Resources 171,282 0.35%
Total United States 171,282 0.35%
Total Equities 48,168,217 99.06%
Total financial assets at fair value through profit or loss 48,168,217 99.06%
Cash and cash equivalents 323,619 0.67%
Other net assets and liabilities 135,399 0.28%
Net assets attributable to holders of redeemable participating shares 48,627,235 100.00%
Satrix UK Equity Tracker Fund
Summary
Classification Description
Fair Value % of % of
GBP Net
Assets Total
Assets
Transferable securities and money market instruments admitted to official stock exchange listing or traded on regulated market 48,168,217 99.06% 98.79%
A Transferable securities and money market instruments other than those referred above - - -
B UCITS and AIFs
- - -
C Financial derivative instruments dealt in on a regulated market - - -
D Over the counter financial derivative instruments - - -
Cash and cash equivalents
323,619 0.67% 0.66%
Other net assets and liabilities
135,399 0.28% 0.28%
Net assets attributable to holders of redeemable participating shares 48,627,235 100.00%
Nominal Security Classification Fair Value
GBP
% of
Net Assets
Financial assets at fair value through profit or loss (continued)

SANLAM UNIVERSAL FUNDS PLC
268
PORTFOLIO OF INVESTMENTS OF SATRIX EUROPE (EX-UK) EQUITY TRACKER FUND as at 30 June 2017
Equities - 93.27%
Austria - 0.53%
3,382 Andritz AG 178,367 0.07%
13,584 Erste Group Bank AG 455,404 0.18%
6,925 OMV AG 314,637 0.12%
8,296 Raiffeisen Intl Bank 183,342 0.07%
5,424 Voestalpine AG 221,299 0.09%
Total Austria 1,353,049 0.53%
Belgium - 2.51%
10,749 Ageas 379,010 0.15%
34,708 Anheuser Busch InBev SA NV 3,356,611 1.33%
5,825 Groupe Bruxelles Lambert SA 490,989 0.19%
11,559 KBC Bankverzekeringsholding 767,633 0.30%
9,427 Proximus SA 288,749 0.12%
3,673 Solvay SA 431,578 0.17%
5,959 UCB S.A. 358,911 0.14%
4,657 Umicore 283,611 0.11%
Total Belgium 6,357,092 2.51%
Denmark - 3.98%
320 APMoller-MaerskA/S 534,934 0.21%
176 AP Moller - Maersk A/S 309,836 0.12%
5,207 Carlsberg A/S 487,039 0.19%
5,514 Chr Hansen Holding AS 351,128 0.14%
6,078 Coloplast A/S 444,671 0.18%
35,457 Danske Bank A/S 1,194,031 0.47%
7,153 Dong Energy A/S 282,727 0.11%
10,142 DSV A/S 545,585 0.22%
2,681 Genmab A/S 500,816 0.20%
2,307 H Lundbeck A/S 113,369 0.04%
9,133 ISS AS 314,068 0.12%
82,580 Novo Nordisk AS 3,096,327 1.22%
11,113 Novozymes AS 425,797 0.17%
5,185 Pandora AS 423,618 0.17%
44,655 TDC A/S 227,368 0.09%
10,278 Vestas Wind Systems AS 830,735 0.33%
Total Denmark 10,082,049 3.98%
European Union - 0.24%
15,954 Rexel SA 228,541 0.09%
Nominal Security Classification Fair Value
EUR
% of
Net Assets
Financial assets at fair value through profit or loss (continued)

SANLAM UNIVERSAL FUNDS PLC
269
PORTFOLIO OF INVESTMENTS OF SATRIX EUROPE (EX-UK) EQUITY TRACKER FUND (CONTINUED)
as at 30 June 2017
Equities - 93.27% (continued)
European Union - 0.24% (continued)
6,231 Symrise AG 386,447 0.15%
Total European Union 614,988 0.24%
Finland - 2.21%
20,240 Fortum Oyj 277,895 0.11%
15,195 Kone OYJ -B 676,785 0.27%
6,560 Metso Oyj 199,162 0.08%
5,865 Nestle Oil Oyj 202,284 0.08%
263,246 Nokia OYJ 1,409,682 0.56%
5,998 Nokiaan Renkaat OYJ 217,368 0.08%
5,300 Orion OYJ/New 296,270 0.12%
22,448 Sampo Oyj 1,007,242 0.40%
26,574 Stora Enso OYJ 300,552 0.12%
25,761 Upm-Kymmene Oy 642,995 0.25%
7,101 Wartsila Oyj 367,477 0.14%
Total Finland 5,597,712 2.21%
France - 16.21%
9,022 Accor SA 370,308 0.15%
10,554 Air Liquide 1,141,943 0.45%
26,867 Airbus Group SE 1,934,424 0.76%
7,627 Alstom 233,462 0.09%
3,615 Arkema 337,749 0.13%
4,768 AtoS 585,987 0.23%
55,809 AXA SA 1,336,626 0.53%
31,746 BNP Paribas SA 2,001,903 0.79%
55,544 Bollore 221,121 0.09%
11,612 Bouygues 428,715 0.17%
15,059 Bureau Veritas 291,768 0.12%
7,460 Cap Gemini 674,981 0.27%
26,342 Carrefour SA 583,475 0.23%
3,424 Casino Guichard 177,569 0.07%
1,572 Christian Dior SE 393,550 0.16%
5,944 Cie Generale D’Optique Essilor International 662,162 0.26%
53,045 Credit Agricole SA 747,139 0.30%
16,774 Danone 1,103,897 0.44%
6,845 Dassault Systemes SA 537,264 0.21%
10,977 Edenred 250,605 0.10%
24,235 Electricite De France 229,796 0.09%
Nominal Security Classification Fair Value
EUR
% of
Net Assets
Financial assets at fair value through profit or loss (continued)

SANLAM UNIVERSAL FUNDS PLC
270
PORTFOLIO OF INVESTMENTS OF SATRIX EUROPE (EX-UK) EQUITY TRACKER FUND (CONTINUED)
as at 30 June 2017
Equities - 93.27% (continued)
France - 16.21% (continued)
48,310 Engie 638,417 0.25%
9,047 Eutelsat Communications 202,291 0.08%
24,931 Groupe Eurotunnel SA 232,806 0.09%
1,284 Hermes International 555,523 0.22%
1,395 Iliad SA 288,905 0.11%
2,658 Ingenico 211,284 0.08%
11,997 Klepierre 430,512 0.17%
8,383 Lagardere S.C.A. 231,790 0.09%
7,856 Legrand SA 481,180 0.19%
6,679 L’Oreal SA 1,218,250 0.48%
7,887 LVMH Moet Hennessy Louis Vuitton SA 1,721,732 0.68%
5,104 Michelin 594,106 0.23%
44,671 Natixis 262,531 0.10%
58,009 Orange 805,745 0.32%
9,966 Pernod-Ricard 1,168,514 0.46%
22,675 Peugeot SA 396,019 0.16%
2,290 Pinault-Printemps 682,878 0.27%
10,257 Publicis Groupe 669,885 0.26%
7,990 Renault SA 633,208 0.25%
9,087 Safran SA 729,141 0.29%
14,756 Saint-Gobain SA 690,286 0.27%
32,537 Sanofi 2,725,299 1.08%
15,936 Schneider Electric SE 1,072,015 0.42%
10,070 Scor SE 349,530 0.14%
1,677 Societe BIC SA 174,240 0.07%
22,469 Societe Generale SA 1,058,515 0.42%
5,031 Sodexo 569,509 0.22%
30,588 Stmicroelectronic 384,491 0.15%
17,773 Suez Environment SA 288,189 0.11%
5,571 Thales SA 525,011 0.21%
64,587 Total SA 2,795,648 1.10%
4,792 Unibail Rodamco 1,057,355 0.42%
6,478 Valeo SA 382,137 0.15%
21,731 Veolia Environnement 402,024 0.16%
14,881 Vinci SA 1,112,057 0.44%
30,669 Vivendi SA 597,739 0.24%
1,975 Wendel 255,960 0.10%
9,816 Zodiac SA 233,130 0.09%
Total France 41,072,296 16.21%
Nominal Security Classification Fair Value
EUR
% of
Net Assets
Financial assets at fair value through profit or loss (continued)

SANLAM UNIVERSAL FUNDS PLC
271
PORTFOLIO OF INVESTMENTS OF SATRIX EUROPE (EX-UK) EQUITY TRACKER FUND (CONTINUED)
as at 30 June 2017
Equities - 93.27% (continued)
Germany - 20.18%
8,858 Adidas AG 1,485,930 0.59%
21,099 Allianz SE 3,637,468 1.43%
42,042 Basf SE 3,409,186 1.34%
37,766 Bayer AG 4,275,111 1.69%
17,488 Bayerische Motoren Werke 1,397,119 0.56%
4,654 Beiersdorf AG 428,354 0.17%
7,641 Brenntag AG 387,246 0.15%
48,709 Commerzbank AG 508,035 0.20%
5,088 Continental AG 961,378 0.38%
5,371 Covestro AG 339,501 0.13%
43,507 Daimler AG 2,757,039 1.09%
94,512 Deutsche Bank AG 1,467,299 0.58%
8,990 Deutsche Boerse AG 830,856 0.33%
45,998 Deutsche Post AG 1,509,654 0.60%
151,607 Deutsche Telekom 2,383,262 0.94%
17,592 Deutsche Wohnen AG 589,156 0.23%
99,876 E.ON AG 823,777 0.32%
8,262 Evonik Industries AG 231,212 0.09%
5,988 Fresenius Medical Care 504,010 0.20%
19,243 Fresenius SE 1,444,380 0.57%
8,116 Gea Group AG 290,796 0.11%
3,767 Hannover Rueckversicherung Ag 395,347 0.16%
6,957 Heidelberg-Cement AG 588,910 0.23%
4,960 Henkel AG & Co KGAA 525,264 0.21%
8,265 Henkel KGAA-VORZUG 995,933 0.39%
3,370 Hugo Boss AG 206,581 0.08%
52,464 Infineon Technologies AG 969,797 0.38%
7,009 Innogy Se 241,565 0.10%
9,230 K+S AG 206,937 0.08%
4,378 Lanxess 290,218 0.11%
8,575 Linde AG 1,421,735 0.56%
11,969 Lufthansa AG 238,482 0.09%
2,922 MAN SE 274,288 0.11%
5,983 Merck KGAA 632,702 0.25%
9,871 Metro AG 291,737 0.11%
7,612 Muenchener Rueckversicherungs AG 1,343,899 0.53%
4,059 Osram Licht AG 283,115 0.11%
7,011 Porsche Ag 344,871 0.14%
11,587 Prosieben Sat 1 Media AG 424,548 0.17%
Nominal Security Classification Fair Value
EUR
% of
Net Assets
Financial assets at fair value through profit or loss (continued)

SANLAM UNIVERSAL FUNDS PLC
272
PORTFOLIO OF INVESTMENTS OF SATRIX EUROPE (EX-UK) EQUITY TRACKER FUND (CONTINUED)
as at 30 June 2017
Equities - 93.27% (continued)
Germany - 20.18% (continued)
23,695 RWE AG 413,359 0.16%
45,097 SAP SE 4,124,121 1.63%
35,074 Siemens AG 4,221,156 1.67%
16,396 ThyssenKrupp AG 407,851 0.16%
5,829 United Internet AG 280,637 0.11%
8,480 Volkswagen 1,130,808 0.45%
1,757 Volkswagen AG 238,513 0.09%
22,301 Vonovia Se 775,294 0.31%
5,514 Zalando SE 220,615 0.09%
Total Germany 51,149,052 20.18%
Great Britain - 0.15%
10,595 Coca Cola European Partners PLC 376,652 0.15%
Total Great Britain 376,652 0.15%
Ireland - 0.98%
1,283,398 Bank of Ireland 295,182 0.12%
39,580 CRH Plc 1,225,991 0.48%
7,745 Kerry Group 583,431 0.23%
3,960 Paddy Power Betfair Public Limited Company 370,141 0.15%
Total Ireland 2,474,745 0.98%
Italy - 3.36%
36,335 Assicurazioni Generali 523,587 0.21%
22,280 Atlantia SPA 548,979 0.22%
230,027 Enel SpA 1,079,747 0.42%
72,956 ENI-Ente Nazionale Idrocarburi SpA 960,101 0.38%
19,076 Finmeccanica Spa 277,556 0.11%
612,950 Intesa Sanpaolo SpA 1,701,549 0.67%
8,962 Luxottica Group SpA 453,925 0.18%
28,041 Mediobanca SpA 242,274 0.09%
10,530 Prysmian SpA 271,148 0.11%
45,592 Saipem SpA 147,445 0.06%
107,505 Snam Rete Gas 410,239 0.16%
366,320 Telecom Italia RNC 236,276 0.09%
455,764 Telecom Italis Spa 368,257 0.14%
78,364 Terna Spa 370,348 0.15%
56,868 Unicredit SpA 929,792 0.37%
Total Italy 8,521,223 3.36%
Nominal Security Classification Fair Value
EUR
% of
Net Assets
Financial assets at fair value through profit or loss (continued)

SANLAM UNIVERSAL FUNDS PLC
273
PORTFOLIO OF INVESTMENTS OF SATRIX EUROPE (EX-UK) EQUITY TRACKER FUND (CONTINUED)
as at 30 June 2017
Equities - 93.27% (continued)
Luxembourg - 0.68%
29,984 ArcelorMittal 595,482 0.23%
613 Eurofins Scientific Se 302,301 0.12%
3,183 Millicom International Cellular SDR 164,313 0.06%
17,947 Ses 368,362 0.15%
21,983 Tenaris SA 300,068 0.12%
Total Luxembourg 1,730,526 0.68%
Netherlands - 8.32%
12,995 ABN AMRO Group 301,614 0.12%
79,593 Aegon NV 355,860 0.14%
7,062 AerCap Holdings NV 287,294 0.11%
11,629 Akzo Nobel NV 884,851 0.35%
22,679 Altice NV 458,169 0.18%
17,004 ASML Holding NV 1,940,156 0.76%
48,194 CNH Industrial NV 477,844 0.19%
5,681 EXOR NV 269,223 0.11%
5,950 Ferrari NV 447,143 0.18%
49,314 Fiat Chrysler Automobiles NV 455,168 0.18%
3,853 Gemalto NV 202,475 0.08%
16,049 Heineken Holding NV 1,338,762 0.53%
173,592 Ing Groep NV 2,621,239 1.03%
59,249 Koninklijke Ahold Delhaize NV 991,828 0.39%
8,570 Koninklijke DSM NV 545,395 0.21%
42,508 Koninklijke Philips NV 1,321,786 0.52%
14,608 NN Group NV 454,601 0.18%
16,006 NXP Semiconductors NV 1,534,966 0.61%
11,118 Qiagen N V 323,812 0.13%
5,604 Randstad Holdings NV 286,476 0.11%
46,261 Relx NV 832,698 0.33%
159,694 Royal KPN NV 447,303 0.18%
75,178 Unilever NV 3,632,601 1.43%
3,739 Vopak 151,803 0.06%
14,353 Wolters Kluwer 531,994 0.21%
Total Netherlands 21,095,061 8.32%
Norway - 1.32%
45,754 DNB ASA 679,489 0.27%
17,814 Marine Harvest 266,231 0.10%
62,251 Norsk Hydro Asa 301,304 0.12%
Nominal Security Classification Fair Value
EUR
% of
Net Assets
Financial assets at fair value through profit or loss (continued)

SANLAM UNIVERSAL FUNDS PLC
274
PORTFOLIO OF INVESTMENTS OF SATRIX EUROPE (EX-UK) EQUITY TRACKER FUND (CONTINUED)
as at 30 June 2017
Equities - 93.27% (continued)
Norway - 1.32% (continued)
41,049 Orkla ASA 364,267 0.14%
9,231 Schibsted ASA 194,628 0.08%
51,267 Statoil ASA 742,060 0.29%
36,005 Telenor ASA 521,528 0.21%
8,456 Yara International ASA 277,336 0.11%
Total Norway 3,346,843 1.32%
Portugal - 0.36%
49,790 Banco Espirito Santo SA - 0.00%
132,682 Energias De Portugal SA 379,869 0.15%
23,254 Galp Energia SGPS SA 308,232 0.12%
13,504 Jeronimo Martin 230,783 0.09%
Total Portugal 918,884 0.36%
Spain - 7.56%
35,878 Abertis Infrastructure 581,941 0.23%
12,068 ACS Actividades Cons Y Serv 408,200 0.16%
3,366 Aena SA 575,081 0.23%
20,474 Amadeus IT Holding SA 1,071,814 0.42%
302,429 Banco Bilbao Viscaya 2,197,147 0.87%
244,721 Banco De Sabadell SA 435,359 0.17%
660,686 Banco Santander SA 3,826,693 1.51%
51,599 Bankia SA 218,367 0.09%
36,541 Bankinter SA 294,703 0.12%
165,683 Criteria Caixacorp SA 692,555 0.27%
33,267 Distribuidora Interncional de Alimentacion SA 181,338 0.07%
11,013 Enagas 270,369 0.11%
15,500 Endesa SA 312,635 0.12%
25,786 Ferrovial SA 501,151 0.20%
7,007 Gamesa Corp Tecnologica SA 130,996 0.05%
16,695 Gas Natural SDG SA 342,081 0.13%
14,646 Grifols SA 357,143 0.14%
263,520 Iberdrola SA 1,826,984 0.72%
50,376 Industria de Diseno Textil SA 1,693,137 0.67%
39,233 International Consolidated Airlines Group SA 272,630 0.11%
19,696 Red Electrica Corporacion SA 360,338 0.14%
54,604 Repsol SA 731,694 0.29%
207,299 Telefonica SA 1,873,568 0.74%
Total Spain 19,155,924 7.56%
Nominal Security Classification Fair Value
EUR
% of
Net Assets
Financial assets at fair value through profit or loss (continued)

SANLAM UNIVERSAL FUNDS PLC
275
PORTFOLIO OF INVESTMENTS OF SATRIX EUROPE (EX-UK) EQUITY TRACKER FUND (CONTINUED)
as at 30 June 2017
Equities - 93.27% (continued)
Sweden - 6.21%
15,385 Alfa Laval AB 275,162 0.11%
47,560 Assa Abloy AB 913,277 0.36%
50,507 Atlas Copco AB 1,525,275 0.60%
12,611 Boliden AB 300,776 0.12%
13,139 Electrolux 376,342 0.15%
27,258 Essity Aktiebolag 651,807 0.26%
12,253 Getinge AB 209,613 0.08%
43,133 Hennes & Mauritz AB 939,240 0.37%
12,088 Hexagon AB 502,240 0.20%
22,631 Investor AB 953,200 0.38%
12,020 Kinnevik AB 321,596 0.13%
10,390 Lundin Petroleum AB 174,724 0.07%
142,021 Nordea Bank AB 1,579,435 0.62%
53,691 Sandvik AB 738,026 0.29%
72,746 Skandinaviska Enskilda Banken SEB 769,020 0.30%
18,994 Skanska AB 393,898 0.16%
17,836 SKF AB-B 315,853 0.13%
71,683 Svenska Handelsbanken AB 896,846 0.35%
42,033 Swedbank AB 895,228 0.35%
10,678 Swedish Match AB 328,671 0.13%
23,035 Tele2 AB 210,771 0.08%
138,166 Telefonaktiebolaget LM Ericsson 863,600 0.34%
131,354 Teliasonera 528,588 0.21%
71,706 Volvo AB 1,068,229 0.42%
Total Sweden 15,731,417 6.21%
Switzerland - 18.47%
90,237 ABB Ltd 1,952,307 0.77%
2,707 Actelion Ltd 662,216 0.26%
7,402 Adecco SA 493,013 0.20%
2,924 Baloise Holding 395,920 0.16%
152 Barry Callebaut AG 183,038 0.07%
24,541 Compagnie Financiere Richemont SA 1,771,336 0.70%
106,031 Credit Suisse Group AG 1,342,696 0.53%
1,702 Dufry AG 244,297 0.10%
1,782 Geberit AG-Reg 728,100 0.29%
419 Givaudan 734,251 0.29%
20,547 Holcim Ltd 1,030,629 0.41%
Nominal Security Classification Fair Value
EUR
% of
Net Assets
Financial assets at fair value through profit or loss (continued)

SANLAM UNIVERSAL FUNDS PLC
276
PORTFOLIO OF INVESTMENTS OF SATRIX EUROPE (EX-UK) EQUITY TRACKER FUND (CONTINUED)
as at 30 June 2017
Equities - 93.27% (continued)
Switzerland - 18.47% (continued)
10,344 Julius Baer Group Ltd 476,795 0.19%
2,886 Kuehne & Nagel International AG 421,889 0.17%
8 Lindt and Spruengli AG 488,622 0.19%
3,394 Lonza AG 642,825 0.25%
140,850 Nestle SA 10,739,025 4.24%
101,166 Novartis AG 7,375,970 2.91%
949 Partners Group Holding AG 515,466 0.20%
31,543 Roche Holding AG 7,037,693 2.78%
2,551 Schindler Holding 472,905 0.19%
266 SGS SA 564,320 0.22%
105 Sika AG 590,951 0.23%
2,440 Sonova Holdings AG 347,104 0.14%
5,948 Swatch Group AG 653,180 0.25%
1,646 Swiss Life Holding Ag 486,654 0.19%
4,708 Swiss Prime Site AG 374,659 0.15%
14,672 Swiss RE AG 1,174,960 0.46%
1,147 Swisscom 484,892 0.19%
165,771 UBS Group AG 2,459,667 0.97%
2,121 Vifor Pharma AG 204,832 0.08%
6,889 Zurich Financial Services AG 1,756,700 0.69%
Total Switzerland 46,806,912 18.47%
Total Equities 236,384,415 93.27%
Derivative Financial Instruments
Rights - 0.00%
Spain - 0.00%
29,800 Repsol SA 11,920 0.00%
Total Spain 11,920 0.00%
Total Rights 11,920 0.00%
Total financial assets at fair value through profit or loss 236,396,335 93.27%
Cash and cash equivalents 19,111,343 7.54%
Other net assets and liabilities (2,053,896) (0.81)%
Net assets attributable to holders of redeemable participating shares 253,453,782 100.00%
Nominal Security Classification Fair Value
EUR
% of
Net Assets
Financial assets at fair value through profit or loss (continued)

SANLAM UNIVERSAL FUNDS PLC
277
PORTFOLIO OF INVESTMENTS OF SATRIX EUROPE (EX-UK) EQUITY TRACKER FUND (CONTINUED)
as at 30 June 2017
Satrix Europe (Ex-UK) Equity Tracker Fund
Summary
Classification Description
Fair Value % of % of
EUR Net
Assets Total
Assets
Transferable securities and money market instruments admitted to official stock exchange listing or traded on regulated market 236,384,415 93.27% 92.49%
A Transferable securities and money market instruments other than those referred above 11,920 0.00% 0.00%
B UCITS and AIFs
- - -
C Financial derivative instruments dealt in on a regulated market - - -
D Over the counter financial derivative instruments - - -
Cash and cash equivalents
19,111,343 7.54% 7.48%
Other net assets and liabilities
(2,053,896) (0.81)% (0.80)%
Net assets attributable to holders of redeemable participating shares 253,453,782 100.00%

SANLAM UNIVERSAL FUNDS PLC
278
PORTFOLIO OF INVESTMENTS OF SANLAM EQUITY ALLOCATION FUND
as at 30 June 2017
Equities - 98.53%
Belgium - 1.38%
9,873 Anheuser Busch InBev SA NV 1,089,733 0.98%
26,463 Euronav SA 209,181 0.19%
3,067 KBC Bankverzekeringsholding 232,459 0.21%
Total Belgium 1,531,373 1.38%
Denmark - 1.75%
89 AP Moller - Maersk A/S 178,817 0.16%
8,609 Danske Bank A/S 330,877 0.30%
752 Genmab A/S 160,324 0.15%
23,923 Novo Nordisk AS 1,023,734 0.92%
2,688 Vestas Wind Systems AS 247,961 0.22%
Total Denmark 1,941,713 1.75%
European Union - 0.62%
4,889 MTU Aero Engines Holding AG 689,107 0.62%
Total European Union 689,107 0.62%
Finland - 1.52%
4,173 Kone OYJ -B 212,128 0.19%
71,843 Nokia OYJ 439,080 0.40%
16,416 Sampo Oyj 840,665 0.76%
6,577 Upm-Kymmene Oy 187,358 0.17%
Total Finland 1,679,231 1.52%
France - 15.46%
4,868 Air Liquide 601,143 0.54%
12,420 Airbus Group SE 1,020,596 0.92%
2,727 AtoS 382,505 0.35%
24,285 AXA SA 663,809 0.60%
13,842 BNP Paribas SA 996,214 0.90%
2,051 Cap Gemini 211,796 0.19%
7,221 Carrefour SA 182,545 0.16%
685 Christian Dior SE 195,721 0.18%
2,627 Cie Generale D’Optique Essilor International 333,999 0.30%
13,629 Credit Agricole SA 219,089 0.20%
7,387 Danone 554,830 0.50%
19,560 Engie 295,009 0.27%
335 Hermes International 165,417 0.15%
3,387 Legrand SA 236,767 0.21%
6,395 L’Oreal SA 1,331,267 1.20%
3,522 LVMH Moet Hennessy Louis Vuitton SA 877,491 0.79%
Nominal Security Classification Fair Value
USD
% of
Net Assets
Financial assets at fair value through profit or loss

SANLAM UNIVERSAL FUNDS PLC
279
PORTFOLIO OF INVESTMENTS OF SANLAM EQUITY ALLOCATION FUND (CONTINUED)
as at 30 June 2017
Equities - 98.53% (continued)
France - 15.46% (continued)
2,202 Michelin 292,530 0.26%
45,043 Orange 714,051 0.64%
2,688 Pernod-Ricard 359,701 0.32%
32,202 Peugeot SA 641,876 0.58%
953 Pinault-Printemps 324,340 0.29%
2,464 Publicis Groupe 183,662 0.17%
2,410 Renault SA 217,980 0.20%
3,943 Safran SA 361,092 0.33%
6,146 Saint-Gobain SA 328,135 0.30%
15,051 Sanofi 1,438,804 1.30%
7,086 Schneider Electric SE 544,029 0.49%
9,452 Societe Generale SA 508,202 0.46%
1,179 Sodexo 152,321 0.14%
29,439 Total SA 1,454,321 1.31%
1,238 Unibail Rodamco 311,763 0.28%
3,059 Valeo SA 205,948 0.19%
6,409 Vinci SA 546,619 0.49%
12,557 Vivendi SA 279,317 0.25%
Total France 17,132,889 15.46%
Germany - 14.74%
2,389 Adidas AG 457,381 0.41%
5,692 Allianz SE 1,119,958 1.01%
11,268 Basf SE 1,042,831 0.94%
14,636 Bayer AG 1,890,900 1.71%
4,139 Bayerische Motoren Werke 383,954 0.35%
1,389 Continental AG 299,536 0.27%
12,042 Daimler AG 870,928 0.79%
25,817 Deutsche Bank AG 457,443 0.41%
2,438 Deutsche Boerse AG 257,158 0.23%
12,526 Deutsche Post AG 469,192 0.42%
41,713 Deutsche Telekom 748,383 0.68%
4,457 Deutsche Wohnen AG 170,356 0.15%
24,691 E.ON AG 232,427 0.21%
2,672 Fresenius Medical Care 256,681 0.23%
5,094 Fresenius SE 436,382 0.39%
1,851 Heidelberg-Cement AG 178,827 0.16%
1,311 Henkel AG & Co KGAA 158,452 0.14%
6,997 Henkel KGAA-VORZUG 962,274 0.87%
Nominal Security Classification Fair Value
USD
% of
Net Assets
Financial assets at fair value through profit or loss (continued)

SANLAM UNIVERSAL FUNDS PLC
280
SANLAM PORTFOLIO OF INVESTMENTS OF SANLAM EQUITY ALLOCATION FUND (CONTINUED)
as at 30 June 2017
Equities - 98.53% (continued)
Germany - 14.74% (continued)
13,863 Infineon Technologies AG 292,467 0.26%
2,231 Linde AG 422,167 0.38%
1,648 Merck KGAA 198,901 0.18%
2,026 Muenchener Rueckversicherungs AG 408,232 0.37%
10,974 Prosieben Sat 1 Media AG 458,902 0.42%
16,657 SAP SE 1,738,522 1.57%
9,517 Siemens AG 1,307,212 1.18%
10,350 Software AG 453,008 0.41%
5,309 Tui Ag 77,278 0.07%
2,372 Volkswagen 361,000 0.33%
5,582 Vonovia Se 221,479 0.20%
Total Germany 16,332,231 14.74%
Great Britain - 26.07%
13,143 AA Plc 38,980 0.03%
17,081 Anglo American PLC 227,522 0.21%
4,616 Associated British Foods Plc 176,292 0.16%
15,838 Astrazeneca Plc 1,057,916 0.95%
51,129 Aviva Plc 349,835 0.32%
317,743 Barclays Plc 838,006 0.76%
39,305 BBA Aviation Plc 157,167 0.14%
26,192 Bhp Billiton Plc 400,670 0.36%
285,366 BP Plc 1,643,691 1.48%
11,704 Brewin Dolphin Holdings Plc 52,175 0.05%
39,853 British Aerospace Plc 328,411 0.30%
28,473 British American Tobacco Plc 1,938,551 1.75%
157,276 BT Group Plc 603,013 0.54%
2,378 Carnival Plc 157,140 0.14%
68,708 Centrica Plc 178,929 0.16%
20,041 Compass Group PLC 422,323 0.38%
18,286 Crest Nicholson Holdings 124,522 0.11%
32,135 Diageo 948,260 0.86%
12,089 Experian Group Ltd 247,675 0.22%
44,475 GKN Plc 188,601 0.17%
72,879 GlaxoSmithKline Plc 1,550,470 1.40%
260,590 HSBC Holdings 2,412,487 2.18%
12,379 Imperial Brands Plc 555,298 0.50%
99,661 ITV PLC 235,165 0.21%
38,146 John Laing Group Plc 150,350 0.14%
Nominal Security Classification Fair Value
USD
% of
Net Assets
Financial assets at fair value through profit or loss (continued)

SANLAM UNIVERSAL FUNDS PLC
281
PORTFOLIO OF INVESTMENTS OF SANLAM EQUITY ALLOCATION FUND (CONTINUED)
as at 30 June 2017
Equities - 98.53% (continued)
Great Britain - 26.07% (continued)
115,704 Legal & General Group Plc 388,761 0.35%
1,053,116 Lloyds Bank Plc 906,184 0.82%
3,983 London Stock Exchange Group Plc 188,902 0.17%
45,800 National Grid Plc 567,050 0.51%
13,244 Novae Group Plc 98,198 0.09%
60,062 Old Mutual Plc 151,101 0.14%
25,050 OneSavings Bank Plc 122,194 0.11%
47,150 Prudential Corp 1,080,069 0.97%
8,030 Reckitt Benckiser Group Plc 813,071 0.73%
20,333 Reed Elsevier plc 439,056 0.40%
19,370 Rio Tinto Plc 816,870 0.74%
29,016 Rolls-Royce Holdings Plc 336,299 0.30%
112,709 Royal Dutch Shell Plc 3,000,587 2.70%
32,005 Sainsbury (J) Plc 104,788 0.09%
13,036 Scottish & Southern Energy 246,388 0.22%
15,985 Shire Plc 881,219 0.79%
13,308 Sky Plc 172,072 0.16%
10,669 Smart Metering Systems Plc 73,208 0.07%
11,183 Smith & Nephew plc 192,746 0.17%
21,072 Sophos Group Plc 121,538 0.11%
46,965 Standard Chartered Plc 474,807 0.43%
106,057 Tesco Plc 232,875 0.21%
85,684 Tungsten Corp Plc 74,119 0.07%
18,245 Unilever Plc 986,110 0.89%
424,250 Vodafone Group PLC 1,201,684 1.08%
2,324 Whitbread Plc 119,925 0.11%
31,273 Worldpay Group Plc 128,060 0.12%
Total Great Britain 28,901,330 26.07%
Guernsey Channel Islands - 0.10%
46,962 Market Tech Holdings Ltd 112,555 0.10%
Total Guernsey Channel Islands 112,555 0.10%
Ireland - 0.64%
10,319 CRH Plc 366,983 0.33%
16,371 Kenmare Resources Plc 54,250 0.05%
1,835 Kerry Group 157,762 0.14%
171 Kerry Group PLC A 14,702 0.02%
1,069 Paddy Power Betfair PLC 113,747 0.10%
Total Ireland 707,444 0.64%
Nominal Security Classification Fair Value
USD
% of
Net Assets
Financial assets at fair value through profit or loss (continued)

SANLAM UNIVERSAL FUNDS PLC
282
SANLAM PORTFOLIO OF INVESTMENTS OF SANLAM EQUITY ALLOCATION FUND (CONTINUED)
as at 30 June 2017
Equities - 98.53% (continued)
Italy - 4.06%
14,803 Assicurazioni Generali 243,452 0.22%
35,280 Azimut Holding Spa 706,652 0.64%
93,853 Enel SpA 502,795 0.45%
32,674 ENI-Ente Nazionale Idrocarburi SpA 490,747 0.44%
528,643 Intesa Sanpaolo SpA 1,674,872 1.51%
45,805 Mediobanca SpA 451,675 0.41%
23,121 Unicredit SpA 431,444 0.39%
Total Italy 4,501,637 4.06%
Jersey Channel Islands - 1.12%
183,434 Glencore Plc 685,290 0.62%
3,379 Wolseley Plc 207,155 0.19%
16,665 WPP Plc 349,880 0.31%
Total Jersey Channel Islands 1,242,325 1.12%
Luxembourg - 0.16%
7,894 ArcelorMittal 178,927 0.16%
Total Luxembourg 178,927 0.16%
Netherlands - 5.37%
3,102 Akzo Nobel NV 269,382 0.24%
12,082 ASML Holding NV 1,573,346 1.42%
2,933 Heineken Holding NV 284,967 0.26%
78,299 Ing Groep NV 1,349,376 1.22%
16,530 Koninklijke Ahold Delhaize NV 315,812 0.28%
2,305 Koninklijke DSM NV 167,417 0.15%
11,554 Koninklijke Philips NV 410,037 0.37%
69 NXP Semiconductors NV 7,552 0.01%
12,594 Relx NV 258,724 0.23%
20,825 Unilever NV 1,148,449 1.04%
3,889 Wolters Kluwer 164,514 0.15%
Total Netherlands 5,949,576 5.37%
Norway - 0.55%
12,371 DNB ASA 209,680 0.19%
14,406 Statoil ASA 237,982 0.21%
9,774 Telenor ASA 161,580 0.15%
Total Norway 609,242 0.55%
Nominal Security Classification Fair Value
USD
% of
Net Assets
Financial assets at fair value through profit or loss (continued)

SANLAM UNIVERSAL FUNDS PLC
283
PORTFOLIO OF INVESTMENTS OF SANLAM EQUITY ALLOCATION FUND (CONTINUED) as at 30 June 2017
Equities - 98.53% (continued)
Spain - 4.50%
837 Aena SA 163,208 0.15%
5,401 Amadeus IT Holding SA 322,694 0.29%
82,404 Banco Bilbao Viscaya 683,256 0.62%
174,534 Banco Santander SA 1,153,741 1.04%
45,593 Criteria Caixacorp SA 217,507 0.20%
69,542 Iberdrola SA 550,260 0.50%
25,554 Industria de Diseno Textil SA 980,228 0.88%
14,245 Int Consol Airlines Group SA 113,032 0.10%
14,106 Repsol SA 215,729 0.19%
56,616 Telefonica SA 583,998 0.53%
Total Spain 4,983,653 4.50%
Sweden - 4.50%
12,697 Assa Abloy AB 278,267 0.25%
13,017 Atlas Copco AB 479,882 0.43%
68,640 Elekta AB 648,943 0.58%
7,643 Essity Aktiebolag 208,588 0.19%
12,597 Hennes & Mauritz AB 313,064 0.28%
5,670 Investor AB 272,561 0.25%
38,166 Nordea Bank AB 484,424 0.44%
12,894 Sandvik AB 202,282 0.18%
74,240 Skandinaviska Enskilda Banken SEB 895,708 0.81%
7,822 Svenska cellulosa AB 59,041 0.05%
19,147 Svenska Handelsbanken AB 273,402 0.25%
11,353 Swedbank AB 275,965 0.25%
38,863 Telefonaktiebolaget LM Ericsson 277,235 0.25%
18,892 Volvo AB 321,208 0.29%
Total Sweden 4,990,570 4.50%
Switzerland - 15.19%
23,554 ABB Ltd 581,605 0.53%
1,226 Actelion Ltd 342,296 0.31%
2,023 Adecco SA 153,782 0.14%
6,723 Compagnie Financiere Richemont SA 553,824 0.50%
29,372 Credit Suisse Group AG 424,500 0.38%
4,564 Dufry AG 747,658 0.67%
471 Geberit AG-Reg 219,636 0.20%
118 Givaudan 236,000 0.21%
1,226 Idorsia Ltd 23,139 0.02%
4,520 Implenia AG 338,411 0.31%
Nominal Security Classification Fair Value
USD
% of
Net Assets
Financial assets at fair value through profit or loss (continued)

SANLAM UNIVERSAL FUNDS PLC
284
PORTFOLIO OF INVESTMENTS OF SANLAM EQUITY ALLOCATION FUND (CONTINUED) as at 30 June 2017
Equities - 98.53% (continued)
Switzerland - 15.19% (continued)
929 Lonza AG 200,815 0.18%
51,057 Nestle SA 4,442,864 4.01%
28,406 Novartis AG 2,363,711 2.13%
13,039 Roche Holding AG 3,320,254 3.00%
69 SGS SA 167,068 0.15%
27 Sika AG 173,431 0.16%
404 Swatch Group AG 149,172 0.13%
4,146 Swiss RE AG 378,933 0.34%
340 Swisscom 164,044 0.15%
1,134 Syngenta AG 525,022 0.47%
45,969 UBS Group AG 778,453 0.70%
1,898 Zurich Financial Services AG 552,379 0.50%
Total Switzerland 16,836,997 15.19%
United States - 0.80%
8,148 Autoliv Inc 891,409 0.80%
Total United States 891,409 0.80%
Total Equities 109,212,208 98.53% Derivative Financial Instruments
Rights - 0.00%
Spain - 0.00%
14,192 Repsol SA 6,479 0.00%
Total Spain 6,479 0.00%
Total Rights 6,479 0.00%
Total financial assets at fair value through profit or loss 109,218,687 98.53%
Cash and cash equivalents 1,653,076 1.49%
Other net assets and liabilities 27,377 0.03%
Net assets attributable to holders of redeemable participating shares 110,899,140 100.00%
Nominal Security Classification Fair Value
USD
% of
Net Assets
Financial assets at fair value through profit or loss (continued)

SANLAM UNIVERSAL FUNDS PLC
285
PORTFOLIO OF INVESTMENTS OF SANLAM EQUITY ALLOCATION FUND (CONTINUED) as at 30 June 2017
Sanlam Equity Allocation Fund
Summary
Classification Description
Fair Value % of % of
USD Net
Assets Total
Assets
Transferable securities and money market instruments admitted to official stock exchange listing or traded on regulated market 109,212,208 98.48% 98.38%
A Transferable securities and money market instruments other than those referred above 6,479 0.00% 0.00%
B UCITS and AIFs
- - -
C Financial derivative instruments dealt in on a regulated market - - -
D Over the counter financial derivative instruments - - -
Cash and cash equivalents
1,653,076 1.49% 1.49%
Other net assets and liabilities
27,377 0.03% 0.02%
Net assets attributable to holders of redeemable participating shares 110,899,140 100.00%

SANLAM UNIVERSAL FUNDS PLC
286
PORTFOLIO OF INVESTMENTS OF SATRIX EMERGING MARKET EQUITY TRACKER FUND as at 30 June 2017
Equities – 95.99%
Bermuda - 0.75%
26,100 Alibaba health Information 12,437 0.03%
96,500 Alibaba Pictures Group Ltd 16,070 0.03%
46,890 Beijing Enterprises Water Group Limited 36,399 0.08%
31,314 Brilliance China Automotive Holdings Limited 57,040 0.12%
19,737 China Gas Holdings Ltd 39,845 0.09%
8,721 China Resources Gas Group Ltd 29,772 0.06%
23,495 Cosco Pacific Ltd 27,568 0.06%
190,011 GOME Electrical Appliances Holdings Ltd 23,366 0.05%
13,460 Haier Electronics Group Co. Ltd 35,001 0.08%
122,070 Hanergy Thin Film Power Group Limited - 0.00%
36,175 Kunlun Energy Company Ltd 30,676 0.07%
16,242 Nine Dragons Paper Holdings Limited 21,638 0.05%
37,000 Sihuan Pharmaceutical Holdings Group Ltd 15,498 0.03%
Total Bermuda 345,310 0.75%
Brazil - 6.56%
47,655 Ambev SA 263,893 0.58%
38,946 Banco Bradesco SA 329,981 0.72%
9,566 Banco Do Brazil 77,535 0.17%
30,467 Banco Itau Holding Financeira 338,625 0.74%
4,786 Banco Santander Brasil SA 36,186 0.08%
6,481 BB Seguridade Participacoes S/A 56,156 0.12%
21,564 Bovespa 128,804 0.28%
7,063 BR Malls Participacoes SA 25,526 0.06%
1,507 Braskem SA 15,587 0.03%
13,561 CCR SA 69,312 0.15%
3,080 Centrais Eletricas Brasileiras SA 15,286 0.03%
11,083 Cia Brasileira de Meios de Pagamentos 82,456 0.18%
4,135 Cia de Saneamento Basico do Estado de Sao Pau 39,593 0.09%
1,527 Companhia Brasileira de Distribuicao Grupo Pa 30,087 0.07%
7,068 Companhia Energetica de Minas Gerais 17,272 0.04%
1,503 Companhia Paranaense de Energia-Copel 11,150 0.02%
8,359 Companhia Siderurgica Nacional S.A. 18,151 0.04%
1,218 Cosan SA Industria e Comercio 12,738 0.03%
3,081 CPFL Energia S.A. 24,702 0.05%
6,174 Duratex SA 15,255 0.03%
2,320 EDP - Energias do Brasil SA 9,956 0.02%
6,181 Embraer SA 28,283 0.06%
2,420 Equatorial Energia SA 39,654 0.09%
Nominal Security Classification Fair Value
USD
% of
Net Assets
Financial assets at fair value through profit or loss

SANLAM UNIVERSAL FUNDS PLC
287
PORTFOLIO OF INVESTMENTS OF SATRIX EMERGING MARKET EQUITY TRACKER
FUND (CONTINUED)
as at 30 June 2017
Equities - 95.99% (continued)
Brazil - 6.56% (continued)
2,026 Fibria Celulose S.A. 20,716 0.04%
7,597 Gerdau SA 23,619 0.05%
2,920 Hypermarcas SA 24,550 0.05%
37,300 Itausa-Investment Itau - pr 101,753 0.22%
6,936 JBS SA 13,698 0.03%
5,720 Klabin SA 28,077 0.06%
14,008 Kroton Educacional SA 62,997 0.14%
1,596 Localiza Rent a Car 21,793 0.05%
9,653 Lojas Americanas SA - Pref 40,872 0.09%
6,952 Lojas Renner SA 57,567 0.13%
1,057 Multiplan Empreendimentos Imobiliarios SA 20,881 0.05%
4,228 Perdigao SA 50,125 0.11%
66,841 Petroleo Brasileiro S.A. 256,678 0.56%
1,192 Porto Seguro SA 11,035 0.02%
4,780 Qualicorp SA 41,490 0.09%
2,507 Raia Drogasil SA 53,158 0.12%
4,300 Rumo SA 11,249 0.02%
4,310 Suzano Papel e Celulose SA 18,588 0.04%
3,928 Telefonica Brasil SA 53,340 0.12%
7,129 Tim Participacoes SA 21,108 0.05%
3,733 Ultrapar Participacoes SA 87,519 0.19%
31,467 Vale SA 265,372 0.58%
5,980 WEG SA 32,011 0.07%
Total Brazil 3,004,384 6.56%
Cayman Islands - 13.23%
925 58.Com Inc 40,802 0.09%
6,888 AAC Technologies Holdings Inc 86,115 0.19%
10,907 Alibaba Group Holding Ltd 1,536,796 3.36%
8,201 Anta Sports Products Limited 27,103 0.06%
500 Autohome Inc ADR 22,680 0.05%
2,676 Baidu Com Inc 478,629 1.05%
61,830 Belle International Holdings 48,789 0.11%
10,659 Chailease Holding 29,757 0.06%
8,490 China Conch Venture Holdings Limited 15,552 0.03%
40,226 China Evergrande Group 72,243 0.16%
57,400 China Huishan Dairy Holdings 3,088 0.01%
13,320 China Medical System Holdings 23,034 0.05%
28,863 China Mengniu Dairy Company Limtied 56,568 0.12%
Nominal Security Classification Fair Value
USD
% of
Net Assets
Financial assets at fair value through profit or loss (continued)

SANLAM UNIVERSAL FUNDS PLC
288
PORTFOLIO OF INVESTMENTS OF SATRIX EMERGING MARKET EQUITY TRACKER
FUND (CONTINUED)
as at 30 June 2017
Equities - 95.99% (continued)
Cayman Islands - 13.23% (continued)
20,220 China State Construction Intl Holdings Ltd 34,604 0.08%
54,491 Country Garden Holdings Company ltd 63,170 0.14%
3,664 Ctrip Com International Limited 197,343 0.43%
8,550 ENN Energy Holdings Ltd 51,585 0.11%
55,322 Fullshare Holdings Limited 22,110 0.05%
47,501 Geely Automobile Holdings Limited 102,467 0.22%
8,315 Hengan International Group Compnay Limited 61,351 0.13%
6,536 JD.Com Inc 256,342 0.56%
6,650 Kingsoft Corporation Ltd 17,335 0.04%
6,500 Minth Group Ltd 27,560 0.06%
800 Momo Inc 29,568 0.06%
788 Netease.Com Inc 236,896 0.52%
1,405 New Oriental Education and Technology Group 99,038 0.22%
29,670 Semiconductor Manufacturing International Cor 34,396 0.08%
4,030 Shenzhou International Group 26,483 0.06%
14,608 Shimao Property Holdings 25,000 0.05%
539 Sina Corp 45,799 0.10%
53,377 Sino Biopharmaceutical Ltd 47,178 0.10%
18,000 Sunac China Holdings Ltd 37,630 0.08%
6,659 Sunny Optical Technology Group Co Limited 59,710 0.13%
470 Tal Education Group 57,486 0.13%
55,236 Tencent Holdings Limited 1,975,494 4.31%
3,750 Vipshop Holdings Ltd 39,563 0.09%
47,395 Want Want China Holdings Ltd 31,995 0.07%
303 Weibo Corp 20,140 0.04%
260 YY Inc 15,088 0.03%
Total Cayman Islands 6,056,487 13.23%
Chile - 1.17%
40,300 AES Gener SA 14,202 0.03%
276,302 Banco de Chile 35,885 0.08%
415 Banco de Credito e Inversiones (CBI) 23,191 0.05%
638,900 Banco Santander Chile 40,651 0.09%
12,640 Cencosud SA 33,572 0.07%
84,700 Colbun SA 18,216 0.04%
1,900 Compania Cervecerias Unidas SA 24,918 0.05%
35,920 Empresa Nacional de Electricidad SA 27,065 0.06%
2,261 Empresa Nacional de Telecomunicaciones SA 24,642 0.05%
10,530 Empresas CMPC SA 25,168 0.06%
Nominal Security Classification Fair Value
USD
% of
Net Assets
Financial assets at fair value through profit or loss (continued)

SANLAM UNIVERSAL FUNDS PLC
289
PORTFOLIO OF INVESTMENTS OF SATRIX EMERGING MARKET EQUITY TRACKER
FUND (CONTINUED)
as at 30 June 2017
Equities - 95.99% (continued)
Chile - 1.17% (continued)
5,223 Empresas Copec SA 57,032 0.12%
549,436 Enersis SA 86,253 0.19%
1,651,300 Itau CorpBanca 14,698 0.03%
2,260 LATAM Airlines Group SA 25,117 0.06%
7,240 S.A.C.I. Falabella 59,482 0.13%
780 Sociedad Quimica y Minera de Chile SA 25,876 0.06%
Total Chile 535,968 1.17%
China - 8.51%
238,640 Agricultural Bank of China 112,800 0.25%
16,472 Air China Ltd 16,986 0.04%
36,560 Aluminium Corp 18,733 0.04%
13,482 Anhui Conch Cement Company Limited 46,888 0.10%
24,659 Avichina Industry & Tech - H 14,467 0.03%
782,891 Bank of China 384,095 0.84%
77,549 Bank of Communications Co. Ltd. 54,735 0.12%
19,467 Beijing Capital International Airport Company 27,430 0.06%
7,715 BYD Company Limited 47,338 0.10%
82,700 CGN Power Co Ltd 23,094 0.05%
86,175 China Cinda Asset Management Company Limited 32,123 0.07%
70,729 China Citic Bank 43,308 0.09%
9,793 China Coal Energy Co 4,742 0.01%
23,501 China Communication Services Corporation Limi 13,547 0.03%
50,185 China Communications Const-H 64,671 0.14%
817,296 China Construction Bank 633,392 1.38%
33,500 China Galaxy Securitites Company 30,039 0.07%
65,300 China Huarong Asset Management Co Ltd 25,345 0.06%
74,405 China Life Insurance Ltd 227,315 0.50%
36,885 China Longyuan Power Group Corp 26,837 0.06%
37,110 China Merchants Bank 111,949 0.24%
47,640 China Minsheng Banking Corp Ltd 47,539 0.10%
16,860 China Oilfield Serv 13,520 0.03%
27,460 China Pacific Insurance Company Ltd 112,209 0.24%
251,134 China Petroleum & Cr 195,912 0.43%
18,000 China Railway Construction Corporation 23,472 0.05%
44,520 China Railway Group Ltd 35,073 0.08%
32,310 China Shenhua Energy 71,932 0.16%
39,531 China South Locomotive and Rolling Stock Corp 35,548 0.08%
14,600 China Southern Airlines Company Limited 12,343 0.03%
Nominal Security Classification Fair Value
USD
% of
Net Assets
Financial assets at fair value through profit or loss (continued)

SANLAM UNIVERSAL FUNDS PLC
290
PORTFOLIO OF INVESTMENTS OF SATRIX EMERGING MARKET EQUITY TRACKER
FUND (CONTINUED)
as at 30 June 2017
Equities - 95.99% (continued)
China - 8.51% (continued)
10,550 China Vanke Co Ltd 29,866 0.07%
9,800 Chongqing Changan Automobile Co 12,930 0.03%
39,511 Chongqing Rural Commercial Bank Co. Ltd 26,673 0.06%
18,970 CITIC Securities Co Ltd 39,220 0.09%
26,955 Dongfeng Motor Grp Co Ltd-H 31,870 0.07%
11,600 GF Securities Co Ltd 23,299 0.05%
35,460 Great Wall Motor Company Limited 43,788 0.10%
19,484 Guangzhou Automobile Group Company Ltd 34,193 0.07%
14,226 Guangzhou R&F Prop 22,123 0.05%
37,871 Haitong Securiies Co Ltd 61,222 0.13%
34,244 Huaneng Power Intl 23,775 0.05%
59,710 Huaneng Renewables Corp Ltd 18,433 0.04%
14,900 Huatai Securities Co Ltd 28,630 0.06%
15,353 Jiangsu Express Co Ltd - H- 21,673 0.05%
18,493 Longfor Properties 39,750 0.09%
8,276 New China Life Insurance Company Limited 42,087 0.09%
81,748 Peoples’s Insurance Company (Group) of China 34,347 0.07%
205,996 PetroChina Co Ltd-H- 126,132 0.28%
42,670 PICC Property & Casual Co Ltd 71,275 0.16%
50,760 Ping An Insurance Group Co of China Ltd 334,538 0.73%
28,655 Shandong Weigao Group Medical Polymer Company 22,501 0.05%
32,161 Shanghai Electric Group Company Ltd 15,449 0.03%
7,920 Shanghai Lujiazui Finance & Trade Zone Develo 12,704 0.03%
9,456 Shanghai Pharmaceuticals - H 28,162 0.06%
39,330 Sino-Ocean Land Holdings 19,245 0.04%
29,730 Sinopec Shanghai Petrochem-H 15,919 0.03%
13,070 Sinopharm Group Co 59,100 0.13%
10,300 Travelsky Technology Limited 30,346 0.07%
4,475 Tsingtao Brewery Company Limited 19,805 0.04%
27,449 Yanzhou Coal Mining CO-H 24,613 0.05%
13,980 Zhejiang Expressway Co Ltd 18,266 0.04%
5,976 Zhuzhou CSR Times Electric Co Ltd 29,319 0.06%
39,757 Zijin Mining Group Co Ltd 13,139 0.03%
5,196 ZTE Corporation 12,407 0.03%
Total China 3,894,181 8.51%
Colombia - 0.45%
1,500 Bancolombia SA 15,624 0.03%
4,559 Bancolombia SA-Pref 50,654 0.11%
Nominal Security Classification Fair Value
USD
% of
Net Assets
Financial assets at fair value through profit or loss (continued)

SANLAM UNIVERSAL FUNDS PLC
291
PORTFOLIO OF INVESTMENTS OF SATRIX EMERGING MARKET EQUITY TRACKER
FUND (CONTINUED)
as at 30 June 2017
Equities - 95.99% (continued)
Colombia - 0.45% (continued)
43,832 Ecopetrol SA 19,825 0.04%
5,689 Grupo Argos SA 38,672 0.09%
4,282 Grupo de Inversiones Suramericana 55,005 0.12%
6,298 Interconexion Electrica S.A. E.S.P 27,536 0.06%
Total Colombia 207,316 0.45%
Czech Republic - 0.15%
1,840 Cez 31,969 0.07%
865 Komercni Banka as 34,589 0.08%
Total Czech Republic 66,558 0.15%
Egypt - 0.12%
12,252 Commercial International Bank 54,072 0.12%
Total Egypt 54,072 0.12%
Greece - 0.37%
10,491 Alpha Bank AE 25,862 0.06%
19,100 Eurobank Ergasias SA 21,363 0.05%
3,340 Hellenic Telecommunications Organization SA 40,178 0.09%
989 Jumbo SA 18,060 0.04%
55,652 National Bank of Greece 21,151 0.04%
2,470 OPAP SA 27,908 0.06%
66,467 Piraeus Bank SA 16,310 0.03%
Total Greece 170,832 0.37%
Hong Kong - 4.95%
3,840 Beijing Enterprises Holdings Limited 18,520 0.04%
33,443 China Everbright Limited 52,803 0.12%
17,103 China Insurance International 43,335 0.09%
12,989 China Merchants Holdings Intl 36,022 0.08%
59,250 China Mobile Hong Kong Ltd 628,809 1.37%
40,062 China Overseas Land & Investments 117,262 0.26%
43,200 China Power International Develpment Limited 15,329 0.03%
23,492 China Resources Energy 46,102 0.10%
12,792 China Resources Enterprise Ltd. 32,281 0.07%
30,713 China Resources Land Ltd 89,504 0.20%
130,900 China Telecom Corp Ltd 62,209 0.14%
54,340 China Unicom Hong Kong Ltd 80,745 0.18%
Nominal Security Classification Fair Value
USD
% of
Net Assets
Financial assets at fair value through profit or loss (continued)

SANLAM UNIVERSAL FUNDS PLC
292
PORTFOLIO OF INVESTMENTS OF SATRIX EMERGING MARKET EQUITY TRACKER
FUND (CONTINUED)
as at 30 June 2017
Equities - 95.99% (continued)
Hong Kong - 4.95% (continued)
48,120 Citic Pacific 72,366 0.16%
179,650 CNOOC Limited 196,758 0.43%
44,620 CSPC Pharmaceutical Group Limited 65,159 0.14%
23,830 Fosun International 37,241 0.08%
33,750 Franshion Properties China Limited 13,921 0.03%
28,152 Guangdong Investment Ltd 38,802 0.08%
717,941 Industial & Comm Bank of China 484,660 1.06%
59,738 Lenovo Group Ltd 37,726 0.08%
8,159 Shanghai Industrial Holdings Ltd 24,143 0.05%
29,801 Sun Art Retail Group Ltd 23,744 0.05%
21,687 Tingyi(Cyman Island) Holdings ORD USD0.005 25,725 0.06%
28,248 Weichai Power Co LTD 24,750 0.05%
Total Hong Kong 2,267,916 4.95%
Hungary - 0.36%
453 Mol Magyar Olaj- es Gazipari R 35,507 0.08%
2,625 OTP Bank Nyrt 87,729 0.19%
1,670 Richter Gedeon Nyrt 43,583 0.09%
Total Hungary 166,819 0.36%
India - 8.76%
860 Acc Limited 20,869 0.05%
7,494 Adani Ports and Special Economic Zone 42,103 0.09%
6,050 Ambuja Cements Ltd 23,083 0.05%
960 Apollo Hospitals Enterprise 18,935 0.04%
12,000 Ashok Leyland Limited 17,428 0.04%
2,880 Asian Paints Ltd 49,157 0.11%
2,520 Aurobindo Pharma Ltd 26,698 0.06%
16,270 Axis Bank Limited 130,258 0.28%
695 Bajaj Auto Limited 30,020 0.07%
1,700 Bajaj Finance Limited 36,123 0.08%
445 Bajaj Finserv Ltd 28,363 0.06%
1,230 Bharat Forge Limited 20,798 0.04%
6,870 Bharat Heavy Electricals Limited 14,384 0.03%
4,359 Bharat Petroleum Corporation Ltd 43,131 0.09%
12,430 Bharti Airtel Limited 73,037 0.16%
4,700 Bharti Infratel Ltd 27,242 0.06%
73 Bosch Limited 26,352 0.06%
3,340 Cipla Ltd 28,717 0.06%
Nominal Security Classification Fair Value
USD
% of
Net Assets
Financial assets at fair value through profit or loss (continued)

SANLAM UNIVERSAL FUNDS PLC
293
PORTFOLIO OF INVESTMENTS OF SATRIX EMERGING MARKET EQUITY TRACKER
FUND (CONTINUED)
as at 30 June 2017
Equities - 95.99% (continued)
India - 8.76% (continued)
7,490 Coal India Ltd 28,311 0.06%
4,710 Dabur India Ltd 21,291 0.05%
1,235 Dr Reddy’s Laboratories Ltd 51,413 0.11%
125 Eicher Motors Ltd 52,305 0.11%
5,120 GAIL India Limited 28,639 0.06%
1,600 Glenmark Pharmaceuticals Limited 15,668 0.03%
2,320 Godrej Consumer Products Limited 34,757 0.08%
2,370 Grasim Industries Ltd 45,555 0.10%
5,160 HCL Technololgies Ltd 67,946 0.15%
540 Hero Honda Motors Limited 30,931 0.07%
14,737 Hindalco Industries Limited 43,547 0.09%
3,902 Hindustan Petroluem Corporation Limited 30,817 0.07%
6,725 Hindustan Unilever Limited 112,354 0.24%
15,137 Housing Development Finance Corporation Ltd 378,297 0.83%
22,374 Icici Bank Ltd 100,462 0.22%
9,680 Idea Cellular Ltd. 12,770 0.03%
3,130 Indiabulls Housing Finance Ltd 52,126 0.11%
5,800 Indian Oil Corporation Ltd 34,574 0.08%
17,837 Infosys Ltd 258,239 0.56%
32,660 ITC Ltd 163,578 0.36%
8,750 JSW Steel Limited 27,542 0.06%
3,340 Larsen & Toubro Ltd 87,227 0.19%
3,310 LIC Housing Finance Ltd 38,017 0.08%
2,075 Lupin Ltd 34,033 0.07%
4,000 Mahindra & Mahindra Financial Services Ltd 21,353 0.05%
3,880 Mahindra & Mahindra Ltd 80,975 0.18%
5,280 Marico Ltd 25,685 0.06%
1,090 Maruti Suziki India Ltd 121,746 0.27%
4,620 Motherson Sumi Systems Limited 33,031 0.07%
245 Nestle India Ltd 25,542 0.06%
21,795 NTPC Ltd 53,611 0.12%
12,960 Oil & Natural Gas Corp 31,548 0.07%
900 Piramal Enterprises Ltd 38,950 0.08%
12,407 Reliance Industries Ltd 264,960 0.58%
6,800 Rural Electrification Corporation Limited 18,094 0.04%
1,060 Shriram Transport Finance 16,400 0.04%
16,120 State Bank of India 68,264 0.15%
9,100 Sun Pharmaceutical Industries Ltd 78,256 0.17%
4,597 Tata Consultancy Services Ltd 168,055 0.37%
Nominal Security Classification Fair Value
USD
% of
Net Assets
Financial assets at fair value through profit or loss (continued)

SANLAM UNIVERSAL FUNDS PLC
294
PORTFOLIO OF INVESTMENTS OF SATRIX EMERGING MARKET EQUITY TRACKER
FUND (CONTINUED)
as at 30 June 2017
Equities - 95.99% (continued)
India - 8.76% (continued)
19,265 Tata Motors Ltd 118,007 0.26%
3,630 Tata Steel Limited 30,657 0.07%
4,864 Tech Mahindra Ltd 28,754 0.06%
3,650 Titan Industries Ltd 29,623 0.06%
833 Ultratech Cement Ltd 51,036 0.11%
4,182 United Phosphorus Ltd 54,388 0.12%
700 United Spirits Ltd 25,980 0.06%
14,736 Vedanta Ltd 56,794 0.12%
10,780 Wipro Ltd 43,098 0.09%
3,380 Yes Bank 76,550 0.17%
5,550 Zee Entertainment Enterprises Ltd 42,201 0.09%
Total India 4,010,655 8.76%
Indonesia - 2.44%
191,394 Astra International Tbk 128,060 0.28%
100,680 Bank Central Asia PT 136,992 0.30%
43,437 Bank Danamon Pt 16,689 0.04%
91,070 Bank Mandiri 87,049 0.19%
69,300 Bank Negara Indonesia 34,289 0.07%
111,715 Bank Rakyat Indonesa 127,720 0.28%
74,720 Bumi Serpong Damai 10,251 0.02%
4,511 Gudang Garam Tbk PT 26,480 0.06%
62,625 Hanjaya Mandala Sampoerna Tbk 18,028 0.04%
12,364 Indocement Tunggal Prakarsa 17,101 0.04%
29,000 Indofood CBP Sukses Makmur TBK 19,132 0.04%
28,445 Jasa Marga Persero Tbk PToperates 11,409 0.02%
293,026 Kalbe Farma Tbk PT 35,697 0.08%
26,726 Matahari Department Store TB 28,401 0.06%
104,549 Perusahaan Gas Negara PT 17,635 0.04%
143,595 PT Adaro Energy 17,009 0.04%
96,780 PT Charoen Pokphand Indonesia Tbk 23,072 0.05%
41,170 PT Indofood Sukses Makmur Tbk 26,543 0.06%
241,190 PT Lippo Karawaci Tbk 11,934 0.03%
528,080 PT Telekomunikasi Indonesia Persero Tbk 178,943 0.39%
13,943 PT XL Axiata Tbk 3,564 0.01%
40,754 Semen Gresik (Persero) Tbk PT 30,553 0.07%
79,700 Surya Citra Media Pt Tbk 15,475 0.03%
16,624 Unilever Idonesia Tbk PT 60,818 0.13%
Nominal Security Classification Fair Value
USD
% of
Net Assets
Financial assets at fair value through profit or loss (continued)

SANLAM UNIVERSAL FUNDS PLC
295
PORTFOLIO OF INVESTMENTS OF SATRIX EMERGING MARKET EQUITY TRACKER
FUND (CONTINUED)
as at 30 June 2017
Equities - 95.99% (continued)
Indonesia - 2.44% (continued)
15,557 United Tractors Tbk PT 32,014 0.07%
Total Indonesia 1,114,858 2.44%
Ireland - 0.05%
2,039 Engie Brasil SA 20,917 0.05%
Total Ireland 20,917 0.05%
Isle of Man - 0.05%
1,960 New Europe Property Investment Plc 24,839 0.05%
Total Isle of Man 24,839 0.05%
Korea (South) - 15.39%
645 Amorepacific Corp 121,376 0.27%
230 BGF Retail Co Ltd 20,310 0.04%
1,980 BS Financial Group Inc 18,956 0.04%
754 Celltrion Inc 75,876 0.17%
781 Cheil Industries Inc 101,058 0.22%
963 Cheil Worldwide 15,492 0.03%
70 CJ CheilJedang Corp 22,124 0.05%
168 CJ Corporation 27,834 0.06%
250 CJ E&M Corporation 16,568 0.04%
110 CJ Korea Express Corp 17,359 0.04%
337 Daelim Industrial Co 26,223 0.06%
3,919 Daewoo Securities Co Ltd 37,861 0.08%
260 Daum Kakao Corp 23,073 0.05%
1,810 DGB Financial Group Inc 18,673 0.04%
575 Dongbu Insurance Co Ltd 34,185 0.07%
510 Doosan Heavy Industries 9,341 0.02%
200 E- Mart Co Ltd 41,004 0.09%
720 GS Engineering & Construction Corp 19,168 0.04%
489 GS Holdings 29,158 0.06%
370 GS Retail Co Ltd 16,692 0.04%
2,480 Halla Visteon Climate Control Corporation 22,333 0.05%
3,120 Hana Financial Holdings 123,433 0.27%
776 Hankook Tire Co. Ltd 43,150 0.09%
225 Hanmi Pharm Co Ltd 35,274 0.07%
140 Hanssem Co Ltd 22,522 0.05%
1,525 Hanwha Chemical Corp 40,266 0.09%
510 Hanwha Corporation 21,135 0.05%
150 Honam Petrochemicals Corporation 45,114 0.10%
Nominal Security Classification Fair Value
USD
% of
Net Assets
Financial assets at fair value through profit or loss (continued)

SANLAM UNIVERSAL FUNDS PLC
296
PORTFOLIO OF INVESTMENTS OF SATRIX EMERGING MARKET EQUITY TRACKER
FUND (CONTINUED)
as at 30 June 2017
Equities - 95.99% (continued)
Korea (South) - 15.39% (continued)
370 Hotel Shilla Co Ltd 18,471 0.04%
5,705 Hynix Semiconductor Inc. 336,181 0.73%
241 Hyosung Corporation 35,293 0.08%
182 Hyundai Department Store Co Ltd 17,583 0.04%
580 Hyundai Development Company 23,808 0.05%
650 Hyundai Engineering & Construction Co Ltd 26,170 0.06%
210 Hyundai Glovis Co Ltd 28,825 0.06%
293 Hyundai Heavy Indust 45,214 0.10%
720 Hyundai Marine & Fire Insurance Co 24,771 0.05%
675 Hyundai Mobis 147,537 0.32%
2,111 Hyundai Motor Co Ltd 267,103 0.59%
62 Hyundai Robotics Co Ltd 20,951 0.05%
220 Hyundai Wia Corp 13,426 0.03%
1,870 Industrial Bank of Korea 23,298 0.05%
748 INI Steel Company 40,677 0.09%
1,200 Kangwon Land Inc 36,563 0.08%
3,845 KB Financial Group Inc 193,968 0.42%
70 KCC Corp 26,714 0.06%
2,610 Kia Motors Corporation 87,169 0.19%
710 Korea Aerospace Industries Ltd 35,383 0.08%
2,380 Korea Electric Power Corp 84,897 0.19%
276 Korea Gas Corporation 12,837 0.03%
480 Korea Investment Holdings Co Ltd 29,418 0.06%
104 Korea Kumho Petrochemical Co 6,683 0.01%
76 Korea Zinc Co Ltd 30,300 0.07%
330 Korean Air Lines Co Ltd 11,166 0.02%
1,128 KT&G Corp 115,386 0.25%
504 LG Chem LTD 128,227 0.28%
1,010 LG Corp 68,259 0.15%
2,285 LG Display Co Ltd 74,117 0.16%
1,000 LG Electronics Inc 70,118 0.15%
99 LG Household & Health Care Ltd. 86,036 0.19%
160 LG Innotek Co Ltd 23,081 0.05%
1,890 LG Telecom Ltd 25,778 0.06%
129 Lotte Shopping Co 34,230 0.07%
173 NCsoft Corporation 57,400 0.13%
269 NHN Corp 197,085 0.43%
190 OCI Company Ltd 14,901 0.03%
38 Orion Corp 26,512 0.06%
722 POSCO 181,166 0.40%
220 S1 Corporation 18,657 0.04%
Nominal Security Classification Fair Value
USD
% of
Net Assets
Financial assets at fair value through profit or loss (continued)

SANLAM UNIVERSAL FUNDS PLC
297
PORTFOLIO OF INVESTMENTS OF SATRIX EMERGING MARKET EQUITY TRACKER
FUND (CONTINUED)
as at 30 June 2017
Equities - 95.99% (continued)
Korea (South) - 15.39% (continued)
170 Samsung Biologics Co Ltd 43,400 0.10%
400 Samsung Card Co 13,656 0.03%
512 Samsung Electro-Mechanics Co 45,659 0.10%
1,122 Samsung Electronics Ltd 2,257,443 4.93%
332 Samsung Fire & Marine Insurance 81,710 0.18%
1,910 Samsung Heavy Industries Co Ltd 20,790 0.05%
645 Samsung Life Insurance Co Ltd 65,979 0.14%
584 Samsung SDI Co Ltd 87,566 0.19%
305 Samsung SDS Co Ltd 49,199 0.11%
4,140 Shinhan Financial Group Ltd 178,445 0.39%
100 Shinsegae Co Ltd 20,065 0.04%
321 SK C and C Co Ltd 78,020 0.17%
570 SK Energy Co LTD 78,988 0.17%
240 SK Telecom 55,815 0.12%
454 S-Oil Corp 37,629 0.08%
570 Woongjin Coway Co Lt 51,828 0.11%
2,743 Woori Bank 44,247 0.10%
1,760 Woori Investment &Securities Co Ltd 22,851 0.05%
108 Yuhan Corporation 23,228 0.05%
Total Korea (South) 7,047,435 15.39%
Malaysia - 2.35%
18,520 Airasia BHD 14,003 0.03%
20,308 AMMB Holding Berhad 23,055 0.05%
16,040 Astro Malaysia Holdings BHD 9,441 0.02%
27,012 Axiata Group Berhad 30,352 0.07%
1,118 British American Tobacco BHD 11,293 0.02%
33,653 CIMB Group Holdings Berhad 51,515 0.11%
41,448 Dialog Group BHD 18,513 0.04%
42,580 Digi.com BHD 49,529 0.11%
12,100 Felda Golbal Ventures Holdings Berhad 4,814 0.01%
18,000 Gamuda BHD 23,031 0.05%
26,956 Genting BHD 59,010 0.13%
6,695 Hong Leong Bank BHD 24,391 0.05%
32,000 IHH Healthcare Bhd 42,806 0.09%
26,380 IJM Corporation Berhad 21,234 0.05%
29,970 IOI Corporation BHD 31,026 0.07%
2,976 IOI Properties Group Sdn Bhd 1,523 0.00%
3,080 Kuala Lumpur Kepong Berhad 17,827 0.04%
Nominal Security Classification Fair Value
USD
% of
Net Assets
Financial assets at fair value through profit or loss (continued)

SANLAM UNIVERSAL FUNDS PLC
298
PORTFOLIO OF INVESTMENTS OF SATRIX EMERGING MARKET EQUITY TRACKER
FUND (CONTINUED)
as at 30 June 2017
Equities - 95.99% (continued)
Malaysia - 2.35% (continued)
31,167 Malayan Banking Berhad 69,824 0.15%
11,190 Malaysia Airports Holdings Berhad 22,284 0.05%
19,690 Maxis Berhad 25,423 0.06%
7,310 MISC Berhad 12,686 0.03%
5,980 Perlis Plantations Group Berhad 23,873 0.05%
28,088 Petronas Chemicals Group Bhd 46,394 0.10%
7,387 Petronas Gas Berhad 31,861 0.07%
28,040 Public Bank Berhad 132,552 0.29%
30,570 Resorts World Berhad 39,115 0.09%
7,825 RHB Capital Berhad 9,211 0.02%
29,387 SapuraKencana Petroleum Bhd 10,870 0.02%
29,171 Sime Derby Berhad 64,470 0.14%
13,400 Telekom Malaysia Berhad 20,730 0.05%
32,290 Tenaga Nasionl Bhd 106,219 0.23%
7,300 UMW Holdings Berhad 10,139 0.02%
48,440 YTL Corp Bhd 16,453 0.04%
Total Malaysia 1,075,467 2.35%
Malta - 0.03%
3,319 Brait SE 15,385 0.03%
Total Malta 15,385 0.03%
Mexico - 3.64%
25,559 Alfa SAB 36,500 0.08%
329,842 America Movil SAB de CV 266,350 0.58%
4,540 Arca Continental SAB de CV 34,248 0.07%
148,056 Cemex SAB de CV 139,619 0.31%
5,741 Coca-Cola Femsa SAB de CV 48,826 0.11%
9,664 Compartamos SAB de CV 14,555 0.03%
2,249 El Puerto de Liverpool SA de CV 17,809 0.04%
30,370 Fibra Uno Administracion SA 57,816 0.13%
17,919 Fomento Economico Mexicano SA DE CV 177,165 0.39%
1,940 Gruma SAB de CV 25,396 0.06%
3,960 Grupo Aeroportuario del Pacifico SAB de CV 44,766 0.10%
2,048 Grupo Aeroportuario del Sureste SAB de CV 43,374 0.09%
13,216 Grupo Bimbo SAB de CV 33,332 0.07%
4,465 Grupo Carso SAB de CV 18,875 0.04%
22,916 Grupo Financiero Banorte SAB de CV 146,252 0.32%
22,458 Grupo Financiero Inb 38,506 0.08%
Nominal Security Classification Fair Value
USD
% of
Net Assets
Financial assets at fair value through profit or loss (continued)

SANLAM UNIVERSAL FUNDS PLC
299
PORTFOLIO OF INVESTMENTS OF SATRIX EMERGING MARKET EQUITY TRACKER
FUND (CONTINUED)
as at 30 June 2017
Equities - 95.99% (continued)
Mexico - 3.64% (continued)
18,265 Grupo Financiero Santander Mexico SAB de CV 35,448 0.08%
36,720 Grupo Mexico SAB de CV 103,720 0.23%
22,790 Grupo Televisa SAB 111,490 0.24%
1,475 Industrias Penoles S.A. de C.V. 33,410 0.07%
4,437 Infrastraestructura Energetica Nova 23,743 0.05%
15,281 Kimberly-Clark de Mexico SAB de CV 32,455 0.07%
11,719 Mexichem SAB de CV 31,579 0.07%
3,840 OHL Mexico SAB de CV 5,565 0.01%
2,200 Promotora Y Operadora De Inf 26,314 0.06%
50,816 Walmart De Mexico SAB de CV 118,409 0.26%
Total Mexico 1,665,522 3.64%
Netherlands - 0.32%
28,475 Steinhoff International Holdings 146,236 0.32%
Total Netherlands 146,236 0.32%
Peru - 0.06%
2,310 Compania de Minas Buenaventura SA 26,565 0.06%
Total Peru 26,565 0.06%
Philippines - 1.16%
23,640 Aboitiz Equity Ventures Inc 35,694 0.08%
18,900 Aboitiz Power Corpration 14,578 0.03%
21,000 Alliance Global Group Inc 5,954 0.01%
2,425 Ayala Corporation 40,870 0.09%
74,260 Ayala Land Inc 58,529 0.13%
7,100 Bank of Philippine Islands 14,641 0.03%
17,260 BDO Unibank Inc 42,436 0.09%
60,510 DMCI Holdings INC 16,917 0.04%
126,000 Energy Development Corp 15,115 0.03%
474 Globe Telecom Inc 19,248 0.04%
1,050 GT Capital Holdings Inc 25,191 0.06%
30,133 JG Summit Holdings INC 48,395 0.11%
151,600 Metro Pacific Investments Corporation 19,208 0.04%
1,070 PLDT Inc 38,146 0.08%
4,810 Security Bank Corporation 20,696 0.05%
2,182 SM Investments Corporation 34,741 0.08%
80,440 SM Prime Holdings INC 52,634 0.11%
Nominal Security Classification Fair Value
USD
% of
Net Assets
Financial assets at fair value through profit or loss (continued)

SANLAM UNIVERSAL FUNDS PLC
300
PORTFOLIO OF INVESTMENTS OF SATRIX EMERGING MARKET EQUITY TRACKER
FUND (CONTINUED)
as at 30 June 2017
Equities - 95.99% (continued)
Philippines - 1.16% (continued)
8,740 Universal Robina Corporation 28,230 0.06%
Total Philippines 531,223 1.16%
Poland - 1.27%
405 Bank Handlowy w Warszawie S.A 7,518 0.02%
1,632 Bank Pekao SA 54,968 0.12%
455 Bank Zachodni WBK SA 42,033 0.09%
400 CCC SA 24,290 0.05%
676 Eurocash SA 5,656 0.01%
1,159 Grupa Azoty SA 19,800 0.04%
1,821 KGHM Polska Miedz 54,380 0.12%
18 LPP SA 34,734 0.08%
173 MBANK SA 21,575 0.05%
5,433 PGE SA 17,757 0.04%
3,050 Polski Koncern Naftowy Orlen SA 92,110 0.20%
20,298 Polskie Gornictwo Naftowe i Gazownictwo SA 34,622 0.08%
9,089 Powszechna Kasa Oszczednosci Bank Polski S.A. 84,529 0.18%
6,130 Powszechny Zaklad Ubezpieczen SA 73,769 0.16%
13,470 Tauron Polska Energia SA 13,014 0.03%
Total Poland 580,755 1.27%
Qatar - 0.65%
600 Barwa Real Estate Co 5,224 0.01%
2,047 Commercial Bank of Qatar QSC 16,746 0.04%
9,370 Ezdan Holding Group 31,797 0.07%
2,055 Industries Qatar 52,898 0.12%
4,940 Masraf AL Rayan 52,596 0.11%
5,790 Qatar Gas Transport Company Ltd 26,593 0.06%
1,497 Qatar Insurance Company 27,196 0.06%
2,437 Qatar National Bank 83,423 0.18%
Total Qatar 296,473 0.65%
Russia - 0.15%
940 Magnit OJSC-SPON GDR 31,960 0.07%
336 Novatek OAO-Spons GDR REG S 37,430 0.08%
Total Russia 69,390 0.15%
South Africa - 6.12%
3,979 AngloGold Ashanti Limited 39,010 0.08%
Nominal Security Classification Fair Value
USD
% of
Net Assets
Financial assets at fair value through profit or loss (continued)

SANLAM UNIVERSAL FUNDS PLC
301
PORTFOLIO OF INVESTMENTS OF SATRIX EMERGING MARKET EQUITY TRACKER
FUND (CONTINUED)
as at 30 June 2017
Equities - 95.99% (continued)
South Africa - 6.12% (continued)
4,057 Aspen Pharmacare Holdings Limited 89,214 0.19%
6,551 Barclays Africa Group Ltd 72,129 0.16%
3,603 Bid Corp Ltd 82,575 0.18%
4,103 Bidvest Group Limited 49,522 0.11%
3,373 Coronation Fund Managers Limited 16,842 0.04%
3,561 Discovery Ltd 34,890 0.08%
31,891 FirstRand Limited 115,171 0.25%
16,235 Fortress Income Fund Ltd 43,149 0.09%
8,118 Gold Fields Ltd 27,937 0.06%
26,365 Growthpoint Properties Ltd 49,435 0.11%
9,739 Impala Platinum Holdings 27,488 0.06%
1,690 Imperial Holdings Limited 20,840 0.04%
2,348 Investec Limited 17,355 0.04%
1,001 Liberty Holdings Limited 8,625 0.02%
11,374 Life Healthcare Group Holdings 22,346 0.05%
12,794 MMI Holdings Limited 19,834 0.04%
1,250 Mondi Ltd 32,467 0.07%
2,540 Mr Price Group Limited 30,350 0.07%
16,626 Mtn Group Ltd 145,300 0.32%
4,304 Naspers Ltd 838,983 1.83%
2,018 Nedbank Group Ltd 32,272 0.07%
9,131 Netcare Limited 17,995 0.04%
950 PSG Group Limited 17,463 0.04%
7,382 Rand Merchant Investment Holdings Limited 22,046 0.05%
50,390 Redefine Properties Limited 40,603 0.09%
5,463 Remgro Ltd 89,318 0.19%
2,976 Resilient Property Income Fund Limited 27,750 0.06%
7,695 RMB Holdings Limited 34,627 0.07%
12,060 Sanlam Limited 59,857 0.13%
5,302 Sappi Limited 35,367 0.08%
5,445 Sasol 152,850 0.33%
4,371 Shoprite Holdings Limited 66,751 0.15%
15,730 Sibanye Gold Limited 18,133 0.04%
14,158 Standard Bank Group Limited 156,199 0.34%
2,219 The Spar Group Ltd. 26,193 0.06%
2,235 Tiger Brands Limited 62,980 0.14%
6,929 Truworths International Limited 37,946 0.08%
5,705 Vodacom Group Limited 71,781 0.16%
Nominal Security Classification Fair Value
USD
% of
Net Assets
Financial assets at fair value through profit or loss (continued)

SANLAM UNIVERSAL FUNDS PLC
302
PORTFOLIO OF INVESTMENTS OF SATRIX EMERGING MARKET EQUITY TRACKER
FUND (CONTINUED)
as at 30 June 2017
Equities - 95.99% (continued)
South Africa - 6.12% (continued)
10,329 Woolworths Holdings Ltd. 48,774 0.11%
Total South Africa 2,802,367 6.12%
Taiwan - 12.18%
37,474 Acer Inc 19,678 0.04%
70,000 Advanced Semiconductor Engr 89,992 0.20%
4,518 Advantech Co Ltd 32,054 0.07%
13,031 Asia Cement Corporation 11,197 0.02%
5,832 Asustek Computer Inc 55,200 0.12%
109,924 AU Optronics Corp 50,303 0.11%
6,121 Catcher Technology CO LTD 73,250 0.16%
78,740 Cathay Financial Holding Co 129,872 0.28%
47,236 Chang Hwa Commercial Bank 27,136 0.06%
15,459 Cheng Shin Rubber Industry Co. 32,928 0.07%
5,199 Chicony Electronics Co. Ltd 13,196 0.03%
45,502 China Airlines Ltd 13,827 0.03%
156,716 China Development Financial Holdings Corporat 45,557 0.10%
38,552 China Life Insurance Co Ltd 38,457 0.08%
127,680 China Steel Corp 104,036 0.23%
169,233 Chinatrust Financial Holding 111,151 0.24%
34,213 Chunghwa Telecom Co Ltd 121,646 0.27%
42,672 Compal Electronics 28,799 0.06%
20,584 Delta Electronics Inc 112,831 0.25%
74,230 E.Sun Financial Holding Company Ltd 45,699 0.10%
2,314 Eclat Textile Company Ltd 28,263 0.06%
30,411 Eva Airways Corp 15,068 0.03%
37,110 Far Eastern Textile Ltd 30,238 0.07%
15,484 Far Eastone Telecomm Co Ltd 39,507 0.09%
108,083 First Financial Holding CO 72,411 0.16%
29,291 Formosa Chemicals & Fibre 92,092 0.20%
11,728 Formosa Petrochemical Corp 40,541 0.09%
36,740 Formosa Plastics Corp 112,125 0.24%
8,736 Foxconn Technology Co KTD 26,402 0.06%
69,664 Fubon Financial Holding Co 111,118 0.24%
3,880 Giant Manufacturing Co. Ltd 22,226 0.05%
2,552 Hiwin Technologies Corp 17,265 0.04%
154,689 Hon Hai Precision Industry 595,839 1.30%
2,180 Hotai Motor Company Ltd 27,344 0.06%
7,995 HTC Corporation 19,109 0.04%
Nominal Security Classification Fair Value
USD
% of
Net Assets
Financial assets at fair value through profit or loss (continued)

SANLAM UNIVERSAL FUNDS PLC
303
PORTFOLIO OF INVESTMENTS OF SATRIX EMERGING MARKET EQUITY TRACKER
FUND (CONTINUED)
as at 30 June 2017
Equities - 95.99% (continued)
Taiwan - 12.18% (continued)
62,269 Hua Nan Financial Holdings Co. Ltd 36,183 0.08%
87,120 Innolux Display Corporation 45,604 0.10%
37,210 Inventec Co Ltd 30,381 0.07%
1,010 Largan Precision Co Ltd 161,267 0.35%
17,482 Lite On Tecno Corporation 28,777 0.06%
14,332 MediaTek Inc 122,913 0.27%
104,490 Mega Financial Holding Co Ltd 87,032 0.19%
2,221 Merida Industry Co Ltd 11,918 0.03%
51,629 Nan Ya Plastics Corp 128,329 0.28%
5,486 Novatek Microelectronics Ltd 22,215 0.05%
860 OBI Pharma Inc 6,823 0.01%
16,981 Pegatron Corp 53,277 0.12%
3,157 Phison Electronics Corp 39,027 0.09%
22,153 Pou Chen Corporation 30,704 0.07%
7,522 Powertech Technology Inc 23,253 0.05%
6,630 President Chain Store Corp 59,697 0.13%
30,700 Quanta Computer Inc 72,770 0.16%
5,176 Realtek Semi-conductor Corp 18,659 0.04%
7,732 Ruentex Industries Limited 11,557 0.03%
18,149 Siliconware Precision Industries Company 29,367 0.06%
95,254 Sinopac Financial Holdings 29,164 0.06%
18,616 Synnex Technology International Corporation 20,899 0.05%
2,450 TaiMed Biologics Inc 14,881 0.03%
106,916 Taishin Financial Holdings Co. Ltd 48,750 0.11%
36,241 Taiwan Cement Corp 41,998 0.09%
77,076 Taiwan Cooperative Financial Holding 40,980 0.09%
12,532 Taiwan Fertilizer Co 16,689 0.04%
15,537 Taiwan Mobile Co Ltd 58,567 0.13%
240,302 Taiwan Semiconductor Manufacturing Company Lt 1,649,480 3.60%
26,640 Teco Electric & Machinery 25,653 0.06%
51,923 Uni-President Enterprises Corp. 104,273 0.23%
24,605 Wistron Corp 25,071 0.05%
14,496 WPG Holdings Ltd 19,376 0.04%
98,348 Yuanta Financial Holdings Co Ltd 43,386 0.09%
9,670 Yulon Motor Co Ltd 8,691 0.02%
Total Taiwan 5,573,968 12.18%
Thailand - 2.10%
10,350 Advanced Info Service PCL 54,153 0.12%
Nominal Security Classification Fair Value
USD
% of
Net Assets
Financial assets at fair value through profit or loss (continued)

SANLAM UNIVERSAL FUNDS PLC
304
PORTFOLIO OF INVESTMENTS OF SATRIX EMERGING MARKET EQUITY TRACKER
FUND (CONTINUED)
as at 30 June 2017
Equities - 95.99% (continued)
Thailand - 2.10% (continued)
44,200 Airports of Thailand Plc 61,561 0.13%
4,410 Bangkok Bank Public Co 24,049 0.05%
36,000 Bangkok Dusit Medical Services 20,374 0.04%
8,700 BEC World Public Company Limited 5,385 0.01%
12,264 Berli Jucker PCL 17,262 0.04%
54,790 BTS Group Holdings 13,728 0.03%
4,500 Bumrungrad Hospital Public Company Limited 22,749 0.05%
49,623 C.P.Seven Eleven PCL-Foreig 91,786 0.20%
14,800 Central Pattana Public Company Limited 30,211 0.07%
29,100 Charoen Pokphand Foods Public Company 21,273 0.05%
4,600 Glow Energy Pcl 10,678 0.02%
17,737 Indorama Ventures-Foreign 19,868 0.04%
172,780 IRPC Pcl 27,248 0.06%
19,125 Kasikornbank Pcl-Foreign 111,903 0.24%
40,130 Krung Thai Bank Public Company Limited 22,239 0.05%
25,857 Minor International PCL 30,678 0.07%
19,090 PTT Exploration & Prod - For&Prod 48,534 0.11%
23,615 PTT Global Chemical PCL 47,682 0.10%
8,625 PTT PCL 94,068 0.21%
4,267 Siam Cement Pub Co-For Reg 63,392 0.14%
16,445 Siam Commercial Bank PCL 75,378 0.16%
9,250 Thai Oil PCL 21,540 0.05%
55,500 TMB Bank Public Corp - Foreign 3,763 0.01%
130,000 True Corporation PCL 23,758 0.05%
Total Thailand 963,260 2.10%
Turkey - 1.15%
26,934 Akbank T.A.S 75,063 0.16%
2,761 Anadolu Efes Biracilik ve Malt Sanayii AS 17,148 0.04%
2,424 Arcelik A.S. 17,964 0.04%
1,880 BIM Birlesik Magazalar AS 34,885 0.08%
583 Coca-Cola Icecek AS 6,695 0.01%
25,133 Emlak Konut Gayrimenkul Yatirim 21,013 0.05%
1,006 Ford Otomotiv Sanayi A.S 12,290 0.03%
10,831 Haci Omer Sabanci Holding A.S. 33,666 0.07%
9,830 Koc Holding AS 45,231 0.10%
1,596 Tupras-Turkiye Petrol Rafinerileri A.S. 45,932 0.10%
7,451 Turk Hava Yollari Anonim Ortakligi 17,057 0.04%
4,727 Turk Telekomunikasyon AS 8,388 0.02%
Nominal Security Classification Fair Value
USD
% of
Net Assets
Financial assets at fair value through profit or loss (continued)

SANLAM UNIVERSAL FUNDS PLC
305
PORTFOLIO OF INVESTMENTS OF SATRIX EMERGING MARKET EQUITY TRACKER
FUND (CONTINUED)
as at 30 June 2017
Equities - 95.99% (continued)
Turkey - 1.15% (continued)
11,389 Turkcell Iletisim Hizmet As 37,506 0.08%
26,970 Turkiye Garanti Bankasi 75,087 0.16%
19,454 Turkiye IS Bankasi 41,216 0.09%
10,517 Turkiye Vakiflar Bankasi T.A.O 19,351 0.04%
14,255 Yapi Ve Kredi Bankasi 18,202 0.04%
Total Turkey 526,694 1.15%
United Arab Emirates - 0.72%
20,600 Abu Dhabi Commercial Bank 39,316 0.08%
36,095 Aldar Properties PJSC 22,602 0.05%
22,600 Damac Properties Dubai Co 19,444 0.04%
1,900 DP World Ltd 39,748 0.09%
36,251 Emaar Properties 76,785 0.17%
19,410 Emirates Telecommunications Group Company 91,422 0.20%
14,906 National Bank of Abu Dhabi 42,612 0.09%
Total United Arab Emirates 331,929 0.72%
United States - 0.78%
723 Credicorp 129,699 0.28%
820 Southern Copper Corp 28,397 0.06%
116,588 United MicroElectronics Corp 56,615 0.13%
3,561 Yum China Holding Inc 140,410 0.31%
Total United States 355,121 0.78%
Total Equities 43,948,896 95.99%
Exchange Traded Funds - 3.10%
49,226 iSahres MSCI Russia Capped ETF 1,417,708 3.10%
Total Exchange Traded Funds 1,417,708 3.10%
Total financial assets at fair value through profit or loss 45,366,604 99.09%
Cash and cash equivalents 339,395 0.74%
Other net assets and liabilities 75,538 0.17%
Net assets attributable to holders of redeemable participating shares 45,781,537 100.00%
Nominal Security Classification Fair Value
USD
% of
Net Assets
Financial assets at fair value through profit or loss (continued)

SANLAM UNIVERSAL FUNDS PLC
306
PORTFOLIO OF INVESTMENTS OF SATRIX EMERGING MARKET EQUITY TRACKER
FUND (CONTINUED)
as at 30 June 2017 Satrix Emerging Market Equity Tracker Fund
Summary
Classification Description
Fair Value % of % of
USD Net
Assets Total
Assets
Transferable securities and money market instruments admitted to official stock exchange listing or traded on regulated market 45,366,604 99.09% 98.65%
A Transferable securities and money market instruments other than those referred above - - -
B UCITS and AIFs
- - -
C Financial derivative instruments dealt in on a regulated market - - -
D Over the counter financial derivative instruments - - -
Cash and cash equivalents
339,395 0.74% 0.74%
Other net assets and liabilities
75,538 0.17% 0.16%
Net assets attributable to holders of redeemable participating shares 45,781,537 100.00%

SANLAM UNIVERSAL FUNDS PLC
307
PORTFOLIO OF INVESTMENTS OF SANLAM MANAGED RISK FUND as at 30 June 2017
Nominal Security Classification Fair Value
USD
% of
Net Assets
Financial assets at fair value through profit or loss
Collective Investment Schemes - 90.15%
18,347,870 Satrix World Equity Tracker Fund
B 40,191,010 90.15%
Total Collective Investment Schemes 40,191,010 90.15%
Derivative Financial Instruments
Nominal Security Coupon Maturity Classification Fair Value % of
USD Net Assets
Futures Contracts - 0.05%1
(35) S&P 500 Emini Future 15/09/2017 C 21,175 0.05%
Total Futures Contracts
21,175 0.05%
Buy Currency Buy Amount Sell currency Sell Amount Maturity Fair Value % of
USD Net Assets
Forward Contracts – 0.75%2
GBP 1,844,975 USD (2,359,022) 20/07/2017 42,495 0.10%
GBP 11,522,071 USD (14,732,350) 20/07/2017 265,383 0.60%
GBP 5,265 USD (6,737) 20/07/2017 116 0.00%
GBP 19,999 USD (25,351) 20/07/2017 680 0.00%
EUR 1,251 USD (1,399) 20/07/2017 30 0.00%
EUR 153,590 USD (171,633) 20/07/2017 3,831 0.01%
GBP 550,626 USD (704,042) 20/07/2017 12,682 0.03%
EUR 21,822 USD (24,385) 20/07/2017 544 0.00%
EUR 179 USD (200) 20/07/2017 4 0.00%
EUR 90,030 USD (212,353) 20/07/2017 4,740 0.01%
EUR 1,595 USD (1,783) 20/07/2017 39 0.00%
GBP 185,311 USD (236,943) 20/07/2017 4,268 0.01%
GBP 30,000 USD (38,986) 20/07/2017 64 0.00%
Total Forward Contracts
334,877 0.75%
Total financial assets at fair value through profit or loss 40,547,062 90.94%
Financial liabilities at fair value through profit or loss
Derivative Financial Instruments
Buy Currency Buy Amount Sell currency Sell Amount Maturity Fair Value % of
USD Net Assets
Forward Contracts – (0.01)%2
USD 23,341 GBP (18,295) 20/07/2017 (472) 0.00%
USD 7,698 GBP (6,073) 20/07/2017 (207) 0.00%
USD 150,234 GBP (117,752) 20/07/2017 (3,038) (0.01)%
USD 266 GBP (209) 20/07/2017 (6) 0.00%
USD 6,890 GBP (5,400) 20/07/2017 (139) 0.00%
USD 2,279 GBP (1,786) 20/07/2017 (46) 0.00%
Total Forward Contracts
(3,908) (0.01)%

SANLAM UNIVERSAL FUNDS PLC
308
PORTFOLIO OF INVESTMENTS OF SANLAM MANAGED RISK FUND (CONTINUED) as at 30 June 2017
Fair Value % of
USD Net Assets
Total financial liabilities at fair value through profit or loss (3,908) (0.01)%
Cash and cash equivalents
3,957,938 8.88%
Other net assets and liabilities
81,441 0.18%
Net assets attributable to holders of redeemable participating shares 44,582,533 100.00%
Sanlam Managed Risk Fund
Summary
Classification Description
Fair Value % of % of
USD Net
Assets Total
Assets
Transferable securities and money market instruments admitted to official stock exchange listing or traded on regulated market 40,191,010 90.15% 89.94%
A Transferable securities and money market instruments other than those referred above - - -
B UCITS and AIFs
- - -
C Financial derivative instruments dealt in on a regulated market 21,175 0.05% 0.05%
D Over the counter financial derivative instruments 330,969 0.74% 0.74%
Cash and cash equivalents
3,957,938 8.88% 8.86%
Other net assets and liabilities
81,441 0.18% 0.18%
Net assets attributable to holders of redeemable participating shares 44,582,533 100.00%
The following entities act as counterparty or clearing broker to the open derivative positions at 30 June 2017: Goldman Sachs
1,
Brown Brothers Harriman2

SANLAM UNIVERSAL FUNDS PLC
309
PORTFOLIO OF INVESTMENTS OF SANLAM PRIVATE WEALTH GLOBAL HIGH QUALITY FUND as at 30 June 2017
Equities - 79.57%
Cayman Islands - 10.70%
40,000 Baidu Com Inc 5,500,002 3.52%
800,000 Hengan International Group Compnay Limited 4,537,746 2.91%
11,000 Netease.Com Inc 2,542,229 1.63%
150,000 Tencent Holdings Limited 4,124,149 2.64%
Total Cayman Islands 16,704,126 10.70%
France - 2.49%
37,800 Pernod-Ricard 3,888,607 2.49%
Total France 3,888,607 2.49%
Germany - 3.19%
67,500 Fresenius Medical Care 4,984,831 3.19%
Total Germany 4,984,831 3.19%
Great Britain - 12.90%
16,000 Aon Plc 1,635,302 1.05%
46,000 British American Tobacco Plc 2,407,640 1.54%
237,000 Diageo 5,376,345 3.44%
160,000 Imperial Brands Plc 5,517,600 3.54%
125,000 Unilever Plc 5,193,750 3.33%
Total Great Britain 20,130,637 12.90%
Ireland - 4.30%
98,500 Medtronic Plc 6,720,386 4.30%
Total Ireland 6,720,386 4.30%
Spain - 0.85%
29,000 Amadeus IT Holding SA 1,331,999 0.85%
Total Spain 1,331,999 0.85%
Switzerland - 4.08%
24,000 Nestle SA 1,605,494 1.03%
24,300 Roche Holding AG 4,756,889 3.05%
Total Switzerland 6,362,383 4.08%
United States - 41.06%
8,000 Alphabet Inc 5,588,748 3.58%
36,000 Altria Group Inc 2,060,979 1.32%
48,700 American Express 3,153,820 2.02%
14,000 Automatic Data Processing Inc 1,102,737 0.71%
Nominal Security Classification Fair Value
GBP
% of
Net Assets
Financial assets at fair value through profit or loss

SANLAM UNIVERSAL FUNDS PLC
310
PORTFOLIO OF INVESTMENTS OF SANLAM PRIVATE WEALTH GLOBAL HIGH QUALITY FUND (CONTINUED)
as at 30 June 2017
Equities - 79.57% (continued)
United States - 41.06% (continued)
77,327 Cognizant Tech Solutions CRP 3,947,198 2.53%
8,700 Edwards Lifesciences Corp 790,812 0.51%
40,000 Johnson & Johnson 4,067,960 2.61%
37,784 Mastercard Inc 3,527,728 2.26%
72,200 Microsoft Corp 3,825,913 2.45%
43,000 Moody’s Corp 4,022,326 2.58%
180,000 Oracle Corp 6,938,195 4.44%
50,000 Paypal Holidings Inc 2,062,962 1.32%
47,000 Pepsico Inc 4,172,841 2.67%
15,000 Philip Morris International Inc 1,354,359 0.87%
3,500 Priceline Group Incorporated 5,032,920 3.22%
48,450 Procter & Gamble 3,246,017 2.08%
6,000 Stryker Corp. 640,129 0.41%
28,000 Waters Corp. 3,957,197 2.53%
33,000 Yum Brands Inc 1,871,218 1.20%
90,000 Yum China Holding Inc 2,728,092 1.75%
Total United States 64,092,151 41.06%
Total Equities 124,215,123 79.57%
Collective Investment Schemes - 2.92%
2,500 Institutional Sterling Liquidity Heritage A 257,968 0.17%
54,917 Institutional Cash Series Plc 4,297,774 2.75%
Total Collective Investment Schemes 4,555,742 2.92%
Total financial assets at fair value through profit or loss 128,770,865 82.49%
Cash and cash equivalents 27,759,101 17.78%
Other net assets and liabilities (423,236) (0.27)%
Net assets attributable to holders of redeemable participating shares 156,106,730 100.00%
Nominal Security Classification Fair Value
GBP
% of
Net Assets
Financial assets at fair value through profit or loss (continued)

SANLAM UNIVERSAL FUNDS PLC
311
PORTFOLIO OF INVESTMENTS OF SANLAM PRIVATE WEALTH GLOBAL HIGH QUALITY FUND (CONTINUED)
as at 30 June 2017
Sanlam Private Wealth Global High Quality Fund
Summary
Classification Description
Fair Value % of % of
GBP Net
Assets Total
Assets
Transferable securities and money market instruments admitted to official stock exchange listing or traded on regulated market 124,215,123 79.57% 78.97%
A Transferable securities and money market instruments other than those referred above - - -
B UCITS and AIFs
4,555,742 2.92% 2.90%
C Financial derivative instruments dealt in on a regulated market - - -
D Over the counter financial derivative instruments - - -
Cash and cash equivalents
27,759,101 17.78% 17.65%
Other net assets and liabilities
(423,236) (0.27)% (0.27)%
Net assets attributable to holders of redeemable participating shares 156,106,730 100.00%

SANLAM UNIVERSAL FUNDS PLC
312
PORTFOLIO OF INVESTMENTS OF SANLAM FOUR US DIVIDEND INCOME FUND as at 30 June 2017
Equities - 92.19%
Canada - 12.77%
87,100 Aecon Group Inc 1,095,378 0.48%
87,677 BCE Inc 3,959,214 1.72%
508,400 Bird Construction Inc 3,298,704 1.44%
447,000 Empire Company ltd 7,367,905 3.20%
279,100 Labrador Iron Ore Royalty Corp 3,396,000 1.48%
26,038 Magna International Inc 1,192,046 0.52%
288,000 Mullen Group Ltd 3,502,073 1.52%
243,300 Power Corp. Of Canada 5,551,447 2.41%
Total Canada 29,362,767 12.77%
Netherlands - 0.41%
9,500 Core Laboratories 948,670 0.41%
Total Netherlands 948,670 0.41%
United States - 79.01%
20,400 Allegiant Travel Company 2,776,440 1.21%
293,200 American Eagle Outfitters 3,506,672 1.53%
89,800 AmTrust Financial Services Inc 1,378,430 0.60%
41,300 AT & T Inc 1,553,706 0.68%
51,200 Avangrid Inc 2,267,648 0.99%
134,500 Avnet Inc 5,242,810 2.28%
18,100 Best Buy Co Inc 1,036,406 0.45%
61,400 Brinker International Inc 2,364,514 1.03%
44,800 Bristol-Myrs Squib 2,500,736 1.09%
24,000 Campbell Soup 1,247,760 0.54%
215,300 Cisco Systems Inc 6,762,573 2.94%
178,900 Coca-Cola Co. 8,020,087 3.49%
118,000 CSG Systems International Inc 4,790,800 2.08%
77,300 CVS Health Corporation 6,204,871 2.70%
186,000 Dean Foods Company 3,195,480 1.39%
146,600 Delta Air Lines INC 7,897,342 3.44%
189,000 DOMTAR CORP 7,363,440 3.20%
12,300 Dr Pepper Snapple Group 1,118,070 0.49%
297,700 Federated Investors Inc 8,287,968 3.60%
155,720 First American Financial Corporation 6,966,913 3.03%
80,700 Flowers Foods Inc. 1,402,566 0.61%
29,500 General Mills Inc 1,621,615 0.71%
18,500 Gilead Sciences Inc 1,310,910 0.57%
157,600 HP Inc 2,769,032 1.20%
131,700 Intel Corp 4,417,218 1.92%
Nominal Security Classification Fair Value
USD
% of
Net Assets
Financial assets at fair value through profit or loss

SANLAM UNIVERSAL FUNDS PLC
313
PORTFOLIO OF INVESTMENTS OF SANLAM FOUR US DIVIDEND INCOME FUND (CONTINUED)
as at 30 June 2017
Equities - 92.19% (continued)
United States - 79.01% (continued)
50,580 International Business Machine Corp 7,795,895 3.39%
26,730 Johnson & Johnson 3,545,467 1.54%
56,165 Kforce Inc 1,092,409 0.48%
32,400 Macy’s Inc 743,580 0.32%
274,400 Mattel Inc 5,726,728 2.49%
111,300 Medifast Inc 4,597,803 2.00%
56,600 MGE Energy Inc 3,630,890 1.58%
329,400 MGM Resorts International 5,237,460 2.28%
49,100 MOVADO GROUP 1,205,405 0.52%
29,500 National-Oilwell Inc 956,980 0.42%
169,600 Netapp Inc 6,800,960 2.96%
13,400 Northwest Natural Gas Co 799,980 0.35%
611,600 Office Depot Inc 3,452,482 1.50%
103,100 Owens & Minor Inc 3,307,448 1.44%
6,000 Pepsico Inc 691,080 0.30%
174,130 Pfizer Inc 5,855,992 2.55%
13,600 Pinnacle West Capital 1,158,584 0.50%
35,000 Qualcomm Inc 1,927,800 0.84%
31,100 Ralph Lauren Corp 2,279,941 0.99%
24,200 Safety Insurance Group Inc 1,662,540 0.72%
18,600 Sonoco Products Co 947,670 0.41%
84,300 SpartanNash Co 2,202,759 0.96%
29,000 Steelcase Inc-CL A 407,450 0.18%
50,200 Sturm Ruger & Co Inc 3,383,480 1.47%
56,800 The Buckle Inc The 1,019,560 0.44%
127,500 Universal Insurance Holdings Inc 3,289,500 1.43%
87,100 Verizon Communications Inc 3,868,111 1.68%
34,800 Viacom Inc 1,195,380 0.52%
45,700 Wal-Mart Stores Inc 3,470,001 1.51%
80,600 Whole Foods Market Inc 3,390,842 1.47%
Total United States 181,648,184 79.01%
Total Equities 211,959,621 92.19%
Total financial assets at fair value through profit or loss 211,959,621 92.19%
Nominal Security Classification Fair Value
USD
% of
Net Assets
Financial assets at fair value through profit or loss (continued)

SANLAM UNIVERSAL FUNDS PLC
314
PORTFOLIO OF INVESTMENTS OF SANLAM FOUR US DIVIDEND INCOME FUND (CONTINUED)
as at 30 June 2017
Cash and cash equivalents 23,479,910 10.21%
Other net assets and liabilities (5,524,123) (2.40)%
Net assets attributable to holders of redeemable participating shares 229,915,408 100.00%
Sanlam FOUR US Dividend Income Fund
Summary
Classification Description
Fair Value % of % of
USD Net
Assets Total
Assets
Transferable securities and money market instruments admitted to official stock exchange listing or traded on regulated market 211,959,621 92.19% 89.80%
A Transferable securities and money market instruments other than those referred above - - -
B UCITS and AIFs
- - -
C Financial derivative instruments dealt in on a regulated market - - -
D Over the counter financial derivative instruments - - -
Cash and cash equivalents
23,479,910 10.21% 9.95%
Other net assets and liabilities
(5,524,123) (2.40)% (2.34)%
Net assets attributable to holders of redeemable participating shares 229,915,408 100.00%
Nominal Security Classification Fair Value
USD
% of
Net Assets

SANLAM UNIVERSAL FUNDS PLC
315
PORTFOLIO OF INVESTMENTS OF HIGH STREET GLOBAL BALANCED FUND as at 30 June 2017
7
Equities - 32.84%
Denmark - 1.76%
15,409 Novo Nordisk AS 659,396 1.76%
Total Denmark 659,396 1.76%
Germany - 3.42%
9,236 Daimler AG 667,986 1.78%
6,563 LEG Immobilien GmbH 616,531 1.64%
Total Germany 1,284,517 3.42%
Great Britain - 9.72%
11,875 British American Tobacco Plc 808,496 2.15%
27,299 GlaxoSmithKline Plc 580,775 1.55%
514,022 Hansteen Holdings Plc 832,456 2.21%
27,694 Royal Dutch Shell Plc 742,592 1.98%
108,192 Segro Plc 688,481 1.83%
Total Great Britain 3,652,800 9.72%
Guernsey Channel Island - 1.83%
925,006 Sirius Real Estate Ltd 688,859 1.83%
Total Guernsey Channel Island 688,859 1.83%
Japan - 2.00%
9,300 Softbank Corp 753,023 2.00%
Total Japan 753,023 2.00%
Switzerland - 2.04%
3,011 Roche Holding AG 766,722 2.04%
Total Switzerland 766,722 2.04%
United States - 12.07%
880 Alphabet Inc 799,682 2.13%
6,330 Celgene Corp 822,077 2.19%
27,050 Cubesmart 650,282 1.73%
8,025 JP Morgan Chase & Co 733,485 1.95%
9,678 Lowes Com 750,335 2.00%
8,319 Visa Inc 780,156 2.07%
Total United States 4,536,017 12.07%
Total Equities 12,341,333 32.84%
Nominal Security Classification Fair Value
USD
% of
Net Assets
Financial assets at fair value through profit or loss

SANLAM UNIVERSAL FUNDS PLC
316
PORTFOLIO OF INVESTMENTS OF HIGH STREET GLOBAL BALANCED FUND (CONTINUED)
as at 30 June 2017
Nominal Security Coupon Maturity Classification Fair Value % of
USD Net Assets
Financial assets at fair value through profit or loss (continued)
Corporate Debt – 8.72%
Canada – 2.81%
260,000 Barclays Bank Plc 10.180% 12/06/2021 326,786 0.87%
658,000 Standard Bank Plc 8.130% 02/12/2019 730,183 1.94%
Total Canada 1,056,969 2.81%
Great Britain – 1.62%
300,000 Jaguar Land Rover 4.250% 15/11/2019 309,585 0.82%
200,000 Old Mutual Plc 8.000% 03/06/2021 300,982 0.80%
Total Great Britain 610,567 1.62%
Isle of Man – 0.55%
200,000 Sasol Financing International 4.500% 14/11/2022 204,940 0.55%
Total Isle of Man 204,940 0.55%
Luxembourg – 1.13%
300,000 Glencore Finance Europe 6.500% 27/02/2019 422,645 1.13%
Total Luxembourg 422,645 1.13%
United States – 2.61%
330,000 Investec Bank Ltd 3.875% 24/07/2017 330,739 0.88%
650,000 Myriad International Holdings 6.380% 28/07/2017 651,398 1.73%
Total United States 982,137 2.61%
Total Corporate Debt 3,277,257 8.72%
Government Debt – 6.82% United States – 6.82%
583,000 US Treasury 0.000% 17/08/2017 582,345 1.55%
2,000,000 US Treasury 0.000% 26/04/2018 1,980,904 5.27%
Total United States 2,563,249 6.82%
Total Government Debt 2,563,249 6.82%

SANLAM UNIVERSAL FUNDS PLC
317
PORTFOLIO OF INVESTMENTS OF HIGH STREET GLOBAL BALANCED FUND (CONTINUED)
as at 30 June 2017
Nominal Security Coupon Maturity Classification Fair Value % of
USD Net Assets
Financial assets at fair value through profit or loss (continued)
Derivative Financial Instruments2
Buy Currency Buy Amount Sell currency Sell Amount Maturity Fair Value % of
USD Net Assets
Forward Contracts - 0.04% EUR 1,520,000 USD (1,734,472) 14/09/2017 7,199 0.04%
Total Forward Contracts
7,199 0.04%
Futures - 0.00%1
12 UEAU7P17 - Euro Curr 2PM Op Sep17 Put 2,550 0.00%
Total Futures 2,550 0.00%
Options - 0.37%1
United States - 0.37%
18 SPX Dec 17 Put Option (Strike 2425) 138,600 0.37%
Total United States 138,600 0.37%
Total Options 138,600 0.37%
Total financial assets at fair value through profit or loss 18,330,188 48.75%
Financial liabilities at fair value through profit or loss
Derivative Financial Instruments2
Buy Currency Buy Amount Sell currency Sell Amount Maturity Fair Value % of
USD Net Assets
Forward Contracts – (0.54)%
USD 4,400,000 GBP (3,432,673) 14/09/2017 (75,844) (0.39)%
USD 1,700,000 EUR (1,509,233) 14/09/2017 (29,333) (0.15)%
Total Forward Contracts
(105,177) (0.54)%
Total financial liabilities at fair value through profit or loss (105,177) (0.54)%
Cash and cash equivalents 1,313,009 6.82%
Other net assets and liabilities (293,084) (1.51)%
Net assets attributable to holders of redeemable participating shares 19,244,936 100.00%

SANLAM UNIVERSAL FUNDS PLC
318
PORTFOLIO OF INVESTMENTS OF HIGH STREET GLOBAL BALANCED FUND (CONTINUED)
as at 30 June 2017
High Street Global Balanced Fund
Summary
Classification Description
Fair Value % of % of
USD Net
Assets Total
Assets
Transferable securities and money market instruments admitted to official stock exchange listing or traded on regulated market 18,181,839 94.48% 92.21%
A Transferable securities and money market instruments other than those referred above - - -
B Collective Investment Schemes
- - -
C Financial derivative instruments dealt in on a regulated market 2,550 0.00% 0.00%
D Over the counter financial derivative instruments 40,622 0.21% 0.21%
Cash and cash equivalents
1,313,009 6.82% 6.86%
Other net assets and liabilities
(293,084) (1.51)% (1.49)%
Net assets attributable to holders of redeemable participating shares 19,244,936 100.00%
The following entities act as counterparty or clearing broker to the open derivative positions at 30 June 2017:BNP Paribas
1 and
Brown Brothers Harriman2.

SANLAM UNIVERSAL FUNDS PLC
319
PORTFOLIO OF INVESTMENTS OF SANLAM FOUR GLOBAL EQUITY FUND
as at 30 June 2017 SANLAM UNIVERSA
Equities - 99.33%
Bermuda - 2.43%
58,865 Norwegian Cruise line Holdings Ltd 2,468,546 1.32%
41,984 Signet Jewelers Ltd 2,060,862 1.11%
Total Bermuda 4,529,408 2.43%
Brazil - 1.56%
1,217,995 Via Varejo SA 2,905,723 1.56%
Total Brazil 2,905,723 1.56%
Canada - 1.05%
45,699 Loblaw Companies Ltd. 1,958,731 1.05%
Total Canada 1,958,731 1.05%
France - 8.10%
44,396 Airbus Group SE 2,842,102 1.53%
83,618 BNP Paribas SA 4,696,899 2.52%
107,479 Societe Generale SA 4,513,021 2.43%
78,143 Total SA 3,013,439 1.62%
Total France 15,065,461 8.10%
Great Britain - 7.22%
271,834 Aggreko Plc 2,506,309 1.35%
26,686 Aon Plc 2,731,731 1.47%
426,898 HSBC Holdings 3,051,467 1.64%
147,177 Imperial Brands Plc 5,143,100 2.76%
Total Great Britain 13,432,607 7.22%
Hong Kong - 1.27%
2,913,524 SJM Holdings Ltd 2,367,276 1.27%
Total Hong Kong 2,367,276 1.27%
Ireland - 4.64%
13,780 Allergan Plc 2,591,196 1.39%
61,529 Medtronic Plc 4,206,085 2.26%
16,324 Willis Towers Watson PLC 1,845,491 0.99%
Total Ireland 8,642,772 4.64%
Italy - 4.31%
435,702 ENI-Ente Nazionale Idrocarburi SpA 5,087,697 2.73%
1,191,173 Intesa Sanpaolo SpA 2,930,486 1.58%
Total Italy 8,018,183 4.31%
Nominal Security Classification Fair Value
GBP
% of
Net Assets
Financial assets at fair value through profit or loss

SANLAM UNIVERSAL FUNDS PLC
320
PORTFOLIO OF INVESTMENTS OF SANLAM FOUR GLOBAL EQUITY FUND (CONTINUED)
as at 30 June 2017 SANLAM UNIVERSA
Equities - 99.33% (continued)
Japan - 6.64%
496,700 Hitachi 2,355,777 1.27%
133,703 Honda Motor Co 2,818,375 1.51%
119,203 Japan Tobacco Inc 3,236,854 1.74%
152,141 MS&AD Insurance Group Holdings 3,950,181 2.12%
Total Japan 12,361,187 6.64%
Jersey Channel Islands - 1.93%
220,297 WPP Plc 3,582,029 1.93%
Total Jersey Channel Islands 3,582,029 1.93%
Korea (South) - 2.88%
2,759 Samsung Electronics Ltd 3,462,707 1.86%
3,027 Samsung Electro-Regs GDR 1,903,392 1.02%
Total Korea (South) 5,366,099 2.88%
Marshall Islands - 0.36%
626,207 Navios Maritime Acquisition Corporation 675,572 0.36%
Total Marshall Islands 675,572 0.36%
Netherlands - 2.89%
195,191 NN Group NV 5,371,409 2.89%
Total Netherlands 5,371,409 2.89%
Philippines - 0.93%
19,528,263 Vista Land & Lifescapes Inc 1,732,096 0.93%
Total Philippines 1,732,096 0.93%
Singapore - 2.73%
7,045,025 Cambridge Industrial Trust 2,326,764 1.25%
20,942,935 Ezion Holdings Ltd 2,755,011 1.48%
Total Singapore 5,081,775 2.73%
Switzerland - 3.37%
21,400 Roche Holding AG 4,220,274 2.27%
155,254 UBS Group AG 2,049,900 1.10%
Total Switzerland 6,270,174 3.37%
Nominal Security Classification Fair Value
GBP
% of
Net Assets
Financial assets at fair value through profit or loss (continued)

SANLAM UNIVERSAL FUNDS PLC
321
PORTFOLIO OF INVESTMENTS OF SANLAM FOUR GLOBAL EQUITY FUND (CONTINUED)
as at 30 June 2017 SANLAM UNIVERSA
Equities - 99.33% (continued)
United States - 45.16%
88,931 American International Group 4,351,636 2.34%
51,014 Amerisourcebergen Corp 3,764,429 2.02%
121,595 Anadarko Petroleum Corp 4,239,942 2.28%
63,825 Arrow Electronics Inc 3,855,468 2.07%
283,643 Bank of America Corp 5,315,710 2.85%
24,351 Celgene Corp 2,471,316 1.33%
99,413 Cobalt International Energy 186,155 0.10%
28,800 Dun & Bradsheet Corp 2,388,422 1.28%
95,647 eBay Inc. 2,543,560 1.37%
102,482 Express Scripts Holdings Inc 5,045,522 2.71%
94,739 Gilead Sciences Inc 5,173,156 2.78%
203,388 Hewlett Packard Enterprise 2,609,547 1.40%
306,364 HP Inc 4,147,965 2.23%
48,671 JP Morgan Chase & Co 3,418,634 1.84%
86,005 Microsoft Corp 4,539,170 2.44%
167,300 Oracle Corp 6,471,803 3.48%
66,997 Pfizer Inc 1,736,232 0.93%
42,057 Tupperware Brands Corp 2,250,472 1.21%
32,812 United Healthcare Corp 4,684,502 2.52%
132,444 VeriFone Holdings Inc 1,842,193 0.99%
125,663 Viacom Inc 3,326,288 1.79%
134,155 Welbilt Inc 1,926,985 1.03%
80,962 Wells Fargo & Co 3,480,049 1.87%
60,713 Western Digital Corporation 4,287,852 2.30%
Total United States 84,057,008 45.16%
Virgin Islands - 1.86%
125,953 Michael Kors Holdings Ltd 3,464,993 1.86%
Total Virgin Islands 3,464,993 1.86%
Total Equities 184,882,505 99.33%
Derivative Financial Instruments
Warrants - 0.03%
Ireland - 0.00%
903 Kenmare Warrants - 0.00%
Total Ireland - 0.00%
Nominal Security Classification Fair Value
GBP
% of
Net Assets
Financial assets at fair value through profit or loss (continued)

SANLAM UNIVERSAL FUNDS PLC
322
PORTFOLIO OF INVESTMENTS OF SANLAM FOUR GLOBAL EQUITY FUND (CONTINUED) as at 30 June 2017
Derivative Financial Instruments (continued)
Warrants - 0.03% (continued)
Singapore - 0.03%
3,017,562 Ezion Holdings Ltd Call Warrant 55,743 0.03%
Total Singapore 55,743 0.03%
Total Warrants 55,743 0.03%
Total financial assets at fair value through profit or loss 184,938,248 99.36%
Cash and cash equivalents 2,446,111 1.31%
Other net assets and liabilities (1,254,059) (0.67)%
Net assets attributable to holders of redeemable participating shares 186,130,300 100.00%
Sanlam FOUR Global Equity Fund
Summary
Classification Description
Fair Value % of % of
GBP Net
Assets Total
Assets
Transferable securities and money market instruments admitted to official stock exchange listing or traded on regulated market 184,882,505 99.33% 98.45%
A Transferable securities and money market instruments other than those referred above 55,743 0.03% 0.03%
B Collective Investment Schemes
- - -
C Financial derivative instruments dealt in on a regulated market - - -
D Over the counter financial derivative instruments - - -
Cash and cash equivalents
2,446,111 1.31% 1.30%
Other net assets and liabilities
(1,254,059) (0.67)% (0.67)%
Net assets attributable to holders of redeemable participating shares 186,130,300 100.00%
Nominal Security Classification Fair Value
GBP
% of
Net Assets
Financial assets at fair value through profit or loss (continued)

SANLAM UNIVERSAL FUNDS PLC
323
PORTFOLIO OF INVESTMENTS OF SANLAM FOUR STABLE GLOBAL EQUITY FUND as at 30 June 2017
Equities – 97.63%
Canada – 2.95%
112,148 Loblaw Companies Ltd. 4,806,841 2.95%
Total Canada 4,806,841 2.95%
Great Britain – 10.06%
71,186 Aon Plc 7,287,005 4.48%
260,024 Imperial Brands Plc 9,086,539 5.58%
Total Great Britain 16,373,544 10.06%
Ireland – 9.64%
24,119 Allergan Plc 4,535,345 2.79%
115,512 Medtronic Plc 7,896,330 4.85%
28,840 Willis Towers Watson PLC 3,260,473 2.00%
Total Ireland 15,692,148 9.64%
Japan – 4.01%
240,378 Japan Tobacco Inc 6,527,256 4.01%
Total Japan 6,527,256 4.01%
Jersey Channel Islands – 4.97%
497,312 WPP Plc 8,086,293 4.97%
Total Jersey Channel Islands 8,086,293 4.97%
Singapore – 2.35%
11,559,517 Cambridge Industrial Trust 3,817,768 2.35%
Total Singapore 3,817,768 2.35%
Switzerland – 4.85%
40,037 Roche Holding AG 7,895,659 4.85%
Total Switzerland 7,895,659 4.85%
United States – 58.81%
87,700 Amerisourcebergen Corp 6,471,566 3.98%
27,419 Celgene Corp 2,782,678 1.71%
60,925 Dun & Bradsheet Corp 5,052,591 3.10%
182,157 eBay Inc. 4,844,137 2.98%
147,905 Express Scripts Holdings Inc 7,281,844 4.47%
135,771 Gilead Sciences Inc 7,413,679 4.55%
322,778 HP Inc 4,370,200 2.68%
137,934 Microsoft Corp 7,279,878 4.47%
101,737 Nasdaq OMX Group Inc 5,608,587 3.45%
255,248 Oracle Corp 9,873,967 6.07%
Nominal Security Classification Fair Value
GBP
% of
Net Assets
Financial assets at fair value through profit or loss

SANLAM UNIVERSAL FUNDS PLC
324
PORTFOLIO OF INVESTMENTS OF SANLAM FOUR STABLE GLOBAL EQUITY FUND (CONTINUED) as at 30 June 2017
Equities – 97.63% (continued)
United States – 58.81% (continued)
210,859 Pfizer Inc 5,464,427 3.36%
80,214 Procter & Gamble 5,377,063 3.30%
82,255 Tupperware Brands Corp 4,401,469 2.70%
70,086 United Healthcare Corp 10,006,035 6.15%
107,698 Verizon Communications Inc 3,685,650 2.26%
219,931 Viacom Inc 5,821,552 3.58%
Total United States 95,735,323 58.81%
Total Equities 158,934,834 97.63%
Total financial assets at fair value through profit or loss 158,934,834 97.63%
Cash and cash equivalents 5,908,379 3.58%
Other net assets and liabilities (2,042,507) (1.26)%
Net assets attributable to holders of redeemable participating shares 162,800,706 100.00%
Sanlam FOUR Stable Global Equity Fund
Summary
Classification Description
Fair Value % of % of
GBP Net
Assets Total
Assets
Transferable securities and money market instruments admitted to official stock exchange listing or traded on regulated market 158,934,834 97.63% 96.19%
A Transferable securities and money market instruments other than those referred above - - -
B UCITS and AIFs
- - -
C Financial derivative instruments dealt in on a regulated market - - -
D Over the counter financial derivative instruments - - -
Cash and cash equivalents
5,908,379 3.63% 3.58%
Other net assets and liabilities
(2,042,507) (1.26)% (1.24)%
Net assets attributable to holders of redeemable participating shares 162,800,706 100.00%
Nominal Security Classification Fair Value
GBP
% of
Net Assets
Financial assets at fair value through profit or loss (continued)

SANLAM UNIVERSAL FUNDS PLC
325
PORTFOLIO OF INVESTMENTS OF SANLAM FOUR ACTIVE UK EQUITY FUND as at 30 June 2017
Equities - 48.90%
Canada - 0.35%
192,251 Entertainment One Ltd. 424,298 0.35%
Total Canada 424,298 0.35%
Germany - 0.59%
63,194 Tui Ag 712,828 0.59%
Total Germany 712,828 0.59%
Great Britain - 43.93%
174,342 AA Plc 397,325 0.33%
1,184,754 Barclays Plc 2,430,523 2.01%
445,155 BBA Aviation Plc 1,365,736 1.13%
664,777 BP Plc 2,972,883 2.45%
139,931 Brewin Dolphin Holdings Plc 477,165 0.39%
54,911 British American Tobacco Plc 2,896,006 2.39%
554,712 BT Group Plc 1,626,416 1.34%
201,996 Crest Nicholson Holdings 1,060,479 0.88%
37,848 First Derivatives Plc 1,113,110 0.92%
452,945 GKN Plc 1,498,795 1.24%
143,602 GlaxoSmithKline Plc 2,363,689 1.95%
212,759 Great Portland Estates PLC 1,268,044 1.05%
252,938 HSBC Holdings 1,808,001 1.49%
27,657 Imperial Brands Plc 966,474 0.80%
1,719,010 IQE Plc 1,478,349 1.22%
1,062,920 ITV PLC 1,929,200 1.59%
475,212 John Laing Group Plc 1,447,021 1.19%
439,278 Legal & General Group Plc 1,140,366 0.94%
2,493,764 Lloyds Bank Plc 1,660,597 1.37%
163,249 Novae Group Plc 935,417 0.77%
323,729 OneSavings Bank Plc 1,230,818 1.02%
172,553 Prudential Corp 3,080,934 2.54%
69,875 Reed Elsevier plc 1,165,515 0.96%
58,633 Rio Tinto Plc 1,923,456 1.59%
86,016 Rolls-Royce Holdings Plc 777,155 0.64%
142,881 Royal Dutch Shell Plc 2,931,918 2.42%
391,909 Sainsbury (J) Plc 995,449 0.82%
43,618 Shire Plc 1,869,249 1.54%
150,035 Smart Metering Systems Plc 780,932 0.64%
253,588 Sophos Group Plc 1,119,084 0.92%
Nominal Security Classification Fair Value
GBP
% of
Net Assets
Financial assets at fair value through profit or loss

SANLAM UNIVERSAL FUNDS PLC
326
PORTFOLIO OF INVESTMENTS OF SANLAM FOUR ACTIVE UK EQUITY FUND (CONTINUED) as at 30 June 2017
Equities - 48.90% (continued)
Great Britain - 43.93% (continued)
107,423 Standard Chartered Plc 838,651 0.69%
979,171 Tungsten Corp Plc 631,565 0.52%
23,827 Unilever Plc 1,002,998 0.83%
855,589 Vodafone Group PLC 1,874,596 1.55%
25,500 Whitbread Plc 1,021,530 0.84%
370,033 Worldpay Group Plc 1,167,454 0.96%
Total Great Britain 53,246,900 43.93%
Ireland - 1.75%
191,508 Kenmare Resources Plc 482,600 0.40%
13,251 Paddy Power Betfair PLC 1,083,269 0.89%
3,516,871 Providence Resources Plc 558,303 0.46%
Total Ireland 2,124,172 1.75%
Israel - 0.45%
179,335 Telit Communications Plc 549,662 0.45%
Total Israel 549,662 0.45%
Jersey Channel Islands - 0.98%
410,233 Glencore Plc 1,188,855 0.98%
Total Jersey Channel Islands 1,188,855 0.98%
Spain - 0.85%
166,224 Int Consol Airlines Group SA 1,025,602 0.85%
Total Spain 1,025,602 0.85%
Total Equities 59,272,314 48.90%
Derivative Financial Instruments
Warrants - 0.00%
Ireland - 0.00%
500 Kenmare Warrants - 0.00%
Total Ireland - 0.00%
Total Warrants - 0.00%
Total financial assets at fair value through profit or loss 59,272,314 48.90%
Cash and cash equivalents 2,503,185 2.07%
Other net assets and liabilities 158,148 0.13%
Net assets attributable to holders of redeemable participating shares 121,205,961 100.00%
Nominal Security Classification Fair Value
GBP
% of
Net Assets
Financial assets at fair value through profit or loss (continued)

SANLAM UNIVERSAL FUNDS PLC
327
PORTFOLIO OF INVESTMENTS OF SANLAM FOUR ACTIVE UK EQUITY FUND (CONTINUED) as at 30 June 2017
Sanlam FOUR Active UK Equity Fund
Summary
Classification Description
Fair Value % of % of
GBP Net
Assets Total
Assets
Transferable securities and money market instruments admitted to official stock exchange listing or traded on regulated market 59,272,314 95.70% 95.63%
A Transferable securities and money market instruments other than those referred above - - -
B UCITS and AIFs
- - -
C Financial derivative instruments dealt in on a regulated market - - -
D Over the counter financial derivative instruments - - -
Cash and cash equivalents
2,503,185 4.04% 4.04%
Other net assets and liabilities
158,148 0.26% 0.26%
Net assets attributable to holders of redeemable participating shares 61,933,647 100.00%

SANLAM UNIVERSAL FUNDS PLC
328
PORTFOLIO OF INVESTMENTS OF SANLAM FOUR MULTI-STRATEGY FUND as at 30 June 2017
Nominal Security Classification Fair Value
GBP
% of
Net Assets
Financial assets at fair value through profit or loss
Equities – 25.01%
Canada – 2.05%
79,218 Brookfield Infra
2,501,621 2.05%
Total Canada
1,944,816 2.05%
Great Britain – 15.43%
450,000 Amedeo Air Four Plus Ltd 469,125 0.39%
1,582,215 Empiric Student Property Plc
1,764,170 1.45%
923,665 Grainger Plc
2,433,857 2.00%
3,775,712 Greencoat UK Wind Plc
4,610,144 3.79%
3,159,757 HICL Infrastructure Company Limited
5,090,369 4.18%
1,396,710 John Laing Environmental Assets Group Ltd
1,504,955 1.24%
42,000 Land Securities Group Plc
426,720 0.35%
1,698,416 Trixtax Big Box REIT Plc
2,489,878 2.04%
Total Great Britain
18,789,218 15.43%
Guernsey Channel Islands - 3.87%
4,267,990 Renewables Infrastructure Group Limited 4,716,129 3.87%
Total Guernsey Channel Islands
4,716,129 3.87%
Jersey Channel Islands - 3.65%
2,318,147 Infrastructure Plc
4,446,206 3.65%
Total Jersey Channel Islands
4,446,206 3.65%
Total Equities
30,453,173 25.01%
Exchange Traded Funds – 3.00%
United States – 3.00%
115,000 iShares MSCI Emerging Markets Index
3,651,074 3.00%
Total United States
3,651,074 3.00%
Total Exchange Traded Funds
3,651,074 3.00%
Nominal Security Coupon Maturity Classification Fair Value % of
GBP Net Assets
Corporate Debt – 59.64%
Australia – 3.46%
4,000,000 National Australia FRN 7.125 12/06/2023
4,217,900 3.46%
Total Australia
4,217,900 3.46%

SANLAM UNIVERSAL FUNDS PLC
329
PORTFOLIO OF INVESTMENTS OF SANLAM FOUR MULTI-STRATEGY FUND (CONTINUED) as at 30 June 2017
Nominal Security Coupon Maturity Classification Fair Value % of
GBP Net Assets
Financial assets at fair value through profit or loss (continued)
Corporate Debt – 59.64% (continued)
France - 0.84%
1,000,000 Lafarge SA 6.625 29/11/2017
1,022,870 0.84%
Total France
1,022,870 0.84%
Germany - 1.07%
1,300,000 Daimler AG 1.750 08/11/2017
1,304,784 1.07%
Total Germany
1,304,784 1.07%
Great Britain – 44.41%
4,000,000 3I Group Plc 6.875 09/03/2023
4,958,820 4.07%
5,440,000 Anglian Water Services Finance 5.500 10/10/2040
5,504,926 4.52%
1,101,000 Aviva Plc 5.902 27/11/2049
1,200,910 0.99%
2,500,000 Barclays Bank 6.750 16/01/2023
2,566,050 2.11%
3,000,000 Barclays Bank 7.875 29/12/2049
3,243,825 2.66%
4,300,000 BG Energy Capital Plc 6.500 30/11/2072
4,397,266 3.61%
5,000,000 HSBC Holdings Plc 6.375 18/10/2022
5,069,775 4.16%
4,000,000 InterContinental Hotel 3.875 28/11/2022
4,390,100 3.61%
4,292,000 J Sainsbury Plc 6.500 30/07/2049
4,678,323 3.84%
3,000,000 Lloyds Bank Plc 7.000 27/06/2049
3,120,045 2.56%
5,000,000 Santander UK Plc 0.818 08/07/2019
5,037,275 4.14%
2,500,000 Standard Life Plc 6.546 06/01/2050
2,745,775 2.26%
4,022,000 Tesco Plc 6.125 24/02/2022
4,618,161 3.79%
2,500,000 Vodafone Group Plc 5.375 05/12/2017
2,548,925 2.09%
Total Great Britain
54,080,177 44.41%
Luxembourg - 0.44%
500,000 Glencore Finance Europe 6.500 27/02/2019
541,455 0.44%
Total Luxembourg
541,455 0.44%
Netherlands - 3.53%
4,100,000 Ing Bank 6.867 29/05/2023
4,298,235 3.53%
Total Netherlands
4,298,235 3.53%
Supra-National – 5.87%
7,100,000 European Investment Bank 0.561 17/02/2020
7,147,535 5.87%
Total Supra-National
7,147,535 5.87%
Total Corporate Debt
72,612,955 59.64%

SANLAM UNIVERSAL FUNDS PLC
330
PORTFOLIO OF INVESTMENTS OF SANLAM FOUR MULTI-STRATEGY FUND (CONTINUED) as at 30 June 2017
Buy Currency Buy Amount Sell currency Sell Amount Maturity Fair Value % of
GBP Net Assets
Financial assets at fair value through profit or loss (continued)
Derivative Financial Instruments
Forward Contracts – 0.08%
2
GBP 3,728,155 USD (4,723,050) 26/07/2017 91,793 0.08%
Total Forward Contracts
91,793 0.08%
Nominal Security Maturity Classification Fair Value % of
GBP Net Assets
Futures - 0.27%1
(31) ESU7-S&P500 Emini Fut Sep17 15/09/2017 C 14,811 0.01%
(11) GXU7-Dax Index Future Sep17 15/09/2017 C 97,858 0.08%
575 MWOU7 - MSCI World Ix Fut Sep17 15/09/2017 C 159,513 0.13%
(40) Z U7-FTSE 100 Idx Fut Sep17 15/09/2017 C 57,200 0.05%
Total Futures
329,381 0.27%
Options - 0.41%1
56 HSI July 17 Call Option (Strike – 26,600) 28/07/2017 C 13,822 0.01%
50 NKY Aug 17 Call Option (Strike – 20,750 ) 10/08/2017 C 29,239 0.02%
38 SPX Sep 17 Call Option (Strike – 2,535 ) 15/09/2017 C 8,931 0.01%
247 SX5E Dec 17 Call Option (Strike – 3,800 ) 15/12/2017 C 49,697 0.04%
50 UKX Dec 17 Call Option (Strike – 7,500 ) 15/12/2017 C 62,250 0.05%
95 UKX Dec 17 Call Option (Strike – 7,700 ) 15/12/2017 C 66,025 0.05%
22 NKY Sept 17 Put Option (Strike – 18,000) 08/09/2017 C 13,622 0.01%
55 SPX Dec 17 Put Option (Strike – 2,150) 15/12/2017 C 109,771 0.09%
155 SX5E Oct 17 Put Option (Strike – 3,300 ) 20/10/2017 C 84,981 0.07%
66 UKX Dec 17 Put Option (Strike – 6,650) 15/12/2017 C 58,410 0.05%
Total Options
496,748 0.41%
Total financial assets at fair value through profit or loss 107,635,125 88.40%

SANLAM UNIVERSAL FUNDS PLC
331
PORTFOLIO OF INVESTMENTS OF SANLAM FOUR MULTI-STRATEGY FUND (CONTINUED) as at 30 June 2017 Financial liabilities at fair value through profit or loss
Derivative Financial Instruments
Buy Currency Buy Amount Sell currency Sell Amount Maturity Fair Value % of
GBP Net Assetss
Forward Contracts – (0.04)%2
USD 3,919,104 GBP (3,065,104) 20/07/2017 (46,932) (0.04)%
USD 40,706 GBP (31,905) 20/07/2017 (557) 0.00%
Total Forward Contracts
(47,489) (0.04)%
Nominal Security Maturity Classification Fair Value % of
GBP Net Assets
Futures - (0.18)%1
21 FAU7-S&P Mid 400 Emini Sep17 15/09/2017 C (35,925) (0.03)%
28 MFU7 - MDAX Index Fut Sep 17 15/09/2017 C (92,010) (0.08)%
78 YBYU7 - FTSE 250 Index Future Sep 17 15/09/2017 C (91,366) (0.08)%
Total Futures
(219,301) (0.18)%
Options - (0.05)%1
(1,150) EEM US Aug 17 Call Option (Strike – 42) 18/08/2017 C (49,626) (0.04)%
(9) NKY July 17 Call Opton (Strike – 20,250) 14/07/2017 C (6,811) (0.01)%
Total Options
(56,437) (0.05)%
Total financial liabilities at fair value through profit or loss
(323,228) (0.27)%
Cash and cash equivalents
12,867,357 10.57%
Other net assets and liabilities
1,582,134 1.30%
Net assets attributable to holders of redeemable participating shares
121,761,388 100.00%

SANLAM UNIVERSAL FUNDS PLC
332
PORTFOLIO OF INVESTMENTS OF SANLAM FOUR MULTI-STRATEGY FUND (CONTINUED) as at 30 June 2017 Sanlam FOUR Multi-Strategy Fund
Summary
Classification Description
Fair Value % of % of
GBP Net
Assets Total
Assets
Transferable securities and money market instruments admitted to official stock exchange listing or traded on regulated market 106,717,203 87.64% 87.37%
A Transferable securities and money market instruments other than those referred above 484,614 0.40% 0.40%
B UCITS and AIFs
- - -
C Financial derivative instruments dealt in on a regulated market 110,080 0.09% 0.09%
D Over the counter financial derivative instruments - - -
Cash and cash equivalents
12,867,357 10.57% 10.53%
Other net assets and liabilities
1,582,134 1.30% 1.30%
Net assets attributable to holders of redeemable participating shares 121,761,388 100.00%
The following entities act as counterparty or clearing broker to the open derivative positions at 30 June 2017: BNP Paribas
1and Brown
Brothers Harriman2. All open option positions at 30 June 2017 are covered.

SANLAM UNIVERSAL FUNDS PLC
333
PORTFOLIO OF INVESTMENTS OF ANCHOR GLOBAL CAPITAL PLUS FUND
as at 30 June 2017
Equities - 19.65%
Denmark - 0.40%
1,200 Novo Nordisk A/S 51,468 0.40%
Total Denmark 51,468 0.40%
France - 1.63%
6,000 Credit Agricole SA 96,451 0.75%
450 Unibail Rodamco 113,323 0.88%
Total France 209,774 1.63%
Germany - 0.89%
3,000 Deutsche Wohnen AG 114,666 0.89%
Total Germany 114,666 0.89%
Great Britain - 3.44%
20,000 British Land 157,527 1.23%
2,000 Glaxo Smith Kline PLC-ADR (1 ADR REPR 2 OS) 86,240 0.67%
3,500 Royal Dutch Shell PLC 92,813 0.72%
25,000 Spire Health Care Group PLC 105,430 0.82%
Total Great Britain 442,010 3.44%
Ireland - 0.38%
198 Allergan Plc 48,132 0.38%
Total Ireland 48,132 0.38%
Israel - 0.60%
700 Check Point Software Technologies Ltd 76,356 0.60%
Total Israel 76,356 0.60%
Netherlands - 1.18%
1,834 Euronext NV 95,133 0.74%
1,011 Unilever NV 55,754 0.44%
Total Netherlands 150,887 1.18%
United States - 11.13%
600 Berkshire Hathaway Inc. 101,622 0.79%
3,100 Blackstone Group LP 103,385 0.81%
550 Boston Properties Inc 67,661 0.53%
400 Camden Property Trust 34,204 0.27%
350 Celgene Corp 45,455 0.35%
1,000 Digital Realty Trust Inc 112,950 0.88%
400 Equity Residential 26,332 0.20%
2,500 General Electric Co 67,525 0.53%
Nominal Security Classification Fair Value
USD
% of
Net Assets
Financial assets at fair value through profit or loss

SANLAM UNIVERSAL FUNDS PLC
334
NLAM UNIVE PORTFOLIO OF INVESTMENTS OF ANCHOR GLOBAL CAPITAL PLUS FUND (CONTINUED) as at 30 June 2017
Equities - 19.65% (continued)
United States - 11.13% (continued)
300 International Business Machine Corp 46,149 0.36%
700 Johnson & Johnson 92,603 0.72%
2,500 Liberty Property Trust 101,775 0.79%
1,800 Newell 96,516 0.75%
1,200 Nike Inc 70,800 0.55%
2,000 Oaktree Capital Group LLC 93,200 0.73%
500 Splunk Inc 28,445 0.22%
800 Tractor Supply Company 43,368 0.34%
2,250 US Bancorp 116,820 0.91%
750 Walt Disney Co 79,688 0.62%
1,800 Wells Fargo & Co 99,738 0.78%
Total United States 1,428,236 11.13%
Total Equities 2,521,529 19.65%
Exchange Traded Funds – 17.40%
3,000 iShares $ Short Corporate Bond 303,165 2.36%
2,000 iShares Barclays TIPS Bond Fund 226,860 1.77%
5,472 ishares CMBS ETF 281,261 2.19%
2,250 iShares Core Euro Corporated Bond 333,008 2.60%
1,550 iShares iBoxx Investment Grade Corporate Bond 186,791 1.46%
5,000 iShares EPRA Asia Property Yield Fund 129,917 1.01%
5,000 iShares Msci Japan fund 67,934 0.53%
6,000 Powershares Financial Preferred Portfolio 114,600 0.89%
650 RBS Market Access Rici Agriculture Index ETF 58,413 0.46%
3,000 The Lyxor ETF Commodities CRB Non Energy 58,710 0.46%
1,500 UBS Etf CMCI Compos USD 87,660 0.68%
4,800 Vanguard Short Term Corporate Bond ETF 384,192 2.99%
Total Exchange Traded Funds 2,232,511 17.40%
Nominal Security Classification Fair Value
USD
% of
Net Assets
Financial assets at fair value through profit or loss (continued)

SANLAM UNIVERSAL FUNDS PLC
335
PLANLA PORTFOLIO OF INVESTMENTS OF ANCHOR GLOBAL CAPITAL PLUS FUND (CONTINUED) as at 30 June 2017
Nominal Security Coupon Maturity Classification Fair Value % of
USD Net Assets
Financial assets at fair value through profit or loss (continued)
Government Debt – 31.60%
Great Britain – 3.78%
150,000 UK Treasury 0.125 22/11/2019 227,130 1.77%
200,000 UK Treasury 0.500 22/07/2022 257,712 2.01%
Total Great Britain 484,841 3.78%
Italy – 4.03%
450,000 Buoni Poliennali Del Tes 2.200 01/06/2027 516,333 4.03%
Total Italy 516,333 4.03%
Spain – 2.66%
300,000 Bonos Y Oblig Del Estado 1.500 30/04/2027 341,691 2.66%
Total Spain 341,691 2.66%
United States – 21.13%
500,000 US Treasury 0.125 15/04/2019 522,173 4.07%
1,000,000 US Treasury 0.000 24/05/2018 989,276 7.71%
600,000 US Treasury 1.250 31/05/2019 598,617 4.67%
600,000 US Treasury 1.875 28/02/2022 600,703 4.68%
Total United States 2,710,770 21.13%
Total Government Debt 4,053,635 31.60%
Derivative Financial Instruments
Nominal Security Maturity Classification Fair Value % of
USD Net Assets
Futures- 0.02%1
(3) OATU7 - Euro-OAT Fut Sep 17 07/09/2017 2,123 0.02%
Total Futures 2,123 0.02%
Options - 0.08%1
150 IYR US Sept 17 Call Option (Strike – 82) 10,950 0.08% Total Options 10,950 0.08%
Total financial assets at fair value through profit or loss 8,820,748 68.75%
SANLAM UNI

SANLAM UNIVERSAL FUNDS PLC
336
PORTFOLIO OF INVESTMENTS OF ANCHOR GLOBAL CAPITAL PLUS FUND (CONTINUED) as at 30 June 2017
Nominal Security Coupon Maturity Classification Fair Value % of
USD Net Assets
Financial liabilities at fair value through profit or loss
Derivative financial instruments
Nominal Security Maturity Classification Fair Value % of
USD Net Assets
Futures - (0.08)%1
(9) BPU7 - BP Currency Future 18/09/2017 (4,213) (0.03)% (8) ECU7 - Euro Fx Curr Future 18/09/2017 (5,937) (0.05)%
0 TYH6A - US 10YR 21/03/2016 (94) 0.00%
0 ESM6A - S&P500 Emini Future 17/06/2016 (12) 0.00%
Total Futures (10,256) (0.08)%
Options - (0.03)%1
(10) US 5YR FUT Oct17 Put Option (3,828) (0.03)%
Total Options (3,828) (0.03)%
Total financial liabilities at fair value through profit or loss (14,084) (0.11)%
Cash and cash equivalents 3,831,037 29.86%
Other net assets and liabilities 193,138 1.50%
Net assets attributable to holders of redeemable participating shares 12,830,839 100.00%
Anchor Global Capital Plus Fund
Summary
Classification Description
Fair Value % of % of
USD Net
Assets Total
Assets
Transferable securities and money market instruments admitted to official stock exchange listing or traded on regulated market 8,807,675 68.64% 68.37%
A Transferable securities and money market instruments other than those referred above - - -
B UCITS and AIFs
- - -
C Financial derivative instruments dealt in on a regulated market (8,133) (0.01)% (0.01)%
D Over the counter financial derivative instruments 7,122 0.01% 0.01%
Cash and cash equivalents
3,831,037 29.86% 29.74%
Other net assets and liabilities
193,138 1.50% 1.50%
Net assets attributable to holders of redeemable participating shares 12,830,839 100.00%
1BNP Paribas acts as counterparty to the open derivative positions at 30 June 2017. All open option positions at 30 June 2017 are
covered.

SANLAM UNIVERSAL FUNDS PLC
337
UN PORTFOLIO OF INVESTMENTS OF BRIDGE GLOBAL EQUITY INCOME GROWTH FUND as at 30 June 2017
Equities - 97.58%
France - 10.36%
2,124 Sanofi 203,044 3.61%
3,259 Total SA 160,998 2.86%
149 Unibail Rodamco 37,522 0.67%
2,126 Vinci SA 181,325 3.22%
Total France 582,889 10.36%
Germany - 3.85%
1,101 Allianz SE 216,633 3.85%
Total Germany 216,633 3.85%
Great Britain - 17.76%
4,772 British Land 37,586 0.67%
12,111 Capita Group Plc 108,939 1.94%
5,737 Diageo 169,291 3.01%
7,407 GlaxoSmithKline Plc 157,581 2.80%
5,201 Hammerson Plc 38,868 0.69%
2,945 Imperial Brands Plc 132,107 2.35%
2,922 Land Securities Group Plc 38,503 0.68%
8,236 Scottish & Southern Energy 155,665 2.77%
56,731 Vodafone Group PLC 160,690 2.85%
Total Great Britain 999,230 17.76%
Switzerland - 15.86%
1,268 ACE Limited 184,342 3.28%
2,079 Nestle SA 180,910 3.21%
2,068 Novartis AG 172,082 3.06%
668 Roche Holding AG 170,100 3.02%
636 Zurich Financial Services AG 185,097 3.29%
Total Switzerland 892,531 15.86%
United States - 49.75%
2,643 AbbVie Inc 191,644 3.41%
4,081 AT & T Inc 153,976 2.74%
3,898 Coca-Cola Co. 174,825 3.11%
2,198 Colgate-Palmolive Co 162,938 2.90%
407 Digital Realty Trust Inc 45,971 0.82%
921 Education Realty Trust Inc 35,689 0.63%
1,840 Exxon Corp 148,543 2.64%
1,210 Healthcare Realty Trust Inc 41,322 0.73%
Nominal Security Classification Fair Value
USD
% of
Net Assets
Financial assets at fair value through profit or loss

SANLAM UNIVERSAL FUNDS PLC
338
PORTFOLIO OF INVESTMENTS OF BRIDGE GLOBAL EQUITY INCOME GROWTH FUND (CONTINUED) as at 30 June 2017
Equities - 97.58% (continued)
United States - 49.75% (continued)
4,741 Intel Corp 159,961 2.84%
1,420 Johnson & Johnson 187,852 3.34%
1,297 Kimco Realty Corp 23,800 0.42%
1,000 Liberty Property Trust 40,710 0.72%
1,614 McCormick & Co 157,381 2.80%
1,422 McDonald’s Corp 217,794 3.87%
2,762 Microsoft Corp 190,385 3.38%
1,871 Procter & Gamble 163,058 2.90%
778 Prologis Inc 45,622 0.81%
181 Public Storage Inc 37,744 0.67%
176 Simon Property Group Inc 28,470 0.51%
2,982 Spirit Realty Cap Inc 22,097 0.39%
3,798 US Bancorp 197,192 3.50%
2,306 Wal-Mart Stores Inc 174,518 3.10%
3,578 Wells Fargo & Co 198,257 3.52%
Total United States 2,799,749 49.75%
Total Equities 5,491,030 97.58%
Total financial assets at fair value through profit or loss 5,491,030 97.58%
Cash and cash equivalents 139,209 2.47%
Other net assets and liabilities (3,267) (0.07)%
Net assets attributable to holders of redeemable participating shares 5,626,972 100.00%
Nominal Security Classification Fair Value
USD
% of
Net Assets
Financial assets at fair value through profit or loss (continued)

SANLAM UNIVERSAL FUNDS PLC
339
PORTFOLIO OF INVESTMENTS OF BRIDGE GLOBAL EQUITY INCOME GROWTH FUND (CONTINUED) as at 30 June 2017 Bridge Global Equity Income Growth Fund
Summary
Classification Description
Fair Value % of % of
USD Net
Assets Total
Assets
Transferable securities and money market instruments admitted to official stock exchange listing or traded on regulated market 5,491,030 97.58% 97.07%
A Transferable securities and money market instruments other than those referred above - - -
B UCITS and AIFs
- - -
C Financial derivative instruments dealt in on a regulated market - - -
D Over the counter financial derivative instruments - - -
Cash and cash equivalents
139,209 2.47% 2.46%
Other net assets and liabilities
(3,267) (0.07)% (0.06)%
Net assets attributable to holders of redeemable participating shares 5,626,972 100.00%

SANLAM UNIVERSAL FUNDS PLC
340
PORTFOLIO OF INVESTMENTS OF ANCHOR GLOBAL EQUITY FUND as at 30 June 2017
Equities – 86.37%
Canada - 3.17%
1,625 Constellation Software Inc 848,600 3.17%
Total Canada 848,600 3.17%
Cayman Islands - 2.24%
1,997 Netease.Com Inc 600,358 2.24%
Total Cayman Islands 600,358 2.24%
Denmark - 1.21%
3,461 Pandora AS 322,721 1.21%
Total Denmark 322,721 1.21%
Great Britain - 1.65%
115,450 Domino’s Pizza Group Plc 441,371 1.65%
Total Great Britain 441,371 1.65%
Ireland - 2.54%
2,793 Allergan Plc 678,950 2.54%
Total Ireland 678,950 2.54%
Japan - 3.59%
6,400 Ain Holdings Inc 462,555 1.73%
20,200 Start Today Company Limited 497,134 1.86%
Total Japan 959,689 3.59%
Jersey Channel Islands - 2.42%
3,920 Shire Plc 647,858 2.42%
Total Jersey Channel Islands 647,858 2.42%
Netherlands - 8.86%
2,328 Cimpress NV 220,066 0.82%
8,217 Euronext NV 426,233 1.59%
19,202 Unilever NV 1,058,944 3.96%
19,218 X5 Retail Group NV 665,904 2.49%
Total Netherlands 2,371,147 8.86%
United States – 60.69%
4,535 Activision Blizzard Inc 261,080 0.98%
690 Alphabet Inc 641,479 2.40%
267 Amazon.Com Inc 258,456 0.97%
3,204 Automatic Data Processing Inc 328,282 1.23%
4,879 Bard CR Inc 1,542,301 5.77%
Nominal Security Classification Fair Value
USD
% of
Net Assets
Financial assets at fair value through profit or loss

SANLAM UNIVERSAL FUNDS PLC
341
PORTFOLIO OF INVESTMENTS OF ANCHOR GLOBAL EQUITY FUND (CONTINUED)
as at 30 June 2017
Equities – 86.37% (continued)
United States - 60.69% (continued)
8,053 Becton Dickinson & Co 1,571,221 5.87%
11,958 Berkshire Hathaway Inc. 2,025,326 7.57%
5,386 Celgene Corp 699,480 2.62%
8,815 Charles Schwab Corp 378,692 1.42%
4,338 Facebook Inc 654,951 2.45%
6,114 Intuit Inc 812,000 3.04%
5,472 Mastercard Inc 664,574 2.48%
29,635 Newell 1,589,029 5.94%
11,695 Philip Morris International Inc 1,373,578 5.14%
254 Priceline Group Incorporated 475,112 1.78%
8,654 Ross Stores Inc 499,595 1.87%
5,396 S&P Global Inc 787,762 2.95%
1,605 Sherwin-Williams Co. 563,291 2.11%
8,140 Starbucks Corp. 474,643 1.77%
7,620 Tractor Supply Company 413,080 1.54%
2,055 Walt Disney Co 218,344 0.82%
Total United States 16,232,276 60.69%
Total Equities 23,102,971 86.37%
Total financial assets at fair value through profit or loss 23,102,971 86.37%
Cash and cash equivalents 3,813,034 14.26%
Other net assets and liabilities (167,749) (0.63)%
Net assets attributable to holders of redeemable participating shares 26,748,256 100.00%
Nominal Security Classification Fair Value
USD
% of
Net Assets
Financial assets at fair value through profit or loss (continued)

SANLAM UNIVERSAL FUNDS PLC
342
SANLAM UNI PORTFOLIO OF INVESTMENTS OF ANCHOR GLOBAL EQUITY FUND (CONTINUED) as at 30 June 2017
Anchor Global Equity Fund
Summary
Classification Description
Fair Value % of % of
USD Net
Assets Total
Assets
Transferable securities and money market instruments admitted to official stock exchange listing or traded on regulated market 23,102,971 86.37% 85.72%
A Transferable securities and money market instruments other than those referred above - - -
B UCITS and AIFs
- - -
C Financial derivative instruments dealt in on a regulated market - - -
D Over the counter financial derivative instruments - - -
Cash and cash equivalents
3,813,034 14.26% 14.15%
Other net assets and liabilities
(167,749) (0.63)% (0.62)%
Net assets attributable to holders of redeemable participating shares 26,748,256 100.00%

SANLAM UNIVERSAL FUNDS PLC
343
PORTFOLIO OF INVESTMENTS OF BRIDGE GLOBAL MANAGED GROWTH FUND as at 30 June 2017
Equities - 90.26%
France - 8.52%
2,252 Sanofi 215,281 2.20%
4,107 Total SA 202,891 2.08%
778 Unibail Rodamco 195,922 2.01%
2,559 Vinci SA 218,255 2.23%
Total France 832,349 8.52%
Germany - 2.33%
1,154 Allianz SE 227,061 2.33%
Total Germany 227,061 2.33%
Great Britain - 20.00%
23,625 British Land 186,079 1.91%
30,920 Capita Group Plc 278,126 2.85%
7,455 Diageo 219,987 2.25%
10,878 GlaxoSmithKline Plc 231,425 2.37%
28,403 Hammerson Plc 212,258 2.17%
4,494 Imperial Brands Plc 201,592 2.07%
14,162 Land Securities Group Plc 186,614 1.91%
11,124 Scottish & Southern Energy 210,250 2.15%
80,033 Vodafone Group PLC 226,693 2.32%
Total Great Britain 1,953,024 20.00%
Switzerland - 11.70%
1,569 ACE Limited 228,101 2.34%
2,748 Nestle SA 239,125 2.45%
2,840 Novartis AG 236,321 2.42%
833 Roche Holding AG 212,115 2.17%
779 Zurich Financial Services AG 226,714 2.32%
Total Switzerland 1,142,376 11.70%
United States - 47.71%
3,352 AbbVie Inc 243,054 2.49%
5,543 AT & T Inc 209,137 2.14%
4,908 Coca-Cola Co. 220,124 2.25%
2,963 Colgate-Palmolive Co 219,647 2.25%
1,935 Digital Realty Trust Inc 218,558 2.24%
4,320 Education Realty Trust Inc 167,400 1.72%
2,686 Exxon Corp 216,841 2.22%
5,726 Healthcare Realty Trust Inc 195,543 2.00%
6,119 Intel Corp 206,455 2.12%
Nominal Security Classification Fair Value
USD
% of
Net Assets
Financial assets at fair value through profit or loss

SANLAM UNIVERSAL FUNDS PLC
344
PORTFOLIO OF INVESTMENTS OF BRIDGE GLOBAL MANAGED GROWTH FUND (CONTINUED)
as at 30 June 2017
Equities - 90.26% (continued)
United States - 47.71% (continued)
1,745 Johnson & Johnson 230,846 2.36%
6,649 Kimco Realty Corp 122,009 1.25%
4,975 Liberty Property Trust 202,532 2.07%
2,135 McCormick & Co 208,184 2.13%
1,478 McDonald’s Corp 226,370 2.32%
3,214 Microsoft Corp 221,541 2.27%
2,555 Procter & Gamble 222,668 2.28%
3,933 Prologis Inc 230,631 2.36%
806 Public Storage Inc 168,075 1.72%
919 Simon Property Group Inc 148,657 1.52%
15,526 Spirit Realty Cap Inc 115,048 1.18%
4,268 US Bancorp 221,595 2.27%
2,828 Wal-Mart Stores Inc 214,023 2.19%
4,163 Wells Fargo & Co 230,672 2.36%
Total United States 4,659,610 47.71%
Total Equities 8,814,421 90.26%
Exchange Traded Funds - 9.73%
2,815 Ishares Core US Aggregate Bond ETF 308,271 3.16%
2,836 Ishares Core US Credit Bond ETF 316,724 3.24%
6,452 Ishares Global High Yield Corporate Bond ETF 325,761 3.33%
Total Exchange Traded Funds 950,757 9.73%
Total financial assets at fair value through profit or loss 9,765,178 99.99%
Cash and cash equivalents 126,391 1.29%
Other net assets and liabilities 715 0.01%
Net assets attributable to holders of redeemable participating shares 9,892,284 100.00%
Nominal Security Classification Fair Value
USD
% of
Net Assets
Financial assets at fair value through profit or loss (continued)

SANLAM UNIVERSAL FUNDS PLC
345
SANLAM UNIV PORTFOLIO OF INVESTMENTS OF BRIDGE GLOBAL MANAGED GROWTH FUND (CONTINUED)
as at 30 June 2017
Bridge Global Managed Growth Fund
Summary
Classification Description
Fair Value % of % of
USD Net
Assets Total
Assets
Transferable securities and money market instruments admitted to official stock exchange listing or traded on regulated market 9,765,178 98.72% 98.33%
A Transferable securities and money market instruments other than those referred above - - -
B UCITS and AIFs
- - -
C Financial derivative instruments dealt in on a regulated market - - -
D Over the counter financial derivative instruments - - -
Cash and cash equivalents
126,391 1.28% 1.27%
Other net assets and liabilities
715 0.00% 0.00%
Net assets attributable to holders of redeemable participating shares 9,892,284 100.00%

SANLAM UNIVERSAL FUNDS PLC
346
PORTFOLIO OF INVESTMENTS OF SIM GLOBAL EMERGING MARKET FUND
as at 30 June 2017
Equities - 98.71%
Austria - 0.89%
16,450 Raiffeisen Intl Bank 414,914 0.89%
Total Austria 414,914 0.89%
Bermuda - 2.98%
766,875 Brilliance China Automotive Holdings Limited 1,396,890 2.98%
Total Bermuda 1,396,890 2.98%
Brazil - 13.43%
128,256 Banco Bradesco SA 1,091,912 2.33%
337,259 BR Malls Participacoes SA 1,218,886 2.61%
109,667 Cia. Hering 655,050 1.40%
235,879 Estacio Participacoes SA 1,042,961 2.23%
391,001 Itausa-Investment Itau - pr 1,066,635 2.28%
268,817 Kroton Educacional SA 1,208,924 2.58%
Total Brazil 6,284,368 13.43%
Cayman Islands - 20.79%
22,917 Alibaba Group Holding Ltd 3,229,005 6.90%
7,760 Baidu Com Inc 1,387,954 2.96%
150,114 MGM China Holdings Ltd 333,817 0.71%
8,730 Netease.Com Inc 2,624,500 5.61%
113,133 Sands China Ltd 518,088 1.11%
155,354 Vipshop Holdings Ltd 1,638,985 3.50%
Total Cayman Islands 9,732,349 20.79%
Cyprus - 2.83%
115,328 TCS Group Holding - Reg S 1,326,272 2.83%
Total Cyprus 1,326,272 2.83%
Great Britain - 3.38%
28,161 Anglo American PLC 375,110 0.80%
22,467 Bhp Billiton Plc 343,687 0.73%
42,000 TBC Bank Group Plc 865,396 1.85%
Total Great Britain 1,584,193 3.38%
Hong Kong - 6.81%
106,483 AIA Group Ltd 778,169 1.66%
133,900 China Mobile Hong Kong Ltd 1,421,056 3.04%
1,850,079 Esprit Holdings Ltd 985,875 2.11%
Total Hong Kong 3,185,100 6.81%
Nominal Security Classification Fair Value
USD
% of
Net Assets
Financial assets at fair value through profit or loss

SANLAM UNIVERSAL FUNDS PLC
347
PORTFOLIO OF INVESTMENTS OF SIM GLOBAL EMERGING MARKET FUND (CONTINUED)
as at 30 June 2017
Equities - 98.71% (continued)
India - 6.27%
109,156 Axis Bank Limited 873,908 1.87%
39,634 Shriram Transport Finance 613,218 1.31%
50,393 Sun TV Network Ltd 636,659 1.36%
121,610 Vakrangee Ltd 810,735 1.73%
Total India 2,934,520 6.27%
Indonesia - 9.75%
1,930,000 Bank Negara Indonesia 954,944 2.04%
1,179,490 Bank Rakyat Indonesa 1,348,469 2.88%
2,126,580 Matahari Department Store TB 2,259,860 4.83%
Total Indonesia 4,563,273 9.75%
Japan - 0.88%
5,109 Softbank Corp 413,677 0.88%
Total Japan 413,677 0.88%
Korea (South) - 6.44%
82,551 DGB Financial Group Inc 851,651 1.82%
1,329 Samsung Electronics Ltd 2,163,526 4.62%
Total Korea (South) 3,015,177 6.44%
Netherlands - 2.06%
27,800 X5 Retail Group NV 963,270 2.06%
Total Netherlands 963,270 2.06%
Russia - 9.72%
68,122 Magnit OJSC-SPON GDR 2,316,148 4.95%
908,004 Sberbank of Russia 2,235,447 4.77%
Total Russia 4,551,595 9.72%
Switzerland - 1.46%
1,852 Swatch Group AG 683,830 1.46%
Total Switzerland 683,830 1.46%
Taiwan - 1.62%
88,160 MediaTek Inc 756,072 1.62%
Total Taiwan 756,072 1.62%
Nominal Security Classification Fair Value
USD
% of
Net Assets
Financial assets at fair value through profit or loss (continued)

SANLAM UNIVERSAL FUNDS PLC
348
PORTFOLIO OF INVESTMENTS OF SIM GLOBAL EMERGING MARKET FUND (CONTINUED)
as at 30 June 2017
Equities - 98.71% (continued)
Thailand - 1.95%
156,250 Kasikornbank PCL-NVDR 914,241 1.95%
Total Thailand 914,241 1.95%
Turkey - 2.94%
29,696 BIM Birlesik Magazalar AS 551,036 1.18%
2,043,882 Turkiye Sinai Kalkin 825,365 1.76%
Total Turkey 1,376,401 2.94%
United States - 1.95%
5,083 Credicorp 911,839 1.95%
Total United States 911,839 1.95%
Virgin Islands - 2.56%
160,839 Arcos Dorados Holdings Inc. 1,198,251 2.56%
Total Virgin Islands 1,198,251 2.56%
Total Equities 46,206,231 98.71%
Total financial assets at fair value through profit or loss 46,206,231 98.71%
Cash and cash equivalents 929,723 1.99%
Other net assets and liabilities (326,704) (0.70)%
Net assets attributable to holders of redeemable participating shares 46,809,250 100.00%
Nominal Security Classification Fair Value
USD
% of
Net Assets
Financial assets at fair value through profit or loss (continued)

SANLAM UNIVERSAL FUNDS PLC
349
PORTFOLIO OF INVESTMENTS OF SIM GLOBAL EMERGING MARKET FUND (CONTINUED)
as at 30 June 2017
SIM Global Emerging Markets Fund
Summary
Classification Description
Fair Value % of % of
USD Net
Assets Total
Assets
Transferable securities and money market instruments admitted to official stock exchange listing or traded on regulated market 46,206,231 98.71% 96.98%
A Transferable securities and money market instruments other than those referred above - - -
B UCITS and AIFs
- - -
C Financial derivative instruments dealt in on a regulated market - - -
D Over the counter financial derivative instruments - - -
Cash and cash equivalents
929,723 1.99% 1.95%
Other net assets and liabilities
(326,704) (0.70)% (0.69)%
Net assets attributable to holders of redeemable participating shares 46,809,250 100.00%

SANLAM UNIVERSAL FUNDS PLC
350
PORTFOLIO OF INVESTMENTS OF ABSA AFRICA EQUITY FUND FUND
as at 30 June 2017 UNIVERSAL FUNDS PLC
Equities - 92.85%
Egypt - 30.14%
47,000 Alexandria Containers Goods 451,452 1.45%
238,500 Commercial International Bank 1,052,570 3.38%
360,000 Credit Agricole Egypt 884,005 2.84%
95,000 Edita Food Industries Group 531,050 1.71%
392,250 EFG-Hermes Holding SAE 528,687 1.70%
950,000 Egypt Kuwait Holding Company 608,000 1.95%
110,000 Egyptian International Pharmaceutical Industries Co 671,001 2.16%
171,000 ElSwedy Cables Holding Company 886,523 2.85%
1,210,000 MM Group for Industry and International Trade 531,604 1.71%
1,730,000 Obour Land For Food Industries 1,742,604 5.60%
686,045 Oriental Weavers Company 682,713 2.20%
470,100 Six of October Development and Investment Co 370,258 1.19%
1,000,000 Talaat Moustafa Group 435,479 1.40%
Total Egypt 9,375,946 30.14%
Great Britain - 2.07%
166,473 Old Mutual PLC 644,251 2.07%
Total Great Britain 644,251 2.07%
Jersey Channel Islands - 1.11%
171,650 Centamin PLC 345,641 1.11%
Total Jersey Channel Islands 345,641 1.11%
Kenya - 19.08%
77,050 British American Tobacco Plc Kenya Ltd 629,024 2.02%
4,512,400 Co-operative Bank of Kenya Ltd 737,207 2.37%
25,300,300 Kenya Electricity Generating 1,938,674 6.23%
11,997,500 Safaricom Ltd 2,630,777 8.46%
Total Kenya 5,935,682 19.08%
Mauritius - 4.86%
191,700 MCB Group Ltd 1,512,251 4.86%
Total Mauritius 1,512,251 4.86%
Morocco - 19.35%
29,540 Attijariwafa Bank 1,345,981 4.33%
85,000 Douja Prom Addoha 428,622 1.38%
6,600 Label Vie 970,417 3.12%
85,000 Maroc Telecom 1,236,138 3.97%
33,292 Residences Dar Saada 606,707 1.95%
Nominal Security Classification Fair Value
USD
% of
Net Assets
Financial assets at fair value through profit or loss

SANLAM UNIVERSAL FUNDS PLC
351
PORTFOLIO OF INVESTMENTS OF ABSA AFRICA EQUITY FUND FUND (CONTINUED) as at 30 June 2017
Equities - 92.85% (continued)
Morocco - 19.35% (continued)
6,471 Societe des Brasseries du Maroc 1,431,195 4.60%
Total Morocco 6,019,060 19.35%
Nigeria - 6.61%
11,620,545 Guaranty Trust Bank 1,102,046 3.54%
528,835 Okomu Oil Palm Plc 84,245 0.27%
650,000 Seplat Petroleum Development 870,885 2.80%
Total Nigeria 2,057,176 6.61%
Senegal - 5.07%
37,977 Sonatel 1,576,666 5.07%
Total Senegal 1,576,666 5.07%
Togo - 3.00%
30,000,000 Ecobank Transnational Inc 934,118 3.00%
Total Togo 934,118 3.00%
United Arab Emirates - 1.14%
27,300 ADES International Holding Ltd 354,900 1.14%
Total United Arab Emirates 354,900 1.14%
Zambia - 0.42%
184,130 Lafarge Cement Zambia PLC 130,617 0.42%
Total Zambia 130,617 0.42%
Total Equities 28,886,307 92.85%
Nominal Security Coupon Maturity Classification Fair Value % of
USD Net Assets
Government Debt - 4.68%
Egypt - 4.68%
22,000,000 Treasury Bill 0.000% 03/04/2018 1,050,847 3.38%
8,575,000 Treasury Bill 0.000% 01/05/2018 404,290 1.30%
Total Egypt 1,455,137 4.68%
Total Government Debt 1,455,137 4.68%
Total financial assets at fair value through profit or loss 30,341,444 97.53%
Nominal Security Classification Fair Value
USD
% of
Net Assets
Financial assets at fair value through profit or loss (continued)

SANLAM UNIVERSAL FUNDS PLC
352
PORTFOLIO OF INVESTMENTS OF ABSA AFRICA EQUITY FUND FUND (CONTINUED) as at 30 June 2017
Cash and cash equivalents 832,376 2.68%
Other net assets and liabilities (64,062) (0.21)%
Net assets attributable to holders of redeemable participating shares 31,109,758 100.00%
Nominal Security Classification Fair Value
USD
% of
Net Assets
ABSA Africa Equity Fund
Summary
Classification Description
Fair Value % of % of
USD Net
Assets Total
Assets
Transferable securities and money market instruments admitted to official stock exchange listing or traded on regulated market 30,341,444 97.53% 97.18%
A Transferable securities and money market instruments other than those referred above - - -
B UCITS and AIFs
- - -
C Financial derivative instruments dealt in on a regulated market - - -
D Over the counter financial derivative instruments - - -
Cash and cash equivalents
832,376 2.68% 2.67%
Other net assets and liabilities
(64,062) (0.21)% (0.21)%
Net assets attributable to holders of redeemable participating shares 31,109,758 100.00%
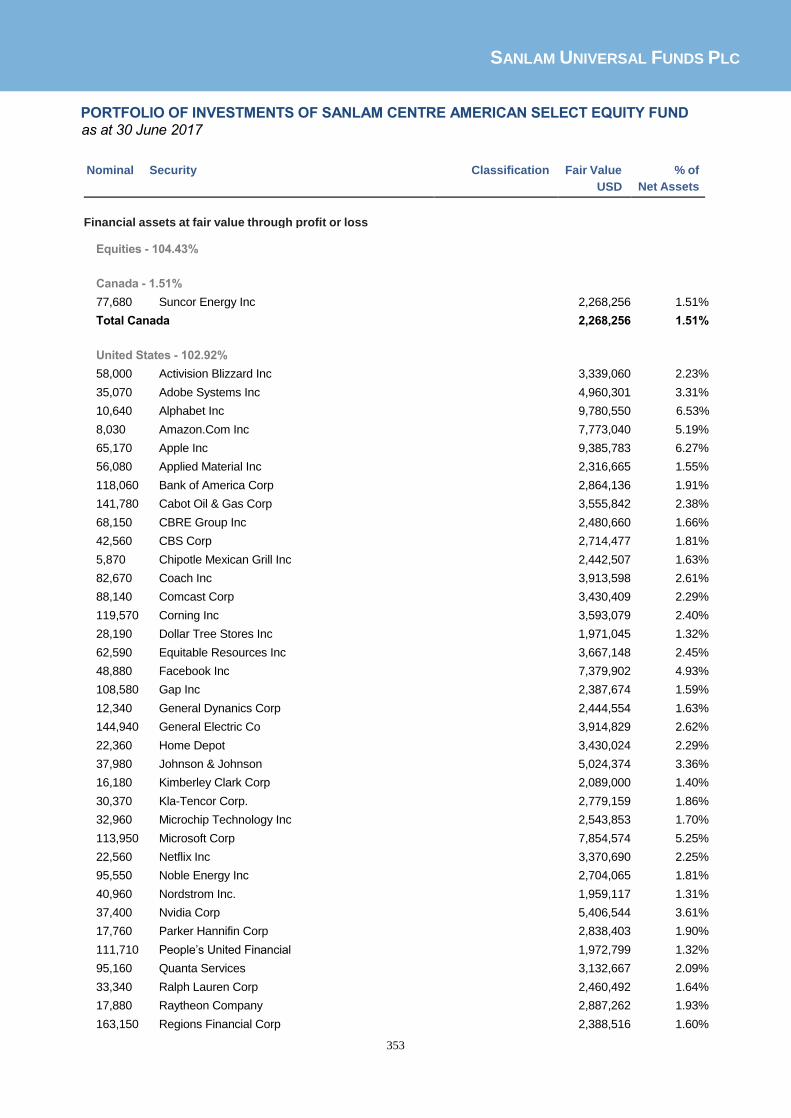
SANLAM UNIVERSAL FUNDS PLC
353
PORTFOLIO OF INVESTMENTS OF SANLAM CENTRE AMERICAN SELECT EQUITY FUND
as at 30 June 2017
Equities - 104.43%
Canada - 1.51%
77,680 Suncor Energy Inc 2,268,256 1.51%
Total Canada 2,268,256 1.51%
United States - 102.92%
58,000 Activision Blizzard Inc 3,339,060 2.23%
35,070 Adobe Systems Inc 4,960,301 3.31%
10,640 Alphabet Inc 9,780,550 6.53%
8,030 Amazon.Com Inc 7,773,040 5.19%
65,170 Apple Inc 9,385,783 6.27%
56,080 Applied Material Inc 2,316,665 1.55%
118,060 Bank of America Corp 2,864,136 1.91%
141,780 Cabot Oil & Gas Corp 3,555,842 2.38%
68,150 CBRE Group Inc 2,480,660 1.66%
42,560 CBS Corp 2,714,477 1.81%
5,870 Chipotle Mexican Grill Inc 2,442,507 1.63%
82,670 Coach Inc 3,913,598 2.61%
88,140 Comcast Corp 3,430,409 2.29%
119,570 Corning Inc 3,593,079 2.40%
28,190 Dollar Tree Stores Inc 1,971,045 1.32%
62,590 Equitable Resources Inc 3,667,148 2.45%
48,880 Facebook Inc 7,379,902 4.93%
108,580 Gap Inc 2,387,674 1.59%
12,340 General Dynanics Corp 2,444,554 1.63%
144,940 General Electric Co 3,914,829 2.62%
22,360 Home Depot 3,430,024 2.29%
37,980 Johnson & Johnson 5,024,374 3.36%
16,180 Kimberley Clark Corp 2,089,000 1.40%
30,370 Kla-Tencor Corp. 2,779,159 1.86%
32,960 Microchip Technology Inc 2,543,853 1.70%
113,950 Microsoft Corp 7,854,574 5.25%
22,560 Netflix Inc 3,370,690 2.25%
95,550 Noble Energy Inc 2,704,065 1.81%
40,960 Nordstrom Inc. 1,959,117 1.31%
37,400 Nvidia Corp 5,406,544 3.61%
17,760 Parker Hannifin Corp 2,838,403 1.90%
111,710 People’s United Financial 1,972,799 1.32%
95,160 Quanta Services 3,132,667 2.09%
33,340 Ralph Lauren Corp 2,460,492 1.64%
17,880 Raytheon Company 2,887,262 1.93%
163,150 Regions Financial Corp 2,388,516 1.60%
Nominal Security Classification Fair Value
USD
% of
Net Assets
Financial assets at fair value through profit or loss

SANLAM UNIVERSAL FUNDS PLC
354
PORTFOLIO OF INVESTMENTS OF SANLAM CENTRE AMERICAN SELECT EQUITY FUND (CONTINUED)
as at 30 June 2017
Equities - 104.43% (continued)
United States - 102.92% (continued)
47,010 Starbucks Corp. 2,741,153 1.83%
31,040 United Healthcare Corp 5,755,437 3.84%
26,090 Visa Inc 2,446,720 1.63%
60,810 Williams Companies 1,841,327 1.23%
22,880 Wyndham Worldwide Corp 2,297,381 1.53%
42,080 Zions Bancorporation 1,847,733 1.23%
Total United States 154,086,549 102.92%
Total Equities 156,354,804 104.43% Derivative Financial Instruments
Buy Currency Buy Amount Sell currency Sell Amount Maturity Fair Value % of
USD Net Assets
Forward Contracts – 0.00%2
USD 4,298 GBP (5,495) 20/07/2017 99 0.00%
Total Forward Contracts
99 0.00%
Options - 1.00%1
655 SPX Dec 17 Put Option (Strike – 2,150) 1,486,850 1.00%
Total Options 1,486,850 1.00%
Total financial assets at fair value through profit or loss 157,841,753 105.43%
Financial liabilities at fair value through profit or loss Derivative Financial Instruments
Forward Contracts – 0.00%2
USD 52 GBP (41) 20/07/2017 (1) 0.00%
Total Forward Contracts
(1) 0.00%
Total financial liabilities at fair value through profit or loss (1) 0.00%
Cash and cash equivalents 1,794,493 1.20%
Other net assets and liabilities (9,917,091) (6.62)%
Net assets attributable to holders of redeemable participating shares 149,719,154 100.00%
Nominal Security Classification Fair Value
USD
% of
Net Assets
Financial assets at fair value through profit or loss (continued)

SANLAM UNIVERSAL FUNDS PLC
355
PORTFOLIO OF INVESTMENTS OF SANLAM CENTRE AMERICAN SELECT EQUITY FUND (CONTINUED)
as at 30 June 2017
The following entities act as counterparty or clearing broker to the open derivative positions at 30 June 2017: Interactive Brokers
1and
Brown Brothers Harriman2. All open option positions at 30 June 2017 are covered.
Sanlam Centre American Select Equity Fund
Summary
Classification Description
Fair Value % of % of
USD Net
Assets Total
Assets
Transferable securities and money market instruments admitted to official stock exchange listing or traded on regulated market 156,354,804 104.43% 97.86%
A Transferable securities and money market instruments other than those referred above - - -
B UCITS and AIFs
- - -
C Financial derivative instruments dealt in on a regulated market - - -
D Over the counter financial derivative instruments 1,486,948 0.99% 0.93%
Cash and cash equivalents
1,794,493 1.20% 1.12%
Other net assets and liabilities
(9,917,091) (6.62)% (6.21)%
Net assets attributable to holders of redeemable participating shares 149,719,154 100.00%

SANLAM UNIVERSAL FUNDS PLC
356
PORTFOLIO OF INVESTMENTS OF SANLAM GLOBAL CONVERTIBLE SECURITIES FUND (CONTINUED)
as at 30 June 2017
Equities - 8.71%
Bermuda - 3.13%
6,050 Bunge Ltd 630,713 3.13%
Total Bermuda 630,713 3.13%
United States - 5.58%
9,000 Amg Capital Trust 537,300 2.67%
90 Cowen Inc 78,175 0.39%
9,850 Ny Community Cap Trust V 507,275 2.52%
Total United States 1,122,750 5.58%
Total Equities 1,753,463 8.71%
Nominal Security Coupon Maturity Classification Fair Value % of
USD Net Assets
Corporate Debt - 91.83%
Austria – 2.96%
400,000 Steinhoff Finance Holding 4.000% 30/01/2021 596,183 2.96%
Total Austria 596,183 2.96%
Bermuda – 0.73%
150,000 Ship Finance Int Ltd 5.750% 15/10/2021 146,325 0.73%
Total Bermuda 146,325 0.73%
Cayman Islands – 4.18%
140,000 Ctrip.Com International Ltd 1.990% 01/07/2025 171,179 0.85%
350,000 Ctrip.Com International Ltd 1.990% 15/09/2022 378,627 1.88%
250,000 Semiconductor Manufacturing International 0.000% 07/07/2022 290,965 1.45%
Total Cayman Islands 840,771 4.18%
China – 2.82%
500,000 China Railway Construction Corp 0.000% 29/01/2021 567,985 2.82%
Total China 567,985 2.82%
France – 1.99%
400,000 Total SA 0.500% 02/12/2022 401,072 1.99%
Total France 401,072 1.99%
Nominal Security Classification Fair Value
USD
% of
Net Assets
Financial assets at fair value through profit or loss

SANLAM UNIVERSAL FUNDS PLC
357
PORTFOLIO OF INVESTMENTS OF SANLAM GLOBAL CONVERTIBLE SECURITIES FUND (CONTINUED)
as at 30 June 2017
Nominal Security Coupon Maturity Classification Fair Value % of
USD Net Assets
Corporate Debt - 91.83% (continued)
Great Britain – 7.21%
300,000 BP Capital Markets Plc 1.000% 28/04/2023 443,223 2.20%
400,000 Inmarsat Plc 3.875% 09/09/2023 467,788 2.32%
400,000 Sainsbury 1.250% 21/11/2019 540,394 2.69%
Total Great Britain 1,451,404 7.21%
Hungary – 3.57%
500,000 Mnv Zrt 3.375% 02/04/2019 717,666 3.57%
Total Hungary 717,666 3.57%
Japan – 7.57%
20,000,000 KSHoldinsCorp 0.000% 20/12/2019 221,212 1.10%
30,000,000 Nagoya Railroad 0.000% 11/12/2024 291,191 1.45%
60,000,000 Toray Industries Inc 0.000% 30/08/2019 610,467 3.03%
40,000,000 Yamada Denki Co Ltd 0.000% 28/06/2019 399,751 1.99%
Total Japan 1,522,621 7.57%
Jersey Channel Islands – 7.39%
300,000 Playtech Plc 0.500% 19/11/2019 428,854 2.13%
300,000 Primary Health Properties Plc 4.250% 20/05/2019 455,812 2.26%
300,000 Remgro Jersey Gbp Ltd 2.625% 22/03/2021 393,510 1.96%
200,000 Tullow Oil Jersey Ltd 6.625% 12/07/2021 209,726 1.04%
Total Jersey Channel Islands 1,487,902 7.39%
Marshall Islands – 0.58%
150,000 Aegean Marine Petroleum 4.250% 15/12/2021 115,938 0.58%
Total Marshall Islands 115,938 0.58%
Mexico – 1.16%
200,000 Cemex Sab De CV 3.720% 15/03/2020 232,690 1.16%
Total Mexico 232,690 1.16%
Netherlands – 5.80%
750,000 Siemens Financieringsmat 1.650% 16/08/2019 913,170 4.54%
200,000 Stmicroelectronics NV 1.000% 03/07/2021 253,346 1.26%
Total Netherlands 1,166,516 5.80%
Financial assets at fair value through profit or loss (continued)

SANLAM UNIVERSAL FUNDS PLC
358
PORTFOLIO OF INVESTMENTS OF SANLAM GLOBAL CONVERTIBLE SECURITIES FUND (CONTINUED)
as at 30 June 2017
Nominal Security Coupon Maturity Classification Fair Value % of
USD Net Assets
Corporate Debt - 91.83% (continued)
Sweden – 4.42%
4,000,000 Ab Industrivarden 0.000% 15/05/2019 533,229 2.65%
3,000,000 Sas Ab 3.625% 01/04/2019 357,287 1.77% Total Sweden 890,516 4.42%
Taiwan – 2.31%
400,000 Nanya Technology 0.000% 24/01/2022 463,928 2.31%
Total Taiwan 463,928 2.31%
United States – 39.14%
320,000 Aerojet Rocketdyne 2.250% 12/15/2023 338,944 1.68%
180,000 Alon USA Energy Inc 3.000% 15/09/2018 205,088 1.02%
110,000 Arbor Realty Trust Inc 6.500% 01/10/2019 117,013 0.58%
550,000 Arconic Inc 1.625% 15/10/2019 591,723 2.94%
315,000 Dycom Industries Inc 0.750% 15/09/2021 369,366 1.84%
350,000 Euronet Worldwide Inc 1.500% 01/10/2044 448,144 2.23%
185,000 Green Plains Inc 4.125% 01/09/2022 186,069 0.92%
380,000 Greenbrier Cos Inc 2.875% 01/02/2024 418,635 2.08%
92,000 Harmonic Inc 4.000% 01/12/2020 104,820 0.52%
130,000 Horizon Global Corp 2.750% 01/07/2022 123,292 0.61%
370,000 Intel Corp 2.950% 15/12/2035 483,268 2.40%
200,000 Kaman Corporation 3.250% 01/05/2024 202,620 1.01%
580,000 Liberty Media Corp 1.375% 15/10/2023 683,263 3.40%
200,000 Medicines Company 2.750% 15/07/2023 209,858 1.04%
400,000 Microchip Technology Inc 1.625% 15/02/2027 420,624 2.09%
490,000 National Health Investor 3.250% 01/04/2021 572,741 2.85%
200,000 NRG Yield Inc 3.250% 01/06/2020 200,460 1.00%
70,000 Synaptics Inc 0.500% 15/06/2022 70,985 0.35%
400,000 TCP Capital Corp 4.625% 01/03/2022 410,292 2.04%
160,000 Teligent Inc 3.750% 15/12/2019 172,456 0.86%
250,000 Teradyne Inc 1.250% 15/12/2023 286,798 1.42%
600,000 Teva Pharm Fin Co Llc 0.250% 01/02/2026 645,432 3.21%
180,000 Workday 1.500% 15/07/2020 239,555 1.19%
350,000 World Wrestling Entertainment 3.375% 15/12/2022 373,601 1.86%
Total United States 7,875,046 39.14%
Total Corporate Debt 18,476,563 91.83%
Financial assets at fair value through profit or loss (continued)

SANLAM UNIVERSAL FUNDS PLC
359
PORTFOLIO OF INVESTMENTS OF SANLAM GLOBAL CONVERTIBLE SECURITIES FUND (CONTINUED)
as at 30 June 2017
Derivative Financial Instruments
Buy Currency Buy Amount Sell currency Sell Amount Maturity Fair Value % of
USD Net Assets
Financial assets at fair value through profit or loss (continued)
Forward Contracts – 0.06%
1
USD 1,407,129 JPY (156,000,000) 27/09/2017 13,153 0.06%
USD 107,336 JPY (12,000,000) 27/09/2017 107 0.00%
Total Forward Contracts 13,261 0.06%
Total financial assets at fair value through profit or loss 20,243,287 100.54%
Financial liabilities at fair value through profit or loss
Derivative Financial Instruments
Forward Contracts – (0.44)%1
USD 809,400 SEK (7,000,000) 05/09/2017 (22,491) (0.11)%
USD 1,737,243 EUR (1,540,000) 05/09/2017 (26,457) (0.13)%
USD 1,785,794 GBP (1,400,000) 27/09/2017 (40,421) (0.20)%
Total Forward Contracts (89,369) (0.44)%
Total financial assets at fair value through profit or loss (89,389) 100.54%
Cash and cash equivalents 128,314 0.64%
Other net assets and liabilities (161,834) (0.80)%
Net assets attributable to holders of redeemable participating shares 20,120,398 100.00%
Sanlam Global Convertible Securities Fund
Summary
Classification Description
Fair Value % of % of
USD Net
Assets Total
Assets
Transferable securities and money market instruments admitted to official stock exchange listing or traded on regulated market 20,230,026 100.54% 98.86%
A Transferable securities and money market instruments other than those referred above - - -
B UCITS and AIFs
- - -
C Financial derivative instruments dealt in on a regulated market - - -
D Over the counter financial derivative instruments (76,108) (0.38)% (0.37)%
Cash and cash equivalents
128,314 0.64% 0.63%
Other net assets and liabilities
(161,834) (0.80)% (0.79)%
Net assets attributable to holders of redeemable participating shares 20,120,398 100.00%
1Brown Brothers Harriman acts as counterparty to the open derivative positions at 30 June 2017.

SANLAM UNIVERSAL FUNDS PLC
360
PORTFOLIO OF INVESTMENTS OF SANLAM JAPAN EQUITY FUND as at 30 June 2017
Equities - 99.52%
Japan - 99.52%
54,500 Adeka Corporation 829,506 1.22%
6,800 Aisin Seiki Co Ltd 348,020 0.51%
11,200 Alps Electric Co Ltd 322,991 0.48%
8,800 Asahi Breweries 331,165 0.49%
41,600 Calbee Inc 960,114 1.42%
7,900 Central Japan Railway Co 1,287,486 1.90%
4,400 Daikin Industries Ltd 449,203 0.66%
4,800 Dainippon Screen Manufacturing Co Ltd 320,427 0.47%
11,000 Daiwa House Industry Co 375,772 0.55%
31,500 DIC Corporation 1,131,308 1.67%
193,000 Fuji Electric Holdings Co Ltd 1,016,965 1.50%
28,900 Fuji Heavy Industries 973,880 1.44%
7,800 Fujibo Holdings Inc 219,039 0.32%
77,200 Fujikura JPY 50 646,597 0.95%
126,000 Fujitsu 928,374 1.37%
18,600 Furukawa Electric Co Ltd 827,770 1.22%
180,000 Furukawa-Sky Alluminium Corp 493,458 0.73%
70,300 Hazama Ando Corp 443,012 0.65%
17,600 Hitachi Chemical Company ltd 524,789 0.77%
23,700 Hitachi High-Technologies Corp 919,733 1.36%
12,400 Honda Motor Co 338,172 0.50%
7,300 Horiba Ltd 443,783 0.65%
7,800 Hoya Pentax HD Corporation 404,961 0.60%
15,800 Idemitsu Kosan Co Ltd 448,616 0.66%
21,100 Iida Group Holdings Co Ltd 351,385 0.52%
15,600 Izumi Co Ltd 885,875 1.31%
8,800 JCU Corp 312,523 0.46%
31,300 JFE Holdings Inc 543,397 0.80%
7,900 Jowa Holdings Co Ltd 219,034 0.32%
91,700 JX Holdings Inc 400,509 0.59%
16,000 Kajima Corp 135,007 0.20%
25,000 Keisei Electric Railway Co 667,557 0.98%
47,000 KH Neochem Co Ltd 899,840 1.33%
25,800 Kirin Holdings Company Limited 525,645 0.78%
14,800 Kohnan Shoji Co Ltd 275,713 0.41%
26,400 Kyudenko Corporation 945,794 1.40%
17,200 Maruha Nichiro Corporation 454,380 0.67%
98,400 Minebea Co Ltd 1,580,881 2.33%
37,200 Mitsubishi Chemical Holdings Corporation 307,964 0.45%
4,300 Mitsubishi Corp 90,172 0.13%
Nominal Security Classification Fair Value
USD
% of
Net Assets
Financial assets at fair value through profit or loss

SANLAM UNIVERSAL FUNDS PLC
361
PORTFOLIO OF INVESTMENTS OF SANLAM JAPAN EQUITY FUND (CONTINUED) as at 30 June 2017
Equities - 99.52% (continued)
Japan - 99.52% (continued)
9,300 Mitsubishi Electric Corp 133,726 0.20%
370,500 Mitsubishi UFJ Holdings Inc 2,489,127 3.67%
156,000 Mitsui Mining & Smelting Co Ltd 609,559 0.90%
9,300 Morinaga & Co Ltd 528,117 0.78%
33,000 Morinaga Milk Industry Co 251,429 0.37%
22,900 MS&AD Insurance Group Holdings 769,244 1.13%
6,800 Murata Manufacturing 1,033,164 1.52%
9,000 Namco Bandai Hldgs Inc 306,809 0.45%
18,100 Nichiha Corp 637,971 0.94%
88,200 Nippon Light Metal Holdings Co Ltd 209,607 0.31%
16,000 Nippon Meat Packers Inc 486,337 0.72%
14,900 Nippon Shinyaku Co Ltd 953,547 1.41%
41,100 Nippon Telegraph and Telephone Company 1,942,510 2.86%
26,000 Nippon Television Network Corp 436,920 0.64%
84,000 Nipro Corporation 1,095,327 1.62%
2,600 Nitori Holdings Co Ltd 348,055 0.51%
8,000 Nitto Denko Corp 657,944 0.97%
24,300 NSK Ltd 303,453 0.45%
10,500 Obayashi Corp 123,458 0.18%
11,500 Omron Tateisi Electronics Co 498,999 0.74%
62,700 Orix Corporation 971,055 1.43%
14,500 Otsuka Holdings KK 618,202 0.91%
95,000 Prima Meat Packers Ltd 558,077 0.82%
10,300 Recruit Holdings Co Ltd 177,030 0.26%
5,700 Rohm Co. 437,837 0.65%
28,600 Sakata INX Corp 455,665 0.67%
64,000 Sanyo Special Steel Co Ltd 362,296 0.53%
22,200 Sekisui Chemical Co Ltd 397,367 0.59%
47,700 Sekisui House Ltd 840,429 1.24%
53,000 Shimizu Corporation 561,842 0.83%
21,000 Shin-Etsu Chemical Co 1,903,738 2.81%
4,400 Shionogi & Co Ltd 245,123 0.36%
56,300 Showa Denko K K 1,305,899 1.93%
1,400 SMC Corp 425,545 0.63%
20,300 Softbank Corp 1,643,695 2.42%
4,400 Sogho Security Services 198,166 0.29%
32,900 Sompo Japan Nipponkoa Holdings Inc 1,270,611 1.87%
42,300 Sony Corp 1,613,688 2.38%
8,500 Sony Financial Holdings Inc 144,806 0.21%
43,400 Sumitomo Electric 668,287 0.99%
Nominal Security Classification Fair Value
USD
% of
Net Assets
Financial assets at fair value through profit or loss (continued)

SANLAM UNIVERSAL FUNDS PLC
362
PORTFOLIO OF INVESTMENTS OF SANLAM JAPAN EQUITY FUND (CONTINUED) as at 30 June 2017
Equities - 99.52% (continued)
Japan - 99.52% (continued)
101,000 Sumitomo Heavy Ind 666,142 0.98%
12,600 Sumitomo Mitsui Financial 491,103 0.72%
55,300 Suzuki Motor Corp 2,623,489 3.87%
9,500 Taiyo Yuden Co Ltd 148,990 0.22%
11,000 Teijin Ltd 211,580 0.31%
32,500 Temp Holdings Co Ltd 609,212 0.90%
8,200 THK Co Ltd 232,096 0.34%
5,400 Tokyo Electron 728,652 1.08%
3,700 Tokyo Ohka Kogyo Co Ltd 123,333 0.18%
13,000 Tokyo Seimitsu Co Ltd 418,291 0.62%
88,200 Tokyo Tatemono Co Ltd 1,155,589 1.70%
226,000 Tosoh Corp 2,315,318 3.41%
73,500 Toyo Tire & Rubber Co Ltd 1,497,477 2.21%
14,800 Toyoda Automat Loom 778,531 1.15%
18,900 TV Asahi Corp 340,654 0.50%
8,600 Ut Group Co Ltd 138,166 0.20%
80,200 Yahoo Japan Corporation 349,068 0.52%
10,800 Yakuodo Co Ltd 316,262 0.47%
48,000 Yamaha Motor Co Ltd 1,238,131 1.83%
22,300 Zenkoku Hosho Co Ltd 912,047 1.35%
Total Japan 67,489,611 99.52%
Total Equities 67,489,611 99.52%
Total financial assets at fair value through profit or loss 67,489,611 99.52%
Cash and cash equivalents 420,352 0.62%
Other net assets and liabilities (92,376) (0.14)%
Net assets attributable to holders of redeemable participating shares 67,817,587 100.00%
Nominal Security Classification Fair Value
USD
% of
Net Assets
Financial assets at fair value through profit or loss (continued)

SANLAM UNIVERSAL FUNDS PLC
363
PORTFOLIO OF INVESTMENTS OF SANLAM JAPAN EQUITY FUND (CONTINUED) as at 30 June 2017
Sanlam Japan Equity Fund
Summary
Classification Description
Fair Value % of % of
USD Net
Assets Total
Assets
Transferable securities and money market instruments admitted to official stock exchange listing or traded on regulated market 67,489,611 99.52% 94.04%
A Transferable securities and money market instruments other than those referred above - - -
B UCITS and AIFs
- - -
C Financial derivative instruments dealt in on a regulated market - - -
D Over the counter financial derivative instruments - - -
Cash and cash equivalents
420,352 0.62% 0.59%
Other net assets and liabilities
(92,376) (0.14)% (0.13)%
Net assets attributable to holders of redeemable participating shares 67,817,587 100.00%

SANLAM UNIVERSAL FUNDS PLC
364
PORTFOLIO OF INVESTMENTS OF SANLAM CENTRE ACTIVE US TREASURY FUND as at 30 June 2017
Nominal Security Coupon Maturity Classification Fair Value % of
USD Net Assets
Financial assets at fair value through profit or loss
Government Debt – 89.05%
United States – 89.05%
248,000 US Treasury 1.625% 15/11/2022 243,844 2.43%
1,645,000 US Treasury 8.125% 15/08/2019 1,876,071 18.71%
1,397,000 US Treasury 8.750% 15/08/2020 1,701,066 16.96%
777,000 US Treasury 8.875% 15/08/2017 784,375 7.82%
992,000 US Treasury 8.500% 15/02/2020 1,171,568 11.68%
992,000 US Treasury 3.125% 15/02/2043 1,049,118 10.46%
992,000 US Treasury 3.375% 15/05/2044 1,096,858 10.94%
248,000 US Treasury 2.500% 15/05/2024 254,006 2.53%
364,000 US Treasury 2.250% 31/07/2021 370,939 3.70%
165,000 US Treasury 2.375% 15/08/2024 167,488 1.67%
215,000 US Treasury 2.250% 15/11/2025 215,000 2.14%
Total Unites States 8,930,332 89.05%
Total Government Debt 8,930,332 89.05%
Nominal Security Maturity Classification Fair Value % of
USD Net Assets
Derivative Financial Instruments
Futures - 0.13%1
(7) FVU7 - US 5Y Note(CBT) Sep17 20/09/2017 4,048 0.04%
(12) TUU7-US 2Yr Note (CBT) Sep17 20/09/2017 3,562 0.04%
(4) USU7-US Long Bond (CBT) Sep17 20/09/2017 3,000 0.03% (2) TYU7-US 10YR Note Fut Sep17 20/09/2017 1,969 0.02%
Total Futures 12,579 0.13%
Total financial assets at fair value through profit or loss 8,942,911 89.15%
Financial liabilities at fair value through profit or loss
Derivative Financial Instruments
Nominal Security Maturity Classification Fair Value % of
USD Net Assets
Futures 0.00%1
(3) WNU7 - US Ultra Bond CBT Sep17 20/09/2017 (188) 0.00%
Total Futures (188) 0.00%
Total financial liabilities at fair value through profit or loss (188) 0.00%

SANLAM UNIVERSAL FUNDS PLC
365
PORTFOLIO OF INVESTMENTS OF SANLAM CENTRE ACTIVE US TREASURY FUND as at 30 June 2017
Nominal Security Maturity Classification Fair Value % of
USD Net Assets
Cash and cash equivalents 642,866 6.41%
Other net assets and liabilities 442,909 4.42%
Net assets attributable to holders of redeemable participating shares 10,028,498 100.00%
Sanlam Centre Active US Treasury Fund
Summary
Classification Description
Fair Value % of % of
USD Net
Assets Total
Assets
Transferable securities and money market instruments admitted to official stock exchange listing or traded on regulated market 8,930,332 89.05% 88.94%
A Transferable securities and money market instruments other than those referred above - - -
B UCITS and AIFs
- - -
C Financial derivative instruments dealt in on a regulated market 12,391 0.12% 0.12%
D Over the counter financial derivative instruments - - -
Cash and cash equivalents
642,866 6.41% 6.40%
Other net assets and liabilities
442,909 4.42% 4.41%
Net assets attributable to holders of redeemable participating shares 10,028,498 100.00%
1Interactive Brokers acts as counterparty to the open derivative positions at 30 June 2017.

SANLAM UNIVERSAL FUNDS PLC
366
PORTFOLIO OF INVESTMENTS OF AUTUS GLOBAL EQUITY FUND as at 30 June 2017
Equities - 74.34%
Cayman Islands - 7.17%
3,250 Alibaba Group Holding Ltd 457,925 3.13%
8,165 JD.Com Inc 320,231 2.19%
7,550 Tencent Holdings Ltd ADR 271,498 1.85%
Total Cayman Islands 1,049,654 7.17%
China - 2.91%
31,860 Ping An Insurance Group Co Of China Ltd 425,331 2.91%
Total China 425,331 2.91%
Germany - 3.69%
1,770 Adidas Ag 169,867 1.16%
970 Bayer Ag 125,969 0.86%
1,780 Siemens AG 244,493 1.67%
Total Germany 540,329 3.69%
Korea (South) - 2.27%
320 Samsung Electronics Ltd 331,200 2.27%
Total Korea (South) 331,200 2.27%
Spain - 2.41%
9,200 Industria de Diseno Textil SA 352,904 2.41%
Total Spain 352,904 2.41%
Switzerland - 1.50%
2,521 Nestle SA 219,831 1.50%
Total Switzerland 219,831 1.50%
United States - 54.39%
2,660 Adobe Systems Inc 376,230 2.57%
480 Alphabet Inc 446,246 3.05%
470 Amazon.Com Inc 454,960 3.11%
4,250 Apple Inc 612,085 4.18%
1,135 Berkshire Hathaway Inc. 192,235 1.31%
570 Blackrock Inc 240,774 1.65%
4,975 Blackstone Group LP 165,916 1.13%
945 Charter Communication Inc 318,323 2.18%
3,600 Coca-Cola Co. 161,460 1.10%
6,505 Comcast Corp 253,175 1.73%
2,005 Estee Lauder Cos 192,440 1.32%
2,795 Facebook Inc 421,989 2.88%
Nominal Security Classification Fair Value
USD
% of
Net Assets
Financial assets at fair value through profit or loss

SANLAM UNIVERSAL FUNDS PLC
367
PORTFOLIO OF INVESTMENTS OF AUTUS GLOBAL EQUITY FUND (CONTINUED) as at 30 June 2017
Equities - 74.34% (continued)
United States - 54.39% (continued)
1,270 FDX Corp 276,009 1.89%
9,355 KKK & Co LP 174,003 1.19%
1,850 Kraft Heinz Company 158,434 1.08%
4,040 Lilly (Eli) & Co 332,492 2.27%
1,880 Masimo Corporation 171,418 1.17%
6,580 Microsoft Corp 453,559 3.10%
6,005 Nike Inc 354,295 2.42%
3,755 Oracle Corp 188,276 1.29%
2,100 Pepsico Inc 242,529 1.66%
4,985 Pfizer Inc 167,446 1.14%
1,525 Philip Morris International Inc 179,111 1.22%
1,875 Procter & Gamble 163,406 1.12%
7,445 Starbucks Corp. 434,118 2.97%
3,275 Visa Inc 307,130 2.10%
1,535 Walt Disney Co 163,094 1.12%
2,225 Western Digital Corporation 197,135 1.35%
2,475 XPO Logistics Inc. 159,959 1.09%
Total United States 7,958,247 54.39%
Total Equities 10,877,497 74.34%
Exchange Traded Funds 7.47%
2,927 Vanguard S&P 500 ETF 649,970 4.44%
3,270 Vanguard Small Cap ETF 443,216 3.03%
Total Exchange Traded Funds 1,093,185 7.47%
Total financial assets at fair value through profit or loss 11,970,682 81.81%
Cash and cash equivalents 2,668,538 18.24%
Other net assets and liabilities (6,411) (0.05)%
Net assets attributable to holders of redeemable participating shares 14,632,809 100.00%
Nominal Security Classification Fair Value
USD
% of
Net Assets
Financial assets at fair value through profit or loss (continued)
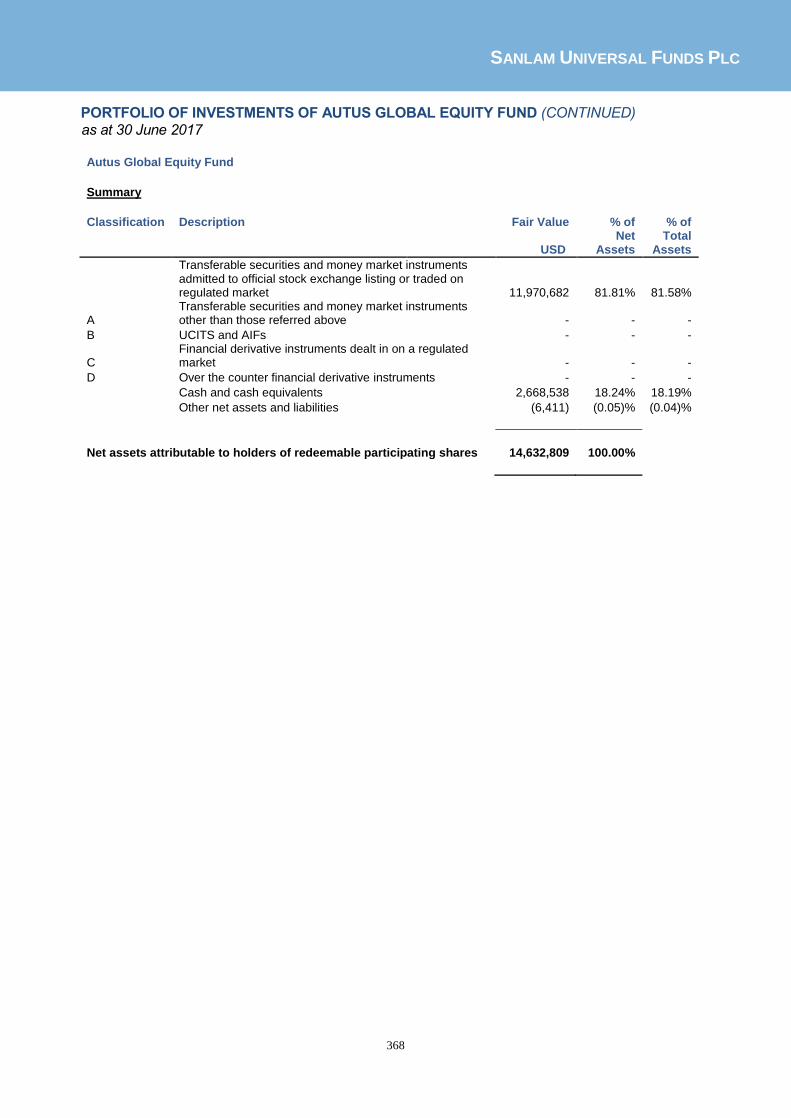
SANLAM UNIVERSAL FUNDS PLC
368
PORTFOLIO OF INVESTMENTS OF AUTUS GLOBAL EQUITY FUND (CONTINUED) as at 30 June 2017
Autus Global Equity Fund
Summary
Classification Description
Fair Value % of % of
USD Net
Assets Total
Assets
Transferable securities and money market instruments admitted to official stock exchange listing or traded on regulated market 11,970,682 81.81% 81.58%
A Transferable securities and money market instruments other than those referred above - - -
B UCITS and AIFs
- - -
C Financial derivative instruments dealt in on a regulated market - - -
D Over the counter financial derivative instruments - - -
Cash and cash equivalents
2,668,538 18.24% 18.19%
Other net assets and liabilities
(6,411) (0.05)% (0.04)%
Net assets attributable to holders of redeemable participating shares 14,632,809 100.00%

SANLAM UNIVERSAL FUNDS PLC
369
NOTES TO AND FORMING PART OF THE UNAUDITED CONDENSED INTERIM FINANCIAL STATEMENTS for the six months ended 30 June 2017 1 General – The Company
Sanlam Universal Funds Plc (the “Company”) is an investment company with variable capital and was incorporated on 9 June 1997 with registration number 267451 under the laws of Ireland and is authorised in Ireland as an undertaking for collective investment in transferable securities pursuant to the UCITS Regulations. The Company is domiciled in Ireland. At 30 June 2017, the Company comprised thirty seven active separate investment sub-funds (“Fund(s)”). The Articles of Association of the Company provide segregated liability between the various Funds. A list of Funds active during the period and their status at the period end is set out below:
Name Status at 30 June 2017 Sanlam Centre Global Select Equity Fund Closed on 22 June 2017 Bridge Global Property Income Fund Active P-Solve Inflation Plus Fund Active Sanlam African Frontier Markets Fund Active Sanlam Global Best Ideas Fund Active Sanlam Global Bond Fund Active Sanlam Global Financial Fund Active Sanlam Global Property Fund Active Sanlam World Equity Fund Active Satrix World Equity Tracker Fund Active SIIP India Opportunities Fund Active SIM Global Equity Income Fund Active Sanlam Strategic Bond Fund Active Sanlam Accel Income Fund Active Satrix North America Equity Tracker Fund Active Satrix UK Equity Tracker Fund Active Satrix Europe (ex UK) Equity Tracker Fund Active Sanlam Equity Allocation Fund Active Satrix Emerging Markets Equity Tracker Fund Active Sanlam Managed Risk Fund Active Sanlam Private Wealth Global High Quality Fund Active Sanlam FOUR US Dividend Income Fund Active
High Street Global Balanced Fund Active
Sanlam FOUR Active European (ex UK) Equity Fund Closed on 30 June 2017
Sanlam FOUR Global Equity Fund Active
Sanlam FOUR Stable Global Equity Fund Active
Sanlam FOUR Active UK Equity Fund Active
Sanlam FOUR Multi-Strategy Fund Active
Anchor Global Capital Plus Fund Active
Bridge Global Equity Income Growth Fund Active
Anchor Global Equity Fund Active
Bridge Global Managed Growth Fund Active
SIM Global Emerging Markets Fund Active
ABSA Africa Equity Fund Active
Sanlam Centre American Select Equity Fund Active
Sanlam Japan Equity Fund Active
Sanlam Global Convertible Securities Fund Active
Sanlam Centre Active US Treasury Fund Active - launched 12 January 2017
Autus Global Equity Fund Active - launched 10 March 2017

SANLAM UNIVERSAL FUNDS PLC
370
NOTES TO AND FORMING PART OF THE UNAUDITED CONDENSED INTERIM FINANCIAL STATEMENTS (CONTINUED) for the six months ended 30 June 2017 1 General – The Company (continued)
During the period ended 30 June 2017, effective from 13 June 2017, a number of Funds had a change in name as follows:
Name at 31 December 2016 Name effective 13 June 2017 Grindrod Global Property Income Fund Bridge Global Property Income Fund Grindrod Global Equity Income Growth Fund Bridge Global Equity Income Growth Fund Grindrod Global Managed Growth Fund Bridge Global Managed Growth Fund
Wisian Capital South African Equity Fund was approved by the Central Bank of Ireland as an authorised designated sub-fund of the Company on 17 January 2017. As of the date of these financial statements the Fund has not yet launched.
Prices There is a single price for buying, selling and switching share classes in each Fund. This is represented by the Net Asset Value per share class of the relevant Fund. In the case of subscriptions, a preliminary charge of up to 5% may be added to the Net Asset Value per share of the classes of certain Funds, as set out in the relevant offering supplements. The Company may waive in whole or in part the preliminary charge.
A conversion fee of up to 2% may be charged on applications to convert shares of any class to shares of another class. A repurchase fee of up to 3% may be deducted from the Net Asset Value per share of the classes of certain Funds, as set out in the relevant offering supplements. The Company may waive in whole or in part the repurchase fee.
Dealing The Dealing Day is, except where otherwise clarified in the Prospectus or Fund supplement, any day other than Saturday or Sunday on which banks are open for business in Dublin or London. The valuation point is, except where otherwise clarified in the Prospectus or Fund supplement, the close of business in each relevant market on the business day immediately preceding a dealing day.
Shares Applications for shares, except where otherwise clarified in the Prospectus or sub-fund supplement, must be sent so as to arrive at the Registrar and Transfer Agent’s office, as detailed below, no later than 4.00pm (Irish time) on the business day preceding the relevant dealing day, or such later time as the Directors may from time to time permit. Applications which are received late, or Funds which are not cleared by the relevant time, will be held over and invested at the next dealing day.
Requests for repurchases, except where otherwise clarified in the Prospectus or sub-fund supplement, should be sent so as to arrive at the Registrar and Transfer Agent’s office by post, facsimile or telex by no later than 4.00pm (Irish time) on the business day preceding the relevant dealing day.

SANLAM UNIVERSAL FUNDS PLC
371
NOTES TO AND FORMING PART OF THE UNAUDITED CONDENSED INTERIM FINANCIAL STATEMENTS (CONTINUED) for the six months ended 30 June 2017 1 General – The Company (continued)
Shares (continued) As at 30 June 2017, the following share classes were admitted to the official list of the Irish Stock Exchange:
Fund Share Class Date listed
Bridge Global Property Income Fund Non distributing (USD) 26 November 2010 P-Solve Inflation Plus Fund A 23 December 2005 B 1 March 2004
Sanlam African Frontier Markets Fund A (USD) 6 January 2009
D (USD) 1 March 2010
G (USD) 21 January 2013
H (USD) 6 August 2013
I (USD) 6 May 2015
Sanlam Global Best Ideas Fund A (USD) 4 September 2006
A (EUR) 22 February 2011
A (GBP) 20 December 2007
B 4 September 2006
C 4 September 2006
C (GBP) 3 November 2008
D (USD) 22 February 2011
F (USD) 27 July 2011
Sanlam Global Bond Fund A 17 August 2004
B 17 August 2004
C 17 August 2004
Sanlam Global Financial Fund A (USD) 19 May 2006
A (EUR) 22 February 2011
A (GBP) 20 December 2007
B 12 April 2004
C (USD) 13 November 2009
C (GBP) 3 July 2008
D (USD) 7 March 2011
F (GBP) 3 February 2012
G (USD) 30 April 2015
Sanlam Global Property Fund A (USD) 08 November 2012 B (USD) 28 March 2012 C (USD) 15 December 2011 Sanlam World Equity Fund A 17 August 2004 B 17 August 2004 C 17 August 2004

SANLAM UNIVERSAL FUNDS PLC
372
NOTES TO AND FORMING PART OF THE UNAUDITED CONDENSED INTERIM FINANCIAL STATEMENTS (CONTINUED) for the six months ended 30 June 2017
1 General – The Company (continued)
Shares (continued)
Fund Share Class Date listed
Satrix World Equity Tracker Fund A 8 December 2011
C 17 August 2004
I (USD) 11 June 2013
I (GBP) 23 May 2013
S 15 June 2015
SIIP India Opportunities Fund A (USD) 14 September 2010
C (USD) 7 March 2012
D (USD) 25 August 2010
SIM Global Equity Income Fund A (USD) 7 September 2012
A (GBP) 22 June 2016
B (USD) 21 October 2012
C (USD) 23 October 2012
C Accumulation (USD) 9 April 2015
C Accumulation (GBP) 13 May 2016
I (USD) 06 December 2012
Sanlam Strategic Bond Fund A Income (GBP) 8 March 2013 A Accumulation (GBP) 6 July 2012 I Income (GBP) 9 May 2014 I Accumulation (GBP) 9 May 2014 P Accumulation (USD) 29 May 2013 Sanlam Accel Income Fund A Net Accumulation 26 April 2013 A Net Income 12 March 2013 Satrix North America Equity Tracker Fund A (USD) 11 June 2013 I (USD) 11 June 2013 I (GBP) 11 June 2013
Satrix UK Equity Tracker Fund A (USD) 11 June 2013 C (USD) 11 July 2013 I (USD) 11 June 2013 I (GBP) 11 June 2013 Satrix Europe (ex UK) Equity Tracker Fund A (USD) 11 June 2013 C (USD) 11 July 2013 I (USD) 11 June 2013 I (GBP) 11 June 2013
Satrix Emerging Markets Equity Tracker Fund A (USD) 15 July 2013 I (USD) 11 June 2013 I (GBP) 11 June 2013

SANLAM UNIVERSAL FUNDS PLC
373
NOTES TO AND FORMING PART OF THE UNAUDITED CONDENSED INTERIM FINANCIAL STATEMENTS (CONTINUED) for the six months ended 30 June 2017 1 General – The Company (continued) Shares (continued)
Fund Share Class Date listed
Sanlam Managed Risk Fund A (USD) 2 January 2014
A (GBP) 10 July 2013
A (EUR) 14 July 2015
I (EUR) 12 May 2016
I (USD) 5 July 2013
I (GBP) 10 July 2013
N (EUR) 12 May 2015
N (GBP) 11 June 2015
N (USD) 11 June 2015
Sanlam Private Wealth Global High Quality Fund A Accumulation (GBP) 2 January 2015 C Accumulation (GBP) 3 March 2014 C Income (GBP) 3 March 2014 D Accumulation (USD) 3 March 2014 D Income (USD) 3 March 2014 E Accumulation (USD) 3 March 2014 E Income (USD) 3 March 2014 F Accumulation (GBP) 27 June 2016 F Income (GBP) 10 November 2015 G Accumulation (GBP) 12 July 2016 Sanlam FOUR US Dividend Income Fund Accumulation A (GBP) 30 December 2014 Distribution A (GBP) 30 December 2014 Accumulation A (USD) 11 June 2015 Distribution A (USD) 5 March 2015 Accumulation B (USD) 17 December 2014 Distribution A (EUR) 5 March 2015 Accumulation B (GBP) 1 June 2016
Sanlam FOUR Global Equity Fund A (EUR) 19 February 2015
A (GBP) 5 February 2015
A (USD) 19 February 2015
B (GBP) 5 February 2015
B (USD) 19 February 2015
C (GBP) 5 February 2015
Sanlam FOUR Stable Global Equity Fund A (EUR) 22 June 2015
A (GBP) 5 February 2015
A (USD) 5 February 2015
B (GBP) 5 February 2015
B (USD) 5 February 2015
Distribution A (GBP) 3 November 2015

SANLAM UNIVERSAL FUNDS PLC
374
NOTES TO AND FORMING PART OF THE UNAUDITED CONDENSED INTERIM FINANCIAL STATEMENTS (CONTINUED) for the six months ended 30 June 2017
1 General – The Company (continued) Shares (continued)
Fund Share Class Date listed
Sanlam FOUR Active UK Equity Fund A (GBP) 19 February 2015 B (GBP) 19 February 2015 B (USD) 12 August 2016 C (GBP) 19 February 2015 C (USD) 5 February 2015 D (GBP) 5 February 2015 I (GBP) 5 February 2015 Sanlam FOUR Multi-Strategy Fund A (GBP) 5 February 2015 A (USD) 5 February 2015 B (GBP) 5 February 2015 B (USD) 5 February 2015 Founder (GBP) 9 February 2015 Income Distribution A
(GBP) 23 July 2015 Income Distribution B
(GBP) 30 July 2015 Income Distribution
Founder (GBP) 5 August 2015 Anchor Global Capital Plus Fund A 2 March 2015 Bridge Global Equity Income Growth Fund A (USD) 13 March 2015 Anchor Global Equity Income Fund A 18 March 2015 Bridge Global Managed Growth Fund A (USD) 15 April 2015 SIM Global Emerging Markets Fund A1 (USD) 5 June 2015 B1 (USD) 23 November 2016 B2 (USD) 7 December 2016 C1 (USD) 5 June 2015 C2 (USD) 19 August 2016
ABSA Africa Equity Fund A (USD) 16 November 2016 Sanlam Centre American Select Equity Fund E (USD) 23 November 2016 Sanlam Japan Equity Fund E (USD) 23 November 2016 Sanlam Global Convertible Securities Fund A 28 November 2016

SANLAM UNIVERSAL FUNDS PLC
375
NOTES TO AND FORMING PART OF THE UNAUDITED CONDENSED INTERIM FINANCIAL STATEMENTS (CONTINUED) for the six months ended 30 June 2017 1 General – The Company (continued) Shares (continued)
Minimum Subscription The minimum initial subscription amounts for the active classes of each Fund at 30 June 2017 are as follows:
Fund Share Class
Minimum initial
investment
Bridge Global Property Income Fund Non distributing (USD) USD1,000 P-Solve Inflation Plus Fund A GBP£1,000 B GBP£500,000 B (Accumulation) GBP£500,000
C GBP£2,500,000
Sanlam African Frontier Markets Fund A (USD) USD1,000
D (USD) USD20,000,000
G (USD) USD50,000,000
H (USD) USD50,000,000
I (USD) USD1,000,000
Sanlam Global Best Ideas Fund A (USD) USD1,000
A (GBP) GBP£1,000
A (EUR) EUR€1,000
B USD750,000
C USD1,000,000
C (GBP) GBP£5,000,000
D (USD) USD10,000,000
E None
F (USD) USD1,000
Sanlam Global Bond Fund A USD1,000
B USD750,000
C USD1,000,000
E (USD) None
E (GBP) None

SANLAM UNIVERSAL FUNDS PLC
376
NOTES TO AND FORMING PART OF THE UNAUDITED CONDENSED INTERIM FINANCIAL STATEMENTS (CONTINUED) for the six months ended 30 June 2017 1 General – The Company (continued)
Minimum Subscription (continued)
Fund Share Class
Minimum initial
investment
Sanlam Global Financial Fund A (USD) USD1,000
A (GBP) GBP£1,000
A (EUR) EUR€1,000
B USD1,000,000
C (GBP) GBP£5,000,000
C (USD) USD5,000,000
D (USD) USD1,000
E None
F (GBP) GBP£1,000
G (USD) USD1,000,000 Sanlam Global Property Fund A (USD) USD1,000 B (USD) USD750,000 C (USD) USD1,000,000 E (USD) None E (GBP) None
Sanlam World Equity Fund A USD1,000
B USD750,000
C USD1,000,000
E None
Satrix World Equity Tracker Fund A USD1,000
C USD1,000,000
E None
I (USD) USD5,000,000
I (GBP) GBP$5,000,000
S USD10,000,000
SIIP India Opportunities Fund A (USD) USD500
C (USD) USD2,000,000
D (USD) USD10,000,000
E None

SANLAM UNIVERSAL FUNDS PLC
377
NOTES TO AND FORMING PART OF THE UNAUDITED CONDENSED INTERIM FINANCIAL STATEMENTS (CONTINUED) for the six months ended 30 June 2017
1 General – The Company (continued)
Minimum Subscription (continued)
Minimum initial
Fund Share Class investment
SIM Global Equity Income Fund A (USD) USD1,000
A (GBP) GBP£1,000
B (USD) USD1,000,000
C (USD) USD10,000,000
C Accumulation (USD) USD10,000,000
C Accumulation (GBP) GBP£10,000,000
E USD20,000,000
I (USD) USD1,000 Sanlam Strategic Bond Fund A Income (GBP) GBP£500 A Accumulation (GBP) GBP£500 I Income (GBP) GBP£500,000 I Accumulation (GBP) GBP£500,000 P Income (GBP) GBP10,000,000 P Accumulation (GBP) GBP10,000,000 P Accumulation (USD) USD10,000,000
Sanlam Accel Income Fund A Net Accumulation GBP£1,000 A Net Income GBP£1,000 Satrix North America Equity Tracker Fund A (USD) USD1,000 E (USD) None I (USD) USD10,000,000 I (GBP) GBP£10,000,000 Satrix UK Equity Tracker Fund A (USD) USD1,000 C (USD) USD1,000,000 E (USD) None E (GBP) None I (USD) USD10,000,000 I (GBP) GBP£10,000,000 Satrix Europe (ex UK) Equity Tracker Fund A (USD) USD1,000 C (USD) USD1,000,000 E (USD) None E (EUR) None I (USD) USD10,000,000 I (GBP) GBP£10,000,000
Sanlam Equity Allocation Fund E None

SANLAM UNIVERSAL FUNDS PLC
378
NOTES TO AND FORMING PART OF THE UNAUDITED CONDENSED INTERIM FINANCIAL STATEMENTS (CONTINUED) for the six months ended 30 June 2017 1 General – The Company (continued)
Minimum Subscription (continued)
Minimum initial
Fund Share Class investment
Satrix Emerging Markets Equity Tracker Fund A (USD) USD1,000
E (USD) None
I (USD) USD10,000,000
I (GBP) GBP£10,000,000
Sanlam Managed Risk Fund A (USD) USD1,000
A (GBP) GBP£1,000
A (EUR) EUR€1,000
I (USD) USD250,000
I (GBP) GBP£250,000
I (EUR) EUR€250,000
N (EUR) EUR€1,000
N (GBP) GBP£1,000
N (USD) USD1,000
N2 (GBP) GBP£10,000,000
Sanlam Private Wealth Global High Quality Fund A Accumulation (GBP) GBP£300 C Income (GBP) GBP£300 C Accumulation (GBP) GBP£300 D Income (USD) USD500 D Accumulation (USD) USD500 E Income (USD) USD500 E Accumulation (USD) USD500 F Income (GBP) GBP£500,000 F Accumulation (GBP) GBP£500,000 G Income (USD) USD750,000 G Accumulation (USD) USD750,000 Sanlam FOUR US Dividend Income Fund A Accumulation (GBP) GBP£1,000 A Accumulation (USD) USD1,000 B Accumulation (USD) USD10,000 B Accumulation (GBP) GBP£10,000 A Distribution (GBP) GBP£1,000 A Distribution (USD) USD1,000 A Distribution (EUR) EUR€1,000 High Street Global Balanced Fund A (USD) USD50,000
Sanlam FOUR Global Equity Fund A (EUR) EUR€1,000
A (GBP) GBP£1,000
A (USD) USD1,000
B (GBP) GBP£10,000
B (USD) USD10,000
C (GBP) GBP£1,000
C (USD) USD1,000

SANLAM UNIVERSAL FUNDS PLC
379
NOTES TO AND FORMING PART OF THE UNAUDITED CONDENSED INTERIM FINANCIAL STATEMENTS (CONTINUED) for the six months ended 30 June 2017 1 General – The Company (continued)
Minimum Subscription (continued)
Minimum initial
Fund Share Class investment
Sanlam FOUR Stable Global Equity Fund A (EUR) EUR€1,000
A (GBP) GBP£1,000
A (USD) USD1,000
B (GBP) GBP£10,000
B (USD) USD10,000
Distribution A (GBP) GBP£1,000
Sanlam FOUR Active UK Equity Fund A (GBP) GBP£1,000 B (GBP) GBP£10,000 B (USD) USD10,000 C (GBP) GBP£1,000 C (USD) USD1,000 D (GBP) GBP£45,000,000 I (GBP) GBP£1,000 Sanlam FOUR Multi-Strategy Fund A (GBP) GBP£1,000 A (USD) USD1,000 B (GBP) GBP£10,000 B (USD) USD10,000 Founder (GBP) GBP£1,000 Income Distribution A
(GBP) GBP£1,000 Income Distribution B
(GBP) GBP£1,000 Income Distribution
Founder (GBP) GBP£1,000 Anchor Global Capital Plus Fund A USD1,000 B USD1,000 Bridge Global Equity Income Growth Fund A (USD) USD1,000 Anchor Global Equity Income Fund A USD1,000 B USD1,000 Bridge Global Managed Growth Fund A (USD) USD1,000 SIM Global Emerging Markets Fund A1 (USD) USD1,000 A2 (USD) USD1,000 B1 (USD) USD1,000 B2 (USD) USD1,000 C1 (USD) USD10,000,000 C2 (USD) USD10,000,000 E USD1,000

SANLAM UNIVERSAL FUNDS PLC
380
NOTES TO AND FORMING PART OF THE UNAUDITED CONDENSED INTERIM FINANCIAL STATEMENTS (CONTINUED) for the six months ended 30 June 2017 1 General – The Company (continued)
Minimum Subscription (continued)
Minimum initial
Fund Share Class investment ABSA Africa Equity Fund A (USD) USD100 Sanlam Centre American Select Equity Fund C (USD) USD5,000 C (GBP) GBP£5,000 E (USD) None Sanlam Japan Equity Fund E (USD) None Sanlam Global Convertible Securities Fund A None Sanlam Centre Active US Treasury Fund C (USD) USD5,000 E (USD) None Autus Global Equity Fund B (USD) USD10,000,000
Minimum Additional Subscription
Minimum additional subscription amounts are the same as the minimum initial investment amounts as
detailed above and on the previous pages for all share classes of Sanlam FOUR US Dividend Income
Fund, Sanlam FOUR Global Equity Fund, Sanlam FOUR Stable Global Equity Fund, Sanlam FOUR
Active UK Equity Fund and Sanlam FOUR Multi-Strategy Fund.
There are no minimum additional subscription amounts for the remainder of the Funds with the exception
of the following share classes:
Minimum additional
Fund Share Class Investment Bridge Global Property Income Fund Non distributing (USD) USD500 P-Solve Inflation Plus Fund A GBP£500 B GBP£50,000 B (Accumulation) GBP£50,000

SANLAM UNIVERSAL FUNDS PLC
381
NOTES TO AND FORMING PART OF THE UNAUDITED CONDENSED INTERIM FINANCIAL STATEMENTS (CONTINUED) for the six months ended 30 June 2017
2 Significant accounting policies
These financial statements have been prepared in accordance with the UCITS Regulations issued by the Central Bank of Ireland and IAS 34 Interim Financial Reporting (“IAS 34”) issued by the International Accounting Standards Board (“IASB”).
(l) Changes in accounting policy and disclosures Change in functional and presentational currency
There have been no changes to the significant accounting policies since the last audited financial
statements to 31 December 2016.
During 2016, the Sanlam FOUR US Dividend Income Fund changed its functional and presentation
currency from GBP to USD reflecting the fact that substantially all of the Fund’s assets and liabilities are
denominated in USD and the Fund’s operations are primarily conducted in USD. The comparative figures
for the period ended 30 June 2016 have been restated in USD. Subscriptions and redemptions, income
and expenses were translated at the average exchange rate for the period resulting in a currency
adjustment of USD 4,478,695. The currency adjustment is recognised in the statement of changes in net
assets attributable to holders of redeemable shares.
(a) Standards, interpretations and amendments to published standards that are not yet effective
The following new standards, amendments to standards and interpretations that may be relevant to
investment funds have been issued to date and are not yet effective for these financial statements of the
Company for the period ended 30 June 2017, and have not been applied nor early adopted in preparing
these financial statements:
Standard: Narrative: Effective date: IFRS 9 Financial Instruments: Classification and Measurement 1 January 2018 IFRS 15 Revenue from Contracts with Customers 1 January 2018
IFRS 2 Classification and Measurement of Share-based Payment Transactions (Amendment) 1 January 2018
IFRS 16 Leases 1 January 2019
IFRS 10/IAS 28 Sale or contribution of asset between an investor and its Associate or Joint Venture (Amendment) Not specified
*Annual periods beginning on or after.
IAS 8, Accounting Polices, Change in Accounting Estimates and Errors (“IAS 8”) states that financial statements disclose either:
(i) A discussion of the impact that initial application of the IFRS is expected to have on the entity’s financial statements; or
(ii) If that impact is not known or reasonably estimable, a statement to that effect.
Other than as set out below, the Directors anticipate that the adoption of new standards, interpretations and amendments that were in issue at the date of authorisation of these financial statements, but not yet effective, will have no material impact on the financial statements in the year of initial application. IFRS 9, Financial Instruments: Classification and Measurement (“IFRS 9”) IFRS 9, issued on 24 July 2014 is the IASB’s replacement of IAS 39. IFRS 9 includes requirements for recognition and measurement, impairment, derecognition and general hedge accounting.
The IASB completed its project to replace IAS 39 in phases, adding to the standard in each phase. The complete standard issued on 24 July 2014 includes requirements previously issued and additional amendments to incorporate a new expected loss impairment model and to introduce limited amendments to the classification and measurement requirements for financial assets.

SANLAM UNIVERSAL FUNDS PLC
382
NOTES TO AND FORMING PART OF THE UNAUDITED CONDENSED INTERIM FINANCIAL STATEMENTS (CONTINUED) for the six months ended 30 June 2017
2. Significant accounting policies (continued)
(a) Standards, interpretations and amendments to published standards that are not yet effective (continued)
IFRS 9, Financial Instruments: Classification and Measurement (“IFRS 9”) (continued) This version of IFRS 9 supersedes all previous versions and is mandatorily effective for periods beginning on or after 1 January 2018 with early adoption permitted (subject to local endorsement requirements). IFRS 9 uses business models and contractual cash flow characteristics to determine whether a financial asset is measured at amortised cost, fair value through profit or loss or fair value through other comprehensive income, replacing the four category classification in IAS 39. The approach is also based on how an entity manages its financial instruments (its business model) and the contractual cash flow characteristics of the financial assets. Most of the requirements for financial liabilities were carried forward unchanged from IAS 39. However, some changes were made to the fair value option for financial liabilities to address the issue of own credit risk. IFRS 9 introduces a substantially-reformed model for hedge accounting with enhanced disclosures about risk management activity.
As part of IFRS 9, the IASB has introduced a new, expected loss impairment model that will require more timely recognition of expected credit losses. Specifically, the new standard requires entities to account for expected credit losses from when financial instruments are first recognised and it lowers the threshold for recognition of full lifetime expected losses.
Based on an initial assessment, IFRS 9 is not expected to have a significant impact on the financial statements of the Company as financial instruments that are currently measured at fair value through profit or loss will continue to be measured at fair value through profit or loss under IFRS 9. Similarly, those financial instruments currently measured at amortised cost will continue to be measured at amortised cost under IFRS 9. Application of the new standard may result in additional disclosure in the financial statements.

SANLAM UNIVERSAL FUNDS PLC
383
NOTES TO AND FORMING PART OF THE UNAUDITED CONDENSED INTERIM FINANCIAL STATEMENTS (CONTINUED) for the six months ended 30 June 2017
3 Distributions per share
The total aggregate distributions per share class during the period ended 30 June 2017 were as follows:
P-Solve Inflation Plus
Fund Sanlam Global
Best Ideas Fund Sanlam Global Financial Fund
Satrix World Equity Tracker
Fund
Distribution per share (in pence)
Share Class A (GBP) - £1.12 £1.25 -
Share Class B £0.15 - - -
Share Class C £0.96 - - -
Share Class C (GBP) - £2.89 £3.56 -
Share Class I (GBP) - - - £2.64
SIM Global Equity Income
Fund
Sanlam Strategic Bond
Fund Sanlam Accel Income Fund
Satrix North American
Equity Tracker Fund
Distribution per share (in cents/pence)
Share Class A $1.59 - - -
Share Class A (Income) - £2.78 £1.91 -
Share Class B $1.53 - - -
Share Class C $1.62 - - -
Share Class C £0.89 - - -
Share Class P (Income) - £2.87 - -
Share Class I (GBP) - - - £2.58
Share Class I (Income) - £2.79 - -
Satrix UK Equity Tracker
Fund
Satrix Europe (ex UK) Equity Tracker Fund
Satrix Emerging Markets Equity
Tracker Fund
Sanlam Private Wealth
Global High Quality Fund
Distribution per share (in pence)
Share Class C Income (GBP) - - - £0.46
Share Class D Income (USD) - - - $0.73
Share Class E Income (USD) - - - $0.73
Share Class F Income (GBP) - - - £0.24
Share Class G Income (GBP) - - - £0.17
Share Class I (GBP) £3.96 £2.76 £2.05 -
Sanlam FOUR
US Dividend Income Fund
Sanlam FOUR Stable Global
Equity Fund
Sanlam FOUR Active UK Equity
Fund
Sanlam FOUR Multi-Strategy
Fund
Distribution per share (in cent/pence)
Share Class A Distribution (EUR) €12.58 - - -
Share Class A Distribution (GBP) £15.01 £12.68 - -
Share Class A Distribution (USD) $11.97 - - -
Share Class A Income (GBP) - - - £15.52
Share Class B Income (GBP) - - - £15.74
Share Class Founder Income (GBP) - - - £15.45
Share Class I (GBP) - - £18.54 -

SANLAM UNIVERSAL FUNDS PLC
384
NOTES TO AND FORMING PART OF THE UNAUDITED CONDENSED INTERIM FINANCIAL STATEMENTS (CONTINUED) for the six months ended 30 June 2017
3 Distributions per share (continued)
The total aggregate distributions per share class during the period ended 30 June 2016 were as follows:
Sanlam Centre Active US
Treasury Fund
Distribution per share (in cents)
Share Class C $0.96
Share Class E $1.74
P-Solve Inflation Plus
Fund
Sanlam African Frontier Markets
Fund Sanlam Global
Best Ideas Fund Sanlam Global Financial Fund
Distribution per share (in pence)
Share Class A (GBP) - £0.89 £0.72 £1.27
Share Class B £0.81 - - -
Share Class C £1.35 - - -
Share Class C (GBP) - £1.58 £2.14 £3.17
Satrix World Equity Tracker
Fund
SIM Global Equity Income
Fund
Sanlam Private Wealth Strategic
Investment Grade Bond
Fund Sanlam Accel Income Fund
Distribution per share (in pence/cents)
Share Class A - $1.75 £2.96 -
Share Class A (Income) - - - £1.98
Share Class B - $1.68 - -
Share Class C - $1.78 - -
Share Class P (Income) - - £3.53 -
Share Class I (GBP) £2.20 - £3.03 -
Share Class I (Income) - - £2.96 -
Satrix North American
Equity Tracker Fund
Satrix UK Equity Tracker
Fund
Satrix Europe (ex UK) Equity Tracker Fund
Satrix Emerging
Markets Equity Tracker Fund
Distribution per share (in pence) Share Class I (GBP) £2.04 £3.63 £3.24 £2.03

SANLAM UNIVERSAL FUNDS PLC
385
NOTES TO AND FORMING PART OF THE UNAUDITED CONDENSED INTERIM FINANCIAL STATEMENTS (CONTINUED) for the six months ended 30 June 2017
3 Distributions per share (continued)
The total aggregate distributions per share class during the period ended 30 June 2016 were as follows
(continued):
4 Investments in subsidiaries
The Funds of the Company did not hold investments in any subsidiaries at 30 June 2017 or 31 December 2016.
Further details regarding the fair values of intercompany positions held by the Funds are disclosed in note
8.
Sanlam Private Wealth
Global High Quality Fund
Sanlam FOUR US Dividend Income Fund
Sanlam FOUR Stable Global
Equity Fund
Sanlam FOUR Active UK
Equity Fund
Distribution per share (in pence/cents)
Share Class A Distribution (EUR) - €10.49 -
Share Class A Distribution (GBP) - £12.79 £9.59 -
Share Class A Distribution (USD) - £10.09 -
Share Class C Income (GBP) £0.48 - - -
Share Class D Income (GBP) $0.74 - - -
Share Class E Income (GBP) $0.74 - - -
Share Class F Income (GBP) £0.25 - - -
Share Class I (GBP) - - - £15.06
Sanlam FOUR Multi-Strategy
Fund
Sanlam FOUR UK Income
Opportunities Fund
Distribution per share (in pence)
Share Class Founder Class Income (GBP) - £23.04
Share Class A Distribution (GBP) - £23.04
Share Class A Income (GBP) £14.62 -
Share Class B Distribution (GBP) - £23.06
Share Class B Income (GBP) £14.69 -
Share Class Founder Income (GBP) £14.53 -

SANLAM UNIVERSAL FUNDS PLC
386
NOTES TO AND FORMING PART OF THE UNAUDITED CONDENSED INTERIM FINANCIAL STATEMENTS (CONTINUED) for the six months ended 30 June 2017
5 Fair value of financial instruments
The following tables show financial instruments recognised at fair value. The fair value hierarchy shall
have the following levels:
Quoted prices in active markets for identical assets or liabilities (Level 1);
Inputs other than quoted prices included in Level 1 that are observable for the asset or liability, either directly (as prices) or indirectly (derived from prices) (Level 2); and
Inputs for the asset or liability that are not based on observable market data (unobservable inputs) (Level 3).
The inputs or methodology used for valuing securities are not necessarily an indication of the risks
associated with investing in those securities.
Assets measured at fair value at 30 June 2017
The following tables analyse within the fair value hierarchy the Funds’ financial assets measured at fair
value through profit or loss at 30 June 2017:
Bridge Global Property Income Fund
Level 1 Level 2 Level 3 Total
USD USD USD USD
Equity 35,223,034 - - 35,223,034
Total financial assets at fair value through
profit or loss 35,223,034 - - 35,223,034
P-Solve Inflation Plus Fund
Level 1 Level 2 Level 3 Total
GBP GBP GBP GBP
Bonds 8,742,721 - - 8,742,721
Collective Investment Schemes 12,571,910 4,314,352 - 16,886,262
Exchange Traded Funds 26,166,349 - - 26,166,349
Total financial assets at fair value through
profit or loss 47,480,980 4,314,352 - 51,795,332
Sanlam African Frontier Markets Fund
Level 1 Level 2 Level 3 Total
USD USD USD USD
Bonds - 318,160 - 318,160
Equity 68,175,522 - - 68,175,522
Rights - 35,807 - 35,807
Total financial assets at fair value through
profit or loss 68,175,522 353,967 - 68,529,489

SANLAM UNIVERSAL FUNDS PLC
387
NOTES TO AND FORMING PART OF THE UNAUDITED CONDENSED INTERIM FINANCIAL STATEMENTS (CONTINUED) for the six months ended 30 June 2017
5 Fair value of financial instruments (continued)
Assets measured at fair value at 30 June 2017 (continued)
Sanlam Global Best Ideas Fund
Level 1 Level 2 Level 3 Total
USD USD USD USD
Equity 111,376,061 - - 111,376,061
Total financial assets at fair value through
profit or loss 111,376,061 - - 111,376,061
Sanlam Global Bond Fund
Level 1 Level 2 Level 3 Total
USD USD USD USD
Bonds 271,976,318 185,440,704 - 457,417,022
Futures 190,825 - - 190,825
Forward Currency Contracts - 1,641,794 - 1,641,794
Swaps - 3,870,821 - 3,870,821
Total financial assets at fair value through
profit or loss 272,167,143 190,953,319 - 463,120,463
Sanlam Global Financial Fund
Level 1 Level 2 Level 3 Total
USD USD USD USD
Equity 114,058,348 - - 114,058,348
Total financial assets at fair value through
profit or loss 114,058,348 - - 114,058,348
Sanlam Global Property Fund
Level 1 Level 2 Level 3 Total
USD USD USD USD
Equity 124,807,901 - - 124,807,901
Forward Currency Contracts - 88,410 - 88,410
Total financial assets at fair value through
profit or loss 124,807,901 88,410 - 124,896,311
Sanlam World Equity Fund
Level 1 Level 2 Level 3 Total
USD USD USD USD
Equity 334,672,530 - - 334,672,530
Collective Investment Schemes 11,088,620 - - 11,088,620
Rights - 16,544 - 16,544
Total financial assets at fair value through
profit or loss 345,761,150 16,544 - 345,777,694

SANLAM UNIVERSAL FUNDS PLC
388
NOTES TO AND FORMING PART OF THE UNAUDITED CONDENSED INTERIM FINANCIAL STATEMENTS (CONTINUED) for the six months ended 30 June 2017
5 Fair value of financial instruments (continued)
Assets measured at fair value at 30 June 2017 (continued)
Satrix World Equity Tracker Fund
Level 1 Level 2 Level 3 Total
USD USD USD USD
Equity 636,675,995 - - 636,675,995
Exchange Traded Funds 34,571,212 - - 34,571,212
Rights - 20,505 - 20,505
Total financial assets at fair value through
profit or loss 671,247,207 20,505 - 671,267,712
SIIP India Opportunities Fund
Level 1 Level 2 Level 3 Total
USD USD USD USD
Bonds - 40,577 - 40,577
Equity 37,858,696 - - 37,858,696
Total financial assets at fair value through
profit or loss 37,858,696 40,577 - 37,899,273
SIM Global Equity Income Fund
Level 1 Level 2 Level 3 Total
USD USD USD USD
Equity 111,382,168 - - 111,382,168
Total financial assets at fair value through
profit or loss 111,382,168 - - 111,382,168
Sanlam Strategic Bond Fund
Level 1 Level 2 Level 3 Total
GBP GBP GBP GBP
Bonds 30,317,630 72,565,204 - 102,882,834
Equity 11,957,442 - - 11,957,442
Forward Currency Contracts - 1,285,125 - 1,285,125
Total financial assets at fair value through
profit or loss 42,275,072 73,850,329 - 116,125,401
Sanlam Accel Income Fund
Level 1 Level 2 Level 3 Total
GBP GBP GBP GBP
Collective Investment Schemes 38,198,816 - - 38,198,816
Total financial assets at fair value through
profit or loss 38,198,816 - - 38,198,816
Satrix North America Equity Tracker Fund
Level 1 Level 2 Level 3 Total
USD USD USD USD
Equity 71,791,210 - - 71,791,210
Rights - 516 - 516
Total financial assets at fair value through
profit or loss 71,791,210 516 - 71,791,726

SANLAM UNIVERSAL FUNDS PLC
389
NOTES TO AND FORMING PART OF THE UNAUDITED CONDENSED INTERIM FINANCIAL STATEMENTS (CONTINUED) for the six months ended 30 June 2017
5 Fair value of financial instruments (continued)
Assets measured at fair value at 30 June 2017 (continued)
Satrix UK Equity Tracker Fund
Level 1 Level 2 Level 3 Total
GBP GBP GBP GBP
Equity 48,168,217 - - 48,168,217
Total financial assets at fair value through
profit or loss 48,168,217 - - 48,168,217
Satrix Europe (ex-UK) Equity Tracker Fund
Level 1 Level 2 Level 3 Total
EUR EUR EUR EUR
Equity 236,384,415 - - 236,384,415
Rights - 11,920 - 11,920
Total financial assets at fair value through
profit or loss 236,384,415 11,920 - 236,396,335
Sanlam Equity Allocation Fund
Level 1 Level 2 Level 3 Total
USD USD USD USD
Equity 109,212,208 - - 109,212,208
Rights - 6,479 - 6,479
Total financial assets at fair value through
profit or loss 109,212,208 6,479 - 109,218,687
Satrix Emerging Markets Equity Tracker Fund
Level 1 Level 2 Level 3 Total
USD USD USD USD
Equity 43,948,896 - - 43,948,896
Exchange Traded Funds 1,417,708 - - 1,417,708
Total financial assets at fair value through
profit or loss 45,366,604 - - 45,366,604
Sanlam Managed Risk Fund
Level 1 Level 2 Level 3 Total
USD USD USD USD
Collective Investment Schemes 40,191,010 - - 40,191,010
Forward Currency Contracts - 334,877 - 334,877
Futures 21,175 - - 21,175
Total financial assets at fair value through
profit or loss 40,212,185 334,877 - 40,547,062
Sanlam Private Wealth Global High Quality Fund
Level 1 Level 2 Level 3 Total
GBP GBP GBP GBP
Collective Investment Schemes 4,555,742 - - 4,555,742
Equity 124,215,123 - - 124,215,123
Total financial assets at fair value through
profit or loss 128,770,865 - - 128,770,865

SANLAM UNIVERSAL FUNDS PLC
390
NOTES TO AND FORMING PART OF THE UNAUDITED CONDENSED INTERIM FINANCIAL STATEMENTS (CONTINUED) for the six months ended 30 June 2017
5 Fair value of financial instruments (continued)
Assets measured at fair value at 30 June 2017 (continued)
Sanlam FOUR US Dividend Income Fund
Level 1 Level 2 Level 3 Total
GBP GBP GBP GBP
Equity 211,959,621 - - 211,959,621
Total financial assets at fair value through
profit or loss 211,959,621 - - 211,959,621
High Street Global Balanced Fund
Level 1 Level 2 Level 3 Total
USD USD USD USD
Bonds 2,563,249 3,277,257 - 5,840,506
Equity 12,341,333 - - 12,341,333
Options 138,600 - - 138,600
Forward Currency Contracts - 7,199 - 7,199
Futures 2,550 - - 2,550
Total financial assets at fair value through
profit or loss 15,045,732 3,284,456 - 18,330,188
Sanlam FOUR Global Equity Fund
Level 1 Level 2 Level 3 Total
GBP GBP GBP GBP
Equity 184,882,505 - - 184,882,505
Warrants - 55,743 - 55,743
Total financial assets at fair value through
profit or loss 184,882,505 55,743 - 184,938,248
Sanlam FOUR Stable Global Equity Fund
Level 1 Level 2 Level 3 Total
GBP GBP GBP GBP
Equity 158,934,834 - - 158,934,834
Total financial assets at fair value through
profit or loss 158,934,834 - - 158,934,834
Sanlam FOUR Active UK Equity Fund
Level 1 Level 2 Level 3 Total
GBP GBP GBP GBP
Equity 59,272,314 - - 59,272,314
Total financial assets at fair value through
profit or loss 59,272,314 - - 59,272,314

SANLAM UNIVERSAL FUNDS PLC
391
NOTES TO AND FORMING PART OF THE UNAUDITED CONDENSED INTERIM FINANCIAL STATEMENTS (CONTINUED) for the six months ended 30 June 2017
5 Fair value of financial instruments (continued)
Assets measured at fair value at 30 June 2017 (continued)
Sanlam FOUR Multi-Strategy Fund
Level 1 Level 2 Level 3 Total
GBP GBP GBP GBP
Bonds - 72,612,955 - 72,612,955
Equity 30,453,173 - - 30,453,173
Exchange Traded Funds 3,651,074 - - 3,651,074
Forward Currency Contracts - 91,793 - 91,793
Futures 329,381 - - 329,381
Options 496,748 - - 496,748
Total financial assets at fair value through
profit or loss 34,930,377 72,704,748 - 107,635,125
Anchor Global Capital Plus Fund
Level 1 Level 2 Level 3 Total
USD USD USD USD
Bonds 4,053,635 - - 4,053,635
Equity 2,521,529 - - 2,521,529
Exchange Traded Funds 2,232,511 - - 2,232,511
Futures 2,123 - - 2,123
Options 10,950 - - 10,950
Total financial assets at fair value through
profit or loss 8,820,748 - - 8,820,748
Bridge Global Equity Income Growth Fund
Level 1 Level 2 Level 3 Total
USD USD USD USD
Equity 5,491,030 - - 5,491,030
Total financial assets at fair value through
profit or loss 5,491,030 - - 5,491,030
Anchor Global Equity Fund
Level 1 Level 2 Level 3 Total
USD USD USD USD
Equity 23,102,971 - - 23,102,971
Total financial assets at fair value through
profit or loss 23,102,971 - - 23,102,971
Bridge Global Managed Growth Fund
Level 1 Level 2 Level 3 Total
USD USD USD USD
Equity 8,814,421 - - 8,814,421
Exchange Traded Funds 950,757 - - 950,757
Total financial assets at fair value through
profit or loss 9,765,178 - - 9,765,178

SANLAM UNIVERSAL FUNDS PLC
392
NOTES TO AND FORMING PART OF THE UNAUDITED CONDENSED INTERIM FINANCIAL STATEMENTS (CONTINUED) for the six months ended 30 June 2017
5 Fair value of financial instruments (continued)
Assets measured at fair value at 30 June 2017 (continued)
SIM Global Emerging Markets Fund
Level 1 Level 2 Level 3 Total
USD USD USD USD
Equity 46,206,231 - - 46,206,231
Total financial assets at fair value through
profit or loss 46,206,231 - - 46,206,231
ABSA Africa Equity Fund
Level 1 Level 2 Level 3 Total
USD USD USD USD
Bonds 1,455,137 - - 1,455,137
Equity 28,886,307 - - 28,886,307
Total financial assets at fair value through
profit or loss 30,341,444 - - 30,341,444
Sanlam Centre American Select Equity Fund
Level 1 Level 2 Level 3 Total
USD USD USD USD
Equity 156,354,804 - - 156,354,804
Forward Currency Contracts - 99 - 99
Options 1,486,850 - - 1,486,850
Total financial assets at fair value through
profit or loss 157,841,654 99 - 157,841,753
Sanlam Japan Equity Fund
Level 1 Level 2 Level 3 Total
USD USD USD USD
Equity 67,489,611 - - 67,489,611
Total financial assets at fair value through
profit or loss 67,489,611 - - 67,489,611
Sanlam Global Convertible Securities Fund
Level 1 Level 2 Level 3 Total
USD USD USD USD
Bonds - 18,476,563 - 18,476,563
Equity 1,753,463 - - 1,753,463
Forward Currency Contracts - 13,261 - 13,261
Total financial assets at fair value through
profit or loss 1,753,463 18,489,824 - 20,243,287
Sanlam Centre Active U.S Treasury Fund
Level 1 Level 2 Level 3 Total
USD USD USD USD
Bonds 8,930,332 - - 8,930,332
Derivatives 12,579 - - 12,579
Total financial assets at fair value through
profit or loss 8,942,911 - - 8,942,911

SANLAM UNIVERSAL FUNDS PLC
393
NOTES TO AND FORMING PART OF THE UNAUDITED CONDENSED INTERIM FINANCIAL STATEMENTS (CONTINUED) for the six months ended 30 June 2017
5 Fair value of financial instruments (continued)
Assets measured at fair value at 30 June 2017 (continued)
Autus Global Equity Fund
Level 1 Level 2 Level 3 Total
USD USD USD USD
Collective Investment Schemes 1,093,185 - - 1,093,185
Equity 10,877,497 - - 10,877,497
Total financial assets at fair value through
profit or loss 11,970,682 - - 11,970,682
Assets measured at fair value at 31 December 2016
The following tables analyse within the fair value hierarchy the Funds’ financial assets measured at fair
value through profit or loss at 31 December 2016:
Sanlam Centre Global Select Equity Fund
Level 1 Level 2 Level 3 Total
USD USD USD USD
Equity 34,977,241 - - 34,977,241
Total financial assets at fair value through
profit or loss 34,977,241 - - 34,977,241
Bridge Global Property Income Fund
Level 1 Level 2 Level 3 Total
USD USD USD USD
Equity 38,122,913 - - 38,122,913
Total financial assets at fair value through
profit or loss 38,122,913 - - 38,122,913
P-Solve Inflation Plus Fund
Level 1 Level 2 Level 3 Total
GBP GBP GBP GBP
Bonds 11,022,115 - - 11,022,115
Exchange Traded Funds 20,087,287 - - 20,087,287
Collective Investment Schemes 14,966,301 4,152,098 - 19,118,399
Total financial assets at fair value through
profit or loss 46,075,676 4,152,098 - 50,227,801
Sanlam African Frontier Markets Fund
Level 1 Level 2 Level 3 Total
USD USD USD USD
Equity 64,278,749 - - 64,278,749
Total financial assets at fair value through
profit or loss 64,278,749 - - 64,278,749
Sanlam Global Best Ideas Fund
Level 1 Level 2 Level 3 Total
USD USD USD USD
Equity 100,991,007 - - 100,991,007
Total financial assets at fair value through
profit or loss 100,991,007 - - 100,991,007

SANLAM UNIVERSAL FUNDS PLC
394
NOTES TO AND FORMING PART OF THE UNAUDITED CONDENSED INTERIM FINANCIAL STATEMENTS (CONTINUED) for the six months ended 30 June 2017
5 Fair value of financial instruments (continued)
Assets measured at fair value at 31 December 2016 (continued)
Sanlam Global Bond Fund
Level 1 Level 2 Level 3 Total
USD USD USD USD
Bonds 191,084,676 141,887,668 - 332,972,344
Futures 153,709 - - 153,709
Forward Currency Contracts - 1,628,437 - 1,628,437
Swaps - 3,536,185 - 3,536,185
Total financial assets at fair value through
profit or loss 191,238,385 147,052,290 - 338,290,675
Sanlam Global Financial Fund
Level 1 Level 2 Level 3 Total
USD USD USD USD
Equity 138,115,927 - - 138,115,927
Total financial assets at fair value through
profit or loss 138,115,927 - - 138,115,927
Sanlam Global Property Fund
Level 1 Level 2 Level 3 Total
USD USD USD USD
Equity 113,418,261 - - 113,418,261
Forward Currency Contracts - 285,249 - 285,249
Total financial assets at fair value through
profit or loss 113,418,261 285,249 - 113,703,510
Sanlam World Equity Fund
Level 1 Level 2 Level 3 Total
USD USD USD USD
Equity 739,438,879 - - 739,438,879
Rights - 85,670 - 85,670
Total financial assets at fair value through
profit or loss 739,438,879 85,670 - 739,524,549
Satrix World Equity Tracker Fund
Level 1 Level 2 Level 3 Total
USD USD USD USD
Equity 475,453,004 - - 475,453,004
Exchange Traded Funds 16,463,441 - - 16,463,441
Rights - 9,550 - 9,550
Total financial assets at fair value through
profit or loss 491,916,445 9,550 - 491,925,995

SANLAM UNIVERSAL FUNDS PLC
395
NOTES TO AND FORMING PART OF THE UNAUDITED CONDENSED INTERIM FINANCIAL STATEMENTS (CONTINUED) for the six months ended 30 June 2017
5 Fair value of financial instruments (continued)
Assets measured at fair value at 31 December 2016 (continued)
SIIP India Opportunities Fund
Level 1 Level 2 Level 3 Total
USD USD USD USD
Bonds - 40,330 - 40,330
Equity 27,611,471 - - 27,611,471
Total financial assets at fair value through
profit or loss 27,611,471 40,330 - 27,651,801
SIM Global Equity Income Fund
Level 1 Level 2 Level 3 Total
USD USD USD USD
Equity 101,926,904 - - 101,926,904
Total financial assets at fair value through
profit or loss 101,926,904 - - 101,926,904
Sanlam Strategic Bond Fund
Level 1 Level 2 Level 3 Total
GBP GBP GBP GBP
Bonds 15,150,252 57,634,383 - 72,784,635
Equity 7,601,855 - - 7,601,855
Forward Currency Contracts - 178,853 - 178,853
Total financial assets at fair value through
profit or loss 22,752,107 57,813,236 - 80,565,343
Sanlam Accel Income Fund
Level 1 Level 2 Level 3 Total
GBP GBP GBP GBP
Collective Investment Schemes 40,983,966 - - 40,983,966
Total financial assets at fair value through
profit or loss 40,983,966 - - 40,983,966
Satrix North America Equity Tracker Fund
Level 1 Level 2 Level 3 Total
USD USD USD USD
Equity 6,290,960 - - 6,290,960
Rights - 516 - 516
Total financial assets at fair value through
profit or loss 6,290,960 516 - 6,291,476
Satrix UK Equity Tracker Fund
Level 1 Level 2 Level 3 Total
GBP GBP GBP GBP
Equity 35,904,967 - - 35,904,967
Total financial assets at fair value through
profit or loss 35,904,967 - - 35,904,967

SANLAM UNIVERSAL FUNDS PLC
396
NOTES TO AND FORMING PART OF THE UNAUDITED CONDENSED INTERIM FINANCIAL STATEMENTS (CONTINUED) for the six months ended 30 June 2017
5 Fair value of financial instruments (continued)
Assets measured at fair value at 31 December 2016 (continued)
Satrix Europe (ex-UK) Equity Tracker Fund
Level 1 Level 2 Level 3 Total
EUR EUR EUR EUR
Equity 118,641,933 - - 118,641,933
Total financial assets at fair value through
profit or loss 118,641,933 - - 118,641,933
Sanlam Equity Allocation Fund
Level 1 Level 2 Level 3 Total
USD USD USD USD
Equity 95,720,423 - - 95,720,423
Total financial assets at fair value through
profit or loss 95,720,423 - - 95,720,423
Satrix Emerging Markets Equity Tracker Fund
Level 1 Level 2 Level 3 Total
USD USD USD USD
Equity 36,593,203 - - 36,593,203
Rights - 430 - 430
Exchange Traded Funds 1,649,385 - - 1,649,385
Total financial assets at fair value through
profit or loss 38,242,588 - - 38,243,018
Sanlam Managed Risk Fund
Level 1 Level 2 Level 3 Total
USD USD USD USD
Collective Investment Schemes 41,784,642 - - 41,784,642
Futures 46,544 - - 46,544
Forward Currency Contracts - 2,408 - 2,408
Total financial assets at fair value through
profit or loss 41,831,186 2,408 - 41,833,594
Sanlam Private Wealth Global High Quality Fund
Level 1 Level 2 Level 3 Total
GBP GBP GBP GBP
Equity 84,418,600 - - 84,418,600
Collective Investment Schemes 4,762,956 - - 4,762,956
Total financial assets at fair value through
profit or loss 89,181,556 - - 89,181,556
Sanlam FOUR US Dividend Income Fund
Level 1 Level 2 Level 3 Total
USD USD USD USD
Equity 163,095,507 - - 163,095,507
Total financial assets at fair value through
profit or loss 163,095,507 - - 163,095,507

SANLAM UNIVERSAL FUNDS PLC
397
NOTES TO AND FORMING PART OF THE UNAUDITED CONDENSED INTERIM FINANCIAL STATEMENTS (CONTINUED) for the six months ended 30 June 2017
5 Fair value of financial instruments (continued)
Assets measured at fair value at 31 December 2016 (continued)
High Street Global Balanced Fund
Level 1 Level 2 Level 3 Total
USD USD USD USD
Bonds 580,548 3,794,820 - 4,375,368
Equity 7,412,144 - - 7,412,144
Forward Currency Contracts - 253,131 - 253,131
Total financial assets at fair value through
profit or loss 7,992,692 4,047,951 - 12,040,643
Sanlam FOUR Active European (ex-UK) Equity Fund
Level 1 Level 2 Level 3 Total
GBP GBP GBP GBP
Equity 77,255,020 - - 77,255,020
Total financial assets at fair value through
profit or loss 77,255,020 - - 77,255,020
Sanlam FOUR Global Equity Fund
Level 1 Level 2 Level 3 Total
GBP GBP GBP GBP
Equity 182,912,879 - - 182,912,879
Warrants - 140,893 - 140,893
Total financial assets at fair value through
profit or loss 182,912,879 140,893 - 183,053,772
Sanlam FOUR Stable Global Equity Fund
Level 1 Level 2 Level 3 Total
GBP GBP GBP GBP
Equity 119,308,944 - - 119,308,944
Total financial assets at fair value through
profit or loss 119,308,944 - - 119,308,944
Sanlam FOUR Active UK Equity Fund
Level 1 Level 2 Level 3 Total
GBP GBP GBP GBP
Equity 76,465,493 - - 76,465,493
Total financial assets at fair value through
profit or loss 76,465,493 - - 76,465,493

SANLAM UNIVERSAL FUNDS PLC
398
NOTES TO AND FORMING PART OF THE UNAUDITED CONDENSED INTERIM FINANCIAL STATEMENTS (CONTINUED) for the six months ended 30 June 2017
5 Fair value of financial instruments (continued)
Assets measured at fair value at 31 December 2016 (continued)
Sanlam FOUR Multi-Strategy Fund
Level 1 Level 2 Level 3 Total
GBP GBP GBP GBP
Bonds - 70,719,510 - 70,719,510
Equity 15,421,620 - - 15,421,620
Exchange Traded Funds 10,309,484 - - 10,309,484
Forward Currency Contracts - 44,984 - 44,984
Futures 259,008 - - 259,008
Options 774,742 - - 774,742
Total financial assets at fair value through
profit or loss 26,764,854 70,764,494 - 97,529,348
Anchor Global Capital Plus Fund
Level 1 Level 2 Level 3 Total
USD USD USD USD
Equity 1,765,797 - - 1,765,797
Exchange Traded Funds 3,321,503 - - 3,321,503
Total financial assets at fair value through
profit or loss 5,087,300 - - 5,087,300
Bridge Global Equity Income Growth Fund
Level 1 Level 2 Level 3 Total
USD USD USD USD
Equity 5,093,511 - - 5,093,511
Total financial assets at fair value through
profit or loss 5,093,511 - - 5,093,511
Anchor Global Equity Fund
Level 1 Level 2 Level 3 Total
USD USD USD USD
Equity 19,956,796 - - 19,956,796
Total financial assets at fair value through
profit or loss 19,956,796 - - 19,956,796
Bridge Global Managed Growth Fund
Level 1 Level 2 Level 3 Total
USD USD USD USD
Equity 8,990,005 - - 8,990,005
Exchange Traded Funds 926,730 - - 926,730
Total financial assets at fair value through
profit or loss 9,916,735 - - 9,916,735
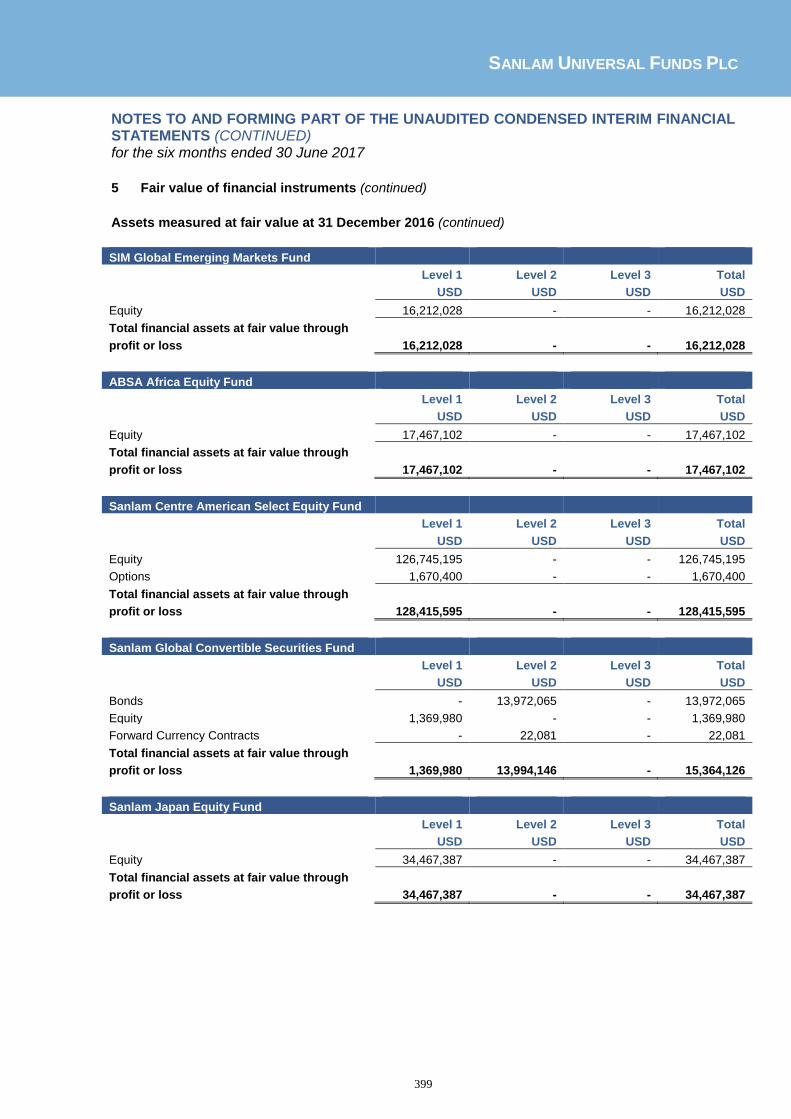
SANLAM UNIVERSAL FUNDS PLC
399
NOTES TO AND FORMING PART OF THE UNAUDITED CONDENSED INTERIM FINANCIAL STATEMENTS (CONTINUED) for the six months ended 30 June 2017
5 Fair value of financial instruments (continued)
Assets measured at fair value at 31 December 2016 (continued)
SIM Global Emerging Markets Fund
Level 1 Level 2 Level 3 Total
USD USD USD USD
Equity 16,212,028 - - 16,212,028
Total financial assets at fair value through
profit or loss 16,212,028 - - 16,212,028
ABSA Africa Equity Fund
Level 1 Level 2 Level 3 Total
USD USD USD USD
Equity 17,467,102 - - 17,467,102
Total financial assets at fair value through
profit or loss 17,467,102 - - 17,467,102
Sanlam Centre American Select Equity Fund
Level 1 Level 2 Level 3 Total
USD USD USD USD
Equity 126,745,195 - - 126,745,195
Options 1,670,400 - - 1,670,400
Total financial assets at fair value through
profit or loss 128,415,595 - - 128,415,595
Sanlam Global Convertible Securities Fund
Level 1 Level 2 Level 3 Total
USD USD USD USD
Bonds - 13,972,065 - 13,972,065
Equity 1,369,980 - - 1,369,980
Forward Currency Contracts - 22,081 - 22,081
Total financial assets at fair value through
profit or loss 1,369,980 13,994,146 - 15,364,126
Sanlam Japan Equity Fund
Level 1 Level 2 Level 3 Total
USD USD USD USD
Equity 34,467,387 - - 34,467,387
Total financial assets at fair value through
profit or loss 34,467,387 - - 34,467,387

SANLAM UNIVERSAL FUNDS PLC
400
NOTES TO AND FORMING PART OF THE UNAUDITED CONDENSED INTERIM FINANCIAL STATEMENTS (CONTINUED) for the six months ended 30 June 2017
5 Fair value of financial instruments (continued)
Liabilities measured at fair value at 30 June 2017
The following tables analyse within the fair value hierarchy the Funds’ financial liabilities measured at fair
value through profit or loss at 30 June 2017:
Sanlam Global Bond Fund
Level 1 Level 2 Level 3 Total
USD USD USD USD
Forward Currency Contracts (1,010,694) - (1,010,694)
Futures (358,311) (358,311) - (358,311)
Swaps - (4,000,447) - (4,000,447)
Total financial liabilities at fair value through
profit or loss (358,311) (5,011,141) - (5,369,453)
Sanlam Global Property Fund
Level 1 Level 2 Level 3 Total
USD USD USD USD
Forward Currency Contracts - (92,632) - (92,632)
Total financial liabilities at fair value through
profit or loss - (92,632) - (92,632)
Sanlam Strategic Bond Fund
Level 1 Level 2 Level 3 Total
GBP GBP GBP GBP
Forward Currency Contracts - (1,911,698) - (1,911,698)
Total financial liabilities at fair value through
profit or loss - (1,911,698) - (1,911,698)
Sanlam Managed Risk Fund
Level 1 Level 2 Level 3 Total
USD USD USD USD
Forward Currency Contracts - (3,908) - (3,908)
Total financial liabilities at fair value through
profit or loss - (3,908) - (3,908)
High Street Global Balanced Fund
Level 1 Level 2 Level 3 Total
USD USD USD USD
Forward Currency Contracts - (105,177) - (105,177)
Total financial liabilities at fair value through
profit or loss - (105,177) - (105,177)

SANLAM UNIVERSAL FUNDS PLC
401
NOTES TO AND FORMING PART OF THE UNAUDITED CONDENSED INTERIM FINANCIAL STATEMENTS (CONTINUED) for the six months ended 30 June 2017
5 Fair value of financial instruments (continued)
Liabilities measured at fair value at 30 June 2017 (continued)
Sanlam FOUR Multi-Strategy Fund
Level 1 Level 2 Level 3 Total
GBP GBP GBP GBP
Forward Currency Contracts - (47,489) - (47,489)
Futures (219,301) - - (219,301)
Options (56,437) - - (56,437)
Total financial liabilities at fair value through
profit or loss (275,739) (47,489) - (323,228)
Anchor Global Capital Plus Fund
Level 1 Level 2 Level 3 Total
USD USD USD USD
Futures (10,256) - - (10,256)
Options (3,828) - - (3,828)
Total financial liabilities at fair value through
profit or loss (14,084) - - (14,084)
Sanlam Global Convertible Securities Fund
Level 1 Level 2 Level 3 Total
USD USD USD USD
Forward Currency Contracts - (89,369) - (89,369)
Total financial liabilities at fair value through
profit or loss - (89,369) - (89,369)
Sanlam Centre Active US Treasury Fund
Level 1 Level 2 Level 3 Total
USD USD USD USD
Futures (188) - - (188)
Total financial liabilities at fair value through
profit or loss (188) - - (188)
Liabilities measured at fair value at 31 December 2016
The following tables analyse within the fair value hierarchy the Funds’ financial liabilities measured at fair
value through profit or loss at 31 December 2016:
Sanlam Global Bond Fund
Level 1 Level 2 Level 3 Total
USD USD USD USD
Futures (103,757) - - (103,757)
Forward Currency Contracts - (2,115,323) - (2,115,323)
Swaps - (3,914,668) - (3,914,668)
Total financial liabilities at fair value through
profit or loss (103,757) (6,029,991) - (6,133,748)

SANLAM UNIVERSAL FUNDS PLC
402
NOTES TO AND FORMING PART OF THE UNAUDITED CONDENSED INTERIM FINANCIAL STATEMENTS (CONTINUED) for the six months ended 30 June 2017
5 Fair value of financial instruments (continued)
Liabilities measured at fair value at 31 December 2016 (continued)
Sanlam Global Property Fund
Level 1 Level 2 Level 3 Total
USD USD USD USD
Forward Currency Contracts - (351,139) - (351,139)
Total financial liabilities at fair value through
profit or loss - (351,139) - (351,139)
Sanlam Strategic Bond Fund
Level 1 Level 2 Level 3 Total
USD USD USD USD
Forward Currency Contracts - (361,120) - (361,120)
Total financial liabilities at fair value through
profit or loss - (361,120) - (361,120)
Sanlam Managed Risk Fund
Level 1 Level 2 Level 3 Total
USD USD USD USD
Futures (48,507) - - (48,507)
Forward Currency Contracts - (213,761) - (213,761)
Total financial liabilities at fair value through
profit or loss (48,507) (213,761) - (262,268)
Sanlam FOUR Multi-Strategy Fund
Level 1 Level 2 Level 3 Total
GBP GBP GBP GBP
Futures (575,212) - - (575,212)
Forward Currency Contracts - (163,889) - (163,889)
Options (3,528) - - (3,528)
Total financial liabilities at fair value through
profit or loss (578,740) (163,889) - (742,629)
Anchor Global Capital Plus Fund
Level 1 Level 2 Level 3 Total
USD USD USD USD
Futures (8,594) - - (8,594)
Options (38,888) - - (38,888)
Total financial liabilities at fair value through
profit or loss (47,482) - - (47,482)
Sanlam Global Convertible Securities Fund
Level 1 Level 2 Level 3 Total
USD USD USD USD
Forward Currency Contracts - (19,950) - (19,950)
Total financial liabilities at fair value through
profit or loss - (19,950) - (19,950)

SANLAM UNIVERSAL FUNDS PLC
403
NOTES TO AND FORMING PART OF THE UNAUDITED CONDENSED INTERIM FINANCIAL STATEMENTS (CONTINUED) for the six months ended 30 June 2017
5 Fair value of financial instruments (continued)
Significant transfers between levels 1, 2 and 3
Investments whose values are based on quoted market prices in active markets, and therefore classified
within level 1, include active listed equities, exchange traded derivatives, government bonds, futures
contracts, exchange traded option contracts and collective investment schemes. The Fund does not
adjust the quoted price for these instruments nor does it apply a discount to securities where the volume
traded in the market is low to the Fund’s holding.
Financial instruments that trade in markets that are not considered to be active but are valued based on
quoted market prices, dealer quotations or alternative pricing sources supported by observable inputs are
classified within level 2. Over-the-counter derivatives such as interest rate swaps and forward currency
contracts are classified within level 2. As level 2 investments include positions that are not traded in active
markets and/or are subject to transfer restrictions, valuations may be adjusted to reflect illiquidity and/or
non-transferability, which are generally based on available market information.
Investments classified within level 3 have significant unobservable inputs, as they trade infrequently.
Level 3 instruments include illiquid equities.
The following tables show significant transfers between level 3 and level 1 of the fair value hierarchy for
financial assets recognised at fair value for the period ended 30 June 2017:
Sanlam Global Property Fund – 2017
Financial assets held for trading:
Transfer from level
3 to level 1
Equity 274,914
Sanlam Global Property Fund held a position in Kaisa Group Holdings Limited. Trading of the company’s shares were suspended in March 2015. A decision was taken by the Valuation Committee to write down the value of this position by 10%. Therefore the position was transferred from level 1 to level 3 of the fair value hierarchy. Subsequently, in March 2017, the suspension on trading was lifted and shares resumed trading. Therefore, the position was transferred from level 3 to level 1 of the fair value hierarchy and valued at the trading price.
The following tables show significant transfers between level 1 and level 3 of the fair value hierarchy for
financial assets recognised at fair value for the year ended 31 December 2016:
Satrix Emerging Markets Equity Tracker Fund – 2016
Financial assets held for trading:
Transfer from level
1 to level 3
Transfer from level
3 to level 1
Equity 12,331 52,636
Satrix Emerging Markets Equity Tracker Fund held a position in Shanghai Lujiazui Finance & Trade Zone Development Co. Ltd. Trading of the company’s shares on Shanghai Stock Exchange were suspended in February 2016. In March 2016, a decision was taken by the Valuation Committee to write down the value of this position by 25% with immediate effect. Therefore the position was transferred from level 1 to level 3 of the fair value hierarchy. Subsequently, in May 2016, the suspension on trading was lifted and shares resumed trading. Therefore, the position was transferred from level 3 to level 1 of the fair value hierarchy and valued at the trading price.

SANLAM UNIVERSAL FUNDS PLC
404
NOTES TO AND FORMING PART OF THE UNAUDITED CONDENSED INTERIM FINANCIAL STATEMENTS (CONTINUED) for the six months ended 30 June 2017
5 Fair value of financial instruments (continued)
Significant transfers between levels 1, 2 and 3 (continued) At 31 December 2015 shares in Sihuan Pharmaceutical Holding Group Limited were suspended and were classified as level 3 due to the trading status. The position was valued at USD 40,305. In February 2016 the suspension on trading was lifted and the shares resumed trading on the Hong Kong Stock Exchange. Therefore the position was transferred from level 3 to level 1 of the fair value hierarchy.
Sanlam Four Active UK Equity Fund – 2016
Financial assets held for trading:
Transfer from level
1 to level 3
Equity 110,004
Sanlam FOUR Active UK Equity Fund held a position in Petroceltic International Plc. The company entered into examinership in March 2016 and trading of shares on the Dublin and London Stock Exchange was suspended in May 2016. Following approval by the Valuation Committee, in April 2016 a decision was taken to write down the value of this position to GBP 0.03. The position was transferred from level 1 to level 3 of the fair value hierarchy due to the uncertainty around the valuation of the position. The company was subsequently subject to a takeover and the Fund's shares were disposed.
Level 3 Assets measured at fair value reconciliation
The following tables show a reconciliation of all movements in the fair value of financial instruments
categorised within Level 3 between 1 January and 30 June 2017:
Sanlam African Frontiers Market Fund
The level 3 position held by Sanlam African Frontiers Market Fund at 30 June 2017 is Stanbic IBTC Holding Co. Rights which is valued at USD Nil. This is a thinly traded illiquid position and is classified as level 3 due to its trading status.
There has been no movement in the value of the position in the period ended 30 June 2017 or the comparative period.
For the purpose of IFRS 7 for the reconciliation showing the change in fair value due to a change in inputs used, changes to one or more of the inputs to reasonably alternative assumptions, is irrelevant as there does not exist a reasonable alternative inputs.
Sanlam Global Best Ideas Fund
The level 3 positions held by the Sanlam Global Best Ideas Fund at 30 June 2017 are Accident Exchange Group Plc which is valued at USD Nil (2016: USD Nil) and DBA Telecommunications Asia which is valued at USD Nil (2016: USD Nil). Accident Exchange Group Plc is a delisted security and classified as level 3 due to its trading status. Shares in DBA Telecommunications Asia have been suspended since June 2013. The position was written down by 50% on 17 December 2013 and subsequently written down to zero on 30 September 2014 pending further news and financial information from the company. There has been no movement in the value of the position in the period ended 30 June 2017 or the comparative period. For the purpose of IFRS 7 for the reconciliation showing the change in fair value due to a change in inputs used, changes to one or more of the inputs to reasonably alternative assumptions, is irrelevant as there does not exist a reasonable alternative inputs.

SANLAM UNIVERSAL FUNDS PLC
405
NOTES TO AND FORMING PART OF THE UNAUDITED CONDENSED INTERIM FINANCIAL STATEMENTS (CONTINUED) for the six months ended 30 June 2017
5 Fair value of financial instruments (continued) Level 3 Assets measured at fair value reconciliation (continued)
Sanlam Global Financial Fund
The level 3 positions held by the Sanlam Global Financial Fund at 30 June 2017 are Accident Exchange Group Plc which is valued at USD Nil (2016: USD Nil) and DBA Telecommunications Asia which is valued at USD Nil (2016: USD Nil). Accident Exchange Group Plc is a delisted security and classified as level 3 due to its trading status. Shares in DBA Telecommunications Asia have been suspended since June 2013. The position was written down by 50% on 17 December 2013 and subsequently written down to zero on 30 September 2014 pending further news and financial information from the company.
There has been no movement in the value of the positions during the period ended 30 June 2017 or the
comparative period.
For the purpose of IFRS 7 for the reconciliation showing the change in fair value due to a change in inputs used, changes to one or more of the inputs to reasonably alternative assumptions, is irrelevant as there does not exist a reasonable alternative inputs.
Sanlam Global Property Fund
Investment in securities
2017 2016
Balance as at 1 January 274,800 274,914
Realised gains/(losses) - -
Change in unrealised gains/(losses) - (114)
Gross Purchases - -
Gross Sales (274,800) -
Transfers in and out of level 3 - -
Balance as at 30 June/31 December - 274,800
Total unrealised gains and losses for the period/year included in profit
or loss for level 3 assets held at period/year end - (114)
The level 3 position held by the Sanlam Global Property Fund at 31 December 2016 was Kaisa Group Shares in Kaisa Group Holdings Limited were suspended on 31 March 2015 and were classified as level 3 due to the trading status. Following approval by the Valuation Committee, in July 2015 a decision was taken to write down the value of the position held in Kaisa Group Holdings Limited by an amount of 10% from the last available reported price. Subsequently, in March 2017, the suspension on trading was lifted and shares resumed trading. Therefore, the position was transferred from level 3 to level 1 of the fair value hierarchy and valued at the trading price. For the purpose of IFRS 7, for the reconciliation showing the change in fair value due to a change in inputs used, changes to one or more of the inputs to reasonably alternative assumptions is irrelevant in this case and would result in this position (possibly) being written down to zero.

SANLAM UNIVERSAL FUNDS PLC
406
NOTES TO AND FORMING PART OF THE UNAUDITED CONDENSED INTERIM FINANCIAL STATEMENTS (CONTINUED) for the six months ended 30 June 2017
5 Fair value of financial instruments (continued) Level 3 Assets measured at fair value reconciliation (continued)
Sanlam World Equity Fund
Investment in securities
2017 2016
Balance as at 1 January - 28,370
Realised gains/(losses) - 42,711
Change in unrealised - (28,370)
Gross Purchases - -
Gross Sales - (42,711)
Transfers in and out of level 3 - -
Balance as at 30 June/ 31 December - -
Total unrealised gains and losses for the period/year included in profit
or loss for level 3 assets held at period/year end - -
The level 3 positions held by Sanlam World Equity Fund at 30 June 2017 Du Pont ‘S’ Fractional Shares which are valued at USD Nil (2015: USD Nil). These securities are thinly traded and are classified as level 3 due to their trading status. There has been no movement in the value of the positions during the period ended 30 June 2017 or the comparative period. In 2016, the Fund held Rolls-Royce Group - C Shares which were thinly traded securities and were therefore classified as level 3 due to the trading status. The position was disposed of during the year ended 31 December 2016.
For the purpose of IFRS 7 for the reconciliation showing the change in fair value due to a change in inputs used, changes to one or more of the inputs to reasonably alternative assumptions, is irrelevant as there does not exist a reasonable alternative inputs.
Satrix World Equity Tracker Fund
Investment in securities
2017 2016
Balance as at 1 January - 4,260
Realised gains/(losses) - 4,825
Change in unrealised - (4,260)
Gross Purchases - -
Gross Sales - (4,825)
Transfers in and out of level 3 - -
Balance as at 30 June/31 December - -
Total unrealised gains and losses for the period/year included in profit
or loss for level 3 assets held at period/year end - -
At 30 June 2017, Satrix World Equity Tracker Fund does not hold any level 3 positions. In 2016, the Fund held Rolls-Royce Group - C Shares which were thinly traded securities and were therefore classified as level 3 due to the trading status. The position was disposed of during the year ended 31 December 2016.

SANLAM UNIVERSAL FUNDS PLC
407
NOTES TO AND FORMING PART OF THE UNAUDITED CONDENSED INTERIM FINANCIAL STATEMENTS (CONTINUED) for the six months ended 30 June 2017
5 Fair value of financial instruments (continued) Level 3 Assets measured at fair value reconciliation (continued) For the purpose of IFRS 7 for the reconciliation showing the change in fair value due to a change in inputs used, changes to one or more of the inputs to reasonably alternative assumptions, is irrelevant as there does not exist a reasonable alternative inputs.
Satrix UK Equity Tracker Fund
Investment in securities
2017 2016
Balance as at 1 January - 4,079
Realised gains/(losses) - 4,330
Change in unrealised - (4,079)
Gross Purchases - -
Gross Sales - (4,330)
Transfers in and out of level 3 - -
Balance as at 30 June/31 December - -
Total unrealised gains and losses for the period/year included in profit
or loss for level 3 assets held at period/year end - -
At 30 June 2017, Satrix UK Equity Tracker Fund does not hold any level 3 positions.
In 2016, the Fund held Rolls-Royce Group - C Shares which were thinly traded securities and were
therefore classified as level 3 due to the trading status. The position was disposed of during the year
ended 31 December 2016. For the purpose of IFRS 7 for the reconciliation showing the change in fair value due to a change in inputs used, changes to one or more of the inputs to reasonably alternative assumptions, is irrelevant as there does not exist a reasonable alternative inputs.
Satrix Europe (ex-UK) Equity Tracker Fund
The level 3 position held by the Satrix Europe (ex-UK) Equity Tracker Fund at 30 June 2017 is Banco Espirito Santo SA which is valued at EUR Nil (2016: EUR Nil). Trading was suspended on this security during 2014 and the position is classified as level 3 due to its trading status. The position was written down to zero on 29 April 2015 pending further news and financial information from the company. There has been no movement in the value of the position during the period ended 30 June 2017 or the comparative period. For the purpose of IFRS 7 for the reconciliation showing the change in fair value due to a change in inputs used, changes to one or more of the inputs to reasonably alternative assumptions, is irrelevant as there does not exist a reasonable alternative inputs.

SANLAM UNIVERSAL FUNDS PLC
408
NOTES TO AND FORMING PART OF THE UNAUDITED CONDENSED INTERIM FINANCIAL STATEMENTS (CONTINUED) for the six months ended 30 June 2017
5 Fair value of financial instruments (continued) Level 3 Assets measured at fair value reconciliation (continued)
Sanlam Equity Allocation Fund
Investment in securities
2017 2016
Balance as at 1 January - 5,684
Realised gains/(losses) - 10,565
Change in unrealised - (5,684)
Gross Purchases - -
Gross Sales - (10,565)
Transfers in and out of level 3 - -
Balance as at 30 June/31 December - -
Total unrealised gains and losses for the period/year included in profit
or loss for level 3 assets held at period/year end - -
At 30 June 2017, Sanlam Equity Allocation Fund does not hold any level 3 positions.
In 2016, the Fund held Rolls-Royce Group - C Shares which were thinly traded securities and were
therefore classified as level 3 due to the trading status. The position was disposed of during the year
ended 31 December 2016. For the purpose of IFRS 7 for the reconciliation showing the change in fair value due to a change in inputs used, changes to one or more of the inputs to reasonably alternative assumptions, is irrelevant as there does not exist a reasonable alternative inputs.
Satrix Emerging Markets Equity Tracker Fund
Investment in securities
2017 2016
Balance as at 1 January - 74,481
Realised gains/(losses) - -
Change in unrealised - (34,176)
Gross Purchases - -
Gross Sales - -
Transfers in and out of level 3 - (40,305)
Balance as at 30 June/31 December - -
Total unrealised gains and losses for the period/year included in profit
or loss for level 3 assets held at period/year end - 10,045
The level 3 positions held by the Satrix Emerging Markets Equity Tracker Fund at 30 June 2017 are African Bank Investments Limited which is valued at USD Nil (2016: USD Nil) and Hanergy Thin Film Power Group Limited which is valued at USD Nil (2016: USD 34,176). There has been no movement in the value of the position during the period ended 30 June 2017. Trading was suspended on African Bank Investments Limited on 10 August 2014 and it is classified as level 3 due to its trading status. The position was written down to zero on 3 October 2014 pending further news and financial information from the company.

SANLAM UNIVERSAL FUNDS PLC
409
NOTES TO AND FORMING PART OF THE UNAUDITED CONDENSED INTERIM FINANCIAL STATEMENTS (CONTINUED) for the six months ended 30 June 2017
5 Fair value of financial instruments (continued) Level 3 Assets measured at fair value reconciliation (continued)
Satrix Emerging Markets Equity Tracker Fund (continued)
Trading was suspended on Hanergy Thin Film Power Group Limited on 20 May 2015 and it is classified as level 3 due to its trading status. Following approval by the Valuation Committee, in July 2015 a decision was taken to write down the value of the positions held in Hanergy Thin Film Power Group Limited by an amount of 44.5% from the last available reported price. In January 2016, the Valuation Committee approved that this position be written down to zero value with immediate effect. The following movement in level 3 investments occurred during the year ended 31 December 2016: At 31 December 2015 shares in Sihuan Pharmaceutical Holding Group Limited was suspended and were classified as level 3 due to the trading status. The position was valued at USD 40,305. In February 2016 the suspension on trading was lifted and the shares resumed trading on the Hong Kong Stock Exchange. Therefore the position was transferred from level 3 to level 1 of the fair value hierarchy. Satrix Emerging Markets Equity Tracker Fund also held a position in Shanghai Lujiazui Finance & Trade Zone Development Co. Ltd. Trading of the company’s shares on Shanghai Stock Exchange were suspended for a period from February 2016 to May 2016. As such the position was transferred to from level 1 to level 3 to reflect the lack of visibility on the fair value of the security and subsequently transferred from level 3 to level 1 once the suspension on trading was lifted. For the purpose of IFRS 7 for the reconciliation showing the change in fair value due to a change in inputs used, changes to one or more of the inputs to reasonably alternative assumptions, is irrelevant as there does not exist a reasonable alternative inputs.
Sanlam FOUR Active UK Equity Fund
Investment in securities
2017 2016
Balance as at 1 January - 43,773
Realised gains/(losses) - 67,923
Change in unrealised - (153,777)
Gross Purchases - -
Gross Sales - (67,923)
Transfers in and out of level 3 - 110,004
Balance as at 30 June/31 December - -
Total unrealised gains and losses for the period/year included in profit
or loss for level 3 assets held at period/year end - -
At 30 June 2017 Sanlam FOUR Active UK Equity Fund does not hold any level 3 positions. The Fund held a position in Petroceltic International Plc. The company entered into examinership in March 2016 and trading of shares on the Dublin and London Stock Exchange was suspended in May 2016. Following approval by the Valuation Committee, in April 2016 a decision was taken to write down the value of this position to GBP 0.03. The position was transferred from level 1 to level 3 of the fair value hierarchy due to the uncertainty around the valuation of the position. The company was subsequently subject to a takeover and the Fund's shares were disposed.

SANLAM UNIVERSAL FUNDS PLC
410
NOTES TO AND FORMING PART OF THE UNAUDITED CONDENSED INTERIM FINANCIAL STATEMENTS (CONTINUED) for the six months ended 30 June 2017
5 Fair value of financial instruments (continued) Level 3 Assets measured at fair value reconciliation (continued)
In 2016, the Fund held Rolls-Royce Group - C Shares which were thinly traded securities and were
therefore classified as level 3 due to the trading status. The position was disposed of during the year
ended 31 December 2016. For the purpose of IFRS 7 for the reconciliation showing the change in fair value due to a change in inputs used, changes to one or more of the inputs to reasonably alternative assumptions, is irrelevant as there does not exist a reasonable alternative inputs.
6 Assets and liabilities not carried at fair value but for which fair value is disclosed
For all non-financial assets and liabilities at fair value through profit and loss, their carrying values are a reasonable approximation of fair value.

SANLAM UNIVERSAL FUNDS PLC
411
NOTES TO AND FORMING PART OF THE UNAUDITED CONDENSED INTERIM FINANCIAL STATEMENTS (CONTINUED) for the six months ended 30 June 2017
7 Exchange rates
The following period end USD exchange rates have been used in this report:
1 USD = 30 June 2017 31 December 2016 30 June 2016
AED 3.6730 3.6730 3.6729
AUD 1.3024 1.3833 1.2972
BRL 3.3065 3.2548 3.1069
BWP - 10.6838 9.8620
CAD 1.2991 1.3430 1.2483
CHF 0.9590 1.0159 0.9352
CLP 663.8763 670.6801 639.0001
CNY - 6.9472 6.1985
COP 3051.0696 3000.7097 2,602.6993
CZK 22.9075 25.6050 24.5254
DKK 6.5151 7.0445 6.6890
EGP 18.1180 18.1264 7.6299
EUR 0.8784 0.9476 0.8967
GBP 0.7688 0.8101 0.6359
GHS - - 4.3550
HKD 7.8066 7.7540 7.7520
HUF 270.7900 292.8400 282.6500
IDR 13338.9990 13510.0013 13,353.0000
ILS 3.4884 3.8490 3.7714
INR 64.6199 67.9380 63.6125
JPY 112.3500 116.7600 122.1200
KES 103.7502 102.4700 99.3000
KRW 1143.7800 1205.1000 1,117.6200
MAD 9.6577 10.1066 9.7233
MUR 34.4800 36.0100 34.9500
MXN 18.0803 20.6181 15.6888
MYR 4.2985 4.4860 3.7443
NGN 367.1600 314.9800 199.0200
NOK 8.3779 8.6130 7.8372
NZD 1.3652 1.4376 1.4765
PHP 50.4340 49.6060 45.0750
PLN 3.7053 4.1757 3.7576
QAR 3.7100 3.6408 3.6413
RUB 59.1364 61.1954 55.2650
SEK 8.4459 9.0821 8.2944
SGD 1.3766 1.4467 1.3474
THB 33.9250 35.8400 33.7800
TND - - 1.9513
TRY 3.5164 3.5226 2.6785
TWD 30.3750 32.3910 30.8880
TZS - 2181.0000 -
UGX - 3610.0000 3,303.0000
USD 1.0000 1.0000 1.0000
XOF 578.0856 627.8315 590.7000
ZAR 13.0559 13.7275 12.1514

SANLAM UNIVERSAL FUNDS PLC
412
NOTES TO AND FORMING PART OF THE UNAUDITED CONDENSED INTERIM FINANCIAL STATEMENTS (CONTINUED) for the six months ended 30 June 2017
7 Exchange rates (continued) The following average USD exchange rates have been used in this report:
1 USD = 30 June 2017 31 December 2016 30 June 2016
EUR 0.9233 0.9035 0.8964
GBP 0.7956 0.7438 0.6980
8 Related party transactions and significant agreements All related party transactions have been entered into and conducted under normal market conditions.
Significant Agreements
Directors’ interests
At 31 December 2016, Haydn Franckeiss had an interest of 60,604 shares in Sanlam Global Best Ideas Fund. During the period these shares were switched for shares in SIM Global Equity Income Fund. At 30 June 2017, Haydn Franckeiss had a beneficial interest of 60,123 shares in SIM Global Equity Income Fund. During the period Richard Aslett disposed of 20,403 shares in Sanlam Strategic Bond Fund. At 30 June 2017, Richard Aslett does not have an interest in any shares of the Company’s Funds. The other Directors who held office on 30 June 2017 had no interest in the shares of the Company or Funds at that date or at any time during the financial period. Manager
Pursuant to the Amended and Restated Management and Administration Agreement effective 29 August 2014, SAMI acts as both Manager and Administrator to the Company. SAMI is an ultimate subsidiary company of Sanlam Limited. Sanlam Life, a fellow subsidiary, is a significant indirect shareholder of the Company. The Manager is entitled to receive a management fee (a percentage of the net assets per annum) from each of the Funds as follows:
Fund
Share Class Rate of
Management fees
Sanlam Centre Global Select Equity Fund1, 3
A 1.50%
B 1.00%
C (USD) 1.00%
E None
Bridge Global Property Income Fund
2 Non distributing (USD) 0.20%
P-Solve Inflation Plus Fund
1 A 1.25%
B 0.60% B Accumulation 0.60%
C None
1 For these Funds, the Manager will pay, out of the management fee, the fees of the Investment Manager(s) and, where applicable, the
fees of the Investment Allocation Manager and Investment Advisors also. 2 For these Funds, the fees of the fees of the Investment Manager(s), the Investment Allocation Manager and Investment Advisors (as
applicable) are paid directly by the Fund. 3 Sanlam Centre Global Select Equity Fund closed during the period ended 30 June 2017.

SANLAM UNIVERSAL FUNDS PLC
413
NOTES TO AND FORMING PART OF THE UNAUDITED CONDENSED INTERIM FINANCIAL STATEMENTS (CONTINUED) for the six months ended 30 June 2017
8 Related party transactions and significant agreements (continued)
Significant Agreements (continued)
Manager (continued)
Fund
Share Class
Rate of
Management fees
Sanlam African Frontier Markets Fund1 A (USD) 1.75%
D (USD) 0.75%
G (USD) 1.50%
H (USD) None
I (USD) 1.00%
Sanlam Global Best Ideas Fund1 A (USD) 1.50%
A (GBP) 1.50%
A (EUR) 1.50%
B 0.85%
C 0.75%
C (GBP) 0.75%
D (USD) 0.75%
E None
F (USD) 1.50%
Sanlam Global Bond Fund1 A 1.00%
B 0.75%
C 0.60%
E (USD) None
E (GBP) None
Sanlam Global Financial Fund1 A (USD) 1.25%
A (GBP) 1.50%
A (EUR) 1.50%
B 1.00%
C (USD) 0.75%
C (GBP) 0.75%
D (USD) 1.50%
E None
F (GBP) 1.50%
G (USD) 1.00%
Sanlam Global Property Fund
1 A (USD) 1.00%
B (USD) 0.75% C (USD) 0.60% E (USD) None E (GBP) None
1 For these Funds, the Manager will pay, out of the management fee, the fees of the Investment Manager(s) and, where applicable,
the fees of the Investment Allocation Manager and Investment Advisors also.

SANLAM UNIVERSAL FUNDS PLC
414
NOTES TO AND FORMING PART OF THE UNAUDITED CONDENSED INTERIM FINANCIAL STATEMENTS (CONTINUED) for the six months ended 30 June 2017
8 Related party transactions and significant agreements (continued)
Significant Agreements (continued)
Manager (continued)
Fund
Share Class
Rate of
Management fees
Sanlam World Equity Fund1 A 1.50%
B 0.85%
C 0.75%
E None
Satrix World Equity Tracker Fund1 A 0.50%
C 0.75%
E None
I (USD) 0.30%
I (GBP) 0.30%
S 0.20%
SIIP India Opportunities Fund1 A (USD) 1.50%
C (USD) 0.75%
D (USD) 0.75%
E None
SIM Global Equity Income Fund1 A (USD) 1.25%
A (GBP) 1.25%
B (USD) 1.00%
C (USD) 0.75%
C Accumulation (USD) 0.75%
C Accumulation (GBP) 0.75%
E None
I (USD) 1.25%
Sanlam Strategic Bond Fund
2 A Income (GBP) 1.00%
A Accumulation (GBP) 1.00% I Income (GBP) 0.58% I Accumulation (GBP) 0.58% P Income (GBP) 0.35% P Accumulation (GBP) 0.35% P Accumulation (USD) 0.35% Sanlam Accel Income Fund
1 A Net Accumulation 1.00%
A Net Income 1.00% Satrix North America Equity Tracker Fund
1 A (USD) 0.50%
E None I (USD) 0.30% I (GBP) 0.30%
1 For these Funds, the Manager will pay, out of the management fee, the fees of the Investment Manager(s) and, where applicable,
the fees of the Investment Allocation Manager and Investment Advisors also. 2 For these Funds, the fees of the fees of the Investment Manager(s), the Investment Allocation Manager and Investment Advisors (as
applicable) are paid directly by the Fund.

SANLAM UNIVERSAL FUNDS PLC
415
NOTES TO AND FORMING PART OF THE UNAUDITED CONDENSED INTERIM FINANCIAL STATEMENTS (CONTINUED) for the six months ended 30 June 2017
8 Related party transactions and significant agreements (continued)
Significant Agreements (continued)
Manager (continued)
Fund
Share Class
Rate of
Management fees Satrix UK Equity Tracker Fund
1 A (USD) 0.50%
C (USD) 0.75% E (USD) None E (GBP) None I (USD) 0.30% I (GBP) 0.30% Satrix UK Equity Tracker Fund
1 A (USD) 0.50%
C (USD) 0.75% E (USD) None E (GBP) None I (USD) 0.30% I (GBP) 0.30% Satrix Europe (ex UK) Equity Tracker Fund
1 A (USD) 0.50%
C (USD) 0.75% E (EUR) None E (USD) None I (USD) 0.30% I (GBP) 0.30% Sanlam Equity Allocation Fund
1 E None
Satrix Emerging Markets Equity Tracker Fund1
A (USD) 0.75% E (USD) None I (USD) 0.30% I (GBP) 0.30%
Sanlam Managed Risk Fund1
A (EUR) 1.75% A (GBP) 1.75% A (USD) 1.75% I (EUR) 0.75% I (GBP) 0.75% I (USD) 0.75% N (EUR) 1.75% N (GBP) 1.75% N (USD) 1.75% N2 (GBP) 1.75%
1 For these Funds, the Manager will pay, out of the management fee, the fees of the Investment Manager(s) and, where applicable, the
fees of the Investment Allocation Manager and Investment Advisors also.

SANLAM UNIVERSAL FUNDS PLC
416
NOTES TO AND FORMING PART OF THE UNAUDITED CONDENSED INTERIM FINANCIAL STATEMENTS (CONTINUED) for the six months ended 30 June 2017
8 Related party transactions and significant agreements (continued)
Significant Agreements (continued)
Manager (continued)
Fund
Share Class
Rate of
Management fees Sanlam Private Wealth Global High A Accumulation (GBP) 1.60% Quality Fund
1 C Accumulation (GBP) 0.55%
C Income (GBP) 0.55% D Accumulation (USD) 0.75% D Income (USD) 0.75% E Accumulation (USD) 1.25% E Income (USD) 1.25% F Income (GBP) 0.75% F Accumulation (GBP) 0.75% G Income (USD 0.75% G Accumulation (USD) 0.75% Sanlam FOUR US Dividend Income Fund
1 A Accumulation (GBP) 0.75%
A Accumulation (USD) 0.75% B Accumulation (USD) None
B Accumulation (GBP) None A Distribution (GBP) 0.75% A Distribution (USD) 0.75% A Distribution (EUR) 0.75% High Street Global Balanced
2 A (USD) 0.15%
Sanlam FOUR Active European (ex UK) Equity Fund
1,3 A (EUR) 0.75%
A (GBP) 0.75% B (EUR) None B (GBP) None B (USD) None C (GBP) 1.50% Sanlam FOUR Global Equity Fund
1 A (EUR) 0.75%
A (GBP) 0.75% A (USD) 0.75% B (GBP) None B (USD) None C (GBP) 1.50% C (USD) 1.50%
1 For these Funds, the Manager will pay, out of the management fee, the fees of the Investment Manager(s) and, where applicable,
the fees of the Investment Allocation Manager and Investment Advisors also. 2 For these Funds, the fees of the fees of the Investment Manager(s), the Investment Allocation Manager and Investment Advisors (as
applicable) are paid directly by the Fund.
3 Sanlam FOUR Active European (ex UK) Equity Fund closed during the period ended 30 June 2017.

SANLAM UNIVERSAL FUNDS PLC
417
NOTES TO AND FORMING PART OF THE UNAUDITED CONDENSED INTERIM FINANCIAL STATEMENTS (CONTINUED) for the six months ended 30 June 2017
8 Related party transactions and significant agreements (continued)
Significant Agreements (continued)
Manager (continued)
Fund
Share Class
Rate of
Management fees Sanlam FOUR Stable Global Equity Fund
1 A (EURO) 0.75%
A (GBP) 0.75% A (USD) 0.75% A Distribution (GBP) 0.75% B (GBP) None B (USD) None Sanlam FOUR Active UK Equity Fund
1 A (GBP) 0.75%
B (GBP) None B (USD) None C (GBP) 1.50% C (USD) 1.50% D (GBP) 0.45% I (GBP) 0.75% Sanlam FOUR Multi-Strategy Fund
1 A (GBP) 0.75%
A (USD) 0.75% B (GBP) None
B (USD) None
Founder (GBP) 0.50% Founder Income Distribution (GBP) 0.50% A Income Distribution (GBP) 0.75% B Income Distribution (GBP) None Anchor Global Capital Plus Fund
2 A 0.20%
B 0.20% Bridge Global Equity Income Growth Fund
2 A (USD) 0.20%
Anchor Global Equity Fund
2 A 0.20%
B 0.20% Bridge Global Managed Growth Fund
2 A (USD) 0.20%
1 For these Funds, the Manager will pay, out of the management fee, the fees of the Investment Manager(s) and, where applicable,
the fees of the Investment Allocation Manager and Investment Advisors also. 2 For these Funds, the fees of the fees of the Investment Manager(s), the Investment Allocation Manager and Investment Advisors (as
applicable) are paid directly by the Fund.

SANLAM UNIVERSAL FUNDS PLC
418
NOTES TO AND FORMING PART OF THE UNAUDITED CONDENSED INTERIM FINANCIAL STATEMENTS (CONTINUED) for the six months ended 30 June 2017
8 Related party transactions and significant agreements (continued)
Significant Agreements (continued) Manager (continued)
Fund
Share Class
Rate of
Management fees
SIM Global Emerging Markets Fund2
A1 (USD) 1.15% A2 (USD) 1.60% B1 (USD) 0.90% B2 (USD) 1.35% C1 (USD) 0.75%
C2 (USD) 1.20%
E (USD) None ABSA Africa Equity Fund
1 A (USD) 1.71%
Sanlam Centre American Select Equity Fund
1 E (USD) None
C (USD) 0.75% C (GBP) 0.75% Sanlam Global Convertible Securities Fund
1 A 0.75%
Sanlam Japan Equity Fund
1 E (USD) None
Sanlam Centre Active U.S Treasury Fund
1 E (USD) None
C (USD) 0.60% Autus Global Equity Fund
2 B (USD) 0.15%
1 For these Funds, the Manager will pay, out of the management fee, the fees of the Investment Manager(s) and, where applicable,
the fees of the Investment Allocation Manager and Investment Advisors also. 2 For these Funds, the fees of the fees of the Investment Manager(s), the Investment Allocation Manager and Investment Advisors (as
applicable) are paid directly by the Fund. Management fees earned by the Manager during the period and outstanding accrued management fees at 30 June 2017 are disclosed as part of the summary of management and investment management fees on pages 425 to 445.

SANLAM UNIVERSAL FUNDS PLC
419
NOTES TO AND FORMING PART OF THE UNAUDITED CONDENSED INTERIM FINANCIAL STATEMENTS (CONTINUED) for the six months ended 30 June 2017
8 Related party transactions and significant agreements (continued)
Significant Agreements (continued) Performance Fee For certain share classes of SIIP India Opportunities Fund, Sanlam Global Property Fund, Sanlam Global Financial Fund, Sanlam Global Best Ideas Fund, Sanlam African Frontier Markets Fund, High Street Global Balanced Fund, Anchor Global Capital Plus Fund, Anchor Global Equity Fund and SIM Global Emerging Markets Fund, Sanlam Global Convertible Securities Fund and Autus Global Equity Fund, the Manager shall also be entitled to receive out of the assets of the Funds a performance fee in respect of each performance period. The performance periods for Sanlam African Frontier Markets Fund, Sanlam Global Financial Fund, Sanlam Global Best Ideas Fund, Sanlam Global Property Fund, SIIP India Opportunities Fund and Sanlam Global Convertible Securities Fund comprise each successive six month period from 1 January to 30 June and from 1 July to 31 December. The performance periods for Anchor Global Equity Fund, Anchor Global Capital Plus Fund and Autus Global Equity Fund comprise each annual period from 1 January to 31 December. The performance periods for High Street Global Balanced Fund comprise each calendar quarterly period, and the performance periods for SIM Global Emerging Markets Fund comprise each calendar monthly period.
(a) The performance fee shall be equal to 10% to 20% (depending on the fund) of the difference between the percentage movement in the Net Asset Value per Share (A) being the Initial Issue Price for the first performance period and the percentage movement in the relevant index as set out in the prospectus (the “Index”) (B) during the performance period multiplied by the average of the Net Asset Value of the Fund as at each Valuation Point during the performance period prior to any accrual for performance fees but after accruing for all other fees and expenses.
(b) Where the Fund has underperformed the Index during a performance period (where A-B is a negative number), the Manager will not repay any amounts of performance fee paid by the Fund in respect of previous performance periods but no further performance fees will be charged until such time as any underperformance is recaptured by the Fund (until A-B measured since the end of the last performance period in respect of which a performance fee was paid becomes positive).
(c) For the performance period in which any underperformance is first recaptured, the performance fee
will be calculated in accordance with paragraph (b) above, except that the performance fee will only take into account any subsequent outperformance (A-B will be measured since the end of the last performance period in respect of which a performance fee was paid). Performance fee calculations in subsequent performance periods will revert to being based on the performance over the relevant performance period as calculated in accordance with paragraph (a) above.
(d) The performance fee shall be calculated by the Administrator (subject to verification by the
Depositary) and accrued in the Net Asset Value calculated in respect of each Dealing Day based on the performance to date of the Fund during that performance period.
Net realised and unrealised capital gains plus net realised and unrealised capital losses as of the relevant Valuation Point shall be taken into account in calculating the Net Asset Value per Share. As a result, performance fees may be paid on unrealised gains which may subsequently never be realised. Benchmarks will take account of income and capital gains/losses.

SANLAM UNIVERSAL FUNDS PLC
420
NOTES TO AND FORMING PART OF THE UNAUDITED CONDENSED INTERIM FINANCIAL STATEMENTS (CONTINUED) for the six months ended 30 June 2017
8 Related party transactions and significant agreements (continued)
Significant Agreements (continued) Administrator SAMI as the Administrator is a related party of the Company. In its role as Administrator, SAMI is entitled to receive out of the assets of each Fund an annual fee ranging from 0.00% - 0.15% of the net assets of the Fund. Certain Funds are also subject to a minimum annual fee and/or additional annual fee ranging from USD 10,000 – 25,000 per annum. In addition, the Administrator is entitled to receive its reasonable costs and expenses incurred in the performance of its duties as Administrator of the Company. These fees shall accrue and be calculated on each dealing day and shall be payable monthly in arrears. The administration fees earned by the administrator during the period and outstanding at the period end date are presented in the Statement of Comprehensive Income and Statement of Financial Position, respectively. Investment Managers, Investment Advisors and Investment Allocation Manager The Investment Managers are appointed by the Manager. For certain Funds, as noted on pages 412 to 418, the Manager will pay out of its fees, the fees of the Investment Managers, Investment Allocation Manager and Investment Advisors (as applicable) appointed to those Funds. For the remaining Funds of the Company, the fees of the appointed Investment Managers, Investment Allocation Manager and Investment Advisors (as applicable) are paid directly by the Fund. The table below sets out the rates for the annual Investment Management fees paid directly by these Funds to the Investment Managers (in respect of each share class of the relevant Fund). These fees are payable monthly in arrears and accrued by reference to the net assets of the relevant share class on each dealing day.
Bridge Global
Property
Income Fund
Sanlam Strategic Bond
Fund
High Street Global Balanced
Fund
Anchor Global Capital Plus
Fund
Class A Shares (USD) - - 1.00% 1.25%
Class B Shares (USD) - - 0.50% No fee
Class C Shares (USD) - - 1.50% -
Class P Income (GBP) - 0.20% - -
Class P Accumulation (GBP) - 0.20% - -
Class P Accumulation (USD) - 0.20% - -
Class I Income (GBP) - 0.43% - -
Class I Accumulation (GBP) - 0.43% - -
Non Distributing Class (USD) 1.52% - - -
Bridge Global
Equity Income
Fund
Anchor Global Equity
Fund Bridge Global
Managed Fund Autus Global Equity Fund
Class A Shares (USD) 1.00% 1.25% 1.00% -
Class B Shares (USD) - No fee - 1.00%
Fees paid directly to the appointed Investment Managers, Investment Allocation Manager and Investment Advisors (as applicable) by these Funds during the period and outstanding accrued fees as at 30 June 2017 are disclosed as part of the summary of management and investment management fees on pages 425 to 445.

SANLAM UNIVERSAL FUNDS PLC
421
NOTES TO AND FORMING PART OF THE UNAUDITED CONDENSED INTERIM FINANCIAL STATEMENTS (CONTINUED) for the six months ended 30 June 2017
8 Related party transactions and significant agreements (continued)
Significant Agreements (continued) Investment Managers, Investment Advisors and Investment Allocation Manager (continued) Five of the appointed Investment Managers, Sanlam FOUR Investments UK Limited, Sanlam Investment Management (Pty) Limited, Sanlam Private Investments (UK) Limited, Centre Asset Management LLC and Sanlam Private Investments (UK) Limited are related parties to the Company and the Manager. Sanlam FOUR Investments UK Limited is also the appointed Investment Allocation Manager for a number of the Funds. Securities Lending Effective from 24 February 2016, pursuant to the Securities Lending Agency Agreement, SAMI was appointed as securities lending agent to the Company. Prior to the appointment of SAMI, Brown Brothers Harriman & Co acted as securities lending agent to the Company Pursuant to the Securities Lending Sub-Agency Agreement, effective 24 February 2016 Brown Brothers Harriman & Co. was appointed by SAMI as securities lending sub-agent to the Company. The securities lending agent and securities lending sub-agent receive remuneration for their services provided as part of the Company’s securities lending arrangements, the terms of which are set out in the agreements referenced above. The securities lending sub-agent is not a related party to the Company. Further details on the Company’s securities lending activity are disclosed in note 13. Registrar and Transfer Agent Brown Brothers Harriman Fund Administration (Ireland) Limited is the appointed Registrar and Transfer Agent to the Company. Transfer agency fees are charged at normal commercial rates. The Registrar and Transfer Agent is not a related party of the Company. Depositary Brown Brothers Harriman Trustee Services (Ireland) Limited is the appointed Depositary to the Company. The Depositary is not a related party to the Company or to the Administrator. The Depositary will be entitled to receive from the Company, out of the assets of the Fund, an annual fee which will not exceed 0.02% of the net assets of the Fund (plus VAT, if any) together with reasonable costs and expenses incurred by the Depositary in the performance of its duties as Depositary of the Fund. These fees shall accrue and be calculated on each Dealing Day and shall be payable monthly in arrears. The Depositary shall also be entitled to be reimbursed out of the assets of the Fund all agreed transaction charges (which will be charged at normal commercial rates).
Distributors
The Distributors are appointed and paid by the Manager. Sanlam FOUR Investments UK Limited and Sanlam Investment Management (Pty) Limited and Sanlam Global Investment Solutions Ltd are related parties to the Company and the Manager.

SANLAM UNIVERSAL FUNDS PLC
422
NOTES TO AND FORMING PART OF THE UNAUDITED CONDENSED INTERIM FINANCIAL STATEMENTS (CONTINUED) for the six months ended 30 June 2017
8 Related party transactions and significant agreements (continued)
Significant shareholders at period end
Shareholder Fund % held at
30/06/2017 % held at
31/12/2016
Agulhas Nominees (Pty) Ltd for SPI Sanlam Centre Global Select Equity Fund 0.00% 27.65%
BBH & CO ACF Sanlam Global Funds Plc/ Sanlam Centre Global Select Equity Fund 0.00% 69.11%
Agulhas Nominees (Pty) Ltd**** Bridge Global Property Income Fund 12.31% 11.98%
SGSS Bridge Global Property Income Fund Bridge Global Property Income Fund 54.96% 55.38%
Nortrust Nominees Limited Bridge Global Property Income Fund 18.85% 18.08%
KAS Nominees P-Solve Inflation Plus Fund 84.53% 84.89%
Standard Life Investment Funds P-Solve Inflation Plus Fund 14.52% 14.10%
Sentinel Mining Industry Retirement Sanlam African Frontier Markets Fund 35.14% 40.00%
Sanlam Life Insurance Ltd** Sanlam African Frontier Markets Fund 35.11% 37.97%
Municipal Gratuity Fund Sanlam African Frontier Markets Fund 15.10% 13.32%
Consolidated Retirement Fund Sanlam African Frontier Markets Fund 7.44% 6.58%
SBSA ITF Sim Global Best Ideas*** Sanlam Global Best Ideas Fund 37.80% 36.92%
Post Office Retirement Fund Sanlam Global Best Ideas Fund 25.65% 25.10%
Fundsettle EOC Nominees Ltd Sanlam Global Best Ideas Fund 8.53% 8.61%
Agulhas Nominees (Pty) Ltd for SPI Sanlam Global Best Ideas Fund 7.63% 8.00%
SBSA ITF Sanlam Value Fund Sanlam Global Best Ideas Fund 7.45% 7.26%
Clearstream Banking SA AFS Sanlam Global Bond Fund 8.33% 0.00%
BBH & Co ACF Sanlam Global Funds Plc Sanlam Global Bond Fund 15.83% 19.30%
BBH & CO ACF Sanlam Qualifying Investors Funds Plc Sanlam Global Bond Fund 28.75% 33.69%
Sanlam Life & Pensions Sanlam Global Bond Fund 35.42% 31.59%
Sanlam Life Insurance Ltd Sanlam Global Bond Fund 7.00% 9.28%
Agulhas Nominees (Pty) Ltd for SPI Sanlam Global Financial Fund 19.11% 14.39%
SBSA PPMSA Inv Sol Balanced Fund Sanlam Global Financial Fund 0.00% 8.88%
SBSA ITF Sanlam Value Fund Sanlam Global Financial Fund 15.59% 12.67%
SBSA ITF SIM Balanced Fund Sanlam Global Financial Fund 11.62% 8.59%
SBSA ITF Prudential Dividend Sanlam Global Financial Fund 11.77% 8.31%
SBSA I.T.F. SIM Global Financial Sanlam Global Financial Fund 8.23% 5.59%
SBSA ITF Prudential Balanced Fund Sanlam Global Financial Fund 0.00% 5.10%
SBSA ITF Prudential Inflation Plus Fund Sanlam Global Financial Fund 0.00% 7.95%
SIM (Pty) Ltd Pooled Segregated Fund Sanlam Global Financial Fund 5.41% 0.00%
Bank Lombard Odier & Co Ltd Sanlam Global Financial Fund 7.48% 0.00%
Sanlam Life Insurance Ltd** Sanlam Global Property Fund 31.29% 30.16%
Sanlam Life & Pensions Sanlam Global Property Fund 35.76% 36.10%
Standard Bank of SA Ltd*** Sanlam Global Property Fund 11.07% 10.99%
SBSA ITF SIM Inflation Plus Fund Sanlam Global Property Fund 7.39% 7.49%
BBH & Co ACF Sanlam Global Funds Plc Sanlam Global Property Fund 5.06% 5.44%
BBH & Co ACF Sanlam Global Funds Plc Sanlam World Equity Fund 15.02% 65.13%
Sanlam Life Insurance Ltd Sanlam World Equity Fund 17.33% 8.36%
*At 30 June 2017, Brown Brothers Harriman Trustee Services (Ireland) Limited held the Class E shares in each of these Funds on behalf of certain Funds of Sanlam Global Funds Plc, Sanlam Qualifying Investors Funds Plc and Sanlam Universal Funds Plc. **These significant shareholders are related parties to the Company and the Manager. ***These are investments by South African Unit Trusts. These Unit Trusts are managed by related parties to the Manager. ****These are nominee accounts managed by the related parties of the Manager.

SANLAM UNIVERSAL FUNDS PLC
423
NOTES TO AND FORMING PART OF THE UNAUDITED CONDENSED INTERIM FINANCIAL STATEMENTS (CONTINUED) for the six months ended 30 June 2017
8 Related party transactions and significant agreements (continued)
Significant shareholders at the period end (continued)
Shareholder Fund % held at
30/106/2017 % held at
31/12/2016
SBSA ITF SIM Balanced Fund Sanlam World Equity Fund 45.49%% 16.79% SBSA ITF SIM Inflation Plus Fund Sanlam World Equity Fund 6.66% 0.00% SIM (Pty) Ltd Pooled Segregated Fund Sanlam World Equity Fund 9.37% 0.00% Sanlam Life Insurance Ltd** Satrix World Equity Tracker Fund 11.20% 14.19% SBSA ITF SIM Balanced Fund*** Satrix World Equity Tracker Fund 6.74% 8.29% SCB ATF Satrix MSCI World Satrix World Equity Tracker Fund 19.06% 19.04% SBSA ITF SIM Inflation Plus Fund Satrix World Equity Tracker Fund 12.10% 13.76% SIM (Pty) Ltd Pooled Segregated Fund Satrix World Equity Tracker Fund 5.73% 7.18% BBH & CO ACF Sanlam Universal Funds Plc Satrix World Equity Tracker Fund 5.94% 8.40% BBH & CO ACF Sanlam Global Funds Plc Satrix World Equity Tracker Fund 18.23% 0.00% Standard Bank of South Africa*** SIIP India Opportunities Fund 54.80% 52.83% BBH & Co ACF Sanlam Global Funds Plc SIIP India Opportunities Fund 44.43% 46.78% Agulhas Nominees (Pty) Ltd**** SIM Global Equity Income Fund 5.47% 5.50% Fundsettle EOC Nominees Ltd SIM Global Equity Income Fund 6.22% 5.70% SBSA ITF Sim Inflation Plus Fund*** SIM Global Equity Income Fund 8.53% 8.30% Sanlam Life Insurance Ltd SIM Global Equity Income Fund 61.96% 60.26% SBSA ITF SIM Global Equity Income SIM Global Equity Income Fund 0.00% 6.61% Principal Nominees Ltd**** Sanlam Strategic Bond Fund 67.58% 81.45% Cofunds Nominees Limited Sanlam Strategic Bond Fund 4.79% 6.23% Clearstream Banking SA Sanlam Strategic Bond Fund 12.01% 0.00% Cofunds Nominees Limited Sanlam Accel Income Fund 89.95% 90.10% Fundsettle EOC Nominees Ltd Satrix North America Equity Tracker Fund 2.52% 99.19% BBH & CO ACF Sanlam Global Funds Plc Satrix North America Equity Tracker Fund 97.43% 0.00% BBH & CO ACF Sanlam Qualifying Investors Funds Plc Satrix UK Equity Tracker Fund 76.37% 69.50% SBSA ITF SIM Balanced Fund Satrix UK Equity Tracker Fund 15.76% 20.30% SBSA ITF SIM Balanced Fund Satrix European (ex UK) Equity Tracker Fund 7.87% 15.37% BBH & CO ACF Sanlam Qualifying Investors Funds Plc Satrix European (ex UK) Equity Tracker Fund 36.39% 52.30% SBSA ITF SIM Inflation Plus Fund Satrix European (ex UK) Equity Tracker Fund 8.45% 14.73% BBH & CO ACF Sanlam Global Funds Plc Satrix European (ex UK) Equity Tracker Fund 38.66% 0.00% BBH & CO ACF Sanlam Qualifying Investors Funds Plc Sanlam Equity Allocation Fund 100.00% 100.00% SIM (Pty) Ltd Pooled Segregated Fund Satrix Emerging Market Equity Tracker Fund 19.08% 19.24% Cofunds Nominees Limited Satrix Emerging Market Equity Tracker Fund 22.80% 20.86% SBSA ITF SIM Inflation Plus Fund Satrix Emerging Market Equity Tracker Fund 33.26% 33.39% African Life Assurance Company Limited Satrix Emerging Market Equity Tracker Fund 0.00% 7.58% Sanlam Life Insurance Ltd Satrix Emerging Market Equity Tracker Fund 5.10% 5.15% Standard Bank In Trust For Sanlam Satrix Emerging Market Equity Tracker Fund 6.94% 6.97% Sanlam Developing Markets Ltd Satrix Emerging Market Equity Tracker Fund 7.75% 0.00% Fundsettle Nominees Ltd Sanlam Managed Risk Fund 63.17% 74.72% RBC IS GFP Sanlam Managed Risk Fund 29.49% 17.02% Agulhas Nominees (Pty) Ltd**** Sanlam Private Wealth Global High Quality Bond Fund 68.38% 60.82% Principal Nominees Limited Sanlam Private Wealth Global High Quality Bond Fund 20.98% 28.23% BBH & Co ACF Sanlam Global Funds Plc Sanlam FOUR US Dividend Income Fund 70.68% 89.66% Cofunds Nominees Limited Sanlam FOUR US Dividend Income Fund 6.62% 7.46% Clearstream Banking SA FBO 15888-34419 Sanlam FOUR US Dividend Income Fund 11.19% 0.00% Nortrust Nominees Limited Sanlam FOUR US Dividend Income Fund 5.39% 0.00% Fundsettle EOC Nominees LTD High Street Global Fund 36.33% 25.20% Clearstream Banking SA AFS High Street Global Fund 17.89% 18.29% Raubenheimer High Street Global Fund 5.29% 6.37% Mackenzie High Street Global Fund 5.58% 6.72% Sirius Trustees Ltd High Street Global Fund 5.38% 9.20% *At 30 June 2017, Brown Brothers Harriman Trustee Services (Ireland) Limited held the Class E shares in each of these Funds on behalf of certain Funds of Sanlam Global Funds Plc, Sanlam Qualifying Investors Funds Plc and Sanlam Universal Funds Plc. **These significant shareholders are related parties to the Company and the Manager. ***These are investments by South African Unit Trusts. These Unit Trusts are managed by related parties to the Manager. ****These are nominee accounts managed by the related parties of the Manager.

SANLAM UNIVERSAL FUNDS PLC
424
NOTES TO AND FORMING PART OF THE UNAUDITED CONDENSED INTERIM FINANCIAL STATEMENTS (CONTINUED) for the six months ended 30 June 2017
8 Related party transactions and significant agreements (continued)
Significant shareholders at the period end (continued)
Shareholder Fund % held at
30/06/2017 % held at
31/12/2016
Davies High Street Global Fund 5.38% 6.48%
JPMBI Re: Sanlam Life & Pensions Sanlam FOUR Global Equity Fund 17.92% 16.12%
BBH & CO ACF Sanlam Global Funds Plc Sanlam FOUR Global Equity Fund 78.36% 79.06%
BBH & CO ACF Sanlam Global Funds Plc Sanlam FOUR Stable Global Equity Fund 92.96% 93.12%
JPMI Re: Sanlam Life and Pensions Sanlam FOUR Active UK Equity Fund 82.52% 67.02%
BBH & CO ACF Sanlam Global Funds Plc Sanlam FOUR Active UK Equity Fund 13.48% 28.50%
JPMBI Re: Sanlam Life & Pensions Sanlam FOUR Multi-Strategy Fund 88.12% 90.28%
Capital International (Nominees) Ltd Anchor Global Capital Plus Fund 89.92% 89.78%
SBSA ITF Anchor BCI Global Capital Anchor Global Capital Plus Fund 9.21% 8.85%
Bridge Pension Fund Bridge Global Equity Income Growth Fund 31.34% 31.84%
SGSS Bridge Balanced Fund Bridge Global Equity Income Growth Fund 31.95% 32.45%
Bridge Global Equity Income Growth Bridge Global Equity Income Growth Fund 28.81% 27.64%
Capital International (Nominees) Ltd Anchor Global Equity Fund 71.48% 68.06%
SBSA ITF Anchor BCI Global Equity Feeder Anchor Global Equity Fund 13.56% 18.62%
SGSS Bridge Global Income Growth Bridge Global Managed Growth Fund 97.87% 98.42%
Sanlam Life Insurance Ltd SIM Global Emerging Markets Fund 40.89% 55.39%
Agulhas Nominees (Pty) Ltd for SPI SIM Global Emerging Markets Fund 12.60% 11.95%
BBH & CO ACF Sanlam Global Funds Plc SIM Global Emerging Markets Fund 30.81% 23.85%
SBSA ITF Sim Global Emerging Markets SIM Global Emerging Markets Fund 6.65% 5.28%
SGSS ITF ABSA Africa Equity Fund ABSA Africa Equity Fund 100.00% 100.00%
BBH & CO ACF Sanlam Global Funds Plc Sanlam Centre American Select Equity Fund 90.42% 100.00%
Clearstream Banking SA FBO 15888-34419 Sanlam Centre American Select Equity Fund 9.58% 0.00%
Sanlam Life Insurance Ltd Sanlam Global Convertible Securities Fund 99.74% 99.89%
BBH & CO ACF Sanlam Global Funds Plc Sanlam Japan Equity Fund 100.00% 100.00%
SBSA ITF AUTUS BCI GLOBAL EQUITY FUND Autus Global Equity Fund 100.00% 0.00%
Sanlam Life Insurance Ltd Sanlam Centre Active U.S Treasury Fund 99.95% 0.00%
*At 30 June 2017, Brown Brothers Harriman Trustee Services (Ireland) Limited held the Class E shares in each of these Funds on behalf of certain Funds of Sanlam Global Funds Plc, Sanlam Qualifying Investors Funds Plc and Sanlam Universal Funds Plc. **These significant shareholders are related parties to the Company and the Manager. ***These are investments by South African Unit Trusts. These Unit Trusts are managed by related parties to the Manager. ****These are nominee accounts managed by the related parties of the Manager.
Management and investment management fees The Manager may rebate a portion of its fees to certain of the Funds of Sanlam Universal Funds plc, Sanlam Global Funds plc and Sanlam Qualifying Investors Funds plc where those Funds are themselves invested into Funds of the Company or enter into special fee arrangements and/or rebate agreements, in its sole discretion, with certain shareholders who may be affiliates of the Manager, including Botswana Insurance Fund Management, Sanlam Private Investments (Pty) Limited, Sanlam Life Insurance Limited, Sanlam Life & Pensions (UK) Limited and Sanlam Collective Investments Limited. With the exception of P-Solve Inflation Plus Fund, rebate income earned by each of the Funds of the Company, as disclosed on the Statement of Comprehensive Income, was paid from the profits of the Manager.

SANLAM UNIVERSAL FUNDS PLC
425
NOTES TO AND FORMING PART OF THE UNAUDITED CONDENSED INTERIM FINANCIAL STATEMENTS (CONTINUED) for the six months ended 30 June 2017
8 Related party transactions and significant agreements (continued)
Management and investment management fees (continued)
A summary of management and investment management fees earned during the period and outstanding accrued fees as at 30 June 2017 is as follows:
Sanlam Centre
Global
Select Equity
Fund
Bridge Global Property
Income Fund
P-Solve Inflation Plus
Fund
Sanlam African Frontier
Markets Fund
USD USD GBP USD
Fees incurred during the period ended 30/06/2017 Class A Management Fees (22,223) - (193) (10,826)
Class B Management Fees (2,992) - (23,753) -
Class B (Accumulation) Management Fees - - (1) -
Class C Management Fees (129) - - -
Class D Management Fees - - - (92,194)
Class G Management Fees - - - (190,370)
Non-Distributing Class Management Fees - (312,614) - -
(25,344) (312,614) (23,947) (293,390)
Fees accrued at 30/06/2017
Class A Management Fees (95) - (20) (5,155)
Class B Management Fees - - (8,196) -
Class C Management Fees (16) - - -
Class D Management Fees - - - (15,749)
Class G Management Fees - - - (32,174)
Non-Distributing Class Management Fees - (46,229) - -
(112) (46,229) (8,216) (53,078)

SANLAM UNIVERSAL FUNDS PLC
426
NOTES TO AND FORMING PART OF THE UNAUDITED CONDENSED INTERIM FINANCIAL STATEMENTS (CONTINUED) for the six months ended 30 June 2017
8 Related party transactions and significant agreements (continued)
Management and investment management fees (continued)
A summary of management and investment management fees earned during the period and outstanding accrued fees as at 30 June 2017 is as follows (continued):
Sanlam Global Best Ideas Fund
Sanlam Global Bond
Fund
Sanlam Global
Financial Fund
Sanlam Global
Property Fund
USD USD USD USD
Fees incurred during the period ended 30/06/2017 Class A Management Fees (129,503) (48) (158,431 (132)
Class A (EUR) Management Fees (2) - (1,193) -
Class A (GBP) Management Fees (736) - (3,432) -
Class B Management Fees (157,304) (1,784) (116,811) (102,603)
Class C Management Fees (63,263) (261,270) (84,890) (132,424)
Class C (GBP) Management Fees (65) - (8,542) -
Class D Management Fees - - (1,993) -
Class F Management Fees (56) - - -
Class F (GBP) Management Fees - - (1,138) -
Class G Management Fees - - (193,062) -
(350,929) (263,102) (569,492) (235,159)
Fees accrued at 30/06/2017
Class A Management Fees (21,833) (8) (26,988) (23)
Class A (EUR) Management Fees - - (208) -
Class A (GBP) Management Fees (129) - (599) -
Class B Management Fees (26,647) (155) (21,713) (17,737)
Class C Management Fees (10,862) (43,717) (5,454) (23,042)
Class C (GBP) Management Fees (7) - (1,499) -
Class D Management Fees - - (339) -
Class F Management Fees (10) - - -
Class F (GBP) Management Fees - - (178) -
Class G Management Fees - - (22,411) -
(59,488) (43,880) (79,389) (40,802)

SANLAM UNIVERSAL FUNDS PLC
427
NOTES TO AND FORMING PART OF THE UNAUDITED CONDENSED INTERIM FINANCIAL STATEMENTS (CONTINUED) for the six months ended 30 June 2017
8 Related party transactions and significant agreements (continued)
Management and investment management fees (continued)
A summary of management and investment management fees earned during the period and outstanding accrued fees as at 30 June 2017 is as follows (continued):
Sanlam World Equity Fund
Satrix World Equity Tracker
Fund
SIIP India Opportunities
Fund
SIM Global Equity Income
Fund
USD USD USD USD
Fees incurred during the period ended 30/06/2017 Class A Management Fees (763) (165,918) (801) (60,955)
Class A (GBP) Management Fees - - - (117)
Class B Management Fees (169,027) - - (344)
Class C Management Fees (1,119,725) (198,009) (68,342) (23,328)
Class C Accumulation Management Fees - - - (329,012)
Class C (GBP) Accumulation Management Fees - - - (333)
Class D Management Fees - - (83) -
Class I Management Fees - (521,098) - (34,833)
Class I (GBP) Management Fees - (1,061) - -
Class S Management Fees - (14,850) - -
(1,289,515) (900,936) (69,226) (448,922)
Fees accrued at 30/06/2017
Class A Management Fees (130) (28,349) (144) (10,574)
Class A (GBP) Management Fees - - - (20)
Class B Management Fees (28,539) - - (59)
Class C Management Fees (194,180) (32,855) (13,715) (3,645)
Class C Accumulation Management Fees - - - (57,116)
Class C (GBP) Accumulation Management Fees - - - (58)
Class D Management Fees - - (14) -
Class I Management Fees - (93,386) - (6,057)
Class I (GBP) Management Fees - (187) - -
Class S Management Fees - (2,842) - -
(222,849) (157,617) (13,873) (77,529)

SANLAM UNIVERSAL FUNDS PLC
428
NOTES TO AND FORMING PART OF THE UNAUDITED CONDENSED INTERIM FINANCIAL STATEMENTS (CONTINUED) for the six months ended 30 June 2017
8 Related party transactions and significant agreements (continued)
Management and investment management fees (continued)
A summary of management and investment management fees earned during the period and outstanding accrued fees as at 30 June 2017 is as follows (continued):
Sanlam Strategic Bond
Fund Sanlam Accel Income Fund
Satrix North America
Equity Tracker Fund
Satrix UK Equity
Tracker Fund
GBP GBP USD GBP
Fees incurred during the period ended 30/06/2017 Class A Management Fees - - (211) (45)
Class A Accumulation Management Fees (4,677) (22,932) - -
Class A Income Management Fees (181) (35,837) - -
Class I Management Fees - - (3,671) (13,976)
Class I (GBP) Management Fees - - (925) (1,076)
Class I Accumulation Management Fees (8,373) - - -
Class I Income Management Fees (11,877) - - -
Class P Income Management Fees (126,325) - - -
Class P Accumulation Management Fees (13,523) - - -
Class P (USD) Accumulation Management Fees (11,292)
(176,248) (58,769) (4,807) (15,097)
Fees accrued at 30/06/2017
Class A Management Fees - - (29) (8)
Class A Accumulation Management Fees (1,801) (11,884) - -
Class A Income Management Fees (70) (18,573) - -
Class I Management Fees - - (280) (2,380)
Class I (GBP) Management Fees - - (148) (182)
Class I Accumulation Management Fees (3,225) - - -
Class I Income Management Fees (4,575) - - -
Class P Income Management Fees (48,658) - - -
Class P Accumulation Management Fees (5,209) - - -
Class P (USD) Accumulation Management Fees (4,350) - - -
(67,888) (30,457) (457) (2,570)

SANLAM UNIVERSAL FUNDS PLC
429
NOTES TO AND FORMING PART OF THE UNAUDITED CONDENSED INTERIM FINANCIAL STATEMENTS (CONTINUED) for the six months ended 30 June 2017
8 Related party transactions and significant agreements (continued)
Management and investment management fees (continued)
A summary of management and investment management fees earned during the period and outstanding accrued fees as at 30 June 2017 is as follows (continued):
Satrix Europe (ex UK) Equity Tracker Fund
Sanlam Equity
Allocation Fund
Satrix Emerging
Market Equity Tracker Fund
Sanlam Managed Risk Fund
EUR USD USD USD
Fees incurred during the period ended 30/06/2017
Class A Management Fees (16,009) - (51,130) (4,362)
Class A (EUR) Management Fees - - - (204)
Class A (GBP) Management Fees - - - (20,241)
Class C Management Fees (4,867) - - -
Class I Management Fees (77,979) - (29,110) (117,574)
Class I (GBP) Management Fees (904) - (14,758) (40,332)
Class I (EUR) Management Fees - - - (738)
Class N Management Fees - - - (6,066)
Class N (EUR) Management Fees - - - (1,429)
Class N (GBP) Management Fees - - - (5,104)
(99,759) - (94,998) (196,050)
Fees accrued at 30/06/2017
Class A Management Fees (2,812) - (8,998) (693)
Class A (EUR) Management Fees - - - (32)
Class A (GBP) Management Fees - - - (3,218)
Class C Management Fees (869) - - -
Class I Management Fees (13,652) - (4,948) (18,692)
Class I (GBP) Management Fees (156) - (2,704) (6,412)
Class I (EUR) Management Fees - - - (117)
Class N Management Fees - - - (964)
Class N (EUR) Management Fees - - - (227)
Class N (GBP) Management Fees - - - (811)
(17,489) - (16,650) (31,169)

SANLAM UNIVERSAL FUNDS PLC
430
NOTES TO AND FORMING PART OF THE UNAUDITED CONDENSED INTERIM FINANCIAL STATEMENTS (CONTINUED) for the six months ended 30 June 2017
8 Related party transactions and significant agreements (continued)
Management and investment management fees (continued)
A summary of management and investment management fees earned during the period and outstanding accrued fees as at 30 June 2017 is as follows (continued):
Sanlam Private Wealth Global
High Quality Fund
Sanlam FOUR US Dividend
Income Fund
High Street Global
Balanced Fund
Sanlam FOUR Active
European ex-UK Equity
Fund
GBP USD USD GBP
Fees incurred during the period ended 30/06/2017
Class A Management Fees - - (102,273) -
Class A (GBP) Management Fees - - - (8,508)
Class A (EUR) Management Fees - - - (36,890)
Class A (USD) Accumulation Management Fees - (3,342) - -
Class A (GBP) Accumulation Management Fees (5,943) (75,067) - -
Class A (USD) Distribution Management Fees - (4,063) - -
Class A (EUR) Distribution Management Fees - (901) - -
Class A (GBP) Distribution Management Fees - (34,347) - -
Class B Management Fees - - - (42,724)
Class B (GBP) Management Fees - - - (2,076)
Class B (EUR) Management Fees - - - (4,298)
Class B (USD) Accumulation Management Fees - (100,413) - -
Class C (GBP) Management Fees - - - (57)
Class C (GBP) Accumulation Management Fees (3,401) - - -
Class C (GBP) Income Management Fees (85,376) - -
Class D (USD) Accumulation Management Fees (196,054) - - -
Class E (USD) Accumulation Management Fees (253,121) - - -
Class F (GBP) Accumulation Management Fees (3,427) - - -
Class F (GBP) Income Management Fees (3,437) - -
Class G Accumulation Management Fees (9,897) - - -
Class G Income Management Fees (18) - - -
(560,674) (218,133) (102,273) (94,553)

SANLAM UNIVERSAL FUNDS PLC
431
NOTES TO AND FORMING PART OF THE UNAUDITED CONDENSED INTERIM FINANCIAL STATEMENTS (CONTINUED) for the six months ended 30 June 2017
8 Related party transactions and significant agreements (continued)
Management and investment management fees (continued)
A summary of management and investment management fees earned during the period and outstanding accrued fees as at 30 June 2017 is as follows (continued):
Sanlam Private Wealth Global
High Quality Fund
Sanlam FOUR US Dividend
Income Fund
High Street Global
Balanced Fund
Sanlam FOUR Active
European ex-UK Equity
Fund
GBP GBP USD GBP
Fees accrued at 30/06/2017
Class A Management Fees - - (15,884) -
Class A (GBP) Management Fees - - - (3,400)
Class A (EUR) Management Fees - - - (14,633)
Class A (USD) Accumulation Management Fees - (1,586) - -
Class A (GBP) Accumulation Management Fees (1,072) (33,545) - -
Class A (USD) Distribution Management Fees - (1,961) - -
Class A (EUR) Distribution Management Fees - (405) - -
Class A (GBP) Distribution Management Fees - (17,050) - -
Class B Management Fees - - - (28,661)
Class B (GBP) Management Fees - - - (585)
Class B (EUR) Management Fees - - - (3)
Class B (USD) Accumulation Management Fees - (28,303) - -
Class C (GBP) Management Fees - - - (21)
Class C (GBP) Accumulation Management Fees (835) - - -
Class C (GBP) Income Management Fees (14,785) - - -
Class D (USD) Accumulation Management Fees (42,339) - - - Class E Accumulation Management Fees (47,846) - - -
Class F (GBP) Accumulation Management Fees (748) - - -
Class F (GBP) Income Management Fees (813) - - -
Class G Accumulation Management Fees (1,775) - - -
Class G Income Management Fees (6) - - -
(110,219) (82,850) (15,884) (47,303)

SANLAM UNIVERSAL FUNDS PLC
432
NOTES TO AND FORMING PART OF THE UNAUDITED CONDENSED INTERIM FINANCIAL STATEMENTS (CONTINUED) for the six months ended 30 June 2017
8 Related party transactions and significant agreements (continued) Management and investment management fees (continued) A summary of management and investment management fees earned during the period and outstanding accrued fees as at 30 June 2017 is as follows (continued):
Sanlam FOUR Global Equity
Fund
Sanlam FOUR Stable
Global Equity Fund
Sanlam FOUR Active UK
Equity Fund
Sanlam FOUR Multi-Strategy
Fund
GBP GBP GBP GBP
Fees incurred during the period ended 30/06/2017
Class (GBP) Founder Management fees - - - (7,311)
Class (GBP) Income Distribution Founder
Management fees - - - (2,146)
Class A (USD) Management Fees (19,864) (42,841) - (506)
Class A (GBP) Management Fees (788) (3,467) (4,422) (18,653)
Class A (EUR) Management Fees (13) (26,974) - -
Class A (GBP) Distribution Management Fees - (19) - (887)
Class B (USD) Management Fees (91,602) (79,874) (10,428) (65,558)
Class B (GBP) Management Fees (20,961) (215) (34,573) (1,994)
Class C Management Fees (1) - (538) -
Class C (GBP) Management Fees (504) - (4,865) -
Class D (GBP) Management Fees - - (242) -
Class I (GBP) Management Fees - - (1,695) -
(133,733) (153,390) (56,763) (97,055)
Fees accrued at 30/06/2017
Class (GBP) Founder Management fees - - - (1,717)
Class (GBP) Income Distribution Founder
Management fees - - - (504)
Class A (USD) Management Fees (7,135) (15,602) - (119)
Class A (GBP) Management Fees (286) (1,306) (215) (4,381)
Class A (EUR) Management Fees (5) (9,796) - -
Class A (GBP) Distribution Management Fees - (9) - (208)
Class B (USD) Management Fees (43,394) (43,876) (506) (15,397)
Class B (GBP) Management Fees (10,129) (153) (1,678) (468)
Class C Management Fees - - (26) -
Class C (GBP) Management Fees (180) - (236) -
Class D (GBP) Management Fees - - (12) -
Class I (GBP) Management Fees - - (82) -
(61,129) (70,742) (2,755) (22,794)

SANLAM UNIVERSAL FUNDS PLC
433
NOTES TO AND FORMING PART OF THE UNAUDITED CONDENSED INTERIM FINANCIAL STATEMENTS (CONTINUED) for the six months ended 30 June 2017
8 Related party transactions and significant agreements (continued)
Management and investment management fees (continued)
A summary of management and investment management fees earned during the period and outstanding accrued fees as at 30 June 2017 is as follows (continued):
Anchor Global Capital
Plus Fund
Bridge Global Equity Income
Growth Fund Anchor Global
Equity Fund
Bridge Global Managed
Growth Fund
USD USD USD USD
Fees incurred during the period ended 30/06/2017
Class A Management Fees (81,138) (32,075) (157,528) (60,832)
(81,138) (32,075) (157,528) (60,832)
Fees accrued at 30/06/2017
Class A Management Fees (11,968) (4,661) (24,183) (8,185)
(11,968) (4,661) (24,183) (8,185)
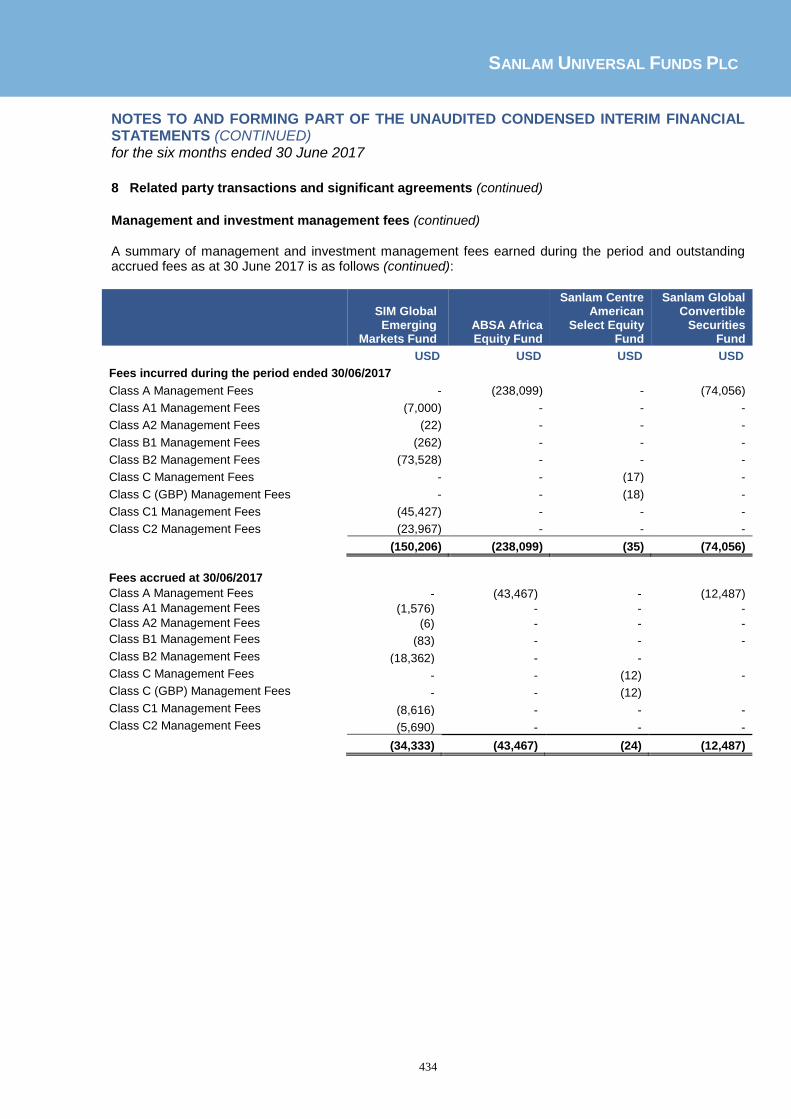
SANLAM UNIVERSAL FUNDS PLC
434
NOTES TO AND FORMING PART OF THE UNAUDITED CONDENSED INTERIM FINANCIAL STATEMENTS (CONTINUED) for the six months ended 30 June 2017
8 Related party transactions and significant agreements (continued)
Management and investment management fees (continued) A summary of management and investment management fees earned during the period and outstanding accrued fees as at 30 June 2017 is as follows (continued):
SIM Global Emerging
Markets Fund ABSA Africa Equity Fund
Sanlam Centre American
Select Equity Fund
Sanlam Global Convertible
Securities Fund
USD USD USD USD
Fees incurred during the period ended 30/06/2017
Class A Management Fees - (238,099) - (74,056)
Class A1 Management Fees (7,000) - - -
Class A2 Management Fees (22) - - -
Class B1 Management Fees (262) - - -
Class B2 Management Fees (73,528) - - -
Class C Management Fees - - (17) -
Class C (GBP) Management Fees - - (18) -
Class C1 Management Fees (45,427) - - -
Class C2 Management Fees (23,967) - - -
(150,206) (238,099) (35) (74,056)
Fees accrued at 30/06/2017
Class A Management Fees - (43,467) - (12,487)
Class A1 Management Fees (1,576) - - -
Class A2 Management Fees (6) - - -
Class B1 Management Fees (83) - - -
Class B2 Management Fees (18,362) - -
Class C Management Fees - - (12) -
Class C (GBP) Management Fees - - (12)
Class C1 Management Fees (8,616) - - -
Class C2 Management Fees (5,690) - - -
(34,333) (43,467) (24) (12,487)

SANLAM UNIVERSAL FUNDS PLC
435
NOTES TO AND FORMING PART OF THE UNAUDITED CONDENSED INTERIM FINANCIAL STATEMENTS (CONTINUED) for the six months ended 30 June 2017
8 Related party transactions and significant agreements (continued)
Management and investment management fees (continued) A summary of management and investment management fees earned during the period and outstanding accrued fees as at 30 June 2017 is as follows (continued):
Sanlam Japan Equity Fund
Autus Global Equity Fund
Sanlam Centre American US
Treasury Fund
USD USD USD
Fees incurred during the period ended 30/06/2017
Class B Management Fees - (57,213) -
Class C Management Fees - - (9)
- (57,213) (9)
Fees accrued at 30/06/2017
Class B Management Fees - (12,696) -
Class C Management Fees - - (9)
- (12,696) (9)

SANLAM UNIVERSAL FUNDS PLC
436
NOTES TO AND FORMING PART OF THE UNAUDITED CONDENSED INTERIM FINANCIAL STATEMENTS (CONTINUED) for the six months ended 30 June 2017
8 Related party transactions and significant agreements (continued)
Management and investment management fees (continued)
A summary of management and investment management fees earned during the period and outstanding accrued fees as at 30 June 2016 is as follows:
Sanlam Centre
Global
Select Equity
Fund
Bridge Global Property
Income Fund
P-Solve Inflation Plus
Fund
Sanlam African Frontier
Markets Fund
USD USD GBP USD
Fees incurred during the period ended 30/06/2016 Class A Management Fees (84,723) - (207) (15,118)
Class A (GBP) Management Fees - - - (390)
Class B Management Fees (9,648) - (19,017) -
Class B (Accumulation) Management Fees - - (5,670) -
Class C Management Fees (304) - - (26)
Class C (GBP) Management Fees - - - (288)
Class D Management Fees - - - (99,095)
Class G Management Fees - - - (211,754)
Class I Management Fees - - - (503)
Non-Distributing Class Management Fees - (332,755) - -
(94,675) (332,755) (24,894) (327,174)
Fees accrued at 30/06/2016
Class A Management Fees (13,860) - (35) (2,493)
Class A (GBP) Management Fees - - - (68)
Class B Management Fees (1,610) - (3,225) -
Class B (Accumulation) Management Fees - - (962) -
Class C Management Fees (51) - - (4)
Class C (GBP) Management Fees - - - (48)
Class D Management Fees - - - (16,591)
Class G Management Fees - - - (36,364)
Class I Management Fees - - - -
Non-Distributing Class Management Fees - (57,666) - -
(15,521) (57,666) (4,222) (55,568)

SANLAM UNIVERSAL FUNDS PLC
437
NOTES TO AND FORMING PART OF THE UNAUDITED CONDENSED INTERIM FINANCIAL STATEMENTS (CONTINUED) for the six months ended 30 June 2017
8 Related party transactions and significant agreements (continued)
Management and investment management fees (continued) A summary of management and investment management fees earned during the period and outstanding accrued fees as at 30 June 2016 is as follows (continued):
Sanlam Global Best Ideas Fund
Sanlam Global Bond
Fund
Sanlam Global
Financial Fund
Sanlam Global
Property Fund
USD USD USD USD
Fees incurred during the period ended 30/06/2016 Class A Management Fees (170,209) (50) (135,708) (40)
Class A (EUR) Management Fees (1) - (573) -
Class A (GBP) Management Fees (764) - (2,022) -
Class B Management Fees (166,676) (3,062) (78,560) (81,481)
Class C Management Fees (95,616) (234,353) (220,671) (120,930)
Class C (GBP) Management Fees (232) - (6,010) -
Class D Management Fees (34,232) - (1,529) -
Class F (EUR) Management Fees - - (191) -
Class F (GBP) Management Fees - - (2,132) -
Class F Management Fees (49) - - -
Class G Management Fees (32,481) - (213,166) -
(500,260) (237,465) (660,562) (202,451)
Fees accrued at 30/06/2016
Class A Management Fees (26,862) (8) (23,115) (14)
Class A (EUR) Management Fees - - (152) -
Class A (GBP) Management Fees (120) - (349) -
Class B Management Fees (26,880) (517) (13,560) (14,840)
Class C Management Fees (13,610) (39,598) (28,962) (20,912)
Class C (GBP) Management Fees (35) - (1,078) -
Class D Management Fees (5,772) - (258) -
Class F Management Fees - - (23) -
Class F (EUR) Management Fees - - (298) -
Class F (GBP) Management Fees (8) - - -
Class G Management Fees (5,175) - (36,262) -
(78,462) (40,123) (104,057) (35,766)

SANLAM UNIVERSAL FUNDS PLC
438
NOTES TO AND FORMING PART OF THE UNAUDITED CONDENSED INTERIM FINANCIAL STATEMENTS (CONTINUED) for the six months ended 30 June 2017
8 Related party transactions and significant agreements (continued)
Management and investment management fees (continued)
A summary of management and investment management fees earned during the period and outstanding accrued fees as at 30 June 2016 is as follows (continued):
Sanlam Strategic
Cash Fund Sanlam World
Equity Fund
Satrix World
Equity Tracker
Fund
SIIP India Opportunities
Fund
USD USD USD USD
Fees incurred during the period ended 30/06/2016 Class A Management Fees (3,048) (670) (185,905) (494)
Class A (GBP) Management Fees - - - -
Class B Management Fees (3,774) (136,870) - -
Class C Management Fees - (989,932) (251,628) (61,640)
Class D Management Fees - - - (199)
Class I Management Fees - - (422,833) -
Class I (GBP) Management Fees - - (913) -
Class S Management Fees - - (6,767) -
(6,822) (1,127,472) (868,046) (62,333)
Fees accrued at 30/06/2016
Class A Management Fees - (112) (29,535) (85)
Class B Management Fees - (22,513) - -
Class C Management Fees - (171,594) (39,024) (10,546)
Class D Management Fees - - - (32)
Class I Management Fees - - (70,164) -
Class I (GBP) Management Fees - - (130) -
Class S Management Fees - - (1,457) -
- (194,219) (140,310) (10,663)

SANLAM UNIVERSAL FUNDS PLC
439
NOTES TO AND FORMING PART OF THE UNAUDITED CONDENSED INTERIM FINANCIAL STATEMENTS (CONTINUED) for the six months ended 30 June 2017
8 Related party transactions and significant agreements (continued)
Management and investment management fees (continued)
A summary of management and investment management fees earned during the period and outstanding accrued fees as at 30 June 2016 is as follows (continued):
SIM Global Equity Income
Fund Sanlam Strategic
Bond Fund
Sanlam Accel
Income Fund
Satrix North America Equity
Tracker Fund
USD GBP GBP USD
Fees incurred during the period ended 30/06/2016 Class A Management Fees (56,809) - - (145)
Class A (GBP) Management Fees (6) - - -
Class A Accumulation Management Fees - (3,914) (32,512) -
Class A Income Management Fees - (135) (38,967) -
Class B Management Fees (315) - - -
Class C Management Fees (20,768) - - -
Class C Accumulating Management Fees (58,120) - - -
Class C (GBP) Accumulating Management Fees (44) - - -
Class I Management Fees (24,684) - - (9,227)
Class I (GBP) Management Fees - - - (1,535)
Class I Accumulation Management Fees - (6,311) - -
Class J Management Fees - (9,887) - -
Class P Income Management Fees - (98,197) - -
Class P Accumulation Management Fees - (10,683) - -
Class P (USD) Accumulation Management Fees - (2,258) - -
(160,746) (131,385) (71,479) (10,907)
Fees accrued at 30/06/2016
Class A Management Fees (9,692) - - (28)
Class A (GBP) Management Fees (6) - - -
Class A Accumulation Management Fees - (660) (15,557) -
Class A Income Management Fees - (4) (18,645) -
Class B Management Fees (54) - - -
Class C Management Fees (5,126) - - -
Class C Accumulating Management Fees (11,203) - - -
Class C (GBP) Accumulating Management Fees (27) - - -
Class I Management Fees (4,573) (1,046) - (1,592)
Class I (GBP) Management Fees - - - (169)
Class J Management Fees - (1,814) - -
Class P Income Management Fees - (16,512) - -
Class P Accumulation Management Fees - (1,770) - -
Class P (USD) Accumulation Management Fees - (319) - -
(30,681) (22,125) (34,202) (1,789)

SANLAM UNIVERSAL FUNDS PLC
440
NOTES TO AND FORMING PART OF THE UNAUDITED CONDENSED INTERIM FINANCIAL STATEMENTS (CONTINUED) for the six months ended 30 June 2017
8 Related party transactions and significant agreements (continued)
Management and investment management fees (continued)
A summary of management and investment management fees earned during the period and outstanding accrued fees as at 30 June 2016 is as follows (continued):
Satrix UK Equity
Tracker Fund
Satrix Europe (ex UK) Equity Tracker Fund
Sanlam Equity Allocation
Fund
Satrix Emerging
Market Equity Tracker Fund
GBP EUR USD USD
Fees incurred during the period ended 30/06/2016
Class A Management Fees (37) (6,589) - (33,165)
Class C Management Fees - (2,315) - -
Class I Management Fees (10,843) (51,695) - (19,533)
Class I (GBP) Management Fees (1,404) (795) - (11,961)
(12,284) (61,394) - (64,659)
Fees accrued at 30/06/2016
Class A Management Fees (6) (1,175) - (5,756)
Class C Management Fees - (381) - -
Class I Management Fees (1,906) (9,655) - (3,842)
Class I (GBP) Management Fees (180) (126) - (2,029)
(2,092) (11,337) - (11,627)

SANLAM UNIVERSAL FUNDS PLC
441
NOTES TO AND FORMING PART OF THE UNAUDITED CONDENSED INTERIM FINANCIAL STATEMENTS (CONTINUED) for the six months ended 30 June 2017
8 Related party transactions and significant agreements (continued)
Management and investment management fees (continued)
A summary of management and investment management fees earned during the period and outstanding accrued fees as at 30 June 2016 is as follows (continued):
Sanlam Managed Risk
Fund
Sanlam P2 Strategies
UK Fund
Sanlam P2 Strategies
North America Fund
Sanlam P2 Strategies Emerging
Market Fund
USD GBP USD USD
Fees incurred during the period ended 30/06/2016
Class A Management Fees (3,081) - - -
Class A (EUR) Management Fees (1,765) - - -
Class A (GBP) Management Fees (16,240) - - -
Class D Management Fees (52) - - -
Class I Management Fees (104,837) (3,477) (42,104) (10,113)
Class I (EUR) Management Fees (221) - - -
Class I (GBP) Management Fees (40,726) (14,972) (1,112) (4,889)
Class N Management Fees (5,871) - - -
Class N (EUR) Management Fees (1,471) - - -
Class N (GBP) Management Fees (6,915) - - -
(181,179) (18,449) (43,216) (15,002)
Fees accrued at 30/06/2016
Class A Management Fees (656) - - -
Class A (EUR) Management Fees (376) - - -
Class A (GBP) Management Fees (3,458) - - -
Class D Management Fees (11) - - -
Class I Management Fees (22,324) - - -
Class I (EUR) Management Fees (47) - - -
Class I (GBP) Management Fees (8,672) - - -
Class N Management Fees (1,250) - - -
Class N (EUR) Management Fees (313) - - -
Class N (GBP) Management Fees (1,472) - - -
(38,580) - - -

SANLAM UNIVERSAL FUNDS PLC
442
NOTES TO AND FORMING PART OF THE UNAUDITED CONDENSED INTERIM FINANCIAL STATEMENTS (CONTINUED) for the six months ended 30 June 2017
8 Related party transactions and significant agreements (continued)
Management and investment management fees (continued)
A summary of management and investment management fees earned during the period and outstanding accrued fees as at 30 June 2016 is as follows (continued):
Sanlam P2 Strategies
Europe (ex UK) Fund
Sanlam Private Wealth
Global High Quality Fund
Sanlam FOUR US Dividend
Income Fund
High Street Global
Balanced Fund
EUR GBP USD USD
Fees incurred during the period ended 30/06/2016
Class A Management Fees - - - (65,759)
Class A (GBP) Management Fees (649) - - -
Class A (USD) Accumulation Management Fees - - (334) -
Class A (GBP) Accumulation Management Fees - (3,835) (41,203) -
Class A (USD) Distribution Management Fees - - (3) -
Class A (EUR) Distribution Management Fees - - (4) -
Class A (GBP) Distribution Management Fees - - (9) -
Class B (USD) Accumulation Management Fees - - (23,241) -
Class C (GBP) Accumulation Management Fees - (1,543) - -
Class C (GBP) Income Management Fees - (73,634) - -
Class D (USD) Accumulation Management Fees - (32,064) - -
Class E (USD) Accumulation Management Fees - (86,511) - -
Class F (GBP) Income Management Fees - (956) - -
Class I Management Shares (19,070) - - -
Class I (EUR) Management Fees (200) - - -
(19,919) (198,543) (64,794) (65,759)
Fees accrued at 30/06/2016
Class A Management Fees - - - (11,755)
Class A (GBP) Management Fees - (657) - -
Class A (USD) Accumulation Management Fees - (17,543) (125) -
Class A (GBP) Accumulation Management Fees - - (9,830) -
Class A (USD) Distribution Management Fees - - (1) -
Class A (EUR) Distribution Management Fees - - (1) -
Class A (GBP) Distribution Management Fees - - (1) -
Class B (USD) Accumulation Management Fees - - (7,249) -
Class C (GBP) Accumulation Management Fees - (315) - -
Class C (GBP) Income Management Fees - (12,365) - -
Class D (USD) Accumulation Management Fees - (7,145) - -
Class F (GBP) Income Management Fees - (281) - -
- (38,306) (17,207) (11,755)

SANLAM UNIVERSAL FUNDS PLC
443
NOTES TO AND FORMING PART OF THE UNAUDITED CONDENSED INTERIM FINANCIAL STATEMENTS (CONTINUED) for the six months ended 30 June 2017
8 Related party transactions and significant agreements (continued)
Management and investment management fees (continued)
A summary of management and investment management fees earned during the period and outstanding accrued fees as at 30 June 2016 is as follows (continued):
Sanlam FOUR Active
European ex-UK Equity Fund
Sanlam FOUR Global Equity Fund
Sanlam FOUR Stable Global
Equity Fund
Sanlam FOUR Active UK
Equity Fund
GBP GBP GBP GBP
Fees incurred during the period ended 30/06/2016
Class A (USD) Management Fees - (25,920) (1,535) -
Class A (GBP) Management Fees (25,279) (1,026) (540) (15,326)
Class A (EUR) Management Fees (31,880) (24) (14,182) -
Class A (GBP) Distribution Management Fees - - (10) -
Class B (USD) Management Fees - (15,210) (43,737) -
Class B (GBP) Management Fees (2,470) (17,438) (105) (38,533)
Class B (EUR) Management Fees (10,023) - - -
Class C Management Fees - - - (5,527)
Class C (GBP) Management Fees (56) (1,101) - (30,787)
Class D (GBP) Management Fees - - - (127)
Class I (GBP) Management Fees - - - (227,347)
(69,709) (60,719) (60,108) (317,647)
Fees accrued at 30/06/2016
Class A (USD) Management Fees - (5,266) (164) -
Class A (GBP) Management Fees (6,084) (180) (312) (2,693)
Class A (EUR) Management Fees (7,720) (6) (3,152) -
Class A (GBP) Distribution Management Fees - - (2) -
Class B (USD) Management Fees - (10,636) (22,267)
Class B (GBP) Management Fees (1,339) (9,072) (52) (19,662)
Class B (EUR) Management Fees (6,452) - - -
Class C Management Fees - - - (241)
Class C (GBP) Management Fees (13) (208) - (4,039)
Class D (GBP) Management Fees - - - (3,506)
Class I (GBP) Management Fees - - - (46,301)
(21,607) (25,367) (25,949) (76,442)

SANLAM UNIVERSAL FUNDS PLC
444
NOTES TO AND FORMING PART OF THE UNAUDITED CONDENSED INTERIM FINANCIAL STATEMENTS (CONTINUED) for the six months ended 30 June 2017
8 Related party transactions and significant agreements (continued)
Management and investment management fees (continued)
A summary of management and investment management fees earned during the period and outstanding accrued fees as at 30 June 2016 is as follows (continued):
Sanlam FOUR Multi-Strategy
Fund
Anchor Global Capital Plus
Fund
Bridge Global Equity Income
Growth Fund Anchor Global
Equity Fund
GBP USD USD USD
Fees incurred during the period ended 30/06/2016
Class Founder Management Fees (7,555) - - -
Class Founder Income Distribution
Management Fees (1,151) - - -
Class A Management Fees (930) (70,427) (29,547) (114,836)
Class A (GBP) Management Fees (16,373) - - -
Class A (GBP) Income Distribution
Management Fees (88) - - -
Class B Management Fees (11,994) (950) - (506)
Class B (GBP) Management Fees (26,272) - - -
(64,363) (71,377) (29,547) (115,342)
Fees accrued at 30/06/2016
Class Founder Management Fees (1,726) - - -
Class Founder Income Distribution
Management Fees (270) - - -
Class A Management Fees (197) (12,651) (5,069) (20,544)
Class A (GBP) Management Fees (3,789) - - -
Class A (GBP) Income Distribution
Management Fees (20) - - -
Class B Management Fees (3,249) (158) - (86)
Class B (GBP) Management Fees (7,053) - - -
(16,304) (12,809) (5,069) (20,630)

SANLAM UNIVERSAL FUNDS PLC
445
NOTES TO AND FORMING PART OF THE UNAUDITED CONDENSED INTERIM FINANCIAL STATEMENTS (CONTINUED) for the six months ended 30 June 2017
8 Related party transactions and significant agreements (continued)
Management and investment management fees (continued)
A summary of management and investment management fees earned during the period and outstanding accrued fees as at 30 June 2016 is as follows (continued):
Bridge Global Managed Growth
Fund
SIM Global Emerging
Markets Fund
Sanlam FOUR UK Income
Opportunities Fund
USD USD GBP
Fees incurred during the period ended 30/06/2016
Class Founder Accumulation Management Fees - - (446)
Class Founder Distribution Management Fees - - (462)
Class A Management Fees (58,153) (716) -
Class A (GBP) Accumulation Management Fees - - (448)
Class A (GBP) Distribution Management Fees - - (569)
Class C Management Fees - (25,987) -
(58,153) (26,703) (1,925)
Fees accrued at 30/06/2016
Class Founder Accumulation Management Fees - - -
Class Founder Distribution Management Fees - - (3)
Class A Management Fees (9,956) (141) -
Class A (GBP) Accumulation Management Fees - - (1)
Class A (GBP) Distribution Management Fees - - (120)
Class C Management Fees - (4,662) -
(9,956) (4,802) (124)
Related Transactions
Certain Sanlam Universal Funds plc sub-funds operate as master funds to certain sub-funds of Sanlam Global Funds plc and Sanlam Qualifying Investors Funds plc.
Sanlam Investments and Pensions Limited invests in the E Class of the Sanlam Global Bond Fund.
SAMI is appointed as Investment Manager to certain segregated portfolios which also invest into Class E share classes of sub-funds of the Company.
The following transactions occurred between Sanlam Universal Funds plc, Sanlam Global Funds plc, Sanlam Qualifying Investors Funds plc and Sanlam Investments and Pensions during the period ended 30 June 2017:
Sanlam
Global Bond Fund
Sanlam World Equity
Fund
Sanlam FOUR Stable Global
Equity Fund
Satrix North America
Equity Tracker Fund
USD USD USD USD
Subscriptions:
Sanlam Global Equity Fund - - 39,459,620 68,071,641
BIFM Global Fixed Income Fund 1,914,709 - - -
Sanlam BIFM World Equity Fund - 3,249,325 - -
Total Subscriptions 1,914,709 3,249,325 39,459,620 68,071,641

SANLAM UNIVERSAL FUNDS PLC
446
NOTES TO AND FORMING PART OF THE UNAUDITED CONDENSED INTERIM FINANCIAL STATEMENTS (CONTINUED) for the six months ended 30 June 2017
8 Related party transactions and significant agreements (continued)
Related Transactions (continued)
Sanlam
Accel Income Fund
Sim Global Emerging
Markets Fund
Sanlam FOUR Active
European Ex-UK Equity
Fund
Salam Centre American
Select Equity Fund
USD USD USD USD
Subscriptions:
Sanlam Global Balanced Fund - - - 11,600,000
Sanlam Global Equity Fund - 9,565,219 39,459,620 -
Sanlam FOUR US Dividend Income Fund 600,000 - - -
Total Subscriptions 600,000 9,565,219 37,316,201 11,600,000
Sanlam
Strategic Bond Fund
Sanlam Japan Equity Fund
USD USD
Subscriptions:
Sanlam Global Balanced Fund - 6,600,000
Sanlam Global Equity Fund - 30,716,201
SPW Global Balanced Fund 1,429 -
Total Subscriptions 1,429 37,316,201
Sanlam FOUR Stable Global
Equity Fund
Sanlam World Equity
Fund
Sanlam FOUR Global Equity
Fund
Satrix World Equity Tracker
Fund USD USD USD USD
Redemptions:
Sanlam Global Balanced Fund 700,000 41,267,323 - -
Sanlam Global Equity Fund 5,500,000 461,177,958 7,500,000 -
Mpile Global Equity Fund 76,980 - - 1,044,212
Total Redemptions 6,276,980 502,445,281 7,500,000 1,044,212
Salam Four Active
European (ex UK) Equity
Fund
Bridge Global Property
Income Fund
Sanlam Centre
American Select Equity
Fund
Sanlam Four Active UK
Equity Fund USD USD
Redemptions:
Sanlam Global Balanced Fund 11,949,366 400,000 -
Sanlam Global Equity Fund 108,769,776 - 14,600,000 18,950,000
Total Redemptions 120,719,142 400,000 14,600,000 18,950,000
Sanlam Four US Dividend
Income Fund Sanlam Japan
Equity Fund USD USD
Redemptions:
Sanlam Global Equity Fund 8,250,000 8,700,000
Total Redemptions 8,250,000 8,700,000

SANLAM UNIVERSAL FUNDS PLC
447
NOTES TO AND FORMING PART OF THE UNAUDITED CONDENSED INTERIM FINANCIAL STATEMENTS (CONTINUED) for the six months ended 30 June 2017
8 Related party transactions and significant agreements (continued)
Related Transactions (continued) The following transactions occurred between Sanlam Universal Funds plc, Sanlam Global Funds plc, Sanlam Qualifying Investors Funds plc and Sanlam Investments and Pensions during the period ended 30 June 2016:
Sanlam
Global Bond Fund
Sanlam World Equity
Fund
Satrix World Equity Tracker
Fund
Sanlam FOUR Stable Global
Equity Fund USD USD USD USD
Subscriptions:
Sanlam Global Balanced Fund - 5,000,000 - -
Sanlam Global Equity Fund - - - 18,000,000
BIFM Global Fixed Income Fund 34,444 - - -
Sanlam BIFM World Equity Fund - 83,849 - -
Mpile Global Equity Fund - - 1,583,003 -
Sanlam Managed Risk Fund - - 34,438,351 -
Total Subscriptions 34,444 5,083,849 36,021,354 18,000,000
Sanlam FOUR Global Equity
Fund
Satrix Emerging
Market Equity Tracker Fund
Satrix North America
Equity Tracker Fund
USD USD USD
Subscriptions:
Sanlam Global Equity Fund 26,500,000 - -
Sanlam P2 Strategies Emerging Markets Fund - 783,752 -
Sanlam P2 Strategies North America Fund - - 1,414,033
Total Subscriptions 26,500,000 783,752 1,414,033
Sanlam Global
Best Ideas Fund
Sanlam Global Bond
Fund
Sanlam World Equity
Fund
Sanlam FOUR Global Equity
Fund USD USD USD USD
Redemptions:
Sanlam Global Balanced Fund - - 2,500,000 6,000,000
Sanlam Best Ideas Feeder Fund 3,200,765 - - -
Sanlam Global Equity Fund - - 83,972,255 -
Sanlam BIFM Global Fixed Income Fund - 1,180,500 - -
Sanlam BIFM World Equity Fund - - 5,700,000 -
Total Redemptions 3,200,765 1,180,500 92,172,255 6,000,000
Satrix World Equity Tracker
Fund
Satrix Emerging
Market Equity Tracker Fund
Satrix North America
Equity Tracker Fund
USD USD USD
Redemptions:
Sanlam Managed Risk Fund 10,943,465 - -
Sanlam P2 Strategies Emerging Markets Fund - 7,358,033 -
Sanlam P2 Strategies North America Fund - - 17,599,528
Total Redemptions 10,943,465 7,358,033 17,599,528

SANLAM UNIVERSAL FUNDS PLC
448
NOTES TO AND FORMING PART OF THE UNAUDITED CONDENSED INTERIM FINANCIAL STATEMENTS (CONTINUED) for the six months ended 30 June 2017
8 Related party transactions and significant agreements (continued)
Related Transactions (continued)
In-specie transfers The following in specie transactions occurred during the period ended 30 June 2017:
Subscriptions in Autus Global Equity Fund include in specie transfers from SBSA ITF Autus BCI Global Equity Fund during the period in exchange for assets with a fair value at the date of transfer of USD 16,950,404.
During the period Sanlam Global Equity Fund, a sub-fund of Sanlam Global Funds Plc, redeemed shares in Sanlam World Equity Fund in the amount of USD 379,145,744. This redemption was made by means of an in specie transfer of equity securities held by the Sanlam World Equity Fund to Sanlam Global Equity Fund. The equity securities transferred had an equivalent fair value at the date of transfer to the redemption amount.
The following in specie transactions occurred during the period ended 30 June 2016:
The Board of Directors and shareholders approved a merger, by way of amalgamation, of Sanlam P2strategies Europe (ex UK) Fund and Sanlam P2strategies UK Fund and Sanlam P2strategies North America Fund (the “Merging Funds”) into Sanlam Managed Risk Fund (formerly Sanlam P2strategies Global Fund) effective from 11 May 2016. To effect the merger the following transactions occurred: Redemptions from Sanlam P2strategies North America Fund and the subsequent subscription into Sanlam Managed Risk Fund included an in-specie transfer of cash and Satrix North America Tracker Fund units with a value of USD 10,946,941 at the date of transfer.
Similarly, redemptions from Sanlam P2strategies Europe (ex UK) Fund and the subsequent subscription into Sanlam Managed Risk Fund included an in-specie transfer of cash and Satrix Europe Ex UK Tracker Fund units with a value of EUR 4,534,507 at the date of transfer.
Subsequently, Sanlam Managed Risk Fund redeemed its interests in the Satrix North America Tracker
Fund and Satrix Europe Ex UK Tracker Fund by means of an in-specie transfer of assets with a fair value
of USD 10,066,045 and EUR 4,285,235, respectively.
Sanlam Manged Risk Fund also redeemed a portion of its interest in the Satrix World Equity Tracker Fund
by means of an in-specie transfer of assets with a fair value of USD 14,964,304.
Redemptions from Sanlam World Equity Fund included an in-specie transfer of securities and cash
positions to Sanlam FOUR US Dividend Income Fund with a total fair value of USD 15,172,255 at the
date of transfer.
Cross Investments
The following are the fair values of intercompany positions held by Funds within the Company at 30 June
2017:
Fund Name Position Held Fair Value at 30
Jun 2017
Sanlam Accel Income Fund Sanlam FOUR US Dividend Income Fund GBP 1,348,918
Sanlam Accel Income Fund Sanlam Strategic Bond Fund GBP 1,880,881
Sanlam Managed Risk Fund Satrix World Equity Tracker Fund USD 40,191,010
Further details regarding the intercompany positions as disclosed above and the investment strategies of the relevant funds are disclosed in the portfolio of investments on pages 157 to 368 and the reports of the investments managers on pages 19 to 87.

SANLAM UNIVERSAL FUNDS PLC
449
NOTES TO AND FORMING PART OF THE UNAUDITED CONDENSED INTERIM FINANCIAL STATEMENTS (CONTINUED) for the six months ended 30 June 2017
9 Transactions in Financial Derivative Instruments
The Funds may engage in transactions in Financial Derivative Instruments (FDI) for the purposes of efficient portfolio management, investment and/or to protect against risks within the conditions and limits laid down by the Central Bank from time to time. Hedging is used by the Funds to limit or control risks, such as adverse movements in exchange rates and interest returns. By purchasing certain instruments, the Funds may more effectively achieve the desired portfolio characteristics that assist the Funds in meeting their investment objectives. The relevant Investment Manager will look to ensure that the techniques and instruments used are economically appropriate in that they will be realised in a cost-effective way. Specific instruments At 30 June 2017, 10 Funds hold derivative financial instruments, namely forward currency contracts, futures contracts, interest rate swaps and option contracts. Details of the open derivative financial instruments at the reporting date are included in the Portfolio of Investment for each Fund.
Forward currency contracts Certain of the Funds may invest in Forward currency contracts. As part of its investment policy, a Fund may enter into transactions which alter the currency exposure of underlying assets in which the Fund is invested from time to time where the Investment Manager considers it appropriate to retain the currency exposure consistent with the Fund's investment objective. This may involve a Fund investing in an asset denominated in currency (X) where the Investment Manager wishes to translate the currency denomination of that asset (X) into a third party currency (Y) that may be different to the base currency through the use of forward currency contracts. There can be no guarantees that the practice of investing in an uncorrelated currency (Y) will be effective and there is a risk of loss in the event of adverse currency movements relative to both the currency of denomination and the base currency. Investment in FDI permits the Fund to manage risk and invest more efficiently to achieve the investment objective of the Fund. These strategies include increasing the level of exposure to non-base currency in the Fund’s portfolio in response to the Investment Manager’s views on market prospects and prices and values. Gains and losses arising from such transactions are reflected at Fund level in the Statement of Comprehensive Income. Where a Fund utilises FDI which alter the currency exposure characteristics of transferable securities held by that Fund, the performance of that Fund may be strongly influenced by movements in foreign exchange rates because currency positions held by the Fund may not correspond with the securities positions held. Futures contracts Certain of the Funds may invest in Futures contracts for hedging or investment purposes. Futures contracts allow investors to hedge against market risk or modify exposure to the underlying market. They can also be used to "equitise" cash balances as described in note 10. Using futures to achieve a particular strategy instead of transacting the underlying or related equity security or equity index, can result in both lower transaction costs as well as more timely execution of portfolio strategy. Since these contracts are marked to market daily, investors can, by closing out their position, exit from their obligation to buy or sell the underlying assets prior to the contract's delivery date. Futures contracts are valued based upon their quoted daily settlement prices. Changes in the value of open futures contracts are recognised as unrealised gains or losses on futures contracts until the contracts are terminated, at which time realised gains and losses are recognised.

SANLAM UNIVERSAL FUNDS PLC
450
NOTES TO AND FORMING PART OF THE UNAUDITED CONDENSED INTERIM FINANCIAL STATEMENTS (CONTINUED) for the six months ended 30 June 2017
9 Transactions in Financial Derivative Instruments (continued)
Interest rate swaps Interest rate swaps may be used for hedging against adverse movements in interest rate. Interest rate swaps involve the exchange by a Fund with a counterparty of their respective commitments to pay or receive interest. The differential to be paid or received on the interest rate swap is recognised over the life of the agreement as a realised gain or loss with payments made or received on a net basis on the stated payment dates. The interest rate swap agreements are stated at fair value. Unrealised gains/losses are reported in the Statement of Comprehensive Income.
Option contracts Put options are contracts sold for a premium that gives one party (the buyer) the right, but not the obligation, to sell to the other party (the seller) of the contract, a currency at a specified rate. Call options are similar contracts sold for a premium that gives the buyer the right, but not the obligation, to buy from the seller of the option. A Fund, where permitted to use options, may be a seller or buyer of put and call options. Options are liquid and traded efficiently. Changes in the value of open options contracts are recognised as unrealised gains or losses in the Statement of Comprehensive Income until the contracts are terminated, at which time realised gains and losses are recognised. All open option positions as at 30 June 2017 are covered and are not used for the purposes of obtaining leverage. Risks Market risk This is the general risk attendant to all investments that the value of a particular investment will change in a way detrimental to the portfolio’s interest. Management risk FDI are highly specialised instruments that require investment techniques and risk analyses different from those associated with stocks and bonds. The successful use of FDI draws upon the Investment Manager’s special skills and experience and usually depends on the Investment Manager’s ability to forecast price movements, interest rates, or currency exchange rate movements correctly. Should prices, interest rates, or exchange rates move unexpectedly, a portfolio may not achieve the anticipated benefits of the transactions or may realise losses and thus be in a worse position than if such strategies had not been used. The use of FDI requires an understanding not only of the underlying instrument but also of the FDI itself, without the benefit of observing the performance of the FDI under all possible market conditions. In particular, the use and complexity of FDI require the maintenance of adequate controls to monitor the transactions entered into, the ability to assess the risk that an FDI adds to a portfolio and the ability to forecast price, interest rate or currency exchange rate movements correctly. Counterparty and Credit Risk This is the risk that a loss may be sustained by a portfolio as a result of the failure of a counterparty to an FDI to comply with the terms of the FDI contract. The credit risk for exchange-traded FDI is generally less than for privately negotiated FDI, since the clearing house, which is the issuer or counterparty to each exchange-traded FDI, provides a guarantee of performance. This guarantee is supported by a daily payment system (i.e., margin requirements) operated by the clearing house in order to reduce overall credit risk. For privately negotiated FDI, there is no similar clearing agency guarantee. Therefore, the Investment Manager will consider the creditworthiness of each counterparty to a privately negotiated FDI in evaluating potential credit risk.
Liquidity Risk Liquidity risk exists when a particular instrument is difficult to purchase or sell. If an FDI transaction is particularly large or if the relevant market is illiquid (as is the case with many privately negotiated FDI), it may not be possible to initiate a transaction or liquidate a position at an advantageous price.

SANLAM UNIVERSAL FUNDS PLC
451
NOTES TO AND FORMING PART OF THE UNAUDITED CONDENSED INTERIM FINANCIAL STATEMENTS (CONTINUED) for the six months ended 30 June 2017
9 Transactions in Financial Derivative Instruments (continued)
Legal Risk The use of OTC FDI, such as forward contracts, swap agreements and CFDs, will expose the Fund to the risk that the legal documentation of the relevant OTC contract may not accurately reflect the intention of the parties. Other risks
Other risks in using FDI include the risk of mispricing or improper valuation of FDI and the inability of FDI to correlate perfectly with underlying assets, rates and indices. Many FDI, in particular privately negotiated FDI, are complex and often valued subjectively. Improper valuations can result in increased cash payment requirements to counterparties or a loss of value to the portfolio concerned. FDI do not always perfectly or even closely track the value of the assets, rates or indices they are designed to track. Consequently, a portfolio’s use of FDI may not always be an effective means of, and sometimes could be counterproductive to, furthering the portfolio’s investment objective.
Collateral At 30 June 2017, the Funds have not received any collateral with respect to the open FDIs. Margin accounts, as disclosed in the Statement of Financial Position, represent cash deposited with brokers transferred against open FDIs. The balances may be restricted
Gains and losses on Financial Derivative Instruments Details of the net unrealised gains/(losses) on open forward currency contracts, interest rate swaps, futures and options if any, are disclosed in the Portfolio of investments of each Fund. Net realised and change in unrealised gains/(losses) on FDI’s are included in the Statement of Comprehensive Income of each Fund within Net gains/(losses) on financial assets and liabilities at fair value through profit or loss – held for trading.

SANLAM UNIVERSAL FUNDS PLC
452
NOTES TO AND FORMING PART OF THE UNAUDITED CONDENSED INTERIM FINANCIAL STATEMENTS (CONTINUED) for the six months ended 30 June 2017
10 Efficient portfolio management
The Company on behalf of a Fund may employ techniques and instruments relating to transferable securities, money market instruments and/or other financial instruments in which it invests for efficient portfolio management purposes. Use of such techniques and instruments should be in line with the best interests of Shareholders and will generally be made for one or more of the following reasons: (a) the reduction of risk; (b) the reduction of cost; or (c) the generation of additional capital or income for the relevant Fund with an appropriate level of risk, taking into account the risk profile of the Fund and the risk diversification rules set out in the Central Bank Rules.
The Funds may engage in transactions in Financial Derivative Instruments (FDI) for the purposes of
efficient portfolio management. Further details on the Funds’ investments in FDIs are disclosed in note 9.
The Funds may enter into forward foreign currency contracts for efficient portfolio management purposes. Forward foreign currency exchange contracts are used to hedge against anticipated future changes in exchange rates which otherwise might either adversely affect the value of the Fund’s portfolio securities or adversely affect the price of securities which the Funds intend to purchase at a later date. The Funds may also enter into futures contracts for efficient portfolio management purposes. The primary purpose for which the Funds use futures contracts are cash equalisation, hedging and return enhancement. The purpose of cash equalisation is to expose uninvested cash within the Funds to equity market-like returns and ensure that the Funds’ liquid assets are utilised as though invested in the markets.
Interest rate swaps are used for hedging against adverse movements in interest rates. Options offer the ability, when used as a hedging tool to be utilised in efficient portfolio management, to provide offsetting insurance of asset value in an uncertain or highly volatile market environment. The Funds, where permitted, may use options to hedge or achieve exposure to a particular currency, underlying security or equity index. By purchasing certain instruments, the Funds may more effectively achieve the desired portfolio characteristics that assist the Funds in meeting their investment objectives.
The Funds also engage in securities lending activities for efficient portfolio management purposes, details
of which are set out in note 13. Disclosures in accordance with the EU Securities Financing Transactions
Regulation (“SFTR”) are set out in the unaudited schedules attached to these financial statements.
11 Soft commissions
During the period, Investment Manager and connected persons to the Sanlam World Equity Fund have entered into soft commission arrangements with brokers in respect of which certain goods and services used to support the investment decision process were received. The Investment Manager and connected persons do not make direct payment for these services but do transact an agreed amount of business with the brokers on behalf of the Company and commission is paid on these transactions.
The goods and services utilised for the Company include computer hardware and software used for economic and political analysis, portfolio analysis including valuation and performance measurement, market analysis, data and quotation services and investment related publications. The Investment Manager considers these arrangements are to the benefit of the Company and has satisfied itself that it obtains best execution on behalf of the Company and the brokerage rates are not in excess of customary institutional full service brokerage rates.

SANLAM UNIVERSAL FUNDS PLC
453
NOTES TO AND FORMING PART OF THE UNAUDITED CONDENSED INTERIM FINANCIAL STATEMENTS (CONTINUED) for the six months ended 30 June 2017
12 Contingent and cross liability of funds
The Directors are not aware of any such existing or contingent liability at 30 June 2017. The Company’s amended Articles provide for segregated liability between the various Funds. These provisions, and the Fund’s application of them may not yet have been fully tested by Irish or foreign courts. Accordingly, while the liabilities of one Fund will not generally impact on or be paid out of the assets of another Fund, it is not entirely free from doubt that the assets of any Fund are protected from the liabilities of other Funds of the Company.
As at 30 June 2017 and 31 December 2016, there were no cross liabilities held between the Funds.
13 Securities lending activities
Securities lending activities are conducted through SAMI and Brown Brothers Harriman & Co pursuant to the Securities Lending Agency Agreement and Securities Lending Sub-Agency Agreement dated 24 February 2016. In this arrangement, the Company transfers securities to a counterparty, in return for which it is agreed that securities of the same kind and amount should be transferred back to the Company at a later date. The arrangement has the substance of a loan of the Company’s securities in return for collateral. Aggregate income arising from securities lending activities consists of fees charged to counterparty, where the counterparty has provided collateral other than cash, plus net realised income derived from investments of cash collateral less any rebate payable to counterparty on cash collateral less any commissions or similar transaction costs.
The tables overleaf disclose the income arising from securities lending activities, the costs and fees incurred, the exposure at the reporting date and the amount of collateral held.
At 30 June 2017, all collateral is in the form of high quality government bonds.
At 30 June 2017, the counterparties to the Funds’ outstanding securities lending activities are Citigroup, Credit Suisse, Deutsche Bank, HSBC Bank, JP Morgan Securities, Societe Generale and UBS. In other months during the reporting period, additional counterparties included ING Bank, Merrill Lynch International and Morgan Stanley & Co. International and Goldman Sachs.
The Funds incurred the following costs and fees in relation to securities lending activities for the period ended 30 June 2017:
Sanlam
Centre Global
Select Equity
Fund
Bridge Global
Property
Income Fund
P-Solve
Inflation Plus
Fund
Sanlam
African
Frontiers
Market Fund
Sanlam Global
Best Ideas
Fund
Sanlam Global
Bond Fund
USD USD GBP USD USD USD
Securities lending
sub-agent fees 403 - 186 64 4,088 -
Manager fees 201 - 93 32 2,044 -
Sanlam Global
Financial Fund
Sanlam Global
Property Fund
Sanlam World
Equity Fund
Satrix
World Equity
Tracker Fund
SIIP India
Opportunities
Fund
SIM Global
Equity Income
Fund
USD USD USD USD USD USD
Securities lending
sub-agent fees 41 597 15,313 10,703 - 3,768
Manager fees 21 298 7,656 5,351 - 1,884

SANLAM UNIVERSAL FUNDS PLC
454
NOTES TO AND FORMING PART OF THE UNAUDITED CONDENSED INTERIM FINANCIAL STATEMENTS (CONTINUED) for the six months ended 30 June 2017
13 Securities lending activities (continued)
The Funds incurred the following costs and fees in relation to securities lending activities for the period
ended 30 June 2017(continued):
Sanlam
Strategic
Bond Fund
Sanlam Accel
Income Fund
Satrix North
America
Equity Tracker
Fund
Satrix UK
Equity Tracker
Fund
Satrix Europe
(ex UK)
Equity Tracker
Fund
Sanlam Equity
Allocation
Fund
GBP GBP USD GBP EUR USD
Securities lending
sub-agent fees - - 249 1,150 10,227 8,621
Manager fees - - 124 575 5,114 4,311
Satrix
Emerging
Market Equity
Tracker
Fund
Sanlam
Managed Risk
Fund
Sanlam
Private Wealth
Global High
Quality Fund
Sanlam FOUR
US Dividend
Income Fund
High Street
Global
Balanced
Fund
Sanlam FOUR
Active
European (ex
UK) Equity
Fund
USD USD GBP GBP USD GBP
Securities lending
sub-agent fees 363 - 1,447 - 800 -
Manager fees 181 - 723 - 400 -
Sanlam
FOUR Global
Equity Fund
Sanlam FOUR
Stable Global
Equity Fund
Sanlam FOUR
Active UK
Equity Fund
Sanlam FOUR
Multi-Strategy
Fund
Anchor Global
Capital Plus
Fund
Bridge Global
Equity Income
Growth Fund
GBP GBP GBP GBP USD USD
Securities lending
sub-agent fees - - - - 114 -
Manager fees - - - - 57 -
Anchor
Global
Equity Fund
Bridge Global
Managed Fund
SIM Global
Emerging
Market Fund
ABSA Africa
Equity Fund
Sanlam Centre
American
Select Equity
Fund
Sanlam Japan
Equity Fund
USD USD USD USD USD USD
Securities lending
sub-agent fees 14 - 836 - - -
Manager fees 7 - 418 - - -
Sanlam Global
Convertible
Securities
Fund
Sanlam
Centre Active
US Treasury
Fund
Autus Global
Equity Fund
USD USD USD
Securities lending sub-agent fees - - -
Manager fees - - -

SANLAM UNIVERSAL FUNDS PLC
455
NOTES TO AND FORMING PART OF THE UNAUDITED CONDENSED INTERIM FINANCIAL STATEMENTS (CONTINUED) for the six months ended 30 June 2017
13 Securities lending activities (continued)
The Funds received income as follows under the terms of those agreements for the period ended 30 June 2017:
Sanlam Centre
Global
Select Equity
Fund
Bridge
Global Property
Income Fund
P-Solve
Inflation Plus
Fund
Sanlam African
Frontiers
Market Fund
Sanlam Global
Best Ideas
Fund
Sanlam Global
Bond Fund
USD USD GBP USD USD USD
Income 1,419 - 1,165 444 14,534 -
Sanlam Global
Financial
Fund
Sanlam Global
Property Fund
Sanlam World
Equity Fund
Satrix
World Equity
Tracker Fund
SIIP India
Opportunities
Fund
SIM Global
Equity Income
Fund
USD USD USD USD USD USD
Income 27 1,847 70,691 35,714 - 12,966
Sanlam
Strategic Bond
Fund
Sanlam
Accel Income
Fund
Satrix
North America
Equity Tracker
Fund
Satrix UK
Equity Tracker
Fund
Satrix Europe
(ex UK)
Equity Tracker
Fund
Sanlam Equity
Allocation
Fund
GBP GBP USD GBP EUR USD
Income - - 673 4,084 35,710 31,663
Satrix
Emerging
Market Equity
Tracker Fund
Sanlam
Managed Risk
Fund
Sanlam Private
Wealth Global
High Quality
Fund
Sanlam FOUR
US Dividend
Income Fund
High Street
Global
Balanced Fund
Sanlam
FOUR Active
European
(ex UK) Equity
Fund
USD USD GBP USD USD GBP
Income 897 - 5,100 - - -
Sanlam FOUR
Global Equity
Fund
Sanlam FOUR
Stable Global
Equity Fund
Sanlam FOUR
Active UK
Equity Fund
Sanlam FOUR
Multi-Strategy
Fund
Anchor Global
Capital Plus
Fund
Bridge Global
Equity Income
Growth Fund
GBP GBP GBP GBP USD USD
Income - - - - 400 -
Anchor Global
Equity Fund
Bridge Global
Managed
Growth Fund
SIM Global
Emerging
Markets Fund
ABSA Africa
Equity Fund
Sanlam Centre
American Select
Equity Fund
Sanlam Japan
Equity Fund
USD USD USD USD USD USD
Income 47 - 157 - - -

SANLAM UNIVERSAL FUNDS PLC
456
NOTES TO AND FORMING PART OF THE UNAUDITED CONDENSED INTERIM FINANCIAL STATEMENTS (CONTINUED) for the six months ended 30 June 2017
13 Securities lending activities (continued)
The Funds received income as follows under the terms of those agreements for the period ended 30 June 2017: (continued)
Sanlam Global
Convertible
Securities Fund
Sanlam Centre
Active US
Treasury Fund
Autus Global
Equity Fund
USD USD USD
Income - - -
Summary of collateral as at 30 June 2017:
Sanlam Centre
Global
Select Equity
Fund
Bridge
Global
Property
Income Fund
P-Solve
Inflation Plus
Fund
Sanlam
African
Frontiers
Market Fund
USD USD GBP USD
Aggregate value of securities on loan at the period end - - 139,747 4,631
Aggregate value of collateral held in respect of the loans - - 150,417 5,833
Collateral % - - 107.64% 125.95%
Sanlam
Global
Best Ideas
Fund
Sanlam
Global
Bond Fund
Sanlam
Global
Financial
Fund
Sanlam
Global
Property Fund
USD USD USD USD
Aggregate value of securities on loan at the period end - - - -
Aggregate value of collateral held in respect of the loans - - - -
Collateral % - - - -
Sanlam
World
Equity Fund
Satrix
World Equity
Tracker Fund
SIIP India
Opportunities
Fund
SIM Global
Equity Income
Fund
USD USD USD USD
Aggregate value of securities on loan at the period end 1,781,029 2,587,487 - -
Aggregate value of collateral held in respect of the loans 2,015,858 2,886,421 - -
Collateral % 113.19% 111.55% - -
Sanlam
Strategic
Bond Fund
Sanlam
Accel Income
Fund
Satrix North
America
Equity Tracker
Fund
Satrix UK
Equity Tracker
Fund
GBP GBP USD GBP
Aggregate value of securities on loan at the period end - - 201,717 379,184
Aggregate value of collateral held in respect of the loans - - 243,368 477,565
Collateral % - - 120.65% 125.95%
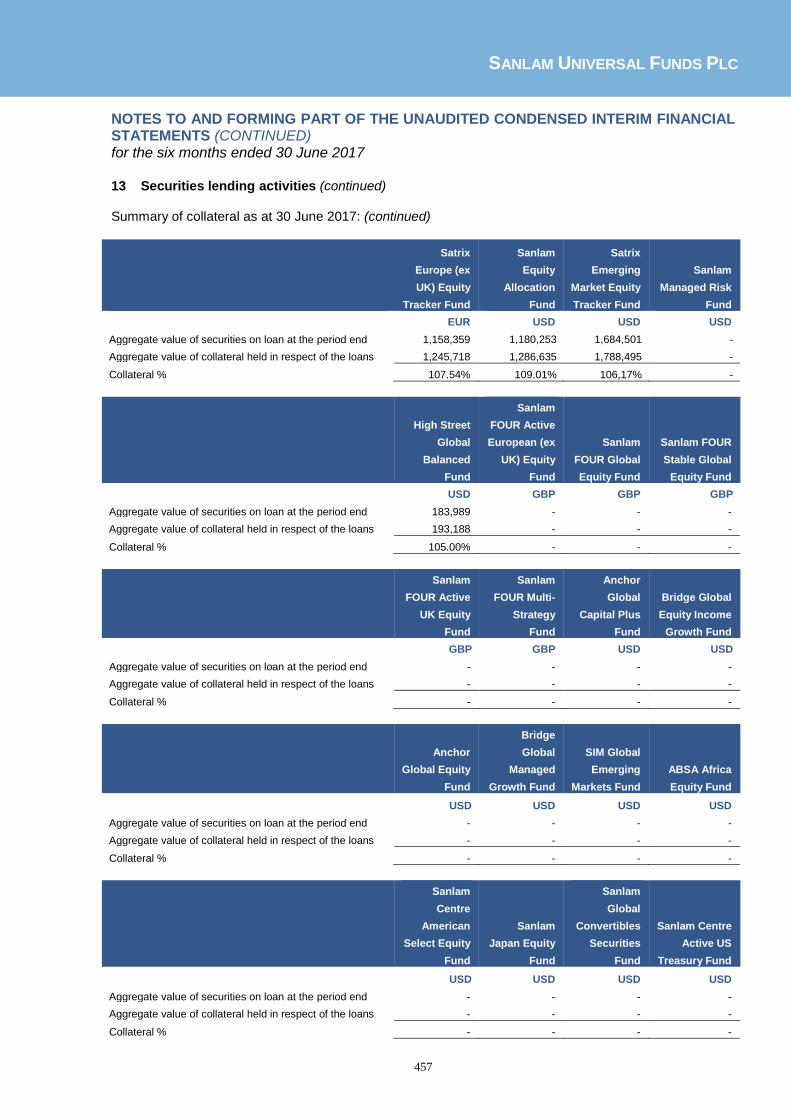
SANLAM UNIVERSAL FUNDS PLC
457
NOTES TO AND FORMING PART OF THE UNAUDITED CONDENSED INTERIM FINANCIAL STATEMENTS (CONTINUED) for the six months ended 30 June 2017
13 Securities lending activities (continued) Summary of collateral as at 30 June 2017: (continued)
Satrix
Europe (ex
UK) Equity
Tracker Fund
Sanlam
Equity
Allocation
Fund
Satrix
Emerging
Market Equity
Tracker Fund
Sanlam
Managed Risk
Fund
EUR USD USD USD
Aggregate value of securities on loan at the period end 1,158,359 1,180,253 1,684,501 -
Aggregate value of collateral held in respect of the loans 1,245,718 1,286,635 1,788,495 -
Collateral % 107.54% 109.01% 106,17% -
High Street
Global
Balanced
Fund
Sanlam
FOUR Active
European (ex
UK) Equity
Fund
Sanlam
FOUR Global
Equity Fund
Sanlam FOUR
Stable Global
Equity Fund
USD GBP GBP GBP
Aggregate value of securities on loan at the period end 183,989 - - -
Aggregate value of collateral held in respect of the loans 193,188 - - -
Collateral % 105.00% - - -
Sanlam
FOUR Active
UK Equity
Fund
Sanlam
FOUR Multi-
Strategy
Fund
Anchor
Global
Capital Plus
Fund
Bridge Global
Equity Income
Growth Fund
GBP GBP USD USD
Aggregate value of securities on loan at the period end - - - -
Aggregate value of collateral held in respect of the loans - - - -
Collateral % - - - -
Anchor
Global Equity
Fund
Bridge
Global
Managed
Growth Fund
SIM Global
Emerging
Markets Fund
ABSA Africa
Equity Fund
USD USD USD USD
Aggregate value of securities on loan at the period end - - - -
Aggregate value of collateral held in respect of the loans - - - -
Collateral % - - - -
Sanlam
Centre
American
Select Equity
Fund
Sanlam
Japan Equity
Fund
Sanlam
Global
Convertibles
Securities
Fund
Sanlam Centre
Active US
Treasury Fund
USD USD USD USD
Aggregate value of securities on loan at the period end - - - -
Aggregate value of collateral held in respect of the loans - - - -
Collateral % - - - -

SANLAM UNIVERSAL FUNDS PLC
458
NOTES TO AND FORMING PART OF THE UNAUDITED CONDENSED INTERIM FINANCIAL STATEMENTS (CONTINUED) for the six months ended 30 June 2017
13 Securities lending activities (continued)
Summary of collateral as at 30 June 2017: (continued)
Autus Global
Equity Fund
USD
Aggregate value of securities on loan at the period end -
Aggregate value of collateral held in respect of the loans -
Collateral % -
The Funds incurred the following costs and fees in relation to securities lending activities for the period
ended 30 June 2016:
Sanlam
Centre Global
Select Equity
Fund
Bridge Global
Property
Income Fund
P-Solve
Inflation Plus
Fund
Sanlam
African
Frontiers
Market Fund
Sanlam Global
Best Ideas
Fund
Sanlam Global
Bond Fund
USD USD GBP USD USD USD
Securities lending
sub-agent fees 513 - 198 9 2,596 -
Manager fees 1,027 - 397 19 5,193 -
Sanlam
Global
Financial
Fund
Sanlam Global
Property Fund
Sanlam
Strategic
Cash Fund
Sanlam World
Equity Fund
Satrix
World Equity
Tracker Fund
SIIP India
Opportunities
Fund
USD USD USD USD USD USD
Securities lending
sub-agent fees 3,471 359 - 47,800 3,874 -
Manager fees 6,941 719 - 95,600 7,747 -
SIM Global
Equity
Income Fund
Sanlam
Strategic
Bond Fund
Sanlam Accel
Income Fund
Satrix North
America
Equity Tracker
Fund
Satrix UK
Equity Tracker
Fund
Satrix Europe
(ex UK)
Equity Tracker
Fund
USD GBP GBP USD GBP EUR
Securities lending
sub-agent fees 247 - - 42 74 2,718
Manager fees 495 - - 85 148 5,437
Sanlam
Equity
Allocation
Fund
Satrix
Emerging
Market Equity
Tracker Fund
Sanlam
Managed Risk
Fund
Sanlam P2
Strategies UK
Fund
Sanlam P2
Strategies
North America
Fund
Sanlam P2
Strategies
Emerging
Market Fund
USD USD USD GBP USD USD
Securities lending
sub-agent fees 1,689 204 - - - -
Manager fees 3,379 409 - - - -

SANLAM UNIVERSAL FUNDS PLC
459
NOTES TO AND FORMING PART OF THE UNAUDITED CONDENSED INTERIM FINANCIAL STATEMENTS (CONTINUED) for the six months ended 30 June 2017
13 Securities lending activities (continued)
The Funds incurred the following costs and fees in relation to securities lending activities for the period
ended 30 June 2016 (continued):
Sanlam P2
Strategies
Europe
(ex-UK)
Fund
Sanlam
Private Wealth
Global High
Quality Fund
Sanlam FOUR
US Dividend
Income Fund
High Street
Global
Balanced
Fund
Sanlam FOUR
Active
European (ex
UK) Equity
Fund
Sanlam FOUR
Global Equity
Fund
EUR GBP GBP USD GBP GBP
Securities lending
sub-agent fees - 52 - - - -
Manager fees - 103 - - - -
Sanlam
FOUR Stable
Global
Equity Fund
Sanlam FOUR
Active UK
Equity Fund
Sanlam FOUR
Multi-Strategy
Fund
Anchor Global
Capital Plus
Fund
Bridge Global
Equity Income
Growth Fund
Anchor Global
Equity Fund
GBP GBP GBP USD USD USD
Securities lending
sub-agent fees - - - 202 - 12
Manager fees - - - 404 - 23
Bridge Global
Managed Fund
SIM Global
Emerging
Market Fund
Sanlam FOUR
UK Income
Opportunities
Fund
USD USD GBP
Securities lending sub-agent fees - - -
Manager fees - - -
Sanlam Centre
Global
Select Equity
Fund
Bridge
Global Property
Income Fund
P-Solve
Inflation Plus
Fund
Sanlam African
Frontiers
Market Fund
Sanlam Global
Best Ideas
Fund
Sanlam Global
Bond Fund
USD USD GBP USD USD USD
Income 3,609 - 1,212 88 30,427 -
The Funds received income as follows under the terms of those agreements for the period ended 30 June 2016:
Sanlam Global
Financial
Fund
USD
Sanlam Global
Property Fund
USD
Sanlam
Strategic Cash
Fund
USD
Sanlam World
Equity Fund
USD
Satrix
World Equity
Tracker Fund
USD
SIIP India
Opportunities
Fund
USD
USD USD USD USD USD USD
Income 17,082 3,352 - 279,068 29,526 -

SANLAM UNIVERSAL FUNDS PLC
460
NOTES TO AND FORMING PART OF THE UNAUDITED CONDENSED INTERIM FINANCIAL STATEMENTS (CONTINUED) for the six months ended 30 June 2017
13 Securities lending activities (continued)
The Funds received income as follows under the terms of those agreements for the period ended 30 June 2016 (continued):
SIM Global
Equity Income
Fund
Sanlam
Strategic Bond
Fund
Sanlam
Accel Income
Fund
Satrix
North America
Equity Tracker
Fund
Satrix UK
Equity Tracker
Fund
Satrix Europe
(ex UK)
Equity Tracker
Fund
USD GBP GBP USD GBP EUR
Income 2,773 - - 357 2,852 18,512
Sanlam Equity
Allocation
Fund
Satrix
Emerging
Market Equity
Tracker Fund
Sanlam
Managed Risk
Fund
Sanlam P2
Strategies
North America
Fund
Sanlam P2
Strategies UK
Fund
Sanlam P2
Strategies
Europe
(ex UK) Fund
USD USD USD USD GBP EUR
Income 9,376 1,453 - - - -
Sanlam P2
Strategies
Emerging
Market Fund
Sanlam Private
Wealth Global
High Quality
Fund
Sanlam FOUR
US Dividend
Income Fund
High Street
Global Balanced
Fund
Sanlam
FOUR Active
European
(ex UK) Equity
Fund
Sanlam FOUR
Global Equity
Fund
USD GBP USD USD GBP GBP
Income - 390 - - - -
Sanlam FOUR
Stable Global
Equity Fund
Sanlam FOUR
Active UK
Equity Fund
Sanlam FOUR
Multi-Strategy
Fund
Anchor Global
Capital Plus
Fund
Bridge Global
Equity Income
Growth Fund
Anchor Global
Equity Fund
GBP GBP GBP USD USD USD
Income - - - 1,718 - 82
Bridge Global
Managed Growth
Fund
SIM Global
Emerging
Markets Fund
Sanlam FOUR
UK Income
Opportunities
Fund
USD USD GBP
Income - - - Summary of collateral as at 30 June 2016:
Sanlam Centre
Global
Select Equity
Fund
Bridge
Global
Property
Income Fund
P-Solve
Inflation Plus
Fund
Sanlam
African
Frontiers
Market Fund
USD USD GBP USD
Aggregate value of securities on loan at the period end - - 794,367 92,984
Aggregate value of collateral held in respect of the loans - - 834,085 97,634
Collateral % - - 105.00% 105.00%

SANLAM UNIVERSAL FUNDS PLC
461
NOTES TO AND FORMING PART OF THE UNAUDITED CONDENSED INTERIM FINANCIAL STATEMENTS (CONTINUED) for the six months ended 30 June 2017
13 Securities lending activities (continued)
Summary of collateral as at 30 June 2016 (continued):
Sanlam
Global
Best Ideas
Fund
Sanlam
Global
Bond Fund
Sanlam
Global
Financial
Fund
Sanlam
Global
Property Fund
USD USD USD USD
Aggregate value of securities on loan at the period end 2,320,152 - 2,093,482 460,526
Aggregate value of collateral held in respect of the loans 2,436,161 - 2,198,156 483,552
Collateral % 105.00% - 105.00% 105.00%
Sanlam
Strategic
Cash Fund
Sanlam
World
Equity Fund
Satrix
World Equity
Tracker Fund
SIIP India
Opportunities
Fund
USD USD USD USD
Aggregate value of securities on loan at the period end - 13,832,282 1,478,761 -
Aggregate value of collateral held in respect of the loans - 16,198,361 1,552,700 -
Collateral % - 117.11% 105.00% -
SIM Global
Equity
Income
Fund
Sanlam
Strategic
Bond Fund
Sanlam
Accel Income
Fund
Satrix
North America
Equity Tracker
Fund
USD GBP GBP USD
Aggregate value of securities on loan at the period end - - - -
Aggregate value of collateral held in respect of the loans - - - -
Collateral % - - - -
Satrix UK
Equity
Tracker
Fund
Satrix
Europe
(ex UK) Equity
Tracker Fund
Sanlam
Equity
Allocation
Fund
Satrix
Emerging
Market Equity
Tracker Fund
GBP EUR USD USD
Aggregate value of securities on loan at the period end - 249,623 620,423 6,825
Aggregate value of collateral held in respect of the loans - 292,665 651,445 7,167
Collateral % - 117.24% 105.00% 105.00%
Sanlam
Managed
Risk Fund
Sanlam P2
Strategies
North
America
Fund
Sanlam P2
Strategies
UK
Fund
Sanlam P2
Strategies
Europe
(ex UK) Fund
USD USD GBP EUR
Aggregate value of securities on loan at the period end - - - -
Aggregate value of collateral held in respect of the loans - - - -
Collateral % - - - -

SANLAM UNIVERSAL FUNDS PLC
462
NOTES TO AND FORMING PART OF THE UNAUDITED CONDENSED INTERIM FINANCIAL STATEMENTS (CONTINUED) for the six months ended 30 June 2017
13 Securities lending activities (continued) Summary of collateral as at 30 June 2016 (continued):
Sanlam P2
Strategies
Emerging
Market Fund
High Street
Global
Balanced
Fund
Sanlam
FOUR Active
European (ex
UK) Equity
Fund
Sanlam FOUR
Global Equity
Fund
USD USD GBP GBP
Aggregate value of securities on loan at the period end - - - -
Aggregate value of collateral held in respect of the loans - - - -
Collateral % - - - -
Sanlam
FOUR Stable
Global Equity
Fund
Sanlam
FOUR Active
UK Equity
Fund
Sanlam
FOUR Multi-
Strategy
Fund
Anchor Global
Capital Plus
Fund
GBP GBP GBP USD
Aggregate value of securities on loan at the period end - - - -
Aggregate value of collateral held in respect of the loans - - - -
Collateral % - - - -
Bridge
Global Equity
Income
Growth Fund
Anchor
Global Equity
Fund
Bridge
Global
Managed
Growth Fund
SIM Global
Emerging
Markets Fund
USD USD USD USD
Aggregate value of securities on loan at the period end - - - -
Aggregate value of collateral held in respect of the loans - - - -
Collateral % - - - -
Sanlam FOUR
UK Income
Opportunities
Fund
GBP
Aggregate value of securities on loan at the period end -
Aggregate value of collateral held in respect of the loans -
Collateral % -

SANLAM UNIVERSAL FUNDS PLC
463
NOTES TO AND FORMING PART OF THE UNAUDITED CONDENSED INTERIM FINANCIAL STATEMENTS (CONTINUED) for the six months ended 30 June 2017
14 Fees of underlying investments
The table below and overleaf summarises the collective investment schemes in which the Funds of the Company hold investments at 30 June 2017 and details the investment management fees and incentive fees incurred relating to these collective investment schemes:
Period ended 30 June 2017
Collective Investment Scheme Name
Collective Investment
Scheme Type
Investment Management
Fees (%)1
Incentive Fees (%)
2 Fund Name
Sanlam Accel Income Fund Artemis Global Income Fund UK UCITS 0.75% -
Sanlam Accel Income Fund Artemis Income Fund UK UCITS 0.75% -
Sanlam Accel Income Fund Artemis Strategic Bond Fund UK UCITS 0.50% -
Sanlam Accel Income Fund BlackRock Continental European Income Fund
UK UCITS 0.75% -
Sanlam World Equity Fund BlackRock Global Funds - Asian Growth Leaders Fund X2
Luxembourg UCITS
0.00% -
Sanlam Accel Income Fund Cazenove Strategic Bond Fund UK UCITS 0.50% -
P-Solve Inflation Plus Fund DB X-Trackers S&P 500 UCITS ETF 0.15% -
P-Solve Inflation Plus Fund ETFS Brent 1Mth Oil Securities Fund
ETF 0.49% -
Sanlam Accel Income Fund Fidelity Enhanced Income Fund UK UCITS 0.75% -
Sanlam Accel Income Fund Fidelity Institutional Funds ICVC - UK Corporate Bond Fund
UK UCITS 0.35% -
P-Solve Inflation Plus Fund Finsbury High Income Fund Irish UCITS 1.00% -
P-Solve Inflation Plus Fund First State Investments ICVC - Asia Pacific Leaders Fund
UK UCITS 0.85% -
P-Solve Inflation Plus Fund GLG Treasury Plus Fund UK OEIC 0.25% 30.00%
Sanlam Accel Income Fund Guinness Asset Management Fund Plc
Irish UCITS 0.25% -
Sanlam Accel Income Fund Henderson UK & Europe Funds - Strategic Bond Fund
UK UCITS 0.60% -
Sanlam Accel Income Fund Henderson UK & Europe Funds - UK Equity Income Fund
UK UCITS 0.75% -
P-Solve Inflation Plus Fund IFDC - Japan Dynamic Fund Luxembourg
UCITS 1.75% 15.00%
P-Solve Inflation Plus Fund Institutional Cash Series Plc Irish UCITS 0.13% -
Sanlam Private Wealth Global High Quality Fund
Institutional Cash Series Plc Irish UCITS 0.13% -
Sanlam Private Wealth Global High Quality Fund
Institutional Sterling Liquidity Heritage
Irish UCITS 0.13% -
Sanlam Accel Income Fund Invesco Perpetual Fixed Interest - Corporate Bond Fund
UK UCITS 0.91% -
Anchor Global Capital Plus Fund iShares $ Short Corporate Bond ETF
ETF 0.20% -
Anchor Global Capital Plus Fund iShares Asia Property Yield UCITS ETF
ETF 0.59% -
Anchor Global Capital Plus Fund iShares Barclays TIPS Bond Fund ETF
ETF 0.20% -
Anchor Global Capital Plus Fund iShares CMBS ETF ETF 0.25% -
Anchor Global Capital Plus Fund iShares Core Euro Corporated Bond ETF
ETF 0.00% -
1 % of net assets
2 % of the gains in net assets above the benchmark

SANLAM UNIVERSAL FUNDS PLC
464
NOTES TO AND FORMING PART OF THE UNAUDITED CONDENSED INTERIM FINANCIAL STATEMENTS (CONTINUED)for the six months ended 30 June 2017 14 Fees of underlying investments (continued)
Period ended 30 June 2017 (continued)
Collective Investment Scheme Name
Collective Investment
Scheme Type
Investment Management
Fees (%)1
Incentive Fees (%)
2 Fund Name
P-Solve Inflation Plus Fund iShares Core S&P Small Cap ETF ETF 0.07% -
Bridge Global Managed Growth Fund
iShares Core US Aggregate Bond ETF ETF 0.08% -
Bridge Global Managed Growth Fund
iShares Core US Credit Bond ETF
ETF 0.15% -
P-Solve Inflation Plus Fund iShares Developed Real Estate Index Fund
Irish UCITS 1.00% -
P-Solve Inflation Plus Fund iShares Euro Stoxx UCITS ETF ETF 0.20% -
Bridge Global Managed Growth Fund
iShares Global High Yield Corporate Bond ETF
ETF 0.55% -
Anchor Global Capital Plus Fund iShares iBoxx Investment Grade Corporate Bond ETF
ETF 0.15% -
Satrix World Equity Tracker Fund iShares MSCI Canada ETF ETF 0.48% -
Satrix World Equity Tracker Fund iShares MSCI EAFE Index ETF ETF 0.33% -
Sanlam FOUR Multi-Strategy Fund iShares MSCI Emerging Markets ETF
ETF 0.71% -
Anchor Global Capital Plus Fund iShares MSCI Japan ETF ETF 0.59% -
P-Solve Inflation Plus Fund iShares MSCI Japan Monthly GBP Hedged ETF
ETF 0.64% -
Satrix Emerging Markets Equity Tracker Fund
iShares MSCI Russia Capped ETF
ETF 0.62% -
P-Solve Inflation Plus Fund iShares MSCI World Islamic ETF
ETF 0.60% -
Satrix World Equity Tracker Fund iShares S&P 500 Index ETF ETF 0.07% -
Sanlam Accel Income Fund JPMorgan Fund ICVC - Sterling Corporate Bond Fund
UK UCITS 0.50% -
Sanlam Accel Income Fund Jupiter Strategic Bond UK UCITS 0.50% -
Sanlam Accel Income Fund Kames ICVC - High Yield Bond Fund
UK UCITS 1.00% -
Sanlam Accel Income Fund Kames ICVC - Sterling Corporate Bond Fund
UK UCITS 0.75% -
Sanlam Accel Income Fund Lazard Global Equity Income Fund
UK UCITS 0.75% -
Anchor Global Capital Plus Fund Lyxor ETF Commodities CRB Non-Energy USD
ETF 0.35% -
Sanlam Accel Income Fund M&G Short Dated Corporate Bond Fund
UK UCITS 0.40% -
P-Solve Inflation Plus Fund Marshall Wace UCITS Funds PLC - MW Liquid Alpha Fund
Irish UCITS 1.50% -
Sanlam Accel Income Fund Muzinich Emerging Markets Short Duration Fund
Irish UCITS 0.80% -
P-Solve Inflation Plus Fund Nomura US Higher Yield Bond Fund
Irish UCITS 0.50% -
Sanlam Accel Income Fund PFS Chelverton UK Equity Fund UK UCITS 0.75% -
Sanlam Accel Income Fund PFS Twenty Four Dynamic Bond Fund UK UCITS 0.75% -
P-Solve Inflation Plus Fund PIMCO Global Investors Irish UCITS 0.89% -
1 % of net assets
2 % of the gains in net assets above the benchmark

SANLAM UNIVERSAL FUNDS PLC
465
NOTES TO AND FORMING PART OF THE UNAUDITED CONDENSED INTERIM FINANCIAL STATEMENTS (CONTINUED)for the six months ended 30 June 2017
14 Fees of underlying investments (continued)
Period ended 30 June 2017 (continued)
Collective Investment Scheme Name
Collective Investment
Scheme Type
Investment Management
Fees (%)1
Incentive Fees (%)
2 Fund Name
P-Solve Inflation Plus Fund PIMCO Hi-Yield Bond Fund Irish UCITS 0.55% -
Anchor Global Capital Plus Fund RBS Market Access RICI Agriculture Index ETF ETF 0.25% -
Sanlam Accel Income Fund Sanlam FOUR US Dividend Income Fund Irish UCITS 0.75% -
Sanlam Accel Income Fund Sanlam Strategic Bond Fund Irish UCITS 0.35% -
Sanlam Managed Risk Fund Satrix World Equity Tracker Fund Irish UCITS 0.00% -
Sanlam Accel Income Fund Schroder Income Maximiser Fund UK UCITS 0.75% -
Sanlam Accel Income Fund Schroder UK Alpha Fund UK UCITS 0.75% -
P-Solve Inflation Plus Fund SPDR Trust Series 1 ETF ETF 0.06% -
P-Solve Inflation Plus Fund T. Rowe Price Funds SICAV - Dynamic Global Bond Fund
Luxembourg
UCITS 0.50% -
P-Solve Inflation Plus Fund T.Rowe Price Funds SICAV- Global Emerging Market Fund
Luxembourg
UCITS 0.65% -
Sanlam Accel Income Fund Trojan Investment Funds - Trojan Income Fund UK UCITS 1.00% -
Anchor Global Capital Plus Fund UBS ETFs plc - CMCI Composite SF UCITS ETF ETF 0.37% -
Sanlam Accel Income Fund Unicorn Investment Funds - UK Income Fund UK UCITS 0.75% -
P-Solve Inflation Plus Fund Vanguard Emerging Market ETF
ETF 0.07% -
P-Solve Inflation Plus Fund Vanguard FTSE 250 ETF ETF 0.10% -
P-Solve Inflation Plus Fund Vanguard FTSE Developed Markets Index Fund ETF
ETF 0.05% -
P-Solve Inflation Plus Fund Vanguard Global ex-U.S. Real Estate Index Fund ETF
ETF 0.11% -
Sanlam Accel Income Fund Vanguard Investment Series - UK Government Bond Index Fund
Irish UCITS 0.15% -
P-Solve Inflation Plus Fund Vanguard REIT Index Fund ETF ETF 0.11% -
P-Solve Inflation Plus Fund Vanguard S&P 500 ETF ETF 0.03% -
Autus Global Equity Fund Vanguard S&P 500 Index Fund ETF
ETF 0.03% -
Anchor Global Capital Plus Fund Vanguard Short-term Corporate Bond ETF
ETF 0.10% -
Autus Global Equity Fund Vanguard Small-Cap Index Fund ETF
ETF 0.05% -
P-Solve Inflation Plus Fund Vanguard Small-Cap Value Index Fund ETF
ETF 0.06% -
P-Solve Inflation Plus Fund Vanguard Total Stock Market Index Fund ETF
ETF 0.04% -
Sanlam Accel Income Fund Veritas Funds Plc - Global Equity Income Fund
UK UCITS 0.75% -
P-Solve Inflation Plus Fund Wisdom Tree German Equity ETF
ETF 0.35% -
1 % of net assets
2 % of the gains in net assets above the benchmark

SANLAM UNIVERSAL FUNDS PLC
466
NOTES TO AND FORMING PART OF THE UNAUDITED CONDENSED INTERIM FINANCIAL STATEMENTS (CONTINUED)for the six months ended 30 June 2017
14 Fees of underlying investments (continued) The table below and overleaf summarises the collective investment schemes in which the Funds of the Company hold investments at 31 December 2016 and details the investment management fees and incentive fees incurred relating to these collective investment schemes:
Year ended 31 December 2016
Collective Investment Scheme Name
Collective Investment
Scheme Type
Investment Management
Fees (%)1
Incentive Fees (%)
2 Fund Name
Sanlam Accel Income Fund Artemis Global Income Fund UK UCITS 0.75% -
Sanlam Accel Income Fund Artemis Income Fund UK UCITS 0.75% -
Sanlam Accel Income Fund Artemis Strategic Bond Fund UK UCITS 0.50% -
Sanlam Accel Income Fund BlackRock Continental European Income Fund UK UCITS 0.75% -
Sanlam Accel Income Fund Cazenove Strategic Bond Fund UK UCITS 0.50% -
P-Solve Inflation Plus Fund DB X-Trackers S&P 500 UCITS ETF 0.15% -
P-Solve Inflation Plus Fund ETFS Brent 1Mth Oil Securities Fund ETF 0.49% -
Sanlam Accel Income Fund Fidelity Enhanced Income Fund UK UCITS 0.75% -
Sanlam Accel Income Fund Fidelity Institutional Funds ICVC - UK Corporate Bond Fund UK UCITS 0.35% -
P-Solve Inflation Plus Fund Finsbury High Income Fund Irish UCITS 1.00% -
P-Solve Inflation Plus Fund First State Investments ICVC - Asia Pacific Leaders Fund UK UCITS 0.85% -
P-Solve Inflation Plus Fund GLG Treasury Plus Fund UK OEIC 0.25% 30.00%
Sanlam Accel Income Fund Guinness Asset Management Fund Plc Irish UCITS 0.25% -
Sanlam Accel Income Fund Henderson UK & Europe Funds - Strategic Bond Fund UK UCITS 0.60% -
Sanlam Accel Income Fund Henderson UK & Europe Funds - UK Equity Income Fund UK UCITS 0.75% -
P-Solve Inflation Plus Fund IFDC - Japan Dynamic Fund Luxembourg
UCITS 1.75% 15.00%
P-Solve Inflation Plus Fund Institutional Cash Series Plc Irish UCITS 0.13% -
P-Solve Inflation Plus Fund Insight Liquidity Funds Plc Irish UCITS 0.10% -
Sanlam Private Wealth Global High Quality Fund Institutional Cash Series Plc Irish UCITS 0.13% -
Sanlam Private Wealth Global High Quality Fund
Institutional Sterling Liquidity Heritage Irish UCITS 0.13% -
Sanlam Accel Income Fund Invesco Perpetual Fixed Interest - Corporate Bond Fund UK UCITS 0.91% -
Anchor Global Capital Plus Fund iShares Barclays TIPS Bond Fund ETF ETF 0.20% -
Anchor Global Capital Plus Fund iShares Currency Hedged MSCI Germany ETF ETF 0.53% -
Anchor Global Capital Plus Fund iShares CMBS ETF ETF 0.25% -
Anchor Global Capital Plus Fund iShares Core Euro Corporated Bond ETF ETF 0.00% -
Bridge Global Managed Growth Fund
iShares Core US Aggregate Bond ETF ETF 0.08% -
Bridge Global Managed Growth Fund
iShares Core US Credit Bond ETF ETF 0.15% -
1 % of net assets
2 % of the gains in net assets above the benchmark

SANLAM UNIVERSAL FUNDS PLC
467
NOTES TO AND FORMING PART OF THE UNAUDITED CONDENSED INTERIM FINANCIAL STATEMENTS (CONTINUED)for the six months ended 30 June 2017
14 Fees of underlying investments (continued)
Year ended 31 December 2016 (continued)
Collective Investment Scheme Name
Collective Investment
Scheme Type
Investment Management
Fees (%)1
Incentive Fees (%)
2 Fund Name
Anchor Global Capital Plus Fund iShares Core UK Gilt ETF ETF 0.20% -
P-Solve Inflation Plus Fund iShares Core S&P Small Cap ETF ETF 0.07% -
Anchor Global Capital Plus Fund iShares Cohen & Steers REIT ETF ETF 0.35% -
Bridge Global Managed Growth Fund
iShares Global High Yield Corporate Bond ETF ETF 0.55% -
Anchor Global Capital Plus Fund iShares Global REIT ETF ETF 0.14% -
Anchor Global Capital Plus Fund iShares iBoxx Investment Grade Corporate Bond ETF ETF 0.15% -
Anchor Global Capital Plus Fund iShares Italy Government Bond ETF ETF 0.20% -
Satrix World Equity Tracker Fund iShares MSCI Canada ETF ETF 0.48% -
Satrix World Equity Tracker Fund iShares MSCI EAFE Index ETF ETF 0.33% -
Anchor Global Capital Plus Fund iShares MSCI Japan ETF ETF 0.59% -
P-Solve Inflation Plus Fund iShares MSCI Japan Monthly GBP Hedged ETF ETF 0.64% -
Satrix Emerging Markets Equity Tracker Fund
iShares MSCI Russia Capped ETF ETF 0.62% -
P-Solve Inflation Plus Fund iShares MSCI World Islamic ETF ETF 0.60% -
Satrix World Equity Tracker Fund iShares S&P 500 Index ETF ETF 0.07% -
Anchor Global Capital Plus Fund iShares Spain Government Bond ETF ETF 0.20% -
Anchor Global Capital Plus Fund iShares Treasury Bond 3-7yr ETF ETF 0.20% -
Anchor Global Capital Plus Fund iShares $ Short Corporate Bond ETF ETF 0.20% -
Sanlam Accel Income Fund JPMorgan Fund ICVC - Sterling Corporate Bond Fund UK UCITS 0.50% -
Sanlam Accel Income Fund Jupiter Strategic Bond UK UCITS 0.50% -
Sanlam Accel Income Fund Kames ICVC - High Yield Bond Fund UK UCITS 1.00% -
Sanlam Accel Income Fund Kames ICVC - Sterling Corporate Bond Fund UK UCITS 0.75% -
Sanlam Accel Income Fund Lazard Global Equity Income Fund UK UCITS 0.75% -
Anchor Global Capital Plus Fund Lyxor ETF Commodities CRB Non-Energy USD ETF 0.35% -
Sanlam Accel Income Fund M&G Short Dated Corporate Bond Fund UK UCITS 0.40% -
Sanlam Accel Income Fund Muzinich Emerging Markets Short Duration Fund Irish UCITS 0.80% -
P-Solve Inflation Plus Fund Nomura US Higher Yield Bond Fund Irish UCITS 0.50% -
1 % of net assets
2 % of the gains in net assets above the benchmark

SANLAM UNIVERSAL FUNDS PLC
468
NOTES TO AND FORMING PART OF THE UNAUDITED CONDENSED INTERIM FINANCIAL STATEMENTS (CONTINUED) for the six months ended 30 June 2017
14 Fees of underlying investments (continued)
Year ended 31 December 2016 (continued)
Collective Investment Scheme Name
Collective Investment
Scheme Type
Investment Management
Fees (%)1
Incentive Fees (%)
2 Fund Name
Sanlam Accel Income Fund PFS Chelverton UK Equity Fund UK UCITS 0.75% -
Sanlam Accel Income Fund PFS Twenty Four Dynamic Bond Fund UK UCITS 0.75% -
P-Solve Inflation Plus Fund PIMCO Global Investors Irish UCITS 0.89% -
P-Solve Inflation Plus Fund PIMCO Hi-Yield Bond Fund Irish UCITS 0.55% -
Anchor Global Capital Plus Fund PowerShares Financial Preferred Portfolio ETF 0.50% -
Anchor Global Capital Plus Fund RBS Market Access RICI Agriculture Index ETF ETF 0.25% -
Sanlam Accel Income Fund Sanlam Strategic Bond Fund Irish UCITS 0.35% -
Sanlam Accel Income Fund Sanlam FOUR US Dividend Income Fund Irish UCITS 0.75% -
Sanlam Managed Risk Fund Satrix World Equity Tracker Fund Irish UCITS 0.00% -
Sanlam Accel Income Fund Schroder Income Maximiser Fund UK UCITS 0.75% -
Sanlam Accel Income Fund Schroder UK Alpha Fund UK UCITS 0.75% -
P-Solve Inflation Plus Fund SPDR Trust Series 1 ETF ETF
0.06% -
P-Solve Inflation Plus Fund T.Rowe Price Funds SICAV- Global Emerging Market Fund
Luxembourg
UCITS 0.65% -
Sanlam Accel Income Fund Trojan Investment Funds - Trojan Income Fund UK UCITS 1.00% -
Sanlam Accel Income Fund Unicorn Investment Funds - UK Income Fund UK UCITS 0.75% -
Anchor Global Capital Plus Fund UBS ETFs plc - CMCI Composite SF UCITS ETF ETF 0.37% -
P-Solve Inflation Plus Fund Vanguard Emerging Market ETF ETF 0.07% -
P-Solve Inflation Plus Fund Vanguard FTSE 250 ETF ETF 0.10% -
Anchor Global Capital Plus Fund Vanguard Global ex- US Real Estate ETF ETF 0.19% -
Sanlam Accel Income Fund Vanguard Investment Series - UK Government Bond Index Fund Irish UCITS 0.15% -
P-Solve Inflation Plus Fund Vanguard S&P 500 ETF ETF 0.03% -
Anchor Global Capital Plus Fund Vanguard Short-term Corporate Bond ETF ETF 0.10% -
Sanlam Accel Income Fund Veritas Funds Plc - Global Equity Income Fund UK UCITS 0.75% -
Anchor Global Capital Plus Fund Wisdom Tree Europe Hedged Equity ETF ETF 0.58% -
P-Solve Inflation Plus Fund Wisdom Tree German Equity ETF ETF 0.35% -
1 % of net assets
2 % of the gains in net assets above the benchmark

SANLAM UNIVERSAL FUNDS PLC
469
NOTES TO AND FORMING PART OF THE UNAUDITED CONDENSED INTERIM FINANCIAL STATEMENTS (CONTINUED) for the six months ended 30 June 2017
15 Net asset value per share
Sanlam Centre Global Select Equity Fund
30 June 31 December 30 June
2017 2016 2016
Share class A
Net Asset Value - USD 9,249,819 USD 11,200,992
Number of Shares in Issue - 9,905,036 12,231,520
Net Asset Value per Share - USD 0.9339 USD 0.9157
Share class B
Net Asset Value - USD 1,760,300 USD 1,952,011
Number of Shares in Issue - 1,805,245 2,046,551
Net Asset Value per Share - USD 0.9751 USD 0.9538
Share class C (USD)
Net Asset Value - USD 25,822 USD 61,532
Number of Shares in Issue - 25,100 61,147
Net Asset Value per Share - USD 1.0288 USD 1.0063
Share class E
Net Asset Value - USD 24,689,065 USD 39,394,173
Number of Shares in Issue - 22,747,593 37,298,363
Net Asset Value per Share - USD 1.0853 USD 1.0562
Bridge Global Property Income Fund
30 June 31 December 30 June
2017 2016 2016
Share class Non – Distributing
Net Asset Value USD 36,207,151 USD 38,417,613 USD 41,248,291
Number of Shares in Issue 26,470,099 27,504,574 28,182,649
Net Asset Value per Share USD 1.3679 USD 1.3968 USD 1.4636
P-Solve Inflation Plus Fund
30 June 31 December 30 June
2017 2016 2016
Share class A
Net Asset Value GBP 19,072 GBP 38,473 GBP 35,178
Number of Shares in Issue 9,436 19,464 19,464
Net Asset Value per Share GBP 2.0211 GBP 1.9767 GBP 1.8074
Share class B
Net Asset Value GBP 8,153,768 GBP 7,684,532 GBP 6,743,199
Number of Shares in Issue 3,888,289 3,756,492 3,616,808
Net Asset Value per Share GBP 2.0970 GBP 2.0457 GBP 1.8644

SANLAM UNIVERSAL FUNDS PLC
470
NOTES TO AND FORMING PART OF THE UNAUDITED CONDENSED INTERIM FINANCIAL STATEMENTS (CONTINUED) for the six months ended 30 June 2017
15 Net asset value per share (continued)
P-Solve Inflation Plus Fund (continued)
30 June 31 December 30 June
2017 2016 2016
Share class B Accumulation
Net Asset Value - GBP 1,806 GBP 1,995,805
Number of Shares in Issue - 1,413 1,713,694 Net Asset Value per Share - GBP 1.2778 GBP 1.1646
Share class C
Net Asset Value GBP44,654,132 GBP 43,401,191 GBP 39,437,157
Number of Shares in Issue 29,517,022 29,330,550 29,330,550 Net Asset Value per Share GBP 1.5128 GBP 1.4797 GBP 1.3446
Share class D
Net Asset Value USD 25,267,297 USD 24,991,720 USD 25,467,898
Number of Shares in Issue 23,882,310 29,264,508 29,515,350
Net Asset Value per Share USD 1.0580 USD 0.8540 USD 0.8629
Share class G
Net Asset Value USD 26,577,982 USD 27,509,386 USD 27,899,578
Number of Shares in Issue 28,611,493 36,551,123 36,551,123
Net Asset Value per Share USD 0.9289 USD 0.7526 USD 0.7633
Sanlam African Frontiers Markets Fund
30 June 31 December 30 June
2017 2016 2016
Share class A
Net Asset Value USD 3,763,992 USD 122,663 USD 132,968
Number of Shares in Issue 3,495,733 140,397 149,874
Net Asset Value per Share USD 1.0767 USD 0.8737 USD 0.8872
Share class A (GBP)
Net Asset Value - - GBP 25,535
Number of Shares in Issue - - 29,689
Net Asset Value per Share - - GBP 0.8601
Share class C
Net Asset Value - - USD 4,960
Number of Shares in Issue - - 5,343
Net Asset Value per Share - - USD 0.9284
Share class C (GBP)
Net Asset Value - - GBP 42,076
Number of Shares in Issue - - 49,015
Net Asset Value per Share - - GBP 0.8585

SANLAM UNIVERSAL FUNDS PLC
471
NOTES TO AND FORMING PART OF THE UNAUDITED CONDENSED INTERIM FINANCIAL STATEMENTS (CONTINUED) for the six months ended 30 June 2017
15 Net asset value per share (continued)
Share class H
Net Asset Value USD 16,185,691 USD 13,070,989 USD 13,207,911
Number of Shares in Issue 17,122,483 17,194,833 17,260,889
Net Asset Value per Share USD 0.9453 0.7602 USD 0.7652
Share class I
Net Asset Value USD 90 USD 72 USD 73
Number of Shares in Issue 100 100 100
Net Asset Value per Share USD 0.9022 USD 0.7246 USD 0.7281
Share class A
Net Asset Value USD 17,678,255 USD 16,941,714 USD 21,390,421 Number of Shares in Issue 8,855,137 9,485,350 12,787,733
Net Asset Value per Share USD 1.9964 USD 1.7861 USD 1.6727
Share class A (EUR) Net Asset Value EUR 130 EUR 126 EUR 113
Number of Shares in Issue 112 112 112 Net Asset Value per Share EUR 1.1620 EUR 1.1303 EUR 1.0150
Share class C (GBP)
Net Asset Value GBP 7,858 GBP 14,197 GBP 42,361
Number of Shares in Issue 4,300 8,142 27,990
Net Asset Value per Share GBP 1.8273 GBP 1.7438 GBP 1.5134
Sanlam African Frontiers Markets Fund (continued)
30 June 31 December 30 June
2017 2016 2016
Sanlam Global Best Ideas Fund
30 June 31 December 30 June
2017 2016 2016
Share class A (GBP)
Net Asset Value GBP 91,679 GBP 81,456 GBP 71,182
Number of Shares in Issue 72,598 67,814 68,013
Net Asset Value per Share GBP 1.2628 GBP 1.2012 GBP 1.0466
Share class B
Net Asset Value USD 37,550,812 USD 34,350,642 USD 38,043,517
Number of Shares in Issue 17,555,269 18,008,127 21,365,204
Net Asset Value per Share USD 2.1390 USD 1.9075 USD 1.7806
Share class C
Net Asset Value USD 17,593,119 USD 15,926,584 USD 21,872,113
Number of Shares in Issue 8,127,223 8,254,384 12,147,672
Net Asset Value per Share USD 2.1647 USD 1.9295 USD 1.8005

SANLAM UNIVERSAL FUNDS PLC
472
NOTES TO AND FORMING PART OF THE UNAUDITED CONDENSED INTERIM FINANCIAL STATEMENTS (CONTINUED) for the six months ended 30 June 2017
15 Net asset value per share (continued)
Share class D
Net Asset Value USD 110 USD 98 USD 9,275,368
Number of Shares in Issue 98 98 9,971,940
Net Asset Value per Share USD 1.1244 USD 0.9975 USD 0.9301
Share class E
Net Asset Value USD 39,662,402 USD 35,312,049 USD 69,833,113
Number of Shares in Issue 30,055,154 30,137,936 64,126,672
Net Asset Value per Share USD 1.3197 USD 1.1717 USD 1.0890
Share class F
Net Asset Value USD 7,895 USD 7,062 USD 6,614
Number of Shares in Issue 8,501 8,501 8,501
Net Asset Value per Share USD 0.9287 USD 0.8308 USD 0.7780
Share class G
Net Asset Value - - USD 6,930,153
Number of Shares in Issue - - 7,778,152
Net Asset Value per Share - - USD 0.8910
Share class A
Net Asset Value USD 9,997 USD 9,617 USD 10,336
Number of Shares in Issue 7,387 7,387 7,390
Net Asset Value per Share USD 1.3533 USD 1.3019 USD 1.3986
Share class B
Net Asset Value USD 248,997 USD 773,873 USD 845,849
Number of Shares in Issue 181,589 587,372 598,275
Net Asset Value per Share USD 1.3712 USD 1.3175 USD 1.4138
Share class C
Net Asset Value USD 87,091,679 USD 82,931,841 USD 80,975,639
Number of Shares in Issue 63,640,672 63,118,027 57,474,752
Net Asset Value per Share USD 1.3685 USD 1.3139 USD 1.4089
Share class E
Net Asset Value USD 339,484,641 USD 276,282,206 USD 265,600,164
Number of Shares in Issue 231,635,672 196,958,932 177,138,260
Net Asset Value per Share USD 1.4656 USD 1.4027 USD 1.4994
Sanlam Global Best Ideas Fund (continued)
30 June 31 December 30 June
2017 2016 2016
Sanlam Global Bond Fund
30 June 31 December 30 June
2017 2016 2016

SANLAM UNIVERSAL FUNDS PLC
473
NOTES TO AND FORMING PART OF THE UNAUDITED CONDENSED INTERIM FINANCIAL STATEMENTS (CONTINUED) for the six months ended 30 June 2017
15 Net asset value per share (continued)
Share class E (GBP)
Net Asset Value GBP 40,089,089 - -
Number of Shares in Issue 39,241,183 - -
Net Asset Value per Share GBP 1.0216 - -
Share class A
Net Asset Value USD 26,405,984 USD 24,159,536 USD 21,709,464
Number of Shares in Issue 798,920 837,051 936,508
Net Asset Value per Share USD 33.0521 USD 28.8627 USD 23.1813
Share class A (EUR)
Net Asset Value EUR 150,029 EUR 142,018 EUR 108,228
Number of Shares in Issue 96,812 96,181 95,315 Net Asset Value per Share EUR 1.5497 EUR 1.4765 EUR 1.1355
Share class A (GBP)
Net Asset Value GBP 381,245 GBP 350,409 GBP 205,823
Number of Shares in Issue 201,136 199,298 156,472
Net Asset Value per Share GBP 1.8954 GBP 1.7582 GBP 1.3154
Share class B
Net Asset Value USD 26,608,420 USD 19,779,204 USD 15,893,966
Number of Shares in Issue 827,720 705,465 706,711
Net Asset Value per Share USD 32.1466 USD 28.0371 USD 22.4901
Share class C
Net Asset Value USD 8,938,852 USD 27,072,248 USD 35,694,008
Number of Shares in Issue 4,622,573 16,071,506 26,448,980
Net Asset Value per Share USD 1.9337 USD 1.6845 USD 1.3495
Share class C (GBP)
Net Asset Value GBP 1,892,820 GBP 1,800,259 GBP 1,270,458
Number of Shares in Issue 681,161 696,630 659,571
Net Asset Value per Share GBP 2.7788 GBP 2.5843 GBP 1.9262
Share class D
Net Asset Value USD 271,925 USD 251,266 USD 202,059
Number of Shares in Issue 194,749 205,816 205,816
Net Asset Value per Share USD 1.3963 USD 1.2208 USD 0.9817
Sanlam Global Bond Fund (continued)
30 June 31 December 30 June
2017 2016 2016
Sanlam Global Financial Fund
30 June 31 December 30 June
2017 2016 2016

SANLAM UNIVERSAL FUNDS PLC
474
NOTES TO AND FORMING PART OF THE UNAUDITED CONDENSED INTERIM FINANCIAL STATEMENTS (CONTINUED) for the six months ended 30 June 2017
15 Net asset value per share (continued)
Share class E
Net Asset Value USD 24,733,232 USD 23,139,384 USD 110
Number of Shares in Issue 1,314,382 1,417,182 8 Net Asset Value per Share USD 18.8174 USD 16.3277 USD 13.0273
Share class F (EUR)
Net Asset Value - - EUR 2,100
Number of Shares in Issue - - 1,700
Net Asset Value per Share - - EUR 1.2357
Share class F (GBP)
Net Asset Value GBP 112,201 GBP 150,161 GBP 171,036
Number of Shares in Issue 63,751 92,600 140,974 Net Asset Value per Share GBP 1.7600 GBP 1.6216 GBP 1.2132
Share class G (USD)
Net Asset Value USD 27,559,669 USD 41,653,998 USD 41,430,778
Number of Shares in Issue 22,537,153 39,055,425 48,426,912
Net Asset Value per Share USD 1.2229 USD 1.0665 USD 0.8555
30 June 31 December 30 June
2017 2016 2016
Share class A
Net Asset Value USD 27,528 USD 25,685 USD 17,542
Number of Shares in Issue 19,562 19,562 12,984
Net Asset Value per Share USD 1.4072 USD 1.3130 USD 1.3510
Share class B
Net Asset Value USD 28,487,184 USD 26,248,987 USD 24,628,563
Number of Shares in Issue 19,282,863 19,064,714 17,404,264
Net Asset Value per Share USD 1.4773 USD 1.3768 USD 1.4151
Share class C
Net Asset Value USD 46,256,610 USD 41,595,263 USD 43,222,087
Number of Shares in Issue 26,615,850 25,699,830 26,002,504
Net Asset Value per Share USD 1.7379 USD 1.6185 USD 1.6622
Share class E
Net Asset Value USD 50,222,288 USD 48,209,800 USD 57,616,116
Number of Shares in Issue 32,006,441 33,094,798 38,632,893
Net Asset Value per Share USD 1.5691 USD 1.4567 USD 1.4914
Share class E (GBP)
Net Asset Value GBP 1,050,639 - -
Number of Shares in Issue 1,014,929 - -
Net Asset Value per Share GBP 1.0352 - -
Sanlam Global Financial Fund (continued)
30 June 31 December 30 June
2017 2016 2016
Sanlam Global Property Fund

SANLAM UNIVERSAL FUNDS PLC
475
NOTES TO AND FORMING PART OF THE UNAUDITED CONDENSED INTERIM FINANCIAL STATEMENTS (CONTINUED) for the six months ended 30 June 2017
15 Net asset value per share (continued)
30 June 31 December 30 June
2017 2016 2016
Share class A
Net Asset Value USD 105,848 USD 96,666 USD 90,259
Number of Shares in Issue 55,552 55,609 55,615
Net Asset Value per Share USD 1.9054 USD 1.7383 USD 1.6229
Share class B
Net Asset Value USD 40,672,178 USD 38,379,921 USD 31,390,441
Number of Shares in Issue 20,774,363 21,557,149 18,946,374
Net Asset Value per Share USD 1.9578 USD 1.7804 USD 1.6568
Share class C
Net Asset Value USD 311,582,347 USD 269,906,963 USD 271,178,177
Number of Shares in Issue 157,048,490 149,674,973 161,677,632
Net Asset Value per Share USD 1.9840 USD 1.8033 USD 1.6773
Share class E
Net Asset Value USD 159 USD 447,270,490 USD 855,369,100
Number of Shares in Issue 73 226,105,496 466,712,433
Net Asset Value per Share USD 2.1851 USD 1.9781 USD 1.8328
30 June 31 December 30 June
2017 2016 2016
Share class A
Net Asset Value USD 68,417,444 USD 63,818,136 USD 69,042,084
Number of Shares in Issue 39,133,209 40,341,334 46,590,161
Net Asset Value per Share USD 1.7483 USD 1.5820 USD 1.4819
Share class C
Net Asset Value USD 52,788,353 USD 54,931,947 USD 62,903,056
Number of Shares in Issue 24,727,785 28,402,570 34,676,519
Net Asset Value per Share USD 2.1348 USD 1.9340 USD 1.8140
Share class I
Net Asset Value USD 382,713,464 USD 317,462,982 USD 292,440,836
Number of Shares in Issue 273,244,649 250,829,934 247,001,053
Net Asset Value per Share USD 1.4006 USD 1.2657 USD 1.1840
Sanlam World Equity Fund
Satrix World Equity Tracker Fund
Share class E
Net Asset Value USD 155,067,431 USD 47,559,183 USD 57,966,630
Number of Shares in Issue 70,792,186 24,058,943 31,386,952
Net Asset Value per Share USD 2.1905 USD 1.9768 USD 1.8468

SANLAM UNIVERSAL FUNDS PLC
476
NOTES TO AND FORMING PART OF THE UNAUDITED CONDENSED INTERIM FINANCIAL STATEMENTS (CONTINUED) for the six months ended 30 June 2017
15 Net asset value per share (continued)
30 June 31 December 30 June
2017 2016 2016
Share class I (GBP)
Net Asset Value GBP 583,228 GBP 542,408 GBP 399,625
Number of Shares in Issue 394,244 378,169 320,135
Net Asset Value per Share GBP 1.4793 GBP 1.4343 GBP 1.2483
Share class S
Net Asset Value USD 17,395,902 USD 13,142,524 USD 8,918,889
Number of Shares in Issue 15,269,151 12,768,026 9,263,746
Net Asset Value per Share USD 1.1393 USD 1.0293 USD 0.9628
30 June 31 December 30 June
2017 2016 2016
Share class A
Net Asset Value USD 114,764 USD 92,291 USD 69,988
Number of Shares in Issue 103,041 103,960 77,262
Net Asset Value per Share USD 1.1138 USD 0.8878 USD 0.9059
Share class C
Net Asset Value USD 20,996,464 USD 15,112,663 USD 17,169,473
Number of Shares in Issue 14,090,776 12,705,951 14,204,575
Net Asset Value per Share USD 1.4901 USD 1.1894 USD 1.2087
Share class D
Net Asset Value USD 22,388 USD 19,220 USD 51,465
Number of Shares in Issue 18,679 20,193 53,195
Net Asset Value per Share USD 1.1986 USD 0.9518 USD 0.9675
Share class E
Net Asset Value USD 16,909,173 USD 13,375,272 USD 13,544,030
Number of Shares in Issue 12,336,666 12,336,666 12,336,665
Net Asset Value per Share USD 1.3706 USD 1.0842 USD 1.0979
30 June 31 December 30 June
2017 2016 2016
Share class A
Net Asset Value USD 10,185,152 USD 9,125,227 USD 9,475,071
Number of Shares in Issue 8,543,418 8,390,423 8,413,244 Net Asset Value per Share USD 1.1922 USD 1.0876 USD 1.1262
Share class A (GBP)
Net Asset Value GBP 15,048 GBP 14,373 GBP 13,530
Number of Shares in Issue 12,570 12,570 12,500
Net Asset Value per Share GBP 1.1972 GBP 1.1434 GBP 1.0824
Satrix World Equity Tracker Fund (continued)
SIIP India Opportunities Fund
SIM Global Equity Income Fund

SANLAM UNIVERSAL FUNDS PLC
477
NOTES TO AND FORMING PART OF THE UNAUDITED CONDENSED INTERIM FINANCIAL STATEMENTS (CONTINUED) for the six months ended 30 June 2017
15 Net asset value per share (continued)
30 June 31 December 30 June
2017 2016 2016
Share class B (USD)
Net Asset Value USD 71,416 USD 66,116 USD 66,765
Number of Shares in Issue 62,194 63,196 61,709
Net Asset Value per Share USD 1.1483 USD 1.0462 USD 1.0819
Share class B (GBP)
Net Asset Value - - GBP 13,530
Number of Shares in Issue - - 12,500
Net Asset Value per Share - - GBP 1.0824
Share class C
Net Asset Value USD 5,851,660 USD 7,547,503 USD 8,777,742
Number of Shares in Issue 4,795,273 6,796,792 7,652,974
Net Asset Value per Share USD 1.2203 USD 1.1105 USD 1.1470
Share class C Accumulating
Net Asset Value USD 91,706,878 USD 7,547,503 USD 18,209,316
Number of Shares in Issue 79,997,264 6,796,792 17,532,514
Net Asset Value per Share USD 1.1464 USD 1.1105 USD 1.0386
Share class C Accumulating (GBP)
Net Asset Value GBP 71,636 GBP 67,758 GBP 32,545
Number of Shares in Issue 58,655 58,655 30,000
Net Asset Value per Share GBP 1.2213 GBP 1.1552 GBP 1.0848
Share class E
Net Asset Value USD 144 USD 128 USD 129
Number of Shares in Issue 95 95 95
Net Asset Value per Share USD 1.5097 USD 1.3499 USD 1.3575
Share class I
Net Asset Value USD 5,884,755 USD 5,374,794 USD 4,508,090
Number of Shares in Issue 4,178,829 4,241,617 3,515,831
Net Asset Value per Share USD 1.4082 USD 1.2672 USD 1.2822
30 June 31 December 30 June
2017 2016 2016
Share class A Accumulating
Net Asset Value GBP 801,204 GBP 1,050,228 GBP 813,967
Number of Shares in Issue 567,307 800,568 659,524
Net Asset Value per Share GBP 1.4123 GBP 1.3119 GBP 1.2342
Share class A Income
Net Asset Value GBP 35,818 GBP 35,419 GBP 4,228
Number of Shares in Issue 33,092 34,313 4,237
Net Asset Value per Share GBP 1.0824 GBP 1.0322 GBP 0.9978
SIM Global Equity Income Fund (continued)
Sanlam Strategic Bond Fund

SANLAM UNIVERSAL FUNDS PLC
478
NOTES TO AND FORMING PART OF THE UNAUDITED CONDENSED INTERIM FINANCIAL STATEMENTS (CONTINUED) for the six months ended 30 June 2017
15 Net asset value per share (continued)
30 June 31 December 30 June
2017 2016 2016
Share class P Accumulating (USD)
Net Asset Value USD 9,312,347 USD 5,098,432 USD 1,224,424
Number of Shares in Issue 7,073,770 4,206,580 1,079,501
Net Asset Value per Share USD 1.3165 USD 1.2120 USD 1.1342
Share class P Accumulating
Net Asset Value GBP 13,092,728 GBP 5,681,494 GBP 5,907,111
Number of Shares in Issue 8,743,910 4,098,204 4,544,075
Net Asset Value per Share GBP 1.4974 GBP 1.3863 GBP 1.3000
Share class P Income
Net Asset Value GBP 86,202,005 GBP 65,794,603 GBP 57,238,884
Number of Shares in Issue 76,963,008 61,797,414 55,796,138
Net Asset Value per Share GBP 1.1200 GBP 1.0647 GBP 1.0259
Share class I Accumulating
Net Asset Value GBP 4,654,787 GBP 2,122,579 GBP 2,181,384
Number of Shares in Issue 3,588,999 1,765,606 1,932,847
Net Asset Value per Share GBP 1.2970 GBP 1.2022 GBP 1.1286
Share class I Income
Net Asset Value GBP 4,626,143 GBP 4,004,876 GBP 3,937,290
Number of Shares in Issue 4,243,046 3,859,774 3,933,481
Net Asset Value per Share GBP 1.0903 GBP 1.0376 GBP 1.0010
30 June 31 December 30 June
2017 2016 2016
Share class A Net Income
Net Asset Value GBP 24,101,853 GBP 24,304,430 GBP 24,596,287
Number of Shares in Issue 21,824,291 22,792,678 24,577,892
Net Asset Value per Share GBP 1.1044 GBP 1.0663 GBP 1.0007
Share class A Net Accumulation
Net Asset Value GBP 15,414,197 GBP 17,523,022 GBP 20,169,069
Number of Shares in Issue 11,910,310 14,272,181 17,871,204
Net Asset Value per Share GBP 1.2942 GBP 1.2278 GBP 1.1286
30 June 31 December 30 June
2017 2016 2016
Share class A
Net Asset Value USD 70,361 USD 74,091 USD 69,642
Number of Shares in Issue 47,945 54,468 54,480
Net Asset Value per Share USD 1.4675 USD 1.3603 USD 1.2783
Sanlam Strategic Bond Fund (continued)
Sanlam Accel Income Fund
Satrix North America Equity Tracker Fund

SANLAM UNIVERSAL FUNDS PLC
479
NOTES TO AND FORMING PART OF THE UNAUDITED CONDENSED INTERIM FINANCIAL STATEMENTS (CONTINUED) for the six months ended 30 June 2017
15 Net asset value per share (continued)
30 June 31 December 30 June
2017 2016 2016
Share class E
Net Asset Value USD 70,325,879 USD 134 USD 125
Number of Shares in Issue 47,064,486 97 97
Net Asset Value per Share USD 1.4942 USD 1.3780 USD 1.2869
Share class I
Net Asset Value USD 1,176,609 USD 5,534,935 USD 6,079,213
Number of Shares in Issue 787,184 4,013,515 4,715,841
Net Asset Value per Share USD 1.4947 USD 1.3791 USD 1.2891
Share class I (GBP)
Net Asset Value GBP 466,362 GBP 579,267 GBP 522,869
Number of Shares in Issue 274,225 345,021 358,104
Net Asset Value per Share GBP 1.7006 GBP 1.6790 GBP 1.4601
30 June 31 December 30 June
2017 2016 2016
Share class A (USD)
Net Asset Value USD 23,554 USD 21,752 USD 21,092
Number of Shares in Issue 22,266 22,560 22,594
Net Asset Value per Share USD 1.0578 USD 0.9642 USD 0.9335
Share class C (USD)
Net Asset Value USD 106 USD 96 USD 93
Number of Shares in Issue 96 96 96
Net Asset Value per Share USD 1.1024 USD 1.0022 USD 0.9663
Share class E (USD)
Net Asset Value USD 49,987,775 USD 32,572,982 USD 29,120,916
Number of Shares in Issue 48,001,286 34,405,529 31,852,267
Net Asset Value per Share USD 1.0414 USD 0.9468 USD 0.9143
Share class E (GBP) Net Asset Value GBP 125 GBP 119 GBP 107
Number of Shares in Issue 100 100 100
Net Asset Value per Share GBP 1.2479 GBP 1.1942 GBP 1.0726
Share class I (USD)
Net Asset Value USD 12,299,582 USD 11,196,027 USD 10,889,776
Number of Shares in Issue 11,515,139 11,518,559 11,591,530
Net Asset Value per Share USD 1.0681 USD 0.9720 USD 0.9395
Share class I (GBP)
Net Asset Value GBP 725,048 GBP 709,426 GBP 746,299
Number of Shares in Issue 651,484 641,606 750,604
Net Asset Value per Share GBP 1.1129 GBP 1.1057 GBP 0.9943
Satrix North America Equity Tracker Fund (continued)
Satrix UK Equity Tracker Fund

SANLAM UNIVERSAL FUNDS PLC
480
NOTES TO AND FORMING PART OF THE UNAUDITED CONDENSED INTERIM FINANCIAL STATEMENTS (CONTINUED) for the six months ended 30 June 2017
15 Net asset value per share (continued)
30 June 31 December 30 June
2017 2016 2016
Share class A (USD)
Net Asset Value USD 7,628,503 USD 6,392,691 USD 3,156,952
Number of Shares in Issue 6,107,435 6,010,094 3,140,494
Net Asset Value per Share USD 1.249 USD 1.0636 USD 1.0052
Share class C (USD)
Net Asset Value USD 1,570,879 USD 1,255,584 USD 681,899
Number of Shares in Issue 1,224,782 1,148,151 658,966
Net Asset Value per Share USD 1.2826 USD 1.0936 USD 1.0348
Share class E (USD)
Net Asset Value USD 217,112,578 USD 65,895,805 USD 63,073,207
Number of Shares in Issue 172,272,549 61,562,117 62,515,205
Net Asset Value per Share USD 1.2603 USD 1.0704 USD 1.0090
Share class E
Net Asset Value EUR 145 EUR 133 EUR 120
Number of Shares in Issue 100 100 100
Net Asset Value per Share EUR 1.4517 EUR 1.3331 EUR 1.1975
Share class I (USD)
Net Asset Value USD 62,246,396 USD 51,836,691 USD 43,479,498
Number of Shares in Issue 49,112,455 48,101,858 42,760,631
Net Asset Value per Share USD 1.2674 USD 1.0777 USD 1.0168
Share class I (GBP)
Net Asset Value GBP 544,447 GBP 492,295 GBP 418,977
Number of Shares in Issue 387,958 383,741 372,039
Net Asset Value per Share GBP 1.4034 GBP 1.2829 GBP 1.1262
30 June 31 December 30 June
2017 2016 2016 Share class E
Net Asset Value USD 110,899,139 USD 96,649,664 USD 91,731,948
Number of Shares in Issue 95,573,218 95,573,218 95,277,031
Net Asset Value per Share USD 1.1604 USD 1.0113 USD 0.9628
Satrix Europe (ex-UK) Equity Tracker Fund
Sanlam Equity Allocation Fund

SANLAM UNIVERSAL FUNDS PLC
481
NOTES TO AND FORMING PART OF THE UNAUDITED CONDENSED INTERIM FINANCIAL STATEMENTS (CONTINUED) for the six months ended 30 June 2017
30 June 31 December 30 June
2017 2016 2016
Share class A
Net Asset Value USD 14,623,550 USD 12,272,398 USD 9,597,097
Number of Shares in Issue 13,102,701 12,989,775 10,495,435
Net Asset Value per Share USD 1.1161 USD 0.9448 USD 0.9144
Share class E
Net Asset Value USD 115 USD 97 USD 93
Number of Shares in Issue 107 107 107
Net Asset Value per Share USD 1.0689 USD 0.9007 USD 0.8672
Share class I
Net Asset Value USD 20,123,580 USD 17,661,795 USD 16,254,526
Number of Shares in Issue 17,899,372 18,624,230 17,792,523
Net Asset Value per Share USD 1.1243 USD 0.9483 USD 0.9136
Share class I (GBP)
Net Asset Value GBP 8,482,659 GBP 6,878,304 GBP 6,370,919
Number of Shares in Issue 6,765,387 6,069,603 6,272,627
Net Asset Value per Share GBP 1.2538 GBP 1.1333 GBP 1.0157
Satrix Emerging Markets Equity Tracker Fund

SANLAM UNIVERSAL FUNDS PLC
482
NOTES TO AND FORMING PART OF THE UNAUDITED CONDENSED INTERIM FINANCIAL STATEMENTS (CONTINUED) for the six months ended 30 June 2017
15 Net asset value per share (continued)
30 June 31 December 30 June
2017 2016 2016 Share class A
Net Asset Value USD 477,344 USD 442,449 USD 483,502
Number of Shares in Issue 447,355 447,355 508,209
Net Asset Value per Share USD 1.0670 USD 0.9890 USD 0.9514
Share class A (GBP) Net Asset Value GBP 1,835,302 GBP 2,111,245 GBP 1,302,921 Number of Shares in Issue 1,612,327 1,994,024 1,275,895 Net Asset Value per Share GBP 1.1383 GBP 1.0588 GBP 1.0212
Share class A (EUR) Net Asset Value EUR 22,141 EUR 20,682 EUR 75,600 Number of Shares in Issue 19,318 19,318 72,755 Net Asset Value per Share EUR 1.1462 EUR 1.0706 EUR 1.0391
Share class D Net Asset Value - - USD 21,351 Number of Shares in Issue - - 20,214 Net Asset Value per Share - - USD 1.0562
Share class I
Net Asset Value USD 24,665,894 USD 31,177,916 USD 43,537,345
Number of Shares in Issue 20,669,999 28,328,332 41,329,368
Net Asset Value per Share USD 1.1933 USD 1.1006 USD 1.0534
Share class I (GBP)
Net Asset Value GBP 11,547,258 GBP 8,189,661 GBP 10,804,944
Number of Shares in Issue 10,014,255 7,663,335 10,526,760
Net Asset Value per Share GBP 1.1531 GBP 1.0687 GBP 1.0264
Share class I (EUR)
Net Asset Value EUR 193,716 EUR 170,387 EUR 149,438
Number of Shares in Issue 165,580 156,514 142,259
Net Asset Value per Share EUR 1.1699 EUR 1.0886 EUR 1.0505
Share class N Net Asset Value USD 618,550 USD 730,501 USD 665,311 Number of Shares in Issue 537,269 685,728 645,143 Net Asset Value per Share USD 1.1513 USD 1.0653 USD 1.0313
Share class N (EUR) Net Asset Value EUR 155,107 EUR 145,842 EUR 151,104 Number of Shares in Issue 138,613 138,613 147,253 Net Asset Value per Share EUR 1.1190 EUR 1.0522 EUR 1.0262
Share class N (GBP) Net Asset Value GBP 547,893 GBP 528,524 GBP 510,195 Number of Shares in Issue 488,064 504,652 498,867 Net Asset Value per Share GBP 1.1226 GBP 1.0473 GBP 1.0227
Sanlam Managed Risk Fund

SANLAM UNIVERSAL FUNDS PLC
483
NOTES TO AND FORMING PART OF THE UNAUDITED CONDENSED INTERIM FINANCIAL STATEMENTS (CONTINUED) for the six months ended 30 June 2017
15 Net asset value per share (continued)
30 June 31 December 30 June
2017 2016 2016 Share class N2 (GBP)
Net Asset Value GBP 216,930 - -
Number of Shares in Issue 209,075 - -
Net Asset Value per Share GBP 1.0376 - -
30 June 31 December 30 June
2017 2016 2016
Share class A Accumulating
Net Asset Value GBP 799,551 GBP 703,832 GBP 541,731
Number of Shares in Issue 508,798 497,849 421,189
Net Asset Value per Share GBP 1.5715 GBP 1.4137 GBP 1.2862
Share class C Accumulating
Net Asset Value GBP 1,821,481 GBP 955,829 GBP 788,623
Number of Shares in Issue 1,004,130 588,781 536,768
Net Asset Value per Share GBP 1.8140 GBP 1.6234 GBP 1.4692
Share class C Income
Net Asset Value GBP 32,104,304 GBP 29,433,440 GBP 29,585,573
Number of Shares in Issue 18,235,018 18,630,150 20,624,366
Net Asset Value per Share GBP 1.7606 GBP 1.5799 GBP 1.4345
Share class D Accumulating
Net Asset Value USD 90,856,215 USD 47,181,950 USD 17,733,397
Number of Shares in Issue 64,857,868 39,620,880 15,293,446
Net Asset Value per Share USD 1.4008 USD 1.1908 USD 1.1595
Share class D Income
Net Asset Value USD 143 USD 121 USD 118
Number of Shares in Issue 105 104 104
Net Asset Value per Share USD 1.3674 USD 1.1643 USD 1.1359
Share class E Accumulating
Net Asset Value USD 60,144,116 USD 41,559,134 USD 25,942,213
Number of Shares in Issue 43,673,500 35,411,474 22,644,523
Net Asset Value per Share USD 1.3772 USD 1.1737 USD 1.1457
Share class E Income
Net Asset Value USD 143 USD 121 USD 118
Number of Shares in Issue 105 104 104
Net Asset Value per Share USD 1.3674 USD 1.1643 USD 1.1359
Sanlam Managed Risk Fund (continued)
Sanlam Private Wealth Global High Quality Fund

SANLAM UNIVERSAL FUNDS PLC
484
NOTES TO AND FORMING PART OF THE UNAUDITED CONDENSED INTERIM FINANCIAL STATEMENTS (CONTINUED) for the six months ended 30 June 2017
15 Net asset value per share (continued)
30 June 31 December 30 June
2017 2016 2016
Share class F Accumulating
Net Asset Value GBP 1,218,117 GBP 479,034 GBP 111
Number of Shares in Issue 892,994 392,014 100
Net Asset Value per Share GBP 1.3641 GBP 1.2220 GBP 1.1058
Share class F Income
Net Asset Value GBP 1,237,087 GBP 753,273 GBP 549,143
Number of Shares in Issue 860,110 583,594 468,526
Net Asset Value per Share GBP 1.4383 GBP 1.2907 GBP 1.1721
Share class G Income
Net Asset Value USD 11,813 - -
Number of Shares in Issue 10,402 - -
Net Asset Value per Share USD 1.1356 - -
Share class G Accumulating
Net Asset Value USD 3,686,787 USD 2,869,304 -
Number of Shares in Issue 3,084,022 2,823,392 -
Net Asset Value per Share USD 1.1954 USD 1.0163 -
30 June 31 December 30 June
2017 2016 2016
Share class A Distributing
Net Asset Value GBP 14,222,401 GBP 1,995,631 GBP 1,374
Number of Shares in Issue 996,891 135,515 113
Net Asset Value per Share GBP 14.2668 GBP 14.7262 GBP 12.1262
Share class A (USD) Distributing
Net Asset Value USD 1,918,427 USD 1,206 USD 1,077
Number of Shares in Issue 161,205 104 103
Net Asset Value per Share USD 11.9005 USD 11.6414 USD 10.4964
Share class A (EUR) Distributing
Net Asset Value EUR 196,210 EUR 45,338 EUR 1,083
Number of Shares in Issue 16,809 3,676 103
Net Asset Value per Share EUR 11.6731 EUR 12.3337 EUR 10.5491
Share class A Accumulating
Net Asset Value GBP15,134,634 GBP 12,835,667 GBP 9,787,375
Number of Shares in Issue 1,009,941 838,282 783,819
Net Asset Value per Share GBP 14.9857 GBP 15.3119 GBP 12.4868
Sanlam Private Wealth Global High Quality Fund (continued)
Sanlam FOUR US Dividend Income Fund

SANLAM UNIVERSAL FUNDS PLC
485
NOTES TO AND FORMING PART OF THE UNAUDITED CONDENSED INTERIM FINANCIAL STATEMENTS (CONTINUED) for the six months ended 30 June 2017
15 Net asset value per share (continued)
30 June 31 December 30 June
2017 2016 2016
Share class A (USD) Accumulating
Net Asset Value USD 1,385,847 USD 383,226 USD 175,733
Number of Shares in Issue 110,624 31,582 16,197
Net Asset Value per Share USD 12.5276 USD 12.1344 USD 10.8496
Share class B Accumulating
Net Asset Value GBP 19,819,865 GBP 4,010 GBP 110
Number of Shares in Issue 1,487,154 296 10
Net Asset Value per Share GBP 13.3273 GBP 13.5587 GBP 11.0080
Share class B (USD) Accumulating
Net Asset Value USD 162,569,954 USD 162,568,596 USD 44,603,714
Number of Shares in Issue 12,470,775 12,922,906 3,980,443
Net Asset Value per Share USD 13.0361 USD 12.5799 USD 11.2057
High Street Global Balanced Fund
30 June 31 December 30 June
2017 2016 2016
Share class A (USD)
Net Asset Value USD 19,244,936 USD 14,849,982 USD 12,359,961
Number of Shares in Issue 18,571,273 15,420,192 13,349,728
Net Asset Value per Share USD 1.0363 USD 0.9630 USD 0.9259
Sanlam FOUR Active European (ex-UK) Equity Fund
30 June 31 December 30 June
2017 2016 2016
Share class A (EUR)
Net Asset Value - EUR 9,438,596 EUR 9,102,762
Number of Shares in Issue - 564,511 584,753
Net Asset Value per Share - EUR 16.7199 EUR 15.5669
Share class A (GBP)
Net Asset Value - GBP 1,859,435 GBP 5,883,936
Number of Shares in Issue - 136,654 482,458
Net Asset Value per Share - GBP 13.6069 GBP 12.1957
Share class B (EUR)
Net Asset Value - EUR 24,500,311 EUR 22,725,335
Number of Shares in Issue - 1,670,282 1,670,282
Net Asset Value per Share - EUR 14.6684 EUR 13.6057
Share class B (GBP)
Net Asset Value - GBP 3,486,497 GBP 3,898,061
Number of Shares in Issue - 206,486 258,540
Net Asset Value per Share - GBP 16.8849 GBP 15.0772
Sanlam FOUR US Dividend Income Fund (continued)

SANLAM UNIVERSAL FUNDS PLC
486
NOTES TO AND FORMING PART OF THE UNAUDITED CONDENSED INTERIM FINANCIAL STATEMENTS (CONTINUED) for the six months ended 30 June 2017
15 Net asset value per share (continued)
Sanlam FOUR Active European (ex-UK) Equity Fund (continued)
30 June 31 December 30 June
2017 2016 2016
Share class B (USD)
Net Asset Value - USD 52,987,447 -
Number of Shares in Issue - 5,372,153 -
Net Asset Value per Share - USD 9.8634 -
Share class C (GBP)
Net Asset Value - GBP 7,854 GBP 7,064
Number of Shares in Issue - 600 600
Net Asset Value per Share - GBP 13.0892 GBP 11.7739
Sanlam FOUR Global Equity Fund
30 June 31 December 30 June
2017 2016 2016
Share class A (USD)
Net Asset Value USD 5,963,947 USD 5,509,439 USD 7,336,493
Number of Shares in Issue 375,117 372,868 566,740
Net Asset Value per Share USD 15.8989 USD 14.7758 USD 12.9451
Share class A (EUR)
Net Asset Value EUR 3,198 EUR 8,944 EUR 7,427
Number of Shares in Issue 290 809 809
Net Asset Value per Share EUR 11.0250 EUR 11.0614 EUR 9.1854
Share class A (GBP)
Net Asset Value GBP 192,425 GBP 176,924 GBP 190,505
Number of Shares in Issue 11,791 11,058 14,894
Net Asset Value per Share GBP 16.3195 GBP 15.9991 GBP 12.7910
Share class B (USD)
Net Asset Value USD 189,299,756 USD 182,721,346 USD 42,079,452
Number of Shares in Issue 11,204,501 11,680,768 3,079,288
Net Asset Value per Share USD 16.8950 USD 15.6430 USD 13.6654
Share class B (GBP)
Net Asset Value GBP 35,386,706 GBP 33,520,672 GBP 26,615,951
Number of Shares in Issue 2,064,970 2,002,753 1,996,318
Net Asset Value per Share GBP 17.1367 GBP 16.7373 GBP 13.3325
Share class C (GBP)
Net Asset Value GBP 78,805 GBP 53,510 GBP 132,010
Number of Shares in Issue 5,040 3,478 10,691
Net Asset Value per Share GBP 15.6352 GBP 15.3850 GBP 12.3475

SANLAM UNIVERSAL FUNDS PLC
487
NOTES TO AND FORMING PART OF THE UNAUDITED CONDENSED INTERIM FINANCIAL STATEMENTS (CONTINUED) for the six months ended 30 June 2017
15 Net asset value per share (continued)
Sanlam FOUR Global Equity Fund (continued)
30 June 31 December 30 June
2017 2016 2016
Share class C
Net Asset Value USD 1,553 - -
Number of Shares in Issue 153 - -
Net Asset Value per Share USD 10.1209 - -
Sanlam FOUR Stable Global Equity Fund
30 June 31 December 30 June
2017 2016 2016
Share class A (USD)
Net Asset Value USD 13,078,439 USD 10,088,947 USD 254,336
Number of Shares in Issue 997,267 848,654 21,437
Net Asset Value per Share USD 13.1143 USD 11.8882 USD 11.8644
Share class A (EUR)
Net Asset Value EUR 7,119,632 EUR 6,968,600 EUR 4,397,239
Number of Shares in Issue 668,223 668,223 445,912
Net Asset Value per Share EUR 10.6545 EUR 10.4285 EUR 9.8613
Share class A (GBP)
Net Asset Value GBP 961,603 GBP 549,796 GBP 366,818
Number of Shares in Issue 70,444 42,119 30,870
Net Asset Value per Share GBP 13.6506 GBP 13.0533 GBP 11.8826
Share class A (GBP) Distributing
Net Asset Value GBP 10,760 GBP 2,569 GBP 2,338
Number of Shares in Issue 850 210 208
Net Asset Value per Share GBP 12.6658 GBP 12.2311 GBP 11.2266
Share class B (USD)
Net Asset Value USD 188,136,161 USD 138,676,733 USD120,298,220
Number of Shares in Issue 10,759,216 8,781,443 7,661,018
Net Asset Value per Share USD 17.4860 USD 15.7921 USD 15.7026
Share class B (GBP)
Net Asset Value GBP 518,882 GBP 223,875 GBP 185,134
Number of Shares in Issue 32,232 14,597 13,310
Net Asset Value per Share GBP 16.0986 GBP 15.3366 GBP 13.9090

SANLAM UNIVERSAL FUNDS PLC
488
NOTES TO AND FORMING PART OF THE UNAUDITED CONDENSED INTERIM FINANCIAL STATEMENTS (CONTINUED) for the six months ended 30 June 2017
15 Net asset value per share (continued)
Sanlam FOUR Active UK Equity Fund
30 June 31 December 30 June
2017 2016 2016
Share class A (GBP)
Net Asset Value GBP 639,578 GBP 1,571,658 GBP 2,221,613
Number of Shares in Issue 38,396 100,786 173,466
Net Asset Value per Share GBP 16.6572 GBP 15.5941 GBP 12.8072
Share class B (USD)
Net Asset Value USD 10,842,452 USD 21,106,802 -
Number of Shares in Issue 917,402 2,019,892 -
Net Asset Value per Share USD 11.8187 USD 10.4494 -
Share class B (GBP)
Net Asset Value GBP 51,809,700 GBP 58,226,026 GBP 54,120,704
Number of Shares in Issue 3,584,900 4,320,915 4,908,538
Net Asset Value per Share GBP 14.4522 GBP 13.4754 GBP 11.0258
Share class C (USD)
Net Asset Value USD 24,195 USD 21,551 USD 19,478
Number of Shares in Issue 2,879 2,879 2,879
Net Asset Value per Share USD 8.4046 USD 7.4861 USD 6.7661
Share class C (GBP)
Net Asset Value GBP 643,631 GBP 621,763 GBP 608,245
Number of Shares in Issue 44,977 46,239 54,870
Net Asset Value per Share GBP 14.3101 GBP 13.4468 GBP 11.0852
Share class D (GBP)
Net Asset Value GBP 74,191 GBP 129,951 GBP 8,867,922
Number of Shares in Issue 6,217 11,650 969,574
Net Asset Value per Share GBP 11.9328 GBP 11.1545 GBP 9.1462
Share class I (GBP)
Net Asset Value GBP 392,779 GBP 373,739 GBP 43,445,907
Number of Shares in Issue 34,699 34,697 4,865,784
Net Asset Value per Share GBP 11.3197 GBP 10.7715 GBP 8.9289

SANLAM UNIVERSAL FUNDS PLC
489
NOTES TO AND FORMING PART OF THE UNAUDITED CONDENSED INTERIM FINANCIAL STATEMENTS (CONTINUED) for the six months ended 30 June 2017
15 Net asset value per share (continued)
Sanlam FOUR Multi-Strategy Fund
30 June 31 December 30 June
2017 2016 2016
Share class Founder (GBP)
Net Asset Value GBP 2,416,410 GBP 2,292,971 GBP 2,178,969
Number of Shares in Issue 210,970 208,640 208,646
Net Asset Value per Share GBP 11.4538 GBP 10.9901 GBP 10.4434
Share class A (USD)
Net Asset Value USD 153,525 USD 139,821 USD 145,855
Number of Shares in Issue 18,000 18,000 18,000
Net Asset Value per Share USD 8.5291 USD 7.7679 USD 8.1030
Share class A (GBP)
Net Asset Value GBP 4,867,728 GBP 4,044,162 GBP 3,802,907
Number of Shares in Issue 446,160 385,834 381,334
Net Asset Value per Share GBP 10.9103 GBP 10.4816 GBP 9.9726
Share class B (USD)
Net Asset Value USD 3,978,561 USD 3,928,660 USD 26,715,271
Number of Shares in Issue 354,464 367,694 2,647,907
Net Asset Value per Share USD 11.2242 USD 10.6846 USD 10.0892
Share class B (GBP)
Net Asset Value GBP 110,217,636 GBP 103,210,503 GBP 40,829,244
Number of Shares in Issue 9,412,729 9,209,148 3,843,383
Net Asset Value per Share GBP 11.7094 GBP 11.2074 GBP 10.6233
Share class Founder (GBP) Income Distributing
Net Asset Value GBP 822,179 GBP 536,121 GBP 380,790
Number of Shares in Issue 79,269 53,068 39,074
Net Asset Value per Share GBP 10.3721 GBP 10.1026 GBP 9.7454
Share class A (GBP) Income Distributing
Net Asset Value GBP 242,601 GBP 188,725 GBP 20,001
Number of Shares in Issue 23,310 18,594 2,040
Net Asset Value per Share GBP 10.4074 GBP 10.1496 GBP 9.8023
Share class B (GBP) Income Distributing
Net Asset Value GBP 1,121 GBP 1,072 GBP 1,015
Number of Shares in Issue 106 104 103
Net Asset Value per Share GBP 10.5853 GBP 10.2730 GBP 9.8737

SANLAM UNIVERSAL FUNDS PLC
490
NOTES TO AND FORMING PART OF THE UNAUDITED CONDENSED INTERIM FINANCIAL STATEMENTS (CONTINUED) for the six months ended 30 June 2017
15 Net asset value per share (continued)
Anchor Global Capital Plus Fund
30 June 31 December 30 June
2017 2016 2016
Share class A
Net Asset Value USD 11,804,410 USD 10,647,918 USD 10,984,318
Number of Shares in Issue 12,127,751 11,233,722 11,531,913
Net Asset Value per Share USD 0.9733 USD 0.9479 USD 0.9525
Share class B
Net Asset Value USD 1,026,428 USD 1,323,422 USD 962,127
Number of Shares in Issue 1,045,105 1,392,397 1,013,629
Net Asset Value per Share USD 0.9821 USD 0.9505 USD 0.9492
Bridge Global Equity Income Growth Fund
30 June 31 December 30 June
2017 2016 2016
Share class A (USD)
Net Asset Value USD 5,626,972 USD 5,099,846 USD 5,260,081
Number of Shares in Issue 5,129,056 5,049,939 5,055,148
Net Asset Value per Share USD 1.0971 USD 1.0099 USD 1.0405
Anchor Global Equity Fund
30 June 31 December 30 June
2017 2016 2016
Share class A
Net Asset Value USD 23,557,796 USD 19,830,523 USD 17,426,150
Number of Shares in Issue 19,967,130 19,685,853 17,663,854
Net Asset Value per Share USD 1.1798 USD 1.0073 USD 0.9865
Share class B
Net Asset Value USD 3,190,462 USD 344,882 USD 526,729
Number of Shares in Issue 2,704,004 343,887 539,644
Net Asset Value per Share USD 1.1799 USD 1.0029 USD 0.9761
Bridge Global Managed Growth Fund
30 June 31 December 30 June
2017 2016 2016
Share class A (USD)
Net Asset Value USD 9,892,272 USD 10,055,747 USD 10,215,166
Number of Shares in Issue 9,081,882 9,879,737 9,670,399
Net Asset Value per Share USD 1.0892 USD 1.0178 USD 1.0563
SIM Global Emerging Markets Fund
30 June 31 December 30 June
2017 2016 2016
Share class A1 (USD)
Net Asset Value USD 1,765,094 USD 511,776 USD 136,980
Number of Shares in Issue 1,411,728 473,889 141,185
Net Asset Value per Share USD 1.2503 USD 1.0800 USD 0.9702

SANLAM UNIVERSAL FUNDS PLC
491
NOTES TO AND FORMING PART OF THE UNAUDITED CONDENSED INTERIM FINANCIAL STATEMENTS (CONTINUED) for the six months ended 30 June 2017
15 Net asset value per share (continued)
SIM Global Emerging Markets Fund (continued)
30 June 31 December 30 June
2017 2016 2016
Share class A2 (USD)
Net Asset Value USD 4,500 - -
Number of Shares in Issue 4,187 - -
Net Asset Value per Share USD 1.0746 - -
Share class B1 (USD)
Net Asset Value USD 117,941 USD 9,978 -
Number of Shares in Issue 100,811 9,923 -
Net Asset Value per Share USD 1.1699 USD 1.0055 -
Share class B2 (USD)
Net Asset Value USD 16,334,728 USD 4,050,397 -
Number of Shares in Issue 13,836,686 3,972,484 -
Net Asset Value per Share USD 1.1805 USD 1.0196 -
Share class C1 (USD)
Net Asset Value USD 13,959,528 USD 9,342,993 USD 7,876,112
Number of Shares in Issue 10,783,823 8,398,152 8,077,732
Net Asset Value per Share USD 1.2945 USD 1.1125 USD 0.9750
Share class C2 (USD)
Net Asset Value USD 5,830,882 USD 2,146,297 -
Number of Shares in Issue 5,103,060 2,176,484 -
Net Asset Value per Share USD 1.1426 USD 0.9861 -
Share class E (USD)
Net Asset Value USD 8,797,113 - -
Number of Shares in Issue 8,006,930 - -
Net Asset Value per Share USD 1.0987 - -
Sanlam FOUR UK Income Opportunities Fund
30 June 31 December 30 June
2017 2016 2016
Share class Accumulation A (GBP)
Net Asset Value - - GBP 832
Number of Shares in Issue - - 100
Net Asset Value per Share - - GBP 8.3229
Share class Accumulation B (GBP)
Net Asset Value - - GBP 177,004
Number of Shares in Issue - - 21,216
Net Asset Value per Share - - GBP 8.3431

SANLAM UNIVERSAL FUNDS PLC
492
NOTES TO AND FORMING PART OF THE UNAUDITED CONDENSED INTERIM FINANCIAL STATEMENTS (CONTINUED) for the six months ended 30 June 2017
15 Net asset value per share (continued)
Sanlam FOUR UK Income Opportunities Fund (continued)
30 June 31 December 30 June
2017 2016 2016
Share class Accumulation Founder (GBP)
Net Asset Value - - GBP 813
Number of Shares in Issue - - 98
Net Asset Value per Share - - GBP 8.3360
Share class Distribution A (GBP)
Net Asset Value - - GBP 303,369
Number of Shares in Issue - - 37,333
Net Asset Value per Share - - GBP 8.1260
Share class Distribution B (GBP)
Net Asset Value - - GBP 235,478
Number of Shares in Issue - - 28,905
Net Asset Value per Share - - GBP 8.1466
Share class Distribution Founder (GBP)
Net Asset Value - - GBP 7,983
Number of Shares in Issue - - 982
Net Asset Value per Share - - GBP 8.1311
ABSA Africa Equity Fund
30 June 31 December 30 June
2017 2016 2016
Share class A (USD)
Net Asset Value USD 31,109,675 USD 22,410,557 -
Number of Shares in Issue 27,203,689 22,548,137 -
Net Asset Value per Share USD 1.1436 USD 0.9939 -
Sanlam Centre American Select Equity Fund
30 June 31 December 30 June
2017 2016 2016
Share class C (USD)
Net Asset Value USD 5,185 - -
Number of Shares in Issue 5,000 - -
Net Asset Value per Share USD 1.0370 - -
Share class C (GBP)
Net Asset Value GBP 4,212 - -
Number of Shares in Issue 4,083 - -
Net Asset Value per Share GBP 1.0316 - -

SANLAM UNIVERSAL FUNDS PLC
493
NOTES TO AND FORMING PART OF THE UNAUDITED CONDENSED INTERIM FINANCIAL STATEMENTS (CONTINUED) for the six months ended 30 June 2017
15 Net asset value per share (continued)
Sanlam Centre American Select Equity Fund (continued)
30 June 31 December 30 June
2017 2016 2016
Share class E (USD)
Net Asset Value USD 149,708,491 USD 129,702,370 -
Number of Shares in Issue 133,637,219 129,664,333 -
Net Asset Value per Share USD 1.1203 USD 1.0003 -
Sanlam Global Convertible Securities Fund
30 June 31 December 30 June
2017 2016 2016
Share class A
Net Asset Value USD 20,120,397 USD 19,191,521 -
Number of Shares in Issue 19,049,957 19,020,902 -
Net Asset Value per Share USD 1.0562 USD 1.0090 -
Sanlam Japan Equity Fund
30 June 31 December 30 June
2017 2016 2016
Share class E (USD)
Net Asset Value USD 67,817,605 USD 35,300,315 -
Number of Shares in Issue 58,726,314 34,885,293 -
Net Asset Value per Share USD 1.1548 USD 1.0119 -
Sanlam Centre Active U.S Treasury Fund
30 June 31 December 30 June
2017 2016 2016
Share class C (USD)
Net Asset Value USD 5,108 - -
Number of Shares in Issue 5,150 - -
Net Asset Value per Share USD 0.9920 - -
Share class E (USD)
Net Asset Value USD 10,023,389 - -
Number of Shares in Issue 10,177,412 - -
Net Asset Value per Share USD 0.9849 - -
Autus Global Equity Fund
30 June 31 December 30 June
2017 2016 2016
Share class B (USD)
Net Asset Value USD 14,632,808 - -
Number of Shares in Issue 13,813,834 - -
Net Asset Value per Share USD 1.0593 - -

SANLAM UNIVERSAL FUNDS PLC
494
NOTES TO AND FORMING PART OF THE UNAUDITED CONDENSED INTERIM FINANCIAL STATEMENTS (CONTINUED) for the six months ended 30 June 2017
16 Significant events during the period Sanlam Centre Global Select Equities Fund and Sanlam FOUR Active European (ex UK) Equity Fund were closed with effect from 22 June 2017 and 30 June 2017, respectively. Sanlam Centre Active US Treasury Fund and Autus Global Equity Fund, authorised designated sub-funds of the Company, launched on 12 January 2017 and 10 March 2017, respectively. During the period ended 30 June 2017, effective from 13 June 2017, a number of Funds had a change in name as follows:
Name at 31 December 2016 Name effective 13 June 2017 Grindrod Global Property Income Fund Bridge Global Property Income Fund Grindrod Global Equity Income Growth Fund Bridge Global Equity Income Growth Fund Grindrod Global Managed Growth Fund Bridge Global Managed Growth Fund
Waisan Capital South African Equity Fund was approved by the Central Bank of Ireland as an authorised designated sub-fund of the Company on 17 January 2017. Effective from 12 June 2017 Sanlam Investment Management (Pty) Ltd replaced Sanlam Four Investments UK Limited and Milliman Financial Strategies Limited as Investment Manager of the Sanlam Managed Risk Fund. Effective from 21 June 2017 Sanlam Four Investments UK Limited replaced Sanlam Investment Management (Pty) Ltd as Investment Manager of the Sanlam Strategic Bond Fund. There were no other significant events during the period.

SANLAM UNIVERSAL FUNDS PLC
495
NOTES TO AND FORMING PART OF THE UNAUDITED CONDENSED INTERIM FINANCIAL STATEMENTS (CONTINUED) for the six months ended 30 June 2017 17 Index Tracking Tracking error is the volatility of the difference between the return of the Index tracking UCITS and the return of the index or indices tracked. The Company has six index-tracking Funds in existence at 30 June 2017. The table below compares the anticipated tracking error (disclosed as a range in the prospectus on an ex ante basis) against the actual realised tracking error of the Funds as at 30 June 2017. An explanation of the difference, if any is provided on the table below:
Fund Name
Benchmark Index
Anticipated
Tracking
Error
Realised
Tracking
Error
% %
Satrix World Equity Tracker Fund
MSCI World Index (Developed
Markets) in US Dollars
Unhedged with income
reinvested (or another
appropriate major world index
selected by the Manager) +/- 1.00 0.41
Satrix North America Equity Tracker Fund MSCI North America Index +/- 0.45 (0.88)
Satrix UK Equity Tracker Fund
MSCI UK Daily Net Total Return
Index +/- 0.90 (0.31)
Satrix Europe (ex UK) Equity Tracker Fund MSCI Europe ex UK Index +/- 0.50 0.09
Satrix Emerging Markets Equity Tracker Fund MSCI Emerging Markets Index +/- 1.00 (0.49)
Fund Name Explanation of difference
Satrix World Equity Tracker Fund The Fund has tracked its benchmark index within the anticipated tracking error range.
Satrix North America Equity Tracker Fund
The realised tracking error is outside the anticipated tracking error due to significant cash inflows over the period. These inflows have seen the AUM of the Fund increase by 1200% since 30 June 2016. With this increased scale, it is expected that the portfolio will see a reduction in the tracking error during the second half of 2017 to within the anticipated range.
Satrix UK Equity Tracker Fund
The Fund has tracked its benchmark index within the anticipated
tracking error range.
Satrix Europe (ex UK) Equity Tracker Fund
The Fund has tracked its benchmark index within the anticipated
tracking error range.
Satrix Emerging Markets Equity Tracker Fund
The Fund has tracked its benchmark index within the anticipated
tracking error range.
Tracking difference is defined as the difference in the annual return of the Index-tracking UCITS and the annual return of the tracked index. The realised Fund performance against the performance of the relevant benchmark index during the period ended 30 June 2017 is set out in the Investment Manager’s report for each of the index- tracking Funds.

SANLAM UNIVERSAL FUNDS PLC
496
NOTES TO AND FORMING PART OF THE UNAUDITED CONDENSED INTERIM FINANCIAL STATEMENTS (CONTINUED) for the six months ended 30 June 2017
18 Significant events since the end of the period
Effective from 21 August 2017 the Sanlam FOUR US Dividend Income Fund changed its name to Sanlam
FOUR US Dividend Fund
There were no other significant events from 30 June 2017 to the date of approval of the financial
statements..
19 Off balance sheet arrangements
The Company was not party to off balance sheet arrangements for the six months from 1 January 2017 to 30 June 2017.
20 Approval of unaudited condensed interim financial statements
The unaudited condensed interim financial statements were approved by the Board of Directors on 30
August 2017.

SANLAM UNIVERSAL FUNDS PLC
497
SECURITIES FINANCING TRANSACTIONS REGULATION ("SFTR") DISCLOSURES (UNAUDITED) P-Solve Inflation Plus Fund 1. Global Data
Proportion of Securities and Commodities on Loan GBP
Total Lendable Assets Excluding Cash and Cash Equivalents 34,909,070
Securities and Commodities on Loan 139,747
% 0.40%
Assets Engaged in SFTs
Fund Assets Under Management 36,295,969
Absolute Value of Assets Engaged in Securities Lending 139,747
%
0.39%
2. Concentration Data Top Ten Largest Collateral Issuers
Name and Value of Collateral and Commodities Received GBP
Federal Republic of Germany Bonds 57,234
United Kingdom Bonds 51,556
Netherlands Government Bonds 30,083
French Republic Bonds 11,543
Total 150,417
Top Ten Counterparties
Name and Gross Volume of Outstanding Transactions GBP
Securities Lending HSBC Bank Plc 102,297
UBS AG London Branch 37,450
Total 139,747
3. Aggregate Transaction Data Type, Quality and Currency of Collateral
Securities Lending Type Currencies GBP
Sovereign Bonds Investment Grade EUR 98,861
Sovereign Bonds Investment Grade GBP 51,556
Total 150,417

SANLAM UNIVERSAL FUNDS PLC
498
SECURITIES FINANCING TRANSACTIONS REGULATION ("SFTR") DISCLOSURES (UNAUDITED) (CONTINUED) P-Solve Inflation Plus Fund (continued) 3. Aggregate Transaction Data (continued) Maturity Tenor of Collateral (Remaining Period to Maturity)
Less than 1 Day
1 Day to 1
Week
1 Week to 1
Month 1 to 3
Months 3 Months to 1 Year
Above 1 Year
Open Maturity Total
Type GBP GBP GBP GBP GBP GBP GBP GBP
Securities Lending
-
-
11,172 2,648 - 136,597 - 150,417
Counterparty Details
Type Country of
establishment Settlement & Clearing GBP
Securities Lending UK Tri-party 150,417
Maturity Tenor of SFTs (Remaining Period to Maturity)
Less than 1 Day
1 Day to 1
Week
1 Week to 1
Month 1 to 3
Months 3 Months to 1 Year
Above 1 Year
Open Maturity Total
Type GBP GBP GBP GBP GBP GBP GBP GBP
Securities Lending
-
-
-
-
-
- 139,747 139,747
4. Re-use of Collateral Re-use of Collateral Received The Fund does not re-use collateral received. Cash Collateral Reinvestment Returns The Fund has no returns on cash collateral. 5. Safekeeping of Collateral Received
Names and Value of Custodians Safekeeping Collateral GBP
Brown Brothers Harriman & Co
150,417
Number of Custodians Safekeeping Collateral
1 6. Safekeeping of Collateral Granted The Fund does not borrow stock from counterparties therefore no collateral has been granted. 7. Securities Lending Income and Costs
Information in respect to income, costs and fees incurred by the Fund in relation to securities lending activities is set out in Note 13 to the financial statements.

SANLAM UNIVERSAL FUNDS PLC
499
SECURITIES FINANCING TRANSACTIONS REGULATION ("SFTR") DISCLOSURES (UNAUDITED) (CONTINUED) Sanlam African Frontier Markets Fund 1. Global Data
Proportion of Securities and Commodities on Loan USD
Total Lendable Assets Excluding Cash and Cash Equivalents 68,529,489
Securities and Commodities on Loan 4,631
% 0.01%
Assets Engaged in SFTs
Fund Assets Under Management 72,033,724
Absolute Value of Assets Engaged in Securities Lending 4,631
%
0.01%
2. Concentration Data Top Ten Largest Collateral Issuers
Name and Value of Collateral and Commodities Received USD
United Kingdom Bonds 2,333
United States of America Treasury Notes 1,166
Swiss Confederation Government Bonds 1,164
Netherlands Government Bonds 672
Swedish Government Bonds 495
French Republic Bonds 3
Total 5,833
Top Ten Counterparties
Name and Gross Volume of Outstanding Transactions USD
Securities Lending Citigroup Global Markets Limited 4,631
3. Aggregate Transaction Data Type, Quality and Currency of Collateral
Securities Lending Type Currencies USD
Sovereign Bonds Investment Grade GBP 2,333
US Treasury Notes Investment Grade USD 1,166
Sovereign Bonds Investment Grade CHF 1,164
Sovereign Bonds Investment Grade EUR 675
Sovereign Bonds Investment Grade SEK 495
Total 5,833

SANLAM UNIVERSAL FUNDS PLC
500
SECURITIES FINANCING TRANSACTIONS REGULATION ("SFTR") DISCLOSURES (UNAUDITED) (CONTINUED) Sanlam African Frontier Markets Fund (continued) 3. Aggregate Transaction Data (continued) Maturity Tenor of Collateral (Remaining Period to Maturity)
Less than 1
Day
1 Day to 1
Week
1 Week to 1
Month 1 to 3
Months 3 Months to 1 Year
Above 1 Year
Open Maturity Total
Type USD USD USD USD USD USD USD USD
Securities Lending
-
-
-
- - 5,833 - 5,833
Counterparty Details
Type Country of
establishment Settlement & Clearing USD
Securities Lending UK Tri-party 5,833
Maturity Tenor of SFTs (Remaining Period to Maturity)
Less than 1 Day
1 Day to 1
Week
1 Week to 1
Month 1 to 3
Months 3 Months to 1 Year
Above 1 Year
Open Maturity Total
Type USD USD USD USD USD USD USD USD
Securities Lending
-
-
-
-
-
- 4,631 4,631
4. Re-use of Collateral Re-use of Collateral Received The Fund does not re-use collateral received. Cash Collateral Reinvestment Returns The Fund has no returns on cash collateral. 5. Safekeeping of Collateral Received
Names and Value of Custodians Safekeeping Collateral USD
Brown Brothers Harriman & Co
5,833
Number of Custodians Safekeeping Collateral
1 6. Safekeeping of Collateral Granted The Fund does not borrow stock from counterparties therefore no collateral has been granted. 7. Securities Lending Income and Costs
Information in respect to income, costs and fees incurred by the Fund in relation to securities lending activities is set out in Note 13 to the financial statements.

SANLAM UNIVERSAL FUNDS PLC
501
SECURITIES FINANCING TRANSACTIONS REGULATION ("SFTR") DISCLOSURES (UNAUDITED) (CONTINUED)
Sanlam World Equity Fund
1. Global Data
Proportion of Securities and Commodities on Loan USD
Total Lendable Assets Excluding Cash and Cash Equivalents 334,672,530
Securities and Commodities on Loan 1,781,029
% 0.53%
Assets Engaged in SFTs
Fund Assets Under Management 353,431,360
Absolute Value of Assets Engaged in Securities Lending 1,781,029
%
0.50%
2. Concentration Data
Top Ten Largest Collateral Issuers
Name and Value of Collateral and Commodities Received USD
United Kingdom Bonds 666,703
Federal Republic of Germany Bonds 345,681
French Republic Bonds 282,950
United States of America Treasury Notes 245,043
Netherlands Government Bonds 226,196
Swiss Confederation Government Bonds 174,954
Sweden Government Bonds 74,331
Total 2,015,858
Top Ten Counterparties
Name and Gross Volume of Outstanding Transactions USD
Securities Lending Citigroup Global Markets Limited 695,983
Credit Suisse Securities (Europe) Limited 488,578
JP Morgan Securities Limited 332,356
HSBC Bank Plc 264,112
Total 1,781,029
3. Aggregate Transaction Data
Type, Quality and Currency of Collateral
Securities Lending Type Currencies USD
Sovereign Bonds Investment Grade EUR 854,827
Sovereign Bonds Investment Grade GBP 666,703
US Treasury Notes Investment Grade USD 245,043
Sovereign Bonds Investment Grade CHF 174,954
Sovereign Bonds Investment Grade SEK 74,331
Total 2,015,858

SANLAM UNIVERSAL FUNDS PLC
502
SECURITIES FINANCING TRANSACTIONS REGULATION ("SFTR") DISCLOSURES (UNAUDITED) (CONTINUED) Sanlam World Equity Fund (continued) 3. Aggregate Transaction Data (continued) Maturity Tenor of Collateral (Remaining Period to Maturity)
Less than 1 Day
1 Day to 1
Week
1 Week to 1
Month 1 to 3
Months 3 Months to 1 Year
Above 1 Year
Open Maturity Total
Type USD USD USD USD USD USD USD USD
Securities Lending
-
-
102,586
-
170 1,913,442 - 2,015,858
Counterparty Details
Type Country of
establishment Settlement & Clearing USD
Securities Lending UK Tri-party 2,015,858
Maturity Tenor of SFTs (Remaining Period to Maturity)
Less than 1 Day
1 Day to 1
Week
1 Week to 1
Month 1 to 3
Months 3 Months to 1 Year
Above 1 Year
Open Maturity Total
Type USD USD USD USD USD USD USD USD
Securities Lending
-
-
-
-
-
- 1,781,029 1,781,029
4. Re-use of Collateral Re-use of Collateral Received The Fund does not re-use collateral received. Cash Collateral Reinvestment Returns The Fund has no returns on cash collateral. 5. Safekeeping of Collateral Received
Names and Value of Custodians Safekeeping Collateral USD
Brown Brothers Harriman & Co
2,015,858
Number of Custodians Safekeeping Collateral
1 6. Safekeeping of Collateral Granted The Fund does not borrow stock from counterparties therefore no collateral has been granted. 7. Securities Lending Income and Costs
Information in respect to income, costs and fees incurred by the Fund in relation to securities lending activities is set out in Note 13 to the financial statements.

SANLAM UNIVERSAL FUNDS PLC
503
SECURITIES FINANCING TRANSACTIONS REGULATION ("SFTR") DISCLOSURES (UNAUDITED) (CONTINUED) Satrix World Equity Tracker Fund 1. Global Data
Proportion of Securities and Commodities on Loan USD
Total Lendable Assets Excluding Cash and Cash Equivalents 671,267,712
Securities and Commodities on Loan 2,587,487
% 0.39%
Assets Engaged in SFTs
Fund Assets Under Management 678,390,481
Absolute Value of Assets Engaged in Securities Lending 2,587,487
%
0.38%
2. Concentration Data Top Ten Largest Collateral Issuers
Name and Value of Collateral and Commodities Received USD
Federal Republic of Germany Bonds 971,363
United Kingdom Bonds 690,091
French Republic Bonds 633,637
Netherlands Government Bonds 413,471
United States of America Treasury Notes 117,608
Swiss Confederation Government Bonds 42,286
Sweden Government Bonds 17,965
Total 2,886,421
Top Ten Counterparties
Name and Gross Volume of Outstanding Transactions USD
Securities Lending UBS AG London Branch 1,365,987
Credit Suisse Securities (Europe) Limited 462,403
Merrill Lynch International 239,594
Deutsche Bank AG 232,140
Citigroup Global Markets Limited 168,216
J.P. Morgan Securities Ltd 119,147
Total 2,587,487

SANLAM UNIVERSAL FUNDS PLC
504
SECURITIES FINANCING TRANSACTIONS REGULATION ("SFTR") DISCLOSURES (UNAUDITED) (CONTINUED) Satrix World Equity Tracker Fund (continued) 3. Aggregate Transaction Data Type, Quality and Currency of Collateral
Securities Lending Type Currencies USD
Sovereign Bonds Investment Grade EUR 2,018,471
Sovereign Bonds Investment Grade GBP 690,091
US Treasury Notes Investment Grade USD 117,608
Sovereign Bonds Investment Grade CHF 42,286
Sovereign Bonds Investment Grade SEK 17,965
Total 2,886,421
Maturity Tenor of Collateral (Remaining Period to Maturity)
Less than 1 Day
1 Day to 1
Week
1 Week to 1
Month 1 to 3
Months 3 Months to 1 Year
Above 1 Year
Open Maturity Total
Type USD USD USD USD USD USD USD USD
Securities Lending
-
-
461,109 74,363 149,362 2,201,587 - 2,886,421
Counterparty Details
Type Country of
establishment Settlement & Clearing USD
Securities Lending UK Tri-party 2,886,421
Maturity Tenor of SFTs (Remaining Period to Maturity)
Less than 1 Day
1 Day to 1
Week
1 Week to 1
Month 1 to 3
Months 3 Months to 1 Year
Above 1 Year
Open Maturity Total
Type USD USD USD USD USD USD USD USD
Securities Lending
-
-
-
-
-
- 2,587,487 2,587,487
4. Re-use of Collateral Re-use of Collateral Received The Fund does not re-use collateral received. Cash Collateral Reinvestment Returns The Fund has no returns on cash collateral.

SANLAM UNIVERSAL FUNDS PLC
505
SECURITIES FINANCING TRANSACTIONS REGULATION ("SFTR") DISCLOSURES (UNAUDITED) (CONTINUED)
Satrix World Equity Tracker Fund (continued) 5. Safekeeping of Collateral Received
Names and Value of Custodians Safekeeping Collateral USD
Brown Brothers Harriman & Co
2,886,421
Number of Custodians Safekeeping Collateral
1 6. Safekeeping of Collateral Granted The Fund does not borrow stock from counterparties therefore no collateral has been granted. 7. Securities Lending Income and Costs
Information in respect to income, costs and fees incurred by the Fund in relation to securities lending activities is set out in Note 13 to the financial statements.

SANLAM UNIVERSAL FUNDS PLC
506
SECURITIES FINANCING TRANSACTIONS REGULATION ("SFTR") DISCLOSURES (UNAUDITED) (CONTINUED) Satrix North America Equity Tracker Fund 1. Global Data
Proportion of Securities and Commodities on Loan USD
Total Lendable Assets Excluding Cash and Cash Equivalents 71,791,726
Securities and Commodities on Loan 201,717
% 0.28%
Assets Engaged in SFTs
Fund Assets Under Management 72,219,063
Absolute Value of Assets Engaged in Securities Lending 201,717
%
0.28%
2. Concentration Data Top Ten Largest Collateral Issuers
Name and Value of Collateral and Commodities Received USD
United Kingdom Bonds 75,900
United States of America Treasury Notes 43,699
Swiss Confederation Bonds 35,370
Netherlands Government Bonds 33,580
French Republic Bonds 21,654
Federal Republic of Germany Bonds 18,138
Sweden Government Bonds 15,027
Total 243,368
Top Ten Counterparties
Name and Gross Volume of Outstanding Transactions USD
Securities Lending Citigroup Global Markets Limited 140,706
Merrill Lynch International 39,415
UBS AG London Branch 21,298
Credit Suisse Securities (Europe) Limited 298
Total 201,717

SANLAM UNIVERSAL FUNDS PLC
507
SECURITIES FINANCING TRANSACTIONS REGULATION ("SFTR") DISCLOSURES (UNAUDITED) (CONTINUED) Satrix North America Equity Tracker Fund (continued) 3. Aggregate Transaction Data
Type, Quality and Currency of Collateral
Securities Lending Type Currencies USD
Sovereign Bonds Investment Grade GBP 75,900
Sovereign Bonds Investment Grade EUR 73,372
US Treasury Notes Investment Grade USD 43,699
Sovereign Bonds Investment Grade CHF 35,370
Sovereign Bonds Investment Grade SEK 15,027
Total 243,368
Maturity Tenor of Collateral (Remaining Period to Maturity)
Less than 1 Day
1 Day to 1
Week
1 Week to 1
Month 1 to 3
Months 3 Months to 1 Year
Above 1 Year
Open Maturity Total
Type USD USD USD USD USD USD USD USD
Securities Lending
-
-
13,230
1,159
8,264 220,715 - 243,368
Counterparty Details
Type Country of
establishment Settlement & Clearing USD
Securities Lending UK Tri-party 243,368
Maturity Tenor of SFTs (Remaining Period to Maturity)
Less than 1 Day
1 Day to 1
Week
1 Week to 1
Month 1 to 3
Months 3 Months to 1 Year
Above 1 Year
Open Maturity Total
Type USD USD USD USD USD USD USD USD
Securities Lending
-
-
-
-
-
- 201,717 201,717
4. Re-use of Collateral Re-use of Collateral Received The Fund does not re-use collateral received. Cash Collateral Reinvestment Returns The Fund has no returns on cash collateral.

SANLAM UNIVERSAL FUNDS PLC
508
SECURITIES FINANCING TRANSACTIONS REGULATION ("SFTR") DISCLOSURES (UNAUDITED) (CONTINUED)
Satrix North America Equity Tracker Fund (continued) 5. Safekeeping of Collateral Received
Names and Value of Custodians Safekeeping Collateral USD
Brown Brothers Harriman & Co
243,368
Number of Custodians Safekeeping Collateral
1 6. Safekeeping of Collateral Granted The Fund does not borrow stock from counterparties therefore no collateral has been granted. 7. Securities Lending Income and Costs
Information in respect to income, costs and fees incurred by the Fund in relation to securities lending activities is set out in Note 13 to the financial statements.

SANLAM UNIVERSAL FUNDS PLC
509
SECURITIES FINANCING TRANSACTIONS REGULATION ("SFTR") DISCLOSURES (UNAUDITED) (CONTINUED) Satrix UK Equity Tracker Fund 1. Global Data
Proportion of Securities and Commodities on Loan GBP
Total Lendable Assets Excluding Cash and Cash Equivalents 48,168,217
Securities and Commodities on Loan 379,184
% 0.79%
Assets Engaged in SFTs
Fund Assets Under Management 48,756,620
Absolute Value of Assets Engaged in Securities Lending 379,184
%
0.78%
2. Concentration Data Top Ten Largest Collateral Issuers
Name and Value of Collateral and Commodities Received GBP
United Kingdom Bonds 191,022
United States of America Treasury Notes 95,491
Swiss Confederation Government Bonds 95,318
Netherlands Government Bonds 55,008
Sweden Government Bonds 40,497
French Republic Government Bonds 229
Total 477,565
Top Ten Counterparties
Name and Gross Volume of Outstanding Transactions GBP
Securities Lending Citigroup Global Markets Limited 379,184
3. Aggregate Transaction Data Type, Quality and Currency of Collateral
Securities Lending Type Currencies GBP
Sovereign Bonds Investment Grade GBP 191,022
US Treasury Notes Investment Grade USD 95,491
Sovereign Bonds Investment Grade CHF 95,318
Sovereign Bonds Investment Grade EUR 55,237
Sovereign Bonds Investment Grade SEK 40,497
Total 477,565

SANLAM UNIVERSAL FUNDS PLC
510
SECURITIES FINANCING TRANSACTIONS REGULATION ("SFTR") DISCLOSURES (UNAUDITED) (CONTINUED) Satrix UK Equity Tracker Fund (continued) 3. Aggregate Transaction Data (continued) Maturity Tenor of Collateral (Remaining Period to Maturity)
Less than 1 Day
1 Day to 1
Week
1 Week to 1
Month 1 to 3
Months 3 Months to 1 Year
Above 1 Year
Open Maturity Total
Type GBP GBP GBP GBP GBP GBP GBP GBP
Securities Lending
-
-
- - - 477,565 - 477,565
Counterparty Details
Type Country of
establishment Settlement & Clearing GBP
Securities Lending UK Tri-party 477,565
Maturity Tenor of SFTs (Remaining Period to Maturity)
Less than 1 Day
1 Day to 1
Week
1 Week to 1
Month 1 to 3
Months 3 Months to 1 Year
Above 1 Year
Open Maturity Total
Type GBP GBP GBP GBP GBP GBP GBP GBP
Securities Lending
-
-
-
-
-
- 379,184 379,184
4. Re-use of Collateral Re-use of Collateral Received The Fund does not re-use collateral received. Cash Collateral Reinvestment Returns The Fund has no returns on cash collateral. 5. Safekeeping of Collateral Received
Names and Value of Custodians Safekeeping Collateral GBP
Brown Brothers Harriman & Co
477,565
Number of Custodians Safekeeping Collateral
1 6. Safekeeping of Collateral Granted The Fund does not borrow stock from counterparties therefore no collateral has been granted. 7. Securities Lending Income and Costs
Information in respect to income, costs and fees incurred by the Fund in relation to securities lending activities is set out in Note 13 to the financial statements.

SANLAM UNIVERSAL FUNDS PLC
511
SECURITIES FINANCING TRANSACTIONS REGULATION ("SFTR") DISCLOSURES (UNAUDITED) (CONTINUED) Satrix Europe (Ex-UK) Equity Tracker Fund 1. Global Data
Proportion of Securities and Commodities on Loan EUR
Total Lendable Assets Excluding Cash and Cash Equivalents 236,396,335
Securities and Commodities on Loan 1,158,359
% 0.49%
Assets Engaged in SFTs
Fund Assets Under Management 255,603,387
Absolute Value of Assets Engaged in Securities Lending 1,158,359
%
0.45%
2. Concentration Data Top Ten Largest Collateral Issuers
Name and Value of Collateral and Commodities Received EUR
French Republic Government Bonds 355,823
United Kingdom Bonds 289,125
Federal Republic of Germany Bonds 258,314
Netherlands Government Bonds 152,293
United States of America Treasury Notes 139,820
Swiss Confederation Bonds 35,332
Sweden Government Bonds 15,011
Total 1,245,718
Top Ten Counterparties
Name and Gross Volume of Outstanding Transactions EUR
Securities Lending Merrill Lynch International 398,969
Credit Suisse Securities (Europe) Limited 389,743
Citigroup Global Markets Limited 140,554
HSBC Bank Plc 130,127
JP Morgan Securities Limited 98,966
Total 1,158,359

SANLAM UNIVERSAL FUNDS PLC
512
SECURITIES FINANCING TRANSACTIONS REGULATION ("SFTR") DISCLOSURES (UNAUDITED) (CONTINUED)
Satrix Europe (Ex-UK) Equity Tracker Fund (continued) 3. Aggregate Transaction Data Type, Quality and Currency of Collateral
Securities Lending Type Currencies EUR
Sovereign Bonds Investment Grade EUR 766,430
Sovereign Bonds Investment Grade GBP 289,125
US Treasury Notes Investment Grade USD 139,820
Sovereign Bonds Investment Grade CHF 35,332
Sovereign Bonds Investment Grade SEK 15,011
Total 1,245,718
Maturity Tenor of Collateral (Remaining Period to Maturity)
Less than 1 Day
1 Day to 1
Week
1 Week to 1
Month 1 to 3
Months 3 Months to 1 Year
Above 1 Year
Open Maturity Total
Type EUR EUR EUR EUR EUR EUR EUR EUR
Securities Lending
-
- 165,604 - 167,491 912,623 - 1,245,718
Counterparty Details
Type Country of
establishment Settlement & Clearing EUR
Securities Lending UK Tri-party 1,245,718
Maturity Tenor of SFTs (Remaining Period to Maturity)
Less than 1 Day
1 Day to 1
Week
1 Week to 1
Month 1 to 3
Months 3 Months to 1 Year
Above 1 Year
Open Maturity Total
Type EUR EUR EUR EUR EUR EUR EUR EUR
Securities Lending
-
-
-
-
-
- 1,158,359 1,158,359
4. Re-use of Collateral Re-use of Collateral Received The Fund does not re-use collateral received. Cash Collateral Reinvestment Returns The Fund has no returns on cash collateral.

SANLAM UNIVERSAL FUNDS PLC
513
SECURITIES FINANCING TRANSACTIONS REGULATION ("SFTR") DISCLOSURES (UNAUDITED) (CONTINUED)
Satrix Europe (Ex-UK) Equity Tracker Fund (continued) 5. Safekeeping of Collateral Received
Names and Value of Custodians Safekeeping Collateral EUR
Brown Brothers Harriman & Co
1,245,718
Number of Custodians Safekeeping Collateral
1 6. Safekeeping of Collateral Granted The Fund does not borrow stock from counterparties therefore no collateral has been granted. 7. Securities Lending Income and Costs
Information in respect to income, costs and fees incurred by the Fund in relation to securities lending activities is set out in Note 13 to the financial statements.

SANLAM UNIVERSAL FUNDS PLC
514
SECURITIES FINANCING TRANSACTIONS REGULATION ("SFTR") DISCLOSURES (UNAUDITED) (CONTINUED) Sanlam Equity Allocation Fund 1. Global Data
Proportion of Securities and Commodities on Loan USD
Total Lendable Assets Excluding Cash and Cash Equivalents 109,212,208
Securities and Commodities on Loan 1,180,253
% 1.09%
Assets Engaged in SFTs
Fund Assets Under Management 111,020,909
Absolute Value of Assets Engaged in Securities Lending 1,180,253
%
1.06%
2. Concentration Data Top Ten Largest Collateral Issuers
Name and Value of Collateral and Commodities Received USD
United Kingdom Bonds 431,283
French Republic Bonds 340,100
Federal Republic of Germany Bonds 240,058
United States of America Treasury Notes 98,550
Netherlands Government Bonds 95,641
Swiss Confederation Bonds 56,850
Sweden Government Bonds 24,153
Total 1,286,635
Top Ten Counterparties
Name and Gross Volume of Outstanding Transactions USD
Securities Lending Credit Suisse Securities (Europe) Limited 604,228
Citigroup Global Markets Limited 226,153
Merrill Lynch International 198,405
HSBC Bank Plc 100,585
Deutsche Bank AG 50,882
Total 1,180,253

SANLAM UNIVERSAL FUNDS PLC
515
SECURITIES FINANCING TRANSACTIONS REGULATION ("SFTR") DISCLOSURES (UNAUDITED) (CONTINUED) Sanlam Equity Allocation Fund (continued) 3. Aggregate Transaction Data Type, Quality and Currency of Collateral
Securities Lending Type Currencies USD
Sovereign Bonds Investment Grade EUR 675,799
Sovereign Bonds Investment Grade GBP 431,283
US Treasury Notes Investment Grade USD 98,550
Sovereign Bonds Investment Grade CHF 56,850
Sovereign Bonds Investment Grade SEK 24,153
Total 1,286,635
Maturity Tenor of Collateral (Remaining Period to Maturity)
Less than 1 Day
1 Day to 1
Week
1 Week to 1
Month 1 to 3
Months 3 Months to 1 Year
Above 1 Year
Open Maturity Total
Type USD USD USD USD USD USD USD USD
Securities Lending
-
- 126,863 - 93,969 1,065,803 - 1,286,635
Counterparty Details
Type Country of
establishment Settlement & Clearing USD
Securities Lending UK Tri-party 1,286,635
Maturity Tenor of SFTs (Remaining Period to Maturity)
Less than 1 Day
1 Day to 1
Week
1 Week to 1
Month 1 to 3
Months 3 Months to 1 Year
Above 1 Year
Open Maturity Total
Type USD USD USD USD USD USD USD USD
Securities Lending
-
-
-
-
-
- 1,180,253 1,180,253
4. Re-use of Collateral Re-use of Collateral Received The Fund does not re-use collateral received. Cash Collateral Reinvestment Returns The Fund has no returns on cash collateral.

SANLAM UNIVERSAL FUNDS PLC
516
SECURITIES FINANCING TRANSACTIONS REGULATION ("SFTR") DISCLOSURES (UNAUDITED) (CONTINUED) Sanlam Equity Allocation Fund (continued) 5. Safekeeping of Collateral Received
Names and Value of Custodians Safekeeping Collateral USD
Brown Brothers Harriman & Co
1,286,635
Number of Custodians Safekeeping Collateral
1 6. Safekeeping of Collateral Granted The Fund does not borrow stock from counterparties therefore no collateral has been granted. 7. Securities Lending Income and Costs
Information in respect to income, costs and fees incurred by the Fund in relation to securities lending activities is set out in Note 13 to the financial statements.

SANLAM UNIVERSAL FUNDS PLC
517
SECURITIES FINANCING TRANSACTIONS REGULATION ("SFTR") DISCLOSURES (UNAUDITED) (CONTINUED) Satrix Emerging Market Equity Tracker Fund 1. Global Data
Proportion of Securities and Commodities on Loan USD
Total Lendable Assets Excluding Cash and Cash Equivalents 45,366,604
Securities and Commodities on Loan 1,684,501
% 3.71%
Assets Engaged in SFTs
Fund Assets Under Management 45,989,435
Absolute Value of Assets Engaged in Securities Lending 1,684,501
%
3.67%
2. Concentration Data
Top Ten Largest Collateral Issuers
Name and Value of Collateral and Commodities Received USD
United Kingdom Bonds 710,034
Federal Republic of Germany Bonds 615,057
Netherlands Government Bonds 333,777
French Republic Bonds 78,589
United States of America Treasury Notes 21,070
Swiss Confederation Bonds 21,032
Sweden Government Bonds 8,936
Total 1,788,495
Top Ten Counterparties
Name and Gross Volume of Outstanding Transactions USD
Securities Lending HSBC Bank Plc 1,506,667
Citigroup Global Markets Limited 83,668
Credit Suisse Securities (Europe) Limited 71,356
UBS AG London Branch 22,810
Total 1,684,501
3. Aggregate Transaction Data
Type, Quality and Currency of Collateral
Securities Lending Type Currencies USD
Sovereign Bonds Investment Grade EUR 1,027,423
Sovereign Bonds Investment Grade GBP 710,034
US Treasury Notes Investment Grade USD 21,070
Sovereign Bonds Investment Grade CHF 21,032
Sovereign Bonds Investment Grade SEK 8,936
Total 1,788,495
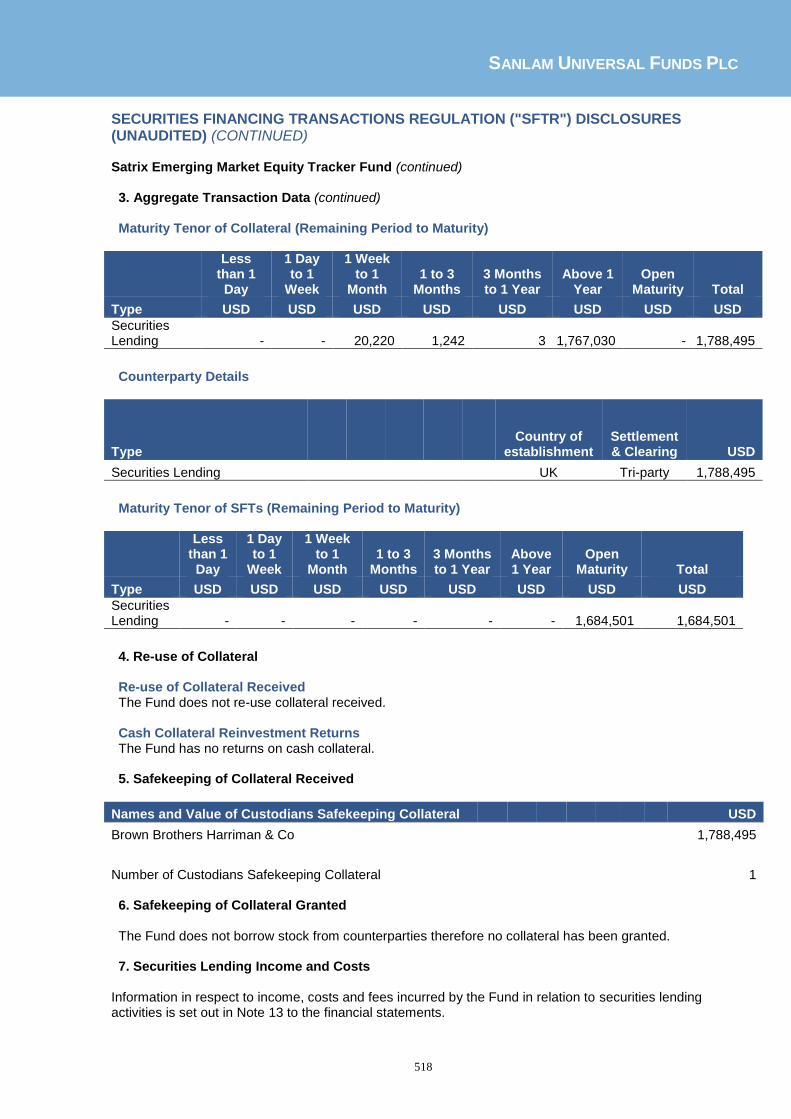
SANLAM UNIVERSAL FUNDS PLC
518
SECURITIES FINANCING TRANSACTIONS REGULATION ("SFTR") DISCLOSURES (UNAUDITED) (CONTINUED) Satrix Emerging Market Equity Tracker Fund (continued) 3. Aggregate Transaction Data (continued) Maturity Tenor of Collateral (Remaining Period to Maturity)
Less than 1 Day
1 Day to 1
Week
1 Week to 1
Month 1 to 3
Months 3 Months to 1 Year
Above 1 Year
Open Maturity Total
Type USD USD USD USD USD USD USD USD
Securities Lending
-
-
20,220 1,242 3 1,767,030 - 1,788,495
Counterparty Details
Type Country of
establishment Settlement & Clearing USD
Securities Lending UK Tri-party 1,788,495
Maturity Tenor of SFTs (Remaining Period to Maturity)
Less than 1 Day
1 Day to 1
Week
1 Week to 1
Month 1 to 3
Months 3 Months to 1 Year
Above 1 Year
Open Maturity Total
Type USD USD USD USD USD USD USD USD
Securities Lending
-
-
-
-
-
- 1,684,501 1,684,501
4. Re-use of Collateral Re-use of Collateral Received The Fund does not re-use collateral received. Cash Collateral Reinvestment Returns The Fund has no returns on cash collateral. 5. Safekeeping of Collateral Received
Names and Value of Custodians Safekeeping Collateral USD
Brown Brothers Harriman & Co
1,788,495
Number of Custodians Safekeeping Collateral
1 6. Safekeeping of Collateral Granted The Fund does not borrow stock from counterparties therefore no collateral has been granted. 7. Securities Lending Income and Costs
Information in respect to income, costs and fees incurred by the Fund in relation to securities lending activities is set out in Note 13 to the financial statements.

SANLAM UNIVERSAL FUNDS PLC
519
SECURITIES FINANCING TRANSACTIONS REGULATION ("SFTR") DISCLOSURES (UNAUDITED) (CONTINUED) High Street Global Balanced Fund 1. Global Data
Proportion of Securities and Commodities on Loan USD
Total Lendable Assets Excluding Cash and Cash Equivalents 18,181,839
Securities and Commodities on Loan 183,989
% 1.01%
Assets Engaged in SFTs
Fund Assets Under Management 19,710,208
Absolute Value of Assets Engaged in Securities Lending 183,989
%
0.93%
2. Concentration Data Top Ten Largest Collateral Issuers
Name and Value of Collateral and Commodities Received USD
United Kingdom Bonds 77,260
Federal Republic of Germany Bonds 71,999
Netherlands Government Bonds 38,637
French Republic Bonds 5,292
Total 193,188
Top Ten Counterparties
Name and Gross Volume of Outstanding Transactions USD
Securities Lending HSBC Bank Plc 183,989
3. Aggregate Transaction Data Type, Quality and Currency of Collateral
Securities Lending Type Currencies USD
Sovereign Bonds Investment Grade EUR 115,928
Sovereign Bonds Investment Grade GBP 77,260
Total 193,188

SANLAM UNIVERSAL FUNDS PLC
520
SECURITIES FINANCING TRANSACTIONS REGULATION ("SFTR") DISCLOSURES (UNAUDITED) (CONTINUED) High Street Global Balanced Fund (continued) 3. Aggregate Transaction Data (continued) Maturity Tenor of Collateral (Remaining Period to Maturity)
Less than 1 Day
1 Day to 1
Week
1 Week to 1
Month 1 to 3
Months 3 Months to 1 Year
Above 1 Year
Open Maturity Total
Type USD USD USD USD USD USD USD USD
Securities Lending
-
-
-
- - 193,188 - 193,188
Counterparty Details
Type Country of
establishment Settlement & Clearing USD
Securities Lending UK Tri-party 193,188
Maturity Tenor of SFTs (Remaining Period to Maturity)
Less than 1 Day
1 Day to 1
Week
1 Week to 1
Month 1 to 3
Months 3 Months to 1 Year
Above 1 Year
Open Maturity Total
Type USD USD USD USD USD USD USD USD
Securities Lending
-
-
-
-
-
- 183,989 183,989
4. Re-use of Collateral Re-use of Collateral Received The Fund does not re-use collateral received. Cash Collateral Reinvestment Returns The Fund has no returns on cash collateral. 5. Safekeeping of Collateral Received
Names and Value of Custodians Safekeeping Collateral USD
Brown Brothers Harriman & Co
193,188
Number of Custodians Safekeeping Collateral
1 6. Safekeeping of Collateral Granted The Fund does not borrow stock from counterparties therefore no collateral has been granted. 7. Securities Lending Income and Costs
Information in respect to income, costs and fees incurred by the Fund in relation to securities lending activities is set out in Note 13 to the financial statements.

SANLAM UNIVERSAL FUNDS PLC
521
PURCHASES AND SALES FOR THE PERIOD ENDED 30 JUNE 2017 (UNAUDITED) Sanlam Centre Global Select Equity Fund
Sales Proceeds (USD) (being the largest sales during the period ended 30 June 2017)
Bank of America Corp (1,104,819)
Samsung Electronics (928,161)
Citigroup Inc (875,465)
Apple Inc (874,262)
Ing Groep NV (836,204)
Facebook Inc (776,972)
Schneider Electri SE (756,799)
Unilever NV (741,784)
Amazon.Com Inc (733,237)
Thales Sa (705,829)
Safran SA (693,004)
Alphabet Inc Cl C (687,079)
Merck & Co (667,861)
Visa INC - Class A (644,337)
Berkshire Hath-B (620,084)
Pepsico Inc Com (619,790)
British Aerospace (616,996)
Conocophillips (614,691)
Kimberley Clark Corp (602,848)
CVS Health Corp (596,596)
Stryker Corp (595,101)
Home Depot (583,430)
British American Tob (581,515)
Capgemini SA (561,001)
Kerry Properties Ltd (534,644)
Banco Bilbao Viscaya (532,319)
Exelon Corp (518,747)
Amgen Corp Com Npv (513,553)
Nippon TeL & Tel (508,026)
Bridgestone Corp (505,882)
Walt Disney Co (505,116)
Securitas Ab-B (504,328)
Barrick Gold Corp (503,917)
Michelin Class B (502,314)
Aust And Nz Bank (474,686)
STRAUMANN HOLDING (464,951)
Roche Hldg-Genus (463,186)
Sony Corp (450,417)
Telstra Corporation (448,236)
Lvmh Moet Hennes (447,608)
Fonciere Des Regions (438,973)
Infineon Tech (435,363)
Daimler AG (435,345)
Contact Energy L (420,497)
Origin Energy (420,249)
Astellas Pharma Inc (416,248)

SANLAM UNIVERSAL FUNDS PLC
522
PURCHASES AND SALES FOR THE PERIOD ENDED 30 JUNE 2017 (UNAUDITED) (CONTINUED) Bridge Global Property Income Fund
Purchases Cost (USD) (being the largest purchases during the period ended 30 June 2017)
Hudson Pacific Prop 950,749
Invitation Homes Inc 948,488
SL Green Realty Corp 947,063
DDR Corp 290,868
KIMCO REALTY CORP 195,243
Spirit Realty Cap 191,072
British Land ORD 25P 190,873
Land Securities Grp 167,133
Hammerson Plc 157,805
Derwent London 83,550
Acadia Realty 52,619
Taubman Centers INC 49,981
Macerich Co/The 48,841
Simon Property 38,230
Westfield Corp 35,697
Federal Realty Inv 33,844
Cubesmart 30,629
RioCan Real Est Inv 16,245
Sales Proceeds (USD) (being the largest sales during the period ended 30 June 2017)
Delta Property Fund Ltd (488,193)
Mid-America Apartment Comm (467,167)
Digital Realty Trust Inc (445,454)
Sun Communities Inc (418,293)
AvalonBay Communities Inc. (351,143)
DCT Industrial Trust Inc (331,980)
Prologis Inc (305,026)
Healthcare Realty Trust Inc (300,442)
Safari Investments RSA Limited (295,945)
Duke Realty Corp (262,105)
Equity Residential (255,582)
LIBERTY PROPERTY TRUST (242,128)
Columbia Property Trust Inc (220,530)
Cubesmart (190,323)
General Property Grp (182,215)
Boston Properties (176,666)
Public Storage Inc (161,243)
Grwthpnt Prop Austr (161,231)
Education Realty Trust Inc (160,591)
Mara Delta Prop Ltd (108,052)
Tower Property Fund (94,898)
Spirit Realty Cap (88,619)
Federal Realty Inv Trust (81,885)
Simon Property (79,729)
Hudson Pacific Prop (72,937)
Unibail-Rodamco (63,118)

SANLAM UNIVERSAL FUNDS PLC
523
PURCHASES AND SALES FOR THE PERIOD ENDED 30 JUNE 2017 (UNAUDITED) (CONTINUED) P-Solve Inflation Plus Fund
Purchases Cost (USD) (being the largest purchases during the period ended 30 June 2017)
Vanguard FTSE Developed ETF 3,592,883
Institutional Cash Series Plc - Insti Sterling Liquidity Fd 3,251,004
TSY 4.25% 07/12/2027 1,309,128
UK Tsy 0.5% 22072022 1,308,313
Ishare Euro Stoxx UCITS ETF (DE) 1,166,654
Marshall Wace UCIT Funds PLC 1,165,725
Vanguard Sml Cap ETF 1,161,010
db x-trackes S&P 500 UCITS ETF 1,157,137
Nomura US Higher Yield Bond Fund 965,700
Blackrock Developed Real Estate Index Sub Fund 903,589
T Rowe GLB Uncons BD 902,300
Vanguard Stock 649,198
UK GOV 4.5% 070934 538,638
UK Tsy 1.5% 220726 529,854
Insight Liquidity Funds Plc 513,781
Vanguard Reit ETF 329,680
Vanguard Glbl EX-US 270,324
Pimco-Hi Yield Bond 236,600
iShares Core S&P 146,784
Sales Proceeds (USD) (being the largest sales during the period ended 30 June 2016)
Institutional Cash Series Plc - Insti Sterling Liquidity Fd (4,403,800) UK Gilt 1.00% 070917 (2,852,029) US Treasury 2.875% 15112046 (2,556,222) Finsbury High Income Fund (1,933,400) Insight Liquidity Funds Plc (1,899,722) iShares MSCI Japan Monthly GBP Hedged (1,283,689) Pimco-Hi Yield Bond (991,400) Nomura US Hg Yld BD (841,600) iShares EURO STOXX Banks 30-15 UCITS ETF (814,315) Vanguard S&P 500 ETF (634,361) T.Rowe-Glb Emk BD-IH (396,600) SPDR Trust Series 1 (305,952) Primco Global Plc (276,782) UK Tsy 1.5% 220726 (261,368) UK GOV 4.5% 070934 (258,225) GLG Treasury Plus Fd (102,000)

SANLAM UNIVERSAL FUNDS PLC
524
PURCHASES AND SALES FOR THE PERIOD ENDED 30 JUNE 2017 (UNAUDITED) (CONTINUED) Sanlam African Frontier Markets Fund Purchases Cost (USD) (being the largest purchases during the period ended 30 June 2017)
Rockcastle Global Real Estate Company Limited 2,023,675
Centamin PLC 1,667,105
Global Telecom Hldg 1,625,716
Guaranty Trust Bank 1,325,724
Safaricom Ltd 1,016,307
ZENITH BANK LTD 931,237
VanEck Vectors Egypt Index ETF 649,707
Attijariwafa Bank 486,131
Stanbic IBTC Holding Co 357,892
Econet 0% 311249 318,160
Seplat Petroleum Dev 161,264
Guinness Nigeria Plc 130,727
Seplat Petroleum Dev 5,670
Sales Proceeds (USD) (being the largest sales during the period ended 30 June 2016)
Centamin Plc (2,889,708)
Global Telecom H (2,380,230)
Eastern Tobacco (2,213,173)
Stanbic IBTC Hldg Co (1,350,287)
Umeme Ltd (1,081,584)
Equity Bank Ltd (1,041,692)
Societe des Brasseri (995,881)
Talaat Moustafa Group (977,188)
Qatar National Bank (789,906)
Credit Agricole Egypt (773,375)
DOUJA PROM ADDOHA (755,727)
Commercial International Bank Egypt SAE (CIB) (672,824)
VanEck Vectors Egypt Index ETF (653,061)
Delta Corp Ltd (546,319)
Ecobank Transnational Inc (540,437)
Lafarge Africa Plc (536,797)
Banque Centrale Pop (500,050)
Econet Wireless Zim (374,619)
Commercial Int Bank (205,575)
Global Telecom Hldg (97,957)

SANLAM UNIVERSAL FUNDS PLC
525
PURCHASES AND SALES FOR THE PERIOD ENDED 30 JUNE 2017 (UNAUDITED) (CONTINUED) Sanlam Global Best Ideas Fund Purchases Cost (USD) (being the largest purchases during the period ended 30 June 2017)
ASML Holding NV 1,639,020
Howden Joinery Grp 1,624,890
Sberbank of Russ ADR 1,094,807
Banco Commercial Por 1,061,889
Credicorp 513,142
TBC Bank Group Plc 432,230
JP Morgan Chase & Co 334,866
Moscow Exchange Mic 214,502
Wells Fargo & Co 210,122
American Int Group 139,888
Mgic Invt Corp 112,432
OneSavings Bank Plc 99,167
Legal & Gen Grp 87,772
UBS Group AG 81,731
Scor SE 78,374
Turkiye Sinai Kalkin 69,575
Citigroup Inc 68,444
Bank Rakyat Indonesa 32,118
LIC Housing Finance 16,602
Sales Proceeds (USD) (being the largest sales during the period ended 30 June 2017)
Deere & Co (2,124,666)
Bank Rakyat Indonesa (1,135,841)
Erste Group Bank AG (1,045,425)
Lockheed Martin Corp (1,010,678)
Illinois Tool Wo (997,479)
Renaissancere Hldgs (752,488)
American Int Group (662,692)
LIC Housing Finance (295,979)
HP Inc (242,335)
Bank of America Corp (215,918)
Scor SE (197,734)
Philip Morris Int (164,578)
Moscow Exchange Mic (94,086)

SANLAM UNIVERSAL FUNDS PLC
526
PURCHASES AND SALES FOR THE PERIOD ENDED 30 JUNE 2017 (UNAUDITED) (CONTINUED) Sanlam Global Bond Fund
Purchases Cost (USD) (being the largest purchases during the period ended 30 June 2017)
FGCI 2.5% 010129 6,960,113
GNMA 3.5% 151241 6,664,362
US Treas 2.1% 311221 4,287,946
FGLMC 3% 010147 3,951,950
Japan Gvt 1% 200921 3,816,069
US Treas 2.7% 150224 3,127,267
Japan 2.5% 200936 3,075,447
Japan 0.10% 200327 2,748,302
USTreas 6.75% 150826 2,242,642
Japan 0.80% 200346 2,066,192
Japan 1.9% 200331 1,997,088
US Trea 3.75% 150841 1,985,080
Japan 2.125% 120221 1,963,000
FHLM 3% 010745 1,870,836
Shell 6.3% 151238 1,845,262
France 8.5% 250423 1,824,414
Tokyo 2.12% 200519 1,799,046
US Treas 1.7% 310123 1,765,684
Westpac 3.35% 080327 1,762,315
Morgan 3.625% 200127 1,674,851
Morgan 2.8% 160620 1,526,123
Euro Fin 3.5% 040222 1,447,378
BP Cap 2.5% 160120 1,417,122
Swedish 1.75% 180520 1,402,240
Buoni 4.5% 010324 1,398,612
Belgium 4.5% 280326 1,385,062
FHLM 3.5% 010446 1,369,248
US Treas 1.3% 310820 1,294,114
Sales Proceeds (USD)
(being the largest sales during the period ended 30 June 2017)
US Treas 1.2% 310119 (5,506,612)
GNMA 3.5% 151241 (650,655)
Euro-Bund Fut Jun17 (596,098)
IRS SWP GBP 080927 (577,223)
IRS SWP GBP 080946 (458,598)
FNMA 3% 010927 (328,786)
Gas Nat 4.12% 260118 (275,689)
GNMA 4.50% 200346 (269,982)
FNMA 4.5% 010245 (266,203)
GNMA 4.0% 150841 (249,882)
FNMA 4.5% 010540 (216,490)
FNMA 5.5% 011135 (215,836)
GNMA 4.50% 200843 (185,763)
IRS SWP GBP 020221 (172,646)
Euro-Bund Fut Mar 17 (168,354)
FHLM 4.0% 011044 (154,724)
IRS GBP 20180908 (146,601)
IRS SWP NZD 160320 (142,437)
IRS SWP GBP 110521 (141,724)
GNMA 4% 200241 (126,463)
FNMA 3% 011142 (126,120)

SANLAM UNIVERSAL FUNDS PLC
527
PURCHASES AND SALES FOR THE PERIOD ENDED 30 JUNE 2017 (UNAUDITED) (CONTINUED) Sanlam Global Financial Fund Purchases Cost (USD) (being the largest purchases during the period ended 30 June 2017)
Citigroup Inc 3,688,339
Banco Commercial Portugues SA 2,716,256
Sberbank of Russia ADR 2,045,419
Intercontinental Exchange Inc 1,955,944
OneSavings Bank Plc 1,664,763
Indiabulls Housing Finance Ltd 1,345,693
OTP Bank Nyrt 1,318,507
TBC Bank Group Plc 1,240,054
Berkshire Hathaway Inc. 1,201,860
Shawbrook Group Plc Ltd 1,152,720
JP Morgan Chase & Co 1,134,545
Societe Generale 1,092,661
Wells Fargo & Co 1,029,560
Aldermore Group Plc 940,312
AXA 915,363
Ageas 866,212
TURKIYE HALK AS 793,386
LIC Housing Finance Ltd 742,190
Bank of Ireland Ord 694,394
Moscow Exchange Micex 585,850
Itau Unibanco Hldgs 511,832
Shriram Finance 425,556
UBS Group AG 386,828
Yes Bank 385,238
Mgic Invt Corp 315,890

SANLAM UNIVERSAL FUNDS PLC
528
PURCHASES AND SALES FOR THE PERIOD ENDED 30 JUNE 2017 (UNAUDITED) (CONTINUED) Sanlam Global Financial Fund (continued) Sales Proceeds (USD) (being the largest sales during the period ended 30 June 2017)
TBC Bank Group Plc (5,220,320)
Dewan Housing Finance Corporation Ltd (4,551,319)
American International Group (3,641,672)
OneSavings Bank Plc (3,057,827)
Bank of Georgia Holdings Plc (3,009,418)
Bank of America Corp (2,983,243)
Bank Rakyat Indonesa (2,564,669)
Erste Group Bank AG (2,522,111)
JP Morgan Chase & Co (2,350,405)
Renaissancere Holdings Ltd (2,203,949)
PRA Group Inc (2,174,209)
Yes Bank (2,161,165)
Citigroup Inc (2,054,100)
Indiabulls Housing Finance Ltd (1,829,594)
ENCORE CAPITAL GROUP INC (1,779,093)
Signature Bank (1,715,182)
Novae Group PLC (1,613,723)
AXA (1,587,736)
Sparebank 1 Nord-Norge (1,534,094)
Deutsche Boerse AG (1,483,855)
US Bancorp (1,405,924)
MGIC Investment Corp. (1,267,818)
Soc Generale-A (1,240,637)
TCS Group Holding - Reg S (1,236,868)
Adira Dinamika Multi Finance (1,193,401)
LIC Housing Finance Ltd (1,134,085)
Moscow Exchange Micex (1,128,813)
Arrow Global Group PLC (904,260)
PT Bank Pembangunan Daerah Jawa Timur (880,662)
Ageas (854,543)
Berkshire Hathaway Inc. (811,032)
TURKIYE HALK BANKASI AS (802,754)
Turkiye Sinai Kalkin (791,726)
Legal & General Group PLC (773,651)
Indusind Bank Ltd (763,575)

SANLAM UNIVERSAL FUNDS PLC
529
PURCHASES AND SALES FOR THE PERIOD ENDED 30 JUNE 2017 (UNAUDITED) (CONTINUED) Sanlam Global Property Fund Purchases Cost (USD) (being the largest purchases during the period ended 30 June 2017)
Mas Real Estate Inc 4,673,213
Welltower Inc 3,207,956
GGP Inc 2,396,505
Essex Property TrInc 2,115,616
Hudson Pacific Prop 1,761,832
Epr Properties 1,619,899
STAG Industrial 1,582,120
Urban Edge Propertie 1,478,171
City Developments 1,448,859
Realty Income Corp 1,357,702
National Retail Prop 1,242,653
Deutsche Wohnen AG 1,186,660
Sabra Health Car 1,137,476
Medical Properti 1,131,271
Park Hotels & Resort 1,119,121
Retail Opportuni 1,115,177
Wharf Holdings 1,112,482
Camden Property Trus 1,059,272
Mid-America Apartmen 1,034,113
LEG Immobilien GmbH 993,469
Brixmor Property Gro 951,044
Entra ASA 937,609
Mapletree Logistics 932,400
Mirvac Group 927,427
Columbia Prop Trust 917,665
Healthcare Realty Tr 887,804
Cheung Kong Property 865,633
Buwog AG 857,806
Aareal Bank AG 838,000
Eurocommercial Prop 827,604
ICADE 719,704
Washington REIT 699,129
Anhui Conch Cement 697,372
Grupo Cementos 693,724
Hispania Activos 690,463
Daiwa Office Inv 685,216
Mitsui Fudosan Co 684,751
Alexandria Real Est 654,448
Digital Realty 647,687
Tag Immobilien AG 638,332

SANLAM UNIVERSAL FUNDS PLC
530
PURCHASES AND SALES FOR THE PERIOD ENDED 30 JUNE 2017 (UNAUDITED) (CONTINUED) Sanlam Global Property Fund (continued) Sales Proceeds (USD) (being the largest sales during the period ended 30 June 2017)
Mas Real Estate Inc (12,994,307)
Ventas Inc (2,413,313)
Extra Space Storage (2,064,810)
Federal Realty Inv (1,835,213)
Simon Property (1,801,469)
National Retail Prop (1,743,254)
Taubman Centers INC (1,430,859)
Apartment Int & Mng (1,209,131)
Prologis Inc (1,163,454)
LEG Immobilien GmbH (1,146,644)
Capitacommercial Tr (1,146,552)
DCT Industrial Trust (1,121,543)
Scentre Group (1,059,178)
Mercialys (1,053,638)
Apple Hosp REIT Inc (1,042,182)
United O/S Land (1,032,277)
DiamondRock Hosptlty (1,026,985)
Ramco Gershenson (958,158)
Spirit Realty Cap (936,547)
Cheung Kong Property (934,856)
Wharf Holdings (870,748)
Gecina (846,629)
Avalonbay Commun (792,988)
Kenedix Realty Inv (738,628)
Sino Land Co (675,563)
Education Realty Trs (658,922)
Buzzi Unicem SPA (652,476)
Goodman Group (652,201)
Big Yellow Group Plc (645,443)
Alstria Office Reit (642,349)
Sumitomo Realty Dev (625,749)
Kungsleden AB (595,874)
Boston Properties (587,566)
Concentradora Hipote (585,711)
Kenedix Res Invest (571,598)

SANLAM UNIVERSAL FUNDS PLC
531
PURCHASES AND SALES FOR THE PERIOD ENDED 30 JUNE 2017 (UNAUDITED) (CONTINUED) Sanlam World Equity Fund Purchases Cost (USD) (being the largest purchases during the period ended 30 June 2017)
Apple Inc 12,125,282
BlackRock Global Fnd 11,000,000
Microsoft Corp 8,979,129
Intesa Sanpaolo SPA 8,351,502
Amazon.Com Inc 8,028,617
UnitedHealthcare 7,096,662
Facebook Inc 7,021,511
Noble Energy Inc 6,555,393
Johnson & Johnson 6,232,172
General Electric Co 5,902,536
Alphabet Inc Cl A 5,878,165
Alphabet Inc Cl C 5,599,680
Merck & Co 5,033,371
Applied Material Inc 4,951,784
CBRE Group Inc 4,878,916
Adobe Sys Inc 4,810,471
ASML Holding NV 4,706,028
CBS Corp-CL B 4,595,123
Raytheon Co 4,564,077 Peugeot Sa 4,486,747 Sales Proceeds (USD) (being the largest sales during the period ended 30 June 2017)
Apple Inc (21,009,416)
Microsoft Corp (19,281,270)
Amazon.Com Inc (17,389,020)
UnitedHealthcare (14,747,204)
Alphabet Inc Cl A (13,924,274)
Alphabet Inc Cl C (13,818,231)
Facebook Inc (13,230,264)
Johnson & Johnson (12,176,379)
Nvidia Corp (11,125,775)
Home Depot (10,214,603)
Adobe Sys Inc (10,108,235)
Pepsico Inc Com (10,046,754)
Merck & Co (10,043,902)
Intesa Sanpaolo SPA (9,644,355)
CBS Corp-CL B (9,519,527)
Carnival Corp (9,385,341)
Procter & Gamble (9,375,308)
General Electric Co (9,300,579)
Bank of America Corp (9,000,431)
Parker Hannifin (8,805,287)

SANLAM UNIVERSAL FUNDS PLC
532
PURCHASES AND SALES FOR THE PERIOD ENDED 30 JUNE 2017 (UNAUDITED) (CONTINUED) Satrix World Equity Tracker Fund Purchases Cost (USD) (being the largest purchases during the period ended 30 June 2017)
Ishares S&P 500 Index 20,060,398
Ishares MSCI EAFE In 12,345,330
Apple Inc 2,064,096
Microsoft Corp 1,379,280
Ishares MSCI Canada 1,181,750
Amazon.Com Inc 1,163,344
Alphabet Inc Cl C 1,156,471
Facebook Inc 1,058,009
JP Morgan Chase & Co 986,283
Johnson & Johnson 974,376
Royal Dutch Shell A 819,701
Exxon Corp 794,496
General Electric Co 791,736
Nestle Sa-R 728,449
Actelion Ltd 689,429
Procter & Gamble 678,148
Wells Fargo & Co 663,564
AT & T Inc 657,558
Berkshire Hath-B 648,063
Enbridge Inc 629,066
Sales Proceeds (USD) (being the largest sales during the period ended 30 June 2017)
Ishares S&P 500 Index Fund (10,343,507)
Ishares MSCI EAFE Index Fund (6,342,009)
Altaba Inc (959,580)
Syngenta Ag (895,347)
Ishares MSCI Canada (592,555)
Mead John Nutrition (468,000)
Deutsche Boerse (466,582)
Enbridge Inc (378,043)
Technipfmc Plc (190,262)
Actelion Ltd (176,131)
Actelion Ltd (170,589)
Banco Popular Espano (136,406)
Liberty Lilac Group (121,297)
Logmein Inc (99,050)
Southwestern Energy (84,753)
Unicredit Spa-rt (81,052)
Bioverativ In-wi (70,708)
Frontier Communicati (66,479)
Conduent Inc (44,042)
Varex Imaging Corp (37,095)
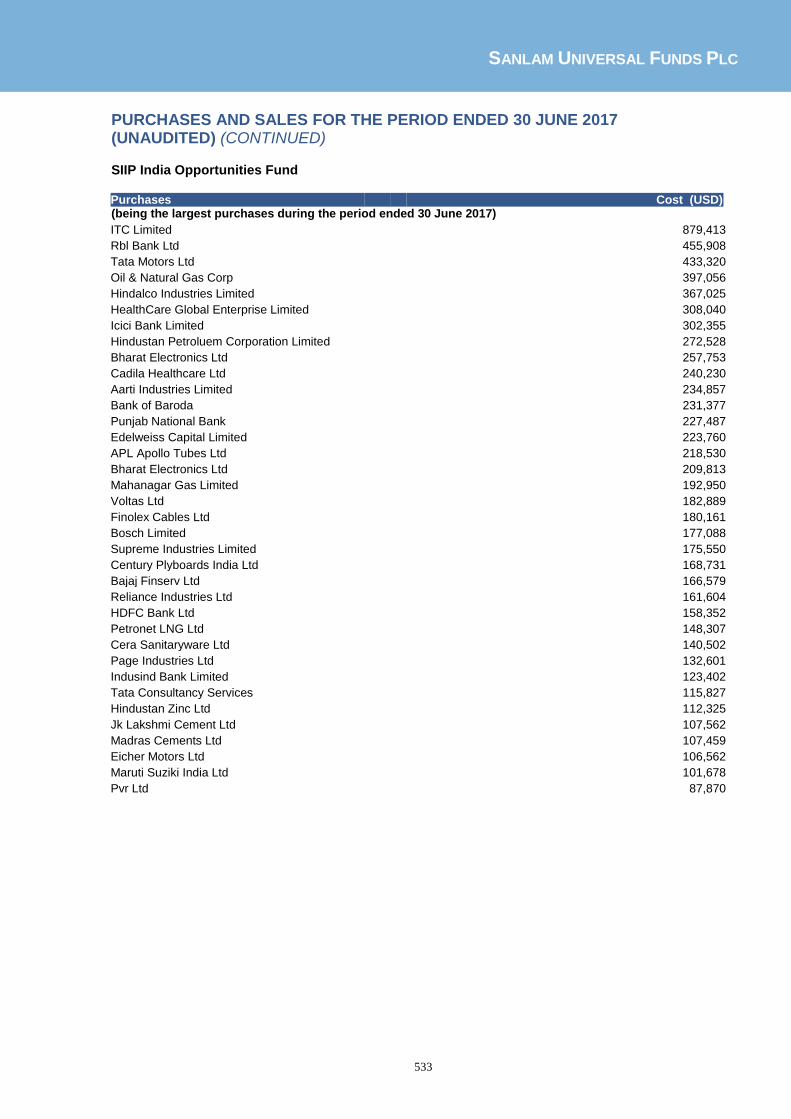
SANLAM UNIVERSAL FUNDS PLC
533
PURCHASES AND SALES FOR THE PERIOD ENDED 30 JUNE 2017 (UNAUDITED) (CONTINUED) SIIP India Opportunities Fund Purchases Cost (USD) (being the largest purchases during the period ended 30 June 2017)
ITC Limited 879,413
Rbl Bank Ltd 455,908
Tata Motors Ltd 433,320
Oil & Natural Gas Corp 397,056
Hindalco Industries Limited 367,025
HealthCare Global Enterprise Limited 308,040
Icici Bank Limited 302,355
Hindustan Petroluem Corporation Limited 272,528
Bharat Electronics Ltd 257,753
Cadila Healthcare Ltd 240,230
Aarti Industries Limited 234,857
Bank of Baroda 231,377
Punjab National Bank 227,487
Edelweiss Capital Limited 223,760
APL Apollo Tubes Ltd 218,530
Bharat Electronics Ltd 209,813
Mahanagar Gas Limited 192,950
Voltas Ltd 182,889
Finolex Cables Ltd 180,161
Bosch Limited 177,088
Supreme Industries Limited 175,550
Century Plyboards India Ltd 168,731
Bajaj Finserv Ltd 166,579
Reliance Industries Ltd 161,604
HDFC Bank Ltd 158,352
Petronet LNG Ltd 148,307
Cera Sanitaryware Ltd 140,502
Page Industries Ltd 132,601
Indusind Bank Limited 123,402
Tata Consultancy Services 115,827
Hindustan Zinc Ltd 112,325
Jk Lakshmi Cement Ltd 107,562
Madras Cements Ltd 107,459
Eicher Motors Ltd 106,562
Maruti Suziki India Ltd 101,678
Pvr Ltd 87,870

SANLAM UNIVERSAL FUNDS PLC
534
PURCHASES AND SALES FOR THE PERIOD ENDED 30 JUNE 2017 (UNAUDITED) (CONTINUED) SIIP India Opportunities Fund (continued) Sales Proceeds (USD) (being the largest sales during the period ended 30 June 2017)
Axis Bank Limited (829,731)
Bharat Petroleum Corporation Limited (571,315)
Sun Pharmaceutical Industries Limited (485,665)
Britannia Industries Ltd (337,982)
Vardhman Textiles Ltd (336,988)
Amara Raja Batteries Ltd (289,941)
Hero Honda Motors Limited (289,146)
Dr Reddy's Laboratories Limited (276,415)
Techno Electric & Engineering Company Ltd (217,344)
Ajanta Pharma Limited (212,203)
Cipla Ltd (194,482)
Pidilite Industries Ltd (190,258)
Dr Lal Pathlabs Ltd (188,295)
Maruti Suziki India Ltd (182,167)
Larsen & Toubro Ltd (180,184)
Voltas Ltd (173,742)
Bajaj Finserv Ltd (146,143)
Madras Cements Ltd (111,063)
Tata Motors Ltd (95,259)
HCL Technololgies Ltd (94,124)
Infrastructure Development Finance Company Ltd (91,992)
Aurobindo Pharma Ltd (84,257)
Reliance Industries (78,078)
Syngene International Ltd (65,463)
Indusind Bank Ltd (62,657)

SANLAM UNIVERSAL FUNDS PLC
535
PURCHASES AND SALES FOR THE PERIOD ENDED 30 JUNE 2017 (UNAUDITED) (CONTINUED) SIM Global Equity Income Fund Purchases Cost (USD) (being the largest purchases during the period ended 30 June 2017)
Unilever Plc 2,043,487
Sparebank 1 Nord-Norge 1,737,701
BP Plc 753,413
Royal Dutch Shell B 618,251
Intl BusinessMachine 432,272
HP Inc 325,384
Boeing Com USD5 290,011
Altria Group Inc 282,223
General Electric Co 263,340
Legal & General Group PLC 240,915
Procter & Gamble 216,850
McDonald's Corp NPV 209,902
Mitie Group Plc 207,935
British American Tob 196,699
Pepsico Inc Com 152,464
Roche Hldg-Genus 146,599
Taylor Wimpey Plc 109,025
Astrazeneca PLC 86,583
Aberdeen Asset Manager 59,831
Sales Proceeds (USD) (being the largest sales during the period ended 30 June 2017)
Unilever NV (1,387,511)
Astrazeneca PLC (1,169,232)
Philip Morris International (1,159,395)
Imperial Brands PLC (1,120,538)
Verizon Comm (799,182)
HP Inc (788,126)
Vodafone Group PLC (713,467)
Icl-Israel Chem (319,066)
McDonald's Corp NPV (312,603)
Altria Group Inc (291,277)
SA (250,306)
Reynolds American IN (184,403)
Singapore Telecommun (183,944)

SANLAM UNIVERSAL FUNDS PLC
536
PURCHASES AND SALES FOR THE PERIOD ENDED 30 JUNE 2017 (UNAUDITED) (CONTINUED) Sanlam Strategic Bond Fund
Purchases Cost (GBP) (being the largest purchases during the period ended 30 June 2017)
UK Gilt 3.5% 220768 49,409,357
US TSY 2.87% 150845 49,006,898
US TSY 3% 150545 42,710,963
US TSY 3.6% 150221 41,443,656
ILB TSY 0.12% 220368 36,591,759
US TSY 2% 151126 28,170,023
US TSY 1.62% 151122 13,259,712
US TSY 3.3% 151119 13,174,972
US TSY 3% 150519 13,060,721
US TSY 2.375%1/25 11,923,565
US TSY 3% 151145 11,349,811
US TSY 2% 150225 10,710,891
US TSY 2% 150825 10,605,035
UK Gilt 5% 07032025 9,608,624
US TSY 3.3% 150544 7,750,608
UK Gilt 2% 260135 7,329,150
UK Gilt 2.5% 0724 5,554,425
UK Gilt 1.2% 221127 5,090,072
US TSY 1.3% 300618 4,131,073
US TSY 3.625% 150843 3,975,151
Sales Proceeds (GBP) (being the largest sales during the period ended 30 June 2017)
UK Gilt 3.5% 220768 (49,942,036)
US TSY 2.87% 150845 (49,326,397)
US TSY 3.6% 150221 (44,812,444)
US TSY 3% 150545 (42,738,125)
ILB TSY 0.12% 220368 (36,092,592)
US TSY 2% 151126 (28,052,511)
US TSY 1.62% 151122 (15,535,897)
US TSY 2.375%1/25 (15,492,209)
US TSY 2% 150825 (13,688,651)
US TSY 3% 150519 (13,070,727)
US TSY 3.3% 151119 (13,055,661)
US TSY 2% 150225 (10,481,205)
US TSY 5% 07032025 (9,604,402)
US TSY 3.3% 150544 (7,821,595)
US TSY 3.37%151119 (4,320,751)
US TSY 1.3% 300618 (3,990,745)
US TSY 3.625% 150843 (3,883,617)
CAN WHARF 6.4 221033 (2,973,876)
US TSY 3.6% 150244 (2,799,242)
US TSY 1.375 300918 (2,152,124)

SANLAM UNIVERSAL FUNDS PLC
537
PURCHASES AND SALES FOR THE PERIOD ENDED 30 JUNE 2017 (UNAUDITED) (CONTINUED) Sanlam Accel Income Fund Purchases Cost (USD) (being the largest purchases during the period ended 30 June 2017)
M&G Sht Dated CrpBD 600,000
Sanlam FOUR US Dividend Income Fund Class A GBP Distribution 600,000
Invesco Perp Corp Bd 300,000
Sales Proceeds (USD) (being the largest sales during the period ended 30 June 2017)
Blackrock Continental European Income Fund Class D (600,000)
Artemis Global Income Fund - I (600,000)
Schroder Income Maximiser Fund (500,000)
Fidelity Institutional Funds ICVC - UK Corporate Bond Fund (400,000)
Cazenove Strategic Bond Fund (400,000)
Unicorn Investment Funds - UK Income Fund (380,000)
PFS TwentyFour Investment Funds- Dynamic Bond Fund (350,000)
Kames ICVC - Sterling Corporate Bond Fund (350,000)
Muzin-Emrg Mk Sh Dur (300,000)
PFS Chelverton UK Equity Fund (280,000)
Hend UK Stra Bnd Fd (200,000)
Schroder UK Alph Fd (200,000)
JPM Fd - Corp Bnd Fd (200,000)
Veritas Fd Gl Eq Inc (200,000)
M&G Sht Dated CrpBD (200,000)
Fidelity Invest Fund (200,000)
PMI Inv Grd Bn C GBP (200,000)
Guinness Asset Plc (100,000)
Kame High Yld Bnd Fd (70,000)

SANLAM UNIVERSAL FUNDS PLC
538
PURCHASES AND SALES FOR THE PERIOD ENDED 30 JUNE 2017 (UNAUDITED) (CONTINUED) Satrix North America Equity Tracker Fund Purchases Cost (USD) (being the largest purchases during the period ended 30 June 2017)
Apple Inc 2,289,166
Microsoft Corp 1,462,463
Amazon.Com Inc 1,127,640
Facebook Inc 1,010,764
Johnson & Johnson 998,708
Exxon Corp 981,559
JP Morgan Chase & Co 918,207
Alphabet Inc Cl C 850,261
General Electric Co 769,595
AT & T Inc 764,430
Wells Fargo & Co 759,113
Bank of America Corp 712,558
Procter & Gamble 664,445
Alphabet Inc Cl A 649,831
Pfizer Inc 617,107
Verizon Comm 601,383
Berkshire Hath-B 595,885
Chevron Corp 584,532
Home Depot 529,785
Comcast Corp-CL A 529,435
Sales Proceeds (USD) (being the largest sales during the period ended 30 June 2017)
Altaba Inc (171,170)
Apple Inc (144,665)
JP Morgan Chase & Co (124,169)
Amazon.Com Inc (110,414)
Microsoft Corp (96,363)
Exxon Corp (71,211)
Johnson & Johnson (65,445)
Facebook Inc (64,994)
Mead John Nutrition (64,871)
Lockheed Martin Corp (64,758)
WR Berkley Corp (62,583)
Texas Instruments (56,106)
AT & T Inc (54,131)
General Electric Co (53,103)
Bank of America Corp (51,642)
Wells Fargo & Co (51,404)
Alphabet Inc Cl A (50,385)
Alphabet Inc Cl C (50,024)
Hewlet Packard Enter (48,412)
Chevron Corp (43,759)

SANLAM UNIVERSAL FUNDS PLC
539
PURCHASES AND SALES FOR THE PERIOD ENDED 30 JUNE 2017 (UNAUDITED) (CONTINUED) Satrix UK Equity Tracker Fund Purchases Cost (USD) (being the largest purchases during the period ended 30 June 2017)
HSBC Holdings 826,026
Royal Dutch Shell A 686,003
British American Tob 602,286
BP Plc 550,542
Royal Dutch Shell B 548,485
GlaxoSmithKline plc 509,463
Lloyds Bank Plc 390,999
Astrazeneca PLC 363,280
Diageo 347,361
Reckitt Benckiser Group PLC 332,874
Vodafone Group PLC 325,904
Unilever Plc 276,732
Shire Plc 263,288
Rio Tinto PLC 261,066
Prudential Corp Ord 5P 252,778
Barclays PLC 239,201
Glencore Plc 234,291
National Grid PLC 231,087
Imperial Brands PLC 210,784
Bhp Billiton Plc 175,709
BT Group PLC 160,889
Standard Chartered PLC 152,842
Compass Group Plc 146,486
WPP Plc 140,916
Aviva PLC 125,981
Anglo American PLC 122,974
Sales Proceeds (GBP) (being the largest sales during the period ended 30 June 2017)
William Hill Plc (60,880)
Rolls-Royce Holdings (54,602)
NEX Group Plc (27,739)
Anglo American Plc (26,856)
Tui Ag (25,785)
Tullett Prebon Plc (19,516)
British American Tob (15,728)
Royal Dutch Shell B (14,560)
Cobham PLC RTS (12,236)
Segro Plc RTS (4,359)
Rolls Royce Hold Plc (3,304)

SANLAM UNIVERSAL FUNDS PLC
540
PURCHASES AND SALES FOR THE PERIOD ENDED 30 JUNE 2017 (UNAUDITED) (CONTINUED) Satrix Europe (ex UK) Equity Tracker Fund Purchases Cost (USD) (being the largest purchases during the period ended 30 June 2017)
Nestle Sa-R 5,254,066
Novartis-Reg Shs 3,768,735
Roche Hldg-Genus 3,576,602
Bayer AG 2,211,595
Siemens Ag 2,165,816
SAP SE 2,089,877
Banco Santander SA 1,880,783
Allianz SE 1,812,969
Unilever NV 1,806,433
Basf SE 1,781,248
Anheuser Busch InBev 1,659,259
Novo Nordisk AS 1,437,271
Daimler AG 1,428,896
Ing Groep NV 1,280,193
Deutsche Telekom 1,245,410
UBS Group AG 1,220,200
Banco Bilbao Viscaya 1,099,676
ASML Holding NV 1,012,557
Iberdrola SA 1,008,024
Telefonica SA 1,007,308
Sales Proceeds (USD) (being the largest sales during the period ended 30 June 2017)
Syngenta Ag (1,068,953)
Deutsche Boerse (339,925)
Technipfmc Plc (153,221)
Unicredit Spa-rt (136,988)
Svenska cellulosa AB (112,019)
SFR Group SA (88,626)
Aryzta AG (82,983)
Man SE (68,560)
Banco Popular Espano (46,131)
Idorsia Ltd (38,368)
Nestle Sa-R (36,487)
Marine Harvest (33,152)
Fortum Oyj (29,542)
Altice NV (28,563)
Actelion Ltd (28,506)
E.ON AG (28,389)
Zodiac SA (28,378)
Coca Cola European (28,218)
Genmab A/S (28,028)
Banco Bilbao RTS (22,503)

SANLAM UNIVERSAL FUNDS PLC
541
PURCHASES AND SALES FOR THE PERIOD ENDED 30 JUNE 2017 (UNAUDITED) (CONTINUED) Sanlam Equity Allocation Fund Purchases Cost (USD) (being the largest purchases during the period ended 30 June 2017)
Intesa Sanpaolo SPA 1,017,318
Elekta AB 680,543
Peugeot Sa 656,070
Syngenta Ag 525,860
Ing Groep NV 490,152
SAP SE 420,002
Mediobanca 405,906
Software AG 400,684
Royal Dutch Shell A 355,630
ASML Holding NV 325,798
AP Moller -Maersk AS 315,457
Lonza AG-Reg 314,790
Genmab A/S 298,340
Roche Hldg-Genus 293,915
Swatch Group-B 292,036
Glaxosmithkline 260,082
HSBC Holdings 259,556
Unicredit SpA 238,648
MTU Aero Engines AG 203,737
British American Tob 194,217
Gemalto NV 170,928
Swisscom 165,628
Dassault Systeme 165,251
Vodafone Group PLC 156,037
Criteria Caixacorp 155,328
Royal Bank of Scotld 154,464
Sodexo 149,754
Carnival PLC 149,433
Deutsche Bk -Reg 149,336
Aena SA 147,872
Sika AG-Bearer 142,530
BP Plc 139,143

SANLAM UNIVERSAL FUNDS PLC
542
PURCHASES AND SALES FOR THE PERIOD ENDED 30 JUNE 2017 (UNAUDITED) (CONTINUED) Sanlam Equity Allocation Fund (continued) Sales Proceeds (USD) (being the largest sales during the period ended 30 June 2017)
Intesa Sanpaolo SPA (828,161)
Novozymes AS (735,965)
Wirecard AG (628,387)
Leonardo SpA (623,411)
Gemalto NV (564,636)
Syngenta Ag (545,203)
Nestle Sa-R (501,079)
NXP Semiconductors (409,504)
Julius Baer Grp Ltd (271,202)
Roche Hldg-Genus (267,842)
Airbus SE (265,682)
WPP Plc (200,052)
Dassault Systeme (168,976)
Shire Plc (149,373)
AP Moller -Maersk AS (149,156)
Swisscom (147,233)
Genmab A/S (144,494)
Royal Bank of Scotld (141,463)
Swatch Group-B (140,835)
Pandora AS (138,454)
Lonza AG-Reg (135,941)
Dufry AG (131,849)
Telia Co AB (131,411)
Sodexo (131,269)
Sika AG-Bearer (129,566)
Thales Sa (126,635)
NN Group NV (125,656)
Kingfisher PLC (122,541)

SANLAM UNIVERSAL FUNDS PLC
543
PURCHASES AND SALES FOR THE PERIOD ENDED 30 JUNE 2017 (UNAUDITED) (CONTINUED) Satrix Emerging Markets Equity Tracker Fund Purchases Cost (USD) (being the largest purchases during the period ended 30 June 2017)
iShares MSCI Russia 47,619
Vodacom Group Limited 43,875
Icici Bank Ltd 43,610
Indian Oil Corp Ltd 38,668
Grasim Inds Ltd 35,921
Hyundai Heavy Indust 35,543
Momo Inc 30,456
Sunac China Holdings 29,298
Tencent Holdings Lim 28,185
CCR SA 27,509
Minth Group Ltd 26,472
Barclays Africa Grp 26,414
China Huarong -h 25,923
Sociedad Quimica 25,895
Haier Elec Grp Co 25,189
Samsung Biologics Co 23,925
Tech Mahindra Ltd 22,658
CCC SA 22,585
Richter Gedeon Nyrt 21,732
Hindustan Petro Corp 21,428
Shoprite Hldgs Ltd 21,250
Largan Precision Co 21,221
Bovespa 21,210
Autohome Inc ADR 21,207
LIC Housing Finance 21,190
Banco Bradesco SA-Pr 21,173
Tiger Brands Limited 21,157
Pow Zak Ub SA 21,145
Ctrip Com Int Ltd 21,131
Alibaba Group Holdin 21,125
ChinaMerchantsBank 21,101
Resorts World Bhd 21,039
Turkcell Iletisim Hi 21,024
Haitong Securiies Co 20,932
Fortress Income Fund 20,880
Taiwan Semiconductor 20,865
United Tractors Tbk 20,847
UnitedMicroElectrCor 20,804
Hynix Semiconductor 20,611
Kia Motors Corp 20,603
Hengan Intl Grp Ltd 20,588
Rural Elect Corp Ltd 20,414
Samsung Electronics 20,379
Damac Prop Dubai Co 18,443
Aluminium Corp 18,044
Hanssem Co Ltd 17,826

SANLAM UNIVERSAL FUNDS PLC
544
PURCHASES AND SALES FOR THE PERIOD ENDED 30 JUNE 2017 (UNAUDITED) (CONTINUED) Satrix Emerging Markets Equity Tracker Fund (continued)
Sales Proceeds (USD) (being the largest sales during the period ended 30 June 2017)
iShares MSCI Russia (47,146)
Samsung Electronics (32,823)
Alibaba Group Holdin (32,298)
Bank Central Asia PT (30,217)
JD.Com Inc (29,877)
Tencent Holdings Lim (25,539)
Perdigao SA (24,293)
Companhia Sao Jose (24,211)
Taiwan Semiconductor (23,476)
SK C and C Co Ltd (23,110)
Vedanta Ltd (18,086)
Suzano Papel SA (16,951)
Geely Automobile Hld (16,849)
C.P.Seven Eleven PCL (16,825)
Novatek PJSC (16,601)
Jastrzebska Spol Weg (16,340)
IRPC Pcl-Foreign (15,961)
Hynix Semiconductor (14,785)
Hotai Motor Co. Ltd (14,254)
Bosch Limited (13,970)
Pow Zak Ub SA (13,928)
Magnit OJSC-SPON GDR (13,900)
NCsoft Corp (13,886)
ChinaMerchantsBank (13,841)
LG Household&Health (13,835)
Vodacom Grp Ltd (13,831)
Woolworths Holdings (13,766)
S-OIL CORP (13,738)
Shoprite Hldgs Ltd (13,710)
GS Holdings (13,707)
Cathay Financial Hld (13,706)
China Shenhua Energy (13,675)
Petroleo Brasileiro (13,653)
ITC Limited (13,639)
Bank Rakyat Indonesa (13,628)
Yapi Ve Kredi Bankas (13,621)
Sunny Optical Tech (13,579)
Southern Copper Corp (13,554)
LIC Housing Finance (13,510)
Itausa-Investment It (13,509)
Walmart De Mexico (13,476)
AIR CHINA LTD-H (13,470)
Discovery Ltd (13,458)
Mol Magyar Olaj- esR (13,452)
Banco Bradesco SA-Pr (13,448)
Grupo Mexico SAB (13,444)
Cencosud SA (13,439)
Grupo Televisa SAB (13,416)
Hindustan Petro Corp (13,368)
Resorts World Bhd (13,366)

SANLAM UNIVERSAL FUNDS PLC
545
PURCHASES AND SALES FOR THE PERIOD ENDED 30 JUNE 2017 (UNAUDITED) (CONTINUED) Satrix Emerging Markets Equity Tracker Fund (continued)
Sales (continued) Proceeds (USD) (being the largest sales during the period ended 30 June 2017)
Pou Chen Corp (13,338)
Cipla Ltd (13,308)
Shinhan Financial Gr (13,264)
Aluminium Corp (13,262)
National Bank of Abu (13,262)
Ctrip Com Int Ltd (13,238)
INI Steel Company (13,235)
UnitedMicroElectrCor (13,221)
Cia Brasil de Meios (13,193)
Yum China Holding (13,168)
Godrej Consumer Prod (13,141)
Largan Precision Co (13,113)
JG Summit Holdings (13,093)
United Tractors Tbk (13,090)
Woori Bank (13,045)
Kia Motors Corp (12,851)
AAC Technologies Hld (12,478)

SANLAM UNIVERSAL FUNDS PLC
546
PURCHASES AND SALES FOR THE PERIOD ENDED 30 JUNE 2017 (UNAUDITED) (CONTINUED) Sanlam Managed Risk Fund
Purchases Cost (USD) (being the largest purchases during the period ended 30 June 2017)
Satrix World Equity Tracker Fund 4,454,822
Sales Proceeds (USD) (being the largest sales during the period ended 30 June 2017)
Satrix World Equity Tracker Fund (10,416,414)

SANLAM UNIVERSAL FUNDS PLC
547
PURCHASES AND SALES FOR THE PERIOD ENDED 30 JUNE 2017 (UNAUDITED) (CONTINUED)
Sanlam Private Wealth Global High Quality Fund
Purchases Cost (GBP) (being the largest purchases during the period ended 30 June 2017) Priceline Group Incorporated 4,974,030
Imperial Brands PLC 4,856,223
Fresenius Medical Care 4,431,494
Yum China Holding Inc 3,907,051
Oracle Corp Com Stk USD0.01 2,509,200
Medtronic Plc 2,427,143
Netease.Com Inc 2,340,238
Altria Group Inc 2,071,760
Hengan International Group Compnay Limited 2,067,788
Baidu Com Inc 2,061,024
Philip Morris Int 1,107,739
Diageo 1,091,342
Automatic Data 1,070,680
Roche Hldg-Genus 934,822
Waters Corp 913,582
Alphabet Inc Cl C 884,206
Procter & Gamble 671,216
Edwards Lifesciences 653,696
Unilever Plc 585,598
Moody's Corp 546,798
Pepsico Inc Com 464,794
Sales Proceeds (GBP) (being the largest sales during the period ended 30 June 2017) Amgen Corp Com Npv (3,016,128)
Nestle SA (2,674,875)
Yum China Holding Inc (2,622,844)
Paypal Holidings Inc (2,429,460)
Stryker Corp. (1,822,250)
British American Tob (1,202,505)
Netease.Com Inc (1,137,248)
Unilever Plc (642,545)
Moody's Corp (566,237)
Alphabet Inc Cl C (151,724)

SANLAM UNIVERSAL FUNDS PLC
548
PURCHASES AND SALES FOR THE PERIOD ENDED 30 JUNE 2017 (UNAUDITED) (CONTINUED)
Sanlam FOUR US Dividend Income Fund
Purchases Cost (USD) (being the largest purchases during the period ended 30 June 2017) DOMTAR 7,368,172
First American Fin 6,693,384
Coca-Cola Co. 6,647,466
MERIDIAN BIOSCI 6,089,088
Mattel Inc 5,807,537
Delta Air Lines INC 5,770,336
Intl BusinessMachine 5,429,754
Avnet Inc 5,116,804
Medifast Inc 4,929,414
CSG Systems Intl Inc 4,637,817
Labrador Iron Ore 4,569,642
Sturm Ruger & Co Inc 4,253,434
Netapp Inc 4,044,644
United Parcel -B 3,920,268
Federated Investors 3,919,443
EmpireCoLtdA 3,902,778
Wal-Mart Stores Inc 3,656,790
American Eagle 3,534,071
Dean Foods Company 3,491,632
Mullen Group Ltd 3,450,711
Intel Corp 3,264,595
HP Inc 3,153,192
Boeing Com USD5 3,064,497
Whole FoodsMarketInc 2,999,522
Cisco Systems 2,993,438
Aecon Group Inc 2,893,701
Owens & Minor Inc 2,872,391
Allegiant Travel Co 2,864,730
Pfizer Inc 2,707,805
Ralph Lauren Corp 2,607,755
Qualcomm Inc 2,598,717
CVS Health Corp 2,415,570
Avangrid Inc 2,342,492
Brinker Internationa 2,312,690
Power Corp Cda 2,291,396
Metlife Inc 2,284,961
SpartanNash Co 2,278,390

SANLAM UNIVERSAL FUNDS PLC
549
PURCHASES AND SALES FOR THE PERIOD ENDED 30 JUNE 2017 (UNAUDITED) (CONTINUED)
Sanlam FOUR US Dividend Income Fund (continued)
Sales Proceeds (USD) (being the largest sales during the period ended 30 June 2017) Best Buy Co Inc (6,103,318)
Bristol-Myrs Squib (5,554,640)
Apple Inc (5,499,761)
Procter & Gamble (5,276,814)
Dr Pepper Snapple (5,147,587)
AT & T Inc (4,994,431)
Mead John Nutrition (4,880,558)
Xilinx Inc (4,298,553)
Oge Energy Corp (4,276,173)
Johnson & Johnson (4,246,002)
United Parcel -B (3,686,030)
Boeing Com USD5 (3,371,049)
Quest Diagnostic (3,365,211)
Emerson Elec Co (3,057,994)
Schweitzer-Mauduit (2,864,034)
Campbell Soup (2,860,333)
SpartanNash Co (2,847,347)
Verizon Comm (2,450,462)
Pack Corp of America (2,366,038)
Metlife Inc (2,215,564)
Gen Mills Inc (2,068,238)
MERIDIAN BIOSCI (2,065,521)
Flowers Foods Inc. (1,988,509)
Intel Corp (1,974,199)
Pepsico Inc Com (1,973,235)
Block H & R Inc (1,972,854)
Aecon Group Inc (1,917,414)
Lilly (Eli) & Co (1,885,095)
Core Laboratories (1,848,792)
Sonoco Products Co (1,837,278)
BCE Inc (1,659,722)
Janus Henderson Grp (1,621,841)
Potash Corp Sas (1,601,157)
Cummins Inc (1,600,661)
National-Oilwell Inc (1,458,057)

SANLAM UNIVERSAL FUNDS PLC
550
PURCHASES AND SALES FOR THE PERIOD ENDED 30 JUNE 2017 (UNAUDITED) (CONTINUED)
High Street Global Balanced Fund
Purchases Cost (USD) (being the largest purchases during the period ended 30 June 2017) Treas Bill 0% 260418 1,982,740
Softbank Corp 754,798
Alphabet Inc Cl C 749,731
Celgene Corp 746,864
JP Morgan Chase & Co 724,407
LEG Immobilien GmbH 524,331
Cubesmart 492,144
British American Tob 390,319
Royal Dutch Shell B 333,571
Daimler AG 324,908
Lowes Com 310,303
Segro Plc 236,350
Roche Hldg-Genus 179,635
Visa INC - Class A Shares 160,493
SPX Dec 17 2425 PO 151,560
Novo Nordisk AS 121,601
Apple Inc 30,366
Royal Dutch Shell A 23,174
MSFT Jun 17 P62.5 PO 21,612
Hansteen Holdings 21,363 Sales Proceeds (USD) (being the largest sales during the period ended 30 June 2017) Apple Inc (802,514)
Boeing Com USD5 (754,909)
Wells Fargo & Co (473,002)
Alcoa 6.75% 150718 (319,090)
Sirius Real Estate Ltd (236,919)
Segro Plc (217,108)
Glaxosmithkline (149,538)
GBP/USD Fut Mar 17 (68,594)
GBP/USD Mar 17 125 Put (64,500)
EuroCurr2PM OpSep17P (600)

SANLAM UNIVERSAL FUNDS PLC
551
PURCHASES AND SALES FOR THE PERIOD ENDED 30 JUNE 2017 (UNAUDITED) (CONTINUED)
Sanlam FOUR Active European (ex UK) Equity Fund
Purchases Cost (GBP) (being the largest purchases during the period ended 30 June 2017) Intesa Sanpaolo SPA 4,698,632
Elekta AB 3,717,657
Peugeot SA 3,136,563
Dufry AG 2,805,480
Autoliv Inc-Swed Dep 2,737,430
Azimut Holding Spa 2,675,018
Ing Groep NV 2,468,131
Mediobanca SpA 2,367,656
ASML Holding NV 2,042,131
Software AG 1,959,636
SAP SE 1,929,383
MTU Aero Engines Holding AG 1,303,423
Nestle Sa-R 1,060,462
Implenia AG 762,069
Henkel KGAA-VORZUG 719,665
Inditex 714,199
Roche Hldg-Genus 705,391
AtoS 688,823
Sampo Oyj-A Shs 623,232
Skandinaviska 613,665
Bayer AG 561,616
L'oreal 529,896
Euronav SA 522,911

SANLAM UNIVERSAL FUNDS PLC
552
PURCHASES AND SALES FOR THE PERIOD ENDED 30 JUNE 2017 (UNAUDITED) (CONTINUED)
Sanlam FOUR Active European (ex UK) Equity Fund (continued)
Sales Proceeds (GBP) (being the largest sales during the period ended 30 June 2017) Intesa Sanpaolo SPA (10,373,117)
Nestle SA (8,330,605)
Dufry AG (8,183,156)
Autoliv Inc-Swed Dep (8,042,085)
ASML Holding NV (6,408,596)
Azimut Holding Spa (6,373,836)
Roche Hldg-Genus (5,764,882)
Henkel KGAA-VORZUG (4,266,724)
AtoS (4,226,529)
Inditex (4,181,553)
Sampo Oyj-A Shs (3,630,248)
Skandinaviska (3,575,680)
Bayer AG (3,565,170)
Elekta AB (3,561,930)
Wirecard AG (3,305,416)
Euronav SA (3,294,791)
L'oreal (3,214,711)
MTU Aero Engines AG (3,201,687)
Implenia AG (3,138,999)
Novozymes AS B Shares (3,101,462)
Peugeot Sa (3,053,171)
Ing Groep NV (2,575,049)
Mediobanca SpA (2,352,385)
Leonardo SpA (2,337,999)
Gas Natural Sdg (2,306,768)
Airbus SE (2,294,707)
Gemalto NV (2,255,401)
Software AG (2,235,459)
SAP SE (2,106,892)
Prosieben Sat 1 (2,002,398)
Orange (1,928,524)
Billerud (1,668,097)

SANLAM UNIVERSAL FUNDS PLC
553
PURCHASES AND SALES FOR THE PERIOD ENDED 30 JUNE 2017 (UNAUDITED) (CONTINUED)
Sanlam FOUR Global Equity Fund
Purchases Cost (GBP) (being the largest purchases during the period ended 30 June 2017) Intesa Sanpaolo SPA 2,864,048
Dun & Bradsheet Corp 2,480,953
Anadarko Petroleum Corp 2,437,657
Norwegian Cruise line Holdings Ltd 2,200,506
Signet Jewelers Ltd 1,969,884
Willis Towers Watson PLC 1,917,032
WPP Plc 1,746,251
Imperial Brands PLC 1,187,218
Japan Tobacco 1,098,718
Michael Kors Holdings Ltd 1,022,394
Gilead Sciences Inc 822,780
Express Scripts Holdings Inc 813,688
Barclays PLC 737,562
Oracle Corp 687,450
Dxc Technology C 664,889
Viacom Inc-Class B 553,397
Bank of America Corp 548,335
Hewlet Packard Enter 502,293
SA 502,000
Soc Generale-A 458,573
Honda Motor Co Y50 420,790
Aggreko Plc 406,958
Allergan Plc 392,503
Loblaw Cos Ltd 302,500
Tupperware Brands Co 291,809

SANLAM UNIVERSAL FUNDS PLC
554
PURCHASES AND SALES FOR THE PERIOD ENDED 30 JUNE 2017 (UNAUDITED) (CONTINUED)
Sanlam FOUR Global Equity Fund (continued)
Sales Proceeds (GBP) (being the largest sales during the period ended 30 June 2017) Computershare Ltd (3,559,164)
Barclays PLC (3,061,388)
Western Digital Corporation (2,569,022)
BRP Inc (2,524,589)
Tupperware Brands Corp (1,316,111)
Airbus SE (1,266,243)
BNP Paribas (1,201,412)
Oracle Corp Com Stk USD0.01 (1,189,452)
Bank of America Corp (1,133,693)
Via Varejo SA (913,242)
Societe Generale (893,866)
Dxc Technology C (891,258)
Celgene Corp (834,684)
ENI-Ente Nazionale Idrocarburi SpA (703,822)
Navios Maritime Acquisition Corporation (686,881)
Samsung Electro-Regs GDR (680,838)
Aon Plc (676,525)
United Healthcare Corp (662,075)
Medtronic Plc (580,802)
JP Morgan Chase & Co (571,288)
MS&AD Insurance Grp (569,838)
Viacom Inc-Class B (539,944)
Hewlett Packard Enterprise (472,742)
HSBC Holdings (466,996)

SANLAM UNIVERSAL FUNDS PLC
555
PURCHASES AND SALES FOR THE PERIOD ENDED 30 JUNE 2017 (UNAUDITED) (CONTINUED)
Sanlam FOUR Stable Global Equity Fund
Purchases Cost (GBP) (being the largest purchases during the period ended 30 June 2017) Dun & Bradsheet Corp 5,219,236
Willis Towers Watson PLC 3,386,869
WPP Plc 3,046,776
Japan Tobacco 2,801,143
Express Scripts Holdings Inc 2,700,108
Gilead Sciences Inc 2,485,867
Imperial Brands PLC 2,356,262
Viacom Inc-Class B 2,096,904
United Healthcare Corp 1,947,186
Oracle Corp Com Stk USD0.01 1,907,131
Roche Hldg-Genus 1,703,324
Aon Plc 1,585,234
Medtronic Plc 1,562,965
Nasdaq OMX Group Inc 1,524,119
Microsoft Corp 1,515,384
Tupperware Brands Corp 1,453,760
Allergan Plc 1,303,478
Loblaw Companies Ltd. 1,272,181
HP Inc 1,256,362
Procter & Gamble 1,239,851
Amerisourcebergen Corp 1,235,338
Pfizer Inc 1,143,873
eBay Inc. 978,160
Computershare Ltd 921,199
Verizon Communications Inc 831,709
Celgene Corp 634,716
Sales Proceeds (GBP) (being the largest sales during the period ended 30 June 2017) Computershare Ltd (6,246,919)
Tupperware Brands Corp (1,626,685)
Celgene Corp (1,511,278)
Aon Plc (1,248,847)
Procter & Gamble (1,094,445)
Oracle Corp Com Stk USD0.01 (774,235)
Microsoft Corp (757,838)
UnitedHealthcare (566,192)
Viacom Inc-Class B (480,757)
Medtronic Plc (463,755)
Roche Hldg-Genus (451,610)
Gilead Sciences Inc (410,149)
Loblaw Cos Ltd (401,416)
Allergan Plc (376,268)

SANLAM UNIVERSAL FUNDS PLC
556
PURCHASES AND SALES FOR THE PERIOD ENDED 30 JUNE 2017 (UNAUDITED) (CONTINUED)
Sanlam FOUR Active UK Equity Fund
Purchases Cost (GBP) (being the largest purchases during the period ended 30 June 2017) GlaxoSmithKline plc 3,177,775
HSBC Holdings 2,371,491
Sainsbury (J) Plc 1,382,237
Sophos Group Plc 1,081,479
Imperial Brands PLC 996,545
Land Securities Grp 831,968
Great Portland Estates PLC 828,853
Great Port Est PLC 763,471
British American Tob 613,721
Paddy Power Betfair PLC 590,782
Royal Dutch Shell A 561,486
John Laing Group Plc 414,882
Vodafone Group PLC 409,368
Bt Group Plc 350,276
Market Tech Hold Ltd 269,379
BBA Aviation PLC 246,792
Prudential Corp Ord 205,289
Lloyds Bank Plc 201,996
AA Plc 194,721
WHITBREAD 157,183

SANLAM UNIVERSAL FUNDS PLC
557
PURCHASES AND SALES FOR THE PERIOD ENDED 30 JUNE 2017 (UNAUDITED) (CONTINUED)
Sanlam FOUR Active UK Equity Fund (continued)
Sales Proceeds (GBP) (being the largest sales during the period ended 30 June 2017) Shire Plc (2,193,740)
Prudential Corp Ord (1,727,012)
WPP Plc (1,719,540)
Market Tech Hold Ltd (1,343,582)
Pets At Home Grp (1,192,625)
Barclays PLC (1,154,893)
BP Plc (1,079,789)
BBA Aviation PLC (1,046,355)
Royal Dutch Shell A (1,045,282)
Tullow Oil PLC (1,006,430)
Equiniti Group PLC (1,001,003)
British American Tob (912,670)
IQE Plc (893,621)
OneSavings Bank Plc (849,700)
Land Securities Grp (847,445)
Rio Tinto PLC (847,115)
Glaxosmithkline (836,660)
Mears Group plc (821,032)
Tui Ag (800,369)
Gkn Plc (799,191)
Crest Nicholson Hold (793,627)
Watkin Jones Plc (770,482)
ITV PLC (766,962)
Unilever Plc (745,367)
AA Plc (638,813)
Vodafone Group PLC (628,459)
Glencore Plc (626,008)
Bt Group Plc (597,766)
HSBC Holdings (588,895)
Lloyds Bank Plc (580,664)
Telit Communications (554,095)
Legal & Gen Grp (539,950)
Rolls-Royce Holdings (530,443)
Int Consol Airlines (530,310)
Sophos Group Plc (485,211)
John Laing Grp Plc (475,252)
OPG Power Ven Plc (464,408)
Worldpay Group Plc (393,968)
Reed Elsevier plc (392,767)
Entertainment One (384,306)

SANLAM UNIVERSAL FUNDS PLC
558
PURCHASES AND SALES FOR THE PERIOD ENDED 30 JUNE 2017 (UNAUDITED) (CONTINUED)
Sanlam FOUR Multi-Strategy Fund
Purchases Cost (GBP) (being the largest purchases during the period ended 30 June 2017) Ishares MSCIEmergMkt 7,239,714
Natl Aus FRN 120623 4,281,580
InterCon 3.8% 281122 3,331,500
Stan Life F/R Perp 2,762,250
Barclays6.75%01/2023 2,606,000
BG Energy F/R 301172 1,779,730
FOUR Multi Stra J 1,321,781
3I Group 6.8% 090323 1,255,000
AvivaPlc F/R 271149 1,153,298
Lloyds F/R 270649 1,044,500
Barclays F/R 291249 1,038,500
Grainger Plc 1,033,250
Trix Big Bo REIT Plc 751,247
HICL Infrastructure 517,275
Renewables Infrastru 488,256
Amedeo Air Four Plus 468,000
Brookfield Infra 220,880
SX5E Dec 17 3800 CO 142,231
SPX Dec 17 2150 PO 138,073
UKX Dec 17 7700 CO 137,530
Sales Proceeds (USD) (being the largest sales during the period ended 30 June 2017)
Legal and General Gr (4,400,000)
Ishares MSCIEmergMkt (3,663,664)
European F/R 170220 (2,815,960)
FOUR Multi Stra J (1,722,778)
MSCI NTR Mar 17 (1,031,184)
MSCI World Fut Jun17 (885,870)
MDAX Ind Fut Mar 17 (491,725)
SX5E Jun 17 3400 CO (402,779)
FTSE 250 Fut Dec 17 (390,192)
UKX Jun 17 7100 CO (337,610)
UKX Jun 17 6700 CO (309,000)
SPX Mar 17 2300 CO (292,794)
MDAX Ind Fut Jun 17 (276,340)
FTSE 250 Fut Jun 17 (208,219)
HSI May 17 25000 CO (191,424)
S&P Mid400 Emi Jun17 (118,636)
Land Securities Grp (88,000)
S&P Mid400 Emi Mar17 (62,450)
NKY Jan 17 19000 CO (54,588)
HSI Mar 17 24200 CO (30,328)
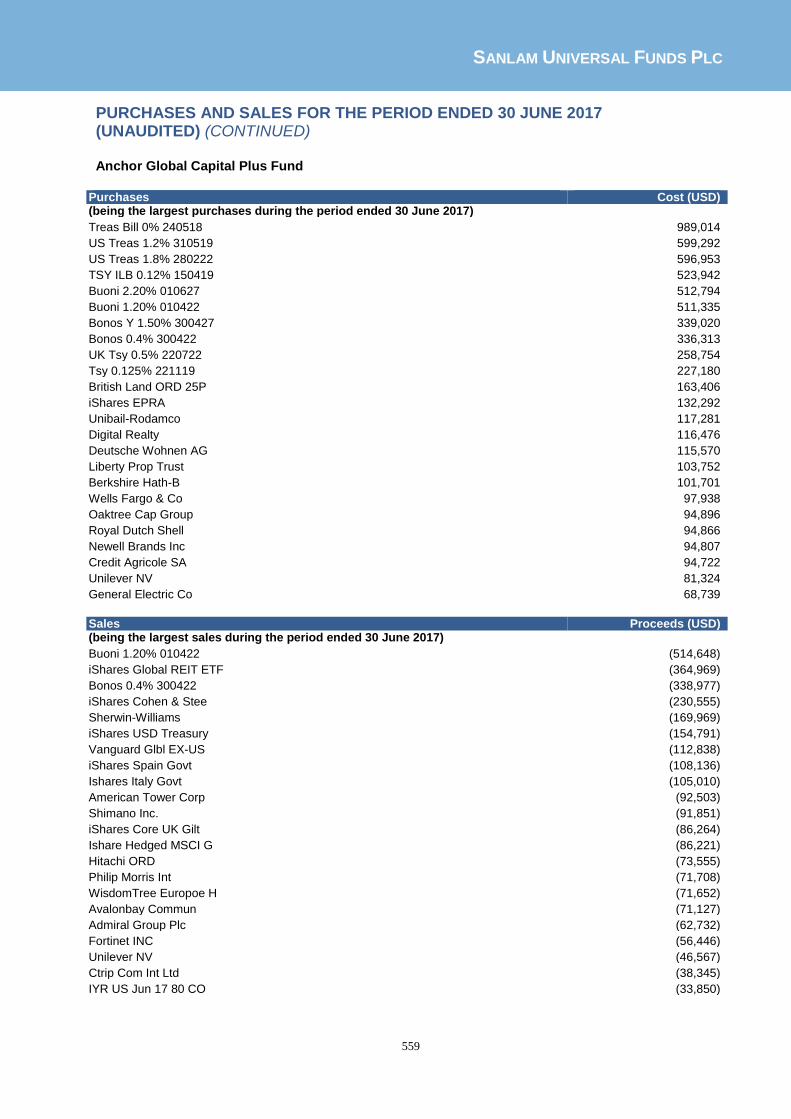
SANLAM UNIVERSAL FUNDS PLC
559
PURCHASES AND SALES FOR THE PERIOD ENDED 30 JUNE 2017 (UNAUDITED) (CONTINUED)
Anchor Global Capital Plus Fund
Purchases Cost (USD) (being the largest purchases during the period ended 30 June 2017) Treas Bill 0% 240518 989,014
US Treas 1.2% 310519 599,292
US Treas 1.8% 280222 596,953
TSY ILB 0.12% 150419 523,942
Buoni 2.20% 010627 512,794
Buoni 1.20% 010422 511,335
Bonos Y 1.50% 300427 339,020
Bonos 0.4% 300422 336,313
UK Tsy 0.5% 220722 258,754
Tsy 0.125% 221119 227,180
British Land ORD 25P 163,406
iShares EPRA 132,292
Unibail-Rodamco 117,281
Digital Realty 116,476
Deutsche Wohnen AG 115,570
Liberty Prop Trust 103,752
Berkshire Hath-B 101,701
Wells Fargo & Co 97,938
Oaktree Cap Group 94,896
Royal Dutch Shell 94,866
Newell Brands Inc 94,807
Credit Agricole SA 94,722
Unilever NV 81,324
General Electric Co 68,739
Sales Proceeds (USD) (being the largest sales during the period ended 30 June 2017) Buoni 1.20% 010422 (514,648)
iShares Global REIT ETF (364,969)
Bonos 0.4% 300422 (338,977)
iShares Cohen & Stee (230,555)
Sherwin-Williams (169,969)
iShares USD Treasury (154,791)
Vanguard Glbl EX-US (112,838)
iShares Spain Govt (108,136)
Ishares Italy Govt (105,010)
American Tower Corp (92,503)
Shimano Inc. (91,851)
iShares Core UK Gilt (86,264)
Ishare Hedged MSCI G (86,221)
Hitachi ORD (73,555)
Philip Morris Int (71,708)
WisdomTree Europoe H (71,652)
Avalonbay Commun (71,127)
Admiral Group Plc (62,732)
Fortinet INC (56,446)
Unilever NV (46,567)
Ctrip Com Int Ltd (38,345)
IYR US Jun 17 80 CO (33,850)

SANLAM UNIVERSAL FUNDS PLC
560
PURCHASES AND SALES FOR THE PERIOD ENDED 30 JUNE 2017 (UNAUDITED) (CONTINUED)
Anchor Global Equity Fund
Purchases Cost (USD) (being the largest purchases during the period ended 30 June 2017) Berkshire Hathaway Inc. 1,357,770
Becton Dickinson & Co 493,701
Domino's Pizza Group Plc 440,153
Newell Brands Inc 330,586
Ross Stores Inc 307,665
Celgene Corp 246,432
Pandora AS 238,122
Shire Plc 176,311
Netease.Com Inc 165,786
TractorSupplyCompany 130,295
Intuit Inc 109,853
X5 Retail Group NV 74,283
Sherwin-Williams 40,177
Allergan Plc 28,990
Unilever NV 5,527
Sales Proceeds (USD) (being the largest sales during the period ended 30 June 2017)
Paypal Holidings Inc (854,980)
Dollarama Inc (596,810)
Facebook Inc (442,473)
Alphabet Inc Cl A (429,318)
Mastercard Incorporated (387,550)
Priceline Group Incorporated (381,989)
Activision Blizzard Inc (325,867)
Netease.Com Inc (253,423)
Pandora AS (220,421)
Amazon.Com Inc (219,423)
Charles Schwab Corp (211,002)
X5 Retail Group NV (191,896)
Starbucks Corp. (127,703)
Start Today CoLtd (87,495)
Intuit Inc (71,710)

SANLAM UNIVERSAL FUNDS PLC
561
PURCHASES AND SALES FOR THE PERIOD ENDED 30 JUNE 2017 (UNAUDITED) (CONTINUED)
Bridge Global Managed Growth Fund
Purchases Cost (USD)
(being the largest purchases during the period ended 30 June 2017)
Exxon Corp 13,664
Capita Group Plc 90,696
Sales Proceeds (USD) (being the largest sales during the period ended 30 June 2017) Diageo (31,276)
Coca-Cola Co. (13,267)
Colgate-Palmolive Co (17,260)
Intel Corp (24,042)
Johnson & Johnson (18,648)
McCormick&Co-Non Vtg (17,533)
McDonald's Corp NPV (59,809)
Microsoft Corp (70,652)
Wells Fargo & Co (37,335)
Procter & Gamble (14,738)
Us Bancorp (71,241)
Wal-Mart Stores Inc (30,903)
Allianz SE (105,028)
Sanofi-Aventis (56,365)
Zurich Finl Svcs (61,869)
Roche Hldg-Genus (24,362)
Nestle Sa-R (18,350)
SA (45,180)
Vinci SA (60,348)
Chubb Ltd (42,722)
AbbVie Inc (27,850)

SANLAM UNIVERSAL FUNDS PLC
562
PURCHASES AND SALES FOR THE PERIOD ENDED 30 JUNE 2017 (UNAUDITED) (CONTINUED)
SIM Global Emerging Markets Fund
Purchases Cost (USD) (being the largest purchases during the period ended 30 June 2017) Sberbank of Russia 1,785,749
Matahari Department Store TB 1,634,253
Magnit OJSC-SPON GDR 1,599,739
Alibaba Group Holding Ltd 1,557,670
Netease.Com Inc 1,296,938
China Mobile Hong Kong Ltd 1,207,286
Samsung Electronics 1,036,136
Esprit Holdings Ltd 1,006,401
Vipshop Holdings Ltd 990,324
Baidu Com Inc 976,976
X5 Retail Group NV 951,790
TBC Bank Group Plc 933,628
Estacio Participacoes SA 809,348
Kroton Educacional SA 796,896
TCS Group Holding - Reg S 732,193
Brilliance China Automotive Holdings Limited 698,692
BR Malls Participacoes SA 692,758
Banco Bradesco SA-Pref 646,426
Bank Rakyat Indonesa 636,737
Itausa-Investment Itau - pr 635,712
Bank of Georgia Holdings Plc 625,823
Credicorp 600,646
Vakrangee Ltd 598,039
Bank Negara Indonesia 573,279
Arcos Dorados Holdings Inc. 539,074
DGB Financial Group Inc 538,902
Axis Bank Limited 537,906
Kasikornbank PCL-NVDR 379,105
MediaTek Inc 339,717
Shriram Transport Finance 333,163
Sun TV Network Ltd 329,410
Turkiye Sinai Kalkin 302,699
AIA Group Ltd 299,273
Swatch Group AG 284,326
Sales Proceeds (USD) (being the largest sales during the period ended 30 June 2017) Bank of Georgia (999,639)
Sun TV Network (411,498)
China Mobile (HK) (328,136)
Softbank Corp (176,303)
Brilliance China Aut (146,276)
TCS Group Holding - Reg S (99,707)
Raiffeisen Intl Bank (65,038)
Samsung Electronics (49,260)
Itausa P-rts (4,665)

SANLAM UNIVERSAL FUNDS PLC
563
PURCHASES AND SALES FOR THE PERIOD ENDED 30 JUNE 2017 (UNAUDITED) (CONTINUED)
ABSA Africa Equity Fund
Purchases Cost (USD) (being the largest purchases during the period ended 30 June 2017)
Safaricom Ltd 1,903,409
STOCK: GOVERNM:FORGN 1,427,148
Commercial Int Bank 1,093,821
Obour Land For Food Industries 1,067,141
Guaranty Trust Bank 923,673
Ecobank Transnational Inc 916,758
Label Vie 881,081
Societe des Brasseries du Maroc 842,983
Seplat Petroleum Development 818,570
EFG-Hermes Holding SAE 807,804
Credit Agricole Egypt 774,849
ElSwedy Cables Holding Company 704,096
Oriental Weavers Company 613,097
Egypt Kuwait Holding Company 610,834
Old Mutual PLC 593,963
Egyptian International Pharmaceutical Industries Company 530,330
Alexandria Container 456,326
ADES Intl Hoding Ltd 450,450
Talaat Moustafa Grp 432,756
DOUJA PROM ADDOHA 403,750
MM Group 401,835
Edita Food Industrie 401,349
Six of October Development and Investment Co 364,794
Alexandria Mineral Oils Company 340,544
MCB Group Ltd 249,709
Eastern Tobacco 241,231
Sales Proceeds (USD) (being the largest sales during the period ended 30 June 2017) Maroc Telecom (1,401,109)
Umeme Ltd (1,027,621)
Seplat Petroleum Development (622,706)
Letshego Holding Ltd (615,150)
Guaranty Trust Bank (605,062)
Safaricom Ltd (596,781)
ZENITH BANK LTD (555,761)
Attijariwafa Bank (546,533)
Centamin Plc (546,116)
KCB Group Ltd (531,782)
Alexandria Mineral Oils Company (468,197)
EAST AFRICAN BREWERIES LTD (454,101)
Obour Land For Food Industries (450,787)
Co-operative Bank of Kenya Ltd (293,671)
EFG-Hermes Holding (284,606)
Athi River Mining Lt (230,419)
Eastern Tobacco (227,186)
Commercial Int Bank (116,233)
Barclays Bank Ltd (87,278)

SANLAM UNIVERSAL FUNDS PLC
564
PURCHASES AND SALES FOR THE PERIOD ENDED 30 JUNE 2017 (UNAUDITED) (CONTINUED)
Sanlam Centre American Select Equity Fund
Purchases Cost (USD) (being the largest purchases during the period ended 30 June 2017)
Equitable Resources 3,597,703
CABOT OIL & GAS 3,365,969
Noble Energy Inc 3,183,153
Raytheon Co 2,727,320
Chipotle Mex Grill 2,596,381
Microchip Technology 2,493,967
CBRE Group Inc 2,472,937
Gap Inc 2,427,408
Suncor Energy Inc 2,364,492
Ralph Lauren Corp 2,356,611
Applied Material Inc 2,224,406
Dollar Tree Stores 2,170,596
SPX Dec 17 2150 PO 2,131,230
Wyndham Worldwide Co 2,126,201
SPX Sep 17 2100 PO 2,004,200
People's United Fin 1,998,448
UnitedHealthcare 1,958,583
Nordstrom Inc. 1,834,923
Whole FoodsMarketInc 1,372,807
Apple Inc 1,357,872
General Electric Co 1,322,695
Johnson & Johnson 1,135,945
Microsoft Corp 1,127,095
CBS Corp-CL B 1,123,167
Comcast Corp-CL A 1,107,464
Amazon.Com Inc 1,104,868
Intl BusinessMachine 1,101,597
Corning Inc 1,087,694
Facebook Inc 1,057,683
Quanta Services 1,014,662
Netflix Inc 944,186
Starbucks Corp 941,697
Nvidia Corp 761,572
Alphabet Inc Cl A 715,078
Adobe Sys Inc 707,302

SANLAM UNIVERSAL FUNDS PLC
565
PURCHASES AND SALES FOR THE PERIOD ENDED 30 JUNE 2017 (UNAUDITED) (CONTINUED)
Sanlam Centre American Select Equity Fund (continued)
Sales Proceeds (USD) (being the largest sales during the period ended 30 June 2017) Bard CR Inc (3,620,065)
Carnival Corp (3,453,853)
Merck & Co (3,383,081)
Pepsico Inc Com (2,779,031)
Becton Dickinson (2,575,080)
Berkshire Hath-B (2,252,516)
TwentyFirst Cent Fox (2,054,072)
JM Smucker Co (2,046,920)
Whole FoodsMarketInc (2,024,141)
Exelon Corp (1,990,271)
Altria Group Inc (1,984,605)
Colgate-Palmolive Co (1,957,569)
L3 Tech Inc (1,670,528)
Verizon Comm (1,643,197)
Urban Outfitters Inc (1,490,880)
Pfizer Inc (1,487,946)
Procter & Gamble (1,473,402)
Mastercard Inc (1,350,127)
AbbVie Inc (1,345,334)
Celgene Corp (1,344,040)
Firstenergy Corp (1,224,946)
Walt Disney Co (1,208,289)
Gilead Sciences Inc (1,183,130)
Coca-Cola Co. (1,121,836)
Intl BusinessMachine (1,116,062)
Intel Corp (1,104,045)
Alphabet Inc Cl A (1,072,165)
Alphabet Inc Cl C (1,051,363)
Qualcomm Inc (999,382)
SPX Sep 17 2100 PO (702,000)
Starbucks Corp (635,019)

SANLAM UNIVERSAL FUNDS PLC
566
PURCHASES AND SALES FOR THE PERIOD ENDED 30 JUNE 2017 (UNAUDITED) (CONTINUED)
Sanlam Global Convertible Securities Fund
Purchases Cost (USD) (being the largest purchases during the period ended 30 June 2017)
BP Cap 1% 280423 428,474
Yamada 0.00% 280619 411,461
Nanya Tech 0% 240122 411,200
Euronet 1.5% 011044 407,470
Ares Cap 3.7% 010222 400,000
Microc 1.625% 150227 400,000
Greenb 2.8% 010224 383,088
British 1.5% 100917 379,966
WWE 3.3% 151223 348,802
Siemens 1.65% 160819 288,375
Semicon 0.00% 070722 274,375
Stmicro 1.0% 030721 259,600
Tullow 6.625% 120721 221,500
Cemex 3.72% 150320 213,483
K S Holdin 0% 201219 207,501
Bunge Ltd 203,161
Toray 0% 300819 202,956
Kaman 3.25% 010524 198,103
Green 4.125% 010922 192,812
Alon USA 3% 150918 191,465
Medicnes 2.7% 150723 188,769
ShipFin 5.75% 151021 148,406
Steinhof 4.0% 300121 144,195
AegeanM 4.25% 151221 136,460
Remgro 2.625% 220321 123,469
Playtech 0.5% 191119 122,684
Horizon 2.75% 010722 120,797
Arbor 6.50% 011019 116,888
Square 0.37% 010322 110,000
Harmonic 4.0% 011220 102,696

SANLAM UNIVERSAL FUNDS PLC
567
PURCHASES AND SALES FOR THE PERIOD ENDED 30 JUNE 2017 (UNAUDITED) (CONTINUED)
Sanlam Global Convertible Securities Fund (continued)
Sales Proceeds (USD) (being the largest sales during the period ended 30 June 2017)
Stmicro 0% 030719 (519,400)
Asics Corp 0% 010319 (458,698)
Molina 1.62% 150844 (454,415)
Terady 1.25% 151223 (416,663)
Ares Cap 3.7% 010222 (402,500)
British 1.5% 100917 (379,819)
Workday 1.5% 150720 (213,351)
Aceto 2% 011120 (198,148)
Medici 2.75% 150723 (188,769)
Remgro 2.625% 220321 (123,030)
Square 0.37% 010322 (111,167)
Nagoya 0% 111224 (96,553)
TCP 4.625% 010322 (80,000)
Neur Bio 2.2% 150524 (70,175)
Dycom 0.75% 150921 (44,721)

SANLAM UNIVERSAL FUNDS PLC
568
PURCHASES AND SALES FOR THE PERIOD ENDED 30 JUNE 2017 (UNAUDITED) (CONTINUED)
Sanlam Japan Equity Fund
Purchases Cost (USD) (being the largest purchases during the period ended 30 June 2017)
Mitsubishi UFJ Hldgs 1,560,520
Minebea Mitsumi Inc 1,374,474
Suzuki Motor 1,339,254
Toyo Tire & RubberCo 1,326,437
Softbank Corp 1,248,214
Shin-Etsu Chemical 1,170,504
Yamaha Motor Co Ltd 1,164,226
Murata Manufacturing 1,074,920
Sony Corp 1,038,641
Nipro Corporation 998,504
Tosoh Corp 966,490
Fujitsu 946,767
Central Japan Rl 915,868
Nippon TeL & Tel 896,523
Subaru Corporation 887,688
Asahi Breweries 763,132
Furukawa Elect 741,557
DIC Coporation 721,746
Otsuka Holdings KK 705,137
Showa Denko K K 666,415
KH Neochem Co Ltd 650,405
Keisei Electric 642,666
Sompo Holdings Inc 641,295
Sumitomo Electric 616,376
Fuji Electric Holdng 597,368
Kirin Holdings Ltd 591,729
Sumitomo Heavy Ind 584,406
Persol Hldngs Co Ltd 579,338
Tokyo Tatemono Co Ld 567,101
JFE Holdings Inc 531,925
Omron Tateisi Elec 493,547
Sumitomo Mitsui Fin 486,569
Orix Corporation 484,435
Rohm Co. 478,741

SANLAM UNIVERSAL FUNDS PLC
569
PURCHASES AND SALES FOR THE PERIOD ENDED 30 JUNE 2017 (UNAUDITED) (CONTINUED)
Sanlam Japan Equity Fund (continued)
Sales Proceeds (USD) (being the largest sales during the period ended 30 June 2017) Subaru Corporation (1,609,180)
Mitsubishi UFJ Hldgs (1,080,832)
Sumitomo Mitsui Fin (1,008,466)
Kirin Holdings Ltd (873,244)
Softbank Corp (761,545)
Mitsub Elec Corp (701,910)
Toyota Motor Co (682,472)
Teijin Limited (569,498)
Honda Motor Co Y50 (509,078)
Screen Holdings Co (508,172)
Asahi Breweries (462,420)
Fujitsu General Ltd (456,889)
Mitsubishi Chem Hold (434,453)
Morinaga & Co Ltd (431,431)
Persol Hldngs Co Ltd (415,772)
Hitachi ORD (385,750)
Mitsui Fudosan Co (381,861)
Fuyo General Lease C (377,313)
MORINAGA MILK INDUS (373,285)
Hitachi Kokusai Elec (370,864)
Mitsubishi Corp (347,040)
Nitori Holdings Co (332,237)
Shimamura Co (330,557)
Resona Holdings Inc (320,063)
Murata Manufacturing (314,687)
Central Japan Rl (276,070)
Mitsui & Co (270,237)
Yahoo Japan Corp (270,148)
Namco Bandai Hldgs (260,026)
Nippon TeL & Tel (258,452)
Nichiha Corp (255,012)
Lixil Group Corp (246,816)
Maruha Nichiro (237,897)
SOHGO SECURITY (236,502)
DIC Coporation (221,785)

SANLAM UNIVERSAL FUNDS PLC
570
PURCHASES AND SALES FOR THE PERIOD ENDED 30 JUNE 2017 (UNAUDITED) (CONTINUED)
Sanlam Centre Active U.S Treasury Fund
Purchases Cost (USD) (being the largest purchases during the period ended 30 June 2017)
US TSY 8.125% 19 1,928,248
US TSY 8.75% 150820 1,742,539
US TSY 8.5%150220 1,201,405
US TSY 3.3% 150544 1,064,385
US TSY 3.125% 150243 1,018,195
US TSY 8.875% 8/17 814,150
US TSY 2.25% 310721 370,086
US TSY 2.50% 150524 252,340
US TSY 1.62% 151122 242,110
US TSY 2.2% 151125 212,716
US TSY 2.375% 150824 166,083

SANLAM UNIVERSAL FUNDS PLC
571
PURCHASES AND SALES FOR THE PERIOD ENDED 30 JUNE 2017 (UNAUDITED) (CONTINUED)
Autus Global Equity Fund
Purchases Cost (USD) (being the largest purchases during the period ended 30 June 2017)
Apple Inc 1,522,066
Microsoft Corp 1,375,599
Visa INC - Class A Shares 1,363,244
Vanguard S&P500 ETF 1,289,075
Nike Inc 1,172,288
Berkshire Hath-B 1,052,220
Verisign Inc 988,503
Simon Property 931,260
Alphabet Inc Cl A 900,732
Amazon.Com Inc 853,000
Gilead Sciences Inc 841,197
Blackrock Inc 730,113
Starbucks Corp 692,635
Comcast Corp-CL A 684,960
Adidas Ag-adr 680,014
Schroder Europea 676,983
Adobe Sys Inc 660,704
Inditex 614,890
Facebook Inc 509,302
Ping An Insurance Group Co Of China Ltd 483,444
Bayer Motoren Wk 464,588
Siemens Ag 459,444
Vanguard Sml Cap ETF 430,674
Nestle SA-Spons Adr For Reg 396,296
Roche Hldgs AG 345,517
Alibaba Group Holdin 344,768
Lilly (Eli) & Co 340,864
Charter Comm Inc 325,990
Samsung Elec-Gdr 319,679

SANLAM UNIVERSAL FUNDS PLC
572
PURCHASES AND SALES FOR THE PERIOD ENDED 30 JUNE 2017 (UNAUDITED) (CONTINUED) Autus Global Equity Fund (continued)
Sales Proceeds (USD) (being the largest sales during the period ended 30 June 2017) Visa INC - Class A Shares (1,085,783)
Verisign Inc (1,007,964)
Microsoft Corp (959,781)
Simon Property (930,396)
Apple Inc (927,668)
Nike Inc (850,687)
Berkshire Hathaway Inc. (844,765)
Gilead Sciences Inc (831,634)
Schroder European Real Estate Invest Trust Plc (700,082)
Vanguard S&P 500 ETF (661,858)
Adidas Ag (530,262)
Blackrock Inc (508,101)
Alphabet Inc Cl A (505,653)
Bayer Motoren Wk (473,378)
Amazon.Com Inc (470,081)
Comcast Corp-CL A (442,157)
Adobe Systems Inc (366,207)
Roche Holdings AG (361,429)
Inditex (316,904)
Starbucks Corp. (287,266)
Siemens Ag (232,023)
Unilever NV (181,806)
Nestle SA-SponsAdr (177,204)
Anthem Inc (171,099)
American Express (168,315)
XPO Logistics Inc. (165,763)
Chevron Corp (164,699)
AT & T Inc (162,866)
China Constr-adr (162,585)
General Electric Co (158,743)

SANLAM UNIVERSAL FUNDS PLC
573
Issued by
Sanlam Asset Management (Ireland) Limited Beech Hill House Beech Hill Road Dublin 4 Ireland