NEUBERGER BERMAN INVESTMENT FUNDS PLC 2019 ANNUAL ...
1789
NEUBERGER BERMAN INVESTMENT FUNDS PLC 2019 ANNUAL REPORT AUDITED FINANCIAL STATEMENTS FOR THE FINANCIAL YEAR ENDED 31 DECEMBER 2019
-
Upload
khangminh22 -
Category
Documents
-
view
0 -
download
0
Transcript of NEUBERGER BERMAN INVESTMENT FUNDS PLC 2019 ANNUAL ...

NEUBERGER BERMAN INVESTMENT FUNDS PLC2019 ANNUAL REPORT
AUDITED FINANCIAL STATEMENTSFOR THE FINANCIAL YEAR ENDED 31 DECEMBER 2019

Table of Contents PAGE MANAGEMENT AND ADMINISTRATION 1
GENERAL INFORMATION 3
DIRECTORS’ REPORT 42
INDEPENDENT AUDITORS’ REPORT TO THE MEMBERS OF NEUBERGER BERMAN INVESTMENT FUNDS PLC 50
INDEPENDENT AUDITORS’ REPORT TO THE DIRECTORS OF NEUBERGER BERMAN INVESTMENT FUNDS PLC 56
REPORT OF THE DEPOSITARY TO THE SHAREHOLDERS 57
AGGREGATE FINANCIAL STATEMENTS 58
Neuberger Berman High Yield Bond Fund 61
Neuberger Berman Diversified Currency Fund 80
Neuberger Berman US Multi Cap Opportunities Fund 89
Neuberger Berman US Real Estate Securities Fund 98
Neuberger Berman China Equity Fund 108
Neuberger Berman Emerging Markets Equity Fund 118
Neuberger Berman US Small Cap Fund 132
Neuberger Berman Short Duration High Yield Bond Fund 144
Neuberger Berman Global Bond Fund 160
Neuberger Berman Emerging Market Debt - Local Currency Fund 181
Neuberger Berman Emerging Market Debt - Hard Currency Fund 205
Neuberger Berman Emerging Market Corporate Debt Fund 223
Neuberger Berman Strategic Income Fund 241
Neuberger Berman Global Bond Absolute Return Fund 279
Neuberger Berman Short Duration Emerging Market Debt Fund 300
Neuberger Berman Absolute Return Multi Strategy Fund 319
Neuberger Berman US Long Short Equity Fund 342
Neuberger Berman Emerging Market Debt Blend Fund 357
Neuberger Berman European High Yield Bond Fund 392

Table of Contents (Continued) PAGE Neuberger Berman Global Equity Fund 405
Neuberger Berman Systematic Global Equity Fund 415
Neuberger Berman Global Real Estate Securities Fund 437
Neuberger Berman US Small Cap Intrinsic Value Fund 448
Neuberger Berman Global Credit Long Short Fund 460
Neuberger Berman Asian Debt – Hard Currency Fund 463
Neuberger Berman China Bond Fund 476
Neuberger Berman Global Dynamic Asset Allocator Fund 487
Neuberger Berman Asian Opportunities Fund 494
Neuberger Berman Corporate Hybrid Bond Fund 501
Neuberger Berman US Equity Fund 512
Neuberger Berman Global High Yield Bond Fund 521
Neuberger Berman Global Opportunistic Bond Fund 538
Neuberger Berman Multi-Asset Risk Premia Fund 561
Neuberger Berman Multi-Asset Class Income Fund 566
Neuberger Berman US Equity Index Putwrite Fund 597
Neuberger Berman Global Equity Index Putwrite Fund 605
Neuberger Berman Uncorrelated Strategies Fund 614
Neuberger Berman Emerging Market Debt Blend Investment Grade Fund 741
Neuberger Berman Emerging Markets Sustainable Equity Fund 759
Neuberger Berman China Equity Opportunities Fund 770
Neuberger Berman Multi-Asset Class Growth Fund 781
Neuberger Berman Global Thematic Equity Fund 804
Neuberger Berman CLO Income Fund 814
Neuberger Berman China A-Share Opportunities Fund 824
Neuberger Berman Next Generation Mobility Fund 830

Table of Contents (Continued) PAGE Neuberger Berman Ultra Short Term Euro Bond Fund 841
Neuberger Berman Euro Opportunistic Bond Fund 856
Neuberger Berman Euro Bond Absolute Return Fund 867
Neuberger Berman Absolute Alpha Fund 883
Neuberger Berman Multi-Style Premia Fund 895
Neuberger Berman Macro Opportunities FX Fund 918
NOTES TO THE AUDITED FINANCIAL STATEMENTS 927
Significant Accounting Policies 927 Financial Assets and Financial Liabilities at Fair Value Through Profit or Loss 935 Cash and Cash Equivalents 968 Bank Overdraft 979 Share Capital 979 Investment Manager, Administrator, Distributor and Depositary Fees 1108 Directors’ Fees and Expenses 1126 Auditors’ Remuneration 1126 Other Fees and Expenses 1126 Related Party Transactions 1127 Net Gain/(Loss) on Financial Assets and Liabilities at Fair Value Through Profit or Loss 1144 Financial Instrument Disclosures 1169 Net Asset Value Comparative 1350 Exchange Rates 1461 Currency Translation Adjustment 1462 Soft Commissions Arrangements 1463 Segregated Liability 1463 Efficient Portfolio Management 1463 Loan Facility 1463 Significant Events During the Year 1463 Significant Events Since the Year End 1464 Approval of Financial Statements 1464 Financial Highlights 1465 Derivative Contracts 1625 Offsetting Financial Instruments 1635 Closed Funds 1713

Table of Contents (Continued) PAGE APPENDIX I – TOTAL EXPENSE RATIOS (UNAUDITED) 1714
APPENDIX II – PERFORMANCE DATA (UNAUDITED) 1736
APPENDIX III – INFORMATON ON GLOBAL EXPOSURE (UNAUDITED) 1763
APPENDIX IV – SECURITIES FINANCING TRANSACTION REGULATION (UNAUDITED) 1765
APPENDIX V – REMUNERATION DISCLOSURE (UNAUDITED) 1772
APPENDIX VI – GLOSSARY OF INDICES (UNAUDITED) 1773
APPENDIX VII – INVESTMENT MANAGERS, SUB-INVESTMENT MANAGERS AND SUB-ADVISERS (UNAUDITED) 1780

COMPANY OVERVIEW MANAGEMENT AND ADMINISTRATION
ANNUAL REPORT 2019 1
Management and Administration Directors: Investment Manager, Distributor and Promoter: Andy Olding (British)* (resigned on 11 June 2019) Neuberger Berman Europe Limited Tom Finlay (Irish)** Lansdowne HousePaul Sullivan (Irish)*** (resigned on 20 February 2019) 57 Berkeley Square Gráinne Alexander (Irish)*** London W1J 6ERMichelle Green (British)* England Naomi Daly (Irish)*** (appointed on 1 July 2019) Alex Duncan (British)* (appointed on 1 August 2019) Affiliated Sub-Adviser: Neuberger Berman Investment Management *Non-Executive Director (Shanghai) Limited**Independent, Non-Executive Director and Permanent Chairman Room B01 of Unit 4205, 4206 and 4207 ***Independent, Non-Executive Director No.479 Lujiazui Ring Road China (Shanghai) Pilot Free Trade Zone, 200120
Legal Advisers as to Irish Law: Republic of ChinaMatheson 70 Sir John Rogerson’s Quay Administrator: Dublin 2 Brown Brothers Harriman Fund Ireland Administration Services (Ireland) Limited 30 Herbert StreetDepositary: Dublin 2Brown Brothers Harriman Trustee Services (Ireland) Limited Ireland 30 Herbert Street Dublin 2 Auditors: Ireland Ernst & Young Chartered AccountantsSponsoring Euronext Dublin Broker: Block One, Harcourt CentreMatheson Harcourt Street 70 Sir John Rogerson’s Quay Dublin 2Dublin 2 Ireland Ireland Swiss Representative:**** Distributors and Sub-Investment Managers: BNP Paribas Securities Services S.A. Paris Neuberger Berman Asia Limited Succursale de Zürich20th Floor Selnaustrasse 16Jardine House P.O. Box 2119 CH-80021 Connaught Place Zurich Central Hong Kong Switzerland Neuberger Berman Singapore Pte. Limited ****The Prospectus, the Articles of Association, the Key Investor
Information Document, the annual and semi-annual report as well as a list containing all purchases and sales which have been made during the reporting period can be obtained free of charge from the Swiss Representative.
Level 15 Ocean Financial Centre 10 Collyer Quay Singapore 049315 Neuberger Berman Asset Management Ireland Limited Sub-Investment Managers: 32 Molesworth Street Neuberger Berman Investment Advisers LLC Dublin 2 1290 Avenue of the Americas Ireland New York, NY 10104-0002 USACompany Secretary & Registered Office: Matsack Trust Limited 70 Sir John Rogerson’s Quay Dublin 2 Ireland

MANAGEMENT AND ADMINISTRATION COMPANY OVERVIEW
2 NEUBERGER BERMAN INVESTMENT FUNDS PLC
Management and Administration (Continued) Sub-Investment Managers (continued): Non-Affiliated Sub-Advisers (continued): Neuberger Berman Breton Hill ULC Green Court Capital Management Limited 2 Bloor Street East Suite 2830 Suites 4007-4008, 40/F, One Exchange Square Toronto, ON M4W 1A8 8 Connaught Place, CentralCanada Hong Kong Master Agent and Distributor in Taiwan: Academy Investment Management LLC Neuberger Berman Taiwan (SITE) Limited 900 Third Avenue, Suite 1100B 20F., No. 68, Sec 5, Zhongxiao E. Road New York, NY 10022XinYi District USATaipei City 110 Taiwan Altiq LLP Republic of China 29 Farm Street
London W1J 5RLNon-Affiliated Sub-Advisers: United KingdomCramer Rosenthal McGlynn, LLC 520 Madison Avenue, 20th Floor Sabre Fund Management Limited New York, NY 10022 46-48 Grosvenor GardensUSA London SW1W 0EB
United KingdomSound Point Capital Management, L.P. (terminated 4 March 2020) BH-DG Systematic Trading LLP 375 Park Avenue 10 Grosvenor Street, 3rd Floor New York, NY 10152 London W1K 4QBUSA United Kingdom Good Hill Partners LP True Partner Capital USA Holding Inc 1 Greenwich Office Park 111 West Jackson Boulevard, Suite 1700 Greenwich, CT 06831 Chicago, IL 60604USA USA Portland Hill Asset Management Limited Alcova Asset Management LLP 21 Knightsbridge 21 KnightsbridgeLondon SW1X 7LY London SW1X 7LYUnited Kingdom United Kingdom GAMCO Asset Management Inc. Sandbar Asset Management LLP One Corporate Center (appointed 19 August 2019)Rye, NY 10580 Warnford CourtUSA 29 Throgmorton Street London EC2N 2ATPerella Weinberg Partners Capital Management LP United Kingdom(terminated 29 March 2019) 767 Fifth Avenue LCJ Investments SANew York, NY 10153 (appointed 30 October 2019)USA 116 Rue du Rhone 1204 GenevaP/E Global LLC Switzerland75 State Street, 31st Floor Boston, MA 02109 USA

COMPANY OVERVIEW GENERAL INFORMATION
ANNUAL REPORT 2019 3
General Information
The following information is derived from and should be read in conjunction with the full texts and definitions section of the Prospectus.
Neuberger Berman Investment Funds plc (the “Company”) is an investment company with variable capital incorporated in Ireland on 11 December 2000 under registration number 336425 as a public limited company pursuant to the Companies Act 2014 (as amended). The Company has been authorised by the Central Bank of Ireland (the “Central Bank”) as an Undertaking for Collective Investment in Transferable Securities pursuant to the provisions of the European Communities (Undertakings for Collective Investment in Transferable Securities) Regulations, 2011 as amended (the “UCITS Regulations”). The Company is constituted as an umbrella fund insofar as its share capital is divided into different series of shares with each series of shares representing a separate investment portfolio of assets (“Portfolio”). Shares of any Portfolio may be divided into different classes to accommodate different subscription and/or redemption provisions and/or dividend and/or charges and/or fee arrangements and/or currencies including different total expense ratios.
At 31 December 2019, the Company was comprised of forty-six separate portfolios of investments (“Portfolios”), each of which is represented by a separate series of Redeemable Participating Shares. These are set out in the table below:
Portfolio Launch Date* Neuberger Berman US Real Estate Securities Fund1 1 February 2006 Neuberger Berman High Yield Bond Fund1 3 May 2006 Neuberger Berman US Multi Cap Opportunities Fund1 13 June 2006 Neuberger Berman Diversified Currency Fund2 25 February 2009 Neuberger Berman China Equity Fund1 14 July 2009 Neuberger Berman Emerging Markets Equity Fund1 4 October 2010 Neuberger Berman US Small Cap Fund1 1 July 2011 Neuberger Berman Short Duration High Yield Bond Fund1 20 December 2011 Neuberger Berman Global Bond Fund1 16 July 2012 Neuberger Berman Strategic Income Fund1 26 April 2013 Neuberger Berman Emerging Market Debt – Hard Currency Fund1 31 May 2013 Neuberger Berman Emerging Market Corporate Debt Fund1 14 June 2013 Neuberger Berman Emerging Market Debt – Local Currency Fund1 28 June 2013 Neuberger Berman Global Bond Absolute Return Fund2 25 September 2013 Neuberger Berman Absolute Return Multi Strategy Fund2 15 October 2013 Neuberger Berman Short Duration Emerging Market Debt Fund1 31 October 2013 Neuberger Berman US Long Short Equity Fund2 28 February 2014 Neuberger Berman Emerging Market Debt Blend Fund1 23 April 2014 Neuberger Berman European High Yield Bond Fund1 27 June 2014 Neuberger Berman Global Equity Fund2 9 December 2014 Neuberger Berman Systematic Global Equity Fund2 18 December 2014 Neuberger Berman Global Real Estate Securities Fund2 30 December 2014 Neuberger Berman US Small Cap Intrinsic Value Fund2 30 April 2015 Neuberger Berman Asian Debt – Hard Currency Fund2 29 June 2015 Neuberger Berman China Bond Fund2 28 August 2015 Neuberger Berman Corporate Hybrid Bond Fund2 19 November 2015 Neuberger Berman US Equity Fund2 18 December 2015 Neuberger Berman Global High Yield Bond Fund2 4 August 2016 Neuberger Berman Global Opportunistic Bond Fund2 20 December 2016 Neuberger Berman Multi-Asset Class Income Fund2 28 December 2016 Neuberger Berman US Equity Index PutWrite Fund2 30 December 2016 Neuberger Berman Global Equity Index PutWrite Fund2 3 May 2017 Neuberger Berman Uncorrelated Strategies Fund2 22 May 2017

GENERAL INFORMATION COMPANY OVERVIEW
4 NEUBERGER BERMAN INVESTMENT FUNDS PLC
General Information (Continued) Portfolio Launch Date*
Neuberger Berman Emerging Market Debt Blend Investment Grade Fund2 10 July 2017 Neuberger Berman Emerging Markets Sustainable Equity Fund2 24 October 2017 Neuberger Berman China Equity Opportunities Fund2 15 December 2017 Neuberger Berman Multi-Asset Class Growth Fund2 22 December 2017 Neuberger Berman Global Thematic Equity Fund2 27 April 2018 Neuberger Berman CLO Income Fund2 12 July 2018 Neuberger Berman Next Generation Mobility Fund2 21 August 2018 Neuberger Berman Ultra Short Term Euro Bond Fund2 31 October 2018 Neuberger Berman Euro Opportunistic Bond Fund2 14 November 2018 Neuberger Berman Euro Bond Absolute Return Fund2 29 November 2018 Neuberger Berman Absolute Alpha Fund2 20 February 2019 Neuberger Berman Multi-Style Premia Fund2 1 March 2019 Neuberger Berman Macro Opportunities FX Fund2 4 December 2019
*First day of operations.
1 Portfolio authorised by the Hong Kong Securities and Futures Commission (the “SFC”) and hence may be offered to the public of Hong Kong.
2 Portfolio not authorised by the SFC and not available to Hong Kong investors.
The Company has segregated liability between its sub-funds and accordingly any liability incurred on behalf of or attributable to any sub-fund shall be discharged solely out of the assets of that sub-fund.
The majority of share classes are listed on Euronext Dublin. A full list of share classes listed on Euronext Dublin is available on the Euronext Dublin website.
Neuberger Berman Multi-Asset Risk Premia Fund, Neuberger Berman Global Dynamic Asset Allocator Fund, Neuberger Berman Asian Opportunities Fund and Neuberger Berman China A-Share Opportunities Fund liquidated on 26 March 2019, 12 April 2019, 24 July 2019 and 6 December 2019, respectively, and are therefore no longer available for subscription.
Please refer to Appendix VII for a full list of Investment Managers, Sub-Investment Managers and Sub-Advisers for each Portfolio.

COMPANY OVERVIEW GENERAL INFORMATION
ANNUAL REPORT 2019 5
General Information (Continued)
Neuberger Berman High Yield Bond Fund
The investment objective of Neuberger Berman High Yield Bond Fund (the “Portfolio”) is to achieve an attractive level of total return (income plus capital appreciation) from the high yield fixed income market. The Portfolio seeks to achieve this objective by investing primarily in high yield fixed income securities issued by US and foreign corporations, which, respectively, have their head office or exercise an overriding part of their economic activity in the US and high yield fixed income securities issued by governments and agencies in the US that are primarily denominated in US dollars; that are listed, dealt or traded on recognised markets. In addition, although the Portfolio concentrates its investments in the US, the Portfolio may also invest in securities of companies located in and governments of emerging market countries, which may involve additional risk, relative to investment in more developed economies.
The following are the active share classes in the Portfolio at the financial year end (referred to herein as the “year end” or “year ended”):
Share Class Name Share Class Launch Date Currency EUR A Accumulating Class1 3 May 2006 EUR USD I Accumulating Class 3 May 2006 USD GBP I Distributing Class 8 November 2006 GBP USD I Distributing Class 16 November 2006 USD JPY I Accumulating Class 26 August 2009 JPY EUR I Accumulating Class 9 November 2009 EUR USD A Accumulating Class1 11 January 2010 USD GBP I Accumulating Class 27 July 2010 GBP GBP A Accumulating Class1 27 April 2011 GBP CHF I Accumulating Class 27 May 2011 CHF SEK A Accumulating Class 16 June 2011 SEK CHF A Accumulating Class 5 July 2011 CHF AUD I Distributing Class 29 December 2011 AUD EUR A Distributing Class1 24 February 2012 EUR GBP A Distributing Class1 24 February 2012 GBP USD A Distributing Class1 24 February 2012 USD SGD A Accumulating Class1 9 March 2012 SGD SGD A (Monthly) Distributing Class1 30 March 2012 SGD USD A (Monthly) Distributing Class1 2 May 2012 USD EUR A (Monthly) Distributing Class1 19 June 2012 EUR CNY A (Monthly) Distributing Class 1 August 2012 CNY AUD A Accumulating Class1 28 August 2012 AUD AUD A (Monthly) Distributing Class1 5 September 2012 AUD USD I (Monthly) Distributing Class 13 September 2012 USD HKD A (Monthly) Distributing Class1 14 September 2012 HKD HKD A Accumulating Class1 19 September 2012 HKD USD U Accumulating Class 9 October 2012 USD EUR I Distributing Class 18 October 2012 EUR USD B (Monthly) Distributing Class 31 October 2012 USD USD B Accumulating Class 31 October 2012 USD USD C2 (Monthly) Distributing Class 31 October 2012 USD

GENERAL INFORMATION COMPANY OVERVIEW
6 NEUBERGER BERMAN INVESTMENT FUNDS PLC
General Information (Continued)
Neuberger Berman High Yield Bond Fund (continued)
Share Class Name Share Class Launch Date Currency USD C2 Accumulating Class 31 October 2012 USD USD T (Monthly) Distributing Class 31 October 2012 USD USD T Accumulating Class 31 October 2012 USD CNY I (Monthly) Distributing Class 9 November 2012 CNY USD C Accumulating Class 21 November 2012 USD USD C Distributing Class 21 November 2012 USD EUR I2 Accumulating Class 5 December 2012 EUR EUR I2 Distributing Class 5 December 2012 EUR GBP I2 Accumulating Class 5 December 2012 GBP GBP I2 Distributing Class 5 December 2012 GBP USD I2 Accumulating Class 5 December 2012 USD USD I2 Distributing Class 5 December 2012 USD CNY A (Weekly) Distributing Class 10 January 2013 CNY USD A (Weekly) Distributing Class1 22 January 2013 USD USD U (Monthly) Distributing Class 2 May 2013 USD CHF I Distributing Class 7 May 2013 CHF AUD B (Weekly) Distributing Class 11 June 2013 AUD AUD C2 (Weekly) Distributing Class 11 June 2013 AUD AUD T (Weekly) Distributing Class 11 June 2013 AUD USD B (Weekly) Distributing Class 11 June 2013 USD USD C2 (Weekly) Distributing Class 11 June 2013 USD USD T (Weekly) Distributing Class 11 June 2013 USD ZAR B (Monthly) Distributing Class 11 June 2013 ZAR ZAR C2 (Monthly) Distributing Class 11 June 2013 ZAR ZAR T (Monthly) Distributing Class 11 June 2013 ZAR AUD T (Monthly) Distributing Class 27 June 2013 AUD AUD C2 (Monthly) Distributing Class 19 July 2013 AUD AUD B (Monthly) Distributing Class 22 July 2013 AUD CAD A (Monthly) Distributing Class1 23 July 2013 CAD AUD T Accumulating Class 2 August 2013 AUD CHF I2 Accumulating Class 22 October 2013 CHF ZAR A (Monthly) Distributing Class 5 November 2013 ZAR CNY B (Monthly) Distributing Class 14 April 2014 CNY CNY T (Monthly) Distributing Class 14 April 2014 CNY USD Z Accumulating Class 2 May 2014 USD AUD E (Monthly) Distributing Class 2 July 2014 AUD AUD E Accumulating Class 2 July 2014 AUD USD E (Monthly) Distributing Class 2 July 2014 USD USD E Accumulating Class 2 July 2014 USD ZAR E (Monthly) Distributing Class 2 July 2014 ZAR ZAR E Accumulating Class 2 July 2014 ZAR GBP A (Monthly) Distributing Class1 7 July 2014 GBP EUR Z Accumulating Class 5 November 2014 EUR

COMPANY OVERVIEW GENERAL INFORMATION
ANNUAL REPORT 2019 7
General Information (Continued)
Neuberger Berman High Yield Bond Fund (continued)
Share Class Name Share Class Launch Date Currency AUD I2 (Monthly) Distributing Class 24 September 2015 AUD AUD I2 Accumulating Class 24 September 2015 AUD EUR I2 (Monthly) Distributing Class 24 September 2015 EUR USD I2 (Monthly) Distributing Class 24 September 2015 USD EUR M Accumulating Class 29 January 2016 EUR EUR M Distributing Class 29 January 2016 EUR USD M Accumulating Class 18 February 2016 USD GBP Z Accumulating Class 17 March 2016 GBP USD I4 (Monthly) Distributing Class 1 June 2016 USD EUR I3 Accumulating Class 22 July 2016 EUR EUR I3 Distributing Class 30 August 2016 EUR ZAR T Accumulating Class 19 December 2016 ZAR USD C1 Distributing Class 7 September 2017 USD USD C1 Accumulating Class 25 October 2017 USD USD P Accumulating Class 9 January 2018 USD USD M Distributing Class 1 March 2018 USD
1Authorised for public distribution in Hong Kong.
Neuberger Berman Diversified Currency Fund
The investment objective of Neuberger Berman Diversified Currency Fund (the “Portfolio”) is to generate an absolute return over a medium- to long-term investment horizon with a moderate level of volatility. The Portfolio seeks to achieve this objective by investing primarily in global liquid currencies (including, without limitation, Australian dollars, Canadian dollars, Swiss franc, euro, sterling, Japanese yen, Norwegian krone, New Zealand dollars, Swedish krona and US dollars) using a fundamentally driven, relative approach. The four-stage investment approach is discretionary in nature and is designed to achieve a diversified, highly liquid Portfolio and may, depending on prevailing market conditions, combine fundamental analysis with a more quantitative approach, designed to consider multiple drivers and trading strategies over different time horizons.
Stage one of the process is the construction of the Portfolio and this includes stage two, which is the analysis of fundamental factors that may, on a discretionary basis, include such variables as opportunities for growth, currency stability, yield, monetary policy, capital flows and risk characteristics, over short-, medium- and long-term investment horizons.
Following the analysis and portfolio construction stages, stages three and four of the investment process are trade implementation and risk management, conducted on a pre-trade, post-trade and ongoing basis.
The securities which the Portfolio invests in may be listed on recognised markets globally. The Portfolio may take positions in currencies representing either a long or, using financial derivative instruments (“FDI”), short exposure to the currency with respect to the base currency.

GENERAL INFORMATION COMPANY OVERVIEW
8 NEUBERGER BERMAN INVESTMENT FUNDS PLC
General Information (Continued)
Neuberger Berman Diversified Currency Fund (continued)
The following are the active share classes in the Portfolio at year end:
Share Class Name Share Class Launch Date Currency EUR I Accumulating Class 25 February 2009 EUR USD I Accumulating Class 25 February 2009 USD EUR A Accumulating Class 8 December 2009 EUR USD A Accumulating Class 8 December 2009 USD GBP I Accumulating Class 4 February 2011 GBP EUR M Accumulating Class 18 February 2016 EUR USD Z Accumulating Class 20 January 2017 USD JPY I Accumulating Class 22 February 2017 JPY
Neuberger Berman US Multi Cap Opportunities Fund
The investment objective of Neuberger Berman US Multi Cap Opportunities Fund (the “Portfolio”) is to achieve capital growth through the selection of investments using systematic, sequential research. The Portfolio seeks to achieve this objective by Neuberger Berman Investment Advisers LLC (the “Sub-Investment Manager”) using systematic, sequential research in identifying potential investments. Investment selection is the result of both quantitative and qualitative analysis in an effort to identify companies that are believed to have the potential to increase in value. This potential may be realised in many ways, some of which include: free cash flow generation, product or process enhancements, margin increases and improved capital structure management.
The following are the active share classes in the Portfolio at year end:
Share Class Name Share Class Launch Date Currency EUR1 A Accumulating Class 28 June 2012 EUR EUR1 I Accumulating Class 28 June 2012 EUR USD1 I Accumulating Class 28 June 2012 USD USD1 A Accumulating Class 29 June 2012 USD USD1 I Distributing Class 29 June 2012 USD USD U Accumulating Class 22 January 2013 USD GBP I Distributing Unhedged Class 11 March 2013 GBP EUR I3 Accumulating Class 21 March 2013 EUR GBP I3 Distributing Class 21 March 2013 GBP USD I3 Accumulating Class 29 April 2013 USD SGD A Accumulating Class1 16 July 2013 SGD USD I3 Distributing Class 30 July 2013 USD USD B Accumulating Class 22 November 2013 USD USD C2 Accumulating Class 22 November 2013 USD USD T Accumulating Class 22 November 2013 USD ZAR B Accumulating Class 13 January 2014 ZAR ZAR C2 Accumulating Class 13 January 2014 ZAR ZAR T Accumulating Class 13 January 2014 ZAR USD Z Accumulating Class 2 May 2014 USD
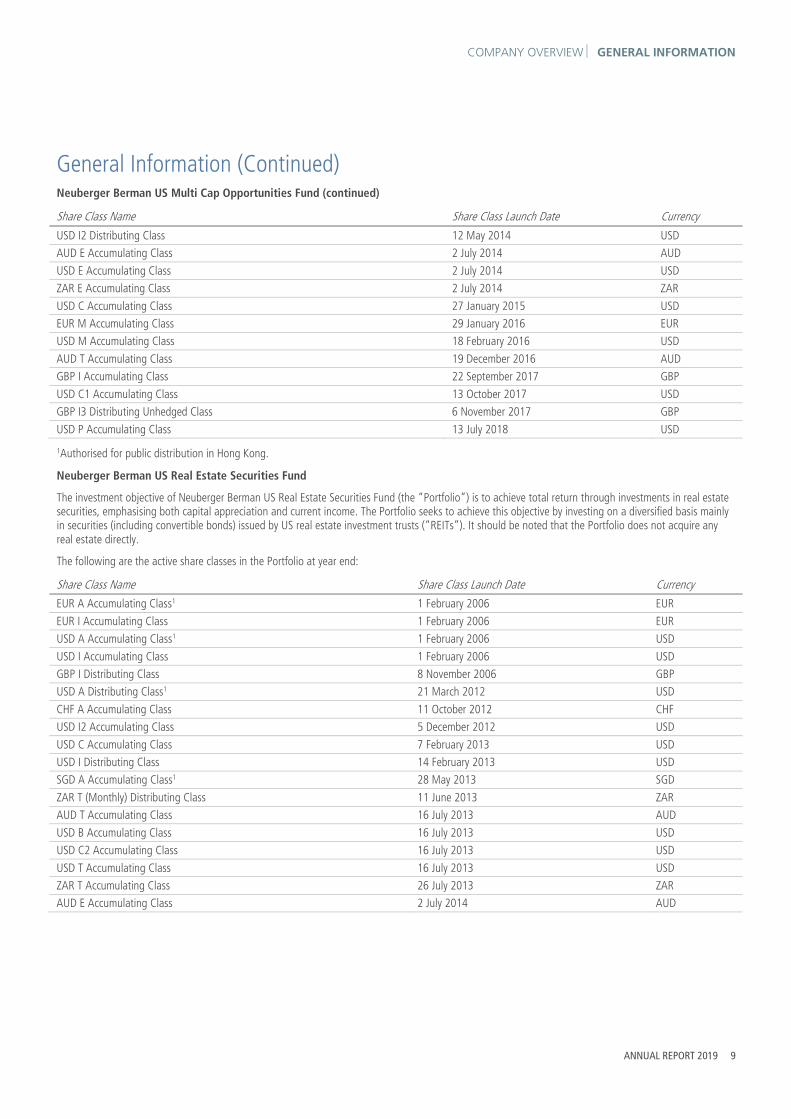
COMPANY OVERVIEW GENERAL INFORMATION
ANNUAL REPORT 2019 9
General Information (Continued)
Neuberger Berman US Multi Cap Opportunities Fund (continued)
Share Class Name Share Class Launch Date Currency USD I2 Distributing Class 12 May 2014 USD AUD E Accumulating Class 2 July 2014 AUD USD E Accumulating Class 2 July 2014 USD ZAR E Accumulating Class 2 July 2014 ZAR USD C Accumulating Class 27 January 2015 USD EUR M Accumulating Class 29 January 2016 EUR USD M Accumulating Class 18 February 2016 USD AUD T Accumulating Class 19 December 2016 AUD GBP I Accumulating Class 22 September 2017 GBP USD C1 Accumulating Class 13 October 2017 USD GBP I3 Distributing Unhedged Class 6 November 2017 GBP USD P Accumulating Class 13 July 2018 USD
1Authorised for public distribution in Hong Kong.
Neuberger Berman US Real Estate Securities Fund
The investment objective of Neuberger Berman US Real Estate Securities Fund (the “Portfolio”) is to achieve total return through investments in real estate securities, emphasising both capital appreciation and current income. The Portfolio seeks to achieve this objective by investing on a diversified basis mainly in securities (including convertible bonds) issued by US real estate investment trusts (“REITs”). It should be noted that the Portfolio does not acquire any real estate directly.
The following are the active share classes in the Portfolio at year end:
Share Class Name Share Class Launch Date Currency EUR A Accumulating Class1 1 February 2006 EUR EUR I Accumulating Class 1 February 2006 EUR USD A Accumulating Class1 1 February 2006 USD USD I Accumulating Class 1 February 2006 USD GBP I Distributing Class 8 November 2006 GBP USD A Distributing Class1 21 March 2012 USD CHF A Accumulating Class 11 October 2012 CHF USD I2 Accumulating Class 5 December 2012 USD USD C Accumulating Class 7 February 2013 USD USD I Distributing Class 14 February 2013 USD SGD A Accumulating Class1 28 May 2013 SGD ZAR T (Monthly) Distributing Class 11 June 2013 ZAR AUD T Accumulating Class 16 July 2013 AUD USD B Accumulating Class 16 July 2013 USD USD C2 Accumulating Class 16 July 2013 USD USD T Accumulating Class 16 July 2013 USD ZAR T Accumulating Class 26 July 2013 ZAR AUD E Accumulating Class 2 July 2014 AUD

GENERAL INFORMATION COMPANY OVERVIEW
10 NEUBERGER BERMAN INVESTMENT FUNDS PLC
General Information (Continued) Neuberger Berman US Real Estate Securities Fund (continued)
Share Class Name Share Class Launch Date Currency USD E Accumulating Class 2 July 2014 USD ZAR E Accumulating Class 2 July 2014 ZAR USD Z Accumulating Class 10 February 2015 USD ZAR B Accumulating Class 13 March 2015 ZAR AUD B Accumulating Class 19 August 2015 AUD AUD C2 Accumulating Class 25 September 2015 AUD AUD T (Monthly) Distributing Class 13 October 2015 AUD USD A (Monthly) Distributing Class1 18 November 2015 USD USD T (Monthly) Distributing Class 1 January 2016 USD EUR M Accumulating Class 29 January 2016 EUR HKD A Accumulating Class1 11 February 2016 HKD USD M Accumulating Class 18 February 2016 USD HKD A (Monthly) Distributing Class1 28 July 2016 HKD AUD A (Monthly) Distributing Class1 8 August 2016 AUD USD B (Monthly) Distributing Class 15 August 2016 USD USD E (Monthly) Distributing Class 15 August 2016 USD ZAR C2 (Monthly) Distributing Class 15 August 2016 ZAR AUD B (Monthly) Distributing Class 16 August 2016 AUD AUD C2 (Monthly) Distributing Class 16 August 2016 AUD AUD E (Monthly) Distributing Class 16 August 2016 AUD USD C2 (Monthly) Distributing Class 16 August 2016 USD ZAR B (Monthly) Distributing Class 16 August 2016 ZAR ZAR E (Monthly) Distributing Class 16 August 2016 ZAR USD C1 Accumulating Class 31 August 2017 USD ZAR C2 Accumulating Class 11 April 2019 ZAR USD I (Monthly) Distributing Class 19 November 2019 USD
1Authorised for public distribution in Hong Kong.

COMPANY OVERVIEW GENERAL INFORMATION
ANNUAL REPORT 2019 11
General Information (Continued) Neuberger Berman China Equity Fund
The investment objective of Neuberger Berman China Equity Fund (the “Portfolio”) is to achieve an attractive level of total return (income plus capital appreciation) from the Greater China equity market. The Portfolio seeks to achieve this objective by investing primarily in equity and equity-linked securities which are listed or traded on recognised markets and issued by companies that:
are incorporated or organised under the laws of, or that have a principal office in, the People’s Republic of China (“PRC”), Hong Kong Special Administrative Region (“SAR”), Macau SAR or Taiwan (the “Greater China Region”);
generally derive a majority of their total revenue or profits from (a) goods that are produced or sold, (b) investments made, or (c) services performed, in the Greater China Region; or
generally hold a majority of their assets in the Greater China Region (each a “Greater China Company”).
The Portfolio may also invest in hybrid securities and equity-related securities, such as convertible debentures, convertible preferred stock, debt instruments with warrants attached, including FDI, which are issued by or give exposure to the performance of Greater China Companies.
For the avoidance of doubt, the Portfolio may invest in securities as described herein and which are issued by or giving exposure to Greater China Companies listed or traded on recognised markets located outside of the Greater China Region, including, without limitation, in the United States, the United Kingdom, Singapore and Japan.
The Portfolio invests primarily in mid and large capitalisation companies.
Green Court Capital Management Limited, the Non-Affiliated Sub-Adviser, employs a research intensive, fundamental-driven and bottom-up approach. Ongoing assessments of macroeconomic and market factors augment the stock-picking discipline. The investment approach is discretionary in nature and is designed to consider multiple drivers and investment strategies over different time horizons.
The Portfolio is primarily constructed by taking under and overweight positions to the market benchmark MSCI China Index. Decisions on whether the Portfolio’s positions will be under- or overweight relative to the benchmark are primarily driven by valuation, quality of valuation and macroeconomic factors, including such variables as opportunities for growth, competitive advantages and risk characteristics, over short-, medium- and long-term investment horizons but the requirements of the Central Bank in respect of concentration limits as set out in the “Investment Restrictions” section of the Prospectus will supersede these factors where relevant.
The following are the active share classes in the Portfolio at year end:
Share Class Name Share Class Launch Date Currency EUR A Accumulating Class1 14 July 2009 EUR EUR I Accumulating Class 14 July 2009 EUR USD A Accumulating Class1 14 July 2009 USD USD I Accumulating Class 14 July 2009 USD EUR Z Accumulating Class 3 June 2014 EUR GBP I Distributing Unhedged Class 23 June 2014 GBP GBP I2 Distributing Unhedged Class 23 June 2014 GBP USD U Accumulating Class 27 June 2014 USD USD Z Accumulating Class 1 August 2014 USD USD I2 Accumulating Class 11 August 2014 USD USD A Distributing Class1 27 August 2014 USD SGD A Accumulating Class1 1 December 2014 SGD EUR I4 Accumulating Class 13 March 2015 EUR GBP I4 Accumulating Class 13 March 2015 GBP EUR A Distributing Class1 25 March 2015 EUR

GENERAL INFORMATION COMPANY OVERVIEW
12 NEUBERGER BERMAN INVESTMENT FUNDS PLC
General Information (Continued) Neuberger Berman China Equity Fund (continued)
Share Class Name Share Class Launch Date Currency GBP I4 Distributing Class 25 March 2015 GBP USD I4 Distributing Class 25 March 2015 USD HKD A Accumulating Class1 23 April 2015 HKD GBP A Distributing Class1 21 May 2015 GBP CHF I Accumulating Class 31 July 2015 CHF EUR M Accumulating Class 29 January 2016 EUR EUR A Accumulating Unhedged Class 4 February 2016 EUR USD M Accumulating Class 27 May 2016 USD USD C1 Accumulating Class 29 August 2017 USD
1Authorised for public distribution in Hong Kong.
Neuberger Berman Emerging Markets Equity Fund
The investment objective of Neuberger Berman Emerging Markets Equity Fund (the “Portfolio”) is to achieve long-term capital growth. The Portfolio seeks to achieve this objective by investing primarily in equity and equity-linked securities which are listed or traded on recognised markets globally and issued by companies that:
trade principally on a recognised stock exchange in emerging market countries; are organised under the laws of and have a principal office in emerging market countries; or derive 50% or more of their total revenues from, and/or have 50% or more of their total assets in, goods produced, sales made, profits generated or
services performed in emerging market countries. The Portfolio may invest more than 20% of its assets in other collective investment schemes.
Neuberger Berman Investment Advisers LLC (the “Sub-Investment Manager”) uses a fundamental bottom-up, research-driven securities selection approach focusing on high return businesses while factoring in economic, legislative and business developments to identify countries and economic sectors (such as Energy, Financials, Health Care, Telecommunication Services and Utilities) that it believes may be particularly attractive.
The Sub-Investment Manager seeks to invest in companies that it believes have sustainable free cash flow growth and are trading at attractive valuations.
The following are the active share classes in the Portfolio at year end:
Share Class Name Share Class Launch Date Currency EUR I Accumulating Class 4 October 2010 EUR JPY I Accumulating Class 4 October 2010 JPY USD A Accumulating Class1 4 October 2010 USD USD I Accumulating Class 4 October 2010 USD GBP I Accumulating Class 15 January 2014 GBP USD Z Accumulating Class 30 June 2014 USD EUR M Accumulating Class 18 February 2016 EUR GBP Z Accumulating Class 17 March 2016 GBP USD M Accumulating Class 27 May 2016 USD EUR A Accumulating Class1 16 June 2016 EUR AUD B Accumulating Class 30 November 2016 AUD AUD C2 Accumulating Class 30 November 2016 AUD AUD E Accumulating Class 30 November 2016 AUD

COMPANY OVERVIEW GENERAL INFORMATION
ANNUAL REPORT 2019 13
General Information (Continued) Neuberger Berman Emerging Markets Equity Fund (continued)
Share Class Name Share Class Launch Date Currency AUD T Accumulating Class 30 November 2016 AUD USD B Accumulating Class 30 November 2016 USD USD C2 Accumulating Class 30 November 2016 USD USD E Accumulating Class 30 November 2016 USD USD T Accumulating Class 30 November 2016 USD ZAR B Accumulating Class 30 November 2016 ZAR ZAR C2 Accumulating Class 30 November 2016 ZAR ZAR E Accumulating Class 30 November 2016 ZAR ZAR T Accumulating Class 30 November 2016 ZAR USD C1 Accumulating Class 15 September 2017 USD CAD I Distributing Unhedged Class 24 January 2018 CAD EUR Z Accumulating Class 5 February 2018 EUR
1Authorised for public distribution in Hong Kong.
Neuberger Berman US Small Cap Fund
The investment objective of Neuberger Berman US Small Cap Fund (the “Portfolio”) is to achieve capital growth through the selection of investments applying analysis of company key metrics and macro economic factors. The Portfolio seeks to achieve this objective by investing primarily in equity securities issued by small-capitalisation companies which have their head office or exercise an overriding part of their economic activity in the US and that are listed or traded on recognised markets.
The Portfolio seeks to identify undervalued companies whose current market share and balance sheet are strong and whose financial strength is largely based on existing business lines rather than on projected growth.
Factors in identifying such companies include:
above-average returns; an established market niche; circumstances that may make it difficult for new competitors to enter the market; an ability to finance their own growth; and sound future business prospects.

GENERAL INFORMATION COMPANY OVERVIEW
14 NEUBERGER BERMAN INVESTMENT FUNDS PLC
General Information (Continued) Neuberger Berman US Small Cap Fund (continued)
The following are the active share classes in the Portfolio at year end:
Share Class Name Share Class Launch Date Currency USD I Accumulating Class 1 July 2011 USD USD A Accumulating Class1 5 July 2011 USD JPY I Distributing Class 29 July 2011 JPY USD C Accumulating Class 21 November 2012 USD USD B Accumulating Class 16 July 2013 USD USD C2 Accumulating Class 16 July 2013 USD USD T Accumulating Class 16 July 2013 USD EUR I Accumulating Class 6 August 2013 EUR USD I Distributing Class 10 December 2013 USD AUD E Accumulating Class 2 July 2014 AUD USD E Accumulating Class 2 July 2014 USD EUR M Accumulating Class 4 February 2016 EUR USD M Accumulating Class 18 February 2016 USD EUR Z Accumulating Class 31 March 2016 EUR EUR A Accumulating Class1 28 June 2016 EUR USD Z Accumulating Class 30 August 2016 USD USD I2 Accumulating Class 23 September 2016 USD USD A Distributing Class1 28 November 2016 USD AUD T Accumulating Class 19 December 2016 AUD ZAR T Accumulating Class 19 December 2016 ZAR ZAR E Accumulating Class 8 August 2017 ZAR EUR I Accumulating Unhedged Class 16 October 2017 EUR USD I3 Accumulating Class 30 July 2018 USD AUD C2 Accumulating Class 4 September 2018 AUD EUR I2 Accumulating Unhedged Class 24 January 2019 EUR GBP I Accumulating Class 31 May 2019 GBP AUD B Accumulating Class 25 October 2019 AUD
1Authorised for public distribution in Hong Kong.

COMPANY OVERVIEW GENERAL INFORMATION
ANNUAL REPORT 2019 15
General Information (Continued) Neuberger Berman Short Duration High Yield Bond Fund
The investment objective of Neuberger Berman Short Duration High Yield Bond Fund (the “Portfolio”) is to generate high current income by investing in short-duration high yield fixed income securities.
The Portfolio seeks to achieve this objective by investing primarily in short duration high yield bonds issued by:
US and non-US corporations, which, respectively, have their head office or exercise an overriding part of their economic activity in the US; and governments and agencies in the US that are primarily denominated in US dollars that are listed, dealt or traded on recognised markets without any
particular focus on any one industrial sector.
In addition, although the Portfolio will concentrate its investments in the US or other Organisation for Economic Co-operation and Development (“OECD”) countries, the Portfolio may also invest in securities of companies located in and governments of emerging market countries, which may involve additional risk, relative to investment in more developed economies.
The following are the active share classes in the Portfolio at year end:
Share Class Name Share Class Launch Date Currency CHF I Accumulating Class 20 December 2011 CHF EUR A Accumulating Class1 20 December 2011 EUR EUR I Accumulating Class 20 December 2011 EUR GBP I Distributing Class 20 December 2011 GBP USD A Accumulating Class1 20 December 2011 USD USD I Accumulating Class 20 December 2011 USD USD I Distributing Class 9 January 2012 USD GBP I Accumulating Class 17 January 2012 GBP EUR I Distributing Class 23 January 2012 EUR CHF A Accumulating Class 9 March 2012 CHF JPY I Accumulating Class 28 March 2012 JPY CNY A (Monthly) Distributing Class 1 August 2012 CNY USD C Accumulating Class 21 November 2012 USD USD C Distributing Class 21 November 2012 USD USD A Distributing Class1 30 November 2012 USD EUR I2 Accumulating Class 5 December 2012 EUR EUR I2 Distributing Class 5 December 2012 EUR GBP I2 Accumulating Class 5 December 2012 GBP GBP I2 Distributing Class 5 December 2012 GBP USD I2 Accumulating Class 5 December 2012 USD USD I2 Distributing Class 5 December 2012 USD AUD A (Monthly) Distributing Class1 11 June 2013 AUD SGD A (Monthly) Distributing Class 17 January 2014 SGD USD A (Monthly) Distributing Class 22 January 2014 USD CHF I2 Accumulating Class 7 February 2014 CHF EUR A Distributing Class1 14 February 2014 EUR USD Z Accumulating Class 1 April 2014 USD

GENERAL INFORMATION COMPANY OVERVIEW
16 NEUBERGER BERMAN INVESTMENT FUNDS PLC
General Information (Continued) Neuberger Berman Short Duration High Yield Bond Fund (continued)
Share Class Name Share Class Launch Date Currency EUR M Accumulating Class 29 January 2016 EUR EUR M Distributing Class 29 January 2016 EUR EUR I3 Distributing Class 30 March 2017 EUR CHF I3 Distributing Class 5 May 2017 CHF USD M Accumulating Class 25 August 2017 USD USD C1 Accumulating Class 2 October 2017 USD USD M Distributing Class 20 December 2017 USD
1Authorised for public distribution in Hong Kong.
Neuberger Berman Global Bond Fund
The investment objective of Neuberger Berman Global Bond Fund (the “Portfolio”) is to achieve an attractive level of total return (income plus capital appreciation) from global fixed income markets.
The Portfolio seeks to achieve this objective by investing primarily in:
Investment grade debt securities issued by governments and agencies from OECD countries; and Investment grade debt securities issued by corporations, which have their head office or exercise an overriding part of their economic activity in OECD
countries.
All securities will be listed, dealt or traded on recognised markets without any particular focus on any one industrial sector.
There are four main differentiating factors that set the Portfolio’s approach:
Diversification through the use of multiple uncorrelated alpha sources Active FX management Integrated Global Macro Overlay Proprietary risk management systems
In addition, Neuberger Berman Europe Limited (the “Investment Manager”) conducts analysis of data and seeks to exploit opportunities across multiple time horizons. Central to the investment philosophy is the Investment Manager’s qualitative judgement, which is exercised at all stages of the investment process. This discretion enables it to take into account information and events that cannot be readily quantified, for example political events, shifts in regulatory regimes or the effects of market positioning and hedging. The following are the active share classes in the Portfolio at year end:
Share Class Name Share Class Launch Date Currency USD I Accumulating Class 16 July 2012 USD USD A Accumulating Class1 4 February 2016 USD USD Z Accumulating Class 20 January 2017 USD USD C1 Accumulating Class 3 January 2018 USD USD M Accumulating Class 2 July 2018 USD USD M Distributing Class 13 July 2018 USD
1Authorised for public distribution in Hong Kong.

COMPANY OVERVIEW GENERAL INFORMATION
ANNUAL REPORT 2019 17
General Information (Continued) Neuberger Berman Emerging Market Debt – Local Currency Fund
The investment objective of Neuberger Berman Emerging Market Debt – Local Currency Fund (the “Portfolio”) is to achieve an attractive level of risk adjusted total return (income plus capital appreciation) from local currencies and local interest rates of emerging market countries.
The Portfolio seeks to achieve this objective by investing primarily in debt securities and money market instruments which are issued by governments of, government agencies in or corporate issuers which have their head office or exercise an overriding part of their economic activity in emerging market countries and which are denominated in or are exposed to the local currencies of such countries.
The following are the active share classes in the Portfolio at year end:
Share Class Name Share Class Launch Date Currency EUR A Accumulating Class1 28 June 2013 EUR EUR I Accumulating Class 28 June 2013 EUR USD A Accumulating Class1 28 June 2013 USD USD I Accumulating Class 28 June 2013 USD USD X Accumulating Class 23 October 2013 USD USD I2 Accumulating Class 13 August 2014 USD USD A (Monthly) Distributing Class1 31 October 2014 USD SGD A (Monthly) Distributing Class1 4 March 2015 SGD AUD B (Monthly) Distributing Class 4 June 2015 AUD AUD B Accumulating Class 4 June 2015 AUD AUD C2 (Monthly) Distributing Class 4 June 2015 AUD AUD C2 Accumulating Class 4 June 2015 AUD AUD E (Monthly) Distributing Class 4 June 2015 AUD AUD E Accumulating Class 4 June 2015 AUD AUD T (Monthly) Distributing Class 4 June 2015 AUD AUD T Accumulating Class 4 June 2015 AUD USD B (Monthly) Distributing Class 4 June 2015 USD USD B Accumulating Class 4 June 2015 USD USD C2 (Monthly) Distributing Class 4 June 2015 USD USD C2 Accumulating Class 4 June 2015 USD USD E (Monthly) Distributing Class 4 June 2015 USD USD E Accumulating Class 4 June 2015 USD USD T Accumulating Class 4 June 2015 USD ZAR B (Monthly) Distributing Class 5 June 2015 ZAR ZAR B Accumulating Class 5 June 2015 ZAR ZAR C2 (Monthly) Distributing Class 5 June 2015 ZAR ZAR C2 Accumulating Class 5 June 2015 ZAR ZAR E (Monthly) Distributing Class 5 June 2015 ZAR ZAR E Accumulating Class 5 June 2015 ZAR ZAR T (Monthly) Distributing Class 5 June 2015 ZAR ZAR T Accumulating Class 5 June 2015 ZAR SEK A Accumulating Class 5 November 2015 SEK EUR I2 Accumulating Unhedged Class 29 December 2015 EUR

GENERAL INFORMATION COMPANY OVERVIEW
18 NEUBERGER BERMAN INVESTMENT FUNDS PLC
General Information (Continued) Neuberger Berman Emerging Market Debt – Local Currency Fund (continued)
Share Class Name Share Class Launch Date Currency EUR M Accumulating Unhedged Class 18 February 2016 EUR EUR M Distributing Unhedged Class 18 February 2016 EUR USD T (Monthly) Distributing Class 31 March 2016 USD USD I Distributing Class 14 October 2016 USD GBP I4 Accumulating Unhedged Class 2 November 2016 GBP GBP I4 Distributing Unhedged Class 2 November 2016 GBP EUR I4 Accumulating Unhedged Class 12 December 2016 EUR EUR I4 Distributing Unhedged Class 14 March 2017 EUR EUR I Accumulating Unhedged Class 27 June 2017 EUR USD M Accumulating Class 29 August 2017 USD GBP I Accumulating Class 22 September 2017 GBP USD C1 Accumulating Class 3 November 2017 USD USD I (Monthly) Distributing Class 30 May 2018 USD GBP I5 Accumulating Unhedged Class 17 September 2018 GBP USD I5 Accumulating Class 26 September 2018 USD EUR I3 Distributing Unhedged Class 12 March 2019 EUR EUR I5 Accumulating Unhedged Class 29 March 2019 EUR USD M Distributing Class 1 August 2019 USD
1Authorised for public distribution in Hong Kong.
Neuberger Berman Emerging Market Debt – Hard Currency Fund
The investment objective of Neuberger Berman Emerging Market Debt – Hard Currency Fund (the “Portfolio”) is to achieve an attractive level of risk adjusted total return (income plus capital appreciation) from hard currency-denominated debt issued in emerging market countries.
The Portfolio seeks to achieve this objective by investing primarily in debt securities and money market instruments issued by public or private issuers in emerging market countries which are denominated in hard currency. For the purposes of the Portfolio, “Hard Currency” is defined as US dollar, euro, sterling, Japanese yen and Swiss franc and investors should also note that public issuers include corporate issuers that are, either directly or indirectly, 100% government-owned.
The following are the active share classes in the Portfolio at year end:
Share Class Name Share Class Launch Date Currency EUR A Accumulating Class1 31 May 2013 EUR EUR I Accumulating Class 31 May 2013 EUR USD A Accumulating Class1 31 May 2013 USD USD I Accumulating Class 31 May 2013 USD USD I Distributing Class 31 May 2013 USD USD A (Monthly) Distributing Class1 31 October 2014 USD SGD A (Monthly) Distributing Class1 17 February 2015 SGD GBP I2 Distributing Class 6 July 2015 GBP SEK A Accumulating Class 5 November 2015 SEK EUR I4 Accumulating Class 10 December 2015 EUR EUR M Accumulating Class 18 February 2016 EUR

COMPANY OVERVIEW GENERAL INFORMATION
ANNUAL REPORT 2019 19
General Information (Continued) Neuberger Berman Emerging Market Debt – Hard Currency Fund (continued)
Share Class Name Share Class Launch Date Currency EUR M Distributing Class 18 February 2016 EUR EUR I3 Accumulating Class 29 July 2016 EUR EUR I Distributing Class 7 October 2016 EUR USD I2 Accumulating Class 15 November 2016 USD GBP I Accumulating Class 16 December 2016 GBP USD Z Accumulating Class 26 April 2017 USD USD C1 Accumulating Class 24 August 2017 USD USD M Accumulating Class 25 August 2017 USD USD M Distributing Class 15 September 2017 USD JPY I Accumulating Class 11 December 2017 JPY EUR Z Accumulating Class 29 December 2017 EUR USD P Accumulating Class 11 January 2018 USD EUR P Accumulating Class 23 January 2018 EUR CHF P Accumulating Class 24 January 2018 CHF GBP I2 Accumulating Class 26 January 2018 GBP GBP I Distributing Class 21 February 2018 GBP GBP P Accumulating Class 14 March 2018 GBP EUR A (Monthly) Distributing Class1 16 April 2018 EUR USD I2 Distributing Class 20 April 2018 USD HKD A (Monthly) Distributing Class1 9 January 2019 HKD AUD A (Monthly) Distributing Class1 26 February 2019 AUD EUR I3 Distributing Class 12 March 2019 EUR USD I3 Distributing Class 20 March 2019 USD EUR I3 Accumulating Unhedged Class 6 September 2019 EUR EUR I Accumulating Unhedged Class 17 September 2019 EUR EUR I2 Distributing Class 6 November 2019 EUR EUR I2 Accumulating Class 18 December 2019 EUR
1Authorised for public distribution in Hong Kong.

GENERAL INFORMATION COMPANY OVERVIEW
20 NEUBERGER BERMAN INVESTMENT FUNDS PLC
General Information (Continued) Neuberger Berman Emerging Market Corporate Debt Fund
The investment objective of Neuberger Berman Emerging Market Corporate Debt Fund (the “Portfolio”) is to achieve an attractive level of risk adjusted total return (income plus capital appreciation) from debt issued in emerging market countries.
The Portfolio seeks to achieve this objective by investing primarily in debt securities and money market instruments issued by corporate issuers which have their head office or exercise an overriding part of their economic activity in emerging market countries, which may be denominated in Hard Currency or the currencies of such emerging market countries. For the purposes of the Portfolio, “Hard Currency” is defined as US dollar, euro, sterling, Japanese yen and Swiss franc.
The following are the active share classes in the Portfolio at year end:
Share Class Name Share Class Launch Date Currency CHF A Accumulating Class 28 June 2013 CHF CHF I Accumulating Class 28 June 2013 CHF EUR I Accumulating Class 28 June 2013 EUR GBP I Accumulating Class 28 June 2013 GBP USD A Accumulating Class1 28 June 2013 USD USD I Accumulating Class 28 June 2013 USD USD I Distributing Class 28 June 2013 USD EUR I5 Accumulating Class 11 June 2014 EUR USD I5 Accumulating Class 11 June 2014 USD CHF I5 Accumulating Class 12 June 2014 CHF GBP I5 Accumulating Class 16 June 2014 GBP USD A (Monthly) Distributing Class1 31 October 2014 USD SGD A (Monthly) Distributing Class1 1 December 2014 SGD EUR I Distributing Class 5 December 2014 EUR CHF I2 Accumulating Class 25 March 2015 CHF EUR I2 Accumulating Class 25 March 2015 EUR USD I2 Accumulating Class 25 March 2015 USD EUR X Accumulating Class 20 July 2015 EUR EUR A Accumulating Class1 17 December 2015 EUR EUR M Accumulating Class 18 February 2016 EUR EUR M Distributing Class 18 February 2016 EUR EUR I3 Accumulating Class 29 July 2016 EUR USD C1 Accumulating Class 29 August 2017 USD USD M Accumulating Class 3 October 2017 USD USD M Distributing Class 3 November 2017 USD SEK A Accumulating Class 1 February 2018 SEK CHF I4 Accumulating Class 5 November 2019 CHF
1Authorised for public distribution in Hong Kong.

COMPANY OVERVIEW GENERAL INFORMATION
ANNUAL REPORT 2019 21
General Information (Continued) Neuberger Berman Strategic Income Fund
The investment objective of Neuberger Berman Strategic Income Fund (the “Portfolio”) is to maximise total return from high current income and long-term capital appreciation by opportunistically investing in a diversified mix of fixed rate and floating rate debt securities under varying market environments.
The Portfolio seeks to achieve this objective by investing primarily in debt securities issued by US corporations or by the US government and its agencies. Such securities will be listed, dealt or traded on recognised markets and may be rated investment grade or below investment grade or non-rated by recognised rating agencies.
The following are the active share classes in the Portfolio at year end:
Share Class Name Share Class Launch Date Currency JPY I Accumulating Class 26 April 2013 JPY JPY I Accumulating Unhedged Class 26 April 2013 JPY USD I Accumulating Class 26 April 2013 USD JPY I Distributing Class 25 June 2014 JPY USD Z Accumulating Class 30 June 2014 USD SGD A (Monthly) Distributing Class1 31 October 2014 SGD USD A (Monthly) Distributing Class1 31 October 2014 USD USD I Distributing Class 10 December 2014 USD USD A Accumulating Class1 11 February 2015 USD JPY I CG Distributing Class 10 August 2015 JPY EUR I Accumulating Class 22 January 2016 EUR EUR M Accumulating Class 29 January 2016 EUR EUR A Accumulating Class1 4 February 2016 EUR EUR M Distributing Class 18 February 2016 EUR USD M Accumulating Class 18 February 2016 USD USD A Distributing Class 10 August 2016 USD EUR A (Monthly) Distributing Class1 7 August 2017 EUR USD C1 Accumulating Class 25 August 2017 USD USD M Distributing Class 25 August 2017 USD AUD A (Monthly) Distributing Class1 15 September 2017 AUD GBP A (Monthly) Distributing Class1 15 September 2017 GBP HKD A (Monthly) Distributing Class1 15 September 2017 HKD SGD A Accumulating Class1 15 September 2017 SGD USD I2 Accumulating Class 19 March 2018 USD SGD I (Monthly) Distributing Class 4 June 2018 SGD GBP I Accumulating Class 31 May 2019 GBP AUD Z (Monthly) Distributing Class 1 July 2019 AUD
1Authorised for public distribution in Hong Kong.

GENERAL INFORMATION COMPANY OVERVIEW
22 NEUBERGER BERMAN INVESTMENT FUNDS PLC
General Information (Continued) Neuberger Berman Global Bond Absolute Return Fund
The investment objective of Neuberger Berman Global Bond Absolute Return Fund (the “Portfolio”) is to generate positive absolute returns over a market cycle (typically 3-5 years), irrespective of market conditions with a moderate level of volatility. It aims to achieve this by implementing an unconstrained strategy combining long and synthetic short positions in a diversified portfolio of debt securities.
The Portfolio seeks to achieve this objective by investing primarily in debt securities and money market instruments issued by governments and their agencies and corporations, that are listed, dealt or traded on recognised markets without any particular focus on any one industrial sector. Securities may be rated investment grade or below by recognised rating agencies.
The following are the active share classes in the Portfolio at year end:
Share Class Name Share Class Launch Date Currency USD I Accumulating Class 30 September 2013 USD USD Z Accumulating Class 4 April 2014 USD GBP I4 Accumulating Class 1 May 2014 GBP GBP I5 Distributing Class 7 May 2014 GBP GBP Z Accumulating Class 2 June 2014 GBP USD A Accumulating Class 5 June 2014 USD GBP I5 Accumulating Class 19 August 2014 GBP SGD A (Monthly) Distributing Class 31 October 2014 SGD USD A (Monthly) Distributing Class 31 October 2014 USD EUR I Accumulating Class 17 November 2014 EUR USD I5 Accumulating Class 17 November 2014 USD JPY I Accumulating Class 11 December 2014 JPY EUR M Accumulating Class 29 January 2016 EUR EUR I4 Distributing Class 29 September 2017 EUR
Neuberger Berman Short Duration Emerging Market Debt Fund
The investment objective of Neuberger Berman Short Duration Emerging Market Debt Fund (the “Portfolio”) is to achieve a stable income and return by investing in a diversified selection of Hard Currency-denominated short duration sovereign and corporate debt issued in emerging market countries. For the purposes of the Portfolio, “Hard Currency” is defined as US dollar, euro, sterling, Japanese yen and Swiss franc.
The Portfolio seeks to achieve this objective by investing primarily in short duration debt securities and money market instruments issued by public or corporate issuers which have their head office, or exercise an overriding part of their economic activity, in emerging market countries and which are denominated in Hard Currency. Investors should also note that corporate issuers that are, either directly or indirectly, 100% government-owned are considered to be public issuers. With the exception of permitted investments in transferable securities and money market instruments which are unlisted, all securities invested in by the Portfolio will be listed, dealt or traded on recognised markets globally, without any particular focus on any one industrial sector or region. Investments in securities issued by companies located in, and governments and government agencies of, emerging markets countries may involve additional risk, relative to investments in more developed economies.

COMPANY OVERVIEW GENERAL INFORMATION
ANNUAL REPORT 2019 23
General Information (Continued) Neuberger Berman Short Duration Emerging Market Debt Fund (continued)
The following are the active share classes in the Portfolio at year end:
Share Class Name Share Class Launch Date Currency USD I Accumulating Class 31 October 2013 USD USD A Accumulating Class1 6 December 2013 USD EUR I5 Accumulating Class 14 March 2014 EUR USD I5 Accumulating Class 19 March 2014 USD CHF I5 Accumulating Class 31 March 2014 CHF USD Z Accumulating Class 1 April 2014 USD GBP I5 Distributing Class 11 April 2014 GBP CHF A Accumulating Class 6 June 2014 CHF CHF A Distributing Class 6 June 2014 CHF CHF I Accumulating Class 6 June 2014 CHF EUR A Distributing Class 6 June 2014 EUR EUR I Accumulating Class 6 June 2014 EUR EUR I Distributing Class 6 June 2014 EUR USD A Distributing Class 6 June 2014 USD CHF I Distributing Class 13 June 2014 CHF EUR A Accumulating Class1 13 June 2014 EUR EUR I2 Accumulating Class 23 June 2014 EUR USD I2 Accumulating Class 12 September 2014 USD JPY I Distributing Class 22 September 2014 JPY USD I5 Distributing Class 9 October 2014 USD SGD A (Monthly) Distributing Class1 31 October 2014 SGD USD A (Monthly) Distributing Class1 31 October 2014 USD CHF I2 Accumulating Class 20 February 2015 CHF JPY I Accumulating Class 23 February 2015 JPY CNY A (Monthly) Distributing Class 10 June 2015 CNY USD P Accumulating Class 10 August 2015 USD USD I2 Distributing Class 30 October 2015 USD CAD A (Monthly) Distributing Class1 6 November 2015 CAD EUR M Accumulating Class 29 January 2016 EUR EUR M Distributing Class 29 January 2016 EUR USD I Distributing Class 2 June 2016 USD AUD A (Monthly) Distributing Class1 31 August 2016 AUD AUD A Accumulating Class1 31 August 2016 AUD GBP I2 Accumulating Class 30 September 2016 GBP GBP A Accumulating Class1 22 November 2016 GBP GBP I Accumulating Class 16 December 2016 GBP EUR P Accumulating Class 23 February 2017 EUR EUR I2 Distributing Class 30 March 2017 EUR CHF I2 Distributing Class 18 April 2017 CHF

GENERAL INFORMATION COMPANY OVERVIEW
24 NEUBERGER BERMAN INVESTMENT FUNDS PLC
General Information (Continued) Neuberger Berman Short Duration Emerging Market Debt Fund (continued)
Share Class Name Share Class Launch Date Currency CHF P Accumulating Class 25 April 2017 CHF CHF P Distributing Class 14 July 2017 CHF USD M Accumulating Class 24 August 2017 USD USD C1 Accumulating Class 29 August 2017 USD USD C1 Distributing Class 29 August 2017 USD USD M Distributing Class 29 August 2017 USD GBP I2 Distributing Class 19 October 2017 GBP SEK A Accumulating Class 2 February 2018 SEK GBP I Distributing Class 20 February 2018 GBP EUR U Accumulating Class 6 June 2018 EUR EUR I Accumulating Unhedged Class 11 April 2019 EUR GBP P Accumulating Class 13 August 2019 GBP
1Authorised for public distribution in Hong Kong.
Neuberger Berman Absolute Return Multi Strategy Fund
The investment objective of Neuberger Berman Absolute Return Multi Strategy Fund (the “Portfolio”) is to seek capital appreciation with an emphasis on absolute returns from a diversified portfolio of investment strategies.
The Portfolio seeks to achieve this objective by allocating its assets to multiple discretionary investment advisers that employ a variety of investment strategies and invest globally without a focus on any particular industrial sector. The Investment Manager and/or Neuberger Berman Investment Advisers LLC (the “Sub-Investment Manager”) are responsible for selecting each adviser to which assets will be allocated and for determining the amount of the Portfolio’s assets to allocate to each adviser. The Investment Manager and/or Sub-Investment Manager will allocate the Portfolio’s assets to advisers whose strategy the Investment Manager and/or Sub-Investment Manager believe, when combined to form a single portfolio, can provide attractive risk-adjusted returns over the long term.
The following are the active share classes in the Portfolio at year end:
Share Class Name Share Class Launch Date Currency USD I Accumulating Class 31 October 2013 USD GBP I3 Accumulating Class 8 November 2013 GBP USD A Accumulating Class 4 December 2013 USD CHF I Accumulating Class 6 February 2014 CHF EUR I Accumulating Class 12 February 2014 EUR USD Z Accumulating Class 4 April 2014 USD EUR A Accumulating Class 22 April 2014 EUR GBP Z Accumulating Class 25 April 2014 GBP EUR Z Accumulating Class 1 May 2014 EUR JPY I Accumulating Class 4 June 2014 JPY GBP I Accumulating Class 24 June 2014 GBP JPY D Distributing Class 29 August 2014 JPY GBP I2 Accumulating Class 25 September 2014 GBP EUR I2 Accumulating Class 24 September 2015 EUR EUR M Accumulating Class 29 January 2016 EUR

COMPANY OVERVIEW GENERAL INFORMATION
ANNUAL REPORT 2019 25
General Information (Continued) Neuberger Berman US Long Short Equity Fund
The investment objective of Neuberger Berman US Long Short Equity Fund (the “Portfolio”) is to seek long term capital appreciation with a secondary objective of principal preservation.
The Portfolio seeks to achieve its objective by taking long and synthetic short positions in equity and equity-linked securities, including Exchange Traded Funds (“ETFs”) listed or traded in US equity markets. The Portfolio may also, but to a lesser extent take long and synthetic short positions in equity, equity-linked securities and ETFs which are listed or traded on recognised markets located in the countries comprising the MSCI All Country World Index (which may include emerging market countries). Investments generally include those companies across all industrial sectors with a market capitalisation of at least US$ 250 million measured at the time of initial investment.
The following are the active share classes in the Portfolio at year end:
Share Class Name Share Class Launch Date Currency USD I Accumulating Class 28 February 2014 USD USD A1 Accumulating Class 3 April 2014 USD USD Z Accumulating Class 15 May 2014 USD SGD A1 Accumulating Class 31 October 2014 SGD EUR I Accumulating Class 1 December 2014 EUR USD D Distributing Class 19 December 2014 USD USD A Accumulating Class 24 February 2015 USD USD U Accumulating Class 6 March 2015 USD USD I (PF) Distributing Class 13 March 2015 USD USD A (PF) Accumulating Class 10 June 2015 USD EUR A Accumulating Class 6 July 2015 EUR EUR M Accumulating Class 4 December 2015 EUR USD M Accumulating Class 9 August 2017 USD USD C1 Accumulating Class 11 September 2017 USD GBP I Accumulating Class 31 May 2019 GBP
Neuberger Berman Emerging Market Debt Blend Fund
The investment objective of Neuberger Berman Emerging Market Debt Blend Fund (the “Portfolio”) is to achieve an attractive level of total return from a blend of Hard Currency-denominated debt issued in emerging market countries, local currencies of emerging market countries and debt issued by corporate issuers in emerging market countries.
The Portfolio seeks to achieve its objective by investing primarily in debt securities and money market instruments which are issued by governments of, government agencies in or corporate issuers which have their head office or exercise an overriding part of their economic activity in emerging market countries and which are either denominated in or are exposed to the local currencies of such emerging market countries or denominated in Hard Currency. For the purposes of the Portfolio, “Hard Currency” is defined as US dollar, euro, sterling, Japanese yen and Swiss franc.
The following are the active share classes in the Portfolio at year end:
Share Class Name Share Class Launch Date Currency EUR I5 Accumulating Class 23 April 2014 EUR USD I Accumulating Class 23 April 2014 USD EUR I2 Accumulating Class 27 May 2014 EUR EUR Z Accumulating Class 2 June 2014 EUR EUR I Accumulating Class 8 July 2014 EUR USD I2 Accumulating Class 24 September 2014 USD

GENERAL INFORMATION COMPANY OVERVIEW
26 NEUBERGER BERMAN INVESTMENT FUNDS PLC
General Information (Continued) Neuberger Berman Emerging Market Debt Blend Fund (continued)
Share Class Name Share Class Launch Date Currency EUR I2 Distributing Class 24 February 2015 EUR USD I2 Distributing Class 24 February 2015 USD GBP I2 Distributing Class 25 February 2015 GBP CHF I2 Distributing Class 27 February 2015 CHF EUR I Distributing Class 19 June 2015 EUR USD Z Accumulating Class 28 September 2015 USD SEK A Accumulating Class 5 November 2015 SEK EUR A Accumulating Class1 4 December 2015 EUR EUR M Accumulating Class 29 January 2016 EUR EUR M Distributing Class 29 January 2016 EUR USD A Accumulating Class1 4 February 2016 USD GBP Z Accumulating Class 17 March 2016 GBP GBP I Accumulating Class 31 March 2016 GBP USD I Distributing Class 1 June 2016 USD NOK U Accumulating Class 13 March 2017 NOK EUR I4 Accumulating Unhedged Class 23 March 2017 EUR GBP I Accumulating Unhedged Class 12 April 2017 GBP USD C1 Accumulating Class 24 August 2017 USD USD M Accumulating Class 25 August 2017 USD SGD A (Monthly) Distributing Class1 15 September 2017 SGD USD A (Monthly) Distributing Class1 15 September 2017 USD USD M Distributing Class 26 September 2017 USD USD I3 Accumulating Class 20 December 2017 USD GBP I Distributing Class 22 May 2018 GBP GBP I Distributing Unhedged Class 22 May 2018 GBP GBP P Accumulating Class 13 May 2019 GBP GBP P Accumulating Unhedged Class 13 May 2019 GBP EUR I3 Distributing Class 5 November 2019 EUR AUD I3 Distributing Class 6 November 2019 AUD
1Authorised for public distribution in Hong Kong.

COMPANY OVERVIEW GENERAL INFORMATION
ANNUAL REPORT 2019 27
General Information (Continued) Neuberger Berman European High Yield Bond Fund
The investment objective of Neuberger Berman European High Yield Bond Fund (the “Portfolio”) is to achieve an attractive level of total return (income plus capital appreciation) from the European high yield fixed income market.
The Portfolio seeks to achieve its objective by investing primarily in corporate high yield fixed income securities, which are (i) denominated in a European currency or (ii) issued or guaranteed by companies of any industrial sector that are domiciled in, or exercise the main part of their economic activity in a European country that are listed, dealt or traded on recognised markets.
The following are the active share classes in the Portfolio at year end:
Share Class Name Share Class Launch Date Currency EUR I Accumulating Class 27 June 2014 EUR USD I Accumulating Class 27 June 2014 USD USD A (Monthly) Distributing Class1 31 October 2014 USD EUR I5 Accumulating Class 10 April 2015 EUR EUR M Accumulating Class 29 January 2016 EUR EUR M Distributing Class 29 January 2016 EUR EUR A Accumulating Class1 4 February 2016 EUR USD A Accumulating Class1 10 January 2018 USD USD X Accumulating Class 12 January 2018 USD EUR X Accumulating Class 20 February 2018 EUR GBP I Accumulating Class 29 March 2019 GBP SGD A Accumulating Class 9 April 2019 SGD USD Z Accumulating Class 26 April 2019 USD SGD A (Monthly) Distributing Class 9 May 2019 SGD USD I5 Accumulating Class 7 October 2019 USD
1Authorised for public distribution in Hong Kong.
Neuberger Berman Global Equity Fund
The investment objective of Neuberger Berman Global Equity Fund (the “Portfolio”) is to achieve long term capital growth.
The Portfolio seeks to achieve its objective by investing primarily in equity securities that are listed or traded on recognised markets globally (which may include emerging market countries) and issued by companies across all market capitalisations and industrial sectors.
The Portfolio may invest in excess of 20% of its assets in equity securities that are issued by companies domiciled in emerging market countries.
The following is the active share class in the Portfolio at year end:
Share Class Name Share Class Launch Date Currency USD I Accumulating Class 9 December 2014 USD

GENERAL INFORMATION COMPANY OVERVIEW
28 NEUBERGER BERMAN INVESTMENT FUNDS PLC
General Information (Continued) Neuberger Berman Systematic Global Equity Fund
The investment objective of Neuberger Berman Systematic Global Equity Fund (the “Portfolio”) is to achieve long term capital growth.
The Portfolio seeks to achieve its objective by investing primarily in equity securities issued by companies that are listed or traded on recognised markets globally (which may include emerging market countries).
Research identifies investment themes (i.e. characteristics of stocks that are believed to be systematically linked to the generation of better than average returns). Investment themes are used to assess the characteristics of security issuers and drive stock selection. Themes include, but are not limited to, the valuation, earnings quality, price dynamics and sentiment of each issue.
The following are the active share classes in the Portfolio at year end:
Share Class Name Share Class Launch Date Currency USD I Accumulating Class 18 December 2014 USD EUR M Accumulating Class 29 January 2016 EUR USD T Accumulating Class 4 February 2016 USD SGD A Accumulating Class 21 April 2016 SGD USD Z Accumulating Class 24 May 2016 USD USD A Accumulating Class 14 August 2017 USD GBP I Accumulating Class 31 May 2019 GBP
Neuberger Berman Global Real Estate Securities Fund
The investment objective of Neuberger Berman Global Real Estate Securities Fund (the “Portfolio”) is to seek total return through investment in securities of real estate companies located globally, emphasising both capital appreciation and current income.
The Portfolio seeks to achieve its investment objective by investing at least 80% of its net assets in US and non-US equity securities issued by real estate investment trusts (“REITs”) and common stocks and other securities issued by other real estate companies. A REIT is a company dedicated to owning, and usually operating, income-producing real estate, or to financing real estate. The Portfolio defines a real estate company as one that derives at least 50% of its revenue from, or has at least 50% of its assets in, real estate. The Portfolio will allocate its assets among various regions and countries, including the US, but will at all times invest in a minimum of three different countries. The Portfolio may also invest up to 20% of its Net Asset Value in real estate equity securities issued by companies domiciled in emerging market countries.
The following are the active share classes in the Portfolio at year end:
Share Class Name Share Class Launch Date Currency USD I Accumulating Class 30 December 2014 USD USD Z Accumulating Class 13 February 2015 USD EUR M Accumulating Class 29 January 2016 EUR GBP Z Accumulating Class 17 March 2016 GBP USD I2 Accumulating Class 29 November 2017 USD USD A Accumulating Class 9 May 2019 USD USD T Accumulating Class 4 September 2019 USD USD M Accumulating Class 2 October 2019 USD USD I5 Distributing Class 20 December 2019 USD

COMPANY OVERVIEW GENERAL INFORMATION
ANNUAL REPORT 2019 29
General Information (Continued) Neuberger Berman US Small Cap Intrinsic Value Fund
The investment objective of Neuberger Berman US Small Cap Intrinsic Value Fund (the “Portfolio”) is to achieve long term capital growth.
The Portfolio seeks to achieve its objective by investing primarily in equity securities issued by small-capitalisation companies which have their head office or exercise an overriding part of their economic activity in the US and that are listed or traded on recognised markets in the US. The Portfolio’s investment in small capitalisation companies will not be restricted by sector or industry.
The following are the active share classes in the Portfolio at year end:
Share Class Name Share Class Launch Date Currency USD I Accumulating Class 30 April 2015 USD USD A Accumulating Class 4 February 2016 USD USD M Accumulating Class 27 May 2016 USD USD C1 Accumulating Class 13 October 2017 USD
Neuberger Berman Asian Debt – Hard Currency Fund
The investment objective of Neuberger Berman Asian Debt – Hard Currency Fund (the “Portfolio”) is to achieve an attractive level of risk adjusted total return (income plus capital appreciation) from hard currency-denominated debt issued in Asian countries.
The Portfolio seeks to achieve its objective by investing primarily in debt securities and money market instruments which are issued by governments of, government agencies or corporate issuers which have their head office or exercise an overriding part of their economic activity in Asian countries and which are denominated in hard currency. For the purposes of the Portfolio, hard currency is defined as US dollar, euro, sterling, Japanese yen and Swiss franc. Investors should note that public issuers include corporate issuers that are, either directly or indirectly, 100% government-owned.
The following are the active share classes in the Portfolio at year end:
Share Class Name Share Class Launch Date Currency USD A (Monthly) Distributing Class 30 June 2015 USD USD A Accumulating Class 30 June 2015 USD USD I Accumulating Class 30 June 2015 USD USD I Distributing Class 30 June 2015 USD USD M Accumulating Class 14 August 2019 USD USD C1 Accumulating Class 15 October 2019 USD SGD A (Monthly) Distributing Class 25 October 2019 SGD
Neuberger Berman China Bond Fund
The investment objective of Neuberger Berman China Bond Fund (the “Portfolio”) is to achieve an attractive level of risk adjusted total return (income plus capital appreciation) by primarily investing in fixed income instruments issued in the Chinese local currency markets.
The Portfolio seeks to achieve its objective by investing primarily in debt securities and money market instruments which are issued within the PRC by PRC government, PRC government agencies or corporate issuers which have their head office or exercise an overriding part of their economic activity in the PRC and which are denominated in or are exposed to the currency of the PRC via the RQFII (Renminbi Qualified Foreign Institutional Investor) Quota. For the purposes of the Portfolio, investors should note that public issuers include corporate issuers that are, either directly or indirectly, 100% government-owned.

GENERAL INFORMATION COMPANY OVERVIEW
30 NEUBERGER BERMAN INVESTMENT FUNDS PLC
General Information (Continued) Neuberger Berman China Bond Fund (continued)
The following are the active share classes in the Portfolio at year end:
Share Class Name Share Class Launch Date Currency CNY Z Accumulating Class 8 September 2015 CNY USD I Accumulating Unhedged Class 8 September 2015 USD USD Z Accumulating Unhedged Class 10 April 2018 USD CNY I Distributing Class 8 June 2018 CNY EUR M Accumulating Unhedged Class 22 October 2018 EUR SGD A (Monthly) Distributing Unhedged Class 12 March 2019 SGD USD Z Accumulating Class 29 March 2019 USD USD M Accumulating Unhedged Class 6 August 2019 USD
Neuberger Berman Corporate Hybrid Bond Fund
The investment objective of Neuberger Berman Corporate Hybrid Bond Fund (the “Portfolio”) is to achieve an attractive level of total return (income plus capital appreciation).
The Portfolio seeks to achieve its objective by investing primarily in investment grade and sub-investment grade corporate hybrid bonds. The Portfolio seeks to use fundamental bottom-up analysis principles in selecting securities for investment, meaning that the analysis done by Neuberger Berman Europe Limited (the “Investment Manager”) and Neuberger Berman Investment Advisers LLC (the “Sub-Investment Manager”) will focus on the strengths of individual securities as opposed to the selection of securities by reference to broader themes, such as industries. The analysis of the strength of a security is specific to the individual security itself, as opposed to having regard to broader themes e.g. the credit rating of the security is analysed relative to its proposed yield. The Portfolio focuses on securities which are listed or traded on recognised markets globally, and not limited by industry or sector. The Portfolio may rotate its exposure to geographic regions and countries and between sectors and issuers, based on economic or regional fundamentals, such as the valuation of each security relative to other similar securities. The Portfolio may have medium levels of volatility due to its investments in subordinated debt and/or below investment grade securities.
The following are the active share classes in the Portfolio at year end:
Share Class Name Share Class Launch Date Currency EUR I Accumulating Class 19 November 2015 EUR EUR I Distributing Class 19 November 2015 EUR EUR I5 Accumulating Class 19 November 2015 EUR EUR M Accumulating Class 18 February 2016 EUR EUR A Accumulating Class 3 June 2016 EUR USD I Accumulating Class 14 June 2016 USD CHF P Distributing Class 17 June 2016 CHF EUR P Distributing Class 24 June 2016 EUR EUR A (Monthly) Distributing Class 18 July 2016 EUR USD A (Monthly) Distributing Class 18 July 2016 USD USD A Accumulating Class 10 August 2016 USD GBP I2 Distributing Class 24 August 2016 GBP EUR I3 Accumulating Class 13 September 2016 EUR AUD A (Monthly) Distributing Class 23 September 2016 AUD USD Z Accumulating Class 20 January 2017 USD EUR I2 Accumulating Class 3 February 2017 EUR

COMPANY OVERVIEW GENERAL INFORMATION
ANNUAL REPORT 2019 31
General Information (Continued) Neuberger Berman Corporate Hybrid Bond Fund (continued)
Share Class Name Share Class Launch Date Currency USD I2 Accumulating Class 3 February 2017 USD USD I2 Distributing Class 3 February 2017 USD EUR M Distributing Class 13 February 2017 EUR GBP I Accumulating Class 9 March 2017 GBP CHF P Accumulating Class 27 April 2017 CHF EUR P Accumulating Class 27 April 2017 EUR USD P Accumulating Class 5 May 2017 USD GBP I2 Accumulating Class 15 May 2017 GBP GBP P Distributing Class 19 May 2017 GBP USD C1 Accumulating Class 13 December 2017 USD USD M Accumulating Class 15 December 2017 USD USD M Distributing Class 15 December 2017 USD SGD A (Monthly) Distributing Class 2 August 2019 SGD GBP P Accumulating Class 16 August 2019 GBP HKD A (Monthly) Distributing Class 31 October 2019 HKD
Neuberger Berman US Equity Fund
The investment objective of Neuberger Berman US Equity Fund (the “Portfolio”) is to achieve long term capital appreciation.
The Portfolio seeks to achieve its objective principally by taking long positions in equity and equity-linked securities, listed or traded on recognised markets in the US. The Portfolio may also but to a lesser extent take long positions in equity and equity-linked securities which are listed or traded on recognised markets located in the countries which comprise the MSCI All Country World Index (which may include emerging market countries).
The following are the active share classes in the Portfolio at year end:
Share Class Name Share Class Launch Date Currency USD I Accumulating Class 18 December 2015 USD USD I Distributing Class 18 December 2015 USD
Neuberger Berman Global High Yield Bond Fund
The investment objective of Neuberger Berman Global High Yield Bond Fund (the “Portfolio”) is to achieve an attractive level of total return (income plus capital appreciation) from the global high yield fixed income market.
The Portfolio seeks to achieve its objective by investing primarily in: US dollar and non-US dollar denominated high yield fixed income securities that are issued or guaranteed by corporate issuers of any industrial sector;
and short duration, high yield fixed income securities issued by governments and agencies globally that are primarily denominated in US dollars located
throughout the world that are listed, dealt or traded on recognised markets.
The Portfolio will invest primarily in securities denominated in the currencies included in the BofA Merrill Lynch Global High Yield Constrained Index (USD Hedged Total Return).
In addition, the Portfolio may also invest in securities of companies located in and governments of emerging market countries, which may involve additional risk, relative to investment in more developed economies.

GENERAL INFORMATION COMPANY OVERVIEW
32 NEUBERGER BERMAN INVESTMENT FUNDS PLC
General Information (Continued) Neuberger Berman Global High Yield Bond Fund (continued)
The following are the active share classes in the Portfolio at year end:
Share Class Name Share Class Launch Date Currency EUR Z (PF) Accumulating Class 4 August 2016 EUR USD I Accumulating Class 4 August 2016 USD USD Z (PF) Accumulating Class 4 August 2016 USD USD Z Accumulating Class 4 August 2016 USD USD A Accumulating Class 16 August 2016 USD EUR M Accumulating Class 13 February 2017 EUR EUR M Distributing Class 13 February 2017 EUR GBP I Accumulating Class 2 June 2017 GBP USD P Accumulating Class 9 January 2018 USD USD M Distributing Class 29 January 2018 USD USD M Accumulating Class 7 August 2019 USD USD C1 Accumulating Class 27 August 2019 USD
Neuberger Berman Global Opportunistic Bond Fund
The investment objective of Neuberger Berman Global Opportunistic Bond Fund (the “Portfolio”) is to achieve an attractive level of total return (income plus capital appreciation) by opportunistically investing in a diversified mix of fixed rate and floating rate debt securities globally under varying market environments.
The Portfolio seeks to achieve its objective by investing primarily in debt securities and money market instruments issued by governments and their agencies and corporations worldwide. Securities will be listed, dealt or traded on recognised markets globally without any particular focus on any one industrial sector. Securities may be rated investment grade or below by a recognised rating agency. On an ancillary basis, the Portfolio may hold preferred stocks issued by public or corporate issuers.
The following are the active share classes in the Portfolio at year end:
Share Class Name Share Class Launch Date Currency EUR I Accumulating Class 20 December 2016 EUR USD I Accumulating Class 20 December 2016 USD USD I Distributing Class 20 December 2016 USD JPY I Accumulating Class 16 March 2017 JPY USD A Accumulating Class 22 September 2017 USD USD I2 Accumulating Class 23 April 2018 USD USD Z Accumulating Class 16 May 2019 USD USD C1 Accumulating Class 1 July 2019 USD USD M Accumulating Class 18 December 2019 USD

COMPANY OVERVIEW GENERAL INFORMATION
ANNUAL REPORT 2019 33
General Information (Continued) Neuberger Berman Multi-Asset Class Income Fund
The investment objective of Neuberger Berman Multi-Asset Class Income Fund (the “Portfolio”) is to seek to generate income and capital appreciation.
The Portfolio seeks to achieve its objective primarily by allocating the Portfolio’s assets amongst multiple asset classes. It will invest in strategies which are intended to generate income for the Portfolio using global equity and debt securities, currencies and UCITS-eligible exposures to commodities. The Portfolio may obtain exposure to these asset classes through direct investment in such securities (other than in the case of commodities), investment in exchange traded notes and certificates or other eligible collective investment schemes (“Underlying Funds”), including exchange traded funds (“ETFs”), which are themselves exposed to such assets, or through the use of financial derivative instruments (“FDI”). Exposure to commodities will be achieved through exposure to commodity indices that have been cleared in advance by the Central Bank for use by UCITS.
The following are the active share classes in the Portfolio at year end:
Share Class Name Share Class Launch Date Currency USD I Accumulating Class 28 December 2016 USD USD I Distributing Class 28 December 2016 USD EUR M Accumulating Class 9 August 2017 EUR EUR M Distributing Class 9 August 2017 EUR USD M Accumulating Class 9 August 2017 USD USD A Accumulating Class 28 February 2018 USD USD C1 Accumulating Class 1 March 2018 USD GBP I Accumulating Class 31 May 2019 GBP EUR I Accumulating Class 13 December 2019 EUR EUR A Distributing Class 30 December 2019 EUR
Neuberger Berman US Equity Index PutWrite Fund
The Investment objective of Neuberger Berman US Equity Index PutWrite Fund (the “Portfolio”) is to seek long term growth of capital and income generation.
The Portfolio seeks to achieve its goal primarily through a strategy of writing collateralised put options on global equity indices and exchanged traded funds (“ETFs”) providing exposure to US equity indices, such as the S&P 500 and Russell 2000. The put options will be traded on recognised markets.
The following are the active share classes in the Portfolio at year end:
Share Class Name Share Class Launch Date Currency USD I Accumulating Class 30 December 2016 USD USD A Accumulating Class 23 January 2017 USD USD Z Accumulating Class 10 February 2017 USD EUR I Accumulating Class 13 February 2017 EUR EUR M Accumulating Class 13 February 2017 EUR USD M Accumulating Class 13 February 2017 USD GBP I Accumulating Unhedged Class 2 March 2017 GBP EUR I4 Accumulating Class 28 April 2017 EUR GBP I4 Accumulating Class 28 April 2017 GBP USD I4 Accumulating Class 28 April 2017 USD GBP I4 Distributing Class 5 May 2017 GBP USD I (Monthly) Distributing Class 18 May 2017 USD GBP I Accumulating Class 12 July 2017 GBP SGD A (Monthly) Distributing Class 15 August 2017 SGD

GENERAL INFORMATION COMPANY OVERVIEW
34 NEUBERGER BERMAN INVESTMENT FUNDS PLC
General Information (Continued) Neuberger Berman US Equity Index PutWrite Fund (continued)
Share Class Name Share Class Launch Date Currency GBP I4 Accumulating Unhedged Class 25 October 2017 GBP USD C1 Accumulating Class 18 December 2017 USD USD A (Monthly) Distributing Class 13 August 2018 USD USD I3 Accumulating Class 24 August 2018 USD USD I4 Distributing Class 25 September 2018 USD USD P Accumulating Class 8 October 2018 USD
Neuberger Berman Global Equity Index PutWrite Fund
The investment objective of Neuberger Berman Global Equity Index PutWrite Fund (the “Portfolio”) is to seek long term growth of capital and income generation.
The Portfolio seeks to achieve its objective primarily through a strategy of writing collateralised put options on global equity indices and exchange traded funds (“ETFs”) providing exposure to US, European, Asian and Emerging Market equity indices such as S&P 500, EuroStoxx, MSCI EAFE and MSCI EM. The put options will be traded on recognised markets.
The following are the active share classes in the Portfolio at year end:
Share Class Name Share Class Launch Date Currency USD I Accumulating Class 3 May 2017 USD USD I Distributing Class 3 May 2017 USD EUR I5 Accumulating Class 25 May 2017 EUR EUR A Accumulating Class 30 May 2017 EUR EUR M Accumulating Class 30 May 2017 EUR USD A Accumulating Class 30 May 2017 USD AUD X Accumulating Class 13 June 2017 AUD CHF I5 Accumulating Class 13 June 2017 CHF CHF X Accumulating Class 13 June 2017 CHF EUR I5 (Monthly) Distributing Class 13 June 2017 EUR EUR X (Monthly) Distributing Class 13 June 2017 EUR EUR X Accumulating Class 13 June 2017 EUR GBP I5 Accumulating Class 13 June 2017 GBP GBP I5 Distributing Class 13 June 2017 GBP SGD I5 Accumulating Class 13 June 2017 SGD SGD X (Monthly) Distributing Class 13 June 2017 SGD SGD X Accumulating Class 13 June 2017 SGD USD I5 (Monthly) Distributing Class 13 June 2017 USD USD I5 Accumulating Class 13 June 2017 USD USD I5 Distributing Class 13 June 2017 USD USD X (Monthly) Distributing Class 13 June 2017 USD USD X Accumulating Class 13 June 2017 USD USD X Distributing Class 13 June 2017 USD EUR Z Accumulating Class 16 June 2017 EUR GBP I Accumulating Class 12 July 2017 GBP

COMPANY OVERVIEW GENERAL INFORMATION
ANNUAL REPORT 2019 35
General Information (Continued) Neuberger Berman Global Equity Index PutWrite Fund (continued)
Share Class Name Share Class Launch Date Currency CHF I5 Distributing Class 24 July 2017 CHF CHF X Distributing Class 24 July 2017 CHF SGD A (Monthly) Distributing Class 15 August 2017 SGD USD Z Accumulating Class 18 August 2017 USD CHF I Distributing Class 3 November 2017 CHF EUR I Accumulating Class 13 November 2017 EUR USD C1 Accumulating Class 26 March 2018 USD
Neuberger Berman Uncorrelated Strategies Fund
The investment objective of Neuberger Berman Uncorrelated Strategies Fund (the “Portfolio”) is to seek capital appreciation with an emphasis on absolute returns from a diversified portfolio of uncorrelated investment strategies.
The Portfolio seeks to achieve its objective by allocating its assets to fully discretionary investment advisers, which employ a variety of investment strategies and will invest globally without a focus on any particular industrial sector.
The following are the active share classes in the Portfolio at year end:
Share Class Name Share Class Launch Date Currency EUR I5 Accumulating Class 31 May 2017 EUR GBP I5 Accumulating Class 31 May 2017 GBP USD I Accumulating Class 31 May 2017 USD USD I5 Accumulating Class 31 May 2017 USD GBP Z Accumulating Class 29 June 2017 GBP GBP I Accumulating Class 30 June 2017 GBP EUR I2 Accumulating Class 6 July 2017 EUR GBP I2 Accumulating Class 6 July 2017 GBP USD I2 Accumulating Class 6 July 2017 USD USD M Accumulating Class 9 August 2017 USD CHF I5 Accumulating Class 8 September 2017 CHF USD Z Accumulating Class 8 September 2017 USD EUR M Accumulating Class 15 September 2017 EUR USD A Accumulating Class 26 January 2018 USD EUR I Accumulating Class 6 March 2018 EUR USD C1 Accumulating Class 6 March 2018 USD CHF I Accumulating Class 13 March 2018 CHF EUR A Accumulating Class 20 August 2018 EUR GBP P Accumulating Class 2 October 2018 GBP SGD A Accumulating Class 6 November 2018 SGD USD P Accumulating Class 12 December 2018 USD

GENERAL INFORMATION COMPANY OVERVIEW
36 NEUBERGER BERMAN INVESTMENT FUNDS PLC
General Information (Continued) Neuberger Berman Emerging Market Debt Blend Investment Grade Fund
The investment objective of Neuberger Berman Emerging Market Debt Blend Investment Grade Fund (the “Portfolio”) is to achieve an attractive level of total return from a blend of investment grade rated hard and local emerging market currency denominated debt, issued by sovereigns, quasi-sovereigns, sub-sovereigns and corporate credits in emerging market countries.
The Portfolio seeks to achieve its objective by investing primarily in investment grade debt securities and money market instruments which are issued by governments of, government agencies in or corporate issuers which have their head office or exercise an overriding part of their economic activity in emerging market countries and which are denominated in or are exposed to the currencies of such emerging market countries (“local currency”) or denominated in Hard Currency. For the purposes of the Portfolio, “Hard Currency” means US dollar, euro, sterling, Japanese yen, and Swiss franc.
The following are the active share classes in the Portfolio at year end:
Share Class Name Share Class Launch Date Currency USD I Accumulating Class 10 July 2017 USD USD I5 Accumulating Class 10 July 2017 USD USD Z Accumulating Class 2 November 2017 USD NOK U Accumulating Class 22 January 2018 NOK NOK I Accumulating Class 9 May 2018 NOK EUR I5 Distributing Class 29 November 2018 EUR GBP I5 Distributing Class 29 November 2018 GBP
Neuberger Berman Emerging Markets Sustainable Equity Fund
The investment objective of Neuberger Berman Emerging Markets Sustainable Equity Fund (the “Portfolio”) is to achieve long-term capital growth by investing primarily in emerging market companies.
The Portfolio seeks to achieve its objective by investing primarily in equity and equity-linked securities which are listed or traded on recognised markets globally and issued by companies that: (1) trade principally on a recognised stock exchange in emerging market countries; (2) are organised under the laws of and have a principal office in emerging market countries; or (3) derive 50% or more of their total revenues from, and/or have 50% or more of their total assets in, goods produced, sales made, profits generated or services performed in emerging market countries. The Portfolio may also invest in other collective investment schemes which provide exposure to such securities, subject to a maximum of 10% of the Portfolio’s Net Asset Value. The Portfolio may seek exposure to a country or region within emerging markets through investment in securities traded on stock exchanges or markets located in other jurisdictions through participatory notes.
The following are the active share classes in the Portfolio at year end:
Share Class Name Share Class Launch Date Currency USD I Accumulating Class 24 October 2017 USD USD I Distributing Class 24 October 2017 USD USD I5 Accumulating Class 22 November 2017 USD EUR M Accumulating Unhedged Class 19 October 2018 EUR USD A Accumulating Class 29 October 2018 USD JPY I Accumulating Unhedged Class 3 December 2018 JPY

COMPANY OVERVIEW GENERAL INFORMATION
ANNUAL REPORT 2019 37
General Information (Continued) Neuberger Berman China Equity Opportunities Fund
The investment objective of Neuberger Berman China Equity Opportunities Fund (the “Portfolio”) is to achieve long-term capital appreciation primarily through investment in a portfolio of equity holdings that are exposed to economic development in China.
The Portfolio seeks to achieve its objective by investing primarily in equity and equity-linked securities which are listed or traded on recognised markets and issued by companies that:
are incorporated or organised under the laws of, or that have a principal office in, the PRC, Hong Kong SAR, Macau SAR or Taiwan (the “Greater China Region”);
generally derive a majority of their total revenue or profits from (a) goods that are produced or sold, (b) investments made, or (c) services performed, in the Greater China Region; or
generally hold a majority of their assets in the Greater China Region (each a “Greater China Company”).
The Portfolio may also invest in hybrid securities and equity-related securities, such as convertible debentures, convertible preferred stock, debt instruments with warrants attached, including FDI, which are issued by or give exposure to the performance of Greater China Companies.
The following are the active share classes in the Portfolio at year end:
Share Class Name Share Class Launch Date Currency USD I Accumulating Class 15 December 2017 USD USD I Distributing Class 15 December 2017 USD USD A Accumulating Class 11 May 2018 USD USD C1 Accumulating Class 14 May 2018 USD EUR M Accumulating Unhedged Class 19 October 2018 EUR USD M Accumulating Class 20 May 2019 USD
Neuberger Berman Multi-Asset Class Growth Fund
The investment objective of Neuberger Berman Multi-Asset Class Growth Fund (the “Portfolio”) is to achieve a target average total return (combination of capital appreciation and income) of 5% over cash before fees over a market cycle (typically 3 years), with lower volatility than equity markets.
Neuberger Berman Europe Limited (the “Investment Manager”) and Neuberger Berman Investment Advisers LLC, Neuberger Berman Breton Hill ULC, Green Court Capital Management Limited and Neuberger Berman Singapore Pte. Limited (the “Sub-Investment Managers”) will invest the Portfolio’s assets in a diversified and broad range of asset classes. The Portfolio seeks to achieve the Portfolio’s investment objective through investing in a range of diversified strategies across traditional sources (e.g. returns from investing in broad-based stock and bond markets) and alternative sources (e.g. collecting premiums through index option writing) which are intended to generate capital appreciation and income.
The following are the active share classes in the Portfolio at year end:
Share Class Name Share Class Launch Date Currency USD I Accumulating Class 22 December 2017 USD USD I Distributing Class 22 December 2017 USD EUR M Accumulating Class 19 October 2018 EUR GBP I Accumulating Class 31 May 2019 GBP

GENERAL INFORMATION COMPANY OVERVIEW
38 NEUBERGER BERMAN INVESTMENT FUNDS PLC
General Information (Continued) Neuberger Berman Global Thematic Equity Fund
The investment objective of Neuberger Berman Global Thematic Equity Fund (the “Portfolio”) is to achieve long-term capital appreciation through investment in a portfolio of equity holdings that are exposed to global long-term themes.
The Portfolio seeks to achieve its objective by investing primarily in equity securities that are listed or traded on recognised markets globally (which may include emerging market countries) and issued by companies across all market capitalisations and industrial sectors.
The following are the active share classes in the Portfolio at year end:
Share Class Name Share Class Launch Date Currency USD A Accumulating Class 27 April 2018 USD USD C1 Accumulating Class 27 April 2018 USD USD I Accumulating Class 27 April 2018 USD USD I Distributing Class 27 April 2018 USD USD M Accumulating Class 27 April 2018 USD EUR M Accumulating Unhedged Class 19 October 2018 EUR
Neuberger Berman CLO Income Fund
The investment objective of Neuberger Berman CLO Income Fund (the “Portfolio”) is to achieve an attractive level of total return (a combination of capital appreciation and income) by investing primarily in USD and EUR denominated floating rate collateralised loan obligations (“CLO”) mezzanine debt securities and also in US high yield debt securities which are listed or traded on recognised markets.
The Portfolio seeks to achieve its objective through a disciplined investment process, which seeks to identify CLO mezzanine debt securities which are backed by an underlying portfolio of loans with a higher portfolio score.
The following are the active share classes in the Portfolio at year end:
Share Class Name Share Class Launch Date Currency EUR I Accumulating Class 12 July 2018 EUR GBP I Accumulating Class 12 July 2018 GBP GBP I5 Distributing Class 12 July 2018 GBP SEK I Accumulating Class 12 July 2018 SEK USD I Accumulating Class 12 July 2018 USD USD I5 Distributing Class 12 July 2018 USD EUR I2 Distributing Class 15 November 2018 EUR GBP I2 Distributing Class 15 November 2018 GBP USD I2 Distributing Class 21 March 2019 USD USD Z Accumulating Class 18 April 2019 USD GBP Z Accumulating Class 12 December 2019 GBP

COMPANY OVERVIEW GENERAL INFORMATION
ANNUAL REPORT 2019 39
General Information (Continued) Neuberger Berman Next Generation Mobility Fund
The investment objective of Neuberger Berman Next Generation Mobility Fund (the “Portfolio”) is to achieve long-term capital appreciation through investing primarily in a portfolio of global equity holdings, focusing on companies that are involved or derive benefit from Next Generation Mobility.
The Portfolio seeks to achieve its investment objective by investing primarily in equity securities that are listed or traded on recognised markets globally (which may include emerging market countries) and issued by companies across all market capitalisations and economic sectors. The Portfolio may invest in companies of any market capitalisation but shall typically invest in companies that have market capitalisation greater than US$ 500 million at time of purchase.
The following are the active share classes in the Portfolio at year end:
Share Class Name Share Class Launch Date Currency USD I Accumulating Class 21 August 2018 USD USD I Distributing Class 21 August 2018 USD EUR A Accumulating Class 7 September 2018 EUR USD A Accumulating Class 11 September 2018 USD EUR M Accumulating Unhedged Class 26 October 2018 EUR AUD X Accumulating Class 23 January 2019 AUD EUR X Accumulating Class 23 January 2019 EUR GBP X Accumulating Class 23 January 2019 GBP HKD X Accumulating Unhedged Class 23 January 2019 HKD SGD X Accumulating Class 23 January 2019 SGD USD X Accumulating Class 23 January 2019 USD USD C1 Accumulating Class 21 May 2019 USD USD M Accumulating Class 21 May 2019 USD GBP I Accumulating Class 31 May 2019 GBP
Neuberger Berman Ultra Short Term Euro Bond Fund
The investment objective of Neuberger Berman Ultra Short Term Bond Fund (the “Portfolio”) is to achieve an attractive level of outperformance over the Euro cash return over a period of 1 year irrespective of the market environment by taking exposure to a diversified mix of short-term Euro-denominated fixed and floating rate debt securities.
The Portfolio seeks to achieve its investment objective through a disciplined investment process investing in Euro-denominated bonds across a variety of sectors and maturities, utilising a combination of top-down and bottom-up strategies to identify multiple sources of value. Top down strategies focus on macroeconomic considerations, country and sector analysis. Bottom up strategies evaluate the characteristics of individual instruments or issuers.
The following are the active share classes in the Portfolio at year end:
Share Class Name Share Class Launch Date Currency EUR I Accumulating Class 31 October 2018 EUR EUR I Distributing Class 31 October 2018 EUR EUR Z Accumulating Class 20 December 2018 EUR USD Z Accumulating Class 24 January 2019 USD EUR I5 Accumulating Class 6 February 2019 EUR USD M Accumulating Class 5 August 2019 USD CHF U Accumulating Class 17 December 2019 CHF EUR U Accumulating Class 17 December 2019 EUR

GENERAL INFORMATION COMPANY OVERVIEW
40 NEUBERGER BERMAN INVESTMENT FUNDS PLC
General Information (Continued) Neuberger Berman Euro Opportunistic Bond Fund
The investment objective of Neuberger Berman Euro Opportunistic Bond Fund (the “Portfolio”) is to achieve an attractive level of total return (income plus capital appreciation) by investing in a diversified mix of Euro-denominated fixed and floating rate debt securities.
The Portfolio seeks to achieve its investment objective through a disciplined investment process investing in Euro-denominated bonds across a variety of sectors and maturities, utilising a combination of top-down and bottom-up strategies to identify multiple sources of value. Top down strategies focus on macroeconomic considerations, country and sector analysis. Bottom up strategies evaluate the characteristics of individual instruments or issuers.
The following are the active share classes in the Portfolio at year end:
Share Class Name Share Class Launch Date Currency EUR I Accumulating Class 14 November 2018 EUR EUR I Distributing Class 14 November 2018 EUR
Neuberger Berman Euro Bond Absolute Return Fund
The investment objective of Neuberger Berman Euro Bond Absolute Return Fund (the “Portfolio”) is to generate positive absolute returns over a market cycle (typically 3-5 years), irrespective of market conditions with a moderate level of volatility. It aims to achieve this by implementing an unconstrained strategy combining long and synthetic short positions in a diversified portfolio of predominantly Euro-denominated debt securities.
The Portfolio seeks to achieve its investment objective through a disciplined investment process utilising a combination of top-down and bottom-up strategies to identify multiple sources of value. Top down strategies focus on macroeconomic considerations, country and sector analysis. Bottom up strategies evaluate the characteristics of individual instruments or issuers.
The following are the active share classes in the Portfolio at year end:
Share Class Name Share Class Launch Date Currency EUR I Accumulating Class 29 November 2018 EUR EUR I Distributing Class 29 November 2018 EUR EUR I5 Accumulating Class 28 March 2019 EUR USD Z Accumulating Class 22 November 2019 USD
Neuberger Berman Absolute Alpha Fund
The investment objective of Neuberger Berman Absolute Alpha Fund (the “Portfolio”) is to generate a positive absolute return over a market cycle (typically 3 years), irrespective of market conditions.
The Portfolio seeks to achieve its investment objective by taking long and synthetic short positions in equity and equity-linked securities which are traded or listed on recognised markets in developed market countries globally and predominantly in the US.
The following are the active share classes in the Portfolio at year end:
Share Class Name Share Class Launch Date Currency USD A Accumulating Class 20 February 2019 USD USD I Accumulating Class 20 February 2019 USD EUR M Accumulating Unhedged Class 27 March 2019 EUR EUR M Accumulating Class 30 July 2019 EUR SGD A Accumulating Class 17 September 2019 SGD GBP Z Accumulating Class 10 December 2019 GBP EUR I Accumulating Class 13 December 2019 EUR

COMPANY OVERVIEW GENERAL INFORMATION
ANNUAL REPORT 2019 41
General Information (Continued) Neuberger Berman Multi-Style Premia Fund
The investment objective of Neuberger Berman Multi-Style Premia Fund (the “Portfolio”) is to generate a positive risk-adjusted return over a market cycle (typically 3-5 years).
The Portfolio seeks to achieve its investment objective by providing exposure to certain investment styles or “factors” (“Factors”). The Factors are based on the Sub-Investment Manager’s market views and seek to derive returns from identifying and capitalising upon market risk premiums, inefficiencies, market trends and biases. These Factors are expected to capture returns, or premia, by taking well known risks, such as investing in smaller issuers, higher yielding securities or undervalued securities.
The following are the active share classes in the Portfolio at year end:
Share Class Name Share Class Launch Date Currency USD I Accumulating Class 1 March 2019 USD USD I Distributing Class 1 March 2019 USD USD Z Accumulating Class 30 October 2019 USD EUR I Accumulating Class 16 December 2019 EUR
Neuberger Berman Macro Opportunities FX Fund
The investment objective of Neuberger Berman Macro Opportunities FX Fund (the “Portfolio”) is to achieve a target average return of 5-6% over cash before fees over a market cycle (typically 3 years).
The Portfolio seeks to achieve its investment objective:
firstly, by obtaining long and short exposures to a range of global liquid currencies, predominantly but not limited to the G10 currencies and opportunistically, in the most liquid emerging market country currencies (these are typically the most heavily traded e.g. Brazilian Real, Singapore Dollar and South Korean Won using a range of financial derivative instruments;
secondly, through investing in global fixed income debt securities and short-dated Euro-denominated bonds to opportunistically seek to enhance cash returns and to provide liquidity and collateral cover for exposures created through the use of financial derivative instruments as outlined above.
The following are the active share classes in the Portfolio at year end:
Share Class Name Share Class Launch Date Currency EUR I Accumulating Class 4 December 2019 EUR GBP Z Accumulating Class 4 December 2019 GBP USD I Accumulating Class 4 December 2019 USD USD X Accumulating Class 4 December 2019 USD USD Z Accumulating Class 4 December 2019 USD SEK I Accumulating Class 11 December 2019 SEK SEK I Distributing Class 11 December 2019 SEK

DIRECTORS’ REPORT GOVERNANCE
42 NEUBERGER BERMAN INVESTMENT FUNDS PLC
Directors’ Report The Directors present, herewith their annual report and audited financial statements for Neuberger Berman Investment Funds plc (the “Company”) for the year ended 31 December 2019 and comparatives for the year ended 31 December 2018.
Statement of Directors’ Responsibilities
The Directors are responsible for preparing the annual report and the financial statements in accordance with applicable Irish Law and Generally Accepted Accounting Practice in Ireland including the accounting standards issued by the Financial Reporting Council and published by the Institute of Chartered Accountants in Ireland.
Under Irish law, the Directors shall not approve the financial statements unless they are satisfied that they give a true and fair view of the Company’s assets, liabilities and financial position as at the end of the financial year and the profit or loss of the Company for the financial year.
In preparing these financial statements, the Directors are required to: select suitable accounting policies and then apply them consistently; make judgements and estimates that are reasonable and prudent; state whether the financial statements have been prepared in accordance with applicable accounting standards and identify the standards in question,
subject to any material departures from those standards being disclosed and explained in the notes to the financial statements; and prepare the financial statements on the going concern basis unless it is inappropriate to presume that the Company will continue in business.
The Directors are responsible for keeping adequate accounting records that are sufficient to: correctly record and explain the transactions of the Company; enable, at any time, the assets, liabilities, financial position and profit or loss of the Company to be determined with reasonable accuracy; and enable the Directors to ensure that the financial statements comply with Financial Reporting Standard (“FRS”) 102: ‘The financial reporting standard
applicable in the UK and Republic of Ireland’, the European Communities (Undertakings for Collective Investment in Transferable Securities) Regulations, 2011 as amended (the “UCITS Regulations”), Irish statute comprising the Companies Act 2014 (as amended) and the Central Bank (Supervision and Enforcement) Act 2013 (Section 48 (1)) (Undertakings for Collective Investment in Transferable Securities) Regulations 2019 (the “Central Bank UCITS Regulations”) and enable those financial statements to be audited.
The Directors are also responsible for safeguarding the assets of the Company and hence for taking reasonable steps for the prevention and detection of fraud and other irregularities.
Under the UCITS Regulations, the Directors are required to entrust the assets of the Company to a depositary for safe-keeping. In carrying out this duty, the Company has declared custody of the Company’s assets to Brown Brothers Harriman Trustee Services (Ireland) Limited (the “Depositary”).
Relevant Audit Information Statement
The Directors in office at the date of this report have each confirmed that: as far as he/she is aware, there is no relevant audit information of which the Company’s auditor is unaware; and he/she has taken all the steps that he/she ought to have taken as a Director in order to make himself/herself aware of any relevant audit information
and to establish that the Company’s auditor is aware of that information.
Directors’ Compliance Statement
It is the policy of the Company to comply with its relevant obligations (as defined in the Companies Act 2014 (as amended)). As required by Section 225(2) of the Companies Act 2014 (as amended), the Directors acknowledge that they are responsible for securing the Company’s compliance with the relevant obligations. The Directors have drawn up a compliance policy statement as defined in Section 225(3)(a) of the Companies Act 2014 (as amended) and a compliance policy which refers to the arrangements and structures that are in place and which are, in the Directors’ opinion, designed to secure material compliance with the Company’s relevant obligations. In discharging their responsibilities under Section 225, the Directors relied upon, among other things, the services provided, advice and/or representations from third parties whom the Directors believe have the requisite knowledge and experience in order to secure material compliance with the Company’s relevant obligations.
GOVERNANCE DIRECTORS’ REPORT
ANNUAL REPORT 2019 43
Directors’ Report (Continued) Accounting records
The Directors are responsible for ensuring that adequate accounting records as outlined in Section 281 of the Companies Act 2014 (as amended) are maintained by the Company. To achieve this, the Directors have appointed a service organisation Brown Brothers Harriman Fund Administration Services (Ireland) Limited (the “Administrator”). The Company’s accounting records are retained at the Administrator’s office at 30 Herbert Street, Dublin 2.
Principal Activities and Review of Business
The Company is an investment company with variable capital incorporated in Ireland on 11 December 2000 as a public limited company. The Company was authorised by the Central Bank as an Undertaking for Collective Investment in Transferable Securities pursuant to the UCITS Regulations. The objective of the Company is the collective investment in transferable securities and other liquid financial assets of capital raised from the public, operating on the principle of risk spreading in accordance with the UCITS Regulations.
The Company is structured as an umbrella fund with segregated liability between sub-funds in that the Directors may from time to time with the prior approval of the Central Bank, issue different series of shares representing separate Portfolios. The assets of each Portfolio are invested in accordance with the investment objectives applicable to such Portfolio as outlined in the general information section of these Financial Statements. Each Portfolio bears its own liabilities and none of the Company, any of the service providers appointed to the Company, the Directors, any receiver, examiner or liquidator, nor any other person will have access to the assets of a Portfolio in satisfaction of a liability of any other Portfolio.
As at 31 December 2019 forty six constituent sub-funds were in existence. These are: Neuberger Berman High Yield Bond Fund, Neuberger Berman Diversified Currency Fund, Neuberger Berman US Multi Cap Opportunities Fund, Neuberger Berman US Real Estate Securities Fund, Neuberger Berman China Equity Fund, Neuberger Berman Emerging Markets Equity Fund, Neuberger Berman US Small Cap Fund, Neuberger Berman Short Duration High Yield Bond Fund, Neuberger Berman Global Bond Fund, Neuberger Berman Emerging Market Debt – Local Currency Fund, Neuberger Berman Emerging Market Debt – Hard Currency Fund, Neuberger Berman Emerging Market Corporate Debt Fund, Neuberger Berman Strategic Income Fund, Neuberger Berman Global Bond Absolute Return Fund, Neuberger Berman Short Duration Emerging Market Debt Fund, Neuberger Berman Absolute Return Multi Strategy Fund, Neuberger Berman US Long Short Equity Fund, Neuberger Berman Emerging Market Debt Blend Fund, Neuberger Berman European High Yield Bond Fund, Neuberger Berman Global Equity Fund, Neuberger Berman Systematic Global Equity Fund, Neuberger Berman Global Real Estate Securities Fund, Neuberger Berman US Small Cap Intrinsic Value Fund, Neuberger Berman Asian Debt – Hard Currency Fund, Neuberger Berman China Bond Fund, Neuberger Berman Corporate Hybrid Bond Fund, Neuberger Berman US Equity Fund, Neuberger Berman Global High Yield Bond Fund, Neuberger Berman Global Opportunistic Bond Fund, Neuberger Berman Multi-Asset Class Income Fund, Neuberger Berman US Equity Index PutWrite Fund, Neuberger Berman Global Equity Index PutWrite Fund, Neuberger Berman Uncorrelated Strategies Fund, Neuberger Berman Emerging Market Debt Blend Investment Grade Fund, Neuberger Berman Emerging Markets Sustainable Equity Fund, Neuberger Berman China Equity Opportunities Fund, Neuberger Berman Multi-Asset Class Growth Fund, Neuberger Berman Global Thematic Equity Fund, Neuberger Berman CLO Income Fund, Neuberger Berman Next Generation Mobility Fund, Neuberger Berman Ultra Short Term Euro Bond Fund, Neuberger Berman Euro Opportunistic Bond Fund and Neuberger Berman Euro Bond Absolute Return Fund.
Neuberger Berman Absolute Alpha Fund, Neuberger Berman Multi-Style Premia Fund and Neuberger Berman Macro Opportunities FX Fund commenced operations on 20 February 2019, 1 March 2019 and 4 December 2019, respectively.
Results for the Year and Assets, Liabilities and Financial Position at 31 December 2019
A detailed review of the year and factors which contributed to the performance for the year is included in the Investment Manager’s reports. Details of the assets, liabilities and financial position of the Company and results for the year ended 31 December 2019 are set out in the Balance Sheet and Profit and Loss Account for each Portfolio.

DIRECTORS’ REPORT GOVERNANCE
44 NEUBERGER BERMAN INVESTMENT FUNDS PLC
Directors’ Report (Continued) Directors
The names and nationalities of the persons who served as Directors at any time during the year ended 31 December 2019 are set out below: Andy Olding* (resigned on 11 June 2019) British Tom Finlay** Irish Paul Sullivan*** (resigned on 20 February 2019) Irish Gráinne Alexander*** Irish Michelle Green* British Naomi Daly*** (appointed on 1 July 2019) Irish Alex Duncan* (appointed on 1 August 2019) British
*Non-Executive Director **Independent Non-Executive Director and Permanent Chairman ***Independent Non-Executive Director
Directors’ and Secretary’s Interests
Mr. Andy Olding was a Director of the Company until 11 June 2019 and also an employee of Neuberger Berman Europe Limited, the Investment Manager, Promoter and Distributor of the Company. As at 31 December 2019, Ms. Michelle Green and Mr. Alex Duncan are Directors of the Company and also Directors and employees of Neuberger Berman Europe Limited, the Investment Manager, Promoter and Distributor of the Company.
None of the Directors, the Company Secretary, or their families holds or held any beneficial interests in the Company at 31 December 2019 or during the year (2018: Nil).
Transactions Involving Directors
There are no contracts or arrangements of any significance in relation to the business of the Company in which the Directors or the Company Secretary had any interest as defined in the Companies Act 2014 (as amended) at any time during the year ended 31 December 2019 other than those disclosed in note 10 of these Financial Statements.
Connected Persons In accordance with the Central Bank’s UCITS Regulation 43(1), any transaction carried out with the Company by the Promoter, the Investment Manager, the Depositary, the Investment Adviser and/or associated or group companies of these entities (“connected persons”) must be carried out as if negotiated at arm’s length. Such transactions must be in the best interest of the shareholders of the Company.
The Board of Directors of the Company (the “Board”) is satisfied that (i) there are arrangements (evidenced by written procedures) in place to ensure that the obligations set out above are applied to all transactions with connected parties; and (ii) transactions with connected parties entered into during the period complied with these obligations.
Political Donations
There were no political donations made during the year ended 31 December 2019 (2018: Nil).
Risk Management Objectives and Policies
Each Portfolio is invested in accordance with the investment objectives and policies applicable to the Portfolio as set out in detail in the Prospectus. Investment in the Company carries with it a degree of risk including, but not limited to, the risks referred to in note 12 of these financial statements.
Dividends and Retention
The dividend distributions declared and paid during the year are disclosed in the Profit and Loss Account under Finance Costs.
Future Developments
The Company will continue to pursue its investment objective as set out in the Directors’ Report.

GOVERNANCE DIRECTORS’ REPORT
ANNUAL REPORT 2019 45
Directors’ Report (Continued) Brexit Statement
On 23 June 2016, the United Kingdom held a referendum and voted to leave the European Union. The UK left the EU at 11pm GMT (midnight in Brussels) on 31 January 2020. The post-Brexit transition period will run from 1 February 2020 to 31 December 2020 (the “Transition Period”). During this Transition Period, EU law will continue to apply to the UK. New EU laws adopted during the Transition Period will apply automatically within the UK, or be implemented domestically as needed, even though the UK will have no say in their adoption. The deadline for the UK to request an extension to the Transition Period is 30 June 2020. During this period there may be a significant increase in volatility and disruption in the global financial markets, including the currency markets. Such events may, in turn, contribute to worsening economic conditions and reduced liquidity in some segments of the market, not only in the UK and Europe but also in the rest of the world. Leaving the European Union may also result in significant changes to law and regulation in the UK. Investors should be aware that these and other similar consequences following from the referendum result may adversely affect the value of the shares and the Company's performance.
COVID-19 Statement
Neuberger Berman continues to monitor the ongoing developments related to COVID-19 with a particular focus on two areas: the safety and health of its employees and clients, and the ability to continue to conduct effectively its investment and business operations, including all critical services. Neuberger Berman has a dedicated Business Continuity Management team staffed with full-time professionals, who partner with over 60 Business Continuity Coordinators covering all business functions across all geographies. Neuberger Berman currently has not experienced a significant impact on its operating model. Neuberger Berman will continue to watch the effectiveness of efforts to contain the spread of the COVID-19 virus and the potential long-term implications on global economies and will continue to monitor and adapt as necessary the firm's operations and processes to most effectively manage portfolios.
Audit Committee
The Company established an audit committee on 7 September 2016.
Significant Events During the Year
A new Supplement to the Prospectus was noted by the Central Bank on 22 January 2019 covering the establishment of Neuberger Berman Absolute Alpha Fund which launched on 20 February 2019.
Paul Sullivan resigned as a Director of the Company on 20 February 2019.
Neuberger Berman Multi-Style Premia Fund launched on 1 March 2019.
Neuberger Berman Multi-Asset Risk Premia Fund liquidated on 26 March 2019.
Neuberger Berman Global Dynamic Asset Allocator Fund liquidated on 12 April 2019.
A new Supplement to the Prospectus was noted by the Central Bank on 12 April 2019 covering changes on Neuberger Berman Emerging Markets Equity Fund, Neuberger Berman Global Equity Fund, Neuberger Berman Systematic Global Equity Fund, Neuberger Berman Asian Opportunities Fund, Neuberger Berman Emerging Markets Sustainable Equity Fund, Neuberger Berman Global Thematic Equity Fund and Neuberger Berman Next Generation Mobility Fund.
Andy Olding resigned as a Director of the Company on 11 June 2019.
Naomi Daly was appointed as a Director of the Company on 1 July 2019.
The Performance Fee methodology, where applicable, has been updated with effect from 1 July 2019 following CBI guidance.
Neuberger Berman Asian Opportunities Fund liquidated on 24 July 2019.
With effect from 31 July 2019, Neuberger Berman Euro Short Term Enhanced Cash Fund changed its name to Neuberger Berman Ultra Short Term Euro Bond Fund.
Alex Duncan was appointed as a Director of the Company on 1 August 2019.
A new version of the Company’s Prospectus and new Supplements to the Prospectus covering changes on all Portfolios were noted by the Central Bank on 2 September 2019.

DIRECTORS’ REPORT GOVERNANCE
46 NEUBERGER BERMAN INVESTMENT FUNDS PLC
Directors’ Report (Continued) Significant Events During the Year (continued)
A new Supplement to the Prospectus was noted by the Central Bank on 26 November 2019 covering the establishment of Neuberger Berman Macro Opportunities FX Fund which launched on 4 December 2019.
Neuberger Berman China A-Share Opportunities Fund liquidated on 6 December 2019.
A new Supplement to the Prospectus was noted by the Central Bank on 30 December 2019 covering the establishment of Neuberger Berman Global High Yield Sustainable Action Fund.
Other than the above, there have been no significant events affecting the Company during the year.
Significant Events Since the Year End
Neuberger Berman Global High Yield Sustainable Action Fund launched on 21 January 2020.
A new Prospectus and Supplements to the Prospectus were noted by the Central Bank on 28 February 2020.
A new Supplement to the Prospectus was noted by the Central Bank on 2 March 2020 covering name changes for Neuberger Berman Emerging Market Debt Blend Investment Grade Fund, Neuberger Berman Multi-Asset Class Income Fund and Neuberger Berman Multi-Asset Class Growth Fund to Neuberger Berman Emerging Market Debt Sustainable Investment Grade Blend Fund, Neuberger Berman Multi-Asset Income Fund and Neuberger Berman Multi-Asset Growth Fund, respectively.
A new Supplement to the Prospectus was noted by the Central Bank on 9 March 2020 covering the establishment of Neuberger Berman Fixed Maturity Bond I 2024 Fund and Neuberger Berman Global High Income FMB - 2024. The Funds were later renamed as Neuberger Berman Global Flexible Credit Fund and Neuberger Berman Global Diversified Income FMB - 2024, respectively.
The recent outbreak of the COVID-19 in many countries, which is a rapidly evolving situation, has, among other things, disrupted global travel and supply chains, and has adversely impacted global commercial activity, the transportation industry and commodity prices in the energy sector. The impact of this virus has negatively affected and may continue to affect the economies of many nations, individual companies and the global securities and commodities markets, including liquidity and volatility, in ways that cannot necessarily be foreseen at the present time. The rapid development and fluidity of this situation precludes any prediction as to its ultimate impact, which may have a continued adverse effect on economic and market conditions and trigger a period of global economic slowdown. Such conditions (which may be across industries, sectors or geographies) may impact operating performance at the Portfolios' companies in the near term.
The Portfolios entered into a Securities Lending Agreement with Brown Brothers Harriman & Co. on 3 March 2020.
With effect from 4 March 2020, Sound Point Capital Management, L.P. ceased acting as a Non-Affiliated Sub-Adviser of the Company.
A new Supplement to the Prospectus was noted by the Central Bank on 23 March 2020 covering the establishment of Neuberger Berman 5G Connectivity Fund, which launched on 8 April 2020.
On 27 March 2020, the maximum amount of the committed liquidity facility has been increased from US$ 600,000,000 to US$ 975,000,000. The cost of the commitment fee has increased accordingly.
There have been no other significant events affecting the Company since the year end. Independent Auditors
The Independent Auditors, Ernst & Young, Chartered Accountants, have indicated their willingness to continue in office in accordance with Section 383(2) of the Companies Act 2014 (as amended). Corporate Governance
The Company is subject to and complies with Irish statute comprising the Companies Act 2014 (as amended) and with the UCITS Regulations and the Listing Rules of Euronext Dublin. The Company does not apply additional requirements in addition to those required by the above. Each of the service providers engaged by the Company is subject to their own corporate governance requirements.
Financial Reporting Process - Description of Main Features The Directors are responsible for establishing and maintaining adequate internal control and risk management systems of the Company in relation to the financial reporting process. Such systems are designed to manage rather than eliminate the risk of failure to achieve the Company’s financial reporting objectives and can only provide reasonable and not absolute assurance against material misstatement or loss.
GOVERNANCE DIRECTORS’ REPORT
ANNUAL REPORT 2019 47
Directors’ Report (Continued) Corporate Governance (continued)
Financial Reporting Process - Description of Main Features (continued) The Directors have established processes regarding internal control and risk management systems to ensure its effective oversight of the financial reporting process. These include appointing the Administrator to maintain the accounting records of the Company independently of the Investment Manager and the Depositary. The Administrator is required under the terms of the administration agreement to maintain adequate accounting records on behalf of the Company. To that end the Administrator performs regular reconciliations of its records to those of the Depositary. The Administrator is also contractually obliged to prepare for review and approval by the Directors the annual report including financial statements intended to give a true and fair view and the interim report and unaudited abridged financial statements.
The Directors evaluate and discuss significant accounting and reporting issues as the need arises. From time to time the Directors also examine and evaluate the Administrator’s financial accounting and reporting routines and monitor and evaluate the external auditors’ performance, qualifications and independence. The Administrator has operating responsibility in respect of its internal controls in relation to the financial reporting process and the Administrator’s report to the Directors.
Risk Assessment The Directors are responsible for assessing the risk of irregularities whether caused by fraud or error in financial reporting and ensuring the processes are in place for the timely identification of internal and external matters with a potential effect on financial reporting. The Directors have also put in place processes to identify changes in accounting rules and recommendations and to ensure that these changes are accurately reflected in the Company’s financial statements.
The Investment Manager completes in depth reviews of the Financial Statements to ensure that all of the content included is accurate. Should a discrepancy be identified the Investment Manager would report this to the Board of Directors at the next board meeting, or immediately where the discrepancy is deemed material. Changes in accounting rules and standards are monitored by the Investment Manager and the Company’s Administrator; all changes are reported to the Board periodically.
The Investment Manager liaises with the Company’s Administrator to ensure that all changes in accounting rules and standards are reflected in the financial statements in a timely manner. The Investment Manager also has regular dialogue with the Company’s Auditors.
Control Activities The Administrator maintains control structures to manage the risks over financial reporting. These control structures include appropriate division of responsibilities and specific control activities aimed at detecting or preventing the risk of significant deficiencies in financial reporting for every significant account in the financial statements and the related notes in the Company’s annual report. Examples of control activities exercised by the Administrator include analytical review procedures, reconciliations and automatic controls in IT systems. Prices not available from independent sources are typically valued by the Investment Manager using methods the Directors have approved in the good-faith belief that the resulting valuation will reflect the fair value of the security.
Diversity With respect to diversity, the Company has no employees and the only individuals engaged directly by it are the Directors and the designated persons. When there is a vacancy on the Board or among the designated persons, the objective is to ensure that the Board is or the designated persons are diversified with an appropriate mix as regards age, gender, race and educational/professional backgrounds, while achieving compliance by all individuals with regulatory requirements and an overall composition with the requisite experience and skills. This was most recently reflected in 2019, in the context of the appointment of Naomi Daly and Alex Duncan as directors.
Information and Communication The Company’s policies and the Directors’ instructions with relevance for financial reporting are updated and communicated via appropriate channels, such as e-mail, correspondence, telephone and meetings to ensure that all financial reporting information requirements are met in a complete and accurate manner.
Monitoring The Directors receive regular presentations and review reports from the Depositary, Investment Manager and Administrator. The Directors also have an annual process to ensure that appropriate measures are taken to consider and address the shortcomings identified and measures recommended by the independent auditors.
Capital Structure No person has a significant direct or indirect holding of securities in the Company. No person has any special rights of control over the Company’s share capital. There are no restrictions on voting rights. With regard to the appointment and replacement of Directors, the Company is governed by its Articles of Association, Irish statute comprising the Companies Act 2014 (as amended) and with the UCITS Regulations and the Listing Rules of Euronext Dublin as applicable to investment funds. The Articles of Association themselves may be amended by special resolution of the Shareholders.

DIRECTORS’ REPORT GOVERNANCE
48 NEUBERGER BERMAN INVESTMENT FUNDS PLC
Directors’ Report (Continued) Corporate Governance (continued)
Powers of the Directors The Directors are responsible for managing the business affairs of the Company in accordance with the Articles of Association. The Directors may delegate certain functions to the Administrator and other parties, subject to the supervision and direction by the Directors. The Directors have delegated the day to day administration of the Company to the Administrator and the investment management and distribution functions to the Investment Manager. Consequently none of the Directors is an executive Director. The Articles of Association provide that the Directors may exercise all the powers of the Company to borrow money, to mortgage or charge its undertaking, property or any part thereof and may delegate these powers to the Investment Manager.
The Directors may at any time, with prior notification to the Depositary, temporarily suspend the calculation of the Net Asset Value of a particular Portfolio and the issue, valuation, sale, purchase, redemption or conversion of shares and/or the payment of redemption proceeds at any time in any of the following instances:
a) any period when any recognised market on which a substantial portion of the investments for the time being comprised in the relevant Portfolio are quoted, listed or dealt in is closed otherwise than for ordinary holidays, or during which dealings on any such recognised market are restricted or suspended;
b) any period when, as a result of political, military, economic or monetary events or other circumstances beyond the control, responsibility and power of the Directors, the disposal or valuation of investments for the time being comprised in the relevant Portfolio cannot, in the opinion of the Directors, be effected or completed normally or without prejudicing the interests of Shareholders;
c) any breakdown in the means of communication normally employed in determining the value of any investments for the time being comprised in the relevant Portfolio or during any period when for any other reason the value of investments for the time being comprised in the relevant Portfolio cannot, in the opinion of the Directors, be promptly or accurately ascertained;
d) any period when the Company is unable to repatriate funds for the purposes of making redemption payments or during which the realisation of investments for the time being comprised in the relevant Portfolio, or the transfer or payment of funds involved in connection therewith cannot, in the opinion of the Directors, be effected at normal prices or normal rates of exchange;
e) any period when, as a result of adverse market conditions, the payment of redemption proceeds may, in the opinion of the Directors, have an adverse impact on the relevant Portfolio or the remaining Shareholders in such Portfolio;
f) any period after a notice convening a meeting of Shareholders for the purpose of dissolving the Company or terminating a Portfolio has been issued, up to and including the date of such meeting of Shareholders;
g) any period during which dealings in a collective investment scheme in which the Portfolio has invested a significant portion of its assets are suspended;
h) any period in which the repurchase of the shares would, in the opinion of the Directors, result in a violation of applicable laws; or i) any period when the Directors determine that it is in the best interests of the Shareholders to do so.
Notice of any such suspension shall be published by the Company at its registered office and in such newspapers and through such other media as the Directors may from time to time determine, if in the opinion of the Directors, it is likely to exceed thirty days, and shall be transmitted immediately to the Central Bank, Euronext Dublin and the Shareholders. Shareholders who have requested the issue or redemption of shares of any series or class will have their subscription or redemption request dealt with on the first Dealing Day after the suspension has been lifted unless applications or redemption requests have been withdrawn prior to the lifting of the suspension. Where possible, all reasonable steps will be taken to bring any period of suspension to an end as soon as possible.
Registered shares may be transferred to another beneficial owner free of cash in a form that has been approved by the Directors. The instrument of transfer of a share must be signed by or on behalf of the transferor. The transferor shall be deemed to remain the holder of the share until the name of the transferee is entered on to the Register in respect of such share.
The Directors may decline to register a transfer if they are aware or reasonably believe the transfer would result in the beneficial ownership of shares by a person in contravention of any restrictions on ownership imposed by the Directors or might result in legal, regulatory, pecuniary, taxation or material administrative disadvantage to the relevant Portfolio or Shareholders generally.

GOVERNANCE DIRECTORS’ REPORT
ANNUAL REPORT 2019 49
Directors’ Report (Continued) Corporate Governance (continued)
Shareholder Meetings The Annual General Meeting of the Company will be held in Ireland, normally during the month of June or such other date as the Directors may determine. Notice convening the Annual General Meeting in each year at which the audited financial statements of the Company will be presented (together with the Directors’ and Auditors’ Reports of the Company) will be sent to Shareholders at their registered addresses not less than twenty one clear days before the date fixed for the meeting. Other general meetings may be convened from time to time by the Directors in such manner as provided by Irish law.
Each of the shares entitles the holder to attend and vote at meetings of the Company and of the Portfolio represented by those shares. All votes shall be cast by a poll of Shareholders present in person or by proxy at the relevant Shareholder meeting or by unanimous written resolution of the Shareholders. No class of shares confers on the holder thereof any preferential or pre-emptive rights or any rights to participate in the profits of any other share class or any voting rights in relation to matters relating solely to any other share class.
Any resolution to alter the class rights of the shares requires the approval of three-fourths of the holders of the shares represented or present and voting at a general meeting of the class. The quorum for any general meeting of the class convened to consider any alteration to the class rights of the shares shall be present in person or by proxy two or more persons holding shares issued in that class. In the event that a quorum is not present at a meeting and the meeting is adjourned, the quorum for the adjourned meeting shall be one Shareholder present in proxy or person.
Each of the shares other than subscriber shares entitle the Shareholder to participate equally (subject to any differences between fees, charges and expenses applicable to different classes of shares) on a pro-rata basis in the profits and net assets of the Portfolio in respect of which the shares have been issued, save in the case of profits declared prior to becoming a Shareholder.
Subscriber shares entitle the Shareholders holding them to attend and vote at all general meetings of the Company but do not entitle the holders to participate in the profits or net assets of the Company except for a return of capital on a winding up.
Composition and Operation of Board and Committees There are five Directors currently, all of whom are non-executive Directors. Ms. Michelle Green and Mr. Alex Duncan are Directors of the Company and are also Directors and employees of Neuberger Berman Europe Limited, the Investment Manager, Promoter and Distributor of the Company. The Articles of Association do not provide for retirement of Directors by rotation. However, the Directors may be removed by the shareholders by ordinary resolution in accordance with the procedures established under the Irish Companies Act 2014 (as amended). The Board meets at least quarterly. Other than the Audit Committee, there are no permanently authorised sub-committees of the Board.
The Board has satisfied itself that the Directors have sufficient time to fully discharge their duties and disclose in writing to the Board their other commitments, including other CIS directorships and non Fund directorships.
Irish Funds Corporate Governance Code The Irish Funds (“IF”) has published a corporate governance code (“IF Code”) that may be adopted on a voluntary basis by Irish authorised collective investment schemes. It should be noted that the IF Code reflects existing corporate governance practices imposed on Irish authorised collective investment schemes, as noted above. If the IF Code is adopted on a voluntary basis, it can be referred to in the disclosures made in the Directors’ Report in compliance with the provisions of the European Communities (Directive 2006/46/EC) Regulations (i.e. S.I. 450 of 2009 and S.I. 83 of 2010).
With effect from 1 January 2013, the Board voluntarily adopted the Corporate Governance Code for Irish Domiciled Collective Investment Schemes as published by the IF, as the Company’s corporate governance code.
On behalf of the Board Director: Director:
Tom Finlay Gráinne Alexander _________________ _________________ Date: 23 April 2020 Date: 23 April 2020

INDEPENDENT AUDITOR'S REPORT GOVERNANCE
50 NEUBERGER BERMAN INVESTMENT FUNDS PLC
Independent Auditors’ Report to the Members of Neuberger Berman Investment Funds Plc
Opinion
We have audited the financial statements of Neuberger Berman Investment Funds plc (‘the Company’) for the year ended 31 December 2019, which comprise the Aggregate Balance Sheet, Aggregate Profit and Loss Account, the Aggregate Statement of Changes in Net Assets Attributable to Holders of Redeemable Participating Shares and notes to the financial statements, including the summary of significant accounting policies set out in note 1. The financial reporting framework that has been applied in their preparation is Irish Law and Accounting Standards including FRS 102 The Financial Reporting Standard applicable in the UK and Republic of Ireland (Irish Generally Accepted Accounting Practice). In our opinion the financial statements:
give a true and fair view of the assets, liabilities and financial position of the Company as at 31 December 2019 and of its aggregate profit for the year then ended;
have been properly prepared in accordance with Irish Generally Accepted Accounting Practice; and
have been properly prepared in accordance with the requirements of the Companies Act 2014, the European Communities (Undertakings for Collective Investment in Transferable Securities) Regulations, 2011, (the “UCITS Regulations”) and the Central Bank (Supervision and Enforcement) Act 2013 (Section 48(1)) (Undertakings for Collective Investment in Transferable Securities) Regulations 2019 (the “Central Bank UCITS Regulations”).
Basis for opinion
We conducted our audit in accordance with International Standards on Auditing (Ireland) (ISAs (Ireland)) and applicable law. Our responsibilities under those standards are further described in the Auditor's Responsibilities for the Audit of the Financial Statements section of our report. We are independent of the Company in accordance with ethical requirements that are relevant to our audit of financial statements in Ireland, including the Ethical Standard as applied to public interest entities issued by the Irish Auditing and Accounting Supervisory Authority (IAASA), and we have fulfilled our other ethical responsibilities in accordance with these requirements.
We believe that the audit evidence we have obtained is sufficient and appropriate to provide a basis for our opinion.
Conclusions relating to going concern
We have nothing to report in respect of the following matters, in relation to which ISAs (Ireland) require us to report to you where:
the directors’ use of the going concern basis of accounting in the preparation of the financial statements is not appropriate: or
the directors have not disclosed in the financial statements any identified material uncertainties that may cast significant doubt about the Company’s ability to continue to adopt the going concern basis of accounting for a period of at least twelve months from the date when the financial statements are authorised for issue.
Key audit matters
Key audit matters are those matters that, in our professional judgment, were of most significance in our audit of the financial statements of the current period and include the most significant assessed risks of material misstatement (whether or not due to fraud) that we identified, including those which had the greatest effect on: the overall audit strategy, the allocation of resources in the audit; and directing the efforts of the engagement team. These matters were addressed in the context of our audit of the financial statements as a whole, and in forming our opinion thereon, and we do not provide a separate opinion on these matters.

GOVERNANCE INDEPENDENT AUDITOR'S REPORT
ANNUAL REPORT 2019 51
Independent Auditors’ Report to the Members of Neuberger Berman Investment Funds Plc (Continued)
Risk Our response to the risk Key observations communicated to the Audit Committee
Existence of financial assets and financial liabilities at fair value through profit or loss held outside the Depositary network amounting to $26,129,384,989 (2018: $20,526,629,831)
We have considered the existence and ownership of financial assets and financial liabilities at fair value through profit or loss to be a key audit matter.
This is one of the key areas our audit is concentrated on, because the existence and ownership of financial assets and financial liabilities at fair value through profit or loss is a key driver of the net asset value.
Please refer to Note 2 – Financial assets and financial liabilities at fair value through profit or loss in the financial statements.
We obtained a listing of all financial assets and liabilities from the Administrator.
We tested the existence and ownership of financial assets and financial liabilities at fair value through profit or loss directly with the depositary or counterparties by obtaining independent confirmations as at 30 June 2019 or as at 31 December 2019 for any sub-funds that launched subsequent to our interim audit procedures.
As at 31 December 2019 we performed roll forward procedure for all sub-funds that existed as at 30 June 2019.
Based on the procedures performed, no issues were noted.
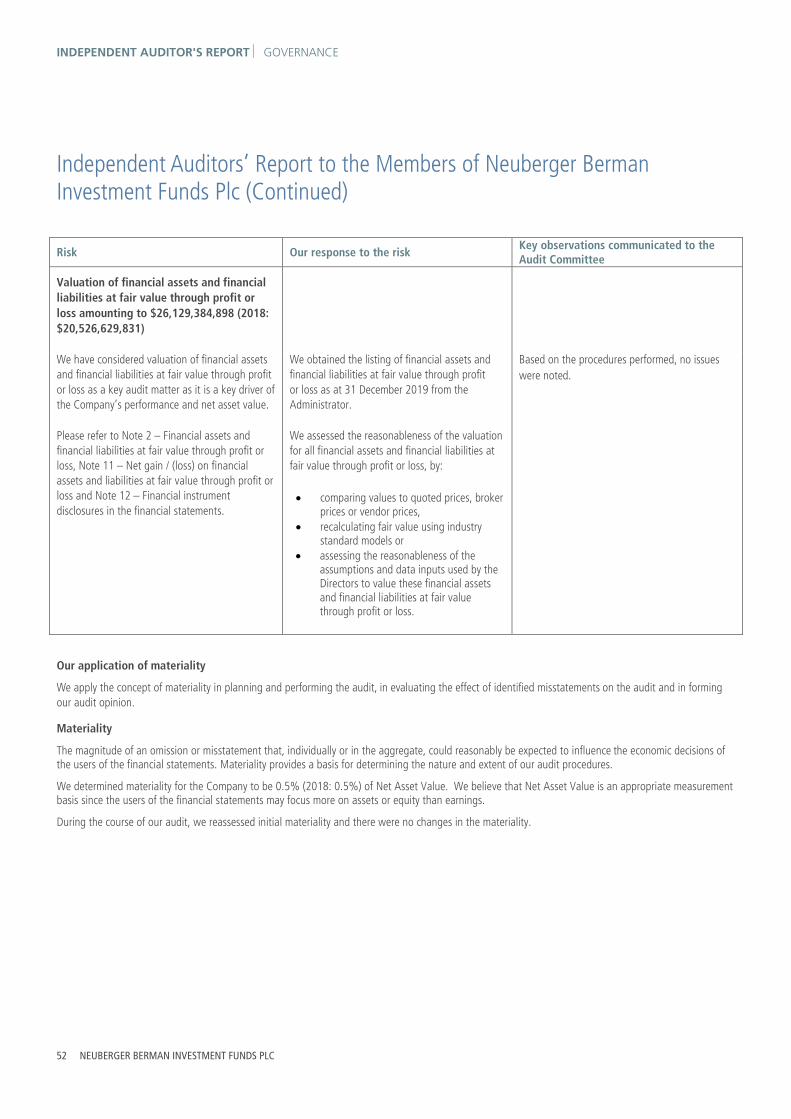
INDEPENDENT AUDITOR'S REPORT GOVERNANCE
52 NEUBERGER BERMAN INVESTMENT FUNDS PLC
Independent Auditors’ Report to the Members of Neuberger Berman Investment Funds Plc (Continued)
Risk Our response to the risk Key observations communicated to the Audit Committee
Valuation of financial assets and financial liabilities at fair value through profit or loss amounting to $26,129,384,898 (2018: $20,526,629,831)
We have considered valuation of financial assets and financial liabilities at fair value through profit or loss as a key audit matter as it is a key driver of the Company’s performance and net asset value.
Please refer to Note 2 – Financial assets and financial liabilities at fair value through profit or loss, Note 11 – Net gain / (loss) on financial assets and liabilities at fair value through profit or loss and Note 12 – Financial instrument disclosures in the financial statements.
We obtained the listing of financial assets and financial liabilities at fair value through profit or loss as at 31 December 2019 from the Administrator.
We assessed the reasonableness of the valuation for all financial assets and financial liabilities at fair value through profit or loss, by:
comparing values to quoted prices, broker prices or vendor prices,
recalculating fair value using industry standard models or
assessing the reasonableness of the assumptions and data inputs used by the Directors to value these financial assets and financial liabilities at fair value through profit or loss.
Based on the procedures performed, no issues were noted.
Our application of materiality
We apply the concept of materiality in planning and performing the audit, in evaluating the effect of identified misstatements on the audit and in forming our audit opinion.
Materiality
The magnitude of an omission or misstatement that, individually or in the aggregate, could reasonably be expected to influence the economic decisions of the users of the financial statements. Materiality provides a basis for determining the nature and extent of our audit procedures.
We determined materiality for the Company to be 0.5% (2018: 0.5%) of Net Asset Value. We believe that Net Asset Value is an appropriate measurement basis since the users of the financial statements may focus more on assets or equity than earnings.
During the course of our audit, we reassessed initial materiality and there were no changes in the materiality.

GOVERNANCE INDEPENDENT AUDITOR'S REPORT
ANNUAL REPORT 2019 53
Independent Auditors’ Report to the Members of Neuberger Berman Investment Funds Plc (Continued) Performance materiality
The application of materiality at the individual account or balance level. It is set at an amount to reduce to an appropriately low level the probability that the aggregate of uncorrected and undetected misstatements exceeds materiality.
On the basis of our risk assessments, together with our assessment of the Company’s overall control environment, our judgement was that performance materiality was 75% (2018: 75%) of our planning materiality. We have set performance materiality at this percentage due to our knowledge of the entity and industry, our past history with the entity, effectiveness of the control environment and our assessment of the risks associated with the engagement.
Reporting threshold
An amount below which identified misstatements are considered as being clearly trivial.
We agreed with the Audit Committee that we would report to them all uncorrected audit differences in excess 5% of planning materiality, as well as differences below that threshold that, in our view, warranted reporting on qualitative grounds.
We evaluate any uncorrected misstatements against both the quantitative measures of materiality discussed above and in light of other relevant qualitative considerations in forming our opinion.
An overview of the scope of our audit report
Tailoring the scope
Our assessment of audit risk, our evaluation of materiality and our allocation of performance materiality determine our audit scope for the company. This enables us to form an opinion on the financial statements. We take into account size, risk profile, the organisation of the company and effectiveness of controls, including controls and changes in the business environment when assessing the level of work to be performed. All audit work was performed directly by the audit engagement team.
Other information
The directors are responsible for the other information. The other information comprises the information included in the annual report other than the financial statements and our auditor’s report thereon. Our opinion on the financial statements does not cover the other information and, except to the extent otherwise explicitly stated in our report, we do not express any form of assurance conclusion thereon.
In connection with our audit of the financial statements, our responsibility is to read the other information and, in doing so, consider whether the other information is materially inconsistent with the financial statements or our knowledge obtained in the audit or otherwise appears to be materially misstated. If we identify such material inconsistencies or apparent material misstatements, we are required to determine whether there is a material misstatement in the financial statements or a material misstatement of the other information. If, based on the work we have performed, we conclude that there is a material misstatement of this other information, we are required to report that fact.
We have nothing to report in this regard.
Opinions on other matters prescribed by the Companies Act 2014
Based solely on the work undertaken in the course of the audit, we report that:
in our opinion, the information given in the directors’ report is consistent with the financial statements; and
in our opinion, the directors’ report is has been prepared in accordance with the Companies Act 2014.
We have obtained all the information and explanations which we consider necessary for the purposes of our audit.
In our opinion the accounting records of the Company were sufficient to permit the financial statements to be readily and properly audited and the Company statement of financial position is in agreement with the accounting records.

INDEPENDENT AUDITOR'S REPORT GOVERNANCE
54 NEUBERGER BERMAN INVESTMENT FUNDS PLC
Independent Auditors’ Report to the Members of Neuberger Berman Investment Funds Plc (Continued) Matters on which we are required to report by exception
Based on the knowledge and understanding of the company and its environment obtained in the course of the audit, we have not identified material misstatements in the directors' report.
The Companies Act 2014 requires us to report to you if, in our opinion, the disclosures of directors’ remuneration and transactions required by sections 305 to 312 of the Act are not made. We have nothing to report in this regard.
Respective responsibilities
Responsibilities of directors for the financial statements
As explained more fully in the directors’ responsibilities statement set on page 32, the directors are responsible for the preparation of the financial statements and for being satisfied that they give a true and fair view, and for such internal control as they determine is necessary to enable the preparation of financial statements that are free from material misstatement, whether due to fraud or error.
In preparing the financial statements, the directors are responsible for assessing the Company’s ability to continue as a going concern, disclosing, as applicable, matters related to going concern and using the going concern basis of accounting unless management either intends to liquidate the Company or to cease operations, or has no realistic alternative but to do so.
Auditor’s responsibilities for the audit of the financial statements
Our objectives are to obtain reasonable assurance about whether the financial statements as a whole are free from material misstatement, whether due to fraud or error, and to issue an auditor's report that includes our opinion. Reasonable assurance is a high level of assurance, but is not a guarantee that an audit conducted in accordance with ISAs (Ireland) will always detect a material misstatement when it exists. Misstatements can arise from fraud or error and are considered material if, individually or in the aggregate, they could reasonably be expected to influence the economic decisions of users taken on the basis of these financial statements.
The objectives of our audit, in respect to fraud, are; to identify and assess the risks of material misstatement of the financial statements due to fraud; to obtain sufficient appropriate audit evidence regarding the assessed risks of material misstatement due to fraud, through designing and implementing appropriate responses; and to respond appropriately to fraud or suspected fraud identified during the audit. However, the primary responsibility for the prevention and detection of fraud rests with both those charged with governance of the entity and management.
Our approach was as follows:
We obtained an understanding of the legal and regulatory frameworks that are applicable to the Company and determined that the most significant are Companies Act 2014 and Undertaking for Collective Investment in Transferable Securities pursuant to the provisions of the European Communities (Undertakings for Collective Investment in Transferable Securities) Regulations, 2011 as amended (the “UCITS Regulations”).
We understood how Neuberger Berman Investment Funds plc is complying with those frameworks by updating our understanding of the adequate system of internal control in place. We also considered the existence of independence service providers, proper segregation of duties and the regulated environment in which the Company operates, which may reduce opportunities for fraud to take place.
We assessed the susceptibility of the Company’s financial statements to material misstatement, including how fraud might occur by management override of controls.
Based on this understanding we designed our audit procedures to identify non-compliance with such laws and regulations. Our procedures involved inquiries to those charged with governance into possible instances of non-compliance with laws and regulations, review of board meeting minutes during the year and obtaining representation from the management.
A further description of our responsibilities for the audit of the financial statements is located on the IAASA's website at: http://www.iaasa.ie/getmedia/b2389013-1cf6-458b-9b8f-a98202dc9c3a/Description_of_auditors_responsibilities_for_audit.pdf. This description forms part of our auditor's report.

GOVERNANCE INDEPENDENT AUDITOR'S REPORT
ANNUAL REPORT 2019 55
Independent Auditors’ Report to the Members of Neuberger Berman Investment Funds Plc (Continued) Other matters which we are required to address
We were appointed by the Directors in 2000 to audit the financial statements for the year ending 31 December 2001 and subsequent financial periods. The period of total uninterrupted engagement including previous renewals and reappointments of the firm is 20 years.
The non-audit services prohibited by IAASA’s Ethical Standard were not provided to the Company and we remain independent of the Company in conducting our audit.
Our audit opinion is consistent with the additional report to the audit committee.
The purpose of our audit work and to whom we owe our responsibilities
Our report is made solely to the Company’s members, as a body, in accordance with section 391 of the Companies Act 2014. Our audit work has been undertaken so that we might state to the Company’s members those matters we are required to state to them in an auditor’s report and for no other purpose. To the fullest extent permitted by law, we do not accept or assume responsibility to anyone other than the Company and the Company’s members, as a body, for our audit work, for this report, or for the opinions we have formed.
Lisa Kealy for and on behalf of Ernst & Young Chartered Accountants and Statutory Audit Firm
Dublin
Date: 28 April 2020

INDEPENDENT AUDITOR'S REPORT GOVERNANCE
56 NEUBERGER BERMAN INVESTMENT FUNDS PLC
Independent Auditors’ Report to the Directors of Neuberger Berman Investment Funds Plc
The Directors Neuberger Berman Investment Funds plc
We have audited the accompanying financial statements of Neuberger Berman Investment Funds plc (the “Fund”), which comprise the Aggregate Balance Sheet as of 31 December 2019, the Aggregate Profit and Loss Account, the Aggregate Statement of Changes in Net Assets Attributable to Holders of Redeemable Participating Shares, for the year then ended, and the related notes to the financial statements.
Management’s Responsibility for the Financial Statements
Management is responsible for the preparation and fair presentation of these financial statements in conformity with accounting standards issued by the Financial Reporting Council and promulgated by the Institute of Chartered Accountants in Ireland (Generally Accepted Accounting Practice in Ireland) including FRS 102 The Financial Reporting Standard applicable in the UK and Republic of Ireland; this includes the design, implementation, and maintenance of internal control relevant to the preparation and fair presentation of financial statements that are free of material misstatement, whether due to fraud or error.
Auditor’s Responsibility
Our responsibility is to express an opinion on these financial statements based on our audit. We conducted our audit in accordance with auditing standards generally accepted in the United States. Those standards require that we plan and perform the audit to obtain reasonable assurance about whether the financial statements are free of material misstatement.
An audit involves performing procedures to obtain audit evidence about the amounts and disclosures in the financial statements. The procedures selected depend on the auditor’s judgment, including the assessment of the risks of material misstatement of the financial statements, whether due to fraud or error. In making those risk assessments, the auditor considers internal control relevant to the Fund’s preparation and fair presentation of the financial statements in order to design audit procedures that are appropriate in the circumstances, but not for the purpose of expressing an opinion on the effectiveness of the Fund’s internal control. Accordingly, we express no such opinion. An audit also includes evaluating the appropriateness of accounting policies used and the reasonableness of significant accounting estimates made by management, as well as evaluating the overall presentation of the financial statements.
We believe that the audit evidence we have obtained is sufficient and appropriate to provide a basis for our audit opinion.
Opinion
In our opinion, the financial statements referred to above present fairly, in all material respects, the financial position of Neuberger Berman Investment Funds plc at 31 December 2019, and the results of its operations and changes in net assets for the year then ended, in conformity with accounting standards issued by the Financial Reporting Council and promulgated by the Institute of Chartered Accountants in Ireland (Generally Accepted Accounting Practice in Ireland) including FRS 102 The Financial Reporting Standard applicable in the UK and Republic of Ireland.
Ernst & Young Chartered Accountants and Registered Auditors Dublin Date: 28 April 2020

REPORT OF THE DEPOSITORY TO THE SHAREHOLDERS GOVERNANCE
ANNUAL REPORT 2019 57
Report of the Depositary to the Shareholders We have enquired into the conduct of Neuberger Berman Investment Funds plc (the “Company”) for the year ended 31 December 2019, in our capacity as Depositary to the Company.
This report including the opinion has been prepared for and solely for the Shareholders in the Company as a body, in accordance with Part 5 of the European Communities (Undertakings for Collective Investment in Transferable Securities) Regulations 2011, as amended, (the ‘UCITS Regulations’), and for no other purpose. We do not, in giving this opinion, accept or assume responsibility for any other purpose or to any other person to whom this report is shown.
Responsibilities of the Depositary
Our duties and responsibilities are outlined in Part 5 of the UCITS Regulations. One of those duties is to enquire into the conduct of the Company in each annual accounting period and report thereon to the shareholders.
Our report shall state whether, in our opinion, the Company has been managed in that period in accordance with the provisions of the Company’s Memorandum and Articles of Association and the UCITS Regulations. It is the overall responsibility of the Company to comply with these provisions. If the Company has not so complied, we as Depositary must state why this is the case and outline the steps which we have taken to rectify the situation.
Basis of Depositary Opinion
The Depositary conducts such reviews as it, in its reasonable opinion, considers necessary in order to comply with its duties as outlined in Part 5 of the UCITS Regulations and to ensure that, in all material respects, the Company has been managed (i) in accordance with the limitations imposed on its investment and borrowing powers by the provisions of the constitutional documentation and the appropriate regulations and (ii) otherwise in accordance with the Company’s constitutional documentation and the appropriate regulations.
Opinion
In our opinion, the Company has been managed during the year, in all material respects:
(i) in accordance with the limitations imposed on the investment and borrowing powers of the Company by the Memorandum & Articles of Association, the UCITS Regulations and the Central Bank (Supervision and Enforcement) Act 2013 (Section 48(1)) (Undertakings for Collective Investment in Transferable Securities) Regulations 2019 (‘the Central Bank UCITS Regulations’); and
(ii) otherwise in accordance with the provisions of the Memorandum & Articles of Association, the UCITS Regulations and the Central Bank UCITS Regulations.
Brown Brothers Harriman Trustee Services (Ireland) Limited 30 Herbert Street Dublin 2 Ireland Date: 23 April 2020

AGGREGATE FINANCIAL STATEMENTS AGGREGATE BALANCE SHEETS
The accompanying notes form an integral part of the financial statements. 58 NEUBERGER BERMAN INVESTMENT FUNDS PLC
Aggregate Balance Sheets*
As at As at
Note 31 December 2019 31 December 2018
US$ US$
Current Assets
Financial Assets at Fair Value through Profit or Loss 2 26,337,072,499 21,494,377,539
Cash and cash equivalents 3 1,341,073,699 943,505,212
Receivable for investments sold 62,421,691 106,158,670
Receivable for shares issued 105,188,312 72,788,698
Due from brokers 167,869,333 379,779,396
Income receivable and other assets 305,578,289 270,172,016
Total Assets 28,319,203,823 23,266,781,531
Current Liabilities
Financial Liabilities at Fair Value through Profit or Loss 2 207,687,510 967,747,708
Bank overdraft 4 3,450,526 57,627
Payable for shares redeemed 49,142,778 47,765,147
Due to brokers 57,014,501 15,410,000
Accrued expenses 27,810,999 39,870,765
Payable for investments purchased 434,947,860 448,678,553
Other payables 22,327,563 17,452,392
Liabilities (excluding Net Assets Attributable to Holders of Redeemable Participating Shares) 802,381,737 1,536,982,192
Net Assets Attributable to Holders of Redeemable Participating Shares 27,516,822,086 21,729,799,339
Statements for each Portfolio are included in these financial statements.
* The Aggregate Financial Statements have been adjusted to account for balances held in the name of the Company and to account for cross investments between Portfolios. Details for any cross investments between Portfolios are included in Note 10 of the Notes to the Audited Financial Statements.
Director: Director:
Tom Finlay Gráinne Alexander
________________ ________________ Date: 23 April 2020 Date: 23 April 2020

AGGREGATE PROFIT AND LOSS ACCOUNTS AGGREGATE FINANCIAL STATEMENTS
The accompanying notes form an integral part of the financial statements.
ANNUAL REPORT 2019 59
Aggregate Profit and Loss Accounts*
Year Ended Year Ended Note 31 December 2019 31 December 2018 US$ US$
Income
Interest Income 1,059,244,146 1,030,966,141
Dividend Income 68,206,751 69,784,302
Miscellaneous Income 627,777 327,226
Net Gain/(Loss) on Financial Assets and Liabilities at Fair Value through Profit or Loss 11 1,894,642,367 (2,667,373,339)
3,022,721,041 (1,566,295,670)
Expenses
Management Fee 6 191,417,062 192,814,615
Distribution Fee 6 15,868,439 15,417,242
Administration Fee 6 32,010,320 33,315,948
Commitment Fee 19 2,841,927 2,479,786
Custody Fee 6 5,407,421 5,673,615
Depositary Fee 6 2,461,123 2,413,456
Professional Fee 9 3,549,138 4,825,647
Directors' Fee 7 213,427 296,495
Performance Fee 6 8,661,752 4,006,254
Transaction Costs 9 14,416,653 10,970,358
Organisation Expenses 9 137,080 313,833
Audit Fee 8 916,545 1,017,840
VAT Rebate (395,277) (306,959)
Other Expenses 9 2,565,630 2,161,025
Expense Waiver 6 (7,929,988) (9,204,124)
Advisory Fee Waiver 6 (540,057) (694,629)
Total Expenses 271,601,195 265,500,402
Finance Costs
Interest Expense 107,008 389,319
Distribution Paid 1 372,392,446 385,896,575
372,499,454 386,285,894
Withholding Tax 1 26,719,807 20,839,910
Capital Gain Tax 1 3,496,644 1,640,952
Profit/(Loss) Attributable to Holders of Redeemable Participating Shares from Operations 2,348,403,941 (2,240,562,828)
Income and expenses arose solely from continuing operations, except for Neuberger Berman Multi-Asset Risk Premia Fund, Neuberger Berman Global Dynamic Asset Allocator Fund, Neuberger Berman Asian Opportunities Fund and Neuberger Berman China A-Share Opportunities Fund which liquidated on 26 March 2019, 12 April 2019, 24 July 2019 and 6 December 2019, respectively.
There are no recognised gains and losses in the financial year other than those dealt with in the Aggregate Profit and Loss Account.
Statements for each Portfolio are included in these financial statements.
* The Aggregate Financial Statements have been adjusted to account for cross investments between Portfolios. Details for any cross investments between Portfolios are included in Note 10 of the Notes to the Audited Financial Statements.

AGGREGATE FINANCIAL STATEMENTS AGGREGATE STATEMENT OF CHANGES
The accompanying notes form an integral part of the financial statements. 60 NEUBERGER BERMAN INVESTMENT FUNDS PLC
Aggregate Statements of Changes in Net Assets Attributable to Holders of Redeemable Participating Shares*
Year Ended Year Ended
Note 31 December 2019 31 December 2018
US$ US$
Net Assets Attributable to Holders of Redeemable Participating Shares at beginning of year 21,729,799,339 24,401,369,276
Profit/(Loss) Attributable to Holders of Redeemable Participating Shares from Operations 2,348,403,941 (2,240,562,828)
Currency exchange rate movement (16,082,261) (47,390,020)
Subscriptions 5 13,681,908,317 12,229,667,037
Redemptions 5 (10,227,207,250) (12,613,284,126)
Net Assets Attributable to Holders of Redeemable Participating Shares at end of year 27,516,822,086 21,729,799,339
Statements for each Portfolio are included in these financial statements.
* The Aggregate Financial Statements have been adjusted to account for cross investments between Portfolios. Details for any cross investments between Portfolios are included in Note 10 of the Notes to the Audited Financial Statements.

INVESTMENT MANAGER’S REPORT FINANCIAL STATEMENTS
ANNUAL REPORT 2019 61
Neuberger Berman High Yield Bond Fund Investment Manager’s Report For the 12 months ended 31 December 2019, the total return for the USD I Accumulating Class was 13.82%. Over the same period, the ICE BofA US High Yield Constrained Index (USD Total Return) (the “Index”) returned 14.41%. (Performance for all share classes is provided in Appendix II. Performance data quoted represent past performance and do not indicate future results. Total returns shown reflect the reinvestment of income dividends and other distributions, if any).
The US high yield market was supported by a number of factors in 2019, including a “dovish pivot” by the US Federal Reserve (“Fed”), as it lowered interest rates three times during the period as well as accommodative policy by the European Central Bank (“ECB”). The backdrop of more accommodative monetary policy was supportive of issuer fundamentals and investor risk sentiment. Later in the year, the Fed and the ECB signaled that rate cuts could be on hold in the near term which may have suggested to market participants that policymakers and economists were less concerned about further deterioration in growth. While there were bouts of volatility in the market during the year driven by political risk (UK, Hong Kong, Argentina and the US), changes in expectations for monetary policy and shifting trade tensions, the global economy was relatively resilient. While the lower growth environment was challenging for some issuers, corporate profits for the majority of issuers often exceeded lowered expectations. While the US-China trade war has not been completely resolved, late in the year there was an announcement of a “phase-one” trade deal, which caused a shift in investor expectations fueling a risk-on rally in December where lower quality high yield saw better returns. For the full year, however, higher quality outperformed lower quality. For the 12 months ended 31 December 2019, securities rated BB and B in the Index returned 15.7% and 14.4%, respectively, whereas CCC-rated securities returned 9.1%.
Credit selection was a key factor in the US high yield market in 2019 and avoiding deteriorating credits was additive to investment results. Issuers with unsustainable capital structures in uneconomic parts of retail, energy, commodity- and/or cyclically-exposed businesses and companies facing increased regulatory scrutiny were the underperformers in 2019. Outside of these pockets of idiosyncratic risk, most of the high yield market was supported by constructive fundamentals: low-but-positive revenue growth, earnings that were generally in-line, good interest coverage and only a modest increase in leverage which was driven primarily by a subset of stressed issuers in the high yield universe. Among the higher-quality issuers, fundamentals remain relatively solid. In the US, high yield defaults, overall, remain below their long-term average and are very low outside of commodities and energy. As of December, the US LTM par-weighted default rate was 2.86% and only 1.26% ex-commodities.
The Portfolio lagged its benchmark index over the reporting period. During the year, security selection within Support-Services, Metals & Mining and an underweight to Energy were the most beneficial to performance. In contrast, security selection within Banking, an underweight to Super Retail and Automotive & Auto Parts were the largest detractors. Within our ratings’ positioning, security selection within the Portfolio’s B rated issuers was the most beneficial to performance and an overweight to BBB and above issuers was the largest detractor.
Spreads in the high yield market have widened in the past few weeks but we believe these wider spreads are likely pricing in a severe temporary stall in global GDP and not a deep, extended recession. Assuming no deep, extended recession, spreads are compensating investors for an above-average rise in default rates from the low levels, with the secularly-challenged, idiosyncratic risk credits impacted by supply disruptions and demand declines in certain industries the most affected. As we continue to be vigilant to the developments of COVID-19, we are finding select opportunities in the high yield universe. That said, our primary goal remains one of avoiding default risk. While uncertainty around the duration and severity of the health crisis as well geopolitical event risk can result in heightened short-term volatility, we believe our portfolio is well positioned. We will continue to look to tactically take advantage of the increased volatility to add to credits with more stable fundamentals and attractive valuations.

FINANCIAL STATEMENTS BALANCE SHEET
The accompanying notes form an integral part of the financial statements.
62 NEUBERGER BERMAN INVESTMENT FUNDS PLC
Neuberger Berman High Yield Bond Fund (Continued) Balance Sheet
As at31 December 2019
As at31 December 2018 Note
US$ US$
Current Assets
Financial Assets at Fair Value through Profit or Loss 2 3,413,444,772 3,841,641,709
Cash and cash equivalents 3 65,675,647 163,792,361
Receivable for investments sold 8,058,761 131,700
Receivable for shares issued 6,754,963 35,005,673
Income receivable and other assets 49,539,305 63,363,338
Total Assets 3,543,473,448 4,103,934,781
Current Liabilities
Financial Liabilities at Fair Value through Profit or Loss 2 19,165,871 19,871,906
Payable for shares redeemed 13,403,770 7,189,467
Accrued expenses 4,510,611 9,311,270
Payable for investments purchased 4,377,653 39,853,578
Other payables 506,405 979,972
Liabilities (excluding Net Assets Attributable to Holders of Redeemable Participating Shares) 41,964,310 77,206,193
Net Assets Attributable to Holders of Redeemable Participating Shares 3,501,509,138 4,026,728,588

PROFIT AND LOSS ACCOUNT FINANCIAL STATEMENTS
The accompanying notes form an integral part of the financial statements.
ANNUAL REPORT 2019 63
Neuberger Berman High Yield Bond Fund (Continued) Profit and Loss Account
Year Ended 31 December 2019
Year Ended31 December 2018 Note
US$ US$
Income
Interest Income 218,010,397 325,486,681
Dividend Income 3,574,044 3,327,554
Miscellaneous Income 146,212 5,407
Net Gain/(Loss) on Financial Assets and Liabilities at Fair Value through Profit or Loss 11 307,889,289 (544,631,641)
529,619,942 (215,811,999)
Expenses
Management Fee 6 37,117,387 51,943,155
Distribution Fee 6 5,296,257 7,264,847
Administration Fee 6 5,436,188 7,864,839
Commitment Fee 19 242,510 789,961
Custody Fee 6 118,786 264,847
Depositary Fee 6 371,334 535,683
Professional Fee 9 105,728 887,193
Directors' Fee 7 4,563 6,615
Transaction Costs 9 521,752 609,074
Audit Fee 8 35,896 51,213
VAT Rebate (61,011) (74,302)
Other Expenses 9 10,959 253,929
Expense Waiver 6 (1,743) (89,331)
Advisory Fee Waiver 6 (501,258) (642,266)
Total Expenses 48,697,348 69,665,457
Finance Costs
Interest Expense 689 73
Distribution Paid 1 154,290,746 204,769,633
154,291,435 204,769,706
Withholding Tax 1 – 22,803
Profit/(Loss) Attributable to Holders of Redeemable Participating Shares from Operations 326,631,159 (490,269,965)
Income and expenses arose solely from continuing operations.

FINANCIAL STATEMENTS STATEMENT OF CHANGES IN NET ASSETS
The accompanying notes form an integral part of the financial statements.
64 NEUBERGER BERMAN INVESTMENT FUNDS PLC
Neuberger Berman High Yield Bond Fund (Continued) Statement of Changes in Net Assets Attributable to Holders of Redeemable Participating Shares
Year Ended31 December 2019
Year Ended31 December 2018 Note
US$ US$
Net Assets Attributable to Holders of Redeemable Participating Shares at beginning of year 4,026,728,588 7,220,758,701
Profit/(Loss) Attributable to Holders of Redeemable Participating Shares from Operations 326,631,159 (490,269,965)
Subscriptions 5 1,203,191,407 1,845,335,134
Redemptions 5 (2,055,042,016) (4,549,095,282)
Net Assets Attributable to Holders of Redeemable Participating Shares at end of year 3,501,509,138 4,026,728,588

SCHEDULE OF INVESTMENTS FINANCIAL STATEMENTS
ANNUAL REPORT 2019 65
Neuberger Berman High Yield Bond Fund (Continued)
Schedule of Investments
Financial Assets at Fair Value through Profit or Loss
Principal Amount Security Description Coupon Maturity
DateFair Value
US$% of Net
Assets
Corporate Bonds 88.98% (31 December 2018: 85.96%)
United States Dollar 8,130,000 1011778 BC ULC/New Red Finance Inc† 4.25% 15/05/2024 8,350,201 0.24
11,850,000 1011778 BC ULC/New Red Finance Inc† 5.00% 15/10/2025 12,259,832 0.35
7,680,000 ADT Security Corp† 4.88% 15/07/2032 7,065,792 0.20
10,142,000 AerCap Global Aviation Trust* 6.50% 15/06/2045 11,207,924 0.32
9,310,000 Alliant Holdings Intermediate LLC/Alliant Holdings Co-Issuer† 6.75% 15/10/2027 9,987,768 0.29
13,760,000 Altice France SA* 5.50% 15/01/2028 14,164,544 0.40
22,410,000 Altice France SA* 7.38% 01/05/2026 24,101,731 0.69
10,340,000 Altice France SA† 8.13% 01/02/2027 11,664,554 0.33
4,820,000 Altice Luxembourg SA† 7.63% 15/02/2025 5,024,850 0.14
1,850,000 Altice Luxembourg SA* 10.50% 15/05/2027 2,112,515 0.06
7,970,000 AMC Entertainment Holdings Inc* 5.75% 15/06/2025 7,388,867 0.21
9,985,000 Amkor Technology Inc† 6.63% 15/09/2027 11,014,453 0.31
5,360,000 Amsted Industries Inc† 4.63% 15/05/2030 5,412,153 0.15
3,720,000 AmWINS Group Inc† 7.75% 01/07/2026 4,121,676 0.12
15,215,000 Antero Midstream Partners LP/Antero Midstream Finance Corp† 5.38% 15/09/2024 14,149,950 0.40
10,205,000 Aramark Services Inc† 5.00% 01/02/2028 10,772,398 0.31
11,235,000 Aramark Services Inc* 5.13% 15/01/2024 11,552,782 0.33
6,840,000 Archrock Partners LP/Archrock Partners Finance Corp† 6.25% 01/04/2028 7,062,300 0.20
6,855,000 ARD Finance SA* 6.50% 30/06/2027 7,100,409 0.20
20,505,000 Ascent Resources Utica Holdings LLC/ARU Finance Corp† 7.00% 01/11/2026 16,411,125 0.47
14,495,000 ASGN Inc† 4.63% 15/05/2028 14,925,936 0.43
12,530,000 AssuredPartners Inc† 7.00% 15/08/2025 12,776,716 0.36
7,430,000 Avis Budget Car Rental LLC/Avis Budget Finance Inc† 5.25% 15/03/2025 7,665,271 0.22
825,000 Avis Budget Car Rental LLC/Avis Budget Finance Inc† 5.50% 01/04/2023 841,842 0.02
14,880,000 Avis Budget Car Rental LLC/Avis Budget Finance Inc† 5.75% 15/07/2027 15,512,772 0.44
9,315,000 Ball Corp* 5.00% 15/03/2022 9,867,193 0.28
1,659,000 Bausch Health Cos Inc† 5.50% 01/03/2023 1,672,131 0.05
2,230,000 Bausch Health Cos Inc† 5.75% 15/08/2027 2,423,675 0.07
1,249,000 Bausch Health Cos Inc† 5.88% 15/05/2023 1,260,709 0.04
16,500,000 Bausch Health Cos Inc† 6.13% 15/04/2025 17,082,698 0.49
2,575,000 Bausch Health Cos Inc† 6.50% 15/03/2022 2,636,156 0.08
4,140,000 Bausch Health Cos Inc† 7.00% 15/03/2024 4,314,232 0.12
16,515,000 Beacon Roofing Supply Inc† 4.88% 01/11/2025 16,632,009 0.48
5,445,000 Berry Global Inc† 4.50% 15/02/2026 5,603,177 0.16
9,815,000 Berry Global Inc* 5.13% 15/07/2023 10,097,083 0.29
9,165,000 Berry Global Inc† 5.63% 15/07/2027 9,852,604 0.28
15,739,000 Big River Steel LLC/BRS Finance Corp† 7.25% 01/09/2025 16,643,835 0.48
6,820,000 Bombardier Inc† 5.75% 15/03/2022 7,055,921 0.20

FINANCIAL STATEMENTS SCHEDULE OF INVESTMENTS
66 NEUBERGER BERMAN INVESTMENT FUNDS PLC
Neuberger Berman High Yield Bond Fund (Continued)
Schedule of Investments (Continued)
Financial Assets at Fair Value through Profit or Loss (continued)
Principal Amount Security Description Coupon Maturity
DateFair Value
US$% of Net
Assets
Corporate Bonds 88.98% (31 December 2018: 85.96%) (continued)
United States Dollar (continued) 9,500,000 Bombardier Inc† 8.75% 01/12/2021 10,429,812 0.30
5,165,000 Boyd Gaming Corp† 4.75% 01/12/2027 5,374,699 0.15
13,925,000 Boyd Gaming Corp* 6.38% 01/04/2026 15,008,191 0.43
6,155,000 Bruin E&P Partners LLC† 8.88% 01/08/2023 4,018,692 0.11
16,310,000 Buckeye Partners LP† 3.95% 01/12/2026 15,753,627 0.45
8,045,000 Buckeye Partners LP† 4.13% 01/12/2027 7,774,430 0.22
2,570,000 Buckeye Partners LP† 5.85% 15/11/2043 2,316,853 0.07
17,970,000 Calpine Corp† 4.50% 15/02/2028 18,151,856 0.52
10,865,000 Calpine Corp† 5.13% 15/03/2028 11,117,068 0.32
23,410,000 Calpine Corp† 5.75% 15/01/2025 24,083,037 0.69
8,105,000 CCO Holdings LLC/CCO Holdings Capital Corp† 4.75% 01/03/2030 8,282,337 0.24
30,670,000 CCO Holdings LLC/CCO Holdings Capital Corp† 5.00% 01/02/2028 32,239,384 0.92
8,674,000 CCO Holdings LLC/CCO Holdings Capital Corp† 5.13% 01/05/2023 8,871,030 0.25
10,262,000 CCO Holdings LLC/CCO Holdings Capital Corp† 5.25% 30/09/2022 10,395,714 0.30
20,605,000 CCO Holdings LLC/CCO Holdings Capital Corp† 5.75% 15/02/2026 21,776,806 0.62
7,821,000 CDK Global Inc† 4.88% 01/06/2027 8,279,096 0.24
5,835,000 CDW LLC/CDW Finance Corp† 5.00% 01/09/2025 6,109,741 0.17
8,285,000 Cedar Fair LP† 5.25% 15/07/2029 8,942,415 0.26
7,245,000 Cedar Fair LP/Canada's Wonderland Co/Magnum Management Corp/Millennium Op* 5.38% 15/04/2027 7,813,026 0.22
6,600,000 Centene Corp* 4.75% 15/05/2022 6,743,748 0.19
8,935,000 Centennial Resource Production LLC† 6.88% 01/04/2027 9,313,152 0.27
18,350,000 Cheniere Energy Partners LP† 5.25% 01/10/2025 19,168,043 0.55
5,227,600 Chesapeake Energy Corp† 11.50% 01/01/2025 4,992,358 0.14
19,520,000 Churchill Downs Inc† 5.50% 01/04/2027 20,727,312 0.59
15,891,000 Clear Channel Worldwide Holdings Inc† 5.13% 15/08/2027 16,576,697 0.47
6,115,000 Cleveland-Cliffs Inc† 5.88% 01/06/2027 5,881,713 0.17
4,930,000 Colfax Corp† 6.00% 15/02/2024 5,248,404 0.15
5,390,000 Colfax Corp† 6.38% 15/02/2026 5,881,837 0.17
5,615,000 CommScope Inc† 6.00% 01/03/2026 5,983,479 0.17
9,585,000 CommScope Inc† 8.25% 01/03/2027 10,105,945 0.29
17,062,000 CommScope Technologies LLC† 5.00% 15/03/2027 16,081,362 0.46
20,308,000 CommScope Technologies LLC† 6.00% 15/06/2025 20,381,718 0.58
11,030,000 Connect Finco Sarl/Connect US Finco LLC† 6.75% 01/10/2026 11,760,737 0.34
9,130,000 Core & Main LP† 6.13% 15/08/2025 9,495,109 0.27
14,470,000 Crown Americas LLC/Crown Americas Capital Corp VI† 4.75% 01/02/2026 15,325,141 0.44
21,760,000 CrownRock LP/CrownRock Finance Inc† 5.63% 15/10/2025 22,249,382 0.64
13,680,000 CSC Holdings LLC† 5.50% 15/05/2026 14,515,335 0.41

SCHEDULE OF INVESTMENTS FINANCIAL STATEMENTS
ANNUAL REPORT 2019 67
Neuberger Berman High Yield Bond Fund (Continued)
Schedule of Investments (Continued)
Financial Assets at Fair Value through Profit or Loss (continued)
Principal Amount Security Description Coupon Maturity
DateFair Value
US$% of Net
Assets
Corporate Bonds 88.98% (31 December 2018: 85.96%) (continued)
United States Dollar (continued)
9,855,000 CSC Holdings LLC† 5.50% 15/04/2027 10,601,023 0.30
14,945,000 CSC Holdings LLC† 5.75% 15/01/2030 15,972,469 0.46
7,755,000 CSC Holdings LLC† 6.50% 01/02/2029 8,661,366 0.25
11,970,000 CSC Holdings LLC† 7.50% 01/04/2028 13,553,900 0.39
9,065,000 CSC Holdings LLC† 7.75% 15/07/2025 9,687,765 0.28
15,642,000 CSC Holdings LLC† 10.88% 15/10/2025 17,509,264 0.50
3,515,000 Cumulus Media New Holdings Inc† 6.75% 01/07/2026 3,772,031 0.11
8,997,000 Daddy Operating Co LLC/GD Finance Co Inc† 5.25% 01/12/2027 9,485,987 0.27
8,185,000 DCP Midstream Operating LP* 5.60% 01/04/2044 7,947,103 0.23
10,355,000 DCP Midstream Operating LP† 5.85% 21/05/2043 9,665,719 0.28
3,845,000 Diamond Sports Group LLC/Diamond Sports Finance Co† 6.63% 15/08/2027 3,746,376 0.11
11,670,000 DISH DBS Corp† 5.88% 15/11/2024 11,949,613 0.34
10,165,000 Eagle Holding Co II LLC† 7.75% 15/05/2022 10,339,431 0.30
11,238,000 Edgewell Personal Care Co* 4.70% 24/05/2022 11,687,441 0.33
9,775,000 Element Solutions Inc† 5.88% 01/12/2025 10,251,434 0.29
8,082,000 Endo Dac/Endo Finance LLC/Endo Finco Inc† 6.00% 15/07/2023 5,859,369 0.17
3,555,000 Energizer Holdings Inc† 5.50% 15/06/2025 3,695,725 0.11
8,855,000 Energizer Holdings Inc† 6.38% 15/07/2026 9,446,957 0.27
19,750,000 Energizer Holdings Inc† 7.75% 15/01/2027 22,108,150 0.63
5,360,000 EnerSys† 4.38% 15/12/2027 5,306,936 0.15
5,840,000 Enviva Partners LP/Enviva Partners Finance Corp† 6.50% 15/01/2026 6,267,079 0.18
7,940,000 ESH Hospitality Inc† 4.63% 01/10/2027 8,053,939 0.23
15,865,000 ESH Hospitality Inc† 5.25% 01/05/2025 16,433,522 0.47
4,460,000 Everi Payments Inc† 7.50% 15/12/2025 4,796,351 0.14
11,035,000 Extraction Oil & Gas Inc† 5.63% 01/02/2026 6,652,422 0.19
3,510,000 First Quantum Minerals Ltd† 6.88% 01/03/2026 3,560,368 0.10
10,260,000 Freeport-McMoRan Inc* 3.55% 01/03/2022 10,406,513 0.30
5,185,000 Freeport-McMoRan Inc* 5.00% 01/09/2027 5,453,842 0.16
6,760,000 Freeport-McMoRan Inc* 5.25% 01/09/2029 7,254,494 0.21
1,285,000 Freeport-McMoRan Inc* 5.40% 14/11/2034 1,349,022 0.04
15,810,000 Freeport-McMoRan Inc* 5.45% 15/03/2043 16,404,456 0.47
10,135,000 frontdoor Inc† 6.75% 15/08/2026 11,076,009 0.32
21,720,000 Frontier Communications Corp† 8.00% 01/04/2027 22,737,582 0.65
18,230,000 Garda World Security Corp† 8.75% 15/05/2025 19,004,593 0.54
8,695,000 Genesis Energy LP/Genesis Energy Finance Corp* 6.25% 15/05/2026 8,328,484 0.24
7,835,000 Genesis Energy LP/Genesis Energy Finance Corp* 6.50% 01/10/2025 7,599,872 0.22
9,735,000 Global Aircraft Leasing Co Ltd† 6.50% 15/09/2024 10,182,323 0.29

FINANCIAL STATEMENTS SCHEDULE OF INVESTMENTS
68 NEUBERGER BERMAN INVESTMENT FUNDS PLC
Neuberger Berman High Yield Bond Fund (Continued)
Schedule of Investments (Continued)
Financial Assets at Fair Value through Profit or Loss (continued)
Principal Amount Security Description Coupon Maturity
DateFair Value
US$% of Net
Assets
Corporate Bonds 88.98% (31 December 2018: 85.96%) (continued)
United States Dollar (continued) 6,120,000 Global Partners LP/GLP Finance Corp† 7.00% 01/08/2027 6,519,927 0.19
4,360,000 Granite Holdings US Acquisition Co† 11.00% 01/10/2027 4,426,915 0.13
10,210,000 Gray Television Inc† 7.00% 15/05/2027 11,364,751 0.32
5,830,000 GTCR AP Finance Inc† 8.00% 15/05/2027 6,079,801 0.17
5,282,000 GW B-CR Security Corp† 9.50% 01/11/2027 5,648,307 0.16
15,315,000 Harsco Corp† 5.75% 31/07/2027 16,368,595 0.47
2,715,000 HB Fuller Co* 4.00% 15/02/2027 2,696,596 0.08
8,795,000 HCA Inc* 7.69% 15/06/2025 10,623,612 0.30
4,675,000 Hertz Corp† 5.50% 15/10/2024 4,801,622 0.14
20,770,000 Hertz Corp† 6.00% 15/01/2028 20,808,424 0.59
12,840,000 Hertz Corp† 7.13% 01/08/2026 13,929,795 0.40
23,585,000 HUB International Ltd† 7.00% 01/05/2026 25,000,690 0.71
5,259,000 Hudbay Minerals Inc† 7.63% 15/01/2025 5,561,840 0.16
9,615,000 IAA Inc† 5.50% 15/06/2027 10,233,725 0.29
5,445,000 iHeartCommunications Inc† 5.25% 15/08/2027 5,707,177 0.16
8,555,000 iHeartCommunications Inc† 6.38% 01/05/2026 9,298,207 0.27
7,935,000 iHeartCommunications Inc† 8.38% 01/05/2027 8,782,855 0.25
31,225,000 Intelsat Jackson Holdings SA* 5.50% 01/08/2023 26,888,628 0.77
11,410,000 IQVIA Inc† 5.00% 15/10/2026 12,064,050 0.34
14,884,000 Iron Mountain Inc† 4.88% 15/09/2027 15,402,298 0.44
13,295,000 Iron Mountain Inc† 4.88% 15/09/2029 13,535,939 0.39
31,511,000 Iron Mountain Inc† 5.25% 15/03/2028 32,829,735 0.94
3,375,000 Iron Mountain Inc* 6.00% 15/08/2023 3,453,756 0.10
5,035,000 Iron Mountain US Holdings Inc† 5.38% 01/06/2026 5,275,912 0.15
11,535,000 j2 Cloud Services LLC/j2 Cloud Co-Obligor Inc† 6.00% 15/07/2025 12,251,150 0.35
2,730,000 JELD-WEN Inc† 4.63% 15/12/2025 2,818,493 0.08
9,665,000 JELD-WEN Inc† 4.88% 15/12/2027 9,909,984 0.28
22,175,000 KAR Auction Services Inc† 5.13% 01/06/2025 23,108,235 0.66
15,860,000 KFC Holding Co/Pizza Hut Holdings LLC/Taco Bell of America LLC† 5.25% 01/06/2026 16,772,346 0.48
6,385,000 Korn Ferry† 4.63% 15/12/2027 6,432,887 0.18
15,500,000 L Brands Inc* 5.25% 01/02/2028 14,714,925 0.42
4,825,000 Lamar Media Corp† 5.00% 01/05/2023 4,921,452 0.14
4,210,000 Lamar Media Corp† 5.75% 01/02/2026 4,469,968 0.13
8,720,000 Lennar Corp† 5.38% 01/10/2022 9,333,121 0.27
1,285,000 Lennar Corp* 8.38% 15/01/2021 1,362,614 0.04
11,700,000 Level 3 Financing Inc† 4.63% 15/09/2027 12,000,105 0.34
9,250,000 Level 3 Financing Inc* 5.13% 01/05/2023 9,327,099 0.27

SCHEDULE OF INVESTMENTS FINANCIAL STATEMENTS
ANNUAL REPORT 2019 69
Neuberger Berman High Yield Bond Fund (Continued)
Schedule of Investments (Continued)
Financial Assets at Fair Value through Profit or Loss (continued)
Principal Amount Security Description Coupon Maturity
DateFair Value
US$% of Net
Assets
Corporate Bonds 88.98% (31 December 2018: 85.96%) (continued)
United States Dollar (continued) 12,205,000 Level 3 Financing Inc* 5.38% 15/01/2024 12,438,909 0.36
5,410,000 Liberty Interactive LLC† 8.50% 15/07/2029 5,378,067 0.15
6,185,000 Lions Gate Capital Holdings LLC† 5.88% 01/11/2024 6,295,804 0.18
10,405,000 Live Nation Entertainment Inc† 4.75% 15/10/2027 10,788,424 0.31
8,105,000 Live Nation Entertainment Inc† 4.88% 01/11/2024 8,408,856 0.24
6,790,000 LPL Holdings Inc† 4.63% 15/11/2027 6,942,775 0.20
24,075,000 LPL Holdings Inc† 5.75% 15/09/2025 25,248,415 0.72
5,200,000 Masonite International Corp† 5.38% 01/02/2028 5,502,120 0.16
5,985,000 Masonite International Corp† 5.75% 15/09/2026 6,376,105 0.18
10,200,000 Matador Resources Co† 5.88% 15/09/2026 10,251,255 0.29
7,164,000 Match Group Inc† 5.63% 15/02/2029 7,650,059 0.22
6,290,000 Mauser Packaging Solutions Holding Co† 5.50% 15/04/2024 6,494,991 0.19
9,175,000 Mauser Packaging Solutions Holding Co† 7.25% 15/04/2025 9,083,158 0.26
22,445,000 MPH Acquisition Holdings LLC† 7.13% 01/06/2024 21,771,426 0.62
5,730,000 MPT Operating Partnership LP/MPT Finance Corp* 5.25% 01/08/2026 6,066,709 0.17
11,185,000 MPT Operating Partnership LP/MPT Finance Corp* 5.50% 01/05/2024 11,492,588 0.33
13,465,000 MPT Operating Partnership LP/MPT Finance Corp* 6.38% 01/03/2024 14,020,027 0.40
17,705,000 Netflix Inc† 4.88% 15/04/2028 18,434,889 0.53
10,520,000 Netflix Inc† 4.88% 15/06/2030 10,703,837 0.31
11,140,000 Netflix Inc† 5.38% 15/11/2029 11,884,486 0.34
7,550,000 Netflix Inc† 5.50% 15/02/2022 8,012,438 0.23
9,540,000 Netflix Inc† 5.88% 15/11/2028 10,593,311 0.30
19,705,000 Netflix Inc† 6.38% 15/05/2029 22,475,523 0.64
16,275,000 Nexstar Broadcasting Inc† 5.63% 15/07/2027 17,180,704 0.49
9,160,000 Nielsen Co Luxembourg Sarl† 5.00% 01/02/2025 9,457,608 0.27
6,205,000 Nielsen Finance LLC/Nielsen Finance Co* 4.50% 01/10/2020 6,220,513 0.18
21,820,000 Nielsen Finance LLC/Nielsen Finance Co† 5.00% 15/04/2022 21,940,665 0.63
10,685,000 NOVA Chemicals Corp† 4.88% 01/06/2024 11,054,541 0.32
13,135,000 Novelis Corp† 5.88% 30/09/2026 14,007,525 0.40
3,540,000 Novelis Corp† 6.25% 15/08/2024 3,721,390 0.11
29,800,000 NRG Energy Inc* 6.63% 15/01/2027 32,388,130 0.92
12,465,000 NRG Energy Inc* 7.25% 15/05/2026 13,641,073 0.39
6,900,000 Olin Corp* 5.00% 01/02/2030 7,016,265 0.20
9,415,000 Olin Corp* 5.63% 01/08/2029 9,961,541 0.28
14,815,000 Open Text Corp† 5.88% 01/06/2026 15,879,458 0.45
21,900,000 Ortho-Clinical Diagnostics Inc/Ortho-Clinical Diagnostics SA† 6.63% 15/05/2022 21,817,733 0.62
11,904,000 Outfront Media Capital LLC/Outfront Media Capital Corp† 5.00% 15/08/2027 12,491,462 0.36

FINANCIAL STATEMENTS SCHEDULE OF INVESTMENTS
70 NEUBERGER BERMAN INVESTMENT FUNDS PLC
Neuberger Berman High Yield Bond Fund (Continued)
Schedule of Investments (Continued)
Financial Assets at Fair Value through Profit or Loss (continued)
Principal Amount Security Description Coupon Maturity
DateFair Value
US$% of Net
Assets
Corporate Bonds 88.98% (31 December 2018: 85.96%) (continued)
United States Dollar (continued) 14,304,000 PDC Energy Inc† 5.75% 15/05/2026 14,304,358 0.41
11,165,000 Penske Automotive Group Inc* 5.50% 15/05/2026 11,715,993 0.33
4,270,000 Penske Automotive Group Inc* 5.75% 01/10/2022 4,339,358 0.12
13,235,000 Performance Food Group Inc† 5.50% 15/10/2027 14,178,325 0.40
5,215,000 Polaris Intermediate Corp† 8.50% 01/12/2022 4,869,472 0.14
8,800,000 Post Holdings Inc† 5.50% 01/03/2025 9,236,348 0.26
7,075,000 Post Holdings Inc† 5.63% 15/01/2028 7,636,401 0.22
5,900,000 Post Holdings Inc† 5.75% 01/03/2027 6,341,453 0.18
10,995,000 Precision Drilling Corp* 5.25% 15/11/2024 10,119,963 0.29
3,820,000 Precision Drilling Corp† 7.13% 15/01/2026 3,639,877 0.10
985,000 Precision Drilling Corp† 7.75% 15/12/2023 985,409 0.03
31,300,000 Prime Security Services Borrower LLC/Prime Finance Inc† 5.75% 15/04/2026 34,078,000 0.97
6,917,000 Prime Security Services Borrower LLC/Prime Finance Inc† 9.25% 15/05/2023 7,267,173 0.21
806,000 QVC Inc† 5.45% 15/08/2034 773,688 0.02
27,055,000 Rackspace Hosting Inc† 8.63% 15/11/2024 26,513,900 0.76
5,430,000 Radiate Holdco LLC/Radiate Finance Inc† 6.63% 15/02/2025 5,500,128 0.16
9,345,000 Range Resources Corp* 4.88% 15/05/2025 8,013,338 0.23
5,125,000 Range Resources Corp* 5.00% 15/03/2023 4,726,839 0.14
6,600,000 RBS Global Inc/Rexnord LLC† 4.88% 15/12/2025 6,830,934 0.20
7,025,000 Realogy Group LLC/Realogy Co-Issuer Corp† 4.88% 01/06/2023 6,919,625 0.20
14,990,000 Realogy Group LLC/Realogy Co-Issuer Corp† 9.38% 01/04/2027 15,679,315 0.45
7,400,000 Resideo Funding Inc† 6.13% 01/11/2026 7,474,185 0.21
14,755,000 Reynolds Group Issuer Inc/Reynolds Group Issuer LLC/Reynolds Group Issuer Lu† 5.13% 15/07/2023 15,136,195 0.43
11,260,000 Ritchie Bros Auctioneers Inc† 5.38% 15/01/2025 11,762,027 0.34
15,065,000 Scientific Games International Inc† 7.00% 15/05/2028 16,147,420 0.46
3,555,000 Scientific Games International Inc† 7.25% 15/11/2029 3,872,639 0.11
14,105,000 Select Medical Corp† 6.25% 15/08/2026 15,294,827 0.44
9,740,000 Sensata Technologies UK Financing Co Plc† 6.25% 15/02/2026 10,512,869 0.30
15,550,000 Service Corp International* 5.38% 15/05/2024 16,048,922 0.46
13,275,000 ServiceMaster Co LLC† 5.13% 15/11/2024 13,800,491 0.39
5,510,000 Shea Homes LP/Shea Homes Funding Corp† 6.13% 01/04/2025 5,718,912 0.16
8,490,000 Signature Aviation US Holdings Inc† 5.38% 01/05/2026 8,956,377 0.26
4,865,000 Sinclair Television Group Inc† 5.13% 15/02/2027 5,012,641 0.14
540,000 Sinclair Television Group Inc† 5.88% 15/03/2026 569,213 0.02
3,268,000 Sirius XM Radio Inc† 4.63% 15/05/2023 3,323,834 0.09
11,775,000 Sirius XM Radio Inc† 4.63% 15/07/2024 12,388,301 0.35
7,640,000 Sirius XM Radio Inc† 5.00% 01/08/2027 8,074,334 0.23

SCHEDULE OF INVESTMENTS FINANCIAL STATEMENTS
ANNUAL REPORT 2019 71
Neuberger Berman High Yield Bond Fund (Continued)
Schedule of Investments (Continued)
Financial Assets at Fair Value through Profit or Loss (continued)
Principal Amount Security Description Coupon Maturity
DateFair Value
US$% of Net
Assets
Corporate Bonds 88.98% (31 December 2018: 85.96%) (continued)
United States Dollar (continued) 13,205,000 Sirius XM Radio Inc† 5.38% 15/07/2026 14,059,529 0.40
19,825,000 Sirius XM Radio Inc† 5.50% 01/07/2029 21,472,259 0.61
6,874,000 Six Flags Entertainment Corp† 4.88% 31/07/2024 7,137,515 0.20
6,830,000 Six Flags Entertainment Corp† 5.50% 15/04/2027 7,295,123 0.21
7,445,000 SM Energy Co* 6.63% 15/01/2027 7,334,646 0.21
12,985,000 Solera LLC/Solera Finance Inc† 10.50% 01/03/2024 13,804,938 0.39
13,480,000 Spectrum Brands Inc* 5.75% 15/07/2025 14,103,585 0.40
1,840,000 Spectrum Brands Inc* 6.13% 15/12/2024 1,905,164 0.05
2,775,000 Sprint Capital Corp* 8.75% 15/03/2032 3,373,290 0.10
48,225,000 Sprint Corp* 7.13% 15/06/2024 52,123,268 1.49
9,605,000 Sprint Corp* 7.63% 01/03/2026 10,610,163 0.30
12,185,000 Sprint Corp* 7.88% 15/09/2023 13,469,482 0.38
27,244,000 SS&C Technologies Inc† 5.50% 30/09/2027 29,134,053 0.83
23,690,000 Staples Inc† 7.50% 15/04/2026 24,622,770 0.70
9,790,000 Staples Inc† 10.75% 15/04/2027 9,954,962 0.28
13,075,000 Starfruit Finco BV/Starfruit US Holdco LLC* 8.00% 01/10/2026 13,892,514 0.40
8,695,000 Starwood Property Trust Inc† 3.63% 01/02/2021 8,774,559 0.25
3,045,000 Starwood Property Trust Inc† 4.75% 15/03/2025 3,221,351 0.09
4,115,000 Summit Midstream Holdings LLC/Summit Midstream Finance Corp* 5.50% 15/08/2022 3,673,921 0.10
17,775,000 Summit Midstream Holdings LLC/Summit Midstream Finance Corp* 5.75% 15/04/2025 13,627,470 0.39
3,655,000 Talen Energy Supply LLC† 6.63% 15/01/2028 3,738,508 0.11
10,410,000 Talen Energy Supply LLC† 7.25% 15/05/2027 10,972,661 0.31
12,955,000 Talen Energy Supply LLC† 10.50% 15/01/2026 12,353,532 0.35
17,095,000 Tallgrass Energy Partners LP/Tallgrass Energy Finance Corp† 5.50% 15/01/2028 16,792,803 0.48
7,370,000 Targa Resources Partners LP/Targa Resources Partners Finance Corp† 5.13% 01/02/2025 7,664,726 0.22
2,001,000 Targa Resources Partners LP/Targa Resources Partners Finance Corp† 5.38% 01/02/2027 2,079,739 0.06
8,915,000 Targa Resources Partners LP/Targa Resources Partners Finance Corp† 5.50% 01/03/2030 9,171,306 0.26
9,788,000 Targa Resources Partners LP/Targa Resources Partners Finance Corp* 6.75% 15/03/2024 10,167,187 0.29
5,320,000 Taylor Morrison Communities Inc† 5.88% 15/06/2027 5,864,356 0.17
3,341,000 Taylor Morrison Communities Inc/Taylor Morrison Holdings II Inc† 5.63% 01/03/2024 3,618,019 0.10
4,260,000 Team Health Holdings Inc† 6.38% 01/02/2025 2,855,968 0.08
7,645,000 TEGNA Inc† 5.00% 15/09/2029 7,788,344 0.22
16,800,000 Telenet Finance Luxembourg Notes Sarl† 5.50% 01/03/2028 18,014,422 0.51
11,475,000 Tenet Healthcare Corp* 6.75% 15/06/2023 12,631,623 0.36
13,685,000 Tenet Healthcare Corp* 8.13% 01/04/2022 15,163,391 0.43
20,931,000 Terex Corp† 5.63% 01/02/2025 21,637,421 0.62
37,095,000 T-Mobile USA Inc* 6.00% 01/03/2023 0 0.00

FINANCIAL STATEMENTS SCHEDULE OF INVESTMENTS
72 NEUBERGER BERMAN INVESTMENT FUNDS PLC
Neuberger Berman High Yield Bond Fund (Continued)
Schedule of Investments (Continued)
Financial Assets at Fair Value through Profit or Loss (continued)
Principal Amount Security Description Coupon Maturity
DateFair Value
US$% of Net
Assets
Corporate Bonds 88.98% (31 December 2018: 85.96%) (continued)
United States Dollar (continued) 8,905,000 T-Mobile USA Inc* 6.00% 15/04/2024 1 0.00
4,905,000 T-Mobile USA Inc† 6.00% 15/04/2024 5,076,626 0.15
6,775,000 Toll Brothers Finance Corp* 4.38% 15/04/2023 7,116,562 0.20
15,150,000 TransDigm Inc† 5.50% 15/11/2027 15,348,162 0.44
23,585,000 TransDigm Inc† 6.25% 15/03/2026 25,577,555 0.73
9,390,000 TransDigm Inc* 6.38% 15/06/2026 9,976,499 0.28
16,265,000 TransDigm Inc* 7.50% 15/03/2027 17,820,747 0.51
4,150,000 TransDigm UK Holdings Plc† 6.88% 15/05/2026 4,431,567 0.13
8,755,000 Trident TPI Holdings Inc† 9.25% 01/08/2024 8,868,071 0.25
1,800,000 Tronox Finance Plc† 5.75% 01/10/2025 1,838,943 0.05
3,740,000 Tronox Inc† 6.50% 15/04/2026 3,862,392 0.11
2,580,000 Twin River Worldwide Holdings Inc† 6.75% 01/06/2027 2,703,447 0.08
4,340,000 United Rentals North America Inc* 5.50% 15/05/2027 4,660,270 0.13
8,210,000 Univar Solutions USA Inc† 5.13% 01/12/2027 8,584,622 0.25
9,924,048 VICI Properties 1 LLC/VICI FC Inc† 8.00% 15/10/2023 10,784,116 0.31
5,250,000 Virgin Media Finance Plc† 6.00% 15/10/2024 5,422,804 0.15
16,690,000 Vistra Operations Co LLC† 5.00% 31/07/2027 17,471,593 0.50
7,740,000 Vistra Operations Co LLC† 5.50% 01/09/2026 8,222,376 0.23
9,990,000 Vistra Operations Co LLC† 5.63% 15/02/2027 10,545,444 0.30
7,485,000 Vizient Inc† 6.25% 15/05/2027 8,030,264 0.23
7,460,000 West Street Merger Sub Inc† 6.38% 01/09/2025 7,459,925 0.21
26,505,000 Western Digital Corp† 4.75% 15/02/2026 27,681,159 0.79
4,390,000 William Carter Co† 5.63% 15/03/2027 4,729,446 0.14
9,890,000 WPX Energy Inc* 5.25% 15/09/2024 10,532,751 0.30
2,560,000 WPX Energy Inc* 5.75% 01/06/2026 2,738,746 0.08
11,115,000 WR Grace & Co-Conn† 5.13% 01/10/2021 11,608,839 0.33
18,575,000 Wynn Las Vegas LLC/Wynn Las Vegas Capital Corp† 5.50% 01/03/2025 19,944,721 0.57
15,675,000 Zayo Group LLC/Zayo Capital Inc† 5.75% 15/01/2027 15,974,353 0.46
10,410,000 Zayo Group LLC/Zayo Capital Inc* 6.00% 01/04/2023 10,665,930 0.30
6,390,000 Zayo Group LLC/Zayo Capital Inc* 6.38% 15/05/2025 6,600,327 0.19
Total Corporate Bonds 3,115,732,226 88.98
Term Loans 5.02% (31 December 2018: 6.69%)
United States Dollar 12,433,879 Altice France SA 5.74% 14/08/2026 12,481,812 0.36
1,423,771 Asurion LLC 4.80% 03/11/2023 1,433,943 0.04
4,083,904 Asurion LLC 4.80% 03/11/2024 4,112,349 0.12

SCHEDULE OF INVESTMENTS FINANCIAL STATEMENTS
ANNUAL REPORT 2019 73
Neuberger Berman High Yield Bond Fund (Continued)
Schedule of Investments (Continued)
Financial Assets at Fair Value through Profit or Loss (continued)
Principal Amount Security Description Coupon Maturity
DateFair Value
US$% of Net
Assets
Term Loans 5.02% (31 December 2018: 6.69%) (continued)
United States Dollar (continued)
3,578,359 Asurion LLC 8.30% 04/08/2025 3,630,692 0.10
18,781,640 Bass Pro Group LLC 6.80% 25/09/2024 18,762,107 0.54
5,730,305 BCP Raptor LLC 6.05% 24/06/2024 5,319,642 0.15
5,741,071 Brazos Delaware II LLC 5.79% 21/05/2025 4,937,321 0.14
6,368,354 BWay Holding Co 5.23% 03/04/2024 6,358,420 0.18
9,630,607 Forterra Finance LLC 4.80% 25/10/2023 9,446,037 0.27
12,605,357 Frontier Communications Corp 5.55% 15/06/2024 12,693,784 0.36
6,922,650 Granite US Holdings Corp 7.21% 30/09/2026 6,957,263 0.20
5,485,000 Intelsat Jackson Holdings SA 5.68% 27/11/2023 5,504,088 0.16
3,699,374 Lower Cadence Holdings LLC 5.80% 22/05/2026 3,669,335 0.10
1,373,811 Medallion Midland Acquisition LLC 5.05% 30/10/2024 1,363,508 0.04
3,604,675 Mohegan Tribal Gaming Authority 5.80% 13/10/2023 3,486,550 0.10
12,175,847 Seaworld Parks & Entertainment Inc 4.80% 01/04/2024 12,254,503 0.35
7,806,150 Sedgwick Claims Management Services Inc 5.05% 31/12/2025 7,820,786 0.22
2,736,250 Sedgwick Claims Management Services Inc 5.80% 03/09/2026 2,764,762 0.08
5,462,412 Sprint Communications Inc 4.81% 02/02/2024 5,447,609 0.16
15,415,478 Staples Inc 6.69% 16/04/2026 15,185,247 0.43
12,159,493 Sunshine Luxembourg VII Sarl 6.19% 01/10/2026 12,290,816 0.35
8,364,773 Team Health Holdings Inc 4.55% 06/02/2024 6,812,062 0.19
5,800,339 Tivity Health Inc 6.05% 08/03/2024 5,818,465 0.17
7,374,646 Tivity Health Inc 7.05% 06/03/2026 7,394,926 0.21
Total Term Loans † 175,946,027 5.02
Number of Shares Security Description Fair Value
US$% of Net
Assets
Investment Funds 1.20% (31 December 2018: 1.97%)
Pound Sterling 34,064,306 NB Global Floating Rate Income Fund Ltd 41,877,566 1.20
Total Investment Funds μ 41,877,566 1.20
Total Investments 3,333,555,819 95.20
Forward Currency Contracts 2.28% (31 December 2018: 0.78%)
Amount Receivable
Amount Payable
Maturity Date Counterparty Contracts Unrealised
Gain US$% of Net
Assets
AUD 1,585 US$ 1,073 22/01/2020 Goldman Sachs International 1 42 0.00
CHF 269 US$ 273 22/01/2020 Westpac Banking Corp 1 6 0.00
CNY 307,795 US$ 43,071 22/01/2020 Westpac Banking Corp 1 1,105 0.00
€ 32,607 US$ 36,131 22/01/2020 UBS AG 1 515 0.00

FINANCIAL STATEMENTS SCHEDULE OF INVESTMENTS
74 NEUBERGER BERMAN INVESTMENT FUNDS PLC
Neuberger Berman High Yield Bond Fund (Continued)
Schedule of Investments (Continued)
Financial Assets at Fair Value through Profit or Loss (continued)
Forward Currency Contracts 2.28% (31 December 2018: 0.78%) (continued)
Amount Receivable
Amount Payable
Maturity Date Counterparty Contracts Unrealised
Gain US$% of Net
Assets
£ 4,533,301 US$ 5,823,954 22/01/2020 Goldman Sachs International 1 184,946 0.00
ZAR 562,711 US$ 36,641 22/01/2020 Westpac Banking Corp 1 3,496 0.00
AUD Hedged Classes AUD 140,606,605 US$ 94,808,652 22/01/2020 Goldman Sachs International 4 4,079,093 0.12
AUD 138,610,245 US$ 93,417,182 22/01/2020 UBS AG 2 4,066,535 0.12
AUD 127,808,685 US$ 86,243,147 22/01/2020 Westpac Banking Corp 32 3,643,904 0.10
CAD Hedged Classes CAD 3,450,973 US$ 2,593,196 22/01/2020 Goldman Sachs International 4 68,356 0.00
CAD 3,368,181 US$ 2,529,131 22/01/2020 UBS AG 1 68,567 0.00
CAD 3,165,854 US$ 2,378,480 22/01/2020 Westpac Banking Corp 8 63,174 0.00
CHF Hedged Classes CHF 4,554,539 US$ 4,591,070 22/01/2020 Goldman Sachs International 3 118,814 0.00
CHF 4,452,917 US$ 4,492,931 22/01/2020 UBS AG 1 111,866 0.00
CHF 4,404,149 US$ 4,448,665 22/01/2020 Westpac Banking Corp 12 105,702 0.00
CNY Hedged Classes CNY 118,000,948 US$ 16,509,716 22/01/2020 Goldman Sachs International 3 426,288 0.01
CNY 117,279,010 US$ 16,399,993 22/01/2020 UBS AG 2 432,395 0.01
CNY 102,836,283 US$ 14,381,193 22/01/2020 Westpac Banking Corp 3 378,314 0.01
EUR Hedged Classes € 166,211,034 US$ 183,505,461 22/01/2020 Goldman Sachs International 6 3,293,845 0.10
€ 161,308,474 US$ 178,167,146 22/01/2020 UBS AG 1 3,122,329 0.09
€ 145,095,228 US$ 160,250,043 22/01/2020 Westpac Banking Corp 41 2,817,879 0.08
GBP Hedged Classes £ 85,819,117 US$ 106,044,986 22/01/2020 Goldman Sachs International 6 7,708,448 0.22
£ 84,831,705 US$ 104,821,448 22/01/2020 UBS AG 1 7,623,169 0.22
£ 77,320,196 US$ 95,736,570 22/01/2020 Westpac Banking Corp 43 6,751,525 0.19
US$ 1,363,266 £ 1,020,570 22/01/2020 Westpac Banking Corp 4 10,499 0.00
HKD Hedged Classes HKD 34,551,035 US$ 4,410,530 22/01/2020 Goldman Sachs International 4 22,721 0.00
HKD 32,420,802 US$ 4,137,419 22/01/2020 UBS AG 1 22,502 0.00
HKD 28,204,297 US$ 3,599,329 22/01/2020 Westpac Banking Corp 3 19,571 0.00
US$ 100,289 HKD 781,549 22/01/2020 Westpac Banking Corp 1 9 0.00
JPY Hedged Classes ¥ 41,792 US$ 383 22/01/2020 Goldman Sachs International 2 2 0.00
US$ 62,030 ¥ 6,595,151 22/01/2020 Goldman Sachs International 2 1,276 0.00
US$ 61,711 ¥ 6,560,093 22/01/2020 UBS AG 1 1,281 0.00
US$ 52,895 ¥ 5,622,938 22/01/2020 Westpac Banking Corp 1 1,098 0.00

SCHEDULE OF INVESTMENTS FINANCIAL STATEMENTS
ANNUAL REPORT 2019 75
Neuberger Berman High Yield Bond Fund (Continued)
Schedule of Investments (Continued)
Financial Assets at Fair Value through Profit or Loss (continued)
Forward Currency Contracts 2.28% (31 December 2018: 0.78%) (continued)
Amount Receivable
Amount Payable
Maturity Date Counterparty Contracts Unrealised
Gain US$% of Net
Assets
SEK Hedged Classes SEK 50,071,009 US$ 5,099,519 22/01/2020 Goldman Sachs International 8 254,525 0.01
SEK 48,365,926 US$ 4,920,204 22/01/2020 UBS AG 1 251,517 0.01
SEK 44,001,884 US$ 4,480,489 22/01/2020 Westpac Banking Corp 26 224,590 0.01
US$ 30,530 SEK 285,232 22/01/2020 Westpac Banking Corp 6 30 0.00
SGD Hedged Classes SGD 16,038,821 US$ 11,630,029 22/01/2020 Goldman Sachs International 4 299,429 0.01
SGD 15,530,425 US$ 11,256,582 22/01/2020 UBS AG 1 294,737 0.01
SGD 13,787,533 US$ 9,993,965 22/01/2020 Westpac Banking Corp 20 261,016 0.01
ZAR Hedged Classes ZAR 1,871,797,316 US$ 121,732,010 22/01/2020 Goldman Sachs International 4 11,781,165 0.34
ZAR 1,799,891,835 US$ 117,047,104 22/01/2020 UBS AG 1 11,337,136 0.32
ZAR 1,655,257,510 US$ 108,032,103 22/01/2020 Westpac Banking Corp 29 10,035,536 0.29
Total Unrealised Gain on Forward Currency Contracts ∞ 79,888,953 2.28
Fair Value % of Net
US$ Assets
Total Financial Assets at Fair Value through Profit or Loss 3,413,444,772 97.48
Financial Liabilities at Fair Value through Profit or Loss
Forward Currency Contracts (0.55%) (31 December 2018: (0.49%))
Amount Receivable
Amount Payable
Maturity Date Counterparty Contracts Unrealised
Loss US$% of Net
Assets
US$ 2,060,833 £ 1,593,868 22/01/2020 Goldman Sachs International 1 (51,843) (0.00)
US$ 52,477,938 £ 42,121,621 22/01/2020 UBS AG 1 (3,354,366) (0.10)
AUD Hedged Classes US$ 5,435,987 AUD 8,036,190 22/01/2020 Goldman Sachs International 8 (215,815) (0.01)
US$ 3,591,613 AUD 5,331,144 22/01/2020 UBS AG 1 (157,747) (0.01)
US$ 12,190,261 AUD 17,875,806 22/01/2020 Westpac Banking Corp 68 (381,685) (0.01)
CAD Hedged Classes US$ 1,377,331 CAD 1,833,108 22/01/2020 Goldman Sachs International 4 (36,448) (0.00)
US$ 1,339,957 CAD 1,784,493 22/01/2020 UBS AG 1 (36,327) (0.00)
US$ 1,154,310 CAD 1,536,963 22/01/2020 Westpac Banking Corp 5 (31,067) (0.00)
CHF Hedged Classes US$ 1,267,590 CHF 1,257,550 22/01/2020 Goldman Sachs International 2 (32,852) (0.00)
US$ 1,160,710 CHF 1,150,373 22/01/2020 UBS AG 1 (28,900) (0.00)
US$ 1,703,238 CHF 1,683,491 22/01/2020 Westpac Banking Corp 13 (37,674) (0.00)

FINANCIAL STATEMENTS SCHEDULE OF INVESTMENTS
76 NEUBERGER BERMAN INVESTMENT FUNDS PLC
Neuberger Berman High Yield Bond Fund (Continued)
Schedule of Investments (Continued)
Financial Liabilities at Fair Value through Profit or Loss (continued)
Forward Currency Contracts (0.55%) (31 December 2018: (0.49%)) (continued)
Amount Receivable
Amount Payable
Maturity Date Counterparty Contracts Unrealised
Loss US$% of Net
Assets
CNY Hedged Classes US$ 1,389,612 CNY 9,917,487 22/01/2020 Goldman Sachs International 3 (33,789) (0.00)
US$ 1,172,007 CNY 8,381,619 22/01/2020 UBS AG 1 (30,959) (0.00)
US$ 39,700,740 CNY 281,618,750 22/01/2020 Westpac Banking Corp 14 (718,395) (0.02)
EUR Hedged Classes US$ 66,402,184 € 60,159,842 22/01/2020 Goldman Sachs International 9 (1,209,552) (0.04)
US$ 64,375,103 € 58,283,751 22/01/2020 UBS AG 1 (1,128,156) (0.03)
US$ 66,516,972 € 60,169,886 22/01/2020 Westpac Banking Corp 50 (1,106,051) (0.03)
GBP Hedged Classes £ 792,715 US$ 1,058,112 22/01/2020 Westpac Banking Corp 1 (7,366) (0.00)
US$ 36,169,374 £ 29,285,548 22/01/2020 Goldman Sachs International 4 (2,648,686) (0.08)
US$ 36,049,727 £ 29,174,944 22/01/2020 UBS AG 1 (2,621,727) (0.08)
US$ 41,434,713 £ 33,140,475 22/01/2020 Westpac Banking Corp 45 (2,493,060) (0.07)
HKD Hedged Classes HKD 395,666 US$ 50,776 22/01/2020 Goldman Sachs International 1 (8) (0.00)
US$ 905,091 HKD 7,090,849 22/01/2020 Goldman Sachs International 3 (4,737) (0.00)
US$ 809,533 HKD 6,343,498 22/01/2020 UBS AG 1 (4,403) (0.00)
US$ 926,523 HKD 7,261,227 22/01/2020 Westpac Banking Corp 3 (5,167) (0.00)
JPY Hedged Classes ¥ 7,841,764 US$ 73,751 22/01/2020 Goldman Sachs International 2 (1,514) (0.00)
¥ 7,823,634 US$ 73,598 22/01/2020 UBS AG 1 (1,528) (0.00)
¥ 6,726,839 US$ 63,276 22/01/2020 Westpac Banking Corp 2 (1,309) (0.00)
SEK Hedged Classes SEK 67,682 US$ 7,270 22/01/2020 Goldman Sachs International 2 (33) (0.00)
SEK 752,973 US$ 80,549 22/01/2020 Westpac Banking Corp 2 (34) (0.00)
US$ 860,043 SEK 8,447,706 22/01/2020 Goldman Sachs International 3 (43,263) (0.00)
US$ 746,992 SEK 7,342,982 22/01/2020 UBS AG 1 (38,186) (0.00)
US$ 1,301,100 SEK 12,625,937 22/01/2020 Westpac Banking Corp 43 (48,978) (0.00)
SGD Hedged Classes US$ 1,013,824 SGD 1,392,632 22/01/2020 Goldman Sachs International 8 (21,996) (0.00)
US$ 689,673 SGD 951,525 22/01/2020 UBS AG 1 (18,058) (0.00)
US$ 1,654,572 SGD 2,264,553 22/01/2020 Westpac Banking Corp 26 (29,774) (0.00)
ZAR Hedged Classes US$ 13,043,105 ZAR 196,285,333 22/01/2020 Goldman Sachs International 11 (957,704) (0.03)
US$ 4,942,910 ZAR 76,009,606 22/01/2020 UBS AG 1 (478,768) (0.01)
US$ 17,528,283 ZAR 261,832,706 22/01/2020 Westpac Banking Corp 82 (1,147,946) (0.03)
Total Unrealised Loss on Forward Currency Contracts ∞ (19,165,871) (0.55)

SCHEDULE OF INVESTMENTS FINANCIAL STATEMENTS
ANNUAL REPORT 2019 77
Neuberger Berman High Yield Bond Fund (Continued)
Schedule of Investments (Continued)
Financial Liabilities at Fair Value through Profit or Loss (continued)
Fair ValueUS$
% of NetAssets
Total Financial Liabilities at Fair Value through Profit or Loss (19,165,871) (0.55)
Net Financial Assets at Fair Value through Profit or Loss 3,394,278,901 96.93
Other Net Assets 107,230,237 3.07
Net Assets Attributable to Holders of Redeemable Participating Shares 3,501,509,138 100.00
% of
Portfolio Analysis US$ TotalAssets
* Transferable securities and/or money market instruments admitted to an official stock exchange listing 683,054,175 19.28
† Other transferable securities and/or money market instruments 2,608,624,078 73.62
μ Investment funds 41,877,566 1.18
∞ OTC financial derivative instruments 60,723,082 1.71
Total Investments 3,394,278,901 95.79

FINANCIAL STATEMENTS STATEMENT OF SIGNIFICANT PURCHASES AND SALES
78 NEUBERGER BERMAN INVESTMENT FUNDS PLC
Neuberger Berman High Yield Bond Fund (Continued) Statement of Significant Purchases and Sales (Unaudited) In accordance with the European Communities (Undertakings for Collective Investment in Transferable Securities) Regulations, 2011 as amended, a statement of changes in the composition of the Schedule of Investments during the reporting period is provided to ensure that Shareholders can identify changes in the investments held by the Portfolio. The following statements present the aggregate purchases and sales of transferable securities exceeding one percent of the total value of purchases or sales, respectively, for the period. At a minimum, the largest twenty purchases and twenty sales are presented, if available.
Top twenty purchases: Units Security Description Cost US$
34,855,000 Bausch Health Cos Inc, 6.13%, 15/04/2025 34,039,919
31,300,000 Prime Security Services Borrower LLC/Prime Finance Inc, 5.75%, 15/04/2026 32,380,456
28,875,000 TransDigm Inc, 6.25%, 15/03/2026 29,010,431
27,244,000 SS&C Technologies Inc, 5.50%, 30/09/2027 28,083,389
26,456,000 Iron Mountain Inc, 5.25%, 15/03/2028 25,922,544
25,755,000 Vistra Operations Co LLC, 5.00%, 31/07/2027 25,755,000
23,690,000 Staples Inc, 7.50%, 15/04/2026 24,018,306
23,585,000 HUB International Ltd, 7.00%, 01/05/2026 23,613,188
21,720,000 Frontier Communications Corp, 8.00%, 01/04/2027 22,898,407
23,340,000 Western Digital Corp, 4.75%, 15/02/2026 22,383,475
22,175,000 KAR Auction Services Inc, 5.13%, 01/06/2025 22,040,950
21,760,000 CrownRock LP/CrownRock Finance Inc, 5.63%, 15/10/2025 21,397,769
20,931,000 Terex Corp, 5.63%, 01/02/2025 21,385,511
21,900,000 Ortho-Clinical Diagnostics Inc/Ortho-Clinical Diagnostics SA, 6.63%, 15/05/2022 21,146,756
22,445,000 MPH Acquisition Holdings LLC, 7.13%, 01/06/2024 21,131,525
19,750,000 Energizer Holdings Inc, 7.75%, 15/01/2027 21,038,136
20,770,000 Hertz Corp, 6.00%, 15/01/2028 20,762,519
19,520,000 Churchill Downs Inc, 5.50%, 01/04/2027 20,172,625
19,825,000 Sirius XM Radio Inc, 5.50%, 01/07/2029 20,139,925
20,090,000 Beacon Roofing Supply Inc, 4.88%, 01/11/2025 19,327,513

STATEMENT OF SIGNIFICANT PURCHASES AND SALES FINANCIAL STATEMENTS
ANNUAL REPORT 2019 79
Neuberger Berman High Yield Bond Fund (Continued) Statement of Significant Purchases and Sales (Unaudited) (Continued) Top twenty sales: Units Security Description Proceeds US$
58,047,000 Ally Financial Inc, 8.00%, 15/03/2020 60,309,365
44,645,000 Altice Luxembourg SA, 7.75%, 15/05/2022 43,592,500
36,399,051 NB Global Floating Rate Income Fund Ltd 42,135,752
36,610,000 Park Aerospace Holdings Ltd, 5.25%, 15/08/2022 37,955,727
53,150,000 Frontier Communications Corp, 11.00%, 15/09/2025 31,584,054
27,760,000 MEDNAX Inc, 6.25%, 15/01/2027 27,886,316
25,040,000 HCA Inc, 5.38%, 01/09/2026 26,735,663
27,775,000 Hertz Corp, 5.50%, 15/10/2024 26,548,156
24,815,000 HCA Inc, 5.88%, 15/03/2022 26,364,263
24,715,000 Ardagh Packaging Finance Plc/Ardagh Holdings USA Inc, 6.00%, 15/02/2025 25,731,031
25,268,000 GLP Capital LP/GLP Financing II Inc, 4.88%, 01/11/2020 25,667,801
19,650,000 NRG Energy Inc, 7.25%, 15/05/2026 21,363,780
21,189,540 Reynolds Group Issuer Inc/Reynolds Group Issuer LLC/Reynolds Group Issuer Lu, 5.75%, 15/10/2020 21,253,109
20,495,000 T-Mobile USA Inc, 6.00%, 01/03/2023 21,087,706
21,113,737 SS&C Technologies Holdings Inc, 4.77%, 16/04/2025 21,052,367
20,005,000 HCA Inc, 5.00%, 15/03/2024 20,996,753
19,345,000 Centene Corp, 4.63%, 15/12/2029 20,331,419
20,040,000 Antero Resources Corp, 5.38%, 01/11/2021 20,086,075
19,415,000 HCA Inc, 4.75%, 01/05/2023 20,063,048
19,345,000 Centene Corp, 4.25%, 15/12/2027 19,973,713

FINANCIAL STATEMENTS INVESTMENT MANAGER’S REPORT
80 NEUBERGER BERMAN INVESTMENT FUNDS PLC
Neuberger Berman Diversified Currency Fund Investment Manager’s Report For the 12 months ended 31 December 2019, the total return for the USD I Accumulating Class was 0.99%. Over the same period, the benchmark index, the ICE BofA US 3-Month Treasury Bill Index (the “Index”), returned 2.28%. (Performance for all share classes is provided in Appendix II. Performance data quoted represent past performance and do not indicate future results. Total returns shown are net of all fees and expenses and include reinvestment of income dividends and other distributions, if any).
Over the course of 2019, the best performing major currencies were the Canadian dollar and the British pound. The worst performing major currencies were the Swedish krona and euro. The Portfolio generated a positive return for the year. Underweights in the euro and Swiss franc were the best performing positions whilst overweights in the Norwegian krone and Swedish krona were detractors of performance.
The year saw central banks turn dovish leading yields lower globally and the money supply higher. Both economic growth and inflation remained low and stable. This combination led to strong performance across the major asset classes and a continued fall in implied volatility. Such an environment meant many of the major currencies traded in extremely narrow ranges with: US dollar/Japanese yen the narrowest since the 1970s; euro/US dollar the narrowest ever at 6.4%, when the previous narrowest was 11.9%; Australian dollar/US dollar the narrowest since 1991; and US dollar/Canadian dollar since 1996. The tight trading ranges and lack of volatility meant a difficult trading environment.
Whilst measures of implied volatility were suppressed by the macro setting, there was a lot of geopolitical risk with Brexit, US-China trade negotiations and episodes of civil unrest in Hong Kong and Chile amongst other countries. This combination led to low natural volatility but high headline risk.
The European Central Bank appointed a new chair with Christine Lagarde, taking over from Mario Draghi. However, it is yet to be seen if this change will have consequences for policy going forward.
The year ended with a consensus building that monetary policy had run its course and fiscal policy support was needed in the form of infrastructure spending and pro-growth policy to move the global economy out of the low growth and low inflation dynamic it has been trapped in since 2008.
At the beginning of 2020, the currency market, as with other asset classes, ignored fundamental economic data and price action was driven by risk sentiment and investor positioning. We believe this macro environment is likely to continue until investors see a slowdown in the spread of the virus both within countries and in terms of new countries affected or an adequate response from policy makers. With limited room for further monetary policy stimulus, it is likely that governments will need to provide the necessary stimulus through fiscal policy. We continue to monitor the situation and manage portfolio risk and act on tactical opportunities.
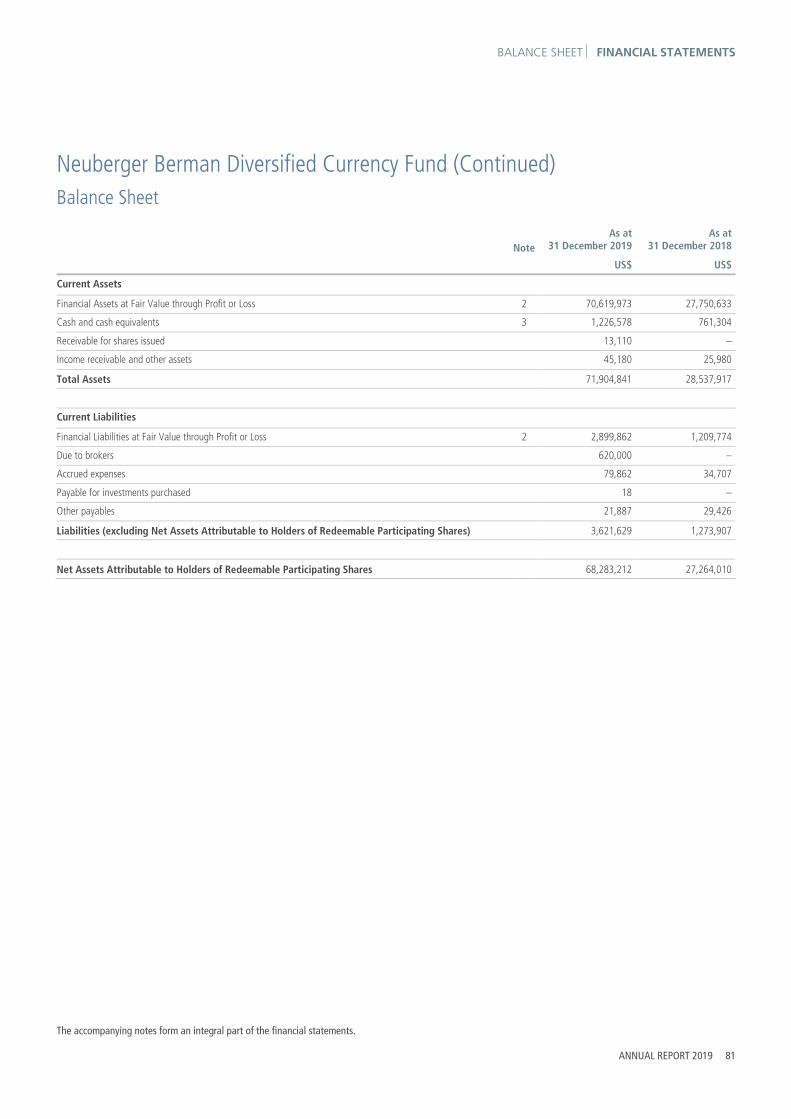
BALANCE SHEET FINANCIAL STATEMENTS
The accompanying notes form an integral part of the financial statements.
ANNUAL REPORT 2019 81
Neuberger Berman Diversified Currency Fund (Continued) Balance Sheet
As at 31 December 2019
As at31 December 2018 Note
US$ US$
Current Assets
Financial Assets at Fair Value through Profit or Loss 2 70,619,973 27,750,633
Cash and cash equivalents 3 1,226,578 761,304
Receivable for shares issued 13,110 –
Income receivable and other assets 45,180 25,980
Total Assets 71,904,841 28,537,917
Current Liabilities
Financial Liabilities at Fair Value through Profit or Loss 2 2,899,862 1,209,774
Due to brokers 620,000 –
Accrued expenses 79,862 34,707
Payable for investments purchased 18 –
Other payables 21,887 29,426
Liabilities (excluding Net Assets Attributable to Holders of Redeemable Participating Shares) 3,621,629 1,273,907
Net Assets Attributable to Holders of Redeemable Participating Shares 68,283,212 27,264,010

FINANCIAL STATEMENTS PROFIT AND LOSS ACCOUNT
The accompanying notes form an integral part of the financial statements.
82 NEUBERGER BERMAN INVESTMENT FUNDS PLC
Neuberger Berman Diversified Currency Fund (Continued) Profit and Loss Account
Year Ended 31 December 2019
Year Ended31 December 2018 Note
US$ US$
Income
Interest Income 80,226 15,432
Net Gain/(Loss) on Financial Assets and Liabilities at Fair Value through Profit or Loss 11 709,058 375,153
789,284 390,585
Expenses
Management Fee 6 270,749 42,150
Distribution Fee 6 2,769 5,725
Administration Fee 6 81,881 70,038
Commitment Fee 19 5,922 1,866
Custody Fee 6 12,026 12,011
Depositary Fee 6 4,650 2,252
Professional Fee 9 49,989 26,946
Directors' Fee 7 4,562 6,613
Transaction Costs 9 31,109 39,954
Audit Fee 8 14,383 16,114
VAT Rebate (819) (258)
Other Expenses 9 10,455 23,807
Expense Waiver 6 (115,250) (153,149)
Total Expenses 372,426 94,069
Finance Costs
Interest Expense 68 –
68 –
Profit/(Loss) Attributable to Holders of Redeemable Participating Shares from Operations 416,790 296,516
Income and expenses arose solely from continuing operations.

STATEMENT OF CHANGES IN NET ASSETS FINANCIAL STATEMENTS
The accompanying notes form an integral part of the financial statements.
ANNUAL REPORT 2019 83
Neuberger Berman Diversified Currency Fund (Continued) Statement of Changes in Net Assets Attributable to Holders of Redeemable Participating Shares
Year Ended 31 December 2019
Year Ended31 December 2018 Note
US$ US$
Net Assets Attributable to Holders of Redeemable Participating Shares at beginning of year 27,264,010 18,755,286
Profit/(Loss) Attributable to Holders of Redeemable Participating Shares from Operations 416,790 296,516
Subscriptions 5 64,353,546 18,824,977
Redemptions 5 (23,751,134) (10,612,769)
Net Assets Attributable to Holders of Redeemable Participating Shares at end of year 68,283,212 27,264,010

FINANCIAL STATEMENTS SCHEDULE OF INVESTMENTS
84 NEUBERGER BERMAN INVESTMENT FUNDS PLC
Neuberger Berman Diversified Currency Fund (Continued)
Schedule of Investments
Financial Assets at Fair Value through Profit or Loss
Principal Amount Security Description Coupon Maturity
Date Fair Value
US$% of Net
Assets
Treasury Bills 82.65% (31 December 2018: 97.66%)
United States Dollar 11,500,000 United States Treasury Bill 0.00% 07/01/2020 11,497,828 16.84
11,500,000 United States Treasury Bill 0.00% 21/01/2020 11,491,108 16.83
7,000,000 United States Treasury Bill 0.00% 28/01/2020 6,992,632 10.24
11,500,000 United States Treasury Bill 0.00% 04/02/2020 11,483,554 16.82
7,000,000 United States Treasury Bill 0.00% 11/02/2020 6,988,469 10.23
8,000,000 United States Treasury Bill 0.00% 18/02/2020 7,984,490 11.69
Total Treasury Bills ** 56,438,081 82.65
Government Bonds 16.84% (31 December 2018: 0.00%)
United States Dollar 11,500,000 United States Treasury Floating Rate Note 1.53% 31/01/2020 11,499,725 16.84
Total Government Bonds * 11,499,725 16.84
Total Investments 67,937,806 99.49
Forward Currency Contracts 3.93% (31 December 2018: 4.12%)
Amount Receivable
Amount Payable
Maturity Date Counterparty Contracts Unrealised
Gain US$% of Net
Assets
AUD 11,279,785 US$ 7,742,555 22/01/2020 Citibank NA 6 190,446 0.28
AUD 1,374,605 US$ 942,536 22/01/2020 Goldman Sachs International 2 24,215 0.04
AUD 1,913,097 US$ 1,314,862 22/01/2020 State Street Bank and Trust and Co 1 30,607 0.05
BRL 18,607,837 US$ 4,507,603 22/01/2020 Goldman Sachs International 1 115,158 0.17
CAD 8,233,293 US$ 6,228,453 22/01/2020 Citibank NA 6 121,448 0.18
CAD 3,762,576 US$ 2,844,367 22/01/2020 Goldman Sachs International 3 57,507 0.08
CAD 1,245,345 US$ 946,005 22/01/2020 State Street Bank and Trust and Co 1 14,463 0.02
CHF 1,526,424 US$ 1,552,746 22/01/2020 Citibank NA 2 25,741 0.04
CHF 868,415 US$ 880,270 22/01/2020 Goldman Sachs International 2 17,766 0.03
CHF 632,525 US$ 648,863 22/01/2020 Société Générale 1 5,236 0.01
CHF 1,009,079 US$ 1,028,621 22/01/2020 UBS AG 1 14,876 0.02
CZK 47,579,088 US$ 2,032,947 22/01/2020 Citibank NA 1 68,642 0.10
CZK 17,564,884 US$ 771,260 22/01/2020 State Street Bank and Trust and Co 1 4,589 0.01
€ 5,705,193 US$ 6,361,333 22/01/2020 Citibank NA 7 50,552 0.07
€ 2,014,618 US$ 2,236,438 22/01/2020 Goldman Sachs International 2 27,727 0.04
€ 4,789,757 US$ 5,349,202 22/01/2020 State Street Bank and Trust and Co 4 33,853 0.05
£ 223,648 US$ 291,065 22/01/2020 Citibank NA 1 5,381 0.01
£ 1,431,162 US$ 1,819,626 22/01/2020 Goldman Sachs International 3 77,382 0.11
£ 534,929 US$ 692,765 22/01/2020 State Street Bank and Trust and Co 1 16,285 0.02
HUF 123,168,959 US$ 411,675 22/01/2020 Goldman Sachs International 1 6,787 0.01
¥ 91,433,309 US$ 837,102 22/01/2020 Citibank NA 1 5,166 0.01

SCHEDULE OF INVESTMENTS FINANCIAL STATEMENTS
ANNUAL REPORT 2019 85
Neuberger Berman Diversified Currency Fund (Continued)
Schedule of Investments (Continued)
Financial Assets at Fair Value through Profit or Loss (continued)
Forward Currency Contracts 3.93% (31 December 2018: 4.12%) (continued)
Amount Receivable
Amount Payable
Maturity Date Counterparty Contracts Unrealised
Gain US$% of Net
Assets
¥ 223,255,492 US$ 2,054,543 22/01/2020 State Street Bank and Trust and Co 1 2,048 0.00
KRW 1,825,248,166 US$ 1,532,792 22/01/2020 Citibank NA 1 48,793 0.07
KRW 969,910,262 US$ 837,140 22/01/2020 Goldman Sachs International 1 3,291 0.01
MXN 47,264,097 US$ 2,436,470 22/01/2020 Goldman Sachs International 2 59,071 0.09
MXN 4,871,567 US$ 256,076 22/01/2020 Royal Bank Of Canada 1 1,142 0.00
MXN 15,339,228 US$ 780,980 22/01/2020 State Street Bank and Trust and Co 1 28,930 0.04
NOK 6,415,876 US$ 703,943 22/01/2020 Citibank NA 1 26,255 0.04
NOK 175,066,930 US$ 19,192,178 22/01/2020 Goldman Sachs International 5 732,384 1.07
NOK 3,142,022 US$ 348,977 22/01/2020 State Street Bank and Trust and Co 1 8,621 0.01
NZD 3,042,155 US$ 1,935,242 22/01/2020 Citibank NA 2 117,719 0.17
NZD 3,876,728 US$ 2,487,265 22/01/2020 Goldman Sachs International 5 128,897 0.19
NZD 657,398 US$ 434,299 22/01/2020 Royal Bank Of Canada 1 9,338 0.01
NZD 817,567 US$ 519,550 22/01/2020 Westpac Banking Corp 1 32,175 0.05
PLN 260 US$ 66 22/01/2020 Goldman Sachs International 1 3 0.00
SEK 11,582,750 US$ 1,211,811 22/01/2020 Citibank NA 2 26,721 0.04
SEK 28,727,295 US$ 2,981,887 22/01/2020 Goldman Sachs International 4 89,894 0.13
SEK 30,433,212 US$ 3,119,177 22/01/2020 State Street Bank and Trust and Co 2 135,016 0.20
US$ 4,955,875 ¥ 535,572,648 22/01/2020 Citibank NA 4 22,273 0.03
US$ 644,672 ¥ 69,935,283 22/01/2020 Goldman Sachs International 1 441 0.00
US$ 1,610,963 KRW 1,858,698,266 22/01/2020 Goldman Sachs International 1 393 0.00
US$ 274,226 BRL 1,102,060 22/01/2020 Goldman Sachs International 1 440 0.00
US$ 1,315,702 ¥ 139,766,916 22/01/2020 State Street Bank and Trust and Co 1 28,194 0.04
US$ 1,175,078 TRY 6,894,443 22/01/2020 State Street Bank and Trust and Co 1 22,419 0.03
ZAR 36,460,752 US$ 2,411,067 22/01/2020 Goldman Sachs International 3 189,637 0.28
EUR Hedged Classes € 150,619 US$ 166,228 22/01/2020 Goldman Sachs International 1 3,048 0.01
€ 150,619 US$ 166,361 22/01/2020 UBS AG 1 2,916 0.00
€ 205,373 US$ 227,716 22/01/2020 Westpac Banking Corp 11 3,095 0.01
GBP Hedged Classes £ 176,310 US$ 217,721 22/01/2020 Goldman Sachs International 3 15,978 0.02
£ 173,733 US$ 214,672 22/01/2020 UBS AG 2 15,612 0.02
£ 148,914 US$ 183,797 22/01/2020 Westpac Banking Corp 2 13,589 0.02
JPY Hedged Classes US$ 857 ¥ 92,247 22/01/2020 Goldman Sachs International 2 7 0.00
Total Unrealised Gain on Forward Currency Contracts ∞ 2,682,167 3.93
Fair ValueUS$
% of NetAssets
Total Financial Assets at Fair Value through Profit or Loss 70,619,973 103.42

FINANCIAL STATEMENTS SCHEDULE OF INVESTMENTS
86 NEUBERGER BERMAN INVESTMENT FUNDS PLC
Neuberger Berman Diversified Currency Fund (Continued)
Schedule of Investments (Continued)
Financial Liabilities at Fair Value through Profit or Loss (continued)
Forward Currency Contracts (4.24%) (31 December 2018: (4.44%))
Amount Receivable
Amount Payable
Maturity Date Counterparty Contracts Unrealised
Loss US$% of Net
Assets
CLP 1,309 US$ 2 22/01/2020 Goldman Sachs International 1 (0) (0.00)
¥ 842,156,435 US$ 7,795,298 22/01/2020 Citibank NA 7 (37,498) (0.06)
¥ 227,394,092 US$ 2,105,458 22/01/2020 Goldman Sachs International 3 (10,743) (0.02)
¥ 1,059,382,552 US$ 9,921,550 22/01/2020 State Street Bank and Trust and Co 4 (162,700) (0.24)
TRY 4,642,106 US$ 780,666 22/01/2020 Goldman Sachs International 1 (4,568) (0.01)
TRY 2,252,892 US$ 377,575 22/01/2020 State Street Bank and Trust and Co 1 (921) (0.00)
US$ 9,959,719 € 8,973,182 22/01/2020 Citibank NA 6 (124,955) (0.18)
US$ 1,091,096 ¥ 119,307,595 22/01/2020 Citibank NA 1 (7,945) (0.01)
US$ 2,003,978 AUD 2,905,958 22/01/2020 Citibank NA 3 (39,765) (0.06)
US$ 3,374,029 NZD 5,246,749 22/01/2020 Citibank NA 5 (166,674) (0.24)
US$ 3,247,394 MXN 64,501,719 22/01/2020 Citibank NA 1 (158,292) (0.23)
US$ 10,337,300 CAD 13,699,409 22/01/2020 Citibank NA 3 (228,323) (0.33)
US$ 2,821,385 £ 2,178,510 22/01/2020 Citibank NA 4 (66,235) (0.10)
US$ 4,401,325 CHF 4,341,349 22/01/2020 Citibank NA 5 (88,099) (0.13)
US$ 1,648,607 SEK 15,894,388 22/01/2020 Citibank NA 2 (50,964) (0.07)
US$ 1,460,007 NOK 13,215,996 22/01/2020 Citibank NA 2 (44,120) (0.06)
US$ 408,674 HUF 123,180,792 22/01/2020 Goldman Sachs International 1 (9,828) (0.01)
US$ 796,588 NZD 1,241,275 22/01/2020 Goldman Sachs International 1 (41,071) (0.06)
US$ 1,147,871 KRW 1,366,624,864 22/01/2020 Goldman Sachs International 2 (36,314) (0.05)
US$ 299,600 BRL 1,230,156 22/01/2020 Goldman Sachs International 1 (6,009) (0.01)
US$ 7,656,057 AUD 11,175,357 22/01/2020 Goldman Sachs International 7 (203,501) (0.30)
US$ 2,068,338 CZK 47,579,160 22/01/2020 Goldman Sachs International 3 (33,254) (0.05)
US$ 1,135,082 MXN 22,180,615 22/01/2020 Goldman Sachs International 2 (36,053) (0.05)
US$ 1,347,216 SEK 13,015,091 22/01/2020 Goldman Sachs International 2 (44,475) (0.07)
US$ 1,306,996 £ 1,019,618 22/01/2020 Goldman Sachs International 2 (44,510) (0.07)
US$ 2,454,131 ZAR 36,457,510 22/01/2020 Goldman Sachs International 2 (146,341) (0.21)
US$ 2,484,769 € 2,230,575 22/01/2020 Goldman Sachs International 4 (22,104) (0.03)
US$ 1,223,686 NOK 11,096,181 22/01/2020 Goldman Sachs International 3 (39,182) (0.06)
US$ 3,906,081 CHF 3,853,605 22/01/2020 Goldman Sachs International 7 (78,963) (0.12)
US$ 1,164,996 CAD 1,538,323 22/01/2020 Goldman Sachs International 3 (21,431) (0.03)
US$ 10,565,149 CHF 10,395,467 22/01/2020 State Street Bank and Trust and Co 5 (184,887) (0.27)
US$ 6,630,786 NZD 10,285,172 22/01/2020 State Street Bank and Trust and Co 4 (310,034) (0.45)
US$ 406,349 KRW 483,921,281 22/01/2020 State Street Bank and Trust and Co 1 (12,971) (0.02)
US$ 6,009,592 NOK 54,695,945 22/01/2020 State Street Bank and Trust and Co 6 (215,414) (0.32)
US$ 2,975,863 € 2,673,768 22/01/2020 State Street Bank and Trust and Co 3 (29,100) (0.04)
US$ 1,577,751 AUD 2,318,988 22/01/2020 State Street Bank and Trust and Co 2 (53,178) (0.08)
US$ 548,360 CAD 723,538 22/01/2020 State Street Bank and Trust and Co 1 (9,666) (0.01)
US$ 660,027 MXN 12,843,825 22/01/2020 State Street Bank and Trust and Co 1 (18,126) (0.03)
US$ 3,689,792 SEK 35,164,952 22/01/2020 State Street Bank and Trust and Co 3 (70,362) (0.10)

SCHEDULE OF INVESTMENTS FINANCIAL STATEMENTS
ANNUAL REPORT 2019 87
Neuberger Berman Diversified Currency Fund (Continued)
Schedule of Investments (Continued)
Financial Liabilities at Fair Value through Profit or Loss (continued)
Forward Currency Contracts (4.24%) (31 December 2018: (4.44%)) (continued)
Amount Receivable
Amount Payable
Maturity Date Counterparty Contracts Unrealised
Loss US$% of Net
Assets
US$ 388,411 BRL 1,580,757 22/01/2020 State Street Bank and Trust and Co 1 (4,297) (0.01)
US$ 513,743 NOK 4,606,442 22/01/2020 UBS AG 1 (10,521) (0.02)
US$ 616,279 ¥ 67,154,245 22/01/2020 Westpac Banking Corp 1 (2,335) (0.00)
US$ 524,610 AUD 766,262 22/01/2020 Westpac Banking Corp 1 (14,298) (0.02)
US$ 100,547 € 90,766 22/01/2020 Westpac Banking Corp 1 (1,462) (0.00)
EUR Hedged Classes US$ 28,509 € 25,810 22/01/2020 Goldman Sachs International 2 (497) (0.00)
US$ 26,251 € 23,767 22/01/2020 UBS AG 1 (460) (0.00)
US$ 94,279 € 84,913 22/01/2020 Westpac Banking Corp 5 (1,152) (0.00)
GBP Hedged Classes US$ 5,193 £ 4,004 22/01/2020 Goldman Sachs International 2 (114) (0.00)
US$ 459,569 £ 350,000 22/01/2020 Westpac Banking Corp 1 (4,357) (0.01)
JPY Hedged Classes ¥ 3,224,867 US$ 30,331 22/01/2020 Goldman Sachs International 2 (624) (0.00)
¥ 3,224,866 US$ 30,336 22/01/2020 UBS AG 2 (630) (0.00)
¥ 2,764,171 US$ 26,003 22/01/2020 Westpac Banking Corp 2 (539) (0.00)
Total Unrealised Loss on Forward Currency Contracts ∞ (2,899,862) (4.24)
Fair ValueUS$
% of NetAssets
Total Financial Liabilities at Fair Value through Profit or Loss (2,899,862) (4.24)
Net Financial Assets at Fair Value through Profit or Loss 67,720,111 99.18
Other Net Assets 563,101 0.82
Net Assets Attributable to Holders of Redeemable Participating Shares 68,283,212 100.00
% of
TotalAssetsPortfolio Analysis US$
* Transferable securities and/or money market instruments admitted to an official stock exchange listing 11,499,725 15.99
** Transferable securities and/or money market instruments dealt in on a regulated market 56,438,081 78.49
∞ OTC financial derivative instruments (217,695) (0.30)
Total Investments 67,720,111 94.18

FINANCIAL STATEMENTS STATEMENT OF SIGNIFICANT PURCHASES AND SALES
88 NEUBERGER BERMAN INVESTMENT FUNDS PLC
Neuberger Berman Diversified Currency Fund (Continued) Statement of Significant Purchases and Sales (Unaudited) In accordance with the European Communities (Undertakings for Collective Investment in Transferable Securities) Regulations, 2011 as amended, a statement of changes in the composition of the Schedule of Investments during the reporting period is provided to ensure that Shareholders can identify changes in the investments held by the Portfolio. The following statements present the aggregate purchases and sales of transferable securities exceeding one percent of the total value of purchases or sales, respectively, for the period. At a minimum, the largest twenty purchases and twenty sales are presented, if available.
Aggregate purchases greater than one percent of the total value of purchases:
Units Security Description Cost US$
11,500,000 United States Treasury Floating Rate Note, 1.53%, 31/01/2020 11,498,073
11,500,000 United States Treasury Bill, 0.00%, 05/11/2019 11,483,619
11,500,000 United States Treasury Bill, 0.00%, 03/09/2019 11,482,855
11,500,000 United States Treasury Bill, 0.00%, 27/08/2019 11,481,866
11,500,000 United States Treasury Bill, 0.00%, 10/09/2019 11,479,022
11,500,000 United States Treasury Bill, 0.00%, 20/08/2019 11,478,497
11,500,000 United States Treasury Bill, 0.00%, 21/01/2020 11,475,411
11,500,000 United States Treasury Bill, 0.00%, 17/09/2019 11,474,397
11,500,000 United States Treasury Bill, 0.00%, 07/01/2020 11,473,207
11,500,000 United States Treasury Bill, 0.00%, 04/02/2020 11,472,997
11,500,000 United States Treasury Bill, 0.00%, 17/12/2019 11,470,870
11,500,000 United States Treasury Bill, 0.00%, 29/10/2019 11,470,108
11,500,000 United States Treasury Bill, 0.00%, 03/12/2019 11,470,044
11,500,000 United States Treasury Bill, 0.00%, 03/10/2019 11,468,447
11,500,000 United States Treasury Bill, 0.00%, 12/11/2019 11,465,397
11,500,000 United States Treasury Bill, 0.00%, 22/10/2019 11,465,221
11,500,000 United States Treasury Bill, 0.00%, 08/10/2019 11,464,685
11,000,000 United States Treasury Bill, 0.00%, 01/10/2019 10,983,253
11,000,000 United States Treasury Bill, 0.00%, 24/12/2019 10,972,271
11,000,000 United States Treasury Bill, 0.00%, 10/12/2019 10,971,994
11,000,000 United States Treasury Bill, 0.00%, 26/11/2019 10,970,010
11,000,000 United States Treasury Bill, 0.00%, 15/10/2019 10,967,876
8,000,000 United States Treasury Bill, 0.00%, 18/02/2020 7,981,700
7,500,000 United States Treasury Bill, 0.00%, 30/04/2019 7,472,180
7,000,000 United States Treasury Bill, 0.00%, 28/01/2020 6,986,191
7,000,000 United States Treasury Bill, 0.00%, 11/02/2020 6,983,659
6,000,000 United States Treasury Bill, 0.00%, 25/06/2019 5,978,083
4,000,000 United States Treasury Bill, 0.00%, 02/07/2019 3,985,443
4,000,000 United States Treasury Bill, 0.00%, 07/05/2019 3,985,008
3,500,000 United States Treasury Bill, 0.00%, 13/08/2019 3,488,783
Total sales:
Units Security Description Proceeds US$
1,400,000 United States Treasury Bill, 0.00%, 30/04/2019 1,396,196
400,000 United States Treasury Bill, 0.00%, 29/10/2019 399,923

INVESTMENT MANAGER’S REPORT FINANCIAL STATEMENTS
ANNUAL REPORT 2019 89
Neuberger Berman US Multi Cap Opportunities Fund Investment Manager’s Report For the 12 months ended 31 December 2019, the total return for the USD I Accumulating Class was 27.20%. Over the same period, the benchmark index, the S&P 500 Index (the “Index”), returned 31.49%. The S&P 500 Net Total Return Index returned 30.70%. (Performance for all share classes is provided in Appendix II. Performance data quoted represent past performance and do not indicate future results. Total returns shown are net of all fees and expenses and include reinvestment of income dividends and other distributions, if any).
The Portfolio generated its second best annual return since inception. Performance was driven by a differentiated set of holdings across sectors and market capitalisations. Superior stock selection within Consumer Discretionary, Consumer Staples, and Materials was beneficial to performance both on an absolute and relative basis. Portfolio positioning benefitted relative performance, primarily due to underweight positions to both Energy and Health Care. The Portfolio also benefitted from having zero exposure to Real Estate and Utilities. Stock selection within Financials, Health Care, and Industrials were the primary detractors from performance. The Portfolio finished the year with an overweight in Financials, Industrials and Materials, an underweight in Energy and Health Care, and had no exposure to Real Estate or Utilities.
Portfolio construction is an important component of our investment process, and we continue to find compelling opportunities across our three investment categories - Special Situation, Opportunistic, and Classic investments. This balanced approach is designed to mitigate risk, while generating alpha through stock selection in various market environments. We continue to find compelling opportunities in each category.
The core of our investment process is an unwavering focus on a company’s generation of free cash flow and its use by management. We believe free cash flow is a cleaner measure of value creation than income statement earnings, which may be obfuscated by various accounting methods. Our analysis considers the stability and sources of free cash flow generation, as well as the potential uses of this capital. This investment focus enables us to look across sectors, market capitalisations, and risk profiles to find opportunities, particularly during periods of increased market volatility.
At the time of publishing this letter, the situation regarding the Coronavirus (COVID-19) is fluid, and the magnitude and duration of the impact on the global economy suggests continued volatility in the very near term. While the timing of a recovery and the normalisation of economic activity is uncertain, the sell-off and related volatility is creating an opportunity to drive differentiated performance through stock selection. We continue to apply disciplined fundamental research to help identify high quality business models with free cash flow characteristics trading at attractive valuations. We believe our investment strategy has the ability to create long-term value for clients and effectively navigate the dynamic market environment.
As we evaluate both potential new positions and current portfolio holdings, we will continue to do so with a long term investment perspective in mind. As always, our focus is to grow our clients’ assets through the disciplined application of our investment philosophy and process.

FINANCIAL STATEMENTS BALANCE SHEET
The accompanying notes form an integral part of the financial statements.
90 NEUBERGER BERMAN INVESTMENT FUNDS PLC
Neuberger Berman US Multi Cap Opportunities Fund (Continued) Balance Sheet
As at31 December 2019
As at31 December 2018 Note
US$ US$
Current Assets
Financial Assets at Fair Value through Profit or Loss 2 760,790,478 891,631,814
Cash and cash equivalents 3 10 5,483,060
Receivable for investments sold 1,687 5,620,410
Receivable for shares issued 8,800,808 2,820,848
Income receivable and other assets 265,156 542,269
Total Assets 769,858,139 906,098,401
Current Liabilities
Financial Liabilities at Fair Value through Profit or Loss 2 543,012 1,328,560
Bank overdraft 4 3,378,983 –
Payable for shares redeemed 1,425,452 8,256,817
Accrued expenses 958,060 1,958,969
Other payables 91,152 110,100
Liabilities (excluding Net Assets Attributable to Holders of Redeemable Participating Shares) 6,396,659 11,654,446
Net Assets Attributable to Holders of Redeemable Participating Shares 763,461,480 894,443,955

PROFIT AND LOSS ACCOUNT FINANCIAL STATEMENTS
The accompanying notes form an integral part of the financial statements.
ANNUAL REPORT 2019 91
Neuberger Berman US Multi Cap Opportunities Fund (Continued) Profit and Loss Account
Year Ended31 December 2019
Year Ended31 December 2018 Note
US$ US$
Income
Interest Income 132,445 164,417
Dividend Income 11,330,603 14,261,427
Net Gain/(Loss) on Financial Assets and Liabilities at Fair Value through Profit or Loss 11 197,935,191 (56,548,909)
209,398,239 (42,123,065)
Expenses
Management Fee 6 8,319,360 10,504,363
Distribution Fee 6 393,050 264,684
Administration Fee 6 985,909 1,260,948
Commitment Fee 19 95,729 105,149
Custody Fee 6 26,350 51,243
Depositary Fee 6 78,809 103,338
Professional Fee 9 110,668 190,406
Directors' Fee 7 4,563 6,613
Transaction Costs 9 283,947 362,332
Audit Fee 8 22,462 22,631
VAT Rebate (13,253) (12,763)
Other Expenses 9 26,293 36,982
Expense Waiver 6 (23) –
Total Expenses 10,333,864 12,895,926
Finance Costs
Interest Expense 4,163 3,064
Distribution Paid 1 80,317 87,311
84,480 90,375
Withholding Tax 1 3,222,636 3,947,965
Profit/(Loss) Attributable to Holders of Redeemable Participating Shares from Operations 195,757,259 (59,057,331)
Income and expenses arose solely from continuing operations.

FINANCIAL STATEMENTS STATEMENT OF CHANGES IN NET ASSETS
The accompanying notes form an integral part of the financial statements.
92 NEUBERGER BERMAN INVESTMENT FUNDS PLC
Neuberger Berman US Multi Cap Opportunities Fund (Continued) Statement of Changes in Net Assets Attributable to Holders of Redeemable Participating Shares
Year Ended31 December 2019
US$
Year Ended31 December 2018
US$ Note
Net Assets Attributable to Holders of Redeemable Participating Shares at beginning of year 894,443,955 994,566,581
Profit/(Loss) Attributable to Holders of Redeemable Participating Shares from Operations 195,757,259 (59,057,331)
Subscriptions 5 231,396,947 673,906,754
Redemptions 5 (558,136,681) (714,972,049)
Net Assets Attributable to Holders of Redeemable Participating Shares at end of year 763,461,480 894,443,955

SCHEDULE OF INVESTMENTS FINANCIAL STATEMENTS
ANNUAL REPORT 2019 93
Neuberger Berman US Multi Cap Opportunities Fund (Continued)
Schedule of Investments Financial Assets at Fair Value through Profit or Loss
Number of Shares Security Description Fair Value
US$% of Net
Assets
Equities 99.41% (31 December 2018: 99.59%) United States Dollar 230,000 Activision Blizzard Inc 13,666,600 1.79
72,000 Advance Auto Parts Inc 11,531,520 1.51
225,000 Allison Transmission Holdings Inc 10,872,000 1.42
27,400 Alphabet Inc Class C 36,634,348 4.80
132,000 Analog Devices Inc 15,686,880 2.05
108,000 Apple Inc 31,714,200 4.15
610,000 Aramark 26,474,000 3.47
350,000 Ball Corp 22,634,500 2.96
162,000 Berkshire Hathaway Inc Class B 36,693,000 4.81
51,000 Boeing Co 16,613,760 2.18
650,000 Brookfield Asset Management Inc Class A 37,570,000 4.92
115,000 CDK Global Inc 6,288,200 0.82
355,000 Charles Schwab Corp 16,883,800 2.21
136,000 Chubb Ltd 21,169,760 2.77
555,000 Cisco Systems Inc 26,617,800 3.49
565,000 Comcast Corp Class A 25,408,050 3.33
317,000 CSX Corp 22,938,120 3.00
145,000 Eagle Materials Inc 13,145,700 1.72
57,000 EOG Resources Inc 4,774,320 0.63
310,000 Fox Corp Class A 11,491,700 1.51
160,000 HCA Healthcare Inc 23,649,600 3.10
107,000 Hill-Rom Holdings Inc 12,147,710 1.59
250,000 JPMorgan Chase & Co 34,850,000 4.56
117,000 Lamb Weston Holdings Inc 10,065,510 1.32
140,000 Lowe's Companies Inc 16,766,400 2.20
77,000 McDonald's Corp 15,215,970 1.99
210,000 Microsoft Corp 33,117,000 4.34
207,000 Mondelez International Inc Class A 11,401,560 1.49
180,000 Motorola Solutions Inc 29,005,200 3.80
175,000 NIKE Inc Class B 17,729,250 2.32
138,000 PayPal Holdings Inc 14,927,460 1.96
485,000 Pfizer Inc 19,002,300 2.49
77,000 Raytheon Co 16,919,980 2.22
68,000 Rockwell Automation Inc 13,781,560 1.81
24,000 Sherwin-Williams Co 14,004,960 1.83
136,000 Stanley Black & Decker Inc 22,540,640 2.95
67,000 Universal Health Services Inc Class B 9,611,820 1.26

FINANCIAL STATEMENTS SCHEDULE OF INVESTMENTS
94 NEUBERGER BERMAN INVESTMENT FUNDS PLC
Neuberger Berman US Multi Cap Opportunities Fund (Continued)
Schedule of Investments (Continued) Financial Assets at Fair Value through Profit or Loss (continued)
Number of Shares Security Description Fair Value
US$% of Net
Assets
Equities 99.41% (31 December 2018: 99.59%) United States Dollar (continued) 845,000 US Foods Holding Corp 35,397,050 4.64
Total Equities * 758,942,228 99.41
Total Investments 758,942,228 99.41
Forward Currency Contracts 0.24% (31 December 2018: 0.10%)
Amount Receivable
Amount Payable
Maturity Date Counterparty Contracts Unrealised
Gain US$% of Net
Assets
AUD Hedged Classes AUD 1,529,267 US$ 1,033,078 22/01/2020 Goldman Sachs International 11 42,445 0.01
AUD 1,408,912 US$ 949,672 22/01/2020 UBS AG 4 41,207 0.01
AUD 1,476,474 US$ 997,999 22/01/2020 Westpac Banking Corp 22 40,394 0.01
EUR Hedged Classes € 12,272,324 US$ 13,560,404 22/01/2020 Goldman Sachs International 14 232,073 0.03
€ 10,543,776 US$ 11,651,438 22/01/2020 UBS AG 4 198,377 0.03
€ 11,276,277 US$ 12,466,890 22/01/2020 Westpac Banking Corp 46 206,160 0.03
GBP Hedged Classes £ 312,742 US$ 387,369 22/01/2020 Goldman Sachs International 9 27,172 0.00
£ 293,716 US$ 363,230 22/01/2020 UBS AG 3 26,091 0.00
£ 263,125 US$ 325,619 22/01/2020 Westpac Banking Corp 6 23,154 0.00
SGD Hedged Classes SGD 6,597,849 US$ 4,794,310 22/01/2020 Goldman Sachs International 15 113,083 0.01
SGD 5,339,642 US$ 3,873,178 22/01/2020 UBS AG 4 98,375 0.01
SGD 7,930,699 US$ 5,776,706 22/01/2020 Westpac Banking Corp 67 122,042 0.02
ZAR Hedged Classes ZAR 18,658,870 US$ 1,223,647 22/01/2020 Goldman Sachs International 16 107,270 0.01
ZAR 14,544,281 US$ 949,447 22/01/2020 UBS AG 5 87,979 0.01
ZAR 92,607,123 US$ 6,123,134 22/01/2020 Westpac Banking Corp 51 482,428 0.06
Total Unrealised Gain on Forward Currency Contracts ∞ 1,848,250 0.24
Fair ValueUS$
% of NetAssets
Total Financial Assets at Fair Value through Profit or Loss 760,790,478 99.65

SCHEDULE OF INVESTMENTS FINANCIAL STATEMENTS
ANNUAL REPORT 2019 95
Neuberger Berman US Multi Cap Opportunities Fund (Continued)
Schedule of Investments (Continued) Financial Liabilities at Fair Value through Profit or Loss Forward Currency Contracts (0.07%) (31 December 2018: (0.15%))
Amount Receivable
Amount Payable
Maturity Date Counterparty Contracts Unrealised
Loss US$% of Net
Assets
AUD Hedged Classes US$ 706,634 AUD 1,047,162 22/01/2020 Goldman Sachs International 8 (29,829) (0.01)
US$ 638,369 AUD 947,551 22/01/2020 UBS AG 1 (28,038) (0.00)
US$ 982,553 AUD 1,443,510 22/01/2020 Westpac Banking Corp 26 (32,660) (0.01)
EUR Hedged Classes US$ 1,731,298 € 1,561,814 22/01/2020 Goldman Sachs International 12 (23,974) (0.00)
US$ 5,356,850 € 4,828,262 22/01/2020 Westpac Banking Corp 51 (69,478) (0.01)
GBP Hedged Classes £ 3,678 US$ 4,909 22/01/2020 Westpac Banking Corp 1 (34) (0.00)
US$ 208,946 £ 168,899 22/01/2020 Goldman Sachs International 4 (14,929) (0.00)
US$ 186,194 £ 150,687 22/01/2020 UBS AG 1 (13,541) (0.00)
US$ 163,346 £ 132,219 22/01/2020 Westpac Banking Corp 2 (11,911) (0.00)
SGD Hedged Classes US$ 776,198 SGD 1,060,722 22/01/2020 Goldman Sachs International 10 (12,753) (0.00)
US$ 1,057,824 SGD 1,435,036 22/01/2020 Westpac Banking Corp 36 (9,534) (0.00)
ZAR Hedged Classes US$ 309,199 ZAR 4,591,859 22/01/2020 Goldman Sachs International 7 (18,333) (0.00)
US$ 5,527,416 ZAR 81,389,364 22/01/2020 Westpac Banking Corp 61 (277,998) (0.04)
Total Unrealised Loss on Forward Currency Contracts ∞ (543,012) (0.07)
Fair ValueUS$
% of NetAssets
Total Financial Liabilities at Fair Value through Profit or Loss (543,012) (0.07)
Net Financial Assets at Fair Value through Profit or Loss 760,247,466 99.58
Other Net Assets 3,214,014 0.42
Net Assets Attributable to Holders of Redeemable Participating Shares 763,461,480 100.00
% ofTotal
AssetsPortfolio Analysis US$
* Transferable securities and/or money market instruments admitted to an official stock exchange listing 758,942,228 98.58
∞ OTC financial derivative instruments 1,305,238 0.17
Total Investments 760,247,466 98.75

FINANCIAL STATEMENTS STATEMENT OF SIGNIFICANT PURCHASES AND SALES
96 NEUBERGER BERMAN INVESTMENT FUNDS PLC
Neuberger Berman US Multi Cap Opportunities Fund (Continued)
Statement of Significant Purchases and Sales (Unaudited) In accordance with the European Communities (Undertakings for Collective Investment in Transferable Securities) Regulations, 2011 as amended, a statement of changes in the composition of the Schedule of Investments during the reporting period is provided to ensure that Shareholders can identify changes in the investments held by the Portfolio. The following statements present the aggregate purchases and sales of transferable securities exceeding one percent of the total value of purchases or sales, respectively, for the period. At a minimum, the largest twenty purchases and twenty sales are presented, if available.
Aggregate purchases greater than one percent of the total value of purchases:
Units Security Description Cost US$
610,000 Aramark 23,258,109
350,000 Comcast Corp Class A 13,894,713
145,000 Eagle Materials Inc 12,629,524
72,000 Advance Auto Parts Inc 11,442,391
225,000 Allison Transmission Holdings Inc 10,466,336
310,000 Fox Corp Class A 10,146,074
68,000 Universal Health Services Inc Class B 9,086,035
122,000 Lamb Weston Holdings Inc 8,432,855
130,000 CVS Health Corp 7,701,520
115,000 CDK Global Inc 6,103,342
45,000 Microsoft Corp 5,540,124
77,000 Ball Corp 5,267,195
50,000 Lowe's Cos Inc 5,184,457
31,000 Motorola Solutions Inc 5,132,300
98,000 Brookfield Asset Management Inc Class A 4,824,120
11,500 Boeing Co 4,191,970
21,000 McDonald's Corp 4,126,448
38,000 Hill-Rom Holdings Inc 3,874,548
19,000 Raytheon Co 3,474,520
87,000 Pfizer Inc 3,305,310
25,000 HCA Healthcare Inc 3,079,007
28,000 PayPal Holdings Inc 2,971,150
70,000 US Foods Holding Corp 2,722,983
2,000 Alphabet Inc Class C 2,410,900
15,000 Stanley Black & Decker Inc 2,021,680
42,000 Activision Blizzard Inc 2,002,410

STATEMENT OF SIGNIFICANT PURCHASES AND SALES FINANCIAL STATEMENTS
ANNUAL REPORT 2019 97
Neuberger Berman US Multi Cap Opportunities Fund (Continued)
Statement of Significant Purchases and Sales (Unaudited) (Continued) Aggregate sales greater than one percent of the total value of sales:
Units Security Description Proceeds US$
390,000 Intercontinental Exchange Inc 30,127,471
191,000 Motorola Solutions Inc 28,690,464
185,000 HCA Healthcare Inc 24,902,997
123,000 Goldman Sachs Group Inc 24,373,151
197,000 JPMorgan Chase & Co 22,286,895
125,000 3M Co 22,195,912
149,000 Stanley Black & Decker Inc 20,916,189
143,000 Chubb Ltd 20,371,340
545,000 US Foods Holding Corp 20,254,827
95,000 Berkshire Hathaway Inc Class B 19,789,620
15,600 Alphabet Inc Class C 18,676,696
236,000 CSX Corp 17,703,714
320,000 CVS Health Corp 17,643,532
83,000 Apple Inc 17,261,773
153,000 PayPal Holdings Inc 15,898,245
41,500 Boeing Co 15,327,101
265,000 Cisco Systems Inc 14,060,624
207,000 Ball Corp 12,761,069
158,000 EOG Resources Inc 12,693,495
55,000 McDonald's Corp 10,953,350
213,000 Brookfield Asset Management Inc Class A 10,547,979
61,000 Rockwell Automation Inc 10,268,251
22,000 Sherwin-Williams Co 10,206,238
240,000 Charles Schwab Corp 10,134,877
265,000 Methanex Corp 9,956,967
212,000 Activision Blizzard Inc 9,701,069
52,000 Raytheon Co 9,597,953
88,000 Analog Devices Inc 9,424,894
104,000 NIKE Inc Class B 8,825,932
169,000 Mondelez International Inc Class A 8,227,216
78,000 Hill-Rom Holdings Inc 8,092,254
55,000 Microsoft Corp 7,132,830
90,000 Scotts Miracle-Gro Co 6,115,833

FINANCIAL STATEMENTS INVESTMENT MANAGER’S REPORT
98 NEUBERGER BERMAN INVESTMENT FUNDS PLC
Neuberger Berman US Real Estate Securities Fund Investment Manager’s Report For the 12 months ended 31 December 2019, the total return of the USD I Accumulating Class was 30.87%. Over the same period, the FTSE NAREIT All Equity REITs Index (USD Total Return Gross of Fees, Net of Tax), returned 27.23% (Performance for all share classes is provided in Appendix II. Performance data quoted represent past performance, and do not indicate future results. Total returns shown reflect the reinvestment of income dividends and other distributions, if any).
For 2019 as a whole, the US stock market rallied sharply and posted its best calendar year since 2013. A “dovish pivot” by the US Federal Reserve (“Fed”), a resilient US economy, generally solid corporate results, and an agreement on the first phase of the trade accord between the US and China supported investor sentiment and triggered periods of robust risk appetite. These positives more than offset concerns over moderating growth overseas, Brexit uncertainties and a number of geopolitical issues. All told, the S&P 500 Index gained 31.49% in 2019. In contrast, the FTSE NAREIT All Equity REITs Index (USD Total Return Gross of Fees, Net of Tax), returned 27.23% over the same period.
During the reporting period, both sector allocation and stock selection contributed to the Portfolio's relative performance. In terms of sector positioning, an overweight to Manufactured Homes and an underweight to Regional Malls contributed the most to results. Conversely, a small cash position was the only meaningful detractor from for returns. From a stock selection perspective, the Portfolio's holdings in the Infrastructure, Diversified and Office sectors contributed the most to performance. In contrast, holdings in the Single Family Homes, Apartment and Free Standing sectors detracted the most from results.
Looking ahead, market uncertainty and volatility has increased, spurred by increasing coronavirus concerns as more countries, including the US, announce additional infections. First half 2020 economic growth is likely to be severely impacted. In a surprise move, the Fed lowered the Fed Funds rate by 50 basis points in early March and by 100 basis points on March 15th. There has also been aggressive monetary easing outside the US, as well as significant fiscal stimulus package in the US to help support the economy (after the reporting period ended). We will be monitoring indicators closely in the weeks and months ahead for signs of economic weakness. A possible extended global economic slowdown triggered by the Covid-19 outbreak, the coming U.S. election, and lingering concerns from US-China trade tension has us re-doubling our effort to position portfolios to better withstand these headwinds. Synchronized global monetary easing should help ease the impact on markets. Stable cash flows anchored by long-term leases, conservative capital structures (lower leverage), and secular demand drivers should allow the US listed real estate market to perform more defensively than the broader market.

BALANCE SHEET FINANCIAL STATEMENTS
The accompanying notes form an integral part of the financial statements.
ANNUAL REPORT 2019 99
Neuberger Berman US Real Estate Securities Fund (Continued) Balance Sheet
As at31 December 2019
US$
As at31 December 2018
US$ Note
Current Assets
Financial Assets at Fair Value through Profit or Loss 2 267,111,922 88,270,190
Cash and cash equivalents 3 3,952,328 1,517,617
Receivable for investments sold 1,111 –
Receivable for shares issued 2,652,287 374,677
Income receivable and other assets 681,605 258,308
Total Assets 274,399,253 90,420,792
Current Liabilities
Financial Liabilities at Fair Value through Profit or Loss 2 695,653 321,650
Payable for shares redeemed 2,435,030 976,163
Accrued expenses 579,297 337,176
Payable for investments purchased – 60
Other payables 52,669 74,732
Liabilities (excluding Net Assets Attributable to Holders of Redeemable Participating Shares) 3,762,649 1,709,781
Net Assets Attributable to Holders of Redeemable Participating Shares 270,636,604 88,711,011

FINANCIAL STATEMENTS PROFIT AND LOSS ACCOUNT
The accompanying notes form an integral part of the financial statements.
100 NEUBERGER BERMAN INVESTMENT FUNDS PLC
Neuberger Berman US Real Estate Securities Fund (Continued) Profit and Loss Account
Year Ended31 December 2019
Year Ended31 December 2018 Note
US$ US$
Income
Interest Income 24,188 21,288
Dividend Income 4,541,237 4,045,062
Net Gain/(Loss) on Financial Assets and Liabilities at Fair Value through Profit or Loss 11 25,839,250 (12,246,543)
30,404,675 (8,180,193)
Expenses
Management Fee 6 2,037,121 1,440,723
Distribution Fee 6 243,519 95,777
Administration Fee 6 516,510 433,887
Commitment Fee 19 12,698 15,972
Custody Fee 6 12,026 12,010
Depositary Fee 6 14,450 10,582
Professional Fee 9 69,470 69,217
Directors' Fee 7 4,563 6,613
Transaction Costs 9 206,541 207,258
Audit Fee 8 21,133 27,557
VAT Rebate (2,327) (1,478)
Other Expenses 9 22,180 18,879
Expense Waiver 6 (371,591) (391,703)
Total Expenses 2,786,293 1,945,294
Finance Costs
Interest Expense 5,944 276
Distribution Paid 1 1,173,265 773,855
1,179,209 774,131
Withholding Tax 1 1,271,247 1,086,857
Profit/(Loss) Attributable to Holders of Redeemable Participating Shares from Operations 25,167,926 (11,986,475)
Income and expenses arose solely from continuing operations.

STATEMENT OF CHANGES IN NET ASSETS FINANCIAL STATEMENTS
The accompanying notes form an integral part of the financial statements.
ANNUAL REPORT 2019 101
Neuberger Berman US Real Estate Securities Fund (Continued) Statement of Changes in Net Assets Attributable to Holders of Redeemable Participating Shares
Year Ended31 December 2019
Year Ended31 December 2018 Note
US$ US$
Net Assets Attributable to Holders of Redeemable Participating Shares at beginning of year 88,711,011 158,171,438
Profit/(Loss) Attributable to Holders of Redeemable Participating Shares from Operations 25,167,926 (11,986,475)
Subscriptions 5 324,443,554 63,698,515
Redemptions 5 (167,685,887) (121,172,467)
Net Assets Attributable to Holders of Redeemable Participating Shares at end of year 270,636,604 88,711,011

FINANCIAL STATEMENTS SCHEDULE OF INVESTMENTS
102 NEUBERGER BERMAN INVESTMENT FUNDS PLC
Neuberger Berman US Real Estate Securities Fund (Continued)
Schedule of Investments
Financial Assets at Fair Value through Profit or Loss
Number of Shares Security Description Fair Value
US$% of Net
Assets
Equities 4.38% (31 December 2018: 4.11%) United States Dollar 76,502 Brookfield Asset Management Inc Class A 4,421,816 1.63
49,315 Hyatt Hotels Corp Class A 4,424,049 1.64
35,876 InterXion Holding NV 3,006,767 1.11
Total Equities * 11,852,632 4.38
Real Estate Investment Trusts 93.32% (31 December 2018: 94.93%)
United States Dollar 364,659 American Homes 4 Rent Class A 9,557,712 3.53
103,855 American Tower Corp 23,867,956 8.82
126,927 Apartment Investment & Management Co Class A 6,555,780 2.42
25,740 Boston Properties Inc 3,548,516 1.31
60,387 Camden Property Trust 6,407,061 2.37
94,717 Crown Castle International Corp 13,464,022 4.98
96,310 CyrusOne Inc 6,301,563 2.33
16,873 Digital Realty Trust Inc 2,020,373 0.75
187,718 Douglas Emmett Inc 8,240,820 3.05
190,060 Duke Realty Corp 6,589,380 2.43
25,075 Equinix Inc 14,636,278 5.41
110,521 Equity LifeStyle Properties Inc 7,779,573 2.87
153,889 Equity Residential 12,452,698 4.60
32,484 Essex Property Trust Inc 9,773,136 3.61
47,474 Extra Space Storage Inc 5,014,204 1.85
124,867 Four Corners Property Trust Inc 3,520,001 1.30
173,656 Healthcare Trust of America Inc Class A 5,258,304 1.94
228,606 Healthpeak Properties Inc 7,880,049 2.91
71,923 Highwoods Properties Inc 3,517,754 1.30
205,153 Kimco Realty Corp 4,248,719 1.57
53,898 Macerich Co 1,450,934 0.54
129,340 National Retail Properties Inc 6,935,211 2.56
93,910 Omega Healthcare Investors Inc 3,977,089 1.47
116,967 Prologis Inc 10,426,438 3.85
44,120 Public Storage 9,395,795 3.47
67,246 Regency Centers Corp 4,242,550 1.57
84,272 Rexford Industrial Realty Inc 3,848,702 1.42
41,356 SBA Communications Corp Class A 9,966,382 3.68
41,663 Simon Property Group Inc 6,206,120 2.29
62,098 SL Green Realty Corp 5,705,564 2.11
115,279 Spirit Realty Capital Inc 5,669,421 2.10

SCHEDULE OF INVESTMENTS FINANCIAL STATEMENTS
ANNUAL REPORT 2019 103
Neuberger Berman US Real Estate Securities Fund (Continued)
Schedule of Investments (Continued)
Financial Assets at Fair Value through Profit or Loss (continued)
Number of Shares Security Description Fair Value
US$% of Net
Assets
Real Estate Investment Trusts 93.32% (31 December 2018: 94.93%) (continued)
United States Dollar (continued) 45,418 Sun Communities Inc 6,817,242 2.52
99,321 Welltower Inc 8,122,471 3.00
303,508 Weyerhaeuser Co 9,165,942 3.39
Total Real Estate Investment Trusts * 252,563,760 93.32
Total Investments 264,416,392 97.70
Forward Currency Contracts 1.00% (31 December 2018: 0.46%)
Amount Receivable
Amount Payable
Maturity Date Counterparty Contracts Unrealised
Gain US$% of Net
Assets
AUD Hedged Classes AUD 4,883,840 US$ 3,316,443 22/01/2020 Goldman Sachs International 16 118,329 0.04
AUD 3,246,125 US$ 2,189,667 22/01/2020 UBS AG 3 93,312 0.04
AUD 6,198,141 US$ 4,220,601 22/01/2020 Westpac Banking Corp 68 138,515 0.05
US$ 1 AUD 1 22/01/2020 Goldman Sachs International 1 0 0.00
CHF Hedged Classes CHF 1,108,900 US$ 1,119,850 22/01/2020 Goldman Sachs International 12 26,872 0.01
CHF 859,238 US$ 866,959 22/01/2020 UBS AG 1 21,586 0.01
CHF 783,984 US$ 791,257 22/01/2020 Westpac Banking Corp 4 19,467 0.01
EUR Hedged Classes € 8,108,851 US$ 8,967,071 22/01/2020 Goldman Sachs International 15 146,210 0.05
€ 6,473,240 US$ 7,152,477 22/01/2020 UBS AG 2 122,593 0.05
€ 8,326,436 US$ 9,218,107 22/01/2020 Westpac Banking Corp 43 139,706 0.05
GBP Hedged Classes £ 5,630 US$ 7,031 22/01/2020 Goldman Sachs International 13 433 0.00
£ 4,445 US$ 5,504 22/01/2020 UBS AG 2 388 0.00
£ 5,900 US$ 7,455 22/01/2020 Westpac Banking Corp 5 367 0.00
US$ 335 £ 252 22/01/2020 Westpac Banking Corp 2 2 0.00
HKD Hedged Classes HKD 6,972,438 US$ 890,029 22/01/2020 Goldman Sachs International 12 4,606 0.00
HKD 4,138,391 US$ 528,126 22/01/2020 UBS AG 2 2,872 0.00
HKD 60,454,931 US$ 7,716,443 22/01/2020 Westpac Banking Corp 20 40,543 0.02
US$ 27,387 HKD 213,426 22/01/2020 Goldman Sachs International 2 2 0.00
US$ 110,089 HKD 857,754 22/01/2020 Westpac Banking Corp 1 30 0.00
SGD Hedged Classes SGD 680,666 US$ 495,845 22/01/2020 Goldman Sachs International 17 10,427 0.00
SGD 446,159 US$ 323,609 22/01/2020 UBS AG 3 8,239 0.00
SGD 563,697 US$ 410,253 22/01/2020 Westpac Banking Corp 40 9,017 0.00

FINANCIAL STATEMENTS SCHEDULE OF INVESTMENTS
104 NEUBERGER BERMAN INVESTMENT FUNDS PLC
Neuberger Berman US Real Estate Securities Fund (Continued)
Schedule of Investments (Continued)
Financial Assets at Fair Value through Profit or Loss (continued)
Forward Currency Contracts 1.00% (31 December 2018: 0.46%) (continued)
Amount Receivable
Amount Payable
Maturity Date Counterparty Contracts Unrealised
Gain US$% of Net
Assets
ZAR Hedged Classes ZAR 106,563,345 US$ 7,040,957 22/01/2020 Goldman Sachs International 17 560,086 0.21
ZAR 70,469,846 US$ 4,597,000 22/01/2020 UBS AG 3 429,534 0.16
ZAR 163,936,123 US$ 10,890,984 22/01/2020 Westpac Banking Corp 64 802,394 0.30
Total Unrealised Gain on Forward Currency Contracts ∞ 2,695,530 1.00
Fair ValueUS$
% of NetAssets
Total Financial Assets at Fair Value through Profit or Loss 267,111,922 98.70
Financial Liabilities at Fair Value through Profit or Loss Forward Currency Contracts (0.26%) (31 December 2018: (0.36%))
Amount Receivable
Amount Payable
Maturity Date Counterparty Contracts Unrealised
Loss US$% of Net
Assets
AUD Hedged Classes US$ 669,450 AUD 974,664 22/01/2020 Goldman Sachs International 11 (16,025) (0.01)
US$ 162,963 AUD 236,747 22/01/2020 UBS AG 2 (3,539) (0.00)
US$ 1,993,187 AUD 2,913,895 22/01/2020 Westpac Banking Corp 40 (56,138) (0.02)
CHF Hedged Classes CHF 24,160 US$ 25,007 22/01/2020 UBS AG 1 (23) (0.00)
US$ 177,003 CHF 174,141 22/01/2020 Goldman Sachs International 8 (3,079) (0.00)
US$ 87,478 CHF 86,116 22/01/2020 UBS AG 3 (1,575) (0.00)
US$ 159,737 CHF 157,975 22/01/2020 Westpac Banking Corp 7 (3,626) (0.00)
EUR Hedged Classes US$ 3,152,327 € 2,835,111 22/01/2020 Goldman Sachs International 16 (33,965) (0.01)
US$ 962,803 € 871,700 22/01/2020 UBS AG 1 (16,873) (0.01)
US$ 5,247,392 € 4,715,003 22/01/2020 Westpac Banking Corp 45 (51,650) (0.02)
GBP Hedged Classes US$ 962 £ 741 22/01/2020 Goldman Sachs International 6 (20) (0.00)
US$ 219 £ 167 22/01/2020 UBS AG 1 (2) (0.00)
US$ 921 £ 715 22/01/2020 Westpac Banking Corp 7 (27) (0.00)
HKD Hedged Classes HKD 122,562 US$ 15,734 22/01/2020 Goldman Sachs International 1 (8) (0.00)
HKD 193,241 US$ 24,815 22/01/2020 UBS AG 1 (20) (0.00)
US$ 283,501 HKD 2,221,252 22/01/2020 Goldman Sachs International 5 (1,509) (0.00)
US$ 37,318 HKD 291,205 22/01/2020 UBS AG 1 (47) (0.00)
US$ 6,436,877 HKD 50,426,985 22/01/2020 Westpac Banking Corp 9 (33,422) (0.01)
SGD Hedged Classes US$ 55,935 SGD 75,997 22/01/2020 Goldman Sachs International 7 (591) (0.00)
US$ 247,766 SGD 336,517 22/01/2020 Westpac Banking Corp 30 (2,530) (0.00)

SCHEDULE OF INVESTMENTS FINANCIAL STATEMENTS
ANNUAL REPORT 2019 105
Neuberger Berman US Real Estate Securities Fund (Continued)
Schedule of Investments (Continued)
Financial Liabilities at Fair Value through Profit or Loss (continued)
Forward Currency Contracts (0.26%) (31 December 2018: (0.36%)) (continued)
Amount Receivable
Amount Payable
Maturity Date Counterparty Contracts Unrealised
Loss US$% of Net
Assets
ZAR Hedged Classes US$ 2,078,959 ZAR 30,562,347 22/01/2020 Goldman Sachs International 15 (101,018) (0.04)
US$ 229,274 ZAR 3,345,839 22/01/2020 UBS AG 1 (9,381) (0.01)
US$ 5,612,839 ZAR 83,744,799 22/01/2020 Westpac Banking Corp 51 (360,585) (0.13)
Total Unrealised Loss on Forward Currency Contracts ∞ (695,653) (0.26)
Fair Value
US$% of Net
Assets Total Financial Liabilities at Fair Value through Profit or Loss (695,653) (0.26)
Net Financial Assets at Fair Value through Profit or Loss 266,416,269 98.44
Other Net Assets 4,220,335 1.56
Net Assets Attributable to Holders of Redeemable Participating Shares 270,636,604 100.00
% of
TotalAssetsPortfolio Analysis US$
* Transferable securities and/or money market instruments admitted to an official stock exchange listing 264,416,392 96.36
∞ OTC financial derivative instruments 1,999,877 0.73
Total Investments 266,416,269 97.09

FINANCIAL STATEMENTS STATEMENT OF SIGNIFICANT PURCHASES AND SALES
106 NEUBERGER BERMAN INVESTMENT FUNDS PLC
Neuberger Berman US Real Estate Securities Fund (Continued) Statement of Significant Purchases and Sales (Unaudited)
In accordance with the European Communities (Undertakings for Collective Investment in Transferable Securities) Regulations, 2011 as amended, a statement of changes in the composition of the Schedule of Investments during the reporting period is provided to ensure that Shareholders can identify changes in the investments held by the Portfolio. The following statements present the aggregate purchases and sales of transferable securities exceeding one percent of the total value of purchases or sales, respectively, for the period. At a minimum, the largest twenty purchases and twenty sales are presented, if available.
Aggregate purchases greater than one percent of the total value of purchases:
Units Security Description Cost US$
77,236 American Tower Corp 16,822,244
125,360 Equity Residential 10,407,782
18,794 Equinix Inc 10,082,926
73,032 Crown Castle International Corp 10,052,589
115,611 Prologis Inc 9,801,393
40,016 Public Storage 9,356,453
86,226 Equity LifeStyle Properties Inc 8,845,984
27,322 Essex Property Trust Inc 8,523,048
117,202 CyrusOne Inc 7,929,811
286,053 Weyerhaeuser Co 7,700,564
30,891 SBA Communications Corp Class A 7,398,994
62,587 Camden Property Trust 7,060,974
271,802 American Homes 4 Rent Class A 6,880,716
192,860 Duke Realty Corp 6,655,319
151,211 Douglas Emmett Inc 6,340,338
73,573 Welltower Inc 6,335,318
106,921 National Retail Properties Inc 5,910,859
111,368 Apartment Investment & Management Co Class A 5,755,448
126,759 Spirit Realty Capital Inc 5,720,428
156,049 HCP Inc 5,365,908
65,098 SL Green Realty Corp 5,313,637
31,850 Simon Property Group Inc 4,995,681
33,785 Sun Communities Inc 4,915,445
34,824 Digital Realty Trust Inc 4,287,012
93,910 Omega Healthcare Investors Inc 4,005,644
35,342 Extra Space Storage Inc 3,978,572
130,025 Healthcare Trust of America Inc Class A 3,773,197
25,740 Boston Properties Inc 3,563,751
172,139 Kimco Realty Corp 3,493,835
49,920 Regency Centers Corp 3,322,789
65,975 Liberty Property Trust 3,318,769
56,646 Brookfield Asset Management Inc Class A 2,967,040
66,107 Rexford Industrial Realty Inc 2,859,679
36,749 Hyatt Hotels Corp Class A 2,772,381
93,597 Four Corners Property Trust Inc 2,650,804
53,892 Highwoods Properties Inc 2,424,394

STATEMENT OF SIGNIFICANT PURCHASES AND SALES FINANCIAL STATEMENTS
ANNUAL REPORT 2019 107
Neuberger Berman US Real Estate Securities Fund (Continued) Statement of Significant Purchases and Sales (Unaudited) (Continued)
Aggregate sales greater than one percent of the total value of sales:
Units Security Description Proceeds US$
73,856 Prologis Inc 5,980,926
113,889 Liberty Property Trust 5,699,819
69,970 Equity LifeStyle Properties Inc 5,661,928
43,545 Digital Realty Trust Inc 5,166,700
24,767 Simon Property Group Inc 4,310,181
13,610 Essex Property Trust Inc 4,137,006
29,288 Alexandria Real Estate Equities Inc 4,095,678
49,226 Equity Residential 3,959,131
19,184 American Tower Corp 3,702,791
43,665 CyrusOne Inc 3,123,513
6,405 Equinix Inc 2,969,747
45,407 Apartment Investment & Management Co Class A 2,378,111
16,025 Crown Castle International Corp 1,997,471
9,143 SBA Communications Corp Class A 1,888,334
67,449 American Homes 4 Rent Class A 1,593,505
47,377 Pebblebrook Hotel Trust 1,502,641
37,264 Douglas Emmett Inc 1,493,441
6,636 Public Storage 1,488,022
18,317 Welltower Inc 1,459,663
21,694 National Retail Properties Inc 1,160,385
8,053 Sun Communities Inc 1,014,205
25,539 Rexford Industrial Realty Inc 1,005,880
37,842 Weyerhaeuser Co 985,623
30,613 HCP Inc 972,872
48,571 Brookfield Property REIT Inc 958,468
32,309 Healthcare Trust of America Inc Class A 915,162
20,032 Highwoods Properties Inc 904,088
8,479 Extra Space Storage Inc 875,747
12,053 Regency Centers Corp 785,854

FINANCIAL STATEMENTS INVESTMENT MANAGER’S REPORT
108 NEUBERGER BERMAN INVESTMENT FUNDS PLC
Neuberger Berman China Equity Fund Investment Manager’s Report For the 12 months ended 31 December 2019, the total return for the USD I Accumulating Class was 33.76%. Over the same period, the benchmark index, the MSCI China (Net) Total Return Index (the “Index”), returned 23.46%. (Performance for all share classes is provided in Appendix II. Performance data quoted represent past performance and do not indicate future results. Total returns shown are net of all fees and expenses and include reinvestment of income dividends and other distributions, if any).
The China equity markets performed strongly in 2019 for both MSCI China Index and the domestic China A-shares market. In January, the markets rallied due to easing trade tensions, the People’s Bank of China (“PBoC”)’s announcement of a 100bps cut in reserve requirement ratio (“RRR”) and plans to set up central bank bills swap aimed at improving liquidity of banks’ perpetual bonds. Investors continued the optimism in February on trade agreement and expectations of additional policy support. A significant increase in retail participation and leverage onshore, coupled with inflows ahead of the MSCI inclusion decision led the onshore market to surge and outperform global indices. Chinese equities retreated in early March primarily because trade headlines turned negative, the US dollar strengthening, decline in global bond yields and concerns over global economic growth. In mid-March, markets gained upward momentum after the conclusion of the National People’s Congress and anticipation of launch of the Shanghai Stock Exchange’s Science and Technology Innovation Board. Chinese equities continued their strength in early April as March Purchasing Managers Index rebounded stronger than expected, but markets drifted lower later in the month despite better trade activity and financing data. The China equity markets pulled back sharply in May as the US imposed tariffs on another US$200 billion worth of Chinese goods and blacklisted Huawei from procuring components from American firms. China retaliated with 25% tariffs on US $60 billion worth of American goods, put soya buying on hold and considered rare earth export curbs. Towards month-end, the China A-shares market declined further despite the announcement of target RRR cuts and the MSCI rebalancing of A-shares as inclusion factor increased from 5% to 10%. In June, the China equity markets rebounded on improved sentiment from optimism on additional stimulus policy, launch of the STAR Board and anticipation of a trade resolution ahead of the G20 meeting between Presidents Xi and Trump.
In the beginning of July, Chinese equities extended gains as trade talks at the G20 were better than expected and President Trump lifted some exports ban to Huawei, but declined later in the month due to expectations of rate cuts by the US Federal Reserve, liquidity concerns from the STAR Board launch and caution amid ongoing 2Q company results. Despite generally solid 1H company earnings, markets continued to go down in August because of concerns over trade war escalation, collapse in global bond yields, sharp depreciation of the CNY and social unrests in Hong Kong. China equity markets rebounded in September as Sino-US trade talks resumed, the State Council signalled targeted RRR cuts and the State Administration of Foreign Exchange announced the removal of QFII and RQFII quotas, but most of the gains reversed ahead of the China National Day holidays amid ongoing trade tensions, policy easing and continued social unrest in Hong Kong. After the Golden Week holidays in October, both offshore and onshore markets rallied strongly because of solid 3Q earnings results, and investors awaited guidance from the 4th Plenary Session of the 19th Central Committee of the Communist Party of China. Markets extended gains into November as China and the US both stated plans to lift tariffs as part of a phase one trade deal, but corrected sharply later in the month after the US passed a bill in support of the Hong Kong protest movement. In December, Chinese equities rallied strongly as China and the US reached a phase one trade deal which prevented additional US tariffs on US $160 billion worth of Chinese imports from coming into effect and both countries agreeing to scale back existing tariffs. Encouraging China macroeconomic data and expectations of additional fiscal and monetary stimulus from Beijing further lifted investor sentiment which led markets to end the year on a strong note.
In 2019, the Portfolio’s main contributors to performance relative to the Index included Communication Services (significant underweight and stock selection, primarily to interactive media & services and diversified telecommunication services), Consumer Staples (significant overweight and stock selection to food & beverage) and Materials (stock selection to construction materials). Main detractors from relative performance included Financials (stock selection to insurance) and Information Technology (significant underweight). The Portfolio’s underweight exposure to Chinese companies listed in Hong Kong and overweight exposure to domestic China A-shares contributed to relative performance, whereas the Portfolio’s underweight exposure to US ADRs detracted from relative performance. As of 31 December 2019, the Portfolio’s largest sector underweight was Communication Services, and also held underweight positions in Information Technology and Utilities. The Portfolio’s largest sector overweight was Consumer Staples, and also held overweight positions in Industrials and Consumer Discretionary. The Portfolio’s top 10 positions comprised more than 53% of total assets at end of December.
Since 2019 year-end, the ongoing COVID-19 outbreak has roiled global risk assets, and policymakers from both developed and emerging economies have struggled to put into place appropriate domestic remedies and formulate a coordinated global response. Indeed, the world is now a more politically fragmented place than what it was back in 2008 when the Global Financial Crisis presented a similar existential threat to the global economy. Moreover, the crisis currently before us is complicated by differing political considerations, health care infrastructure and social/cultural norms, rather than limited to capital markets which by comparison are far more integrated. As such, the hope for a strong unified stance against the current pandemic is unlikely to materialize in the short-term. Individual countries are largely left to their own devices on how best to contain the viral outbreak within their own borders and manage the resultant economic fallout.

INVESTMENT MANAGER’S REPORT FINANCIAL STATEMENTS
ANNUAL REPORT 2019 109
Neuberger Berman China Equity Fund (Continued) Investment Manager’s Report (Continued) As an investment manager assessing the economic and financial implications, we note that the unprecedented measures implemented by China to contain the COVID-19 outbreak seem to be bearing fruit, whereas it continues to pick up pace in other parts of the world, especially in Europe and North America. Not only has the infection curve within China been flattening out for some time, the number of total cases and deaths outside of China has recently exceeded that of the virus’ original epicentre and continues to grow at an alarming rate.
With further escalation of the viral risk abating, the attention of Chinese policymakers has gradually shifted towards reinforcing the economy while continuing to control the outbreak. While the latest statistics point to a significant collapse in economic activity for 1Q 2020, it is not surprising to us given the Lunar New Year holidays and subsequent lockdown measures to contain the virus. In addition, what is more important is the trajectory the economy is headed and the pace of which this is occurring. According to CICC, roughly 80% of China’s economy has resumed normal operations, with this figure over 85% if we were to exclude Hubei Province where the outbreak originated. The resumption of economic activity is improving daily and further buttressed by decisive monetary and fiscal stimulus by the Chinese government who have an abundance of options in their policy toolkit. In comparison, the rest of the world is only now beginning to experience the clinical process that China and some other Asian countries have been subject to for the past two months, so the full economic impact of what is expected to be a long and drawn out slowdown remains to be seen.
Interestingly, equity market returns have been much less discriminate. While China equity markets have outperformed its developed market counterparts, they have not gone unscathed amidst broad based de-risking. However, notwithstanding the spectacular cratering of developed market equities, both the S&P 500 and MSCI World indices continue to trade at a premium vis-à-vis China equities. While we cannot claim to have a clear view on the directionality of markets, the disintermediation of economic fundamentals and equity market valuations between China and developed markets point to an increasingly interesting dislocation. We are beginning to observe value emerge within the China equity opportunity set. At the same time, earnings visibility has also improved due to a less uncertain economic outlook in China, and may continue to re-rate upwards as domestic conditions improve.

FINANCIAL STATEMENTS BALANCE SHEET
The accompanying notes form an integral part of the financial statements.
110 NEUBERGER BERMAN INVESTMENT FUNDS PLC
Neuberger Berman China Equity Fund (Continued) Balance Sheet
As at31 December 2019
As at31 December 2018 Note
US$ US$
Current Assets
Financial Assets at Fair Value through Profit or Loss 2 830,094,316 787,809,626
Cash and cash equivalents 3 30,932,768 32,951,594
Receivable for investments sold 4,933,439 5,763,287
Income receivable and other assets 215,972 6,592
Total Assets 866,176,495 826,531,099
Current Liabilities
Financial Liabilities at Fair Value through Profit or Loss 2 307,424 363,639
Payable for shares redeemed 423,734 759,104
Accrued expenses 1,173,548 2,133,384
Payable for investments purchased 5,514,944 –
Other payables 71,831 139,711
Liabilities (excluding Net Assets Attributable to Holders of Redeemable Participating Shares) 7,491,481 3,395,838
Net Assets Attributable to Holders of Redeemable Participating Shares 858,685,014 823,135,261

PROFIT AND LOSS ACCOUNT FINANCIAL STATEMENTS
The accompanying notes form an integral part of the financial statements.
ANNUAL REPORT 2019 111
Neuberger Berman China Equity Fund (Continued) Profit and Loss Account
Year Ended31 December 2019
Year Ended31 December 2018 Note
US$ US$
Income
Interest Income 156,219 124,549
Dividend Income 23,288,132 22,235,377
Net Gain/(Loss) on Financial Assets and Liabilities at Fair Value through Profit or Loss 11 234,641,907 (222,953,845)
258,086,258 (200,593,919)
Expenses
Management Fee 6 10,805,299 14,996,720
Distribution Fee 6 367,832 398,453
Administration Fee 6 845,132 1,177,804
Commitment Fee 19 98,099 124,487
Custody Fee 6 295,968 445,483
Depositary Fee 6 85,976 117,421
Professional Fee 9 87,103 234,139
Directors' Fee 7 4,563 6,559
Transaction Costs 9 1,064,862 1,751,795
Audit Fee 8 18,113 21,311
VAT Rebate (13,915) (15,433)
Other Expenses 9 85,021 92,357
Total Expenses 13,744,053 19,351,096
Finance Costs
Interest Expense 1,693 2,912
Distribution Paid 1 4,508 11,834
6,201 14,746
Withholding Tax 1 1,601,301 1,643,567
Profit/(Loss) Attributable to Holders of Redeemable Participating Shares from Operations 242,734,703 (221,603,328)
Income and expenses arose solely from continuing operations.

FINANCIAL STATEMENTS STATEMENT OF CHANGES IN NET ASSETS
The accompanying notes form an integral part of the financial statements.
112 NEUBERGER BERMAN INVESTMENT FUNDS PLC
Neuberger Berman China Equity Fund (Continued) Statement of Changes in Net Assets Attributable to Holders of Redeemable Participating Shares
Year Ended31 December 2019
Year Ended31 December 2018 Note
US$ US$
Net Assets Attributable to Holders of Redeemable Participating Shares at beginning of year 823,135,261 1,415,424,646
Profit/(Loss) Attributable to Holders of Redeemable Participating Shares from Operations 242,734,703 (221,603,328)
Subscriptions 5 1,127,266 14,178,348
Redemptions 5 (208,312,216) (384,864,405)
Net Assets Attributable to Holders of Redeemable Participating Shares at end of year 858,685,014 823,135,261

SCHEDULE OF INVESTMENTS FINANCIAL STATEMENTS
ANNUAL REPORT 2019 113
Neuberger Berman China Equity Fund (Continued)
Schedule of Investments
Financial Assets at Fair Value through Profit or Loss
Number of Shares Security Description Fair Value
US$% of Net
Assets
Equities 96.58% (31 December 2018: 95.66%)
Chinese Yuan Renminbi
5,092,576 Anhui Conch Cement Co Ltd Class A 40,067,072 4.67
1,500,000 Gree Electric Appliances Inc of Zhuhai Class A 14,123,170 1.64
12,500,000 Haier Smart Home Co Ltd Class A 34,995,657 4.08
6,999,864 Inner Mongolia Yili Industrial Group Co Ltd Class A 31,094,204 3.62
175,000 Kweichow Moutai Co Ltd Class A 29,722,978 3.46
Total Chinese Yuan Renminbi 150,003,081 17.47
Hong Kong Dollar 15,000,000 Brilliance China Automotive Holdings Ltd 15,554,814 1.81
45,000,000 China Construction Bank Corp - H Shares 38,867,784 4.53
4,260,382 China Everbright Greentech Ltd 2,307,402 0.27
30,000,481 China Everbright International Ltd 24,064,145 2.80
8,499,000 China Medical System Holdings Ltd 12,238,351 1.43
3,000,000 China Merchants Bank Co Ltd - H Shares 15,420,057 1.80
6,500,000 China Pacific Insurance Group Co Ltd - H Shares 25,610,257 2.98
40,000,000 China Petroleum & Chemical Corp - H Shares 24,076,593 2.80
3,632,000 China Resources Beer Holdings Co Ltd 20,090,249 2.34
7,500,000 China Resources Land Ltd 37,346,954 4.35
10,000,000 China Taiping Insurance Holdings Co Ltd 24,795,298 2.89
14,530,000 CSPC Pharmaceutical Group Ltd 34,647,630 4.03
25,510,000 Guangzhou Automobile Group Co Ltd - H Shares 31,757,360 3.70
37,500,000 Industrial & Commercial Bank of China Ltd - H Shares 28,876,511 3.36
4,195,500 Longfor Group Holdings Ltd 19,653,450 2.29
650,000 Meituan Dianping Class B 8,500,603 0.99
1,748,000 Minth Group Ltd 6,169,306 0.72
2,500,000 Ping An Insurance Group Co of China Ltd - H Shares 29,550,296 3.44
2,423,900 Shenzhou International Group Holdings Ltd 35,432,405 4.13
1,613,100 Tencent Holdings Ltd 77,758,716 9.06
1,108,000 Tingyi Cayman Islands Holding Corp 1,891,270 0.22
3,469,000 Weichai Power Co Ltd - H Shares 7,319,279 0.85
2,000,000 Zhuzhou CRRC Times Electric Co Ltd - H Shares 7,238,379 0.84
Total Hong Kong Dollar 529,167,109 61.63
United States Dollar 385,000 Alibaba Group Holding Ltd ADR 81,658,500 9.51
95,158 Huazhu Group Ltd ADR 3,812,981 0.44
167,073 New Oriental Education & Technology Group Inc ADR 20,257,601 2.36

FINANCIAL STATEMENTS SCHEDULE OF INVESTMENTS
114 NEUBERGER BERMAN INVESTMENT FUNDS PLC
Neuberger Berman China Equity Fund (Continued)
Schedule of Investments (Continued)
Financial Assets at Fair Value through Profit or Loss (continued)
Number of Shares Security Description Fair Value
US$% of Net
Assets
Equities 96.58% (31 December 2018: 95.66%) (continued)
United States Dollar (continued) 1,900,709 ZTO Express Cayman Inc ADR 44,381,555 5.17
Total United States Dollar 150,110,637 17.48
Total Equities * 829,280,827 96.58
Total Investments 829,280,827 96.58
Forward Currency Contracts 0.09% (31 December 2018: 0.05%)
Amount Receivable
Amount Payable
Maturity Date Counterparty Contracts Unrealised
Gain US$% of Net
Assets
CHF Hedged Classes CHF 2,515,082 US$ 2,539,789 22/01/2020 Goldman Sachs International 14 61,077 0.01
CHF 1,954,017 US$ 1,973,204 22/01/2020 UBS AG 4 47,460 0.01
CHF 1,805,944 US$ 1,822,806 22/01/2020 Westpac Banking Corp 7 44,734 0.01
EUR Hedged Classes € 5,595,031 US$ 6,184,371 22/01/2020 Goldman Sachs International 17 103,710 0.01
€ 4,654,793 US$ 5,143,806 22/01/2020 UBS AG 3 87,568 0.01
€ 4,239,594 US$ 4,684,590 22/01/2020 Westpac Banking Corp 20 80,153 0.01
US$ 1 € 1 22/01/2020 Westpac Banking Corp 1 0 0.00
GBP Hedged Classes £ 468,877 US$ 585,745 22/01/2020 Goldman Sachs International 14 35,750 0.00
£ 369,118 US$ 458,529 22/01/2020 UBS AG 4 30,738 0.00
£ 334,417 US$ 415,803 22/01/2020 Westpac Banking Corp 6 27,467 0.00
HKD Hedged Classes HKD 3,537,714 US$ 451,552 22/01/2020 Goldman Sachs International 13 2,373 0.00
HKD 3,231,794 US$ 412,458 22/01/2020 UBS AG 3 2,215 0.00
HKD 2,898,887 US$ 369,955 22/01/2020 Westpac Banking Corp 7 2,004 0.00
SGD Hedged Classes SGD 6,173,871 US$ 4,485,852 22/01/2020 Goldman Sachs International 16 106,189 0.01
SGD 5,171,683 US$ 3,751,296 22/01/2020 UBS AG 3 95,332 0.01
SGD 4,897,684 US$ 3,556,112 22/01/2020 Westpac Banking Corp 14 86,719 0.01
Total Unrealised Gain on Forward Currency Contracts ∞ 813,489 0.09
Fair Value
US$% of Net
Assets Total Financial Assets at Fair Value through Profit or Loss 830,094,316 96.67

SCHEDULE OF INVESTMENTS FINANCIAL STATEMENTS
ANNUAL REPORT 2019 115
Neuberger Berman China Equity Fund (Continued)
Schedule of Investments (Continued)
Financial Liabilities at Fair Value through Profit or Loss
Forward Currency Contracts (0.04%) (31 December 2018: (0.04%))
Amount Receivable
Amount Payable
Maturity Date Counterparty Contracts Unrealised
Loss US$% of Net
Assets
CHF Hedged Classes CHF 101,071 US$ 104,614 22/01/2020 UBS AG 1 (96) (0.00)
US$ 650,307 CHF 641,133 22/01/2020 Goldman Sachs International 11 (12,696) (0.00)
US$ 2,057 CHF 2,038 22/01/2020 UBS AG 1 (51) (0.00)
US$ 96,421 CHF 95,420 22/01/2020 Westpac Banking Corp 3 (2,253) (0.00)
EUR Hedged Classes US$ 3,261,227 € 2,950,174 22/01/2020 Goldman Sachs International 16 (54,380) (0.01)
US$ 2,366,984 € 2,143,014 22/01/2020 UBS AG 1 (41,481) (0.00)
US$ 2,840,550 € 2,570,307 22/01/2020 Westpac Banking Corp 60 (48,137) (0.01)
GBP Hedged Classes £ 11,242 US$ 15,011 22/01/2020 Goldman Sachs International 1 (110) (0.00)
£ 17,172 US$ 22,921 22/01/2020 Westpac Banking Corp 1 (160) (0.00)
US$ 150,396 £ 117,198 22/01/2020 Goldman Sachs International 10 (4,950) (0.00)
US$ 125,429 £ 95,770 22/01/2020 Westpac Banking Corp 4 (1,514) (0.00)
HKD Hedged Classes HKD 75,627 US$ 9,705 22/01/2020 Goldman Sachs International 2 (1) (0.00)
HKD 58,334 US$ 7,491 22/01/2020 UBS AG 1 (6) (0.00)
US$ 319,252 HKD 2,501,227 22/01/2020 Goldman Sachs International 11 (1,680) (0.00)
US$ 274,505 HKD 2,151,023 22/01/2020 UBS AG 1 (1,493) (0.00)
US$ 242,406 HKD 1,899,541 22/01/2020 Westpac Banking Corp 3 (1,324) (0.00)
SGD Hedged Classes US$ 2,335,791 SGD 3,212,582 22/01/2020 Goldman Sachs International 17 (53,686) (0.01)
US$ 1,623,483 SGD 2,239,878 22/01/2020 UBS AG 1 (42,508) (0.01)
US$ 1,704,677 SGD 2,346,873 22/01/2020 Westpac Banking Corp 53 (40,898) (0.00)
Total Unrealised Loss on Forward Currency Contracts ∞ (307,424) (0.04)
Fair ValueUS$
% of NetAssets
Total Financial Liabilities at Fair Value through Profit or Loss (307,424) (0.04)
Net Financial Assets at Fair Value through Profit or Loss 829,786,892 96.63
Other Net Assets 28,898,122 3.37
Net Assets Attributable to Holders of Redeemable Participating Shares 858,685,014 100.00
% of
TotalAssetsPortfolio Analysis US$
* Transferable securities and/or money market instruments admitted to an official stock exchange listing 829,280,827 95.74
∞ OTC financial derivative instruments 506,065 0.06
Total Investments 829,786,892 95.80

FINANCIAL STATEMENTS STATEMENT OF SIGNIFICANT PURCHASES AND SALES
116 NEUBERGER BERMAN INVESTMENT FUNDS PLC
Neuberger Berman China Equity Fund (Continued) Statement of Significant Purchases and Sales (Unaudited) In accordance with the European Communities (Undertakings for Collective Investment in Transferable Securities) Regulations, 2011 as amended, a statement of changes in the composition of the Schedule of Investments during the reporting period is provided to ensure that Shareholders can identify changes in the investments held by the Portfolio. The following statements present the aggregate purchases and sales of transferable securities exceeding one percent of the total value of purchases or sales, respectively, for the period. At a minimum, the largest twenty purchases and twenty sales are presented, if available.
Aggregate purchases greater than one percent of the total value of purchases:
Units Security Description Cost US$
7,500,000 China Resources Land Ltd 31,140,322
167,073 New Oriental Education & Technology Group Inc ADR 20,752,709
25,000,000 China Petroleum & Chemical Corp - H Shares 17,895,134
3,000,000 China Merchants Bank Co Ltd - H Shares 15,156,147
6,000,049 Haier Smart Home Co Ltd Class A 14,657,926
3,632,000 China Resources Beer Holdings Co Ltd 13,872,452
350,055 Huazhu Group Ltd ADR 12,222,447
6,530,000 CSPC Pharmaceutical Group Ltd 11,418,323
2,526,600 China Pacific Insurance Group Co Ltd - H Shares 10,181,419
64,100 Alibaba Group Holding Ltd ADR 10,126,473
65,021 Kweichow Moutai Co Ltd Class A 9,011,307
9,991,000 China Construction Bank Corp - H Shares 8,884,075
200,000 Yum China Holdings Inc 8,663,398
165,324 Baozun Inc 8,505,542
650,000 Meituan Dianping Class B 7,863,028
2,000,000 Zhuzhou CRRC Times Electric Co Ltd - H Shares 7,798,804
3,469,000 Weichai Power Co Ltd - H Shares 6,768,102
7,500,000 Industrial & Commercial Bank of China Ltd - H Shares 5,725,805
120,000 Tencent Holdings Ltd 5,386,637
999,864 Inner Mongolia Yili Industrial Group Co Ltd Class A 4,169,702
2,800,000 Topsports International Holdings Ltd 3,298,040
780,000 Longfor Group Holdings Ltd 2,737,126
2,683,000 China Everbright International Ltd 2,697,223

STATEMENT OF SIGNIFICANT PURCHASES AND SALES FINANCIAL STATEMENTS
ANNUAL REPORT 2019 117
Neuberger Berman China Equity Fund (Continued) Statement of Significant Purchases and Sales (Unaudited) (Continued) Aggregate sales greater than one percent of the total value of sales:
Units Security Description Proceeds US$
259,100 Alibaba Group Holding Ltd ADR 45,732,306
6,000,800 Gree Electric Appliances Inc of Zhuhai Class A 43,650,187
45,000,000 China Construction Bank Corp - H Shares 33,493,969
3,349,201 Midea Group Co Ltd 25,628,452
456,900 Tencent Holdings Ltd 20,840,556
4,072,963 Huadong Medicine Co Ltd 20,627,320
9,500,000 Guangzhou Baiyun International Airport Co Ltd 20,347,746
400,098 SINA Corp 20,200,148
22,500,000 China National Building Material Co Ltd 19,078,930
4,129,290 Inner Mongolia Yili Industrial Group Co Ltd Class A 18,411,451
16,547,707 PICC Property & Casualty Co Ltd 18,114,341
25,000,000 CIFI Holdings Group Co Ltd 17,137,123
65,000,000 China Tower Corp Ltd 16,433,988
122,898 Kweichow Moutai Co Ltd Class A 16,118,461
1,500,000 Ping An Insurance Group Co of China Ltd - H Shares 13,886,556
8,756,000 Guangzhou Automobile Group Co Ltd - H Shares 10,702,521
254,897 Huazhu Group Ltd ADR 9,894,579
15,000,000 China Jinmao Holdings Group Ltd 9,818,924
200,000 Yum China Holdings Inc 9,552,797
11,773,000 BAIC Motor Corp Ltd 7,714,937
165,324 Baozun Inc 5,797,645
4,024,000 China Medical System Holdings Ltd 5,496,648
5,000,000 Brilliance China Automotive Holdings Ltd 5,450,921

FINANCIAL STATEMENTS INVESTMENT MANAGER’S REPORT
118 NEUBERGER BERMAN INVESTMENT FUNDS PLC
Neuberger Berman Emerging Markets Equity Fund Investment Manager’s Report For the 12 months ended 31 December 2019, the total return for the USD I Accumulating Class was 18.74%. Over the same period, the benchmark index, the MSCI EM Index (USD Net Total Return) (the “Index”), returned 18.42%. (Performance for all share classes is provided in Appendix II. Performance data quoted represent past performance and do not indicate future results. Total returns shown are net of all fees and expenses and include reinvestment of income dividends and other distributions, if any).
Emerging markets (“EM”) equities performed well in 2019. After trailing US and developed international equities for much of the year, they closed on a high note. The last few months of global monetary policy easing plus indications that a “phase one” US-China trade deal was imminent boosted risk-on sentiment. This was reflected in an EM equities rally, the US Dollar Index weakening, and flows into EM equity funds turning strongly positive in the final months of the year.
The Index performance was led by Information Technology (“IT”), Consumer Discretionary and Real Estate stocks. All sectors were positive, but Health Care, Materials and Industrials lagged. By country, Russia, Greece and Egypt were top performers, while Argentina, Chile and Poland detracted.
Stock selection was the key driver of the portfolio’s outperformance this year. IT holdings contributed most, followed by Financials and Consumer Staples. By country, stocks based in Taiwan and Korea, and our overweight to the top-performing Russian market were positives. Our Consumer Discretionary, Real Estate and Communications names underperformed their peers. By country, Indian, Indonesian and Philippines-based holdings detracted.
With investors optimistic that monetary easing can boost global economic prospects, equity markets all rallied at year-end, with EM leading the way.
Global equity markets are attempting to assess the broader impact of COVID-19: as it spreads across communities, and corporates highlight the impact to their businesses. The impact can be categorized in three broad categories: first, the lost demand to the services sector; second, a postponement of discretionary spending; and third, a potential impact to global supply chains. Each emerging market and developed market are in a various stages of the virus spreading and government policies to tackle the virus. The early March breakdown of key oil supplier talks also added to the market turbulence.
The severity of both the COVID-19 disruption – and the oil price retreat – speaks to the lack of earnings visibility for the remainder of 2020, with the uncertainty also likely contributing to the volatility in equity markets.
In March 2020, emerging market equities were sold off indiscriminately, although countries that are further along in the Coronavirus curve, e.g. China and Taiwan, are outperforming and their economies seem to be getting back to normal. Commodity-sensitive markets like Russia and Brazil continue to be underperformers. On a sector basis, commodity sectors (Energy/Materials) have been the hardest hit during the month. Challenges are likely to persist in these markets, so we remain underweight, which has been helpful on a relative basis. We continue to monitor currencies that have taken a big hit, in particular commodity currencies like the Brazilian real, and Russian ruble.
Easy monetary policy can be helpful in the longer run, but March 2020’s dollar funding squeeze is putting further pressure on emerging markets. The portfolio favors domestically-driven names, and the team expect locally-focused companies to recover first given exporters will likely still have to deal with virus-related demand destruction in the developed world. As things recover and liquidity improves, the team believes the portfolio is well positioned to benefit.
The portfolio positioning has not changed radically, but the team is staying in close contact with existing holdings to assess the impact. When the team believe stock prices are dislocated from fundamentals, the team looks to add. The portfolio’s large underweight towards China is being reduced, adding to domestically-focused Consumer names as the economy recovers and pent-up demand could drive a second half 2020 recovery. In addition, we are also looking for opportunities in niche tech players, and quality financials with structural growth.
Our quality bias helps the portfolio avoid businesses with significant debt or with short term funding cliffs. Issues in credit markets should therefore be less impactful for our companies.
The team believes that despite short-term disruptions, the quality businesses in the portfolio could gradually return to normal activity. Current valuation makes many of them look very attractive on long-term view. Markets appear to already be discounting a sharp earnings drop, but stimulus combined with pent-up demand could lead to a recovery.

BALANCE SHEET FINANCIAL STATEMENTS
The accompanying notes form an integral part of the financial statements.
ANNUAL REPORT 2019 119
Neuberger Berman Emerging Markets Equity Fund (Continued) Balance Sheet
As at31 December 2019
As at31 December 2018 Note
US$ US$
Current Assets
Financial Assets at Fair Value through Profit or Loss 2 429,852,379 434,380,746
Cash and cash equivalents 3 22,101,483 14,071,945
Receivable for investments sold 385,926 282
Receivable for shares issued 682,046 203,162
Income receivable and other assets 1,122,121 746,012
Total Assets 454,143,955 449,402,147
Current Liabilities
Financial Liabilities at Fair Value through Profit or Loss 2 649,899 2,573,630
Payable for shares redeemed 1,376,638 1,413,884
Accrued expenses 668,543 1,218,470
Payable for investments purchased 149,283 18,672
Other payables 635,340 1,112,778
Liabilities (excluding Net Assets Attributable to Holders of Redeemable Participating Shares) 3,479,703 6,337,434
Net Assets Attributable to Holders of Redeemable Participating Shares 450,664,252 443,064,713

FINANCIAL STATEMENTS PROFIT AND LOSS ACCOUNT
The accompanying notes form an integral part of the financial statements.
120 NEUBERGER BERMAN INVESTMENT FUNDS PLC
Neuberger Berman Emerging Markets Equity Fund (Continued) Profit and Loss Account
Year Ended31 December 2019
Year Ended31 December 2018 Note
US$ US$
Income
Interest Income 395,858 247,384
Dividend Income 12,185,949 12,455,665
Miscellaneous Income 2,224 –
Net Gain/(Loss) on Financial Assets and Liabilities at Fair Value through Profit or Loss 11 69,994,228 (113,264,580)
82,578,259 (100,561,531)
Expenses
Management Fee 6 5,162,853 5,893,119
Distribution Fee 6 632,683 906,534
Administration Fee 6 603,118 819,978
Commitment Fee 19 55,980 42,891
Custody Fee 6 198,483 263,949
Depositary Fee 6 44,569 49,450
Professional Fee 9 110,387 118,841
Directors' Fee 7 4,563 6,613
Transaction Costs 9 1,076,181 1,027,497
Audit Fee 8 19,935 21,103
VAT Rebate (7,306) (6,140)
Other Expenses 9 60,301 49,088
Expense Waiver 6 – (98,799)
Total Expenses 7,961,747 9,094,124
Finance Costs
Interest Expense 1,914 –
Distribution Paid 1 374,473 –
376,387 –
Withholding Tax 1 1,371,383 1,380,972
Capital Gain Tax 1 1,135,298 621,173
Profit/(Loss) Attributable to Holders of Redeemable Participating Shares from Operations 71,733,444 (111,657,800)
Income and expenses arose solely from continuing operations.

STATEMENT OF CHANGES IN NET ASSETS FINANCIAL STATEMENTS
The accompanying notes form an integral part of the financial statements.
ANNUAL REPORT 2019 121
Neuberger Berman Emerging Markets Equity Fund (Continued) Statement of Changes in Net Assets Attributable to Holders of Redeemable Participating Shares
Year Ended31 December 2019
Year Ended31 December 2018 Note
US$ US$
Net Assets Attributable to Holders of Redeemable Participating Shares at beginning of year 443,064,713 462,468,759
Profit/(Loss) Attributable to Holders of Redeemable Participating Shares from Operations 71,733,444 (111,657,800)
Subscriptions 5 182,850,411 320,864,642
Redemptions 5 (246,984,316) (228,610,888)
Net Assets Attributable to Holders of Redeemable Participating Shares at end of year 450,664,252 443,064,713

FINANCIAL STATEMENTS SCHEDULE OF INVESTMENTS
122 NEUBERGER BERMAN INVESTMENT FUNDS PLC
Neuberger Berman Emerging Markets Equity Fund (Continued)
Schedule of Investments
Financial Assets at Fair Value through Profit or Loss
Number of Shares Security Description Fair Value
US$% of Net
Assets
Equities 94.19% (31 December 2018: 97.66%)
Brazilian Real 794,300 Atacadao SA* 4,626,297 1.03
600,935 B3 SA - Brasil Bolsa Balcao* 6,455,620 1.43
688,962 BK Brasil Operacao e Assessoria a Restaurantes SA* 3,054,787 0.68
519,922 Energisa SA* 6,938,730 1.54
542,268 Itau Unibanco Holding SA - Preferred Shares* 5,022,458 1.11
207,795 Localiza Rent a Car SA* 2,460,316 0.55
Total Brazilian Real 28,558,208 6.34
Canadian Dollar 190,042 Parex Resources Inc** 3,539,244 0.79
Total Canadian Dollar 3,539,244 0.79
Chinese Yuan Renminbi
146,300 Jiangsu Yanghe Brewery Joint-Stock Co Ltd Class A* 2,321,005 0.52
1,203,658 NARI Technology Co Ltd Class A* 3,660,148 0.81
1,276,100 Suofeiya Home Collection Co Ltd Class A* 3,838,294 0.85
Total Chinese Yuan Renminbi 9,819,447 2.18
Czech Koruna 904,010 Moneta Money Bank AS* 3,396,405 0.75
Total Czech Koruna 3,396,405 0.75
Euro 40,558 Prosus NV* 3,028,868 0.67
Total Euro 3,028,868 0.67
Hong Kong Dollar 2,505,000 3SBio Inc* 3,247,067 0.72
1,255,000 A-Living Services Co Ltd - H Shares* 4,332,696 0.96
332,000 ASM Pacific Technology Ltd* 4,606,022 1.02
457,390 Budweiser Brewing Co APAC Ltd* 1,543,848 0.34
4,106,800 China Everbright International Ltd* 3,294,168 0.73
792,600 China Gas Holdings Ltd* 2,970,292 0.66
1,111,800 China Mobile Ltd* 9,346,095 2.07
3,092,900 CNOOC Ltd* 5,144,381 1.14
394,189 Haier Electronics Group Co Ltd* 1,231,872 0.27
482,000 Hang Lung Properties Ltd* 1,057,804 0.24
2,916,200 Huatai Securities Co Ltd - H Shares* 5,157,375 1.15

SCHEDULE OF INVESTMENTS FINANCIAL STATEMENTS
ANNUAL REPORT 2019 123
Neuberger Berman Emerging Markets Equity Fund (Continued)
Schedule of Investments (Continued)
Financial Assets at Fair Value through Profit or Loss (continued)
Number of Shares Security Description Fair Value
US$% of Net
Assets
Equities 94.19% (31 December 2018: 97.66%) (continued)
Hong Kong Dollar (continued) 11,178,400 Industrial & Commercial Bank of China Ltd - H Shares* 8,607,818 1.91
417,439 Midea Real Estate Holding Ltd* 1,280,422 0.29
973,800 Ping An Insurance Group Co of China Ltd - H Shares* 11,510,432 2.55
744,632 Sinopharm Group Co Ltd - H Shares* 2,718,856 0.60
437,100 Sunny Optical Technology Group Co Ltd* 7,567,544 1.68
492,600 Tencent Holdings Ltd* 23,745,548 5.27
733,927 Zhuzhou CRRC Times Electric Co Ltd - H Shares* 2,656,221 0.59
Total Hong Kong Dollar 100,018,461 22.19
Hungarian Forint 153,204 Richter Gedeon Nyrt* 3,335,844 0.74
Total Hungarian Forint 3,335,844 0.74
Indian Rupee 281,291 Bandhan Bank Ltd* 2,009,048 0.45
346,055 HDFC Bank Ltd* 6,183,869 1.37
142,192 Housing Development Finance Corp Ltd* 4,807,023 1.07
1,037,969 ICICI Bank Ltd* 7,832,957 1.74
515,881 JM Financial Ltd* 681,186 0.15
267,847 Mahindra & Mahindra Ltd* 1,993,519 0.44
73,919 Metropolis Healthcare Ltd* 1,501,616 0.33
1,590,226 Power Grid Corp of India Ltd* 4,246,357 0.94
219,524 Reliance Industries Ltd* 4,662,469 1.04
Total Indian Rupee 33,918,044 7.53
Indonesian Rupiah 8,092,145 Bank Rakyat Indonesia Persero Tbk PT* 2,561,374 0.57
3,682,800 Map Aktif Adiperkasa PT* 1,406,003 0.31
5,676,600 Telekomunikasi Indonesia Persero Tbk PT* 1,626,218 0.36
Total Indonesian Rupiah 5,593,595 1.24
Malaysian Ringgit 5,979,550 Inari Amertron Bhd* 2,485,084 0.55
Total Malaysian Ringgit 2,485,084 0.55
Mexican Peso 929,707 Alsea SAB de CV* 2,453,257 0.54

FINANCIAL STATEMENTS SCHEDULE OF INVESTMENTS
124 NEUBERGER BERMAN INVESTMENT FUNDS PLC
Neuberger Berman Emerging Markets Equity Fund (Continued)
Schedule of Investments (Continued)
Financial Assets at Fair Value through Profit or Loss (continued)
Number of Shares Security Description Fair Value
US$% of Net
Assets
Equities 94.19% (31 December 2018: 97.66%) (continued)
Mexican Peso (continued)
566,934 Fomento Economico Mexicano SAB de CV* 5,353,809 1.19
644,321 Grupo Financiero Banorte SAB de CV Class O* 3,601,701 0.80
Total Mexican Peso 11,408,767 2.53
New Taiwan Dollar 686,200 Accton Technology Corp* 3,845,668 0.85
388,000 Chilisin Electronics Corp* 1,656,737 0.37
512,400 Elite Material Co Ltd* 2,341,755 0.52
195,700 eMemory Technology Inc* 2,327,353 0.52
221,000 LandMark Optoelectronics Corp* 2,278,046 0.51
359,200 Makalot Industrial Co Ltd* 1,887,247 0.42
189,200 Parade Technologies Ltd* 3,881,576 0.86
1,407,000 Uni-President Enterprises Corp* 3,482,650 0.77
Total New Taiwan Dollar 21,701,032 4.82
Philippine Peso 74,515 Ayala Corp* 1,155,722 0.26
106,323 GT Capital Holdings Inc* 1,778,173 0.39
2,974,251 Metropolitan Bank & Trust Co* 3,893,629 0.86
Total Philippine Peso 6,827,524 1.51
Polish Zloty 139,679 Dino Polska SA* 5,309,045 1.18
433,386 Powszechny Zaklad Ubezpieczen SA* 4,585,159 1.02
Total Polish Zloty 9,894,204 2.20
Pound Sterling 134,574 Network International Holdings Plc* 1,142,755 0.25
77,574 Rio Tinto Plc* 4,627,560 1.03
Total Pound Sterling 5,770,315 1.28
South African Rand 185,708 Bid Corp Ltd* 4,385,357 0.97
850,486 FirstRand Ltd* 3,819,539 0.85
234,244 JSE Ltd* 2,002,134 0.44
40,558 Naspers Ltd Class N* 6,644,249 1.48
Total South African Rand 16,851,279 3.74

SCHEDULE OF INVESTMENTS FINANCIAL STATEMENTS
ANNUAL REPORT 2019 125
Neuberger Berman Emerging Markets Equity Fund (Continued)
Schedule of Investments (Continued)
Financial Assets at Fair Value through Profit or Loss (continued)
Number of Shares Security Description Fair Value
US$% of Net
Assets
Equities 94.19% (31 December 2018: 97.66%) (continued)
South Korean Won 33,059 Com2uS Corp* 3,065,152 0.68
72,750 DB Insurance Co Ltd* 3,286,231 0.73
16,139 LG Chem Ltd* 4,422,963 0.98
11,111 Medy-Tox Inc* 2,889,489 0.64
24,322 NAVER Corp* 3,913,287 0.87
45,038 Orion Corp* 4,107,503 0.91
454,630 Samsung Electronics Co Ltd* 21,907,202 4.86
83,241 SK Hynix Inc* 6,770,636 1.50
18,942 SK Telecom Co Ltd* 3,902,972 0.87
73,136 Woongjin Coway Co Ltd* 5,887,813 1.31
396,988 Woori Financial Group Inc* 3,974,662 0.88
Total South Korean Won 64,127,910 14.23
Thai Baht 2,167,300 CP ALL PCL* 5,247,778 1.16
244,600 PTT Exploration & Production PCL* 1,031,554 0.23
Total Thai Baht 6,279,332 1.39
Turkish Lira 158,670 Mavi Giyim Sanayi Ve Ticaret AS Class B* 1,543,773 0.34
1,017,429 Sok Marketler Ticaret AS* 1,839,613 0.41
Total Turkish Lira 3,383,386 0.75
United States Dollar 59,288 Alibaba Group Holding Ltd ADR* 12,574,985 2.79
26,647 Credicorp Ltd* 5,679,275 1.26
1,221,594 Detsky Mir PJSC* 1,966,783 0.44
98,615 Lukoil PJSC ADR* 9,780,636 2.17
119,946 Momo Inc ADR* 4,018,191 0.89
91,586 Pagseguro Digital Ltd Class A* 3,128,578 0.69
835,527 Sberbank of Russia PJSC* 3,426,923 0.76
369,100 Taiwan Semiconductor Manufacturing Co Ltd ADR* 21,444,710 4.76
123,217 TCS Group Holding Plc GDR* 2,649,165 0.59
129,033 Trip.com Group Ltd ADR* 4,327,767 0.96
64,680 Weibo Corp ADR* 2,997,918 0.66
80,496 X5 Retail Group NV GDR* 2,777,112 0.62
201,069 Yandex NV Class A* 8,744,491 1.94

FINANCIAL STATEMENTS SCHEDULE OF INVESTMENTS
126 NEUBERGER BERMAN INVESTMENT FUNDS PLC
Neuberger Berman Emerging Markets Equity Fund (Continued)
Schedule of Investments (Continued)
Financial Assets at Fair Value through Profit or Loss (continued)
Number of Shares Security Description Fair Value
US$% of Net
Assets
Equities 94.19% (31 December 2018: 97.66%) (continued)
United States Dollar (continued) 45,000 ZTO Express Cayman Inc ADR* 1,050,750 0.23
Total United States Dollar 84,567,284 18.76
Total Equities 424,504,233 94.19
Real Estate Investment Trusts 0.84% (31 December 2018: 0.00%)
Hong Kong Dollar 356,110 Link REIT 3,770,512 0.84
Total Real Estate Investment Trusts * 3,770,512 0.84
Total Investments 428,274,745 95.03
Forward Currency Contracts 0.35% (31 December 2018: 0.20%)
Amount Receivable
Amount Payable
Maturity Date Counterparty Contracts Unrealised
Gain US$% of Net
Assets
AUD Hedged Classes AUD 7,596,398 US$ 5,132,422 22/01/2020 Goldman Sachs International 17 210,078 0.05
AUD 6,849,680 US$ 4,622,181 22/01/2020 UBS AG 5 195,156 0.04
AUD 6,386,749 US$ 4,311,893 22/01/2020 Westpac Banking Corp 48 179,869 0.04
EUR Hedged Classes € 2,992,640 US$ 3,306,431 22/01/2020 Goldman Sachs International 13 56,903 0.01
€ 2,670,915 US$ 2,950,757 22/01/2020 UBS AG 3 51,000 0.01
€ 2,873,629 US$ 3,179,832 22/01/2020 Westpac Banking Corp 28 49,747 0.01
GBP Hedged Classes £ 293,801 US$ 365,887 22/01/2020 Goldman Sachs International 12 23,547 0.01
£ 247,186 US$ 306,391 22/01/2020 UBS AG 5 21,254 0.01
£ 227,563 US$ 282,528 22/01/2020 Westpac Banking Corp 7 19,106 0.00
ZAR Hedged Classes ZAR 47,337,409 US$ 3,100,202 22/01/2020 Goldman Sachs International 17 276,321 0.06
ZAR 40,185,448 US$ 2,621,720 22/01/2020 UBS AG 4 244,663 0.05
ZAR 45,589,572 US$ 3,001,862 22/01/2020 Westpac Banking Corp 48 249,990 0.06
Total Unrealised Gain on Forward Currency Contracts ∞ 1,577,634 0.35
Fair ValueUS$
% of NetAssets
Total Financial Assets at Fair Value through Profit or Loss 429,852,379 95.38

SCHEDULE OF INVESTMENTS FINANCIAL STATEMENTS
ANNUAL REPORT 2019 127
Neuberger Berman Emerging Markets Equity Fund (Continued)
Schedule of Investments (Continued)
Financial Liabilities at Fair Value through Profit or Loss
Forward Currency Contracts (0.14%) (31 December 2018: (0.58%))
Amount Receivable
Amount Payable
Maturity Date Counterparty Contracts Unrealised
Loss US$% of Net
Assets
AUD Hedged Classes US$ 2,035,237 AUD 3,005,838 22/01/2020 Goldman Sachs International 13 (78,751) (0.02)
US$ 1,386,515 AUD 2,058,048 22/01/2020 UBS AG 1 (60,897) (0.01)
US$ 2,903,449 AUD 4,271,292 22/01/2020 Westpac Banking Corp 49 (100,525) (0.02)
EUR Hedged Classes US$ 1,775,678 € 1,607,682 22/01/2020 Goldman Sachs International 14 (31,146) (0.01)
US$ 1,455,822 € 1,318,068 22/01/2020 UBS AG 1 (25,513) (0.01)
US$ 2,325,871 € 2,098,087 22/01/2020 Westpac Banking Corp 33 (32,106) (0.01)
GBP Hedged Classes £ 6,415 US$ 8,566 22/01/2020 Goldman Sachs International 1 (63) (0.00)
£ 13,250 US$ 17,686 22/01/2020 Westpac Banking Corp 1 (123) (0.00)
US$ 63,336 £ 49,739 22/01/2020 Goldman Sachs International 10 (2,595) (0.00)
US$ 15,847 £ 12,215 22/01/2020 Westpac Banking Corp 3 (344) (0.00)
ZAR Hedged Classes US$ 1,451,002 ZAR 21,698,182 22/01/2020 Goldman Sachs International 17 (96,702) (0.02)
US$ 712,094 ZAR 10,950,219 22/01/2020 UBS AG 1 (68,973) (0.01)
US$ 2,372,317 ZAR 35,392,046 22/01/2020 Westpac Banking Corp 66 (152,161) (0.03)
Total Unrealised Loss on Forward Currency Contracts ∞ (649,899) (0.14)
Fair ValueUS$
% of NetAssets
Total Financial Liabilities at Fair Value through Profit or Loss (649,899) (0.14)
Net Financial Assets at Fair Value through Profit or Loss 429,202,480 95.24
Other Net Assets 21,461,772 4.76
Net Assets Attributable to Holders of Redeemable Participating Shares 450,664,252 100.00
% of
TotalAssetsPortfolio Analysis US$
* Transferable securities and/or money market instruments admitted to an official stock exchange listing 424,735,501 93.52
** Transferable securities and/or money market instruments dealt in on a regulated market 3,539,244 0.78
∞ OTC financial derivative instruments 927,735 0.21
Total Investments 429,202,480 94.51
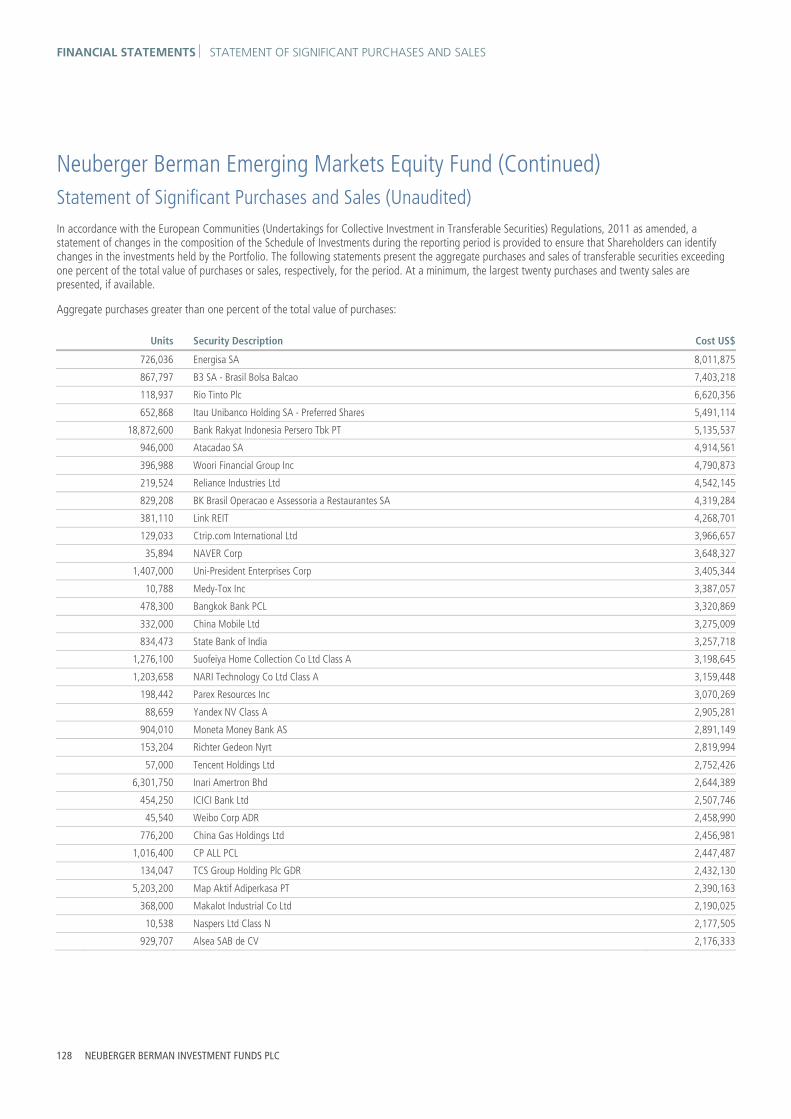
FINANCIAL STATEMENTS STATEMENT OF SIGNIFICANT PURCHASES AND SALES
128 NEUBERGER BERMAN INVESTMENT FUNDS PLC
Neuberger Berman Emerging Markets Equity Fund (Continued) Statement of Significant Purchases and Sales (Unaudited) In accordance with the European Communities (Undertakings for Collective Investment in Transferable Securities) Regulations, 2011 as amended, a statement of changes in the composition of the Schedule of Investments during the reporting period is provided to ensure that Shareholders can identify changes in the investments held by the Portfolio. The following statements present the aggregate purchases and sales of transferable securities exceeding one percent of the total value of purchases or sales, respectively, for the period. At a minimum, the largest twenty purchases and twenty sales are presented, if available.
Aggregate purchases greater than one percent of the total value of purchases:
Units Security Description Cost US$
726,036 Energisa SA 8,011,875
867,797 B3 SA - Brasil Bolsa Balcao 7,403,218
118,937 Rio Tinto Plc 6,620,356
652,868 Itau Unibanco Holding SA - Preferred Shares 5,491,114
18,872,600 Bank Rakyat Indonesia Persero Tbk PT 5,135,537
946,000 Atacadao SA 4,914,561
396,988 Woori Financial Group Inc 4,790,873
219,524 Reliance Industries Ltd 4,542,145
829,208 BK Brasil Operacao e Assessoria a Restaurantes SA 4,319,284
381,110 Link REIT 4,268,701
129,033 Ctrip.com International Ltd 3,966,657
35,894 NAVER Corp 3,648,327
1,407,000 Uni-President Enterprises Corp 3,405,344
10,788 Medy-Tox Inc 3,387,057
478,300 Bangkok Bank PCL 3,320,869
332,000 China Mobile Ltd 3,275,009
834,473 State Bank of India 3,257,718
1,276,100 Suofeiya Home Collection Co Ltd Class A 3,198,645
1,203,658 NARI Technology Co Ltd Class A 3,159,448
198,442 Parex Resources Inc 3,070,269
88,659 Yandex NV Class A 2,905,281
904,010 Moneta Money Bank AS 2,891,149
153,204 Richter Gedeon Nyrt 2,819,994
57,000 Tencent Holdings Ltd 2,752,426
6,301,750 Inari Amertron Bhd 2,644,389
454,250 ICICI Bank Ltd 2,507,746
45,540 Weibo Corp ADR 2,458,990
776,200 China Gas Holdings Ltd 2,456,981
1,016,400 CP ALL PCL 2,447,487
134,047 TCS Group Holding Plc GDR 2,432,130
5,203,200 Map Aktif Adiperkasa PT 2,390,163
368,000 Makalot Industrial Co Ltd 2,190,025
10,538 Naspers Ltd Class N 2,177,505
929,707 Alsea SAB de CV 2,176,333

STATEMENT OF SIGNIFICANT PURCHASES AND SALES FINANCIAL STATEMENTS
ANNUAL REPORT 2019 129
Neuberger Berman Emerging Markets Equity Fund (Continued) Statement of Significant Purchases and Sales (Unaudited) (Continued) Aggregate purchases greater than one percent of the total value of purchases: (continued)
Units Security Description Cost US$
235,500 Localiza Rent a Car SA 2,117,286
146,300 Jiangsu Yanghe Brewery Joint-Stock Co Ltd Class A 2,097,017
516,213 GRUH Finance Ltd 2,005,403
241,000 LandMark Optoelectronics Corp 1,988,489

FINANCIAL STATEMENTS STATEMENT OF SIGNIFICANT PURCHASES AND SALES
130 NEUBERGER BERMAN INVESTMENT FUNDS PLC
Neuberger Berman Emerging Markets Equity Fund (Continued) Statement of Significant Purchases and Sales (Unaudited) (Continued) Aggregate sales greater than one percent of the total value of sales:
Units Security Description Proceeds US$
1,224,562 B3 SA - Brasil Bolsa Balcao 10,802,766
954,503 Energisa SA 10,665,998
770,000 Ping An Insurance Group Co of China Ltd - H Shares 8,772,537
911,068 Itau Unibanco Holding SA - Preferred Shares 7,792,657
152,500 Tencent Holdings Ltd 7,169,558
1,160,100 Atacadao SA 6,121,414
232,665 Sasol Ltd 5,635,127
6,001,950 Sino Biopharmaceutical Ltd 5,527,763
971,162 BK Brasil Operacao e Assessoria a Restaurantes SA 5,146,824
167,740 Housing Development Finance Corp Ltd 4,964,932
126,180 Samsung Electronics Co Ltd 4,777,420
43,970 Baidu Inc 4,665,320
385,200 Sunny Optical Technology Group Co Ltd 4,643,238
102,500 Taiwan Semiconductor Manufacturing Co Ltd ADR 4,406,979
200,902 ZTO Express Cayman Inc ADR 4,182,589
768,165 ICICI Bank Ltd 4,171,639
513,366 Vipshop Holdings Ltd ADR 3,981,574
8,380,700 Astra International Tbk PT 3,969,270
11,858 LG Chem Ltd 3,811,663
916,170 Infraestructura Energetica Nova SAB de CV 3,729,987
834,473 State Bank of India 3,547,226
105,724 X5 Retail Group NV GDR 3,403,020
102,035 Komercni Banka AS 3,386,548
5,416,200 Bank Negara Indonesia Persero Tbk PT 3,383,845
23,800 Kweichow Moutai Co Ltd 3,236,856
10,780,455 Bank Rakyat Indonesia Persero Tbk PT 3,154,000
3,386,639 Zhejiang Huace Film & TV Co Ltd 3,118,767
344,000 China Mobile Ltd 3,103,102
7,484,450 Inari Amertron Bhd 3,092,298
1,180,000 CP ALL PCL 3,091,316
13,250 Naspers Ltd Class N 3,076,951
24,477 NAVER Corp 2,977,092
44,122 SK Hynix Inc 2,941,184
261,523 Powszechny Zaklad Ubezpieczen SA 2,928,021
478,300 Bangkok Bank PCL 2,913,473
346,822 Cummins India Ltd 2,896,397
16,200 Alibaba Group Holding Ltd ADR 2,852,837
25,110 Hyundai Motor Co 2,792,285
323,325 KAZ Minerals Plc 2,757,885
48,864 Rio Tinto Plc 2,736,777

STATEMENT OF SIGNIFICANT PURCHASES AND SALES FINANCIAL STATEMENTS
ANNUAL REPORT 2019 131
Neuberger Berman Emerging Markets Equity Fund (Continued) Statement of Significant Purchases and Sales (Unaudited) (Continued) Aggregate sales greater than one percent of the total value of sales (continued):
Units Security Description Proceeds US$
94,109 Mando Corp 2,712,793
82,524 HDFC Bank Ltd 2,701,874
2,323,321 Ashok Leyland Ltd 2,691,106
810,000 Elite Material Co Ltd 2,685,921
68,054 SFA Engineering Corp 2,666,817

FINANCIAL STATEMENTS INVESTMENT MANAGER’S REPORT
132 NEUBERGER BERMAN INVESTMENT FUNDS PLC
Neuberger Berman US Small Cap Fund Investment Manager’s Report For the 12 months ended 31 December 2019, the total return of the USD I Accumulating Class shares returned 28.89%. Over the same period, the benchmark index, the Russell 2000 Index (the “Index”), returned 25.52%. (Performance for all share classes is provided in Appendix II. Performance data quoted represent past performance, and do not indicate future results. Total returns shown reflect the reinvestment of income dividends and other distributions, if any).
For 2019 as a whole, the US stock market rallied sharply and posted its best calendar year since 2013. A “dovish pivot” by the US Federal Reserve (“Fed”), a resilient US economy, generally solid corporate results, and an agreement on the first phase of the trade accord between the US and China supported investor sentiment and triggered periods of robust risk appetite. These positives more than offset concerns over moderating growth overseas, Brexit uncertainties and a number of geopolitical issues. All told, the S&P 500 Index gained 31.49% in 2019. Small-cap stocks underperformed the overall stock market during the year, as the Index rose 25.52%. Within the small-cap universe, the Russell 2000 Growth and Russell 2000 Value Indexes returned 28.48% and 22.39%, respectively.
The Portfolio generated a strong return during the reporting period and outperformed the small-cap market. This was driven by both stock selection and sector allocation.
In terms of stock selection, the Portfolio’s holdings in the Consumer Discretionary, Communication Services and Financials sectors were the most additive for relative returns. Within Consumer Discretionary, the Portfolio’s holdings in the Specialty Retail and Auto Component industries added the most to performance. Within the Communication Services sector, holdings in the Media industry were up sharply, outperforming the Index’s offerings in this sector. Within Financials, the Portfolio’s Capital Markets holdings were the most beneficial for results. On the downside, stock selection was negative in the Industrials, Consumer Staples and Health Care sectors. Within the Industrials sector, the Portfolio’s positioning the Commercial Services & Supplies industry were drag on results. Within Consumer Staples, the Portfolio’s Food Product holdings detracted from results. In terms of the Health Care sector, Biotechnology was negative for performance.
Sector allocation, overall, also contributed to the Portfolio’s relative performance during the reporting period. In particular, an overweight to Information Technology and no allocation to Utilities added the most value. In contrast, the underweight to the biotechnology industry, and overweight to the Consumer Staples sector detracted from performance.
Looking ahead, as the coronavirus has introduced risk to global economic growth and led to heightened market volatility, history suggests the panic will eventually pass. We would expect market volatility to remain elevated as the number of coronavirus cases continues to climb globally. Until now, the US economy has been quite strong, driven by low unemployment, healthy corporate profits and tame inflation. While it is very difficult to time the market and call the bottom, we continue to believe that a diversified portfolio of financially strong companies, with strong returns on capital and defendable barriers to entry can weather the storm relatively well. This has been the case, thus far, since the market’s peak in mid-February.
As far as recent investment implications go, we are growing even more averse to leverage and favor reducing exposure to oil related equities. We also view this an opportunity to selectively trim names that have held up extraordinarily well or modestly add to names that appear to have been beaten down disproportionately. Please note this is an evolving situation and we continue to closely monitor the market and our portfolio and will make adjustments as we deem necessary or appropriate.

BALANCE SHEET FINANCIAL STATEMENTS
The accompanying notes form an integral part of the financial statements.
ANNUAL REPORT 2019 133
Neuberger Berman US Small Cap Fund (Continued) Balance Sheet
As at31 December 2019
US$
As at31 December 2018
US$ Note
Current Assets
Financial Assets at Fair Value through Profit or Loss 2 411,189,771 328,104,337
Cash and cash equivalents 3 5,719,174 5,785,378
Receivable for investments sold 158,659 1,338,567
Receivable for shares issued 701,494 640,515
Income receivable and other assets 111,581 83,060
Total Assets 417,880,679 335,951,857
Current Liabilities
Financial Liabilities at Fair Value through Profit or Loss 2 118,358 210,285
Payable for shares redeemed 1,995,840 2,942,664
Accrued expenses 581,974 843,064
Payable for investments purchased 29,139 37,146
Other payables 48,212 44,001
Liabilities (excluding Net Assets Attributable to Holders of Redeemable Participating Shares) 2,773,523 4,077,160
Net Assets Attributable to Holders of Redeemable Participating Shares 415,107,156 331,874,697

FINANCIAL STATEMENTS PROFIT AND LOSS ACCOUNT
The accompanying notes form an integral part of the financial statements.
134 NEUBERGER BERMAN INVESTMENT FUNDS PLC
Neuberger Berman US Small Cap Fund (Continued) Profit and Loss Account
Year Ended31 December 2019
US$
Year Ended31 December 2018
US$ Note
Income
Interest Income 81,116 75,961
Dividend Income 4,094,566 4,612,366
Miscellaneous Income 114,878 –
Net Gain/(Loss) on Financial Assets and Liabilities at Fair Value through Profit or Loss 11 96,287,475 (20,134,121)
100,578,035 (15,445,794)
Expenses
Management Fee 6 3,834,405 4,367,208
Distribution Fee 6 560,535 563,185
Administration Fee 6 508,892 634,774
Commitment Fee 19 48,666 41,967
Custody Fee 6 9,285 21,970
Depositary Fee 6 37,759 41,643
Professional Fee 9 69,489 87,764
Directors' Fee 7 4,563 6,613
Transaction Costs 9 175,541 200,563
Audit Fee 8 18,384 20,041
VAT Rebate (6,228) (5,270)
Other Expenses 9 20,054 23,974
Total Expenses 5,281,345 6,004,432
Finance Costs
Interest Expense 8,214 9,751
8,214 9,751
Withholding Tax 1 1,178,444 1,316,412
Profit/(Loss) Attributable to Holders of Redeemable Participating Shares from Operations 94,110,032 (22,776,389)
Income and expenses arose solely from continuing operations.

STATEMENT OF CHANGES IN NET ASSETS FINANCIAL STATEMENTS
The accompanying notes form an integral part of the financial statements.
ANNUAL REPORT 2019 135
Neuberger Berman US Small Cap Fund (Continued) Statement of Changes in Net Assets Attributable to Holders of Redeemable Participating Shares
Year Ended31 December 2019
US$
Year Ended31 December 2018
US$ Note
Net Assets Attributable to Holders of Redeemable Participating Shares at beginning of year 331,874,697 412,939,286
Profit/(Loss) Attributable to Holders of Redeemable Participating Shares from Operations 94,110,032 (22,776,389)
Subscriptions 5 150,555,343 340,554,482
Redemptions 5 (161,432,916) (398,842,682)
Net Assets Attributable to Holders of Redeemable Participating Shares at end of year 415,107,156 331,874,697

FINANCIAL STATEMENTS SCHEDULE OF INVESTMENTS
136 NEUBERGER BERMAN INVESTMENT FUNDS PLC
Neuberger Berman US Small Cap Fund (Continued)
Schedule of Investments
Financial Assets at Fair Value through Profit or Loss
Number of Shares Security Description Fair Value
US$% of Net
Assets
Equities 98.98% (31 December 2018: 98.67%) Pound Sterling 83,860 Abcam Plc* 1,501,984 0.36
Total Pound Sterling 1,501,984 0.36
United States Dollar 83,570 AAON Inc* 4,129,194 1.00
16,065 Allegiant Travel Co Class A* 2,795,953 0.67
59,255 Altair Engineering Inc Class A* 2,127,847 0.51
45,695 AMERISAFE Inc* 3,017,241 0.73
45,805 Apergy Corp* 1,547,293 0.37
18,170 Applied Industrial Technologies Inc* 1,211,757 0.29
43,455 AptarGroup Inc* 5,024,267 1.21
42,665 Artisan Partners Asset Management Inc Class A* 1,378,933 0.33
30,500 Asbury Automotive Group Inc* 3,409,595 0.82
78,910 Aspen Technology Inc* 9,542,586 2.30
33,569 Astronics Corp* 938,254 0.23
4,913 Atrion Corp* 3,692,119 0.89
67,175 Bank of Hawaii Corp* 6,392,373 1.54
89,535 Bank OZK* 2,731,265 0.66
37,730 Bio-Techne Corp* 8,282,112 2.00
38,305 BOK Financial Corp* 3,347,857 0.81
36,560 Bright Horizons Family Solutions Inc* 5,494,602 1.32
3,240 Cable One Inc* 4,822,643 1.16
46,360 Cabot Microelectronics Corp* 6,690,675 1.61
52,435 Cactus Inc Class A* 1,799,569 0.43
3,365 Calavo Growers Inc* 304,835 0.07
53,580 Cantel Medical Corp* 3,798,822 0.92
20,667 Chase Corp* 2,448,626 0.59
18,535 Chemed Corp* 8,141,684 1.96
65,335 Church & Dwight Co Inc* 4,595,664 1.11
80,665 Cognex Corp* 4,520,467 1.09
98,145 Columbia Banking System Inc* 3,993,029 0.96
63,890 Community Bank System Inc* 4,532,357 1.09
8,920 Computer Services Inc** 396,940 0.10
42,060 Cullen/Frost Bankers Inc* 4,112,627 0.99
193,480 CVB Financial Corp* 4,175,298 1.01
38,750 Eagle Materials Inc* 3,513,075 0.85
67,465 Emergent BioSolutions Inc* 3,639,737 0.88
98,215 Exponent Inc* 6,777,817 1.63
9,160 FactSet Research Systems Inc* 2,457,628 0.59
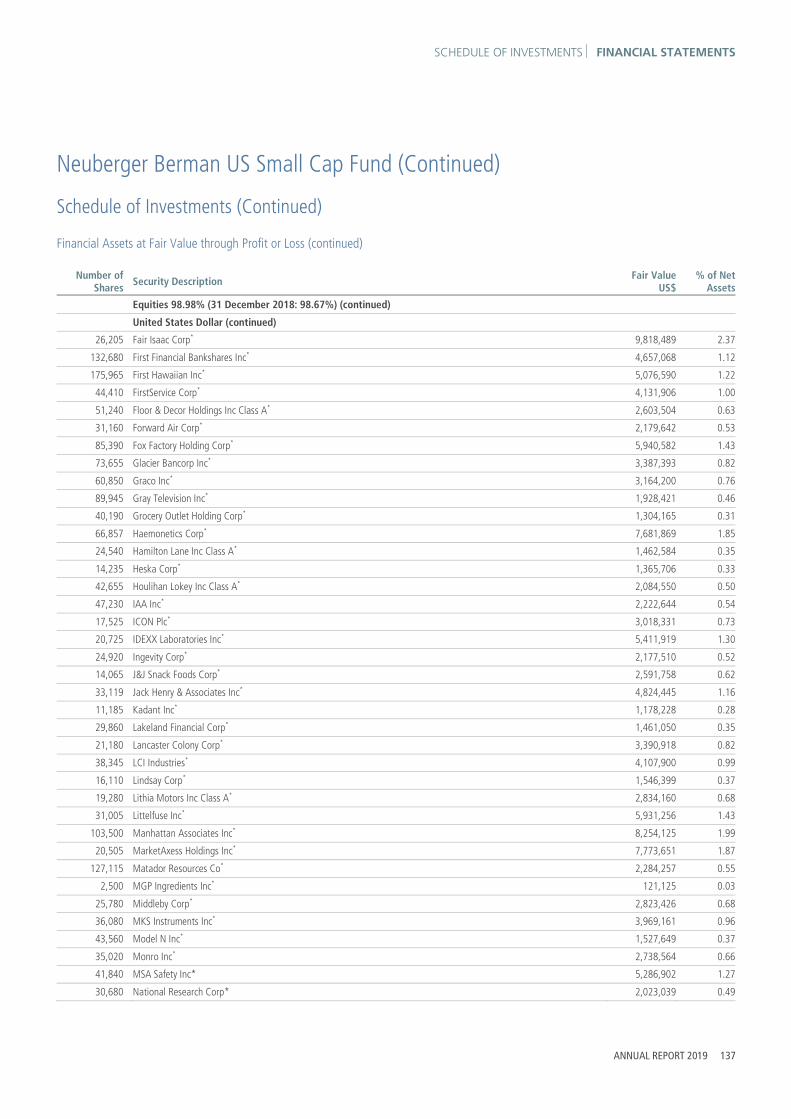
SCHEDULE OF INVESTMENTS FINANCIAL STATEMENTS
ANNUAL REPORT 2019 137
Neuberger Berman US Small Cap Fund (Continued)
Schedule of Investments (Continued)
Financial Assets at Fair Value through Profit or Loss (continued)
Number of Shares Security Description Fair Value
US$% of Net
Assets
Equities 98.98% (31 December 2018: 98.67%) (continued)
United States Dollar (continued) 26,205 Fair Isaac Corp* 9,818,489 2.37
132,680 First Financial Bankshares Inc* 4,657,068 1.12
175,965 First Hawaiian Inc* 5,076,590 1.22
44,410 FirstService Corp* 4,131,906 1.00
51,240 Floor & Decor Holdings Inc Class A* 2,603,504 0.63
31,160 Forward Air Corp* 2,179,642 0.53
85,390 Fox Factory Holding Corp* 5,940,582 1.43
73,655 Glacier Bancorp Inc* 3,387,393 0.82
60,850 Graco Inc* 3,164,200 0.76
89,945 Gray Television Inc* 1,928,421 0.46
40,190 Grocery Outlet Holding Corp* 1,304,165 0.31
66,857 Haemonetics Corp* 7,681,869 1.85
24,540 Hamilton Lane Inc Class A* 1,462,584 0.35
14,235 Heska Corp* 1,365,706 0.33
42,655 Houlihan Lokey Inc Class A* 2,084,550 0.50
47,230 IAA Inc* 2,222,644 0.54
17,525 ICON Plc* 3,018,331 0.73
20,725 IDEXX Laboratories Inc* 5,411,919 1.30
24,920 Ingevity Corp* 2,177,510 0.52
14,065 J&J Snack Foods Corp* 2,591,758 0.62
33,119 Jack Henry & Associates Inc* 4,824,445 1.16
11,185 Kadant Inc* 1,178,228 0.28
29,860 Lakeland Financial Corp* 1,461,050 0.35
21,180 Lancaster Colony Corp* 3,390,918 0.82
38,345 LCI Industries* 4,107,900 0.99
16,110 Lindsay Corp* 1,546,399 0.37
19,280 Lithia Motors Inc Class A* 2,834,160 0.68
31,005 Littelfuse Inc* 5,931,256 1.43
103,500 Manhattan Associates Inc* 8,254,125 1.99
20,505 MarketAxess Holdings Inc* 7,773,651 1.87
127,115 Matador Resources Co* 2,284,257 0.55
2,500 MGP Ingredients Inc* 121,125 0.03
25,780 Middleby Corp* 2,823,426 0.68
36,080 MKS Instruments Inc* 3,969,161 0.96
43,560 Model N Inc* 1,527,649 0.37
35,020 Monro Inc* 2,738,564 0.66
41,840 MSA Safety Inc* 5,286,902 1.27
30,680 National Research Corp* 2,023,039 0.49

FINANCIAL STATEMENTS SCHEDULE OF INVESTMENTS
138 NEUBERGER BERMAN INVESTMENT FUNDS PLC
Neuberger Berman US Small Cap Fund (Continued)
Schedule of Investments (Continued)
Financial Assets at Fair Value through Profit or Loss (continued)
Number of Shares Security Description Fair Value
US$% of Net
Assets
Equities 98.98% (31 December 2018: 98.67%) (continued)
United States Dollar (continued) 29,183 Neogen Corp* 1,904,483 0.46
173,085 NetScout Systems Inc* 4,166,156 1.00
4,260 NewMarket Corp* 2,072,575 0.50
58,235 Nexstar Media Group Inc Class A* 6,828,054 1.65
24,270 Nordson Corp* 3,952,127 0.95
55,205 Novanta Inc* 4,882,330 1.18
25,135 Ollie's Bargain Outlet Holdings Inc* 1,641,567 0.40
142,935 Pason Systems Inc** 1,446,974 0.35
50,970 Pool Corp* 10,825,009 2.61
74,735 Power Integrations Inc* 7,392,039 1.78
39,673 Prosperity Bancshares Inc* 2,852,092 0.69
21,310 Quaker Chemical Corp* 3,505,921 0.84
68,935 Qualys Inc* 5,747,111 1.38
40,325 Raven Industries Inc* 1,389,599 0.34
37,550 RBC Bearings Inc* 5,945,667 1.43
67,660 Richelieu Hardware Ltd** 1,415,551 0.34
48,635 RLI Corp* 4,378,123 1.06
48,115 Rogers Corp* 6,001,384 1.45
121,656 Rollins Inc* 4,034,113 0.97
27,645 Simulations Plus Inc* 803,640 0.19
23,855 SiteOne Landscape Supply Inc* 2,162,456 0.52
49,435 Stella-Jones Inc** 1,430,346 0.34
24,060 Tetra Tech Inc* 2,073,010 0.50
60,315 Texas Roadhouse Inc Class A* 3,396,941 0.82
76,940 Toro Co* 6,129,810 1.48
20,030 Tractor Supply Co* 1,871,603 0.45
26,707 Tyler Technologies Inc* 8,012,634 1.93
11,345 UniFirst Corp* 2,291,463 0.55
19,930 US Physical Therapy Inc* 2,278,996 0.55
24,185 Valmont Industries Inc* 3,622,429 0.87
17,270 Watsco Inc* 3,111,191 0.75
27,585 WD-40 Co* 5,355,352 1.29
60,985 West Pharmaceutical Services Inc* 9,167,875 2.21
188,630 WPX Energy Inc* 2,591,776 0.62
17,996 Zebra Technologies Corp Class A* 4,596,898 1.11
Total United States Dollar 409,347,122 98.62
Total Equities 410,849,106 98.98
Total Investments 410,849,106 98.98

SCHEDULE OF INVESTMENTS FINANCIAL STATEMENTS
ANNUAL REPORT 2019 139
Neuberger Berman US Small Cap Fund (Continued)
Schedule of Investments (Continued)
Financial Assets at Fair Value through Profit or Loss (continued)
Forward Currency Contracts 0.08% (31 December 2018: 0.19%)
Amount Receivable
Amount Payable
Maturity Date Counterparty Contracts Unrealised
Gain US$% of Net
Assets
AUD Hedged Classes AUD 2,182,677 US$ 1,475,845 22/01/2020 Goldman Sachs International 17 59,218 0.02
AUD 1,785,216 US$ 1,203,949 22/01/2020 UBS AG 4 51,582 0.01
AUD 2,067,973 US$ 1,399,444 22/01/2020 Westpac Banking Corp 30 54,948 0.01
US$ 21,222 AUD 30,169 22/01/2020 Westpac Banking Corp 1 5 0.00
EUR Hedged Classes € 560,889 US$ 619,938 22/01/2020 Goldman Sachs International 16 10,426 0.00
€ 460,166 US$ 508,311 22/01/2020 UBS AG 2 8,855 0.00
€ 483,536 US$ 534,554 22/01/2020 Westpac Banking Corp 21 8,876 0.00
US$ 6,187 € 5,503 22/01/2020 Westpac Banking Corp 1 2 0.00
GBP Hedged Classes £ 2,780 US$ 3,588 22/01/2020 Goldman Sachs International 11 98 0.00
£ 242 US$ 301 22/01/2020 UBS AG 1 20 0.00
£ 26,966 US$ 33,391 22/01/2020 Westpac Banking Corp 7 2,352 0.00
US$ 223 £ 167 22/01/2020 Goldman Sachs International 1 2 0.00
US$ 195 £ 147 22/01/2020 Westpac Banking Corp 1 0 0.00
ZAR Hedged Classes US$ 3,204 ZAR 44,901 22/01/2020 Westpac Banking Corp 1 2 0.00
ZAR 7,552,062 US$ 493,475 22/01/2020 Goldman Sachs International 18 45,203 0.01
ZAR 6,456,844 US$ 420,343 22/01/2020 UBS AG 3 40,216 0.01
ZAR 11,235,776 US$ 742,573 22/01/2020 Westpac Banking Corp 45 58,860 0.02
Total Unrealised Gain on Forward Currency Contracts ∞ 340,665 0.08
Fair ValueUS$
% of NetAssets
Total Financial Assets at Fair Value through Profit or Loss 411,189,771 99.06
Financial Liabilities at Fair Value through Profit or Loss Forward Currency Contracts (0.03%) (31 December 2018: (0.06%))
Amount Receivable
Amount Payable
Maturity Date Counterparty Contracts Unrealised
Loss US$% of Net
Assets
AUD Hedged Classes US$ 304,621 AUD 446,523 22/01/2020 Goldman Sachs International 9 (9,417) (0.00)
US$ 295,017 AUD 430,129 22/01/2020 Westpac Banking Corp 23 (7,489) (0.00)
EUR Hedged Classes US$ 241,561 € 218,225 22/01/2020 Goldman Sachs International 13 (3,695) (0.00)
US$ 135,232 € 122,436 22/01/2020 UBS AG 1 (2,370) (0.00)
US$ 221,985 € 200,370 22/01/2020 Westpac Banking Corp 18 (3,205) (0.00)

FINANCIAL STATEMENTS SCHEDULE OF INVESTMENTS
140 NEUBERGER BERMAN INVESTMENT FUNDS PLC
Neuberger Berman US Small Cap Fund (Continued)
Schedule of Investments (Continued)
Financial Liabilities at Fair Value through Profit or Loss (continued)
Forward Currency Contracts (0.03%) (31 December 2018: (0.06%)) (continued)
Amount Receivable
Amount Payable
Maturity Date Counterparty Contracts Unrealised
Loss US$% of Net
Assets
GBP Hedged Classes £ 397 US$ 530 22/01/2020 Westpac Banking Corp 1 (4) (0.00)
US$ 3,729 £ 2,938 22/01/2020 Goldman Sachs International 9 (165) (0.00)
US$ 463 £ 359 22/01/2020 Westpac Banking Corp 2 (14) (0.00)
ZAR Hedged Classes US$ 250,621 ZAR 3,803,106 22/01/2020 Goldman Sachs International 14 (20,652) (0.01)
US$ 170,265 ZAR 2,618,248 22/01/2020 UBS AG 1 (16,492) (0.01)
US$ 760,404 ZAR 11,429,579 22/01/2020 Westpac Banking Corp 41 (54,855) (0.01)
Total Unrealised Loss on Forward Currency Contracts ∞ (118,358) (0.03)
Fair ValueUS$
% of NetAssets
Total Financial Liabilities at Fair Value through Profit or Loss (118,358) (0.03)
Net Financial Assets at Fair Value through Profit or Loss 411,071,413 99.03
Other Net Assets 4,035,743 0.97
Net Assets Attributable to Holders of Redeemable Participating Shares 415,107,156 100.00
% ofTotal
AssetsPortfolio Analysis US$
* Transferable securities and/or money market instruments admitted to an official stock exchange listing 406,159,295 97.20
** Transferable securities and/or money market instruments dealt in on a regulated market 4,689,811 1.12
∞ OTC financial derivative instruments 222,307 0.05
Total Investments 411,071,413 98.37

STATEMENT OF SIGNIFICANT PURCHASES AND SALES FINANCIAL STATEMENTS
ANNUAL REPORT 2019 141
Neuberger Berman US Small Cap Fund (Continued) Statement of Significant Purchases and Sales (Unaudited) In accordance with the European Communities (Undertakings for Collective Investment in Transferable Securities) Regulations, 2011 as amended, a statement of changes in the composition of the Schedule of Investments during the reporting period is provided to ensure that Shareholders can identify changes in the investments held by the Portfolio. The following statements present the aggregate purchases and sales of transferable securities exceeding one percent of the total value of purchases or sales, respectively, for the period. At a minimum, the largest twenty purchases and twenty sales are presented, if available.
Aggregate purchases greater than one percent of the total value of purchases:
Units Security Description Cost US$
35,295 Haemonetics Corp 3,861,755
24,090 Cabot Microelectronics Corp 3,010,566
19,930 West Pharmaceutical Services Inc 2,419,919
51,395 IAA Inc 2,313,468
20,170 Aspen Technology Inc 2,226,699
11,025 Bio-Techne Corp 2,148,264
37,990 Emergent BioSolutions Inc 2,125,340
77,640 First Hawaiian Inc 2,053,772
5,485 Chemed Corp 2,024,891
24,545 Tetra Tech Inc 1,972,137
10,265 Pool Corp 1,960,813
8,050 IDEXX Laboratories Inc 1,858,868
27,375 Fox Factory Holding Corp 1,833,369
5,980 Fair Isaac Corp 1,801,680
16,395 MSA Safety Inc 1,751,289
30,680 National Research Corp Class A 1,748,996
11,880 Rogers Corp 1,722,686
21,680 Qualys Inc 1,711,134
1,350 Cable One Inc 1,643,619
5,085 MarketAxess Holdings Inc 1,583,644
6,595 Tyler Technologies Inc 1,575,305
22,040 Toro Co 1,497,236
7,995 Littelfuse Inc 1,459,478
14,665 FirstService Corp 1,458,401
22,220 Exponent Inc 1,451,777
19,740 Manhattan Associates Inc 1,443,743
24,540 Hamilton Lane Inc Class A 1,442,237
16,320 RLI Corp 1,368,221
23,840 Texas Roadhouse Inc Class A 1,346,438
40,190 Grocery Outlet Holding Corp 1,338,864
15,550 Asbury Automotive Group Inc 1,321,087
54,740 NetScout Systems Inc 1,307,217
8,440 RBC Bearings Inc 1,300,056

FINANCIAL STATEMENTS STATEMENT OF SIGNIFICANT PURCHASES AND SALES
142 NEUBERGER BERMAN INVESTMENT FUNDS PLC
Neuberger Berman US Small Cap Fund (Continued) Statement of Significant Purchases and Sales (Unaudited) (Continued) Aggregate purchases greater than one percent of the total value of purchases (continued):
Units Security Description Cost US$
19,960 AMERISAFE Inc 1,293,552
14,670 Power Integrations Inc 1,238,167
8,615 Bright Horizons Family Solutions Inc 1,209,636
6,680 WD-40 Co 1,205,330
10,810 AptarGroup Inc 1,190,201
9,260 US Physical Therapy Inc 1,185,439
12,665 LCI Industries 1,181,742
25,165 Graco Inc 1,181,649
14,320 Novanta Inc 1,155,477

STATEMENT OF SIGNIFICANT PURCHASES AND SALES FINANCIAL STATEMENTS
ANNUAL REPORT 2019 143
Neuberger Berman US Small Cap Fund (Continued) Statement of Significant Purchases and Sales (Unaudited) (Continued) Aggregate sales greater than one percent of the total value of sales:
Units Security Description Proceeds US$
20,585 Pool Corp 3,736,895
33,350 Nexstar Media Group Inc Class A 3,555,855
33,995 Calavo Growers Inc 3,032,470
24,995 Aspen Technology Inc 2,788,281
9,220 Fair Isaac Corp 2,717,174
21,815 West Pharmaceutical Services Inc 2,662,541
58,050 AAON Inc 2,542,779
36,125 Sensient Technologies Corp 2,486,161
36,300 Manhattan Associates Inc 2,368,250
26,285 Eagle Materials Inc 2,282,764
53,160 AZZ Inc 2,272,703
9,445 Tyler Technologies Inc 2,213,951
8,890 IDEXX Laboratories Inc 2,199,009
33,695 Henry Schein Inc 2,129,343
347,040 Centennial Resource Development Inc 2,081,748
10,430 Bio-Techne Corp 2,075,831
36,160 MGP Ingredients Inc 1,974,877
25,150 Power Integrations Inc 1,953,276
6,460 MarketAxess Holdings Inc 1,901,856
60,940 Stella-Jones Inc 1,823,086
39,605 AO Smith Corp 1,792,226
15,130 Lithia Motors Inc Class A 1,782,487
11,520 RBC Bearings Inc 1,696,997
19,855 Bank of Hawaii Corp 1,657,473
4,585 Chemed Corp 1,637,909
14,210 US Physical Therapy Inc 1,633,692
23,300 Church & Dwight Co Inc 1,626,011
26,110 Exponent Inc 1,554,612
46,460 Healthcare Services Group Inc 1,519,530
17,775 Qualys Inc 1,509,729
7,000 Zebra Technologies Corp Class A 1,465,992
36,515 Rollins Inc 1,402,955
10,080 Jack Henry & Associates Inc 1,393,930
12,655 AptarGroup Inc 1,373,079
8,880 Bright Horizons Family Solutions Inc 1,312,811

FINANCIAL STATEMENTS INVESTMENT MANAGER’S REPORT
144 NEUBERGER BERMAN INVESTMENT FUNDS PLC
Neuberger Berman Short Duration High Yield Bond Fund Investment Manager’s Report For the 12 months ended 31 December 2019, the total return for the USD I Accumulating Class was 9.24%. (Performance for all share classes is provided in Appendix II. Performance data quoted represent past performance and do not indicate future results. Total returns shown reflect the reinvestment of income dividends and other distributions, if any).
The US high yield market was supported by a number of factors in 2019, including a “dovish pivot” by the US Federal Reserve (“Fed”), as it lowered interest rates three times during the period as well as accommodative policy by the European Central Bank (“ECB”). The backdrop of more accommodative monetary policy was supportive of issuer fundamentals and investor risk sentiment. Later in the year, the Fed and the ECB signaled that rate cuts could be on hold in the near term which may have suggested to market participants that policymakers and economists were less concerned about further deterioration in growth. While there were bouts of volatility in the market during the year driven by political risk (UK, Hong Kong, Argentina and the US), changes in expectations for monetary policy and shifting trade tensions, the global economy was relatively resilient. While the lower growth environment was challenging for some issuers, corporate profits for the majority of issuers often exceeded lowered expectations. While the US/China trade war has not been completely resolved, late in the year there was an announcement of a “Phase-One” trade deal, which caused a shift in investor expectations fueling a risk-on rally in December where lower quality high yield saw better returns. For the full year, however, higher quality outperformed lower quality. For the 12 months ended 31 December 2019, securities rated BB and B in the US high yield index returned 15.7% and 14.4%, respectively, whereas securities rated CCC returned 9.1%.
Credit selection was a key factor in the US high yield market in 2019 and avoiding deteriorating credits contributed to investment results. Issuers with unsustainable capital structures in uneconomic parts of retail, energy, commodity- and/or cyclically-exposed businesses and companies facing increased regulatory scrutiny were the underperformers in 2019. Outside of these pockets of idiosyncratic risk, most of the high yield market was supported by constructive fundamentals: low-but-positive revenue growth, earnings that were generally in-line, good interest coverage and only a modest increase in leverage which was driven primarily by a subset of stressed issuers in the high yield universe. Among the higher-quality issuers, fundamentals remained relatively solid. In the US, high yield defaults, overall, remained below their long-term average and were very low outside of commodities/energy. As of December, over the last 12 months, the US par-weighted default rate was 2.86% and only 1.26% excluding commodities.
During the year, Healthcare, Diversified Financial Services and Media-Cable were the largest contributors to performance while Energy, Paper and Printing & Publishing contributed the least.
Spreads in the high yield market have widened in the past few weeks but we believe these wider spreads are likely pricing in a severe temporary stall in global GDP and not a deep, extended recession. Assuming no deep, extended recession, spreads are compensating investors for an above-average rise in default rates from the low levels, with the secularly-challenged, idiosyncratic risk credits impacted by supply disruptions and demand declines in certain industries the most affected. As we continue to be vigilant to the developments of COVID-19, we are finding select opportunities in the high yield universe. That said, our primary goal remains one of avoiding default risk. While uncertainty around the duration and severity of the health crisis as well geopolitical event risk can result in heightened short-term volatility, we believe our portfolio is well positioned. We will continue to look to tactically take advantage of the increased volatility to add to credits with more stable fundamentals and attractive valuations.

BALANCE SHEET FINANCIAL STATEMENTS
The accompanying notes form an integral part of the financial statements.
ANNUAL REPORT 2019 145
Neuberger Berman Short Duration High Yield Bond Fund (Continued) Balance Sheet
As at31 December 2019
US$
As at31 December 2018
US$ Note
Current Assets
Financial Assets at Fair Value through Profit or Loss 2 993,772,471 997,830,085
Cash and cash equivalents 3 36,546,439 38,658,794
Receivable for investments sold 3,052,656 67,004
Receivable for shares issued 279,306 155,744
Income receivable and other assets 13,596,944 14,873,183
Total Assets 1,047,247,816 1,051,584,810
Current Liabilities
Financial Liabilities at Fair Value through Profit or Loss 2 6,359,779 5,019,757
Payable for shares redeemed 773,546 937,072
Accrued expenses 754,954 1,325,388
Payable for investments purchased 4,984,487 27,887,748
Other payables 80,458 177,486
Liabilities (excluding Net Assets Attributable to Holders of Redeemable Participating Shares) 12,953,224 35,347,451
Net Assets Attributable to Holders of Redeemable Participating Shares 1,034,294,592 1,016,237,359

FINANCIAL STATEMENTS PROFIT AND LOSS ACCOUNT
The accompanying notes form an integral part of the financial statements.
146 NEUBERGER BERMAN INVESTMENT FUNDS PLC
Neuberger Berman Short Duration High Yield Bond Fund (Continued) Profit and Loss Account
Year Ended31 December 2019
US$
Year Ended31 December 2018
US$ Note
Income
Interest Income 54,302,787 66,983,259
Dividend Income 268,628 266,705
Miscellaneous Income 90,524 2,214
Net Gain/(Loss) on Financial Assets and Liabilities at Fair Value through Profit or Loss 11 21,467,371 (92,534,536)
76,129,310 (25,282,358)
Expenses
Management Fee 6 5,884,948 7,194,419
Distribution Fee 6 156,384 66,528
Administration Fee 6 1,094,201 1,314,489
Commitment Fee 19 103,465 138,512
Custody Fee 6 21,755 58,263
Depositary Fee 6 97,958 117,774
Professional Fee 9 79,104 196,848
Directors' Fee 7 4,563 6,612
Transaction Costs 9 86,558 102,620
Audit Fee 8 26,873 31,431
VAT Rebate (16,008) (15,578)
Other Expenses 9 9,771 106,349
Advisory Fee Waiver 6 (37,675) (50,912)
Total Expenses 7,511,897 9,267,355
Finance Costs
Interest Expense 4 38
Distribution Paid 1 20,748,178 23,860,029
20,748,182 23,860,067
Withholding Tax 1 – 34,109
Profit/(Loss) Attributable to Holders of Redeemable Participating Shares from Operations 47,869,231 (58,443,889)
Income and expenses arose solely from continuing operations.

STATEMENT OF CHANGES IN NET ASSETS FINANCIAL STATEMENTS
The accompanying notes form an integral part of the financial statements.
ANNUAL REPORT 2019 147
Neuberger Berman Short Duration High Yield Bond Fund (Continued) Statement of Changes in Net Assets Attributable to Holders of Redeemable Participating Shares
Year Ended31 December 2019
US$
Year Ended31 December 2018
US$ Note
Net Assets Attributable to Holders of Redeemable Participating Shares at beginning of year 1,016,237,359 1,372,087,566
Profit/(Loss) Attributable to Holders of Redeemable Participating Shares from Operations 47,869,231 (58,443,889)
Subscriptions 5 232,242,997 234,636,033
Redemptions 5 (262,054,995) (532,042,351)
Net Assets Attributable to Holders of Redeemable Participating Shares at end of year 1,034,294,592 1,016,237,359

FINANCIAL STATEMENTS SCHEDULE OF INVESTMENTS
148 NEUBERGER BERMAN INVESTMENT FUNDS PLC
Neuberger Berman Short Duration High Yield Bond Fund (Continued)
Schedule of Investments
Financial Assets at Fair Value through Profit or Loss
Principal Amount Security Description Coupon Maturity
Date Fair Value
US$% of Net
Assets
Corporate Bonds 85.84% (31 December 2018: 90.42%)
United States Dollar 2,120,000 1011778 BC ULC/New Red Finance Inc† 4.25% 15/05/2024 2,177,420 0.21
3,000,000 Acadia Healthcare Co Inc† 5.13% 01/07/2022 3,030,936 0.29
2,590,000 Acadia Healthcare Co Inc† 5.63% 15/02/2023 2,637,488 0.25
1,780,000 Acadia Healthcare Co Inc† 6.50% 01/03/2024 1,849,714 0.18
9,555,000 ADT Security Corp† 4.13% 15/06/2023 9,873,516 0.95
2,035,000 Ally Financial Inc* 4.13% 13/02/2022 2,104,760 0.20
2,760,000 Ally Financial Inc* 4.25% 15/04/2021 2,827,123 0.27
4,600,000 Ally Financial Inc* 7.50% 15/09/2020 4,774,282 0.46
880,000 Ally Financial Inc* 8.00% 15/03/2020 888,140 0.09
15,839,000 Altice France SA* 7.38% 01/05/2026 17,034,686 1.65
1,085,000 AMC Entertainment Holdings Inc* 5.75% 15/06/2025 1,005,887 0.10
1,300,000 AmWINS Group Inc† 7.75% 01/07/2026 1,440,371 0.14
3,190,000 Anixter Inc* 5.13% 01/10/2021 3,320,311 0.32
2,055,000 Antero Midstream Partners LP/Antero Midstream Finance Corp† 5.38% 15/09/2024 1,911,150 0.18
3,730,000 Aramark Services Inc† 5.00% 01/04/2025 3,897,813 0.38
3,610,000 Archrock Partners LP/Archrock Partners Finance Corp* 6.00% 01/10/2022 3,647,226 0.35
2,205,000 Arconic Inc* 5.40% 15/04/2021 2,273,985 0.22
1,345,000 Arconic Inc* 5.87% 23/02/2022 1,436,753 0.14
5,128,000 Ascent Resources Utica Holdings LLC/ARU Finance Corp† 10.00% 01/04/2022 5,113,249 0.49
2,905,000 AssuredPartners Inc† 7.00% 15/08/2025 2,962,199 0.29
6,410,000 Avantor Inc† 6.00% 01/10/2024 6,847,899 0.66
5,015,000 Avis Budget Car Rental LLC/Avis Budget Finance Inc† 5.25% 15/03/2025 5,173,800 0.50
884,000 Avis Budget Car Rental LLC/Avis Budget Finance Inc† 5.50% 01/04/2023 902,047 0.09
1,670,000 Avolon Holdings Funding Ltd† 5.13% 01/10/2023 1,804,928 0.17
286,000 Bausch Health Cos Inc† 5.88% 15/05/2023 288,681 0.03
2,245,000 Bausch Health Cos Inc† 6.13% 15/04/2025 2,324,282 0.22
3,530,000 Bausch Health Cos Inc† 6.50% 15/03/2022 3,613,838 0.35
8,880,000 Bausch Health Cos Inc† 7.00% 15/03/2024 9,253,715 0.89
890,000 Bausch Health Cos Inc† 9.00% 15/12/2025 1,014,333 0.10
9,520,000 Berry Global Inc* 5.13% 15/07/2023 9,793,605 0.95
3,410,000 Berry Global Inc* 5.50% 15/05/2022 3,456,864 0.33
7,270,000 Big River Steel LLC/BRS Finance Corp† 7.25% 01/09/2025 7,687,952 0.74
2,465,000 Bombardier Inc† 5.75% 15/03/2022 2,550,271 0.25
3,285,000 Boyd Gaming Corp* 6.38% 01/04/2026 3,540,532 0.34
940,000 Bruin E&P Partners LLC† 8.88% 01/08/2023 613,740 0.06
10,060,000 Buckeye Partners LP† 4.35% 15/10/2024 10,119,044 0.98
2,465,000 Calpine Corp† 5.25% 01/06/2026 2,572,406 0.25
1,960,000 Calpine Corp† 5.50% 01/02/2024 1,994,280 0.19

SCHEDULE OF INVESTMENTS FINANCIAL STATEMENTS
ANNUAL REPORT 2019 149
Neuberger Berman Short Duration High Yield Bond Fund (Continued)
Schedule of Investments (Continued)
Financial Assets at Fair Value through Profit or Loss (continued)
Principal Amount Security Description Coupon Maturity
DateFair Value
US$% of Net
Assets
Corporate Bonds 85.84% (31 December 2018: 90.42%) (continued)
United States Dollar (continued) 3,580,000 CCO Holdings LLC/CCO Holdings Capital Corp† 4.00% 01/03/2023 3,638,139 0.35
11,295,000 CCO Holdings LLC/CCO Holdings Capital Corp† 5.13% 15/02/2023 11,436,075 1.11
371,000 CCO Holdings LLC/CCO Holdings Capital Corp† 5.75% 15/01/2024 378,574 0.04
5,270,000 CCO Holdings LLC/CCO Holdings Capital Corp† 5.88% 01/04/2024 5,458,850 0.53
2,705,000 CDK Global Inc† 5.00% 15/10/2024 2,934,898 0.28
5,555,000 Cedar Fair LP/Canada's Wonderland Co/Magnum Management Corp* 5.38% 01/06/2024 5,723,955 0.55
4,280,000 Centene Corp† 4.75% 15/01/2025 4,454,688 0.43
2,680,000 Centene Corp† 5.38% 01/06/2026 2,849,108 0.28
1,555,000 CenturyLink Inc* 5.63% 01/04/2020 1,566,569 0.15
4,025,000 CenturyLink Inc* 5.80% 15/03/2022 4,238,526 0.41
1,405,000 CF Industries Inc* 3.45% 01/06/2023 1,449,356 0.14
2,465,000 Chesapeake Energy Corp* 5.75% 15/03/2023 1,674,672 0.16
870,000 Clear Channel Worldwide Holdings Inc† 9.25% 15/02/2024 965,339 0.09
7,150,000 Cleveland-Cliffs Inc† 4.88% 15/01/2024 7,322,422 0.71
13,057,000 Colfax Corp† 6.00% 15/02/2024 13,900,286 1.34
615,000 CommScope Inc† 5.00% 15/06/2021 617,091 0.06
7,380,000 CommScope Inc† 5.50% 01/03/2024 7,709,037 0.75
5,005,000 CommScope Inc† 5.50% 15/06/2024 5,080,125 0.49
1,425,000 CommScope Inc† 6.00% 01/03/2026 1,518,514 0.15
4,057,000 Constellium SE* 5.75% 15/05/2024 4,180,394 0.40
540,000 Crown Americas LLC/Crown Americas Capital Corp IV* 4.50% 15/01/2023 569,020 0.06
2,695,000 CSC Holdings LLC† 5.25% 01/06/2024 2,909,482 0.28
7,280,000 CSC Holdings LLC† 5.38% 15/07/2023 7,477,179 0.72
4,120,000 CSC Holdings LLC† 6.75% 15/11/2021 4,443,420 0.43
1,400,000 Cumulus Media New Holdings Inc† 6.75% 01/07/2026 1,502,374 0.15
6,945,000 DCP Midstream Operating LP† 4.75% 30/09/2021 7,151,614 0.69
915,000 DCP Midstream Operating LP* 4.95% 01/04/2022 951,885 0.09
1,465,000 DCP Midstream Operating LP† 5.35% 15/03/2020 1,474,837 0.14
3,250,000 DISH DBS Corp† 5.00% 15/03/2023 3,342,105 0.32
5,670,000 DISH DBS Corp† 5.88% 15/07/2022 6,020,293 0.58
7,240,000 DISH DBS Corp† 6.75% 01/06/2021 7,624,661 0.74
1,435,000 Eagle Holding Co II LLC† 7.75% 15/05/2022 1,459,625 0.14
5,205,000 Edgewell Personal Care Co* 4.70% 19/05/2021 5,333,824 0.52
7,125,000 Edgewell Personal Care Co* 4.70% 24/05/2022 7,409,950 0.72
1,115,000 Eldorado Resorts Inc† 6.00% 01/04/2025 1,175,862 0.11
4,335,000 Element Solutions Inc† 5.88% 01/12/2025 4,546,288 0.44
10,390,000 Energizer Holdings Inc† 5.50% 15/06/2025 10,801,288 1.04
3,910,000 EnerSys† 5.00% 30/04/2023 4,107,123 0.40

FINANCIAL STATEMENTS SCHEDULE OF INVESTMENTS
150 NEUBERGER BERMAN INVESTMENT FUNDS PLC
Neuberger Berman Short Duration High Yield Bond Fund (Continued)
Schedule of Investments (Continued)
Financial Assets at Fair Value through Profit or Loss (continued)
Principal Amount Security Description Coupon Maturity
DateFair Value
US$% of Net
Assets
Corporate Bonds 85.84% (31 December 2018: 90.42%) (continued)
United States Dollar (continued) 1,730,000 Enviva Partners LP/Enviva Partners Finance Corp† 6.50% 15/01/2026 1,856,515 0.18
930,000 Everi Payments Inc† 7.50% 15/12/2025 1,000,136 0.10
955,000 Extraction Oil & Gas Inc† 7.38% 15/05/2024 599,659 0.06
2,360,000 First Quantum Minerals Ltd† 7.25% 01/04/2023 2,448,181 0.24
4,430,000 FMG Resources August 2006 Pty Ltd† 4.75% 15/05/2022 4,581,860 0.44
570,000 FMG Resources August 2006 Pty Ltd† 5.13% 15/03/2023 603,482 0.06
13,575,000 Freeport-McMoRan Inc* 3.55% 01/03/2022 13,768,851 1.33
2,345,000 Freeport-McMoRan Inc* 4.55% 14/11/2024 2,483,742 0.24
2,340,000 Garda World Security Corp† 8.75% 15/05/2025 2,439,427 0.24
4,575,000 Genesis Energy LP/Genesis Energy Finance Corp* 6.00% 15/05/2023 4,542,586 0.44
4,910,000 Global Aircraft Leasing Co Ltd† 6.50% 15/09/2024 5,135,614 0.50
1,825,000 Global Partners LP/GLP Finance Corp* 7.00% 15/06/2023 1,885,070 0.18
2,904,000 Graphic Packaging International LLC* 4.75% 15/04/2021 2,981,392 0.29
2,280,000 Graphic Packaging International LLC* 4.88% 15/11/2022 2,394,711 0.23
8,165,000 Gray Television Inc† 5.13% 15/10/2024 8,488,212 0.82
4,040,000 HCA Inc* 5.88% 01/05/2023 4,473,270 0.43
2,330,000 HCA Inc* 7.50% 15/02/2022 2,578,797 0.25
9,065,000 Hertz Corp† 5.50% 15/10/2024 9,310,526 0.90
2,485,000 Hertz Corp* 6.25% 15/10/2022 2,519,151 0.24
850,000 Hertz Corp† 7.63% 01/06/2022 888,250 0.09
2,370,000 HUB International Ltd† 7.00% 01/05/2026 2,512,259 0.24
7,379,000 Hudbay Minerals Inc† 7.25% 15/01/2023 7,672,610 0.74
1,430,000 Hudbay Minerals Inc† 7.63% 15/01/2025 1,512,347 0.15
2,290,000 iHeartCommunications Inc† 6.38% 01/05/2026 2,488,941 0.24
10,426,000 INEOS Group Holdings SA† 5.63% 01/08/2024 10,733,463 1.04
6,310,000 Intelsat Jackson Holdings SA† 9.50% 30/09/2022 7,159,881 0.69
2,660,000 International Game Technology Plc† 6.25% 15/02/2022 2,811,035 0.27
5,685,000 Iron Mountain Inc† 4.38% 01/06/2021 5,754,925 0.56
2,450,000 Iron Mountain US Holdings Inc† 5.38% 01/06/2026 2,567,226 0.25
220,000 Jack Ohio Finance LLC/Jack Ohio Finance 1 Corp† 6.75% 15/11/2021 224,895 0.02
3,610,000 Jaguar Holding Co II/Pharmaceutical Product Development LLC† 6.38% 01/08/2023 3,735,186 0.36
2,015,000 Jeld-Wen Inc† 4.63% 15/12/2025 2,080,316 0.20
5,825,000 Kar Auction Services Inc† 5.13% 01/06/2025 6,070,145 0.59
1,420,000 KFC Holding Co/Pizza Hut Holdings LLC/Taco Bell of America LLC† 5.00% 01/06/2024 1,474,436 0.14
11,549,000 L Brands Inc* 5.63% 15/10/2023 12,482,563 1.21
3,590,000 Lennar Corp* 4.75% 01/04/2021 3,677,309 0.36
4,975,000 Level 3 Financing Inc* 5.13% 01/05/2023 5,016,467 0.48
540,000 Level 3 Financing Inc* 5.38% 15/01/2024 550,349 0.05

SCHEDULE OF INVESTMENTS FINANCIAL STATEMENTS
ANNUAL REPORT 2019 151
Neuberger Berman Short Duration High Yield Bond Fund (Continued)
Schedule of Investments (Continued)
Financial Assets at Fair Value through Profit or Loss (continued)
Principal Amount Security Description Coupon Maturity
DateFair Value
US$% of Net
Assets
Corporate Bonds 85.84% (31 December 2018: 90.42%) (continued)
United States Dollar (continued) 3,395,000 Level 3 Financing Inc* 5.63% 01/02/2023 3,413,639 0.33
1,345,000 Lions Gate Capital Holdings LLC† 5.88% 01/11/2024 1,369,096 0.13
2,095,000 Live Nation Entertainment Inc† 4.88% 01/11/2024 2,173,542 0.21
4,880,000 LKQ Corp† 4.75% 15/05/2023 4,959,544 0.48
2,260,000 Masonite International Corp† 5.75% 15/09/2026 2,407,685 0.23
11,110,000 Mauser Packaging Solutions Holding Co† 5.50% 15/04/2024 11,472,075 1.11
4,540,000 MEDNAX Inc† 5.25% 01/12/2023 4,651,616 0.45
4,345,000 Meritage Homes Corp* 7.00% 01/04/2022 4,753,699 0.46
2,425,000 MGM Resorts International* 6.00% 15/03/2023 2,666,494 0.26
3,185,000 MGM Resorts International* 7.75% 15/03/2022 3,556,944 0.34
5,460,000 MPH Acquisition Holdings LLC† 7.13% 01/06/2024 5,296,145 0.51
4,835,000 MPT Operating Partnership LP/MPT Finance Corp* 5.50% 01/05/2024 4,967,962 0.48
1,670,000 MPT Operating Partnership LP/MPT Finance Corp* 6.38% 01/03/2024 1,738,837 0.17
3,825,000 Navient Corp† 6.50% 15/06/2022 4,154,906 0.40
3,230,000 Navient Corp† 7.25% 25/01/2022 3,514,951 0.34
7,080,000 Netflix Inc† 5.75% 01/03/2024 7,852,888 0.76
1,800,000 Nexstar Broadcasting Inc† 5.63% 01/08/2024 1,880,253 0.18
6,890,000 NextEra Energy Operating Partners LP† 4.25% 15/07/2024 7,188,578 0.70
3,730,000 Nielsen Finance LLC/Nielsen Finance Co* 4.50% 01/10/2020 3,739,325 0.36
9,745,000 Nielsen Finance LLC/Nielsen Finance Co† 5.00% 15/04/2022 9,798,890 0.95
4,595,000 NOVA Chemicals Corp† 5.25% 01/08/2023 4,704,269 0.45
1,025,000 NuStar Logistics LP* 4.75% 01/02/2022 1,058,632 0.10
4,647,000 NuStar Logistics LP* 6.75% 01/02/2021 4,834,739 0.47
3,270,000 Oasis Petroleum Inc† 6.88% 15/01/2023 3,204,600 0.31
8,470,000 Open Text Corp† 5.63% 15/01/2023 8,635,885 0.83
6,461,000 Ortho-Clinical Diagnostics Inc/Ortho-Clinical Diagnostics SA† 6.63% 15/05/2022 6,436,729 0.62
2,115,000 Owens-Brockway Glass Container Inc† 5.00% 15/01/2022 2,199,114 0.21
2,340,000 Park Aerospace Holdings Ltd† 4.50% 15/03/2023 2,456,801 0.24
5,150,000 Park Aerospace Holdings Ltd† 5.50% 15/02/2024 5,660,674 0.55
2,521,000 Parsley Energy LLC/Parsley Finance Corp† 6.25% 01/06/2024 2,629,189 0.25
2,350,000 PDC Energy Inc† 6.13% 15/09/2024 2,386,225 0.23
5,131,000 Penske Automotive Group Inc* 3.75% 15/08/2020 5,197,126 0.50
1,350,000 Penske Automotive Group Inc* 5.38% 01/12/2024 1,392,748 0.13
1,280,000 Post Holdings Inc† 5.50% 01/03/2025 1,343,469 0.13
6,385,000 PQ Corp† 6.75% 15/11/2022 6,616,412 0.64
5,475,000 Precision Drilling Corp† 7.75% 15/12/2023 5,477,272 0.53
4,425,000 Prime Security Services Borrower LLC/Prime Finance Inc† 5.25% 15/04/2024 4,690,876 0.45
3,014,000 Prime Security Services Borrower LLC/Prime Finance Inc† 9.25% 15/05/2023 3,166,584 0.31

FINANCIAL STATEMENTS SCHEDULE OF INVESTMENTS
152 NEUBERGER BERMAN INVESTMENT FUNDS PLC
Neuberger Berman Short Duration High Yield Bond Fund (Continued)
Schedule of Investments (Continued)
Financial Assets at Fair Value through Profit or Loss (continued)
Principal Amount Security Description Coupon Maturity
DateFair Value
US$% of Net
Assets
Corporate Bonds 85.84% (31 December 2018: 90.42%) (continued)
United States Dollar (continued) 4,695,000 QVC Inc† 5.13% 02/07/2022 4,939,385 0.48
795,000 Qwest Corp* 6.75% 01/12/2021 855,641 0.08
3,595,000 Rackspace Hosting Inc† 8.63% 15/11/2024 3,523,100 0.34
2,289,000 Radiate Holdco LLC/Radiate Finance Inc† 6.88% 15/02/2023 2,335,730 0.23
1,060,000 Range Resources Corp* 5.00% 15/08/2022 1,041,450 0.10
1,985,000 Range Resources Corp* 5.88% 01/07/2022 1,975,694 0.19
3,375,000 RBS Global Inc/Rexnord LLC† 4.88% 15/12/2025 3,493,091 0.34
2,750,000 Realogy Group LLC/Realogy Co-Issuer Corp† 4.88% 01/06/2023 2,708,750 0.26
6,700,000 Realogy Group LLC/Realogy Co-Issuer Corp† 5.25% 01/12/2021 6,782,075 0.66
8,840,000 Reynolds Group Issuer Inc/Reynolds Group Issuer LLC/Reynolds Group Issuer Lu† 5.13% 15/07/2023 9,068,381 0.88
580,000 Reynolds Group Issuer Inc/Reynolds Group Issuer LLC/Reynolds Group Issuer Lu† 5.50% 15/07/2021 582,030 0.06
2,305,000 RHP Hotel Properties LP/RHP Finance Corp† 5.00% 15/04/2023 2,357,819 0.23
2,990,000 Sealed Air Corp† 5.25% 01/04/2023 3,193,066 0.31
470,000 Sensata Technologies BV† 4.88% 15/10/2023 501,720 0.05
2,200,000 Sensata Technologies BV† 5.63% 01/11/2024 2,453,913 0.24
3,708,000 Shea Homes LP/Shea Homes Funding Corp† 5.88% 01/04/2023 3,788,334 0.37
2,275,000 Sinclair Television Group Inc† 5.63% 01/08/2024 2,345,150 0.23
9,405,000 Sirius XM Radio Inc† 3.88% 01/08/2022 9,628,303 0.93
2,390,000 Sirius XM Radio Inc† 4.63% 15/05/2023 2,430,833 0.24
4,700,000 Sirius XM Radio Inc† 4.63% 15/07/2024 4,944,800 0.48
2,220,000 Sirius XM Radio Inc† 5.38% 15/07/2026 2,363,662 0.23
9,215,000 Six Flags Entertainment Corp† 4.88% 31/07/2024 9,568,257 0.93
1,930,000 Solera LLC/Solera Finance Inc† 10.50% 01/03/2024 2,051,870 0.20
930,000 Spectrum Brands Inc* 6.13% 15/12/2024 962,936 0.09
8,435,000 Springleaf Finance Corp† 7.75% 01/10/2021 9,177,870 0.89
3,715,000 Sprint Communications Inc* 6.00% 15/11/2022 3,902,719 0.38
2,575,000 Sprint Corp* 7.13% 15/06/2024 2,783,150 0.27
10,915,000 Sprint Corp* 7.25% 15/09/2021 11,562,478 1.12
2,085,000 Sprint Corp* 7.88% 15/09/2023 2,304,790 0.22
3,205,000 SPX FLOW Inc† 5.63% 15/08/2024 3,346,549 0.32
5,055,000 Staples Inc† 7.50% 15/04/2026 5,254,036 0.51
1,445,000 Starfruit Finco BV/Starfruit US Holdco LLC* 8.00% 01/10/2026 1,535,349 0.15
1,140,000 Starwood Property Trust Inc† 3.63% 01/02/2021 1,150,431 0.11
6,385,000 Starwood Property Trust Inc* 5.00% 15/12/2021 6,638,804 0.64
4,915,000 Summit Midstream Holdings LLC/Summit Midstream Finance Corp* 5.50% 15/08/2022 4,388,171 0.42
5,705,000 Tallgrass Energy Partners LP/Tallgrass Energy Finance Corp† 5.50% 15/09/2024 5,747,730 0.56
580,000 Targa Resources Partners LP/Targa Resources Partners Finance Corp† 4.25% 15/11/2023 587,009 0.06
6,525,000 Targa Resources Partners LP/Targa Resources Partners Finance Corp† 5.25% 01/05/2023 6,603,855 0.64
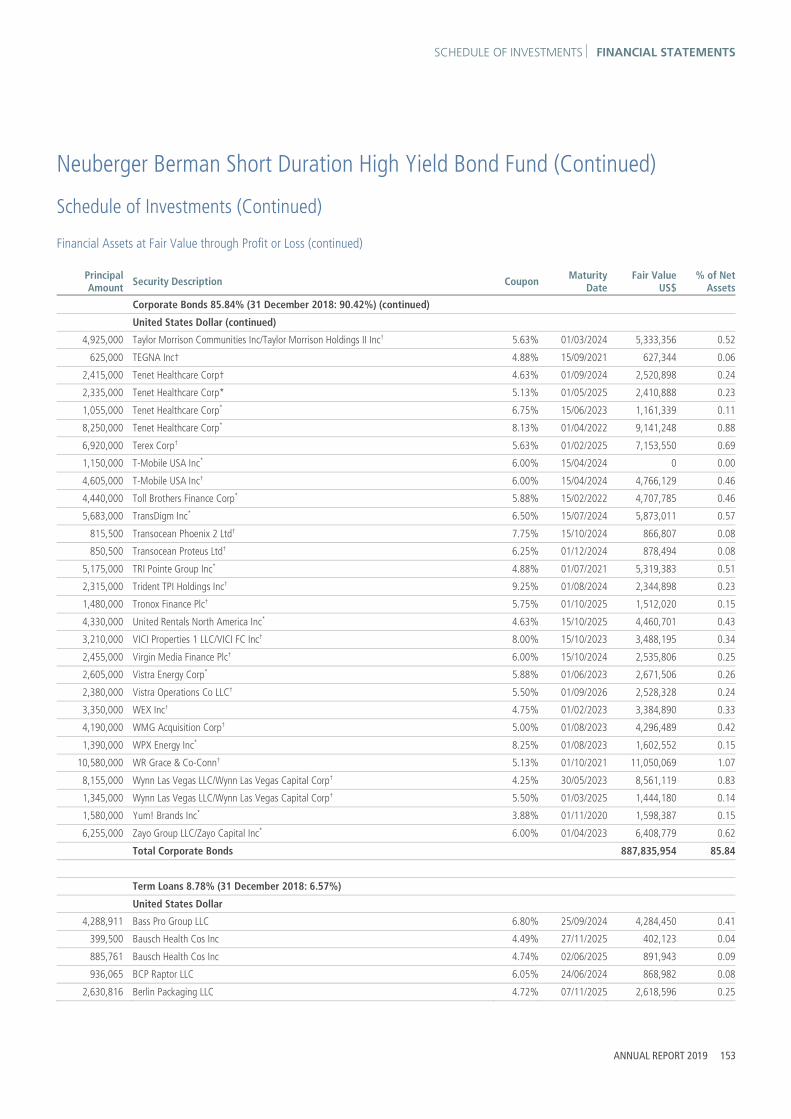
SCHEDULE OF INVESTMENTS FINANCIAL STATEMENTS
ANNUAL REPORT 2019 153
Neuberger Berman Short Duration High Yield Bond Fund (Continued)
Schedule of Investments (Continued)
Financial Assets at Fair Value through Profit or Loss (continued)
Principal Amount Security Description Coupon Maturity
DateFair Value
US$% of Net
Assets
Corporate Bonds 85.84% (31 December 2018: 90.42%) (continued)
United States Dollar (continued) 4,925,000 Taylor Morrison Communities Inc/Taylor Morrison Holdings II Inc† 5.63% 01/03/2024 5,333,356 0.52
625,000 TEGNA Inc† 4.88% 15/09/2021 627,344 0.06
2,415,000 Tenet Healthcare Corp† 4.63% 01/09/2024 2,520,898 0.24
2,335,000 Tenet Healthcare Corp* 5.13% 01/05/2025 2,410,888 0.23
1,055,000 Tenet Healthcare Corp* 6.75% 15/06/2023 1,161,339 0.11
8,250,000 Tenet Healthcare Corp* 8.13% 01/04/2022 9,141,248 0.88
6,920,000 Terex Corp† 5.63% 01/02/2025 7,153,550 0.69
1,150,000 T-Mobile USA Inc* 6.00% 15/04/2024 0 0.00
4,605,000 T-Mobile USA Inc† 6.00% 15/04/2024 4,766,129 0.46
4,440,000 Toll Brothers Finance Corp* 5.88% 15/02/2022 4,707,785 0.46
5,683,000 TransDigm Inc* 6.50% 15/07/2024 5,873,011 0.57
815,500 Transocean Phoenix 2 Ltd† 7.75% 15/10/2024 866,807 0.08
850,500 Transocean Proteus Ltd† 6.25% 01/12/2024 878,494 0.08
5,175,000 TRI Pointe Group Inc* 4.88% 01/07/2021 5,319,383 0.51
2,315,000 Trident TPI Holdings Inc† 9.25% 01/08/2024 2,344,898 0.23
1,480,000 Tronox Finance Plc† 5.75% 01/10/2025 1,512,020 0.15
4,330,000 United Rentals North America Inc* 4.63% 15/10/2025 4,460,701 0.43
3,210,000 VICI Properties 1 LLC/VICI FC Inc† 8.00% 15/10/2023 3,488,195 0.34
2,455,000 Virgin Media Finance Plc† 6.00% 15/10/2024 2,535,806 0.25
2,605,000 Vistra Energy Corp* 5.88% 01/06/2023 2,671,506 0.26
2,380,000 Vistra Operations Co LLC† 5.50% 01/09/2026 2,528,328 0.24
3,350,000 WEX Inc† 4.75% 01/02/2023 3,384,890 0.33
4,190,000 WMG Acquisition Corp† 5.00% 01/08/2023 4,296,489 0.42
1,390,000 WPX Energy Inc* 8.25% 01/08/2023 1,602,552 0.15
10,580,000 WR Grace & Co-Conn† 5.13% 01/10/2021 11,050,069 1.07
8,155,000 Wynn Las Vegas LLC/Wynn Las Vegas Capital Corp† 4.25% 30/05/2023 8,561,119 0.83
1,345,000 Wynn Las Vegas LLC/Wynn Las Vegas Capital Corp† 5.50% 01/03/2025 1,444,180 0.14
1,580,000 Yum! Brands Inc* 3.88% 01/11/2020 1,598,387 0.15
6,255,000 Zayo Group LLC/Zayo Capital Inc* 6.00% 01/04/2023 6,408,779 0.62
Total Corporate Bonds 887,835,954 85.84
Term Loans 8.78% (31 December 2018: 6.57%)
United States Dollar
4,288,911 Bass Pro Group LLC 6.80% 25/09/2024 4,284,450 0.41
399,500 Bausch Health Cos Inc 4.49% 27/11/2025 402,123 0.04
885,761 Bausch Health Cos Inc 4.74% 02/06/2025 891,943 0.09
936,065 BCP Raptor LLC 6.05% 24/06/2024 868,982 0.08
2,630,816 Berlin Packaging LLC 4.72% 07/11/2025 2,618,596 0.25

FINANCIAL STATEMENTS SCHEDULE OF INVESTMENTS
154 NEUBERGER BERMAN INVESTMENT FUNDS PLC
Neuberger Berman Short Duration High Yield Bond Fund (Continued)
Schedule of Investments (Continued)
Financial Assets at Fair Value through Profit or Loss (continued)
Principal Amount Security Description Coupon Maturity
Date Fair Value
US$% of Net
Assets
Term Loans 8.78% (31 December 2018: 6.57%) (continued)
United States Dollar (continued) 925,350 Blackstone CQP Holdco LP 5.41% 30/09/2024 931,499 0.09
942,785 Brazos Delaware II LLC 5.79% 21/05/2025 810,795 0.08
4,838,972 BWay Holding Co 5.23% 03/04/2024 4,831,423 0.47
3,238,690 Caesars Resort Collection LLC 4.55% 23/12/2024 3,249,151 0.31
1,707,245 Eldorado Resorts Inc 4.05% 17/04/2024 1,708,576 0.17
3,189,114 Endo Luxembourg Finance Co I Sarl 6.06% 29/04/2024 3,062,044 0.30
1,578,242 Epicor Software Corp 5.05% 01/06/2022 1,588,998 0.15
4,141,512 Forterra Finance LLC 4.80% 25/10/2023 4,062,139 0.39
1,571,063 Granite US Holdings Corp 0.07% 30/09/2026 1,578,918 0.15
2,376,902 Hub International Ltd 4.69% 25/04/2025 2,379,195 0.23
1,225,000 Hub International Ltd 5.90% 25/04/2025 1,238,941 0.12
1,575,513 Infor US Inc 4.69% 01/02/2022 1,584,801 0.15
1,572,649 Jaguar Holding Co I LLC 4.30% 18/08/2022 1,583,194 0.15
3,273,249 Jeld-Wen Inc 3.94% 14/12/2024 3,283,822 0.32
850,486 Lower Cadence Holdings LLC 5.80% 22/05/2026 843,580 0.08
1,145,296 Medallion Midland Acquisition LLC 5.05% 30/10/2024 1,136,707 0.11
1,690,000 MHI Holdings LLC 6.80% 21/09/2026 1,696,338 0.16
727,136 Mohegan Tribal Gaming Authority 5.55% 13/10/2021 717,527 0.07
787,731 Mohegan Tribal Gaming Authority 5.80% 13/10/2023 761,917 0.07
1,000,793 Nouryon Finance BV 4.96% 01/10/2025 1,002,880 0.10
1,372,659 Parexel International Corp 4.55% 27/09/2024 1,350,353 0.13
6,927,638 Prime Security Services Borrower LLC 4.94% 23/09/2026 6,957,530 0.67
4,946,587 Rackspace Hosting Inc 4.90% 03/11/2023 4,818,470 0.47
1,158,328 Realogy Group LLC 4.05% 08/02/2025 1,150,364 0.11
2,627,384 Scientific Games International Inc 4.58% 14/08/2024 2,638,157 0.26
2,639,345 Seaworld Parks & Entertainment Inc 4.80% 01/04/2024 2,656,395 0.26
1,895,850 Sedgwick Claims Management Services Inc 5.05% 31/12/2025 1,899,405 0.18
1,502,286 Sophia LP 5.19% 30/09/2022 1,507,657 0.15
5,616,803 Staples Inc 6.69% 16/04/2026 5,532,916 0.54
4,138,176 Nouryon Finance BV 4.30% 08/06/2023 4,163,875 0.40
2,832,925 Sunshine Luxembourg VII Sarl 6.19% 01/10/2026 2,863,520 0.28
938,288 Syniverse Holdings Inc 6.85% 09/03/2023 878,472 0.09
4,892,738 Talen Energy Supply LLC 5.55% 08/07/2026 4,907,000 0.47
2,280,513 Team Health Holdings Inc 4.55% 06/02/2024 1,857,192 0.18
508,250 Welbilt Inc 4.30% 23/10/2025 510,791 0.05
Total Term Loans † 90,810,636 8.78
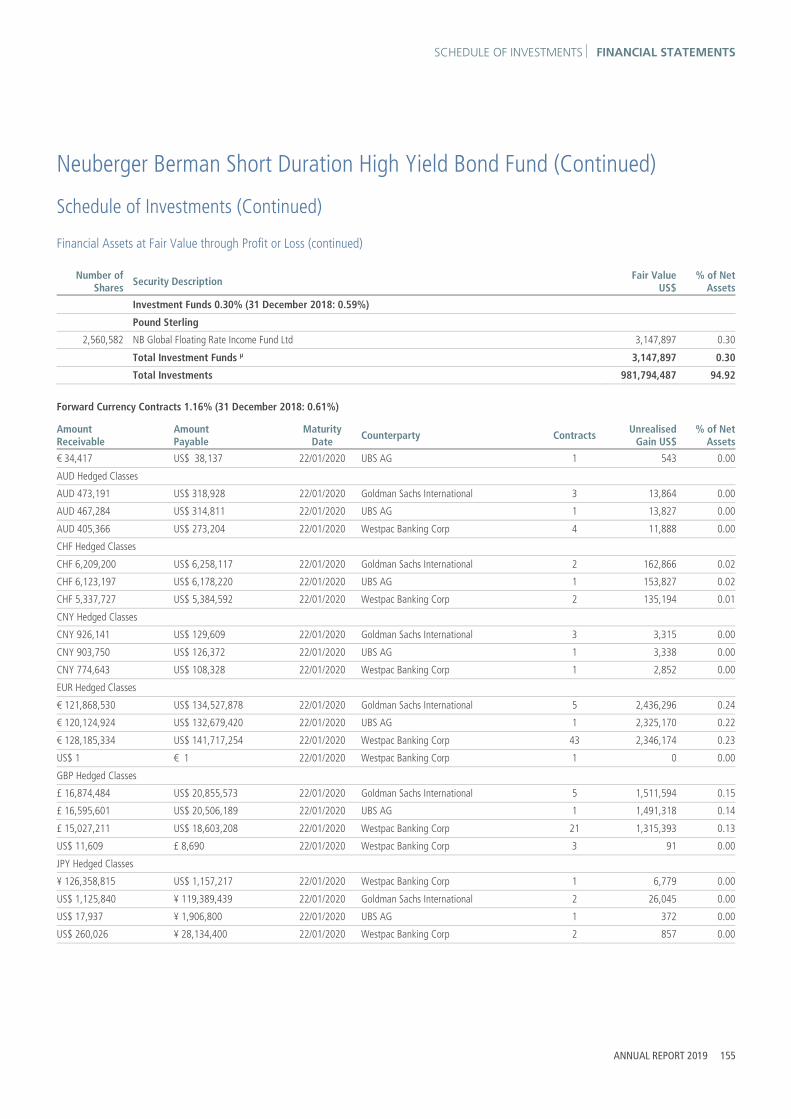
SCHEDULE OF INVESTMENTS FINANCIAL STATEMENTS
ANNUAL REPORT 2019 155
Neuberger Berman Short Duration High Yield Bond Fund (Continued)
Schedule of Investments (Continued)
Financial Assets at Fair Value through Profit or Loss (continued)
Number of Shares Security Description Fair Value
US$% of Net
Assets
Investment Funds 0.30% (31 December 2018: 0.59%)
Pound Sterling 2,560,582 NB Global Floating Rate Income Fund Ltd 3,147,897 0.30
Total Investment Funds μ 3,147,897 0.30
Total Investments 981,794,487 94.92
Forward Currency Contracts 1.16% (31 December 2018: 0.61%)
Amount Receivable
Amount Payable
Maturity Date Counterparty Contracts Unrealised
Gain US$% of Net
Assets
€ 34,417 US$ 38,137 22/01/2020 UBS AG 1 543 0.00
AUD Hedged Classes AUD 473,191 US$ 318,928 22/01/2020 Goldman Sachs International 3 13,864 0.00
AUD 467,284 US$ 314,811 22/01/2020 UBS AG 1 13,827 0.00
AUD 405,366 US$ 273,204 22/01/2020 Westpac Banking Corp 4 11,888 0.00
CHF Hedged Classes CHF 6,209,200 US$ 6,258,117 22/01/2020 Goldman Sachs International 2 162,866 0.02
CHF 6,123,197 US$ 6,178,220 22/01/2020 UBS AG 1 153,827 0.02
CHF 5,337,727 US$ 5,384,592 22/01/2020 Westpac Banking Corp 2 135,194 0.01
CNY Hedged Classes CNY 926,141 US$ 129,609 22/01/2020 Goldman Sachs International 3 3,315 0.00
CNY 903,750 US$ 126,372 22/01/2020 UBS AG 1 3,338 0.00
CNY 774,643 US$ 108,328 22/01/2020 Westpac Banking Corp 1 2,852 0.00
EUR Hedged Classes € 121,868,530 US$ 134,527,878 22/01/2020 Goldman Sachs International 5 2,436,296 0.24
€ 120,124,924 US$ 132,679,420 22/01/2020 UBS AG 1 2,325,170 0.22
€ 128,185,334 US$ 141,717,254 22/01/2020 Westpac Banking Corp 43 2,346,174 0.23
US$ 1 € 1 22/01/2020 Westpac Banking Corp 1 0 0.00
GBP Hedged Classes £ 16,874,484 US$ 20,855,573 22/01/2020 Goldman Sachs International 5 1,511,594 0.15
£ 16,595,601 US$ 20,506,189 22/01/2020 UBS AG 1 1,491,318 0.14
£ 15,027,211 US$ 18,603,208 22/01/2020 Westpac Banking Corp 21 1,315,393 0.13
US$ 11,609 £ 8,690 22/01/2020 Westpac Banking Corp 3 91 0.00
JPY Hedged Classes ¥ 126,358,815 US$ 1,157,217 22/01/2020 Westpac Banking Corp 1 6,779 0.00
US$ 1,125,840 ¥ 119,389,439 22/01/2020 Goldman Sachs International 2 26,045 0.00
US$ 17,937 ¥ 1,906,800 22/01/2020 UBS AG 1 372 0.00
US$ 260,026 ¥ 28,134,400 22/01/2020 Westpac Banking Corp 2 857 0.00

FINANCIAL STATEMENTS SCHEDULE OF INVESTMENTS
156 NEUBERGER BERMAN INVESTMENT FUNDS PLC
Neuberger Berman Short Duration High Yield Bond Fund (Continued)
Schedule of Investments (Continued)
Financial Assets at Fair Value through Profit or Loss (continued)
Forward Currency Contracts 1.16% (31 December 2018: 0.61%) (continued)
Amount Receivable
Amount Payable
Maturity Date Counterparty Contracts Unrealised
Gain US$% of Net
Assets
SGD Hedged Classes SGD 302,718 US$ 219,417 22/01/2020 Goldman Sachs International 3 5,741 0.00
SGD 298,989 US$ 216,710 22/01/2020 UBS AG 1 5,674 0.00
SGD 259,286 US$ 187,888 22/01/2020 Westpac Banking Corp 7 4,966 0.00
US$ 88 SGD 118 22/01/2020 Westpac Banking Corp 1 0 0.00
Total Unrealised Gain on Forward Currency Contracts ∞ 11,977,984 1.16
Fair ValueUS$
% of NetAssets
Total Financial Assets at Fair Value through Profit or Loss 993,772,471 96.08
Financial Liabilities at Fair Value through Profit or Loss
Forward Currency Contracts (0.61%) (31 December 2018: (0.49%))
Amount Receivable
Amount Payable
Maturity Date Counterparty Contracts Unrealised
Loss US$% of Net
Assets
US$ 5,833,180 £ 4,682,025 22/01/2020 UBS AG 1 (372,855) (0.04)
US$ 472,645 £ 375,097 22/01/2020 Westpac Banking Corp 1 (24,547) (0.00)
AUD Hedged Classes US$ 16,496 AUD 24,374 22/01/2020 Goldman Sachs International 2 (646) (0.00)
US$ 11,983 AUD 17,787 22/01/2020 UBS AG 1 (526) (0.00)
US$ 188,066 AUD 275,022 22/01/2020 Westpac Banking Corp 8 (5,356) (0.00)
CHF Hedged Classes US$ 376,418 CHF 373,226 22/01/2020 Goldman Sachs International 2 (9,539) (0.00)
US$ 287,418 CHF 284,858 22/01/2020 UBS AG 1 (7,156) (0.00)
US$ 246,278 CHF 244,164 22/01/2020 Westpac Banking Corp 1 (6,214) (0.00)
CNY Hedged Classes US$ 27,766 CNY 198,297 22/01/2020 Goldman Sachs International 2 (695) (0.00)
US$ 25,983 CNY 185,818 22/01/2020 UBS AG 1 (686) (0.00)
US$ 22,273 CNY 159,272 22/01/2020 Westpac Banking Corp 1 (586) (0.00)
EUR Hedged Classes US$ 21,872,496 € 19,810,104 22/01/2020 Goldman Sachs International 7 (391,452) (0.04)
US$ 19,814,961 € 17,940,015 22/01/2020 UBS AG 1 (347,252) (0.03)
US$ 24,666,797 € 22,297,532 22/01/2020 Westpac Banking Corp 45 (392,689) (0.04)
GBP Hedged Classes £ 189,627 US$ 253,164 22/01/2020 Westpac Banking Corp 1 (1,813) (0.00)
US$ 2,388,506 £ 1,908,727 22/01/2020 Goldman Sachs International 4 (141,516) (0.01)
US$ 1,883,796 £ 1,524,551 22/01/2020 UBS AG 1 (137,000) (0.01)
US$ 3,048,374 £ 2,418,364 22/01/2020 Westpac Banking Corp 39 (157,176) (0.01)

SCHEDULE OF INVESTMENTS FINANCIAL STATEMENTS
ANNUAL REPORT 2019 157
Neuberger Berman Short Duration High Yield Bond Fund (Continued)
Schedule of Investments (Continued)
Financial Liabilities at Fair Value through Profit or Loss (continued)
Forward Currency Contracts (0.61%) (31 December 2018: (0.49%)) (continued)
Amount Receivable
Amount Payable
Maturity Date Counterparty Contracts Unrealised
Loss US$% of Net
Assets
JPY Hedged Classes ¥ 7,935,525,443 US$ 74,615,364 22/01/2020 Goldman Sachs International 2 (1,514,671) (0.15)
¥ 7,817,448,177 US$ 73,539,438 22/01/2020 UBS AG 1 (1,526,453) (0.15)
¥ 6,711,409,866 US$ 63,134,466 22/01/2020 Westpac Banking Corp 4 (1,310,114) (0.13)
US$ 1,538,984 ¥ 167,200,000 22/01/2020 Westpac Banking Corp 2 (1,234) (0.00)
SGD Hedged Classes US$ 125,546 SGD 173,203 22/01/2020 Goldman Sachs International 3 (3,281) (0.00)
US$ 123,900 SGD 170,942 22/01/2020 UBS AG 1 (3,244) (0.00)
US$ 130,153 SGD 179,126 22/01/2020 Westpac Banking Corp 9 (3,078) (0.00)
Total Unrealised Loss on Forward Currency Contracts ∞ (6,359,779) (0.61)
Fair ValueUS$
% of NetAssets
Total Financial Liabilities at Fair Value through Profit or Loss (6,359,779) (0.61)
Net Financial Assets at Fair Value through Profit or Loss 987,412,692 95.47
Other Net Assets 46,881,900 4.53
Net Assets Attributable to Holders of Redeemable Participating Shares 1,034,294,592 100.00
% ofTotal
AssetsPortfolio Analysis US$
* Transferable securities and/or money market instruments admitted to an official stock exchange listing 269,183,469 25.70
† Other transferable securities and/or money market instruments 709,463,121 67.75
μ Investment funds 3,147,897 0.30
∞ OTC financial derivative instruments 5,618,205 0.54
Total Investments 987,412,692 94.29

FINANCIAL STATEMENTS STATEMENT OF SIGNIFICANT PURCHASES AND SALES
158 NEUBERGER BERMAN INVESTMENT FUNDS PLC
Neuberger Berman Short Duration High Yield Bond Fund (Continued) Statement of Significant Purchases and Sales (Unaudited) In accordance with the European Communities (Undertakings for Collective Investment in Transferable Securities) Regulations, 2011 as amended, a statement of changes in the composition of the Schedule of Investments during the reporting period is provided to ensure that Shareholders can identify changes in the investments held by the Portfolio. The following statements present the aggregate purchases and sales of transferable securities exceeding one percent of the total value of purchases or sales, respectively, for the period. At a minimum, the largest twenty purchases and twenty sales are presented, if available.
Top twenty purchases:
Units Security Description Cost US$
15,839,000 Altice France SA, 7.38%, 01/05/2026 16,993,093
13,057,000 Colfax Corp, 6.00%, 15/02/2024 13,605,767
11,549,000 L Brands Inc, 5.63%, 15/10/2023 12,183,487
10,390,000 Energizer Holdings Inc, 5.50%, 15/06/2025 10,756,788
10,426,000 INEOS Group Holdings SA, 5.63%, 01/08/2024 10,578,880
10,060,000 Buckeye Partners LP, 4.35%, 15/10/2024 9,935,444
9,555,000 ADT Security Corp, 4.13%, 15/06/2023 9,599,657
9,065,000 Hertz Corp, 5.50%, 15/10/2024 9,053,100
8,250,000 Tenet Healthcare Corp, 8.13%, 01/04/2022 8,827,514
8,165,000 Gray Television Inc, 5.13%, 15/10/2024 8,328,463
7,080,000 Netflix Inc, 5.75%, 01/03/2024 7,788,306
7,510,000 Genesis Energy LP/Genesis Energy Finance Corp, 6.00%, 15/05/2023 7,649,675
7,150,000 Cleveland-Cliffs Inc, 4.88%, 15/01/2024 7,331,888
7,225,000 Tenet Healthcare Corp, 4.38%, 01/10/2021 7,211,919
6,890,000 NextEra Energy Operating Partners LP, 4.25%, 15/07/2024 7,028,963
6,920,000 Terex Corp, 5.63%, 01/02/2025 7,023,206
6,945,000 Prime Security Services Borrower LLC, 4.94%, 23/09/2026 6,850,969
6,410,000 Avantor Inc, 6.00%, 01/10/2024 6,806,550
6,420,000 Wynn Las Vegas LLC/Wynn Las Vegas Capital Corp, 4.25%, 30/05/2023 6,567,375
6,200,000 Edgewell Personal Care Co, 4.70%, 24/05/2022 6,360,488

STATEMENT OF SIGNIFICANT PURCHASES AND SALES FINANCIAL STATEMENTS
ANNUAL REPORT 2019 159
Neuberger Berman Short Duration High Yield Bond Fund (Continued) Statement of Significant Purchases and Sales (Unaudited) (Continued) Aggregate sales greater than one percent of the total value of sales:
Units Security Description Proceeds US$
14,180,000 Park Aerospace Holdings Ltd, 5.25%, 15/08/2022 14,717,237
13,325,000 HCA Inc, 5.88%, 15/03/2022 14,122,863
8,980,000 Springleaf Finance Corp, 7.75%, 01/10/2021 9,809,290
9,070,000 Dell International LLC/EMC Corp, 5.88%, 15/06/2021 9,218,764
7,930,000 Freeport-McMoRan Inc, 3.55%, 01/03/2022 7,946,081
7,670,000 Range Resources Corp, 5.75%, 01/06/2021 7,611,463
6,975,000 First Data Corp, 5.38%, 15/08/2023 7,099,210
7,010,000 Lennar Corp, 4.50%, 15/11/2019 7,027,781
6,495,000 Netflix Inc, 5.38%, 01/02/2021 6,747,626
6,543,392 Prime Security Services Borrower LLC, 5.15%, 02/05/2022 6,543,392
6,525,000 Nielsen Co Luxembourg Sarl, 5.50%, 01/10/2021 6,541,313
6,185,000 Centene Corp, 6.13%, 15/02/2024 6,486,519
6,185,000 Novelis Corp, 6.25%, 15/08/2024 6,413,475
6,420,000 Hertz Corp, 5.88%, 15/10/2020 6,403,950
6,160,000 HCA Inc, 6.50%, 15/02/2020 6,344,800
6,245,000 Lamar Media Corp, 5.00%, 01/05/2023 6,273,063
6,370,000 SM Energy Co, 6.13%, 15/11/2022 6,218,309
5,855,000 AMC Networks Inc, 5.00%, 01/04/2024 6,002,050
5,900,000 Universal Health Services Inc, 4.75%, 01/08/2022 5,967,566
5,855,000 NOVA Chemicals Corp, 5.25%, 01/08/2023 5,942,192
5,873,000 RHP Hotel Properties LP/RHP Finance Corp, 5.00%, 15/04/2021 5,887,822
5,275,000 Navient Corp, 7.25%, 25/01/2022 5,685,611
5,495,000 CenturyLink Inc, 5.63%, 01/04/2020 5,561,785
5,480,000 Crestwood Midstream Partners LP/Crestwood Midstream Finance Corp, 6.25%, 01/04/2023 5,558,424
5,250,000 Cable One Inc, 5.75%, 15/06/2022 5,351,997
5,295,000 TEGNA Inc, 5.13%, 15/07/2020 5,328,670
5,310,000 Ascent Resources Utica Holdings LLC/ARU Finance Corp, 10.00%, 01/04/2022 5,175,225
4,980,000 Boyd Gaming Corp, 6.88%, 15/05/2023 5,166,754
FINANCIAL STATEMENTS INVESTMENT MANAGER’S REPORT
160 NEUBERGER BERMAN INVESTMENT FUNDS PLC
Neuberger Berman Global Bond Fund Investment Manager’s Report For the 12 months ended 31 December 2019, the total return for the USD I Accumulating Class was 6.64%. Over the same period, the benchmark index, the Bloomberg Barclays Global Aggregate Index (USD Unhedged Total Return), returned 6.84%. (Performance for all share classes is provided in Appendix II. Performance data quoted represent past performance and do not indicate future results. Total returns shown are net of all fees and expenses and include reinvestment of income dividends and other distributions, if any).
Developed market government bond yields rallied aggressively in 2019, as the progress towards monetary policy normalisation seen in 2018 came to a halt in the face of slowing global growth, heightened trade tensions, and persistent concerns surrounding the evolution of Brexit. US yields rallied across the curve in 2019. Yields were similarly lower across the remaining G4 countries (Germany, the UK and Japan). In Europe, rising political uncertainties like Brexit and the tariff trade war weighed on growth. In response the European Central Bank (“ECB”) reduced its deposit rate by 10 basis points (“bps”) to -50 bps and announced a restart of quantitative easing. In the UK, a “no deal Brexit” was ruled out and the Conservatives strengthened their position in parliament under Boris Johnson in the December election. However, the nature of UK’s trading relationship with the eurozone remains in question.
Elsewhere, the Bank of Japan held policy unchanged in 2019, but realised inflation continues to disappoint and the consumption tax hike introduced in October poses a challenge for growth in the coming quarters. Global investment-grade credit spreads rebounded in 2019 after a rocky 2018, driven in large part by increasingly dovish signals from central banks in the first half of the year and by diminishing political risks in the second half. Overall, the best performing major currencies during the year were the Canadian dollar and the British pound. The worst performing major currencies were the Swedish krona and euro.
In terms of the Portfolio’s performance, rates positioning detracted from performance during the year. The primary driver of underperformance was our underweight in duration in the US for parts of the year, as we underestimated the US Federal Reserve’s willingness to abruptly reverse course on monetary policy, particularly in the face of solid fundamentals. Our overweight in breakeven inflation positioning was a modestly contributor, albeit insufficient to offset losses on duration. Elsewhere, the credit portion of the Portfolio positively contributed to returns. The best performing credits were the bonds of Volkswagen, AroundTown and Discovery Communications, while the worst performers were E.ON, Engie and AT&T. Currency positioning, overall, generated a small negative return for the year. Overweights in the Norwegian krone and Swedish krona detracted from results, whereas underweights in the euro and Swiss franc were the best performing positions.
Coming into 2020, our thesis of a modest slowdown in US growth, stabilization in international developed market growth (led by a global recovery in manufacturing and an attendant rebound in trade), and bouts of elevated volatility ahead of the known unknown (the US election) appeared sound. However, an unknown unknown, COVID-19, has disrupted the chain of events.
We expect a stark slowdown in the US and global growth in the first half of 2020. We are viewing the impact of the virus as a growth shock, analogous to other growth shocks over the past 20 years (9/11 attacks, European crises in 2011 and 2013, and the energy issues of 2015/2016). We do not see a material permanent impact to the global growth trajectory, and while we expect markets to remain volatile, monetary easing and fiscal easing will stabilize the impacts of this growth shock. We would also note that the ‘outcome’ of this crisis is now a return to approximately 0% policy rates in the US and lower overall government bond yields, which will only heighten investors’ need for income, particularly in high quality securities.

BALANCE SHEET FINANCIAL STATEMENTS
The accompanying notes form an integral part of the financial statements.
ANNUAL REPORT 2019 161
Neuberger Berman Global Bond Fund (Continued) Balance Sheet
As at31 December 2019
US$
As at31 December 2018
US$ Note
Current Assets
Financial Assets at Fair Value through Profit or Loss 2 205,768,887 154,899,982
Cash and cash equivalents 3 1,145,392 1,256,218
Receivable for shares issued 270,300 –
Due from brokers – 677,347
Income receivable and other assets 1,461,248 1,059,565
Total Assets 208,645,827 157,893,112
Current Liabilities
Financial Liabilities at Fair Value through Profit or Loss 2 2,630,172 1,859,686
Due to brokers 37,051 –
Accrued expenses 44,731 57,204
Payable for investments purchased 2,785,414 10,994,177
Other payables 30,771 50,453
Liabilities (excluding Net Assets Attributable to Holders of Redeemable Participating Shares) 5,528,139 12,961,520
Net Assets Attributable to Holders of Redeemable Participating Shares 203,117,688 144,931,592
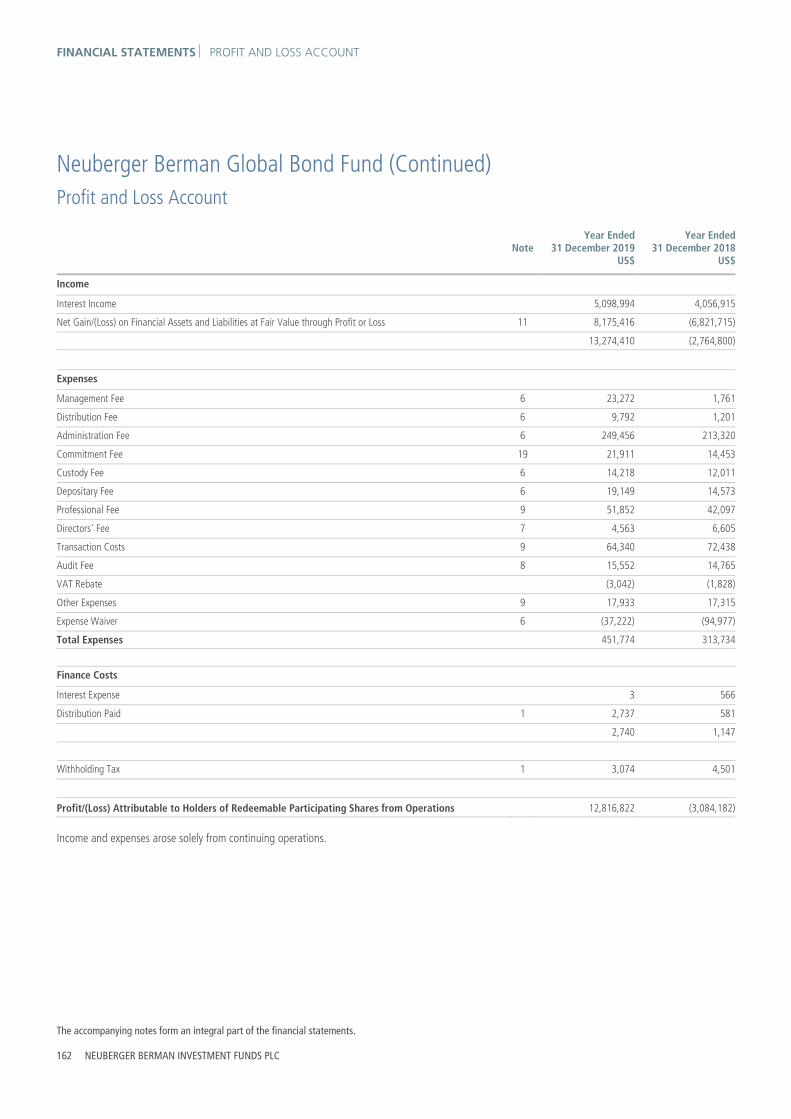
FINANCIAL STATEMENTS PROFIT AND LOSS ACCOUNT
The accompanying notes form an integral part of the financial statements.
162 NEUBERGER BERMAN INVESTMENT FUNDS PLC
Neuberger Berman Global Bond Fund (Continued) Profit and Loss Account
Year Ended 31 December 2019
US$
Year Ended31 December 2018
US$ Note
Income
Interest Income 5,098,994 4,056,915
Net Gain/(Loss) on Financial Assets and Liabilities at Fair Value through Profit or Loss 11 8,175,416 (6,821,715)
13,274,410 (2,764,800)
Expenses
Management Fee 6 23,272 1,761
Distribution Fee 6 9,792 1,201
Administration Fee 6 249,456 213,320
Commitment Fee 19 21,911 14,453
Custody Fee 6 14,218 12,011
Depositary Fee 6 19,149 14,573
Professional Fee 9 51,852 42,097
Directors' Fee 7 4,563 6,605
Transaction Costs 9 64,340 72,438
Audit Fee 8 15,552 14,765
VAT Rebate (3,042) (1,828)
Other Expenses 9 17,933 17,315
Expense Waiver 6 (37,222) (94,977)
Total Expenses 451,774 313,734
Finance Costs
Interest Expense 3 566
Distribution Paid 1 2,737 581
2,740 1,147
Withholding Tax 1 3,074 4,501
Profit/(Loss) Attributable to Holders of Redeemable Participating Shares from Operations 12,816,822 (3,084,182)
Income and expenses arose solely from continuing operations.

STATEMENT OF CHANGES IN NET ASSETS FINANCIAL STATEMENTS
The accompanying notes form an integral part of the financial statements.
ANNUAL REPORT 2019 163
Neuberger Berman Global Bond Fund (Continued) Statement of Changes in Net Assets Attributable to Holders of Redeemable Participating Shares
Year Ended31 December 2019
US$
Year Ended31 December 2018
US$ Note
Net Assets Attributable to Holders of Redeemable Participating Shares at beginning of year 144,931,592 131,793,279
Profit/(Loss) Attributable to Holders of Redeemable Participating Shares from Operations 12,816,822 (3,084,182)
Subscriptions 5 62,580,740 21,881,299
Redemptions 5 (17,211,466) (5,658,804)
Net Assets Attributable to Holders of Redeemable Participating Shares at end of year 203,117,688 144,931,592

FINANCIAL STATEMENTS SCHEDULE OF INVESTMENTS
164 NEUBERGER BERMAN INVESTMENT FUNDS PLC
Neuberger Berman Global Bond Fund (Continued)
Schedule of Investments
Financial Assets at Fair Value through Profit or Loss
Principal Amount Security Description Coupon Maturity
Date Fair Value
US$% of Net
Assets
Treasury Bills 1.62% (31 December 2018: 2.41%)
United States Dollar 3,300,000 United States Treasury Bill 0.00% 28/05/2020 3,279,380 1.62
Total Treasury Bills ** 3,279,380 1.62
Agency Bonds 0.40% (31 December 2018: 0.51%)
United States Dollar 490,000 Federal Home Loan Banks 5.50% 15/07/2036 688,060 0.34
85,000 Tennessee Valley Authority 5.88% 01/04/2036 119,969 0.06
Total Agency Bonds * 808,029 0.40
Asset Backed Securities 3.49% (31 December 2018: 4.03%)
Euro 985,404 European Residential Loan Securitisation 2019-NPL2 DAC Class A 1.05% 24/02/2058 1,097,940 0.54
Total Euro 1,097,940 0.54
Pound Sterling 636,708 Residential Mortgage Securities 31 Plc 2.00% 20/09/2065 848,865 0.42
932,000 Ripon Mortgages Plc Class D1 2.60% 20/08/2056 1,236,040 0.61
1,098,455 Towd Point Mortgage Funding 2018 - Auburn 12 Plc Class A 1.60% 20/02/2045 1,457,078 0.72
Total Pound Sterling 3,541,983 1.75
United States Dollar 1,260,772 Citigroup Commercial Mortgage Trust 2015-GC27 Class XA 1.36% 10/02/2048 67,563 0.03
325,000 Citigroup Commercial Mortgage Trust 2017-C4 Class A4 3.47% 12/10/2050 346,155 0.17
2,001,578 COMM 2014-CCRE17 Mortgage Trust Class XA 0.98% 10/05/2047 71,492 0.04
2,520,470 COMM 2014-LC15 Mortgage Trust Class XA 1.10% 10/04/2047 97,642 0.05
1,714,778 COMM 2014-UBS3 Mortgage Trust Class XA 1.08% 10/06/2047 69,528 0.03
2,673,255 Csail 2015-C2 Commercial Mortgage Trust Class XA 0.76% 15/06/2057 88,465 0.04
1,015,312 Fannie Mae REMICS Class HS 4.21% 25/07/2042 190,283 0.09
1,059,233 Fannie Mae REMICS Class PI 3.50% 25/12/2042 162,453 0.08
1,201,662 Fannie Mae REMICS Class SA 4.06% 25/07/2046 197,006 0.10
953,166 Freddie Mac REMICS Class HS 4.71% 15/03/2042 197,191 0.10
1,282,324 Freddie Mac REMICS Class SA 4.31% 15/04/2046 264,205 0.13
1,038,399 Freddie Mac Strips Class S1 4.21% 15/09/2043 182,412 0.09
1,424,127 GS Mortgage Securities Trust 2014-GC18 Class XA 1.02% 10/01/2047 49,003 0.02
3,240,554 GS Mortgage Securities Trust 2015-GC30 Class XA 0.81% 10/05/2050 98,888 0.05
260,000 Morgan Stanley Bank of America Merrill Lynch Trust 2015-C25 Class A5 3.64% 15/10/2048 275,941 0.14
2,160,107 WFRBS Commercial Mortgage Trust 2014-C21 Class XA 1.04% 15/08/2047 82,963 0.04
Total United States Dollar 2,441,190 1.20
Total Asset Backed Securities ** 7,081,113 3.49

SCHEDULE OF INVESTMENTS FINANCIAL STATEMENTS
ANNUAL REPORT 2019 165
Neuberger Berman Global Bond Fund (Continued)
Schedule of Investments (Continued)
Financial Assets at Fair Value through Profit or Loss (continued)
Principal Amount Security Description Coupon Maturity
DateFair Value
US$% of Net
Assets
Corporate Bonds 26.52% (31 December 2018: 28.99%)
Euro 600,000 Anglo American Capital Plc* 3.25% 03/04/2023 738,761 0.36
1,200,000 Aroundtown SA* 1.63% 31/01/2028 1,394,342 0.69
300,000 AT&T Inc* 0.25% 04/03/2026 329,929 0.16
875,000 CK Hutchison Group Telecom Finance SA* 0.75% 17/04/2026 978,897 0.48
1,700,000 E.ON SE* 0.63% 07/11/2031 1,840,488 0.91
600,000 Elia System Operator SA/NV* 2.75% 29/12/2049 710,829 0.35
289,000 JPMorgan Chase & Co* 1.64% 18/05/2028 348,853 0.17
200,000 Kraft Heinz Foods Co* 2.00% 30/06/2023 236,762 0.12
380,000 Morgan Stanley* 1.75% 30/01/2025 456,403 0.22
700,000 National Grid North America Inc* 1.00% 12/07/2024 809,063 0.40
905,000 Nationwide Building Society* 2.00% 25/07/2029 1,056,990 0.52
600,000 Orsted A/S* 2.25% 24/11/3017 705,150 0.35
600,000 Royal Mail Plc* 1.25% 08/10/2026 678,230 0.33
200,000 SSE Plc* 2.38% 29/12/2049 229,803 0.11
500,000 UBS Group AG* 1.25% 17/04/2025 585,021 0.29
900,000 Volkswagen Bank GmbH* 1.25% 10/06/2024 1,038,237 0.51
312,000 Volkswagen Bank GmbH* 1.25% 15/12/2025 360,838 0.18
900,000 Volkswagen International Finance NV* 3.88% 29/12/2049 1,097,384 0.54
695,000 Volkswagen Leasing GmbH* 1.38% 20/01/2025 805,416 0.40
400,000 Vonovia Finance BV* 0.75% 15/01/2024 456,914 0.22
200,000 Vonovia Finance BV* 1.50% 14/01/2028 235,768 0.12
Total Euro 15,094,078 7.43
Pound Sterling 720,000 Anglo American Capital Plc* 3.38% 11/03/2029 1,001,036 0.49
400,000 BAT Capital Corp* 2.13% 15/08/2025 528,894 0.26
800,000 Discovery Communications LLC* 2.50% 20/09/2024 1,087,809 0.54
251,000 E.ON International Finance BV* 6.38% 07/06/2032 477,402 0.23
520,000 Enel Finance International NV* 5.63% 14/08/2024 816,873 0.40
100,000 HSBC Holdings Plc* 2.18% 27/06/2023 134,820 0.07
200,000 HSBC Holdings Plc* 3.00% 22/07/2028 279,807 0.14
150,000 Imperial Brands Finance Plc* 9.00% 17/02/2022 229,704 0.11
612,000 Next Group Plc* 4.38% 02/10/2026 912,286 0.45
255,000 NGG Finance Plc* 5.63% 18/06/2073 383,416 0.19
300,000 Phoenix Group Holdings* 5.75% 07/07/2021 422,561 0.21
380,000 Principality Building Society* 2.38% 23/11/2023 511,918 0.25
Total Pound Sterling 6,786,526 3.34
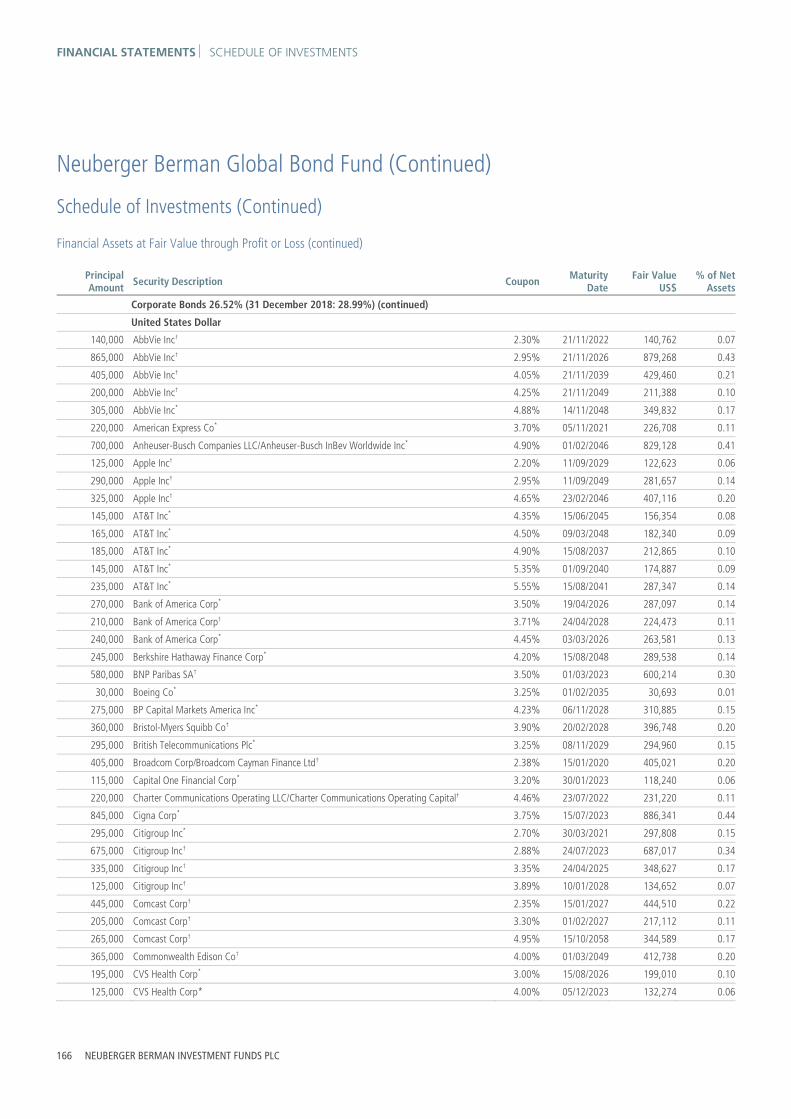
FINANCIAL STATEMENTS SCHEDULE OF INVESTMENTS
166 NEUBERGER BERMAN INVESTMENT FUNDS PLC
Neuberger Berman Global Bond Fund (Continued)
Schedule of Investments (Continued)
Financial Assets at Fair Value through Profit or Loss (continued)
Principal Amount Security Description Coupon Maturity
Date Fair Value
US$% of Net
Assets
Corporate Bonds 26.52% (31 December 2018: 28.99%) (continued)
United States Dollar 140,000 AbbVie Inc† 2.30% 21/11/2022 140,762 0.07
865,000 AbbVie Inc† 2.95% 21/11/2026 879,268 0.43
405,000 AbbVie Inc† 4.05% 21/11/2039 429,460 0.21
200,000 AbbVie Inc† 4.25% 21/11/2049 211,388 0.10
305,000 AbbVie Inc* 4.88% 14/11/2048 349,832 0.17
220,000 American Express Co* 3.70% 05/11/2021 226,708 0.11
700,000 Anheuser-Busch Companies LLC/Anheuser-Busch InBev Worldwide Inc* 4.90% 01/02/2046 829,128 0.41
125,000 Apple Inc† 2.20% 11/09/2029 122,623 0.06
290,000 Apple Inc† 2.95% 11/09/2049 281,657 0.14
325,000 Apple Inc† 4.65% 23/02/2046 407,116 0.20
145,000 AT&T Inc* 4.35% 15/06/2045 156,354 0.08
165,000 AT&T Inc* 4.50% 09/03/2048 182,340 0.09
185,000 AT&T Inc* 4.90% 15/08/2037 212,865 0.10
145,000 AT&T Inc* 5.35% 01/09/2040 174,887 0.09
235,000 AT&T Inc* 5.55% 15/08/2041 287,347 0.14
270,000 Bank of America Corp* 3.50% 19/04/2026 287,097 0.14
210,000 Bank of America Corp† 3.71% 24/04/2028 224,473 0.11
240,000 Bank of America Corp* 4.45% 03/03/2026 263,581 0.13
245,000 Berkshire Hathaway Finance Corp* 4.20% 15/08/2048 289,538 0.14
580,000 BNP Paribas SA† 3.50% 01/03/2023 600,214 0.30
30,000 Boeing Co* 3.25% 01/02/2035 30,693 0.01
275,000 BP Capital Markets America Inc* 4.23% 06/11/2028 310,885 0.15
360,000 Bristol-Myers Squibb Co† 3.90% 20/02/2028 396,748 0.20
295,000 British Telecommunications Plc* 3.25% 08/11/2029 294,960 0.15
405,000 Broadcom Corp/Broadcom Cayman Finance Ltd† 2.38% 15/01/2020 405,021 0.20
115,000 Capital One Financial Corp* 3.20% 30/01/2023 118,240 0.06
220,000 Charter Communications Operating LLC/Charter Communications Operating Capital† 4.46% 23/07/2022 231,220 0.11
845,000 Cigna Corp* 3.75% 15/07/2023 886,341 0.44
295,000 Citigroup Inc* 2.70% 30/03/2021 297,808 0.15
675,000 Citigroup Inc† 2.88% 24/07/2023 687,017 0.34
335,000 Citigroup Inc† 3.35% 24/04/2025 348,627 0.17
125,000 Citigroup Inc† 3.89% 10/01/2028 134,652 0.07
445,000 Comcast Corp† 2.35% 15/01/2027 444,510 0.22
205,000 Comcast Corp† 3.30% 01/02/2027 217,112 0.11
265,000 Comcast Corp† 4.95% 15/10/2058 344,589 0.17
365,000 Commonwealth Edison Co† 4.00% 01/03/2049 412,738 0.20
195,000 CVS Health Corp* 3.00% 15/08/2026 199,010 0.10
125,000 CVS Health Corp* 4.00% 05/12/2023 132,274 0.06

SCHEDULE OF INVESTMENTS FINANCIAL STATEMENTS
ANNUAL REPORT 2019 167
Neuberger Berman Global Bond Fund (Continued)
Schedule of Investments (Continued)
Financial Assets at Fair Value through Profit or Loss (continued)
Principal Amount Security Description Coupon Maturity
DateFair Value
US$% of Net
Assets
Corporate Bonds 26.52% (31 December 2018: 28.99%) (continued)
United States Dollar (continued) 175,000 CVS Health Corp* 5.05% 25/03/2048 207,089 0.10
475,000 Dell International LLC/EMC Corp† 4.42% 15/06/2021 488,836 0.24
115,000 Dell International LLC/EMC Corp† 6.02% 15/06/2026 132,361 0.06
280,000 DH Europe Finance II Sarl* 2.60% 15/11/2029 279,158 0.14
295,000 DH Europe Finance II Sarl* 3.25% 15/11/2039 297,604 0.15
175,000 Dominion Energy Inc† 4.25% 01/06/2028 193,547 0.10
240,000 Duke Energy Indiana LLC* 3.25% 01/10/2049 239,852 0.12
215,000 Energy Transfer Operating LP† 4.95% 15/06/2028 235,507 0.12
180,000 Energy Transfer Operating LP† 5.80% 15/06/2038 203,714 0.10
125,000 Energy Transfer Operating LP* 6.25% 15/04/2049 150,646 0.07
290,000 Entergy Arkansas LLC* 4.20% 01/04/2049 338,596 0.17
300,000 Enterprise Products Operating LLC* 4.25% 15/02/2048 321,860 0.16
290,000 Evergy Inc* 2.45% 15/09/2024 291,783 0.14
435,000 Fiserv Inc† 2.75% 01/07/2024 442,805 0.22
300,000 Fox Corp† 5.58% 25/01/2049 381,573 0.19
460,000 Goldman Sachs Group Inc† 3.27% 29/09/2025 476,121 0.23
150,000 Goldman Sachs Group Inc† 3.81% 23/04/2029 160,798 0.08
250,000 Goldman Sachs Group Inc† 4.02% 31/10/2038 271,544 0.13
125,000 Hartford Financial Services Group Inc* 3.60% 19/08/2049 128,839 0.06
355,000 HCA Inc* 4.13% 15/06/2029 376,891 0.19
360,000 Imperial Brands Finance Plc† 3.88% 26/07/2029 363,363 0.18
805,000 International Business Machines Corp* 2.85% 13/05/2022 822,664 0.40
155,000 International Business Machines Corp* 3.30% 15/05/2026 163,468 0.08
105,000 International Business Machines Corp* 4.15% 15/05/2039 118,357 0.06
180,000 International Business Machines Corp† 4.25% 15/05/2049 205,713 0.10
295,000 JPMorgan Chase & Co† 2.74% 15/10/2030 294,954 0.14
1,140,000 JPMorgan Chase & Co† 3.22% 01/03/2025 1,181,759 0.58
130,000 Kinder Morgan Inc* 5.55% 01/06/2045 155,627 0.08
370,000 Kraft Heinz Foods Co† 3.75% 01/04/2030 381,024 0.19
100,000 Kraft Heinz Foods Co† 4.88% 01/10/2049 105,402 0.05
990,000 Kreditanstalt fuer Wiederaufbau* 2.38% 29/12/2022 1,010,111 0.50
175,000 Marathon Oil Corp* 4.40% 15/07/2027 190,268 0.09
415,000 Microchip Technology Inc† 3.92% 01/06/2021 424,463 0.21
580,000 Mitsubishi UFJ Financial Group Inc* 2.62% 18/07/2022 587,855 0.29
295,000 Morgan Stanley* 2.50% 21/04/2021 297,305 0.15
235,000 Morgan Stanley† 2.72% 22/07/2025 237,998 0.12
240,000 Morgan Stanley* 3.63% 20/01/2027 255,487 0.13
195,000 Morgan Stanley† 3.77% 24/01/2029 209,808 0.10

FINANCIAL STATEMENTS SCHEDULE OF INVESTMENTS
168 NEUBERGER BERMAN INVESTMENT FUNDS PLC
Neuberger Berman Global Bond Fund (Continued)
Schedule of Investments (Continued)
Financial Assets at Fair Value through Profit or Loss (continued)
Principal Amount Security Description Coupon Maturity
DateFair Value
US$% of Net
Assets
Corporate Bonds 26.52% (31 December 2018: 28.99%) (continued)
United States Dollar (continued) 395,000 MPLX LP* 4.50% 15/04/2038 401,681 0.20
300,000 Occidental Petroleum Corp* 2.90% 15/08/2024 304,956 0.15
55,000 Oracle Corp* 4.00% 15/07/2046 61,129 0.03
140,000 Plains All American Pipeline LP/PAA Finance Corp* 3.55% 15/12/2029 138,082 0.07
150,000 Rogers Communications Inc* 3.70% 15/11/2049 151,593 0.07
610,000 Santander UK Plc* 2.13% 03/11/2020 610,780 0.30
685,000 State Street Corp† 2.35% 01/11/2025 687,825 0.34
475,000 Total Capital International SA* 2.83% 10/01/2030 488,168 0.24
305,000 UnitedHealth Group Inc* 3.88% 15/08/2059 329,152 0.16
565,000 US Bancorp* 3.00% 30/07/2029 583,869 0.29
405,000 Ventas Realty LP* 3.50% 15/04/2024 423,001 0.21
365,000 Volkswagen Group of America Finance LLC† 2.85% 26/09/2024 370,860 0.18
635,000 Walmart Inc* 2.85% 08/07/2024 658,668 0.32
575,000 Walmart Inc* 3.40% 26/06/2023 604,550 0.30
210,000 Walmart Inc* 3.70% 26/06/2028 231,571 0.11
255,000 Walmart Inc* 4.05% 29/06/2048 301,686 0.15
570,000 Wells Fargo & Co† 2.88% 30/10/2030 573,824 0.28
Total United States Dollar 31,995,228 15.75
Total Corporate Bonds 53,875,832 26.52
Government Bonds 54.02% (31 December 2018: 53.09%)
Australian Dollar 1,130,000 Australia Government Bond* 3.00% 21/03/2047 959,940 0.47
425,000 Australia Government Bond* 3.25% 21/06/2039 369,543 0.18
4,945,000 Treasury Corp of Victoria* 3.00% 20/10/2028 3,846,791 1.90
Total Australian Dollar 5,176,274 2.55
Canadian Dollar 1,730,000 Canada Housing Trust No 1* 2.90% 15/06/2024 1,387,002 0.68
6,100,000 International Bank for Reconstruction & Development* 2.50% 03/08/2023 4,800,595 2.36
6,615,000 Province of Quebec Canada* 3.00% 01/09/2023 5,291,235 2.61
Total Canadian Dollar 11,478,832 5.65
Danish Krone 21,410,000 Denmark Government Bond* 0.50% 15/11/2027 3,417,812 1.68
Total Danish Krone 3,417,812 1.68

SCHEDULE OF INVESTMENTS FINANCIAL STATEMENTS
ANNUAL REPORT 2019 169
Neuberger Berman Global Bond Fund (Continued)
Schedule of Investments (Continued)
Financial Assets at Fair Value through Profit or Loss (continued)
Principal Amount Security Description Coupon Maturity
DateFair Value
US$% of Net
Assets
Government Bonds 54.02% (31 December 2018: 53.09%) (continued)
Euro 4,095,000 French Republic Government Bond OAT* 0.75% 25/05/2028 4,888,782 2.41
2,025,000 French Republic Government Bond OAT* 2.00% 25/05/2048 2,914,730 1.44
2,090,000 Ireland Government Bond* 1.10% 15/05/2029 2,561,007 1.26
1,745,000 Italy Buoni Poliennali Del Tesoro* 3.00% 01/08/2029 2,257,899 1.11
2,440,000 Italy Buoni Poliennali Del Tesoro** 3.45% 01/03/2048 3,337,003 1.64
1,755,000 Kingdom of Belgium Government Bond* 1.60% 22/06/2047 2,332,768 1.15
5,915,000 Portugal Obrigacoes do Tesouro OT** 5.65% 15/02/2024 8,225,682 4.05
2,115,000 Spain Government Bond* 0.35% 30/07/2023 2,422,222 1.19
3,020,000 Spain Government Bond** 1.95% 30/07/2030 3,884,058 1.91
755,000 Spain Government Bond** 2.90% 31/10/2046 1,159,112 0.57
Total Euro 33,983,263 16.73
Japanese Yen 761,000,000 Japan Government Five Year Bond* 0.10% 20/12/2023 7,066,429 3.48
491,000,000 Japan Government Ten Year Bond* 0.10% 20/12/2028 4,575,296 2.25
937,000,000 Japan Government Thirty Year Bond* 0.70% 20/12/2048 9,304,885 4.58
215,000,000 Japan Government Two Year Bond* 0.10% 01/05/2021 1,984,391 0.98
Total Japanese Yen 22,931,001 11.29
New Zealand Dollar 1,565,000 International Bank for Reconstruction & Development* 3.38% 25/01/2022 1,095,380 0.54
2,210,000 New Zealand Government Bond* 3.50% 14/04/2033 1,769,192 0.87
Total New Zealand Dollar 2,864,572 1.41
Polish Zloty 1,100,000 Republic of Poland Government Bond** 3.25% 25/07/2025 310,661 0.15
Total Polish Zloty 310,661 0.15
Pound Sterling 650,000 United Kingdom Gilt* 1.50% 22/07/2047 891,415 0.44
335,000 United Kingdom Gilt* 4.25% 07/06/2032 612,185 0.30
Total Pound Sterling 1,503,600 0.74
Swedish Krona 14,620,000 Sweden Government Bond* 1.50% 13/11/2023 1,668,157 0.82
Total Swedish Krona 1,668,157 0.82

FINANCIAL STATEMENTS SCHEDULE OF INVESTMENTS
170 NEUBERGER BERMAN INVESTMENT FUNDS PLC
Neuberger Berman Global Bond Fund (Continued)
Schedule of Investments (Continued)
Financial Assets at Fair Value through Profit or Loss (continued)
Principal Amount Security Description Coupon Maturity
Date Fair Value
US$% of Net
Assets
Government Bonds 54.02% (31 December 2018: 53.09%) (continued)
United States Dollar 6,100,465 United States Treasury Inflation Indexed Bonds* 0.13% 15/04/2022 6,091,957 3.00
756,384 United States Treasury Inflation Indexed Bonds** 1.38% 15/02/2044 892,683 0.44
3,167,129 United States Treasury Inflation Indexed Bonds* 2.13% 15/02/2040 4,142,162 2.04
1,475,000 United States Treasury Note/Bond* 2.25% 15/04/2022 1,496,394 0.74
4,240,000 United States Treasury Note/Bond* 2.25% 15/11/2027 4,355,934 2.14
1,935,000 United States Treasury Note/Bond* 2.25% 15/08/2046 1,878,849 0.93
3,155,000 United States Treasury Note/Bond* 2.38% 15/08/2024 3,249,468 1.60
1,845,000 United States Treasury Note/Bond* 2.38% 15/05/2029 1,916,532 0.94
2,225,000 United States Treasury Note/Bond* 2.75% 15/08/2042 2,374,447 1.17
Total United States Dollar 26,398,426 13.00
Total Government Bonds 109,732,598 54.02
Mortgage Backed Securities 14.20% (31 December 2018: 16.61%)
United States Dollar 535,000 Fannie Mae Pool 3.00% 01/01/2048 542,292 0.27
411,868 Fannie Mae Pool 3.00% 01/04/2049 417,817 0.21
484,059 Fannie Mae Pool 3.00% 01/08/2049 491,415 0.24
394,175 Fannie Mae Pool 3.00% 01/09/2049 400,234 0.20
493,850 Fannie Mae Pool 3.00% 01/10/2049 500,906 0.25
819,310 Fannie Mae Pool 3.00% 01/11/2049 830,882 0.41
498,637 Fannie Mae Pool 3.00% 01/12/2049 505,680 0.25
458,015 Fannie Mae Pool 3.50% 01/03/2026 474,635 0.23
149,131 Fannie Mae Pool 3.50% 01/09/2028 154,514 0.08
144,879 Fannie Mae Pool 3.50% 01/12/2041 152,684 0.08
82,228 Fannie Mae Pool 3.50% 01/04/2042 86,657 0.04
89,695 Fannie Mae Pool 3.50% 01/05/2042 94,527 0.05
129,513 Fannie Mae Pool 3.50% 01/01/2043 136,489 0.07
173,750 Fannie Mae Pool 3.50% 01/12/2044 182,981 0.09
160,375 Fannie Mae Pool 3.50% 01/03/2045 167,551 0.08
344,347 Fannie Mae Pool 3.50% 01/12/2045 359,402 0.18
100,257 Fannie Mae Pool 3.50% 01/03/2046 104,637 0.05
272,053 Fannie Mae Pool 3.50% 01/05/2046 283,190 0.14
274,843 Fannie Mae Pool 3.50% 01/05/2047 285,229 0.14
123,007 Fannie Mae Pool 3.50% 01/06/2047 127,654 0.06
118,291 Fannie Mae Pool 3.50% 01/11/2047 123,004 0.06
579,614 Fannie Mae Pool 3.50% 01/12/2047 602,434 0.30
678,800 Fannie Mae Pool 3.50% 01/02/2048 704,344 0.35
286,730 Fannie Mae Pool 3.50% 01/08/2048 295,875 0.15

SCHEDULE OF INVESTMENTS FINANCIAL STATEMENTS
ANNUAL REPORT 2019 171
Neuberger Berman Global Bond Fund (Continued)
Schedule of Investments (Continued)
Financial Assets at Fair Value through Profit or Loss (continued)
Principal Amount Security Description Coupon Maturity
DateFair Value
US$% of Net
Assets
Mortgage Backed Securities 14.20% (31 December 2018: 16.61%) (continued)
United States Dollar (continued) 625,000 Fannie Mae Pool 3.50% 01/01/2049 642,643 0.32
763,188 Fannie Mae Pool 3.50% 01/08/2049 784,603 0.39
626,312 Fannie Mae Pool 3.50% 01/09/2049 644,094 0.32
476,932 Fannie Mae Pool 3.50% 01/10/2049 490,750 0.24
480,801 Fannie Mae Pool 3.50% 01/11/2049 495,322 0.24
56,026 Fannie Mae Pool 4.00% 01/12/2040 60,119 0.03
174,831 Fannie Mae Pool 4.00% 01/12/2041 187,363 0.09
117,131 Fannie Mae Pool 4.00% 01/05/2042 125,455 0.06
158,329 Fannie Mae Pool 4.00% 01/10/2043 168,907 0.08
512,758 Fannie Mae Pool 4.00% 01/09/2044 545,897 0.27
93,526 Fannie Mae Pool 4.00% 01/01/2045 99,220 0.05
186,669 Fannie Mae Pool 4.00% 01/02/2045 198,058 0.10
121,790 Fannie Mae Pool 4.00% 01/08/2045 129,092 0.06
107,247 Fannie Mae Pool 4.00% 01/10/2045 113,668 0.06
497,155 Fannie Mae Pool 4.00% 01/02/2046 526,353 0.26
223,750 Fannie Mae Pool 4.00% 01/07/2046 234,912 0.12
244,177 Fannie Mae Pool 4.00% 01/03/2047 255,403 0.13
212,135 Fannie Mae Pool 4.00% 01/05/2047 223,182 0.11
304,970 Fannie Mae Pool 4.00% 01/06/2047 320,406 0.16
244,972 Fannie Mae Pool 4.00% 01/08/2047 256,593 0.13
245,071 Fannie Mae Pool 4.00% 01/09/2047 257,440 0.13
103,270 Fannie Mae Pool 4.00% 01/10/2047 108,573 0.05
180,488 Fannie Mae Pool 4.00% 01/11/2047 189,811 0.09
213,170 Fannie Mae Pool 4.00% 01/12/2047 223,968 0.11
199,653 Fannie Mae Pool 4.00% 01/04/2048 207,768 0.10
125,275 Fannie Mae Pool 4.00% 01/07/2048 130,627 0.06
368,186 Fannie Mae Pool 4.00% 01/09/2048 383,264 0.19
433,972 Fannie Mae Pool 4.00% 01/03/2049 454,045 0.22
413,287 Fannie Mae Pool 4.00% 01/07/2049 429,770 0.21
16,118 Fannie Mae Pool 4.50% 01/03/2036 16,972 0.01
167,174 Fannie Mae Pool 4.50% 01/04/2041 181,587 0.09
46,821 Fannie Mae Pool 4.50% 01/09/2043 50,642 0.02
33,344 Fannie Mae Pool 4.50% 01/12/2043 35,966 0.02
65,100 Fannie Mae Pool 4.50% 01/05/2044 68,705 0.03
36,019 Fannie Mae Pool 4.50% 01/03/2047 38,121 0.02
309,643 Fannie Mae Pool 4.50% 01/07/2047 327,682 0.16
265,369 Fannie Mae Pool 4.50% 01/11/2048 280,048 0.14
38,728 Fannie Mae Pool 5.00% 01/10/2023 41,344 0.02

FINANCIAL STATEMENTS SCHEDULE OF INVESTMENTS
172 NEUBERGER BERMAN INVESTMENT FUNDS PLC
Neuberger Berman Global Bond Fund (Continued)
Schedule of Investments (Continued)
Financial Assets at Fair Value through Profit or Loss (continued)
Principal Amount Security Description Coupon Maturity
DateFair Value
US$% of Net
Assets
Mortgage Backed Securities 14.20% (31 December 2018: 16.61%) (continued)
United States Dollar (continued) 25,558 Fannie Mae Pool 5.00% 01/07/2035 28,146 0.01
50,898 Fannie Mae Pool 5.00% 01/06/2038 56,035 0.03
68,604 Fannie Mae Pool 5.00% 01/07/2039 75,448 0.04
82,487 Fannie Mae Pool 5.00% 01/09/2040 91,035 0.04
68,266 Fannie Mae Pool 5.00% 01/02/2041 75,244 0.04
68,957 Fannie Mae Pool 5.00% 01/01/2044 75,825 0.04
29,521 Fannie Mae Pool 5.00% 01/03/2044 31,932 0.02
92,400 Fannie Mae Pool 5.00% 01/06/2048 98,794 0.05
234,192 Fannie Mae Pool 5.00% 01/09/2048 250,397 0.12
28,602 Fannie Mae Pool 5.50% 01/09/2038 32,199 0.02
19,355 Fannie Mae Pool 6.00% 01/12/2038 21,435 0.01
54,896 Fannie Mae Pool (AJ7686) 4.00% 01/12/2041 58,904 0.03
63,669 Fannie Mae Pool (AL6432) 4.00% 01/01/2045 67,561 0.03
314,215 Fannie Mae Pool (AS6328) 3.50% 01/12/2045 327,315 0.16
413,059 Fannie Mae Pool (AS6673) 4.00% 01/02/2046 437,580 0.22
99,565 Fannie Mae Pool (AS7558) 4.00% 01/07/2046 104,711 0.05
35,825 Fannie Mae Pool (AU4386) 4.00% 01/10/2043 38,266 0.02
61,577 Fannie Mae Pool (BH2877) 4.00% 01/05/2047 64,275 0.03
194,533 Fannie Mae Pool (CA2182) 3.50% 01/08/2048 200,545 0.10
62,364 Fannie Mae Pool (MA3211) 4.00% 01/12/2047 65,459 0.03
411,525 Fannie Mae Pool (MA3774) 3.00% 01/09/2049 417,337 0.21
67,125 Freddie Mac Gold Pool 3.50% 01/10/2042 70,784 0.03
70,258 Freddie Mac Gold Pool 3.50% 01/05/2043 74,004 0.04
51,583 Freddie Mac Gold Pool 3.50% 01/06/2043 54,398 0.03
47,302 Freddie Mac Gold Pool 3.50% 01/04/2045 49,407 0.02
158,173 Freddie Mac Gold Pool 3.50% 01/08/2045 166,069 0.08
48,667 Freddie Mac Gold Pool 3.50% 01/12/2045 50,861 0.02
52,130 Freddie Mac Gold Pool 3.50% 01/04/2046 54,377 0.03
569,807 Freddie Mac Gold Pool 3.50% 01/04/2047 591,773 0.29
266,053 Freddie Mac Gold Pool 3.50% 01/07/2047 276,150 0.14
57,672 Freddie Mac Gold Pool 3.50% 01/09/2047 59,905 0.03
96,924 Freddie Mac Gold Pool 3.50% 01/10/2047 100,689 0.05
400,133 Freddie Mac Gold Pool 3.50% 01/11/2047 415,637 0.20
399,411 Freddie Mac Gold Pool 3.50% 01/12/2047 414,955 0.20
438,698 Freddie Mac Gold Pool 3.50% 01/02/2048 456,533 0.22
117,225 Freddie Mac Gold Pool 4.00% 01/02/2041 125,826 0.06
75,636 Freddie Mac Gold Pool 4.00% 01/11/2041 81,096 0.04
66,920 Freddie Mac Gold Pool 4.00% 01/11/2044 70,917 0.03

SCHEDULE OF INVESTMENTS FINANCIAL STATEMENTS
ANNUAL REPORT 2019 173
Neuberger Berman Global Bond Fund (Continued)
Schedule of Investments (Continued)
Financial Assets at Fair Value through Profit or Loss (continued)
Principal Amount Security Description Coupon Maturity
DateFair Value
US$% of Net
Assets
Mortgage Backed Securities 14.20% (31 December 2018: 16.61%) (continued)
United States Dollar (continued) 43,082 Freddie Mac Gold Pool 4.00% 01/12/2045 45,691 0.02
44,121 Freddie Mac Gold Pool 4.00% 01/03/2046 46,746 0.02
463,075 Freddie Mac Gold Pool 4.00% 01/04/2046 490,385 0.24
46,882 Freddie Mac Gold Pool 4.00% 01/09/2046 49,525 0.02
528,490 Freddie Mac Gold Pool 4.00% 01/12/2046 559,294 0.28
248,321 Freddie Mac Gold Pool 4.00% 01/01/2047 261,801 0.13
411,198 Freddie Mac Gold Pool 4.00% 01/04/2047 433,900 0.21
69,349 Freddie Mac Gold Pool 4.00% 01/05/2047 72,939 0.04
394,980 Freddie Mac Gold Pool 4.00% 01/08/2048 411,563 0.20
154,948 Freddie Mac Gold Pool 4.00% 01/10/2048 161,445 0.08
102,357 Freddie Mac Gold Pool 4.50% 01/08/2039 111,150 0.05
28,714 Freddie Mac Gold Pool 4.50% 01/12/2039 31,214 0.02
7,674 Freddie Mac Gold Pool 4.50% 01/03/2041 8,315 0.00
96,760 Freddie Mac Gold Pool 4.50% 01/11/2043 104,676 0.05
21,917 Freddie Mac Gold Pool 4.50% 01/10/2046 23,239 0.01
263,166 Freddie Mac Gold Pool 4.50% 01/09/2048 277,568 0.14
32,311 Freddie Mac Gold Pool 5.00% 01/11/2022 34,506 0.02
19,081 Freddie Mac Gold Pool 5.00% 01/10/2035 21,042 0.01
43,037 Freddie Mac Gold Pool 5.00% 01/09/2038 47,473 0.02
56,984 Freddie Mac Gold Pool 5.00% 01/03/2047 61,111 0.03
24,698 Freddie Mac Gold Pool (Q18306) 3.50% 01/05/2043 26,042 0.01
436,795 Freddie Mac Pool 3.00% 01/06/2049 443,432 0.22
460,435 Freddie Mac Pool 3.00% 01/08/2049 466,955 0.23
238,895 Ginnie Mae II Pool 3.00% 20/10/2049 245,437 0.12
218,602 Ginnie Mae II Pool 4.00% 20/02/2049 226,524 0.11
475,001 Ginnie Mae II Pool 4.00% 20/04/2049 492,069 0.24
Total Mortgage Backed Securities ** 28,839,272 14.20
Total Investments 203,616,224 100.25
Forward Currency Contracts 0.73% (31 December 2018: 1.07%)
Amount Receivable
Amount Payable
Maturity Date Counterparty Contracts Unrealised
Gain US$% of Net
Assets
AUD 3,728,095 US$ 2,559,834 22/01/2020 Citibank NA 6 62,113 0.03
AUD 1,947,218 US$ 1,327,224 22/01/2020 Goldman Sachs International 2 42,243 0.02
AUD 682,731 US$ 469,238 22/01/2020 State Street Bank and Trust and Co 1 10,923 0.01
AUD 149,125 US$ 102,682 22/01/2020 Westpac Banking Corp 1 2,197 0.00
BRL 6,173,933 US$ 1,495,587 22/01/2020 Goldman Sachs International 1 38,208 0.02

FINANCIAL STATEMENTS SCHEDULE OF INVESTMENTS
174 NEUBERGER BERMAN INVESTMENT FUNDS PLC
Neuberger Berman Global Bond Fund (Continued)
Schedule of Investments (Continued)
Financial Assets at Fair Value through Profit or Loss (continued)
Forward Currency Contracts 0.73% (31 December 2018: 1.07%) (continued)
Amount Receivable
Amount Payable
Maturity Date Counterparty Contracts Unrealised
Gain US$% of Net
Assets
CAD 3,002,083 US$ 2,270,258 22/01/2020 Citibank NA 7 45,088 0.02
CAD 1,425,591 US$ 1,077,808 22/01/2020 Goldman Sachs International 4 21,675 0.01
CAD 451,943 US$ 343,311 22/01/2020 State Street Bank and Trust and Co 1 5,249 0.00
CHF 539,530 US$ 548,777 22/01/2020 Citibank NA 2 9,155 0.01
CHF 164,880 US$ 168,026 22/01/2020 Goldman Sachs International 1 2,478 0.00
CHF 1,161,785 US$ 1,179,351 22/01/2020 Westpac Banking Corp 1 22,060 0.01
CNY 39,433,995 US$ 5,546,901 22/01/2020 Goldman Sachs International 3 112,378 0.06
CZK 20,115,149 US$ 859,568 22/01/2020 Citibank NA 2 28,926 0.01
CZK 6,216,766 US$ 272,973 22/01/2020 State Street Bank and Trust and Co 1 1,624 0.00
€ 1,571,491 US$ 1,752,161 22/01/2020 Citibank NA 5 13,988 0.01
€ 2,300,124 US$ 2,551,418 22/01/2020 Goldman Sachs International 6 33,618 0.02
€ 99,756 US$ 110,439 22/01/2020 Royal Bank of Canada 1 1,674 0.00
€ 1,757,141 US$ 1,962,751 22/01/2020 State Street Bank and Trust and Co 4 12,045 0.01
€ 2,532,916 US$ 2,799,966 22/01/2020 UBS AG 1 46,698 0.02
€ 700,000 US$ 779,876 22/01/2020 Westpac Banking Corp 2 6,831 0.00
£ 131,353 US$ 170,948 22/01/2020 Citibank NA 1 3,161 0.00
£ 357,168 US$ 454,384 22/01/2020 Goldman Sachs International 3 19,044 0.01
£ 206,936 US$ 267,994 22/01/2020 State Street Bank and Trust and Co 1 6,300 0.00
£ 1,518,843 US$ 1,873,894 22/01/2020 UBS AG 1 139,336 0.07
£ 852,702 US$ 1,112,846 22/01/2020 Westpac Banking Corp 3 17,413 0.01
HUF 27,739,157 US$ 92,221 22/01/2020 Citibank NA 1 2,022 0.00
HUF 45,957,565 US$ 153,607 22/01/2020 Goldman Sachs International 1 2,532 0.00
IDR 8,135,113,656 US$ 568,214 22/01/2020 Goldman Sachs International 1 18,838 0.01
ILS 691,960 US$ 199,568 22/01/2020 UBS AG 1 953 0.00
¥ 29,651,776 US$ 271,472 22/01/2020 Citibank NA 1 1,675 0.00
¥ 46,146,331 US$ 424,257 22/01/2020 Goldman Sachs International 2 834 0.00
¥ 70,777,028 US$ 651,337 22/01/2020 State Street Bank and Trust and Co 1 649 0.00
¥ 12,516,607 US$ 115,254 22/01/2020 UBS AG 1 47 0.00
KRW 658,493,472 US$ 552,984 22/01/2020 Citibank NA 1 17,603 0.01
KRW 3,229,632,598 US$ 2,717,089 22/01/2020 Goldman Sachs International 3 81,400 0.04
KRW 130,422,983 US$ 112,105 22/01/2020 State Street Bank and Trust and Co 1 907 0.00
MXN 26,056,657 US$ 1,330,145 22/01/2020 Goldman Sachs International 3 45,645 0.02
MXN 4,941,632 US$ 251,598 22/01/2020 State Street Bank and Trust and Co 1 9,320 0.01
MYR 2,176,754 US$ 518,336 22/01/2020 Goldman Sachs International 1 14,480 0.01
NOK 3,609,597 US$ 396,436 22/01/2020 Citibank NA 2 14,376 0.01
NOK 58,416,244 US$ 6,404,127 22/01/2020 Goldman Sachs International 5 244,291 0.12
NOK 1,130,405 US$ 125,551 22/01/2020 State Street Bank and Trust and Co 1 3,101 0.00
NZD 1,093,948 US$ 695,901 22/01/2020 Citibank NA 2 42,336 0.02

SCHEDULE OF INVESTMENTS FINANCIAL STATEMENTS
ANNUAL REPORT 2019 175
Neuberger Berman Global Bond Fund (Continued)
Schedule of Investments (Continued)
Financial Assets at Fair Value through Profit or Loss (continued)
Forward Currency Contracts 0.73% (31 December 2018: 1.07%) (continued)
Amount Receivable
Amount Payable
Maturity Date Counterparty Contracts Unrealised
Gain US$% of Net
Assets
NZD 1,386,186 US$ 892,830 22/01/2020 Goldman Sachs International 5 42,621 0.02
NZD 219,218 US$ 139,309 22/01/2020 Westpac Banking Corp 1 8,627 0.00
PLN 113,162 US$ 28,746 22/01/2020 Citibank NA 1 1,135 0.00
PLN 296,971 US$ 75,491 22/01/2020 Goldman Sachs International 1 2,926 0.00
RUB 22,439,683 US$ 344,047 22/01/2020 Goldman Sachs International 2 16,406 0.01
SEK 24,823,935 US$ 2,635,101 22/01/2020 Citibank NA 3 19,299 0.01
SEK 10,808,199 US$ 1,123,357 22/01/2020 Goldman Sachs International 5 32,353 0.02
SEK 10,391,777 US$ 1,065,257 22/01/2020 State Street Bank and Trust and Co 2 45,925 0.02
SGD 471,740 US$ 342,457 22/01/2020 Westpac Banking Corp 1 8,417 0.00
THB 21,212,324 US$ 697,079 22/01/2020 Westpac Banking Corp 1 11,430 0.01
US$ 1,566,862 ¥ 169,343,780 22/01/2020 Citibank NA 4 6,897 0.00
US$ 107,221 ¥ 11,624,880 22/01/2020 Goldman Sachs International 1 134 0.00
US$ 551,275 KRW 636,050,067 22/01/2020 Goldman Sachs International 1 135 0.00
US$ 72 TRY 425 22/01/2020 Royal Bank of Canada 1 1 0.00
US$ 398,131 TRY 2,335,920 22/01/2020 State Street Bank and Trust and Co 1 7,596 0.00
US$ 420,060 ¥ 44,622,886 22/01/2020 State Street Bank and Trust and Co 1 9,001 0.01
US$ 127,367 ¥ 13,797,835 22/01/2020 Westpac Banking Corp 1 264 0.00
ZAR 11,594,350 US$ 767,356 22/01/2020 Goldman Sachs International 3 59,655 0.03
ZAR 588,432 US$ 38,280 22/01/2020 Westpac Banking Corp 1 3,692 0.00
Total Unrealised Gain on Forward Currency Contracts ∞ 1,481,948 0.73
Futures Contracts 0.32% (31 December 2018: 0.16%)
Number of Contracts Description Unrealised
Gain US$% of Net
Assets
(49) Australian Government Bond 10-Year Future March 2020 96,169 0.05
(24) Canadian 10-Year Bond Future March 2020 47,010 0.02
(48) Euro-BOBL Future March 2020 38,255 0.02
(14) Euro-Buxl 30-Year Bond Future March 2020 119,120 0.06
(29) Euro-OAT Future March 2020 66,407 0.03
(24) US Treasury 10-Year Ultra Future March 2020 40,125 0.02
(1) US Treasury Long Bond (CBT) Future March 2020 3,182 0.00
(40) US Treasury Ultra Bond (CBT) Future March 2020 249,075 0.12
Total Unrealised Gain on Futures Contracts ± 659,343 0.32

FINANCIAL STATEMENTS SCHEDULE OF INVESTMENTS
176 NEUBERGER BERMAN INVESTMENT FUNDS PLC
Neuberger Berman Global Bond Fund (Continued)
Schedule of Investments (Continued)
Financial Assets at Fair Value through Profit or Loss (continued)
Interest Rate Swap Contracts 0.01% (31 December 2018: 0.01%)
Notional Amount Expiration Date Counterparty Receive
/(Pay)# Fixed Rate Variable Rate Fair Value US$
% of NetAssets
JPY 314,560,000 30/07/23 Chicago Mercantile Exchange1 (Pay) 0.12% 6M JPY LIBOR 11,372 0.01
Total Interest Rate Swap Contracts at Fair Value ± 11,372 0.01
#Receive - Funds receives variable rate and pays fixed rate. (Pay) - Fund pays variable rate and receives fixed rate. 1 Centrally cleared swap.
Fair ValueUS$
% of NetAssets
Total Financial Assets at Fair Value through Profit or Loss 205,768,887 101.31
Financial Liabilities at Fair Value through Profit or Loss Forward Currency Contracts (1.12%) (31 December 2018: (0.74%))
Amount Receivable
Amount Payable
Maturity Date Counterparty Contracts Unrealised
Loss US$% of Net
Assets
CLP 91,036,405 US$ 125,995 22/01/2020 Goldman Sachs International 1 (4,897) (0.00)
¥ 303,835,157 US$ 2,811,629 22/01/2020 Citibank NA 7 (12,752) (0.01)
¥ 80,365,247 US$ 744,015 22/01/2020 Goldman Sachs International 3 (3,704) (0.00)
¥ 353,574,004 US$ 3,311,297 22/01/2020 State Street Bank and Trust and Co 4 (54,234) (0.03)
¥ 1,037,182,898 US$ 9,792,985 22/01/2020 Westpac Banking Corp 1 (238,635) (0.12)
TRY 1,540,577 US$ 259,080 22/01/2020 Goldman Sachs International 1 (1,516) (0.00)
TRY 795,964 US$ 133,400 22/01/2020 State Street Bank and Trust and Co 1 (326) (0.00)
US$ 244,160 ¥ 26,672,520 22/01/2020 Citibank NA 1 (1,543) (0.00)
US$ 599,999 SEK 5,775,577 22/01/2020 Citibank NA 2 (17,578) (0.01)
US$ 1,471,918 CHF 1,451,614 22/01/2020 Citibank NA 4 (29,208) (0.01)
US$ 1,059,456 £ 818,120 22/01/2020 Citibank NA 4 (24,965) (0.01)
US$ 3,446,818 CAD 4,568,451 22/01/2020 Citibank NA 3 (76,584) (0.04)
US$ 1,293,298 NZD 2,008,156 22/01/2020 Citibank NA 5 (61,881) (0.03)
US$ 3,673,427 € 3,309,441 22/01/2020 Citibank NA 7 (45,949) (0.02)
US$ 211,646 KRW 245,469,472 22/01/2020 Citibank NA 2 (1,055) (0.00)
US$ 1,040,513 MXN 20,667,309 22/01/2020 Citibank NA 1 (50,719) (0.03)
US$ 704,575 AUD 1,020,053 22/01/2020 Citibank NA 3 (12,822) (0.01)
US$ 88,996 HUF 26,824,688 22/01/2020 Goldman Sachs International 1 (2,140) (0.00)
US$ 230,302 NOK 2,061,957 22/01/2020 Goldman Sachs International 2 (4,371) (0.00)
US$ 2,502,430 AUD 3,655,047 22/01/2020 Goldman Sachs International 8 (68,141) (0.03)
US$ 172,428 BRL 707,991 22/01/2020 Goldman Sachs International 1 (3,458) (0.00)
US$ 358,727 KRW 427,126,920 22/01/2020 Goldman Sachs International 2 (11,379) (0.01)
US$ 695,045 CZK 15,988,496 22/01/2020 Goldman Sachs International 3 (11,173) (0.01)
US$ 184,202 NZD 287,030 22/01/2020 Goldman Sachs International 1 (9,497) (0.00)

SCHEDULE OF INVESTMENTS FINANCIAL STATEMENTS
ANNUAL REPORT 2019 177
Neuberger Berman Global Bond Fund (Continued)
Schedule of Investments (Continued)
Financial Liabilities at Fair Value through Profit or Loss (continued)
Forward Currency Contracts (1.12%) (31 December 2018: (0.74%)) (continued)
Amount Receivable
Amount Payable
Maturity Date Counterparty Contracts Unrealised
Loss US$% of Net
Assets
US$ 351,154 MXN 6,862,431 22/01/2020 Goldman Sachs International 2 (11,181) (0.01)
US$ 453,655 £ 353,170 22/01/2020 Goldman Sachs International 2 (14,473) (0.01)
US$ 820,351 ZAR 12,186,822 22/01/2020 Goldman Sachs International 2 (48,921) (0.02)
US$ 5,708,843 € 5,126,079 22/01/2020 Goldman Sachs International 9 (52,194) (0.03)
US$ 1,386,839 CHF 1,368,111 22/01/2020 Goldman Sachs International 7 (27,936) (0.01)
US$ 5,363,616 CAD 7,130,223 22/01/2020 Goldman Sachs International 7 (135,545) (0.07)
US$ 3,213,386 SEK 31,354,764 22/01/2020 Goldman Sachs International 3 (139,347) (0.07)
US$ 3,006,960 DKK 20,267,491 22/01/2020 Société Générale 1 (41,636) (0.02)
US$ 796,846 € 716,799 22/01/2020 State Street Bank and Trust and Co 2 (8,742) (0.00)
US$ 156,500 KRW 186,376,376 22/01/2020 State Street Bank and Trust and Co 1 (4,995) (0.00)
US$ 624,768 AUD 918,357 22/01/2020 State Street Bank and Trust and Co 2 (21,107) (0.01)
US$ 249,446 MXN 4,854,097 22/01/2020 State Street Bank and Trust and Co 1 (6,850) (0.00)
US$ 2,227,052 NZD 3,451,125 22/01/2020 State Street Bank and Trust and Co 4 (101,897) (0.05)
US$ 3,712,636 CHF 3,652,289 22/01/2020 State Street Bank and Trust and Co 5 (64,225) (0.03)
US$ 1,239,763 SEK 11,814,249 22/01/2020 State Street Bank and Trust and Co 3 (23,524) (0.01)
US$ 2,103,217 NOK 19,136,447 22/01/2020 State Street Bank and Trust and Co 6 (74,723) (0.04)
US$ 220,235 CAD 290,590 22/01/2020 State Street Bank and Trust and Co 1 (3,882) (0.00)
US$ 103,213 CHF 101,298 22/01/2020 UBS AG 1 (1,540) (0.00)
US$ 1,477,551 ¥ 161,210,517 22/01/2020 Westpac Banking Corp 1 (7,493) (0.00)
US$ 5,173,177 £ 4,180,845 22/01/2020 Westpac Banking Corp 2 (368,543) (0.18)
US$ 4,035,857 AUD 5,946,974 22/01/2020 Westpac Banking Corp 2 (146,613) (0.07)
US$ 2,774,484 NZD 4,373,316 22/01/2020 Westpac Banking Corp 1 (176,794) (0.09)
US$ 1,264,825 CAD 1,664,349 22/01/2020 Westpac Banking Corp 1 (18,799) (0.01)
US$ 2,660,049 € 2,396,046 22/01/2020 Westpac Banking Corp 4 (32,791) (0.02)
Total Unrealised Loss on Forward Currency Contracts ∞ (2,282,278) (1.12)
Futures Contracts (0.16%) (31 December 2018: (0.46%))
Number of Contracts Description Unrealised
Loss US$% of Net
Assets
17 10-Year Mini Japanese Government Bond Future March 2020 (6,837) (0.00)
178 Australian Government Bond 3-Year Future March 2020 (98,911) (0.05)
100 Canadian 5-Year Bond Future March 2020 (85,599) (0.05)
(5) Euro-BTP Future March 2020 (729) (0.00)
14 Euro-Bund Future March 2020 (39,288) (0.02)
26 United Kingdom Long Gilt Future March 2020 (46,843) (0.02)
16 US Treasury 10-Year Note (CBT) Future March 2020 (2,968) (0.00)
92 US Treasury 2-Year Note (CBT) Future March 2020 (13,380) (0.01)
42 US Treasury 5-Year Note (CBT) Future March 2020 (9,015) (0.00)

FINANCIAL STATEMENTS SCHEDULE OF INVESTMENTS
178 NEUBERGER BERMAN INVESTMENT FUNDS PLC
Neuberger Berman Global Bond Fund (Continued)
Schedule of Investments (Continued)
Financial Liabilities at Fair Value through Profit or Loss (continued)
Futures Contracts (0.16%) (31 December 2018: (0.46%)) (continued)
Number of Contracts Description Unrealised
Loss US$% of Net
Assets
2 US Treasury Ultra Bond (CBT) Future March 2020 (12,635) (0.01)
Total Unrealised Loss on Futures Contracts ± (316,205) (0.16)
Interest Rate Swap Contracts (0.02%) (31 December 2018: (0.08%))
Notional Amount Expiration Date Counterparty Receive
/(Pay)# Fixed Rate Variable Rate Fair Value US$
% of Net Assets
JPY 158,790,000 30/07/28 Chicago Mercantile Exchange1 Receive 0.35% 6M JPY LIBOR (31,689) (0.02)
Total Interest Rate Swap Contracts at Fair Value ± (31,689) (0.02)
#Receive - Funds receives variable rate and pays fixed rate.
(Pay) - Fund pays variable rate and receives fixed rate. 1 Centrally cleared swap.
Fair ValueUS$
% of NetAssets
Total Financial Liabilities at Fair Value through Profit or Loss (2,630,172) (1.30)
Net Financial Assets at Fair Value through Profit or Loss 203,138,715 100.01
Other Net Liabilities (21,027) (0.01)
Net Assets Attributable to Holders of Redeemable Participating Shares 203,117,688 100.00
% of
TotalAssetsPortfolio Analysis US$
* Transferable securities and/or money market instruments admitted to an official stock exchange listing 131,664,266 63.10
** Transferable securities and/or money market instruments dealt in on a regulated market 57,008,964 27.33
† Other transferable securities and/or money market instruments 14,942,994 7.16
± Financial derivative instruments traded on a regulated market 322,821 0.15
∞ OTC financial derivative instruments (800,330) (0.38)
Total Investments 203,138,715 97.36

STATEMENT OF SIGNIFICANT PURCHASES AND SALES FINANCIAL STATEMENTS
ANNUAL REPORT 2019 179
Neuberger Berman Global Bond Fund (Continued) Statement of Significant Purchases and Sales (Unaudited) In accordance with the European Communities (Undertakings for Collective Investment in Transferable Securities) Regulations, 2011 as amended, a statement of changes in the composition of the Schedule of Investments during the reporting period is provided to ensure that Shareholders can identify changes in the investments held by the Portfolio. The following statements present the aggregate purchases and sales of transferable securities exceeding one percent of the total value of purchases or sales, respectively, for the period. At a minimum, the largest twenty purchases and twenty sales are presented, if available.
Aggregate purchases greater than one percent of the total value of purchases:
Units Security Description Cost US$
1,028,000,000 Japan Government Thirty Year Bond, 0.70%, 20/12/2048 10,501,095
9,065,000 United States Treasury Note/Bond, 2.38%, 15/08/2024 8,969,368
6,225,000 Portugal Obrigacoes do Tesouro OT, 5.65%, 15/02/2024 8,883,144
789,000,000 Japan Government Five Year Bond, 0.10%, 20/12/2023 7,472,463
6,082,017 United States Treasury Inflation Indexed Bonds, 0.13%, 15/04/2022 6,041,629
5,730,000 United States Treasury Note/Bond, 2.75%, 15/08/2042 5,919,955
5,910,000 United States Treasury Note/Bond, 2.38%, 30/04/2020 5,900,046
5,340,000 Fannie Mae Pool, 4.00%, 01/03/2049 5,444,535
4,220,000 French Republic Government Bond OAT, 0.75%, 25/05/2028 5,170,986
5,005,000 United States Treasury Note/Bond, 2.25%, 31/07/2021 4,975,500
5,015,000 United States Treasury Note/Bond, 2.25%, 15/11/2027 4,964,407
3,881,162 United States Treasury Inflation Indexed Bonds, 2.13%, 15/02/2040 4,931,353
4,841,275 United States Treasury Inflation Indexed Bonds, 0.13%, 15/04/2021 4,799,654
4,565,000 Fannie Mae Pool, 4.00%, 15/02/2049 4,666,342
493,000,000 Japan Government Ten Year /Bond, 0.10%, 20/12/2028 4,638,007
4,895,000 United States Treasury Note/Bond, 2.25%, 15/08/2046 4,195,224
33,290,000 Sweden Government Bond, 1.50%, 13/11/2023 3,814,003
3,455,000 United States Treasury Note/Bond, 2.75%, 15/02/2028 3,668,654
2,720,000 French Republic Government Bond OAT, 2.00%, 25/05/2048 3,472,919
21,410,000 Denmark Government Bond, 0.50%, 15/11/2027 3,468,382
3,500,000 United States Treasury Bill, 0.00%, 08/08/2019 3,461,806
3,500,000 United States Treasury Bill, 0.00%, 02/01/2020 3,436,254
3,300,000 United States Treasury Bill, 0.00%, 28/05/2020 3,279,210

FINANCIAL STATEMENTS STATEMENT OF SIGNIFICANT PURCHASES AND SALES
180 NEUBERGER BERMAN INVESTMENT FUNDS PLC
Neuberger Berman Global Bond Fund (Continued) Statement of Significant Purchases and Sales (Unaudited) (Continued) Aggregate sales greater than one percent of the total value of sales:
Units Security Description Proceeds US$
1,056,698,360 Japanese Government CPI Linked Bond, 0.10%, 10/03/2025 10,148,234
7,275,000 United States Treasury Note/Bond, 2.25%, 15/11/2027 7,275,079
6,375,000 United States Treasury Note/Bond, 2.38%, 15/08/2024 6,474,074
5,815,000 United States Treasury Note/Bond, 2.75%, 15/08/2042 5,930,955
5,910,000 United States Treasury Note/Bond, 2.38%, 30/04/2020 5,927,168
5,340,000 Fannie Mae Pool, 4.00%, 01/03/2049 5,446,618
5,783,000 United States Treasury Note/Bond, 1.63%, 15/02/2026 5,402,790
5,005,000 United States Treasury Note/Bond, 2.25%, 31/07/2021 5,057,225
4,885,826 United States Treasury Inflation Indexed Bonds, 0.13%, 15/04/2021 4,834,913
3,525,286 United States Treasury Inflation Indexed Bonds, 3.88%, 15/04/2029 4,765,287
4,565,000 Fannie Mae Pool, 4.00%, 15/02/2049 4,658,365
3,030,000 French Republic Government Bond OAT, 2.00%, 25/05/2048 4,541,688
4,420,000 United States Treasury Note/Bond, 1.00%, 31/08/2019 4,378,962
3,660,000 Italy Buoni Poliennali Del Tesoro, 2.80%, 01/12/2028 4,361,339
3,730,000 Fannie Mae Pool, 4.00%, 01/01/2049 3,818,943
3,280,431 United States Treasury Inflation Indexed Bonds, 2.38%, 15/01/2027 3,738,655
3,455,000 United States Treasury Note/Bond, 2.75%, 15/02/2028 3,683,101
3,500,000 United States Treasury Bill, 0.00%, 28/02/2019 3,499,773
3,500,000 United States Treasury Bill, 0.00%, 02/01/2020 3,497,744
3,500,000 United States Treasury Bill, 0.00%, 08/08/2019 3,468,817
3,090,000 Italy Buoni Poliennali Del Tesoro, 2.70%, 01/03/2047 3,070,365
2,694,576 United States Treasury Inflation Indexed Bonds, 2.00%, 15/01/2026 2,963,498
2,595,000 United States Treasury Note/Bond, 2.88%, 31/05/2025 2,770,217
2,345,000 United States Treasury Note/Bond, 3.88%, 15/08/2040 2,692,493
2,960,000 United States Treasury Note/Bond, 2.25%, 15/08/2046 2,676,328
2,485,000 Fannie Mae Pool, 4.00%, 01/07/2049 2,569,625

INVESTMENT MANAGER’S REPORT FINANCIAL STATEMENTS
ANNUAL REPORT 2019 181
Neuberger Berman Emerging Market Debt - Local Currency Fund Investment Manager’s Report For the 12 months ended 31 December 2019, the total return for the USD I Accumulating Class was 13.80%. Over the same period, the benchmark index, the JPMorgan GBI-EM Global Diversified Index (the “Index”), returned 13.47%. (Performance for all share classes is provided in Appendix II. Performance data quoted represent past performance and do not indicate future results. Total returns shown are net of all fees and expenses and include reinvestment of income dividends and other distributions, if any).
Emerging markets (“EM”) debt posted strong gains in 2019 following a down year in 2018. The Index returned 13.47% in USD terms over the full year 2019, driven mostly by strong local bond returns whilst EM currencies appreciated slightly against the USD in aggregate. A sharp drop in US Treasury yields supported EM fixed income as the market started to price in multiple rate cuts by the Federal Reserve (“Fed”) for 2019. The ongoing trade negotiations between the US and China contributed to market volatility throughout the year, however, this abated as the countries came to a phase one agreement in mid-December to support a year-end rally. Soft inflation across most emerging countries and the dovish turn by the Fed allowed many EM central banks to cut rates multiple times. As a result, we saw strong local bond performance in various large local markets including Russia, Mexico, Indonesia, Brazil and Turkey. Meanwhile, Argentina was the negative outlier as the Peso sold off heavily following the surprise primary election result in August.
The Portfolio outperformed the Index in 2019, driven by both foreign exchange (“FX”) positioning and local duration exposure. Overweights in Mexico, Russia and Indonesia were among the main contributors on the duration side. Frontier market exposures including positions in Egypt, Nigeria, Sri Lanka, Ukraine and Serbia also contributed across FX and rates. Portfolio positioning in the Brazilian Real and in CEE currencies were among other main contributors on the FX side. Meanwhile, short-term sovereign credit exposure in Argentina was the main detractor, followed by Portfolio positioning in Turkey.
As we entered 2020, we had been seeing increasing signs that economic activity is bottoming out following last year’s slowdown, on the back of the lagged effects of global monetary policy easing and improved sentiment post the ‘Phase 1’ trade deal between the US and China. In the coming months though, the fallout from the Covid-19 virus will likely result in a severe short-term dip in global growth due to the substantial demand and supply side disruptions globally. Our base case is for a recovery in economic activity later in the year, assuming containment of the virus and strong policy support from governments and central banks globally.
As for valuations, we believe that EM yields in aggregate are less compelling today after the strong recent tightening, although we continue to find attractive bottom-up opportunities in select local markets. Meanwhile, on the FX side valuations look attractive for most EM currencies.

FINANCIAL STATEMENTS BALANCE SHEET
The accompanying notes form an integral part of the financial statements.
182 NEUBERGER BERMAN INVESTMENT FUNDS PLC
Neuberger Berman Emerging Market Debt - Local Currency Fund (Continued) Balance Sheet
As at31 December 2019
US$
As at31 December 2018
US$ Note
Current Assets
Financial Assets at Fair Value through Profit or Loss 2 3,140,919,924 2,498,199,880
Cash and cash equivalents 3 79,509,570 36,222,106
Receivable for investments sold 21,909 –
Receivable for shares issued 16,101,623 12,415,318
Due from brokers 2,027,236 9,142,273
Income receivable and other assets 50,431,580 44,222,165
Total Assets 3,289,011,842 2,600,201,742
Current Liabilities
Financial Liabilities at Fair Value through Profit or Loss 2 39,344,436 73,646,287
Bank overdraft 4 – 29,466
Payable for shares redeemed 2,621,563 1,940,487
Due to brokers 29,960,000 13,090,000
Accrued expenses 4,016,685 5,642,964
Payable for investments purchased 3,005,644 1,233,022
Other payables 6,361,714 3,459,043
Liabilities (excluding Net Assets Attributable to Holders of Redeemable Participating Shares) 85,310,042 99,041,269
Net Assets Attributable to Holders of Redeemable Participating Shares 3,203,701,800 2,501,160,473

PROFIT AND LOSS ACCOUNT FINANCIAL STATEMENTS
The accompanying notes form an integral part of the financial statements.
ANNUAL REPORT 2019 183
Neuberger Berman Emerging Market Debt - Local Currency Fund (Continued) Profit and Loss Account
Year Ended31 December 2019
US$
Year Ended31 December 2018
US$ Note
Income
Interest Income 184,856,917 157,052,636
Miscellaneous Income – 122,137
Net Gain/(Loss) on Financial Assets and Liabilities at Fair Value through Profit or Loss 11 222,222,992 (484,137,756)
407,079,909 (326,962,983)
Expenses
Management Fee 6 25,914,079 23,969,809
Distribution Fee 6 3,989,665 3,634,041
Administration Fee 6 3,945,510 4,248,792
Commitment Fee 19 384,393 207,704
Custody Fee 6 2,572,412 2,605,142
Depositary Fee 6 292,844 263,833
Professional Fee 9 213,218 399,847
Directors' Fee 7 4,563 6,612
Transaction Costs 9 612,216 648,730
Audit Fee 8 43,754 26,437
VAT Rebate (46,659) (32,587)
Other Expenses 9 237,670 84,526
Expense Waiver 6 (1,737,280) (2,776,287)
Total Expenses 36,426,385 33,286,599
Finance Costs
Interest Expense 30,051 66,554
Distribution Paid 1 70,147,710 59,212,808
70,177,761 59,279,362
Withholding Tax 1 8,698,211 5,315,635
Capital Gain Tax 1 1,724,789 708,104
Profit/(Loss) Attributable to Holders of Redeemable Participating Shares from Operations 290,052,763 (425,552,683)
Income and expenses arose solely from continuing operations.

FINANCIAL STATEMENTS STATEMENT OF CHANGES IN NET ASSETS
The accompanying notes form an integral part of the financial statements.
184 NEUBERGER BERMAN INVESTMENT FUNDS PLC
Neuberger Berman Emerging Market Debt - Local Currency Fund (Continued) Statement of Changes in Net Assets Attributable to Holders of Redeemable Participating Shares
Year Ended31 December 2019
US$
Year Ended31 December 2018
US$ Note
Net Assets Attributable to Holders of Redeemable Participating Shares at beginning of year 2,501,160,473 2,140,834,040
Profit/(Loss) Attributable to Holders of Redeemable Participating Shares from Operations 290,052,763 (425,552,683)
Subscriptions 5 1,272,456,673 2,251,070,944
Redemptions 5 (859,968,109) (1,465,191,828)
Net Assets Attributable to Holders of Redeemable Participating Shares at end of year 3,203,701,800 2,501,160,473

SCHEDULE OF INVESTMENTS FINANCIAL STATEMENTS
ANNUAL REPORT 2019 185
Neuberger Berman Emerging Market Debt - Local Currency Fund (Continued)
Schedule of Investments
Financial Assets at Fair Value through Profit or Loss
Principal Amount Security Description Coupon Maturity
Date Fair Value
US$% of Net
Assets
Treasury Bills 2.62% (31 December 2018: 3.64%)
Egyptian Pound 185,850,000 Egypt Treasury Bill 0.00% 03/03/2020 11,340,917 0.35
Total Egyptian Pound 11,340,917 0.35
Hungarian Forint 2,430,000,000 Hungary Treasury Bill 0.00% 05/02/2020 8,250,036 0.26
3,827,240,000 Hungary Treasury Bill 0.00% 21/10/2020 13,005,650 0.40
Total Hungarian Forint 21,255,686 0.66
Nigerian Naira 2,305,784,000 Nigeria Treasury Bill 0.00% 27/02/2020 6,228,016 0.20
Total Nigerian Naira 6,228,016 0.20
United States Dollar
45,364,800 United States Treasury Bill 0.00% 07/05/2020 45,123,658 1.41
Total United States Dollar 45,123,658 1.41
Total Treasury Bills ** 83,948,277 2.62
Corporate Bonds 2.55% (31 December 2018: 2.63%)
Chinese Yuan Renminbi
10,000,000 Central Huijin Investment Ltd** 3.86% 06/08/2021 1,450,647 0.05
10,000,000 China Southern Power Grid Co Ltd** 3.65% 20/03/2022 1,446,986 0.05
10,000,000 PetroChina Co Ltd** 3.45% 12/05/2021 1,441,576 0.04
10,000,000 State Grid Corp of China** 2.99% 20/10/2021 1,429,849 0.04
10,000,000 State Power Investment Corp Ltd** 3.87% 08/05/2022 1,451,647 0.05
Total Chinese Yuan Renminbi 7,220,705 0.23
Colombian Peso 6,865,000,000 Empresas Publicas de Medellin ESP* 7.63% 10/09/2024 2,188,264 0.07
38,720,000,000 Empresas Publicas de Medellin ESP* 8.38% 08/11/2027 12,485,669 0.39
Total Colombian Peso 14,673,933 0.46
Indonesian Rupiah
10,000,000,000 JPMorgan Chase Bank NA† 7.00% 18/09/2030 724,210 0.02
Total Indonesian Rupiah 724,210 0.02
Mexican Peso 77,298,300 Comision Federal de Electricidad* 7.35% 25/11/2025 3,822,303 0.12
66,722,200 Comision Federal de Electricidad* 8.18% 23/12/2027 3,376,940 0.10

FINANCIAL STATEMENTS SCHEDULE OF INVESTMENTS
186 NEUBERGER BERMAN INVESTMENT FUNDS PLC
Neuberger Berman Emerging Market Debt - Local Currency Fund (Continued)
Schedule of Investments (Continued)
Financial Assets at Fair Value through Profit or Loss (continued)
Principal Amount Security Description Coupon Maturity
Date Fair Value
US$% of Net
Assets
Corporate Bonds 2.55% (31 December 2018: 2.63%) (continued)
Mexican Peso (continued) 142,570,000 Petroleos Mexicanos* 7.19% 12/09/2024 6,908,407 0.22
955,595,600 Petroleos Mexicanos* 7.47% 12/11/2026 44,511,511 1.39
Total Mexican Peso 58,619,161 1.83
United States Dollar
1,293,000 YPF SA* 63.35% 07/07/2020 326,802 0.01
Total United States Dollar 326,802 0.01
Total Corporate Bonds 81,564,811 2.55
Government Bonds 88.64% (31 December 2018: 90.23%)
Argentine Peso 165,107,887 Argentina POM Politica Monetaria* 56.59% 21/06/2020 1,532,337 0.05
11,667,000 Argentina Treasury Bond BONCER* 2.50% 22/07/2021 283,684 0.01
24,541,132 Argentine Bonos del Tesoro* 18.20% 03/10/2021 147,079 0.00
101,767,000 Bonos de la Nacion Argentina con Ajuste por CER* 4.00% 06/03/2020 2,230,509 0.07
162,167,842 Ciudad Autonoma de Buenos Aires* 44.09% 29/03/2024 1,899,363 0.06
Total Argentine Peso 6,092,972 0.19
Chilean Peso 3,700,000,000 Bonos de la Tesoreria de la Republica en pesos* 4.50% 01/03/2026 5,503,609 0.17
18,140,000,000 Bonos de la Tesoreria de la Republica en pesos* 4.70% 01/09/2030 27,539,217 0.86
2,185,000,000 Bonos de la Tesoreria de la Republica en pesos* 5.00% 01/03/2035 3,477,921 0.11
3,045,000,000 Bonos de la Tesoreria de la Republica en pesos* 5.10% 15/07/2050 5,004,944 0.16
15,170,000,000 Bonos de la Tesoreria de la Republica en pesos* 6.00% 01/01/2043 27,895,894 0.87
Total Chilean Peso 69,421,585 2.17
Chinese Yuan Renminbi
10,000,000 China Development Bank** 3.76% 14/08/2023 1,467,634 0.05
10,000,000 China Government Bond** 2.94% 17/10/2024 1,440,326 0.04
20,000,000 China Government Bond** 3.19% 11/04/2024 2,913,293 0.09
20,000,000 China Government Bond** 3.25% 06/06/2026 2,905,026 0.09
10,000,000 China Government Bond** 3.25% 22/11/2028 1,449,501 0.04
10,900,000 China Government Bond** 3.27% 22/08/2046 1,440,863 0.04
20,000,000 China Government Bond** 3.29% 23/05/2029 2,901,063 0.09
10,000,000 China Government Bond** 3.47% 13/07/2022 1,464,737 0.05
3,600,000 China Government Bond** 3.52% 25/04/2046 495,844 0.01
10,000,000 China Government Bond** 3.59% 03/08/2027 1,483,144 0.05
10,000,000 China Government Bond** 3.60% 06/09/2025 1,486,532 0.05

SCHEDULE OF INVESTMENTS FINANCIAL STATEMENTS
ANNUAL REPORT 2019 187
Neuberger Berman Emerging Market Debt - Local Currency Fund (Continued)
Schedule of Investments (Continued)
Financial Assets at Fair Value through Profit or Loss (continued)
Principal Amount Security Description Coupon Maturity
Date Fair Value
US$% of Net
Assets
Government Bonds 88.64% (31 December 2018: 90.23%) (continued)
Chinese Yuan Renminbi (continued) 10,000,000 China Government Bond** 3.61% 07/06/2025 1,487,147 0.05
2,000,000 China Government Bond** 3.97% 23/07/2048 298,688 0.01
Total Chinese Yuan Renminbi 21,233,798 0.66
Colombian Peso
2,037,000,000 Colombia Government International Bond* 4.38% 21/03/2023 608,219 0.02
252,000,000 Colombia Government International Bond* 9.85% 28/06/2027 96,555 0.00
42,967,400,000 Colombian TES* 6.25% 26/11/2025 13,483,349 0.42
88,966,400,000 Colombian TES* 7.00% 30/06/2032 28,355,626 0.89
83,856,400,000 Colombian TES* 7.25% 18/10/2034 27,173,119 0.85
91,556,000,000 Colombian TES* 7.50% 26/08/2026 30,493,945 0.95
92,888,700,000 Colombian TES* 7.75% 18/09/2030 31,350,555 0.98
1,387,000,000 Financiera de Desarrollo Territorial SA Findeter* 7.88% 12/08/2024 447,383 0.01
Total Colombian Peso 132,008,751 4.12
Czech Koruna 542,770,000 Czech Republic Government Bond* 0.95% 15/05/2030 22,460,195 0.70
818,510,000 Czech Republic Government Bond* 2.40% 17/09/2025 37,887,478 1.18
710,940,000 Czech Republic Government Bond* 2.75% 23/07/2029 34,580,254 1.08
Total Czech Koruna 94,927,927 2.96
Dominican Republic Peso 117,100,000 Dominican Republic Bond* 11.25% 05/02/2027 2,342,056 0.07
348,700,000 Dominican Republic International Bond* 8.90% 15/02/2023 6,575,700 0.21
652,700,000 Dominican Republic International Bond* 9.75% 05/06/2026 12,658,781 0.39
Total Dominican Republic Peso 21,576,537 0.67
Egyptian Pound 407,001,000 Egypt Government Bond* 14.22% 15/10/2026 26,304,066 0.82
126,200,000 Egypt Government Bond* 14.80% 30/01/2023 8,133,922 0.25
373,418,000 Egypt Government Bond* 15.90% 02/07/2024 25,192,873 0.79
205,000,000 Egypt Government Bond* 16.00% 12/12/2020 12,950,573 0.41
Total Egyptian Pound 72,581,434 2.27
Euro 32,651,000 Argentine Republic Government International Bond* 3.88% 15/01/2022 17,610,684 0.55
Total Euro 17,610,684 0.55

FINANCIAL STATEMENTS SCHEDULE OF INVESTMENTS
188 NEUBERGER BERMAN INVESTMENT FUNDS PLC
Neuberger Berman Emerging Market Debt - Local Currency Fund (Continued)
Schedule of Investments (Continued)
Financial Assets at Fair Value through Profit or Loss (continued)
Principal Amount Security Description Coupon Maturity
DateFair Value
US$% of Net
Assets
Government Bonds 88.64% (31 December 2018: 90.23%) (continued)
Ghanaian Cedi 418 Republic of Ghana Government Bonds* 24.75% 19/07/2021 79 0.00
Total Ghanaian Cedi 79 0.00
Hungarian Forint 950,000,000 Hungary Government Bond* 2.75% 22/12/2026 3,509,837 0.11
6,700,000,000 Hungary Government Bond* 3.00% 26/06/2024 24,994,590 0.78
10,146,310,000 Hungary Government Bond* 3.00% 27/10/2027 37,903,375 1.18
3,600,000,000 Hungary Government Bond* 5.50% 24/06/2025 15,107,165 0.47
1,545,300,000 Hungary Government Bond* 6.75% 22/10/2028 7,360,107 0.23
Total Hungarian Forint 88,875,074 2.77
Indonesian Rupiah
110,288,000,000 Indonesia Treasury Bond* 5.63% 15/05/2023 7,816,256 0.24
567,514,000,000 Indonesia Treasury Bond* 6.13% 15/05/2028 38,611,091 1.20
146,350,000,000 Indonesia Treasury Bond* 6.50% 15/06/2025 10,610,488 0.33
205,944,000,000 Indonesia Treasury Bond* 6.63% 15/05/2033 13,732,902 0.43
120,881,000,000 Indonesia Treasury Bond* 7.00% 15/05/2022 8,876,407 0.28
372,000,000,000 Indonesia Treasury Bond* 7.00% 15/05/2027 26,758,219 0.84
133,350,000,000 Indonesia Treasury Bond* 7.00% 15/09/2030 9,528,142 0.30
303,000,000,000 Indonesia Treasury Bond* 7.50% 15/08/2032 21,804,134 0.68
390,928,000,000 Indonesia Treasury Bond* 7.50% 15/05/2038 27,948,903 0.87
546,370,000,000 Indonesia Treasury Bond* 8.13% 15/05/2024 42,028,740 1.31
286,965,000,000 Indonesia Treasury Bond* 8.25% 15/05/2029 22,337,043 0.70
442,453,000,000 Indonesia Treasury Bond* 8.25% 15/05/2036 33,417,047 1.04
137,328,000,000 Indonesia Treasury Bond* 8.38% 15/03/2024 10,615,219 0.33
222,000,000,000 Indonesia Treasury Bond* 8.38% 15/09/2026 17,229,642 0.54
85,767,000,000 Indonesia Treasury Bond* 8.38% 15/03/2034 6,628,879 0.21
238,959,000,000 Indonesia Treasury Bond* 8.38% 15/04/2039 18,466,315 0.58
220,679,000,000 Indonesia Treasury Bond* 8.75% 15/05/2031 17,594,303 0.55
99,265,000,000 Indonesia Treasury Bond* 9.00% 15/03/2029 7,992,403 0.25
Total Indonesian Rupiah 341,996,133 10.68
Malaysian Ringgit
18,000,000 Malaysia Government Bond** 3.44% 15/02/2021 4,424,940 0.14
4,810,000 Malaysia Government Bond** 3.48% 15/03/2023 1,189,357 0.04
265,696,000 Malaysia Government Bond** 3.49% 31/03/2020 65,084,484 2.03
35,000,000 Malaysia Government Bond** 3.73% 15/06/2028 8,779,587 0.27
25,000,000 Malaysia Government Bond** 3.76% 20/04/2023 6,239,707 0.20

SCHEDULE OF INVESTMENTS FINANCIAL STATEMENTS
ANNUAL REPORT 2019 189
Neuberger Berman Emerging Market Debt - Local Currency Fund (Continued)
Schedule of Investments (Continued)
Financial Assets at Fair Value through Profit or Loss (continued)
Principal Amount Security Description Coupon Maturity
DateFair Value
US$% of Net
Assets
Government Bonds 88.64% (31 December 2018: 90.23%) (continued)
Malaysian Ringgit (continued) 13,000,000 Malaysia Government Bond** 3.80% 30/09/2022 3,238,207 0.10
39,000,000 Malaysia Government Bond** 3.80% 17/08/2023 9,756,464 0.31
30,000,000 Malaysia Government Bond** 3.84% 15/04/2033 7,483,867 0.23
38,240,000 Malaysia Government Bond** 3.89% 15/08/2029 9,781,929 0.31
65,000,000 Malaysia Government Bond** 3.90% 16/11/2027 16,476,137 0.51
22,500,000 Malaysia Government Bond** 3.90% 30/11/2026 5,690,848 0.18
27,345,000 Malaysia Government Bond** 3.91% 15/07/2026 6,918,564 0.22
30,900,000 Malaysia Government Bond** 3.96% 15/09/2025 7,825,451 0.24
14,000,000 Malaysia Government Bond** 4.05% 30/09/2021 3,482,297 0.11
94,500,000 Malaysia Government Bond** 4.06% 30/09/2024 23,968,761 0.75
9,700,000 Malaysia Government Bond** 4.23% 30/06/2031 2,517,762 0.08
86,125,000 Malaysia Government Bond** 4.64% 07/11/2033 23,246,652 0.73
18,919,000 Malaysia Government Bond** 4.89% 08/06/2038 5,270,574 0.16
5,100,000 Malaysia Government Bond** 4.94% 30/09/2043 1,421,330 0.04
28,000,000 Malaysia Government Investment Issue** 4.07% 30/09/2026 7,126,879 0.22
28,500,000 Malaysia Government Investment Issue** 4.37% 31/10/2028 7,448,872 0.23
Total Malaysian Ringgit 227,372,669 7.10
Mexican Peso 681,099,200 Mexican Bonos* 6.50% 09/06/2022 35,893,683 1.12
1,287,299,800 Mexican Bonos* 7.50% 03/06/2027 70,863,523 2.21
184,810,100 Mexican Bonos* 7.75% 29/05/2031 10,449,639 0.33
732,202,800 Mexican Bonos* 7.75% 13/11/2042 41,157,909 1.29
876,670,400 Mexican Bonos* 8.50% 31/05/2029 51,707,955 1.61
45,453,000 Mexican Bonos* 8.50% 18/11/2038 2,746,387 0.09
2,134,000,000 Mexican Bonos* 10.00% 05/12/2024 128,373,367 4.01
95,092,700 Mexican Bonos* 10.00% 20/11/2036 6,507,535 0.20
5,801,101,900 Mexico Cetes* 0.00% 23/01/2020 30,578,433 0.95
Total Mexican Peso 378,278,431 11.81
Peruvian Sol 26,015,000 Fondo MIVIVIENDA SA* 7.00% 14/02/2024 8,752,593 0.27
8,021,000 Peru Government Bond* 5.35% 12/08/2040 2,453,718 0.08
34,775,000 Peru Government Bond* 5.40% 12/08/2034 11,039,241 0.34
3,681,000 Peru Government Bond* 5.94% 12/02/2029 1,255,917 0.04
29,591,000 Peru Government Bond* 6.15% 12/08/2032 10,135,796 0.32
18,558,000 Peruvian Government International Bond** 5.70% 12/08/2024 6,264,179 0.20
44,112,000 Peruvian Government International Bond** 6.35% 12/08/2028 15,461,826 0.48

FINANCIAL STATEMENTS SCHEDULE OF INVESTMENTS
190 NEUBERGER BERMAN INVESTMENT FUNDS PLC
Neuberger Berman Emerging Market Debt - Local Currency Fund (Continued)
Schedule of Investments (Continued)
Financial Assets at Fair Value through Profit or Loss (continued)
Principal Amount Security Description Coupon Maturity
DateFair Value
US$% of Net
Assets
Government Bonds 88.64% (31 December 2018: 90.23%) (continued)
Peruvian Sol (continued) 52,178,000 Peruvian Government International Bond* 6.95% 12/08/2031 19,004,255 0.59
1,000 Peruvian Government International Bond** 7.84% 12/08/2020 313 0.00
131,037,000 Peruvian Government International Bond** 8.20% 12/08/2026 50,394,911 1.57
Total Peruvian Sol 124,762,749 3.89
Philippine Peso 7,000,000 Philippine Government International Bond* 4.95% 15/01/2021 139,931 0.01
Total Philippine Peso 139,931 0.01
Polish Zloty 190,000,000 Republic of Poland Government Bond* 2.50% 25/01/2023 51,405,693 1.60
176,531,000 Republic of Poland Government Bond* 2.50% 25/07/2026 48,060,457 1.50
123,435,000 Republic of Poland Government Bond* 2.50% 25/07/2027 33,540,926 1.05
89,953,000 Republic of Poland Government Bond** 2.75% 25/04/2028 24,894,583 0.78
93,582,000 Republic of Poland Government Bond** 3.25% 25/07/2025 26,429,384 0.82
Total Polish Zloty 184,331,043 5.75
Romanian New Leu
11,720,000 Romania Government Bond* 4.25% 28/06/2023 2,785,137 0.09
73,040,000 Romania Government Bond* 4.40% 25/09/2023 17,517,507 0.55
76,590,000 Romania Government Bond* 4.50% 17/06/2024 18,377,127 0.58
88,125,000 Romania Government Bond* 4.85% 22/04/2026 21,555,733 0.67
17,020,000 Romania Government Bond* 5.00% 12/02/2029 4,171,244 0.13
99,370,000 Romania Government Bond* 5.80% 26/07/2027 25,703,337 0.80
19,720,000 Romania Government Bond* 5.85% 26/04/2023 4,916,692 0.15
Total Romanian New Leu 95,026,777 2.97
Russian Ruble 2,275,065,000 Russian Federal Bond - OFZ* 6.90% 23/05/2029 38,625,511 1.20
2,859,136,000 Russian Federal Bond - OFZ* 7.00% 16/08/2023 47,909,933 1.50
1,285,300,000 Russian Federal Bond - OFZ* 7.10% 16/10/2024 21,689,079 0.68
2,200,857,000 Russian Federal Bond - OFZ* 7.25% 10/05/2034 38,215,690 1.19
2,944,066,000 Russian Federal Bond - OFZ* 7.95% 07/10/2026 52,175,422 1.63
506,011,000 Russian Federal Bond - OFZ* 8.50% 17/09/2031 9,636,501 0.30
Total Russian Ruble 208,252,136 6.50

SCHEDULE OF INVESTMENTS FINANCIAL STATEMENTS
ANNUAL REPORT 2019 191
Neuberger Berman Emerging Market Debt - Local Currency Fund (Continued)
Schedule of Investments (Continued)
Financial Assets at Fair Value through Profit or Loss (continued)
Principal Amount Security Description Coupon Maturity
DateFair Value
US$% of Net
Assets
Government Bonds 88.64% (31 December 2018: 90.23%) (continued)
Serbian Dinar 438,780,000 Serbia Treasury Bonds* 5.88% 08/02/2028 5,079,343 0.16
Total Serbian Dinar 5,079,343 0.16
South African Rand
132,109,601 Republic of South Africa Government Bond* 6.25% 31/03/2036 6,767,278 0.21
644,792,385 Republic of South Africa Government Bond* 8.25% 31/03/2032 42,345,516 1.32
330,080,259 Republic of South Africa Government Bond* 8.50% 31/01/2037 20,931,480 0.65
396,498,342 Republic of South Africa Government Bond* 8.75% 31/01/2044 24,920,061 0.78
402,056,696 Republic of South Africa Government Bond* 8.75% 28/02/2048 25,386,886 0.79
276,414,186 Republic of South Africa Government Bond* 8.88% 28/02/2035 18,435,875 0.58
1,340,531,809 Republic of South Africa Government Bond* 9.00% 31/01/2040 87,482,849 2.73
Total South African Rand 226,269,945 7.06
Thai Baht 1,120,870,000 Thailand Government Bond* 1.45% 17/12/2024 37,777,940 1.18
100,000,000 Thailand Government Bond* 1.60% 17/12/2029 3,364,637 0.11
1,080,000,000 Thailand Government Bond* 2.00% 17/12/2022 36,910,587 1.15
742,000,000 Thailand Government Bond* 2.13% 17/12/2026 26,036,496 0.81
542,500,000 Thailand Government Bond* 2.40% 17/12/2023 18,926,337 0.59
972,050,000 Thailand Government Bond* 2.88% 17/12/2028 36,310,026 1.13
29,629,000 Thailand Government Bond* 2.88% 17/06/2046 1,168,716 0.04
804,559,000 Thailand Government Bond* 3.30% 17/06/2038 33,008,824 1.03
691,000,000 Thailand Government Bond* 3.40% 17/06/2036 28,582,927 0.89
80,000,000 Thailand Government Bond* 3.63% 16/06/2023 2,888,719 0.09
2,000 Thailand Government Bond* 3.65% 17/12/2021 70 0.00
672,000,000 Thailand Government Bond* 3.65% 20/06/2031 27,247,538 0.85
480,000,000 Thailand Government Bond* 3.78% 25/06/2032 19,860,798 0.62
224,699,000 Thailand Government Bond* 3.85% 12/12/2025 8,595,634 0.27
145,000,000 Thailand Government Bond* 4.88% 22/06/2029 6,283,864 0.20
Total Thai Baht 286,963,113 8.96
Turkish Lira 15,344,099 Turkey Government Bond* 3.00% 02/08/2023 2,562,163 0.08
36,821,041 Turkey Government Bond* 7.40% 05/02/2020 6,181,802 0.19
29,964,073 Turkey Government Bond* 8.50% 14/09/2022 4,748,130 0.15
3,801,000 Turkey Government Bond* 8.80% 27/09/2023 592,090 0.02
42,820,145 Turkey Government Bond* 9.20% 22/09/2021 6,975,992 0.22
60,610,578 Turkey Government Bond* 9.40% 08/07/2020 10,149,293 0.31

FINANCIAL STATEMENTS SCHEDULE OF INVESTMENTS
192 NEUBERGER BERMAN INVESTMENT FUNDS PLC
Neuberger Berman Emerging Market Debt - Local Currency Fund (Continued)
Schedule of Investments (Continued)
Financial Assets at Fair Value through Profit or Loss (continued)
Principal Amount Security Description Coupon Maturity
DateFair Value
US$% of Net
Assets
Government Bonds 88.64% (31 December 2018: 90.23%) (continued)
Turkish Lira (continued)
45,704,545 Turkey Government Bond* 9.50% 12/01/2022 7,445,901 0.23
9,200,000 Turkey Government Bond* 10.70% 17/02/2021 1,541,321 0.05
365,006,000 Turkey Government Bond* 10.70% 17/08/2022 60,476,544 1.89
204,600,000 Turkey Government Bond* 11.00% 02/03/2022 34,208,872 1.07
52,522,146 Turkey Government Bond* 11.00% 24/02/2027 8,402,131 0.26
209,547,000 Turkey Government Bond* 12.20% 18/01/2023 36,162,791 1.13
110,393,231 Turkey Government Bond* 16.20% 14/06/2023 21,165,968 0.66
Total Turkish Lira 200,612,998 6.26
Ukrainian Hryvnia
500,000,000 Ukraine Government International Bond* 15.70% 20/01/2021 21,523,500 0.67
Total Ukrainian Hryvnia 21,523,500 0.67
United States Dollar
13,033,000 Bonos De La Nacion Argentina En Moneda Dua* 4.50% 13/02/2020 7,689,470 0.24
Total United States Dollar 7,689,470 0.24
Uruguayan Peso 92,485,000 Uruguay Government International Bond* 8.50% 15/03/2028 2,143,926 0.07
188,871,000 Uruguay Government International Bond* 9.88% 20/06/2022 4,988,617 0.15
Total Uruguayan Peso 7,132,543 0.22
Total Government Bonds 2,839,759,622 88.64
Number of Shares Security Description Fair Value
US$% of Net
Assets
Investment Funds 0.80% (31 December 2018: 0.00%)
United States Dollar
2,470,000 Neuberger Berman China Bond Fund 25,786,800 0.80
Total Investment Funds μ 25,786,800 0.80
Total Investments 3,031,059,510 94.61

SCHEDULE OF INVESTMENTS FINANCIAL STATEMENTS
ANNUAL REPORT 2019 193
Neuberger Berman Emerging Market Debt - Local Currency Fund (Continued)
Schedule of Investments (Continued)
Financial Assets at Fair Value through Profit or Loss (continued)
Forward Currency Contracts 1.90% (31 December 2018: 1.47%)
Amount Receivable
Amount Payable
Maturity Date Counterparty Contracts Unrealised
Gain US$% of Net
Assets
BRL 427,399,066 US$ 101,293,801 04/02/2020 Citibank NA 1 4,838,511 0.15
BRL 261,948,796 US$ 61,767,449 12/02/2020 Citibank NA 2 3,258,070 0.10
BRL 19,266,619 US$ 4,711,529 03/03/2020 Deutsche Bank AG 1 67,136 0.00
BRL 74,755,593 US$ 18,216,188 22/01/2020 JPMorgan Chase Bank 1 355,407 0.01
BRL 42,286,150 US$ 10,182,686 15/01/2020 Morgan Stanley 1 324,881 0.01
BRL 52,864,288 US$ 12,739,918 03/03/2020 State Street Bank and Trust and Co 1 371,915 0.01
BRL 76,462,347 US$ 18,025,070 22/01/2020 State Street Bank and Trust and Co 1 970,536 0.03
CLP 50,956,707,808 US$ 66,414,738 18/03/2020 Deutsche Bank AG 1 1,405,463 0.04
CNY 214,972,471 US$ 30,634,642 07/02/2020 Citibank NA 1 207,044 0.01
CNY 212,415,191 US$ 30,418,902 17/01/2020 Standard Chartered Bank 1 71,600 0.00
COP 149,491,601,248 US$ 43,527,973 18/03/2020 Citibank NA 1 1,851,720 0.06
CZK 1,157,681,018 € 45,171,485 18/03/2020 Deutsche Bank AG 1 197,042 0.01
CZK 352,230,394 € 13,730,466 21/01/2020 Goldman Sachs International 2 127,912 0.00
CZK 208,564,755 € 8,133,685 21/01/2020 HSBC Bank Plc 1 71,785 0.00
CZK 172,791,705 € 6,733,390 21/01/2020 Merrill Lynch International 1 65,321 0.00
€ 23,048,306 US$ 25,559,603 06/01/2020 Brown Brothers Harriman 3 316,960 0.01
€ 27,605,021 RON 133,325,517 02/04/2020 Citibank NA 1 15,130 0.00
€ 26,882,770 HUF 8,887,981,427 08/01/2020 Deutsche Bank AG 1 10,463 0.00
€ 14,499,132 RON 69,980,060 02/04/2020 Goldman Sachs International 1 18,976 0.00
€ 27,368,575 HUF 9,042,057,272 19/02/2020 HSBC Bank Plc 1 49,136 0.00
€ 20,307,743 US$ 22,740,274 06/01/2020 JPMorgan Chase Bank 1 59,432 0.00
€ 75,363,928 US$ 83,329,120 06/01/2020 State Street Bank and Trust and Co 2 1,282,713 0.04
HUF 8,943,973,261 € 26,951,953 08/01/2020 Deutsche Bank AG 1 101,948 0.00
HUF 7,750,000,000 € 23,196,117 08/01/2020 Goldman Sachs International 1 265,629 0.01
HUF 1,121,198,098 € 3,378,301 08/01/2020 Standard Chartered Bank 1 13,162 0.00
IDR 59,609,539,635 US$ 4,199,334 22/01/2020 Citibank NA 1 102,253 0.00
IDR 127,881,851,092 US$ 9,120,086 22/01/2020 Standard Chartered Bank 1 108,215 0.00
IDR 92,747,128,077 US$ 6,630,004 22/01/2020 State Street Bank and Trust and Co 1 62,880 0.00
INR 2,164,257,933 US$ 30,052,877 17/01/2020 Standard Chartered Bank 1 300,631 0.01
KRW 35,727,657,342 US$ 30,734,437 28/01/2020 Goldman Sachs International 1 226,834 0.01
KRW 17,927,341,082 US$ 15,297,671 16/01/2020 Goldman Sachs International 1 234,878 0.01
KRW 17,927,341,081 US$ 15,117,077 16/01/2020 Standard Chartered Bank 1 415,473 0.01
KZT 3,015,906,977 US$ 7,465,116 05/06/2020 Goldman Sachs International 1 138,202 0.01
KZT 9,195,480,174 US$ 22,728,341 05/06/2020 JPMorgan Chase Bank 2 454,126 0.01
MXN 114,294,511 US$ 5,808,586 05/02/2020 Citibank NA 1 212,629 0.01
MXN 125,799,371 US$ 6,611,862 05/02/2020 Goldman Sachs International 1 15,446 0.00
MYR 11,627,010 US$ 2,805,543 28/01/2020 Standard Chartered Bank 1 41,560 0.00

FINANCIAL STATEMENTS SCHEDULE OF INVESTMENTS
194 NEUBERGER BERMAN INVESTMENT FUNDS PLC
Neuberger Berman Emerging Market Debt - Local Currency Fund (Continued)
Schedule of Investments (Continued)
Financial Assets at Fair Value through Profit or Loss (continued)
Forward Currency Contracts 1.90% (31 December 2018: 1.47%) (continued)
Amount Receivable
Amount Payable
Maturity Date Counterparty Contracts Unrealised
Gain US$% of Net
Assets
PHP 405,044,757 US$ 7,906,089 30/01/2020 Standard Chartered Bank 1 72,593 0.00
PLN 141,723,079 € 32,868,001 14/01/2020 Citibank NA 2 501,529 0.02
PLN 24,920,516 € 5,840,157 18/02/2020 Citibank NA 1 6,320 0.00
PLN 233,934,326 € 54,455,736 18/02/2020 Goldman Sachs International 1 472,580 0.02
PLN 22,518,624 € 5,270,963 18/02/2020 HSBC Bank Plc 1 12,811 0.00
PLN 353,745,575 € 82,596,829 14/01/2020 HSBC Bank Plc 1 625,948 0.02
PLN 16,199,433 € 3,777,730 14/01/2020 Morgan Stanley 1 33,956 0.00
RUB 220,173,862 US$ 3,420,203 23/01/2020 Citibank NA 1 116,067 0.00
RUB 438,669,820 US$ 7,022,343 23/01/2020 Société Générale 1 23,248 0.00
RUB 6,756,478,181 US$ 104,859,715 23/01/2020 Standard Chartered Bank 2 3,657,849 0.12
THB 317,319,796 US$ 10,512,395 16/01/2020 HSBC Bank Plc 1 84,778 0.00
Uah 233,200,000 US$ 9,460,446 27/02/2020 Morgan Stanley 1 211,922 0.01
US$ 9,641,708 TRY 56,389,056 06/02/2020 Goldman Sachs International 1 250,239 0.01
US$ 39,671,942 TRY 233,509,766 06/02/2020 HSBC Bank Plc 1 781,422 0.03
US$ 34,678,130 TRY 202,867,063 07/02/2020 JPMorgan Chase Bank 1 898,965 0.03
US$ 18,039,289 TRY 106,975,509 18/03/2020 Standard Chartered Bank 1 400,042 0.01
UYU 48,289,059 US$ 1,182,686 07/12/2020 Citibank NA 1 3,923 0.00
ZAR 165,054,527 US$ 10,822,300 06/02/2020 Citibank NA 1 926,808 0.03
ZAR 999,529,537 US$ 68,201,674 06/02/2020 Goldman Sachs International 4 2,948,029 0.09
ZAR 75,416,617 US$ 5,100,939 06/02/2020 HSBC Bank Plc 1 267,457 0.01
ZAR 160,782,658 US$ 10,566,904 06/02/2020 JPMorgan Chase Bank 1 878,119 0.03
ZAR 536,566,969 US$ 35,767,450 06/02/2020 Standard Chartered Bank 2 2,427,100 0.08
ZAR 66,671,880 US$ 4,658,032 06/02/2020 State Street Bank and Trust and Co 1 87,886 0.00
AUD Hedged Classes AUD 2,051,996 US$ 1,404,843 21/02/2020 Goldman Sachs International 4 39,366 0.00
AUD 3,135,128 US$ 2,181,175 21/02/2020 UBS AG 2 25,349 0.00
AUD 153,810,028 US$ 104,627,258 21/02/2020 Westpac Banking Corp 23 3,625,245 0.11
EUR Hedged Classes € 112,560,393 US$ 124,835,554 21/02/2020 Citibank NA 2 1,902,949 0.06
€ 1,702,782 US$ 1,899,189 21/02/2020 Goldman Sachs International 5 18,074 0.00
€ 1,302,295 US$ 1,465,069 21/02/2020 UBS AG 1 1,263 0.00
€ 3,839,997 US$ 4,289,405 21/02/2020 Westpac Banking Corp 28 34,279 0.00
GBP Hedged Classes £ 1,290 US$ 1,703 21/02/2020 Goldman Sachs International 2 8 0.00
£ 85,188 US$ 110,018 21/02/2020 UBS AG 3 2,991 0.00
£ 1,381 US$ 1,804 21/02/2020 Westpac Banking Corp 2 28 0.00

SCHEDULE OF INVESTMENTS FINANCIAL STATEMENTS
ANNUAL REPORT 2019 195
Neuberger Berman Emerging Market Debt - Local Currency Fund (Continued)
Schedule of Investments (Continued)
Financial Assets at Fair Value through Profit or Loss (continued)
Forward Currency Contracts 1.90% (31 December 2018: 1.47%) (continued)
Amount Receivable
Amount Payable
Maturity Date Counterparty Contracts Unrealised
Gain US$% of Net
Assets
SEK Hedged Classes SEK 2,220,868,431 US$ 230,800,163 21/02/2020 Goldman Sachs International 4 7,012,774 0.22
SEK 9,690,505 US$ 1,034,901 21/02/2020 UBS AG 1 2,768 0.00
SEK 8,441,531 US$ 883,041 21/02/2020 Westpac Banking Corp 10 20,887 0.00
SGD Hedged Classes SGD 34,584 US$ 25,460 21/02/2020 Goldman Sachs International 2 270 0.00
SGD 30,154 US$ 22,383 21/02/2020 UBS AG 1 51 0.00
SGD 3,657,984 US$ 2,688,575 21/02/2020 Westpac Banking Corp 14 32,950 0.00
US$ 5 SGD 6 21/02/2020 Westpac Banking Corp 1 0 0.00
ZAR Hedged Classes US$ 854 ZAR 12,024 21/02/2020 Westpac Banking Corp 1 0 0.00
ZAR 3,201,183,119 US$ 214,029,166 21/02/2020 Goldman Sachs International 8 13,408,389 0.42
ZAR 66,888,959 US$ 4,664,112 21/02/2020 UBS AG 2 88,212 0.00
ZAR 148,830,503 US$ 10,104,887 21/02/2020 Westpac Banking Corp 24 469,216 0.02
Total Unrealised Gain on Forward Currency Contracts ∞ 61,005,679 1.90
Futures Contracts 0.02% (31 December 2018: 0.00%)
Number of Contracts Description Unrealised
Gain US$% of Net
Assets
(332) South Korea 10-Year Bond Future March 2020 146,414 0.01
1,768 South Korea 3-Year Bond Future March 2020 95,575 0.00
(356) US Treasury 10-Year Note (CBT) Future March 2020 386,594 0.01
Total Unrealised Gain on Futures Contracts ± 628,583 0.02
Interest Rate Swap Contracts 1.50% (31 December 2018: 1.53%)
Notional Amount Expiration Date Counterparty Receive /(Pay)# Fixed Rate Variable Rate Fair Value
US$% of Net
Assets
BRL 83,033,119 04/01/21 Goldman Sachs International (Pay) 11.42% 1D BROIS∞ 4,813,689 0.15
RUB 8,780,328,535 21/02/21 Goldman Sachs International (Pay) 9.01% 3M MOSPRIME∞ 3,322,890 0.11
RUB 6,346,790,059 23/03/22 Goldman Sachs International (Pay) 8.11% 3M MOSPRIME∞ 3,163,025 0.10
BRL 117,833,896 04/01/21 Chicago Mercantile Exchange1 (Pay) 8.62% 1D BROIS± 2,824,791 0.09
BRL 52,868,074 02/01/20 JPMorgan Chase Bank (Pay) 11.88% 1D BROIS∞ 2,076,827 0.07
BRL 68,994,899 04/01/21 Credit Suisse International (Pay) 9.10% 1D BROIS∞ 2,004,609 0.06
BRL 67,755,959 04/01/21 Chicago Mercantile Exchange1 (Pay) 10.02% 1D BROIS± 1,926,748 0.06
BRL 65,962,190 04/01/21 JPMorgan Chase Bank (Pay) 8.87% 1D BROIS∞ 1,869,396 0.06
BRL 83,093,619 04/01/21 Chicago Mercantile Exchange1 (Pay) 8.75% 1D BROIS± 1,867,029 0.06
RUB 11,212,729,164 10/06/21 Goldman Sachs International (Pay) 7.52% 3M MOSPRIME∞ 1,810,851 0.06
BRL 38,723,035 04/06/21 JPMorgan Chase Bank (Pay) 10.30% 1D BROIS∞ 1,699,934 0.05

FINANCIAL STATEMENTS SCHEDULE OF INVESTMENTS
196 NEUBERGER BERMAN INVESTMENT FUNDS PLC
Neuberger Berman Emerging Market Debt - Local Currency Fund (Continued)
Schedule of Investments (Continued)
Financial Assets at Fair Value through Profit or Loss (continued)
Interest Rate Swap Contracts 1.50% (31 December 2018: 1.53%) (continued)
Notional Amount Expiration Date Counterparty Receive /(Pay)# Fixed Rate Variable Rate Fair Value
US$% of Net
Assets
BRL 40,331,137 04/01/21 JPMorgan Chase Bank (Pay) 9.28% 1D BROIS∞ 1,308,728 0.04
BRL 35,484,877 04/01/21 JPMorgan Chase Bank (Pay) 9.20% 1D BROIS∞ 1,128,653 0.04
BRL 180,976,073 02/01/23 Chicago Mercantile Exchange1 (Pay) 6.48% 1D BROIS± 1,085,434 0.04
BRL 28,465,496 04/01/21 Goldman Sachs International (Pay) 9.76% 1D BROIS∞ 1,078,813 0.03
CZK 1,370,000,000 18/06/24 LCH Clearnet Ltd1 Receive 1.70% 6M PRIBOR± 1,065,539 0.03
BRL 23,266,207 02/01/23 Chicago Mercantile Exchange1 (Pay) 9.26% 1D BROIS± 1,028,199 0.03
BRL 27,341,351 04/01/21 JPMorgan Chase Bank (Pay) 9.61% 1D BROIS∞ 987,355 0.03
BRL 163,837,099 03/01/22 Chicago Mercantile Exchange1 (Pay) 6.24% 1D BROIS± 964,720 0.03
BRL 227,468,792 03/01/22 Chicago Mercantile Exchange1 (Pay) 5.89% 1D BROIS± 860,123 0.03
BRL 20,038,348 04/01/21 JPMorgan Chase Bank (Pay) 10.19% 1D BROIS∞ 850,942 0.03
BRL 37,134,888 02/01/20 Goldman Sachs International (Pay) 9.67% 1D BROIS∞ 765,049 0.02
BRL 125,737,792 03/01/22 Chicago Mercantile Exchange1 (Pay) 6.07% 1D BROIS± 600,821 0.02
BRL 97,270,087 03/01/22 Chicago Mercantile Exchange1 (Pay) 6.23% 1D BROIS± 568,126 0.02
BRL 6,697,271 02/01/23 Goldman Sachs International (Pay) 10.84% 1D BROIS∞ 565,631 0.02
BRL 14,194,562 04/01/21 Goldman Sachs International (Pay) 9.92% 1D BROIS∞ 559,904 0.02
BRL 15,824,390 02/01/20 JPMorgan Chase Bank (Pay) 11.46% 1D BROIS∞ 559,651 0.02
CLP 5,135,753,282 22/05/29 Chicago Mercantile Exchange1 (Pay) 3.83% 1D CLICP± 558,317 0.02
BRL 32,688,720 02/01/20 JPMorgan Chase Bank (Pay) 9.07% 1D BROIS∞ 543,574 0.02
BRL 26,002,203 02/01/20 JPMorgan Chase Bank (Pay) 9.61% 1D BROIS∞ 531,182 0.02
MXN 150,000,000 20/02/25 Chicago Mercantile Exchange1 (Pay) 7.82% 28D MXIBTIIE± 426,065 0.01
MXN 95,000,000 28/12/26 Chicago Mercantile Exchange1 (Pay) 8.16% 28D MXIBTIIE± 425,153 0.01
BRL 19,188,188 02/01/20 Goldman Sachs International (Pay) 9.73% 1D BROIS∞ 413,412 0.01
BRL 127,702,115 03/01/22 Morgan Stanley (Pay) 5.79% 1D BROIS∞ 409,093 0.01
BRL 3,000,000 02/01/23 Goldman Sachs International (Pay) 11.99% 1D BROIS∞ 356,367 0.01
MXN 123,677,961 20/04/27 Chicago Mercantile Exchange1 (Pay) 7.51% 28D MXIBTIIE± 315,773 0.01
PLN 125,000,000 12/11/21 LCH Clearnet Ltd1 (Pay) 2.26% 6M WIBOR± 303,967 0.01
MXN 730,795,274 26/08/24 Chicago Mercantile Exchange1 (Pay) 6.75% 28D MXIBTIIE± 239,218 0.01
PLN 130,000,000 17/12/29 LCH Clearnet Ltd1 Receive 1.81% 6M WIBOR± 191,183 0.01
COP 255,482,041,588 18/11/21 Chicago Mercantile Exchange1 (Pay) 4.90% 1D COOVIBR± 188,031 0.01
CZK 222,724,663 17/07/24 LCH Clearnet Ltd1 Receive 1.68% 6M PRIBOR± 184,283 0.01
CLP 3,236,620,707 10/05/22 JPMorgan Chase Bank (Pay) 3.43% 6M CLICP∞ 165,298 0.01
BRL 42,352,484 03/01/22 Chicago Mercantile Exchange1 (Pay) 5.89% 1D BROIS± 160,147 0.00
CZK 172,400,000 21/06/24 LCH Clearnet Ltd1 Receive 1.64% 6M PRIBOR± 153,671 0.00
HUF 6,700,000,000 21/09/22 Goldman Sachs International (Pay) 0.84% 6M BUBOR∞ 151,514 0.00
COP 197,778,804,000 18/11/21 Chicago Mercantile Exchange1 (Pay) 4.91% 1D COOVIBR± 151,193 0.00
PLN 62,441,922 16/11/21 LCH Clearnet Ltd1 (Pay) 2.21% 6M WIBOR± 136,344 0.00
BRL 3,463,316 04/01/21 Goldman Sachs International (Pay) 9.73% 1D BROIS∞ 130,246 0.00

SCHEDULE OF INVESTMENTS FINANCIAL STATEMENTS
ANNUAL REPORT 2019 197
Neuberger Berman Emerging Market Debt - Local Currency Fund (Continued)
Schedule of Investments (Continued)
Financial Assets at Fair Value through Profit or Loss (continued)
Interest Rate Swap Contracts 1.50% (31 December 2018: 1.53%) (continued)
Notional Amount Expiration Date Counterparty Receive /(Pay)# Fixed Rate Variable Rate Fair Value
US$% of Net
Assets
MXN 100,000,000 21/01/22 Chicago Mercantile Exchange1 (Pay) 7.71% 28D MXIBTIIE± 107,308 0.00
CLP 6,951,979,941 29/11/29 Chicago Mercantile Exchange1 (Pay) 3.05% 1D CLICP± 99,263 0.00
MXN 496,707,800 07/07/22 Chicago Mercantile Exchange1 (Pay) 6.71% 28D MXIBTIIE± 62,839 0.00
CZK 380,000,000 18/11/29 LCH Clearnet Ltd1 Receive 1.49% 6M PRIBOR± 40,852 0.00
PLN 11,000,000 06/04/22 LCH Clearnet Ltd1 (Pay) 2.33% 6M WIBOR± 37,306 0.00
COP 76,739,154,412 19/11/21 Chicago Mercantile Exchange1 (Pay) 4.81% 1D COOVIBR± 36,633 0.00
BRL 751,192 04/01/21 JPMorgan Chase Bank (Pay) 10.23% 1D BROIS∞ 32,391 0.00
MXN 116,684,677 23/06/22 Chicago Mercantile Exchange1 (Pay) 6.75% 28D MXIBTIIE± 18,839 0.00
RUB 2,094,217,124 06/12/21 JPMorgan Chase Bank (Pay) 6.38% 3M MOSPRIME∞ 13,766 0.00
ZAR 1,516,583 26/06/23 UBS AG (Pay) 8.16% 3M JIBAR∞ 4,786 0.00
ZAR 1,229,566 28/06/28 Citibank NA (Pay) 8.21% 3M JIBAR∞ 4,020 0.00
Total Interest Rate Swap Contracts at Fair Value 47,949,511 1.50
# Receive - Funds receives variable rate and pays fixed rate. (Pay) - Fund pays variable rate and receives fixed rate. 1 Centrally cleared swap. Cross Currency Swap Contracts 0.01% (31 December 2018: 0.38%)
Counterparty Fund Pays on Notional Amount
Rate Paid by the Fund
Fund Receives on NotionalAmount
Rate Received by the Fund
Maturity Date
Fair ValueUS$
% of Net Assets
JPMorgan Chase Bank TRY 110,000,000 Fixed rate of 11.07%
US$ 19,155,420 Floating rate basedon 3M LIBOR
07/12/25 276,641 0.01
Total Cross Currency Swap Contracts at Fair Value ∞ 276,641 0.01
Fair ValueUS$
% of NetAssets
Total Financial Assets at Fair Value through Profit or Loss 3,140,919,924 98.04

FINANCIAL STATEMENTS SCHEDULE OF INVESTMENTS
198 NEUBERGER BERMAN INVESTMENT FUNDS PLC
Neuberger Berman Emerging Market Debt - Local Currency Fund (Continued)
Schedule of Investments (Continued)
Financial Liabilities at Fair Value through Profit or Loss
Forward Currency Contracts (0.60%) (31 December 2018: (1.61%))
Amount Receivable
Amount Payable
MaturityDate Counterparty Contracts Unrealised
Loss US$% of Net
Assets
BRL 78,953,244 US$ 19,776,915 22/01/2020 Citibank NA 2 (162,494) (0.01)
BRL 504,528,490 US$ 125,454,667 22/01/2020 UBS AG 1 (114,226) (0.00)
CZK 104,701,083 € 4,104,412 18/03/2020 Citibank NA 1 (3,706) (0.00)
€ 31,056,991 HUF 10,320,648,541 08/01/2020 Citibank NA 2 (166,443) (0.01)
€ 4,873,180 HUF 1,613,005,624 02/03/2020 Citibank NA 1 (704) (0.00)
€ 2,696,264 CZK 69,071,823 21/01/2020 Citibank NA 1 (20,878) (0.00)
€ 9,978,968 HUF 3,346,000,000 08/01/2020 Deutsche Bank AG 1 (154,845) (0.00)
€ 397,490 RON 1,909,792 03/02/2020 Goldman Sachs International 1 (204) (0.00)
€ 5,190,260 PLN 22,200,560 14/01/2020 JPMorgan Chase Bank 1 (31,867) (0.00)
€ 27,577,177 RON 132,570,938 03/02/2020 JPMorgan Chase Bank 1 (31,173) (0.00)
€ 27,282,007 HUF 9,092,026,218 08/01/2020 Merrill Lynch International 1 (233,990) (0.01)
€ 8,374,304 PLN 36,046,112 14/01/2020 Morgan Stanley 1 (111,165) (0.00)
€ 27,116,517 PLN 116,046,354 14/01/2020 Standard Chartered Bank 1 (182,203) (0.01)
IDR 69,790,579,519 US$ 5,039,338 22/01/2020 State Street Bank and Trust and Co 1 (3,061) (0.00)
RON 17,776,164 € 3,688,223 02/04/2020 JPMorgan Chase Bank 1 (10,678) (0.00)
TRY 17,827,150 US$ 3,026,965 06/02/2020 Goldman Sachs International 1 (57,894) (0.00)
TRY 87,291,090 US$ 14,982,765 06/02/2020 Morgan Stanley 1 (444,633) (0.01)
US$ 7,955,978 ZAR 116,917,504 06/02/2020 Brown Brothers Harriman 1 (366,583) (0.01)
US$ 9,133,551 € 8,155,985 06/01/2020 Citibank NA 1 (23,255) (0.00)
US$ 6,638,223 BRL 27,680,727 15/01/2020 Citibank NA 1 (240,083) (0.01)
US$ 60,120,942 ILS 208,079,302 11/02/2020 Citibank NA 1 (241,624) (0.01)
US$ 21,519,471 IDR 305,447,369,896 22/01/2020 Citibank NA 1 (522,441) (0.02)
US$ 28,667,937 ZAR 429,362,565 06/02/2020 Citibank NA 1 (1,895,461) (0.06)
US$ 7,435,788 MXN 144,580,287 05/02/2020 Citibank NA 1 (180,929) (0.01)
US$ 27,820,499 ZAR 418,042,051 06/02/2020 Goldman Sachs International 1 (1,937,069) (0.06)
US$ 21,524,020 IDR 305,447,369,895 22/01/2020 Goldman Sachs International 1 (517,891) (0.02)
US$ 9,591,239 € 8,681,564 06/01/2020 HSBC Bank Plc 1 (155,639) (0.01)
US$ 7,667,732 EGP 132,000,000 23/03/2020 HSBC Bank Plc 1 (445,958) (0.01)
US$ 28,790,563 CNY 202,058,991 23/03/2020 HSBC Bank Plc 1 (167,259) (0.01)
US$ 27,145,866 € 24,408,954 06/01/2020 JPMorgan Chase Bank 2 (258,310) (0.01)
US$ 1,747,347 KRW 2,032,146,552 14/01/2020 JPMorgan Chase Bank 1 (13,280) (0.00)
US$ 22,781,951 € 20,307,743 05/02/2020 JPMorgan Chase Bank 1 (61,764) (0.00)
US$ 11,843,685 CLP 8,994,855,395 18/03/2020 JPMorgan Chase Bank 2 (127,906) (0.00)
US$ 8,428,594 ZAR 128,758,012 06/02/2020 Morgan Stanley 1 (736,813) (0.02)
US$ 32,397,696 € 29,053,307 06/01/2020 Morgan Stanley 2 (220,741) (0.01)
US$ 3,845,558 IDR 54,559,623,935 22/01/2020 Morgan Stanley 1 (91,613) (0.00)
US$ 15,726,619 EGP 256,359,616 23/03/2020 Morgan Stanley 1 (31,127) (0.00)
US$ 4,017,085 PEN 13,589,798 18/03/2020 Morgan Stanley 1 (76,505) (0.00)

SCHEDULE OF INVESTMENTS FINANCIAL STATEMENTS
ANNUAL REPORT 2019 199
Neuberger Berman Emerging Market Debt - Local Currency Fund (Continued)
Schedule of Investments (Continued)
Financial Liabilities at Fair Value through Profit or Loss (continued) Forward Currency Contracts (0.60%) (31 December 2018: (1.61%)) (continued)
Amount Receivable
Amount Payable
MaturityDate Counterparty Contracts Unrealised
Loss US$% of Net
Assets
US$ 3,622,300 TRY 24,278,069 07/10/2020 Standard Chartered Bank 1 (173,514) (0.01)
US$ 7,732,700 CLP 5,840,121,547 18/03/2020 Standard Chartered Bank 1 (40,138) (0.00)
US$ 37,375,549 € 33,576,593 06/01/2020 Standard Chartered Bank 5 (321,227) (0.01)
US$ 6,258,846 IDR 87,580,028,447 22/01/2020 Standard Chartered Bank 1 (61,167) (0.00)
US$ 706,565 MYR 2,950,476 09/01/2020 Standard Chartered Bank 1 (15,037) (0.00)
US$ 5,854,061 MYR 24,418,459 28/01/2020 Standard Chartered Bank 1 (125,281) (0.00)
US$ 92,484,261 MXN 1,795,001,038 05/02/2020 Standard Chartered Bank 1 (2,079,213) (0.07)
US$ 5,751,273 BRL 24,445,786 04/02/2020 State Street Bank and Trust and Co 1 (319,137) (0.01)
US$ 32,638,345 MXN 633,432,575 05/02/2020 State Street Bank and Trust and Co 3 (731,879) (0.02)
US$ 10,087,066 € 9,081,854 06/01/2020 State Street Bank and Trust and Co 1 (109,223) (0.00)
US$ 8,444,093 BRL 34,059,248 22/01/2020 State Street Bank and Trust and Co 1 (17,275) (0.00)
US$ 6,400,036 € 5,761,719 06/01/2020 UBS AG 1 (68,702) (0.00)
UYU 180,000,000 US$ 4,806,409 19/10/2020 JPMorgan Chase Bank 1 (755,092) (0.02)
AUD Hedged Classes US$ 1,943,676 AUD 2,853,492 21/02/2020 Goldman Sachs International 7 (64,630) (0.00)
US$ 1,612,026 AUD 2,347,051 21/02/2020 Westpac Banking Corp 34 (39,843) (0.00)
EUR Hedged Classes US$ 1,428,327 € 1,289,634 21/02/2020 Goldman Sachs International 5 (23,749) (0.00)
US$ 13,495,080 € 12,126,628 21/02/2020 Westpac Banking Corp 24 (159,020) (0.01)
GBP Hedged Classes £ 749 US$ 1,001 21/02/2020 Westpac Banking Corp 1 (7) (0.00)
US$ 1,282 £ 993 21/02/2020 Goldman Sachs International 2 (35) (0.00)
SEK Hedged Classes SEK 24,795 US$ 2,667 21/02/2020 Goldman Sachs International 1 (12) (0.00)
SEK 14,095,065 US$ 1,516,508 21/02/2020 UBS AG 1 (7,194) (0.00)
SEK 7,583,054 US$ 812,374 21/02/2020 Westpac Banking Corp 3 (373) (0.00)
US$ 116,295,263 SEK 1,119,083,077 21/02/2020 Goldman Sachs International 3 (3,537,335) (0.11)
SGD Hedged Classes SGD 2,678 US$ 1,993 21/02/2020 Westpac Banking Corp 1 (0) (0.00)
US$ 284,478 SGD 386,995 21/02/2020 Goldman Sachs International 6 (3,446) (0.00)
US$ 653,394 SGD 890,267 21/02/2020 Westpac Banking Corp 12 (8,961) (0.00)
ZAR Hedged Classes US$ 4,598,799 ZAR 68,459,336 21/02/2020 Goldman Sachs International 6 (265,098) (0.01)
US$ 4,584,939 ZAR 67,616,566 21/02/2020 Westpac Banking Corp 29 (219,080) (0.01)
ZAR 289,382 US$ 20,565 21/02/2020 Westpac Banking Corp 1 (5) (0.00)
Total Unrealised Loss on Forward Currency Contracts ∞ (19,188,088) (0.60)

FINANCIAL STATEMENTS SCHEDULE OF INVESTMENTS
200 NEUBERGER BERMAN INVESTMENT FUNDS PLC
Neuberger Berman Emerging Market Debt - Local Currency Fund (Continued)
Schedule of Investments (Continued)
Financial Liabilities at Fair Value through Profit or Loss (continued)
Credit Default Swap Contracts (0.30%) (31 December 2018: (0.07%))
Notional Amount Expiration Date Counterparty Referenced Obligation Fair Value US$
% of Net Assets
USD 17,296,113 20/06/23 JPMorgan Chase Bank Selling default protection on Argentine Republic Government International Bond, Senior Securities (9,456,177) (0.30)
Total Credit Default Swap Contracts at Fair Value ∞ (9,456,177) (0.30)
Interest Rate Swap Contracts (0.28%) (31 December 2018: (0.85%))
Notional Amount Expiration Date Counterparty Receive /(Pay)# Fixed Rate Variable Rate Fair Value US$
% of Net Assets
HUF 800,000,000 12/09/24 LCH Clearnet Ltd¹ (Pay) 0.81% 6M BUBOR± (8,925) 0.00
HUF 3,750,000,000 20/04/20 JPMorgan Chase Bank Receive 0.69% 6M BUBOR∞ (16,969) 0.00
MXN 424,177,706 10/09/29 Chicago Mercantile Exchange¹ Receive 6.82% 28D MXIBTIIE± (18,720) 0.00
CNY 230,760,000 05/07/24 LCH Clearnet Ltd¹ (Pay) 2.75% 7D CNRR007± (33,931) 0.00
HUF 650,000,000 06/04/22 JPMorgan Chase Bank Receive 1.30% 6M BUBOR∞ (38,747) 0.00
MXN 34,061,309 08/12/25 Goldman Sachs International (Pay) 6.21% 28D MXIBTIIE∞ (42,559) 0.00
ZAR 200,000,000 18/07/29 LCH Clearnet Ltd¹ (Pay) 8.49% 3M JIBAR± (59,612) 0.00
HUF 1,341,938,309 17/06/21 JPMorgan Chase Bank Receive 1.38% 6M BUBOR∞ (65,618) 0.00
MXN 95,000,000 16/09/26 Goldman Sachs International (Pay) 6.38% 28D MXIBTIIE∞ (92,923) 0.00
MXN 90,000,000 21/05/26 JPMorgan Chase Bank (Pay) 6.33% 28D MXIBTIIE∞ (93,607) 0.00
MXN 111,287,626 12/09/22 Goldman Sachs International (Pay) 5.90% 28D MXIBTIIE∞ (104,044) 0.00
HUF 2,125,441,486 06/11/29 LCH Clearnet Ltd¹ (Pay) 1.86% 6M BUBOR± (109,388) 0.00
MXN 215,918,365 20/08/29 Chicago Mercantile Exchange¹ Receive 6.94% 28D MXIBTIIE± (113,550) 0.00
MXN 76,391,828 28/05/26 JPMorgan Chase Bank (Pay) 6.16% 28D MXIBTIIE∞ (116,810) 0.00
MXN 75,000,000 18/06/26 JPMorgan Chase Bank (Pay) 6.13% 28D MXIBTIIE∞ (122,494) 0.00
MXN 60,000,000 08/04/26 Goldman Sachs International (Pay) 5.95% 28D MXIBTIIE∞ (123,940) 0.00
CZK 1,000,000,000 03/10/21 LCH Clearnet Ltd¹ (Pay) 2.10% 6M PRIBOR± (128,578) 0.00
MXN 94,552,835 05/03/26 Goldman Sachs International (Pay) 6.17% 28D MXIBTIIE∞ (135,921) 0.00
CLP 29,571,205,266 12/12/21 Chicago Mercantile Exchange¹ Receive 1.96% 1D CLICP± (162,623) (0.01)
CZK 1,800,000,000 18/11/21 LCH Clearnet Ltd¹ (Pay) 2.14% 6M PRIBOR± (193,509) (0.01)
COP 19,533,769,466 15/05/29 Chicago Mercantile Exchange¹ Receive 5.93% 1D COOVIBR± (215,963) (0.01)
COP 25,311,850,539 03/04/29 Chicago Mercantile Exchange¹ Receive 5.81% 1D COOVIBR± (216,630) (0.01)
CZK 1,811,903,478 30/09/21 LCH Clearnet Ltd¹ (Pay) 2.10% 6M PRIBOR± (230,251) (0.01)
MXN 512,441,055 31/08/29 Chicago Mercantile Exchange¹ Receive 6.92% 28D MXIBTIIE± (231,996) (0.01)
HUF 5,350,802,515 09/01/22 Goldman Sachs International Receive 1.27% 6M BUBOR∞ (289,415) (0.01)
CZK 2,000,000,000 30/09/21 LCH Clearnet Ltd¹ (Pay) 2.07% 6M PRIBOR± (299,622) (0.01)
COP 33,466,230,534 15/05/29 Chicago Mercantile Exchange¹ Receive 5.92% 1D COOVIBR± (358,457) (0.01)
PLN 221,000,000 25/03/24 LCH Clearnet Ltd¹ Receive 1.99% 6M WIBOR± (509,157) (0.02)
MXN 1,273,650,830 28/01/21 Chicago Mercantile Exchange¹ Receive 8.09% 28D MXIBTIIE± (771,619) (0.03)
MXN 1,303,270,616 28/01/21 Chicago Mercantile Exchange¹ Receive 8.15% 28D MXIBTIIE± (826,368) (0.03)BRL 783,878,336 02/01/20 Chicago Mercantile Exchange¹ Receive 7.45% 1D BROIS± (3,368,126) (0.11)
Total Interest Rate Swap Contracts at Fair Value (9,100,072) (0.28)

SCHEDULE OF INVESTMENTS FINANCIAL STATEMENTS
ANNUAL REPORT 2019 201
Neuberger Berman Emerging Market Debt - Local Currency Fund (Continued)
Schedule of Investments (Continued)
Financial Liabilities at Fair Value through Profit or Loss (continued) # Receive - Funds receives variable rate and pays fixed rate. (Pay) - Fund pays variable rate and receives fixed rate. 1 Centrally cleared swap. Cross Currency Swap Contracts (0.05%) (31 December 2018: (0.39%))
Counterparty Fund Pays on Notional Amount
Rate Paid by the Fund
Fund Receives on NotionalAmount
Rate Receivedby the Fund
Maturity Date
Fair ValueUS$
% of Net Assets
JPMorgan Chase Bank TRY 209,700,000 Fixed rate of 12.90% US$ 36,789,474 Floating rate based
on 3M LIBOR07/10/25 (1,600,099) (0.05)
Total Cross Currency Swap Contracts at Fair Value ∞ (1,600,099) (0.05)
Fair ValueUS$
% of NetAssets
Total Financial Liabilities at Fair Value through Profit or Loss (39,344,436) (1.23)
Net Financial Assets at Fair Value through Profit or Loss 3,101,575,488 96.81
Other Net Assets 102,126,312 3.19
Net Assets Attributable to Holders of Redeemable Participating Shares 3,203,701,800 100.00
% ofTotal
AssetsPortfolio Analysis US$
* Transferable securities and/or money market instruments admitted to an official stock exchange listing 2,541,327,855 77.27
** Transferable securities and/or money market instruments dealt in on a regulated market 463,220,645 14.08
† Other transferable securities and/or money market instruments 724,210 0.02
μ Investment funds 25,786,800 0.78
± Financial derivative instruments traded on a regulated market 9,399,473 0.29
∞ OTC financial derivative instruments 61,116,505 1.86
Total Investments 3,101,575,488 94.30

FINANCIAL STATEMENTS STATEMENT OF SIGNIFICANT PURCHASES AND SALES
202 NEUBERGER BERMAN INVESTMENT FUNDS PLC
Neuberger Berman Emerging Market Debt - Local Currency Fund (Continued) Statement of Significant Purchases and Sales (Unaudited) In accordance with the European Communities (Undertakings for Collective Investment in Transferable Securities) Regulations, 2011 as amended, a statement of changes in the composition of the Schedule of Investments during the reporting period is provided to ensure that Shareholders can identify changes in the investments held by the Portfolio. The following statements present the aggregate purchases and sales of transferable securities exceeding one percent of the total value of purchases or sales, respectively, for the period. At a minimum, the largest twenty purchases and twenty sales are presented, if available.
Aggregate purchases greater than one percent of the total value of purchases:
Units Security Description Cost US$
180,000,000 United States Treasury Bill, 0.00%, 19/09/2019 178,737,728
2,387,350,000 Thailand Government Bond, 2.88%, 17/12/2028 79,669,843
1,287,299,800 Mexican Bonos, 7.50%, 03/06/2027 65,768,568
4,300,857,000 Russian Federal Bond - OFZ, 7.25%, 10/05/2034 63,285,233
989,586,248 Republic of South Africa Government Bond, 8.25%, 31/03/2032 63,051,707
16,742,480,000 Hungary Government Bond, 2.50%, 24/10/2024 60,880,038
4,264,926,000 Russian Federal Bond - OFZ, 6.90%, 23/05/2029 60,223,400
50,000,000 United States Treasury Bill, 0.00%, 12/09/2019 49,581,334
2,944,066,000 Russian Federal Bond - OFZ, 7.95%, 07/10/2026 45,447,057
45,364,800 United States Treasury Bill, 0.00%, 07/05/2020 45,024,030
749,440,000 Mexican Bonos, 10.00%, 05/12/2024 43,612,124
674,433,676 Republic of South Africa Government Bond, 9.00%, 31/01/2040 43,400,675
1,201,059,000 Thailand Government Bond, 3.30%, 17/06/2038 41,036,644
2,711,041,000 Russian Federal Bond - OFZ, 7.00%, 16/08/2023 39,794,617
151,825,000 Malaysia Government Bond, 4.64%, 07/11/2033 38,800,389
10,598,660,000 Hungary Government Bond, 3.00%, 27/10/2027 38,084,810
818,510,000 Czech Republic Government Bond, 2.40%, 17/09/2025 37,258,498
1,111,000,000 Thailand Government Bond, 2.40%, 17/12/2023 37,202,161
1,120,870,000 Thailand Government Bond, 1.45%, 17/12/2024 37,186,519
498,959,000,000 Indonesia Treasury Bond, 8.38%, 15/04/2039 35,455,267
633,910,000 Mexican Bonos, 8.50%, 31/05/2029 35,275,668
710,940,000 Czech Republic Government Bond, 2.75%, 23/07/2029 33,869,686
92,888,700,000 Colombian TES, 7.75%, 18/09/2030 31,262,687
30,524,500 United States Treasury Bill, 0.00%, 12/12/2019 30,389,887
5,801,101,900 Mexico Cetes, 0.00%, 23/01/2020 29,789,917
81,878,000 Peruvian Government International Bond, 6.95%, 12/08/2031 28,796,284
18,140,000,000 Bonos de la Tesoreria de la Republica en pesos, 4.70%, 01/09/2030 27,520,372
345,551,154 Republic of South Africa Government Bond, 10.50%, 21/12/2026 27,089,909
407,001,000 Egypt Government International Bond, 14.22%, 15/10/2026 26,097,173
2,470,000 Neuberger Berman China Bond Fund 25,219,800
104,070,000 Malaysia Government Bond, 3.49%, 31/03/2020 25,210,179
100,750,000 Malaysia Government Bond, 3.65%, 31/10/2019 24,554,172
1,595,425,000 Russian Federal Bond - OFZ, 7.75%, 16/09/2026 24,503,543

STATEMENT OF SIGNIFICANT PURCHASES AND SALES FINANCIAL STATEMENTS
ANNUAL REPORT 2019 203
Neuberger Berman Emerging Market Debt - Local Currency Fund (Continued) Statement of Significant Purchases and Sales (Unaudited) (Continued) Aggregate purchases greater than one percent of the total value of purchases (continued): Units Security Description Cost US$
91,010,000 Romania Government Bond, 5.80%, 26/07/2027 23,215,834
128,036,808 Turkey Government Bond, 16.20%, 14/06/2023 22,883,708
373,418,000 Egypt Government Bond, 15.90%, 02/07/2024 22,698,597
7,785,324,000 Nigeria Government Bond, 13.98%, 23/02/2028 21,734,557
542,770,000 Czech Republic Government Bond, 0.95%, 15/05/2030 21,315,607
88,125,000 Romania Government Bond, 4.85%, 22/04/2026 21,192,792

FINANCIAL STATEMENTS STATEMENT OF SIGNIFICANT PURCHASES AND SALES
204 NEUBERGER BERMAN INVESTMENT FUNDS PLC
Neuberger Berman Emerging Market Debt - Local Currency Fund (Continued) Statement of Significant Purchases and Sales (Unaudited) (Continued) Aggregate sales greater than one percent of the total value of sales:
Units Security Description Proceeds US$
140,000,000 United States Treasury Bill, 0.00%, 19/09/2019 139,233,525
1,571,500,000 Czech Republic Government Bond, 0.00%, 17/07/2019 69,451,483
4,490,483,000 Russian Federal Bond - OFZ, 7.75%, 16/09/2026 68,407,921
1,715,300,000 Thailand Government Bond, 2.88%, 17/12/2028 62,410,969
16,742,480,000 Hungary Government Bond, 2.50%, 24/10/2024 59,785,648
846,428,424 Republic of South Africa Government Bond, 8.75%, 28/02/2048 53,598,362
144,344,400,000 Colombian TES, 10.00%, 24/07/2024 50,488,189
50,000,000 United States Treasury Bill, 0.00%, 12/09/2019 49,615,025
1,088,180,000 Czech Republic Government Bond, 1.50%, 29/10/2019 47,985,167
183,930,000 Romania Government Bond, 4.25%, 28/06/2023 43,928,205
505,325,491 Republic of South Africa Government Bond, 10.50%, 21/12/2026 39,329,215
125,483,000 Republic of Poland Government Bond, 2.75%, 25/04/2028 32,678,806
2,100,000,000 Russian Federal Bond - OFZ, 7.25%, 10/05/2034 32,463,070
1,989,861,000 Russian Federal Bond - OFZ, 6.90%, 23/05/2029 31,830,966
615,290,000 Mexican Bonos, 6.50%, 09/06/2022 31,056,606
460,964,066 Republic of South Africa Government Bond, 8.88%, 28/02/2035 30,105,750
7,718,190,000 Hungary Government Bond, 3.00%, 27/10/2027 28,321,415
79,255,400,000 Colombian TES, 7.00%, 04/05/2022 24,665,426
7,785,324,000 Nigeria Government Bond, 13.98%, 23/02/2028 22,282,857
68,651,700,000 Colombian TES, 6.25%, 26/11/2025 22,130,089
109,905,753 Turkey Government Bond, 16.20%, 14/06/2023 21,983,751
344,793,863 Republic of South Africa Government Bond, 8.25%, 31/03/2032 21,211,000
635,355,000 Thailand Government Bond, 3.88%, 13/06/2019 20,118,122
260,000,000,000 Indonesia Treasury Bond, 8.38%, 15/04/2039 19,540,906
53,326,000 Peruvian Government International Bond, 6.95%, 12/08/2031 19,441,880
568,500,000 Thailand Government Bond, 2.40%, 17/12/2023 19,408,073
83,300,000 Romania Government Bond, 3.40%, 08/03/2022 19,407,332
496,500,000 Thailand Government Bond, 3.30%, 17/06/2038 18,689,103
65,700,000 Malaysia Government Bond, 4.64%, 07/11/2033 16,844,100
1,401,220,000 Serbia Treasury Bonds, 5.88%, 08/02/2028 15,926,259
7,335,000,000 Bonos de la Tesoreria de la Republica en pesos, 6.00%, 01/01/2043 14,852,262

INVESTMENT MANAGER’S REPORT FINANCIAL STATEMENTS
ANNUAL REPORT 2019 205
Neuberger Berman Emerging Market Debt - Hard Currency Fund Investment Manager’s Report For the 12 months ended 31 December 2019, the total return for the USD I Accumulating Class was 15.29%. Over the same period, the benchmark index, JPMorgan EMBI Global Diversified (USD Total Return) (the “Index”), returned 15.04%. (Performance for all share classes is provided in Appendix II. Performance data quoted represent past performance and do not indicate future results. Total returns shown are net of all fees and expenses and include reinvestment of income dividends and other distributions, if any).
Emerging markets debt posted strong gains in 2019 following a down year in 2018. The recovery was driven by spread compression as risk appetite returned to global markets in the first quarter. A sharp drop in US Treasury yields drove gains from March onwards as the market started to price in multiple rate cuts by the US Federal Reserve in 2019. The ongoing trade negotiations between the US and China contributed to market volatility throughout the year, however, this abated as the countries came to a “Phase 1” agreement in mid-December to support a year-end rally. Idiosyncratic country developments, such as in Argentina, Lebanon and Venezuela, did not cause an overall systemic risk for emerging markets (“EM”). Index spreads tightened from 415 basis points to 291 basis points while US Treasury yields ended the year at 1.92% down from 2.68% at the start of the year and up from 1.46% at their bottom in early September. The index yield to maturity ended 2019 at 4.93%, down from 6.86% at year-end 2018.
The best performer was Ukraine, which saw a strong, reform-oriented administration take office following presidential and parliamentary elections amid strengthening growth, the development of the local bond market improving financing opportunities and lower debt ratios. Next in line was Senegal, where the authorities agreed with the International Monetary Fund’s new unfunded 3-year plan that will anchor fiscal and governance reforms while growth remains high on the back of investments in the hydrocarbon sector ahead of commercial production in 2020. The worst performer was Venezuela, which remained in a political and economic crisis, while sovereign and the state-owned oil company PDVSA bonds were taken out of the Index as a result of impaired liquidity under US sanctions.
The Portfolio outperformed the Index, driven mainly by security selection and to a lesser extent country allocation. Top down positioning contributed negatively. In country selection, our absence from Lebanon, where widespread protests and political uncertainty complicated concerns over deposit outflows and debt sustainability, and an overweight in Ukraine contributed the most. Our overweight in Argentina, whose bonds and currency took a big hit after the populist win in the August primary and ultimately the presidential election, was the main detractor. In security selection, our positioning in Brazil contributed the most.
As we entered 2020, we had been seeing increasing signs that economic activity is bottoming out following last year’s slowdown, on the back of the lagged effects of global monetary policy easing and improved sentiment post the ‘Phase 1’ trade deal between the US and China. In the coming months though, the fallout from the Covid-19 virus will likely result in a severe short-term dip in global growth due to the substantial demand and supply side disruptions globally. Our base case is for a recovery in economic activity later in the year, assuming containment of the virus and strong policy support from governments and central banks globally.
We see market technicals as challenging due to potential outflows from the asset class, partly offset by net issuance that is expected to remain low in 2020. As for valuations, spreads in EM hard currency sovereigns have become more compelling after the recent widening and continue to provide an attractive risk premium relative to developed market credits in our view.

FINANCIAL STATEMENTS BALANCE SHEET
The accompanying notes form an integral part of the financial statements.
206 NEUBERGER BERMAN INVESTMENT FUNDS PLC
Neuberger Berman Emerging Market Debt - Hard Currency Fund (Continued) Balance Sheet
As at31 December 2019
US$
As at31 December 2018
US$ Note
Current Assets
Financial Assets at Fair Value through Profit or Loss 2 2,306,827,138 1,358,429,292
Cash and cash equivalents 3 168,014,510 95,120,326
Receivable for investments sold – 2,691,206
Receivable for shares issued 10,415,933 3,087,953
Due from brokers 7,276,747 1,515,083
Income receivable and other assets 37,747,438 25,760,430
Total Assets 2,530,281,766 1,486,604,290
Current Liabilities
Financial Liabilities at Fair Value through Profit or Loss 2 8,622,191 1,887,561
Bank overdraft 4 3,591 3,480
Payable for shares redeemed 13,414,218 2,409,384
Accrued expenses 2,163,917 2,361,111
Payable for investments purchased 1,982,758 –
Other payables 82,762 109,495
Liabilities (excluding Net Assets Attributable to Holders of Redeemable Participating Shares) 26,269,437 6,771,031
Net Assets Attributable to Holders of Redeemable Participating Shares 2,504,012,329 1,479,833,259

PROFIT AND LOSS ACCOUNT FINANCIAL STATEMENTS
The accompanying notes form an integral part of the financial statements.
ANNUAL REPORT 2019 207
Neuberger Berman Emerging Market Debt - Hard Currency Fund (Continued) Profit and Loss Account
Year Ended31 December 2019
US$
Year Ended31 December 2018
US$ Note
Income
Interest Income 108,105,072 70,218,200
Miscellaneous Income – 1,020
Net Gain/(Loss) on Financial Assets and Liabilities at Fair Value through Profit or Loss 11 133,476,925 (188,811,780)
241,581,997 (118,592,560)
Expenses
Management Fee 6 16,006,570 10,519,341
Distribution Fee 6 559,168 290,075
Administration Fee 6 2,139,900 1,509,690
Commitment Fee 19 262,673 95,954
Custody Fee 6 185,617 124,708
Depositary Fee 6 200,205 133,907
Professional Fee 9 131,553 211,104
Directors' Fee 7 4,563 7,632
Transaction Costs 9 186,941 177,150
Audit Fee 8 27,600 19,952
VAT Rebate (31,741) (16,124)
Other Expenses 9 23,685 50,236
Total Expenses 19,696,734 13,123,625
Finance Costs
Interest Expense – 34,366
Distribution Paid 1 24,725,932 13,100,619
24,725,932 13,134,985
Withholding Tax 1 15,574 3,890
Profit/(Loss) Attributable to Holders of Redeemable Participating Shares from Operations 197,143,757 (144,855,060)
Income and expenses arose solely from continuing operations.

FINANCIAL STATEMENTS STATEMENT OF CHANGES IN NET ASSETS
The accompanying notes form an integral part of the financial statements.
208 NEUBERGER BERMAN INVESTMENT FUNDS PLC
Neuberger Berman Emerging Market Debt - Hard Currency Fund (Continued) Statement of Changes in Net Assets Attributable to Holders of Redeemable Participating Shares
Year Ended31 December 2019
US$
Year Ended31 December 2018
US$ Note
Net Assets Attributable to Holders of Redeemable Participating Shares at beginning of year 1,479,833,259 975,348,673
Profit/(Loss) Attributable to Holders of Redeemable Participating Shares from Operations 197,143,757 (144,855,060)
Subscriptions 5 1,942,809,164 1,110,237,365
Redemptions 5 (1,115,773,851) (460,897,719)
Net Assets Attributable to Holders of Redeemable Participating Shares at end of year 2,504,012,329 1,479,833,259

SCHEDULE OF INVESTMENTS FINANCIAL STATEMENTS
ANNUAL REPORT 2019 209
Neuberger Berman Emerging Market Debt - Hard Currency Fund (Continued)
Schedule of Investments
Financial Assets at Fair Value through Profit or Loss
Principal Amount Security Description Coupon Maturity
DateFair Value
US$% of Net
Assets
Treasury Bills 0.88% (31 December 2018: 0.00%)
United States Dollar 22,000,000 United States Treasury Bill 0.00% 13/02/2020 21,961,949 0.88
Total Treasury Bills ** 21,961,949 0.88
Corporate Bonds 29.55% (31 December 2018: 28.26%)
Euro 5,921,000 NAK Naftogaz Ukraine via Kondor Finance Plc* 7.13% 19/07/2024 7,107,411 0.29
5,859,000 Perusahaan Listrik Negara PT* 1.88% 05/11/2031 6,556,175 0.26
Total Euro 13,663,586 0.55
United States Dollar 7,200,000 1MDB Energy Ltd** 5.99% 11/05/2022 7,603,658 0.30
20,000,000 1MDB Global Investments Ltd† 4.40% 09/03/2023 19,447,337 0.78
11,752,000 Abu Dhabi Crude Oil Pipeline LLC* 3.65% 02/11/2029 12,659,795 0.51
11,827,000 Abu Dhabi Crude Oil Pipeline LLC* 4.60% 02/11/2047 13,632,922 0.54
2,208,000 Aeropuerto Internacional de Tocumen SA* 6.00% 18/11/2048 2,742,767 0.11
3,078,000 African Export-Import Bank* 3.99% 21/09/2029 3,116,385 0.12
891,000 Alibaba Group Holding Ltd* 4.20% 06/12/2047 988,381 0.04
3,108,000 Banco de Credito e Inversiones SA* 3.50% 12/10/2027 3,178,939 0.13
667,000 Banco Nacional de Comercio Exterior SNC* 3.80% 11/08/2026 676,410 0.03
5,546,000 Banque Ouest Africaine de Developpement* 4.70% 22/10/2031 5,617,532 0.22
5,045,000 Banque Ouest Africaine de Developpement* 5.00% 27/07/2027 5,353,568 0.21
1,122,715 Brazil Loan Trust 1* 5.48% 24/07/2023 1,169,038 0.05
8,343,000 Brazil Minas SPE via State of Minas Gerais† 5.33% 15/02/2028 8,967,536 0.36
1,876,000 Cable Onda SA† 4.50% 30/01/2030 1,978,899 0.08
2,480,000 Cemex SAB de CV* 7.75% 16/04/2026 2,701,588 0.11
4,626,000 Cencosud SA* 4.38% 17/07/2027 4,569,066 0.18
2,036,000 Charming Light Investments Ltd* 3.08% 21/12/2020 2,041,382 0.08
3,459,000 Charming Light Investments Ltd* 4.38% 21/12/2027 3,694,849 0.15
227,000 China Huadian Overseas Development Management Co Ltd* 4.00% 29/12/2049 233,843 0.01
13,913,000 China Minmetals Corp* 3.75% 29/12/2049 14,110,021 0.56
2,640,000 China Minmetals Corp* 4.45% 29/12/2049 2,687,613 0.11
600,000 Chinalco Capital Holdings Ltd* 4.00% 25/08/2021 606,001 0.02
1,743,000 Chinalco Capital Holdings Ltd* 4.10% 29/12/2049 1,767,140 0.07
4,666,000 Chinalco Capital Holdings Ltd* 4.25% 21/04/2022 4,735,986 0.19
4,471,000 CNAC HK Finbridge Co Ltd* 3.38% 19/06/2024 4,541,287 0.18
1,198,000 CNAC HK Finbridge Co Ltd* 4.63% 14/03/2023 1,259,528 0.05
6,580,000 CNAC HK Finbridge Co Ltd* 5.13% 14/03/2028 7,392,824 0.30
2,649,000 Comision Federal de Electricidad* 4.75% 23/02/2027 2,802,264 0.11

FINANCIAL STATEMENTS SCHEDULE OF INVESTMENTS
210 NEUBERGER BERMAN INVESTMENT FUNDS PLC
Neuberger Berman Emerging Market Debt - Hard Currency Fund (Continued)
Schedule of Investments (Continued)
Financial Assets at Fair Value through Profit or Loss (continued)
Principal Amount Security Description Coupon Maturity
DateFair Value
US$% of Net
Assets
Corporate Bonds 29.55% (31 December 2018: 28.26%) (continued)
United States Dollar (continued) 323,000 Comunicaciones Celulares SA Via Comcel Trust* 6.88% 06/02/2024 331,752 0.01
5,323,000 Corp Nacional del Cobre de Chile* 3.00% 30/09/2029 5,250,843 0.21
1,973,000 Corp Nacional del Cobre de Chile* 4.38% 05/02/2049 2,131,235 0.09
150,000 Corp Nacional del Cobre de Chile* 6.15% 24/10/2036 200,956 0.01
4,264,000 CSN Resources SA† 7.63% 13/02/2023 4,554,357 0.18
4,688,000 CSN Resources SA† 7.63% 17/04/2026 5,001,369 0.20
2,693,000 Dianjian Haiyu Ltd* 4.30% 29/12/2049 2,753,592 0.11
2,867,000 Dianjian International Finance Ltd* 4.60% 29/12/2049 2,964,818 0.12
4,664,000 DP World Crescent Ltd* 3.88% 18/07/2029 4,783,537 0.19
3,949,000 Eastern & Southern African Trade & Development Bank* 4.88% 23/05/2024 4,121,574 0.16
7,555,000 Empresa de Transmision Electrica SA* 5.13% 02/05/2049 8,619,839 0.34
599,000 Empresa Nacional del Petroleo† 3.75% 05/08/2026 614,095 0.02
1,925,000 Empresa Nacional del Petroleo* 4.38% 30/10/2024 2,031,182 0.08
2,231,000 Empresa Nacional del Petroleo† 4.50% 14/09/2047 2,282,927 0.09
1,340,000 Empresa Nacional del Petroleo – Private Placement† 4.50% 14/09/2047 1,367,164 0.05
2,130,000 Empresa Nacional del Petroleo* 5.25% 06/11/2029 2,391,571 0.10
6,270,000 Eskom Holdings SOC Ltd* 5.75% 26/01/2021 6,297,104 0.25
5,471,000 Eskom Holdings SOC Ltd* 6.35% 10/08/2028 5,879,822 0.24
1,040,000 Eskom Holdings SOC Ltd* 6.75% 06/08/2023 1,062,015 0.04
6,044,000 Eskom Holdings SOC Ltd* 7.13% 11/02/2025 6,191,190 0.25
10,190,000 Gazprom PJSC Via Gaz Capital SA* 5.15% 11/02/2026 11,344,690 0.45
2,120,000 GTH Finance BV* 6.25% 26/04/2020 2,127,610 0.09
7,672,000 Gtlk Europe Capital DAC* 4.95% 18/02/2026 7,937,141 0.32
1,610,000 GTLK Europe DAC* 5.95% 19/07/2021 1,681,236 0.07
5,210,000 Hanwha Life Insurance Co Ltd* 4.70% 29/12/2049 5,320,194 0.21
2,423,000 HBIS Group Hong Kong Co Ltd* 4.25% 07/04/2020 2,419,865 0.10
7,000,000 Huarong Finance 2017 Co Ltd* 4.50% 29/12/2049 7,123,053 0.28
1,685,000 IHS Netherlands Holdco BV* 8.00% 18/09/2027 1,793,278 0.07
2,872,000 Industrias Penoles SAB de CV† 5.65% 12/09/2049 3,071,647 0.12
3,665,000 JBS Investments II GmbH* 5.75% 15/01/2028 3,871,523 0.15
1,866,000 Kallpa Generacion SA* 4.13% 16/08/2027 1,906,320 0.08
3,868,000 KazMunayGas National Co JSC* 4.75% 24/04/2025 4,243,359 0.17
10,077,000 KazMunayGas National Co JSC* 5.38% 24/04/2030 11,675,680 0.47
18,547,000 KazMunayGas National Co JSC* 5.75% 19/04/2047 22,084,000 0.88
9,134,000 KazMunayGas National Co JSC* 6.38% 24/10/2048 11,698,326 0.47
1,323,000 Leader Goal International Ltd* 4.25% 29/12/2049 1,353,583 0.05
6,834,000 Liquid Telecommunications Financing Plc* 8.50% 13/07/2022 6,960,867 0.28
8,883,000 MDGH - GMTN BV* 3.70% 07/11/2049 9,196,817 0.37
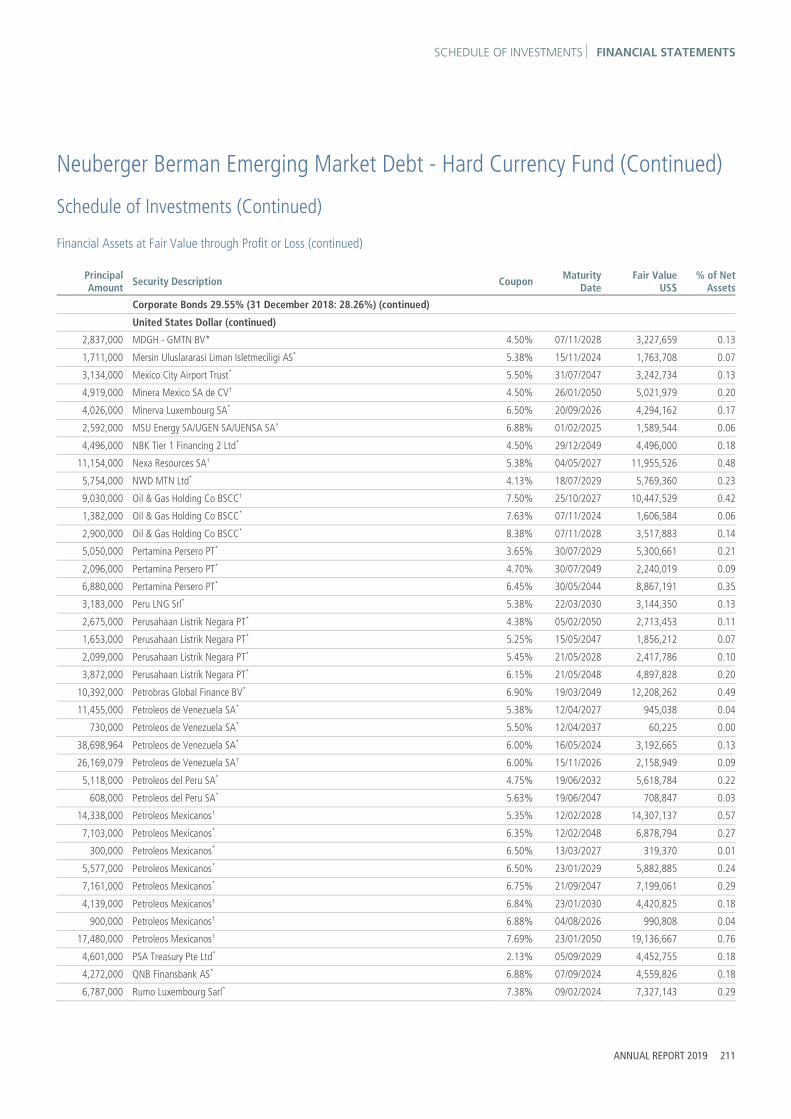
SCHEDULE OF INVESTMENTS FINANCIAL STATEMENTS
ANNUAL REPORT 2019 211
Neuberger Berman Emerging Market Debt - Hard Currency Fund (Continued)
Schedule of Investments (Continued)
Financial Assets at Fair Value through Profit or Loss (continued)
Principal Amount Security Description Coupon Maturity
DateFair Value
US$% of Net
Assets
Corporate Bonds 29.55% (31 December 2018: 28.26%) (continued)
United States Dollar (continued) 2,837,000 MDGH - GMTN BV* 4.50% 07/11/2028 3,227,659 0.13
1,711,000 Mersin Uluslararasi Liman Isletmeciligi AS* 5.38% 15/11/2024 1,763,708 0.07
3,134,000 Mexico City Airport Trust* 5.50% 31/07/2047 3,242,734 0.13
4,919,000 Minera Mexico SA de CV† 4.50% 26/01/2050 5,021,979 0.20
4,026,000 Minerva Luxembourg SA* 6.50% 20/09/2026 4,294,162 0.17
2,592,000 MSU Energy SA/UGEN SA/UENSA SA† 6.88% 01/02/2025 1,589,544 0.06
4,496,000 NBK Tier 1 Financing 2 Ltd* 4.50% 29/12/2049 4,496,000 0.18
11,154,000 Nexa Resources SA† 5.38% 04/05/2027 11,955,526 0.48
5,754,000 NWD MTN Ltd* 4.13% 18/07/2029 5,769,360 0.23
9,030,000 Oil & Gas Holding Co BSCC† 7.50% 25/10/2027 10,447,529 0.42
1,382,000 Oil & Gas Holding Co BSCC* 7.63% 07/11/2024 1,606,584 0.06
2,900,000 Oil & Gas Holding Co BSCC* 8.38% 07/11/2028 3,517,883 0.14
5,050,000 Pertamina Persero PT* 3.65% 30/07/2029 5,300,661 0.21
2,096,000 Pertamina Persero PT* 4.70% 30/07/2049 2,240,019 0.09
6,880,000 Pertamina Persero PT* 6.45% 30/05/2044 8,867,191 0.35
3,183,000 Peru LNG Srl* 5.38% 22/03/2030 3,144,350 0.13
2,675,000 Perusahaan Listrik Negara PT* 4.38% 05/02/2050 2,713,453 0.11
1,653,000 Perusahaan Listrik Negara PT* 5.25% 15/05/2047 1,856,212 0.07
2,099,000 Perusahaan Listrik Negara PT* 5.45% 21/05/2028 2,417,786 0.10
3,872,000 Perusahaan Listrik Negara PT* 6.15% 21/05/2048 4,897,828 0.20
10,392,000 Petrobras Global Finance BV* 6.90% 19/03/2049 12,208,262 0.49
11,455,000 Petroleos de Venezuela SA* 5.38% 12/04/2027 945,038 0.04
730,000 Petroleos de Venezuela SA* 5.50% 12/04/2037 60,225 0.00
38,698,964 Petroleos de Venezuela SA* 6.00% 16/05/2024 3,192,665 0.13
26,169,079 Petroleos de Venezuela SA† 6.00% 15/11/2026 2,158,949 0.09
5,118,000 Petroleos del Peru SA* 4.75% 19/06/2032 5,618,784 0.22
608,000 Petroleos del Peru SA* 5.63% 19/06/2047 708,847 0.03
14,338,000 Petroleos Mexicanos† 5.35% 12/02/2028 14,307,137 0.57
7,103,000 Petroleos Mexicanos* 6.35% 12/02/2048 6,878,794 0.27
300,000 Petroleos Mexicanos* 6.50% 13/03/2027 319,370 0.01
5,577,000 Petroleos Mexicanos* 6.50% 23/01/2029 5,882,885 0.24
7,161,000 Petroleos Mexicanos* 6.75% 21/09/2047 7,199,061 0.29
4,139,000 Petroleos Mexicanos† 6.84% 23/01/2030 4,420,825 0.18
900,000 Petroleos Mexicanos† 6.88% 04/08/2026 990,808 0.04
17,480,000 Petroleos Mexicanos† 7.69% 23/01/2050 19,136,667 0.76
4,601,000 PSA Treasury Pte Ltd* 2.13% 05/09/2029 4,452,755 0.18
4,272,000 QNB Finansbank AS* 6.88% 07/09/2024 4,559,826 0.18
6,787,000 Rumo Luxembourg Sarl* 7.38% 09/02/2024 7,327,143 0.29

FINANCIAL STATEMENTS SCHEDULE OF INVESTMENTS
212 NEUBERGER BERMAN INVESTMENT FUNDS PLC
Neuberger Berman Emerging Market Debt - Hard Currency Fund (Continued)
Schedule of Investments (Continued)
Financial Assets at Fair Value through Profit or Loss (continued)
Principal Amount Security Description Coupon Maturity
DateFair Value
US$% of Net
Assets
Corporate Bonds 29.55% (31 December 2018: 28.26%) (continued)
United States Dollar (continued) 2,560,000 Rusal Capital DAC* 5.13% 02/02/2022 2,629,436 0.11
2,466,000 SABIC Capital II BV* 4.00% 10/10/2023 2,598,854 0.10
7,781,000 Samba Funding Ltd* 2.75% 02/10/2024 7,719,323 0.31
2,230,000 Sasol Financing USA LLC* 5.88% 27/03/2024 2,414,293 0.10
25,194,000 Saudi Arabian Oil Co* 4.25% 16/04/2039 26,973,444 1.08
3,411,000 Saudi Electricity Global Sukuk Co 4* 4.22% 27/01/2024 3,625,579 0.15
2,962,000 Saudi Electricity Global Sukuk Co 4* 4.72% 27/09/2028 3,302,087 0.13
1,114,000 SCF Capital Designated Activity Co* 5.38% 16/06/2023 1,200,937 0.05
4,070,000 Sinopec Group Overseas Development 2015 Ltd* 3.25% 28/04/2025 4,201,332 0.17
4,475,000 Sinopec Group Overseas Development 2017 Ltd* 3.25% 13/09/2027 4,598,296 0.18
12,760,000 Sinopec Group Overseas Development 2018 Ltd* 2.50% 08/08/2024 12,817,311 0.51
46,222,000 Southern Gas Corridor CJSC* 6.88% 24/03/2026 54,910,026 2.19
20,647,000 State Oil Co of the Azerbaijan Republic* 4.75% 13/03/2023 21,720,864 0.87
13,241,000 State Oil Co of the Azerbaijan Republic* 6.95% 18/03/2030 16,207,015 0.65
3,439,000 Suzano Austria GmbH* 5.00% 15/01/2030 3,621,164 0.14
3,166,000 Suzano Austria GmbH* 6.00% 15/01/2029 3,578,680 0.14
4,196,000 Suzano Austria GmbH† 7.00% 16/03/2047 4,943,454 0.19
2,391,000 TC Ziraat Bankasi AS* 4.75% 29/04/2021 2,407,916 0.10
1,634,000 TC Ziraat Bankasi AS* 5.13% 03/05/2022 1,629,973 0.07
5,220,000 Trade & Development Bank of Mongolia LLC* 9.38% 19/05/2020 5,320,577 0.21
2,768,000 Tullow Oil Plc† 7.00% 01/03/2025 2,337,050 0.09
1,870,000 Turkiye Garanti Bankasi AS* 6.13% 24/05/2027 1,777,902 0.07
3,905,000 Turkiye Sise ve Cam Fabrikalari AS* 6.95% 14/03/2026 4,132,073 0.17
1,041,667 Ukreximbank Via Biz Finance Plc* 9.63% 27/04/2022 1,094,885 0.04
580,000 Ukreximbank Via Biz Finance Plc* 9.75% 22/01/2025 620,600 0.02
4,010,000 Vedanta Resources Ltd† 8.25% 07/06/2021 4,153,037 0.17
450,000 Vnesheconombank Via VEB Finance Plc* 6.80% 22/11/2025 538,042 0.02
6,930,000 Votorantim Cimentos International SA† 7.25% 05/04/2041 8,816,311 0.35
724,000 Yapi ve Kredi Bankasi AS* 5.85% 21/06/2024 713,671 0.03
2,000,000 ZAR Sovereign Capital Fund Propriety Ltd* 3.90% 24/06/2020 2,012,016 0.08
Total United States Dollar 726,271,047 29.00
Total Corporate Bonds 739,934,633 29.55
Government Bonds 60.29% (31 December 2018: 63.16%)
Euro 1,832,000 Albania Government International Bond* 3.50% 09/10/2025 2,249,319 0.09
1,980,000 Argentine Republic Government International Bond* 3.38% 15/01/2023 1,020,027 0.04
4,479,046 Argentine Republic Government International Bond** 3.38% 31/12/2038 2,242,166 0.09

SCHEDULE OF INVESTMENTS FINANCIAL STATEMENTS
ANNUAL REPORT 2019 213
Neuberger Berman Emerging Market Debt - Hard Currency Fund (Continued)
Schedule of Investments (Continued)
Financial Assets at Fair Value through Profit or Loss (continued)
Principal Amount Security Description Coupon Maturity
DateFair Value
US$% of Net
Assets
Government Bonds 60.29% (31 December 2018: 63.16%) (continued)
Euro (continued) 42,820,954 Argentine Republic Government International Bond - Unsecured** 3.38% 31/12/2038 21,761,877 0.87
1,710,000 Argentine Republic Government International Bond* 3.88% 15/01/2022 922,308 0.04
43,948,803 Argentine Republic Government International Bond* 7.82% 31/12/2033 28,489,536 1.14
9,040,000 Banque Centrale de Tunisie International Bond* 5.63% 17/02/2024 10,113,175 0.40
3,551,000 Banque Centrale de Tunisie International Bond* 6.38% 15/07/2026 3,962,889 0.16
1,000,000 Banque Centrale de Tunisie International Bond* 6.75% 31/10/2023 1,163,531 0.05
12,922,000 Croatia Government International Bond* 1.13% 19/06/2029 14,984,922 0.60
16,167,000 Croatia Government International Bond** 2.75% 27/01/2030 21,645,398 0.86
6,582,000 Croatia Government International Bond* 3.00% 20/03/2027 8,641,394 0.35
2,757,000 Egypt Government International Bond* 4.75% 11/04/2025 3,266,632 0.13
3,670,000 Egypt Government International Bond* 4.75% 16/04/2026 4,343,559 0.17
5,044,000 Egypt Government International Bond* 5.63% 16/04/2030 5,846,832 0.23
9,083,000 Egypt Government International Bond* 6.38% 11/04/2031 10,927,922 0.44
5,931,000 Indonesia Government International Bond* 1.40% 30/10/2031 6,642,257 0.27
12,545,000 Ivory Coast Government International Bond* 5.13% 15/06/2025 15,555,715 0.62
3,530,000 Ivory Coast Government International Bond* 5.25% 22/03/2030 4,046,133 0.16
10,371,000 Ivory Coast Government International Bond* 5.88% 17/10/2031 12,132,798 0.48
12,235,000 Ivory Coast Government International Bond* 6.63% 22/03/2048 13,837,701 0.55
9,480,000 Ivory Coast Government International Bond* 6.88% 17/10/2040 11,133,973 0.44
7,968,000 Kazakhstan Government International Bond* 2.38% 09/11/2028 10,147,334 0.41
11,192,000 Morocco Government International Bond* 1.50% 27/11/2031 12,599,506 0.50
7,240,000 Peruvian Government International Bond* 3.75% 01/03/2030 10,479,922 0.42
2,530,000 Provincia de Buenos Aires* 5.38% 20/01/2023 1,114,606 0.04
2,869,000 Romanian Government International Bond* 2.12% 16/07/2031 3,290,198 0.13
1,641,000 Romanian Government International Bond* 4.63% 03/04/2049 2,273,076 0.09
27,291,000 Serbia International Bond* 1.50% 26/06/2029 31,193,412 1.25
10,416,000 Ukraine Government International Bond** 6.75% 20/06/2026 13,150,042 0.53
Total Euro 289,178,160 11.55
United States Dollar 2,924,000 Angolan Government International Bond* 8.00% 26/11/2029 3,122,672 0.12
4,320,000 Angolan Government International Bond* 8.25% 09/05/2028 4,670,536 0.19
5,254,000 Angolan Government International Bond* 9.13% 26/11/2049 5,614,017 0.22
23,913,000 Angolan Government International Bond* 9.38% 08/05/2048 26,206,506 1.05
3,560,000 Angolan Government International Bond* 9.50% 12/11/2025 4,184,575 0.17
2,120,000 Argentine Republic Government International Bond* 4.63% 11/01/2023 1,052,400 0.04
12,059,000 Argentine Republic Government International Bond** 6.88% 11/01/2048 5,814,669 0.23
17,267,560 Argentine Republic Government International Bond* 8.28% 31/12/2033 10,718,518 0.43

FINANCIAL STATEMENTS SCHEDULE OF INVESTMENTS
214 NEUBERGER BERMAN INVESTMENT FUNDS PLC
Neuberger Berman Emerging Market Debt - Hard Currency Fund (Continued)
Schedule of Investments (Continued)
Financial Assets at Fair Value through Profit or Loss (continued)
Principal Amount Security Description Coupon Maturity
DateFair Value
US$% of Net
Assets
Government Bonds 60.29% (31 December 2018: 63.16%) (continued)
United States Dollar (continued) 1,000,000 Banque Centrale de Tunisie International Bond* 5.75% 30/01/2025 936,361 0.04
860,000 Belize Government International Bond* 4.94% 20/02/2034 533,499 0.02
13,709,000 Bermuda Government International Bond* 3.72% 25/01/2027 14,433,623 0.58
1,000,000 Bermuda Government International Bond* 4.14% 03/01/2023 1,049,175 0.04
13,968,000 Bermuda Government International Bond* 4.75% 15/02/2029 15,806,154 0.63
5,721,000 Bermuda Government International Bond* 4.85% 06/02/2024 6,245,473 0.25
2,000,000 Brazilian Government International Bond* 4.50% 30/05/2029 2,121,500 0.09
6,100,000 Brazilian Government International Bond* 5.00% 27/01/2045 6,357,633 0.25
5,755,000 Colombia Government International Bond* 4.50% 15/03/2029 6,398,682 0.26
21,198,000 Colombia Government International Bond* 5.00% 15/06/2045 24,694,292 0.99
2,934,000 Colombia Government International Bond* 5.20% 15/05/2049 3,541,147 0.14
4,330,000 Colombia Government International Bond* 6.13% 18/01/2041 5,617,894 0.22
240,000 Costa Rica Government International Bond* 5.63% 30/04/2043 223,424 0.01
8,743,000 Costa Rica Government International Bond* 6.13% 19/02/2031 9,313,481 0.37
7,969,000 Costa Rica Government International Bond* 7.00% 04/04/2044 8,414,746 0.34
27,841,000 Costa Rica Government International Bond* 7.16% 12/03/2045 29,746,299 1.19
9,035,000 Croatia Government International Bond* 6.00% 26/01/2024 10,359,234 0.41
2,814,000 Croatia Government International Bond* 6.38% 24/03/2021 2,964,416 0.12
5,616,000 Development Bank of Mongolia LLC* 7.25% 23/10/2023 5,950,027 0.23
3,000,000 Dominican Republic International Bond* 5.50% 27/01/2025 3,237,525 0.13
1,888,000 Dominican Republic International Bond* 6.00% 19/07/2028 2,103,435 0.08
3,761,000 Dominican Republic International Bond* 6.40% 05/06/2049 4,135,915 0.17
17,941,000 Dominican Republic International Bond* 6.85% 27/01/2045 20,536,794 0.82
2,000,000 Dominican Republic International Bond* 6.88% 29/01/2026 2,288,215 0.09
21,461,000 Ecuador Government International Bond* 7.88% 23/01/2028 19,134,789 0.76
5,222,000 Ecuador Government International Bond* 7.95% 20/06/2024 4,963,067 0.20
9,289,000 Ecuador Government International Bond* 8.88% 23/10/2027 8,549,108 0.34
6,271,000 Ecuador Government International Bond* 9.50% 27/03/2030 5,865,564 0.23
905,000 Ecuador Government International Bond* 9.63% 02/06/2027 855,539 0.03
2,192,000 Ecuador Government International Bond* 9.65% 13/12/2026 2,088,642 0.08
293,000 Ecuador Government International Bond* 10.50% 24/03/2020 297,598 0.01
6,175,000 Ecuador Government International Bond* 10.75% 31/01/2029 6,038,208 0.24
1,376,000 Egypt Government International Bond* 5.58% 21/02/2023 1,441,521 0.06
3,231,000 Egypt Government International Bond* 7.05% 15/01/2032 3,384,608 0.14
2,243,000 Egypt Government International Bond* 7.60% 01/03/2029 2,454,633 0.10
11,331,000 Egypt Government International Bond* 7.90% 21/02/2048 11,868,713 0.47
2,478,000 Egypt Government International Bond* 8.15% 20/11/2059 2,643,795 0.11
14,850,000 Egypt Government International Bond* 8.50% 31/01/2047 16,464,807 0.66

SCHEDULE OF INVESTMENTS FINANCIAL STATEMENTS
ANNUAL REPORT 2019 215
Neuberger Berman Emerging Market Debt - Hard Currency Fund (Continued)
Schedule of Investments (Continued)
Financial Assets at Fair Value through Profit or Loss (continued)
Principal Amount Security Description Coupon Maturity
DateFair Value
US$% of Net
Assets
Government Bonds 60.29% (31 December 2018: 63.16%) (continued)
United States Dollar (continued) 10,483,000 Egypt Government International Bond* 8.70% 01/03/2049 11,714,176 0.47
5,058,000 El Salvador Government International Bond* 7.12% 20/01/2050 5,401,008 0.22
1,040,000 El Salvador Government International Bond* 7.63% 01/02/2041 1,189,172 0.05
4,640,000 El Salvador Government International Bond* 7.75% 24/01/2023 5,105,926 0.20
753,000 El Salvador Government International Bond* 8.63% 28/02/2029 905,744 0.04
4,130,000 Emirate of Dubai Government International Bonds* 5.25% 30/01/2043 4,705,658 0.19
5,780,000 Export Credit Bank of Turkey* 5.00% 23/09/2021 5,876,484 0.23
4,811,000 Export Credit Bank of Turkey* 5.38% 24/10/2023 4,795,342 0.19
2,278,000 Export Credit Bank of Turkey* 6.13% 03/05/2024 2,310,390 0.09
2,414,000 Export Credit Bank of Turkey* 8.25% 24/01/2024 2,629,476 0.11
8,151,000 Ghana Government International Bond* 8.95% 26/03/2051 8,330,152 0.33
13,991,000 Ghana Government International Bond* 10.75% 14/10/2030 17,915,113 0.71
1,247,000 Honduras Government International Bond* 6.25% 19/01/2027 1,364,340 0.05
5,620,000 Hungary Government International Bond* 5.38% 21/02/2023 6,174,042 0.25
4,249,000 Indonesia Government International Bond* 4.75% 11/02/2029 4,870,191 0.19
1,650,000 Indonesia Government International Bond* 4.75% 18/07/2047 1,907,549 0.08
6,600,000 Indonesia Government International Bond* 5.13% 15/01/2045 7,879,547 0.31
23,407,000 Indonesia Government International Bond* 5.25% 17/01/2042 28,246,189 1.13
400,000 Indonesia Government International Bond* 7.75% 17/01/2038 601,951 0.02
8,770,000 Indonesia Government International Bond* 8.50% 12/10/2035 13,757,370 0.55
3,373,000 Iraq International Bond* 5.80% 15/01/2028 3,310,164 0.13
31,560,615 Ivory Coast Government International Bond* 5.75% 31/12/2032 31,619,318 1.26
3,830,000 Kazakhstan Government International Bond* 6.50% 21/07/2045 5,659,476 0.23
9,415,000 Kenya Government International Bond* 8.00% 22/05/2032 10,259,374 0.41
2,372,000 Korea Housing Finance Corp* 3.00% 31/10/2022 2,426,621 0.10
37,904,000 Mexico Government International Bond* 5.75% 12/10/2110 44,970,632 1.80
200,000 Mexico Government International Bond* 6.05% 11/01/2040 260,687 0.01
7,777,000 Mongolia Government International Bond* 5.63% 01/05/2023 8,021,635 0.32
18,333,000 Mongolia Government International Bond* 8.75% 09/03/2024 20,852,661 0.83
5,314,000 Mongolia Government International Bond* 10.88% 06/04/2021 5,808,202 0.23
5,927,000 Nigeria Government International Bond* 6.50% 28/11/2027 6,059,915 0.24
3,128,000 Nigeria Government International Bond* 7.63% 21/11/2025 3,457,746 0.14
2,059,000 Nigeria Government International Bond* 7.70% 23/02/2038 2,066,567 0.08
19,361,000 Nigeria Government International Bond* 7.88% 16/02/2032 20,092,580 0.80
4,165,000 Nigeria Government International Bond* 8.75% 21/01/2031 4,603,290 0.18
11,859,000 Nigeria Government International Bond* 9.25% 21/01/2049 13,225,350 0.53
17,057,000 Oman Government International Bond* 6.75% 17/01/2048 17,105,628 0.68
2,917,000 Panama Government International Bond* 3.16% 23/01/2030 3,008,886 0.12
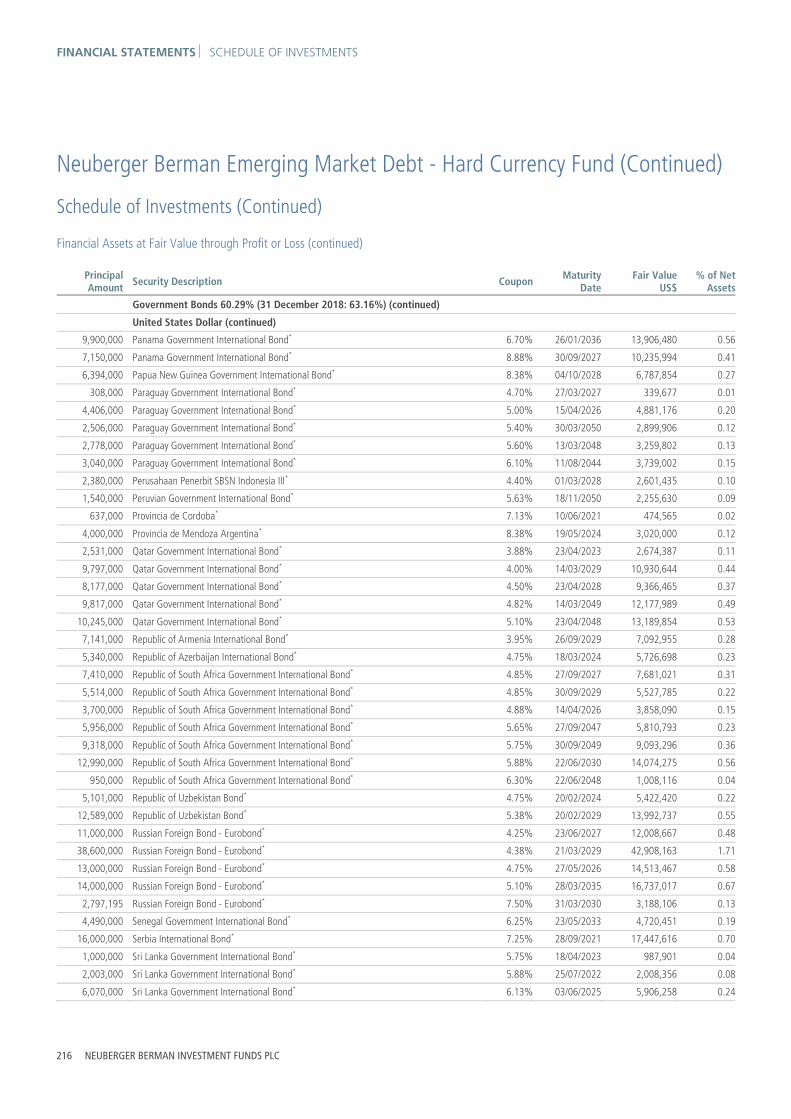
FINANCIAL STATEMENTS SCHEDULE OF INVESTMENTS
216 NEUBERGER BERMAN INVESTMENT FUNDS PLC
Neuberger Berman Emerging Market Debt - Hard Currency Fund (Continued)
Schedule of Investments (Continued)
Financial Assets at Fair Value through Profit or Loss (continued)
Principal Amount Security Description Coupon Maturity
DateFair Value
US$% of Net
Assets
Government Bonds 60.29% (31 December 2018: 63.16%) (continued)
United States Dollar (continued) 9,900,000 Panama Government International Bond* 6.70% 26/01/2036 13,906,480 0.56
7,150,000 Panama Government International Bond* 8.88% 30/09/2027 10,235,994 0.41
6,394,000 Papua New Guinea Government International Bond* 8.38% 04/10/2028 6,787,854 0.27
308,000 Paraguay Government International Bond* 4.70% 27/03/2027 339,677 0.01
4,406,000 Paraguay Government International Bond* 5.00% 15/04/2026 4,881,176 0.20
2,506,000 Paraguay Government International Bond* 5.40% 30/03/2050 2,899,906 0.12
2,778,000 Paraguay Government International Bond* 5.60% 13/03/2048 3,259,802 0.13
3,040,000 Paraguay Government International Bond* 6.10% 11/08/2044 3,739,002 0.15
2,380,000 Perusahaan Penerbit SBSN Indonesia III* 4.40% 01/03/2028 2,601,435 0.10
1,540,000 Peruvian Government International Bond* 5.63% 18/11/2050 2,255,630 0.09
637,000 Provincia de Cordoba* 7.13% 10/06/2021 474,565 0.02
4,000,000 Provincia de Mendoza Argentina* 8.38% 19/05/2024 3,020,000 0.12
2,531,000 Qatar Government International Bond* 3.88% 23/04/2023 2,674,387 0.11
9,797,000 Qatar Government International Bond* 4.00% 14/03/2029 10,930,644 0.44
8,177,000 Qatar Government International Bond* 4.50% 23/04/2028 9,366,465 0.37
9,817,000 Qatar Government International Bond* 4.82% 14/03/2049 12,177,989 0.49
10,245,000 Qatar Government International Bond* 5.10% 23/04/2048 13,189,854 0.53
7,141,000 Republic of Armenia International Bond* 3.95% 26/09/2029 7,092,955 0.28
5,340,000 Republic of Azerbaijan International Bond* 4.75% 18/03/2024 5,726,698 0.23
7,410,000 Republic of South Africa Government International Bond* 4.85% 27/09/2027 7,681,021 0.31
5,514,000 Republic of South Africa Government International Bond* 4.85% 30/09/2029 5,527,785 0.22
3,700,000 Republic of South Africa Government International Bond* 4.88% 14/04/2026 3,858,090 0.15
5,956,000 Republic of South Africa Government International Bond* 5.65% 27/09/2047 5,810,793 0.23
9,318,000 Republic of South Africa Government International Bond* 5.75% 30/09/2049 9,093,296 0.36
12,990,000 Republic of South Africa Government International Bond* 5.88% 22/06/2030 14,074,275 0.56
950,000 Republic of South Africa Government International Bond* 6.30% 22/06/2048 1,008,116 0.04
5,101,000 Republic of Uzbekistan Bond* 4.75% 20/02/2024 5,422,420 0.22
12,589,000 Republic of Uzbekistan Bond* 5.38% 20/02/2029 13,992,737 0.55
11,000,000 Russian Foreign Bond - Eurobond* 4.25% 23/06/2027 12,008,667 0.48
38,600,000 Russian Foreign Bond - Eurobond* 4.38% 21/03/2029 42,908,163 1.71
13,000,000 Russian Foreign Bond - Eurobond* 4.75% 27/05/2026 14,513,467 0.58
14,000,000 Russian Foreign Bond - Eurobond* 5.10% 28/03/2035 16,737,017 0.67
2,797,195 Russian Foreign Bond - Eurobond* 7.50% 31/03/2030 3,188,106 0.13
4,490,000 Senegal Government International Bond* 6.25% 23/05/2033 4,720,451 0.19
16,000,000 Serbia International Bond* 7.25% 28/09/2021 17,447,616 0.70
1,000,000 Sri Lanka Government International Bond* 5.75% 18/04/2023 987,901 0.04
2,003,000 Sri Lanka Government International Bond* 5.88% 25/07/2022 2,008,356 0.08
6,070,000 Sri Lanka Government International Bond* 6.13% 03/06/2025 5,906,258 0.24
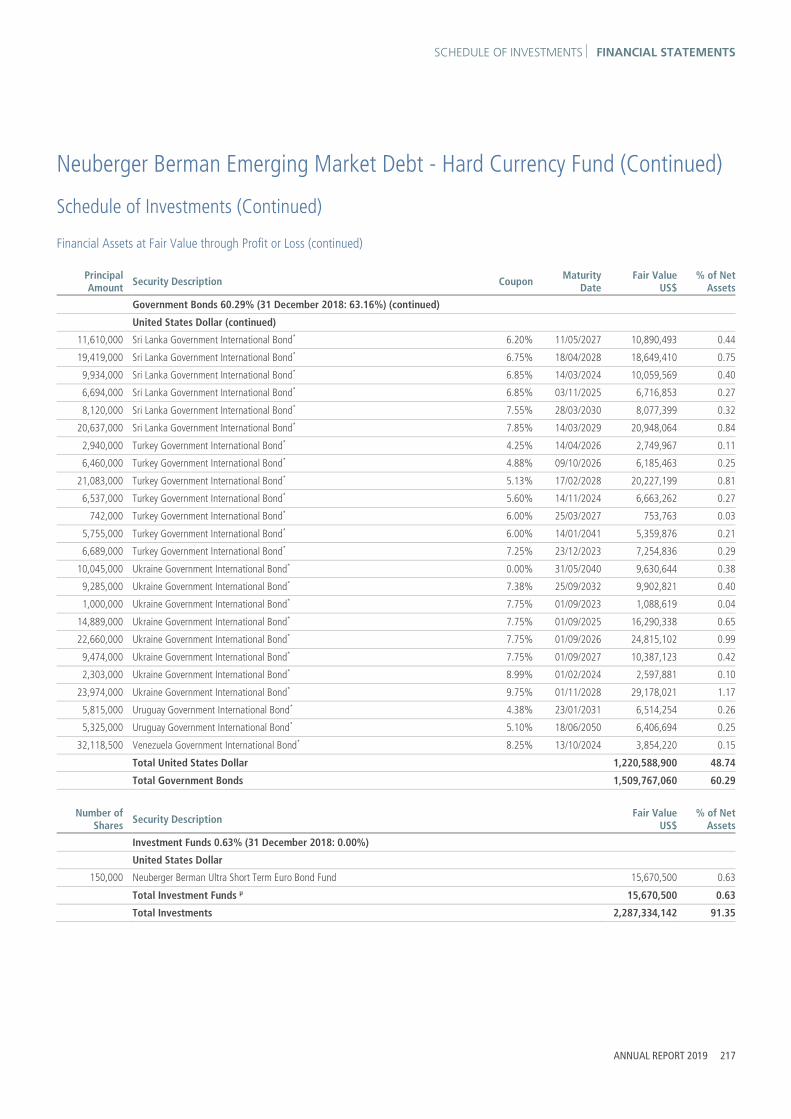
SCHEDULE OF INVESTMENTS FINANCIAL STATEMENTS
ANNUAL REPORT 2019 217
Neuberger Berman Emerging Market Debt - Hard Currency Fund (Continued)
Schedule of Investments (Continued)
Financial Assets at Fair Value through Profit or Loss (continued)
Principal Amount Security Description Coupon Maturity
DateFair Value
US$% of Net
Assets
Government Bonds 60.29% (31 December 2018: 63.16%) (continued)
United States Dollar (continued) 11,610,000 Sri Lanka Government International Bond* 6.20% 11/05/2027 10,890,493 0.44
19,419,000 Sri Lanka Government International Bond* 6.75% 18/04/2028 18,649,410 0.75
9,934,000 Sri Lanka Government International Bond* 6.85% 14/03/2024 10,059,569 0.40
6,694,000 Sri Lanka Government International Bond* 6.85% 03/11/2025 6,716,853 0.27
8,120,000 Sri Lanka Government International Bond* 7.55% 28/03/2030 8,077,399 0.32
20,637,000 Sri Lanka Government International Bond* 7.85% 14/03/2029 20,948,064 0.84
2,940,000 Turkey Government International Bond* 4.25% 14/04/2026 2,749,967 0.11
6,460,000 Turkey Government International Bond* 4.88% 09/10/2026 6,185,463 0.25
21,083,000 Turkey Government International Bond* 5.13% 17/02/2028 20,227,199 0.81
6,537,000 Turkey Government International Bond* 5.60% 14/11/2024 6,663,262 0.27
742,000 Turkey Government International Bond* 6.00% 25/03/2027 753,763 0.03
5,755,000 Turkey Government International Bond* 6.00% 14/01/2041 5,359,876 0.21
6,689,000 Turkey Government International Bond* 7.25% 23/12/2023 7,254,836 0.29
10,045,000 Ukraine Government International Bond* 0.00% 31/05/2040 9,630,644 0.38
9,285,000 Ukraine Government International Bond* 7.38% 25/09/2032 9,902,821 0.40
1,000,000 Ukraine Government International Bond* 7.75% 01/09/2023 1,088,619 0.04
14,889,000 Ukraine Government International Bond* 7.75% 01/09/2025 16,290,338 0.65
22,660,000 Ukraine Government International Bond* 7.75% 01/09/2026 24,815,102 0.99
9,474,000 Ukraine Government International Bond* 7.75% 01/09/2027 10,387,123 0.42
2,303,000 Ukraine Government International Bond* 8.99% 01/02/2024 2,597,881 0.10
23,974,000 Ukraine Government International Bond* 9.75% 01/11/2028 29,178,021 1.17
5,815,000 Uruguay Government International Bond* 4.38% 23/01/2031 6,514,254 0.26
5,325,000 Uruguay Government International Bond* 5.10% 18/06/2050 6,406,694 0.25
32,118,500 Venezuela Government International Bond* 8.25% 13/10/2024 3,854,220 0.15
Total United States Dollar 1,220,588,900 48.74
Total Government Bonds 1,509,767,060 60.29
Number of Shares Security Description Fair Value
US$% of Net
Assets
Investment Funds 0.63% (31 December 2018: 0.00%)
United States Dollar 150,000 Neuberger Berman Ultra Short Term Euro Bond Fund 15,670,500 0.63
Total Investment Funds μ 15,670,500 0.63
Total Investments 2,287,334,142 91.35

FINANCIAL STATEMENTS SCHEDULE OF INVESTMENTS
218 NEUBERGER BERMAN INVESTMENT FUNDS PLC
Neuberger Berman Emerging Market Debt - Hard Currency Fund (Continued)
Schedule of Investments (Continued)
Financial Assets at Fair Value through Profit or Loss (continued)
Forward Currency Contracts 0.63% (31 December 2018: 0.14%)
Amount Receivable
Amount Payable
Maturity Date Counterparty Contracts Unrealised
Gain US$% of Net
Assets
AUD Hedged Classes AUD 98,377 US$ 68,037 21/02/2020 UBS AG 3 1,202 0.00
AUD 5,079,454 US$ 3,454,784 21/02/2020 Westpac Banking Corp 2 120,168 0.01
CHF Hedged Classes CHF 394,650 US$ 404,240 21/02/2020 Goldman Sachs International 6 4,730 0.00
CHF 23,275,585 US$ 23,665,815 21/02/2020 UBS AG 3 454,311 0.02
CHF 1,545,587 US$ 1,573,641 21/02/2020 Westpac Banking Corp 33 28,025 0.00
EUR Hedged Classes € 703,279,070 US$ 779,974,466 21/02/2020 Citibank NA 2 11,889,651 0.48
€ 10,713,483 US$ 11,958,473 21/02/2020 Goldman Sachs International 7 104,479 0.00
€ 115,941,556 US$ 129,518,840 21/02/2020 Westpac Banking Corp 30 1,026,717 0.04
US$ 139 € 123 21/02/2020 Westpac Banking Corp 1 0 0.00
GBP Hedged Classes £ 435,651 US$ 568,177 21/02/2020 Goldman Sachs International 5 9,749 0.00
£ 27,545,912 US$ 35,568,659 21/02/2020 UBS AG 3 973,201 0.04
£ 802,037 US$ 1,057,119 21/02/2020 Westpac Banking Corp 14 6,847 0.00
HKD Hedged Classes HKD 20,222,270 US$ 2,579,878 21/02/2020 Citibank NA 2 14,183 0.00
HKD 289,432 US$ 36,945 21/02/2020 Goldman Sachs International 2 183 0.00
HKD 136,105 US$ 17,444 21/02/2020 UBS AG 1 16 0.00
US$ 125,814 HKD 980,728 21/02/2020 Westpac Banking Corp 2 8 0.00
JPY Hedged Classes ¥ 13,514,286 US$ 123,836 21/02/2020 Goldman Sachs International 1 867 0.00
¥ 13,413,442 US$ 123,519 21/02/2020 UBS AG 1 253 0.00
¥ 10,966,537 US$ 100,799 21/02/2020 Westpac Banking Corp 1 395 0.00
SEK Hedged Classes SEK 269,122,732 US$ 27,968,809 21/02/2020 Goldman Sachs International 6 849,137 0.03
SEK 43,896,863 US$ 4,678,522 21/02/2020 Westpac Banking Corp 20 22,001 0.00
US$ 16,116 SEK 149,844 21/02/2020 Goldman Sachs International 2 71 0.00
US$ 10,322 SEK 96,253 21/02/2020 Westpac Banking Corp 4 15 0.00
SGD Hedged Classes SGD 589,148 US$ 434,223 21/02/2020 Goldman Sachs International 5 4,102 0.00
SGD 169,070 US$ 125,500 21/02/2020 UBS AG 1 287 0.00
SGD 28,167,871 US$ 20,701,698 21/02/2020 Westpac Banking Corp 28 255,092 0.01
US$ 19 SGD 25 21/02/2020 Westpac Banking Corp 1 0 0.00
Total Unrealised Gain on Forward Currency Contracts ∞ 15,765,690 0.63

SCHEDULE OF INVESTMENTS FINANCIAL STATEMENTS
ANNUAL REPORT 2019 219
Neuberger Berman Emerging Market Debt - Hard Currency Fund (Continued)
Schedule of Investments (Continued)
Financial Assets at Fair Value through Profit or Loss (continued)
Futures Contracts 0.15% (31 December 2018: 0.24%)
Number of Contracts Description Unrealised
Gain US$% of Net
Assets
(1,083) Euro-Bund Future March 2020 2,623,462 0.11
(167) Euro-Buxl 30-Year Bond Future March 2020 1,103,844 0.04
Total Unrealised Gain on Futures Contracts ± 3,727,306 0.15
Fair Value % of Net
US$ Assets
Total Financial Assets at Fair Value through Profit or Loss 2,306,827,138 92.13
Financial Liabilities at Fair Value through Profit or Loss
Forward Currency Contracts (0.19%) (31 December 2018: (0.08%))
Amount Receivable
Amount Payable
Maturity Date Counterparty Contracts Unrealised
Loss US$% of Net
Assets
US$ 36,394,442 € 32,746,750 05/02/2020 Citibank NA 4 (441,629) (0.02)
US$ 95,730,861 € 85,290,000 05/02/2020 Deutsche Bank AG 1 (209,908) (0.01)
US$ 128,945,156 € 116,750,000 06/01/2020 JPMorgan Chase Bank 1 (2,131,230) (0.09)
US$ 28,927,829 € 25,826,132 05/02/2020 UBS AG 3 (123,396) (0.00)
AUD Hedged Classes US$ 20,127 AUD 29,358 21/02/2020 UBS AG 1 (535) (0.00)
CHF Hedged Classes US$ 62,537 CHF 61,048 21/02/2020 Westpac Banking Corp 15 (725) (0.00)
EUR Hedged Classes US$ 4,069,172 € 3,654,664 21/02/2020 Goldman Sachs International 2 (45,833) (0.00)
US$ 72,359,853 € 65,281,459 21/02/2020 Westpac Banking Corp 22 (1,144,461) (0.05)
GBP Hedged Classes £ 2,656,512 US$ 3,553,620 21/02/2020 Westpac Banking Corp 4 (29,544) (0.00)
US$ 119,434 £ 91,423 21/02/2020 Goldman Sachs International 2 (1,845) (0.00)
US$ 18,442,815 £ 14,251,409 21/02/2020 Westpac Banking Corp 4 (462,822) (0.02)
HKD Hedged Classes HKD 130,320 US$ 16,723 21/02/2020 Goldman Sachs International 1 (6) (0.00)
HKD 102,307 US$ 13,134 21/02/2020 UBS AG 1 (11) (0.00)
US$ 25,007 HKD 195,883 21/02/2020 Goldman Sachs International 1 (121) (0.00)
US$ 406,666 HKD 3,170,273 21/02/2020 Westpac Banking Corp 2 (9) (0.00)
JPY Hedged Classes ¥ 2,032,260,075 US$ 18,812,091 21/02/2020 Westpac Banking Corp 3 (59,429) (0.00)

FINANCIAL STATEMENTS SCHEDULE OF INVESTMENTS
220 NEUBERGER BERMAN INVESTMENT FUNDS PLC
Neuberger Berman Emerging Market Debt - Hard Currency Fund (Continued)
Schedule of Investments (Continued)
Financial Liabilities at Fair Value through Profit or Loss (continued)
Forward Currency Contracts (0.19%) (31 December 2018: (0.08%)) (continued)
Amount Receivable
Amount Payable
Maturity Date Counterparty Contracts Unrealised
Loss US$% of Net
Assets
SEK Hedged Classes SEK 2,655,154 US$ 284,791 21/02/2020 Goldman Sachs International 1 (474) (0.00)
SEK 15,208 US$ 1,630 21/02/2020 Westpac Banking Corp 2 (1) (0.00)
US$ 13 SEK 126 21/02/2020 Goldman Sachs International 1 (0) (0.00)
US$ 103,889 SEK 980,609 21/02/2020 Westpac Banking Corp 11 (1,116) (0.00)
SGD Hedged Classes SGD 64,093 US$ 47,688 21/02/2020 Westpac Banking Corp 1 (3) (0.00)
US$ 288,667 SGD 392,690 21/02/2020 Goldman Sachs International 4 (3,492) (0.00)
US$ 194,736 SGD 263,788 21/02/2020 Westpac Banking Corp 19 (1,521) (0.00)
Total Unrealised Loss on Forward Currency Contracts ∞ (4,658,111) (0.19)
Futures Contracts (0.16%) (31 December 2018: (0.05%))
Number of Contracts Description Unrealised
Loss US$% of Net
Assets
1,382 US Treasury 10-Year Note (CBT) Future March 2020 (1,352,656) (0.05)
518 US Treasury Ultra Bond (CBT) Future March 2020 (2,611,424) (0.11)
Total Unrealised Loss on Futures Contracts ± (3,964,080) (0.16)
Fair Value % of Net
US$ Assets
Total Financial Liabilities at Fair Value through Profit or Loss (8,622,191) (0.35)
Net Financial Assets at Fair Value through Profit or Loss 2,298,204,947 91.78
Other Net Assets 205,807,382 8.22
Net Assets Attributable to Holders of Redeemable Participating Shares 2,504,012,329 100.00
% of
TotalAssetsPortfolio Analysis US$
* Transferable securities and/or money market instruments admitted to an official stock exchange listing 2,039,919,736 80.62
** Transferable securities and/or money market instruments dealt in on a regulated market 94,179,759 3.72
† Other transferable securities and/or money market instruments 137,564,147 5.44
μ Investment funds 15,670,500 0.62
± Financial derivative instruments traded on a regulated market (236,774) (0.01)
∞ OTC financial derivative instruments 11,107,579 0.44
Total Investments 2,298,204,947 90.83
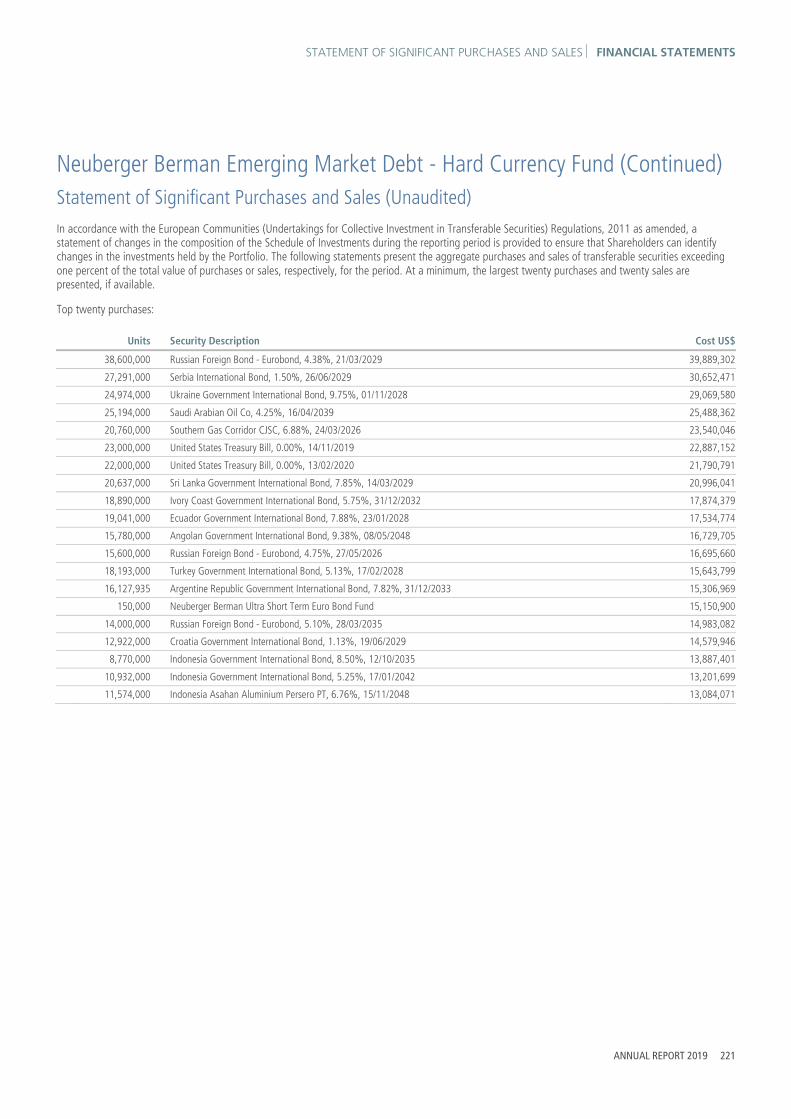
STATEMENT OF SIGNIFICANT PURCHASES AND SALES FINANCIAL STATEMENTS
ANNUAL REPORT 2019 221
Neuberger Berman Emerging Market Debt - Hard Currency Fund (Continued) Statement of Significant Purchases and Sales (Unaudited) In accordance with the European Communities (Undertakings for Collective Investment in Transferable Securities) Regulations, 2011 as amended, a statement of changes in the composition of the Schedule of Investments during the reporting period is provided to ensure that Shareholders can identify changes in the investments held by the Portfolio. The following statements present the aggregate purchases and sales of transferable securities exceeding one percent of the total value of purchases or sales, respectively, for the period. At a minimum, the largest twenty purchases and twenty sales are presented, if available.
Top twenty purchases:
Units Security Description Cost US$
38,600,000 Russian Foreign Bond - Eurobond, 4.38%, 21/03/2029 39,889,302
27,291,000 Serbia International Bond, 1.50%, 26/06/2029 30,652,471
24,974,000 Ukraine Government International Bond, 9.75%, 01/11/2028 29,069,580
25,194,000 Saudi Arabian Oil Co, 4.25%, 16/04/2039 25,488,362
20,760,000 Southern Gas Corridor CJSC, 6.88%, 24/03/2026 23,540,046
23,000,000 United States Treasury Bill, 0.00%, 14/11/2019 22,887,152
22,000,000 United States Treasury Bill, 0.00%, 13/02/2020 21,790,791
20,637,000 Sri Lanka Government International Bond, 7.85%, 14/03/2029 20,996,041
18,890,000 Ivory Coast Government International Bond, 5.75%, 31/12/2032 17,874,379
19,041,000 Ecuador Government International Bond, 7.88%, 23/01/2028 17,534,774
15,780,000 Angolan Government International Bond, 9.38%, 08/05/2048 16,729,705
15,600,000 Russian Foreign Bond - Eurobond, 4.75%, 27/05/2026 16,695,660
18,193,000 Turkey Government International Bond, 5.13%, 17/02/2028 15,643,799
16,127,935 Argentine Republic Government International Bond, 7.82%, 31/12/2033 15,306,969
150,000 Neuberger Berman Ultra Short Term Euro Bond Fund 15,150,900
14,000,000 Russian Foreign Bond - Eurobond, 5.10%, 28/03/2035 14,983,082
12,922,000 Croatia Government International Bond, 1.13%, 19/06/2029 14,579,946
8,770,000 Indonesia Government International Bond, 8.50%, 12/10/2035 13,887,401
10,932,000 Indonesia Government International Bond, 5.25%, 17/01/2042 13,201,699
11,574,000 Indonesia Asahan Aluminium Persero PT, 6.76%, 15/11/2048 13,084,071

FINANCIAL STATEMENTS STATEMENT OF SIGNIFICANT PURCHASES AND SALES
222 NEUBERGER BERMAN INVESTMENT FUNDS PLC
Neuberger Berman Emerging Market Debt - Hard Currency Fund (Continued)
Statement of Significant Purchases and Sales (Unaudited) (Continued) Aggregate sales greater than one percent of the total value of sales:
Units Security Description Proceeds US$
15,989,000 Indonesia Asahan Aluminium Persero PT, 6.76%, 15/11/2048 20,420,228
16,600,000 Russian Foreign Bond - Eurobond, 5.25%, 23/06/2047 18,111,250
11,209,000 Indonesia Government International Bond, 3.75%, 14/06/2028 14,912,248
11,058,000 Senegal Government International Bond, 4.75%, 13/03/2028 12,797,996
9,694,000 Croatia Government International Bond, 3.00%, 11/03/2025 12,400,987
12,439,000 Turkey Government International Bond, 7.63%, 26/04/2029 12,327,919
6,832,000 Hungary Government International Bond, 7.63%, 29/03/2041 10,376,100
7,650,000 Romanian Government International Bond, 3.88%, 29/10/2035 10,089,539
8,572,000 Gazprom PJSC Via Gaz Capital SA, 2.95%, 24/01/2024 10,027,421
9,649,000 Nigeria Government International Bond, 7.14%, 23/02/2030 9,854,041
9,858,000 Turkey Government International Bond, 6.13%, 24/10/2028 9,803,030
7,902,000 Turkey Government International Bond, 5.20%, 16/02/2026 9,267,383
8,556,000 Saudi Government International Bond, 4.50%, 17/04/2030 9,088,570
7,808,000 Petrobras Global Finance BV, 7.38%, 17/01/2027 8,752,797
7,310,000 Colombia Government International Bond, 5.00%, 15/06/2045 8,359,341
8,251,760 Ivory Coast Government International Bond, 5.75%, 31/12/2032 8,102,196
8,368,000 Abu Dhabi Government International Bond, 3.13%, 30/09/2049 7,936,301
5,920,000 Croatia Government International Bond, 2.75%, 27/01/2030 7,755,940
7,478,000 Brazilian Government International Bond, 4.63%, 13/01/2028 7,511,900
7,185,000 Ghana Government International Bond, 7.63%, 16/05/2029 7,315,228
8,080,000 Turkey Government International Bond, 6.00%, 14/01/2041 7,034,651
5,830,000 Dominican Republic International Bond, 6.00%, 19/07/2028 6,370,199
6,100,000 Sri Lanka Government International Bond, 5.88%, 25/07/2022 6,132,598
5,430,000 Egypt Government International Bond, 4.75%, 16/04/2026 6,064,193
5,330,000 JBS Investments II GmbH, 7.00%, 15/01/2026 5,787,771
5,981,000 Tsinghua Unic Ltd, 5.38%, 31/01/2023 5,638,283
5,930,000 Turkey Government International Bond, 5.13%, 17/02/2028 5,544,550
5,878,000 Oman Government International Bond, 6.50%, 08/03/2047 5,439,183
5,260,000 Turkey Government International Bond, 5.13%, 25/03/2022 5,378,876
5,022,000 Mexico Government International Bond, 4.50%, 22/04/2029 5,152,572
5,250,000 Sri Lanka Government International Bond, 6.75%, 18/04/2028 5,021,909
5,031,000 Oztel Holdings SPC Ltd, 6.63%, 24/04/2028 4,829,760
4,490,000 Hungary Government International Bond, 5.38%, 21/02/2023 4,819,557
4,460,000 Republic of Belarus International Bond, 7.63%, 29/06/2027 4,805,650
4,678,000 Saudi Arabian Oil Co, 4.38%, 16/04/2049 4,800,798
4,878,000 Kenya Government International Bond, 8.25%, 28/02/2048 4,748,737
6,660,000 Zambia Government International Bond, 8.97%, 30/07/2027 4,740,363

INVESTMENT MANAGER’S REPORT FINANCIAL STATEMENTS
ANNUAL REPORT 2019 223
Neuberger Berman Emerging Market Corporate Debt Fund Investment Manager’s Report For the 12 months ended 31 December 2019, the total return for the USD I Accumulating Class was 13.12%. (Performance for all share classes is provided in Appendix II). Over the same period, the benchmark index, the JPMorgan CEMBI Diversified (USD Total Return) (the “Index”), returned 13.55%. (Performance data quoted represent past performance and do not indicate future results. Total returns shown are net of all fees and expenses and include reinvestment of income dividends and other distributions, if any).
Emerging markets (“EM”) debt posted strong gains in 2019 following a down year in 2018. The recovery was driven by spread compression as risk appetite returned to global markets in the first quarter. A sharp drop in US Treasury yields drove gains from March onwards as the market started to price in multiple rate cuts by the US Federal Reserve for 2019. A more dovish monetary policy stance in developed markets also acted as a tailwind for emerging market assets, especially in local markets where local interest rates moved down. The ongoing trade negotiations between the US and China contributed to market volatility throughout the year, however, this abated as the countries came to a phase one agreement in mid-December to support a year-end rally.
The corporate Index posted a positive return of 13.55% over the course of the year, the second best year of the past decade. Default rates were lower than average with 2019 levels ending the year at 1.5%, another multi-year low. Sector performance was positive with double-digit returns across the board; real estate and metals & mining led the way while financials, utilities, industrials and technology media and telecom (“TMT”) lagged the index. From a credit rating perspective, the high yield segment of the index outperformed investment grade.
Performance drivers for the Portfolio included duration positioning and positive security selection across key markets. However, country allocation detracted from performance. The primary detractor during the year was our positioning in Argentina. We entered August with an overweight exposure in both sovereign and corporate Argentine risk. This position materially detracted from relative performance for the year because Argentine bonds sold off in August following the unexpected results of the presidential primary election mid-month. Capital flight and FX pressure forced the government to extreme measures including the re-profiling of short-term local debt and introduction of capital controls resulting in prices falling significantly across the board in both sovereign and corporates.
Aside from Argentina, the primary driver of performance was security selection from positions in Brazil, Mexico and China. In Brazil, political stability and the passage of pension reforms lifted market sentiment. Our position in a leading global metals & mining company was positive as they engaged in effective balance sheet management. Our positions in the financials sector also added value. In Mexico, security selection in the industrials and utilities sectors was positive as they were largely unaffected by the new administration’s domestic policies early in the year. In China, our active positioning in the Chinese real estate and financials sectors added value. We also benefitted from our participation in a range of new issues that came to market throughout the year. In contrast, the position in South Africa’s Petra Diamonds detracted due to ongoing weakness in diamond prices coupled with the associated write-downs of diamond mines’ values that weighed on the company. Security selection in Turkey detracted due to our positions in the financials sector as the subordinated paper outperformed the senior as investor sentiment turned more positive on the country even though earlier the country was impacted the by the currency volatility due to the unorthodox policy of the current regime. Our overweight to Mexico and underweights to Zambia and Russia detracted from country allocation. However, the overweight to Brazil was positive while the underweight to Jamaica contributed throughout the year as bonds of its telecom industry performed poorly due to significant deterioration of the company. Finally, the underweight to lower beta investment grade Asian countries was positive as high yielders outperformed during the year.
As we entered 2020, we had been seeing increasing signs that economic activity is bottoming out following last year’s slowdown, on the back of the lagged effects of global monetary policy easing and improved sentiment post the ‘Phase 1’ trade deal between the US and China. In the coming months though, the fallout from the Covid-19 virus will likely result in a severe short term dip in global growth due to the substantial demand and supply side disruptions globally. Our base case is for a recovery in economic activity later in the year, assuming containment of the virus and strong policy support from governments and central banks globally.
Regarding corporate credit fundamentals, we believe leverage metrics have bottomed though we expect default rates to remain at below historical averages in the coming year. From a technical perspective, we see strong new issuance in the corporate space is mitigated by continued asset liability management exercises which reduce overall net issuance. As for valuations, spreads in EM hard currency sovereigns and credits have become more compelling after the recent widening and continue to provide an attractive risk premium relative to developed market credits in our view.

FINANCIAL STATEMENTS BALANCE SHEET
The accompanying notes form an integral part of the financial statements.
224 NEUBERGER BERMAN INVESTMENT FUNDS PLC
Neuberger Berman Emerging Market Corporate Debt Fund (Continued) Balance Sheet
As at31 December 2019
US$
As at31 December 2018
US$ Note
Current Assets
Financial Assets at Fair Value through Profit or Loss 2 164,087,033 116,235,206
Cash and cash equivalents 3 7,842,101 186,326
Receivable for investments sold – 423,240
Receivable for shares issued 1,842,897 127,509
Due from brokers 35,816 402,243
Income receivable and other assets 2,332,921 1,838,504
Total Assets 176,140,768 119,213,028
Current Liabilities
Financial Liabilities at Fair Value through Profit or Loss 2 204,131 335,743
Payable for shares redeemed 50,390 5,258
Accrued expenses 234,757 217,643
Payable for investments purchased 36 5
Other payables 43,543 99,572
Liabilities (excluding Net Assets Attributable to Holders of Redeemable Participating Shares) 532,857 658,221
Net Assets Attributable to Holders of Redeemable Participating Shares 175,607,911 118,554,807
.

PROFIT AND LOSS ACCOUNT FINANCIAL STATEMENTS
The accompanying notes form an integral part of the financial statements.
ANNUAL REPORT 2019 225
Neuberger Berman Emerging Market Corporate Debt Fund (Continued) Profit and Loss Account
Year Ended31 December 2019
US$
Year Ended31 December 2018
US$ Note
Income
Interest Income 8,003,907 7,647,058
Net Gain/(Loss) on Financial Assets and Liabilities at Fair Value through Profit or Loss 11 7,713,901 (18,535,555)
15,717,808 (10,888,497)
Expenses
Management Fee 6 1,168,995 990,658
Distribution Fee 6 88,039 40,180
Administration Fee 6 290,617 301,124
Commitment Fee 19 7,660 14,084
Custody Fee 6 13,444 12,775
Depositary Fee 6 15,065 13,683
Professional Fee 9 54,142 95,382
Directors' Fee 7 4,563 6,613
Transaction Costs 9 62,896 64,401
Audit Fee 8 22,258 21,000
VAT Rebate (2,322) (1,751)
Other Expenses 9 8,233 25,208
Expense Waiver 6 (206,209) (297,995)
Total Expenses 1,527,381 1,285,362
Finance Costs
Interest Expense 1 961
Distribution Paid 1 410,253 825,054
410,254 826,015
Withholding Tax 1 – 12
Profit/(Loss) Attributable to Holders of Redeemable Participating Shares from Operations 13,780,173 (12,999,886)
Income and expenses arose solely from continuing operations.

FINANCIAL STATEMENTS STATEMENT OF CHANGES IN NET ASSETS
The accompanying notes form an integral part of the financial statements.
226 NEUBERGER BERMAN INVESTMENT FUNDS PLC
Neuberger Berman Emerging Market Corporate Debt Fund (Continued) Statement of Changes in Net Assets Attributable to Holders of Redeemable Participating Shares
Year Ended31 December 2019
US$
Year Ended31 December 2018
US$ Note
Net Assets Attributable to Holders of Redeemable Participating Shares at beginning of year 118,554,807 145,421,396
Profit/(Loss) Attributable to Holders of Redeemable Participating Shares from Operations 13,780,173 (12,999,886)
Subscriptions 5 86,114,746 20,439,186
Redemptions 5 (42,841,815) (34,305,889)
Net Assets Attributable to Holders of Redeemable Participating Shares at end of year 175,607,911 118,554,807

SCHEDULE OF INVESTMENTS FINANCIAL STATEMENTS
ANNUAL REPORT 2019 227
Neuberger Berman Emerging Market Corporate Debt Fund (Continued)
Schedule of Investments
Financial Assets at Fair Value through Profit or Loss
Principal Amount Security Description Coupon Maturity
Date Fair Value
US$% of Net
Assets
Corporate Bonds 87.11% (31 December 2018: 95.59%)
Euro 469,000 Gazprom PJSC Via Gaz Capital SA* 2.95% 24/01/2024 572,944 0.33
Total Euro 572,944 0.33
United States Dollar 1,000,000 1MDB Global Investments Ltd† 4.40% 09/03/2023 972,367 0.55
992,000 ABJA Investment Co Pte Ltd* 5.45% 24/01/2028 967,125 0.55
200,000 ABJA Investment Co Pte Ltd* 5.95% 31/07/2024 209,548 0.12
391,000 ABQ Finance Ltd* 3.13% 24/09/2024 392,432 0.22
586,000 Abu Dhabi Crude Oil Pipeline LLC* 4.60% 02/11/2047 675,479 0.38
278,000 Abu Dhabi National Energy Co PJSC* 4.88% 23/04/2030 318,326 0.18
300,000 Adani Green Energy UP Ltd/Prayatna Developers Pvt Ltd/Parampujya Solar Energ* 6.25% 10/12/2024 322,563 0.18
200,000 Adani Ports & Special Economic Zone Ltd† 4.38% 03/07/2029 207,443 0.12
400,000 Adani Transmission Ltd* 4.00% 03/08/2026 412,595 0.23
346,000 AES Gener SA† 6.35% 07/10/2079 355,169 0.20
410,000 AES Gener SA* 7.13% 26/03/2079 431,029 0.25
335,000 African Export-Import Bank* 3.99% 21/09/2029 339,178 0.19
300,000 Akbank TAS* 5.13% 31/03/2025 294,153 0.17
274,000 Aldar Sukuk No 2 Ltd* 3.88% 22/10/2029 279,113 0.16
500,000 Alfa SAB de CV† 6.88% 25/03/2044 608,593 0.35
550,000 Alibaba Group Holding Ltd* 4.00% 06/12/2037 590,505 0.34
213,000 Alibaba Group Holding Ltd* 4.20% 06/12/2047 236,280 0.13
357,000 Alpek SAB de CV† 4.25% 18/09/2029 364,765 0.21
2,115,000 Altice Financing SA* 7.50% 15/05/2026 2,277,538 1.30
717,000 America Movil SAB de CV* 3.63% 22/04/2029 756,068 0.43
224,000 Arabian Centres Sukuk Ltd† 5.38% 26/11/2024 230,870 0.13
273,000 AYC Finance Ltd* 4.85% 29/12/2049 270,300 0.15
920,000 Azure Orbit IV International Finance Ltd* 3.75% 25/01/2023 942,991 0.54
400,000 Azure Power Energy Ltd* 5.50% 03/11/2022 408,810 0.23
409,000 Banco BTG Pactual SA* 4.50% 10/01/2025 415,135 0.24
500,000 Banco de Bogota SA* 4.38% 03/08/2027 530,804 0.30
750,000 Banco de Bogota SA* 6.25% 12/05/2026 841,206 0.48
78,000 Banco de Credito del Peru† 2.70% 11/01/2025 77,707 0.04
479,000 Banco de Credito e Inversiones SA* 3.50% 12/10/2027 489,933 0.28
245,000 Banco do Brasil SA* 4.88% 19/04/2023 258,251 0.15
970,000 Banco do Brasil SA† 9.00% 29/12/2049 1,107,929 0.63
442,000 Banco General SA* 4.13% 07/08/2027 465,363 0.27
650,000 Banco Inbursa SA Institucion de Banca Multiple Grupo Financiero Inbursa* 4.38% 11/04/2027 671,357 0.38
539,000 Banco Internacional del Peru SAA Interbank† 3.25% 04/10/2026 540,285 0.30

FINANCIAL STATEMENTS SCHEDULE OF INVESTMENTS
228 NEUBERGER BERMAN INVESTMENT FUNDS PLC
Neuberger Berman Emerging Market Corporate Debt Fund (Continued)
Schedule of Investments (Continued)
Financial Assets at Fair Value through Profit or Loss (continued)
Principal Amount Security Description Coupon Maturity
Date Fair Value
US$% of Net
Assets
Corporate Bonds 87.11% (31 December 2018: 95.59%) (continued)
United States Dollar (continued) 179,000 Banco Internacional del Peru SAA Interbank* 6.63% 19/03/2029 200,542 0.11
300,000 Banco Mercantil del Norte SA* 5.75% 04/10/2031 310,982 0.18
213,000 Banco Mercantil del Norte SA* 7.50% 29/12/2049 227,646 0.13
250,000 Banco Mercantil del Norte SA* 7.63% 29/12/2049 267,634 0.15
632,000 Banco Votorantim SA† 4.50% 24/09/2024 650,966 0.37
395,000 Bancolombia SA* 4.63% 18/12/2029 401,419 0.23
548,000 Bangkok Bank PCL† 3.73% 25/09/2034 555,558 0.32
200,000 Banistmo SA† 3.65% 19/09/2022 202,564 0.12
204,000 Bank Mandiri Persero Tbk PT* 3.75% 11/04/2024 210,306 0.12
400,000 Bank of China Ltd* 5.00% 13/11/2024 437,213 0.25
575,000 Banque Ouest Africaine de Developpement* 4.70% 22/10/2031 582,416 0.33
200,000 BBK BSC* 5.50% 09/07/2024 206,983 0.12
200,000 BBVA Bancomer SA† 5.13% 18/01/2033 202,257 0.12
259,000 BBVA Bancomer SA† 5.88% 13/09/2034 271,652 0.15
750,000 BBVA Bancomer SA* 6.75% 30/09/2022 817,905 0.47
300,000 BOC Aviation Ltd* 3.50% 10/10/2024 310,021 0.18
300,000 Braskem Finance Ltd† 6.45% 03/02/2024 334,378 0.19
370,000 Braskem Idesa SAPI* 7.45% 15/11/2029 394,886 0.22
320,000 BRF SA† 4.88% 24/01/2030 330,483 0.19
250,000 Burgan Bank SAK* 5.75% 29/12/2049 255,585 0.15
400,000 C&W Senior Financing DAC† 6.88% 15/09/2027 428,661 0.24
662,000 C&W Senior Financing DAC† 7.50% 15/10/2026 718,391 0.41
266,000 Cable Onda SA† 4.50% 30/01/2030 280,590 0.16
400,000 CBQ Finance Ltd* 5.00% 24/05/2023 429,581 0.24
494,000 CCBL Cayman 1 Corp Ltd* 3.50% 16/05/2024 506,885 0.29
723,000 CDBL Funding 1* 3.00% 24/04/2023 723,475 0.41
300,000 CDBL Funding 1* 3.50% 24/10/2027 303,709 0.17
400,000 CDBL Funding 2* 3.00% 01/08/2022 402,816 0.23
774,000 Celestial Miles Ltd* 5.75% 29/12/2049 815,398 0.46
579,000 Celulosa Arauco y Constitucion SA† 4.20% 29/01/2030 581,809 0.33
748,000 Cemex SAB de CV† 5.45% 19/11/2029 782,595 0.45
400,000 Cemex SAB de CV* 7.75% 16/04/2026 435,740 0.25
250,000 Cemig Geracao e Transmissao SA* 9.25% 05/12/2024 288,104 0.16
500,000 Cencosud SA* 4.38% 17/07/2027 493,846 0.28
200,000 Cencosud SA† 6.63% 12/02/2045 210,087 0.12
841,000 Central American Bottling Corp* 5.75% 31/01/2027 888,607 0.51
600,000 CFLD Cayman Investment Ltd* 8.60% 08/04/2024 617,612 0.35
900,000 Champion Sincerity Holdings Ltd* 8.13% 29/12/2049 948,195 0.54

SCHEDULE OF INVESTMENTS FINANCIAL STATEMENTS
ANNUAL REPORT 2019 229
Neuberger Berman Emerging Market Corporate Debt Fund (Continued)
Schedule of Investments (Continued)
Financial Assets at Fair Value through Profit or Loss (continued)
Principal Amount Security Description Coupon Maturity
DateFair Value
US$% of Net
Assets
Corporate Bonds 87.11% (31 December 2018: 95.59%) (continued)
United States Dollar (continued) 358,000 Charming Light Investments Ltd* 4.38% 21/12/2027 382,410 0.22
216,000 China Construction Bank Corp* 4.25% 27/02/2029 226,696 0.13
635,000 China Evergrande Group* 8.25% 23/03/2022 596,115 0.34
250,000 China Evergrande Group* 8.75% 28/06/2025 214,577 0.12
200,000 China Overseas Finance Cayman VI Ltd* 6.45% 11/06/2034 266,866 0.15
200,000 China Overseas Finance Cayman VII Ltd* 4.75% 26/04/2028 221,564 0.13
1,500,000 China Reinsurance Finance Corp Ltd* 3.38% 09/03/2022 1,505,414 0.86
203,000 China Resources Land Ltd* 4.13% 26/02/2029 218,362 0.12
750,000 Chinalco Capital Holdings Ltd* 4.25% 21/04/2022 761,249 0.43
400,000 CK Hutchison Capital Securities 17 Ltd† 4.00% 29/12/2049 403,798 0.23
200,000 CLP Power HK Finance Ltd* 3.55% 29/12/2049 200,483 0.11
350,000 CNOOC Curtis Funding No 1 Pty Ltd* 4.50% 03/10/2023 374,976 0.21
606,594 Cometa Energia SA de CV† 6.38% 24/04/2035 661,755 0.38
595,000 Corp Nacional del Cobre de Chile* 3.00% 30/09/2029 586,934 0.33
408,000 Cosan Ltd† 5.50% 20/09/2029 425,646 0.24
230,000 Country Garden Holdings Co Ltd* 6.15% 17/09/2025 241,076 0.14
222,000 CSN Islands XII Corp† 7.00% 29/12/2049 204,727 0.12
885,000 CSN Resources SA† 7.63% 13/02/2023 945,264 0.54
545,000 CSN Resources SA† 7.63% 17/04/2026 581,431 0.33
200,000 DBS Group Holdings Ltd* 4.52% 11/12/2028 213,046 0.12
250,000 DIB Tier 1 Sukuk 3 Ltd* 6.25% 29/12/2049 266,276 0.15
717,000 DP World Crescent Ltd* 3.88% 18/07/2029 735,376 0.42
292,000 DP World Crescent Ltd* 4.85% 26/09/2028 320,418 0.18
600,000 DP World Plc* 6.85% 02/07/2037 788,701 0.45
434,000 Eastern & Southern African Trade & Development Bank* 4.88% 23/05/2024 452,966 0.26
500,000 Easy Tactic Ltd* 5.75% 13/01/2022 494,858 0.28
356,000 Easy Tactic Ltd* 8.13% 27/02/2023 365,808 0.21
229,000 Ecopetrol SA* 5.38% 26/06/2026 257,134 0.15
580,000 Ecopetrol SA* 5.88% 28/05/2045 685,668 0.39
539,000 Ecopetrol SA* 7.38% 18/09/2043 730,849 0.42
300,000 El Puerto de Liverpool SAB de CV† 3.88% 06/10/2026 306,857 0.17
250,000 Elementia SAB de CV† 5.50% 15/01/2025 254,169 0.14
292,000 Emaar Sukuk Ltd* 3.88% 17/09/2029 290,437 0.17
500,000 Emirates NBD Bank PJSC* 6.13% 29/12/2049 527,012 0.30
600,000 Empresa Electrica Guacolda SA* 4.56% 30/04/2025 546,790 0.31
502,000 Empresas Publicas de Medellin ESP† 4.25% 18/07/2029 523,110 0.30
205,000 Enel Chile SA* 4.88% 12/06/2028 227,109 0.13
400,000 Equate Petrochemical BV* 4.25% 03/11/2026 427,803 0.24

FINANCIAL STATEMENTS SCHEDULE OF INVESTMENTS
230 NEUBERGER BERMAN INVESTMENT FUNDS PLC
Neuberger Berman Emerging Market Corporate Debt Fund (Continued)
Schedule of Investments (Continued)
Financial Assets at Fair Value through Profit or Loss (continued)
Principal Amount Security Description Coupon Maturity
DateFair Value
US$% of Net
Assets
Corporate Bonds 87.11% (31 December 2018: 95.59%) (continued)
United States Dollar (continued) 500,000 Evraz Plc* 5.38% 20/03/2023 537,943 0.31
300,000 First Quantum Minerals Ltd† 7.25% 01/04/2023 311,210 0.18
200,000 FirstRand Bank Ltd* 6.25% 23/04/2028 212,605 0.12
200,000 Fomento Economico Mexicano SAB de CV* 4.38% 10/05/2043 221,517 0.13
500,000 Formosa Group Cayman Ltd* 3.38% 22/04/2025 511,894 0.29
300,000 Franshion Brilliant Ltd* 4.00% 29/12/2049 299,285 0.17
400,000 FWD Group Ltd* 5.75% 09/07/2024 414,598 0.24
1,201,000 Gazprom PJSC Via Gaz Capital SA* 5.15% 11/02/2026 1,337,092 0.76
379,000 Gazprom PJSC Via Gaz Capital SA† 8.63% 28/04/2034 568,323 0.32
200,000 GC Treasury Center Co Ltd* 4.25% 19/09/2022 208,032 0.12
156,000 Genneia SA† 8.75% 20/01/2022 122,970 0.07
348,000 Geopark Ltd* 6.50% 21/09/2024 363,808 0.21
1,050,000 Gol Finance SA* 7.00% 31/01/2025 1,083,689 0.62
426,000 Gold Fields Orogen Holdings BVI Ltd* 6.13% 15/05/2029 473,648 0.27
650,000 Greenko Dutch BV† 5.25% 24/07/2024 660,641 0.38
200,000 Greenko Solar Mauritius Ltd* 5.55% 29/01/2025 203,724 0.12
300,000 Greenland Global Investment Ltd* 6.75% 25/06/2022 303,094 0.17
485,000 Grupo Bimbo SAB de CV† 4.00% 06/09/2049 453,953 0.26
400,000 GTH Finance BV* 7.25% 26/04/2023 450,826 0.26
211,000 GTL Trade Finance Inc* 7.25% 16/04/2044 267,640 0.15
681,000 Gtlk Europe Capital DAC* 4.95% 18/02/2026 704,535 0.40
717,000 GUSAP III LP* 4.25% 21/01/2030 729,548 0.42
301,000 Haitong International Securities Group Ltd* 3.13% 18/05/2025 298,655 0.17
458,000 Haitong International Securities Group Ltd* 3.38% 19/07/2024 462,052 0.26
921,000 Hanwha Life Insurance Co Ltd* 4.70% 29/12/2049 940,480 0.54
200,000 HKT Capital No 2 Ltd* 3.63% 02/04/2025 205,446 0.12
217,000 HPHT Finance 17 Ltd* 2.75% 11/09/2022 217,601 0.12
587,000 HPHT Finance 19 Ltd* 2.88% 05/11/2024 586,149 0.33
500,000 Huarong Finance 2017 Co Ltd* 4.00% 29/12/2049 504,054 0.29
250,000 Huarong Finance 2017 Co Ltd* 4.50% 29/12/2049 254,395 0.14
552,000 Hunt Oil Co of Peru LLC Sucursal Del Peru† 6.38% 01/06/2028 608,911 0.35
600,000 Hyundai Capital America† 2.75% 27/09/2026 582,804 0.33
711,000 Hyundai Capital America† 3.50% 02/11/2026 721,270 0.41
291,000 IHS Netherlands Holdco BV* 8.00% 18/09/2027 309,700 0.18
114,000 Indo Energy Finance II BV† 6.38% 24/01/2023 114,993 0.07
200,000 Indonesia Asahan Aluminium Persero PT* 6.76% 15/11/2048 258,227 0.15
428,000 Industrial & Commercial Bank of China Ltd† 3.54% 08/11/2027 444,005 0.25
252,000 Industrias Penoles SAB de CV† 4.15% 12/09/2029 260,908 0.15

SCHEDULE OF INVESTMENTS FINANCIAL STATEMENTS
ANNUAL REPORT 2019 231
Neuberger Berman Emerging Market Corporate Debt Fund (Continued)
Schedule of Investments (Continued)
Financial Assets at Fair Value through Profit or Loss (continued)
Principal Amount Security Description Coupon Maturity
DateFair Value
US$% of Net
Assets
Corporate Bonds 87.11% (31 December 2018: 95.59%) (continued)
United States Dollar (continued) 322,000 Industrias Penoles SAB de CV† 5.65% 12/09/2049 344,384 0.20
260,000 Infraestructura Energetica Nova SAB de CV† 4.88% 14/01/2048 248,543 0.14
475,000 Inkia Energy Ltd* 5.88% 09/11/2027 496,071 0.28
456,000 Israel Chemicals Ltd* 6.38% 31/05/2038 545,578 0.31
500,000 Israel Electric Corp Ltd* 5.00% 12/11/2024 550,858 0.31
400,000 Israel Electric Corp Ltd* 6.88% 21/06/2023 455,082 0.26
523,000 Itau Unibanco Holding SA† 4.50% 21/11/2029 536,080 0.31
324,000 JBS Investments II GmbH* 5.75% 15/01/2028 342,257 0.19
240,000 JSW Steel Ltd* 5.95% 18/04/2024 247,014 0.14
237,000 Kallpa Generacion SA* 4.13% 16/08/2027 242,121 0.14
450,000 Kasikornbank PCL* 3.34% 02/10/2031 452,673 0.26
394,000 KazMunayGas National Co JSC* 5.75% 19/04/2047 469,138 0.27
250,000 KazMunayGas National Co JSC* 6.38% 24/10/2048 320,186 0.18
400,000 KOC Holding AS* 5.25% 15/03/2023 410,108 0.23
226,000 Kookmin Bank* 4.35% 29/12/2049 230,435 0.13
507,000 Kosmos Energy Ltd* 7.13% 04/04/2026 519,358 0.30
200,000 Kuwait Projects Co SPC Ltd* 4.23% 29/10/2026 208,317 0.12
484,000 Kuwait Projects Co SPC Ltd* 4.50% 23/02/2027 506,593 0.29
300,000 Kuwait Projects Co SPC Ltd* 5.00% 15/03/2023 319,543 0.18
301,000 Kyobo Life Insurance Co Ltd* 3.95% 29/12/2049 305,891 0.17
500,000 Li & Fung Ltd* 4.38% 04/10/2024 514,144 0.29
431,000 Light Servicos de Eletricidade SA/Light Energia SA* 7.25% 03/05/2023 461,892 0.26
800,000 Liquid Telecommunications Financing Plc* 8.50% 13/07/2022 814,851 0.46
414,000 MARB BondCo Plc* 6.88% 19/01/2025 440,378 0.25
243,000 Marble II Pte Ltd* 5.30% 20/06/2022 246,383 0.14
246,000 Mashreqbank PSC* 4.25% 26/02/2024 257,382 0.15
413,000 MDGH - GMTN BV* 3.70% 07/11/2049 427,590 0.24
579,000 Medco Oak Tree Pte Ltd* 7.38% 14/05/2026 590,974 0.34
600,000 Melco Resorts Finance Ltd* 5.25% 26/04/2026 621,209 0.35
218,000 Melco Resorts Finance Ltd* 5.38% 04/12/2029 224,372 0.13
1,650,000 Melco Resorts Finance Ltd† 5.63% 17/07/2027 1,721,481 0.98
200,000 Mersin Uluslararasi Liman Isletmeciligi AS* 5.38% 15/11/2024 206,161 0.12
602,000 Metropolitan Light Co Ltd* 5.50% 21/11/2022 623,006 0.35
1,632,000 MGM China Holdings Ltd* 5.88% 15/05/2026 1,732,978 0.99
387,000 MHP Lux SA* 6.95% 03/04/2026 405,896 0.23
400,000 Millicom International Cellular SA* 6.00% 15/03/2025 415,666 0.24
223,000 Millicom International Cellular SA* 6.25% 25/03/2029 246,446 0.14
402,000 Millicom International Cellular SA* 6.63% 15/10/2026 445,878 0.25

FINANCIAL STATEMENTS SCHEDULE OF INVESTMENTS
232 NEUBERGER BERMAN INVESTMENT FUNDS PLC
Neuberger Berman Emerging Market Corporate Debt Fund (Continued)
Schedule of Investments (Continued)
Financial Assets at Fair Value through Profit or Loss (continued)
Principal Amount Security Description Coupon Maturity
DateFair Value
US$% of Net
Assets
Corporate Bonds 87.11% (31 December 2018: 95.59%) (continued)
United States Dollar (continued) 705,000 Minera Mexico SA de CV† 4.50% 26/01/2050 719,759 0.41
200,000 Minera y Metalurgica del Boleo SAPI de CV* 3.25% 17/04/2024 204,385 0.12
400,000 Minerva Luxembourg SA* 6.50% 20/09/2026 426,643 0.24
546,000 MSU Energy SA/UGEN SA/UENSA SA† 6.88% 01/02/2025 334,835 0.19
500,000 MTN Mauritius Investments Ltd* 6.50% 13/10/2026 554,329 0.32
1,122,136 MV24 Capital BV* 6.75% 01/06/2034 1,187,389 0.68
350,000 Nakilat Inc† 6.07% 31/12/2033 427,000 0.24
450,000 Nanyang Commercial Bank Ltd* 3.80% 20/11/2029 454,147 0.26
559,000 NBK Tier 1 Financing 2 Ltd* 4.50% 29/12/2049 559,000 0.32
400,000 NBK Tier 1 Financing Ltd* 5.75% 29/12/2049 410,919 0.23
362,000 NBM US Holdings Inc† 7.00% 14/05/2026 392,908 0.22
626,000 Network i2i Ltd* 5.65% 29/12/2049 619,427 0.35
400,000 Nexa Resources SA† 5.38% 04/05/2027 428,744 0.24
1,007,000 Nexen Inc† 5.88% 10/03/2035 1,295,444 0.74
308,000 NTPC Ltd* 4.50% 19/03/2028 330,361 0.19
200,000 NWD Finance BVI Ltd* 5.75% 29/12/2049 199,989 0.11
377,000 NWD MTN Ltd* 4.13% 18/07/2029 378,006 0.22
200,000 NWD MTN Ltd* 5.25% 26/02/2021 205,178 0.12
200,000 OCP SA* 6.88% 25/04/2044 254,316 0.14
237,000 Oil & Gas Holding Co BSCC* 7.63% 07/11/2024 275,514 0.16
250,000 Oil India International Pte Ltd* 4.00% 21/04/2027 256,193 0.15
200,000 Oil India Ltd* 5.13% 04/02/2029 222,134 0.13
1,000,000 Orazul Energy Egenor SCA* 5.63% 28/04/2027 1,031,598 0.59
500,000 Orbia Advance Corp SAB de CV* 5.88% 17/09/2044 528,598 0.30
650,000 Oversea-Chinese Banking Corp Ltd* 4.25% 19/06/2024 690,889 0.39
300,000 OVPH Ltd* 5.88% 29/12/2049 307,695 0.18
483,000 Oztel Holdings SPC Ltd* 6.63% 24/04/2028 512,908 0.29
500,000 Pampa Energia SA* 7.38% 21/07/2023 473,958 0.27
750,000 Parkway Pantai Ltd* 4.25% 29/12/2049 751,545 0.43
241,000 Pertamina Persero PT* 3.65% 30/07/2029 252,962 0.14
367,000 Peru LNG Srl* 5.38% 22/03/2030 362,544 0.21
233,000 Perusahaan Listrik Negara PT* 4.38% 05/02/2050 236,349 0.13
250,000 Petra Diamonds US Treasury Plc† 7.25% 01/05/2022 158,436 0.09
748,000 Petrobras Global Finance BV† 5.09% 15/01/2030 802,424 0.46
300,000 Petrobras Global Finance BV* 6.88% 20/01/2040 352,558 0.20
427,000 Petrobras Global Finance BV* 6.90% 19/03/2049 501,629 0.29
440,000 Petroleos Mexicanos† 7.69% 23/01/2050 481,701 0.27
342,000 Philippine National Bank* 3.28% 27/09/2024 345,961 0.20

SCHEDULE OF INVESTMENTS FINANCIAL STATEMENTS
ANNUAL REPORT 2019 233
Neuberger Berman Emerging Market Corporate Debt Fund (Continued)
Schedule of Investments (Continued)
Financial Assets at Fair Value through Profit or Loss (continued)
Principal Amount Security Description Coupon Maturity
DateFair Value
US$% of Net
Assets
Corporate Bonds 87.11% (31 December 2018: 95.59%) (continued)
United States Dollar (continued) 400,000 Polyus Finance Plc* 4.70% 29/01/2024 426,358 0.24
307,000 Polyus Finance Plc* 5.25% 07/02/2023 328,665 0.19
200,000 Power Finance Corp Ltd* 3.75% 18/06/2024 203,558 0.12
600,000 Power Finance Corp Ltd* 6.15% 06/12/2028 692,715 0.39
509,000 Prosus NV* 4.85% 06/07/2027 556,240 0.32
300,000 Prosus NV* 5.50% 21/07/2025 334,147 0.19
500,000 Proven Glory Capital Ltd* 3.25% 21/02/2022 501,718 0.29
200,000 Proven Honour Capital Ltd* 4.13% 19/05/2025 208,118 0.12
325,000 PSA Treasury Pte Ltd* 2.13% 05/09/2029 314,528 0.18
480,000 PTTEP Treasury Center Co Ltd* 3.90% 06/12/2059 479,218 0.27
200,000 QIB Sukuk Ltd* 3.25% 23/05/2022 202,189 0.12
291,000 QNB Finance Ltd* 3.50% 28/03/2024 301,286 0.17
400,000 QNB Finansbank AS* 4.88% 19/05/2022 402,673 0.23
397,000 QNB Finansbank AS* 6.88% 07/09/2024 423,748 0.24
300,000 Raizen Fuels Finance SA* 5.30% 20/01/2027 327,854 0.19
309,000 Rakfunding Cayman Ltd* 4.13% 09/04/2024 321,690 0.18
519,000 REC Ltd* 3.50% 12/12/2024 519,961 0.30
500,000 REC Ltd* 5.25% 13/11/2023 534,187 0.30
285,000 Rede D'or Finance Sarl† 4.95% 17/01/2028 295,505 0.17
250,000 Reliance Industries Ltd* 3.67% 30/11/2027 259,254 0.15
250,000 Reliance Industries Ltd* 4.88% 10/02/2045 292,882 0.17
450,000 Rizal Commercial Banking Corp* 4.13% 16/03/2023 463,185 0.26
2,135,000 Rumo Luxembourg Sarl* 7.38% 09/02/2024 2,304,914 1.31
200,000 SABIC Capital II BV* 4.00% 10/10/2023 210,775 0.12
300,000 SACI Falabella† 3.75% 30/10/2027 306,916 0.17
1,278,000 Saka Energi Indonesia PT* 4.45% 05/05/2024 1,297,881 0.74
776,000 Samba Funding Ltd* 2.75% 02/10/2024 769,849 0.44
550,000 Sands China Ltd* 5.13% 08/08/2025 605,140 0.34
800,000 Sands China Ltd* 5.40% 08/08/2028 904,022 0.51
740,000 Sasol Financing USA LLC* 5.88% 27/03/2024 801,156 0.46
278,000 Sasol Financing USA LLC* 6.50% 27/09/2028 309,110 0.18
342,000 Saudi Arabian Oil Co* 4.38% 16/04/2049 374,614 0.21
315,000 Saudi Electricity Global Sukuk Co 4* 4.22% 27/01/2024 334,816 0.19
272,000 Saudi Electricity Global Sukuk Co 4* 4.72% 27/09/2028 303,230 0.17
200,000 Sberbank of Russia Via SB Capital SA* 5.13% 29/10/2022 212,018 0.12
500,000 Sberbank of Russia Via SB Capital SA* 6.13% 07/02/2022 535,605 0.30
700,000 SCF Capital Designated Activity Co* 5.38% 16/06/2023 754,628 0.43
200,000 Shanghai Port Group BVI Development Co Ltd* 2.85% 11/09/2029 194,724 0.11

FINANCIAL STATEMENTS SCHEDULE OF INVESTMENTS
234 NEUBERGER BERMAN INVESTMENT FUNDS PLC
Neuberger Berman Emerging Market Corporate Debt Fund (Continued)
Schedule of Investments (Continued)
Financial Assets at Fair Value through Profit or Loss (continued)
Principal Amount Security Description Coupon Maturity
DateFair Value
US$% of Net
Assets
Corporate Bonds 87.11% (31 December 2018: 95.59%) (continued)
United States Dollar (continued) 229,000 Shimao Property Holdings Ltd* 6.13% 21/02/2024 244,512 0.14
520,000 Shinhan Bank Co Ltd* 4.00% 23/04/2029 547,700 0.31
327,000 Shinhan Bank Co Ltd* 4.50% 26/03/2028 354,357 0.20
446,000 Shinhan Financial Group Co Ltd* 5.88% 29/12/2049 479,981 0.27
200,000 Siam Commercial Bank PCL* 4.40% 11/02/2029 220,056 0.13
330,000 Sigma Alimentos SA de CV* 4.13% 02/05/2026 346,205 0.20
300,000 Sigma Finance Netherlands BV* 4.88% 27/03/2028 324,482 0.18
300,000 Sino-Ocean Land Treasure IV Ltd* 4.75% 05/08/2029 298,307 0.17
476,000 SK Hynix Inc* 3.00% 17/09/2024 475,775 0.27
1,150,000 Southern Copper Corp* 6.75% 16/04/2040 1,536,150 0.87
351,000 Southern Gas Corridor CJSC* 6.88% 24/03/2026 416,975 0.24
500,000 St Marys Cement Inc Canada† 5.75% 28/01/2027 562,674 0.32
1,625,000 Studio City Finance Ltd* 7.25% 11/02/2024 1,721,826 0.98
200,000 Sun Hung Kai Properties Capital Market Ltd* 3.75% 25/02/2029 211,072 0.12
209,000 Sunac China Holdings Ltd* 7.50% 01/02/2024 215,914 0.12
291,000 Sunac China Holdings Ltd* 7.88% 15/02/2022 302,637 0.17
200,000 Sunac China Holdings Ltd* 7.95% 08/08/2022 208,761 0.12
800,000 Sunac China Holdings Ltd* 8.35% 19/04/2023 851,945 0.49
400,000 Sunny Optical Technology Group Co Ltd* 3.75% 23/01/2023 408,978 0.23
229,000 SURA Asset Management SA† 4.38% 11/04/2027 245,684 0.14
258,000 SURA Asset Management SA† 4.88% 17/04/2024 278,105 0.16
571,000 Suzano Austria GmbH* 5.00% 15/01/2030 601,246 0.34
257,000 Suzano Austria GmbH* 6.00% 15/01/2029 290,499 0.17
476,000 Suzano Austria GmbH† 7.00% 16/03/2047 560,792 0.32
272,000 Tecpetrol SA† 4.88% 12/12/2022 276,969 0.16
279,000 Telecom Argentina SA† 8.00% 18/07/2026 268,715 0.15
1,000,000 Tencent Holdings Ltd* 3.60% 19/01/2028 1,044,407 0.59
995,000 Teva Pharmaceutical Finance Netherlands III BV* 3.15% 01/10/2026 830,850 0.47
560,000 Teva Pharmaceutical Finance Netherlands III BV† 7.13% 31/01/2025 576,400 0.33
339,000 TNB Global Ventures Capital Bhd* 4.85% 01/11/2028 379,272 0.22
241,000 Transportadora de Gas del Sur SA* 6.75% 02/05/2025 213,466 0.12
216,000 Trust F/1401* 6.39% 15/01/2050 232,944 0.13
400,000 Trust F/1401† 6.95% 30/01/2044 466,378 0.27
250,000 Tullow Oil Plc† 6.25% 15/04/2022 226,188 0.13
556,000 Tullow Oil Plc† 7.00% 01/03/2025 469,436 0.27
700,000 Tupras Turkiye Petrol Rafinerileri AS* 4.50% 18/10/2024 684,579 0.39
200,000 Turk Telekomunikasyon AS* 6.88% 28/02/2025 214,262 0.12
400,000 Turkcell Iletisim Hizmetleri AS* 5.80% 11/04/2028 399,250 0.23

SCHEDULE OF INVESTMENTS FINANCIAL STATEMENTS
ANNUAL REPORT 2019 235
Neuberger Berman Emerging Market Corporate Debt Fund (Continued)
Schedule of Investments (Continued)
Financial Assets at Fair Value through Profit or Loss (continued)
Principal Amount Security Description Coupon Maturity
Date Fair Value
US$% of Net
Assets
Corporate Bonds 87.11% (31 December 2018: 95.59%) (continued)
United States Dollar (continued) 500,000 Turkiye Garanti Bankasi AS* 5.25% 13/09/2022 510,183 0.29
300,000 Turkiye Garanti Bankasi AS* 5.88% 16/03/2023 308,989 0.18
445,000 Turkiye Is Bankasi AS* 6.13% 25/04/2024 445,237 0.25
365,000 Turkiye Sise ve Cam Fabrikalari AS* 6.95% 14/03/2026 386,225 0.22
382,000 Ultrapar International SA* 5.25% 06/06/2029 403,526 0.23
800,000 United Bank for Africa Plc* 7.75% 08/06/2022 852,076 0.49
258,000 United Overseas Bank Ltd* 3.75% 15/04/2029 267,832 0.15
320,000 Vale Overseas Ltd* 6.88% 21/11/2036 417,099 0.24
119,000 Vale Overseas Ltd* 8.25% 17/01/2034 167,385 0.10
200,000 Vedanta Resources Ltd* 6.38% 30/07/2022 196,662 0.11
600,000 Vedanta Resources Ltd† 8.25% 07/06/2021 621,402 0.35
597,000 VEON Holdings BV† 4.00% 09/04/2025 622,856 0.35
388,000 Volcan Compania Minera SAA† 5.38% 02/02/2022 404,696 0.23
946,000 VTR Finance BV* 6.88% 15/01/2024 969,257 0.55
282,000 Weibo Corp* 3.50% 05/07/2024 287,095 0.16
900,000 Woori Bank* 4.75% 30/04/2024 966,271 0.55
535,000 Wynn Macau Ltd* 4.88% 01/10/2024 547,653 0.32
300,000 Yapi ve Kredi Bankasi AS* 8.25% 15/10/2024 322,067 0.18
275,000 YPF Energia Electrica SA* 10.00% 25/07/2026 239,973 0.14
450,000 YPF SA† 7.00% 15/12/2047 357,046 0.20
306,000 YPF SA* 8.50% 28/07/2025 290,062 0.17
216,000 Yuzhou Properties Co Ltd* 6.00% 25/10/2023 211,084 0.12
Total United States Dollar 152,399,456 86.78
Total Corporate Bonds 152,972,400 87.11
Government Bonds 3.86% (31 December 2018: 2.34%)
Euro 300,000 Argentine Republic Government International Bond** 3.38% 31/12/2038 152,462 0.09
200,000 Argentine Republic Government International Bond* 5.00% 15/01/2027 101,094 0.06
688,052 Argentine Republic Government International Bond* 7.82% 31/12/2033 446,025 0.25
551,000 Ivory Coast Government International Bond* 5.88% 17/10/2031 644,603 0.37
355,000 Ukraine Government International Bond** 6.75% 20/06/2026 448,182 0.25
Total Euro 1,792,366 1.02
United States Dollar 487,000 Angolan Government International Bond* 9.13% 26/11/2049 520,370 0.30
350,000 Argentine Republic Government International Bond* 4.63% 11/01/2023 173,745 0.10
700,000 Argentine Republic Government International Bond* 6.88% 26/01/2027 350,243 0.20

FINANCIAL STATEMENTS SCHEDULE OF INVESTMENTS
236 NEUBERGER BERMAN INVESTMENT FUNDS PLC
Neuberger Berman Emerging Market Corporate Debt Fund (Continued)
Schedule of Investments (Continued)
Financial Assets at Fair Value through Profit or Loss (continued)
Principal Amount Security Description Coupon Maturity
DateFair Value
US$% of Net
Assets
Government Bonds 3.86% (31 December 2018: 2.34%) (continued)
United States Dollar (continued) 441,000 Costa Rica Government International Bond* 6.13% 19/02/2031 469,775 0.27
392,000 Export Credit Bank of Turkey* 5.38% 24/10/2023 390,724 0.22
319,000 Export Credit Bank of Turkey* 8.25% 24/01/2024 347,474 0.20
638,000 Republic of South Africa Government International Bond* 5.75% 30/09/2049 622,615 0.35
600,000 Ukraine Government International Bond* 7.38% 25/09/2032 639,924 0.36
300,000 Ukraine Government International Bond* 7.75% 01/09/2027 328,915 0.19
204,000 Ukraine Government International Bond* 8.99% 01/02/2024 230,121 0.13
750,000 Ukraine Government International Bond* 9.75% 01/11/2028 912,802 0.52
Total United States Dollar 4,986,708 2.84
Total Government Bonds 6,779,074 3.86
Number of Shares Security Description Fair Value
US$% of Net
Assets
Investment Funds 1.14% (31 December 2018: 0.00%)
United States Dollar 191,846 Neuberger Berman China Bond Fund 2,002,873 1.14
Total Investment Funds μ 2,002,873 1.14
Total Investments 161,754,347 92.11
Forward Currency Contracts 1.18% (31 December 2018: 0.11%)
Amount Receivable
Amount Payable
Maturity Date Counterparty Contracts Unrealised
Gain US$% of Net
Assets
CHF Hedged Classes CHF 437,471 US$ 447,832 21/02/2020 Goldman Sachs International 2 5,513 0.00
CHF 40,150,332 US$ 40,822,641 21/02/2020 UBS AG 2 784,525 0.45
CHF 2,210,684 US$ 2,235,778 21/02/2020 Westpac Banking Corp 5 55,119 0.03
EUR Hedged Classes € 70,122,263 US$ 77,769,376 21/02/2020 Citibank NA 1 1,185,489 0.67
€ 320,759 US$ 358,221 21/02/2020 Goldman Sachs International 2 2,941 0.00
€ 974,840 US$ 1,087,431 21/02/2020 Westpac Banking Corp 10 10,200 0.01
GBP Hedged Classes £ 740 US$ 961 21/02/2020 Goldman Sachs International 1 21 0.00
£ 352,429 US$ 455,042 21/02/2020 UBS AG 1 12,483 0.01
SEK Hedged Classes SEK 6,557,374 US$ 681,371 21/02/2020 Goldman Sachs International 2 20,800 0.01
SEK 736,044 US$ 77,824 21/02/2020 Westpac Banking Corp 8 993 0.00
US$ 7 SEK 66 21/02/2020 Goldman Sachs International 1 0 0.00
US$ 21,378 SEK 199,320 21/02/2020 Westpac Banking Corp 2 34 0.00

SCHEDULE OF INVESTMENTS FINANCIAL STATEMENTS
ANNUAL REPORT 2019 237
Neuberger Berman Emerging Market Corporate Debt Fund (Continued)
Schedule of Investments (Continued)
Financial Assets at Fair Value through Profit or Loss (continued)
Forward Currency Contracts 1.18% (31 December 2018: 0.11%) (continued)
Amount Receivable
Amount Payable
Maturity Date Counterparty Contracts Unrealised
Gain US$% of Net
Assets
SGD Hedged Classes SGD 531 US$ 392 21/02/2020 Goldman Sachs International 2 4 0.00
SGD 267 US$ 198 21/02/2020 UBS AG 1 0 0.00
SGD 87,313 US$ 64,167 21/02/2020 Westpac Banking Corp 4 794 0.00
US$ 110 SGD 147 21/02/2020 Westpac Banking Corp 1 0 0.00
Total Unrealised Gain on Forward Currency Contracts ∞ 2,078,916 1.18
Futures Contracts 0.15% (31 December 2018: 0.00%)
Number of Contracts Description Unrealised
Gain US$% of Net
Assets
(11) Euro-Bund Future March 2020 29,387 0.02
(33) US Treasury 10-Year Note (CBT) Future March 2020 37,640 0.02
(62) US Treasury Long Bond (CBT) Future March 2020 186,743 0.11
Total Unrealised Gain on Futures Contracts ± 253,770 0.15
Fair ValueUS$
% of NetAssets
Total Financial Assets at Fair Value through Profit or Loss 164,087,033 93.44
Financial Liabilities at Fair Value through Profit or Loss
Forward Currency Contracts (0.12%) (31 December 2018: (0.08%))
Amount Receivable
Amount Payable
Maturity Date Counterparty Contracts Unrealised
Loss US$% of Net
Assets
US$ 2,606,315 € 2,360,000 06/01/2020 JPMorgan Chase Bank 1 (43,281) (0.03)
CHF Hedged Classes US$ 34,147 CHF 33,774 21/02/2020 Westpac Banking Corp 2 (852) (0.00)
EUR Hedged Classes US$ 9,419,492 € 8,493,267 21/02/2020 Citibank NA 1 (143,587) (0.08)
US$ 617,906 € 555,270 21/02/2020 Westpac Banking Corp 13 (7,304) (0.00)
GBP Hedged Classes £ 937 US$ 1,252 21/02/2020 Goldman Sachs International 1 (9) (0.00)
US$ 276,287 £ 213,984 21/02/2020 UBS AG 1 (7,580) (0.01)
SEK Hedged Classes SEK 89,628 US$ 9,628 21/02/2020 Goldman Sachs International 3 (30) (0.00)
SEK 333,754 US$ 35,763 21/02/2020 Westpac Banking Corp 2 (24) (0.00)
US$ 59 SEK 553 21/02/2020 Goldman Sachs International 1 (1) (0.00)
US$ 103,003 SEK 971,677 21/02/2020 Westpac Banking Corp 5 (1,045) (0.00)

FINANCIAL STATEMENTS SCHEDULE OF INVESTMENTS
238 NEUBERGER BERMAN INVESTMENT FUNDS PLC
Neuberger Berman Emerging Market Corporate Debt Fund (Continued)
Schedule of Investments (Continued)
Financial Liabilities at Fair Value through Profit or Loss (continued)
Forward Currency Contracts (0.12%) (31 December 2018: (0.08%)) (continued)
Amount Receivable
Amount Payable
Maturity Date Counterparty Contracts Unrealised
Loss US$% of Net
Assets
SGD Hedged Classes US$ 2 SGD 3 21/02/2020 Goldman Sachs International 1 (0) (0.00)
US$ 35,031 SGD 47,647 21/02/2020 Westpac Banking Corp 3 (418) (0.00)
Total Unrealised Loss on Forward Currency Contracts ∞ (204,131) (0.12)
Fair ValueUS$
% of NetAssets
Total Financial Liabilities at Fair Value through Profit or Loss (204,131) (0.12)
Net Financial Assets at Fair Value through Profit or Loss 163,882,902 93.32
Other Net Assets 11,725,009 6.68
Net Assets Attributable to Holders of Redeemable Participating Shares 175,607,911 100.00
% of
TotalAssetsPortfolio Analysis US$
* Transferable securities and/or money market instruments admitted to an official stock exchange listing 125,547,465 71.28
** Transferable securities and/or money market instruments dealt in on a regulated market 600,644 0.34
† Other transferable securities and/or money market instruments 33,603,365 19.08
μ Investment funds 2,002,873 1.14
± Financial derivative instruments traded on a regulated market 253,770 0.14
∞ OTC financial derivative instruments 1,874,785 1.06
Total Investments 163,882,902 93.04

STATEMENT OF SIGNIFICANT PURCHASES AND SALES FINANCIAL STATEMENTS
ANNUAL REPORT 2019 239
Neuberger Berman Emerging Market Corporate Debt Fund (Continued) Statement of Significant Purchases and Sales (Unaudited) In accordance with the European Communities (Undertakings for Collective Investment in Transferable Securities) Regulations, 2011 as amended, a statement of changes in the composition of the Schedule of Investments during the reporting period is provided to ensure that Shareholders can identify changes in the investments held by the Portfolio. The following statements present the aggregate purchases and sales of transferable securities exceeding one percent of the total value of purchases or sales, respectively, for the period. At a minimum, the largest twenty purchases and twenty sales are presented, if available.
Top twenty purchases:
Units Security Description Cost US$
1,885,000 Rumo Luxembourg Sarl, 7.38%, 09/02/2024 2,038,859
191,846 Neuberger Berman China Bond Fund 1,918,960
1,650,000 Melco Resorts Finance Ltd, 5.63%, 17/07/2027 1,709,550
1,632,000 MGM China Holdings Ltd, 5.88%, 15/05/2026 1,701,800
1,625,000 Studio City Finance Ltd, 7.25%, 11/02/2024 1,694,340
1,515,000 Altice Financing SA, 7.50%, 15/05/2026 1,570,738
1,300,000 Braskem Finance Ltd, 6.45%, 03/02/2024 1,416,987
1,150,000 Southern Copper Corp, 6.75%, 16/04/2040 1,406,561
1,200,000 Banco do Brasil SA, 9.00%, 29/12/2049 1,279,500
1,250,000 Rongshi International Finance Ltd, 3.75%, 21/05/2029 1,243,600
1,200,000 Tencent Holdings Ltd, 3.60%, 19/01/2028 1,223,108
1,201,000 Gazprom PJSC Via Gaz Capital SA, 5.15%, 11/02/2026 1,201,000
1,200,000 Sinopec Engineering Group Co Ltd, 3.68%, 08/08/2049 1,200,000
1,100,000 REC Ltd, 5.25%, 13/11/2023 1,183,013
1,112,000 Champion Sincerity Holdings Ltd, 8.13%, 29/12/2049 1,147,760
1,138,000 MV24 Capital BV, 6.75%, 01/06/2034 1,147,000
1,150,000 Greenko Dutch BV, 5.25%, 24/07/2024 1,111,270
1,098,000 Cemex SAB de CV, 5.45%, 19/11/2029 1,098,000
1,050,000 Gol Finance SA, 7.00%, 31/01/2025 1,056,413
1,050,000 Saka Energi Indonesia PT, 4.45%, 05/05/2024 1,044,938

FINANCIAL STATEMENTS STATEMENT OF SIGNIFICANT PURCHASES AND SALES
240 NEUBERGER BERMAN INVESTMENT FUNDS PLC
Neuberger Berman Emerging Market Corporate Debt Fund (Continued) Statement of Significant Purchases and Sales (Unaudited) (Continued) Top twenty sales:
Units Security Description Proceeds US$
1,364,000 Petrobras Global Finance BV, 7.38%, 17/01/2027 1,547,336
1,259,000 PCPD Capital Ltd, 4.75%, 09/03/2022 1,264,874
1,200,000 Sinopec Engineering Group Co Ltd, 3.68%, 08/08/2049 1,212,156
1,150,000 Ukreximbank Via Biz Finance Plc, 9.63%, 27/04/2022 1,161,500
1,000,000 Braskem Finance Ltd, 6.45%, 03/02/2024 1,107,500
1,000,000 Banco de Bogota SA, 6.25%, 12/05/2026 1,100,698
1,200,000 Teva Pharmaceutical Finance Netherlands III BV, 2.80%, 21/07/2023 1,060,080
1,000,000 SURA Asset Management SA, 4.88%, 17/04/2024 1,054,000
1,000,000 Studio City Co Ltd, 7.25%, 30/11/2021 1,030,298
750,000 Southern Copper Corp, 6.75%, 16/04/2040 981,975
868,000 Volcan Compania Minera SAA, 5.38%, 02/02/2022 896,801
900,000 Wisdom Glory Group Ltd, 5.25%, 29/12/2049 896,220
800,000 Ptt Pcl, 4.50%, 25/10/2042 896,000
900,000 HBIS Group Hong Kong Co Ltd, 4.25%, 07/04/2020 893,644
850,000 Rongshi International Finance Ltd, 3.75%, 21/05/2029 848,258
800,000 Melco Resorts Finance Ltd, 4.88%, 06/06/2025 820,434
800,000 China Construction Bank Corp, 3.88%, 13/05/2025 804,400
800,000 Bank of East Asia Ltd, 5.50%, 29/12/2049 798,625
757,000 Bharti Airtel International Netherlands BV, 5.35%, 20/05/2024 770,762
750,000 Grupo Aval Ltd, 4.75%, 26/09/2022 765,425

INVESTMENT MANAGER’S REPORT FINANCIAL STATEMENTS
ANNUAL REPORT 2019 241
Neuberger Berman Strategic Income Fund Investment Manager’s Report For the 12 months ended 31 December 2019, the total return for the USD I Accumulating Class was 10.10%. Over the same period, the benchmark index, the Bloomberg Barclays US Aggregate Bond Index (USD Total Return), returned 8.72%. (Performance for all share classes is provided in Appendix II. Performance data quoted represent past performance and do not indicate future results. Total returns shown are net of all fees and expenses and include reinvestment of income dividends and other distributions, if any).
After hiking rates four times in 2018, the Federal Reserve (“Fed”) reversed course and cut rates three times in 2019, with numerous other central banks following suit in lowering policy rates. The dovish pivot was in response to slowing global growth, attributed in large part to elevated uncertainty around global trade policy and geopolitical issues such as Brexit. This more accommodative stance helped drive Treasury yields lower and credit spreads tighter, creating a powerful tailwind for US fixed income performance.
During the year, security selection in investment grade credit and the Portfolio’s allocations to US and European high yield, emerging markets debt, bank loans and mortgage credit were the largest contributors to relative performance. Conversely, interest rate positioning was the primary detractor from relative performance, as rates rallied while the Portfolio was underweight duration. To a lesser degree, security selection in agency mortgage-backed securities and underweight exposure in investment grade credit weighed on relative performance.
Coming into 2020, our thesis of a modest slowdown in US growth, stabilization in international developed market growth (led by a global recovery in manufacturing and an attendant rebound in trade), and bouts of elevated volatility ahead of the known unknown (the US election) appeared sound. However, an unknown unknown, COVID-19, has disrupted the chain of events.
We expect a stark slowdown in the US and global growth in the first half of 2020. We think this slowdown will take US GDP levels to negative rates, as both consumption and capital spending weakens. We are viewing the impact of the virus as a growth shock, analogous to other growth shocks over the past 20 years (9/11 attacks, European crises in 2011 and 2013, and the energy issues of 2015/2016). We do not see a material permanent impact to the global growth trajectory, and while we expect markets to remain volatile, monetary easing and fiscal easing will stabilize the impacts of this growth shock. We would also note that the ‘outcome’ of this crisis is now a return to approximately 0% policy rates in the US and lower overall government bond yields, which will only heighten investors’ need for income, particularly in high quality securities.

FINANCIAL STATEMENTS BALANCE SHEET
The accompanying notes form an integral part of the financial statements.
242 NEUBERGER BERMAN INVESTMENT FUNDS PLC
Neuberger Berman Strategic Income Fund (Continued)
Balance Sheet
As at31 December 2019
US$
As at31 December 2018
US$ Note
Current Assets
Financial Assets at Fair Value through Profit or Loss 2 1,672,310,994 1,295,420,733
Cash and cash equivalents 3 9,046,196 15,305,669
Receivable for investments sold 31,076,996 17,149,818
Receivable for shares issued 4,505,042 343,550
Due from brokers 270,000 7,209,807
Income receivable and other assets 11,333,865 10,882,662
Total Assets 1,728,543,093 1,346,312,239
Current Liabilities
Financial Liabilities at Fair Value through Profit or Loss 2 10,242,080 11,788,258
Bank overdraft 4 2,132 –
Payable for shares redeemed 1,361,279 644,147
Due to brokers 4,110,467 –
Accrued expenses 1,292,835 1,418,687
Payable for investments purchased 268,601,132 287,929,195
Other payables 186,473 123,916
Liabilities (excluding Net Assets Attributable to Holders of Redeemable Participating Shares) 285,796,398 301,904,203
Net Assets Attributable to Holders of Redeemable Participating Shares 1,442,746,695 1,044,408,036
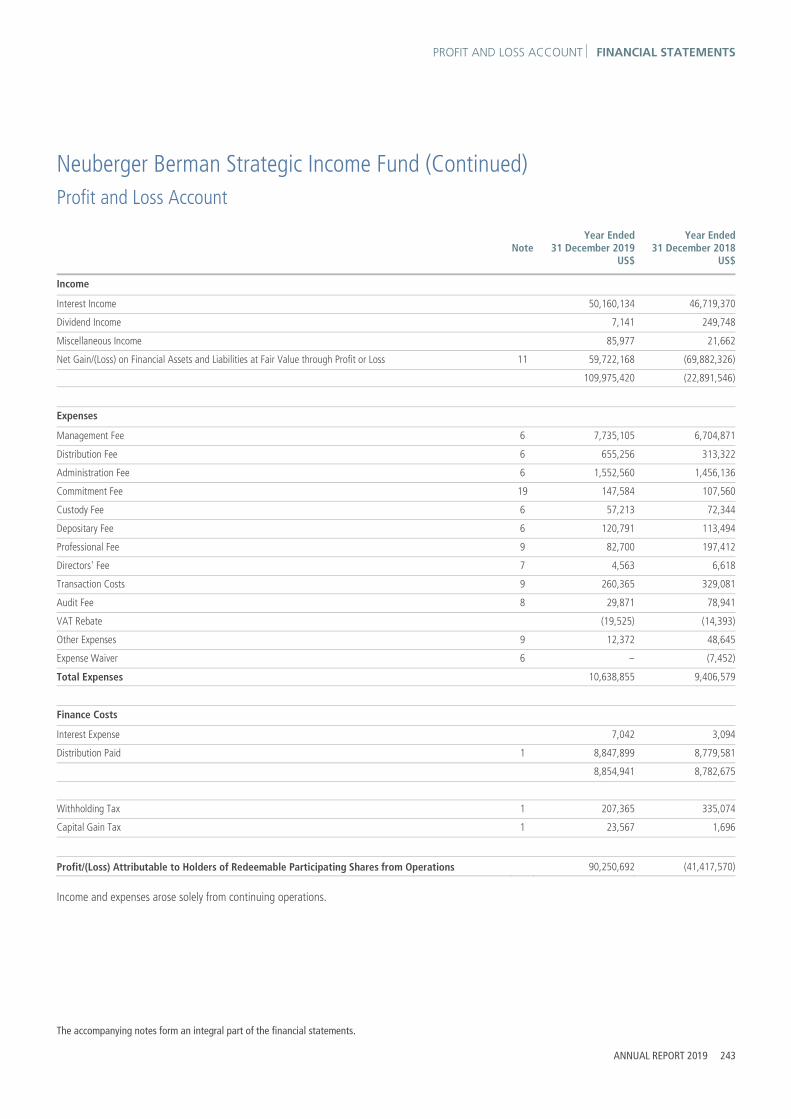
PROFIT AND LOSS ACCOUNT FINANCIAL STATEMENTS
The accompanying notes form an integral part of the financial statements.
ANNUAL REPORT 2019 243
Neuberger Berman Strategic Income Fund (Continued)
Profit and Loss Account
Year Ended31 December 2019
US$
Year Ended31 December 2018
US$ Note
Income
Interest Income 50,160,134 46,719,370
Dividend Income 7,141 249,748
Miscellaneous Income 85,977 21,662
Net Gain/(Loss) on Financial Assets and Liabilities at Fair Value through Profit or Loss 11 59,722,168 (69,882,326)
109,975,420 (22,891,546)
Expenses
Management Fee 6 7,735,105 6,704,871
Distribution Fee 6 655,256 313,322
Administration Fee 6 1,552,560 1,456,136
Commitment Fee 19 147,584 107,560
Custody Fee 6 57,213 72,344
Depositary Fee 6 120,791 113,494
Professional Fee 9 82,700 197,412
Directors' Fee 7 4,563 6,618
Transaction Costs 9 260,365 329,081
Audit Fee 8 29,871 78,941
VAT Rebate (19,525) (14,393)
Other Expenses 9 12,372 48,645
Expense Waiver 6 – (7,452)
Total Expenses 10,638,855 9,406,579
Finance Costs
Interest Expense 7,042 3,094
Distribution Paid 1 8,847,899 8,779,581
8,854,941 8,782,675
Withholding Tax 1 207,365 335,074
Capital Gain Tax 1 23,567 1,696
Profit/(Loss) Attributable to Holders of Redeemable Participating Shares from Operations 90,250,692 (41,417,570)
Income and expenses arose solely from continuing operations.

FINANCIAL STATEMENTS STATEMENT OF CHANGES IN NET ASSETS
The accompanying notes form an integral part of the financial statements.
244 NEUBERGER BERMAN INVESTMENT FUNDS PLC
Neuberger Berman Strategic Income Fund (Continued) Statement of Changes in Net Assets Attributable to Holders of Redeemable Participating Shares
Year Ended31 December 2019
US$
Year Ended31 December 2018
US$ Note
Net Assets Attributable to Holders of Redeemable Participating Shares at beginning of year 1,044,408,036 1,086,091,211
Profit/(Loss) Attributable to Holders of Redeemable Participating Shares from Operations 90,250,692 (41,417,570)
Subscriptions 5 611,968,399 405,620,699
Redemptions 5 (303,880,432) (405,886,304)
Net Assets Attributable to Holders of Redeemable Participating Shares at end of year 1,442,746,695 1,044,408,036

SCHEDULE OF INVESTMENTS FINANCIAL STATEMENTS
ANNUAL REPORT 2019 245
Neuberger Berman Strategic Income Fund (Continued)
Schedule of Investments
Financial Assets at Fair Value through Profit or Loss
Number of Shares Security Description Fair Value
US$% of Net
Assets
Equities 0.00% (31 December 2018: 0.00%)
United States Dollar
407 Cumulus Media Holdings Inc 6,614 0.00
425 Cumulus Media Holdings Inc Class B 6,322 0.00
Total Equities † 12,936 0.00
Principal Amount Security Description Coupon
MaturityDate
Fair ValueUS$
% of NetAssets
Treasury Bills 0.96% (31 December 2018: 1.33%)
United States Dollar 438,600 United States Treasury Bill 0.00% 07/05/2020 436,268 0.03
13,000,000 United States Treasury Bill 0.00% 28/05/2020 12,918,769 0.90
439,200 United States Treasury Bill 0.00% 04/06/2020 436,323 0.03
Total Treasury Bills ** 13,791,360 0.96
Agency Bonds 0.07% (31 December 2018: 0.09%)
United States Dollar
690,000 Federal National Mortgage Association 5.63% 15/07/2037 1,008,490 0.07
Total Agency Bonds † 1,008,490 0.07
Asset Backed Securities 11.49% (31 December 2018: 15.47%)
United States Dollar
1,275,000 American Express Credit Account Master Trust Class A 2.19% 16/09/2024 1,281,740 0.09
540,000 Bear Stearns Asset Backed Securities I Trust 2006-HE1 Class 1M3 2.25% 25/12/2035 538,186 0.04
1,302,545 Bear Stearns Asset Backed Securities Trust 2005-SD2 Class 2M2 3.29% 25/12/2044 1,312,543 0.09
2,630,437 BX Commercial Mortgage Trust 2018-IND Class A 2.49% 15/11/2035 2,631,251 0.18
756,000 BX Commercial Mortgage Trust 2018-IND Class B 2.64% 15/11/2035 756,233 0.05
3,905,000 Citibank Credit Card Issuance Trust Class A3 2.20% 07/12/2023 3,929,616 0.27
1,800,000 Citibank Credit Card Issuance Trust Class A7 2.08% 08/08/2024 1,806,879 0.12
823,855 Citigroup Commercial Mortgage Trust 2012-GC8 Class AAB 2.61% 10/09/2045 828,747 0.06
23,327,887 Citigroup Commercial Mortgage Trust 2014-GC25 Class XA 0.99% 10/10/2047 943,858 0.07
18,486,657 Citigroup Commercial Mortgage Trust 2015-GC27 Class XA 1.36% 10/02/2048 990,670 0.07
15,197,123 COMM 2012-CCRE2 Mortgage Trust Class XA 1.64% 15/08/2045 509,075 0.03
6,447,840 COMM 2014-CCRE16 Mortgage Trust Class XA 0.98% 10/04/2047 229,277 0.02
9,289,720 COMM 2014-CCRE17 Mortgage Trust Class XA 0.98% 10/05/2047 331,807 0.02
29,916,181 COMM 2014-LC15 Mortgage Trust Class XA 1.10% 10/04/2047 1,158,938 0.08
1,886,256 COMM 2014-UBS3 Mortgage Trust Class XA 1.08% 10/06/2047 76,481 0.00
16,271,441 COMM 2014-UBS6 Mortgage Trust Class XA 0.90% 10/12/2047 568,238 0.04
5,249,418 CSAIL 2018-CX11 Commercial Mortgage Trust Class A1 2.89% 15/04/2051 5,296,185 0.37
188,382 EquiFirst Mortgage Loan Trust 2003-2 Class 1A1 2.86% 25/09/2033 187,846 0.01

FINANCIAL STATEMENTS SCHEDULE OF INVESTMENTS
246 NEUBERGER BERMAN INVESTMENT FUNDS PLC
Neuberger Berman Strategic Income Fund (Continued)
Schedule of Investments (Continued)
Financial Assets at Fair Value through Profit or Loss (continued)
Principal Amount Security Description Coupon
MaturityDate
Fair ValueUS$
% of NetAssets
Asset Backed Securities 11.49% (31 December 2018: 15.47%) (continued)
United States Dollar (continued) 9,740,000 Fannie Mae Connecticut Avenue Securities Class 1M2 4.04% 25/07/2030 9,877,767 0.68
9,797,271 Fannie Mae Connecticut Avenue Securities Class 1M2 4.14% 25/01/2031 9,946,270 0.69
5,031,335 Fannie Mae Connecticut Avenue Securities Class 1M2 4.44% 25/02/2030 5,167,571 0.36
7,895,000 Fannie Mae Connecticut Avenue Securities Class 1M2 4.79% 25/10/2029 8,254,906 0.57
5,339,509 Fannie Mae Connecticut Avenue Securities Class 2M2 3.99% 25/08/2030 5,390,366 0.37
7,780,000 Fannie Mae Connecticut Avenue Securities Class 2M2 4.29% 25/05/2030 7,905,516 0.55
9,314,782 Fannie Mae Connecticut Avenue Securities Class 2M2 4.59% 25/02/2030 9,574,406 0.66
4,214,000 Fannie Mae Connecticut Avenue Securities Class 2M2 4.64% 25/11/2029 4,361,741 0.30
8,334,000 Fannie Mae Connecticut Avenue Securities Class 2M2 5.44% 25/09/2029 8,761,258 0.61
6,152,972 Fannie Mae REMICS Class DS 4.36% 25/06/2043 1,277,971 0.09
5,297,356 Fannie Mae REMICS Class HS 4.21% 25/06/2046 942,243 0.07
6,193,406 Fannie Mae REMICS Class SA 4.21% 25/09/2046 1,322,671 0.09
8,992,497 Fannie Mae REMICS Class ST 4.31% 25/12/2044 1,673,926 0.12
3,975,631 Freddie Mac REMICS Class SA 4.41% 15/03/2045 723,323 0.05
5,855,428 Freddie Mac REMICS Class SP 4.41% 15/01/2043 1,060,739 0.07
2,320,000 Freddie Mac Structured Agency Credit Risk Debt Notes Class M2 3.59% 25/07/2030 2,326,900 0.16
5,380,000 Freddie Mac Structured Agency Credit Risk Debt Notes Class M2 4.09% 25/09/2030 5,445,454 0.38
6,519,505 Freddie Mac Structured Agency Credit Risk Debt Notes Class M2 4.14% 25/04/2030 6,636,797 0.46
7,605,000 Freddie Mac Structured Agency Credit Risk Debt Notes Class M2 4.29% 25/03/2030 7,790,771 0.54
4,010,000 Freddie Mac Structured Agency Credit Risk Debt Notes Class M2 4.44% 25/12/2029 4,124,071 0.29
14,740,000 Freddie Mac Structured Agency Credit Risk Debt Notes Class M2 5.04% 25/07/2029 15,506,057 1.07
8,650,000 Freddie Mac Structured Agency Credit Risk Debt Notes Class M2 5.24% 25/10/2029 9,222,869 0.64
715,004 Global SC Finance IV Ltd 4.29% 17/05/2038 735,356 0.05
2,853,944 GS Mortgage Securities Trust 2011-GC3 Class A4 4.75% 10/03/2044 2,895,946 0.20
454,642 GS Mortgage Securities Trust 2013-GCJ12 Class AAB 2.68% 10/06/2046 457,490 0.03
24,093,060 GS Mortgage Securities Trust 2014-GC18 Class XA 1.02% 10/01/2047 829,013 0.06
13,585,885 GS Mortgage Securities Trust 2014-GC26 Class XA 0.97% 10/11/2047 539,872 0.04
12,499,278 GS Mortgage Securities Trust 2015-GC30 Class XA 0.81% 10/05/2050 381,426 0.03
1,680,000 Home Equity Asset Trust Class M5 2.89% 25/05/2035 1,686,437 0.12
15,477 Home Equity Mortgage Trust Class M2 3.39% 25/02/2035 15,554 0.00
1,100,000 Permanent Master Issuer Plc 2018-1X Class 1A1 3.17% 15/07/2058 1,100,136 0.08
2,271,532 RASC Series 2005-EMX2 Trust Class M4 2.44% 25/07/2035 2,292,072 0.16
441,195 Securitized Asset Backed Receivables LLC Trust 2004-DO1 Class M1 2.77% 25/07/2034 442,513 0.03
670,000 STACR Trust 2018-DNA2 Class M2 3.94% 25/12/2030 677,207 0.05
47,214 Structured Asset Securities Corp Mortgage Loan Trust 2006-AM1 Class A4 1.95% 25/04/2036 47,321 0.00
249,091 Verizon Owner Trust 2016-2 Class A 1.68% 20/05/2021 249,043 0.02
1,465,811 Verizon Owner Trust 2017-1 Class A 2.06% 20/09/2021 1,465,923 0.10
10,998,349 WFRBS Commercial Mortgage Trust 2014-C21 Class XA 1.04% 15/08/2047 422,410 0.03

SCHEDULE OF INVESTMENTS FINANCIAL STATEMENTS
ANNUAL REPORT 2019 247
Neuberger Berman Strategic Income Fund (Continued)
Schedule of Investments (Continued)
Financial Assets at Fair Value through Profit or Loss (continued)
Principal Amount Security Description Coupon
Maturity Date
Fair ValueUS$
% of NetAssets
Asset Backed Securities 11.49% (31 December 2018: 15.47%) (continued)
United States Dollar (continued) 18,274,268 WFRBS Commercial Mortgage Trust 2014-C22 Class XA 0.81% 15/09/2057 557,645 0.04
9,186,478 WFRBS Commercial Mortgage Trust 2014-LC14 Class XA 1.22% 15/03/2047 353,345 0.02
Total Asset Backed Securities ** 165,819,872 11.49
Corporate Bonds 43.97% (31 December 2018: 45.28%)
United States Dollar
585,000 1011778 BC ULC/New Red Finance Inc† 4.25% 15/05/2024 600,845 0.04
1,045,000 1011778 BC ULC/New Red Finance Inc† 5.00% 15/10/2025 1,081,141 0.07
950,000 AbbVie Inc† 2.95% 21/11/2026 965,670 0.07
1,655,000 AbbVie Inc† 3.20% 21/11/2029 1,684,681 0.12
1,820,000 AbbVie Inc* 3.60% 14/05/2025 1,920,905 0.13
6,785,000 AbbVie Inc† 4.05% 21/11/2039 7,194,783 0.50
5,565,000 AbbVie Inc† 4.25% 21/11/2049 5,881,866 0.41
4,040,000 AbbVie Inc* 4.70% 14/05/2045 4,527,924 0.31
200,000 Abu Dhabi Crude Oil Pipeline LLC* 4.60% 02/11/2047 230,539 0.02
150,000 Acadia Healthcare Co Inc† 5.13% 01/07/2022 151,547 0.01
190,000 Acadia Healthcare Co Inc† 5.63% 15/02/2023 193,484 0.01
100,000 Acadia Healthcare Co Inc† 6.50% 01/03/2024 103,916 0.01
380,000 ADT Security Corp† 4.13% 15/06/2023 392,667 0.03
200,000 ADT Security Corp† 6.25% 15/10/2021 211,364 0.01
591,000 AerCap Global Aviation Trust* 6.50% 15/06/2045 653,114 0.05
5,305,000 AerCap Ireland Capital DAC/AerCap Global Aviation Trust* 4.45% 01/10/2025 5,703,086 0.40
200,000 African Export-Import Bank* 3.99% 21/09/2029 202,494 0.01
615,000 Alliant Holdings Intermediate LLC/Alliant Holdings Co-Issuer† 6.75% 15/10/2027 659,772 0.05
540,000 Ally Financial Inc* 4.13% 13/02/2022 558,511 0.04
530,000 Altice France SA* 5.50% 15/01/2028 545,582 0.04
1,425,000 Altice France SA* 7.38% 01/05/2026 1,532,573 0.11
780,000 Altice France SA† 8.13% 01/02/2027 879,918 0.06
200,000 Altice Luxembourg SA† 7.63% 15/02/2025 208,500 0.01
300,000 AMC Entertainment Holdings Inc* 5.75% 15/06/2025 278,125 0.02
1,625,000 American Express Co† 2.52% 20/05/2022 1,635,945 0.11
1,270,000 Amkor Technology Inc† 6.63% 15/09/2027 1,400,937 0.10
220,000 Amsted Industries Inc† 4.63% 15/05/2030 222,141 0.02
210,000 AmWINS Group Inc† 7.75% 01/07/2026 232,675 0.02
3,000,000 Anheuser-Busch InBev Worldwide Inc* 4.60% 15/04/2048 3,418,818 0.24
4,925,000 Anheuser-Busch InBev Worldwide Inc* 4.75% 15/04/2058 5,749,545 0.40
3,555,000 Anheuser-Busch InBev Worldwide Inc* 5.80% 23/01/2059 4,845,580 0.34
100,000 Anixter Inc* 5.13% 01/10/2021 104,085 0.01

FINANCIAL STATEMENTS SCHEDULE OF INVESTMENTS
248 NEUBERGER BERMAN INVESTMENT FUNDS PLC
Neuberger Berman Strategic Income Fund (Continued)
Schedule of Investments (Continued)
Financial Assets at Fair Value through Profit or Loss (continued)
Principal Amount Security Description Coupon
Maturity Date
Fair ValueUS$
% of NetAssets
Corporate Bonds 43.97% (31 December 2018: 45.28%) (continued)
United States Dollar (continued) 80,000 Anixter Inc* 5.50% 01/03/2023 84,433 0.01
605,000 Antero Midstream Partners LP/Antero Midstream Finance Corp† 5.38% 15/09/2024 562,650 0.04
3,775,000 Apple Inc† 4.65% 23/02/2046 4,728,806 0.33
190,000 Aramark Services Inc† 5.00% 01/04/2025 198,548 0.01
490,000 Aramark Services Inc† 5.00% 01/02/2028 517,244 0.04
285,000 Archrock Partners LP/Archrock Partners Finance Corp† 6.25% 01/04/2028 294,262 0.02
140,000 Arconic Inc* 6.15% 15/08/2020 143,188 0.01
550,000 ARD Finance SA* 6.50% 30/06/2027 569,690 0.04
215,000 Ardagh Packaging Finance Plc/Ardagh Holdings USA Inc† 4.25% 15/09/2022 218,137 0.01
495,000 Ardagh Packaging Finance Plc/Ardagh Holdings USA Inc† 6.00% 15/02/2025 520,369 0.04
550,000 Ascent Resources Utica Holdings LLC/ARU Finance Corp† 7.00% 01/11/2026 440,191 0.03
443,000 Ascent Resources Utica Holdings LLC/ARU Finance Corp† 10.00% 01/04/2022 441,726 0.03
1,300,000 ASGN Inc† 4.63% 15/05/2028 1,338,649 0.09
160,000 Ashland LLC* 4.75% 15/08/2022 167,600 0.01
740,000 AssuredPartners Inc† 7.00% 15/08/2025 754,571 0.05
6,425,000 AT&T Inc† 2.66% 01/06/2021 6,464,746 0.45
1,160,000 AT&T Inc* 4.35% 15/06/2045 1,250,830 0.09
4,335,000 AT&T Inc* 4.50% 09/03/2048 4,790,579 0.33
5,550,000 AT&T Inc* 5.45% 01/03/2047 6,884,780 0.48
817,000 Australia & New Zealand Banking Group Ltd* 6.75% 29/12/2049 933,100 0.06
410,000 Avantor Inc† 6.00% 01/10/2024 438,009 0.03
1,070,000 Avantor Inc† 9.00% 01/10/2025 1,197,988 0.08
535,000 Avis Budget Car Rental LLC/Avis Budget Finance Inc† 5.25% 15/03/2025 551,941 0.04
1,765,000 Avis Budget Car Rental LLC/Avis Budget Finance Inc† 5.75% 15/07/2027 1,840,057 0.13
4,060,000 Avolon Holdings Funding Ltd† 3.95% 01/07/2024 4,236,001 0.29
3,430,000 AXA Equitable Holdings Inc† 5.00% 20/04/2048 3,686,726 0.26
600,000 Banco Bilbao Vizcaya Argentaria SA* 6.50% 29/12/2049 636,000 0.04
600,000 Banco Santander SA* 7.50% 29/12/2049 663,000 0.05
2,740,000 Bank of America Corp† 2.74% 23/01/2022 2,760,882 0.19
4,225,000 Bank of America Corp† 3.71% 24/04/2028 4,516,182 0.31
3,670,000 Bank of America Corp† 3.97% 05/03/2029 3,997,576 0.28
439,000 Bank of America Corp** 5.13% 29/12/2049 464,923 0.03
468,000 Bank of America Corp† 6.25% 29/12/2049 520,400 0.04
402,000 Bank of New York Mellon Corp† 4.63% 29/12/2049 423,463 0.03
200,000 Banque Ouest Africaine de Developpement* 4.70% 22/10/2031 202,580 0.01
270,000 Bausch Health Americas Inc† 8.50% 31/01/2027 307,976 0.02
24,000 Bausch Health Cos Inc† 5.50% 01/03/2023 24,190 0.00
455,000 Bausch Health Cos Inc† 5.50% 01/11/2025 476,424 0.03

SCHEDULE OF INVESTMENTS FINANCIAL STATEMENTS
ANNUAL REPORT 2019 249
Neuberger Berman Strategic Income Fund (Continued)
Schedule of Investments (Continued)
Financial Assets at Fair Value through Profit or Loss (continued)
Principal Amount Security Description Coupon
Maturity Date
Fair ValueUS$
% of NetAssets
Corporate Bonds 43.97% (31 December 2018: 45.28%) (continued)
United States Dollar (continued) 180,000 Bausch Health Cos Inc† 5.75% 15/08/2027 195,633 0.01
62,000 Bausch Health Cos Inc† 5.88% 15/05/2023 62,581 0.00
1,380,000 Bausch Health Cos Inc† 6.13% 15/04/2025 1,428,735 0.10
575,000 Bausch Health Cos Inc† 6.50% 15/03/2022 588,656 0.04
185,000 Bausch Health Cos Inc† 7.00% 15/03/2024 192,786 0.01
1,540,000 Beacon Roofing Supply Inc† 4.88% 01/11/2025 1,550,911 0.11
215,000 Berry Global Inc† 4.50% 15/02/2026 221,246 0.02
320,000 Berry Global Inc* 5.13% 15/07/2023 329,197 0.02
585,000 Berry Global Inc* 5.50% 15/05/2022 593,040 0.04
470,000 Berry Global Inc† 5.63% 15/07/2027 505,262 0.03
1,082,000 Big River Steel LLC/BRS Finance Corp† 7.25% 01/09/2025 1,144,204 0.08
914,000 BNP Paribas SA* 7.38% 29/12/2049 1,055,309 0.07
390,000 Bombardier Inc† 5.75% 15/03/2022 403,491 0.03
395,000 Bombardier Inc† 8.75% 01/12/2021 433,661 0.03
445,000 Boyd Gaming Corp† 4.75% 01/12/2027 463,067 0.03
1,350,000 Boyd Gaming Corp* 6.38% 01/04/2026 1,455,013 0.10
6,105,000 British Telecommunications Plc* 3.25% 08/11/2029 6,104,165 0.42
425,000 Bruin E&P Partners LLC† 8.88% 01/08/2023 277,489 0.02
730,000 Buckeye Partners LP† 3.95% 01/12/2026 705,098 0.05
405,000 Buckeye Partners LP† 4.13% 01/12/2027 391,379 0.03
505,000 Buckeye Partners LP† 4.35% 15/10/2024 507,964 0.04
105,000 Buckeye Partners LP† 5.85% 15/11/2043 94,657 0.01
610,000 C&W Senior Financing DAC† 6.88% 15/09/2027 653,708 0.05
755,000 Calpine Corp† 4.50% 15/02/2028 762,641 0.05
460,000 Calpine Corp† 5.13% 15/03/2028 470,672 0.03
105,000 Calpine Corp† 5.25% 01/06/2026 109,575 0.01
1,135,000 Calpine Corp† 5.75% 15/01/2025 1,167,631 0.08
2,270,000 Canadian Natural Resources Ltd* 4.95% 01/06/2047 2,756,096 0.19
2,975,000 Capital One Financial Corp† 2.84% 09/03/2022 3,006,569 0.21
250,000 CCO Holdings LLC/CCO Holdings Capital Corp† 4.00% 01/03/2023 254,060 0.02
330,000 CCO Holdings LLC/CCO Holdings Capital Corp† 4.75% 01/03/2030 337,220 0.02
1,845,000 CCO Holdings LLC/CCO Holdings Capital Corp† 5.00% 01/02/2028 1,939,409 0.13
225,000 CCO Holdings LLC/CCO Holdings Capital Corp† 5.13% 01/05/2023 230,111 0.02
325,000 CCO Holdings LLC/CCO Holdings Capital Corp† 5.25% 30/09/2022 329,235 0.02
1,225,000 CCO Holdings LLC/CCO Holdings Capital Corp† 5.75% 15/02/2026 1,294,666 0.09
425,000 CCO Holdings LLC/CCO Holdings Capital Corp† 5.88% 01/04/2024 440,230 0.03
205,000 CDK Global Inc† 5.00% 15/10/2024 222,423 0.02
250,000 CDK Global Inc† 5.88% 15/06/2026 267,532 0.02

FINANCIAL STATEMENTS SCHEDULE OF INVESTMENTS
250 NEUBERGER BERMAN INVESTMENT FUNDS PLC
Neuberger Berman Strategic Income Fund (Continued)
Schedule of Investments (Continued)
Financial Assets at Fair Value through Profit or Loss (continued)
Principal Amount Security Description Coupon
Maturity Date
Fair ValueUS$
% of NetAssets
Corporate Bonds 43.97% (31 December 2018: 45.28%) (continued)
United States Dollar (continued) 515,000 CDW LLC/CDW Finance Corp† 5.00% 01/09/2025 539,249 0.04
865,000 Cedar Fair LP† 5.25% 15/07/2029 933,638 0.06
770,000 Cedar Fair LP/Canada's Wonderland Co/Magnum Management Corp/Millennium Op* 5.38% 15/04/2027 830,370 0.06
260,000 Cencosud SA* 4.38% 17/07/2027 256,800 0.02
180,000 Centene Corp† 4.75% 15/01/2025 187,347 0.01
185,000 Centene Corp† 5.38% 01/06/2026 196,673 0.01
545,000 Centennial Resource Production LLC† 6.88% 01/04/2027 568,066 0.04
420,000 CenturyLink Inc* 6.45% 15/06/2021 440,580 0.03
130,000 CF Industries Inc* 3.45% 01/06/2023 134,104 0.01
585,000 CF Industries Inc* 5.38% 15/03/2044 639,171 0.04
1,390,000 Cheniere Energy Partners LP† 5.25% 01/10/2025 1,451,966 0.10
80,500 Chesapeake Energy Corp† 11.50% 01/01/2025 76,877 0.01
467,000 China Minmetals Corp* 3.75% 29/12/2049 473,613 0.03
200,000 Chinalco Capital Holdings Ltd* 4.25% 21/04/2022 203,000 0.01
1,380,000 Churchill Downs Inc† 5.50% 01/04/2027 1,465,353 0.10
3,850,000 Cigna Corp* 4.80% 15/08/2038 4,494,209 0.31
60,000 CIT Group Inc* 4.13% 09/03/2021 61,241 0.00
80,000 CIT Group Inc* 5.00% 15/08/2022 84,999 0.01
2,955,000 Citigroup Inc† 2.90% 25/04/2022 2,994,798 0.21
2,260,000 Citigroup Inc† 3.52% 27/10/2028 2,378,519 0.16
6,200,000 Citigroup Inc† 3.89% 10/01/2028 6,678,740 0.46
447,000 Citigroup Inc† 5.00% 29/12/2049 468,512 0.03
342,000 Citigroup Inc† 5.90% 29/12/2049 363,620 0.03
294,000 Citizens Financial Group Inc† 6.00% 29/12/2049 311,352 0.02
393,000 Citizens Financial Group Inc† 6.38% 29/12/2049 420,125 0.03
914,000 Clear Channel Worldwide Holdings Inc† 5.13% 15/08/2027 953,439 0.07
140,000 Clear Channel Worldwide Holdings Inc† 9.25% 15/02/2024 155,342 0.01
380,000 Cleveland-Cliffs Inc† 4.88% 15/01/2024 389,164 0.03
200,000 CNAC HK Finbridge Co Ltd* 3.38% 19/06/2024 203,144 0.01
615,000 Colfax Corp† 6.00% 15/02/2024 654,720 0.05
2,490,000 Comcast Corp† 4.00% 15/08/2047 2,741,041 0.19
4,955,000 Comcast Corp† 4.95% 15/10/2058 6,443,165 0.45
3,220,000 Commonwealth Bank of Australia† 3.74% 12/09/2039 3,231,636 0.22
460,000 CommScope Inc† 5.50% 01/03/2024 480,509 0.03
310,000 CommScope Inc† 5.50% 15/06/2024 314,653 0.02
395,000 CommScope Inc† 6.00% 01/03/2026 420,921 0.03
665,000 CommScope Inc† 8.25% 01/03/2027 701,143 0.05
805,000 CommScope Technologies LLC† 5.00% 15/03/2027 758,733 0.05

SCHEDULE OF INVESTMENTS FINANCIAL STATEMENTS
ANNUAL REPORT 2019 251
Neuberger Berman Strategic Income Fund (Continued)
Schedule of Investments (Continued)
Financial Assets at Fair Value through Profit or Loss (continued)
Principal Amount Security Description Coupon
Maturity Date
Fair ValueUS$
% of NetAssets
Corporate Bonds 43.97% (31 December 2018: 45.28%) (continued)
United States Dollar (continued) 659,000 CommScope Technologies LLC† 6.00% 15/06/2025 661,392 0.05
3,155,000 Concho Resources Inc* 4.88% 01/10/2047 3,680,732 0.25
390,000 Core & Main LP† 6.13% 15/08/2025 405,596 0.03
589,000 Credit Suisse Group AG* 6.38% 29/12/2049 636,415 0.04
569,000 Credit Suisse Group AG* 7.50% 29/12/2049 623,092 0.04
220,000 Crown Americas LLC/Crown Americas Capital Corp IV* 4.50% 15/01/2023 231,823 0.02
1,465,000 CrownRock LP/CrownRock Finance Inc† 5.63% 15/10/2025 1,497,948 0.10
540,000 CSC Holdings LLC† 5.38% 15/07/2023 554,626 0.04
535,000 CSC Holdings LLC† 5.50% 15/05/2026 567,668 0.04
200,000 CSC Holdings LLC† 5.50% 15/04/2027 215,140 0.01
1,150,000 CSC Holdings LLC† 5.75% 15/01/2030 1,229,062 0.09
200,000 CSC Holdings LLC† 6.50% 01/02/2029 223,375 0.02
200,000 CSC Holdings LLC† 6.63% 15/10/2025 212,748 0.01
335,000 CSC Holdings LLC† 6.75% 15/11/2021 361,297 0.02
420,000 CSC Holdings LLC† 7.50% 01/04/2028 475,575 0.03
260,000 CSC Holdings LLC† 7.75% 15/07/2025 277,862 0.02
320,000 CSC Holdings LLC† 10.88% 15/10/2025 358,200 0.02
316,000 CSN Resources SA† 7.63% 17/04/2026 337,123 0.02
660,000 CSN Resources SA 144A† 7.63% 17/04/2026 704,118 0.05
1,430,000 Cumulus Media New Holdings Inc† 6.75% 01/07/2026 1,534,567 0.11
4,570,000 CVS Health Corp* 5.05% 25/03/2048 5,407,972 0.37
5,755,000 Daimler Finance North America LLC† 2.81% 15/02/2022 5,801,179 0.40
510,000 Darling Ingredients Inc† 5.25% 15/04/2027 543,697 0.04
60,000 DCP Midstream Operating LP* 3.88% 15/03/2023 61,499 0.00
90,000 DCP Midstream Operating LP* 4.95% 01/04/2022 93,628 0.01
520,000 DCP Midstream Operating LP† 5.35% 15/03/2020 523,492 0.04
90,000 DCP Midstream Operating LP† 5.38% 15/07/2025 98,099 0.01
565,000 DCP Midstream Operating LP* 5.60% 01/04/2044 548,578 0.04
1,030,000 DCP Midstream Operating LP† 5.85% 21/05/2043 961,438 0.07
6,830,000 Dell International LLC/EMC Corp† 5.45% 15/06/2023 7,408,258 0.51
200,000 Dianjian International Finance Ltd* 4.60% 29/12/2049 206,824 0.01
662,000 Discover Financial Services† 5.50% 29/12/2049 698,092 0.05
140,000 DISH DBS Corp† 5.88% 15/07/2022 148,649 0.01
480,000 DISH DBS Corp† 5.88% 15/11/2024 491,501 0.03
600,000 DISH DBS Corp† 6.75% 01/06/2021 631,878 0.04
720,000 Dominion Energy Inc† 4.65% 29/12/2049 735,422 0.05
3,365,000 DTE Energy Co* 2.25% 01/11/2022 3,365,153 0.23
5,835,000 DTE Energy Co* 3.40% 15/06/2029 6,019,671 0.42

FINANCIAL STATEMENTS SCHEDULE OF INVESTMENTS
252 NEUBERGER BERMAN INVESTMENT FUNDS PLC
Neuberger Berman Strategic Income Fund (Continued)
Schedule of Investments (Continued)
Financial Assets at Fair Value through Profit or Loss (continued)
Principal Amount Security Description Coupon
Maturity Date
Fair ValueUS$
% of NetAssets
Corporate Bonds 43.97% (31 December 2018: 45.28%) (continued)
United States Dollar (continued) 210,000 Edgewell Personal Care Co* 4.70% 19/05/2021 215,197 0.01
380,000 Edgewell Personal Care Co* 4.70% 24/05/2022 395,197 0.03
80,000 Eldorado Resorts Inc† 6.00% 01/04/2025 84,367 0.01
745,000 Element Solutions Inc† 5.88% 01/12/2025 781,311 0.05
615,000 Elementia SAB de CV† 5.50% 15/01/2025 625,255 0.04
1,350,000 Emirates NBD Bank PJSC* 6.13% 29/12/2049 1,422,932 0.10
200,000 Empresa de Transmision Electrica SA* 5.13% 02/05/2049 228,189 0.02
705,000 Energizer Holdings Inc† 5.50% 15/06/2025 732,907 0.05
620,000 Energizer Holdings Inc† 6.38% 15/07/2026 661,447 0.05
1,570,000 Energizer Holdings Inc† 7.75% 15/01/2027 1,757,458 0.12
3,470,000 Energy Transfer Operating LP* 6.25% 15/04/2049 4,181,941 0.29
4,780,000 Energy Transfer Operating LP† 6.63% 29/12/2049 4,524,366 0.31
715,000 EnerSys† 4.38% 15/12/2027 707,921 0.05
170,000 EnerSys† 5.00% 30/04/2023 178,571 0.01
520,000 Enviva Partners LP/Enviva Partners Finance Corp† 6.50% 15/01/2026 558,028 0.04
480,000 Equinix Inc† 5.88% 15/01/2026 510,293 0.04
960,000 ESH Hospitality Inc† 5.25% 01/05/2025 994,402 0.07
200,000 Eskom Holdings SOC Ltd* 6.35% 10/08/2028 214,945 0.01
230,000 Eskom Holdings SOC Ltd* 7.13% 11/02/2025 235,601 0.02
5,650,000 Evergy Inc* 2.90% 15/09/2029 5,626,847 0.39
40,000 Everi Payments Inc† 7.50% 15/12/2025 43,017 0.00
390,000 Extraction Oil & Gas Inc† 5.63% 01/02/2026 235,111 0.02
441,000 Fifth Third Bancorp** 5.10% 29/12/2049 454,349 0.03
220,000 First Quantum Minerals Ltd† 7.25% 01/04/2023 228,220 0.02
290,000 FMG Resources August 2006 Pty Ltd† 4.75% 15/05/2022 299,941 0.02
515,000 FMG Resources August 2006 Pty Ltd† 5.13% 15/05/2024 548,261 0.04
5,290,000 Fox Corp† 5.58% 25/01/2049 6,728,403 0.47
1,255,000 Freeport-McMoRan Inc* 3.55% 01/03/2022 1,272,921 0.09
700,000 Freeport-McMoRan Inc* 3.88% 15/03/2023 714,220 0.05
240,000 Freeport-McMoRan Inc* 5.00% 01/09/2027 252,444 0.02
590,000 Freeport-McMoRan Inc* 5.25% 01/09/2029 633,158 0.04
100,000 Freeport-McMoRan Inc* 5.40% 14/11/2034 104,982 0.01
420,000 Freeport-McMoRan Inc* 5.45% 15/03/2043 435,792 0.03
550,000 frontdoor Inc† 6.75% 15/08/2026 601,066 0.04
1,510,000 Frontier Communications Corp† 8.00% 01/04/2027 1,580,743 0.11
970,000 Garda World Security Corp† 8.75% 15/05/2025 1,011,215 0.07
520,000 Gartner Inc† 5.13% 01/04/2025 542,534 0.04
302,000 Gazprom PJSC Via Gaz Capital SA* 5.15% 11/02/2026 336,221 0.02

SCHEDULE OF INVESTMENTS FINANCIAL STATEMENTS
ANNUAL REPORT 2019 253
Neuberger Berman Strategic Income Fund (Continued)
Schedule of Investments (Continued)
Financial Assets at Fair Value through Profit or Loss (continued)
Principal Amount Security Description Coupon
Maturity Date
Fair ValueUS$
% of NetAssets
Corporate Bonds 43.97% (31 December 2018: 45.28%) (continued)
United States Dollar (continued) 2,199,000 General Electric Co† 5.00% 29/12/2049 2,157,175 0.15
1,610,000 General Motors Financial Co Inc* 5.10% 17/01/2024 1,748,024 0.12
220,000 Genesis Energy LP/Genesis Energy Finance Corp* 6.00% 15/05/2023 218,441 0.01
385,000 Genesis Energy LP/Genesis Energy Finance Corp* 6.25% 15/05/2026 368,771 0.03
555,000 Genesis Energy LP/Genesis Energy Finance Corp* 6.50% 01/10/2025 538,344 0.04
530,000 Global Aircraft Leasing Co Ltd† 6.50% 15/09/2024 554,353 0.04
140,000 Global Partners LP/GLP Finance Corp* 7.00% 15/06/2023 144,608 0.01
710,000 Global Partners LP/GLP Finance Corp† 7.00% 01/08/2027 756,397 0.05
520,000 Go Daddy Operating Co LLC/GD Finance Co Inc† 5.25% 01/12/2027 548,262 0.04
4,550,000 Goldman Sachs Group Inc† 2.66% 23/02/2023 4,578,314 0.32
3,940,000 Goldman Sachs Group Inc† 3.69% 05/06/2028 4,185,729 0.29
4,535,000 Goldman Sachs Group Inc† 3.81% 23/04/2029 4,861,450 0.34
1,675,000 Goldman Sachs Group Inc† 4.02% 31/10/2038 1,819,344 0.13
360,000 Goldman Sachs Group Inc† 4.95% 29/12/2049 373,635 0.03
2,005,000 Goldman Sachs Group Inc* 5.15% 22/05/2045 2,461,357 0.17
509,000 Goldman Sachs Group Inc† 5.30% 29/12/2049 547,633 0.04
57,000 Goldman Sachs Group Inc† 5.50% 29/12/2049 61,061 0.00
80,000 Goodyear Tire & Rubber Co† 8.75% 15/08/2020 83,331 0.01
385,000 Granite Holdings US Acquisition Co† 11.00% 01/10/2027 390,909 0.03
335,000 Graphic Packaging International LLC* 4.75% 15/04/2021 343,928 0.02
250,000 Gray Television Inc† 5.13% 15/10/2024 259,896 0.02
475,000 Gray Television Inc† 7.00% 15/05/2027 528,722 0.04
610,000 Greenko Mauritius Ltd* 6.25% 21/02/2023 627,870 0.04
4,260,000 Grupo Bimbo SAB de CV* 4.70% 10/11/2047 4,461,860 0.31
1,005,000 GTCR AP Finance Inc† 8.00% 15/05/2027 1,048,062 0.07
1,643,000 Gtlk Europe Capital DAC* 4.95% 18/02/2026 1,699,781 0.12
213,000 GW B-CR Security Corp† 9.50% 01/11/2027 227,772 0.02
935,000 Harsco Corp† 5.75% 31/07/2027 999,323 0.07
3,010,000 HCA Inc* 4.13% 15/06/2029 3,195,607 0.22
4,875,000 HCA Inc* 5.25% 15/06/2049 5,450,710 0.38
500,000 HCA Inc* 5.38% 01/09/2026 558,137 0.04
705,000 HCA Inc* 5.63% 01/09/2028 804,722 0.06
290,000 HCA Inc* 5.88% 01/05/2023 321,101 0.02
645,000 HCA Inc* 5.88% 01/02/2029 746,587 0.05
325,000 HCA Inc* 7.69% 15/06/2025 392,572 0.03
480,000 HD Supply Inc† 5.38% 15/10/2026 509,915 0.04
4,710,000 Healthcare Trust of America Holdings LP* 3.10% 15/02/2030 4,676,606 0.32
490,000 Hertz Corp† 5.50% 15/10/2024 503,272 0.03

FINANCIAL STATEMENTS SCHEDULE OF INVESTMENTS
254 NEUBERGER BERMAN INVESTMENT FUNDS PLC
Neuberger Berman Strategic Income Fund (Continued)
Schedule of Investments (Continued)
Financial Assets at Fair Value through Profit or Loss (continued)
Principal Amount Security Description Coupon
Maturity Date
Fair ValueUS$
% of NetAssets
Corporate Bonds 43.97% (31 December 2018: 45.28%) (continued)
United States Dollar (continued) 1,285,000 Hertz Corp† 6.00% 15/01/2028 1,287,377 0.09
105,000 Hertz Corp* 6.25% 15/10/2022 106,443 0.01
1,190,000 Hertz Corp† 7.13% 01/08/2026 1,291,001 0.09
1,965,000 Hewlett Packard Enterprise Co* 3.60% 15/10/2020 1,987,463 0.14
515,000 Hilton Domestic Operating Co Inc† 5.13% 01/05/2026 543,504 0.04
5,830,000 HSBC Holdings Plc† 6.00% 29/12/2049 6,217,812 0.43
781,000 HSBC Holdings Plc† 6.38% 29/12/2049 849,896 0.06
200,000 Huarong Finance 2017 Co Ltd* 4.00% 29/12/2049 201,622 0.01
1,995,000 HUB International Ltd† 7.00% 01/05/2026 2,114,750 0.15
345,000 Hudbay Minerals Inc† 7.25% 15/01/2023 358,728 0.02
760,000 Hudbay Minerals Inc† 7.63% 15/01/2025 803,765 0.06
608,000 Huntington Bancshares Inc† 5.70% 29/12/2049 631,235 0.04
1,505,000 IAA Inc† 5.50% 15/06/2027 1,601,847 0.11
680,000 iHeartCommunications Inc† 5.25% 15/08/2027 712,742 0.05
630,000 iHeartCommunications Inc† 6.38% 01/05/2026 684,731 0.05
990,000 iHeartCommunications Inc† 8.38% 01/05/2027 1,095,781 0.08
500,000 INEOS Group Holdings SA† 5.63% 01/08/2024 514,745 0.04
602,000 ING Groep NV* 5.75% 29/12/2049 634,282 0.04
589,000 ING Groep NV* 6.50% 29/12/2049 638,859 0.04
1,055,000 Intelsat Jackson Holdings SA* 5.50% 01/08/2023 908,487 0.06
300,000 Intelsat Jackson Holdings SA† 9.50% 30/09/2022 340,406 0.02
1,800,000 International Business Machines Corp* 4.15% 15/05/2039 2,028,975 0.14
4,965,000 International Business Machines Corp† 4.25% 15/05/2049 5,674,249 0.39
200,000 International Game Technology Plc† 6.25% 15/02/2022 211,356 0.01
165,000 Iron Mountain Inc† 4.38% 01/06/2021 167,029 0.01
585,000 Iron Mountain Inc† 4.88% 15/09/2027 605,371 0.04
485,000 Iron Mountain Inc† 4.88% 15/09/2029 493,789 0.03
2,540,000 Iron Mountain Inc† 5.25% 15/03/2028 2,646,299 0.18
275,000 Iron Mountain US Holdings Inc† 5.38% 01/06/2026 288,158 0.02
1,325,000 j2 Cloud Services LLC/j2 Cloud Co-Obligor Inc† 6.00% 15/07/2025 1,407,263 0.10
300,000 JBS Investments II GmbH* 5.75% 15/01/2028 316,905 0.02
735,000 JELD-WEN Inc† 4.63% 15/12/2025 758,825 0.05
1,205,000 JELD-WEN Inc† 4.88% 15/12/2027 1,235,544 0.09
6,200,000 JPMorgan Chase & Co† 3.00% 15/01/2023 6,269,254 0.43
3,035,000 JPMorgan Chase & Co† 3.88% 24/07/2038 3,356,581 0.23
472,000 JPMorgan Chase & Co† 4.63% 29/12/2049 476,257 0.03
449,000 JPMorgan Chase & Co† 5.00% 29/12/2049 467,521 0.03
1,900,000 KAR Auction Services Inc† 5.13% 01/06/2025 1,979,961 0.14

SCHEDULE OF INVESTMENTS FINANCIAL STATEMENTS
ANNUAL REPORT 2019 255
Neuberger Berman Strategic Income Fund (Continued)
Schedule of Investments (Continued)
Financial Assets at Fair Value through Profit or Loss (continued)
Principal Amount Security Description Coupon
Maturity Date
Fair ValueUS$
% of NetAssets
Corporate Bonds 43.97% (31 December 2018: 45.28%) (continued)
United States Dollar (continued) 499,000 KazMunayGas National Co JSC* 5.38% 24/04/2030 578,165 0.04
220,000 KazMunayGas National Co JSC* 6.38% 24/10/2048 281,764 0.02
990,000 KFC Holding Co/Pizza Hut Holdings LLC/Taco Bell of America LLC† 5.25% 01/06/2026 1,046,950 0.07
4,435,000 Kinder Morgan Energy Partners LP* 4.15% 01/02/2024 4,707,194 0.33
5,200,000 Kinder Morgan Inc* 5.55% 01/06/2045 6,225,082 0.43
265,000 Korn Ferry† 4.63% 15/12/2027 266,987 0.02
4,470,000 Kraft Heinz Foods Co† 3.75% 01/04/2030 4,603,185 0.32
920,000 Kraft Heinz Foods Co† 4.88% 01/10/2049 969,699 0.07
365,000 Kraft Heinz Foods Co† 5.20% 15/07/2045 395,926 0.03
805,000 Kroger Co* 5.40% 15/01/2049 981,972 0.07
1,390,000 L Brands Inc* 5.25% 01/02/2028 1,319,596 0.09
520,000 L Brands Inc* 5.63% 15/10/2023 562,034 0.04
490,000 Lamar Media Corp† 5.75% 01/02/2026 520,257 0.04
235,000 Lennar Corp† 5.38% 01/10/2022 251,523 0.02
420,000 Level 3 Financing Inc† 4.63% 15/09/2027 430,773 0.03
485,000 Level 3 Financing Inc* 5.13% 01/05/2023 489,042 0.03
575,000 Level 3 Financing Inc* 5.38% 15/01/2024 586,020 0.04
545,000 Lions Gate Capital Holdings LLC† 5.88% 01/11/2024 554,764 0.04
605,000 Live Nation Entertainment Inc† 4.75% 15/10/2027 627,294 0.04
1,015,000 Live Nation Entertainment Inc† 4.88% 01/11/2024 1,053,052 0.07
530,000 LKQ Corp† 4.75% 15/05/2023 538,639 0.04
758,000 Lloyds Banking Group Plc* 7.50% 29/12/2049 838,935 0.06
275,000 LPL Holdings Inc† 4.63% 15/11/2027 281,187 0.02
1,540,000 LPL Holdings Inc† 5.75% 15/09/2025 1,615,060 0.11
397,000 M&T Bank Corp† 5.00% 29/12/2049 416,354 0.03
4,375,000 Marathon Oil Corp* 4.40% 15/07/2027 4,756,702 0.33
935,000 Masonite International Corp† 5.38% 01/02/2028 989,324 0.07
1,175,000 Masonite International Corp† 5.75% 15/09/2026 1,251,783 0.09
1,255,000 Matador Resources Co† 5.88% 15/09/2026 1,261,306 0.09
870,000 Mauser Packaging Solutions Holding Co† 5.50% 15/04/2024 898,353 0.06
645,000 Mauser Packaging Solutions Holding Co† 7.25% 15/04/2025 638,544 0.04
320,000 MEDNAX Inc† 5.25% 01/12/2023 327,867 0.02
160,000 Meritage Homes Corp* 7.00% 01/04/2022 175,050 0.01
4,750,000 Microchip Technology Inc† 4.33% 01/06/2023 5,018,788 0.35
6,435,000 Morgan Stanley† 2.88% 22/07/2022 6,497,188 0.45
8,005,000 Morgan Stanley† 3.59% 22/07/2028 8,508,258 0.59
1,945,000 Morgan Stanley† 5.61% 29/12/2049 1,964,547 0.14
1,670,000 MPH Acquisition Holdings LLC† 7.13% 01/06/2024 1,619,883 0.11
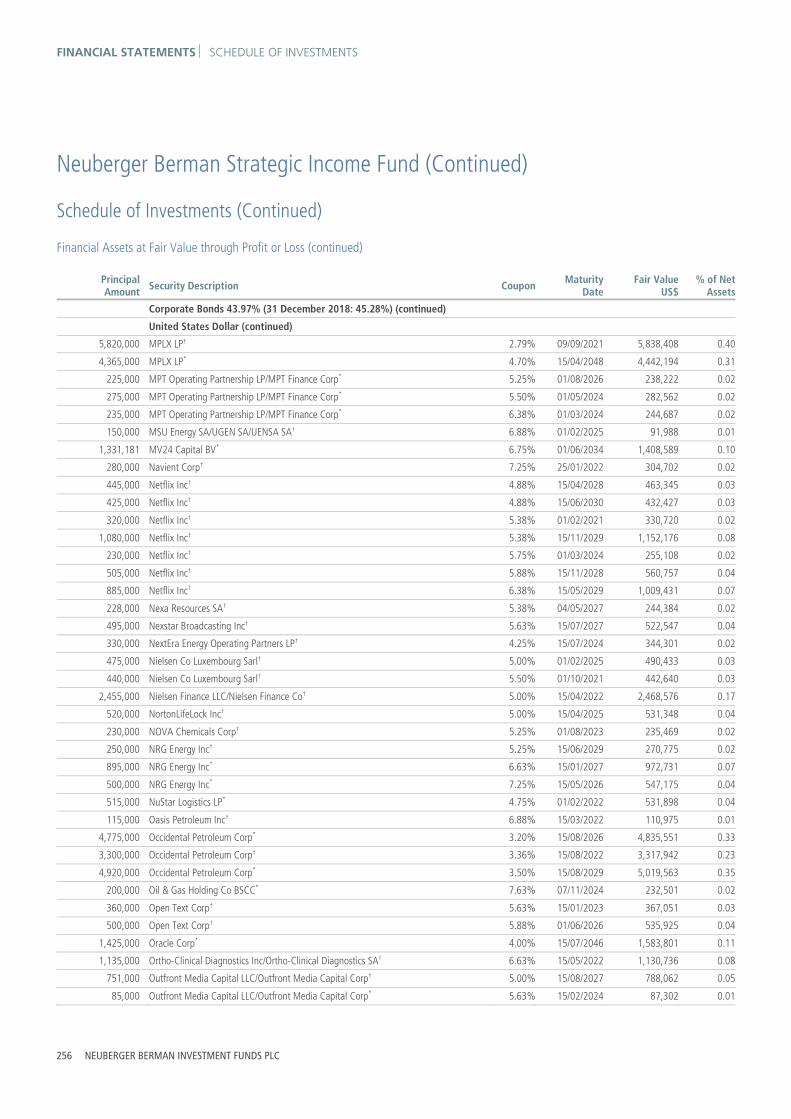
FINANCIAL STATEMENTS SCHEDULE OF INVESTMENTS
256 NEUBERGER BERMAN INVESTMENT FUNDS PLC
Neuberger Berman Strategic Income Fund (Continued)
Schedule of Investments (Continued)
Financial Assets at Fair Value through Profit or Loss (continued)
Principal Amount Security Description Coupon
Maturity Date
Fair ValueUS$
% of NetAssets
Corporate Bonds 43.97% (31 December 2018: 45.28%) (continued)
United States Dollar (continued) 5,820,000 MPLX LP† 2.79% 09/09/2021 5,838,408 0.40
4,365,000 MPLX LP* 4.70% 15/04/2048 4,442,194 0.31
225,000 MPT Operating Partnership LP/MPT Finance Corp* 5.25% 01/08/2026 238,222 0.02
275,000 MPT Operating Partnership LP/MPT Finance Corp* 5.50% 01/05/2024 282,562 0.02
235,000 MPT Operating Partnership LP/MPT Finance Corp* 6.38% 01/03/2024 244,687 0.02
150,000 MSU Energy SA/UGEN SA/UENSA SA† 6.88% 01/02/2025 91,988 0.01
1,331,181 MV24 Capital BV* 6.75% 01/06/2034 1,408,589 0.10
280,000 Navient Corp† 7.25% 25/01/2022 304,702 0.02
445,000 Netflix Inc† 4.88% 15/04/2028 463,345 0.03
425,000 Netflix Inc† 4.88% 15/06/2030 432,427 0.03
320,000 Netflix Inc† 5.38% 01/02/2021 330,720 0.02
1,080,000 Netflix Inc† 5.38% 15/11/2029 1,152,176 0.08
230,000 Netflix Inc† 5.75% 01/03/2024 255,108 0.02
505,000 Netflix Inc† 5.88% 15/11/2028 560,757 0.04
885,000 Netflix Inc† 6.38% 15/05/2029 1,009,431 0.07
228,000 Nexa Resources SA† 5.38% 04/05/2027 244,384 0.02
495,000 Nexstar Broadcasting Inc† 5.63% 15/07/2027 522,547 0.04
330,000 NextEra Energy Operating Partners LP† 4.25% 15/07/2024 344,301 0.02
475,000 Nielsen Co Luxembourg Sarl† 5.00% 01/02/2025 490,433 0.03
440,000 Nielsen Co Luxembourg Sarl† 5.50% 01/10/2021 442,640 0.03
2,455,000 Nielsen Finance LLC/Nielsen Finance Co† 5.00% 15/04/2022 2,468,576 0.17
520,000 NortonLifeLock Inc† 5.00% 15/04/2025 531,348 0.04
230,000 NOVA Chemicals Corp† 5.25% 01/08/2023 235,469 0.02
250,000 NRG Energy Inc† 5.25% 15/06/2029 270,775 0.02
895,000 NRG Energy Inc* 6.63% 15/01/2027 972,731 0.07
500,000 NRG Energy Inc* 7.25% 15/05/2026 547,175 0.04
515,000 NuStar Logistics LP* 4.75% 01/02/2022 531,898 0.04
115,000 Oasis Petroleum Inc† 6.88% 15/03/2022 110,975 0.01
4,775,000 Occidental Petroleum Corp* 3.20% 15/08/2026 4,835,551 0.33
3,300,000 Occidental Petroleum Corp† 3.36% 15/08/2022 3,317,942 0.23
4,920,000 Occidental Petroleum Corp* 3.50% 15/08/2029 5,019,563 0.35
200,000 Oil & Gas Holding Co BSCC* 7.63% 07/11/2024 232,501 0.02
360,000 Open Text Corp† 5.63% 15/01/2023 367,051 0.03
500,000 Open Text Corp† 5.88% 01/06/2026 535,925 0.04
1,425,000 Oracle Corp* 4.00% 15/07/2046 1,583,801 0.11
1,135,000 Ortho-Clinical Diagnostics Inc/Ortho-Clinical Diagnostics SA† 6.63% 15/05/2022 1,130,736 0.08
751,000 Outfront Media Capital LLC/Outfront Media Capital Corp† 5.00% 15/08/2027 788,062 0.05
85,000 Outfront Media Capital LLC/Outfront Media Capital Corp* 5.63% 15/02/2024 87,302 0.01

SCHEDULE OF INVESTMENTS FINANCIAL STATEMENTS
ANNUAL REPORT 2019 257
Neuberger Berman Strategic Income Fund (Continued)
Schedule of Investments (Continued)
Financial Assets at Fair Value through Profit or Loss (continued)
Principal Amount Security Description Coupon
Maturity Date
Fair ValueUS$
% of NetAssets
Corporate Bonds 43.97% (31 December 2018: 45.28%) (continued)
United States Dollar (continued) 170,000 Owens-Brockway Glass Container Inc† 5.00% 15/01/2022 176,761 0.01
420,000 Park Aerospace Holdings Ltd† 3.63% 15/03/2021 426,220 0.03
530,000 Parsley Energy LLC/Parsley Finance Corp† 5.25% 15/08/2025 546,120 0.04
180,000 Parsley Energy LLC/Parsley Finance Corp† 6.25% 01/06/2024 187,725 0.01
980,000 PDC Energy Inc† 5.75% 15/05/2026 980,025 0.07
160,000 PDC Energy Inc† 6.13% 15/09/2024 162,466 0.01
695,000 Penske Automotive Group Inc* 3.75% 15/08/2020 703,957 0.05
1,050,000 Penske Automotive Group Inc* 5.50% 15/05/2026 1,101,818 0.08
95,000 Penske Automotive Group Inc* 5.75% 01/10/2022 96,543 0.01
545,000 Performance Food Group Inc† 5.50% 15/10/2027 583,845 0.04
205,000 Pertamina Persero PT* 3.65% 30/07/2029 215,175 0.01
166,000 Petrobras Global Finance BV* 6.90% 19/03/2049 195,013 0.01
762,400 Petroleos de Venezuela SA* 5.38% 12/04/2027 62,898 0.00
4,488,565 Petroleos de Venezuela SA* 6.00% 16/05/2024 370,307 0.03
2,302,978 Petroleos de Venezuela SA† 6.00% 15/11/2026 189,996 0.01
200,000 Petroleos Mexicanos† 5.35% 12/02/2028 199,570 0.01
168,000 Petroleos Mexicanos* 6.35% 12/02/2048 162,697 0.01
50,000 Petroleos Mexicanos† 6.63% 15/06/2038 50,097 0.00
41,000 Petroleos Mexicanos† 6.84% 23/01/2030 43,792 0.00
25,000 Petroleos Mexicanos† 6.88% 04/08/2026 27,522 0.00
268,000 Petroleos Mexicanos† 7.69% 23/01/2050 293,400 0.02
3,675,000 Plains All American Pipeline LP/PAA Finance Corp* 3.55% 15/12/2029 3,624,660 0.25
395,000 PNC Financial Services Group Inc† 5.00% 29/12/2049 422,757 0.03
215,000 Polaris Intermediate Corp† 8.50% 01/12/2022 200,755 0.01
645,000 Post Holdings Inc† 5.50% 01/03/2025 676,982 0.05
1,210,000 Post Holdings Inc† 5.63% 15/01/2028 1,306,014 0.09
210,000 Post Holdings Inc† 5.75% 01/03/2027 225,713 0.02
235,000 Precision Drilling Corp* 5.25% 15/11/2024 216,298 0.01
105,000 Precision Drilling Corp† 7.13% 15/01/2026 100,049 0.01
570,000 Precision Drilling Corp† 7.75% 15/12/2023 570,237 0.04
330,000 Prime Security Services Borrower LLC/Prime Finance Inc† 5.25% 15/04/2024 349,828 0.02
3,060,000 Prime Security Services Borrower LLC/Prime Finance Inc† 5.75% 15/04/2026 3,331,587 0.23
370,000 Prime Security Services Borrower LLC/Prime Finance Inc† 9.25% 15/05/2023 388,731 0.03
565,000 Prudential Financial Inc† 5.38% 15/05/2045 611,663 0.04
317,000 QNB Finansbank AS* 6.88% 07/09/2024 338,358 0.02
165,000 QVC Inc† 5.13% 02/07/2022 173,589 0.01
1,535,000 Rackspace Hosting Inc† 8.63% 15/11/2024 1,504,300 0.10
405,000 Radiate Holdco LLC/Radiate Finance Inc† 6.63% 15/02/2025 410,231 0.03

FINANCIAL STATEMENTS SCHEDULE OF INVESTMENTS
258 NEUBERGER BERMAN INVESTMENT FUNDS PLC
Neuberger Berman Strategic Income Fund (Continued)
Schedule of Investments (Continued)
Financial Assets at Fair Value through Profit or Loss (continued)
Principal Amount Security Description Coupon
Maturity Date
Fair ValueUS$
% of NetAssets
Corporate Bonds 43.97% (31 December 2018: 45.28%) (continued)
United States Dollar (continued) 680,000 Range Resources Corp* 4.88% 15/05/2025 583,100 0.04
70,000 Range Resources Corp* 5.00% 15/08/2022 68,775 0.00
155,000 Range Resources Corp* 5.00% 15/03/2023 142,958 0.01
90,000 Range Resources Corp* 5.88% 01/07/2022 89,578 0.01
230,000 RBS Global Inc/Rexnord LLC† 4.88% 15/12/2025 238,048 0.02
1,015,000 Realogy Group LLC/Realogy Co-Issuer Corp† 4.88% 01/06/2023 999,775 0.07
500,000 Realogy Group LLC/Realogy Co-Issuer Corp† 5.25% 01/12/2021 506,125 0.03
1,015,000 Realogy Group LLC/Realogy Co-Issuer Corp† 9.38% 01/04/2027 1,061,675 0.07
1,215,000 Resideo Funding Inc† 6.13% 01/11/2026 1,227,180 0.08
375,000 Reynolds Group Issuer Inc/Reynolds Group Issuer LLC/Reynolds Group Issuer Lu† 5.13% 15/07/2023 384,688 0.03
625,074 Reynolds Group Issuer Inc/Reynolds Group Issuer LLC/Reynolds Group Issuer Lu† 5.75% 15/10/2020 626,637 0.04
510,000 Ritchie Bros Auctioneers Inc† 5.38% 15/01/2025 532,738 0.04
445,000 Rumo Luxembourg Sarl* 7.38% 09/02/2024 480,415 0.03
200,000 Rusal Capital DAC* 5.13% 02/02/2022 205,425 0.01
1,395,000 Saka Energi Indonesia PT* 4.45% 05/05/2024 1,418,912 0.10
200,000 Sasol Financing USA LLC* 5.88% 27/03/2024 216,529 0.01
719,000 Saudi Arabian Oil Co* 4.25% 16/04/2039 769,783 0.05
125,000 Scientific Games International Inc† 5.00% 15/10/2025 131,250 0.01
620,000 Scientific Games International Inc† 7.00% 15/05/2028 664,547 0.05
680,000 Scientific Games International Inc† 7.25% 15/11/2029 740,758 0.05
120,000 Sealed Air Corp† 4.88% 01/12/2022 127,387 0.01
205,000 Sealed Air Corp† 5.25% 01/04/2023 218,923 0.02
510,000 Sealed Air Corp† 5.50% 15/09/2025 562,487 0.04
730,000 Select Medical Corp† 6.25% 15/08/2026 791,579 0.05
45,000 Sensata Technologies BV† 4.88% 15/10/2023 48,037 0.00
150,000 Sensata Technologies BV† 5.63% 01/11/2024 167,312 0.01
500,000 Sensata Technologies UK Financing Co Plc† 6.25% 15/02/2026 539,675 0.04
520,000 ServiceMaster Co LLC† 5.13% 15/11/2024 540,584 0.04
270,000 Shea Homes LP/Shea Homes Funding Corp† 5.88% 01/04/2023 275,850 0.02
515,000 Shea Homes LP/Shea Homes Funding Corp† 6.13% 01/04/2025 534,526 0.04
510,000 Signature Aviation US Holdings Inc† 5.38% 01/05/2026 538,016 0.04
525,000 Silgan Holdings Inc† 4.75% 15/03/2025 538,343 0.04
515,000 Sinclair Television Group Inc† 5.13% 15/02/2027 530,629 0.04
130,000 Sinclair Television Group Inc† 5.88% 15/03/2026 137,033 0.01
60,000 Sirius XM Radio Inc† 3.88% 01/08/2022 61,425 0.00
660,000 Sirius XM Radio Inc† 4.63% 15/05/2023 671,276 0.05
585,000 Sirius XM Radio Inc† 4.63% 15/07/2024 615,470 0.04
645,000 Sirius XM Radio Inc† 5.00% 01/08/2027 681,668 0.05

SCHEDULE OF INVESTMENTS FINANCIAL STATEMENTS
ANNUAL REPORT 2019 259
Neuberger Berman Strategic Income Fund (Continued)
Schedule of Investments (Continued)
Financial Assets at Fair Value through Profit or Loss (continued)
Principal Amount Security Description Coupon
Maturity Date
Fair ValueUS$
% of NetAssets
Corporate Bonds 43.97% (31 December 2018: 45.28%) (continued)
United States Dollar (continued) 170,000 Sirius XM Radio Inc† 5.38% 15/04/2025 176,012 0.01
945,000 Sirius XM Radio Inc† 5.38% 15/07/2026 1,006,153 0.07
1,740,000 Sirius XM Radio Inc† 5.50% 01/07/2029 1,884,577 0.13
1,640,000 Six Flags Entertainment Corp† 4.88% 31/07/2024 1,702,869 0.12
590,000 Six Flags Entertainment Corp† 5.50% 15/04/2027 630,179 0.04
800,000 Skandinaviska Enskilda Banken AB* 5.13% 29/12/2049 802,700 0.06
210,000 SM Energy Co* 6.63% 15/01/2027 206,887 0.01
875,000 Solera LLC/Solera Finance Inc† 10.50% 01/03/2024 930,252 0.06
850,000 Southern Gas Corridor CJSC* 6.88% 24/03/2026 1,009,769 0.07
1,210,000 Southern Gas Corridor CJSC 144A* 6.88% 24/03/2026 1,436,820 0.10
75,000 Spectrum Brands Inc† 5.00% 01/10/2029 77,651 0.01
895,000 Spectrum Brands Inc* 5.75% 15/07/2025 936,403 0.06
415,000 Spectrum Brands Inc* 6.13% 15/12/2024 429,697 0.03
385,000 Springleaf Finance Corp† 5.63% 15/03/2023 415,800 0.03
100,000 Sprint Capital Corp* 8.75% 15/03/2032 121,560 0.01
690,000 Sprint Communications Inc* 6.00% 15/11/2022 724,866 0.05
2,185,000 Sprint Corp* 7.13% 15/06/2024 2,361,624 0.16
430,000 Sprint Corp* 7.63% 01/03/2026 475,000 0.03
645,000 Sprint Corp* 7.88% 15/09/2023 712,993 0.05
140,000 SPX FLOW Inc† 5.63% 15/08/2024 146,183 0.01
510,000 SPX FLOW Inc† 5.88% 15/08/2026 540,777 0.04
880,000 SS&C Technologies Inc† 5.50% 30/09/2027 941,050 0.07
2,450,000 Staples Inc† 7.50% 15/04/2026 2,546,466 0.18
265,000 Staples Inc† 10.75% 15/04/2027 269,465 0.02
1,075,000 Starfruit Finco BV/Starfruit US Holdco LLC* 8.00% 01/10/2026 1,142,214 0.08
60,000 Starwood Property Trust Inc† 3.63% 01/02/2021 60,549 0.00
410,000 Starwood Property Trust Inc* 5.00% 15/12/2021 426,298 0.03
200,000 State Oil Co of the Azerbaijan Republic* 4.75% 13/03/2023 210,402 0.01
985,000 State Oil Co of the Azerbaijan Republic* 6.95% 18/03/2030 1,205,642 0.08
510,000 Station Casinos LLC† 5.00% 01/10/2025 520,200 0.04
200,000 Summit Midstream Holdings LLC/Summit Midstream Finance Corp* 5.50% 15/08/2022 178,562 0.01
590,000 Summit Midstream Holdings LLC/Summit Midstream Finance Corp* 5.75% 15/04/2025 452,332 0.03
200,000 Suzano Austria GmbH* 5.00% 15/01/2030 210,594 0.01
7,970,000 Synchrony Financial* 2.85% 25/07/2022 8,067,491 0.56
330,000 Talen Energy Supply LLC† 6.50% 01/06/2025 282,594 0.02
100,000 Talen Energy Supply LLC† 6.63% 15/01/2028 102,285 0.01
495,000 Talen Energy Supply LLC† 7.25% 15/05/2027 521,755 0.04
455,000 Talen Energy Supply LLC† 10.50% 15/01/2026 433,875 0.03

FINANCIAL STATEMENTS SCHEDULE OF INVESTMENTS
260 NEUBERGER BERMAN INVESTMENT FUNDS PLC
Neuberger Berman Strategic Income Fund (Continued)
Schedule of Investments (Continued)
Financial Assets at Fair Value through Profit or Loss (continued)
Principal Amount Security Description Coupon
Maturity Date
Fair ValueUS$
% of NetAssets
Corporate Bonds 43.97% (31 December 2018: 45.28%) (continued)
United States Dollar (continued) 260,000 Tallgrass Energy Partners LP/Tallgrass Energy Finance Corp† 5.50% 15/09/2024 261,947 0.02
480,000 Tallgrass Energy Partners LP/Tallgrass Energy Finance Corp† 5.50% 15/01/2028 471,515 0.03
395,000 Targa Resources Partners LP/Targa Resources Partners Finance Corp† 4.25% 15/11/2023 399,774 0.03
80,000 Targa Resources Partners LP/Targa Resources Partners Finance Corp† 5.00% 15/01/2028 81,786 0.01
400,000 Targa Resources Partners LP/Targa Resources Partners Finance Corp† 5.13% 01/02/2025 415,996 0.03
400,000 Targa Resources Partners LP/Targa Resources Partners Finance Corp† 5.25% 01/05/2023 404,834 0.03
172,000 Targa Resources Partners LP/Targa Resources Partners Finance Corp† 5.38% 01/02/2027 178,768 0.01
365,000 Targa Resources Partners LP/Targa Resources Partners Finance Corp† 5.50% 01/03/2030 375,494 0.03
70,000 Targa Resources Partners LP/Targa Resources Partners Finance Corp* 5.88% 15/04/2026 74,506 0.00
200,000 Targa Resources Partners LP/Targa Resources Partners Finance Corp† 6.50% 15/07/2027 219,370 0.02
227,000 Targa Resources Partners LP/Targa Resources Partners Finance Corp* 6.75% 15/03/2024 235,794 0.02
70,000 Targa Resources Partners LP/Targa Resources Partners Finance Corp† 6.88% 15/01/2029 77,830 0.01
925,000 Taylor Morrison Communities Inc† 5.75% 15/01/2028 1,010,884 0.07
625,000 Taylor Morrison Communities Inc† 5.88% 15/06/2027 688,952 0.05
505,000 Taylor Morrison Communities Inc/Taylor Morrison Holdings II Inc† 5.63% 01/03/2024 546,872 0.04
220,000 Taylor Morrison Communities Inc/Taylor Morrison Holdings II Inc† 5.88% 15/04/2023 237,691 0.02
400,000 Telenet Finance Luxembourg Notes Sarl† 5.50% 01/03/2028 428,915 0.03
110,000 Tenet Healthcare Corp† 4.63% 01/09/2024 114,824 0.01
175,000 Tenet Healthcare Corp* 5.13% 01/05/2025 180,688 0.01
380,000 Tenet Healthcare Corp* 6.75% 15/06/2023 418,302 0.03
330,000 Tenet Healthcare Corp* 7.00% 01/08/2025 349,251 0.02
1,425,000 Tenet Healthcare Corp* 8.13% 01/04/2022 1,578,943 0.11
2,435,000 Terex Corp† 5.63% 01/02/2025 2,517,181 0.17
190,000 T-Mobile USA Inc† 4.00% 15/04/2022 194,986 0.01
55,000 T-Mobile USA Inc 4.50% 01/02/2026 0 0.00
730,000 T-Mobile USA Inc 6.00% 01/03/2023 0 0.00
135,000 T-Mobile USA Inc 6.00% 15/04/2024 0 0.00
500,000 Toll Brothers Finance Corp* 4.35% 15/02/2028 522,674 0.04
220,000 Toll Brothers Finance Corp* 5.88% 15/02/2022 233,269 0.02
940,000 TransDigm Inc† 5.50% 15/11/2027 952,295 0.07
1,725,000 TransDigm Inc† 6.25% 15/03/2026 1,870,735 0.13
955,000 TransDigm Inc* 6.38% 15/06/2026 1,014,649 0.07
210,000 TransDigm Inc* 6.50% 15/07/2024 217,021 0.01
1,115,000 TransDigm Inc* 7.50% 15/03/2027 1,221,650 0.08
28,000 Transocean Phoenix 2 Ltd† 7.75% 15/10/2024 29,762 0.00
28,000 Transocean Proteus Ltd† 6.25% 01/12/2024 28,922 0.00
390,000 TRI Pointe Group Inc* 4.88% 01/07/2021 400,881 0.03
620,000 Trident TPI Holdings Inc† 9.25% 01/08/2024 628,007 0.04

SCHEDULE OF INVESTMENTS FINANCIAL STATEMENTS
ANNUAL REPORT 2019 261
Neuberger Berman Strategic Income Fund (Continued)
Schedule of Investments (Continued)
Financial Assets at Fair Value through Profit or Loss (continued)
Principal Amount Security Description Coupon
Maturity Date
Fair ValueUS$
% of NetAssets
Corporate Bonds 43.97% (31 December 2018: 45.28%) (continued)
United States Dollar (continued) 220,000 Tronox Finance Plc† 5.75% 01/10/2025 224,760 0.02
740,000 Tronox Inc† 6.50% 15/04/2026 764,217 0.05
708,000 Truist Financial Corp* 4.80% 29/12/2049 731,895 0.05
404,000 Truist Financial Corp* 5.05% 29/12/2049 412,694 0.03
262,000 Turkiye Sise ve Cam Fabrikalari AS* 6.95% 14/03/2026 277,235 0.02
1,225,000 Turkiye Sise ve Cam Fabrikalari AS 144A* 6.95% 14/03/2026 1,297,765 0.09
951,000 UBS Group AG* 6.88% 29/12/2049 1,054,605 0.07
108,333 Ukreximbank Via Biz Finance Plc* 9.63% 27/04/2022 113,868 0.01
481,000 UniCredit SpA† 8.00% 29/12/2049 526,142 0.04
230,000 United Rentals North America Inc* 4.63% 15/10/2025 236,943 0.02
500,000 United Rentals North America Inc* 5.25% 15/01/2030 539,075 0.04
1,255,000 United Rentals North America Inc* 5.50% 15/05/2027 1,347,613 0.09
3,365,000 UnitedHealth Group Inc* 3.88% 15/08/2059 3,631,460 0.25
775,000 Univar Solutions USA Inc† 5.13% 01/12/2027 810,363 0.06
130,000 Universal Health Services Inc† 4.75% 01/08/2022 131,624 0.01
4,750,000 Verizon Communications Inc* 4.52% 15/09/2048 5,690,145 0.39
160,000 VICI Properties 1 LLC/VICI FC Inc† 8.00% 15/10/2023 173,866 0.01
555,000 Vistra Energy Corp* 5.88% 01/06/2023 569,169 0.04
465,000 Vistra Operations Co LLC† 5.00% 31/07/2027 486,776 0.03
510,000 Vistra Operations Co LLC† 5.50% 01/09/2026 541,784 0.04
660,000 Vistra Operations Co LLC† 5.63% 15/02/2027 696,696 0.05
215,000 Vizient Inc† 6.25% 15/05/2027 230,662 0.02
6,055,000 Volkswagen Group of America Finance LLC† 2.70% 26/09/2022 6,128,207 0.42
200,000 Votorantim Cimentos International SA† 7.25% 05/04/2041 254,439 0.02
3,730,000 Walmart Inc* 3.25% 08/07/2029 4,001,134 0.28
335,000 WellCare Health Plans Inc* 5.25% 01/04/2025 349,234 0.02
250,000 WellCare Health Plans Inc† 5.38% 15/08/2026 266,713 0.02
2,905,000 Wells Fargo & Co† 2.41% 30/10/2025 2,906,975 0.20
5,790,000 Wells Fargo & Co† 3.05% 24/01/2023 5,868,025 0.41
324,000 Wells Fargo & Co† 5.88% 29/12/2049 360,727 0.02
426,000 Wells Fargo & Co† 5.90% 29/12/2049 464,142 0.03
780,000 West Street Merger Sub Inc† 6.38% 01/09/2025 779,992 0.05
1,295,000 Western Digital Corp† 4.75% 15/02/2026 1,352,466 0.09
1,565,000 William Carter Co† 5.63% 15/03/2027 1,686,010 0.12
380,000 WPX Energy Inc* 5.25% 15/09/2024 404,696 0.03
935,000 WPX Energy Inc* 5.75% 01/06/2026 1,000,284 0.07
90,000 WPX Energy Inc* 8.25% 01/08/2023 103,762 0.01
529,000 WR Grace & Co-Conn† 5.13% 01/10/2021 552,503 0.04

FINANCIAL STATEMENTS SCHEDULE OF INVESTMENTS
262 NEUBERGER BERMAN INVESTMENT FUNDS PLC
Neuberger Berman Strategic Income Fund (Continued)
Schedule of Investments (Continued)
Financial Assets at Fair Value through Profit or Loss (continued)
Principal Amount Security Description Coupon
Maturity Date
Fair ValueUS$
% of NetAssets
Corporate Bonds 43.97% (31 December 2018: 45.28%) (continued)
United States Dollar (continued) 310,000 Wynn Las Vegas LLC/Wynn Las Vegas Capital Corp† 4.25% 30/05/2023 325,438 0.02
1,455,000 Wynn Las Vegas LLC/Wynn Las Vegas Capital Corp† 5.50% 01/03/2025 1,562,292 0.11
385,000 Zayo Group LLC/Zayo Capital Inc† 5.75% 15/01/2027 392,353 0.03
680,000 Zayo Group LLC/Zayo Capital Inc* 6.00% 01/04/2023 696,718 0.05
750,000 Zayo Group LLC/Zayo Capital Inc* 6.38% 15/05/2025 774,686 0.05
Total Corporate Bonds 634,341,091 43.97
Government Bonds 30.70% (31 December 2018: 28.84%)
Colombian Peso 5,865,800,000 Colombian TES 6.00% 28/04/2028 1,781,318 0.12
1,991,100,000 Colombian TES 7.00% 04/05/2022 634,822 0.05
3,618,000,000 Colombian TES 7.25% 18/10/2034 1,172,389 0.08
Total Colombian Peso 3,588,529 0.25
Indonesian Rupiah
39,105,000,000 Indonesia Treasury Bond 6.13% 15/05/2028 2,660,528 0.18
925,000,000 Indonesia Treasury Bond 8.13% 15/05/2024 71,154 0.01
2,220,000,000 Indonesia Treasury Bond 8.25% 15/05/2029 172,802 0.01
Total Indonesian Rupiah 2,904,484 0.20
Mexican Peso 44,242,600 Mexican Bonos 7.50% 03/06/2027 2,435,475 0.17
12,960,000 Mexican Bonos 7.75% 13/11/2042 728,496 0.05
37,410,000 Mexican Bonos 8.50% 31/05/2029 2,206,524 0.15
Total Mexican Peso 5,370,495 0.37
Russian Ruble 156,061,000 Russian Federal Bond - OFZ 7.05% 19/01/2028 2,653,938 0.18
43,871,000 Russian Federal Bond - OFZ 7.10% 16/10/2024 740,311 0.05
22,998,000 Russian Federal Bond - OFZ 7.70% 23/03/2033 413,317 0.03
53,518,000 Russian Federal Bond - OFZ 7.95% 07/10/2026 948,459 0.07
Total Russian Ruble 4,756,025 0.33
South African Rand
26,084,538 Republic of South Africa Government Bond 8.25% 31/03/2032 1,713,053 0.12
9,812,463 Republic of South Africa Government Bond 9.00% 31/01/2040 640,359 0.04
7,214,130 Republic of South Africa Government Bond 10.50% 21/12/2026 577,427 0.04
Total South African Rand 2,930,839 0.20

SCHEDULE OF INVESTMENTS FINANCIAL STATEMENTS
ANNUAL REPORT 2019 263
Neuberger Berman Strategic Income Fund (Continued)
Schedule of Investments (Continued)
Financial Assets at Fair Value through Profit or Loss (continued)
Principal Amount Security Description Coupon
Maturity Date
Fair ValueUS$
% of NetAssets
Government Bonds 30.70% (31 December 2018: 28.84%) (continued)
Turkish Lira 4,862,489 Turkey Government Bond 10.70% 17/08/2022 805,649 0.06
735,000 Turkey Government Bond 11.00% 02/03/2022 122,891 0.01
4,096,317 Turkey Government Bond 12.40% 08/03/2028 708,647 0.05
Total Turkish Lira 1,637,187 0.12
United States Dollar
200,000 Angolan Government International Bond 8.25% 09/05/2028 216,229 0.02
200,000 Angolan Government International Bond 9.13% 26/11/2049 213,704 0.01
237,000 Angolan Government International Bond 9.38% 08/05/2048 259,731 0.02
665,000 Angolan Government International Bond 144A 9.38% 08/05/2048 731,504 0.05
410,000 Argentine Republic Government International Bond 3.75% 31/12/2038 201,287 0.01
799,162 Argentine Republic Government International Bond 8.28% 31/12/2033 480,782 0.03
200,000 Banque Centrale de Tunisie International Bond 5.75% 30/01/2025 187,272 0.01
270,000 Bermuda Government International Bond 3.72% 25/01/2027 284,272 0.02
1,395,000 Brazilian Government International Bond 5.00% 27/01/2045 1,453,918 0.10
282,000 Colombia Government International Bond 5.00% 15/06/2045 328,512 0.02
166,000 Colombia Government International Bond 7.38% 18/09/2037 236,290 0.02
203,000 Costa Rica Government International Bond 6.13% 19/02/2031 216,246 0.02
1,420,000 Costa Rica Government International Bond 7.00% 04/04/2044 1,499,428 0.10
368,000 Costa Rica Government International Bond 7.16% 12/03/2045 393,184 0.03
529,000 Development Bank of Mongolia LLC 7.25% 23/10/2023 560,448 0.03
150,000 Dominican Republic International Bond 6.40% 05/06/2049 164,953 0.01
153,000 Dominican Republic International Bond 6.85% 27/01/2045 175,137 0.01
630,000 Ecuador Government International Bond 8.88% 23/10/2027 579,819 0.04
200,000 Ecuador Government International Bond 9.50% 27/03/2030 187,069 0.01
200,000 Egypt Government International Bond 7.05% 15/01/2032 209,508 0.01
770,000 Egypt Government International Bond 7.90% 21/02/2048 806,540 0.06
1,085,000 Egypt Government International Bond 8.50% 31/01/2047 1,208,082 0.08
240,000 El Salvador Government International Bond 7.75% 24/01/2023 264,100 0.02
48,000 El Salvador Government International Bond 8.63% 28/02/2029 57,737 0.00
710,000 Export Credit Bank of Turkey 6.13% 03/05/2024 720,095 0.05
350,000 Ghana Government International Bond 10.75% 14/10/2030 448,166 0.03
840,000 Indonesia Government International Bond 8.50% 12/10/2035 1,317,696 0.09
1,137,150 Ivory Coast Government International Bond 5.75% 31/12/2032 1,135,408 0.08
1,205,550 Ivory Coast Government International Bond 144A 5.75% 31/12/2032 1,208,114 0.08
200,000 Kenya Government International Bond 8.00% 22/05/2032 217,937 0.02
340,000 Mexico Government International Bond 5.75% 12/10/2110 403,388 0.03
200,000 Mongolia Government International Bond 8.75% 09/03/2024 227,488 0.02

FINANCIAL STATEMENTS SCHEDULE OF INVESTMENTS
264 NEUBERGER BERMAN INVESTMENT FUNDS PLC
Neuberger Berman Strategic Income Fund (Continued)
Schedule of Investments (Continued)
Financial Assets at Fair Value through Profit or Loss (continued)
Principal Amount Security Description Coupon
Maturity Date
Fair ValueUS$
% of NetAssets
Government Bonds 30.70% (31 December 2018: 28.84%) (continued)
United States Dollar (continued) 1,370,000 Namibia International Bonds 5.25% 29/10/2025 1,426,732 0.10
400,000 Nigeria Government International Bond 7.88% 16/02/2032 415,115 0.03
200,000 Nigeria Government International Bond 9.25% 21/01/2049 223,043 0.02
200,000 Oman Government International Bond 6.00% 01/08/2029 208,956 0.01
1,430,000 Oman Government International Bond 6.75% 17/01/2048 1,441,201 0.10
429,000 Panama Government International Bond 3.16% 23/01/2030 442,513 0.03
206,000 Papua New Guinea Government International Bond 8.38% 04/10/2028 218,689 0.02
350,000 Paraguay Government International Bond 5.00% 15/04/2026 387,747 0.03
200,000 Provincia de Cordoba 7.13% 10/06/2021 149,000 0.01
350,000 Qatar Government International Bond 5.10% 23/04/2048 450,605 0.03
200,000 Republic of Armenia International Bond 3.95% 26/09/2029 198,654 0.01
220,000 Republic of South Africa Government International Bond 4.85% 27/09/2027 228,046 0.02
264,000 Republic of South Africa Government International Bond 4.85% 30/09/2029 264,660 0.02
1,325,000 Republic of South Africa Government International Bond 5.88% 22/06/2030 1,435,598 0.10
200,000 Republic of Uzbekistan Bond 5.38% 20/02/2029 222,301 0.02
400,000 Russian Foreign Bond - Eurobond 5.10% 28/03/2035 478,200 0.03
1,365,000 Senegal Government International Bond 6.25% 23/05/2033 1,439,311 0.10
320,000 Senegal Government International Bond 6.75% 13/03/2048 321,442 0.02
709,000 Sri Lanka Government International Bond 6.75% 18/04/2028 680,902 0.05
220,000 Sri Lanka Government International Bond 7.85% 14/03/2029 223,316 0.02
1,350,000 Trinidad & Tobago Government International Bond 4.50% 04/08/2026 1,439,920 0.10
1,405,000 Turkey Government International Bond 6.00% 25/03/2027 1,427,273 0.10
505,000 Ukraine Government International Bond 7.75% 01/09/2027 553,673 0.04
606,000 Ukraine Government International Bond 9.75% 01/11/2028 737,544 0.05
68,933,283 United States Treasury Inflation Indexed Bonds 0.13% 15/04/2021 68,794,094 4.77
8,411,845 United States Treasury Inflation Indexed Bonds 1.00% 15/02/2046 9,258,649 0.64
17,636,671 United States Treasury Inflation Indexed Bonds 1.00% 15/02/2048 19,533,474 1.35
12,693,349 United States Treasury Inflation Indexed Bonds 3.38% 15/04/2032 17,433,602 1.21
3,720,000 United States Treasury Note/Bond 1.63% 15/02/2026 3,684,080 0.26
123,800,000 United States Treasury Note/Bond 2.00% 31/01/2020 123,833,731 8.58
6,735,000 United States Treasury Note/Bond 2.00% 15/01/2021 6,760,042 0.47
25,244,000 United States Treasury Note/Bond 2.25% 15/11/2027 25,934,247 1.80
39,215,000 United States Treasury Note/Bond 2.75% 15/02/2028 41,763,559 2.89
33,705,000 United States Treasury Note/Bond 2.75% 15/08/2042 35,968,866 2.49
34,550,000 United States Treasury Note/Bond 2.88% 31/05/2025 36,568,491 2.53
200,000 Uruguay Government International Bond 4.38% 23/01/2031 224,050 0.02
3,136,300 Venezuela Government International Bond 8.25% 13/10/2024 376,356 0.03
Total United States Dollar 421,741,726 29.23
Total Government Bonds * 442,929,285 30.70
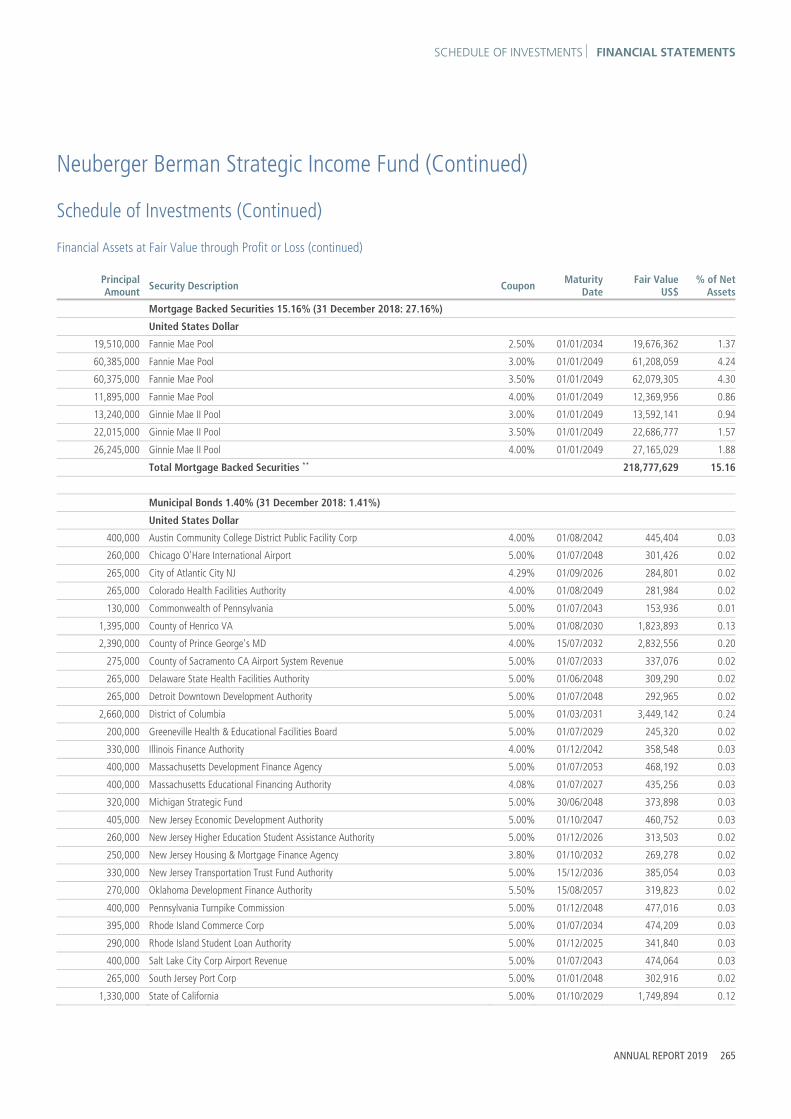
SCHEDULE OF INVESTMENTS FINANCIAL STATEMENTS
ANNUAL REPORT 2019 265
Neuberger Berman Strategic Income Fund (Continued)
Schedule of Investments (Continued)
Financial Assets at Fair Value through Profit or Loss (continued)
Principal Amount Security Description Coupon
Maturity Date
Fair ValueUS$
% of NetAssets
Mortgage Backed Securities 15.16% (31 December 2018: 27.16%)
United States Dollar
19,510,000 Fannie Mae Pool 2.50% 01/01/2034 19,676,362 1.37
60,385,000 Fannie Mae Pool 3.00% 01/01/2049 61,208,059 4.24
60,375,000 Fannie Mae Pool 3.50% 01/01/2049 62,079,305 4.30
11,895,000 Fannie Mae Pool 4.00% 01/01/2049 12,369,956 0.86
13,240,000 Ginnie Mae II Pool 3.00% 01/01/2049 13,592,141 0.94
22,015,000 Ginnie Mae II Pool 3.50% 01/01/2049 22,686,777 1.57
26,245,000 Ginnie Mae II Pool 4.00% 01/01/2049 27,165,029 1.88
Total Mortgage Backed Securities ** 218,777,629 15.16
Municipal Bonds 1.40% (31 December 2018: 1.41%)
United States Dollar
400,000 Austin Community College District Public Facility Corp 4.00% 01/08/2042 445,404 0.03
260,000 Chicago O'Hare International Airport 5.00% 01/07/2048 301,426 0.02
265,000 City of Atlantic City NJ 4.29% 01/09/2026 284,801 0.02
265,000 Colorado Health Facilities Authority 4.00% 01/08/2049 281,984 0.02
130,000 Commonwealth of Pennsylvania 5.00% 01/07/2043 153,936 0.01
1,395,000 County of Henrico VA 5.00% 01/08/2030 1,823,893 0.13
2,390,000 County of Prince George's MD 4.00% 15/07/2032 2,832,556 0.20
275,000 County of Sacramento CA Airport System Revenue 5.00% 01/07/2033 337,076 0.02
265,000 Delaware State Health Facilities Authority 5.00% 01/06/2048 309,290 0.02
265,000 Detroit Downtown Development Authority 5.00% 01/07/2048 292,965 0.02
2,660,000 District of Columbia 5.00% 01/03/2031 3,449,142 0.24
200,000 Greeneville Health & Educational Facilities Board 5.00% 01/07/2029 245,320 0.02
330,000 Illinois Finance Authority 4.00% 01/12/2042 358,548 0.03
400,000 Massachusetts Development Finance Agency 5.00% 01/07/2053 468,192 0.03
400,000 Massachusetts Educational Financing Authority 4.08% 01/07/2027 435,256 0.03
320,000 Michigan Strategic Fund 5.00% 30/06/2048 373,898 0.03
405,000 New Jersey Economic Development Authority 5.00% 01/10/2047 460,752 0.03
260,000 New Jersey Higher Education Student Assistance Authority 5.00% 01/12/2026 313,503 0.02
250,000 New Jersey Housing & Mortgage Finance Agency 3.80% 01/10/2032 269,278 0.02
330,000 New Jersey Transportation Trust Fund Authority 5.00% 15/12/2036 385,054 0.03
270,000 Oklahoma Development Finance Authority 5.50% 15/08/2057 319,823 0.02
400,000 Pennsylvania Turnpike Commission 5.00% 01/12/2048 477,016 0.03
395,000 Rhode Island Commerce Corp 5.00% 01/07/2034 474,209 0.03
290,000 Rhode Island Student Loan Authority 5.00% 01/12/2025 341,840 0.03
400,000 Salt Lake City Corp Airport Revenue 5.00% 01/07/2043 474,064 0.03
265,000 South Jersey Port Corp 5.00% 01/01/2048 302,916 0.02
1,330,000 State of California 5.00% 01/10/2029 1,749,894 0.12
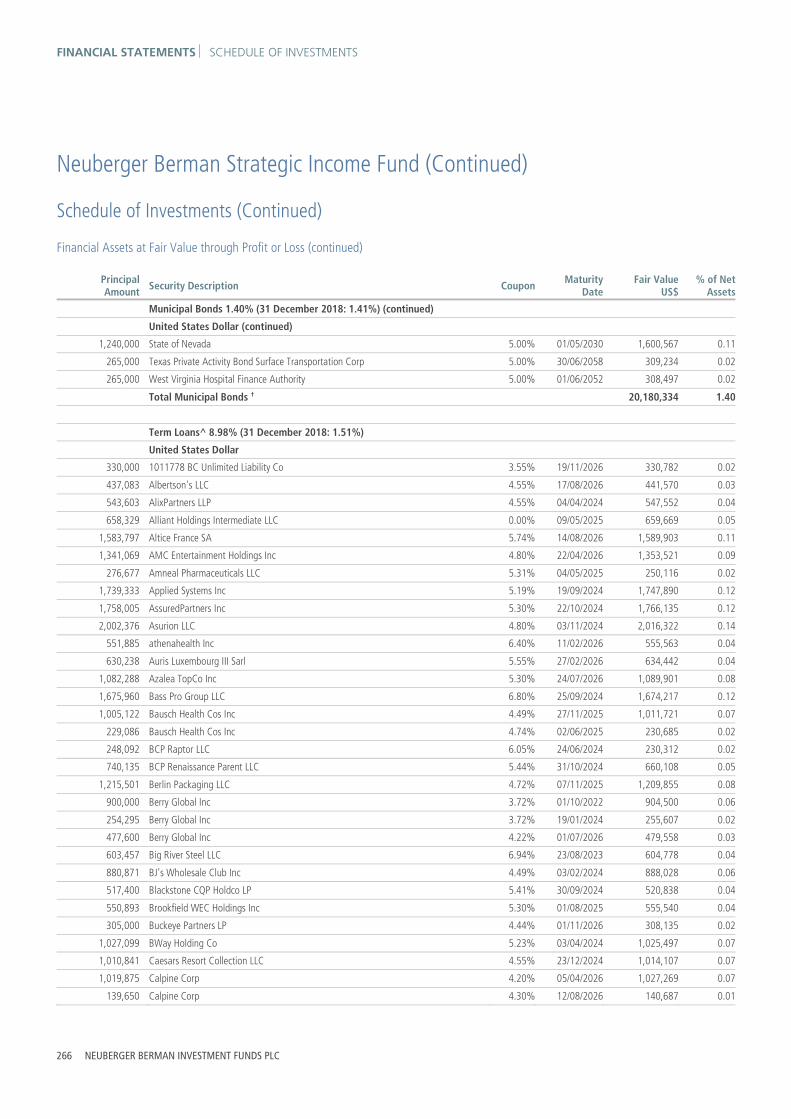
FINANCIAL STATEMENTS SCHEDULE OF INVESTMENTS
266 NEUBERGER BERMAN INVESTMENT FUNDS PLC
Neuberger Berman Strategic Income Fund (Continued)
Schedule of Investments (Continued)
Financial Assets at Fair Value through Profit or Loss (continued)
Principal Amount Security Description Coupon
Maturity Date
Fair ValueUS$
% of NetAssets
Municipal Bonds 1.40% (31 December 2018: 1.41%) (continued)
United States Dollar (continued) 1,240,000 State of Nevada 5.00% 01/05/2030 1,600,567 0.11
265,000 Texas Private Activity Bond Surface Transportation Corp 5.00% 30/06/2058 309,234 0.02
265,000 West Virginia Hospital Finance Authority 5.00% 01/06/2052 308,497 0.02
Total Municipal Bonds † 20,180,334 1.40
Term Loans^ 8.98% (31 December 2018: 1.51%)
United States Dollar
330,000 1011778 BC Unlimited Liability Co 3.55% 19/11/2026 330,782 0.02
437,083 Albertson's LLC 4.55% 17/08/2026 441,570 0.03
543,603 AlixPartners LLP 4.55% 04/04/2024 547,552 0.04
658,329 Alliant Holdings Intermediate LLC 0.00% 09/05/2025 659,669 0.05
1,583,797 Altice France SA 5.74% 14/08/2026 1,589,903 0.11
1,341,069 AMC Entertainment Holdings Inc 4.80% 22/04/2026 1,353,521 0.09
276,677 Amneal Pharmaceuticals LLC 5.31% 04/05/2025 250,116 0.02
1,739,333 Applied Systems Inc 5.19% 19/09/2024 1,747,890 0.12
1,758,005 AssuredPartners Inc 5.30% 22/10/2024 1,766,135 0.12
2,002,376 Asurion LLC 4.80% 03/11/2024 2,016,322 0.14
551,885 athenahealth Inc 6.40% 11/02/2026 555,563 0.04
630,238 Auris Luxembourg III Sarl 5.55% 27/02/2026 634,442 0.04
1,082,288 Azalea TopCo Inc 5.30% 24/07/2026 1,089,901 0.08
1,675,960 Bass Pro Group LLC 6.80% 25/09/2024 1,674,217 0.12
1,005,122 Bausch Health Cos Inc 4.49% 27/11/2025 1,011,721 0.07
229,086 Bausch Health Cos Inc 4.74% 02/06/2025 230,685 0.02
248,092 BCP Raptor LLC 6.05% 24/06/2024 230,312 0.02
740,135 BCP Renaissance Parent LLC 5.44% 31/10/2024 660,108 0.05
1,215,501 Berlin Packaging LLC 4.72% 07/11/2025 1,209,855 0.08
900,000 Berry Global Inc 3.72% 01/10/2022 904,500 0.06
254,295 Berry Global Inc 3.72% 19/01/2024 255,607 0.02
477,600 Berry Global Inc 4.22% 01/07/2026 479,558 0.03
603,457 Big River Steel LLC 6.94% 23/08/2023 604,778 0.04
880,871 BJ's Wholesale Club Inc 4.49% 03/02/2024 888,028 0.06
517,400 Blackstone CQP Holdco LP 5.41% 30/09/2024 520,838 0.04
550,893 Brookfield WEC Holdings Inc 5.30% 01/08/2025 555,540 0.04
305,000 Buckeye Partners LP 4.44% 01/11/2026 308,135 0.02
1,027,099 BWay Holding Co 5.23% 03/04/2024 1,025,497 0.07
1,010,841 Caesars Resort Collection LLC 4.55% 23/12/2024 1,014,107 0.07
1,019,875 Calpine Corp 4.20% 05/04/2026 1,027,269 0.07
139,650 Calpine Corp 4.30% 12/08/2026 140,687 0.01

SCHEDULE OF INVESTMENTS FINANCIAL STATEMENTS
ANNUAL REPORT 2019 267
Neuberger Berman Strategic Income Fund (Continued)
Schedule of Investments (Continued)
Financial Assets at Fair Value through Profit or Loss (continued)
Principal Amount Security Description Coupon
Maturity Date
Fair ValueUS$
% of NetAssets
Term Loans^ 8.98% (31 December 2018: 1.51%) (continued)
United States Dollar (continued) 740,840 Capital Automotive LP 4.30% 25/03/2024 744,489 0.05
100,571 Capital Automotive LP 7.80% 24/03/2025 101,200 0.01
728,114 CDW LLC 3.55% 13/10/2026 733,123 0.05
996,633 CenturyLink Inc 4.55% 31/01/2025 1,002,239 0.07
515,014 Ceridian HCM Holding Inc 4.80% 30/04/2025 518,984 0.04
1,039,847 Change Healthcare Holdings Inc 4.30% 01/03/2024 1,045,046 0.07
1,361,588 Charter Communications Operating LLC 3.55% 01/02/2027 1,371,806 0.10
648,371 Charter NEX US Inc 5.30% 16/05/2024 653,639 0.05
275,000 CIRCOR International Inc 5.24% 11/12/2024 276,547 0.02
1,017,176 CityCenter Holdings LLC 4.05% 18/04/2024 1,022,816 0.07
817,950 Clear Channel Outdoor Holdings Inc 5.30% 21/08/2026 823,864 0.06
2,004,975 Commscope Inc 5.05% 06/04/2026 2,020,012 0.14
1,240,000 Connect Finco Sarl 2.57% 11/12/2026 1,249,201 0.09
73,889 Covia Holdings Corp 6.04% 01/06/2025 57,362 0.00
274,295 CPG International LLC 5.93% 05/05/2024 275,096 0.02
492,525 Crosby US Acquisition Corp 6.54% 26/06/2026 483,290 0.03
1,134,843 Crown Finance US Inc 4.05% 28/02/2025 1,136,125 0.08
1,642,838 CSC Holdings LLC 4.24% 15/04/2027 1,652,760 0.11
817,950 Cumulus Media New Holdings Inc 5.55% 31/03/2026 827,647 0.06
1,231,702 Deerfield Dakota Holding LLC 5.05% 13/02/2025 1,230,489 0.09
1,485,000 Dell International LLC 3.80% 19/09/2025 1,497,259 0.10
1,115,658 DiscoverOrg LLC 6.30% 02/02/2026 1,121,236 0.08
1,260,079 DTZ US Borrower LLC 5.05% 21/08/2025 1,263,425 0.09
493,669 Eastern Power LLC 5.55% 02/10/2023 495,713 0.03
548,615 Edelman Financial Center LLC 5.04% 27/07/2025 552,672 0.04
1,270,285 Edgewater Generation LLC 5.55% 13/12/2025 1,221,855 0.08
543,757 EG Group Ltd 5.96% 07/02/2025 542,683 0.04
22,692 EG Group Ltd 9.96% 20/04/2026 21,671 0.00
278,226 Emerald 2 Ltd 0.00% 10/07/2026 279,513 0.02
1,449,451 Emerald Expositions Holding Inc 4.55% 22/05/2024 1,384,226 0.10
951,328 Endo Luxembourg Finance Co I Sarl 6.06% 29/04/2024 913,423 0.06
361,660 Envision Healthcare Corp 5.55% 10/10/2025 310,274 0.02
1,735,457 Epicor Software Corp 5.05% 01/06/2022 1,747,284 0.12
496,520 Filtration Group Corp 4.80% 29/03/2025 499,211 0.03
802,988 Fleet Midco I Ltd 5.24% 07/10/2026 810,014 0.06
1,015,000 Formula One Management Ltd 4.30% 01/02/2024 1,021,506 0.07
1,543,286 Forterra Finance LLC 0.00% 25/10/2023 1,513,709 0.11
661,192 Frontier Communications Corp 5.55% 15/06/2024 665,830 0.05

FINANCIAL STATEMENTS SCHEDULE OF INVESTMENTS
268 NEUBERGER BERMAN INVESTMENT FUNDS PLC
Neuberger Berman Strategic Income Fund (Continued)
Schedule of Investments (Continued)
Financial Assets at Fair Value through Profit or Loss (continued)
Principal Amount Security Description Coupon
Maturity Date
Fair ValueUS$
% of NetAssets
Term Loans^ 8.98% (31 December 2018: 1.51%) (continued)
United States Dollar (continued) 1,490,000 Garda World Security Corp 6.66% 30/10/2026 1,502,114 0.10
741,209 Gates Global LLC 4.55% 01/04/2024 742,976 0.05
160,000 Gavilan Resources LLC 7.80% 01/03/2024 64,000 0.00
545,000 Genesee & Wyoming Inc 0.00% 30/12/2026 550,935 0.04
1,091,282 Go Daddy Operating Co LLC 3.55% 15/02/2024 1,098,588 0.08
1,200,000 Granite Generation LLC 5.57% 09/11/2026 1,194,000 0.08
658,327 Greeneden US Holdings I LLC 5.05% 01/12/2023 661,411 0.05
1,310,000 Grifols Worldwide Operations Ltd 3.74% 15/11/2027 1,322,759 0.09
543,366 GTT Communications Inc 4.55% 31/05/2025 457,204 0.03
177,844 Harland Clarke Holdings Corp 6.69% 03/11/2023 142,887 0.01
463,838 HCA Inc 3.55% 13/03/2025 467,057 0.03
1,257,758 Hertz Corp 4.55% 30/06/2023 1,267,719 0.09
1,210,526 Hub International Ltd 0.00% 25/04/2025 1,211,694 0.08
830,000 Hub International Ltd 5.90% 25/04/2025 839,445 0.06
1,679,665 Hyland Software Inc 5.30% 01/07/2024 1,691,607 0.12
65,105 Hyland Software Inc 8.80% 07/07/2025 66,122 0.00
70,000 IGT Holding IV AB 5.95% 29/07/2024 69,315 0.00
422,789 iHeartCommunications Inc 5.69% 01/05/2026 426,928 0.03
1,002,915 Infor US Inc 4.69% 01/02/2022 1,008,828 0.07
2,015,000 Intelsat Jackson Holdings SA 5.68% 27/11/2023 2,022,012 0.14
20,000 Intelsat Jackson Holdings SA 6.43% 02/01/2024 20,221 0.00
305,000 Iqvia Inc 0.00% 07/03/2024 307,034 0.02
358,166 Iqvia Inc 0.00% 17/01/2025 360,404 0.03
640,000 Iridium Satellite LLC 5.55% 04/11/2026 649,002 0.05
1,478,825 Jaguar Holding Co I LLC 4.30% 18/08/2022 1,488,741 0.10
293,844 Kestrel Acquisition LLC 6.05% 02/06/2025 261,521 0.02
1,390,031 Kronos Inc 4.91% 01/11/2023 1,398,942 0.10
1,484,838 Learning Care Group US No 2 Inc 5.32% 13/03/2025 1,489,018 0.10
1,315,000 Level 3 Financing Inc 3.55% 01/03/2027 1,321,167 0.09
697,786 Lions Gate Capital Holdings LLC 4.05% 24/03/2025 697,790 0.05
252,369 Lower Cadence Holdings LLC 5.80% 22/05/2026 250,320 0.02
820,000 LPL Holdings Inc 3.54% 12/11/2026 825,125 0.06
533,031 Lucid Energy Group II Borrower LLC 4.80% 17/02/2025 495,719 0.03
1,735,606 McAfee LLC 5.55% 30/09/2024 1,745,369 0.12
645,283 Medallion Midland Acquisition LLC 5.05% 30/10/2024 640,444 0.04
550,000 MHI Holdings LLC 6.80% 21/09/2026 552,063 0.04
532,339 Mohegan Tribal Gaming Authority 5.80% 13/10/2023 514,894 0.04
274,311 Momentive Performance Materials Inc 5.05% 15/05/2024 273,369 0.02

SCHEDULE OF INVESTMENTS FINANCIAL STATEMENTS
ANNUAL REPORT 2019 269
Neuberger Berman Strategic Income Fund (Continued)
Schedule of Investments (Continued)
Financial Assets at Fair Value through Profit or Loss (continued)
Principal Amount Security Description Coupon
Maturity Date
Fair ValueUS$
% of NetAssets
Term Loans^ 8.98% (31 December 2018: 1.51%) (continued)
United States Dollar (continued) 1,189,602 MPH Acquisition Holdings LLC 4.69% 07/06/2023 1,175,791 0.08
518,824 MRC Global US Inc 4.80% 20/09/2024 521,418 0.04
552,708 MTN Infrastructure TopCo Inc 4.80% 15/11/2024 553,606 0.04
456,014 Nautilus Power LLC 6.05% 16/05/2024 456,014 0.03
495,000 Navicure Inc 5.80% 22/10/2026 498,403 0.03
1,119,896 Nielsen Finance LLC 3.71% 04/10/2023 1,125,238 0.08
519,414 Nomad Foods Ltd 3.99% 15/05/2024 521,361 0.04
309,211 Numericable US LLC 5.43% 31/01/2026 310,178 0.02
248,024 Optiv Inc 5.05% 01/02/2024 217,641 0.02
572,036 Ortho-Clinical Diagnostics Inc 5.31% 30/06/2025 566,673 0.04
743,138 Panther BF Aggregator 2 LP 5.30% 30/04/2026 747,087 0.05
583,344 Parexel International Corp 4.55% 27/09/2024 573,865 0.04
548,604 PI UK Holdco II Ltd 5.05% 03/01/2025 552,378 0.04
550,000 Playtika Holding Corp 7.80% 10/12/2024 556,875 0.04
839,038 PQ Corp 4.43% 08/02/2025 845,029 0.06
498,496 Prairie ECI Acquiror LP 6.69% 11/03/2026 496,004 0.03
1,276,800 Prime Security Services Borrower LLC 4.94% 23/09/2026 1,282,309 0.09
279,284 Project Alpha Intermediate Holding Inc 5.49% 26/04/2024 280,333 0.02
274,311 Project Alpha Intermediate Holding Inc 6.24% 26/04/2024 277,168 0.02
1,235,960 Rackspace Hosting Inc 4.90% 03/11/2023 1,203,949 0.08
274,295 Radiate Holdco LLC 4.80% 01/02/2024 275,684 0.02
274,311 Radiate Holdco LLC 5.30% 01/02/2024 276,505 0.02
1,027,139 Realogy Group LLC 4.05% 08/02/2025 1,020,078 0.07
1,086,981 Reynolds Group Holdings Inc 4.55% 05/02/2023 1,091,742 0.08
283,203 Riverbed Technology Inc 5.05% 24/04/2022 248,689 0.02
769,129 Scientific Games International Inc 4.58% 14/08/2024 772,282 0.05
1,017,790 Seaworld Parks & Entertainment Inc 4.80% 01/04/2024 1,024,365 0.07
520,321 Sedgwick Claims Management Services Inc 5.05% 31/12/2025 521,296 0.04
472,625 Sedgwick Claims Management Services Inc 5.80% 03/09/2026 477,550 0.03
1,318,285 Select Medical Corp 4.58% 06/03/2025 1,322,820 0.09
605,818 Solenis Holdings LLC 5.91% 26/06/2025 600,971 0.04
764,687 Solera LLC 4.55% 03/03/2023 767,138 0.05
1,787,235 Sophia LP 5.19% 30/09/2022 1,793,624 0.12
1,645,367 Sprint Communications Inc 4.81% 02/02/2024 1,640,908 0.11
609,393 SS&C Technologies Holdings Inc B-3 Term Loan 4.05% 16/04/2025 614,371 0.04
453,547 SS&C Technologies Holdings Inc B-4 Term Loan 4.05% 16/04/2025 457,253 0.03
1,664,835 Staples Inc 6.69% 16/04/2026 1,639,970 0.11
515,954 Station Casinos LLC 4.30% 08/06/2023 519,158 0.04

FINANCIAL STATEMENTS SCHEDULE OF INVESTMENTS
270 NEUBERGER BERMAN INVESTMENT FUNDS PLC
Neuberger Berman Strategic Income Fund (Continued)
Schedule of Investments (Continued)
Financial Assets at Fair Value through Profit or Loss (continued)
Principal Amount Security Description Coupon
Maturity Date
Fair ValueUS$
% of NetAssets
Term Loans^ 8.98% (31 December 2018: 1.51%) (continued)
United States Dollar (continued) 460,000 Sunshine Luxembourg VII Sarl 6.19% 01/10/2026 464,968 0.03
40,000 Syniverse Holdings Inc 10.85% 11/03/2024 30,133 0.00
518,700 Talen Energy Supply LLC 5.55% 08/07/2026 520,212 0.04
745,000 Telenet Financing USD LLC 3.99% 15/08/2026 749,965 0.05
460,000 Telesat Canada 4.63% 07/12/2026 462,972 0.03
764,395 Tempo Acquisition LLC 4.55% 01/05/2024 770,289 0.05
1,192,013 TIBCO Software Inc 5.71% 30/06/2026 1,198,908 0.08
721,184 TMS International Corp 4.63% 14/08/2024 719,381 0.05
768,973 Transdigm Inc 4.30% 09/06/2023 772,737 0.05
279,281 Tricorbraun Holdings Inc 5.69% 30/11/2023 277,256 0.02
764,731 Trident TPI Holdings Inc 4.80% 17/10/2024 744,917 0.05
771,732 Univision Communications Inc 4.55% 15/03/2024 763,752 0.05
1,075,081 Verscend Holding Corp 6.30% 27/08/2025 1,084,934 0.08
670,000 Vertiv Group Corp 5.93% 30/11/2023 670,000 0.05
375,000 Virgin Media Bristol LLC 4.24% 31/01/2028 377,837 0.03
435,000 Vistra Operations Co LLC 3.54% 31/12/2025 438,212 0.03
595,000 Welbilt Inc 4.30% 23/10/2025 597,975 0.04
294,086 West Corp 5.93% 10/10/2024 250,076 0.02
595,274 William Morris Endeavor Entertainment LLC 4.61% 18/05/2025 593,538 0.04
579,463 Wilsonart LLC 5.20% 19/12/2023 581,998 0.04
745,000 WMG Acquisition Corp 3.92% 01/11/2023 750,185 0.05
Total Term Loans † 129,556,760 8.98
Number of Shares Security Description Fair Value
US$% of Net
Assets
Investment Funds 2.54% (31 December 2018: 1.38%)
United States Dollar
1,245,691 Neuberger Berman Euro Bond Absolute Return Fund 12,618,854 0.87
1,253,811 Neuberger Berman Global High Yield Bond Fund 15,685,170 1.09
80,000 Neuberger Berman Ultra Short Term Euro Bond Fund 8,357,600 0.58
Total Investment Funds μ 36,661,624 2.54
Total Investments 1,663,079,381 115.27
Forward Currency Contracts 0.29% (31 December 2018: 1.22%)
Amount Receivable
Amount Payable
Maturity Date Counterparty Contracts Unrealised
Gain US$% of Net
Assets
BRL 297,363 US$ 71,588 22/01/2020 Citibank NA 2 2,286 0.00
BRL 6,162,605 US$ 1,461,199 12/02/2020 Citibank NA 1 68,591 0.01
BRL 555,888 US$ 136,475 22/01/2020 Goldman Sachs International 1 1,625 0.00
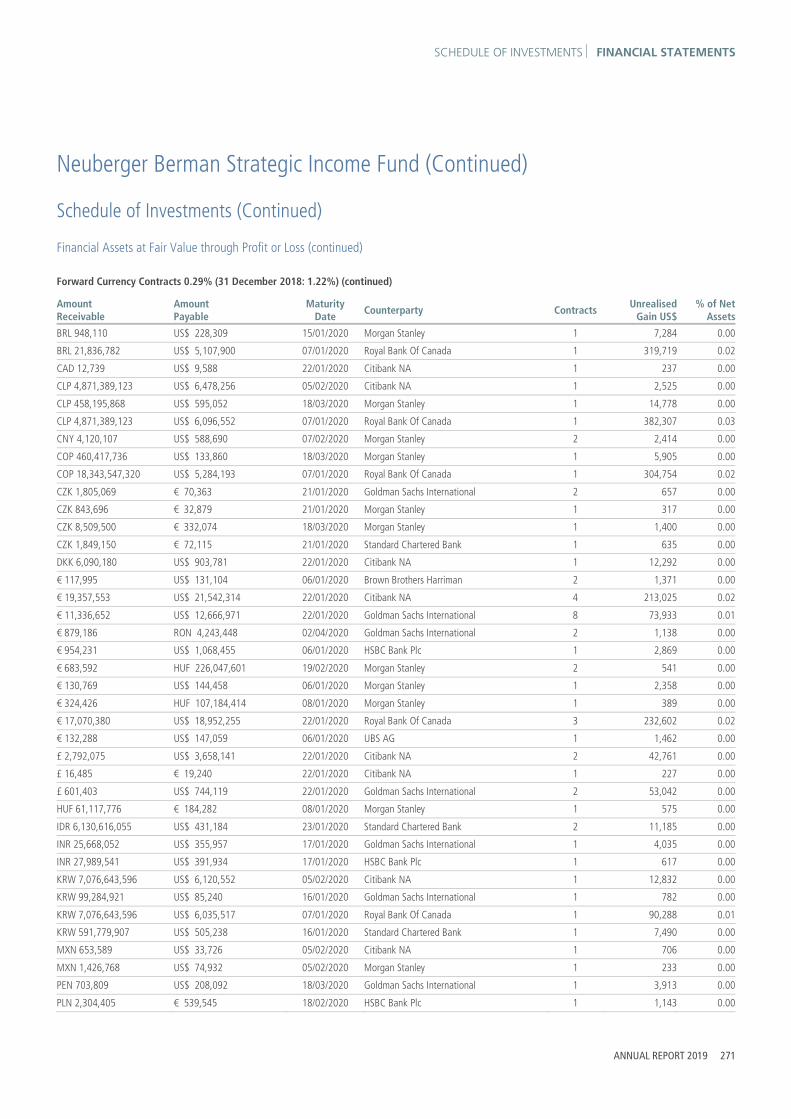
SCHEDULE OF INVESTMENTS FINANCIAL STATEMENTS
ANNUAL REPORT 2019 271
Neuberger Berman Strategic Income Fund (Continued)
Schedule of Investments (Continued)
Financial Assets at Fair Value through Profit or Loss (continued)
Forward Currency Contracts 0.29% (31 December 2018: 1.22%) (continued)
Amount Receivable
Amount Payable
Maturity Date Counterparty Contracts Unrealised
Gain US$% of Net
Assets
BRL 948,110 US$ 228,309 15/01/2020 Morgan Stanley 1 7,284 0.00
BRL 21,836,782 US$ 5,107,900 07/01/2020 Royal Bank Of Canada 1 319,719 0.02
CAD 12,739 US$ 9,588 22/01/2020 Citibank NA 1 237 0.00
CLP 4,871,389,123 US$ 6,478,256 05/02/2020 Citibank NA 1 2,525 0.00
CLP 458,195,868 US$ 595,052 18/03/2020 Morgan Stanley 1 14,778 0.00
CLP 4,871,389,123 US$ 6,096,552 07/01/2020 Royal Bank Of Canada 1 382,307 0.03
CNY 4,120,107 US$ 588,690 07/02/2020 Morgan Stanley 2 2,414 0.00
COP 460,417,736 US$ 133,860 18/03/2020 Morgan Stanley 1 5,905 0.00
COP 18,343,547,320 US$ 5,284,193 07/01/2020 Royal Bank Of Canada 1 304,754 0.02
CZK 1,805,069 € 70,363 21/01/2020 Goldman Sachs International 2 657 0.00
CZK 843,696 € 32,879 21/01/2020 Morgan Stanley 1 317 0.00
CZK 8,509,500 € 332,074 18/03/2020 Morgan Stanley 1 1,400 0.00
CZK 1,849,150 € 72,115 21/01/2020 Standard Chartered Bank 1 635 0.00
DKK 6,090,180 US$ 903,781 22/01/2020 Citibank NA 1 12,292 0.00
€ 117,995 US$ 131,104 06/01/2020 Brown Brothers Harriman 2 1,371 0.00
€ 19,357,553 US$ 21,542,314 22/01/2020 Citibank NA 4 213,025 0.02
€ 11,336,652 US$ 12,666,971 22/01/2020 Goldman Sachs International 8 73,933 0.01
€ 879,186 RON 4,243,448 02/04/2020 Goldman Sachs International 2 1,138 0.00
€ 954,231 US$ 1,068,455 06/01/2020 HSBC Bank Plc 1 2,869 0.00
€ 683,592 HUF 226,047,601 19/02/2020 Morgan Stanley 2 541 0.00
€ 130,769 US$ 144,458 06/01/2020 Morgan Stanley 1 2,358 0.00
€ 324,426 HUF 107,184,414 08/01/2020 Morgan Stanley 1 389 0.00
€ 17,070,380 US$ 18,952,255 22/01/2020 Royal Bank Of Canada 3 232,602 0.02
€ 132,288 US$ 147,059 06/01/2020 UBS AG 1 1,462 0.00
£ 2,792,075 US$ 3,658,141 22/01/2020 Citibank NA 2 42,761 0.00
£ 16,485 € 19,240 22/01/2020 Citibank NA 1 227 0.00
£ 601,403 US$ 744,119 22/01/2020 Goldman Sachs International 2 53,042 0.00
HUF 61,117,776 € 184,282 08/01/2020 Morgan Stanley 1 575 0.00
IDR 6,130,616,055 US$ 431,184 23/01/2020 Standard Chartered Bank 2 11,185 0.00
INR 25,668,052 US$ 355,957 17/01/2020 Goldman Sachs International 1 4,035 0.00
INR 27,989,541 US$ 391,934 17/01/2020 HSBC Bank Plc 1 617 0.00
KRW 7,076,643,596 US$ 6,120,552 05/02/2020 Citibank NA 1 12,832 0.00
KRW 99,284,921 US$ 85,240 16/01/2020 Goldman Sachs International 1 782 0.00
KRW 7,076,643,596 US$ 6,035,517 07/01/2020 Royal Bank Of Canada 1 90,288 0.01
KRW 591,779,907 US$ 505,238 16/01/2020 Standard Chartered Bank 1 7,490 0.00
MXN 653,589 US$ 33,726 05/02/2020 Citibank NA 1 706 0.00
MXN 1,426,768 US$ 74,932 05/02/2020 Morgan Stanley 1 233 0.00
PEN 703,809 US$ 208,092 18/03/2020 Goldman Sachs International 1 3,913 0.00
PLN 2,304,405 € 539,545 18/02/2020 HSBC Bank Plc 1 1,143 0.00

FINANCIAL STATEMENTS SCHEDULE OF INVESTMENTS
272 NEUBERGER BERMAN INVESTMENT FUNDS PLC
Neuberger Berman Strategic Income Fund (Continued)
Schedule of Investments (Continued)
Financial Assets at Fair Value through Profit or Loss (continued)
Forward Currency Contracts 0.29% (31 December 2018: 1.22%) (continued)
Amount Receivable
Amount Payable
Maturity Date Counterparty Contracts Unrealised
Gain US$% of Net
Assets
PLN 1,452,108 € 336,891 14/01/2020 Standard Chartered Bank 2 5,002 0.00
PLN 2,263,670 € 527,088 18/02/2020 Standard Chartered Bank 1 4,408 0.00
RON 2,306 € 480 03/02/2020 Goldman Sachs International 1 0 0.00
RUB 31,944,166 US$ 495,976 23/01/2020 Standard Chartered Bank 1 17,088 0.00
SEK 42,652 US$ 4,337 22/01/2020 Citibank NA 1 223 0.00
TRY 566,607 US$ 93,400 18/03/2020 HSBC Bank Plc 1 28 0.00
US$ 174,308 TRY 1,018,657 07/02/2020 Citibank NA 1 4,693 0.00
US$ 5,431,360 BRL 21,836,782 07/01/2020 Citibank NA 1 3,741 0.00
US$ 5,598,536 COP 18,343,547,320 07/01/2020 Citibank NA 1 9,589 0.00
US$ 126,527 TRY 744,620 06/02/2020 Standard Chartered Bank 1 2,512 0.00
US$ 479,758 TRY 2,827,646 06/02/2020 UBS AG 1 8,820 0.00
ZAR 846,886 US$ 56,644 06/02/2020 Goldman Sachs International 1 3,640 0.00
ZAR 2,081,577 US$ 139,337 06/02/2020 Morgan Stanley 1 8,836 0.00
ZAR 9,732,859 US$ 663,056 06/02/2020 Standard Chartered Bank 3 29,760 0.00
AUD Hedged Classes AUD 2,115,478 US$ 1,425,932 22/01/2020 Goldman Sachs International 2 61,870 0.01
AUD 2,072,976 US$ 1,396,572 22/01/2020 UBS AG 1 61,339 0.01
AUD 4,283,162 US$ 2,899,988 22/01/2020 Westpac Banking Corp 7 112,333 0.01
EUR Hedged Classes € 8,747,992 US$ 9,657,776 22/01/2020 Goldman Sachs International 6 173,814 0.01
€ 8,512,786 US$ 9,402,474 22/01/2020 UBS AG 2 164,776 0.01
€ 8,890,596 US$ 9,831,394 22/01/2020 Westpac Banking Corp 28 160,464 0.01
GBP Hedged Classes £ 526,071 US$ 652,950 22/01/2020 Goldman Sachs International 3 44,359 0.00
£ 476,679 US$ 589,004 22/01/2020 UBS AG 2 42,836 0.00
£ 832,490 US$ 1,055,391 22/01/2020 Westpac Banking Corp 6 48,077 0.00
HKD Hedged Classes HKD 7,371,127 US$ 940,874 22/01/2020 Goldman Sachs International 1 4,917 0.00
HKD 7,371,127 US$ 940,675 22/01/2020 UBS AG 1 5,116 0.00
HKD 6,338,109 US$ 808,814 22/01/2020 Westpac Banking Corp 2 4,430 0.00
JPY Hedged Classes ¥ 280,053,854 US$ 2,562,929 22/01/2020 UBS AG 1 16,879 0.00
US$ 3,770,900 ¥ 404,021,736 22/01/2020 Goldman Sachs International 2 49,121 0.00
US$ 1,595,762 ¥ 169,633,946 22/01/2020 UBS AG 1 33,123 0.00
US$ 3,010,253 ¥ 323,000,525 22/01/2020 Westpac Banking Corp 4 34,828 0.00
SGD Hedged Classes SGD 21,271,873 US$ 15,422,104 22/01/2020 Goldman Sachs International 7 399,626 0.03
SGD 20,657,186 US$ 14,972,501 22/01/2020 UBS AG 2 392,033 0.03
SGD 21,269,278 US$ 15,447,486 22/01/2020 Westpac Banking Corp 47 372,314 0.03

SCHEDULE OF INVESTMENTS FINANCIAL STATEMENTS
ANNUAL REPORT 2019 273
Neuberger Berman Strategic Income Fund (Continued)
Schedule of Investments (Continued)
Financial Assets at Fair Value through Profit or Loss (continued)
Forward Currency Contracts 0.29% (31 December 2018: 1.22%) (continued)
Amount Receivable
Amount Payable
Maturity Date Counterparty Contracts Unrealised
Gain US$% of Net
Assets
SGD Hedged Classes (continued) US$ 2 SGD 2 22/01/2020 Goldman Sachs International 1 0 0.00
Total Unrealised Gain on Forward Currency Contracts ∞ 4,167,838 0.29
Futures Contracts 0.34% (31 December 2018: 0.32%)
Number of Contracts Description Unrealised
Gain US$% of Net
Assets
(224) Euro-BOBL Future March 2020 178,522 0.01
(7) United Kingdom Long Gilt Future March 2020 12,704 0.00
(5) US Treasury 10-Year Note (CBT) Future March 2020 5,625 0.00
(764) US Treasury 10-Year Ultra Future March 2020 1,258,406 0.09
(88) US Treasury Long Bond (CBT) Future March 2020 102,116 0.01
(531) US Treasury Ultra Bond (CBT) Future March 2020 3,306,478 0.23
Total Unrealised Gain on Futures Contracts ± 4,863,851 0.34
Interest Rate Swap Contracts 0.01% (31 December 2018: 0.02%)
Notional Amount Expiration Date Counterparty Receive
/(Pay)# Fixed Rate Variable Rate Fair ValueUS$
% of Net Assets
BRL 2,099,808 02/01/23 Chicago Mercantile Exchange1 (Pay) 9.08% 1D BROIS± 88,274 0.01
BRL 1,102,672 02/01/25 Chicago Mercantile Exchange1 (Pay) 9.55% 1D BROIS± 71,398 0.00
BRL 6,088,776 02/01/23 Chicago Mercantile Exchange1 (Pay) 6.34% 1D BROIS± 34,274 0.00
BRL 1,391,591 03/01/22 Morgan Stanley (Pay) 5.98% 1D BROIS∞ 5,978 0.00
Total Interest Rate Swap Contracts at Fair Value 199,924 0.01
# Receive - Funds receives variable rate and pays fixed rate.
(Pay) - Fund pays variable rate and receives fixed rate. 2 Centrally cleared swap.
Fair ValueUS$
% of NetAssets
Total Financial Assets at Fair Value through Profit or Loss 1,672,310,994 115.91

FINANCIAL STATEMENTS SCHEDULE OF INVESTMENTS
274 NEUBERGER BERMAN INVESTMENT FUNDS PLC
Neuberger Berman Strategic Income Fund (Continued)
Schedule of Investments (Continued)
Financial Liabilities at Fair Value through Profit or Loss
Forward Currency Contracts (0.69%) (31 December 2018: (0.12%))
Amount Receivable
Amount Payable
Maturity Date Counterparty Contracts Unrealised
Loss US$% of Net
Assets
BRL 21,836,782 US$ 5,426,231 05/02/2020 Citibank NA 1 (3,921) (0.00)
BRL 1,662,936 US$ 413,501 22/01/2020 UBS AG 1 (376) (0.00)
CNY 4,278,576 US$ 614,162 07/02/2020 Standard Chartered Bank 1 (323) (0.00)
COP 18,343,547,320 US$ 5,594,046 05/02/2020 Citibank NA 1 (11,198) (0.00)
CZK 13,952,312 € 546,838 18/03/2020 Morgan Stanley 1 (370) (0.00)
€ 11,236 £ 9,610 22/01/2020 Citibank NA 1 (111) (0.00)
€ 331,635 PLN 1,419,479 14/01/2020 Goldman Sachs International 1 (2,289) (0.00)
€ 191,858 HUF 63,960,400 08/01/2020 Goldman Sachs International 1 (1,719) (0.00)
€ 7,111 PLN 30,416 14/01/2020 Morgan Stanley 1 (44) (0.00)
€ 195,804 HUF 64,985,586 08/01/2020 UBS AG 1 (769) (0.00)
€ 192,570 RON 925,657 3/2/2020 UBS AG 1 (199) (0.00)
£ 152,206 € 181,139 22/01/2020 Citibank NA 2 (1,827) (0.00)
¥ 45,868 US$ 432 22/01/2020 Citibank NA 1 (9) (0.00)
KRW 697,989,768 US$ 605,400 16/01/2020 HSBC Bank Plc 1 (650) (0.00)
RUB 42,206,667 US$ 678,337 23/01/2020 Goldman Sachs International 1 (445) (0.00)
TRY 2,557,902 US$ 432,049 18/03/2020 Citibank NA 1 (10,275) (0.00)
TRY 456,347 US$ 76,238 18/03/2020 Morgan Stanley 1 (990) (0.00)
TRY 932,694 US$ 160,092 06/02/2020 Standard Chartered Bank 1 (4,754) (0.00)
US$ 44,354 € 39,607 06/01/2020 Citibank NA 1 (113) (0.00)
US$ 581,467 ILS 2,012,464 11/02/2020 Citibank NA 1 (2,337) (0.00)
US$ 44,760 COP 152,199,029 18/03/2020 Citibank NA 1 (1,442) (0.00)
US$ 6,114,946 KRW 7,076,643,596 07/01/2020 Citibank NA 1 (10,859) (0.00)
US$ 6,470,425 CLP 4,871,389,123 07/01/2020 Citibank NA 1 (8,433) (0.00)
US$ 5,807 NOK 52,924 22/01/2020 Citibank NA 1 (216) (0.00)
US$ 330,889 £ 258,610 22/01/2020 Citibank NA 2 (11,900) (0.00)
US$ 4,528,435 € 4,094,224 22/01/2020 Citibank NA 2 (72,933) (0.01)
US$ 63,920 MXN 1,240,299 05/02/2020 Goldman Sachs International 2 (1,421) (0.00)
US$ 3,136,407 £ 2,529,499 22/01/2020 Goldman Sachs International 4 (216,450) (0.02)
US$ 20,497,072 € 18,461,358 22/01/2020 Goldman Sachs International 10 (251,063) (0.02)
US$ 620,793 ILS 2,142,251 11/02/2020 HSBC Bank Plc 1 (661) (0.00)
US$ 1,070,414 € 954,231 05/02/2020 HSBC Bank Plc 1 (2,979) (0.00)
US$ 41,936 MXN 796,445 05/02/2020 HSBC Bank Plc 1 (22) (0.00)
US$ 457,779 ZAR 6,802,826 06/02/2020 Morgan Stanley 3 (26,468) (0.00)
US$ 92,375 € 82,819 06/01/2020 Morgan Stanley 1 (607) (0.00)
US$ 939,969 € 846,316 22/01/2020 Royal Bank Of Canada 4 (11,178) (0.00)
US$ 1,234,638 € 1,114,960 06/01/2020 Standard Chartered Bank 4 (17,139) (0.00)
US$ 1,047,503 € 931,965 05/02/2020 Standard Chartered Bank 1 (843) (0.00)
US$ 233,400 CLP 176,226,969 18/03/2020 Standard Chartered Bank 2 (1,146) (0.00)
US$ 368,638 ZAR 5,543,055 06/02/2020 Standard Chartered Bank 1 (25,935) (0.00)
US$ 328,539 IDR 4,732,597,489 23/01/2020 Standard Chartered Bank 1 (12,953) (0.00)
US$ 108,335 € 97,897 06/01/2020 UBS AG 2 (1,574) (0.00)

SCHEDULE OF INVESTMENTS FINANCIAL STATEMENTS
ANNUAL REPORT 2019 275
Neuberger Berman Strategic Income Fund (Continued)
Schedule of Investments (Continued)
Financial Liabilities at Fair Value through Profit or Loss (continued)
Forward Currency Contracts (0.69%) (31 December 2018: (0.12%)) (continued)
Amount Receivable
Amount Payable
Maturity Date Counterparty Contracts Unrealised
Loss US$% of Net
Assets
AUD Hedged Classes US$ 30,499 AUD 45,264 22/01/2020 Goldman Sachs International 1 (1,335) (0.00)
US$ 30,495 AUD 45,264 22/01/2020 UBS AG 1 (1,339) (0.00)
US$ 123,882 AUD 181,748 22/01/2020 Westpac Banking Corp 2 (3,940) (0.00)
EUR Hedged Classes US$ 233,954 € 211,138 22/01/2020 Goldman Sachs International 3 (3,338) (0.00)
US$ 4,002,504 € 3,601,147 22/01/2020 Westpac Banking Corp 19 (44,710) (0.00)
GBP Hedged Classes £ 10,182 US$ 13,596 22/01/2020 Goldman Sachs International 1 (100) (0.00)
US$ 9,735 £ 7,651 22/01/2020 Goldman Sachs International 1 (406) (0.00)
US$ 102,555 £ 79,660 22/01/2020 Westpac Banking Corp 1 (3,034) (0.00)
HKD Hedged Classes HKD 68,951 US$ 8,849 22/01/2020 Goldman Sachs International 1 (1) (0.00)
US$ 374,665 HKD 2,935,253 22/01/2020 Goldman Sachs International 1 (1,958) (0.00)
US$ 374,586 HKD 2,935,253 22/01/2020 UBS AG 1 (2,037) (0.00)
US$ 869,358 HKD 6,796,760 22/01/2020 Westpac Banking Corp 6 (2,736) (0.00)
JPY Hedged Classes ¥ 16,418,209,826 US$ 154,380,808 22/01/2020 Goldman Sachs International 2 (3,139,089) (0.22)
¥ 16,180,279,779 US$ 152,209,347 22/01/2020 UBS AG 1 (3,159,399) (0.22)
¥ 13,876,261,239 US$ 130,534,053 22/01/2020 Westpac Banking Corp 4 (2,708,324) (0.19)
US$ 1,068,389 ¥ 116,140,000 22/01/2020 Westpac Banking Corp 4 (1,473) (0.00)
SGD Hedged Classes SGD 296,981 US$ 220,892 22/01/2020 Westpac Banking Corp 1 (2) (0.00)
US$ 227,756 SGD 310,587 22/01/2020 Goldman Sachs International 2 (3,255) (0.00)
US$ 6,485,823 SGD 8,860,883 22/01/2020 Westpac Banking Corp 43 (104,783) (0.01)
Total Unrealised Loss on Forward Currency Contracts ∞ (9,900,200) (0.69)
Futures Contracts (0.02%) (31 December 2018: (1.00%))
Number of Contracts Description Unrealised
Loss US$% of Net
Assets
225 Euro-BOBL Future March 2020 (171,673) (0.01)
998 US Treasury 2-Year Note (CBT) Future March 2020 (145,148) (0.01)
50 US Treasury 5-Year Note (CBT) Future March 2020 (23,307) (0.00)
Total Unrealised Loss on Futures Contracts ± (340,128) (0.02)

FINANCIAL STATEMENTS SCHEDULE OF INVESTMENTS
276 NEUBERGER BERMAN INVESTMENT FUNDS PLC
Neuberger Berman Strategic Income Fund (Continued)
Schedule of Investments (Continued)
Financial Liabilities at Fair Value through Profit or Loss (continued)
Interest Rate Swap Contracts (0.00%) (31 December 2018: (0.00%))
Notional Amount Expiration Date Counterparty Receive
/(Pay)# Fixed Rate Variable Rate Fair Value US$
% of NetAssets
BRL 7,748,256 02/01/25 Chicago Mercantile Exchange1 (Pay) 6.28% 1D BROIS (1,752) (0.00)
Total Interest Rate Swap Contracts at Fair Value ± (1,752) (0.00)
# Receive - Funds receives variable rate and pays fixed rate.
(Pay) - Fund pays variable rate and receives fixed rate. 1 Centrally cleared swap.
Fair ValueUS$
% of NetAssets
Total Financial Liabilities at Fair Value through Profit or Loss (10,242,080) (0.71)
Net Financial Assets at Fair Value through Profit or Loss 1,662,068,914 115.20
Other Net Liabilities (219,322,219) (15.20)
Net Assets Attributable to Holders of Redeemable Participating Shares 1,442,746,695 100.00
^ Term loans showing a 0.00% coupon rate may not have settled as at 31 December 2019 and thus do not have an interest rate in effect. Interest rates do not take effect until settlement.
% ofTotal
AssetsPortfolio Analysis US$
* Transferable securities and/or money market instruments admitted to an official stock exchange listing 686,152,027 39.70
** Transferable securities and/or money market instruments dealt in on a regulated market 399,308,133 23.10
† Other transferable securities and/or money market instruments 540,957,597 31.30
μ Investment funds 36,661,624 2.12
± Financial derivative instruments traded on a regulated market 4,715,917 0.27
∞ OTC financial derivative instruments (5,726,384) (0.34)
Total Investments 1,662,068,914 96.15

STATEMENT OF SIGNIFICANT PURCHASES AND SALES FINANCIAL STATEMENTS
ANNUAL REPORT 2019 277
Neuberger Berman Strategic Income Fund (Continued) Statement of Significant Purchases and Sales (Unaudited) In accordance with the European Communities (Undertakings for Collective Investment in Transferable Securities) Regulations, 2011 as amended, a statement of changes in the composition of the Schedule of Investments during the reporting period is provided to ensure that Shareholders can identify changes in the investments held by the Portfolio. The following statements present the aggregate purchases and sales of transferable securities exceeding one percent of the total value of purchases or sales, respectively, for the period. At a minimum, the largest twenty purchases and twenty sales are presented, if available.
Aggregate purchases greater than one percent of the total value of purchases:
Units Security Description Cost US$
210,335,000 United States Treasury Note/Bond, 1.38%, 15/01/2020 209,523,998
156,075,000 United States Treasury Note/Bond, 2.00%, 31/01/2020 156,169,310
109,405,000 Fannie Mae Pool, 4.00%, 01/07/2049 112,975,858
107,950,000 Fannie Mae Pool, 4.00%, 01/06/2049 110,906,472
89,140,000 Fannie Mae Pool, 4.00%, 15/02/2049 91,179,360
82,120,000 Fannie Mae Pool, 4.00%, 01/09/2049 85,243,746
84,301,764 United States Treasury Note/Bond, 0.13%, 15/04/2021 83,543,162
79,785,000 Fannie Mae Pool. 4.00%, 01/08/2049 82,538,268
79,090,000 United States Treasury Note/Bond, 2.75%,15/02/2028 82,388,651
71,960,000 Freddie Mac Gold Pool, 4.00%, 01/05/2049 73,839,330
64,240,000 Fannie Mae Pool, 3.50%, 01/11/2048 65,982,772
62,840,000 Fannie Mae Pool, 4.00%, 01/05/2049 64,396,871
62,400,000 Fannie Mae Pool, 4.00%, 01/03/2049 63,615,563
61,395,000 Freddie Mac Gold Pool, 4.00%, 01/03/2049 62,633,719
61,155,000 Freddie Mac Gold Pool, 4.00%, 01/02/2049 62,554,453
60,375,000 Fannie Mae Pool, 3.50%, 01/01/2049 61,962,232
60,225,000 Fannie Mae Pool, 4.00%, 01/04/2049 61,316,185
60,385,000 Fannie Mae Pool, 3.00%, 01/01/2049 61,204,249
58,100,000 Freddie Mac Gold Pool, 4.00%, 01/04/2049 59,182,897
57,420,000 Fannie Mae Pool, 3.50%, 01/12/2048 58,877,047
56,360,000 Fannie Mae Pool, 3.00%, 01/12/2049 57,010,205
55,375,000 Freddie Mac Gold Pool, 4.00%, 01/06/2049 56,890,241
54,255,000 Fannie Mae Pool, 3.00%, 01/10/2048 55,430,326
51,950,000 United States Treasury Note/Bond, 2.75%, 15/08/2042 53,789,311
54,175,000 United States Treasury Note/Bond, 2.25%, 15/11/2027 52,929,413
50,910,000 Fannie Mae Pool, 3.00%, 01/11/2048 51,777,048
50,110,000 Fannie Mae Pool, 3.50%, 01/10/2049 51,437,330

FINANCIAL STATEMENTS STATEMENT OF SIGNIFICANT PURCHASES AND SALES
278 NEUBERGER BERMAN INVESTMENT FUNDS PLC
Neuberger Berman Strategic Income Fund (Continued)
Statement of Significant Purchases and Sales (Unaudited) (Continued) Aggregate sales greater than one percent of the total value of sales:
Units Security Description Proceeds US$
210,335,000 United States Treasury Note/Bond, 1.38%, 15/01/2020 209,671,642
109,405,000 Fannie Mae Pool, 4.00%, 01/07/2049 113,175,246
107,950,000 Fannie Mae Pool, 4.00%, 01/06/2049 111,493,589
89,140,000 Fannie Mae Pool, 4.00%, 15/02/2049 90,974,376
85,975,000 Fannie Mae Pool, 4.00%, 01/01/2049 88,052,190
82,120,000 Fannie Mae Pool, 4.00%, 01/09/2049 85,166,678
79,785,000 Fannie Mae Pool, 4.00%, 01/08/2049 82,780,954
71,960,000 Freddie Mac Gold Pool, 4.00%, 01/05/2049 73,929,409
66,975,000 United States Treasury Note/Bond, 2.25%, 15/11/2027 66,775,877
64,240,000 Fannie Mae Pool, 3.50%, 01/11/2048 65,884,362
62,840,000 Fannie Mae Pool, 4.00%, 01/05/2049 64,510,985
62,400,000 Fannie Mae Pool, 4.00%, 01/03/2049 63,570,571
61,395,000 Freddie Mac Gold Pool, 4.00%, 01/03/2049 62,587,738
61,155,000 Freddie Mac Gold Pool, 4.00%, 01/02/2049 62,452,884
60,225,000 Fannie Mae Pool, 4.00%, 01/04/2049 61,756,555
58,100,000 Freddie Mac Gold Pool, 4.00%, 01/04/2049 59,627,744
57,955,000 Freddie Mac Gold Pool, 4.00%, 01/01/2049 59,339,082
57,420,000 Fannie Mae Pool, 3.50%, 01/12/2048 58,920,791
56,360,000 Fannie Mae Pool, 3.00%, 01/12/2049 57,145,921
55,375,000 Freddie Mac Gold Pool, 4.00%, 01/06/2049 57,037,023
54,255,000 Fannie Mae Pool, 3.00%, 01/10/2048 55,189,713
50,910,000 Fannie Mae Pool, 3.00%, 01/11/2048 51,515,321
50,110,000 Fannie Mae Pool, 3.50%, 01/10/2049 51,484,398
49,015,000 Fannie Mae Pool, 3.50%, 01/09/2049 50,286,406
50,000,000 United States Treasury Note/Bond, 1.63%, 31/12/2019 49,616,372

INVESTMENT MANAGER’S REPORT FINANCIAL STATEMENTS
ANNUAL REPORT 2019 279
Neuberger Berman Global Bond Absolute Return Fund Investment Manager’s Report For the 12 months ended 31 December 2019, the total return for the USD I Accumulating Class was 3.87%. Over the same period, the benchmark index, the ICE BofA US 3-Month Treasury Bill Index (“the Index”), returned 2.28%. (Performance for all share classes is provided in Appendix II. Performance data quoted represent past performance and do not indicate future results. Total returns shown are net of all fees and expenses and include reinvestment of income dividends and other distributions, if any).
In response to slowing global growth – attributed in large part to overhangs from trade policy and Brexit negatively impacting investment spending - global central banks turned more accommodative in 2019. The Federal Reserve (“Fed”) cut rates three times after hiking rates four times in 2018, while numerous other central banks also loosened policy in seeking to support growth amid falling inflation expectations. This helped drive developed markets government bond yields lower and global credit spreads tighter over the period, creating a powerful tailwind for fixed income performance.
During the reporting period, the Portfolio's diversified overweight to credit was the primary contributor to performance. Specifically, allocations to European high yield, global investment grade credit, emerging markets (“EM”) debt, CLOs and mortgage credit were all notable contributors. Allocation to inflation-linked bonds also contributed but to a more modest degree. Rates positioning overall detracted for the period. Although our long exposure in South African rates was additive, this was more than offset by shorts in US, core European and Swedish rates. Our active foreign exchange strategy also detracted for the period; overweights in Norwegian krone and Swedish krona were the worst performing positions whereas underweights to euro and Swiss franc were the best performing positions.
Coming into 2020, our thesis of a modest slowdown in US growth, stabilization in international developed market growth (led by a global recovery in manufacturing and an attendant rebound in trade), and bouts of elevated volatility ahead of the known unknown (the US election) appeared sound. However, an unknown unknown, COVID-19, has disrupted the chain of events.
We expect a stark slowdown in the US and global growth in the first half of 2020. We are viewing the impact of the virus as a growth shock, analogous to other growth shocks over the past 20 years (9/11 attacks, European crises in 2011 and 2013, and the energy issues of 2015/2016). We do not see a material permanent impact to the global growth trajectory, and while we expect markets to remain volatile, monetary easing and fiscal easing will likely help stabilize the impacts of this growth shock. We would also note that the ‘outcome’ of this crisis is now a return to approximately 0% policy rates in the US and lower overall government bond yields, which will only heighten investors’ need for income, particularly in high quality securities.
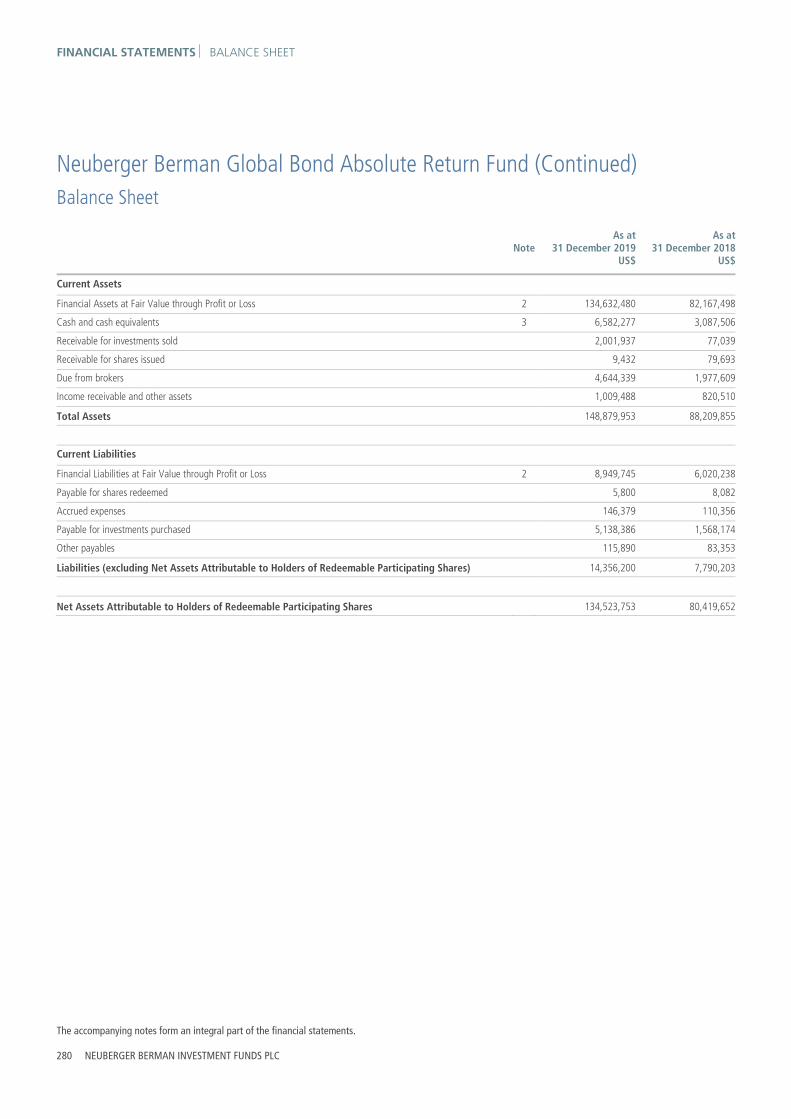
FINANCIAL STATEMENTS BALANCE SHEET
The accompanying notes form an integral part of the financial statements.
280 NEUBERGER BERMAN INVESTMENT FUNDS PLC
Neuberger Berman Global Bond Absolute Return Fund (Continued)
Balance Sheet
As at31 December 2019
US$
As at31 December 2018
US$ Note
Current Assets
Financial Assets at Fair Value through Profit or Loss 2 134,632,480 82,167,498
Cash and cash equivalents 3 6,582,277 3,087,506
Receivable for investments sold 2,001,937 77,039
Receivable for shares issued 9,432 79,693
Due from brokers 4,644,339 1,977,609
Income receivable and other assets 1,009,488 820,510
Total Assets 148,879,953 88,209,855
Current Liabilities
Financial Liabilities at Fair Value through Profit or Loss 2 8,949,745 6,020,238
Payable for shares redeemed 5,800 8,082
Accrued expenses 146,379 110,356
Payable for investments purchased 5,138,386 1,568,174
Other payables 115,890 83,353
Liabilities (excluding Net Assets Attributable to Holders of Redeemable Participating Shares) 14,356,200 7,790,203
Net Assets Attributable to Holders of Redeemable Participating Shares 134,523,753 80,419,652

PROFIT AND LOSS ACCOUNT FINANCIAL STATEMENTS
The accompanying notes form an integral part of the financial statements.
ANNUAL REPORT 2019 281
Neuberger Berman Global Bond Absolute Return Fund (Continued) Profit and Loss Account
Year Ended31 December 2019
US$
Year Ended31 December 2018
US$ Note
Income
Interest Income 3,727,592 4,145,044
Dividend Income 212,531 232,527
Miscellaneous Income 5,472 3,108
Net Gain/(Loss) on Financial Assets and Liabilities at Fair Value through Profit or Loss 11 1,907,301 (10,178,827)
5,852,896 (5,798,148)
Expenses
Management Fee 6 522,402 375,970
Distribution Fee 6 5,062 6,882
Administration Fee 6 201,662 252,874
Commitment Fee 19 9,143 12,069
Custody Fee 6 12,057 12,000
Depositary Fee 6 9,039 10,596
Professional Fee 9 64,801 45,033
Directors' Fee 7 4,530 6,613
Transaction Costs 9 137,598 147,848
Audit Fee 8 11,844 19,320
VAT Rebate (1,595) (1,342)
Other Expenses 9 18,161 21,893
Expense Waiver 6 (247,716) (268,646)
Total Expenses 746,988 641,110
Finance Costs
Interest Expense 654 4,749
Distribution Paid 1 248,078 415,903
248,732 420,652
Withholding Tax 1 12,196 35,192
Profit/(Loss) Attributable to Holders of Redeemable Participating Shares from Operations 4,844,980 (6,895,102)
Income and expenses arose solely from continuing operations. .

FINANCIAL STATEMENTS STATEMENT OF CHANGES IN NET ASSETS
The accompanying notes form an integral part of the financial statements.
282 NEUBERGER BERMAN INVESTMENT FUNDS PLC
Neuberger Berman Global Bond Absolute Return Fund (Continued) Statement of Changes in Net Assets Attributable to Holders of Redeemable Participating Shares
Year Ended31 December 2019
US$
Year Ended31 December 2018
US$ Note
Net Assets Attributable to Holders of Redeemable Participating Shares at beginning of year 80,419,652 98,127,145
Profit/(Loss) Attributable to Holders of Redeemable Participating Shares from Operations 4,844,980 (6,895,102)
Subscriptions 5 120,803,903 46,194,954
Redemptions 5 (71,544,782) (57,007,345)
Net Assets Attributable to Holders of Redeemable Participating Shares at end of year 134,523,753 80,419,652

SCHEDULE OF INVESTMENTS FINANCIAL STATEMENTS
ANNUAL REPORT 2019 283
Neuberger Berman Global Bond Absolute Return Fund (Continued)
Schedule of Investments
Financial Assets at Fair Value through Profit or Loss
Principal Amount Security Description Coupon Maturity
Date Fair Value
US$% of Net
Assets
Treasury Bills 0.96% (31 December 2018: 1.61%)
United States Dollar 1,300,000 United States Treasury Bill 0.00% 28/05/2020 1,291,877 0.96
Total Treasury Bills ** 1,291,877 0.96
Asset Backed Securities 26.14% (31 December 2018: 17.13%)
Euro 1,182,485 European Residential Loan Securitisation 2019-NPL2 DAC Class A 1.05% 24/02/2058 1,317,528 0.98
Total Euro 1,317,528 0.98
Pound Sterling 3,242,000 Ripon Mortgages Plc Series 1X Class D1 2.60% 20/08/2056 4,299,615 3.20
Total Pound Sterling 4,299,615 3.20
United States Dollar 250,000 Assurant CLO I Ltd 2017-1X Class E 8.28% 20/10/2029 239,681 0.18
600,000 Bear Stearns Asset Backed Securities I Trust 2006-HE1 Class 1M3 2.25% 25/12/2035 597,984 0.44
2,500,000 CIFC Funding 2019-III Ltd 2019-3X Class D 8.64% 16/07/2032 2,477,739 1.84
1,937,854 Citigroup Commercial Mortgage Trust 2015-GC27 Class XA 1.36% 10/02/2048 103,847 0.08
925,823 COMM 2014-CCRE17 Mortgage Trust Class XA 0.98% 10/05/2047 33,068 0.02
3,162,511 COMM 2014-LC15 Mortgage Trust Class XA 1.10% 10/04/2047 122,514 0.09
1,797,926 COMM 2014-UBS6 Mortgage Trust Class XA 0.90% 10/12/2047 62,788 0.05
1,000,000 Fannie Mae Connecticut Avenue Securities Class 1M2 3.94% 25/10/2030 1,008,620 0.75
1,250,000 Fannie Mae Connecticut Avenue Securities Class 1M2 4.04% 25/07/2030 1,267,681 0.94
1,250,000 Fannie Mae Connecticut Avenue Securities Class 1M2 4.14% 25/01/2031 1,269,010 0.94
1,000,000 Fannie Mae Connecticut Avenue Securities Class 1M2 4.19% 25/05/2030 1,019,444 0.76
940,000 Fannie Mae Connecticut Avenue Securities Class 1M2 4.44% 25/02/2030 965,453 0.72
1,140,000 Fannie Mae Connecticut Avenue Securities Class 1M2 4.79% 25/10/2029 1,191,969 0.89
1,170,303 Fannie Mae Connecticut Avenue Securities Class 2M2 3.99% 25/08/2030 1,181,450 0.88
880,000 Fannie Mae Connecticut Avenue Securities Class 2M2 4.29% 25/05/2030 894,197 0.66
795,336 Fannie Mae Connecticut Avenue Securities Class 2M2 4.59% 25/02/2030 817,503 0.61
1,080,000 Fannie Mae Connecticut Avenue Securities Class 2M2 4.64% 25/11/2029 1,117,864 0.83
1,250,148 Fannie Mae Connecticut Avenue Securities Class 2M2 5.44% 25/09/2029 1,314,239 0.98
600,000 Flatiron CLO 17 Ltd 2017-1X Class E 7.91% 15/05/2030 573,512 0.43
1,360,000 Freddie Mac Structured Agency Credit Risk Debt Notes Class M2 3.59% 25/07/2030 1,364,045 1.01
1,180,000 Freddie Mac Structured Agency Credit Risk Debt Notes Class M2 4.09% 25/09/2030 1,194,356 0.89
611,112 Freddie Mac Structured Agency Credit Risk Debt Notes Class M2 4.14% 25/04/2030 622,107 0.46
1,050,000 Freddie Mac Structured Agency Credit Risk Debt Notes Class M2 4.29% 25/03/2030 1,075,649 0.80
865,000 Freddie Mac Structured Agency Credit Risk Debt Notes Class M2 4.44% 25/12/2029 889,606 0.66
750,000 Freddie Mac Structured Agency Credit Risk Debt Notes Class M2 5.04% 25/07/2029 788,978 0.59

FINANCIAL STATEMENTS SCHEDULE OF INVESTMENTS
284 NEUBERGER BERMAN INVESTMENT FUNDS PLC
Neuberger Berman Global Bond Absolute Return Fund (Continued)
Schedule of Investments (Continued)
Financial Assets at Fair Value through Profit or Loss (continued)
Principal Amount Security Description Coupon Maturity
DateFair Value
US$% of Net
Assets
Asset Backed Securities 26.14% (31 December 2018: 17.13%) (continued)
United States Dollar (continued) 875,000 Freddie Mac Structured Agency Credit Risk Debt Notes Class M2 5.24% 25/10/2029 932,949 0.69
1,042,597 GS Mortgage Securities Trust 2014-GC18 Class XA 1.02% 10/01/2047 35,875 0.03
600,000 JP Morgan Mortgage Acquisition Trust 2006-CH1 Class M1 2.01% 25/07/2036 599,940 0.44
345,000 JP Morgan Mortgage Acquisition Trust 2007-CH1 Class MV2 2.07% 25/11/2036 345,028 0.26
1,000,000 Marble Point CLO X Ltd Class E 8.40% 15/10/2030 955,770 0.71
250,000 Milos CLO Ltd 2017-1X Class E 8.12% 20/10/2030 246,512 0.18
1,173,158 Morgan Stanley Bank of America Merrill Lynch Trust 2014-C16 Class XA 1.00% 15/06/2047 39,410 0.03
1,400,000 OCP CLO 2017-13 Ltd Class D 8.46% 15/07/2030 1,386,521 1.03
144,746 RAAC Series 2006-SP2 Trust Class M1 2.13% 25/02/2036 145,198 0.11
151,823 Securitized Asset Backed Receivables LLC Trust 2004-DO1 Class M1 2.77% 25/07/2034 152,277 0.11
1,600,000 Trafigura Securitisation Finance Plc 2017-1 Class A1 2.59% 15/12/2020 1,601,966 1.19
640,000 Trafigura Securitisation Finance Plc 2017-1 Class B 3.38% 15/12/2020 641,933 0.48
200,000 Trafigura Securitisation Finance Plc 2017-1 Class B 3.44% 15/12/2020 200,522 0.15
2,136,280 WFRBS Commercial Mortgage Trust 2014-C22 Class XA 0.81% 15/09/2057 65,189 0.05
Total United States Dollar 29,542,394 21.96
Total Asset Backed Securities ** 35,159,537 26.14
Corporate Bonds 35.22% (31 December 2018: 44.37%)
Euro 510,000 Altice Finco SA* 4.75% 15/01/2028 580,060 0.43
167,000 Altice France SA* 2.50% 15/01/2025 190,231 0.14
121,000 Altice France SA* 3.38% 15/01/2028 140,321 0.10
435,000 Altice France SA* 5.88% 01/02/2027 551,154 0.41
458,000 Altice Luxembourg SA* 6.25% 15/02/2025 533,895 0.40
297,000 Altice Luxembourg SA* 8.00% 15/05/2027 374,639 0.28
326,000 ARD Finance SA* 5.00% 30/06/2027 369,973 0.27
200,000 Arkema SA* 2.75% 29/12/2049 238,251 0.18
281,000 Avantor Inc* 4.75% 01/10/2024 336,487 0.25
250,000 Avis Budget Finance Plc* 4.50% 15/05/2025 293,945 0.22
773,000 Bayer AG* 2.38% 02/04/2075 891,141 0.66
413,000 Belden Inc* 3.38% 15/07/2027 487,574 0.36
100,000 Bombardier Inc* 6.13% 15/05/2021 118,141 0.09
800,000 Casino Guichard Perrachon SA* 4.05% 05/08/2026 765,692 0.57
50,000 Celanese US Holdings LLC* 2.13% 01/03/2027 59,937 0.04
309,000 Cemex SAB de CV* 3.13% 19/03/2026 360,999 0.27
460,000 CeramTec BondCo GmbH* 5.25% 15/12/2025 541,445 0.40
182,000 Cirsa Finance International Sarl* 4.75% 22/05/2025 214,765 0.16
570,000 CK Hutchison Group Telecom Finance SA* 0.75% 17/04/2026 637,682 0.47
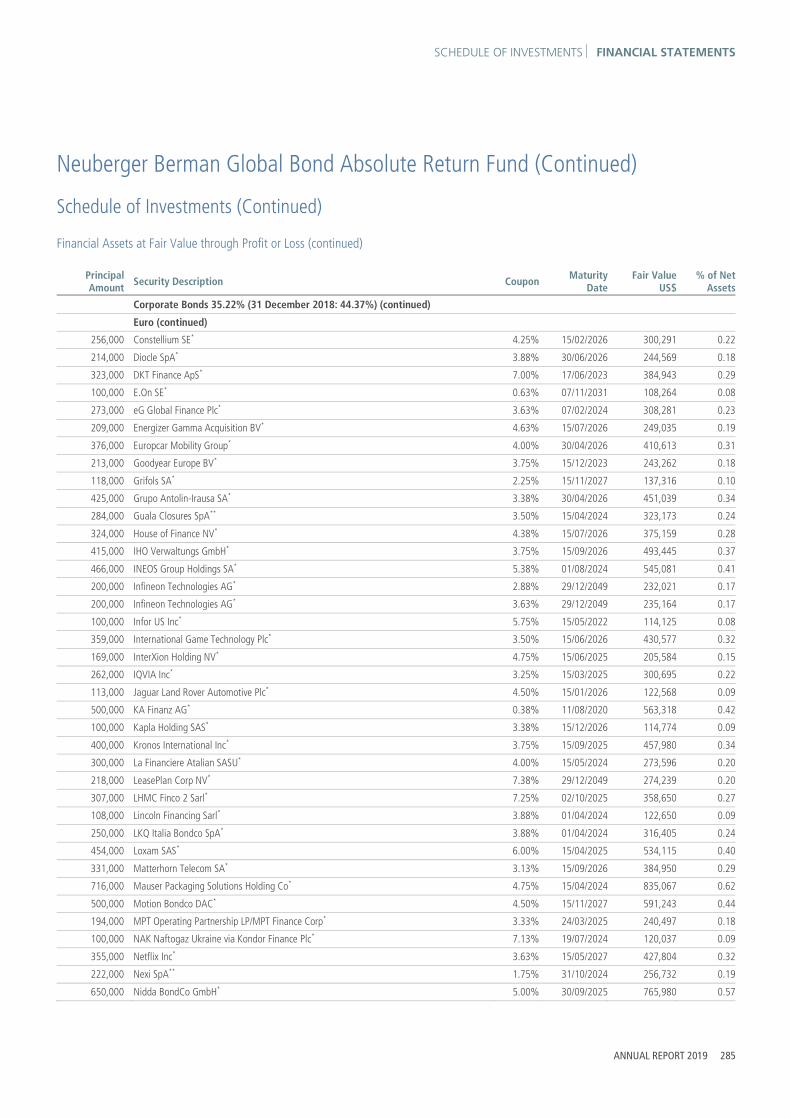
SCHEDULE OF INVESTMENTS FINANCIAL STATEMENTS
ANNUAL REPORT 2019 285
Neuberger Berman Global Bond Absolute Return Fund (Continued)
Schedule of Investments (Continued)
Financial Assets at Fair Value through Profit or Loss (continued)
Principal Amount Security Description Coupon Maturity
DateFair Value
US$% of Net
Assets
Corporate Bonds 35.22% (31 December 2018: 44.37%) (continued)
Euro (continued) 256,000 Constellium SE* 4.25% 15/02/2026 300,291 0.22
214,000 Diocle SpA* 3.88% 30/06/2026 244,569 0.18
323,000 DKT Finance ApS* 7.00% 17/06/2023 384,943 0.29
100,000 E.On SE* 0.63% 07/11/2031 108,264 0.08
273,000 eG Global Finance Plc* 3.63% 07/02/2024 308,281 0.23
209,000 Energizer Gamma Acquisition BV* 4.63% 15/07/2026 249,035 0.19
376,000 Europcar Mobility Group* 4.00% 30/04/2026 410,613 0.31
213,000 Goodyear Europe BV* 3.75% 15/12/2023 243,262 0.18
118,000 Grifols SA* 2.25% 15/11/2027 137,316 0.10
425,000 Grupo Antolin-Irausa SA* 3.38% 30/04/2026 451,039 0.34
284,000 Guala Closures SpA** 3.50% 15/04/2024 323,173 0.24
324,000 House of Finance NV* 4.38% 15/07/2026 375,159 0.28
415,000 IHO Verwaltungs GmbH* 3.75% 15/09/2026 493,445 0.37
466,000 INEOS Group Holdings SA* 5.38% 01/08/2024 545,081 0.41
200,000 Infineon Technologies AG* 2.88% 29/12/2049 232,021 0.17
200,000 Infineon Technologies AG* 3.63% 29/12/2049 235,164 0.17
100,000 Infor US Inc* 5.75% 15/05/2022 114,125 0.08
359,000 International Game Technology Plc* 3.50% 15/06/2026 430,577 0.32
169,000 InterXion Holding NV* 4.75% 15/06/2025 205,584 0.15
262,000 IQVIA Inc* 3.25% 15/03/2025 300,695 0.22
113,000 Jaguar Land Rover Automotive Plc* 4.50% 15/01/2026 122,568 0.09
500,000 KA Finanz AG* 0.38% 11/08/2020 563,318 0.42
100,000 Kapla Holding SAS* 3.38% 15/12/2026 114,774 0.09
400,000 Kronos International Inc* 3.75% 15/09/2025 457,980 0.34
300,000 La Financiere Atalian SASU* 4.00% 15/05/2024 273,596 0.20
218,000 LeasePlan Corp NV* 7.38% 29/12/2049 274,239 0.20
307,000 LHMC Finco 2 Sarl* 7.25% 02/10/2025 358,650 0.27
108,000 Lincoln Financing Sarl* 3.88% 01/04/2024 122,650 0.09
250,000 LKQ Italia Bondco SpA* 3.88% 01/04/2024 316,405 0.24
454,000 Loxam SAS* 6.00% 15/04/2025 534,115 0.40
331,000 Matterhorn Telecom SA* 3.13% 15/09/2026 384,950 0.29
716,000 Mauser Packaging Solutions Holding Co* 4.75% 15/04/2024 835,067 0.62
500,000 Motion Bondco DAC* 4.50% 15/11/2027 591,243 0.44
194,000 MPT Operating Partnership LP/MPT Finance Corp* 3.33% 24/03/2025 240,497 0.18
100,000 NAK Naftogaz Ukraine via Kondor Finance Plc* 7.13% 19/07/2024 120,037 0.09
355,000 Netflix Inc* 3.63% 15/05/2027 427,804 0.32
222,000 Nexi SpA** 1.75% 31/10/2024 256,732 0.19
650,000 Nidda BondCo GmbH* 5.00% 30/09/2025 765,980 0.57

FINANCIAL STATEMENTS SCHEDULE OF INVESTMENTS
286 NEUBERGER BERMAN INVESTMENT FUNDS PLC
Neuberger Berman Global Bond Absolute Return Fund (Continued)
Schedule of Investments (Continued)
Financial Assets at Fair Value through Profit or Loss (continued)
Principal Amount Security Description Coupon Maturity
DateFair Value
US$% of Net
Assets
Corporate Bonds 35.22% (31 December 2018: 44.37%) (continued)
Euro (continued) 150,000 Panther BF Aggregator 2 LP/Panther Finance Co Inc† 4.38% 15/05/2026 177,175 0.13
327,000 Paprec Holding SA* 4.00% 31/03/2025 354,761 0.26
189,000 Petrobras Global Finance BV* 4.75% 14/01/2025 245,042 0.18
204,000 Piaggio & C SpA* 3.63% 30/04/2025 242,045 0.18
516,000 Platin 1426 GmbH* 5.38% 15/06/2023 587,041 0.44
203,000 Playtech Plc* 4.25% 07/03/2026 242,618 0.18
100,000 Quatrim SASU* 5.88% 15/01/2024 118,819 0.09
573,000 Repsol International Finance BV* 4.50% 25/03/2075 743,177 0.55
403,000 Rossini Sarl* 6.75% 30/10/2025 505,442 0.38
494,000 Sazka Group AS* 4.13% 20/11/2024 583,211 0.43
100,000 Scientific Games International Inc* 3.38% 15/02/2026 116,354 0.09
200,000 Scientific Games International Inc* 5.50% 15/02/2026 234,471 0.17
250,000 SGL Carbon SE* 4.63% 30/09/2024 275,012 0.20
206,000 Sisal Pay SpA** 3.88% 17/12/2026 234,125 0.17
400,000 SoftBank Group Corp* 5.00% 15/04/2028 496,569 0.37
200,000 Solvay Finance SA* 5.87% 29/12/2049 266,055 0.20
203,000 Spectrum Brands Inc* 4.00% 01/10/2026 241,449 0.18
200,000 SPIE SA* 2.63% 18/06/2026 235,762 0.18
367,000 Starfruit Finco BV/Starfruit US Holdco LLC* 6.50% 01/10/2026 442,777 0.33
492,000 Summer BidCo BV* 9.00% 15/11/2025 591,582 0.44
240,000 Summit Properties Ltd* 2.00% 31/01/2025 264,185 0.20
200,000 Sunshine Mid BV* 6.50% 15/05/2026 240,829 0.18
200,000 Swissport Financing Sarl* 9.00% 15/02/2025 239,616 0.18
393,000 Tasty Bondco 1 SA* 6.25% 15/05/2026 463,519 0.34
431,000 Techem Verwaltungsgesellschaft 674 mbH* 6.00% 30/07/2026 524,013 0.39
35,000 Telecom Italia Finance SA* 7.75% 24/01/2033 58,869 0.04
143,000 Telecom Italia SpA* 3.63% 19/01/2024 176,734 0.13
50,000 Telecom Italia SpA** 5.25% 10/02/2022 62,364 0.05
500,000 Telefonica Europe BV* 2.88% 29/12/2049 574,867 0.43
400,000 Telefonica Europe BV* 3.88% 29/12/2049 489,506 0.36
200,000 Telenet Finance Luxembourg Notes Sarl* 3.50% 01/03/2028 243,462 0.18
150,000 Teva Pharmaceutical Finance Netherlands II BV* 1.88% 31/03/2027 139,485 0.10
100,000 Teva Pharmaceutical Finance Netherlands II BV* 6.00% 31/01/2025 118,985 0.09
250,000 thyssenkrupp AG* 1.88% 06/03/2023 282,012 0.21
103,000 thyssenkrupp AG* 2.88% 22/02/2024 119,543 0.09
396,000 UPC Holding BV* 3.88% 15/06/2029 466,422 0.35
300,000 Vivion Investments Sarl* 3.50% 01/11/2025 347,972 0.26
567,000 Volkswagen Bank GmbH* 1.25% 15/12/2025 655,753 0.49

SCHEDULE OF INVESTMENTS FINANCIAL STATEMENTS
ANNUAL REPORT 2019 287
Neuberger Berman Global Bond Absolute Return Fund (Continued)
Schedule of Investments (Continued)
Financial Assets at Fair Value through Profit or Loss (continued)
Principal Amount Security Description Coupon Maturity
DateFair Value
US$% of Net
Assets
Corporate Bonds 35.22% (31 December 2018: 44.37%) (continued)
Euro (continued) 300,000 Volkswagen Bank GmbH* 1.88% 31/01/2024 354,424 0.26
202,000 WMG Acquisition Corp* 3.63% 15/10/2026 240,520 0.18
340,000 Ziggo BV* 4.25% 15/01/2027 412,363 0.31
Total Euro 33,948,504 25.24
Pound Sterling 113,000 Anglian Water Osprey Financing Plc* 5.00% 30/04/2023 155,142 0.11
679,000 Anglo American Capital Plc* 3.38% 11/03/2029 944,033 0.70
362,000 Ardagh Packaging Finance Plc/Ardagh Holdings USA Inc* 4.75% 15/07/2027 504,046 0.37
350,000 Co-operative Group Holdings 2011 Ltd* 7.50% 08/07/2026 532,928 0.40
122,000 EI Group Plc* 7.50% 15/03/2024 174,023 0.13
325,000 Heathrow Finance Plc* 3.88% 01/03/2027 438,210 0.33
150,000 Iceland Bondco Plc* 4.63% 15/03/2025 174,361 0.13
253,000 Iron Mountain UK Plc* 3.88% 15/11/2025 343,614 0.26
400,000 Ladbrokes Group Finance Plc* 5.13% 08/09/2023 577,828 0.43
450,000 Miller Homes Group Holdings Plc* 5.50% 15/10/2024 620,642 0.46
471,000 NGG Finance Plc* 5.63% 18/06/2073 708,191 0.53
200,000 NWEN Finance Plc* 5.88% 21/06/2021 270,686 0.20
258,000 Petrobras Global Finance BV* 5.38% 01/10/2029 379,932 0.28
119,000 Pinewood Finance Co Ltd* 3.25% 30/09/2025 162,082 0.12
200,000 Premier Foods Finance Plc* 6.25% 15/10/2023 278,446 0.21
100,000 Stonegate Pub Co Financing Plc* 4.88% 15/03/2022 135,718 0.10
264,000 TVL Finance Plc* 6.16% 15/07/2025 351,920 0.26
508,500 Virgin Media Secured Finance Plc* 6.25% 28/03/2029 720,365 0.54
435,000 Vodafone Group Plc* 4.88% 03/10/2078 625,753 0.46
568,000 William Hill Plc* 4.75% 01/05/2026 783,743 0.58
Total Pound Sterling 8,881,663 6.60
United States Dollar 200,000 Abu Dhabi Crude Oil Pipeline LLC* 4.60% 02/11/2047 230,539 0.17
205,000 Banque Ouest Africaine de Developpement* 5.00% 27/07/2027 217,538 0.16
200,000 Cencosud SA* 4.38% 17/07/2027 197,539 0.15
200,000 China Minmetals Corp* 3.75% 29/12/2049 202,832 0.15
200,000 CNAC HK Finbridge Co Ltd* 3.50% 19/07/2022 203,454 0.15
200,000 Dianjian Haiyu Ltd* 4.30% 29/12/2049 204,500 0.15
200,000 Eskom Holdings SOC Ltd* 7.13% 11/02/2025 204,871 0.15
200,000 Huarong Finance 2017 Co Ltd* 4.50% 29/12/2049 203,516 0.15
200,000 KazMunayGas National Co JSC* 6.38% 24/10/2048 256,149 0.19

FINANCIAL STATEMENTS SCHEDULE OF INVESTMENTS
288 NEUBERGER BERMAN INVESTMENT FUNDS PLC
Neuberger Berman Global Bond Absolute Return Fund (Continued)
Schedule of Investments (Continued)
Financial Assets at Fair Value through Profit or Loss (continued)
Principal Amount Security Description Coupon Maturity
DateFair Value
US$% of Net
Assets
Corporate Bonds 35.22% (31 December 2018: 44.37%) (continued)
United States Dollar (continued) 200,000 Nexa Resources SA† 5.38% 04/05/2027 214,372 0.16
181,000 Petrobras Global Finance BV* 6.90% 19/03/2049 212,634 0.16
124,900 Petroleos de Venezuela SA* 5.38% 12/04/2027 10,304 0.01
199,681 Petroleos de Venezuela SA* 6.00% 16/05/2024 16,474 0.01
506,321 Petroleos de Venezuela SA† 6.00% 15/11/2026 41,771 0.03
16,000 Petroleos Mexicanos* 6.50% 23/01/2029 16,878 0.01
125,000 Petroleos Mexicanos† 6.84% 23/01/2030 133,511 0.10
248,000 Petroleos Mexicanos† 7.69% 23/01/2050 271,504 0.20
230,000 Samba Funding Ltd* 2.75% 02/10/2024 228,177 0.17
200,000 Sasol Financing USA LLC* 5.88% 27/03/2024 216,529 0.16
200,000 Saudi Arabian Oil Co* 4.25% 16/04/2039 214,126 0.16
400,000 Southern Gas Corridor CJSC* 6.88% 24/03/2026 475,185 0.35
250,000 State Oil Co of the Azerbaijan Republic* 4.75% 13/03/2023 263,003 0.20
200,000 TC Ziraat Bankasi AS* 5.13% 03/05/2022 199,507 0.15
100,000 Vnesheconombank Via VEB Finance Plc* 6.80% 22/11/2025 119,565 0.09
Total United States Dollar 4,554,478 3.38
Total Corporate Bonds 47,384,645 35.22
Government Bonds 25.99% (31 December 2018: 26.90%)
Euro 600,000 Argentine Republic Government International Bond** 3.38% 31/12/2038 304,924 0.23
165,132 Argentine Republic Government International Bond* 7.82% 31/12/2033 107,046 0.08
100,000 Croatia Government International Bond* 1.13% 19/06/2029 115,964 0.09
15,000 Cyprus Government International Bond* 2.75% 26/02/2034 20,766 0.01
228,222 Deutsche Bundesrepublik Inflation Linked Bond* 0.10% 15/04/2023 266,971 0.20
86,736 Deutsche Bundesrepublik Inflation Linked Bond* 0.10% 15/04/2026 105,949 0.08
114,983 Deutsche Bundesrepublik Inflation Linked Bond** 1.75% 15/04/2020 128,743 0.09
360,000 Egypt Government International Bond* 5.63% 16/04/2030 417,300 0.31
231,042 French Republic Government Bond OAT** 0.10% 25/07/2021 265,038 0.20
63,641 French Republic Government Bond OAT* 0.10% 01/03/2029 78,889 0.06
248,425 French Republic Government Bond OAT** 0.25% 25/07/2024 300,109 0.22
115,268 French Republic Government Bond OAT** 2.25% 25/07/2020 132,260 0.10
380,000 Indonesia Government International Bond* 1.40% 30/10/2031 425,570 0.32
20,000 Ireland Government Bond* 2.40% 15/05/2030 27,540 0.02
92,677 Italy Buoni Poliennali Del Tesoro** 0.25% 20/11/2023 104,160 0.08
71,944 Italy Buoni Poliennali Del Tesoro** 0.40% 11/04/2024 80,809 0.06
71,105 Italy Buoni Poliennali Del Tesoro* 0.40% 15/05/2030 78,228 0.06
79,758 Italy Buoni Poliennali Del Tesoro** 0.45% 22/05/2023 90,233 0.07

SCHEDULE OF INVESTMENTS FINANCIAL STATEMENTS
ANNUAL REPORT 2019 289
Neuberger Berman Global Bond Absolute Return Fund (Continued)
Schedule of Investments (Continued)
Financial Assets at Fair Value through Profit or Loss (continued)
Principal Amount Security Description Coupon Maturity
DateFair Value
US$% of Net
Assets
Government Bonds 25.99% (31 December 2018: 26.90%) (continued)
Euro (continued) 92,000 Italy Buoni Poliennali Del Tesoro* 1.35% 01/04/2030 102,748 0.08
83,000 Italy Buoni Poliennali Del Tesoro* 2.05% 01/08/2027 99,752 0.07
22,807 Italy Buoni Poliennali Del Tesoro** 2.55% 15/09/2041 32,752 0.02
38,000 Italy Buoni Poliennali Del Tesoro* 3.00% 01/08/2029 49,169 0.04
110,000 Ivory Coast Government International Bond* 5.88% 17/10/2031 128,687 0.09
100,000 Ivory Coast Government International Bond* 6.63% 22/03/2048 113,099 0.08
103,000 Ivory Coast Government International Bond* 6.88% 17/10/2040 120,970 0.09
40,000 Kingdom of Belgium Government Bond* 5.00% 28/03/2035 74,981 0.05
100,000 Morocco Government International Bond* 1.50% 27/11/2031 112,576 0.08
435,000 Portugal Obrigacoes do Tesouro OT** 2.20% 17/10/2022 523,294 0.39
30,000 Romanian Government International Bond** 2.88% 26/05/2028 37,977 0.03
100,000 Serbia International Bond* 1.50% 26/06/2029 114,299 0.08
32,000 Spain Government Bond* 1.30% 31/10/2026 38,682 0.03
122,000 Spain Government Bond* 1.85% 30/07/2035 156,595 0.12
Total Euro 4,756,080 3.53
Japanese Yen 138,816,960 Japanese Government CPI Linked Bond** 0.10% 10/03/2029 1,314,402 0.98
Total Japanese Yen 1,314,402 0.98
United States Dollar 200,000 Angolan Government International Bond* 8.25% 09/05/2028 216,229 0.16
200,000 Angolan Government International Bond* 9.13% 26/11/2049 213,705 0.16
200,000 Angolan Government International Bond* 9.50% 12/11/2025 235,088 0.18
160,000 Argentine Republic Government International Bond* 6.88% 26/01/2027 80,056 0.06
70,000 Brazilian Government International Bond* 7.13% 20/01/2037 90,057 0.07
200,000 Colombia Government International Bond* 5.00% 15/06/2045 232,987 0.17
210,000 Costa Rica Government International Bond* 7.16% 12/03/2045 224,371 0.17
200,000 Development Bank of Mongolia LLC* 7.25% 23/10/2023 211,990 0.16
200,000 Dominican Republic International Bond* 6.85% 27/01/2045 228,937 0.17
200,000 Ecuador Government International Bond* 7.88% 23/01/2028 178,322 0.13
200,000 Egypt Government International Bond* 7.05% 15/01/2032 209,508 0.16
30,000 El Salvador Government International Bond* 7.75% 24/01/2023 33,012 0.02
200,000 Export Credit Bank of Turkey* 6.13% 03/05/2024 202,844 0.15
260,000 Ghana Government International Bond* 10.75% 14/10/2030 332,923 0.25
200,000 Indonesia Government International Bond* 5.25% 17/01/2042 241,348 0.18
393,300 Ivory Coast Government International Bond* 5.75% 31/12/2032 391,954 0.29
200,000 Kenya Government International Bond* 8.00% 22/05/2032 217,937 0.16

FINANCIAL STATEMENTS SCHEDULE OF INVESTMENTS
290 NEUBERGER BERMAN INVESTMENT FUNDS PLC
Neuberger Berman Global Bond Absolute Return Fund (Continued)
Schedule of Investments (Continued)
Financial Assets at Fair Value through Profit or Loss (continued)
Principal Amount Security Description Coupon Maturity
DateFair Value
US$% of Net
Assets
Government Bonds 25.99% (31 December 2018: 26.90%) (continued)
United States Dollar (continued) 194,000 Mexico Government International Bond* 5.75% 12/10/2110 230,168 0.17
200,000 Nigeria Government International Bond* 7.14% 23/02/2030 203,930 0.15
200,000 Nigeria Government International Bond* 7.88% 16/02/2032 207,557 0.15
200,000 Oman Government International Bond* 6.00% 01/08/2029 208,956 0.16
200,000 Paraguay Government International Bond* 5.00% 15/04/2026 221,570 0.17
200,000 Qatar Government International Bond* 4.82% 14/03/2049 248,100 0.18
200,000 Republic of Armenia International Bond* 3.95% 26/09/2029 198,654 0.15
263,000 Republic of South Africa Government International Bond* 4.85% 30/09/2029 263,658 0.20
200,000 Republic of Uzbekistan Bond* 5.38% 20/02/2029 222,301 0.17
200,000 Russian Foreign Bond - Eurobond* 4.38% 21/03/2029 222,322 0.17
400,000 Russian Foreign Bond - Eurobond* 4.75% 27/05/2026 446,568 0.33
214,562 Russian Foreign Bond - Eurobond* 7.50% 31/03/2030 244,547 0.18
200,000 Senegal Government International Bond* 6.25% 23/05/2033 210,265 0.16
200,000 Sri Lanka Government International Bond* 6.13% 03/06/2025 194,605 0.14
400,000 Sri Lanka Government International Bond* 7.85% 14/03/2029 406,029 0.30
200,000 Turkey Government International Bond* 7.63% 26/04/2029 221,428 0.16
360,000 Ukraine Government International Bond* 7.75% 01/09/2026 394,238 0.29
200,000 Ukraine Government International Bond* 9.75% 01/11/2028 243,414 0.18
10,518,409 United States Treasury Inflation Indexed Bonds* 0.13% 15/04/2022 10,503,739 7.81
2,169,773 United States Treasury Inflation Indexed Bonds** 1.38% 15/02/2044 2,560,764 1.90
3,415,244 United States Treasury Inflation Indexed Bonds* 2.00% 15/01/2026 3,797,013 2.82
2,982,578 United States Treasury Inflation Indexed Bonds* 2.13% 15/02/2040 3,900,795 2.90
Total United States Dollar 28,891,889 21.48
Total Government Bonds 34,962,371 25.99
Mortgage Backed Securities 2.36% (31 December 2018: 1.87%)
United States Dollar 1,620,000 Fannie Mae Pool 3.00% 01/01/2049 1,642,081 1.22
1,485,000 Fannie Mae Pool 3.50% 01/01/2049 1,526,919 1.14
Total Mortgage Backed Securities ** 3,169,000 2.36
Number of Shares Security Description Fair Value
US$% of Net
Assets
Investment Funds 4.49% (31 December 2018: 5.35%)
Euro 3,000 Neuberger Berman Euro Bond Absolute Return Fund 35,056 0.02
Total Euro 35,056 0.02

SCHEDULE OF INVESTMENTS FINANCIAL STATEMENTS
ANNUAL REPORT 2019 291
Neuberger Berman Global Bond Absolute Return Fund (Continued)
Schedule of Investments (Continued)
Financial Assets at Fair Value through Profit or Loss (continued)
Number of Shares Security Description Fair Value
US$% of Net
Assets
Investment Funds 4.49% (31 December 2018: 5.35%) (continued)
United States Dollar 64,586 iShares JP Morgan EM Local Government Bond UCITS ETF 4,019,187 2.99
196,546 Neuberger Berman Euro Bond Absolute Return Fund 1,991,012 1.48
Total United States Dollar 6,010,199 4.47
Total Investment Funds μ 6,045,255 4.49
Total Investments 128,012,685 95.16
Forward Currency Contracts 3.50% (31 December 2018: 3.35%)
Amount Receivable
Amount Payable
Maturity Date Counterparty Contracts Unrealised
Gain US$% of Net
Assets
AUD 9,223,274 US$ 6,331,077 22/01/2020 Citibank NA 6 155,594 0.12
AUD 928,182 US$ 636,371 22/01/2020 Goldman Sachs International 1 16,414 0.01
AUD 1,639,318 US$ 1,126,695 22/01/2020 State Street Bank and Trust and Co 1 26,227 0.02
AUD 330,158 US$ 223,963 22/01/2020 Westpac Banking Corp 1 8,235 0.01
BRL 15,498,392 US$ 3,751,885 22/01/2020 Goldman Sachs International 3 98,394 0.07
CAD 6,797,666 US$ 5,142,591 22/01/2020 Citibank NA 6 100,087 0.07
CAD 4,264,698 US$ 3,218,970 22/01/2020 Goldman Sachs International 4 70,165 0.05
CAD 1,061,583 US$ 806,413 22/01/2020 State Street Bank and Trust and Co 1 12,329 0.01
CHF 1,265,125 US$ 1,286,963 22/01/2020 Citibank NA 2 21,313 0.02
CHF 890,024 US$ 904,710 22/01/2020 Goldman Sachs International 6 15,671 0.01
CZK 38,592,018 US$ 1,648,950 22/01/2020 Citibank NA 1 55,676 0.04
CZK 15,259,332 US$ 670,025 22/01/2020 State Street Bank and Trust and Co 1 3,986 0.00
€ 4,709,561 US$ 5,250,289 22/01/2020 Citibank NA 9 42,637 0.03
€ 4,587,813 US$ 5,092,751 22/01/2020 Goldman Sachs International 11 63,344 0.05
€ 35,736 US$ 40,000 22/01/2020 Société Générale 1 162 0.00
€ 4,324,728 US$ 4,829,241 22/01/2020 State Street Bank and Trust and Co 5 31,184 0.02
€ 1,062,192 US$ 1,180,982 22/01/2020 Westpac Banking Corp 7 12,782 0.01
£ 168,290 US$ 218,869 22/01/2020 Citibank NA 2 4,200 0.00
£ 955,658 US$ 1,212,535 22/01/2020 Goldman Sachs International 4 54,193 0.04
£ 8,451 € 9,442 22/01/2020 Royal Bank of Canada 1 590 0.00
£ 437,141 US$ 566,123 22/01/2020 State Street Bank and Trust and Co 1 13,308 0.01
£ 4,155 US$ 5,475 22/01/2020 UBS AG 1 32 0.00
£ 283,589 US$ 365,737 22/01/2020 Westpac Banking Corp 4 10,161 0.01
HUF 99,599,104 US$ 332,896 22/01/2020 Goldman Sachs International 1 5,488 0.00
¥ 72,612,979 US$ 664,796 22/01/2020 Citibank NA 1 4,102 0.00
¥ 180,017,553 US$ 1,656,639 22/01/2020 State Street Bank and Trust and Co 1 1,651 0.00
¥ 26,929,459 US$ 247,188 22/01/2020 Westpac Banking Corp 2 883 0.00
KRW 1,569,561,375 US$ 1,318,073 22/01/2020 Citibank NA 1 41,958 0.03
KRW 777,905,189 US$ 671,418 22/01/2020 Goldman Sachs International 1 2,640 0.00

FINANCIAL STATEMENTS SCHEDULE OF INVESTMENTS
292 NEUBERGER BERMAN INVESTMENT FUNDS PLC
Neuberger Berman Global Bond Absolute Return Fund (Continued)
Schedule of Investments (Continued)
Financial Assets at Fair Value through Profit or Loss (continued)
Forward Currency Contracts 3.50% (31 December 2018: 3.35%) (continued)
Amount Receivable
Amount Payable
Maturity Date Counterparty Contracts Unrealised
Gain US$% of Net
Assets
MXN 50,320,130 US$ 2,577,704 22/01/2020 Goldman Sachs International 3 79,195 0.06
MXN 12,630,718 US$ 643,079 22/01/2020 State Street Bank and Trust and Co 1 23,822 0.02
NOK 6,266,267 US$ 686,188 22/01/2020 Citibank NA 2 26,983 0.02
NOK 143,262,573 US$ 15,704,165 22/01/2020 Goldman Sachs International 6 600,708 0.45
NOK 3,239,546 US$ 359,808 22/01/2020 State Street Bank and Trust and Co 1 8,888 0.01
NOK 1,355,057 US$ 147,862 22/01/2020 Westpac Banking Corp 1 6,359 0.01
NZD 2,595,516 US$ 1,658,145 22/01/2020 Citibank NA 3 93,407 0.07
NZD 2,948,519 US$ 1,880,722 22/01/2020 Goldman Sachs International 6 109,050 0.08
NZD 1,752,981 US$ 1,119,093 22/01/2020 Westpac Banking Corp 3 63,884 0.05
PLN 176 US$ 45 22/01/2020 Goldman Sachs International 1 2 0.00
SEK 12,875,773 US$ 1,344,559 22/01/2020 Citibank NA 3 32,235 0.02
SEK 18,386,682 US$ 1,909,141 22/01/2020 Goldman Sachs International 4 56,928 0.04
SEK 31,188,344 US$ 3,203,145 22/01/2020 State Street Bank and Trust and Co 3 131,794 0.10
US$ 3,888,261 ¥ 420,148,759 22/01/2020 Citibank NA 4 17,923 0.01
US$ 439,647 ¥ 47,650,284 22/01/2020 Goldman Sachs International 3 700 0.00
US$ 8,837 £ 6,618 22/01/2020 Goldman Sachs International 1 65 0.00
US$ 119,071 BRL 478,524 22/01/2020 Goldman Sachs International 1 191 0.00
US$ 1,322,321 KRW 1,525,668,277 22/01/2020 Goldman Sachs International 1 323 0.00
US$ 1,088,701 ¥ 115,652,596 22/01/2020 State Street Bank and Trust and Co 1 23,329 0.02
US$ 971,016 TRY 5,697,164 22/01/2020 State Street Bank and Trust and Co 1 18,526 0.01
US$ 2,063,552 ¥ 218,552,412 22/01/2020 Westpac Banking Corp 1 50,285 0.04
US$ 104,482 NOK 917,493 22/01/2020 Westpac Banking Corp 1 61 0.00
US$ 95,651 £ 71,999 22/01/2020 Westpac Banking Corp 1 217 0.00
US$ 199,721 € 177,639 22/01/2020 Westpac Banking Corp 1 78 0.00
ZAR 29,695,484 US$ 1,963,928 22/01/2020 Goldman Sachs International 3 154,217 0.12
ZAR 1,205,563 US$ 78,428 22/01/2020 Westpac Banking Corp 1 7,564 0.01
EUR Hedged Classes € 8,103,031 US$ 8,950,732 22/01/2020 Citibank NA 2 156,007 0.11
€ 8,570,454 US$ 9,463,159 22/01/2020 Goldman Sachs International 6 168,904 0.12
€ 8,073,666 US$ 8,926,895 22/01/2020 Westpac Banking Corp 34 146,839 0.11
US$ 2 € 2 22/01/2020 Westpac Banking Corp 1 0 0.00
GBP Hedged Classes £ 6,858,182 US$ 8,474,855 22/01/2020 Citibank NA 1 615,680 0.46
£ 7,061,565 US$ 8,729,118 22/01/2020 Goldman Sachs International 4 631,003 0.47
£ 5,986,429 US$ 7,394,658 22/01/2020 Westpac Banking Corp 7 540,367 0.40

SCHEDULE OF INVESTMENTS FINANCIAL STATEMENTS
ANNUAL REPORT 2019 293
Neuberger Berman Global Bond Absolute Return Fund (Continued)
Schedule of Investments (Continued)
Financial Assets at Fair Value through Profit or Loss (continued)
Forward Currency Contracts 3.50% (31 December 2018: 3.35%) (continued)
Amount Receivable
Amount Payable
Maturity Date Counterparty Contracts Unrealised
Gain US$% of Net
Assets
JPY Hedged Classes ¥ 17,532 US$ 161 22/01/2020 Goldman Sachs International 1 1 0.00
¥ 50,319 US$ 463 22/01/2020 Westpac Banking Corp 2 1 0.00
US$ 28,455 ¥ 3,024,430 22/01/2020 Citibank NA 1 594 0.00
US$ 28,595 ¥ 3,040,599 22/01/2020 Goldman Sachs International 2 586 0.00
US$ 24,393 ¥ 2,593,133 22/01/2020 Westpac Banking Corp 2 506 0.00
SGD Hedged Classes SGD 1,155,684 US$ 837,797 22/01/2020 Citibank NA 1 21,786 0.02
SGD 1,179,261 US$ 854,913 22/01/2020 Goldman Sachs International 6 22,205 0.02
SGD 1,550,485 US$ 1,129,278 22/01/2020 Westpac Banking Corp 26 23,953 0.02
Total Unrealised Gain on Forward Currency Contracts ∞ 4,708,572 3.50
Futures Contracts 1.25% (31 December 2018: 1.38%)
Number of Contracts Description Unrealised
Gain US$% of Net
Assets
(12) 10-Year Mini Japanese Government Bond Future March 2020 5,374 0.00
(78) Euro-BOBL Future March 2020 62,164 0.05
3 Euro-Bund Future January 2020 416 0.00
2 Euro-Bund Future January 2020 698 0.00
3 Euro-Bund Future January 2020 2,486 0.00
(81) Euro-Bund Future March 2020 222,760 0.17
(11) Euro-Buxl 30-Year Bond Future March 2020 93,594 0.07
(28) Euro-OAT Future March 2020 64,117 0.05
(20) United Kingdom Long Gilt Future March 2020 36,298 0.03
(406) US Treasury 10-Year Note (CBT) Future March 2020 456,754 0.34
(282) US Treasury 10-Year Ultra Future March 2020 471,469 0.35
(18) US Treasury Long Bond (CBT) Future March 2020 57,282 0.04
(32) US Treasury Ultra Bond (CBT) Future March 2020 199,261 0.15
Total Unrealised Gain on Futures Contracts ± 1,672,673 1.25

FINANCIAL STATEMENTS SCHEDULE OF INVESTMENTS
294 NEUBERGER BERMAN INVESTMENT FUNDS PLC
Neuberger Berman Global Bond Absolute Return Fund (Continued)
Schedule of Investments (Continued)
Financial Assets at Fair Value through Profit or Loss (continued)
Interest Rate Swap Contracts 0.00% (31 December 2018: 0.07%)
Notional Amount Expiration Date Counterparty Receive
/(Pay)# Fixed Rate Variable Rate Fair Value US$
% of Net Assets
SEK 16,590,000 19/10/20 LCH Clearnet Ltd1 Receive (0.01%) 3M STIBOR 2,569 0.00
SEK 40,000,000 15/01/21 LCH Clearnet Ltd1 Receive 0.15% 3M STIBOR 1,264 0.00
Total Interest Rate Swap Contracts at Fair Value ± 3,833 0.00
# Receive - Funds receives variable rate and pays fixed rate. (Pay) - Fund pays variable rate and receives fixed rate.
Credit Default Swap Contracts 0.17% (31 December 2018: 0.14%)
Notional Amount Expiration Date Counterparty Referenced Obligation Fair Value US$
% of Net Assets
USD 6,980,000 20/12/24 ICE Clear U.S.1 Buying default protection on CDX.EM 32.V1 234,717 0.17
Total Credit Default Swap Contracts at Fair Value ± 234,717 0.17
1 Centrally cleared swap.
Fair Value % of Net
US$ Assets
Total Financial Assets at Fair Value through Profit or Loss 134,632,480 100.08
Financial Liabilities at Fair Value through Profit or Loss
Forward Currency Contracts (3.29%) (31 December 2018: (4.04%))
Amount Receivable
Amount Payable
Maturity Date Counterparty Contracts Unrealised
Loss US$% of Net
Assets
CLP 1,301 US$ 2 22/01/2020 Goldman Sachs International 1 (0) (0.00)
€ 4,595 US$ 5,166 22/01/2020 Westpac Banking Corp 1 (2) (0.00)
¥ 711,685,729 US$ 6,586,319 22/01/2020 Citibank NA 7 (30,394) (0.02)
¥ 203,878,931 US$ 1,887,972 22/01/2020 Goldman Sachs International 5 (9,874) (0.01)
¥ 865,210,736 US$ 8,102,037 22/01/2020 State Street Bank and Trust and Co 4 (131,865) (0.10)
¥ 223,623,460 US$ 2,111,432 22/01/2020 Westpac Banking Corp 1 (51,451) (0.04)
TRY 3,749,416 US$ 630,542 22/01/2020 Goldman Sachs International 1 (3,689) (0.00)
TRY 1,948,228 US$ 326,515 22/01/2020 State Street Bank and Trust and Co 1 (797) (0.00)
US$ 2,566,214 £ 1,980,380 22/01/2020 Citibank NA 4 (58,784) (0.04)
US$ 2,972,461 NZD 4,619,955 22/01/2020 Citibank NA 5 (145,258) (0.11)
US$ 442,853 NOK 4,049,169 22/01/2020 Citibank NA 2 (17,987) (0.01)
US$ 1,327,581 SEK 12,799,157 22/01/2020 Citibank NA 2 (41,020) (0.03)
US$ 8,772,515 € 7,903,358 22/01/2020 Citibank NA 8 (109,819) (0.08)
US$ 114,939 BRL 466,392 22/01/2020 Citibank NA 2 (928) (0.00)
US$ 5,598,319 CHF 5,505,473 22/01/2020 Citibank NA 6 (94,934) (0.07)
US$ 8,744,821 CAD 11,583,141 22/01/2020 Citibank NA 4 (188,638) (0.14)
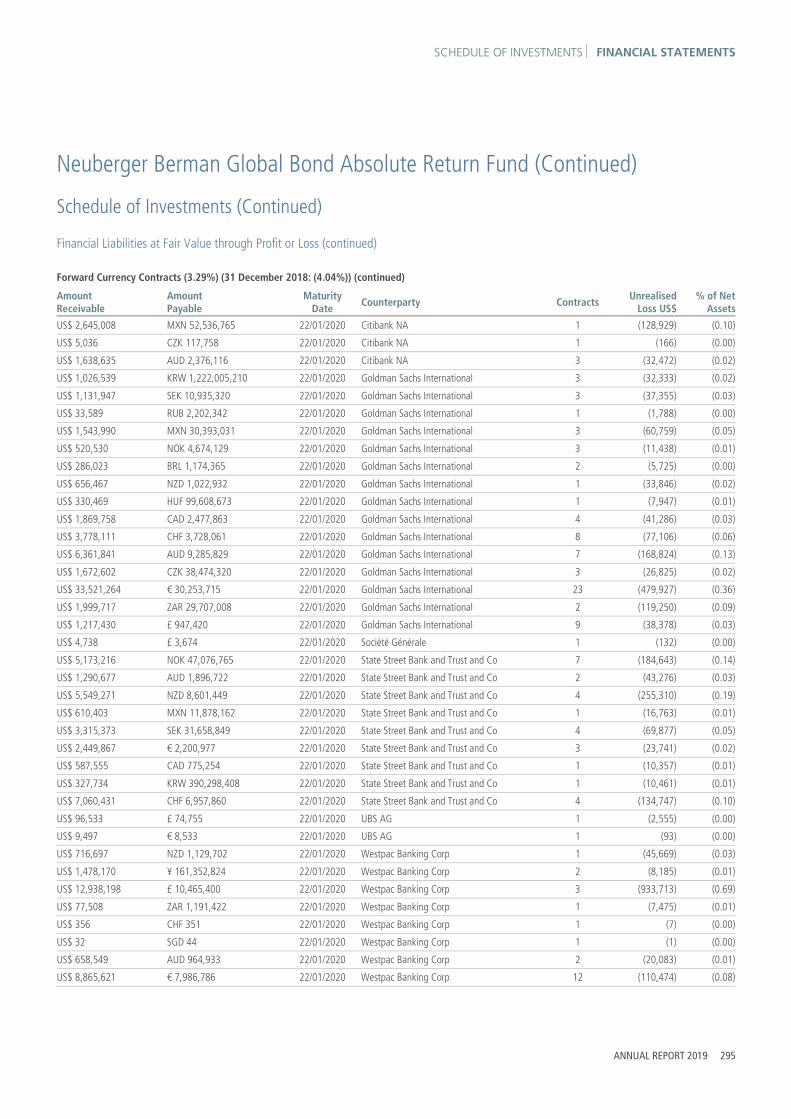
SCHEDULE OF INVESTMENTS FINANCIAL STATEMENTS
ANNUAL REPORT 2019 295
Neuberger Berman Global Bond Absolute Return Fund (Continued)
Schedule of Investments (Continued)
Financial Liabilities at Fair Value through Profit or Loss (continued)
Forward Currency Contracts (3.29%) (31 December 2018: (4.04%)) (continued)
Amount Receivable
Amount Payable
Maturity Date Counterparty Contracts Unrealised
Loss US$% of Net
Assets
US$ 2,645,008 MXN 52,536,765 22/01/2020 Citibank NA 1 (128,929) (0.10)
US$ 5,036 CZK 117,758 22/01/2020 Citibank NA 1 (166) (0.00)
US$ 1,638,635 AUD 2,376,116 22/01/2020 Citibank NA 3 (32,472) (0.02)
US$ 1,026,539 KRW 1,222,005,210 22/01/2020 Goldman Sachs International 3 (32,333) (0.02)
US$ 1,131,947 SEK 10,935,320 22/01/2020 Goldman Sachs International 3 (37,355) (0.03)
US$ 33,589 RUB 2,202,342 22/01/2020 Goldman Sachs International 1 (1,788) (0.00)
US$ 1,543,990 MXN 30,393,031 22/01/2020 Goldman Sachs International 3 (60,759) (0.05)
US$ 520,530 NOK 4,674,129 22/01/2020 Goldman Sachs International 3 (11,438) (0.01)
US$ 286,023 BRL 1,174,365 22/01/2020 Goldman Sachs International 2 (5,725) (0.00)
US$ 656,467 NZD 1,022,932 22/01/2020 Goldman Sachs International 1 (33,846) (0.02)
US$ 330,469 HUF 99,608,673 22/01/2020 Goldman Sachs International 1 (7,947) (0.01)
US$ 1,869,758 CAD 2,477,863 22/01/2020 Goldman Sachs International 4 (41,286) (0.03)
US$ 3,778,111 CHF 3,728,061 22/01/2020 Goldman Sachs International 8 (77,106) (0.06)
US$ 6,361,841 AUD 9,285,829 22/01/2020 Goldman Sachs International 7 (168,824) (0.13)
US$ 1,672,602 CZK 38,474,320 22/01/2020 Goldman Sachs International 3 (26,825) (0.02)
US$ 33,521,264 € 30,253,715 22/01/2020 Goldman Sachs International 23 (479,927) (0.36)
US$ 1,999,717 ZAR 29,707,008 22/01/2020 Goldman Sachs International 2 (119,250) (0.09)
US$ 1,217,430 £ 947,420 22/01/2020 Goldman Sachs International 9 (38,378) (0.03)
US$ 4,738 £ 3,674 22/01/2020 Société Générale 1 (132) (0.00)
US$ 5,173,216 NOK 47,076,765 22/01/2020 State Street Bank and Trust and Co 7 (184,643) (0.14)
US$ 1,290,677 AUD 1,896,722 22/01/2020 State Street Bank and Trust and Co 2 (43,276) (0.03)
US$ 5,549,271 NZD 8,601,449 22/01/2020 State Street Bank and Trust and Co 4 (255,310) (0.19)
US$ 610,403 MXN 11,878,162 22/01/2020 State Street Bank and Trust and Co 1 (16,763) (0.01)
US$ 3,315,373 SEK 31,658,849 22/01/2020 State Street Bank and Trust and Co 4 (69,877) (0.05)
US$ 2,449,867 € 2,200,977 22/01/2020 State Street Bank and Trust and Co 3 (23,741) (0.02)
US$ 587,555 CAD 775,254 22/01/2020 State Street Bank and Trust and Co 1 (10,357) (0.01)
US$ 327,734 KRW 390,298,408 22/01/2020 State Street Bank and Trust and Co 1 (10,461) (0.01)
US$ 7,060,431 CHF 6,957,860 22/01/2020 State Street Bank and Trust and Co 4 (134,747) (0.10)
US$ 96,533 £ 74,755 22/01/2020 UBS AG 1 (2,555) (0.00)
US$ 9,497 € 8,533 22/01/2020 UBS AG 1 (93) (0.00)
US$ 716,697 NZD 1,129,702 22/01/2020 Westpac Banking Corp 1 (45,669) (0.03)
US$ 1,478,170 ¥ 161,352,824 22/01/2020 Westpac Banking Corp 2 (8,185) (0.01)
US$ 12,938,198 £ 10,465,400 22/01/2020 Westpac Banking Corp 3 (933,713) (0.69)
US$ 77,508 ZAR 1,191,422 22/01/2020 Westpac Banking Corp 1 (7,475) (0.01)
US$ 356 CHF 351 22/01/2020 Westpac Banking Corp 1 (7) (0.00)
US$ 32 SGD 44 22/01/2020 Westpac Banking Corp 1 (1) (0.00)
US$ 658,549 AUD 964,933 22/01/2020 Westpac Banking Corp 2 (20,083) (0.01)
US$ 8,865,621 € 7,986,786 22/01/2020 Westpac Banking Corp 12 (110,474) (0.08)

FINANCIAL STATEMENTS SCHEDULE OF INVESTMENTS
296 NEUBERGER BERMAN INVESTMENT FUNDS PLC
Neuberger Berman Global Bond Absolute Return Fund (Continued)
Schedule of Investments (Continued)
Financial Liabilities at Fair Value through Profit or Loss (continued)
Forward Currency Contracts (3.29%) (31 December 2018: (4.04%)) (continued)
Amount Receivable
Amount Payable
Maturity Date Counterparty Contracts Unrealised
Loss US$% of Net
Assets
EUR Hedged Classes US$ 214,345 € 193,408 22/01/2020 Goldman Sachs International 3 (3,020) (0.00)
US$ 1,781,736 € 1,595,970 22/01/2020 Westpac Banking Corp 19 (11,924) (0.01)
GBP Hedged Classes £ 110,355 US$ 147,301 22/01/2020 Westpac Banking Corp 1 (1,026) (0.00)
US$ 1,384,438 £ 1,120,341 22/01/2020 Citibank NA 1 (100,576) (0.07)
US$ 1,384,991 £ 1,121,534 22/01/2020 Goldman Sachs International 2 (101,604) (0.08)
US$ 1,216,571 £ 984,345 22/01/2020 Westpac Banking Corp 10 (88,181) (0.07)
JPY Hedged Classes ¥ 4,141,055 US$ 38,961 22/01/2020 Citibank NA 1 (814) (0.00)
¥ 4,159,149 US$ 39,116 22/01/2020 Goldman Sachs International 2 (802) (0.00)
¥ 3,549,476 US$ 33,390 22/01/2020 Westpac Banking Corp 1 (693) (0.00)
SGD Hedged Classes US$ 764,506 SGD 1,054,584 22/01/2020 Citibank NA 1 (19,880) (0.01)
US$ 770,715 SGD 1,063,382 22/01/2020 Goldman Sachs International 3 (20,214) (0.02)
US$ 702,498 SGD 969,009 22/01/2020 Westpac Banking Corp 16 (18,236) (0.01)
Total Unrealised Loss on Forward Currency Contracts ∞ (4,434,326) (3.29)
Futures Contracts (0.24%) (31 December 2018: (2.97%))
Number of Contracts Description Unrealised
Loss US$% of Net
Assets
40 Euro-Bund Future March 2020 (112,250) (0.09)
373 US Treasury 2-Year Note (CBT) Future March 2020 (54,249) (0.04)
327 US Treasury 5-Year Note (CBT) Future March 2020 (152,425) (0.11)
Total Unrealised Loss on Futures Contracts ± (318,924) (0.24)
Interest Rate Swap Contracts (0.02%) (31 December 2018: (0.01%))
Notional Amount Expiration Date Counterparty Receive
/(Pay)# Fixed Rate Variable Rate Fair Value US$
% of Net Assets
USD 550,000 07/12/27 Chicago Mercantile Exchange1 Receive 2.43% 3M LIBOR (24,703) (0.02)
Total Interest Rate Swap Contracts at Fair Value ± (24,703) (0.02)
# Receive - Funds receives variable rate and pays fixed rate. (Pay) - Fund pays variable rate and receives fixed rate.

SCHEDULE OF INVESTMENTS FINANCIAL STATEMENTS
ANNUAL REPORT 2019 297
Neuberger Berman Global Bond Absolute Return Fund (Continued)
Schedule of Investments (Continued)
Financial Liabilities at Fair Value through Profit or Loss (continued)
Credit Default Swap Contracts (3.10%) (31 December 2018: (0.46%))
Notional Amount Expiration Date Counterparty Referenced Obligation Fair Value US$
% of Net Assets
EUR 27,275,000 20/12/24 ICE Clear U.S.1 Buying default protection on iTraxx Europe Crossover 32.V1
(4,171,792) (3.10)
Total Credit Default Swap Contracts at Fair Value ± (4,171,792) (3.10)
1 Centrally cleared swap. Fair Value % of Net
US$ Assets
Total Financial Liabilities at Fair Value through Profit or Loss (8,949,745) (6.65)
Net Financial Assets at Fair Value through Profit or Loss 125,682,735 93.43
Other Net Assets 8,841,018 6.57
Net Assets Attributable to Holders of Redeemable Participating Shares 134,523,753 100.00
% ofTotal
AssetsPortfolio Analysis US$
* Transferable securities and/or money market instruments admitted to an official stock exchange listing 74,756,824 50.21
** Transferable securities and/or money market instruments dealt in on a regulated market 46,372,273 31.15
† Other transferable securities and/or money market instruments 838,333 0.56
μ Investment funds 6,045,255 4.06
± Financial derivative instruments traded on a regulated market (2,604,196) (1.75)
∞ OTC financial derivative instruments 274,246 0.19
Total Investments 125,682,735 84.42

FINANCIAL STATEMENTS STATEMENT OF SIGNIFICANT PURCHASES AND SALES
298 NEUBERGER BERMAN INVESTMENT FUNDS PLC
Neuberger Berman Global Bond Absolute Return Fund (Continued) Statement of Significant Purchases and Sales (Unaudited) In accordance with the European Communities (Undertakings for Collective Investment in Transferable Securities) Regulations, 2011 as amended, a statement of changes in the composition of the Schedule of Investments during the reporting period is provided to ensure that Shareholders can identify changes in the investments held by the Portfolio. The following statements present the aggregate purchases and sales of transferable securities exceeding one percent of the total value of purchases or sales, respectively, for the period. At a minimum, the largest twenty purchases and twenty sales are presented, if available.
Top twenty purchases:
Units Security Description Cost US$
10,486,601 United States Treasury Inflation Indexed Bonds, 0.13%, 15/04/2022 10,416,963
7,641,052 United States Treasury Inflation Indexed Bonds, 3.88%, 15/04/2029 10,330,835
4,888,799 United States Treasury Inflation Indexed Bonds, 2.00%, 15/01/2026 5,463,947
2,972,655 United States Treasury Inflation Indexed Bonds, 2.13%, 15/02/2040 3,985,587
2,957,000 CK Hutchison Group Telecom Finance SA, 0.75%, 17/04/2026 3,232,094
2,600,000 Ripon Mortgages Plc Class D1, 2.60%, 20/08/2056 3,164,615
2,162,962 United States Treasury Inflation Indexed Bonds, 1.38%, 15/02/2044 2,619,683
2,500,000 Cifc Funding 2019-III Ltd Series 2019-3X Class D, 8.64%, 16/07/2032 2,436,250
19,718 Neuberger Berman Ultra Short Term Euro Bond Fund 2,000,000
175,872 Neuberger Berman Euro Bond Absolute Return Fund 1,998,224
32,384 iShares JP Morgan EM Local Government Bond UCITS ETF 1,994,443
196,546 Neuberger Berman Euro Bond Absolute Return 1,965,462
1,735,000 United States Treasury Bill, 0.00%, 25/07/2019 1,726,128
1,620,000 Fannie Mae Pool, 3.00%, 01/01/2049 1,642,314
1,600,000 Trafigura Securitisation Finance Plc 2017-1 Class A1, 2.59%, 15/12/2020 1,602,557
1,520,000 Fannie Mae Pool, 3.00%, 01/11/2048 1,544,848
1,520,000 Fannie Mae Pool, 3.00%, 01/12/2049 1,537,080
1,485,000 Fannie Mae Pool, 3.50%, 01/01/2049 1,524,768
1,400,000 OCP CLO Ltd 2017-13X Class D, 8.63%, 15/07/2030 1,364,038
1,360,000 Freddie Mac Structured Agency Credit Risk Debt Notes Class M2, 3.59%, 25/07/2030 1,360,000

STATEMENT OF SIGNIFICANT PURCHASES AND SALES FINANCIAL STATEMENTS
ANNUAL REPORT 2019 299
Neuberger Berman Global Bond Absolute Return Fund (Continued)
Statement of Significant Purchases and Sales (Unaudited) (Continued) Top twenty sales:
Units Security Description Proceeds US$
11,677,520 United States Treasury Inflation Indexed Bonds, 3.88%, 15/04/2029 15,717,866
6,862,722 United States Treasury Inflation Indexed Bonds, 2.00%, 15/01/2026 7,649,011
2,387,000 CK Hutchison Group Telecom Finance SA, 0.75%, 17/04/2026 2,615,922
41,077 iShares JP Morgan EM Local Government Bond UCITS ETF 2,424,291
248,312,455 Japanese Government CPI Linked Bond, 0.10%, 10/03/2027 2,377,777
19,718 Neuberger Berman Ultra Short Term Euro Bond Fund 2,011,042
34,040,000 Mexican Bonos, 10.00%, 05/12/2024 1,975,266
172,872 Neuberger Berman Euro Bond Absolute Return Fund 1,966,513
29,005,000 Republic of South Africa Government Bond, 9.00%, 31/01/2040 1,795,078
109,645,000 Russian Federal Bond - OFZ, 7.70%, 23/03/2033 1,753,820
1,735,000 United States Treasury Bill, 0.00%, 25/07/2019 1,729,967
1,520,000 Fannie Mae Pool, 3.00%, 01/12/2049 1,541,509
1,520,000 Fannie Mae Pool, 3.00%, 01/11/2048 1,538,327
1,295,000 Fannie Mae Pool, 3.00%, 01/10/2048 1,317,904
1,300,000 United States Treasury Bill, 0.00%, 28/02/2019 1,299,916
1,300,000 United States Treasury Bill, 0.00%, 02/01/2020 1,299,866
1,300,000 United States Treasury Bill, 0.00%, 08/08/2019 1,288,418
1,235,000 Fannie Mae Pool, 4.00%, 01/07/2049 1,277,947
1,235,000 Fannie Mae Pool, 4.00%, 01/06/2049 1,275,548
1,145,000 Fannie Mae Pool, 4.00%, 01/09/2049 1,187,938

FINANCIAL STATEMENTS INVESTMENT MANAGER’S REPORT
300 NEUBERGER BERMAN INVESTMENT FUNDS PLC
Neuberger Berman Short Duration Emerging Market Debt Fund Investment Manager’s Report For the 12 months ended 31 December 2019, the total return for the USD I Accumulating Class shares was 7.31%. (Performance for all share classes is provided in Appendix II. Performance data quoted represent past performance and do not indicate future results. Total returns shown are net of all fees and expenses and include reinvestment of income dividends and other distributions, if any).
Emerging markets debt posted strong gains in 2019 following a turbulent 2018. The recovery was driven by spread compression as risk appetite returned to global markets in the first quarter. A sharp drop in US Treasury yields drove gains from March onwards as the market started to price in multiple rate cuts by the US Federal Reserve in 2019. The ongoing trade negotiations between the US and China contributed to market volatility throughout the year, however, this abated as the countries came to a “Phase 1” agreement in mid-December to support a year-end rally. Idiosyncratic country developments, such as in Argentina and Lebanon, did not cause an overall systemic risk for emerging markets (“EM”) as most countries posted positive returns in 2019.
The Portfolio posted a positive total return for the year, driven by spread tightening on many Portfolio holdings, as well as by lower US Treasury yields and carry. China was the largest contributor to performance, followed by Portfolio exposures to Brazil, Mexico and Turkey. Holdings in Russia and South Africa contributed positively while frontier market exposures including Sri Lanka and Ukraine also added value. Meanwhile Portfolio exposure to Argentina was the main detractor, driven by sovereign bonds which sold off following the outcome of primary presidential elections in August 2019.
As we entered 2020, we had been seeing increasing signs that economic activity is bottoming out following last year’s slowdown, on the back of the lagged effects of global monetary policy easing and improved sentiment post the ‘Phase 1’ trade deal between the US and China. In the coming months though, the fallout from the Covid-19 virus will likely result in a severe short term dip in global growth due to the substantial demand and supply side disruptions globally. Our base case is for a recovery in economic activity later in the year, assuming containment of the virus and strong policy support from governments and central banks globally.
Regarding corporate credit fundamentals, we believe leverage metrics have bottomed though we expect default rates to remain at below historical averages in the coming year. From a technical perspective, we see strong new issuance in the corporate space is mitigated by continued asset liability management exercises which reduce overall net issuance. As for valuations, spreads in EM hard currency sovereigns and credits have become more compelling after the recent widening and continue to provide an attractive risk premium relative to developed market credits in our view.
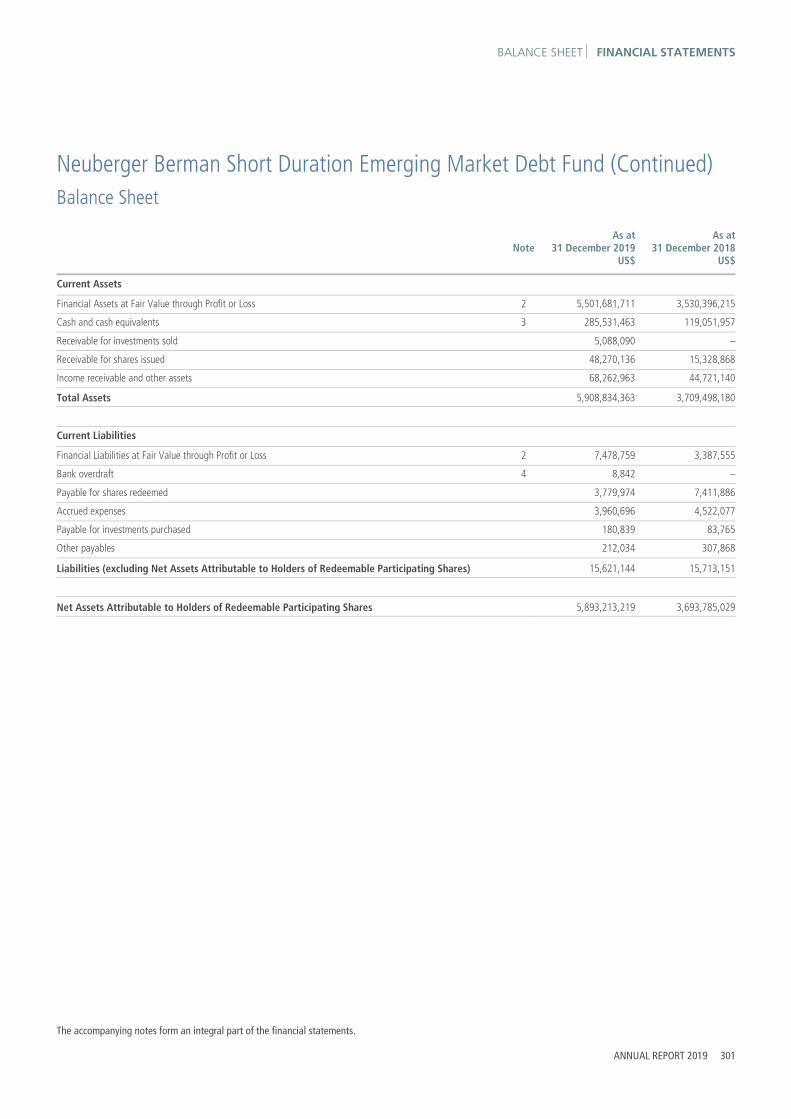
BALANCE SHEET FINANCIAL STATEMENTS
The accompanying notes form an integral part of the financial statements.
ANNUAL REPORT 2019 301
Neuberger Berman Short Duration Emerging Market Debt Fund (Continued)
Balance Sheet
As at31 December 2019
US$
As at31 December 2018
US$ Note
Current Assets
Financial Assets at Fair Value through Profit or Loss 2 5,501,681,711 3,530,396,215
Cash and cash equivalents 3 285,531,463 119,051,957
Receivable for investments sold 5,088,090 –
Receivable for shares issued 48,270,136 15,328,868
Income receivable and other assets 68,262,963 44,721,140
Total Assets 5,908,834,363 3,709,498,180
Current Liabilities
Financial Liabilities at Fair Value through Profit or Loss 2 7,478,759 3,387,555
Bank overdraft 4 8,842 –
Payable for shares redeemed 3,779,974 7,411,886
Accrued expenses 3,960,696 4,522,077
Payable for investments purchased 180,839 83,765
Other payables 212,034 307,868
Liabilities (excluding Net Assets Attributable to Holders of Redeemable Participating Shares) 15,621,144 15,713,151
Net Assets Attributable to Holders of Redeemable Participating Shares 5,893,213,219 3,693,785,029

FINANCIAL STATEMENTS PROFIT AND LOSS ACCOUNT
The accompanying notes form an integral part of the financial statements.
302 NEUBERGER BERMAN INVESTMENT FUNDS PLC
Neuberger Berman Short Duration Emerging Market Debt Fund (Continued) Profit and Loss Account
Year Ended31 December 2019
US$
Year Ended31 December 2018
US$ Note
Income
Interest Income 238,567,594 178,223,601
Net Gain/(Loss) on Financial Assets and Liabilities at Fair Value through Profit or Loss 11 53,419,108 (290,922,423)
291,986,702 (112,698,822)
Expenses
Management Fee 6 29,173,266 20,745,359
Distribution Fee 6 1,079,898 471,079
Administration Fee 6 5,108,521 3,810,610
Commitment Fee 19 618,706 350,930
Custody Fee 6 475,482 367,536
Depositary Fee 6 514,936 368,914
Professional Fee 9 258,639 584,763
Directors' Fee 7 4,530 6,612
Transaction Costs 9 131,129 155,324
Audit Fee 8 28,144 26,609
VAT Rebate (81,403) (46,731)
Other Expenses 9 29,655 62,139
Total Expenses 37,341,503 26,903,144
Finance Costs
Interest Expense 1,650 1,110
Distribution Paid 1 62,887,337 53,213,106
62,888,987 53,214,216
Profit/(Loss) Attributable to Holders of Redeemable Participating Shares from Operations 191,756,212 (192,816,182)
Income and expenses arose solely from continuing operations.

STATEMENT OF CHANGES IN NET ASSETS FINANCIAL STATEMENTS
The accompanying notes form an integral part of the financial statements.
ANNUAL REPORT 2019 303
Neuberger Berman Short Duration Emerging Market Debt Fund (Continued) Statement of Changes in Net Assets Attributable to Holders of Redeemable Participating Shares
Year Ended31 December 2019
US$
Year Ended31 December 2018
US$ Note
Net Assets Attributable to Holders of Redeemable Participating Shares at beginning of year 3,693,785,029 3,631,078,525
Profit/(Loss) Attributable to Holders of Redeemable Participating Shares from Operations 191,756,212 (192,816,182)
Subscriptions 5 3,872,801,788 1,967,334,164
Redemptions 5 (1,865,129,810) (1,711,811,478)
Net Assets Attributable to Holders of Redeemable Participating Shares at end of year 5,893,213,219 3,693,785,029

FINANCIAL STATEMENTS SCHEDULE OF INVESTMENTS
304 NEUBERGER BERMAN INVESTMENT FUNDS PLC
Neuberger Berman Short Duration Emerging Market Debt Fund (Continued)
Schedule of Investments
Financial Assets at Fair Value through Profit or Loss
Principal Amount Security Description Coupon Maturity
Date Fair Value
US$% of Net
Assets
Treasury Bills 1.02% (31 December 2018: 0.00%)
United States Dollar 60,000,000 United States Treasury Bill 0.00% 13/02/2020 59,896,225 1.02
Total Treasury Bills ** 59,896,225 1.02
Corporate Bonds 68.57% (31 December 2018: 74.89%)
Euro 10,000,000 Petroleos Mexicanos* 1.88% 21/04/2022 11,463,155 0.20
2,000,000 Petroleos Mexicanos* 3.75% 21/02/2024 2,399,542 0.04
8,493,000 Petroleos Mexicanos* 5.13% 15/03/2023 10,666,488 0.18
Total Euro 24,529,185 0.42
United States Dollar 116,200,000 1MDB Energy Ltd** 5.99% 11/05/2022 122,714,595 2.08
10,000,000 1MDB Global Investments Ltd† 4.40% 09/03/2023 9,723,668 0.16
3,000,000 ABJA Investment Co Pte Ltd* 4.85% 31/01/2020 3,007,110 0.05
19,543,000 ABQ Finance Ltd* 3.13% 24/09/2024 19,614,599 0.33
8,000,000 Africa Finance Corp* 3.88% 13/04/2024 8,332,767 0.14
1,000,000 African Export-Import Bank* 4.00% 24/05/2021 1,020,923 0.02
1,000,000 African Export-Import Bank* 4.13% 20/06/2024 1,046,494 0.02
300,000 African Export-Import Bank* 5.25% 11/10/2023 325,307 0.01
36,500,000 Akbank T.A.S.* 4.00% 24/01/2020 36,515,121 0.62
5,000,000 AKCB Finance Ltd* 4.75% 09/10/2023 5,357,677 0.09
26,317,000 Alpek SAB de CV† 4.50% 20/11/2022 27,476,843 0.47
2,000,000 Alpek SAB de CV† 5.38% 08/08/2023 2,163,330 0.04
21,012,000 APICORP Sukuk Ltd* 3.14% 01/11/2022 21,519,314 0.37
26,613,000 Arab Petroleum Investments Corp* 4.13% 18/09/2023 28,255,546 0.48
2,500,000 Azure Nova International Finance Ltd* 3.00% 21/03/2020 2,500,713 0.04
10,000,000 Azure Orbit IV International Finance Ltd* 3.75% 25/01/2023 10,249,903 0.17
9,872,000 Azure Power Energy Ltd* 5.50% 03/11/2022 10,089,244 0.17
34,628,000 Banco BTG Pactual SA* 4.00% 16/01/2020 34,662,974 0.59
13,616,000 Banco BTG Pactual SA* 4.50% 10/01/2025 13,820,240 0.23
10,000,000 Banco BTG Pactual SA* 5.50% 31/01/2023 10,466,750 0.18
13,287,000 Banco BTG Pactual SA* 5.75% 28/09/2022 13,872,585 0.24
8,522,000 Banco Continental SA via Continental Senior Trustees Cayman Ltd† 5.50% 18/11/2020 8,802,267 0.15
5,389,000 Banco de Credito del Peru† 2.70% 11/01/2025 5,368,791 0.09
10,896,000 Banco del Estado de Chile* 2.67% 08/01/2021 10,932,615 0.19
24,800,000 Banco do Brasil SA* 4.88% 19/04/2023 26,141,308 0.44
14,600,000 Banco Inbursa SA Institucion de Banca Multiple Grupo Financiero Inbursa* 4.13% 06/06/2024 15,153,705 0.26
1,820,000 Banco Internacional del Peru SAA Interbank† 3.38% 18/01/2023 1,841,230 0.03

SCHEDULE OF INVESTMENTS FINANCIAL STATEMENTS
ANNUAL REPORT 2019 305
Neuberger Berman Short Duration Emerging Market Debt Fund (Continued)
Schedule of Investments (Continued)
Financial Assets at Fair Value through Profit or Loss (continued)
Principal Amount Security Description Coupon Maturity
Date Fair Value
US$% of Net
Assets
Corporate Bonds 68.57% (31 December 2018: 74.89%) (continued)
United States Dollar (continued)
6,400,000 Banco Santander Chile† 2.50% 15/12/2020 6,405,760 0.11
10,524,000 Banco Votorantim SA† 4.50% 24/09/2024 10,839,825 0.18
21,428,000 Bancolombia SA* 5.95% 03/06/2021 22,561,541 0.38
12,000,000 Bank of China Ltd* 2.68% 14/02/2020 12,004,020 0.20
2,121,000 Bank of East Asia Ltd* 6.13% 16/07/2020 2,160,441 0.04
44,539,000 Banque Ouest Africaine de Developpement* 5.50% 06/05/2021 46,237,890 0.78
2,000,000 Baosteel Financing 2015 Pty Ltd* 3.88% 28/01/2020 2,001,732 0.03
20,000,000 Batelco International Finance No 1 Ltd* 4.25% 01/05/2020 20,081,041 0.34
10,000,000 BBK BSC* 5.50% 09/07/2024 10,349,135 0.18
39,127,000 BBVA Bancomer SA* 6.75% 30/09/2022 42,669,559 0.72
7,072,000 BBVA Bancomer SA† 7.25% 22/04/2020 7,160,046 0.12
10,000,000 Binhai Investment Co Ltd* 4.45% 30/11/2020 9,453,155 0.16
9,194,000 Black Sea Trade & Development Bank* 3.50% 25/06/2024 9,408,703 0.16
13,502,000 Bluestar Finance Holdings Ltd* 3.50% 30/09/2021 13,650,829 0.23
6,000,000 Bocom Leasing Management Hong Kong Co Ltd* 4.00% 22/01/2022 6,139,509 0.10
13,000,000 Braskem Finance Ltd† 6.45% 03/02/2024 14,489,735 0.25
44,661,218 Brazil Loan Trust 1* 5.48% 24/07/2023 46,503,939 0.79
65,467,800 Brazil Minas SPE via State of Minas Gerais† 5.33% 15/02/2028 70,368,556 1.19
1,400,000 CBD Cayman Ltd* 4.00% 17/11/2020 1,419,286 0.02
1,900,000 CBQ Finance Ltd* 3.25% 13/06/2021 1,919,803 0.03
37,038,000 CCBL Cayman 1 Corp Ltd* 3.50% 16/05/2024 38,004,030 0.64
10,000,000 CCBL Cayman Corp Ltd* 3.25% 28/07/2020 10,042,617 0.17
5,709,000 CDBL Funding 1* 3.00% 24/04/2023 5,712,747 0.10
3,000,000 CDBL Funding 1* 3.16% 15/11/2021 3,014,754 0.05
7,000,000 CDBL Funding 2* 2.63% 01/08/2020 7,008,683 0.12
3,000,000 CDBL Funding 2* 3.00% 01/08/2022 3,021,118 0.05
1,500,000 CDBL Funding 2* 3.15% 18/07/2021 1,504,121 0.03
25,000,000 CDBL Funding 2* 3.75% 11/03/2022 25,510,446 0.43
5,745,000 Chang Development International Ltd* 3.63% 20/01/2020 5,735,716 0.10
19,952,000 Charming Light Investments Ltd* 3.08% 21/12/2020 20,004,746 0.34
8,000,000 China Great Wall International Holdings III Ltd* 2.75% 31/08/2020 8,020,497 0.14
29,108,000 China Huadian Overseas Development Management Co Ltd* 4.00% 29/12/2049 29,985,505 0.51
47,383,000 China Minmetals Corp* 3.75% 29/12/2049 48,053,988 0.82
10,440,000 China Minmetals Corp* 4.45% 29/12/2049 10,628,286 0.18
5,489,000 China SCE Group Holdings Ltd* 7.45% 17/04/2021 5,617,537 0.10
7,000,000 China SCE Group Holdings Ltd* 8.75% 15/01/2021 7,236,251 0.12
4,442,000 Chinalco Capital Holdings Ltd* 4.10% 29/12/2049 4,503,519 0.08
14,390,000 Chinalco Capital Holdings Ltd* 4.25% 21/04/2022 14,605,836 0.25

FINANCIAL STATEMENTS SCHEDULE OF INVESTMENTS
306 NEUBERGER BERMAN INVESTMENT FUNDS PLC
Neuberger Berman Short Duration Emerging Market Debt Fund (Continued)
Schedule of Investments (Continued)
Financial Assets at Fair Value through Profit or Loss (continued)
Principal Amount Security Description Coupon Maturity
Date Fair Value
US$% of Net
Assets
Corporate Bonds 68.57% (31 December 2018: 74.89%) (continued)
United States Dollar (continued)
7,000,000 CICC Hong Kong Finance 2016 MTN Ltd* 3.14% 25/04/2021 7,023,844 0.12
7,000,000 CIFI Holdings Group Co Ltd* 6.38% 02/05/2020 7,050,169 0.12
780,000 CIFI Holdings Group Co Ltd* 6.88% 23/04/2021 799,307 0.01
13,000,000 CNAC HK Finbridge Co Ltd* 3.13% 19/06/2022 13,093,853 0.22
11,683,000 CNAC HK Finbridge Co Ltd* 3.38% 19/06/2024 11,866,664 0.20
15,268,000 CNAC HK Finbridge Co Ltd* 3.50% 19/07/2022 15,531,690 0.26
4,000,000 CNAC HK Finbridge Co Ltd* 4.13% 14/03/2021 4,066,105 0.07
20,010,000 CNAC HK Finbridge Co Ltd* 4.63% 14/03/2023 21,037,684 0.36
49,140,000 Comision Federal de Electricidad* 4.88% 26/05/2021 50,757,197 0.86
33,600,000 Comision Federal de Electricidad* 4.88% 15/01/2024 36,218,280 0.61
13,600,000 Comunicaciones Celulares SA Via Comcel Trust* 6.88% 06/02/2024 13,968,492 0.24
1,985,000 Country Garden Holdings Co Ltd* 7.13% 27/01/2022 2,107,717 0.04
12,000,000 Country Garden Holdings Co Ltd* 7.50% 09/03/2020 12,083,193 0.21
2,407,000 CSN Resources SA† 6.50% 21/07/2020 2,450,080 0.04
56,713,000 CSN Resources SA† 7.63% 13/02/2023 60,574,872 1.03
5,538,000 Cssc Capital One Ltd* 4.13% 27/09/2021 5,658,673 0.10
2,875,000 Dianjian Haiyu Ltd* 3.50% 29/12/2049 2,888,001 0.05
4,451,000 Dianjian Haiyu Ltd* 4.30% 29/12/2049 4,551,148 0.08
12,400,000 Dianjian International Finance Ltd* 4.60% 29/12/2049 12,823,072 0.22
20,600,000 DIB Sukuk Ltd* 2.92% 03/06/2020 20,668,614 0.35
13,000,000 DIB Sukuk Ltd* 3.60% 30/03/2021 13,151,446 0.22
11,535,000 DIB Sukuk Ltd* 3.63% 06/02/2023 11,803,592 0.20
25,000,000 DP World Crescent Ltd* 3.91% 31/05/2023 25,901,375 0.44
26,843,000 Eastern & Southern African Trade & Development Bank* 4.88% 23/05/2024 28,016,055 0.48
10,000,000 Easy Tactic Ltd* 8.13% 27/02/2023 10,275,510 0.17
28,200,000 Emirates Development Bank PJSC* 3.52% 06/03/2024 29,171,429 0.50
5,000,000 ENN Clean Energy International Investment Ltd* 7.50% 27/02/2021 5,167,537 0.09
37,000,000 Eskom Holdings SOC Ltd* 5.75% 26/01/2021 37,159,946 0.63
10,766,000 Evraz Plc* 6.75% 31/01/2022 11,644,096 0.20
15,000,000 Fab Sukuk Co Ltd* 3.63% 05/03/2023 15,532,795 0.26
10,457,000 Fab Sukuk Co Ltd* 3.88% 22/01/2024 10,998,464 0.19
7,288,000 Far East Horizon Ltd* 3.91% 03/07/2021 7,341,146 0.12
16,875,000 FirstRand Bank Ltd* 4.25% 30/04/2020 16,970,489 0.29
30,200,000 Gazprom PJSC Via Gaz Capital SA* 4.95% 19/07/2022 31,987,655 0.54
22,000,000 Gazprom PJSC Via Gaz Capital SA* 6.00% 23/01/2021 22,888,654 0.39
15,007,000 Genneia SA† 8.75% 20/01/2022 11,829,568 0.20
18,415,000 Gold Fields Orogen Holdings BVI Ltd* 4.88% 07/10/2020 18,713,139 0.32
11,500,000 Gold Fields Orogen Holdings BVI Ltd* 5.13% 15/05/2024 12,305,978 0.21

SCHEDULE OF INVESTMENTS FINANCIAL STATEMENTS
ANNUAL REPORT 2019 307
Neuberger Berman Short Duration Emerging Market Debt Fund (Continued)
Schedule of Investments (Continued)
Financial Assets at Fair Value through Profit or Loss (continued)
Principal Amount Security Description Coupon Maturity
Date Fair Value
US$% of Net
Assets
Corporate Bonds 68.57% (31 December 2018: 74.89%) (continued)
United States Dollar (continued)
11,000,000 Greenko Dutch BV* 4.88% 24/07/2022 11,052,360 0.19
5,000,000 Greenko Dutch BV† 5.25% 24/07/2024 5,081,850 0.09
9,000,000 Greenland Global Investment Ltd* 6.75% 25/06/2022 9,092,811 0.15
9,004,000 Greenland Global Investment Ltd* 6.75% 26/09/2023 9,079,856 0.15
8,600,000 Greentown China Holdings Ltd* 4.55% 10/11/2020 8,613,941 0.15
23,979,000 Grupo Aval Ltd† 4.75% 26/09/2022 25,065,776 0.43
44,000,000 GTH Finance BV* 6.25% 26/04/2020 44,157,953 0.75
48,694,000 GTH Finance BV* 7.25% 26/04/2023 54,881,303 0.93
12,000,000 GTL Trade Finance Inc/Gerdau Holdings Inc* 5.89% 29/04/2024 13,310,100 0.23
8,709,000 GTLK Europe DAC* 5.95% 19/07/2021 9,094,337 0.15
25,000,000 Gulf International Bank BSC* 3.50% 25/03/2022 25,335,393 0.43
4,537,000 Guotai Junan Holdings Ltd* 3.88% 11/03/2022 4,634,317 0.08
10,000,000 Haitong International Securities Group Ltd* 3.13% 18/05/2025 9,922,090 0.17
5,000,000 Hanjin International Corp* 2.91% 28/09/2020 5,020,412 0.09
13,500,000 Harvest Operations Corp* 3.00% 21/09/2022 13,810,171 0.23
2,500,000 Harvest Operations Corp* 4.20% 01/06/2023 2,651,897 0.04
5,000,000 Hazine Mustesarligi Varlik Kiralama AS* 4.49% 25/11/2024 4,906,445 0.08
2,000,000 Hazine Mustesarligi Varlik Kiralama AS* 5.00% 06/04/2023 2,026,625 0.03
40,000,000 Hazine Mustesarligi Varlik Kiralama AS* 5.80% 21/02/2022 41,311,224 0.70
36,000,000 HBIS Group Hong Kong Co Ltd* 4.25% 07/04/2020 35,953,418 0.61
10,000,000 Hikma Pharmaceuticals Plc* 4.25% 10/04/2020 10,028,120 0.17
2,000,000 Horse Gallop Finance Ltd* 3.14% 28/06/2021 2,006,843 0.03
19,569,000 HPHT Finance 19 Ltd* 2.88% 05/11/2024 19,540,629 0.33
3,350,000 Huarong Finance 2017 Co Ltd* 3.04% 07/11/2022 3,339,308 0.06
13,000,000 Huarong Finance 2017 Co Ltd* 3.38% 24/01/2020 13,004,543 0.22
6,000,000 Huarong Finance 2017 Co Ltd* 3.59% 27/04/2020 6,011,376 0.10
17,722,000 Huarong Finance 2017 Co Ltd* 3.79% 27/04/2022 17,979,370 0.31
16,000,000 Huarong Finance 2017 Co Ltd* 4.00% 29/12/2049 16,129,736 0.27
17,000,000 Huarong Finance 2017 Co Ltd* 4.50% 29/12/2049 17,298,843 0.29
14,600,000 Huarong Finance 2019 Co Ltd* 3.25% 13/11/2024 14,560,094 0.25
15,000,000 Hyundai Capital America† 3.40% 20/06/2024 15,309,410 0.26
72,000,000 ICBCIL Finance Co Ltd* 3.00% 05/04/2020 72,053,896 1.22
769,000 ICBCIL Finance Co Ltd* 3.01% 15/05/2023 771,207 0.01
22,000,000 ICBCIL Finance Co Ltd* 3.65% 05/03/2022 22,407,142 0.38
2,000,000 IDBI Bank Ltd/GIFT-IFC* 4.13% 23/04/2020 2,004,422 0.03
17,000,000 IDBI Bank Ltd/GIFT-IFC* 4.25% 30/11/2020 17,142,463 0.29
9,000,000 IHS Netherlands Holdco BV* 7.13% 18/03/2025 9,503,460 0.16
11,400,000 Indo Energy Finance II BV† 6.38% 24/01/2023 11,499,318 0.20

FINANCIAL STATEMENTS SCHEDULE OF INVESTMENTS
308 NEUBERGER BERMAN INVESTMENT FUNDS PLC
Neuberger Berman Short Duration Emerging Market Debt Fund (Continued)
Schedule of Investments (Continued)
Financial Assets at Fair Value through Profit or Loss (continued)
Principal Amount Security Description Coupon Maturity
Date Fair Value
US$% of Net
Assets
Corporate Bonds 68.57% (31 December 2018: 74.89%) (continued)
United States Dollar (continued)
7,789,000 Indonesia Asahan Aluminium Persero PT* 5.23% 15/11/2021 8,173,354 0.14
41,300,000 Indonesia Asahan Aluminium Persero PT* 5.71% 15/11/2023 45,569,745 0.77
5,000,000 Itau Unibanco Holding SA† 6.20% 21/12/2021 5,302,050 0.09
7,715,000 JBS Investments GmbH* 6.25% 05/02/2023 7,814,639 0.13
10,000,000 JIC Zhixin Ltd* 3.00% 24/11/2022 10,091,846 0.17
22,971,000 KazMunayGas National Co JSC* 3.88% 19/04/2022 23,677,706 0.40
12,000,000 KazMunayGas National Co JSC* 4.40% 30/04/2023 12,710,554 0.22
4,000,000 KEB Hana Bank* 2.64% 02/10/2022 4,016,500 0.07
6,000,000 KEB Hana Bank* 2.77% 05/04/2020 6,005,340 0.10
35,000,000 KOC Holding AS* 3.50% 24/04/2020 35,074,839 0.60
4,000,000 Kookmin Bank* 2.84% 09/06/2022 4,032,322 0.07
15,000,000 Korean Air Lines Co Ltd* 2.00% 04/09/2022 14,917,202 0.25
4,873,000 Kuwait Projects Co SPC Ltd* 5.00% 15/03/2023 5,190,439 0.09
15,000,000 Kyobo Life Insurance Co Ltd* 3.95% 29/12/2049 15,243,750 0.26
16,192,000 Leader Goal International Ltd* 4.25% 29/12/2049 16,566,298 0.28
13,950,000 Lotte Shopping Business Management Hong Kong Ltd* 2.38% 05/09/2020 13,956,311 0.24
10,000,000 MAF Global Securities Ltd* 4.75% 07/05/2024 10,705,734 0.18
35,000,000 MARB BondCo Plc* 6.88% 19/01/2025 37,230,025 0.63
5,000,000 MARB BondCo Plc* 7.00% 15/03/2024 5,222,925 0.09
15,206,000 Mashreqbank PSC* 4.25% 26/02/2024 15,909,542 0.27
1,000,000 MCC Holding Hong Kong Corp Ltd* 2.95% 31/05/2020 1,001,301 0.02
27,500,000 MDGH - GMTN BV* 2.50% 07/11/2024 27,622,705 0.47
4,800,000 MDGH - GMTN BV* 3.00% 19/04/2024 4,921,707 0.08
3,675,000 Mersin Uluslararasi Liman Isletmeciligi AS* 5.38% 15/11/2024 3,788,210 0.06
475,000 Mestenio Ltd for Dominican Republic* 8.50% 02/01/2020 475,000 0.01
4,499,000 Metropolitan Light Co Ltd* 5.50% 21/11/2022 4,655,989 0.08
9,000,000 MGM China Holdings Ltd† 5.38% 15/05/2024 9,378,765 0.16
11,983,000 Minera y Metalurgica del Boleo SAPI de CV* 3.25% 17/04/2024 12,245,740 0.21
7,800,000 Minsheng Hong Kong International Leasing Ltd Via Landmark Funding 2019 Ltd* 4.50% 26/03/2022 7,873,107 0.13
20,600,000 Minsur SA† 6.25% 07/02/2024 22,694,505 0.39
12,000,000 MTN Mauritius Investments Ltd* 4.76% 11/11/2024 12,344,514 0.21
17,287,000 NBK SPC Ltd* 2.75% 30/05/2022 17,437,133 0.30
8,800,000 Oil & Gas Holding Co BSCC* 7.63% 07/11/2024 10,230,056 0.17
1,000,000 Olam International Ltd* 4.50% 05/02/2020 1,001,500 0.02
20,983,000 Orbia Advance Corp SAB de CV† 4.88% 19/09/2022 22,143,822 0.38
24,127,000 Pampa Energia SA* 7.38% 21/07/2023 22,870,345 0.39
20,000,000 Perusahaan Listrik Negara PT* 5.50% 22/11/2021 21,208,000 0.36
7,955,000 Philippine National Bank* 3.28% 27/09/2024 8,047,143 0.14

SCHEDULE OF INVESTMENTS FINANCIAL STATEMENTS
ANNUAL REPORT 2019 309
Neuberger Berman Short Duration Emerging Market Debt Fund (Continued)
Schedule of Investments (Continued)
Financial Assets at Fair Value through Profit or Loss (continued)
Principal Amount Security Description Coupon Maturity
Date Fair Value
US$% of Net
Assets
Corporate Bonds 68.57% (31 December 2018: 74.89%) (continued)
United States Dollar (continued)
4,763,000 Powerchina Real Estate Group Ltd* 4.50% 06/12/2021 4,893,915 0.08
28,445,000 Qatari Diar Finance QSC* 5.00% 21/07/2020 28,922,677 0.49
7,975,000 QIB Sukuk Ltd* 3.25% 23/05/2022 8,062,273 0.14
39,492,000 QIB Sukuk Ltd* 3.98% 26/03/2024 41,180,907 0.70
38,560,000 QNB Finance Ltd* 2.88% 29/04/2020 38,626,083 0.66
10,000,000 QNB Finance Ltd* 3.26% 31/05/2021 10,072,381 0.17
39,944,000 QNB Finance Ltd* 3.50% 28/03/2024 41,355,901 0.70
5,000,000 QNB Finansbank AS* 4.88% 19/05/2022 5,033,412 0.09
37,157,000 QNB Finansbank AS* 6.88% 07/09/2024 39,660,453 0.67
7,157,000 Rakfunding Cayman Ltd* 4.13% 09/04/2024 7,450,931 0.13
2,410,150 Ras Laffan Liquefied Natural Gas Co Ltd II† 5.30% 30/09/2020 2,445,308 0.04
10,000,000 REC Ltd* 3.07% 18/12/2020 10,050,516 0.17
4,990,000 REC Ltd* 3.38% 25/07/2024 4,987,908 0.08
20,769,000 REC Ltd* 3.50% 12/12/2024 20,807,453 0.35
5,000,000 REC Ltd* 5.25% 13/11/2023 5,341,870 0.09
25,000,000 Rongshi International Finance Ltd* 3.25% 21/05/2024 25,616,792 0.43
30,000,000 Rumo Luxembourg Sarl* 7.38% 09/02/2024 32,387,550 0.55
5,000,000 Rusal Capital DAC* 5.13% 02/02/2022 5,135,617 0.09
10,000,000 SACI Falabella* 3.75% 30/04/2023 10,209,905 0.17
16,541,000 Samba Funding Ltd* 2.75% 02/10/2024 16,409,885 0.28
8,000,000 Sands China Ltd* 4.60% 08/08/2023 8,458,880 0.14
23,000,000 Sasol Financing International Ltd* 4.50% 14/11/2022 23,762,450 0.40
40,000,000 Sasol Financing USA LLC* 5.88% 27/03/2024 43,305,707 0.73
53,000,000 Saudi Arabian Oil Co* 2.88% 16/04/2024 53,834,879 0.91
31,944,000 Saudi Electricity Global Sukuk Co 4* 4.22% 27/01/2024 33,953,529 0.58
5,000,000 Scenery Journey Ltd* 11.00% 06/11/2020 5,111,603 0.09
8,000,000 Severstal OAO Via Steel Capital SA† 5.90% 17/10/2022 8,673,671 0.15
8,000,000 Shandong Energy Australia Pty Ltd* 4.55% 26/07/2020 7,978,337 0.14
4,000,000 Shanghai Port Group BVI Development Co Ltd* 2.88% 18/06/2024 4,046,114 0.07
10,700,000 Shinhan Bank Co Ltd* 3.88% 07/12/2026 10,942,727 0.19
3,000,000 SIHC International Capital Ltd* 3.95% 26/09/2021 3,060,020 0.05
15,000,000 Sino-Ocean Land Treasure IV Ltd* 4.23% 31/07/2021 15,136,519 0.26
8,000,000 Sinopec Group Overseas Development 2012 Ltd* 3.90% 17/05/2022 8,289,721 0.14
5,000,000 Sinopec Group Overseas Development 2015 Ltd* 2.50% 28/04/2020 5,003,847 0.08
4,000,000 Sinopec Group Overseas Development 2017 Ltd* 2.38% 12/04/2020 4,001,640 0.07
3,000,000 Sinopec Group Overseas Development 2017 Ltd* 3.00% 12/04/2022 3,041,658 0.05
17,104,000 Sinopec Group Overseas Development 2018 Ltd* 2.50% 08/08/2024 17,180,822 0.29
20,000,000 Sinopec Group Overseas Development 2018 Ltd* 2.50% 12/11/2024 20,077,730 0.34

FINANCIAL STATEMENTS SCHEDULE OF INVESTMENTS
310 NEUBERGER BERMAN INVESTMENT FUNDS PLC
Neuberger Berman Short Duration Emerging Market Debt Fund (Continued)
Schedule of Investments (Continued)
Financial Assets at Fair Value through Profit or Loss (continued)
Principal Amount Security Description Coupon Maturity
Date Fair Value
US$% of Net
Assets
Corporate Bonds 68.57% (31 December 2018: 74.89%) (continued)
United States Dollar (continued)
4,702,000 Spic 2018 Usd Senior Perpetual Bond Co Ltd* 5.80% 29/12/2049 4,990,591 0.08
65,930,000 State Oil Co of the Azerbaijan Republic* 4.75% 13/03/2023 69,359,063 1.18
3,500,000 Studio City Co Ltd* 7.25% 30/11/2021 3,586,625 0.06
25,000,000 Sunac China Holdings Ltd* 7.35% 19/07/2021 25,614,336 0.43
4,159,000 Sunac China Holdings Ltd* 7.50% 01/02/2024 4,296,590 0.07
7,455,000 Sunac China Holdings Ltd* 7.88% 15/02/2022 7,753,122 0.13
10,000,000 Sunac China Holdings Ltd* 7.95% 11/10/2023 10,544,693 0.18
8,000,000 Sunac China Holdings Ltd* 8.38% 15/01/2021 8,252,024 0.14
4,378,000 Sunac China Holdings Ltd* 8.63% 27/07/2020 4,470,500 0.08
5,000,000 Sunny Express Enterprises Corp* 3.50% 21/03/2022 5,106,433 0.09
8,500,000 SURA Asset Management SA† 4.88% 17/04/2024 9,162,363 0.16
11,910,000 TC Ziraat Bankasi AS* 4.75% 29/04/2021 11,994,259 0.20
42,500,000 Tecpetrol SA† 4.88% 12/12/2022 43,276,475 0.73
4,000,000 Tewoo Group No 4 Ltd* 3.15% 01/12/2020 3,968,250 0.07
27,000,000 TMK OAO Via TMK Capital SA* 6.75% 03/04/2020 27,327,612 0.46
12,465,000 Trade & Development Bank of Mongolia LLC* 9.38% 19/05/2020 12,705,168 0.22
17,000,000 Trust F/1401* 5.25% 15/12/2024 18,460,555 0.31
11,327,000 Tsinghua Unic Ltd* 5.38% 31/01/2023 8,830,275 0.15
5,000,000 Turkiye Garanti Bankasi AS* 5.25% 13/09/2022 5,101,825 0.09
5,000,000 Turkiye Vakiflar Bankasi TAO* 5.50% 27/10/2021 5,063,247 0.09
7,916,667 Ukreximbank Via Biz Finance Plc* 9.63% 27/04/2022 8,321,129 0.14
12,100,000 United Bank for Africa Plc* 7.75% 08/06/2022 12,887,644 0.22
24,000,000 Unity 1 Sukuk Ltd* 3.86% 30/11/2021 24,560,592 0.42
18,000,000 Vedanta Resources Ltd* 6.38% 30/07/2022 17,699,616 0.30
36,000,000 Vedanta Resources Ltd† 8.25% 07/06/2021 37,284,120 0.63
11,941,000 VEON Holdings BV† 4.00% 09/04/2025 12,458,165 0.21
24,001,000 Volcan Compania Minera SAA† 5.38% 02/02/2022 25,033,763 0.42
1,900,000 Votorantim SA† 6.75% 05/04/2021 1,995,760 0.03
12,953,000 VTR Finance BV* 6.88% 15/01/2024 13,271,450 0.23
10,000,000 Weichai International Hong Kong Energy Group Co Ltd* 3.75% 29/12/2049 10,046,078 0.17
11,852,000 Wisdom Glory Group Ltd* 5.25% 29/12/2049 11,837,518 0.20
3,000,000 Xi Yang Overseas Ltd* 4.30% 05/06/2024 3,082,813 0.05
9,800,000 Xingsheng BVI Co Ltd* 3.38% 25/07/2022 9,872,899 0.17
13,000,000 Yankuang Group Cayman Ltd* 4.75% 30/11/2020 13,088,356 0.22
5,000,000 Yapi ve Kredi Bankasi AS* 4.00% 22/01/2020 5,003,351 0.08
8,000,000 Yapi ve Kredi Bankasi AS* 5.75% 24/02/2022 8,145,966 0.14
18,565,000 YPF SA* 8.50% 23/03/2021 18,433,374 0.31
5,300,000 Yuexiu REIT MTN Co Ltd* 4.75% 27/04/2021 5,429,148 0.09
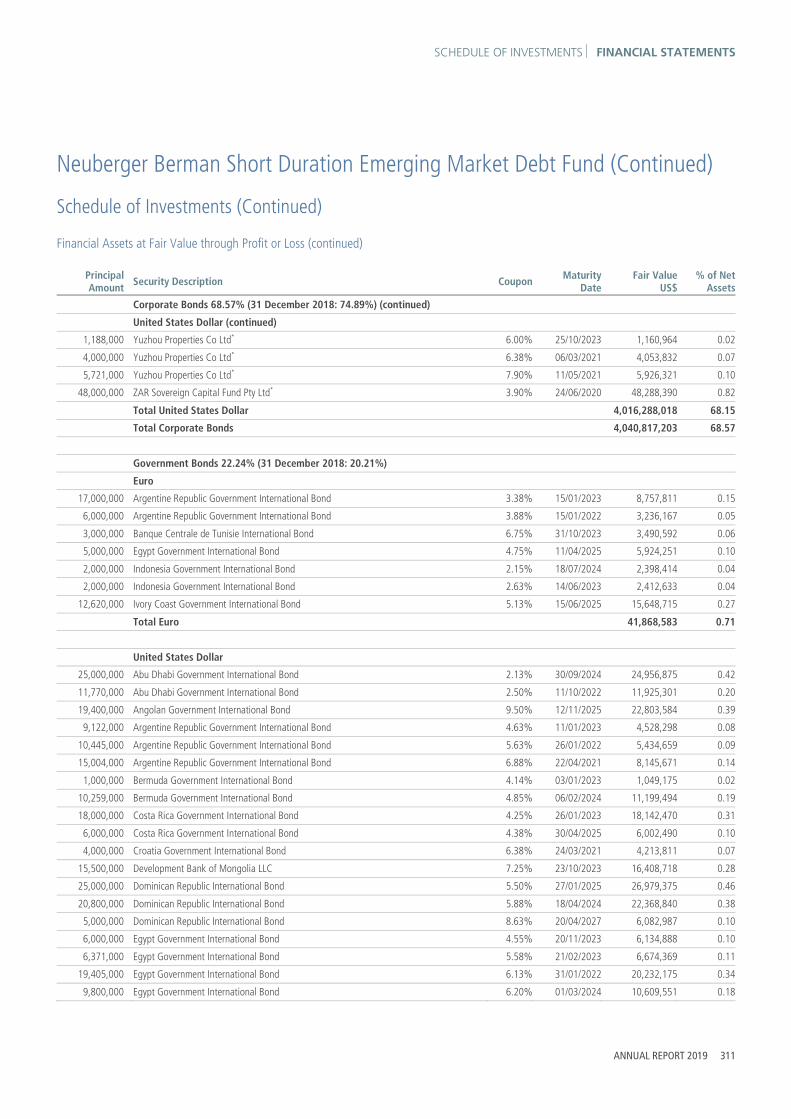
SCHEDULE OF INVESTMENTS FINANCIAL STATEMENTS
ANNUAL REPORT 2019 311
Neuberger Berman Short Duration Emerging Market Debt Fund (Continued)
Schedule of Investments (Continued)
Financial Assets at Fair Value through Profit or Loss (continued)
Principal Amount Security Description Coupon Maturity
Date Fair Value
US$% of Net
Assets
Corporate Bonds 68.57% (31 December 2018: 74.89%) (continued)
United States Dollar (continued)
1,188,000 Yuzhou Properties Co Ltd* 6.00% 25/10/2023 1,160,964 0.02
4,000,000 Yuzhou Properties Co Ltd* 6.38% 06/03/2021 4,053,832 0.07
5,721,000 Yuzhou Properties Co Ltd* 7.90% 11/05/2021 5,926,321 0.10
48,000,000 ZAR Sovereign Capital Fund Pty Ltd* 3.90% 24/06/2020 48,288,390 0.82
Total United States Dollar 4,016,288,018 68.15
Total Corporate Bonds 4,040,817,203 68.57
Government Bonds 22.24% (31 December 2018: 20.21%)
Euro 17,000,000 Argentine Republic Government International Bond 3.38% 15/01/2023 8,757,811 0.15
6,000,000 Argentine Republic Government International Bond 3.88% 15/01/2022 3,236,167 0.05
3,000,000 Banque Centrale de Tunisie International Bond 6.75% 31/10/2023 3,490,592 0.06
5,000,000 Egypt Government International Bond 4.75% 11/04/2025 5,924,251 0.10
2,000,000 Indonesia Government International Bond 2.15% 18/07/2024 2,398,414 0.04
2,000,000 Indonesia Government International Bond 2.63% 14/06/2023 2,412,633 0.04
12,620,000 Ivory Coast Government International Bond 5.13% 15/06/2025 15,648,715 0.27
Total Euro 41,868,583 0.71
United States Dollar 25,000,000 Abu Dhabi Government International Bond 2.13% 30/09/2024 24,956,875 0.42
11,770,000 Abu Dhabi Government International Bond 2.50% 11/10/2022 11,925,301 0.20
19,400,000 Angolan Government International Bond 9.50% 12/11/2025 22,803,584 0.39
9,122,000 Argentine Republic Government International Bond 4.63% 11/01/2023 4,528,298 0.08
10,445,000 Argentine Republic Government International Bond 5.63% 26/01/2022 5,434,659 0.09
15,004,000 Argentine Republic Government International Bond 6.88% 22/04/2021 8,145,671 0.14
1,000,000 Bermuda Government International Bond 4.14% 03/01/2023 1,049,175 0.02
10,259,000 Bermuda Government International Bond 4.85% 06/02/2024 11,199,494 0.19
18,000,000 Costa Rica Government International Bond 4.25% 26/01/2023 18,142,470 0.31
6,000,000 Costa Rica Government International Bond 4.38% 30/04/2025 6,002,490 0.10
4,000,000 Croatia Government International Bond 6.38% 24/03/2021 4,213,811 0.07
15,500,000 Development Bank of Mongolia LLC 7.25% 23/10/2023 16,408,718 0.28
25,000,000 Dominican Republic International Bond 5.50% 27/01/2025 26,979,375 0.46
20,800,000 Dominican Republic International Bond 5.88% 18/04/2024 22,368,840 0.38
5,000,000 Dominican Republic International Bond 8.63% 20/04/2027 6,082,987 0.10
6,000,000 Egypt Government International Bond 4.55% 20/11/2023 6,134,888 0.10
6,371,000 Egypt Government International Bond 5.58% 21/02/2023 6,674,369 0.11
19,405,000 Egypt Government International Bond 6.13% 31/01/2022 20,232,175 0.34
9,800,000 Egypt Government International Bond 6.20% 01/03/2024 10,609,551 0.18

FINANCIAL STATEMENTS SCHEDULE OF INVESTMENTS
312 NEUBERGER BERMAN INVESTMENT FUNDS PLC
Neuberger Berman Short Duration Emerging Market Debt Fund (Continued)
Schedule of Investments (Continued)
Financial Assets at Fair Value through Profit or Loss (continued)
Principal Amount Security Description Coupon Maturity
Date Fair Value
US$% of Net
Assets
Government Bonds 22.24% (31 December 2018: 20.21%) (continued)
United States Dollar (continued)
3,000,000 El Salvador Government International Bond 7.75% 24/01/2023 3,301,245 0.06
5,500,000 Export Credit Bank of Turkey 4.25% 18/09/2022 5,393,712 0.09
9,000,000 Export Credit Bank of Turkey 5.00% 23/09/2021 9,150,234 0.16
24,404,000 Export Credit Bank of Turkey 5.38% 08/02/2021 24,826,532 0.42
7,000,000 Export Credit Bank of Turkey 5.38% 24/10/2023 6,977,218 0.12
12,003,000 Export Credit Bank of Turkey 8.25% 24/01/2024 13,074,398 0.22
10,000,000 Export-Import Bank of Korea 2.50% 01/11/2020 10,037,578 0.17
9,239,000 Export-Import Bank of Korea 2.81% 25/01/2022 9,333,312 0.16
8,454,000 Export-Import Bank of Korea 2.83% 01/11/2022 8,582,999 0.15
27,500,000 Ghana Government International Bond 8.13% 18/01/2026 29,689,160 0.50
6,431,000 Indonesia Government International Bond 3.70% 08/01/2022 6,610,218 0.11
7,600,000 Indonesia Government International Bond 4.45% 11/02/2024 8,194,461 0.14
30,609,000 Ivory Coast Government International Bond 5.38% 23/07/2024 32,226,930 0.55
14,000,000 Kenya Government International Bond 6.88% 24/06/2024 15,179,105 0.26
19,418,000 Korea Development Bank 2.38% 01/10/2022 19,452,011 0.33
20,000,000 Korea Development Bank 3.25% 19/02/2024 20,816,308 0.35
24,817,000 Korea Expressway Corp 2.67% 20/04/2020 24,837,969 0.42
24,468,000 Korea Housing Finance Corp 3.00% 31/10/2022 25,033,562 0.42
17,778,000 Korea Resources Corp 4.00% 18/04/2023 18,535,878 0.32
23,329,000 Kuwait International Government Bond 2.75% 20/03/2022 23,716,681 0.40
1,000,000 Mongolia Government International Bond 5.13% 05/12/2022 1,025,960 0.02
4,500,000 Mongolia Government International Bond 5.63% 01/05/2023 4,641,553 0.08
9,215,000 Mongolia Government International Bond 10.88% 06/04/2021 10,071,995 0.17
814,000 Nacional Financiera SNC 3.38% 05/11/2020 819,981 0.01
13,050,000 Namibia International Bonds 5.50% 03/11/2021 13,575,284 0.23
16,000,000 Nigeria Government International Bond 5.63% 27/06/2022 16,681,472 0.28
2,420,000 Nigeria Government International Bond 6.38% 12/07/2023 2,591,209 0.04
11,200,000 Nigeria Government International Bond 7.63% 21/11/2025 12,380,677 0.21
14,005,000 Oman Government International Bond 3.63% 15/06/2021 14,093,007 0.24
31,324,000 Oman Government International Bond 4.13% 17/01/2023 32,109,184 0.55
5,000,000 Oman Government International Bond 4.88% 01/02/2025 5,179,238 0.09
1,000,000 Paraguay Government International Bond 4.63% 25/01/2023 1,058,915 0.02
2,000,000 Perusahaan Penerbit SBSN Indonesia III 3.30% 21/11/2022 2,052,764 0.04
10,000,000 Perusahaan Penerbit SBSN Indonesia III 3.90% 20/08/2024 10,620,500 0.18
1,000,000 Perusahaan Penerbit SBSN Indonesia III 4.35% 10/09/2024 1,080,765 0.02
3,763,000 Provincia de Cordoba 7.13% 10/06/2021 2,803,435 0.05
4,000,000 Provincia de Mendoza Argentina 8.38% 19/05/2024 3,020,000 0.05
37,691,000 Qatar Government International Bond 2.38% 02/06/2021 37,849,326 0.64

SCHEDULE OF INVESTMENTS FINANCIAL STATEMENTS
ANNUAL REPORT 2019 313
Neuberger Berman Short Duration Emerging Market Debt Fund (Continued)
Schedule of Investments (Continued)
Financial Assets at Fair Value through Profit or Loss (continued)
Principal Amount Security Description Coupon Maturity
Date Fair Value
US$% of Net
Assets
Government Bonds 22.24% (31 December 2018: 20.21%) (continued)
United States Dollar (continued)
36,361,000 Qatar Government International Bond 3.38% 14/03/2024 38,088,382 0.65
44,793,000 Qatar Government International Bond 3.88% 23/04/2023 47,330,618 0.80
19,000,000 Qatar Government International Bond 4.50% 20/01/2022 19,933,036 0.34
27,849,000 Qatar Government International Bond 5.25% 20/01/2020 27,914,696 0.47
14,000,000 Republic of Azerbaijan International Bond 4.75% 18/03/2024 15,013,815 0.26
15,100,000 Republic of South Africa Government International Bond 4.67% 17/01/2024 15,788,560 0.27
5,000,000 Republic of South Africa Government International Bond 5.88% 30/05/2022 5,358,115 0.09
6,000,000 Russian Foreign Bond - Eurobond 4.88% 16/09/2023 6,545,771 0.11
37,321,453 Russian Foreign Bond - Eurobond 7.50% 31/03/2030 42,538,300 0.72
43,974,000 Saudi Government International Bond 2.38% 26/10/2021 44,175,587 0.75
11,419,000 Saudi Government International Bond 2.88% 04/03/2023 11,634,238 0.20
8,000,000 Senegal Government International Bond 6.25% 30/07/2024 8,873,415 0.15
1,000,000 Serbia International Bond 7.25% 28/09/2021 1,090,476 0.02
46,672,000 Sri Lanka Government International Bond 5.75% 18/04/2023 46,334,564 0.79
3,000,000 Sri Lanka Government International Bond 5.88% 25/07/2022 3,008,023 0.05
6,000,000 Sri Lanka Government International Bond 6.25% 04/10/2020 6,095,043 0.10
21,000,000 Sri Lanka Government International Bond 6.25% 27/07/2021 21,368,101 0.36
20,600,000 Sri Lanka Government International Bond 6.35% 28/06/2024 20,598,765 0.35
24,037,000 Sri Lanka Government International Bond 6.85% 14/03/2024 24,340,835 0.41
5,000,000 Turkey Government International Bond 5.13% 25/03/2022 5,125,314 0.09
15,791,000 Turkey Government International Bond 5.60% 14/11/2024 16,096,003 0.27
15,000,000 Turkey Government International Bond 5.63% 30/03/2021 15,470,835 0.26
35,000,000 Turkey Government International Bond 5.75% 22/03/2024 35,873,145 0.61
5,000,000 Turkey Government International Bond 7.25% 23/12/2023 5,422,960 0.09
26,800,000 Ukraine Government International Bond 7.75% 01/09/2020 27,624,154 0.47
10,000,000 Ukraine Government International Bond 7.75% 01/09/2021 10,606,180 0.18
5,000,000 Ukraine Government International Bond 7.75% 01/09/2022 5,406,750 0.09
7,000,000 Ukraine Government International Bond 7.75% 01/09/2025 7,658,833 0.13
11,500,000 Ukraine Government International Bond 8.99% 01/02/2024 12,972,482 0.22
Total United States Dollar 1,268,804,503 21.53
Total Government Bonds * 1,310,673,086 22.24
Number of Shares Security Description Fair Value
US$% of Net
Assets
Investment Funds 0.53% (31 December 2018: 0.00%)
United States Dollar 300,000 Neuberger Berman Ultra Short Term Euro Bond Fund 31,341,000 0.53
Total Investment Funds μ 31,341,000 0.53
Total Investments 5,442,727,514 92.36

FINANCIAL STATEMENTS SCHEDULE OF INVESTMENTS
314 NEUBERGER BERMAN INVESTMENT FUNDS PLC
Neuberger Berman Short Duration Emerging Market Debt Fund (Continued)
Schedule of Investments (Continued)
Financial Assets at Fair Value through Profit or Loss (continued)
Forward Currency Contracts 1.00% (31 December 2018: 0.48%)
Amount Receivable
Amount Payable
Maturity Date Counterparty Contracts Unrealised
Gain US$% of Net
Assets
€ 2,596,000 US$ 2,910,490 05/02/2020 Deutsche Bank AG 1 9,691 0.00
AUD Hedged Classes AUD 1,845,812 US$ 1,255,402 21/02/2020 Westpac Banking Corp 1 43,693 0.00
CAD Hedged Classes CAD 1,002 US$ 762 21/02/2020 Citibank NA 1 11 0.00
CAD 192,756 US$ 145,611 21/02/2020 UBS AG 1 3,065 0.00
CHF Hedged Classes CHF 36,964 US$ 37,617 21/02/2020 Goldman Sachs International 1 688 0.00
CHF 118,131,636 US$ 120,109,723 21/02/2020 UBS AG 2 2,308,256 0.04
CHF 7,321,928 US$ 7,441,077 21/02/2020 Westpac Banking Corp 20 146,525 0.00
CNY Hedged Classes CNY 402 US$ 57 21/02/2020 Goldman Sachs International 1 0 0.00
CNY 68,317 US$ 9,715 21/02/2020 Royal Bank of Canada 1 83 0.00
EUR Hedged Classes € 1,927,152,012 US$ 2,137,315,647 21/02/2020 Citibank NA 1 32,580,474 0.55
€ 4,648,635 US$ 5,178,506 21/02/2020 Goldman Sachs International 4 55,671 0.00
€ 10,454,870 US$ 11,707,771 21/02/2020 Royal Bank of Canada 1 63,994 0.00
€ 64,901,593 US$ 72,142,868 21/02/2020 Westpac Banking Corp 37 933,730 0.02
GBP Hedged Classes £ 7,749,500 US$ 10,074,747 21/02/2020 Goldman Sachs International 4 205,586 0.01
£ 620,902,374 US$ 801,683,688 21/02/2020 UBS AG 2 21,993,080 0.38
£ 5,855,480 US$ 7,622,664 21/02/2020 Westpac Banking Corp 21 145,100 0.00
US$ 11,239,650 £ 8,412,456 21/02/2020 Westpac Banking Corp 3 79,854 0.00
JPY Hedged Classes ¥ 466,308,571 US$ 4,285,066 21/02/2020 Royal Bank of Canada 1 17,793 0.00
¥ 4,596,434,418 US$ 42,227,649 21/02/2020 Westpac Banking Corp 3 185,911 0.00
US$ 8,304 ¥ 897,490 21/02/2020 Westpac Banking Corp 1 22 0.00
SEK Hedged Classes SEK 11,782,285 US$ 1,227,312 21/02/2020 Goldman Sachs International 5 34,348 0.00
SEK 298,845 US$ 31,595 21/02/2020 Westpac Banking Corp 13 406 0.00
US$ 1 SEK 7 21/02/2020 Westpac Banking Corp 1 0 0.00
SGD Hedged Classes SGD 163,204 US$ 120,365 21/02/2020 Goldman Sachs International 4 1,058 0.00
SGD 91,766 US$ 68,118 21/02/2020 UBS AG 1 156 0.00
SGD 15,940,780 US$ 11,714,880 21/02/2020 Westpac Banking Corp 18 145,000 0.00
US$ 26,575 SGD 35,717 21/02/2020 Westpac Banking Corp 1 2 0.00
Total Unrealised Gain on Forward Currency Contracts ∞ 58,954,197 1.00

SCHEDULE OF INVESTMENTS FINANCIAL STATEMENTS
ANNUAL REPORT 2019 315
Neuberger Berman Short Duration Emerging Market Debt Fund (Continued)
Schedule of Investments (Continued)
Financial Assets at Fair Value through Profit or Loss (continued)
Fair Value % of Net
US$ Assets
Total Financial Assets at Fair Value through Profit or Loss 5,501,681,711 93.36
Financial Liabilities at Fair Value through Profit or Loss
Forward Currency Contracts (0.13%) (31 December 2018: (0.09%))
Amount Receivable
Amount Payable
Maturity Date Counterparty Contracts Unrealised
Loss US$% of Net
Assets
US$ 53,374,047 € 48,330,000 06/01/2020 Citibank NA 1 (886,525) (0.02)
US$ 30,145,381 € 26,860,000 05/02/2020 Deutsche Bank AG 1 (68,818) (0.00)
AUD Hedged Classes US$ 71 AUD 104 21/02/2020 Westpac Banking Corp 1 (2) (0.00)
CHF Hedged Classes CHF 661,153 US$ 685,822 21/02/2020 UBS AG 1 (679) (0.00)
US$ 216,320 CHF 209,077 21/02/2020 Goldman Sachs International 2 (343) (0.00)
US$ 8,627,865 CHF 8,512,060 21/02/2020 Westpac Banking Corp 11 (193,051) (0.00)
EUR Hedged Classes US$ 227,887,200 € 205,478,903 21/02/2020 Citibank NA 1 (3,473,831) (0.06)
US$ 1,262,949 € 1,132,927 21/02/2020 Goldman Sachs International 2 (12,682) (0.00)
US$ 9,415,746 € 8,437,080 21/02/2020 Westpac Banking Corp 10 (84,070) (0.00)
GBP Hedged Classes US$ 161,791 £ 122,702 21/02/2020 Goldman Sachs International 2 (983) (0.00)
US$ 4,435,191 £ 3,383,172 21/02/2020 Westpac Banking Corp 15 (52,858) (0.00)
JPY Hedged Classes ¥ 70,000,001 US$ 646,770 21/02/2020 Goldman Sachs International 1 (845) (0.00)
¥ 92,194,896,873 US$ 853,430,070 21/02/2020 Westpac Banking Corp 3 (2,702,421) (0.05)
SEK Hedged Classes SEK 3,130 US$ 337 21/02/2020 Goldman Sachs International 1 (1) (0.00)
SEK 16,787 US$ 1,801 21/02/2020 Westpac Banking Corp 2 (3) (0.00)
US$ 73,735 SEK 692,111 21/02/2020 Westpac Banking Corp 7 (377) (0.00)
SGD Hedged Classes US$ 29 SGD 39 21/02/2020 Goldman Sachs International 1 (0) (0.00)
US$ 133,156 SGD 180,682 21/02/2020 Westpac Banking Corp 18 (1,270) (0.00)
Total Unrealised Loss on Forward Currency Contracts ∞ (7,478,759) (0.13)
Fair Value % of Net
US$ Assets
Total Financial Liabilities at Fair Value through Profit or Loss (7,478,759) (0.13)
Net Financial Assets at Fair Value through Profit or Loss 5,494,202,952 93.23
Other Net Assets 399,010,267 6.77
Net Assets Attributable to Holders of Redeemable Participating Shares 5,893,213,219 100.00

FINANCIAL STATEMENTS SCHEDULE OF INVESTMENTS
316 NEUBERGER BERMAN INVESTMENT FUNDS PLC
Neuberger Berman Short Duration Emerging Market Debt Fund (Continued)
Schedule of Investments (Continued)
% ofTotal
AssetsPortfolio Analysis US$
* Transferable securities and/or money market instruments admitted to an official stock exchange listing 4,732,476,002 80.09
** Transferable securities and/or money market instruments dealt in on a regulated market 182,610,820 3.09
† Other transferable securities and/or money market instruments 496,299,692 8.40
μ Investment funds 31,341,000 0.53
∞ OTC financial derivative instruments 51,475,438 0.87
Total Investments 5,494,202,952 92.98

STATEMENT OF SIGNIFICANT PURCHASES AND SALES FINANCIAL STATEMENTS
ANNUAL REPORT 2019 317
Neuberger Berman Short Duration Emerging Market Debt Fund (Continued)
Statement of Significant Purchases and Sales (Unaudited) In accordance with the European Communities (Undertakings for Collective Investment in Transferable Securities) Regulations, 2011 as amended, a statement of changes in the composition of the Schedule of Investments during the reporting period is provided to ensure that Shareholders can identify changes in the investments held by the Portfolio. The following statements present the aggregate purchases and sales of transferable securities exceeding one percent of the total value of purchases or sales, respectively, for the period. At a minimum, the largest twenty purchases and twenty sales are presented, if available.
Top twenty purchases:
Units Security Description Cost US$
150,000,000 United States Treasury Bill, 0.00%, 28/05/2019 149,762,445
100,000,000 United States Treasury Bill, 0.00%, 12/03/2019 99,835,069
60,000,000 United States Treasury Bill, 0.00%, 13/02/2020 59,597,932
55,000,000 United States Treasury Bill, 0.00%, 15/08/2019 54,376,884
53,000,000 Saudi Arabian Oil Co, 2.88%, 16/04/2024 52,751,575
48,694,000 GTH Finance BV, 7.25%, 26/04/2023 51,795,808
40,400,000 JBS Investments GmbH, 6.25%, 05/02/2023 41,042,850
40,000,000 Hazine Mustesarligi Varlik Kiralama AS, 5.80%, 21/02/2022 40,000,000
39,944,000 QNB Finance Ltd, 3.50%, 28/03/2024 39,612,679
39,492,000 QIB Sukuk Ltd, 3.98%, 26/03/2024 39,493,500
34,500,000 Indonesia Asahan Aluminium Persero PT, 5.71%, 15/11/2023 37,223,540
37,038,000 CCBL Cayman 1 Corp Ltd, 3.50%, 16/05/2024 36,953,924
36,361,000 Qatar Government International Bond, 3.38%, 14/03/2024 36,402,603
36,609,000 Ivory Coast Government International Bond, 5.38%, 23/07/2024 35,545,943
34,788,000 CSN Resources SA, 7.63%, 13/02/2023 35,334,670
35,000,000 MARB BondCo Plc, 6.88%, 19/01/2025 34,895,680
35,000,000 KOC Holding AS, 3.50%, 24/04/2020 34,658,750
33,600,000 Comision Federal de Electricidad, 4.88%, 15/01/2024 34,657,260
31,327,000 BBVA Bancomer SA, 6.75%, 30/09/2022 34,012,598
35,000,000 Turkey Government International Bond, 5.75%, 22/03/2024 33,505,525

FINANCIAL STATEMENTS STATEMENT OF SIGNIFICANT PURCHASES AND SALES
318 NEUBERGER BERMAN INVESTMENT FUNDS PLC
Neuberger Berman Short Duration Emerging Market Debt Fund (Continued) Statement of Significant Purchases and Sales (Unaudited) (Continued) Aggregate sales greater than one percent of the total value of sales:
Units Security Description Proceeds US$
61,092,000 Petroleos Mexicanos, 5.54%, 11/03/2022 65,062,980
28,000,000 Petroleos Mexicanos, 4.88%, 24/01/2022 29,190,000
25,000,000 Qatar Government International Bond, 5.25%, 20/01/2020 25,487,500
20,000,000 United States Treasury Bill, 0.00%, 12/03/2019 19,994,811
18,000,000 Petroleos Mexicanos, 5.38%, 13/03/2022 18,990,000
16,299,000 YPF SA, 8.50%, 23/03/2021 15,554,104
11,183,000 TC Ziraat Bankasi AS, 5.13%, 03/05/2022 11,103,008
10,000,000 Gazprom OAO Via Gaz Capital SA, 3.85%, 06/02/2020 10,062,500
10,000,000 Caiyun International Investment Ltd, 5.50%, 08/04/2022 9,729,000
10,000,000 Teva Pharmaceutical Finance Co BV, 2.95%, 18/12/2022 8,425,000
17,000,000 Argentine Republic Government International Bond, 6.88%, 22/04/2021 7,967,550
7,125,970 Ghana Government International Bond, 7.88%, 07/08/2023 7,802,937
7,511,000 GCL New Energy Holdings Ltd, 7.10%, 30/01/2021 7,314,811
7,000,000 Emirates Reit Sukuk Ltd, 5.13%, 12/12/2022 6,812,500
5,000,000 Republic of Uzbekistan Bond, 4.75%, 20/02/2024 5,281,250
5,000,000 Nigeria Government International Bond, 5.63%, 27/06/2022 5,143,750
7,000,000 Provincia de Cordoba, 7.13%, 10/06/2021 5,110,000
5,000,000 Beijing Capital Polaris Investment Co Ltd, 4.25%, 26/03/2021 5,062,500
5,000,000 Yancoal International Resources Development Co Ltd, 5.75%, 29/12/2049 5,025,000
10,000,000 Argentine Republic Government International Bond, 3.38%, 15/01/2023 4,352,432
4,000,000 Shimao Property Holdings Ltd, 8.38%, 10/02/2022 4,167,520
9,426,000 Agua y Saneamientos Argentinos SA, 6.63%, 01/02/2023 3,731,835
3,000,000 United States Treasury Bill, 0.00%, 28/05/2019 2,999,060

INVESTMENT MANAGER’S REPORT FINANCIAL STATEMENTS
ANNUAL REPORT 2019 319
Neuberger Berman Absolute Return Multi Strategy Fund Investment Manager’s Report For the 12 months ended 31 December 2019, the total return for the USD I Accumulating Class was 8.88%. (Performance for all share classes is provided in Appendix II. Performance data quoted represent past performance and do not indicate future results. Total returns shown reflect the reinvestment of income dividends and other distributions, if any). Gains were spread across strategies; positive performance was led by the allocations to long/short equity, global macro/managed strategies and, to a lesser extent, credit and merger arbitrage/event driven strategies.
Equity markets rallied strongly throughout the year, with developed markets generally outperforming emerging markets. Treasury yields declined across the yield curve as US Federal Reserve rate cuts weighed on the short end and broad risk-on sentiment weighed on the long end. The US dollar remained range bound for the most part, strengthening slightly versus both the euro and yen, and weakening slightly versus the British pound. Energy prices were mixed as crude oil prices rose sharply while natural gas prices declined; meanwhile, the gold price increased on the back of lower bond yields and persistent geopolitical risks.
The long/short equity allocation was the largest contributor for the period. Gains from longs outpaced losses from shorts and the managers in aggregate generated positive alpha from both longs and shorts. Gains were spread across sectors and led by Information Technology, Communication Services and Health Care, while the bulk of losses came from equity index hedges.
The global macro/managed futures allocation was the second largest contributor. The managed futures strategy was responsible for the bulk of positive performance in this sleeve, with gains from interest rate positioning outpacing losses from currencies. Smaller gains within the global macro strategy were driven by long US dollar positioning primarily versus the euro. The allocation to credit strategies was a modest contributor. Gains from the asset-backed securities strategy were spread across sectors; positive performance was led by CLO debt and, to a lesser degree, came from commercial mortgage-backed securities (CMBS) and residential mortgage-backed securities (“RMBS”). Gains from the allocation to merger arbitrage/event driven strategies were driven primarily by a number of deals that tightened and/or closed during the period.
Market volatility spiked towards the end of February due to fears related to the coronavirus and its impact on global growth. We believe these factors, in addition to tensions in the Middle East, Brexit and the US Presidential Election, are likely to keep volatility at elevated levels, and we have positioned the Fund accordingly.
The allocation to the four broad strategy buckets are all similarly sized currently (20-25%).
The Portfolio’s largest strategy allocation is long/short equity. While correlations between stocks have picked up in recent weeks, we believe fear-driven selling can provide both long and short opportunities as the market prices in the potential impacts on various sectors/subsectors. Additionally, higher volatility has the potential to enable our subadvisers to trade their books more tactically to exploit attractive entry/exit points.
The third second strategy allocation is global macro/managed futures. We believe that the level of market volatility has the potential to rise and that factor has historically been beneficial for these strategies; however, we have trimmed both the systematic currency and managed futures allocations slightly given recent strong performance.
The Portfolio’s third largest allocation is to merger arbitrage/event driven strategies. Spreads have widened to more attractive levels in recent weeks and we believe robust deal volume has the potential to offer opportunity.
The fourth largest allocation in the Portfolio is credit strategies. We view this as a defensive allocation given the short duration and seniority of positioning within capital structures.

FINANCIAL STATEMENTS BALANCE SHEET
The accompanying notes form an integral part of the financial statements.
320 NEUBERGER BERMAN INVESTMENT FUNDS PLC
Neuberger Berman Absolute Return Multi Strategy Fund (Continued)
Balance Sheet
As at31 December 2019
US$
As at31 December 2018
US$ Note
Current Assets
Financial Assets at Fair Value through Profit or Loss 2 30,481,951 43,671,879
Cash and cash equivalents 3 23,598,927 23,837,303
Receivable for investments sold 146,506 7,368,910
Receivable for shares issued – 7,276
Due from brokers 3,327,037 4,025,688
Income receivable and other assets 249,281 281,622
Total Assets 57,803,702 79,192,678
Current Liabilities
Financial Liabilities at Fair Value through Profit or Loss 2 2,067,155 12,560,624
Bank overdraft 4 – 2,356
Payable for shares redeemed 3,127 64,799
Accrued expenses 236,179 322,228
Payable for investments purchased 404,537 71,670
Other payables 98,372 1,466,165
Liabilities (excluding Net Assets Attributable to Holders of Redeemable Participating Shares) 2,809,370 14,487,842
Net Assets Attributable to Holders of Redeemable Participating Shares 54,994,332 64,704,836

PROFIT AND LOSS ACCOUNT FINANCIAL STATEMENTS
The accompanying notes form an integral part of the financial statements.
ANNUAL REPORT 2019 321
Neuberger Berman Absolute Return Multi Strategy Fund (Continued) Profit and Loss Account
Year Ended31 December 2019
US$
Year Ended31 December 2018
US$ Note
Income
Interest Income 914,001 1,541,879
Dividend Income 226,754 650,256
Miscellaneous Income 121 2,853
Net Gain/(Loss) on Financial Assets and Liabilities at Fair Value through Profit or Loss 11 4,405,428 (3,973,841)
5,546,304 (1,778,853)
Expenses
Management Fee 6 867,150 1,470,468
Distribution Fee 6 13,508 15,666
Administration Fee 6 319,699 451,626
Commitment Fee 19 4,241 12,257
Custody Fee 6 4,377 3,530
Depositary Fee 6 5,611 9,352
Professional Fee 9 71,225 98,043
Directors' Fee 7 4,563 6,613
Transaction Costs 9 159,646 266,138
Audit Fee 8 24,592 31,473
VAT Rebate (911) (1,276)
Other Expenses 9 176,586 350,493
Expense Waiver 6 (286,425) (468,729)
Total Expenses 1,363,862 2,245,654
Finance Costs
Interest Expense 1,786 1,096
Distribution Paid 1 15,555 96,671
17,341 97,767
Withholding Tax 1 68,647 164,225
Profit/(Loss) Attributable to Holders of Redeemable Participating Shares from Operations 4,096,454 (4,286,499)
Income and expenses arose solely from continuing operations. .

FINANCIAL STATEMENTS STATEMENT OF CHANGES IN NET ASSETS
The accompanying notes form an integral part of the financial statements.
322 NEUBERGER BERMAN INVESTMENT FUNDS PLC
Neuberger Berman Absolute Return Multi Strategy Fund (Continued) Statement of Changes in Net Assets Attributable to Holders of Redeemable Participating Shares
Year Ended31 December 2019
US$
Year Ended31 December 2018
US$ Note
Net Assets Attributable to Holders of Redeemable Participating Shares at beginning of year 64,704,836 119,614,920
Profit/(Loss) Attributable to Holders of Redeemable Participating Shares from Operations 4,096,454 (4,286,499)
Subscriptions 5 7,679,647 11,213,324
Redemptions 5 (21,486,605) (61,836,909)
Net Assets Attributable to Holders of Redeemable Participating Shares at end of year 54,994,332 64,704,836

SCHEDULE OF INVESTMENTS FINANCIAL STATEMENTS
ANNUAL REPORT 2019 323
Neuberger Berman Absolute Return Multi Strategy Fund (Continued)
Schedule of Investments
Financial Assets at Fair Value through Profit or Loss
Number of Shares Security Description Fair Value
US$% of Net
Assets
Equities 33.74% (31 December 2018: 36.70%)
Canadian Dollar 1,000 AltaGas Canada Inc** 25,733 0.05
285 Artemis Gold Inc** 286 0.00
13,880 Canfor Corp* 129,943 0.24
4,621 Conic Metals Corp** 1,621 0.00
9,472 Continental Gold Inc* 39,079 0.07
2,600 Hudson's Bay Co* 19,809 0.03
Total Canadian Dollar 216,471 0.39
Euro 22,137 Anima Holding SpA* 114,477 0.21
876 Brenntag AG* 47,671 0.09
833 Gerresheimer AG* 64,518 0.12
620 IMCD NV* 54,145 0.10
14,028 Intertrust NV* 272,571 0.49
334 Stroeer SE & Co KGaA* 27,013 0.05
675 Wirecard AG* 81,451 0.15
76 zooplus AG* 7,285 0.01
Total Euro 669,131 1.22
Hong Kong Dollar 10,249 AIA Group Ltd* 107,596 0.20
4,149 Shanghai Pharmaceuticals Holding Co Ltd - H Shares* 8,073 0.01
2,329 Sinopharm Group Co Ltd - H Shares* 8,504 0.02
2,187 Tencent Holdings Ltd* 105,423 0.19
Total Hong Kong Dollar 229,596 0.42
Mexican Peso 6,356 Wal-Mart de Mexico SAB de CV* 18,270 0.03
Total Mexican Peso 18,270 0.03
Pound Sterling 120 ASOS Plc* 5,362 0.01
3,712 Barclays Plc* 8,834 0.02
16,243 Frasers Group Plc* 98,681 0.18
1,057 Hikma Pharmaceuticals Plc* 27,879 0.05
563 Intertek Group Plc* 43,646 0.08
36,664 ITV Plc* 73,342 0.13
2,851 Pets at Home Group Plc* 10,560 0.02

FINANCIAL STATEMENTS SCHEDULE OF INVESTMENTS
324 NEUBERGER BERMAN INVESTMENT FUNDS PLC
Neuberger Berman Absolute Return Multi Strategy Fund (Continued)
Schedule of Investments (Continued)
Financial Assets at Fair Value through Profit or Loss (continued)
Number of Shares Security Description Fair Value
US$% of Net
Assets
Equities 33.74% (31 December 2018: 36.70%) (continued)
Pound Sterling (continued)
6,599 RSA Insurance Group Plc* 49,445 0.09
622 Smiths Group Plc* 13,901 0.02
Total Pound Sterling 331,650 0.60
United States Dollar 3,550 A Schulman Inc† 1,857 0.00
1,679 Acacia Communications Inc* 113,853 0.21
3,610 Achillion Pharmaceuticals Inc* 21,768 0.04
2,650 Actua Corp* 1,179 0.00
5,490 Advanced Disposal Services Inc* 180,456 0.33
977 Air Products & Chemicals Inc* 229,585 0.42
100 Aircastle Ltd* 3,201 0.01
14,468 Alder Biopharmaceuticals Inc* 13,021 0.02
994 Alibaba Group Holding Ltd ADR* 210,827 0.38
2,900 Allergan Plc* 554,393 1.01
135 Alphabet Inc Class A* 180,818 0.33
17 Amazon.com Inc* 31,413 0.06
4,837 American International Group Inc* 248,283 0.45
407 Anixter International Inc* 37,485 0.07
2,400 API Group Corp* 25,320 0.05
756 Apple Inc* 221,999 0.40
648 Aptiv Plc* 61,541 0.11
9,784 ArQule Inc* 195,289 0.36
4,393 Audentes Therapeutics Inc* 262,877 0.48
2,346 AVX Corp* 48,023 0.09
3,870 AXA Equitable Holdings Inc* 95,899 0.17
126 Baidu Inc ADR* 15,926 0.03
2,071 Bank of America Corp* 72,941 0.13
5,923 BankUnited Inc* 216,545 0.39
860 BioMarin Pharmaceutical Inc* 72,713 0.13
1,551 Blackstone Group Inc Class A* 86,763 0.16
26 Booking Holdings Inc* 53,397 0.10
1,382 Bristol-Myers Squibb Co* 88,711 0.16
6,543 Bristol-Myers Squibb Co (Right, 31/03/2021)* 19,694 0.04
16,313 Caesars Entertainment Corp* 221,857 0.40
4,022 Canadian National Railway Co* 363,790 0.66
616 Capri Holdings Ltd* 23,500 0.04
197 Care.com Inc* 2,961 0.01

SCHEDULE OF INVESTMENTS FINANCIAL STATEMENTS
ANNUAL REPORT 2019 325
Neuberger Berman Absolute Return Multi Strategy Fund (Continued)
Schedule of Investments (Continued)
Financial Assets at Fair Value through Profit or Loss (continued)
Number of Shares Security Description Fair Value
US$% of Net
Assets
Equities 33.74% (31 December 2018: 36.70%) (continued)
United States Dollar (continued)
548 Caterpillar Inc* 80,929 0.15
6,676 Central European Media Enterprises Ltd Class A* 30,242 0.06
1,018 Cheniere Energy Inc* 62,169 0.11
528 Cia Brasileira de Distribuicao ADR* 11,547 0.02
512 Cincinnati Bell Inc* 24,320 0.04
1,114 CIRCOR International Inc* 51,511 0.09
7,084 Cision Ltd* 70,627 0.13
2,932 Clean Harbors Inc* 251,419 0.46
1,356 Clementia Pharmaceuticals Inc* 1,831 0.00
1,481 Coca-Cola Co* 81,973 0.15
1,492 Continental Building Products Inc* 54,354 0.10
2,370 Craft Brew Alliance Inc* 39,105 0.07
17,470 Cypress Semiconductor Corp* 407,575 0.74
1,614 Danaher Corp* 247,717 0.45
887 Dominion Energy Inc* 73,461 0.13
3,641 Dova Pharmaceuticals Inc* 1,821 0.00
1,663 Dover Corp* 191,677 0.35
419 Dr Reddy's Laboratories Ltd ADR* 17,003 0.03
708 eBay Inc* 25,566 0.05
3,758 El Paso Electric Co* 255,131 0.46
5,458 Elanco Animal Health Inc* 273 0.00
7,727 elf Beauty Inc* 124,637 0.23
11,113 Envista Holdings Corp* 329,389 0.60
18,381 Escrow Altaba Inc* 381,406 0.69
327 Expedia Group Inc* 35,362 0.06
957 Facebook Inc Class A* 196,424 0.36
828 Falcon Minerals Corp* 5,846 0.01
16,606 Fitbit Inc Class A* 109,101 0.20
5,424 Forum Merger II Corp Class A* 55,379 0.10
1,136 Fox Corp Class B* 41,350 0.08
603 GCI Liberty Inc* 15,967 0.03
2,138 General Motors Co* 78,251 0.14
7,456 Genworth Financial Inc Class A* 32,806 0.06
12,372 G-III Apparel Group Ltd* 414,462 0.75
5,188 Grifols SA ADR* 120,829 0.22
47,520 Gulf Coast Ultra Deep Royalty Trust** 1,236 0.00
3,183 Hancock Whitney Corp* 139,670 0.25
800 HEICO Corp Class A* 71,624 0.13

FINANCIAL STATEMENTS SCHEDULE OF INVESTMENTS
326 NEUBERGER BERMAN INVESTMENT FUNDS PLC
Neuberger Berman Absolute Return Multi Strategy Fund (Continued)
Schedule of Investments (Continued)
Financial Assets at Fair Value through Profit or Loss (continued)
Number of Shares Security Description Fair Value
US$% of Net
Assets
Equities 33.74% (31 December 2018: 36.70%) (continued)
United States Dollar (continued)
625 Hemacare Corp** 15,781 0.03
999 Innophos Holdings Inc* 31,948 0.06
325 InterXion Holding NV* 27,238 0.05
772 JPMorgan Chase & Co* 107,617 0.20
2,468 KEMET Corp* 66,759 0.12
1,905 Kirby Corp* 170,555 0.31
14,916 Ladenburg Thalmann Financial Services Inc* 51,908 0.09
782 Leidos Holdings Inc* 76,550 0.14
10,297 LKQ Corp* 367,603 0.67
345 LogMeIn Inc* 29,580 0.05
1,923 Loral Space & Communications Inc* 62,151 0.11
519 Magnit PJSC GDR* 6,257 0.01
414 Mail.Ru Group Ltd GDR* 9,232 0.02
374 Maxar Technologies Inc* 5,861 0.01
25,735 Media General Inc CVRØ 0 0.00
4,455 Medicines Co* 378,408 0.69
3,301 Mellanox Technologies Ltd* 386,811 0.70
78 MercadoLibre Inc* 44,611 0.08
1,377 Morgan Stanley* 70,392 0.13
5,121 Nebula Acquisition Corp Class A* 53,975 0.10
1,903 Nestle SA ADR** 206,019 0.37
1,012 NextEra Energy Inc* 245,066 0.45
11,794 Nomad Foods Ltd* 263,832 0.48
13,765 OMNOVA Solutions Inc* 139,164 0.25
11,050 Option Care Health Inc* 41,216 0.08
13,324 Pacific Biosciences of California Inc* 68,485 0.12
11,700 Pan American Silver Corp** 8,775 0.02
2,542 Pattern Energy Group Inc Class A* 68,011 0.12
708 PayPal Holdings Inc* 76,584 0.14
2,607 Philip Morris International Inc* 221,830 0.40
6,565 Ping Identity Holding Corp* 159,530 0.29
776 Procter & Gamble Co* 96,922 0.18
2,982 PTC Inc* 223,322 0.41
2,482 PVH Corp* 260,982 0.47
4,699 Ra Pharmaceuticals Inc* 220,524 0.40
2,184 RPM International Inc* 167,644 0.31
476 Salesforce.com Inc* 77,417 0.14
50 Samsung Electronics Co Ltd GDR* 59,650 0.11

SCHEDULE OF INVESTMENTS FINANCIAL STATEMENTS
ANNUAL REPORT 2019 327
Neuberger Berman Absolute Return Multi Strategy Fund (Continued)
Schedule of Investments (Continued)
Financial Assets at Fair Value through Profit or Loss (continued)
Number of Shares Security Description Fair Value
US$% of Net
Assets
Equities 33.74% (31 December 2018: 36.70%) (continued)
United States Dollar (continued)
2,869 ServiceMaster Global Holdings Inc* 110,916 0.20
6,066 Stars Group Inc* 158,262 0.29
24,635 Syncora Holdings Ltd** 122,682 0.22
614 Synthorx Inc* 42,912 0.08
14,713 Tallgrass Energy LP Class A* 325,452 0.59
1,013 Tapestry Inc* 27,321 0.05
1,600 TD Ameritrade Holding Corp* 79,520 0.14
2,406 Tech Data Corp* 345,502 0.63
229 Teva Pharmaceutical Industries Ltd ADR* 2,244 0.00
287 Thermo Fisher Scientific Inc* 93,238 0.17
2,181 Tiffany & Co* 291,491 0.53
823 T-Mobile US Inc* 64,540 0.12
1,250 Tobira Therapeutics Inc† 75 0.00
2,697 TriNet Group Inc* 152,677 0.28
1,089 Valmont Industries Inc* 163,110 0.30
3,300 VectoIQ Acquisition Corp* 34,056 0.06
536 Visa Inc Class A* 100,714 0.18
4,555 Vistra Energy Corp* 104,719 0.19
3,007 WABCO Holdings Inc* 407,449 0.74
702 Walt Disney Co* 101,530 0.19
2,000 WellCare Health Plans Inc* 660,420 1.20
16,539 Wesco Aircraft Holdings Inc* 182,260 0.33
1,796 WR Grace & Co* 125,451 0.23
4,241 Wright Medical Group NV* 129,266 0.24
1,392 X5 Retail Group NV GDR* 48,024 0.09
453 Yandex NV Class A* 19,701 0.04
12,507 Zayo Group Holdings Inc* 433,368 0.79
555 Zimmer Biomet Holdings Inc* 83,072 0.15
Total United States Dollar 17,090,057 31.08
Total Equities 18,555,175 33.74
Real Estate Investment Trusts 0.50% (31 December 2018: 0.08%)
United States Dollar 429 Equinix Inc 250,407 0.46
400 Liberty Property Trust 24,020 0.04
Total Real Estate Investment Trusts * 274,427 0.50

FINANCIAL STATEMENTS SCHEDULE OF INVESTMENTS
328 NEUBERGER BERMAN INVESTMENT FUNDS PLC
Neuberger Berman Absolute Return Multi Strategy Fund (Continued)
Schedule of Investments (Continued)
Financial Assets at Fair Value through Profit or Loss (continued)
Number of Shares Security Description Maturity
DateFair Value
US$% of Net
Assets
Participatory Notes 0.01% (31 December 2018: 0.01%)
United States Dollar 3,500 API Group Corp 10/10/2020 963 0.00
3,150 Forum Merger II Corp 30/09/2025 1,449 0.01
935 Nebula Acquisition Corp 12/01/2023 1,197 0.00
2,100 VectoIQ Acquisition Corp 11/06/2023 1,050 0.00
Total Participatory Notes ** 4,659 0.01
Principal Amount Security Description Coupon
Maturity Date
Fair ValueUS$
% of NetAssets
Asset Backed Securities 19.22% (31 December 2018: 16.77%)
United States Dollar 1,000,000 ALM VII R Ltd Class CR 6.04% 15/10/2028 1,003,154 1.82
187,515 Alternative Loan Trust 2005-21CB Class A17 6.00% 25/06/2035 188,595 0.34
25,922 Bear Stearns Asset Backed Securities Trust 2007-2 Class A2 2.11% 25/01/2047 26,138 0.05
1,000,000 Black Diamond CLO 2017-1 Ltd Class C 5.89% 24/04/2029 984,169 1.79
1,000,000 Catamaran CLO 2013-1A Ltd Class DR 4.74% 27/01/2028 979,226 1.78
1,000,000 Catamaran CLO 2015-1A Ltd Class DR 4.75% 22/04/2027 1,001,229 1.82
31,450 Chase Mortgage Finance Trust Series 2007-A2 Class 3A2 4.72% 25/07/2037 30,008 0.06
88,473 Citicorp Mortgage Securities Trust Series 2006-3 Class 1A10 6.25% 25/06/2036 90,906 0.17
736 Countrywide Asset-Backed Certificates Class 1AF6 3.80% 25/04/2036 739 0.00
1,000,000 Fannie Mae Connecticut Avenue Securities Class 1M2 3.94% 25/10/2030 1,008,620 1.83
1,000,000 Fannie Mae Connecticut Avenue Securities Class 2M2 5.44% 25/09/2029 1,051,267 1.91
549,712 Freddie Mac Structured Agency Credit Risk Debt Notes Class M3 5.94% 25/01/2025 574,160 1.04
1,000,000 GS Mortgage Securities Corp Trust 2017-SLP Class E 4.59% 10/10/2032 1,008,767 1.84
1,000,000 Hilton Orlando Trust 2018-ORL Class E 4.39% 15/12/2034 1,002,617 1.82
802,448 Motel 6 Trust 2017-MTL6 Class E 4.99% 15/08/2034 807,442 1.47
660,318 New Residential Mortgage LLC Class D 4.69% 25/05/2023 663,521 1.21
44,279 RALI Series 2004-QS13 Trust Class CB 5.00% 25/09/2019 44,120 0.08
105,171 Washington Mutual Mortgage Pass-Through Certificates WMALT Series 2005-1 Trust Class 1A1 5.50% 25/03/2035 106,338 0.19
Total Asset Backed Securities ** 10,571,016 19.22
Total Investments 29,405,277 53.47
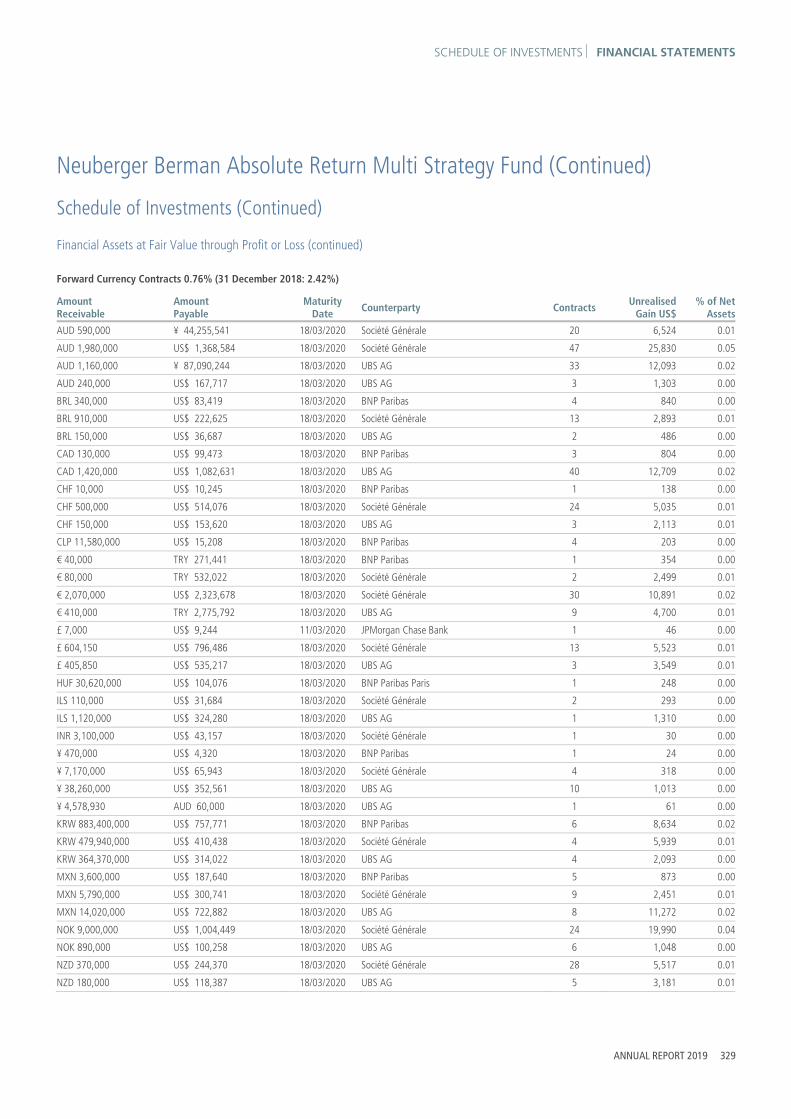
SCHEDULE OF INVESTMENTS FINANCIAL STATEMENTS
ANNUAL REPORT 2019 329
Neuberger Berman Absolute Return Multi Strategy Fund (Continued)
Schedule of Investments (Continued)
Financial Assets at Fair Value through Profit or Loss (continued)
Forward Currency Contracts 0.76% (31 December 2018: 2.42%)
Amount Receivable
Amount Payable
Maturity Date Counterparty Contracts Unrealised
Gain US$% of Net
Assets
AUD 590,000 ¥ 44,255,541 18/03/2020 Société Générale 20 6,524 0.01
AUD 1,980,000 US$ 1,368,584 18/03/2020 Société Générale 47 25,830 0.05
AUD 1,160,000 ¥ 87,090,244 18/03/2020 UBS AG 33 12,093 0.02
AUD 240,000 US$ 167,717 18/03/2020 UBS AG 3 1,303 0.00
BRL 340,000 US$ 83,419 18/03/2020 BNP Paribas 4 840 0.00
BRL 910,000 US$ 222,625 18/03/2020 Société Générale 13 2,893 0.01
BRL 150,000 US$ 36,687 18/03/2020 UBS AG 2 486 0.00
CAD 130,000 US$ 99,473 18/03/2020 BNP Paribas 3 804 0.00
CAD 1,420,000 US$ 1,082,631 18/03/2020 UBS AG 40 12,709 0.02
CHF 10,000 US$ 10,245 18/03/2020 BNP Paribas 1 138 0.00
CHF 500,000 US$ 514,076 18/03/2020 Société Générale 24 5,035 0.01
CHF 150,000 US$ 153,620 18/03/2020 UBS AG 3 2,113 0.01
CLP 11,580,000 US$ 15,208 18/03/2020 BNP Paribas 4 203 0.00
€ 40,000 TRY 271,441 18/03/2020 BNP Paribas 1 354 0.00
€ 80,000 TRY 532,022 18/03/2020 Société Générale 2 2,499 0.01
€ 2,070,000 US$ 2,323,678 18/03/2020 Société Générale 30 10,891 0.02
€ 410,000 TRY 2,775,792 18/03/2020 UBS AG 9 4,700 0.01
£ 7,000 US$ 9,244 11/03/2020 JPMorgan Chase Bank 1 46 0.00
£ 604,150 US$ 796,486 18/03/2020 Société Générale 13 5,523 0.01
£ 405,850 US$ 535,217 18/03/2020 UBS AG 3 3,549 0.01
HUF 30,620,000 US$ 104,076 18/03/2020 BNP Paribas Paris 1 248 0.00
ILS 110,000 US$ 31,684 18/03/2020 Société Générale 2 293 0.00
ILS 1,120,000 US$ 324,280 18/03/2020 UBS AG 1 1,310 0.00
INR 3,100,000 US$ 43,157 18/03/2020 Société Générale 1 30 0.00
¥ 470,000 US$ 4,320 18/03/2020 BNP Paribas 1 24 0.00
¥ 7,170,000 US$ 65,943 18/03/2020 Société Générale 4 318 0.00
¥ 38,260,000 US$ 352,561 18/03/2020 UBS AG 10 1,013 0.00
¥ 4,578,930 AUD 60,000 18/03/2020 UBS AG 1 61 0.00
KRW 883,400,000 US$ 757,771 18/03/2020 BNP Paribas 6 8,634 0.02
KRW 479,940,000 US$ 410,438 18/03/2020 Société Générale 4 5,939 0.01
KRW 364,370,000 US$ 314,022 18/03/2020 UBS AG 4 2,093 0.00
MXN 3,600,000 US$ 187,640 18/03/2020 BNP Paribas 5 873 0.00
MXN 5,790,000 US$ 300,741 18/03/2020 Société Générale 9 2,451 0.01
MXN 14,020,000 US$ 722,882 18/03/2020 UBS AG 8 11,272 0.02
NOK 9,000,000 US$ 1,004,449 18/03/2020 Société Générale 24 19,990 0.04
NOK 890,000 US$ 100,258 18/03/2020 UBS AG 6 1,048 0.00
NZD 370,000 US$ 244,370 18/03/2020 Société Générale 28 5,517 0.01
NZD 180,000 US$ 118,387 18/03/2020 UBS AG 5 3,181 0.01

FINANCIAL STATEMENTS SCHEDULE OF INVESTMENTS
330 NEUBERGER BERMAN INVESTMENT FUNDS PLC
Neuberger Berman Absolute Return Multi Strategy Fund (Continued)
Schedule of Investments (Continued)
Financial Assets at Fair Value through Profit or Loss (continued)
Forward Currency Contracts 0.76% (31 December 2018: 2.42%) (continued)
Amount Receivable
Amount Payable
Maturity Date Counterparty Contracts Unrealised
Gain US$% of Net
Assets
PHP 21,070,000 US$ 413,385 18/03/2020 UBS AG 1 887 0.00
PLN 80,000 US$ 21,044 18/03/2020 BNP Paribas 1 83 0.00
PLN 3,540,000 € 822,644 18/03/2020 Société Générale 17 7,088 0.01
PLN 2,060,000 US$ 536,747 18/03/2020 Société Générale 14 7,274 0.01
PLN 480,000 US$ 126,357 18/03/2020 UBS AG 2 406 0.00
PLN 280,000 € 65,417 18/03/2020 UBS AG 4 167 0.00
SEK 4,390,000 US$ 469,253 18/03/2020 Société Générale 7 1,421 0.00
SGD 1,780,000 US$ 1,310,464 18/03/2020 BNP Paribas 2 14,262 0.03
SGD 150,000 US$ 110,818 18/03/2020 Société Générale 1 816 0.00
THB 8,090,000 US$ 266,913 18/03/2020 BNP Paribas 1 3,653 0.01
THB 670,000 US$ 22,182 18/03/2020 Société Générale 1 226 0.00
US$ 66,048 TRY 400,000 18/03/2020 BNP Paribas 2 92 0.00
US$ 4,629 ¥ 500,000 18/03/2020 BNP Paribas 1 8 0.00
US$ 294,802 £ 220,000 18/03/2020 Société Générale 5 2,752 0.01
US$ 11,288 ¥ 1,220,000 18/03/2020 Société Générale 2 14 0.00
US$ 13,971 SEK 130,000 18/03/2020 Société Générale 2 33 0.00
US$ 116,271 TRY 700,000 18/03/2020 Société Générale 3 848 0.00
US$ 42,920 INR 3,080,000 18/03/2020 Société Générale 2 10 0.00
US$ 26,893 £ 20,000 18/03/2020 UBS AG 1 343 0.00
US$ 51,481 MXN 980,000 18/03/2020 UBS AG 1 163 0.00
US$ 113,275 TRY 680,000 18/03/2020 UBS AG 4 1,149 0.00
US$ 360,326 ¥ 38,920,000 18/03/2020 UBS AG 3 651 0.00
ZAR 5,310,000 US$ 363,277 18/03/2020 Société Générale 24 12,703 0.02
CHF Hedged Classes CHF 589,127 US$ 594,703 22/01/2020 Citibank NA 1 14,518 0.03
CHF 615,836 US$ 620,768 22/01/2020 Goldman Sachs International 2 16,073 0.03
CHF 848,352 US$ 858,151 22/01/2020 Westpac Banking Corp 6 19,136 0.03
EUR Hedged Classes € 1,289,089 US$ 1,423,947 22/01/2020 Citibank NA 1 24,819 0.05
€ 1,289,089 US$ 1,422,677 22/01/2020 Goldman Sachs International 1 26,089 0.05
€ 1,174,153 US$ 1,296,914 22/01/2020 Westpac Banking Corp 11 22,680 0.04
GBP Hedged Classes £ 267,990 US$ 331,163 22/01/2020 Citibank NA 1 24,058 0.04
£ 267,990 US$ 330,919 22/01/2020 Goldman Sachs International 1 24,302 0.04
£ 254,382 US$ 315,149 22/01/2020 Westpac Banking Corp 6 22,034 0.04
US$ 6 £ 5 22/01/2020 Westpac Banking Corp 1 0 0.00

SCHEDULE OF INVESTMENTS FINANCIAL STATEMENTS
ANNUAL REPORT 2019 331
Neuberger Berman Absolute Return Multi Strategy Fund (Continued)
Schedule of Investments (Continued)
Financial Assets at Fair Value through Profit or Loss (continued)
Forward Currency Contracts 0.76% (31 December 2018: 2.42%) (continued)
Amount Receivable
Amount Payable
Maturity Date Counterparty Contracts Unrealised
Gain US$% of Net
Assets
JPY Hedged Classes ¥ 35,481,614 US$ 325,039 22/01/2020 Westpac Banking Corp 4 1,811 0.00
US$ 563,019 ¥ 60,797,420 22/01/2020 Goldman Sachs International 2 2,964 0.01
US$ 397,204 ¥ 42,998,866 22/01/2020 Westpac Banking Corp 6 1,105 0.00
Total Unrealised Gain on Forward Currency Contracts ∞ 417,466 0.76
Futures Contracts 0.04% (31 December 2018: 0.62%)
Number of Contracts Description Unrealised
Gain US$% of Net
Assets
(47) 3-Month Euro Euribor Future March 2022 6,033 0.01
(2) British Pound Currency Future March 2020 1,655 0.00
(6) Euro-BOBL Future March 2020 2,032 0.01
(6) Euro-Bund Future March 2020 3,648 0.01
3 Hang Seng China Enterprises Index Future January 2020 1,264 0.00
1 Hang Seng Index Future January 2020 1,842 0.00
(1) Japanese Yen Currency Future March 2020 101 0.00
1 Nasdaq 100 E-mini Future March 2020 2,940 0.01
1 S&P 500 E-mini Future March 2020 387 0.00
(1) United Kingdom Long Gilt Future March 2020 782 0.00
5 US Treasury 5-Year Note (CBT) Future March 2020 164 0.00
Total Unrealised Gain on Futures Contracts ± 20,848 0.04
Contracts for Differences 1.16% (31 December 2018: 10.40%)
Units Security Description Counterparty UnrealisedGain US$
% of Net Assets
(469) Alliance Data Systems Corp JPMorgan Chase Bank 5,394 0.01
(181) Allianz SE Morgan Stanley 53 0.00
3,188 Altran Technologies SA JPMorgan Chase Bank 643 0.00
51 Amazon.com Inc JPMorgan Chase Bank 4,103 0.01
2,033 Amundi SA Morgan Stanley 44,100 0.08
(320) Anheuser-Busch InBev SA Morgan Stanley 256 0.00
28,901 Anima Holdings SPA Morgan Stanley 36,811 0.07
418 Aon Plc JPMorgan Chase Bank 6,688 0.01
(1,613) Banco Bilbao Vizcaya Argentaria SA Morgan Stanley 84 0.00
9,295 Barclays Plc Morgan Stanley 2,702 0.01
(9,226) Blackberry Ltd JPMorgan Chase Bank 2,312 0.00
2,209 BNP Paribas SA Morgan Stanley 6,655 0.01
3,406 Brenntag AG Morgan Stanley 20,081 0.04
671 Broadcom Ltd JPMorgan Chase Bank 31,324 0.06

FINANCIAL STATEMENTS SCHEDULE OF INVESTMENTS
332 NEUBERGER BERMAN INVESTMENT FUNDS PLC
Neuberger Berman Absolute Return Multi Strategy Fund (Continued)
Schedule of Investments (Continued)
Financial Assets at Fair Value through Profit or Loss (continued)
Contracts for Differences 1.16% (31 December 2018: 10.40%) (continued)
Units Security Description Counterparty UnrealisedGain US$
% of Net Assets
(1,712) Bunzl Plc Morgan Stanley 302 0.00
1,442 Bureau Veritas SA Morgan Stanley 3,972 0.01
(909) C.H. Robinson Worldwide Inc JPMorgan Chase Bank 7,564 0.01
(985) Canadian Imperial Bank of Commerce - CAD JPMorgan Chase Bank 2,463 0.00
(2,229) Canadian Tire Corp JPMorgan Chase Bank 3,673 0.01
(1,113) Cardinal Health Inc JPMorgan Chase Bank 5,109 0.01
(1,393) Cheesecake Factory Inc JPMorgan Chase Bank 5,718 0.01
(2,630) Cinemark Holdings Inc JPMorgan Chase Bank 8,542 0.02
2,426 Cisco Systems Inc JPMorgan Chase Bank 3,882 0.01
1,522 Citigroup Inc JPMorgan Chase Bank 13,196 0.02
18,544 Clarivate Analytics Plc JPMorgan Chase Bank 185 0.00
239,973 Cobham Plc JPMorgan Chase Bank 44,239 0.08
(2,304) Colruyt SA Morgan Stanley 11,225 0.02
600 Croda International Plc Morgan Stanley 6,971 0.01
(193) Cummins Inc JPMorgan Chase Bank 180 0.00
1,748 Danone Morgan Stanley 6,531 0.01
(2,653) Deutsche Telekom AG Morgan Stanley 899 0.00
(2,872) Diageo Plc Morgan Stanley 749 0.00
(1,520) EDF Morgan Stanley 4,327 0.01
19,406 EI Group Plc JPMorgan Chase Bank 2,965 0.01
(2,776) Enel SpA Morgan Stanley 96 0.00
(1,431) Engie SA Morgan Stanley 197 0.00
(2,249) Eni SpA Morgan Stanley 985 0.00
361 Eurofins Scientific Morgan Stanley 32,891 0.06
977 Evergy Inc JPMorgan Chase Bank 1,172 0.00
35 Faurecia SA JPMorgan Chase Bank 70 0.00
1,047 Fiserv Inc JPMorgan Chase Bank 9,151 0.02
(2,773) Franklin Resources Inc JPMorgan Chase Bank 3,577 0.01
1,737 Gamenet Group SpA JPMorgan Chase Bank 920 0.00
(3,706) Gap Inc JPMorgan Chase Bank 459 0.00
1,848 Gerresheimer Morgan Stanley 22,271 0.04
1,779 GrandVision NV JPMorgan Chase Bank 848 0.00
(6,578) Hanesbrands Inc JPMorgan Chase Bank 1,080 0.00
(640) Heico Corp JPMorgan Chase Bank 9,176 0.02
(1,087) Hershey Co JPMorgan Chase Bank 1,428 0.00
1,117 Hiedelbergcement AG Morgan Stanley 7,251 0.01
1,035 Humana Inc JPMorgan Chase Bank 11,805 0.02
1,914 Hypermarcas SA Morgan Stanley 2,367 0.00

SCHEDULE OF INVESTMENTS FINANCIAL STATEMENTS
ANNUAL REPORT 2019 333
Neuberger Berman Absolute Return Multi Strategy Fund (Continued)
Schedule of Investments (Continued)
Financial Assets at Fair Value through Profit or Loss (continued)
Contracts for Differences 1.16% (31 December 2018: 10.40%) (continued)
Units Security Description Counterparty UnrealisedGain US$
% of Net Assets
651 Iliad SA Morgan Stanley 7,500 0.01
(4,583) Intesa Sanpaolo SpA Morgan Stanley 112 0.00
(3,652) Iron Mountain Europe Plc JPMorgan Chase Bank 1,732 0.00
(1,529) JM Smucker Co JPMorgan Chase Bank 12,160 0.02
1,070 Just Eat Plc JPMorgan Chase Bank 1,726 0.00
59 Kering SA Morgan Stanley 8,684 0.02
(518) Koninklijke Philips NV Morgan Stanley 24 0.00
1,378 LafargeHolcim Ltd Morgan Stanley 10,700 0.02
(1,260) Lagardere SCA Morgan Stanley 4,613 0.01
(693) Landstar System Inc JPMorgan Chase Bank 128 0.00
995 Lennar Corp - Class B JPMorgan Chase Bank 5,055 0.01
(21,505) Marks & Spencer Group Plc Morgan Stanley 12,810 0.02
2,842 Microsoft Corp JPMorgan Chase Bank 20,026 0.04
1,494 Migros Ticaret A.S Morgan Stanley 762 0.00
149 Naver Corp Morgan Stanley 2,925 0.01
(5,981) Orange SA Morgan Stanley 4,689 0.01
562 OSRAM Licht AG JPMorgan Chase Bank 3,242 0.01
(10,014) Pearson Plc JPMorgan Chase Bank 13,535 0.02
(512) Peugeot SA JPMorgan Chase Bank 1,175 0.00
881 Phillips 66 JPMorgan Chase Bank 3,621 0.01
20,099 Pioneer Foods Group Ltd JPMorgan Chase Bank 15,181 0.03
20,635 Premier Foods Plc JPMorgan Chase Bank 843 0.00
1,210 Progressive Corp JPMorgan Chase Bank 3,298 0.01
36,628 QMS Media Ltd JPMorgan Chase Bank 519 0.00
(1,075) Royal Bank of Canada JPMorgan Chase Bank 1,562 0.00
3,494 Ryanair Holdings Plc Morgan Stanley 16,914 0.03
(469) Sanofi Morgan Stanley 64 0.00
(1,734) Schwab Charles Corp JPMorgan Chase Bank 4,497 0.01
986 Societe Generale SA Morgan Stanley 8,232 0.02
23,546 Sophos Group Plc JPMorgan Chase Bank 1,709 0.00
2,530 Spire Healthcare Group Plc JPMorgan Chase Bank 731 0.00
1,149 Stroeer Media AG Morgan Stanley 13,660 0.03
400 Swedol AB JPMorgan Chase Bank 74 0.00
(1,365) Telefonica SA Morgan Stanley 230 0.00
(2,095) Texas Roadhouse Inc JPMorgan Chase Bank 2,999 0.01
(595) Trex Co Inc JPMorgan Chase Bank 851 0.00
1,288 United Technologies Corp JPMorgan Chase Bank 29,416 0.05
1,743 Walt Disney Co JPMorgan Chase Bank 22,541 0.04

FINANCIAL STATEMENTS SCHEDULE OF INVESTMENTS
334 NEUBERGER BERMAN INVESTMENT FUNDS PLC
Neuberger Berman Absolute Return Multi Strategy Fund (Continued)
Schedule of Investments (Continued)
Financial Assets at Fair Value through Profit or Loss (continued)
Contracts for Differences 1.16% (31 December 2018: 10.40%) (continued)
Units Security Description Counterparty UnrealisedGain US$
% of Net Assets
(865) Zscaler Inc JPMorgan Chase Bank 178 0.00
Total Unreazlised Gain on Contracts for Differences ∞ 638,360 1.16
Fair Value % of Net
US$ Assets
Total Financial Assets at Fair Value through Profit or Loss 30,481,951 55.43
Financial Liabilities at Fair Value through Profit or Loss
Forward Currency Contracts (2.06%) (31 December 2018: (0.58%))
Amount Receivable
Amount Payable
Maturity Date Counterparty Contracts Unrealised
Loss US$% of Net
Assets
AUD 30,000 ¥ 2,286,750 18/03/2020 UBS AG 1 (5) (0.00)
BRL 60,000 US$ 14,884 18/03/2020 BNP Paribas 1 (15) (0.00)
CHF 10,000 US$ 10,396 18/03/2020 Société Générale 1 (14) (0.00)
CLP 9,020,000 US$ 12,063 18/03/2020 BNP Paribas 2 (58) (0.00)
€ 84,081 PLN 360,000 18/03/2020 Société Générale 4 (244) (0.00)
€ 60,000 US$ 67,687 18/03/2020 Société Générale 1 (19) (0.00)
€ 140,147 PLN 600,000 18/03/2020 UBS AG 2 (394) (0.00)
£ 90,000 US$ 120,387 18/03/2020 Société Générale 3 (912) (0.00)
HUF 1,050,000 US$ 3,588 18/03/2020 Société Générale 1 (11) (0.00)
INR 2,540,000 US$ 35,514 18/03/2020 BNP Paribas 1 (128) (0.00)
INR 31,850,000 US$ 445,397 18/03/2020 Société Générale 11 (1,681) (0.00)
INR 31,050,000 US$ 433,856 18/03/2020 UBS AG 2 (1,285) (0.00)
¥ 3,737,807 AUD 50,000 18/03/2020 Société Générale 3 (670) (0.00)
¥ 680,000 US$ 6,298 18/03/2020 Société Générale 1 (14) (0.00)
¥ 4,438,044 AUD 60,000 18/03/2020 UBS AG 1 (1,241) (0.00)
¥ 22,590,000 US$ 208,935 18/03/2020 UBS AG 4 (172) (0.00)
MXN 890,000 US$ 46,662 18/03/2020 BNP Paribas 1 (58) (0.00)
PHP 1,710,000 US$ 33,711 18/03/2020 Société Générale 1 (90) (0.00)
SEK 790,000 US$ 84,982 18/03/2020 Société Générale 2 (282) (0.00)
TRY 2,384,189 € 360,000 18/03/2020 Société Générale 1 (12,881) (0.03)
TRY 1,660,000 US$ 279,539 18/03/2020 Société Générale 6 (5,820) (0.01)
US$ 25,789 ¥ 2,810,000 18/03/2020 BNP Paribas 3 (178) (0.00)
US$ 291,342 HUF 86,300,000 18/03/2020 BNP Paribas 1 (2,690) (0.01)
US$ 5,643 THB 170,000 18/03/2020 BNP Paribas 1 (43) (0.00)
US$ 9,507 CLP 7,230,000 18/03/2020 BNP Paribas 1 (116) (0.00)
US$ 226,017 CAD 294,947 31/03/2020 Brown Brothers Harriman 2 (1,505) (0.00)
US$ 247,728 HKD 1,934,658 17/01/2020 Brown Brothers Harriman 1 (520) (0.00)

SCHEDULE OF INVESTMENTS FINANCIAL STATEMENTS
ANNUAL REPORT 2019 335
Neuberger Berman Absolute Return Multi Strategy Fund (Continued)
Schedule of Investments (Continued)
Financial Liabilities at Fair Value through Profit or Loss (continued)
Forward Currency Contracts (2.06%) (31 December 2018: (0.58%)) (continued)
Amount Receivable
Amount Payable
Maturity Date Counterparty Contracts Unrealised
Loss US$% of Net
Assets
US$ 406,265 £ 307,875 17/01/2020 Brown Brothers Harriman 1 (1,763) (0.00)
US$ 778 CHF 762 17/01/2020 Brown Brothers Harriman 1 (10) (0.00)
US$ 941,626 € 843,687 17/01/2020 Brown Brothers Harriman 1 (6,258) (0.01)
US$ 11,949 € 10,700 11/03/2020 JPMorgan Chase Bank 3 (114) (0.00)
US$ 19,387 £ 14,700 11/03/2020 JPMorgan Chase Bank 1 (124) (0.00)
US$ 11,279 CAD 14,900 11/03/2020 JPMorgan Chase Bank 2 (214) (0.00)
US$ 105,939 CLP 81,930,000 18/03/2020 Société Générale 1 (3,105) (0.01)
US$ 29,831 HUF 8,790,000 18/03/2020 Société Générale 2 (117) (0.00)
US$ 37,066 SGD 50,000 18/03/2020 Société Générale 2 (145) (0.00)
US$ 493,739 ¥ 53,720,000 18/03/2020 Société Générale 22 (2,709) (0.01)
US$ 15,200 CAD 20,000 18/03/2020 Société Générale 1 (227) (0.00)
US$ 475,266 INR 34,170,000 18/03/2020 Société Générale 9 (772) (0.00)
US$ 20,202 NZD 30,000 18/03/2020 Société Générale 3 (60) (0.00)
US$ 201,000 PLN 770,000 18/03/2020 Société Générale 6 (2,348) (0.01)
US$ 1,907,796 € 1,710,000 18/03/2020 Société Générale 25 (20,760) (0.04)
US$ 275,462 £ 210,000 18/03/2020 Société Générale 9 (3,312) (0.01)
US$ 112,507 CHF 110,000 18/03/2020 Société Générale 5 (1,697) (0.00)
US$ 1,168,678 NOK 10,670,000 18/03/2020 Société Générale 8 (45,853) (0.08)
US$ 157,942 AUD 230,000 18/03/2020 Société Générale 10 (4,033) (0.01)
US$ 8,688 ILS 30,000 18/03/2020 Société Générale 1 (33) (0.00)
US$ 673,932 KRW 803,350,000 18/03/2020 UBS AG 2 (23,024) (0.04)
US$ 33,793 PLN 130,000 18/03/2020 UBS AG 2 (538) (0.00)
US$ 70,141 BRL 290,000 18/03/2020 UBS AG 1 (1,727) (0.00)
US$ 121,873 TRY 740,000 18/03/2020 UBS AG 4 (146) (0.00)
US$ 187,019 ¥ 20,340,000 18/03/2020 UBS AG 11 (951) (0.00)
US$ 37,971 CAD 50,000 18/03/2020 UBS AG 2 (597) (0.00)
US$ 499,694 AUD 730,000 18/03/2020 UBS AG 1 (14,407) (0.03)
CHF Hedged Classes US$ 160,229 CHF 158,726 22/01/2020 Citibank NA 1 (3,912) (0.01)
US$ 173,827 CHF 172,379 22/01/2020 Goldman Sachs International 3 (4,432) (0.01)
US$ 236,423 CHF 234,037 22/01/2020 Westpac Banking Corp 3 (5,597) (0.01)
EUR Hedged Classes US$ 179,406 € 162,415 22/01/2020 Citibank NA 1 (3,127) (0.01)
US$ 233,581 € 211,293 22/01/2020 Goldman Sachs International 4 (3,886) (0.01)
US$ 370,369 € 334,174 22/01/2020 Westpac Banking Corp 17 (5,201) (0.01)
GBP Hedged Classes US$ 87,551 £ 70,850 22/01/2020 Citibank NA 1 (6,360) (0.01)
US$ 95,112 £ 76,795 22/01/2020 Goldman Sachs International 3 (6,679) (0.01)
US$ 97,055 £ 77,810 22/01/2020 Westpac Banking Corp 7 (6,083) (0.01)

FINANCIAL STATEMENTS SCHEDULE OF INVESTMENTS
336 NEUBERGER BERMAN INVESTMENT FUNDS PLC
Neuberger Berman Absolute Return Multi Strategy Fund (Continued)
Schedule of Investments (Continued)
Financial Liabilities at Fair Value through Profit or Loss (continued)
Forward Currency Contracts (2.06%) (31 December 2018: (0.58%)) (continued)
Amount Receivable
Amount Payable
Maturity Date Counterparty Contracts Unrealised
Loss US$% of Net
Assets
JPY Hedged Classes ¥ 1,655,213,606 US$ 15,572,913 22/01/2020 Citibank NA 2 (325,370) (0.59)
¥ 1,655,213,608 US$ 15,567,639 22/01/2020 Goldman Sachs International 2 (320,096) (0.58)
¥ 1,420,540,276 US$ 13,362,745 22/01/2020 Westpac Banking Corp 3 (276,972) (0.50)
US$ 107,273 ¥ 11,718,420 22/01/2020 Westpac Banking Corp 3 (675) (0.00)
Total Unrealised Loss on Forward Currency Contracts ∞ (1,134,480) (2.06)
Futures Contracts (0.31%) (31 December 2018: (0.20%))
Number of Contracts Description Unrealised
Loss US$% of Net
Assets
(2) 90-Day Eurodollar Future September 2021 (300) (0.00)
(3) 90-Day Eurodollar Future March 2022 (363) (0.00)
(14) 90-Day Sterling Future September 2021 (903) (0.00)
(21) Australian Dollar Currency Future March 2020 (36,791) (0.07)
(7) Bankers Acceptance Future September 2020 (174) (0.00)
2 Canadian 10-Year Bond Future March 2020 (2,437) (0.01)
(3) Canadian Dollar Currency Future March 2020 (4,314) (0.01)
(59) Euro FX Currency Future March 2020 (86,542) (0.16)
6 Euro Stoxx 50 Future March 2020 (707) (0.00)
(1) Euro-BTP Future March 2020 (370) (0.00)
2 Euro-Bund Future March 2020 (3,592) (0.01)
1 Euro-Buxl 30-Year Bond Future March 2020 (4,984) (0.01)
1 Euro-OAT Future March 2020 (1,549) (0.00)
3 FTSE 100 Index Future March 2020 (689) (0.00)
(1) New Zealand Dollar Currency Future March 2020 (1,850) (0.00)
1 Norwegian Krone Currency Future March 2020 (4,193) (0.01)
(2) S&P 500 E-mini Future March 2020 (3,170) (0.01)
9 SGX Nifty 50 Future January 2020 (1,587) (0.00)
(4) South African Rand Currency (CME) Future March 2020 (7,950) (0.01)
3 United Kingdom Long Gilt Future March 2020 (4,544) (0.01)
2 US Treasury 10-Year Note (CBT) Future March 2020 (203) (0.00)
1 US Treasury Long Bond (CBT) Future March 2020 (1,000) (0.00)
Total Unrealised Loss on Futures Contracts ± (168,212) (0.31)

SCHEDULE OF INVESTMENTS FINANCIAL STATEMENTS
ANNUAL REPORT 2019 337
Neuberger Berman Absolute Return Multi Strategy Fund (Continued)
Schedule of Investments (Continued)
Financial Liabilities at Fair Value through Profit or Loss (continued)
Written Options Contracts (0.00%) (31 December 2018: (0.00%))
Number of Contracts
Expiration Date Type Premium
US$Fair Value
US$% of Net
Assets
Call Options
33 17/01/20 ArQule Inc, Strike Price $20 1,139 (413) (0.00)
42 17/04/20 ArQule Inc, Strike Price $20 1,541 (735) (0.00)
Total Loss on Written Options Contracts ± (1,148) (0.00)
Contracts for Differences (1.39%) (31 December 2018: (17.99%))
Units Security Description Counterparty Unrealised Loss US$
% of Net Assets
(454) 3M Co JPMorgan Chase Bank (4,008) (0.01)
(2,512) AbbVie Inc JPMorgan Chase Bank (45,463) (0.07)
(4,940) Abercrombie & Fitch Co JPMorgan Chase Bank (4,690) (0.01)
(1,421) Acuity Brands Inc JPMorgan Chase Bank (13,940) (0.03)
(2,535) Adtalem Global Education Inc JPMorgan Chase Bank (451) (0.00)
(304) Air Liquide SA Morgan Stanley (264) (0.00)
29 ASOS Plc Morgan Stanley (1,083) (0.00)
729 Aspen Pharmacare Holding Morgan Stanley (226) (0.00)
10,911 Atrium European Real Estate Inc JPMorgan Chase Bank (1,622) (0.00)
(825) AXA SA Morgan Stanley (61) (0.00)
(5,037) Banco Santander SA Morgan Stanley (56) (0.00)
(372) BASF SE Morgan Stanley (186) (0.00)
(220) Bayerische Motoren Werke AG Morgan Stanley (54) (0.00)
(1,193) Belden Inc JPMorgan Chase Bank (3,764) (0.01)
(2,957) Bloom Energdy Corp JPMorgan Chase Bank (4,534) (0.01)
248 Bolsas y Mercados Espanoles SHMSF SA JPMorgan Chase Bank (122) (0.00)
(983) Canadian Imperial Bank of Commerce - USD JPMorgan Chase Bank (573) (0.00)
(2,920) Career Education Corp Morgan Stanley (9,362) (0.02)
(5,306) Career Education Corp JPMorgan Chase Bank (10,486) (0.02)
(6,760) Centene Corp JPMorgan Chase Bank (111,342) (0.20)
(4,044) Cerence Inc JPMorgan Chase Bank (47,875) (0.09)
(249) Clorox Co JPMorgan Chase Bank (1,327) (0.00)
15,327 Cott Corp JPMorgan Chase Bank (9,337) (0.02)
(18) Credit Acceptance Corp JPMorgan Chase Bank (159) (0.00)
3,535 Credit Acceptance Corp JPMorgan Chase Bank (162) (0.00)
(48) Credit Acceptance Corp Morgan Stanley (960) (0.00)
(414) Daimler AG Morgan Stanley (115) (0.00)
(653) Deutsche Post AG Morgan Stanley (188) (0.00)
(1,400) Eldorado Resorts Inc JPMorgan Chase Bank (10,730) (0.02)
(376) Elisa OYJ Morgan Stanley (560) (0.00)

FINANCIAL STATEMENTS SCHEDULE OF INVESTMENTS
338 NEUBERGER BERMAN INVESTMENT FUNDS PLC
Neuberger Berman Absolute Return Multi Strategy Fund (Continued)
Schedule of Investments (Continued)
Financial Liabilities at Fair Value through Profit or Loss (continued)
Contracts for Differences (1.39%) (31 December 2018: (17.99%)) (continued)
Units Security Description Counterparty Unrealised Loss US$
% of Net Assets
(424) Estee Lauder Companies JPMorgan Chase Bank (9,254) (0.02)
(1,035) Exxon Mobil Corp JPMorgan Chase Bank (674) (0.00)
899 Fiat Chrysler Automobiles NV JPMorgan Chase Bank (882) (0.00)
(2,748) Flowers Foods Inc JPMorgan Chase Bank (557) (0.00)
(1,346) Flutter Entertainment Plc JPMorgan Chase Bank (27,943) (0.05)
(7,935) Fulton Financial Corp JPMorgan Chase Bank (9,642) (0.02)
(780) General Mills Inc JPMorgan Chase Bank (1,152) (0.00)
(23) Givaudan SA Morgan Stanley (19,143) (0.03)
(1,346) GlaxoSmithKline Plc Morgan Stanley (5,005) (0.01)
(3,601) Grifols SA JPMorgan Chase Bank (25,839) (0.05)
1,841 Haldex AB JPMorgan Chase Bank (834) (0.00)
(200) Hannover Rueck SE Morgan Stanley (2,230) (0.00)
4,015 Health Insurance Innovation JPMorgan Chase Bank (26,001) (0.05)
(2,701) Hennes & Mauritz AB Morgan Stanley (2,071) (0.00)
(2,324) Hormel Foods Corp JPMorgan Chase Bank (8,425) (0.02)
(10,560) HSBC Holdings Plc JPMorgan Chase Bank (4,859) (0.01)
(435) International Flavors & Fragrances Inc JPMorgan Chase Bank (2,976) (0.01)
50 Kabel Deutschland Holding AG JPMorgan Chase Bank (138) (0.00)
(3,206) Koninklijke Ahold NV Morgan Stanley (6,381) (0.01)
(784) Lennar Corp - Class A JPMorgan Chase Bank (4,767) (0.01)
1,650 Lennar Corp - Class A JPMorgan Chase Bank (6,350) (0.01)
(1,403) LyondellBasell Industries NV JPMorgan Chase Bank (15,553) (0.03)
(270) Merck & Co Inc Morgan Stanley (3,566) (0.01)
948 Motorola Solutions Inc JPMorgan Chase Bank (8,124) (0.01)
(845) Murphy USA Inc JPMorgan Chase Bank (24,367) (0.04)
(2,540) National Bank of Canada JPMorgan Chase Bank (14,813) (0.03)
(164) Netflix Inc JPMorgan Chase Bank (5,261) (0.01)
(242) Next Plc Morgan Stanley (5,131) (0.01)
(2,907) Nokia OYJ Morgan Stanley (135) (0.00)
(10,295) Nuance Communications Inc JPMorgan Chase Bank (28,012) (0.05)
(2,443) Omnicom Group Inc JPMorgan Chase Bank (11,941) (0.02)
(1,618) PACCAR Inc JPMorgan Chase Bank (17,018) (0.03)
(464) Pfizer Inc Morgan Stanley (268) (0.00)
520 Publicis Groupe Morgan Stanley (5,112) (0.01)
(1,109) Qualys Inc JPMorgan Chase Bank (2,074) (0.00)
(691) Ralph Lauren Corp JPMorgan Chase Bank (13,397) (0.02)
(1,757) Robert Half International Inc JPMorgan Chase Bank (3,443) (0.01)
(64) Roche Holding AG Morgan Stanley (4,498) (0.01)

SCHEDULE OF INVESTMENTS FINANCIAL STATEMENTS
ANNUAL REPORT 2019 339
Neuberger Berman Absolute Return Multi Strategy Fund (Continued)
Schedule of Investments (Continued)
Financial Liabilities at Fair Value through Profit or Loss (continued)
Contracts for Differences (1.39%) (31 December 2018: (17.99%)) (continued)
Units Security Description Counterparty Unrealised Loss US$
% of Net Assets
(647) Rockwell Automation Inc JPMorgan Chase Bank (27,504) (0.05)
(253) Schneider Electric SA Morgan Stanley (23) (0.00)
(254) Siemens AG Morgan Stanley (13) (0.00)
(281) Simon Property Group Inc JPMorgan Chase Bank (20) (0.00)
(2,580) SoftBank Group Corp Morgan Stanley (7,044) (0.01)
(926) Square Inc Morgan Stanley (2,903) (0.01)
(8,870) Standard Chartered Plc JPMorgan Chase Bank (4,168) (0.01)
(321) Strategic Education Inc JPMorgan Chase Bank (9,114) (0.02)
(3,227) Svebska Handelsbanken AB SA JPMorgan Chase Bank (4,132) (0.01)
(69) Swisscom AG Morgan Stanley (682) (0.00)
(102) Tesla Motors Inc JPMorgan Chase Bank (16,365) (0.03)
(1,790) Trupanion Inc JPMorgan Chase Bank (26,277) (0.05)
(1,456) UMB Financial Corp JPMorgan Chase Bank (7,184) (0.01)
(314) Vinci SA Morgan Stanley (226) (0.00)
(7,946) Volvo AB JPMorgan Chase Bank (13,550) (0.02)
(1,154) Wabtec Corp JPMorgan Chase Bank (3,914) (0.01)
(1,133) Wells Fargo & Co JPMorgan Chase Bank (4,181) (0.01)
(1,485) WestRock Co JPMorgan Chase Bank (3,395) (0.01)
(1,457) Zillow Group Inc JPMorgan Chase Bank (21,084) (0.04)
Total Unrealised Loss on Contracts for Differences ∞ (763,315) (1.39)
Fair Value % of Net
US$ Assets
Total Financial Liabilities at Fair Value through Profit or Loss (2,067,155) (3.76)
Net Financial Assets at Fair Value through Profit or Loss 28,414,796 51.67
Other Net Assets 26,579,536 48.33
Net Assets Attributable to Holders of Redeemable Participating Shares 54,994,332 100.00
% of
TotalAssetsPortfolio Analysis US$
* Transferable securities and/or money market instruments admitted to an official stock exchange listing 18,445,537 31.92
** Transferable securities and/or money market instruments dealt in on a regulated market 10,957,808 18.96
† Other transferable securities and/or money market instruments 1,932 0.00
± Financial derivative instruments traded on a regulated market (148,512) (0.26)
Ø Other securities 0 0.00
∞ OTC financial derivative instruments (841,969) (1.46)
Total Investments 28,414,796 49.16

FINANCIAL STATEMENTS STATEMENT OF SIGNIFICANT PURCHASES AND SALES
340 NEUBERGER BERMAN INVESTMENT FUNDS PLC
Neuberger Berman Absolute Return Multi Strategy Fund (Continued) Statement of Significant Purchases and Sales (Unaudited) In accordance with the European Communities (Undertakings for Collective Investment in Transferable Securities) Regulations, 2011 as amended, a statement of changes in the composition of the Schedule of Investments during the reporting period is provided to ensure that Shareholders can identify changes in the investments held by the Portfolio. The following statements present the aggregate purchases and sales of transferable securities exceeding one percent of the total value of purchases or sales, respectively, for the period. At a minimum, the largest twenty purchases and twenty sales are presented, if available.
Aggregate purchases greater than one percent of the total value of purchases:
Units Security Description Cost US$
1,000,000 Fannie Mae Connecticut Avenue Securities Class 2M2, 4.63%, 25/09/2029 1,051,953
1,000,000 Hilton Orlando Trust 2018-ORL Class E, 4.33%, 15/12/2034 1,007,813
1,000,000 Black Diamond CLO 2017-1 Ltd Class C, 5.75%, 24/04/2029 947,500
805,423 New Residential Mortgage LLC Class D, 4.69%, 25/5/2023 807,437
10,564 Anadarko Petroleum Corp 751,010
703,806 Freddie Mac Structured Agency Credit Risk Debt Notes Class M3, 5.81%, 25/01/2025 738,996
6,926 Celgene Corp 625,889
8,700 Suntrust Banks Inc 569,496
2,000 WellCare Health Plans Inc 539,021
4,697 Genesee & Wyoming Inc Class A 517,867
2,900 Allergan Plc 481,275
2,013 Loxo Oncology Inc 468,599
1,323 Ultimate Software Group Inc 437,531
5,175 Medicines Corp 434,908
6,743 Altaba Inc 424,720
3,787 Spark Therapeutics Inc 421,270
12,507 Zayo Group Holdings Inc 417,930
3,601 Mellanox Technologies Ltd 417,594
17,470 Cypress Semiconductor Corp 399,253
3,007 WABCO Holdings Inc 398,493
7,752 Versum Materials Inc 397,026
2,300 Tableau Software Inc Class A 383,191
4,014 Medidata Solutions Inc 365,497

STATEMENT OF SIGNIFICANT PURCHASES AND SALES FINANCIAL STATEMENTS
ANNUAL REPORT 2019 341
Neuberger Berman Absolute Return Multi Strategy Fund (Continued)
Statement of Significant Purchases and Sales (Unaudited) (Continued) Aggregate sales greater than one percent of the total value of sales:
Units Security Description Proceeds US$
1,000,000 Madison Park Funding XV Ltd, 7.23%, 27/01/2026 994,063
9,416 Stroeer SE & Co KGaA 620,600
3,682 Microsoft Corp 515,104
9,324 Truist Financial Corp 514,159
2,809 Alibaba Group Holding Ltd ADR* 511,648
8,713 Bristol-Myers Squibb Co 484,729
9,413 Brenntag AG 482,862
126,088 Frasers Group Plc 462,601
3,832 Walt Disney Co 449,002
23,052 Intertrust NV 435,204
3,072 Carlisle Cos Inc 423,474
358 Alphabet Inc Class A 419,305
2,875 Salesforce.com Inc 417,161
3,939 Fiserv Inc 408,606
5,625 Vectren Corp 407,123
6,099 Gerresheimer AG 398,879
1,350 Anthem Inc 394,181
2,109 Cigna Corp 382,091
2,489 Allergan Plc 364,307
5,387 Cheniere Energy Inc 351,808
23,326 Energy Transfer LP 338,484
12,131 Enterprise Products Partners LP 335,325
1,637 Apple Inc 332,059
18,544 Clarivate Analytics Plc 310,797

FINANCIAL STATEMENTS INVESTMENT MANAGER’S REPORT
342 NEUBERGER BERMAN INVESTMENT FUNDS PLC
Neuberger Berman US Long Short Equity Fund Investment Manager’s Report For the 12 months ended 31 December 2019, the total return of the USD I Accumulating Class was 16.53%. (Performance for all share classes is provided in Appendix II. Performance data quoted represent past performance and do not indicate future results. Total returns shown are net of all fees and expenses and include reinvestment of income dividends and other distributions, if any).
For 2019 as a whole, the US stock market rallied sharply and posted its best calendar year since 2013. A “dovish pivot” by the US Federal Reserve (“Fed”), a resilient US economy, generally solid corporate results, and an agreement on the first phase of the trade accord between the US and China supported investor sentiment and triggered periods of robust risk appetite. These positives more than offset concerns over moderating growth overseas, Brexit uncertainties and a number of geopolitical issues. All told, the S&P 500 Index gained 31.49% in 2019.
We categorize the Portfolio’s investments on the long side into three buckets: Capital Growth, Total Return and Opportunistic. Capital Growth investments demonstrate attractive industry fundamentals, strong competitive positions, growing revenues, and attractive re-investment opportunities. Total Return investments demonstrate sustainable and/or growing streams of income that are underpinned by asset value and which can result in growing cash returns to shareholders (e.g., increased dividends, share repurchases, return of capital). The Total Return bucket also includes fixed income holdings, which today consist mainly of high yield securities. Opportunistic investments are those with identifiable catalysts. This bucket may include companies with management changes, company reorganisations, merger and acquisition activity, “hidden assets”, or other market dislocations that have the potential to unlock intrinsic value.
For the reporting period, equity longs outperformed, primarily driven by security selection in the Financials, Information Technology and Utilities sectors. On the long side, the Capital Growth, Total Return (includes fixed income) and Opportunistic buckets were positive for the period. In contrast, individual security shorts and market shorts to hedge the Portfolio detracted from performance, partially driven by the overall rise in the market during the reporting period.
Despite the market’s gyrations – due to uncertainty over global growth concerns driven by the abrupt halt in economic activity from the COVID-19 outbreak – the key market debate continues to revolve around the magnitude of the global deceleration of growth – coupled with the permanent loss of corporate cash flows from the slowdown in economic activity and how much this will impede the growth in corporate earnings in the US and elsewhere. We believe that recent volatility and wild oscillations of the stock market (meaningful peak to trough drawdowns) driven by low (and in many cases negative) global interest rates will continue to occur due to the interconnectivity and tight correlations of both the global economy and the credit and equity markets. As market dynamics change this can cause company market values to dislocate from their long-term potential values.
Nevertheless, we are very mindful of the complex world in which we live and invest. We remain mindful that our constructive view on risk assets is not without challenges as we embark on over a decade of economic expansion. Despite positive US and economic data, China and the Eurozone economies remain fragile. Additionally, the current Federal Reserve policy presents the potential for spikes in volatility, as seen during the past few years. Given the vicissitudes of an increasingly global economy, we will also remain flexible in our decisions and open-minded to new ideas across different sectors, asset classes and geographies.

BALANCE SHEET FINANCIAL STATEMENTS
The accompanying notes form an integral part of the financial statements.
ANNUAL REPORT 2019 343
Neuberger Berman US Long Short Equity Fund (Continued)
Balance Sheet
As at31 December 2019
US$
As at31 December 2018
US$ Note
Current Assets
Financial Assets at Fair Value through Profit or Loss 2 130,175,872 153,157,145
Cash and cash equivalents 3 22,356,659 28,174,644
Receivable for investments sold 76,690 54,565,126
Receivable for shares issued 181,286 17,399
Due from brokers 7,678,305 1,048,654
Income receivable and other assets 123,557 220,494
Total Assets 160,592,369 237,183,462
Current Liabilities
Financial Liabilities at Fair Value through Profit or Loss 2 4,217,268 47,810,450
Bank overdraft 4 – 494
Payable for shares redeemed 984,339 679,039
Due to brokers – 840,000
Accrued expenses 263,936 576,427
Payable for investments purchased 80,414 2,108,734
Other payables 722,898 257,534
Liabilities (excluding Net Assets Attributable to Holders of Redeemable Participating Shares) 6,268,855 52,272,678
Net Assets Attributable to Holders of Redeemable Participating Shares 154,323,514 184,910,784
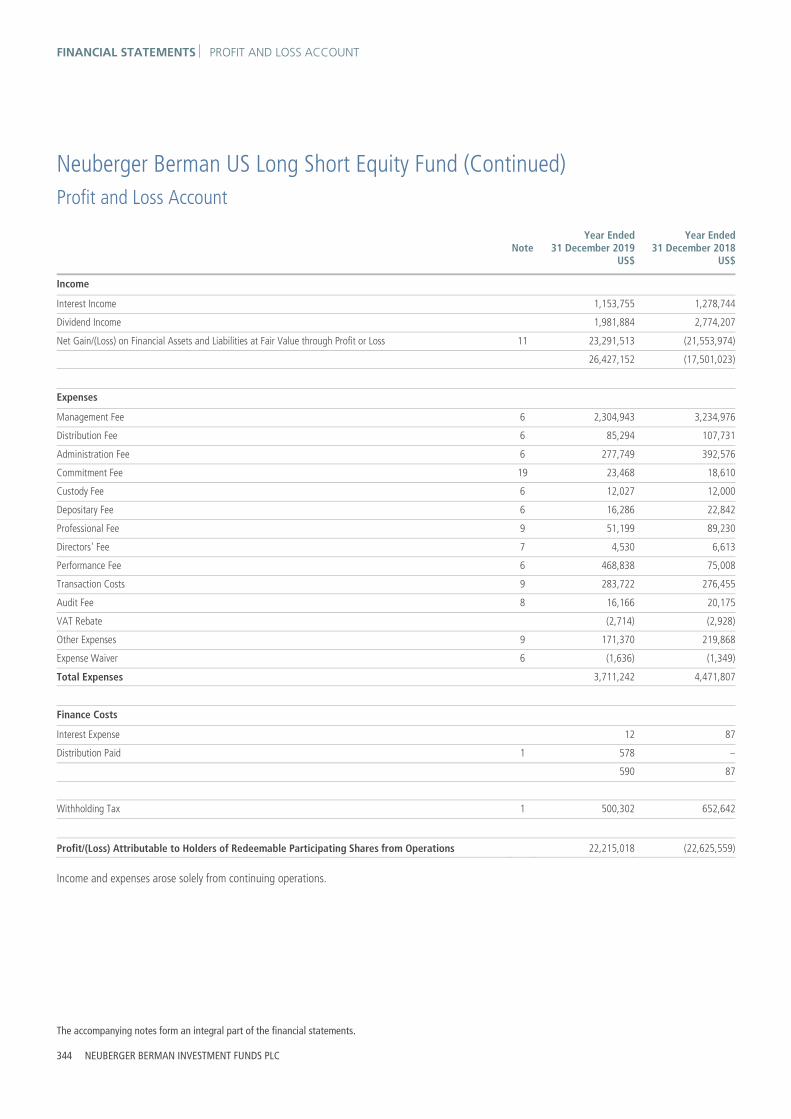
FINANCIAL STATEMENTS PROFIT AND LOSS ACCOUNT
The accompanying notes form an integral part of the financial statements.
344 NEUBERGER BERMAN INVESTMENT FUNDS PLC
Neuberger Berman US Long Short Equity Fund (Continued)
Profit and Loss Account
Year Ended31 December 2019
US$
Year Ended31 December 2018
US$ Note
Income
Interest Income 1,153,755 1,278,744
Dividend Income 1,981,884 2,774,207
Net Gain/(Loss) on Financial Assets and Liabilities at Fair Value through Profit or Loss 11 23,291,513 (21,553,974)
26,427,152 (17,501,023)
Expenses
Management Fee 6 2,304,943 3,234,976
Distribution Fee 6 85,294 107,731
Administration Fee 6 277,749 392,576
Commitment Fee 19 23,468 18,610
Custody Fee 6 12,027 12,000
Depositary Fee 6 16,286 22,842
Professional Fee 9 51,199 89,230
Directors' Fee 7 4,530 6,613
Performance Fee 6 468,838 75,008
Transaction Costs 9 283,722 276,455
Audit Fee 8 16,166 20,175
VAT Rebate (2,714) (2,928)
Other Expenses 9 171,370 219,868
Expense Waiver 6 (1,636) (1,349)
Total Expenses 3,711,242 4,471,807
Finance Costs
Interest Expense 12 87
Distribution Paid 1 578 –
590 87
Withholding Tax 1 500,302 652,642
Profit/(Loss) Attributable to Holders of Redeemable Participating Shares from Operations 22,215,018 (22,625,559)
Income and expenses arose solely from continuing operations.

STATEMENT OF CHANGES IN NET ASSETS FINANCIAL STATEMENTS
The accompanying notes form an integral part of the financial statements.
ANNUAL REPORT 2019 345
Neuberger Berman US Long Short Equity Fund (Continued) Statement of Changes in Net Assets Attributable to Holders of Redeemable Participating Shares
Year Ended31 December 2019
US$
Year Ended31 December 2018
US$ Note
Net Assets Attributable to Holders of Redeemable Participating Shares at beginning of year 184,910,784 204,967,118
Profit/(Loss) Attributable to Holders of Redeemable Participating Shares from Operations 22,215,018 (22,625,559)
Subscriptions 5 40,232,966 107,638,168
Redemptions 5 (93,035,254) (105,068,943)
Net Assets Attributable to Holders of Redeemable Participating Shares at end of year 154,323,514 184,910,784

FINANCIAL STATEMENTS SCHEDULE OF INVESTMENTS
346 NEUBERGER BERMAN INVESTMENT FUNDS PLC
Neuberger Berman US Long Short Equity Fund (Continued)
Schedule of Investments
Financial Assets at Fair Value through Profit or Loss
Number of Shares Security Description Fair Value
US$% of Net
Assets
Equities 78.39% (31 December 2018: 77.11%)
United States Dollar 44,500 Activision Blizzard Inc 2,644,190 1.71
2,930 Alphabet Inc Class A 3,924,413 2.54
37 Alphabet Inc Class C 49,470 0.03
1,700 Amazon.com Inc 3,141,328 2.04
5,800 American Water Works Co Inc 712,530 0.46
9,800 Amphenol Corp Class A 1,060,654 0.69
9,500 Apple Inc 2,789,675 1.81
8,000 Asbury Automotive Group Inc 894,320 0.58
41,700 Ashland Global Holdings Inc 3,191,301 2.07
3,100 ASML Holding NV Class REG 917,414 0.59
27,100 Axalta Coating Systems Ltd 823,840 0.53
27,700 Axogen Inc 495,553 0.32
1,400 Becton Dickinson and Co 380,758 0.25
3,800 BlackRock Inc Class A 1,910,260 1.24
42,400 Blackstone Group Inc Class A 2,371,856 1.54
3,310 Boeing Co 1,078,266 0.70
51,800 Brookfield Asset Management Inc Class A 2,994,040 1.94
46,436 Brookfield Infrastructure Partners LP 2,321,336 1.50
15,300 CDW Corp 2,185,452 1.42
32,600 Chewy Inc Class A 945,400 0.61
8,100 CME Group Inc Class A 1,625,832 1.05
11,600 Conagra Brands Inc 397,184 0.26
1,500 Costco Wholesale Corp 440,880 0.29
10,650 CSX Corp 770,634 0.50
16,900 CVS Health Corp 1,255,501 0.81
30,800 Delta Air Lines Inc 1,801,184 1.17
10,100 Dominion Energy Inc 836,482 0.54
3,900 Elastic NV 250,770 0.16
51,700 Enbridge Inc 2,056,109 1.33
89,800 Enterprise Products Partners LP 2,528,768 1.64
17,600 Equifax Inc 2,466,112 1.60
27,600 Expedia Group Inc 2,984,664 1.93
14,100 Facebook Inc Class A 2,894,025 1.88
207,589 FGL Holdings 2,210,823 1.43
11,500 ForeScout Technologies Inc 377,200 0.24
91,190 Gates Industrial Corp Plc 1,254,774 0.81
700 General Dynamics Corp 123,445 0.08
31,900 Gilead Sciences Inc 2,072,862 1.34

SCHEDULE OF INVESTMENTS FINANCIAL STATEMENTS
ANNUAL REPORT 2019 347
Neuberger Berman US Long Short Equity Fund (Continued)
Schedule of Investments (Continued)
Financial Assets at Fair Value through Profit or Loss (continued)
Number of Shares Security Description Fair Value
US$% of Net
Assets
Equities 78.39% (31 December 2018: 77.11%) (continued)
United States Dollar (continued) 65,200 HD Supply Holdings Inc 2,622,344 1.70
6,500 Home Depot Inc 1,419,470 0.92
58,600 Hudson Ltd Class A 898,924 0.58
5,000 Humana Inc 1,832,600 1.19
43,700 IHS Markit Ltd 3,292,795 2.13
8,600 Johnson & Johnson 1,254,482 0.81
16,900 JPMorgan Chase & Co 2,355,860 1.53
3,000 L3Harris Technologies Inc 593,610 0.39
16,797 Lowe's Cos Inc 2,011,609 1.30
2,760 Marriott International Inc Class A 417,947 0.27
16,600 McDonald's Corp 3,280,326 2.13
18,100 Medtronic Plc 2,053,445 1.33
24,100 MGM Resorts International 801,807 0.52
19,400 Microsoft Corp 3,059,380 1.98
23,700 Moderna Inc 463,572 0.30
11,300 Mondelez International Inc Class A 622,404 0.40
11,500 NextEra Energy Inc 2,784,840 1.81
20,000 NIKE Inc Class B 2,026,200 1.31
50,700 OneSpaWorld Holdings Ltd 853,788 0.55
5,500 PayPal Holdings Inc 594,935 0.39
8,400 Philip Morris International Inc 714,756 0.46
3,700 PVH Corp 389,055 0.25
147,922 Repay Holdings Corp 2,167,057 1.40
4,100 S&P Global Inc 1,119,505 0.73
44,900 SailPoint Technologies Holding Inc 1,059,640 0.69
7,000 Salesforce.com Inc 1,138,480 0.74
3,200 Sempra Energy 484,736 0.31
7,900 Sempra Energy – Preferred Shares 940,653 0.61
4,300 ServiceNow Inc 1,213,976 0.79
12,700 Spotify Technology SA 1,899,285 1.23
23,150 Tradeweb Markets Inc Class A 1,073,002 0.70
6,600 Union Pacific Corp 1,193,214 0.77
4,878 UnitedHealth Group Inc 1,434,034 0.93
134,500 Univar Solutions Inc 3,260,280 2.11
4,200 Verisk Analytics Inc Class A 627,228 0.41
16,100 Visa Inc Class A 3,025,190 1.96
19,000 Walmart Inc 2,257,960 1.46
8,226 WEX Inc 1,723,018 1.12

FINANCIAL STATEMENTS SCHEDULE OF INVESTMENTS
348 NEUBERGER BERMAN INVESTMENT FUNDS PLC
Neuberger Berman US Long Short Equity Fund (Continued)
Schedule of Investments (Continued)
Financial Assets at Fair Value through Profit or Loss (continued)
Number of Shares Security Description Fair Value
US$% of Net
Assets
Equities 78.39% (31 December 2018: 77.11%) (continued)
United States Dollar (continued) 2,800 Workday Inc Class A 460,460 0.30
5,000 Zendesk Inc 383,150 0.25
Total Equities * 120,984,322 78.39
Number of Shares Security Description Maturity
DateFair Value
US$% of Net
Assets
Participatory Notes 0.12% (31 December 2018: 0.00%)
United States Dollar 3,000 OneSpaWorld Holdings Ltd 19/03/2024 17,520 0.01
147,922 Repay Holdings Corp 11/07/2024 165,672 0.11
Total Participatory Notes ** 183,192 0.12
Principal Amount Security Description Coupon Maturity
DateFair Value
US$% of Net
Assets
Corporate Bonds 4.83% (31 December 2018: 5.22%)
United States Dollar 828,000 APX Group Inc* 8.75% 01/12/2020 829,035 0.54
315,000 GTT Communications Inc† 7.88% 31/12/2024 238,521 0.15
575,000 MagnaChip Semiconductor Corp* 6.63% 15/07/2021 573,792 0.37
255,000 MagnaChip Semiconductor SA† 5.00% 01/03/2021 386,231 0.25
1,160,000 PetSmart Inc† 7.13% 15/03/2023 1,139,700 0.74
2,054,000 PetSmart Inc† 8.88% 01/06/2025 2,033,460 1.32
770,000 Rockpoint Gas Storage Canada Ltd† 7.00% 31/03/2023 758,770 0.49
1,200,000 SailPoint Technologies Holding Inc† 0.13% 15/09/2024 1,296,888 0.84
185,000 ViacomCBS Inc† 5.88% 28/02/2057 192,747 0.13
Total Corporate Bonds 7,449,144 4.83
Total Investments 128,616,658 83.34
Forward Currency Contracts 0.75% (31 December 2018: 0.06%)
Amount Receivable
Amount Payable
Maturity Date Counterparty Contracts Unrealised
Gain US$% of Net
Assets
EUR Hedged Classes € 19,981,451 US$ 22,073,321 22/01/2020 Citibank NA 2 383,198 0.25
€ 20,941,343 US$ 23,123,770 22/01/2020 Goldman Sachs International 9 411,539 0.27
€ 18,122,072 US$ 20,017,286 22/01/2020 Westpac Banking Corp 38 349,538 0.23
US$ 1 € 1 22/01/2020 Goldman Sachs International 1 0 0.00

SCHEDULE OF INVESTMENTS FINANCIAL STATEMENTS
ANNUAL REPORT 2019 349
Neuberger Berman US Long Short Equity Fund (Continued)
Schedule of Investments (Continued)
Financial Assets at Fair Value through Profit or Loss (continued)
Forward Currency Contracts 0.75% (31 December 2018: 0.06%) (continued)
Amount Receivable
Amount Payable
Maturity Date Counterparty Contracts Unrealised
Gain US$% of Net
Assets
GBP Hedged Classes £ 551 US$ 719 22/01/2020 Goldman Sachs International 1 11 0.00
£ 157 US$ 206 22/01/2020 UBS AG 1 2 0.00
£ 24,681 US$ 30,508 22/01/2020 Westpac Banking Corp 1 2,206 0.00
SGD Hedged Classes SGD 223,777 US$ 162,268 22/01/2020 Citibank NA 2 4,174 0.00
SGD 232,691 US$ 168,754 22/01/2020 Goldman Sachs International 5 4,318 0.00
SGD 256,717 US$ 186,576 22/01/2020 Westpac Banking Corp 15 4,368 0.00
Total Unrealised Gain on Forward Currency Contracts ∞ 1,159,354 0.75
Futures Contracts 0.01% (31 December 2018: 0.20%)
Number of Contracts Description Unrealised
Gain US$% of Net
Assets
(4) US Treasury Long Bond (CBT) Future March 2020 6,458 0.01
Total Unrealised Gain on Futures Contracts ± 6,458 0.01
Contracts for Differences (0.12%) (31 December 2018: (0.00%))
Units Security Description Counterparty Unrealised Gain US$
% of Net Assets
(7,200) AutoNation Inc JPMorgan Chase Bank 8,208 0.00
(2,000) Beyond Meat Inc JPMorgan Chase Bank 8,725 0.00
(17,000) BJ's Wholesale Club Inc JPMorgan Chase Bank 44,374 0.03
(10,620) Core Laboratories NV JPMorgan Chase Bank 73,066 0.05
(7,000) Datadog Inc JPMorgan Chase Bank 8,688 0.00
(1,950) Guidewire Software Inc JPMorgan Chase Bank 14,791 0.01
(15,000) Iron Mountain Europe Plc JPMorgan Chase Bank 13,800 0.01
(4,200) Kohls Corp JPMorgan Chase Bank 62 0.00
(4,400) Ollie's Bargain Outlet Holdings Inc JPMorgan Chase Bank 11,123 0.01
(2,000) Ulta Salon Cosmetics & Fragrance Inc JPMorgan Chase Bank 9,183 0.01
Total Unrealised Gain on Contracts for Differences ∞ 192,020 0.12

FINANCIAL STATEMENTS SCHEDULE OF INVESTMENTS
350 NEUBERGER BERMAN INVESTMENT FUNDS PLC
Neuberger Berman US Long Short Equity Fund (Continued)
Schedule of Investments (Continued)
Financial Assets at Fair Value through Profit or Loss (continued)
Purchased Options Contracts 0.13% (31 December 2018: 0.24%)
Number of Contracts
Expiration Date Type Premium
US$ Fair Value
US$% of Net
Assets
Call Options
51 17/01/20 CSX Corp, Strike Price $72.5 (11,984) 8,721 0.01
35 21/02/20 CVS Caremark Corp, Strike Price $60 (7,649) 50,225 0.03
128 17/07/20 Dave & Buster's Entertainment Inc, Strike Price $45 (33,285) 31,360 0.02
22 17/01/20 Deere & Co, Strike Price $170 (12,099) 11,330 0.01
120 17/01/20 General Motors Co, Strike Price $38 (7,681) 2,400 0.00
157 17/01/20 Party City Holdco Inc, Strike Price $10 (16,570) 0 0.00
38 17/04/20 Party City Holdco Inc, Strike Price $7.5 (2,465) 285 0.00
100 15/05/20 Tapestry Inc, Strike Price $32.5 (9,554) 8,000 0.01
108 17/01/20 Tradeweb Markets LLC, Strike Price $40 (25,006) 69,120 0.04
150 20/03/20 Univar Inc, Strike Price $25 (23,481) 17,250 0.01
Total Gain on Purchased Options Contracts ± 198,691 0.13
Total Return Swap Contracts 0.00% (31 December 2018: 0.00%)
Notional Amount Termination Date Variable Rate Reference Entity Unrealised
Gain US$% of Net
Assets
USD (895,908) 06/03/20 0.941 S&P Retail Select Industry Index2 2,691 0.00
Total Unrealised Gain on Total Return Swap Contracts ∞ 2,691 0.00
1 The 1 month LIBOR is the benchmark for this total return swap contract. 2 The counterparty for this total return swap contract is JPMorgan Chase Bank.
Fair Value % of Net
US$ Assets
Total Financial Assets at Fair Value through Profit or Loss 130,175,872 84.35
Financial Liabilities at Fair Value through Profit or Loss
Forward Currency Contracts (0.09%) (31 December 2018: (0.44%))
Amount Receivable
Amount Payable
Maturity Date Counterparty Contracts Unrealised
Loss US$% of Net
Assets
EUR Hedged Classes US$ 1,566,970 € 1,418,566 22/01/2020 Citibank NA 1 (27,311) (0.02)
US$ 2,903,666 € 2,623,295 22/01/2020 Goldman Sachs International 9 (44,574) (0.03)
US$ 4,554,055 € 4,107,577 22/01/2020 Westpac Banking Corp 68 (62,318) (0.04)

SCHEDULE OF INVESTMENTS FINANCIAL STATEMENTS
ANNUAL REPORT 2019 351
Neuberger Berman US Long Short Equity Fund (Continued)
Schedule of Investments (Continued)
Financial Liabilities at Fair Value through Profit or Loss (continued)
Forward Currency Contracts (0.09%) (31 December 2018: (0.44%)) (continued)
Amount Receivable
Amount Payable
Maturity Date Counterparty Contracts Unrealised
Loss US$% of Net
Assets
SGD Hedged Classes US$ 31,641 SGD 43,646 22/01/2020 Citibank NA 1 (823) (0.00)
US$ 33,751 SGD 46,570 22/01/2020 Goldman Sachs International 3 (887) (0.00)
US$ 49,885 SGD 68,292 22/01/2020 Westpac Banking Corp 6 (910) (0.00)
Total Unrealised Loss on Forward Currency Contracts ∞ (136,823) (0.09)
Futures Contracts (0.16%) (31 December 2018: (0.01%))
Number of Contracts Description Unrealised
Loss US$% of Net
Assets
(23) E-mini Russell 2000 Index Future March 2020 (17,710) (0.01)
(37) Nasdaq 100 E-mini Future March 2020 (108,887) (0.07)
(71) S&P 500 E-mini Future March 2020 (117,505) (0.08)
Total Unrealised Loss on Futures Contracts ± (244,102) (0.16)
Written Options Contracts (0.09%) (31 December 2018: (0.37%))
Number of Contracts
Expiration Date Type Premium
US$Fair Value
US$% of Net
Assets
Call Options
11 17/04/20 Asbury Automotive Group Inc, Strike Price $130 2,149 (1,843) (0.00)
13 21/02/20 Chewy Inc, Strike Price $33 893 (878) (0.00)
36 21/02/20 Delta Air Lines Inc, Strike Price $62.5 2,519 (2,016) (0.00)
254 20/03/20 HD Supply Holdings Inc, Strike Price $42.5 36,979 (20,320) (0.02)
7 17/01/20 Home Depot Inc, Strike Price $245 2,955 (7) (0.00)
47 17/04/20 IHS Markit Ltd, Strike Price $80 5,662 (7,050) (0.01)
27 17/01/20 Nike Inc, Strike Price $110 777 (67) (0.00)
11 21/02/20 S&P Global Inc, Strike Price $280 5,153 (5,885) (0.00)
Put Options
154 17/01/20 Apollo Global Management LLC, Strike Price $31 15,317 (0) (0.00)
117 17/01/20 Ashland Global Holdings Inc, Strike Price $65 28,568 (0) (0.00)
49 17/01/20 Ashland Global Holdings Inc, Strike Price $75 20,994 (2,817) (0.00)
23 31/01/20 Chewy Inc, Strike Price $25.5 1,138 (805) (0.00)
128 17/07/20 Dave & Buster's Entertainment Inc, Strike Price $35 31,738 (29,440) (0.02)
120 17/01/20 General Motors Co, Strike Price $33 4,376 (600) (0.00)
48 17/04/20 Motorola Solutions Inc, Strike Price $155 30,405 (29,160) (0.02)
70 17/01/20 PVH Corp, Strike Price $55 15,199 (0) (0.00)
108 17/01/20 Tradeweb Markets LLC, Strike Price $35 19,813 (324) (0.00)
26 19/06/20 Workday Inc, Strike Price $145 18,550 (18,330) (0.01)
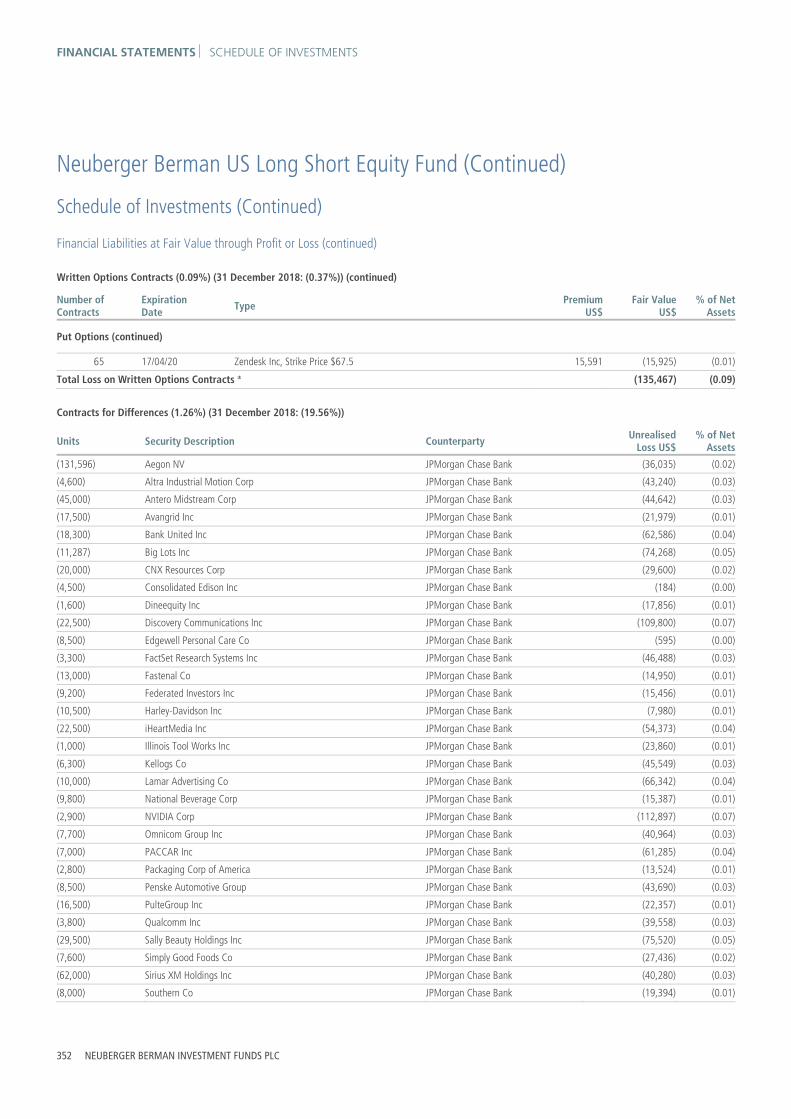
FINANCIAL STATEMENTS SCHEDULE OF INVESTMENTS
352 NEUBERGER BERMAN INVESTMENT FUNDS PLC
Neuberger Berman US Long Short Equity Fund (Continued)
Schedule of Investments (Continued)
Financial Liabilities at Fair Value through Profit or Loss (continued)
Written Options Contracts (0.09%) (31 December 2018: (0.37%)) (continued)
Number of Contracts
Expiration Date Type Premium
US$Fair Value
US$% of Net
Assets
Put Options (continued)
65 17/04/20 Zendesk Inc, Strike Price $67.5 15,591 (15,925) (0.01)
Total Loss on Written Options Contracts ± (135,467) (0.09)
Contracts for Differences (1.26%) (31 December 2018: (19.56%))
Units Security Description Counterparty UnrealisedLoss US$
% of Net Assets
(131,596) Aegon NV JPMorgan Chase Bank (36,035) (0.02)
(4,600) Altra Industrial Motion Corp JPMorgan Chase Bank (43,240) (0.03)
(45,000) Antero Midstream Corp JPMorgan Chase Bank (44,642) (0.03)
(17,500) Avangrid Inc JPMorgan Chase Bank (21,979) (0.01)
(18,300) Bank United Inc JPMorgan Chase Bank (62,586) (0.04)
(11,287) Big Lots Inc JPMorgan Chase Bank (74,268) (0.05)
(20,000) CNX Resources Corp JPMorgan Chase Bank (29,600) (0.02)
(4,500) Consolidated Edison Inc JPMorgan Chase Bank (184) (0.00)
(1,600) Dineequity Inc JPMorgan Chase Bank (17,856) (0.01)
(22,500) Discovery Communications Inc JPMorgan Chase Bank (109,800) (0.07)
(8,500) Edgewell Personal Care Co JPMorgan Chase Bank (595) (0.00)
(3,300) FactSet Research Systems Inc JPMorgan Chase Bank (46,488) (0.03)
(13,000) Fastenal Co JPMorgan Chase Bank (14,950) (0.01)
(9,200) Federated Investors Inc JPMorgan Chase Bank (15,456) (0.01)
(10,500) Harley-Davidson Inc JPMorgan Chase Bank (7,980) (0.01)
(22,500) iHeartMedia Inc JPMorgan Chase Bank (54,373) (0.04)
(1,000) Illinois Tool Works Inc JPMorgan Chase Bank (23,860) (0.01)
(6,300) Kellogs Co JPMorgan Chase Bank (45,549) (0.03)
(10,000) Lamar Advertising Co JPMorgan Chase Bank (66,342) (0.04)
(9,800) National Beverage Corp JPMorgan Chase Bank (15,387) (0.01)
(2,900) NVIDIA Corp JPMorgan Chase Bank (112,897) (0.07)
(7,700) Omnicom Group Inc JPMorgan Chase Bank (40,964) (0.03)
(7,000) PACCAR Inc JPMorgan Chase Bank (61,285) (0.04)
(2,800) Packaging Corp of America JPMorgan Chase Bank (13,524) (0.01)
(8,500) Penske Automotive Group JPMorgan Chase Bank (43,690) (0.03)
(16,500) PulteGroup Inc JPMorgan Chase Bank (22,357) (0.01)
(3,800) Qualcomm Inc JPMorgan Chase Bank (39,558) (0.03)
(29,500) Sally Beauty Holdings Inc JPMorgan Chase Bank (75,520) (0.05)
(7,600) Simply Good Foods Co JPMorgan Chase Bank (27,436) (0.02)
(62,000) Sirius XM Holdings Inc JPMorgan Chase Bank (40,280) (0.03)
(8,000) Southern Co JPMorgan Chase Bank (19,394) (0.01)

SCHEDULE OF INVESTMENTS FINANCIAL STATEMENTS
ANNUAL REPORT 2019 353
Neuberger Berman US Long Short Equity Fund (Continued)
Schedule of Investments (Continued)
Financial Liabilities at Fair Value through Profit or Loss (continued)
Contracts for Differences (1.26%) (31 December 2018: (19.56%)) (continued)
Units Security Description Counterparty UnrealisedLoss US$
% of Net Assets
(10,600) Taiwan Semiconductor Manufacturing Co Ltd JPMorgan Chase Bank (81,726) (0.05)
(1,600) Tesla Motors Inc JPMorgan Chase Bank (239,546) (0.16)
(14,000) Trupanion Inc JPMorgan Chase Bank (205,520) (0.13)
(50,000) Waddell & Reed Financial Inc JPMorgan Chase Bank (69,000) (0.04)
(38,000) Western Union Co JPMorgan Chase Bank (106,780) (0.07)
(3,400) Williams-Sonoma Inc JPMorgan Chase Bank (11,968) (0.01)
Total Unrealised Loss on Contracts for Differences ∞ (1,942,615) (1.26)
Total Return Swap Contracts (1.14%) (31 December 2018: (5.48%))
Notional Amount Termination Date Variable Rate Reference Entity Unrealised
Loss US$% of Net
Assets
USD (315,309) 30/12/20 1.821 Dow Jones U.S. Select Medical Equipment Total Return Index3 (34,642) (0.02)
USD (308,253) 29/09/20 1.982 S&P Regional Banks Select Industry Total Return Index4 (50,039) (0.03)
USD (374,811) 09/11/20 1.592 Consumer Staples Select Sector Total Return Index4 (19,972) (0.01)
USD (431,313) 16/11/20 1.972 MSCI World Gross Total Return Index5 (47,011) (0.03)
USD (499,874) 20/03/20 1.892 iBoxx USD Liquid High Yield Index5 (12,469) (0.01)
USD (575,238) 17/02/21 1.802 Goldman Sachs Basket GSCBNBVL3 (115,196) (0.08)
USD (1,768,339) 31/07/20 1.441 Russell Midcap Total Return Index3 (352,671) (0.23)
USD (2,185,831) 09/11/20 1.592 S&P 500 Growth Total Return Index4 (164,500) (0.11)
USD (2,023,976) 04/05/20 1.242 JPMorgan Basket JPNBGCND5 (451,625) (0.29)
USD (4,468,697) 03/06/21 2.081 S&P 500 Value Total Return Index3 (138,868) (0.09)
USD (4,521,673) 10/11/20 1.882 JPMorgan Basket JPNBRMV35 (371,268) (0.24)
Total Unrealised Loss on Total Return Swap Contracts ∞ (1,758,261) (1.14)
1 The 1 month LIBOR is the benchmark for this total return swap contract. 2 The 3 month LIBOR is the benchmark for this total return swap contract.
3 The counterparty for this total return swap contract is Goldman Sachs International. 4 The counterparty for this total return swap contract is Citibank NA.
5 The counterparty for this total return swap contract is JPMorgan Chase Bank.
Fair Value % of Net
US$ Assets
Total Financial Liabilities at Fair Value through Profit or Loss (4,217,268) (2.74)
Net Financial Assets at Fair Value through Profit or Loss 125,958,604 81.61
Other Net Assets 28,364,910 18.39
Net Assets Attributable to Holders of Redeemable Participating Shares 154,323,514 100.00

FINANCIAL STATEMENTS SCHEDULE OF INVESTMENTS
354 NEUBERGER BERMAN INVESTMENT FUNDS PLC
Neuberger Berman US Long Short Equity Fund (Continued)
Schedule of Investments (Continued)
% ofTotal
AssetsPortfolio Analysis US$
* Transferable securities and/or money market instruments admitted to an official stock exchange listing 122,387,149 76.21
** Transferable securities and/or money market instruments dealt in on a regulated market 183,192 0.11
† Other transferable securities and/or money market instruments 6,046,317 3.77
± Financial derivative instruments traded on a regulated market (174,420) (0.11)
∞ OTC financial derivative instruments (2,483,634) (1.55)
Total Investments 125,958,604 78.43

STATEMENT OF SIGNIFICANT PURCHASES AND SALES FINANCIAL STATEMENTS
ANNUAL REPORT 2019 355
Neuberger Berman US Long Short Equity Fund (Continued) Statement of Significant Purchases and Sales (Unaudited) In accordance with the European Communities (Undertakings for Collective Investment in Transferable Securities) Regulations, 2011 as amended, a statement of changes in the composition of the Schedule of Investments during the reporting period is provided to ensure that Shareholders can identify changes in the investments held by the Portfolio. The following statements present the aggregate purchases and sales of transferable securities exceeding one percent of the total value of purchases or sales, respectively, for the period. At a minimum, the largest twenty purchases and twenty sales are presented, if available.
Aggregate purchases greater than one percent of the total value of purchases:
Units Security Description Cost US$
27,600 Expedia Group Inc 3,443,747
96,200 Enterprise Products Partners LP 2,665,141
29,000 Medtronic Plc 2,503,227
21,000 NIKE Inc Class B 1,745,495
6,750 Domino's Pizza Inc 1,736,771
161,000 OneSpaWorld Holdings Ltd 1,620,768
147,922 Repay Holdings LLC 1,479,220
3,910 Boeing Co 1,420,513
61,600 Univar Solutions Inc 1,404,788
5,400 Humana Inc 1,383,648
72,100 EQT Corp 1,370,599
31,550 Tradeweb Markets Inc Class A 1,228,526
1,460,000 PetSmart Inc, 7.13%, 15/03/2023 1,202,275
1,200,000 SailPoint Technologies Holding Inc, 0.13%, 15/09/2024 1,200,000
1,315,000 APX Group Inc, 7.63%, 01/09/2023 1,156,906
15,100 Ashland Global Holdings Inc 1,150,363
6,900 WEX Inc 1,143,813
8,600 Johnson & Johnson 1,138,717
6,600 Union Pacific Corp 1,083,054
7,000 Salesforce.com Inc 1,055,843
4,300 ServiceNow Inc 1,051,022
21,100 Activision Blizzard Inc 1,033,890
34,800 Chewy Inc Class A 1,018,135
5,200 NextEra Energy Inc 985,562
12,400 Dominion Energy Inc 955,542
59,000 Moderna Inc 913,600
8,600 Lowe's Cos Inc 859,018
44,900 SailPoint Technologies Holding Inc 849,797
27,100 Axalta Coating Systems Ltd 819,327
18,200 Brookfield Asset Management Inc Class A 794,466
16,400 Papa John's International Inc 740,921
600 Alphabet Inc Class A 669,742

FINANCIAL STATEMENTS STATEMENT OF SIGNIFICANT PURCHASES AND SALES
356 NEUBERGER BERMAN INVESTMENT FUNDS PLC
Neuberger Berman US Long Short Equity Fund (Continued)
Statement of Significant Purchases and Sales (Unaudited) (Continued) Aggregate sales greater than one percent of the total value of sales:
Units Security Description Proceeds US$
26,700 General Dynamics Corp 4,684,704
202,700 Hain Celestial Group Inc 4,246,267
44,100 PVH Corp 4,073,833
148,200 Conagra Brands Inc 3,992,446
20,217 WEX Inc 3,835,085
47,800 Eaton Corp Plc 3,741,240
1,850 Booking Holdings Inc 3,634,258
95,500 Enbridge Inc 3,474,650
56,403 IHS Markit Ltd 3,444,352
64,500 Dentsply Sirona Inc 3,218,045
19,200 Visa Inc Class A 3,143,344
2,921,000 PetSmart Inc, 5.88%, 01/06/2025 2,833,235
13,900 Home Depot Inc 2,774,599
5,550 BlackRock Inc Class A 2,461,835
12,179 Goldman Sachs Group Inc 2,342,832
11,700 Facebook Inc Class A 2,131,016
1,770 Alphabet Inc Class A 2,027,762
13,100 Spotify Technology SA 1,877,021
54,099 Cactus Inc 1,799,275
16,500 CDW Corp 1,753,709
970 Amazon.com Inc 1,746,526
48,100 eBay Inc 1,745,688
6,750 Domino's Pizza Inc 1,737,690
110,300 OneSpaWorld Holdings Ltd 1,735,054
33,000 Brookfield Asset Management Inc Class A 1,727,593
29,200 CVS Health Corp 1,685,624
9,400 Raytheon Co 1,674,731
15,203 Lowe's Cos Inc 1,668,817
241,604 Party City Holdco Inc 1,584,962
8,200 CME Group Inc Class A 1,530,214
13,800 JPMorgan Chase & Co 1,463,688
10,900 Equifax Inc 1,381,357
5,600 Costco Wholesale Corp 1,375,059
154,300 FGL Holdings 1,331,545
10,500 Microsoft Corp 1,329,698
30,900 HD Supply Holdings Inc 1,307,691
6,400 McDonald's Corp 1,297,598
27,899 Papa John's International Inc 1,297,464

INVESTMENT MANAGER’S REPORT FINANCIAL STATEMENTS
ANNUAL REPORT 2019 357
Neuberger Berman Emerging Market Debt Blend Fund Investment Manager’s Report For the 12 months ended 31 December 2019, the total return for the USD I Accumulating Class was 13.57%. Over the same period, the benchmark Index, the weighted average of 25% JP Morgan EMBI Global Diversified (USD Total Return), 25% of JP Morgan CEMBI Diversified (USD Total Return) and 50% of JP Morgan GBI Emerging Markets Global Diversified (USD Unhedged Total Return) (the “Index”), returned 13.96%.
Emerging markets (“EM”) debt posted strong gains in 2019 following a down year in 2018. The recovery was driven by spread compression as risk appetite returned to global markets in the first quarter. A sharp drop in US Treasury yields drove gains from March onwards as the market started to price in multiple rate cuts by the US Federal Reserve for 2019. A more dovish monetary policy stance in developed markets also acted as a tailwind for emerging market assets, especially in local markets where local interest rates moved down. The ongoing trade negotiations between the US and China contributed to market volatility throughout the year, however, this abated as the countries came to a phase one agreement in mid-December to support a year-end rally.
The hard currency sovereign Index returned 15.04% in 2019. The best performer was Ukraine, which saw a strong, reform-oriented administration take office following presidential and parliamentary elections amid strengthening growth, the development of the local bond market improving financing opportunities and lower debt ratios. Next in line was Senegal, where the authorities agreed with the IMF a new unfunded 3-year plan that will anchor fiscal and governance reforms while growth remains high on the back of investments in the hydrocarbon sector ahead of commercial production in 2020. The worst performer was Venezuela which remained in a political and economic crisis, while sovereign and PDVSA bonds were taken out of the Index as a result of impaired liquidity under US sanctions.
The local currency benchmark returned 13.47% in USD terms over the full year 2019, driven mostly by strong local bond returns while EM currencies appreciated slightly against the USD in aggregate. Soft inflation across most emerging countries and a dovish turn by the Fed allowed many emerging markets Central Banks to cut rates multiple times. As a result, we saw strong local bond performance in various large local markets including Russia, Mexico, Indonesia, Brazil and Turkey. Meanwhile, Argentina was the negative outlier as the peso sold off heavily following the surprise primary election result in August.
Corporates edged out local currency and posted a positive return of 13.55% over the course of the year, the second best year of the past decade. Default rates were lower than average with 2019 levels ending the year at 1.5%, another multi-year low. Sector performance was positive with double-digit returns across the board; real estate and metals & mining led the way while financials, utilities, industrials and technology, media and telecom (“TMT”) lagged the Index. From a credit rating perspective, the high yield segment of the Index outperformed investment grade.
The Portfolio underperformed the benchmark over the period. Bottom-up positioning across the asset classes was positive. Tactical asset allocation (“TAA”) added value with an overweight to hard currency over corporates but cash holdings and underweight in local currency detracted from performance until November. The rotation to local currency from hard currency and the foreign exchange (“FX”) overlay implemented at the end of the year reversed the TAA underperformance to a more neutral contribution. The largest contributors to performance from a bottom-up perspective in hard currency included the underweight to Lebanon and Ukraine, where both security selection and an overweight were positive. In corporates, security selection in Brazilian mining and proteins companies was positive. The local currency part of the Portfolio outperformed, driven by both FX positioning and local duration exposure. Overweights in Mexico, Russia and Indonesia were among the main contributors on the duration side. Frontier market exposures including positions in Egypt, Nigeria, Sri Lanka, Ukraine and Serbia also contributed across FX and rates. The largest detractor to the Portfolio was Argentina. We entered August with an overweight exposure to Argentine risk across the Portfolio. This position materially detracted from relative performance for the year because Argentine bonds and FX sold off in August following the unexpected results of the presidential primary election mid-month. Capital flight and FX pressure forced the government to extreme measures including the re-profiling of short-term local debt and introduction of capital controls.
We anticipate emerging markets growth to see a modest pickup in growth in the course of 2020. While emerging markets countries are recovering from a slowdown, the US is expected to somewhat slow, albeit from a relatively higher starting point. Historically, such a growth differential is supportive of emerging markets capital inflows. External and internal credit and debt indicators, such as fiscal and current account balances, remain generally well behaved while inflation continues to track at around historical lows, allowing for continued accommodative monetary policy stance by EM central banks.
Potential risks in 2020 remain mostly geopolitical, with US elections in November added into the mix. Across emerging markets, we will watch elections/referendums in Peru, Chile, and Taiwan, tensions between the US and Iran, and the development of protests in Colombia and Hong Kong. The chances of any trade war re-escalation should be low now, but by no means non-existent given the electoral calendar in the US as well as the possibility of China playing hardball and reasserting certain demands.
As for valuations, we feel that emerging markets yields in aggregate are less compelling today after the strong recent tightening, although we continue to find attractive bottom-up opportunities in select higher yielding sovereign and corporate credits as well as in local rates. Also, spreads in hard currency sovereigns continue to provide an attractive risk premium relative to developed market credits in our view. Meanwhile on the FX side, valuations still look attractive for most EM currencies as the late 2019 rally was modest and they stand to benefit from better growth dynamics.

FINANCIAL STATEMENTS INVESTMENT MANAGER’S REPORT
358 NEUBERGER BERMAN INVESTMENT FUNDS PLC
Neuberger Berman Emerging Market Debt Blend Fund (Continued) Investment Manager’s Report (Continued) While we still anticipate hard currency spreads are likely to tighten, especially among higher yielders, its longer duration profile can lead to underperformance relative to local currency bonds when underlying US Treasury yields rise. It is also important to note, however, that notwithstanding the fact nominal local bond yields are effectively trading at historically low levels in the aggregate, the local bond asset class still has room to be supported by inflows, as EM FX should remain strong in the growth rebound scenario. Therefore, we favour EM currency exposure and local duration in higher-yielding countries, while we are selective in hard currency space where we prefer less vulnerable and less correlated high-yield countries with fundamental credit improvement prospects.

BALANCE SHEET FINANCIAL STATEMENTS
The accompanying notes form an integral part of the financial statements.
ANNUAL REPORT 2019 359
Neuberger Berman Emerging Market Debt Blend Fund (Continued)
Balance Sheet
As at31 December 2019
US$
As at31 December 2018
US$ Note
Current Assets
Financial Assets at Fair Value through Profit or Loss 2 1,643,615,071 1,626,632,045
Cash and cash equivalents 3 62,919,150 93,338,241
Receivable for investments sold 16,447 2,719,193
Receivable for shares issued 3,673,575 1,373,467
Due from brokers 2,356,015 8,479,777
Income receivable and other assets 26,470,935 29,088,277
Total Assets 1,739,051,193 1,761,631,000
Current Liabilities
Financial Liabilities at Fair Value through Profit or Loss 2 12,690,454 24,767,879
Bank overdraft 4 2,014 3,517
Payable for shares redeemed 1,381,908 2,901,314
Due to brokers 11,620,000 130,000
Accrued expenses 1,474,706 2,373,975
Payable for investments purchased 785,108 2,223
Other payables 1,892,034 1,485,494
Liabilities (excluding Net Assets Attributable to Holders of Redeemable Participating Shares) 29,846,224 31,664,402
Net Assets Attributable to Holders of Redeemable Participating Shares 1,709,204,969 1,729,966,598

FINANCIAL STATEMENTS PROFIT AND LOSS ACCOUNT
The accompanying notes form an integral part of the financial statements.
360 NEUBERGER BERMAN INVESTMENT FUNDS PLC
Neuberger Berman Emerging Market Debt Blend Fund (Continued)
Profit and Loss Account
Year Ended31 December 2019
US$
Year Ended31 December 2018
US$ Note
Income
Interest Income 100,976,061 102,637,961
Miscellaneous Income – 124,608
Net Gain/(Loss) on Financial Assets and Liabilities at Fair Value through Profit or Loss 11 121,352,129 (255,851,402)
222,328,190 (153,088,833)
Expenses
Management Fee 6 11,263,857 11,647,379
Distribution Fee 6 174,291 184,078
Administration Fee 6 1,793,006 1,904,935
Commitment Fee 19 218,120 168,063
Custody Fee 6 818,009 866,984
Depositary Fee 6 171,768 181,270
Professional Fee 9 115,470 281,465
Directors' Fee 7 4,530 6,613
Transaction Costs 9 389,153 409,703
Audit Fee 8 26,824 22,420
VAT Rebate (27,656) (23,010)
Other Expenses 9 29,342 61,010
Expense Waiver 6 (147,643) (299,090)
Total Expenses 14,829,071 15,411,820
Finance Costs
Interest Expense 11,445 34,819
Distribution Paid 1 13,891,414 13,937,481
13,902,859 13,972,300
Withholding Tax 1 2,462,794 1,750,006
Capital Gain Tax 1 462,963 288,001
Profit/(Loss) Attributable to Holders of Redeemable Participating Shares from Operations 190,670,503 (184,510,960)
Income and expenses arose solely from continuing operations.

STATEMENT OF CHANGES IN NET ASSETS FINANCIAL STATEMENTS
The accompanying notes form an integral part of the financial statements.
ANNUAL REPORT 2019 361
Neuberger Berman Emerging Market Debt Blend Fund (Continued) Statement of Changes in Net Assets Attributable to Holders of Redeemable Participating Shares
Year Ended31 December 2019
US$
Year Ended31 December 2018
US$ Note
Net Assets Attributable to Holders of Redeemable Participating Shares at beginning of year 1,729,966,598 1,754,196,109
Profit/(Loss) Attributable to Holders of Redeemable Participating Shares from Operations 190,670,503 (184,510,960)
Subscriptions 5 463,179,060 497,024,948
Redemptions 5 (674,611,192) (336,743,499)
Net Assets Attributable to Holders of Redeemable Participating Shares at end of year 1,709,204,969 1,729,966,598

FINANCIAL STATEMENTS SCHEDULE OF INVESTMENTS
362 NEUBERGER BERMAN INVESTMENT FUNDS PLC
Neuberger Berman Emerging Market Debt Blend Fund (Continued)
Schedule of Investments
Financial Assets at Fair Value through Profit or Loss
Principal Amount Security Description Coupon Maturity
DateFair Value
US$% of Net
Assets
Treasury Bills 1.27% (31 December 2018: 3.77%)
Egyptian Pound 71,200,000 Egypt Treasury Bill 0.00% 03/03/2020 4,344,758 0.25
Total Egyptian Pound 4,344,758 0.25
Nigerian Naira 666,890,000 Nigeria Treasury Bill 0.00% 27/02/2020 1,801,297 0.11
Total Nigerian Naira 1,801,297 0.11
United States Dollar
15,680,900 United States Treasury Bill 0.00% 07/05/2020 15,597,546 0.91
Total United States Dollar 15,597,546 0.91
Total Treasury Bills ** 21,743,601 1.27
Corporate Bonds 27.28% (31 December 2018: 25.95%)
Colombian Peso 4,060,000,000 Empresas Publicas de Medellin ESP* 7.63% 10/09/2024 1,294,152 0.08
17,077,000,000 Empresas Publicas de Medellin ESP* 8.38% 08/11/2027 5,506,657 0.32
Total Colombian Peso 6,800,809 0.40
Euro 1,632,000 Gazprom PJSC Via Gaz Capital SA* 2.95% 24/01/2024 1,993,699 0.12
2,582,000 NAK Naftogaz Ukraine via Kondor Finance Plc* 7.13% 19/07/2024 3,099,364 0.18
1,271,000 Perusahaan Listrik Negara PT* 1.88% 05/11/2031 1,422,239 0.08
Total Euro 6,515,302 0.38
Mexican Peso 46,510,400 Comision Federal de Electricidad* 7.35% 25/11/2025 2,299,880 0.14
43,963,800 Comision Federal de Electricidad* 8.18% 23/12/2027 2,225,094 0.13
70,750,000 Petroleos Mexicanos* 7.19% 12/09/2024 3,428,279 0.20
327,233,000 Petroleos Mexicanos* 7.47% 12/11/2026 15,242,468 0.89
Total Mexican Peso 23,195,721 1.36
United States Dollar
1,000,000 1MDB Energy Ltd** 5.99% 11/05/2022 1,056,064 0.06
4,000,000 1MDB Global Investments Ltd† 4.40% 09/03/2023 3,889,467 0.23
929,000 ABJA Investment Co Pte Ltd* 5.45% 24/01/2028 905,705 0.05
800,000 ABJA Investment Co Pte Ltd* 5.95% 31/07/2024 838,192 0.05
1,250,000 ABQ Finance Ltd* 3.13% 24/09/2024 1,254,580 0.07
2,109,000 Abu Dhabi Crude Oil Pipeline LLC* 3.65% 02/11/2029 2,271,912 0.13

SCHEDULE OF INVESTMENTS FINANCIAL STATEMENTS
ANNUAL REPORT 2019 363
Neuberger Berman Emerging Market Debt Blend Fund (Continued)
Schedule of Investments (Continued)
Financial Assets at Fair Value through Profit or Loss (continued)
Principal Amount Security Description Coupon Maturity
DateFair Value
US$% of Net
Assets
Corporate Bonds 27.28% (31 December 2018: 25.95%) (continued)
United States Dollar (continued)
2,609,000 Abu Dhabi Crude Oil Pipeline LLC* 4.60% 02/11/2047 3,007,381 0.18
250,000 Adani Ports & Special Economic Zone Ltd† 4.38% 03/07/2029 259,304 0.02
624,000 ADCB Finance Cayman Ltd* 4.00% 29/03/2023 651,592 0.04
825,000 Aeropuerto Internacional de Tocumen SA* 6.00% 18/11/2048 1,024,811 0.06
1,661,000 AES Gener SA† 6.35% 07/10/2079 1,705,017 0.10
650,000 AES Gener SA* 7.13% 26/03/2079 683,339 0.04
972,000 African Export-Import Bank* 3.99% 21/09/2029 984,122 0.06
1,400,000 Akbank TAS* 5.13% 31/03/2025 1,372,715 0.08
1,300,000 Alfa SAB de CV† 6.88% 25/03/2044 1,582,341 0.09
1,250,000 Alibaba Group Holding Ltd* 4.00% 06/12/2037 1,342,057 0.08
514,000 Alibaba Group Holding Ltd* 4.20% 06/12/2047 570,177 0.03
2,746,000 Altice Financing SA* 7.50% 15/05/2026 2,957,030 0.17
2,716,000 America Movil SAB de CV* 3.63% 22/04/2029 2,863,988 0.17
1,500,000 Azure Orbit IV International Finance Ltd* 3.75% 25/01/2023 1,537,485 0.09
1,000,000 Azure Power Energy Ltd* 5.50% 03/11/2022 1,022,022 0.06
1,702,000 Banco BTG Pactual SA* 4.50% 10/01/2025 1,727,530 0.10
1,500,000 Banco de Bogota SA* 4.38% 03/08/2027 1,592,411 0.09
676,000 Banco de Credito del Peru† 2.70% 11/01/2025 673,465 0.04
2,247,000 Banco do Brasil SA† 9.00% 29/12/2049 2,566,512 0.15
894,000 Banco Inbursa SA Institucion de Banca Multiple Grupo Financiero Inbursa* 4.38% 11/04/2027 923,375 0.05
200,000 Banco Mercantil del Norte SA* 6.75% 29/12/2049 208,107 0.01
799,000 Banco Mercantil del Norte SA* 7.50% 29/12/2049 853,939 0.05
1,500,000 Banco Mercantil del Norte SA* 7.63% 29/12/2049 1,605,803 0.09
322,000 Banco Nacional de Comercio Exterior SNC* 3.80% 11/08/2026 326,543 0.02
2,632,000 Banco Votorantim SA† 4.50% 24/09/2024 2,710,986 0.16
1,645,000 Bancolombia SA* 4.63% 18/12/2029 1,671,731 0.10
2,000,000 Bangkok Bank PCL† 3.73% 25/09/2034 2,027,583 0.12
1,218,000 Banque Ouest Africaine de Developpement* 4.70% 22/10/2031 1,233,710 0.07
1,139,000 Banque Ouest Africaine de Developpement* 5.00% 27/07/2027 1,208,665 0.07
576,000 BBK BSC* 5.50% 09/07/2024 596,110 0.03
434,000 BBVA Bancomer SA† 5.13% 18/01/2033 438,898 0.03
2,400,000 BBVA Bancomer SA* 6.75% 30/09/2022 2,617,296 0.15
950,000 Braskem Idesa SAPI* 7.45% 15/11/2029 1,013,897 0.06
3,336,300 Brazil Minas SPE via State of Minas Gerais† 5.33% 15/02/2028 3,586,047 0.21
1,216,000 BRF SA† 4.88% 24/01/2030 1,255,836 0.07
2,889,000 C&W Senior Financing DAC† 6.88% 15/09/2027 3,096,004 0.18
1,000,000 C&W Senior Financing DAC† 7.50% 15/10/2026 1,085,183 0.06
850,000 Cable Onda SA† 4.50% 30/01/2030 896,622 0.05

FINANCIAL STATEMENTS SCHEDULE OF INVESTMENTS
364 NEUBERGER BERMAN INVESTMENT FUNDS PLC
Neuberger Berman Emerging Market Debt Blend Fund (Continued)
Schedule of Investments (Continued)
Financial Assets at Fair Value through Profit or Loss (continued)
Principal Amount Security Description Coupon Maturity
DateFair Value
US$% of Net
Assets
Corporate Bonds 27.28% (31 December 2018: 25.95%) (continued)
United States Dollar (continued)
1,100,000 CBQ Finance Ltd* 5.00% 24/05/2023 1,181,347 0.07
2,393,000 CDBL Funding 1* 3.00% 24/04/2023 2,394,571 0.14
2,303,000 Celestial Miles Ltd* 5.75% 29/12/2049 2,426,176 0.14
1,200,000 Celulosa Arauco y Constitucion SA† 4.20% 29/01/2030 1,205,820 0.07
1,987,000 Cemex SAB de CV* 7.75% 16/04/2026 2,164,538 0.13
900,000 Cemig Geracao e Transmissao SA* 9.25% 05/12/2024 1,037,174 0.06
1,600,000 Cencosud SA* 4.38% 17/07/2027 1,580,308 0.09
2,349,000 Central American Bottling Corp* 5.75% 31/01/2027 2,481,971 0.15
1,600,000 CFLD Cayman Investment Ltd* 8.60% 08/04/2024 1,646,964 0.10
1,908,000 Champion Sincerity Holdings Ltd* 8.13% 29/12/2049 2,010,173 0.12
837,000 Charming Light Investments Ltd* 3.08% 21/12/2020 839,213 0.05
1,316,000 Charming Light Investments Ltd* 4.38% 21/12/2027 1,405,730 0.08
698,000 China Construction Bank Corp* 4.25% 27/02/2029 732,565 0.04
1,500,000 China Evergrande Group* 8.25% 23/03/2022 1,408,146 0.08
300,000 China Evergrande Group* 8.75% 28/06/2025 257,492 0.02
3,791,000 China Minmetals Corp* 3.75% 29/12/2049 3,844,684 0.23
860,000 China Minmetals Corp* 4.45% 29/12/2049 875,510 0.05
1,000,000 China Overseas Finance Cayman VI Ltd* 5.95% 08/05/2024 1,123,427 0.07
3,348,000 China Reinsurance Finance Corp Ltd* 3.38% 09/03/2022 3,360,084 0.20
654,000 China Resources Land Ltd* 4.13% 26/02/2029 703,491 0.04
239,000 Chinalco Capital Holdings Ltd* 4.00% 25/08/2021 241,390 0.01
402,000 Chinalco Capital Holdings Ltd* 4.10% 29/12/2049 407,567 0.02
541,000 Chinalco Capital Holdings Ltd* 4.25% 21/04/2022 549,114 0.03
1,067,000 CNAC HK Finbridge Co Ltd* 3.38% 19/06/2024 1,083,774 0.06
478,000 CNAC HK Finbridge Co Ltd* 4.63% 14/03/2023 502,549 0.03
1,170,000 CNAC HK Finbridge Co Ltd* 5.13% 14/03/2028 1,314,529 0.08
1,500,000 CNOOC Finance 2015 USA LLC* 3.50% 05/05/2025 1,568,781 0.09
2,970,954 Cometa Energia SA de CV† 6.38% 24/04/2035 3,241,118 0.19
546,000 Comision Federal de Electricidad* 4.75% 23/02/2027 577,590 0.03
1,214,000 Corp Nacional del Cobre de Chile* 3.00% 30/09/2029 1,197,543 0.07
731,000 Corp Nacional del Cobre de Chile* 4.38% 05/02/2049 789,626 0.05
1,500,000 Cosan Ltd† 5.50% 20/09/2029 1,564,875 0.09
621,000 CSN Islands XII Corp† 7.00% 29/12/2049 572,683 0.03
3,574,000 CSN Resources SA† 7.63% 13/02/2023 3,817,372 0.22
1,635,000 CSN Resources SA† 7.63% 17/04/2026 1,744,292 0.10
1,447,000 DBS Group Holdings Ltd* 4.52% 11/12/2028 1,541,387 0.09
205,000 Dianjian Haiyu Ltd* 4.30% 29/12/2049 209,612 0.01
502,000 Dianjian International Finance Ltd* 4.60% 29/12/2049 519,128 0.03

SCHEDULE OF INVESTMENTS FINANCIAL STATEMENTS
ANNUAL REPORT 2019 365
Neuberger Berman Emerging Market Debt Blend Fund (Continued)
Schedule of Investments (Continued)
Financial Assets at Fair Value through Profit or Loss (continued)
Principal Amount Security Description Coupon Maturity
DateFair Value
US$% of Net
Assets
Corporate Bonds 27.28% (31 December 2018: 25.95%) (continued)
United States Dollar (continued)
700,000 DIB Tier 1 Sukuk 3 Ltd* 6.25% 29/12/2049 745,573 0.04
1,504,000 DP World Crescent Ltd* 3.88% 18/07/2029 1,542,547 0.09
990,000 DP World Plc* 6.85% 02/07/2037 1,301,357 0.08
1,016,000 Eastern & Southern African Trade & Development Bank* 4.88% 23/05/2024 1,060,400 0.06
1,593,000 Easy Tactic Ltd* 5.75% 13/01/2022 1,576,617 0.09
1,177,000 Easy Tactic Ltd* 8.13% 27/02/2023 1,209,427 0.07
400,000 Ecopetrol SA* 5.38% 26/06/2026 449,143 0.03
2,429,000 Ecopetrol SA* 5.88% 28/05/2045 2,871,528 0.16
994,000 Ecopetrol SA* 7.38% 18/09/2043 1,347,799 0.08
2,000,000 Elementia SAB de CV† 5.50% 15/01/2025 2,033,350 0.12
1,364,000 Emirates NBD Bank PJSC* 6.13% 29/12/2049 1,437,689 0.08
1,351,000 Empresa de Transmision Electrica SA* 5.13% 02/05/2049 1,541,417 0.09
1,793,000 Empresa Electrica Guacolda SA* 4.56% 30/04/2025 1,633,991 0.10
406,000 Empresa Nacional del Petroleo† 4.50% 14/09/2047 415,450 0.02
2,260,000 Empresas Publicas de Medellin ESP† 4.25% 18/07/2029 2,355,039 0.14
710,000 Eskom Holdings SOC Ltd* 5.75% 26/01/2021 713,069 0.04
619,000 Eskom Holdings SOC Ltd* 6.35% 10/08/2028 665,255 0.04
887,000 Eskom Holdings SOC Ltd* 6.75% 06/08/2023 905,777 0.05
2,212,000 Eskom Holdings SOC Ltd* 7.13% 11/02/2025 2,265,869 0.13
1,250,000 Evraz Plc* 5.38% 20/03/2023 1,344,856 0.08
700,000 Evraz Plc* 8.25% 28/01/2021 745,780 0.04
3,182,000 Gazprom PJSC Via Gaz Capital SA* 5.15% 11/02/2026 3,542,571 0.21
697,000 Genneia SA† 8.75% 20/01/2022 549,424 0.03
500,000 Geopark Ltd* 6.50% 21/09/2024 522,713 0.03
269,000 GLP China Holdings Ltd* 4.97% 26/02/2024 284,082 0.02
1,500,000 Gol Finance SA* 7.00% 31/01/2025 1,548,128 0.09
400,000 Gold Fields Orogen Holdings BVI Ltd* 6.13% 15/05/2029 444,740 0.03
2,200,000 Greenko Dutch BV† 5.25% 24/07/2024 2,236,014 0.13
391,000 Greenko Solar Mauritius Ltd* 5.55% 29/01/2025 398,281 0.02
1,100,000 Greenland Global Investment Ltd* 6.75% 25/06/2022 1,111,344 0.07
700,000 GTH Finance BV* 7.25% 26/04/2023 788,946 0.05
1,716,000 Gtlk Europe Capital DAC* 4.95% 18/02/2026 1,775,304 0.10
710,000 GTLK Europe DAC* 5.95% 19/07/2021 741,415 0.04
2,486,000 GUSAP III LP* 4.25% 21/01/2030 2,529,505 0.15
1,579,000 Hanwha Life Insurance Co Ltd* 4.70% 29/12/2049 1,612,397 0.09
1,761,000 HPHT Finance 19 Ltd* 2.88% 05/11/2024 1,758,447 0.10
1,700,000 Huarong Finance 2017 Co Ltd* 4.00% 29/12/2049 1,713,784 0.10
200,000 Huarong Finance 2017 Co Ltd* 4.50% 29/12/2049 203,516 0.01

FINANCIAL STATEMENTS SCHEDULE OF INVESTMENTS
366 NEUBERGER BERMAN INVESTMENT FUNDS PLC
Neuberger Berman Emerging Market Debt Blend Fund (Continued)
Schedule of Investments (Continued)
Financial Assets at Fair Value through Profit or Loss (continued)
Principal Amount Security Description Coupon Maturity
DateFair Value
US$% of Net
Assets
Corporate Bonds 27.28% (31 December 2018: 25.95%) (continued)
United States Dollar (continued)
600,000 Huarong Finance II Co Ltd* 5.50% 16/01/2025 661,310 0.04
1,747,000 Hunt Oil Co of Peru LLC Sucursal Del Peru† 6.38% 01/06/2028 1,927,116 0.11
1,490,000 Hyundai Capital America† 2.75% 27/09/2026 1,447,296 0.08
943,000 IHS Netherlands Holdco BV* 8.00% 18/09/2027 1,003,597 0.06
285,000 Indo Energy Finance II BV† 6.38% 24/01/2023 287,483 0.02
1,184,000 Industrial & Commercial Bank of China Ltd† 3.54% 08/11/2027 1,228,276 0.07
1,111,000 Industrias Penoles SAB de CV† 4.15% 12/09/2029 1,150,271 0.07
1,259,000 Industrias Penoles SAB de CV† 5.65% 12/09/2049 1,346,519 0.08
991,000 Infraestructura Energetica Nova SAB de CV† 4.88% 14/01/2048 947,332 0.06
1,050,000 Inkia Energy Ltd* 5.88% 09/11/2027 1,096,578 0.06
460,000 Israel Electric Corp Ltd* 4.25% 14/08/2028 502,176 0.03
1,793,000 Israel Electric Corp Ltd* 5.00% 12/11/2024 1,975,375 0.12
1,400,000 Itau Unibanco Holding SA† 5.65% 19/03/2022 1,476,006 0.09
1,552,000 JBS Investments II GmbH* 5.75% 15/01/2028 1,639,455 0.10
492,000 Kallpa Generacion SA* 4.13% 16/08/2027 502,631 0.03
1,413,000 KazMunayGas National Co JSC* 4.75% 24/04/2025 1,550,121 0.09
1,654,000 KazMunayGas National Co JSC* 5.38% 24/04/2030 1,916,401 0.11
4,797,000 KazMunayGas National Co JSC* 5.75% 19/04/2047 5,711,810 0.33
1,014,000 KazMunayGas National Co JSC* 6.38% 24/10/2048 1,298,676 0.08
1,001,000 Kosmos Energy Ltd* 7.13% 04/04/2026 1,025,398 0.06
523,000 Kuwait Projects Co SPC Ltd* 4.23% 29/10/2026 544,750 0.03
1,940,000 Kuwait Projects Co SPC Ltd* 4.50% 23/02/2027 2,030,560 0.12
700,000 Kyobo Life Insurance Co Ltd* 3.95% 29/12/2049 711,375 0.04
791,000 Leader Goal International Ltd* 4.25% 29/12/2049 809,285 0.05
1,600,000 Li & Fung Ltd* 4.38% 04/10/2024 1,645,261 0.10
1,312,000 Light Servicos de Eletricidade SA/Light Energia SA* 7.25% 03/05/2023 1,406,037 0.08
1,000,000 Liquid Telecommunications Financing Plc* 8.50% 13/07/2022 1,018,564 0.06
328,000 Longfor Group Holdings Ltd* 4.50% 16/01/2028 339,947 0.02
2,330,000 MARB BondCo Plc* 6.88% 19/01/2025 2,478,456 0.15
300,000 MARB BondCo Plc* 7.00% 15/03/2024 313,376 0.02
950,000 Mashreqbank PSC* 4.25% 26/02/2024 993,954 0.06
1,282,000 MDGH - GMTN BV* 3.70% 07/11/2049 1,327,290 0.08
859,000 MDGH - GMTN BV* 4.50% 07/11/2028 977,285 0.06
1,583,000 Medco Oak Tree Pte Ltd* 7.38% 14/05/2026 1,615,752 0.09
1,300,000 Melco Resorts Finance Ltd* 5.25% 26/04/2026 1,345,952 0.08
332,000 Melco Resorts Finance Ltd* 5.38% 04/12/2029 341,705 0.02
3,900,000 Melco Resorts Finance Ltd† 5.63% 17/07/2027 4,068,954 0.24
401,000 Mersin Uluslararasi Liman Isletmeciligi AS* 5.38% 15/11/2024 413,353 0.02

SCHEDULE OF INVESTMENTS FINANCIAL STATEMENTS
ANNUAL REPORT 2019 367
Neuberger Berman Emerging Market Debt Blend Fund (Continued)
Schedule of Investments (Continued)
Financial Assets at Fair Value through Profit or Loss (continued)
Principal Amount Security Description Coupon Maturity
DateFair Value
US$% of Net
Assets
Corporate Bonds 27.28% (31 December 2018: 25.95%) (continued)
United States Dollar (continued)
2,877,000 Metropolitan Light Co Ltd* 5.50% 21/11/2022 2,977,391 0.17
1,185,000 Mexico City Airport Trust* 5.50% 31/07/2047 1,226,114 0.07
2,294,000 MGM China Holdings Ltd* 5.88% 15/05/2026 2,435,939 0.14
1,550,000 MHP LUX SA* 6.95% 03/04/2026 1,625,681 0.10
1,770,000 Millicom International Cellular SA* 5.13% 15/01/2028 1,860,903 0.11
1,116,000 Millicom International Cellular SA* 6.25% 25/03/2029 1,233,336 0.07
800,000 Millicom International Cellular SA* 6.63% 15/10/2026 887,320 0.05
2,293,000 Minera Mexico SA de CV† 4.50% 26/01/2050 2,341,004 0.14
2,060,000 MSU Energy SA/UGEN SA/UENSA SA† 6.88% 01/02/2025 1,263,295 0.07
2,883,239 MV24 Capital BV* 6.75% 01/06/2034 3,050,900 0.18
500,000 Nakilat Inc† 6.07% 31/12/2033 610,000 0.04
1,684,000 NBK Tier 1 Financing 2 Ltd* 4.50% 29/12/2049 1,684,000 0.10
1,000,000 NBK Tier 1 Financing Ltd* 5.75% 29/12/2049 1,027,298 0.06
1,801,000 NBM US Holdings Inc† 7.00% 14/05/2026 1,954,774 0.11
2,050,000 Network i2i Ltd* 5.65% 29/12/2049 2,028,475 0.12
2,224,000 Nexa Resources SA† 5.38% 04/05/2027 2,383,817 0.14
167,000 Nexen Inc† 5.88% 10/03/2035 214,835 0.01
1,695,000 NWD MTN Ltd* 4.13% 18/07/2029 1,699,525 0.10
200,000 OCP SA* 6.88% 25/04/2044 254,316 0.01
509,000 Oil & Gas Holding Co BSCC* 7.63% 07/11/2024 591,716 0.03
870,000 Oil & Gas Holding Co BSCC* 8.38% 07/11/2028 1,055,365 0.06
600,000 Oil India Ltd* 5.13% 04/02/2029 666,401 0.04
2,832,000 Orazul Energy Egenor SCA* 5.63% 28/04/2027 2,921,484 0.17
1,100,000 Orbia Advance Corp SAB de CV* 5.88% 17/09/2044 1,162,915 0.07
1,200,000 Orbia Advance Corp SAB de CV† 6.75% 19/09/2042 1,388,634 0.08
2,582,000 Oversea-Chinese Banking Corp Ltd* 4.25% 19/06/2024 2,744,424 0.16
1,352,000 Oztel Holdings SPC Ltd* 6.63% 24/04/2028 1,435,717 0.08
1,749,000 Pampa Energia SA* 7.38% 21/07/2023 1,657,903 0.10
2,134,000 Parkway Pantai Ltd* 4.25% 29/12/2049 2,138,396 0.13
1,250,000 Pertamina Persero PT* 3.65% 30/07/2029 1,312,045 0.08
520,000 Pertamina Persero PT* 4.70% 30/07/2049 555,730 0.03
1,246,000 Pertamina Persero PT* 6.45% 30/05/2044 1,605,889 0.09
589,000 Perusahaan Listrik Negara PT* 4.38% 05/02/2050 597,467 0.04
825,000 Perusahaan Listrik Negara PT* 5.45% 21/05/2028 950,297 0.06
1,640,000 Perusahaan Listrik Negara PT* 6.15% 21/05/2048 2,074,493 0.12
300,000 Petra Diamonds US Treasury Plc† 7.25% 01/05/2022 190,123 0.01
1,068,000 Petrobras Global Finance BV† 5.09% 15/01/2030 1,145,708 0.07
879,000 Petrobras Global Finance BV* 6.90% 19/03/2049 1,032,627 0.06

FINANCIAL STATEMENTS SCHEDULE OF INVESTMENTS
368 NEUBERGER BERMAN INVESTMENT FUNDS PLC
Neuberger Berman Emerging Market Debt Blend Fund (Continued)
Schedule of Investments (Continued)
Financial Assets at Fair Value through Profit or Loss (continued)
Principal Amount Security Description Coupon Maturity
DateFair Value
US$% of Net
Assets
Corporate Bonds 27.28% (31 December 2018: 25.95%) (continued)
United States Dollar (continued)
7,391,600 Petroleos de Venezuela SA* 5.38% 12/04/2027 609,807 0.04
1,580,000 Petroleos de Venezuela SA* 5.50% 12/04/2037 130,350 0.01
13,366,824 Petroleos de Venezuela SA* 6.00% 16/05/2024 1,102,763 0.06
12,004,188 Petroleos de Venezuela SA† 6.00% 15/11/2026 990,346 0.06
723,000 Petroleos del Peru SA* 4.75% 19/06/2032 793,744 0.05
430,000 Petroleos del Peru SA* 5.63% 19/06/2047 501,322 0.03
2,273,000 Petroleos Mexicanos† 5.35% 12/02/2028 2,268,107 0.13
2,947,000 Petroleos Mexicanos* 6.35% 12/02/2048 2,853,978 0.17
787,000 Petroleos Mexicanos* 6.50% 23/01/2029 830,165 0.05
588,000 Petroleos Mexicanos* 6.75% 21/09/2047 591,125 0.03
691,000 Petroleos Mexicanos† 6.84% 23/01/2030 738,050 0.04
5,064,000 Petroleos Mexicanos† 7.69% 23/01/2050 5,543,941 0.32
2,000,000 Proven Glory Capital Ltd* 3.25% 21/02/2022 2,006,870 0.12
1,020,000 PTTEP Treasury Center Co Ltd* 3.90% 06/12/2059 1,018,339 0.06
1,200,000 QNB Finansbank AS* 4.88% 19/05/2022 1,208,019 0.07
1,151,000 QNB Finansbank AS* 6.88% 07/09/2024 1,228,549 0.07
1,390,000 Raizen Fuels Finance SA* 5.30% 20/01/2027 1,519,058 0.09
727,000 REC Ltd* 3.38% 25/07/2024 726,695 0.04
1,869,000 REC Ltd* 3.50% 12/12/2024 1,872,460 0.11
800,000 REC Ltd* 5.25% 13/11/2023 854,699 0.05
800,000 Reliance Industries Ltd* 3.67% 30/11/2027 829,611 0.05
400,000 Reliance Industries Ltd* 4.13% 28/01/2025 423,386 0.02
250,000 Reliance Industries Ltd* 4.88% 10/02/2045 292,882 0.02
3,258,000 Rumo Luxembourg Sarl* 7.38% 09/02/2024 3,517,288 0.21
2,661,000 Saka Energi Indonesia PT* 4.45% 05/05/2024 2,702,395 0.16
2,072,000 Samba Funding Ltd* 2.75% 02/10/2024 2,055,576 0.12
1,400,000 Sands China Ltd* 5.13% 08/08/2025 1,540,357 0.09
1,400,000 Sands China Ltd* 5.40% 08/08/2028 1,582,038 0.09
1,600,000 Sasol Financing USA LLC* 5.88% 27/03/2024 1,732,228 0.10
1,000,000 Sasol Financing USA LLC* 6.50% 27/09/2028 1,111,907 0.07
994,000 Saudi Electricity Global Sukuk Co 4* 4.22% 27/01/2024 1,056,530 0.06
687,000 Saudi Electricity Global Sukuk Co 4* 4.72% 27/09/2028 765,879 0.04
1,600,000 Sberbank of Russia Via SB Capital SA* 5.13% 29/10/2022 1,696,145 0.10
794,000 SCF Capital Designated Activity Co* 5.38% 16/06/2023 855,964 0.05
251,000 Shimao Property Holdings Ltd* 5.60% 15/07/2026 262,132 0.02
578,000 Shimao Property Holdings Ltd* 6.13% 21/02/2024 617,153 0.04
1,700,000 Shinhan Bank Co Ltd* 4.50% 26/03/2028 1,842,222 0.11
906,000 Shinhan Financial Group Co Ltd* 5.88% 29/12/2049 975,028 0.06

SCHEDULE OF INVESTMENTS FINANCIAL STATEMENTS
ANNUAL REPORT 2019 369
Neuberger Berman Emerging Market Debt Blend Fund (Continued)
Schedule of Investments (Continued)
Financial Assets at Fair Value through Profit or Loss (continued)
Principal Amount Security Description Coupon Maturity
DateFair Value
US$% of Net
Assets
Corporate Bonds 27.28% (31 December 2018: 25.95%) (continued)
United States Dollar (continued)
1,150,000 Sigma Alimentos SA de CV* 4.13% 02/05/2026 1,206,474 0.07
760,000 Sinopec Group Overseas Development 2016 Ltd* 3.50% 03/05/2026 790,688 0.05
1,481,000 Sinopec Group Overseas Development 2017 Ltd* 3.25% 13/09/2027 1,521,805 0.09
1,202,000 SK Hynix Inc* 3.00% 17/09/2024 1,201,432 0.07
1,838,000 Southern Copper Corp* 6.75% 16/04/2040 2,455,168 0.14
15,391,000 Southern Gas Corridor CJSC* 6.88% 24/03/2026 18,283,939 1.07
600,000 St Marys Cement Inc Canada† 5.75% 28/01/2027 675,208 0.04
1,040,000 Standard Bank Group Ltd* 5.95% 31/05/2029 1,092,000 0.06
8,518,000 State Oil Co of the Azerbaijan Republic* 4.75% 13/03/2023 8,961,027 0.52
4,626,000 State Oil Co of the Azerbaijan Republic* 6.95% 18/03/2030 5,662,235 0.34
3,055,000 Studio City Finance Ltd* 7.25% 11/02/2024 3,237,032 0.19
1,050,000 Sun Hung Kai Properties Capital Market Ltd* 3.75% 25/02/2029 1,108,128 0.06
208,000 Sunac China Holdings Ltd* 7.50% 01/02/2024 214,881 0.01
440,000 Sunac China Holdings Ltd* 7.88% 15/02/2022 457,595 0.03
1,100,000 Sunac China Holdings Ltd* 7.95% 08/08/2022 1,148,185 0.07
1,600,000 Sunac China Holdings Ltd* 8.35% 19/04/2023 1,703,891 0.10
1,000,000 Sunny Optical Technology Group Co Ltd* 3.75% 23/01/2023 1,022,445 0.06
350,000 SURA Asset Management SA† 4.38% 11/04/2027 375,500 0.02
2,187,000 Suzano Austria GmbH* 5.00% 15/01/2030 2,302,845 0.13
239,000 Suzano Austria GmbH* 6.00% 15/01/2029 270,153 0.02
1,204,000 Suzano Austria GmbH† 7.00% 16/03/2047 1,418,475 0.08
814,000 TC Ziraat Bankasi AS* 4.75% 29/04/2021 819,759 0.05
507,000 Tecpetrol SA† 4.88% 12/12/2022 516,263 0.03
1,141,000 Telecom Argentina SA† 8.00% 18/07/2026 1,098,937 0.07
2,000,000 Tencent Holdings Ltd* 3.60% 19/01/2028 2,088,814 0.12
2,616,000 Teva Pharmaceutical Finance Netherlands III BV* 3.15% 01/10/2026 2,184,425 0.13
1,425,000 Teva Pharmaceutical Finance Netherlands III BV† 7.13% 31/01/2025 1,466,731 0.09
1,030,000 TNB Global Ventures Capital Bhd* 4.85% 01/11/2028 1,152,359 0.07
1,000,000 Trade & Development Bank of Mongolia LLC* 9.38% 19/05/2020 1,019,262 0.06
519,000 Transportadora de Gas del Sur SA* 6.75% 02/05/2025 459,704 0.03
1,000,000 Trust F/1401* 5.25% 15/12/2024 1,085,915 0.06
1,078,000 Trust F/1401* 6.39% 15/01/2050 1,162,564 0.07
1,000,000 Trust F/1401† 6.95% 30/01/2044 1,165,945 0.07
1,731,000 Tullow Oil Plc† 7.00% 01/03/2025 1,461,501 0.09
1,500,000 Turkcell Iletisim Hizmetleri AS* 5.80% 11/04/2028 1,497,189 0.09
2,400,000 Turkiye Garanti Bankasi AS* 5.25% 13/09/2022 2,448,876 0.14
1,000,000 Turkiye Garanti Bankasi AS* 5.88% 16/03/2023 1,029,964 0.06
700,000 Turkiye Is Bankasi AS* 5.50% 21/04/2022 709,927 0.04

FINANCIAL STATEMENTS SCHEDULE OF INVESTMENTS
370 NEUBERGER BERMAN INVESTMENT FUNDS PLC
Neuberger Berman Emerging Market Debt Blend Fund (Continued)
Schedule of Investments (Continued)
Financial Assets at Fair Value through Profit or Loss (continued)
Principal Amount Security Description Coupon Maturity
DateFair Value
US$% of Net
Assets
Corporate Bonds 27.28% (31 December 2018: 25.95%) (continued)
United States Dollar (continued)
1,200,000 Turkiye Is Bankasi AS* 6.13% 25/04/2024 1,200,638 0.07
956,000 Turkiye Sise ve Cam Fabrikalari AS* 6.95% 14/03/2026 1,011,591 0.06
487,083 Ukreximbank Via Biz Finance Plc* 9.63% 27/04/2022 511,968 0.03
2,000,000 United Bank for Africa Plc* 7.75% 08/06/2022 2,130,189 0.12
752,000 Vale Overseas Ltd* 8.25% 17/01/2034 1,057,761 0.06
800,000 Vedanta Resources Ltd* 6.38% 30/07/2022 786,650 0.05
1,150,000 Vedanta Resources Ltd† 8.25% 07/06/2021 1,191,021 0.07
1,910,000 VEON Holdings BV† 4.00% 09/04/2025 1,992,722 0.12
100,000 Vnesheconombank Via VEB Finance Plc* 6.80% 22/11/2025 119,565 0.01
200,000 Vnesheconombank Via VEB Finance Plc* 6.90% 09/07/2020 204,609 0.01
1,724,000 Volcan Compania Minera SAA† 5.38% 02/02/2022 1,798,184 0.11
1,656,000 VTR Finance BV* 6.88% 15/01/2024 1,696,713 0.10
4,173,000 Woori Bank* 4.75% 30/04/2024 4,480,276 0.26
1,000,000 Yapi ve Kredi Bankasi AS* 5.75% 24/02/2022 1,018,246 0.06
2,245,000 YPF Energia Electrica SA* 10.00% 25/07/2026 1,959,049 0.11
808,000 YPF SA† 7.00% 15/12/2047 641,095 0.04
3,000,000 YPF SA* 8.50% 28/07/2025 2,838,755 0.17
634,000 YPF SA* 63.35% 07/07/2020 160,242 0.01
368,000 Yuzhou Properties Co Ltd* 6.00% 25/10/2023 359,625 0.02
Total United States Dollar 429,685,600 25.14
Total Corporate Bonds 466,197,432 27.28
Government Bonds 64.35% (31 December 2018: 62.53%)
Argentine Peso 26,872,934 Argentina POM Politica Monetaria* 56.59% 21/06/2020 249,403 0.02
5,898,962 Argentina Treasury Bond BONCER* 2.50% 22/07/2021 143,434 0.01
11,483,917 Argentine Bonos del Tesoro* 18.20% 03/10/2021 68,825 0.00
37,422,616 Bonos de la Nacion Argentina con Ajuste por CER* 4.00% 06/03/2020 820,222 0.05
46,641,674 Ciudad Autonoma de Buenos Aires* 44.09% 29/03/2024 546,282 0.03
Total Argentine Peso 1,828,166 0.11
Chilean Peso 5,175,000,000 Bonos de la Tesoreria de la Republica en pesos* 4.70% 01/09/2030 7,856,419 0.46
410,000,000 Bonos de la Tesoreria de la Republica en pesos* 5.00% 01/03/2035 652,608 0.04
295,000,000 Bonos de la Tesoreria de la Republica en pesos* 5.10% 15/07/2050 484,880 0.03
5,450,000,000 Bonos de la Tesoreria de la Republica en pesos* 6.00% 01/01/2043 10,021,926 0.58
Total Chilean Peso 19,015,833 1.11

SCHEDULE OF INVESTMENTS FINANCIAL STATEMENTS
ANNUAL REPORT 2019 371
Neuberger Berman Emerging Market Debt Blend Fund (Continued)
Schedule of Investments (Continued)
Financial Assets at Fair Value through Profit or Loss (continued)
Principal Amount Security Description Coupon Maturity
DateFair Value
US$% of Net
Assets
Government Bonds 64.35% (31 December 2018: 62.53%) (continued)
Colombian Peso 13,765,100,000 Colombian TES* 6.25% 26/11/2025 4,319,545 0.25
30,942,900,000 Colombian TES* 7.00% 30/06/2032 9,862,210 0.58
17,306,200,000 Colombian TES* 7.25% 18/10/2034 5,607,961 0.33
14,329,200,000 Colombian TES* 7.50% 26/08/2026 4,772,531 0.28
21,046,100,000 Colombian TES* 10.00% 24/07/2024 7,608,197 0.44
171,000,000 Financiera de Desarrollo Territorial SA Findeter* 7.88% 12/08/2024 55,157 0.00
Total Colombian Peso 32,225,601 1.88
Czech Koruna 145,230,000 Czech Republic Government Bond* 0.95% 15/05/2030 6,009,717 0.35
227,200,000 Czech Republic Government Bond* 2.40% 17/09/2025 10,516,713 0.62
219,480,000 Czech Republic Government Bond* 2.75% 23/07/2029 10,675,548 0.62
Total Czech Koruna 27,201,978 1.59
Dominican Republic Peso 36,200,000 Dominican Republic Bond* 11.25% 05/02/2027 724,017 0.04
91,950,000 Dominican Republic International Bond* 8.90% 15/02/2023 1,733,971 0.10
172,050,000 Dominican Republic International Bond* 9.75% 05/06/2026 3,336,821 0.20
Total Dominican Republic Peso 5,794,809 0.34
Egyptian Pound 129,314,000 Egypt Government Bond* 14.22% 15/10/2026 8,357,434 0.49
34,800,000 Egypt Government Bond* 14.80% 30/01/2023 2,242,951 0.13
79,293,000 Egypt Government Bond* 15.90% 02/07/2024 5,349,551 0.31
30,000,000 Egypt Government Bond* 16.00% 12/12/2020 1,895,206 0.11
Total Egyptian Pound 17,845,142 1.04
Euro 594,000 Albania Government International Bond* 3.50% 09/10/2025 729,310 0.04
1,792,547 Argentine Republic Government International Bond** 3.38% 31/12/2038 897,331 0.05
16,461,773 Argentine Republic Government International Bond - Unsecured** 3.38% 31/12/2038 8,365,976 0.49
9,565,000 Argentine Republic Government International Bond* 3.88% 15/01/2022 5,158,990 0.30
8,975,767 Argentine Republic Government International Bond* 7.82% 31/12/2033 5,818,485 0.34
3,778,000 Banque Centrale de Tunisie International Bond* 5.63% 17/02/2024 4,226,502 0.25
997,000 Banque Centrale de Tunisie International Bond* 6.38% 15/07/2026 1,112,644 0.07
1,773,000 Croatia Government International Bond* 1.13% 19/06/2029 2,056,049 0.12
1,235,000 Croatia Government International Bond** 2.75% 27/01/2030 1,653,496 0.10
2,959,000 Croatia Government International Bond* 3.00% 20/03/2027 3,884,820 0.23

FINANCIAL STATEMENTS SCHEDULE OF INVESTMENTS
372 NEUBERGER BERMAN INVESTMENT FUNDS PLC
Neuberger Berman Emerging Market Debt Blend Fund (Continued)
Schedule of Investments (Continued)
Financial Assets at Fair Value through Profit or Loss (continued)
Principal Amount Security Description Coupon Maturity
DateFair Value
US$% of Net
Assets
Government Bonds 64.35% (31 December 2018: 62.53%) (continued)
Euro (continued)
826,000 Egypt Government International Bond* 4.75% 11/04/2025 978,686 0.06
750,000 Egypt Government International Bond* 4.75% 16/04/2026 887,648 0.05
1,098,000 Egypt Government International Bond* 5.63% 16/04/2030 1,272,764 0.08
800,000 Egypt Government International Bond* 6.38% 11/04/2031 962,495 0.06
810,000 Indonesia Government International Bond* 1.40% 30/10/2031 907,137 0.05
2,061,000 Ivory Coast Government International Bond* 5.13% 15/06/2025 2,555,626 0.15
201,000 Ivory Coast Government International Bond* 5.25% 22/03/2030 230,389 0.01
1,664,000 Ivory Coast Government International Bond* 5.88% 17/10/2031 1,946,676 0.11
3,306,000 Ivory Coast Government International Bond* 6.63% 22/03/2048 3,739,063 0.22
2,090,000 Ivory Coast Government International Bond* 6.88% 17/10/2040 2,454,642 0.14
969,000 Kazakhstan Government International Bond* 2.38% 09/11/2028 1,234,032 0.07
1,978,000 Morocco Government International Bond* 1.50% 27/11/2031 2,226,753 0.13
3,343,000 Peruvian Government International Bond* 3.75% 01/03/2030 4,839,003 0.28
920,000 Provincia de Buenos Aires* 5.38% 20/01/2023 405,311 0.02
169,000 Romanian Government International Bond* 3.88% 29/10/2035 220,418 0.01
544,000 Romanian Government International Bond* 4.63% 03/04/2049 753,537 0.05
5,892,000 Serbia International Bond* 1.50% 26/06/2029 6,734,513 0.40
2,208,000 Ukraine Government International Bond** 6.75% 20/06/2026 2,787,566 0.16
Total Euro 69,039,862 4.04
Ghanaian Cedi 81 Republic of Ghana Government Bonds* 24.75% 19/07/2021 15 0.00
Total Ghanaian Cedi 15 0.00
Hungarian Forint
371,620,000 Hungary Government Bond* 2.75% 22/12/2026 1,372,974 0.08
2,252,780,000 Hungary Government Bond* 3.00% 26/06/2024 8,404,076 0.49
2,171,620,000 Hungary Government Bond* 3.00% 27/10/2027 8,112,479 0.47
222,080,000 Hungary Government Bond* 3.00% 21/08/2030 824,056 0.05
600,000,000 Hungary Government Bond* 5.50% 24/06/2025 2,517,861 0.15
678,770,000 Hungary Government Bond* 6.75% 22/10/2028 3,232,913 0.19
Total Hungarian Forint 24,464,359 1.43
Indonesian Rupiah
132,223,000,000 Indonesia Treasury Bond* 6.13% 15/05/2028 8,995,856 0.53
49,000,000,000 Indonesia Treasury Bond* 6.50% 15/06/2025 3,552,538 0.21
67,383,000,000 Indonesia Treasury Bond* 6.63% 15/05/2033 4,493,280 0.26
51,537,000,000 Indonesia Treasury Bond* 7.00% 15/05/2022 3,784,411 0.22

SCHEDULE OF INVESTMENTS FINANCIAL STATEMENTS
ANNUAL REPORT 2019 373
Neuberger Berman Emerging Market Debt Blend Fund (Continued)
Schedule of Investments (Continued)
Financial Assets at Fair Value through Profit or Loss (continued)
Principal Amount Security Description Coupon Maturity
DateFair Value
US$% of Net
Assets
Government Bonds 64.35% (31 December 2018: 62.53%) (continued)
Indonesian Rupiah (continued)
97,300,000,000 Indonesia Treasury Bond* 7.00% 15/05/2027 6,998,857 0.41
86,200,000,000 Indonesia Treasury Bond* 7.00% 15/09/2030 6,159,174 0.36
60,000,000,000 Indonesia Treasury Bond* 7.50% 15/08/2032 4,317,650 0.25
14,700,000,000 Indonesia Treasury Bond* 7.50% 15/06/2035 1,063,521 0.06
25,630,000,000 Indonesia Treasury Bond* 7.50% 15/05/2038 1,832,385 0.11
114,376,000,000 Indonesia Treasury Bond* 8.13% 15/05/2024 8,798,212 0.51
77,424,000,000 Indonesia Treasury Bond* 8.25% 15/05/2029 6,026,600 0.35
163,741,000,000 Indonesia Treasury Bond* 8.25% 15/05/2036 12,366,829 0.72
69,584,000,000 Indonesia Treasury Bond* 8.38% 15/03/2024 5,378,724 0.31
75,000,000,000 Indonesia Treasury Bond* 8.38% 15/09/2026 5,820,825 0.34
23,917,000,000 Indonesia Treasury Bond* 8.38% 15/03/2034 1,848,530 0.11
25,610,000,000 Indonesia Treasury Bond* 8.38% 15/04/2039 1,979,094 0.12
93,761,000,000 Indonesia Treasury Bond* 8.75% 15/05/2031 7,475,380 0.44
41,961,000,000 Indonesia Treasury Bond* 9.00% 15/03/2029 3,378,524 0.20
Total Indonesian Rupiah 94,270,390 5.51
Malaysian Ringgit
135,035,000 Malaysia Government Bond** 3.49% 31/03/2020 33,077,966 1.94
7,000,000 Malaysia Government Bond** 3.73% 15/06/2028 1,755,918 0.10
11,000,000 Malaysia Government Bond** 3.76% 20/04/2023 2,745,471 0.16
7,500,000 Malaysia Government Bond** 3.80% 30/09/2022 1,868,196 0.11
22,200,000 Malaysia Government Bond** 3.80% 17/08/2023 5,553,680 0.32
860,000 Malaysia Government Bond** 3.83% 05/07/2034 215,013 0.01
5,500,000 Malaysia Government Bond** 3.84% 15/04/2033 1,372,042 0.08
12,100,000 Malaysia Government Bond** 3.89% 15/08/2029 3,095,223 0.18
8,700,000 Malaysia Government Bond** 3.90% 30/11/2026 2,200,461 0.13
10,000,000 Malaysia Government Bond** 3.90% 16/11/2027 2,534,790 0.15
6,000,000 Malaysia Government Bond** 3.91% 15/07/2026 1,518,061 0.09
19,600,000 Malaysia Government Bond** 3.96% 15/09/2025 4,963,717 0.29
1,000,000 Malaysia Government Bond** 4.05% 30/09/2021 248,735 0.01
19,925,000 Malaysia Government Bond** 4.06% 30/09/2024 5,053,731 0.30
2,000,000 Malaysia Government Bond** 4.23% 30/06/2031 519,126 0.03
12,130,000 Malaysia Government Bond** 4.64% 07/11/2033 3,274,100 0.19
8,400,000 Malaysia Government Bond** 4.89% 08/06/2038 2,340,125 0.14
3,100,000 Malaysia Government Bond** 4.94% 30/09/2043 863,946 0.05
15,000,000 Malaysia Government Investment Issue** 4.07% 30/09/2026 3,817,971 0.22
5,000,000 Malaysia Government Investment Issue** 4.37% 31/10/2028 1,306,820 0.08
Total Malaysian Ringgit 78,325,092 4.58

FINANCIAL STATEMENTS SCHEDULE OF INVESTMENTS
374 NEUBERGER BERMAN INVESTMENT FUNDS PLC
Neuberger Berman Emerging Market Debt Blend Fund (Continued)
Schedule of Investments (Continued)
Financial Assets at Fair Value through Profit or Loss (continued)
Principal Amount Security Description Coupon Maturity
DateFair Value
US$% of Net
Assets
Government Bonds 64.35% (31 December 2018: 62.53%) (continued)
Mexican Peso 73,325,400 Mexican Bonos* 6.50% 09/06/2022 3,864,222 0.23
407,053,200 Mexican Bonos* 7.50% 03/06/2027 22,407,541 1.31
38,390,000 Mexican Bonos* 7.75% 29/05/2031 2,170,670 0.13
189,230,000 Mexican Bonos* 7.75% 13/11/2042 10,636,822 0.62
233,560,000 Mexican Bonos* 8.50% 31/05/2029 13,775,884 0.81
349,270,000 Mexican Bonos* 10.00% 05/12/2024 21,010,762 1.23
1,438,599,500 Mexico Cetes* 0.00% 23/01/2020 7,583,063 0.44
2,974,705,100 Mexico Cetes* 0.00% 23/04/2020 15,398,510 0.90
Total Mexican Peso 96,847,474 5.67
Peruvian Sol 12,864,000 Fondo MIVIVIENDA SA* 7.00% 14/02/2024 4,328,017 0.25
2,110,000 Peru Government Bond* 5.35% 12/08/2040 645,474 0.04
14,305,000 Peru Government Bond* 5.40% 12/08/2034 4,541,088 0.27
1,529,000 Peru Government Bond* 5.94% 12/02/2029 521,678 0.03
9,323,000 Peru Government Bond* 6.15% 12/08/2032 3,193,404 0.19
12,114,000 Peruvian Government International Bond** 5.70% 12/08/2024 4,089,033 0.24
7,668,000 Peruvian Government International Bond* 6.95% 12/08/2031 2,792,837 0.16
42,631,000 Peruvian Government International Bond** 8.20% 12/08/2026 16,395,258 0.96
Total Peruvian Sol 36,506,789 2.14
Polish Zloty 52,000,000 Republic of Poland Government Bond* 2.50% 25/01/2023 14,068,926 0.82
59,636,000 Republic of Poland Government Bond* 2.50% 25/07/2026 16,235,865 0.95
49,770,000 Republic of Poland Government Bond* 2.50% 25/07/2027 13,523,975 0.79
7,380,000 Republic of Poland Government Bond** 2.75% 25/04/2028 2,042,422 0.12
11,012,000 Republic of Poland Government Bond** 3.25% 25/07/2025 3,110,004 0.18
3,645,000 Republic of Poland Government Bond** 5.75% 25/04/2029 1,272,750 0.08
Total Polish Zloty 50,253,942 2.94
Romanian New Leu
2,785,000 Romania Government Bond* 4.25% 28/06/2023 661,826 0.04
23,000,000 Romania Government Bond* 4.40% 25/09/2023 5,516,192 0.32
20,310,000 Romania Government Bond* 4.50% 17/06/2024 4,873,214 0.29
23,700,000 Romania Government Bond* 4.85% 22/04/2026 5,797,116 0.34
4,485,000 Romania Government Bond* 5.00% 12/02/2029 1,099,179 0.06
26,000,000 Romania Government Bond* 5.80% 26/07/2027 6,725,237 0.39

SCHEDULE OF INVESTMENTS FINANCIAL STATEMENTS
ANNUAL REPORT 2019 375
Neuberger Berman Emerging Market Debt Blend Fund (Continued)
Schedule of Investments (Continued)
Financial Assets at Fair Value through Profit or Loss (continued)
Principal Amount Security Description Coupon Maturity
DateFair Value
US$% of Net
Assets
Government Bonds 64.35% (31 December 2018: 62.53%) (continued)
Romanian New Leu (continued)
5,130,000 Romania Government Bond* 5.85% 26/04/2023 1,279,038 0.08
Total Romanian New Leu 25,951,802 1.52
Russian Ruble 484,729,000 Russian Federal Bond - OFZ* 6.90% 23/05/2029 8,229,613 0.48
187,099,000 Russian Federal Bond - OFZ* 7.00% 16/08/2023 3,135,178 0.19
71,682,000 Russian Federal Bond - OFZ* 7.05% 19/01/2028 1,219,008 0.07
1,158,591,000 Russian Federal Bond - OFZ* 7.10% 16/10/2024 19,550,900 1.15
435,520,000 Russian Federal Bond - OFZ* 7.25% 10/05/2034 7,562,371 0.44
444,919,000 Russian Federal Bond - OFZ* 7.95% 07/10/2026 7,884,958 0.46
76,210,000 Russian Federal Bond - OFZ* 8.15% 03/02/2027 1,371,716 0.08
90,986,000 Russian Federal Bond - OFZ* 8.50% 17/09/2031 1,732,742 0.10
Total Russian Ruble 50,686,486 2.97
Serbian Dinar 120,490,000 Serbia Treasury Bonds* 5.88% 08/02/2028 1,394,799 0.08
Total Serbian Dinar 1,394,799 0.08
South African Rand
18,855,342 Republic of South Africa Government Bond* 8.00% 31/01/2030 1,259,581 0.07
126,393,382 Republic of South Africa Government Bond* 8.25% 31/03/2032 8,300,646 0.49
92,596,745 Republic of South Africa Government Bond* 8.50% 31/01/2037 5,871,865 0.34
88,529,095 Republic of South Africa Government Bond* 8.75% 31/01/2044 5,564,085 0.32
113,329,716 Republic of South Africa Government Bond* 8.75% 28/02/2048 7,155,927 0.42
196,325,813 Republic of South Africa Government Bond* 8.88% 28/02/2035 13,094,257 0.77
305,810,009 Republic of South Africa Government Bond* 9.00% 31/01/2040 19,957,103 1.17
Total South African Rand 61,203,464 3.58
Thai Baht 332,000,000 Thailand Government Bond* 1.45% 17/12/2024 11,189,769 0.65
115,024,000 Thailand Government Bond* 2.00% 17/12/2022 3,931,114 0.23
127,323,000 Thailand Government Bond* 2.13% 17/12/2026 4,467,715 0.26
154,618,000 Thailand Government Bond* 2.40% 17/12/2023 5,394,198 0.32
243,502,000 Thailand Government Bond* 2.88% 17/12/2028 9,095,791 0.53
8,831,000 Thailand Government Bond* 2.88% 17/06/2046 348,339 0.02
193,957,000 Thailand Government Bond* 3.30% 17/06/2038 7,957,518 0.47
228,278,000 Thailand Government Bond* 3.40% 17/06/2036 9,442,624 0.55
79,632,000 Thailand Government Bond* 3.63% 16/06/2023 2,875,431 0.17

FINANCIAL STATEMENTS SCHEDULE OF INVESTMENTS
376 NEUBERGER BERMAN INVESTMENT FUNDS PLC
Neuberger Berman Emerging Market Debt Blend Fund (Continued)
Schedule of Investments (Continued)
Financial Assets at Fair Value through Profit or Loss (continued)
Principal Amount Security Description Coupon Maturity
DateFair Value
US$% of Net
Assets
Government Bonds 64.35% (31 December 2018: 62.53%) (continued)
Thai Baht (continued)
266,325,000 Thailand Government Bond* 3.65% 20/06/2031 10,798,662 0.63
43,380,000 Thailand Government Bond* 3.78% 25/06/2032 1,794,920 0.11
88,188,000 Thailand Government Bond* 3.85% 12/12/2025 3,373,543 0.20
87,595,000 Thailand Government Bond* 4.88% 22/06/2029 3,796,104 0.22
Total Thai Baht 74,465,728 4.36
Turkish Lira 6,956,691 Turkey Government Bond* 3.00% 02/08/2023 1,161,631 0.07
28,074,124 Turkey Government Bond* 7.40% 05/02/2020 4,713,302 0.28
9,897,881 Turkey Government Bond* 8.50% 14/09/2022 1,568,426 0.09
14,144,562 Turkey Government Bond* 9.20% 22/09/2021 2,304,344 0.14
25,758,736 Turkey Government Bond* 9.40% 08/07/2020 4,313,322 0.25
13,470,813 Turkey Government Bond* 9.50% 12/01/2022 2,194,581 0.13
56,556,416 Turkey Government Bond* 10.70% 17/08/2022 9,370,631 0.55
65,161,096 Turkey Government Bond* 11.00% 02/03/2022 10,894,856 0.64
13,224,481 Turkey Government Bond* 11.00% 24/02/2027 2,115,561 0.12
63,692,328 Turkey Government Bond* 12.20% 18/01/2023 10,991,770 0.64
45,709,363 Turkey Government Bond* 16.20% 14/06/2023 8,763,970 0.51
Total Turkish Lira 58,392,394 3.42
Ukrainian Hryvnia
132,720,000 Ukraine Government International Bond* 15.70% 20/01/2021 5,713,198 0.33
Total Ukrainian Hryvnia 5,713,198 0.33
United States Dollar
589,000 Angolan Government International Bond* 8.00% 26/11/2029 629,020 0.04
356,000 Angolan Government International Bond* 8.25% 09/05/2028 384,887 0.02
1,005,000 Angolan Government International Bond* 9.13% 26/11/2049 1,073,865 0.06
5,932,000 Angolan Government International Bond* 9.38% 08/05/2048 6,500,941 0.38
265,400 Belize Government International Bond* 4.94% 20/02/2034 164,640 0.01
1,612,000 Bermuda Government International Bond* 3.72% 25/01/2027 1,697,206 0.10
3,364,000 Bermuda Government International Bond* 4.75% 15/02/2029 3,806,694 0.22
2,037,000 Bermuda Government International Bond* 4.85% 06/02/2024 2,223,742 0.13
3,871,885 Bonos De La Nacion Argentina En Moneda Dua* 4.50% 13/02/2020 2,284,412 0.13
1,090,000 Brazilian Government International Bond* 4.63% 13/01/2028 1,172,567 0.07
5,556,000 Brazilian Government International Bond* 5.00% 27/01/2045 5,790,658 0.34
416,000 Brazilian Government International Bond* 8.25% 20/01/2034 574,749 0.03
435,000 Colombia Government International Bond* 4.50% 15/03/2029 483,654 0.03

SCHEDULE OF INVESTMENTS FINANCIAL STATEMENTS
ANNUAL REPORT 2019 377
Neuberger Berman Emerging Market Debt Blend Fund (Continued)
Schedule of Investments (Continued)
Financial Assets at Fair Value through Profit or Loss (continued)
Principal Amount Security Description Coupon Maturity
DateFair Value
US$% of Net
Assets
Government Bonds 64.35% (31 December 2018: 62.53%) (continued)
United States Dollar (continued)
4,134,000 Colombia Government International Bond* 5.00% 15/06/2045 4,815,841 0.28
472,000 Colombia Government International Bond* 5.20% 15/05/2049 569,673 0.03
320,000 Colombia Government International Bond* 5.63% 26/02/2044 398,699 0.02
920,000 Colombia Government International Bond* 6.13% 18/01/2041 1,193,640 0.07
283,000 Colombia Government International Bond* 7.38% 18/09/2037 402,832 0.02
561,000 Corp Financiera de Desarrollo SA* 5.25% 15/07/2029 600,276 0.04
1,580,000 Costa Rica Government International Bond* 6.13% 19/02/2031 1,683,095 0.10
2,783,000 Costa Rica Government International Bond* 7.00% 04/04/2044 2,938,667 0.17
5,077,000 Costa Rica Government International Bond* 7.16% 12/03/2045 5,424,445 0.32
1,145,000 Development Bank of Mongolia LLC* 7.25% 23/10/2023 1,213,641 0.07
1,218,000 Dominican Republic International Bond* 6.00% 19/07/2028 1,356,983 0.08
924,000 Dominican Republic International Bond* 6.40% 05/06/2049 1,016,109 0.06
619,000 Dominican Republic International Bond* 6.50% 15/02/2048 684,580 0.04
2,784,000 Dominican Republic International Bond* 6.85% 27/01/2045 3,186,803 0.19
4,990,000 Ecuador Government International Bond* 7.88% 23/01/2028 4,449,121 0.26
1,140,000 Ecuador Government International Bond* 7.95% 20/06/2024 1,083,473 0.06
2,363,000 Ecuador Government International Bond* 8.88% 23/10/2027 2,174,781 0.13
1,406,000 Ecuador Government International Bond* 9.50% 27/03/2030 1,315,099 0.08
749,000 Ecuador Government International Bond* 9.63% 02/06/2027 708,065 0.04
995,000 Ecuador Government International Bond* 10.75% 31/01/2029 972,958 0.06
611,000 Egypt Government International Bond* 5.58% 21/02/2023 640,094 0.04
606,000 Egypt Government International Bond* 7.05% 15/01/2032 634,810 0.04
3,202,000 Egypt Government International Bond* 7.90% 21/02/2048 3,353,951 0.20
492,000 Egypt Government International Bond* 8.15% 20/11/2059 524,918 0.03
5,414,000 Egypt Government International Bond* 8.50% 31/01/2047 6,002,725 0.35
990,000 Egypt Government International Bond* 8.70% 01/03/2049 1,106,271 0.06
1,219,000 El Salvador Government International Bond* 7.12% 20/01/2050 1,301,666 0.08
584,000 El Salvador Government International Bond* 7.65% 15/06/2035 667,766 0.04
1,071,000 El Salvador Government International Bond* 7.75% 24/01/2023 1,178,544 0.07
242,000 El Salvador Government International Bond* 8.63% 28/02/2029 291,089 0.02
1,050,000 Export Credit Bank of Turkey* 5.00% 23/09/2021 1,067,527 0.06
666,000 Export Credit Bank of Turkey* 5.38% 08/02/2021 677,531 0.04
2,186,000 Export Credit Bank of Turkey* 5.38% 24/10/2023 2,178,885 0.13
726,000 Export Credit Bank of Turkey* 6.13% 03/05/2024 736,323 0.04
695,000 Export Credit Bank of Turkey* 8.25% 24/01/2024 757,036 0.04
292,000 Ghana Government International Bond* 8.63% 16/06/2049 290,928 0.02
561,000 Ghana Government International Bond* 8.95% 26/03/2051 573,330 0.03
4,229,000 Ghana Government International Bond* 10.75% 14/10/2030 5,415,125 0.32

FINANCIAL STATEMENTS SCHEDULE OF INVESTMENTS
378 NEUBERGER BERMAN INVESTMENT FUNDS PLC
Neuberger Berman Emerging Market Debt Blend Fund (Continued)
Schedule of Investments (Continued)
Financial Assets at Fair Value through Profit or Loss (continued)
Principal Amount Security Description Coupon Maturity
DateFair Value
US$% of Net
Assets
Government Bonds 64.35% (31 December 2018: 62.53%) (continued)
United States Dollar (continued)
351,000 Honduras Government International Bond* 6.25% 19/01/2027 384,028 0.02
837,000 Indonesia Government International Bond* 4.75% 11/02/2029 959,367 0.06
2,495,000 Indonesia Government International Bond* 5.13% 15/01/2045 2,978,708 0.17
3,617,000 Indonesia Government International Bond* 5.25% 17/01/2042 4,364,783 0.26
1,450,000 Indonesia Government International Bond* 8.50% 12/10/2035 2,274,594 0.13
892,000 Iraq International Bond* 5.80% 15/01/2028 875,383 0.05
7,282,890 Ivory Coast Government International Bond* 5.75% 31/12/2032 7,257,963 0.42
1,450,000 Kazakhstan Government International Bond* 6.50% 21/07/2045 2,142,622 0.13
2,060,000 Kenya Government International Bond* 8.00% 22/05/2032 2,244,749 0.13
1,091,000 Korea Housing Finance Corp* 3.00% 31/10/2022 1,116,123 0.07
9,180,000 Mexico Government International Bond* 5.75% 12/10/2110 10,891,473 0.64
1,867,000 Mongolia Government International Bond* 5.63% 01/05/2023 1,925,729 0.11
3,003,000 Mongolia Government International Bond* 8.75% 09/03/2024 3,415,728 0.20
2,070,000 Mongolia Government International Bond* 10.88% 06/04/2021 2,262,510 0.13
332,000 Nigeria Government International Bond* 6.50% 28/11/2027 339,445 0.02
482,000 Nigeria Government International Bond* 7.70% 23/02/2038 483,771 0.03
5,887,000 Nigeria Government International Bond* 7.88% 16/02/2032 6,109,448 0.36
1,353,000 Nigeria Government International Bond* 8.75% 21/01/2031 1,495,378 0.09
1,949,000 Nigeria Government International Bond* 9.25% 21/01/2049 2,173,557 0.13
3,750,000 Oman Government International Bond* 6.75% 17/01/2048 3,760,691 0.22
485,000 Papua New Guinea Government International Bond* 8.38% 04/10/2028 514,875 0.03
765,000 Paraguay Government International Bond* 5.40% 30/03/2050 885,247 0.05
263,000 Paraguay Government International Bond* 5.60% 13/03/2048 308,613 0.02
1,278,000 Paraguay Government International Bond* 6.10% 11/08/2044 1,571,857 0.09
763,000 Perusahaan Penerbit SBSN Indonesia III* 4.40% 01/03/2028 833,990 0.05
357,000 Provincia de Cordoba* 7.13% 10/06/2021 265,965 0.02
3,102,000 Qatar Government International Bond* 4.00% 14/03/2029 3,460,943 0.20
951,000 Qatar Government International Bond* 4.50% 23/04/2028 1,089,337 0.06
2,478,000 Qatar Government International Bond* 4.82% 14/03/2049 3,073,959 0.18
1,492,000 Qatar Government International Bond* 5.10% 23/04/2048 1,920,865 0.11
1,373,000 Republic of Armenia International Bond* 3.95% 26/09/2029 1,363,762 0.08
1,134,000 Republic of South Africa Government International Bond* 4.85% 30/09/2029 1,136,835 0.07
2,923,000 Republic of South Africa Government International Bond* 5.65% 27/09/2047 2,851,737 0.17
1,086,000 Republic of South Africa Government International Bond* 5.75% 30/09/2049 1,059,811 0.06
2,092,000 Republic of South Africa Government International Bond* 5.88% 22/06/2030 2,266,619 0.13
350,000 Republic of South Africa Government International Bond* 6.30% 22/06/2048 371,411 0.02
1,158,000 Republic of Uzbekistan Bond* 4.75% 20/02/2024 1,230,967 0.07
1,697,000 Republic of Uzbekistan Bond* 5.38% 20/02/2029 1,886,224 0.11

SCHEDULE OF INVESTMENTS FINANCIAL STATEMENTS
ANNUAL REPORT 2019 379
Neuberger Berman Emerging Market Debt Blend Fund (Continued)
Schedule of Investments (Continued)
Financial Assets at Fair Value through Profit or Loss (continued)
Principal Amount Security Description Coupon Maturity
DateFair Value
US$% of Net
Assets
Government Bonds 64.35% (31 December 2018: 62.53%) (continued)
United States Dollar (continued)
1,800,000 Russian Foreign Bond - Eurobond* 4.25% 23/06/2027 1,965,055 0.11
14,000,000 Russian Foreign Bond - Eurobond* 4.38% 21/03/2029 15,562,546 0.91
139,960 Russian Foreign Bond - Eurobond* 7.50% 31/03/2030 159,519 0.01
1,300,000 Senegal Government International Bond* 6.25% 23/05/2033 1,366,723 0.08
4,755,000 Serbia International Bond* 7.25% 28/09/2021 5,185,213 0.30
923,000 Sri Lanka Government International Bond* 6.20% 11/05/2027 865,799 0.05
5,800,000 Sri Lanka Government International Bond* 6.75% 18/04/2028 5,570,142 0.33
1,075,000 Sri Lanka Government International Bond* 6.83% 18/07/2026 1,063,641 0.06
2,196,000 Sri Lanka Government International Bond* 6.85% 14/03/2024 2,223,758 0.13
3,913,000 Sri Lanka Government International Bond* 6.85% 03/11/2025 3,926,359 0.23
669,000 Sri Lanka Government International Bond* 7.55% 28/03/2030 665,490 0.04
3,426,000 Sri Lanka Government International Bond* 7.85% 14/03/2029 3,477,641 0.20
2,557,000 Turkey Government International Bond* 4.88% 09/10/2026 2,448,333 0.14
2,062,000 Turkey Government International Bond* 5.13% 25/03/2022 2,113,680 0.12
2,380,000 Turkey Government International Bond* 5.13% 17/02/2028 2,283,391 0.13
1,431,000 Turkey Government International Bond* 5.60% 14/11/2024 1,458,640 0.09
600,000 Turkey Government International Bond* 5.63% 30/03/2021 618,833 0.04
2,804,000 Turkey Government International Bond* 6.00% 25/03/2027 2,848,452 0.17
633,000 Turkey Government International Bond* 6.13% 24/10/2028 642,366 0.04
1,219,000 Turkey Government International Bond* 7.25% 23/12/2023 1,322,118 0.08
3,701,000 Ukraine Government International Bond* 0.00% 31/05/2040 3,548,334 0.21
1,713,000 Ukraine Government International Bond* 7.38% 25/09/2032 1,826,982 0.11
2,830,000 Ukraine Government International Bond* 7.75% 01/09/2025 3,096,357 0.18
7,200,000 Ukraine Government International Bond* 7.75% 01/09/2026 7,884,763 0.46
489,000 Ukraine Government International Bond* 8.99% 01/02/2024 551,612 0.03
13,739,000 Ukraine Government International Bond* 9.75% 01/11/2028 16,721,316 0.98
1,719,166 Uruguay Government International Bond* 5.10% 18/06/2050 2,068,389 0.12
7,776,600 Venezuela Government International Bond* 8.25% 13/10/2024 933,192 0.05
Total United States Dollar 266,322,046 15.58
Uruguayan Peso 25,466,000 Uruguay Government International Bond* 8.50% 15/03/2028 590,336 0.04
61,166,000 Uruguay Government International Bond* 9.88% 20/06/2022 1,615,567 0.09
Total Uruguayan Peso 2,205,903 0.13
Total Government Bonds 1,099,955,272 64.35

FINANCIAL STATEMENTS SCHEDULE OF INVESTMENTS
380 NEUBERGER BERMAN INVESTMENT FUNDS PLC
Neuberger Berman Emerging Market Debt Blend Fund (Continued)
Schedule of Investments (Continued)
Financial Assets at Fair Value through Profit or Loss (continued)
Number of Shares Security Description Fair Value
US$% of Net
Assets
Investment Funds 0.98% (31 December 2018: 0.00%)
United States Dollar
1,596,964 Neuberger Berman China Bond Fund 16,672,304 0.98
Total Investment Funds μ 16,672,304 0.98
Total Investments 1,604,568,609 93.88
Forward Currency Contracts 1.17% (31 December 2018: 0.59%)
Amount Receivable
Amount Payable
Maturity Date Counterparty Contracts Unrealised
Gain US$% of Net
Assets
BRL 111,467,631 US$ 26,417,887 04/02/2020 Citibank NA 1 1,261,906 0.07
BRL 25,897,259 US$ 6,146,112 12/02/2020 Citibank NA 1 282,559 0.02
BRL 72,240,635 US$ 17,557,573 16/03/2020 Goldman Sachs International 1 347,053 0.02
BRL 24,931,405 US$ 6,082,579 22/01/2020 JPMorgan Chase Bank 2 111,151 0.01
BRL 21,252,095 US$ 5,142,673 03/03/2020 Standard Chartered Bank 1 128,446 0.01
BRL 17,407,946 US$ 4,103,712 22/01/2020 State Street Bank and Trust and Co 1 220,959 0.01
BRL 28,580,310 US$ 6,887,652 03/03/2020 State Street Bank and Trust and Co 1 201,071 0.01
CLP 13,571,017,505 US$ 17,687,869 18/03/2020 Deutsche Bank AG 1 374,309 0.02
CLP 3,418,275,903 US$ 4,388,031 18/02/2020 JPMorgan Chase Bank 1 159,904 0.01
CLP 3,030,879,717 US$ 3,807,638 18/02/2020 Standard Chartered Bank 1 224,875 0.01
CNY 53,410,892 US$ 7,611,317 07/02/2020 Citibank NA 1 51,441 0.00
CNY 58,516,242 US$ 8,379,814 17/01/2020 Standard Chartered Bank 1 19,724 0.00
COP 35,501,888,843 US$ 10,337,205 18/03/2020 Citibank NA 1 439,754 0.03
COP 8,098,124,333 US$ 2,380,751 18/03/2020 JPMorgan Chase Bank 1 77,517 0.01
CZK 30,371,198 € 1,189,850 21/01/2020 Citibank NA 1 4,359 0.00
CZK 285,787,646 € 11,151,131 18/03/2020 Deutsche Bank AG 1 48,642 0.00
CZK 45,204,181 € 1,762,918 21/01/2020 Deutsche Bank AG 1 15,526 0.00
CZK 92,144,429 € 3,591,927 21/01/2020 Goldman Sachs International 2 33,462 0.00
CZK 45,204,207 € 1,761,635 21/01/2020 HSBC Bank Plc 1 16,969 0.00
CZK 19,638,297 € 769,218 21/01/2020 Société Générale 1 2,987 0.00
€ 6,133,107 US$ 6,802,331 06/01/2020 Brown Brothers Harriman 3 83,369 0.01
€ 7,004,794 HUF 2,315,925,149 08/01/2020 Deutsche Bank AG 1 2,726 0.00
€ 10,615,019 RON 51,252,481 02/04/2020 Goldman Sachs International 2 9,433 0.00
€ 7,523,765 HUF 2,485,709,140 19/02/2020 HSBC Bank Plc 1 13,508 0.00
€ 979,333 US$ 1,096,641 06/01/2020 JPMorgan Chase Bank 1 2,866 0.00
€ 23,087,579 US$ 25,526,035 06/01/2020 State Street Bank and Trust and Co 2 394,621 0.02
HUF 3,172,171,648 € 9,559,087 08/01/2020 Deutsche Bank AG 1 36,158 0.00
HUF 2,000,000,000 € 5,986,095 08/01/2020 Goldman Sachs International 1 68,549 0.01
HUF 336,890,598 € 1,015,091 08/01/2020 Standard Chartered Bank 1 3,955 0.00
IDR 51,343,539,457 US$ 3,645,781 22/01/2020 JPMorgan Chase Bank 1 59,308 0.00
IDR 215,684,818,678 US$ 15,174,111 29/01/2020 Standard Chartered Bank 1 382,091 0.02

SCHEDULE OF INVESTMENTS FINANCIAL STATEMENTS
ANNUAL REPORT 2019 381
Neuberger Berman Emerging Market Debt Blend Fund (Continued)
Schedule of Investments (Continued)
Financial Assets at Fair Value through Profit or Loss (continued)
Forward Currency Contracts 1.17% (31 December 2018: 0.59%) (continued)
Amount Receivable
Amount Payable
Maturity Date Counterparty Contracts Unrealised
Gain US$% of Net
Assets
IDR 24,138,161,493 US$ 1,719,242 22/01/2020 State Street Bank and Trust and Co 1 22,633 0.00
INR 537,248,129 US$ 7,460,225 17/01/2020 Standard Chartered Bank 1 74,628 0.01
KRW 19,801,516,402 US$ 16,941,749 16/03/2020 Citibank NA 1 236,097 0.01
KRW 9,157,265,521 US$ 7,877,466 28/01/2020 Goldman Sachs International 1 58,139 0.00
KRW 4,937,129,950 US$ 4,212,928 16/01/2020 Goldman Sachs International 1 64,685 0.00
KRW 4,937,129,950 US$ 4,163,192 16/01/2020 Standard Chartered Bank 1 114,420 0.01
KZT 782,036,110 US$ 1,935,733 05/06/2020 Goldman Sachs International 1 35,836 0.00
KZT 2,570,716,001 US$ 6,357,268 05/06/2020 JPMorgan Chase Bank 3 123,692 0.01
MXN 339,434,932 US$ 17,636,086 17/03/2020 Brown Brothers Harriman 1 141,029 0.01
MXN 23,583,731 US$ 1,217,437 05/02/2020 Brown Brothers Harriman 1 24,991 0.00
MXN 62,711,119 US$ 3,217,746 05/02/2020 Citibank NA 2 85,974 0.01
MXN 19,463,923 US$ 1,012,183 05/02/2020 Goldman Sachs International 1 13,207 0.00
MYR 3,095,454 US$ 744,404 28/01/2020 Standard Chartered Bank 1 13,579 0.00
PHP 119,598,760 US$ 2,334,454 30/01/2020 Standard Chartered Bank 1 21,435 0.00
PLN 57,656,452 US$ 14,898,955 12/02/2020 Citibank NA 1 326,536 0.02
PLN 58,841,290 € 13,680,904 14/01/2020 Citibank NA 5 169,357 0.01
PLN 7,021,372 € 1,645,468 18/02/2020 Citibank NA 1 1,781 0.00
PLN 64,433,076 € 14,998,870 18/02/2020 Goldman Sachs International 1 130,164 0.01
PLN 81,265,367 € 18,974,711 14/01/2020 JPMorgan Chase Bank 1 143,930 0.01
RUB 100,686,834 US$ 1,564,079 23/01/2020 Citibank NA 1 53,078 0.00
RUB 246,742,119 US$ 3,862,929 23/01/2020 Goldman Sachs International 1 100,061 0.01
RUB 1,961,404,617 US$ 30,457,609 23/01/2020 Standard Chartered Bank 3 1,045,024 0.06
THB 246,607,988 US$ 8,169,804 16/01/2020 HSBC Bank Plc 1 65,886 0.00
Uah 52,000,000 US$ 2,109,533 27/02/2020 Morgan Stanley 1 47,255 0.00
US$ 5,419,140 TRY 32,083,474 18/03/2020 Citibank NA 1 128,879 0.01
US$ 3,400,304 TRY 19,886,510 06/02/2020 Goldman Sachs International 1 88,251 0.01
US$ 17,568,393 TRY 103,407,878 06/02/2020 HSBC Bank Plc 1 346,046 0.02
US$ 6,985,007 TRY 40,862,292 07/02/2020 JPMorgan Chase Bank 1 181,073 0.01
ZAR 15,235,518 US$ 1,030,435 06/02/2020 Citibank NA 1 54,077 0.00
ZAR 262,662,885 US$ 17,934,593 06/02/2020 Goldman Sachs International 4 762,589 0.05
ZAR 40,659,787 US$ 2,665,676 06/02/2020 HSBC Bank Plc 1 228,617 0.01
ZAR 62,707,461 US$ 4,121,239 06/02/2020 JPMorgan Chase Bank 1 342,479 0.02
ZAR 129,272,661 US$ 8,612,775 06/02/2020 Standard Chartered Bank 2 589,266 0.04
ZAR 16,142,511 US$ 1,090,360 06/02/2020 State Street Bank and Trust and Co 1 58,715 0.00
AUD Hedged Classes AUD 102,183 US$ 70,604 21/02/2020 Goldman Sachs International 2 1,312 0.00
AUD 10,984,097 US$ 7,516,118 22/01/2020 Westpac Banking Corp 3 208,929 0.01
AUD 5,707,729 US$ 3,882,995 21/02/2020 Westpac Banking Corp 4 134,142 0.01

FINANCIAL STATEMENTS SCHEDULE OF INVESTMENTS
382 NEUBERGER BERMAN INVESTMENT FUNDS PLC
Neuberger Berman Emerging Market Debt Blend Fund (Continued)
Schedule of Investments (Continued)
Financial Assets at Fair Value through Profit or Loss (continued)
Forward Currency Contracts 1.17% (31 December 2018: 0.59%) (continued)
Amount Receivable
Amount Payable
Maturity Date Counterparty Contracts Unrealised
Gain US$% of Net
Assets
CHF Hedged Classes CHF 20,886 US$ 21,187 21/02/2020 Goldman Sachs International 2 457 0.00
CHF 1,816,460 US$ 1,846,876 21/02/2020 UBS AG 1 35,493 0.00
CHF 11,285 US$ 11,547 21/02/2020 Westpac Banking Corp 2 148 0.00
EUR Hedged Classes € 437,638,128 US$ 485,364,316 21/02/2020 Citibank NA 2 7,398,720 0.43
€ 10,822,769 US$ 12,086,771 21/02/2020 Goldman Sachs International 4 99,234 0.01
€ 11,960,277 US$ 13,308,807 21/02/2020 Westpac Banking Corp 27 157,987 0.01
US$ 110 € 98 21/02/2020 Westpac Banking Corp 1 0 0.00
GBP Hedged Classes £ 269,902 US$ 352,494 21/02/2020 Goldman Sachs International 3 5,553 0.00
£ 19,221,028 US$ 24,817,404 21/02/2020 UBS AG 2 680,831 0.04
£ 3,068,827 US$ 3,981,643 21/02/2020 Westpac Banking Corp 24 89,404 0.01
NOK Hedged Classes NOK 4,519,574 US$ 493,990 21/02/2020 Citibank NA 1 20,436 0.00
NOK 46,422 US$ 5,135 21/02/2020 Westpac Banking Corp 1 149 0.00
SEK Hedged Classes SEK 47,360,397 US$ 4,922,675 21/02/2020 Goldman Sachs International 3 148,727 0.01
SEK 690,776 US$ 73,500 21/02/2020 Westpac Banking Corp 11 471 0.00
US$ 17,042 SEK 158,900 21/02/2020 Westpac Banking Corp 2 27 0.00
SGD Hedged Classes SGD 14,875 US$ 10,985 21/02/2020 Goldman Sachs International 2 83 0.00
SGD 11,497 US$ 8,534 21/02/2020 UBS AG 1 20 0.00
SGD 1,056,124 US$ 776,423 21/02/2020 Westpac Banking Corp 13 9,331 0.00
US$ 12 SGD 15 21/02/2020 Westpac Banking Corp 1 0 0.00
Total Unrealised Gain on Forward Currency Contracts ∞ 19,964,061 1.17
Futures Contracts 0.06% (31 December 2018: 0.14%)
Number of Contracts Description Unrealised
Gain US$% of Net
Assets
(305) Euro-Bund Future March 2020 791,261 0.05
(32) Euro-Buxl 30-Year Bond Future March 2020 233,458 0.01
(80) South Korea 10-Year Bond Future March 2020 35,280 0.00
423 South Korea 3-Year Bond Future March 2020 22,867 0.00
(53) US Treasury Long Bond (CBT) Future March 2020 159,635 0.00
Total Unrealised Gain on Futures Contracts ± 1,242,501 0.06

SCHEDULE OF INVESTMENTS FINANCIAL STATEMENTS
ANNUAL REPORT 2019 383
Neuberger Berman Emerging Market Debt Blend Fund (Continued)
Schedule of Investments (Continued)
Financial Assets at Fair Value through Profit or Loss (continued)
Interest Rate Swap Contracts 1.04% (31 December 2018: 0.86%)
Notional Amount Expiration Date Counterparty Receive
/(Pay)# Fixed Rate Variable Rate Fair Value US$
% of Net Assets
BRL 45,912,431 04/01/21 Goldman Sachs International (Pay) 11.42% 1D BROIS∞ 2,661,687 0.16
BRL 13,322,327 02/01/25 Chicago Mercantile Exchange1 (Pay) 11.45% 1D BROIS± 1,398,894 0.08
RUB 3,116,944,714 21/02/21 Goldman Sachs International (Pay) 9.01% 3M MOSPRIME∞ 1,179,599 0.07
BRL 9,000,000 02/01/23 Goldman Sachs International (Pay) 11.99% 1D BROIS∞ 1,069,101 0.06
RUB 2,016,290,234 23/03/22 Goldman Sachs International (Pay) 8.11% 3M MOSPRIME∞ 1,004,851 0.06
BRL 20,038,118 04/01/21 JPMorgan Chase Bank (Pay) 10.19% 1D BROIS∞ 850,933 0.05
BRL 24,390,449 04/01/21 JPMorgan Chase Bank (Pay) 8.87% 1D BROIS∞ 691,236 0.04
BRL 23,135,177 04/01/21 Chicago Mercantile Exchange1 (Pay) 10.02% 1D BROIS± 657,885 0.04
BRL 27,539,175 04/01/21 Chicago Mercantile Exchange1 (Pay) 8.75% 1D BROIS± 618,777 0.04
BRL 19,358,539 02/01/20 JPMorgan Chase Bank (Pay) 11.02% 1D BROIS∞ 592,000 0.03
RUB 3,349,833,383 10/06/21 Goldman Sachs International (Pay) 7.52% 3M MOSPRIME∞ 540,997 0.03
BRL 13,217,959 04/01/21 JPMorgan Chase Bank (Pay) 9.61% 1D BROIS∞ 477,329 0.03
BRL 13,140,868 02/01/20 JPMorgan Chase Bank (Pay) 11.46% 1D BROIS∞ 464,744 0.03
BRL 5,309,628 04/01/21 Goldman Sachs International (Pay) 12.73% 1D BROIS∞ 457,760 0.03
BRL 14,741,580 02/01/20 JPMorgan Chase Bank (Pay) 10.87% 1D BROIS∞ 445,327 0.03
BRL 12,212,869 02/01/20 JPMorgan Chase Bank (Pay) 11.51% 1D BROIS∞ 437,777 0.03
MXN 150,000,000 11/03/27 Chicago Mercantile Exchange1 (Pay) 7.61% 28D MXIBTIIE± 427,688 0.03
BRL 10,884,706 04/01/21 Goldman Sachs International (Pay) 9.73% 1D BROIS∞ 409,346 0.02
CZK 435,000,000 18/06/24 LCH Clearnet Ltd1 Receive 1.70% 6M PRIBOR± 338,328 0.02
BRL 53,561,407 02/01/23 Chicago Mercantile Exchange1 (Pay) 6.48% 1D BROIS± 321,243 0.02
BRL 48,722,946 03/01/22 Chicago Mercantile Exchange1 (Pay) 6.24% 1D BROIS± 286,895 0.02
BRL 4,999,220 02/01/23 Chicago Mercantile Exchange1 (Pay) 9.26% 1D BROIS± 220,930 0.01
BRL 5,576,435 04/01/21 Goldman Sachs International (Pay) 9.92% 1D BROIS∞ 219,962 0.01
BRL 8,479,705 02/01/20 Goldman Sachs International (Pay) 9.73% 1D BROIS∞ 182,696 0.01
BRL 28,926,812 03/01/22 Chicago Mercantile Exchange1 (Pay) 6.23% 1D BROIS± 168,953 0.01
BRL 9,509,217 02/01/20 JPMorgan Chase Bank (Pay) 9.07% 1D BROIS∞ 158,127 0.01
MXN 55,000,000 24/02/25 Chicago Mercantile Exchange1 (Pay) 7.76% 28D MXIBTIIE± 148,595 0.01
MXN 115,000,000 12/08/27 Chicago Mercantile Exchange1 (Pay) 7.10% 28D MXIBTIIE± 144,356 0.01
BRL 3,436,994 04/01/21 JPMorgan Chase Bank (Pay) 10.04% 1D BROIS∞ 140,211 0.01
BRL 6,727,814 02/01/20 JPMorgan Chase Bank (Pay) 9.61% 1D BROIS∞ 137,438 0.01
CLP 1,985,896,996 10/05/22 JPMorgan Chase Bank (Pay) 3.43% 1D CLICP∞ 101,422 0.01
BRL 29,361,709 03/01/22 Morgan Stanley (Pay) 5.79% 1D BROIS∞ 94,060 0.01
BRL 1,006,291 02/01/23 Goldman Sachs International (Pay) 10.84% 1D BROIS∞ 84,988 0.01
MXN 32,793,698 20/04/27 Chicago Mercantile Exchange1 (Pay) 7.51% 28D MXIBTIIE± 83,729 0.00
PLN 33,000,000 12/11/21 LCH Clearnet Ltd1 (Pay) 2.26% 6M WIBOR± 80,247 0.00
HUF 2,800,000,000 21/09/22 Goldman Sachs International (Pay) 0.84% 6M BUBOR∞ 63,319 0.00
COP 84,839,319,471 18/11/21 Chicago Mercantile Exchange1 (Pay) 4.90% 1D COOVIBR± 62,441 0.00
PLN 35,000,000 17/12/29 LCH Clearnet Ltd1 Receive 1.81% 6M WIBOR± 51,472 0.00
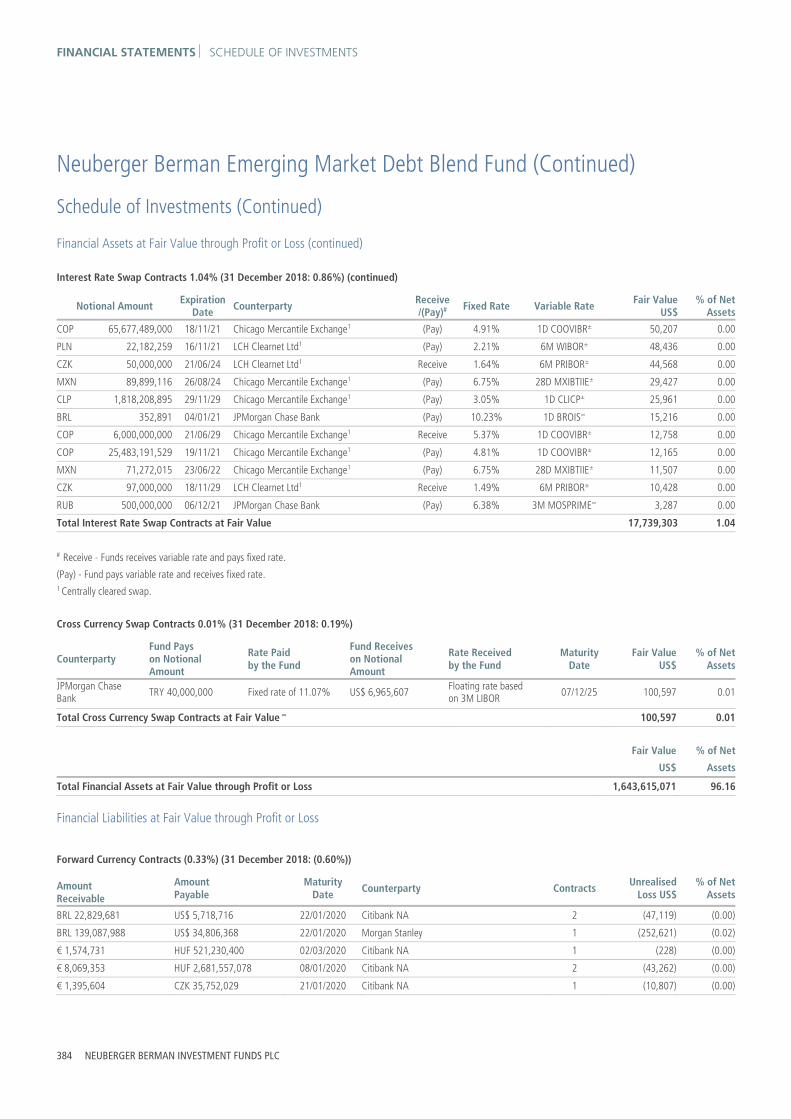
FINANCIAL STATEMENTS SCHEDULE OF INVESTMENTS
384 NEUBERGER BERMAN INVESTMENT FUNDS PLC
Neuberger Berman Emerging Market Debt Blend Fund (Continued)
Schedule of Investments (Continued)
Financial Assets at Fair Value through Profit or Loss (continued)
Interest Rate Swap Contracts 1.04% (31 December 2018: 0.86%) (continued)
Notional Amount Expiration Date Counterparty Receive
/(Pay)# Fixed Rate Variable Rate Fair Value US$
% of Net Assets
COP 65,677,489,000 18/11/21 Chicago Mercantile Exchange1 (Pay) 4.91% 1D COOVIBR± 50,207 0.00
PLN 22,182,259 16/11/21 LCH Clearnet Ltd1 (Pay) 2.21% 6M WIBOR± 48,436 0.00
CZK 50,000,000 21/06/24 LCH Clearnet Ltd1 Receive 1.64% 6M PRIBOR± 44,568 0.00
MXN 89,899,116 26/08/24 Chicago Mercantile Exchange1 (Pay) 6.75% 28D MXIBTIIE± 29,427 0.00
CLP 1,818,208,895 29/11/29 Chicago Mercantile Exchange1 (Pay) 3.05% 1D CLICP± 25,961 0.00
BRL 352,891 04/01/21 JPMorgan Chase Bank (Pay) 10.23% 1D BROIS∞ 15,216 0.00
COP 6,000,000,000 21/06/29 Chicago Mercantile Exchange1 Receive 5.37% 1D COOVIBR± 12,758 0.00
COP 25,483,191,529 19/11/21 Chicago Mercantile Exchange1 (Pay) 4.81% 1D COOVIBR± 12,165 0.00
MXN 71,272,015 23/06/22 Chicago Mercantile Exchange1 (Pay) 6.75% 28D MXIBTIIE± 11,507 0.00
CZK 97,000,000 18/11/29 LCH Clearnet Ltd1 Receive 1.49% 6M PRIBOR± 10,428 0.00
RUB 500,000,000 06/12/21 JPMorgan Chase Bank (Pay) 6.38% 3M MOSPRIME∞ 3,287 0.00
Total Interest Rate Swap Contracts at Fair Value 17,739,303 1.04
# Receive - Funds receives variable rate and pays fixed rate. (Pay) - Fund pays variable rate and receives fixed rate. 1 Centrally cleared swap.
Cross Currency Swap Contracts 0.01% (31 December 2018: 0.19%)
Counterparty Fund Pays on Notional Amount
Rate Paid by the Fund
Fund Receives on Notional Amount
Rate Received by the Fund
Maturity Date
Fair ValueUS$
% of Net Assets
JPMorgan Chase Bank TRY 40,000,000 Fixed rate of 11.07% US$ 6,965,607 Floating rate based
on 3M LIBOR07/12/25 100,597 0.01
Total Cross Currency Swap Contracts at Fair Value ∞ 100,597 0.01
Fair Value % of Net
US$ Assets
Total Financial Assets at Fair Value through Profit or Loss 1,643,615,071 96.16
Financial Liabilities at Fair Value through Profit or Loss
Forward Currency Contracts (0.33%) (31 December 2018: (0.60%))
Amount Receivable
Amount Payable
Maturity Date Counterparty Contracts Unrealised
Loss US$% of Net
Assets
BRL 22,829,681 US$ 5,718,716 22/01/2020 Citibank NA 2 (47,119) (0.00)
BRL 139,087,988 US$ 34,806,368 22/01/2020 Morgan Stanley 1 (252,621) (0.02)
€ 1,574,731 HUF 521,230,400 02/03/2020 Citibank NA 1 (228) (0.00)
€ 8,069,353 HUF 2,681,557,078 08/01/2020 Citibank NA 2 (43,262) (0.00)
€ 1,395,604 CZK 35,752,029 21/01/2020 Citibank NA 1 (10,807) (0.00)

SCHEDULE OF INVESTMENTS FINANCIAL STATEMENTS
ANNUAL REPORT 2019 385
Neuberger Berman Emerging Market Debt Blend Fund (Continued)
Schedule of Investments (Continued)
Financial Liabilities at Fair Value through Profit or Loss (continued)
Forward Currency Contracts (0.33%) (31 December 2018: (0.60%)) (continued)
Amount Receivable
Amount Payable
Maturity Date Counterparty Contracts Unrealised
Loss US$% of Net
Assets
€ 1,952,417 RON 9,380,647 03/02/2020 Goldman Sachs International 1 (1,002) (0.00)
€ 728,639 PLN 3,116,644 14/01/2020 JPMorgan Chase Bank 1 (4,474) (0.00)
€ 6,661,922 RON 32,025,659 03/02/2020 JPMorgan Chase Bank 1 (7,531) (0.00)
€ 7,950,231 HUF 2,650,307,946 08/01/2020 Morgan Stanley 1 (70,926) (0.01)
€ 7,094,440 PLN 30,367,906 14/01/2020 Société Générale 1 (49,499) (0.00)
€ 3,124,216 PLN 13,445,521 14/01/2020 State Street Bank and Trust and Co 1 (40,874) (0.00)
IDR 24,774,407,106 US$ 1,788,688 22/01/2020 Morgan Stanley 1 (900) (0.00)
INR 50,145,690 US$ 706,347 17/01/2020 Morgan Stanley 1 (3,058) (0.00)
RON 5,858,897 € 1,215,612 02/04/2020 JPMorgan Chase Bank 1 (3,519) (0.00)
TRY 8,753,969 US$ 1,486,382 06/02/2020 Goldman Sachs International 1 (28,429) (0.00)
TRY 22,842,470 US$ 3,920,714 06/02/2020 Morgan Stanley 1 (116,352) (0.01)
US$ 1,745,640 ZAR 25,653,839 06/02/2020 Brown Brothers Harriman 1 (80,482) (0.01)
US$ 15,572,980 ILS 53,898,270 11/02/2020 Citibank NA 1 (62,587) (0.00)
US$ 2,945,330 € 2,629,918 06/01/2020 Citibank NA 1 (7,305) (0.00)
US$ 3,983,806 CLP 3,030,879,717 18/02/2020 Citibank NA 1 (48,707) (0.00)
US$ 1,858,304 EGP 32,000,000 23/03/2020 Citibank NA 1 (108,651) (0.01)
US$ 6,460,511 IDR 91,700,492,065 22/01/2020 Citibank NA 1 (156,846) (0.01)
US$ 1,252,355 MXN 23,960,447 05/02/2020 Citibank NA 1 (9,919) (0.00)
US$ 7,441,684 ZAR 111,454,849 06/02/2020 Citibank NA 1 (492,028) (0.03)
US$ 1,513,001 € 1,357,000 05/02/2020 Credit Suisse 1 (13,457) (0.00)
US$ 6,461,877 IDR 91,700,492,065 22/01/2020 Goldman Sachs International 1 (155,480) (0.01)
US$ 4,492,116 CLP 3,418,275,903 18/02/2020 Goldman Sachs International 1 (55,818) (0.00)
US$ 4,704,288 MXN 90,790,736 05/02/2020 Goldman Sachs International 1 (78,711) (0.01)
US$ 6,912,953 ZAR 103,876,832 06/02/2020 Goldman Sachs International 1 (481,331) (0.03)
US$ 4,086,524 € 3,647,378 05/02/2020 HSBC Bank Plc 2 (16,328) (0.00)
US$ 3,579,751 THB 108,060,168 11/02/2020 HSBC Bank Plc 1 (31,288) (0.00)
US$ 2,638,125 CLP 1,995,082,169 18/03/2020 JPMorgan Chase Bank 1 (17,205) (0.00)
US$ 1,098,651 € 979,333 05/02/2020 JPMorgan Chase Bank 1 (2,979) (0.00)
US$ 33,006,485 € 29,867,617 06/01/2020 JPMorgan Chase Bank 3 (526,186) (0.03)
US$ 729,975 KRW 848,954,148 14/01/2020 JPMorgan Chase Bank 1 (5,548) (0.00)
US$ 4,236,875 EGP 69,065,300 23/03/2020 Morgan Stanley 1 (8,386) (0.00)
US$ 14,885,565 MXN 287,975,152 05/02/2020 Morgan Stanley 1 (285,419) (0.02)
US$ 3,457,301 PEN 11,696,048 18/03/2020 Morgan Stanley 1 (65,844) (0.00)
US$ 12,533,097 € 11,231,519 06/01/2020 Morgan Stanley 3 (76,641) (0.01)
US$ 1,804,541 IDR 25,602,284,593 22/01/2020 Morgan Stanley 1 (42,989) (0.00)
US$ 1,575,211 BRL 6,541,456 15/01/2020 Morgan Stanley 1 (50,257) (0.00)
US$ 2,934,397 ZAR 44,211,982 06/02/2020 Morgan Stanley 2 (212,753) (0.01)
US$ 2,125,758 CLP 1,605,478,707 18/03/2020 Standard Chartered Bank 1 (11,034) (0.00)

FINANCIAL STATEMENTS SCHEDULE OF INVESTMENTS
386 NEUBERGER BERMAN INVESTMENT FUNDS PLC
Neuberger Berman Emerging Market Debt Blend Fund (Continued)
Schedule of Investments (Continued)
Financial Liabilities at Fair Value through Profit or Loss (continued)
Forward Currency Contracts (0.33%) (31 December 2018: (0.60%)) (continued)
Amount Receivable
Amount Payable
Maturity Date Counterparty Contracts Unrealised
Loss US$% of Net
Assets
US$ 13,566,698 MYR 56,589,410 28/01/2020 Standard Chartered Bank 1 (290,336) (0.02)
US$ 5,450,707 MYR 22,761,062 09/01/2020 Standard Chartered Bank 1 (115,997) (0.01)
US$ 5,898,793 € 5,309,590 06/01/2020 Standard Chartered Bank 3 (62,337) (0.00)
US$ 1,418,412 € 1,262,000 05/02/2020 Standard Chartered Bank 1 (1,183) (0.00)
US$ 2,073,545 IDR 29,075,250,214 22/01/2020 Standard Chartered Bank 1 (24,604) (0.00)
US$ 2,626,468 € 2,364,689 06/01/2020 State Street Bank and Trust and Co 1 (28,391) (0.00)
US$ 1,993,748 BRL 8,041,782 22/01/2020 State Street Bank and Trust and Co 1 (4,079) (0.00)
US$ 19,043,748 MXN 370,228,484 05/02/2020 State Street Bank and Trust and Co 4 (460,471) (0.03)
US$ 27,127,475 € 24,170,000 05/02/2020 State Street Bank and Trust and Co 1 (60,805) (0.00)
US$ 5,380,179 € 4,853,687 06/01/2020 UBS AG 3 (69,104) (0.01)
UYU 50,000,000 US$ 1,335,113 19/10/2020 JPMorgan Chase Bank 1 (209,748) (0.01)
AUD Hedged Classes US$ 214,513 AUD 312,387 22/01/2020 Goldman Sachs International 1 (5,187) (0.00)
US$ 7,348,571 AUD 10,818,355 22/01/2020 Westpac Banking Corp 2 (259,910) (0.02)
US$ 39,338 AUD 57,884 21/02/2020 Westpac Banking Corp 1 (1,401) (0.00)
CHF Hedged Classes US$ 11,725 CHF 11,532 21/02/2020 Goldman Sachs International 1 (226) (0.00)
US$ 180,929 CHF 177,949 21/02/2020 UBS AG 1 (3,477) (0.00)
US$ 728,477 CHF 722,525 21/02/2020 Westpac Banking Corp 1 (20,264) (0.00)
EUR Hedged Classes US$ 6,189,579 € 5,552,237 21/02/2020 Goldman Sachs International 5 (62,018) (0.00)
US$ 7,009,539 € 6,296,352 21/02/2020 Westpac Banking Corp 25 (79,901) (0.01)
GBP Hedged Classes £ 311,610 US$ 416,310 21/02/2020 Westpac Banking Corp 5 (2,934) (0.00)
US$ 316,782 £ 240,149 21/02/2020 Goldman Sachs International 2 (1,795) (0.00)
US$ 286,071 £ 219,634 21/02/2020 Westpac Banking Corp 15 (5,289) (0.00)
SEK Hedged Classes SEK 68,863 US$ 7,407 21/02/2020 Goldman Sachs International 1 (33) (0.00)
SEK 144,857 US$ 15,533 21/02/2020 Westpac Banking Corp 1 (22) (0.00)
US$ 458,386 SEK 4,406,630 21/02/2020 Goldman Sachs International 3 (13,482) (0.00)
US$ 52,727 SEK 501,725 21/02/2020 Westpac Banking Corp 10 (999) (0.00)
SGD Hedged Classes US$ 9,094 SGD 12,356 21/02/2020 Goldman Sachs International 3 (99) (0.00)
US$ 54,897 SGD 74,759 21/02/2020 Westpac Banking Corp 6 (725) (0.00)
Total Unrealised Loss on Forward Currency Contracts ∞ (5,569,597) (0.33)

SCHEDULE OF INVESTMENTS FINANCIAL STATEMENTS
ANNUAL REPORT 2019 387
Neuberger Berman Emerging Market Debt Blend Fund (Continued)
Schedule of Investments (Continued)
Financial Liabilities at Fair Value through Profit or Loss (continued)
Futures Contracts (0.03%) (31 December 2018: (0.07%))
Number of Contracts Description Unrealised
Loss US$% of Net
Assets
118 US Treasury 10-Year Note (CBT) Future March 2020 (45,437) (0.00)
104 US Treasury Ultra Bond (CBT) Future March 2020 (553,292) (0.03)
Total Unrealised Loss on Futures Contracts ± (598,729) (0.03)
Credit Default Swap Contracts (0.18%) (31 December 2018: (0.03%))
Notional Amount Expiration Date Counterparty Referenced Obligation Fair Value US$
% of Net Assets
USD 5,590,777 20/06/23 JPMorgan Chase Bank Selling default protection on Argentine Republic Government International Bond, Senior Securities (3,056,605) (0.18)
Total Credit Default Swap Contracts at Fair Value ∞ (3,056,605) (0.18)
Interest Rate Swap Contracts (0.18%) (31 December 2018: (0.54%))
Notional Amount Expiration Date Counterparty Receive
/(Pay)# Fixed Rate Variable Rate Fair Value US$
% of NetAssets
HUF 220,000,000 12/09/24 LCH Clearnet Ltd1 (Pay) 0.81% 6M BUBOR± (2,454) 0.00
MXN 82,628,426 10/09/29 Chicago Mercantile Exchange1 Receive 6.82% 28D MXIBTIIE± (3,647) 0.00
CZK 155,000,000 11/11/21 LCH Clearnet Ltd1 (Pay) 2.23% 6M PRIBOR± (5,385) 0.00
MXN 8,944,028 21/05/25 Goldman Sachs International (Pay) 6.36% 28D MXIBTIIE∞ (6,216) 0.00
HUF 1,500,000,000 20/04/20 JPMorgan Chase Bank Receive 0.69% 6M BUBOR∞ (6,787) 0.00
BRL 21,400,254 02/01/23 Chicago Mercantile Exchange1 (Pay) 5.66% 1D BROIS± (8,348) 0.00
CNY 68,300,000 05/07/24 LCH Clearnet Ltd1 (Pay) 2.75% 7D CNRR007± (10,042) 0.00
RUB 1,900,000,000 14/12/21 Goldman Sachs International (Pay) 6.29% 3M MOSPRIME∞ (10,567) 0.00
MXN 9,645,130 08/12/25 Goldman Sachs International (Pay) 6.21% 28D MXIBTIIE∞ (12,051) 0.00
PLN 4,000,000 16/08/29 LCH Clearnet Ltd1 (Pay) 1.66% 6M WIBOR± (19,043) 0.00
CZK 210,000,000 03/10/21 LCH Clearnet Ltd1 (Pay) 2.10% 6M PRIBOR± (27,001) 0.00
COP 3,040,633,926 15/05/29 Chicago Mercantile Exchange1 Receive 5.93% 1D COOVIBR± (33,617) 0.00
ZAR 115,000,000 18/07/29 LCH Clearnet Ltd1 (Pay) 8.49% 3M JIBAR± (34,277) 0.00
HUF 741,256,054 17/06/21 JPMorgan Chase Bank Receive 1.38% 6M BUBOR∞ (36,246) 0.00
MXN 43,500,000 17/03/21 Goldman Sachs International (Pay) 5.37% 28D MXIBTIIE∞ (41,181) 0.00
HUF 814,313,352 06/11/29 LCH Clearnet Ltd1 (Pay) 1.86% 6M BUBOR± (41,909) 0.00
CLP 7,794,281,686 12/12/21 Chicago Mercantile Exchange1 Receive 1.96% 1D CLICP± (42,864) 0.00
CZK 325,000,000 30/09/21 LCH Clearnet Ltd1 (Pay) 2.07% 6M PRIBOR± (48,689) 0.00
CZK 460,000,000 18/11/21 LCH Clearnet Ltd1 (Pay) 2.14% 6M PRIBOR± (49,452) 0.00
MXN 37,080,494 05/03/26 Goldman Sachs International (Pay) 6.17% 28D MXIBTIIE∞ (53,304) 0.00
CZK 437,729,932 30/09/21 LCH Clearnet Ltd1 (Pay) 2.10% 6M PRIBOR± (55,625) 0.00
COP 5,209,366,074 15/05/29 Chicago Mercantile Exchange1 Receive 5.92% 1D COOVIBR± (55,798) 0.00
MXN 106,245,188 20/08/29 Chicago Mercantile Exchange1 Receive 6.94% 28D MXIBTIIE± (55,874) 0.00

FINANCIAL STATEMENTS SCHEDULE OF INVESTMENTS
388 NEUBERGER BERMAN INVESTMENT FUNDS PLC
Neuberger Berman Emerging Market Debt Blend Fund (Continued)
Schedule of Investments (Continued)
Financial Liabilities at Fair Value through Profit or Loss (continued)
Interest Rate Swap Contracts (0.18%) (31 December 2018: (0.54%)) (continued)
Notional Amount Expiration Date Counterparty Receive
/(Pay)# Fixed Rate Variable Rate Fair Value US$
% of NetAssets
MXN 59,914,381 12/09/22 Goldman Sachs International (Pay) 5.90% 28D MXIBTIIE∞ (56,015) (0.01)
MXN 60,000,000 16/09/26 Goldman Sachs International (Pay) 6.38% 28D MXIBTIIE∞ (58,688) (0.01)
MXN 144,900,054 31/08/29 Chicago Mercantile Exchange1 Receive 6.92% 28D MXIBTIIE± (65,600) (0.01)
MXN 47,500,000 18/06/26 JPMorgan Chase Bank (Pay) 6.13% 28D MXIBTIIE∞ (77,580) (0.01)
MXN 82,000,000 17/06/26 Citigroup Global Markets Ltd (Pay) 6.20% 28D MXIBTIIE∞ (118,573) (0.01)
HUF 2,806,535,884 10/01/22 Goldman Sachs International Receive 1.27% 6M BUBOR∞ (151,800) (0.01)
PLN 71,000,000 25/03/24 LCH Clearnet Ltd1 Receive 1.99% 6M WIBOR± (163,575) (0.01)
MXN 445,223,360 28/01/21 Chicago Mercantile Exchange1 Receive 8.09% 28D MXIBTIIE± (269,731) (0.02)
MXN 455,577,392 28/01/21 Chicago Mercantile Exchange1 Receive 8.15% 28D MXIBTIIE± (288,869) (0.02)
BRL 273,042,390 02/01/20 Chicago Mercantile Exchange1 Receive 7.45% 1D BROIS± (1,173,194) (0.07)
Total Interest Rate Swap Contracts at Fair Value (3,084,002) (0.18)
# Receive - Funds receives variable rate and pays fixed rate. (Pay) - Fund pays variable rate and receives fixed rate. 1 Centrally cleared swap.
Cross Currency Swap Contracts (0.02%) (31 December 2018: (0.19%))
Counterparty Fund Pays on Notional Amount
Rate Paid by the Fund
Fund Receiveson Notional Amount
Rate Received by the Fund
Maturity Date
Fair ValueUS$
% of Net Assets
JPMorgan Chase Bank TRY 50,000,000 Fixed rate of 12.90% US$ 8,771,930 Floating rate basedon 3M LIBOR
07/10/25 (381,521) (0.02)
Total Cross Currency Swap Contracts at Fair Value ∞ (381,521) (0.02)
Fair Value % of Net
US$ Assets
Total Financial Liabilities at Fair Value through Profit or Loss (12,690,454) (0.74)
Net Financial Assets at Fair Value through Profit or Loss 1,630,924,617 95.42
Other Net Assets 78,280,352 4.58
Net Assets Attributable to Holders of Redeemable Participating Shares 1,709,204,969 100.00
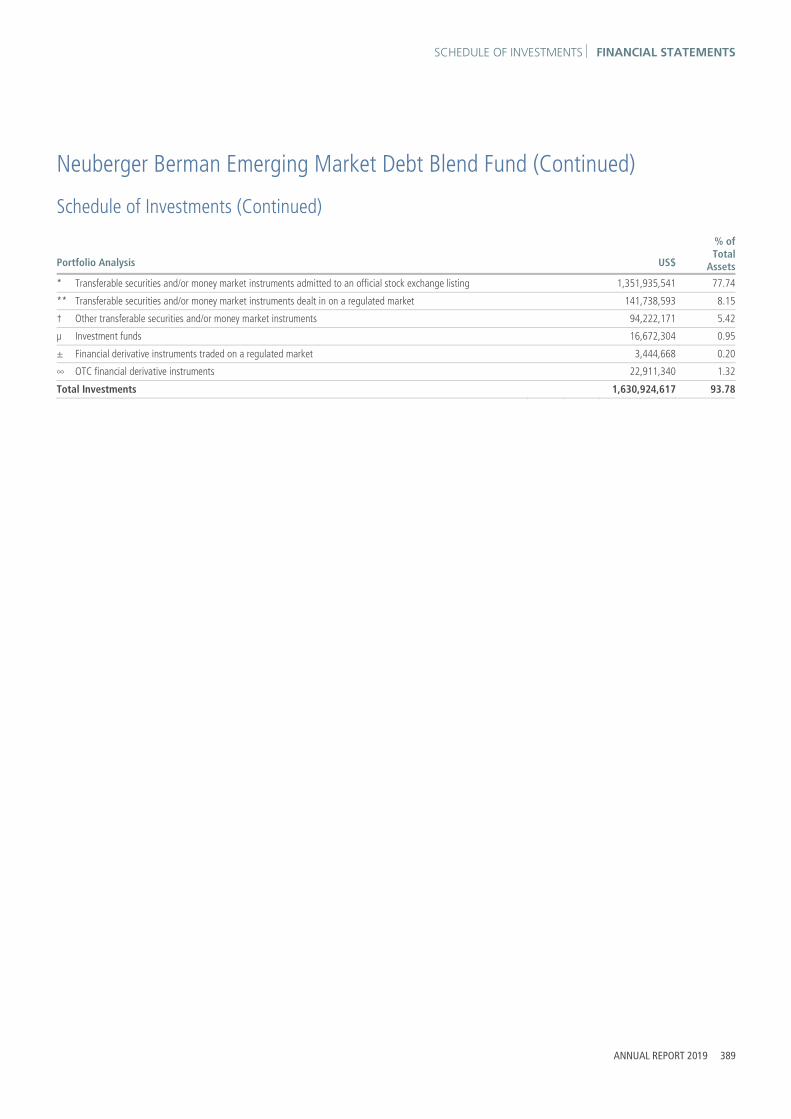
SCHEDULE OF INVESTMENTS FINANCIAL STATEMENTS
ANNUAL REPORT 2019 389
Neuberger Berman Emerging Market Debt Blend Fund (Continued)
Schedule of Investments (Continued)
% ofTotal
AssetsPortfolio Analysis US$
* Transferable securities and/or money market instruments admitted to an official stock exchange listing 1,351,935,541 77.74
** Transferable securities and/or money market instruments dealt in on a regulated market 141,738,593 8.15
† Other transferable securities and/or money market instruments 94,222,171 5.42
μ Investment funds 16,672,304 0.95
± Financial derivative instruments traded on a regulated market 3,444,668 0.20
∞ OTC financial derivative instruments 22,911,340 1.32
Total Investments 1,630,924,617 93.78

FINANCIAL STATEMENTS STATEMENT OF SIGNIFICANT PURCHASES AND SALES
390 NEUBERGER BERMAN INVESTMENT FUNDS PLC
Neuberger Berman Emerging Market Debt Blend Fund (Continued) Statement of Significant Purchases and Sales (Unaudited) In accordance with the European Communities (Undertakings for Collective Investment in Transferable Securities) Regulations, 2011 as amended, a statement of changes in the composition of the Schedule of Investments during the reporting period is provided to ensure that Shareholders can identify changes in the investments held by the Portfolio. The following statements present the aggregate purchases and sales of transferable securities exceeding one percent of the total value of purchases or sales, respectively, for the period. At a minimum, the largest twenty purchases and twenty sales are presented, if available.
Aggregate purchases greater than one percent of the total value of purchases:
Units Security Description Cost US$
528,513,200 Mexican Bonos, 7.50%, 03/06/2027 27,445,923
25,000,000 United States Treasury Bill, 0.00%, 19/09/2019 24,769,827
24,380,000 United States Treasury Bill, 0.00%, 12/09/2019 24,175,858
625,000,000 Thailand Government Bond, 2.88%, 17/12/2028 20,879,460
323,567,325 Republic of South Africa Government Bond, 8.25%, 31/03/2032 20,664,675
1,390,739,000 Russian Federal Bond - OFZ, 7.25%, 10/05/2034 20,659,495
5,135,360,000 Hungary Government Bond, 2.50%, 24/10/2024 18,674,860
15,800,000 Russian Foreign Bond - Eurobond, 4.38%, 21/03/2029 16,342,258
1,596,964 Neuberger Berman China Bond Fund 16,254,851
13,939,000 Ukraine Government International Bond, 9.75%, 01/11/2028 16,128,339
66,000,000 Malaysia Government Bond, 3.65%, 31/10/2019 16,085,115
65,000,000 Malaysia Government Bond, 3.49%, 31/03/2020 15,745,764
15,680,900 United States Treasury Bill, 0.00%, 07/05/2020 15,563,109
2,974,705,100 Mexico Cetes, 7.36%, 23/04/2020 15,067,765
1,063,964,000 Russian Federal Bond - OFZ, 6.90%, 23/05/2029 15,054,677
233,560,000 Mexican Bonos, 8.50%, 31/05/2029 13,115,783
3,474,850,000 Hungary Government Bond, 3.00%, 27/10/2027 12,530,198
354,900,000 Thailand Government Bond, 3.30%, 17/06/2038 12,519,009
256,780,000 Czech Republic Government Bond, 2.40%, 17/09/2025 11,694,410
244,260,000 Czech Republic Government Bond, 2.75%, 23/07/2029 11,643,211
332,000,000 Thailand Government Bond, 1.45%, 17/12/2024 11,020,806
324,500,000 Thailand Government Bond, 2.40%, 17/12/2023 10,865,964
183,110,000 Mexican Bonos, 10.00%, 05/12/2024 10,655,720
165,350,166 Republic of South Africa Government Bond, 8.88%, 28/02/2035 10,542,953

STATEMENT OF SIGNIFICANT PURCHASES AND SALES FINANCIAL STATEMENTS
ANNUAL REPORT 2019 391
Neuberger Berman Emerging Market Debt Blend Fund (Continued)
Statement of Significant Purchases and Sales (Unaudited) (Continued) Top twenty sales:
Units Security Description Proceeds US$
25,000,000 United States Treasury Bill, 0.00%, 19/09/2019 24,892,535
24,380,000 United States Treasury Bill, 0.00%, 12/09/2019 24,192,286
351,730,000 Mexican Bonos, 10.00%, 05/12/2024 20,165,623
5,135,360,000 Hungary Government Bond, 2.50%, 24/10/2024 18,520,931
514,498,000 Thailand Government Bond, 2.88%, 17/12/2028 18,477,579
288,348,767 Republic of South Africa Government Bond, 8.75%, 28/02/2048 18,290,914
65,300,000 Romania Government Bond, 4.25%, 28/06/2023 15,572,447
197,726,810 Republic of South Africa Government Bond, 10.50%, 21/12/2026 15,526,373
955,219,000 Russian Federal Bond - OFZ, 7.25%, 10/05/2034 14,710,410
13,801,300 United States Treasury Bill, 0.00%, 07/02/2019 13,774,158
300,000,000 Czech Republic Government Bond, 0.00%, 17/07/2019 13,205,425
2,600,000,000 Mexico Cetes, 0.00%, 23/05/2019 13,185,474
813,838,000 Russian Federal Bond - OFZ, 7.75%, 16/09/2026 12,387,251
197,173,943 Republic of South Africa Government Bond, 8.25%, 31/03/2032 12,098,270
33,288,900,000 Colombian TES, 10.00%, 24/07/2024 11,649,338
41,959,000 Republic of Poland Government Bond, 2.75%, 25/04/2028 10,927,138
2,686,740,000 Hungary Government Bond, 3.00%, 27/10/2027 9,893,751
191,475,500 Mexican Bonos, 7.50%, 03/06/2027 9,833,758
579,235,000 Russian Federal Bond - OFZ, 6.90%, 23/05/2029 9,187,347
40,895,086 Turkey Government Bond, 16.20%, 14/06/2023 8,036,718

FINANCIAL STATEMENTS INVESTMENT MANAGER’S REPORT
392 NEUBERGER BERMAN INVESTMENT FUNDS PLC
Neuberger Berman European High Yield Bond Fund Investment Manager’s Report For the 12 months ended 31 December 2019, the total return for the EUR I Accumulating Class was 11.69%. Over the same period, the ICE BofA European Currency Non-Financial High Yield 3% Constrained Index (the “Index”)* returned 10.74%. (Performance for all share classes is provided in Appendix II. Performance data quoted represent past performance and do not indicate future results. Total returns shown reflect the reinvestment of income dividends and other distributions, if any).
High yield had a strong total return year in a market environment characterised by an increase in idiosyncratic credit events, on the margin (e.g., increasing credit dispersion), and somewhat of a lessening in macro and geopolitical risk driven by changes in monetary policy and the reduction of uncertainty with Brexit and US/China trade. The European high yield market was supported by a number of factors in 2019, including accommodative policy by the European Central Bank (“ECB”) and changes in policy and elections in the US that reduced uncertainty in the region. The backdrop of more accommodative monetary policy from the ECB and the Bank of England was supportive of issuer fundamentals and investor risk sentiment. Later in the year, the ECB signaled that rate cuts could be on hold in the near term which may have suggested to market participants that policymakers and economists were less concerned about further deterioration in growth. While there were bouts of volatility in the market during the year driven by shifting political winds (Brexit, elections, Germany, Hong Kong, China and the US), changes in expectations for monetary policy and flare-ups in trade tension, the European economy was more resilient than anticipated. While the lower growth environment was challenging for many issuers, corporate profits for the majority of high quality issuers often exceeded much lowered anticipations. While the US-China trade war has not been completely resolved, late in the year there was an announcement of a “phase-one” trade deal, which caused a shift in investor expectations fueling a global risk-on rally in December where lower quality high yield saw better returns. For the full year, however, higher quality outperformed lower quality. For the 12 months ended 31 December 2019, securities rated BB and B in the ICE BofA Global High Yield Constrained Index returned 14.4% and 13.5%, respectively, whereas CCC-rated securities returned 12.0%.
Credit selection was a key factor in high yield in 2019 and avoiding deteriorating credits was additive to investment results. Issuers with unsustainable capital structures in uneconomic parts of retail, energy, commodity- and/or cyclically-exposed businesses and companies facing increased regulatory scrutiny were the underperformers in 2019. Outside of these pockets of idiosyncratic risk, most of the European high yield issuer were supported by constructive fundamentals: very low-but-positive revenue growth, earnings that were generally in-line (or less bad than feared), good interest coverage and only a modest increase in leverage which was driven primarily by a subset of stressed issuers in the high yield universe. Among the higher-quality issuers, fundamentals remain relatively solid.
In a strong market, the Portfolio saw upside participation and outperformed its benchmark index over the reporting period. During the year, security selection within Support-Services, an underweight to Telecommunications and security selection within Gaming were the most beneficial to performance. In contrast, security selection within Consumer Products, Utilities and Restaurants were the largest detractors.
Developments in recent weeks point to a period of near term challenges to aggregate demand from the coronavirus outbreak. Unusually, we anticipate demand and supply chain disruptions related to Covid-19. Despite the high level of uncertainty of how deep or over what length of time the virus will impact, we do believe this to be a temporary decline in GDP. Expansionary monetary and inventive fiscal policies will likely moderate the economic impact of the closures and social distancing efforts to “flatten the curve” of the virus.
With spread levels now at multi-year wides, we believe valuations are at attractive levels which compensate investors even in an environment with an above-average increase in default rates in European High Yield.
* The performance of certain rated bonds within the Index, as noted above, represent issues that are rated Ba1/BB+ through Ba3/BB and CCC+/Caa1 or lower, based on an average of Moody’s, S&P and Fitch, as calculated by ICE BofA.

BALANCE SHEET FINANCIAL STATEMENTS
The accompanying notes form an integral part of the financial statements.
ANNUAL REPORT 2019 393
Neuberger Berman European High Yield Bond Fund (Continued)
Balance Sheet
As at31 December 2019
EUR
As at31 December 2018
EUR Note
Current Assets
Financial Assets at Fair Value through Profit or Loss 2 39,969,631 24,348,490
Cash and cash equivalents 3 335,867 489,022
Receivable for investments sold 306,490 59,925
Receivable for shares issued 385,989 5,988
Due from brokers – 65,797
Income receivable and other assets 512,509 348,661
Total Assets 41,510,486 25,317,883
Current Liabilities
Financial Liabilities at Fair Value through Profit or Loss 2 1,048,628 157,191
Bank overdraft 4 289 149
Payable for shares redeemed 45,958 –
Accrued expenses 52,494 46,048
Payable for investments purchased 502,409 –
Other payables 23,204 38,080
Liabilities (excluding Net Assets Attributable to Holders of Redeemable Participating Shares) 1,672,982 241,468
Net Assets Attributable to Holders of Redeemable Participating Shares 39,837,504 25,076,415

FINANCIAL STATEMENTS PROFIT AND LOSS ACCOUNT
The accompanying notes form an integral part of the financial statements.
394 NEUBERGER BERMAN INVESTMENT FUNDS PLC
Neuberger Berman European High Yield Bond Fund (Continued)
Profit and Loss Account
Year Ended 31 December 2019
EUR
Year Ended31 December 2018
EUR Note
Income
Interest Income 1,258,684 1,280,397
Miscellaneous Income – 4,129
Net Gain/(Loss) on Financial Assets and Liabilities at Fair Value through Profit or Loss 11 3,073,093 (46,155)
4,331,777 1,238,371
Expenses
Management Fee 6 184,641 203,910
Distribution Fee 6 5,497 5,044
Administration Fee 6 113,965 102,906
Commitment Fee 19 3,520 2,823
Custody Fee 6 10,874 10,284
Depositary Fee 6 3,006 3,252
Professional Fee 9 47,622 23,206
Directors' Fee 7 4,080 5,693
Transaction Costs 9 30,177 14,765
Audit Fee 8 25,539 14,805
VAT Rebate (493) (374)
Other Expenses 9 15,708 16,121
Expense Waiver 6 (189,796) (126,905)
Total Expenses 254,340 275,530
Finance Costs
Interest Expense 28 3,947
Distribution Paid 1 36,907 29,055
36,935 33,002
Withholding Tax 1 1,567 –
Profit/(Loss) Attributable to Holders of Redeemable Participating Shares from Operations 4,038,935 929,839
Income and expenses arose solely from continuing operations.

STATEMENT OF CHANGES IN NET ASSETS FINANCIAL STATEMENTS
The accompanying notes form an integral part of the financial statements.
ANNUAL REPORT 2019 395
Neuberger Berman European High Yield Bond Fund (Continued) Statement of Changes in Net Assets Attributable to Holders of Redeemable Participating Shares
Year Ended31 December 2019
EUR
Year Ended31 December 2018
EUR Note
Net Assets Attributable to Holders of Redeemable Participating Shares at beginning of year 25,076,415 22,750,203
Profit/(Loss) Attributable to Holders of Redeemable Participating Shares from Operations 4,038,935 929,839
Subscriptions 5 31,182,475 21,729,994
Redemptions 5 (20,460,321) (20,333,621)
Net Assets Attributable to Holders of Redeemable Participating Shares at end of year 39,837,504 25,076,415
.

FINANCIAL STATEMENTS SCHEDULE OF INVESTMENTS
396 NEUBERGER BERMAN INVESTMENT FUNDS PLC
Neuberger Berman European High Yield Bond Fund (Continued)
Schedule of Investments
Financial Assets at Fair Value through Profit or Loss
Principal Amount Security Description Coupon Maturity
DateFair Value
EUR% of Net
Assets
Corporate Bonds 96.98% (31 December 2018: 89.69%)
Euro 200,000 Accor SA* 2.63% 29/12/2049 203,200 0.51
200,000 Accor SA* 4.38% 29/12/2049 217,988 0.55
100,000 Altice Finco SA* 4.75% 15/01/2028 101,325 0.25
300,000 Altice Finco SA* 9.00% 15/06/2023 311,992 0.78
188,000 Altice France SA* 2.50% 15/01/2025 190,811 0.48
273,000 Altice France SA* 3.38% 15/01/2028 282,055 0.71
100,000 Altice France SA* 5.88% 01/02/2027 112,875 0.28
200,000 Altice Luxembourg SA* 6.25% 15/02/2025 207,700 0.52
500,000 Altice Luxembourg SA* 8.00% 15/05/2027 561,875 1.41
100,000 Aramark International Finance Sarl* 3.13% 01/04/2025 103,312 0.26
353,000 ARD Finance SA* 5.00% 30/06/2027 356,901 0.90
124,000 Avantor Inc* 4.75% 01/10/2024 132,286 0.33
300,000 Avis Budget Finance Plc* 4.75% 30/01/2026 322,500 0.81
150,000 Axalta Coating Systems Dutch Holding B BV* 3.75% 15/01/2025 155,062 0.39
100,000 Ball Corp* 1.50% 15/03/2027 101,057 0.25
523,000 Bausch Health Cos Inc* 4.50% 15/05/2023 530,845 1.33
100,000 Belden Inc* 3.88% 15/03/2028 106,717 0.27
200,000 Belden Inc* 4.13% 15/10/2026 214,813 0.54
400,000 Berry Global Inc* 1.50% 15/01/2027 404,000 1.01
190,000 Bombardier Inc* 6.13% 15/05/2021 199,975 0.50
200,000 Casino Guichard Perrachon SA* 1.87% 13/06/2022 192,754 0.48
500,000 Casino Guichard Perrachon SA** 3.58% 07/02/2025 431,250 1.08
200,000 Casino Guichard Perrachon SA* 4.56% 25/01/2023 196,925 0.49
200,000 Casino Guichard Perrachon SA* 5.98% 26/05/2021 210,380 0.53
200,000 Cemex SAB de CV* 3.13% 19/03/2026 208,157 0.52
328,000 CeramTec BondCo GmbH* 5.25% 15/12/2025 343,941 0.86
540,000 Cirsa Finance International Sarl* 4.75% 22/05/2025 567,675 1.43
195,000 Colfax Corp* 3.25% 15/05/2025 200,934 0.50
136,000 Constellium SE* 4.25% 15/02/2026 142,120 0.36
249,000 Crown European Holdings SA* 2.88% 01/02/2026 270,862 0.68
125,000 Darling Global Finance BV* 3.63% 15/05/2026 132,344 0.33
217,000 Diocle SpA* 3.88% 30/06/2026 220,933 0.55
253,000 DKT Finance ApS* 7.00% 17/06/2023 268,620 0.67
100,000 Dufry One BV* 2.00% 15/02/2027 101,602 0.26
100,000 EDP - Energias de Portugal SA* 4.50% 30/04/2079 112,062 0.28
300,000 eG Global Finance Plc* 4.38% 07/02/2025 301,313 0.76
149,000 eG Global Finance Plc* 6.25% 30/10/2025 158,074 0.40
100,000 eircom Finance DAC* 3.50% 15/05/2026 105,729 0.27

SCHEDULE OF INVESTMENTS FINANCIAL STATEMENTS
ANNUAL REPORT 2019 397
Neuberger Berman European High Yield Bond Fund (Continued)
Schedule of Investments (Continued)
Financial Assets at Fair Value through Profit or Loss (continued)
Principal Amount Security Description Coupon Maturity
Date Fair Value
EUR% of Net
Assets
Corporate Bonds 96.98% (31 December 2018: 89.69%) (continued)
Euro (continued) 100,000 Elis SA* 1.75% 11/04/2024 103,992 0.26
132,000 Energizer Gamma Acquisition BV* 4.63% 15/07/2026 140,142 0.35
335,000 Europcar Mobility Group* 4.00% 30/04/2026 326,039 0.82
150,000 Gestamp Funding Luxembourg SA* 3.50% 15/05/2023 153,371 0.39
226,000 Grifols SA* 2.25% 15/11/2027 234,283 0.59
313,000 Grupo Antolin-Irausa SA* 3.38% 30/04/2026 295,926 0.74
350,000 Guala Closures SpA** 3.50% 15/04/2024 354,812 0.89
100,000 Hertz Holdings Netherlands BV* 5.50% 30/03/2023 104,445 0.26
200,000 House of Finance NV* 4.38% 15/07/2026 206,395 0.52
451,000 IHO Verwaltungs GmbH* 3.88% 15/05/2027 478,624 1.20
215,000 INEOS Finance Plc* 2.13% 15/11/2025 216,881 0.54
116,000 INEOS Finance Plc* 2.88% 01/05/2026 120,205 0.30
200,000 INEOS Group Holdings SA* 5.38% 01/08/2024 208,410 0.52
200,000 Infineon Technologies AG* 2.88% 29/12/2049 206,700 0.52
100,000 Infineon Technologies AG* 3.63% 29/12/2049 104,750 0.26
100,000 Infor US Inc* 5.75% 15/05/2022 101,670 0.26
400,000 International Game Technology Plc* 3.50% 15/06/2026 427,500 1.07
100,000 International Game Technology Plc* 4.75% 15/02/2023 109,700 0.28
200,000 IQVIA Inc* 2.25% 15/01/2028 207,192 0.52
535,000 IQVIA Inc* 3.25% 15/03/2025 547,015 1.37
151,000 Jaguar Land Rover Automotive Plc* 4.50% 15/01/2026 145,911 0.37
295,000 Kapla Holding SAS* 3.38% 15/12/2026 301,678 0.76
200,000 Koninklijke KPN NV* 2.00% 29/12/2049 204,120 0.51
101,000 Kraton Polymers LLC/Kraton Polymers Capital Corp* 5.25% 15/05/2026 105,040 0.26
320,000 Kronos International Inc* 3.75% 15/09/2025 326,400 0.82
154,000 La Financiere Atalian SASU* 4.00% 15/05/2024 125,119 0.31
100,000 Leonardo SpA* 4.88% 24/03/2025 120,489 0.30
204,000 Levi Strauss & Co* 3.38% 15/03/2027 218,452 0.55
299,000 LKQ European Holdings BV* 4.13% 01/04/2028 333,554 0.84
200,000 Loxam SAS* 4.50% 15/04/2027 201,000 0.50
200,000 Loxam SAS* 6.00% 15/04/2025 209,615 0.53
102,000 Matterhorn Telecom SA* 3.13% 15/09/2026 105,717 0.27
400,000 Mauser Packaging Solutions Holding Co* 4.75% 15/04/2024 415,606 1.04
520,000 Motion Bondco DAC* 4.50% 15/11/2027 547,820 1.38
100,000 Netflix Inc* 3.63% 15/06/2030 103,125 0.26
400,000 Netflix Inc* 4.63% 15/05/2029 447,150 1.12
228,000 Nexi SpA** 1.75% 31/10/2024 234,896 0.59
500,000 Nidda BondCo GmbH* 5.00% 30/09/2025 524,937 1.32

FINANCIAL STATEMENTS SCHEDULE OF INVESTMENTS
398 NEUBERGER BERMAN INVESTMENT FUNDS PLC
Neuberger Berman European High Yield Bond Fund (Continued)
Schedule of Investments (Continued)
Financial Assets at Fair Value through Profit or Loss (continued)
Principal Amount Security Description Coupon Maturity
Date Fair Value
EUR% of Net
Assets
Corporate Bonds 96.98% (31 December 2018: 89.69%) (continued)
Euro (continued) 100,000 Nokia OYJ* 2.00% 11/03/2026 103,950 0.26
100,000 OI European Group BV* 3.13% 15/11/2024 106,850 0.27
400,000 Orano SA* 3.38% 23/04/2026 430,542 1.08
130,000 Panther BF Aggregator 2 LP/Panther Finance Co Inc† 4.38% 15/05/2026 136,793 0.34
162,000 Paprec Holding SA* 3.50% 31/03/2025 153,900 0.39
200,000 Piaggio & C SpA* 3.63% 30/04/2025 211,402 0.53
416,000 Platin 1426 GmbH* 5.38% 15/06/2023 420,701 1.06
141,000 Playtech Plc* 4.25% 07/03/2026 150,185 0.38
100,000 Quatrim SASU* 5.88% 15/01/2024 105,875 0.27
572,000 Repsol International Finance BV* 4.50% 25/03/2075 660,917 1.66
150,000 Rexel SA* 2.75% 15/06/2026 158,183 0.40
100,000 Rossini Sarl* 3.88% 30/10/2025 101,938 0.26
336,000 Rossini Sarl* 6.75% 30/10/2025 375,480 0.94
396,000 Sazka Group AS* 4.13% 20/11/2024 416,493 1.05
100,000 Scientific Games International Inc* 3.38% 15/02/2026 103,820 0.26
100,000 Scientific Games International Inc* 5.50% 15/02/2026 104,467 0.26
365,000 SGL Carbon SE* 4.63% 30/09/2024 357,700 0.90
228,000 Sisal Pay SpA** 3.88% 17/12/2026 230,850 0.58
201,000 Smurfit Kappa Acquisitions ULC* 2.88% 15/01/2026 221,594 0.56
100,000 Solvay Finance SA* 5.87% 29/12/2049 118,524 0.30
200,000 Solvay SA* 4.25% 29/12/2049 222,740 0.56
200,000 SPIE SA* 2.63% 18/06/2026 209,970 0.53
200,000 Standard Industries Inc* 2.25% 21/11/2026 206,569 0.52
234,000 Starfruit Finco BV/Starfruit US Holdco LLC* 6.50% 01/10/2026 251,550 0.63
300,000 Summer BidCo BV* 9.00% 15/11/2025 321,355 0.81
217,000 Summit Properties Ltd* 2.00% 31/01/2025 212,888 0.53
100,000 Sunshine Mid BV* 6.50% 15/05/2026 107,333 0.27
214,000 Swissport Financing Sarl* 9.00% 15/02/2025 228,445 0.57
304,000 Tasty Bondco 1 SA* 6.25% 15/05/2026 319,420 0.80
437,000 Techem Verwaltungsgesellschaft 674 mbH* 6.00% 30/07/2026 473,326 1.19
600,000 Telecom Italia SpA* 2.88% 28/01/2026 632,752 1.59
299,000 Telecom Italia SpA** 3.00% 30/09/2025 320,561 0.80
200,000 Telecom Italia SpA* 3.63% 25/05/2026 221,581 0.56
400,000 Telefonica Europe BV* 2.88% 29/12/2049 409,706 1.03
400,000 Telefonica Europe BV* 3.88% 29/12/2049 436,086 1.09
100,000 Telenet Finance Luxembourg Notes Sarl* 3.50% 01/03/2028 108,446 0.27
472,000 Tenneco Inc* 4.88% 15/04/2022 481,794 1.21
100,000 Teva Pharmaceutical Finance Netherlands II BV* 1.13% 15/10/2024 87,580 0.22

SCHEDULE OF INVESTMENTS FINANCIAL STATEMENTS
ANNUAL REPORT 2019 399
Neuberger Berman European High Yield Bond Fund (Continued)
Schedule of Investments (Continued)
Financial Assets at Fair Value through Profit or Loss (continued)
Principal Amount Security Description Coupon Maturity
DateFair Value
EUR% of Net
Assets
Corporate Bonds 96.98% (31 December 2018: 89.69%) (continued)
Euro (continued) 427,000 Teva Pharmaceutical Finance Netherlands II BV* 1.88% 31/03/2027 353,983 0.89
100,000 Teva Pharmaceutical Finance Netherlands II BV* 3.25% 15/04/2022 101,410 0.25
250,000 thyssenkrupp AG* 1.88% 06/03/2023 251,211 0.63
304,000 thyssenkrupp AG* 2.88% 22/02/2024 314,321 0.79
259,000 Trivium Packaging Finance BV* 3.75% 15/08/2026 275,149 0.69
176,000 UGI International LLC* 3.25% 01/11/2025 186,398 0.47
150,000 Unilabs Subholding AB* 5.75% 15/05/2025 156,076 0.39
130,000 United Group BV* 4.13% 15/05/2025 130,553 0.33
207,000 UPC Holding BV* 3.88% 15/06/2029 217,204 0.55
410,400 UPCB Finance IV Ltd* 4.00% 15/01/2027 433,358 1.09
300,000 Vivion Investments Sarl* 3.00% 08/08/2024 306,945 0.77
163,000 Volvo Car AB* 2.00% 24/01/2025 168,860 0.42
125,000 VZ Vendor Financing BV* 2.50% 31/01/2024 128,010 0.32
380,000 WEPA Hygieneprodukte GmbH* 2.88% 15/12/2027 394,526 0.99
300,000 WMG Acquisition Corp* 3.63% 15/10/2026 318,375 0.80
189,000 Ziggo BV* 4.25% 15/01/2027 204,226 0.51
Total Euro 32,164,516 80.74
Pound Sterling 100,000 Anglian Water Osprey Financing Plc* 5.00% 30/04/2023 122,311 0.31
345,000 Ardagh Packaging Finance Plc/Ardagh Holdings USA Inc* 4.75% 15/07/2027 428,843 1.08
200,000 Co-operative Group Holdings 2011 Ltd* 7.50% 08/07/2026 271,168 0.68
200,000 CPUK Finance Ltd* 4.88% 28/08/2025 244,889 0.61
100,000 Drax Finco Plc* 4.25% 01/05/2022 120,772 0.30
200,000 EI Group Plc* 6.00% 06/10/2023 239,443 0.60
170,000 EI Group Plc* 7.50% 15/03/2024 216,382 0.54
200,000 Heathrow Finance Plc* 3.88% 01/03/2027 239,960 0.60
158,000 Iceland Bondco Plc* 4.63% 15/03/2025 163,723 0.41
200,000 Iron Mountain UK Plc* 3.88% 15/11/2025 241,945 0.61
200,000 Ladbrokes Group Finance Plc* 5.13% 08/09/2023 257,193 0.65
425,000 Miller Homes Group Holdings Plc* 5.50% 15/10/2024 522,311 1.31
320,000 MPT Operating Partnership LP/MPT Finance Corp* 3.69% 05/06/2028 388,507 0.97
300,000 NWEN Finance Plc* 5.88% 21/06/2021 361,719 0.91
365,000 Petrobras Global Finance BV* 5.38% 01/10/2029 479,127 1.20
231,000 Pinewood Finance Co Ltd* 3.25% 30/09/2025 280,077 0.70
172,000 Premier Foods Finance Plc* 6.25% 15/10/2023 213,323 0.54
245,000 TVL Finance Plc* 6.16% 15/07/2025 290,951 0.73
100,000 Virgin Media Receivables Financing Notes I DAC* 5.50% 15/09/2024 121,706 0.31

FINANCIAL STATEMENTS SCHEDULE OF INVESTMENTS
400 NEUBERGER BERMAN INVESTMENT FUNDS PLC
Neuberger Berman European High Yield Bond Fund (Continued)
Schedule of Investments (Continued)
Financial Assets at Fair Value through Profit or Loss (continued)
Principal Amount Security Description Coupon Maturity
DateFair Value
EUR% of Net
Assets
Corporate Bonds 96.98% (31 December 2018: 89.69%) (continued)
Pound Sterling (continued)
491,000 Virgin Media Secured Finance Plc* 5.25% 15/05/2029 627,861 1.58
305,000 Vodafone Group Plc* 4.88% 03/10/2078 390,865 0.98
200,000 William Hill Plc* 4.75% 01/05/2026 245,561 0.62
Total Pound Sterling 6,468,637 16.24
Total Corporate Bonds 38,633,153 96.98
Term Loans 2.62% (31 December 2018: 5.76%)
Euro 160,000 Mascot Bidco Oy 4.50% 30/03/2026 159,922 0.40
170,000 Nets Holdco 4 ApS 3.25% 06/02/2025 169,711 0.42
170,000 PI UK Holdco II Ltd 3.00% 03/01/2025 170,978 0.43
100,000 Rain Carbon Inc 3.00% 16/01/2025 95,188 0.24
147,739 Trident TPI Holdings Inc 3.25% 17/10/2024 143,491 0.36
Total Euro 739,290 1.85
Pound Sterling 74,743 BBD Bidco Ltd 5.54% 13/11/2026 88,885 0.22
185,000 Sigma Holdco BV 4.70% 02/07/2025 216,890 0.55
Total Pound Sterling 305,775 0.77
Total Term Loans † 1,045,065 2.62
Total Investments 39,678,218 99.60
Forward Currency Contracts 0.73% (31 December 2018: 1.65%)
Amount Receivable
Amount Payable
Maturity Date Counterparty Contracts Unrealised
Gain EUR% of Net
Assets
€ 203,848 £ 170,680 22/01/2020 UBS AG 1 2,547 0.00
£ 445,060 € 497,427 22/01/2020 Westpac Banking Corp 3 27,480 0.07
GBP Hedged Classes £ 10,704 € 11,993 22/01/2020 Goldman Sachs International 3 631 0.00
£ 10,347 € 11,565 22/01/2020 UBS AG 1 639 0.00
£ 11,371 € 12,826 22/01/2020 Westpac Banking Corp 4 585 0.00
SGD Hedged Classes € 52,214 SGD 78,590 22/01/2020 Westpac Banking Corp 7 204 0.00
SGD 237,454 € 155,982 22/01/2020 Goldman Sachs International 3 1,167 0.00
SGD 234,095 € 153,636 22/01/2020 UBS AG 2 1,290 0.01
SGD 256,448 € 168,436 22/01/2020 Westpac Banking Corp 13 1,284 0.01

SCHEDULE OF INVESTMENTS FINANCIAL STATEMENTS
ANNUAL REPORT 2019 401
Neuberger Berman European High Yield Bond Fund (Continued)
Schedule of Investments (Continued)
Financial Assets at Fair Value through Profit or Loss (continued)
Forward Currency Contracts 0.73% (31 December 2018: 1.65%) (continued)
Amount Receivable
Amount Payable
Maturity Date Counterparty Contracts Unrealised
Gain EUR% of Net
Assets
USD Hedged Classes € 5,156,000 US$ 5,690,568 22/01/2020 Goldman Sachs International 3 92,626 0.23
€ 5,008,914 US$ 5,532,406 22/01/2020 UBS AG 1 86,271 0.22
€ 4,375,911 US$ 4,831,762 22/01/2020 Westpac Banking Corp 7 76,689 0.19
Total Unrealised Gain on Forward Currency Contracts ∞ 291,413 0.73
Fair ValueEUR
% of NetAssets
Total Financial Assets at Fair Value through Profit or Loss 39,969,631 100.33
Financial Liabilities at Fair Value through Profit or Loss
Forward Currency Contracts (2.63%) (31 December 2018: (0.59%))
Amount Receivable
Amount Payable
Maturity Date Counterparty Contracts Unrealised
Loss EUR% of Net
Assets
€ 6,840,746 £ 6,074,087 22/01/2020 UBS AG 6 (323,090) (0.81)
€ 28,590 £ 24,668 22/01/2020 Westpac Banking Corp 1 (503) (0.00)
£ 47,209 € 55,791 22/01/2020 UBS AG 1 (113) (0.00)
US$ 13,186 € 11,899 22/01/2020 UBS AG 1 (167) (0.00)
GBP Hedged Classes € 208 £ 187 22/01/2020 Goldman Sachs International 2 (13) (0.00)
€ 18 £ 15 22/01/2020 Westpac Banking Corp 3 (0) (0.00)
£ 380 € 453 22/01/2020 Goldman Sachs International 2 (4) (0.00)
SGD Hedged Classes € 5,244 SGD 7,973 22/01/2020 Goldman Sachs International 3 (33) (0.00)
€ 241,696 SGD 367,905 22/01/2020 Westpac Banking Corp 10 (1,786) (0.00)
SGD 14,874 € 9,876 22/01/2020 Goldman Sachs International 2 (32) (0.00)
SGD 1,299 € 861 22/01/2020 UBS AG 1 (1) (0.00)
SGD 14,098 € 9,346 22/01/2020 Westpac Banking Corp 6 (14) (0.00)
USD Hedged Classes US$ 15,909,818 € 14,413,512 22/01/2020 Goldman Sachs International 5 (257,219) (0.65)
US$ 15,406,632 € 13,948,814 22/01/2020 UBS AG 1 (240,248) (0.60)
US$ 15,861,992 € 14,339,142 22/01/2020 Westpac Banking Corp 19 (225,405) (0.57)
Total Unrealised Loss on Forward Currency Contracts ∞ (1,048,628) (2.63)

FINANCIAL STATEMENTS SCHEDULE OF INVESTMENTS
402 NEUBERGER BERMAN INVESTMENT FUNDS PLC
Neuberger Berman European High Yield Bond Fund (Continued)
Schedule of Investments (Continued)
Financial Liabilities at Fair Value through Profit or Loss (continued)
Fair Value % of Net
EUR Assets
Total Financial Liabilities at Fair Value through Profit or Loss (1,048,628) (2.63)
Net Financial Assets at Fair Value through Profit or Loss 38,921,003 97.70
Other Net Assets 916,501 2.30
Net Assets Attributable to Holders of Redeemable Participating Shares 39,837,504 100.00
% of
TotalAssetsPortfolio Analysis EUR
* Transferable securities and/or money market instruments admitted to an official stock exchange listing 36,923,991 88.95
** Transferable securities and/or money market instruments dealt in on a regulated market 1,572,369 3.78
† Other transferable securities and/or money market instruments 1,181,858 2.85
∞ OTC financial derivative instruments (757,215) (1.82)
Total Investments 38,921,003 93.76

STATEMENT OF SIGNIFICANT PURCHASES AND SALES FINANCIAL STATEMENTS
ANNUAL REPORT 2019 403
Neuberger Berman European High Yield Bond Fund (Continued) Statement of Significant Purchases and Sales (Unaudited) In accordance with the European Communities (Undertakings for Collective Investment in Transferable Securities) Regulations, 2011 as amended, a statement of changes in the composition of the Schedule of Investments during the reporting period is provided to ensure that Shareholders can identify changes in the investments held by the Portfolio. The following statements present the aggregate purchases and sales of transferable securities exceeding one percent of the total value of purchases or sales, respectively, for the period. At a minimum, the largest twenty purchases and twenty sales are presented, if available.
Top twenty purchases:
Units Security Description Cost EUR
672,000 Repsol International Finance BV, 4.50%, 25/03/2075 768,453
591,000 Virgin Media Secured Finance Plc, 5.25%, 15/05/2029 701,095
700,000 Telefonica Europe BV, 3.88%, 29/12/2049 685,519
600,000 William Hill Plc, 4.75%, 01/05/2026 683,771
600,000 Telecom Italia SpA, 2.88%, 28/01/2026 617,856
508,000 Vodafone Group Plc, 4.88%, 03/10/2078 590,777
550,000 Equinix Inc, 2.88%, 01/10/2025 571,225
465,000 Petrobras Global Finance BV, 5.38%, 01/10/2029 555,779
540,000 Cirsa Finance International Sarl, 4.75%, 22/05/2025 551,904
589,000 Altice Finco SA, 4.75%, 15/01/2028 540,824
500,000 Altice Luxembourg SA, 8.00%, 15/05/2027 537,638
520,000 Motion Bondco DAC, 4.50%, 15/11/2027 527,300
511,000 Equinix Inc, 2.88%, 01/02/2026 524,404
500,000 Vivion Investments Sarl, 3.00%, 08/08/2024 500,858
491,000 eG Global Finance Plc, 4.38%, 07/02/2025 485,849
472,000 Tenneco Inc, 4.88%, 15/04/2022 480,747
425,000 Entertainment One Ltd, 4.63%, 15/07/2026 480,724
462,000 Cemex SAB de CV, 3.13%, 19/03/2026 468,047
451,000 IHO Verwaltungs GmbH, 3.88%, 15/05/2027 464,110
400,000 Netflix Inc, 4.63%, 15/05/2029 444,812

FINANCIAL STATEMENTS STATEMENT OF SIGNIFICANT PURCHASES AND SALES
404 NEUBERGER BERMAN INVESTMENT FUNDS PLC
Neuberger Berman European High Yield Bond Fund (Continued) Statement of Significant Purchases and Sales (Unaudited) (Continued) Aggregate sales greater than one percent of the total value of sales:
Units Security Description Proceeds EUR
540,000 Unitymedia Hessen GmbH & Co KG/Unitymedia NRW GmbH, 6.25%, 15/01/2029 598,004
550,000 Equinix Inc, 2.88%, 01/10/2025 570,735
525,000 InterXion Holding NV, 4.75%, 15/06/2025 569,641
589,000 Altice Finco SA, 4.75%, 15/01/2028 537,426
511,000 Equinix Inc, 2.88%, 01/02/2026 536,583
425,000 Entertainment One Ltd, 4.63%, 15/07/2026 514,306
485,000 Teva Pharmaceutical Finance Netherlands II BV, 0.38%, 25/07/2020 481,864
400,000 William Hill Plc, 4.75%, 01/05/2026 456,560
400,000 Silgan Holdings Inc, 3.25%, 15/03/2025 412,019
430,000 Banff Merger Sub Inc, 8.38%, 01/09/2026 399,785
350,000 Repsol International Finance BV, 4.50%, 25/03/2075 396,813
370,000 Wind Tre SpA, 3.13%, 20/01/2025 388,974
274,000 Tesco Plc, 5.50%, 13/01/2033 386,126
352,000 Petrobras Global Finance BV, 4.75%, 14/01/2025 385,968
330,000 Virgin Media Secured Finance Plc, 5.13%, 15/01/2025 379,989
375,000 IHO Verwaltungs GmbH, 3.75%, 15/09/2026 379,351
350,000 Cemex Finance LLC, 4.63%, 15/06/2024 368,733
350,000 Grifols SA, 3.20%, 01/05/2025 358,677
344,200 Altice France SA, 5.63%, 15/05/2024 354,069
324,000 Cirsa Finance International Sarl, 6.25%, 20/12/2023 343,898
300,000 AMC Entertainment Holdings Inc, 6.38%, 15/11/2024 337,048

INVESTMENT MANAGER’S REPORT FINANCIAL STATEMENTS
ANNUAL REPORT 2019 405
Neuberger Berman Global Equity Fund Investment Manager’s Report For the 12 months ended 31 December 2019, the total return for the USD I Accumulating Class was 27.32%. Over the same period, the benchmark index, the MSCI All Country World Index (Net) (the “Index”), returned 26.60%. (Performance for all share classes is provided in Appendix II. Performance data quoted represent past performance and do not indicate future results. Total returns shown are net of all fees and expenses and include reinvestment of income dividends and other distributions, if any).
Global equity markets enjoyed a very strong year despite a backdrop of negative earnings revisions, weakening global growth momentum and trade tensions. Monetary policy grew increasingly accommodative as the year progressed, providing a tailwind, and global economic data appeared to stabilize. Late in the year, the US and China appeared to move closer to the beginnings of a trade deal, calming investor sentiment. The US outperformed developed international markets, but both, along with emerging markets, posted strong results.
Within the All Country World Index, Information Technology (“IT”) was the top performer, followed by Consumer Discretionary and Industrials. Energy, Materials, and Utilities, while positive, lagged. Top-performing countries included Argentina, Russia and Greece. Chile, Poland, and Saudi Arabia declined most.
The Portfolio benefited from stock selection, particularly within IT, Financials and Industrials. By country, holdings based in the Netherlands, Switzerland and Canada contributed most. Weaker areas included Energy, Consumer Discretionary and Health Care, and by country, US-based, German and Israeli holdings.
In 2019, our Portfolio delivered strong absolute and relative returns. Many of the names we continued to own, or added to, after the broad market selloff in late 2018 were among top contributors.
As the year progressed, some of these names, along with many other high profitability (“quality”) growth stocks, began to look more richly valued. In keeping with our ‘quality at a reasonable price’ discipline, we realised some profits throughout the year, investing the proceeds into more attractively valued areas of the market.
During the first quarter of 2020, global markets appear to be suffering significantly given that Europe and the US are currently the epicenters of the COV-19 crisis. In our view, the recently announced central bank programs should help ease funding stresses. In addition, fiscal policy action is gathering pace with governments in the largest world economies announcing significant spending programs to support businesses and workers.
Easy US Federal Reserve policy and rising fiscal deficits (post stimulus) could help US Dollar strength abate over time, but the current dollar funding squeeze is putting pressure on some normally stable currencies like British Pound, Aussie Dollar, and Norwegian Kroner. This will likely ease as central banks know how to deal with this as a result of the 2008-2009 global financial crisis (swap lines etc.).
We believe we own quality assets, and despite short-term disruptions, these businesses could gradually get back to normal. Additionally, we believe current valuation makes many of them look very attractive on a long-term view. The markets appear to already be discounting a sharp earnings drop in our view, but stimulus combined with pent-up demand could lead to a recovery later in the year.

FINANCIAL STATEMENTS BALANCE SHEET
The accompanying notes form an integral part of the financial statements.
406 NEUBERGER BERMAN INVESTMENT FUNDS PLC
Neuberger Berman Global Equity Fund (Continued) Balance Sheet
As at31 December 2019
US$
As at31 December 2018
US$ Note
Current Assets
Financial Assets at Fair Value through Profit or Loss 2 1,372,120 1,218,774
Cash and cash equivalents 3 59,361 20,599
Income receivable and other assets 39,641 21,061
Total Assets 1,471,122 1,260,434
Current Liabilities
Accrued expenses 29,973 34,201
Payable for investments purchased – 1,814
Other payables 18,752 14,736
Liabilities (excluding Net Assets Attributable to Holders of Redeemable Participating Shares) 48,725 50,751
Net Assets Attributable to Holders of Redeemable Participating Shares 1,422,397 1,209,683

PROFIT AND LOSS ACCOUNT FINANCIAL STATEMENTS
The accompanying notes form an integral part of the financial statements.
ANNUAL REPORT 2019 407
Neuberger Berman Global Equity Fund (Continued) Profit and Loss Account
Year Ended 31 December 2019
US$
Year Ended31 December 2018
US$ Note
Income
Interest Income 422 484
Dividend Income 21,196 22,680
Miscellaneous Income 13,277 –
Net Gain/(Loss) on Financial Assets and Liabilities at Fair Value through Profit or Loss 11 313,060 (148,069)
347,955 (124,905)
Expenses
Management Fee 6 9,747 10,329
Administration Fee 6 17,428 22,110
Commitment Fee 19 140 158
Custody Fee 6 13,573 12,000
Depositary Fee 6 130 139
Professional Fee 9 50,395 18,012
Directors' Fee 7 4,530 6,613
Transaction Costs 9 13,797 18,282
Audit Fee 8 13,105 14,131
VAT Rebate (21) (18)
Other Expenses 9 15,218 15,995
Expense Waiver 6 (110,428) (102,283)
Total Expenses 27,614 15,468
Finance Costs
Interest Expense 1 –
1 –
Withholding Tax 1 4,272 4,037
Profit/(Loss) Attributable to Holders of Redeemable Participating Shares from Operations 316,068 (144,410)
Income and expenses arose solely from continuing operations.

FINANCIAL STATEMENTS STATEMENT OF CHANGES IN NET ASSETS
The accompanying notes form an integral part of the financial statements.
408 NEUBERGER BERMAN INVESTMENT FUNDS PLC
Neuberger Berman Global Equity Fund (Continued) Statement of Changes in Net Assets Attributable to Holders of Redeemable Participating Shares
Year Ended 31 December 2019
US$
Year Ended31 December 2018
US$ Note
Net Assets Attributable to Holders of Redeemable Participating Shares at beginning of year 1,209,683 1,354,093
Profit/(Loss) Attributable to Holders of Redeemable Participating Shares from Operations 316,068 (144,410)
Subscriptions 5 10,000 –
Redemptions 5 (113,354) –
Net Assets Attributable to Holders of Redeemable Participating Shares at end of year 1,422,397 1,209,683

SCHEDULE OF INVESTMENTS FINANCIAL STATEMENTS
ANNUAL REPORT 2019 409
Neuberger Berman Global Equity Fund (Continued)
Schedule of Investments
Financial Assets at Fair Value through Profit or Loss
Number of Shares Security Description Fair Value
US$% of Net
Assets
Equities 96.47% (31 December 2018: 100.75%)
Australian Dollar 1,628 Insurance Australia Group Ltd* 8,766 0.62
Total Australian Dollar 8,766 0.62
Canadian Dollar 524 Alimentation Couche-Tard Inc Class B* 16,652 1.17
217 Kinaxis Inc** 16,738 1.18
247 Suncor Energy Inc* 8,107 0.57
Total Canadian Dollar 41,497 2.92
Euro 78 ASML Holding NV* 23,088 1.62
60 Continental AG* 7,763 0.55
167 Gerresheimer AG* 12,935 0.91
95 Heineken NV* 10,122 0.71
807 Infineon Technologies AG* 18,398 1.29
409 Intertrust NV* 7,947 0.56
180 KBC Group NV* 13,549 0.95
60 Kerry Group Plc Class A* 7,483 0.53
54 Linde Plc* 11,565 0.81
Total Euro 112,850 7.93
Hong Kong Dollar 1,500 AIA Group Ltd* 15,747 1.11
900 Budweiser Brewing Co APAC Ltd* 3,038 0.21
3,650 Haier Electronics Group Co Ltd* 11,406 0.80
8,064 Samsonite International SA* 19,353 1.36
2,850 Techtronic Industries Co Ltd* 23,245 1.64
Total Hong Kong Dollar 72,789 5.12
Japanese Yen 270 Bridgestone Corp* 10,029 0.70
100 Daikin Industries Ltd* 14,106 0.99
150 Hoya Corp* 14,317 1.01
3,500 Ichigo Inc* 14,735 1.04
100 KAO Corp* 8,246 0.58
75 Kose Corp* 10,930 0.77
1,100 Sanwa Holdings Corp* 12,324 0.87
235 Toyota Motor Corp* 16,555 1.16
Total Japanese Yen 101,242 7.12

FINANCIAL STATEMENTS SCHEDULE OF INVESTMENTS
410 NEUBERGER BERMAN INVESTMENT FUNDS PLC
Neuberger Berman Global Equity Fund (Continued)
Schedule of Investments (Continued)
Financial Assets at Fair Value through Profit or Loss (continued)
Number of Shares Security Description Fair Value
US$% of Net
Assets
Equities 96.47% (31 December 2018: 100.75%) (continued)
Mexican Peso 1,641 Infraestructura Energetica Nova SAB de CV* 7,715 0.54
Total Mexican Peso 7,715 0.54
Norwegian Krone 1,275 Sbanken ASA* 10,824 0.76
Total Norwegian Krone 10,824 0.76
Pound Sterling 351 Bunzl Plc* 9,602 0.68
536 Compass Group Plc* 13,420 0.94
404 CRH Plc* 16,281 1.14
223 Ferguson Plc* 20,236 1.42
623 Fevertree Drinks Plc* 17,274 1.21
649 Prudential Plc* 12,458 0.88
467 RELX Plc* 11,789 0.83
949 St James's Place Plc* 14,640 1.03
Total Pound Sterling 115,700 8.13
Singapore Dollar 700 DBS Group Holdings Ltd* 13,473 0.95
Total Singapore Dollar 13,473 0.95
Swedish Krona 468 Assa Abloy AB Class B* 10,949 0.77
Total Swedish Krona 10,949 0.77
Swiss Franc 150 Cie Financiere Richemont SA* 11,782 0.83
3 Givaudan SA* 9,390 0.66
305 Julius Baer Group Ltd* 15,726 1.11
29 Lonza Group AG* 10,578 0.74
110 Novartis AG* 10,439 0.74
55 Roche Holding AG* 17,834 1.25
4 SGS SA* 10,951 0.77
96 Sonova Holding AG* 21,959 1.54
Total Swiss Franc 108,659 7.64

SCHEDULE OF INVESTMENTS FINANCIAL STATEMENTS
ANNUAL REPORT 2019 411
Neuberger Berman Global Equity Fund (Continued)
Schedule of Investments (Continued)
Financial Assets at Fair Value through Profit or Loss (continued)
Number of Shares Security Description Fair Value
US$% of Net
Assets
Equities 96.47% (31 December 2018: 100.75%) (continued)
United States Dollar 316 Activision Blizzard Inc* 18,777 1.32
342 AerCap Holdings NV* 21,023 1.48
156 Alexion Pharmaceuticals Inc* 16,871 1.19
112 Alibaba Group Holding Ltd ADR* 23,755 1.67
11 Alphabet Inc Class A* 14,733 1.04
11 Alphabet Inc Class C* 14,707 1.03
20 Amazon.com Inc* 36,957 2.60
98 Aon Plc* 20,412 1.44
121 Apple Inc* 35,532 2.50
36 BlackRock Inc Class A* 18,097 1.27
640 Cabot Oil & Gas Corp* 11,142 0.78
148 CDW Corp* 21,140 1.49
290 Centene Corp* 18,232 1.28
153 Check Point Software Technologies Ltd* 16,977 1.19
270 Cognex Corp* 15,131 1.06
145 Comerica Inc* 10,404 0.73
41 Core Laboratories NV* 1,544 0.11
186 CVS Health Corp* 13,818 0.97
165 EOG Resources Inc* 13,820 0.97
125 Estee Lauder Companies Inc Class A* 25,818 1.82
42 Expedia Group Inc* 4,542 0.32
211 Exxon Mobil Corp* 14,724 1.04
164 Fidelity National Information Services Inc* 22,811 1.60
101 First Republic Bank* 11,862 0.83
195 Gilead Sciences Inc* 12,671 0.89
355 Graco Inc* 18,460 1.30
195 Halliburton Co* 4,772 0.34
225 Henry Schein Inc* 15,012 1.06
260 Intercontinental Exchange Inc* 24,063 1.69
185 JPMorgan Chase & Co* 25,789 1.81
21 Kontoor Brands Inc* 882 0.06
207 Medtronic Plc* 23,484 1.65
47 Motorola Solutions Inc* 7,574 0.53
108 NXP Semiconductors NV* 13,744 0.97
245 RPM International Inc* 18,806 1.32
114 SAP SE ADR* 15,275 1.07
325 Sealed Air Corp* 12,945 0.91
537 Sensata Technologies Holding Plc* 28,928 2.03

FINANCIAL STATEMENTS SCHEDULE OF INVESTMENTS
412 NEUBERGER BERMAN INVESTMENT FUNDS PLC
Neuberger Berman Global Equity Fund (Continued)
Schedule of Investments (Continued)
Financial Assets at Fair Value through Profit or Loss (continued)
Number of Shares Security Description Fair Value
US$% of Net
Assets
Equities 96.47% (31 December 2018: 100.75%) (continued)
United States Dollar (continued)
264 Service Corp International* 12,152 0.85
43 SVB Financial Group* 10,795 0.76
255 T-Mobile US Inc* 19,997 1.41
150 VF Corp* 14,949 1.05
150 Visa Inc Class A* 28,185 1.98
250 Waste Connections Inc* 22,698 1.60
215 Western Digital Corp* 13,646 0.96
Total United States Dollar 767,656 53.97
Total Equities 1,372,120 96.47
Total Investments 1,372,120 96.47
Fair ValueUS$
% of NetAssets
Total Financial Assets at Fair Value through Profit or Loss 1,372,120 96.47
Net Financial Assets at Fair Value through Profit or Loss 1,372,120 96.47
Other Net Assets 50,277 3.53
Net Assets Attributable to Holders of Redeemable Participating Shares 1,422,397 100.00
% ofTotal
AssetsPortfolio Analysis US$
* Transferable securities and/or money market instruments admitted to an official stock exchange listing 1,355,382 92.13
** Transferable securities and/or money market instruments dealt in on a regulated market 16,738 1.14
Total Investments 1,372,120 93.27
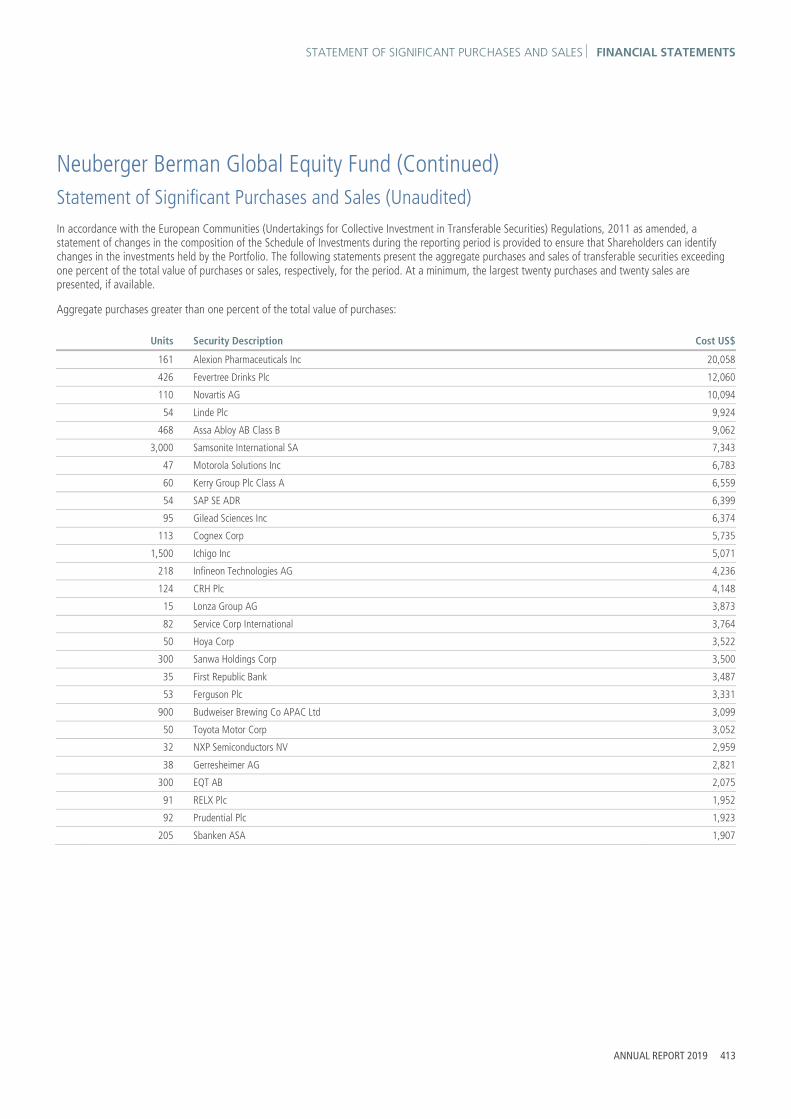
STATEMENT OF SIGNIFICANT PURCHASES AND SALES FINANCIAL STATEMENTS
ANNUAL REPORT 2019 413
Neuberger Berman Global Equity Fund (Continued) Statement of Significant Purchases and Sales (Unaudited) In accordance with the European Communities (Undertakings for Collective Investment in Transferable Securities) Regulations, 2011 as amended, a statement of changes in the composition of the Schedule of Investments during the reporting period is provided to ensure that Shareholders can identify changes in the investments held by the Portfolio. The following statements present the aggregate purchases and sales of transferable securities exceeding one percent of the total value of purchases or sales, respectively, for the period. At a minimum, the largest twenty purchases and twenty sales are presented, if available.
Aggregate purchases greater than one percent of the total value of purchases:
Units Security Description Cost US$
161 Alexion Pharmaceuticals Inc 20,058
426 Fevertree Drinks Plc 12,060
110 Novartis AG 10,094
54 Linde Plc 9,924
468 Assa Abloy AB Class B 9,062
3,000 Samsonite International SA 7,343
47 Motorola Solutions Inc 6,783
60 Kerry Group Plc Class A 6,559
54 SAP SE ADR 6,399
95 Gilead Sciences Inc 6,374
113 Cognex Corp 5,735
1,500 Ichigo Inc 5,071
218 Infineon Technologies AG 4,236
124 CRH Plc 4,148
15 Lonza Group AG 3,873
82 Service Corp International 3,764
50 Hoya Corp 3,522
300 Sanwa Holdings Corp 3,500
35 First Republic Bank 3,487
53 Ferguson Plc 3,331
900 Budweiser Brewing Co APAC Ltd 3,099
50 Toyota Motor Corp 3,052
32 NXP Semiconductors NV 2,959
38 Gerresheimer AG 2,821
300 EQT AB 2,075
91 RELX Plc 1,952
92 Prudential Plc 1,923
205 Sbanken ASA 1,907

FINANCIAL STATEMENTS STATEMENT OF SIGNIFICANT PURCHASES AND SALES
414 NEUBERGER BERMAN INVESTMENT FUNDS PLC
Neuberger Berman Global Equity Fund (Continued) Statement of Significant Purchases and Sales (Unaudited) (Continued) Top twenty sales:
Units Security Description Proceeds US$
120 ASML Holding NV 26,705
154 Fidelity National Information Services Inc 20,319
154 CDW Corp 16,791
8 Amazon.com Inc 13,468
125 Henkel AG & Co KGaA – Preferred Shares 12,412
5 Givaudan SA 12,195
48 Biogen Inc 11,804
87 Air Liquide SA 11,195
82 NXP Semiconductors NV 8,400
376 Infineon Technologies AG 8,352
800 AIA Group Ltd 8,222
97 Kinaxis Inc 7,325
324 RELX Plc 7,106
470 Tower Semiconductor Ltd 7,005
129 AerCap Holdings NV 6,957
56 Baidu Inc ADR 6,457
58 Worldpay Inc 5,923
65 Ferguson Plc 5,447
74 Alimentation Couche-Tard Inc Class B 4,447
183 Compass Group Plc 4,400
50 KAO Corp 3,873
500 Techtronic Industries Co Ltd 3,867
99 Fevertree Drinks Plc 3,849
72 Cognex Corp 3,812
88 Service Corp International 3,809
110 Valeo SA 3,641
23 Visa Inc Class A 3,529
300 EQT AB 3,262

INVESTMENT MANAGER’S REPORT FINANCIAL STATEMENTS
ANNUAL REPORT 2019 415
Neuberger Berman Systematic Global Equity Fund Investment Manager’s Report For the 12 months ended 31 December 2019, the total return for the USD I Accumulating Class was 22.90%. Over the same period, the MSCI All Country World Index (ACWI) (USD Net Total Return) returned 26.60%. (Performance for all share classes is provided in Appendix II. Performance data quoted represents past performance and does not indicate future results. Total returns shown are net of all fees and expenses and include reinvestment of income dividends and other distributions, if any).
Global equity markets rallied higher in 2019. The China-US trade dispute was an overhang for most of the year; however, markets finished with a strong fourth quarter rally as the trade dispute pushed toward a resolution, which materially improved investor sentiment. Despite strong equity markets, global economic growth continued to slow as global manufacturing PMI declined over the year. US markets rallied over 30% during 2019; with the help of an accommodative US Federal Reserve, which cut rates for the first time since 2009 in July, September, and again in October. The 10-year US Treasury yield declined sharply mid-year, spending nearly the entire second half of 2019 below 2%, which signaled defensive market sentiment. Non-US developed markets rallied more than 20% on the year. Boris Johnson’s landslide victory in the UK general election moved his plan to reach a Brexit agreement by 31 January 2020 closer to realisation. Europe continued to struggle to meet inflation targets despite a stimulus package announced by the European Central Bank.
For the 12 months ended 31 December 2019, our underperformance versus the benchmark was driven mainly by security selection in the US and Europe ex-UK The Materials and Financials sectors each did well relative to the benchmark, while security selection in Health Care, Communication Services, Utilities, and Information Technology drove the Portfolio’s underperformance. The Portfolio’s performance lagged relative to the benchmark due to value, momentum, and low risk equity factors.
Heading into 2020, global markets have experienced acute volatility in the face of COVID-19. We will continue to monitor COVID-19 virus’ impact on global financial markets which will inform our investment process as we continue evaluate our portfolio holdings.

FINANCIAL STATEMENTS BALANCE SHEET
The accompanying notes form an integral part of the financial statements.
416 NEUBERGER BERMAN INVESTMENT FUNDS PLC
Neuberger Berman Systematic Global Equity Fund (Continued) Balance Sheet
As at31 December 2019
US$
As at31 December 2018
US$ Note
Current Assets
Financial Assets at Fair Value through Profit or Loss 2 31,667,314 20,635,659
Cash and cash equivalents 3 144,233 168,940
Receivable for investments sold – 116,911
Income receivable and other assets 10,479 107,867
Total Assets 31,822,026 21,029,377
Current Liabilities
Financial Liabilities at Fair Value through Profit or Loss 2 26,731 51,813
Payable for shares redeemed – 36,532
Accrued expenses 76,742 98,800
Payable for investments purchased 7 –
Other payables 51,172 139,943
Liabilities (excluding Net Assets Attributable to Holders of Redeemable Participating Shares) 154,652 327,088
Net Assets Attributable to Holders of Redeemable Participating Shares 31,667,374 20,702,289

PROFIT AND LOSS ACCOUNT FINANCIAL STATEMENTS
The accompanying notes form an integral part of the financial statements.
ANNUAL REPORT 2019 417
Neuberger Berman Systematic Global Equity Fund (Continued) Profit and Loss Account
Year Ended31 December 2019
US$
Year Ended31 December 2018
US$ Note
Income
Interest Income 721 1,998
Dividend Income 740,572 817,948
Net Gain/(Loss) on Financial Assets and Liabilities at Fair Value through Profit or Loss 11 4,481,280 (3,057,086)
5,222,573 (2,237,140)
Expenses
Management Fee 6 379,925 404,028
Distribution Fee 6 23,266 38,018
Administration Fee 6 73,711 95,697
Commitment Fee 19 2,823 2,324
Custody Fee 6 14,073 12,000
Depositary Fee 6 2,358 2,493
Professional Fee 9 47,152 46,450
Directors' Fee 7 4,530 6,612
Transaction Costs 9 201,417 263,974
Audit Fee 8 16,151 15,830
VAT Rebate (396) (318)
Other Expenses 9 14,592 14,946
Expense Waiver 6 (263,717) (337,341)
Total Expenses 515,885 564,713
Finance Costs
Interest Expense 419 224
419 224
Withholding Tax 1 142,120 165,667
Capital Gain Tax 1 7,062 (200)
Profit/(Loss) Attributable to Holders of Redeemable Participating Shares from Operations 4,557,087 (2,967,544)
Income and expenses arose solely from continuing operations.

FINANCIAL STATEMENTS PROFIT AND LOSS ACCOUNT
The accompanying notes form an integral part of the financial statements.
418 NEUBERGER BERMAN INVESTMENT FUNDS PLC
Neuberger Berman Systematic Global Equity Fund (Continued) Statement of Changes in Net Assets Attributable to Holders of Redeemable Participating Shares
Year Ended 31 December 2019
US$
Year Ended31 December 2018
US$ Note
Net Assets Attributable to Holders of Redeemable Participating Shares at beginning of year 20,702,289 24,074,748
Profit/(Loss) Attributable to Holders of Redeemable Participating Shares from Operations 4,557,087 (2,967,544)
Subscriptions 5 8,011,167 3,384,298
Redemptions 5 (1,603,169) (3,789,213)
Net Assets Attributable to Holders of Redeemable Participating Shares at end of year 31,667,374 20,702,289

SCHEDULE OF INVESTMENTS FINANCIAL STATEMENTS
ANNUAL REPORT 2019 419
Neuberger Berman Systematic Global Equity Fund (Continued)
Schedule of Investments
Financial Assets at Fair Value through Profit or Loss
Number of Shares Security Description Fair Value
US$% of Net
Assets
Equities 96.45% (31 December 2018: 94.31%)
Australian Dollar 1,918 AGL Energy Ltd* 27,680 0.09
9,135 Aurizon Holdings Ltd* 33,584 0.11
3,101 BHP Group Ltd* 84,839 0.27
2,971 Rio Tinto Ltd* 209,682 0.66
8,940 Santos Ltd* 51,406 0.16
4,959 Woodside Petroleum Ltd* 119,846 0.38
Total Australian Dollar 527,037 1.67
Brazilian Real 300 Atacadao SA* 1,747 0.01
700 B3 SA - Brasil Bolsa Balcao* 7,520 0.02
600 Banco Bradesco SA* 5,107 0.02
1,800 Banco Bradesco SA - Preferred Shares* 16,267 0.05
1,900 BB Seguridade Participacoes SA* 17,862 0.06
400 Braskem SA Class A - Preferred Shares* 2,985 0.01
700 CCR SA* 3,316 0.01
800 Centrais Eletricas Brasileiras SA* 7,547 0.02
200 Centrais Eletricas Brasileiras SA - Preferred Shares* 1,909 0.01
700 Compania de Saneamento Basico do Estado de Sao Paulo* 10,577 0.03
800 Compania Energetica de Minas Gerais - Preferred Shares* 2,756 0.01
3,000 Compania Siderurgica Nacional SA* 10,578 0.03
800 Cosan SA* 13,902 0.05
700 Energisa SA* 9,342 0.03
600 Engie Brasil Energia SA* 7,595 0.02
500 Equatorial Energia SA* 2,845 0.01
700 IRB Brasil Resseguros S/A* 6,800 0.02
1,640 Itau Unibanco Holding SA - Preferred Shares* 15,190 0.05
1,900 JBS SA* 12,234 0.04
1,011 Magazine Luiza SA* 12,061 0.04
1,000 Petrobras Distribuidora SA* 7,493 0.02
3,300 Petroleo Brasileiro SA - Preferred Shares* 24,925 0.08
1,700 Sul America SA* 25,374 0.08
1,300 Telefonica Brasil SA - Preferred Shares* 18,790 0.06
1,311 Vale SA* 17,444 0.05
Total Brazilian Real 262,166 0.83
Canadian Dollar 754 BCE Inc* 34,980 0.11

FINANCIAL STATEMENTS SCHEDULE OF INVESTMENTS
420 NEUBERGER BERMAN INVESTMENT FUNDS PLC
Neuberger Berman Systematic Global Equity Fund (Continued)
Schedule of Investments (Continued)
Financial Assets at Fair Value through Profit or Loss (continued)
Number of Shares Security Description Fair Value
US$% of Net
Assets
Equities 96.45% (31 December 2018: 94.31%) (continued)
Canadian Dollar (continued)
115 CGI Inc* 9,637 0.03
1,005 Emera Inc** 43,238 0.13
699 iA Financial Corp Inc** 38,450 0.12
1,283 Loblaw Companies Ltd** 66,290 0.21
1,741 Manulife Financial Corp* 35,390 0.11
2,437 National Bank of Canada** 135,461 0.43
910 Power Corp of Canada** 23,474 0.07
1,761 Power Financial Corp** 47,449 0.15
2,983 Sun Life Financial Inc* 136,205 0.43
2,239 Suncor Energy Inc* 73,485 0.23
5,107 Toronto-Dominion Bank* 286,827 0.91
Total Canadian Dollar 930,886 2.93
Chilean Peso 248 Cia Cervecerias Unidas SA* 2,431 0.01
28,326 Enel Americas SA* 6,291 0.02
Total Chilean Peso 8,722 0.03
Danish Krone 592 Carlsberg A/S Class B* 88,412 0.28
1,343 Novo Nordisk A/S Class B* 77,882 0.25
Total Danish Krone 166,294 0.53
Euro 388 adidas AG* 126,217 0.40
393 Aena SME SA* 75,215 0.24
1,160 Ageas* 68,595 0.21
730 Air Liquide SA* 103,411 0.33
2,654 Amadeus IT Group SA* 216,879 0.68
421 Arkema SA* 44,753 0.14
4,119 Assicurazioni Generali SpA* 85,096 0.27
15,947 Banco Bilbao Vizcaya Argentaria SA* 89,198 0.28
1,051 Capgemini SE* 128,474 0.40
4,510 Deutsche Telekom AG* 73,760 0.23
529 Eiffage SA* 60,568 0.19
2,285 Endesa SA* 61,019 0.19
8,551 Eurobank Ergasias SA* 8,830 0.03
612 EVN AG* 11,885 0.04

SCHEDULE OF INVESTMENTS FINANCIAL STATEMENTS
ANNUAL REPORT 2019 421
Neuberger Berman Systematic Global Equity Fund (Continued)
Schedule of Investments (Continued)
Financial Assets at Fair Value through Profit or Loss (continued)
Number of Shares Security Description Fair Value
US$% of Net
Assets
Equities 96.45% (31 December 2018: 94.31%) (continued)
Euro (continued)
428 Hannover Rueck SE* 82,778 0.26
1,045 Hellenic Telecommunications Organization SA* 16,727 0.05
9,334 Iberdrola SA* 96,183 0.31
5,522 Industria de Diseno Textil SA* 194,941 0.61
26,951 Intesa Sanpaolo SpA* 71,045 0.22
210 JUMBO SA* 4,373 0.02
27 Kering SA* 17,736 0.06
8,424 Koninklijke Ahold Delhaize NV* 210,820 0.67
3,972 Mediobanca Banca di Credito Finanziario SpA* 43,765 0.14
333 Merck KGaA* 39,379 0.13
577 OMV AG* 32,436 0.10
1,506 OPAP SA* 19,593 0.06
3,053 Peugeot SA* 72,995 0.23
969 Proximus SADP* 27,758 0.09
2,863 Red Electrica Corp SA* 57,606 0.18
1,446 Schneider Electric SE* 148,517 0.47
13,691 Snam SpA* 72,036 0.23
606 Sodexo SA* 71,867 0.23
9,357 Telefonica SA* 65,404 0.21
1,551 Total SA* 85,657 0.27
838 UCB SA* 66,692 0.21
3,400 Unilever NV* 195,519 0.62
264 Vinci SA* 29,338 0.09
2,089 Wolters Kluwer NV* 152,466 0.48
Total Euro 3,029,531 9.57
Hong Kong Dollar 4,000 Agile Group Holdings Ltd* 6,016 0.02
1,500 Anhui Conch Cement Co Ltd - H Shares* 10,935 0.03
1,000 ANTA Sports Products Ltd* 8,952 0.03
43,000 Bank of China Ltd - H Shares* 18,377 0.06
6,000 Bank of Communications Co Ltd - H Shares* 4,266 0.01
500 Beijing Enterprises Holdings Ltd* 2,294 0.01
1,800 BOC Aviation Ltd* 18,308 0.06
50,000 Bosideng International Holdings Ltd* 18,032 0.06
5,000 China Aoyuan Group Ltd* 8,150 0.03
22,000 China CITIC Bank Corp Ltd - H Shares* 13,186 0.04
3,500 China Conch Venture Holdings Ltd* 15,272 0.05

FINANCIAL STATEMENTS SCHEDULE OF INVESTMENTS
422 NEUBERGER BERMAN INVESTMENT FUNDS PLC
Neuberger Berman Systematic Global Equity Fund (Continued)
Schedule of Investments (Continued)
Financial Assets at Fair Value through Profit or Loss (continued)
Number of Shares Security Description Fair Value
US$% of Net
Assets
Equities 96.45% (31 December 2018: 94.31%) (continued)
Hong Kong Dollar (continued)
46,000 China Construction Bank Corp - H Shares* 39,732 0.13
21,000 China Everbright Bank Co Ltd - H Shares* 9,756 0.03
4,000 China Jinmao Holdings Group Ltd* 3,116 0.01
2,000 China Medical System Holdings Ltd* 2,880 0.01
2,000 China Mengniu Dairy Co Ltd* 8,085 0.02
2,000 China Merchants Bank Co Ltd - H Shares* 10,280 0.03
22,500 China Minsheng Banking Corp Ltd - H Shares* 17,008 0.05
3,000 China Mobile Ltd* 25,219 0.08
8,000 China National Building Material Co Ltd - H Shares* 8,932 0.03
1,600 China Pacific Insurance Group Co Ltd - H Shares* 6,304 0.02
10,000 China Petroleum & Chemical Corp - H Shares* 6,019 0.02
2,000 China Resources Land Ltd* 9,959 0.03
1,500 China Shenhua Energy Co Ltd - H Shares* 3,134 0.01
34,000 China Telecom Corp Ltd - H Shares* 14,007 0.04
1,500 China Vanke Co Ltd - H Shares* 6,401 0.02
3,000 CITIC Ltd* 4,012 0.01
4,000 CLP Holdings Ltd* 42,044 0.14
6,000 CNOOC Ltd* 9,980 0.03
2,000 Country Garden Holdings Co Ltd* 3,203 0.01
6,000 CSPC Pharmaceutical Group Ltd* 14,307 0.05
1,000 Fosun International Ltd* 1,458 0.01
2,000 Great Wall Motor Co Ltd - H Shares* 1,479 0.00
21,000 HKT Trust & HKT Ltd* 29,592 0.09
76,000 Industrial & Commercial Bank of China Ltd - H Shares* 58,523 0.19
9,000 Kaisa Group Holdings Ltd* 4,297 0.01
2,500 Kingboard Laminates Holdings Ltd* 3,099 0.01
4,000 Kunlun Energy Co Ltd* 3,532 0.01
25,000 Lee & Man Paper Manufacturing Ltd* 18,930 0.06
7,500 Li Ning Co Ltd* 22,475 0.07
4,000 Logan Property Holdings Co Ltd* 6,715 0.02
2,500 Longfor Group Holdings Ltd* 11,711 0.04
6,000 PetroChina Co Ltd - H Shares* 3,011 0.01
4,000 Ping An Insurance Group Co of China Ltd - H Shares* 47,281 0.15
20,000 Postal Savings Bank of China Co Ltd - H Shares* 13,604 0.04
4,000 Power Assets Holdings Ltd* 29,262 0.09
42,000 Shenzhen Investment Ltd* 16,818 0.05
2,000 Shimao Property Holdings Ltd* 7,752 0.02
20,000 Sino Land Co Ltd* 29,056 0.09

SCHEDULE OF INVESTMENTS FINANCIAL STATEMENTS
ANNUAL REPORT 2019 423
Neuberger Berman Systematic Global Equity Fund (Continued)
Schedule of Investments (Continued)
Financial Assets at Fair Value through Profit or Loss (continued)
Number of Shares Security Description Fair Value
US$% of Net
Assets
Equities 96.45% (31 December 2018: 94.31%) (continued)
Hong Kong Dollar (continued)
4,200 Sinotruk Hong Kong Ltd* 8,959 0.03
300 Sunny Optical Technology Group Co Ltd* 5,194 0.01
3,600 Tencent Holdings Ltd* 173,536 0.55
6,000 Weichai Power Co Ltd - H Shares* 12,659 0.04
7,000 Wharf Real Estate Investment Co Ltd* 42,718 0.14
5,000 Wheelock & Co Ltd* 33,336 0.11
67,800 Yuexiu Property Co Ltd* 15,663 0.05
Total Hong Kong Dollar 968,826 3.06
Hungarian Forint 164 OTP Bank Nyrt* 8,600 0.03
Total Hungarian Forint 8,600 0.03
Indonesian Rupiah 6,900 Bank Central Asia Tbk PT* 16,595 0.05
5,900 Bank Mandiri Persero Tbk PT* 3,260 0.01
26,200 Bank Rakyat Indonesia Persero Tbk PT* 8,293 0.03
116,800 Barito Pacific Tbk PT* 12,690 0.04
700 Gudang Garam Tbk PT* 2,670 0.01
17,900 Indofood CBP Sukses Makmur Tbk PT* 14,374 0.05
6,400 Indofood Sukses Makmur Tbk PT* 3,649 0.01
1,500 Semen Indonesia Persero Tbk PT* 1,294 0.00
39,600 Telekomunikasi Indonesia Persero Tbk PT* 11,345 0.03
3,400 United Tractors Tbk PT* 5,264 0.02
Total Indonesian Rupiah 79,434 0.25
Israeli Shekel 10,642 Bank Leumi Le-Israel BM* 77,458 0.24
Total Israeli Shekel 77,458 0.24
Japanese Yen 2,800 Ajinomoto Co Inc* 46,604 0.15
12,000 Astellas Pharma Inc* 204,802 0.65
1,400 Bridgestone Corp* 52,001 0.16
1,400 Brother Industries Ltd* 28,909 0.09
1,400 Canon Inc* 38,309 0.12
500 Daito Trust Construction Co Ltd* 61,777 0.19
2,900 FUJIFILM Holdings Corp* 138,466 0.44

FINANCIAL STATEMENTS SCHEDULE OF INVESTMENTS
424 NEUBERGER BERMAN INVESTMENT FUNDS PLC
Neuberger Berman Systematic Global Equity Fund (Continued)
Schedule of Investments (Continued)
Financial Assets at Fair Value through Profit or Loss (continued)
Number of Shares Security Description Fair Value
US$% of Net
Assets
Equities 96.45% (31 December 2018: 94.31%) (continued)
Japanese Yen (continued)
800 Hankyu Hanshin Holdings Inc* 34,214 0.11
6,500 Inpex Corp* 67,326 0.21
8,323 ITOCHU Corp* 192,864 0.61
4,200 Japan Tobacco Inc* 93,628 0.30
18,208 Marubeni Corp* 134,503 0.43
1,300 Mitsubishi Heavy Industries Ltd* 50,401 0.16
6,072 Nippon Telegraph & Telephone Corp* 153,434 0.48
2,200 Nomura Research Institute Ltd* 47,041 0.15
3,783 NTT DOCOMO Inc* 105,360 0.33
2,200 Santen Pharmaceutical Co Ltd* 41,887 0.13
4,100 Sekisui House Ltd* 87,539 0.28
3,700 Shimizu Corp* 37,684 0.12
1,600 Shionogi & Co Ltd* 98,961 0.31
7,111 Sumitomo Corp* 105,602 0.33
700 Sumitomo Mitsui Financial Group Inc* 25,850 0.08
2,100 Tokio Marine Holdings Inc* 117,555 0.37
100 Tokyo Electron Ltd* 21,829 0.07
1,300 Tokyo Gas Co Ltd* 31,583 0.10
3,868 Toyota Motor Corp* 272,495 0.86
Total Japanese Yen 2,290,624 7.23
Malaysian Ringgit 7,400 AMMB Holdings Bhd* 7,074 0.02
1,000 PPB Group Bhd* 4,606 0.02
7,500 Telekom Malaysia Bhd* 7,004 0.02
14,900 Westports Holdings Bhd* 15,335 0.05
Total Malaysian Ringgit 34,019 0.11
Mexican Peso 6,700 Alfa SAB de CV Class A* 5,556 0.02
18,567 America Movil SAB de CV* 14,846 0.05
13,400 Cemex SAB de CV - Preferred Shares* 5,024 0.02
8,400 Kimberly-Clark de Mexico SAB de CV Class A* 16,739 0.05
6,400 Orbia Advance Corp SAB de CV* 13,665 0.04
Total Mexican Peso 55,830 0.18
New Taiwan Dollar 9,000 Asia Cement Corp* 14,396 0.05

SCHEDULE OF INVESTMENTS FINANCIAL STATEMENTS
ANNUAL REPORT 2019 425
Neuberger Berman Systematic Global Equity Fund (Continued)
Schedule of Investments (Continued)
Financial Assets at Fair Value through Profit or Loss (continued)
Number of Shares Security Description Fair Value
US$% of Net
Assets
Equities 96.45% (31 December 2018: 94.31%) (continued)
New Taiwan Dollar (continued)
4,000 Chicony Electronics Co Ltd* 11,876 0.04
1,720 China Life Insurance Co Ltd* 1,469 0.00
3,000 China Steel Corp* 2,392 0.01
9,000 Compal Electronics Inc* 5,659 0.02
11,000 E.Sun Financial Holding Co Ltd* 10,238 0.03
37,080 First Financial Holding Co Ltd* 29,316 0.09
3,120 Hon Hai Precision Industry Co Ltd* 9,450 0.03
38,545 Hua Nan Financial Holdings Co Ltd* 28,288 0.09
60 Largan Precision Co Ltd* 10,008 0.03
19,000 Lite-On Technology Corp* 31,279 0.10
1,600 MediaTek Inc* 23,671 0.07
15,000 Mega Financial Holding Co Ltd* 15,312 0.05
5,000 Nanya Technology Corp* 13,911 0.05
1,000 Novatek Microelectronics Corp* 7,306 0.02
12,000 Pou Chen Corp* 15,692 0.05
3,000 Powertech Technology Inc* 9,988 0.03
3,000 Quanta Computer Inc* 6,435 0.02
1,000 Realtek Semiconductor Corp* 7,839 0.03
26,860 SinoPac Financial Holdings Co Ltd* 11,648 0.04
51,450 Taiwan Business Bank* 21,625 0.07
11,280 Taiwan Cement Corp* 16,444 0.05
40,510 Taiwan Cooperative Financial Holding Co Ltd* 28,041 0.09
2,000 Taiwan High Speed Rail Corp* 2,562 0.01
17,000 Taiwan Semiconductor Manufacturing Co Ltd* 187,710 0.59
13,000 United Microelectronics Corp* 7,134 0.02
600 Walsin Technology Corp* 4,784 0.01
3,000 Wistron Corp* 2,837 0.01
1,840 WPG Holdings Ltd* 2,400 0.01
475 Yageo Corp* 6,925 0.02
29,000 Yuanta Financial Holding Co Ltd* 19,541 0.06
3,000 Zhen Ding Technology Holding Ltd* 14,311 0.04
Total New Taiwan Dollar 580,487 1.83
New Zealand Dollar 8,296 Meridian Energy Ltd* 27,984 0.09
Total New Zealand Dollar 27,984 0.09

FINANCIAL STATEMENTS SCHEDULE OF INVESTMENTS
426 NEUBERGER BERMAN INVESTMENT FUNDS PLC
Neuberger Berman Systematic Global Equity Fund (Continued)
Schedule of Investments (Continued)
Financial Assets at Fair Value through Profit or Loss (continued)
Number of Shares Security Description Fair Value
US$% of Net
Assets
Equities 96.45% (31 December 2018: 94.31%) (continued)
Norwegian Krone 5,292 DNB ASA* 98,939 0.31
Total Norwegian Krone 98,939 0.31
Philippine Peso 8,730 Aboitiz Equity Ventures Inc* 8,877 0.03
217 Altus San Nicolas Corp* 0 0.00
2,500 Ayala Land Inc* 2,246 0.00
750 BDO Unibank Inc* 2,340 0.01
6,370 JG Summit Holdings Inc* 10,163 0.03
5,900 Robinsons Land Corp* 3,210 0.01
130 SM Investments Corp* 2,677 0.01
Total Philippine Peso 29,513 0.09
Polish Zloty 340 Cyfrowy Polsat SA* 2,504 0.01
109 Dino Polska SA* 4,143 0.01
619 Grupa Lotos SA* 13,678 0.04
Total Polish Zloty 20,325 0.06
Pound Sterling 2,521 Ashtead Group Plc* 80,620 0.25
6,076 Barratt Developments Plc* 60,095 0.19
802 Berkeley Group Holdings Plc* 51,625 0.16
8,237 BHP Group Plc* 193,884 0.61
5,886 GlaxoSmithKline Plc* 138,717 0.44
2,425 Halma Plc* 67,977 0.22
8,548 HSBC Holdings Plc* 67,026 0.21
136,326 Lloyds Banking Group Plc* 112,874 0.36
931 Next Plc* 86,556 0.27
2,078 Persimmon Plc* 74,189 0.24
2,885 RELX Plc* 72,826 0.23
2,473 Rio Tinto Plc* 147,523 0.47
4,744 Royal Dutch Shell Plc Class A* 140,461 0.44
6,991 Sage Group Plc* 69,367 0.22
3,060 Unilever Plc* 176,358 0.55
Total Pound Sterling 1,540,098 4.86

SCHEDULE OF INVESTMENTS FINANCIAL STATEMENTS
ANNUAL REPORT 2019 427
Neuberger Berman Systematic Global Equity Fund (Continued)
Schedule of Investments (Continued)
Financial Assets at Fair Value through Profit or Loss (continued)
Number of Shares Security Description Fair Value
US$% of Net
Assets
Equities 96.45% (31 December 2018: 94.31%) (continued)
Qatari Rial 18,750 Mesaieed Petrochemical Holding Co* 12,926 0.04
3,288 Qatar Fuel QSC* 20,680 0.07
385 Qatar Islamic Bank SAQ* 1,621 0.00
Total Qatari Rial 35,227 0.11
Singapore Dollar 13,900 ComfortDelGro Corp Ltd* 24,602 0.08
12,500 Wilmar International Ltd* 38,300 0.12
Total Singapore Dollar 62,902 0.20
South African Rand 229 Absa Group Ltd* 2,445 0.01
152 Anglo American Platinum Ltd* 14,211 0.05
337 Exxaro Resources Ltd* 3,160 0.01
411 Kumba Iron Ore Ltd* 12,258 0.04
570 MTN Group Ltd* 3,362 0.01
181 Naspers Ltd Class N* 29,652 0.09
147 Nedbank Group Ltd* 2,253 0.01
448 Standard Bank Group Ltd* 5,392 0.01
1,404 Telkom SA SOC Ltd* 3,496 0.01
Total South African Rand 76,229 0.24
South Korean Won 64 Celltrion Inc* 9,977 0.03
196 Cheil Worldwide Inc* 4,076 0.01
80 Daelim Industrial Co Ltd* 6,258 0.02
45 DB Insurance Co Ltd* 2,033 0.01
48 Fila Korea Ltd* 2,193 0.01
313 GS Holdings Corp* 13,964 0.04
90 Hana Financial Group Inc* 2,863 0.01
118 Hankook Tire & Technology Co Ltd* 3,417 0.01
127 Hyundai Glovis Co Ltd* 15,670 0.05
70 Hyundai Mobis Co Ltd* 15,487 0.05
133 Hyundai Motor Co* 13,853 0.04
111 Hyundai Motor Co - Preferred Shares* 7,615 0.03
502 Industrial Bank of Korea* 5,117 0.02
280 KB Financial Group Inc* 11,535 0.04
517 Kia Motors Corp* 19,744 0.06

FINANCIAL STATEMENTS SCHEDULE OF INVESTMENTS
428 NEUBERGER BERMAN INVESTMENT FUNDS PLC
Neuberger Berman Systematic Global Equity Fund (Continued)
Schedule of Investments (Continued)
Financial Assets at Fair Value through Profit or Loss (continued)
Number of Shares Security Description Fair Value
US$% of Net
Assets
Equities 96.45% (31 December 2018: 94.31%) (continued)
South Korean Won (continued)
183 Korea Aerospace Industries Ltd* 5,386 0.02
78 LG Electronics Inc* 4,845 0.01
21 LG Household & Health Care Ltd* 22,811 0.07
1,789 Meritz Securities Co Ltd* 5,848 0.02
126 NAVER Corp* 20,273 0.06
11 NCSoft Corp* 5,133 0.02
109 Samsung Card Co Ltd* 3,637 0.01
2,788 Samsung Electronics Co Ltd* 134,345 0.43
560 Samsung Electronics Co Ltd - Preferred Shares* 21,925 0.07
252 Samsung Securities Co Ltd* 8,393 0.02
318 Shinhan Financial Group Co Ltd* 11,923 0.04
11 SK Holdings Co Ltd* 2,482 0.01
559 SK Hynix Inc* 45,468 0.14
75 SK Innovation Co Ltd* 9,706 0.03
21 SK Telecom Co Ltd* 4,327 0.01
118 Woongjin Coway Co Ltd* 9,500 0.03
Total South Korean Won 449,804 1.42
Swedish Krona 284 Sandvik AB* 5,541 0.02
10,133 Skandinaviska Enskilda Banken AB Class A* 95,343 0.30
2,431 SKF AB Class B* 49,186 0.15
16,103 Telia Co AB* 69,239 0.22
Total Swedish Krona 219,309 0.69
Swiss Franc 1,048 Adecco Group AG* 66,256 0.21
8 Chocoladefabriken Lindt & Spruengli AG* 62,085 0.20
3,995 Novartis AG* 379,140 1.20
34 Swiss Life Holding AG* 17,057 0.05
131 Swisscom AG* 69,346 0.22
818 Zurich Insurance Group AG* 335,444 1.06
Total Swiss Franc 929,328 2.94
Thai Baht 1,500 Airports of Thailand PCL* 3,734 0.01
12,600 Bangkok Expressway & Metro PCL* 4,585 0.01
13,700 Home Product Center PCL* 7,308 0.02

SCHEDULE OF INVESTMENTS FINANCIAL STATEMENTS
ANNUAL REPORT 2019 429
Neuberger Berman Systematic Global Equity Fund (Continued)
Schedule of Investments (Continued)
Financial Assets at Fair Value through Profit or Loss (continued)
Number of Shares Security Description Fair Value
US$% of Net
Assets
Equities 96.45% (31 December 2018: 94.31%) (continued)
Thai Baht (continued)
4,400 Intouch Holdings PCL Class F* 8,420 0.03
300 Kasikornbank PCL* 1,512 0.01
4,000 Ratch Group PCL* 9,181 0.03
Total Thai Baht 34,740 0.11
Turkish Lira 1,574 BIM Birlesik Magazalar AS* 12,341 0.04
260 Tupras Turkiye Petrol Rafinerileri AS* 5,540 0.02
4,643 Turkcell Iletisim Hizmetleri AS* 10,767 0.03
2,317 Turkiye Is Bankasi AS Class C* 2,496 0.01
Total Turkish Lira 31,144 0.10
United Arab Emirates Dirham 29,190 Aldar Properties PJSC* 17,165 0.05
6,442 Dubai Islamic Bank PJSC* 9,664 0.03
Total United Arab Emirates Dirham 26,829 0.08
United States Dollar 4,769 Aflac Inc* 252,280 0.80
304 Air Products & Chemicals Inc* 71,437 0.23
1,058 Alibaba Group Holding Ltd ADR* 224,402 0.71
718 Allstate Corp* 80,739 0.26
156 Alphabet Inc Class A* 208,945 0.66
13,570 Alrosa PJSC* 18,422 0.06
411 Amazon.com Inc* 759,462 2.40
731 Ameriprise Financial Inc* 121,770 0.39
1,471 AMETEK Inc* 146,717 0.46
548 Amphenol Corp Class A* 59,310 0.19
1,492 Analog Devices Inc* 177,309 0.56
4,113 Apple Inc* 1,207,782 3.81
2,325 Applied Materials Inc* 141,918 0.45
12,314 AT&T Inc* 481,231 1.52
104 Baidu Inc ADR* 13,146 0.04
119 Booking Holdings Inc* 244,394 0.77
2,982 Bristol-Myers Squibb Co* 191,414 0.60
838 CDW Corp* 119,700 0.38
2,204 Chevron Corp* 265,604 0.84
745 Chubb Ltd* 115,967 0.36

FINANCIAL STATEMENTS SCHEDULE OF INVESTMENTS
430 NEUBERGER BERMAN INVESTMENT FUNDS PLC
Neuberger Berman Systematic Global Equity Fund (Continued)
Schedule of Investments (Continued)
Financial Assets at Fair Value through Profit or Loss (continued)
Number of Shares Security Description Fair Value
US$% of Net
Assets
Equities 96.45% (31 December 2018: 94.31%) (continued)
United States Dollar (continued)
8,436 Cisco Systems Inc* 404,591 1.28
682 Citigroup Inc* 54,485 0.17
9,798 Comcast Corp Class A* 440,616 1.39
1,173 Comerica Inc* 84,163 0.27
4,666 ConocoPhillips* 303,430 0.96
295 Cooper Companies Inc* 94,781 0.30
4,471 CSX Corp* 323,521 1.02
1,096 Delta Air Lines Inc* 64,094 0.20
912 Discover Financial Services* 77,356 0.24
890 Dollar General Corp* 138,822 0.44
105 Dominion Energy Inc* 8,696 0.03
2,937 Eaton Corp Plc* 278,193 0.88
188 Emerson Electric Co* 14,337 0.05
1,434 Evergy Inc* 93,339 0.29
6,059 Exelon Corp* 276,230 0.87
4,024 Gilead Sciences Inc* 261,480 0.83
394 Globe Life Inc* 41,468 0.13
2,239 Hartford Financial Services Group Inc* 136,064 0.43
2,033 Honeywell International Inc* 359,841 1.14
208,000 Inter RAO UES PJSC* 16,885 0.05
2,188 International Paper Co* 100,758 0.31
151 Intuit Inc* 39,551 0.13
200 JD.com Inc ADR* 7,046 0.02
3,663 Johnson & Johnson* 534,322 1.68
52 JOYY Inc ADR* 2,745 0.01
3,757 JPMorgan Chase & Co* 523,726 1.66
546 Lam Research Corp* 159,650 0.50
415 Lockheed Martin Corp* 161,593 0.51
395 Lukoil PJSC* 39,232 0.13
1,461 McDonald's Corp* 288,708 0.91
5,453 Media General Inc CVRØ 0 0.00
3,245 Medtronic Plc* 368,145 1.16
6,519 Microsoft Corp* 1,028,046 3.24
62 MMC Norilsk Nickel PJSC* 19,068 0.06
2,367 Morgan Stanley* 121,001 0.38
986 Motorola Solutions Inc* 158,884 0.50
40 NetEase Inc ADR* 12,266 0.04
100 New Oriental Education & Technology Group Inc ADR* 12,125 0.04

SCHEDULE OF INVESTMENTS FINANCIAL STATEMENTS
ANNUAL REPORT 2019 431
Neuberger Berman Systematic Global Equity Fund (Continued)
Schedule of Investments (Continued)
Financial Assets at Fair Value through Profit or Loss (continued)
Number of Shares Security Description Fair Value
US$% of Net
Assets
Equities 96.45% (31 December 2018: 94.31%) (continued)
United States Dollar (continued)
1,365 Norwegian Cruise Line Holdings Ltd* 79,730 0.25
1,705 Nucor Corp* 95,957 0.30
1,534 Omnicom Group Inc* 124,285 0.39
620 Packaging Corp of America* 69,434 0.22
53 Parker-Hannifin Corp* 10,908 0.03
2,252 PepsiCo Inc* 307,781 0.97
1,758 Phillips 66* 195,859 0.62
2,011 PNC Financial Services Group Inc* 321,016 1.02
117 Polyus PJSC* 13,381 0.04
1,191 PPG Industries Inc* 158,987 0.50
1,228 Principal Financial Group Inc* 67,540 0.21
4,152 Procter & Gamble Co* 518,585 1.64
2,632 Starbucks Corp* 231,406 0.73
1,561 Steel Dynamics Inc* 53,136 0.17
146 STERIS Plc* 22,253 0.07
306 Sysco Corp* 26,175 0.08
200 TAL Education Group ADR* 9,640 0.03
2,399 TE Connectivity Ltd* 229,920 0.73
2,878 Texas Instruments Inc* 369,219 1.17
1,196 Thermo Fisher Scientific Inc* 388,545 1.23
1,701 Travelers Companies Inc* 232,952 0.74
400 Trip.com Group Ltd ADR* 13,416 0.04
1,641 Union Pacific Corp* 296,676 0.94
1,541 UnitedHealth Group Inc* 453,023 1.43
1,564 US Bancorp* 92,730 0.29
1,136 Valero Energy Corp* 106,386 0.33
737 Verisk Analytics Inc Class A* 110,064 0.35
7,243 Verizon Communications Inc* 444,720 1.40
676 Visa Inc Class A* 127,020 0.40
3,589 Walmart Inc* 426,517 1.35
423 Whirlpool Corp* 62,405 0.20
500 Yum China Holdings Inc* 24,005 0.08
2,316 Zoetis Inc Class A* 306,522 0.97
Total United States Dollar 17,941,400 56.66
Total Equities 30,543,685 96.45

FINANCIAL STATEMENTS SCHEDULE OF INVESTMENTS
432 NEUBERGER BERMAN INVESTMENT FUNDS PLC
Neuberger Berman Systematic Global Equity Fund (Continued)
Schedule of Investments (Continued)
Financial Assets at Fair Value through Profit or Loss (continued)
Number of Shares Security Description Fair Value
US$% of Net
Assets
Real Estate Investment Trusts 2.42% (31 December 2018: 4.26%)
Australian Dollar 21,043 Vicinity Centres 36,833 0.12
Total Australian Dollar 36,833 0.12
Euro 1,313 Klepierre SA 49,890 0.16
Total Euro 49,890 0.16
Hong Kong Dollar 2,500 Link REIT 26,470 0.08
Total Hong Kong Dollar 26,470 0.08
Japanese Yen 20 United Urban Investment Corp 37,554 0.12
Total Japanese Yen 37,554 0.12
Mexican Peso 11,200 Fibra Uno Administracion SA de CV 17,366 0.05
Total Mexican Peso 17,366 0.05
Singapore Dollar 16,000 Ascendas Real Estate Investment Trust 35,340 0.11
Total Singapore Dollar 35,340 0.11
United States Dollar 501 AvalonBay Communities Inc 105,060 0.33
2,166 Brixmor Property Group Inc 46,807 0.15
1,134 Equity LifeStyle Properties Inc 79,822 0.25
1,902 Equity Residential 153,910 0.49
203 Essex Property Trust Inc 61,075 0.19
527 Mid-America Apartment Communities Inc 69,490 0.22
595 WP Carey Inc 47,624 0.15
Total United States Dollar 563,788 1.78
Total Real Estate Investment Trusts * 767,241 2.42
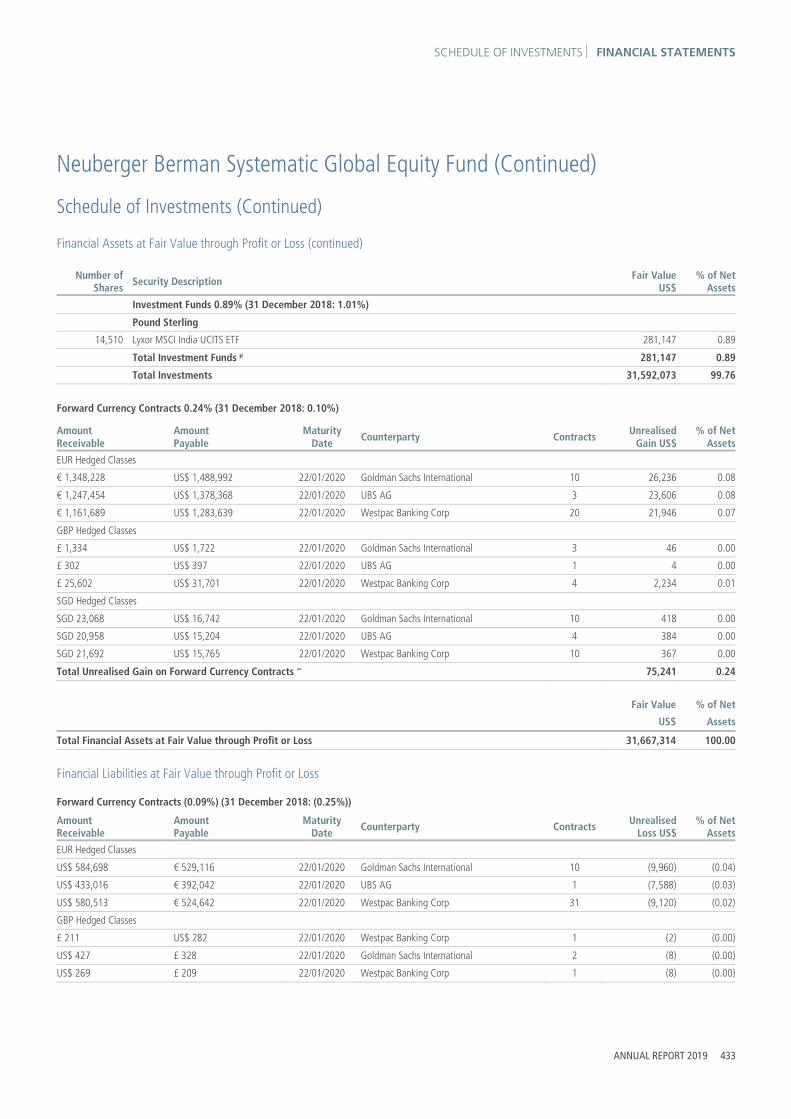
SCHEDULE OF INVESTMENTS FINANCIAL STATEMENTS
ANNUAL REPORT 2019 433
Neuberger Berman Systematic Global Equity Fund (Continued)
Schedule of Investments (Continued)
Financial Assets at Fair Value through Profit or Loss (continued)
Number of Shares Security Description Fair Value
US$% of Net
Assets
Investment Funds 0.89% (31 December 2018: 1.01%)
Pound Sterling 14,510 Lyxor MSCI India UCITS ETF 281,147 0.89
Total Investment Funds μ 281,147 0.89
Total Investments 31,592,073 99.76
Forward Currency Contracts 0.24% (31 December 2018: 0.10%)
Amount Receivable
Amount Payable
Maturity Date Counterparty Contracts Unrealised
Gain US$% of Net
Assets
EUR Hedged Classes € 1,348,228 US$ 1,488,992 22/01/2020 Goldman Sachs International 10 26,236 0.08
€ 1,247,454 US$ 1,378,368 22/01/2020 UBS AG 3 23,606 0.08
€ 1,161,689 US$ 1,283,639 22/01/2020 Westpac Banking Corp 20 21,946 0.07
GBP Hedged Classes £ 1,334 US$ 1,722 22/01/2020 Goldman Sachs International 3 46 0.00
£ 302 US$ 397 22/01/2020 UBS AG 1 4 0.00
£ 25,602 US$ 31,701 22/01/2020 Westpac Banking Corp 4 2,234 0.01
SGD Hedged Classes SGD 23,068 US$ 16,742 22/01/2020 Goldman Sachs International 10 418 0.00
SGD 20,958 US$ 15,204 22/01/2020 UBS AG 4 384 0.00
SGD 21,692 US$ 15,765 22/01/2020 Westpac Banking Corp 10 367 0.00
Total Unrealised Gain on Forward Currency Contracts ∞ 75,241 0.24
Fair Value % of Net
US$ Assets
Total Financial Assets at Fair Value through Profit or Loss 31,667,314 100.00
Financial Liabilities at Fair Value through Profit or Loss
Forward Currency Contracts (0.09%) (31 December 2018: (0.25%))
Amount Receivable
Amount Payable
Maturity Date Counterparty Contracts Unrealised
Loss US$% of Net
Assets
EUR Hedged Classes US$ 584,698 € 529,116 22/01/2020 Goldman Sachs International 10 (9,960) (0.04)
US$ 433,016 € 392,042 22/01/2020 UBS AG 1 (7,588) (0.03)
US$ 580,513 € 524,642 22/01/2020 Westpac Banking Corp 31 (9,120) (0.02)
GBP Hedged Classes £ 211 US$ 282 22/01/2020 Westpac Banking Corp 1 (2) (0.00)
US$ 427 £ 328 22/01/2020 Goldman Sachs International 2 (8) (0.00)
US$ 269 £ 209 22/01/2020 Westpac Banking Corp 1 (8) (0.00)

FINANCIAL STATEMENTS SCHEDULE OF INVESTMENTS
434 NEUBERGER BERMAN INVESTMENT FUNDS PLC
Neuberger Berman Systematic Global Equity Fund (Continued)
Schedule of Investments (Continued)
Financial Liabilities at Fair Value through Profit or Loss (continued)
Forward Currency Contracts (0.09%) (31 December 2018: (0.25%)) (continued)
Amount Receivable
Amount Payable
Maturity Date Counterparty Contracts Unrealised
Loss US$% of Net
Assets
SGD Hedged Classes US$ 1,979 SGD 2,716 22/01/2020 Goldman Sachs International 5 (41) (0.00)
US$ 289 SGD 394 22/01/2020 Westpac Banking Corp 1 (4) (0.00)
Total Unrealised Loss on Forward Currency Contracts ∞ (26,731) (0.09)
Fair Value % of Net
US$ Assets
Total Financial Liabilities at Fair Value through Profit or Loss (26,731) (0.09)
Net Financial Assets at Fair Value through Profit or Loss 31,640,583 99.91
Other Net Assets 26,791 0.09
Net Assets Attributable to Holders of Redeemable Participating Shares 31,667,374 100.00
% of
TotalAssetsPortfolio Analysis US$
* Transferable securities and/or money market instruments admitted to an official stock exchange listing 30,956,564 97.28
** Transferable securities and/or money market instruments dealt in on a regulated market 354,362 1.11
μ Investment funds 281,147 0.88
Ø Other securities 0 0.00
∞ OTC financial derivative instruments 48,510 0.16
Total Investments 31,640,583 99.43
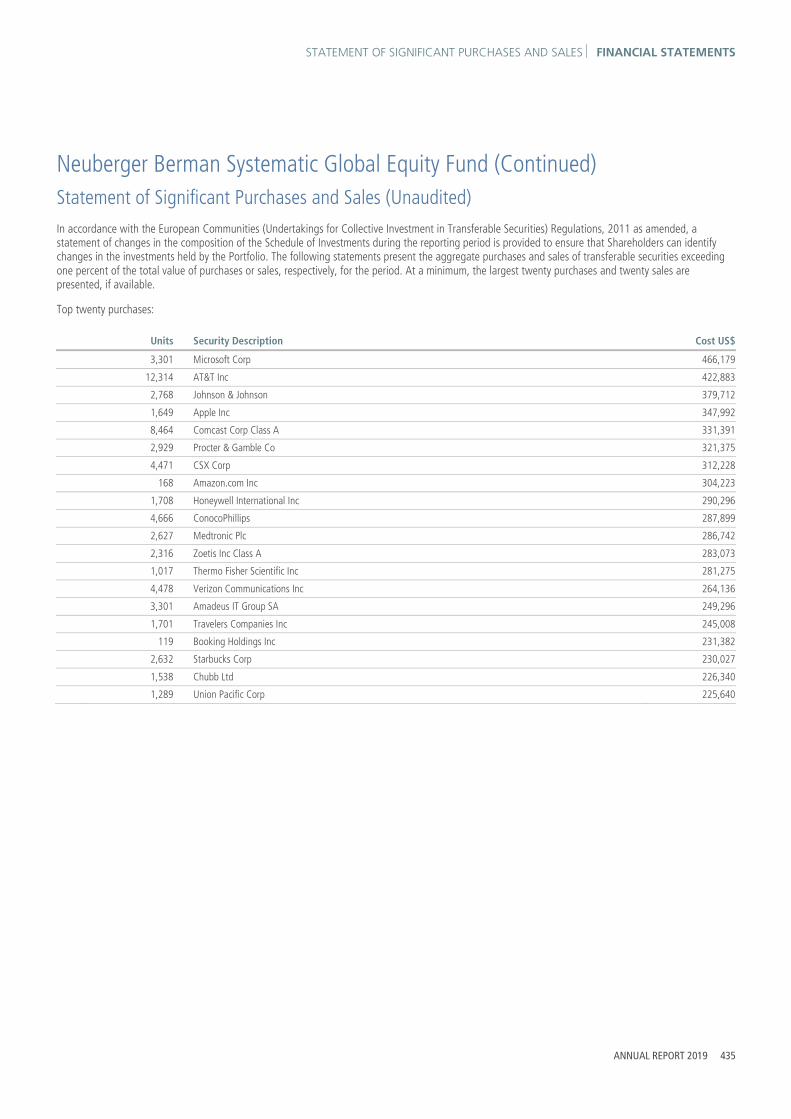
STATEMENT OF SIGNIFICANT PURCHASES AND SALES FINANCIAL STATEMENTS
ANNUAL REPORT 2019 435
Neuberger Berman Systematic Global Equity Fund (Continued) Statement of Significant Purchases and Sales (Unaudited) In accordance with the European Communities (Undertakings for Collective Investment in Transferable Securities) Regulations, 2011 as amended, a statement of changes in the composition of the Schedule of Investments during the reporting period is provided to ensure that Shareholders can identify changes in the investments held by the Portfolio. The following statements present the aggregate purchases and sales of transferable securities exceeding one percent of the total value of purchases or sales, respectively, for the period. At a minimum, the largest twenty purchases and twenty sales are presented, if available.
Top twenty purchases:
Units Security Description Cost US$
3,301 Microsoft Corp 466,179
12,314 AT&T Inc 422,883
2,768 Johnson & Johnson 379,712
1,649 Apple Inc 347,992
8,464 Comcast Corp Class A 331,391
2,929 Procter & Gamble Co 321,375
4,471 CSX Corp 312,228
168 Amazon.com Inc 304,223
1,708 Honeywell International Inc 290,296
4,666 ConocoPhillips 287,899
2,627 Medtronic Plc 286,742
2,316 Zoetis Inc Class A 283,073
1,017 Thermo Fisher Scientific Inc 281,275
4,478 Verizon Communications Inc 264,136
3,301 Amadeus IT Group SA 249,296
1,701 Travelers Companies Inc 245,008
119 Booking Holdings Inc 231,382
2,632 Starbucks Corp 230,027
1,538 Chubb Ltd 226,340
1,289 Union Pacific Corp 225,640

FINANCIAL STATEMENTS STATEMENT OF SIGNIFICANT PURCHASES AND SALES
436 NEUBERGER BERMAN INVESTMENT FUNDS PLC
Neuberger Berman Systematic Global Equity Fund (Continued) Statement of Significant Purchases and Sales (Unaudited) (Continued) Top twenty sales:
Units Security Description Proceeds US$
1,934 Home Depot Inc 397,051
9,141 Pfizer Inc 344,073
18,252 Eni SpA 285,056
2,341 Waste Management Inc 274,201
5,067 Intel Corp 243,919
1,683 Walt Disney Co 236,562
1,731 Fidelity National Information Services Inc 230,151
2,764 Baxter International Inc 227,459
5,206 Johnson Controls International Plc 222,063
3,636 Total SA 201,481
1,191 Amgen Inc 201,224
2,280 Valero Energy Corp 198,210
5,301 eBay Inc 188,738
2,184 NIKE Inc 188,105
2,687 Exxon Mobil Corp 187,197
1,166 STERIS Plc 176,766
6,500 Mitsubishi Corp 172,213
350 Swiss Life Holding AG 170,102
6,218 Wesfarmers Ltd 160,308
1,824 LyondellBasell Industries NV 156,275

INVESTMENT MANAGER’S REPORT FINANCIAL STATEMENTS
ANNUAL REPORT 2019 437
Neuberger Berman Global Real Estate Securities Fund Investment Manager’s Report For the 12 months ended 31 December 2019, the total return of the USD I Accumulating Class shares was 25.96%. Over the same period, the benchmark index, the FTSE EPRA/NAREIT Developed Real Estate Index USD TR (gross of fees, net of tax), returned 22.00%. (Performance data quoted represent past performance and do not indicate future results. Total returns shown are net of all fees and expenses and include reinvestment of income dividends and other distributions, if any.)
The global stock market rallied sharply in 2019. A “dovish pivot” by the US Federal Reserve (“Fed”) and monetary policy accommodation by a number of other Central Banks, a resilient US economy, generally solid corporate results, and an agreement on the first phase of the trade accord between the US and China supported investor sentiment and triggered periods of robust risk appetite. These positives more than offset concerns over moderating growth overseas, Brexit uncertainties and a number of geopolitical issues. All told, the global stock market, as measured by the MSCI AC World Index (net), returned 26.60% during the 12 months ended 31 December 2019. In contrast, the FTSE EPRA/NAREIT Developed Real Estate Index USD TR (gross of fees, net of tax), returned 22.00%.
The Portfolio generated a positive return and outperformed its benchmark index during the reporting period. Stock selection, in aggregate, was beneficial for relative results. The Portfolio’s holdings in the Specialty, Hotel & Lodging and Industrial & Office and sectors added the most value. Conversely, stock selection in Real Estate Holding & Development, Diversified and Retail sectors were the largest detractors from performance. Country positioning, overall, was also additive to the Portfolio’s relative returns. In particular, an overweight to the UK and an underweight to Hong Kong added the most value. In contrast, underweights to Europe Ex-UK and Japan were the largest headwinds from performance.
Looking ahead, market uncertainty and volatility has increased, spurred by increasing coronavirus concerns as more countries, including the U.S., announce additional infections. First half 2020 economic growth is likely to be severely impacted. In a surprise move, the Fed lowered the Fed Funds rate by 50 basis points in early March and by 100 basis points on March 15th. There has also been aggressive monetary easing outside the U.S., as well as significant fiscal stimulus package in the U.S. to help support the economy (after the reporting period ended). We will be monitoring indicators closely in the weeks and months ahead for signs of economic weakness. A possible extended global economic slowdown triggered by the Covid-19 outbreak, the coming U.S. election, and lingering concerns from U.S.-China trade tension has us re-doubling our effort to position portfolios to better withstand these headwinds. Synchronized global monetary easing should help ease the impact on markets. Stable cash flows anchored by long-term leases, conservative capital structures (lower leverage), and secular demand drivers should allow the global listed real estate market to perform more defensively than the broader market.

FINANCIAL STATEMENTS BALANCE SHEET
The accompanying notes form an integral part of the financial statements.
438 NEUBERGER BERMAN INVESTMENT FUNDS PLC
Neuberger Berman Global Real Estate Securities Fund (Continued) Balance Sheet
As at31 December 2019
US$
As at31 December 2018
US$ Note
Current Assets
Financial Assets at Fair Value through Profit or Loss 2 66,222,191 3,236,072
Cash and cash equivalents 3 1,396,369 62,294
Receivable for shares issued 101,638 –
Income receivable and other assets 136,644 1,334
Total Assets 67,856,842 3,299,700
Current Liabilities
Financial Liabilities at Fair Value through Profit or Loss 2 502 3,187
Accrued expenses 120,795 24,746
Other payables 30,380 18,706
Liabilities (excluding Net Assets Attributable to Holders of Redeemable Participating Shares) 151,677 46,639
Net Assets Attributable to Holders of Redeemable Participating Shares 67,705,165 3,253,061

PROFIT AND LOSS ACCOUNT FINANCIAL STATEMENTS
The accompanying notes form an integral part of the financial statements.
ANNUAL REPORT 2019 439
Neuberger Berman Global Real Estate Securities Fund (Continued) Profit and Loss Account
Year Ended 31 December 2019
US$
Year Ended31 December 2018
US$ Note
Income
Interest Income 4,290 4,066
Dividend Income 712,649 654,411
Miscellaneous Income – 28,257
Net Gain/(Loss) on Financial Assets and Liabilities at Fair Value through Profit or Loss 11 1,880,045 (445,978)
2,596,984 240,756
Expenses
Management Fee 6 379,253 328,406
Distribution Fee 6 2,158 1,168
Administration Fee 6 49,398 55,611
Commitment Fee 19 3,470 1,859
Custody Fee 6 13,533 12,000
Depositary Fee 6 2,345 2,106
Professional Fee 9 55,290 26,029
Directors' Fee 7 4,530 6,611
Transaction Costs 9 90,933 56,209
Organisation Expenses 9 1,128 –
Audit Fee 8 13,455 15,247
VAT Rebate (369) (264)
Other Expenses 9 15,645 15,852
Expense Waiver 6 (110,712) (66,005)
Total Expenses 520,057 454,829
Finance Costs
Interest Expense 17 827
17 827
Withholding Tax 1 165,417 121,068
Profit/(Loss) Attributable to Holders of Redeemable Participating Shares from Operations 1,911,493 (335,968)
Income and expenses arose solely from continuing operations.

FINANCIAL STATEMENTS STATEMENT OF CHANGES IN NET ASSETS
The accompanying notes form an integral part of the financial statements.
440 NEUBERGER BERMAN INVESTMENT FUNDS PLC
Neuberger Berman Global Real Estate Securities Fund (Continued) Statement of Changes in Net Assets Attributable to Holders of Redeemable Participating Shares
Year Ended31 December 2019
US$
Year Ended31 December 2018
US$ Note
Net Assets Attributable to Holders of Redeemable Participating Shares at beginning of year 3,253,061 35,313,513
Profit/(Loss) Attributable to Holders of Redeemable Participating Shares from Operations 1,911,493 (335,968)
Subscriptions 5 63,795,646 789,497
Redemptions 5 (1,255,035) (32,513,981)
Net Assets Attributable to Holders of Redeemable Participating Shares at end of year 67,705,165 3,253,061

SCHEDULE OF INVESTMENTS FINANCIAL STATEMENTS
ANNUAL REPORT 2019 441
Neuberger Berman Global Real Estate Securities Fund (Continued)
Schedule of Investments
Financial Assets at Fair Value through Profit or Loss
Number of Shares Security Description Fair Value
US$% of Net
Assets
Equities 21.18% (31 December 2018: 26.18%)
Canadian Dollar 10,416 Brookfield Asset Management Inc Class A 602,670 0.89
Total Canadian Dollar 602,670 0.89
Euro 47,076 ADLER Real Estate AG 718,662 1.06
5,210 LEG Immobilien AG 617,280 0.91
40,674 Shurgard Self Storage SA 1,552,323 2.29
Total Euro 2,888,265 4.26
Hong Kong Dollar 245,332 CK Asset Holdings Ltd 1,771,083 2.62
120,088 Sun Hung Kai Properties Ltd 1,838,664 2.71
Total Hong Kong Dollar 3,609,747 5.33
Japanese Yen 60,001 Mitsubishi Estate Co Ltd 1,147,901 1.69
104,640 Mitsui Fudosan Co Ltd 2,556,923 3.78
23,504 Sumitomo Realty & Development Co Ltd 819,892 1.21
Total Japanese Yen 4,524,716 6.68
Singapore Dollar 373,271 CapitaLand Ltd 1,040,989 1.54
Total Singapore Dollar 1,040,989 1.54
Swedish Krona 55,004 Hufvudstaden AB Class A 1,087,617 1.61
Total Swedish Krona 1,087,617 1.61
United States Dollar 6,589 Hyatt Hotels Corp Class A 591,099 0.87
Total United States Dollar 591,099 0.87
Total Equities * 14,345,103 21.18
Real Estate Investment Trusts 76.61% (31 December 2018: 73.29%)
Australian Dollar 114,342 Dexus 940,408 1.39
193,204 Goodman Group 1,815,816 2.68
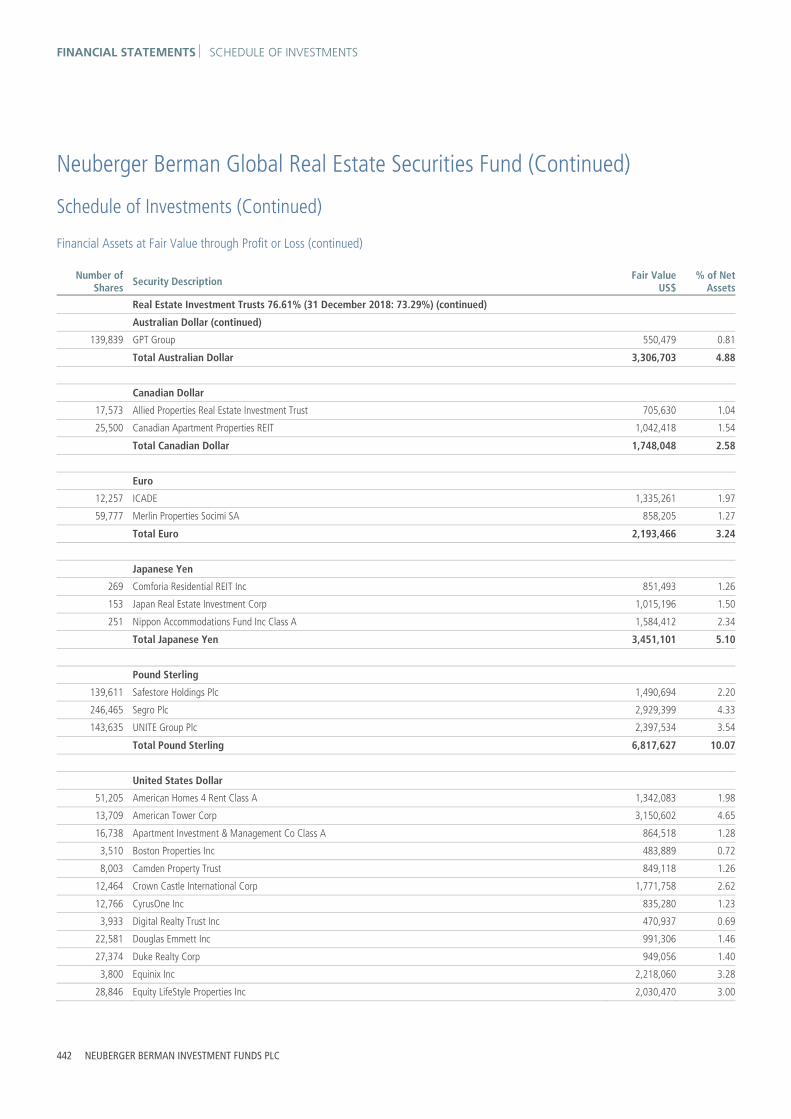
FINANCIAL STATEMENTS SCHEDULE OF INVESTMENTS
442 NEUBERGER BERMAN INVESTMENT FUNDS PLC
Neuberger Berman Global Real Estate Securities Fund (Continued)
Schedule of Investments (Continued)
Financial Assets at Fair Value through Profit or Loss (continued)
Number of Shares Security Description Fair Value
US$% of Net
Assets
Real Estate Investment Trusts 76.61% (31 December 2018: 73.29%) (continued)
Australian Dollar (continued)
139,839 GPT Group 550,479 0.81
Total Australian Dollar 3,306,703 4.88
Canadian Dollar 17,573 Allied Properties Real Estate Investment Trust 705,630 1.04
25,500 Canadian Apartment Properties REIT 1,042,418 1.54
Total Canadian Dollar 1,748,048 2.58
Euro 12,257 ICADE 1,335,261 1.97
59,777 Merlin Properties Socimi SA 858,205 1.27
Total Euro 2,193,466 3.24
Japanese Yen 269 Comforia Residential REIT Inc 851,493 1.26
153 Japan Real Estate Investment Corp 1,015,196 1.50
251 Nippon Accommodations Fund Inc Class A 1,584,412 2.34
Total Japanese Yen 3,451,101 5.10
Pound Sterling 139,611 Safestore Holdings Plc 1,490,694 2.20
246,465 Segro Plc 2,929,399 4.33
143,635 UNITE Group Plc 2,397,534 3.54
Total Pound Sterling 6,817,627 10.07
United States Dollar 51,205 American Homes 4 Rent Class A 1,342,083 1.98
13,709 American Tower Corp 3,150,602 4.65
16,738 Apartment Investment & Management Co Class A 864,518 1.28
3,510 Boston Properties Inc 483,889 0.72
8,003 Camden Property Trust 849,118 1.26
12,464 Crown Castle International Corp 1,771,758 2.62
12,766 CyrusOne Inc 835,280 1.23
3,933 Digital Realty Trust Inc 470,937 0.69
22,581 Douglas Emmett Inc 991,306 1.46
27,374 Duke Realty Corp 949,056 1.40
3,800 Equinix Inc 2,218,060 3.28
28,846 Equity LifeStyle Properties Inc 2,030,470 3.00

SCHEDULE OF INVESTMENTS FINANCIAL STATEMENTS
ANNUAL REPORT 2019 443
Neuberger Berman Global Real Estate Securities Fund (Continued)
Schedule of Investments (Continued)
Financial Assets at Fair Value through Profit or Loss (continued)
Number of Shares Security Description Fair Value
US$% of Net
Assets
Real Estate Investment Trusts 76.61% (31 December 2018: 73.29%) (continued)
United States Dollar (continued) 21,107 Equity Residential 1,707,979 2.52
4,197 Essex Property Trust Inc 1,262,709 1.87
5,928 Extra Space Storage Inc 626,115 0.93
22,154 Healthcare Trust of America Inc Class A 670,823 0.99
30,912 Healthpeak Properties Inc 1,065,537 1.57
9,939 Highwoods Properties Inc 486,116 0.72
10,575 Macerich Co 284,679 0.42
24,418 National Retail Properties Inc 1,309,293 1.93
7,722 Omega Healthcare Investors Inc 327,027 0.48
21,098 Prologis Inc 1,880,676 2.78
6,219 Public Storage 1,324,398 1.96
14,369 Regency Centers Corp 906,540 1.34
5,720 SBA Communications Corp Class A 1,378,463 2.04
5,179 Simon Property Group Inc 771,464 1.14
10,049 SL Green Realty Corp 923,302 1.36
17,085 Spirit Realty Capital Inc 840,240 1.24
16,715 Welltower Inc 1,366,953 2.02
41,686 Weyerhaeuser Co 1,258,917 1.86
Total United States Dollar 34,348,308 50.74
Total Real Estate Investment Trusts * 51,865,253 76.61
Total Investments 66,210,356 97.79
Forward Currency Contracts 0.02% (31 December 2018: 0.01%)
Amount Receivable
Amount Payable
Maturity Date Counterparty Contracts Unrealised
Gain US$% of Net
Assets
EUR Hedged Classes € 103,150 US$ 114,047 22/01/2020 Goldman Sachs International 14 1,880 0.00
€ 84,659 US$ 93,565 22/01/2020 UBS AG 3 1,581 0.00
€ 112,256 US$ 124,492 22/01/2020 Westpac Banking Corp 11 1,670 0.00
GBP Hedged Classes £ 26,918 US$ 33,561 22/01/2020 Goldman Sachs International 11 2,119 0.01
£ 22,263 US$ 27,590 22/01/2020 UBS AG 2 1,918 0.01
£ 45,542 US$ 57,706 22/01/2020 Westpac Banking Corp 6 2,660 0.00
US$ 1,057 £ 792 22/01/2020 Westpac Banking Corp 1 7 0.00
Total Unrealised Gain on Forward Currency Contracts ∞ 11,835 0.02
Fair ValueUS$
% of NetAssets
Total Financial Assets at Fair Value through Profit or Loss 66,222,191 97.81

FINANCIAL STATEMENTS SCHEDULE OF INVESTMENTS
444 NEUBERGER BERMAN INVESTMENT FUNDS PLC
Neuberger Berman Global Real Estate Securities Fund (Continued)
Schedule of Investments (Continued)
Financial Liabilities at Fair Value through Profit or Loss
Forward Currency Contracts (0.00%) (31 December 2018: (0.10%))
Amount Receivable
Amount Payable
Maturity Date Counterparty Contracts Unrealised
Loss US$% of Net
Assets
EUR Hedged Classes US$ 13,929 € 12,526 22/01/2020 Goldman Sachs International 6 (150) (0.00)
US$ 14,766 € 13,278 22/01/2020 Westpac Banking Corp 6 (157) (0.00)
GBP Hedged Classes £ 454 US$ 606 22/01/2020 Goldman Sachs International 1 (4) (0.00)
US$ 3,118 £ 2,398 22/01/2020 Goldman Sachs International 4 (61) (0.00)
US$ 1,437 £ 1,094 22/01/2020 UBS AG 1 (13) (0.00)
US$ 4,089 £ 3,174 22/01/2020 Westpac Banking Corp 4 (117) (0.00)
Total Unrealised Loss on Forward Currency Contracts ∞ (502) (0.00)
Fair ValueUS$
% of NetAssets
Total Financial Liabilities at Fair Value through Profit or Loss (502) (0.00)
Net Financial Assets at Fair Value through Profit or Loss 66,221,689 97.81
Other Net Assets 1,483,476 2.19
Net Assets Attributable to Holders of Redeemable Participating Shares 67,705,165 100.00
% of
TotalAssetsPortfolio Analysis US$
* Transferable securities and/or money market instruments admitted to an official stock exchange listing 66,210,356 97.57
∞ OTC financial derivative instruments 11,333 0.02
Total Investments 66,221,689 97.59
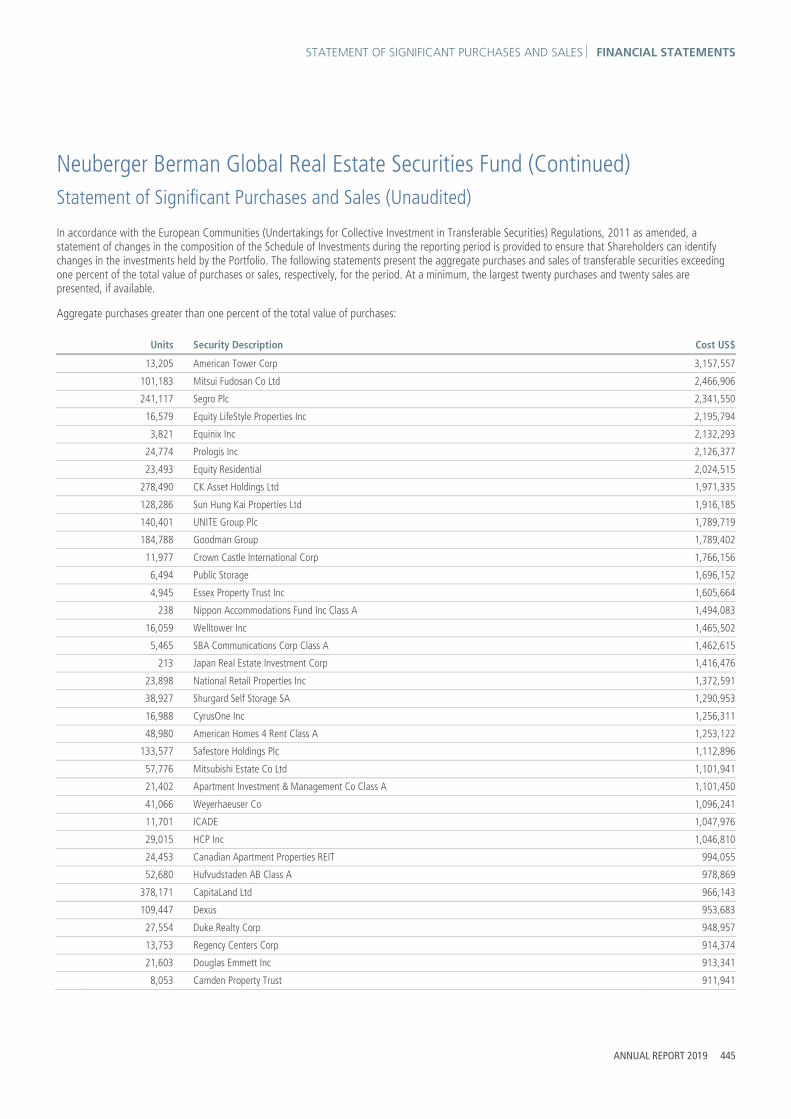
STATEMENT OF SIGNIFICANT PURCHASES AND SALES FINANCIAL STATEMENTS
ANNUAL REPORT 2019 445
Neuberger Berman Global Real Estate Securities Fund (Continued) Statement of Significant Purchases and Sales (Unaudited)
In accordance with the European Communities (Undertakings for Collective Investment in Transferable Securities) Regulations, 2011 as amended, a statement of changes in the composition of the Schedule of Investments during the reporting period is provided to ensure that Shareholders can identify changes in the investments held by the Portfolio. The following statements present the aggregate purchases and sales of transferable securities exceeding one percent of the total value of purchases or sales, respectively, for the period. At a minimum, the largest twenty purchases and twenty sales are presented, if available.
Aggregate purchases greater than one percent of the total value of purchases:
Units Security Description Cost US$
13,205 American Tower Corp 3,157,557
101,183 Mitsui Fudosan Co Ltd 2,466,906
241,117 Segro Plc 2,341,550
16,579 Equity LifeStyle Properties Inc 2,195,794
3,821 Equinix Inc 2,132,293
24,774 Prologis Inc 2,126,377
23,493 Equity Residential 2,024,515
278,490 CK Asset Holdings Ltd 1,971,335
128,286 Sun Hung Kai Properties Ltd 1,916,185
140,401 UNITE Group Plc 1,789,719
184,788 Goodman Group 1,789,402
11,977 Crown Castle International Corp 1,766,156
6,494 Public Storage 1,696,152
4,945 Essex Property Trust Inc 1,605,664
238 Nippon Accommodations Fund Inc Class A 1,494,083
16,059 Welltower Inc 1,465,502
5,465 SBA Communications Corp Class A 1,462,615
213 Japan Real Estate Investment Corp 1,416,476
23,898 National Retail Properties Inc 1,372,591
38,927 Shurgard Self Storage SA 1,290,953
16,988 CyrusOne Inc 1,256,311
48,980 American Homes 4 Rent Class A 1,253,122
133,577 Safestore Holdings Plc 1,112,896
57,776 Mitsubishi Estate Co Ltd 1,101,941
21,402 Apartment Investment & Management Co Class A 1,101,450
41,066 Weyerhaeuser Co 1,096,241
11,701 ICADE 1,047,976
29,015 HCP Inc 1,046,810
24,453 Canadian Apartment Properties REIT 994,055
52,680 Hufvudstaden AB Class A 978,869
378,171 CapitaLand Ltd 966,143
109,447 Dexus 953,683
27,554 Duke Realty Corp 948,957
13,753 Regency Centers Corp 914,374
21,603 Douglas Emmett Inc 913,341
8,053 Camden Property Trust 911,941

FINANCIAL STATEMENTS STATEMENT OF SIGNIFICANT PURCHASES AND SALES
446 NEUBERGER BERMAN INVESTMENT FUNDS PLC
Neuberger Berman Global Real Estate Securities Fund (Continued) Statement of Significant Purchases and Sales (Unaudited) (Continued) Aggregate purchases greater than one percent of the total value of purchases (continued):
Units Security Description Cost US$
17,029 Liberty Property Trust 895,435
272 Comforia Residential REIT Inc 866,403
6,836 Digital Realty Trust Inc 863,623
17,318 Spirit Realty Capital Inc 834,213
22,550 Sumitomo Realty & Development Co Ltd 829,862
10,169 SL Green Realty Corp 823,053
57,297 Merlin Properties Socimi SA 768,884
4,957 Simon Property Group Inc 745,671
5,667 Extra Space Storage Inc 696,060

STATEMENT OF SIGNIFICANT PURCHASES AND SALES FINANCIAL STATEMENTS
ANNUAL REPORT 2019 447
Neuberger Berman Global Real Estate Securities Fund (Continued) Statement of Significant Purchases and Sales (Unaudited) (Continued)
Top twenty sales:
Units Security Description Proceeds US$
18,561 Liberty Property Trust 934,689
20,860 Daiwa House Industry Co Ltd 647,428
280,195 Ascendas Real Estate Investment Trust 634,835
5,097 Prologis Inc 454,570
3,434 Digital Realty Trust Inc 408,903
60 Japan Real Estate Investment Corp 404,025
4,819 CyrusOne Inc 367,857
1,120 Essex Property Trust Inc 365,597
51,484 CK Asset Holdings Ltd 347,977
4,740 Equity LifeStyle Properties Inc 347,702
3,931 Equity Residential 342,316
6,029 Apartment Investment & Management Co Class A 320,879
16,145 Sun Hung Kai Properties Ltd 231,677
297 Equinix Inc 160,875
468 Public Storage 99,662
2,228 Deutsche Wohnen SE 93,431
465 Simon Property Group Inc 81,120
7,762 Goodman Group 68,942
477 Alexandria Real Estate Equities Inc 67,606
9,392 City Developments Ltd 65,362
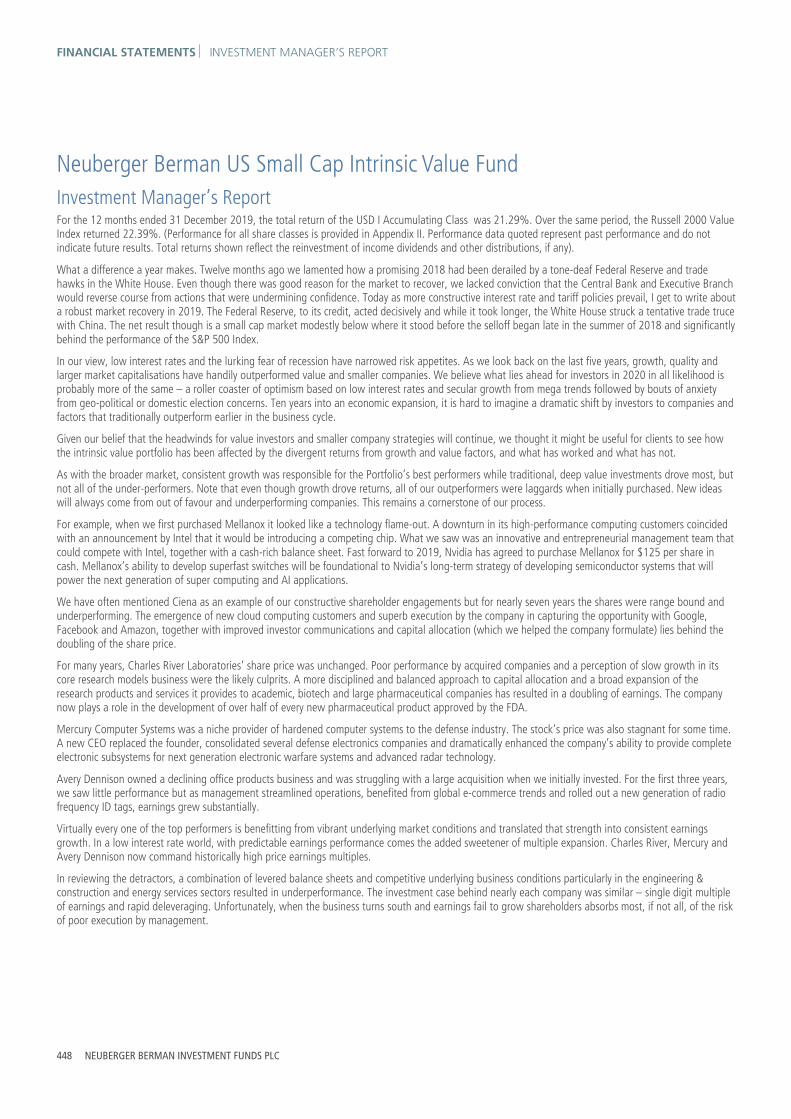
FINANCIAL STATEMENTS INVESTMENT MANAGER’S REPORT
448 NEUBERGER BERMAN INVESTMENT FUNDS PLC
Neuberger Berman US Small Cap Intrinsic Value Fund Investment Manager’s Report For the 12 months ended 31 December 2019, the total return of the USD I Accumulating Class was 21.29%. Over the same period, the Russell 2000 Value Index returned 22.39%. (Performance for all share classes is provided in Appendix II. Performance data quoted represent past performance and do not indicate future results. Total returns shown reflect the reinvestment of income dividends and other distributions, if any).
What a difference a year makes. Twelve months ago we lamented how a promising 2018 had been derailed by a tone-deaf Federal Reserve and trade hawks in the White House. Even though there was good reason for the market to recover, we lacked conviction that the Central Bank and Executive Branch would reverse course from actions that were undermining confidence. Today as more constructive interest rate and tariff policies prevail, I get to write about a robust market recovery in 2019. The Federal Reserve, to its credit, acted decisively and while it took longer, the White House struck a tentative trade truce with China. The net result though is a small cap market modestly below where it stood before the selloff began late in the summer of 2018 and significantly behind the performance of the S&P 500 Index.
In our view, low interest rates and the lurking fear of recession have narrowed risk appetites. As we look back on the last five years, growth, quality and larger market capitalisations have handily outperformed value and smaller companies. We believe what lies ahead for investors in 2020 in all likelihood is probably more of the same – a roller coaster of optimism based on low interest rates and secular growth from mega trends followed by bouts of anxiety from geo-political or domestic election concerns. Ten years into an economic expansion, it is hard to imagine a dramatic shift by investors to companies and factors that traditionally outperform earlier in the business cycle.
Given our belief that the headwinds for value investors and smaller company strategies will continue, we thought it might be useful for clients to see how the intrinsic value portfolio has been affected by the divergent returns from growth and value factors, and what has worked and what has not.
As with the broader market, consistent growth was responsible for the Portfolio’s best performers while traditional, deep value investments drove most, but not all of the under-performers. Note that even though growth drove returns, all of our outperformers were laggards when initially purchased. New ideas will always come from out of favour and underperforming companies. This remains a cornerstone of our process.
For example, when we first purchased Mellanox it looked like a technology flame-out. A downturn in its high-performance computing customers coincided with an announcement by Intel that it would be introducing a competing chip. What we saw was an innovative and entrepreneurial management team that could compete with Intel, together with a cash-rich balance sheet. Fast forward to 2019, Nvidia has agreed to purchase Mellanox for $125 per share in cash. Mellanox’s ability to develop superfast switches will be foundational to Nvidia’s long-term strategy of developing semiconductor systems that will power the next generation of super computing and AI applications.
We have often mentioned Ciena as an example of our constructive shareholder engagements but for nearly seven years the shares were range bound and underperforming. The emergence of new cloud computing customers and superb execution by the company in capturing the opportunity with Google, Facebook and Amazon, together with improved investor communications and capital allocation (which we helped the company formulate) lies behind the doubling of the share price.
For many years, Charles River Laboratories’ share price was unchanged. Poor performance by acquired companies and a perception of slow growth in its core research models business were the likely culprits. A more disciplined and balanced approach to capital allocation and a broad expansion of the research products and services it provides to academic, biotech and large pharmaceutical companies has resulted in a doubling of earnings. The company now plays a role in the development of over half of every new pharmaceutical product approved by the FDA.
Mercury Computer Systems was a niche provider of hardened computer systems to the defense industry. The stock’s price was also stagnant for some time. A new CEO replaced the founder, consolidated several defense electronics companies and dramatically enhanced the company’s ability to provide complete electronic subsystems for next generation electronic warfare systems and advanced radar technology.
Avery Dennison owned a declining office products business and was struggling with a large acquisition when we initially invested. For the first three years, we saw little performance but as management streamlined operations, benefited from global e-commerce trends and rolled out a new generation of radio frequency ID tags, earnings grew substantially.
Virtually every one of the top performers is benefitting from vibrant underlying market conditions and translated that strength into consistent earnings growth. In a low interest rate world, with predictable earnings performance comes the added sweetener of multiple expansion. Charles River, Mercury and Avery Dennison now command historically high price earnings multiples.
In reviewing the detractors, a combination of levered balance sheets and competitive underlying business conditions particularly in the engineering & construction and energy services sectors resulted in underperformance. The investment case behind nearly each company was similar – single digit multiple of earnings and rapid deleveraging. Unfortunately, when the business turns south and earnings fail to grow shareholders absorbs most, if not all, of the risk of poor execution by management.

INVESTMENT MANAGER’S REPORT FINANCIAL STATEMENTS
ANNUAL REPORT 2019 449
Neuberger Berman US Small Cap Intrinsic Value Fund (Continued) Investment Manager’s Report (Continued) Party City has to deal with increasing competition from Wal-Mart, Target and Amazon. A helium shortage and costumes in a bag from Amazon resulted in a $60 MM revenue decline and a $45 MM cash flow shortfall. Babcock & Wilcox and McDermott, because of a lack of growth in their core businesses, committed to fixed price construction projects. Both companies badly underestimated the costs to complete their projects and required dilutive equity injections to forestall bankruptcy. Asset sales will now determine whether shareholders in either company realize any value. In the energy services sector, leverage in excess of four times EBITDA overwhelmed stock prices. In fact, the mere shadow of debt by a related entity has made TETRA Technologies a long-term underperformer even though the debt is non-recourse to the company.
Amneal Pharmaceuticals was the result of a merger between Impax laboratories and Amneal Pharmaceuticals. The industrial logic was that a broader portfolio of generic products could help the combined company compete in a market dominated by a handful of managed care formularies. It has not yet worked. Cutthroat pricing in its generic drug business and market share losses in its branded pharmaceutical lines has resulted in a 30% decline in cash flow. Fortunately, Amneal has few debt covenants and time to get its product pipeline into higher gear.
The takeaway is obvious. If a stock is depressed because the markets the company serves are challenged, balance sheet flexibility is essential. It will provide management with the necessary time to execute their growth or turnaround plans. Equity markets can be unforgiving. If a company’s cash flow starts declining and it is leveraged, the stock will swiftly be pronounced dead even with a strong pulse.
As we look into 2020, our challenge is to create a portfolio with new ideas that can blossom into consistent growers and drive returns over the years to come. To this end, over the last five years we have introduced 72 new ideas, 47 over three years and 13 in 2019. Although some have since been acquired or sold, several will have to outperform in order for our strategy to flourish. Of the newer investments, the majority are in the Information Technology (16), Health Care (19), Consumer (16) and Industrials (11) sectors. Given the long-term trends in these sectors, the likelihood of finding some new, consistent growers among this group is encouraging.
It has been a robust three and five year period for investors but not excessive, so we enter 2020 guardedly optimistic. Nevertheless, we live in a fragile, fast changing world where sentiment towards equity markets can swiftly turn negative as we saw in 2018. We remain committed to achieving the best possible outcomes for our clients by staying true to our value philosophy and capturing the ever-present opportunities presented by the significant changes in demographics and technology.
To what degree will world economies be slowed by the coronavirus outbreak?
In terms of the potential long-term economic ramifications resulting from COVID-19, containment is inherently recessionary in nature. If we continue down a path of potentially having long-term containment, we believe this will depress economic activity for the short term and will likely lead to a recession. The question is, How long will it last and is this likely to be V, L or U shaped? It is way too early to give an accurate opinion.
Every negative period comes from a different trigger. We have been running our strategy since 1997, and we have seen many different severe market sell-offs over the last 23 years. Potential tax cuts, targeted financial relief and more fed rate cuts will likely provide significant stimulus. With some new technology and breakthrough on testing and therapies, we believe this will become manageable. The ultimate question is, How severe will the recession be?
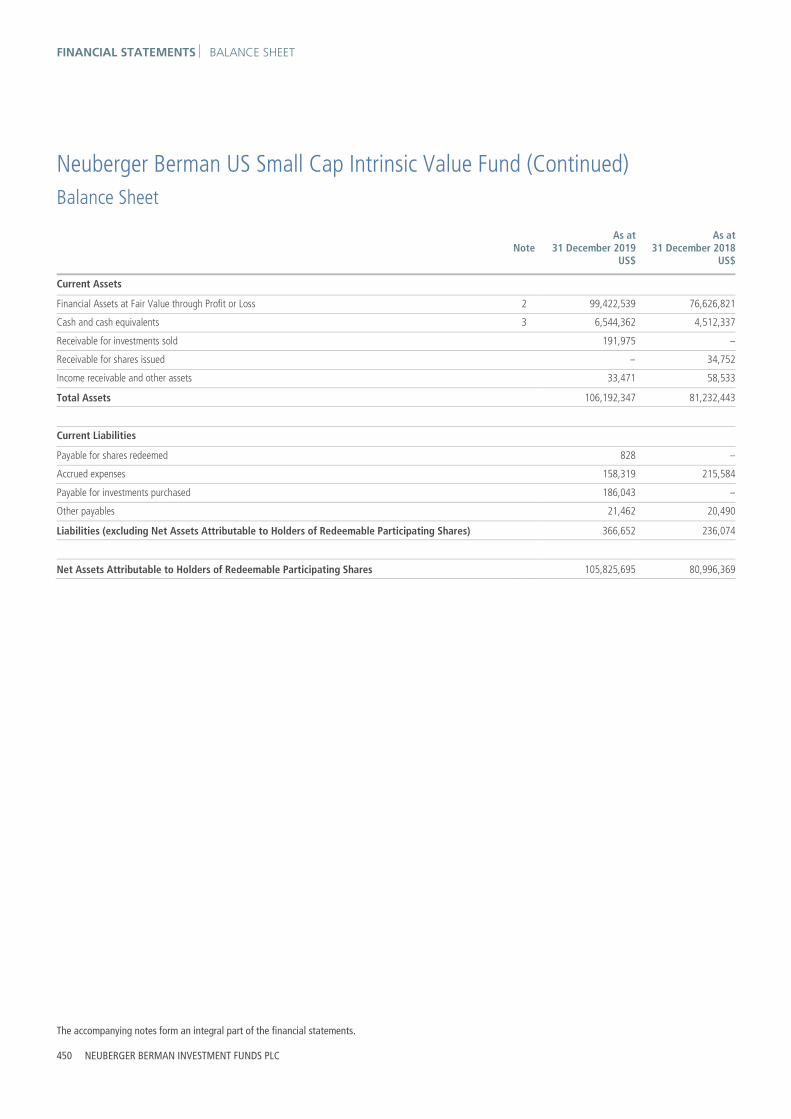
FINANCIAL STATEMENTS BALANCE SHEET
The accompanying notes form an integral part of the financial statements.
450 NEUBERGER BERMAN INVESTMENT FUNDS PLC
Neuberger Berman US Small Cap Intrinsic Value Fund (Continued) Balance Sheet
As at31 December 2019
US$
As at31 December 2018
US$ Note
Current Assets
Financial Assets at Fair Value through Profit or Loss 2 99,422,539 76,626,821
Cash and cash equivalents 3 6,544,362 4,512,337
Receivable for investments sold 191,975 –
Receivable for shares issued – 34,752
Income receivable and other assets 33,471 58,533
Total Assets 106,192,347 81,232,443
Current Liabilities
Payable for shares redeemed 828 –
Accrued expenses 158,319 215,584
Payable for investments purchased 186,043 –
Other payables 21,462 20,490
Liabilities (excluding Net Assets Attributable to Holders of Redeemable Participating Shares) 366,652 236,074
Net Assets Attributable to Holders of Redeemable Participating Shares 105,825,695 80,996,369

PROFIT AND LOSS ACCOUNT FINANCIAL STATEMENTS
The accompanying notes form an integral part of the financial statements.
ANNUAL REPORT 2019 451
Neuberger Berman US Small Cap Intrinsic Value Fund (Continued) Profit and Loss Account
Year Ended 31 December 2019
US$
Year Ended31 December 2018
US$ Note
Income
Interest Income 55,170 53,337
Dividend Income 601,910 564,936
Miscellaneous Income 3,740 –
Net Gain/(Loss) on Financial Assets and Liabilities at Fair Value through Profit or Loss 11 21,031,897 (7,180,975)
21,692,717 (6,562,702)
Expenses
Management Fee 6 909,877 834,083
Distribution Fee 6 190,760 116,776
Administration Fee 6 103,394 110,837
Commitment Fee 19 14,314 8,682
Custody Fee 6 12,015 12,000
Depositary Fee 6 8,788 8,642
Professional Fee 9 47,975 34,076
Directors' Fee 7 4,530 6,613
Transaction Costs 9 81,386 51,560
Audit Fee 8 13,219 14,696
VAT Rebate (1,510) (1,088)
Other Expenses 9 19,327 13,936
Total Expenses 1,404,075 1,210,813
Finance Costs
Interest Expense 330 22
330 22
Withholding Tax 1 150,002 143,714
Profit/(Loss) Attributable to Holders of Redeemable Participating Shares from Operations 20,138,310 (7,917,251)
Income and expenses arose solely from continuing operations.

FINANCIAL STATEMENTS STATEMENT OF CHANGES IN NET ASSETS
The accompanying notes form an integral part of the financial statements.
452 NEUBERGER BERMAN INVESTMENT FUNDS PLC
Neuberger Berman US Small Cap Intrinsic Value Fund (Continued) Statement of Changes in Net Assets Attributable to Holders of Redeemable Participating Shares
Year Ended31 December 2019
US$
Year Ended31 December 2018
US$ Note
Net Assets Attributable to Holders of Redeemable Participating Shares at beginning of year 80,996,369 84,128,497
Profit/(Loss) Attributable to Holders of Redeemable Participating Shares from Operations 20,138,310 (7,917,251)
Subscriptions 5 33,795,200 27,260,083
Redemptions 5 (29,104,184) (22,474,960)
Net Assets Attributable to Holders of Redeemable Participating Shares at end of year 105,825,695 80,996,369

SCHEDULE OF INVESTMENTS FINANCIAL STATEMENTS
ANNUAL REPORT 2019 453
Neuberger Berman US Small Cap Intrinsic Value Fund (Continued)
Schedule of Investments
Financial Assets at Fair Value through Profit or Loss
Number of Shares Security Description Fair Value
US$% of Net
Assets
Equities 93.90% (31 December 2018: 93.86%) United States Dollar 49,200 Acadia Healthcare Co Inc* 1,634,424 1.54
258,923 Accuray Inc* 730,163 0.69
39,160 Actuant Corp Class A* 1,019,335 0.96
152,400 Amneal Pharmaceuticals Inc* 734,568 0.69
294,049 Atlantic Power Corp* 685,134 0.65
32,500 AtriCure Inc* 1,056,575 1.00
20,746 Avery Dennison Corp* 2,713,992 2.56
35,350 Avis Budget Group Inc* 1,139,684 1.08
57,987 Babcock & Wilcox Enterprises Inc* 211,073 0.20
28,495 BankUnited Inc* 1,041,777 0.98
51,500 Bloom Energy Corp Class A* 384,705 0.36
31,500 Box Inc Class A* 528,570 0.50
20,668 CEVA Inc* 557,209 0.53
20,700 Charles River Laboratories International Inc* 3,162,132 2.99
80,200 Chico's FAS Inc* 305,562 0.29
12,200 Children's Place Inc* 762,744 0.72
98,095 Ciena Corp* 4,187,676 3.96
12,800 Clean Harbors Inc* 1,097,600 1.04
86,983 Cleveland-Cliffs Inc* 730,657 0.69
182,700 Cloudera Inc* 2,124,801 2.01
10,301 Comerica Inc* 739,097 0.70
104,600 Conduent Inc* 648,520 0.61
40,973 CoreLogic Inc* 1,790,930 1.69
63,489 Covanta Holding Corp* 942,177 0.89
58,600 Criteo SA ADR* 1,015,538 0.96
52,227 Crown Holdings Inc* 3,788,547 3.58
3,202 Danaos Corp* 29,394 0.03
107,200 Diebold Nixdorf Inc* 1,132,032 1.07
12,800 Dril-Quip Inc* 600,448 0.57
17,500 Entegris Inc* 876,575 0.83
50,508 Express Inc* 245,974 0.23
123,500 FireEye Inc* 2,041,455 1.93
227,950 Fluidigm Corp* 793,266 0.75
79,100 Forum Energy Technologies Inc* 132,888 0.12
42,600 Hain Celestial Group Inc* 1,105,683 1.04
42,253 Harsco Corp* 972,241 0.92
93,098 Hertz Global Holdings Inc* 1,466,294 1.39
64,161 Huntington Bancshares Inc* 967,548 0.92

FINANCIAL STATEMENTS SCHEDULE OF INVESTMENTS
454 NEUBERGER BERMAN INVESTMENT FUNDS PLC
Neuberger Berman US Small Cap Intrinsic Value Fund (Continued)
Schedule of Investments (Continued)
Financial Assets at Fair Value through Profit or Loss (continued)
Number of Shares Security Description Fair Value
US$% of Net
Assets
Equities 93.90% (31 December 2018: 93.86%) (continued)
United States Dollar (continued) 10,166 II-VI Inc* 342,289 0.32
9,500 Impinj Inc* 245,670 0.23
181,451 Infinera Corp* 1,440,721 1.36
33,400 International Game Technology Plc* 499,998 0.47
26,200 Intersect ENT Inc* 652,380 0.62
17,971 ION Geophysical Corp* 155,988 0.15
31,090 Itron Inc* 2,610,005 2.47
81,381 KBR Inc* 2,482,120 2.35
48,450 Luminex Corp* 1,122,102 1.06
42,100 Lydall Inc* 863,892 0.82
67,582 MACOM Technology Solutions Holdings Inc* 1,797,681 1.70
19,700 Mallinckrodt Plc* 68,753 0.06
65,383 McDermott International Inc* 44,238 0.04
32,800 MEDNAX Inc* 911,512 0.86
11,765 Mercury Systems Inc* 813,079 0.77
9,200 Molina Healthcare Inc* 1,248,348 1.18
28,300 MSG Networks Inc Class A* 492,420 0.47
54,500 NanoString Technologies Inc* 1,516,190 1.43
139,241 Nuance Communications Inc* 2,482,667 2.34
243,240 Office Depot Inc* 666,478 0.63
29,000 Oil States International Inc* 472,990 0.45
44,100 OneSpan Inc* 754,992 0.72
51,900 OraSure Technologies Inc* 416,757 0.40
19,096 Ormat Technologies Inc* 1,423,034 1.34
13,558 OSI Systems Inc* 1,365,833 1.29
103,300 Party City Holdco Inc* 241,722 0.23
52,700 Patterson Cos Inc* 1,079,296 1.02
37,900 Patterson-UTI Energy Inc* 397,950 0.38
12,033 Quantum Corp** 89,285 0.08
117,835 Rambus Inc* 1,623,177 1.53
46,053 Repay Holdings Corp* 674,676 0.64
121,800 Resideo Technologies Inc* 1,453,074 1.37
137,638 Ribbon Communications Inc* 426,678 0.40
35,700 RTW RetailWinds Inc* 28,596 0.03
9,804 Ryder System Inc* 532,455 0.50
35,800 SeaWorld Entertainment Inc* 1,135,218 1.07
21,450 Spirit AeroSystems Holdings Inc Class A* 1,563,276 1.48
37,200 Stericycle Inc* 2,373,732 2.24

SCHEDULE OF INVESTMENTS FINANCIAL STATEMENTS
ANNUAL REPORT 2019 455
Neuberger Berman US Small Cap Intrinsic Value Fund (Continued)
Schedule of Investments (Continued)
Financial Assets at Fair Value through Profit or Loss (continued)
Number of Shares Security Description Fair Value
US$% of Net
Assets
Equities 93.90% (31 December 2018: 93.86%) (continued)
United States Dollar (continued) 37,600 Stratasys Ltd* 760,460 0.72
9,340 Superior Energy Services Inc* 46,793 0.04
13,200 Talend SA ADR* 516,252 0.49
37,491 TCF Financial Corp* 1,754,579 1.66
3,394 Teledyne Technologies Inc* 1,176,157 1.11
15,000 Tempur Sealy International Inc* 1,305,900 1.23
118,208 TETRA Technologies Inc* 231,688 0.22
12,770 Texas Capital Bancshares Inc* 724,953 0.68
139,151 TiVo Corp* 1,180,000 1.12
19,700 TreeHouse Foods Inc* 955,450 0.90
19,725 Twin Disc Inc* 217,369 0.21
50,200 Unisys Corp* 595,372 0.56
5,260 Valmont Industries Inc* 787,843 0.74
88,137 Veeco Instruments Inc* 1,294,292 1.22
49,639 Verint Systems Inc* 2,748,015 2.60
112,732 Viavi Solutions Inc* 1,690,980 1.60
75,844 Vistra Energy Corp* 1,743,654 1.65
66,300 Welbilt Inc* 1,034,943 0.98
Total Equities 99,370,960 93.90
Number of Shares Security Description Maturity
DateFair Value
US$% of Net
Assets
Participatory Notes 0.05% (31 December 2018: 0.00%)
United States Dollar 46,053 Repay Holdings Corp 11/07/2024 51,579 0.05
Total Participatory Notes ** 51,579 0.05
Total Investments 99,422,539 93.95
Fair ValueUS$
% of NetAssets
Total Financial Assets at Fair Value through Profit or Loss 99,422,539 93.95
Net Financial Assets at Fair Value through Profit or Loss 99,422,539 93.95
Other Net Assets 6,403,156 6.05
Net Assets Attributable to Holders of Redeemable Participating Shares 105,825,695 100.00

FINANCIAL STATEMENTS SCHEDULE OF INVESTMENTS
456 NEUBERGER BERMAN INVESTMENT FUNDS PLC
Neuberger Berman US Small Cap Intrinsic Value Fund (Continued)
Schedule of Investments (Continued)
% ofTotal
AssetsPortfolio Analysis US$
* Transferable securities and/or money market instruments admitted to an official stock exchange listing 99,281,675 93.49
** Transferable securities and/or money market instruments dealt in on a regulated market 140,864 0.13
Total Investments 99,422,539 93.62

STATEMENT OF SIGNIFICANT PURCHASES AND SALES FINANCIAL STATEMENTS
ANNUAL REPORT 2019 457
Neuberger Berman US Small Cap Intrinsic Value Fund (Continued)
Statement of Significant Purchases and Sales (Unaudited) In accordance with the European Communities (Undertakings for Collective Investment in Transferable Securities) Regulations, 2011 as amended, a statement of changes in the composition of the Schedule of Investments during the reporting period is provided to ensure that Shareholders can identify changes in the investments held by the Portfolio. The following statements present the aggregate purchases and sales of transferable securities exceeding one percent of the total value of purchases or sales, respectively, for the period. At a minimum, the largest twenty purchases and twenty sales are presented, if available.
Aggregate purchases greater than one percent of the total value of purchases:
Units Security Description Cost US$
131,800 Resideo Technologies Inc 1,925,987
33,000 Ciena Corp 1,358,734
23,800 Verint Systems Inc 1,272,867
140,800 Cloudera Inc 1,247,038
81,300 Welbilt Inc 1,164,449
17,600 Crown Holdings Inc 1,146,091
13,800 Children's Place Inc 1,134,568
39,200 MEDNAX Inc 1,061,581
16,900 Itron Inc 1,053,878
22,600 Stericycle Inc 1,043,216
41,200 Stratasys Ltd 964,610
7,100 Charles River Laboratories International Inc 919,553
61,600 FireEye Inc 887,491
50,400 Nuance Communications Inc 849,558
6,900 Avery Dennison Corp 782,194
30,900 KBR Inc 767,204
35,700 Patterson Cos Inc 715,133
36,500 Criteo SA ADR 658,324
13,500 CoreLogic Inc 623,257
66,400 Diebold Nixdorf Inc 607,906
19,400 Innophos Holdings Inc 600,654
21,800 Acadia Healthcare Co Inc 591,136
76,400 TiVo Corp 589,287
30,300 Hain Celestial Group Inc 588,832
60,600 OraSure Technologies Inc 582,215
40,700 International Game Technology Plc 576,788
22,000 Avis Budget Group Inc 576,111
26,100 Lydall Inc 564,316
7,200 Spirit AeroSystems Holdings Inc Class A 543,376
84,000 Fluidigm Corp 537,222
31,500 Box Inc Class A 529,770
21,500 Vistra Energy Corp 510,720
36,800 Viavi Solutions Inc 505,435
6,700 Ormat Technologies Inc 481,532
13,200 Talend SA ADR 472,735

FINANCIAL STATEMENTS STATEMENT OF SIGNIFICANT PURCHASES AND SALES
458 NEUBERGER BERMAN INVESTMENT FUNDS PLC
Neuberger Berman US Small Cap Intrinsic Value Fund (Continued)
Statement of Significant Purchases and Sales (Unaudited) (Continued) Aggregate purchases greater than one percent of the total value of purchases (continued):
Units Security Description Cost US$
38,900 Rambus Inc 469,011
4,500 OSI Systems Inc 460,775
46,053 Repay Holdings LLC 460,530
142,900 Accuray Inc 459,536
17,000 NanoString Technologies Inc 456,179

STATEMENT OF SIGNIFICANT PURCHASES AND SALES FINANCIAL STATEMENTS
ANNUAL REPORT 2019 459
Neuberger Berman US Small Cap Intrinsic Value Fund (Continued)
Statement of Significant Purchases and Sales (Unaudited) (Continued) Aggregate sales greater than one percent of the total value of sales:
Units Security Description Proceeds US$
28,157 Mellanox Technologies Ltd 3,324,251
103,363 ARRIS International Plc 3,163,811
66,700 Ciena Corp 2,696,198
39,400 Verint Systems Inc 2,062,319
94,494 Cypress Semiconductor Corp 2,043,461
124,475 Allscripts Healthcare Solutions Inc 1,297,111
111,025 KEYW Holding Corp 1,246,939
25,196 LiveRamp Holdings Inc 1,069,285
16,888 ITT Inc 999,309
6,762 Charles River Laboratories International Inc 933,344
12,000 Clean Harbors Inc 889,892
15,000 Crown Holdings Inc 876,715
11,200 Mercury Systems Inc 843,541
70,400 Fluidigm Corp 839,414
19,400 Innophos Holdings Inc 618,928
35,500 Nuance Communications Inc 604,024
9,500 Ryder System Inc 526,198
34,939 OneSpaWorld Holdings Ltd 520,595
4,600 Avery Dennison Corp 488,476
16,217 Crocs Inc 486,821
53,750 Uniti Group Inc 483,391
51,700 Cleveland-Cliffs Inc 469,031
21,600 TCF Financial Corp 468,503
6,600 Tempur Sealy International Inc 459,617

FINANCIAL STATEMENTS BALANCE SHEET
The accompanying notes form an integral part of the financial statements.
460 NEUBERGER BERMAN INVESTMENT FUNDS PLC
Neuberger Berman Global Credit Long Short Fund
Balance Sheet
As at31 December 2018*
US$ Note
Current Assets
Financial Assets at Fair Value through Profit or Loss 2 12,109
Cash and cash equivalents 3 82,073
Total Assets 94,182
Current Liabilities
Financial Liabilities at Fair Value through Profit or Loss 2 14,607
Accrued expenses 31,809
Other payables 47,766
Liabilities (excluding Net Assets Attributable to Holders of Redeemable Participating Shares) 94,182
Net Assets Attributable to Holders of Redeemable Participating Shares –
* Portfolio liquidated on 26 November 2018.

PROFIT AND LOSS ACCOUNT FINANCIAL STATEMENTS
The accompanying notes form an integral part of the financial statements.
ANNUAL REPORT 2019 461
Neuberger Berman Global Credit Long Short Fund (Continued)
Profit and Loss Account
Period Ended31 December 2018*
US$ Note
Income
Interest Income 1,257,672
Dividend Income 14,503
Miscellaneous Income 3,892
Net Gain/(Loss) on Financial Assets and Liabilities at Fair Value through Profit or Loss 11 (1,375,706)
(99,639)
Expenses
Management Fee 6 155,756
Distribution Fee 6 4,338
Administration Fee 6 75,445
Commitment Fee 19 2,218
Custody Fee 6 10,876
Depositary Fee 6 1,903
Professional Fee 9 6,077
Directors' Fee 7 7,386
Performance Fee 6 69
Transaction Costs 9 24,356
Audit Fee 8 20,566
VAT Rebate (292)
Other Expenses 9 35,564
Expense Waiver 6 (110,740)
Total Expenses 233,522
Finance Costs
Interest Expense 76,751
Distribution Paid 1 680,623
757,374
Withholding Tax 1 7,964
Profit/(Loss) Attributable to Holders of Redeemable Participating Shares from Operations (1,098,499)
* Portfolio liquidated on 26 November 2018. Income and expenses arose solely from continuing operations.

FINANCIAL STATEMENTS STATEMENT OF CHANGES IN NET ASSETS
The accompanying notes form an integral part of the financial statements.
462 NEUBERGER BERMAN INVESTMENT FUNDS PLC
Neuberger Berman Global Credit Long Short Fund (Continued)
Statement of Changes in Net Assets Attributable to Holders of Redeemable Participating Shares
Period Ended31 December 2018*
US$ Note
Net Assets Attributable to Holders of Redeemable Participating Shares at beginning of period 27,213,879
Profit/(Loss) Attributable to Holders of Redeemable Participating Shares from Operations (1,098,499)
Subscriptions 5 832,991
Redemptions 5 (26,948,371)
Net Assets Attributable to Holders of Redeemable Participating Shares at end of period –
* Portfolio liquidated on 26 November 2018.

INVESTMENT MANAGER’S REPORT FINANCIAL STATEMENTS
ANNUAL REPORT 2019 463
Neuberger Berman Asian Debt – Hard Currency Fund Investment Manager’s Report For the 12 months ended 31 December 2019, the total return for the USD I Accumulating Class was 13.35%. Over the same period, the benchmark index, the JP Morgan Asia Credit Index (JACI) returned 11.34%. Asian credit benchmark spreads tightened 36 basis points over the year; overall total return was further driven by lower US Treasury yields during the same period. (Performance for all share classes is provided in Appendix II. Performance data quoted represent past performance and do not indicate future results. Total returns shown are net of all fees and expenses and include reinvestment of income dividends and other distributions, if any).
Asian hard currency bonds had a strong year in 2019, the highest return for the asset class since 2012. A key focus for investors had been the significant shift in global central banks’ policy bias towards the dovish side. The positive sentiment in the markets, emanating from the easier policy bias, was also supported by de-escalation in US-China trade tensions with the Phase 1 trade deal. Within Asia, markets were supported by healthy profit growth and disciplined balance sheet management which resulted in improving credit fundamentals led by investment grade corporates. Technicals were generally positive as well – healthy demand for bonds kept bonds supported despite the higher than expected primary supply.
From a country perspective, the biggest contributors to performance were positions in China, Philippines, Macau, South Korea and Indonesia. In China and Macau, the Portfolio’s corporate exposures outperformed and added to performance. In Indonesia, the Portfolio’s overweight, relative to the benchmark, in quasi-sovereigns, which was the best performing sector in Asia, added to performance. In South Korea, the overweight positions in financial subordinated securities contributed to performance, while the underweight sovereign positions in Philippines and South Korea also added to performance as these defensive countries had lagged the rally in Asian credit. On the other hand, the Portfolio’s underweight in Pakistan detracted as sovereign bonds has rallied as the country availed of another IMF bailout. The Portfolio’s overweight in Thailand and Taiwan, considered to be defensive countries, also detracted from performance. By sector, outperformance was led by the Consumer, Utilities, Metals & Mining and Financials sectors. In the consumer sector, the Portfolio’s overweight in Macau gaming credits contributed to performance as the companies continued to generate strong cash flows. In Utilities, our overweight in renewables versus the underweight in state-owned utility companies performed strongly as did our positioning in Financials where outperformance was from our overweight positions in non-bank financials.
Despite the generally solid fundamental picture for Asia Hard Currency at the beginning of 2020, the risk to the outlook centers on the Covid-19 pandemic. In the coming months, the fallout from the Covid-19 virus will likely result in a severe short term dip in global growth due to the substantial demand and supply side disruptions globally. Our base case is for a recovery in economic activity later in the year, assuming containment of the virus and strong policy support from governments and central banks globally.
With this medium term view in mind, our outlook on Asian hard currency bonds is focused on its attractive valuations versus developed markets The broader trend in sovereign macroeconomic fundamentals still remains on stable footing, and the markets’ near term direction will likely be driven by the risks emanating from the external environment. We prefer countries where we see structural reforms providing significant improvements in fundamentals (Indonesia and India), and where IMF has stepped in to provide a liquidity backstop and anchor for policy reforms (Sri Lanka and Mongolia). We maintain an underweight on countries where we see higher concerns on near-term fundamental developments (Malaysia and Pakistan) or where valuations appear expensive (Philippines). The outlook for Asia corporate credit fundamentals is stable, as companies maintain solid metrics and leverage remains stable. Meanwhile valuations in the HY space continue to offer value.

FINANCIAL STATEMENTS BALANCE SHEET
The accompanying notes form an integral part of the financial statements.
464 NEUBERGER BERMAN INVESTMENT FUNDS PLC
Neuberger Berman Asian Debt – Hard Currency Fund (Continued) Balance Sheet
As at As at
Note 31 December 2019 31 December 2018
US$ US$
Current Assets
Financial Assets at Fair Value through Profit or Loss 2 21,716,532 15,696,343
Cash and cash equivalents 3 3,188,351 21,479
Receivable for shares issued 77,896 –
Due from brokers 25,840 59,970
Income receivable and other assets 308,573 216,961
Total Assets 25,317,192 15,994,753
Current Liabilities
Financial Liabilities at Fair Value through Profit or Loss 2 1 52,100
Accrued expenses 38,883 52,118
Other payables 31,785 36,768
Liabilities (excluding Net Assets Attributable to Holders of Redeemable Participating Shares) 70,669 140,986
Net Assets Attributable to Holders of Redeemable Participating Shares 25,246,523 15,853,767

PROFIT AND LOSS ACCOUNT FINANCIAL STATEMENTS
The accompanying notes form an integral part of the financial statements.
ANNUAL REPORT 2019 465
Neuberger Berman Asian Debt – Hard Currency Fund (Continued) Profit and Loss Account
Year Ended Year Ended
Note 31 December 2019 31 December 2018
US$ US$
Income
Interest Income 870,385 797,464
Miscellaneous Income 14,732 –
Net Gain/(Loss) on Financial Assets and Liabilities at Fair Value through Profit or Loss 11 1,449,195 (1,042,336)
2,334,312 (244,872)
Expenses
Management Fee 6 118,645 95,189
Distribution Fee 6 2,717 –
Administration Fee 6 62,182 61,282
Commitment Fee 19 1,935 1,811
Custody Fee 6 11,980 12,000
Depositary Fee 6 1,809 1,585
Professional Fee 9 44,266 23,131
Directors' Fee 7 4,530 6,612
Transaction Costs 9 7,391 8,061
Audit Fee 8 14,041 15,264
VAT Rebate (285) (205)
Other Expenses 9 16,477 17,909
Expense Waiver 6 (110,713) (120,809)
Total Expenses 174,975 121,830
Finance Costs
Interest Expense 288 –
Distribution Paid 1 673,671 628,905
673,959 628,905
Profit/(Loss) Attributable to Holders of Redeemable Participating Shares from Operations 1,485,378 (995,607)
Income and expenses arose solely from continuing operations.

FINANCIAL STATEMENTS STATEMENT OF CHANGES IN NET ASSETS
The accompanying notes form an integral part of the financial statements.
466 NEUBERGER BERMAN INVESTMENT FUNDS PLC
Neuberger Berman Asian Debt – Hard Currency Fund (Continued)
Statement of Changes in Net Assets Attributable to Holders of Redeemable Participating Shares
Year Ended Year Ended
31 December 2019 31 December 2018
US$ US$
Net Assets Attributable to Holders of Redeemable Participating Shares at beginning of year 15,853,767 16,830,042
Profit/(Loss) Attributable to Holders of Redeemable Participating Shares from Operations 1,485,378 (995,607)
Subscriptions 5 8,193,497 28,335
Redemptions 5 (286,119) (9,003)
Net Assets Attributable to Holders of Redeemable Participating Shares at end of year 25,246,523 15,853,767

SCHEDULE OF INVESTMENTS FINANCIAL STATEMENTS
ANNUAL REPORT 2019 467
Neuberger Berman Asian Debt – Hard Currency Fund (Continued)
Schedule of Investments
Financial Assets at Fair Value through Profit or Loss
Principal Amount Security Description Coupon Maturity
DateFair Value
US$% of Net
Assets
Corporate Bonds 78.23% (31 December 2018: 87.37%)
United States Dollar 250,000 ABJA Investment Co Pte Ltd* 5.45% 24/01/2028 244,525 0.97
200,000 Adani Ports & Special Economic Zone Ltd† 4.38% 03/07/2029 207,443 0.82
200,000 Alibaba Group Holding Ltd* 4.00% 06/12/2037 214,729 0.85
200,000 Alibaba Group Holding Ltd* 4.20% 06/12/2047 221,859 0.88
200,000 AYC Finance Ltd* 4.85% 29/12/2049 198,986 0.79
200,000 Azure Orbit IV International Finance Ltd* 3.75% 25/01/2023 205,184 0.81
200,000 Azure Power Energy Ltd* 5.50% 03/11/2022 204,405 0.81
200,000 Bangkok Bank PCL† 3.73% 25/09/2034 202,758 0.80
200,000 Bank Mandiri Persero Tbk PT* 3.75% 11/04/2024 206,478 0.82
200,000 CCBL Cayman 1 Corp Ltd* 3.50% 16/05/2024 205,216 0.81
260,000 CDBL Funding 2* 3.00% 01/08/2022 262,042 1.04
200,000 Celestial Miles Ltd* 5.75% 29/12/2049 210,718 0.83
200,000 CFLD Cayman Investment Ltd* 8.60% 08/04/2024 206,291 0.82
400,000 Champion Sincerity Holdings Ltd* 8.13% 29/12/2049 421,420 1.67
200,000 China Cinda Finance 2017 I Ltd* 4.75% 21/02/2029 224,280 0.89
200,000 China Construction Bank Corp* 4.25% 27/02/2029 209,929 0.83
200,000 China Evergrande Group* 8.25% 23/03/2022 187,877 0.74
200,000 China Huadian Overseas Development Management Co Ltd* 4.00% 29/12/2049 206,026 0.82
200,000 China Overseas Finance Cayman VI Ltd* 6.45% 11/06/2034 267,089 1.06
400,000 China Reinsurance Finance Corp Ltd* 3.38% 09/03/2022 401,704 1.59
200,000 China Resources Land Ltd* 4.13% 26/02/2029 215,972 0.86
200,000 Chinalco Capital Holdings Ltd* 4.25% 21/04/2022 203,151 0.80
200,000 CK Hutchison Capital Securities 17 Ltd† 4.00% 29/12/2049 201,899 0.80
200,000 CLP Power HK Finance Ltd* 3.55% 29/12/2049 201,276 0.80
200,000 CNAC HK Finbridge Co Ltd* 5.13% 14/03/2028 225,479 0.89
200,000 CNOOC Curtis Funding No 1 Pty Ltd* 4.50% 03/10/2023 214,419 0.85
200,000 CNOOC Nexen Finance 2014 ULC* 4.25% 30/04/2024 214,008 0.85
200,000 Country Garden Holdings Co Ltd* 6.15% 17/09/2025 209,903 0.83
200,000 DBS Group Holdings Ltd* 4.52% 11/12/2028 213,046 0.84
400,000 Easy Tactic Ltd* 8.13% 27/02/2023 411,450 1.63
200,000 Formosa Group Cayman Ltd* 3.38% 22/04/2025 205,150 0.81
200,000 FWD Group Ltd* 5.75% 09/07/2024 207,496 0.82
200,000 Greenko Solar Mauritius Ltd* 5.55% 29/01/2025 203,724 0.81
200,000 Greenland Global Investment Ltd* 6.75% 25/06/2022 202,222 0.80
200,000 Haitong International Securities Group Ltd* 3.38% 19/07/2024 202,103 0.80
200,000 Hanwha Life Insurance Co Ltd* 4.70% 29/12/2049 204,230 0.81
200,000 HPHT Finance 19 Ltd* 2.88% 05/11/2024 199,847 0.79
200,000 Huarong Finance 2017 Co Ltd* 3.23% 03/07/2023 199,650 0.79

FINANCIAL STATEMENTS SCHEDULE OF INVESTMENTS
468 NEUBERGER BERMAN INVESTMENT FUNDS PLC
Neuberger Berman Asian Debt – Hard Currency Fund (Continued)
Schedule of Investments (Continued)
Financial Assets at Fair Value through Profit or Loss (continued)
Principal Amount Security Description Coupon Maturity
DateFair Value
US$% of Net
Assets
Corporate Bonds 78.23% (31 December 2018: 87.37%) (continued)
United States Dollar (continued) 288,000 Huarong Finance 2017 Co Ltd* 4.00% 29/12/2049 290,295 1.15
200,000 Huarong Finance 2019 Co Ltd* 3.88% 13/11/2029 202,254 0.80
325,000 Industrial & Commercial Bank of China Ltd† 3.54% 08/11/2027 337,154 1.34
200,000 JGSH Philippines Ltd* 4.38% 23/01/2023 207,961 0.82
200,000 Kasikornbank PCL* 3.34% 02/10/2031 201,326 0.80
200,000 Li & Fung Ltd* 4.38% 04/10/2024 205,989 0.82
200,000 Medco Oak Tree Pte Ltd* 7.38% 14/05/2026 204,118 0.81
200,000 Melco Resorts Finance Ltd† 5.63% 17/07/2027 208,664 0.83
180,000 Metropolitan Light Co Ltd* 5.50% 21/11/2022 186,281 0.74
200,000 MGM China Holdings Ltd* 5.88% 15/05/2026 212,375 0.84
200,000 Minera y Metalurgica del Boleo SAPI de CV* 3.25% 17/04/2024 204,715 0.81
200,000 Muthoot Finance Ltd* 6.13% 31/10/2022 207,989 0.82
250,000 Nanyang Commercial Bank Ltd* 3.80% 20/11/2029 252,287 1.00
200,000 Network i2i Ltd* 5.65% 29/12/2049 197,900 0.78
10,000 Nexen Inc† 5.88% 10/03/2035 12,864 0.05
200,000 NWD MTN Ltd* 4.13% 18/07/2029 201,336 0.80
200,000 Oil India Ltd* 5.13% 04/02/2029 222,990 0.88
200,000 Oversea-Chinese Banking Corp Ltd* 4.25% 19/06/2024 212,919 0.84
200,000 OVPH Ltd* 5.88% 29/12/2049 205,130 0.81
200,000 Parkway Pantai Ltd* 4.25% 29/12/2049 200,412 0.79
200,000 Pertamina Persero PT* 3.65% 30/07/2029 209,927 0.83
200,000 Pertamina Persero PT* 5.25% 23/05/2021 208,272 0.83
200,000 Pertamina Persero PT* 6.50% 27/05/2041 254,302 1.01
200,000 Perusahaan Listrik Negara PT* 4.38% 05/02/2050 202,875 0.80
200,000 Perusahaan Listrik Negara PT* 4.88% 17/07/2049 217,187 0.86
200,000 Philippine National Bank* 3.28% 27/09/2024 202,606 0.80
200,000 Poly Real Estate Finance Ltd* 4.75% 17/09/2023 211,424 0.84
200,000 Power Finance Corp Ltd* 3.90% 16/09/2029 197,397 0.78
200,000 PSA Treasury Pte Ltd* 2.13% 05/09/2029 194,488 0.77
200,000 PTTEP Treasury Center Co Ltd* 3.90% 06/12/2059 199,674 0.79
200,000 REC Ltd* 3.38% 25/07/2024 200,238 0.79
200,000 REC Ltd* 3.50% 12/12/2024 200,719 0.80
200,000 Rizal Commercial Banking Corp* 4.13% 16/03/2023 206,091 0.82
200,000 Saka Energi Indonesia PT* 4.45% 05/05/2024 203,428 0.81
200,000 Sands China Ltd* 5.40% 08/08/2028 226,006 0.90
200,000 Shanghai Port Group BVI Development Co Ltd* 2.85% 11/09/2029 195,349 0.77
200,000 Shimao Property Holdings Ltd* 5.60% 15/07/2026 209,570 0.83
200,000 Shimao Property Holdings Ltd* 6.13% 21/02/2024 213,743 0.85

SCHEDULE OF INVESTMENTS FINANCIAL STATEMENTS
ANNUAL REPORT 2019 469
Neuberger Berman Asian Debt – Hard Currency Fund (Continued)
Schedule of Investments (Continued)
Financial Assets at Fair Value through Profit or Loss (continued)
Principal Amount Security Description Coupon Maturity
DateFair Value
US$% of Net
Assets
Corporate Bonds 78.23% (31 December 2018: 87.37%) (continued)
United States Dollar (continued) 240,000 Shinhan Bank Co Ltd* 3.88% 24/03/2026 250,175 0.99
200,000 Shinhan Financial Group Co Ltd* 5.88% 29/12/2049 215,239 0.85
200,000 Sino-Ocean Land Treasure IV Ltd* 4.75% 05/08/2029 199,746 0.79
200,000 Sinopec Group Overseas Development 2018 Ltd* 4.25% 12/09/2028 220,936 0.88
200,000 SK Hynix Inc* 3.00% 17/09/2024 200,230 0.79
200,000 SriLankan Airlines Ltd* 7.00% 25/06/2024 197,500 0.78
200,000 Studio City Finance Ltd* 7.25% 11/02/2024 211,917 0.84
200,000 Sun Hung Kai Properties Capital Market Ltd* 3.75% 25/02/2029 211,905 0.84
200,000 Sunac China Holdings Ltd* 7.50% 01/02/2024 207,010 0.82
200,000 Sunac China Holdings Ltd* 8.35% 19/04/2023 213,222 0.84
200,000 Tencent Holdings Ltd* 3.60% 19/01/2028 208,881 0.83
200,000 TNB Global Ventures Capital Bhd* 4.85% 01/11/2028 224,434 0.89
200,000 Vanke Real Estate Hong Kong Co Ltd* 5.35% 11/03/2024 217,330 0.86
200,000 Weibo Corp* 3.50% 05/07/2024 203,614 0.81
200,000 Yuzhou Properties Co Ltd* 6.00% 25/10/2023 195,714 0.78
Total Corporate Bonds 19,750,092 78.23
Government Bonds 7.67% (31 December 2018: 11.58%)
United States Dollar 200,000 Indonesia Government International Bond 4.75% 11/02/2029 229,239 0.91
200,000 Indonesia Government International Bond 6.63% 17/02/2037 271,924 1.08
125,000 Indonesia Government International Bond 7.75% 17/01/2038 188,110 0.74
260,000 Indonesia Government International Bond 8.50% 12/10/2035 409,584 1.62
200,000 Mongolia Government International Bond 8.75% 09/03/2024 227,488 0.90
200,000 Sri Lanka Government International Bond 6.25% 27/07/2021 203,600 0.81
200,000 Sri Lanka Government International Bond 6.85% 14/03/2024 202,789 0.80
200,000 Sri Lanka Government International Bond 7.85% 14/03/2029 203,459 0.81
Total Government Bonds * 1,936,193 7.67
Total Investments 21,686,285 85.90
Forward Currency Contracts 0.06% (31 December 2018: 0.01%)
Amount Receivable
Amount Payable
Maturity Date Counterparty Contracts Unrealised
Gain US$% of Net
Assets
CNY 1,466,697 US$ 209,121 07/02/2020 Citibank NA 1 1,303 0.00
CNY 1,693,772 US$ 242,556 17/01/2020 Goldman Sachs International 1 571 0.00
CNY 370,925 US$ 53,021 07/02/2020 Standard Chartered Bank 1 195 0.00
INR 14,172,055 US$ 196,760 17/01/2020 HSBC Bank Plc 1 2,001 0.01
INR 3,770,573 US$ 52,872 17/01/2020 Standard Chartered Bank 1 9 0.00
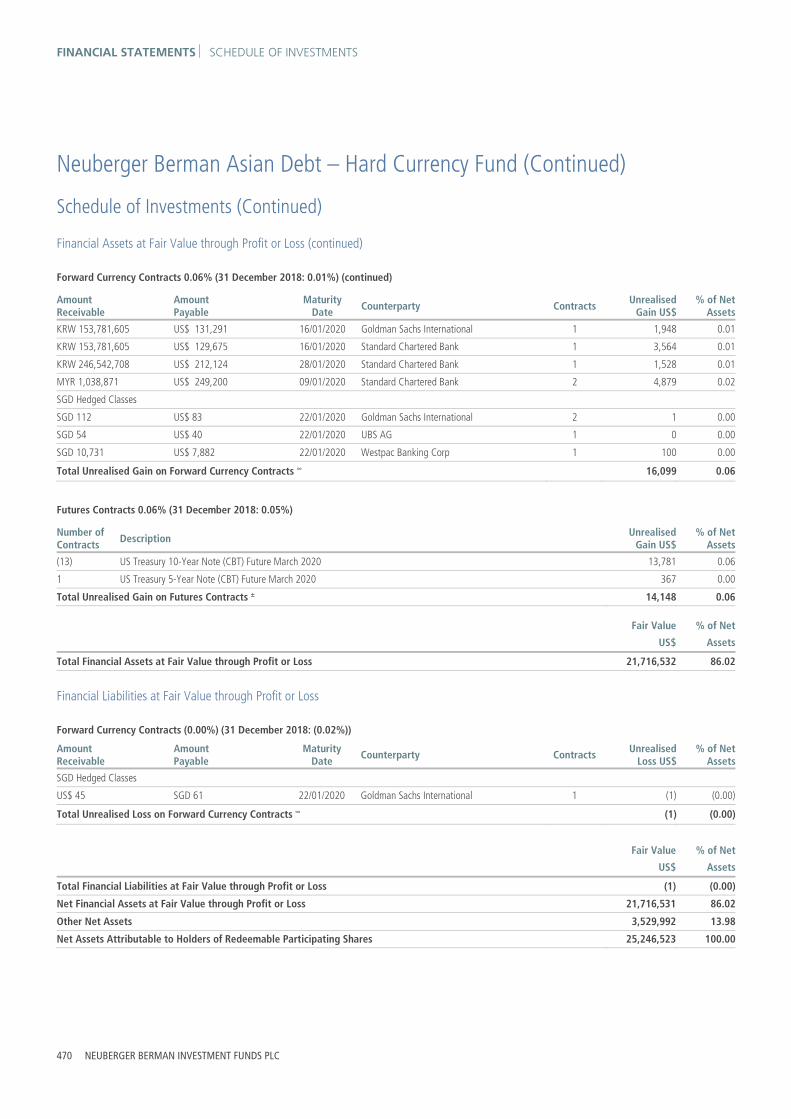
FINANCIAL STATEMENTS SCHEDULE OF INVESTMENTS
470 NEUBERGER BERMAN INVESTMENT FUNDS PLC
Neuberger Berman Asian Debt – Hard Currency Fund (Continued)
Schedule of Investments (Continued)
Financial Assets at Fair Value through Profit or Loss (continued)
Forward Currency Contracts 0.06% (31 December 2018: 0.01%) (continued)
Amount Receivable
Amount Payable
Maturity Date Counterparty Contracts Unrealised
Gain US$% of Net
Assets
KRW 153,781,605 US$ 131,291 16/01/2020 Goldman Sachs International 1 1,948 0.01
KRW 153,781,605 US$ 129,675 16/01/2020 Standard Chartered Bank 1 3,564 0.01
KRW 246,542,708 US$ 212,124 28/01/2020 Standard Chartered Bank 1 1,528 0.01
MYR 1,038,871 US$ 249,200 09/01/2020 Standard Chartered Bank 2 4,879 0.02
SGD Hedged Classes SGD 112 US$ 83 22/01/2020 Goldman Sachs International 2 1 0.00
SGD 54 US$ 40 22/01/2020 UBS AG 1 0 0.00
SGD 10,731 US$ 7,882 22/01/2020 Westpac Banking Corp 1 100 0.00
Total Unrealised Gain on Forward Currency Contracts ∞ 16,099 0.06
Futures Contracts 0.06% (31 December 2018: 0.05%)
Number of Contracts Description Unrealised
Gain US$% of Net
Assets
(13) US Treasury 10-Year Note (CBT) Future March 2020 13,781 0.06
1 US Treasury 5-Year Note (CBT) Future March 2020 367 0.00
Total Unrealised Gain on Futures Contracts ± 14,148 0.06
Fair Value % of Net
US$ Assets
Total Financial Assets at Fair Value through Profit or Loss 21,716,532 86.02
Financial Liabilities at Fair Value through Profit or Loss
Forward Currency Contracts (0.00%) (31 December 2018: (0.02%))
Amount Receivable
Amount Payable
Maturity Date Counterparty Contracts Unrealised
Loss US$% of Net
Assets
SGD Hedged Classes US$ 45 SGD 61 22/01/2020 Goldman Sachs International 1 (1) (0.00)
Total Unrealised Loss on Forward Currency Contracts ∞ (1) (0.00)
Fair Value % of Net
US$ Assets
Total Financial Liabilities at Fair Value through Profit or Loss (1) (0.00)
Net Financial Assets at Fair Value through Profit or Loss 21,716,531 86.02
Other Net Assets 3,529,992 13.98
Net Assets Attributable to Holders of Redeemable Participating Shares 25,246,523 100.00

SCHEDULE OF INVESTMENTS FINANCIAL STATEMENTS
ANNUAL REPORT 2019 471
Neuberger Berman Asian Debt – Hard Currency Fund (Continued)
Schedule of Investments (Continued) % of
TotalAssetsPortfolio Analysis US$
* Transferable securities and/or money market instruments admitted to an official stock exchange listing 20,515,503 81.04
† Other transferable securities and/or money market instruments 1,170,782 4.62
± Financial derivative instruments traded on a regulated market 14,148 0.06
∞ OTC financial derivative instruments 16,098 0.06
Total Investments 21,716,531 85.78

FINANCIAL STATEMENTS SCHEDULE OF INVESTMENTS
472 NEUBERGER BERMAN INVESTMENT FUNDS PLC
Neuberger Berman Asian Debt – Hard Currency Fund (Continued) Statement of Significant Purchases and Sales (Unaudited) In accordance with the European Communities (Undertakings for Collective Investment in Transferable Securities) Regulations, 2011 as amended, a statement of changes in the composition of the Schedule of Investments during the reporting period is provided to ensure that Shareholders can identify changes in the investments held by the Portfolio. The following statements present the aggregate purchases and sales of transferable securities exceeding one percent of the total value of purchases or sales, respectively, for the period. At a minimum, the largest twenty purchases and twenty sales are presented, if available.
Top twenty purchases:
Units Security Description Cost US$
600,000 Sri Lanka Government International Bond, 6.85%, 14/03/2024 601,898
400,000 Champion Sincerity Holdings Ltd, 8.13%, 29/12/2049 407,960
400,000 Sri Lanka Government International Bond, 7.85%, 14/03/2029 403,698
400,000 SriLankan Airlines Ltd, 7.00%, 25/06/2024 398,500
400,000 Easy Tactic Ltd, 8.13%, 27/02/2023 397,224
200,000 Pertamina Persero PT, 6.50%, 27/05/2041 254,500
250,000 Mong Duong Finance Holdings BV, 5.13%, 07/05/2029 250,000
250,000 Nanyang Commercial Bank Ltd, 3.80%, 20/11/2029 249,223
250,000 ABJA Investment Co Pte Ltd, 5.45%, 24/01/2028 227,375
200,000 Mongolia Government International Bond, 8.75%, 09/03/2024 226,000
200,000 Mongolia Government International Bond, 10.88%, 06/04/2021 221,360
200,000 Indonesia Asahan Aluminium Persero PT, 6.76%, 15/11/2048 219,950
200,000 Alibaba Group Holding Ltd, 4.00%, 06/12/2037 215,628
200,000 Indonesia Government International Bond, 4.75%, 11/02/2029 213,750
200,000 Perusahaan Listrik Negara PT, 5.38%, 25/01/2029 213,500
200,000 Pertamina Persero PT, 5.25%, 23/05/2021 208,740
200,000 Tencent Holdings Ltd, 3.60%, 19/01/2028 207,800
200,000 Perusahaan Listrik Negara PT, 6.15%, 21/05/2048 206,750
200,000 OVPH Ltd, 5.88%, 29/12/2049 205,000
200,000 Sri Lanka Government International Bond, 6.25%, 27/07/2021 204,400

STATEMENT OF SIGNIFICANT PURCHASES AND SALES FINANCIAL STATEMENTS
ANNUAL REPORT 2019 473
Neuberger Berman Asian Debt – Hard Currency Fund (Continued) Statement of Significant Purchases and Sales (Unaudited) (Continued) Aggregate sales greater than one percent of the total value of sales:
Units Security Description Proceeds US$
400,000 Sri Lanka Government International Bond, 6.85%, 14/03/2024 406,850
250,000 Mong Duong Finance Holdings BV, 5.13%, 07/05/2029 250,625
250,000 Reliance Industries Ltd, 4.13%, 28/01/2025 250,540
200,000 Indonesia Asahan Aluminium Persero PT, 6.76%, 15/11/2048 225,750
200,000 Indonesia Government International Bond, 4.75%, 11/02/2029 225,700
200,000 Ptt Pcl, 4.50%, 25/10/2042 224,000
200,000 Indonesia Asahan Aluminium Persero PT, 6.53%, 15/11/2028 222,622
222,000 Wisdom Glory Group Ltd, 5.25%, 29/12/2049 219,780
200,000 Mongolia Government International Bond, 10.88%, 06/04/2021 219,700
200,000 Perusahaan Listrik Negara PT, 6.15%, 21/05/2048 219,520
200,000 AIA Group Ltd, 3.60%, 09/04/2029 217,898
200,000 Nan Fung Treasury Ltd, 5.00%, 05/09/2028 214,700
200,000 Perusahaan Listrik Negara PT, 5.38%, 25/01/2029 213,044
200,000 PCCW Capital No 4 Ltd, 5.75%, 17/04/2022 210,920
200,000 Yuzhou Properties Co Ltd, 8.63%, 23/01/2022 210,600
200,000 China Mengniu Dairy Co Ltd, 4.25%, 07/08/2023 210,526
200,000 Vigorous Champion International Ltd, 4.38%, 10/09/2023 210,400
200,000 Korea East-West Power Co Ltd, 3.88%, 19/07/2023 210,070
200,000 Korea Resources Corp, 4.00%, 18/04/2023 210,056
200,000 Thaioil Treasury Center Co Ltd, 5.38%, 20/11/2048 210,000
200,000 GLP China Holdings Ltd, 4.97%, 26/02/2024 209,426
200,000 Posco, 4.00%, 01/08/2023 209,386
200,000 RKPF Overseas 2019 A Ltd, 7.88%, 01/02/2023 209,250
200,000 Woori Bank, 4.75%, 30/04/2024 208,732
200,000 Rongshi International Finance Ltd, 3.75%, 21/05/2029 208,380
200,000 Development Bank of Mongolia LLC, 7.25%, 23/10/2023 207,550
200,000 Bank of the Philippine Islands, 4.25%, 04/09/2023 206,500
200,000 Fita International Ltd, 7.00%, 10/02/2020 206,024
200,000 Sunac China Holdings Ltd, 8.38%, 15/01/2021 205,800
200,000 Perusahaan Listrik Negara PT, 5.45%, 21/05/2028 205,740
200,000 BOC Aviation Ltd, 3.50%, 10/10/2024 205,450
200,000 SingTel Group Treasury Pte Ltd, 3.88%, 28/08/2028 204,734
200,000 Indo Energy Finance II BV, 6.38%, 24/01/2023 204,300
200,000 China SCE Group Holdings Ltd, 7.45%, 17/04/2021 204,250
200,000 HLP Finance Ltd, 4.45%, 16/04/2021 204,000
200,000 Tencent Holdings Ltd, 4.53%, 11/04/2049 203,974
200,000 LLPL Capital Pte Ltd, 6.88%, 04/02/2039 203,750
200,000 CNAC HK Finbridge Co Ltd, 3.38%, 19/06/2024 203,280
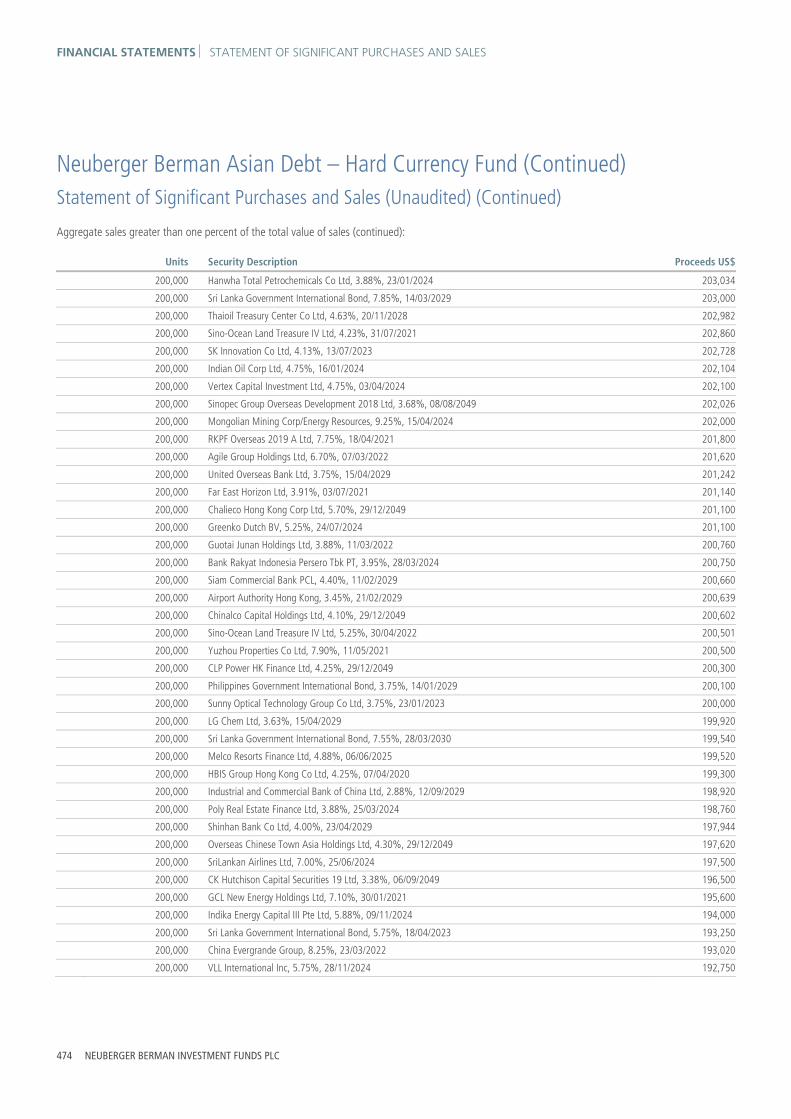
FINANCIAL STATEMENTS STATEMENT OF SIGNIFICANT PURCHASES AND SALES
474 NEUBERGER BERMAN INVESTMENT FUNDS PLC
Neuberger Berman Asian Debt – Hard Currency Fund (Continued) Statement of Significant Purchases and Sales (Unaudited) (Continued)
Aggregate sales greater than one percent of the total value of sales (continued):
Units Security Description Proceeds US$
200,000 Hanwha Total Petrochemicals Co Ltd, 3.88%, 23/01/2024 203,034
200,000 Sri Lanka Government International Bond, 7.85%, 14/03/2029 203,000
200,000 Thaioil Treasury Center Co Ltd, 4.63%, 20/11/2028 202,982
200,000 Sino-Ocean Land Treasure IV Ltd, 4.23%, 31/07/2021 202,860
200,000 SK Innovation Co Ltd, 4.13%, 13/07/2023 202,728
200,000 Indian Oil Corp Ltd, 4.75%, 16/01/2024 202,104
200,000 Vertex Capital Investment Ltd, 4.75%, 03/04/2024 202,100
200,000 Sinopec Group Overseas Development 2018 Ltd, 3.68%, 08/08/2049 202,026
200,000 Mongolian Mining Corp/Energy Resources, 9.25%, 15/04/2024 202,000
200,000 RKPF Overseas 2019 A Ltd, 7.75%, 18/04/2021 201,800
200,000 Agile Group Holdings Ltd, 6.70%, 07/03/2022 201,620
200,000 United Overseas Bank Ltd, 3.75%, 15/04/2029 201,242
200,000 Far East Horizon Ltd, 3.91%, 03/07/2021 201,140
200,000 Chalieco Hong Kong Corp Ltd, 5.70%, 29/12/2049 201,100
200,000 Greenko Dutch BV, 5.25%, 24/07/2024 201,100
200,000 Guotai Junan Holdings Ltd, 3.88%, 11/03/2022 200,760
200,000 Bank Rakyat Indonesia Persero Tbk PT, 3.95%, 28/03/2024 200,750
200,000 Siam Commercial Bank PCL, 4.40%, 11/02/2029 200,660
200,000 Airport Authority Hong Kong, 3.45%, 21/02/2029 200,639
200,000 Chinalco Capital Holdings Ltd, 4.10%, 29/12/2049 200,602
200,000 Sino-Ocean Land Treasure IV Ltd, 5.25%, 30/04/2022 200,501
200,000 Yuzhou Properties Co Ltd, 7.90%, 11/05/2021 200,500
200,000 CLP Power HK Finance Ltd, 4.25%, 29/12/2049 200,300
200,000 Philippines Government International Bond, 3.75%, 14/01/2029 200,100
200,000 Sunny Optical Technology Group Co Ltd, 3.75%, 23/01/2023 200,000
200,000 LG Chem Ltd, 3.63%, 15/04/2029 199,920
200,000 Sri Lanka Government International Bond, 7.55%, 28/03/2030 199,540
200,000 Melco Resorts Finance Ltd, 4.88%, 06/06/2025 199,520
200,000 HBIS Group Hong Kong Co Ltd, 4.25%, 07/04/2020 199,300
200,000 Industrial and Commercial Bank of China Ltd, 2.88%, 12/09/2029 198,920
200,000 Poly Real Estate Finance Ltd, 3.88%, 25/03/2024 198,760
200,000 Shinhan Bank Co Ltd, 4.00%, 23/04/2029 197,944
200,000 Overseas Chinese Town Asia Holdings Ltd, 4.30%, 29/12/2049 197,620
200,000 SriLankan Airlines Ltd, 7.00%, 25/06/2024 197,500
200,000 CK Hutchison Capital Securities 19 Ltd, 3.38%, 06/09/2049 196,500
200,000 GCL New Energy Holdings Ltd, 7.10%, 30/01/2021 195,600
200,000 Indika Energy Capital III Pte Ltd, 5.88%, 09/11/2024 194,000
200,000 Sri Lanka Government International Bond, 5.75%, 18/04/2023 193,250
200,000 China Evergrande Group, 8.25%, 23/03/2022 193,020
200,000 VLL International Inc, 5.75%, 28/11/2024 192,750

STATEMENT OF SIGNIFICANT PURCHASES AND SALES FINANCIAL STATEMENTS
ANNUAL REPORT 2019 475
Neuberger Berman Asian Debt – Hard Currency Fund (Continued) Statement of Significant Purchases and Sales (Unaudited) (Continued)
Aggregate sales greater than one percent of the total value of sales (continued):
Units Security Description Proceeds US$
200,000 Tsinghua Unic Ltd, 5.38%, 31/01/2023 192,500
200,000 Hysan MTN Ltd, 2.82%, 04/09/2029 191,616
200,000 Charming Light Investments Ltd, 4.38%, 21/12/2027 190,646
200,000 Vedanta Resources Ltd, 6.38%, 30/07/2022 189,250
200,000 Sri Lanka Government International Bond, 6.75%, 18/04/2028 189,020
200,000 Hyundai Capital Services Inc, 3.63%, 29/08/2027 187,524
200,000 Longfor Group Holdings Ltd, 4.50%, 16/01/2028 183,060
200,000 Proven Honour Capital Ltd, 4.13%, 06/05/2026 181,348
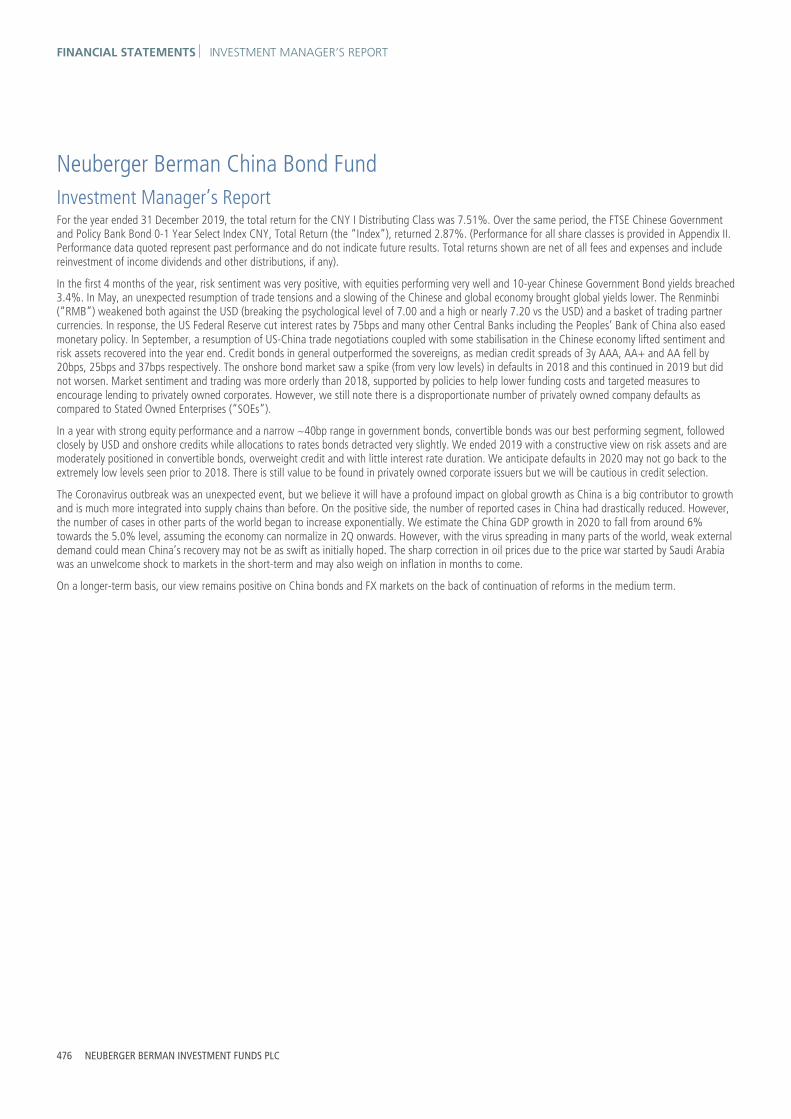
FINANCIAL STATEMENTS INVESTMENT MANAGER’S REPORT
476 NEUBERGER BERMAN INVESTMENT FUNDS PLC
Neuberger Berman China Bond Fund Investment Manager’s Report For the year ended 31 December 2019, the total return for the CNY I Distributing Class was 7.51%. Over the same period, the FTSE Chinese Government and Policy Bank Bond 0-1 Year Select Index CNY, Total Return (the “Index”), returned 2.87%. (Performance for all share classes is provided in Appendix II. Performance data quoted represent past performance and do not indicate future results. Total returns shown are net of all fees and expenses and include reinvestment of income dividends and other distributions, if any).
In the first 4 months of the year, risk sentiment was very positive, with equities performing very well and 10-year Chinese Government Bond yields breached 3.4%. In May, an unexpected resumption of trade tensions and a slowing of the Chinese and global economy brought global yields lower. The Renminbi (“RMB”) weakened both against the USD (breaking the psychological level of 7.00 and a high or nearly 7.20 vs the USD) and a basket of trading partner currencies. In response, the US Federal Reserve cut interest rates by 75bps and many other Central Banks including the Peoples’ Bank of China also eased monetary policy. In September, a resumption of US-China trade negotiations coupled with some stabilisation in the Chinese economy lifted sentiment and risk assets recovered into the year end. Credit bonds in general outperformed the sovereigns, as median credit spreads of 3y AAA, AA+ and AA fell by 20bps, 25bps and 37bps respectively. The onshore bond market saw a spike (from very low levels) in defaults in 2018 and this continued in 2019 but did not worsen. Market sentiment and trading was more orderly than 2018, supported by policies to help lower funding costs and targeted measures to encourage lending to privately owned corporates. However, we still note there is a disproportionate number of privately owned company defaults as compared to Stated Owned Enterprises (“SOEs”).
In a year with strong equity performance and a narrow ~40bp range in government bonds, convertible bonds was our best performing segment, followed closely by USD and onshore credits while allocations to rates bonds detracted very slightly. We ended 2019 with a constructive view on risk assets and are moderately positioned in convertible bonds, overweight credit and with little interest rate duration. We anticipate defaults in 2020 may not go back to the extremely low levels seen prior to 2018. There is still value to be found in privately owned corporate issuers but we will be cautious in credit selection.
The Coronavirus outbreak was an unexpected event, but we believe it will have a profound impact on global growth as China is a big contributor to growth and is much more integrated into supply chains than before. On the positive side, the number of reported cases in China had drastically reduced. However, the number of cases in other parts of the world began to increase exponentially. We estimate the China GDP growth in 2020 to fall from around 6% towards the 5.0% level, assuming the economy can normalize in 2Q onwards. However, with the virus spreading in many parts of the world, weak external demand could mean China’s recovery may not be as swift as initially hoped. The sharp correction in oil prices due to the price war started by Saudi Arabia was an unwelcome shock to markets in the short-term and may also weigh on inflation in months to come.
On a longer-term basis, our view remains positive on China bonds and FX markets on the back of continuation of reforms in the medium term.
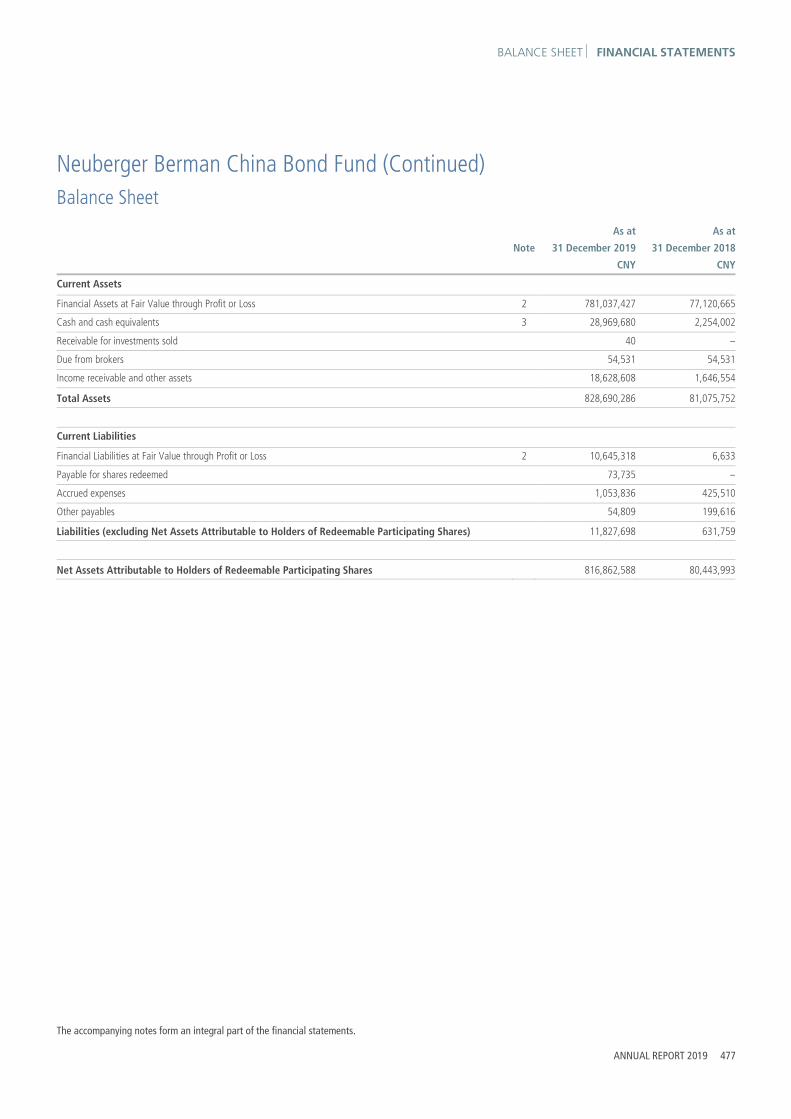
BALANCE SHEET FINANCIAL STATEMENTS
The accompanying notes form an integral part of the financial statements.
ANNUAL REPORT 2019 477
Neuberger Berman China Bond Fund (Continued) Balance Sheet
As at As at
Note 31 December 2019 31 December 2018
CNY CNY
Current Assets
Financial Assets at Fair Value through Profit or Loss 2 781,037,427 77,120,665
Cash and cash equivalents 3 28,969,680 2,254,002
Receivable for investments sold 40 –
Due from brokers 54,531 54,531
Income receivable and other assets 18,628,608 1,646,554
Total Assets 828,690,286 81,075,752
Current Liabilities
Financial Liabilities at Fair Value through Profit or Loss 2 10,645,318 6,633
Payable for shares redeemed 73,735 –
Accrued expenses 1,053,836 425,510
Other payables 54,809 199,616
Liabilities (excluding Net Assets Attributable to Holders of Redeemable Participating Shares) 11,827,698 631,759
Net Assets Attributable to Holders of Redeemable Participating Shares 816,862,588 80,443,993

FINANCIAL STATEMENTS PROFIT AND LOSS ACCOUNT
The accompanying notes form an integral part of the financial statements.
478 NEUBERGER BERMAN INVESTMENT FUNDS PLC
Neuberger Berman China Bond Fund (Continued) Profit and Loss Account
Year Ended Year Ended
Note 31 December 2019 31 December 2018
CNY CNY
Income
Interest Income 21,349,980 3,987,760
Miscellaneous Income 130,556 –
Net Gain/(Loss) on Financial Assets and Liabilities at Fair Value through Profit or Loss 11 7,773,700 2,736,114
29,254,236 6,723,874
Expenses
Management Fee 6 2,062,393 439,107
Distribution Fee 6 1,032,849 322
Administration Fee 6 769,893 315,518
Commitment Fee 19 28,927 18,659
Custody Fee 6 188,374 66,876
Depositary Fee 6 41,718 8,122
Professional Fee 9 660,903 292,870
Directors' Fee 7 31,591 50,800
Transaction Costs 9 748,886 214,033
Audit Fee 8 143,818 183,739
VAT Rebate (7,036) (1,436)
Other Expenses 9 304,166 105,124
Expense Waiver 6 (1,692,649) (1,066,080)
Total Expenses 4,313,833 627,654
Finance Costs
Interest Expense 753 585
Distribution Paid 1 217,633 634
218,386 1,219
Withholding Tax 1 130 247,346
Profit/(Loss) Attributable to Holders of Redeemable Participating Shares from Operations 24,721,887 5,847,655
Income and expenses arose solely from continuing operations.

STATEMENT OF CHANGES IN NET ASSETS FINANCIAL STATEMENTS
The accompanying notes form an integral part of the financial statements.
ANNUAL REPORT 2019 479
Neuberger Berman China Bond Fund (Continued) Statement of Changes in Net Assets Attributable to Holders of Redeemable Participating Shares
Year Ended Year Ended
31 December 2019 31 December 2018
CNY CNY
Net Assets Attributable to Holders of Redeemable Participating Shares at beginning of year 80,443,993 202,323,805
Profit/(Loss) Attributable to Holders of Redeemable Participating Shares from Operations 24,721,887 5,847,655
Subscriptions 5 780,090,240 23,075,821
Redemptions 5 (68,393,532) (150,803,288)
Net Assets Attributable to Holders of Redeemable Participating Shares at end of year 816,862,588 80,443,993

FINANCIAL STATEMENTS SCHEDULE OF INVESTMENTS
480 NEUBERGER BERMAN INVESTMENT FUNDS PLC
Neuberger Berman China Bond Fund (Continued)
Schedule of Investments
Financial Assets at Fair Value through Profit or Loss
Principal Amount Security Description Coupon Maturity
DateFair Value
CNY% of Net
Assets
Corporate Bonds 90.46% (31 December 2018: 92.78%)
Chinese Yuan Renminbi
1,900,000 Aisino Corp* 1.50% 12/06/2021 2,364,550 0.29
10,000,000 Aoyuan Corp Group Ltd* 7.20% 24/07/2021 10,004,495 1.23
1,100,000 Bank of Jiangsu Co Ltd* 0.20% 14/03/2025 1,291,620 0.16
500,000 Changjiang Securities Co Ltd* 0.40% 12/03/2024 608,500 0.07
7,000,000 China Aoyuan Group Ltd** 8.50% 12/10/2021 7,105,714 0.87
3,500,000 China Avionics Systems Co Ltd* 1.00% 25/12/2023 4,177,600 0.51
1,300,000 China CITIC Bank Corp Ltd* 0.30% 04/03/2025 1,473,290 0.18
2,500,000 China Everbright Bank Co Ltd* 1.00% 17/03/2023 3,125,000 0.38
3,000,000 China Hi-Tech Group Corp Ltd* 3.78% 21/01/2021 3,053,754 0.37
350,000 China Merchants Expressway Network & Technology Holdings Co Ltd* 0.10% 22/03/2025 401,275 0.05
2,100,000 China National Nuclear Power Co Ltd* 0.20% 15/04/2025 2,275,560 0.28
30,000,000 Chongqing Energy Investment Group Co Ltd** 4.93% 23/09/2020 29,854,770 3.65
1,500,000 Chuantou Energy Co Ltd** 0.20% 11/11/2025 1,826,250 0.22
1,700,000 Dawning Information Industry Co Ltd* 0.60% 06/08/2024 2,022,490 0.25
451,000 Fujian Funeng Co Ltd* 0.60% 07/12/2024 547,018 0.07
300,000 Ganfeng Lithium Co Ltd* 0.80% 21/12/2023 358,464 0.04
920,000 Giant Leap Technologies A/S* 3.90% 21/10/2023 901,731 0.11
2,000,000 Greenland Holding Group Co Ltd* 6.80% 10/12/2020 2,019,739 0.25
1,000,000 Guanghui Energy Co Ltd* 7.70% 22/06/2022 992,349 0.12
30,000,000 Guangxi Financial Investment Group Co Ltd* 5.00% 21/08/2023 29,534,265 3.62
1,500,000 Guangzhou Automobile Group Co Ltd* 1.50% 22/01/2022 1,758,150 0.22
5,000,000 Guangzhou Hejing Real Estate Development Ltd** 4.94% 17/12/2021 5,092,850 0.62
5,600,000 Guotai Junan Securities Co Ltd* 1.00% 07/07/2023 6,991,600 0.86
2,700,000 Guoxin Investment Co Ltd* 4.26% 18/11/2022 2,390,379 0.29
22,000,000 Guoxin Investment Co Ltd* 4.68% 09/03/2020 21,565,852 2.64
10,000,000 Henan Energy & Chemical Industry Group Co Ltd** 7.00% 20/09/2023 10,187,545 1.25
20,000,000 Henan Energy & Chemical Industry Group Co Ltd** 7.20% 06/09/2021 20,399,310 2.50
1,600,000 Hengtong Optic-electric Co Ltd* 0.30% 19/03/2025 1,896,000 0.23
5,000,000 Hengyi Petrochem Regd** 6.43% 19/04/2021 5,030,213 0.62
6,000,000 Hengyi Petrochemical Co Ltd* 6.78% 22/03/2021 6,024,708 0.74
20,000,000 Huachen Automotive Group Holding Co Ltd** 5.50% 14/07/2020 19,993,590 2.45
250,000 Hubei Broadcasting & Television Information Network Co Ltd* 0.80% 28/06/2024 280,500 0.03
2,050,000 Inner Mongolia MengDian HuaNeng Thermal Power Corp Ltd* 1.00% 22/12/2023 2,409,980 0.29
2,100,000 Jiangsu Zhongtian Technology Co Ltd* 0.40% 28/02/2025 2,341,500 0.29
300,000 JiShi Media Co Ltd** 0.30% 27/12/2023 300,780 0.04
10,000,000 Jizhong Energy Group* 3.99% 19/04/2020 10,006,705 1.22
20,000,000 Jizhong Energy Group Co Ltd** 5.40% 14/11/2021 20,318,030 2.49

SCHEDULE OF INVESTMENTS FINANCIAL STATEMENTS
ANNUAL REPORT 2019 481
Neuberger Berman China Bond Fund (Continued)
Schedule of Investments (Continued)
Financial Assets at Fair Value through Profit or Loss (continued)
Principal Amount Security Description Coupon Maturity
DateFair Value
CNY% of Net
Assets
Corporate Bonds 90.46% (31 December 2018: 92.78%) (continued)
Chinese Yuan Renminbi (continued) 1,800,000 Jointown Pharmaceutical Group Co Ltd* 0.80% 15/01/2022 1,955,700 0.24
513,000 Lens Technology Co Ltd* 1.00% 08/12/2023 678,596 0.08
500,000 LONGi Green Energy Technology Co Ltd* 5.85% 07/03/2021 508,808 0.06
5,000,000 Midea Properties Group Co Ltd* 7.50% 17/09/2021 5,109,985 0.63
16,000,000 Nanshan Group Co Ltd* 5.50% 14/03/2021 15,667,928 1.92
7,000,000 Nanshan Group Co Ltd** 5.50% 19/04/2023 6,852,608 0.84
1,500,000 OPPEIN Home Group Inc** 0.40% 16/08/2025 1,904,850 0.23
350,000 PCI-Suntek Technology Co Ltd* 0.60% 19/12/2024 442,365 0.05
20,000,000 Seazen Holdings Co Ltd** 5.25% 14/04/2022 19,783,960 2.42
1,500,000 Seazen Holdings Co Ltd* 7.00% 03/11/2020 1,495,657 0.18
1,499,300 Sf Holding Co Ltd** 0.20% 18/11/2025 1,787,166 0.22
10,000,000 Shandong Hongqiao New Material Co Ltd** 6.75% 23/04/2021 9,917,470 1.21
1,800,000 Shandong Linglong Tyre Co Ltd* 0.50% 01/03/2023 2,329,200 0.29
16,000,000 Shandong Weiqiao Aluminum & Power Co Ltd* 4.00% 17/10/2023 14,747,856 1.81
1,550,000 Shanghai Environment Group Co Ltd** 0.20% 18/06/2025 1,884,490 0.23
1,900,000 Shanghai Powerlong Industrial Development Group Co Ltd* 6.20% 18/01/2021 1,917,781 0.23
4,000,000 Shanghai Pudong Development Bank Co Ltd* 0.20% 28/10/2025 4,370,800 0.54
1,003,000 Shanghai Shyndec Pharmaceutical Co Ltd** 0.20% 01/04/2025 1,112,327 0.14
10,000,000 Shanxi Coal Import & Export Group Co Ltd** 5.40% 23/02/2020 10,002,450 1.22
10,000,000 Shanxi Coal Import & Export Group Co Ltd** 5.99% 18/09/2020 10,022,510 1.23
10,000,000 Shanxi Coal Import & Export Group Co Ltd** 6.35% 05/08/2020 10,039,590 1.23
1,000,000 Shenzhen Logan Holdings Co Ltd* 7.30% 19/08/2020 1,019,484 0.13
1,000,000 Sunac Real Estate Group Co Ltd* 5.70% 14/08/2020 1,006,513 0.12
20,000,000 Suning Commerce Group Co Ltd** 5.20% 19/04/2021 20,140,200 2.46
10,000,000 Suning.com Co Ltd** 4.70% 16/11/2021 10,025,930 1.23
10,000,000 Tianjin Dongli City Infrastructure Investment Group Co Ltd** 4.28% 02/12/2022 5,879,270 0.72
6,000,000 Tianrui Group Co Ltd** 8.00% 15/01/2021 5,748,282 0.70
1,500,000 Toly Bread Co Ltd** 0.40% 20/09/2025 1,774,800 0.22
800,000 Tongkun Group Co Ltd* 0.50% 19/11/2024 1,020,000 0.13
1,400,000 Tongwei Co Ltd* 0.50% 18/03/2025 1,762,600 0.22
700,000 Venustech Group Inc* 0.40% 27/03/2025 917,000 0.11
450,200 Wuhu Token Science Co Ltd* 0.40% 18/03/2025 753,185 0.09
5,000,000 Xinjiang Luyuan State-owned Asset Management Group Co Ltd** 5.29% 13/02/2022 5,005,380 0.61
20,000,000 Xinjiang Tianfu Group Co Ltd** 4.30% 21/12/2020 19,749,860 2.42
10,000,000 Xinjiang Tianfu Group Co Ltd** 5.60% 28/08/2020 10,020,400 1.23
15,000,000 Xinjiang Zhongtai Group** 6.69% 12/03/2023 15,336,345 1.88
445,700 Yixintang Pharmaceutical Group Co Ltd* 0.30% 19/04/2025 511,664 0.06
10,000,000 Yunnan Metropolitan Construction Investment Group Co Ltd** 5.90% 15/08/2021 10,041,545 1.23

FINANCIAL STATEMENTS SCHEDULE OF INVESTMENTS
482 NEUBERGER BERMAN INVESTMENT FUNDS PLC
Neuberger Berman China Bond Fund (Continued)
Schedule of Investments (Continued)
Financial Assets at Fair Value through Profit or Loss (continued)
Principal Amount Security Description Coupon Maturity
DateFair Value
CNY% of Net
Assets
Corporate Bonds 90.46% (31 December 2018: 92.78%) (continued)
Chinese Yuan Renminbi (continued)
2,000,000 Yunnan Metropolitan Construction Investment Group Co Ltd** 5.97% 26/03/2022 2,006,284 0.25
1,000,000 Zhejiang Crystal-Optech Co Ltd* 0.80% 17/11/2023 1,329,990 0.16
10,000,000 Zhejiang Hengyi Group Co Ltd** 6.80% 14/04/2020 9,995,505 1.22
10,000,000 Zhejiang Rongsheng Holding Group Co Ltd* 5.60% 13/10/2021 10,064,445 1.23
15,000,000 Zhejiang Rongsheng Holding Group Co Ltd** 5.69% 13/03/2022 15,058,890 1.84
5,000,000 Zhuzhou State- owned Asset Investment Holding Group Co Ltd* 5.93% 02/05/2024 5,211,787 0.64
Total Chinese Yuan Renminbi 517,837,582 63.40
United States Dollar 2,000,000 Bi Hai Co Ltd* 6.25% 05/03/2022 14,402,920 1.76
1,600,000 Caiyun International Investment Ltd* 5.50% 08/04/2022 11,035,119 1.35
200,000 Chalco Hong Kong Investment Co Ltd* 4.88% 07/09/2021 1,439,748 0.18
600,000 Champion Sincerity Holdings Ltd* 8.13% 29/12/2049 4,402,880 0.54
2,900,000 China Evergrande Group* 7.00% 23/03/2020 20,136,318 2.47
500,000 China Evergrande Group* 8.25% 23/03/2022 3,271,471 0.40
700,000 CNAC HK Finbridge Co Ltd* 3.38% 19/06/2024 4,962,530 0.61
200,000 CNAC HK Finbridge Co Ltd* 3.50% 19/07/2022 1,416,870 0.17
1,400,000 Greenland Global Investment Ltd* 6.75% 25/06/2022 9,859,533 1.21
500,000 Greenland Global Investment Ltd* 7.25% 12/03/2022 3,547,815 0.43
1,800,000 Greenland Global Investment Ltd* 7.88% 24/10/2020 12,757,521 1.56
400,000 HBIS Group Hong Kong Co Ltd* 4.25% 07/04/2020 2,782,953 0.34
1,900,000 Hejun Shunze Investment Co Ltd* 11.00% 20/09/2020 13,438,724 1.65
400,000 Hejun Shunze Investment Co Ltd* 12.00% 25/04/2021 2,815,172 0.35
1,800,000 Logan Property Holdings Co Ltd* 7.50% 27/08/2021 13,026,466 1.59
1,400,000 MGM China Holdings Ltd† 5.38% 15/05/2024 10,161,589 1.25
750,000 Ronshine China Holdings Ltd* 11.25% 22/08/2021 5,573,189 0.68
400,000 Seazen Group Ltd* 5.00% 16/02/2020 2,780,883 0.34
200,000 Shandong Energy Australia Pty Ltd* 4.55% 26/07/2020 1,389,423 0.17
400,000 Shimao Property Holdings Ltd* 4.75% 03/07/2022 2,852,095 0.35
200,000 Shimao Property Holdings Ltd† 6.38% 15/10/2021 1,459,199 0.18
3,000,000 Sunac China Holdings Ltd* 7.88% 15/02/2022 21,731,049 2.66
1,700,000 Sunac China Holdings Ltd* 8.63% 27/07/2020 12,098,291 1.48
2,400,000 Unigroup International Holdings Ltd* 6.00% 10/12/2020 15,295,470 1.87
1,500,000 Wealth Driven Ltd* 5.50% 17/08/2023 10,476,514 1.28
250,000 Yancoal International Resources Development Co Ltd* 5.75% 29/12/2049 1,747,949 0.21
1,500,000 Yango Justice International Ltd* 9.50% 03/04/2021 10,479,621 1.28
800,000 Yango Justice International Ltd* 10.00% 12/02/2023 5,671,037 0.70
Total United States Dollar 221,012,349 27.06
Total Corporate Bonds 738,849,931 90.46

SCHEDULE OF INVESTMENTS FINANCIAL STATEMENTS
ANNUAL REPORT 2019 483
Neuberger Berman China Bond Fund (Continued)
Schedule of Investments (Continued)
Financial Assets at Fair Value through Profit or Loss (Continued)
Principal Amount Security Description Coupon Maturity
DateFair Value
CNY% of Net
Assets
Government Bonds 4.86% (31 December 2018: 3.01%)
Chinese Yuan Renminbi
10,000,000 Agriculture Development Bank of China 3.54% 06/01/2020 10,002,265 1.22
20,000,000 China Development Bank 3.45% 20/09/2029 19,777,340 2.42
10,000,000 Export-Import Bank of China 2.40% 14/01/2020 10,003,605 1.22
Total Government Bonds ** 39,783,210 4.86
Total Investments 778,633,141 95.32
Forward Currency Contracts 0.29% (31 December 2018: 0.08%)
Amount Receivable
Amount Payable
Maturity Date Counterparty Contracts Unrealised
Gain CNY% of Net
Assets
CNY 30,502,216 US$ 4,300,000 12/02/2020 Citibank NA 1 526,824 0.06
CNY 14,836,740 US$ 2,068,773 09/03/2020 Citibank NA 8 406,225 0.05
CNY 24,292,784 US$ 3,440,407 16/04/2020 Citibank NA 4 273,130 0.03
CNY 11,163,275 US$ 1,580,000 27/05/2020 Citibank NA 1 121,736 0.02
CNY 8,404,280 US$ 1,200,000 16/04/2020 Goldman Sachs International 1 26,323 0.00
CNY 47,189,676 US$ 6,695,740 12/05/2020 Goldman Sachs International 2 414,076 0.05
CNY 29,688,273 US$ 4,200,000 27/05/2020 Goldman Sachs International 1 337,348 0.04
CNY 26,466,249 US$ 3,743,183 11/06/2020 Goldman Sachs International 2 298,562 0.04
SGD 6,953 CNY 35,953 02/01/2020 Brown Brothers Harriman 2 62 0.00
Total Unrealised Gain on Forward Currency Contracts ∞ 2,404,286 0.29
Fair Value % of Net
CNY Assets
Total Financial Assets at Fair Value through Profit or Loss 781,037,427 95.61
Financial Liabilities at Fair Value through Profit or Loss
Forward Currency Contracts (1.30%) (31 December 2018: (0.01%))
Amount Receivable
Amount Payable
Maturity Date Counterparty Contracts Unrealised
Loss CNY% of Net
Assets
CNY 7,145,855 US$ 1,048,875 09/03/2020 Citibank NA 4 (170,465) (0.02)
CNY 8,271,550 US$ 1,200,000 06/01/2020 Citibank NA 1 (86,742) (0.01)
CNY 17,925,948 US$ 2,600,000 06/01/2020 Goldman Sachs International 1 (183,685) (0.02)
USD Hedged Classes US$ 1,612,936 CNY 11,302,267 22/01/2020 UBS AG 1 (64,174) (0.01)
US$ 62,626,551 CNY 446,489,229 22/01/2020 Westpac Banking Corp 1 (10,140,252) (1.24)
Total Unrealised Loss on Forward Currency Contracts ∞ (10,645,318) (1.30)

FINANCIAL STATEMENTS SCHEDULE OF INVESTMENTS
484 NEUBERGER BERMAN INVESTMENT FUNDS PLC
Neuberger Berman China Bond Fund (Continued)
Schedule of Investments (Continued)
Financial Liabilities at Fair Value through Profit or Loss (Continued) Fair Value % of Net
CNY Assets
Total Financial Liabilities at Fair Value through Profit or Loss (10,645,318) (1.30)
Net Financial Assets at Fair Value through Profit or Loss 770,392,109 94.31
Other Net Assets 46,470,479 5.69
Net Assets Attributable to Holders of Redeemable Participating Shares 816,862,588 100.00
% ofTotal
AssetsPortfolio Analysis CNY
* Transferable securities and/or money market instruments admitted to an official stock exchange listing 403,029,979 48.64
** Transferable securities and/or money market instruments dealt in on a regulated market 363,982,374 43.92
† Other transferable securities and/or money market instruments 11,620,788 1.40
∞ OTC financial derivative instruments (8,241,032) (0.99)
Total Investments 770,392,109 92.97

STATEMENT OF SIGNIFICANT PURCHASES AND SALES FINANCIAL STATEMENTS
ANNUAL REPORT 2019 485
Neuberger Berman China Bond Fund (Continued) Statement of Significant Purchases and Sales (Unaudited) In accordance with the European Communities (Undertakings for Collective Investment in Transferable Securities) Regulations, 2011 as amended, a statement of changes in the composition of the Schedule of Investments during the reporting period is provided to ensure that Shareholders can identify changes in the investments held by the Portfolio. The following statements present the aggregate purchases and sales of transferable securities exceeding one percent of the total value of purchases or sales, respectively, for the period. At a minimum, the largest twenty purchases and twenty sales are presented, if available.
Aggregate purchases greater than one percent of the total value of purchases:
Units Security Description Cost CNY
60,000,000 China Government Bond, 3.29%, 23/05/2029 61,325,760
40,000,000 China Development Bank, 3.65%, 21/05/2029 40,807,190
40,000,000 China Government Bond, 3.86%, 22/07/2049 40,703,620
40,000,000 China Government Bond, 2.79%, 16/08/2019 40,004,520
30,000,000 Shandong Commercial Group Co Ltd, 6.99%, 17/12/2019 29,997,600
30,000,000 China Treasury Bill, 0.00%, 19/08/2019 29,982,795
30,000,000 Shandong Commercial Group Co Ltd, 6.99%, 06/11/2019 29,964,860
30,000,000 Chongqing Energy Investment Group Co Ltd, 4.93%, 23/09/2020 29,718,540
30,000,000 Guangxi Financial Investment Group Co Ltd, 5.00%, 21/08/2023 29,122,098
21,500,000 Hengli Group Co Ltd, 6.48%, 08/11/2021 21,495,255
3,000,000 Sunac China Holdings Ltd, 7.88%, 15/02/2022 21,335,554
20,000,000 China Government Bond, 4.08%, 22/10/2048 21,224,200
20,000,000 Jizhong Energy Group, 5.40%, 14/11/2021 20,459,010
20,000,000 Henan Energy & Chemical Industry Group Co Ltd, 7.20%, 06/09/2021 20,372,860
16,935,000 Guotai Junan Securities Co Ltd, 1.00%, 07/07/2023 20,071,511
20,000,000 Suning Commerce Group Co Ltd, 5.20%, 19/04/2021 20,070,000
20,000,000 China Development Bank, 2.65%, 20/10/2019 20,006,040
20,000,000 China Development Bank, 2.54%, 08/01/2020 20,002,960
20,000,000 Huachen Automotive Group Holding Co Ltd, 5.50%, 14/07/2020 20,000,400
20,000,000 China Treasury Bill, 0.00%, 14/10/2019 19,971,057
20,000,000 Agricultural Bank of China Ltd, 0.00%, 08/08/2019 19,965,314
20,700,000 Guoxin Investment Co Ltd, 4.68%, 09/03/2020 19,908,832
20,000,000 China Development Bank, 3.45%, 20/09/2029 19,853,500
20,000,000 Xinjiang Tianfu Group Co Ltd, 4.30%, 21/12/2020 19,382,420
2,700,000 China Evergrande Group, 7.00%, 23/03/2020 19,065,693
20,000,000 Seazen Holdings Co, 5.25%, 14/04/2022 18,690,200
18,000,000 Shanghai Aijan Group Co, 5.40%, 25/12/2021 18,012,610
16,000,000 Nanshan Group Co Ltd, 5.50%, 11/03/2021 16,047,666
2,400,000 Unigroup International Holdings Ltd, 6.00%, 10/12/2020 15,848,437
17,000,000 China Wanda Group Co Ltd, 6.80%, 08/09/2021 15,773,850
15,000,000 Xinjiang Zhongtai Group Co Ltd, 6.69%, 12/03/2023 15,272,500
13,000,000 China Everbright Bank Co Ltd, 1.00%, 17/03/2023 15,059,331
15,000,000 Zhejiang Rongsheng Holding Group, 5.69%, 13/03/2022 15,017,700

FINANCIAL STATEMENTS STATEMENT OF SIGNIFICANT PURCHASES AND SALES
486 NEUBERGER BERMAN INVESTMENT FUNDS PLC
Neuberger Berman China Bond Fund (Continued) Statement of Significant Purchases and Sales (Unaudited) (Continued) Aggregate sales greater than one percent of the total value of sales:
Units Security Description Proceeds CNY
60,000,000 China Government Bond, 3.29%, 23/05/2029 61,030,860
40,000,000 China Development Bank, 3.65%, 21/05/2029 40,712,440
40,000,000 China Government Bond, 3.86%, 22/07/2049 39,995,730
20,000,000 China Government Bond, 4.08%, 22/10/2048 20,724,690
20,000,000 China Development Bank, 2.54%, 08/01/2020 20,002,760
20,000,000 Agricultural Bank of China Ltd, 0.00%, 08/08/2019 19,996,981
17,118,000 China Government Bond, 3.27%, 22/08/2046 15,591,078
11,985,000 Guotai Junan Securities Co Ltd, 1.00%, 07/07/2023 14,255,484
10,950,000 China Everbright Bank Co Ltd, 1.00%, 17/03/2023 12,760,636
10,000,000 China Merchants Bank Co Ltd, 0.00%, 01/08/2019 9,998,495
10,000,000 China Development Bank, 3.30%, 01/02/2024 9,849,610
7,200,000 Ping An Bank Co Ltd, 0.20%, 21/01/2025 8,798,843
1,100,000 China Evergrande Group, 6.25%, 28/06/2021 7,347,372
1,000,000 Ronshine China Holdings Ltd, 8.75%, 25/10/2022 7,222,750
5,350,000 Tongwei Co Ltd, 0.50%, 18/03/2025 6,932,313
6,200,000 Bank of Jiangsu Co Ltd, 0.20%, 14/03/2025 6,736,247
5,233,000 Haier Smart Home Co Ltd, 0.20%, 17/12/2024 6,326,826
5,150,000 Dawning Information Industry Co Ltd, 0.60%, 06/08/2024 5,994,330
800,000 CNAC HK Finbridge Co Ltd, 3.38%, 19/06/2024 5,781,108
750,000 Ronshine China Holdings Ltd, 11.25%, 22/08/2021 5,612,510
800,000 China Evergrande Group, 8.25%, 23/03/2022 5,324,143
3,736,000 AVIC Jonhon Optronic Technology Co Ltd, 0.20%, 05/11/2024 4,999,444

INVESTMENT MANAGER’S REPORT FINANCIAL STATEMENTS
ANNUAL REPORT 2019 487
Neuberger Berman Global Dynamic Asset Allocator Fund* Investment Manager’s Report For the period ended 12 April 2019, the total return for the USD I (PF) Accumulating Class was 4.79%. Over the same period, the Bloomberg Barclays U.S. Aggregate Bond Index (the “Index”) returned -1.82%. While underperforming the ICE BofA U.S. High Yield Index and outperforming HFRX Fixed Income - Credit Index, which returned 8.58% and 1.53% respectively. (Performance data quoted represent past performance and do not indicate future results. Total returns shown are net of all fees and expenses and include reinvestment of income dividends and other distributions, if any. Please note that each of the above indices are used as a reference index and are not the official benchmarks of the Portfolio).
In a reversal of performance from the end of 2018, the New Year began with equities and credit rallying strongly across the world. Fears of an escalation in trade tensions between the US and China, potentially higher interest rates and a potential slowdown in global growth have begun to subside for each of these potential pitfalls. In fact these fears have led to a more dovish US Federal Reserve (“Fed”) with expectations for a rate cut increasingly being priced in by market participants. A more dovish Fed, combined with the news that quantitative tightening will end in September had supported the full spectrum fixed income asset classes. In some regards the Fed is following in the lead of other central banks as the European Central Bank has kept the deposit rate steady at -0.4% and said it would not raise rates until at least next year and the Bank of England remained on hold, despite rising wage pressures.
The Portfolio performed well in this accommodative backdrop by blending discretionary and systematic processes in order to provide growth with a steady stream of income. Each of the strategies’ components performed in line with expectations.
* Portfolio liquidated on 12 April 2019.

FINANCIAL STATEMENTS BALANCE SHEET
The accompanying notes form an integral part of the financial statements.
488 NEUBERGER BERMAN INVESTMENT FUNDS PLC
Neuberger Berman Global Dynamic Asset Allocator Fund (Continued)
Balance Sheet
As at As at
Note 31 December 2019 31 December 2018
US$ US$
Current Assets
Financial Assets at Fair Value through Profit or Loss 2 15,719 25,232,249
Cash and cash equivalents 3 102 606,395
Receivable for investments sold – 25,837
Due from brokers – 1,140,558
Income receivable and other assets – 248,458
Total Assets 15,821 27,253,497
Current Liabilities
Financial Liabilities at Fair Value through Profit or Loss 2 – 2,428,849
Bank overdraft 4 2,523 –
Accrued expenses 7,622 55,727
Payable for investments purchased – 440,034
Other payables 5,676 33,669
Liabilities (excluding Net Assets Attributable to Holders of Redeemable Participating Shares) 15,821 2,958,279
Net Assets Attributable to Holders of Redeemable Participating Shares – 24,295,218

PROFIT AND LOSS ACCOUNT FINANCIAL STATEMENTS
The accompanying notes form an integral part of the financial statements.
ANNUAL REPORT 2019 489
Neuberger Berman Global Dynamic Asset Allocator Fund (Continued)
Profit and Loss Account
Period Ended Year Ended
Note 31 December 2019* 31 December 2018
US$ US$
Income
Interest Income 196,787 1,002,012
Dividend Income 28,245 61,332
Miscellaneous Income 1,151 1,108
Net Gain/(Loss) on Financial Assets and Liabilities at Fair Value through Profit or Loss 11 447,218 (1,942,993)
673,401 (878,541)
Expenses
Management Fee 6 24,240 99,220
Distribution Fee 6 805 3,299
Administration Fee 6 30,843 116,808
Commitment Fee 19 842 3,051
Custody Fee 6 3,354 12,000
Depositary Fee 6 492 2,778
Professional Fee 9 13,229 24,718
Directors' Fee 7 1,317 6,613
Transaction Costs 9 19,600 81,316
Audit Fee 8 6,123 16,787
VAT Rebate (98) (364)
Other Expenses 9 29,254 14,549
Expense Waiver 6 (63,316) (172,389)
Total Expenses 66,685 208,386
Finance Costs
Interest Expense 333 1,607
Distribution Paid 1 272,750 327,658
273,083 329,265
Withholding Tax 1 1,268 16,965
Profit/(Loss) Attributable to Holders of Redeemable Participating Shares from Operations 332,365 (1,433,157)
* Portfolio liquidated on 12 April 2019. Income and expenses arose solely from continuing operations.

FINANCIAL STATEMENTS STATEMENT OF CHANGES IN NET ASSETS
The accompanying notes form an integral part of the financial statements.
490 NEUBERGER BERMAN INVESTMENT FUNDS PLC
Neuberger Berman Global Dynamic Asset Allocator Fund (Continued)
Statement of Changes in Net Assets Attributable to Holders of Redeemable Participating Shares
Period Ended Year Ended
31 December 2019* 31 December 2018
US$ US$
Net Assets Attributable to Holders of Redeemable Participating Shares at beginning of period/year 24,295,218 29,118,082
Profit/(Loss) Attributable to Holders of Redeemable Participating Shares from Operations 332,365 (1,433,157)
Subscriptions 5 8,132 427,623
Redemptions 5 (24,635,715) (3,817,330)
Net Assets Attributable to Holders of Redeemable Participating Shares at end of period/year – 24,295,218
* Portfolio liquidated on 12 April 2019.

SCHEDULE OF INVESTMENTS FINANCIAL STATEMENTS
ANNUAL REPORT 2019 491
Neuberger Berman Global Dynamic Asset Allocator Fund (Continued)
Schedule of Investments
Financial Assets at Fair Value through Profit or Loss
Principal Amount Security Description Coupon Maturity
DateFair Value
US$% of Net
Assets
Corporate Bonds 0.00% (31 December 2018: 44.75%)
United States Dollar 25,000 Petroleos de Venezuela SA* 5.38% 12/04/2027 2,062 0.00
80,904 Petroleos de Venezuela SA* 6.00% 16/05/2024 6,675 0.00
64,125 Petroleos de Venezuela SA† 6.00% 15/11/2026 5,290 0.00
Total Corporate Bonds 14,027 0.00
Government Bonds 0.00% (31 December 2018: 27.07%)
United States Dollar 14,100 Venezuela Government International Bond 8.25% 13/10/2024 1,692 0.00
Total Government Bonds * 1,692 0.00
Total Investments 15,719 0.00
Total Financial Assets at Fair Value through Profit or Loss 15,719 0.00
Net Financial Assets at Fair Value through Profit or Loss 15,719 0.00
Other Net Liabilities (15,719) (0.00)
Net Assets Attributable to Holders of Redeemable Participating Shares 0 0.00
% ofTotal
AssetsPortfolio Analysis US$
* Transferable securities and/or money market instruments admitted to an official stock exchange listing 10,429 65.92
† Other transferable securities and/or money market instruments 5,290 33.44
Total Investments 15,719 99.36

FINANCIAL STATEMENTS STATEMENT OF SIGNIFICANT PURCHASES AND SALES
492 NEUBERGER BERMAN INVESTMENT FUNDS PLC
Neuberger Berman Global Dynamic Asset Allocator Fund (Continued) Statement of Significant Purchases and Sales (Unaudited) In accordance with the European Communities (Undertakings for Collective Investment in Transferable Securities) Regulations, 2011 as amended, a statement of changes in the composition of the Schedule of Investments during the reporting period is provided to ensure that Shareholders can identify changes in the investments held by the Portfolio. The following statements present the aggregate purchases and sales of transferable securities exceeding one percent of the total value of purchases or sales, respectively, for the period. At a minimum, the largest twenty purchases and twenty sales are presented, if available.
Total purchases:
Units Security Description Cost US$
400,000 United States Treasury Bill, 0.00%, 08/08/2019 395,635
400,000 United States Treasury Bill, 0.00%, 02/01/2020 392,715
295,000 Fannie Mae Pool, 4.00%, 15/02/2049 301,833
265,000 Fannie Mae Pool, 4.00%, 01/03/2049 270,161
250,000 Freddie Mac Structured Agency Credit Risk Debt Notes, 4.16%, 25/03/2030 257,510
250,000 Freddie Mac Structured Agency Credit Risk Debt Notes, 4.01%, 25/04/2030 253,691
155,000 Fannie Mae Pool, 4.00%, 01/05/2049 158,850
155,000 Fannie Mae Pool, 4.00%, 01/04/2049 157,779
140,000 Freddie Mac Gold Pool, 4.00%, 01/02/2049 143,259
140,000 Freddie Mac Gold Pool, 4.00%, 15/03/2049 142,822
135,000 Anheuser-Busch InBev Worldwide Inc, 4.75%, 23/01/2029 134,575
100,000 Anglo American Capital Plc, 3.38%, 11/03/2029 130,155
100,000 Ball Corp, 4.38%, 15/12/2023 128,583
100,000 Anglo American Capital Plc, 3.25%, 03/04/2023 122,917
100,000 Vantiv LLC, 3.88%, 15/11/2025 121,974
100,000 Tenneco Inc, 4.88%, 15/04/2022 119,079
100,000 Avantor Inc, 4.75%, 01/10/2024 117,795
100,000 Rossini Sarl, 6.75%, 30/10/2025 117,084
100,000 Intertrust Group BV, 3.38%, 15/11/2025 114,603
100,000 Bayer AG, 2.38%, 02/04/2075 111,834
110,000 AT&T Inc, 4.35%, 01/03/2029 109,459
100,000 Platin 1426 GmbH, 5.38%, 15/06/2023 108,740
100,000 Faurecia SA, 2.63%, 15/06/2025 106,678
100,000 Jaguar Land Rover Automotive Plc, 4.50%, 15/01/2026 97,840
100,000 Paprec Holding SA, 3.50%, 31/03/2025 94,456
100,000 Grupo Antolin-Irausa SA, 3.38%, 30/04/2026 89,352
80,000 Freddie Mac Gold Pool, 4.00%, 01/05/2046 82,038
80,000 Freddie Mac Gold Pool, 4.00%, 01/04/2046 81,488

STATEMENT OF SIGNIFICANT PURCHASES AND SALES FINANCIAL STATEMENTS
ANNUAL REPORT 2019 493
Neuberger Berman Global Dynamic Asset Allocator Fund (Continued) Statement of Significant Purchases and Sales (Unaudited) (Continued) Top twenty sales:
Units Security Description Proceeds US$
1,821,548 United States Treasury Inflation Indexed Bonds, 2.00%, 15/01/2026 1,980,086
18,272 iShares JP Morgan EM Local Government Bond UCITS ETF 1,090,256
720,837 United States Treasury Inflation Indexed Bonds, 3.88%, 15/04/2029 934,361
88,372,878 Japanese Government CPI Linked Bond, 0.10%, 10/03/2027 824,708
600,000 United States Treasury Bill, 0.00%, 28/02/2019 599,935
552,347 United States Treasury Inflation Indexed Bonds, 0.38%, 15/07/2023 545,707
530,000 Freddie Mac Structured Agency Credit Risk Debt Notes, 4.16%, 25/04/2030 538,799
500,000 Freddie Mac Structured Agency Credit Risk Debt Notes, 4.01%, 25/03/2030 515,508
500,000 Marble Point CLO X Ltd, 8.80%, 15/10/2030 477,250
400,000 United States Treasury Bill, 0.00%, 08/08/2019 396,436
400,000 United States Treasury Bill, 0.00%, 02/01/2020 393,215
364,000 General Electric Co, 5.00%, 29/12/2049 327,408
295,000 Fannie Mae Pool, 4.00%, 01/01/2049 302,052
295,000 Fannie Mae Pool, 4.00%, 15/02/2049 301,139
295,000 Bear Stearns Asset Backed Securities I Trust 2005-AQ2, 2.15%, 25/09/2035 291,313
250,000 Freddie Mac Structured Agency Credit Risk Debt Notes, 5.11%, 25/10/2029 270,781
265,000 Fannie Mae Pool, 4.00%, 01/03/2049 270,218
250,000 Freddie Mac Structured Agency Credit Risk Debt Notes, 4.91%, 25/07/2029 263,975
200,000 Ripon Mortgages Plc, 2.60%, 20/08/2056 260,752
260,000 Trafigura Securitisation Finance Plc, 3.38%, 15/12/2020 260,546

FINANCIAL STATEMENTS INVESTMENT MANAGER’S REPORT
494 NEUBERGER BERMAN INVESTMENT FUNDS PLC
Neuberger Berman Asian Opportunities Fund* Investment Manager’s Report For the period from 1 January 2019 to the Portfolio’s close on 24 July 2019, the total return for the USD I Accumulating Class was 8.11%. Over the same period, the benchmark index, the MSCI All Country Asia Ex-Japan Index (the “Index”), returned 10.97%. (Performance for all share classes is provided in Appendix II. Performance data quoted represent past performance and do not indicate future results. Total returns shown are net of all fees and expenses and include reinvestment of income dividends and other distributions, if any).
Developing Asian equities performed well this period, in line with broader Emerging Markets equities, but trailing developed markets. Asian markets rebounded from a weak 2018, but volatility was high as investors digested US-China trade war headlines. A late June agreement to keep the trade standoff from escalating boosted all markets, as did the US Federal Reserve’s signal of coming rate cuts. Elsewhere, Chinese economic indicators remained subdued. More broadly, lower growth and benign inflation figures provided room for emerging market central banks to loosen monetary policy.
The Consumer Discretionary, Real Estate and Information Technology sectors led the Index. All sectors except Health Care were positive, with Materials and Industrials also underperforming. By country, top performers included Hong Kong, Thailand and Taiwan. Pakistan was a detractor, and Korea and Malaysia trailed the average of the benchmark.
Stock selection was positive for the Portfolio this period, with particular strength in Real Estate. Industrials and Health Care holdings also outperformed. Sector allocation was a minor headwind, and Communication Services and Financials holdings underperformed. By country, holdings in China, Thailand, and Malaysia were additive while Korean and Taiwanese holdings, and an underweight to Hong Kong detracted.
While global political tussles were well publicised this period, many local domestic news items were not. These included incumbents maintaining control in recent Indian and Indonesian elections, spurring hopes for continued reforms.
* Portfolio liquidated on 24 July 2019.

BALANCE SHEET FINANCIAL STATEMENTS
The accompanying notes form an integral part of the financial statements.
ANNUAL REPORT 2019 495
Neuberger Berman Asian Opportunities Fund (Continued)
Balance Sheet
As at As at
Note 31 December 2019 31 December 2018
US$ US$
Current Assets
Financial Assets at Fair Value through Profit or Loss 2 – 3,268,313
Cash and cash equivalents 3 16 298,082
Income receivable and other assets 17,041 23,930
Total Assets 17,057 3,590,325
Current Liabilities
Bank overdraft 4 5,444 –
Accrued expenses 6,102 26,457
Other payables 5,511 9,895
Liabilities (excluding Net Assets Attributable to Holders of Redeemable Participating Shares) 17,057 36,352
Net Assets Attributable to Holders of Redeemable Participating Shares – 3,553,973

FINANCIAL STATEMENTS PROFIT AND LOSS ACCOUNT
The accompanying notes form an integral part of the financial statements.
496 NEUBERGER BERMAN INVESTMENT FUNDS PLC
Neuberger Berman Asian Opportunities Fund (Continued)
Profit and Loss Account
Period Ended Year Ended
Note 31 December 2019* 31 December 2018
US$ US$
Income
Interest Income 13,027 12,804
Dividend Income 208,478 509,773
Net Gain/(Loss) on Financial Assets and Liabilities at Fair Value through Profit or Loss 11 82,529 (3,884,959)
304,034 (3,362,382)
Expenses
Management Fee 6 86,622 265,543
Distribution Fee 6 40,526 131,182
Administration Fee 6 20,874 51,269
Commitment Fee 19 1,353 586
Custody Fee 6 7,000 12,165
Depositary Fee 6 614 1,875
Professional Fee 9 27,921 11,966
Directors' Fee 7 2,887 6,613
Transaction Costs 9 72,791 122,278
Audit Fee 8 12,252 14,413
VAT Rebate (103) (225)
Other Expenses 9 18,828 13,120
Expense Waiver 6 (91,840) (96,703)
Total Expenses 199,725 534,082
Finance Costs
Interest Expense 244 4,991
Distribution Paid 1 29,889 48,416
30,133 53,407
Withholding Tax 1 20,608 42,177
Capital Gain Tax 1 – (16)
Profit/(Loss) Attributable to Holders of Redeemable Participating Shares from Operations 53,568 (3,992,032)
* Portfolio liquidated on 24 July 2019. Income and expenses arose solely from continuing operations.

STATEMENT OF CHANGES IN NET ASSETS FINANCIAL STATEMENTS
The accompanying notes form an integral part of the financial statements.
ANNUAL REPORT 2019 497
Neuberger Berman Asian Opportunities Fund (Continued)
Statement of Changes in Net Assets Attributable to Holders of Redeemable Participating Shares
Period Ended Year Ended
31 December 2019* 31 December 2018
US$ US$
Net Assets Attributable to Holders of Redeemable Participating Shares at beginning of period/year 3,553,973 7,020,784
Profit/(Loss) Attributable to Holders of Redeemable Participating Shares from Operations 53,568 (3,992,032)
Subscriptions 5 10,750,000 20,935,095
Redemptions 5 (14,357,541) (20,409,874)
Net Assets Attributable to Holders of Redeemable Participating Shares at end of period/year – 3,553,973
* Portfolio liquidated on 24 July 2019.

FINANCIAL STATEMENTS STATEMENT OF SIGNIFICANT PURCHASES AND SALES
498 NEUBERGER BERMAN INVESTMENT FUNDS PLC
Neuberger Berman Asian Opportunities Fund (Continued) Statement of Significant Purchases and Sales (Unaudited)
In accordance with the European Communities (Undertakings for Collective Investment in Transferable Securities) Regulations, 2011 as amended, a statement of changes in the composition of the Schedule of Investments during the reporting period is provided to ensure that Shareholders can identify changes in the investments held by the Portfolio. The following statements present the aggregate purchases and sales of transferable securities exceeding one percent of the total value of purchases or sales, respectively, for the period. At a minimum, the largest twenty purchases and twenty sales are presented, if available.
Aggregate purchases greater than one percent of the total value of purchases:
Units Security Description Cost US$
16,000 Tencent Holdings Ltd 699,931
782,000 Industrial & Commercial Bank of China Ltd – H Shares 592,342
37,000 China Mobile Ltd 393,948
10,960 Samsung Electronics Co Ltd – Preferred Shares 365,196
37,000 AIA Group Ltd 358,208
46,000 Taiwan Semiconductor Manufacturing Co Ltd 351,846
9,260 HDFC Bank Ltd, 02/07/2020 – Participatory Notes 329,058
1,630 Alibaba Group Holding Ltd 280,467
8,630 Housing Development Finance Corp Ltd, 26/04/2021- Participatory Notes 231,621
18,900 Sunny Optical Technology Group Co Ltd 226,958
7,058 HDFC Bank Ltd, 02/07/2019 – Participatory Notes 214,507
39,000 VHQ Media Holdings Ltd 208,858
80,000 China Life Insurance Co Ltd 206,460
875 SK Telecom Co Ltd 201,238
81,500 CP ALL Pcl 198,776
17,250 Link REIT 191,264
88,600 Huatai Securities Co Ltd – H Shares 182,278
2,650 SK Hynix Inc 179,425
14,121 Woori Financial Group Inc 171,334
92,000 CNOOC Ltd 163,877
1,470 Com2uSCorp 158,789
920 Baidu Inc ADR 157,576
154,000 China Everbright International Ltd 156,630
572,400 Bank Rakyat Indonesia Persero Tbk PT 156,316
8,200 DBS Group Holdings Ltd 153,447
1,875 Woongjin Coway Co Ltd 152,128
1,540 Orion Corp 150,955
105,000 Times China Holdings Ltd 149,165
24,200 Zhuzhou CRRC Times Electric Co Ltd 142,644
2,530 Hana Tour Service Inc 139,549
1,316 NAVER Corp 137,426
245,500 Astra International Tbk PT 136,497
3,205 Samsung Electronics Co Ltd 132,876

STATEMENT OF SIGNIFICANT PURCHASES AND SALES FINANCIAL STATEMENTS
ANNUAL REPORT 2019 499
Neuberger Berman Asian Opportunities Fund (Continued) Statement of Significant Purchases and Sales (Unaudited) (Continued) Aggregate purchases greater than one percent of the total value of purchases (continued):
Units Security Description Cost US$
2,033 DB Insurance Co Ltd 129,045
78,500 JNBY Design Ltd 125,302
316,100 Inari Amertron Bhd 125,090
3,873 Momo Inc ADR 122,463
266,200 Map Aktif Adiperkasa PT 122,283
1,975 Weibo Corp ADR 121,862
62,000 Guangdong Investment Ltd 120,647
1,678,700 Mitra Adiperkasa 120,087
235,000 Canvest Environmental Protection Group Co Ltd 119,918

FINANCIAL STATEMENTS STATEMENT OF SIGNIFICANT PURCHASES AND SALES
500 NEUBERGER BERMAN INVESTMENT FUNDS PLC
Neuberger Berman Asian Opportunities Fund (Continued) Statement of Significant Purchases and Sales (Unaudited) (Continued) Aggregate sales greater than one percent of the total value of sales:
Units Security Description Proceeds US$
21,600 Tencent Holdings Ltd 982,254
1,054,550 Industrial & Commercial Bank of China Ltd – H Shares 739,515
49,800 AIA Group Ltd 531,671
62,400 Taiwan Semiconductor Manufacturing Co Ltd 491,009
14,775 Samsung Electronics Co Ltd – Preferred Shares 472,178
47,500 China Mobile Ltd 425,291
2,211 Alibaba Group Holding Ltd ADH 373,236
11,158 Housing Development Finance Corp Ltd, 26/04/2021- Participatory Notes 352,902
9,260 HDFC Bank Ltd, 02/07/2019 – Participatory Notes 327,828
9,260 HDFC Bank Ltd, 02/07/2020 – Participatory Notes 320,684
25,500 Sunny Optical Technology Group Co Ltd 279,542
143,670 Times China Holdings Ltd 263,083
91,400 CP ALL Pcl 259,417
1,178 SK Telecom Co Ltd 255,894
102,500 Li Ning Co Ltd 253,093
93,450 China Life Insurance Co Ltd – H Shares 240,506
52,542 VHQ Media Holdings Ltd 228,426
3,571 SK Hynix Inc 224,291
106,600 JNBY Design Ltd 220,134
17,250 Link REIT 214,920
123,550 CNOOC Ltd 208,031
120,600 Huatai Securities Co Ltd – H Shares 205,870
17,582 ICICI Bank Ltd ADR 201,059
204,250 China Everbright International Ltd 194,677
572,400 Bank Rakyat Indonesia Persero Tbk PT 180,573
5,114 Momo Inc ADR 176,034
426,225 Inari Amertron Bhd 170,397
82,100 Guangdong Investment Ltd 169,490
4,320 Samsung Electronics Co Ltd 167,837
32,700 Zhuzhou CRRC Times Electric Co Ltd 167,093
14,000 eMemory Technology Inc 166,048
2,525 Woongjin Coway Co Ltd 165,713
14,121 Woori Financial Group Inc 163,351
1,980 Com2uSCorp 160,938
8,200 DBS Group Holdings Ltd 153,556

INVESTMENT MANAGER’S REPORT FINANCIAL STATEMENTS
ANNUAL REPORT 2019 501
Neuberger Berman Corporate Hybrid Bond Fund Investment Manager’s Report For the 12 months ended 31 December 2019, the total return for the EUR I Accumulating Class was 12.17%. Over the same period, the benchmark index, the ICE BofA Global Hybrid Non-Financial 5% Constrained Custom Index (EUR Hedged) (the “Index”) returned 11.64%. (Performance for all share classes is provided in Appendix II. Performance data quoted represent past performance and do not indicate future results. Total returns shown are net of all fees and expenses and include reinvestment of income dividends and other distributions, if any).
As we reflect back on 2019, it is our view that the Corporate Hybrid market started the year with the most compelling valuation case since the inception of the strategy. The volatility of the fourth quarter of 2018 - which was driven solely by the macroeconomic backdrop, and ignored the improving fundamentals of many of our issuers - left the asset class with a starting euro-hedged yield of 3.4%. For context, that yield exceeded the Euro IG Credit and Euro High Yield BB indices by 210 basis points (“bps”) and 10bps, respectively. The latter is rated two notches lower than the Corporate Hybrid universe at the bond level, and four-to-five notches lower at the issuer level. Additionally, Corporate Hybrids also began the year just 60bps inside of contingent convertible bonds (“CoCos”), a structure that is far weaker and arguably warrants over 200bps of additional spread versus Corporate Hybrid Bonds. We took advantage by adding to many of our highest conviction positions during the end of year 2018 sell-off. Overall, these valuations made little sense to us and left the sector trading well over 100bps wide of fair value.
Even with prospective returns going into 2019 seeming very attractive against that backdrop, we did not fully anticipate just how strong the market would be in 2019. The Portfolio’s benchmark, the ‘ICE BofA Global Hybrid Non-Financial 5% Constrained Index’ returned 11.64% in euros. Our Portfolio delivered an additional 136bps, with a total return of 13.00% before fees. It is encouraging, though not surprising to us, that Corporate Hybrids have once again shown good resilience following a significant risk-off period.
We are pleased to report that positive security selection was the key driver of the Portfolio’s outperformance versus the Index. As most of our investors already know, our value philosophy emphasises deep fundamental, bottom-up research with capital subsequently allocated to what we believe are the most undervalued securities in our investment universe. At times, this means our Portfolio’s largest positions can be dominated by idiosyncratic, non-consensus issuers. Examples of this have been Volkswagen in the aftermath of ‘Diesel Gate’, UK Utilities during the Brexit uncertainties and Bayer with their ongoing glyphosate litigation. Unfortunately, non-consensus ideas - by definition - can take months to come to fruition and are impossible to time perfectly in our opinion. This has periodically cost us in terms of performance – as happened in late 2018. However, rigidly sticking to the same process held us in good stead in 2019.
The Portfolio benefitted from security selection within the Energy sector. The key driver behind this was our allocation to US and Canadian midstream issuers such as Enbridge, EPD and TransCanada. This segment of the portfolio particularly underperformed in the final stages of 2018; As the bonds became even further undervalued, we added to our exposure. The rebound, which predominantly occurred in Q1’19, outpaced the broader Corporate Hybrid market as our issuers posted results ahead of expectations. We continue to maintain an allocation to the midstream sector, although our exposure has gradually declined over the course of the year as spreads have compressed.
The Portfolio benefitted from security selection within the Basic Industry sector. BHP Billiton and - more recently - Bayer, have been our largest Basics Industry positions and both have outperformed the broader sector. We had and continue to have a high conviction position in Bayer. After stress-testing the probability-weighted outcomes of the glyphosate litigation, we have concluded that the market has excessively penalised the name. Bayer remains one of our largest holdings and we expect it to add significant value over time.
The Portfolio gained from security selection within the Utility sector. Our two key high conviction UK utility positions in National Grid and SSE were responsible for most of that outperformance. We have been running a significant overweight to UK risk in the Portfolio for quite some time. Our thesis is that these names had been oversold on Brexit/Nationalisation concerns. This has now begun to play out in our favour following the December 2019 election result. On a risk-adjusted basis, our view had been that the market had been assigning too high a probability that a Labour Party-led government, could actually implement their nationalisation plans. With the Conservatives delivering their strongest election result for many decades, we can now say that the UK has firmly rejected Labour’s left-wing policies that have been weighing on our UK exposure. We expect further outperformance of these names in 2020.
If we split performance by currency, our significant overweight to US Dollar credit added significantly to our returns. We assess valuations on a fully-swapped out basis and continue to find mispriced bonds in USD. These include the USD hybrids of non-US issuers such as SSE, Enel and EnBW, together with the pipeline issuers we have previously mentioned. From time to time, we also find valuation anomalies in certain Sterling hybrids and we will continue to remain currency agnostic in allocating to the most undervalued opportunities.

FINANCIAL STATEMENTS INVESTMENT MANAGER’S REPORT
502 NEUBERGER BERMAN INVESTMENT FUNDS PLC
Neuberger Berman Corporate Hybrid Bond Fund (Continued) Investment Manager’s Report (Continued) We also benefitted from our participation in the new issue market, where new deals typically come at a discount to fair value. Once again, we have seen a collection of first-time issuers enter the market in 2019. Names such as Deutsche Bahn, Heimstaden and Infineon all brought deals. Infineon was a particularly strong performer that added to our returns. 2019 saw gross issuance of ~$30bn equivalent and we expect the market will continue to grow by ~$20-25bn equivalent per year. Overall, the universe continues to diversify by both issuer and sector, which in turn is attracting more investors to the space.
Despite their performance in 2019, Corporate Hybrids are still offering around 3.5 times the yield on the broad Euro Investment Grade Credit index of which they are a part. They are also trading flat to Euro bonds rated BB with similar duration and a ratings differential as previously described.
This still does not make sense to us and points to Corporate Hybrids trading over 50bps wide of fair value on a relative basis. We believe the ongoing search for high quality, positive yield - particularly inside the Eurozone - will continue to benefit Corporate Hybrids. This is a key reason why the asset class continue to be our top idea in global investment grade credit.
The Portfolio remains significantly more diversified than the benchmark, particularly at the single name level. However, following a long term value approach, we continue to allocate a considerable portion of the Portfolio to the utility sector, alongside energy and telecommunications. Our decisions on a bond-by-bond basis are driven by valuations considered in the context of overall low business risk, low peak-to-trough EBITDA level and a favourable regulatory backdrop going into 2020. We still see significant opportunities in UK Utilities and Bayer as previously mentioned. We also continue to hold a sizeable position in Volkswagen. This continues to play out in our favour. Overall, we are confident that our allocations will outperform and deliver an attractive total return over the long term.
Moving into 2020, concerns over the spread of the coronavirus (COVID-19) and its potential impact on global growth dominated financial markets. Outbreak fears quickly replaced trade as the main focus and fueled one of the sharpest equity sell-offs in recent history with European Credit spreads responding in kind, widening by 21bps. Against this backdrop, virtually all risk assets posted negative returns as fears of an impending economic slowdown dominated sentiment. Unsurprisingly, the worst performing areas were energy and cyclical sectors such as autos.
It is worth highlighting that the fund has zero exposure to travel, hotel or leisure companies. Most corporate hybrid issuers we hold are extremely robust with limited fundamental sensitivity to either the economic outlook or oil prices.
Our commitment to having zero exposure to emerging market issuers, as well as only limited exposure to bonds issued by peripheral Eurozone issuers, also continue to protect us.

BALANCE SHEET FINANCIAL STATEMENTS
The accompanying notes form an integral part of the financial statements.
ANNUAL REPORT 2019 503
Neuberger Berman Corporate Hybrid Bond Fund (Continued) Balance Sheet
As at As at
Note 31 December 2019 31 December 2018
EUR EUR
Current Assets
Financial Assets at Fair Value through Profit or Loss 2 1,059,129,157 799,501,324
Cash and cash equivalents 3 66,653,202 10,349,069
Receivable for investments sold – 773
Receivable for shares issued 4,009,921 230,108
Income receivable and other assets 18,368,368 14,425,096
Total Assets 1,148,160,648 824,506,370
Current Liabilities
Financial Liabilities at Fair Value through Profit or Loss 2 13,692,146 5,295,685
Bank overdraft 4 23,721 1,751
Payable for shares redeemed 1,293,258 5,195,233
Accrued expenses 884,519 1,182,409
Payable for investments purchased 1,984 –
Other payables 42,028 37,764
Liabilities (excluding Net Assets Attributable to Holders of Redeemable Participating Shares) 15,937,656 11,712,842
Net Assets Attributable to Holders of Redeemable Participating Shares 1,132,222,992 812,793,528

FINANCIAL STATEMENTS PROFIT AND LOSS ACCOUNT
The accompanying notes form an integral part of the financial statements.
504 NEUBERGER BERMAN INVESTMENT FUNDS PLC
Neuberger Berman Corporate Hybrid Bond Fund (Continued) Profit and Loss Account
Year Ended Year Ended
Note 31 December 2019 31 December 2018
EUR EUR
Income
Interest Income 34,678,374 32,079,318
Miscellaneous Income – 613
Net Gain/(Loss) on Financial Assets and Liabilities at Fair Value through Profit or Loss 11 77,986,847 (74,154,118)
112,665,221 (42,074,187)
Expenses
Management Fee 6 6,006,982 5,734,219
Distribution Fee 6 169,201 119,537
Administration Fee 6 943,222 1,039,969
Commitment Fee 19 116,726 70,514
Custody Fee 6 61,669 93,532
Depositary Fee 6 88,338 89,302
Professional Fee 9 102,199 142,318
Directors' Fee 7 4,103 5,670
Transaction Costs 9 82,159 79,026
Audit Fee 8 17,855 18,925
VAT Rebate (12,278) (10,983)
Other Expenses 9 12,749 154
Total Expenses 7,592,925 7,382,183
Finance Costs
Interest Expense 165 95,058
Distribution Paid 1 3,326,261 2,532,283
3,326,426 2,627,341
Withholding Tax 1 276,121 425,679
Profit/(Loss) Attributable to Holders of Redeemable Participating Shares from Operations 101,469,749 (52,509,390)
Income and expenses arose solely from continuing operations.

STATEMENT OF CHANGES IN NET ASSETS FINANCIAL STATEMENTS
The accompanying notes form an integral part of the financial statements.
ANNUAL REPORT 2019 505
Neuberger Berman Corporate Hybrid Bond Fund (Continued) Statement of Changes in Net Assets Attributable to Holders of Redeemable Participating Shares
Year Ended Year Ended
31 December 2019 31 December 2018
EUR EUR
Net Assets Attributable to Holders of Redeemable Participating Shares at beginning of year 812,793,528 731,776,635
Profit/(Loss) Attributable to Holders of Redeemable Participating Shares from Operations 101,469,749 (52,509,390)
Subscriptions 5 647,959,950 504,330,098
Redemptions 5 (430,000,235) (370,803,815)
Net Assets Attributable to Holders of Redeemable Participating Shares at end of year 1,132,222,992 812,793,528

FINANCIAL STATEMENTS SCHEDULE OF INVESTMENTS
506 NEUBERGER BERMAN INVESTMENT FUNDS PLC
Neuberger Berman Corporate Hybrid Bond Fund (Continued)
Schedule of Investments
Financial Assets at Fair Value through Profit or Loss
Principal Amount Security Description Coupon Maturity
DateFair Value
EUR% of Net
Assets
Corporate Bonds 92.63% (31 December 2018: 97.74%)
Euro 21,500,000 Arkema SA* 2.75% 29/12/2049 22,816,875 2.01
90,246,000 Bayer AG* 2.38% 02/04/2075 92,682,348 8.19
8,900,000 Bayer AG* 2.38% 12/11/2079 9,044,625 0.80
7,100,000 Bertelsmann SE & Co KGaA* 3.00% 23/04/2075 7,543,750 0.67
21,645,000 BHP Billiton Finance Ltd* 5.63% 22/10/2079 26,490,991 2.34
52,180,000 Centrica Plc* 3.00% 10/04/2076 53,647,510 4.74
14,500,000 Danone SA* 1.75% 29/12/2049 14,938,045 1.32
28,500,000 Elia System Operator SA* 2.75% 29/12/2049 30,096,408 2.66
17,300,000 Engie SA* 1.38% 29/12/2049 17,503,102 1.55
3,600,000 Grand City Properties SA* 2.50% 29/12/2049 3,728,934 0.33
10,000,000 Heimstaden Bostad AB* 3.25% 29/12/2049 10,062,500 0.89
6,631,000 Holcim Finance Luxembourg SA* 3.00% 29/12/2049 7,020,571 0.62
100,000 Iberdrola International BV* 1.88% 29/12/2049 103,073 0.01
17,900,000 Infineon Technologies AG* 2.88% 29/12/2049 18,499,650 1.63
2,000,000 Merck KGaA* 1.63% 25/06/2079 2,063,042 0.18
6,200,000 Orange SA* 2.38% 29/12/2049 6,552,005 0.58
2,005,000 Orange SA* 5.25% 29/12/2049 2,350,191 0.21
21,960,000 Orsted A/S* 6.25% 26/06/3013 25,862,292 2.28
6,400,000 Solvay SA* 4.25% 29/12/2049 7,127,680 0.63
18,000,000 Telefonica Europe BV* 2.63% 29/12/2049 18,643,554 1.65
7,350,000 Telia Co AB* 3.00% 04/04/2078 7,762,703 0.68
5,565,000 Total SA* 1.75% 29/12/2049 5,776,164 0.51
11,545,000 Total SA* 2.63% 29/12/2049 12,490,247 1.10
28,146,000 Total SA* 2.71% 29/12/2049 30,116,220 2.66
24,000,000 Unibail-Rodamco-Westfield SE* 2.13% 29/12/2049 24,665,640 2.18
7,200,000 Unibail-Rodamco-Westfield SE* 2.88% 29/12/2049 7,657,947 0.68
24,290,000 Vodafone Group Plc* 3.10% 03/01/2079 25,581,766 2.26
48,600,000 Volkswagen International Finance NV* 2.70% 29/12/2049 50,536,103 4.46
41,200,000 Volkswagen International Finance NV* 3.38% 29/12/2049 44,092,240 3.89
100,000 Volvo Treasury AB* 4.20% 10/06/2075 101,803 0.01
21,240,000 Volvo Treasury AB* 4.85% 10/03/2078 23,796,022 2.10
Total Euro 609,354,001 53.82
Pound Sterling 3,533,000 BHP Billiton Finance Ltd* 6.50% 22/10/2077 4,698,150 0.42
80,240,000 NGG Finance Plc* 5.63% 18/06/2073 107,481,653 9.49
30,972,000 Orange SA* 5.75% 29/12/2049 40,525,255 3.58
Total Pound Sterling 152,705,058 13.49

SCHEDULE OF INVESTMENTS FINANCIAL STATEMENTS
ANNUAL REPORT 2019 507
Neuberger Berman Corporate Hybrid Bond Fund (Continued)
Schedule of Investments (Continued)
Financial Assets at Fair Value through Profit or Loss (continued)
Principal Amount Security Description Coupon Maturity
DateFair Value
EUR% of Net
Assets
Corporate Bonds 92.63% (31 December 2018: 97.74%) (continued)
United States Dollar 250,000 AT Securities BV* 5.25% 29/12/2049 232,996 0.02
29,056,000 Enbridge Inc† 5.50% 15/07/2077 26,745,239 2.36
3,980,000 Enbridge Inc† 6.00% 15/01/2077 3,759,531 0.33
47,396,000 EnBW Energie Baden-Wuerttemberg AG* 5.13% 05/04/2077 44,308,399 3.91
48,988,000 Enel SpA* 8.75% 24/09/2073 51,338,115 4.54
1,680,000 Enterprise Products Operating LLC† 4.88% 16/08/2077 1,480,226 0.13
30,000,000 Enterprise Products Operating LLC† 5.38% 15/02/2078 26,600,779 2.35
87,271,000 SSE Plc* 4.75% 16/09/2077 80,108,480 7.08
28,828,000 Transcanada Trust† 5.30% 15/03/2077 26,413,382 2.33
26,420,000 Vodafone Group Plc* 6.25% 03/10/2078 25,702,129 2.27
Total United States Dollar 286,689,276 25.32
Total Corporate Bonds 1,048,748,335 92.63
Total Investments 1,048,748,335 92.63
Forward Currency Contracts 0.91% (31 December 2018: 0.62%)
Amount Receivable
Amount Payable
Maturity Date Counterparty Contracts Unrealised
Gain EUR% of Net
Assets
€ 287,999,076 US$ 319,025,858 22/01/2020 Goldman Sachs International 4 4,135,159 0.36
€ 1,315,655 US$ 1,464,258 22/01/2020 UBS AG 1 12,782 0.00
€ 3,741,609 US$ 4,174,415 22/01/2020 Westpac Banking Corp 4 27,284 0.00
£ 13,828,538 € 15,527,564 22/01/2020 Goldman Sachs International 1 781,944 0.07
£ 19,644,908 US$ 24,436,479 22/01/2020 Westpac Banking Corp 3 1,426,215 0.13
AUD Hedged Classes AUD 1,970,534 € 1,203,126 22/01/2020 Goldman Sachs International 2 29,992 0.00
AUD 1,952,462 € 1,191,361 22/01/2020 UBS AG 1 30,449 0.00
AUD 6,103,850 € 3,739,542 22/01/2020 Westpac Banking Corp 9 80,119 0.01
CHF Hedged Classes CHF 8,223,759 € 7,509,133 22/01/2020 Goldman Sachs International 2 57,815 0.01
CHF 8,107,065 € 7,408,807 22/01/2020 UBS AG 1 50,767 0.00
CHF 8,096,947 € 7,396,775 22/01/2020 Westpac Banking Corp 28 53,489 0.01
GBP Hedged Classes € 60,769 £ 51,203 22/01/2020 Westpac Banking Corp 8 379 0.00
£ 19,519,503 € 21,856,950 22/01/2020 Goldman Sachs International 5 1,164,535 0.10
£ 19,191,504 € 21,450,356 22/01/2020 UBS AG 1 1,184,285 0.10
£ 18,116,181 € 20,320,950 22/01/2020 Westpac Banking Corp 44 1,045,445 0.09
HKD Hedged Classes € 3,769 HKD 32,853 22/01/2020 Goldman Sachs International 1 19 0.00
HKD 5,500,000 € 625,446 22/01/2020 Westpac Banking Corp 1 2,479 0.00

FINANCIAL STATEMENTS SCHEDULE OF INVESTMENTS
508 NEUBERGER BERMAN INVESTMENT FUNDS PLC
Neuberger Berman Corporate Hybrid Bond Fund (Continued)
Schedule of Investments (Continued)
Financial Assets at Fair Value through Profit or Loss (continued)
Forward Currency Contracts 0.91% (31 December 2018: 0.62%) (continued)
Amount Receivable
Amount Payable
Maturity Date Counterparty Contracts Unrealised
Gain EUR% of Net
Assets
SGD Hedged Classes SGD 179,395 € 117,831 22/01/2020 Goldman Sachs International 2 895 0.00
SGD 738,849 € 485,266 22/01/2020 Westpac Banking Corp 6 3,710 0.00
USD Hedged Classes € 5,855,909 US$ 6,469,922 22/01/2020 Goldman Sachs International 6 99,079 0.01
€ 5,439,343 US$ 6,007,819 22/01/2020 UBS AG 1 93,685 0.01
€ 6,315,264 US$ 6,984,813 22/01/2020 Westpac Banking Corp 25 100,296 0.01
Total Unrealised Gain on Forward Currency Contracts ∞ 10,380,822 0.91
Fair ValueEUR
% of NetAssets
Total Financial Assets at Fair Value through Profit or Loss 1,059,129,157 93.54
Financial Liabilities at Fair Value through Profit or Loss Forward Currency Contracts (1.21%) (31 December 2018: (0.65%))
Amount Receivable
Amount Payable
Maturity Date Counterparty Contracts Unrealised
Loss EUR% of Net
Assets
€ 173,458,841 £ 154,478,974 22/01/2020 Goldman Sachs International 1 (8,735,113) (0.77)
€ 160,200 £ 143,482 22/01/2020 UBS AG 2 (9,024) (0.00)
€ 12,041,218 £ 10,384,501 22/01/2020 Westpac Banking Corp 4 (206,360) (0.02)
US$ 1,370,196 £ 1,057,244 22/01/2020 UBS AG 2 (27,746) (0.00)
AUD Hedged Classes € 21,035 AUD 34,134 22/01/2020 Goldman Sachs International 1 (326) (0.00)
€ 61 AUD 99 22/01/2020 Westpac Banking Corp 1 (1) (0.00)
CHF Hedged Classes CHF 23,403 € 21,559 22/01/2020 Goldman Sachs International 1 (25) (0.00)
€ 1,627,721 CHF 1,782,635 22/01/2020 Goldman Sachs International 3 (12,539) (0.00)
€ 1,537,242 CHF 1,682,123 22/01/2020 UBS AG 1 (10,533) (0.00)
€ 1,471,918 CHF 1,611,130 22/01/2020 Westpac Banking Corp 22 (10,533) (0.00)
GBP Hedged Classes € 1,503,522 £ 1,343,675 22/01/2020 Goldman Sachs International 3 (81,221) (0.01)
€ 1,501,780 £ 1,343,633 22/01/2020 UBS AG 1 (82,914) (0.01)
€ 1,957,547 £ 1,729,898 22/01/2020 Westpac Banking Corp 40 (82,712) (0.01)
£ 335,133 € 400,512 22/01/2020 Goldman Sachs International 2 (5,253) (0.00)
£ 290,485 € 346,020 22/01/2020 Westpac Banking Corp 7 (3,419) (0.00)
HKD Hedged Classes HKD 67,573 € 7,756 22/01/2020 Goldman Sachs International 2 (41) (0.00)

SCHEDULE OF INVESTMENTS FINANCIAL STATEMENTS
ANNUAL REPORT 2019 509
Neuberger Berman Corporate Hybrid Bond Fund (Continued)
Schedule of Investments (Continued)
Financial Liabilities at Fair Value through Profit or Loss (continued)
Forward Currency Contracts (1.21%) (31 December 2018: (0.65%))
Amount Receivable
Amount Payable
Maturity Date Counterparty Contracts Unrealised
Loss EUR% of Net
Assets
SGD Hedged Classes € 3,249 SGD 4,918 22/01/2020 Goldman Sachs International 1 (6) (0.00)
€ 194 SGD 296 22/01/2020 Westpac Banking Corp 1 (2) (0.00)
SGD 506,750 € 336,284 22/01/2020 Westpac Banking Corp 1 (912) (0.00)
USD Hedged Classes US$ 90,455,601 € 81,939,667 22/01/2020 Goldman Sachs International 8 (1,453,773) (0.13)
US$ 87,036,573 € 78,800,930 22/01/2020 UBS AG 1 (1,357,231) (0.12)
US$ 116,259,372 € 105,058,128 22/01/2020 Westpac Banking Corp 67 (1,612,462) (0.14)
Total Unrealised Loss on Forward Currency Contracts ∞ (13,692,146) (1.21)
Fair Value % of Net
EUR Assets
Total Financial Liabilities at Fair Value through Profit or Loss (13,692,146) (1.21)
Net Financial Assets at Fair Value through Profit or Loss 1,045,437,011 92.33
Other Net Assets 86,785,981 7.67
Net Assets Attributable to Holders of Redeemable Participating Shares 1,132,222,992 100.00
% of
TotalAssetsPortfolio Analysis EUR
* Transferable securities and/or money market instruments admitted to an official stock exchange listing 963,749,178 83.94
† Other transferable securities and/or money market instruments 84,999,157 7.40
∞ OTC financial derivative instruments (3,311,324) (0.29)
Total Investments 1,045,437,011 91.05

FINANCIAL STATEMENTS STATEMENT OF SIGNIFICANT PURCHASES AND SALES
510 NEUBERGER BERMAN INVESTMENT FUNDS PLC
Neuberger Berman Corporate Hybrid Bond Fund (Continued) Statement of Significant Purchases and Sales (Unaudited) In accordance with the European Communities (Undertakings for Collective Investment in Transferable Securities) Regulations, 2011 as amended, a statement of changes in the composition of the Schedule of Investments during the reporting period is provided to ensure that Shareholders can identify changes in the investments held by the Portfolio. The following statements present the aggregate purchases and sales of transferable securities exceeding one percent of the total value of purchases or sales, respectively, for the period. At a minimum, the largest twenty purchases and twenty sales are presented, if available.
Aggregate purchases greater than one percent of the total value of purchases:
Units Security Description Cost EUR
65,680,000 Bayer AG, 2.38%, 02/04/2075 65,529,366
49,400,000 Infineon Technologies AG, 2.88%, 29/12/2049 49,096,190
47,225,000 Enel SpA, 8.75%, 24/09/2073 46,757,430
47,396,000 EnBW Energie Baden-Wuerttemberg AG, 5.13%, 05/04/2077 44,474,142
41,200,000 Volkswagen International Finance NV, 3.38%, 29/12/2049 43,425,675
37,185,000 Centrica Plc, 3.00%, 10/04/2076 37,740,455
28,697,000 NGG Finance Plc, 5.63%, 18/06/2073 36,127,153
25,820,000 Total SA, 2.71%, 29/12/2049 27,697,533
26,420,000 Vodafone Group Plc, 6.25%, 03/10/2078 24,742,118
25,382,000 SSE Plc, 4.75%, 16/09/2077 23,149,174
23,100,000 EDP - Energias de Portugal SA, 4.50%, 30/04/2079 23,100,000
22,700,000 Volkswagen International Finance NV, 2.70%, 29/12/2049 22,942,670
21,500,000 Arkema SA, 2.75%, 29/12/2049 21,936,719
19,700,000 Engie SA, 3.25%, 29/12/2049 19,433,262
17,200,000 Elia System Operator SA, 2.75%, 29/12/2049 18,246,300
17,300,000 Engie SA, 1.38%, 29/12/2049 16,114,495
16,000,000 Accor SA, 4.38%, 29/12/2049 15,911,200
14,500,000 Danone SA, 1.75%, 29/12/2049 14,416,200
11,500,000 Orange SA, 5.75%, 29/12/2049 14,134,937
11,545,000 Total SA, 2.63%, 29/12/2049 12,459,415
10,095,000 BHP Billiton Finance Ltd, 5.63%, 22/10/2079 12,284,376
10,000,000 Heimstaden Bostad AB, 3.25%, 29/12/2049 10,000,000
7,671,000 Centrica Plc, 5.25%, 10/04/2075 8,859,982
8,900,000 Bayer AG, 2.38%, 12/05/2079 8,844,197
7,350,000 Telia Co AB, 3.00%, 04/04/2078 7,531,580
7,200,000 Unibail-Rodamco-Westfield SE, 2.88%, 29/12/2049 7,305,250
7,100,000 Bertelsmann SE & Co KGaA, 3.00%, 23/04/2075 7,294,920
6,600,000 Volvo Treasury AB, 4.85%, 10/03/2078 7,146,750
6,600,000 Solvay SA, 4.25%, 29/12/2049 7,139,090

STATEMENT OF SIGNIFICANT PURCHASES AND SALES FINANCIAL STATEMENTS
ANNUAL REPORT 2019 511
Neuberger Berman Corporate Hybrid Bond Fund (Continued) Statement of Significant Purchases and Sales (Unaudited) (Continued)
Aggregate sales greater than one percent of the total value of sales:
Units Security Description Proceeds EUR
41,915,000 EnBW Energie Baden-Wuerttemberg AG, 3.63%, 02/04/2076 44,016,680
34,260,000 Vodafone Group Plc, 3.10%, 03/01/2079 32,943,676
31,500,000 Infineon Technologies AG, 2.88%, 29/12/2049 31,640,075
28,887,000 Enel SpA, 8.75%, 24/09/2073 30,818,410
29,271,000 SSE Plc, 2.38%, 29/12/2049 29,299,742
28,000,000 Volkswagen International Finance NV, 3.88%, 29/12/2049 26,737,430
23,100,000 EDP - Energias de Portugal SA, 4.50%, 30/04/2079 23,119,175
22,200,000 Telefonica Europe BV, 2.63%, 29/12/2049 22,113,150
19,700,000 Engie SA, 1.38%, 29/12/2049 19,598,450
18,600,000 NextEra Energy Capital Holdings Inc, 4.80%, 01/12/2077 17,262,110
21,149,000 Energy Transfer Operating LP, 6.63%, 29/12/2049 17,212,698
17,101,000 Bayer AG, 2.38%, 02/04/2075 17,158,897
16,685,000 Volkswagen International Finance NV, 2.50%, 29/12/2049 16,665,844
16,000,000 Elia System Operator SA, 2.75%, 29/12/2049 16,043,000
16,000,000 Accor SA, 4.38%, 29/12/2049 15,958,000
12,477,000 NGG Finance Plc, 5.63%, 18/06/2073 15,410,940
17,285,000 Enbridge Inc, 6.00%, 15/01/2077 14,746,580
15,360,000 Orsted A/S, 2.25%, 24/11/3017 14,571,900
15,385,000 NiSource Inc, 5.65%, 29/12/2049 13,755,348
7,732,000 Enel SpA, 6.63%, 15/09/2076 9,717,934
8,830,000 BHP Billiton Finance Ltd, 4.75%, 22/04/2076 9,514,423
7,150,000 BHP Billiton Finance Ltd, 6.50%, 22/10/2077 9,107,608
7,671,000 Centrica Plc, 5.25%, 10/04/2075 9,022,773
7,400,000 Solvay SA, 4.25%, 29/12/2049 8,197,060
7,900,000 Volkswagen International Finance NV, 2.70%, 29/12/2049 8,055,950
9,400,000 Enterprise Products Operating LLC, 4.88%, 16/08/2077 7,567,646
7,500,000 Engie SA, 1.38%, 29/12/2049 6,881,250
6,600,000 NGG Finance Plc, 1.63%, 05/12/2079 6,613,200

FINANCIAL STATEMENTS INVESTMENT MANAGER’S REPORT
512 NEUBERGER BERMAN INVESTMENT FUNDS PLC
Neuberger Berman US Equity Fund Investment Manager’s Report For the 12 months ended 31 December 2019, the total return of the USD I Accumulating Class was 33.75%. Over the same period, the benchmark index, the S&P 500 Index, returned 31.49%. (Performance for all share classes is provided in Appendix II. Performance data quoted represent past performance and do not indicate future results. Total returns shown are net of all fees and expenses and include reinvestment of income dividends and other distributions, if any).
For 2019 as a whole, the US stock market rallied sharply and posted its best calendar year since 2013. A “dovish pivot” by the US Federal Reserve (“Fed”), a resilient US economy, generally solid corporate results, and an agreement on the first phase of the trade accord between the US and China supported investor sentiment and triggered periods of robust risk appetite. These positives more than offset concerns over moderating growth overseas, Brexit uncertainties and a number of geopolitical issues. All told, the S&P 500 Index gained 31.49% in 2019.
The Portfolio posted a positive absolute return and outperformed its benchmark during the reporting period. Both stock selection and sector allocation contributed to relative results. From a stock selection perspective, holdings in the Financials, Health Care and Consumer Staples sectors were the largest contributors to performance. On the downside, stock selection in the Consumer Discretionary, Materials and Industrials sectors detracted the most from returns.
In terms of sector allocation, underweights to the Heath Care and Energy sectors added the most value. In contrast, the Portfolio’s cash position and an underweight to the Information Technology sector were the largest detractors from performance.
Despite the market’s gyrations – due to uncertainty over global growth concerns driven by the abrupt halt in economic activity from the COVID-19 outbreak – the key market debate continues to revolve around the magnitude of the global deceleration of growth – coupled with the permanent loss of corporate cash flows from the slowdown in economic activity and how much this will impede the growth in corporate earnings in the U.S. and elsewhere. We believe that recent volatility and wild oscillations of the stock market (meaningful peak to trough drawdowns) driven by low (and in many cases negative) global interest rates will continue to occur due to the interconnectivity and tight correlations of both the global economy and the credit and equity markets. As market dynamics change this can cause company market values to dislocate from their long-term potential values.
Nevertheless, we are very mindful of the complex world in which we live and invest. We remain mindful that our constructive view on risk assets is not without challenges as we embark on over a decade of economic expansion. Despite positive US and economic data, China and the Eurozone economies remain fragile. Additionally, the current Federal Reserve policy presents the potential for spikes in volatility, as seen during the past few years. Given the vicissitudes of an increasingly global economy, we will also remain flexible in our decisions and open-minded to new ideas across different sectors, asset classes and geographies.

BALANCE SHEET FINANCIAL STATEMENTS
The accompanying notes form an integral part of the financial statements.
ANNUAL REPORT 2019 513
Neuberger Berman US Equity Fund (Continued) Balance Sheet
As at As at
Note 31 December 2019 31 December 2018
US$ US$
Current Assets
Financial Assets at Fair Value through Profit or Loss 2 5,095,501 3,481,558
Cash and cash equivalents 3 239,398 378,344
Receivable for investments sold – 58,515
Income receivable and other assets 36,922 7,840
Total Assets 5,371,821 3,926,257
Current Liabilities
Accrued expenses 20,934 22,105
Payable for investments purchased – 12,759
Other payables 15,459 7,666
Liabilities (excluding Net Assets Attributable to Holders of Redeemable Participating Shares) 36,393 42,530
Net Assets Attributable to Holders of Redeemable Participating Shares 5,335,428 3,883,727

FINANCIAL STATEMENTS PROFIT AND LOSS ACCOUNT
The accompanying notes form an integral part of the financial statements.
514 NEUBERGER BERMAN INVESTMENT FUNDS PLC
Neuberger Berman US Equity Fund (Continued) Profit and Loss Account
Year Ended Year Ended
Note 31 December 2019 31 December 2018
US$ US$
Income
Interest Income 6,241 3,098
Dividend Income 60,087 64,079
Miscellaneous Income 24,344 –
Net Gain/(Loss) on Financial Assets and Liabilities at Fair Value through Profit or Loss 11 1,315,237 (291,904)
1,405,909 (224,727)
Expenses
Management Fee 6 34,865 32,366
Administration Fee 6 20,016 20,898
Commitment Fee 19 551 444
Custody Fee 6 12,000 12,000
Depositary Fee 6 465 434
Professional Fee 9 77,260 2,273
Directors' Fee 7 4,530 6,613
Transaction Costs 9 7,539 4,439
Audit Fee 8 12,666 14,413
VAT Rebate (74) (55)
Other Expenses 9 15,011 5,788
Expense Waiver 6 (114,228) (56,990)
Total Expenses 70,601 42,623
Finance Costs
Distribution Paid 1 9,919 7,712
9,919 7,712
Withholding Tax 1 15,688 15,207
Profit/(Loss) Attributable to Holders of Redeemable Participating Shares from Operations 1,309,701 (290,269)
Income and expenses arose solely from continuing operations.

STATEMENT OF CHANGES IN NET ASSETS FINANCIAL STATEMENTS
The accompanying notes form an integral part of the financial statements.
ANNUAL REPORT 2019 515
Neuberger Berman US Equity Fund (Continued) Statement of Changes in Net Assets Attributable to Holders of Redeemable Participating Shares
Year Ended Year Ended
31 December 2019 31 December 2018
US$ US$
Net Assets Attributable to Holders of Redeemable Participating Shares at beginning of year 3,883,727 4,173,996
Profit/(Loss) Attributable to Holders of Redeemable Participating Shares from Operations 1,309,701 (290,269)
Subscriptions 5 142,000 –
Net Assets Attributable to Holders of Redeemable Participating Shares at end of year 5,335,428 3,883,727

FINANCIAL STATEMENTS SCHEDULE OF INVESTMENTS
516 NEUBERGER BERMAN INVESTMENT FUNDS PLC
Neuberger Berman US Equity Fund (Continued)
Schedule of Investments
Financial Assets at Fair Value through Profit or Loss
Number of Shares Security Description Fair Value
US$% of Net
Assets
Equities 95.38% (31 December 2018: 89.64%)
United States Dollar 2,000 Activision Blizzard Inc 118,840 2.23
145 Alibaba Group Holding Ltd ADR 30,754 0.58
215 Alphabet Inc Class A 287,969 5.40
112 Amazon.com Inc 206,958 3.88
675 Apple Inc 198,214 3.71
1,650 Ashland Global Holdings Inc 126,274 2.37
60 Becton Dickinson & Co 16,318 0.31
200 BlackRock Inc Class A 100,540 1.88
2,150 Blackstone Group Inc Class A 120,271 2.25
150 Boeing Co 48,864 0.91
2,400 Brookfield Asset Management Inc Class A 138,720 2.60
1,800 Brookfield Infrastructure Partners LP 89,982 1.69
910 CDW Corp 129,984 2.44
2,800 Chewy Inc Class A 81,200 1.52
360 CME Group Inc Class A 72,259 1.35
1,400 Conagra Brands Inc 47,936 0.90
270 Costco Wholesale Corp 79,358 1.49
340 CSX Corp 24,602 0.46
900 CVS Health Corp 66,861 1.25
1,730 Delta Air Lines Inc 101,170 1.90
200 Elastic NV 12,860 0.24
2,200 Enbridge Inc 87,494 1.64
830 Equifax Inc 116,300 2.18
1,190 Expedia Group Inc 128,687 2.41
845 Facebook Inc Class A 173,436 3.25
20 General Dynamics Corp 3,527 0.07
1,000 Gilead Sciences Inc 64,980 1.22
2,000 HD Supply Holdings Inc 80,440 1.51
350 Home Depot Inc 76,433 1.43
240 Humana Inc 87,965 1.65
2,100 IHS Markit Ltd 158,235 2.96
625 Johnson & Johnson 91,169 1.71
110 L3Harris Technologies Inc 21,766 0.41
800 Lowe's Companies Inc 95,808 1.79
675 McDonald's Corp 133,387 2.50
850 Medtronic Plc 96,433 1.81
1,800 Microsoft Corp 283,860 5.32
1,050 Moderna Inc 20,538 0.38

SCHEDULE OF INVESTMENTS FINANCIAL STATEMENTS
ANNUAL REPORT 2019 517
Neuberger Berman US Equity Fund (Continued)
Schedule of Investments (Continued)
Financial Assets at Fair Value through Profit or Loss (continued)
Number of Shares Security Description Fair Value
US$% of Net
Assets
Equities 95.38% (31 December 2018: 89.64%) (continued)
United States Dollar (continued) 375 Motorola Solutions Inc 60,427 1.13
375 NextEra Energy Inc 90,810 1.70
1,100 NIKE Inc Class B 111,441 2.09
295 PayPal Holdings Inc 31,910 0.60
50 PVH Corp 5,257 0.10
90 Raytheon Co 19,777 0.37
5,610 Repay Holdings Corp 82,186 1.54
220 S&P Global Inc 60,071 1.13
750 Salesforce.com Inc 121,980 2.29
330 ServiceNow Inc 93,166 1.75
525 Spotify Technology SA 78,514 1.47
140 Thermo Fisher Scientific Inc 45,482 0.85
1,148 Tradeweb Markets Inc Class A 53,210 1.00
240 Union Pacific Corp 43,390 0.81
265 UnitedHealth Group Inc 77,905 1.46
1,000 Univar Solutions Inc 24,240 0.45
175 Verisk Analytics Inc Class A 26,134 0.49
775 Visa Inc Class A 145,622 2.73
450 Walmart Inc 53,478 1.00
150 Workday Inc Class A 24,668 0.46
250 Zendesk Inc 19,158 0.36
Total Equities * 5,089,218 95.38
Number of Shares Security Description Maturity
Date Fair Value
US$% of Net
Assets
Participatory Notes 0.12% (31 December 2018: 0.00%)
United States Dollar 5,610 Repay Holdings Corp 11/07/2024 6,283 0.12
Total Participatory Notes ** 6,283 0.12
Total Investments 5,095,501 95.50
Fair ValueUS$
% of NetAssets
Total Financial Assets at Fair Value through Profit or Loss 5,095,501 95.50
Net Financial Assets at Fair Value through Profit or Loss 5,095,501 95.50
Other Net Assets 239,927 4.50
Net Assets Attributable to Holders of Redeemable Participating Shares 5,335,428 100.00

FINANCIAL STATEMENTS SCHEDULE OF INVESTMENTS
518 NEUBERGER BERMAN INVESTMENT FUNDS PLC
Neuberger Berman US Equity Fund (Continued)
Schedule of Investments (Continued) % of
TotalAssetsPortfolio Analysis US$
* Transferable securities and/or money market instruments admitted to an official stock exchange listing 5,089,218 94.74
** Transferable securities and/or money market instruments dealt in on a regulated market 6,283 0.12
Total Investments 5,095,501 94.86

STATEMENT OF SIGNIFICANT PURCHASES AND SALES FINANCIAL STATEMENTS
ANNUAL REPORT 2019 519
Neuberger Berman US Equity Fund (Continued) Statement of Significant Purchases and Sales (Unaudited) In accordance with the European Communities (Undertakings for Collective Investment in Transferable Securities) Regulations, 2011 as amended, a statement of changes in the composition of the Schedule of Investments during the reporting period is provided to ensure that Shareholders can identify changes in the investments held by the Portfolio. The following statements present the aggregate purchases and sales of transferable securities exceeding one percent of the total value of purchases or sales, respectively, for the period. At a minimum, the largest twenty purchases and twenty sales are presented, if available.
Aggregate purchases greater than one percent of the total value of purchases:
Units Security Description Cost US$
1,190 Expedia Group Inc 147,845
1,150 NIKE Inc Class B 95,298
1,050 Medtronic Plc 92,055
330 ServiceNow Inc 85,780
625 Johnson & Johnson 83,154
70 Alphabet Inc Class A 81,011
2,850 Chewy Inc Class A 79,756
7,720 OneSpaWorld Holdings Ltd 77,200
375 Motorola Solutions Inc 62,564
35 Amazon.com Inc 61,763
240 Humana Inc 61,403
160 Boeing Co 58,837
750 Ashland Global Holdings Inc 56,593
5,610 Repay Holdings LLC 56,100
1,130 Activision Blizzard Inc 53,143
200 Domino's Pizza Inc 52,300
450 Walmart Inc 51,146
1,250 Tradeweb Markets Inc Class A 50,519
565 Elastic NV 42,894
215 Facebook Inc Class A 39,731
240 Union Pacific Corp 39,355
140 Thermo Fisher Scientific Inc 38,879
190 Home Depot Inc 38,719
235 Salesforce.com Inc 35,641
2,150 Moderna Inc 32,885
245 Spotify Technology SA 31,308
18 Booking Holdings Inc 30,957
295 Lowe's Companies Inc 29,885
600 Brookfield Asset Management Inc Class A 26,544
60 BlackRock Inc Class A 24,881
150 Workday Inc Class A 24,869
1,000 Univar Solutions Inc 24,381
600 Blackstone Group LP 23,066
110 L3Harris Technologies Inc 21,944

FINANCIAL STATEMENTS STATEMENT OF SIGNIFICANT PURCHASES AND SALES
520 NEUBERGER BERMAN INVESTMENT FUNDS PLC
Neuberger Berman US Equity Fund (Continued) Statement of Significant Purchases and Sales (Unaudited) (Continued) Aggregate sales greater than one percent of the total value of sales:
Units Security Description Proceeds US$
73 Booking Holdings Inc 146,686
7,720 OneSpaWorld Holdings Ltd 120,910
550 General Dynamics Corp 96,854
1,230 Eaton Corp Plc 96,557
875 JPMorgan Chase & Co 92,110
1,080 PVH Corp 91,347
2,110 eBay Inc 76,731
1,250 Dentsply Sirona Inc 64,146
285 Home Depot Inc 56,418
1,900 Conagra Brands Inc 54,624
300 Raytheon Co 53,071
200 Domino's Pizza Inc 50,582
275 Visa Inc Class A 46,053
230 3M Co 43,388
500 Baxter International Inc 42,891
1,000 Enbridge Inc 35,882
295 Lowe's Companies Inc 34,447
225 Spotify Technology SA 33,744
365 Elastic NV 33,707
370 Tractor Supply Co 33,581
550 CVS Health Corp 31,634
240 Expedia Group Inc 31,029
1,450 Moderna Inc 29,812
150 CME Group Inc Class A 29,585
1,300 Hain Celestial Group Inc 28,529
2,050 Hudson Ltd 28,443
3,000 FGL Holdings 23,613
200 CDW Corp 22,314
200 Equifax Inc 21,586
90 Costco Wholesale Corp 21,386
200 Medtronic Plc 21,289
1,550 Gates Industrial Corp Plc 20,905
100 Apple Inc 19,881

INVESTMENT MANAGER’S REPORT FINANCIAL STATEMENTS
ANNUAL REPORT 2019 521
Neuberger Berman Global High Yield Bond Fund Investment Manager’s Report For the 12 months ended 31 December 2019, the total return for the USD I Accumulating Class was 14.38%. Over the same period, the ICE BofA Global High Yield Constrained Index (USD Hedged Total Return) (the “Index”) returned 14.54%. (Performance for all share classes is provided in Appendix II. Performance data quoted represent past performance and do not indicate future results. Total returns shown reflect the reinvestment of income dividends and other distributions, if any).
The global high yield market was supported by a number of factors in 2019, including a “dovish pivot” by the US Federal Reserve (“Fed”), as it lowered interest rates three times during the period as well as accommodative policy by the European Central Bank (“ECB”). The backdrop of more accommodative monetary policy was supportive of issuer fundamentals and investor risk sentiment. Later in the year, the Fed and the ECB signaled that rate cuts could be on hold in the near term which may have suggested to market participants that policymakers and economists were less concerned about further deterioration in growth. While there were bouts of volatility in the market during the year driven by political risk (UK, Hong Kong, Argentina and the US), changes in expectations for monetary policy and shifting trade tensions, the global economy was relatively resilient. While the lower growth environment was challenging for some issuers, corporate profits for the majority of issuers often exceeded lowered expectations. While the US-China trade war has not been completely resolved, late in the year there was an announcement of a “phase-one” trade deal, which caused a shift in investor expectations fueling a risk-on rally in December where lower quality high yield saw better returns. For the full year, however, higher quality outperformed lower quality. For the 12 months ended 31 December 2019, securities rated BB and B in the Index returned 14.4% and 13.5%, respectively, whereas CCC-rated securities returned 12.0%.
Credit selection was a key factor in global high yield in 2019 and avoiding deteriorating credits was additive to investment results. Issuers with unsustainable capital structures in uneconomic parts of retail, energy, commodity- and/or cyclically-exposed businesses and companies facing increased regulatory scrutiny were the underperformers in 2019. Outside of these pockets of idiosyncratic risk, most of the high yield market was supported by constructive fundamentals: low-but-positive revenue growth, earnings that were generally in-line, good interest coverage and only a modest increase in leverage which was driven primarily by a subset of stressed issuers in the high yield universe. Among the higher-quality issuers, fundamentals remain relatively solid. In both the US and Europe, high yield defaults, overall, remain below their long-term averages and are very low outside of commodities and energy. As of December, the US LTM par-weighted default rate was 2.86% and only 1.26% ex-commodities.
The Portfolio lagged its benchmark index over the reporting period. During the year, security selection within Energy, Support-Services and Telecommunications were the most beneficial to performance. In contrast, security selection within Media-Cable, Utilities and an underweight to Banking were the largest detractors. Within our ratings’ positioning, security selection within the Portfolio’s BB rated issuers was the most beneficial to performance and an overweight to BBB and above issuers was the largest detractor.
Spreads in the high yield market have widened in the past few weeks but we believe these wider spreads are likely pricing in a severe temporary stall in global GDP and not a deep, extended recession. Assuming no deep, extended recession, spreads are compensating investors for an above-average rise in default rates from the low levels, with the secularly-challenged, idiosyncratic risk credits impacted by supply disruptions and demand declines in certain industries the most affected. As we continue to be vigilant to the developments of COVID-19, we are finding select opportunities in the high yield universe. That said, our primary goal remains one of avoiding default risk. While uncertainty around the duration and severity of the health crisis as well geopolitical event risk can result in heightened short-term volatility, we believe our portfolio is well positioned. We will continue to look to tactically take advantage of the increased volatility to add to credits with more stable fundamentals and attractive valuations.

FINANCIAL STATEMENTS BALANCE SHEET
The accompanying notes form an integral part of the financial statements.
522 NEUBERGER BERMAN INVESTMENT FUNDS PLC
Neuberger Berman Global High Yield Bond Fund (Continued)
Balance Sheet
As at As at
Note 31 December 2019 31 December 2018
US$ US$
Current Assets
Financial Assets at Fair Value through Profit or Loss 2 72,407,814 58,438,191
Cash and cash equivalents 3 2,247,629 1,718,426
Receivable for investments sold 657 371,532
Due from brokers 8,656 45,540
Income receivable and other assets 1,133,464 1,048,347
Total Assets 75,798,220 61,622,036
Current Liabilities
Financial Liabilities at Fair Value through Profit or Loss 2 863,973 692,472
Payable for shares redeemed – 143,384
Accrued expenses 76,345 63,516
Payable for investments purchased 778,305 537,110
Other payables 23,462 62,055
Liabilities (excluding Net Assets Attributable to Holders of Redeemable Participating Shares) 1,742,085 1,498,537
Net Assets Attributable to Holders of Redeemable Participating Shares 74,056,135 60,123,499

PROFIT AND LOSS ACCOUNT FINANCIAL STATEMENTS
The accompanying notes form an integral part of the financial statements.
ANNUAL REPORT 2019 523
Neuberger Berman Global High Yield Bond Fund (Continued)
Profit and Loss Account
Year Ended Year Ended
Note 31 December 2019 31 December 2018
US$ US$
Income
Interest Income 4,126,235 5,955,390
Miscellaneous Income 7,348 682
Net Gain/(Loss) on Financial Assets and Liabilities at Fair Value through Profit or Loss 11 3,956,416 (11,487,204)
8,089,999 (5,531,132)
Expenses
Management Fee 6 164,085 174,779
Distribution Fee 6 679 470
Administration Fee 6 200,757 225,727
Commitment Fee 19 5,860 14,364
Custody Fee 6 12,060 12,000
Depositary Fee 6 7,038 10,408
Professional Fee 9 44,060 49,246
Directors' Fee 7 4,530 6,613
Transaction Costs 9 47,344 54,520
Audit Fee 8 21,581 23,063
VAT Rebate (1,139) (1,402)
Other Expenses 9 – 37,856
Expense Waiver 6 (187,368) (220,981)
Total Expenses 319,487 386,663
Finance Costs
Interest Expense – 1,758
Distribution Paid 1 2,701 2,883
2,701 4,641
Withholding Tax 1 – 657
Profit/(Loss) Attributable to Holders of Redeemable Participating Shares from Operations 7,767,811 (5,923,093)
Income and expenses arose solely from continuing operations.

FINANCIAL STATEMENTS STATEMENT OF CHANGES IN NET ASSETS
The accompanying notes form an integral part of the financial statements.
524 NEUBERGER BERMAN INVESTMENT FUNDS PLC
Neuberger Berman Global High Yield Bond Fund (Continued)
Statement of Changes in Net Assets Attributable to Holders of Redeemable Participating Shares
Year Ended Year Ended
31 December 2019 31 December 2018
US$ US$
Net Assets Attributable to Holders of Redeemable Participating Shares at beginning of year 60,123,499 133,641,912
Profit/(Loss) Attributable to Holders of Redeemable Participating Shares from Operations 7,767,811 (5,923,093)
Subscriptions 5 18,026,658 9,921,566
Redemptions 5 (11,861,833) (77,516,886)
Net Assets Attributable to Holders of Redeemable Participating Shares at end of year 74,056,135 60,123,499

SCHEDULE OF INVESTMENTS FINANCIAL STATEMENTS
ANNUAL REPORT 2019 525
Neuberger Berman Global High Yield Bond Fund (Continued)
Schedule of Investments
Financial Assets at Fair Value through Profit or Loss
Principal Amount Security Description Coupon Maturity
DateFair Value
US$% of Net
Assets
Corporate Bonds 93.27% (31 December 2018: 90.62%)
Euro 107,000 Altice France SA* 3.38% 15/01/2028 124,085 0.17
259,000 Altice France SA* 5.88% 01/02/2027 328,159 0.44
100,000 Altice Luxembourg SA* 6.25% 15/02/2025 116,571 0.16
205,000 Altice Luxembourg SA* 8.00% 15/05/2027 258,589 0.35
227,000 ARD Finance SA* 5.00% 30/06/2027 257,619 0.35
300,000 Casino Guichard Perrachon SA** 3.58% 07/02/2025 290,336 0.39
227,000 CeramTec BondCo GmbH* 5.25% 15/12/2025 267,191 0.36
104,000 Cirsa Finance International Sarl* 4.75% 22/05/2025 122,723 0.16
262,000 eG Global Finance Plc* 4.38% 07/02/2025 295,382 0.40
125,000 Europcar Mobility Group* 4.00% 30/04/2026 136,507 0.18
200,000 Grupo Antolin-Irausa SA* 3.38% 30/04/2026 212,253 0.28
226,000 House of Finance NV* 4.38% 15/07/2026 261,685 0.35
150,000 INEOS Group Holdings SA* 5.38% 01/08/2024 175,455 0.24
100,000 Infineon Technologies AG* 3.63% 29/12/2049 117,582 0.16
110,000 Kraton Polymers LLC/Kraton Polymers Capital Corp* 5.25% 15/05/2026 128,414 0.17
200,000 Kronos International Inc* 3.75% 15/09/2025 228,990 0.31
163,000 La Financiere Atalian SASU* 4.00% 15/05/2024 148,654 0.20
200,000 LeasePlan Corp NV* 7.38% 29/12/2049 251,596 0.34
114,000 LHMC Finco 2 Sarl* 7.25% 02/10/2025 133,180 0.18
110,000 Loxam SAS* 4.50% 15/04/2027 124,092 0.17
100,000 Loxam SAS* 6.00% 15/04/2025 117,646 0.16
200,000 Mauser Packaging Solutions Holding Co* 4.75% 15/04/2024 233,259 0.31
350,000 Motion Bondco DAC* 4.50% 15/11/2027 413,870 0.56
221,000 Netflix Inc* 3.63% 15/06/2030 255,845 0.35
226,000 Nidda BondCo GmbH* 5.00% 30/09/2025 266,325 0.36
237,000 Platin 1426 GmbH* 5.38% 15/06/2023 269,630 0.36
201,000 Rossini Sarl* 6.75% 30/10/2025 252,094 0.34
219,000 Sazka Group AS* 4.13% 20/11/2024 258,549 0.35
243,000 Scientific Games International Inc* 5.50% 15/02/2026 284,882 0.38
377,000 SGL Carbon SE* 4.63% 30/09/2024 414,719 0.56
100,000 Sisal Pay SpA** 3.88% 17/12/2026 113,653 0.15
214,000 SoftBank Group Corp* 3.13% 19/09/2025 246,421 0.33
231,000 Starfruit Finco BV/Starfruit US Holdco LLC* 6.50% 01/10/2026 278,696 0.38
215,000 Summer BidCo BV* 9.00% 15/11/2025 258,516 0.35
100,000 Sunshine Mid BV* 6.50% 15/05/2026 120,415 0.16
210,000 Swissport Financing Sarl* 9.00% 15/02/2025 251,597 0.34
218,000 Tasty Bondco 1 SA* 6.25% 15/05/2026 257,118 0.35
223,000 Techem Verwaltungsgesellschaft 674 mbH* 6.00% 30/07/2026 271,125 0.37

FINANCIAL STATEMENTS SCHEDULE OF INVESTMENTS
526 NEUBERGER BERMAN INVESTMENT FUNDS PLC
Neuberger Berman Global High Yield Bond Fund (Continued)
Schedule of Investments (Continued)
Financial Assets at Fair Value through Profit or Loss (continued)
Principal Amount Security Description Coupon Maturity
DateFair Value
US$% of Net
Assets
Corporate Bonds 93.27% (31 December 2018: 90.62%) (continued)
Euro (continued) 185,000 Telecom Italia SpA* 3.63% 25/05/2026 229,939 0.31
224,000 Tenneco Inc* 4.88% 15/04/2022 256,647 0.35
112,000 Unilabs Subholding AB* 5.75% 15/05/2025 130,781 0.18
200,000 Vivion Investments Sarl* 3.00% 08/08/2024 229,697 0.31
221,000 WEPA Hygieneprodukte GmbH* 2.88% 15/12/2027 257,554 0.35
Total Euro 9,648,041 13.02
Pound Sterling 100,000 Anglian Water Osprey Financing Plc* 5.00% 30/04/2023 137,294 0.19
100,000 EI Group Plc* 6.00% 06/10/2023 134,333 0.18
108,000 EI Group Plc* 7.50% 15/03/2024 154,053 0.21
100,000 Heathrow Finance Plc* 4.13% 01/09/2029 135,170 0.18
100,000 Iceland Bondco Plc* 4.63% 15/03/2025 116,241 0.16
213,000 Iron Mountain UK Plc* 3.88% 15/11/2025 289,288 0.39
275,000 Miller Homes Group Holdings Plc* 5.50% 15/10/2024 379,281 0.51
200,000 Premier Foods Finance Plc* 6.25% 15/10/2023 278,446 0.38
193,000 TVL Finance Plc* 6.16% 15/07/2025 257,275 0.35
180,000 Virgin Media Secured Finance Plc* 6.25% 28/03/2029 254,996 0.35
172,000 Vodafone Group Plc* 4.88% 03/10/2078 247,424 0.33
200,000 William Hill Plc* 4.75% 01/05/2026 275,966 0.37
Total Pound Sterling 2,659,767 3.60
United States Dollar 200,000 ABJA Investment Co Pte Ltd* 5.45% 24/01/2028 194,985 0.26
200,000 AES Gener SA† 6.35% 07/10/2079 205,300 0.28
200,000 Agile Group Holdings Ltd* 6.70% 07/03/2022 207,042 0.28
205,000 Alliant Holdings Intermediate LLC/Alliant Holdings Co-Issuer† 6.75% 15/10/2027 219,924 0.30
200,000 Altice France SA* 5.50% 15/01/2028 205,880 0.28
600,000 Altice France SA* 7.38% 01/05/2026 645,294 0.87
200,000 Altice France SA 144A* 7.38% 01/05/2026 215,098 0.29
145,000 AMC Entertainment Holdings Inc* 5.75% 15/06/2025 134,427 0.18
220,000 Amkor Technology Inc† 6.63% 15/09/2027 242,682 0.33
60,000 AmWINS Group Inc* 7.75% 01/07/2026 66,600 0.09
200,000 Arabian Centres Sukuk Ltd† 5.38% 26/11/2024 206,134 0.28
55,000 Archrock Partners LP/Archrock Partners Finance Corp† 6.25% 01/04/2028 56,787 0.08
200,000 ARD Finance SA* 6.50% 30/06/2027 207,160 0.28
150,000 Ascent Resources Utica Holdings LLC/ARU Finance Corp† 7.00% 01/11/2026 120,052 0.16
43,000 Ascent Resources Utica Holdings LLC/ARU Finance Corp† 10.00% 01/04/2022 42,876 0.06
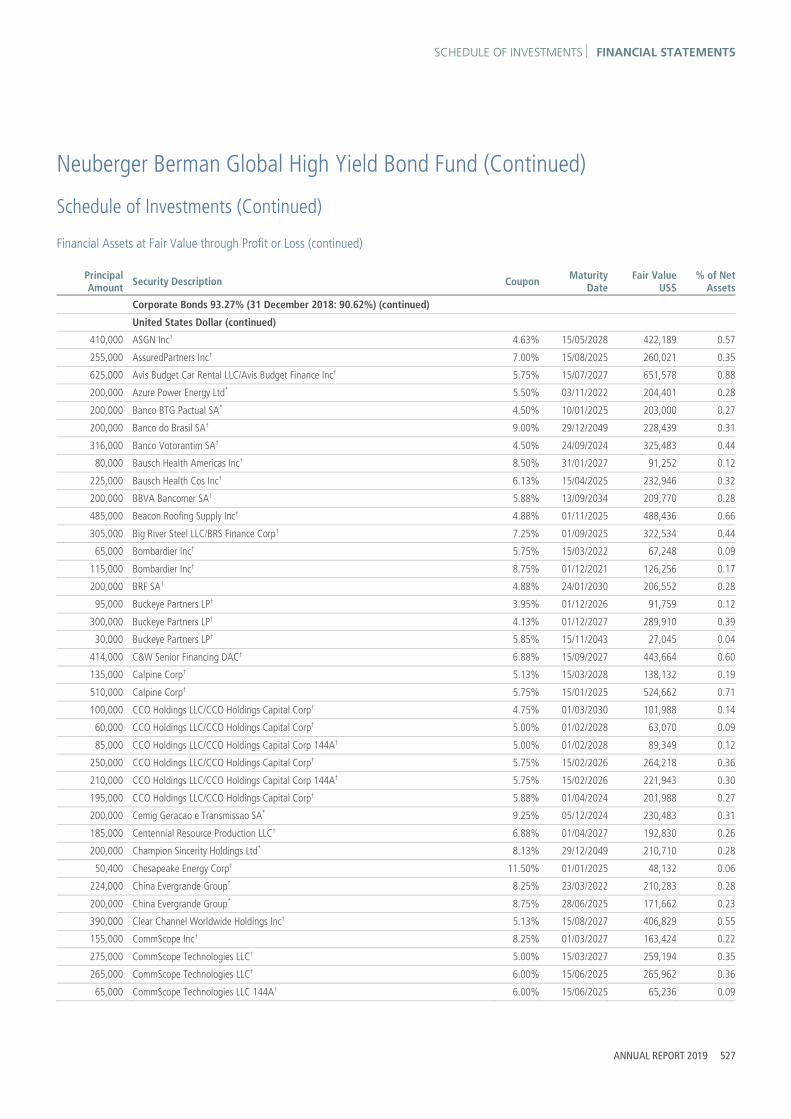
SCHEDULE OF INVESTMENTS FINANCIAL STATEMENTS
ANNUAL REPORT 2019 527
Neuberger Berman Global High Yield Bond Fund (Continued)
Schedule of Investments (Continued)
Financial Assets at Fair Value through Profit or Loss (continued)
Principal Amount Security Description Coupon Maturity
DateFair Value
US$% of Net
Assets
Corporate Bonds 93.27% (31 December 2018: 90.62%) (continued)
United States Dollar (continued)
410,000 ASGN Inc† 4.63% 15/05/2028 422,189 0.57
255,000 AssuredPartners Inc† 7.00% 15/08/2025 260,021 0.35
625,000 Avis Budget Car Rental LLC/Avis Budget Finance Inc† 5.75% 15/07/2027 651,578 0.88
200,000 Azure Power Energy Ltd* 5.50% 03/11/2022 204,401 0.28
200,000 Banco BTG Pactual SA* 4.50% 10/01/2025 203,000 0.27
200,000 Banco do Brasil SA† 9.00% 29/12/2049 228,439 0.31
316,000 Banco Votorantim SA† 4.50% 24/09/2024 325,483 0.44
80,000 Bausch Health Americas Inc† 8.50% 31/01/2027 91,252 0.12
225,000 Bausch Health Cos Inc† 6.13% 15/04/2025 232,946 0.32
200,000 BBVA Bancomer SA† 5.88% 13/09/2034 209,770 0.28
485,000 Beacon Roofing Supply Inc† 4.88% 01/11/2025 488,436 0.66
305,000 Big River Steel LLC/BRS Finance Corp† 7.25% 01/09/2025 322,534 0.44
65,000 Bombardier Inc† 5.75% 15/03/2022 67,248 0.09
115,000 Bombardier Inc† 8.75% 01/12/2021 126,256 0.17
200,000 BRF SA† 4.88% 24/01/2030 206,552 0.28
95,000 Buckeye Partners LP† 3.95% 01/12/2026 91,759 0.12
300,000 Buckeye Partners LP† 4.13% 01/12/2027 289,910 0.39
30,000 Buckeye Partners LP† 5.85% 15/11/2043 27,045 0.04
414,000 C&W Senior Financing DAC† 6.88% 15/09/2027 443,664 0.60
135,000 Calpine Corp† 5.13% 15/03/2028 138,132 0.19
510,000 Calpine Corp† 5.75% 15/01/2025 524,662 0.71
100,000 CCO Holdings LLC/CCO Holdings Capital Corp† 4.75% 01/03/2030 101,988 0.14
60,000 CCO Holdings LLC/CCO Holdings Capital Corp† 5.00% 01/02/2028 63,070 0.09
85,000 CCO Holdings LLC/CCO Holdings Capital Corp 144A† 5.00% 01/02/2028 89,349 0.12
250,000 CCO Holdings LLC/CCO Holdings Capital Corp† 5.75% 15/02/2026 264,218 0.36
210,000 CCO Holdings LLC/CCO Holdings Capital Corp 144A† 5.75% 15/02/2026 221,943 0.30
195,000 CCO Holdings LLC/CCO Holdings Capital Corp† 5.88% 01/04/2024 201,988 0.27
200,000 Cemig Geracao e Transmissao SA* 9.25% 05/12/2024 230,483 0.31
185,000 Centennial Resource Production LLC† 6.88% 01/04/2027 192,830 0.26
200,000 Champion Sincerity Holdings Ltd* 8.13% 29/12/2049 210,710 0.28
50,400 Chesapeake Energy Corp† 11.50% 01/01/2025 48,132 0.06
224,000 China Evergrande Group* 8.25% 23/03/2022 210,283 0.28
200,000 China Evergrande Group* 8.75% 28/06/2025 171,662 0.23
390,000 Clear Channel Worldwide Holdings Inc† 5.13% 15/08/2027 406,829 0.55
155,000 CommScope Inc† 8.25% 01/03/2027 163,424 0.22
275,000 CommScope Technologies LLC† 5.00% 15/03/2027 259,194 0.35
265,000 CommScope Technologies LLC† 6.00% 15/06/2025 265,962 0.36
65,000 CommScope Technologies LLC 144A† 6.00% 15/06/2025 65,236 0.09

FINANCIAL STATEMENTS SCHEDULE OF INVESTMENTS
528 NEUBERGER BERMAN INVESTMENT FUNDS PLC
Neuberger Berman Global High Yield Bond Fund (Continued)
Schedule of Investments (Continued)
Financial Assets at Fair Value through Profit or Loss (continued)
Principal Amount Security Description Coupon Maturity
DateFair Value
US$% of Net
Assets
Corporate Bonds 93.27% (31 December 2018: 90.62%) (continued)
United States Dollar (continued)
200,000 Cosan Ltd† 5.50% 20/09/2029 208,650 0.28
285,000 CrownRock LP/CrownRock Finance Inc† 5.63% 15/10/2025 291,410 0.39
640,000 CSC Holdings LLC† 5.50% 15/05/2026 679,080 0.92
229,000 CSC Holdings LLC† 10.88% 15/10/2025 256,337 0.35
272,000 CSN Resources SA† 7.63% 17/04/2026 290,182 0.39
365,000 Cumulus Media New Holdings Inc† 6.75% 01/07/2026 391,690 0.53
440,000 DCP Midstream Operating LP† 5.85% 21/05/2043 410,711 0.55
60,000 DCP Midstream Operating LP 144A† 5.85% 21/05/2043 56,006 0.07
400,000 Easy Tactic Ltd* 8.13% 27/02/2023 411,020 0.56
200,000 Elementia SAB de CV† 5.50% 15/01/2025 203,335 0.28
227,000 Emirates NBD Bank PJSC* 6.13% 29/12/2049 239,264 0.32
40,000 Energizer Holdings Inc† 5.50% 15/06/2025 41,583 0.06
200,000 Energizer Holdings Inc* 6.38% 15/07/2026 213,370 0.29
355,000 Energizer Holdings Inc† 7.75% 15/01/2027 397,387 0.54
140,000 Enviva Partners LP/Enviva Partners Finance Corp† 6.50% 15/01/2026 150,238 0.20
200,000 Eskom Holdings SOC Ltd* 5.75% 26/01/2021 200,864 0.27
200,000 Eskom Holdings SOC Ltd* 8.45% 10/08/2028 216,362 0.29
330,000 Freeport-McMoRan Inc* 3.55% 01/03/2022 334,712 0.45
110,000 Freeport-McMoRan Inc* 5.00% 01/09/2027 115,703 0.16
105,000 Freeport-McMoRan Inc* 5.25% 01/09/2029 112,681 0.15
200,000 Freeport-McMoRan Inc* 5.40% 14/11/2034 209,964 0.28
375,000 frontdoor Inc† 6.75% 15/08/2026 409,818 0.55
385,000 Frontier Communications Corp† 8.00% 01/04/2027 403,037 0.54
200,000 FWD Group Ltd* 5.75% 09/07/2024 207,299 0.28
415,000 Garda World Security Corp† 8.75% 15/05/2025 432,633 0.58
115,000 Genesis Energy LP/Genesis Energy Finance Corp* 6.25% 15/05/2026 110,152 0.15
245,000 Genesis Energy LP/Genesis Energy Finance Corp* 6.50% 01/10/2025 237,648 0.32
150,000 Genneia SA† 8.75% 20/01/2022 118,240 0.16
310,000 Global Aircraft Leasing Co Ltd† 6.50% 15/09/2024 324,244 0.44
240,000 Global Partners LP/GLP Finance Corp* 7.00% 15/06/2023 247,900 0.33
70,000 Global Partners LP/GLP Finance Corp† 7.00% 01/08/2027 74,574 0.10
100,000 Gol Finance SA* 7.00% 31/01/2025 103,208 0.14
200,000 Gold Fields Orogen Holdings BVI Ltd* 6.13% 15/05/2029 222,370 0.30
50,000 Granite Holdings US Acquisition Co† 11.00% 01/10/2027 50,767 0.07
200,000 Greenland Global Investment Ltd* 6.75% 25/06/2022 202,062 0.27
200,000 Greenland Global Investment Ltd* 6.75% 26/09/2023 201,685 0.27
250,000 GTCR AP Finance Inc† 8.00% 15/05/2027 260,712 0.35
300,000 GTH Finance BV* 7.25% 26/04/2023 338,119 0.46

SCHEDULE OF INVESTMENTS FINANCIAL STATEMENTS
ANNUAL REPORT 2019 529
Neuberger Berman Global High Yield Bond Fund (Continued)
Schedule of Investments (Continued)
Financial Assets at Fair Value through Profit or Loss (continued)
Principal Amount Security Description Coupon Maturity
DateFair Value
US$% of Net
Assets
Corporate Bonds 93.27% (31 December 2018: 90.62%) (continued)
United States Dollar (continued)
62,000 GW B-CR Security Corp† 9.50% 01/11/2027 66,300 0.09
500,000 Harsco Corp† 5.75% 31/07/2027 534,398 0.72
220,000 Hertz Corp† 5.50% 15/10/2024 225,959 0.30
250,000 Hertz Corp† 6.00% 15/01/2028 250,463 0.34
185,000 Hertz Corp† 7.13% 01/08/2026 200,702 0.27
620,000 HUB International Ltd† 7.00% 01/05/2026 657,216 0.89
200,000 Hunt Oil Co of Peru LLC Sucursal Del Peru† 6.38% 01/06/2028 220,620 0.30
65,000 iHeartCommunications Inc† 5.25% 15/08/2027 68,130 0.09
385,000 iHeartCommunications Inc† 6.38% 01/05/2026 418,446 0.56
200,000 IHS Netherlands Holdco BV* 8.00% 18/09/2027 212,852 0.29
114,000 Indo Energy Finance II BV† 6.38% 24/01/2023 114,993 0.15
200,000 Inkia Energy Ltd* 5.88% 09/11/2027 208,872 0.28
275,000 Intelsat Jackson Holdings SA* 5.50% 01/08/2023 236,809 0.32
60,000 Iron Mountain Inc† 4.88% 15/09/2027 62,089 0.09
365,000 Iron Mountain Inc† 4.88% 15/09/2029 371,615 0.50
340,000 Iron Mountain Inc† 5.25% 15/03/2028 354,229 0.48
45,000 Iron Mountain Inc 144A† 5.25% 15/03/2028 46,883 0.06
270,000 Iron Mountain US Holdings Inc† 5.38% 01/06/2026 282,919 0.38
30,000 Iron Mountain US Holdings Inc 144A† 5.38% 01/06/2026 31,435 0.04
200,000 JBS Investments II GmbH* 5.75% 15/01/2028 211,270 0.29
150,000 JELD-WEN Inc† 4.63% 15/12/2025 154,862 0.21
170,000 JELD-WEN Inc† 4.88% 15/12/2027 174,309 0.23
445,000 KAR Auction Services Inc† 5.13% 01/06/2025 463,728 0.63
50,000 Korn Ferry† 4.63% 15/12/2027 50,375 0.07
215,000 Kosmos Energy Ltd* 7.13% 04/04/2026 220,240 0.30
445,000 L Brands Inc* 5.25% 01/02/2028 422,461 0.57
318,000 Liquid Telecommunications Financing Plc* 8.50% 13/07/2022 323,903 0.44
85,000 LPL Holdings Inc† 4.63% 15/11/2027 86,913 0.12
245,000 LPL Holdings Inc† 5.75% 15/09/2025 256,941 0.35
200,000 LPL Holdings Inc 144A† 5.75% 15/09/2025 209,748 0.28
476,000 MARB BondCo Plc* 6.88% 19/01/2025 506,328 0.68
140,000 Masonite International Corp† 5.38% 01/02/2028 148,134 0.20
425,000 Masonite International Corp† 5.75% 15/09/2026 452,773 0.61
220,000 Matador Resources Co† 5.88% 15/09/2026 221,105 0.30
115,000 Mauser Packaging Solutions Holding Co† 5.50% 15/04/2024 118,748 0.16
35,000 Mauser Packaging Solutions Holding Co 144A† 5.50% 15/04/2024 36,141 0.05
95,000 Mauser Packaging Solutions Holding Co† 7.25% 15/04/2025 94,049 0.13
200,000 Medco Oak Tree Pte Ltd* 7.38% 14/05/2026 204,148 0.28

FINANCIAL STATEMENTS SCHEDULE OF INVESTMENTS
530 NEUBERGER BERMAN INVESTMENT FUNDS PLC
Neuberger Berman Global High Yield Bond Fund (Continued)
Schedule of Investments (Continued)
Financial Assets at Fair Value through Profit or Loss (continued)
Principal Amount Security Description Coupon Maturity
DateFair Value
US$% of Net
Assets
Corporate Bonds 93.27% (31 December 2018: 90.62%) (continued)
United States Dollar (continued)
200,000 Melco Resorts Finance Ltd* 5.25% 26/04/2026 207,069 0.28
200,000 Melco Resorts Finance Ltd† 5.63% 17/07/2027 208,812 0.28
250,000 Metinvest BV* 7.75% 17/10/2029 255,557 0.35
180,000 Metropolitan Light Co Ltd* 5.50% 21/11/2022 186,281 0.25
200,000 MGM China Holdings Ltd* 5.88% 15/05/2026 212,375 0.29
200,000 MHP Lux SA* 6.95% 03/04/2026 209,765 0.29
200,000 Millicom International Cellular SA* 6.63% 15/10/2026 221,830 0.30
200,000 Minerva Luxembourg SA* 6.50% 20/09/2026 213,322 0.29
405,000 MPH Acquisition Holdings LLC† 7.13% 01/06/2024 392,846 0.53
200,000 MSU Energy SA/UGEN SA/UENSA SA† 6.88% 01/02/2025 122,650 0.17
200,000 Muthoot Finance Ltd* 6.13% 31/10/2022 207,989 0.28
205,100 MV24 Capital BV* 6.75% 01/06/2034 217,027 0.29
205,000 Netflix Inc† 4.88% 15/04/2028 213,451 0.29
130,000 Netflix Inc† 4.88% 15/06/2030 132,272 0.18
55,000 Netflix Inc† 5.38% 15/11/2029 58,676 0.08
110,000 Netflix Inc† 5.88% 15/11/2028 122,145 0.16
680,000 Netflix Inc† 6.38% 15/05/2029 775,608 1.05
228,000 Network i2i Ltd* 5.65% 29/12/2049 225,606 0.30
200,000 Nexa Resources SA† 5.38% 04/05/2027 214,372 0.29
395,000 Nexstar Broadcasting Inc† 5.63% 15/07/2027 416,982 0.56
75,000 Nielsen Co Luxembourg Sarl† 5.00% 01/02/2025 77,437 0.10
690,000 Nielsen Finance LLC/Nielsen Finance Co† 5.00% 15/04/2022 693,816 0.94
145,000 Nielsen Finance LLC/Nielsen Finance Co 144A† 5.00% 15/04/2022 145,802 0.20
290,000 NRG Energy Inc* 6.63% 15/01/2027 315,187 0.43
75,000 NRG Energy Inc* 7.25% 15/05/2026 82,076 0.11
250,000 Orazul Energy Egenor SCA* 5.63% 28/04/2027 257,899 0.35
265,000 Ortho-Clinical Diagnostics Inc/Ortho-Clinical Diagnostics SA† 6.63% 15/05/2022 264,005 0.36
145,000 PDC Energy Inc† 5.75% 15/05/2026 145,004 0.20
590,000 Performance Food Group Inc† 5.50% 15/10/2027 632,052 0.85
420,000 Petrobras Global Finance BV† 5.09% 15/01/2030 450,559 0.61
221,000 Petrobras Global Finance BV* 6.90% 19/03/2049 259,625 0.35
65,000 Polaris Intermediate Corp† 8.50% 01/12/2022 60,693 0.08
295,000 Post Holdings Inc† 5.50% 01/03/2025 309,628 0.42
195,000 Post Holdings Inc† 5.75% 01/03/2027 209,590 0.28
175,000 Precision Drilling Corp* 5.25% 15/11/2024 161,072 0.22
40,000 Precision Drilling Corp† 7.13% 15/01/2026 38,114 0.05
65,000 Precision Drilling Corp† 7.75% 15/12/2023 65,027 0.09
740,000 Prime Security Services Borrower LLC/Prime Finance Inc† 5.75% 15/04/2026 805,678 1.09

SCHEDULE OF INVESTMENTS FINANCIAL STATEMENTS
ANNUAL REPORT 2019 531
Neuberger Berman Global High Yield Bond Fund (Continued)
Schedule of Investments (Continued)
Financial Assets at Fair Value through Profit or Loss (continued)
Principal Amount Security Description Coupon Maturity
DateFair Value
US$% of Net
Assets
Corporate Bonds 93.27% (31 December 2018: 90.62%) (continued)
United States Dollar (continued)
90,000 Prime Security Services Borrower LLC/Prime Finance Inc REG S† 5.75% 15/04/2026 97,988 0.13
75,000 Prime Security Services Borrower LLC/Prime Finance Inc† 9.25% 15/05/2023 78,797 0.11
200,000 QNB Finansbank AS* 6.88% 07/09/2024 213,475 0.29
240,000 Rackspace Hosting Inc† 8.63% 15/11/2024 235,200 0.32
185,000 Rackspace Hosting Inc 144A† 8.63% 15/11/2024 181,300 0.24
160,000 Radiate Holdco LLC/Radiate Finance Inc† 6.63% 15/02/2025 162,066 0.22
225,000 Range Resources Corp* 4.88% 15/05/2025 192,937 0.26
385,000 Realogy Group LLC/Realogy Co-Issuer Corp† 9.38% 01/04/2027 402,704 0.54
415,000 Resideo Funding Inc† 6.13% 01/11/2026 419,160 0.57
200,000 RKPF Overseas 2019 A Ltd* 7.88% 01/02/2023 214,141 0.29
400,000 Rumo Luxembourg Sarl* 7.38% 09/02/2024 431,834 0.58
200,000 Saka Energi Indonesia PT* 4.45% 05/05/2024 203,111 0.27
210,000 Scientific Games International Inc† 7.00% 15/05/2028 225,614 0.30
195,000 Scientific Games International Inc† 7.25% 15/11/2029 211,936 0.29
605,000 Sirius XM Radio Inc† 5.00% 01/08/2027 639,394 0.86
70,000 Sirius XM Radio Inc 144A† 5.00% 01/08/2027 73,979 0.10
315,000 Sirius XM Radio Inc† 5.50% 01/07/2029 341,173 0.46
100,000 SM Energy Co* 6.63% 15/01/2027 98,518 0.13
275,000 Solera LLC/Solera Finance Inc† 10.50% 01/03/2024 291,924 0.39
30,000 Sprint Capital Corp* 8.75% 15/03/2032 36,468 0.05
625,000 Sprint Corp* 7.13% 15/06/2024 675,522 0.91
90,000 Sprint Corp* 7.63% 01/03/2026 99,419 0.14
145,000 Sprint Corp* 7.88% 15/09/2023 160,285 0.22
460,000 Staples Inc† 7.50% 15/04/2026 478,112 0.65
150,000 Staples Inc† 10.75% 15/04/2027 152,528 0.21
450,000 Starfruit Finco BV/Starfruit US Holdco LLC* 8.00% 01/10/2026 478,136 0.64
230,000 State Oil Co of the Azerbaijan Republic* 6.95% 18/03/2030 281,521 0.38
200,000 Studio City Finance Ltd* 7.25% 11/02/2024 211,917 0.29
135,000 Summit Midstream Holdings LLC/Summit Midstream Finance Corp* 5.50% 15/08/2022 120,530 0.16
80,000 Summit Midstream Holdings LLC/Summit Midstream Finance Corp* 5.75% 15/04/2025 61,333 0.08
400,000 Sunac China Holdings Ltd* 8.35% 19/04/2023 425,973 0.58
45,000 Talen Energy Supply LLC† 6.50% 01/06/2025 38,536 0.05
215,000 Talen Energy Supply LLC† 6.63% 15/01/2028 219,912 0.30
125,000 Talen Energy Supply LLC† 7.25% 15/05/2027 131,756 0.18
155,000 Talen Energy Supply LLC† 10.50% 15/01/2026 147,804 0.20
325,000 Tallgrass Energy Partners LP/Tallgrass Energy Finance Corp† 5.50% 15/01/2028 319,255 0.43
80,000 Targa Resources Partners LP/Targa Resources Partners Finance Corp† 5.13% 01/02/2025 83,199 0.11
235,000 Targa Resources Partners LP/Targa Resources Partners Finance Corp† 5.50% 01/03/2030 241,756 0.33

FINANCIAL STATEMENTS SCHEDULE OF INVESTMENTS
532 NEUBERGER BERMAN INVESTMENT FUNDS PLC
Neuberger Berman Global High Yield Bond Fund (Continued)
Schedule of Investments (Continued)
Financial Assets at Fair Value through Profit or Loss (continued)
Principal Amount Security Description Coupon Maturity
DateFair Value
US$% of Net
Assets
Corporate Bonds 93.27% (31 December 2018: 90.62%) (continued)
United States Dollar (continued)
190,000 Targa Resources Partners LP/Targa Resources Partners Finance Corp† 6.50% 15/07/2027 208,402 0.28
380,000 Taylor Morrison Communities Inc† 5.88% 15/06/2027 418,883 0.57
200,000 Telecom Argentina SA† 8.00% 18/07/2026 192,627 0.26
395,000 Tenet Healthcare Corp* 6.75% 15/06/2023 434,814 0.59
280,000 Tenet Healthcare Corp* 8.13% 01/04/2022 310,248 0.42
460,000 Terex Corp† 5.63% 01/02/2025 475,525 0.64
100,000 Teva Pharmaceutical Finance Netherlands III BV* 3.15% 01/10/2026 83,503 0.11
200,000 Teva Pharmaceutical Finance Netherlands III BV* 4.10% 01/10/2046 144,520 0.19
200,000 Teva Pharmaceutical Finance Netherlands III BV† 7.13% 31/01/2025 205,857 0.28
40,000 T-Mobile USA Inc* 4.50% 01/02/2026 0 0.00
340,000 T-Mobile USA Inc* 6.00% 01/03/2023 0 0.00
105,000 T-Mobile USA Inc* 6.00% 15/04/2024 0 0.00
395,000 TransDigm Inc† 5.50% 15/11/2027 400,167 0.54
150,000 TransDigm Inc† 6.25% 15/03/2026 162,673 0.22
160,000 TransDigm Inc* 6.38% 15/06/2026 169,994 0.23
350,000 TransDigm Inc* 7.50% 15/03/2027 383,477 0.52
75,000 Tronox Finance Plc† 5.75% 01/10/2025 76,623 0.10
125,000 Tronox Inc† 6.50% 15/04/2026 129,091 0.17
200,000 Tullow Oil Plc† 7.00% 01/03/2025 168,862 0.23
200,000 Turk Telekomunikasyon AS* 6.88% 28/02/2025 214,263 0.29
200,000 Turkiye Garanti Bankasi AS* 5.25% 13/09/2022 204,073 0.27
200,000 Turkiye Sise ve Cam Fabrikalari AS* 6.95% 14/03/2026 211,630 0.29
200,000 United Bank for Africa Plc* 7.75% 08/06/2022 213,019 0.29
200,000 Vedanta Resources Ltd* 6.38% 30/07/2022 196,662 0.27
105,000 Vistra Energy Corp* 5.88% 01/06/2023 107,681 0.15
285,000 Vistra Operations Co LLC† 5.00% 31/07/2027 298,347 0.40
310,000 Vistra Operations Co LLC† 5.50% 01/09/2026 329,320 0.44
120,000 Vistra Operations Co LLC† 5.63% 15/02/2027 126,672 0.17
179,000 VTR Finance BV* 6.88% 15/01/2024 183,401 0.25
620,000 Western Digital Corp† 4.75% 15/02/2026 647,513 0.87
70,000 WPX Energy Inc* 5.25% 15/09/2024 74,549 0.10
160,000 WPX Energy Inc* 5.75% 01/06/2026 171,172 0.23
232,000 Yapi ve Kredi Bankasi AS* 8.25% 15/10/2024 249,065 0.34
200,000 YPF Energia Electrica SA* 10.00% 25/07/2026 174,526 0.23
200,000 YPF SA* 8.50% 28/07/2025 189,583 0.26
200,000 Yuzhou Properties Co Ltd* 6.00% 25/10/2023 195,448 0.26
25,000 Zayo Group LLC/Zayo Capital Inc† 5.75% 15/01/2027 25,477 0.03
125,000 Zayo Group LLC/Zayo Capital Inc 144A† 5.75% 15/01/2027 127,388 0.17
Total United States Dollar 56,761,109 76.65
Total Corporate Bonds 69,068,917 93.27

SCHEDULE OF INVESTMENTS FINANCIAL STATEMENTS
ANNUAL REPORT 2019 533
Neuberger Berman Global High Yield Bond Fund (Continued)
Schedule of Investments (Continued)
Financial Assets at Fair Value through Profit or Loss (continued)
Principal Amount Security Description Coupon Maturity
DateFair Value
US$% of Net
Assets
Term Loans 3.02% (31 December 2018: 5.72%)
Euro 100,000 Rain Carbon Inc 3.00% 16/01/2025 106,848 0.14
98,492 Trident TPI Holdings Inc 3.25% 17/10/2024 107,379 0.14
Total Euro 214,227 0.28
Pound Sterling 115,000 Sigma Holdco BV 4.70% 02/07/2025 151,339 0.21
Total Pound Sterling 151,339 0.21
United States Dollar 434,879 Bass Pro Group LLC 6.80% 25/09/2024 434,427 0.59
263,521 Forterra Finance LLC 4.80% 25/10/2023 258,470 0.35
412,883 Frontier Communications Corp 5.55% 15/06/2024 415,779 0.56
79,800 Granite US Holdings Corp 7.21% 30/09/2026 80,199 0.11
217,412 Staples Inc 6.69% 16/04/2026 214,165 0.29
199,456 Tivity Health Inc 6.05% 08/03/2024 200,079 0.27
267,514 Tivity Health Inc 7.05% 06/03/2026 268,250 0.36
Total United States Dollar 1,871,369 2.53
Total Term Loans † 2,236,935 3.02
Total Investments 71,305,852 96.29
Forward Currency Contracts 1.49% (31 December 2018: 0.85%)
Amount Receivable
Amount Payable
Maturity Date Counterparty Contracts Unrealised
Gain US$% of Net
Assets
€ 122,055 US$ 136,729 22/01/2020 Goldman Sachs International 4 445 0.00
€ 1,474,755 US$ 1,634,227 22/01/2020 UBS AG 2 23,204 0.03
€ 504,310 US$ 564,267 22/01/2020 Westpac Banking Corp 2 2,512 0.00
£ 28,770 US$ 37,568 22/01/2020 Goldman Sachs International 3 568 0.00
£ 212,351 € 238,774 22/01/2020 Goldman Sachs International 1 13,120 0.02
£ 396,708 US$ 500,551 22/01/2020 UBS AG 5 25,285 0.04
£ 172,244 US$ 222,757 22/01/2020 Westpac Banking Corp 4 5,553 0.01
£ 29,496 € 32,981 22/01/2020 Westpac Banking Corp 1 2,030 0.01
EUR Hedged Classes € 18,640,578 US$ 20,579,567 22/01/2020 Goldman Sachs International 8 369,988 0.50
€ 17,962,458 US$ 19,839,750 22/01/2020 UBS AG 1 347,686 0.47
€ 15,832,837 US$ 17,483,294 22/01/2020 Westpac Banking Corp 19 310,729 0.41

FINANCIAL STATEMENTS SCHEDULE OF INVESTMENTS
534 NEUBERGER BERMAN INVESTMENT FUNDS PLC
Neuberger Berman Global High Yield Bond Fund (Continued)
Schedule of Investments (Continued)
Financial Assets at Fair Value through Profit or Loss (continued)
Forward Currency Contracts 1.49% (31 December 2018: 0.85%) (continued)
Amount Receivable
Amount Payable
Maturity Date Counterparty Contracts Unrealised
Gain US$% of Net
Assets
GBP Hedged Classes £ 3,347 US$ 4,140 22/01/2020 Goldman Sachs International 3 296 0.00
£ 3,238 US$ 4,001 22/01/2020 UBS AG 1 291 0.00
£ 2,822 US$ 3,487 22/01/2020 Westpac Banking Corp 2 255 0.00
Total Unrealised Gain on Forward Currency Contracts ∞ 1,101,962 1.49
Fair Value % of Net
US$ Assets
Total Financial Assets at Fair Value through Profit or Loss 72,407,814 97.78
Financial Liabilities at Fair Value through Profit or Loss
Forward Currency Contracts (1.17%) (31 December 2018: (1.14%))
Amount Receivable
Amount Payable
Maturity Date Counterparty Contracts Unrealised
Loss US$% of Net
Assets
€ 746,980 £ 660,368 22/01/2020 Goldman Sachs International 2 (35,811) (0.05)
£ 7,100 US$ 9,537 22/01/2020 Goldman Sachs International 1 (125) (0.00)
£ 20,286 US$ 27,172 22/01/2020 Westpac Banking Corp 1 (283) (0.00)
£ 86,511 € 102,768 22/01/2020 Westpac Banking Corp 1 (828) (0.00)
US$ 362,608 € 328,021 22/01/2020 Goldman Sachs International 1 (6,045) (0.01)
US$ 11,768,620 € 10,620,770 22/01/2020 UBS AG 1 (167,726) (0.23)
US$ 2,880,520 £ 2,312,060 22/01/2020 UBS AG 1 (184,121) (0.25)
US$ 222,722 € 201,035 22/01/2020 Westpac Banking Corp 3 (3,215) (0.00)
EUR Hedged Classes US$ 365,318 € 329,926 22/01/2020 Goldman Sachs International 3 (5,475) (0.01)
US$ 17,326,743 € 15,685,115 22/01/2020 UBS AG 2 (301,261) (0.41)
US$ 9,645,395 € 8,721,378 22/01/2020 Westpac Banking Corp 23 (156,285) (0.21)
GBP Hedged Classes £ 63 US$ 84 22/01/2020 Westpac Banking Corp 1 (1) (0.00)
Total Unrealised Loss on Forward Currency Contracts ∞ (861,176) (1.17)
Futures Contracts (0.00%) (31 December 2018: (0.02%))
Number of Contracts Description Unrealised
Loss US$% of Net
Assets
6 US Treasury 5-Year Note (CBT) Future March 2020 (2,797) (0.00)
Total Unrealised Loss on Futures Contracts ± (2,797) (0.00)

SCHEDULE OF INVESTMENTS FINANCIAL STATEMENTS
ANNUAL REPORT 2019 535
Neuberger Berman Global High Yield Bond Fund (Continued)
Schedule of Investments (Continued)
Financial Liabilities at Fair Value through Profit or Loss (continued)
Fair Value % of Net
US$ Assets
Total Financial Liabilities at Fair Value through Profit or Loss (863,973) (1.17)
Net Financial Assets at Fair Value through Profit or Loss 71,543,841 96.61
Other Net Assets 2,512,294 3.39
Net Assets Attributable to Holders of Redeemable Participating Shares 74,056,135 100.00
% ofTotal
AssetsPortfolio Analysis US$
* Transferable securities and/or money market instruments admitted to an official stock exchange listing 32,531,538 42.92
** Transferable securities and/or money market instruments dealt in on a regulated market 403,989 0.53
† Other transferable securities and/or money market instruments 38,370,325 50.62
± Financial derivative instruments traded on a regulated market (2,797) 0.00
∞ OTC financial derivative instruments 240,786 0.32
Total Investments 71,543,841 94.39

FINANCIAL STATEMENTS STATEMENT OF SIGNIFICANT PURCHASES AND SALES
536 NEUBERGER BERMAN INVESTMENT FUNDS PLC
Neuberger Berman Global High Yield Bond Fund (Continued) Statement of Significant Purchases and Sales (Unaudited)
In accordance with the European Communities (Undertakings for Collective Investment in Transferable Securities) Regulations, 2011 as amended, a statement of changes in the composition of the Schedule of Investments during the reporting period is provided to ensure that Shareholders can identify changes in the investments held by the Portfolio. The following statements present the aggregate purchases and sales of transferable securities exceeding one percent of the total value of purchases or sales, respectively, for the period. At a minimum, the largest twenty purchases and twenty sales are presented, if available.
Top twenty purchases:
Units Security Description Cost US$
740,000 Prime Security Services Borrower LLC/Prime Finance Inc, 5.75%, 15/04/2026 770,124
625,000 Netflix Inc, 6.38%, 15/05/2029 699,504
690,000 Nielsen Finance LLC/Nielsen Finance Co, 5.00%, 15/04/2022 691,531
600,000 Altice France SA, 7.38%, 01/05/2026 628,256
605,000 Sirius XM Radio Inc, 5.00%, 01/08/2027 628,141
625,000 Avis Budget Car Rental LLC / Avis Budget Finance Inc, 5.75%, 15/07/2027 627,097
620,000 HUB International Ltd, 7.00%, 01/05/2026 622,625
590,000 Performance Food Group Inc, 5.50%, 15/10/2027 611,988
540,000 Cedar Fair LP/Canada's Wonderland Co/Magnum Management Corp/Millennium Op, 5.38%, 15/04/2027 563,840
580,000 Western Digital Corp, 4.75%, 15/02/2026 561,925
525,000 Taylor Morrison Communities Inc, 5.88%, 15/06/2027 546,510
500,000 Harsco Corp, 5.75%, 31/07/2027 512,340
530,000 Beacon Roofing Supply Inc, 4.88%, 01/11/2025 508,547
485,000 Vistra Operations Co LLC, 5.00%, 31/07/2027 495,500
485,000 Bausch Health Cos Inc, 6.13%, 15/04/2025 478,533
450,000 Starfruit Finco BV / Starfruit US Holdco LLC, 8.00%, 01/10/2026 475,875
465,000 Crestwood Midstream Partners LP/Crestwood Midstream Finance Corp, 5.75%, 01/04/2025 469,717
515,000 L Brands Inc, 5.25%, 01/02/2028 469,305
470,000 Calpine Corp, 5.75%, 15/01/2025 465,096
460,000 Terex Corp, 5.63%, 01/02/2025 460,548

STATEMENT OF SIGNIFICANT PURCHASES AND SALES FINANCIAL STATEMENTS
ANNUAL REPORT 2019 537
Neuberger Berman Global High Yield Bond Fund (Continued) Statement of Significant Purchases and Sales (Unaudited) (Continued)
Top twenty sales:
Units Security Description Proceeds US$
665,000 Ally Financial Inc, 8.00%, 15/03/2020 689,422
625,000 MEDNAX Inc, 6.25%, 15/01/2027 620,919
650,000 Cleveland-Cliffs Inc, 5.88%, 01/06/2027 620,750
560,000 SS&C Technologies Inc, 5.50%, 30/09/2027 592,813
540,000 Cedar Fair LP/Canada's Wonderland Co/Magnum Management Corp/Millennium Op, 5.38%, 15/04/2027 576,306
500,000 Crestwood Midstream Partners LP/Crestwood Midstream Finance Corp, 5.75%, 01/04/2025 511,563
450,000 Petrobras Global Finance BV, 7.38%, 17/01/2027 495,843
405,000 Select Medical Corp, 6.25%, 15/08/2026 437,906
410,000 Spectrum Brands Inc, 5.75%, 15/07/2025 428,346
400,000 CSC Holdings LLC, 7.75%, 15/07/2025 428,000
400,000 Ardagh Packaging Finance Plc/Ardagh Holdings USA Inc, 6.00%, 15/02/2025 420,004
405,000 Six Flags Entertainment Corp, 4.88%, 31/07/2024 419,681
400,000 INEOS Group Holdings SA, 5.63%, 01/08/2024 407,000
405,000 Diamond Sports Group LLC / Diamond Sports Finance Co, 5.38%, 15/08/2026 406,626
400,000 CFLD Cayman Investment Ltd, 8.60%, 08/04/2024 404,500
378,000 Altice Finco SA, 4.75%, 15/01/2028 400,114
322,000 InterXion Holding NV, 4.75%, 15/06/2025 388,274
370,000 Cheniere Energy Partners LP, 5.25%, 01/10/2025 378,788
295,000 Iron Mountain UK Plc, 3.88%, 15/11/2025 365,662
350,000 Element Solutions Inc, 5.88%, 01/12/2025 365,375

FINANCIAL STATEMENTS INVESTMENT MANAGER’S REPORT
538 NEUBERGER BERMAN INVESTMENT FUNDS PLC
Neuberger Berman Global Opportunistic Bond Fund Investment Manager’s Report For the 12 months ended 31 December 2019, the total return for the USD I Accumulating Class was 9.25%. Over the same period, the benchmark index, the Bloomberg Barclays Global Aggregate Index hedged in USD, returned 8.22%. (Performance for all share classes is provided in Appendix II. Performance data quoted represent past performance and do not indicate future results. Total returns shown are net of all fees and expenses and include reinvestment of income dividends and other distributions, if any).
In response to slowing global growth - attributed in large part to overhangs from trade policy and Brexit negatively impacting investment spending - global central banks turned more accommodative in 2019. The Federal Reserve (“Fed”) cut rates three times after hiking rates four times in 2018, while numerous other central banks also loosened policy in seeking to support growth amid falling inflation expectations. This helped drive developed markets government bond yields lower and global credit spreads tighter over the period, creating a powerful tailwind for fixed income performance.
During the reporting period, the Portfolio's diversified overweight to credit was a primary reason for relative outperformance. Allocations to European high yield, emerging markets (“EM”) debt, and mortgage credit, as well as security selection in global investment grade credit were all key contributors. Allocation to CLOs and US TIPS were lesser contributors. Rates positioning overall detracted over the period. Although overweights in Australian, South African and New Zealand rates were additive, these positives were more than offset by underweights in US and core European rates and short exposure to Sweden. Our active FX strategy also detracted for the period; overweights in Norwegian krone and Swedish krona were the worst performing positions whereas underweights to euro and New Zealand dollar were the best performing positions.
Coming into 2020, our thesis of a modest slowdown in US growth, stabilization in international developed market growth (led by a global recovery in manufacturing and an attendant rebound in trade), and bouts of elevated volatility ahead of the known unknown (the US election) appeared sound. However, an unknown unknown, COVID-19, has disrupted the chain of events.
We expect a stark slowdown in the US and global growth in the first half of 2020. We are viewing the impact of the virus as a growth shock, analogous to other growth shocks over the past 20 years (9/11 attacks, European crises in 2011 and 2013, and the energy issues of 2015/2016). We do not see a material permanent impact to the global growth trajectory, and while we expect markets to remain volatile, monetary easing and fiscal easing will stabilize the impacts of this growth shock. We would also note that the ‘outcome’ of this crisis is now a return to approximately 0% policy rates in the US and lower overall government bond yields, which will only heighten investors’ need for income, particularly in high quality securities.

BALANCE SHEET FINANCIAL STATEMENTS
The accompanying notes form an integral part of the financial statements.
ANNUAL REPORT 2019 539
Neuberger Berman Global Opportunistic Bond Fund (Continued)
Balance Sheet
As at As at
Note 31 December 2019 31 December 2018
US$ US$
Current Assets
Financial Assets at Fair Value through Profit or Loss 2 183,423,408 109,611,666
Cash and cash equivalents 3 4,601,327 2,783,875
Receivable for investments sold 5,107,134 –
Receivable for shares issued 487,260 24,431
Due from brokers 4,843,283 1,398,765
Income receivable and other assets 1,318,594 821,596
Total Assets 199,781,006 114,640,333
Current Liabilities
Financial Liabilities at Fair Value through Profit or Loss 2 9,459,928 3,538,648
Bank overdraft 4 1,203 –
Payable for shares redeemed 141,385 59,737
Accrued expenses 100,121 84,986
Payable for investments purchased 16,313,496 10,892,453
Other payables 70,121 35,129
Liabilities (excluding Net Assets Attributable to Holders of Redeemable Participating Shares) 26,086,254 14,610,953
Net Assets Attributable to Holders of Redeemable Participating Shares 173,694,752 100,029,380
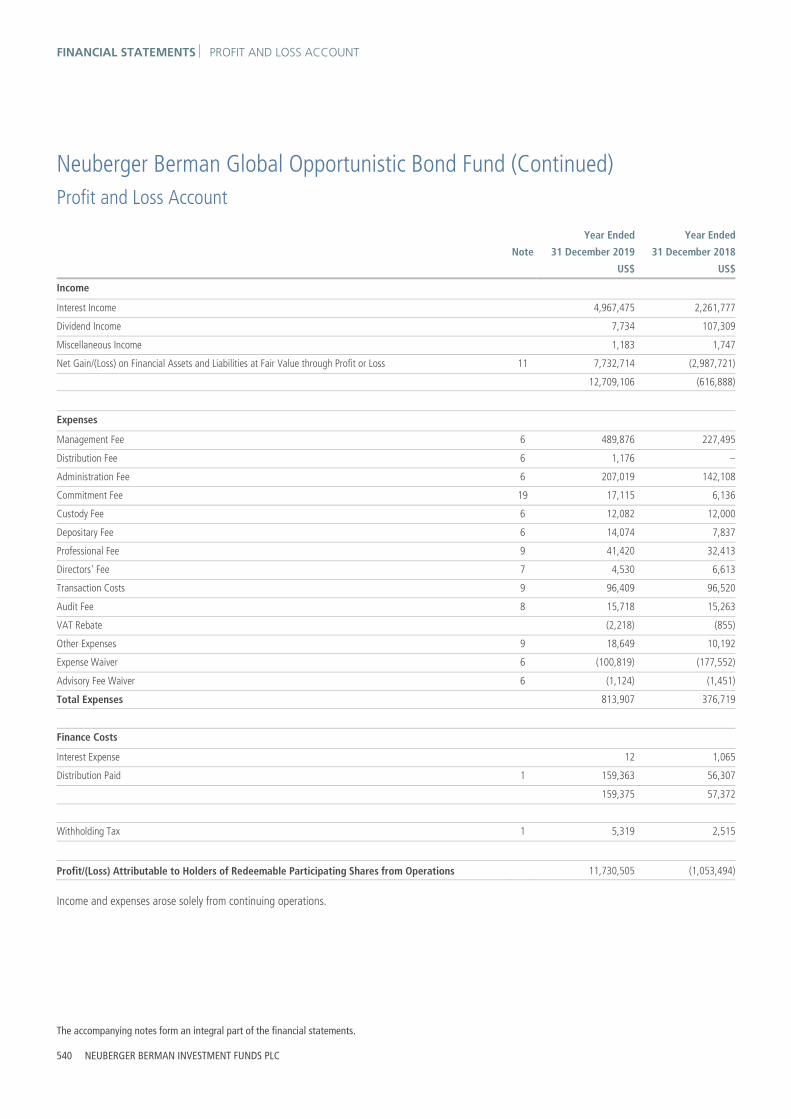
FINANCIAL STATEMENTS PROFIT AND LOSS ACCOUNT
The accompanying notes form an integral part of the financial statements.
540 NEUBERGER BERMAN INVESTMENT FUNDS PLC
Neuberger Berman Global Opportunistic Bond Fund (Continued)
Profit and Loss Account
Year Ended Year Ended
Note 31 December 2019 31 December 2018
US$ US$
Income
Interest Income 4,967,475 2,261,777
Dividend Income 7,734 107,309
Miscellaneous Income 1,183 1,747
Net Gain/(Loss) on Financial Assets and Liabilities at Fair Value through Profit or Loss 11 7,732,714 (2,987,721)
12,709,106 (616,888)
Expenses
Management Fee 6 489,876 227,495
Distribution Fee 6 1,176 –
Administration Fee 6 207,019 142,108
Commitment Fee 19 17,115 6,136
Custody Fee 6 12,082 12,000
Depositary Fee 6 14,074 7,837
Professional Fee 9 41,420 32,413
Directors' Fee 7 4,530 6,613
Transaction Costs 9 96,409 96,520
Audit Fee 8 15,718 15,263
VAT Rebate (2,218) (855)
Other Expenses 9 18,649 10,192
Expense Waiver 6 (100,819) (177,552)
Advisory Fee Waiver 6 (1,124) (1,451)
Total Expenses 813,907 376,719
Finance Costs
Interest Expense 12 1,065
Distribution Paid 1 159,363 56,307
159,375 57,372
Withholding Tax 1 5,319 2,515
Profit/(Loss) Attributable to Holders of Redeemable Participating Shares from Operations 11,730,505 (1,053,494)
Income and expenses arose solely from continuing operations.

STATEMENT OF CHANGES IN NET ASSETS FINANCIAL STATEMENTS
The accompanying notes form an integral part of the financial statements.
ANNUAL REPORT 2019 541
Neuberger Berman Global Opportunistic Bond Fund (Continued)
Statement of Changes in Net Assets Attributable to Holders of Redeemable Participating Shares
Year Ended Year Ended
31 December 2019 31 December 2018
US$ US$
Net Assets Attributable to Holders of Redeemable Participating Shares at beginning of year 100,029,380 44,615,281
Profit/(Loss) Attributable to Holders of Redeemable Participating Shares from Operations 11,730,505 (1,053,494)
Subscriptions 5 192,983,859 74,190,126
Redemptions 5 (131,048,992) (17,722,533)
Net Assets Attributable to Holders of Redeemable Participating Shares at end of year 173,694,752 100,029,380

FINANCIAL STATEMENTS SCHEDULE OF INVESTMENTS
542 NEUBERGER BERMAN INVESTMENT FUNDS PLC
Neuberger Berman Global Opportunistic Bond Fund (Continued)
Schedule of Investments
Financial Assets at Fair Value through Profit or Loss
Principal Amount Security Description Coupon Maturity
DateFair Value
US$% of Net
Assets
Treasury Bills 1.90% (31 December 2018: 0.33%)
United States Dollar 3,325,000 United States Treasury Bill 0.00% 28/05/2020 3,304,224 1.90
Total Treasury Bills ** 3,304,224 1.90
Agency Bonds 0.23% (31 December 2018: 0.36%)
United States Dollar 280,000 Federal Home Loan Banks 5.50% 15/07/2036 393,177 0.23
Total Agency Bonds * 393,177 0.23
Asset Backed Securities 7.03% (31 December 2018: 9.44%)
Euro 714,418 European Residential Loan Securitisation 2019-NPL2 DAC Class A 1.05% 24/02/2058 796,006 0.46
Total Euro 796,006 0.46
United States Dollar 112,540 Accredited Mortgage Loan Trust 2005-1 Class M4 2.95% 25/04/2035 112,657 0.07
155,000 Bear Stearns Asset Backed Securities Trust 2006-SD2 Class M2 2.59% 25/06/2036 156,229 0.09
1,100,000 Fannie Mae Connecticut Avenue Securities Class 1M2 4.04% 25/07/2030 1,115,559 0.64
395,000 Fannie Mae Connecticut Avenue Securities Class 1M2 4.44% 25/02/2030 405,696 0.23
1,295,000 Fannie Mae Connecticut Avenue Securities Class 1M2 4.79% 25/10/2029 1,354,035 0.78
677,801 Fannie Mae Connecticut Avenue Securities Class 2M2 3.99% 25/08/2030 684,256 0.39
1,006,482 Fannie Mae Connecticut Avenue Securities Class 2M2 6.14% 25/05/2029 1,062,191 0.61
250,000 Flatiron CLO 17 Ltd 2017-1X Class E 7.91% 15/05/2030 238,963 0.14
1,000,000 Freddie Mac Structured Agency Credit Risk Debt Notes Class M2 3.59% 25/07/2030 1,002,974 0.58
1,250,000 Freddie Mac Structured Agency Credit Risk Debt Notes Class M2 4.09% 25/09/2030 1,265,208 0.73
1,173,000 Freddie Mac Structured Agency Credit Risk Debt Notes Class M2 4.29% 25/03/2030 1,201,653 0.69
1,250,000 Freddie Mac Structured Agency Credit Risk Debt Notes Class M2 4.44% 25/12/2029 1,285,558 0.74
1,200,000 Freddie Mac Structured Agency Credit Risk Debt Notes Class M2 5.24% 25/10/2029 1,279,473 0.74
250,000 Milos CLO Ltd 2017-1X Class E 8.12% 20/10/2030 246,512 0.14
Total United States Dollar 11,410,964 6.57
Total Asset Backed Securities ** 12,206,970 7.03
Corporate Bonds 44.53% (31 December 2018: 38.55%)
Euro 399,000 Altice Finco SA* 4.75% 15/01/2028 453,812 0.26
197,000 Altice France SA* 2.50% 15/01/2025 224,404 0.13
143,000 Altice France SA* 3.38% 15/01/2028 165,834 0.10
372,000 Altice France SA* 5.88% 01/02/2027 471,332 0.27
200,000 Altice Luxembourg SA* 6.25% 15/02/2025 233,142 0.13

SCHEDULE OF INVESTMENTS FINANCIAL STATEMENTS
ANNUAL REPORT 2019 543
Neuberger Berman Global Opportunistic Bond Fund (Continued)
Schedule of Investments (Continued)
Financial Assets at Fair Value through Profit or Loss (continued)
Principal Amount Security Description Coupon Maturity
DateFair Value
US$% of Net
Assets
Corporate Bonds 44.53% (31 December 2018: 38.55%) (continued)
Euro (continued) 346,000 Altice Luxembourg SA* 8.00% 15/05/2027 436,448 0.25
393,000 ARD Finance SA* 5.00% 30/06/2027 446,011 0.26
300,000 Arkema SA* 2.75% 29/12/2049 357,376 0.21
315,000 Avantor Inc* 4.75% 01/10/2024 377,201 0.22
300,000 Axalta Coating Systems Dutch Holding B BV* 3.75% 15/01/2025 348,115 0.20
300,000 Barclays Plc* 1.38% 24/01/2026 347,379 0.20
404,000 Bausch Health Cos Inc* 4.50% 15/05/2023 460,304 0.26
1,075,000 Bayer AG* 2.38% 02/04/2075 1,239,297 0.71
100,000 Bayer AG* 2.38% 12/11/2079 114,074 0.07
317,000 Belden Inc* 3.38% 15/07/2027 374,240 0.22
100,000 Belden Inc* 4.13% 15/10/2026 120,541 0.07
700,000 Casino Guichard Perrachon SA* 4.05% 05/08/2026 669,981 0.39
380,000 Cemex SAB de CV* 3.13% 19/03/2026 443,947 0.26
564,000 CeramTec BondCo GmbH* 5.25% 15/12/2025 663,858 0.38
150,000 Cirsa Finance International Sarl* 4.75% 22/05/2025 177,004 0.10
415,000 CK Hutchison Group Telecom Finance SA* 0.75% 17/04/2026 464,277 0.27
390,000 Constellium SE* 4.25% 15/02/2026 457,475 0.26
367,000 Darling Global Finance BV* 3.63% 15/05/2026 436,160 0.25
355,000 Diocle SpA* 3.88% 30/06/2026 405,710 0.23
363,000 DKT Finance ApS* 7.00% 17/06/2023 432,614 0.25
200,000 E.ON SE* 0.63% 07/11/2031 216,528 0.12
361,000 eG Global Finance Plc* 4.38% 07/02/2025 406,995 0.23
201,000 eircom Finance DAC* 3.50% 15/05/2026 238,493 0.14
135,000 EnBW Energie Baden-Wuerttemberg AG* 3.38% 05/04/2077 160,335 0.09
348,000 Energizer Gamma Acquisition BV* 4.63% 15/07/2026 414,662 0.24
200,000 Europcar Mobility Group* 4.00% 30/04/2026 218,411 0.13
200,000 Europcar Mobility Group* 4.13% 15/11/2024 223,577 0.13
505,000 Glencore Finance Europe Ltd** 2.75% 01/04/2021 581,858 0.33
328,000 Goodyear Europe BV* 3.75% 15/12/2023 374,600 0.22
124,000 Grifols SA* 2.25% 15/11/2027 144,298 0.08
396,000 Grupo Antolin-Irausa SA* 3.38% 30/04/2026 420,262 0.24
303,000 Guala Closures SpA** 3.50% 15/04/2024 344,794 0.20
100,000 Heimstaden Bostad AB* 3.25% 29/12/2049 112,952 0.06
190,000 Hertz Holdings Netherlands BV* 5.50% 30/03/2023 222,755 0.13
268,000 House of Finance NV* 4.38% 15/07/2026 310,317 0.18
318,000 IHO Verwaltungs GmbH* 3.75% 15/09/2026 378,109 0.22
569,000 INEOS Group Holdings SA* 5.38% 01/08/2024 665,560 0.38
300,000 Infineon Technologies AG* 2.88% 29/12/2049 348,031 0.20

FINANCIAL STATEMENTS SCHEDULE OF INVESTMENTS
544 NEUBERGER BERMAN INVESTMENT FUNDS PLC
Neuberger Berman Global Opportunistic Bond Fund (Continued)
Schedule of Investments (Continued)
Financial Assets at Fair Value through Profit or Loss (continued)
Principal Amount Security Description Coupon Maturity
DateFair Value
US$% of Net
Assets
Corporate Bonds 44.53% (31 December 2018: 38.55%) (continued)
Euro (continued)
200,000 Infineon Technologies AG* 3.63% 29/12/2049 235,164 0.14
200,000 Infor US Inc* 5.75% 15/05/2022 228,249 0.13
457,000 International Game Technology Plc* 3.50% 15/06/2026 548,116 0.32
287,000 IQVIA Inc* 2.25% 15/01/2028 333,827 0.19
323,000 IQVIA Inc* 3.25% 15/03/2025 370,704 0.21
137,000 Jaguar Land Rover Automotive Plc* 4.50% 15/01/2026 148,600 0.09
250,000 JPMorgan Chase & Co* 1.64% 18/05/2028 301,776 0.17
500,000 KA Finanz AG* 0.38% 11/08/2020 563,318 0.32
100,000 Kapla Holding SAS* 3.38% 15/12/2026 114,774 0.07
441,000 Kronos International Inc* 3.75% 15/09/2025 504,923 0.29
230,000 La Financiere Atalian SASU* 4.00% 15/05/2024 209,757 0.12
405,000 LeasePlan Corp NV* 7.38% 29/12/2049 509,481 0.29
344,000 Levi Strauss & Co* 3.38% 15/03/2027 413,443 0.24
309,000 LHMC Finco 2 Sarl* 7.25% 02/10/2025 360,987 0.21
343,000 Lincoln Financing Sarl* 3.88% 01/04/2024 389,526 0.22
300,000 LKQ European Holdings BV* 4.13% 01/04/2028 375,666 0.22
327,000 Loxam SAS* 6.00% 15/04/2025 384,704 0.22
215,000 Matterhorn Telecom SA* 3.13% 15/09/2026 250,043 0.14
651,000 Mauser Packaging Solutions Holding Co* 4.75% 15/04/2024 759,258 0.44
552,000 Motion Bondco DAC* 4.50% 15/11/2027 652,732 0.38
194,000 MPT Operating Partnership LP/MPT Finance Corp* 3.33% 24/03/2025 240,498 0.14
100,000 NAK Naftogaz Ukraine via Kondor Finance Plc* 7.13% 19/07/2024 120,037 0.07
466,000 Netflix Inc* 3.63% 15/05/2027 561,568 0.32
387,000 Nexi SpA** 1.75% 31/10/2024 447,546 0.26
440,000 Nidda BondCo GmbH* 5.00% 30/09/2025 518,509 0.30
300,000 Orano SA* 4.88% 23/09/2024 391,302 0.22
228,000 Panther BF Aggregator 2 LP/Panther Finance Co Inc† 4.38% 15/05/2026 269,307 0.15
390,000 Paprec Holding SA* 4.00% 31/03/2025 423,110 0.24
282,000 Petrobras Global Finance BV* 4.75% 14/01/2025 365,619 0.21
340,000 Platin 1426 GmbH* 5.38% 15/06/2023 386,810 0.22
201,000 Playtech Plc* 4.25% 07/03/2026 240,227 0.14
100,000 Quatrim SASU* 5.88% 15/01/2024 118,819 0.07
501,000 Repsol International Finance BV* 4.50% 25/03/2075 649,793 0.37
517,000 Rossini Sarl* 6.75% 30/10/2025 648,420 0.37
100,000 Royal Bank of Scotland Group Plc* 2.00% 04/03/2025 118,737 0.07
100,000 Royal Mail Plc* 1.25% 08/10/2026 113,038 0.06
569,000 Sazka Group AS* 4.13% 20/11/2024 671,755 0.39
241,000 Scientific Games International Inc* 5.50% 15/02/2026 282,538 0.16

SCHEDULE OF INVESTMENTS FINANCIAL STATEMENTS
ANNUAL REPORT 2019 545
Neuberger Berman Global Opportunistic Bond Fund (Continued)
Schedule of Investments (Continued)
Financial Assets at Fair Value through Profit or Loss (continued)
Principal Amount Security Description Coupon Maturity
DateFair Value
US$% of Net
Assets
Corporate Bonds 44.53% (31 December 2018: 38.55%) (continued)
Euro (continued)
430,000 SGL Carbon SE* 4.63% 30/09/2024 473,021 0.27
238,000 Sisal Pay SpA** 3.88% 17/12/2026 270,494 0.16
284,000 Smurfit Kappa Acquisitions ULC* 2.88% 15/01/2026 351,452 0.20
200,000 SoftBank Group Corp* 5.00% 15/04/2028 248,284 0.14
300,000 Solvay Finance SA* 5.87% 29/12/2049 399,082 0.23
318,000 Spectrum Brands Inc* 4.00% 01/10/2026 378,231 0.22
200,000 SPIE SA* 2.63% 18/06/2026 235,762 0.14
271,000 Starfruit Finco BV/Starfruit US Holdco LLC* 6.50% 01/10/2026 326,955 0.19
200,000 Summer BidCo BV* 9.00% 15/11/2025 240,480 0.14
352,000 Summit Properties Ltd* 2.00% 31/01/2025 387,472 0.22
257,000 Sunshine Mid BV* 6.50% 15/05/2026 309,466 0.18
200,000 Swissport Financing Sarl* 5.25% 15/08/2024 239,296 0.14
210,000 Swissport Financing Sarl* 9.00% 15/02/2025 251,597 0.14
449,000 Tasty Bondco 1 SA* 6.25% 15/05/2026 529,568 0.30
464,000 Techem Verwaltungsgesellschaft 674 mbH* 6.00% 30/07/2026 564,135 0.32
216,000 Telecom Italia SpA** 3.00% 30/09/2025 259,808 0.15
525,000 Telecom Italia SpA* 3.63% 25/05/2026 652,529 0.38
400,000 Telefonica Europe BV* 2.63% 29/12/2049 464,973 0.27
500,000 Telefonica Europe BV* 3.88% 29/12/2049 611,883 0.35
242,780 Teva Pharmaceutical Finance Netherlands II BV* 0.38% 25/07/2020 272,224 0.16
162,000 thyssenkrupp AG* 2.88% 22/02/2024 188,019 0.11
400,000 UBS Group AG* 1.25% 17/04/2025 468,017 0.27
345,000 UGI International LLC* 3.25% 01/11/2025 410,142 0.24
210,000 United Group BV* 4.13% 15/05/2025 236,736 0.14
376,000 UPC Holding BV* 3.88% 15/06/2029 442,865 0.25
500,000 Vivion Investments Sarl* 3.50% 01/11/2025 579,953 0.33
100,000 Volkswagen Bank GmbH* 1.25% 10/06/2024 115,360 0.07
1,660,000 Volkswagen Bank GmbH* 1.25% 15/12/2025 1,919,842 1.11
235,000 Wells Fargo & Co* 1.00% 02/02/2027 272,040 0.16
200,000 Westlake Chemical Corp* 1.63% 17/07/2029 224,237 0.13
186,000 WMG Acquisition Corp* 3.63% 15/10/2026 221,469 0.13
324,000 Ziggo BV* 4.25% 15/01/2027 392,958 0.23
Total Euro 43,264,104 24.91
Pound Sterling 131,000 Anglian Water Osprey Financing Plc* 5.00% 30/04/2023 179,855 0.10
100,000 Anglo American Capital Plc* 3.38% 11/03/2029 139,033 0.08
296,000 Ardagh Packaging Finance Plc/Ardagh Holdings USA Inc* 4.75% 15/07/2027 412,148 0.24

FINANCIAL STATEMENTS SCHEDULE OF INVESTMENTS
546 NEUBERGER BERMAN INVESTMENT FUNDS PLC
Neuberger Berman Global Opportunistic Bond Fund (Continued)
Schedule of Investments (Continued)
Financial Assets at Fair Value through Profit or Loss (continued)
Principal Amount Security Description Coupon Maturity
DateFair Value
US$% of Net
Assets
Corporate Bonds 44.53% (31 December 2018: 38.55%) (continued)
Pound Sterling (continued)
470,000 BAT Capital Corp* 2.13% 15/08/2025 621,451 0.36
355,000 Co-operative Group Holdings 2011 Ltd* 7.50% 08/07/2026 540,542 0.31
100,000 Drax Finco Plc* 4.25% 01/05/2022 135,554 0.08
155,000 E.ON International Finance BV* 6.38% 07/06/2032 294,810 0.17
100,000 EI Group Plc* 6.00% 06/10/2023 134,333 0.08
135,000 EI Group Plc* 7.50% 15/03/2024 192,567 0.11
210,000 Heathrow Finance Plc* 3.88% 01/03/2027 283,151 0.16
300,000 HSBC Holdings Plc* 2.26% 13/11/2026 404,264 0.23
100,000 Iberdrola Finanzas SA* 7.38% 29/01/2024 163,884 0.09
165,000 Iceland Bondco Plc* 4.63% 15/03/2025 191,798 0.11
324,000 Iron Mountain UK Plc* 3.88% 15/11/2025 440,043 0.25
400,000 Ladbrokes Group Finance Plc* 5.13% 08/09/2023 577,828 0.33
300,000 Miller Homes Group Holdings Plc* 5.50% 15/10/2024 413,761 0.24
100,000 Next Group Plc* 3.63% 18/05/2028 141,827 0.08
100,000 Next Group Plc* 4.38% 02/10/2026 149,067 0.09
400,000 NGG Finance Plc* 5.63% 18/06/2073 601,437 0.35
100,000 NWEN Finance Plc* 5.88% 21/06/2021 135,343 0.08
100,000 Petrobras Global Finance BV* 5.38% 01/10/2029 147,260 0.08
375,000 Phoenix Group Holdings* 5.75% 07/07/2021 528,201 0.30
331,000 Pinewood Finance Co Ltd* 3.25% 30/09/2025 450,833 0.26
303,000 Premier Foods Finance Plc* 6.25% 15/10/2023 421,845 0.24
100,000 Principality Building Society* 2.38% 23/11/2023 134,715 0.08
103,000 Stonegate Pub Co Financing Plc* 4.88% 15/03/2022 139,789 0.08
300,000 Stonegate Pub Co Financing Plc* 7.05% 15/03/2022 401,399 0.23
379,000 TVL Finance Plc* 6.16% 15/07/2025 505,218 0.29
100,000 Virgin Media Receivables Financing Notes I DAC* 5.50% 15/09/2024 136,616 0.08
685,000 Virgin Media Secured Finance Plc* 4.88% 15/01/2027 948,475 0.55
300,000 Virgin Money UK Plc* 4.00% 03/09/2027 414,930 0.24
637,000 Vodafone Group Plc* 4.88% 03/10/2078 916,333 0.53
293,000 William Hill Plc* 4.75% 01/05/2026 404,290 0.23
300,000 Yorkshire Building Society* 3.38% 13/09/2028 408,121 0.24
Total Pound Sterling 12,110,721 6.97
United States Dollar 190,000 AbbVie Inc* 4.70% 14/05/2045 212,947 0.12
190,000 AbbVie Inc* 4.88% 14/11/2048 217,928 0.13
200,000 Abu Dhabi Crude Oil Pipeline LLC* 4.60% 02/11/2047 230,539 0.13
325,000 AerCap Ireland Capital DAC/AerCap Global Aviation Trust* 4.45% 01/10/2025 349,388 0.20

SCHEDULE OF INVESTMENTS FINANCIAL STATEMENTS
ANNUAL REPORT 2019 547
Neuberger Berman Global Opportunistic Bond Fund (Continued)
Schedule of Investments (Continued)
Financial Assets at Fair Value through Profit or Loss (continued)
Principal Amount Security Description Coupon Maturity
DateFair Value
US$% of Net
Assets
Corporate Bonds 44.53% (31 December 2018: 38.55%) (continued)
United States Dollar (continued)
140,000 American Express Co* 3.70% 05/11/2021 144,269 0.08
670,000 Anheuser-Busch Companies LLC/Anheuser-Busch InBev Worldwide Inc* 4.90% 01/02/2046 793,594 0.46
175,000 Apple Inc† 4.65% 23/02/2046 219,216 0.13
100,000 AT&T Inc* 4.35% 01/03/2029 111,195 0.06
95,000 AT&T Inc* 4.35% 15/06/2045 102,439 0.06
260,000 AT&T Inc* 4.50% 09/03/2048 287,324 0.17
95,000 AT&T Inc* 4.90% 15/08/2037 109,309 0.06
70,000 AT&T Inc* 5.35% 01/09/2040 84,428 0.05
300,000 AT&T Inc* 5.45% 01/03/2047 372,150 0.21
200,000 Banco Santander SA* 3.13% 23/02/2023 204,150 0.12
115,000 Bank of America Corp* 3.50% 19/04/2026 122,282 0.07
225,000 Bank of America Corp† 3.71% 24/04/2028 240,507 0.14
175,000 Bank of America Corp* 4.45% 03/03/2026 192,194 0.11
200,000 Banque Ouest Africaine de Developpement* 5.00% 27/07/2027 212,233 0.12
180,000 Brazil Minas SPE via State of Minas Gerais† 5.33% 15/02/2028 193,474 0.11
330,000 British Telecommunications Plc* 3.25% 08/11/2029 329,955 0.19
120,000 Canadian Natural Resources Ltd* 4.95% 01/06/2047 145,697 0.08
80,000 Capital One Financial Corp* 3.20% 30/01/2023 82,254 0.05
400,000 China Minmetals Corp* 3.75% 29/12/2049 405,664 0.23
200,000 Cigna Corp* 4.80% 15/08/2038 233,465 0.13
230,000 Citigroup Inc* 2.70% 30/03/2021 232,190 0.13
300,000 Citigroup Inc† 2.88% 24/07/2023 305,341 0.18
115,000 Citigroup Inc† 3.35% 24/04/2025 119,678 0.07
75,000 Citigroup Inc† 3.52% 27/10/2028 78,933 0.05
75,000 Citigroup Inc† 3.89% 10/01/2028 80,791 0.05
200,000 CNAC HK Finbridge Co Ltd* 3.38% 19/06/2024 203,144 0.12
100,000 Comcast Corp† 3.30% 01/02/2027 105,908 0.06
150,000 Comcast Corp† 4.00% 15/08/2047 165,123 0.10
290,000 Comcast Corp† 4.95% 15/10/2058 377,097 0.22
130,000 Concho Resources Inc* 4.88% 01/10/2047 151,662 0.09
185,000 CVS Health Corp* 5.05% 25/03/2048 218,922 0.13
315,000 Dominion Energy Inc† 4.25% 01/06/2028 348,385 0.20
360,000 DTE Energy Co* 2.25% 01/11/2022 360,016 0.21
275,000 DTE Energy Co* 3.40% 15/06/2029 283,703 0.16
135,000 Energy Transfer Operating LP† 4.95% 15/06/2028 147,877 0.09
200,000 Energy Transfer Operating LP* 6.25% 15/04/2049 241,034 0.14
200,000 Eskom Holdings SOC Ltd* 7.13% 11/02/2025 204,871 0.12
220,000 Evergy Inc* 2.90% 15/09/2029 219,098 0.13

FINANCIAL STATEMENTS SCHEDULE OF INVESTMENTS
548 NEUBERGER BERMAN INVESTMENT FUNDS PLC
Neuberger Berman Global Opportunistic Bond Fund (Continued)
Schedule of Investments (Continued)
Financial Assets at Fair Value through Profit or Loss (continued)
Principal Amount Security Description Coupon Maturity
DateFair Value
US$% of Net
Assets
Corporate Bonds 44.53% (31 December 2018: 38.55%) (continued)
United States Dollar (continued)
100,000 General Motors Financial Co Inc* 5.10% 17/01/2024 108,573 0.06
230,000 Goldman Sachs Group Inc† 3.27% 29/09/2025 238,060 0.14
235,000 Goldman Sachs Group Inc† 3.69% 05/06/2028 249,656 0.14
145,000 Goldman Sachs Group Inc† 3.81% 23/04/2029 155,438 0.09
155,000 Goldman Sachs Group Inc† 4.02% 31/10/2038 168,357 0.10
100,000 Goldman Sachs Group Inc* 5.15% 22/05/2045 122,761 0.07
270,000 HCA Inc* 4.13% 15/06/2029 286,649 0.17
205,000 HCA Inc* 5.25% 15/06/2049 229,209 0.13
190,000 Healthcare Trust of America Holdings LP* 3.10% 15/02/2030 188,653 0.11
200,000 Huarong Finance 2017 Co Ltd* 4.50% 29/12/2049 203,516 0.12
120,000 International Business Machines Corp* 4.15% 15/05/2039 135,265 0.08
220,000 International Business Machines Corp† 4.25% 15/05/2049 251,427 0.14
425,000 JPMorgan Chase & Co† 3.22% 01/03/2025 440,568 0.25
205,000 KazMunayGas National Co JSC* 6.38% 24/10/2048 262,553 0.15
135,000 Kinder Morgan Inc* 4.30% 01/03/2028 147,230 0.08
250,000 Kinder Morgan Inc* 5.55% 01/06/2045 299,283 0.17
250,000 Kraft Heinz Foods Co† 4.63% 30/01/2029 274,912 0.16
15,000 Kraft Heinz Foods Co† 5.20% 15/07/2045 16,271 0.01
155,000 Marathon Oil Corp* 4.40% 15/07/2027 168,523 0.10
155,000 Morgan Stanley* 2.50% 21/04/2021 156,211 0.09
450,000 Morgan Stanley† 3.59% 22/07/2028 478,291 0.28
165,000 Morgan Stanley* 3.63% 20/01/2027 175,647 0.10
115,000 Morgan Stanley* 3.88% 27/01/2026 123,510 0.07
270,000 Morgan Stanley† 4.43% 23/01/2030 305,210 0.18
175,000 MPLX LP* 4.50% 15/04/2038 177,960 0.10
255,000 MPLX LP* 4.70% 15/04/2048 259,510 0.15
200,000 Nexa Resources SA† 5.38% 04/05/2027 214,372 0.12
205,000 Occidental Petroleum Corp* 3.20% 15/08/2026 207,600 0.12
275,000 Occidental Petroleum Corp* 3.50% 15/08/2029 280,565 0.16
75,000 Oracle Corp* 4.00% 15/07/2046 83,358 0.05
221,000 Petrobras Global Finance BV* 6.90% 19/03/2049 259,625 0.15
1,360,000 Petroleos de Venezuela SA* 5.38% 12/04/2027 112,200 0.06
315,000 Petroleos Mexicanos* 6.75% 21/09/2047 316,674 0.18
21,000 Petroleos Mexicanos† 6.84% 23/01/2030 22,430 0.01
29,000 Petroleos Mexicanos† 7.69% 23/01/2050 31,748 0.02
215,000 Plains All American Pipeline LP/PAA Finance Corp* 3.55% 15/12/2029 212,055 0.12
230,000 Samba Funding Ltd* 2.75% 02/10/2024 228,177 0.13
200,000 Saudi Arabian Oil Co* 4.25% 16/04/2039 214,126 0.12
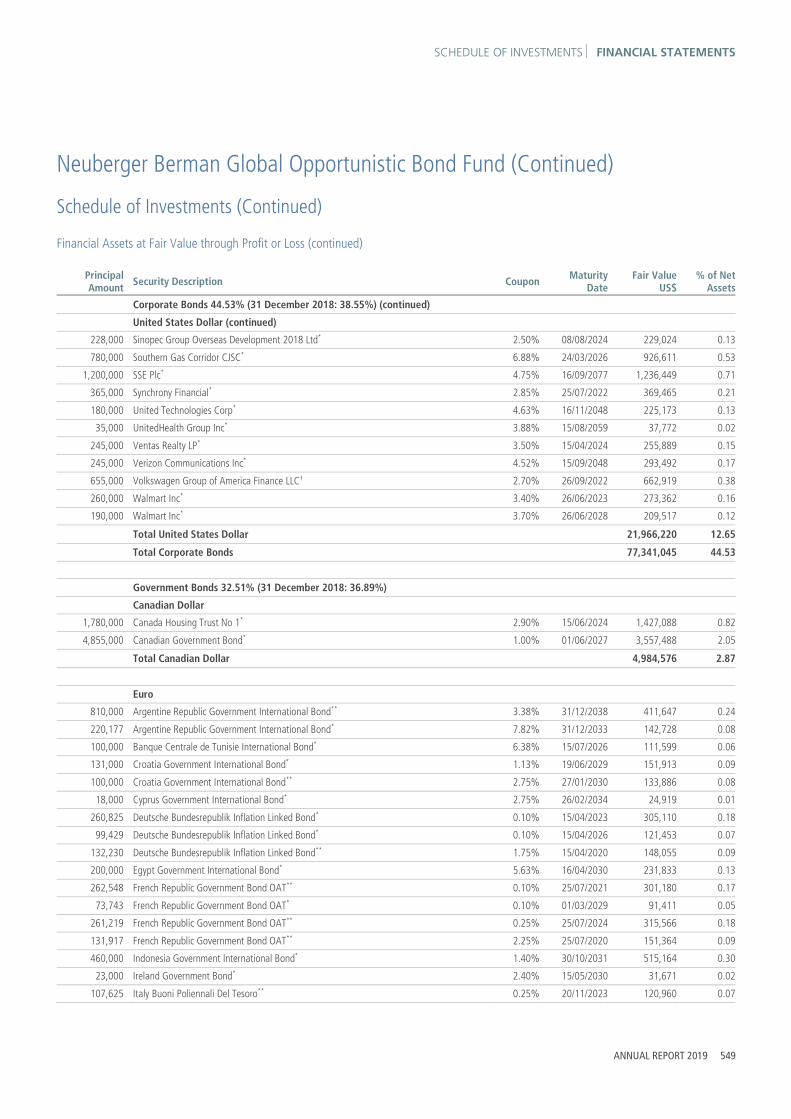
SCHEDULE OF INVESTMENTS FINANCIAL STATEMENTS
ANNUAL REPORT 2019 549
Neuberger Berman Global Opportunistic Bond Fund (Continued)
Schedule of Investments (Continued)
Financial Assets at Fair Value through Profit or Loss (continued)
Principal Amount Security Description Coupon Maturity
DateFair Value
US$% of Net
Assets
Corporate Bonds 44.53% (31 December 2018: 38.55%) (continued)
United States Dollar (continued)
228,000 Sinopec Group Overseas Development 2018 Ltd* 2.50% 08/08/2024 229,024 0.13
780,000 Southern Gas Corridor CJSC* 6.88% 24/03/2026 926,611 0.53
1,200,000 SSE Plc* 4.75% 16/09/2077 1,236,449 0.71
365,000 Synchrony Financial* 2.85% 25/07/2022 369,465 0.21
180,000 United Technologies Corp* 4.63% 16/11/2048 225,173 0.13
35,000 UnitedHealth Group Inc* 3.88% 15/08/2059 37,772 0.02
245,000 Ventas Realty LP* 3.50% 15/04/2024 255,889 0.15
245,000 Verizon Communications Inc* 4.52% 15/09/2048 293,492 0.17
655,000 Volkswagen Group of America Finance LLC† 2.70% 26/09/2022 662,919 0.38
260,000 Walmart Inc* 3.40% 26/06/2023 273,362 0.16
190,000 Walmart Inc* 3.70% 26/06/2028 209,517 0.12
Total United States Dollar 21,966,220 12.65
Total Corporate Bonds 77,341,045 44.53
Government Bonds 32.51% (31 December 2018: 36.89%)
Canadian Dollar 1,780,000 Canada Housing Trust No 1* 2.90% 15/06/2024 1,427,088 0.82
4,855,000 Canadian Government Bond* 1.00% 01/06/2027 3,557,488 2.05
Total Canadian Dollar 4,984,576 2.87
Euro 810,000 Argentine Republic Government International Bond** 3.38% 31/12/2038 411,647 0.24
220,177 Argentine Republic Government International Bond* 7.82% 31/12/2033 142,728 0.08
100,000 Banque Centrale de Tunisie International Bond* 6.38% 15/07/2026 111,599 0.06
131,000 Croatia Government International Bond* 1.13% 19/06/2029 151,913 0.09
100,000 Croatia Government International Bond** 2.75% 27/01/2030 133,886 0.08
18,000 Cyprus Government International Bond* 2.75% 26/02/2034 24,919 0.01
260,825 Deutsche Bundesrepublik Inflation Linked Bond* 0.10% 15/04/2023 305,110 0.18
99,429 Deutsche Bundesrepublik Inflation Linked Bond* 0.10% 15/04/2026 121,453 0.07
132,230 Deutsche Bundesrepublik Inflation Linked Bond** 1.75% 15/04/2020 148,055 0.09
200,000 Egypt Government International Bond* 5.63% 16/04/2030 231,833 0.13
262,548 French Republic Government Bond OAT** 0.10% 25/07/2021 301,180 0.17
73,743 French Republic Government Bond OAT* 0.10% 01/03/2029 91,411 0.05
261,219 French Republic Government Bond OAT** 0.25% 25/07/2024 315,566 0.18
131,917 French Republic Government Bond OAT** 2.25% 25/07/2020 151,364 0.09
460,000 Indonesia Government International Bond* 1.40% 30/10/2031 515,164 0.30
23,000 Ireland Government Bond* 2.40% 15/05/2030 31,671 0.02
107,625 Italy Buoni Poliennali Del Tesoro** 0.25% 20/11/2023 120,960 0.07

FINANCIAL STATEMENTS SCHEDULE OF INVESTMENTS
550 NEUBERGER BERMAN INVESTMENT FUNDS PLC
Neuberger Berman Global Opportunistic Bond Fund (Continued)
Schedule of Investments (Continued)
Financial Assets at Fair Value through Profit or Loss (continued)
Principal Amount Security Description Coupon Maturity
DateFair Value
US$% of Net
Assets
Government Bonds 32.51% (31 December 2018: 36.89%) (continued)
Euro (continued)
83,249 Italy Buoni Poliennali Del Tesoro** 0.40% 11/04/2024 93,508 0.05
81,263 Italy Buoni Poliennali Del Tesoro* 0.40% 15/05/2030 89,404 0.05
89,728 Italy Buoni Poliennali Del Tesoro** 0.45% 22/05/2023 101,512 0.06
106,000 Italy Buoni Poliennali Del Tesoro* 1.35% 01/04/2030 118,383 0.07
95,000 Italy Buoni Poliennali Del Tesoro* 2.05% 01/08/2027 114,174 0.07
22,807 Italy Buoni Poliennali Del Tesoro** 2.55% 15/09/2041 32,752 0.02
44,000 Italy Buoni Poliennali Del Tesoro* 3.00% 01/08/2029 56,933 0.03
2,930,000 Italy Buoni Poliennali Del Tesoro** 3.45% 01/03/2048 4,007,139 2.31
210,000 Ivory Coast Government International Bond* 5.88% 17/10/2031 245,674 0.14
100,000 Ivory Coast Government International Bond* 6.63% 22/03/2048 113,099 0.06
103,000 Ivory Coast Government International Bond* 6.88% 17/10/2040 120,970 0.07
100,000 Kazakhstan Government International Bond* 2.38% 09/11/2028 127,351 0.07
47,000 Kingdom of Belgium Government Bond* 5.00% 28/03/2035 88,102 0.05
100,000 Morocco Government International Bond* 1.50% 27/11/2031 112,576 0.06
500,000 Portugal Obrigacoes do Tesouro OT** 2.20% 17/10/2022 601,487 0.35
35,000 Romanian Government International Bond** 2.88% 26/05/2028 44,306 0.03
100,000 Serbia International Bond* 1.50% 26/06/2029 114,299 0.07
37,000 Spain Government Bond* 1.30% 31/10/2026 44,726 0.03
141,000 Spain Government Bond* 1.85% 30/07/2035 180,983 0.10
2,070,000 Spain Government Bond* 1.95% 30/07/2030 2,662,252 1.53
100,000 Ukraine Government International Bond** 6.75% 20/06/2026 126,249 0.07
Total Euro 12,506,338 7.20
Japanese Yen 38,000,000 Japan Government Thirty Year Bond* 0.70% 20/12/2048 377,359 0.22
174,024,160 Japanese Government CPI Linked Bond** 0.10% 10/03/2029 1,647,765 0.95
Total Japanese Yen 2,025,124 1.17
New Zealand Dollar 140,000 International Bank for Reconstruction & Development* 3.38% 25/01/2022 97,989 0.05
845,000 New Zealand Government Bond* 3.50% 14/04/2033 676,456 0.39
Total New Zealand Dollar 774,445 0.44
United States Dollar 200,000 Abu Dhabi Government International Bond* 3.13% 30/09/2049 195,383 0.11
200,000 Angolan Government International Bond* 9.13% 26/11/2049 213,705 0.12
200,000 Angolan Government International Bond* 9.38% 08/05/2048 219,182 0.13
200,000 Angolan Government International Bond* 9.50% 12/11/2025 235,089 0.13

SCHEDULE OF INVESTMENTS FINANCIAL STATEMENTS
ANNUAL REPORT 2019 551
Neuberger Berman Global Opportunistic Bond Fund (Continued)
Schedule of Investments (Continued)
Financial Assets at Fair Value through Profit or Loss (continued)
Principal Amount Security Description Coupon Maturity
DateFair Value
US$% of Net
Assets
Government Bonds 32.51% (31 December 2018: 36.89%) (continued)
United States Dollar (continued)
200,000 Costa Rica Government International Bond* 7.16% 12/03/2045 213,687 0.12
400,000 Development Bank of Mongolia LLC* 7.25% 23/10/2023 423,451 0.24
208,000 Dominican Republic International Bond* 6.85% 27/01/2045 238,095 0.14
200,000 Ecuador Government International Bond* 7.88% 23/01/2028 178,322 0.10
220,000 Ecuador Government International Bond* 8.88% 23/10/2027 202,476 0.12
200,000 Egypt Government International Bond* 7.05% 15/01/2032 209,508 0.12
229,000 Egypt Government International Bond* 8.50% 31/01/2047 253,902 0.15
220,000 El Salvador Government International Bond* 7.75% 24/01/2023 242,091 0.14
400,000 Export Credit Bank of Turkey* 6.13% 03/05/2024 405,687 0.23
200,000 Ghana Government International Bond* 10.75% 14/10/2030 256,095 0.15
190,000 Indonesia Government International Bond* 8.50% 12/10/2035 298,050 0.17
427,500 Ivory Coast Government International Bond* 5.75% 31/12/2032 426,037 0.24
200,000 Kenya Government International Bond* 8.00% 22/05/2032 217,937 0.13
210,000 Mexico Government International Bond* 5.75% 12/10/2110 249,151 0.14
290,000 Nigeria Government International Bond* 9.25% 21/01/2049 323,413 0.19
200,000 Oman Government International Bond* 6.00% 01/08/2029 208,956 0.12
200,000 Qatar Government International Bond* 5.10% 23/04/2048 257,489 0.15
200,000 Republic of Armenia International Bond* 3.95% 26/09/2029 198,654 0.11
264,000 Republic of South Africa Government International Bond* 4.85% 30/09/2029 264,660 0.15
200,000 Republic of South Africa Government International Bond* 5.88% 16/09/2025 220,529 0.13
200,000 Republic of Uzbekistan Bond* 5.38% 20/02/2029 222,301 0.13
400,000 Russian Foreign Bond - Eurobond* 4.38% 21/03/2029 444,644 0.26
400,000 Russian Foreign Bond - Eurobond* 4.75% 27/05/2026 446,568 0.26
270,000 Senegal Government International Bond* 6.25% 23/05/2033 283,858 0.16
200,000 Sri Lanka Government International Bond* 5.88% 25/07/2022 200,535 0.11
200,000 Sri Lanka Government International Bond* 6.75% 18/04/2028 192,074 0.11
400,000 Sri Lanka Government International Bond* 7.85% 14/03/2029 406,029 0.23
280,000 Turkey Government International Bond* 7.63% 26/04/2029 310,000 0.18
220,000 Ukraine Government International Bond* 0.00% 31/05/2040 210,925 0.12
525,000 Ukraine Government International Bond* 7.75% 01/09/2026 574,931 0.33
100,000 Ukraine Government International Bond* 7.75% 01/09/2027 109,638 0.06
13,952,235 United States Treasury Inflation Indexed Bonds* 0.13% 15/04/2022 13,932,776 8.02
2,109,041 United States Treasury Inflation Indexed Bonds** 1.38% 15/02/2044 2,489,088 1.43
2,238,422 United States Treasury Inflation Indexed Bonds* 2.13% 15/02/2040 2,927,543 1.69
445,000 United States Treasury Note/Bond* 1.38% 30/04/2020 444,596 0.26
3,105,000 United States Treasury Note/Bond* 2.25% 15/11/2027 3,189,900 1.84
1,060,000 United States Treasury Note/Bond* 2.38% 15/08/2024 1,091,739 0.63
650,000 United States Treasury Note/Bond* 2.50% 15/02/2046 663,059 0.38

FINANCIAL STATEMENTS SCHEDULE OF INVESTMENTS
552 NEUBERGER BERMAN INVESTMENT FUNDS PLC
Neuberger Berman Global Opportunistic Bond Fund (Continued)
Schedule of Investments (Continued)
Financial Assets at Fair Value through Profit or Loss (continued)
Principal Amount Security Description Coupon Maturity
DateFair Value
US$% of Net
Assets
Government Bonds 32.51% (31 December 2018: 36.89%) (continued)
United States Dollar (continued)
385,000 United States Treasury Note/Bond* 2.75% 15/08/2042 410,859 0.24
860,000 United States Treasury Note/Bond* 3.63% 15/02/2044 1,055,997 0.61
325,000 United States Treasury Note/Bond* 3.88% 15/08/2040 409,331 0.24
17,000 Uruguay Government International Bond* 4.38% 23/01/2031 19,044 0.01
Total United States Dollar 36,186,984 20.83
Total Government Bonds 56,477,467 32.51
Mortgage Backed Securities 9.57% (31 December 2018: 11.39%)
United States Dollar 585,000 Fannie Mae Pool 2.50% 01/01/2034 589,988 0.34
2,500,000 Fannie Mae Pool 3.00% 01/01/2049 2,534,075 1.46
318,442 Fannie Mae Pool 3.00% 01/09/2049 322,939 0.19
345,695 Fannie Mae Pool 3.00% 01/10/2049 350,634 0.20
573,433 Fannie Mae Pool 3.00% 01/12/2049 581,532 0.33
4,380,000 Fannie Mae Pool 3.50% 01/01/2049 4,503,642 2.59
461,768 Fannie Mae Pool 3.50% 01/06/2049 474,848 0.27
348,204 Fannie Mae Pool 3.50% 01/08/2049 357,975 0.21
1,218,638 Fannie Mae Pool 3.50% 01/09/2049 1,253,236 0.72
1,224,289 Fannie Mae Pool 3.50% 01/10/2049 1,259,761 0.73
371,753 Fannie Mae Pool 3.50% 01/11/2049 382,981 0.22
2,325,000 Fannie Mae Pool 4.00% 01/01/2049 2,417,835 1.39
369,715 Fannie Mae Pool 4.00% 01/07/2049 385,456 0.22
720,000 Ginnie Mae II Pool 3.00% 01/01/2049 739,150 0.43
455,000 Ginnie Mae II Pool 4.00% 01/01/2049 470,950 0.27
Total Mortgage Backed Securities ** 16,625,002 9.57
Number of Shares Security Description
Fair ValueUS$
% of NetAssets
Investment Funds 7.49% (31 December 2018: 9.26%)
Pound Sterling 125,000 NB Global Floating Rate Income Fund Ltd 153,671 0.09
Total Pound Sterling 153,671 0.09
United States Dollar 73,350 iShares JP Morgan EM Local Government Bond UCITS ETF 4,564,571 2.63
158,879 Neuberger Berman China Bond Fund 1,612,619 0.93
239,618 Neuberger Berman Euro Bond Absolute Return Fund 2,427,329 1.39

SCHEDULE OF INVESTMENTS FINANCIAL STATEMENTS
ANNUAL REPORT 2019 553
Neuberger Berman Global Opportunistic Bond Fund (Continued)
Schedule of Investments (Continued)
Financial Assets at Fair Value through Profit or Loss (continued)
Number of Shares Security Description Fair Value
US$% of Net
Assets
Investment Funds 7.49% (31 December 2018: 9.26%) (continued)
United States Dollar (continued)
40,740 Neuberger Berman Ultra Short Term Euro Bond Fund 4,256,111 2.45
Total United States Dollar 12,860,630 7.40
Total Investment Funds μ 13,014,301 7.49
Total Investments 179,362,186 103.26
Forward Currency Contracts 1.74% (31 December 2018: 2.60%)
Amount Receivable
Amount Payable
Maturity Date Counterparty Contracts Unrealised
Gain US$% of Net
Assets
AUD 11,910,608 US$ 8,175,580 22/01/2020 Citibank NA 6 201,075 0.12
AUD 1,245,944 US$ 854,259 22/01/2020 Goldman Sachs International 2 22,006 0.01
AUD 2,002,149 US$ 1,376,067 22/01/2020 State Street Bank and Trust and Co 1 32,032 0.02
AUD 113,307 US$ 76,861 22/01/2020 Westpac Banking Corp 1 2,826 0.00
BRL 18,105,029 US$ 4,382,471 22/01/2020 Goldman Sachs International 4 115,376 0.07
BRL 556,295 US$ 133,918 22/01/2020 State Street Bank and Trust and Co 1 4,283 0.00
CAD 6,785,670 US$ 5,131,286 22/01/2020 Citibank NA 5 102,140 0.06
CAD 4,709,158 US$ 3,560,739 22/01/2020 Goldman Sachs International 5 71,182 0.04
CAD 1,381,219 US$ 1,049,219 22/01/2020 State Street Bank and Trust and Co 1 16,041 0.01
CHF 797,783 US$ 810,041 22/01/2020 Citibank NA 1 14,952 0.01
CHF 668,029 US$ 679,893 22/01/2020 Goldman Sachs International 2 10,921 0.01
CZK 43,556,481 US$ 1,861,070 22/01/2020 Citibank NA 1 62,839 0.04
CZK 19,095,643 US$ 838,474 22/01/2020 State Street Bank and Trust and Co 1 4,989 0.00
€ 6,935,349 US$ 7,738,531 22/01/2020 Citibank NA 8 55,888 0.03
€ 4,631,637 US$ 5,142,859 22/01/2020 Goldman Sachs International 7 62,491 0.04
€ 4,867,269 US$ 5,435,093 22/01/2020 State Street Bank and Trust and Co 6 35,077 0.02
€ 1,037,791 US$ 1,153,865 22/01/2020 Westpac Banking Corp 4 12,475 0.01
£ 639,059 US$ 828,261 22/01/2020 Citibank NA 3 18,813 0.01
£ 1,247,619 US$ 1,583,939 22/01/2020 Goldman Sachs International 3 69,783 0.04
£ 511,194 US$ 662,026 22/01/2020 State Street Bank and Trust and Co 1 15,562 0.01
£ 225,125 US$ 289,960 22/01/2020 Westpac Banking Corp 3 8,445 0.00
HUF 112,755,576 US$ 376,869 22/01/2020 Goldman Sachs International 1 6,213 0.00
¥ 148,890,360 US$ 1,363,594 22/01/2020 Citibank NA 4 7,958 0.00
¥ 67,179,418 US$ 615,347 22/01/2020 Goldman Sachs International 2 3,499 0.00
¥ 221,575,744 US$ 2,039,085 22/01/2020 State Street Bank and Trust and Co 1 2,033 0.00
¥ 32,905,772 US$ 302,840 22/01/2020 Westpac Banking Corp 2 282 0.00
KRW 1,952,543,576 US$ 1,639,691 22/01/2020 Citibank NA 1 52,196 0.03
KRW 904,412,792 US$ 780,608 22/01/2020 Goldman Sachs International 1 3,069 0.00
MXN 59,131,456 US$ 3,048,147 22/01/2020 Goldman Sachs International 5 73,989 0.04
MXN 14,547,833 US$ 740,687 22/01/2020 State Street Bank and Trust and Co 1 27,437 0.02

FINANCIAL STATEMENTS SCHEDULE OF INVESTMENTS
554 NEUBERGER BERMAN INVESTMENT FUNDS PLC
Neuberger Berman Global Opportunistic Bond Fund (Continued)
Schedule of Investments (Continued)
Financial Assets at Fair Value through Profit or Loss (continued)
Forward Currency Contracts 1.74% (31 December 2018: 2.60%) (continued)
Amount Receivable
Amount Payable
Maturity Date Counterparty Contracts Unrealised
Gain US$% of Net
Assets
NOK 14,269,947 US$ 1,561,153 22/01/2020 Citibank NA 6 62,926 0.04
NOK 166,500,051 US$ 18,258,956 22/01/2020 Goldman Sachs International 9 690,601 0.40
NOK 3,430,261 US$ 380,991 22/01/2020 State Street Bank and Trust and Co 1 9,411 0.01
NOK 1,553,461 US$ 170,132 22/01/2020 Westpac Banking Corp 1 6,669 0.00
NZD 2,780,748 US$ 1,773,454 22/01/2020 Citibank NA 3 103,100 0.06
NZD 4,036,786 US$ 2,574,710 22/01/2020 Goldman Sachs International 6 149,466 0.09
PLN 234 US$ 59 22/01/2020 Goldman Sachs International 1 2 0.00
SEK 25,072,078 US$ 2,614,188 22/01/2020 Citibank NA 4 66,744 0.04
SEK 21,503,730 US$ 2,232,802 22/01/2020 Goldman Sachs International 5 66,571 0.04
SEK 28,147,236 US$ 2,883,568 22/01/2020 State Street Bank and Trust and Co 2 126,187 0.07
US$ 7,154,532 ¥ 772,852,198 22/01/2020 Citibank NA 6 35,150 0.02
US$ 635,374 ¥ 68,500,049 22/01/2020 Goldman Sachs International 4 4,364 0.00
US$ 118,353 BRL 473,317 22/01/2020 Goldman Sachs International 1 766 0.00
US$ 1,582,660 KRW 1,826,042,985 22/01/2020 Goldman Sachs International 1 386 0.00
US$ 1,177,459 ¥ 125,081,313 22/01/2020 State Street Bank and Trust and Co 2 25,231 0.01
US$ 1,147,922 TRY 6,735,114 22/01/2020 State Street Bank and Trust and Co 1 21,901 0.01
US$ 1,518,822 ¥ 161,148,765 22/01/2020 Westpac Banking Corp 3 34,347 0.02
ZAR 45,373,931 US$ 3,014,208 22/01/2020 Goldman Sachs International 4 222,264 0.13
EUR Hedged Classes € 43,271 US$ 47,798 22/01/2020 Citibank NA 1 833 0.00
€ 43,897 US$ 48,453 22/01/2020 Goldman Sachs International 2 881 0.00
€ 37,089 US$ 40,947 22/01/2020 Westpac Banking Corp 1 736 0.00
JPY Hedged Classes ¥ 12,945,463 US$ 118,492 22/01/2020 Goldman Sachs International 1 759 0.00
US$ 139,759 ¥ 15,052,270 22/01/2020 Goldman Sachs International 1 1,100 0.00
US$ 190,598 ¥ 20,355,509 22/01/2020 UBS AG 1 3,086 0.00
US$ 23,551,064 ¥ 2,526,582,031 22/01/2020 Westpac Banking Corp 2 276,625 0.16
Total Unrealised Gain on Forward Currency Contracts ∞ 3,025,978 1.74
Futures Contracts 0.44% (31 December 2018: 0.71%)
Number of Contracts Description Unrealised
Gain US$% of Net
Assets
(2) Canadian 10-Year Bond Future March 2020 3,918 0.00
(38) Euro-BOBL Future March 2020 30,285 0.02
4 Euro-Bund Future January 2020 554 0.00
3 Euro-Bund Future January 2020 1,004 0.00
3 Euro-Bund Future January 2020 2,486 0.00
(31) Euro-Bund Future March 2020 85,254 0.05

SCHEDULE OF INVESTMENTS FINANCIAL STATEMENTS
ANNUAL REPORT 2019 555
Neuberger Berman Global Opportunistic Bond Fund (Continued)
Schedule of Investments (Continued)
Financial Assets at Fair Value through Profit or Loss (continued)
Futures Contracts 0.44% (31 December 2018: 0.71%) (continued)
Number of Contracts Description Unrealised
Gain US$% of Net
Assets
(36) US Treasury 10-Year Note (CBT) Future March 2020 40,500 0.02
(225) US Treasury 10-Year Ultra Future March 2020 376,172 0.22
(31) US Treasury Long Bond (CBT) Future March 2020 98,652 0.06
(20) US Treasury Ultra Bond (CBT) Future March 2020 124,538 0.07
Total Unrealised Gain on Futures Contracts ± 763,363 0.44
Credit Default Swap Contracts 0.15% (31 December 2018: 0.00%)
Notional Amount Expiration Date Counterparty Referenced Obligation Fair ValueUS$
% of Net Assets
USD 7,500,000 20/12/24 ICE Clear U.S.1 Buying default protection on CDX.EM.32 252,202 0.15
Total Credit Default Swap Contracts at Fair Value ± 252,202 0.15
Interest Rate Swap Contracts 0.01% (31 December 2018: 0.05%)
Notional Amount Expiration Date Counterparty Receive
/(Pay)# Fixed Rate Variable Rate Fair ValueUS$
% of Net Assets
SEK 57,000,000 02/05/21 LCH Clearnet Ltd1 Receive 0.07% 3M STIBOR 9,507 0.01
SEK 38,810,000 02/08/21 LCH Clearnet Ltd1 Receive 0.12% 3M STIBOR 5,108 0.00
SEK 28,825,000 17/01/22 LCH Clearnet Ltd1 Receive 0.17% 3M STIBOR 2,813 0.00
SEK 9,255,000 16/08/21 LCH Clearnet Ltd1 Receive 0.06% 3M STIBOR 2,251 0.00
Total Interest Rate Swap Contracts at Fair Value ± 19,679 0.01
# Receive - Funds receives variable rate and pays fixed rate.
(Pay) - Fund pays variable rate and receives fixed rate. 1 Centrally cleared swap.
Fair Value % of Net
US$ Assets
Total Financial Assets at Fair Value through Profit or Loss 183,423,408 105.60
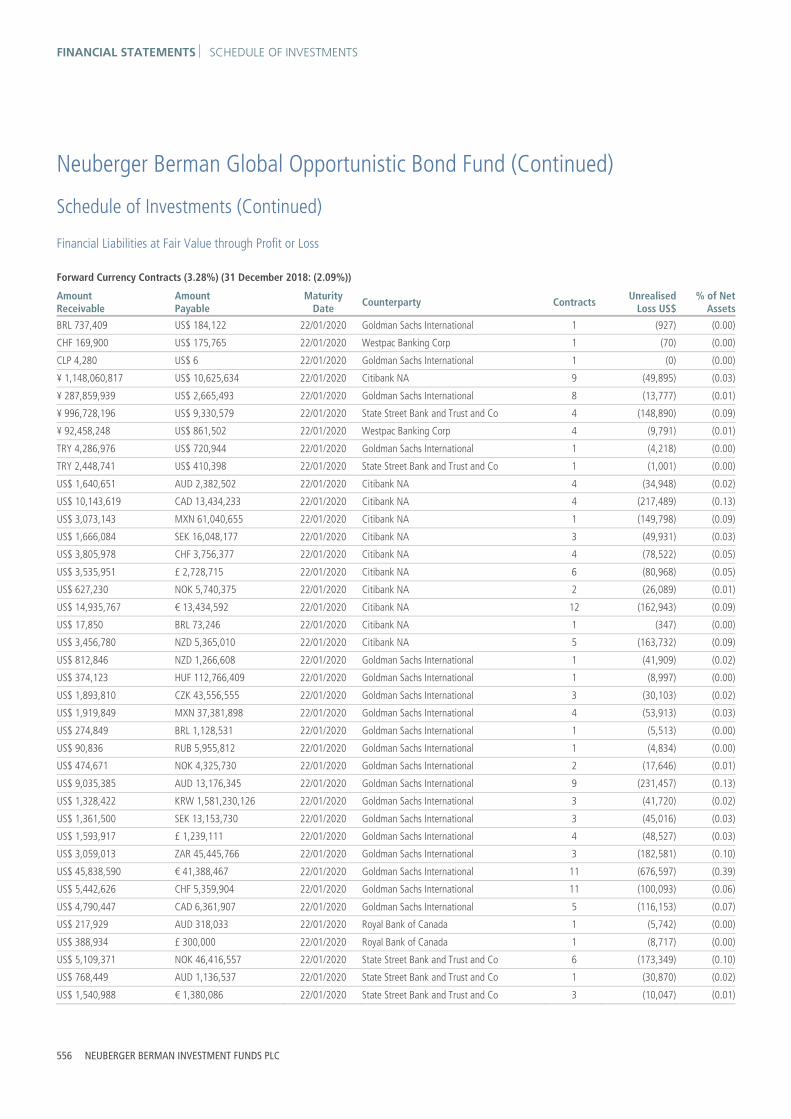
FINANCIAL STATEMENTS SCHEDULE OF INVESTMENTS
556 NEUBERGER BERMAN INVESTMENT FUNDS PLC
Neuberger Berman Global Opportunistic Bond Fund (Continued)
Schedule of Investments (Continued)
Financial Liabilities at Fair Value through Profit or Loss Forward Currency Contracts (3.28%) (31 December 2018: (2.09%))
Amount Receivable
Amount Payable
Maturity Date Counterparty Contracts Unrealised
Loss US$% of Net
Assets
BRL 737,409 US$ 184,122 22/01/2020 Goldman Sachs International 1 (927) (0.00)
CHF 169,900 US$ 175,765 22/01/2020 Westpac Banking Corp 1 (70) (0.00)
CLP 4,280 US$ 6 22/01/2020 Goldman Sachs International 1 (0) (0.00)
¥ 1,148,060,817 US$ 10,625,634 22/01/2020 Citibank NA 9 (49,895) (0.03)
¥ 287,859,939 US$ 2,665,493 22/01/2020 Goldman Sachs International 8 (13,777) (0.01)
¥ 996,728,196 US$ 9,330,579 22/01/2020 State Street Bank and Trust and Co 4 (148,890) (0.09)
¥ 92,458,248 US$ 861,502 22/01/2020 Westpac Banking Corp 4 (9,791) (0.01)
TRY 4,286,976 US$ 720,944 22/01/2020 Goldman Sachs International 1 (4,218) (0.00)
TRY 2,448,741 US$ 410,398 22/01/2020 State Street Bank and Trust and Co 1 (1,001) (0.00)
US$ 1,640,651 AUD 2,382,502 22/01/2020 Citibank NA 4 (34,948) (0.02)
US$ 10,143,619 CAD 13,434,233 22/01/2020 Citibank NA 4 (217,489) (0.13)
US$ 3,073,143 MXN 61,040,655 22/01/2020 Citibank NA 1 (149,798) (0.09)
US$ 1,666,084 SEK 16,048,177 22/01/2020 Citibank NA 3 (49,931) (0.03)
US$ 3,805,978 CHF 3,756,377 22/01/2020 Citibank NA 4 (78,522) (0.05)
US$ 3,535,951 £ 2,728,715 22/01/2020 Citibank NA 6 (80,968) (0.05)
US$ 627,230 NOK 5,740,375 22/01/2020 Citibank NA 2 (26,089) (0.01)
US$ 14,935,767 € 13,434,592 22/01/2020 Citibank NA 12 (162,943) (0.09)
US$ 17,850 BRL 73,246 22/01/2020 Citibank NA 1 (347) (0.00)
US$ 3,456,780 NZD 5,365,010 22/01/2020 Citibank NA 5 (163,732) (0.09)
US$ 812,846 NZD 1,266,608 22/01/2020 Goldman Sachs International 1 (41,909) (0.02)
US$ 374,123 HUF 112,766,409 22/01/2020 Goldman Sachs International 1 (8,997) (0.00)
US$ 1,893,810 CZK 43,556,555 22/01/2020 Goldman Sachs International 3 (30,103) (0.02)
US$ 1,919,849 MXN 37,381,898 22/01/2020 Goldman Sachs International 4 (53,913) (0.03)
US$ 274,849 BRL 1,128,531 22/01/2020 Goldman Sachs International 1 (5,513) (0.00)
US$ 90,836 RUB 5,955,812 22/01/2020 Goldman Sachs International 1 (4,834) (0.00)
US$ 474,671 NOK 4,325,730 22/01/2020 Goldman Sachs International 2 (17,646) (0.01)
US$ 9,035,385 AUD 13,176,345 22/01/2020 Goldman Sachs International 9 (231,457) (0.13)
US$ 1,328,422 KRW 1,581,230,126 22/01/2020 Goldman Sachs International 3 (41,720) (0.02)
US$ 1,361,500 SEK 13,153,730 22/01/2020 Goldman Sachs International 3 (45,016) (0.03)
US$ 1,593,917 £ 1,239,111 22/01/2020 Goldman Sachs International 4 (48,527) (0.03)
US$ 3,059,013 ZAR 45,445,766 22/01/2020 Goldman Sachs International 3 (182,581) (0.10)
US$ 45,838,590 € 41,388,467 22/01/2020 Goldman Sachs International 11 (676,597) (0.39)
US$ 5,442,626 CHF 5,359,904 22/01/2020 Goldman Sachs International 11 (100,093) (0.06)
US$ 4,790,447 CAD 6,361,907 22/01/2020 Goldman Sachs International 5 (116,153) (0.07)
US$ 217,929 AUD 318,033 22/01/2020 Royal Bank of Canada 1 (5,742) (0.00)
US$ 388,934 £ 300,000 22/01/2020 Royal Bank of Canada 1 (8,717) (0.00)
US$ 5,109,371 NOK 46,416,557 22/01/2020 State Street Bank and Trust and Co 6 (173,349) (0.10)
US$ 768,449 AUD 1,136,537 22/01/2020 State Street Bank and Trust and Co 1 (30,870) (0.02)
US$ 1,540,988 € 1,380,086 22/01/2020 State Street Bank and Trust and Co 3 (10,047) (0.01)

SCHEDULE OF INVESTMENTS FINANCIAL STATEMENTS
ANNUAL REPORT 2019 557
Neuberger Berman Global Opportunistic Bond Fund (Continued)
Schedule of Investments (Continued)
Financial Liabilities at Fair Value through Profit or Loss (continued) Forward Currency Contracts (3.28%) (31 December 2018: (2.09%)) (continued)
Amount Receivable
Amount Payable
Maturity Date Counterparty Contracts Unrealised
Loss US$% of Net
Assets
US$ 769,432 CAD 1,015,233 22/01/2020 State Street Bank and Trust and Co 1 (13,563) (0.01)
US$ 372,269 KRW 443,334,672 22/01/2020 State Street Bank and Trust and Co 1 (11,883) (0.01)
US$ 6,713,144 NZD 10,399,356 22/01/2020 State Street Bank and Trust and Co 4 (304,732) (0.17)
US$ 10,900,206 CHF 10,721,068 22/01/2020 State Street Bank and Trust and Co 5 (186,536) (0.11)
US$ 3,908,627 SEK 37,303,713 22/01/2020 State Street Bank and Trust and Co 4 (80,224) (0.05)
US$ 768,842 MXN 14,961,312 22/01/2020 State Street Bank and Trust and Co 1 (21,114) (0.01)
US$ 138,967 CHF 137,534 22/01/2020 UBS AG 1 (3,258) (0.00)
US$ 126,474 BRL 522,352 22/01/2020 UBS AG 1 (3,294) (0.00)
US$ 1,395,676 AUD 2,047,626 22/01/2020 Westpac Banking Corp 2 (44,406) (0.03)
US$ 11,976,077 £ 9,687,306 22/01/2020 Westpac Banking Corp 2 (864,469) (0.50)
US$ 301,784 ZAR 4,638,916 22/01/2020 Westpac Banking Corp 2 (29,104) (0.02)
US$ 1,560,557 CAD 2,054,121 22/01/2020 Westpac Banking Corp 2 (23,677) (0.01)
US$ 1,649,178 ¥ 180,000,000 22/01/2020 Westpac Banking Corp 1 (8,951) (0.00)
US$ 836,340 NZD 1,317,989 22/01/2020 Westpac Banking Corp 3 (53,088) (0.03)
US$ 14,781,351 € 13,265,667 22/01/2020 Westpac Banking Corp 6 (127,511) (0.07)
JPY Hedged Classes ¥ 1,611,992,571 US$ 15,166,273 22/01/2020 Citibank NA 2 (316,875) (0.18)
¥ 1,626,000,431 US$ 15,291,568 22/01/2020 Goldman Sachs International 3 (313,131) (0.18)
¥ 1,383,565,271 US$ 13,015,187 22/01/2020 Westpac Banking Corp 3 (270,022) (0.16)
Total Unrealised Loss on Forward Currency Contracts ∞ (5,702,958) (3.28)
Futures Contracts (0.14%) (31 December 2018: (1.31%))
Number of Contracts Description Unrealised
Loss US$% of Net
Assets
213 10-Year Mini Japanese Government Bond Future March 2020 (80,939) (0.05)
44 Australian Government Bond 10-Year Future March 2020 (85,446) (0.05)
(24) Euro-BTP Future March 2020 (3,502) (0.00)
9 Euro-OAT Future March 2020 (20,912) (0.01)
17 United Kingdom Long Gilt Future March 2020 (24,561) (0.01)
240 US Treasury 2-Year Note (CBT) Future March 2020 (32,704) (0.02)
14 US Treasury 5-Year Note (CBT) Future March 2020 (6,526) (0.00)
Total Unrealised Loss on Futures Contracts ± (254,590) (0.14)

FINANCIAL STATEMENTS SCHEDULE OF INVESTMENTS
558 NEUBERGER BERMAN INVESTMENT FUNDS PLC
Neuberger Berman Global Opportunistic Bond Fund (Continued)
Schedule of Investments (Continued)
Financial Liabilities at Fair Value through Profit or Loss (continued) Credit Default Swap Contracts (2.01%) (31 December 2018: (0.14%))
Notional Amount Expiration Date Counterparty Referenced Obligation Fair ValueUS$
% of NetAssets
EUR 22,825,000 20/12/24 ICE Clear U.S.1 Buying default protection on iTraxx Europe Crossover 32.V1
(3,491,151) (2.01)
Total Credit Default Swap Contracts at Fair Value ± (3,491,151) (2.01)
Interest Rate Swap Contracts (0.01%) (31 December 2018: (0.00%))
Notional Amount Expiration Date Counterparty Receive
/(Pay)# Fixed Rate Variable Rate Fair ValueUS$
% of NetAssets
USD 250,000 07/12/27 Chicago Mercantile Exchange1 Receive 2.43% 3M LIBOR (11,229) (0.01)
Total Interest Rate Swap Contracts at Fair Value ± (11,229) (0.01)
# Receive - Funds receives variable rate and pays fixed rate.
(Pay) - Fund pays variable rate and receives fixed rate. 2 Centrally cleared swap.
Fair Value % of Net
US$ Assets
Total Financial Liabilities at Fair Value through Profit or Loss (9,459,928) (5.44)
Net Financial Assets at Fair Value through Profit or Loss 173,963,480 100.16
Other Net Liabilities (268,728) (0.16)
Net Assets Attributable to Holders of Redeemable Participating Shares 173,694,752 100.00
% ofTotal
AssetsPortfolio Analysis US$
* Transferable securities and/or money market instruments admitted to an official stock exchange listing 115,419,429 57.77
** Transferable securities and/or money market instruments dealt in on a regulated market 44,767,160 22.41
† Other transferable securities and/or money market instruments 6,161,296 3.08
μ Investment funds 13,014,301 6.52
± Financial derivative instruments traded on a regulated market (2,721,726) (1.36)
∞ OTC financial derivative instruments (2,676,980) (1.34)
Total Investments 173,963,480 87.08

STATEMENT OF SIGNIFICANT PURCHASES AND SALES FINANCIAL STATEMENTS
ANNUAL REPORT 2019 559
Neuberger Berman Global Opportunistic Bond Fund (Continued) Statement of Significant Purchases and Sales (Unaudited) In accordance with the European Communities (Undertakings for Collective Investment in Transferable Securities) Regulations, 2011 as amended, a statement of changes in the composition of the Schedule of Investments during the reporting period is provided to ensure that Shareholders can identify changes in the investments held by the Portfolio. The following statements present the aggregate purchases and sales of transferable securities exceeding one percent of the total value of purchases or sales, respectively, for the period. At a minimum, the largest twenty purchases and twenty sales are presented, if available.
Aggregate purchases greater than one percent of the total value of purchases:
Units Security Description Cost US$
13,860,794 United States Treasury Inflation Indexed Bonds, 0.13%, 15/04/2022 13,756,353
8,390,000 Fannie Mae Pool, 4.00%, 01/06/2049 8,611,418
8,265,000 Fannie Mae Pool, 4.00%, 01/07/2049 8,534,978
6,920,000 Fannie Mae Pool, 3.50%, 01/11/2048 7,111,224
6,780,000 Fannie Mae Pool, 3.50%, 01/09/2049 6,966,414
6,780,000 Fannie Mae Pool, 3.50%, 01/10/2049 6,959,896
6,780,000 Fannie Mae Pool, 3.50%, 01/08/2049 6,938,531
6,780,000 Fannie Mae Pool, 3.50%, 01/07/2049 6,922,462
6,560,000 Fannie Mae Pool, 3.50%, 01/12/2048 6,724,699
6,365,000 Fannie Mae Pool, 4.00%, 01/09/2049 6,606,840
6,365,000 Fannie Mae Pool, 4.00%, 01/08/2049 6,584,312
5,750,000 Fannie Mae Pool, 3.50%, 01/01/2049 5,901,519
5,715,000 Fannie Mae Pool, 3.50%, 01/06/2049 5,771,085
4,815,000 Fannie Mae Pool, 4.00%, 15/02/2049 4,920,572
4,705,000 Fannie Mae Pool, 4.00%, 01/03/2049 4,796,256
499,600,580 Japanese Government CPI Linked Bond, 0.10%, 10/03/2025 4,707,419
4,150,000 Italy Buoni Poliennali Del Tesoro, 3.45%, 01/03/2048 4,631,109
73,350 iShares JP Morgan EM Local Government Bond UCITS ETF 4,484,428
4,019,796 United States Treasury Inflation Indexed Bonds, 2.00%, 15/01/2026 4,378,495
4,000,000 CK Hutchison Group Telecom Finance SA, 0.75%, 17/04/2026 4,372,126
40,740 Neuberger Berman Ultra Short Term Euro Bond Fund 4,250,000
3,960,000 Fannie Mae Pool, 4.00%, 01/05/2049 4,057,741
3,960,000 Fannie Mae Pool, 4.00%, 01/04/2049 4,030,624

FINANCIAL STATEMENTS STATEMENT OF SIGNIFICANT PURCHASES AND SALES
560 NEUBERGER BERMAN INVESTMENT FUNDS PLC
Neuberger Berman Global Opportunistic Bond Fund (Continued) Statement of Significant Purchases and Sales (Unaudited) (Continued)
Aggregate sales greater than one percent of the total value of sales:
Units Security Description Proceeds US$
1,208,960,940 Japanese Government CPI Linked Bond, 0.10%, 10/03/2025 11,435,485
8,253,834 United States Treasury Inflation Indexed Bonds, 2.00%, 15/01/2026 9,204,496
8,390,000 Fannie Mae Pool, 4.00%, 01/06/2049 8,664,996
8,265,000 Fannie Mae Pool, 4.00%, 01/07/2049 8,547,928
6,920,000 Fannie Mae Pool, 3.50%, 01/11/2048 7,094,399
6,780,000 Fannie Mae Pool, 3.50%, 01/08/2049 6,967,738
6,780,000 Fannie Mae Pool, 3.50%, 01/10/2049 6,965,355
6,780,000 Fannie Mae Pool, 3.50%, 01/09/2049 6,955,923
6,780,000 Fannie Mae Pool, 3.50%, 01/07/2049 6,940,120
6,560,000 Fannie Mae Pool, 3.50%, 01/12/2048 6,732,247
6,365,000 Fannie Mae Pool, 4.00%, 01/08/2049 6,604,354
6,365,000 Fannie Mae Pool, 4.00%, 01/09/2049 6,600,625
5,715,000 Fannie Mae Pool, 3.50%, 01/06/2049 5,836,614
3,950,066 United States Treasury Inflation Indexed Bonds, 3.88%, 15/04/2029 5,306,981
4,815,000 Fannie Mae Pool, 4.00%, 15/02/2049 4,913,384
4,705,000 Fannie Mae Pool, 4.00%, 01/03/2049 4,794,278
3,960,000 Fannie Mae Pool, 4.00%, 01/05/2049 4,064,608
3,960,000 Fannie Mae Pool, 4.00%, 01/04/2049 4,060,680
66,350 iShares JP Morgan EM Local Government Bond UCITS ETF 4,009,590
3,585,000 CK Hutchison Group Telecom Finance SA, 0.75%, 17/04/2026 3,926,787
364,184 Neuberger Berman Emerging Market Debt - Hard Currency Fund 3,780,233
3,455,000 Fannie Mae Pool, 3.50%, 01/01/2049 3,493,319
3,320,000 Fannie Mae Pool, 4.00%, 01/01/2049 3,398,837
3,400,000 Italy Buoni Poliennali Del Tesoro, 2.70%, 01/03/2047 3,377,449
3,325,000 United States Treasury Bill, 0.00%, 02/01/2020 3,324,657

INVESTMENT MANAGER’S REPORT FINANCIAL STATEMENTS
ANNUAL REPORT 2019 561
Neuberger Berman Multi-Asset Risk Premia Fund* Investment Manager’s Report For the period from 1 January 2019 through 12 March 2019 (the liquidation date of the USD I Accumulating Class), the total return of the USD I Accumulating Class was 0.55% compared to the benchmark, the ICE BofA US Dollar 3-Month Deposit Offered Rate Constant Maturity Index, which returned 0.59%. (Performance data quoted represent past performance and do not indicate future results. Total returns shown are net of all fees and expenses and include reinvestment of income dividends and other distributions, if any).
By investing in a portfolio of diversified risk premia, the strategy seeks attractive absolute returns with managed volatility and low correlation to traditional asset classes, as well as better drawdown characteristics during highly volatile periods. The Portfolio is comprised of well-diversified exposure to four styles of risk premia (value, momentum, carry and liquidity) identified across equities, fixed income, currencies and commodities - for a total of 14 risk premia included in the Portfolio. The Portfolio construction for the risk premia is based upon the team’s proprietary risk-balancing methodology, which seeks balanced risk from each of the four styles of risk premia, and then balanced risk across premia within each style, so as to achieve better diversification and drawdown management, and ultimately to achieve the Portfolio’s investment objectives.
In a reversal of performance from the end of 2018, the New Year began with the majority of asset classes rallying strongly across the world. Fears of an escalation in trade tensions between the US and China, potentially higher interest rates and a potential slowdown in global growth have begun to subside for each of these potential pitfalls. In fact these fears have led to a more dovish fed with expectations for a rate cut increasingly being priced in by market participants. A more dovish Fed, combined with the news that quantitative tightening will end in September, had supported the full spectrum fixed income asset classes. In some regards the fed is following in the lead of other central banks as the European Central Bank has kept the deposit rate steady at -0.4% and said it would not raise rates until at least next year and the Bank of England remained on hold, despite rising wage pressures.
The strategy’s performance during the period was balanced with an equal number of premia contributing to performance as there were detracting. Commodity value which went long four commodity markets with the highest ratio of longs to total positions and short the four markets with the lowest positioning was the stand out contributor. Equity Momentum was the premia which detracted the most during the reporting period as global equity markets outperformed following poor performance at the end of last year which had the strategy positions short.
* Portfolio liquidated on 26 March 2019.

FINANCIAL STATEMENTS BALANCE SHEET
The accompanying notes form an integral part of the financial statements.
562 NEUBERGER BERMAN INVESTMENT FUNDS PLC
Neuberger Berman Multi-Asset Risk Premia Fund (Continued)
Balance Sheet
As at As at
Note 31 December 2019 31 December 2018
US$ US$
Current Assets
Financial Assets at Fair Value through Profit or Loss 2 – 48,177,537
Cash and cash equivalents 3 643 1,877,285
Receivable for shares issued – 31,584
Income receivable and other assets 38,211 133,424
Total Assets 38,854 50,219,830
Current Liabilities
Financial Liabilities at Fair Value through Profit or Loss 2 – 888,174
Bank overdraft 4 3,848 –
Payable for shares redeemed – 19,813
Due to brokers – 1,350,000
Accrued expenses 23,893 77,964
Payable for investments purchased – 77
Other payables 11,113 59,337
Liabilities (excluding Net Assets Attributable to Holders of Redeemable Participating Shares) 38,854 2,395,365
Net Assets Attributable to Holders of Redeemable Participating Shares – 47,824,465
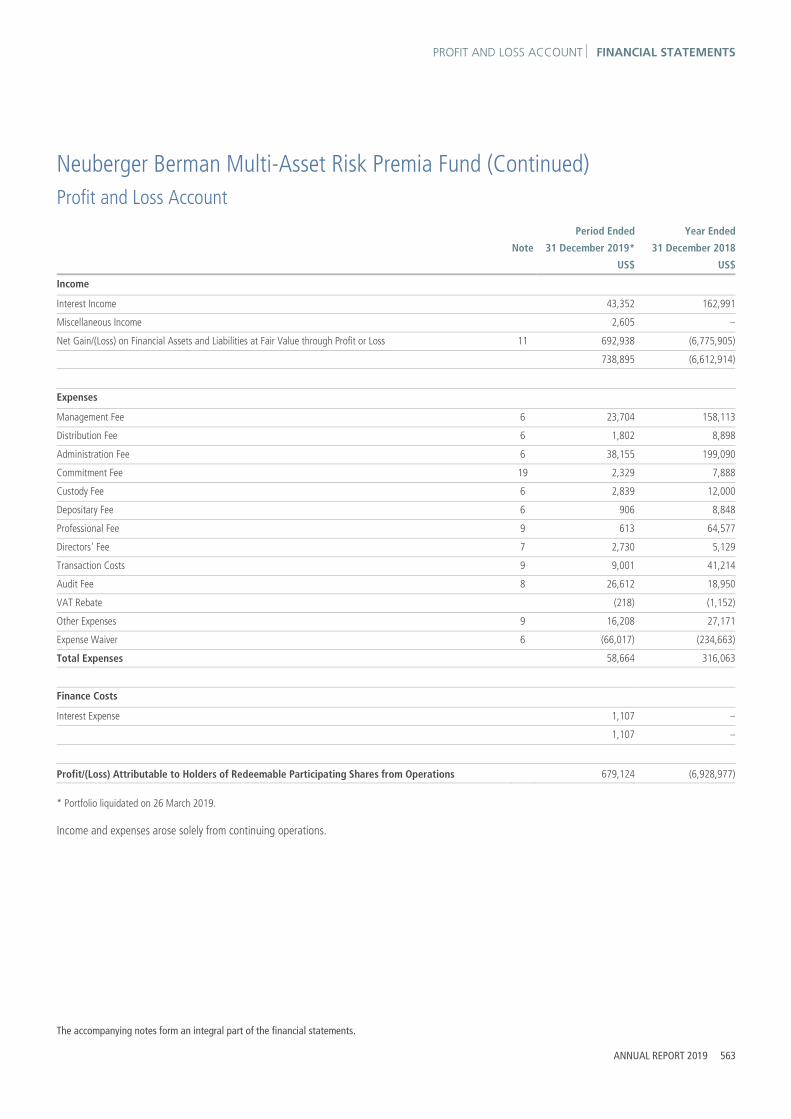
PROFIT AND LOSS ACCOUNT FINANCIAL STATEMENTS
The accompanying notes form an integral part of the financial statements.
ANNUAL REPORT 2019 563
Neuberger Berman Multi-Asset Risk Premia Fund (Continued)
Profit and Loss Account
Period Ended Year Ended
Note 31 December 2019* 31 December 2018
US$ US$
Income
Interest Income 43,352 162,991
Miscellaneous Income 2,605 –
Net Gain/(Loss) on Financial Assets and Liabilities at Fair Value through Profit or Loss 11 692,938 (6,775,905)
738,895 (6,612,914)
Expenses
Management Fee 6 23,704 158,113
Distribution Fee 6 1,802 8,898
Administration Fee 6 38,155 199,090
Commitment Fee 19 2,329 7,888
Custody Fee 6 2,839 12,000
Depositary Fee 6 906 8,848
Professional Fee 9 613 64,577
Directors' Fee 7 2,730 5,129
Transaction Costs 9 9,001 41,214
Audit Fee 8 26,612 18,950
VAT Rebate (218) (1,152)
Other Expenses 9 16,208 27,171
Expense Waiver 6 (66,017) (234,663)
Total Expenses 58,664 316,063
Finance Costs
Interest Expense 1,107 –
1,107 –
Profit/(Loss) Attributable to Holders of Redeemable Participating Shares from Operations 679,124 (6,928,977)
* Portfolio liquidated on 26 March 2019. Income and expenses arose solely from continuing operations.

FINANCIAL STATEMENTS STATEMENT OF CHANGES IN NET ASSETS
The accompanying notes form an integral part of the financial statements.
564 NEUBERGER BERMAN INVESTMENT FUNDS PLC
Neuberger Berman Multi-Asset Risk Premia Fund (Continued)
Statement of Changes in Net Assets Attributable to Holders of Redeemable Participating Shares
Period Ended Year Ended
31 December 2019* 31 December 2018
US$ US$
Net Assets Attributable to Holders of Redeemable Participating Shares at beginning of period/year 47,824,465 98,292,225
Profit/(Loss) Attributable to Holders of Redeemable Participating Shares from Operations 679,124 (6,928,977)
Subscriptions 5 1,321,002 20,451,788
Redemptions 5 (49,824,591) (63,990,571)
Net Assets Attributable to Holders of Redeemable Participating Shares at end of period/year – 47,824,465
* Portfolio liquidated on 26 March 2019.

STATEMENT OF SIGNIFICANT PURCHASES AND SALES FINANCIAL STATEMENTS
ANNUAL REPORT 2019 565
Neuberger Berman Multi-Asset Risk Premia Fund (Continued) Statement of Significant Purchases and Sales (Unaudited) In accordance with the European Communities (Undertakings for Collective Investment in Transferable Securities) Regulations, 2011 as amended, a statement of changes in the composition of the Schedule of Investments during the reporting period is provided to ensure that Shareholders can identify changes in the investments held by the Portfolio. The following statements present the aggregate purchases and sales of transferable securities exceeding one percent of the total value of purchases or sales, respectively, for the period. At a minimum, the largest twenty purchases and twenty sales are presented, if available.
Total purchases:
Units Security Description Cost US$
8,000,000 United States Treasury Bill, 0.00%, 12/03/2019 7,994,269
5,000,000 United States Treasury Bill, 0.00%, 26/03/2019 4,995,731
5,000,000 United States Treasury Bill, 0.00%, 28/03/2019 4,995,063
4,250,000 United States Treasury Bill, 0.00%, 02/04/2019 4,239,268
4,000,000 United States Treasury Bill, 0.00%, 21/03/2019 3,999,204
4,000,000 United States Treasury Bill, 0.00%, 04/04/2019 3,995,557
3,750,000 United States Treasury Bill, 0.00%, 19/03/2019 3,746,842
3,500,000 United States Treasury Bill, 0.00%, 09/04/2019 3,486,998
3,000,000 United States Treasury Bill, 0.00%, 11/04/2019 2,995,979
3,000,000 United States Treasury Bill, 0.00%, 05/03/2019 2,989,579
Total sales:
Units Security Description Proceeds US$
5,110,000 United States Treasury Bill, 0.00%, 28/02/2019 5,106,569
5,090,000 United States Treasury Note/Bond, 1.00%, 15/03/2019 5,085,296
5,000,000 United States Treasury Bill, 0.00%, 28/03/2019 4,998,931
4,250,000 United States Treasury Bill, 0.00%, 02/04/2019 4,247,106
4,000,000 United States Treasury Bill, 0.00%, 04/04/2019 3,997,863
3,500,000 United States Treasury Bill, 0.00%, 09/04/2019 3,496,938
3,300,000 United States Treasury Bill, 0.00%, 31/01/2019 3,298,668
3,000,000 United States Treasury Bill, 0.00%, 11/04/2019 2,996,978
2,000,000 United States Treasury Bill, 0.00%, 19/03/2019 1,999,868
2,000,000 United States Treasury Bill, 0.00%, 26/03/2019 1,998,944
1,000,000 United States Treasury Bill, 0.00%, 24/01/2019 999,545

FINANCIAL STATEMENTS INVESTMENT MANAGER’S REPORT
566 NEUBERGER BERMAN INVESTMENT FUNDS PLC
Neuberger Berman Multi-Asset Class Income Fund Investment Manager’s Report For the 12 months ended 31 December 2019, the total return for the USD I Accumulating Class was 12.72%. (Performance for all share classes is provided in Appendix II. Performance data quoted represent past performance and do not indicate future results. Total returns shown are net of all fees and expenses and include reinvestment of income dividends and other distributions, if any).
After a particularly challenging 2018, 2019 proved very strong across all major asset classes: equities, fixed income, commodities, inflation-linked strategies, Real Estate Investment Trusts (“REITS”) and hedge funds. The global macroeconomic backdrop remained healthy and the market cycle was extended by another year, becoming the longest growth cycle since 1900. Central banks globally (the US Federal Reserve (“Fed”) and the European Central Bank in particular) shifted to a more dovish stance and indicated their willingness to support the economy further via ultra-easy monetary policy, fueling the equity market rally. Job market and confidence indicators remained robust, while geopolitical tensions eased with US-China tensions reducing and the Brexit impasse broken in the UK after an emphatic Conservative election victory.
High equity allocation and pro-risk positioning in tactical strategies in the beginning of the year contributed positively to the Portfolio’s performance. The portfolio is naturally tilted towards high-dividend equities that slightly underperformed broad equity indices, but still had a very strong year. Our allocation to REITS also contributed positively both in income and total return terms, and significantly outperformed equity indices in the first 3 quarters of the year. High yield fixed income strategies such as European High Yield and CLOs also performed well, both with positive contributions by their overall respective markets and security selection in the Portfolio. Despite political turmoil in Argentina and Chile, good news on the trade front and the dovish Fed shift boosted confidence in emerging market debt, which also posted strong returns. Diversifying strategies were modestly positive in 2019, with tactical asset allocation and options posting small gains in the beginning of the year and currency overlay being flat.
As we enter 2020, the balance of economic and market risks has changed drastically as the Coronavirus outbreak has created significant economic and social disruption, which will likely lead to the next global recession. With the pandemic spreading rapidly across the globe, governments have been forced to expand quarantine measures, with several countries essentially in complete lockdown. The unique circumstances have created extreme market volatility, with equities posting their worst drawdown since 2008, crude oil dropping to multi-year lows, credit markets suffering and even Treasury securities experiencing pricing and liquidity challenges. Despite the exceptional fiscal and monetary measures taken by authorities globally, we expect the level of uncertainty around the path of the coronavirus and its impact on GDP growth and corporate earnings to remain high for an extended period, accompanied by elevated market volatility. This is a challenging environment, where correlations are rising across assets and diversification is not as beneficial as in more normal periods. Amid this volatility, the multi-asset class portfolio management team continues to focus on risk management, and are closely evaluating the path of the virus and its impact on the economy. The team has increased cash levels in the portfolio and is monitoring the elevated level of overall market volatility, scarce liquidity in credit markets, and the lack of a bottoming process in equity markets. They are looking for evidence of normalization in these areas as key indicators to increase risk and potentially deploy capital into asset classes that provide opportunities after the selloff.
Diversifying and hedging strategies remain a key component of the investment process and their allocation was increased during 2019. We believe they will continue to play a crucial role in a market environment of increased volatility and provide uncorrelated returns if traditional asset classes face challenges.
Finally, we continue to believe that a multi-dimensional approach to yield is prudent, and during 2019, we expanded our income sources and diversification within the Portfolio. Our multi-asset class approach avoids concentration of Portfolio risk in equity, duration or spread risk and attempts to diversify across asset classes to achieve a high and sustainable income level in a risk managed framework.

BALANCE SHEET FINANCIAL STATEMENTS
The accompanying notes form an integral part of the financial statements.
ANNUAL REPORT 2019 567
Neuberger Berman Multi-Asset Class Income Fund (Continued)
Balance Sheet
As at As at
Note 31 December 2019 31 December 2018
US$ US$
Current Assets
Financial Assets at Fair Value through Profit or Loss 2 95,220,727 40,076,432
Cash and cash equivalents 3 1,819,066 1,628,741
Receivable for investments sold 89,943 83,639
Receivable for shares issued 80,538 25,000
Due from brokers 3,540,173 1,388,038
Income receivable and other assets 822,848 238,361
Total Assets 101,573,295 43,440,211
Current Liabilities
Financial Liabilities at Fair Value through Profit or Loss 2 2,050,824 1,083,180
Bank overdraft 4 – 10,110
Payable for shares redeemed 30,000 15,275
Accrued expenses 208,373 122,764
Payable for investments purchased 64,555 5,246,758
Other payables 98,718 94,441
Liabilities (excluding Net Assets Attributable to Holders of Redeemable Participating Shares) 2,452,470 6,572,528
Net Assets Attributable to Holders of Redeemable Participating Shares 99,120,825 36,867,683

FINANCIAL STATEMENTS PROFIT AND LOSS ACCOUNT
The accompanying notes form an integral part of the financial statements.
568 NEUBERGER BERMAN INVESTMENT FUNDS PLC
Neuberger Berman Multi-Asset Class Income Fund (Continued)
Profit and Loss Account
Year Ended Year Ended
Note 31 December 2019 31 December 2018
US$ US$
Income
Interest Income 1,091,547 532,706
Dividend Income 1,372,337 1,038,617
Miscellaneous Income 15,433 786
Net Gain/(Loss) on Financial Assets and Liabilities at Fair Value through Profit or Loss 11 5,750,007 (3,781,219)
8,229,324 (2,209,110)
Expenses
Management Fee 6 695,444 332,367
Distribution Fee 6 284,401 45,685
Administration Fee 6 144,884 128,009
Commitment Fee 19 8,136 3,038
Custody Fee 6 14,597 12,000
Depositary Fee 6 6,294 4,095
Professional Fee 9 28,867 38,547
Directors' Fee 7 4,530 6,613
Transaction Costs 9 171,884 190,874
Audit Fee 8 15,537 15,264
VAT Rebate (1,066) (488)
Other Expenses 9 16,056 13,696
Expense Waiver 6 (196,582) (317,714)
Total Expenses 1,192,982 471,986
Finance Costs
Interest Expense 6,834 1,356
Distribution Paid 1 366,543 421,713
373,377 423,069
Withholding Tax 1 272,488 196,904
Profit/(Loss) Attributable to Holders of Redeemable Participating Shares from Operations 6,390,477 (3,301,069)
Income and expenses arose solely from continuing operations.

STATEMENT OF CHANGES IN NET ASSETS FINANCIAL STATEMENTS
The accompanying notes form an integral part of the financial statements.
ANNUAL REPORT 2019 569
Neuberger Berman Multi-Asset Class Income Fund (Continued)
Statement of Changes in Net Assets Attributable to Holders of Redeemable Participating Shares
Year Ended Year Ended
31 December 2019 31 December 2018
US$ US$
Net Assets Attributable to Holders of Redeemable Participating Shares at beginning of year 36,867,683 28,306,904
Profit/(Loss) Attributable to Holders of Redeemable Participating Shares from Operations 6,390,477 (3,301,069)
Subscriptions 5 73,678,168 31,526,742
Redemptions 5 (17,815,503) (19,664,894)
Net Assets Attributable to Holders of Redeemable Participating Shares at end of year 99,120,825 36,867,683

FINANCIAL STATEMENTS SCHEDULE OF INVESTMENTS
570 NEUBERGER BERMAN INVESTMENT FUNDS PLC
Neuberger Berman Multi-Asset Class Income Fund (Continued)
Schedule of Investments
Financial Assets at Fair Value through Profit or Loss
Number of Shares Security Description Fair Value
US$% of Net
Assets
Equities 26.24% (31 December 2018: 37.00%)
Australian Dollar 46,555 Alumina Ltd* 75,269 0.07
4,592 Aurizon Holdings Ltd* 16,882 0.02
4,013 BHP Group Ltd* 109,791 0.11
2,099 Coca-Cola Amatil Ltd* 16,319 0.02
4,325 Crown Resorts Ltd* 36,514 0.04
15,479 Fortescue Metals Group Ltd* 116,318 0.12
14,091 Harvey Norman Holdings Ltd* 40,314 0.04
4,391 Sonic Healthcare Ltd* 88,741 0.09
18,109 South32 Ltd* 34,370 0.03
4,100 Wesfarmers Ltd* 119,319 0.12
Total Australian Dollar 653,837 0.66
Canadian Dollar 1,009 BCE Inc* 46,811 0.05
2,174 Genworth MI Canada Inc* 95,259 0.09
6,403 Inter Pipeline Ltd** 111,296 0.11
1,430 Nutrien Ltd* 68,558 0.07
3,723 Power Corp of Canada** 96,036 0.10
1,843 Power Financial Corp** 49,658 0.05
740 Royal Bank of Canada* 58,635 0.06
627 Sun Life Financial Inc* 28,629 0.03
3,265 Suncor Energy Inc* 107,159 0.11
526 Toronto-Dominion Bank* 29,542 0.03
Total Canadian Dollar 691,583 0.70
Danish Krone 318 Novo Nordisk A/S Class B* 18,441 0.02
2,550 Pandora A/S* 111,010 0.11
Total Danish Krone 129,451 0.13
Euro 2,630 ACS Actividades de Construccion y Servicios SA* 105,245 0.11
1,966 Ageas* 116,256 0.12
2,558 AXA SA* 72,100 0.07
16,238 Banco Bilbao Vizcaya Argentaria SA* 90,826 0.09
346 BAWAG Group AG* 15,768 0.02
252 Bayerische Motoren Werke AG - Preferred Shares* 15,572 0.02
3,396 Compania de Distribucion Integral Logista Holdings SA* 76,621 0.08

SCHEDULE OF INVESTMENTS FINANCIAL STATEMENTS
ANNUAL REPORT 2019 571
Neuberger Berman Multi-Asset Class Income Fund (Continued)
Schedule of Investments (Continued)
Financial Assets at Fair Value through Profit or Loss (continued)
Number of Shares Security Description Fair Value
US$% of Net
Assets
Equities 26.24% (31 December 2018: 37.00%) (continued)
Euro (continued) 334 Daimler AG* 18,510 0.02
7,665 EDP - Energias de Portugal SA* 33,246 0.03
3,516 Enagas SA* 89,748 0.09
3,877 Endesa SA* 103,532 0.10
5,893 Engie SA* 95,254 0.10
5,590 Eni SpA* 86,881 0.09
4,866 Eutelsat Communications SA* 79,146 0.08
857 Fortum OYJ* 21,169 0.02
4,460 Iberdrola SA* 45,958 0.05
2,816 Intesa Sanpaolo SpA* 7,423 0.01
510 Kesko OYJ Class B* 36,126 0.04
4,232 Koninklijke Ahold Delhaize NV* 105,911 0.11
32,765 Koninklijke KPN NV* 96,765 0.10
1,551 METRO AG* 24,983 0.02
898 Naturgy Energy Group SA* 22,579 0.02
6,978 Nokia OYJ* 25,829 0.03
1,253 Nokian Renkaat OYJ* 36,064 0.04
14,785 NOS SGPS SA* 79,662 0.08
1,921 Oesterreichische Post AG* 73,315 0.07
2,894 Orion OYJ Class B* 134,122 0.13
1,741 Proximus SADP* 49,873 0.05
860 Randstad NV* 52,554 0.05
2,251 Red Electrica Corp SA* 45,292 0.04
1,113 Renault SA* 52,697 0.05
6,130 Repsol SA* 95,851 0.10
6,130 Repsol SA (Right, 10/01/2020)* 2,911 0.00
1,141 Sanofi* 114,783 0.12
2,995 Signify NV* 93,662 0.09
22,958 Snam SpA* 120,795 0.12
1,362 Societe BIC SA* 94,788 0.09
1,855 Societe Generale SA* 64,581 0.06
13,935 Telefonica SA* 97,403 0.10
1,675 Total SA* 92,505 0.09
1,616 UNIQA Insurance Group AG* 16,498 0.02
3,389 UPM-Kymmene OYJ* 117,664 0.12
Total Euro 2,820,468 2.84

FINANCIAL STATEMENTS SCHEDULE OF INVESTMENTS
572 NEUBERGER BERMAN INVESTMENT FUNDS PLC
Neuberger Berman Multi-Asset Class Income Fund (Continued)
Schedule of Investments (Continued)
Financial Assets at Fair Value through Profit or Loss (continued)
Number of Shares Security Description Fair Value
US$% of Net
Assets
Equities 26.24% (31 December 2018: 37.00%) (continued)
Hong Kong Dollar 4,700 ASM Pacific Technology Ltd* 65,206 0.06
67,500 HK Electric Investments & HK Electric Investments Ltd* 66,532 0.07
15,500 Kerry Properties Ltd* 49,234 0.05
20,000 NWS Holdings Ltd* 28,029 0.03
9,000 Power Assets Holdings Ltd* 65,838 0.07
10,400 Sands China Ltd* 55,592 0.06
8,300 VTech Holdings Ltd* 82,022 0.08
32,000 Xinyi Glass Holdings Ltd* 42,383 0.04
Total Hong Kong Dollar 454,836 0.46
Israeli Shekel 2,100 Israel Chemicals Ltd* 9,880 0.01
Total Israeli Shekel 9,880 0.01
Japanese Yen 8,300 Amada Holdings Co Ltd* 94,385 0.10
2,400 Bridgestone Corp* 89,144 0.09
3,100 Brother Industries Ltd* 64,013 0.06
3,500 Canon Inc* 95,772 0.10
5,700 Concordia Financial Group Ltd* 23,404 0.02
600 Daito Trust Construction Co Ltd* 74,132 0.08
4,000 Daiwa Securities Group Inc* 20,190 0.02
200 Idemitsu Kosan Co Ltd* 5,525 0.01
5,700 ITOCHU Corp* 132,083 0.13
4,500 Japan Tobacco Inc* 100,316 0.10
22,800 JXTG Holdings Inc* 103,461 0.10
12,200 Marubeni Corp* 90,122 0.09
11,600 Mitsubishi Chemical Holdings Corp* 86,418 0.09
3,700 Mitsubishi Corp* 98,000 0.10
1,700 Mitsubishi Tanabe Pharma Corp* 31,181 0.03
9,400 Mitsubishi UFJ Financial Group Inc* 50,810 0.05
2,800 Mitsui & Co Ltd* 49,762 0.05
1,200 Mitsui Chemicals Inc* 29,226 0.03
3,100 MS&AD Insurance Group Holdings Inc* 102,308 0.10
4,600 Nippon Telegraph & Telephone Corp* 116,238 0.12
2,300 Nomura Real Estate Holdings Inc* 55,156 0.06
3,100 NTT DOCOMO Inc* 86,338 0.09
5,000 Seiko Epson Corp* 75,480 0.08

SCHEDULE OF INVESTMENTS FINANCIAL STATEMENTS
ANNUAL REPORT 2019 573
Neuberger Berman Multi-Asset Class Income Fund (Continued)
Schedule of Investments (Continued)
Financial Assets at Fair Value through Profit or Loss (continued)
Number of Shares Security Description Fair Value
US$% of Net
Assets
Equities 26.24% (31 December 2018: 37.00%) (continued)
Japanese Yen (continued)
2,100 Sekisui House Ltd* 44,837 0.05
10,100 Shimizu Corp* 102,868 0.10
800 Showa Denko KK* 21,081 0.02
1,000 Sompo Holdings Inc* 39,262 0.04
3,700 SUMCO Corp* 61,293 0.06
6,300 Sumitomo Corp* 93,559 0.09
1,400 Sumitomo Mitsui Financial Group Inc* 51,700 0.05
2,300 Takeda Pharmaceutical Co Ltd* 90,953 0.09
3,100 Teijin Ltd* 57,904 0.06
1,000 Tokio Marine Holdings Inc* 55,978 0.06
700 Tokyo Electron Ltd* 152,803 0.15
Total Japanese Yen 2,445,702 2.47
New Zealand Dollar 1,918 Mercury NZ Ltd* 6,535 0.00
2,741 Meridian Energy Ltd* 9,246 0.01
Total New Zealand Dollar 15,781 0.01
Norwegian Krone 11,462 Orkla ASA* 116,128 0.12
2,352 Telenor ASA* 42,123 0.04
Total Norwegian Krone 158,251 0.16
Pound Sterling 3,091 Anglo American Plc* 88,980 0.09
349 AstraZeneca Plc* 35,170 0.04
25,782 Avast Plc* 154,653 0.16
11,918 Barratt Developments Plc* 117,876 0.12
1,263 Berkeley Group Holdings Plc* 81,299 0.08
223 BHP Group Plc* 5,249 0.00
671 British American Tobacco Plc* 28,725 0.03
1,403 Carnival Plc* 67,728 0.07
5,052 GlaxoSmithKline Plc* 119,062 0.12
4,330 Imperial Brands Plc* 107,209 0.11
148,238 Lloyds Banking Group Plc* 122,737 0.12
4,174 Persimmon Plc* 149,020 0.15
4,433 RELX Plc* 111,903 0.11
1,947 Rio Tinto Plc* 116,145 0.12

FINANCIAL STATEMENTS SCHEDULE OF INVESTMENTS
574 NEUBERGER BERMAN INVESTMENT FUNDS PLC
Neuberger Berman Multi-Asset Class Income Fund (Continued)
Schedule of Investments (Continued)
Financial Assets at Fair Value through Profit or Loss (continued)
Number of Shares Security Description Fair Value
US$% of Net
Assets
Equities 26.24% (31 December 2018: 37.00%) (continued)
Pound Sterling (continued)
252 Royal Dutch Shell Plc Class A* 7,461 0.01
11,464 Tate & Lyle Plc* 115,451 0.12
1,117 Unilever Plc* 64,376 0.06
Total Pound Sterling 1,493,044 1.51
Singapore Dollar 20,700 Genting Singapore Ltd* 14,163 0.01
10,100 Singapore Technologies Engineering Ltd* 29,594 0.03
5,700 Venture Corp Ltd* 68,672 0.07
Total Singapore Dollar 112,429 0.11
Swedish Krona 14,194 Nordea Bank Abp* 114,691 0.12
17,141 Telia Co AB* 73,702 0.07
Total Swedish Krona 188,393 0.19
Swiss Franc 1,696 Adecco Group AG* 107,223 0.11
10 Chocoladefabriken Lindt & Spruengli AG* 77,606 0.08
1,231 Nestle SA* 133,200 0.13
1,358 Novartis AG* 128,879 0.13
309 Roche Holding AG* 100,197 0.10
665 Swiss Re AG* 74,648 0.08
Total Swiss Franc 621,753 0.63
United States Dollar 245 3M Co* 43,223 0.04
5,487 AES Corp* 109,191 0.11
2,098 Altria Group Inc* 104,711 0.11
7,968 American Homes 4 Rent* 208,682 0.21
1,231 AmerisourceBergen Corp Class A* 104,660 0.11
17,560 Apollo Investment Corp* 306,598 0.31
25,883 Ares Capital Corp* 482,718 0.49
2,931 AT&T Inc* 114,543 0.12
87 Automatic Data Processing Inc* 14,833 0.02
11,518 Bain Capital Specialty Finance Inc* 227,596 0.23
27,143 Barings BDC Inc* 279,030 0.28
12,577 BlackRock TCP Capital Corp* 176,707 0.18

SCHEDULE OF INVESTMENTS FINANCIAL STATEMENTS
ANNUAL REPORT 2019 575
Neuberger Berman Multi-Asset Class Income Fund (Continued)
Schedule of Investments (Continued)
Financial Assets at Fair Value through Profit or Loss (continued)
Number of Shares Security Description Fair Value
US$% of Net
Assets
Equities 26.24% (31 December 2018: 37.00%) (continued)
United States Dollar (continued)
341 Bristol-Myers Squibb Co* 21,889 0.02
317 Broadcom Inc* 100,178 0.10
6,781 Brookfield Property Partners LP* 123,957 0.13
6,885 Brookfield Property REIT Inc* 172,882 0.17
1,849 Cardinal Health Inc* 93,522 0.09
272 Cedar Realty Trust Inc* 6,822 0.01
828 Celanese Corp Class A* 101,943 0.10
1,341 CenterPoint Energy Inc* 36,569 0.04
5,512 CenturyLink Inc* 72,814 0.07
508 CH Robinson Worldwide Inc* 39,726 0.04
716 Chevron Corp* 86,285 0.09
346 Cinemark Holdings Inc* 11,712 0.01
2,042 Cisco Systems Inc* 97,934 0.10
5,000 City Office REIT Inc* 129,000 0.13
953 CNA Financial Corp* 42,704 0.04
342 Cogent Communications Holdings Inc* 22,507 0.02
1,091 Colgate-Palmolive Co* 75,104 0.08
1,330 Colony Capital Inc* 31,814 0.03
2,133 Comcast Corp Class A* 95,921 0.10
1,285 Comerica Inc* 92,199 0.09
1,521 ConocoPhillips* 98,911 0.10
76 Cracker Barrel Old Country Store Inc* 11,684 0.01
611 Cummins Inc* 109,345 0.11
850 CVR Energy Inc* 34,365 0.03
533 Darden Restaurants Inc* 58,102 0.06
669 Delek US Holdings Inc* 22,432 0.02
1,263 Delta Air Lines Inc* 73,860 0.07
554 Dick's Sporting Goods Inc* 27,417 0.03
2,100 Digital Realty Trust Inc* 54,201 0.05
1,938 Digital Realty Trust Inc Class C* 51,047 0.05
587 Dominion Energy Inc* 48,615 0.05
807 Dover Corp* 93,015 0.09
175 Duke Energy Corp* 15,962 0.02
1,180 Eastman Chemical Co* 93,527 0.09
1,125 Eaton Corp Plc* 106,560 0.11
905 Eli Lilly & Co* 118,944 0.12
5,000 EPR Properties* 129,100 0.13
1,931 Exelon Corp* 88,034 0.09

FINANCIAL STATEMENTS SCHEDULE OF INVESTMENTS
576 NEUBERGER BERMAN INVESTMENT FUNDS PLC
Neuberger Berman Multi-Asset Class Income Fund (Continued)
Schedule of Investments (Continued)
Financial Assets at Fair Value through Profit or Loss (continued)
Number of Shares Security Description Fair Value
US$% of Net
Assets
Equities 26.24% (31 December 2018: 37.00%) (continued)
United States Dollar (continued)
1,039 First Hawaiian Inc* 29,975 0.03
518 FirstEnergy Corp* 25,175 0.03
9,848 Ford Motor Co* 91,586 0.09
46,692 FS KKR Capital Corp* 286,222 0.29
2,140 Gentex Corp* 62,017 0.06
7,125 Goldman Sachs BDC Inc* 151,620 0.15
26,497 Golub Capital BDC Inc* 489,002 0.49
1,802 H&R Block Inc* 42,311 0.04
22,305 Hercules Capital Inc* 312,716 0.32
6,911 Hersha Hospitality Trust* 172,084 0.17
979 Hersha Hospitality Trust Series C* 24,495 0.02
4,102 Hewlett Packard Enterprise Co* 65,058 0.07
292 HollyFrontier Corp* 14,807 0.02
452 Home Depot Inc* 98,708 0.10
130 Honeywell International Inc* 23,010 0.02
4,507 HP Inc* 92,619 0.09
975 Huntington Bancshares Inc* 14,703 0.01
604 Illinois Tool Works Inc* 108,497 0.11
1,497 Intel Corp* 89,595 0.09
683 International Business Machines Corp* 91,549 0.09
2,009 International Paper Co* 92,514 0.09
3,162 Interpublic Group of Cos Inc* 73,042 0.07
1,642 Janus Henderson Group Plc* 40,147 0.04
631 Johnson & Johnson* 92,044 0.09
1,371 Johnson Controls International Plc* 55,813 0.06
146 JPMorgan Chase & Co* 20,352 0.02
1,073 KAR Auction Services Inc* 23,381 0.02
702 Kimberly-Clark Corp* 96,560 0.10
513 KLA Corp* 91,401 0.09
1,200 Kohl's Corp* 61,140 0.06
367 Lam Research Corp* 107,311 0.11
1,006 Las Vegas Sands Corp* 69,454 0.07
959 Lazard Ltd Class A* 38,322 0.04
1,199 Leidos Holdings Inc* 117,370 0.12
263 Lockheed Martin Corp* 102,407 0.10
1,110 LyondellBasell Industries NV Class A* 104,873 0.11
1,195 Main Street Capital Corp* 51,516 0.05
1,586 Maxim Integrated Products Inc* 97,555 0.10

SCHEDULE OF INVESTMENTS FINANCIAL STATEMENTS
ANNUAL REPORT 2019 577
Neuberger Berman Multi-Asset Class Income Fund (Continued)
Schedule of Investments (Continued)
Financial Assets at Fair Value through Profit or Loss (continued)
Number of Shares Security Description Fair Value
US$% of Net
Assets
Equities 26.24% (31 December 2018: 37.00%) (continued)
United States Dollar (continued)
396 McDonald's Corp* 78,254 0.08
1,020 Medtronic Plc* 115,719 0.12
1,386 Merck & Co Inc* 126,057 0.13
229 Meredith Corp* 7,436 0.01
1,837 MetLife Inc* 93,632 0.09
1,011 Mondelez International Inc Class A* 55,686 0.06
1,413 Morgan Stanley* 72,233 0.07
2,100 Navient Corp* 28,728 0.03
351 NetApp Inc* 21,850 0.02
33,392 New Mountain Finance Corp* 458,806 0.46
1,700 Nucor Corp* 95,676 0.10
67,901 Oaktree Specialty Lending Corp* 370,739 0.37
1,572 OGE Energy Corp* 69,907 0.07
1,200 Omnicom Group Inc* 97,224 0.10
1,308 PACCAR Inc* 103,463 0.10
272 Parker-Hannifin Corp* 55,983 0.06
18,456 PennantPark Floating Rate Capital Ltd* 224,794 0.23
3,500 Pennsylvania Real Estate Investment Trust* 70,210 0.07
6,075 Pennsylvania Real Estate Investment Trust Series D* 117,247 0.12
738 PepsiCo Inc* 100,862 0.10
2,440 Pfizer Inc* 95,599 0.10
1,179 Philip Morris International Inc* 100,321 0.10
1,087 Phillips 66* 121,103 0.12
1,444 Plains GP Holdings LP Class A* 27,364 0.03
251 PNC Financial Services Group Inc* 40,067 0.04
32 Popular Inc* 1,880 0.00
924 PPL Corp* 33,153 0.03
40 Principal Financial Group Inc* 2,200 0.00
892 Procter & Gamble Co* 111,411 0.11
376 Prudential Financial Inc* 35,246 0.04
1,950 Public Storage* 50,212 0.05
1,825 Public Storage - Preferred* 46,501 0.05
5,000 Public Storage Series G* 129,350 0.13
1,300 QTS Realty Trust Inc* 35,360 0.04
997 QUALCOMM Inc* 87,965 0.09
971 Quest Diagnostics Inc* 103,693 0.10
82 Raytheon Co* 18,019 0.02
239 Reliance Steel & Aluminum Co* 28,623 0.03

FINANCIAL STATEMENTS SCHEDULE OF INVESTMENTS
578 NEUBERGER BERMAN INVESTMENT FUNDS PLC
Neuberger Berman Multi-Asset Class Income Fund (Continued)
Schedule of Investments (Continued)
Financial Assets at Fair Value through Profit or Loss (continued)
Number of Shares Security Description Fair Value
US$% of Net
Assets
Equities 26.24% (31 December 2018: 37.00%) (continued)
United States Dollar (continued)
5,951 Rexford Industrial Realty Inc* 153,670 0.16
2,996 Saul Centers Inc* 77,267 0.08
1,538 Seagate Technology Plc* 91,511 0.09
278 Sinclair Broadcast Group Inc Class A* 9,269 0.01
3,500 SITE Centers Corp Class A* 91,700 0.09
1,504 SITE Centers Corp Class K* 38,141 0.04
22,942 Solar Capital Ltd* 473,064 0.48
1,415 Southern Co* 90,136 0.09
6,610 STAG Industrial Inc Preferred* 176,355 0.18
641 Starbucks Corp* 56,357 0.06
2,014 Steel Dynamics Inc* 68,557 0.07
6,755 Sunstone Hotel Investors Inc* 175,698 0.18
2,401 Synchrony Financial* 86,460 0.09
1,323 Sysco Corp* 113,169 0.11
1,394 Tallgrass Energy LP Class A* 30,835 0.03
925 Target Corp* 118,594 0.12
2,000 Taubman Centers Inc* 51,820 0.05
960 TE Connectivity Ltd* 92,006 0.09
862 Texas Instruments Inc* 110,586 0.11
1,993 TFS Financial Corp* 39,222 0.04
492 Timken Co* 27,705 0.03
22,607 TPG Specialty Lending Inc* 485,372 0.49
557 Travelers Cos Inc* 76,281 0.08
13,048 TriplePoint Venture Growth BDC Corp* 185,543 0.19
651 Triton International Ltd* 26,170 0.03
1,267 Truist Financial Corp* 71,357 0.07
3,316 UMH Properties Inc* 82,966 0.08
1,486 US Bancorp* 88,105 0.09
1,201 Valero Energy Corp* 112,474 0.11
5,764 VEREIT Inc* 146,982 0.15
1,620 Verizon Communications Inc* 99,468 0.10
1,640 ViacomCBS Inc Class B* 68,831 0.07
5,000 Vornado Realty Trust* 127,700 0.13
1,850 Vornado Realty Trust - Preferred* 46,639 0.05
1,548 Vornado Realty Trust Series L* 39,025 0.04
505 WEC Energy Group Inc* 46,576 0.05
1,262 Wells Fargo & Co* 67,896 0.07
3,997 Western Union Co* 107,040 0.11

SCHEDULE OF INVESTMENTS FINANCIAL STATEMENTS
ANNUAL REPORT 2019 579
Neuberger Berman Multi-Asset Class Income Fund (Continued)
Schedule of Investments (Continued)
Financial Assets at Fair Value through Profit or Loss (continued)
Number of Shares Security Description Fair Value
US$% of Net
Assets
Equities 26.24% (31 December 2018: 37.00%) (continued)
United States Dollar (continued)
282 Whirlpool Corp* 41,603 0.04
3,516 Williams Cos Inc* 83,400 0.08
16 WW Grainger Inc* 5,416 0.01
784 Wyndham Destinations Inc* 40,525 0.04
2,119 Xerox Holdings Corp* 78,128 0.08
Total United States Dollar 16,216,238 16.36
Total Equities 26,011,646 26.24
Real Estate Investment Trusts 5.38% (31 December 2018: 7.28%)
Canadian Dollar 4,347 H&R Real Estate Investment Trust 70,732 0.07
4,935 RioCan Real Estate Investment Trust 101,840 0.10
Total Canadian Dollar 172,572 0.17
Euro 145 Covivio 16,471 0.02
3,062 Klepierre SA 116,346 0.12
6,377 Merlin Properties Socimi SA 91,553 0.09
Total Euro 224,370 0.23
Japanese Yen 89 Invincible Investment Corp 50,693 0.05
Total Japanese Yen 50,693 0.05
Singapore Dollar 35,700 Ascendas Real Estate Investment Trust 78,853 0.08
89,700 Mapletree North Asia Commercial Trust 77,382 0.08
Total Singapore Dollar 156,235 0.16
United States Dollar 3,409 AGNC Investment Corp 60,271 0.06
983 Alexandria Real Estate Equities Inc 158,833 0.16
2,368 American Campus Communities Inc 111,367 0.11
1,305 American Tower Corp 299,915 0.30
12,890 Annaly Capital Management Inc 121,424 0.12
1,323 Apollo Commercial Real Estate Finance Inc 24,198 0.03
1,685 Apple Hospitality REIT Inc 27,381 0.03

FINANCIAL STATEMENTS SCHEDULE OF INVESTMENTS
580 NEUBERGER BERMAN INVESTMENT FUNDS PLC
Neuberger Berman Multi-Asset Class Income Fund (Continued)
Schedule of Investments (Continued)
Financial Assets at Fair Value through Profit or Loss (continued)
Number of Shares Security Description Fair Value
US$% of Net
Assets
Real Estate Investment Trusts 5.38% (31 December 2018: 7.28%) (continued)
United States Dollar (continued)
5,793 Blackstone Mortgage Trust Inc Class A 215,616 0.22
2,473 Brixmor Property Group Inc 53,442 0.05
1,240 Brookfield Property REIT Inc Class A 22,872 0.02
1,125 CoreCivic Inc 19,553 0.02
1,069 CoreSite Realty Corp 119,856 0.12
2,447 Crown Castle International Corp 347,841 0.35
1,085 Digital Realty Trust Inc 129,918 0.13
572 EPR Properties 40,406 0.04
1,470 Extra Space Storage Inc 155,261 0.16
2,463 Four Corners Property Trust Inc 69,432 0.07
1,790 Gaming & Leisure Properties Inc 77,060 0.08
2,462 Highwoods Properties Inc 120,417 0.12
2,702 Host Hotels & Resorts Inc 50,122 0.05
1,084 Iron Mountain Inc 34,547 0.04
6,492 Kimco Realty Corp 134,449 0.14
1,951 Lexington Realty Trust Class B 20,720 0.02
10,857 Medical Properties Trust Inc 229,191 0.23
4,102 MFA Financial Inc 31,380 0.03
1,076 Mid-America Apartment Communities Inc 141,881 0.14
282 National Health Investors Inc 22,977 0.02
1,156 National Retail Properties Inc 61,985 0.06
7,229 Omega Healthcare Investors Inc 306,148 0.31
5,244 Park Hotels & Resorts Inc 135,662 0.14
2,454 Prologis Inc 218,750 0.22
567 Public Storage 120,748 0.12
263 Retail Properties of America Inc Class A 3,524 0.00
1,236 RLJ Lodging Trust 21,902 0.02
1,503 Service Properties Trust 36,568 0.04
510 Simon Property Group Inc 75,970 0.08
1,550 Spirit Realty Capital Inc 76,229 0.08
4,909 STAG Industrial Inc 154,977 0.16
7,875 Starwood Property Trust Inc 195,773 0.20
983 Sun Communities Inc 147,548 0.15
1,369 Ventas Inc 79,046 0.08
1,835 VEREIT Inc 16,955 0.02
98 VICI Properties Inc 2,504 0.00
1,790 Welltower Inc 146,386 0.15
1,664 Weyerhaeuser Co 50,253 0.05

SCHEDULE OF INVESTMENTS FINANCIAL STATEMENTS
ANNUAL REPORT 2019 581
Neuberger Berman Multi-Asset Class Income Fund (Continued)
Schedule of Investments (Continued)
Financial Assets at Fair Value through Profit or Loss (continued)
Number of Shares Security Description Fair Value
US$% of Net
Assets
Real Estate Investment Trusts 5.38% (31 December 2018: 7.28%) (continued)
United States Dollar (continued)
424 WP Carey Inc 33,937 0.03
Total United States Dollar 4,725,195 4.77
Total Real Estate Investment Trusts * 5,329,065 5.38
Principal Amount Security Description Coupon
Maturity Date
Fair ValueUS$
% of NetAssets
Agency Bonds 0.12% (31 December 2018: 0.28%)
United States Dollar 80,000 Federal Home Loan Banks 5.50% 15/07/2036 112,336 0.12
Total Agency Bonds * 112,336 0.12
Asset Backed Securities 5.14% (31 December 2018: 6.48%)
United States Dollar 1,000,000 Bardot CLO Ltd 2019-2X Class D 5.67% 22/10/2032 1,008,875 1.02
2,600,000 OCP CLO Ltd 2017-13X Class D 8.46% 15/07/2030 2,574,968 2.60
1,500,000 VERDE CLO Ltd 2019-1X Class D 5.63% 15/04/2032 1,510,815 1.52
Total Asset Backed Securities ** 5,094,658 5.14
Corporate Bonds 29.36% (31 December 2018: 13.53%)
Euro 150,000 Altice Finco SA* 4.75% 15/01/2028 170,606 0.17
250,000 Altice France SA* 3.38% 15/01/2028 289,919 0.29
230,000 Altice Luxembourg SA* 8.00% 15/05/2027 290,124 0.29
140,000 ARD Finance SA* 5.00% 30/06/2027 158,884 0.16
175,000 Ardagh Packaging Finance Plc/Ardagh Holdings USA Inc* 2.13% 15/08/2026 203,659 0.21
200,000 Arkema SA* 2.75% 29/12/2049 238,251 0.24
124,000 Avis Budget Finance Plc* 4.50% 15/05/2025 145,796 0.15
171,000 Bausch Health Cos Inc* 4.50% 15/05/2023 194,831 0.20
420,000 Bayer AG* 2.38% 02/04/2075 484,190 0.49
109,000 Belden Inc* 3.38% 15/07/2027 128,682 0.13
200,000 Bertelsmann SE & Co KGaA* 3.00% 23/04/2075 238,522 0.24
100,000 BHP Billiton Finance Ltd* 5.63% 22/10/2079 137,366 0.14
200,000 Casino Guichard Perrachon SA* 4.05% 05/08/2026 191,423 0.19
125,000 Cemex SAB de CV* 3.13% 19/03/2026 146,035 0.15
110,000 Centrica Plc* 3.00% 10/04/2076 126,948 0.13
150,000 CeramTec BondCo GmbH* 5.25% 15/12/2025 176,558 0.18
150,000 Constellium SE* 4.25% 15/02/2026 175,952 0.18
300,000 Danone SA* 1.75% 29/12/2049 346,923 0.35

FINANCIAL STATEMENTS SCHEDULE OF INVESTMENTS
582 NEUBERGER BERMAN INVESTMENT FUNDS PLC
Neuberger Berman Multi-Asset Class Income Fund (Continued)
Schedule of Investments (Continued)
Financial Assets at Fair Value through Profit or Loss (continued)
Principal Amount Security Description Coupon Maturity
DateFair Value
US$% of Net
Assets
Corporate Bonds 29.36% (31 December 2018: 13.53%) (continued)
Euro (continued) 150,000 DKT Finance ApS* 7.00% 17/06/2023 178,766 0.18
134,000 eG Global Finance Plc* 3.63% 07/02/2024 151,317 0.15
100,000 Engie SA* 1.38% 29/12/2049 113,569 0.11
129,000 Europcar Mobility Group* 4.00% 30/04/2026 140,875 0.14
200,000 Grand City Properties SA* 2.50% 29/12/2049 232,540 0.23
102,000 Grupo Antolin-Irausa SA* 3.38% 30/04/2026 108,249 0.11
125,000 House of Finance NV* 4.38% 15/07/2026 144,737 0.15
130,000 IHO Verwaltungs GmbH* 3.75% 15/09/2026 154,573 0.16
130,000 INEOS Finance Plc* 2.88% 01/05/2026 151,215 0.15
200,000 Infineon Technologies AG* 2.88% 29/12/2049 232,021 0.23
200,000 Infineon Technologies AG* 3.63% 29/12/2049 235,164 0.24
123,000 International Game Technology Plc* 3.50% 15/06/2026 147,524 0.15
150,000 InterXion Holding NV* 4.75% 15/06/2025 182,471 0.18
200,000 IQVIA Inc* 2.25% 15/01/2028 232,632 0.23
134,000 Kronos International Inc* 3.75% 15/09/2025 153,423 0.16
100,000 La Financiere Atalian SASU* 4.00% 15/05/2024 91,199 0.09
125,000 LHMC Finco 2 Sarl* 7.25% 02/10/2025 146,030 0.15
130,000 Loxam SAS* 6.00% 15/04/2025 152,940 0.15
131,000 Matterhorn Telecom SA* 3.13% 15/09/2026 152,352 0.15
200,000 Mauser Packaging Solutions Holding Co* 4.75% 15/04/2024 233,259 0.24
100,000 Merck KGaA* 1.63% 25/06/2079 115,791 0.12
150,000 Motion Bondco DAC* 4.50% 15/11/2027 177,373 0.18
300,000 Netflix Inc* 3.63% 15/06/2030 347,300 0.35
131,000 Nexi SpA** 1.75% 31/10/2024 151,495 0.15
150,000 Nidda BondCo GmbH* 5.00% 30/09/2025 176,765 0.18
100,000 Orange SA* 5.25% 29/12/2049 131,588 0.13
100,000 Orano SA* 3.38% 23/04/2026 120,821 0.12
300,000 Orsted A/S* 6.25% 26/06/3013 396,597 0.40
120,000 Paprec Holding SA* 4.00% 31/03/2025 130,188 0.13
200,000 Petrobras Global Finance BV* 4.75% 14/01/2025 259,304 0.26
150,000 Platin 1426 GmbH* 5.38% 15/06/2023 170,651 0.17
150,000 Repsol International Finance BV* 4.50% 25/03/2075 194,549 0.20
109,000 Rossini Sarl* 6.75% 30/10/2025 136,708 0.14
100,000 Sazka Group AS* 4.13% 20/11/2024 118,059 0.12
175,000 SGL Carbon SE* 4.63% 30/09/2024 192,509 0.19
100,000 Sisal Pay SpA** 3.88% 17/12/2026 113,653 0.11
138,000 SoftBank Group Corp* 5.00% 15/04/2028 171,316 0.17
110,000 Solvay Finance SA* 5.87% 29/12/2049 146,330 0.15

SCHEDULE OF INVESTMENTS FINANCIAL STATEMENTS
ANNUAL REPORT 2019 583
Neuberger Berman Multi-Asset Class Income Fund (Continued)
Schedule of Investments (Continued)
Financial Assets at Fair Value through Profit or Loss (continued)
Principal Amount Security Description Coupon Maturity
DateFair Value
US$% of Net
Assets
Corporate Bonds 29.36% (31 December 2018: 13.53%) (continued)
Euro (continued) 100,000 Solvay SA* 4.25% 29/12/2049 125,013 0.13
129,000 Starfruit Finco BV/Starfruit US Holdco LLC* 6.50% 01/10/2026 155,635 0.16
150,000 Summer BidCo BV* 9.00% 15/11/2025 180,360 0.18
100,000 Sunshine Mid BV* 6.50% 15/05/2026 120,415 0.12
100,000 Swissport Financing Sarl* 9.00% 15/02/2025 119,808 0.12
123,000 Tasty Bondco 1 SA* 6.25% 15/05/2026 145,071 0.15
150,000 Techem Verwaltungsgesellschaft 674 mbH* 6.00% 30/07/2026 182,371 0.18
200,000 Telecom Italia SpA* 2.38% 12/10/2027 229,264 0.23
200,000 Telefonica Europe BV* 2.88% 29/12/2049 229,947 0.23
100,000 Telefonica Europe BV* 3.00% 29/12/2049 117,722 0.12
100,000 Telenet Finance Luxembourg Notes Sarl* 3.50% 01/03/2028 121,731 0.12
100,000 Teva Pharmaceutical Finance Netherlands II BV* 1.88% 31/03/2027 92,990 0.09
105,000 Total SA* 2.71% 29/12/2049 126,113 0.13
100,000 Trivium Packaging Finance BV* 3.75% 15/08/2026 119,249 0.12
100,000 Unibail-Rodamco-Westfield SE* 2.13% 29/12/2049 115,364 0.12
150,000 UPC Holding BV* 3.88% 15/06/2029 176,675 0.18
100,000 Vivion Investments Sarl* 3.50% 01/11/2025 115,991 0.12
200,000 Vodafone Group Plc* 3.10% 03/01/2079 236,439 0.24
400,000 Volkswagen International Finance NV* 3.38% 29/12/2049 480,510 0.49
150,000 Volvo Treasury AB* 4.85% 10/03/2078 188,608 0.19
Total Euro 13,809,798 13.93
Pound Sterling 375,000 NGG Finance Plc* 5.63% 18/06/2073 563,847 0.57
Total Pound Sterling 563,847 0.57
United States Dollar 100,000 Abbott Laboratories* 4.75% 15/04/2043 125,856 0.13
220,000 AbbVie Inc* 4.70% 14/05/2045 246,570 0.25
75,000 Air Lease Corp* 3.25% 01/10/2029 74,655 0.07
75,000 Altria Group Inc* 4.25% 09/08/2042 75,010 0.08
75,000 Amazon.com Inc† 3.88% 22/08/2037 85,164 0.09
50,000 American International Group Inc* 4.50% 16/07/2044 57,599 0.06
75,000 Amgen Inc† 4.66% 15/06/2051 88,216 0.09
110,000 Anglo American Capital Plc† 4.00% 11/09/2027 115,237 0.12
90,000 Anheuser-Busch InBev Worldwide Inc* 4.60% 15/04/2048 102,565 0.10
125,000 Anheuser-Busch InBev Worldwide Inc* 5.80% 23/01/2059 170,379 0.17
135,000 Apple Inc† 4.65% 23/02/2046 169,110 0.17

FINANCIAL STATEMENTS SCHEDULE OF INVESTMENTS
584 NEUBERGER BERMAN INVESTMENT FUNDS PLC
Neuberger Berman Multi-Asset Class Income Fund (Continued)
Schedule of Investments (Continued)
Financial Assets at Fair Value through Profit or Loss (continued)
Principal Amount Security Description Coupon Maturity
DateFair Value
US$% of Net
Assets
Corporate Bonds 29.36% (31 December 2018: 13.53%) (continued)
United States Dollar (continued) 50,000 Aqua America Inc* 4.28% 01/05/2049 56,044 0.06
75,000 AstraZeneca Plc* 4.38% 16/11/2045 87,334 0.09
135,000 AT&T Inc* 4.50% 09/03/2048 149,188 0.15
185,000 AT&T Inc* 5.45% 01/03/2047 229,493 0.23
200,000 Banco Bilbao Vizcaya Argentaria SA* 6.50% 29/12/2049 212,000 0.21
125,000 Bank of America Corp† 3.97% 05/03/2029 136,157 0.14
115,000 Bank of America Corp** 5.13% 29/12/2049 121,791 0.12
100,000 BAT Capital Corp† 4.54% 15/08/2047 100,458 0.10
100,000 Berkshire Hathaway Energy Co* 6.13% 01/04/2036 137,803 0.14
200,000 BNP Paribas SA* 7.38% 29/12/2049 230,921 0.23
100,000 Burlington Northern Santa Fe LLC* 4.38% 01/09/2042 116,109 0.12
80,000 Canadian Natural Resources Ltd* 4.95% 01/06/2047 97,131 0.10
100,000 Charter Communications Operating LLC/Charter Communications Operating Capital† 5.38% 01/04/2038 114,599 0.12
100,000 Cigna Corp* 4.80% 15/08/2038 116,733 0.12
100,000 Citigroup Inc† 3.98% 20/03/2030 109,402 0.11
240,000 Citigroup Inc† 5.00% 29/12/2049 251,550 0.25
240,000 Citizens Financial Group Inc† 6.00% 29/12/2049 254,165 0.26
85,000 Comcast Corp† 4.00% 15/08/2047 93,570 0.09
150,000 Comcast Corp† 4.65% 15/07/2042 180,310 0.18
135,000 Comcast Corp† 4.95% 15/10/2058 175,545 0.18
115,000 Concho Resources Inc* 4.88% 01/10/2047 134,163 0.13
200,000 Credit Suisse Group AG* 7.50% 29/12/2049 219,013 0.22
50,000 CVS Health Corp* 4.88% 20/07/2035 57,459 0.06
80,000 CVS Health Corp* 5.05% 25/03/2048 94,669 0.10
95,000 CyrusOne LP/CyrusOne Finance Corp† 3.45% 15/11/2029 95,436 0.10
75,000 DH Europe Finance II Sarl* 3.25% 15/11/2039 75,662 0.08
245,000 Discover Financial Services† 5.50% 29/12/2049 258,357 0.26
340,000 Dominion Energy Inc† 4.65% 29/12/2049 347,283 0.35
50,000 DTE Electric Co* 3.95% 01/03/2049 57,124 0.06
50,000 Duke Energy Corp* 3.95% 15/08/2047 52,883 0.05
120,000 EnBW Energie Baden-Wuerttemberg AG* 5.13% 05/04/2077 125,925 0.13
50,000 Energy Transfer Operating LP* 5.25% 15/04/2029 56,158 0.06
120,000 Energy Transfer Operating LP* 6.25% 15/04/2049 144,620 0.15
175,000 Evergy Inc* 2.90% 15/09/2029 174,283 0.18
100,000 Exelon Corp† 4.45% 15/04/2046 112,261 0.11
50,000 FedEx Corp* 4.95% 17/10/2048 54,583 0.05
55,000 Fifth Third Bancorp** 5.10% 29/12/2049 56,665 0.06
75,000 Florida Power & Light Co* 3.70% 01/12/2047 81,759 0.08

SCHEDULE OF INVESTMENTS FINANCIAL STATEMENTS
ANNUAL REPORT 2019 585
Neuberger Berman Multi-Asset Class Income Fund (Continued)
Schedule of Investments (Continued)
Financial Assets at Fair Value through Profit or Loss (continued)
Principal Amount Security Description Coupon Maturity
DateFair Value
US$% of Net
Assets
Corporate Bonds 29.36% (31 December 2018: 13.53%) (continued)
United States Dollar (continued) 100,000 General Electric Co* 5.88% 14/01/2038 121,164 0.12
100,000 General Motors Co* 5.00% 01/04/2035 103,341 0.10
145,000 Goldman Sachs Group Inc† 4.02% 31/10/2038 157,495 0.16
171,000 Goldman Sachs Group Inc† 4.95% 29/12/2049 177,477 0.18
60,000 Goldman Sachs Group Inc* 5.15% 22/05/2045 73,657 0.07
60,000 Grupo Bimbo SAB de CV* 4.70% 10/11/2047 62,843 0.06
120,000 HCA Inc* 4.13% 15/06/2029 127,400 0.13
150,000 HCA Inc* 5.25% 15/06/2049 167,714 0.17
150,000 Healthcare Trust of America Holdings LP* 3.10% 15/02/2030 148,936 0.15
50,000 Home Depot Inc* 4.40% 15/03/2045 59,663 0.06
50,000 Home Depot Inc* 5.88% 16/12/2036 68,957 0.07
230,000 HSBC Holdings Plc† 6.38% 29/12/2049 250,289 0.25
245,000 Huntington Bancshares Inc† 5.70% 29/12/2049 254,363 0.26
75,000 Indiana Michigan Power Co* 4.25% 15/08/2048 85,698 0.09
200,000 ING Groep NV* 5.75% 29/12/2049 210,725 0.21
45,000 Intel Corp† 3.25% 15/11/2049 45,333 0.05
100,000 International Business Machines Corp* 4.15% 15/05/2039 112,721 0.11
100,000 International Business Machines Corp† 4.25% 15/05/2049 114,285 0.11
50,000 Interstate Power & Light Co† 3.50% 30/09/2049 49,114 0.05
110,000 JPMorgan Chase & Co† 3.88% 24/07/2038 121,655 0.12
240,000 JPMorgan Chase & Co† 5.00% 29/12/2049 249,900 0.25
100,000 JPMorgan Chase & Co* 5.40% 06/01/2042 134,558 0.14
175,000 Kinder Morgan Inc* 5.55% 01/06/2045 209,498 0.21
75,000 Kraft Heinz Foods Co† 5.20% 15/07/2045 81,355 0.08
15,000 Kroger Co* 5.40% 15/01/2049 18,298 0.02
200,000 Lloyds Banking Group Plc* 7.50% 29/12/2049 221,355 0.22
50,000 Lockheed Martin Corp* 4.07% 15/12/2042 57,276 0.06
50,000 Lowe's Cos Inc* 4.38% 15/09/2045 55,739 0.06
50,000 Magellan Midstream Partners LP* 3.95% 01/03/2050 51,482 0.05
75,000 Marathon Oil Corp* 5.20% 01/06/2045 87,155 0.09
50,000 McDonald's Corp* 4.45% 01/03/2047 57,392 0.06
75,000 Merck & Co Inc* 4.00% 07/03/2049 87,804 0.09
100,000 Microsoft Corp† 4.45% 03/11/2045 125,009 0.13
145,000 MPLX LP* 4.70% 15/04/2048 147,564 0.15
155,000 Occidental Petroleum Corp* 3.50% 15/08/2029 158,137 0.16
135,000 Oracle Corp* 4.00% 15/07/2046 150,044 0.15
50,000 PepsiCo Inc* 3.45% 06/10/2046 52,993 0.05
50,000 Pfizer Inc* 4.13% 15/12/2046 58,038 0.06

FINANCIAL STATEMENTS SCHEDULE OF INVESTMENTS
586 NEUBERGER BERMAN INVESTMENT FUNDS PLC
Neuberger Berman Multi-Asset Class Income Fund (Continued)
Schedule of Investments (Continued)
Financial Assets at Fair Value through Profit or Loss (continued)
Principal Amount Security Description Coupon Maturity
DateFair Value
US$% of Net
Assets
Corporate Bonds 29.36% (31 December 2018: 13.53%) (continued)
United States Dollar (continued) 50,000 Philip Morris International Inc* 3.88% 21/08/2042 52,070 0.05
125,000 Plains All American Pipeline LP/PAA Finance Corp* 3.55% 15/12/2029 123,288 0.12
75,000 Prudential Financial Inc* 4.60% 15/05/2044 88,435 0.09
215,000 Royal Bank of Scotland Group Plc† 8.00% 29/12/2049 247,900 0.25
75,000 Shell International Finance BV* 4.38% 11/05/2045 89,696 0.09
200,000 Skandinaviska Enskilda Banken AB* 5.13% 29/12/2049 200,675 0.20
50,000 Southern Co* 4.40% 01/07/2046 55,370 0.06
245,000 SSE Plc* 4.75% 16/09/2077 252,442 0.25
75,000 Starbucks Corp† 4.45% 15/08/2049 86,852 0.09
75,000 Total Capital International SA* 3.46% 12/07/2049 78,856 0.08
250,000 Truist Financial Corp* 4.80% 29/12/2049 258,437 0.26
245,000 Truist Financial Corp* 5.05% 29/12/2049 250,272 0.25
225,000 UBS Group AG* 6.88% 29/12/2049 249,512 0.25
230,000 UniCredit SpA† 8.00% 29/12/2049 251,585 0.25
100,000 United Technologies Corp* 4.63% 16/11/2048 125,096 0.13
75,000 UnitedHealth Group Inc* 3.50% 15/08/2039 78,722 0.08
155,000 UnitedHealth Group Inc* 3.88% 15/08/2059 167,274 0.17
165,000 Verizon Communications Inc* 4.52% 15/09/2048 197,658 0.20
75,000 ViacomCBS Inc† 4.60% 15/01/2045 83,054 0.08
50,000 Visa Inc* 4.30% 14/12/2045 61,575 0.06
200,000 Vodafone Group Plc* 6.25% 03/10/2078 218,400 0.22
135,000 Walmart Inc* 3.25% 08/07/2029 144,813 0.15
100,000 Wells Fargo & Co* 4.90% 17/11/2045 122,140 0.12
250,000 Westpac Banking Corp† 5.00% 29/12/2049 251,706 0.25
Total United States Dollar 14,731,222 14.86
Total Corporate Bonds 29,104,867 29.36
Government Bonds 23.04% (31 December 2018: 17.92%)
United States Dollar 436,539 United States Treasury Inflation Indexed Bonds** 0.63% 15/02/2043 441,829 0.45
478,338 United States Treasury Inflation Indexed Bonds* 0.75% 15/02/2042 497,189 0.50
590,139 United States Treasury Inflation Indexed Bonds** 0.75% 15/02/2045 612,532 0.62
426,436 United States Treasury Inflation Indexed Bonds* 0.88% 15/02/2047 457,380 0.46
407,288 United States Treasury Inflation Indexed Bonds* 1.00% 15/02/2046 448,288 0.45
1,487,116 United States Treasury Inflation Indexed Bonds* 1.00% 15/02/2048 1,647,053 1.66
546,584 United States Treasury Inflation Indexed Bonds** 1.38% 15/02/2044 645,078 0.65
29,379 United States Treasury Inflation Indexed Bonds* 2.13% 15/02/2041 38,721 0.04
200,000 United States Treasury Note/Bond* 1.38% 15/01/2020 199,981 0.20

SCHEDULE OF INVESTMENTS FINANCIAL STATEMENTS
ANNUAL REPORT 2019 587
Neuberger Berman Multi-Asset Class Income Fund (Continued)
Schedule of Investments (Continued)
Financial Assets at Fair Value through Profit or Loss (continued)
Principal Amount Security Description Coupon Maturity
DateFair Value
US$% of Net
Assets
Government Bonds 23.04% (31 December 2018: 17.92%) (continued)
United States Dollar (continued) 160,000 United States Treasury Note/Bond* 2.25% 15/08/2046 155,357 0.16
3,070,000 United States Treasury Note/Bond* 2.25% 15/08/2049 2,975,556 3.00
375,000 United States Treasury Note/Bond* 2.50% 30/06/2020 376,601 0.38
2,860,000 United States Treasury Note/Bond** 2.50% 15/02/2045 2,915,703 2.94
2,855,000 United States Treasury Note/Bond* 2.50% 15/02/2046 2,912,359 2.94
2,105,000 United States Treasury Note/Bond* 2.75% 15/02/2028 2,241,803 2.26
1,135,000 United States Treasury Note/Bond* 2.75% 15/08/2042 1,211,235 1.22
285,000 United States Treasury Note/Bond* 2.88% 15/08/2028 307,029 0.31
3,090,000 United States Treasury Note/Bond* 3.88% 15/08/2040 3,891,791 3.93
650,000 United States Treasury Note/Bond* 4.50% 15/02/2036 861,280 0.87
Total Government Bonds 22,836,765 23.04
Number of Shares Security Description Fair Value
US$% of Net
Assets
Investment Funds 5.03% (31 December 2018: 9.55%)
United States Dollar 43,692 iShares JP Morgan USD EM Bond UCITS ETF 4,987,879 5.03
Total Investment Funds μ 4,987,879 5.03
Total Investments 93,477,216 94.31
Forward Currency Contracts 0.93% (31 December 2018: 1.19%)
Amount Receivable
Amount Payable
Maturity Date Counterparty Contracts Unrealised
Gain US$% of Net
Assets
AUD 3,670,501 US$ 2,519,447 22/01/2020 Citibank NA 6 61,994 0.06
AUD 356,781 US$ 244,613 22/01/2020 Goldman Sachs International 1 6,309 0.01
AUD 644,230 US$ 442,776 22/01/2020 State Street Bank and Trust and Co 1 10,307 0.01
BRL 6,627,947 US$ 1,603,436 22/01/2020 Goldman Sachs International 3 43,150 0.04
CAD 2,724,880 US$ 2,061,460 22/01/2020 Citibank NA 6 40,095 0.04
CAD 1,353,251 US$ 1,023,074 22/01/2020 Goldman Sachs International 4 20,617 0.02
CAD 432,749 US$ 328,730 22/01/2020 State Street Bank and Trust and Co 1 5,026 0.00
CHF 529,054 US$ 538,133 22/01/2020 Citibank NA 2 8,966 0.01
CHF 375,326 US$ 381,579 22/01/2020 Goldman Sachs International 4 6,548 0.01
CZK 15,493,529 US$ 662,003 22/01/2020 Citibank NA 1 22,352 0.02
CZK 6,016,078 US$ 264,161 22/01/2020 State Street Bank and Trust and Co 1 1,572 0.00
€ 2,249,405 US$ 2,511,307 22/01/2020 Citibank NA 9 16,728 0.02
€ 816,809 US$ 906,708 22/01/2020 Goldman Sachs International 6 11,279 0.01
€ 1,642,115 US$ 1,834,146 22/01/2020 State Street Bank and Trust and Co 6 11,376 0.01
£ 234,860 US$ 304,339 22/01/2020 Citibank NA 3 6,969 0.01

FINANCIAL STATEMENTS SCHEDULE OF INVESTMENTS
588 NEUBERGER BERMAN INVESTMENT FUNDS PLC
Neuberger Berman Multi-Asset Class Income Fund (Continued)
Schedule of Investments (Continued)
Financial Assets at Fair Value through Profit or Loss (continued)
Forward Currency Contracts 0.93% (31 December 2018: 1.19%) (continued)
Amount Receivable
Amount Payable
Maturity Date Counterparty Contracts Unrealised
Gain US$% of Net
Assets
£ 404,333 US$ 513,299 22/01/2020 Goldman Sachs International 3 22,646 0.02
£ 174,949 US$ 226,569 22/01/2020 State Street Bank and Trust and Co 1 5,326 0.01
HUF 40,108,412 US$ 134,057 22/01/2020 Goldman Sachs International 1 2,210 0.00
¥ 33,505,787 US$ 306,757 22/01/2020 Citibank NA 1 1,893 0.00
¥ 7,951,963 US$ 73,226 22/01/2020 Goldman Sachs International 1 26 0.00
¥ 70,568,762 US$ 649,420 22/01/2020 State Street Bank and Trust and Co 1 647 0.00
KRW 622,199,368 US$ 522,505 22/01/2020 Citibank NA 1 16,633 0.02
KRW 314,554,490 US$ 271,495 22/01/2020 Goldman Sachs International 1 1,067 0.00
MXN 21,457,523 US$ 1,105,915 22/01/2020 Goldman Sachs International 4 27,041 0.03
MXN 4,984,060 US$ 253,758 22/01/2020 State Street Bank and Trust and Co 1 9,400 0.01
NOK 2,200,856 US$ 241,476 22/01/2020 Citibank NA 1 9,006 0.01
NOK 60,708,214 US$ 6,654,697 22/01/2020 Goldman Sachs International 7 254,572 0.26
NOK 985,854 US$ 109,496 22/01/2020 State Street Bank and Trust and Co 1 2,705 0.00
NZD 920,732 US$ 585,674 22/01/2020 Citibank NA 2 35,671 0.04
NZD 1,400,411 US$ 894,683 22/01/2020 Goldman Sachs International 8 50,366 0.05
PLN 85 US$ 22 22/01/2020 Goldman Sachs International 1 1 0.00
SEK 10,074,836 US$ 1,049,404 22/01/2020 Citibank NA 4 27,888 0.03
SEK 6,076,835 US$ 630,776 22/01/2020 Goldman Sachs International 3 19,014 0.02
SEK 9,849,384 US$ 1,009,353 22/01/2020 State Street Bank and Trust and Co 2 43,833 0.04
US$ 2,197,361 ¥ 237,377,743 22/01/2020 Citibank NA 5 10,677 0.01
US$ 217,407 ¥ 23,499,076 22/01/2020 Goldman Sachs International 3 937 0.00
US$ 526,713 KRW 607,711,703 22/01/2020 Goldman Sachs International 1 129 0.00
US$ 62,516 NOK 548,995 22/01/2020 Goldman Sachs International 1 34 0.00
US$ 413,838 ¥ 43,961,957 22/01/2020 State Street Bank and Trust and Co 1 8,868 0.01
US$ 389,214 TRY 2,283,603 22/01/2020 State Street Bank and Trust and Co 1 7,426 0.01
ZAR 15,912,647 US$ 1,057,014 22/01/2020 Goldman Sachs International 4 78,017 0.08
EUR Hedged Classes € 180,817 US$ 199,733 22/01/2020 Citibank NA 2 3,481 0.00
€ 220,025 US$ 243,409 22/01/2020 Goldman Sachs International 8 3,869 0.00
€ 4,041 US$ 4,538 22/01/2020 UBS AG 1 4 0.00
€ 332,974 US$ 369,729 22/01/2020 Westpac Banking Corp 12 4,488 0.01
GBP Hedged Classes £ 535 US$ 698 22/01/2020 Goldman Sachs International 1 11 0.00
£ 140 US$ 184 22/01/2020 UBS AG 1 2 0.00
£ 24,503 US$ 30,288 22/01/2020 Westpac Banking Corp 1 2,191 0.00
Total Unrealised Gain on Forward Currency Contracts ∞ 923,367 0.93

SCHEDULE OF INVESTMENTS FINANCIAL STATEMENTS
ANNUAL REPORT 2019 589
Neuberger Berman Multi-Asset Class Income Fund (Continued)
Schedule of Investments (Continued)
Financial Assets at Fair Value through Profit or Loss (continued)
Futures Contracts 0.17% (31 December 2018: 0.54%)
Number of Contracts Description
UnrealisedGain US$
% of Net Assets
(6) Amsterdam Index Future January 2020 3,219 0.00
29 CAC40 Index Future January 2020 1,465 0.00
(52) Euro Stoxx 50 Future March 2020 5,253 0.01
(4) Euro-BOBL Future March 2020 1,437 0.00
(28) Euro-Bund Future March 2020 55,541 0.06
(10) Euro-OAT Future March 2020 20,429 0.02
8 FTSE 100 Index Future March 2020 4,239 0.01
(11) Mini-DAX Future March 2020 4,167 0.00
10 MSCI EAFE Index Future March 2020 3,626 0.00
18 MSCI Emerging Markets Index Future March 2020 4,789 0.01
6 Nasdaq 100 E-mini Future March 2020 17,568 0.02
19 S&P 500 E-mini Future March 2020 31,112 0.03
7 S&P/TSX 60 Index Future March 2020 378 0.00
2 Swiss Franc Currency Future March 2020 4,588 0.01
(12) TOPIX Index Future March 2020 0 0.00
(2) US Treasury 10-Year Ultra Future March 2020 3,344 0.00
(1) US Treasury Ultra Bond (CBT) Future March 2020 3,534 0.00
Total Unrealised Gain on Futures Contracts ± 164,689 0.17
Purchased Options Contracts 0.00% (31 December 2018: 0.03%)
Number of Contracts
Expiration Date Type Premium
US$Fair Value
US$% of Net
Assets
Call Options
14 08/01/20 CBOE S&P 500 Index, Strike Price $3,500 (144) 70 0.00
6 15/01/20 CBOE S&P 500 Index, Strike Price $3,500 (123) 0 0.00
7 08/01/20 CBOE S&P 500 Index, Strike Price $3,525 (51) 0 0.00
8 15/01/20 CBOE S&P 500 Index, Strike Price $3,550 (58) 0 0.00
6 22/01/20 CBOE S&P 500 Index, Strike Price $3,550 (62) 60 0.00
Put Options
6 08/01/20 CBOE S&P 500 Index, Strike Price $2,850 (1,743) 315 0.00
9 08/01/20 CBOE S&P 500 Index, Strike Price $2,890 (1,580) 607 0.00
6 15/01/20 CBOE S&P 500 Index, Strike Price $2,890 (1,743) 825 0.00
6 22/01/20 CBOE S&P 500 Index, Strike Price $2,910 (1,673) 1,425 0.00
7 08/01/20 CBOE S&P 500 Index, Strike Price $2,920 (564) 543 0.00
8 15/01/20 CBOE S&P 500 Index, Strike Price $2,920 (1,508) 1,280 0.00
Total Gain on Purchased Options Contracts ± 5,125 0.00

FINANCIAL STATEMENTS SCHEDULE OF INVESTMENTS
590 NEUBERGER BERMAN INVESTMENT FUNDS PLC
Neuberger Berman Multi-Asset Class Income Fund (Continued)
Schedule of Investments (Continued)
Financial Assets at Fair Value through Profit or Loss (continued)
Total Return Swap Contracts 0.66% (31 December 2018: 0.42%)
Notional Amount Termination Date Variable Rate Reference Entity Unrealised
Gain US$% of Net
Assets
USD 897,545 14/08/20 2.151 S&P 500 Equal Weight Industrials Index4 140,468 0.14
USD 892,496 14/08/20 2.141 S&P 500 Equal Weight Materials Index4 118,169 0.12
USD 904,173 14/08/20 2.171 S&P 500 Equal Weight Consumer Staples Index4 98,358 0.10
USD 915,261 14/08/20 2.101 S&P 500 Equal Weight Utilities Index4 77,466 0.08
JPY 109,104,091 28/09/20 0.132 Goldman Sachs Basket GSCBJICY5 64,546 0.06
EUR 442,196 23/05/20 (0.45)3 Goldman Sachs Basket GSCBNBEU5 55,153 0.06
USD 272,317 29/04/20 2.201 S&P 500 Financial Sector Total Return Index4 40,430 0.04
USD 222,095 24/04/20 2.201 S&P 500 Financial Sector Total Return Index4 28,626 0.03
EUR 127,237 23/05/20 (0.60)3 Goldman Sachs Basket GSCBNBEU5 16,069 0.02
EUR 89,957 23/05/20 (0.60)3 Goldman Sachs Basket GSCBNBEU5 8,657 0.01
USD (491,827) 08/10/20 2.101 MSCI US REIT Index5 2,388 0.00
Total Unrealised Gain on Total Return Swap Contracts ∞ 650,330 0.66
1 The 3 month LIBOR is the benchmark for this total return swap contract. 2 The 3 month JPY LIBOR is the benchmark for this total return swap contract.
3 The 3 month EURIBOR is the benchmark for this total return swap contract.
4 The counterparty for this total return swap contract is Citibank NA. 5 The counterparty for this total return swap contract is Goldman Sachs International.
Fair Value % of Net
US$ Assets
Total Financial Assets at Fair Value through Profit or Loss 95,220,727 96.07

SCHEDULE OF INVESTMENTS FINANCIAL STATEMENTS
ANNUAL REPORT 2019 591
Neuberger Berman Multi-Asset Class Income Fund (Continued)
Schedule of Investments (Continued)
Financial Liabilities at Fair Value through Profit or Loss
Forward Currency Contracts (1.11%) (31 December 2018: (1.32%))
Amount Receivable
Amount Payable
Maturity Date Counterparty Contracts Unrealised
Loss US$% of Net
Assets
CHF 48,129 US$ 49,798 22/01/2020 Goldman Sachs International 1 (28) (0.00)
CLP 593 US$ 1 22/01/2020 Goldman Sachs International 1 (0) (0.00)
€ 267,869 £ 230,047 22/01/2020 Goldman Sachs International 1 (3,878) (0.00)
¥ 342,846,839 US$ 3,173,520 22/01/2020 Citibank NA 7 (15,274) (0.02)
¥ 76,302,873 US$ 706,495 22/01/2020 Goldman Sachs International 3 (3,605) (0.00)
¥ 358,667,179 US$ 3,357,095 22/01/2020 State Street Bank and Trust and Co 4 (53,115) (0.05)
TRY 1,510,618 US$ 254,042 22/01/2020 Goldman Sachs International 1 (1,486) (0.00)
TRY 773,175 US$ 129,581 22/01/2020 State Street Bank and Trust and Co 1 (316) (0.00)
US$ 655,051 AUD 949,867 22/01/2020 Citibank NA 3 (12,985) (0.01)
US$ 56,599 BRL 228,095 22/01/2020 Citibank NA 1 (67) (0.00)
US$ 3,610,848 CAD 4,781,634 22/01/2020 Citibank NA 5 (76,972) (0.08)
US$ 1,437,563 CHF 1,417,986 22/01/2020 Citibank NA 5 (28,789) (0.03)
US$ 4,833,393 € 4,349,424 22/01/2020 Citibank NA 10 (54,787) (0.06)
US$ 1,098,159 £ 847,418 22/01/2020 Citibank NA 5 (25,096) (0.03)
US$ 1,057,657 MXN 21,007,839 22/01/2020 Citibank NA 1 (51,555) (0.05)
US$ 113,443 NOK 1,040,166 22/01/2020 Citibank NA 1 (4,939) (0.01)
US$ 1,128,531 NZD 1,752,702 22/01/2020 Citibank NA 5 (54,258) (0.06)
US$ 693,082 SEK 6,671,165 22/01/2020 Citibank NA 3 (20,258) (0.02)
US$ 2,687,162 AUD 3,922,141 22/01/2020 Goldman Sachs International 8 (71,256) (0.07)
US$ 258,207 BRL 1,063,079 22/01/2020 Goldman Sachs International 3 (5,895) (0.01)
US$ 378,242 CAD 499,463 22/01/2020 Goldman Sachs International 3 (6,967) (0.01)
US$ 1,666,919 CHF 1,643,789 22/01/2020 Goldman Sachs International 9 (32,939) (0.03)
US$ 672,747 CZK 15,493,553 22/01/2020 Goldman Sachs International 4 (11,610) (0.01)
US$ 596,751 € 534,876 22/01/2020 Goldman Sachs International 5 (4,378) (0.00)
US$ 438,041 £ 341,430 22/01/2020 Goldman Sachs International 3 (14,526) (0.02)
US$ 133,080 HUF 40,112,265 22/01/2020 Goldman Sachs International 1 (3,200) (0.00)
US$ 683,454 MXN 13,310,016 22/01/2020 Goldman Sachs International 3 (19,314) (0.02)
US$ 550,454 NOK 5,008,223 22/01/2020 Goldman Sachs International 4 (19,538) (0.02)
US$ 260,851 NZD 406,469 22/01/2020 Goldman Sachs International 1 (13,449) (0.01)
US$ 407,327 KRW 484,898,182 22/01/2020 Goldman Sachs International 2 (12,839) (0.01)
US$ 434,289 SEK 4,195,593 22/01/2020 Goldman Sachs International 2 (14,342) (0.02)
US$ 1,071,041 ZAR 15,911,587 22/01/2020 Goldman Sachs International 3 (63,914) (0.07)
US$ 518,775 AUD 762,403 22/01/2020 State Street Bank and Trust and Co 2 (17,418) (0.02)
US$ 240,218 CAD 316,957 22/01/2020 State Street Bank and Trust and Co 1 (4,234) (0.00)
US$ 3,526,457 CHF 3,468,889 22/01/2020 State Street Bank and Trust and Co 5 (60,748) (0.06)
US$ 14,404,929 € 12,888,839 22/01/2020 State Street Bank and Trust and Co 9 (80,427) (0.08)
US$ 245,855 £ 199,453 22/01/2020 State Street Bank and Trust and Co 1 (18,521) (0.02)
US$ 243,341 MXN 4,735,300 22/01/2020 State Street Bank and Trust and Co 1 (6,683) (0.01)
US$ 2,013,798 NOK 18,321,769 22/01/2020 State Street Bank and Trust and Co 7 (71,423) (0.07)

FINANCIAL STATEMENTS SCHEDULE OF INVESTMENTS
592 NEUBERGER BERMAN INVESTMENT FUNDS PLC
Neuberger Berman Multi-Asset Class Income Fund (Continued)
Schedule of Investments (Continued)
Financial Liabilities at Fair Value through Profit or Loss (continued)
Forward Currency Contracts (1.11%) (31 December 2018: (1.32%)) (continued)
Amount Receivable
Amount Payable
Maturity Date Counterparty Contracts Unrealised
Loss US$% of Net
Assets
US$ 2,194,451 NZD 3,402,657 22/01/2020 State Street Bank and Trust and Co 4 (101,790) (0.10)
US$ 1,326,120 SEK 12,663,632 22/01/2020 State Street Bank and Trust and Co 4 (27,991) (0.03)
US$ 132,557 KRW 157,861,594 22/01/2020 State Street Bank and Trust and Co 1 (4,231) (0.00)
EUR Hedged Classes US$ 12,397 € 11,187 22/01/2020 Goldman Sachs International 3 (175) (0.00)
US$ 131,047 € 117,752 22/01/2020 Westpac Banking Corp 6 (1,291) (0.00)
Total Unrealised Loss on Forward Currency Contracts ∞ (1,096,507) (1.11)
Futures Contracts (0.40%) (31 December 2018: (0.77%))
Number of Contracts Description Unrealised
Loss US$% of Net
Assets
(4) Australian Dollar Currency Future March 2020 (6,896) (0.01)
(3) British Pound Currency Future March 2020 (1,369) (0.00)
(4) Canadian Dollar Currency Future March 2020 (7,361) (0.01)
(4) DJIA Mini E-CBOT Future March 2020 (4,960) (0.01)
(2) Euro Currency Future March 2020 (2,935) (0.00)
(12) Hang Seng China Enterprises Index Future January 2020 (2,490) (0.00)
2 Japanese Yen Currency Future March 2020 (367) (0.00)
(4) New Zealand Dollar Currency Future March 2020 (9,411) (0.01)
55 Nikkei 225 (CME) Future March 2020 (16,500) (0.02)
(5) Nikkei 225 (OSE) Future March 2020 (11,962) (0.01)
(1) Norwegian Krone Currency Future March 2020 (9,191) (0.01)
(3) S&P 500 E-mini Future March 2020 (4,913) (0.00)
16 SPI 200 Index Future March 2020 (59,329) (0.06)
(1) Swedish Krona Futures March 2020 (3,879) (0.00)
53 United Kingdom Long Gilt Future March 2020 (59,190) (0.06)
44 US Treasury 10-Year Note (CBT) Future March 2020 (29,772) (0.03)
22 US Treasury 5-Year Note (CBT) Future March 2020 (6,976) (0.01)
50 US Treasury Long Bond (CBT) Future March 2020 (159,446) (0.16)
Total Unrealised Loss on Futures Contracts ± (396,947) (0.40)

SCHEDULE OF INVESTMENTS FINANCIAL STATEMENTS
ANNUAL REPORT 2019 593
Neuberger Berman Multi-Asset Class Income Fund (Continued)
Schedule of Investments (Continued)
Financial Liabilities at Fair Value through Profit or Loss (continued)
Written Options Contracts (0.06%) (31 December 2018: (0.50%))
Number of Contracts
Expiration Date Type Premium
US$Fair Value
US$% of Net
Assets
Call Options
5 08/01/20 CBOE S&P 500 Index, Strike Price $3,220 7,097 (13,550) (0.01)
9 08/01/20 CBOE S&P 500 Index, Strike Price $3,255 4,135 (7,245) (0.01)
6 15/01/20 CBOE S&P 500 Index, Strike Price $3,265 3,777 (6,630) (0.01)
7 08/01/20 CBOE S&P 500 Index, Strike Price $3,280 2,075 (1,680) (0.00)
8 15/01/20 CBOE S&P 500 Index, Strike Price $3,290 3,764 (3,640) (0.00)
6 22/01/20 CBOE S&P 500 Index, Strike Price $3,300 3,477 (3,420) (0.00)
Put Options
6 08/01/20 CBOE S&P 500 Index, Strike Price $3,090 10,171 (1,200) (0.00)
6 15/01/20 CBOE S&P 500 Index, Strike Price $3,130 9,117 (4,440) (0.01)
9 08/01/20 CBOE S&P 500 Index, Strike Price $3,140 10,165 (3,015) (0.00)
6 22/01/20 CBOE S&P 500 Index, Strike Price $3,165 9,837 (9,330) (0.01)
8 15/01/20 CBOE S&P 500 Index, Strike Price $3,170 10,188 (9,000) (0.01)
7 08/01/20 CBOE S&P 500 Index, Strike Price $3,180 5,561 (4,200) (0.00)
Total Loss on Written Options Contracts ± (67,350) (0.06)
Total Return Swap Contracts (0.50%) (31 December 2018: (0.19%))
Notional Amount Termination Date Variable Rate Reference Entity Unrealised
Loss US$% of Net
Assets
EUR (82,975) 22/05/20 (0.57)1 JPMorgan Basket JPNBEDFN3 (5,068) (0.00)
EUR (136,211) 22/05/20 (0.57)1 JPMorgan Basket JPNBEDFN3 (15,476) (0.02)
USD (487,787) 29/04/20 1.952 S&P 500 Utilities Sector Index4 (39,455) (0.04)
EUR (437,065) 22/05/20 (0.57)1 JPMorgan Basket JPNBEDFN3 (46,461) (0.05)
USD (908,114) 14/08/20 2.102 S&P 500 Consumer Staples Index4 (78,420) (0.08)
USD (914,628) 14/08/20 1.952 S&P 500 Utilities Sector Index4 (83,366) (0.08)
USD (893,270) 14/08/20 2.072 S&P 500 Materials Sector Index4 (105,924) (0.11)
USD (894,952) 14/08/20 2.082 S&P 500 Industrials Sector Index4 (115,850) (0.12)
Total Unrealised Loss on Total Return Swap Contracts ∞ (490,020) (0.50)
1 The 3 month EURIBOR is the benchmark for this total return swap contract. 2 The 3 month LIBOR is the benchmark for this total return swap contract. 3 The counterparty for this total return swap contract is JPMorgan Chase Bank. 4 The counterparty for this total return swap contract is Citibank NA.

FINANCIAL STATEMENTS SCHEDULE OF INVESTMENTS
594 NEUBERGER BERMAN INVESTMENT FUNDS PLC
Neuberger Berman Multi-Asset Class Income Fund (Continued)
Schedule of Investments (Continued)
Financial Liabilities at Fair Value through Profit or Loss (continued)
Fair Value % of Net
US$ Assets
Total Financial Liabilities at Fair Value through Profit or Loss (2,050,824) (2.07)
Net Financial Assets at Fair Value through Profit or Loss 93,169,903 94.00
Other Net Assets 5,950,922 6.00
Net Assets Attributable to Holders of Redeemable Participating Shares 99,120,825 100.00
% ofTotal
AssetsPortfolio Analysis US$
* Transferable securities and/or money market instruments admitted to an official stock exchange listing 72,844,751 71.72
** Transferable securities and/or money market instruments dealt in on a regulated market 10,410,394 10.25
† Other transferable securities and/or money market instruments 5,234,192 5.15
μ Investment funds 4,987,879 4.91
± Financial derivative instruments traded on a regulated market (294,483) (0.29)
∞ OTC financial derivative instruments (12,830) (0.01)
Total Investments 93,169,903 91.73

STATEMENT OF SIGNIFICANT PURCHASES AND SALES FINANCIAL STATEMENTS
ANNUAL REPORT 2019 595
Neuberger Berman Multi-Asset Class Income Fund (Continued) Statement of Significant Purchases and Sales (Unaudited) In accordance with the European Communities (Undertakings for Collective Investment in Transferable Securities) Regulations, 2011 as amended, a statement of changes in the composition of the Schedule of Investments during the reporting period is provided to ensure that Shareholders can identify changes in the investments held by the Portfolio. The following statements present the aggregate purchases and sales of transferable securities exceeding one percent of the total value of purchases or sales, respectively, for the period. At a minimum, the largest twenty purchases and twenty sales are presented, if available.
Aggregate purchases greater than one percent of the total value of purchases:
Units Security Description Cost US$
43,692 iShares JP Morgan USD EM Bond UCITS ETF USD Dist 4,924,573
3,165,000 United States Treasury Note/Bond, 3.88%, 15/08/2040 4,122,243
3,870,000 Fannie Mae Pool, 4.00%, 01/09/2049 4,019,647
3,565,000 United States Treasury Note/Bond, 2.88%, 31/05/2025 3,746,801
3,436,711 United States Treasury Inflation Indexed Bonds, 0.13%, 15/04/2021 3,405,387
2,749,245 United States Treasury Inflation Indexed Bonds, 1.00%, 15/02/2048 3,159,984
3,070,000 United States Treasury Note/Bond, 2.25%, 15/08/2049 3,111,213
2,860,000 United States Treasury Note/Bond, 2.50%, 15/02/2045 3,039,432
2,855,000 United States Treasury Note/Bond, 2.50%, 15/02/2046 3,036,237
29,472 iShares USD High Yield Corp Bond UCITS ETF 3,008,207
2,535,000 United States Treasury Note/Bond, 2.75%, 15/02/2028 2,680,043
2,600,000 OCP CLO Ltd 2017-13X Class D, 8.46%, 15/07/2030 2,533,213
2,455,000 Fannie Mae Pool, 3.00%, 01/10/2048 2,508,528
2,250,000 Fannie Mae Pool, 3.50%, 01/11/2048 2,312,623
2,250,000 Fannie Mae Pool, 3.50%, 01/10/2049 2,309,651
2,250,000 Fannie Mae Pool, 3.00%, 01/11/2048 2,288,328
2,150,000 Ginnie Mae, 4.00%, 01/11/2048 2,234,348
2,150,000 Ginnie Mae II Pool, 4.00%, 01/10/2049 2,234,223
2,095,000 Fannie Mae Pool, 3.50%, 01/09/2049 2,154,760
2,055,000 Fannie Mae Pool, 3.00%, 01/09/2049 2,089,113
1,995,000 Fannie Mae Pool, 4.00%, 01/07/2049 2,060,086
1,995,000 Fannie Mae Pool, 4.00%, 01/06/2049 2,049,695
1,960,000 Ginnie Mae II Pool, 4.00%, 01/09/2049 2,039,645
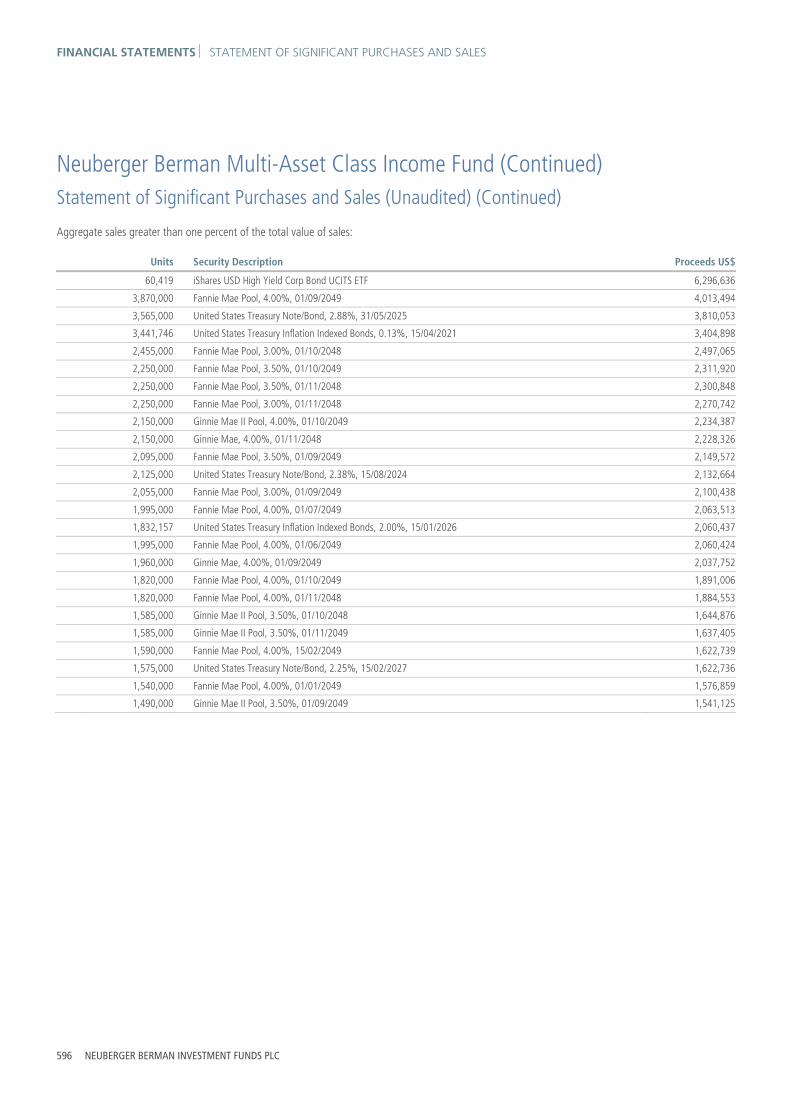
FINANCIAL STATEMENTS STATEMENT OF SIGNIFICANT PURCHASES AND SALES
596 NEUBERGER BERMAN INVESTMENT FUNDS PLC
Neuberger Berman Multi-Asset Class Income Fund (Continued) Statement of Significant Purchases and Sales (Unaudited) (Continued)
Aggregate sales greater than one percent of the total value of sales:
Units Security Description Proceeds US$
60,419 iShares USD High Yield Corp Bond UCITS ETF 6,296,636
3,870,000 Fannie Mae Pool, 4.00%, 01/09/2049 4,013,494
3,565,000 United States Treasury Note/Bond, 2.88%, 31/05/2025 3,810,053
3,441,746 United States Treasury Inflation Indexed Bonds, 0.13%, 15/04/2021 3,404,898
2,455,000 Fannie Mae Pool, 3.00%, 01/10/2048 2,497,065
2,250,000 Fannie Mae Pool, 3.50%, 01/10/2049 2,311,920
2,250,000 Fannie Mae Pool, 3.50%, 01/11/2048 2,300,848
2,250,000 Fannie Mae Pool, 3.00%, 01/11/2048 2,270,742
2,150,000 Ginnie Mae II Pool, 4.00%, 01/10/2049 2,234,387
2,150,000 Ginnie Mae, 4.00%, 01/11/2048 2,228,326
2,095,000 Fannie Mae Pool, 3.50%, 01/09/2049 2,149,572
2,125,000 United States Treasury Note/Bond, 2.38%, 15/08/2024 2,132,664
2,055,000 Fannie Mae Pool, 3.00%, 01/09/2049 2,100,438
1,995,000 Fannie Mae Pool, 4.00%, 01/07/2049 2,063,513
1,832,157 United States Treasury Inflation Indexed Bonds, 2.00%, 15/01/2026 2,060,437
1,995,000 Fannie Mae Pool, 4.00%, 01/06/2049 2,060,424
1,960,000 Ginnie Mae, 4.00%, 01/09/2049 2,037,752
1,820,000 Fannie Mae Pool, 4.00%, 01/10/2049 1,891,006
1,820,000 Fannie Mae Pool, 4.00%, 01/11/2048 1,884,553
1,585,000 Ginnie Mae II Pool, 3.50%, 01/10/2048 1,644,876
1,585,000 Ginnie Mae II Pool, 3.50%, 01/11/2049 1,637,405
1,590,000 Fannie Mae Pool, 4.00%, 15/02/2049 1,622,739
1,575,000 United States Treasury Note/Bond, 2.25%, 15/02/2027 1,622,736
1,540,000 Fannie Mae Pool, 4.00%, 01/01/2049 1,576,859
1,490,000 Ginnie Mae II Pool, 3.50%, 01/09/2049 1,541,125

INVESTMENT MANAGER’S REPORT FINANCIAL STATEMENTS
ANNUAL REPORT 2019 597
Neuberger Berman US Equity Index Putwrite Fund Investment Manager’s Report For the 12 months ended 31 December 2019, the total return for the USD I Accumulating Class was 15.09%. Over the same period, the Blended Benchmark (85% CBOE S&P 500 PutWrite Index and 15% CBOE Russell 2000 PutWrite Index) returned 13.66%. (Performance for all share classes is provided in Appendix II. Performance data quoted represent past performance and do not indicate future results. Total returns shown reflect the reinvestment of income dividends and other distributions, if any).
Historically speaking, 2019 was not a particularly exceptional year in volatility terms even though only three years in the past 30 have seen higher S&P 500 calendar year returns while implied volatility levels and implied volatility premiums were around median levels. In our opinion, what made it seem so exceptional was how few investors anticipated the spectacular returns. Given the persistent outflows from equity mutual Portfolios and exchange traded Portfolios in 2019, participation in market gains in 2019 may not have been as wide spread as most investors might perceive.
In 2019, the portfolio benefited from increased index implied volatility premiums, strong equity market returns led by the 31.5% return of the S&P 500 and reasonable short-term US Treasury rates. Somewhat surprisingly, the CBOE S&P 500 Volatility Index (“VIX”) averaged 15.4 for the year which was slightly lower than its 2018 average of 16.6. Yet, the implied volatility premium earned in 2019 was markedly higher. Thus, year-over-year, the average 30-day realised volatility level of the S&P 500 Index was materially lower. Comparatively, the S&P 500’s average 30-day realised volatility for 2019 was approximately 11.4 while 2018’s average was 15.0. This lower realised volatility environment in 2019 yielded an attractive average S&P 500 implied volatility premium of 4.2 versus the 2018 average of just about 1.0.
On the year, the Portfolio produced an attractive 15.09%, outperforming its benchmark return of 13.66% but, as expected, underperformed the blended S&P 500 Index/Russell 2000 Index return of 30.6%. Average option notional exposure over the month remained consistent with our strategic targets of 85% S&P 500 Index and 15% Russell 2000 Index.
Year-to-date, the Portfolio’s S&P 500 Index put writing strategy was the largest contributor to performance as it produced an attractive 15.80%, outperforming the 13.51% return of the PUT but lagging the S&P 500 Index’s 31.5%. During the year, the VIX level fell -11.6 points from 25.4 at the start of the year, averaging 15.4 for the period. Meanwhile, volatility on the S&P 500 Index has realised at 12.5 well below its historical average, leading to a positive average implied volatility premium of 3.0 on the year.
The Portfolio’s Russell 2000 Index put writing strategy also positively contributed to performance for the year and rallied approximately 14.48%, matching the 14.50% return of the CBOE Russell 2000 PutWrite Index (“PUTR”) but lacked the beta exposure to keep pace with the Russell 2000 Index’s 25.5%. During 2019, the RVX level fell -12.5 points from 28.5 at the start of the year, averaging 18.6 for the period. Meanwhile, volatility on the Russell 2000 Index has realised at 16.1, leading to a positive average implied volatility premium of 2.6 on the year.
Year-to-date, the collateral Portfolio has posted a gain of 2.45%, as 2-Year US Treasury Yields fell -92bps. The Portfolio outperformed the ICE BofA 0-3 Month US T-Bill Index return of 2.21% but failed to keep pace with the longer duration exposure of the ICE BofA 1-3 Year US Treasury Index which returned of 3.55% on the year.
After years of waiting for risk to build in the system, 2020 looks to be a year in which any number of anticipated and unanticipated risks, like strategic assassinations of military leaders or global pandemics, could, and have, come to weigh on the markets. Having managed through one of the worst equity sell-offs in modern times and the 2nd largest increase in implied volatility levels on record (only 1987 was higher), elevated option premium levels offer a substantial opportunity to either recoup losses as a recovery takes hold or mitigate additional losses in the event the market continue to decline. With rates at zero or negative, credit spreads widening based on the growing possibility of real default risk and other strategies failing to navigate the volatility, monetizing equity volatility is one of the more liquid and direct ways to profit from the current fear in the markets. Importantly, the longer VIX remains in a historically high range—in 2008/09 VIX was above 50 for 56 days and has been above 50 for 14 days in 2020—the more insulated our strategies become from any additional deterioration in equity markets. With the VIX futures curve elevated above 30 out into the 3rd quarter of this year, option markets are expecting high levels of equity volatility to continue on into the 2020 election. Regardless of what we think, a lot happens in 365 days and the markets will continue to surprise investors in 2020, so we will just have to wait and see.

FINANCIAL STATEMENTS BALANCE SHEET
The accompanying notes form an integral part of the financial statements.
598 NEUBERGER BERMAN INVESTMENT FUNDS PLC
Neuberger Berman US Equity Index Putwrite Fund (Continued)
Balance Sheet
As at As at
Note 31 December 2019 31 December 2018
US$ US$
Current Assets
Financial Assets at Fair Value through Profit or Loss 2 523,549,435 399,165,448
Cash and cash equivalents 3 32,398,253 18,668,522
Receivable for investments sold 224,840 49,317
Receivable for shares issued 83,310 181,093
Due from brokers – 82,052,740
Income receivable and other assets 1,820,248 901,442
Total Assets 558,076,086 501,018,562
Current Liabilities
Financial Liabilities at Fair Value through Profit or Loss 2 3,206,602 8,106,942
Payable for shares redeemed 76,408 362,303
Accrued expenses 343,267 528,081
Payable for investments purchased 10,385 73
Other payables 8,301 34,554
Liabilities (excluding Net Assets Attributable to Holders of Redeemable Participating Shares) 3,644,963 9,031,953
Net Assets Attributable to Holders of Redeemable Participating Shares 554,431,123 491,986,609

PROFIT AND LOSS ACCOUNT FINANCIAL STATEMENTS
The accompanying notes form an integral part of the financial statements.
ANNUAL REPORT 2019 599
Neuberger Berman US Equity Index Putwrite Fund (Continued)
Profit and Loss Account
Year Ended Year Ended
Note 31 December 2019 31 December 2018
US$ US$
Income
Interest Income 8,036,472 4,217,507
Net Gain/(Loss) on Financial Assets and Liabilities at Fair Value through Profit or Loss 11 66,726,186 (44,926,218)
74,762,658 (40,708,711)
Expenses
Management Fee 6 2,402,910 1,806,245
Distribution Fee 6 62,357 76,860
Administration Fee 6 558,522 476,778
Commitment Fee 19 77,986 22,602
Custody Fee 6 15,650 13,960
Depositary Fee 6 50,352 39,162
Professional Fee 9 46,727 79,235
Directors' Fee 7 4,530 6,613
Transaction Costs 9 116,853 102,413
Audit Fee 8 17,489 18,951
VAT Rebate (8,218) (4,350)
Other Expenses 9 20,674 35,662
Expense Waiver 6 – (28,668)
Total Expenses 3,365,832 2,645,463
Finance Costs
Interest Expense 116 3,191
Distribution Paid 1 130,583 117,223
130,699 120,414
Profit/(Loss) Attributable to Holders of Redeemable Participating Shares from Operations 71,266,127 (43,474,588)
Income and expenses arose solely from continuing operations.

FINANCIAL STATEMENTS STATEMENT OF CHANGES IN NET ASSETS
The accompanying notes form an integral part of the financial statements.
600 NEUBERGER BERMAN INVESTMENT FUNDS PLC
Neuberger Berman US Equity Index Putwrite Fund (Continued)
Statement of Changes in Net Assets Attributable to Holders of Redeemable Participating Shares
Year Ended Year Ended
31 December 2019 31 December 2018
US$ US$
Net Assets Attributable to Holders of Redeemable Participating Shares at beginning of year 491,986,609 194,874,376
Profit/(Loss) Attributable to Holders of Redeemable Participating Shares from Operations 71,266,127 (43,474,588)
Subscriptions 5 126,658,886 480,425,796
Redemptions 5 (135,480,499) (139,838,975)
Net Assets Attributable to Holders of Redeemable Participating Shares at end of year 554,431,123 491,986,609

SCHEDULE OF INVESTMENTS FINANCIAL STATEMENTS
ANNUAL REPORT 2019 601
Neuberger Berman US Equity Index Putwrite Fund (Continued)
Schedule of Investments
Financial Assets at Fair Value through Profit or Loss
Principal Amount Security Description Coupon Maturity
DateFair Value
US$% of Net
Assets
Government Bonds 94.14% (31 December 2018: 81.10%)
United States Dollar 44,000,000 United States Treasury Note/Bond 1.38% 15/09/2020 43,921,118 7.92
45,400,000 United States Treasury Note/Bond 1.50% 15/06/2020 45,386,072 8.19
35,000,000 United States Treasury Note/Bond 1.50% 15/09/2022 34,907,032 6.30
45,400,000 United States Treasury Note/Bond 1.63% 15/03/2020 45,397,365 8.19
45,800,000 United States Treasury Note/Bond 1.75% 15/06/2022 45,974,301 8.29
76,400,000 United States Treasury Note/Bond 1.88% 15/12/2020 76,568,396 13.81
45,800,000 United States Treasury Note/Bond 2.38% 15/03/2021 46,198,694 8.33
45,700,000 United States Treasury Note/Bond 2.38% 15/03/2022 46,482,702 8.38
43,600,000 United States Treasury Note/Bond 2.63% 15/06/2021 44,232,082 7.98
44,200,000 United States Treasury Note/Bond 2.63% 15/12/2021 45,073,180 8.13
46,900,000 United States Treasury Note/Bond 2.75% 15/09/2021 47,798,826 8.62
Total Government Bonds * 521,939,768 94.14
Total Investments 521,939,768 94.14
Forward Currency Contracts 0.29% (31 December 2018: 0.03%)
Amount Receivable
Amount Payable
Maturity Date Counterparty Contracts Unrealised
Gain US$% of Net
Assets
EUR Hedged Classes € 20,811,412 US$ 22,990,722 22/01/2020 Citibank NA 3 398,564 0.07
€ 22,951,471 US$ 25,349,512 22/01/2020 Goldman Sachs International 10 444,919 0.08
€ 21,573,409 US$ 23,855,468 22/01/2020 Westpac Banking Corp 40 390,204 0.07
GBP Hedged Classes £ 1,379,599 US$ 1,705,000 22/01/2020 Citibank NA 3 123,661 0.02
£ 1,509,103 US$ 1,869,206 22/01/2020 Goldman Sachs International 9 131,113 0.03
£ 1,406,995 US$ 1,749,492 22/01/2020 Westpac Banking Corp 13 115,483 0.02
SGD Hedged Classes SGD 103,501 US$ 75,061 22/01/2020 Citibank NA 4 1,922 0.00
SGD 111,295 US$ 80,737 22/01/2020 Goldman Sachs International 7 2,042 0.00
SGD 95,050 US$ 68,937 22/01/2020 Westpac Banking Corp 10 1,759 0.00
Total Unrealised Gain on Forward Currency Contracts ∞ 1,609,667 0.29
Fair Value % of Net
US$ Assets
Total Financial Assets at Fair Value through Profit or Loss 523,549,435 94.43

FINANCIAL STATEMENTS SCHEDULE OF INVESTMENTS
602 NEUBERGER BERMAN INVESTMENT FUNDS PLC
Neuberger Berman US Equity Index Putwrite Fund (Continued)
Schedule of Investments (Continued)
Financial Liabilities at Fair Value through Profit or Loss
Forward Currency Contracts (0.01%) (31 December 2018: (0.18%))
Amount Receivable
Amount Payable
Maturity Date Counterparty Contracts Unrealised
Loss US$% of Net
Assets
EUR Hedged Classes US$ 2,442,125 € 2,204,258 22/01/2020 Goldman Sachs International 7 (35,173) (0.01)
US$ 1,318,315 € 1,185,327 22/01/2020 Westpac Banking Corp 33 (13,839) (0.00)
GBP Hedged Classes £ 4,091 US$ 5,466 22/01/2020 Westpac Banking Corp 2 (43) (0.00)
US$ 158,318 £ 126,556 22/01/2020 Goldman Sachs International 3 (9,432) (0.00)
US$ 206,288 £ 159,377 22/01/2020 Westpac Banking Corp 12 (4,967) (0.00)
SGD Hedged Classes US$ 6,075 SGD 8,358 22/01/2020 Goldman Sachs International 3 (141) (0.00)
Total Unrealised Loss on Forward Currency Contracts ∞ (63,595) (0.01)
Written Options Contracts (0.57%) (31 December 2018: (1.47%))
Number of Contracts
Expiration Date Type Premium
US$Fair Value
US$% of Net
Assets
Put Options
7 17/01/20 CBOE Russell 2000 Index, Strike Price $1,635 18,354 (5,985) (0.00)
69 17/01/20 CBOE Russell 2000 Index, Strike Price $1,650 146,318 (80,730) (0.01)
33 17/01/20 CBOE Russell 2000 Index, Strike Price $1,660 65,938 (48,015) (0.01)
12 17/01/20 CBOE Russell 2000 Index, Strike Price $1,670 23,898 (21,660) (0.00)
6 10/01/20 CBOE S&P 500 Index, Strike Price $3,140 26,442 (3,180) (0.00)
17 03/01/20 CBOE S&P 500 Index, Strike Price $3,145 63,056 (2,082) (0.00)
187 10/01/20 CBOE S&P 500 Index, Strike Price $3,160 768,479 (126,225) (0.02)
176 10/01/20 CBOE S&P 500 Index, Strike Price $3,165 565,560 (126,720) (0.02)
2 03/01/20 CBOE S&P 500 Index, Strike Price $3,190 2,799 (515) (0.00)
12 03/01/20 CBOE S&P 500 Index, Strike Price $3,200 10,554 (4,020) (0.00)
185 03/01/20 CBOE S&P 500 Index, Strike Price $3,210 156,430 (85,100) (0.02)
23 03/01/20 CBOE S&P 500 Index, Strike Price $3,215 28,599 (12,535) (0.00)
17 31/01/20 CBOE S&P 500 Index, Strike Price $3,215 71,748 (59,075) (0.01)
69 03/01/20 CBOE S&P 500 Index, Strike Price $3,220 50,941 (45,195) (0.01)
108 24/01/20 CBOE S&P 500 Index, Strike Price $3,220 367,951 (320,220) (0.06)
63 24/01/20 CBOE S&P 500 Index, Strike Price $3,225 221,704 (196,245) (0.04)
41 31/01/20 CBOE S&P 500 Index, Strike Price $3,225 171,752 (154,775) (0.03)
109 24/01/20 CBOE S&P 500 Index, Strike Price $3,230 348,993 (358,065) (0.06)
85 24/01/20 CBOE S&P 500 Index, Strike Price $3,240 295,824 (309,825) (0.06)
19 31/01/20 CBOE S&P 500 Index, Strike Price $3,240 77,890 (81,605) (0.01)
1 10/01/20 Russell 2000 Index, Strike Price $1,630 2,724 (470) (0.00)
61 03/01/20 Russell 2000 Index, Strike Price $1,635 148,398 (7,320) (0.00)
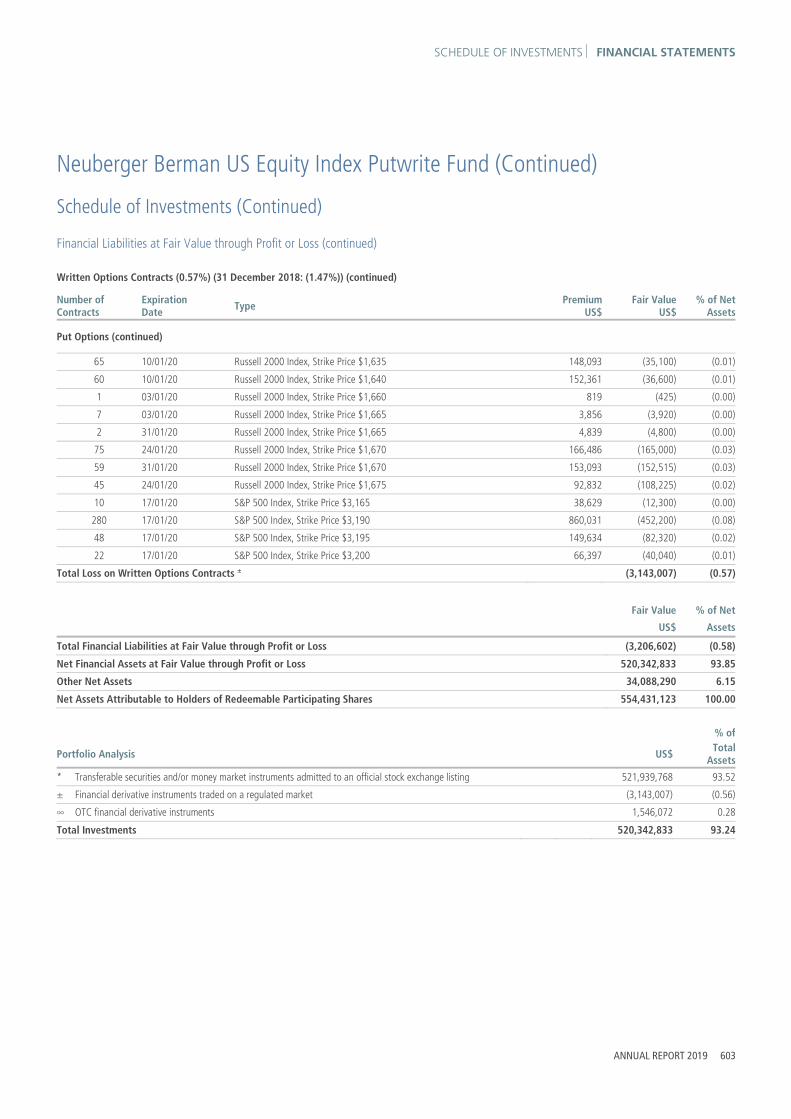
SCHEDULE OF INVESTMENTS FINANCIAL STATEMENTS
ANNUAL REPORT 2019 603
Neuberger Berman US Equity Index Putwrite Fund (Continued)
Schedule of Investments (Continued)
Financial Liabilities at Fair Value through Profit or Loss (continued)
Written Options Contracts (0.57%) (31 December 2018: (1.47%)) (continued)
Number of Contracts
Expiration Date Type Premium
US$Fair Value
US$% of Net
Assets
Put Options (continued)
65 10/01/20 Russell 2000 Index, Strike Price $1,635 148,093 (35,100) (0.01)
60 10/01/20 Russell 2000 Index, Strike Price $1,640 152,361 (36,600) (0.01)
1 03/01/20 Russell 2000 Index, Strike Price $1,660 819 (425) (0.00)
7 03/01/20 Russell 2000 Index, Strike Price $1,665 3,856 (3,920) (0.00)
2 31/01/20 Russell 2000 Index, Strike Price $1,665 4,839 (4,800) (0.00)
75 24/01/20 Russell 2000 Index, Strike Price $1,670 166,486 (165,000) (0.03)
59 31/01/20 Russell 2000 Index, Strike Price $1,670 153,093 (152,515) (0.03)
45 24/01/20 Russell 2000 Index, Strike Price $1,675 92,832 (108,225) (0.02)
10 17/01/20 S&P 500 Index, Strike Price $3,165 38,629 (12,300) (0.00)
280 17/01/20 S&P 500 Index, Strike Price $3,190 860,031 (452,200) (0.08)
48 17/01/20 S&P 500 Index, Strike Price $3,195 149,634 (82,320) (0.02)
22 17/01/20 S&P 500 Index, Strike Price $3,200 66,397 (40,040) (0.01)
Total Loss on Written Options Contracts ± (3,143,007) (0.57)
Fair Value % of Net
US$ Assets
Total Financial Liabilities at Fair Value through Profit or Loss (3,206,602) (0.58)
Net Financial Assets at Fair Value through Profit or Loss 520,342,833 93.85
Other Net Assets 34,088,290 6.15
Net Assets Attributable to Holders of Redeemable Participating Shares 554,431,123 100.00
% of
Portfolio Analysis US$Total
Assets
* Transferable securities and/or money market instruments admitted to an official stock exchange listing 521,939,768 93.52
± Financial derivative instruments traded on a regulated market (3,143,007) (0.56)
∞ OTC financial derivative instruments 1,546,072 0.28
Total Investments 520,342,833 93.24

FINANCIAL STATEMENTS STATEMENT OF SIGNIFICANT PURCHASES AND SALES
604 NEUBERGER BERMAN INVESTMENT FUNDS PLC
Neuberger Berman US Equity Index Putwrite Fund (Continued) Statement of Significant Purchases and Sales (Unaudited)
In accordance with the European Communities (Undertakings for Collective Investment in Transferable Securities) Regulations, 2011 as amended, a statement of changes in the composition of the Schedule of Investments during the reporting period is provided to ensure that Shareholders can identify changes in the investments held by the Portfolio. The following statements present the aggregate purchases and sales of transferable securities exceeding one percent of the total value of purchases or sales, respectively, for the period. At a minimum, the largest twenty purchases and twenty sales are presented, if available.
Total purchases:
Units Security Description Cost US$
46,900,000 United States Treasury Note/Bond, 2.75%, 15/09/2021 47,961,883
45,700,000 United States Treasury Note/Bond, 2.38%, 15/03/2022 46,718,938
45,800,000 United States Treasury Note/Bond, 1.75%, 15/06/2022 45,969,394
44,200,000 United States Treasury Note/Bond, 2.63%, 15/12/2021 45,251,246
43,600,000 United States Treasury Note/Bond, 2.63%, 15/06/2021 43,850,305
35,000,000 United States Treasury Note/Bond, 1.50%, 15/09/2022 34,860,547
18,800,000 United States Treasury Note/Bond, 2.38%, 15/03/2021 18,759,609
6,900,000 United States Treasury Note/Bond, 0.88%, 15/06/2019 6,851,754
Total sales:
Units Security Description Proceeds US$
40,000,000 United States Treasury Note/Bond, 1.88%, 15/12/2020 39,481,250
39,000,000 United States Treasury Note/Bond, 0.88%, 15/09/2019 38,873,867
21,100,000 United States Treasury Note/Bond, 0.88%, 15/06/2019 21,064,148
400,000 United States Treasury Note/Bond, 1.00%, 15/03/2019 399,906

INVESTMENT MANAGER’S REPORT FINANCIAL STATEMENTS
ANNUAL REPORT 2019 605
Neuberger Berman Global Equity Index Putwrite Fund Investment Manager’s Report For the 12 months ended 31 December 2019, the total return for the USD I Accumulating Class was 12.42%. Over the same period, the Blended Benchmark1 (the “Index”) returned 12.61%. (Performance for all share classes is provided in Appendix II. Performance data quoted represent past performance and do not indicate future results. Total returns shown reflect the reinvestment of income dividends and other distributions, if any).
Historically speaking, 2019 was not a particularly exceptional year in volatility terms even though only three years in the past 30 have seen higher S&P 500 calendar year returns while implied volatility levels and implied volatility premiums were around median levels. In our opinion, what made it seem so exceptional was how few investors anticipated the spectacular returns. Given the persistent outflows from equity mutual fund portfolios and exchange-traded portfolios in 2019, participation in market gains in 2019 may not have been as wide spread as most investors might perceive.
For the year, the MSCI All Country World Index (“MSCI ACWI”) at 27.30%, outperforming the 12.61% return of the Index. Meanwhile, the Blended PutWrite Index2 returned 8.83%. In 2019, the Portfolio benefited from increased index implied volatility premiums, strong equity market returns led by the 31.49% return of the S&P 500 and reasonable short-term US Treasury rates. For the year, the Portfolio rallied 12.42%, outperforming the Blended PutWrite Index return of 8.83% but lagged its benchmark return of 12.61%. As anticipated, the Portfolio lacked the beta exposure to keep pace with the MSCI ACWI.
Year-to-date, the Portfolio’s S&P 500 Index put writing strategy was the largest contributor to performance and posted a 15.99% return, outperforming the 13.51% return of the CBOE PUT Index but lagged the S&P 500 Index’s 31.49%. During the year, the CBOE S&P 500 Volatility Index (“VIX”) level fell -11.6 points from 25.4 at the start of the year, averaging 15.4 for the period. Meanwhile, volatility on the S&P 500 Index realised at 12.5, well below its historical average, leading to a positive average implied volatility premium of 3.0 for the year.
Non-US developed markets was the second best contributor to Portfolio performance during the year. The Portfolio's MSCI EAFE put writing strategy rallied approximately 10.45%, outperforming the 5.45% return of the CBOE MSCI EAFE PutWrite Index but lagged the MSCI EAFE Index’s 22.66% for the year. Meanwhile, the CBOE EFA ETF Volatility Index level retreated -7.4 points from 19.4 at the start of the year, averaging 13.7 for the period. In addition, volatility on the MSCI EAFE Index has realised at 8.8, leading to a positive average implied volatility premium of 5.0 for 2019.
For the year, the Portfolio's MSCI EM put writing strategy at approximately 9.72%, outperforming the 1.65% return of the CBOE MSCI Emerging Markets PutWrite Index and capturing more than half of the MSCI Emerging Markets Index’s (“MSCI EM Index”) 18.88%. During 2019, the CBOE EEM ETF Volatility Index level retreated -7.6 points from 24.9 at the start of the year, averaging 18.6 for the period. Meanwhile, volatility on the MSCI EM Index realised at a low 11.4, leading to a positive average implied volatility premium of 7.2 for the year.
Year-to-date, the collateral Portfolio posted a gain of approximately 2.32% as 2-Year US Treasury Yields fell -92bps. The Portfolio outperformed the ICE BofA 0-3 Month US Treasury Bill Index return of 2.21% but lagged against the longer duration exposure of the ICE BofA 1-3 Year US Treasury Index, which returned of 3.55% for the year.
After years of waiting for risk to build in the system, 2020 looks to be a year in which any number of anticipated and unanticipated risks, like strategic assassinations of military leaders or global pandemics, could, and have, come to weigh on the markets. Having managed through one of the worst equity sell-offs in modern times and the 2nd largest increase in implied volatility levels on record (only 1987 was higher), elevated option premium levels offer a substantial opportunity to either recoup losses as a recovery takes hold or mitigate additional losses in the event the market continue to decline. With rates at zero or negative, credit spreads widening based on the growing possibility of real default risk and other strategies failing to navigate the volatility, monetizing equity volatility is one of the more liquid and direct ways to profit from the current fear in the markets. Importantly, the longer VIX remains in a historically high range in 2008/09 VIX was above 50 for 56 days and has been above 50 for 14 days in 2020 - the more insulated our strategies become from any additional deterioration in equity markets. With the VIX futures curve elevated above 30 out into the 3rd quarter of this year, option markets are expecting high levels of equity volatility to continue on into the 2020 election. Regardless of what we think, a lot happens in 365 days and the markets will continue to surprise investors in 2020, so we will just have to wait and see.
1 The Blended Benchmark is comprised of 50% CBOE S&P 500 PutWrite Index, 25% MSCI ACWI ex-U.S. Index and 25% ICE BofA US 0-3-MonthTreasury Bill Index. 2 The Blended PutWrite Index is comprised of 50% CBOE S&P 500 PutWrite / 35% CBOE MSCI EAFE PutWrite / 15% CBOE MSCI Emerging Markets PutWrite Index.

FINANCIAL STATEMENTS BALANCE SHEET
The accompanying notes form an integral part of the financial statements.
606 NEUBERGER BERMAN INVESTMENT FUNDS PLC
Neuberger Berman Global Equity Index Putwrite Fund (Continued) Balance Sheet
As at As at
Note 31 December 2019 31 December 2018
US$ US$
Current Assets
Financial Assets at Fair Value through Profit or Loss 2 54,949,964 81,855,461
Cash and cash equivalents 3 2,802,683 4,678,833
Receivable for investments sold 8,441 –
Receivable for shares issued 8,755 22,922
Due from brokers – 14,095,202
Income receivable and other assets 217,119 257,269
Total Assets 57,986,962 100,909,687
Current Liabilities
Financial Liabilities at Fair Value through Profit or Loss 2 768,308 2,074,596
Payable for shares redeemed 184,336 6,754
Accrued expenses 98,310 143,619
Payable for investments purchased 138 73
Other payables 11,794 18,305
Liabilities (excluding Net Assets Attributable to Holders of Redeemable Participating Shares) 1,062,886 2,243,347
Net Assets Attributable to Holders of Redeemable Participating Shares 56,924,076 98,666,340

PROFIT AND LOSS ACCOUNT FINANCIAL STATEMENTS
The accompanying notes form an integral part of the financial statements.
ANNUAL REPORT 2019 607
Neuberger Berman Global Equity Index Putwrite Fund (Continued) Profit and Loss Account
Year Ended Year Ended
Note 31 December 2019 31 December 2018
US$ US$
Income
Interest Income 1,003,836 1,498,512
Net Gain/(Loss) on Financial Assets and Liabilities at Fair Value through Profit or Loss 11 7,413,642 (14,714,157)
8,417,478 (13,215,645)
Expenses
Management Fee 6 364,514 859,728
Distribution Fee 6 9,991 13,094
Administration Fee 6 216,881 357,758
Commitment Fee 19 15,900 7,443
Custody Fee 6 12,000 12,000
Depositary Fee 6 7,656 15,104
Professional Fee 9 116,807 52,325
Directors' Fee 7 4,507 6,613
Transaction Costs 9 109,920 119,894
Audit Fee 8 19,800 25,680
VAT Rebate (1,281) (1,796)
Other Expenses 9 16,031 10,730
Expense Waiver 6 (344,290) (321,251)
Total Expenses 548,436 1,157,322
Finance Costs
Distribution Paid 1 564,866 316,485
564,866 316,485
Profit/(Loss) Attributable to Holders of Redeemable Participating Shares from Operations 7,304,176 (14,689,452)
Income and expenses arose solely from continuing operations.

FINANCIAL STATEMENTS STATEMENT OF CHANGES IN NET ASSETS
The accompanying notes form an integral part of the financial statements.
608 NEUBERGER BERMAN INVESTMENT FUNDS PLC
Neuberger Berman Global Equity Index Putwrite Fund (Continued) Statement of Changes in Net Assets Attributable to Holders of Redeemable Participating Shares
Year Ended Year Ended
31 December 2019 31 December 2018
US$ US$
Net Assets Attributable to Holders of Redeemable Participating Shares at beginning of year 98,666,340 111,017,088
Profit/(Loss) Attributable to Holders of Redeemable Participating Shares from Operations 7,304,176 (14,689,452)
Subscriptions 5 11,013,410 96,840,225
Redemptions 5 (60,059,850) (94,501,521)
Net Assets Attributable to Holders of Redeemable Participating Shares at end of year 56,924,076 98,666,340

SCHEDULE OF INVESTMENTS FINANCIAL STATEMENTS
ANNUAL REPORT 2019 609
Neuberger Berman Global Equity Index Putwrite Fund (Continued)
Schedule of Investments
Financial Assets at Fair Value through Profit or Loss
Principal Amount Security Description Coupon
Maturity Date
Fair ValueUS$
% of NetAssets
Government Bonds 94.85% (31 December 2018: 82.66%)
United States Dollar 11,800,000 United States Treasury Note/Bond 1.38% 15/09/2020 11,778,845 20.69
12,600,000 United States Treasury Note/Bond 1.50% 15/06/2020 12,596,135 22.13
14,900,000 United States Treasury Note/Bond 1.63% 15/03/2020 14,899,135 26.17
5,100,000 United States Treasury Note/Bond 1.88% 15/12/2020 5,111,241 8.98
5,300,000 United States Treasury Note/Bond 2.38% 15/03/2021 5,346,137 9.39
4,200,000 United States Treasury Note/Bond 2.63% 15/06/2021 4,260,889 7.49
Total Government Bonds * 53,992,382 94.85
Total Investments 53,992,382 94.85
Forward Currency Contracts 1.68% (31 December 2018: 0.30%)
Amount Receivable
Amount Payable
Maturity Date Counterparty Contracts Unrealised
Gain US$% of Net
Assets
AUD Hedged Classes AUD 155,843 US$ 105,066 22/01/2020 Citibank NA 2 4,537 0.01
AUD 171,093 US$ 115,456 22/01/2020 Goldman Sachs International 7 4,873 0.01
AUD 2,866 US$ 1,970 22/01/2020 UBS AG 1 46 0.00
AUD 138,920 US$ 93,652 22/01/2020 Westpac Banking Corp 4 4,049 0.01
CHF Hedged Classes CHF 3,350,023 US$ 3,381,983 22/01/2020 Citibank NA 3 82,303 0.14
CHF 3,726,722 US$ 3,757,627 22/01/2020 Goldman Sachs International 9 96,207 0.17
CHF 61,269 US$ 62,426 22/01/2020 UBS AG 1 932 0.00
CHF 2,939,960 US$ 2,966,010 22/01/2020 Westpac Banking Corp 9 74,227 0.13
EUR Hedged Classes € 7,930,091 US$ 8,760,243 22/01/2020 Citibank NA 2 152,135 0.27
€ 8,495,901 US$ 9,380,621 22/01/2020 Goldman Sachs International 8 167,654 0.29
€ 7,024,475 US$ 7,757,647 22/01/2020 Westpac Banking Corp 16 136,935 0.24
GBP Hedged Classes £ 846,478 US$ 1,046,044 22/01/2020 Citibank NA 2 75,964 0.13
£ 866,508 US$ 1,070,941 22/01/2020 Goldman Sachs International 8 77,617 0.13
£ 729,565 US$ 900,642 22/01/2020 Westpac Banking Corp 6 66,400 0.12
US$ 41,934 £ 31,410 22/01/2020 Westpac Banking Corp 1 300 0.00
SGD Hedged Classes SGD 244,149 US$ 176,997 22/01/2020 Citibank NA 2 4,598 0.01
SGD 250,455 US$ 181,554 22/01/2020 Goldman Sachs International 6 4,731 0.01
SGD 213,412 US$ 154,657 22/01/2020 Westpac Banking Corp 8 4,074 0.01
Total Unrealised Gain on Forward Currency Contracts ∞ 957,582 1.68

FINANCIAL STATEMENTS SCHEDULE OF INVESTMENTS
610 NEUBERGER BERMAN INVESTMENT FUNDS PLC
Neuberger Berman Global Equity Index Putwrite Fund (Continued)
Schedule of Investments (Continued)
Financial Assets at Fair Value through Profit or Loss (continued)
Fair Value % of Net
US$ Assets
Total Financial Assets at Fair Value through Profit or Loss 54,949,964 96.53
Financial Liabilities at Fair Value through Profit or Loss
Forward Currency Contracts (0.71%) (31 December 2018: (0.61%))
Amount Receivable
Amount Payable
Maturity Date Counterparty Contracts Unrealised
Loss US$% of Net
Assets
AUD Hedged Classes US$ 8,940 AUD 13,182 22/01/2020 Goldman Sachs International 3 (331) (0.00)
CHF Hedged Classes US$ 420,885 CHF 414,853 22/01/2020 Goldman Sachs International 6 (8,118) (0.01)
US$ 285,605 CHF 281,648 22/01/2020 Westpac Banking Corp 22 (5,649) (0.01)
EUR Hedged Classes US$ 2,353,636 € 2,130,729 22/01/2020 Citibank NA 1 (41,023) (0.07)
US$ 3,025,067 € 2,738,873 22/01/2020 Goldman Sachs International 8 (53,065) (0.09)
US$ 8,506,108 € 7,667,502 22/01/2020 Westpac Banking Corp 32 (111,150) (0.20)
GBP Hedged Classes £ 2,975 US$ 3,971 22/01/2020 Westpac Banking Corp 1 (28) (0.00)
US$ 809,516 £ 655,092 22/01/2020 Citibank NA 1 (58,809) (0.10)
US$ 835,301 £ 676,217 22/01/2020 Goldman Sachs International 5 (61,024) (0.11)
US$ 817,498 £ 657,999 22/01/2020 Westpac Banking Corp 7 (54,682) (0.10)
SGD Hedged Classes US$ 120,588 SGD 166,343 22/01/2020 Citibank NA 1 (3,136) (0.01)
US$ 124,824 SGD 172,228 22/01/2020 Goldman Sachs International 4 (3,277) (0.01)
US$ 103,298 SGD 142,580 22/01/2020 Westpac Banking Corp 1 (2,751) (0.00)
Total Unrealised Loss on Forward Currency Contracts ∞ (403,043) (0.71)
Written Options Contracts (0.64%) (31 December 2018: (1.49%))
Number of Contracts
Expiration Date Type Premium
US$Fair Value
US$% of Net
Assets
Put Options
9 10/01/20 CBOE S&P 500 Index, Strike Price $3,130 39,415 (4,275) (0.01)
1 10/01/20 CBOE S&P 500 Index, Strike Price $3,135 4,550 (505) (0.00)
1 10/01/20 CBOE S&P 500 Index, Strike Price $3,140 4,407 (530) (0.00)
8 10/01/20 CBOE S&P 500 Index, Strike Price $3,160 32,876 (5,400) (0.01)
3 10/01/20 CBOE S&P 500 Index, Strike Price $3,165 9,640 (2,160) (0.00)
5 24/01/20 CBOE S&P 500 Index, Strike Price $3,195 18,147 (11,625) (0.02)
9 24/01/20 CBOE S&P 500 Index, Strike Price $3,200 31,645 (21,960) (0.04)

SCHEDULE OF INVESTMENTS FINANCIAL STATEMENTS
ANNUAL REPORT 2019 611
Neuberger Berman Global Equity Index Putwrite Fund (Continued)
Schedule of Investments (Continued)
Financial Liabilities at Fair Value through Profit or Loss (continued)
Written Options Contracts (0.64%) (31 December 2018: (1.49%)) (continued)
Number of Contracts
Expiration Date Type Premium
US$Fair Value
US$% of Net
Assets
Put Options (continued)
3 03/01/20 CBOE S&P 500 Index, Strike Price $3,210 4,176 (1,380) (0.00)
2 31/01/20 CBOE S&P 500 Index, Strike Price $3,215 8,441 (6,950) (0.01)
6 24/01/20 CBOE S&P 500 Index, Strike Price $3,220 21,160 (17,790) (0.03)
1 31/01/20 CBOE S&P 500 Index, Strike Price $3,220 3,999 (3,620) (0.01)
2 24/01/20 CBOE S&P 500 Index, Strike Price $3,225 7,038 (6,230) (0.01)
4 31/01/20 CBOE S&P 500 Index, Strike Price $3,225 16,577 (15,100) (0.03)
10 31/01/20 CBOE S&P 500 Index, Strike Price $3,230 37,875 (39,400) (0.07)
3 31/01/20 CBOE S&P 500 Index, Strike Price $3,240 12,298 (12,885) (0.02)
25 10/01/20 MSCI EAFE Index, Strike Price $2,010 39,887 (12,125) (0.02)
5 17/01/20 MSCI EAFE Index, Strike Price $2,010 9,492 (4,025) (0.01)
1 24/01/20 MSCI EAFE Index, Strike Price $2,020 1,898 (1,315) (0.00)
27 24/01/20 MSCI EAFE Index, Strike Price $2,025 47,153 (39,015) (0.07)
15 21/02/20 MSCI EAFE Index, Strike Price $2,025 39,842 (38,175) (0.07)
20 17/01/20 MSCI EAFE Index, Strike Price $2,030 30,889 (25,900) (0.04)
1 24/01/20 MSCI EAFE Index, Strike Price $2,030 1,799 (1,600) (0.00)
2 31/01/20 MSCI EAFE Index, Strike Price $2,030 3,480 (3,820) (0.01)
2 31/01/20 MSCI EAFE Index, Strike Price $2,040 3,797 (4,490) (0.01)
1 10/01/20 MSCI Emerging Markets Index, Strike Price $1,070 1,485 (140) (0.00)
3 10/01/20 MSCI Emerging Markets Index, Strike Price $1,080 3,763 (660) (0.00)
9 17/01/20 MSCI Emerging Markets Index, Strike Price $1,080 13,324 (3,735) (0.01)
11 17/01/20 MSCI Emerging Markets Index, Strike Price $1,090 16,263 (6,325) (0.01)
15 03/01/20 MSCI Emerging Markets Index, Strike Price $1,100 12,670 (2,100) (0.00)
10 10/01/20 MSCI Emerging Markets Index, Strike Price $1,100 7,527 (5,150) (0.01)
15 24/01/20 MSCI Emerging Markets Index, Strike Price $1,100 21,848 (15,375) (0.03)
4 10/01/20 MSCI Emerging Markets Index, Strike Price $1,110 2,785 (3,220) (0.01)
4 24/01/20 MSCI Emerging Markets Index, Strike Price $1,110 5,252 (5,380) (0.01)
2 31/01/20 MSCI Emerging Markets Index, Strike Price $1,110 2,663 (3,170) (0.00)
2 31/01/20 MSCI Emerging Markets Index, Strike Price $1,120 3,777 (4,000) (0.01)
21 17/01/20 S&P 500 Index, Strike Price $3,190 64,476 (33,915) (0.06)
1 17/01/20 S&P 500 Index, Strike Price $3,200 3,018 (1,820) (0.00)
Total Loss on Written Options Contracts ± (365,265) (0.64)

FINANCIAL STATEMENTS SCHEDULE OF INVESTMENTS
612 NEUBERGER BERMAN INVESTMENT FUNDS PLC
Neuberger Berman Global Equity Index Putwrite Fund (Continued)
Schedule of Investments (Continued)
Financial Liabilities at Fair Value through Profit or Loss (continued)
Fair Value % of Net
US$ Assets
Total Financial Liabilities at Fair Value through Profit or Loss (768,308) (1.35)
Net Financial Assets at Fair Value through Profit or Loss 54,181,656 95.18
Other Net Assets 2,742,420 4.82
Net Assets Attributable to Holders of Redeemable Participating Shares 56,924,076 100.00
% ofTotal
AssetsPortfolio Analysis US$
* Transferable securities and/or money market instruments admitted to an official stock exchange listing 53,992,382 93.11
± Financial derivative instruments traded on a regulated market (365,265) (0.63)
∞ OTC financial derivative instruments 554,539 0.96
Total Investments 54,181,656 93.44

STATEMENT OF SIGNIFICANT PURCHASES AND SALES FINANCIAL STATEMENTS
ANNUAL REPORT 2019 613
Neuberger Berman Global Equity Index Putwrite Fund (Continued) Statement of Significant Purchases and Sales (Unaudited) In accordance with the European Communities (Undertakings for Collective Investment in Transferable Securities) Regulations, 2011 as amended, a statement of changes in the composition of the Schedule of Investments during the reporting period is provided to ensure that Shareholders can identify changes in the investments held by the Portfolio. The following statements present the aggregate purchases and sales of transferable securities exceeding one percent of the total value of purchases or sales, respectively, for the period. At a minimum, the largest twenty purchases and twenty sales are presented, if available.
Total purchases:
Units Security Description Cost US$
5,300,000 United States Treasury Note/Bond, 2.38%, 15/03/2021 5,354,855
5,100,000 United States Treasury Note/Bond, 1.88%, 15/12/2020 5,070,297
4,200,000 United States Treasury Note/Bond, 2.63%, 15/06/2021 4,258,922
Total sales:
Units Security Description Proceeds US$
15,500,000 United States Treasury Note/Bond, 0.88%, 15/09/2019 15,431,407
11,300,000 United States Treasury Note/Bond, 0.88%, 15/06/2019 11,266,122
7,000,000 United States Treasury Note/Bond, 1.38%, 15/12/2019 6,982,773

FINANCIAL STATEMENTS INVESTMENT MANAGER’S REPORT
614 NEUBERGER BERMAN INVESTMENT FUNDS PLC
Neuberger Berman Uncorrelated Strategies Fund Investment Manager’s Report For the 12 months ended 31 December 2019, the total return for the USD I Accumulating Class was 2.32%. (Performance for all share classes is provided in Appendix II. Performance data quoted represent past performance and do not indicate future results. Total returns shown reflect the reinvestment of income dividends and other distributions, if any).
2019 saw equities rally strongly across the board, with European stocks appreciating +23.9% (MSCI AC Europe Index), US equities +31.5% (S&P 500 Index), and Asia +16.3% (MSCI AC Asia Pacific Index). The US Federal Reserve set the tone in early January with a dovish turn which provided the catalyst for a sharp early year bounce in equities, following what had been a dismal fourth quarter in 2018. The rally was perpetuated in the second half of the year – and from September onwards in particular – by positive narrative around trade negotiations between the US and China, culminating in an eagerly anticipated “Phase One” agreement by year-end. Over the year the US dollar was mixed, generally trading higher in more muted periods for equities but giving back some of these gains as risk-appetite returned. Overall the US dollar appreciated against the euro (+2.2%) and the Australian dollar (+0.4%), but depreciated vs the British pound (-3.9%) and the Japanese yen (-1.0%). Developed Sovereign Fixed Income markets had a very strong year, although they gave back some gains in the last four months of the year. 10-Year bond yields in the US moved from 2.7% to 1.92%, UK Gilt yields were at 0.8% by year-end versus 1.28% a year ago and German 10 Year Bunds moved to negative levels at -0.19% from 0.24%.
The Portfolio allocated to six core strategies over the period. Four of the strategies contributed positively to return: Global Macro, Short-Term Trading, Trend Following and Equity Market Neutral. The two negatively contributing strategies were Volatility Relative Value and Statistical Arbitrage.
The Portfolio traded currencies, fixed income and equity securities throughout the year.
Fixed Income trading was the most profitable area, with gains being driven by the positions in US, UK and European sovereign bonds and interest rates. The gains came from the Trend Following strategy maintaining structural positions while our short-term trading allocation also profited from active trading within the interest rate and sovereign bond futures areas. Finally, the Global Macro strategy also generated gains from North American and European fixed income.
The Portfolio also profited from currency trading during the year. The most profitable source related to short positioning in the euro against the US dollar within the Global Macro strategy.
Equity trading was a negative for the year. Gains in the Equity Market Neutral strategy were more than offset by challenging conditions within Statistical Arbitrage and equity options trading. The options positions within the Volatility Relative Value book had a defensive characteristic, which historically has produced its best returns in adverse periods for equities; given the strong equity market and complacent levels of equity volatility over the year, this ended up as a net cost, though it did perform during brief bouts of “risk-off” in May and August. Statistical Arbitrage saw a headwind driven by an exodus of capital from related strategies on a global basis – a trend which we believe will abate in 2020.
The Portfolio added two new managers during the year. The first addition related to a second Equity Market Neutral strategy. This manager adopted a discretionary trading approach to a global portfolio of equities on a market neutral basis. We see the allocation as an effective complement to our incumbent systematic Equity Market Neutral manager, due to the differentiated approach. The second addition related to a discretionary Global Macro manager. This diversifies our Global Macro bucket by bringing in a discretionary, options based approach to complement the existing systematic futures-centric allocation.
February 2020 was a good reminder as to why it can make sense to allocate to strategies with low correlation to equities and with the ability to trade dynamically in volatile times. High turnover and/or positively convex trading strategies can be somewhat boring to own during prolonged periods of low volatility and asset price inflation, but they can also provide a valuable source of differentiated returns during less benign periods for risk assets.
We are continuing to try to make sure that the portfolio remains diversified and isn’t over-reliant on one particular strategy, asset-class or market condition in order to generate returns. We also want to be sufficiently prudent in what is a high risk environment. Over recent weeks, we have seen gross exposures coming gradually down in the single stock equity strategies, reflecting the more volatile conditions. The Global Macro book has also rebalanced somewhat, taking risk down in some areas – most notably with a significant cut in the longstanding short Euro trade and an increase in short Australian Dollar. Trend Following has seen a reduction in risk and some modest hedging of the sizable fixed income exposure, so should be somewhat better positioned if we see a snap back up in yields during the month, at the cost of some further upside if there is continued yield compression. Short Term Trading remains very active, but has at least realised the majority of the profits from February, so trading risk today represents new trades rather than stale positions. Volatility Relative Value has also reined in risk somewhat at the current time.
Overall, we believe that these conditions are setting up some interesting opportunities for our strategies. We are currently on the front foot from a trading perspective but will remain mindful of the need for caution given the levels of uncertainty.

BALANCE SHEET FINANCIAL STATEMENTS
The accompanying notes form an integral part of the financial statements.
ANNUAL REPORT 2019 615
Neuberger Berman Uncorrelated Strategies Fund (Continued) Balance Sheet
As at As at
Note 31 December 2019 31 December 2018
US$ US$
Current Assets
Financial Assets at Fair Value through Profit or Loss 2 919,974,202 1,202,766,634
Cash and cash equivalents 3 318,106,121 198,447,916
Receivable for investments sold 239,838 7,297,327
Receivable for shares issued 2,522,866 1,014,417
Due from brokers 120,451,174 243,066,696
Income receivable and other assets 4,459,739 7,150,076
Total Assets 1,365,753,940 1,659,743,066
Current Liabilities
Financial Liabilities at Fair Value through Profit or Loss 2 36,023,891 724,496,093
Bank overdraft 4 4,412 2,681
Payable for shares redeemed 891,428 2,114,539
Due to brokers 10,666,983 –
Accrued expenses 1,012,956 1,378,952
Payable for investments purchased 111,805,820 56,636,889
Other payables 10,040,094 6,457,649
Liabilities (excluding Net Assets Attributable to Holders of Redeemable Participating Shares) 170,445,584 791,086,803
Net Assets Attributable to Holders of Redeemable Participating Shares 1,195,308,356 868,656,263

FINANCIAL STATEMENTS PROFIT AND LOSS ACCOUNT
The accompanying notes form an integral part of the financial statements.
616 NEUBERGER BERMAN INVESTMENT FUNDS PLC
Neuberger Berman Uncorrelated Strategies Fund (Continued) Profit and Loss Account
Year Ended Year Ended
Note 31 December 2019 31 December 2018
US$ US$
Income
Interest Income 4,706,572 2,079,686
Miscellaneous Income 53,073 407
Net Gain/(Loss) on Financial Assets and Liabilities at Fair Value through Profit or Loss 11 60,133,530 (35,990,093)
64,893,175 (33,910,000)
Expenses
Management Fee 6 6,634,231 3,261,066
Distribution Fee 6 385,043 190,803
Administration Fee 6 1,997,195 1,336,940
Commitment Fee 19 126,188 39,169
Custody Fee 6 126,595 79,030
Depositary Fee 6 97,704 56,988
Professional Fee 9 176,196 98,572
Directors' Fee 7 4,539 7,416
Performance Fee 6 8,192,914 3,931,177
Transaction Costs 9 6,705,756 2,393,943
Audit Fee 8 21,945 17,650
VAT Rebate (15,690) (6,197)
Other Expenses 9 542,537 207,319
Expense Waiver 6 (612,878) (659,223)
Total Expenses 24,382,275 10,954,653
Finance Costs
Interest Expense 18,348 14,858
18,348 14,858
Withholding Tax 1 4,377,836 1,744,866
Profit/(Loss) Attributable to Holders of Redeemable Participating Shares from Operations 36,114,716 (46,624,377)
Income and expenses arose solely from continuing operations.

STATEMENT OF CHANGES IN NET ASSETS FINANCIAL STATEMENTS
The accompanying notes form an integral part of the financial statements.
ANNUAL REPORT 2019 617
Neuberger Berman Uncorrelated Strategies Fund (Continued) Statement of Changes in Net Assets Attributable to Holders of Redeemable Participating Shares
Year Ended Year Ended
31 December 2019 31 December 2018
US$ US$
Net Assets Attributable to Holders of Redeemable Participating Shares at beginning of year 868,656,263 274,933,022
Profit/(Loss) Attributable to Holders of Redeemable Participating Shares from Operations 36,114,716 (46,624,377)
Subscriptions 5 586,387,669 705,583,795
Redemptions 5 (295,850,292) (65,236,177)
Net Assets Attributable to Holders of Redeemable Participating Shares at end of year 1,195,308,356 868,656,263

FINANCIAL STATEMENTS SCHEDULE OF INVESTMENTS
618 NEUBERGER BERMAN INVESTMENT FUNDS PLC
Neuberger Berman Uncorrelated Strategies Fund (Continued)
Schedule of Investments Financial Assets at Fair Value through Profit or Loss
Principal Amount Security Description Coupon Maturity
DateFair Value
US$ % of Net
Assets
Treasury Bills 63.33% (31 December 2018: 50.65%) United States Dollar
74,000,000 United States Treasury Bill 0.00% 07/01/2020 73,986,022 6.19
115,000,000 United States Treasury Bill 0.00% 14/01/2020 114,943,938 9.62
100,000,000 United States Treasury Bill 0.00% 21/01/2020 99,922,681 8.36
98,000,000 United States Treasury Bill 0.00% 28/01/2020 97,896,841 8.19
100,000,000 United States Treasury Bill 0.00% 04/02/2020 99,856,991 8.35
81,000,000 United States Treasury Bill 0.00% 11/02/2020 80,866,575 6.77
75,000,000 United States Treasury Bill 0.00% 18/02/2020 74,854,594 6.26
115,000,000 United States Treasury Bill 0.00% 12/03/2020 114,665,120 9.59
Total Treasury Bills ** 756,992,762 63.33
Government Bonds 6.69% (31 December 2018: 0.00%) United States Dollar
80,000,000 United States Treasury Floating Rate Note 1.53% 31/01/2020 79,998,088 6.69
Total Government Bonds * 79,998,088 6.69
Total Investments 836,990,850 70.02
Forward Currency Contracts 4.72% (31 December 2018: 0.38%)
Amount Receivable
Amount Payable Maturity Date Counterparty Contracts Unrealised
Gain US$ % of Net
Assets
AUD 36,690,000 US$ 25,353,384 18/03/2020 Société Générale 48 485,448 0.04
AUD 6,100,000 ¥ 457,525,333 18/03/2020 Société Générale 14 67,743 0.00
AUD 9,200,000 ¥ 688,764,839 18/03/2020 UBS AG 21 113,935 0.01
AUD 2,090,000 US$ 1,450,876 18/03/2020 UBS AG 3 21,000 0.00
BRL 1,410,000 US$ 345,345 18/03/2020 BNP Paribas 2 4,080 0.00
BRL 8,540,000 US$ 2,087,535 18/03/2020 Société Générale 11 28,843 0.00
BRL 1,480,000 US$ 361,448 18/03/2020 UBS AG 2 5,324 0.00
CAD 3,310,000 US$ 2,518,381 18/03/2020 BNP Paribas Paris 4 34,843 0.01
CAD 33,300,000 US$ 25,313,663 18/03/2020 UBS AG 34 372,858 0.04
CHF 120,000 US$ 122,934 18/03/2020 BNP Paribas 1 1,652 0.00
CHF 6,580,000 US$ 6,749,831 18/03/2020 Société Générale 24 81,652 0.01
CHF 2,510,000 US$ 2,571,408 18/03/2020 UBS AG 4 34,522 0.00
CLP 537,840,000 US$ 714,724 18/03/2020 BNP Paribas 4 1,107 0.00
€ 350,000 TRY 2,375,110 18/03/2020 BNP Paribas 1 3,100 0.00
€ 17,680,000 US$ 19,845,464 18/03/2020 Société Générale 24 94,198 0.01
€ 1,070,000 TRY 7,118,933 18/03/2020 Société Générale 2 32,911 0.00
€ 7,080,000 TRY 47,842,770 18/03/2020 UBS AG 11 96,068 0.01
£ 5,144,750 US$ 6,784,818 18/03/2020 Société Générale 19 44,834 0.00
£ 12,115,250 US$ 15,982,328 18/03/2020 UBS AG 6 100,659 0.01

SCHEDULE OF INVESTMENTS FINANCIAL STATEMENTS
ANNUAL REPORT 2019 619
Neuberger Berman Uncorrelated Strategies Fund (Continued)
Schedule of Investments (Continued) Financial Assets at Fair Value through Profit or Loss (continued) Forward Currency Contracts 4.72% (31 December 2018: 0.38%) (continued)
Amount Receivable
Amount Payable Maturity Date Counterparty Contracts Unrealised
Gain US$% of Net
Assets
HUF 462,940,000 US$ 1,573,520 18/03/2020 BNP Paribas 1 3,755 0.00
HUF 960,910,000 US$ 3,259,029 18/03/2020 Société Générale 4 14,872 0.00
ILS 4,910,000 US$ 1,416,278 18/03/2020 Société Générale 5 11,085 0.00
ILS 25,110,000 US$ 7,270,744 18/03/2020 UBS AG 2 28,871 0.00
INR 23,170,000 US$ 322,567 18/03/2020 Société Générale 1 225 0.00
¥ 95,970,000 US$ 882,265 18/03/2020 Société Générale 3 4,630 0.00
¥ 553,500,000 US$ 5,089,221 18/03/2020 UBS AG 13 25,885 0.00
¥ 106,078,545 AUD 1,390,000 18/03/2020 UBS AG 1 1,409 0.00
KRW 11,244,380,000 US$ 9,630,526 18/03/2020 BNP Paribas 7 124,674 0.01
KRW 6,355,010,000 US$ 5,466,391 18/03/2020 Société Générale 3 46,977 0.00
KRW 3,189,640,000 US$ 2,749,099 18/03/2020 UBS AG 3 18,112 0.00
MXN 44,530,000 US$ 2,319,655 18/03/2020 BNP Paribas 3 12,149 0.00
MXN 61,450,000 US$ 3,166,711 18/03/2020 Société Générale 5 51,107 0.00
MXN 233,230,000 US$ 12,025,086 18/03/2020 UBS AG 10 187,955 0.02
NOK 173,400,000 US$ 19,354,932 18/03/2020 Société Générale 36 382,606 0.04
NOK 13,170,000 US$ 1,478,913 18/03/2020 UBS AG 6 20,184 0.00
NZD 3,490,000 US$ 2,303,603 18/03/2020 Société Générale 16 53,465 0.00
NZD 1,520,000 US$ 996,301 18/03/2020 UBS AG 1 30,273 0.01
PHP 473,320,000 US$ 9,288,716 18/03/2020 BNP Paribas 2 17,569 0.00
PHP 4,860,000 US$ 95,332 18/03/2020 Société Générale 1 224 0.00
PLN 86,580,000 € 20,155,468 18/03/2020 Société Générale 18 133,272 0.01
PLN 26,650,000 US$ 6,949,346 18/03/2020 Société Générale 13 88,615 0.01
PLN 7,520,000 US$ 1,979,826 18/03/2020 UBS AG 1 6,120 0.00
SEK 58,250,000 US$ 6,228,687 18/03/2020 Société Générale 9 16,587 0.00
SGD 2,790,000 US$ 2,060,251 18/03/2020 BNP Paribas 1 16,147 0.00
SGD 53,380,000 US$ 39,331,316 18/03/2020 Société Générale 7 395,613 0.04
THB 31,190,000 US$ 1,033,427 18/03/2020 Société Générale 4 9,708 0.00
THB 181,950,000 US$ 6,005,109 18/03/2020 UBS AG 2 80,124 0.02
US$ 218,935 PHP 11,130,000 18/03/2020 BNP Paribas 1 100 0.00
US$ 2,563,109 TRY 15,520,000 18/03/2020 BNP Paribas 3 4,008 0.00
US$ 95,933 ¥ 10,370,000 18/03/2020 Société Générale 1 100 0.00
US$ 3,844,808 £ 2,870,000 18/03/2020 Société Générale 5 34,886 0.00
US$ 4,644,791 TRY 27,970,000 18/03/2020 Société Générale 4 32,803 0.00
US$ 498,338 SEK 4,640,000 18/03/2020 Société Générale 1 860 0.00
US$ 3,716,915 INR 266,700,000 18/03/2020 Société Générale 8 1,396 0.00
US$ 677,630 PHP 34,450,000 18/03/2020 Société Générale 2 283 0.00
US$ 537,867 £ 400,000 18/03/2020 UBS AG 1 6,867 0.00
US$ 802,432 TRY 4,790,000 18/03/2020 UBS AG 1 12,607 0.00
US$ 3,854,144 ¥ 416,290,000 18/03/2020 UBS AG 2 7,050 0.00

FINANCIAL STATEMENTS SCHEDULE OF INVESTMENTS
620 NEUBERGER BERMAN INVESTMENT FUNDS PLC
Neuberger Berman Uncorrelated Strategies Fund (Continued)
Schedule of Investments (Continued) Financial Assets at Fair Value through Profit or Loss (continued) Forward Currency Contracts 4.72% (31 December 2018: 0.38%) (continued)
Amount Receivable
Amount Payable Maturity Date Counterparty Contracts Unrealised
Gain US$% of Net
Assets
US$ 2,383,868 MXN 45,380,000 18/03/2020 UBS AG 2 7,553 0.00
ZAR 102,070,000 US$ 6,932,434 18/03/2020 Société Générale 21 294,750 0.02
CHF Hedged Classes CHF 3,960,455 US$ 3,998,652 22/01/2020 UBS AG 4 96,885 0.01
CHF 1,686,607 US$ 1,701,209 22/01/2020 Westpac Banking Corp 1 42,925 0.00
EUR Hedged Classes € 32,817,066 US$ 36,221,183 22/01/2020 Goldman Sachs International 9 660,878 0.06
€ 31,800,257 US$ 35,123,766 22/01/2020 UBS AG 2 615,534 0.05
€ 30,788,931 US$ 34,021,886 22/01/2020 Westpac Banking Corp 52 580,817 0.05
GBP Hedged Classes £ 185,971,698 US$ 230,235,011 22/01/2020 Goldman Sachs International 9 16,270,895 1.36
£ 177,014,491 US$ 218,726,185 22/01/2020 UBS AG 2 15,906,923 1.33
£ 296,384,256 US$ 374,515,655 22/01/2020 Westpac Banking Corp 75 18,342,347 1.54
US$ 4,595,481 £ 3,442,150 22/01/2020 Westpac Banking Corp 3 32,903 0.00
SGD Hedged Classes SGD 15,362 US$ 11,135 22/01/2020 Goldman Sachs International 3 291 0.00
SGD 14,833 US$ 10,751 22/01/2020 UBS AG 1 282 0.00
SGD 12,714 US$ 9,211 22/01/2020 Westpac Banking Corp 1 245 0.00
Total Unrealised Gain on Forward Currency Contracts ∞ 56,361,178 4.72
Futures Contracts 0.54% (31 December 2018: 1.63%)
Number of Contracts Description Unrealised
Gain US$% of Net
Assets
(134) 3-Month Euro Euribor Future March 2022 15,729 0.00
(125) 3-Month Euro Euribor Future March 2021 14,228 0.00
(286) 3-Month Euro Euribor Future December 2020 86,123 0.01
(189) 3-Month Euro Euribor Future June 2020 29,936 0.00
(116) 3-Month Euro Euribor Future September 2020 12,376 0.00
(39) 90-Day Bank Bill Future December 2020 6,114 0.00
(134) 90-Day Bank Bill Future March 2020 21,818 0.00
(228) 90-Day Eurodollar Future June 2020 44,343 0.00
(186) 90-Day Eurodollar Future March 2020 498 0.00
(515) 90-Day Sterling Future March 2020 13,388 0.00
270 90-Day Sterling Future December 2020 7,242 0.00
954 Australian Dollar Currency Future March 2020 541,674 0.05
(12) Australian Government Bond 10-Year Future March 2020 21,403 0.00
(480) Bankers Acceptance Future September 2020 95,951 0.01
(622) Bankers Acceptance Future March 2020 41,498 0.00
(177) Bankers Acceptance Future June 2020 23,646 0.00

SCHEDULE OF INVESTMENTS FINANCIAL STATEMENTS
ANNUAL REPORT 2019 621
Neuberger Berman Uncorrelated Strategies Fund (Continued)
Schedule of Investments (Continued) Financial Assets at Fair Value through Profit or Loss (continued) Futures Contracts 0.54% (31 December 2018: 1.63%) (continued)
Number of Contracts Description Unrealised
Gain US$% of Net
Assets
(154) Bankers Acceptance Future December 2020 19,163 0.00
(103) British Pound Currency Future March 2020 45,082 0.00
552 Canadian Dollar Currency Future March 2020 577,681 0.05
(59) CBOE VIX Index Future January 2020 142,775 0.01
(57) CBOE VIX Index Future February 2020 54,395 0.01
(57) DAX Index Future March 2020 60,489 0.01
557 Euro FX Currency Future March 2020 106,370 0.01
(498) Euro-BOBL Future March 2020 321,349 0.03
5 Euro-BTP Future March 2020 2,413 0.00
(24) Euro-Bund Future March 2020 11,416 0.00
(7) Euro-OAT Future March 2020 3,435 0.00
(987) Euro-Schatz Future March 2020 81,589 0.01
(281) FTSE 100 Index Future March 2020 143,763 0.01
343 FTSE 100 Index Future March 2020 63,635 0.01
47 FTSE China A50 Index Future January 2020 3,405 0.00
238 Hang Seng China Enterprises Index Future January 2020 157,326 0.01
65 Hang Seng Index Future January 2020 83,273 0.01
58 Japan Government 10-Year Bond (OSE) Future March 2020 16,103 0.00
244 MSCI Emerging Markets Index Future March 2020 87,760 0.01
(247) MSCI Singapore Index Future January 2020 892 0.00
(195) Nasdaq 100 E-mini Future March 2020 69,383 0.01
834 New Zealand Dollar Currency Future March 2020 1,092,571 0.09
(8) Nikkei 225 (CME) Future March 2020 9,025 0.00
(377) Nikkei 225 Mini Future March 2020 46,501 0.01
(179) S&P 500 E-mini Future March 2020 17,039 0.00
(207) S&P/TSX 60 Index Future March 2020 99,762 0.01
(247) SGX Nifty 50 Future January 2020 29,351 0.00
391 Swiss Franc Currency Future March 2020 681,307 0.06
(110) TOPIX Index Future March 2020 74,810 0.01
(140) United Kingdom Long Gilt Future March 2020 109,789 0.01
(652) US Treasury 10-Year Note (CBT) Future March 2020 253,538 0.02
39 US Treasury 5-Year Note (CBT) Future March 2020 156 0.00
(102) US Treasury Long Bond (CBT) Future March 2020 16,221 0.00
(331) Yen Denominated Nikkei Future March 2020 810,122 0.07
Total Unrealised Gain on Futures Contracts ± 6,267,856 0.54

FINANCIAL STATEMENTS SCHEDULE OF INVESTMENTS
622 NEUBERGER BERMAN INVESTMENT FUNDS PLC
Neuberger Berman Uncorrelated Strategies Fund (Continued)
Schedule of Investments (Continued) Financial Assets at Fair Value through Profit or Loss (continued) Purchased Options Contracts 1.12% (31 December 2018: 0.56%)
Number of Contracts
Expiration Date Type Premium
US$Fair Value
US$% of Net
Assets
Call Options
16 17/01/20 EURO Stoxx 50 Index, Strike Price EUR3,775± (6,058) 3,484 0.00
124 17/01/20 FTSE 100 Index, Strike Price GBP7,200± (222,552) 606,153 0.05
100 17/01/20 FTSE 100 Index, Strike Price GBP7,225± (163,960) 457,039 0.04
21 17/01/20 FTSE 100 Index, Strike Price GBP7,350± (25,235) 63,707 0.01
22 17/01/20 FTSE 100 Index, Strike Price GBP7,500± (24,658) 31,330 0.00
25 17/01/20 FTSE 100 Index, Strike Price GBP7,625± (21,187) 12,585 0.00
25 17/01/20 FTSE 100 Index, Strike Price GBP7,650± (16,508) 9,604 0.00
35 21/02/20 FTSE 100 Index, Strike Price GBP7,650± (45,106) 33,616 0.00
11 21/02/20 FTSE 100 Index, Strike Price GBP7,700± (10,970) 7,869 0.00
28 21/02/20 FTSE 100 Index, Strike Price GBP7,750± (24,326) 14,652 0.00
94 21/02/20 FTSE 100 Index, Strike Price GBP7,800± (59,137) 34,867 0.00
14 21/02/20 FTSE 100 Index, Strike Price GBP7,900± (4,224) 2,504 0.00
14 30/01/20 Hang Seng China Enterprises Index, Strike Price HKD11,200± (17,177) 17,339 0.00
41 30/01/20 Hong Kong Hang Seng Index, Strike Price HKD26,200± (170,832) 556,450 0.05
49 30/01/20 Hong Kong Hang Seng Index, Strike Price HKD26,400± (177,373) 605,598 0.05
55 30/01/20 Hong Kong Hang Seng Index, Strike Price HKD26,600± (173,250) 614,460 0.05
42 30/01/20 Hong Kong Hang Seng Index, Strike Price HKD26,800± (114,007) 419,903 0.04
10 30/01/20 Hong Kong Hang Seng Index, Strike Price HKD27,000± (23,090) 88,555 0.01
10 30/01/20 Hong Kong Hang Seng Index, Strike Price HKD27,200± (21,744) 77,453 0.01
10 30/01/20 Hong Kong Hang Seng Index, Strike Price HKD27,400± (18,719) 67,764 0.01
10 30/01/20 Hong Kong Hang Seng Index, Strike Price HKD27,600± (18,288) 57,304 0.01
2 30/01/20 Hong Kong Hang Seng Index, Strike Price HKD27,800± (3,211) 9,536 0.00
324 30/01/20 Hong Kong Hang Seng Index, Strike Price HKD28,000± (608,038) 1,268,256 0.11
11 09/01/20 KOSPI 200 Index, Strike Price KRW277.5± (7,369) 39,831 0.01
51 09/01/20 KOSPI 200 Index, Strike Price KRW280± (23,011) 158,210 0.01
155 09/01/20 KOSPI 200 Index, Strike Price KRW282.5± (47,020) 395,391 0.03
192 09/01/20 KOSPI 200 Index, Strike Price KRW285± (35,144) 403,442 0.04
11 09/01/20 KOSPI 200 Index, Strike Price KRW287.5± (2,399) 17,859 0.00
40 13/02/20 KOSPI 200 Index, Strike Price KRW292.5± (7,733) 61,395 0.01
45 13/02/20 KOSPI 200 Index, Strike Price KRW295± (5,692) 54,283 0.01
16 09/01/20 KOSPI 200 Index, Strike Price KRW297.5± (2,014) 4,981 0.00
104 09/01/20 KOSPI 200 Index, Strike Price KRW300± (11,747) 17,761 0.00
136 13/02/20 KOSPI 200 Index, Strike Price KRW300± (21,469) 102,901 0.01
179 13/02/20 KOSPI 200 Index, Strike Price KRW302.5± (24,383) 103,318 0.01
133 13/02/20 KOSPI 200 Index, Strike Price KRW305± (19,401) 57,216 0.01
106 13/02/20 KOSPI 200 Index, Strike Price KRW307.5± (18,955) 33,685 0.00
373 13/02/20 KOSPI 200 Index, Strike Price KRW310± (37,707) 86,279 0.01

SCHEDULE OF INVESTMENTS FINANCIAL STATEMENTS
ANNUAL REPORT 2019 623
Neuberger Berman Uncorrelated Strategies Fund (Continued)
Schedule of Investments (Continued) Financial Assets at Fair Value through Profit or Loss (continued) Purchased Options Contracts 1.12% (31 December 2018: 0.56%) (continued)
Number of Contracts
Expiration Date Type Premium
US$Fair Value
US$% of Net
Assets
Call Options (continued)
17 13/02/20 KOSPI 200 Index, Strike Price KRW312.5± (1,422) 2,793 0.00
6 12/03/20 KOSPI 200 Index, Strike Price KRW312.5± (1,139) 2,127 0.00
24 12/03/20 KOSPI 200 Index, Strike Price KRW315± (3,359) 6,589 0.00
20 13/02/20 KOSPI 200 Index, Strike Price KRW320± (1,766) 1,124 0.00
11 10/01/20 Nikkei 225 Index, Strike Price JPY23,125± (40,424) 60,225 0.01
36 10/01/20 Nikkei 225 Index, Strike Price JPY23,250± (106,585) 162,319 0.02
34 10/01/20 Nikkei 225 Index, Strike Price JPY23,375± (87,493) 122,015 0.01
97 10/01/20 Nikkei 225 Index, Strike Price JPY23,500± (199,041) 267,771 0.02
1 14/02/20 Nikkei 225 Index, Strike Price JPY24,000± (2,617) 2,623 0.00
130 10/01/20 Nikkei 225 Index, Strike Price JPY24,125± (111,496) 63,400 0.01
9 14/02/20 Nikkei 225 Index, Strike Price JPY24,125± (21,904) 19,876 0.00
20 10/01/20 Nikkei 225 Index, Strike Price JPY24,250± (11,328) 6,441 0.00
20 14/02/20 Nikkei 225 Index, Strike Price JPY24,250± (41,362) 35,887 0.00
14 14/02/20 Nikkei 225 Index, Strike Price JPY24,375± (24,197) 20,612 0.00
20 10/01/20 Nikkei 225 Index, Strike Price JPY24,500± (16,391) 2,761 0.00
58 14/02/20 Nikkei 225 Index, Strike Price JPY24,500± (86,161) 69,381 0.01
17 10/01/20 Nikkei 225 Index, Strike Price JPY24,625± (9,120) 1,721 0.00
36 14/02/20 Nikkei 225 Index, Strike Price JPY24,625± (46,137) 34,783 0.00
58 10/01/20 Nikkei 225 Index, Strike Price JPY24,750± (14,108) 3,736 0.00
134 14/02/20 Nikkei 225 Index, Strike Price JPY24,750± (148,719) 98,643 0.01
20 10/01/20 Nikkei 225 Index, Strike Price JPY24,875± (2,373) 920 0.00
119 14/02/20 Nikkei 225 Index, Strike Price JPY24,875± (84,457) 68,986 0.01
169 14/02/20 Nikkei 225 Index, Strike Price JPY25,000± (90,066) 76,200 0.01
99 14/02/20 Nikkei 225 Index, Strike Price JPY25,125± (54,143) 34,617 0.00
6 14/02/20 Nikkei 225 Index, Strike Price JPY25,250± (2,438) 1,656 0.00
2 03/01/20 S&P 500 E-mini Futures, Strike Price US$3,215± (1,877) 2,250 0.00
81 17/01/20 S&P 500 E-mini Futures, Strike Price US$3,220± (97,033) 149,850 0.01
217 17/01/20 S&P 500 E-mini Futures, Strike Price US$3,240± (142,464) 265,825 0.02
229 17/01/20 S&P 500 E-mini Futures, Strike Price US$3,250± (136,287) 217,550 0.02
40 17/01/20 S&P 500 E-mini Futures, Strike Price US$3,255± (20,535) 33,500 0.00
335 17/01/20 S&P 500 E-mini Futures, Strike Price US$3,260± (137,104) 242,875 0.02
225 17/01/20 S&P 500 E-mini Futures, Strike Price US$3,270± (86,221) 123,750 0.01
88 17/01/20 S&P 500 E-mini Futures, Strike Price US$3,280± (26,477) 35,200 0.00
36 20/02/20 S&P ASX 200 Index, Strike Price AUD6,700± (23,710) 21,890 0.00
106 16/01/20 S&P ASX 200 Index, Strike Price AUD6,750± (48,688) 21,385 0.00
160 16/01/20 S&P ASX 200 Index, Strike Price AUD6,775± (69,308) 24,181 0.00
180 16/01/20 S&P ASX 200 Index, Strike Price AUD6,800± (52,434) 19,865 0.00
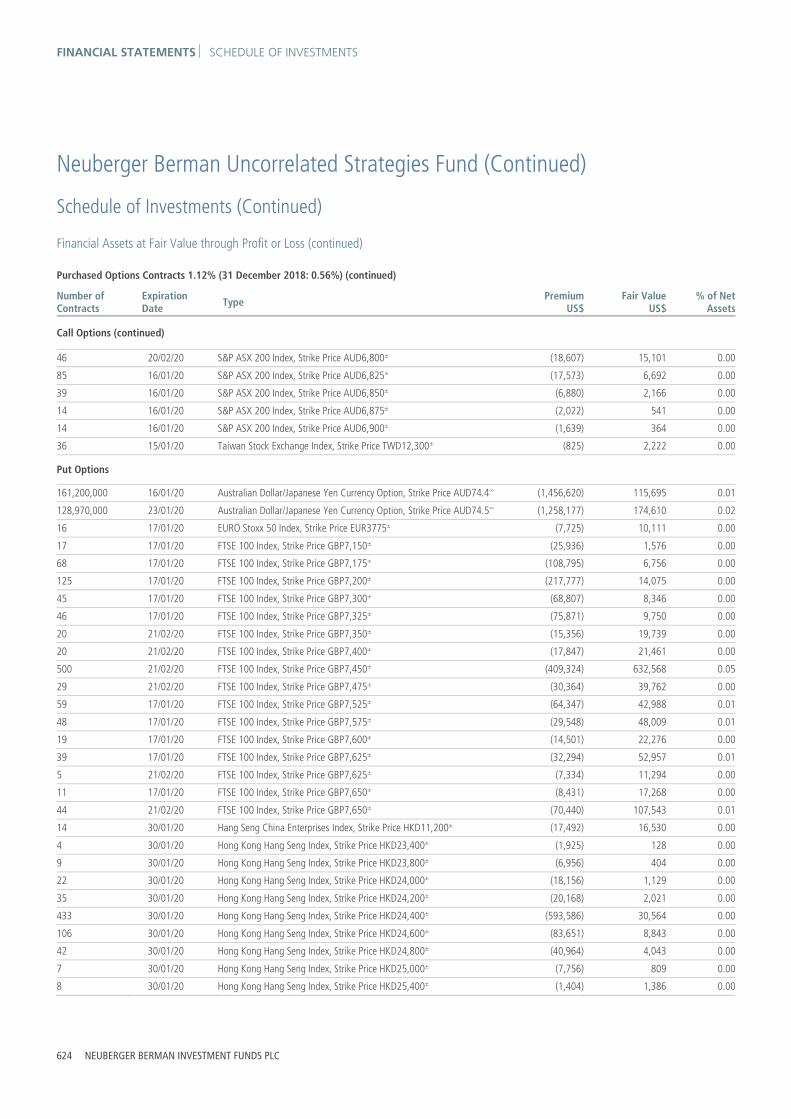
FINANCIAL STATEMENTS SCHEDULE OF INVESTMENTS
624 NEUBERGER BERMAN INVESTMENT FUNDS PLC
Neuberger Berman Uncorrelated Strategies Fund (Continued)
Schedule of Investments (Continued) Financial Assets at Fair Value through Profit or Loss (continued) Purchased Options Contracts 1.12% (31 December 2018: 0.56%) (continued)
Number of Contracts
Expiration Date Type Premium
US$Fair Value
US$% of Net
Assets
Call Options (continued)
46 20/02/20 S&P ASX 200 Index, Strike Price AUD6,800± (18,607) 15,101 0.00
85 16/01/20 S&P ASX 200 Index, Strike Price AUD6,825± (17,573) 6,692 0.00
39 16/01/20 S&P ASX 200 Index, Strike Price AUD6,850± (6,880) 2,166 0.00
14 16/01/20 S&P ASX 200 Index, Strike Price AUD6,875± (2,022) 541 0.00
14 16/01/20 S&P ASX 200 Index, Strike Price AUD6,900± (1,639) 364 0.00
36 15/01/20 Taiwan Stock Exchange Index, Strike Price TWD12,300± (825) 2,222 0.00
Put Options
161,200,000 16/01/20 Australian Dollar/Japanese Yen Currency Option, Strike Price AUD74.4∞ (1,456,620) 115,695 0.01
128,970,000 23/01/20 Australian Dollar/Japanese Yen Currency Option, Strike Price AUD74.5∞ (1,258,177) 174,610 0.02
16 17/01/20 EURO Stoxx 50 Index, Strike Price EUR3775± (7,725) 10,111 0.00
17 17/01/20 FTSE 100 Index, Strike Price GBP7,150± (25,936) 1,576 0.00
68 17/01/20 FTSE 100 Index, Strike Price GBP7,175± (108,795) 6,756 0.00
125 17/01/20 FTSE 100 Index, Strike Price GBP7,200± (217,777) 14,075 0.00
45 17/01/20 FTSE 100 Index, Strike Price GBP7,300± (68,807) 8,346 0.00
46 17/01/20 FTSE 100 Index, Strike Price GBP7,325± (75,871) 9,750 0.00
20 21/02/20 FTSE 100 Index, Strike Price GBP7,350± (15,356) 19,739 0.00
20 21/02/20 FTSE 100 Index, Strike Price GBP7,400± (17,847) 21,461 0.00
500 21/02/20 FTSE 100 Index, Strike Price GBP7,450± (409,324) 632,568 0.05
29 21/02/20 FTSE 100 Index, Strike Price GBP7,475± (30,364) 39,762 0.00
59 17/01/20 FTSE 100 Index, Strike Price GBP7,525± (64,347) 42,988 0.01
48 17/01/20 FTSE 100 Index, Strike Price GBP7,575± (29,548) 48,009 0.01
19 17/01/20 FTSE 100 Index, Strike Price GBP7,600± (14,501) 22,276 0.00
39 17/01/20 FTSE 100 Index, Strike Price GBP7,625± (32,294) 52,957 0.01
5 21/02/20 FTSE 100 Index, Strike Price GBP7,625± (7,334) 11,294 0.00
11 17/01/20 FTSE 100 Index, Strike Price GBP7,650± (8,431) 17,268 0.00
44 21/02/20 FTSE 100 Index, Strike Price GBP7,650± (70,440) 107,543 0.01
14 30/01/20 Hang Seng China Enterprises Index, Strike Price HKD11,200± (17,492) 16,530 0.00
4 30/01/20 Hong Kong Hang Seng Index, Strike Price HKD23,400± (1,925) 128 0.00
9 30/01/20 Hong Kong Hang Seng Index, Strike Price HKD23,800± (6,956) 404 0.00
22 30/01/20 Hong Kong Hang Seng Index, Strike Price HKD24,000± (18,156) 1,129 0.00
35 30/01/20 Hong Kong Hang Seng Index, Strike Price HKD24,200± (20,168) 2,021 0.00
433 30/01/20 Hong Kong Hang Seng Index, Strike Price HKD24,400± (593,586) 30,564 0.00
106 30/01/20 Hong Kong Hang Seng Index, Strike Price HKD24,600± (83,651) 8,843 0.00
42 30/01/20 Hong Kong Hang Seng Index, Strike Price HKD24,800± (40,964) 4,043 0.00
7 30/01/20 Hong Kong Hang Seng Index, Strike Price HKD25,000± (7,756) 809 0.00
8 30/01/20 Hong Kong Hang Seng Index, Strike Price HKD25,400± (1,404) 1,386 0.00

SCHEDULE OF INVESTMENTS FINANCIAL STATEMENTS
ANNUAL REPORT 2019 625
Neuberger Berman Uncorrelated Strategies Fund (Continued)
Schedule of Investments (Continued) Financial Assets at Fair Value through Profit or Loss (continued) Purchased Options Contracts 1.12% (31 December 2018: 0.56%) (continued)
Number of Contracts
Expiration Date Type Premium
US$Fair Value
US$% of Net
Assets
Put Options (continued)
7 30/01/20 Hong Kong Hang Seng Index, Strike Price HKD25,600± (1,498) 1,437 0.00
14 30/01/20 Hong Kong Hang Seng Index, Strike Price HKD25,800± (26,371) 3,324 0.00
70 30/01/20 Hong Kong Hang Seng Index, Strike Price HKD26,000± (241,424) 20,663 0.00
114 30/01/20 Hong Kong Hang Seng Index, Strike Price HKD26,200± (456,926) 39,503 0.00
24 30/01/20 Hong Kong Hang Seng Index, Strike Price HKD26,400± (92,480) 10,165 0.00
5 30/01/20 Hong Kong Hang Seng Index, Strike Price HKD26,800± (4,249) 3,144 0.00
35 30/01/20 Hong Kong Hang Seng Index, Strike Price HKD27,800± (83,982) 59,967 0.01
15 09/01/20 KOSPI 200 Index, Strike Price KRW232.5± (189) 32 0.00
89 09/01/20 KOSPI 200 Index, Strike Price KRW235± (1,491) 192 0.00
14 09/01/20 KOSPI 200 Index, Strike Price KRW237.5± (293) 30 0.00
14 09/01/20 KOSPI 200 Index, Strike Price KRW240± (411) 30 0.00
43 09/01/20 KOSPI 200 Index, Strike Price KRW245± (2,222) 93 0.00
97 09/01/20 KOSPI 200 Index, Strike Price KRW247.5± (4,241) 210 0.00
329 09/01/20 KOSPI 200 Index, Strike Price KRW250± (18,731) 711 0.00
425 09/01/20 KOSPI 200 Index, Strike Price KRW252.5± (20,672) 919 0.00
559 09/01/20 KOSPI 200 Index, Strike Price KRW255± (29,167) 1,208 0.00
644 09/01/20 KOSPI 200 Index, Strike Price KRW257.5± (45,112) 1,392 0.00
581 09/01/20 KOSPI 200 Index, Strike Price KRW260± (58,401) 1,256 0.00
801 09/01/20 KOSPI 200 Index, Strike Price KRW262.5± (40,399) 1,732 0.00
181 09/01/20 KOSPI 200 Index, Strike Price KRW265± (10,007) 391 0.00
164 09/01/20 KOSPI 200 Index, Strike Price KRW267.5± (10,304) 709 0.00
87 09/01/20 KOSPI 200 Index, Strike Price KRW270± (6,709) 376 0.00
247 09/01/20 KOSPI 200 Index, Strike Price KRW272.5± (10,340) 1,602 0.00
261 09/01/20 KOSPI 200 Index, Strike Price KRW275± (11,608) 2,821 0.00
242 09/01/20 KOSPI 200 Index, Strike Price KRW277.5± (12,876) 3,662 0.00
402 09/01/20 KOSPI 200 Index, Strike Price KRW280± (17,581) 9,559 0.00
304 09/01/20 KOSPI 200 Index, Strike Price KRW282.5 (14,311) 13,144 0.00
184 09/01/20 KOSPI 200 Index, Strike Price KRW285± (14,491) 13,922 0.00
75 09/01/20 KOSPI 200 Index, Strike Price KRW287.5± (10,201) 10,377 0.00
2 13/02/20 KOSPI 200 Index, Strike Price KRW295± (2,492) 2,490 0.00
1 09/01/20 KOSPI 200 Index, Strike Price KRW300± (1,159) 1,397 0.00
20 10/01/20 Nikkei 225 Index, Strike Price JPY18,750± (1,858) 184 0.00
26 10/01/20 Nikkei 225 Index, Strike Price JPY19,000± (2,728) 239 0.00
30 10/01/20 Nikkei 225 Index, Strike Price JPY19,250± (3,375) 276 0.00
242 10/01/20 Nikkei 225 Index, Strike Price JPY19,500± (31,936) 4,454 0.00
37 10/01/20 Nikkei 225 Index, Strike Price JPY19,625± (5,284) 681 0.00
31 10/01/20 Nikkei 225 Index, Strike Price JPY19,750± (4,847) 571 0.00

FINANCIAL STATEMENTS SCHEDULE OF INVESTMENTS
626 NEUBERGER BERMAN INVESTMENT FUNDS PLC
Neuberger Berman Uncorrelated Strategies Fund (Continued)
Schedule of Investments (Continued) Financial Assets at Fair Value through Profit or Loss (continued) Purchased Options Contracts 1.12% (31 December 2018: 0.56%) (continued)
Number of Contracts
Expiration Date Type Premium
US$Fair Value
US$% of Net
Assets
Put Options (continued)
18 10/01/20 Nikkei 225 Index, Strike Price JPY19,875± (2,932) 331 0.00
22 10/01/20 Nikkei 225 Index, Strike Price JPY20,000± (4,416) 405 0.00
12 10/01/20 Nikkei 225 Index, Strike Price JPY20,750± (3,551) 221 0.00
21 10/01/20 Nikkei 225 Index, Strike Price JPY21,000± (7,540) 386 0.00
13 10/01/20 Nikkei 225 Index, Strike Price JPY21,250± (6,001) 359 0.00
23 10/01/20 Nikkei 225 Index, Strike Price JPY21375± (13,137) 635 0.00
135 10/01/20 Nikkei 225 Index, Strike Price JPY21,500± (88,630) 4,969 0.00
221 10/01/20 Nikkei 225 Index, Strike Price JPY21,625± (151,968) 8,134 0.00
250 10/01/20 Nikkei 225 Index, Strike Price JPY21,750± (198,703) 11,502 0.00
229 10/01/20 Nikkei 225 Index, Strike Price JPY21,875± (191,507) 12,643 0.00
174 10/01/20 Nikkei 225 Index, Strike Price JPY22,000± (160,444) 11,208 0.00
44 10/01/20 Nikkei 225 Index, Strike Price JPY22,125± (53,049) 3,644 0.00
30 10/01/20 Nikkei 225 Index, Strike Price JPY22,250± (41,300) 3,037 0.00
11 10/01/20 Nikkei 225 Index, Strike Price JPY22,375± (19,003) 1,316 0.00
14 10/01/20 Nikkei 225 Index, Strike Price JPY22,500± (13,469) 2,061 0.00
55 10/01/20 Nikkei 225 Index, Strike Price JPY22,625± (89,535) 10,122 0.00
81 10/01/20 Nikkei 225 Index, Strike Price JPY22,750± (76,834) 19,379 0.00
92 10/01/20 Nikkei 225 Index, Strike Price JPY22,875± (109,087) 28,783 0.00
64 14/02/20 Nikkei 225 Index, Strike Price JPY22,875± (106,174) 120,727 0.01
55 10/01/20 Nikkei 225 Index, Strike Price JPY23,000± (101,725) 23,280 0.00
47 10/01/20 Nikkei 225 Index, Strike Price JPY23,125± (113,152) 26,381 0.00
40 10/01/20 Nikkei 225 Index, Strike Price JPY23,250± (129,495) 29,814 0.00
11 10/01/20 Nikkei 225 Index, Strike Price JPY23,375± (35,563) 11,134 0.00
2 14/02/20 Nikkei 225 Index, Strike Price JPY23,500± (5,757) 6,993 0.00
26 10/01/20 Nikkei 225 Index, Strike Price JPY24,000± (59,946) 101,679 0.01
6 10/01/20 Nikkei 225 Index, Strike Price JPY24,125± (15,627) 28,986 0.00
30 03/01/20 S&P 500 E-mini Futures, Strike Price US$3,130± (1,526) 1,575 0.00
103 03/01/20 S&P 500 E-mini Futures, Strike Price US$3,150± (8,590) 6,695 0.00
58 03/01/20 S&P 500 E-mini Futures, Strike Price US$3,160± (6,793) 4,350 0.00
32 03/01/20 S&P 500 E-mini Futures, Strike Price US$3,220± (22,399) 12,400 0.00
30 03/01/20 S&P 500 E-mini Futures, Strike Price US$3,225± (21,026) 13,875 0.00
118 03/01/20 S&P 500 E-mini Futures, Strike Price US$3,230± (62,053) 66,375 0.01
163 03/01/20 S&P 500 E-mini Futures, Strike Price US$3,235± (89,542) 110,025 0.01
25 16/01/20 S&P ASX 200 Index, Strike Price AUD6,400± (4,358) 1,828 0.00
23 20/02/20 S&P ASX 200 Index, Strike Price AUD6,450± (16,146) 8,052 0.00
29 16/01/20 S&P ASX 200 Index, Strike Price AUD6,500± (15,307) 3,914 0.00
69 16/01/20 S&P ASX 200 Index, Strike Price AUD6,550± (44,452) 13,144 0.00

SCHEDULE OF INVESTMENTS FINANCIAL STATEMENTS
ANNUAL REPORT 2019 627
Neuberger Berman Uncorrelated Strategies Fund (Continued)
Schedule of Investments (Continued) Financial Assets at Fair Value through Profit or Loss (continued) Purchased Options Contracts 1.12% (31 December 2018: 0.56%) (continued)
Number of Contracts
Expiration Date Type Premium
US$Fair Value
US$% of Net
Assets
Put Options (continued)
13 20/02/20 S&P ASX 200 Index, Strike Price AUD6,550± (12,743) 6,863 0.00
112 16/01/20 S&P ASX 200 Index, Strike Price AUD6,600± (81,814) 30,469 0.00
94 16/01/20 S&P ASX 200 Index, Strike Price AUD6,650± (59,461) 36,607 0.00
108 16/01/20 S&P ASX 200 Index, Strike Price AUD6,700± (74,233) 59,672 0.00
13 15/01/20 Taiwan Stock Exchange Index, Strike Price TWD10,900± (173) 74 0.00
12 15/01/20 Taiwan Stock Exchange Index, Strike Price TWD11,000± (186) 86 0.00
107 15/01/20 Taiwan Stock Exchange Index, Strike Price TWD11,200± (3,299) 1,196 0.00
29 15/01/20 Taiwan Stock Exchange Index, Strike Price TWD11,300± (1,029) 455 0.00
425,000,000 22/01/20 United States Dollar/Japanese Yen Currency Option, Strike Price JPY108.5∞ (3,892,698) 2,085,050 0.17
Total Gain on Purchased Options Contracts 13,515,331 1.12
Contracts for Differences 0.53% (31 December 2018: 85.09%)
Units Security Description Counterparty UnrealisedGain US$
% of Net Assets
63,377 3i Group Plc Morgan Stanley 4,265 0.00
27,500 3SBio Inc Morgan Stanley 638 0.00
12,881 a2 Milk Co Ltd Morgan Stanley 692 0.00
388,018 A2A SpA Morgan Stanley 916 0.00
(1,900) Aalberts NV Morgan Stanley 77 0.00
(900) AAON Inc Morgan Stanley 111 0.00
(2,131) Abacus Property Group Morgan Stanley 3 0.00
469,716 ABB Ltd Goldman Sachs International 9,357 0.00
(41,189) ABB Ltd Morgan Stanley 4,202 0.00
(4,056) Abbott Laboratories Morgan Stanley 0 0.00
3,810 AbbVie Inc Morgan Stanley 0 0.00
(79,692) Abcam Plc Morgan Stanley 5,423 0.00
100 Abercrombie & Fitch Co Morgan Stanley 1 0.00
794 ABIOMED Inc Morgan Stanley 0 0.00
500 Acacia Communications Inc Morgan Stanley 363 0.00
20,900 Acadia Realty Trust Morgan Stanley 559 0.00
737 Accenture Plc Morgan Stanley 0 0.00
(37,110) Accor SA Morgan Stanley 127 0.00
31,833 ACEA SpA Morgan Stanley 305 0.00
5,118 Acerinox SA Morgan Stanley 946 0.00
383 Ackermans & van Haaren NV Morgan Stanley 1,045 0.00
32,996 ACS Actividades de Construccion y Servicios SA Morgan Stanley 0 0.00

FINANCIAL STATEMENTS SCHEDULE OF INVESTMENTS
628 NEUBERGER BERMAN INVESTMENT FUNDS PLC
Neuberger Berman Uncorrelated Strategies Fund (Continued)
Schedule of Investments (Continued) Financial Assets at Fair Value through Profit or Loss (continued) Contracts for Differences 0.53% (31 December 2018: 85.09%) (continued)
Units Security Description Counterparty Unrealised Gain US$
% of NetAssets
(2,500) Actuant Corp Morgan Stanley 1,129 0.00
38,731 Adecco Group AG Goldman Sachs International 2,021 0.00
1,122 adidas AG Morgan Stanley 12,639 0.00
32,447 Admiral Group Plc Morgan Stanley 0 0.00
4,762 ADO Properties SA Morgan Stanley 1,868 0.00
24,000 ADT Inc Morgan Stanley 2,494 0.00
1,100 Advance Auto Parts Inc Morgan Stanley 3,990 0.00
1,428 Aedifica SA Morgan Stanley 9,685 0.00
(25,073) Aegon NV Morgan Stanley 0 0.00
(3,504) Aena SME SA Morgan Stanley 0 0.00
11,800 AEON Financial Service Co Ltd Morgan Stanley 1,839 0.00
16,600 Aeon Mall Co Ltd Morgan Stanley 7,300 0.00
1,500 AerCap Holdings NV Morgan Stanley 8 0.00
(7,468) Aeroports de Paris Morgan Stanley 206 0.00
(1,700) AeroVironment Inc Morgan Stanley 2,326 0.00
13,888 AES Corp Morgan Stanley 0 0.00
(65,232) AGCO Corp Morgan Stanley 0 0.00
(69,251) Aggreko Plc Goldman Sachs International 0 0.00
202,000 Agile Group Holdings Ltd Morgan Stanley 13,084 0.00
(4,425) Agilent Technologies Inc Morgan Stanley 0 0.00
(1,835) Agnico Eagle Mines Ltd Morgan Stanley 0 0.00
4,700 Agree Realty Corp Morgan Stanley 7,078 0.00
604,000 Agricultural Bank of China Ltd Morgan Stanley 9,947 0.00
28,200 AIA Group Ltd Morgan Stanley 2,501 0.00
190,604 AIB Group Plc Morgan Stanley 0 0.00
1,600 Aica Kogyo Co Ltd Morgan Stanley 253 0.00
(39,048) Airbus SE Goldman Sachs International 0 0.00
(129,052) Air France-KLM Morgan Stanley 0 0.00
(382,989) Air France-KLM Goldman Sachs International 0 0.00
(5,700) Air Lease Corp Morgan Stanley 1,517 0.00
(9,935) Air Liquide SA Morgan Stanley 4,617 0.00
6,238 Air Products & Chemicals Inc Morgan Stanley 2,328 0.00
(3,300) Air Water Inc Morgan Stanley 938 0.00
204,817 AJ Bell Plc Morgan Stanley 23 0.00
9,300 Ajinomoto Co Inc Morgan Stanley 1,034 0.00
(90,900) AK Steel Holding Corp Morgan Stanley 327 0.00
5,258 Akamai Technologies Inc Morgan Stanley 1,635 0.00
5,251 Aker BP ASA Morgan Stanley 11,930 0.00
1,176 Akka Technologies Morgan Stanley 7,747 0.00

SCHEDULE OF INVESTMENTS FINANCIAL STATEMENTS
ANNUAL REPORT 2019 629
Neuberger Berman Uncorrelated Strategies Fund (Continued)
Schedule of Investments (Continued) Financial Assets at Fair Value through Profit or Loss (continued) Contracts for Differences 0.53% (31 December 2018: 85.09%) (continued)
Units Security Description Counterparty Unrealised Gain US$
% of NetAssets
93,406 Akzo Nobel NV Morgan Stanley 0 0.00
29,400 Alacer Gold Corp Morgan Stanley 5,056 0.00
4,600 Alamos Gold Inc Morgan Stanley 3,025 0.00
7,500 Alarm.com Holdings Inc Morgan Stanley 5,448 0.00
(4,644) Alcoa Corp Morgan Stanley 6,156 0.00
(1,805) Alcon Inc Morgan Stanley 57 0.00
4,302 Alexion Pharmaceuticals Inc Morgan Stanley 0 0.00
219,985 Alfa Laval AB Morgan Stanley 1,445 0.00
(8,800) Alfresa Holdings Corp Morgan Stanley 4,895 0.00
800 Algonquin Power & Utilities Corp Morgan Stanley 81 0.00
(492) Alibaba Group Holding Ltd Morgan Stanley 0 0.00
(369) Align Technology Inc Morgan Stanley 0 0.00
(4,548) Allegheny Technologies Inc Morgan Stanley 0 0.00
(1,400) Allegiant Travel Co Morgan Stanley 3,708 0.00
2,826 Alliance Data Systems Corp Morgan Stanley 0 0.00
3,100 Alliance Resource Partners LP Morgan Stanley 360 0.00
10,451 Allison Transmission Holdings Inc Morgan Stanley 2,264 0.00
66,400 Allscripts Healthcare Solutions Inc Morgan Stanley 17,940 0.00
4,502 Allstate Corp Morgan Stanley 0 0.00
21,426 Almirall SA Morgan Stanley 0 0.00
123 Alphabet Inc Morgan Stanley 0 0.00
(920) Alps Alpine Co Ltd Morgan Stanley 211 0.00
900 AltaGas Canada Inc Morgan Stanley 366 0.00
4,400 AltaGas Ltd Morgan Stanley 323 0.00
(34) Altarea SCA Morgan Stanley 14 0.00
400 Alteryx Inc Morgan Stanley 203 0.00
183,960 Altice Europe NV Morgan Stanley 411 0.00
7,010 Altice USA Inc Morgan Stanley 936 0.00
(600) Altus Group Ltd Morgan Stanley 103 0.00
(2,580) Alumina Ltd Morgan Stanley 89 0.00
(17,739) AMA Group Ltd Morgan Stanley 1,816 0.00
(32) Amazon.com Inc Morgan Stanley 0 0.00
(101,284) Ambu A/S Morgan Stanley 47 0.00
10,600 AMC Networks Inc Morgan Stanley 16,655 0.00
(1,600) Amdocs Ltd Morgan Stanley 455 0.00
231 Ameren Corp Morgan Stanley 428 0.00
(5,564) American Airlines Group Inc Morgan Stanley 4,676 0.00
32,300 American Eagle Outfitters Inc Morgan Stanley 1,909 0.00
(5,300) American Equity Investment Life Holding Co Morgan Stanley 2,874 0.00

FINANCIAL STATEMENTS SCHEDULE OF INVESTMENTS
630 NEUBERGER BERMAN INVESTMENT FUNDS PLC
Neuberger Berman Uncorrelated Strategies Fund (Continued)
Schedule of Investments (Continued) Financial Assets at Fair Value through Profit or Loss (continued) Contracts for Differences 0.53% (31 December 2018: 85.09%) (continued)
Units Security Description Counterparty Unrealised Gain US$
% of NetAssets
(4,935) American Express Co Morgan Stanley 1,045 0.00
(1,900) American Financial Group Inc Morgan Stanley 2,592 0.00
(7,620) American International Group Inc Morgan Stanley 0 0.00
(1,300) American States Water Co Morgan Stanley 435 0.00
860 American Tower Corp Morgan Stanley 0 0.00
2,500 American Water Works Co Inc Morgan Stanley 3,001 0.00
(1,200) American Woodmark Corp Morgan Stanley 2,733 0.00
(737) Ameriprise Financial Inc Morgan Stanley 0 0.00
4,670 AmerisourceBergen Corp Morgan Stanley 0 0.00
(4,548) AMETEK Inc Morgan Stanley 0 0.00
2,336 Amgen Inc Morgan Stanley 0 0.00
28,269 Amplifon SpA Morgan Stanley 534 0.00
16,759 Amundi SA Morgan Stanley 0 0.00
(3,564) Analog Devices Inc Morgan Stanley 0 0.00
(1,500) Anaplan Inc Morgan Stanley 905 0.00
(29,130) Andritz Ag Morgan Stanley 0 0.00
(77,311) Anglo American Plc Morgan Stanley 253 0.00
21,509 Annaly Capital Management Inc Morgan Stanley 0 0.00
(3,098) ANSYS Inc Morgan Stanley 289 0.00
186,500 Antero Midstream Corp Morgan Stanley 300,265 0.03
66,200 Antero Resources Corp Morgan Stanley 11,254 0.00
2,192 Anthem Inc Morgan Stanley 10,136 0.00
(22,634) Antofagasta Plc Morgan Stanley 0 0.00
11,200 AO Smith Corp Morgan Stanley 12,416 0.00
(700) Aozora Bank Ltd Morgan Stanley 42 0.00
9,309 AP Eagers Ltd Morgan Stanley 1,919 0.00
1,388 AP Moller - Maersk A/S Morgan Stanley 812 0.00
(711) APA Group Morgan Stanley 137 0.00
5,550 Apache Corp Morgan Stanley 24,984 0.01
4,500 Apartment Investment & Management Co Morgan Stanley 2,117 0.00
3,359 Aperam Sa Morgan Stanley 1,083 0.00
3,700 Apogee Enterprises Inc Morgan Stanley 723 0.00
50,500 Apple Hospitality REIT Inc Morgan Stanley 10,898 0.00
202 Apple Inc Morgan Stanley 0 0.00
13,696 Applus Services SA Morgan Stanley 2,587 0.00
(6,073) Aptiv Plc Morgan Stanley 964 0.00
(4,793) Aramark Morgan Stanley 0 0.00
7,000 ARC Resources Ltd Morgan Stanley 2,295 0.00
71,196 Arcadis NV Morgan Stanley 1,066 0.00

SCHEDULE OF INVESTMENTS FINANCIAL STATEMENTS
ANNUAL REPORT 2019 631
Neuberger Berman Uncorrelated Strategies Fund (Continued)
Schedule of Investments (Continued) Financial Assets at Fair Value through Profit or Loss (continued) Contracts for Differences 0.53% (31 December 2018: 85.09%) (continued)
Units Security Description Counterparty Unrealised Gain US$
% of NetAssets
(91,872) ArcelorMittal SA Morgan Stanley 677 0.00
3,100 Archer-Daniels-Midland Co Morgan Stanley 376 0.00
7,200 Archrock Inc Morgan Stanley 4,232 0.00
(1,106) Arconic Inc Morgan Stanley 0 0.00
(8,400) Arcosa Inc Morgan Stanley 250 0.00
4,800 Arcs Co Ltd Morgan Stanley 481 0.00
10,266 Ardent Leisure Group Ltd Morgan Stanley 993 0.00
(1,615) Argenx SE Morgan Stanley 7,178 0.00
200 Ariake Japan Co Ltd Morgan Stanley 761 0.00
(300) Arista Networks Inc Morgan Stanley 108 0.00
(5,564) Aristocrat Leisure Ltd Morgan Stanley 3,782 0.00
68,221 Arkema SA Goldman Sachs International 0 0.00
18,893 Arkema SA Morgan Stanley 73 0.00
30,855 Aroundtown SA Morgan Stanley 0 0.00
(120,000) ArtGo Holdings Ltd Morgan Stanley 306 0.00
4,600 Arthur J Gallagher & Co Morgan Stanley 993 0.00
(2,700) Asahi Group Holdings Ltd Morgan Stanley 3,711 0.00
(5,800) Asbury Automotive Group Inc Morgan Stanley 25,149 0.01
195,075 Ascential Plc Morgan Stanley 8,940 0.00
100 ASGN Inc Morgan Stanley 67 0.00
1,352 Ashland Global Holdings Inc Morgan Stanley 0 0.00
56,884 Ashmore Group Plc Morgan Stanley 2,399 0.00
3,675 Ashtead Group Plc Morgan Stanley 239 0.00
117,500 Asia Cement China Holdings Corp Morgan Stanley 6,706 0.00
6,700 Asics Corp Morgan Stanley 207 0.00
4,200 ASKUL Corp Morgan Stanley 12,936 0.00
2,708 ASOS Plc Morgan Stanley 22,444 0.01
1,600 Aspen Technology Inc Morgan Stanley 592 0.00
443,680 Assa Abloy AB Morgan Stanley 0 0.00
(37,291) Associated British Foods Plc Morgan Stanley 11,992 0.00
(89,467) Assura Plc Morgan Stanley 1,444 0.00
5,700 Astellas Pharma Inc Morgan Stanley 501 0.00
(27,040) Aston Martin Lagonda Global Holdings Plc Morgan Stanley 0 0.00
(819) AstraZeneca Plc Morgan Stanley 14,985 0.00
3,235 AT&T Inc Morgan Stanley 109 0.00
(1,100) Atkore International Group Inc Morgan Stanley 200 0.00
(13,809) Atlas Copco AB Morgan Stanley 0 0.00
1,500 Atmos Energy Corp Morgan Stanley 1,126 0.00
12,754 Atos SE Morgan Stanley 749 0.00

FINANCIAL STATEMENTS SCHEDULE OF INVESTMENTS
632 NEUBERGER BERMAN INVESTMENT FUNDS PLC
Neuberger Berman Uncorrelated Strategies Fund (Continued)
Schedule of Investments (Continued) Financial Assets at Fair Value through Profit or Loss (continued) Contracts for Differences 0.53% (31 December 2018: 85.09%) (continued)
Units Security Description Counterparty Unrealised Gain US$
% of NetAssets
2,827 AURELIUS Equity Opportunities SE & Co KGaA Morgan Stanley 5,816 0.00
1,000 Aurinia Pharmaceuticals Inc Morgan Stanley 1,225 0.00
(35,041) Aurizon Holdings Ltd Morgan Stanley 3,508 0.00
(15,085) Aurubis AG Morgan Stanley 3,562 0.00
32,886 Australian Agricultural Co Ltd Morgan Stanley 485 0.00
40,104 Australian Pharmaceutical Industries Ltd Morgan Stanley 1,826 0.00
(11,817) Auto Trader Group Plc Morgan Stanley 0 0.00
(7,433) Autodesk Inc Morgan Stanley 1,518 0.00
(136,822) Autoliv Inc Morgan Stanley 3,985 0.00
137 Automatic Data Processing Inc Morgan Stanley 19 0.00
292 AutoZone Inc Morgan Stanley 6,116 0.00
2,827 AvalonBay Communities Inc Morgan Stanley 0 0.00
6,200 Avanos Medical Inc Morgan Stanley 2,774 0.00
355,622 Avast Plc Morgan Stanley 356 0.00
(2,700) Avaya Holdings Corp Morgan Stanley 61 0.00
(16,750) AVEVA Group Plc Morgan Stanley 614 0.00
(2,200) Avista Corp Morgan Stanley 1,779 0.00
2,200 Axalta Coating Systems Ltd Morgan Stanley 164 0.00
979 Axel Springer SE Morgan Stanley 1,356 0.00
98,343 Axfood AB Morgan Stanley 0 0.00
45,967 Azimut Holding SpA Morgan Stanley 1,106 0.00
(3,000) AZZ Inc Morgan Stanley 2,012 0.00
8,600 B&G Foods Inc Morgan Stanley 6,020 0.00
(488,365) B&M European Value Retail SA Morgan Stanley 14,591 0.00
21,300 B2Gold Corp Morgan Stanley 6,378 0.00
743,273 Babcock International Group Plc Goldman Sachs International 0 0.00
(77,237) Babcock International Group Plc Morgan Stanley 2,460 0.00
(1,200) Badger Daylighting Ltd Morgan Stanley 727 0.00
(3,400) Badger Meter Inc Morgan Stanley 3 0.00
774,733 BAE Systems Plc Goldman Sachs International 0 0.00
(124,351) BAE Systems Plc Morgan Stanley 8,537 0.00
3,073 Baidu Inc Morgan Stanley 0 0.00
13,898 Bakkafrost P/F Morgan Stanley 7,960 0.00
(321,548) Balfour Beatty Plc Morgan Stanley 0 0.00
(33,332) Ball Corp Morgan Stanley 3,856 0.00
1,300 Ballard Power Systems Inc Morgan Stanley 377 0.00
(800) BancFirst Corp Morgan Stanley 318 0.00
(55,764) Banco Bilbao Vizcaya Argentaria SA Morgan Stanley 0 0.00
2,763,217 Banco Comercial Portugues SA Morgan Stanley 0 0.00

SCHEDULE OF INVESTMENTS FINANCIAL STATEMENTS
ANNUAL REPORT 2019 633
Neuberger Berman Uncorrelated Strategies Fund (Continued)
Schedule of Investments (Continued) Financial Assets at Fair Value through Profit or Loss (continued) Contracts for Differences 0.53% (31 December 2018: 85.09%) (continued)
Units Security Description Counterparty Unrealised Gain US$
% of NetAssets
(5,100) Bandai Namco Holdings Inc Morgan Stanley 1,498 0.00
(43,332) Bank of America Corp Morgan Stanley 737 0.00
316,000 Bank of Communications Co Ltd Morgan Stanley 3,777 0.00
(211,681) Bank of East Asia Ltd Morgan Stanley 8,493 0.00
9,685 Bank of Ireland Group Plc Morgan Stanley 0 0.00
6,637 Bank of New York Mellon Corp Morgan Stanley 0 0.00
6,100 Bank of Nova Scotia Morgan Stanley 1,581 0.00
(861) Bank of Queensland Ltd Morgan Stanley 35 0.00
(1,600) Bank OZK Morgan Stanley 371 0.00
17,837 Bankia SA Morgan Stanley 426 0.00
(10,700) BankUnited Inc Morgan Stanley 1,162 0.00
(200) Banner Corp Morgan Stanley 18 0.00
161 Banque Cantonale Vaudoise Morgan Stanley 3,378 0.00
(335,915) Barclays Plc Morgan Stanley 22,244 0.01
7,229 Barco NV Morgan Stanley 851 0.00
(108,915) Barratt Developments Plc Morgan Stanley 25,004 0.01
(16,295) Barrick Gold Corp Morgan Stanley 6,611 0.00
85 Barry Callebaut AG Morgan Stanley 0 0.00
(152,196) BASF SE Morgan Stanley 0 0.00
7,611 BAWAG Group AG Morgan Stanley 0 0.00
(2,950) Baxter International Inc Morgan Stanley 0 0.00
(7,201) Bayer AG Morgan Stanley 3,752 0.00
(13,048) Bayerische Motoren Werke AG Morgan Stanley 20,930 0.01
91,900 Baytex Energy Corp Morgan Stanley 14,904 0.00
(7,339) BB Biotech AG Morgan Stanley 6,636 0.00
5,279 BCE Inc Morgan Stanley 136 0.00
29,692 BE Semiconductor Industries NV Morgan Stanley 129 0.00
(13,533) Beach Energy Ltd Morgan Stanley 637 0.00
(40,867) Beazley Plc Morgan Stanley 0 0.00
(8,726) Bed Bath & Beyond Inc Morgan Stanley 0 0.00
1,608 Befesa SA Morgan Stanley 3,669 0.00
(1,577) Beiersdorf AG Morgan Stanley 10,561 0.00
(22,000) Beijing Capital International Airport Co Ltd Morgan Stanley 539 0.00
34,500 Beijing Enterprises Holdings Ltd Morgan Stanley 1,757 0.00
(78,000) Beijing Enterprises Water Group Ltd Morgan Stanley 524 0.00
(6,223) Bellway Plc Morgan Stanley 6,775 0.00
3,000 Bengo4.com Inc Morgan Stanley 1,768 0.00
(2,200) Berkshire Hills Bancorp Inc Morgan Stanley 41 0.00
218,038 Betsson AB Morgan Stanley 0 0.00

FINANCIAL STATEMENTS SCHEDULE OF INVESTMENTS
634 NEUBERGER BERMAN INVESTMENT FUNDS PLC
Neuberger Berman Uncorrelated Strategies Fund (Continued)
Schedule of Investments (Continued) Financial Assets at Fair Value through Profit or Loss (continued) Contracts for Differences 0.53% (31 December 2018: 85.09%) (continued)
Units Security Description Counterparty Unrealised Gain US$
% of NetAssets
(12,193) BHP Group Plc Morgan Stanley 0 0.00
(56,278) Big Yellow Group Plc Morgan Stanley 7,850 0.00
(15,088) Bilfinger SE Morgan Stanley 10,227 0.00
(133,969) BillerudKorsnas AB Morgan Stanley 0 0.00
(11,530) Bingo Industries Ltd Morgan Stanley 395 0.00
614 Biogen Inc Morgan Stanley 0 0.00
(1,106) BioMarin Pharmaceutical Inc Morgan Stanley 0 0.00
400 Bio-Rad Laboratories Inc Morgan Stanley 2,814 0.00
2,444 BKW AG Morgan Stanley 1,100 0.00
6,600 Blackbaud Inc Morgan Stanley 711 0.00
(500) Blackline Inc Morgan Stanley 423 0.00
(1,500) Bloomin' Brands Inc Morgan Stanley 152 0.00
66,657 Blue Prism Group Plc Morgan Stanley 0 0.00
(2,500) BMC Stock Holdings Inc Morgan Stanley 1,564 0.00
4,300 BOC Aviation Ltd Morgan Stanley 337 0.00
(149,500) BOC Hong Kong Holdings Ltd Morgan Stanley 5,714 0.00
8,558 Boeing Co Morgan Stanley 0 0.00
(700) Boise Cascade Co Morgan Stanley 242 0.00
(5,200) BOK Financial Corp Morgan Stanley 1,177 0.00
41,948 Boliden AB Morgan Stanley 2,109 0.00
(110,509) Bollore SA Morgan Stanley 7,562 0.00
477,837 boohoo Group Plc Morgan Stanley 6,695 0.00
45 Booking Holdings Inc Morgan Stanley 0 0.00
7,200 Booz Allen Hamilton Holding Corp Morgan Stanley 6,196 0.00
(2,800) Boralex Inc Morgan Stanley 737 0.00
933 Boston Beer Co Inc Morgan Stanley 136 0.00
(12,500) Boston Private Financial Holdings Inc Morgan Stanley 370 0.00
12,037 Boston Properties Inc Morgan Stanley 18,880 0.00
24,736 Bouygues SA Morgan Stanley 1,716 0.00
60,893 Bovis Homes Group Plc Morgan Stanley 1,058 0.00
(29,147) BP Plc Morgan Stanley 594 0.00
(1,598) bpost SA Morgan Stanley 0 0.00
(17,494) Brambles Ltd Morgan Stanley 2,544 0.00
(88,862) Bravida Holding AB Morgan Stanley 0 0.00
(103) Brederode SA Morgan Stanley 26 0.00
(860) Brenntag AG Morgan Stanley 0 0.00
71,722 Brewin Dolphin Holdings Plc Morgan Stanley 0 0.00
(6,600) Bridgestone Corp Morgan Stanley 12,308 0.00
(174,000) Brilliance China Automotive Holdings Ltd Morgan Stanley 8,240 0.00

SCHEDULE OF INVESTMENTS FINANCIAL STATEMENTS
ANNUAL REPORT 2019 635
Neuberger Berman Uncorrelated Strategies Fund (Continued)
Schedule of Investments (Continued) Financial Assets at Fair Value through Profit or Loss (continued) Contracts for Differences 0.53% (31 December 2018: 85.09%) (continued)
Units Security Description Counterparty Unrealised Gain US$
% of NetAssets
8,604 Bristol-Myers Squibb Co Morgan Stanley 0 0.00
600 Bristol-Myers Squibb Co (Right, 31/03/2021) Morgan Stanley 216 0.00
157,535 Britvic Plc Morgan Stanley 2,563 0.00
246 Broadcom Inc Morgan Stanley 0 0.00
11,500 Brooks Automation Inc Morgan Stanley 7,269 0.00
2,600 Brown & Brown Inc Morgan Stanley 1,300 0.00
1,300 BRP Inc Morgan Stanley 138 0.00
5,400 Bruker Corp Morgan Stanley 3,913 0.00
8,227 Bunge Ltd Morgan Stanley 7,127 0.00
75,659 Burberry Group Plc Morgan Stanley 2,983 0.00
(52,713) Bureau Veritas SA Morgan Stanley 730 0.00
2,827 Burlington Stores Inc Morgan Stanley 0 0.00
358,870 Buzzi Unicem SpA Goldman Sachs International 26,210 0.01
13,889 Buzzi Unicem SpA Morgan Stanley 344 0.00
4,800 Cabot Corp Morgan Stanley 445 0.00
58,987 Cabot Oil & Gas Corp Morgan Stanley 12,325 0.00
800 Cactus Inc Morgan Stanley 189 0.00
4,900 CAE Inc Morgan Stanley 1,428 0.00
120,818 CaixaBank SA Morgan Stanley 0 0.00
4,200 Calbee Inc Morgan Stanley 17 0.00
(3,000) Caleres Inc Morgan Stanley 163 0.00
7,600 California Water Service Group Morgan Stanley 4,063 0.00
44,600 Callon Petroleum Co Morgan Stanley 12,765 0.00
(600) Cal-Maine Foods Inc Morgan Stanley 206 0.00
6,690 Caltex Australia Ltd Morgan Stanley 2,254 0.00
100 Camden Property Trust Morgan Stanley 46 0.00
2,275 Campbell Soup Co Morgan Stanley 749 0.00
5,300 Canacol Energy Ltd Morgan Stanley 777 0.00
(2,500) Canadian Imperial Bank of Commerce Morgan Stanley 543 0.00
369 Canadian National Railway Co Morgan Stanley 0 0.00
(1,300) Canadian National Railway Co Morgan Stanley 115 0.00
1,300 Canadian Natural Resources Ltd Morgan Stanley 737 0.00
(2,864) Canadian Pacific Railway Ltd Morgan Stanley 0 0.00
200 Canadian Tire Corp Ltd Morgan Stanley 114 0.00
(2,400) Canadian Utilities Ltd Morgan Stanley 34 0.00
(4,800) Canfor Corp Morgan Stanley 8,821 0.00
(1,500) Canon Inc Morgan Stanley 805 0.00
(1,400) Canon Marketing Japan Inc Morgan Stanley 713 0.00
11,800 Canopy Growth Corp Morgan Stanley 8,143 0.00

FINANCIAL STATEMENTS SCHEDULE OF INVESTMENTS
636 NEUBERGER BERMAN INVESTMENT FUNDS PLC
Neuberger Berman Uncorrelated Strategies Fund (Continued)
Schedule of Investments (Continued) Financial Assets at Fair Value through Profit or Loss (continued) Contracts for Differences 0.53% (31 December 2018: 85.09%) (continued)
Units Security Description Counterparty Unrealised Gain US$
% of NetAssets
13,600 Capcom Co Ltd Morgan Stanley 15,005 0.00
(2,629,766) Capita Plc Goldman Sachs International 0 0.00
(430,667) Capita Plc Morgan Stanley 0 0.00
23,736 Capital & Counties Properties Plc Morgan Stanley 524 0.00
(8,837) Capital One Financial Corp Morgan Stanley 3,844 0.00
4,900 Capital Power Corp Morgan Stanley 1,484 0.00
4,811 Capri Holdings Ltd Morgan Stanley 2,691 0.00
600 Cargojet Inc Morgan Stanley 924 0.00
25,692 Cargotec Oyj Morgan Stanley 629 0.00
(2,678) Carl Zeiss Meditec AG Morgan Stanley 0 0.00
26,293 Carlisle Cos Inc Morgan Stanley 0 0.00
6,358 Carmila SA Morgan Stanley 14,567 0.00
51,201 Carnarvon Petroleum Ltd Morgan Stanley 1,313 0.00
(15,572) Carnival Plc Morgan Stanley 11,706 0.00
6,700 Carpenter Technology Corp Morgan Stanley 3,282 0.00
8,952 Carrefour SA Morgan Stanley 445 0.00
(11,307) Carvana Co Morgan Stanley 0 0.00
(7,700) Cascades Inc Morgan Stanley 3,928 0.00
1,200 Casio Computer Co Ltd Morgan Stanley 208 0.00
(10,661) Castile Resources Ltd (Right, 31/12/2049) Morgan Stanley 0 0.00
16,171 Caterpillar Inc Morgan Stanley 251 0.00
(3,800) Cathay General Bancorp Morgan Stanley 1,295 0.00
2,000 Cathay Pacific Airways Ltd Morgan Stanley 5 0.00
(2,900) CBIZ Inc Morgan Stanley 676 0.00
250,230 Ceconomy Ag Morgan Stanley 0 0.00
369 Celanese Corp Morgan Stanley 0 0.00
1,800 Celestica Inc Morgan Stanley 412 0.00
(25,929) Cenovus Energy Inc Morgan Stanley 169 0.00
471,313 Centamin Plc Morgan Stanley 1,815 0.00
12,783 CenterPoint Energy Inc Morgan Stanley 0 0.00
1,300 Centerra Gold Inc Morgan Stanley 397 0.00
(2,800) Central Glass Co Ltd Morgan Stanley 1,799 0.00
(24,833) Centuria Industrial REIT Morgan Stanley 943 0.00
(100) Century Communities Inc Morgan Stanley 36 0.00
(30,973) CenturyLink Inc Morgan Stanley 0 0.00
2,335 Cerner Corp Morgan Stanley 0 0.00
860 CF Industries Holdings Inc Morgan Stanley 0 0.00
2,700 CGI Inc Morgan Stanley 947 0.00
8,603 CH Robinson Worldwide Inc Morgan Stanley 0 0.00

SCHEDULE OF INVESTMENTS FINANCIAL STATEMENTS
ANNUAL REPORT 2019 637
Neuberger Berman Uncorrelated Strategies Fund (Continued)
Schedule of Investments (Continued) Financial Assets at Fair Value through Profit or Loss (continued) Contracts for Differences 0.53% (31 December 2018: 85.09%) (continued)
Units Security Description Counterparty Unrealised Gain US$
% of NetAssets
410,000 Champion REIT Morgan Stanley 9,581 0.00
(13,658) Charles Schwab Corp Morgan Stanley 19,234 0.00
(1,500) Chart Industries Inc Morgan Stanley 491 0.00
400 Charter Communications Inc Morgan Stanley 5,558 0.00
(1,106) Charter Hall Long Wale REIT (Right, 08/01/2020) Morgan Stanley 137 0.00
(15,624) Charter Hall Retail REIT Morgan Stanley 1,647 0.00
4,200 Chatham Lodging Trust Morgan Stanley 0 0.00
(100) Chemed Corp Morgan Stanley 284 0.00
(8,983) Cheniere Energy Inc Morgan Stanley 0 0.00
122,390 Chesapeake Energy Corp Morgan Stanley 5,851 0.00
3,629 Chevron Corp Morgan Stanley 2,769 0.00
15,071 Chewy Inc Morgan Stanley 0 0.00
10,400 Children's Place Inc Morgan Stanley 29,449 0.01
33,000 China Aoyuan Group Ltd Morgan Stanley 3,682 0.00
509,000 China CITIC Bank Corp Ltd Morgan Stanley 4,929 0.00
222,000 China Communications Construction Co Ltd Morgan Stanley 5,184 0.00
875,000 China Construction Bank Corp Morgan Stanley 29,837 0.01
60,000 China East Education Holdings Ltd Morgan Stanley 8,249 0.00
70,000 China Eastern Airlines Corp Ltd Morgan Stanley 725 0.00
(103,000) China Education Group Holdings Ltd Morgan Stanley 6,850 0.00
242,000 China Everbright Bank Co Ltd Morgan Stanley 2,470 0.00
52,000 China Everbright Ltd Morgan Stanley 7,442 0.00
68,000 China Foods Ltd Morgan Stanley 185 0.00
(41,800) China Gas Holdings Ltd Morgan Stanley 1,429 0.00
(104,000) China Grand Pharmaceutical and Healthcare Holdings Ltd Morgan Stanley 377 0.00
236,000 China Kepei Education Group Ltd Morgan Stanley 1,864 0.00
62,000 China Lesso Group Holdings Ltd Morgan Stanley 3,249 0.00
40,000 China Life Insurance Co Ltd Morgan Stanley 1,346 0.00
37,000 China Longyuan Power Group Corp Ltd Morgan Stanley 730 0.00
154,000 China Maple Leaf Educational Systems Ltd Morgan Stanley 8,374 0.00
5,000 China Mengniu Dairy Co Ltd Morgan Stanley 97 0.00
68,000 China Merchants Port Holdings Co Ltd Morgan Stanley 1,578 0.00
203,500 China Minsheng Banking Corp Ltd Morgan Stanley 2,976 0.00
122,000 China National Building Material Co Ltd Morgan Stanley 14,787 0.00
544,000 China Oriental Group Co Ltd Morgan Stanley 19,635 0.01
331,000 China Overseas Grand Oceans Group Ltd Morgan Stanley 19,204 0.00
(285,000) China Overseas Property Holdings Ltd Morgan Stanley 1,022 0.00
94,500 China Railway Construction Corp Ltd Morgan Stanley 1,509 0.00
229,000 China Railway Group Ltd Morgan Stanley 1,376 0.00

FINANCIAL STATEMENTS SCHEDULE OF INVESTMENTS
638 NEUBERGER BERMAN INVESTMENT FUNDS PLC
Neuberger Berman Uncorrelated Strategies Fund (Continued)
Schedule of Investments (Continued) Financial Assets at Fair Value through Profit or Loss (continued) Contracts for Differences 0.53% (31 December 2018: 85.09%) (continued)
Units Security Description Counterparty Unrealised Gain US$
% of NetAssets
92,000 China Resources Beer Holdings Co Ltd Morgan Stanley 11,650 0.00
210,000 China Resources Cement Holdings Ltd Morgan Stanley 6,037 0.00
339,000 China SCE Group Holdings Ltd Morgan Stanley 4,512 0.00
107,000 China Shenhua Energy Co Ltd Morgan Stanley 11,108 0.00
2,784,000 China South City Holdings Ltd Morgan Stanley 25,148 0.01
98,000 China State Construction International Holdings Ltd Morgan Stanley 5,785 0.00
(43,400) China Taiping Insurance Holdings Co Ltd Morgan Stanley 459 0.00
252,000 China Telecom Corp Ltd Morgan Stanley 3,524 0.00
64,000 China Tianrui Group Cement Co Ltd Morgan Stanley 3,311 0.00
168,000 China Tower Corp Ltd Morgan Stanley 1,302 0.00
32,900 China Vanke Co Ltd Morgan Stanley 7,388 0.00
17,500 China Yongda Automobiles Services Holdings Ltd Morgan Stanley 98 0.00
170,000 China Yuhua Education Corp Ltd Morgan Stanley 294 0.00
485,200 China Zhongwang Holdings Ltd Morgan Stanley 3,193 0.00
(64,000) Chinasoft International Ltd Morgan Stanley 1,134 0.00
170 Chocoladefabriken Lindt & Spruengli AG Morgan Stanley 0 0.00
1,118,000 Chongqing Rural Commercial Bank Co Ltd Morgan Stanley 3,107 0.00
24,606 Chorus Ltd Morgan Stanley 5,672 0.00
1,475 Chubb Ltd Morgan Stanley 0 0.00
(9,600) Chubu Electric Power Co Inc Morgan Stanley 792 0.00
(38,700) Chugoku Bank Ltd Morgan Stanley 5,694 0.00
1,546 Church & Dwight Co Inc Morgan Stanley 741 0.00
(1,776) Cia de Distribucion Integral Logista Holdings SA Morgan Stanley 954 0.00
(16,662) Cie de Saint-Gobain Morgan Stanley 4,600 0.00
834 Cie d'Entreprises CFE Morgan Stanley 1,825 0.00
(41,275) Cie Financiere Richemont SA Morgan Stanley 0 0.00
(83,568) Cie Generale des Etablissements Michelin SCA Goldman Sachs International 0 0.00
16,000 CIFI Holdings Group Co Ltd Morgan Stanley 5 0.00
(860) Cigna Corp Morgan Stanley 0 0.00
2,800 Cimarex Energy Co Morgan Stanley 3,407 0.00
(172,000) CIMC Enric Holdings Ltd Morgan Stanley 1,281 0.00
17,054 Cincinnati Financial Corp Morgan Stanley 3,558 0.00
(7,400) Cinemark Holdings Inc Morgan Stanley 4,702 0.00
1,844 Cintas Corp Morgan Stanley 0 0.00
860 Cisco Systems Inc Morgan Stanley 0 0.00
6,391 CIT Group Inc Morgan Stanley 0 0.00
220,000 CITIC Ltd Morgan Stanley 5,198 0.00
(1,229) Citigroup Inc Morgan Stanley 0 0.00
1,352 Citrix Systems Inc Morgan Stanley 0 0.00

SCHEDULE OF INVESTMENTS FINANCIAL STATEMENTS
ANNUAL REPORT 2019 639
Neuberger Berman Uncorrelated Strategies Fund (Continued)
Schedule of Investments (Continued) Financial Assets at Fair Value through Profit or Loss (continued) Contracts for Differences 0.53% (31 December 2018: 85.09%) (continued)
Units Security Description Counterparty Unrealised Gain US$
% of NetAssets
(200) Citrix Systems Inc Morgan Stanley 136 0.00
(1,100) City Holding Co Morgan Stanley 459 0.00
3,000 CK Asset Holdings Ltd Morgan Stanley 319 0.00
(44,000) CK Infrastructure Holdings Ltd Morgan Stanley 9,488 0.00
75,244 Clariant AG Goldman Sachs International 1,386 0.00
(119,852) Clariant AG Morgan Stanley 6,328 0.00
(4,400) Cleveland-Cliffs Inc Morgan Stanley 309 0.00
1,797 Clinuvel Pharmaceuticals Ltd Morgan Stanley 1,410 0.00
492 Clorox Co Morgan Stanley 0 0.00
(21,429) Close Brothers Group Plc Morgan Stanley 3,962 0.00
600 Cloudflare Inc Morgan Stanley 287 0.00
(42,000) CLP Holdings Ltd Morgan Stanley 3,589 0.00
983 CME Group Inc Morgan Stanley 0 0.00
11,785 CMS Energy Corp Morgan Stanley 5,814 0.00
443,495 CNH Industrial NV Morgan Stanley 100 0.00
(13,600) CNO Financial Group Inc Morgan Stanley 10,063 0.00
77,415 CNP Assurances Morgan Stanley 822 0.00
37,846 CNX Resources Corp Morgan Stanley 13,542 0.00
(1,990) Coca-Cola Amatil Ltd Morgan Stanley 2 0.00
(6,400) Coca-Cola Bottlers Japan Holdings Inc Morgan Stanley 731 0.00
2,212 Coca-Cola Co Morgan Stanley 0 0.00
24,612 Coca-Cola European Partners Plc Morgan Stanley 11,346 0.00
6,907 Coca-Cola HBC AG Morgan Stanley 2,516 0.00
2,600 cocokara fine Inc Morgan Stanley 2,489 0.00
195 Codan Ltd Morgan Stanley 73 0.00
21,625 Coface SA Morgan Stanley 9,783 0.00
18,048 Cofinimmo SA Morgan Stanley 2,782 0.00
400 Cogeco Communications Inc Morgan Stanley 173 0.00
1,000 Cogeco Inc Morgan Stanley 1,472 0.00
6,121 Cognizant Technology Solutions Corp Morgan Stanley 632 0.00
(300) Coherent Inc Morgan Stanley 126 0.00
2,200 Colfax Corp Morgan Stanley 2,283 0.00
1,721 Colgate-Palmolive Co Morgan Stanley 0 0.00
5,529 Collins Foods Ltd Morgan Stanley 101 0.00
7,200 Columbia Property Trust Inc Morgan Stanley 3,381 0.00
3,900 Columbus McKinnon Corp Morgan Stanley 332 0.00
15,989 comdirect bank AG Morgan Stanley 8,942 0.00
10,479 Comerica Inc Morgan Stanley 679 0.00
(500) Comfort Systems USA Inc Morgan Stanley 154 0.00

FINANCIAL STATEMENTS SCHEDULE OF INVESTMENTS
640 NEUBERGER BERMAN INVESTMENT FUNDS PLC
Neuberger Berman Uncorrelated Strategies Fund (Continued)
Schedule of Investments (Continued) Financial Assets at Fair Value through Profit or Loss (continued) Contracts for Differences 0.53% (31 December 2018: 85.09%) (continued)
Units Security Description Counterparty Unrealised Gain US$
% of NetAssets
(62,975) Commerzbank AG Morgan Stanley 0 0.00
7,600 CommScope Holding Co Inc Morgan Stanley 1,719 0.00
15,965 Compass Group Plc Morgan Stanley 0 0.00
8,804 Computacenter Plc Morgan Stanley 2,238 0.00
(3,108) Computershare Ltd Morgan Stanley 608 0.00
(10,300) COMSYS Holdings Corp Morgan Stanley 2,449 0.00
(80,600) Concordia Financial Group Ltd Morgan Stanley 5,664 0.00
2,000 ConnectOne Bancorp Inc Morgan Stanley 155 0.00
1,488 Constellation Brands Inc Morgan Stanley 0 0.00
300 Constellation Software Inc Morgan Stanley 4,656 0.00
(8,600) Continental Building Products Inc Morgan Stanley 377 0.00
7,600 Continental Gold Inc Morgan Stanley 192 0.00
6,542 Continental Resources Inc Morgan Stanley 1,521 0.00
566,597 ConvaTec Group Plc Morgan Stanley 0 0.00
(41,128) Cooper Energy Ltd Morgan Stanley 111 0.00
(7,000) Cooper Tire & Rubber Co Morgan Stanley 4,182 0.00
(22,567) Corbion NV Morgan Stanley 122 0.00
1,800 Cornerstone OnDemand Inc Morgan Stanley 323 0.00
14,700 Corning Inc Morgan Stanley 6,219 0.00
4,100 Corporate Office Properties Trust Morgan Stanley 3,732 0.00
(300) Cosmos Pharmaceutical Corp Morgan Stanley 538 0.00
10,994 Costa Group Holdings Ltd Morgan Stanley 551 0.00
2,369 Costco Wholesale Corp Morgan Stanley 117 0.00
(400) Coupa Software Inc Morgan Stanley 1,320 0.00
(61,562) Covestro AG Morgan Stanley 0 0.00
6,383 Covivio Morgan Stanley 0 0.00
23,598 Cranswick Plc Morgan Stanley 0 0.00
5,200 Create SD Holdings Co Ltd Morgan Stanley 4,474 0.00
(700) Credit Acceptance Corp Morgan Stanley 1,204 0.00
(86,158) Credit Agricole SA Morgan Stanley 0 0.00
(3,622) Credit Corp Group Ltd Morgan Stanley 1,026 0.00
(178,741) Credit Suisse Group AG Morgan Stanley 2,067 0.00
3,000 Cree Inc Morgan Stanley 1,323 0.00
(1,300) Crescent Point Energy Corp Morgan Stanley 23 0.00
(70,625) Crest Nicholson Holdings Plc Morgan Stanley 0 0.00
16,800 Crestwood Equity Partners LP Morgan Stanley 8,598 0.00
200,720 CRH Plc Goldman Sachs International 0 0.00
(30,074) CRH Plc Morgan Stanley 1,162 0.00
35,303 Croda International Plc Goldman Sachs International 0 0.00
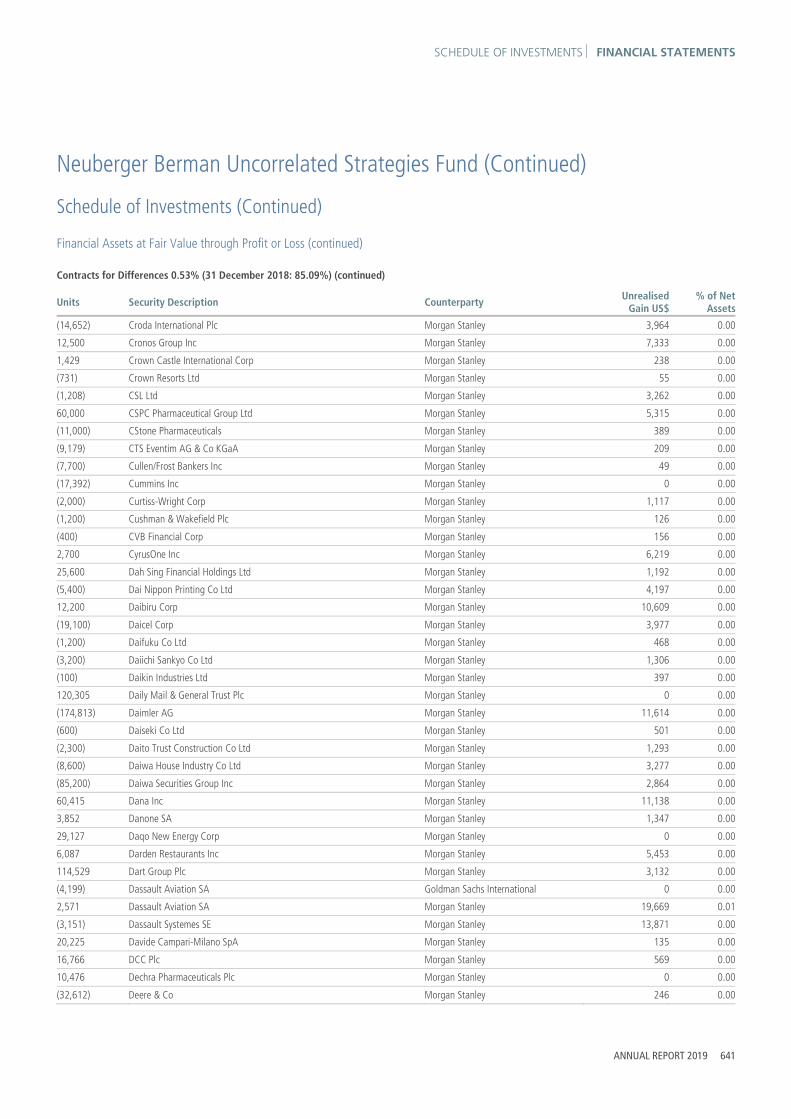
SCHEDULE OF INVESTMENTS FINANCIAL STATEMENTS
ANNUAL REPORT 2019 641
Neuberger Berman Uncorrelated Strategies Fund (Continued)
Schedule of Investments (Continued) Financial Assets at Fair Value through Profit or Loss (continued) Contracts for Differences 0.53% (31 December 2018: 85.09%) (continued)
Units Security Description Counterparty Unrealised Gain US$
% of NetAssets
(14,652) Croda International Plc Morgan Stanley 3,964 0.00
12,500 Cronos Group Inc Morgan Stanley 7,333 0.00
1,429 Crown Castle International Corp Morgan Stanley 238 0.00
(731) Crown Resorts Ltd Morgan Stanley 55 0.00
(1,208) CSL Ltd Morgan Stanley 3,262 0.00
60,000 CSPC Pharmaceutical Group Ltd Morgan Stanley 5,315 0.00
(11,000) CStone Pharmaceuticals Morgan Stanley 389 0.00
(9,179) CTS Eventim AG & Co KGaA Morgan Stanley 209 0.00
(7,700) Cullen/Frost Bankers Inc Morgan Stanley 49 0.00
(17,392) Cummins Inc Morgan Stanley 0 0.00
(2,000) Curtiss-Wright Corp Morgan Stanley 1,117 0.00
(1,200) Cushman & Wakefield Plc Morgan Stanley 126 0.00
(400) CVB Financial Corp Morgan Stanley 156 0.00
2,700 CyrusOne Inc Morgan Stanley 6,219 0.00
25,600 Dah Sing Financial Holdings Ltd Morgan Stanley 1,192 0.00
(5,400) Dai Nippon Printing Co Ltd Morgan Stanley 4,197 0.00
12,200 Daibiru Corp Morgan Stanley 10,609 0.00
(19,100) Daicel Corp Morgan Stanley 3,977 0.00
(1,200) Daifuku Co Ltd Morgan Stanley 468 0.00
(3,200) Daiichi Sankyo Co Ltd Morgan Stanley 1,306 0.00
(100) Daikin Industries Ltd Morgan Stanley 397 0.00
120,305 Daily Mail & General Trust Plc Morgan Stanley 0 0.00
(174,813) Daimler AG Morgan Stanley 11,614 0.00
(600) Daiseki Co Ltd Morgan Stanley 501 0.00
(2,300) Daito Trust Construction Co Ltd Morgan Stanley 1,293 0.00
(8,600) Daiwa House Industry Co Ltd Morgan Stanley 3,277 0.00
(85,200) Daiwa Securities Group Inc Morgan Stanley 2,864 0.00
60,415 Dana Inc Morgan Stanley 11,138 0.00
3,852 Danone SA Morgan Stanley 1,347 0.00
29,127 Daqo New Energy Corp Morgan Stanley 0 0.00
6,087 Darden Restaurants Inc Morgan Stanley 5,453 0.00
114,529 Dart Group Plc Morgan Stanley 3,132 0.00
(4,199) Dassault Aviation SA Goldman Sachs International 0 0.00
2,571 Dassault Aviation SA Morgan Stanley 19,669 0.01
(3,151) Dassault Systemes SE Morgan Stanley 13,871 0.00
20,225 Davide Campari-Milano SpA Morgan Stanley 135 0.00
16,766 DCC Plc Morgan Stanley 569 0.00
10,476 Dechra Pharmaceuticals Plc Morgan Stanley 0 0.00
(32,612) Deere & Co Morgan Stanley 246 0.00

FINANCIAL STATEMENTS SCHEDULE OF INVESTMENTS
642 NEUBERGER BERMAN INVESTMENT FUNDS PLC
Neuberger Berman Uncorrelated Strategies Fund (Continued)
Schedule of Investments (Continued) Financial Assets at Fair Value through Profit or Loss (continued) Contracts for Differences 0.53% (31 December 2018: 85.09%) (continued)
Units Security Description Counterparty Unrealised Gain US$
% of NetAssets
7,700 Dell Technologies Inc Morgan Stanley 13,413 0.00
(11,500) Delphi Technologies Plc Morgan Stanley 2,858 0.00
(18,860) Delta Air Lines Inc Morgan Stanley 3,386 0.00
(8,500) DeNA Co Ltd Morgan Stanley 1,006 0.00
(1,600) Denka Co Ltd Morgan Stanley 1,275 0.00
(600) Denny's Corp Morgan Stanley 19 0.00
(9,141) Derwent London Plc Morgan Stanley 580 0.00
152 Descente Ltd Morgan Stanley 485 0.00
15,300 Designer Brands Inc Morgan Stanley 9,680 0.00
2,300 Detour Gold Corp Morgan Stanley 473 0.00
7,968 Deutsche Boerse AG Morgan Stanley 4,515 0.00
24,081 Deutsche EuroShop AG Morgan Stanley 6,952 0.00
10,062 Deutsche Pfandbriefbank AG Morgan Stanley 3,109 0.00
(14,257) Deutsche Post AG Morgan Stanley 0 0.00
(78,169) Deutsche Telekom AG Morgan Stanley 0 0.00
(42,012) Deutsche Wohnen SE Morgan Stanley 52 0.00
2,122 Dfds A/S Morgan Stanley 1,006 0.00
42,900 DHT Holdings Inc Morgan Stanley 34,234 0.01
2,964 Diageo Plc Morgan Stanley 8,809 0.00
52,700 Diamond Offshore Drilling Inc Morgan Stanley 54,158 0.01
4,364 DiaSorin SpA Morgan Stanley 279 0.00
(1,700) DIC Corp Morgan Stanley 870 0.00
7,579 Dicker Data Ltd Morgan Stanley 3,941 0.00
21,120 D'ieteren SA Morgan Stanley 0 0.00
3,100 Digital Realty Trust Inc Morgan Stanley 7,536 0.00
1,300 Dillard's Inc Morgan Stanley 4,843 0.00
4,400 Dip Corp Morgan Stanley 1,334 0.00
(29,563) Diploma Plc Morgan Stanley 795 0.00
26,823 Direct Line Insurance Group Plc Morgan Stanley 428 0.00
700 Disco Corp Morgan Stanley 378 0.00
(1,352) Discover Financial Services Morgan Stanley 0 0.00
(8,726) Discovery Inc Morgan Stanley 0 0.00
(4,247) DKSH Holding AG Morgan Stanley 427 0.00
2,212 DNA Oyj Morgan Stanley 404 0.00
122,347 DNB ASA Morgan Stanley 56,667 0.01
887,636 Dno Asa Morgan Stanley 920 0.00
2,000 Dolby Laboratories Inc Morgan Stanley 842 0.00
(953) Dollar General Corp Morgan Stanley 0 0.00
(4,730) Dollar Tree Inc Morgan Stanley 0 0.00

SCHEDULE OF INVESTMENTS FINANCIAL STATEMENTS
ANNUAL REPORT 2019 643
Neuberger Berman Uncorrelated Strategies Fund (Continued)
Schedule of Investments (Continued) Financial Assets at Fair Value through Profit or Loss (continued) Contracts for Differences 0.53% (31 December 2018: 85.09%) (continued)
Units Security Description Counterparty Unrealised Gain US$
% of NetAssets
18,799 Domain Holdings Australia Ltd Morgan Stanley 25 0.00
(98,578) Dometic Group AB Morgan Stanley 0 0.00
7,092 Dominion Energy Inc Morgan Stanley 6,362 0.00
(298,218) Domino's Pizza Group Plc Morgan Stanley 25 0.00
1,352 Domino's Pizza Inc Morgan Stanley 0 0.00
(150,726) Domtar Corp Morgan Stanley 93 0.00
2,559 Dover Corp Morgan Stanley 0 0.00
51,267 Dow Inc Morgan Stanley 0 0.00
(2,500) Dowa Holdings Co Ltd Morgan Stanley 2,419 0.00
(4,392) DR Horton Inc Morgan Stanley 985 0.00
3,700 Dril-Quip Inc Morgan Stanley 457 0.00
(544,627) DS Smith Plc Goldman Sachs International 0 0.00
(364,089) DS Smith Plc Morgan Stanley 12 0.00
1,673 Dsv Panalpina A/S Morgan Stanley 38 0.00
(298,592) Duerr AG Morgan Stanley 0 0.00
(3,071) Dufry AG Morgan Stanley 0 0.00
133,283 Dunelm Group Plc Morgan Stanley 87 0.00
15,599 Dunkin' Brands Group Inc Morgan Stanley 4,420 0.00
11,329 DuPont de Nemours Inc Morgan Stanley 122 0.00
(600) Duskin Co Ltd Morgan Stanley 73 0.00
1,529 DWS Group GmbH & Co KGaA Morgan Stanley 636 0.00
(2,581) DXC Technology Co Morgan Stanley 0 0.00
2,400 Dycom Industries Inc Morgan Stanley 147 0.00
98,527 E.ON SE Morgan Stanley 0 0.00
5,200 Eagle Materials Inc Morgan Stanley 438 0.00
412,206 easyJet Plc Goldman Sachs International 0 0.00
79,628 easyJet Plc Morgan Stanley 0 0.00
994 Eaton Corp Plc Morgan Stanley 767 0.00
5,162 eBay Inc Morgan Stanley 0 0.00
(5,100) EchoStar Corp Morgan Stanley 3,688 0.00
(615) Ecolab Inc Morgan Stanley 0 0.00
25,966 Edenred Morgan Stanley 16,906 0.00
(31,505) EI Group Plc Morgan Stanley 698 0.00
9,833 Eiffage SA Morgan Stanley 0 0.00
(7,000) Eisai Co Ltd Morgan Stanley 4,584 0.00
5,408 Elanco Animal Health Inc Morgan Stanley 0 0.00
500 Eldorado Gold Corp Morgan Stanley 177 0.00
(8,444) Eldorado Resorts Inc Morgan Stanley 0 0.00
112,064 Electricite de France SA Morgan Stanley 6,004 0.00

FINANCIAL STATEMENTS SCHEDULE OF INVESTMENTS
644 NEUBERGER BERMAN INVESTMENT FUNDS PLC
Neuberger Berman Uncorrelated Strategies Fund (Continued)
Schedule of Investments (Continued) Financial Assets at Fair Value through Profit or Loss (continued) Contracts for Differences 0.53% (31 December 2018: 85.09%) (continued)
Units Security Description Counterparty Unrealised Gain US$
% of NetAssets
(8,235) Electrocomponents Plc Morgan Stanley 0 0.00
41,596 Electrolux AB Morgan Stanley 0 0.00
2,212 Electronic Arts Inc Morgan Stanley 0 0.00
(15,220) Elekta AB Morgan Stanley 0 0.00
33,200 Element Fleet Management Corp Morgan Stanley 3,884 0.00
11,900 Element Solutions Inc Morgan Stanley 2,190 0.00
106,630 Elementis Plc Morgan Stanley 0 0.00
6,000 elf Beauty Inc Morgan Stanley 2,257 0.00
4,671 Eli Lilly & Co Morgan Stanley 0 0.00
3,763 Elia System Operator SA Morgan Stanley 5,119 0.00
5,381 Elior Group SA Morgan Stanley 730 0.00
(46,052) Elis SA Morgan Stanley 91 0.00
1,500 Emera Inc Morgan Stanley 1,028 0.00
(6,145) Emerson Electric Co Morgan Stanley 0 0.00
11,834 EML Payments Ltd Morgan Stanley 1,536 0.00
38 Emmi AG Morgan Stanley 747 0.00
44,800 Empire State Realty Trust Inc Morgan Stanley 7,950 0.00
2,090 EMS-Chemie Holding AG Morgan Stanley 0 0.00
(2,100) Enable Midstream Partners LP Morgan Stanley 434 0.00
33,274 Enagas SA Morgan Stanley 7,213 0.00
11,900 Enbridge Inc Morgan Stanley 11,428 0.00
(10,910) Encavis AG Morgan Stanley 2,506 0.00
(2,800) Encore Capital Group Inc Morgan Stanley 3,646 0.00
(606) Endesa SA Morgan Stanley 893 0.00
(21,919) Energy Transfer LP Morgan Stanley 1,464 0.00
19,800 Enerplus Corp Morgan Stanley 8,612 0.00
(3,900) EnerSys Morgan Stanley 2,175 0.00
2,400 Enova International Inc Morgan Stanley 1,968 0.00
3,800 EnPro Industries Inc Morgan Stanley 532 0.00
100 Ensign Group Inc Morgan Stanley 218 0.00
1,500 Entergy Corp Morgan Stanley 835 0.00
(123) Entergy Corp Morgan Stanley 0 0.00
16,771 Enterprise Products Partners LP Morgan Stanley 0 0.00
(942,717) Epiroc AB Morgan Stanley 0 0.00
(133,422) Epiroc AB Morgan Stanley 0 0.00
2,200 ePlus Inc Morgan Stanley 1,934 0.00
11,307 EQT Corp Morgan Stanley 0 0.00
(3,072) Equifax Inc Morgan Stanley 0 0.00
21,062 Equinor ASA Morgan Stanley 13,688 0.00

SCHEDULE OF INVESTMENTS FINANCIAL STATEMENTS
ANNUAL REPORT 2019 645
Neuberger Berman Uncorrelated Strategies Fund (Continued)
Schedule of Investments (Continued) Financial Assets at Fair Value through Profit or Loss (continued) Contracts for Differences 0.53% (31 December 2018: 85.09%) (continued)
Units Security Description Counterparty Unrealised Gain US$
% of NetAssets
8,300 Equinox Gold Corp Morgan Stanley 11,370 0.00
(200) Equitable Group Inc Morgan Stanley 49 0.00
19,596 Equity Residential Morgan Stanley 137 0.00
10,514 Eramet Morgan Stanley 0 0.00
3,000 ERO Copper Corp Morgan Stanley 7,026 0.00
26,946 Erste Group Bank AG Morgan Stanley 0 0.00
(42,968) Essentra Plc Morgan Stanley 0 0.00
1,400 Essex Property Trust Inc Morgan Stanley 1,579 0.00
(16,989) EssilorLuxottica SA Morgan Stanley 30,025 0.01
19,051 Essity AB Morgan Stanley 0 0.00
19,174 Eurazeo SE Morgan Stanley 0 0.00
(4,000) Eurazeo SE Morgan Stanley 984 0.00
5,162 Eurocommercial Properties NV Morgan Stanley 0 0.00
122,905 Euronav NV Morgan Stanley 0 0.00
5,571 Euronext NV Morgan Stanley 1,919 0.00
1,800 Evergy Inc Morgan Stanley 1,877 0.00
11,300 Evo Payments Inc Morgan Stanley 4,047 0.00
52,694 Evolution Gaming Group AB Morgan Stanley 0 0.00
7,851 Evolution Mining Ltd Morgan Stanley 1,497 0.00
(81,982) Evonik Industries AG Morgan Stanley 6,880 0.00
354,594 Evraz Plc Morgan Stanley 0 0.00
60 Exact Sciences Corp Morgan Stanley 66 0.00
900 Exchange Income Corp Morgan Stanley 182 0.00
15,732 Exor Nv Morgan Stanley 699 0.00
6,942 Expeditors International of Washington Inc Morgan Stanley 0 0.00
(1,100) Extendicare Inc Morgan Stanley 34 0.00
5,200 Extra Space Storage Inc Morgan Stanley 7,532 0.00
10,306 F5 Networks Inc Morgan Stanley 308 0.00
246 Facebook Inc Morgan Stanley 0 0.00
(1,100) FactSet Research Systems Inc Morgan Stanley 2,278 0.00
15,200 Fancl Corp Morgan Stanley 11,517 0.00
(130,000) Far East Horizon Ltd Morgan Stanley 1,951 0.00
(62,929) Farfetch Ltd Morgan Stanley 0 0.00
(100) FARO Technologies Inc Morgan Stanley 39 0.00
(2,089) Fastenal Co Morgan Stanley 0 0.00
(7,620) Faurecia SE Morgan Stanley 0 0.00
8,900 Federal Signal Corp Morgan Stanley 2,631 0.00
(900) Federated Investors Inc Morgan Stanley 678 0.00
(2,553) FedEx Corp Morgan Stanley 958 0.00

FINANCIAL STATEMENTS SCHEDULE OF INVESTMENTS
646 NEUBERGER BERMAN INVESTMENT FUNDS PLC
Neuberger Berman Uncorrelated Strategies Fund (Continued)
Schedule of Investments (Continued) Financial Assets at Fair Value through Profit or Loss (continued) Contracts for Differences 0.53% (31 December 2018: 85.09%) (continued)
Units Security Description Counterparty Unrealised Gain US$
% of NetAssets
66,186 Ferguson Plc Goldman Sachs International 0 0.00
(4,917) Ferguson Plc Morgan Stanley 0 0.00
(246) Ferrari NV Morgan Stanley 0 0.00
68,742 Ferrexpo Plc Morgan Stanley 0 0.00
(48,140) Ferrovial SA Morgan Stanley 493 0.00
58,320 Fevertree Drinks Plc Morgan Stanley 3,347 0.00
671,694 Fiat Chrysler Automobiles NV Goldman Sachs International 37,085 0.01
291,033 Fiat Chrysler Automobiles NV Morgan Stanley 2,514 0.00
1,352 Fidelity National Information Services Inc Morgan Stanley 0 0.00
6,883 Fielmann AG Morgan Stanley 0 0.00
(3,441) Fifth Third Bancorp Morgan Stanley 0 0.00
1,581,000 FIH Mobile Ltd Morgan Stanley 12,297 0.00
2,700 Finning International Inc Morgan Stanley 1,585 0.00
(2,800) FireEye Inc Morgan Stanley 251 0.00
8,700 First Capital Real Estate Investment Trust Morgan Stanley 935 0.00
(14,700) First Financial Bancorp Morgan Stanley 2,769 0.00
(500) First Hawaiian Inc Morgan Stanley 64 0.00
(11,700) First Horizon National Corp Morgan Stanley 277 0.00
11,300 First Majestic Silver Corp Morgan Stanley 13,491 0.00
2,700 First Merchants Corp Morgan Stanley 121 0.00
(19,800) First Midwest Bancorp Inc Morgan Stanley 1,531 0.00
(1,686,000) First Pacific Co Ltd Morgan Stanley 6,250 0.00
4,600 First Quantum Minerals Ltd Morgan Stanley 733 0.00
(8,112) First Solar Inc Morgan Stanley 0 0.00
(4,793) FirstEnergy Corp Morgan Stanley 0 0.00
844 Fiserv Inc Morgan Stanley 849 0.00
1,306 Fisher & Paykel Healthcare Corp Ltd Morgan Stanley 559 0.00
(68,000) FIT Hon Teng Ltd Morgan Stanley 449 0.00
3,073 Five Below Inc Morgan Stanley 0 0.00
(300) Five9 Inc Morgan Stanley 303 0.00
300 Flex Ltd Morgan Stanley 54 0.00
(8,656) FlexiGroup Ltd Morgan Stanley 585 0.00
937 Flight Centre Travel Group Ltd Morgan Stanley 88 0.00
2,600 FLIR Systems Inc Morgan Stanley 71 0.00
24,103 Flow Traders Morgan Stanley 0 0.00
2,000 Flowers Foods Inc Morgan Stanley 91 0.00
(18,570) Flowserve Corp Morgan Stanley 3,414 0.00
209,145 FLSmidth & Co A/S Morgan Stanley 8,356 0.00
2,813 Flughafen Zurich AG Morgan Stanley 1,526 0.00

SCHEDULE OF INVESTMENTS FINANCIAL STATEMENTS
ANNUAL REPORT 2019 647
Neuberger Berman Uncorrelated Strategies Fund (Continued)
Schedule of Investments (Continued) Financial Assets at Fair Value through Profit or Loss (continued) Contracts for Differences 0.53% (31 December 2018: 85.09%) (continued)
Units Security Description Counterparty Unrealised Gain US$
% of NetAssets
(1,135) Flutter Entertainment Plc Morgan Stanley 10,026 0.00
1,793 Fnac Darty SA Morgan Stanley 1,999 0.00
5,300 FNB Corp Morgan Stanley 290 0.00
10,469 Foot Locker Inc Morgan Stanley 2,214 0.00
824 Forbo Holding AG Morgan Stanley 972 0.00
(278,281) Ford Motor Co Morgan Stanley 3,155 0.00
17,480 Fortescue Metals Group Ltd Morgan Stanley 647 0.00
(2,600) Fortinet Inc Morgan Stanley 2,375 0.00
15,720 Fortum Oyj Morgan Stanley 9,104 0.00
72,000 Fortune Real Estate Investment Trust Morgan Stanley 1,481 0.00
2,600 Forward Air Corp Morgan Stanley 3,051 0.00
238,500 Fosun International Ltd Morgan Stanley 12,884 0.00
1,400 Franklin Electric Co Inc Morgan Stanley 1,928 0.00
7,989 Fraport AG Frankfurt Airport Services Worldwide Morgan Stanley 0 0.00
(89,916) Frasers Group Plc Morgan Stanley 0 0.00
(3,318) Freenet AG Morgan Stanley 0 0.00
(40,585) Freeport-McMoRan Inc Morgan Stanley 0 0.00
24,936 Fresenius Medical Care AG & Co KGaA Morgan Stanley 0 0.00
(8,275) Fresenius SE & Co KGaA Morgan Stanley 3,202 0.00
186,000 Frontage Holdings Corp Morgan Stanley 135 0.00
39,667 Fuchs Petrolub Se Morgan Stanley 0 0.00
(6,200) Fuji Oil Holdings Inc Morgan Stanley 2,803 0.00
(1,200) Fuji Seal International Inc Morgan Stanley 825 0.00
5,700 Fuji Soft Inc Morgan Stanley 2,415 0.00
(3,600) Fujikura Ltd Morgan Stanley 575 0.00
126,382 Future Plc Morgan Stanley 0 0.00
(59,200) Fuyao Glass Industry Group Co Ltd Morgan Stanley 684 0.00
51,029 G4S Plc Morgan Stanley 3,819 0.00
2,177 G8 Education Ltd Morgan Stanley 53 0.00
6,760 Galenica AG Morgan Stanley 0 0.00
59,794 Galliford Try Plc Morgan Stanley 0 0.00
(90,583) Galp Energia SGPS SA Morgan Stanley 0 0.00
148,589 GAM Holding AG Morgan Stanley 0 0.00
70 Gannett Co Inc Morgan Stanley 23 0.00
28,424 Gap Inc Morgan Stanley 3,205 0.00
196,805 Gardner Denver Holdings Inc Morgan Stanley 0 0.00
5,008 Garmin Ltd Morgan Stanley 84 0.00
16,300 GasLog Ltd Morgan Stanley 815 0.00
12,500 GCI Liberty Inc Morgan Stanley 21,536 0.01

FINANCIAL STATEMENTS SCHEDULE OF INVESTMENTS
648 NEUBERGER BERMAN INVESTMENT FUNDS PLC
Neuberger Berman Uncorrelated Strategies Fund (Continued)
Schedule of Investments (Continued) Financial Assets at Fair Value through Profit or Loss (continued) Contracts for Differences 0.53% (31 December 2018: 85.09%) (continued)
Units Security Description Counterparty Unrealised Gain US$
% of NetAssets
(5,639,000) GCL-Poly Energy Holdings Ltd Morgan Stanley 3,528 0.00
(47,024) GEA Group AG Morgan Stanley 0 0.00
(2,461) Geberit AG Morgan Stanley 3 0.00
2,886 Gecina SA Morgan Stanley 15,059 0.00
484,000 Gemdale Properties & Investment Corp Ltd Morgan Stanley 4,373 0.00
(1,600) Generac Holdings Inc Morgan Stanley 1,348 0.00
(16,974) General Dynamics Corp Morgan Stanley 0 0.00
4,548 General Electric Co Morgan Stanley 0 0.00
9,212 General Mills Inc Morgan Stanley 2,396 0.00
71,017 General Motors Co Morgan Stanley 1,811 0.00
60,500 Genertec Universal Medical Group Co Ltd Morgan Stanley 1,789 0.00
(172,000) Genscript Biotech Corp Morgan Stanley 23,864 0.01
(3,500) Gentherm Inc Morgan Stanley 1,456 0.00
615 Genuine Parts Co Morgan Stanley 0 0.00
(14,964) Genus Plc Morgan Stanley 5,025 0.00
(1,200) Genworth MI Canada Inc Morgan Stanley 536 0.00
25,416 Genworth Mortgage Insurance Australia Ltd Morgan Stanley 16 0.00
(4,100) GEO Group Inc Morgan Stanley 333 0.00
254 Georg Fischer AG Morgan Stanley 0 0.00
10,778 Gerresheimer AG Morgan Stanley 1,519 0.00
60,072 Gestamp Automocion SA Morgan Stanley 3,992 0.00
32,439 Getinge AB Morgan Stanley 0 0.00
(103,635) Getlink SE Morgan Stanley 2,529 0.00
78,400 GF Securities Co Ltd Morgan Stanley 3,488 0.00
1,484 Gimv NV Morgan Stanley 712 0.00
338 Givaudan SA Morgan Stanley 145 0.00
959 Gjensidige Forsikring ASA Morgan Stanley 523 0.00
161,604 Glanbia Plc Morgan Stanley 0 0.00
(20,872) Glencore Plc Morgan Stanley 0 0.00
(1,340) Global Payments Inc Morgan Stanley 190 0.00
(13,900) Globe Life Inc Morgan Stanley 11,400 0.00
(2,800) Globus Medical Inc Morgan Stanley 56 0.00
1,300 GMO Payment Gateway Inc Morgan Stanley 3,108 0.00
20,947 GN Store Nord A/S Morgan Stanley 236 0.00
44,260 Go-Ahead Group Plc Morgan Stanley 0 0.00
11,051 GoDaddy Inc Morgan Stanley 835 0.00
102,015 Gold Road Resources Ltd Morgan Stanley 19,057 0.00
(2,000) Goldin Financial Holdings Ltd Morgan Stanley 33 0.00
(1,500) Goldman Sachs Group Inc Morgan Stanley 1,272 0.00

SCHEDULE OF INVESTMENTS FINANCIAL STATEMENTS
ANNUAL REPORT 2019 649
Neuberger Berman Uncorrelated Strategies Fund (Continued)
Schedule of Investments (Continued) Financial Assets at Fair Value through Profit or Loss (continued) Contracts for Differences 0.53% (31 December 2018: 85.09%) (continued)
Units Security Description Counterparty Unrealised Gain US$
% of NetAssets
(700) Goldwin Inc Morgan Stanley 300 0.00
4,344,000 GOME Retail Holdings Ltd Morgan Stanley 5,740 0.00
60,123 Goodyear Tire & Rubber Co Morgan Stanley 3,452 0.00
(21,200) GPT Group Morgan Stanley 1,655 0.00
25,591 Grafton Group Plc Morgan Stanley 0 0.00
32,734 Grainger Plc Morgan Stanley 2,158 0.00
(1,500) Grand Canyon Education Inc Morgan Stanley 1,141 0.00
8,188 GrandVision NV Morgan Stanley 2,147 0.00
(2,500) Granite Construction Inc Morgan Stanley 127 0.00
(15,900) Graphic Packaging Holding Co Morgan Stanley 892 0.00
(186,000) Great Wall Motor Co Ltd Morgan Stanley 1,126 0.00
7,700 Great-West Lifeco Inc Morgan Stanley 398 0.00
(18,500) Gree Inc Morgan Stanley 1,308 0.00
(203,551) Greencore Group Plc Morgan Stanley 0 0.00
53,759 Greggs Plc Morgan Stanley 2,122 0.00
(4,200) Greif Inc Morgan Stanley 2,099 0.00
1,106 Groupe Bruxelles Lambert SA Morgan Stanley 0 0.00
(203,042) Groupon Inc Morgan Stanley 0 0.00
(52,000) Guangdong Investment Ltd Morgan Stanley 900 0.00
(1,800) Guardant Health Inc Morgan Stanley 321 0.00
4,200 Guidewire Software Inc Morgan Stanley 11,815 0.00
(39,500) Gunma Bank Ltd Morgan Stanley 923 0.00
(54,293) GVC Holdings Plc Morgan Stanley 0 0.00
6,700 H&E Equipment Services Inc Morgan Stanley 1,849 0.00
900 Hachijuni Bank Ltd Morgan Stanley 5 0.00
84,000 Haier Electronics Group Co Ltd Morgan Stanley 27,050 0.01
26,000 Haitong International Securities Group Ltd Morgan Stanley 1 0.00
(2,000) Hamilton Lane Inc Morgan Stanley 2,505 0.00
29,689 Hammerson Plc Morgan Stanley 2,608 0.00
67,075 Hanesbrands Inc Morgan Stanley 2,555 0.00
41,000 Hang Lung Properties Ltd Morgan Stanley 2,765 0.00
(13,300) Hang Seng Bank Ltd Morgan Stanley 898 0.00
(5,300) Hankyu Hanshin Holdings Inc Morgan Stanley 2,548 0.00
6,391 Hannover Rueck SE Morgan Stanley 1,108 0.00
(3,600) Hanover Insurance Group Inc Morgan Stanley 899 0.00
15,350 Hansen Technologies Ltd Morgan Stanley 2,475 0.00
24,000 Hansoh Pharmaceutical Group Co Ltd Morgan Stanley 5,795 0.00
(200) Hanwa Co Ltd Morgan Stanley 30 0.00
(37,575) Hargreaves Lansdown Plc Morgan Stanley 0 0.00

FINANCIAL STATEMENTS SCHEDULE OF INVESTMENTS
650 NEUBERGER BERMAN INVESTMENT FUNDS PLC
Neuberger Berman Uncorrelated Strategies Fund (Continued)
Schedule of Investments (Continued) Financial Assets at Fair Value through Profit or Loss (continued) Contracts for Differences 0.53% (31 December 2018: 85.09%) (continued)
Units Security Description Counterparty Unrealised Gain US$
% of NetAssets
9,710 Harley-Davidson Inc Morgan Stanley 0 0.00
(48,950) Harvey Norman Holdings Ltd Morgan Stanley 3,928 0.00
(246) Hasbro Inc Morgan Stanley 0 0.00
(12,500) Haseko Corp Morgan Stanley 305 0.00
(500) Hawaiian Holdings Inc Morgan Stanley 542 0.00
(11,676) Hays Plc Morgan Stanley 0 0.00
(1,300) HCA Healthcare Inc Morgan Stanley 1,236 0.00
6,100 HD Supply Holdings Inc Morgan Stanley 436 0.00
8,500 Health & Happiness H&H International Holdings Ltd Morgan Stanley 709 0.00
1,100 Health Catalyst Inc Morgan Stanley 942 0.00
22,087 Healthpeak Properties Inc Morgan Stanley 22,463 0.01
1,100 Heartland Financial USA Inc Morgan Stanley 173 0.00
(118,011) HeidelbergCement AG Morgan Stanley 35 0.00
200 Heiwa Corp Morgan Stanley 54 0.00
(130,244) Hella GmbH & Co KGaA Morgan Stanley 0 0.00
18,017 HelloFresh SE Morgan Stanley 2,540 0.00
7,500 Helmerich & Payne Inc Morgan Stanley 17,493 0.00
8,765 Helvetia Holding AG Morgan Stanley 0 0.00
(29,567) Henkel AG & Co KGaA Morgan Stanley 0 0.00
(40,969) Hennes & Mauritz AB Morgan Stanley 0 0.00
305,271 Hera SpA Morgan Stanley 1,653 0.00
4,500 Heritage Financial Corp Morgan Stanley 89 0.00
2,715 Hermes International Morgan Stanley 2,554 0.00
(275) Hershey Co Morgan Stanley 122 0.00
(2,059) Hess Corp Morgan Stanley 24,857 0.01
11,267 Hewlett Packard Enterprise Co Morgan Stanley 382 0.00
262,558 Hexagon AB Morgan Stanley 0 0.00
(20,054) Hexcel Corp Morgan Stanley 0 0.00
19,300 Hikma Pharmaceuticals Plc Morgan Stanley 545 0.00
(4,206) Hilton Worldwide Holdings Inc Morgan Stanley 3,677 0.00
(4,300) Hino Motors Ltd Morgan Stanley 334 0.00
300 Hirose Electric Co Ltd Morgan Stanley 223 0.00
(4,700) HIS Co Ltd Morgan Stanley 678 0.00
(600) Hisamitsu Pharmaceutical Co Inc Morgan Stanley 693 0.00
(123,877) Hiscox Ltd Morgan Stanley 1,847 0.00
(10,400) Hitachi Construction Machinery Co Ltd Morgan Stanley 1,867 0.00
5,200 Hitachi Ltd Morgan Stanley 14,282 0.00
5,100 Hitachi Transport System Ltd Morgan Stanley 3,408 0.00
(44,000) HKT Trust & HKT Ltd Morgan Stanley 1,363 0.00

SCHEDULE OF INVESTMENTS FINANCIAL STATEMENTS
ANNUAL REPORT 2019 651
Neuberger Berman Uncorrelated Strategies Fund (Continued)
Schedule of Investments (Continued) Financial Assets at Fair Value through Profit or Loss (continued) Contracts for Differences 0.53% (31 December 2018: 85.09%) (continued)
Units Security Description Counterparty Unrealised Gain US$
% of NetAssets
2,153 Hochtief Ag Morgan Stanley 10,765 0.00
14,400 Hokkaido Electric Power Co Inc Morgan Stanley 73 0.00
(8,700) Hokuriku Electric Power Co Morgan Stanley 1,263 0.00
7,787 HollyFrontier Corp Morgan Stanley 0 0.00
72,430 Holmen AB Morgan Stanley 0 0.00
(15,900) Home BancShares Inc Morgan Stanley 1,214 0.00
7,000 Home Capital Group Inc Morgan Stanley 2,340 0.00
80,120 HomeServe Plc Morgan Stanley 7 0.00
(1,700) Honda Motor Co Ltd Morgan Stanley 1,423 0.00
29,828 Honeywell International Inc Morgan Stanley 2,077 0.00
36,400 Hong Kong Exchanges & Clearing Ltd Morgan Stanley 3,175 0.00
452,000 Hope Education Group Co Ltd Morgan Stanley 33 0.00
8,000 Hopson Development Holdings Ltd Morgan Stanley 198 0.00
(1,000) Horiba Ltd Morgan Stanley 3,757 0.00
(600) Hoshizaki Corp Morgan Stanley 1,298 0.00
(500) Houlihan Lokey Inc Morgan Stanley 52 0.00
(72,586) Howden Joinery Group Plc Morgan Stanley 1,131 0.00
2,100 Hoya Corp Morgan Stanley 13,850 0.00
(66,000) Hua Hong Semiconductor Ltd Morgan Stanley 5,198 0.00
770,000 Huaneng Renewables Corp Ltd Morgan Stanley 1,113 0.00
6,665 HUB24 Ltd Morgan Stanley 3,319 0.00
2,500 Hubbell Inc Morgan Stanley 303 0.00
(47,073) Hufvudstaden AB Morgan Stanley 0 0.00
13,188 Hugo Boss Ag Morgan Stanley 6 0.00
12,277 Huhtamaki Oyj Morgan Stanley 3,385 0.00
47,216 Hunting Plc Morgan Stanley 0 0.00
(30,220) Huntington Bancshares Inc Morgan Stanley 5,003 0.00
(600) Huntington Ingalls Industries Inc Morgan Stanley 1,277 0.00
(53,342) Husqvarna AB Morgan Stanley 0 0.00
369 IAC/InterActiveCorp Morgan Stanley 0 0.00
8,206 ICA Gruppen AB Morgan Stanley 5,395 0.00
57,200 Ichigo Inc Morgan Stanley 795 0.00
100 ICU Medical Inc Morgan Stanley 14 0.00
6,400 IDACORP Inc Morgan Stanley 899 0.00
177,922 IG Group Holdings Plc Morgan Stanley 2,077 0.00
(142,000) IGG Inc Morgan Stanley 3,600 0.00
(3,000) IGM Financial Inc Morgan Stanley 1,327 0.00
(11,600) IHI Corp Morgan Stanley 4,794 0.00
(4,300) Iida Group Holdings Co Ltd Morgan Stanley 861 0.00
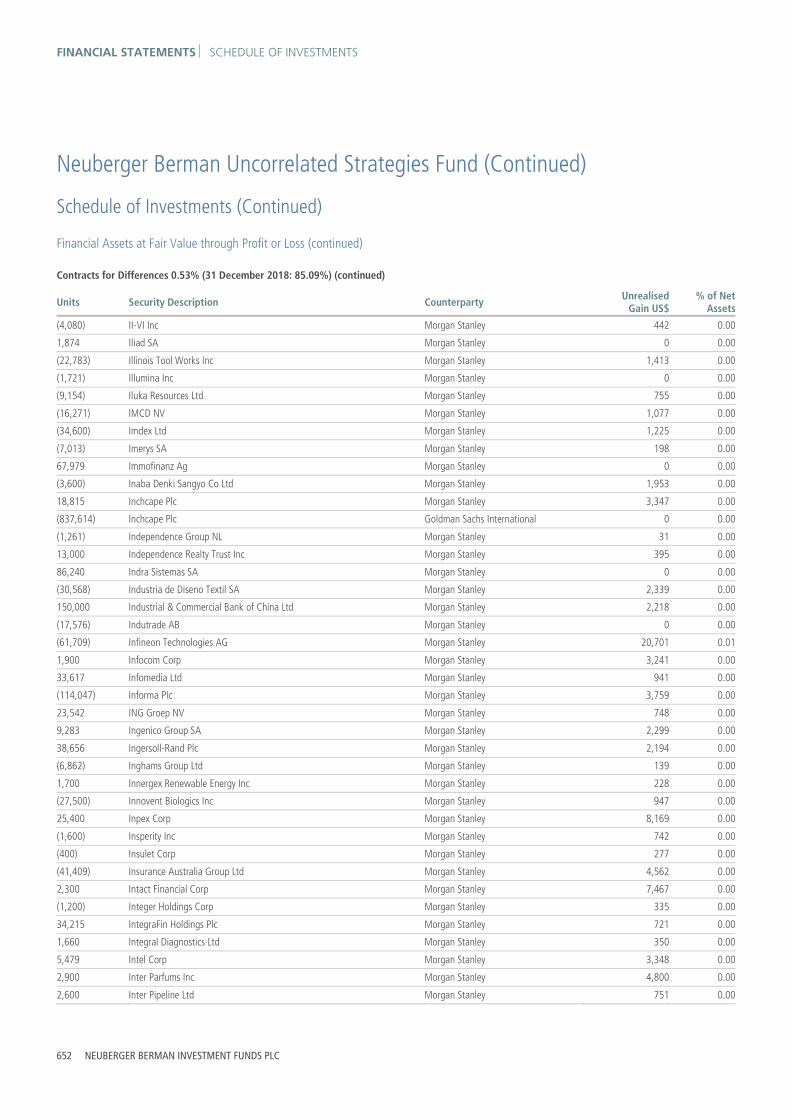
FINANCIAL STATEMENTS SCHEDULE OF INVESTMENTS
652 NEUBERGER BERMAN INVESTMENT FUNDS PLC
Neuberger Berman Uncorrelated Strategies Fund (Continued)
Schedule of Investments (Continued) Financial Assets at Fair Value through Profit or Loss (continued) Contracts for Differences 0.53% (31 December 2018: 85.09%) (continued)
Units Security Description Counterparty Unrealised Gain US$
% of NetAssets
(4,080) II-VI Inc Morgan Stanley 442 0.00
1,874 Iliad SA Morgan Stanley 0 0.00
(22,783) Illinois Tool Works Inc Morgan Stanley 1,413 0.00
(1,721) Illumina Inc Morgan Stanley 0 0.00
(9,154) Iluka Resources Ltd Morgan Stanley 755 0.00
(16,271) IMCD NV Morgan Stanley 1,077 0.00
(34,600) Imdex Ltd Morgan Stanley 1,225 0.00
(7,013) Imerys SA Morgan Stanley 198 0.00
67,979 Immofinanz Ag Morgan Stanley 0 0.00
(3,600) Inaba Denki Sangyo Co Ltd Morgan Stanley 1,953 0.00
18,815 Inchcape Plc Morgan Stanley 3,347 0.00
(837,614) Inchcape Plc Goldman Sachs International 0 0.00
(1,261) Independence Group NL Morgan Stanley 31 0.00
13,000 Independence Realty Trust Inc Morgan Stanley 395 0.00
86,240 Indra Sistemas SA Morgan Stanley 0 0.00
(30,568) Industria de Diseno Textil SA Morgan Stanley 2,339 0.00
150,000 Industrial & Commercial Bank of China Ltd Morgan Stanley 2,218 0.00
(17,576) Indutrade AB Morgan Stanley 0 0.00
(61,709) Infineon Technologies AG Morgan Stanley 20,701 0.01
1,900 Infocom Corp Morgan Stanley 3,241 0.00
33,617 Infomedia Ltd Morgan Stanley 941 0.00
(114,047) Informa Plc Morgan Stanley 3,759 0.00
23,542 ING Groep NV Morgan Stanley 748 0.00
9,283 Ingenico Group SA Morgan Stanley 2,299 0.00
38,656 Ingersoll-Rand Plc Morgan Stanley 2,194 0.00
(6,862) Inghams Group Ltd Morgan Stanley 139 0.00
1,700 Innergex Renewable Energy Inc Morgan Stanley 228 0.00
(27,500) Innovent Biologics Inc Morgan Stanley 947 0.00
25,400 Inpex Corp Morgan Stanley 8,169 0.00
(1,600) Insperity Inc Morgan Stanley 742 0.00
(400) Insulet Corp Morgan Stanley 277 0.00
(41,409) Insurance Australia Group Ltd Morgan Stanley 4,562 0.00
2,300 Intact Financial Corp Morgan Stanley 7,467 0.00
(1,200) Integer Holdings Corp Morgan Stanley 335 0.00
34,215 IntegraFin Holdings Plc Morgan Stanley 721 0.00
1,660 Integral Diagnostics Ltd Morgan Stanley 350 0.00
5,479 Intel Corp Morgan Stanley 3,348 0.00
2,900 Inter Parfums Inc Morgan Stanley 4,800 0.00
2,600 Inter Pipeline Ltd Morgan Stanley 751 0.00

SCHEDULE OF INVESTMENTS FINANCIAL STATEMENTS
ANNUAL REPORT 2019 653
Neuberger Berman Uncorrelated Strategies Fund (Continued)
Schedule of Investments (Continued) Financial Assets at Fair Value through Profit or Loss (continued) Contracts for Differences 0.53% (31 December 2018: 85.09%) (continued)
Units Security Description Counterparty Unrealised Gain US$
% of NetAssets
1,229 Interactive Brokers Group Inc Morgan Stanley 0 0.00
121 Intercontinental Exchange Inc Morgan Stanley 174 0.00
(12,832) InterContinental Hotels Group Plc Morgan Stanley 13,000 0.00
931 International Consolidated Airlines Group SA Goldman Sachs International 0 0.00
(146,183) International Consolidated Airlines Group SA Morgan Stanley 0 0.00
23,615 International Flavors & Fragrances Inc Morgan Stanley 0 0.00
(28,515) International Game Technology Plc Morgan Stanley 0 0.00
(129,509) International Paper Co Morgan Stanley 287 0.00
209 Interparfums SA Morgan Stanley 196 0.00
19,144 Interpublic Group of Cos Inc Morgan Stanley 0 0.00
3,000 Intertape Polymer Group Inc Morgan Stanley 2,036 0.00
(562) Intuitive Surgical Inc Morgan Stanley 222 0.00
38,470 Invesco Ltd Morgan Stanley 0 0.00
252,594 Investec Plc Morgan Stanley 12,664 0.00
(14,482) Investment AB Latour Morgan Stanley 0 0.00
(5,654) Investor AB Morgan Stanley 0 0.00
100 Invincible Investment Corp Morgan Stanley 861 0.00
(6,436) InvoCare Ltd Morgan Stanley 708 0.00
(4,286) IOOF Holdings Ltd Morgan Stanley 589 0.00
300 IPG Photonics Corp Morgan Stanley 45 0.00
4,499 IPH Ltd Morgan Stanley 188 0.00
46,249 IPSOS Morgan Stanley 2,234 0.00
(2,281) IQVIA Holdings Inc Morgan Stanley 0 0.00
167,277 Iren SpA Morgan Stanley 569 0.00
(3,754) IRESS Ltd Morgan Stanley 663 0.00
471 iRobot Corp Morgan Stanley 2,788 0.00
(2,400) Isetan Mitsukoshi Holdings Ltd Morgan Stanley 232 0.00
(109,060) Iss A/S Morgan Stanley 1,996 0.00
(20,800) Isuzu Motors Ltd Morgan Stanley 15,491 0.00
168,506 Italgas SpA Morgan Stanley 1,208 0.00
(7,600) ITOCHU Corp Morgan Stanley 89 0.00
(11,500) Itoham Yonekyu Holdings Inc Morgan Stanley 1,527 0.00
(1,900) Itron Inc Morgan Stanley 348 0.00
66,505 ITT Inc Morgan Stanley 0 0.00
169,047 ITV Plc Morgan Stanley 3,667 0.00
4,500 Ivanhoe Mines Ltd Morgan Stanley 914 0.00
(24,900) Iyo Bank Ltd Morgan Stanley 384 0.00
(3,200) J Front Retailing Co Ltd Morgan Stanley 1 0.00
(364,386) J Sainsbury Plc Morgan Stanley 1,701 0.00

FINANCIAL STATEMENTS SCHEDULE OF INVESTMENTS
654 NEUBERGER BERMAN INVESTMENT FUNDS PLC
Neuberger Berman Uncorrelated Strategies Fund (Continued)
Schedule of Investments (Continued) Financial Assets at Fair Value through Profit or Loss (continued) Contracts for Differences 0.53% (31 December 2018: 85.09%) (continued)
Units Security Description Counterparty Unrealised Gain US$
% of NetAssets
5,000 j2 Global Inc Morgan Stanley 117 0.00
5,000 Jack in the Box Inc Morgan Stanley 8,027 0.00
2,600 Jacobs Engineering Group Inc Morgan Stanley 1,626 0.00
(900) Jafco Co Ltd Morgan Stanley 132 0.00
(2,300) Janus Henderson Group Plc Morgan Stanley 1,010 0.00
(4,100) Japan Aviation Electronics Industry Ltd Morgan Stanley 2,547 0.00
(8,600) Japan Petroleum Exploration Co Ltd Morgan Stanley 4,177 0.00
(22,400) Japan Post Bank Co Ltd Morgan Stanley 3,550 0.00
(11,700) Japan Post Insurance Co Ltd Morgan Stanley 11,553 0.00
700 JCR Pharmaceuticals Co Ltd Morgan Stanley 581 0.00
214,772 JD Sports Fashion Plc Morgan Stanley 0 0.00
(9,000) Jefferies Financial Group Inc Morgan Stanley 427 0.00
(15,600) JELD-WEN Holding Inc Morgan Stanley 7,846 0.00
(3,348) Jenoptik AG Morgan Stanley 4,395 0.00
(3,318) Jeronimo Martins SGPS SA Morgan Stanley 0 0.00
(2,581) JetBlue Airways Corp Morgan Stanley 0 0.00
(7,500) JGC Holdings Corp Morgan Stanley 142 0.00
(52,000) Jiangsu Expressway Co Ltd Morgan Stanley 1,116 0.00
36,000 Jiangxi Copper Co Ltd Morgan Stanley 1,286 0.00
104,000 Jiayuan International Group Ltd Morgan Stanley 684 0.00
1,100 JINS Holdings Inc Morgan Stanley 1,680 0.00
73,041 Jm Ab Morgan Stanley 0 0.00
6,821 JM Smucker Co Morgan Stanley 5,249 0.00
(2,600) John Bean Technologies Corp Morgan Stanley 1,492 0.00
187,881 John Laing Group Plc Morgan Stanley 4,581 0.00
851 John Wood Group Plc Morgan Stanley 92 0.00
3,442 Johnson & Johnson Morgan Stanley 0 0.00
(53,053) Johnson Controls International Plc Morgan Stanley 0 0.00
80,000 Johnson Electric Holdings Ltd Morgan Stanley 1,923 0.00
400 Jones Lang LaSalle Inc Morgan Stanley 134 0.00
(9,000) JSR Corp Morgan Stanley 7,188 0.00
9,682 Jungheinrich AG Morgan Stanley 0 0.00
49,241 Juniper Networks Inc Morgan Stanley 5,475 0.00
(156,139) Jupiter Fund Management Plc Morgan Stanley 4,585 0.00
509,957 Just Group Plc Morgan Stanley 0 0.00
1,500 Justsystems Corp Morgan Stanley 770 0.00
(4,700) JXTG Holdings Inc Morgan Stanley 189 0.00
1,281 Jyske Bank A/S Morgan Stanley 3,480 0.00
(188,081) K+S AG Morgan Stanley 264 0.00

SCHEDULE OF INVESTMENTS FINANCIAL STATEMENTS
ANNUAL REPORT 2019 655
Neuberger Berman Uncorrelated Strategies Fund (Continued)
Schedule of Investments (Continued) Financial Assets at Fair Value through Profit or Loss (continued) Contracts for Differences 0.53% (31 December 2018: 85.09%) (continued)
Units Security Description Counterparty Unrealised Gain US$
% of NetAssets
(1,000) Kagome Co Ltd Morgan Stanley 316 0.00
248,000 Kaisa Group Holdings Ltd Morgan Stanley 14,319 0.00
(300) Kaiser Aluminum Corp Morgan Stanley 285 0.00
8,900 Kakaku.com Inc Morgan Stanley 7,743 0.00
(4,700) Kaman Corp Morgan Stanley 5,302 0.00
5,200 Kamigumi Co Ltd Morgan Stanley 195 0.00
(7,300) Kanamoto Co Ltd Morgan Stanley 8,339 0.00
(3,600) Kandenko Co Ltd Morgan Stanley 1,072 0.00
7,300 Kansai Electric Power Co Inc Morgan Stanley 106 0.00
(23,900) Kansai Mirai Financial Group Inc Morgan Stanley 1,490 0.00
(2,400) Kansai Paint Co Ltd Morgan Stanley 401 0.00
1,300 Katitas Co Ltd Morgan Stanley 1,993 0.00
(11,200) Kawasaki Heavy Industries Ltd Morgan Stanley 16,761 0.00
47,355 KAZ Minerals Plc Morgan Stanley 1,484 0.00
1,800 KDDI Corp Morgan Stanley 493 0.00
(1,800) Keihin Corp Morgan Stanley 132 0.00
(300) Keio Corp Morgan Stanley 241 0.00
(2,400) Keisei Electric Railway Co Ltd Morgan Stanley 1,689 0.00
1,721 Kellogg Co Morgan Stanley 0 0.00
900 Kelly Services Inc Morgan Stanley 220 0.00
320,148 Kemira Oyj Morgan Stanley 1,820 0.00
(14,600) Kenedix Inc Morgan Stanley 1,519 0.00
(88,378) Kennametal Inc Morgan Stanley 3,371 0.00
360 Kering SA Morgan Stanley 0 0.00
16,702 Kerry Group Plc Morgan Stanley 0 0.00
(17,503) Kerry Group Plc Goldman Sachs International 0 0.00
46,500 Kerry Logistics Network Ltd Morgan Stanley 2,419 0.00
2,182 Kesko Oyj Morgan Stanley 284 0.00
23,670 Keurig Dr Pepper Inc Morgan Stanley 2,873 0.00
(5,200) Kewpie Corp Morgan Stanley 655 0.00
2,827 KeyCorp Morgan Stanley 0 0.00
(25,498) Keywords Studios Plc Morgan Stanley 0 0.00
6,300 Kilroy Realty Corp Morgan Stanley 9,116 0.00
1,106 Kimberly-Clark Corp Morgan Stanley 0 0.00
17,910 Kimco Realty Corp Morgan Stanley 111 0.00
(1,700) Kinaxis Inc Morgan Stanley 2,910 0.00
6,591 Kinder Morgan Inc Morgan Stanley 27 0.00
208,451 Kindred Group Plc Morgan Stanley 0 0.00
61,500 Kingboard Holdings Ltd Morgan Stanley 9,847 0.00

FINANCIAL STATEMENTS SCHEDULE OF INVESTMENTS
656 NEUBERGER BERMAN INVESTMENT FUNDS PLC
Neuberger Berman Uncorrelated Strategies Fund (Continued)
Schedule of Investments (Continued) Financial Assets at Fair Value through Profit or Loss (continued) Contracts for Differences 0.53% (31 December 2018: 85.09%) (continued)
Units Security Description Counterparty Unrealised Gain US$
% of NetAssets
(672,457) Kingfisher Plc Morgan Stanley 0 0.00
(44,987) Kingspan Group Plc Morgan Stanley 0 0.00
(46,896) Kinnevik AB Morgan Stanley 0 0.00
5,200 Kinross Gold Corp Morgan Stanley 2,532 0.00
1,800 Kintetsu Group Holdings Co Ltd Morgan Stanley 250 0.00
2,400 Kintetsu World Express Inc Morgan Stanley 385 0.00
(2,000) Kirin Holdings Co Ltd Morgan Stanley 1,817 0.00
8,000 Kirkland Lake Gold Ltd Morgan Stanley 18,184 0.00
300 KLA Corp Morgan Stanley 601 0.00
26,916 Klepierre SA Morgan Stanley 32,919 0.01
4,000 Knight-Swift Transportation Holdings Inc Morgan Stanley 172 0.00
(103,880) Knorr-Bremse AG Morgan Stanley 998 0.00
200 Kobayashi Pharmaceutical Co Ltd Morgan Stanley 409 0.00
(18,100) Kobe Steel Ltd Morgan Stanley 4,471 0.00
1,800 Koei Tecmo Holdings Co Ltd Morgan Stanley 2,106 0.00
(2,600) Koito Manufacturing Co Ltd Morgan Stanley 9,897 0.00
11,864 Kojamo Oyj Morgan Stanley 2,739 0.00
(2,100) Kokuyo Co Ltd Morgan Stanley 746 0.00
(5,600) Komatsu Ltd Morgan Stanley 3,500 0.00
6,823 Kone Oyj Morgan Stanley 3,049 0.00
868 Konecranes Oyj Morgan Stanley 5,320 0.00
(11,100) Konica Minolta Inc Morgan Stanley 749 0.00
58,808 Koninklijke DSM NV Morgan Stanley 2 0.00
226,027 Koninklijke KPN NV Morgan Stanley 0 0.00
(65,406) Koninklijke Philips NV Morgan Stanley 22,982 0.01
9,871 Koninklijke Volkerwessels NV Morgan Stanley 1,346 0.00
21,564 Koninklijke Vopak NV Morgan Stanley 3,738 0.00
134,900 Kosmos Energy Ltd Morgan Stanley 28,302 0.01
238 Kraft Heinz Co Morgan Stanley 1,683 0.00
1,474 Krones AG Morgan Stanley 730 0.00
6,000 K's Holdings Corp Morgan Stanley 1,019 0.00
1,256 Kuehne + Nagel International AG Morgan Stanley 1,679 0.00
2,300 Kumagai Gumi Co Ltd Morgan Stanley 708 0.00
(8,200) Kumiai Chemical Industry Co Ltd Morgan Stanley 3,810 0.00
99,186 Kungsleden AB Morgan Stanley 0 0.00
(58,000) Kunlun Energy Co Ltd Morgan Stanley 118 0.00
(600) Kuraray Co Ltd Morgan Stanley 270 0.00
1,900 Kurita Water Industries Ltd Morgan Stanley 390 0.00
(800) Kusuri no Aoki Holdings Co Ltd Morgan Stanley 2,093 0.00

SCHEDULE OF INVESTMENTS FINANCIAL STATEMENTS
ANNUAL REPORT 2019 657
Neuberger Berman Uncorrelated Strategies Fund (Continued)
Schedule of Investments (Continued) Financial Assets at Fair Value through Profit or Loss (continued) Contracts for Differences 0.53% (31 December 2018: 85.09%) (continued)
Units Security Description Counterparty Unrealised Gain US$
% of NetAssets
93,024 KWG Group Holdings Ltd Morgan Stanley 4,088 0.00
507 KWS Saat SE & Co KGaA Morgan Stanley 87 0.00
(9,100) Kyocera Corp Morgan Stanley 1,800 0.00
(1,500) KYORIN Holdings Inc Morgan Stanley 114 0.00
(9,200) Kyowa Exeo Corp Morgan Stanley 5,737 0.00
10,600 Kyowa Kirin Co Ltd Morgan Stanley 4,747 0.00
(9,900) Kyushu Electric Power Co Inc Morgan Stanley 962 0.00
(6,500) Kyushu Railway Co Morgan Stanley 322 0.00
(3,318) L Brands Inc Morgan Stanley 0 0.00
32,880 L3Harris Technologies Inc Morgan Stanley 0 0.00
422 Laboratory Corp of America Holdings Morgan Stanley 1,617 0.00
139,163 LafargeHolcim Ltd Goldman Sachs International 6,370 0.00
50,392 Lagardere SCA Morgan Stanley 656 0.00
(188) Lam Research Corp Morgan Stanley 1,606 0.00
(158) Lancashire Holdings Ltd Morgan Stanley 14 0.00
500 Lancaster Colony Corp Morgan Stanley 56 0.00
77,041 Land Securities Group Plc Morgan Stanley 5,121 0.00
4,325 Las Vegas Sands Corp Morgan Stanley 592 0.00
(1,100) Lasertec Corp Morgan Stanley 526 0.00
4,500 Laureate Education Inc Morgan Stanley 292 0.00
21,386 Lazard Ltd Morgan Stanley 0 0.00
5,900 La-Z-Boy Inc Morgan Stanley 1,079 0.00
(5,300) Lear Corp Morgan Stanley 11,201 0.00
(716,954) Legal & General Group Plc Morgan Stanley 51,964 0.01
50,100 Legend Holdings Corp Morgan Stanley 6,346 0.00
(269) Legend Holdings Corp (Right, 31/12/2049) Morgan Stanley 0 0.00
(600) Leggett & Platt Inc Morgan Stanley 227 0.00
(108,052) Legrand SA Goldman Sachs International 0 0.00
(13,051) Legrand SA Morgan Stanley 0 0.00
(615) Lennar Corp Morgan Stanley 0 0.00
(10,485) Lennox International Inc Morgan Stanley 550 0.00
4,056 Lenzing AG Morgan Stanley 0 0.00
3,700 Levi Strauss & Co Morgan Stanley 1,887 0.00
(100) LGI Homes Inc Morgan Stanley 39 0.00
984,000 Li & Fung Ltd Morgan Stanley 1,307 0.00
1,800 Liberty Broadband Corp Morgan Stanley 918 0.00
(3,196) Liberty Global Plc Morgan Stanley 0 0.00
(14,283) Lifco AB Morgan Stanley 0 0.00
5,200 Life Storage Inc Morgan Stanley 7,280 0.00

FINANCIAL STATEMENTS SCHEDULE OF INVESTMENTS
658 NEUBERGER BERMAN INVESTMENT FUNDS PLC
Neuberger Berman Uncorrelated Strategies Fund (Continued)
Schedule of Investments (Continued) Financial Assets at Fair Value through Profit or Loss (continued) Contracts for Differences 0.53% (31 December 2018: 85.09%) (continued)
Units Security Description Counterparty Unrealised Gain US$
% of NetAssets
1,056 Lifestyle Communities Ltd Morgan Stanley 700 0.00
(31,768) Lincoln Electric Holdings Inc Morgan Stanley 20 0.00
(1,844) Lincoln National Corp Morgan Stanley 0 0.00
938 Linde Plc Morgan Stanley 0 0.00
800 Lindsay Corp Morgan Stanley 1,472 0.00
5,500 Link REIT Morgan Stanley 2,226 0.00
(5,200) Lintec Corp Morgan Stanley 2,480 0.00
500 Littelfuse Inc Morgan Stanley 870 0.00
3,800 Live Nation Entertainment Inc Morgan Stanley 13,923 0.00
(1,100) LKQ Corp Morgan Stanley 164 0.00
(3,301,121) Lloyds Banking Group Plc Morgan Stanley 39,188 0.01
123 Lockheed Martin Corp Morgan Stanley 0 0.00
(7,189) Loews Corp Morgan Stanley 0 0.00
(2,037) Logitech International SA Morgan Stanley 7,859 0.00
8,693 London Stock Exchange Group Plc Morgan Stanley 58,991 0.01
797,168 LondonMetric Property Plc Morgan Stanley 230 0.00
(5,714) Lonza Group AG Morgan Stanley 988 0.00
27,040 Loomis AB Morgan Stanley 0 0.00
(5,396) L'Oreal SA Goldman Sachs International 0 0.00
972 L'Oreal SA Morgan Stanley 12,108 0.00
47 Lotus Bakeries NV Morgan Stanley 2,636 0.00
(3,700) Louisiana-Pacific Corp Morgan Stanley 315 0.00
11,230 Lovisa Holdings Ltd Morgan Stanley 545 0.00
(5,115) Lowe's Cos Inc Morgan Stanley 1,002 0.00
9,900 LTC Properties Inc Morgan Stanley 6,108 0.00
1,000 Luk Fook Holdings International Ltd Morgan Stanley 64 0.00
20,460 Lundin Petroleum AB Morgan Stanley 25,664 0.01
96,500 Luye Pharma Group Ltd Morgan Stanley 1,233 0.00
580,000 LVGEM China Real Estate Investment Co Ltd Morgan Stanley 8,271 0.00
(123) LVMH Moet Hennessy Louis Vuitton SE Morgan Stanley 0 0.00
(77,868) Lynas Corp Ltd Morgan Stanley 9,599 0.00
(26,126) LyondellBasell Industries NV Morgan Stanley 560 0.00
1,200 M&A Capital Partners Co Ltd Morgan Stanley 2,134 0.00
(234,194) M&G Plc Morgan Stanley 0 0.00
(369) M&T Bank Corp Morgan Stanley 0 0.00
(500) Mabuchi Motor Co Ltd Morgan Stanley 465 0.00
8,600 Mack-Cali Realty Corp Morgan Stanley 14,506 0.00
(2,000) MACOM Technology Solutions Holdings Inc Morgan Stanley 112 0.00
700 MAG Silver Corp Morgan Stanley 378 0.00

SCHEDULE OF INVESTMENTS FINANCIAL STATEMENTS
ANNUAL REPORT 2019 659
Neuberger Berman Uncorrelated Strategies Fund (Continued)
Schedule of Investments (Continued) Financial Assets at Fair Value through Profit or Loss (continued) Contracts for Differences 0.53% (31 December 2018: 85.09%) (continued)
Units Security Description Counterparty Unrealised Gain US$
% of NetAssets
6,140 Magellan Financial Group Ltd Morgan Stanley 3,951 0.00
1,400 Magellan Health Inc Morgan Stanley 104 0.00
4,400 Magellan Midstream Partners LP Morgan Stanley 4,830 0.00
(56,684) Magna International Inc Morgan Stanley 443 0.00
229,042 Man Group Plc Morgan Stanley 0 0.00
6,493 Man Se Morgan Stanley 9,397 0.00
222,000 Man Wah Holdings Ltd Morgan Stanley 593 0.00
(1,800) Mandom Corp Morgan Stanley 106 0.00
1,100 ManpowerGroup Inc Morgan Stanley 365 0.00
(114,372) Mapfre SA Morgan Stanley 1,429 0.00
2,100 Maple Leaf Foods Inc Morgan Stanley 1,097 0.00
16 Mapletree Logistics Trust Morgan Stanley 1 0.00
2,700 Marcus & Millichap Inc Morgan Stanley 1,473 0.00
246 MarketAxess Holdings Inc Morgan Stanley 0 0.00
(668,616) Marks & Spencer Group Plc Morgan Stanley 4,994 0.00
1,839 Marshalls Plc Morgan Stanley 92 0.00
(751,261) Marston's Plc Morgan Stanley 0 0.00
(19,200) Marubeni Corp Morgan Stanley 3,221 0.00
(1,100) Maruha Nichiro Corp Morgan Stanley 137 0.00
(2,200) Maruichi Steel Tube Ltd Morgan Stanley 1,523 0.00
(537) Marvell Technology Group Ltd Morgan Stanley 7,079 0.00
(14,017) Masco Corp Morgan Stanley 517 0.00
48,037 Masmovil Ibercom SA Morgan Stanley 2,670 0.00
(4,600) Masonite International Corp Morgan Stanley 4,040 0.00
1,800 MasTec Inc Morgan Stanley 2,425 0.00
369 Mastercard Inc Morgan Stanley 0 0.00
8,191 Match Group Inc Morgan Stanley 17,640 0.00
(13,900) Matsui Securities Co Ltd Morgan Stanley 1,777 0.00
5,600 Matsumotokiyoshi Holdings Co Ltd Morgan Stanley 3,120 0.00
12,849 Maxim Integrated Products Inc Morgan Stanley 2,711 0.00
2,600 MAXIMUS Inc Morgan Stanley 888 0.00
(45,488) Mayne Pharma Group Ltd Morgan Stanley 130 0.00
18,700 MBIA Inc Morgan Stanley 352 0.00
418,692 McCarthy & Stone Plc Morgan Stanley 0 0.00
(84) McCormick & Co Inc Morgan Stanley 1,171 0.00
(854) McDonald's Corp Morgan Stanley 142 0.00
2,531 McKesson Corp Morgan Stanley 0 0.00
3,306 McMillan Shakespeare Ltd Morgan Stanley 597 0.00
(3,020) MDC Holdings Inc Morgan Stanley 238 0.00

FINANCIAL STATEMENTS SCHEDULE OF INVESTMENTS
660 NEUBERGER BERMAN INVESTMENT FUNDS PLC
Neuberger Berman Uncorrelated Strategies Fund (Continued)
Schedule of Investments (Continued) Financial Assets at Fair Value through Profit or Loss (continued) Contracts for Differences 0.53% (31 December 2018: 85.09%) (continued)
Units Security Description Counterparty Unrealised Gain US$
% of NetAssets
6,700 MDU Resources Group Inc Morgan Stanley 2,013 0.00
147,874 Mediaset Espana Comunicacion SA Morgan Stanley 0 0.00
(3,747) Mediclinic International Plc Morgan Stanley 135 0.00
1,600 MEDNAX Inc Morgan Stanley 932 0.00
5,285 Medtronic Plc Morgan Stanley 0 0.00
(79,693) Meggitt Plc Morgan Stanley 98 0.00
(3,500) MEIJI Holdings Co Ltd Morgan Stanley 1,659 0.00
35,000 Melco International Development Ltd Morgan Stanley 3,797 0.00
(1,456) Melexis NV Morgan Stanley 443 0.00
(30,608) Melia Hotels International SA Morgan Stanley 176 0.00
3,627,970 Melrose Industries Plc Goldman Sachs International 0 0.00
(747,101) Melrose Industries Plc Morgan Stanley 0 0.00
400 Menicon Co Ltd Morgan Stanley 792 0.00
(100) MercadoLibre Inc Morgan Stanley 1,024 0.00
43,775 Mercialys SA Morgan Stanley 0 0.00
21,140 Merck KGaA Morgan Stanley 0 0.00
(300) Mercury General Corp Morgan Stanley 40 0.00
6,900 Meredith Corp Morgan Stanley 197 0.00
30,680 Meritor Inc Morgan Stanley 21,391 0.01
132,264 Merlin Properties Socimi SA Morgan Stanley 6,590 0.00
52,822 Mesoblast Ltd Morgan Stanley 7,846 0.00
(1,800) Methode Electronics Inc Morgan Stanley 1,164 0.00
63,420 Metropole Television SA Morgan Stanley 0 0.00
(23,268) Metsa Board Oyj Morgan Stanley 796 0.00
49,654 Metso Oyj Morgan Stanley 2,170 0.00
(1,700) MGE Energy Inc Morgan Stanley 748 0.00
(18,200) MGIC Investment Corp Morgan Stanley 914 0.00
(41,200) MGM China Holdings Ltd Morgan Stanley 761 0.00
(2,458) MGM Resorts International Morgan Stanley 0 0.00
(983) Microsoft Corp Morgan Stanley 0 0.00
3,500 Mid-America Apartment Communities Inc Morgan Stanley 6,551 0.00
(2,300) Middlesex Water Co Morgan Stanley 177 0.00
500 Milbon Co Ltd Morgan Stanley 343 0.00
200 Mimecast Ltd Morgan Stanley 40 0.00
(4,500) MINEBEA MITSUMI Inc Morgan Stanley 1,713 0.00
(14,000) Minth Group Ltd Morgan Stanley 1,786 0.00
200 Miraca Holdings Inc Morgan Stanley 79 0.00
(5,400) Mirait Holdings Corp Morgan Stanley 1,158 0.00
27,674 Mirvac Group Morgan Stanley 416 0.00

SCHEDULE OF INVESTMENTS FINANCIAL STATEMENTS
ANNUAL REPORT 2019 661
Neuberger Berman Uncorrelated Strategies Fund (Continued)
Schedule of Investments (Continued) Financial Assets at Fair Value through Profit or Loss (continued) Contracts for Differences 0.53% (31 December 2018: 85.09%) (continued)
Units Security Description Counterparty Unrealised Gain US$
% of NetAssets
(700) MISUMI Group Inc Morgan Stanley 140 0.00
110,650 Mitchells & Butlers Plc Morgan Stanley 0 0.00
(15,900) Mitsubishi Gas Chemical Co Inc Morgan Stanley 5,201 0.00
8,500 Mitsubishi Heavy Industries Ltd Morgan Stanley 1,033 0.00
(1,800) Mitsubishi Logistics Corp Morgan Stanley 552 0.00
(7,700) Mitsubishi Materials Corp Morgan Stanley 7,299 0.00
(2,700) Mitsui Chemicals Inc Morgan Stanley 1,912 0.00
(10,100) Mitsui Fudosan Co Ltd Morgan Stanley 5,574 0.00
(207,700) Mizuho Financial Group Inc Morgan Stanley 2,376 0.00
1,721 Mobimo Holding AG Morgan Stanley 0 0.00
14,300 Moelis & Co Morgan Stanley 2,562 0.00
493 Moelis Australia Ltd Morgan Stanley 41 0.00
1,100 Molina Healthcare Inc Morgan Stanley 978 0.00
4,056 Molson Coors Brewing Co Morgan Stanley 0 0.00
(16,664) Mondelez International Inc Morgan Stanley 689 0.00
74,105 Mondi Plc Goldman Sachs International 0 0.00
4,916 Mondi Plc Morgan Stanley 0 0.00
614,277 Moneysupermarket.com Group Plc Morgan Stanley 0 0.00
600 MongoDB Inc Morgan Stanley 174 0.00
(700) Monolithic Power Systems Inc Morgan Stanley 1,600 0.00
2,597 Montea C.V.A Morgan Stanley 9,072 0.00
(2,646) Moody's Corp Morgan Stanley 2,684 0.00
(68,342) Morgan Advanced Materials Plc Morgan Stanley 0 0.00
1,800 Morneau Shepell Inc Morgan Stanley 815 0.00
3,100 Morningstar Inc Morgan Stanley 311 0.00
(3,862) MorphoSys AG Morgan Stanley 9,049 0.00
(25,286) Mosaic Co Morgan Stanley 0 0.00
2,212 Motorola Solutions Inc Morgan Stanley 0 0.00
(1,600) MPLX LP Morgan Stanley 562 0.00
(400) MSC Industrial Direct Co Morgan Stanley 179 0.00
(123) MSCI Inc Morgan Stanley 0 0.00
5,900 MTS Systems Corp Morgan Stanley 6,615 0.00
23,442 MTU Aero Engines AG Morgan Stanley 0 0.00
400 Murata Manufacturing Co Ltd Morgan Stanley 497 0.00
10,866 Mylan NV Morgan Stanley 0 0.00
(34,000) NagaCorp Ltd Morgan Stanley 1,101 0.00
(5,900) Nagase & Co Ltd Morgan Stanley 2,179 0.00
(2,500) Nagoya Railroad Co Ltd Morgan Stanley 161 0.00
(6,400) Nankai Electric Railway Co Ltd Morgan Stanley 1,154 0.00
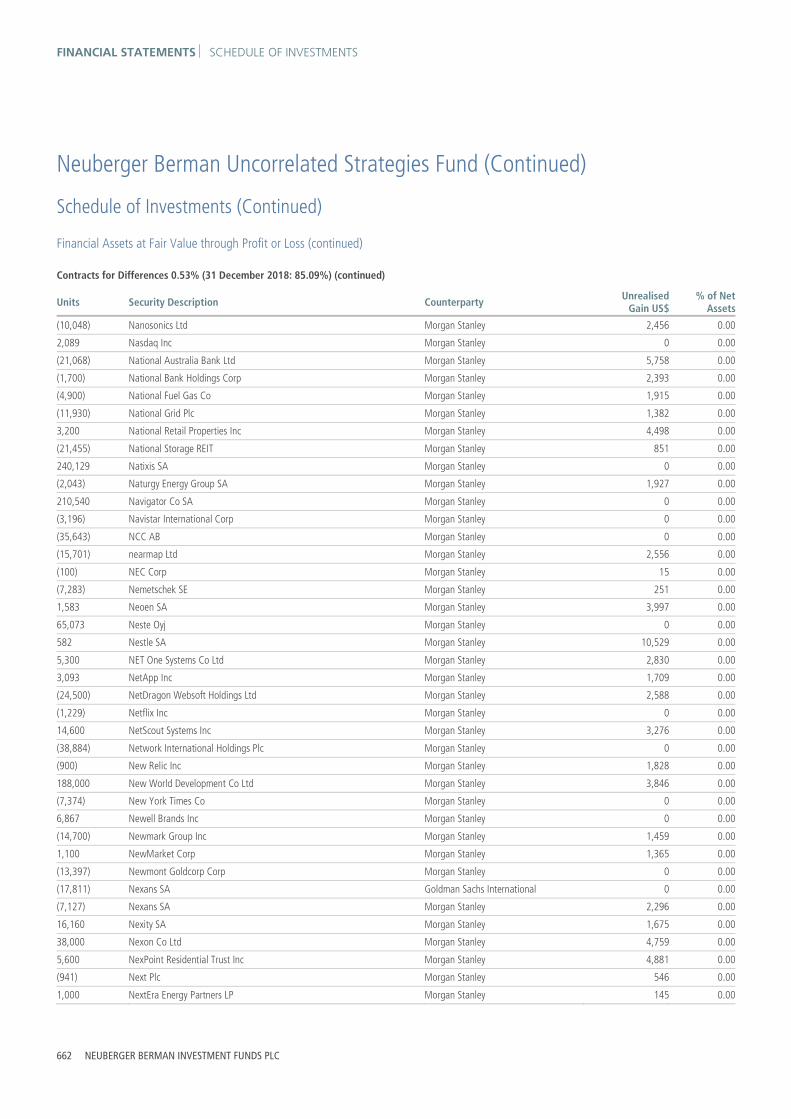
FINANCIAL STATEMENTS SCHEDULE OF INVESTMENTS
662 NEUBERGER BERMAN INVESTMENT FUNDS PLC
Neuberger Berman Uncorrelated Strategies Fund (Continued)
Schedule of Investments (Continued) Financial Assets at Fair Value through Profit or Loss (continued) Contracts for Differences 0.53% (31 December 2018: 85.09%) (continued)
Units Security Description Counterparty Unrealised Gain US$
% of NetAssets
(10,048) Nanosonics Ltd Morgan Stanley 2,456 0.00
2,089 Nasdaq Inc Morgan Stanley 0 0.00
(21,068) National Australia Bank Ltd Morgan Stanley 5,758 0.00
(1,700) National Bank Holdings Corp Morgan Stanley 2,393 0.00
(4,900) National Fuel Gas Co Morgan Stanley 1,915 0.00
(11,930) National Grid Plc Morgan Stanley 1,382 0.00
3,200 National Retail Properties Inc Morgan Stanley 4,498 0.00
(21,455) National Storage REIT Morgan Stanley 851 0.00
240,129 Natixis SA Morgan Stanley 0 0.00
(2,043) Naturgy Energy Group SA Morgan Stanley 1,927 0.00
210,540 Navigator Co SA Morgan Stanley 0 0.00
(3,196) Navistar International Corp Morgan Stanley 0 0.00
(35,643) NCC AB Morgan Stanley 0 0.00
(15,701) nearmap Ltd Morgan Stanley 2,556 0.00
(100) NEC Corp Morgan Stanley 15 0.00
(7,283) Nemetschek SE Morgan Stanley 251 0.00
1,583 Neoen SA Morgan Stanley 3,997 0.00
65,073 Neste Oyj Morgan Stanley 0 0.00
582 Nestle SA Morgan Stanley 10,529 0.00
5,300 NET One Systems Co Ltd Morgan Stanley 2,830 0.00
3,093 NetApp Inc Morgan Stanley 1,709 0.00
(24,500) NetDragon Websoft Holdings Ltd Morgan Stanley 2,588 0.00
(1,229) Netflix Inc Morgan Stanley 0 0.00
14,600 NetScout Systems Inc Morgan Stanley 3,276 0.00
(38,884) Network International Holdings Plc Morgan Stanley 0 0.00
(900) New Relic Inc Morgan Stanley 1,828 0.00
188,000 New World Development Co Ltd Morgan Stanley 3,846 0.00
(7,374) New York Times Co Morgan Stanley 0 0.00
6,867 Newell Brands Inc Morgan Stanley 0 0.00
(14,700) Newmark Group Inc Morgan Stanley 1,459 0.00
1,100 NewMarket Corp Morgan Stanley 1,365 0.00
(13,397) Newmont Goldcorp Corp Morgan Stanley 0 0.00
(17,811) Nexans SA Goldman Sachs International 0 0.00
(7,127) Nexans SA Morgan Stanley 2,296 0.00
16,160 Nexity SA Morgan Stanley 1,675 0.00
38,000 Nexon Co Ltd Morgan Stanley 4,759 0.00
5,600 NexPoint Residential Trust Inc Morgan Stanley 4,881 0.00
(941) Next Plc Morgan Stanley 546 0.00
1,000 NextEra Energy Partners LP Morgan Stanley 145 0.00
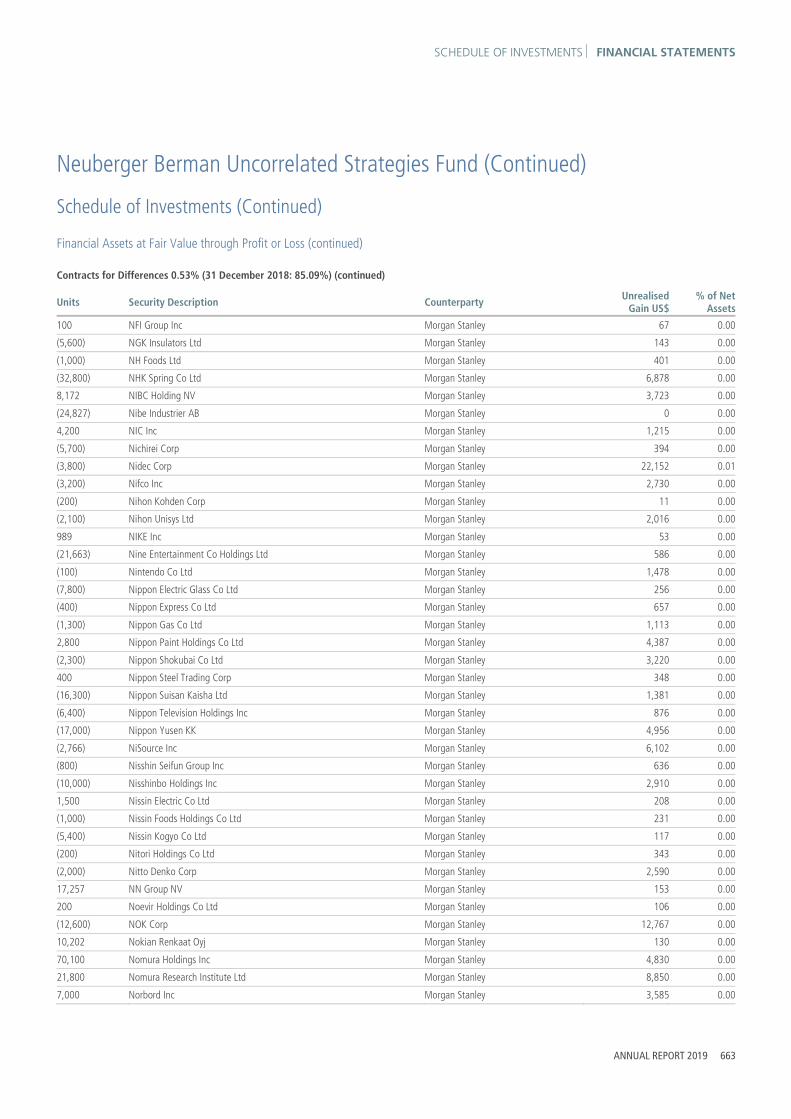
SCHEDULE OF INVESTMENTS FINANCIAL STATEMENTS
ANNUAL REPORT 2019 663
Neuberger Berman Uncorrelated Strategies Fund (Continued)
Schedule of Investments (Continued) Financial Assets at Fair Value through Profit or Loss (continued) Contracts for Differences 0.53% (31 December 2018: 85.09%) (continued)
Units Security Description Counterparty Unrealised Gain US$
% of NetAssets
100 NFI Group Inc Morgan Stanley 67 0.00
(5,600) NGK Insulators Ltd Morgan Stanley 143 0.00
(1,000) NH Foods Ltd Morgan Stanley 401 0.00
(32,800) NHK Spring Co Ltd Morgan Stanley 6,878 0.00
8,172 NIBC Holding NV Morgan Stanley 3,723 0.00
(24,827) Nibe Industrier AB Morgan Stanley 0 0.00
4,200 NIC Inc Morgan Stanley 1,215 0.00
(5,700) Nichirei Corp Morgan Stanley 394 0.00
(3,800) Nidec Corp Morgan Stanley 22,152 0.01
(3,200) Nifco Inc Morgan Stanley 2,730 0.00
(200) Nihon Kohden Corp Morgan Stanley 11 0.00
(2,100) Nihon Unisys Ltd Morgan Stanley 2,016 0.00
989 NIKE Inc Morgan Stanley 53 0.00
(21,663) Nine Entertainment Co Holdings Ltd Morgan Stanley 586 0.00
(100) Nintendo Co Ltd Morgan Stanley 1,478 0.00
(7,800) Nippon Electric Glass Co Ltd Morgan Stanley 256 0.00
(400) Nippon Express Co Ltd Morgan Stanley 657 0.00
(1,300) Nippon Gas Co Ltd Morgan Stanley 1,113 0.00
2,800 Nippon Paint Holdings Co Ltd Morgan Stanley 4,387 0.00
(2,300) Nippon Shokubai Co Ltd Morgan Stanley 3,220 0.00
400 Nippon Steel Trading Corp Morgan Stanley 348 0.00
(16,300) Nippon Suisan Kaisha Ltd Morgan Stanley 1,381 0.00
(6,400) Nippon Television Holdings Inc Morgan Stanley 876 0.00
(17,000) Nippon Yusen KK Morgan Stanley 4,956 0.00
(2,766) NiSource Inc Morgan Stanley 6,102 0.00
(800) Nisshin Seifun Group Inc Morgan Stanley 636 0.00
(10,000) Nisshinbo Holdings Inc Morgan Stanley 2,910 0.00
1,500 Nissin Electric Co Ltd Morgan Stanley 208 0.00
(1,000) Nissin Foods Holdings Co Ltd Morgan Stanley 231 0.00
(5,400) Nissin Kogyo Co Ltd Morgan Stanley 117 0.00
(200) Nitori Holdings Co Ltd Morgan Stanley 343 0.00
(2,000) Nitto Denko Corp Morgan Stanley 2,590 0.00
17,257 NN Group NV Morgan Stanley 153 0.00
200 Noevir Holdings Co Ltd Morgan Stanley 106 0.00
(12,600) NOK Corp Morgan Stanley 12,767 0.00
10,202 Nokian Renkaat Oyj Morgan Stanley 130 0.00
70,100 Nomura Holdings Inc Morgan Stanley 4,830 0.00
21,800 Nomura Research Institute Ltd Morgan Stanley 8,850 0.00
7,000 Norbord Inc Morgan Stanley 3,585 0.00

FINANCIAL STATEMENTS SCHEDULE OF INVESTMENTS
664 NEUBERGER BERMAN INVESTMENT FUNDS PLC
Neuberger Berman Uncorrelated Strategies Fund (Continued)
Schedule of Investments (Continued) Financial Assets at Fair Value through Profit or Loss (continued) Contracts for Differences 0.53% (31 December 2018: 85.09%) (continued)
Units Security Description Counterparty Unrealised Gain US$
% of NetAssets
(273,141) Nordea Bank Abp Morgan Stanley 0 0.00
10,447 Nordstrom Inc Morgan Stanley 0 0.00
969,458 Norsk Hydro ASA Morgan Stanley 752 0.00
1,842 Northern Trust Corp Morgan Stanley 0 0.00
(8,293) Northrop Grumman Corp Morgan Stanley 37 0.00
(400) NorthWestern Corp Morgan Stanley 342 0.00
(4,111) NortonLifeLock Inc Morgan Stanley 2,443 0.00
10,100 Norwegian Cruise Line Holdings Ltd Morgan Stanley 26,045 0.01
137,779 Nos Sgps Sa Morgan Stanley 0 0.00
4,700 Novagold Resources Inc Morgan Stanley 6,949 0.00
(1,300) Novanta Inc Morgan Stanley 2,827 0.00
27,920 Novartis AG Morgan Stanley 16,227 0.00
(500) NS Solutions Corp Morgan Stanley 15 0.00
(24,900) NTT Data Corp Morgan Stanley 952 0.00
3,600 NTT DOCOMO Inc Morgan Stanley 137 0.00
800 Nu Skin Enterprises Inc Morgan Stanley 897 0.00
7,252 Nuance Communications Inc Morgan Stanley 0 0.00
(3,100) Nutanix Inc Morgan Stanley 1,998 0.00
1,229 NVIDIA Corp Morgan Stanley 0 0.00
(203,000) NWS Holdings Ltd Morgan Stanley 5,090 0.00
46,600 Oasis Petroleum Inc Morgan Stanley 7,977 0.00
(8,500) Obayashi Corp Morgan Stanley 2,110 0.00
4,300 OBIC Business Consultants Co Ltd Morgan Stanley 7,188 0.00
800 Obic Co Ltd Morgan Stanley 1,989 0.00
(50,115) OC Oerlikon Corp AG Morgan Stanley 136 0.00
(27,978) Ocado Group Plc Morgan Stanley 223 0.00
14,028 Occidental Petroleum Corp Morgan Stanley 18,916 0.00
46,200 OceanaGold Corp Morgan Stanley 9,213 0.00
21,894 OceanaGold Corp - CDI Morgan Stanley 514 0.00
18,343 Oci Nv Morgan Stanley 1,508 0.00
(600) Odakyu Electric Railway Co Ltd Morgan Stanley 154 0.00
25,197 Oesterreichische Post AG Morgan Stanley 0 0.00
1,500 Ohsho Food Service Corp Morgan Stanley 801 0.00
(1,829) Oil Search Ltd Morgan Stanley 56 0.00
(7,600) Oji Holdings Corp Morgan Stanley 3,372 0.00
300 Okta Inc Morgan Stanley 228 0.00
(900) OKUMA Corp Morgan Stanley 2,490 0.00
47,100 Olam International Ltd Morgan Stanley 1,843 0.00
1,315,030 Old Mutual Ltd Morgan Stanley 0 0.00

SCHEDULE OF INVESTMENTS FINANCIAL STATEMENTS
ANNUAL REPORT 2019 665
Neuberger Berman Uncorrelated Strategies Fund (Continued)
Schedule of Investments (Continued) Financial Assets at Fair Value through Profit or Loss (continued) Contracts for Differences 0.53% (31 December 2018: 85.09%) (continued)
Units Security Description Counterparty Unrealised Gain US$
% of NetAssets
(2,500) Ollie's Bargain Outlet Holdings Inc Morgan Stanley 3,274 0.00
8,700 Olympus Corp Morgan Stanley 5,428 0.00
1,229 Omnicom Group Inc Morgan Stanley 0 0.00
25,519 OMV AG Morgan Stanley 0 0.00
(5,800) OneMain Holdings Inc Morgan Stanley 10,487 0.00
900 Onex Corp Morgan Stanley 1,281 0.00
4,600 Ono Pharmaceutical Co Ltd Morgan Stanley 1,517 0.00
(25,981) Ontex Group NV Morgan Stanley 13,574 0.00
(11,275) oOh!media Ltd Morgan Stanley 1,793 0.00
(6,200) Optorun Co Ltd Morgan Stanley 4,541 0.00
(700) Opus Bank Morgan Stanley 12 0.00
(2,100) Oracle Corp Japan Morgan Stanley 1,694 0.00
75,556 Orange Belgium SA Morgan Stanley 1,721 0.00
(94,480) Orange SA Morgan Stanley 2,903 0.00
(1,853) Orica Ltd Morgan Stanley 977 0.00
(13,098) Origin Energy Ltd Morgan Stanley 1,486 0.00
7,252 Orion Oyj Morgan Stanley 139 0.00
4,642 Orkla ASA Morgan Stanley 561 0.00
62 Ossur HF Morgan Stanley 17 0.00
(1,500) Otsuka Corp Morgan Stanley 3,895 0.00
48,505 Outotec Oyj Morgan Stanley 359 0.00
(10,900) Outsourcing Inc Morgan Stanley 4,608 0.00
76 Oversea-Chinese Banking Corp Ltd Morgan Stanley 8 0.00
(1,860) OZ Minerals Ltd Morgan Stanley 582 0.00
(560) PACCAR Inc Morgan Stanley 4 0.00
(274,000) Pacific Textiles Holdings Ltd Morgan Stanley 2,382 0.00
(38,207) Packaging Corp of America Morgan Stanley 235 0.00
18,101 Pact Group Holdings Ltd Morgan Stanley 251 0.00
(900) PagerDuty Inc Morgan Stanley 939 0.00
(629) Palo Alto Networks Inc Morgan Stanley 393 0.00
1,128 Panalpina Welttransport Holding AG Morgan Stanley 7,116 0.00
2,106 Pandora A/S Morgan Stanley 7,982 0.00
141,683 Paragon Banking Group Plc Morgan Stanley 896 0.00
1,700 Parex Resources Inc Morgan Stanley 2,524 0.00
1,475 Pargesa Holding SA Morgan Stanley 0 0.00
1,200 Park Lawn Corp Morgan Stanley 247 0.00
5,837 Parker-Hannifin Corp Morgan Stanley 617 0.00
1,900 Parkland Fuel Corp Morgan Stanley 756 0.00
6,600 Parsley Energy Inc Morgan Stanley 9,082 0.00

FINANCIAL STATEMENTS SCHEDULE OF INVESTMENTS
666 NEUBERGER BERMAN INVESTMENT FUNDS PLC
Neuberger Berman Uncorrelated Strategies Fund (Continued)
Schedule of Investments (Continued) Financial Assets at Fair Value through Profit or Loss (continued) Contracts for Differences 0.53% (31 December 2018: 85.09%) (continued)
Units Security Description Counterparty Unrealised Gain US$
% of NetAssets
369 Partners Group Holding AG Morgan Stanley 0 0.00
1,000 Pason Systems Inc Morgan Stanley 68 0.00
(3,778) Patrizia Ag Morgan Stanley 1,700 0.00
(27,000) Patterson Cos Inc Morgan Stanley 16,212 0.00
6,400 Patterson-UTI Energy Inc Morgan Stanley 205 0.00
6,393 Paychex Inc Morgan Stanley 301 0.00
(1,624) PayPal Holdings Inc Morgan Stanley 0 0.00
(209,000) PCCW Ltd Morgan Stanley 966 0.00
7,900 PDC Energy Inc Morgan Stanley 8,570 0.00
37,117 Pearson Plc Morgan Stanley 1,023 0.00
(2,900) Pebblebrook Hotel Trust Morgan Stanley 1,577 0.00
20 Pembina Pipeline Corp Morgan Stanley 2 0.00
(3,551) Pendal Group Ltd Morgan Stanley 366 0.00
124,759 Pennon Group Plc Morgan Stanley 425 0.00
1,900 PennyMac Financial Services Inc Morgan Stanley 83 0.00
(3,200) Penske Automotive Group Inc Morgan Stanley 6,088 0.00
4,056 Pentair Plc Morgan Stanley 0 0.00
(9,300) Penta-Ocean Construction Co Ltd Morgan Stanley 100 0.00
1,500 Penumbra Inc Morgan Stanley 6,653 0.00
41,700 People's United Financial Inc Morgan Stanley 450 0.00
100 PeptiDream Inc Morgan Stanley 494 0.00
(77,175) Perenti Global Ltd Morgan Stanley 706 0.00
(1,966) Pernod Ricard SA Morgan Stanley 0 0.00
10,816 Perseus Mining Ltd Morgan Stanley 1,361 0.00
32,610 Persimmon Plc Morgan Stanley 23,583 0.01
41,045 Pfizer Inc Morgan Stanley 670 0.00
6,391 Phillips 66 Morgan Stanley 0 0.00
258,196 Phoenix Group Holdings Plc Morgan Stanley 0 0.00
(19,539) Phoslock Environmental Technologies Ltd Morgan Stanley 530 0.00
1,200 Phreesia Inc Morgan Stanley 686 0.00
411,371 Piaggio & C SpA Morgan Stanley 439 0.00
(352,000) PICC Property & Casualty Co Ltd Morgan Stanley 7,915 0.00
(600) Pigeon Corp Morgan Stanley 391 0.00
10,200 Pilgrim's Pride Corp Morgan Stanley 2,311 0.00
(1,300) Pilot Corp Morgan Stanley 2,299 0.00
(69,000) Ping An Insurance Group Co of China Ltd Morgan Stanley 3,382 0.00
(4,600) Pinnacle Financial Partners Inc Morgan Stanley 511 0.00
5,000 Pinnacle West Capital Corp Morgan Stanley 10,478 0.00
11,800 Pinterest Inc Morgan Stanley 2,842 0.00

SCHEDULE OF INVESTMENTS FINANCIAL STATEMENTS
ANNUAL REPORT 2019 667
Neuberger Berman Uncorrelated Strategies Fund (Continued)
Schedule of Investments (Continued) Financial Assets at Fair Value through Profit or Loss (continued) Contracts for Differences 0.53% (31 December 2018: 85.09%) (continued)
Units Security Description Counterparty Unrealised Gain US$
% of NetAssets
(335,646) Pirelli & C SpA Morgan Stanley 0 0.00
1,400 PJT Partners Inc Morgan Stanley 923 0.00
4,400 Plains GP Holdings LP Morgan Stanley 2,256 0.00
6,600 Plantronics Inc Morgan Stanley 8,448 0.00
202,182 Plus500 Ltd Morgan Stanley 0 0.00
(4,269) PNC Financial Services Group Inc Morgan Stanley 2,708 0.00
(3,400) PNM Resources Inc Morgan Stanley 1,487 0.00
2,417 Polaris Inc Morgan Stanley 0 0.00
82,717 Polymetal International Plc Morgan Stanley 0 0.00
22,151 PolyNovo Ltd Morgan Stanley 436 0.00
(2,200) PolyOne Corp Morgan Stanley 348 0.00
97,250 Porsche Automobil Holding SE Morgan Stanley 0 0.00
(215,000) Postal Savings Bank of China Co Ltd Morgan Stanley 829 0.00
84,941 Poste Italiane SpA Morgan Stanley 958 0.00
(336,000) Pou Sheng International Holdings Ltd Morgan Stanley 5,990 0.00
5,500 Power Corp of Canada Morgan Stanley 295 0.00
(7,900) Power Financial Corp Morgan Stanley 997 0.00
2,500 Power Integrations Inc Morgan Stanley 11,507 0.00
400,000 Powerlong Real Estate Holdings Ltd Morgan Stanley 10,374 0.00
(2,808) PPG Industries Inc Morgan Stanley 621 0.00
2,212 PPL Corp Morgan Stanley 0 0.00
2,200 PRA Health Sciences Inc Morgan Stanley 8,877 0.00
(5,405) Premier Investments Ltd Morgan Stanley 3,462 0.00
(1,475) Principal Financial Group Inc Morgan Stanley 0 0.00
10,474 Pro Medicus Ltd Morgan Stanley 2,839 0.00
(2,217) Procter & Gamble Co Morgan Stanley 1,388 0.00
5,504 Progressive Corp Morgan Stanley 946 0.00
860 Prologis Inc Morgan Stanley 0 0.00
1,300 Proofpoint Inc Morgan Stanley 103 0.00
(69,696) ProSiebenSat.1 Media SE Morgan Stanley 0 0.00
12,356 Prosperity Bancshares Inc Morgan Stanley 1,879 0.00
(46,061) Provident Financial Plc Morgan Stanley 1,105 0.00
(18,805) Proximus SADP Morgan Stanley 0 0.00
(983) Prudential Financial Inc Morgan Stanley 0 0.00
(154,000) Prudential Plc Morgan Stanley 915 0.00
315,394 Prysmian SpA Goldman Sachs International 25,270 0.01
15,030 PSP Swiss Property AG Morgan Stanley 20,338 0.01
1,000 PTC Inc Morgan Stanley 660 0.00
4,387 Public Storage Morgan Stanley 4,212 0.00

FINANCIAL STATEMENTS SCHEDULE OF INVESTMENTS
668 NEUBERGER BERMAN INVESTMENT FUNDS PLC
Neuberger Berman Uncorrelated Strategies Fund (Continued)
Schedule of Investments (Continued) Financial Assets at Fair Value through Profit or Loss (continued) Contracts for Differences 0.53% (31 December 2018: 85.09%) (continued)
Units Security Description Counterparty Unrealised Gain US$
% of NetAssets
3,810 Publicis Groupe SA Morgan Stanley 0 0.00
7,104 PulteGroup Inc Morgan Stanley 7,785 0.00
6,928 Puma SE Morgan Stanley 51 0.00
14,100 Pure Storage Inc Morgan Stanley 3,588 0.00
894 PVH Corp Morgan Stanley 1,963 0.00
61,698 PZ Cussons Plc Morgan Stanley 0 0.00
(6,975) Qantas Airways Ltd Morgan Stanley 673 0.00
6,915 QIAGEN NV Morgan Stanley 13,213 0.00
335,234 QinetiQ Group Plc Morgan Stanley 182 0.00
615 Qorvo Inc Morgan Stanley 0 0.00
86,404 Quadient Morgan Stanley 0 0.00
3,441 QUALCOMM Inc Morgan Stanley 0 0.00
1,400 Quebecor Inc Morgan Stanley 270 0.00
(1,117) Quest Diagnostics Inc Morgan Stanley 1,615 0.00
(840,932) Quilter Plc Morgan Stanley 0 0.00
20,034 Qurate Retail Inc Morgan Stanley 0 0.00
(2,000) Radian Group Inc Morgan Stanley 781 0.00
28,023 Raiffeisen Bank International AG Morgan Stanley 0 0.00
3,000 Rakus Co Ltd Morgan Stanley 2,617 0.00
3,856 Ralph Lauren Corp Morgan Stanley 218 0.00
(59,233) Randstad NV Morgan Stanley 146 0.00
(3,800) Rapid7 Inc Morgan Stanley 3,653 0.00
1,967 Rational AG Morgan Stanley 0 0.00
(1,106) Raymond James Financial Inc Morgan Stanley 0 0.00
23,739 Raytheon Co Morgan Stanley 1,481 0.00
6,000 RealPage Inc Morgan Stanley 1,650 0.00
(28,795) Reckitt Benckiser Group Plc Morgan Stanley 0 0.00
(14,200) Recruit Holdings Co Ltd Morgan Stanley 4,519 0.00
4,894 Red Electrica Corp SA Morgan Stanley 11,504 0.00
176,000 Redco Properties Group Ltd Morgan Stanley 6,132 0.00
168,544 Redrow Plc Morgan Stanley 0 0.00
123,000 Redsun Properties Group Ltd Morgan Stanley 648 0.00
4,674 Reece Ltd Morgan Stanley 3,167 0.00
900 Regal Beloit Corp Morgan Stanley 443 0.00
811 Regeneron Pharmaceuticals Inc Morgan Stanley 0 0.00
(6,883) Regions Financial Corp Morgan Stanley 0 0.00
(14,523) Regis Healthcare Ltd Morgan Stanley 3,527 0.00
14,580 Regis Resources Ltd Morgan Stanley 3,255 0.00
5,646 Reliance Steel & Aluminum Co Morgan Stanley 211 0.00

SCHEDULE OF INVESTMENTS FINANCIAL STATEMENTS
ANNUAL REPORT 2019 669
Neuberger Berman Uncorrelated Strategies Fund (Continued)
Schedule of Investments (Continued) Financial Assets at Fair Value through Profit or Loss (continued) Contracts for Differences 0.53% (31 December 2018: 85.09%) (continued)
Units Security Description Counterparty Unrealised Gain US$
% of NetAssets
(67,551) Reliance Worldwide Corp Ltd Morgan Stanley 5,613 0.00
(6,435) Remy Cointreau SA Morgan Stanley 4,056 0.00
(1,900) RenaissanceRe Holdings Ltd Morgan Stanley 4,877 0.00
(2,800) Renasant Corp Morgan Stanley 2,302 0.00
(124,950) Renault SA Goldman Sachs International 0 0.00
6,693 Renault SA Morgan Stanley 1,301 0.00
18,800 Renesas Electronics Corp Morgan Stanley 457 0.00
3,523 Renishaw Plc Morgan Stanley 8,587 0.00
100 Rent-A-Center Inc Morgan Stanley 14 0.00
39,460 Rentokil Initial Plc Morgan Stanley 988 0.00
(7,700) Resideo Technologies Inc Morgan Stanley 487 0.00
75,708 Resolute Mining Ltd Morgan Stanley 7,600 0.00
3,700 Resorttrust Inc Morgan Stanley 151 0.00
(803,814) Restaurant Group Plc Morgan Stanley 0 0.00
14,200 Retail Properties of America Inc Morgan Stanley 1,469 0.00
(143,131) Rexel SA Goldman Sachs International 0 0.00
(142,718) Rexel SA Morgan Stanley 202 0.00
117,678 Rexnord Corp Morgan Stanley 0 0.00
(100) RH Morgan Stanley 902 0.00
41,306 Rheinmetall AG Morgan Stanley 0 0.00
(43,534) Rhi Magnesita NV Goldman Sachs International 0 0.00
(6,279) RHOEN-KLINIKUM AG Morgan Stanley 2,676 0.00
(330) RIB Software SE Morgan Stanley 89 0.00
(70,795) Rightmove Plc Morgan Stanley 0 0.00
1,392 RingCentral Inc Morgan Stanley 1,432 0.00
2,928 Ringkjoebing Landbobank A/S Morgan Stanley 8,110 0.00
(1,900) Rinnai Corp Morgan Stanley 1,089 0.00
3,856 Rio Tinto Ltd Morgan Stanley 1,299 0.00
(13,067) Rio Tinto Plc Morgan Stanley 5,806 0.00
14,391 Roche Holding AG Morgan Stanley 20,724 0.01
25,419 Rocket Internet SE Morgan Stanley 4,033 0.00
(29,238) Rockwell Automation Inc Morgan Stanley 0 0.00
(4,916) Roku Inc Morgan Stanley 0 0.00
(1,652,975) Rolls-Royce Holdings Plc Goldman Sachs International 194 0.00
(1,106) Roper Technologies Inc Morgan Stanley 0 0.00
4,300 Rothschild & Co Morgan Stanley 2,160 0.00
(905,772) Rotork Plc Goldman Sachs International 0 0.00
(50,610) Rotork Plc Morgan Stanley 0 0.00
4,400 Round One Corp Morgan Stanley 325 0.00

FINANCIAL STATEMENTS SCHEDULE OF INVESTMENTS
670 NEUBERGER BERMAN INVESTMENT FUNDS PLC
Neuberger Berman Uncorrelated Strategies Fund (Continued)
Schedule of Investments (Continued) Financial Assets at Fair Value through Profit or Loss (continued) Contracts for Differences 0.53% (31 December 2018: 85.09%) (continued)
Units Security Description Counterparty Unrealised Gain US$
% of NetAssets
(943,678) Royal Bank of Scotland Group Plc Morgan Stanley 18,574 0.00
19,666 Royal Dutch Shell Plc - A Shares - GBP Morgan Stanley 11,758 0.00
9,698 Royal Dutch Shell Plc - A Shares - EUR Morgan Stanley 2,259 0.00
(17,848) Royal Dutch Shell Plc - B Shares Morgan Stanley 5,856 0.00
6,200 Royal Gold Inc Morgan Stanley 41,397 0.01
(4,308) Royal Mail Plc Morgan Stanley 1,290 0.00
17,370 Royal Unibrew A/S Morgan Stanley 1,435 0.00
(8,731) RPM International Inc Morgan Stanley 370 0.00
41,075 RSA Insurance Group Plc Morgan Stanley 2,484 0.00
12,934 RTL Group SA Morgan Stanley 764 0.00
5,039 Rubis SCA Morgan Stanley 0 0.00
51,252 RWE AG Morgan Stanley 0 0.00
(480,333) Ryanair Holdings Plc Goldman Sachs International 0 0.00
(96,113) Ryanair Holdings Plc Morgan Stanley 0 0.00
1,516 S&P Global Inc Morgan Stanley 429 0.00
11,799 Saab AB Morgan Stanley 0 0.00
28,200 Sabra Health Care REIT Inc Morgan Stanley 7,005 0.00
(2,400) Sabre Corp Morgan Stanley 804 0.00
140,953 Sacyr SA Morgan Stanley 0 0.00
33,205 Safran SA Goldman Sachs International 0 0.00
9,497 Safran SA Morgan Stanley 0 0.00
848,291 Saga Plc Morgan Stanley 0 0.00
(112,532) Sage Group Plc Morgan Stanley 191 0.00
1,100 Saia Inc Morgan Stanley 789 0.00
(900) SailPoint Technologies Holding Inc Morgan Stanley 115 0.00
100 Saizeriya Co Ltd Morgan Stanley 18 0.00
2,600 Sakata Seed Corp Morgan Stanley 2,501 0.00
(1,700) salesforce.com Inc Morgan Stanley 998 0.00
12,290 Salmar ASA Morgan Stanley 847 0.00
(5,039) Salzgitter AG Morgan Stanley 0 0.00
812 Sampo Oyj Morgan Stanley 736 0.00
59,100 Samsonite International SA Morgan Stanley 5,518 0.00
(200) Sandstorm Gold Ltd Morgan Stanley 9 0.00
505,721 Sandvik AB Morgan Stanley 11,137 0.00
(3,400) Sankyu Inc Morgan Stanley 1,918 0.00
(5,462) Sanofi Morgan Stanley 1,889 0.00
(800) Sanrio Co Ltd Morgan Stanley 254 0.00
8,100 Santen Pharmaceutical Co Ltd Morgan Stanley 7,980 0.00
(11,000) Sanwa Holdings Corp Morgan Stanley 3,602 0.00

SCHEDULE OF INVESTMENTS FINANCIAL STATEMENTS
ANNUAL REPORT 2019 671
Neuberger Berman Uncorrelated Strategies Fund (Continued)
Schedule of Investments (Continued) Financial Assets at Fair Value through Profit or Loss (continued) Contracts for Differences 0.53% (31 December 2018: 85.09%) (continued)
Units Security Description Counterparty Unrealised Gain US$
% of NetAssets
(1,600) Sanyo Chemical Industries Ltd Morgan Stanley 2,976 0.00
6,700 Saputo Inc Morgan Stanley 3,263 0.00
4,968 Saracen Mineral Holdings Ltd Morgan Stanley 788 0.00
374,499 Saras SpA Morgan Stanley 336 0.00
(5,285) Sarepta Therapeutics Inc Morgan Stanley 0 0.00
900 Saul Centers Inc Morgan Stanley 910 0.00
2,800 Sawai Pharmaceutical Co Ltd Morgan Stanley 3,683 0.00
4,386 SBA Communications Corp Morgan Stanley 497 0.00
84,873 SBM Offshore NV Morgan Stanley 2,012 0.00
28,564 Scentre Group Morgan Stanley 1,700 0.00
711,042 Schaeffler AG Morgan Stanley 0 0.00
12,168 Schibsted ASA Morgan Stanley 446 0.00
(1,856) Schindler Holding AG Morgan Stanley 4,511 0.00
4,179 Schlumberger Ltd Morgan Stanley 0 0.00
96,962 Schneider Electric SE Goldman Sachs International 0 0.00
(10,810) Schneider Electric SE Morgan Stanley 0 0.00
4,265 Schoeller-Bleckmann Oilfield Equipment AG Morgan Stanley 0 0.00
(39) Schouw & Co A/S Morgan Stanley 14 0.00
(6,781) Schroders Plc Morgan Stanley 5,319 0.00
(2,100) Science Applications International Corp Morgan Stanley 1,389 0.00
(2,305) SCOR SE Morgan Stanley 576 0.00
3,300 Seacoast Banking Corp of Florida Morgan Stanley 33 0.00
7,646 Seagate Technology Plc Morgan Stanley 360 0.00
(17,908) SeaLink Travel Group Ltd Morgan Stanley 59 0.00
(8,000) SeaWorld Entertainment Inc Morgan Stanley 3,563 0.00
(2,700) Secom Co Ltd Morgan Stanley 1,652 0.00
2,950 Securitas AB Morgan Stanley 0 0.00
14,917 Segro Plc Morgan Stanley 3,203 0.00
(9,400) SEI Investments Co Morgan Stanley 6,122 0.00
(2,200) Seiko Epson Corp Morgan Stanley 1,194 0.00
(5,200) Sekisui House Ltd Morgan Stanley 1,227 0.00
1,291 Select Harvests Ltd Morgan Stanley 30 0.00
6,000 Semtech Corp Morgan Stanley 17,178 0.00
17,600 Senior Housing Properties Trust Morgan Stanley 16,308 0.00
(276,994) Senior Plc Goldman Sachs International 0 0.00
2,000 S-Enjoy Service Group Co Ltd Morgan Stanley 263 0.00
11,000 Senko Group Holdings Co Ltd Morgan Stanley 475 0.00
1,100 Sensata Technologies Holding Plc Morgan Stanley 326 0.00
2,826,075 Serco Group Plc Goldman Sachs International 0 0.00

FINANCIAL STATEMENTS SCHEDULE OF INVESTMENTS
672 NEUBERGER BERMAN INVESTMENT FUNDS PLC
Neuberger Berman Uncorrelated Strategies Fund (Continued)
Schedule of Investments (Continued) Financial Assets at Fair Value through Profit or Loss (continued) Contracts for Differences 0.53% (31 December 2018: 85.09%) (continued)
Units Security Description Counterparty Unrealised Gain US$
% of NetAssets
733,388 Serco Group Plc Morgan Stanley 0 0.00
5,900 Service Properties Trust Morgan Stanley 3,387 0.00
(7,873) SES SA Morgan Stanley 0 0.00
36,500 Seven Bank Ltd Morgan Stanley 38 0.00
14,500 Seven Generations Energy Ltd Morgan Stanley 4,853 0.00
12,300 SFL Corp Ltd Morgan Stanley 449 0.00
5,789 SFS Group AG Morgan Stanley 366 0.00
58 SGS SA Morgan Stanley 15,736 0.00
(92,907) Shaftesbury Plc Morgan Stanley 4,352 0.00
5,900 Shake Shack Inc Morgan Stanley 779 0.00
2,000 Shandong Gold Mining Co Ltd Morgan Stanley 66 0.00
(21) Shanghai Henlius Biotech Inc Morgan Stanley 1 0.00
23,600 Shanghai Pharmaceuticals Holding Co Ltd Morgan Stanley 182 0.00
(232,000) Shangri-La Asia Ltd Morgan Stanley 7,042 0.00
(300) Sharp Corp Morgan Stanley 151 0.00
22,300 Shaw Communications Inc Morgan Stanley 1,313 0.00
18,700 Shell Midstream Partners LP Morgan Stanley 3,170 0.00
5,900 Shenzhou International Group Holdings Ltd Morgan Stanley 6,008 0.00
1,046 Sherwin-Williams Co Morgan Stanley 3,972 0.00
(4,000) Shimachu Co Ltd Morgan Stanley 1,187 0.00
69,500 Shimao Property Holdings Ltd Morgan Stanley 6,774 0.00
(7,400) Shimizu Corp Morgan Stanley 404 0.00
(1,600) Shin-Etsu Chemical Co Ltd Morgan Stanley 3,124 0.00
(6,100) Shinsei Bank Ltd Morgan Stanley 2,613 0.00
4,200 Shionogi & Co Ltd Morgan Stanley 13,206 0.00
500 Ship Healthcare Holdings Inc Morgan Stanley 1,158 0.00
2,800 SHO-BOND Holdings Co Ltd Morgan Stanley 568 0.00
200 Shochiku Co Ltd Morgan Stanley 370 0.00
(200) Showa Corp Morgan Stanley 1 0.00
(3,700) Showa Denko KK Morgan Stanley 3,753 0.00
(468,000) Shun Tak Holdings Ltd Morgan Stanley 13,115 0.00
209 Shurgard Self Storage SA Morgan Stanley 39 0.00
1,633 Siemens AG Morgan Stanley 7,590 0.00
213,496 Siemens Gamesa Renewable Energy SA Morgan Stanley 605 0.00
(19,383) Siemens Healthineers AG Morgan Stanley 6,464 0.00
6,723 SIG Combibloc Group AG Morgan Stanley 5,108 0.00
82,725 SIG Plc Morgan Stanley 0 0.00
152,159 Signature Aviation Plc Morgan Stanley 0 0.00
(144,494) Signify NV Morgan Stanley 0 0.00

SCHEDULE OF INVESTMENTS FINANCIAL STATEMENTS
ANNUAL REPORT 2019 673
Neuberger Berman Uncorrelated Strategies Fund (Continued)
Schedule of Investments (Continued) Financial Assets at Fair Value through Profit or Loss (continued) Contracts for Differences 0.53% (31 December 2018: 85.09%) (continued)
Units Security Description Counterparty Unrealised Gain US$
% of NetAssets
3,146 Sika AG Morgan Stanley 0 0.00
900 Silicon Laboratories Inc Morgan Stanley 1,422 0.00
353 Siltronic AG Morgan Stanley 555 0.00
1,900 Silvercorp Metals Inc Morgan Stanley 138 0.00
13,361 SimCorp A/S Morgan Stanley 5 0.00
4,916 Simon Property Group Inc Morgan Stanley 0 0.00
2,800 Simpson Manufacturing Co Inc Morgan Stanley 5,726 0.00
19,000 Sinclair Broadcast Group Inc Morgan Stanley 39,347 0.01
143,000 Sino Biopharmaceutical Ltd Morgan Stanley 8,093 0.00
(214,000) Sino Land Co Ltd Morgan Stanley 1,505 0.00
349,000 Sino-Ocean Group Holding Ltd Morgan Stanley 4,088 0.00
(435,000) Sinopec Engineering Group Co Ltd Morgan Stanley 450 0.00
8,235 Sirius XM Holdings Inc Morgan Stanley 0 0.00
15,004 Six Flags Entertainment Corp Morgan Stanley 3,225 0.00
(7,656) Sixt SE Morgan Stanley 3,075 0.00
63,000 SJM Holdings Ltd Morgan Stanley 120 0.00
60,301 Skandinaviska Enskilda Banken AB Morgan Stanley 0 0.00
66,247 Skanska AB Morgan Stanley 0 0.00
(10,225) SKF AB Morgan Stanley 0 0.00
(9,300) Skylark Holdings Co Ltd Morgan Stanley 3,603 0.00
1,967 SL Green Realty Corp Morgan Stanley 0 0.00
(11,821) SLM Corp Morgan Stanley 3,520 0.00
(2,787) SmartGroup Corp Ltd Morgan Stanley 396 0.00
324,521 Smiths Group Plc Goldman Sachs International 0 0.00
(29,940) Smiths Group Plc Morgan Stanley 276 0.00
(46,646) Smurfit Kappa Group Plc Goldman Sachs International 0 0.00
7,323 Sodexo SA Morgan Stanley 2,467 0.00
8,400 SoftBank Group Corp Morgan Stanley 23,211 0.01
64,515 Softcat Plc Morgan Stanley 4,036 0.00
117,000 SOHO China Ltd Morgan Stanley 2,543 0.00
(2,149) SOITEC Morgan Stanley 2,476 0.00
(16,300) Sojitz Corp Morgan Stanley 512 0.00
6,500 SolarWinds Corp Morgan Stanley 1,246 0.00
1,161,228 Sonae SGPS SA Morgan Stanley 0 0.00
(7,825) Sonic Healthcare Ltd Morgan Stanley 1,279 0.00
1,800 Sonos Inc Morgan Stanley 2,007 0.00
3,422 Sonova Holding AG Morgan Stanley 29,334 0.01
(3,300) Sony Corp Morgan Stanley 391 0.00
43,464 Sophos Group Plc Morgan Stanley 2,399 0.00

FINANCIAL STATEMENTS SCHEDULE OF INVESTMENTS
674 NEUBERGER BERMAN INVESTMENT FUNDS PLC
Neuberger Berman Uncorrelated Strategies Fund (Continued)
Schedule of Investments (Continued) Financial Assets at Fair Value through Profit or Loss (continued) Contracts for Differences 0.53% (31 December 2018: 85.09%) (continued)
Units Security Description Counterparty Unrealised Gain US$
% of NetAssets
8,481 Sopra Steria Group Morgan Stanley 0 0.00
72,201 South32 Ltd Morgan Stanley 2,863 0.00
4,115 Southern Co Morgan Stanley 3,686 0.00
1,106 Southern Copper Corp Morgan Stanley 0 0.00
(1,800) Southside Bancshares Inc Morgan Stanley 77 0.00
9,600 Southwest Gas Holdings Inc Morgan Stanley 2,533 0.00
17,940 Spark New Zealand Ltd Morgan Stanley 614 0.00
(55,554) Spectris Plc Morgan Stanley 0 0.00
347 Spectrum Brands Holdings Inc Morgan Stanley 3 0.00
600 Spin Master Corp Morgan Stanley 197 0.00
(2,623) Spirax-Sarco Engineering Plc Morgan Stanley 2,252 0.00
1,200 Spire Inc Morgan Stanley 2,819 0.00
38,068 Spirent Communications Plc Morgan Stanley 14,645 0.00
(21,162) Spirit AeroSystems Holdings Inc Morgan Stanley 0 0.00
(4,283) Spotify Technology SA Morgan Stanley 533 0.00
(800) SPS Commerce Inc Morgan Stanley 1,401 0.00
(500) Square Enix Holdings Co Ltd Morgan Stanley 263 0.00
(8,973) Square Inc Morgan Stanley 0 0.00
(95,745) SSAB AB Morgan Stanley 0 0.00
(46,670) SSE Plc Morgan Stanley 11,041 0.00
(2,627) SSP Group Plc Morgan Stanley 523 0.00
4,400 SSR Mining Inc Morgan Stanley 11,390 0.00
(116,000) SSY Group Ltd Morgan Stanley 1,165 0.00
(191,330) St James's Place Plc Morgan Stanley 0 0.00
1,130 Stadler Rail AG Morgan Stanley 2,888 0.00
(183,627) Standard Life Aberdeen Plc Morgan Stanley 0 0.00
1,400 Standard Motor Products Inc Morgan Stanley 913 0.00
(1,800) Standex International Corp Morgan Stanley 1,793 0.00
(2,704) Stanley Black & Decker Inc Morgan Stanley 0 0.00
(5,700) Stanley Electric Co Ltd Morgan Stanley 430 0.00
1,200 Stantec Inc Morgan Stanley 255 0.00
700 Star Bulk Carriers Corp Morgan Stanley 235 0.00
5,962 Star Entertainment Grp Ltd Morgan Stanley 373 0.00
2,089 Starbucks Corp Morgan Stanley 0 0.00
4,900 Starts Corp Inc Morgan Stanley 1,033 0.00
(698) State Street Corp Morgan Stanley 2,285 0.00
(51,905) Steadfast Group Ltd Morgan Stanley 2,320 0.00
(4,033) Steel Dynamics Inc Morgan Stanley 2,797 0.00
(9,500) Steelcase Inc Morgan Stanley 7,362 0.00
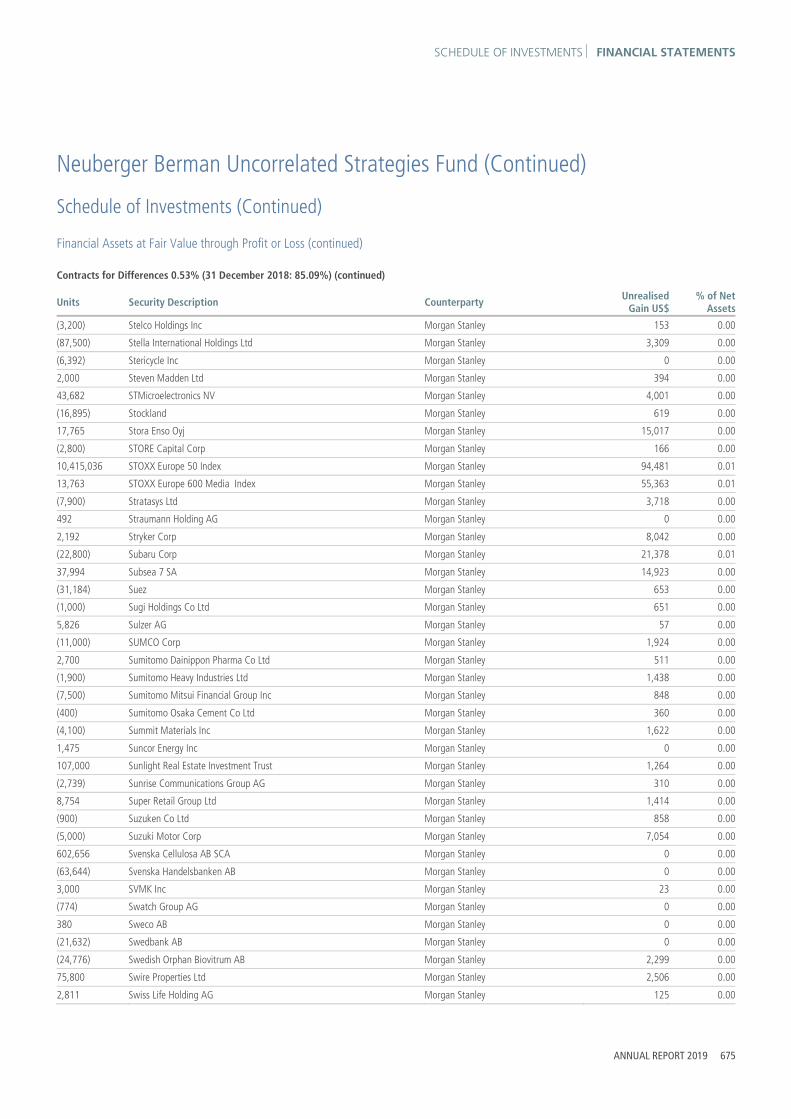
SCHEDULE OF INVESTMENTS FINANCIAL STATEMENTS
ANNUAL REPORT 2019 675
Neuberger Berman Uncorrelated Strategies Fund (Continued)
Schedule of Investments (Continued) Financial Assets at Fair Value through Profit or Loss (continued) Contracts for Differences 0.53% (31 December 2018: 85.09%) (continued)
Units Security Description Counterparty Unrealised Gain US$
% of NetAssets
(3,200) Stelco Holdings Inc Morgan Stanley 153 0.00
(87,500) Stella International Holdings Ltd Morgan Stanley 3,309 0.00
(6,392) Stericycle Inc Morgan Stanley 0 0.00
2,000 Steven Madden Ltd Morgan Stanley 394 0.00
43,682 STMicroelectronics NV Morgan Stanley 4,001 0.00
(16,895) Stockland Morgan Stanley 619 0.00
17,765 Stora Enso Oyj Morgan Stanley 15,017 0.00
(2,800) STORE Capital Corp Morgan Stanley 166 0.00
10,415,036 STOXX Europe 50 Index Morgan Stanley 94,481 0.01
13,763 STOXX Europe 600 Media Index Morgan Stanley 55,363 0.01
(7,900) Stratasys Ltd Morgan Stanley 3,718 0.00
492 Straumann Holding AG Morgan Stanley 0 0.00
2,192 Stryker Corp Morgan Stanley 8,042 0.00
(22,800) Subaru Corp Morgan Stanley 21,378 0.01
37,994 Subsea 7 SA Morgan Stanley 14,923 0.00
(31,184) Suez Morgan Stanley 653 0.00
(1,000) Sugi Holdings Co Ltd Morgan Stanley 651 0.00
5,826 Sulzer AG Morgan Stanley 57 0.00
(11,000) SUMCO Corp Morgan Stanley 1,924 0.00
2,700 Sumitomo Dainippon Pharma Co Ltd Morgan Stanley 511 0.00
(1,900) Sumitomo Heavy Industries Ltd Morgan Stanley 1,438 0.00
(7,500) Sumitomo Mitsui Financial Group Inc Morgan Stanley 848 0.00
(400) Sumitomo Osaka Cement Co Ltd Morgan Stanley 360 0.00
(4,100) Summit Materials Inc Morgan Stanley 1,622 0.00
1,475 Suncor Energy Inc Morgan Stanley 0 0.00
107,000 Sunlight Real Estate Investment Trust Morgan Stanley 1,264 0.00
(2,739) Sunrise Communications Group AG Morgan Stanley 310 0.00
8,754 Super Retail Group Ltd Morgan Stanley 1,414 0.00
(900) Suzuken Co Ltd Morgan Stanley 858 0.00
(5,000) Suzuki Motor Corp Morgan Stanley 7,054 0.00
602,656 Svenska Cellulosa AB SCA Morgan Stanley 0 0.00
(63,644) Svenska Handelsbanken AB Morgan Stanley 0 0.00
3,000 SVMK Inc Morgan Stanley 23 0.00
(774) Swatch Group AG Morgan Stanley 0 0.00
380 Sweco AB Morgan Stanley 0 0.00
(21,632) Swedbank AB Morgan Stanley 0 0.00
(24,776) Swedish Orphan Biovitrum AB Morgan Stanley 2,299 0.00
75,800 Swire Properties Ltd Morgan Stanley 2,506 0.00
2,811 Swiss Life Holding AG Morgan Stanley 125 0.00

FINANCIAL STATEMENTS SCHEDULE OF INVESTMENTS
676 NEUBERGER BERMAN INVESTMENT FUNDS PLC
Neuberger Berman Uncorrelated Strategies Fund (Continued)
Schedule of Investments (Continued) Financial Assets at Fair Value through Profit or Loss (continued) Contracts for Differences 0.53% (31 December 2018: 85.09%) (continued)
Units Security Description Counterparty Unrealised Gain US$
% of NetAssets
(12,355) Swiss Re AG Morgan Stanley 2,501 0.00
6,500 Switch Inc Morgan Stanley 952 0.00
87,732 Sydbank A/S Morgan Stanley 5,254 0.00
(2,400) Sykes Enterprises Inc Morgan Stanley 454 0.00
76,317 Symrise AG Morgan Stanley 0 0.00
(5,900) Synaptics Inc Morgan Stanley 2,202 0.00
2,300 Synovus Financial Corp Morgan Stanley 578 0.00
2,458 Sysco Corp Morgan Stanley 0 0.00
(400) Sysmex Corp Morgan Stanley 253 0.00
1,933 T Rowe Price Group Inc Morgan Stanley 355 0.00
(54,396) Tabcorp Holdings Ltd Morgan Stanley 4,087 0.00
28,488 TAG Immobilien AG Morgan Stanley 1,148 0.00
(200) Taiheiyo Cement Corp Morgan Stanley 233 0.00
(3,500) Taisho Pharmaceutical Holdings Co Ltd Morgan Stanley 200 0.00
(800) Takasago Thermal Engineering Co Ltd Morgan Stanley 115 0.00
(347) Takeaway.com NV Morgan Stanley 0 0.00
(5,000) Takeda Pharmaceutical Co Ltd Morgan Stanley 4,723 0.00
4,056 Take-Two Interactive Software Inc Morgan Stanley 0 0.00
(646,251) TalkTalk Telecom Group Plc Morgan Stanley 5,411 0.00
37,686 Tapestry Inc Morgan Stanley 12,977 0.00
4,200 Targa Resources Corp Morgan Stanley 7,333 0.00
1,721 Target Corp Morgan Stanley 0 0.00
(22,313) Tassal Group Ltd Morgan Stanley 678 0.00
35,244 Tate & Lyle Plc Morgan Stanley 117 0.00
26,400 Taubman Centers Inc Morgan Stanley 21,597 0.01
120,039 Taylor Wimpey Plc Morgan Stanley 11,942 0.00
3,500 TC Energy Corp Morgan Stanley 5,341 0.00
(19,600) TD Ameritrade Holding Corp Morgan Stanley 33,470 0.01
400 TE Connectivity Ltd Morgan Stanley 194 0.00
(52,725) TechnipFMC Plc Morgan Stanley 20,957 0.01
13,583 TechnipFMC Plc - EUR Morgan Stanley 14,123 0.00
(1,300) TechnoPro Holdings Inc Morgan Stanley 130 0.00
7,000 Techtronic Industries Co Ltd Morgan Stanley 613 0.00
4,200 Teck Resources Ltd Morgan Stanley 617 0.00
10,514 Tecnicas Reunidas SA Morgan Stanley 0 0.00
4,200 Teekay LNG Partners LP Morgan Stanley 756 0.00
12,168 Tele2 AB Morgan Stanley 0 0.00
(19,297) Telefonaktiebolaget LM Ericsson Morgan Stanley 0 0.00
(46,619) Telefonica Deutschland Holding AG Morgan Stanley 1,393 0.00

SCHEDULE OF INVESTMENTS FINANCIAL STATEMENTS
ANNUAL REPORT 2019 677
Neuberger Berman Uncorrelated Strategies Fund (Continued)
Schedule of Investments (Continued) Financial Assets at Fair Value through Profit or Loss (continued) Contracts for Differences 0.53% (31 December 2018: 85.09%) (continued)
Units Security Description Counterparty Unrealised Gain US$
% of NetAssets
(17,835) Telefonica SA Morgan Stanley 0 0.00
40,711 Telenet Group Holding NV Morgan Stanley 10,452 0.00
11,389 Teleperformance Morgan Stanley 0 0.00
(5,408) Television Francaise 1 Morgan Stanley 0 0.00
(265,234) Telia Co AB Morgan Stanley 0 0.00
(102,033) Telstra Corp Ltd Morgan Stanley 7,704 0.00
(1,300) Tempur Sealy International Inc Morgan Stanley 2,278 0.00
8,600 Tenable Holdings Inc Morgan Stanley 3,269 0.00
2,800 Tencent Holdings Ltd Morgan Stanley 495 0.00
(7,800) Tenet Healthcare Corp Morgan Stanley 161 0.00
7,100 Teradata Corp Morgan Stanley 547 0.00
(400) Teradyne Inc Morgan Stanley 307 0.00
(3,900) Terex Corp Morgan Stanley 355 0.00
14,200 TerraForm Power Inc Morgan Stanley 2,931 0.00
3,481 Terveystalo Oyj Morgan Stanley 2,439 0.00
(640,169) Tesco Plc Morgan Stanley 12,532 0.00
39,653 Tessenderlo Group SA Morgan Stanley 959 0.00
(11,062) Teva Pharmaceutical Industries Ltd Morgan Stanley 0 0.00
21,400 Textron Inc Morgan Stanley 3,410 0.00
1,300 TFI International Inc Morgan Stanley 238 0.00
11,666 Thales SA Morgan Stanley 5,626 0.00
(337) Thermo Fisher Scientific Inc Morgan Stanley 165 0.00
(9,500) THK Co Ltd Morgan Stanley 11,585 0.00
2,704 Thomson Reuters Corp Morgan Stanley 0 0.00
(19,542) Thule Group AB Morgan Stanley 0 0.00
2,808 TI Fluid Systems Plc Morgan Stanley 665 0.00
16,565 TietoEVRY Oyj Morgan Stanley 186 0.00
55,559 Timken Co Morgan Stanley 0 0.00
(3,200) TIS Inc Morgan Stanley 1,455 0.00
7,989 TJX Cos Inc Morgan Stanley 0 0.00
2,458 T-Mobile US Inc Morgan Stanley 0 0.00
200 TMX Group Ltd Morgan Stanley 340 0.00
8,200 Toho Co Ltd Morgan Stanley 9,703 0.00
2,500 Toho Gas Co Ltd Morgan Stanley 242 0.00
(400) Toho Holdings Co Ltd Morgan Stanley 97 0.00
(6,800) Tohoku Electric Power Co Inc Morgan Stanley 1,097 0.00
(2,500) Tokai Rika Co Ltd Morgan Stanley 2,495 0.00
(100) Tokio Marine Holdings Inc Morgan Stanley 90 0.00
(1,800) Tokuyama Corp Morgan Stanley 1,918 0.00

FINANCIAL STATEMENTS SCHEDULE OF INVESTMENTS
678 NEUBERGER BERMAN INVESTMENT FUNDS PLC
Neuberger Berman Uncorrelated Strategies Fund (Continued)
Schedule of Investments (Continued) Financial Assets at Fair Value through Profit or Loss (continued) Contracts for Differences 0.53% (31 December 2018: 85.09%) (continued)
Units Security Description Counterparty Unrealised Gain US$
% of NetAssets
(1,000) Tokyo Century Corp Morgan Stanley 948 0.00
(2,700) Tokyo Dome Corp Morgan Stanley 60 0.00
(92,800) Tokyo Electric Power Co Holdings Inc Morgan Stanley 11,761 0.00
(2,700) Tokyo Gas Co Ltd Morgan Stanley 206 0.00
(1,700) Tokyo Ohka Kogyo Co Ltd Morgan Stanley 3,378 0.00
(1,100) Tokyo Steel Manufacturing Co Ltd Morgan Stanley 124 0.00
(6,900) Tokyo Tatemono Co Ltd Morgan Stanley 271 0.00
(1,900) Tokyu Corp Morgan Stanley 619 0.00
(29,500) Tokyu Fudosan Holdings Corp Morgan Stanley 2,320 0.00
(10,500) Toll Brothers Inc Morgan Stanley 47 0.00
117,376 TomTom NV Morgan Stanley 0 0.00
24,800 Tongcheng-Elong Holdings Ltd Morgan Stanley 4,100 0.00
4,400 Toppan Printing Co Ltd Morgan Stanley 140 0.00
18,100 TORC Oil & Gas Ltd Morgan Stanley 3,777 0.00
2,800 Torex Gold Resources Inc Morgan Stanley 4,544 0.00
2,700 Toridoll Holdings Corp Morgan Stanley 2,310 0.00
(3,400) Toro Co Morgan Stanley 169 0.00
700 Toromont Industries Ltd Morgan Stanley 1,747 0.00
(10,900) Toronto-Dominion Bank Morgan Stanley 4,501 0.00
(7,100) Toshiba Corp Morgan Stanley 2,904 0.00
1,200 Tourmaline Oil Corp Morgan Stanley 1,073 0.00
(27,000) Towngas China Co Ltd Morgan Stanley 1,170 0.00
(3,100) Toyo Seikan Group Holdings Ltd Morgan Stanley 2,690 0.00
(1,200) Toyo Suisan Kaisha Ltd Morgan Stanley 365 0.00
(8,200) Toyo Tire Corp Morgan Stanley 5,168 0.00
(14,000) Toyota Boshoku Corp Morgan Stanley 8,428 0.00
(2,000) Toyota Tsusho Corp Morgan Stanley 2,730 0.00
(268,021) TP ICAP Plc Morgan Stanley 0 0.00
(129,955) Trainline Plc Morgan Stanley 0 0.00
12,800 TransAlta Corp Morgan Stanley 2,309 0.00
1,700 Transcontinental Inc Morgan Stanley 1,170 0.00
6,166 TransDigm Group Inc Morgan Stanley 9,758 0.00
(3,135) Transurban Group Morgan Stanley 395 0.00
983 Travelers Cos Inc Morgan Stanley 0 0.00
(5,867) Treasury Wine Estates Ltd Morgan Stanley 479 0.00
(165,450) Trelleborg AB Morgan Stanley 0 0.00
(1,100) TriCo Bancshares Morgan Stanley 37 0.00
(4,489) Trimble Inc Morgan Stanley 646 0.00
(11,200) Trinity Industries Inc Morgan Stanley 4,291 0.00

SCHEDULE OF INVESTMENTS FINANCIAL STATEMENTS
ANNUAL REPORT 2019 679
Neuberger Berman Uncorrelated Strategies Fund (Continued)
Schedule of Investments (Continued) Financial Assets at Fair Value through Profit or Loss (continued) Contracts for Differences 0.53% (31 December 2018: 85.09%) (continued)
Units Security Description Counterparty Unrealised Gain US$
% of NetAssets
639,802 Tritax Big Box REIT Plc Morgan Stanley 3,741 0.00
1,800 Triumph Group Inc Morgan Stanley 199 0.00
1,683 Truist Financial Corp Morgan Stanley 1,357 0.00
(6,500) Trusco Nakayama Corp Morgan Stanley 7,418 0.00
22,737 Tryg A/S Morgan Stanley 250 0.00
(1,600) TS Tech Co Ltd Morgan Stanley 1,151 0.00
28,000 Tsingtao Brewery Co Ltd Morgan Stanley 3,132 0.00
(500) Tsumura & Co Morgan Stanley 217 0.00
(18,940) TUI AG Morgan Stanley 9,295 0.00
218,538 Tullow Oil Plc Morgan Stanley 0 0.00
238,600 Turquoise Hill Resources Ltd Morgan Stanley 631 0.00
(3,000) TV Asahi Holdings Corp Morgan Stanley 461 0.00
(3,664) Twilio Inc Morgan Stanley 254 0.00
14,155 Tyson Foods Inc Morgan Stanley 765 0.00
(1,700) UACJ Corp Morgan Stanley 1,714 0.00
(10,719) Ubisoft Entertainment SA Morgan Stanley 5,710 0.00
44,642 UDG Healthcare Plc Morgan Stanley 202 0.00
3,300 UDR Inc Morgan Stanley 1,254 0.00
6,500 UGI Corp Morgan Stanley 3,028 0.00
2,089 Ulta Beauty Inc Morgan Stanley 0 0.00
282,101 Ultra Electronics Holdings Plc Goldman Sachs International 0 0.00
68,878 Ultra Electronics Holdings Plc Morgan Stanley 585 0.00
(400) UMB Financial Corp Morgan Stanley 106 0.00
136,087 Umicore SA Morgan Stanley 0 0.00
(28,600) Umpqua Holdings Corp Morgan Stanley 4,512 0.00
17,650 Unibail-Rodamco-Westfield Morgan Stanley 2,212 0.00
19,097 UniCredit SpA Morgan Stanley 238 0.00
(12,456) Unilever NV Morgan Stanley 44,878 0.01
33,500 Unilever Plc Morgan Stanley 38,678 0.01
227,544 Unipol Gruppo SpA Morgan Stanley 1,580 0.00
17,330 UNIQA Insurance Group AG Morgan Stanley 0 0.00
60,986 UNITE Group Plc Morgan Stanley 327 0.00
(4,916) United Airlines Holdings Inc Morgan Stanley 0 0.00
13,100 United Bankshares Inc Morgan Stanley 181 0.00
13,500 United Community Banks Inc Morgan Stanley 25 0.00
(41,051) United Internet AG Morgan Stanley 0 0.00
10,000 United Laboratories International Holdings Ltd Morgan Stanley 92 0.00
(2,023) United Parcel Service Inc Morgan Stanley 2,899 0.00
22,402 United Rentals Inc Morgan Stanley 0 0.00

FINANCIAL STATEMENTS SCHEDULE OF INVESTMENTS
680 NEUBERGER BERMAN INVESTMENT FUNDS PLC
Neuberger Berman Uncorrelated Strategies Fund (Continued)
Schedule of Investments (Continued) Financial Assets at Fair Value through Profit or Loss (continued) Contracts for Differences 0.53% (31 December 2018: 85.09%) (continued)
Units Security Description Counterparty Unrealised Gain US$
% of NetAssets
4,900 United States Cellular Corp Morgan Stanley 7,623 0.00
(9,095) United States Steel Corp Morgan Stanley 0 0.00
(1,091) United Technologies Corp Morgan Stanley 0 0.00
4,916 United Therapeutics Corp Morgan Stanley 0 0.00
(15,318) United Utilities Group Plc Morgan Stanley 0 0.00
(995) UnitedHealth Group Inc Morgan Stanley 257 0.00
1,475 Universal Display Corp Morgan Stanley 0 0.00
1,100 Universal Health Realty Income Trust Morgan Stanley 1,647 0.00
3,200 Universal Health Services Inc Morgan Stanley 4,090 0.00
3,200 Unizo Holdings Co Ltd Morgan Stanley 6,903 0.00
21,100 Unum Group Morgan Stanley 3,187 0.00
262,894 UPM-Kymmene Oyj Morgan Stanley 7,936 0.00
34,000 Urban Edge Properties Morgan Stanley 5,201 0.00
10,200 Urban Outfitters Inc Morgan Stanley 5,204 0.00
(492) US Bancorp Morgan Stanley 0 0.00
(2,100) US Foods Holding Corp Morgan Stanley 20 0.00
3,100 UT Group Co Ltd Morgan Stanley 1,875 0.00
1,613 Vail Resorts Inc Morgan Stanley 0 0.00
11,300 Valaris Plc Morgan Stanley 13,899 0.00
52,175 Valmet Oyj Morgan Stanley 2,054 0.00
5,600 Valor Holdings Co Ltd Morgan Stanley 3,889 0.00
369 Varian Medical Systems Inc Morgan Stanley 0 0.00
7,620 Varta AG Morgan Stanley 0 0.00
3,381 VAT Group AG Morgan Stanley 587 0.00
58,200 Veloxis Pharmaceuticals A/S Morgan Stanley 693 0.00
(2,400) Ventas Inc Morgan Stanley 29 0.00
8,692 Veolia Environnement SA Morgan Stanley 442 0.00
(223,045) Veoneer Inc Morgan Stanley 0 0.00
(85) VeriSign Inc Morgan Stanley 111 0.00
(1,598) Verisk Analytics Inc Morgan Stanley 0 0.00
1,106 Vertex Pharmaceuticals Inc Morgan Stanley 0 0.00
(67,541) Vestas Wind Systems A/S Morgan Stanley 3,143 0.00
516,748 Vesuvius Plc Goldman Sachs International 0 0.00
108,527 Vesuvius Plc Morgan Stanley 0 0.00
(5,604) VGP NV Morgan Stanley 3,184 0.00
1,500 ViaSat Inc Morgan Stanley 1,379 0.00
18,184 Vicat SA Morgan Stanley 699 0.00
(20,752) Victrex Plc Morgan Stanley 1,916 0.00
1,599 Vidrala SA Morgan Stanley 7,366 0.00

SCHEDULE OF INVESTMENTS FINANCIAL STATEMENTS
ANNUAL REPORT 2019 681
Neuberger Berman Uncorrelated Strategies Fund (Continued)
Schedule of Investments (Continued) Financial Assets at Fair Value through Profit or Loss (continued) Contracts for Differences 0.53% (31 December 2018: 85.09%) (continued)
Units Security Description Counterparty Unrealised Gain US$
% of NetAssets
13,766 Vienna Insurance Group AG Wiener Versicherung Gruppe Morgan Stanley 0 0.00
(1,259) Vifor Pharma AG Morgan Stanley 580 0.00
14,749 Vinci SA Morgan Stanley 0 0.00
(48,000) Vinda International Holdings Ltd Morgan Stanley 5,752 0.00
(524,734) Virgin Money UK Plc Morgan Stanley 10,095 0.00
(51,024) Virgin Money UK Plc - CDI Morgan Stanley 16,383 0.00
983 Visa Inc Morgan Stanley 0 0.00
20,835 Viscofan SA Morgan Stanley 3,060 0.00
(9,800) Vishay Intertechnology Inc Morgan Stanley 415 0.00
(56,000) Vitasoy International Holdings Ltd Morgan Stanley 6,235 0.00
5,272 Vivendi SA Morgan Stanley 5 0.00
(7,700) Vivint Solar Inc Morgan Stanley 4,255 0.00
6,725 VMware Inc Morgan Stanley 4,012 0.00
233,111 Vodafone Group Plc Morgan Stanley 15,614 0.00
(29,608) voestalpine AG Morgan Stanley 0 0.00
(38,121) Volkswagen AG Morgan Stanley 0 0.00
742,070 Volvo AB Morgan Stanley 0 0.00
737 Vornado Realty Trust Morgan Stanley 0 0.00
1,700 Vulcan Materials Co Morgan Stanley 264 0.00
9,900 Wabash National Corp Morgan Stanley 1,545 0.00
(36,893) Wacker Chemie AG Morgan Stanley 0 0.00
(5,765) Wacker Neuson SE Morgan Stanley 1,772 0.00
(3,200) Wacoal Holdings Corp Morgan Stanley 2,649 0.00
(1,500) Waddell & Reed Financial Inc Morgan Stanley 136 0.00
3,400 Walgreens Boots Alliance Inc Morgan Stanley 3,409 0.00
(1,056) Walmart Inc Morgan Stanley 0 0.00
(2,365) Walt Disney Co Morgan Stanley 0 0.00
1,427 Warehouses De Pauw CVA Morgan Stanley 12,197 0.00
(20,200) Warrior Met Coal Inc Morgan Stanley 5,263 0.00
(5,361) Washington H Soul Pattinson & Co Ltd Morgan Stanley 3,307 0.00
(900) Washington Trust Bancorp Inc Morgan Stanley 244 0.00
500 Waste Connections Inc Morgan Stanley 283 0.00
6,889 Waste Management Inc Morgan Stanley 1,624 0.00
(500) Waters Corp Morgan Stanley 55 0.00
(20,945) Watsco Inc Morgan Stanley 493 0.00
600 Watts Water Technologies Inc Morgan Stanley 319 0.00
(1,106) Wayfair Inc Morgan Stanley 0 0.00
2,858 Webster Ltd Morgan Stanley 76 0.00
(11,548) WEC Energy Group Inc Morgan Stanley 93 0.00

FINANCIAL STATEMENTS SCHEDULE OF INVESTMENTS
682 NEUBERGER BERMAN INVESTMENT FUNDS PLC
Neuberger Berman Uncorrelated Strategies Fund (Continued)
Schedule of Investments (Continued) Financial Assets at Fair Value through Profit or Loss (continued) Contracts for Differences 0.53% (31 December 2018: 85.09%) (continued)
Units Security Description Counterparty Unrealised Gain US$
% of NetAssets
51,000 Weichai Power Co Ltd Morgan Stanley 8,800 0.00
33,000 Weimob Inc Morgan Stanley 172 0.00
(3,030) Weir Group Plc Goldman Sachs International 135 0.00
(580,947) Weir Group Plc Morgan Stanley 17,371 0.00
900 WellCare Health Plans Inc Morgan Stanley 6,626 0.00
6,731 Wells Fargo & Co Morgan Stanley 671 0.00
6,500 Welltower Inc Morgan Stanley 10,473 0.00
4,039 Wereldhave NV Morgan Stanley 0 0.00
36,814 Werner Enterprises Inc Morgan Stanley 112 0.00
100 Wesdome Gold Mines Ltd Morgan Stanley 73 0.00
(1,200) West Japan Railway Co Morgan Stanley 1,180 0.00
1,300 West Pharmaceutical Services Inc Morgan Stanley 3,376 0.00
5,777 Western Union Co Morgan Stanley 0 0.00
4,361 Westinghouse Air Brake Technologies Corp Morgan Stanley 10,380 0.00
7,292 Westlake Chemical Corp Morgan Stanley 970 0.00
(4,285) Westpac Banking Corp Morgan Stanley 72 0.00
267,991 Westrock Co Morgan Stanley 0 0.00
(21,017) Weyerhaeuser Co Morgan Stanley 0 0.00
18,191 WH Smith Plc Morgan Stanley 0 0.00
61,000 Wharf Real Estate Investment Co Ltd Morgan Stanley 32,478 0.01
(18,805) Wheaton Precious Metals Corp Morgan Stanley 0 0.00
16,000 Wheelock & Co Ltd Morgan Stanley 3,023 0.00
(9,454) Whirlpool Corp Morgan Stanley 0 0.00
(45,595) Whitbread Plc Morgan Stanley 1,185 0.00
700 Whitecap Resources Inc Morgan Stanley 1 0.00
8,713 Wienerberger AG Morgan Stanley 0 0.00
325,952 William Hill Plc Morgan Stanley 0 0.00
6,587 Williams-Sonoma Inc Morgan Stanley 5,610 0.00
(3,381) Willis Towers Watson Plc Morgan Stanley 613 0.00
7,618 Wirecard AG Morgan Stanley 0 0.00
20,583 Wolters Kluwer NV Morgan Stanley 7,207 0.00
1,900 Workday Inc Morgan Stanley 2,498 0.00
2,000 Workiva Inc Morgan Stanley 720 0.00
(1,852) Workspace Group Plc Morgan Stanley 58 0.00
1,967 World Wrestling Entertainment Inc Morgan Stanley 0 0.00
22,634 WPP Plc Morgan Stanley 8,452 0.00
900 WR Berkley Corp Morgan Stanley 502 0.00
32,702 WR Grace & Co Morgan Stanley 705 0.00
7,300 WSFS Financial Corp Morgan Stanley 289 0.00

SCHEDULE OF INVESTMENTS FINANCIAL STATEMENTS
ANNUAL REPORT 2019 683
Neuberger Berman Uncorrelated Strategies Fund (Continued)
Schedule of Investments (Continued) Financial Assets at Fair Value through Profit or Loss (continued) Contracts for Differences 0.53% (31 December 2018: 85.09%) (continued)
Units Security Description Counterparty Unrealised Gain US$
% of NetAssets
500 WSP Global Inc Morgan Stanley 172 0.00
(2,000) Wuxi Biologics Cayman Inc Morgan Stanley 119 0.00
11,876 Wyndham Destinations Inc Morgan Stanley 119 0.00
(8,114) Wynn Resorts Ltd Morgan Stanley 673 0.00
(15,075) Xcel Energy Inc Morgan Stanley 727 0.00
16,500 Xenia Hotels & Resorts Inc Morgan Stanley 4,138 0.00
1,495 Xero Ltd Morgan Stanley 520 0.00
(737) Xerox Holdings Corp Morgan Stanley 0 0.00
10,500 Xiabuxiabu Catering Management China Holdings Co Ltd Morgan Stanley 1,123 0.00
64,000 Xinyi Energy Holdings Ltd Morgan Stanley 828 0.00
12,000 Xinyi Solar Holdings Ltd Morgan Stanley 16 0.00
6,700 Xylem Inc Morgan Stanley 8,603 0.00
(2,700) Yamaha Motor Co Ltd Morgan Stanley 2,844 0.00
2,300 Yamana Gold Inc Morgan Stanley 881 0.00
(9,500) Yamato Holdings Co Ltd Morgan Stanley 1,645 0.00
3,300 Yamazaki Baking Co Ltd Morgan Stanley 444 0.00
430,000 Yanzhou Coal Mining Co Ltd Morgan Stanley 2,919 0.00
(3,000) Yaskawa Electric Corp Morgan Stanley 4,774 0.00
20,700 Yext Inc Morgan Stanley 8,285 0.00
66,739 YIT Oyj Morgan Stanley 200 0.00
4,500 Yoshinoya Holdings Co Ltd Morgan Stanley 8,455 0.00
624,000 Yuexiu Property Co Ltd Morgan Stanley 4,063 0.00
1,767 Yum! Brands Inc Morgan Stanley 14 0.00
18,500 Z Holdings Corp Morgan Stanley 6,784 0.00
(31,120) Zalando SE Morgan Stanley 8,551 0.00
571,000 Zall Smart Commerce Group Ltd Morgan Stanley 2,221 0.00
24,082 Zardoya Otis SA Morgan Stanley 431 0.00
(500) Zebra Technologies Corp Morgan Stanley 5 0.00
2,700 Zenkoku Hosho Co Ltd Morgan Stanley 1,227 0.00
6,900 Zensho Holdings Co Ltd Morgan Stanley 2,436 0.00
(8,000) Zeon Corp Morgan Stanley 4,070 0.00
(61,600) ZhongAn Online P&C Insurance Co Ltd Morgan Stanley 15,712 0.00
(28,000) Zhou Hei Ya International Holdings Co Ltd Morgan Stanley 948 0.00
(16,716) Zillow Group Inc Morgan Stanley 0 0.00
(1,352) Zimmer Biomet Holdings Inc Morgan Stanley 0 0.00
4,500 Zions Bancorp NA Morgan Stanley 2,249 0.00
2,552 Zoetis Inc Morgan Stanley 5,005 0.00
300 Zoom Video Communications Inc Morgan Stanley 507 0.00
55,400 Zoomlion Heavy Industry Science and Technology Co Ltd Morgan Stanley 2,645 0.00

FINANCIAL STATEMENTS SCHEDULE OF INVESTMENTS
684 NEUBERGER BERMAN INVESTMENT FUNDS PLC
Neuberger Berman Uncorrelated Strategies Fund (Continued)
Schedule of Investments (Continued) Financial Assets at Fair Value through Profit or Loss (continued) Contracts for Differences 0.53% (31 December 2018: 85.09%) (continued)
Units Security Description Counterparty Unrealised Gain US$
% of NetAssets
300 ZOZO Inc Morgan Stanley 30 0.00
(1,800) Zscaler Inc Morgan Stanley 1,893 0.00
7,000 ZTE Corp Morgan Stanley 538 0.00
6,400 Zuora Inc Morgan Stanley 89 0.00
76 Zurich Insurance Group AG Morgan Stanley 7,503 0.00
Total Unrealised Gain on Contracts for Differences ∞ 6,445,844 0.53
Purchased Swaptions 0.03% (31 December 2018: 0.15%)
Number of Contracts
Expiration Date Description Counterparty Fair Value
US$ % of Net
Assets
Call Swaptions
500,000,000 23/03/20 Constant Maturity Swap on spread between 30-year and 2-year USD Constant Maturity Swap rates, strike 0.6%
Goldman Sachs International 89,800 0.01
300,000,000 19/03/20 Constant Maturity Swap on spread between 30-year and 5-year USD Constant Maturity Swap rates, strike 0.5%
Goldman Sachs International 31,035 0.00
Put Swaptions
200,000,000 3/07/23 Constant Maturity Swap on spread between 10-year and 2-year USD Constant Maturity Swap rates, strike 0.5%
Goldman Sachs International 272,308 0.02
Total Unrealised Gain on Purchased Swaptions ∞ 393,143 0.03
Fair Value % of Net
US$ Assets
Total Financial Assets at Fair Value through Profit or Loss 919,974,202 76.96
Financial Liabilities at Fair Value through Profit or Loss Forward Currency Contracts (0.42%) (31 December 2018: (2.15%))
Amount Receivable
Amount Payable Maturity Date Counterparty Contracts Unrealised
Loss US$ % of Net
Assets
AUD 720,000 ¥ 54,882,000 18/03/2020 UBS AG 2 (128) (0.00)
BRL 430,000 US$ 106,667 18/03/2020 BNP Paribas 1 (105) (0.00)
CLP 1,462,930,000 US$ 1,956,920 18/03/2020 BNP Paribas 4 (9,851) (0.00)
€ 470,000 US$ 530,216 18/03/2020 Société Générale 1 (146) (0.00)
€ 5,073,208 PLN 21,790,000 18/03/2020 Société Générale 11 (32,881) (0.01)
€ 4,075,041 PLN 17,450,000 18/03/2020 UBS AG 9 (12,480) (0.00)
£ 1,940,000 US$ 2,594,411 18/03/2020 Société Générale 4 (19,061) (0.00)
HUF 390,860,000 US$ 1,335,633 18/03/2020 Société Générale 1 (3,940) (0.00)

SCHEDULE OF INVESTMENTS FINANCIAL STATEMENTS
ANNUAL REPORT 2019 685
Neuberger Berman Uncorrelated Strategies Fund (Continued)
Schedule of Investments (Continued) Financial Liabilities at Fair Value through Profit or Loss (continued) Forward Currency Contracts (0.42%) (31 December 2018: (2.15%)) (continued)
Amount Receivable
Amount Payable Maturity Date Counterparty Contracts Unrealised
Loss US$% of Net
Assets
INR 16,650,000 US$ 232,801 18/03/2020 BNP Paribas 1 (842) (0.00)
INR 941,100,000 US$ 13,161,078 18/03/2020 Société Générale 14 (50,184) (0.00)
INR 409,350,000 US$ 5,718,366 18/03/2020 UBS AG 3 (15,523) (0.00)
¥ 40,359,533 AUD 540,000 18/03/2020 Société Générale 3 (7,316) (0.00)
¥ 165,200,000 US$ 1,527,872 18/03/2020 UBS AG 3 (1,196) (0.00)
¥ 155,342,996 AUD 2,070,000 18/03/2020 UBS AG 5 (22,208) (0.00)
MXN 6,650,000 US$ 348,657 18/03/2020 BNP Paribas 1 (431) (0.00)
PHP 27,280,000 US$ 537,021 18/03/2020 BNP Paribas 2 (649) (0.00)
PHP 50,230,000 US$ 990,236 18/03/2020 Société Générale 3 (2,629) (0.00)
SEK 10,460,000 US$ 1,125,807 18/03/2020 Société Générale 3 (4,338) (0.00)
TRY 48,014,908 € 7,250,000 18/03/2020 Société Générale 2 (259,412) (0.03)
TRY 47,530,000 US$ 8,005,050 18/03/2020 Société Générale 10 (167,805) (0.01)
US$ 634,497 ¥ 69,070,000 18/03/2020 BNP Paribas 2 (3,805) (0.00)
US$ 2,503,855 MXN 48,020,000 18/03/2020 BNP Paribas 3 (10,703) (0.00)
US$ 6,593,091 HUF 1,953,300,000 18/03/2020 BNP Paribas 2 (61,963) (0.01)
US$ 2,987,783 SGD 4,050,000 18/03/2020 BNP Paribas 2 (26,342) (0.00)
US$ 1,541,616 THB 46,480,000 18/03/2020 BNP Paribas 5 (12,888) (0.00)
US$ 663,794 CLP 507,810,000 18/03/2020 BNP Paribas 2 (12,069) (0.00)
US$ 351,030 CAD 460,000 18/03/2020 BNP Paribas 1 (3,798) (0.00)
US$ 824,467 ILS 2,850,000 18/03/2020 BNP Paribas 2 (4,043) (0.00)
US$ 13,282,580 SGD 17,950,000 18/03/2020 Société Générale 10 (76,325) (0.01)
US$ 620,952 KRW 716,740,000 18/03/2020 Société Générale 1 (865) (0.00)
US$ 709,850 SEK 6,670,000 18/03/2020 Société Générale 1 (5,274) (0.00)
US$ 2,779,859 PLN 10,650,000 18/03/2020 Société Générale 6 (32,684) (0.00)
US$ 12,372,218 INR 889,610,000 18/03/2020 Société Générale 17 (21,346) (0.00)
US$ 1,874,325 PHP 95,420,000 18/03/2020 Société Générale 2 (1,797) (0.00)
US$ 3,710,060 NOK 33,370,000 18/03/2020 Société Générale 12 (88,336) (0.01)
US$ 631,090 MXN 12,110,000 18/03/2020 Société Générale 1 (3,048) (0.00)
US$ 1,039,398 THB 31,400,000 18/03/2020 Société Générale 7 (10,760) (0.00)
US$ 248,989 NZD 370,000 18/03/2020 Société Générale 2 (900) (0.00)
US$ 2,109,119 ZAR 30,140,000 18/03/2020 Société Générale 12 (24,979) (0.00)
US$ 9,941,633 € 8,910,000 18/03/2020 Société Générale 17 (107,148) (0.00)
US$ 20,105,251 AUD 29,360,000 18/03/2020 Société Générale 10 (571,446) (0.05)
US$ 2,395,123 ILS 8,290,000 18/03/2020 Société Générale 8 (14,825) (0.00)
US$ 1,134,301 HUF 335,560,000 18/03/2020 Société Générale 3 (8,980) (0.00)
US$ 478,816 CAD 630,000 18/03/2020 Société Générale 2 (7,146) (0.00)
US$ 5,218,252 CHF 5,100,000 18/03/2020 Société Générale 8 (76,663) (0.01)
US$ 9,887,831 £ 7,560,000 18/03/2020 Société Générale 31 (148,065) (0.01)
US$ 7,204,084 ¥ 784,170,000 18/03/2020 Société Générale 19 (42,731) (0.00)

FINANCIAL STATEMENTS SCHEDULE OF INVESTMENTS
686 NEUBERGER BERMAN INVESTMENT FUNDS PLC
Neuberger Berman Uncorrelated Strategies Fund (Continued)
Schedule of Investments (Continued) Financial Liabilities at Fair Value through Profit or Loss (continued) Forward Currency Contracts (0.42%) (31 December 2018: (2.15%)) (continued)
Amount Receivable
Amount Payable Maturity Date Counterparty Contracts Unrealised
Loss US$% of Net
Assets
US$ 4,502,528 CLP 3,482,120,000 18/03/2020 Société Générale 2 (131,956) (0.02)
US$ 11,067,224 KRW 13,161,020,000 18/03/2020 UBS AG 3 (350,781) (0.04)
US$ 8,441,934 CAD 11,090,000 18/03/2020 UBS AG 24 (112,525) (0.00)
US$ 910,617 TRY 5,530,000 18/03/2020 UBS AG 3 (1,227) (0.00)
US$ 6,783,821 € 6,080,000 18/03/2020 UBS AG 1 (73,258) (0.01)
US$ 432,759 NZD 650,000 18/03/2020 UBS AG 2 (6,236) (0.00)
US$ 756,874 BRL 3,130,000 18/03/2020 UBS AG 1 (18,800) (0.00)
US$ 17,373,560 NOK 159,020,000 18/03/2020 UBS AG 2 (727,152) (0.07)
US$ 4,074,224 ¥ 443,060,000 18/03/2020 UBS AG 13 (20,263) (0.00)
US$ 1,564,881 PLN 6,020,000 18/03/2020 UBS AG 2 (24,932) (0.00)
US$ 701,356 £ 540,000 18/03/2020 UBS AG 2 (15,494) (0.00)
CHF Hedged Classes US$ 1,058,013 CHF 1,047,399 22/01/2020 UBS AG 6 (25,111) (0.00)
US$ 542,766 CHF 537,861 22/01/2020 Westpac Banking Corp 4 (13,441) (0.00)
EUR Hedged Classes US$ 3,321,184 € 2,980,670 22/01/2020 Goldman Sachs International 9 (28,698) (0.00)
US$ 3,505,477 € 3,147,084 22/01/2020 Westpac Banking Corp 46 (31,433) (0.01)
GBP Hedged Classes £ 641,645 US$ 857,211 22/01/2020 Westpac Banking Corp 2 (6,709) (0.00)
US$ 8,501,095 £ 6,622,937 22/01/2020 Goldman Sachs International 6 (277,623) (0.03)
US$ 7,993,600 £ 6,141,376 22/01/2020 UBS AG 2 (146,808) (0.01)
US$ 29,175,468 £ 22,741,150 22/01/2020 Westpac Banking Corp 29 (967,979) (0.08)
SGD Hedged Classes US$ 1,009 SGD 1,379 22/01/2020 Goldman Sachs International 5 (16) (0.00)
US$ 183 SGD 249 22/01/2020 Westpac Banking Corp 1 (2) (0.00)
Total Unrealised Loss on Forward Currency Contracts ∞ (4,970,498) (0.42)
Futures Contracts (0.99%) (31 December 2018: (0.67%))
Number of Contracts Description Unrealised
Loss US$% of Net
Assets
164 3-Month Euro Euribor Future December 2020 (18,956) (0.00)
(1,506) 3-Month Euro Euribor Future March 2020 (486,059) (0.04)
(28) 90-Day Bank Bill Future September 2020 (552) (0.00)
134 90-Day Bank Bill Future December 2020 (40,842) (0.00)
(40) 90-Day Bank Bill Future June 2020 (708) (0.00)
2,016 90-Day Bank Bill Future March 2020 (373,774) (0.03)
(39) 90-Day Eurodollar Future March 2023 (1,700) (0.00)
(19) 90-Day Eurodollar Future March 2022 (1,963) (0.00)
(9) 90-Day Eurodollar Future September 2021 (850) (0.00)

SCHEDULE OF INVESTMENTS FINANCIAL STATEMENTS
ANNUAL REPORT 2019 687
Neuberger Berman Uncorrelated Strategies Fund (Continued)
Schedule of Investments (Continued) Financial Liabilities at Fair Value through Profit or Loss (continued) Futures Contracts (0.99%) (31 December 2018: (0.67%)) (continued)
Number of Contracts Description Unrealised
Loss US$% of Net
Assets
(16) 90-Day Eurodollar Future March 2021 (1,875) (0.00)
108 90-Day Eurodollar Future September 2020 (16,049) (0.00)
456 90-Day Eurodollar Future December 2020 (167,218) (0.02)
12 90-Day Sterling Future March 2021 (265) (0.00)
(72) 90-Day Sterling Future September 2021 (4,156) (0.00)
(122) 90-Day Sterling Future March 2022 (8,056) (0.00)
(51) 90-Day Sterling Future September 2020 (2,567) (0.00)
98 90-Day Sterling Future September 2020 (8,105) (0.00)
(72) 90-Day Sterling Future June 2020 (1,714) (0.00)
98 90-Day Sterling Future June 2020 (8,041) (0.00)
19 Amsterdam Index Future January 2020 (12,186) (0.00)
(903) Australian Dollar Currency Future March 2020 (1,581,998) (0.13)
27 Australian Government Bond 10-Year Future March 2020 (48,086) (0.01)
448 Australian Government Bond 3-Year Future March 2020 (198,729) (0.02)
213 CAC40 Index Future January 2020 (29,859) (0.00)
728 Canadian 10-Year Bond Future March 2020 (276,599) (0.02)
(120) Canadian Dollar Currency Future March 2020 (172,570) (0.02)
(56) CBOE VIX Index Future April 2020 (400) (0.00)
(74) CBOE VIX Index Future March 2020 (10,130) (0.00)
(183) DJIA Mini E-CBOT Future March 2020 (24,245) (0.00)
(86) E-mini Russell 2000 Index Future March 2020 (27,568) (0.00)
(2,527) Euro FX Currency Future March 2020 (3,706,645) (0.31)
401 Euro Stoxx 50 Future March 2020 (38,502) (0.00)
(2) Euro-BTP Future March 2020 (415) (0.00)
367 Euro-Bund Future March 2020 (481,350) (0.04)
2 Euro-Buxl 30-Year Bond Future March 2020 (11,090) (0.00)
50 Euro-OAT Future March 2020 (80,596) (0.01)
189 FTSE/JSE Top 40 Index Future March 2020 (109,983) (0.01)
(371) Hang Seng Index Future January 2020 (532,040) (0.05)
(16) Japan Government 10-Year Bond (OSE) Future March 2020 (9,754) (0.00)
(31) Japanese Yen Currency Future March 2020 (237) (0.00)
(106) KOSPI 200 Index Future March 2020 (97,399) (0.01)
336 MSCI Taiwan Index Future January 2020 (53,760) (0.01)
44 Nasdaq 100 E-mini Future March 2020 (12,885) (0.00)
(23) New Zealand Dollar Currency Future March 2020 (42,550) (0.00)
273 Nikkei 225 (SGX) Future March 2020 (355,785) (0.03)
(80) Nikkei 225 Mini Future January 2020 (19,140) (0.00)
23 Norwegian Krone Currency Future March 2020 (96,439) (0.01)
224 OMXS30 Index Future January 2020 (56,014) (0.01)
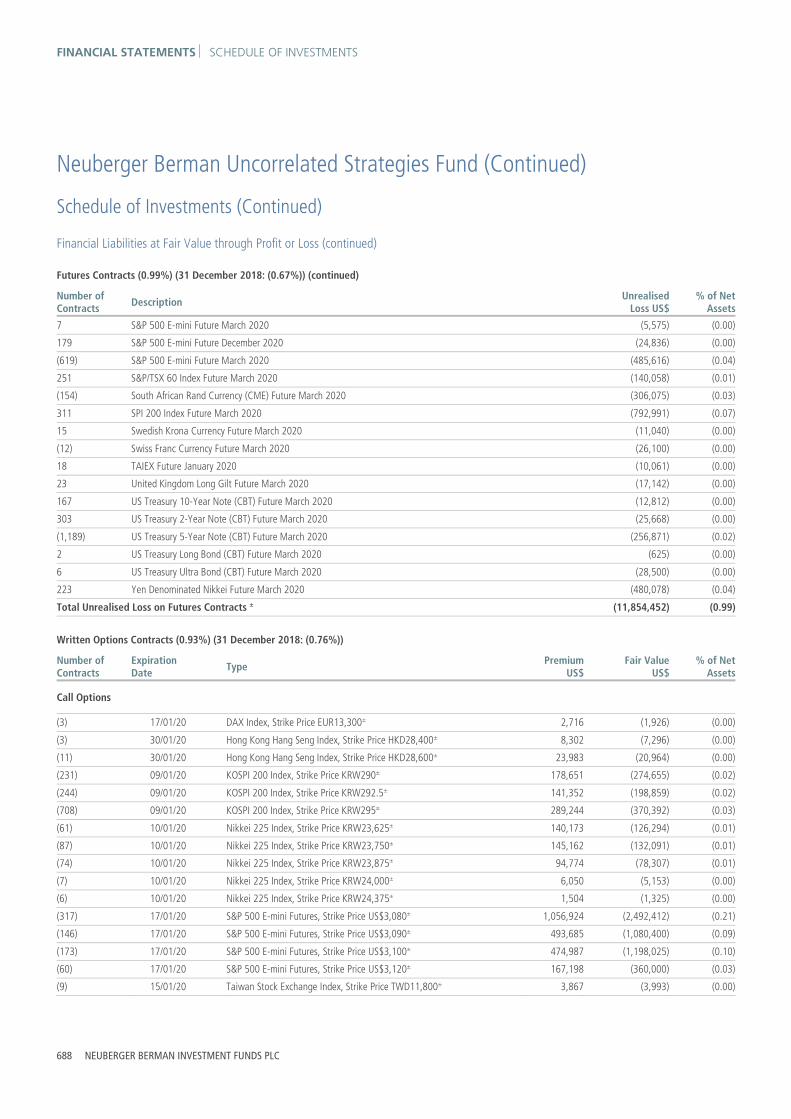
FINANCIAL STATEMENTS SCHEDULE OF INVESTMENTS
688 NEUBERGER BERMAN INVESTMENT FUNDS PLC
Neuberger Berman Uncorrelated Strategies Fund (Continued)
Schedule of Investments (Continued) Financial Liabilities at Fair Value through Profit or Loss (continued) Futures Contracts (0.99%) (31 December 2018: (0.67%)) (continued)
Number of Contracts Description Unrealised
Loss US$% of Net
Assets
7 S&P 500 E-mini Future March 2020 (5,575) (0.00)
179 S&P 500 E-mini Future December 2020 (24,836) (0.00)
(619) S&P 500 E-mini Future March 2020 (485,616) (0.04)
251 S&P/TSX 60 Index Future March 2020 (140,058) (0.01)
(154) South African Rand Currency (CME) Future March 2020 (306,075) (0.03)
311 SPI 200 Index Future March 2020 (792,991) (0.07)
15 Swedish Krona Currency Future March 2020 (11,040) (0.00)
(12) Swiss Franc Currency Future March 2020 (26,100) (0.00)
18 TAIEX Future January 2020 (10,061) (0.00)
23 United Kingdom Long Gilt Future March 2020 (17,142) (0.00)
167 US Treasury 10-Year Note (CBT) Future March 2020 (12,812) (0.00)
303 US Treasury 2-Year Note (CBT) Future March 2020 (25,668) (0.00)
(1,189) US Treasury 5-Year Note (CBT) Future March 2020 (256,871) (0.02)
2 US Treasury Long Bond (CBT) Future March 2020 (625) (0.00)
6 US Treasury Ultra Bond (CBT) Future March 2020 (28,500) (0.00)
223 Yen Denominated Nikkei Future March 2020 (480,078) (0.04)
Total Unrealised Loss on Futures Contracts ± (11,854,452) (0.99)
Written Options Contracts (0.93%) (31 December 2018: (0.76%))
Number of Contracts
Expiration Date Type Premium
US$Fair Value
US$% of Net
Assets
Call Options
(3) 17/01/20 DAX Index, Strike Price EUR13,300± 2,716 (1,926) (0.00)
(3) 30/01/20 Hong Kong Hang Seng Index, Strike Price HKD28,400± 8,302 (7,296) (0.00)
(11) 30/01/20 Hong Kong Hang Seng Index, Strike Price HKD28,600± 23,983 (20,964) (0.00)
(231) 09/01/20 KOSPI 200 Index, Strike Price KRW290± 178,651 (274,655) (0.02)
(244) 09/01/20 KOSPI 200 Index, Strike Price KRW292.5± 141,352 (198,859) (0.02)
(708) 09/01/20 KOSPI 200 Index, Strike Price KRW295± 289,244 (370,392) (0.03)
(61) 10/01/20 Nikkei 225 Index, Strike Price KRW23,625± 140,173 (126,294) (0.01)
(87) 10/01/20 Nikkei 225 Index, Strike Price KRW23,750± 145,162 (132,091) (0.01)
(74) 10/01/20 Nikkei 225 Index, Strike Price KRW23,875± 94,774 (78,307) (0.01)
(7) 10/01/20 Nikkei 225 Index, Strike Price KRW24,000± 6,050 (5,153) (0.00)
(6) 10/01/20 Nikkei 225 Index, Strike Price KRW24,375± 1,504 (1,325) (0.00)
(317) 17/01/20 S&P 500 E-mini Futures, Strike Price US$3,080± 1,056,924 (2,492,412) (0.21)
(146) 17/01/20 S&P 500 E-mini Futures, Strike Price US$3,090± 493,685 (1,080,400) (0.09)
(173) 17/01/20 S&P 500 E-mini Futures, Strike Price US$3,100± 474,987 (1,198,025) (0.10)
(60) 17/01/20 S&P 500 E-mini Futures, Strike Price US$3,120± 167,198 (360,000) (0.03)
(9) 15/01/20 Taiwan Stock Exchange Index, Strike Price TWD11,800± 3,867 (3,993) (0.00)

SCHEDULE OF INVESTMENTS FINANCIAL STATEMENTS
ANNUAL REPORT 2019 689
Neuberger Berman Uncorrelated Strategies Fund (Continued)
Schedule of Investments (Continued) Financial Liabilities at Fair Value through Profit or Loss (continued) Written Options Contracts (0.93%) (31 December 2018: (0.76%)) (continued)
Number of Contracts
Expiration Date Type Premium
US$Fair Value
US$% of Net
Assets
Call Options (continued)
(29) 15/01/20 Taiwan Stock Exchange Index, Strike Price TWD11,900± 10,254 (9,626) (0.00)
(134) 15/01/20 Taiwan Stock Exchange Index, Strike Price TWD12,000± 37,168 (31,291) (0.00)
(8) 02/01/20 Taiwan Stock Exchange Index, Strike Price TWD12,050± 697 (124) (0.00)
(149) 15/01/20 Taiwan Stock Exchange Index, Strike Price TWD12,100± 32,941 (23,610) (0.00)
(109) 15/01/20 Taiwan Stock Exchange Index, Strike Price TWD12,200± 19,194 (11,090) (0.00)
(46) 15/01/20 Taiwan Stock Exchange Index, Strike Price TWD12,400± 4,539 (1,650) (0.00)
Put Options
(322,400,000) 22/05/20 Australian Dollar/Japanese Yen Currency Option, Strike Price AUD66∞ 851,068 (353,318) (0.03)
(193,455,000) 21/05/20 Australian Dollar/Japanese Yen Currency Option, Strike Price AUD66.25∞ 531,200 (222,614) (0.02)
(3) 17/01/20 DAX Index, Strike Price EUR13,300± 2,608 (2,773) (0.00)
(12) 30/01/20 Hong Kong Hang Seng Index, Strike Price HKD27,000± 8,646 (9,163) (0.00)
(14) 30/01/20 Hong Kong Hang Seng Index, Strike Price HKD27,200± 12,570 (13,386) (0.00)
(9) 30/01/20 Hong Kong Hang Seng Index, Strike Price HKD27,400± 10,096 (10,338) (0.00)
(7) 30/01/20 Hong Kong Hang Seng Index, Strike Price HKD27,600± 9,881 (9,837) (0.00)
(115) 09/01/20 KOSPI 200 Index, Strike Price KRW290± 53,271 (27,595) (0.00)
(212) 09/01/20 KOSPI 200 Index, Strike Price KRW292.5± 165,422 (86,619) (0.01)
(5) 09/01/20 KOSPI 200 Index, Strike Price KRW295± 5,855 (3,275) (0.00)
(10) 10/01/20 Nikkei 225 Index, Strike Price KRW23,500± 12,575 (13,343) (0.00)
(39) 10/01/20 Nikkei 225 Index, Strike Price KRW23,625± 58,382 (69,979) (0.01)
(25) 10/01/20 Nikkei 225 Index, Strike Price KRW23,750± 39,602 (59,811) (0.01)
(12) 10/01/20 Nikkei 225 Index, Strike Price KRW23,875± 22,220 (36,991) (0.00)
(3) 17/01/20 S&P 500 E-mini Futures, Strike Price US$2,830± 1,385 (180) (0.00)
(134) 17/01/20 S&P 500 E-mini Futures, Strike Price US$2,960± 124,996 (17,420) (0.00)
(253) 17/01/20 S&P 500 E-mini Futures, Strike Price US$2,980± 370,505 (37,317) (0.00)
(609) 17/01/20 S&P 500 E-mini Futures, Strike Price US$3,000± 870,233 (103,530) (0.01)
(239) 17/01/20 S&P 500 E-mini Futures, Strike Price US$3,010± 478,167 (43,617) (0.00)
(429) 17/01/20 S&P 500 E-mini Futures, Strike Price US$3,020± 652,715 (83,655) (0.01)
(294) 17/01/20 S&P 500 E-mini Futures, Strike Price US$3,030± 543,657 (61,740) (0.01)
(360) 17/01/20 S&P 500 E-mini Futures, Strike Price US$3,040± 651,437 (81,900) (0.01)
(285) 17/01/20 S&P 500 E-mini Futures, Strike Price US$3,050± 576,852 (69,825) (0.01)
(352) 17/01/20 S&P 500 E-mini Futures, Strike Price US$3,060± 956,769 (92,400) (0.01)
(297) 17/01/20 S&P 500 E-mini Futures, Strike Price US$3,070± 613,429 (85,387) (0.01)
(31) 21/02/20 S&P 500 E-mini Futures, Strike Price US$3,070± 37,561 (35,263) (0.00)
(308) 17/01/20 S&P 500 E-mini Futures, Strike Price US$3,080± 975,644 (96,250) (0.01)
(44) 17/01/20 S&P 500 E-mini Futures, Strike Price US$3,090± 134,487 (15,400) (0.00)
(93) 21/02/20 S&P 500 E-mini Futures, Strike Price US$3,100± 150,657 (125,550) (0.01)

FINANCIAL STATEMENTS SCHEDULE OF INVESTMENTS
690 NEUBERGER BERMAN INVESTMENT FUNDS PLC
Neuberger Berman Uncorrelated Strategies Fund (Continued)
Schedule of Investments (Continued) Financial Liabilities at Fair Value through Profit or Loss (continued) Written Options Contracts (0.93%) (31 December 2018: (0.76%)) (continued)
Number of Contracts
Expiration Date Type Premium
US$Fair Value
US$% of Net
Assets
Put Options (continued)
(31) 17/01/20 S&P 500 E-mini Futures, Strike Price US$3,110± 17,411 (12,788) (0.00)
(139) 21/02/20 S&P 500 E-mini Futures, Strike Price US$3,110± 241,167 (198,075) (0.02)
(59) 17/01/20 S&P 500 E-mini Futures, Strike Price US$3,120± 173,999 (26,550) (0.00)
(153) 21/02/20 S&P 500 E-mini Futures, Strike Price US$3,120± 243,229 (229,500) (0.02)
(249) 21/02/20 S&P 500 E-mini Futures, Strike Price US$3,130± 380,921 (395,288) (0.03)
(59) 17/01/20 S&P 500 E-mini Futures, Strike Price US$3,140± 39,774 (31,713) (0.00)
(164) 21/02/20 S&P 500 E-mini Futures, Strike Price US$3,140± 269,095 (276,750) (0.02)
(149) 21/02/20 S&P 500 E-mini Futures, Strike Price US$3,150± 271,395 (264,475) (0.02)
(1) 16/01/20 S&P ASX 200 Index, Strike Price AUD6,300± (1,492) (45) (0.00)
(9) 15/01/20 Taiwan Stock Exchange Index, Strike Price TWD10,300± 200 (20) (0.00)
(1) 15/01/20 Taiwan Stock Exchange Index, Strike Price TWD10,600± 48 (3) (0.00)
(11) 15/01/20 Taiwan Stock Exchange Index, Strike Price TWD10,700± 712 (42) (0.00)
(14) 15/01/20 Taiwan Stock Exchange Index, Strike Price TWD10,800± 558 (63) (0.00)
(10) 15/01/20 Taiwan Stock Exchange Index, Strike Price TWD11,600± 1,329 (517) (0.00)
(14) 15/01/20 Taiwan Stock Exchange Index, Strike Price TWD11,700± 2,505 (1,098) (0.00)
(6) 15/01/20 Taiwan Stock Exchange Index, Strike Price TWD11,800± 979 (701) (0.00)
(48) 15/01/20 Taiwan Stock Exchange Index, Strike Price TWD11,900± 11,761 (8,166) (0.00)
(11) 02/01/20 Taiwan Stock Exchange Index, Strike Price TWD11,950± 548 (202) (0.00)
(53) 02/01/20 Taiwan Stock Exchange Index, Strike Price TWD12,000± 4,182 (2,475) (0.00)
(136) 15/01/20 Taiwan Stock Exchange Index, Strike Price TWD12,000± 37,788 (32,892) (0.00)
(23) 02/01/20 Taiwan Stock Exchange Index, Strike Price TWD12,050± 2,709 (2,340) (0.00)
(1) 02/01/20 Taiwan Stock Exchange Index, Strike Price TWD12,100± 173 (175) (0.00)
(49) 15/01/20 Taiwan Stock Exchange Index, Strike Price TWD12,100± 15,877 (16,264) (0.00)
(4) 15/01/20 Taiwan Stock Exchange Index, Strike Price TWD12,200± 1,519 (1,768) (0.00)
(850,000,000) 19/05/20 United States Dollar/Japanese Yen Currency Option, Strike Price JPY99∞ 2,090,702 (1,280,950) (0.12)
Total Loss on Written Options Contracts (11,080,819) (0.93)
Contracts for Differences (0.67%) (31 December 2018: (79.83%))
Units Security Description Counterparty Unrealised Loss US$
% of NetAssets
(1,239) 1&1 Drillisch AG Morgan Stanley (662) (0.00)
600 1st Source Corp Morgan Stanley (90) (0.00)
9,200 3D Systems Corp Morgan Stanley (1,164) (0.00)
(31,098) 3M Co Morgan Stanley (208) (0.00)
4,200 77 Bank Ltd Morgan Stanley (597) (0.00)
17,700 8x8 Inc Morgan Stanley (2,739) (0.00)

SCHEDULE OF INVESTMENTS FINANCIAL STATEMENTS
ANNUAL REPORT 2019 691
Neuberger Berman Uncorrelated Strategies Fund (Continued)
Schedule of Investments (Continued) Financial Liabilities at Fair Value through Profit or Loss (continued) Contracts for Differences (0.67%) (31 December 2018: (79.83%)) (continued)
Units Security Description Counterparty Unrealised Loss US$
% of NetAssets
(4,500) AAC Technologies Holdings Inc Morgan Stanley (542) (0.00)
(4,700) AAR Corp Morgan Stanley (489) (0.00)
(44,521) Aareal Bank AG Morgan Stanley (12,484) (0.00)
800 ABC-Mart Inc Morgan Stanley (432) (0.00)
(47,178) ABN AMRO Bank NV Morgan Stanley (5,464) (0.00)
(69,770) Accent Group Ltd Morgan Stanley (9,201) (0.00)
(4,300) Accenture Plc Morgan Stanley (10,971) (0.00)
2,486 Acciona SA Morgan Stanley (313) (0.00)
(2,600) ACI Worldwide Inc Morgan Stanley (1,428) (0.00)
(10,204) ACS Actividades de Construccion y Servicios SA Morgan Stanley (2,520) (0.00)
(1,537) Acuity Brands Inc Morgan Stanley (3,040) (0.00)
1,700 Adastria Co Ltd Morgan Stanley (1,348) (0.00)
(1,681) Adecco Group AG Morgan Stanley (1,275) (0.00)
3,000 ADEKA Corp Morgan Stanley (801) (0.00)
(28,848) Adelaide Brighton Ltd Morgan Stanley (741) (0.00)
6,000 Adient Plc Morgan Stanley (6,514) (0.00)
(6,264) Admiral Group Plc Morgan Stanley (1,574) (0.00)
(2,692) Adobe Inc Morgan Stanley (2,165) (0.00)
4,500 Advanced Disposal Services Inc Morgan Stanley (151) (0.00)
(6,600) Advanced Energy Industries Inc Morgan Stanley (17,162) (0.00)
(8,781) Advanced Micro Devices Inc Morgan Stanley (16,011) (0.00)
(4,000) Advantest Corp Morgan Stanley (14,295) (0.00)
(1,504) Adyen NV Morgan Stanley (25,337) (0.01)
(10,500) AECOM Morgan Stanley (194) (0.00)
100 Aecon Group Inc Morgan Stanley (37) (0.00)
51,593 Aegon NV Morgan Stanley (5,597) (0.00)
167 Aena SME SA Morgan Stanley (617) (0.00)
7,100 Aeon Co Ltd Morgan Stanley (1,921) (0.00)
(1,000) Aeon Delight Co Ltd Morgan Stanley (327) (0.00)
(1,800) Aerojet Rocketdyne Holdings Inc Morgan Stanley (772) (0.00)
3,300 Affiliated Managers Group Inc Morgan Stanley (4,075) (0.00)
21,387 Aflac Inc Morgan Stanley (2,205) (0.00)
(589) Afterpay Ltd Morgan Stanley (238) (0.00)
3,100 AGC Inc Morgan Stanley (2,844) (0.00)
3,300 AGCO Corp Morgan Stanley (1,865) (0.00)
18,267 Ageas Morgan Stanley (532) (0.00)
140,891 Aggreko Plc Morgan Stanley (1,235) (0.00)
3,147 AGL Energy Ltd Morgan Stanley (319) (0.00)
(400) Agnico Eagle Mines Ltd Morgan Stanley (45) (0.00)

FINANCIAL STATEMENTS SCHEDULE OF INVESTMENTS
692 NEUBERGER BERMAN INVESTMENT FUNDS PLC
Neuberger Berman Uncorrelated Strategies Fund (Continued)
Schedule of Investments (Continued) Financial Liabilities at Fair Value through Profit or Loss (continued) Contracts for Differences (0.67%) (31 December 2018: (79.83%)) (continued)
Units Security Description Counterparty Unrealised Loss US$
% of NetAssets
(31,700) Aiful Corp Morgan Stanley (3,428) (0.00)
(1,300) Ain Holdings Inc Morgan Stanley (5,821) (0.00)
2,100 Air Canada Morgan Stanley (1,116) (0.00)
(20,000) Air China Ltd Morgan Stanley (663) (0.00)
3,354 Air France-KLM Morgan Stanley (869) (0.00)
300 Air Transport Services Group Inc Morgan Stanley (30) (0.00)
(9,445) Airbus SE Morgan Stanley (39,288) (0.01)
1,700 Aircastle Ltd Morgan Stanley (35) (0.00)
5,000 Aisin Seiki Co Ltd Morgan Stanley (5,927) (0.00)
96,000 AK Medical Holdings Ltd Morgan Stanley (161) (0.00)
(40,017) Aker BP ASA Morgan Stanley (638) (0.00)
(5,356) Akzo Nobel NV Morgan Stanley (2,757) (0.00)
(3,076) Alacer Gold Corp Morgan Stanley (878) (0.00)
(1,700) Alamo Group Inc Morgan Stanley (11,458) (0.00)
1,200 Alaska Air Group Inc Morgan Stanley (1,352) (0.00)
(1,100) Albemarle Corp Morgan Stanley (460) (0.00)
11,217 ALD SA Morgan Stanley (141) (0.00)
(18,700) Alibaba Group Holding Ltd Morgan Stanley (977) (0.00)
(29,250) A-Living Services Co Ltd Morgan Stanley (512) (0.00)
12,900 Allegheny Technologies Inc Morgan Stanley (2,899) (0.00)
(40,446) Allegion Plc Morgan Stanley (9,321) (0.00)
(1,100) Alliance Data Systems Corp Morgan Stanley (1,696) (0.00)
(3,900) AllianceBernstein Holding LP Morgan Stanley (455) (0.00)
(14,700) Alliant Energy Corp Morgan Stanley (14,807) (0.00)
4,972 Allianz SE Morgan Stanley (6,004) (0.00)
(1,066) Allreal Holding AG Morgan Stanley (5,937) (0.00)
(4,700) Allstate Corp Morgan Stanley (11,774) (0.00)
(149) Alm Brand A/S Morgan Stanley (0) (0.00)
(6,661) Almirall SA Morgan Stanley (717) (0.00)
(1,979) Alpiq Holding AG Morgan Stanley (2,254) (0.00)
1,711 ALS Ltd Morgan Stanley (0) (0.00)
(5,682) Alstom SA Morgan Stanley (138) (0.00)
(4,053) alstria office REIT-AG Morgan Stanley (37) (0.00)
(4,100) Altair Engineering Inc Morgan Stanley (123) (0.00)
(2,823) Alten SA Morgan Stanley (2,705) (0.00)
2,582 Altium Ltd Morgan Stanley (332) (0.00)
(5,400) Altra Industrial Motion Corp Morgan Stanley (5,548) (0.00)
(17,600) Altran Technologies SA Morgan Stanley (1,363) (0.00)
(644,000) Aluminum Corp of China Ltd Morgan Stanley (10,832) (0.00)

SCHEDULE OF INVESTMENTS FINANCIAL STATEMENTS
ANNUAL REPORT 2019 693
Neuberger Berman Uncorrelated Strategies Fund (Continued)
Schedule of Investments (Continued) Financial Liabilities at Fair Value through Profit or Loss (continued) Contracts for Differences (0.67%) (31 December 2018: (79.83%)) (continued)
Units Security Description Counterparty Unrealised Loss US$
% of NetAssets
2,000 Amada Holdings Co Ltd Morgan Stanley (973) (0.00)
(17,774) Amadeus IT Group SA Morgan Stanley (1,953) (0.00)
600 Amano Corp Morgan Stanley (188) (0.00)
(1,000) Amedisys Inc Morgan Stanley (5,457) (0.00)
(7,500) American Axle & Manufacturing Holdings Inc Morgan Stanley (164) (0.00)
(6,469) American Electric Power Co Inc Morgan Stanley (4,549) (0.00)
(9,200) American Homes 4 Rent Morgan Stanley (4,045) (0.00)
18,800 American International Group Inc Morgan Stanley (10,113) (0.00)
(3,500) American Tower Corp Morgan Stanley (6,373) (0.00)
13,000 Ameris Bancorp Morgan Stanley (19,012) (0.00)
(2,600) AmerisourceBergen Corp Morgan Stanley (1,454) (0.00)
35,420 AMP Ltd Morgan Stanley (107) (0.00)
(5,004) Amphenol Corp Morgan Stanley (1,087) (0.00)
5,764 ams AG Morgan Stanley (23,443) (0.01)
(2,499) Amundi SA Morgan Stanley (1,807) (0.00)
1,400 ANA Holdings Inc Morgan Stanley (150) (0.00)
2,800 Analog Devices Inc Morgan Stanley (764) (0.00)
(33,214) Anheuser-Busch InBev SA Morgan Stanley (1,476) (0.00)
(34,500) Anhui Conch Cement Co Ltd Morgan Stanley (16,233) (0.00)
3,000 Anritsu Corp Morgan Stanley (95) (0.00)
4,124 Ansell Ltd Morgan Stanley (715) (0.00)
22,000 ANTA Sports Products Ltd Morgan Stanley (3,446) (0.00)
33,639 Antofagasta Plc Morgan Stanley (10,154) (0.00)
(2,990) Aon Plc Morgan Stanley (663) (0.00)
(5,500) Apergy Corp Morgan Stanley (1,669) (0.00)
30,700 Aplus Financial Co Ltd Morgan Stanley (1,119) (0.00)
181 Appen Ltd Morgan Stanley (133) (0.00)
(600) Appfolio Inc Morgan Stanley (1,562) (0.00)
3,900 Appian Corp Morgan Stanley (12,922) (0.00)
(3,200) Apple Inc Morgan Stanley (24,598) (0.01)
(1,800) Applied Industrial Technologies Inc Morgan Stanley (265) (0.00)
7,362 Applied Materials Inc Morgan Stanley (316) (0.00)
(1,000) AptarGroup Inc Morgan Stanley (236) (0.00)
(28,400) Aqua America Inc Morgan Stanley (29,972) (0.01)
396 ARB Corp Ltd Morgan Stanley (9) (0.00)
(1,400) Arch Capital Group Ltd Morgan Stanley (187) (0.00)
2,600 Arch Coal Inc Morgan Stanley (398) (0.00)
4,800 Arconic Inc Morgan Stanley (620) (0.00)
4,944 Arena REIT Morgan Stanley (254) (0.00)

FINANCIAL STATEMENTS SCHEDULE OF INVESTMENTS
694 NEUBERGER BERMAN INVESTMENT FUNDS PLC
Neuberger Berman Uncorrelated Strategies Fund (Continued)
Schedule of Investments (Continued) Financial Liabilities at Fair Value through Profit or Loss (continued) Contracts for Differences (0.67%) (31 December 2018: (79.83%)) (continued)
Units Security Description Counterparty Unrealised Loss US$
% of NetAssets
2,400 Argo Group International Holdings Ltd Morgan Stanley (1,089) (0.00)
(3,300) Aritzia Inc Morgan Stanley (580) (0.00)
2,200 Armstrong World Industries Inc Morgan Stanley (924) (0.00)
(26,860) Aroundtown SA Morgan Stanley (5,825) (0.00)
(1,300) Arrow Electronics Inc Morgan Stanley (190) (0.00)
(13,200) Artisan Partners Asset Management Inc Morgan Stanley (11,504) (0.00)
(900) Asahi Holdings Inc Morgan Stanley (26) (0.00)
(9,600) Asahi Intecc Co Ltd Morgan Stanley (7,400) (0.00)
4,300 Asahi Kasei Corp Morgan Stanley (629) (0.00)
(2,200) Ashland Global Holdings Inc Morgan Stanley (193) (0.00)
(117,993) Ashtead Group Plc Goldman Sachs International (288) (0.00)
18,666 ASM International NV Morgan Stanley (7,524) (0.00)
20,900 ASM Pacific Technology Ltd Morgan Stanley (4,773) (0.00)
(7,058) ASML Holding NV Morgan Stanley (8,128) (0.00)
15,580 ASR Nederland NV Morgan Stanley (1,873) (0.00)
5,100 Associated Banc-Corp Morgan Stanley (97) (0.00)
18,896 Aston Martin Lagonda Global Holdings Plc Morgan Stanley (15,525) (0.00)
3,225 ASX Ltd Morgan Stanley (4,920) (0.00)
(1,500) Atco Ltd Morgan Stanley (245) (0.00)
(10,800) Athene Holding Ltd Morgan Stanley (2,623) (0.00)
(38,374) Atlantia SpA Morgan Stanley (721) (0.00)
8,900 Atlantic Union Bankshares Corp Morgan Stanley (7,294) (0.00)
(9,500) Atlantica Yield Plc Morgan Stanley (5,495) (0.00)
(20,836) Atlas Arteria Ltd Morgan Stanley (3,985) (0.00)
1,900 Atlassian Corp Plc Morgan Stanley (847) (0.00)
(100) ATS Automation Tooling Systems Inc Morgan Stanley (35) (0.00)
(3,836) AUB Group Ltd Morgan Stanley (1,256) (0.00)
(114,877) Aurelia Metals Ltd Morgan Stanley (3,046) (0.00)
21,800 Aurora Cannabis Inc Morgan Stanley (7,963) (0.00)
48,234 AusNet Services Morgan Stanley (710) (0.00)
11,233 Austal Ltd Morgan Stanley (286) (0.00)
(1,826) Australia & New Zealand Banking Group Ltd Morgan Stanley (84) (0.00)
69,166 Auto Trader Group Plc Morgan Stanley (5,628) (0.00)
4,000 Autobacs Seven Co Ltd Morgan Stanley (442) (0.00)
(83,839) Autogrill SpA Morgan Stanley (264) (0.00)
7,200 AutoNation Inc Morgan Stanley (12,917) (0.00)
1,900 Avalara Inc Morgan Stanley (611) (0.00)
(10,000) AvalonBay Communities Inc Morgan Stanley (7,533) (0.00)
3,800 Avery Dennison Corp Morgan Stanley (1,798) (0.00)

SCHEDULE OF INVESTMENTS FINANCIAL STATEMENTS
ANNUAL REPORT 2019 695
Neuberger Berman Uncorrelated Strategies Fund (Continued)
Schedule of Investments (Continued) Financial Liabilities at Fair Value through Profit or Loss (continued) Contracts for Differences (0.67%) (31 December 2018: (79.83%)) (continued)
Units Security Description Counterparty Unrealised Loss US$
% of NetAssets
4,300 Avis Budget Group Inc Morgan Stanley (1,674) (0.00)
(59,348) Avita Medical Ltd Morgan Stanley (2,966) (0.00)
165,356 Aviva Plc Morgan Stanley (16,238) (0.00)
400 Avnet Inc Morgan Stanley (8) (0.00)
(70,392) AXA SA Morgan Stanley (18,273) (0.00)
3,900 Azbil Corp Morgan Stanley (4,102) (0.00)
(11,700) Baker Hughes Co Morgan Stanley (10,110) (0.00)
2,600 Balchem Corp Morgan Stanley (2,297) (0.00)
16,407 Balfour Beatty Plc Morgan Stanley (2,222) (0.00)
(2,541) Baloise Holding AG Morgan Stanley (5,742) (0.00)
102,766 Banco Bilbao Vizcaya Argentaria SA Morgan Stanley (4,678) (0.00)
699,485 Banco de Sabadell SA Morgan Stanley (516) (0.00)
(109,309) Banco Santander SA Morgan Stanley (24) (0.00)
8,800 BancorpSouth Bank Morgan Stanley (5,798) (0.00)
36,000 Bank of China Ltd Morgan Stanley (65) (0.00)
(4,900) Bank of Hawaii Corp Morgan Stanley (7,624) (0.00)
5,600 Bank of Kyoto Ltd Morgan Stanley (8,997) (0.00)
(2,900) Bank of Montreal Morgan Stanley (869) (0.00)
(4,500) Bank of New York Mellon Corp Morgan Stanley (275) (0.00)
94,467 Bankinter SA Morgan Stanley (1,656) (0.00)
(7,442) Bapcor Ltd Morgan Stanley (322) (0.00)
(266) Barry Callebaut AG Morgan Stanley (19,321) (0.00)
14,840 BASF SE Morgan Stanley (15,475) (0.00)
(4,142) Basic-Fit NV Morgan Stanley (9,761) (0.00)
(2,400) Beacon Roofing Supply Inc Morgan Stanley (252) (0.00)
24,726 Beazley Plc Morgan Stanley (873) (0.00)
(1,826) Bechtle AG Morgan Stanley (2,545) (0.00)
(5,018) Becton Dickinson and Co Morgan Stanley (4,224) (0.00)
(175) Befimmo SA Morgan Stanley (57) (0.00)
(11,354) Bega Cheese Ltd Morgan Stanley (3,467) (0.00)
3,000 BeiGene Ltd Morgan Stanley (2,522) (0.00)
(158,000) Beijing Tong Ren Tang Chinese Medicine Co Ltd Morgan Stanley (32,936) (0.01)
(5,032) Bekaert SA Morgan Stanley (355) (0.00)
300 Belden Inc Morgan Stanley (36) (0.00)
(24) Belimo Holding AG Morgan Stanley (16,019) (0.00)
(6,100) Bell System24 Holdings Inc Morgan Stanley (3,101) (0.00)
2,900 Benchmark Electronics Inc Morgan Stanley (707) (0.00)
(5,103) Bendigo & Adelaide Bank Ltd Morgan Stanley (130) (0.00)
400 Benefit One Inc Morgan Stanley (52) (0.00)

FINANCIAL STATEMENTS SCHEDULE OF INVESTMENTS
696 NEUBERGER BERMAN INVESTMENT FUNDS PLC
Neuberger Berman Uncorrelated Strategies Fund (Continued)
Schedule of Investments (Continued) Financial Liabilities at Fair Value through Profit or Loss (continued) Contracts for Differences (0.67%) (31 December 2018: (79.83%)) (continued)
Units Security Description Counterparty Unrealised Loss US$
% of NetAssets
4,300 Benesse Holdings Inc Morgan Stanley (1,231) (0.00)
4,563 Berkeley Group Holdings Plc Morgan Stanley (8,322) (0.00)
(9,000) Berry Global Group Inc Morgan Stanley (3,066) (0.00)
1,978 Best Buy Co Inc Morgan Stanley (1) (0.00)
(874) BHP Group Ltd Morgan Stanley (185) (0.00)
20,433 BHP Group Plc Morgan Stanley (3,453) (0.00)
4,200 Bic Camera Inc Morgan Stanley (26) (0.00)
1,605 BioMerieux Morgan Stanley (226) (0.00)
(6,200) Black Knight Inc Morgan Stanley (6,696) (0.00)
(8,800) BlackBerry Ltd Morgan Stanley (4,729) (0.00)
(1,546) BlackRock Inc Morgan Stanley (1,025) (0.00)
(4,760) Blackstone Group Inc Morgan Stanley (820) (0.00)
(11,100) Blucora Inc Morgan Stanley (13,290) (0.00)
5,754 BlueScope Steel Ltd Morgan Stanley (610) (0.00)
(31,134) BNP Paribas SA Morgan Stanley (457) (0.00)
10,967 Bodycote Plc Morgan Stanley (1,499) (0.00)
(78,900) Bombardier Inc Morgan Stanley (2,284) (0.00)
(4,100) Boot Barn Holdings Inc Morgan Stanley (9,455) (0.00)
(14,398) Boral Ltd Morgan Stanley (788) (0.00)
6,462 BorgWarner Inc Morgan Stanley (4,929) (0.00)
290,000 Bosideng International Holdings Ltd Morgan Stanley (10,481) (0.00)
(50,015) Boskalis Westminster Morgan Stanley (7,341) (0.00)
(7,389) Boston Scientific Corp Morgan Stanley (724) (0.00)
(9,800) Bottomline Technologies DE Inc Morgan Stanley (6,654) (0.00)
10,600 Box Inc Morgan Stanley (4,095) (0.00)
16,500 Boyd Gaming Corp Morgan Stanley (1,804) (0.00)
22,266 bpost SA Morgan Stanley (7,417) (0.00)
(4,800) Brandywine Realty Trust Morgan Stanley (552) (0.00)
(22,717) Bravura Solutions Ltd Morgan Stanley (336) (0.00)
60,568 Brenntag AG Morgan Stanley (2,291) (0.00)
(1,012) Breville Group Ltd Morgan Stanley (167) (0.00)
1,187 Brickworks Ltd Morgan Stanley (128) (0.00)
12,200 Brighthouse Financial Inc Morgan Stanley (17,065) (0.00)
3,500 Brinker International Inc Morgan Stanley (528) (0.00)
(5,700) Bristol-Myers Squibb Co Morgan Stanley (4,520) (0.00)
(140,473) British Land Co Plc Morgan Stanley (2,368) (0.00)
(5,500) Brixmor Property Group Inc Morgan Stanley (520) (0.00)
4,700 Brookfield Asset Management Inc Morgan Stanley (293) (0.00)
31,700 Brookfield Property Partners LP Morgan Stanley (6,411) (0.00)

SCHEDULE OF INVESTMENTS FINANCIAL STATEMENTS
ANNUAL REPORT 2019 697
Neuberger Berman Uncorrelated Strategies Fund (Continued)
Schedule of Investments (Continued) Financial Liabilities at Fair Value through Profit or Loss (continued) Contracts for Differences (0.67%) (31 December 2018: (79.83%)) (continued)
Units Security Description Counterparty Unrealised Loss US$
% of NetAssets
1,000 Brother Industries Ltd Morgan Stanley (285) (0.00)
(7,138) Brown-Forman Corp Morgan Stanley (3,278) (0.00)
210,543 BT Group Plc Morgan Stanley (21,143) (0.01)
(515) Bucher Industries AG Morgan Stanley (3,161) (0.00)
(1,400) Buckle Inc Morgan Stanley (1,065) (0.00)
(4,600) Builders FirstSource Inc Morgan Stanley (389) (0.00)
24,562 Bunzl Plc Morgan Stanley (2,554) (0.00)
16,219 Burford Capital Ltd Morgan Stanley (5,336) (0.00)
(400) Burlington Stores Inc Morgan Stanley (1,328) (0.00)
44,033 BWP Trust Morgan Stanley (2,545) (0.00)
(72,500) BYD Co Ltd Morgan Stanley (6,936) (0.00)
124,000 BYD Electronic International Co Ltd Morgan Stanley (23,444) (0.01)
(2,000) CACI International Inc Morgan Stanley (8,017) (0.00)
(10,400) Cadence BanCorp Morgan Stanley (2,716) (0.00)
(114,902) CaixaBank SA Morgan Stanley (3,965) (0.00)
(1,500) Cameco Corp Morgan Stanley (111) (0.00)
5,100 Canada Goose Holdings Inc Morgan Stanley (6,612) (0.00)
(700) Canadian Pacific Railway Ltd Morgan Stanley (1,457) (0.00)
(20,700) Canadian Solar Inc Morgan Stanley (24,244) (0.01)
(2,000) Canadian Western Bank Morgan Stanley (414) (0.00)
422 Cancom Se Morgan Stanley (393) (0.00)
(7,478) Capgemini SE Morgan Stanley (1,026) (0.00)
776 Capita Plc Morgan Stanley (20) (0.00)
6,762 Cardinal Health Inc Morgan Stanley (1,627) (0.00)
(800) Cardiovascular Systems Inc Morgan Stanley (364) (0.00)
(1,900) Cardlytics Inc Morgan Stanley (5,279) (0.00)
(2,400) CareTrust REIT Inc Morgan Stanley (11) (0.00)
(216,446) Cargotec Oyj Morgan Stanley (2,641) (0.00)
301 Carl Zeiss Meditec AG Morgan Stanley (371) (0.00)
(1,660) Carlsberg A/S Morgan Stanley (97) (0.00)
(17,300) Carlyle Group LP Morgan Stanley (20,871) (0.01)
2,500 Carnival Corp Morgan Stanley (1,237) (0.00)
(1,500) Carolina Financial Corp Morgan Stanley (337) (0.00)
3,532 carsales.com Ltd Morgan Stanley (846) (0.00)
(5,000) Carter's Inc Morgan Stanley (13,228) (0.00)
1,286 Casino Guichard Perrachon SA Morgan Stanley (2,568) (0.00)
5,815 Castellum AB Morgan Stanley (89) (0.00)
(10,661) Castile Resources Ltd Morgan Stanley (1,499) (0.00)
(14,111) CBRE Group Inc Morgan Stanley (8,252) (0.00)

FINANCIAL STATEMENTS SCHEDULE OF INVESTMENTS
698 NEUBERGER BERMAN INVESTMENT FUNDS PLC
Neuberger Berman Uncorrelated Strategies Fund (Continued)
Schedule of Investments (Continued) Financial Liabilities at Fair Value through Profit or Loss (continued) Contracts for Differences (0.67%) (31 December 2018: (79.83%)) (continued)
Units Security Description Counterparty Unrealised Loss US$
% of NetAssets
2,700 CCL Industries Inc Morgan Stanley (1,303) (0.00)
(8,223) CECONOMY AG Morgan Stanley (3,332) (0.00)
1,200 Cedar Fair LP Morgan Stanley (529) (0.00)
(9,193) Cellnex Telecom SA Morgan Stanley (1,680) (0.00)
3,807 Cembra Money Bank AG Morgan Stanley (570) (0.00)
(2,400) Centene Corp Morgan Stanley (6,277) (0.00)
(47,700) Centennial Resource Development Inc Morgan Stanley (12,492) (0.00)
13,900 CenterState Bank Corp Morgan Stanley (8,855) (0.00)
3,700 Central Japan Railway Co Morgan Stanley (3,116) (0.00)
817,513 Centrica Plc Morgan Stanley (15) (0.00)
(22,603) Centuria Capital Group Morgan Stanley (1,451) (0.00)
(17,427) Centuria Metropolitan REIT Morgan Stanley (389) (0.00)
25,800 CenturyLink Inc Morgan Stanley (2,856) (0.00)
(8,400) Ceridian HCM Holding Inc Morgan Stanley (32,700) (0.01)
(4,000) Cerner Corp Morgan Stanley (4,070) (0.00)
(4,000) CH Robinson Worldwide Inc Morgan Stanley (2,289) (0.00)
7,927 Challenger Ltd Morgan Stanley (459) (0.00)
4,235 Champion Iron Ltd Morgan Stanley (155) (0.00)
(2,100) Charles River Laboratories International Inc Morgan Stanley (8,418) (0.00)
4,200 Charlottes Web Holdings Inc Morgan Stanley (2,353) (0.00)
10,566 Charter Hall Group Morgan Stanley (1,636) (0.00)
(16,604) Charter Hall Long Wale REIT Morgan Stanley (766) (0.00)
(16,906) Charter Hall Social Infrastructure REIT Morgan Stanley (35) (0.00)
8,825 Check Point Software Technologies Ltd Morgan Stanley (7,106) (0.00)
9,900 Cheesecake Factory Inc Morgan Stanley (1,926) (0.00)
(6,800) Chemours Co Morgan Stanley (2,053) (0.00)
(2,100) Chesapeake Utilities Corp Morgan Stanley (1,363) (0.00)
3,000 Chiba Bank Ltd Morgan Stanley (380) (0.00)
(317,000) China Agri-Industries Holdings Ltd Morgan Stanley (477) (0.00)
(56,000) China Cinda Asset Management Co Ltd Morgan Stanley (258) (0.00)
(20,000) China Coal Energy Co Ltd Morgan Stanley (36) (0.00)
(96,000) China Communications Services Corp Ltd Morgan Stanley (3,116) (0.00)
(11,500) China Conch Venture Holdings Ltd Morgan Stanley (2,830) (0.00)
10,000 China Everbright Greentech Ltd Morgan Stanley (126) (0.00)
(53,000) China Everbright International Ltd Morgan Stanley (210) (0.00)
(251,000) China Evergrande Group Morgan Stanley (6,966) (0.00)
(223,500) China Galaxy Securities Co Ltd Morgan Stanley (7,008) (0.00)
(58,000) China High Speed Transmission Equipment Group Co Ltd Morgan Stanley (4,630) (0.00)
(15,500) China Hongqiao Group Ltd Morgan Stanley (484) (0.00)

SCHEDULE OF INVESTMENTS FINANCIAL STATEMENTS
ANNUAL REPORT 2019 699
Neuberger Berman Uncorrelated Strategies Fund (Continued)
Schedule of Investments (Continued) Financial Liabilities at Fair Value through Profit or Loss (continued) Contracts for Differences (0.67%) (31 December 2018: (79.83%)) (continued)
Units Security Description Counterparty Unrealised Loss US$
% of NetAssets
36,000 China Huarong Asset Management Co Ltd Morgan Stanley (17) (0.00)
(102,800) China International Capital Corp Ltd Morgan Stanley (10,276) (0.00)
66,440 China International Marine Containers Group Co Ltd Morgan Stanley (4,065) (0.00)
(138,000) China Jinmao Holdings Group Ltd Morgan Stanley (5,119) (0.00)
9,600 China Literature Ltd Morgan Stanley (76) (0.00)
36,000 China Medical System Holdings Ltd Morgan Stanley (193) (0.00)
15,500 China Merchants Bank Co Ltd Morgan Stanley (726) (0.00)
9,000 China Mobile Ltd Morgan Stanley (568) (0.00)
(57,000) China Molybdenum Co Ltd Morgan Stanley (2,559) (0.00)
(126,000) China Oilfield Services Ltd Morgan Stanley (10,685) (0.00)
(22,000) China Overseas Land & Investment Ltd Morgan Stanley (3,326) (0.00)
(82,600) China Pacific Insurance Group Co Ltd Morgan Stanley (3,261) (0.00)
(320,000) China Petroleum & Chemical Corp Morgan Stanley (7,732) (0.00)
129,000 China Power International Development Ltd Morgan Stanley (50) (0.00)
31,000 China Railway Signal & Communication Corp Ltd Morgan Stanley (68) (0.00)
(2,020,000) China Reinsurance Group Corp Morgan Stanley (10,504) (0.00)
(40,000) China Resources Land Ltd Morgan Stanley (5,089) (0.00)
(39,000) China Resources Pharmaceutical Group Ltd Morgan Stanley (263) (0.00)
(76,000) China Resources Power Holdings Co Ltd Morgan Stanley (4,947) (0.00)
86,000 China Southern Airlines Co Ltd Morgan Stanley (1,082) (0.00)
78,500 China Tian Lun Gas Holdings Ltd Morgan Stanley (3,697) (0.00)
(36,000) China Traditional Chinese Medicine Holdings Co Ltd Morgan Stanley (782) (0.00)
(88,000) China Travel International Investment Hong Kong Ltd Morgan Stanley (1,361) (0.00)
(14,000) China Unicom Hong Kong Ltd Morgan Stanley (15) (0.00)
222,000 China Water Affairs Group Ltd Morgan Stanley (6,481) (0.00)
(1,031) Chipotle Mexican Grill Inc Morgan Stanley (2,916) (0.00)
(28) Chocoladefabriken Lindt & Spruengli AG Morgan Stanley (5,408) (0.00)
(3,800) Choice Hotels International Inc Morgan Stanley (4,303) (0.00)
(1,600) Chorus Aviation Inc Morgan Stanley (119) (0.00)
(18,595) Chr Hansen Holding A/S Morgan Stanley (589) (0.00)
(509) Christian Dior SE Morgan Stanley (1,200) (0.00)
(700) Chubb Ltd Morgan Stanley (237) (0.00)
(3,100) Chugai Pharmaceutical Co Ltd Morgan Stanley (1,005) (0.00)
16,700 Chugoku Electric Power Co Inc Morgan Stanley (2,746) (0.00)
(6,800) CI Financial Corp Morgan Stanley (1,111) (0.00)
24,488 CIE Automotive SA Morgan Stanley (1,574) (0.00)
4,535 Cie Financiere Richemont SA Morgan Stanley (188) (0.00)
8,074 Cie Generale des Etablissements Michelin SCA Morgan Stanley (6,722) (0.00)
32,850 Cie Plastic Omnium SA Morgan Stanley (5,134) (0.00)

FINANCIAL STATEMENTS SCHEDULE OF INVESTMENTS
700 NEUBERGER BERMAN INVESTMENT FUNDS PLC
Neuberger Berman Uncorrelated Strategies Fund (Continued)
Schedule of Investments (Continued) Financial Liabilities at Fair Value through Profit or Loss (continued) Contracts for Differences (0.67%) (31 December 2018: (79.83%)) (continued)
Units Security Description Counterparty Unrealised Loss US$
% of NetAssets
(5,200) Ciena Corp Morgan Stanley (801) (0.00)
3,441 CIMIC Group Ltd Morgan Stanley (2,145) (0.00)
(4,200) Cineplex Inc Morgan Stanley (547) (0.00)
(58,890) Cineworld Group Plc Morgan Stanley (610) (0.00)
(1,000) CIRCOR International Inc Morgan Stanley (685) (0.00)
(3,600) Cirrus Logic Inc Morgan Stanley (13,146) (0.00)
(7,000) Cisco Systems Inc Morgan Stanley (1,601) (0.00)
14,300 Cision Ltd Morgan Stanley (9) (0.00)
(63,000) CITIC Securities Co Ltd Morgan Stanley (12,399) (0.00)
(28,000) CITIC Telecom International Holdings Ltd Morgan Stanley (75) (0.00)
9,700 Citizen Watch Co Ltd Morgan Stanley (1,512) (0.00)
(14,000) Citizens Financial Group Inc Morgan Stanley (3,037) (0.00)
102,000 CK Life Sciences International Holdings Morgan Stanley (73) (0.00)
200 CKD Corp Morgan Stanley (43) (0.00)
(33,994) Cleanaway Waste Management Ltd Morgan Stanley (497) (0.00)
(10,801) Clinigen Group Plc Morgan Stanley (4,383) (0.00)
(1,100) CME Group Inc Morgan Stanley (565) (0.00)
7,300 CNA Financial Corp Morgan Stanley (906) (0.00)
(98,000) CNOOC Ltd Morgan Stanley (11,074) (0.00)
(10,300) CNX Midstream Partners LP Morgan Stanley (6,681) (0.00)
9,042 Cobham Plc Morgan Stanley (64) (0.00)
(4,700) Coca-Cola Co Morgan Stanley (3,925) (0.00)
768 Cochlear Ltd Morgan Stanley (1,522) (0.00)
(22,700) Coeur Mining Inc Morgan Stanley (15,557) (0.00)
(600) Cognex Corp Morgan Stanley (81) (0.00)
5,300 Cohen & Steers Inc Morgan Stanley (5,338) (0.00)
3,788 Coles Group Ltd Morgan Stanley (381) (0.00)
(6,600) Colgate-Palmolive Co Morgan Stanley (325) (0.00)
(2,400) Colliers International Group Inc Morgan Stanley (15,337) (0.00)
(9,491) Coloplast A/S Morgan Stanley (109) (0.00)
(600) Colowide Co Ltd Morgan Stanley (412) (0.00)
37,271 Colruyt SA Morgan Stanley (14) (0.00)
3,600 Columbia Banking System Inc Morgan Stanley (311) (0.00)
(100) Columbia Sportswear Co Morgan Stanley (8) (0.00)
12,183 Comcast Corp Morgan Stanley (1,451) (0.00)
(13,835) Commerce Bancshares Inc Morgan Stanley (6,290) (0.00)
(17,700) Commercial Metals Co Morgan Stanley (5,209) (0.00)
15,412 Commerzbank AG Morgan Stanley (319) (0.00)
1,823 Commonwealth Bank of Australia Morgan Stanley (353) (0.00)

SCHEDULE OF INVESTMENTS FINANCIAL STATEMENTS
ANNUAL REPORT 2019 701
Neuberger Berman Uncorrelated Strategies Fund (Continued)
Schedule of Investments (Continued) Financial Liabilities at Fair Value through Profit or Loss (continued) Contracts for Differences (0.67%) (31 December 2018: (79.83%)) (continued)
Units Security Description Counterparty Unrealised Loss US$
% of NetAssets
15,200 CommVault Systems Inc Morgan Stanley (25,956) (0.01)
(39,963) Compass Group Plc Morgan Stanley (8,569) (0.00)
(569) CompuGroup Medical SE Morgan Stanley (824) (0.00)
(15,041) Conagra Brands Inc Morgan Stanley (443) (0.00)
(16,997) Concho Resources Inc Morgan Stanley (23,838) (0.01)
(9,800) ConocoPhillips Morgan Stanley (19,952) (0.00)
(8,877) Consolidated Edison Inc Morgan Stanley (3,732) (0.00)
(100) Constellation Brands Inc Morgan Stanley (97) (0.00)
23,438 Continental AG Morgan Stanley (3,205) (0.00)
(7,380) ConvaTec Group Plc Morgan Stanley (446) (0.00)
(600) Cooper Cos Inc Morgan Stanley (1,270) (0.00)
12,100 Core Laboratories NV Morgan Stanley (95,320) (0.02)
(6,600) CoreCivic Inc Morgan Stanley (3,739) (0.00)
3,300 CoreSite Realty Corp Morgan Stanley (854) (0.00)
(16,773) Coronado Global Resources Inc Morgan Stanley (1,422) (0.00)
(734) Corporate Travel Management Ltd Morgan Stanley (129) (0.00)
29,300 Corus Entertainment Inc Morgan Stanley (3,756) (0.00)
(69,500) COSCO SHIPPING Holdings Co Ltd Morgan Stanley (256) (0.00)
394,000 COSCO SHIPPING Ports Ltd Morgan Stanley (1,382) (0.00)
400 Cosmo Energy Holdings Co Ltd Morgan Stanley (164) (0.00)
(200) CoStar Group Inc Morgan Stanley (1,010) (0.00)
(200) Cott Corp Morgan Stanley (43) (0.00)
10,500 Coty Inc Morgan Stanley (1,150) (0.00)
(117,374) Country Garden Holdings Co Ltd Morgan Stanley (9,005) (0.00)
19,667 Countryside Properties Plc Morgan Stanley (2,971) (0.00)
8,807 Covestro AG Morgan Stanley (10,867) (0.00)
(2,710) Covivio Morgan Stanley (7,380) (0.00)
900 Cracker Barrel Old Country Store Inc Morgan Stanley (90) (0.00)
(3,551) Cranswick Plc Morgan Stanley (2,167) (0.00)
(10,700) Create Restaurants Holdings Inc Morgan Stanley (7,068) (0.00)
23,291 Credit Agricole SA Morgan Stanley (2,973) (0.00)
(2,700) Credit Saison Co Ltd Morgan Stanley (320) (0.00)
(8,029) Crocs Inc Morgan Stanley (10,986) (0.00)
(53,768) Cromwell Property Group Morgan Stanley (194) (0.00)
44,553 Crown Holdings Inc Morgan Stanley (2,169) (0.00)
(107,000) CRRC Corp Ltd Morgan Stanley (3,902) (0.00)
7,900 CSG Systems International Inc Morgan Stanley (10,020) (0.00)
20,182 CSR Ltd Morgan Stanley (2,056) (0.00)
(300) CSW Industrials Inc Morgan Stanley (138) (0.00)

FINANCIAL STATEMENTS SCHEDULE OF INVESTMENTS
702 NEUBERGER BERMAN INVESTMENT FUNDS PLC
Neuberger Berman Uncorrelated Strategies Fund (Continued)
Schedule of Investments (Continued) Financial Liabilities at Fair Value through Profit or Loss (continued) Contracts for Differences (0.67%) (31 December 2018: (79.83%)) (continued)
Units Security Description Counterparty Unrealised Loss US$
% of NetAssets
(2,015) CSX Corp Morgan Stanley (32) (0.00)
(23,800) CubeSmart Morgan Stanley (16,667) (0.00)
5,000 Cubic Corp Morgan Stanley (2,533) (0.00)
2,800 Cummins Inc Morgan Stanley (4,763) (0.00)
(4,200) CVS Health Corp Morgan Stanley (69) (0.00)
7,200 CyberAgent Inc Morgan Stanley (3,271) (0.00)
7,600 Cypress Semiconductor Corp Morgan Stanley (627) (0.00)
72,800 Dah Sing Banking Group Ltd Morgan Stanley (333) (0.00)
2,000 Daido Steel Co Ltd Morgan Stanley (2,816) (0.00)
6,900 Dai-ichi Life Holdings Inc Morgan Stanley (3,638) (0.00)
(1,300) Daiichikosho Co Ltd Morgan Stanley (3,606) (0.00)
4,800 Daio Paper Corp Morgan Stanley (319) (0.00)
(2,400) Daiwabo Holdings Co Ltd Morgan Stanley (6,378) (0.00)
(271,000) Dali Foods Group Co Ltd Morgan Stanley (5,994) (0.00)
(5,794) Danaher Corp Morgan Stanley (6,784) (0.00)
(1,836) Danske Bank A/S Morgan Stanley (2,587) (0.00)
(136,000) Datang International Power Generation Co Ltd Morgan Stanley (175) (0.00)
(3,400) Dave & Buster's Entertainment Inc Morgan Stanley (968) (0.00)
(3,183) DaVita Inc Morgan Stanley (4,931) (0.00)
(21,600) DCP Midstream LP Morgan Stanley (2,194) (0.00)
(2,419) Dechra Pharmaceuticals Plc Morgan Stanley (2,934) (0.00)
(300) Deckers Outdoor Corp Morgan Stanley (1,224) (0.00)
(30,813) Delivery Hero SE Morgan Stanley (52,282) (0.01)
7,267 Demant A/S Morgan Stanley (4,228) (0.00)
9,100 Denso Corp Morgan Stanley (12,905) (0.00)
2,300 Dentsu Inc Morgan Stanley (3,718) (0.00)
(3,120) Dermapharm Holding SE Morgan Stanley (5,724) (0.00)
(200) Descartes Systems Group Inc Morgan Stanley (263) (0.00)
(1,100) Descente Ltd Morgan Stanley (71) (0.00)
(83,434) Deutsche Bank AG Morgan Stanley (1,143) (0.00)
73,622 Deutsche Lufthansa AG Morgan Stanley (15,472) (0.00)
4,338 Deutsche Post AG Morgan Stanley (2,760) (0.00)
32,843 Deutsche Telekom AG Morgan Stanley (6,977) (0.00)
(17,587) Devon Energy Corp Morgan Stanley (20,459) (0.00)
(1,600) DexCom Inc Morgan Stanley (6,866) (0.00)
2,586 Dexus Morgan Stanley (169) (0.00)
69,249 Dialog Semiconductor Plc Morgan Stanley (1,460) (0.00)
(10,095) Diamondback Energy Inc Morgan Stanley (5,393) (0.00)
(43,100) DiamondRock Hospitality Co Morgan Stanley (2,861) (0.00)

SCHEDULE OF INVESTMENTS FINANCIAL STATEMENTS
ANNUAL REPORT 2019 703
Neuberger Berman Uncorrelated Strategies Fund (Continued)
Schedule of Investments (Continued) Financial Liabilities at Fair Value through Profit or Loss (continued) Contracts for Differences (0.67%) (31 December 2018: (79.83%)) (continued)
Units Security Description Counterparty Unrealised Loss US$
% of NetAssets
(2,473) D'ieteren SA Morgan Stanley (5,211) (0.00)
(3,400) Digital Garage Inc Morgan Stanley (4,754) (0.00)
(3,800) Dine Brands Global Inc Morgan Stanley (7,463) (0.00)
(7,300) Diodes Inc Morgan Stanley (26,959) (0.01)
6,000 Discover Financial Services Morgan Stanley (4,440) (0.00)
(15,000) Discovery Inc Morgan Stanley (4,340) (0.00)
(14,923) DISH Network Corp Morgan Stanley (155) (0.00)
406,235 Dixons Carphone Plc Morgan Stanley (6,127) (0.00)
(4,029) DMG Mori AG Morgan Stanley (596) (0.00)
8,600 DMG Mori Co Ltd Morgan Stanley (6,920) (0.00)
(1,500) DocuSign Inc Morgan Stanley (326) (0.00)
(2,900) Dollarama Inc Morgan Stanley (1,426) (0.00)
948 Domino's Pizza Enterprises Ltd Morgan Stanley (70) (0.00)
(400) Domino's Pizza Inc Morgan Stanley (652) (0.00)
(2,900) Donaldson Co Inc Morgan Stanley (2,218) (0.00)
116,000 Dongfeng Motor Group Co Ltd Morgan Stanley (6,045) (0.00)
(1,065) dormakaba Holding AG Goldman Sachs International (629) (0.00)
(205) dormakaba Holding AG Morgan Stanley (429) (0.00)
(600) Dorman Products Inc Morgan Stanley (1,012) (0.00)
14,900 Downer EDI Ltd Morgan Stanley (812) (0.00)
506,111 Drax Group Plc Morgan Stanley (4,680) (0.00)
(4,427) Dsv Panalpina A/S Morgan Stanley (4,782) (0.00)
(3,600) DTS Corp Morgan Stanley (1,808) (0.00)
48,579 Duerr AG Morgan Stanley (649) (0.00)
(3,000) Duke Energy Corp Morgan Stanley (2,433) (0.00)
600 Dundee Precious Metals Inc Morgan Stanley (26) (0.00)
26,375 E*TRADE Financial Corp Morgan Stanley (6,772) (0.00)
(40,146) E.ON SE Morgan Stanley (2,821) (0.00)
700 East Japan Railway Co Morgan Stanley (70) (0.00)
(9,700) East West Bancorp Inc Morgan Stanley (506) (0.00)
(2,300) EastGroup Properties Inc Morgan Stanley (1,654) (0.00)
16,314 easyJet Plc Morgan Stanley (16,348) (0.00)
6,000 Eaton Vance Corp Morgan Stanley (3,036) (0.00)
1,400 Ebara Corp Morgan Stanley (1,374) (0.00)
9,978 Ebro Foods SA Morgan Stanley (1,787) (0.00)
23,500 ECN Capital Corp Morgan Stanley (358) (0.00)
13,100 EDION Corp Morgan Stanley (1,403) (0.00)
1,900 Edwards Lifesciences Corp Morgan Stanley (2,936) (0.00)
(1,726) Eiffage SA Morgan Stanley (2,024) (0.00)

FINANCIAL STATEMENTS SCHEDULE OF INVESTMENTS
704 NEUBERGER BERMAN INVESTMENT FUNDS PLC
Neuberger Berman Uncorrelated Strategies Fund (Continued)
Schedule of Investments (Continued) Financial Liabilities at Fair Value through Profit or Loss (continued) Contracts for Differences (0.67%) (31 December 2018: (79.83%)) (continued)
Units Security Description Counterparty Unrealised Loss US$
% of NetAssets
(3,200) El Paso Electric Co Morgan Stanley (754) (0.00)
(17,548) Elders Ltd Morgan Stanley (2,382) (0.00)
(200) Elecom Co Ltd Morgan Stanley (281) (0.00)
5,600 Electric Power Development Co Ltd Morgan Stanley (3,218) (0.00)
(5,512) Electro Optic Systems Holdings Ltd Morgan Stanley (2,319) (0.00)
630 Electrocomponents Plc Morgan Stanley (157) (0.00)
(9,900) Eli Lilly & Co Morgan Stanley (33,272) (0.01)
(16,011) Elisa Oyj Morgan Stanley (1,799) (0.00)
1,115,920 Elkem ASA Morgan Stanley (354) (0.00)
2,600 EMCOR Group Inc Morgan Stanley (3,779) (0.00)
(28,459) Emeco Holdings Ltd Morgan Stanley (1,809) (0.00)
100 Emerson Electric Co Morgan Stanley (12) (0.00)
5,200 Empire Co Ltd Morgan Stanley (630) (0.00)
(75) EMS-Chemie Holding AG Morgan Stanley (618) (0.00)
(24,919) Encana Corp Morgan Stanley (6,586) (0.00)
6,000 Encompass Health Corp Morgan Stanley (2,741) (0.00)
2,700 Encore Wire Corp Morgan Stanley (31) (0.00)
(2,100) Endeavour Mining Corp Morgan Stanley (630) (0.00)
(3,500) Enerflex Ltd Morgan Stanley (573) (0.00)
(8,937) Energean Oil & Gas Plc Morgan Stanley (107) (0.00)
(3,300) Enghouse Systems Ltd Morgan Stanley (5,637) (0.00)
50,158 Engie SA Morgan Stanley (6,467) (0.00)
(107,667) Eni SpA Morgan Stanley (19) (0.00)
100 en-japan Inc Morgan Stanley (49) (0.00)
(27,945) EnLink Midstream LLC Morgan Stanley (3,088) (0.00)
(5,200) ENN Energy Holdings Ltd Morgan Stanley (685) (0.00)
1,500 Entegris Inc Morgan Stanley (699) (0.00)
(1,400) Enterprise Financial Services Corp Morgan Stanley (13) (0.00)
(14,300) Enterprise Products Partners LP Morgan Stanley (4,034) (0.00)
(317) Envista Holdings Corp Morgan Stanley (764) (0.00)
(2,846) EOG Resources Inc Morgan Stanley (3,291) (0.00)
(500) EPAM Systems Inc Morgan Stanley (17) (0.00)
(2,400) EPR Properties Morgan Stanley (1,093) (0.00)
(5,400) EQM Midstream Partners LP Morgan Stanley (5,044) (0.00)
3,351 EQT AB Morgan Stanley (84) (0.00)
(3,100) EQT Corp Morgan Stanley (178) (0.00)
(1,323) Equinix Inc Morgan Stanley (17,317) (0.00)
(10,200) Equitrans Midstream Corp Morgan Stanley (2,300) (0.00)
(1,639) Eramet Morgan Stanley (6,643) (0.00)

SCHEDULE OF INVESTMENTS FINANCIAL STATEMENTS
ANNUAL REPORT 2019 705
Neuberger Berman Uncorrelated Strategies Fund (Continued)
Schedule of Investments (Continued) Financial Liabilities at Fair Value through Profit or Loss (continued) Contracts for Differences (0.67%) (31 December 2018: (79.83%)) (continued)
Units Security Description Counterparty Unrealised Loss US$
% of NetAssets
(3,900) ESCO Technologies Inc Morgan Stanley (10,475) (0.00)
3,400 Essent Group Ltd Morgan Stanley (3,848) (0.00)
(4,642) Estee Lauder Cos Inc Morgan Stanley (5,768) (0.00)
7,863 Estia Health Ltd Morgan Stanley (26) (0.00)
(1,175) Eurofins Scientific SE Morgan Stanley (242) (0.00)
(12,724) Euromoney Institutional Investor Plc Morgan Stanley (2,283) (0.00)
(47,713) Euronav NV Morgan Stanley (30,623) (0.01)
(1,900) Euronet Worldwide Inc Morgan Stanley (1,042) (0.00)
2,661 Eutelsat Communications SA Morgan Stanley (126) (0.00)
6,100 Evercore Inc Morgan Stanley (5,195) (0.00)
(700) Everest Re Group Ltd Morgan Stanley (521) (0.00)
(6,500) Eversource Energy Morgan Stanley (3,878) (0.00)
(41,035) Evotec SE Morgan Stanley (1,857) (0.00)
(55,819) Evraz Plc Morgan Stanley (8,075) (0.00)
(6,600) EW Scripps Co Morgan Stanley (5,280) (0.00)
4,000 Exedy Corp Morgan Stanley (2,252) (0.00)
(3,300) Expeditors International of Washington Inc Morgan Stanley (720) (0.00)
(42,764) Experian Plc Morgan Stanley (1,045) (0.00)
9,667 Exxon Mobil Corp Morgan Stanley (897) (0.00)
700 Ezaki Glico Co Ltd Morgan Stanley (693) (0.00)
(12,752) Fabege AB Morgan Stanley (7,193) (0.00)
(600) Fabrinet Morgan Stanley (177) (0.00)
(5,428) Fagron Morgan Stanley (253) (0.00)
(900) Fair Isaac Corp Morgan Stanley (4,577) (0.00)
600 FANUC Corp Morgan Stanley (6,982) (0.00)
300 Fast Retailing Co Ltd Morgan Stanley (5,127) (0.00)
13,100 Fastenal Co Morgan Stanley (4,055) (0.00)
2,765 Faurecia SE Morgan Stanley (6,258) (0.00)
2,000 FCC Co Ltd Morgan Stanley (815) (0.00)
(600) Federal Realty Investment Trust Morgan Stanley (696) (0.00)
(26,200) Ferro Corp Morgan Stanley (2,540) (0.00)
1,717 FFP Morgan Stanley (732) (0.00)
(2,700) Fidelity National Information Services Inc Morgan Stanley (2,901) (0.00)
(4,166) Fielmann AG Morgan Stanley (3,209) (0.00)
(2,000) Fiera Capital Corp Morgan Stanley (986) (0.00)
10,100 Fifth Third Bancorp Morgan Stanley (2,163) (0.00)
(300) First Citizens BancShares Inc Morgan Stanley (732) (0.00)
12,500 First Commonwealth Financial Corp Morgan Stanley (2,830) (0.00)
5,100 First Financial Bankshares Inc Morgan Stanley (4,946) (0.00)

FINANCIAL STATEMENTS SCHEDULE OF INVESTMENTS
706 NEUBERGER BERMAN INVESTMENT FUNDS PLC
Neuberger Berman Uncorrelated Strategies Fund (Continued)
Schedule of Investments (Continued) Financial Liabilities at Fair Value through Profit or Loss (continued) Contracts for Differences (0.67%) (31 December 2018: (79.83%)) (continued)
Units Security Description Counterparty Unrealised Loss US$
% of NetAssets
(3,800) First Industrial Realty Trust Inc Morgan Stanley (832) (0.00)
6,400 First Interstate BancSystem Inc Morgan Stanley (2,469) (0.00)
2,300 First National Financial Corp Morgan Stanley (3,372) (0.00)
(4,000) First Republic Bank Morgan Stanley (2,750) (0.00)
10,199 Firstgroup Plc Morgan Stanley (112) (0.00)
(100) FirstService Corp Morgan Stanley (345) (0.00)
1,400 FleetCor Technologies Inc Morgan Stanley (3,745) (0.00)
16,144 Fletcher Building Ltd Morgan Stanley (1,086) (0.00)
(4,900) Floor & Decor Holdings Inc Morgan Stanley (1,253) (0.00)
(10,946) FLSmidth & Co A/S Morgan Stanley (253) (0.00)
(45,977) Fluidra SA Morgan Stanley (24,367) (0.01)
(10,245) Fluor Corp Morgan Stanley (2,237) (0.00)
(8,600) Focus Financial Partners Inc Morgan Stanley (3,283) (0.00)
1,600 ForeScout Technologies Inc Morgan Stanley (72) (0.00)
(11,000) FormFactor Inc Morgan Stanley (5,169) (0.00)
1,600 Fortis Inc Morgan Stanley (140) (0.00)
(6,200) Fortive Corp Morgan Stanley (840) (0.00)
(5,700) Fortune Brands Home & Security Inc Morgan Stanley (10) (0.00)
6,500 Foundation Building Materials Inc Morgan Stanley (1,163) (0.00)
1,300 FP Corp Morgan Stanley (2,072) (0.00)
(1,900) Franco-Nevada Corp Morgan Stanley (10,609) (0.00)
65,614 Franklin Resources Inc Morgan Stanley (8,107) (0.00)
(434) Fraport AG Frankfurt Airport Services Worldwide Morgan Stanley (249) (0.00)
22,238 Frasers Group Plc Morgan Stanley (4,925) (0.00)
(27,968) Freedom Foods Group Ltd Morgan Stanley (2,876) (0.00)
3,400 Freehold Royalties Ltd Morgan Stanley (22) (0.00)
2,331 Freenet AG Morgan Stanley (338) (0.00)
(32,939) Freni Brembo SpA Morgan Stanley (318) (0.00)
(1,210) Fresenius Medical Care AG & Co KGaA Morgan Stanley (402) (0.00)
(55,856) Fresnillo Plc Morgan Stanley (12,829) (0.00)
(7,100) Frontera Energy Corp Morgan Stanley (3,882) (0.00)
(9,700) Frontline Ltd Morgan Stanley (9,913) (0.00)
136,000 Fu Shou Yuan International Group Ltd Morgan Stanley (3,092) (0.00)
292,000 Fufeng Group Ltd Morgan Stanley (1,070) (0.00)
4,300 Fuji Corp Morgan Stanley (1,602) (0.00)
3,400 Fuji Electric Co Ltd Morgan Stanley (4,508) (0.00)
6,800 Fuji Media Holdings Inc Morgan Stanley (914) (0.00)
7,700 FUJIFILM Holdings Corp Morgan Stanley (4,476) (0.00)
2,000 Fujitec Co Ltd Morgan Stanley (215) (0.00)

SCHEDULE OF INVESTMENTS FINANCIAL STATEMENTS
ANNUAL REPORT 2019 707
Neuberger Berman Uncorrelated Strategies Fund (Continued)
Schedule of Investments (Continued) Financial Liabilities at Fair Value through Profit or Loss (continued) Contracts for Differences (0.67%) (31 December 2018: (79.83%)) (continued)
Units Security Description Counterparty Unrealised Loss US$
% of NetAssets
(2,700) Fujitsu General Ltd Morgan Stanley (720) (0.00)
(1,000) Fujitsu Ltd Morgan Stanley (1,910) (0.00)
4,400 Fukuoka Financial Group Inc Morgan Stanley (2,575) (0.00)
3,100 Fulton Financial Corp Morgan Stanley (1,343) (0.00)
4,700 Furukawa Electric Co Ltd Morgan Stanley (11,191) (0.00)
(4,617) Future Plc Morgan Stanley (6,124) (0.00)
(1,100) Fuyo General Lease Co Ltd Morgan Stanley (1,032) (0.00)
3,477 Galapagos NV Morgan Stanley (11,281) (0.00)
48,000 Galaxy Entertainment Group Ltd Morgan Stanley (4,670) (0.00)
(630) Galenica AG Morgan Stanley (464) (0.00)
(24) Games Workshop Group Plc Morgan Stanley (13) (0.00)
(5,500) Gardner Denver Holdings Inc Morgan Stanley (1,692) (0.00)
15,100 Garrett Motion Inc Morgan Stanley (4,664) (0.00)
2,400 Gartner Inc Morgan Stanley (4,242) (0.00)
(7,000) Gates Industrial Corp Plc Morgan Stanley (167) (0.00)
22,810 Gaztransport Et Technigaz SA Morgan Stanley (1,564) (0.00)
(1,221) GB Group Plc Morgan Stanley (324) (0.00)
89 GDI Property Group Morgan Stanley (3) (0.00)
28,118 GEA Group AG Morgan Stanley (1,548) (0.00)
31,000 Geely Automobile Holdings Ltd Morgan Stanley (160) (0.00)
2,500 General Dynamics Corp Morgan Stanley (4,936) (0.00)
(518,131) General Electric Co Morgan Stanley (1,077) (0.00)
(9,600) Genesis Energy LP Morgan Stanley (2,791) (0.00)
12,773 Genmab A/S Morgan Stanley (2,266) (0.00)
3,200 Gentex Corp Morgan Stanley (669) (0.00)
700 George Weston Ltd Morgan Stanley (90) (0.00)
5,600 Gibraltar Industries Inc Morgan Stanley (5,582) (0.00)
(500) Gibson Energy Inc Morgan Stanley (31) (0.00)
(8,600) G-III Apparel Group Ltd Morgan Stanley (7,457) (0.00)
(600) Giken Ltd Morgan Stanley (77) (0.00)
(2,800) Gildan Activewear Inc Morgan Stanley (2,354) (0.00)
(2,450) Givaudan SA Goldman Sachs International (6,330) (0.00)
(10,492) Gjensidige Forsikring ASA Morgan Stanley (43) (0.00)
(8,000) Glacier Bancorp Inc Morgan Stanley (759) (0.00)
(3,088) GlaxoSmithKline Plc Morgan Stanley (37) (0.00)
1,500 Glory Ltd Morgan Stanley (558) (0.00)
2,500 GMO internet Inc Morgan Stanley (1,428) (0.00)
8,400 GMS Inc Morgan Stanley (3,359) (0.00)
(2,200) goeasy Ltd Morgan Stanley (4,160) (0.00)

FINANCIAL STATEMENTS SCHEDULE OF INVESTMENTS
708 NEUBERGER BERMAN INVESTMENT FUNDS PLC
Neuberger Berman Uncorrelated Strategies Fund (Continued)
Schedule of Investments (Continued) Financial Liabilities at Fair Value through Profit or Loss (continued) Contracts for Differences (0.67%) (31 December 2018: (79.83%)) (continued)
Units Security Description Counterparty Unrealised Loss US$
% of NetAssets
(21,400) Golar LNG Ltd Morgan Stanley (18,183) (0.00)
10,776 Goodman Group Morgan Stanley (1,804) (0.00)
(9,200) Graco Inc Morgan Stanley (5,482) (0.00)
34,800 GrafTech International Ltd Morgan Stanley (7,534) (0.00)
9,520 GrainCorp Ltd Morgan Stanley (477) (0.00)
(3,032) Grand City Properties SA Morgan Stanley (1,595) (0.00)
(16,100) Gray Television Inc Morgan Stanley (16,192) (0.00)
(2,500) Great Canadian Gaming Corp Morgan Stanley (1,493) (0.00)
105,000 Great Eagle Holdings Ltd Morgan Stanley (12,649) (0.00)
27,846 Great Portland Estates Plc Morgan Stanley (3,834) (0.00)
9,600 Great Western Bancorp Inc Morgan Stanley (9,190) (0.00)
(2,800) Greenbrier Cos Inc Morgan Stanley (942) (0.00)
(375,500) Greentown China Holdings Ltd Morgan Stanley (44,028) (0.01)
(12,000) Greentown Service Group Co Ltd Morgan Stanley (253) (0.00)
(23,344) Grifols SA Morgan Stanley (2,528) (0.00)
1,500 Group 1 Automotive Inc Morgan Stanley (894) (0.00)
(6,158) Groupe Bruxelles Lambert SA Morgan Stanley (3,965) (0.00)
1,468 Growthpoint Properties Australia Ltd Morgan Stanley (127) (0.00)
4,500 GS Yuasa Corp Morgan Stanley (2,603) (0.00)
(26,000) Guangzhou Automobile Group Co Ltd Morgan Stanley (1,251) (0.00)
65,600 Guangzhou R&F Properties Co Ltd Morgan Stanley (990) (0.00)
(1,217) GUD Holdings Ltd Morgan Stanley (160) (0.00)
(12,600) Guess? Inc Morgan Stanley (15,772) (0.00)
150 GungHo Online Entertainment Inc Morgan Stanley (73) (0.00)
(725,000) Guotai Junan International Holdings Ltd Morgan Stanley (6,564) (0.00)
(125,800) Guotai Junan Securities Co Ltd Morgan Stanley (11,067) (0.00)
3,861 GVC Holdings Plc Morgan Stanley (466) (0.00)
8,336 GWA Group Ltd Morgan Stanley (248) (0.00)
8,930 H Lundbeck A/S Morgan Stanley (6,259) (0.00)
4,900 H2O Retailing Corp Morgan Stanley (4,246) (0.00)
4,500 Haemonetics Corp Morgan Stanley (11,376) (0.00)
63,000 Haidilao International Holding Ltd Morgan Stanley (10,401) (0.00)
6,000 Haitian International Holdings Ltd Morgan Stanley (465) (0.00)
5,500 Hakuhodo DY Holdings Inc Morgan Stanley (814) (0.00)
698 HAL Trust Morgan Stanley (364) (0.00)
(51,660) Halliburton Co Morgan Stanley (1,383) (0.00)
2,375 Halma Plc Morgan Stanley (476) (0.00)
1,100 Hamamatsu Photonics KK Morgan Stanley (724) (0.00)
7,201 Hamburger Hafen und Logistik AG Morgan Stanley (1,983) (0.00)

SCHEDULE OF INVESTMENTS FINANCIAL STATEMENTS
ANNUAL REPORT 2019 709
Neuberger Berman Uncorrelated Strategies Fund (Continued)
Schedule of Investments (Continued) Financial Liabilities at Fair Value through Profit or Loss (continued) Contracts for Differences (0.67%) (31 December 2018: (79.83%)) (continued)
Units Security Description Counterparty Unrealised Loss US$
% of NetAssets
(13,500) Hancock Whitney Corp Morgan Stanley (4,735) (0.00)
143,000 Hang Lung Group Ltd Morgan Stanley (1,687) (0.00)
(206) Hapag-Lloyd AG Morgan Stanley (283) (0.00)
12,684 Hargreaves Lansdown Plc Morgan Stanley (21,021) (0.01)
400 Harsco Corp Morgan Stanley (2) (0.00)
12,777 Hartford Financial Services Group Inc Morgan Stanley (1,000) (0.00)
757 Hastings Group Holdings Plc Morgan Stanley (38) (0.00)
1,716 Hays Plc Morgan Stanley (50) (0.00)
3,300 Hazama Ando Corp Morgan Stanley (366) (0.00)
43,176 Healius Ltd Morgan Stanley (3,118) (0.00)
(22,500) Healthcare Realty Trust Inc Morgan Stanley (16,535) (0.00)
(28,400) Healthcare Trust of America Inc Morgan Stanley (22,342) (0.01)
(1,600) Heartland Express Inc Morgan Stanley (213) (0.00)
(88,800) Hecla Mining Co Morgan Stanley (28,783) (0.01)
7,400 HEICO Corp Morgan Stanley (10,392) (0.00)
(3,576) Heineken Holding NV Morgan Stanley (2,106) (0.00)
(11,908) Heineken NV Morgan Stanley (4,971) (0.00)
(1,000) Heiwa Real Estate Co Ltd Morgan Stanley (38) (0.00)
100 Heiwado Co Ltd Morgan Stanley (19) (0.00)
(1,900) Helen of Troy Ltd Morgan Stanley (16,553) (0.00)
(1,300) Helix Energy Solutions Group Inc Morgan Stanley (52) (0.00)
42,709 Hella GmbH & Co KGaA Morgan Stanley (3,436) (0.00)
(1,310) Helvetia Holding AG Morgan Stanley (1,557) (0.00)
9,500 Henderson Land Development Co Ltd Morgan Stanley (41) (0.00)
(9,000) Hengan International Group Co Ltd Morgan Stanley (1,061) (0.00)
1,164,000 HengTen Networks Group Ltd Morgan Stanley (152) (0.00)
2,921 Henry Schein Inc Morgan Stanley (2,364) (0.00)
1,000 Herc Holdings Inc Morgan Stanley (656) (0.00)
12,400 Herman Miller Inc Morgan Stanley (27,554) (0.01)
25,140 Hertz Global Holdings Inc Morgan Stanley (2,372) (0.00)
6,400 Hexcel Corp Morgan Stanley (3,748) (0.00)
81,700 HEXO Corp Morgan Stanley (46,631) (0.01)
(2,900) Highwoods Properties Inc Morgan Stanley (4,693) (0.00)
(700) Hikari Tsushin Inc Morgan Stanley (4,755) (0.00)
(67) Hillenbrand Inc Morgan Stanley (3) (0.00)
17,600 Hilton Grand Vacations Inc Morgan Stanley (3,658) (0.00)
15,800 Hiroshima Bank Ltd Morgan Stanley (1,700) (0.00)
(3,200) Hitachi Capital Corp Morgan Stanley (924) (0.00)
(1,500) Hitachi Chemical Co Ltd Morgan Stanley (1,488) (0.00)

FINANCIAL STATEMENTS SCHEDULE OF INVESTMENTS
710 NEUBERGER BERMAN INVESTMENT FUNDS PLC
Neuberger Berman Uncorrelated Strategies Fund (Continued)
Schedule of Investments (Continued) Financial Liabilities at Fair Value through Profit or Loss (continued) Contracts for Differences (0.67%) (31 December 2018: (79.83%)) (continued)
Units Security Description Counterparty Unrealised Loss US$
% of NetAssets
(3,700) Hitachi High-Technologies Corp Morgan Stanley (8,987) (0.00)
(4,900) Hitachi Metals Ltd Morgan Stanley (3,254) (0.00)
184,000 HK Electric Investments & HK Electric Investments Ltd Morgan Stanley (1,813) (0.00)
1,000 HKBN Ltd Morgan Stanley (7) (0.00)
300 HNI Corp Morgan Stanley (9) (0.00)
100 Hogy Medical Co Ltd Morgan Stanley (93) (0.00)
4,800 Hokuhoku Financial Group Inc Morgan Stanley (267) (0.00)
14,600 Holly Energy Partners LP Morgan Stanley (1,841) (0.00)
(800) HollyFrontier Corp Morgan Stanley (316) (0.00)
1,700 Home Depot Inc Morgan Stanley (507) (0.00)
(104,000) Hong Kong & China Gas Co Ltd Morgan Stanley (1,289) (0.00)
67,000 Hongkong & Shanghai Hotels Ltd Morgan Stanley (5,041) (0.00)
13,000 Hope Bancorp Inc Morgan Stanley (155) (0.00)
2,200 Horace Mann Educators Corp Morgan Stanley (317) (0.00)
(4,525) Hormel Foods Corp Morgan Stanley (10) (0.00)
(69,200) Host Hotels & Resorts Inc Morgan Stanley (9,584) (0.00)
4,600 House Foods Group Inc Morgan Stanley (1,924) (0.00)
(2,300) Howard Hughes Corp Morgan Stanley (5,876) (0.00)
(25,100) HP Inc Morgan Stanley (2,158) (0.00)
(80,878) HSBC Holdings Plc Morgan Stanley (511) (0.00)
(12,000) Huaneng Power International Inc Morgan Stanley (11) (0.00)
(123,600) Huatai Securities Co Ltd Morgan Stanley (11,454) (0.00)
(4,600) Hub Group Inc Morgan Stanley (1,611) (0.00)
400 HubSpot Inc Morgan Stanley (45) (0.00)
(11,500) Hudbay Minerals Inc Morgan Stanley (1,238) (0.00)
(17,100) Hudson Pacific Properties Inc Morgan Stanley (23,196) (0.01)
(26,500) Hudson's Bay Co Morgan Stanley (29,013) (0.01)
1,200 Hulic Co Ltd Morgan Stanley (161) (0.00)
(1,500) Humana Inc Morgan Stanley (66) (0.00)
(15,100) Huntsman Corp Morgan Stanley (936) (0.00)
(10,700) Husky Energy Inc Morgan Stanley (3,654) (0.00)
(1,716,000) Hutchison Telecommunications Hong Kong Holdings Ltd Morgan Stanley (144) (0.00)
(9,816) Hyatt Hotels Corp Morgan Stanley (13,218) (0.00)
4,300 Hydro One Ltd Morgan Stanley (456) (0.00)
(384) Hypoport AG Morgan Stanley (3,838) (0.00)
76,000 Hysan Development Co Ltd Morgan Stanley (837) (0.00)
(1,800) IAC/InterActiveCorp Morgan Stanley (18,107) (0.00)
(12,900) IAMGOLD Corp Morgan Stanley (4,606) (0.00)
(153,568) Iberdrola SA Morgan Stanley (17,582) (0.00)

SCHEDULE OF INVESTMENTS FINANCIAL STATEMENTS
ANNUAL REPORT 2019 711
Neuberger Berman Uncorrelated Strategies Fund (Continued)
Schedule of Investments (Continued) Financial Liabilities at Fair Value through Profit or Loss (continued) Contracts for Differences (0.67%) (31 December 2018: (79.83%)) (continued)
Units Security Description Counterparty Unrealised Loss US$
% of NetAssets
1,200 Ibiden Co Ltd Morgan Stanley (52) (0.00)
(18,654) ICADE Morgan Stanley (23,477) (0.01)
(3,000) ICF International Inc Morgan Stanley (2,020) (0.00)
(1,600) Ichibanya Co Ltd Morgan Stanley (4,031) (0.00)
(332) Idemitsu Kosan Co Ltd Morgan Stanley (15) (0.00)
(2,200) IDEX Corp Morgan Stanley (1,801) (0.00)
(12,839) Idorsia Ltd Morgan Stanley (15,216) (0.00)
6,133 IDP Education Ltd Morgan Stanley (1,926) (0.00)
(9,594) IHS Markit Ltd Morgan Stanley (1,876) (0.00)
(279) Iliad SA Morgan Stanley (453) (0.00)
2,300 IMAX Corp Morgan Stanley (431) (0.00)
(6,696) IMF Bentham Ltd Morgan Stanley (1,906) (0.00)
72,581 IMI Plc Morgan Stanley (2,272) (0.00)
(2,900) Imperial Oil Ltd Morgan Stanley (3,292) (0.00)
3,440,000 Imperial Pacific International Holdings Ltd Morgan Stanley (7,483) (0.00)
45,199 Incitec Pivot Ltd Morgan Stanley (258) (0.00)
3,700 Independent Bank Corp Morgan Stanley (10,535) (0.00)
5,100 Independent Bank Group Inc Morgan Stanley (106) (0.00)
(21,004) Indra Sistemas SA Morgan Stanley (6,550) (0.00)
(26,000) Infinera Corp Morgan Stanley (16,339) (0.00)
(600) Information Services International-Dentsu Ltd Morgan Stanley (753) (0.00)
(29,924) Ingenia Communities Group Morgan Stanley (10,862) (0.00)
(1,969) Ingredion Inc Morgan Stanley (3,014) (0.00)
(30,498) Inmobiliaria Colonial Socimi SA Morgan Stanley (6,089) (0.00)
(9,418) Innogy SE Morgan Stanley (5,773) (0.00)
(1,900) Innospec Inc Morgan Stanley (5,220) (0.00)
600 Inphi Corp Morgan Stanley (63) (0.00)
1,700 Instructure Inc Morgan Stanley (357) (0.00)
5,200 Integra LifeSciences Holdings Corp Morgan Stanley (486) (0.00)
6,200 InterDigital Inc Morgan Stanley (493) (0.00)
6,900 Interface Inc Morgan Stanley (304) (0.00)
(7,500) Interfor Corp Morgan Stanley (2,010) (0.00)
39,369 Intermediate Capital Group Plc Morgan Stanley (356) (0.00)
400 International Bancshares Corp Morgan Stanley (29) (0.00)
49,518 International Consolidated Airlines Group SA Morgan Stanley (12,334) (0.00)
(6,400) Internet Initiative Japan Inc Morgan Stanley (16,050) (0.00)
(9,400) Interpublic Group of Cos Inc Morgan Stanley (280) (0.00)
(16,680) Intertek Group Plc Morgan Stanley (4,327) (0.00)
(5,955) Intertrust NV Morgan Stanley (6,937) (0.00)

FINANCIAL STATEMENTS SCHEDULE OF INVESTMENTS
712 NEUBERGER BERMAN INVESTMENT FUNDS PLC
Neuberger Berman Uncorrelated Strategies Fund (Continued)
Schedule of Investments (Continued) Financial Liabilities at Fair Value through Profit or Loss (continued) Contracts for Differences (0.67%) (31 December 2018: (79.83%)) (continued)
Units Security Description Counterparty Unrealised Loss US$
% of NetAssets
205,624 Intesa Sanpaolo SpA Morgan Stanley (25) (0.00)
969 Intuit Inc Morgan Stanley (1,235) (0.00)
(15,400) Invesco Ltd Morgan Stanley (1,010) (0.00)
(900) Invesco Office J-Reit Inc Morgan Stanley (17,029) (0.00)
47,400 Investors Bancorp Inc Morgan Stanley (6,698) (0.00)
7,200 Invitae Corp Morgan Stanley (3,590) (0.00)
(15,600) Invitation Homes Inc Morgan Stanley (10,807) (0.00)
5,117 Ipsen SA Morgan Stanley (4,727) (0.00)
1,300 Iriso Electronics Co Ltd Morgan Stanley (3,195) (0.00)
(38,334) iSignthis Ltd Morgan Stanley (550) (0.00)
2,800 Ito En Ltd Morgan Stanley (5,967) (0.00)
(5,900) Itochu Techno-Solutions Corp Morgan Stanley (1,873) (0.00)
(2,300) ITT Inc Morgan Stanley (1,583) (0.00)
1,900 Iwatani Corp Morgan Stanley (132) (0.00)
(124,657) IWG Plc Morgan Stanley (842) (0.00)
2,500 Izumi Co Ltd Morgan Stanley (2,818) (0.00)
37,314 J D Wetherspoon Plc Morgan Stanley (30) (0.00)
1,400 J&J Snack Foods Corp Morgan Stanley (431) (0.00)
200 Jabil Inc Morgan Stanley (1) (0.00)
3,300 Jack Henry & Associates Inc Morgan Stanley (2,084) (0.00)
(11,100) Jagged Peak Energy Inc Morgan Stanley (5,267) (0.00)
(8,367) James Hardie Industries Plc Morgan Stanley (2,203) (0.00)
(4,200) Jamieson Wellness Inc Morgan Stanley (1,136) (0.00)
7,269 Janus Henderson Group Plc Morgan Stanley (3,412) (0.00)
(2,800) Japan Airlines Co Ltd Morgan Stanley (616) (0.00)
(2,400) Japan Airport Terminal Co Ltd Morgan Stanley (28) (0.00)
(600) Japan Elevator Service Holdings Co Ltd Morgan Stanley (32) (0.00)
3,300 Japan Exchange Group Inc Morgan Stanley (933) (0.00)
14,300 Japan Lifeline Co Ltd Morgan Stanley (5,294) (0.00)
(7,500) Japan Material Co Ltd Morgan Stanley (4,734) (0.00)
20,600 Japan Post Holdings Co Ltd Morgan Stanley (4,420) (0.00)
2,400 Japan Steel Works Ltd Morgan Stanley (1,083) (0.00)
2,137 JB Hi-Fi Ltd Morgan Stanley (332) (0.00)
(1,400) JB Hunt Transport Services Inc Morgan Stanley (228) (0.00)
(102,501) JCDecaux SA Morgan Stanley (3,002) (0.00)
(1,662) JD Sports Fashion Plc Morgan Stanley (217) (0.00)
(600) Jeol Ltd Morgan Stanley (177) (0.00)
11,200 JetBlue Airways Corp Morgan Stanley (2,049) (0.00)
4,900 JFE Holdings Inc Morgan Stanley (3,901) (0.00)

SCHEDULE OF INVESTMENTS FINANCIAL STATEMENTS
ANNUAL REPORT 2019 713
Neuberger Berman Uncorrelated Strategies Fund (Continued)
Schedule of Investments (Continued) Financial Liabilities at Fair Value through Profit or Loss (continued) Contracts for Differences (0.67%) (31 December 2018: (79.83%)) (continued)
Units Security Description Counterparty Unrealised Loss US$
% of NetAssets
(1,585) Johnson & Johnson Morgan Stanley (5,228) (0.00)
(30,643) Johnson Matthey Plc Morgan Stanley (7,832) (0.00)
(13,348) JPMorgan Chase & Co Morgan Stanley (14,409) (0.00)
9,500 JTEKT Corp Morgan Stanley (6,114) (0.00)
(59,807) Julius Baer Group Ltd Morgan Stanley (6,802) (0.00)
4,525 Jumbo Interactive Ltd Morgan Stanley (8,522) (0.00)
693,000 K Wah International Holdings Ltd Morgan Stanley (728) (0.00)
(100) Kadokawa Corp Morgan Stanley (146) (0.00)
3,900 Kajima Corp Morgan Stanley (732) (0.00)
1,800 Kaken Pharmaceutical Co Ltd Morgan Stanley (529) (0.00)
1,300 Kaneka Corp Morgan Stanley (1,261) (0.00)
12,100 Kanematsu Corp Morgan Stanley (351) (0.00)
800 Kansas City Southern Morgan Stanley (628) (0.00)
(6,700) Kao Corp Morgan Stanley (3,632) (0.00)
(61,882) Karoon Energy Ltd Morgan Stanley (5,107) (0.00)
67,000 Kasen International Holdings Ltd Morgan Stanley (331) (0.00)
10,300 Kawasaki Kisen Kaisha Ltd Morgan Stanley (3,927) (0.00)
(2,900) KB Home Morgan Stanley (1,600) (0.00)
3,620 KBC Ancora Morgan Stanley (1,163) (0.00)
(16,563) KBC Group NV Morgan Stanley (1,477) (0.00)
(6,500) KBR Inc Morgan Stanley (334) (0.00)
(400) Keihan Holdings Co Ltd Morgan Stanley (25) (0.00)
1,800 Keikyu Corp Morgan Stanley (6) (0.00)
(6,700) Kellogg Co Morgan Stanley (11,834) (0.00)
(1,500) Kemper Corp Morgan Stanley (113) (0.00)
(939) Kering SA Morgan Stanley (11,711) (0.00)
54,500 Kerry Properties Ltd Morgan Stanley (5,215) (0.00)
(43,200) KeyCorp Morgan Stanley (1,265) (0.00)
700 Keyence Corp Morgan Stanley (10,291) (0.00)
(7,200) Keyera Corp Morgan Stanley (3,265) (0.00)
3,800 Keysight Technologies Inc Morgan Stanley (5,353) (0.00)
5,200 Kforce Inc Morgan Stanley (2,948) (0.00)
2,100 Kikkoman Corp Morgan Stanley (3,377) (0.00)
7,100 Kinden Corp Morgan Stanley (1,378) (0.00)
(68) Kinepolis Group NV Morgan Stanley (103) (0.00)
(48,500) Kingboard Laminates Holdings Ltd Morgan Stanley (1,366) (0.00)
5,574 Kingfisher Plc Morgan Stanley (626) (0.00)
(105,000) Kingsoft Corp Ltd Morgan Stanley (7,989) (0.00)
3,901 KION Group AG Morgan Stanley (4,675) (0.00)

FINANCIAL STATEMENTS SCHEDULE OF INVESTMENTS
714 NEUBERGER BERMAN INVESTMENT FUNDS PLC
Neuberger Berman Uncorrelated Strategies Fund (Continued)
Schedule of Investments (Continued) Financial Liabilities at Fair Value through Profit or Loss (continued) Contracts for Differences (0.67%) (31 December 2018: (79.83%)) (continued)
Units Security Description Counterparty Unrealised Loss US$
% of NetAssets
14,764 KKR & Co Inc Morgan Stanley (2,123) (0.00)
(9,000) Knight Therapeutics Inc Morgan Stanley (804) (0.00)
3,600 Knoll Inc Morgan Stanley (465) (0.00)
12,400 Knowles Corp Morgan Stanley (1,688) (0.00)
(11,700) Kobe Bussan Co Ltd Morgan Stanley (12,741) (0.00)
(3,960) Kohl's Corp Morgan Stanley (415) (0.00)
1,500 Komeri Co Ltd Morgan Stanley (308) (0.00)
(173,943) Kone Oyj Morgan Stanley (2,640) (0.00)
57,199 Koninklijke Ahold Delhaize NV Morgan Stanley (3,535) (0.00)
(5,640) Koninklijke DSM NV Morgan Stanley (198) (0.00)
(91,159) Koninklijke KPN NV Morgan Stanley (2,708) (0.00)
68,000 Koolearn Technology Holding Ltd Morgan Stanley (7,888) (0.00)
(5,330) Korian SA Morgan Stanley (10,385) (0.00)
(6,600) Korn Ferry Morgan Stanley (3,025) (0.00)
1,300 Kose Corp Morgan Stanley (5,996) (0.00)
(4,000) Koshidaka Holdings Co Ltd Morgan Stanley (5,144) (0.00)
(800) Kotobuki Spirits Co Ltd Morgan Stanley (6,072) (0.00)
7,700 Kratos Defense & Security Solutions Inc Morgan Stanley (384) (0.00)
(28,721) Kroger Co Morgan Stanley (7,445) (0.00)
18,100 Kubota Corp Morgan Stanley (10,088) (0.00)
(13,400) Kulicke & Soffa Industries Inc Morgan Stanley (11,223) (0.00)
300 Kureha Corp Morgan Stanley (268) (0.00)
(1,000) Kyoritsu Maintenance Co Ltd Morgan Stanley (1,880) (0.00)
2,800 Kyudenko Corp Morgan Stanley (6,349) (0.00)
7,400 Kyushu Financial Group Inc Morgan Stanley (928) (0.00)
7,900 L Brands Inc Morgan Stanley (172) (0.00)
100 Labrador Iron Ore Royalty Corp Morgan Stanley (8) (0.00)
(21,597) LafargeHolcim Ltd Morgan Stanley (13,806) (0.00)
(1,200) Lakeland Financial Corp Morgan Stanley (29) (0.00)
(1,000) Lamb Weston Holdings Inc Morgan Stanley (1,913) (0.00)
26,282 Landis+Gyr Group AG Morgan Stanley (3,260) (0.00)
116,616 LANXESS AG Morgan Stanley (2,499) (0.00)
162,100 Largo Resources Ltd Morgan Stanley (3,199) (0.00)
8,100 Lattice Semiconductor Corp Morgan Stanley (4,555) (0.00)
(1,100) Laurentian Bank of Canada Morgan Stanley (265) (0.00)
(2,100) Lazard Ltd Morgan Stanley (710) (0.00)
92,000 Lee & Man Paper Manufacturing Ltd Morgan Stanley (1,269) (0.00)
(5,720) LEG Immobilien AG Morgan Stanley (8,549) (0.00)
31,224 Legg Mason Inc Morgan Stanley (8,650) (0.00)

SCHEDULE OF INVESTMENTS FINANCIAL STATEMENTS
ANNUAL REPORT 2019 715
Neuberger Berman Uncorrelated Strategies Fund (Continued)
Schedule of Investments (Continued) Financial Liabilities at Fair Value through Profit or Loss (continued) Contracts for Differences (0.67%) (31 December 2018: (79.83%)) (continued)
Units Security Description Counterparty Unrealised Loss US$
% of NetAssets
4,536 Legrand SA Morgan Stanley (2,068) (0.00)
(6,100) Leidos Holdings Inc Morgan Stanley (11,695) (0.00)
2,221 Lendlease Group Morgan Stanley (1,320) (0.00)
12,000 Lennar Corp Morgan Stanley (18,985) (0.00)
(262,265) Leonardo SpA Goldman Sachs International (7,355) (0.00)
(100,260) Leroy Seafood Group ASA Morgan Stanley (1,916) (0.00)
94,500 Li Ning Co Ltd Morgan Stanley (11,206) (0.00)
(10,400) Liberty Broadband Corp Morgan Stanley (47,897) (0.01)
(11,500) Liberty Property Trust Morgan Stanley (6,663) (0.00)
(118,000) Lifestyle International Holdings Ltd Morgan Stanley (6,868) (0.00)
(4,800) Lightspeed POS Inc Morgan Stanley (9,931) (0.00)
(100) Linamar Corp Morgan Stanley (20) (0.00)
10,500 Lincoln National Corp Morgan Stanley (11,551) (0.00)
(5,500) LINE Corp Morgan Stanley (9,129) (0.00)
(4,994) Link Administration Holdings Ltd Morgan Stanley (347) (0.00)
7,200 Lion Corp Morgan Stanley (1,988) (0.00)
1,022 LISI Morgan Stanley (2,179) (0.00)
2,600 Lithia Motors Inc Morgan Stanley (15,669) (0.00)
(21,927) Livent Corp Morgan Stanley (2,174) (0.00)
3,100 LivePerson Inc Morgan Stanley (4,304) (0.00)
1,600 LIXIL Group Corp Morgan Stanley (498) (0.00)
4,600 Loblaw Cos Ltd Morgan Stanley (4,091) (0.00)
54,000 L'Occitane International SA Morgan Stanley (1,886) (0.00)
(24,698) Lockheed Martin Corp Morgan Stanley (1,504) (0.00)
(76,000) Logan Property Holdings Co Ltd Morgan Stanley (5,527) (0.00)
(4,400) LogMeIn Inc Morgan Stanley (10,378) (0.00)
(22,000) Longfor Group Holdings Ltd Morgan Stanley (6,037) (0.00)
(92,000) Lonking Holdings Ltd Morgan Stanley (203) (0.00)
(400) Lululemon Athletica Inc Morgan Stanley (2,528) (0.00)
(3,000) Lumentum Holdings Inc Morgan Stanley (9,195) (0.00)
(17,600) Lundin Gold Inc Morgan Stanley (6,998) (0.00)
(24,700) Lundin Mining Corp Morgan Stanley (2,536) (0.00)
28 LVMH Moet Hennessy Louis Vuitton SE Morgan Stanley (24) (0.00)
1,300 Lyft Inc Morgan Stanley (269) (0.00)
8,500 M/I Homes Inc Morgan Stanley (3,611) (0.00)
(14,500) M3 Inc Morgan Stanley (25,520) (0.01)
(6,400) Macerich Co Morgan Stanley (2,100) (0.00)
4,100 Macnica Fuji Electronics Holdings Inc Morgan Stanley (2,220) (0.00)
(1,608) Macquarie Group Ltd Morgan Stanley (2,067) (0.00)

FINANCIAL STATEMENTS SCHEDULE OF INVESTMENTS
716 NEUBERGER BERMAN INVESTMENT FUNDS PLC
Neuberger Berman Uncorrelated Strategies Fund (Continued)
Schedule of Investments (Continued) Financial Liabilities at Fair Value through Profit or Loss (continued) Contracts for Differences (0.67%) (31 December 2018: (79.83%)) (continued)
Units Security Description Counterparty Unrealised Loss US$
% of NetAssets
(22,300) Macy's Inc Morgan Stanley (16,959) (0.00)
200 Madison Square Garden Co Morgan Stanley (332) (0.00)
8,600 Maeda Corp Morgan Stanley (1,055) (0.00)
(6,800) Maeda Road Construction Co Ltd Morgan Stanley (427) (0.00)
3,300 Magna International Inc Morgan Stanley (1,933) (0.00)
400 Makino Milling Machine Co Ltd Morgan Stanley (635) (0.00)
(200) Makita Corp Morgan Stanley (37) (0.00)
(4,700) Mani Inc Morgan Stanley (6,329) (0.00)
(1,500) ManTech International Corp Morgan Stanley (571) (0.00)
(11,100) Manulife Financial Corp Morgan Stanley (7,053) (0.00)
(22,160) Marathon Oil Corp Morgan Stanley (5,646) (0.00)
7,449 Marathon Petroleum Corp Morgan Stanley (231) (0.00)
(7,048) Marriott International Inc Morgan Stanley (2,529) (0.00)
2,044 Marsh & McLennan Cos Inc Morgan Stanley (127) (0.00)
(3,591) Martin Marietta Materials Inc Morgan Stanley (12,298) (0.00)
(3,000) Martinrea International Inc Morgan Stanley (1,361) (0.00)
1,500 Marui Group Co Ltd Morgan Stanley (184) (0.00)
400 Maruwa Co Ltd Morgan Stanley (408) (0.00)
2,100 Maruwa Unyu Kikan Co Ltd Morgan Stanley (678) (0.00)
(800) Mastercard Inc Morgan Stanley (858) (0.00)
(8,000) Matador Resources Co Morgan Stanley (10,410) (0.00)
14,300 Mazda Motor Corp Morgan Stanley (2,998) (0.00)
(1,300) McKesson Corp Morgan Stanley (219) (0.00)
46,600 Mebuki Financial Group Inc Morgan Stanley (1,730) (0.00)
2,800 Medallia Inc Morgan Stanley (336) (0.00)
(31,867) Mediaset Espana Comunicacion SA Morgan Stanley (1,081) (0.00)
17,632 Medibank Pvt Ltd Morgan Stanley (1,015) (0.00)
(6,500) Medipal Holdings Corp Morgan Stanley (1,581) (0.00)
(28,400) MEG Energy Corp Morgan Stanley (11,313) (0.00)
(7,696) Megaport Ltd Morgan Stanley (2,714) (0.00)
5,800 Megmilk Snow Brand Co Ltd Morgan Stanley (3,544) (0.00)
1,700 Meidensha Corp Morgan Stanley (275) (0.00)
100 Meitec Corp Morgan Stanley (32) (0.00)
21,100 Meituan Dianping Morgan Stanley (982) (0.00)
49,698 Melrose Industries Plc Morgan Stanley (797) (0.00)
(5,200) Mercari Inc Morgan Stanley (6,513) (0.00)
5,954 Merck & Co Inc Morgan Stanley (166) (0.00)
(1,330) Merck KGaA Morgan Stanley (3,305) (0.00)
2,800 Mercury Systems Inc Morgan Stanley (6,058) (0.00)

SCHEDULE OF INVESTMENTS FINANCIAL STATEMENTS
ANNUAL REPORT 2019 717
Neuberger Berman Uncorrelated Strategies Fund (Continued)
Schedule of Investments (Continued) Financial Liabilities at Fair Value through Profit or Loss (continued) Contracts for Differences (0.67%) (31 December 2018: (79.83%)) (continued)
Units Security Description Counterparty Unrealised Loss US$
% of NetAssets
(12,000) Merit Medical Systems Inc Morgan Stanley (7,422) (0.00)
12,800 Meritage Homes Corp Morgan Stanley (25,041) (0.01)
(7,700) Meta Financial Group Inc Morgan Stanley (14,706) (0.00)
(1,600) Methanex Corp Morgan Stanley (866) (0.00)
(14,829) MetLife Inc Morgan Stanley (3,458) (0.00)
(25,676) Metro Ag Morgan Stanley (3,748) (0.00)
1,200 Metro Inc Morgan Stanley (51) (0.00)
(6,026) Metropole Television SA Morgan Stanley (5,784) (0.00)
(57,364) Metso Oyj Morgan Stanley (1,460) (0.00)
(300) Mettler-Toledo International Inc Morgan Stanley (603) (0.00)
800 MGM Resorts International Morgan Stanley (58) (0.00)
23,310 Micro Focus International Plc Morgan Stanley (70) (0.00)
(2,469) Microchip Technology Inc Morgan Stanley (611) (0.00)
(6,889) Micron Technology Inc Morgan Stanley (318) (0.00)
(33,065) Microport Scientific Corp Morgan Stanley (5,586) (0.00)
2,100 MicroStrategy Inc Morgan Stanley (8,031) (0.00)
600 Middleby Corp Morgan Stanley (583) (0.00)
(31,000) Midea Real Estate Holding Ltd Morgan Stanley (7,495) (0.00)
1,952 Mineral Resources Ltd Morgan Stanley (161) (0.00)
(7,000) Minerals Technologies Inc Morgan Stanley (8,853) (0.00)
8,300 Miroku Jyoho Service Co Ltd Morgan Stanley (11,705) (0.00)
(5,328) Mitchells & Butlers Plc Morgan Stanley (638) (0.00)
35,800 Mitsubishi Chemical Holdings Corp Morgan Stanley (2,831) (0.00)
1,400 Mitsubishi Corp Morgan Stanley (393) (0.00)
18,700 Mitsubishi Electric Corp Morgan Stanley (9,444) (0.00)
4,300 Mitsubishi Estate Co Ltd Morgan Stanley (1,131) (0.00)
(4,800) Mitsubishi Logisnext Co Ltd Morgan Stanley (860) (0.00)
1,400 Mitsubishi Motors Corp Morgan Stanley (137) (0.00)
32,700 Mitsubishi UFJ Financial Group Inc Morgan Stanley (404) (0.00)
(5,600) Mitsubishi UFJ Lease & Finance Co Ltd Morgan Stanley (122) (0.00)
9,800 Mitsui & Co Ltd Morgan Stanley (2,941) (0.00)
(1,500) Mitsui Mining & Smelting Co Ltd Morgan Stanley (428) (0.00)
(3,600) Mitsui OSK Lines Ltd Morgan Stanley (701) (0.00)
(700) Miura Co Ltd Morgan Stanley (323) (0.00)
2,400 Mixi Inc Morgan Stanley (19) (0.00)
(3,000) Mizuho Leasing Co Ltd Morgan Stanley (1,526) (0.00)
10,108 MKS Instruments Inc Morgan Stanley (2,704) (0.00)
(486) Mobimo Holding AG Morgan Stanley (4,504) (0.00)
700 Mochida Pharmaceutical Co Ltd Morgan Stanley (620) (0.00)

FINANCIAL STATEMENTS SCHEDULE OF INVESTMENTS
718 NEUBERGER BERMAN INVESTMENT FUNDS PLC
Neuberger Berman Uncorrelated Strategies Fund (Continued)
Schedule of Investments (Continued) Financial Liabilities at Fair Value through Profit or Loss (continued) Contracts for Differences (0.67%) (31 December 2018: (79.83%)) (continued)
Units Security Description Counterparty Unrealised Loss US$
% of NetAssets
100 Modec Inc Morgan Stanley (6) (0.00)
(4,900) Model N Inc Morgan Stanley (862) (0.00)
1,600 Mohawk Industries Inc Morgan Stanley (887) (0.00)
(900) Molson Coors Brewing Co Morgan Stanley (80) (0.00)
1,567 Monadelphous Group Ltd Morgan Stanley (381) (0.00)
(14,291) Mondi Plc Morgan Stanley (6,616) (0.00)
(6,741) Moneysupermarket.com Group Plc Morgan Stanley (371) (0.00)
(4,800) MonotaRO Co Ltd Morgan Stanley (5,032) (0.00)
(4,175) Monster Beverage Corp Morgan Stanley (546) (0.00)
1,600 Moog Inc Morgan Stanley (1,451) (0.00)
1,500 Morinaga & Co Ltd Morgan Stanley (2,216) (0.00)
(500) Morinaga Milk Industry Co Ltd Morgan Stanley (168) (0.00)
(85,048) Mount Gibson Iron Ltd Morgan Stanley (3,141) (0.00)
(53,484) Mowi ASA Morgan Stanley (8,925) (0.00)
21,700 MRC Global Inc Morgan Stanley (5,594) (0.00)
2,000 MS&AD Insurance Group Holdings Inc Morgan Stanley (1,393) (0.00)
2,200 MSCI Inc Morgan Stanley (3,677) (0.00)
(75,200) MTR Corp Ltd Morgan Stanley (740) (0.00)
(6,701) MTU Aero Engines AG Morgan Stanley (9,112) (0.00)
(300) MTY Food Group Inc Morgan Stanley (2) (0.00)
6,200 Mueller Industries Inc Morgan Stanley (445) (0.00)
(16,400) Mueller Water Products Inc Morgan Stanley (4,913) (0.00)
829 Muenchener Rueckversicherungs-Gesellschaft AG in Muenchen Morgan Stanley (113) (0.00)
(2,200) Mullen Group Ltd Morgan Stanley (96) (0.00)
(16,210) Murphy Oil Corp Morgan Stanley (17,411) (0.00)
44,730 Myer Holdings Ltd Morgan Stanley (21) (0.00)
(70,500) Nabors Industries Ltd Morgan Stanley (1,527) (0.00)
2,400 Nabtesco Corp Morgan Stanley (6,411) (0.00)
700 Nachi-Fujikoshi Corp Morgan Stanley (1,256) (0.00)
(8,700) Nasdaq Inc Morgan Stanley (6,885) (0.00)
34,453 National Express Group Plc Morgan Stanley (479) (0.00)
2,400 National Instruments Corp Morgan Stanley (400) (0.00)
(10,970) National Oilwell Varco Inc Morgan Stanley (30) (0.00)
(8,073) Natixis SA Morgan Stanley (352) (0.00)
(6,200) Navient Corp Morgan Stanley (62) (0.00)
(4,931) Navigator Global Investments Ltd Morgan Stanley (867) (0.00)
9,400 Navistar International Corp Morgan Stanley (12,128) (0.00)
3,800 NBT Bancorp Inc Morgan Stanley (1,310) (0.00)
(5,700) NCR Corp Morgan Stanley (4,436) (0.00)

SCHEDULE OF INVESTMENTS FINANCIAL STATEMENTS
ANNUAL REPORT 2019 719
Neuberger Berman Uncorrelated Strategies Fund (Continued)
Schedule of Investments (Continued) Financial Liabilities at Fair Value through Profit or Loss (continued) Contracts for Differences (0.67%) (31 December 2018: (79.83%)) (continued)
Units Security Description Counterparty Unrealised Loss US$
% of NetAssets
(1,100) NEC Networks & System Integration Corp Morgan Stanley (2,112) (0.00)
400 Neenah Inc Morgan Stanley (123) (0.00)
(200) Nelnet Inc Morgan Stanley (9) (0.00)
(10,500) NeoGenomics Inc Morgan Stanley (11,189) (0.00)
(11,036) Neste Oyj Morgan Stanley (37,288) (0.01)
(3,894) Netcompany Group A/S Morgan Stanley (3,729) (0.00)
14,553 Netwealth Group Ltd Morgan Stanley (1,209) (0.00)
(900) Nevro Corp Morgan Stanley (4,478) (0.00)
(172,200) New Gold Inc Morgan Stanley (6,700) (0.00)
(12,560) New Hope Corp Ltd Morgan Stanley (150) (0.00)
(1,500) New Jersey Resources Corp Morgan Stanley (348) (0.00)
(42) New Work SE Morgan Stanley (684) (0.00)
(2,079) Newcrest Mining Ltd Morgan Stanley (3,219) (0.00)
(3,700) Nexstar Media Group Inc Morgan Stanley (19,210) (0.00)
1,502 NEXTDC Ltd Morgan Stanley (56) (0.00)
(23,000) Nexteer Automotive Group Ltd Morgan Stanley (141) (0.00)
(5,956) NextEra Energy Inc Morgan Stanley (8,444) (0.00)
8,500 NextGen Healthcare Inc Morgan Stanley (351) (0.00)
1,000 NGK Spark Plug Co Ltd Morgan Stanley (104) (0.00)
(14,900) NGL Energy Partners LP Morgan Stanley (931) (0.00)
9,957 nib holdings Ltd Morgan Stanley (3,062) (0.00)
(2,000) Nichias Corp Morgan Stanley (732) (0.00)
(3,400) NichiiGakkan Co Ltd Morgan Stanley (3,098) (0.00)
(41,576) Nickel Mines Ltd Morgan Stanley (946) (0.00)
(200) Nihon M&A Center Inc Morgan Stanley (27) (0.00)
2,300 Nikkiso Co Ltd Morgan Stanley (236) (0.00)
8,900 Nikkon Holdings Co Ltd Morgan Stanley (693) (0.00)
2,300 Nikon Corp Morgan Stanley (644) (0.00)
124,000 Nine Dragons Paper Holdings Ltd Morgan Stanley (7,868) (0.00)
4,600 Nippo Corp Morgan Stanley (1,036) (0.00)
6,000 Nippon Kayaku Co Ltd Morgan Stanley (1,713) (0.00)
8,100 Nippon Light Metal Holdings Co Ltd Morgan Stanley (271) (0.00)
1,777 Nippon Steel Corp Morgan Stanley (984) (0.00)
20,700 Nippon Telegraph & Telephone Corp Morgan Stanley (2,807) (0.00)
(200) Nipro Corp Morgan Stanley (16) (0.00)
3,000 Nishimatsu Construction Co Ltd Morgan Stanley (909) (0.00)
4,200 Nishi-Nippon Financial Holdings Inc Morgan Stanley (888) (0.00)
400 Nishi-Nippon Railroad Co Ltd Morgan Stanley (249) (0.00)
1,200 Nissan Chemical Corp Morgan Stanley (1,804) (0.00)

FINANCIAL STATEMENTS SCHEDULE OF INVESTMENTS
720 NEUBERGER BERMAN INVESTMENT FUNDS PLC
Neuberger Berman Uncorrelated Strategies Fund (Continued)
Schedule of Investments (Continued) Financial Liabilities at Fair Value through Profit or Loss (continued) Contracts for Differences (0.67%) (31 December 2018: (79.83%)) (continued)
Units Security Description Counterparty Unrealised Loss US$
% of NetAssets
97,100 Nissan Motor Co Ltd Morgan Stanley (34,000) (0.01)
(1,700) Nisshin Oillio Group Ltd Morgan Stanley (408) (0.00)
(3,100) Nitto Boseki Co Ltd Morgan Stanley (10,932) (0.00)
5,935 NMC Health Plc Morgan Stanley (46,311) (0.01)
(34,021) Noble Energy Inc Morgan Stanley (20,490) (0.00)
(12,200) Noble Midstream Partners LP Morgan Stanley (13,502) (0.00)
1,300 NOF Corp Morgan Stanley (967) (0.00)
(156,778) Nokia Oyj Morgan Stanley (2,242) (0.00)
(4,126) Nokian Renkaat Oyj Morgan Stanley (1,374) (0.00)
(6,300) Nomura Co Ltd Morgan Stanley (2,158) (0.00)
1,400 Nomura Real Estate Holdings Inc Morgan Stanley (287) (0.00)
1,900 Nordson Corp Morgan Stanley (1,077) (0.00)
(3,200) Nordstrom Inc Morgan Stanley (3,394) (0.00)
(1,944) Norfolk Southern Corp Morgan Stanley (52) (0.00)
19,606 Norma Group SE Morgan Stanley (1,772) (0.00)
(27,723) Norsk Hydro ASA Morgan Stanley (1,500) (0.00)
3,600 North West Co Inc Morgan Stanley (341) (0.00)
(11,421) Northern Star Resources Ltd Morgan Stanley (10,676) (0.00)
(9,500) Northland Power Inc Morgan Stanley (1,170) (0.00)
19,600 Northwest Bancshares Inc Morgan Stanley (1,969) (0.00)
(5,500) Northwest Natural Holding Co Morgan Stanley (13,802) (0.00)
17,928 Novo Nordisk A/S Morgan Stanley (1,625) (0.00)
(39,199) Novozymes A/S Morgan Stanley (461) (0.00)
18,500 NOW Inc Morgan Stanley (4,594) (0.00)
(6,096) NRW Holdings Ltd Morgan Stanley (282) (0.00)
1,800 NSD Co Ltd Morgan Stanley (76) (0.00)
21,200 NSK Ltd Morgan Stanley (8,107) (0.00)
19,000 NTN Corp Morgan Stanley (2,596) (0.00)
(13,900) Nuance Communications Inc Morgan Stanley (209) (0.00)
4,700 Nucor Corp Morgan Stanley (1,349) (0.00)
(4,584) Nufarm Ltd Morgan Stanley (313) (0.00)
(800) Nutrien Ltd Morgan Stanley (114) (0.00)
(1,700) NuVasive Inc Morgan Stanley (493) (0.00)
(1,600) nVent Electric Plc Morgan Stanley (636) (0.00)
(1,600) NXP Semiconductors NV Morgan Stanley (627) (0.00)
(5,400) OceanFirst Financial Corp Morgan Stanley (3,762) (0.00)
(48,700) O-I Glass Inc Morgan Stanley (34,050) (0.01)
8,000 Oil States International Inc Morgan Stanley (2,245) (0.00)
8,800 Oki Electric Industry Co Ltd Morgan Stanley (3,033) (0.00)

SCHEDULE OF INVESTMENTS FINANCIAL STATEMENTS
ANNUAL REPORT 2019 721
Neuberger Berman Uncorrelated Strategies Fund (Continued)
Schedule of Investments (Continued) Financial Liabilities at Fair Value through Profit or Loss (continued) Contracts for Differences (0.67%) (31 December 2018: (79.83%)) (continued)
Units Security Description Counterparty Unrealised Loss US$
% of NetAssets
3,600 Okumura Corp Morgan Stanley (356) (0.00)
(900) Old Dominion Freight Line Inc Morgan Stanley (2,906) (0.00)
15,600 Old National Bancorp Morgan Stanley (2,726) (0.00)
1,100 Olin Corp Morgan Stanley (71) (0.00)
(17,800) Omega Healthcare Investors Inc Morgan Stanley (19,180) (0.00)
(4,400) Omnicom Group Inc Morgan Stanley (11) (0.00)
4,600 Omron Corp Morgan Stanley (12,474) (0.00)
(12,700) ON Semiconductor Corp Morgan Stanley (6,927) (0.00)
(6,200) ONE Gas Inc Morgan Stanley (3,785) (0.00)
(6,394) ONEOK Inc Morgan Stanley (12,226) (0.00)
217,131 OneSavings Bank Plc Morgan Stanley (13,268) (0.00)
25,200 Onward Holdings Co Ltd Morgan Stanley (1,426) (0.00)
(4,600) Open House Co Ltd Morgan Stanley (2,028) (0.00)
(2,400) Open Text Corp Morgan Stanley (734) (0.00)
(20,001) Opthea Ltd Morgan Stanley (3,833) (0.00)
6,452 Oracle Corp Morgan Stanley (1,696) (0.00)
1,848 O'Reilly Automotive Inc Morgan Stanley (1,189) (0.00)
(38,200) Orient Corp Morgan Stanley (780) (0.00)
(2,800) Oriental Land Co Ltd Morgan Stanley (3,974) (0.00)
(1,507) Orion Oyj Morgan Stanley (3,390) (0.00)
17,100 ORIX Corp Morgan Stanley (4,107) (0.00)
(144,539) Orkla ASA Morgan Stanley (1,139) (0.00)
8,896 Orocobre Ltd Morgan Stanley (136) (0.00)
(7,358) Orora Ltd Morgan Stanley (65) (0.00)
(6,493) Orpea Morgan Stanley (2,093) (0.00)
(11,302) Orsted A/S Morgan Stanley (13,984) (0.00)
1,700 Osaka Gas Co Ltd Morgan Stanley (925) (0.00)
5,900 OSG Corp Morgan Stanley (3,410) (0.00)
(3,000) Oshkosh Corp Morgan Stanley (6,380) (0.00)
100 OSI Systems Inc Morgan Stanley (60) (0.00)
(17,300) Osisko Gold Royalties Ltd Morgan Stanley (13,451) (0.00)
(2,000) Osisko Mining Inc Morgan Stanley (210) (0.00)
10,500 Otsuka Holdings Co Ltd Morgan Stanley (7,055) (0.00)
(92,347) Outokumpu Oyj Morgan Stanley (381) (0.00)
2,400 Oxford Industries Inc Morgan Stanley (1,455) (0.00)
(422,000) Pacific Basin Shipping Ltd Morgan Stanley (37) (0.00)
12,400 PacWest Bancorp Morgan Stanley (5,398) (0.00)
21,056 Pagegroup Plc Morgan Stanley (3,771) (0.00)
(3,300) PALTAC CORPORATION Morgan Stanley (3,185) (0.00)

FINANCIAL STATEMENTS SCHEDULE OF INVESTMENTS
722 NEUBERGER BERMAN INVESTMENT FUNDS PLC
Neuberger Berman Uncorrelated Strategies Fund (Continued)
Schedule of Investments (Continued) Financial Liabilities at Fair Value through Profit or Loss (continued) Contracts for Differences (0.67%) (31 December 2018: (79.83%)) (continued)
Units Security Description Counterparty Unrealised Loss US$
% of NetAssets
(6,855) Pan American Silver Corp Morgan Stanley (14,685) (0.00)
(18,600) Pan American Silver Corp (Right, 15/01/2029) Morgan Stanley (6,885) (0.00)
400 Pan Pacific International Holdings Corp Morgan Stanley (98) (0.00)
33,900 Panasonic Corp Morgan Stanley (2,523) (0.00)
(400) Papa John's International Inc Morgan Stanley (375) (0.00)
(15,200) Paramount Group Inc Morgan Stanley (4,812) (0.00)
23,500 Paramount Resources Ltd Morgan Stanley (2,019) (0.00)
(3,328) Pargesa Holding SA Morgan Stanley (1,061) (0.00)
(7) Park Hotels & Resorts Inc Morgan Stanley (7) (0.00)
(7,300) Park24 Co Ltd Morgan Stanley (11,260) (0.00)
(6,400) Parsons Corp Morgan Stanley (1,533) (0.00)
(505) Partners Group Holding AG Morgan Stanley (14,169) (0.00)
(2,200) Patrick Industries Inc Morgan Stanley (1,114) (0.00)
4,300 Pattern Energy Group Inc Morgan Stanley (702) (0.00)
(1,300) Paycom Software Inc Morgan Stanley (6,057) (0.00)
(1,800) Paylocity Holding Corp Morgan Stanley (2,022) (0.00)
2,600 PayPal Holdings Inc Morgan Stanley (1,769) (0.00)
28,300 Peabody Energy Corp Morgan Stanley (20,835) (0.01)
(1,200) Pegasystems Inc Morgan Stanley (728) (0.00)
(7,200) Pembina Pipeline Corp Morgan Stanley (6,051) (0.00)
(17,000) Penn National Gaming Inc Morgan Stanley (3,585) (0.00)
173,000 People's Insurance Co Group of China Ltd Morgan Stanley (743) (0.00)
2,837 PepsiCo Inc Morgan Stanley (1,275) (0.00)
(6,200) Performance Food Group Co Morgan Stanley (9,140) (0.00)
(4,100) PerkinElmer Inc Morgan Stanley (2,926) (0.00)
2,242 Pernod Ricard SA Morgan Stanley (1,243) (0.00)
(1,184) Perpetual Ltd Morgan Stanley (200) (0.00)
(3,900) Persol Holdings Co Ltd Morgan Stanley (1,411) (0.00)
2,500 Perspecta Inc Morgan Stanley (1,048) (0.00)
(628,000) PetroChina Co Ltd Morgan Stanley (8,282) (0.00)
120,456 Petrofac Ltd Morgan Stanley (5,314) (0.00)
493,657 Pets at Home Group Plc Morgan Stanley (255) (0.00)
90,867 Peugeot SA Morgan Stanley (19,846) (0.00)
(144) Pfeiffer Vacuum Technology AG Morgan Stanley (155) (0.00)
12,800 PGT Innovations Inc Morgan Stanley (1,341) (0.00)
(100) Phillips 66 Morgan Stanley (82) (0.00)
(48,300) Physicians Realty Trust Morgan Stanley (22,366) (0.01)
(12,100) Ping An Healthcare and Technology Co Ltd Morgan Stanley (879) (0.00)
(10,858) Pinnacle Investment Management Group Ltd Morgan Stanley (837) (0.00)
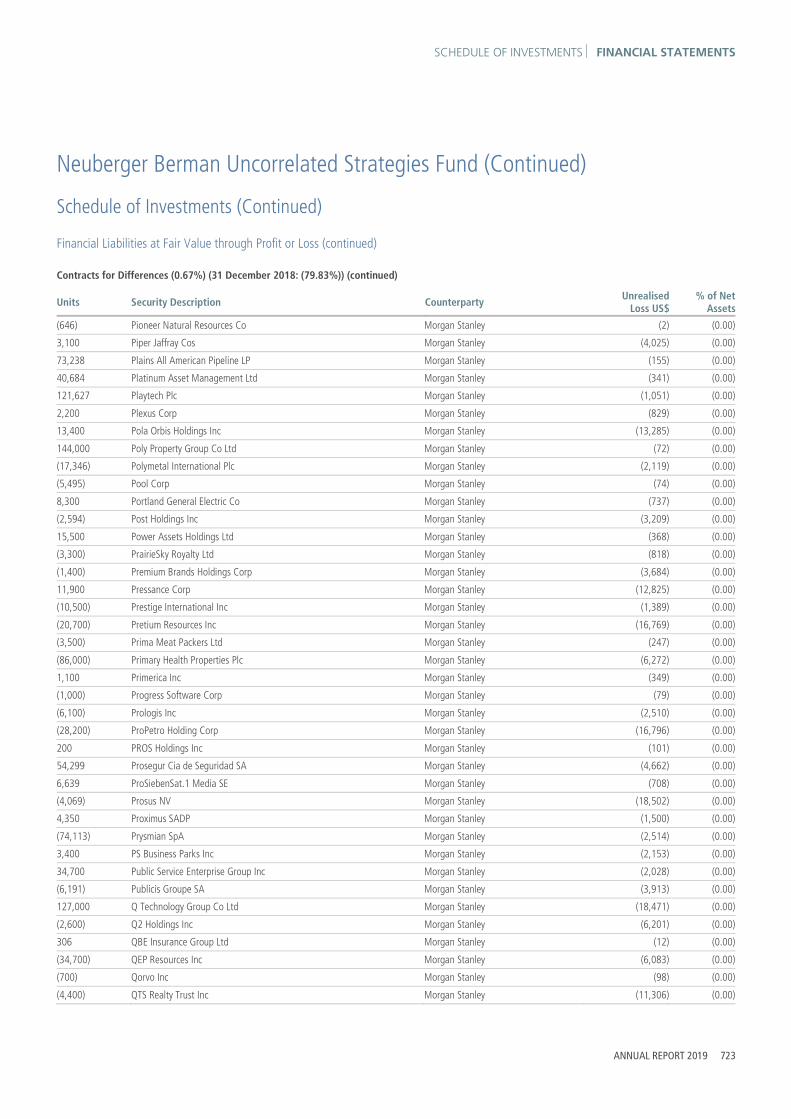
SCHEDULE OF INVESTMENTS FINANCIAL STATEMENTS
ANNUAL REPORT 2019 723
Neuberger Berman Uncorrelated Strategies Fund (Continued)
Schedule of Investments (Continued) Financial Liabilities at Fair Value through Profit or Loss (continued) Contracts for Differences (0.67%) (31 December 2018: (79.83%)) (continued)
Units Security Description Counterparty Unrealised Loss US$
% of NetAssets
(646) Pioneer Natural Resources Co Morgan Stanley (2) (0.00)
3,100 Piper Jaffray Cos Morgan Stanley (4,025) (0.00)
73,238 Plains All American Pipeline LP Morgan Stanley (155) (0.00)
40,684 Platinum Asset Management Ltd Morgan Stanley (341) (0.00)
121,627 Playtech Plc Morgan Stanley (1,051) (0.00)
2,200 Plexus Corp Morgan Stanley (829) (0.00)
13,400 Pola Orbis Holdings Inc Morgan Stanley (13,285) (0.00)
144,000 Poly Property Group Co Ltd Morgan Stanley (72) (0.00)
(17,346) Polymetal International Plc Morgan Stanley (2,119) (0.00)
(5,495) Pool Corp Morgan Stanley (74) (0.00)
8,300 Portland General Electric Co Morgan Stanley (737) (0.00)
(2,594) Post Holdings Inc Morgan Stanley (3,209) (0.00)
15,500 Power Assets Holdings Ltd Morgan Stanley (368) (0.00)
(3,300) PrairieSky Royalty Ltd Morgan Stanley (818) (0.00)
(1,400) Premium Brands Holdings Corp Morgan Stanley (3,684) (0.00)
11,900 Pressance Corp Morgan Stanley (12,825) (0.00)
(10,500) Prestige International Inc Morgan Stanley (1,389) (0.00)
(20,700) Pretium Resources Inc Morgan Stanley (16,769) (0.00)
(3,500) Prima Meat Packers Ltd Morgan Stanley (247) (0.00)
(86,000) Primary Health Properties Plc Morgan Stanley (6,272) (0.00)
1,100 Primerica Inc Morgan Stanley (349) (0.00)
(1,000) Progress Software Corp Morgan Stanley (79) (0.00)
(6,100) Prologis Inc Morgan Stanley (2,510) (0.00)
(28,200) ProPetro Holding Corp Morgan Stanley (16,796) (0.00)
200 PROS Holdings Inc Morgan Stanley (101) (0.00)
54,299 Prosegur Cia de Seguridad SA Morgan Stanley (4,662) (0.00)
6,639 ProSiebenSat.1 Media SE Morgan Stanley (708) (0.00)
(4,069) Prosus NV Morgan Stanley (18,502) (0.00)
4,350 Proximus SADP Morgan Stanley (1,500) (0.00)
(74,113) Prysmian SpA Morgan Stanley (2,514) (0.00)
3,400 PS Business Parks Inc Morgan Stanley (2,153) (0.00)
34,700 Public Service Enterprise Group Inc Morgan Stanley (2,028) (0.00)
(6,191) Publicis Groupe SA Morgan Stanley (3,913) (0.00)
127,000 Q Technology Group Co Ltd Morgan Stanley (18,471) (0.00)
(2,600) Q2 Holdings Inc Morgan Stanley (6,201) (0.00)
306 QBE Insurance Group Ltd Morgan Stanley (12) (0.00)
(34,700) QEP Resources Inc Morgan Stanley (6,083) (0.00)
(700) Qorvo Inc Morgan Stanley (98) (0.00)
(4,400) QTS Realty Trust Inc Morgan Stanley (11,306) (0.00)

FINANCIAL STATEMENTS SCHEDULE OF INVESTMENTS
724 NEUBERGER BERMAN INVESTMENT FUNDS PLC
Neuberger Berman Uncorrelated Strategies Fund (Continued)
Schedule of Investments (Continued) Financial Liabilities at Fair Value through Profit or Loss (continued) Contracts for Differences (0.67%) (31 December 2018: (79.83%)) (continued)
Units Security Description Counterparty Unrealised Loss US$
% of NetAssets
(1,200) Quaker Chemical Corp Morgan Stanley (3,900) (0.00)
(300) QUALCOMM Inc Morgan Stanley (36) (0.00)
1,900 Qualys Inc Morgan Stanley (2,661) (0.00)
1,100 Quanta Services Inc Morgan Stanley (119) (0.00)
(10,631) Qube Holdings Ltd Morgan Stanley (202) (0.00)
49,856 Quilter Plc Morgan Stanley (3,144) (0.00)
(300) Raksul Inc Morgan Stanley (537) (0.00)
(2,300) Rakuten Inc Morgan Stanley (51) (0.00)
(2,748) Ramelius Resources Ltd Morgan Stanley (529) (0.00)
(2,224) Ramsay Health Care Ltd Morgan Stanley (633) (0.00)
(45,600) Range Resources Corp Morgan Stanley (6,870) (0.00)
(324) Rational AG Morgan Stanley (2,366) (0.00)
(535,000) Razer Inc Morgan Stanley (1,409) (0.00)
2,700 RBC Bearings Inc Morgan Stanley (4,308) (0.00)
1,457 REA Group Ltd Morgan Stanley (3,202) (0.00)
2,600 Real Matters Inc Morgan Stanley (547) (0.00)
(16,800) Realty Income Corp Morgan Stanley (11,696) (0.00)
2,781 Reckitt Benckiser Group Plc Morgan Stanley (3,309) (0.00)
2,900 Red Rock Resorts Inc Morgan Stanley (301) (0.00)
(13,470) Redrow Plc Morgan Stanley (739) (0.00)
13,300 Regions Financial Corp Morgan Stanley (1,111) (0.00)
3,500 Reinsurance Group of America Inc Morgan Stanley (4,709) (0.00)
(8,300) Relo Group Inc Morgan Stanley (7,467) (0.00)
(34,489) RELX Plc Morgan Stanley (7,588) (0.00)
(3,500) Rengo Co Ltd Morgan Stanley (322) (0.00)
23,632 Repsol SA Morgan Stanley (4,352) (0.00)
8,771 Repsol SA (Right, 31/12/2019) Morgan Stanley (3) (0.00)
7,050 Republic Services Inc Morgan Stanley (941) (0.00)
664 ResMed Inc Morgan Stanley (57) (0.00)
45,400 Resona Holdings Inc Morgan Stanley (3,610) (0.00)
1,100 Restaurant Brands International Inc Morgan Stanley (1,666) (0.00)
(10,600) Retail Opportunity Investments Corp Morgan Stanley (3,694) (0.00)
(9,300) Rexnord Corp Morgan Stanley (1,081) (0.00)
(3,469) Rheinmetall AG Morgan Stanley (3,178) (0.00)
17,727 Rhi Magnesita NV Morgan Stanley (982) (0.00)
(2,800) Richelieu Hardware Ltd Morgan Stanley (828) (0.00)
(13,300) Ricoh Co Ltd Morgan Stanley (827) (0.00)
94,914 Rightmove Plc Morgan Stanley (24,753) (0.01)
300 Ritchie Bros Auctioneers Inc Morgan Stanley (71) (0.00)

SCHEDULE OF INVESTMENTS FINANCIAL STATEMENTS
ANNUAL REPORT 2019 725
Neuberger Berman Uncorrelated Strategies Fund (Continued)
Schedule of Investments (Continued) Financial Liabilities at Fair Value through Profit or Loss (continued) Contracts for Differences (0.67%) (31 December 2018: (79.83%)) (continued)
Units Security Description Counterparty Unrealised Loss US$
% of NetAssets
7,000 RLI Corp Morgan Stanley (10,896) (0.00)
(37,400) RLJ Lodging Trust Morgan Stanley (5,161) (0.00)
(2,600) Robert Half International Inc Morgan Stanley (2,790) (0.00)
(231) Robertet SA Morgan Stanley (27,593) (0.01)
(5,300) Rogers Communications Inc Morgan Stanley (4,581) (0.00)
3,200 Rogers Corp Morgan Stanley (15,811) (0.00)
900 Rohm Co Ltd Morgan Stanley (2,344) (0.00)
4,200 Rohto Pharmaceutical Co Ltd Morgan Stanley (1,622) (0.00)
1,000 Roku Inc Morgan Stanley (2,053) (0.00)
(63,053,442) Rolls-Royce Holdings Plc Goldman Sachs International (83,530) (0.02)
118,793 Rolls-Royce Holdings Plc (Right, 31/12/2049) Goldman Sachs International (9,856) (0.00)
(2,700) Ross Stores Inc Morgan Stanley (2,207) (0.00)
25,136 Rotork Plc Morgan Stanley (2,078) (0.00)
5,700 Royal Bank of Canada Morgan Stanley (2,566) (0.00)
(4,937) Royal Caribbean Cruises Ltd Morgan Stanley (24,594) (0.01)
5,900 Royal Holdings Co Ltd Morgan Stanley (1,902) (0.00)
(9,100) RPC Inc Morgan Stanley (256) (0.00)
(23,100) RPT Realty Morgan Stanley (10,905) (0.00)
(8,268) Rubis SCA Morgan Stanley (13,630) (0.00)
(14,139) Rural Funds Group Morgan Stanley (1,144) (0.00)
2,000 Russel Metals Inc Morgan Stanley (329) (0.00)
10,015 RWS Holdings Plc Morgan Stanley (2,003) (0.00)
(7,700) Ryohin Keikaku Co Ltd Morgan Stanley (1,457) (0.00)
(9,101) S&T AG Morgan Stanley (3,316) (0.00)
(5,900) S&T Bancorp Inc Morgan Stanley (3,734) (0.00)
(134,187) Safestore Holdings Plc Morgan Stanley (1) (0.00)
1,400 Safety Insurance Group Inc Morgan Stanley (794) (0.00)
6,242 Safran SA Morgan Stanley (19,595) (0.00)
(4,161) Salmar ASA Morgan Stanley (5,061) (0.00)
(11,378) Sampo Oyj Morgan Stanley (203) (0.00)
(900) Sanderson Farms Inc Morgan Stanley (4,988) (0.00)
(10,385) Sandfire Resources NL Morgan Stanley (394) (0.00)
(84,000) Sands China Ltd Morgan Stanley (20,482) (0.00)
(700) Sankyo Co Ltd Morgan Stanley (39) (0.00)
(1,900) Sanmina Corp Morgan Stanley (388) (0.00)
2,500 Santander Consumer USA Holdings Inc Morgan Stanley (1,204) (0.00)
9,097 Santos Ltd Morgan Stanley (633) (0.00)
4,969 SAP SE Morgan Stanley (6,890) (0.00)
4,400 Sapporo Holdings Ltd Morgan Stanley (5,450) (0.00)

FINANCIAL STATEMENTS SCHEDULE OF INVESTMENTS
726 NEUBERGER BERMAN INVESTMENT FUNDS PLC
Neuberger Berman Uncorrelated Strategies Fund (Continued)
Schedule of Investments (Continued) Financial Liabilities at Fair Value through Profit or Loss (continued) Contracts for Differences (0.67%) (31 December 2018: (79.83%)) (continued)
Units Security Description Counterparty Unrealised Loss US$
% of NetAssets
(1,138) Sartorius Stedim Biotech Morgan Stanley (7,808) (0.00)
4,200 Sato Holdings Corp Morgan Stanley (1,482) (0.00)
8,189 Savills Plc Morgan Stanley (5,181) (0.00)
(36,922) Schindler Holding AG Goldman Sachs International (7,749) (0.00)
(4,400) Schlumberger Ltd Morgan Stanley (3,109) (0.00)
4,110 Schneider Electric SE Morgan Stanley (6,606) (0.00)
14,000 Schneider National Inc Morgan Stanley (737) (0.00)
(300) Scorpio Tankers Inc Morgan Stanley (683) (0.00)
(1,249) Scout24 AG Morgan Stanley (1,479) (0.00)
400 SCREEN Holdings Co Ltd Morgan Stanley (745) (0.00)
2,800 SCSK Corp Morgan Stanley (2,830) (0.00)
(3,100) Seabridge Gold Inc Morgan Stanley (3,362) (0.00)
(2,400) Sealed Air Corp Morgan Stanley (656) (0.00)
(29,300) Seaspan Corp Morgan Stanley (2,001) (0.00)
(28,000) Seazen Group Ltd Morgan Stanley (1,037) (0.00)
780 SEB SA Morgan Stanley (1,181) (0.00)
(3,400) Secure Energy Services Inc Morgan Stanley (472) (0.00)
1,939 SEEK Ltd Morgan Stanley (20) (0.00)
700 Sega Sammy Holdings Inc Morgan Stanley (13) (0.00)
2,700 Seibu Holdings Inc Morgan Stanley (730) (0.00)
(100) Seiko Holdings Corp Morgan Stanley (68) (0.00)
6,100 Seino Holdings Co Ltd Morgan Stanley (834) (0.00)
1,500 Sekisui Chemical Co Ltd Morgan Stanley (334) (0.00)
(10,800) Select Medical Holdings Corp Morgan Stanley (7,293) (0.00)
9,000 Selective Insurance Group Inc Morgan Stanley (11,507) (0.00)
(18,000) SEMAFO Inc Morgan Stanley (2,556) (0.00)
(191,000) Semiconductor Manufacturing International Corp Morgan Stanley (15,012) (0.00)
(3,066) Sempra Energy Morgan Stanley (851) (0.00)
(2,000) S-Enjoy Service Group Co Ltd Morgan Stanley (308) (0.00)
19,793 Serco Group Plc Morgan Stanley (401) (0.00)
(810) Service Stream Ltd Morgan Stanley (105) (0.00)
(2,206) ServiceNow Inc Morgan Stanley (2,267) (0.00)
2,900 ServisFirst Bancshares Inc Morgan Stanley (675) (0.00)
6,376 SES SA Morgan Stanley (13) (0.00)
(13,576) Seven Group Holdings Ltd Morgan Stanley (4,940) (0.00)
219,828 Seven West Media Ltd Morgan Stanley (2,817) (0.00)
(8,127) Severn Trent Plc Morgan Stanley (73) (0.00)
700 SG Holdings Co Ltd Morgan Stanley (378) (0.00)
(52,000) Shandong Weigao Group Medical Polymer Co Ltd Morgan Stanley (3,275) (0.00)

SCHEDULE OF INVESTMENTS FINANCIAL STATEMENTS
ANNUAL REPORT 2019 727
Neuberger Berman Uncorrelated Strategies Fund (Continued)
Schedule of Investments (Continued) Financial Liabilities at Fair Value through Profit or Loss (continued) Contracts for Differences (0.67%) (31 December 2018: (79.83%)) (continued)
Units Security Description Counterparty Unrealised Loss US$
% of NetAssets
(20,000) Shanghai Electric Group Co Ltd Morgan Stanley (208) (0.00)
(33,500) Shanghai Fosun Pharmaceutical Group Co Ltd Morgan Stanley (4,185) (0.00)
(6,300) ShawCor Ltd Morgan Stanley (573) (0.00)
(6,800) Shenandoah Telecommunications Co Morgan Stanley (18,919) (0.00)
44,000 Shenzhen Expressway Co Ltd Morgan Stanley (1,265) (0.00)
19,500 Shenzhen International Holdings Ltd Morgan Stanley (512) (0.00)
216,000 Shenzhen Investment Ltd Morgan Stanley (1,349) (0.00)
(400) SHIFT Inc Morgan Stanley (795) (0.00)
16,200 Shikoku Electric Power Co Inc Morgan Stanley (2,009) (0.00)
(3,000) Shimadzu Corp Morgan Stanley (1,036) (0.00)
(1,100) Shimano Inc Morgan Stanley (1,526) (0.00)
(22,000) Shinko Electric Industries Co Ltd Morgan Stanley (11,747) (0.00)
4,200 Shinmaywa Industries Ltd Morgan Stanley (463) (0.00)
900 Shiseido Co Ltd Morgan Stanley (671) (0.00)
7,800 Shizuoka Bank Ltd Morgan Stanley (824) (0.00)
(3,216) Shopify Inc Morgan Stanley (3,280) (0.00)
2,704 Shopping Centres Australasia Property Group Morgan Stanley (113) (0.00)
(2,808,000) Shougang Concord International Enterprises Co Ltd Morgan Stanley (7,262) (0.00)
210,500 Shui On Land Ltd Morgan Stanley (768) (0.00)
(200) Sienna Senior Living Inc Morgan Stanley (46) (0.00)
(3,824) Sigma Healthcare Ltd Morgan Stanley (15) (0.00)
(7,541) Signature Aviation Plc Morgan Stanley (180) (0.00)
36,251 Signify NV Morgan Stanley (8,277) (0.00)
(1,026,000) Sihuan Pharmaceutical Holdings Group Ltd Morgan Stanley (7,948) (0.00)
(39,428) Sika AG Goldman Sachs International (6,112) (0.00)
(2,323) Sika AG Morgan Stanley (11,241) (0.00)
(4,100) Silgan Holdings Inc Morgan Stanley (237) (0.00)
(59,189) Silver Lake Resources Ltd Morgan Stanley (9,532) (0.00)
(19,200) Simmons First National Corp Morgan Stanley (310) (0.00)
8,096 Sims Metal Management Ltd Morgan Stanley (1,683) (0.00)
(216,000) Sinopec Shanghai Petrochemical Co Ltd Morgan Stanley (2,058) (0.00)
(19,200) Sinopharm Group Co Ltd Morgan Stanley (3,600) (0.00)
(32,000) Sinotruk Hong Kong Ltd Morgan Stanley (5,602) (0.00)
(75,000) SITC International Holdings Co Ltd Morgan Stanley (58) (0.00)
(1,700) SiteOne Landscape Supply Inc Morgan Stanley (1,546) (0.00)
(1,400) SJW Group Morgan Stanley (395) (0.00)
(4,100) Skechers USA Inc Morgan Stanley (2,535) (0.00)
32,246 SKYCITY Entertainment Group Ltd Morgan Stanley (1,540) (0.00)
(2,700) SkyWest Inc Morgan Stanley (1,716) (0.00)

FINANCIAL STATEMENTS SCHEDULE OF INVESTMENTS
728 NEUBERGER BERMAN INVESTMENT FUNDS PLC
Neuberger Berman Uncorrelated Strategies Fund (Continued)
Schedule of Investments (Continued) Financial Liabilities at Fair Value through Profit or Loss (continued) Contracts for Differences (0.67%) (31 December 2018: (79.83%)) (continued)
Units Security Description Counterparty Unrealised Loss US$
% of NetAssets
(8,537) Skyworks Solutions Inc Morgan Stanley (29,263) (0.01)
(12,100) SL Green Realty Corp Morgan Stanley (29,847) (0.01)
(1,900) Slack Technologies Inc Morgan Stanley (638) (0.00)
(3,800) Sleep Country Canada Holdings Inc Morgan Stanley (2,646) (0.00)
100 Sleep Number Corp Morgan Stanley (14) (0.00)
(13,000) SM Energy Co Morgan Stanley (10,990) (0.00)
(400) Smartsheet Inc Morgan Stanley (822) (0.00)
200 SMC Corp Morgan Stanley (3,053) (0.00)
(47,054) Smith & Nephew Plc Morgan Stanley (4,214) (0.00)
3,200 SMS Co Ltd Morgan Stanley (752) (0.00)
(900) Snap Inc Morgan Stanley (688) (0.00)
100 SNC-Lavalin Group Inc Morgan Stanley (9) (0.00)
21,431 Societe BIC SA Morgan Stanley (1,021) (0.00)
(17,498) Societe Generale SA Morgan Stanley (2,782) (0.00)
495 Sofina SA Morgan Stanley (1,371) (0.00)
(36,200) Softbank Corp Morgan Stanley (3,800) (0.00)
38,831 Software AG Morgan Stanley (1,830) (0.00)
200 Sohgo Security Services Co Ltd Morgan Stanley (15) (0.00)
(21,500) Solasto Corp Morgan Stanley (17,502) (0.00)
7,522 Solvay SA Morgan Stanley (150) (0.00)
(67,662) Solvay SA Morgan Stanley (208) (0.00)
200 Sompo Holdings Inc Morgan Stanley (93) (0.00)
10,800 Sonic Automotive Inc Morgan Stanley (10,801) (0.00)
(2,100) Sonoco Products Co Morgan Stanley (343) (0.00)
1,400 Sony Financial Holdings Inc Morgan Stanley (353) (0.00)
(17) Sopra Steria Group Morgan Stanley (44) (0.00)
(9,900) Sosei Group Corp Morgan Stanley (2,390) (0.00)
2,900 Sotetsu Holdings Inc Morgan Stanley (726) (0.00)
(11,500) South Jersey Industries Inc Morgan Stanley (11,057) (0.00)
(4,300) South State Corp Morgan Stanley (1,947) (0.00)
71,793 Southern Cross Media Group Ltd Morgan Stanley (4,317) (0.00)
14,256 Southwest Airlines Co Morgan Stanley (3,320) (0.00)
(81,800) Southwestern Energy Co Morgan Stanley (17,898) (0.00)
686 Spark Infrastructure Group Morgan Stanley (9) (0.00)
3,022 Spectris Plc Morgan Stanley (2,300) (0.00)
65,079 SPIE SA Morgan Stanley (2,607) (0.00)
15,200 Spirit AeroSystems Holdings Inc Morgan Stanley (49,452) (0.01)
(4,400) Spirit Airlines Inc Morgan Stanley (950) (0.00)
(5,419) Splunk Inc Morgan Stanley (4,736) (0.00)

SCHEDULE OF INVESTMENTS FINANCIAL STATEMENTS
ANNUAL REPORT 2019 729
Neuberger Berman Uncorrelated Strategies Fund (Continued)
Schedule of Investments (Continued) Financial Liabilities at Fair Value through Profit or Loss (continued) Contracts for Differences (0.67%) (31 December 2018: (79.83%)) (continued)
Units Security Description Counterparty Unrealised Loss US$
% of NetAssets
102,400 Sprint Corp Morgan Stanley (3,791) (0.00)
(11,400) Sprott Inc Morgan Stanley (367) (0.00)
7,200 Sprouts Farmers Market Inc Morgan Stanley (3,571) (0.00)
100 SPX FLOW Inc Morgan Stanley (23) (0.00)
4,000 Square Inc Morgan Stanley (4,728) (0.00)
(3,500) SS&C Technologies Holdings Inc Morgan Stanley (2,507) (0.00)
(23,484) St Barbara Ltd Morgan Stanley (4,180) (0.00)
3,517 St James's Place Plc Morgan Stanley (2,000) (0.00)
975 Stabilus SA Morgan Stanley (3,555) (0.00)
(97,900) Stadler Rail AG Goldman Sachs International (182,255) (0.03)
93,547 Standard Chartered Plc Morgan Stanley (10,381) (0.00)
38,909 Standard Life Aberdeen Plc Morgan Stanley (1) (0.00)
(37,800) Stars Group Inc Morgan Stanley (45,437) (0.01)
(1,800) Stella-Jones Inc Morgan Stanley (893) (0.00)
(500) Stepan Co Morgan Stanley (2,181) (0.00)
500 Sterling Bancorp Morgan Stanley (16) (0.00)
5,800 Stifel Financial Corp Morgan Stanley (7,125) (0.00)
600 Stock Yards Bancorp Inc Morgan Stanley (13) (0.00)
1,500 Stoneridge Inc Morgan Stanley (2,535) (0.00)
(776,437) Stora Enso Oyj Morgan Stanley (6,171) (0.00)
(42,351) Storebrand ASA Morgan Stanley (8,534) (0.00)
(3,057) STOXX Europe 50 Index Morgan Stanley (81,041) (0.02)
(4,203,507) STOXX Europe 600 Media Index Morgan Stanley (38,073) (0.01)
(4,261,658) STOXX Europe 600 Personal & Household Goods Index Morgan Stanley (41,124) (0.01)
(4,196,115) STOXX Europe 600 Telecommunications Morgan Stanley (128,852) (0.02)
(1,500) Strategic Education Inc Morgan Stanley (12,356) (0.00)
(79) Straumann Holding AG Morgan Stanley (1,414) (0.00)
(2,601) Stroeer SE & Co KGaA Morgan Stanley (2,219) (0.00)
(5,221) Suedzucker AG Morgan Stanley (7,262) (0.00)
3,400 Sumitomo Bakelite Co Ltd Morgan Stanley (6,016) (0.00)
87,800 Sumitomo Chemical Co Ltd Morgan Stanley (6,788) (0.00)
25,500 Sumitomo Corp Morgan Stanley (8,944) (0.00)
700 Sumitomo Electric Industries Ltd Morgan Stanley (178) (0.00)
900 Sumitomo Forestry Co Ltd Morgan Stanley (36) (0.00)
1,900 Sumitomo Metal Mining Co Ltd Morgan Stanley (2,315) (0.00)
15,600 Sumitomo Mitsui Construction Co Ltd Morgan Stanley (1,335) (0.00)
(5,500) Sumitomo Mitsui Trust Holdings Inc Morgan Stanley (1,860) (0.00)
11,200 Sumitomo Realty & Development Co Ltd Morgan Stanley (10,748) (0.00)
6,800 Sumitomo Rubber Industries Ltd Morgan Stanley (4,955) (0.00)

FINANCIAL STATEMENTS SCHEDULE OF INVESTMENTS
730 NEUBERGER BERMAN INVESTMENT FUNDS PLC
Neuberger Berman Uncorrelated Strategies Fund (Continued)
Schedule of Investments (Continued) Financial Liabilities at Fair Value through Profit or Loss (continued) Contracts for Differences (0.67%) (31 December 2018: (79.83%)) (continued)
Units Security Description Counterparty Unrealised Loss US$
% of NetAssets
(109,000) Sun Art Retail Group Ltd Morgan Stanley (7,538) (0.00)
(14,500) Sun Hung Kai Properties Ltd Morgan Stanley (3,132) (0.00)
(2,100) Sun Life Financial Inc Morgan Stanley (1,239) (0.00)
(125,000) Sunac China Holdings Ltd Morgan Stanley (36,291) (0.01)
(8,400) Suncor Energy Inc Morgan Stanley (5,361) (0.00)
34,561 Suncorp Group Ltd Morgan Stanley (2,689) (0.00)
2,600 Sundrug Co Ltd Morgan Stanley (225) (0.00)
27,300 SunPower Corp Morgan Stanley (937) (0.00)
15,000 Sunrun Inc Morgan Stanley (8,140) (0.00)
72,700 Sunstone Hotel Investors Inc Morgan Stanley (20,800) (0.01)
2,000 Suntory Beverage & Food Ltd Morgan Stanley (3,671) (0.00)
(9,500) Superior Plus Corp Morgan Stanley (1,654) (0.00)
13,800 Suruga Bank Ltd Morgan Stanley (4,348) (0.00)
(800) Sushiro Global Holdings Ltd Morgan Stanley (5,104) (0.00)
1,499 SVB Financial Group Morgan Stanley (36) (0.00)
187 Swatch Group AG Morgan Stanley (827) (0.00)
(10,194) Swiss Prime Site AG Morgan Stanley (33,878) (0.01)
1,207 Swisscom AG Morgan Stanley (24) (0.00)
33,504 Sydney Airport Morgan Stanley (1,395) (0.00)
(17,332) Symrise AG Morgan Stanley (9,083) (0.00)
11,100 Synchrony Financial Morgan Stanley (5,904) (0.00)
500 SYNNEX Corp Morgan Stanley (19) (0.00)
(69,614) Synthomer Plc Morgan Stanley (698) (0.00)
(7,300) Sysco Corp Morgan Stanley (3,002) (0.00)
(6,400) Systena Corp Morgan Stanley (943) (0.00)
(10,300) T&D Holdings Inc Morgan Stanley (457) (0.00)
5,900 Tadano Ltd Morgan Stanley (1,466) (0.00)
(3,100) Taisei Corp Morgan Stanley (15) (0.00)
15,100 Taiyo Nippon Sanso Corp Morgan Stanley (4,585) (0.00)
(3,100) Taiyo Yuden Co Ltd Morgan Stanley (6,174) (0.00)
16,900 Takara Bio Inc Morgan Stanley (1,113) (0.00)
7,900 Takara Holdings Inc Morgan Stanley (2,065) (0.00)
8,200 Takashimaya Co Ltd Morgan Stanley (3,122) (0.00)
5,400 Takuma Co Ltd Morgan Stanley (977) (0.00)
19,887 Talanx AG Morgan Stanley (10,149) (0.00)
(15,200) Tallgrass Energy LP Morgan Stanley (7,880) (0.00)
(9,100) Talos Energy Inc Morgan Stanley (15,934) (0.00)
(1,900) Target Corp Morgan Stanley (413) (0.00)
14,500 Taylor Morrison Home Corp Morgan Stanley (6,656) (0.00)

SCHEDULE OF INVESTMENTS FINANCIAL STATEMENTS
ANNUAL REPORT 2019 731
Neuberger Berman Uncorrelated Strategies Fund (Continued)
Schedule of Investments (Continued) Financial Liabilities at Fair Value through Profit or Loss (continued) Contracts for Differences (0.67%) (31 December 2018: (79.83%)) (continued)
Units Security Description Counterparty Unrealised Loss US$
% of NetAssets
(1,200) TC PipeLines LP Morgan Stanley (2,347) (0.00)
(102,000) TCL Electronics Holdings Ltd Morgan Stanley (1,459) (0.00)
200 TDK Corp Morgan Stanley (533) (0.00)
(190) Tecan Group AG Morgan Stanley (560) (0.00)
(2,500) Tech Data Corp Morgan Stanley (295) (0.00)
9,312 Technology One Ltd Morgan Stanley (2,713) (0.00)
(24,800) TEGNA Inc Morgan Stanley (3,938) (0.00)
900 Teijin Ltd Morgan Stanley (418) (0.00)
(807,624) Telecom Italia SpA Morgan Stanley (320) (0.00)
(300) Teledyne Technologies Inc Morgan Stanley (280) (0.00)
(500) Teleflex Inc Morgan Stanley (2,263) (0.00)
92,646 Telefonica SA Morgan Stanley (58,742) (0.01)
4,341 Telenor ASA Morgan Stanley (312) (0.00)
(884) Teleperformance Morgan Stanley (3,419) (0.00)
(5,800) Telephone & Data Systems Inc Morgan Stanley (2,383) (0.00)
17,378 Television Francaise 1 Morgan Stanley (3,520) (0.00)
929 Telia Co AB Morgan Stanley (46) (0.00)
(15,347) Temenos AG Morgan Stanley (11,187) (0.00)
(171,824) Tenaris SA Morgan Stanley (9,775) (0.00)
(35,397) Terna Rete Elettrica Nazionale SpA Morgan Stanley (330) (0.00)
800 Terumo Corp Morgan Stanley (368) (0.00)
(2,574) Tesla Inc Morgan Stanley (8,652) (0.00)
13,100 Texas Capital Bancshares Inc Morgan Stanley (14,737) (0.00)
(3,418) Texas Instruments Inc Morgan Stanley (263) (0.00)
(900) Texas Roadhouse Inc Morgan Stanley (868) (0.00)
(2,400) T-Gaia Corp Morgan Stanley (16) (0.00)
(41,567) TGS NOPEC Geophysical Co ASA Morgan Stanley (2,658) (0.00)
1,000 Thomson Reuters Corp Morgan Stanley (861) (0.00)
(191,219) thyssenkrupp AG Morgan Stanley (5,608) (0.00)
(5,199) TietoEVRY Oyj Morgan Stanley (6,994) (0.00)
(10,000) Timken Co Morgan Stanley (2,874) (0.00)
(102,000) Tingyi Cayman Islands Holding Corp Morgan Stanley (7,108) (0.00)
(4,300) TJX Cos Inc Morgan Stanley (440) (0.00)
(10,429) TKH Group NV Morgan Stanley (1,478) (0.00)
(6,356) TLG Immobilien AG Morgan Stanley (4,060) (0.00)
(4,100) T-Mobile US Inc Morgan Stanley (7,847) (0.00)
4,900 Toagosei Co Ltd Morgan Stanley (1,310) (0.00)
5,300 Tobu Railway Co Ltd Morgan Stanley (4,449) (0.00)
15,700 Toda Corp Morgan Stanley (2,010) (0.00)

FINANCIAL STATEMENTS SCHEDULE OF INVESTMENTS
732 NEUBERGER BERMAN INVESTMENT FUNDS PLC
Neuberger Berman Uncorrelated Strategies Fund (Continued)
Schedule of Investments (Continued) Financial Liabilities at Fair Value through Profit or Loss (continued) Contracts for Differences (0.67%) (31 December 2018: (79.83%)) (continued)
Units Security Description Counterparty Unrealised Loss US$
% of NetAssets
600 Toei Co Ltd Morgan Stanley (3,210) (0.00)
800 Tokai Carbon Co Ltd Morgan Stanley (252) (0.00)
17,700 TOKAI Holdings Corp Morgan Stanley (6,320) (0.00)
100 Tokyo Broadcasting System Holdings Inc Morgan Stanley (28) (0.00)
100 Tokyo Electron Ltd Morgan Stanley (893) (0.00)
(600) Tokyo Seimitsu Co Ltd Morgan Stanley (87) (0.00)
(21,108) Tomra Systems ASA Morgan Stanley (1,832) (0.00)
(8,385) TomTom NV Morgan Stanley (600) (0.00)
(3,500) Tomy Co Ltd Morgan Stanley (544) (0.00)
3,400 TopBuild Corp Morgan Stanley (2,237) (0.00)
9,500 Topcon Corp Morgan Stanley (4,147) (0.00)
6,713 Topdanmark A/S Morgan Stanley (1,191) (0.00)
23,400 Toray Industries Inc Morgan Stanley (4,265) (0.00)
1,000 Toshiba TEC Corp Morgan Stanley (300) (0.00)
(6,100) Tosoh Corp Morgan Stanley (544) (0.00)
(7,945) TOTAL SA Morgan Stanley (3,092) (0.00)
2,300 TOTO Ltd Morgan Stanley (4,647) (0.00)
1,200 Towa Pharmaceutical Co Ltd Morgan Stanley (612) (0.00)
2,400 Towne Bank Morgan Stanley (194) (0.00)
(4,200) Toyobo Co Ltd Morgan Stanley (1,203) (0.00)
6,500 Toyoda Gosei Co Ltd Morgan Stanley (121) (0.00)
7,600 Toyota Industries Corp Morgan Stanley (18,235) (0.00)
7,600 Toyota Motor Corp Morgan Stanley (4,454) (0.00)
12,554 TP ICAP Plc Morgan Stanley (1,134) (0.00)
14,834 TPG Telecom Ltd Morgan Stanley (29) (0.00)
6,669 Trainline Plc Morgan Stanley (417) (0.00)
(11,700) TransAlta Renewables Inc Morgan Stanley (7,195) (0.00)
(202,734) Transocean Ltd Morgan Stanley (72,255) (0.02)
7,316 Traton SE Morgan Stanley (10,121) (0.00)
(4,200) Travelers Cos Inc Morgan Stanley (2,895) (0.00)
(13,000) TravelSky Technology Ltd Morgan Stanley (552) (0.00)
76,602 Travis Perkins Plc Morgan Stanley (2,874) (0.00)
5,600 TreeHouse Foods Inc Morgan Stanley (1,198) (0.00)
3,600 Trend Micro Inc Morgan Stanley (6,056) (0.00)
(1,200) Trex Co Inc Morgan Stanley (1,583) (0.00)
(26,800) TRI Pointe Group Inc Morgan Stanley (1,914) (0.00)
7,600 Tricon Capital Group Inc Morgan Stanley (798) (0.00)
32 Trigano SA Morgan Stanley (15) (0.00)
(2,100) TriNet Group Inc Morgan Stanley (318) (0.00)

SCHEDULE OF INVESTMENTS FINANCIAL STATEMENTS
ANNUAL REPORT 2019 733
Neuberger Berman Uncorrelated Strategies Fund (Continued)
Schedule of Investments (Continued) Financial Liabilities at Fair Value through Profit or Loss (continued) Contracts for Differences (0.67%) (31 December 2018: (79.83%)) (continued)
Units Security Description Counterparty Unrealised Loss US$
% of NetAssets
(3,550) Truist Financial Corp Morgan Stanley (1,899) (0.00)
5,800 Trustmark Corp Morgan Stanley (2,987) (0.00)
(5,970) Tryg A/S Morgan Stanley (1,970) (0.00)
500 Tsubakimoto Chain Co Morgan Stanley (442) (0.00)
(200) Tsuruha Holdings Inc Morgan Stanley (1,871) (0.00)
(23,400) TTM Technologies Inc Morgan Stanley (5,664) (0.00)
(26,677) Tullow Oil Plc Morgan Stanley (342) (0.00)
(13,114) Twitter Inc Morgan Stanley (46) (0.00)
5,800 Ube Industries Ltd Morgan Stanley (3,574) (0.00)
(4,067) Uber Technologies Inc Morgan Stanley (179) (0.00)
(700) Ubiquiti Inc Morgan Stanley (804) (0.00)
(120,416) UBS Group AG Morgan Stanley (8,589) (0.00)
7,664 UCB SA Morgan Stanley (5,090) (0.00)
3,600 Ulvac Inc Morgan Stanley (6,871) (0.00)
(53,071) Umicore SA Morgan Stanley (9,303) (0.00)
(11,081) Under Armour Inc Morgan Stanley (1,490) (0.00)
(23,400) Unicharm Corp Morgan Stanley (12,565) (0.00)
(3,265) Union Pacific Corp Morgan Stanley (794) (0.00)
6,560 Uniper SE Morgan Stanley (563) (0.00)
(153,000) Uni-President China Holdings Ltd Morgan Stanley (7,526) (0.00)
5,000 United Airlines Holdings Inc Morgan Stanley (3,601) (0.00)
3,000 United Arrows Ltd Morgan Stanley (3,562) (0.00)
244 United Internet AG Morgan Stanley (150) (0.00)
(5,137) United Rentals Inc Morgan Stanley (3,761) (0.00)
44,900 United States Steel Corp Morgan Stanley (20,464) (0.00)
21,300 United Super Markets Holdings Inc Morgan Stanley (566) (0.00)
44,803 United Technologies Corp Morgan Stanley (1,043) (0.00)
1,601 United Utilities Group Plc Morgan Stanley (204) (0.00)
4,500 Universal Forest Products Inc Morgan Stanley (2,415) (0.00)
4,200 Upland Software Inc Morgan Stanley (2,492) (0.00)
(29,744) UPM-Kymmene Oyj Morgan Stanley (677) (0.00)
21,200 US Bancorp Morgan Stanley (18,171) (0.00)
3,600 US Physical Therapy Inc Morgan Stanley (8,396) (0.00)
(1,300) USANA Health Sciences Inc Morgan Stanley (303) (0.00)
10,000 Ushio Inc Morgan Stanley (3,968) (0.00)
27,100 USS Co Ltd Morgan Stanley (6,430) (0.00)
14,480 Valeo SA Morgan Stanley (16,546) (0.00)
5,939 Valero Energy Corp Morgan Stanley (725) (0.00)
92,000 Valley National Bancorp Morgan Stanley (15,688) (0.00)
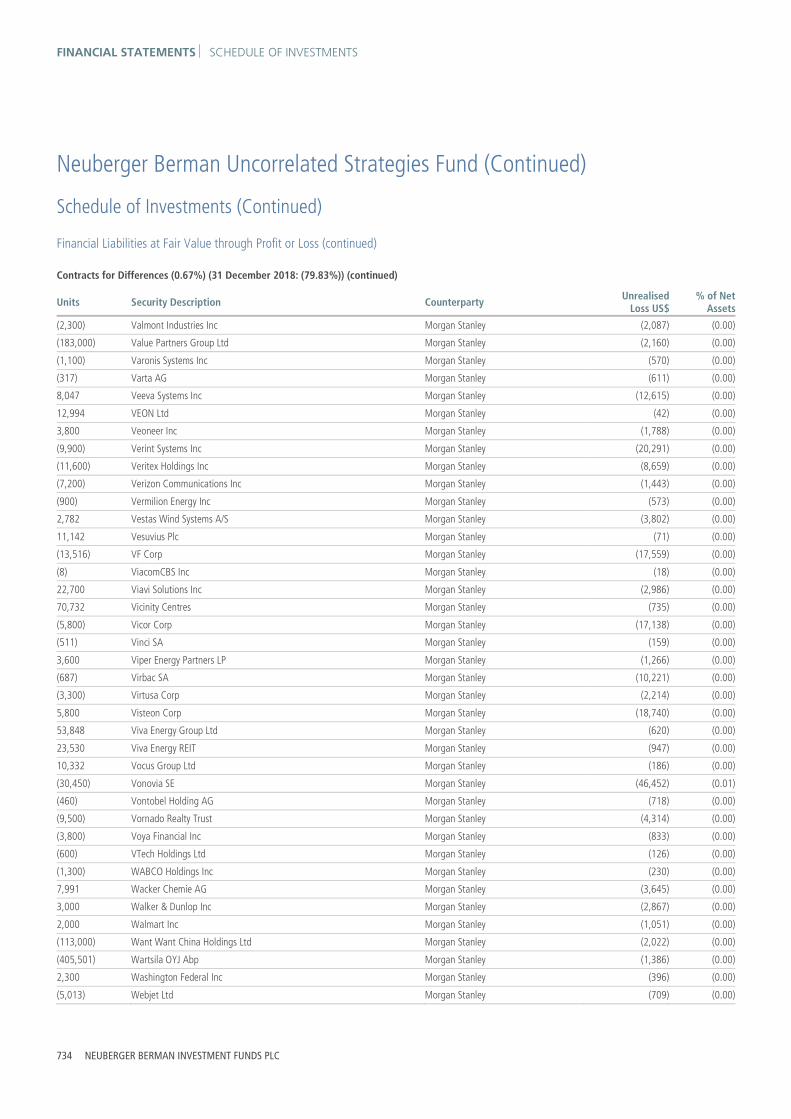
FINANCIAL STATEMENTS SCHEDULE OF INVESTMENTS
734 NEUBERGER BERMAN INVESTMENT FUNDS PLC
Neuberger Berman Uncorrelated Strategies Fund (Continued)
Schedule of Investments (Continued) Financial Liabilities at Fair Value through Profit or Loss (continued) Contracts for Differences (0.67%) (31 December 2018: (79.83%)) (continued)
Units Security Description Counterparty Unrealised Loss US$
% of NetAssets
(2,300) Valmont Industries Inc Morgan Stanley (2,087) (0.00)
(183,000) Value Partners Group Ltd Morgan Stanley (2,160) (0.00)
(1,100) Varonis Systems Inc Morgan Stanley (570) (0.00)
(317) Varta AG Morgan Stanley (611) (0.00)
8,047 Veeva Systems Inc Morgan Stanley (12,615) (0.00)
12,994 VEON Ltd Morgan Stanley (42) (0.00)
3,800 Veoneer Inc Morgan Stanley (1,788) (0.00)
(9,900) Verint Systems Inc Morgan Stanley (20,291) (0.00)
(11,600) Veritex Holdings Inc Morgan Stanley (8,659) (0.00)
(7,200) Verizon Communications Inc Morgan Stanley (1,443) (0.00)
(900) Vermilion Energy Inc Morgan Stanley (573) (0.00)
2,782 Vestas Wind Systems A/S Morgan Stanley (3,802) (0.00)
11,142 Vesuvius Plc Morgan Stanley (71) (0.00)
(13,516) VF Corp Morgan Stanley (17,559) (0.00)
(8) ViacomCBS Inc Morgan Stanley (18) (0.00)
22,700 Viavi Solutions Inc Morgan Stanley (2,986) (0.00)
70,732 Vicinity Centres Morgan Stanley (735) (0.00)
(5,800) Vicor Corp Morgan Stanley (17,138) (0.00)
(511) Vinci SA Morgan Stanley (159) (0.00)
3,600 Viper Energy Partners LP Morgan Stanley (1,266) (0.00)
(687) Virbac SA Morgan Stanley (10,221) (0.00)
(3,300) Virtusa Corp Morgan Stanley (2,214) (0.00)
5,800 Visteon Corp Morgan Stanley (18,740) (0.00)
53,848 Viva Energy Group Ltd Morgan Stanley (620) (0.00)
23,530 Viva Energy REIT Morgan Stanley (947) (0.00)
10,332 Vocus Group Ltd Morgan Stanley (186) (0.00)
(30,450) Vonovia SE Morgan Stanley (46,452) (0.01)
(460) Vontobel Holding AG Morgan Stanley (718) (0.00)
(9,500) Vornado Realty Trust Morgan Stanley (4,314) (0.00)
(3,800) Voya Financial Inc Morgan Stanley (833) (0.00)
(600) VTech Holdings Ltd Morgan Stanley (126) (0.00)
(1,300) WABCO Holdings Inc Morgan Stanley (230) (0.00)
7,991 Wacker Chemie AG Morgan Stanley (3,645) (0.00)
3,000 Walker & Dunlop Inc Morgan Stanley (2,867) (0.00)
2,000 Walmart Inc Morgan Stanley (1,051) (0.00)
(113,000) Want Want China Holdings Ltd Morgan Stanley (2,022) (0.00)
(405,501) Wartsila OYJ Abp Morgan Stanley (1,386) (0.00)
2,300 Washington Federal Inc Morgan Stanley (396) (0.00)
(5,013) Webjet Ltd Morgan Stanley (709) (0.00)

SCHEDULE OF INVESTMENTS FINANCIAL STATEMENTS
ANNUAL REPORT 2019 735
Neuberger Berman Uncorrelated Strategies Fund (Continued)
Schedule of Investments (Continued) Financial Liabilities at Fair Value through Profit or Loss (continued) Contracts for Differences (0.67%) (31 December 2018: (79.83%)) (continued)
Units Security Description Counterparty Unrealised Loss US$
% of NetAssets
(16,200) Webster Financial Corp Morgan Stanley (8,129) (0.00)
20,500 Welbilt Inc Morgan Stanley (6,325) (0.00)
(1,900) Welcia Holdings Co Ltd Morgan Stanley (6,261) (0.00)
1,614 Wendel SA Morgan Stanley (3,899) (0.00)
(13,600) Wendy's Co Morgan Stanley (962) (0.00)
300 Wesco Aircraft Holdings Inc Morgan Stanley (0) (0.00)
(6,400) WESCO International Inc Morgan Stanley (16,164) (0.00)
(5,479) Wesfarmers Ltd Morgan Stanley (1,705) (0.00)
(1,000) West Fraser Timber Co Ltd Morgan Stanley (1,352) (0.00)
1,600 Westamerica Bancorporation Morgan Stanley (477) (0.00)
(10,800) Western Alliance Bancorp Morgan Stanley (1,496) (0.00)
11,702 Western Areas Ltd Morgan Stanley (155) (0.00)
(8,375) Western Digital Corp Morgan Stanley (10,843) (0.00)
13,800 Western Midstream Partners LP Morgan Stanley (530) (0.00)
(28,823) Westgold Resources Ltd Morgan Stanley (5,185) (0.00)
7,100 Westshore Terminals Investment Corp Morgan Stanley (1,947) (0.00)
(153,000) WH Group Ltd Morgan Stanley (1,010) (0.00)
(6,015) WH Smith Plc Morgan Stanley (681) (0.00)
(59,000) Wharf Holdings Ltd Morgan Stanley (5,012) (0.00)
(700) Wheaton Precious Metals Corp Morgan Stanley (62) (0.00)
5,581 Whirlpool Corp Morgan Stanley (735) (0.00)
9,070 Whitehaven Coal Ltd Morgan Stanley (195) (0.00)
(11,603) William Hill Plc Morgan Stanley (699) (0.00)
(3,700) Wingstop Inc Morgan Stanley (664) (0.00)
(1,200) Winpak Ltd Morgan Stanley (918) (0.00)
5,391 WiseTech Global Ltd Morgan Stanley (689) (0.00)
(100) Wix.com Ltd Morgan Stanley (71) (0.00)
40,533 Wizz Air Holdings Plc Morgan Stanley (3,883) (0.00)
34,009 Wm Morrison Supermarkets Plc Morgan Stanley (173) (0.00)
(2,500) Wolverine World Wide Inc Morgan Stanley (625) (0.00)
(1,371) Woodside Petroleum Ltd Morgan Stanley (74) (0.00)
1,541 Woolworths Group Ltd Morgan Stanley (852) (0.00)
(43,599) Worldline SA Morgan Stanley (17,883) (0.00)
(5,987) Worley Ltd Morgan Stanley (155) (0.00)
(7,200) Worthington Industries Inc Morgan Stanley (8,392) (0.00)
(56,300) WPX Energy Inc Morgan Stanley (62,920) (0.02)
(5,400) Wright Medical Group NV Morgan Stanley (3,371) (0.00)
3,642 Wuestenrot & Wuerttembergische AG Morgan Stanley (1,087) (0.00)
8,840 WuXi AppTec Co Ltd Morgan Stanley (3,282) (0.00)

FINANCIAL STATEMENTS SCHEDULE OF INVESTMENTS
736 NEUBERGER BERMAN INVESTMENT FUNDS PLC
Neuberger Berman Uncorrelated Strategies Fund (Continued)
Schedule of Investments (Continued) Financial Liabilities at Fair Value through Profit or Loss (continued) Contracts for Differences (0.67%) (31 December 2018: (79.83%)) (continued)
Units Security Description Counterparty Unrealised Loss US$
% of NetAssets
(700) WW Grainger Inc Morgan Stanley (1,281) (0.00)
(2,500) Wyndham Hotels & Resorts Inc Morgan Stanley (203) (0.00)
(72,000) Wynn Macau Ltd Morgan Stanley (6,321) (0.00)
(219,400) Xiaomi Corp Morgan Stanley (7,626) (0.00)
2,681 Xilinx Inc Morgan Stanley (20) (0.00)
(58,000) Xinyi Glass Holdings Ltd Morgan Stanley (5,336) (0.00)
13,500 Xperi Corp Morgan Stanley (7,651) (0.00)
(245,500) Xtep International Holdings Ltd Morgan Stanley (2,510) (0.00)
4,300 Yakult Honsha Co Ltd Morgan Stanley (5,463) (0.00)
(3,400) Yamada Denki Co Ltd Morgan Stanley (638) (0.00)
9,500 Yamaguchi Financial Group Inc Morgan Stanley (2,753) (0.00)
3,700 Yamaha Corp Morgan Stanley (3,492) (0.00)
(200) Yamato Kogyo Co Ltd Morgan Stanley (20) (0.00)
(101,372) Yara International ASA Morgan Stanley (16,256) (0.00)
(26,600) YiChang HEC ChangJiang Pharmaceutical Co Ltd Morgan Stanley (20,838) (0.01)
4,900 Yokogawa Electric Corp Morgan Stanley (896) (0.00)
10,600 Yokohama Rubber Co Ltd Morgan Stanley (16,856) (0.00)
(74,500) Yue Yuen Industrial Holdings Ltd Morgan Stanley (9,171) (0.00)
(173,000) Yuexiu Real Estate Investment Trust Morgan Stanley (715) (0.00)
134,000 Yuexiu Transport Infrastructure Ltd Morgan Stanley (1,669) (0.00)
5,500 Zenrin Co Ltd Morgan Stanley (6,723) (0.00)
(50,000) Zhaojin Mining Industry Co Ltd Morgan Stanley (2,532) (0.00)
96,000 Zhejiang Expressway Co Ltd Morgan Stanley (3,877) (0.00)
(109,000) Zhenro Properties Group Ltd Morgan Stanley (592) (0.00)
(19,000) Zhongsheng Group Holdings Ltd Morgan Stanley (3,303) (0.00)
193,000 Zhongyu Gas Holdings Ltd Morgan Stanley (920) (0.00)
(40,500) Zhuzhou CRRC Times Electric Co Ltd Morgan Stanley (3,520) (0.00)
(400,000) Zijin Mining Group Co Ltd Morgan Stanley (29,400) (0.01)
(1,772) Zip Co Ltd Morgan Stanley (11) (0.00)
116,426 Zynga Inc Morgan Stanley (1,158) (0.00)
Total Unrealised Loss on Contracts for Differences ∞ (8,118,122) (0.67)
Fair Value % of Net
US$ Assets
Total Financial Liabilities at Fair Value through Profit or Loss (36,023,891) (3.01)
Net Financial Assets at Fair Value through Profit or Loss 883,950,311 73.95
Other Net Assets 311,358,045 26.05
Net Assets Attributable to Holders of Redeemable Participating Shares 1,195,308,356 100.00

SCHEDULE OF INVESTMENTS FINANCIAL STATEMENTS
ANNUAL REPORT 2019 737
,
Neuberger Berman Uncorrelated Strategies Fund (Continued)
Schedule of Investments (Continued) % of
TotalAssetsPortfolio Analysis US$
* Transferable securities and/or money market instruments admitted to an official stock exchange listing 79,998,088 5.86** Transferable securities and/or money market instruments dealt in on a regulated market 756,992,762 55.43± Financial derivative instruments traded on a regulated market (3,670,557) (0.27)∞ OTC financial derivative instruments 50,630,018 3.70
883,950,311 64.72

FINANCIAL STATEMENTS STATEMENT OF SIGNIFICANT PURCHASES AND SALES
738 NEUBERGER BERMAN INVESTMENT FUNDS PLC
Neuberger Berman Uncorrelated Strategies Fund (Continued) Statement of Significant Purchases and Sales (Unaudited) In accordance with the European Communities (Undertakings for Collective Investment in Transferable Securities) Regulations, 2011 as amended, a statement of changes in the composition of the Schedule of Investments during the reporting period is provided to ensure that Shareholders can identify changes in the investments held by the Portfolio. The following statements present the aggregate purchases and sales of transferable securities exceeding one percent of the total value of purchases or sales, respectively, for the period. At a minimum, the largest twenty purchases and twenty sales are presented, if available.
Aggregate purchases greater than one percent of the total value of purchases:
Units Security Description Cost US$
127,000,000 United States Treasury Bill, 0.00%, 24/09/2019 126,744,255
115,000,000 United States Treasury Bill, 0.00%, 31/12/2019 114,750,113
115,000,000 United States Treasury Bill, 0.00%, 14/01/2020 114,732,154
115,000,000 United States Treasury Bill, 0.00%, 12/03/2020 114,670,285
114,000,000 United States Treasury Bill, 0.00%, 19/11/2019 113,672,654
100,500,000 United States Treasury Bill, 0.00%, 01/10/2019 100,341,694
100,000,000 United States Treasury Bill, 0.00%, 21/01/2020 99,786,181
100,000,000 United States Treasury Bill, 0.00%, 04/02/2020 99,765,189
100,000,000 United States Treasury Bill, 0.00%, 03/12/2019 99,761,991
100,000,000 United States Treasury Bill, 0.00%, 26/11/2019 99,726,604
98,000,000 United States Treasury Bill, 0.00%, 28/01/2020 97,806,679
97,000,000 United States Treasury Bill, 0.00%, 15/10/2019 96,841,819
97,000,000 United States Treasury Bill, 0.00%, 10/12/2019 96,753,034
95,000,000 United States Treasury Bill, 0.00%, 17/09/2019 94,692,959
95,000,000 United States Treasury Bill, 0.00%, 23/07/2019 94,661,507
81,000,000 United States Treasury Bill, 0.00%, 11/02/2020 80,810,910
81,000,000 United States Treasury Bill, 0.00%, 17/12/2019 80,794,823
81,000,000 United States Treasury Bill, 0.00%, 22/10/2019 80,756,792
80,000,000 United States Treasury Note/Bond, 1.66%, 31/10/2019 79,991,169
80,000,000 United States Treasury Note/Bond, 1.54%, 31/01/2020 79,983,876
80,000,000 United States Treasury Bill, 0.00%, 07/11/2019 79,803,946
78,250,000 United States Treasury Bill, 0.00%, 28/05/2019 77,967,865
78,000,000 United States Treasury Bill, 0.00%, 02/04/2019 77,755,680
78,000,000 United States Treasury Bill, 0.00%, 27/08/2019 77,749,988
78,000,000 United States Treasury Bill, 0.00%, 02/07/2019 77,723,808
75,000,000 United States Treasury Bill, 0.00%, 18/02/2020 74,828,438
75,000,000 United States Treasury Bill, 0.00%, 24/12/2019 74,804,292
75,000,000 United States Treasury Bill, 0.00%, 08/10/2019 74,769,688
75,000,000 United States Treasury Bill, 0.00%, 13/08/2019 74,761,077
74,000,000 United States Treasury Bill, 0.00%, 07/01/2020 73,827,590
74,000,000 United States Treasury Bill, 0.00%, 12/11/2019 73,777,337
55,000,000 United States Treasury Bill, 0.00%, 16/07/2019 54,804,257
54,000,000 United States Treasury Bill, 0.00%, 09/05/2019 53,729,624
52,000,000 United States Treasury Bill, 0.00%, 30/07/2019 51,817,198
51,500,000 United States Treasury Bill, 0.00%, 04/06/2019 51,312,976

STATEMENT OF SIGNIFICANT PURCHASES AND SALES FINANCIAL STATEMENTS
ANNUAL REPORT 2019 739
Neuberger Berman Uncorrelated Strategies Fund (Continued) Statement of Significant Purchases and Sales (Unaudited) (Continued) Aggregate purchases greater than one percent of the total value of purchases (continued):
Units Security Description Cost US$
51,500,000 United States Treasury Bill, 0.00%, 09/04/2019 51,308,575
50,000,000 United States Treasury Bill, 0.00%, 02/05/2019 49,787,956
48,750,000 United States Treasury Bill, 0.00%, 21/05/2019 48,570,468
48,500,000 United States Treasury Bill, 0.00%, 26/03/2019 48,322,668
43,000,000 United States Treasury Bill, 0.00%, 17/10/2019 42,974,154
39,000,000 United States Treasury Bill, 0.00%, 20/06/2019 38,908,214
39,000,000 United States Treasury Bill, 0.00%, 14/05/2019 38,857,149
39,000,000 United States Treasury Bill, 0.00%, 19/03/2019 38,855,644

FINANCIAL STATEMENTS STATEMENT OF SIGNIFICANT PURCHASES AND SALES
740 NEUBERGER BERMAN INVESTMENT FUNDS PLC
Neuberger Berman Uncorrelated Strategies Fund (Continued) Statement of Significant Purchases and Sales (Unaudited) (Continued) Total sales:
Units Security Description Proceeds US$
29,000,000 United States Treasury Bill, 0.00%, 02/05/2019 28,988,458
24,695,000 United States Treasury Bill, 0.00%, 17/09/2019 24,653,392
23,000,000 United States Treasury Bill, 0.00%, 30/04/2019 22,992,399
19,485,000 United States Treasury Bill, 0.00%, 27/08/2019 19,473,804
19,285,000 United States Treasury Bill, 0.00%, 08/10/2019 19,231,552
13,905,000 United States Treasury Bill, 0.00%, 24/09/2019 13,876,002
8,660,000 United States Treasury Bill, 0.00%, 03/09/2019 8,651,513
7,350,000 United States Treasury Bill, 0.00%, 29/08/2019 7,345,327
5,620,000 United States Treasury Bill, 0.00%, 20/08/2019 5,618,824
1,195,000 United States Treasury Bill, 0.00%, 10/09/2019 1,193,382

INVESTMENT MANAGER’S REPORT FINANCIAL STATEMENTS
ANNUAL REPORT 2019 741
Neuberger Berman Emerging Market Debt Blend Investment Grade Fund Investment Manager’s Report For the 12 months ended 31 December 2019, the total return for the USD I Accumulating Class was 15.07%. Over the same period, the benchmark index, the weighted average of 2/3 JP Morgan Emerging Markets Bond Index Global Diversified Investment Grade and 1/3 of JP Morgan GBI EM Global Diversified Index Investment Grade 15% Cap (the “Index”), returned 15.70%. (Performance for all share classes is provided in Appendix II. Performance data quoted represent past performance and do not indicate future results. Total returns shown are net of all fees and expenses and include reinvestment of income dividends and other distributions, if any).
Emerging markets (“EM”) debt posted strong gains in 2019 following a down year in 2018. The recovery was driven by spread compression as risk appetite returned to global markets in the first quarter. A sharp drop in US Treasury yields drove gains from March onwards as the market started to price in multiple rate cuts by the Federal Reserve (“Fed”) for 2019. A more dovish monetary policy stance in developed markets also acted as a tailwind for EM assets, especially in local markets where local interest rates moved down. The ongoing trade negotiations between the US and China contributed to market volatility throughout the year, however, this abated as the countries came to a phase one agreement in mid-December to support a year-end rally.
The hard currency sovereign index returned 16.57% in 2019. The best performers were Kazakhstan, Uruguay and Mexico, which all posted returns over 20%. The worst performers were Lithuania and the Slovak Republic, but they were both still in positive territory for the year. In addition, there were new countries introduced to the Index over the course of the year. These were from the Gulf Cooperation Council (“GCC”) and included Bahrain, Kuwait, Qatar, Saudi Arabia and the United Arab Emirates (“UAE”).
The local currency benchmark returned 13.73% in USD terms over the year 2019, driven mostly by strong local bond returns. The benchmark yield came down from 5.13% to 4.43% during the year. Soft inflation across most emerging countries and a dovish turn by the Fed allowed many EM central banks to cut rates multiple times. As a result, we saw strong local bond performance in various large local markets including Russia, Mexico and Indonesia.
The Portfolio underperformed over the period: Within hard currency sovereigns security selection was the primary driver of performance, while country allocation and top down positioning were also positive. Within local currency, rates added to performance but foreign exchange (“FX”) detracted. The tactical asset allocation (“TAA”) sleeve was also additive as the currency overlay performed well in the December rally. Within hard currency sovereigns our security selection in Chile, where we hold metals & mining companies rather than sovereign exposure as valuations are less attractive, was positive. Positions in China and Kazakhstan were also additive. Security selection and the overweight position in Mexico dragged on performance as concerns about Pemex weighed on markets early in the year. The overweight in lower beta markets such as the UAE, Hong Kong, and Singapore detracted as did the underweight in Russia. The local currency sleeve outperformed its portion of the benchmark. Overweights in Mexico, Indonesia and Thailand were among the main contributors on the duration side while underweights in Poland and Russia detracted. On the currency side, overweights in the Kazakh tenge, Polish zloty and Peruvian sol added most value while the Russian ruble and the Philippine peso detracted the most.
As we entered 2020, we had been seeing increasing signs that economic activity is bottoming out following last year’s slowdown, on the back of the lagged effects of global monetary policy easing and improved sentiment post the ‘Phase 1’ trade deal between the US and China. In the coming months though, the fallout from the Covid-19 virus will likely result in a severe short term dip in global growth due to the substantial demand and supply side disruptions globally. Our base case is for a recovery in economic activity later in the year, assuming containment of the virus and strong policy support from governments and central banks globally.
As for valuations, we believe that EM yields in aggregate are less compelling today after the strong recent tightening, although we continue to find attractive bottom-up opportunities in select local markets. Meanwhile, on the FX side, we believe valuations look attractive for most EM currencies.
We see market technicals as challenging due to potential outflows from the asset class, partly offset by net issuance that is expected to remain low in 2020. As for valuations, spreads in EM hard currency sovereigns and credits have become more compelling after the recent widening and continue to provide an attractive risk premium relative to developed market credits in our view.

FINANCIAL STATEMENTS BALANCE SHEET
The accompanying notes form an integral part of the financial statements.
742 NEUBERGER BERMAN INVESTMENT FUNDS PLC
Neuberger Berman Emerging Market Debt Blend Investment Grade Fund (Continued) Balance Sheet
As at As at
Note 31 December 2019 31 December 2018
US$ US$
Current Assets
Financial Assets at Fair Value through Profit or Loss 2 18,606,818 16,304,058
Cash and cash equivalents 3 716,035 567,152
Receivable for investments sold – 43,360
Receivable for shares issued 2,674 –
Due from brokers 88,441 107,686
Income receivable and other assets 255,790 254,494
Total Assets 19,669,758 17,276,750
Current Liabilities
Financial Liabilities at Fair Value through Profit or Loss 2 94,058 129,650
Payable for shares redeemed 605 –
Accrued expenses 34,627 32,979
Payable for investments purchased 40 279
Other payables 47,794 19,787
Liabilities (excluding Net Assets Attributable to Holders of Redeemable Participating Shares) 177,124 182,695
Net Assets Attributable to Holders of Redeemable Participating Shares 19,492,634 17,094,055
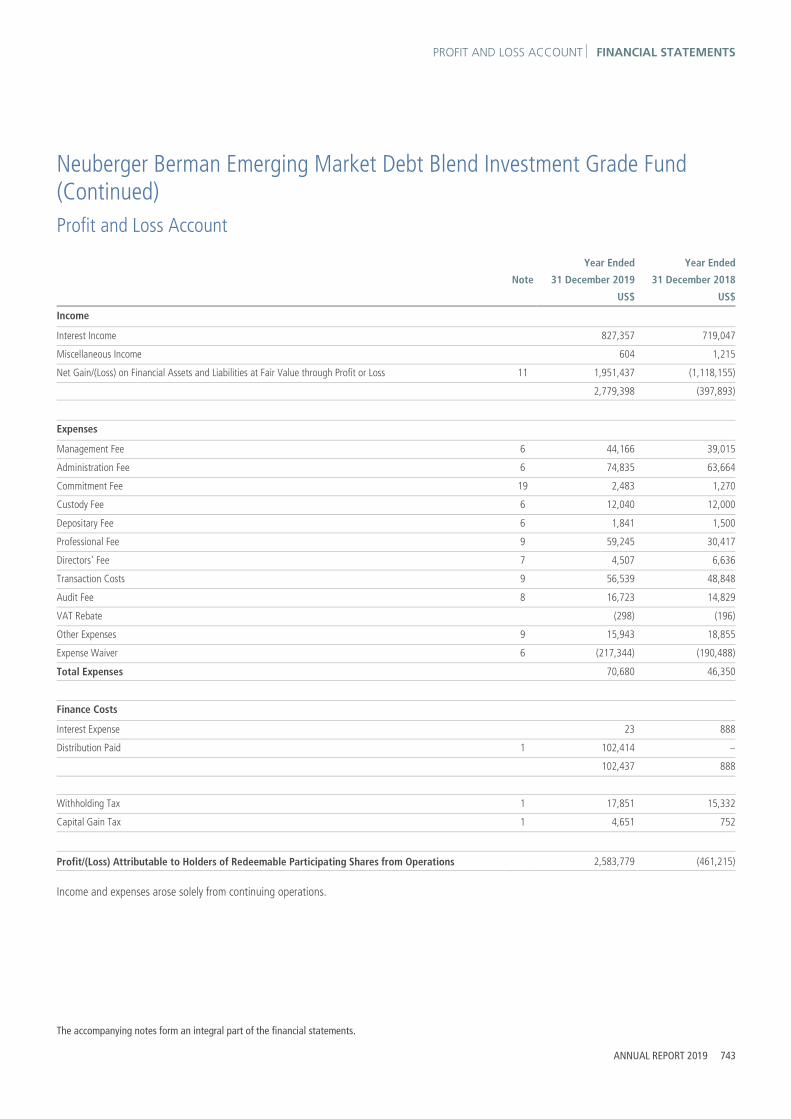
PROFIT AND LOSS ACCOUNT FINANCIAL STATEMENTS
The accompanying notes form an integral part of the financial statements.
ANNUAL REPORT 2019 743
Neuberger Berman Emerging Market Debt Blend Investment Grade Fund (Continued) Profit and Loss Account
Year Ended Year Ended
Note 31 December 2019 31 December 2018
US$ US$
Income
Interest Income 827,357 719,047
Miscellaneous Income 604 1,215
Net Gain/(Loss) on Financial Assets and Liabilities at Fair Value through Profit or Loss 11 1,951,437 (1,118,155)
2,779,398 (397,893)
Expenses
Management Fee 6 44,166 39,015
Administration Fee 6 74,835 63,664
Commitment Fee 19 2,483 1,270
Custody Fee 6 12,040 12,000
Depositary Fee 6 1,841 1,500
Professional Fee 9 59,245 30,417
Directors' Fee 7 4,507 6,636
Transaction Costs 9 56,539 48,848
Audit Fee 8 16,723 14,829
VAT Rebate (298) (196)
Other Expenses 9 15,943 18,855
Expense Waiver 6 (217,344) (190,488)
Total Expenses 70,680 46,350
Finance Costs
Interest Expense 23 888
Distribution Paid 1 102,414 –
102,437 888
Withholding Tax 1 17,851 15,332
Capital Gain Tax 1 4,651 752
Profit/(Loss) Attributable to Holders of Redeemable Participating Shares from Operations 2,583,779 (461,215)
Income and expenses arose solely from continuing operations.
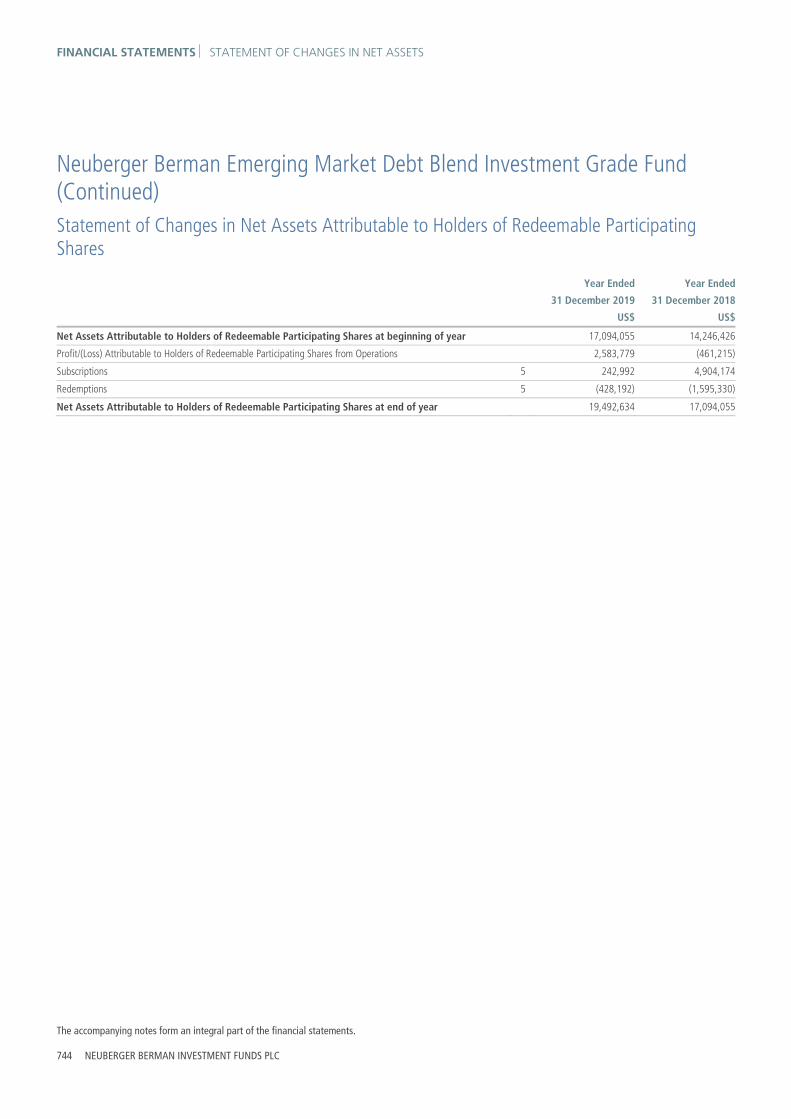
FINANCIAL STATEMENTS STATEMENT OF CHANGES IN NET ASSETS
The accompanying notes form an integral part of the financial statements.
744 NEUBERGER BERMAN INVESTMENT FUNDS PLC
Neuberger Berman Emerging Market Debt Blend Investment Grade Fund (Continued) Statement of Changes in Net Assets Attributable to Holders of Redeemable Participating Shares
Year Ended Year Ended
31 December 2019 31 December 2018
US$ US$
Net Assets Attributable to Holders of Redeemable Participating Shares at beginning of year 17,094,055 14,246,426
Profit/(Loss) Attributable to Holders of Redeemable Participating Shares from Operations 2,583,779 (461,215)
Subscriptions 5 242,992 4,904,174
Redemptions 5 (428,192) (1,595,330)
Net Assets Attributable to Holders of Redeemable Participating Shares at end of year 19,492,634 17,094,055

SCHEDULE OF INVESTMENTS FINANCIAL STATEMENTS
ANNUAL REPORT 2019 745
Neuberger Berman Emerging Market Debt Blend Investment Grade Fund (Continued)
Schedule of Investments
Financial Assets at Fair Value through Profit or Loss
Principal Amount Security Description Coupon
Maturity Date
Fair ValueUS$
% of NetAssets
Treasury Bills 1.92% (31 December 2018: 1.38%)
Hungarian Forint 35,740,000 Hungary Treasury Bill 0.00% 21/10/2020 121,451 0.62
Total Hungarian Forint 121,451 0.62
United States Dollar
255,500 United States Treasury Bill 0.00% 13/08/2020 253,080 1.30
Total United States Dollar 253,080 1.30
Total Treasury Bills ** 374,531 1.92
Corporate Bonds 31.26% (31 December 2018: 30.33%)
United States Dollar
235,000 ABQ Finance Ltd* 3.13% 24/09/2024 235,861 1.21
400,000 Abu Dhabi Crude Oil Pipeline LLC* 3.65% 02/11/2029 430,898 2.21
200,000 Abu Dhabi Crude Oil Pipeline LLC* 4.60% 02/11/2047 230,539 1.18
200,000 African Export-Import Bank* 3.99% 21/09/2029 202,494 1.04
200,000 APICORP Sukuk Ltd* 3.14% 01/11/2022 204,829 1.05
200,000 Banco de Credito e Inversiones SA* 3.50% 12/10/2027 204,565 1.05
200,000 Banque Ouest Africaine de Developpement* 4.70% 22/10/2031 202,580 1.04
205,000 Banque Ouest Africaine de Developpement* 5.00% 27/07/2027 217,538 1.12
260,000 Cencosud SA* 4.38% 17/07/2027 256,800 1.32
200,000 China Minmetals Corp* 3.75% 29/12/2049 202,832 1.04
200,000 CNAC HK Finbridge Co Ltd* 5.13% 14/03/2028 224,706 1.15
200,000 DP World Crescent Ltd* 3.88% 18/07/2029 205,126 1.05
246,000 DP World Crescent Ltd* 4.85% 26/09/2028 269,941 1.39
200,000 Emirates Development Bank PJSC* 3.52% 06/03/2024 206,890 1.06
200,000 Huarong Finance 2017 Co Ltd* 4.50% 29/12/2049 203,516 1.05
200,000 MDGH - GMTN BV* 3.70% 07/11/2049 207,066 1.06
200,000 Mexico City Airport Trust* 5.50% 31/07/2047 206,939 1.06
200,000 NBK Tier 1 Financing 2 Ltd* 4.50% 29/12/2049 200,000 1.03
200,000 PSA Treasury Pte Ltd* 2.13% 05/09/2029 193,556 0.99
200,000 QIB Sukuk Ltd* 3.98% 26/03/2024 208,553 1.07
200,000 QNB Finance Ltd* 3.50% 28/03/2024 207,069 1.06
230,000 Samba Funding Ltd* 2.75% 02/10/2024 228,177 1.17
200,000 Sharjah Sukuk Program Ltd* 3.85% 03/04/2026 211,221 1.08
400,000 SP Group Treasury Pte Ltd* 3.38% 27/02/2029 428,536 2.20
200,000 Suzano Austria GmbH† 7.00% 16/03/2047 235,627 1.21
260,000 Wharf REIC Finance BVI Ltd* 3.50% 17/01/2028 266,222 1.37
Total Corporate Bonds 6,092,081 31.26

FINANCIAL STATEMENTS SCHEDULE OF INVESTMENTS
746 NEUBERGER BERMAN INVESTMENT FUNDS PLC
Neuberger Berman Emerging Market Debt Blend Investment Grade Fund (Continued)
Schedule of Investments (Continued)
Financial Assets at Fair Value through Profit or Loss (continued)
Principal Amount Security Description Coupon
Maturity Date
Fair ValueUS$
% of NetAssets
Government Bonds 61.38% (31 December 2018: 63.19%)
Chilean Peso 10,000,000 Bonos de la Tesoreria de la Republica en pesos* 4.50% 01/03/2026 14,875 0.08
20,000,000 Bonos de la Tesoreria de la Republica en pesos* 4.70% 01/09/2030 30,363 0.15
15,000,000 Bonos de la Tesoreria de la Republica en pesos* 5.00% 01/03/2035 23,876 0.12
40,000,000 Bonos de la Tesoreria de la Republica en pesos* 6.00% 01/01/2043 73,555 0.38
Total Chilean Peso 142,669 0.73
Colombian Peso 596,200,000 Colombian TES* 7.00% 30/06/2032 190,023 0.98
115,800,000 Colombian TES* 7.25% 18/10/2034 37,524 0.19
316,100,000 Colombian TES* 7.50% 26/08/2026 105,281 0.54
63,100,000 Colombian TES* 7.75% 18/09/2030 21,297 0.11
Total Colombian Peso 354,125 1.82
Czech Koruna 1,080,000 Czech Republic Government Bond* 0.95% 15/05/2030 44,691 0.23
1,100,000 Czech Republic Government Bond* 2.40% 17/09/2025 50,917 0.26
2,870,000 Czech Republic Government Bond* 2.75% 23/07/2029 139,598 0.72
Total Czech Koruna 235,206 1.21
Euro 100,000 Chile Government International Bond* 0.83% 02/07/2031 113,828 0.59
131,000 Croatia Government International Bond* 1.13% 19/06/2029 151,913 0.78
200,000 Croatia Government International Bond** 2.75% 27/01/2030 267,773 1.37
240,000 Kazakhstan Government International Bond* 2.38% 09/11/2028 305,642 1.57
118,000 Morocco Government International Bond* 1.50% 27/11/2031 132,840 0.68
99,000 Romanian Government International Bond* 2.12% 16/07/2031 113,534 0.58
23,000 Romanian Government International Bond* 3.88% 29/10/2035 29,998 0.15
Total Euro 1,115,528 5.72
Hungarian Forint 42,710,000 Hungary Government Bond* 3.00% 27/10/2027 159,551 0.82
3,890,000 Hungary Government Bond* 3.00% 21/08/2030 14,434 0.07
2,600,000 Hungary Government Bond* 5.50% 24/06/2025 10,911 0.06
7,310,000 Hungary Government Bond* 6.75% 22/10/2028 34,817 0.18
Total Hungarian Forint 219,713 1.13

SCHEDULE OF INVESTMENTS FINANCIAL STATEMENTS
ANNUAL REPORT 2019 747
Neuberger Berman Emerging Market Debt Blend Investment Grade Fund (Continued)
Schedule of Investments (Continued)
Financial Assets at Fair Value through Profit or Loss (continued)
Principal Amount Security Description Coupon
Maturity Date
Fair ValueUS$
% of NetAssets
Government Bonds 61.38% (31 December 2018: 63.19%) (continued)
Indonesian Rupiah 524,000,000 Indonesia Treasury Bond* 6.13% 15/05/2028 35,651 0.18
850,000,000 Indonesia Treasury Bond* 6.50% 15/06/2025 61,626 0.32
186,000,000 Indonesia Treasury Bond* 6.63% 15/05/2033 12,403 0.06
1,400,000,000 Indonesia Treasury Bond* 7.00% 15/05/2022 102,803 0.53
2,450,000,000 Indonesia Treasury Bond* 7.00% 15/05/2027 176,230 0.90
950,000,000 Indonesia Treasury Bond* 7.00% 15/09/2030 67,880 0.35
2,450,000,000 Indonesia Treasury Bond* 7.50% 15/08/2032 176,304 0.91
300,000,000 Indonesia Treasury Bond* 7.50% 15/06/2035 21,704 0.11
2,484,000,000 Indonesia Treasury Bond* 8.13% 15/05/2024 191,078 0.98
2,202,000,000 Indonesia Treasury Bond* 8.25% 15/05/2029 171,401 0.88
1,372,000,000 Indonesia Treasury Bond* 8.25% 15/05/2036 103,623 0.53
100,000,000 Indonesia Treasury Bond* 8.38% 15/03/2034 7,729 0.04
651,000,000 Indonesia Treasury Bond* 8.38% 15/04/2039 50,308 0.26
Total Indonesian Rupiah 1,178,740 6.05
Malaysian Ringgit 150,000 Malaysia Government Bond** 3.48% 14/06/2024 37,100 0.19
1,041,000 Malaysia Government Bond** 3.49% 31/03/2020 255,002 1.31
250,000 Malaysia Government Bond** 3.73% 15/06/2028 62,711 0.32
40,000 Malaysia Government Bond** 3.76% 20/04/2023 9,984 0.05
25,000 Malaysia Government Bond** 3.83% 05/07/2034 6,250 0.03
60,000 Malaysia Government Bond** 3.84% 15/04/2033 14,968 0.08
535,000 Malaysia Government Bond** 3.88% 10/03/2022 133,245 0.68
90,000 Malaysia Government Bond** 3.89% 15/08/2029 23,022 0.12
100,000 Malaysia Government Bond** 3.90% 16/11/2027 25,348 0.13
100,000 Malaysia Government Bond** 3.91% 15/07/2026 25,301 0.13
385,000 Malaysia Government Bond** 4.06% 30/09/2024 97,651 0.50
50,000 Malaysia Government Bond** 4.23% 30/06/2031 12,978 0.07
15,000 Malaysia Government Bond** 4.64% 07/11/2033 4,049 0.02
81,000 Malaysia Government Bond** 4.89% 08/06/2038 22,566 0.12
70,000 Malaysia Government Investment Issue** 4.37% 31/10/2028 18,295 0.09
Total Malaysian Ringgit 748,470 3.84
Mexican Peso 970,000 Mexican Bonos* 5.75% 05/03/2026 48,716 0.25
2,243,200 Mexican Bonos* 6.50% 09/06/2022 118,216 0.61

FINANCIAL STATEMENTS SCHEDULE OF INVESTMENTS
748 NEUBERGER BERMAN INVESTMENT FUNDS PLC
Neuberger Berman Emerging Market Debt Blend Investment Grade Fund (Continued)
Schedule of Investments (Continued)
Financial Assets at Fair Value through Profit or Loss (continued)
Principal Amount Security Description Coupon
Maturity Date
Fair ValueUS$
% of NetAssets
Government Bonds 61.38% (31 December 2018: 63.19%) (continued)
Mexican Peso (continued)
7,658,800 Mexican Bonos* 7.50% 03/06/2027 421,603 2.16
1,270,000 Mexican Bonos* 7.75% 13/11/2042 71,388 0.37
3,650,000 Mexican Bonos* 8.50% 31/05/2029 215,285 1.10
5,910,000 Mexican Bonos* 10.00% 05/12/2024 355,523 1.82
11,333,800 Mexico Cetes* 0.00% 23/04/2020 58,669 0.30
Total Mexican Peso 1,289,400 6.61
Peruvian Sol 16,000 Peru Government Bond* 5.35% 12/08/2040 4,895 0.03
125,000 Peru Government Bond* 5.40% 12/08/2034 39,681 0.20
13,000 Peru Government Bond* 5.94% 12/02/2029 4,435 0.02
20,000 Peru Government Bond* 6.15% 12/08/2032 6,851 0.04
94,000 Peruvian Government International Bond** 6.35% 12/08/2028 32,948 0.17
120,000 Peruvian Government International Bond* 6.95% 12/08/2031 43,706 0.22
483,000 Peruvian Government International Bond** 8.20% 12/08/2026 185,755 0.95
Total Peruvian Sol 318,271 1.63
Polish Zloty 95,000 Republic of Poland Government Bond* 2.50% 25/07/2026 25,864 0.13
505,000 Republic of Poland Government Bond* 2.50% 25/07/2027 137,223 0.70
292,000 Republic of Poland Government Bond** 2.75% 25/04/2028 80,811 0.42
191,000 Republic of Poland Government Bond** 4.00% 25/10/2023 54,640 0.28
55,000 Republic of Poland Government Bond** 5.75% 25/04/2029 19,205 0.10
Total Polish Zloty 317,743 1.63
Romanian New Leu 200,000 Romania Government Bond* 4.40% 25/09/2023 47,967 0.24
160,000 Romania Government Bond* 4.50% 17/06/2024 38,390 0.20
175,000 Romania Government Bond* 4.85% 22/04/2026 42,806 0.22
35,000 Romania Government Bond* 5.00% 12/02/2029 8,578 0.04
270,000 Romania Government Bond* 5.80% 26/07/2027 69,839 0.36
40,000 Romania Government Bond* 5.85% 26/04/2023 9,973 0.05
Total Romanian New Leu 217,553 1.11
Thai Baht 2,430,000 Thailand Government Bond* 1.45% 17/12/2024 81,901 0.42

SCHEDULE OF INVESTMENTS FINANCIAL STATEMENTS
ANNUAL REPORT 2019 749
Neuberger Berman Emerging Market Debt Blend Investment Grade Fund (Continued)
Schedule of Investments (Continued)
Financial Assets at Fair Value through Profit or Loss (continued)
Principal Amount Security Description Coupon
Maturity Date
Fair ValueUS$
% of NetAssets
Government Bonds 61.38% (31 December 2018: 63.19%) (continued)
Thai Baht (continued)
3,900,000 Thailand Government Bond* 1.88% 17/06/2022 132,418 0.68
1,000,000 Thailand Government Bond* 2.00% 17/12/2022 34,176 0.17
1,650,000 Thailand Government Bond* 2.13% 17/12/2026 57,898 0.30
2,000,000 Thailand Government Bond* 2.40% 17/12/2023 69,775 0.36
2,550,000 Thailand Government Bond* 2.88% 17/12/2028 95,253 0.49
62,000 Thailand Government Bond* 2.88% 17/06/2046 2,446 0.01
2,100,000 Thailand Government Bond* 3.30% 17/06/2038 86,157 0.44
1,700,000 Thailand Government Bond* 3.40% 17/06/2036 70,320 0.36
3,020,000 Thailand Government Bond* 3.65% 20/06/2031 122,452 0.63
450,000 Thailand Government Bond* 3.78% 25/06/2032 18,619 0.10
Total Thai Baht 771,415 3.96
United States Dollar
272,000 Bermuda Government International Bond* 4.75% 15/02/2029 307,795 1.58
150,000 Colombia Government International Bond* 6.13% 18/01/2041 194,615 1.00
250,000 Colombia Government International Bond* 7.38% 18/09/2037 355,859 1.83
520,000 Indonesia Government International Bond* 5.25% 17/01/2042 627,505 3.22
100,000 Indonesia Government International Bond* 6.63% 17/02/2037 135,258 0.69
200,000 Kazakhstan Government International Bond* 3.88% 14/10/2024 214,858 1.10
200,000 Kazakhstan Government International Bond* 6.50% 21/07/2045 295,509 1.52
426,000 Mexico Government International Bond* 5.75% 12/10/2110 505,421 2.59
100,000 Panama Government International Bond* 6.70% 26/01/2036 140,470 0.72
150,000 Panama Government International Bond* 8.88% 30/09/2027 214,741 1.10
150,000 Panama Government International Bond* 9.38% 01/04/2029 229,552 1.18
330,000 Peruvian Government International Bond* 8.75% 21/11/2033 543,790 2.79
400,000 Qatar Government International Bond* 4.00% 14/03/2029 446,285 2.29
463,000 Uruguay Government International Bond* 4.38% 23/01/2031 518,676 2.66
260,000 Uruguay Government International Bond* 5.10% 18/06/2050 312,815 1.60
Total United States Dollar 5,043,149 25.87
Uruguayan Peso 193,000 Uruguay Government International Bond* 8.50% 15/03/2028 4,474 0.02
325,000 Uruguay Government International Bond* 9.88% 20/06/2022 8,584 0.05
Total Uruguayan Peso 13,058 0.07
Total Government Bonds 11,965,040 61.38
Total Investments 18,431,652 94.56

FINANCIAL STATEMENTS SCHEDULE OF INVESTMENTS
750 NEUBERGER BERMAN INVESTMENT FUNDS PLC
Neuberger Berman Emerging Market Debt Blend Investment Grade Fund (Continued)
Schedule of Investments (Continued)
Financial Assets at Fair Value through Profit or Loss (continued)
Forward Currency Contracts 0.68% (31 December 2018: 0.34%)
Amount Receivable
Amount Payable
Maturity Date Counterparty Contracts Unrealised
Gain US$% of Net
Assets
CLP 127,937,863 US$ 166,749 18/03/2020 Deutsche Bank AG 1 3,529 0.02
CLP 39,937,142 US$ 51,267 18/02/2020 JPMorgan Chase Bank 1 1,868 0.01
CLP 35,369,599 US$ 44,434 18/02/2020 Standard Chartered Bank 1 2,624 0.02
CNY 401,133 US$ 57,163 07/02/2020 Citibank NA 1 386 0.00
CNY 441,761 US$ 63,262 17/01/2020 Standard Chartered Bank 1 149 0.00
CZK 288,304 € 11,295 21/01/2020 Citibank NA 1 41 0.00
COP 436,496,273 US$ 127,339 18/03/2020 Citibank NA 2 5,164 0.03
CZK 4,616,233 € 180,122 18/03/2020 Citibank NA 1 784 0.01
CZK 700,368 € 27,301 21/01/2020 Goldman Sachs International 2 254 0.00
CZK 343,576 € 13,389 21/01/2020 Morgan Stanley 1 129 0.00
CZK 343,576 € 13,399 21/01/2020 Standard Chartered Bank 1 119 0.00
€ 7,350 HUF 2,429,439 08/01/2020 Citibank NA 1 5 0.00
€ 8,033 US$ 8,862 06/01/2020 Deutsche Bank AG 1 156 0.00
€ 78,240 RON 377,772 02/04/2020 Goldman Sachs International 2 69 0.00
€ 175,418 US$ 196,790 05/02/2020 JPMorgan Chase Bank 1 534 0.00
€ 17,093 US$ 19,104 06/01/2020 Standard Chartered Bank 1 87 0.00
€ 360,205 US$ 398,105 06/01/2020 State Street Bank and Trust and Co 2 6,301 0.03
€ 53,472 HUF 17,664,827 08/01/2020 State Street Bank and Trust and Co 1 68 0.00
€ 56,817 HUF 18,762,173 19/02/2020 State Street Bank and Trust and Co 1 133 0.00
HUF 25,937,391 € 78,160 08/01/2020 Deutsche Bank AG 1 296 0.00
HUF 9,700,000 € 29,035 08/01/2020 Goldman Sachs International 1 330 0.00
HUF 5,014,395 € 15,109 08/01/2020 Standard Chartered Bank 1 59 0.00
IDR 142,443,586 US$ 10,035 22/01/2020 Citibank NA 1 244 0.00
IDR 771,781,860 US$ 54,802 22/01/2020 JPMorgan Chase Bank 1 892 0.01
INR 4,039,513 US$ 56,093 17/01/2020 Standard Chartered Bank 1 561 0.00
KRW 70,442,608 US$ 60,598 28/01/2020 Goldman Sachs International 1 447 0.00
KRW 344,333,358 US$ 294,604 16/03/2020 Citibank NA 1 4,106 0.02
KRW 37,506,576 US$ 32,005 16/01/2020 Goldman Sachs International 1 491 0.00
KRW 37,506,576 US$ 31,627 16/01/2020 Standard Chartered Bank 1 869 0.01
KZT 5,792,229 US$ 14,337 05/06/2020 Goldman Sachs International 1 265 0.00
KZT 146,974,186 US$ 363,387 05/06/2020 JPMorgan Chase Bank 3 7,145 0.04
MXN 361,370 US$ 18,365 05/02/2020 Citibank NA 1 672 0.00
MXN 5,621,408 US$ 291,944 17/03/2020 Citibank NA 1 2,465 0.01
MXN 729,056 US$ 37,913 05/02/2020 Goldman Sachs International 1 495 0.00
MYR 147,372 US$ 35,294 28/01/2020 Goldman Sachs International 1 792 0.01
PHP 1,042,441 US$ 20,347 30/01/2020 Standard Chartered Bank 1 187 0.00
PLN 1,115,292 US$ 288,202 12/02/2020 Citibank NA 1 6,316 0.03

SCHEDULE OF INVESTMENTS FINANCIAL STATEMENTS
ANNUAL REPORT 2019 751
Neuberger Berman Emerging Market Debt Blend Investment Grade Fund (Continued)
Schedule of Investments (Continued)
Financial Assets at Fair Value through Profit or Loss (continued)
Forward Currency Contracts 0.68% (31 December 2018: 0.34%) (continued)
Amount Receivable
Amount Payable
Maturity Date Counterparty Contracts Unrealised
Gain US$% of Net
Assets
PLN 288,045 € 67,137 14/01/2020 Citibank NA 3 643 0.00
PLN 190,000 € 44,090 14/01/2020 Goldman Sachs International 1 643 0.00
PLN 488,494 € 113,713 18/02/2020 Goldman Sachs International 1 987 0.01
PLN 1,745,383 € 407,531 14/01/2020 JPMorgan Chase Bank 1 3,091 0.02
RON 232,020 € 48,291 03/02/2020 Goldman Sachs International 1 25 0.00
THB 542,137 US$ 17,960 16/01/2020 Standard Chartered Bank 1 145 0.00
UYU 340,983 US$ 8,351 07/12/2020 Citibank NA 1 28 0.00
EUR Hedged Classes € 77,569 US$ 86,028 21/02/2020 Citibank NA 1 1,311 0.00
€ 612 US$ 683 21/02/2020 Goldman Sachs International 1 5 0.00
GBP Hedged Classes £ 11,812 US$ 15,427 21/02/2020 Citibank NA 1 243 0.00
£ 1,566,966 US$ 2,022,759 21/02/2020 State Street Bank and Trust and Co 1 55,947 0.29
NOK Hedged Classes NOK 4,688,154 US$ 512,720 21/02/2020 Citibank NA 6 20,894 0.11
NOK 45,332 US$ 4,986 21/02/2020 Goldman Sachs International 3 174 0.00
NOK 47,371 US$ 5,232 21/02/2020 State Street Bank and Trust and Co 10 161 0.00
Total Unrealised Gain on Forward Currency Contracts ∞ 133,329 0.68
Futures Contracts 0.15% (31 December 2018: 0.07%)
Number of Contracts Description Unrealised
Gain US$% of Net
Assets
(3) Euro-Bund Future March 2020 7,476 0.04
(1) Euro-Buxl 30-Year Bond Future March 2020 7,903 0.04
1 Korean 3-Year Bond Future March 2020 54 0.00
(12) US Treasury 10-Year Note (CBT) Future March 2020 13,992 0.07
Total Unrealised Gain on Futures Contracts ± 29,425 0.15
Interest Rate Swap Contracts 0.06% (31 December 2018: 0.07%)
Notional Amount Expiration Date Counterparty Receive
/(Pay)# Fixed Rate Variable Rate Fair ValueUS$
% of Net Assets
CLP 83,808,499 12/07/22 JPMorgan Chase Bank (Pay) 3.37% 1D CLICP∞ 4,351 0.02
CZK 3,000,000 18/06/24 LCH Clearnet Ltd1 Receive 1.70% 6M PRIBOR± 2,333 0.01
PLN 375,000 12/11/21 LCH Clearnet Ltd1 (Pay) 2.26% 6M WIBOR± 912 0.01
MXN 4,118,285 05/07/22 Chicago Mercantile Exchange1 (Pay) 6.76% 28D MXIBTIIE± 774 0.01

FINANCIAL STATEMENTS SCHEDULE OF INVESTMENTS
752 NEUBERGER BERMAN INVESTMENT FUNDS PLC
Neuberger Berman Emerging Market Debt Blend Investment Grade Fund (Continued)
Schedule of Investments (Continued)
Financial Assets at Fair Value through Profit or Loss (continued)
Interest Rate Swap Contracts 0.06% (31 December 2018: 0.07%)
Notional Amount Expiration Date Counterparty Receive
/(Pay)# Fixed Rate Variable Rate Fair ValueUS$
% of Net Assets
CZK 700,000 21/06/24 LCH Clearnet Ltd1 Receive 1.64% 6M PRIBOR± 624 0.01
COP 771,266,541 18/11/21 Chicago Mercantile Exchange1 (Pay) 4.90% 1D COOVIBR± 568 0.00
COP 597,068,000 18/11/21 Chicago Mercantile Exchange1 (Pay) 4.91% 1D COOVIBR± 456 0.00
MXN 1,343,585 26/08/24 Chicago Mercantile Exchange1 (Pay) 6.75% 28D MXIBTIIE± 440 0.00
CLP 30,378,417 29/11/29 Chicago Mercantile Exchange1 (Pay) 3.05% 1D CLICP± 434 0.00
PLN 265,000 17/12/29 LCH Clearnet Ltd1 Receive 1.81% 6M WIBOR± 390 0.00
CZK 334,013 17/07/24 LCH Clearnet Ltd1 Receive 1.68% 6M PRIBOR± 276 0.00
PLN 121,896 16/11/21 LCH Clearnet Ltd1 (Pay) 2.21% 6M WIBOR± 266 0.00
COP 100,000,000 21/06/29 Chicago Mercantile Exchange1 Receive 5.37% 1D COOVIBR± 213 0.00
MXN 502,058 29/08/29 Chicago Mercantile Exchange1 (Pay) 6.90% 28D MXIBTIIE± 184 0.00
COP 231,665,459 19/11/21 Chicago Mercantile Exchange1 (Pay) 4.81% 1D COOVIBR± 110 0.00
CZK 750,000 18/11/29 LCH Clearnet Ltd1 Receive 1.49% 6M PRIBOR± 81 0.00
Total Interest Rate Swap Contracts at Fair Value 12,412 0.06
# Receive - Funds receives variable rate and pays fixed rate. (Pay) - Fund pays variable rate and receives fixed rate. 1 Centrally cleared swap.
Fair Value % of Net
US$ Assets
Total Financial Assets at Fair Value through Profit or Loss 18,606,818 95.45
Financial Liabilities at Fair Value through Profit or Loss
Forward Currency Contracts (0.28%) (31 December 2018: (0.49%))
Amount Receivable
Amount Payable
Maturity Date Counterparty Contracts Unrealised
Loss US$% of Net
Assets
COP 25,588,803 US$ 7,772 18/03/2020 Goldman Sachs International 1 (4) (0.00)
€ 175,480 HUF 58,676,496 08/01/2020 Citibank NA 4 (2,170) (0.01)
€ 50,419 HUF 16,799,168 08/01/2020 Goldman Sachs International 1 (420) (0.00)
€ 53,800 PLN 230,278 14/01/2020 Goldman Sachs International 1 (371) (0.00)
€ 6,861 HUF 2,270,262 19/02/2020 JPMorgan Chase Bank 1 (0) (0.00)
€ 10,109 PLN 43,240 14/01/2020 JPMorgan Chase Bank 1 (62) (0.00)
€ 50,366 RON 242,121 03/02/2020 JPMorgan Chase Bank 1 (57) (0.00)
€ 20,949 PLN 90,158 14/01/2020 State Street Bank and Trust and Co 1 (274) (0.00)
HUF 10,366,901 € 31,552 08/01/2020 Citibank NA 1 (232) (0.00)
INR 421,204 US$ 5,933 17/01/2020 Morgan Stanley 1 (26) (0.00)

SCHEDULE OF INVESTMENTS FINANCIAL STATEMENTS
ANNUAL REPORT 2019 753
Neuberger Berman Emerging Market Debt Blend Investment Grade Fund (Continued)
Schedule of Investments (Continued)
Financial Liabilities at Fair Value through Profit or Loss (continued)
Forward Currency Contracts (0.28%) (31 December 2018: (0.49%)) (continued)
Amount Receivable
Amount Payable
Maturity Date Counterparty Contracts Unrealised
Loss US$% of Net
Assets
RON 43,838 € 9,096 02/04/2020 JPMorgan Chase Bank 1 (26) (0.00)
US$ 42,916 THB 1,295,808 11/02/2020 Citibank NA 1 (386) (0.00)
US$ 52,494 CLP 39,937,142 18/02/2020 Citibank NA 1 (642) (0.01)
US$ 118,399 ILS 409,779 11/02/2020 Citibank NA 1 (476) (0.00)
US$ 68,832 IDR 976,997,481 22/01/2020 Citibank NA 1 (1,671) (0.01)
US$ 42,779 MXN 822,512 05/02/2020 Citibank NA 2 (552) (0.00)
US$ 27,778 € 25,143 06/01/2020 Deutsche Bank AG 1 (450) (0.00)
US$ 34,798 MXN 671,583 05/02/2020 Goldman Sachs International 1 (582) (0.00)
US$ 17,958 PEN 60,737 18/03/2020 Goldman Sachs International 1 (338) (0.00)
US$ 46,481 CLP 35,369,599 18/02/2020 Goldman Sachs International 1 (578) (0.00)
US$ 68,846 IDR 976,997,481 22/01/2020 Goldman Sachs International 1 (1,657) (0.01)
US$ 2,054 KRW 2,388,526 14/01/2020 JPMorgan Chase Bank 1 (16) (0.00)
US$ 16,385 CLP 12,390,855 18/03/2020 JPMorgan Chase Bank 1 (107) (0.00)
US$ 806,959 € 728,033 06/01/2020 JPMorgan Chase Bank 4 (10,410) (0.06)
US$ 15,695 € 14,000 05/02/2020 JPMorgan Chase Bank 1 (53) (0.00)
US$ 103,143 € 92,422 06/01/2020 Morgan Stanley 4 (621) (0.00)
US$ 56,557 MXN 1,094,373 05/02/2020 Morgan Stanley 1 (1,096) (0.01)
US$ 16,045 CLP 12,118,216 18/03/2020 Standard Chartered Bank 1 (83) (0.00)
US$ 164,091 MYR 684,325 28/01/2020 Standard Chartered Bank 2 (3,480) (0.02)
US$ 39,616 IDR 555,495,697 22/01/2020 Standard Chartered Bank 1 (470) (0.00)
US$ 75,448 MYR 315,054 09/01/2020 Standard Chartered Bank 1 (1,606) (0.01)
US$ 45,805 € 41,235 06/01/2020 Standard Chartered Bank 3 (491) (0.00)
US$ 20,546 € 18,498 06/01/2020 State Street Bank and Trust and Co 1 (222) (0.00)
US$ 434,623 € 388,730 05/02/2020 State Street Bank and Trust and Co 2 (2,650) (0.02)
US$ 244,240 MXN 4,751,409 05/02/2020 State Street Bank and Trust and Co 2 (6,072) (0.03)
UYU 320,000 US$ 8,545 19/10/2020 JPMorgan Chase Bank 1 (1,342) (0.01)
GBP Hedged Classes US$ 17,609 £ 13,326 21/02/2020 Citibank NA 1 (70) (0.00)
NOK Hedged Classes NOK 320 US$ 36 21/02/2020 Goldman Sachs International 1 (0) (0.00)
US$ 361,746 NOK 3,309,786 21/02/2020 Citibank NA 4 (14,980) (0.08)
US$ 2,377 NOK 21,308 21/02/2020 Goldman Sachs International 1 (48) (0.00)
US$ 1,889 NOK 17,234 21/02/2020 State Street Bank and Trust and Co 4 (73) (0.00)
Total Unrealised Loss on Forward Currency Contracts ∞ (54,864) (0.28)

FINANCIAL STATEMENTS SCHEDULE OF INVESTMENTS
754 NEUBERGER BERMAN INVESTMENT FUNDS PLC
Neuberger Berman Emerging Market Debt Blend Investment Grade Fund (Continued)
Schedule of Investments (Continued)
Financial Liabilities at Fair Value through Profit or Loss (continued)
Futures Contracts (0.14%) (31 December 2018: (0.04%))
Number of Contracts Description Unrealised
Loss US$% of Net
Assets
5 US Treasury Ultra Bond (CBT) Future March 2020 (27,184) (0.14)
Total Unrealised Loss on Futures Contracts ± (27,184) (0.14)
Interest Rate Swap Contracts (0.06%) (31 December 2018: (0.23%))
Notional Amount Expiration Date Counterparty Receive
/(Pay)# Fixed Rate Variable Rate Fair ValueUS$
% of Net Assets
CZK 1,600,000 11/11/21 LCH Clearnet Ltd1 (Pay) 2.23% 6M PRIBOR (56) (0.00)
CNY 440,000 05/07/24 LCH Clearnet Ltd1 (Pay) 2.75% 7D CNRR007 (65) (0.00)
MXN 238,183 20/08/29 Chicago Mercantile Exchange1 Receive 6.94% 28D MXIBTIIE (125) (0.00)
PLN 40,000 16/08/29 LCH Clearnet Ltd1 (Pay) 1.66% 6M WIBOR (190) (0.00)
CLP 58,692,267 12/12/21 Chicago Mercantile Exchange1 Receive 1.96% 1D CLICP (323) (0.00)
COP 29,484,935 15/05/29 Chicago Mercantile Exchange1 Receive 5.93% 1D COOVIBR (326) (0.00)
CZK 3,500,000 18/11/21 LCH Clearnet Ltd1 (Pay) 2.14% 6M PRIBOR (376) (0.00)
HUF 7,562,431 06/11/29 LCH Clearnet Ltd1 (Pay) 1.86% 6M BUBOR (389) (0.00)
CZK 3,320,717 30/09/21 LCH Clearnet Ltd1 (Pay) 2.10% 6M PRIBOR (422) (0.00)
HUF 45,000,000 12/09/24 LCH Clearnet Ltd1 (Pay) 0.81% 6M BUBOR (502) (0.00)
COP 50,515,065 15/05/29 Chicago Mercantile Exchange1 Receive 5.92% 1D COOVIBR (541) (0.00)
CZK 4,000,000 08/10/21 LCH Clearnet Ltd1 (Pay) 1.95% 6M PRIBOR (983) (0.01)
COP 117,823,720 03/04/29 Chicago Mercantile Exchange1 Receive 5.81% 1D COOVIBR (1,008) (0.01)
HUF 10,000,000 08/02/29 LCH Clearnet Ltd1 Receive 2.97% 6M BUBOR (1,474) (0.01)
COP 550,000,000 12/09/24 Chicago Mercantile Exchange1 (Pay) 4.56% 1D COOVIBR (1,627) (0.01)
MXN 2,871,201 28/01/21 Chicago Mercantile Exchange1 Receive 8.09% 28D MXIBTIIE (1,740) (0.01)
MXN 2,937,973 28/01/21 Chicago Mercantile Exchange1 Receive 8.15% 28D MXIBTIIE (1,863) (0.01)
Total Interest Rate Swap Contracts at Fair Value± (12,010) (0.06)
# Receive - Funds receives variable rate and pays fixed rate. (Pay) - Fund pays variable rate and receives fixed rate. 1 Centrally cleared swap. Fair Value % of Net
US$ Assets
Total Financial Liabilities at Fair Value through Profit or Loss (94,058) (0.48)
Net Financial Assets at Fair Value through Profit or Loss 18,512,760 94.97
Other Net Assets 979,874 5.03
Net Assets Attributable to Holders of Redeemable Participating Shares 19,492,634 100.00

SCHEDULE OF INVESTMENTS FINANCIAL STATEMENTS
ANNUAL REPORT 2019 755
Neuberger Berman Emerging Market Debt Blend Investment Grade Fund (Continued)
Schedule of Investments (Continued)
% ofTotal
AssetsPortfolio Analysis US$
* Transferable securities and/or money market instruments admitted to an official stock exchange listing 16,431,892 83.54
** Transferable securities and/or money market instruments dealt in on a regulated market 1,764,133 8.97
† Other transferable securities and/or money market instruments 235,627 1.20
± Financial derivative instruments traded on a regulated market (1,708) (0.01)
∞ OTC financial derivative instruments 82,816 0.42
Total Investments 18,512,760 94.12

FINANCIAL STATEMENTS STATEMENT OF SIGNIFICANT PURCHASES AND SALES
756 NEUBERGER BERMAN INVESTMENT FUNDS PLC
Neuberger Berman Emerging Market Debt Blend Investment Grade Fund (Continued)
Statement of Significant Purchases and Sales (Unaudited) In accordance with the European Communities (Undertakings for Collective Investment in Transferable Securities) Regulations, 2011 as amended, a statement of changes in the composition of the Schedule of Investments during the reporting period is provided to ensure that Shareholders can identify changes in the investments held by the Portfolio. The following statements present the aggregate purchases and sales of transferable securities exceeding one percent of the total value of purchases or sales, respectively, for the period. At a minimum, the largest twenty purchases and twenty sales are presented, if available.
Aggregate purchases greater than one percent of the total value of purchases:
Units Security Description Cost US$
800,000 Russian Foreign Bond - Eurobond, 4.38%, 21/03/2029 803,180
520,000 Indonesia Government International Bond, 5.25%, 17/01/2042 630,400
330,000 Peruvian Government International Bond, 8.75%, 21/11/2033 556,972
500,000 Rongshi International Finance Ltd, 3.75%, 21/05/2029 497,440
463,000 Uruguay Government International Bond, 4.38%, 23/01/2031 486,722
400,000 Qatar Government International Bond, 4.00%, 14/03/2029 421,048
400,000 SP Group Treasury Pte Ltd, 3.38%, 27/02/2029 396,612
375,000 United States Treasury Bill, 0.00%, 13/08/2020 369,022
240,000 Kazakhstan Government International Bond, 2.38%, 09/11/2028 302,415
200,000 Kazakhstan Government International Bond, 6.50%, 21/07/2045 282,000
200,000 Croatia Government International Bond, 2.75%, 27/01/2030 256,511
200,000 Indonesia Asahan Aluminium Persero PT, 6.53%, 15/11/2028 244,750
4,572,900 Mexican Bonos, 7.50%, 03/06/2027 239,001
235,000 ABQ Finance Ltd, 3.13%, 24/09/2024 233,900
200,000 Suzano Austria GmbH, 7.00%, 16/03/2047 232,720
230,000 Samba Funding Ltd, 2.75%, 02/10/2024 228,776
200,000 Croatia Government International Bond, 5.50%, 04/04/2023 222,582
200,000 Russian Foreign Bond - Eurobond, 4.75%, 27/05/2026 216,660
200,000 Indonesia Asahan Aluminium Persero PT, 6.76%, 15/11/2048 213,500
200,000 Kazakhstan Government International Bond, 3.88%, 14/10/2024 213,200
200,000 Development Bank of Kazakhstan JSC, 4.13%, 10/12/2022 205,980
200,000 CNAC (HK) Finbridge Co Ltd, 3.50%, 19/07/2022 202,990
200,000 NBK Tier 1 Financing 2 Ltd, 4.50%, 29/12/2049 200,000
200,000 Emirates Development Bank PJSC, 3.52%, 06/03/2024 200,000
200,000 Mdgh - Gmtn Bv, 3.70%, 07/11/2049 200,000
200,000 QIB Sukuk Ltd, 3.98%, 26/03/2024 200,000
200,000 African Export-Import Bank, 3.99%, 21/09/2029 200,000
200,000 Banque Ouest Africaine de Developpement, 4.70%, 22/10/2031 200,000
200,000 Sharjah Sukuk Program Ltd, 3.85%, 03/04/2026 200,000
200,000 Airport Authority Hong Kong, 3.45%, 21/02/2029 199,714

STATEMENT OF SIGNIFICANT PURCHASES AND SALES FINANCIAL STATEMENTS
ANNUAL REPORT 2019 757
Neuberger Berman Emerging Market Debt Blend Investment Grade Fund (Continued) Statement of Significant Purchases and Sales (Unaudited) (Continued)
Aggregate purchases greater than one percent of the total value of purchases (continued):
Units Security Description Cost US$
200,000 Sun Hung Kai Properties Capital Market Ltd, 3.75%, 25/02/2029 198,352
200,000 QNB Finance Ltd, 3.50%, 28/03/2024 198,288
200,000 PSA Treasury Pte Ltd, 2.13%, 05/09/2029 198,162
200,000 DP World Crescent Ltd, 3.88%, 18/07/2029 198,102
200,000 Perusahaan Listrik Negara PT, 4.88%, 17/07/2049 197,668
200,000 Suzano Austria GmbH, 5.00%, 15/01/2030 197,066
200,000 Abu Dhabi Government International Bond, 3.13%, 30/09/2049 195,270
11,867,000 Russian Federal Bond - OFZ, 6.90%, 23/05/2029 164,740
136,000 Mexico Government International Bond, 5.75%, 12/10/2110 156,840
131,000 Croatia Government International Bond, 1.13%, 19/06/2029 145,552

FINANCIAL STATEMENTS STATEMENT OF SIGNIFICANT PURCHASES AND SALES
758 NEUBERGER BERMAN INVESTMENT FUNDS PLC
Neuberger Berman Emerging Market Debt Blend Investment Grade Fund (Continued) Statement of Significant Purchases and Sales (Unaudited) (Continued) Aggregate sales greater than one percent of the total value of sales:
Units Security Description Proceeds US$
792,150 Russian Foreign Bond - Eurobond, 7.50%, 31/03/2030 879,468
800,000 Russian Foreign Bond - Eurobond, 4.38%, 21/03/2029 862,080
490,000 Indonesia Government International Bond, 3.75%, 14/06/2028 654,676
500,000 Rongshi International Finance Ltd, 3.75%, 21/05/2029 520,950
450,000 Hungary Government International Bond, 5.75%, 22/11/2023 502,158
400,000 Sinopec Group Overseas Development 2016 Ltd, 3.50%, 03/05/2026 417,938
6,500,000 Czech Republic Government Bond, 0.00%, 17/07/2019 284,049
230,000 KazMunayGas National Co JSC, 5.75%, 19/04/2047 263,925
200,000 Indonesia Asahan Aluminium Persero PT, 6.76%, 15/11/2048 258,000
200,000 Indonesia Asahan Aluminium Persero PT, 6.53%, 15/11/2028 243,800
767,500,000 Colombian TES, 7.00%, 04/05/2022 238,857
200,000 Kazakhstan Government International Bond, 1.55%, 09/11/2023 232,167
200,000 Indonesia Government International Bond, 4.75%, 11/02/2029 224,500
200,000 KazMunayGas National Co JSC, 5.38%, 24/04/2030 223,800
200,000 Croatia Government International Bond, 5.50%, 04/04/2023 221,830
200,000 Thaioil Treasury Center Co Ltd, 5.38%, 20/11/2048 221,528
200,000 Russian Foreign Bond - Eurobond, 5.25%, 23/06/2047 219,900
200,000 Russian Foreign Bond - Eurobond, 4.75%, 27/05/2026 218,750
200,000 KazMunayGas National Co JSC, 4.75%, 19/04/2027 215,500
200,000 Petroleos del Peru SA, 4.75%, 19/06/2032 214,500
200,000 Sasol Financing USA LLC, 5.88%, 27/03/2024 212,820
200,000 Sun Hung Kai Properties Capital Market Ltd, 3.75%, 25/02/2029 212,052
200,000 Development Bank of Kazakhstan JSC, 4.13%, 10/12/2022 208,020
200,000 Perusahaan Listrik Negara PT, 4.88%, 17/07/2049 207,200
200,000 Airport Authority Hong Kong, 3.45%, 21/02/2029 206,708
200,000 Suzano Austria GmbH, 5.00%, 15/01/2030 205,300
203,000 Israel Electric Corp Ltd, 4.25%, 14/08/2028 204,776
200,000 Indonesia Government International Bond, 5.13%, 15/01/2045 204,600
200,000 CNAC HK Finbridge Co Ltd, 3.50%, 19/07/2022 203,028
200,000 Export-Import Bank of Korea, 2.83%, 01/11/2022 202,088
200,000 Charming Light Investments Ltd, 3.08%, 21/12/2020 200,176
150,000 Colombia Government International Bond, 6.13%, 18/01/2041 190,200
200,000 Abu Dhabi Government International Bond, 3.13%, 30/09/2049 189,000
200,000 Petroleos Mexicanos, 5.35%, 12/02/2028 185,700
11,867,000 Russian Federal Bond - OFZ, 6.90%, 23/05/2029 176,371
132,000 Romanian Government International Bond, 3.88%, 29/10/2035 175,867
200,000 Oman Government International Bond, 6.75%, 17/01/2048 173,500
200,000 Oman Government International Bond, 6.50%, 08/03/2047 169,250
100,000 Peruvian Government International Bond, 8.75%, 21/11/2033 151,910
9,000,000 Russian Federal Bond - OFZ, 7.95%, 07/10/2026 142,472

INVESTMENT MANAGER’S REPORT FINANCIAL STATEMENTS
ANNUAL REPORT 2019 759
Neuberger Berman Emerging Markets Sustainable Equity Fund Investment Manager’s Report For the 12 months ended 31 December 2019, the total return for the USD I Accumulating Class was 19.48%. Over the same period, the benchmark index, the MSCI Emerging Markets Index (Net) (the “Index”), returned 18.42%. (Performance for all share classes is provided in Appendix II. Performance data quoted represent past performance and do not indicate future results. Total returns shown are net of all fees and expenses and include reinvestment of income dividends and other distributions, if any).
Emerging markets (“EM”) equities rallied in 2019. After trailing developed equities for much of the year, they closed on a high note. Global monetary policy easing plus indications that a “phase one” US-China trade deal was imminent boosted risk-on sentiment. This was reflected in an EM equities rally, the dollar (DXY Index) weakening, and flows into EM equity funds turning strongly positive to end the year.
The EM Index was led by Information Technology (“IT”), Consumer Discretionary and Real Estate stocks. All sectors were positive, but Health Care, Materials and Industrials lagged. By country, Russia, Greece and Egypt were top performers, while Argentina, Chile and Poland declined.
Stock selection was the key driver of the Portfolio’s outperformance this year. IT holdings contributed most, followed by Utilities. By country, stocks based in Taiwan, Russian and were positives. Sector allocation had a minor negative impact, including our overweight to Communications and underweight to Consumer Discretionary. Stock selection within Consumer Discretionary also detracted. By country, Philippines-based and Indonesian holdings underperformed.
Separately during 2019, the team signed the KnowTheChain Investor Statement encouraging corporations to follow basic protocols on Modern Slavery, and are engaging the relevant portfolio holdings on the topic.
With investors optimistic that monetary easing can boost global economic prospects, equity markets all rallied at year-end, with EM leading the way.
Global equity markets are attempting to assess the broader impact of COVID-19: as it spreads across communities, and corporates highlight the impact to their businesses. The impact can be categorized in three broad categories: first, the lost demand to the services sector; second, a postponement of discretionary spending; and third, a potential impact to global supply chains. Each emerging market and developed market are in a various stages of the virus spreading and government policies to tackle the virus. The early March breakdown of key oil supplier talks also added to the market turbulence.
The severity of both the COVID-19 disruption – and the oil price retreat – speaks to the lack of earnings visibility for the remainder of 2020, with the uncertainty also likely contributing to the volatility in equity markets.
In March 2020, emerging market equities were sold off indiscriminately, although countries that are further along in the Coronavirus curve, e.g. China and Taiwan, are outperforming and their economies seem to be getting back to normal. Commodity-sensitive markets like Russia and Brazil continue to be underperformers. On a sector basis, commodity sectors (Energy/Materials) have been the hardest hit during the month. Challenges are likely to persist in these markets, so we remain underweight, which has been helpful on a relative basis. We continue to monitor currencies that have taken a big hit, in particular commodity currencies like the Brazilian real, and Russian ruble.
Easy monetary policy can be helpful in the longer run, but March 2020’s dollar funding squeeze is putting further pressure on emerging markets. The portfolio favors domestically-driven names, and the team expect locally-focused companies to recover first given exporters will likely still have to deal with virus-related demand destruction in the developed world. As things recover and liquidity improves, the team believes the portfolio is well positioned to benefit.
The portfolio positioning has not changed radically, but the team is staying in close contact with existing holdings to assess the impact. When the team believe stock prices are dislocated from fundamentals, the team looks to add. The portfolio’s large underweight towards China is being reduced, adding to domestically-focused Consumer names as the economy recovers and pent-up demand could drive a second half 2020 recovery. In addition, we are also looking for opportunities in niche tech players, and quality financials with structural growth.
Our quality bias helps the portfolio avoid businesses with significant debt or with short term funding cliffs. Issues in credit markets should therefore be less impactful for our companies.
The team believes that despite short-term disruptions, the quality businesses in the portfolio could gradually return to normal activity. Current valuation makes many of them look very attractive on long-term view. Markets appear to already be discounting a sharp earnings drop, but stimulus combined with pent-up demand could lead to a recovery.

FINANCIAL STATEMENTS BALANCE SHEET
The accompanying notes form an integral part of the financial statements.
760 NEUBERGER BERMAN INVESTMENT FUNDS PLC
Neuberger Berman Emerging Markets Sustainable Equity Fund (Continued) Balance Sheet
As at As at
Note 31 December 2019 31 December 2018
US$ US$
Current Assets
Financial Assets at Fair Value through Profit or Loss 2 127,179,345 30,784,333
Cash and cash equivalents 3 2,580,346 1,460,563
Receivable for investments sold 109,467 –
Income receivable and other assets 322,094 58,915
Total Assets 130,191,252 32,303,811
Current Liabilities
Accrued expenses 124,973 54,722
Payable for investments purchased 47,304 17
Other payables 154,493 30,040
Liabilities (excluding Net Assets Attributable to Holders of Redeemable Participating Shares) 326,770 84,779
Net Assets Attributable to Holders of Redeemable Participating Shares 129,864,482 32,219,032

PROFIT AND LOSS ACCOUNT FINANCIAL STATEMENTS
The accompanying notes form an integral part of the financial statements.
ANNUAL REPORT 2019 761
Neuberger Berman Emerging Markets Sustainable Equity Fund (Continued) Profit and Loss Account
Year Ended Year Ended
Note 31 December 2019 31 December 2018
US$ US$
Income
Interest Income 43,344 17,340
Dividend Income 1,249,530 556,297
Net Gain/(Loss) on Financial Assets and Liabilities at Fair Value through Profit or Loss 11 10,733,231 (6,227,348)
12,026,105 (5,653,711)
Expenses
Management Fee 6 352,663 127,799
Distribution Fee 6 265 48
Administration Fee 6 67,202 43,210
Commitment Fee 19 5,649 630
Custody Fee 6 16,905 11,649
Depositary Fee 6 2,536 1,405
Professional Fee 9 52,519 19,406
Directors' Fee 7 4,507 8,384
Transaction Costs 9 182,784 114,405
Audit Fee 8 9,922 14,743
VAT Rebate (571) (282)
Other Expenses 9 24,166 14,943
Expense Waiver 6 (85,446) (116,856)
Total Expenses 633,101 239,484
Finance Costs
Interest Expense – 446
Distribution Paid 1 30,022 –
30,022 446
Withholding Tax 1 168,728 70,654
Capital Gain Tax 1 138,314 21,442
Profit/(Loss) Attributable to Holders of Redeemable Participating Shares from Operations 11,055,940 (5,985,737)
Income and expenses arose solely from continuing operations.

FINANCIAL STATEMENTS STATEMENT OF CHANGES IN NET ASSETS
The accompanying notes form an integral part of the financial statements.
762 NEUBERGER BERMAN INVESTMENT FUNDS PLC
Neuberger Berman Emerging Markets Sustainable Equity Fund (Continued) Statement of Changes in Net Assets Attributable to Holders of Redeemable Participating Shares
Year Ended Year Ended
31 December 2019 31 December 2018
US$ US$
Net Assets Attributable to Holders of Redeemable Participating Shares at beginning of year 32,219,032 8,271,686
Profit/(Loss) Attributable to Holders of Redeemable Participating Shares from Operations 11,055,940 (5,985,737)
Subscriptions 5 91,915,884 31,508,668
Redemptions 5 (5,326,374) (1,575,585)
Net Assets Attributable to Holders of Redeemable Participating Shares at end of year 129,864,482 32,219,032

SCHEDULE OF INVESTMENTS FINANCIAL STATEMENTS
ANNUAL REPORT 2019 763
Neuberger Berman Emerging Markets Sustainable Equity Fund (Continued)
Schedule of Investments
Financial Assets at Fair Value through Profit or Loss
Number of Shares Security Description Fair Value
US$% of Net
Assets
Equities 91.78% (31 December 2018: 89.62%)
Brazilian Real 228,900 Atacadao SA* 1,333,198 1.03
170,079 B3 SA - Brasil Bolsa Balcao* 1,827,095 1.41
242,927 BK Brasil Operacao e Assessoria a Restaurantes SA* 1,077,114 0.83
156,720 Energisa SA* 2,091,540 1.61
135,350 Itau Unibanco Holding SA - Preferred Shares* 1,253,605 0.96
87,885 Localiza Rent a Car SA* 1,040,568 0.80
Total Brazilian Real 8,623,120 6.64
Chinese Yuan Renminbi
67,800 Jiangsu Yanghe Brewery Joint-Stock Co Ltd Class A* 1,075,626 0.83
353,945 NARI Technology Co Ltd Class A* 1,076,295 0.83
Total Chinese Yuan Renminbi 2,151,921 1.66
Czech Koruna 27,635 Komercni Banka AS* 1,013,356 0.78
Total Czech Koruna 1,013,356 0.78
Euro 12,477 Prosus NV* 931,781 0.72
Total Euro 931,781 0.72
Hong Kong Dollar 935,000 3SBio Inc* 1,211,979 0.93
468,162 A-Living Services Co Ltd - H Shares* 1,616,258 1.24
105,000 ASM Pacific Technology Ltd* 1,456,724 1.12
148,221 Budweiser Brewing Co APAC Ltd* 500,297 0.39
1,529,000 China Longyuan Power Group Corp Ltd - H Shares* 967,423 0.75
330,500 China Mobile Ltd* 2,778,273 2.14
174,000 China Resources Gas Group Ltd* 955,774 0.74
97,225 Haier Electronics Group Co Ltd* 303,836 0.23
618,000 Huatai Securities Co Ltd - H Shares* 1,092,949 0.84
3,544,000 Industrial & Commercial Bank of China Ltd - H Shares* 2,729,023 2.10
281,000 Ping An Insurance Group Co of China Ltd - H Shares* 3,321,453 2.56
131,100 Sunny Optical Technology Group Co Ltd* 2,269,744 1.75
141,500 Tencent Holdings Ltd* 6,820,940 5.25
340,000 Times China Holdings Ltd* 678,098 0.52
254,200 Zhuzhou CRRC Times Electric Co Ltd - H Shares* 919,998 0.71
Total Hong Kong Dollar 27,622,769 21.27

FINANCIAL STATEMENTS SCHEDULE OF INVESTMENTS
764 NEUBERGER BERMAN INVESTMENT FUNDS PLC
Neuberger Berman Emerging Markets Sustainable Equity Fund (Continued)
Schedule of Investments (Continued)
Financial Assets at Fair Value through Profit or Loss (continued)
Number of Shares Security Description Fair Value
US$% of Net
Assets
Equities 91.78% (31 December 2018: 89.62%) (continued)
Hungarian Forint 99,137 MOL Hungarian Oil & Gas Plc* 989,676 0.76
Total Hungarian Forint 989,676 0.76
Indonesian Rupiah 3,292,393 Bank Rakyat Indonesia Persero Tbk PT* 1,042,128 0.80
2,580,100 Telekomunikasi Indonesia Persero Tbk PT* 739,140 0.57
Total Indonesian Rupiah 1,781,268 1.37
Mexican Peso 164,220 Fomento Economico Mexicano SAB de CV* 1,550,803 1.20
188,554 Grupo Financiero Banorte SAB de CV Class O* 1,054,001 0.81
290,770 Infraestructura Energetica Nova SAB de CV* 1,367,007 1.05
Total Mexican Peso 3,971,811 3.06
New Taiwan Dollar 210,000 Accton Technology Corp* 1,176,902 0.91
98,000 Eclat Textile Co Ltd* 1,317,477 1.02
264,000 Elite Material Co Ltd* 1,206,525 0.93
58,400 Parade Technologies Ltd* 1,198,118 0.92
593,000 Taiwan Semiconductor Manufacturing Co Ltd* 6,547,787 5.04
532,000 Uni-President Enterprises Corp* 1,316,823 1.01
Total New Taiwan Dollar 12,763,632 9.83
Philippine Peso 54,644 GT Capital Holdings Inc* 913,880 0.71
1,063,965 Metropolitan Bank & Trust Co* 1,392,850 1.07
Total Philippine Peso 2,306,730 1.78
Polish Zloty 52,509 Dino Polska SA* 1,995,809 1.54
125,245 Powszechny Zaklad Ubezpieczen SA* 1,325,073 1.02
Total Polish Zloty 3,320,882 2.56
Pound Sterling 27,295 Rio Tinto Plc* 1,628,242 1.25
Total Pound Sterling 1,628,242 1.25

SCHEDULE OF INVESTMENTS FINANCIAL STATEMENTS
ANNUAL REPORT 2019 765
Neuberger Berman Emerging Markets Sustainable Equity Fund (Continued)
Schedule of Investments (Continued)
Financial Assets at Fair Value through Profit or Loss (continued)
Number of Shares Security Description Fair Value
US$% of Net
Assets
Equities 91.78% (31 December 2018: 89.62%) (continued)
South African Rand 59,628 Bid Corp Ltd* 1,408,071 1.08
261,513 FirstRand Ltd* 1,174,457 0.91
12,477 Naspers Ltd Class N* 2,043,994 1.57
Total South African Rand 4,626,522 3.56
South Korean Won 11,900 Com2uSCorp* 1,103,340 0.85
22,455 DB Insurance Co Ltd* 1,014,327 0.78
5,568 LG Chem Ltd* 1,525,935 1.17
11,677 NAVER Corp* 1,878,770 1.45
14,225 Orion Corp* 1,297,332 1.00
129,770 Samsung Electronics Co Ltd* 6,253,212 4.82
25,525 SK Hynix Inc* 2,076,146 1.60
6,256 SK Telecom Co Ltd* 1,289,040 0.99
24,890 Woongjin Coway Co Ltd* 2,003,769 1.54
133,917 Woori Financial Group Inc* 1,340,783 1.03
Total South Korean Won 19,782,654 15.23
Thai Baht 82,200 Advanced Info Service PCL* 584,676 0.45
636,000 CP ALL PCL* 1,539,974 1.19
158,100 PTT Exploration & Production PCL* 666,757 0.51
Total Thai Baht 2,791,407 2.15
Turkish Lira 97,560 BIM Birlesik Magazalar AS* 764,939 0.59
Total Turkish Lira 764,939 0.59
United States Dollar 16,961 Alibaba Group Holding Ltd ADR* 3,597,428 2.77
10,059 Credicorp Ltd* 2,143,875 1.65
36,852 HDFC Bank Ltd ADR* 2,335,311 1.80
174,656 ICICI Bank Ltd ADR* 2,635,559 2.03
31,875 Lukoil Pjsc Adr** 3,146,381 2.42
77,836 Mahindra & Mahindra Ltd GDR** 588,440 0.45
34,788 Momo Inc ADR* 1,165,398 0.90
34,061 Pagseguro Digital Ltd Class A* 1,163,524 0.90
259,948 Sberbank of Russia PJSC* 1,066,180 0.82

FINANCIAL STATEMENTS SCHEDULE OF INVESTMENTS
766 NEUBERGER BERMAN INVESTMENT FUNDS PLC
Neuberger Berman Emerging Markets Sustainable Equity Fund (Continued)
Schedule of Investments (Continued)
Financial Assets at Fair Value through Profit or Loss (continued)
Number of Shares Security Description Fair Value
US$% of Net
Assets
Equities 91.78% (31 December 2018: 89.62%) (continued)
United States Dollar (continued)
21,212 Trip.com Group Ltd ADR* 711,450 0.55
19,319 Weibo Corp ADR* 895,436 0.69
27,177 X5 Retail Group NV GDR* 937,606 0.72
78,802 Yandex NV Class A* 3,427,099 2.64
12,928 ZTO Express Cayman Inc ADR* 301,869 0.23
Total United States Dollar 24,115,556 18.57
Total Equities 119,186,266 91.78
Real Estate Investment Trusts 1.05% (31 December 2018: 0.00%)
Hong Kong Dollar 129,195 Link REIT 1,367,924 1.05
Total Real Estate Investment Trusts * 1,367,924 1.05
Number of Shares Security Description Maturity
DateFair Value
US$% of Net
Assets
Participatory Notes 5.10% (31 December 2018: 5.93%)
United States Dollar 138,989 Bandhan Bank Ltd 30/03/2020 989,996 0.76
49,715 Housing Development Finance Corp Ltd 19/04/2021 1,680,890 1.29
69,520 Mahanagar Gas Ltd 21/10/2020 1,037,807 0.80
526,425 Power Grid Corp of India Ltd 07/12/2020 1,403,579 1.08
71,300 Reliance Industries Ltd 10/11/2020 1,512,883 1.17
Total Participatory Notes ** 6,625,155 5.10
Total Investments 127,179,345 97.93
Total Financial Assets at Fair Value through Profit or Loss 127,179,345 97.93
Net Financial Assets at Fair Value through Profit or Loss 127,179,345 97.93
Other Net Assets 2,685,137 2.07
Net Assets Attributable to Holders of Redeemable Participating Shares 129,864,482 100.00
% of
TotalAssetsPortfolio Analysis US$
* Transferable securities and/or money market instruments admitted to an official stock exchange listing 116,819,369 89.73
** Transferable securities and/or money market instruments dealt in on a regulated market 10,359,976 7.96
Total Investments 127,179,345 97.69

STATEMENT OF SIGNIFICANT PURCHASES AND SALES FINANCIAL STATEMENTS
ANNUAL REPORT 2019 767
Neuberger Berman Emerging Markets Sustainable Equity Fund (Continued) Statement of Significant Purchases and Sales (Unaudited) In accordance with the European Communities (Undertakings for Collective Investment in Transferable Securities) Regulations, 2011 as amended, a statement of changes in the composition of the Schedule of Investments during the reporting period is provided to ensure that Shareholders can identify changes in the investments held by the Portfolio. The following statements present the aggregate purchases and sales of transferable securities exceeding one percent of the total value of purchases or sales, respectively, for the period. At a minimum, the largest twenty purchases and twenty sales are presented, if available.
Aggregate purchases greater than one percent of the total value of purchases:
Units Security Description Cost US$
95,480 Samsung Electronics Co Ltd 4,158,531
101,500 Tencent Holdings Ltd 4,158,279
418,000 Taiwan Semiconductor Manufacturing Co Ltd 4,115,987
198,500 Ping An Insurance Group Co of China Ltd - H Shares 2,307,781
12,000 Alibaba Group Holding Ltd ADR 2,117,645
22,470 Lukoil PJSC ADR 2,075,010
62,325 Yandex NV Class A 2,067,279
245,500 China Mobile Ltd 2,033,286
2,499,000 Industrial & Commercial Bank of China Ltd - H Shares 1,795,472
136,262 ICICI Bank Ltd ADR 1,738,291
7,737 Credicorp Ltd 1,644,949
26,200 HDFC Bank Ltd ADR 1,597,461
28,984 Rio Tinto Plc 1,539,950
5,249,300 Bank Rakyat Indonesia Persero Tbk PT 1,526,958
92,800 Sunny Optical Technology Group Co Ltd 1,520,888
187,032 Bandhan Bank Ltd, 30/03/2020 - Participatory Notes 1,493,185
37,606 Dino Polska SA 1,491,928
71,300 Reliance Industries Ltd, 10/11/2020 - Participatory Notes 1,476,744
10,970 NAVER Corp 1,450,741
120,200 B3 SA - Brasil Bolsa Balcao 1,446,068
526,425 Power Grid Corp of India Ltd, 07/12/2020 - Participatory Notes 1,442,773
133,917 Woori Financial Group Inc 1,432,946
129,195 Link REIT 1,432,147
817,000 3SBio Inc 1,393,807
17,550 Woongjin Coway Co Ltd 1,382,940
9,182 Naspers Ltd Class N 1,336,097
532,000 Uni-President Enterprises Corp 1,316,731
110,600 Energisa SA 1,311,435
98,000 Eclat Textile Co Ltd 1,307,301
463,705 Power Grid Corp of India Ltd, 06/12/2019 - Participatory Notes 1,300,304
498,800 CP ALL PCL 1,290,332
17,670 SK Hynix Inc 1,255,708
4,572 LG Chem Ltd 1,215,535

FINANCIAL STATEMENTS STATEMENT OF SIGNIFICANT PURCHASES AND SALES
768 NEUBERGER BERMAN INVESTMENT FUNDS PLC
Neuberger Berman Emerging Markets Sustainable Equity Fund (Continued) Statement of Significant Purchases and Sales (Unaudited) (Continued) Aggregate purchases greater than one percent of the total value of purchases (continued):
Units Security Description Cost US$
39,022 Housing Development Finance Corp Ltd, 26/04/2021 - Participatory Notes 1,154,997
375,500 A-Living Services Co Ltd - H Shares 1,147,628
120,921 Fomento Economico Mexicano SAB de CV 1,088,320
353,945 NARI Technology Co Ltd Class A 1,058,204
74,100 ASM Pacific Technology Ltd 1,023,549
43,898 Bid Corp Ltd 1,014,319
10,845 Orion Corp 1,000,850
750,120 Metropolitan Bank & Trust Co 993,259
99,137 MOL Hungarian Oil & Gas Plc 989,733
69,520 Mahanagar Gas Ltd, 21/10/2020 - Participatory Notes 980,990

STATEMENT OF SIGNIFICANT PURCHASES AND SALES FINANCIAL STATEMENTS
ANNUAL REPORT 2019 769
Neuberger Berman Emerging Markets Sustainable Equity Fund (Continued) Statement of Significant Purchases and Sales (Unaudited) (Continued) Aggregate sales greater than one percent of the total value of sales:
Units Security Description Proceeds US$
526,425 Power Grid Corp of India Ltd, 06/12/2019 - Participatory Notes 1,437,403
90,135 Bandhan Bank Ltd, 28/03/2019 - Participatory Notes 644,931
1,956,907 Bank Rakyat Indonesia Persero Tbk PT 557,865
24,005 ZTO Express Cayman Inc ADR 533,006
19,664 Sasol Ltd 435,696
48,043 Bandhan Bank Ltd, 30/03/2020 - Participatory Notes 385,251
42,618 Vipshop Holdings Ltd 329,293
710,900 Astra International Tbk PT 323,171
944 LG Chem Ltd 312,453
491,300 Bank Negara Indonesia Persero Tbk PT 306,735
3,100 Baidu Inc 300,094
25,000 Ping An Insurance Group Co of China Ltd - H Shares 283,245
16,781 Parex Resources Inc 278,667
255,500 Sino Biopharmaceutical Ltd 265,922
8,837 Mando Corp 254,019
89,775 Haier Electronics Group Co Ltd 253,695
208,589 Ashok Leyland Ltd, 01/08/2019 - Participatory Notes 240,178
8,415 Housing Development Finance Corp Ltd, 26/04/2021 - Participatory Notes 239,295
1,700 Kweichow Moutai Co Ltd 232,113
42,000 Kasikornbank PCL 230,271
134,780 Sok Marketler Ticaret AS 229,413
54,000 Sinopharm Group Co Ltd 204,884
23,558 KAZ Minerals Plc 200,944
18,515 ICICI Bank Ltd ADR 193,124
169,511 Lens Technology Co Ltd 192,011
36,000 China Resources Gas Group Ltd 186,461
203,406 Zhejiang Huace Film & TV Co Ltd 185,470
1,593 Hyundai Motor Co 184,004
14,100 Sunny Optical Technology Group Co Ltd 179,359
20,126 Barloworld Ltd 175,328
51,000 Elite Material Co Ltd 167,604
62,720 Power Grid Corp of India Ltd, 07/12/2018 - Participatory Notes 163,618
60,600 CP ALL PCL 161,100
2,240 SK Hynix Inc 153,217
15,490 JSE Ltd 152,900
72,000 Bank Central Asia Tbk PT 140,440
1,174 HDFC Bank Ltd ADR 133,784
2,351 Rio Tinto Plc 127,211
3,843 X5 Retail Group NV GDR 124,907

FINANCIAL STATEMENTS INVESTMENT MANAGER’S REPORT
770 NEUBERGER BERMAN INVESTMENT FUNDS PLC
Neuberger Berman China Equity Opportunities Fund Investment Manager’s Report For the 12 months ended 31 December 2019, the total return for the USD I Accumulating Class was 26.22%. Over the same period, the benchmark index, the MSCI China Index (Net) (the “Index”), returned 23.46%. (Performance for all share classes is provided in Appendix II. Performance data quoted represent past performance and do not indicate future results. Total returns shown are net of all fees and expenses and include reinvestment of income dividends and other distributions, if any).
Chinese equities performed well during this period, outperforming developed international and emerging markets equities, and trailing the US S&P 500 Index which gained 31.49% in 2019. US-China trade war headlines impacted all markets throughout this year, creating tensions and volatility. Chinese economic indicators remained subdued as well.
In the first half, markets welcomed a late June agreement, which kept the trade standoff from escalating, and the US Federal Reserve’s move toward easing. As the year ended, indications that a “phase one” US-China trade deal was imminent and a weaker dollar boosted sentiment.
Top performing Index sectors for the Portfolio included Consumer Discretionary, Information Technology and Consumer Staples. All sectors were positive, but Energy, Industrials and Utilities lagged.
Stock selection drove the Portfolio’s outperformance this year, with Consumer Staples holdings, along with an advantageous overweight, the key factor. Communications holdings also outperformed. The Portfolio underperformed the benchmark in Financials and Information Technology.
Under the leadership of Patrick Ru as of July 2019, we seek to identify and own quality companies that are positioned to be beneficiaries of positive domestic secular trends – and that are thus somewhat insulated from headline trade-tension news. We believe our deep research capability and disciplined strategy should continue to help us identify exceptional opportunities, and deliver strong risk-adjusted returns going forward.
Global equity markets are attempting to assess the broader impact of COVID-19: as it spreads across communities, and corporates highlight the impact to their businesses. The impact can be categorized in three broad categories: first, the lost demand to the services sector; second, a postponement of discretionary spending; and third, a potential impact to global supply chains. Each emerging market and developed market are in a various stages of the virus spreading and government policies to tackle the virus. The early March breakdown of key oil supplier talks also added to the market turbulence.
The severity of both the COVID-19 disruption – and the oil price retreat – speaks to the lack of earnings visibility for the remainder of 2020, with the uncertainty also likely contributing to the volatility in equity markets. The portfolio favors domestically-driven names, and the team expect locally-focused companies to recover first given exporters will likely still have to deal with virus-related demand destruction in the developed world. As things recover and liquidity improves, the team believes the portfolio is well positioned to benefit.
Our quality bias helps the portfolio avoid businesses with significant debt or with short term funding cliffs. Issues in credit markets should therefore be less impactful for our companies.
The team believes that despite short-term disruptions, the quality businesses in the portfolio could gradually return to normal activity. Current valuation makes many of them look very attractive on long-term view. Markets appear to already be discounting a sharp earnings drop, but stimulus combined with pent-up demand could lead to a recovery.

BALANCE SHEET FINANCIAL STATEMENTS
The accompanying notes form an integral part of the financial statements.
ANNUAL REPORT 2019 771
Neuberger Berman China Equity Opportunities Fund (Continued) Balance Sheet
As at As at
Note 31 December 2019 31 December 2018
US$ US$
Current Assets
Financial Assets at Fair Value through Profit or Loss 2 1,227,394 928,599
Cash and cash equivalents 3 83,351 12,055
Receivable for investments sold 456,756 –
Income receivable and other assets 31,043 27,190
Total Assets 1,798,544 967,844
Current Liabilities
Accrued expenses 44,009 52,062
Payable for investments purchased 445,534 46
Other payables 1,627 4,534
Liabilities (excluding Net Assets Attributable to Holders of Redeemable Participating Shares) 491,170 56,642
Net Assets Attributable to Holders of Redeemable Participating Shares 1,307,374 911,202

FINANCIAL STATEMENTS PROFIT AND LOSS ACCOUNT
The accompanying notes form an integral part of the financial statements.
772 NEUBERGER BERMAN INVESTMENT FUNDS PLC
Neuberger Berman China Equity Opportunities Fund (Continued) Profit and Loss Account
Year Ended Year Ended
Note 31 December 2019 31 December 2018
US$ US$
Income
Interest Income 1,108 471
Dividend Income 22,963 14,371
Net Gain/(Loss) on Financial Assets and Liabilities at Fair Value through Profit or Loss 11 249,182 (295,254)
273,253 (280,412)
Expenses
Management Fee 6 12,272 11,543
Distribution Fee 6 1,172 74
Administration Fee 6 23,127 24,971
Commitment Fee 19 123 29
Custody Fee 6 12,000 9,807
Depositary Fee 6 114 84
Professional Fee 9 47,977 9,539
Directors' Fee 7 4,524 6,403
Transaction Costs 9 19,671 23,030
Audit Fee 8 6,761 14,517
VAT Rebate (18) (14)
Other Expenses 9 11,984 4,001
Expense Waiver 6 (142,936) (109,839)
Total Expenses (3,229) (5,855)
Withholding Tax 1 2,073 1,270
Profit/(Loss) Attributable to Holders of Redeemable Participating Shares from Operations 274,409 (275,827)
Income and expenses arose solely from continuing operations.

STATEMENT OF CHANGES IN NET ASSETS FINANCIAL STATEMENTS
The accompanying notes form an integral part of the financial statements.
ANNUAL REPORT 2019 773
Neuberger Berman China Equity Opportunities Fund (Continued) Statement of Changes in Net Assets Attributable to Holders of Redeemable Participating Shares
Year Ended Year Ended
31 December 2019 31 December 2018
US$ US$
Net Assets Attributable to Holders of Redeemable Participating Shares at beginning of year 911,202 982,039
Profit/(Loss) Attributable to Holders of Redeemable Participating Shares from Operations 274,409 (275,827)
Subscriptions 5 134,263 204,990
Redemptions 5 (12,500) –
Net Assets Attributable to Holders of Redeemable Participating Shares at end of year 1,307,374 911,202

FINANCIAL STATEMENTS SCHEDULE OF INVESTMENTS
774 NEUBERGER BERMAN INVESTMENT FUNDS PLC
Neuberger Berman China Equity Opportunities Fund (Continued)
Schedule of Investments
Financial Assets at Fair Value through Profit or Loss
Number of Shares Security Description Fair Value
US$% of Net
Assets
Equities 89.58% (31 December 2018: 101.91%)
Chinese Yuan Renminbi
8,500 China Jushi Co Ltd Class A 13,302 1.02
28,400 GEM Co Ltd Class A 19,857 1.52
11,100 Hangcha Group Co Ltd Class A 20,526 1.57
29,027 Jiangsu Changshu Rural Commercial Bank Co Ltd Class A 37,965 2.90
1,000 Jiangsu Yanghe Brewery Joint-Stock Co Ltd Class A 15,865 1.21
3,791 Joyoung Co Ltd Class A 13,694 1.05
6,000 Sichuan Kelun Pharmaceutical Co Ltd Class A 20,235 1.55
8,800 Suofeiya Home Collection Co Ltd Class A 26,469 2.03
5,400 Yangzhou Yangjie Electronic Technology Co Ltd Class A 13,335 1.02
24,400 Yonghui Superstores Co Ltd Class A 26,414 2.02
Total Chinese Yuan Renminbi 207,662 15.89
Hong Kong Dollar 15,500 3SBio Inc 20,092 1.54
3,200 AIA Group Ltd 33,594 2.57
114,000 Anton Oilfield Services Group 13,021 1.00
8,500 BOC Hong Kong Holdings Ltd 29,509 2.26
61,000 China Construction Bank Corp - H Shares 52,687 4.03
18,000 China Eastern Airlines Corp Ltd - H Shares 9,980 0.76
12,000 China Life Insurance Co Ltd - H Shares 33,343 2.55
26,500 China Longyuan Power Group Corp Ltd - H Shares 16,767 1.28
3,300 China Mengniu Dairy Co Ltd 13,341 1.02
5,500 China Mobile Ltd 46,234 3.54
4,500 CITIC Securities Co Ltd - H Shares 10,268 0.78
14,000 CNOOC Ltd 23,286 1.78
10,000 Guangdong Investment Ltd 20,919 1.60
12,800 Guangzhou R&F Properties Co Ltd - H Shares 23,623 1.81
6,000 Hang Lung Properties Ltd 13,168 1.01
6,000 Johnson Electric Holdings Ltd 13,645 1.04
30,000 Lenovo Group Ltd 20,136 1.54
5,400 Midea Real Estate Holding Ltd 16,564 1.27
3,600 Sinopharm Group Co Ltd - H Shares 13,145 1.00
2,600 Tencent Holdings Ltd 125,332 9.59
22,000 Topsports International Holdings Ltd 26,597 2.03
Total Hong Kong Dollar 575,251 44.00
New Taiwan Dollar 32,000 Mega Financial Holding Co Ltd 32,665 2.50

SCHEDULE OF INVESTMENTS FINANCIAL STATEMENTS
ANNUAL REPORT 2019 775
Neuberger Berman China Equity Opportunities Fund (Continued)
Schedule of Investments (Continued)
Financial Assets at Fair Value through Profit or Loss (continued)
Number of Shares Security Description Fair Value
US$% of Net
Assets
Equities 89.58% (31 December 2018: 101.91%) (continued)
New Taiwan Dollar (continued)
1,000 Taiwan Semiconductor Manufacturing Co Ltd 11,042 0.84
8,000 Uni-President Enterprises Corp 19,802 1.52
Total New Taiwan Dollar 63,509 4.86
United States Dollar 2,100 360 Finance Inc ADR 20,517 1.57
584 Alibaba Group Holding Ltd ADR 123,867 9.47
1,200 Baozun Inc ADR 39,744 3.04
1,112 HUYA Inc ADR 19,960 1.53
100 NetEase Inc ADR 30,664 2.34
1,520 Trip.com Group Ltd ADR 50,981 3.90
840 Weibo Corp ADR 38,934 2.98
Total United States Dollar 324,667 24.83
Total Equities * 1,171,089 89.58
Real Estate Investment Trusts 1.78% (31 December 2018: 0.00%)
Hong Kong Dollar 2,200 Link REIT 23,294 1.78
Total Real Estate Investment Trusts * 23,294 1.78
Number of Shares Security Description Maturity
Date Fair Value
US$% of Net
Assets
Participatory Notes 2.52% (31 December 2018: 0.00%)
United States Dollar 13,400 CICC Financial Trading Ltd 27/12/2022 33,011 2.52
Total Participatory Notes ** 33,011 2.52
Total Investments 1,227,394 93.88
Fair ValueUS$
% of NetAssets
Total Financial Assets at Fair Value through Profit or Loss 1,227,394 93.88
Net Financial Assets at Fair Value through Profit or Loss 1,227,394 93.88
Other Net Assets 79,980 6.12
Net Assets Attributable to Holders of Redeemable Participating Shares 1,307,374 100.00

FINANCIAL STATEMENTS SCHEDULE OF INVESTMENTS
776 NEUBERGER BERMAN INVESTMENT FUNDS PLC
Neuberger Berman China Equity Opportunities Fund (Continued)
Schedule of Investments (Continued)
% ofTotal
AssetsPortfolio Analysis US$
* Transferable securities and/or money market instruments admitted to an official stock exchange listing 1,194,383 66.40
** Transferable securities and/or money market instruments dealt in on a regulated market 33,011 1.84
Total Investments 1,227,394 68.24

STATEMENT OF SIGNIFICANT PURCHASES AND SALES FINANCIAL STATEMENTS
ANNUAL REPORT 2019 777
Neuberger Berman China Equity Opportunities Fund (Continued) Statement of Significant Purchases and Sales (Unaudited) In accordance with the European Communities (Undertakings for Collective Investment in Transferable Securities) Regulations, 2011 as amended, a statement of changes in the composition of the Schedule of Investments during the reporting period is provided to ensure that Shareholders can identify changes in the investments held by the Portfolio. The following statements present the aggregate purchases and sales of transferable securities exceeding one percent of the total value of purchases or sales, respectively, for the period. At a minimum, the largest twenty purchases and twenty sales are presented, if available.
Aggregate purchases greater than one percent of the total value of purchases:
Units Security Description Cost US$
612 Alibaba Group Holding Ltd ADR 109,065
109,000 China Construction Bank Corp - H Shares 85,608
9,500 China Mobile Ltd 81,196
23,000 China Life Insurance Co Ltd - H Shares 61,455
1,200 Tencent Holdings Ltd 56,252
17,200 NARI Technology Co Ltd Class A 50,082
2,150 HUYA Inc ADR 47,503
11,000 China Resources Beer Holdings Co Ltd 46,698
1,140 Weibo Corp ADR 46,452
1,200 Baozun Inc ADR 40,237
50,500 Tianshui Huatian Technology Co Ltd Class A 39,972
15,300 Shanghai Mechanical & Electrical Industry Co Ltd Class A 39,298
23,000 3SBio Inc 39,228
23,800 Huatai Securities Co Ltd - H Shares 39,158
29,027 Jiangsu Changshu Rural Commercial Bank Co Ltd Class A 37,242
1,900 ZTO Express Cayman Inc ADR 36,433
64,000 China Eastern Airlines Corp Ltd - H Shares 35,622
26,000 Xiabuxiabu Catering Management China Holdings Co Ltd 35,383
3,300 Ping An Insurance Group Co of China Ltd 35,362
3,200 AIA Group Ltd 33,654
13,400 CICC Financial Trading Ltd, 27/12/2022 - Participatory Notes 33,105
32,000 Mega Financial Holding Co Ltd 32,738
2,900 Yunnan Baiyao Group Co Ltd Class A 31,937
100 NetEase Inc ADR 30,446
4,800 Luzhou Laojiao Co Ltd 30,197
8,500 BOC Hong Kong Holdings Ltd 29,521
8,000 Shanghai Jinjiang International Hotels Development Co Ltd 29,453
7,000 China Mengniu Dairy Co Ltd 28,284
22,000 Topsports International Holdings Ltd 26,627
24,400 Yonghui Superstores Co Ltd Class A 26,417
9,600 Midea Real Estate Holding Ltd 26,065
405 YY Inc ADR 25,883

FINANCIAL STATEMENTS STATEMENT OF SIGNIFICANT PURCHASES AND SALES
778 NEUBERGER BERMAN INVESTMENT FUNDS PLC
Neuberger Berman China Equity Opportunities Fund (Continued) Statement of Significant Purchases and Sales (Unaudited) (Continued) Aggregate purchases greater than one percent of the total value of purchases (continued):
Units Security Description Cost US$
23,000 China Tian Lun Gas Holdings Ltd 25,793
2,200 Link REIT 25,691
3,500 OneSmart International Education Group Ltd ADR 25,505
820 Ctrip.com International Ltd ADR 25,351
5,000 China Merchants Bank Co Ltd - H Shares 25,179
8,800 Suofeiya Home Collection Co Ltd Class A 24,257
12,800 Guangzhou R&F Properties Co Ltd - H Shares 23,654
700 Trip.com Group Ltd ADR 23,646
4,000 Health & Happiness H&H International Holdings Ltd 23,540
5,300 Zhuzhou CRRC Times Electric Co Ltd - H Shares 23,341
14,000 CNOOC Ltd 23,132
1,400 Jiangsu Yanghe Brewery Joint-Stock Co Ltd Class A 22,755
10,000 Hang Lung Properties Ltd 21,837
5,600 Sinopharm Group Co Ltd - H Shares 21,779
35,000 China Longyuan Power Group Corp Ltd - H Shares 21,431
10,000 Guangdong Investment Ltd 21,045
2,100 360 Finance Inc ADR 20,475
11,100 Hangcha Group Co Ltd Class A 20,297

STATEMENT OF SIGNIFICANT PURCHASES AND SALES FINANCIAL STATEMENTS
ANNUAL REPORT 2019 779
Neuberger Berman China Equity Opportunities Fund (Continued) Statement of Significant Purchases and Sales (Unaudited) (Continued) Aggregate sales greater than one percent of the total value of sales:
Units Security Description Proceeds US$
7,000 Wuliangye Yibin Co Ltd 106,338
36,870 Tangshan Jidong Cement Co Ltd 95,038
23,000 China Taiping Insurance Holdings Co Ltd 71,121
24,900 China Life Insurance Co Ltd - H Shares 67,419
3,400 Jiangsu Yanghe Brewery Joint-Stock Co Ltd Class A 59,328
4,800 Luzhou Laojiao Co Ltd 56,874
80,000 Industrial & Commercial Bank of China Ltd 55,563
50,500 Tianshui Huatian Technology Co Ltd Class A 53,982
11,000 China Resources Beer Holdings Co Ltd 52,387
17,200 NARI Technology Co Ltd Class A 51,436
800 Weibo Corp ADR 50,313
11,000 Inner Mongolia Yili Industrial Group Co Ltd 49,586
19,200 BTG Hotels Group Co Ltd 48,121
1,100 Noah Holdings Ltd ADR 46,588
12,200 Sinopharm Group Co Ltd - H Shares 45,179
3,300 Ping An Insurance Group Co of China Ltd 42,806
23,800 Huatai Securities Co Ltd - H Shares 41,892
48,000 China Construction Bank Corp - H Shares 41,459
1,200 Momo Inc ADR 40,590
1,900 ZTO Express Cayman Inc ADR 37,962
2,900 Yunnan Baiyao Group Co Ltd Class A 37,147
15,300 Shanghai Mechanical & Electrical Industry Co Ltd Class A 36,345
16,000 TravelSky Technology Ltd 35,276
7,000 New China Life Insurance Co Ltd 35,249
40,000 China State Construction Engineering Corp Ltd 34,880
4,000 China Mobile Ltd 33,882
51,000 China Longyuan Power Group Corp Ltd - H Shares 33,168
26,000 Xiabuxiabu Catering Management China Holdings Co Ltd 32,186
120,850 Huaneng Renewables Corp Ltd 31,869
39,800 China National Building Material Co Ltd 30,361
8,000 Shanghai Jinjiang International Hotels Development Co Ltd 30,238
35,000 China Communications Construction Co Ltd 29,629
8,800 Focused Photonics Hangzhou Inc 28,801
1,038 HUYA Inc ADR 28,545
56,000 Dynagreen Environmental Protection Group Co Ltd 26,964
5,000 China Merchants Bank Co Ltd - H Shares 25,690
46,000 China Eastern Airlines Corp Ltd - H Shares 25,521
24,780 Focus Media Information Technology Co Ltd 25,089

FINANCIAL STATEMENTS STATEMENT OF SIGNIFICANT PURCHASES AND SALES
780 NEUBERGER BERMAN INVESTMENT FUNDS PLC
Neuberger Berman China Equity Opportunities Fund (Continued) Statement of Significant Purchases and Sales (Unaudited) (Continued) Aggregate sales greater than one percent of the total value of sales (continued):
Units Security Description Proceeds US$
128 Alibaba Group Holding Ltd ADR 23,602
200 Kweichow Moutai Co Ltd 23,380
3,500 OneSmart International Education Group Ltd ADR 23,270
405 JOYY Inc ADR 21,508
700 Anhui Conch Cement Co Ltd ADR 21,000
23,000 China Tian Lun Gas Holdings Ltd 20,622
1,645 GreenTree Hospitality Group Ltd ADR 20,314
INVESTMENT MANAGER’S REPORT FINANCIAL STATEMENTS
ANNUAL REPORT 2019 781
Neuberger Berman Multi-Asset Class Growth Fund Investment Manager’s Report For the 12 months ended 31 December 2019, the total return for the USD I Accumulating Class was 9.48%. Over the same period, the benchmark index, the ICE BofA US 3-Month Treasury Bill Index (the “Index”), returned 2.28%. (Performance for all share classes is provided in Appendix II. Performance data quoted represent past performance and do not indicate future results. Total returns shown are net of all fees and expenses and include reinvestment of income dividends and other distributions, if any).
After a particularly challenging 2018, 2019 proved very strong across all major asset classes; equities, fixed income, commodities, inflation-linked strategies, Real Estate Investment Trusts (“REITS”) and hedge funds, all posted positive returns. The global macroeconomic backdrop remained healthy and the market cycle was extended by another year, becoming the longest growth cycle since 1900. Central banks globally (Federal Reserve and ECB in particular) shifted to a more dovish stance and indicated their willingness to support the economy further via ultra-easy monetary policy, fueling the equity market rally. Job market and confidence indicators remain robust, while geopolitical tensions eased with US-China tensions reducing and the Brexit impasse was broken in the UK after an emphatic Conservatives election victory.
High equity allocation and pro-risk positioning in tactical strategies at the beginning of the year contributed positively to the Portfolio’s performance. Option writing strategies also contributed positively over the year as equity markets reached new heights and volatility remained muted. US Investment Grade Credit, inflation-linked bonds and European High Yield were the top contributors within the fixed income part of the Portfolio, while relative value trades in rates markets had a modest negative impact. Currency positioning also detracted value as the Portfolio held long positions in Scandinavian currencies which depreciated over the year.
As we enter 2020, the balance of economic and market risks has changed drastically as the Coronavirus outbreak has created significant economic and social disruption, which will likely lead to the next global recession. With the pandemic spreading rapidly across the globe, governments have been forced to expand quarantine measures, with several countries essentially in complete lockdown. The unique circumstances have created extreme market volatility, with equities posting their worst drawdown since 2008, crude oil dropping to multi-year lows, credit markets suffering and even Treasury securities experiencing pricing and liquidity challenges. Despite the exceptional fiscal and monetary measures taken by authorities globally, we expect the level of uncertainty around the path of the coronavirus and its impact on GDP growth and corporate earnings to remain high for an extended period, accompanied by elevated market volatility. This is a challenging environment, where correlations are rising across assets and diversification is not as beneficial as in more normal periods. Amid this volatility, the multi-asset class portfolio management team continues to focus on risk management, and are closely evaluating the path of the virus and its impact on the economy. The team has increased cash levels in the portfolio and is monitoring the elevated level of overall market volatility, scarce liquidity in credit markets, and the lack of a bottoming process in equity markets. They are looking for evidence of normalization in these areas as key indicators to increase risk and potentially deploy capital into asset classes that provide opportunities after the selloff.

FINANCIAL STATEMENTS BALANCE SHEET
The accompanying notes form an integral part of the financial statements.
782 NEUBERGER BERMAN INVESTMENT FUNDS PLC
Neuberger Berman Multi-Asset Class Growth Fund (Continued) Balance Sheet
As at As at
Note 31 December 2019 31 December 2018
US$ US$
Current Assets
Financial Assets at Fair Value through Profit or Loss 2 18,752,348 19,744,711
Cash and cash equivalents 3 872,592 605,145
Receivable for investments sold 28,520 –
Due from brokers 905,239 1,747,938
Income receivable and other assets 103,760 192,139
Total Assets 20,662,459 22,289,933
Current Liabilities
Financial Liabilities at Fair Value through Profit or Loss 2 714,934 903,716
Bank overdraft 4 313 –
Accrued expenses 41,551 53,317
Payable for investments purchased 221,497 197,626
Other payables 56,948 29,421
Liabilities (excluding Net Assets Attributable to Holders of Redeemable Participating Shares) 1,035,243 1,184,080
Net Assets Attributable to Holders of Redeemable Participating Shares 19,627,216 21,105,853

PROFIT AND LOSS ACCOUNT FINANCIAL STATEMENTS
The accompanying notes form an integral part of the financial statements.
ANNUAL REPORT 2019 783
Neuberger Berman Multi-Asset Class Growth Fund (Continued) Profit and Loss Account
Year Ended Year Ended
Note 31 December 2019 31 December 2018
US$ US$
Income
Interest Income 460,269 473,590
Dividend Income 183,518 138,504
Miscellaneous Income 1,331 524
Net Gain/(Loss) on Financial Assets and Liabilities at Fair Value through Profit or Loss 11 1,368,532 (1,719,300)
2,013,650 (1,106,682)
Expenses
Management Fee 6 127,451 140,400
Distribution Fee 6 302 46
Administration Fee 6 78,740 76,034
Commitment Fee 19 3,517 666
Custody Fee 6 15,837 10,678
Depositary Fee 6 1,957 1,674
Professional Fee 9 50,627 12,404
Directors' Fee 7 4,507 6,532
Transaction Costs 9 116,865 100,958
Audit Fee 8 13,294 14,541
VAT Rebate (317) (278)
Other Expenses 9 15,702 30,161
Expense Waiver 6 (266,676) (218,651)
Total Expenses 161,806 175,165
Finance Costs
Interest Expense 1,102 696
Distribution Paid 1 292,307 –
293,409 696
Withholding Tax 1 24,087 23,861
Profit/(Loss) Attributable to Holders of Redeemable Participating Shares from Operations 1,534,348 (1,306,404)
Income and expenses arose solely from continuing operations.
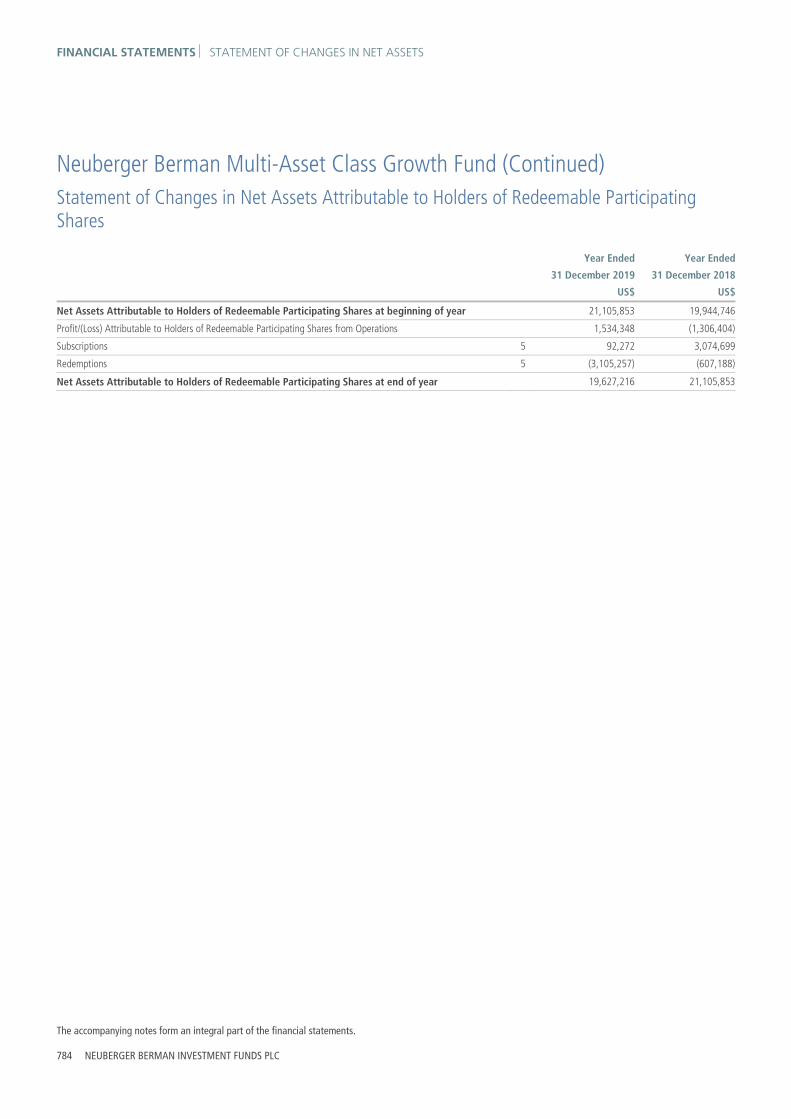
FINANCIAL STATEMENTS STATEMENT OF CHANGES IN NET ASSETS
The accompanying notes form an integral part of the financial statements.
784 NEUBERGER BERMAN INVESTMENT FUNDS PLC
Neuberger Berman Multi-Asset Class Growth Fund (Continued) Statement of Changes in Net Assets Attributable to Holders of Redeemable Participating Shares
Year Ended Year Ended
31 December 2019 31 December 2018
US$ US$
Net Assets Attributable to Holders of Redeemable Participating Shares at beginning of year 21,105,853 19,944,746
Profit/(Loss) Attributable to Holders of Redeemable Participating Shares from Operations 1,534,348 (1,306,404)
Subscriptions 5 92,272 3,074,699
Redemptions 5 (3,105,257) (607,188)
Net Assets Attributable to Holders of Redeemable Participating Shares at end of year 19,627,216 21,105,853

SCHEDULE OF INVESTMENTS FINANCIAL STATEMENTS
ANNUAL REPORT 2019 785
Neuberger Berman Multi-Asset Class Growth Fund (Continued)
Schedule of Investments
Financial Assets at Fair Value through Profit or Loss
Number of Shares Security Description Fair Value
US$% of Net
Assets
Equities 20.17% (31 December 2018: 14.66%)
Australian Dollar 1,882 Aurizon Holdings Ltd* 6,919 0.03
1,021 BHP Group Ltd* 27,933 0.14
622 Fortescue Metals Group Ltd* 4,674 0.02
295 Rio Tinto Ltd* 20,820 0.11
1,645 Santos Ltd* 9,459 0.05
614 Woodside Petroleum Ltd* 14,839 0.08
Total Australian Dollar 84,644 0.43
Canadian Dollar 144 BCE Inc* 6,681 0.03
310 Hydro One Ltd** 5,996 0.03
107 iA Financial Corp Inc** 5,886 0.03
100 Loblaw Companies Ltd** 5,167 0.03
553 Manulife Financial Corp* 11,241 0.06
305 National Bank of Canada** 16,953 0.09
326 Power Corp of Canada** 8,409 0.04
249 Power Financial Corp** 6,709 0.03
547 Sun Life Financial Inc* 24,976 0.13
766 Toronto-Dominion Bank* 43,021 0.22
Total Canadian Dollar 135,039 0.69
Danish Krone 80 Carlsberg A/S Class B* 11,947 0.06
236 Novo Nordisk A/S Class B* 13,686 0.07
Total Danish Krone 25,633 0.13
Euro 138 adidas AG* 44,892 0.23
170 Ageas* 10,053 0.05
396 Amadeus IT Group SA* 32,360 0.17
68 Arkema SA* 7,228 0.04
1,079 Assicurazioni Generali SpA* 22,292 0.11
3,035 Banco Bilbao Vizcaya Argentaria SA* 16,976 0.09
135 Capgemini SE* 16,502 0.08
165 CRH Plc* 6,607 0.03
333 Deutsche Telekom AG* 5,446 0.03
76 Eiffage SA* 8,702 0.04
130 Elisa OYJ* 7,188 0.04

FINANCIAL STATEMENTS SCHEDULE OF INVESTMENTS
786 NEUBERGER BERMAN INVESTMENT FUNDS PLC
Neuberger Berman Multi-Asset Class Growth Fund (Continued)
Schedule of Investments (Continued)
Financial Assets at Fair Value through Profit or Loss (continued)
Number of Shares Security Description Fair Value
US$% of Net
Assets
Equities 20.17% (31 December 2018: 14.66%) (continued)
Euro (continued)
298 Endesa SA* 7,958 0.04
54 Hannover Rueck SE* 10,444 0.05
10 Heineken Holding NV* 970 0.01
3,196 Iberdrola SA* 32,933 0.17
576 Industria de Diseno Textil SA* 20,334 0.10
2,869 Intesa Sanpaolo SpA* 7,563 0.04
1,100 Koninklijke Ahold Delhaize NV* 27,529 0.14
569 Mediobanca Banca di Credito Finanziario SpA* 6,269 0.03
19 Naturgy Energy Group SA* 478 0.00
143 Proximus SADP* 4,096 0.02
446 Schneider Electric SE* 45,808 0.23
83 Sodexo SA* 9,843 0.05
67 Solvay SA* 7,769 0.04
413 Telefonica SA* 2,887 0.01
274 Total SA* 15,132 0.08
102 UCB SA* 8,118 0.04
399 Unilever NV* 22,945 0.12
263 Wolters Kluwer NV* 19,195 0.10
Total Euro 428,517 2.18
Hong Kong Dollar 1,500 CLP Holdings Ltd* 15,767 0.08
3,000 HKT Trust & HKT Ltd* 4,227 0.02
500 Power Assets Holdings Ltd* 3,658 0.02
2,000 Sino Land Co Ltd* 2,906 0.02
500 Swire Pacific Ltd Class A* 4,646 0.02
1,000 Wharf Real Estate Investment Co Ltd* 6,102 0.03
Total Hong Kong Dollar 37,306 0.19
Japanese Yen 400 Ajinomoto Co Inc* 6,658 0.03
1,400 Astellas Pharma Inc* 23,894 0.12
100 Daito Trust Construction Co Ltd* 12,355 0.06
400 FUJIFILM Holdings Corp* 19,099 0.10
300 Hitachi Ltd* 12,656 0.07
700 Inpex Corp* 7,250 0.04
1,300 ITOCHU Corp* 30,124 0.15
1,000 Japan Tobacco Inc* 22,292 0.11

SCHEDULE OF INVESTMENTS FINANCIAL STATEMENTS
ANNUAL REPORT 2019 787
Neuberger Berman Multi-Asset Class Growth Fund (Continued)
Schedule of Investments (Continued)
Financial Assets at Fair Value through Profit or Loss (continued)
Number of Shares Security Description Fair Value
US$% of Net
Assets
Equities 20.17% (31 December 2018: 14.66%) (continued)
Japanese Yen (continued)
500 Mitsubishi Corp* 13,243 0.07
300 Mitsubishi Heavy Industries Ltd* 11,631 0.06
800 Nippon Telegraph & Telephone Corp* 20,215 0.10
300 Nomura Research Institute Ltd* 6,415 0.03
500 NTT DOCOMO Inc* 13,926 0.07
500 Sekisui House Ltd* 10,675 0.06
500 Shimizu Corp* 5,093 0.03
200 Shionogi & Co Ltd* 12,370 0.06
1,000 Sumitomo Corp* 14,851 0.08
300 Sumitomo Mitsui Financial Group Inc* 11,079 0.06
400 Tokio Marine Holdings Inc* 22,391 0.11
500 Toyota Motor Corp* 35,224 0.18
300 UBS Co Ltd* 5,670 0.03
Total Japanese Yen 317,111 1.62
Norwegian Krone 670 Telenor ASA* 11,999 0.06
Total Norwegian Krone 11,999 0.06
Pound Sterling 342 Ashtead Group Plc* 10,937 0.06
897 Barratt Developments Plc* 8,872 0.05
517 BHP Group Plc* 12,169 0.06
117 Diageo Plc* 4,961 0.03
459 GlaxoSmithKline Plc* 10,817 0.05
358 Halma Plc* 10,035 0.05
5,708 HSBC Holdings Plc* 44,758 0.23
130 Next Plc* 12,086 0.06
237 Persimmon Plc* 8,461 0.04
233 RELX Plc* 5,882 0.03
545 Rio Tinto Plc* 32,511 0.17
961 Royal Dutch Shell Plc Class A* 28,454 0.14
810 Sage Group Plc* 8,037 0.04
132 Unilever Plc* 7,608 0.04
Total Pound Sterling 205,588 1.05
Singapore Dollar 4,400 Singapore Telecommunications Ltd* 11,028 0.05

FINANCIAL STATEMENTS SCHEDULE OF INVESTMENTS
788 NEUBERGER BERMAN INVESTMENT FUNDS PLC
Neuberger Berman Multi-Asset Class Growth Fund (Continued)
Schedule of Investments (Continued)
Financial Assets at Fair Value through Profit or Loss (continued)
Number of Shares Security Description Fair Value
US$% of Net
Assets
Equities 20.17% (31 December 2018: 14.66%) (continued)
Singapore Dollar (continued)
1,800 Wilmar International Ltd* 5,515 0.03
Total Singapore Dollar 16,543 0.08
Swedish Krona 198 Hennes & Mauritz AB Class B* 4,029 0.02
1,168 Skandinaviska Enskilda Banken AB Class A* 10,990 0.06
220 Skanska AB Class B* 4,975 0.02
255 SKF AB Class B* 5,159 0.03
2,508 Telia Co AB* 10,784 0.05
Total Swedish Krona 35,937 0.18
Swiss Franc 102 Adecco Group AG* 6,448 0.03
1 Chocoladefabriken Lindt & Spruengli AG* 7,761 0.04
28 Geberit AG* 15,707 0.08
94 Nestle SA* 10,171 0.05
552 Novartis AG* 52,387 0.27
110 Roche Holding AG* 35,669 0.18
41 Zurich Insurance Group AG* 16,813 0.09
Total Swiss Franc 144,956 0.74
United States Dollar 254 Accenture Plc Class A* 53,485 0.27
646 Aflac Inc* 34,173 0.17
289 Allstate Corp* 32,498 0.17
33 Alphabet Inc Class A* 44,200 0.23
61 Amazon.com Inc* 112,718 0.57
98 Ameriprise Financial Inc* 16,325 0.08
195 AMETEK Inc* 19,449 0.10
96 Amphenol Corp Class A* 10,390 0.05
569 Apple Inc* 167,087 0.85
1,783 AT&T Inc* 69,680 0.35
109 Baxter International Inc* 9,115 0.05
7 Booking Holdings Inc* 14,376 0.07
491 Bristol-Myers Squibb Co* 31,517 0.16
129 CDW Corp* 18,426 0.09
383 Chevron Corp* 46,155 0.24
57 Chubb Ltd* 8,873 0.05

SCHEDULE OF INVESTMENTS FINANCIAL STATEMENTS
ANNUAL REPORT 2019 789
Neuberger Berman Multi-Asset Class Growth Fund (Continued)
Schedule of Investments (Continued)
Financial Assets at Fair Value through Profit or Loss (continued)
Number of Shares Security Description Fair Value
US$% of Net
Assets
Equities 20.17% (31 December 2018: 14.66%) (continued)
United States Dollar (continued)
1,246 Cisco Systems Inc* 59,758 0.30
409 Citigroup Inc* 32,675 0.17
1,383 Comcast Corp Class A* 62,193 0.32
158 Comerica Inc* 11,336 0.06
622 ConocoPhillips* 40,449 0.21
45 Cooper Companies Inc* 14,458 0.07
621 CSX Corp* 44,936 0.23
36 Cummins Inc* 6,443 0.03
162 Delta Air Lines Inc* 9,474 0.05
292 Discover Financial Services* 24,767 0.13
263 Dollar General Corp* 41,023 0.21
401 Eaton Corp Plc* 37,983 0.19
182 Evergy Inc* 11,846 0.06
852 Exelon Corp* 38,843 0.20
419 Gilead Sciences Inc* 27,227 0.14
280 Hartford Financial Services Group Inc* 17,016 0.09
81 Home Depot Inc* 17,689 0.09
290 Honeywell International Inc* 51,330 0.26
18 Ingersoll-Rand Plc* 2,393 0.01
30 International Business Machines Corp* 4,021 0.02
334 International Paper Co* 15,381 0.08
48 Intuit Inc* 12,573 0.06
523 Johnson & Johnson* 76,290 0.39
429 JPMorgan Chase & Co* 59,803 0.30
100 Lam Research Corp* 29,240 0.15
69 Lockheed Martin Corp* 26,867 0.14
6 Lululemon Athletica Inc* 1,390 0.01
117 LyondellBasell Industries NV Class A* 11,054 0.06
257 McDonald's Corp* 50,786 0.26
471 Medtronic Plc* 53,435 0.27
945 Microsoft Corp* 149,026 0.76
513 Mondelez International Inc Class A* 28,256 0.14
424 Morgan Stanley* 21,675 0.11
143 Motorola Solutions Inc* 23,043 0.12
14 NextEra Energy Inc* 3,390 0.02
231 NIKE Inc Class B* 23,403 0.12
108 Norwegian Cruise Line Holdings Ltd* 6,308 0.03
304 Nucor Corp* 17,109 0.09

FINANCIAL STATEMENTS SCHEDULE OF INVESTMENTS
790 NEUBERGER BERMAN INVESTMENT FUNDS PLC
Neuberger Berman Multi-Asset Class Growth Fund (Continued)
Schedule of Investments (Continued)
Financial Assets at Fair Value through Profit or Loss (continued)
Number of Shares Security Description Fair Value
US$% of Net
Assets
Equities 20.17% (31 December 2018: 14.66%) (continued)
United States Dollar (continued)
209 Omnicom Group Inc* 16,933 0.09
23 Parker-Hannifin Corp* 4,734 0.02
294 PepsiCo Inc* 40,181 0.20
348 Phillips 66* 38,771 0.20
234 PNC Financial Services Group Inc* 37,353 0.19
188 PPG Industries Inc* 25,096 0.13
495 Procter & Gamble Co* 61,825 0.31
210 Steel Dynamics Inc* 7,148 0.04
325 TE Connectivity Ltd* 31,148 0.16
405 Texas Instruments Inc* 51,957 0.26
172 Thermo Fisher Scientific Inc* 55,878 0.28
248 Travelers Companies Inc* 33,964 0.17
202 Union Pacific Corp* 36,520 0.19
184 UnitedHealth Group Inc* 54,092 0.28
60 US Bancorp* 3,557 0.02
826 Verizon Communications Inc* 50,716 0.26
334 Vistra Energy Corp* 7,679 0.04
468 Walmart Inc* 55,617 0.28
368 Zoetis Inc Class A* 48,705 0.25
Total United States Dollar 2,515,230 12.82
Total Equities 3,958,503 20.17
Real Estate Investment Trusts 0.58% (31 December 2018: 0.35%)
Australian Dollar 369 Goodman Group 3,468 0.02
Total Australian Dollar 3,468 0.02
Euro 181 Klepierre SA 6,877 0.04
Total Euro 6,877 0.04
Japanese Yen 2 Orix JREIT Inc 4,335 0.02
3 United Urban Investment Corp 5,633 0.03
Total Japanese Yen 9,968 0.05

SCHEDULE OF INVESTMENTS FINANCIAL STATEMENTS
ANNUAL REPORT 2019 791
Neuberger Berman Multi-Asset Class Growth Fund (Continued)
Schedule of Investments (Continued)
Financial Assets at Fair Value through Profit or Loss (continued)
Number of Shares Security Description Fair Value
US$% of Net
Assets
Real Estate Investment Trusts 0.58% (31 December 2018: 0.35%) (continued)
Pound Sterling 1,009 Segro Plc 11,993 0.06
Total Pound Sterling 11,993 0.06
Singapore Dollar 1,500 Ascendas Real Estate Investment Trust 3,313 0.02
Total Singapore Dollar 3,313 0.02
United States Dollar 27 AvalonBay Communities Inc 5,662 0.03
173 Brixmor Property Group Inc 3,739 0.02
12 Camden Property Trust 1,273 0.01
142 Equity LifeStyle Properties Inc 9,995 0.05
238 Equity Residential 19,259 0.10
61 Extra Space Storage Inc 6,443 0.03
105 Mid-America Apartment Communities Inc 13,845 0.07
27 Sun Communities Inc 4,053 0.02
161 WP Carey Inc 12,886 0.06
Total United States Dollar 77,155 0.39
Total Real Estate Investment Trusts * 112,774 0.58
Principal Amount Security Description Coupon
Maturity Date
Fair ValueUS$
% of NetAssets
Asset Backed Securities 6.27% (31 December 2018: 5.84%)
United States Dollar 286,839 Freddie Mac Structured Agency Credit Risk Debt Notes Class M2 4.14% 25/04/2030 291,999 1.49
290,000 Freddie Mac Structured Agency Credit Risk Debt Notes Class M2 4.29% 25/03/2030 297,084 1.51
290,000 Freddie Mac Structured Agency Credit Risk Debt Notes Class M2 4.44% 25/12/2029 298,250 1.52
275,000 Freddie Mac Structured Agency Credit Risk Debt Notes Class M2 5.24% 25/10/2029 293,213 1.49
407,493 WFRBS Commercial Mortgage Trust 2014-C21 Class XA 1.04% 15/08/2047 15,650 0.08
1,133,536 WFRBS Commercial Mortgage Trust 2014-C22 Class XA 0.81% 15/09/2057 34,590 0.18
Total Asset Backed Securities ** 1,230,786 6.27
Corporate Bonds 16.22% (31 December 2018: 21.86%)
Euro 100,000 Altice Finco SA* 9.00% 15/06/2023 116,737 0.60
100,000 Altice France SA* 3.38% 15/01/2028 115,968 0.59
100,000 Altice Luxembourg SA* 6.25% 15/02/2025 116,571 0.59
100,000 Casino Guichard Perrachon SA** 3.58% 07/02/2025 96,779 0.49

FINANCIAL STATEMENTS SCHEDULE OF INVESTMENTS
792 NEUBERGER BERMAN INVESTMENT FUNDS PLC
Neuberger Berman Multi-Asset Class Growth Fund (Continued)
Schedule of Investments (Continued)
Financial Assets at Fair Value through Profit or Loss (continued)
Principal Amount Security Description Coupon Maturity
DateFair Value
US$% of Net
Assets
Corporate Bonds 16.22% (31 December 2018: 21.86%) (continued)
Euro (continued) 100,000 Cirsa Finance International Sarl* 4.75% 22/05/2025 118,003 0.60
100,000 Constellium SE* 4.25% 15/02/2026 117,301 0.60
100,000 DKT Finance ApS* 7.00% 17/06/2023 119,177 0.61
100,000 Hertz Holdings Netherlands BV* 5.50% 30/03/2023 117,240 0.60
100,000 Jaguar Land Rover Automotive Plc* 4.50% 15/01/2026 108,467 0.55
100,000 Lincoln Financing Sarl* 3.88% 01/04/2024 113,564 0.58
100,000 Loxam SAS* 4.50% 15/04/2027 112,811 0.58
100,000 Mauser Packaging Solutions Holding Co* 4.75% 15/04/2024 116,629 0.59
100,000 Nidda BondCo GmbH* 5.00% 30/09/2025 117,843 0.60
100,000 Paprec Holding SA* 3.50% 31/03/2025 106,637 0.54
100,000 Rossini Sarl* 6.75% 30/10/2025 125,420 0.64
100,000 Scientific Games International Inc* 5.50% 15/02/2026 117,236 0.60
100,000 Techem Verwaltungsgesellschaft 674 mbH* 6.00% 30/07/2026 121,581 0.62
100,000 Telefonica Europe BV* 3.88% 29/12/2049 122,377 0.62
100,000 Trivium Packaging Finance BV* 3.75% 15/08/2026 119,249 0.61
100,000 UPC Holding BV* 3.88% 15/06/2029 117,783 0.60
Total Euro 2,317,373 11.81
Pound Sterling 100,000 Miller Homes Group Holdings Plc* 5.50% 15/10/2024 137,920 0.70
100,000 TVL Finance Plc* 6.16% 15/07/2025 133,303 0.68
Total Pound Sterling 271,223 1.38
United States Dollar 120,000 AbbVie Inc* 4.25% 14/11/2028 132,669 0.68
55,000 Apache Corp* 4.38% 15/10/2028 57,467 0.29
110,000 AT&T Inc* 4.35% 01/03/2029 122,314 0.62
95,000 Charter Communications Operating LLC/Charter Communications Operating Capital† 4.20% 15/03/2028 101,240 0.52
80,000 CVS Health Corp* 4.30% 25/03/2028 87,370 0.44
100,000 Energy Transfer Operating LP† 6.63% 29/12/2049 94,652 0.48
Total United States Dollar 595,712 3.03
Total Corporate Bonds 3,184,308 16.22
Government Bonds 40.57% (31 December 2018: 39.12%)
Japanese Yen 9,053,280 Japanese Government CPI Linked Bond** 0.10% 10/03/2029 85,722 0.44
Total Japanese Yen 85,722 0.44

SCHEDULE OF INVESTMENTS FINANCIAL STATEMENTS
ANNUAL REPORT 2019 793
Neuberger Berman Multi-Asset Class Growth Fund (Continued)
Schedule of Investments (Continued)
Financial Assets at Fair Value through Profit or Loss (continued)
Principal Amount Security Description Coupon Maturity
DateFair Value
US$% of Net
Assets
Government Bonds 40.57% (31 December 2018: 39.12%) (continued)
United States Dollar 128,833 United States Treasury Inflation Indexed Bonds* 0.13% 15/07/2026 129,271 0.66
32,596 United States Treasury Inflation Indexed Bonds** 0.25% 15/01/2025 32,891 0.17
42,614 United States Treasury Inflation Indexed Bonds* 0.38% 15/01/2027 43,272 0.22
63,122 United States Treasury Inflation Indexed Bonds* 0.38% 15/07/2027 64,404 0.33
93,748 United States Treasury Inflation Indexed Bonds* 0.63% 15/01/2024 95,747 0.49
48,737 United States Treasury Inflation Indexed Bonds* 0.63% 15/01/2026 50,242 0.26
11,193 United States Treasury Inflation Indexed Bonds** 0.63% 15/02/2043 11,329 0.06
5,464 United States Treasury Inflation Indexed Bonds** 0.75% 15/02/2045 5,672 0.03
69,296 United States Treasury Inflation Indexed Bonds* 0.88% 15/02/2047 74,324 0.38
59,736 United States Treasury Inflation Indexed Bonds* 1.00% 15/02/2046 65,749 0.33
120,013 United States Treasury Inflation Indexed Bonds* 1.00% 15/02/2048 132,920 0.68
325,742 United States Treasury Inflation Indexed Bonds** 1.38% 15/02/2044 384,440 1.96
104,414 United States Treasury Inflation Indexed Bonds** 1.75% 15/01/2028 117,329 0.60
149,109 United States Treasury Inflation Indexed Bonds* 2.00% 15/01/2026 165,777 0.84
279,803 United States Treasury Inflation Indexed Bonds* 2.13% 15/02/2040 365,943 1.86
29,379 United States Treasury Inflation Indexed Bonds* 2.13% 15/02/2041 38,721 0.20
170,656 United States Treasury Inflation Indexed Bonds* 2.38% 15/01/2025 190,227 0.97
89,328 United States Treasury Inflation Indexed Bonds* 2.38% 15/01/2027 103,131 0.52
50,744 United States Treasury Inflation Indexed Bonds* 3.38% 15/04/2032 69,694 0.35
111,378 United States Treasury Inflation Indexed Bonds* 3.63% 15/04/2028 142,512 0.73
93,926 United States Treasury Inflation Indexed Bonds* 3.88% 15/04/2029 125,361 0.64
130,757 United States Treasury Inflation Indexed Notes* 0.13% 15/01/2022 130,697 0.67
1,074,063 United States Treasury Inflation Indexed Notes* 0.13% 15/04/2022 1,072,565 5.46
352,257 United States Treasury Inflation Indexed Notes* 0.63% 15/04/2023 357,751 1.82
400,000 United States Treasury Note/Bond* 1.38% 15/09/2020 399,283 2.03
400,000 United States Treasury Note/Bond* 1.50% 15/06/2020 399,877 2.04
400,000 United States Treasury Note/Bond* 1.63% 15/03/2020 399,977 2.04
300,000 United States Treasury Note/Bond* 1.75% 15/06/2022 301,142 1.53
400,000 United States Treasury Note/Bond* 1.88% 15/12/2020 400,882 2.04
400,000 United States Treasury Note/Bond* 2.38% 15/03/2021 403,482 2.05
300,000 United States Treasury Note/Bond* 2.38% 15/03/2022 305,138 1.55
75,000 United States Treasury Note/Bond* 2.50% 15/02/2046 76,507 0.39
400,000 United States Treasury Note/Bond* 2.63% 15/06/2021 405,799 2.07
400,000 United States Treasury Note/Bond* 2.63% 15/12/2021 407,902 2.08
400,000 United States Treasury Note/Bond* 2.75% 15/09/2021 407,666 2.08
Total United States Dollar 7,877,624 40.13
Total Government Bonds 7,963,346 40.57

FINANCIAL STATEMENTS SCHEDULE OF INVESTMENTS
794 NEUBERGER BERMAN INVESTMENT FUNDS PLC
Neuberger Berman Multi-Asset Class Growth Fund (Continued)
Schedule of Investments (Continued)
Financial Assets at Fair Value through Profit or Loss (continued)
Principal Amount Security Description Coupon Maturity
DateFair Value
US$% of Net
Assets
Mortgage Backed Securities 1.01% (31 December 2018: 0.92%)
United States Dollar 95,000 Fannie Mae Pool 3.00% 01/01/2049 96,295 0.49
100,000 Fannie Mae Pool 3.50% 13/01/2049 102,823 0.52
Total Mortgage Backed Securities** 199,118 1.01
Number of Shares Security Description Fair Value
US$% of Net
Assets
Investment Funds 8.39% (31 December 2018: 8.02%)
United States Dollar 13,021 iShares JP Morgan EM Local Government Bond UCITS ETF 810,297 4.13
7,326 iShares JP Morgan USD EM Bond UCITS ETF USD Dist 836,336 4.26
Total Investment Funds μ 1,646,633 8.39
Total Investments 18,295,468 93.21
Forward Currency Contracts 0.96% (31 December 2018: 1.54%)
Amount Receivable
Amount Payable
Maturity Date Counterparty Contracts Unrealised
Gain US$% of Net
Assets
AUD 727,344 US$ 499,255 22/01/2020 Citibank NA 6 12,281 0.06
AUD 72,285 US$ 49,559 22/01/2020 Goldman Sachs International 1 1,278 0.01
AUD 131,009 US$ 90,042 22/01/2020 State Street Bank and Trust and Co 1 2,096 0.01
BRL 1,277,105 US$ 309,127 22/01/2020 Goldman Sachs International 3 8,146 0.04
CAD 535,680 US$ 405,272 22/01/2020 Citibank NA 6 7,869 0.04
CAD 244,188 US$ 184,600 22/01/2020 Goldman Sachs International 3 3,730 0.02
CAD 84,345 US$ 64,071 22/01/2020 State Street Bank and Trust and Co 1 980 0.01
CHF 108,514 US$ 110,369 22/01/2020 Citibank NA 2 1,846 0.01
CHF 50,736 US$ 51,613 22/01/2020 Goldman Sachs International 3 853 0.00
CZK 3,022,710 US$ 129,154 22/01/2020 Citibank NA 1 4,361 0.02
CZK 1,196,316 US$ 52,529 22/01/2020 State Street Bank and Trust and Co 1 312 0.00
€ 453,246 US$ 505,986 22/01/2020 Citibank NA 9 3,403 0.02
€ 173,083 US$ 192,045 22/01/2020 Goldman Sachs International 7 2,478 0.01
€ 5,293 US$ 5,860 22/01/2020 Royal Bank of Canada 1 89 0.00
€ 316,374 US$ 353,340 22/01/2020 State Street Bank and Trust and Co 5 2,223 0.01
€ 41,893 US$ 46,609 22/01/2020 Westpac Banking Corp 4 474 0.00
£ 50,815 US$ 65,618 22/01/2020 Citibank NA 4 1,737 0.01
£ 80,274 US$ 101,920 22/01/2020 Goldman Sachs International 3 4,484 0.02
£ 34,688 US$ 44,923 22/01/2020 State Street Bank and Trust and Co 1 1,056 0.01
HUF 7,824,951 US$ 26,154 22/01/2020 Goldman Sachs International 1 431 0.00
¥ 5,825,576 US$ 53,335 22/01/2020 Citibank NA 1 329 0.00
¥ 14,817,189 US$ 136,357 22/01/2020 State Street Bank and Trust and Co 1 136 0.00

SCHEDULE OF INVESTMENTS FINANCIAL STATEMENTS
ANNUAL REPORT 2019 795
Neuberger Berman Multi-Asset Class Growth Fund (Continued)
Schedule of Investments (Continued)
Financial Assets at Fair Value through Profit or Loss (continued)
Forward Currency Contracts 0.96% (31 December 2018: 1.54%)
Amount Receivable
Amount Payable
Maturity Date Counterparty Contracts Unrealised
Gain US$% of Net
Assets
KRW 124,307,101 US$ 104,390 22/01/2020 Citibank NA 1 3,323 0.02
KRW 61,418,178 US$ 53,011 22/01/2020 Goldman Sachs International 1 208 0.00
MXN 3,990,319 US$ 205,739 22/01/2020 Goldman Sachs International 3 4,950 0.03
MXN 994,450 US$ 50,631 22/01/2020 State Street Bank and Trust and Co 1 1,876 0.01
NOK 331,296 US$ 36,349 22/01/2020 Citibank NA 1 1,356 0.01
NOK 11,347,462 US$ 1,243,890 22/01/2020 Goldman Sachs International 6 47,576 0.24
NOK 208,993 US$ 23,212 22/01/2020 State Street Bank and Trust and Co 1 573 0.00
NZD 200,815 US$ 128,181 22/01/2020 Citibank NA 3 7,336 0.04
NZD 256,152 US$ 163,405 22/01/2020 Goldman Sachs International 6 9,456 0.05
PLN 16 US$ 4 22/01/2020 Goldman Sachs International 1 0 0.00
SEK 1,992,463 US$ 207,529 22/01/2020 Citibank NA 4 5,523 0.03
SEK 1,322,118 US$ 137,088 22/01/2020 Goldman Sachs International 4 4,285 0.02
SEK 1,935,048 US$ 198,342 22/01/2020 State Street Bank and Trust and Co 2 8,571 0.04
US$ 434,508 ¥ 46,940,030 22/01/2020 Citibank NA 5 2,104 0.01
US$ 10,227 BRL 41,101 22/01/2020 Goldman Sachs International 1 16 0.00
US$ 16,033 ¥ 1,738,293 22/01/2020 Goldman Sachs International 1 20 0.00
US$ 104,767 KRW 120,877,991 22/01/2020 Goldman Sachs International 1 26 0.00
US$ 80,071 ¥ 8,505,898 22/01/2020 State Street Bank and Trust and Co 1 1,716 0.01
US$ 76,322 TRY 447,798 22/01/2020 State Street Bank and Trust and Co 1 1,456 0.01
US$ 331,786 ¥ 35,139,746 22/01/2020 Westpac Banking Corp 1 8,085 0.04
ZAR 3,131,728 US$ 208,040 22/01/2020 Goldman Sachs International 4 15,343 0.08
EUR Hedged Classes € 19,581 US$ 21,630 22/01/2020 Citibank NA 1 377 0.00
€ 20,165 US$ 22,258 22/01/2020 Goldman Sachs International 3 405 0.01
€ 18,140 US$ 20,040 22/01/2020 Westpac Banking Corp 5 347 0.00
GBP Hedged Classes £ 650 US$ 849 22/01/2020 Goldman Sachs International 1 13 0.00
£ 24,178 US$ 29,890 22/01/2020 State Street Bank and Trust and Co 1 2,158 0.01
Total Unrealised Gain on Forward Currency Contracts ∞ 187,691 0.96
Futures Contracts 0.63% (31 December 2018: 0.77%)
Number of Contracts Description Unrealised
Gain US$% of Net
Assets
(1) 10-Year Mini Japanese Government Bond Future March 2020 359 0.00
(5) Euro Stoxx 50 Future March 2020 505 0.00
(5) Euro-BOBL Future March 2020 3,985 0.02
(3) Euro-Bund Future March 2020 8,306 0.04
(4) Euro-OAT Future March 2020 8,913 0.05
1 FTSE 100 Index Future March 2020 530 0.00

FINANCIAL STATEMENTS SCHEDULE OF INVESTMENTS
796 NEUBERGER BERMAN INVESTMENT FUNDS PLC
Neuberger Berman Multi-Asset Class Growth Fund (Continued)
Schedule of Investments (Continued)
Financial Assets at Fair Value through Profit or Loss (continued)
Futures Contracts 0.63% (31 December 2018: 0.77%) (continued)
Number of Contracts Description Unrealised
Gain US$% of Net
Assets
2 MSCI EAFE Index Future March 2020 725 0.00
4 MSCI Emerging Markets Index Future March 2020 1,064 0.01
2 S&P 500 E-mini Future March 2020 3,275 0.02
1 S&P/TSX 60 Index Future March 2020 54 0.00
3 TOPIX Index Future March 2020 0 0.00
(33) US Treasury 10-Year Note (CBT) Future March 2020 37,125 0.19
(22) US Treasury 10-Year Ultra Future March 2020 36,781 0.19
(4) US Treasury Ultra Bond (CBT) Future March 2020 22,215 0.11
Total Unrealised Gain on Futures Contracts ± 123,837 0.63
Purchased Options Contracts 0.01% (31 December 2018: 0.03%)
Number of Contracts
Expiration Date Type Premium
US$Fair Value
US$% of Net
Assets
Call Options
27 08/01/20 CBOE Mini S&P 500 Index, Strike Price $350 (49) 0 0.00
14 15/01/20 CBOE Mini S&P 500 Index, Strike Price $350 (46) 0 0.00
13 08/01/20 CBOE Mini S&P 500 Index, Strike Price $355 (17) 0 0.00
14 15/01/20 CBOE Mini S&P 500 Index, Strike Price $355 (18) 0 0.00
14 22/01/20 CBOE Mini S&P 500 Index, Strike Price $355 (18) 14 0.00
Put Options
13 08/01/20 CBOE Mini S&P 500 Index, Strike Price $284 (359) 72 0.00
14 08/01/20 CBOE Mini S&P 500 Index, Strike Price $288 (255) 91 0.00
14 15/01/20 CBOE Mini S&P 500 Index, Strike Price $288 (408) 189 0.00
14 08/01/20 CBOE Mini S&P 500 Index, Strike Price $291 (103) 105 0.00
14 15/01/20 CBOE Mini S&P 500 Index, Strike Price $291 (245) 217 0.00
14 22/01/20 CBOE Mini S&P 500 Index, Strike Price $291 (386) 336 0.01
Total Gain on Purchased Options Contracts ± 1,024 0.01

SCHEDULE OF INVESTMENTS FINANCIAL STATEMENTS
ANNUAL REPORT 2019 797
Neuberger Berman Multi-Asset Class Growth Fund (Continued)
Schedule of Investments (Continued)
Financial Assets at Fair Value through Profit or Loss (continued)
Interest Rate Swap Contracts 0.00% (31 December 2018: 0.00%)
Notional Amount Expiration Date Counterparty Receive
/(Pay)# Fixed Rate Variable Rate Fair Value US$
% of Net Assets
SEK 11,910,000 22/01/21 LCH Clearnet Ltd1 Receive 0.15% 3M STIBOR 380 0.00
Total Interest Rate Swap Contracts at Fair Value ± 380 0.00
# Receive - Funds receives variable rate and pays fixed rate.
(Pay) - Fund pays variable rate and receives fixed rate. 1 Centrally cleared swap.
Credit Default Swap Contracts 0.08% (31 December 2018: 0.06%)
Notional Amount Expiration Date Counterparty Referenced Obligation Fair Value US$
% of NetAssets
USD 485,000 20/12/24 ICE Clear U.S.2 Buying default protection on CDX.EM.32 16,309 0.08
Total Credit Default Swap Contracts at Fair Value ± 16,309 0.08
2 Centrally cleared swap.
Total Return Swap Contracts 0.65% (31 December 2018: 0.38%)
Notional Amount Termination Date
Variable Rate Reference Entity Unrealised
GainUS$% of Net
Assets
USD 174,343 14/08/20 2.153 S&P 500 Equal Weight Industrials Index6 27,285 0.14
USD 174,510 14/08/20 2.143 S&P 500 Equal Weight Materials Index6 23,106 0.12
USD 177,106 14/08/20 2.173 S&P 500 Equal Weight Consumer Staples Index6 19,266 0.10
USD 178,587 14/08/20 2.103 S&P 500 Equal Weight Utilities Index6 15,115 0.08
USD 116,078 24/04/20 2.203 S&P 500 Financial Sector Total Return Index6 14,962 0.08
JPY 21,159,216 28/09/20 0.104 Goldman Sachs Basket GSCBJICY7 12,518 0.06
EUR 86,465 23/05/20 (0.47)5 Goldman Sachs Basket GSCBNBEU7 10,784 0.05
EUR 42,968 23/05/20 (0.60)5 Goldman Sachs Basket GSCBNBEU7 4,135 0.02
USD (96,437) 08/10/20 2.103 MSCI US REIT Index7 468 0.00
Total Unrealised Gain on Total Return Swap Contracts ∞ 127,639 0.65
3 The 3 month LIBOR is the benchmark for this total return swap contract.
4 The 3 month JPY LIBOR is the benchmark for this total return swap contract.
5 The 3 month EURIBOR is the benchmark for this total return swap contract.
6 The counterparty for this total return swap contract is Citibank NA. 7 The counterparty for this total return swap contract is Goldman Sachs International.
Fair Value % of Net
US$ Assets
Total Financial Assets at Fair Value through Profit or Loss 18,752,348 95.54

FINANCIAL STATEMENTS SCHEDULE OF INVESTMENTS
798 NEUBERGER BERMAN INVESTMENT FUNDS PLC
Neuberger Berman Multi-Asset Class Growth Fund (Continued)
Schedule of Investments (Continued)
Financial Liabilities at Fair Value through Profit or Loss
Forward Currency Contracts (1.39%) (31 December 2018: (1.40%))
Amount Receivable
Amount Payable
Maturity Date Counterparty Contracts Unrealised
Loss US$% of Net
Assets
CLP 285 US$ 0 22/01/2020 Goldman Sachs International 1 (0) (0.00)
¥ 69,817,691 US$ 646,247 22/01/2020 Citibank NA 7 (3,098) (0.02)
¥ 14,863,882 US$ 137,625 22/01/2020 Goldman Sachs International 3 (701) (0.00)
¥ 67,192,071 US$ 629,208 22/01/2020 State Street Bank and Trust and Co 4 (10,248) (0.05)
¥ 35,692,681 US$ 337,007 22/01/2020 Westpac Banking Corp 1 (8,212) (0.04)
TRY 294,315 US$ 49,495 22/01/2020 Goldman Sachs International 1 (290) (0.00)
TRY 153,521 US$ 25,729 22/01/2020 State Street Bank and Trust and Co 1 (63) (0.00)
US$ 129,850 AUD 188,291 22/01/2020 Citibank NA 3 (2,573) (0.01)
US$ 35,004 NOK 320,277 22/01/2020 Citibank NA 2 (1,448) (0.01)
US$ 206,116 MXN 4,094,001 22/01/2020 Citibank NA 1 (10,047) (0.05)
US$ 690,821 CAD 914,980 22/01/2020 Citibank NA 4 (14,853) (0.08)
US$ 223,193 NZD 346,625 22/01/2020 Citibank NA 5 (10,723) (0.06)
US$ 10,473 BRL 42,432 22/01/2020 Citibank NA 1 (69) (0.00)
US$ 887,315 € 798,507 22/01/2020 Citibank NA 9 (10,101) (0.05)
US$ 217,376 £ 167,751 22/01/2020 Citibank NA 5 (4,978) (0.03)
US$ 286,797 CHF 282,892 22/01/2020 Citibank NA 5 (5,743) (0.03)
US$ 135,663 SEK 1,305,797 22/01/2020 Citibank NA 3 (3,964) (0.02)
US$ 80,931 KRW 96,341,418 22/01/2020 Goldman Sachs International 2 (2,549) (0.01)
US$ 32,111 BRL 131,900 22/01/2020 Goldman Sachs International 2 (657) (0.00)
US$ 15,593 NOK 137,290 22/01/2020 Goldman Sachs International 1 (32) (0.00)
US$ 51,886 NZD 80,851 22/01/2020 Goldman Sachs International 1 (2,675) (0.01)
US$ 25,963 HUF 7,825,703 22/01/2020 Goldman Sachs International 1 (624) (0.00)
US$ 131,409 CZK 3,022,715 22/01/2020 Goldman Sachs International 3 (2,106) (0.01)
US$ 87,954 SEK 849,686 22/01/2020 Goldman Sachs International 2 (2,902) (0.02)
US$ 208,088 MXN 4,087,036 22/01/2020 Goldman Sachs International 4 (7,708) (0.04)
US$ 82,634 RUB 5,418,046 22/01/2020 Goldman Sachs International 1 (4,397) (0.02)
US$ 535,811 AUD 782,029 22/01/2020 Goldman Sachs International 8 (14,185) (0.07)
US$ 91,596 £ 71,339 22/01/2020 Goldman Sachs International 3 (2,964) (0.02)
US$ 210,788 ZAR 3,131,517 22/01/2020 Goldman Sachs International 3 (12,579) (0.06)
US$ 2,313,407 € 2,088,018 22/01/2020 Goldman Sachs International 14 (33,250) (0.17)
US$ 80,510 CAD 106,337 22/01/2020 Goldman Sachs International 4 (1,502) (0.01)
US$ 305,867 CHF 301,734 22/01/2020 Goldman Sachs International 8 (6,160) (0.03)
US$ 46,011 CAD 60,710 22/01/2020 State Street Bank and Trust and Co 1 (811) (0.00)
US$ 405,007 NOK 3,684,135 22/01/2020 State Street Bank and Trust and Co 8 (14,288) (0.07)
US$ 262,258 SEK 2,504,120 22/01/2020 State Street Bank and Trust and Co 4 (5,505) (0.03)
US$ 695,099 CHF 683,832 22/01/2020 State Street Bank and Trust and Co 5 (12,056) (0.06)
US$ 432,469 NZD 670,445 22/01/2020 State Street Bank and Trust and Co 4 (19,973) (0.10)
US$ 87,274 € 78,090 22/01/2020 State Street Bank and Trust and Co 2 (488) (0.00)
US$ 48,449 MXN 942,788 22/01/2020 State Street Bank and Trust and Co 1 (1,331) (0.01)

SCHEDULE OF INVESTMENTS FINANCIAL STATEMENTS
ANNUAL REPORT 2019 799
Neuberger Berman Multi-Asset Class Growth Fund (Continued)
Schedule of Investments (Continued)
Financial Liabilities at Fair Value through Profit or Loss (continued)
Forward Currency Contracts (1.39%) (31 December 2018: (1.40%)) (continued)
Amount Receivable
Amount Payable
Maturity Date Counterparty Contracts Unrealised
Loss US$% of Net
Assets
US$ 102,173 AUD 150,151 22/01/2020 State Street Bank and Trust and Co 2 (3,427) (0.02)
US$ 5,437 £ 4,198 22/01/2020 State Street Bank and Trust and Co 1 (128) (0.00)
US$ 25,861 KRW 30,798,012 22/01/2020 State Street Bank and Trust and Co 1 (826) (0.01)
US$ 12 NZD 19 22/01/2020 Westpac Banking Corp 1 (1) (0.00)
US$ 79,234 ZAR 1,217,960 22/01/2020 Westpac Banking Corp 1 (7,641) (0.04)
US$ 12 AUD 17 22/01/2020 Westpac Banking Corp 1 (0) (0.00)
US$ 85,574 ¥ 9,340,000 22/01/2020 Westpac Banking Corp 1 (465) (0.00)
US$ 328,698 £ 265,880 22/01/2020 Westpac Banking Corp 2 (23,726) (0.12)
US$ 134,351 € 120,392 22/01/2020 Westpac Banking Corp 2 (953) (0.01)
EUR Hedged Classes US$ 905 € 817 22/01/2020 Goldman Sachs International 1 (14) (0.00)
Total Unrealised Loss on Forward Currency Contracts ∞ (273,034) (1.39)
Futures Contracts (0.30%) (31 December 2018: (1.55%))
Number of Contracts Description Unrealised
Loss US$% of Net
Assets
(1) Hang Seng China Enterprises Index Future January 2020 (321) (0.00)
(1) Nikkei 225 (OSE) Future March 2020 (2,392) (0.01)
(1) S&P 500 E-mini Future March 2020 (396) (0.00)
2 SPI 200 Index Future March 2020 (7,416) (0.04)
5 United Kingdom Long Gilt Future March 2020 (10,359) (0.05)
3 US Treasury 10-Year Note (CBT) Future March 2020 (4,372) (0.02)
27 US Treasury 2-Year Note (CBT) Future March 2020 (3,927) (0.02)
25 US Treasury 5-Year Note (CBT) Future March 2020 (11,086) (0.06)
6 US Treasury Long Bond (CBT) Future March 2020 (20,059) (0.10)
Total Unrealised Loss on Futures Contracts ± (60,328) (0.30)
Written Options Contracts (0.17%) (31 December 2018: (0.86%))
Number of Contracts
Expiration Date Type Premium
US$Fair Value
US$% of Net
Assets
Call Options
13 08/01/20 CBOE Mini S&P 500 Index, Strike Price $322 1,813 (3,516) (0.02)
14 08/01/20 CBOE Mini S&P 500 Index, Strike Price $325 739 (1,379) (0.01)
14 15/01/20 CBOE Mini S&P 500 Index, Strike Price $326 996 (1,813) (0.01)
13 08/01/20 CBOE Mini S&P 500 Index, Strike Price $328 357 (305) (0.00)
14 15/01/20 CBOE Mini S&P 500 Index, Strike Price $329 636 (630) (0.00)
14 22/01/20 CBOE Mini S&P 500 Index, Strike Price $330 804 (798) (0.00)
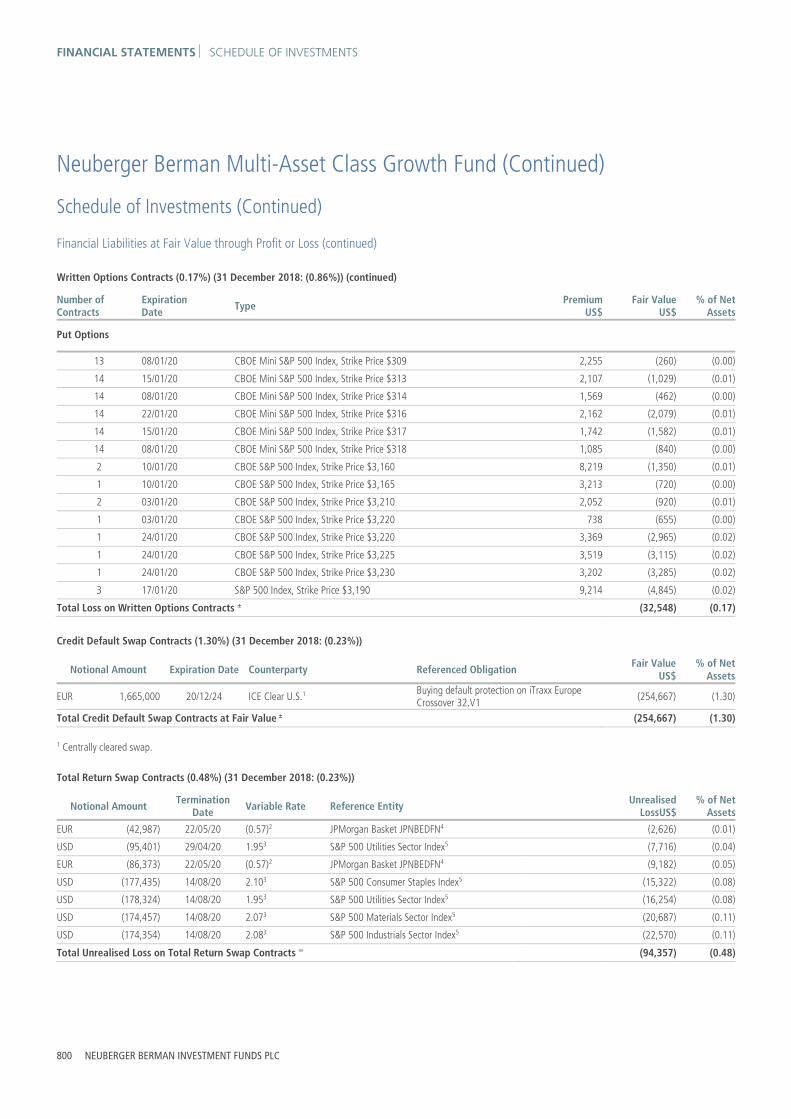
FINANCIAL STATEMENTS SCHEDULE OF INVESTMENTS
800 NEUBERGER BERMAN INVESTMENT FUNDS PLC
Neuberger Berman Multi-Asset Class Growth Fund (Continued)
Schedule of Investments (Continued)
Financial Liabilities at Fair Value through Profit or Loss (continued)
Written Options Contracts (0.17%) (31 December 2018: (0.86%)) (continued)
Number of Contracts
Expiration Date Type Premium
US$Fair Value
US$% of Net
Assets
Put Options
13 08/01/20 CBOE Mini S&P 500 Index, Strike Price $309 2,255 (260) (0.00)
14 15/01/20 CBOE Mini S&P 500 Index, Strike Price $313 2,107 (1,029) (0.01)
14 08/01/20 CBOE Mini S&P 500 Index, Strike Price $314 1,569 (462) (0.00)
14 22/01/20 CBOE Mini S&P 500 Index, Strike Price $316 2,162 (2,079) (0.01)
14 15/01/20 CBOE Mini S&P 500 Index, Strike Price $317 1,742 (1,582) (0.01)
14 08/01/20 CBOE Mini S&P 500 Index, Strike Price $318 1,085 (840) (0.00)
2 10/01/20 CBOE S&P 500 Index, Strike Price $3,160 8,219 (1,350) (0.01)
1 10/01/20 CBOE S&P 500 Index, Strike Price $3,165 3,213 (720) (0.00)
2 03/01/20 CBOE S&P 500 Index, Strike Price $3,210 2,052 (920) (0.01)
1 03/01/20 CBOE S&P 500 Index, Strike Price $3,220 738 (655) (0.00)
1 24/01/20 CBOE S&P 500 Index, Strike Price $3,220 3,369 (2,965) (0.02)
1 24/01/20 CBOE S&P 500 Index, Strike Price $3,225 3,519 (3,115) (0.02)
1 24/01/20 CBOE S&P 500 Index, Strike Price $3,230 3,202 (3,285) (0.02)
3 17/01/20 S&P 500 Index, Strike Price $3,190 9,214 (4,845) (0.02)
Total Loss on Written Options Contracts ± (32,548) (0.17)
Credit Default Swap Contracts (1.30%) (31 December 2018: (0.23%))
Notional Amount Expiration Date Counterparty Referenced Obligation Fair Value US$
% of Net Assets
EUR 1,665,000 20/12/24 ICE Clear U.S.1 Buying default protection on iTraxx Europe Crossover 32.V1
(254,667) (1.30)
Total Credit Default Swap Contracts at Fair Value ± (254,667) (1.30)
1 Centrally cleared swap.
Total Return Swap Contracts (0.48%) (31 December 2018: (0.23%))
Notional Amount Termination Date Variable Rate Reference Entity Unrealised
LossUS$% of Net
Assets
EUR (42,987) 22/05/20 (0.57)2 JPMorgan Basket JPNBEDFN4 (2,626) (0.01)
USD (95,401) 29/04/20 1.953 S&P 500 Utilities Sector Index5 (7,716) (0.04)
EUR (86,373) 22/05/20 (0.57)2 JPMorgan Basket JPNBEDFN4 (9,182) (0.05)
USD (177,435) 14/08/20 2.103 S&P 500 Consumer Staples Index5 (15,322) (0.08)
USD (178,324) 14/08/20 1.953 S&P 500 Utilities Sector Index5 (16,254) (0.08)
USD (174,457) 14/08/20 2.073 S&P 500 Materials Sector Index5 (20,687) (0.11)
USD (174,354) 14/08/20 2.083 S&P 500 Industrials Sector Index5 (22,570) (0.11)
Total Unrealised Loss on Total Return Swap Contracts ∞ (94,357) (0.48)

SCHEDULE OF INVESTMENTS FINANCIAL STATEMENTS
ANNUAL REPORT 2019 801
Neuberger Berman Multi-Asset Class Growth Fund (Continued)
Schedule of Investments (Continued)
Financial Liabilities at Fair Value through Profit or Loss (continued) 2 The 3 month EURIBOR is the benchmark for this total return swap contract. 3 The 3 month LIBOR is the benchmark for this total return swap contract. 4 The counterparty for this total return swap contract is JPMorgan Chase Bank. 5 The counterparty for this total return swap contract is Citibank NA.
Fair Value % of Net
US$ Assets
Total Financial Liabilities at Fair Value through Profit or Loss (714,934) (3.64)
Net Financial Assets at Fair Value through Profit or Loss 18,037,414 91.90
Other Net Assets 1,589,802 8.10
Net Assets Attributable to Holders of Redeemable Participating Shares 19,627,216 100.00
% ofTotal
AssetsPortfolio Analysis US$
* Transferable securities and/or money market instruments admitted to an official stock exchange listing 14,239,757 68.92
** Transferable securities and/or money market instruments dealt in on a regulated market 2,213,186 10.71
† Other transferable securities and/or money market instruments 195,892 0.95
μ Investment funds 1,646,633 7.97
± Financial derivative instruments traded on a regulated market (205,993) (1.00)
∞ OTC financial derivative instruments (52,061) (0.25)
Total Investments 18,037,414 87.30

FINANCIAL STATEMENTS STATEMENT OF SIGNIFICANT PURCHASES AND SALES
802 NEUBERGER BERMAN INVESTMENT FUNDS PLC
Neuberger Berman Multi-Asset Class Growth Fund (Continued) Statement of Significant Purchases and Sales (Unaudited) In accordance with the European Communities (Undertakings for Collective Investment in Transferable Securities) Regulations, 2011 as amended, a statement of changes in the composition of the Schedule of Investments during the reporting period is provided to ensure that Shareholders can identify changes in the investments held by the Portfolio. The following statements present the aggregate purchases and sales of transferable securities exceeding one percent of the total value of purchases or sales, respectively, for the period. At a minimum, the largest twenty purchases and twenty sales are presented, if available.
Top twenty purchases:
Units Security Description Cost US$
1,221,212 United States Treasury Inflation Indexed Bonds, 0.13%, 15/04/2022 1,212,589
8,226 iShares JP Morgan USD EM Bond UCITS ETF USD Dist 868,012
800,000 United States Treasury Note/Bond, 2.63%, 15/12/2021 814,359
320,078 United States Treasury Inflation Indexed Bonds, 2.13%, 15/02/2040 425,883
327,709 United States Treasury Inflation Indexed Bonds, 1.38%, 15/02/2044 376,868
350,974 United States Treasury Inflation Indexed Bonds, 0.63%, 15/04/2023 355,177
339,923 United States Treasury Inflation Indexed Bonds, 0.63%, 15/01/2024 341,087
300,000 United States Treasury Note/Bond, 2.38%, 15/03/2022 305,101
300,000 United States Treasury Note/Bond, 1.75%, 15/06/2022 300,809
282,707 United States Treasury Inflation Indexed Bonds, 0.13%, 15/04/2021 279,865
182,805 United States Treasury Inflation Indexed Bonds, 0.50%, 15/04/2024 186,197
139,183 United States Treasury Inflation Indexed Bonds, 3.88%, 15/04/2029 184,716
165,000 Fannie Mae Pool, 4.00%, 01/07/2049 170,382
165,000 Fannie Mae Pool, 4.00%, 01/06/2049 169,315
169,769 United States Treasury Inflation Indexed Notes, 0.13%, 15/01/2022 168,659
132,788 United States Treasury Inflation Indexed Bonds, 2.38%, 15/01/2027 152,022
134,634 United States Treasury Inflation Indexed Bonds, 2.38%, 15/01/2025 149,617
134,692 United States Treasury Inflation Indexed Bonds, 2.00%, 15/01/2026 149,081
139,905 United States Treasury Inflation Indexed Bonds, 0.38%, 15/07/2027 138,561
135,000 Fannie Mae Pool, 4.00%, 15/02/2049 138,127

STATEMENT OF SIGNIFICANT PURCHASES AND SALES FINANCIAL STATEMENTS
ANNUAL REPORT 2019 803
Neuberger Berman Multi-Asset Class Growth Fund (Continued) Statement of Significant Purchases and Sales (Unaudited) (Continued) Top twenty sales:
Units Security Description Proceeds US$
800,843 United States Treasury Inflation Indexed Bonds, 2.00%, 15/01/2026 885,201
81,677 Neuberger Berman Emerging Market Debt - Hard Currency Fund 855,158
629,864 United States Treasury Inflation Indexed Bonds, 3.88%, 15/04/2029 846,138
400,000 United States Treasury Note/Bond, 2.63%, 15/12/2021 404,531
400,000 United States Treasury Note/Bond, 0.88%, 15/06/2019 397,484
400,000 United States Treasury Note/Bond, 0.88%, 15/09/2019 396,500
359,144 United States Treasury Inflation Indexed Bonds, 0.13%, 15/04/2021 355,301
331,518 United States Treasury Inflation Indexed Bonds, 0.13%, 15/04/2022 329,352
33,595,320 Japanese Government CPI Linked Bond, 0.10%, 10/03/2027 322,669
227,537 United States Treasury Inflation Indexed Bonds, 3.38%, 15/04/2032 306,257
286,683 United States Treasury Inflation Indexed Bonds, 0.63%, 15/01/2024 289,550
241,869 United States Treasury Inflation Indexed Bonds, 2.38%, 15/01/2025 267,979
220,244 United States Treasury Inflation Indexed Bonds, 2.50%, 15/01/2029 266,775
231,523 United States Treasury Inflation Indexed Bonds, 0.38%, 15/07/2023 234,154
183,107 United States Treasury Inflation Indexed Bonds, 0.50%, 15/04/2024 185,510
165,000 Fannie Mae Pool, 4.00%, 01/07/2049 170,715
165,000 Fannie Mae Pool, 4.00%, 01/06/2049 170,410
150,440 United States Treasury Inflation Indexed Bonds, 1.75%, 15/01/2028 164,406
145,000 AT&T Inc, 4.25%, 01/03/2027 157,389
138,042 United States Treasury Inflation Indexed Bonds, 2.38%, 15/01/2027 156,648
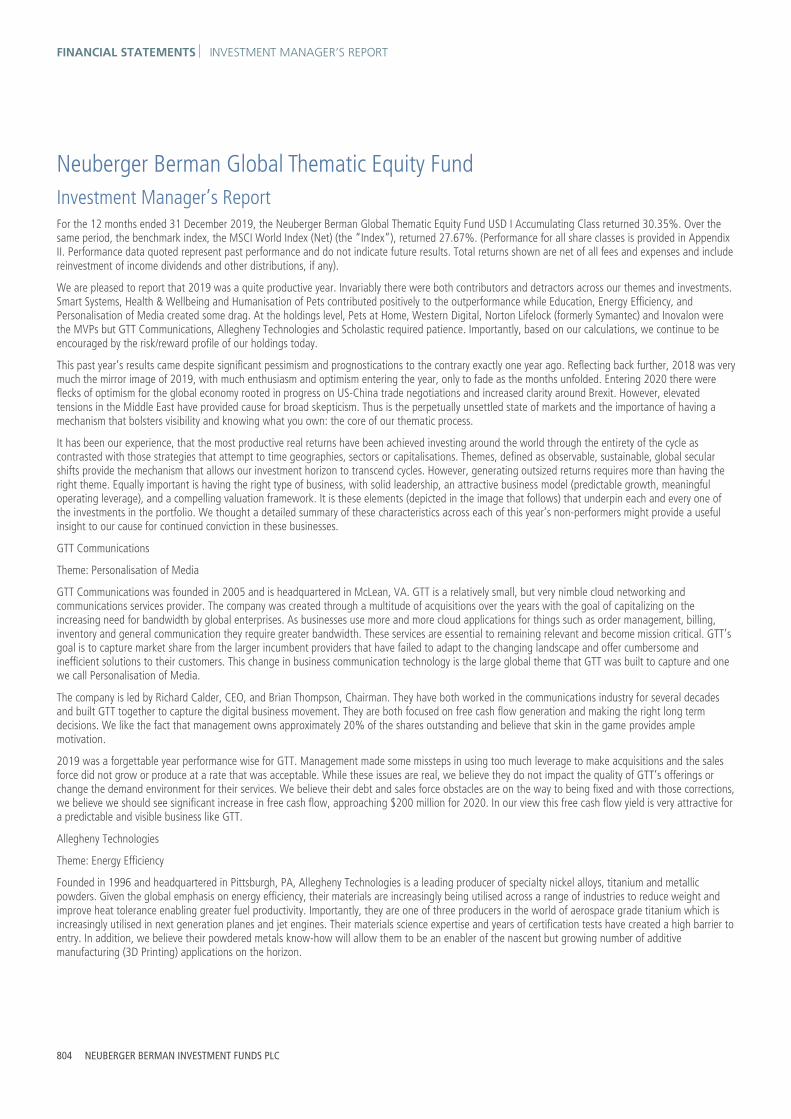
FINANCIAL STATEMENTS INVESTMENT MANAGER’S REPORT
804 NEUBERGER BERMAN INVESTMENT FUNDS PLC
Neuberger Berman Global Thematic Equity Fund Investment Manager’s Report For the 12 months ended 31 December 2019, the Neuberger Berman Global Thematic Equity Fund USD I Accumulating Class returned 30.35%. Over the same period, the benchmark index, the MSCI World Index (Net) (the “Index”), returned 27.67%. (Performance for all share classes is provided in Appendix II. Performance data quoted represent past performance and do not indicate future results. Total returns shown are net of all fees and expenses and include reinvestment of income dividends and other distributions, if any).
We are pleased to report that 2019 was a quite productive year. Invariably there were both contributors and detractors across our themes and investments. Smart Systems, Health & Wellbeing and Humanisation of Pets contributed positively to the outperformance while Education, Energy Efficiency, and Personalisation of Media created some drag. At the holdings level, Pets at Home, Western Digital, Norton Lifelock (formerly Symantec) and Inovalon were the MVPs but GTT Communications, Allegheny Technologies and Scholastic required patience. Importantly, based on our calculations, we continue to be encouraged by the risk/reward profile of our holdings today.
This past year’s results came despite significant pessimism and prognostications to the contrary exactly one year ago. Reflecting back further, 2018 was very much the mirror image of 2019, with much enthusiasm and optimism entering the year, only to fade as the months unfolded. Entering 2020 there were flecks of optimism for the global economy rooted in progress on US-China trade negotiations and increased clarity around Brexit. However, elevated tensions in the Middle East have provided cause for broad skepticism. Thus is the perpetually unsettled state of markets and the importance of having a mechanism that bolsters visibility and knowing what you own: the core of our thematic process.
It has been our experience, that the most productive real returns have been achieved investing around the world through the entirety of the cycle as contrasted with those strategies that attempt to time geographies, sectors or capitalisations. Themes, defined as observable, sustainable, global secular shifts provide the mechanism that allows our investment horizon to transcend cycles. However, generating outsized returns requires more than having the right theme. Equally important is having the right type of business, with solid leadership, an attractive business model (predictable growth, meaningful operating leverage), and a compelling valuation framework. It is these elements (depicted in the image that follows) that underpin each and every one of the investments in the portfolio. We thought a detailed summary of these characteristics across each of this year’s non-performers might provide a useful insight to our cause for continued conviction in these businesses.
GTT Communications
Theme: Personalisation of Media
GTT Communications was founded in 2005 and is headquartered in McLean, VA. GTT is a relatively small, but very nimble cloud networking and communications services provider. The company was created through a multitude of acquisitions over the years with the goal of capitalizing on the increasing need for bandwidth by global enterprises. As businesses use more and more cloud applications for things such as order management, billing, inventory and general communication they require greater bandwidth. These services are essential to remaining relevant and become mission critical. GTT’s goal is to capture market share from the larger incumbent providers that have failed to adapt to the changing landscape and offer cumbersome and inefficient solutions to their customers. This change in business communication technology is the large global theme that GTT was built to capture and one we call Personalisation of Media.
The company is led by Richard Calder, CEO, and Brian Thompson, Chairman. They have both worked in the communications industry for several decades and built GTT together to capture the digital business movement. They are both focused on free cash flow generation and making the right long term decisions. We like the fact that management owns approximately 20% of the shares outstanding and believe that skin in the game provides ample motivation.
2019 was a forgettable year performance wise for GTT. Management made some missteps in using too much leverage to make acquisitions and the sales force did not grow or produce at a rate that was acceptable. While these issues are real, we believe they do not impact the quality of GTT’s offerings or change the demand environment for their services. We believe their debt and sales force obstacles are on the way to being fixed and with those corrections, we believe we should see significant increase in free cash flow, approaching $200 million for 2020. In our view this free cash flow yield is very attractive for a predictable and visible business like GTT.
Allegheny Technologies
Theme: Energy Efficiency
Founded in 1996 and headquartered in Pittsburgh, PA, Allegheny Technologies is a leading producer of specialty nickel alloys, titanium and metallic powders. Given the global emphasis on energy efficiency, their materials are increasingly being utilised across a range of industries to reduce weight and improve heat tolerance enabling greater fuel productivity. Importantly, they are one of three producers in the world of aerospace grade titanium which is increasingly utilised in next generation planes and jet engines. Their materials science expertise and years of certification tests have created a high barrier to entry. In addition, we believe their powdered metals know-how will allow them to be an enabler of the nascent but growing number of additive manufacturing (3D Printing) applications on the horizon.

INVESTMENT MANAGER’S REPORT FINANCIAL STATEMENTS
ANNUAL REPORT 2019 805
Neuberger Berman Global Thematic Equity Fund (Continued) Investment Manager’s Report (Continued) As for leadership, we are confident Allegheny has a high caliber team that thinks like owners and understands that returns are measured in free cash flow. CEO, Bob Weatherbee, supported by EVPs and Division Presidents, Kim Fields and John Sims have collectively demonstrated the importance of consistent execution and delivering results. While we will miss Pat DeCourcy, retiring CFO, whom we credit with driving the organisational emphasis on free cash flow, we are confident he has chosen a capable successor in Donald Newman.
In 2019, respectable operating results and business progress was overshadowed by fears surrounding 737MAX production. While this will have some near-term financial impact, in our opinion it is a short term distraction. We believe ATI is well positioned to be a direct beneficiary of the increasing global implementation of specialty metals across a number of industries, most significantly in aerospace. We believe this is a visible and predictable shift that will materialize over the coming years. Given the fixed cost nature of the business, increased volumes should drive meaningful operating leverage and resulting free cash flow. Over the past few years the company has had great success improving operational efficiency and addressing leverage and pension obligations. As a result, we believe ATI has the capacity to generate $275-300m annually in free cash flow. Given the company’s current $4B enterprise value we anticipate a healthy free cash flow yield. Few in the market seem to share our perspective.
Scholastic Corp
Theme: Education
Founded in 1920 and headquartered in New York City, Scholastic is the largest global publisher of children’s books, magazines and teaching materials serving tens of thousands of schools and tens of millions of homes, across 165 countries in 45 languages. Highly correlated with long-term academic success, early reading is accepted as a foundational skillset for children around the world. Serving both institutions and individuals, Scholastic boasts an impressive lineup of leading titles from Clifford the Big Red Dog to Harry Potter in addition to a growing portfolio of early literacy curriculums for teachers use in the classroom. We believe Scholastic’s content gives it a wide and deep competitive moat as an enabler of early child education.
Led by Dick Robinson, the second generation of family management, Scholastic maintains a unique private company culture that attracts high caliber creative talent (writers and artists). We have met with Mr. Robinson, as well as other senior leaders of the organisation on numerous occasions over the past few years and feel confident they share our emphasis on maximizing free cash flow. As the single largest individual shareholder, Mr. Robinson undeniably brings an owner mindset – though admittedly investment time horizons can conflict.
Our investment in Scholastic has warranted greater patience than we had anticipated as the company embarked on a facilities and technology upgrade utilizing material cash flow. However, with visible, predictable secular growth underpinned by the steady increase in dollars directed to education around the world and multi-year initiatives to improve the company’s operating efficiency, Scholastic is a business that we believe is capable of generating $75-$100 million of annual free cash flow by 2021.
In our opinion, this is quite attractive relative to the current enterprise value of less than $1 billion which ascribes minimal value to their significant real estate holdings in the prime SoHo region of NYC.
In light of the recent market correction associated the COVID-19 pandemic and the oil price war between Russia and Saudi Arabia:
COVID-19
There are many unknowns and that is what makes this virus and the possible outcomes even more concerning.
The spread of the virus has been quick and statistics around risk have been unreliable adding to the fear that has entered the financial markets.
We believe the best medical minds are working around the clock to develop treatments/vaccines and will show progress in the near future.
Oil Price War
We’ve seen Saudi Arabia enter into an oil price war with Russia.
We believe this is about market share and an attempt to put enough pressure on oil producers around the world to potentially shut down marginal supply.
o The shale oil producers in North America could see tremendous pressure as their balance sheets are leveraged and many of them stand to burn cash at current oil prices.
It is important to note that lower oil prices are an economic stimulus to most of the world.

FINANCIAL STATEMENTS INVESTMENT MANAGER’S REPORT
806 NEUBERGER BERMAN INVESTMENT FUNDS PLC
Neuberger Berman Global Thematic Equity Fund (Continued) Investment Manager’s Report (Continued) We are taking these events very seriously and continue to monitor the real impacts on our portfolio companies. It is exactly during such extreme times that our Thematic strategy and knowing what you own become increasingly important. As we noted in our 2020 outlook, the themes that make up our portfolio stand to benefit from powerful long-term tailwinds that transcend the current market volatility. Themes such as Rising Value of Water, Smart Systems, Humanization of Pets will continue to endure and will outlast the concerns around COVID-19 and the plunge in oil prices.
We believe the best course of action during volatile markets is to remain disciplined and be ready to take advantage of opportunities as they present themselves.

BALANCE SHEET FINANCIAL STATEMENTS
The accompanying notes form an integral part of the financial statements.
ANNUAL REPORT 2019 807
Neuberger Berman Global Thematic Equity Fund (Continued) Balance Sheet
As at As at
Note 31 December 2019 31 December 2018
US$ US$
Current Assets
Financial Assets at Fair Value through Profit or Loss 2 24,333,884 12,146,994
Cash and cash equivalents 3 2,179 188,957
Receivable for shares issued 447,160 15,000
Income receivable and other assets 57,220 46,375
Total Assets 24,840,443 12,397,326
Current Liabilities
Bank overdraft 4 664 –
Payable for shares redeemed 44,970 –
Accrued expenses 106,405 80,039
Payable for investments purchased 199,915 124,700
Other payables 3,600 11,913
Liabilities (excluding Net Assets Attributable to Holders of Redeemable Participating Shares) 355,554 216,652
Net Assets Attributable to Holders of Redeemable Participating Shares 24,484,889 12,180,674

FINANCIAL STATEMENTS PROFIT AND LOSS ACCOUNT
The accompanying notes form an integral part of the financial statements.
808 NEUBERGER BERMAN INVESTMENT FUNDS PLC
Neuberger Berman Global Thematic Equity Fund (Continued) Profit and Loss Account
Year Ended Period Ended
Note 31 December 2019 31 December 2018*
US$ US$
Income
Interest Income 4,120 5,792
Dividend Income 224,107 96,840
Net Gain/(Loss) on Financial Assets and Liabilities at Fair Value through Profit or Loss 11 4,580,198 (1,951,886)
4,808,425 (1,849,254)
Expenses
Management Fee 6 332,757 93,426
Distribution Fee 6 67,647 9,298
Administration Fee 6 59,175 21,901
Commitment Fee 19 2,344 398
Custody Fee 6 12,015 5,567
Depositary Fee 6 1,774 329
Professional Fee 9 51,133 13,647
Directors' Fee 7 4,493 5,583
Transaction Costs 9 12,512 14,802
Organisation Expenses 9 – 54,900
Audit Fee 8 8,516 19,508
VAT Rebate (281) (70)
Other Expenses 9 14,353 2,262
Expense Waiver 6 (127,826) (72,278)
Total Expenses 438,612 169,273
Finance Costs
Interest Expense 450 55
Distribution Paid 1 2,281 –
2,731 55
Withholding Tax 1 37,684 14,934
Profit/(Loss) Attributable to Holders of Redeemable Participating Shares from Operations 4,329,398 (2,033,516)
* Portfolio launched on 27 April 2018, as such Profit & Loss figures are not directly comparable. Income and expenses arose solely from continuing operations.

STATEMENT OF CHANGES IN NET ASSETS FINANCIAL STATEMENTS
The accompanying notes form an integral part of the financial statements.
ANNUAL REPORT 2019 809
Neuberger Berman Global Thematic Equity Fund (Continued) Statement of Changes in Net Assets Attributable to Holders of Redeemable Participating Shares
Year Ended Period Ended
31 December 2019 31 December 2018*
US$ US$
Net Assets Attributable to Holders of Redeemable Participating Shares at beginning of year/period 12,180,674 –
Profit/(Loss) Attributable to Holders of Redeemable Participating Shares from Operations 4,329,398 (2,033,516)
Subscriptions 5 18,889,828 15,325,108
Redemptions 5 (10,915,011) (1,110,918)
Net Assets Attributable to Holders of Redeemable Participating Shares at end of year/period 24,484,889 12,180,674
* Portfolio launched on 27 April 2018, as such Profit & Loss figures are not directly comparable.
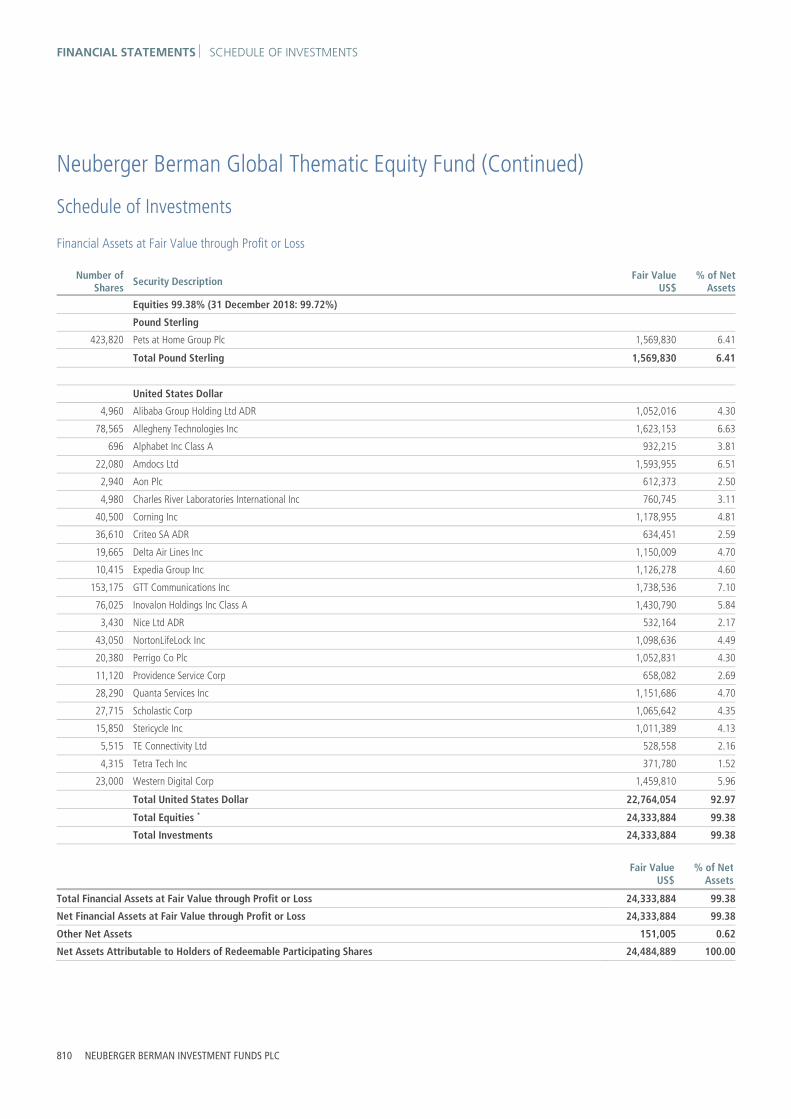
FINANCIAL STATEMENTS SCHEDULE OF INVESTMENTS
810 NEUBERGER BERMAN INVESTMENT FUNDS PLC
Neuberger Berman Global Thematic Equity Fund (Continued)
Schedule of Investments
Financial Assets at Fair Value through Profit or Loss
Number of Shares Security Description Fair Value
US$% of Net
Assets
Equities 99.38% (31 December 2018: 99.72%)
Pound Sterling 423,820 Pets at Home Group Plc 1,569,830 6.41
Total Pound Sterling 1,569,830 6.41
United States Dollar 4,960 Alibaba Group Holding Ltd ADR 1,052,016 4.30
78,565 Allegheny Technologies Inc 1,623,153 6.63
696 Alphabet Inc Class A 932,215 3.81
22,080 Amdocs Ltd 1,593,955 6.51
2,940 Aon Plc 612,373 2.50
4,980 Charles River Laboratories International Inc 760,745 3.11
40,500 Corning Inc 1,178,955 4.81
36,610 Criteo SA ADR 634,451 2.59
19,665 Delta Air Lines Inc 1,150,009 4.70
10,415 Expedia Group Inc 1,126,278 4.60
153,175 GTT Communications Inc 1,738,536 7.10
76,025 Inovalon Holdings Inc Class A 1,430,790 5.84
3,430 Nice Ltd ADR 532,164 2.17
43,050 NortonLifeLock Inc 1,098,636 4.49
20,380 Perrigo Co Plc 1,052,831 4.30
11,120 Providence Service Corp 658,082 2.69
28,290 Quanta Services Inc 1,151,686 4.70
27,715 Scholastic Corp 1,065,642 4.35
15,850 Stericycle Inc 1,011,389 4.13
5,515 TE Connectivity Ltd 528,558 2.16
4,315 Tetra Tech Inc 371,780 1.52
23,000 Western Digital Corp 1,459,810 5.96
Total United States Dollar 22,764,054 92.97
Total Equities * 24,333,884 99.38
Total Investments 24,333,884 99.38
Fair ValueUS$
% of NetAssets
Total Financial Assets at Fair Value through Profit or Loss 24,333,884 99.38
Net Financial Assets at Fair Value through Profit or Loss 24,333,884 99.38
Other Net Assets 151,005 0.62
Net Assets Attributable to Holders of Redeemable Participating Shares 24,484,889 100.00

SCHEDULE OF INVESTMENTS FINANCIAL STATEMENTS
ANNUAL REPORT 2019 811
Neuberger Berman Global Thematic Equity Fund (Continued)
Schedule of Investments (Continued)
% ofTotal
AssetsPortfolio Analysis US$
* Transferable securities and/or money market instruments admitted to an official stock exchange listing 24,333,884 97.96
Total Investments 24,333,884 97.96

FINANCIAL STATEMENTS STATEMENT OF SIGNIFICANT PURCHASES AND SALES
812 NEUBERGER BERMAN INVESTMENT FUNDS PLC
Neuberger Berman Global Thematic Equity Fund (Continued) Statement of Significant Purchases and Sales (Unaudited) In accordance with the European Communities (Undertakings for Collective Investment in Transferable Securities) Regulations, 2011 as amended, a statement of changes in the composition of the Schedule of Investments during the reporting period is provided to ensure that Shareholders can identify changes in the investments held by the Portfolio. The following statements present the aggregate purchases and sales of transferable securities exceeding one percent of the total value of purchases or sales, respectively, for the period. At a minimum, the largest twenty purchases and twenty sales are presented, if available.
Top twenty purchases:
Units Security Description Cost US$
136,295 GTT Communications Inc 1,607,698
59,460 Allegheny Technologies Inc 1,280,134
31,860 Corning Inc 927,414
13,230 Amdocs Ltd 851,574
17,715 Western Digital Corp 824,226
7,385 Expedia Group Inc 797,652
13,025 Delta Air Lines Inc 699,992
5,370 Charles River Laboratories International Inc 694,642
36,610 Criteo SA ADR 627,384
16,870 Scholastic Corp 598,927
11,450 Perrigo Co Plc 531,993
13,095 Quanta Services Inc 487,619
19,380 Cabot Oil & Gas Corp 415,990
6,065 Providence Service Corp 375,674
16,295 Symantec Corp 337,150
2,090 Alibaba Group Holding Ltd ADR 328,228
290 Alphabet Inc Class A 314,193
13,025 Inovalon Holdings Inc Class A 195,527
3,530 Stericycle Inc 161,355
5,220 NortonLifeLock Inc 132,823

STATEMENT OF SIGNIFICANT PURCHASES AND SALES FINANCIAL STATEMENTS
ANNUAL REPORT 2019 813
Neuberger Berman Global Thematic Equity Fund (Continued) Statement of Significant Purchases and Sales (Unaudited) (Continued) Aggregate sales greater than one percent of the total value of sales:
Units Security Description Proceeds US$
10,210 Thomson Reuters Corp 704,550
41,515 Cabot Oil & Gas Corp 669,804
9,835 Western Digital Corp 561,170
98,285 Pets at Home Group Plc 266,493
11,035 Symantec Corp 263,136
3,885 Providence Service Corp 243,727
1,085 Alibaba Group Holding Ltd ADR 204,054
4,930 Quanta Services Inc 201,951
3,070 Perrigo Co Plc 160,602
2,390 Stericycle Inc 149,863
7,130 Inovalon Holdings Inc Class A 126,287
5,380 Allegheny Technologies Inc 124,484
1,720 Amdocs Ltd 118,620
7,550 GTT Communications Inc 98,934
910 Expedia Group Inc 92,736
3,060 Corning Inc 89,270
3,550 NortonLifeLock Inc 88,235
65 Alphabet Inc Class A 84,861
2,280 Scholastic Corp 84,509
1,450 Delta Air Lines Inc 83,090
390 Charles River Laboratories International Inc 56,834
275 Aon Plc 55,986
320 Nice Ltd ADR 48,379
515 TE Connectivity Ltd 47,846

FINANCIAL STATEMENTS INVESTMENT MANAGER’S REPORT
814 NEUBERGER BERMAN INVESTMENT FUNDS PLC
Neuberger Berman CLO Income Fund Investment Manager’s Report For the 12 months ended 31 December 2019, the total return for the USD I Accumulating Class of the Neuberger Berman CLO Income Portfolio was 11.83%. Over the same period, the benchmark index, the ICE BofA US Dollar 3-Month Deposit Offered Rate Constant Maturity Index (the “Index”), returned 2.60%. (Performance for all share classes is provided in Appendix II. Performance data quoted represent past performance and do not indicate future results. Total returns shown are net of all fees and expenses and include reinvestment of income dividends and other distributions, if any).
The CLO market experienced a robust rally for the first months of the year, rebounding off a sharp drawdown in the later stages of 2018. With international trade tensions building, the US Federal Reserve (“Fed”) took an increasingly accommodative stance throughout most of the year. Three quarter-point rate cuts were made by the Fed in 2019, negatively impacting investor demand for floating-rate securities; specifically for the Portfolio, leveraged loans and CLO debt.
As a result of more dovish central bank stances persisting, loan funds saw outflows for most of the year which weighted on market prices of loans an CLO mezzanine debt. Over the fall, concern built up in the loan market about elevated downgrades and the susceptibility of the Single-B rated loan market being downgrade to Triple-C rating levels. These concerns lead to a temporary sharp decline in CLO mezzanine debt as it is primarily exposed to single-B rated loans. October was a particularly weak month for CLO BB debt as primary spreads widened approximately 100 basis points (“bps”) from L+700 to L+800 and the CLO BB index lost 3.22% for the month. In our view, the selloff was predicated by the selloff in lower quality loans in early October and resulting investor concerns around the quality of CLO portfolios. Following the CLO BB debt selloff in October, the rate-hedged yield basis between CLO BBs and high yield securities rated BB increased to 5.56%, the widest level since the market dislocation in early 2016.
Starting in mid-November, the CLO BB market reversed course and rallied back strongly for the remainder of the quarter. The CLO BB index returned 6.48% over the last two months, reversing the entire October selloff and more. The rally was driven by the rally in loan markets as the Fed put further rate cuts on hold, and by a renewed conviction that CLO mezzanine debt offers attractive relative value given the basis versus high yield is still near the wider end of the historical range. This was coupled with a continued lack of secondary supply and light dealer inventories of higher quality CLOs rated BB.
Over the year, the Portfolio had net inflows of $33 million as clients remained assured of the relative attractiveness of CLO mezzanine debt. The Portfolio ended the year at a net asset value of $152.5 million. As of December 31 2019, primary CLO BB spreads tightened approximately 25bps quarter-over-quarter from L+700 to L+675 into year-end. Even at these tighter levels, higher quality primary CLOs continued to see robust levels of interest, indicating a persistent deep bid from a broad range of investors.
Clearly the short-term outlook for CLO debt markets will be dominated by further developments around the coronavirus. As we have discussed in the past, we would expect CLO mezzanine debt to continue to be sensitive to broader macro volatility.
With respect to the underlying credits, efforts to assess the top-down impact of supply chain disruptions and changes in consumer and business behavior from the COVID-19 virus are challenging. The magnitude of the hit to economic activity will depend on the duration and severity of the spread of the virus which is an unknown variable at this point. Central banks and policymakers have been very vocal in their support of monetary and fiscal stimulus to mitigate any downside in activity. Along these lines, on March 3rd the Federal Reserve announced an intermeeting 50-bp rate cut with the ability and willingness to take further action. We would expect a continuation of volatility, in both directions, in the near term as market participants calibrate the detractions from real economic activity.
While pockets of volatility can create temporary dislocations in parts of the loans market, such as the larger, more liquid issuers and lower quality and more highly leveraged capital structures, it is important to focus on the underlying fundamentals of individual credits and differentiate between price moves due to panic selling and price moves of those issuers facing a material hit to their fundamentals. We are focused on understanding which issuers’ balance sheets and enterprise values can weather a stall in global economic growth. While credit differentiation continues to be a theme and concerns over global growth stemming from the heightened uncertainty of the virus are warranted, there remains a strong demand for issuers with stable to improving fundamentals. Avoiding credit deterioration remains our primary focus.

BALANCE SHEET FINANCIAL STATEMENTS
The accompanying notes form an integral part of the financial statements.
ANNUAL REPORT 2019 815
Neuberger Berman CLO Income Fund (Continued) Balance Sheet
As at As at
Note 31 December 2019 31 December 2018
US$ US$
Current Assets
Financial Assets at Fair Value through Profit or Loss 2 145,194,737 106,540,558
Cash and cash equivalents 3 8,440,863 7,045,150
Receivable for investments sold – 2,449
Receivable for shares issued 1,011,654 2,331,873
Income receivable and other assets 2,034,020 2,042,282
Total Assets 156,681,274 117,962,312
Current Liabilities
Financial Liabilities at Fair Value through Profit or Loss 2 290,230 2,075,894
Bank overdraft 4 – 1,233
Payable for shares redeemed 727,754 528,312
Accrued expenses 163,390 170,333
Payable for investments purchased 3,001,133 2,514,716
Other payables 15,142 8,906
Liabilities (excluding Net Assets Attributable to Holders of Redeemable Participating Shares) 4,197,649 5,299,394
Net Assets Attributable to Holders of Redeemable Participating Shares 152,483,625 112,662,918

FINANCIAL STATEMENTS PROFIT AND LOSS ACCOUNT
The accompanying notes form an integral part of the financial statements.
816 NEUBERGER BERMAN INVESTMENT FUNDS PLC
Neuberger Berman CLO Income Fund (Continued) Profit and Loss Account
Year Ended Period Ended
Note 31 December 2019 31 December 2018*
US$ US$
Income
Interest Income 11,770,620 3,222,083
Net Gain/(Loss) on Financial Assets and Liabilities at Fair Value through Profit or Loss 11 3,899,106 (14,706,607)
15,669,726 (11,484,524)
Expenses
Management Fee 6 754,337 214,628
Administration Fee 6 153,194 66,073
Commitment Fee 19 17,499 3,014
Custody Fee 6 11,978 2,823
Depositary Fee 6 14,253 22,692
Professional Fee 9 86,473 14,046
Directors' Fee 7 4,529 3,493
Transaction Costs 9 14,837 23,556
Organisation Expenses 9 – 52,650
Audit Fee 8 14,634 25,528
VAT Rebate (2,437) (222)
Other Expenses 9 15,623 4,275
Expense Waiver 6 (3) (17,336)
Total Expenses 1,084,917 415,220
Finance Costs
Interest Expense 189 74
Distribution Paid 1 7,906,118 1,179,660
7,906,307 1,179,734
Withholding Tax 1 3,162 15,712
Profit/(Loss) Attributable to Holders of Redeemable Participating Shares from Operations 6,675,340 (13,095,190)
* Portfolio launched on 12 July 2018, as such Profit & Loss figures are not directly comparable. Income and expenses arose solely from continuing operations.

STATEMENT OF CHANGES IN NET ASSETS FINANCIAL STATEMENTS
The accompanying notes form an integral part of the financial statements.
ANNUAL REPORT 2019 817
Neuberger Berman CLO Income Fund (Continued) Statement of Changes in Net Assets Attributable to Holders of Redeemable Participating Shares
Year Ended Period Ended
31 December 2019 31 December 2018*
US$ US$
Net Assets Attributable to Holders of Redeemable Participating Shares at beginning of year/period 112,662,918 –
Profit/(Loss) Attributable to Holders of Redeemable Participating Shares from Operations 6,675,340 (13,095,190)
Subscriptions 5 75,005,722 135,649,328
Redemptions 5 (41,860,355) (9,891,220)
Net Assets Attributable to Holders of Redeemable Participating Shares at end of year/period 152,483,625 112,662,918
* Portfolio launched on 12 July 2018, as such Profit & Loss figures are not directly comparable.

FINANCIAL STATEMENTS SCHEDULE OF INVESTMENTS
818 NEUBERGER BERMAN INVESTMENT FUNDS PLC
Neuberger Berman CLO Income Fund (Continued)
Schedule of Investments
Financial Assets at Fair Value through Profit or Loss
Principal Amount Security Description Coupon Maturity
DateFair Value
US$% of Net
Assets
Asset Backed Securities 88.63% (31 December 2018: 89.22%)
Euro 4,000,000 Avoca CLO XIX Dac Series 19X Class E 5.28% 15/10/2031 4,214,286 2.76
4,000,000 Phoenix Park CLO Dac Series 1X Class DR 5.26% 29/10/2031 4,165,397 2.73
Total Euro 8,379,683 5.49
United States Dollar 3,000,000 522 Funding CLO I Ltd Series 2019-1X Class D 0.00% 15/01/2033 3,011,597 1.98
3,000,000 Allegany Park CLO Ltd Series 2019-1X Class D 0.00% 20/01/2033 3,000,000 1.97
4,900,000 Apidos CLO XVIII Series 2018-18X Class E 7.65% 22/10/2030 4,681,901 3.07
2,000,000 Apidos CLO XX Series 2015-20X Class DR 7.70% 16/07/2031 1,874,520 1.23
2,100,000 Apidos CLO XXIV Series 2016-24X Class DR 7.77% 20/10/2030 2,004,102 1.31
2,000,000 Ares CLO Series 2015-35RX Class D 5.00% 15/07/2030 1,960,230 1.29
3,000,000 Ares XLII CLO Ltd Series 2017-42X Class E 8.00% 22/01/2028 2,883,919 1.89
1,500,000 Ares XLIII CLO Ltd Series 2017-43X Class E 8.47% 15/10/2029 1,480,283 0.97
3,000,000 Ares XXXIIR CLO Ltd Series 2014-32RX Class D 7.76% 15/05/2030 2,824,148 1.85
3,000,000 Assurant CLO I Ltd Series 2018-2X Class E 8.12% 20/10/2031 2,896,687 1.90
4,750,000 Atrium XII Series 12X Class DR 4.75% 22/04/2027 4,646,788 3.05
1,000,000 Barings CLO Ltd 2018-III Series 2018-3X Class E 7.72% 20/07/2029 941,974 0.62
1,000,000 Benefit Street Partners CLO IV Ltd Series 2014-IVX Class DR 9.22% 20/01/2029 992,132 0.65
2,750,000 BlueMountain CLO Ltd Series 2015 1X Class D 7.30% 13/04/2027 2,733,406 1.79
3,850,000 Bluemountain CLO Ltd Series 2018-1X Class E 7.89% 30/07/2030 3,548,563 2.33
5,000,000 Carlyle Global Market Strategies Series 2014-2RX Class D 7.26% 15/05/2031 4,267,520 2.80
4,500,000 Chenango Park CLO Ltd Series 2018-1X Class D 7.80% 15/04/2030 4,229,154 2.77
2,250,000 Cifc Funding 2017-III Ltd Series 2017-3X Class D 7.97% 20/07/2030 2,138,854 1.40
1,000,000 CIFC Funding 2018-V Ltd Series 2018-5X Class D 8.15% 15/01/2032 951,858 0.62
1,250,000 CIFC Funding Ltd Series 2018-4X Class D 7.90% 17/10/2031 1,180,149 0.77
900,000 Dryden 45 Senior Loan Fund Series 2016-45X Class ER 7.85% 15/10/2030 852,602 0.56
5,000,000 Dryden 60 CLO Ltd Series 2018-60X Class E 7.60% 15/07/2031 4,635,288 3.04
2,300,000 Dryden 65 CLO Ltd Series 2018-65X Class E 7.75% 18/07/2030 2,151,735 1.41
1,600,000 Dryden Senior Loan Fund Series 2017-54X Class E 8.17% 19/10/2029 1,537,754 1.01
2,000,000 Eaton Vance CLO 2018-1 Ltd Series 2018-1X Class E 8.00% 15/10/2030 1,912,056 1.25
2,000,000 Galaxy XVIII CLO Ltd Series 2018-28X Class D 5.00% 15/07/2031 1,903,778 1.25
4,000,000 Galaxy XXV CLO Ltd Series 2018-25X Class E 7.89% 25/10/2031 3,815,880 2.50
5,400,000 Galaxy XXVII CLO Ltd Series 2018-27X Class E 7.68% 16/05/2031 5,059,039 3.32
2,900,000 KKR CLO 14 Ltd Series 14X Class ER 8.15% 15/07/2031 2,780,568 1.82
2,500,000 KKR CLO 22 Ltd Series 22X Class E 7.97% 20/07/2031 2,392,797 1.57
900,000 KKR CLO 23 Ltd Series 23X Class E 7.97% 20/10/2031 860,597 0.57
2,150,000 LCM XIII LP Series 13X Class ER 9.27% 19/07/2027 1,984,968 1.30
2,000,000 LCM XVIII LP Series 19X Class E2 7.70% 15/07/2027 1,925,276 1.26

SCHEDULE OF INVESTMENTS FINANCIAL STATEMENTS
ANNUAL REPORT 2019 819
Neuberger Berman CLO Income Fund (Continued)
Schedule of Investments (Continued)
Financial Assets at Fair Value through Profit or Loss (continued)
Principal Amount Security Description Coupon Maturity
DateFair Value
US$% of Net
Assets
Asset Backed Securities 88.63% (31 December 2018: 89.22%) (continued)
United States Dollar (continued) 4,000,000 Long Point Park CLO Ltd Series 2017-1X Class D2 7.60% 17/01/2030 3,734,728 2.45
3,300,000 Magnetite CLO Ltd Series 2015-14RX Class E 7.60% 18/10/2031 3,053,968 2.00
4,500,000 Magnetite VIII Ltd Series 2014-8X Class ER2 7.65% 15/04/2031 4,402,214 2.89
4,600,000 Magnetite XII Ltd Series 2015-12X Class ER 7.68% 15/10/2031 4,312,545 2.83
1,000,000 Octagon Investment Partners 18-R Ltd Series 2018-18X Class D 7.51% 16/04/2031 913,540 0.60
2,500,000 Octagon Investment Partners 27 Ltd Series 2016-1X Class ER 7.95% 15/07/2030 2,372,384 1.56
950,000 Octagon Investment Partners 38 Ltd Series 2018-1X Class D 7.67% 20/07/2030 887,394 0.58
500,000 Octagon Loan Funding Ltd Series 2014-1X Class ERR 7.90% 18/11/2031 472,566 0.31
4,000,000 Oha Loan Funding 2013-1 Ltd Series 2013-1X Class ER2 7.43% 23/07/2031 3,703,179 2.43
5,000,000 Riserva CLO Ltd Series 2016-3X Class ER 8.35% 18/10/2028 4,887,795 3.21
3,900,000 TICP CLO IX Ltd Series 2017-9X Class E 7.57% 20/01/2031 3,648,702 2.39
3,500,000 TICP CLO V 2016-1 Ltd Series 2016-5X Class ER 7.75% 17/07/2031 3,243,021 2.13
1,500,000 TICP CLO XI Ltd Series 2018-11X Class E 7.97% 20/10/2031 1,434,959 0.94
2,500,000 Voya CLO 2015-1 Ltd Series 2015-1X Class DR 7.65% 18/01/2029 2,278,874 1.50
2,000,000 Voya CLO 2018-3 Ltd Series 2018-3X Class E 7.75% 15/10/2031 1,880,824 1.23
1,500,000 York CLO 1 Ltd Series 2014-1X Class DRR 4.96% 22/10/2029 1,484,367 0.97
Total United States Dollar 126,771,183 83.14
Total Asset Backed Securities ** 135,150,866 88.63
Corporate Bonds 2.09% (31 December 2018: 4.88%)
United States Dollar 125,000 Anixter Inc* 5.13% 01/10/2021 130,106 0.09
250,000 Bausch Health Cos Inc† 7.00% 15/03/2024 260,521 0.17
200,000 Berry Global Inc* 5.50% 15/05/2022 202,749 0.13
250,000 HCA Inc* 7.50% 15/02/2022 276,695 0.18
22,000 Jack Ohio Finance LLC/Jack Ohio Finance 1 Corp† 6.75% 15/11/2021 22,490 0.01
250,000 Nielsen Co Luxembourg Sarl† 5.50% 01/10/2021 251,500 0.16
250,000 PQ Corp† 6.75% 15/11/2022 259,061 0.17
89,000 Prime Security Services Borrower LLC/Prime Finance Inc† 9.25% 15/05/2023 93,506 0.06
125,000 Qwest Corp* 6.75% 01/12/2021 134,535 0.09
250,000 Realogy Group LLC/Realogy Co-Issuer Corp† 5.25% 01/12/2021 253,062 0.17
250,000 Reynolds Group Issuer Inc/Reynolds Group Issuer LLC/Reynolds Group Issuer Lu† 5.50% 15/07/2021 250,875 0.16
250,000 Springleaf Finance Corp† 7.75% 01/10/2021 272,017 0.18
250,000 Univision Communications Inc† 6.75% 15/09/2022 254,453 0.17
250,000 VICI Properties 1 LLC/VICI FC Inc† 8.00% 15/10/2023 271,666 0.18
250,000 Vistra Energy Corp* 5.88% 01/06/2023 256,382 0.17
Total Corporate Bonds 3,189,618 2.09
Total Investments 138,340,484 90.72
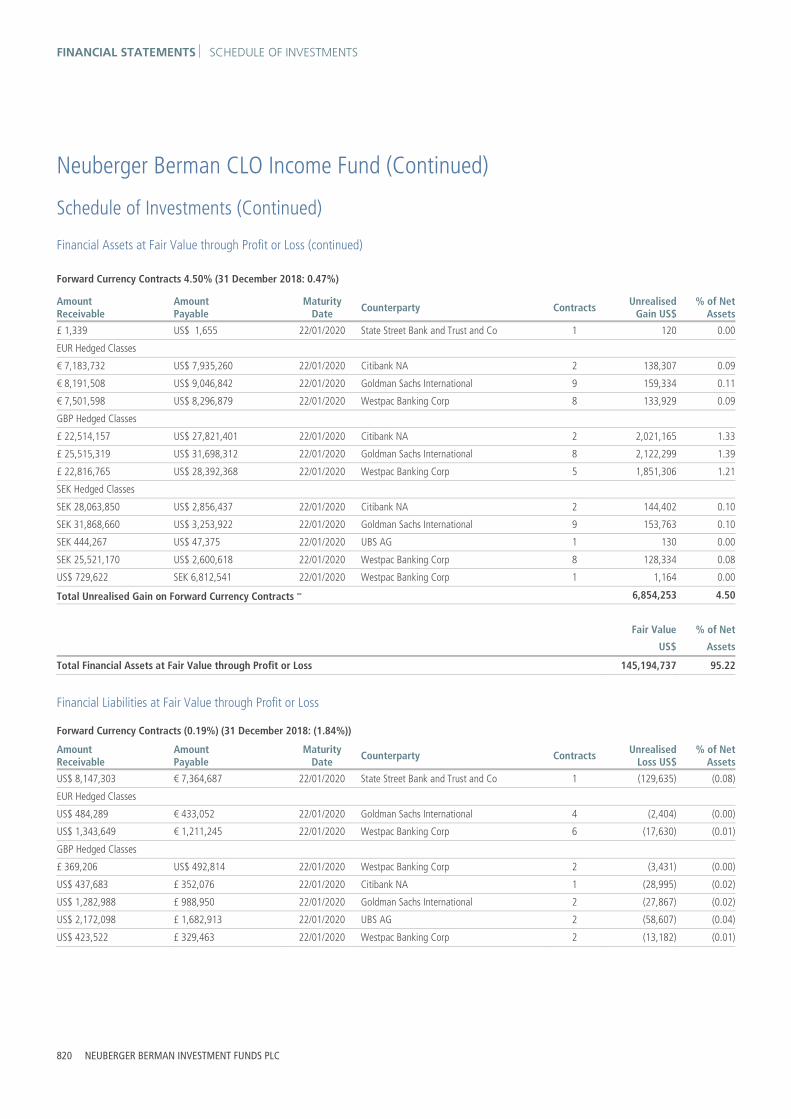
FINANCIAL STATEMENTS SCHEDULE OF INVESTMENTS
820 NEUBERGER BERMAN INVESTMENT FUNDS PLC
Neuberger Berman CLO Income Fund (Continued)
Schedule of Investments (Continued)
Financial Assets at Fair Value through Profit or Loss (continued)
Forward Currency Contracts 4.50% (31 December 2018: 0.47%)
Amount Receivable
Amount Payable
Maturity Date Counterparty Contracts Unrealised
Gain US$% of Net
Assets
£ 1,339 US$ 1,655 22/01/2020 State Street Bank and Trust and Co 1 120 0.00
EUR Hedged Classes € 7,183,732 US$ 7,935,260 22/01/2020 Citibank NA 2 138,307 0.09
€ 8,191,508 US$ 9,046,842 22/01/2020 Goldman Sachs International 9 159,334 0.11
€ 7,501,598 US$ 8,296,879 22/01/2020 Westpac Banking Corp 8 133,929 0.09
GBP Hedged Classes £ 22,514,157 US$ 27,821,401 22/01/2020 Citibank NA 2 2,021,165 1.33
£ 25,515,319 US$ 31,698,312 22/01/2020 Goldman Sachs International 8 2,122,299 1.39
£ 22,816,765 US$ 28,392,368 22/01/2020 Westpac Banking Corp 5 1,851,306 1.21
SEK Hedged Classes SEK 28,063,850 US$ 2,856,437 22/01/2020 Citibank NA 2 144,402 0.10
SEK 31,868,660 US$ 3,253,922 22/01/2020 Goldman Sachs International 9 153,763 0.10
SEK 444,267 US$ 47,375 22/01/2020 UBS AG 1 130 0.00
SEK 25,521,170 US$ 2,600,618 22/01/2020 Westpac Banking Corp 8 128,334 0.08
US$ 729,622 SEK 6,812,541 22/01/2020 Westpac Banking Corp 1 1,164 0.00
Total Unrealised Gain on Forward Currency Contracts ∞ 6,854,253 4.50
Fair Value % of Net
US$ Assets
Total Financial Assets at Fair Value through Profit or Loss 145,194,737 95.22
Financial Liabilities at Fair Value through Profit or Loss
Forward Currency Contracts (0.19%) (31 December 2018: (1.84%))
Amount Receivable
Amount Payable
Maturity Date Counterparty Contracts Unrealised
Loss US$% of Net
Assets
US$ 8,147,303 € 7,364,687 22/01/2020 State Street Bank and Trust and Co 1 (129,635) (0.08)
EUR Hedged Classes US$ 484,289 € 433,052 22/01/2020 Goldman Sachs International 4 (2,404) (0.00)
US$ 1,343,649 € 1,211,245 22/01/2020 Westpac Banking Corp 6 (17,630) (0.01)
GBP Hedged Classes £ 369,206 US$ 492,814 22/01/2020 Westpac Banking Corp 2 (3,431) (0.00)
US$ 437,683 £ 352,076 22/01/2020 Citibank NA 1 (28,995) (0.02)
US$ 1,282,988 £ 988,950 22/01/2020 Goldman Sachs International 2 (27,867) (0.02)
US$ 2,172,098 £ 1,682,913 22/01/2020 UBS AG 2 (58,607) (0.04)
US$ 423,522 £ 329,463 22/01/2020 Westpac Banking Corp 2 (13,182) (0.01)

SCHEDULE OF INVESTMENTS FINANCIAL STATEMENTS
ANNUAL REPORT 2019 821
Neuberger Berman CLO Income Fund (Continued)
Schedule of Investments (Continued)
Financial Liabilities at Fair Value through Profit or Loss (continued)
Forward Currency Contracts (0.19%) (31 December 2018: (1.84%)) (continued)
Amount Receivable
Amount Payable
Maturity Date Counterparty Contracts Unrealised
Loss US$% of Net
Assets
SEK Hedged Classes SEK 618,006 US$ 66,106 22/01/2020 Westpac Banking Corp 1 (23) (0.00)
US$ 165,905 SEK 1,598,817 22/01/2020 Goldman Sachs International 3 (5,055) (0.01)
US$ 118,181 SEK 1,137,035 22/01/2020 Westpac Banking Corp 5 (3,401) (0.00)
Total Unrealised Loss on Forward Currency Contracts ∞ (290,230) (0.19)
Net Financial Assets at Fair Value through Profit or Loss 144,904,507 95.03
Other Net Assets 7,579,118 4.97
Net Assets Attributable to Holders of Redeemable Participating Shares 152,483,625 100.00
% ofTotal
AssetsPortfolio Analysis US$
* Transferable securities and/or money market instruments admitted to an official stock exchange listing 1,000,467 0.63
** Transferable securities and/or money market instruments dealt in on a regulated market 135,150,866 86.26
† Other transferable securities and/or money market instruments 2,189,151 1.40
∞ OTC financial derivative instruments 6,564,023 4.19
Total Investments 144,904,507 92.48
Fair Value % of Net
US$ Assets
Total Financial Liabilities at Fair Value through Profit or Loss (290,230) (0.19)

FINANCIAL STATEMENTS STATEMENT OF SIGNIFICANT PURCHASES AND SALES
822 NEUBERGER BERMAN INVESTMENT FUNDS PLC
Neuberger Berman CLO Income Fund (Continued) Statement of Significant Purchases and Sales (Unaudited) In accordance with the European Communities (Undertakings for Collective Investment in Transferable Securities) Regulations, 2011 as amended, a statement of changes in the composition of the Schedule of Investments during the reporting period is provided to ensure that Shareholders can identify changes in the investments held by the Portfolio. The following statements present the aggregate purchases and sales of transferable securities exceeding one percent of the total value of purchases or sales, respectively, for the period. At a minimum, the largest twenty purchases and twenty sales are presented, if available.
Aggregate purchases greater than one percent of the total value of purchases:
Units Security Description Cost US$
5,200,000 VERDE CLO Ltd Series 2019-1X Class E, 9.46%, 15/04/2032 5,148,000
5,000,000 Riserva CLO Ltd Series 2016-3X Class ER, 8.35%, 18/10/2028 5,000,000
5,000,000 CIFC Funding 2019-I Ltd Series 2019-1X Class E, 9.46%, 20/04/2032 4,900,000
4,750,000 Atrium XII Series 12X Class DR, 4.75%, 22/04/2027 4,696,563
3,500,000 TICP CLO V 2016-1 Ltd Series 2016-5X Class ER, 7.75%, 17/07/2031 3,360,000
3,000,000 522 Funding CLO I Ltd Series 2019-1X Class D, 0.00%, 15/01/2033 3,000,000
3,000,000 Allegany Park CLO Ltd Series 2019-1X Class D, 0.00%, 20/01/2033 3,000,000
3,000,000 Ares XXXIIR CLO Ltd Series 2014-32RX Class D, 7.76%, 15/05/2030 2,827,530
2,750,000 BlueMountain CLO Ltd Series 2015 1X Class D, 7.30%, 13/04/2027 2,746,563
2,500,000 KKR CLO 22 Ltd Series 22X Class E, 7.97%, 20/07/2031 2,432,000
2,500,000 Voya CLO 2015-1 Ltd Series 2015-1X Class DR, 7.65%, 18/01/2029 2,387,500
2,150,000 LCM XIII LP Series 13X Class ER, 9.27%, 19/07/2027 2,150,000
2,000,000 Apidos CLO XXXI Series 2019-31X Class E, 9.23%, 15/04/2031 1,980,000
2,000,000 LCM XVIII LP Series 19X Class E2, 7.70%, 15/07/2027 1,980,000
2,000,000 ARES CLO Series 2015-35RX Class D, 5.00%, 15/07/2030 1,975,000
2,000,000 Galaxy XVIII CLO Ltd Series 2018-28X Class D, 5.00%, 15/07/2031 1,965,000
2,000,000 Apidos CLO XX Series 2015-20X Class DR, 7.70%, 16/07/2031 1,895,820
1,600,000 Dryden Senior Loan Fund Series 2017-54X Class E, 8.17%, 19/10/2029 1,508,000
1,500,000 Dryden Senior Loan Fund 2014-33X Class, 10.33%, 15/10/2028 1,496,250
1,500,000 York CLO 1 Ltd Series 2014-1X Class DRR, 4.96%, 22/10/2029 1,490,250
1,250,000 CIFC Funding Ltd Series 2018-4X Class D, 7.90%, 17/10/2031 1,191,888
1,000,000 Benefit Street Partners CLO IV Ltd Series 2014-IVX Class DR, 9.84%, 20/01/2029 1,000,000
1,000,000 CIFC Funding 2018-V Ltd Series 2018-5X Class D, 8.15%, 15/01/2032 961,810
1,000,000 Barings CLO Ltd 2018-III Series 2018-3X Class E, 7.72%, 20/07/2029 958,510
950,000 Octagon Investment Partners 38 Ltd Series 2018-1X Class D, 7.67%, 20/07/2030 897,000

STATEMENT OF SIGNIFICANT PURCHASES AND SALES FINANCIAL STATEMENTS
ANNUAL REPORT 2019 823
Neuberger Berman CLO Income Fund (Continued) Statement of Significant Purchases and Sales (Unaudited) (Continued) Total sales:
Units Security Description Proceeds US$
5,200,000 VERDE CLO Ltd Series 2019-1X Class E, 9.46%, 15/04/2032 5,073,120
5,000,000 CIFC Funding 2019-I Ltd Class E, 9.46%, 20/04/2032 4,845,000
4,000,000 Octagon Investment Partners 18-R Ltd Series 2018-18X Class D, 7.51%, 16/04/2031 3,625,000
3,400,000 Galaxy XXVI CLO Ltd Series 2018-26X Class E, 8.37%, 22/11/2031 3,135,820
2,000,000 Apidos CLO XXXI Series 2019-31X Class E, 9.23%, 15/04/2031 1,980,220
2,000,000 Madison Park Funding XX Ltd Series 2016-20X Class DR, 5.51%, 27/07/2030 1,938,220
2,000,000 Ares XLIII CLO Ltd Series 2017-43X Class E, 8.47%, 15/10/2029 1,938,000
2,000,000 Assurant CLO I Ltd Series 2018-2X Class E, 8.12%, 20/10/2031 1,763,000
1,700,000 Voya Clo 2016-3 Ltd Series 2016-3X Class DR, 8.68%, 18/10/2031 1,589,500
1,750,000 York Clo-2 Ltd Series 2015-1X Class ER, 8.24%, 22/01/2031 1,588,650
1,500,000 Dryden Senior Loan Fund 2014-33X Class, 10.33%, 15/10/2028 1,500,000
1,500,000 Apidos Clo XXVIII Series 2017-28X Class D, 8.09%, 20/01/2031 1,392,750
250,000 Centene Corp, 4.75%, 15/05/2022 255,313
250,000 CenturyLink Inc, 5.63%, 01/04/2020 253,403
250,000 Park Aerospace Holdings Ltd, 3.63%, 15/03/2021 252,125
250,000 CommScope Inc, 5.00%, 15/06/2021 250,000

FINANCIAL STATEMENTS INVESTMENT MANAGER’S REPORT
824 NEUBERGER BERMAN INVESTMENT FUNDS PLC
Neuberger Berman China A-Share Opportunities Fund* Investment Manager’s Report For the period beginning 1 January 2019 and ending with the Portfolio’s termination on 6 December 2019, the total return for the USD I Accumulating Class was 24.89%. Over the same period, the MSCI China A Onshore Index (the “Index”), returned 28.23%. (Performance data quoted represent past performance and do not indicate future results. Total returns shown are net of all fees and expenses and include reinvestment of income dividends and other distributions, if any).
Chinese equities performed well during this period, outperforming developed international and emerging equities, and slightly trailing the US S&P 500. US-China trade war headlines impacted all markets throughout this year, creating tensions and volatility. Chinese economic indicators remained subdued as well.
In the first half, markets welcomed a late June agreement, which kept the trade standoff from escalating, and the US Federal Reserve’s move toward easing. As the year ended, indications that a “phase one” US-China trade deal was imminent and a weaker dollar boosted sentiment.
Top performing Index sectors included Consumer Staples, Information Technology and Health Care. All sectors were positive, but Energy, Utilities and Industrials lagged.
The Portfolio outperformed the Index within Consumer Staples and Materials, where stock selection and sector overweights were advantageous. Avoiding the Real Estate sector was another relative benefit. Industrials, Information Technology and Financials detracted most. Overall, the Portfolio underperformed the Index.
With investors optimistic that monetary easing can boost global economic prospects, along with an improved US-China trade outlook, global equity markets rallied at year-end. We saw risk sentiment improve, with allocations flowing into emerging markets.
* Portfolio liquidated on 6 December 2019.

BALANCE SHEET FINANCIAL STATEMENTS
The accompanying notes form an integral part of the financial statements.
ANNUAL REPORT 2019 825
Neuberger Berman China A-Share Opportunities Fund (Continued)
Balance Sheet
As at As at
Note 31 December 2019 31 December 2018
US$ US$
Current Assets
Financial Assets at Fair Value through Profit or Loss 2 – 730,092
Cash and cash equivalents 3 18,622 44,755
Income receivable and other assets 26,609 40,785
Total Assets 45,231 815,632
Current Liabilities
Accrued expenses 29,281 49,104
Other payables 15,950 12,024
Liabilities (excluding Net Assets Attributable to Holders of Redeemable Participating Shares) 45,231 61,128
Net Assets Attributable to Holders of Redeemable Participating Shares – 754,504

FINANCIAL STATEMENTS PROFIT AND LOSS ACCOUNT
The accompanying notes form an integral part of the financial statements.
826 NEUBERGER BERMAN INVESTMENT FUNDS PLC
Neuberger Berman China A-Share Opportunities Fund (Continued)
Profit and Loss Account
Period Ended Period Ended
Note 31 December 2019* 31 December 2018*
US$ US$
Income
Interest Income 1,598 189
Dividend Income 25,342 1,665
Miscellaneous Income 24,656 –
Net Gain/(Loss) on Financial Assets and Liabilities at Fair Value through Profit or Loss 11 171,750 (196,445)
223,346 (194,591)
Expenses
Management Fee 6 8,468 3,348
Administration Fee 6 21,451 9,536
Commitment Fee 19 133 24
Custody Fee 6 11,295 2,758
Depositary Fee 6 175 19
Professional Fee 9 42,609 8,115
Directors' Fee 7 4,629 3,492
Transaction Costs 9 19,787 9,668
Organisation Expenses 9 – 52,650
Audit Fee 8 9,077 17,556
VAT Rebate (16) (2)
Other Expenses 9 3,445 5,844
Expense Waiver 6 (126,105) (62,270)
Total Expenses (5,052) 50,738
Withholding Tax 1 2,534 167
Profit/(Loss) Attributable to Holders of Redeemable Participating Shares from Operations 225,864 (245,496)
* Portfolio launched on 26 July 2018 and liquidated on 6 December 2019, as such Profit & Loss figures are not directly comparable. Income and expenses arose solely from discontinued operations.

STATEMENT OF CHANGES IN NET ASSETS FINANCIAL STATEMENTS
The accompanying notes form an integral part of the financial statements.
ANNUAL REPORT 2019 827
Neuberger Berman China A-Share Opportunities Fund (Continued)
Statement of Changes in Net Assets Attributable to Holders of Redeemable Participating Shares
Period Ended Period Ended
31 December 2019* 31 December 2018*
US$ US$
Net Assets Attributable to Holders of Redeemable Participating Shares at beginning of period 754,504 –
Profit/(Loss) Attributable to Holders of Redeemable Participating Shares from Operations 225,864 (245,496)
Subscriptions 5 – 1,000,000
Redemptions 5 (980,368) –
Net Assets Attributable to Holders of Redeemable Participating Shares at end of period – 754,504
* Portfolio launched on 26 July 2018 and liquidated on 6 December 2019, as such Profit & Loss figures are not directly comparable.

FINANCIAL STATEMENTS STATEMENT OF SIGNIFICANT PURCHASES AND SALES
828 NEUBERGER BERMAN INVESTMENT FUNDS PLC
Neuberger Berman China A-Share Opportunities Fund (Continued)
Statement of Significant Purchases and Sales (Unaudited) In accordance with the European Communities (Undertakings for Collective Investment in Transferable Securities) Regulations, 2011 as amended, a statement of changes in the composition of the Schedule of Investments during the reporting period is provided to ensure that Shareholders can identify changes in the investments held by the Portfolio. The following statements present the aggregate purchases and sales of transferable securities exceeding one percent of the total value of purchases or sales, respectively, for the period. At a minimum, the largest twenty purchases and twenty sales are presented, if available.
Aggregate purchases greater than one percent of the total value of purchases:
Units Security Description Cost US$
13,200 CITIC Securities Co Ltd Class A 49,160
4,000 Ping An Insurance Group Co of China Ltd Class A 42,659
9,600 China Life Insurance Co Ltd Class A 40,935
8,000 China Merchants Bank Co Ltd Class A 38,812
32,800 China Construction Bank Corp Class A 33,166
19,100 China Jushi Co Ltd Class A 30,378
11,600 Shanghai Mechanical & Electrical Industry Co Ltd Class A 28,427
9,000 NARI Technology Co Ltd Class A 27,003
4,100 Luzhou Laojiao Co Ltd Class A 26,054
200 Kweichow Moutai Co Ltd Class A 25,148
30,700 Shanghai International Port Group Co Ltd Class A 24,183
38,000 Bank of China Ltd Class A 21,553
3,800 China Pacific Insurance Group Co Ltd Class A 18,308
10,000 CNOOC Ltd 15,930
14,200 Industrial & Commercial Bank of China Ltd Class A 11,591
5,000 BTG Hotels Group Co Ltd 11,350
3,000 Shanghai Jinjiang International Hotels Development Co Ltd Class A 11,221
20,000 Agricultural Bank of China Ltd Class A 10,982
600 Jiangsu Yanghe Brewery Joint-Stock Co Ltd Class A 10,397
5,000 China Communications Construction Co Ltd Class A 9,071
1,700 Focused Photonics Hangzhou Inc Class A 5,739

STATEMENT OF SIGNIFICANT PURCHASES AND SALES FINANCIAL STATEMENTS
ANNUAL REPORT 2019 829
Neuberger Berman China A-Share Opportunities Fund (Continued)
Statement of Significant Purchases and Sales (Unaudited) (Continued) Aggregate sales greater than one percent of the total value of sales:
Units Security Description Proceeds US$
7,408 Wuliangye Yibin Co Ltd Class A 119,665
86,500 China Construction Bank Corp Class A 90,030
17,200 China Life Insurance Co Ltd Class A 73,872
500 Kweichow Moutai Co Ltd Class A 69,061
80,600 Industrial & Commercial Bank of China Ltd Class A 66,921
29,656 Tangshan Jidong Cement Co Ltd Class A 65,399
18,400 NARI Technology Co Ltd Class A 60,928
98,000 Bank of China Ltd Class A 52,255
4,100 Luzhou Laojiao Co Ltd Class A 49,325
4,000 Ping An Insurance Group Co of China Ltd Class A 48,376
3,100 Jiangsu Yanghe Brewery Joint-Stock Co Ltd Class A 45,751
86,815 Agricultural Bank of China Ltd Class A 45,294
6,000 New China Life Insurance Co Ltd Class A 44,455
18,300 BTG Hotels Group Co Ltd 42,786
17,000 China Yangtze Power Co Ltd Class A 41,700
8,000 China Merchants Bank Co Ltd Class A 41,567
10,000 Inner Mongolia Yili Industrial Group Co Ltd Class A 41,405
13,200 CITIC Securities Co Ltd Class A 40,215
7,483 China Pacific Insurance Group Co Ltd Class A 36,840
5,300 Anhui Conch Cement Co Ltd Class A 35,581
43,800 China State Construction Engineering Corp Ltd Class A 32,396
29,900 Focus Media Information Technology Co Ltd Class A 28,723
9,300 Beijing New Building Materials Plc Class A 28,668
8,000 Shanghai Jinjiang International Hotels Development Co Ltd Class A 27,488
19,100 China Jushi Co Ltd Class A 25,694
11,600 Shanghai Mechanical & Electrical Industry Co Ltd Class A 25,245
30,700 Shanghai International Port Group Co Ltd Class A 24,121
8,000 China Shenhua Energy Co Ltd Class A 23,247
18,000 China Communications Construction Co Ltd Class A 23,126
9,000 Focused Photonics Hangzhou Inc Class A 20,098
10,000 CNOOC Ltd 15,277

FINANCIAL STATEMENTS INVESTMENT MANAGER’S REPORT
830 NEUBERGER BERMAN INVESTMENT FUNDS PLC
Neuberger Berman Next Generation Mobility Fund Investment Manager’s Report For the 12 months ended 31 December 2019, the USD I Accumulating Class total return was 29.99%. Over the same period, the benchmark index, the MSCI All-Country World Index (Net) (the “Index”)*, returned 26.60%. (Performance for all share classes is provided in Appendix II). Performance data quoted represent past performance and do not indicate future results. Total returns shown are net of all fees and expenses and include reinvestment of income dividends and other distributions, if any).
The Portfolio outperformed the Index by 339 basis points over the reporting period. Sector allocation to Information Technology was the largest positive contributor to performance during the period. Unallocated sectors such as Consumer Staples, Energy, Health Care, and Real Estate were additional positive contributors to performance. Conversely, security selection in Materials detracted the most.
Equity market performance was broadly positive in 2019 following the sharp correction in the fourth quarter of 2018. Gains during 2019 were primarily a result of more accommodative monetary policy as the US Federal Reserve reduced interest rates three times and other central banks also instilled supportive monetary policies. Additionally, the prospect for improved trade relations between the US and China added to positive market sentiment. Despite the gains experienced in 2019, we continue to see compelling long-term opportunities across the investable universe.
The transportation industry continues to evolve as evidenced in 2019 by accelerated timelines for electric vehicle introductions, continued growth of ride-sharing services, ongoing proliferation of active safety features on the automobile and investments in autonomous vehicle technologies. Automakers including BMW, Toyota, Honda and Jaguar Land Rover announced accelerated timelines for the rollout of electrified vehicles as both electric and hybrid vehicles are gaining in popularity across the globe. Tesla also began delivering its first electric vehicles from its local factory in China, underscoring the long-term growth opportunity in that market. Additionally, the industry continues to build out the associated EV infrastructure including charging stations. On the autonomous front, Apple purchased Drive.ai, an autonomous vehicle start-up, to advance the company’s mobility efforts. Relatedly, Honda, Softbank and T. Rowe Price invested in GM’s Cruise Automation subsidiary at a valuation of $19 billion and Volkswagen’s investment in Ford’s autonomous vehicle business, Argo AI, valuing it at $7 billion to help scale the development of autonomous taxi fleets. In ride-sharing, Lyft and Uber priced their initial public offerings at a valuation of $24 billion and $75 billion, respectively, reflecting continued expected growth in consumer acceptance of ride-sharing services. These are just a few examples that highlight the transportation industry’s evolution towards Next-Generation Mobility.
Looking ahead, the Coronavirus (COVID-19) has created additional market volatility and added some risk to the outlook for global economic growth. We believe market volatility will likely remain elevated as the number of COVID-19 cases continue to increase. While we are of the view that virus-related uncertainty may create some economic softness, we believe this could prove temporary and that longer-term demand is unlikely to be fundamentally altered. Despite the volatility caused by COVID-19, we have seen little indication that the demand for autonomous, electric or connected vehicle related technologies within the global transportation industry is slowing, and remain positive on the outlook for the evolution of these technologies. * While the Index captures the global nature of the Portfolio, its scope is significantly broader than the investable universe of the Portfolio and therefore has limitations for comparative performance purposes.

BALANCE SHEET FINANCIAL STATEMENTS
The accompanying notes form an integral part of the financial statements.
ANNUAL REPORT 2019 831
Neuberger Berman Next Generation Mobility Fund (Continued) Balance Sheet
As at As at
Note 31 December 2019 31 December 2018
US$ US$
Current Assets
Financial Assets at Fair Value through Profit or Loss 2 40,626,718 2,087,601
Cash and cash equivalents 3 2,012,062 70,675
Receivable for investments sold – 123,902
Receivable for shares issued 382,447 –
Income receivable and other assets 51,964 25,153
Total Assets 43,073,191 2,307,331
Current Liabilities
Financial Liabilities at Fair Value through Profit or Loss 2 633 177
Payable for shares redeemed 28,125 –
Accrued expenses 116,154 66,012
Payable for investments purchased 267,548 40,340
Other payables 5,283 8,716
Liabilities (excluding Net Assets Attributable to Holders of Redeemable Participating Shares) 417,743 115,245
Net Assets Attributable to Holders of Redeemable Participating Shares 42,655,448 2,192,086

FINANCIAL STATEMENTS PROFIT AND LOSS ACCOUNT
The accompanying notes form an integral part of the financial statements.
832 NEUBERGER BERMAN INVESTMENT FUNDS PLC
Neuberger Berman Next Generation Mobility Fund (Continued) Profit and Loss Account
Year Ended Period Ended
Note 31 December 2019 31 December 2018*
US$ US$
Income
Interest Income 32,096 907
Dividend Income 437,084 10,143
Net Gain/(Loss) on Financial Assets and Liabilities at Fair Value through Profit or Loss 11 7,294,217 (550,864)
7,763,397 (539,814)
Expenses
Management Fee 6 317,310 8,242
Distribution Fee 6 1,479 43
Administration Fee 6 79,160 4,919
Commitment Fee 19 3,151 74
Custody Fee 6 13,057 2,178
Depositary Fee 6 3,149 45
Professional Fee 9 69,752 8,566
Directors' Fee 7 4,141 2,999
Transaction Costs 9 68,443 6,054
Organisation Expenses 9 – 51,300
Audit Fee 8 15,757 14,182
VAT Rebate (485) (6)
Other Expenses 9 33,982 5,830
Expense Waiver 6 (165,367) (47,107)
Total Expenses 443,529 57,319
Finance Costs
Interest Expense 1 –
1 –
Withholding Tax 1 92,757 2,287
Profit/(Loss) Attributable to Holders of Redeemable Participating Shares from Operations 7,227,110 (599,420)
* Portfolio launched on 21 August 2018, as such Profit & Loss figures are not directly comparable. Income and expenses arose solely from continuing operations.

STATEMENT OF CHANGES IN NET ASSETS FINANCIAL STATEMENTS
The accompanying notes form an integral part of the financial statements.
ANNUAL REPORT 2019 833
Neuberger Berman Next Generation Mobility Fund (Continued) Statement of Changes in Net Assets Attributable to Holders of Redeemable Participating Shares
Year Ended Period Ended
31 December 2019 31 December 2018*
US$ US$
Net Assets Attributable to Holders of Redeemable Participating Shares at beginning of year/period 2,192,086 –
Profit/(Loss) Attributable to Holders of Redeemable Participating Shares from Operations 7,227,110 (599,420)
Subscriptions 5 33,992,375 2,791,506
Redemptions 5 (756,123) –
Net Assets Attributable to Holders of Redeemable Participating Shares at end of year/period 42,655,448 2,192,086
* Portfolio launched on 21 August 2018, as such Profit & Loss figures are not directly comparable.

FINANCIAL STATEMENTS SCHEDULE OF INVESTMENTS
834 NEUBERGER BERMAN INVESTMENT FUNDS PLC
Neuberger Berman Next Generation Mobility Fund (Continued)
Schedule of Investments
Financial Assets at Fair Value through Profit or Loss
Number of Shares Security Description Fair Value
US$% of Net
Assets
Equities 95.22% (31 December 2018: 95.23%)
Euro 24,209 Infineon Technologies AG 551,916 1.29
6,348 Verbund AG 318,801 0.75
Total Euro 870,717 2.04
Hong Kong Dollar 53,400 Sunny Optical Technology Group Co Ltd 924,518 2.17
Total Hong Kong Dollar 924,518 2.17
Japanese Yen 11,500 Horiba Ltd 766,609 1.79
11,314 Murata Manufacturing Co Ltd 696,233 1.63
7,151 Rohm Co Ltd 570,467 1.34
33,141 Taiyo Yuden Co Ltd 1,010,691 2.37
Total Japanese Yen 3,044,000 7.13
New Taiwan Dollar 66,000 MediaTek Inc 976,448 2.29
Total New Taiwan Dollar 976,448 2.29
United States Dollar 4,446 Alibaba Group Holding Ltd ADR 942,997 2.21
707 Alphabet Inc Class A 946,949 2.22
36,336 Altair Engineering Inc Class A 1,304,826 3.06
356 Amazon.com Inc 657,831 1.54
23,769 Ambarella Inc 1,439,451 3.38
9,915 Amphenol Corp Class A 1,073,100 2.52
10,923 Analog Devices Inc 1,298,089 3.04
4,762 ANSYS Inc 1,225,786 2.87
12,338 Aptiv Plc 1,171,740 2.75
5,844 ASML Holding NV 1,729,473 4.05
4,132 Autodesk Inc 758,057 1.78
12,886 Cisco Systems Inc 618,013 1.45
33,228 Delphi Technologies Plc 426,315 1.00
23,872 General Motors Co 873,715 2.05
5,291 Hubbell Inc Class B 782,116 1.83
13,245 IHS Markit Ltd 998,011 2.34
17,534 II-VI Inc 590,370 1.38

SCHEDULE OF INVESTMENTS FINANCIAL STATEMENTS
ANNUAL REPORT 2019 835
Neuberger Berman Next Generation Mobility Fund (Continued)
Schedule of Investments (Continued)
Financial Assets at Fair Value through Profit or Loss (continued)
Number of Shares Security Description Fair Value
US$% of Net
Assets
Equities 95.22% (31 December 2018: 95.23%) (continued)
United States Dollar (continued)
13,693 Keysight Technologies Inc 1,405,313 3.30
9,363 Lumentum Holdings Inc 742,486 1.74
4,071 NextEra Energy Inc 985,833 2.31
1,802 NVIDIA Corp 424,011 0.99
10,061 NXP Semiconductors NV 1,280,363 3.00
52,677 ON Semiconductor Corp 1,284,265 3.01
10,683 Progressive Corp 773,342 1.81
9,919 Qorvo Inc 1,152,885 2.70
23,081 Sensata Technologies Holding Plc 1,243,373 2.92
11,973 TE Connectivity Ltd 1,147,492 2.69
67,276 Telefonaktiebolaget LM Ericsson ADR 590,683 1.39
3,291 Texas Instruments Inc 422,202 0.99
16,348 T-Mobile US Inc 1,282,010 3.01
31,251 Trimble Inc 1,302,854 3.05
12,793 Uber Technologies Inc 380,464 0.89
4,352 Verisk Analytics Inc Class A 649,928 1.52
7,391 Visteon Corp 639,987 1.50
12,153 Xilinx Inc 1,188,199 2.79
3,387 Zebra Technologies Corp Class A 865,175 2.03
4,401 Zscaler Inc 204,647 0.48
Total United States Dollar 34,802,351 81.59
Total Equities * 40,618,034 95.22
Total Investments 40,618,034 95.22
Forward Currency Contracts 0.02% (31 December 2018: 0.00%)
Amount Receivable
Amount Payable
Maturity Date Counterparty Contracts Unrealised
Gain US$% of Net
Assets
AUD Hedged Classes AUD 16,620 US$ 11,206 22/01/2020 Citibank NA 3 483 0.00
AUD 21,689 US$ 14,670 22/01/2020 Goldman Sachs International 13 585 0.00
AUD 1,262 US$ 869 22/01/2020 UBS AG 2 19 0.00
AUD 17,615 US$ 11,903 22/01/2020 Westpac Banking Corp 10 486 0.00
EUR Hedged Classes € 17,057 US$ 18,844 22/01/2020 Citibank NA 3 325 0.00
€ 23,352 US$ 25,831 22/01/2020 Goldman Sachs International 15 416 0.00
€ 18,220 US$ 20,155 22/01/2020 Westpac Banking Corp 10 324 0.00

FINANCIAL STATEMENTS SCHEDULE OF INVESTMENTS
836 NEUBERGER BERMAN INVESTMENT FUNDS PLC
Neuberger Berman Next Generation Mobility Fund (Continued)
Schedule of Investments (Continued)
Financial Assets at Fair Value through Profit or Loss (continued)
Forward Currency Contracts 0.02% (31 December 2018: 0.00%) (continued)
Amount Receivable
Amount Payable
Maturity Date Counterparty Contracts Unrealised
Gain US$% of Net
Assets
GBP Hedged Classes £ 18,444 US$ 22,797 22/01/2020 Citibank NA 3 1,651 0.01
£ 24,741 US$ 30,890 22/01/2020 Goldman Sachs International 14 1,906 0.01
£ 544 US$ 715 22/01/2020 UBS AG 1 6 0.00
£ 18,848 US$ 23,461 22/01/2020 Westpac Banking Corp 9 1,521 0.00
SGD Hedged Classes SGD 16,149 US$ 11,708 22/01/2020 Citibank NA 3 303 0.00
SGD 21,691 US$ 15,772 22/01/2020 Goldman Sachs International 14 362 0.00
SGD 17,749 US$ 12,905 22/01/2020 Westpac Banking Corp 11 297 0.00
Total Unrealised Gain on Forward Currency Contracts ∞ 8,684 0.02
Fair Value % of Net
US$ Assets
Total Financial Assets at Fair Value through Profit or Loss 40,626,718 95.24
Financial Liabilities at Fair Value through Profit or Loss
Forward Currency Contracts (0.00%) (31 December 2018: (0.01%))
Amount Receivable
Amount Payable
Maturity Date Counterparty Contracts Unrealised
Loss US$% of Net
Assets
AUD Hedged Classes US$ 3,604 AUD 5,301 22/01/2020 Goldman Sachs International 11 (122) (0.00)
US$ 361 AUD 527 22/01/2020 Westpac Banking Corp 2 (10) (0.00)
EUR Hedged Classes US$ 6,221 € 5,607 22/01/2020 Goldman Sachs International 11 (79) (0.00)
US$ 592 € 532 22/01/2020 Westpac Banking Corp 2 (6) (0.00)
GBP Hedged Classes £ 877 US$ 1,171 22/01/2020 Westpac Banking Corp 1 (8) (0.00)
US$ 7,515 £ 5,908 22/01/2020 Goldman Sachs International 11 (314) (0.00)
US$ 742 £ 576 22/01/2020 Westpac Banking Corp 2 (22) (0.00)
SGD Hedged Classes US$ 3,713 SGD 5,084 22/01/2020 Goldman Sachs International 11 (67) (0.00)
US$ 377 SGD 514 22/01/2020 Westpac Banking Corp 2 (5) (0.00)
Total Unrealised Loss on Forward Currency Contracts ∞ (633) (0.00)

SCHEDULE OF INVESTMENTS FINANCIAL STATEMENTS
ANNUAL REPORT 2019 837
Neuberger Berman Next Generation Mobility Fund (Continued)
Schedule of Investments (Continued)
Financial Liabilities at Fair Value through Profit or Loss (continued)
Fair Value % of Net
US$ Assets
Total Financial Liabilities at Fair Value through Profit or Loss (633) (0.00)
Net Financial Assets at Fair Value through Profit or Loss 40,626,085 95.24
Other Net Assets 2,029,363 4.76
Net Assets Attributable to Holders of Redeemable Participating Shares 42,655,448 100.00
% ofTotal
AssetsPortfolio Analysis US$
* Transferable securities and/or money market instruments admitted to an official stock exchange listing 40,618,034 94.30
∞ OTC financial derivative instruments 8,051 0.02
Total Investments 40,626,085 94.32

FINANCIAL STATEMENTS STATEMENT OF SIGNIFICANT PURCHASES AND SALES
838 NEUBERGER BERMAN INVESTMENT FUNDS PLC
Neuberger Berman Next Generation Mobility Fund (Continued) Statement of Significant Purchases and Sales (Unaudited) In accordance with the European Communities (Undertakings for Collective Investment in Transferable Securities) Regulations, 2011 as amended, a statement of changes in the composition of the Schedule of Investments during the reporting period is provided to ensure that Shareholders can identify changes in the investments held by the Portfolio. The following statements present the aggregate purchases and sales of transferable securities exceeding one percent of the total value of purchases or sales, respectively, for the period. At a minimum, the largest twenty purchases and twenty sales are presented, if available.
Aggregate purchases greater than one percent of the total value of purchases:
Units Security Description Cost US$
14,087 Xilinx Inc 1,348,713
30,114 Ambarella Inc 1,284,918
17,950 T-Mobile US Inc 1,266,665
25,426 Sensata Technologies Holding Plc 1,196,588
34,807 Altair Engineering Inc Class A 1,166,374
29,974 Trimble Inc 1,150,148
15,325 Aptiv Plc 1,133,231
11,973 TE Connectivity Ltd 1,092,739
27,804 General Motors Co 1,050,202
10,061 NXP Semiconductors NV 1,036,370
5,926 ASML Holding NV Class REG 1,009,189
54,134 ON Semiconductor Corp 990,798
12,743 Keysight Technologies Inc 972,534
10,094 Analog Devices Inc 947,034
12,506 Albemarle Corp 943,549
5,085 Littelfuse Inc 915,935
2,907 Tesla Inc 853,993
13,245 IHS Markit Ltd 850,801
12,061 Qorvo Inc 842,267
5,076 ANSYS Inc 826,323
38,265 Infineon Technologies AG 812,639
4,423 NextEra Energy Inc 808,942
12,568 Toyota Motor Corp 769,261
9,239 Amphenol Corp Class A 767,822
6,251 Verisk Analytics Inc Class A 760,399
10,683 Progressive Corp 755,902
662 Alphabet Inc Class A 731,599
32,354 Fortum OYJ 724,491
17,499 Umicore SA 691,418
4,132 Autodesk Inc 684,761
12,886 Cisco Systems Inc 678,899
66,000 MediaTek Inc 674,525
3,387 Zebra Technologies Corp Class A 670,496

STATEMENT OF SIGNIFICANT PURCHASES AND SALES FINANCIAL STATEMENTS
ANNUAL REPORT 2019 839
Neuberger Berman Next Generation Mobility Fund (Continued) Statement of Significant Purchases and Sales (Unaudited) (Continued) Aggregate purchases greater than one percent of the total value of purchases (continued):
Units Security Description Cost US$
33,141 Taiyo Yuden Co Ltd 667,284
7,391 Visteon Corp 662,649
13,456 Verbund AG 662,282
8,029 Murata Manufacturing Co Ltd 661,262
12,025 XPO Logistics Inc 657,103
39,341 Deutsche Telekom AG 644,488
4,119 Alibaba Group Holding Ltd ADR 637,717
33,228 Delphi Technologies Plc 624,908
67,276 Telefonaktiebolaget LM Ericsson ADR 617,605
11,500 Horiba Ltd 591,658
5,589 Hubbell Inc Class B 580,995
60,676 Sunny Optical Technology Group Co Ltd 580,061
17,534 II-VI Inc 568,717
9,363 Lumentum Holdings Inc 548,021
336 Amazon.com Inc 547,665
12,793 Uber Technologies Inc 523,100
4,545 Nidec Corp 519,013
49,822 China Mobile Ltd 517,485
2,981 Baidu Inc ADR 510,218
21,283 BHP Group Ltd 501,432
7,151 Rohm Co Ltd 499,510
46,599 Antofagasta Plc 496,116
15,361 AT&T Inc 473,388
8,169 Verizon Communications Inc 470,861

FINANCIAL STATEMENTS STATEMENT OF SIGNIFICANT PURCHASES AND SALES
840 NEUBERGER BERMAN INVESTMENT FUNDS PLC
Neuberger Berman Next Generation Mobility Fund (Continued) Statement of Significant Purchases and Sales (Unaudited) (Continued) Aggregate sales greater than one percent of the total value of sales:
Units Security Description Proceeds US$
13,317 Albemarle Corp 981,595
5,363 Littelfuse Inc 857,067
13,612 Toyota Motor Corp 855,704
34,430 Fortum OYJ 783,336
3,035 Tesla Inc 702,679
39,341 Deutsche Telekom AG 660,025
4,919 Nidec Corp 644,952
12,584 XPO Logistics Inc 603,503
23,353 BHP Group Ltd 588,649
18,257 Umicore SA 557,065
15,361 AT&T Inc 536,726
9,470 Verizon Communications Inc 526,696
244,988 Geely Automobile Holdings Ltd 520,989
50,994 Antofagasta Plc 505,391
455,000 Brilliance China Automotive Holdings Ltd 464,296
49,822 China Mobile Ltd 450,996
5,559 Schneider Electric SE 447,547
15,120 Valeo SA 432,938
7,108 Verbund AG 394,788
6,345 Ambarella Inc 381,918
4,001 Aptiv Plc 336,596
73,757 NIO Inc 295,489
2,981 Baidu Inc ADR 290,125
2,305 Verisk Analytics Inc Class A 286,971
2,456 Xilinx Inc 266,893
15,203 Infineon Technologies AG 256,726
2,142 Qorvo Inc 219,489
5,911 General Motors Co 216,852
4,932 Murata Manufacturing Co Ltd 211,726
3,907 Sensata Technologies Holding Plc 187,124
2,316 T-Mobile US Inc 170,157
11,400 Sunny Optical Technology Group Co Ltd 168,263

INVESTMENT MANAGER’S REPORT FINANCIAL STATEMENTS
ANNUAL REPORT 2019 841
Neuberger Berman Ultra Short Term Euro Bond Fund Investment Manager’s Report For the 12 months ended 31 December 2019, the total return for the EUR I Accumulating Class was 1.65%. Over the same period, the benchmark index, the ICE BofA 0-1 year AAA Euro Government Index (EUR Total Return, Hedged) returned -0.66%. (Performance for all share classes is provided in Appendix II. Performance data quoted represent past performance and do not indicate future results. Total returns shown are net of all fees and expenses and include reinvestment of income dividends and other distributions, if any).
Euro government yields spiraled downwards in the first eight months of 2019, reaching a new lowest level ever for most countries. Rising political uncertainties like Brexit and the tariff trade war weighed on growth pace, particularly on German exports, which raised fears of recession in the wake of the fall in corporate confidence. Particularly during the second quarter of the year, the European Central Bank ("ECB") started to react by extending its forward guidance period, announcing no key rate increase up to mid-2020. Later, when the growth outlook was reviewed to the downside below its potential level, the ECB cut its medium term inflation forecasts: considering its inflation target of 2% not being achievable in the coming years, the Central Bank concluded in June further accommodative monetary policy was needed.
During the summer, the service sector showed its resilience, which reduced the market expectation of a recession feared in the wake of the Chinese deeper than expected slowdown: large part of the Eurozone exports are towards Asia, especially for carmaker sector. This led the market bond yields to bottom up.
Nevertheless, the ECB decided to focus on all these growing uncertainties to support the economy when the inflation risk, being so low, is not its issue: it decided to act again mid-September by extending its forward guidance period, cutting its key rate by 10 bps and reopening its QE buy program. However, it failed to meet the market expectations, which were very strong, leading to a small rebound of rates in September. Investors agree the central policy is not the best answer to the recession fears but rather the fiscal economic boost from the governments of the North of the Eurozone which new objective is to switch from an export model to more a domestic growth.
Such an ECB policy led again to a new period of government yields convergence. Southern European State debts outperformed significantly again, as shown by the Spanish government yield falling close to 0% on the 10 years maturity.
But the economic slowdown outcome out-passed the usual search for yield from investors, which became more cautious about the credit market which slightly underperformed at the end of the 3rd quarter: the numerous primary trades weighted on private bonds as investors analysed yields too low to bear a credit risk on the long run. Some credit defaults for high yield rated companies led investors to take their profits.
Euro yields rose over the last quarter of 2019 from their all-time low reached in September. The economic growth slowdown seemed to have bottomed out as shown by the rebound of most Euro leading corporate business indicators at the end of the year. Despite an industrial recession led by the fall in exports, Germany finally avoided recession thanks to its domestic activity resilience: low rates supported real estate activity and wage increase led to steady consumer spending. Moreover, political uncertainties diminished with the Brexit decision taken by the UK new government and the trade tariff war truce since China and the USA said to be ready to sign a “phase 1” deal.
In fact, the main economic outcome of the fourth quarter was the rebound in the Euro inflation whose core rate increased gradually up to +1.3% in November year on year. For the first time, inflation started to converge towards the ECB rate target of 2%. It is a significant change as it is due to a rise in service prices led by the protracted domestic demand.
However, for the time being, the ECB considers the inflation rebound as too recent and preferred to maintain its dovish stance, focus on the risks for the activity due to significant external threats. The new Central Bank president ensured clearly the stability of the monetary policy, leading the market to expect no rate increase for years. Nevertheless, she asked for the ECB policy review considering that now the Eurozone governments should take the lead by increasing the public expense to boost growth.
Such a better economic and political context led to global risk-on sentiment reinforced by the Fed’s rate cut policy. Thus, the equity market rallied again, reaching a new all-time high in the USA, which helped the credit market to absorb heavy primary flows and to perform up to year-end: Credit spreads tightened over the last quarter whereas German rates increased. Itraxx Xover spread tightened from +232 to +206 bps while 10 years Bund’s yield jumped from -57bps to -19bps.
Moreover, the ECB bond buy program, which recommenced in November, offered a support to the Euro credit as well as peripheral debt markets. Southern European State debts outperformed significantly again, going on their convergence towards core country rates, as shown by the Spanish government yields tightening to 0.65% on the 10 years maturity relative to the German yields. However, in the wake of its higher debt level than expected, the Italian BTP underperformed ahead of coming regional elections, given that the risk surrounding longevity of the government coalition became more prominent.
The Portfolio was importantly rotated over the year; however, the Portfolio was heavily exposed to credit, which ranged from 55 to 70% of the assets under management ("AUM"). Attractive spreads, improving economic picture and accommodative Central Banks behavior made credit very attractive in 2019: it ended being a strong performer. We invested in Italian government bonds as well, in particular BOTs and short maturity BTPs, as all core and semi-core countries’ government bonds were offering negative yields on short maturities.

FINANCIAL STATEMENTS INVESTMENT MANAGER’S REPORT
842 NEUBERGER BERMAN INVESTMENT FUNDS PLC
Neuberger Berman Ultra Short Term Euro Bond Fund (Continued) Investment Manager’s Report (Continued) Exposure to this asset class was however managed actively as Italian politics proved once again to be a bumpy road: government bonds ranged from 0 to 15% of the Portfolio AUM during the year. We invested both in nominal and inflation linked government bonds depending on relative value and inflation expectations.
European senior asset backed securities ("ABS") were used as well this year as they lagged credit rally during the first quarter and we could invest in very highly rated bonds at the beginning of the year offering much higher yields than equally rated corporate bonds. ABS ranged from 0 to 16% of the AUM of the Portfolio in 2019.
As far as spread risk is concerned, we actively managed the Portfolio spread risk in the so-called “tactical bucket” of the Portfolio, which went from 0% to 12% over the year. We mainly invested in corporate high yield, subordinated, corporate hybrids and inflation linked bonds. We started the year with a “tactical bucket” at 8%, which was gradually reduced to 4% at the end of April, aiming at taking profit after the strong rally of the first quarter 2019. We increased it to almost 12% in May given a sell-off in credit and thus we managed invest on attractive yields. After this parenthesis, the rally in credit spread continued until the summer when we decided to lower risks in the Portfolio as August is generally a month with low liquidity for credit. We thus brought the “tactical bucket” to 3% of the AUM. That was a good decision as spread widened in August after the Italian government collapsed. We managed to buy back risky bonds at the end of August at cheaper prices. The “tactical bucket” was then increased throughout the fourth quarter as trade war tensions were easing. This decision contributed positively to Portfolio performance as credit spreads rallied strongly into year-end.
Interest rate risk was managed actively in 2019: modified duration was slightly reduced during the first quarter, from slightly above 1 to around 0.5 years, and increased to 1 year at the end of June. This repositioning was mainly prompted by easing in the US-China trade war on one hand and by a very dovish stance of the European Central Bank on the other hand. The interest rate active management during the period contributed positively to the performance for the Portfolio. Moreover, the ECB highlighted throughout the period the weak inflation environment in Europe and admitted to be ready to use new tools to help boosting growth. This dovish stance was a clear support for risky assets, credit and Italian debt: this is the reason why we increased credit over the second quarter from 52% to 76%, after having been more cautious over the first quarter.
Notwithstanding the Portfolio’s natural short duration stance, we actively managed portfolio duration between 0.2 and 2 years over the second semester, thus exploiting the complete positive duration range available to the Portfolio. Duration management was primarily done through futures on German rates, Gilt and BTPs.
Over the next months, the market should face challenges coming from the coronavirus risk: euro bonds still discount a pessimistic economic scenario despite current resilient domestic activity. The Chinese flu will likely hurt global growth in the near term. Nevertheless, later this year, we anticipate inflation rate to rise again towards the ECB target and the tariff war fears to fade thanks to a truce between China and the USA. Because of the very low rates and steady corporate profits, we expect capital expenditure to recover later this year thanks to the sustainability of consumption. Thus, bond yields should start to rise back towards positive territories and credit spreads to come back to their average past year level supported by the cash in excess from investors.

BALANCE SHEET FINANCIAL STATEMENTS
The accompanying notes form an integral part of the financial statements.
ANNUAL REPORT 2019 843
Neuberger Berman Ultra Short Term Euro Bond Fund (Continued) Balance Sheet
As at As at
Note 31 December 2019 31 December 2018
EUR EUR
Current Assets
Financial Assets at Fair Value through Profit or Loss 2 358,003,520 11,066,379
Cash and cash equivalents 3 18,353,226 169,638
Receivable for investments sold 474,990 623
Receivable for shares issued 2,076,231 –
Due from brokers 937,536 38,933
Income receivable and other assets 1,930,070 121,341
Total Assets 381,775,573 11,396,914
Current Liabilities
Financial Liabilities at Fair Value through Profit or Loss 2 1,934,369 2,340
Bank overdraft 4 6,214 168
Payable for shares redeemed 59,223 –
Accrued expenses 151,543 36,241
Payable for investments purchased 2,007,784 1,946
Other payables 97,324 4,716
Liabilities (excluding Net Assets Attributable to Holders of Redeemable Participating Shares) 4,256,457 45,411
Net Assets Attributable to Holders of Redeemable Participating Shares 377,519,116 11,351,503

FINANCIAL STATEMENTS PROFIT AND LOSS ACCOUNT
The accompanying notes form an integral part of the financial statements.
844 NEUBERGER BERMAN INVESTMENT FUNDS PLC
Neuberger Berman Ultra Short Term Euro Bond Fund (Continued) Profit and Loss Account
Year Ended Period Ended
Note 31 December 2019 31 December 2018*
EUR EUR
Income
Interest Income 1,854,559 24,519
Net Gain/(Loss) on Financial Assets and Liabilities at Fair Value through Profit or Loss 11 2,964,778 (36,208)
4,819,337 (11,689)
Expenses
Management Fee 6 213,768 3,359
Distribution Fee 6 119,365 –
Administration Fee 6 216,712 5,476
Commitment Fee 19 18,083 –
Custody Fee 6 13,659 1,764
Depositary Fee 6 16,899 89
Professional Fee 9 57,325 2,451
Directors' Fee 7 3,630 1,754
Transaction Costs 9 56,804 3,279
Organisation Expenses 9 – 30,000
Audit Fee 8 17,410 13,530
VAT Rebate (2,846) –
Other Expenses 9 45,098 1,056
Expense Waiver 6 (229,345) (29,387)
Total Expenses 546,562 33,371
Finance Costs
Interest Expense 257 –
Distribution Paid 1 35,114 –
35,371 –
Withholding Tax 1 33,903 17
Profit/(Loss) Attributable to Holders of Redeemable Participating Shares from Operations 4,203,501 (45,077)
* Portfolio launched on 31 October 2018, as such Profit & Loss figures are not directly comparable. Income and expenses arose solely from continuing operations.

STATEMENT OF CHANGES IN NET ASSETS FINANCIAL STATEMENTS
The accompanying notes form an integral part of the financial statements.
ANNUAL REPORT 2019 845
Neuberger Berman Ultra Short Term Euro Bond Fund (Continued) Statement of Changes in Net Assets Attributable to Holders of Redeemable Participating Shares
Year Ended Period Ended
31 December 2019 31 December 2018*
EUR EUR
Net Assets Attributable to Holders of Redeemable Participating Shares at beginning of year/period 11,351,503 –
Profit/(Loss) Attributable to Holders of Redeemable Participating Shares from Operations 4,203,501 (45,077)
Subscriptions 5 474,909,057 11,396,580
Redemptions 5 (112,944,945) –
Net Assets Attributable to Holders of Redeemable Participating Shares at end of year/period 377,519,116 11,351,503
* Portfolio launched on 31 October 2018, as such Profit & Loss figures are not directly comparable.

FINANCIAL STATEMENTS SCHEDULE OF INVESTMENTS
846 NEUBERGER BERMAN INVESTMENT FUNDS PLC
Neuberger Berman Ultra Short Term Euro Bond Fund (Continued)
Schedule of Investments
Financial Assets at Fair Value through Profit or Loss
Principal Amount Security Description Coupon Maturity
Date Fair Value
EUR% of Net
Assets
Asset Backed Securities 18.36% (31 December 2018: 2.05%)
Euro
3,840,000 Brignole Co S.r.l. Series 2019-1 Class A 0.30% 24/07/2034 3,856,305 1.02
3,000,000 Brignole CQ S.r.l. Series 2019-1 Class A 0.25% 24/03/2036 3,014,007 0.80
6,859,500 Delft BV Series 2017-1 Class A 0.33% 17/01/2040 6,865,790 1.82
3,500,000 EDML BV Series 2019-1 Class A 0.28% 28/01/2058 3,525,364 0.93
39,614 E-Mac de 2006-I BV Class A 1.67% 25/08/2048 39,595 0.01
402,328 E-Mac de 2006-II BV Class A2 3.34% 25/02/2058 401,758 0.11
7,602,437 European Residential Loan Securitisation 2018-1 DAC Class A 0.55% 24/03/2061 7,609,295 2.02
7,094,910 European Residential Loan Securitisation 2019-NPL2 DAC Class A 1.05% 24/02/2058 7,042,464 1.87
5,336,615 European Residential Loan Securitisation 2019-PL1 DAC Class A 0.39% 24/03/2063 5,345,015 1.42
4,661,814 Jepson Residentail Series 2019-1 DAC Class A 0.40% 24/11/2057 4,661,809 1.23
1,700,000 Jepson Residentail Series 2019-1 DAC Class B 0.80% 24/11/2057 1,701,436 0.45
3,573,191 Lanterna S.r.l. Series 2015-1 Class A 0.10% 28/10/2065 3,576,718 0.95
443,422 Mulcair Securities DAC Series 1 Class A 0.60% 24/04/2071 445,488 0.12
1,823,140 Pembroke Property Finance Series 1 Class A 0.77% 01/06/2037 1,811,040 0.48
5,257,365 Pepper Residential Securities Trust No 25 Series 25X Class A1 0.66% 12/03/2061 5,260,617 1.39
2,867,125 Shamrock Residential Seires 2019-1 DAC Class A 0.40% 24/11/2057 2,871,752 0.76
2,842,202 Siena Mortgages S.r.l. Series 2010-7 Class A3 0.19% 22/11/2070 2,847,290 0.75
3,066,292 Tagus - Sociedade de Titularizacao de Creditos SA Series 4 Class A1 1.50% 12/05/2025 3,149,873 0.83
535,368 Tagus - Sociedade de Titularizacao de Creditos SA Series 4 Class SNR 2.42% 12/02/2021 542,888 0.14
3,350,372 Tagus - Sociedade de Titularizacao de Creditos SA Series 5 Class SEN 0.85% 12/02/2022 3,382,998 0.90
1,349,847 Tagus - Sociedade de Titularizacao de Creditos SA Series 6 Class SEN 1.10% 13/02/2023 1,368,159 0.36
Total Asset Backed Securities ** 69,319,661 18.36
Corporate Bonds 63.79% (31 December 2018: 89.97%)
Euro 1,400,000 Abbott Ireland Financing DAC* 0.00% 27/09/2020 1,402,315 0.37
200,000 AbbVie Inc* 1.38% 17/05/2024 210,597 0.06
1,300,000 ALD SA* 0.20% 16/07/2021 1,305,868 0.35
3,200,000 ALD SA* 0.88% 18/07/2022 3,264,214 0.86
3,000,000 Allergan Funding SCS* 1.50% 15/11/2023 3,154,192 0.84
4,500,000 Altria Group Inc* 1.00% 15/02/2023 4,582,601 1.21
1,000,000 Amadeus Capital Markets SAU* 0.13% 06/10/2020 1,002,147 0.27
2,000,000 American Honda Finance Corp* 0.35% 26/08/2022 2,019,218 0.53
2,400,000 Anglo American Capital Plc* 3.50% 28/03/2022 2,581,589 0.68
500,000 Anheuser-Busch InBev SA* 0.88% 17/03/2022 511,141 0.14
1,800,000 APRR SA* 2.25% 16/01/2020 1,801,651 0.48
600,000 Assicurazioni Generali SpA** 2.88% 14/01/2020 600,566 0.16

SCHEDULE OF INVESTMENTS FINANCIAL STATEMENTS
ANNUAL REPORT 2019 847
Neuberger Berman Ultra Short Term Euro Bond Fund (Continued)
Schedule of Investments (Continued)
Financial Assets at Fair Value through Profit or Loss (continued)
Principal Amount Security Description Coupon Maturity
DateFair Value
EUR% of Net
Assets
Corporate Bonds 63.79% (31 December 2018: 89.97%) (continued)
Euro (continued) 2,600,000 Assicurazioni Generali SpA** 4.13% 04/05/2026 3,068,284 0.81
1,100,000 AT&T Inc* 1.45% 01/06/2022 1,133,293 0.30
2,400,000 Banco Bilbao Vizcaya Argentaria SA* 0.75% 11/09/2022 2,441,176 0.65
500,000 Banco Comercial Portugues SA* 0.75% 31/05/2022 509,622 0.13
3,500,000 Banco Santander SA* 1.38% 14/12/2022 3,642,113 0.96
1,000,000 Bank of America Corp* 0.39% 04/05/2023 1,008,954 0.27
1,700,000 Bank of America Corp* 0.40% 07/02/2022 1,709,170 0.45
750,000 Bank of America Corp* 0.74% 07/02/2022 756,896 0.20
390,000 Bank of America Corp* 1.63% 14/09/2022 406,977 0.11
1,300,000 Banque Federative du Credit Mutuel SA* 0.13% 30/08/2021 1,305,271 0.35
3,200,000 Banque Federative du Credit Mutuel SA* 0.50% 16/11/2022 3,245,343 0.86
1,200,000 Barclays Plc* 1.88% 08/12/2023 1,269,489 0.34
1,300,000 BAT International Finance Plc* 2.38% 19/01/2023 1,391,433 0.37
800,000 BAT International Finance Plc* 4.00% 07/07/2020 817,100 0.22
1,000,000 Bayer AG* 2.38% 02/04/2075 1,027,024 0.27
600,000 Becton Dickinson and Co* 1.40% 24/05/2023 622,459 0.16
2,000,000 Belfius Bank SA* 0.75% 12/09/2022 2,037,645 0.54
1,000,000 Berry Global Inc* 1.50% 15/01/2027 1,010,000 0.27
945,000 BHP Billiton Finance Ltd* 4.75% 22/04/2076 1,002,872 0.27
1,200,000 BMW Finance NV* 0.13% 13/07/2022 1,204,993 0.32
1,500,000 BNP Paribas SA* 1.13% 15/01/2023 1,550,941 0.41
1,000,000 Booking Holdings Inc* 0.80% 10/03/2022 1,016,583 0.27
1,000,000 BPCE SA* 1.13% 14/12/2022 1,033,892 0.27
800,000 British Telecommunications Plc* 0.63% 10/03/2021 807,195 0.21
600,000 CaixaBank SA* 3.50% 15/02/2027 634,226 0.17
500,000 Capgemini SE* 1.75% 01/07/2020 502,478 0.13
3,000,000 Citigroup Inc* 1.38% 27/10/2021 3,082,082 0.82
515,000 CK Hutchison Finance 16 Ltd* 1.25% 06/04/2023 530,266 0.14
1,000,000 CNP Assurances* 4.00% 29/12/2049 1,128,866 0.30
800,000 Commerzbank AG* 0.50% 06/12/2021 808,456 0.21
800,000 Commerzbank AG* 4.00% 16/09/2020 823,248 0.22
1,500,000 Commerzbank AG* 4.00% 23/03/2026 1,691,276 0.45
1,000,000 Continental AG* 0.00% 05/02/2020 1,000,220 0.26
2,000,000 Continental AG* 0.11% 11/04/2021 2,006,233 0.53
650,000 Credit Agricole SA* 3.39% 18/10/2023 729,810 0.19
3,000,000 Credit Agricole SA* 4.25% 04/07/2021 3,191,474 0.85
2,000,000 Credit Suisse AG* 0.75% 17/09/2021 2,034,831 0.54
4,000,000 Credit Suisse AG* 1.38% 31/01/2022 4,124,347 1.09

FINANCIAL STATEMENTS SCHEDULE OF INVESTMENTS
848 NEUBERGER BERMAN INVESTMENT FUNDS PLC
Neuberger Berman Ultra Short Term Euro Bond Fund (Continued)
Schedule of Investments (Continued)
Financial Assets at Fair Value through Profit or Loss (continued)
Principal Amount Security Description Coupon Maturity
DateFair Value
EUR% of Net
Assets
Corporate Bonds 63.79% (31 December 2018: 89.97%) (continued)
Euro (continued) 1,000,000 CRH Finland Services OYJ* 2.75% 15/10/2020 1,015,940 0.27
550,000 Daimler AG* 1.75% 21/01/2020 550,567 0.15
1,500,000 Daimler International Finance BV* 0.20% 13/09/2021 1,506,398 0.40
1,000,000 Danske Bank A/S* 0.25% 28/11/2022 1,004,483 0.27
1,500,000 Danske Bank A/S* 1.38% 12/02/2030 1,495,878 0.40
1,000,000 DNB Bank ASA* 0.05% 14/11/2023 996,346 0.26
1,000,000 E.ON SE* 0.00% 29/09/2022 999,231 0.26
700,000 EDP Finance BV** 4.13% 20/01/2021 730,704 0.19
1,200,000 eircom Finance DAC* 1.75% 01/11/2024 1,203,461 0.32
1,300,000 eircom Finance DAC* 2.63% 15/02/2027 1,315,416 0.35
1,200,000 Europcar Mobility Group* 4.00% 30/04/2026 1,167,453 0.31
1,500,000 Faurecia SE* 3.13% 15/06/2026 1,598,175 0.42
400,000 FCA Bank SpA* 0.00% 17/06/2021 399,908 0.11
1,200,000 FCA Bank SpA* 0.36% 16/04/2021 1,199,559 0.32
3,000,000 FCA Bank SpA* 0.63% 24/11/2022 3,032,760 0.80
1,300,000 FCA Bank SpA* 1.25% 23/09/2020 1,313,358 0.35
1,600,000 FCA Bank SpA* 1.25% 21/06/2022 1,642,058 0.43
800,000 FCC Servicios Medio Ambiente Holding SA* 0.82% 04/12/2023 804,569 0.21
1,000,000 FCE Bank Plc* 1.11% 13/05/2020 1,003,980 0.27
750,000 FCE Bank Plc* 1.88% 24/06/2021 766,495 0.20
800,000 Fidelity National Information Services Inc* 0.13% 03/12/2022 801,502 0.21
2,000,000 Fidelity National Information Services Inc* 0.75% 21/05/2023 2,046,213 0.54
2,500,000 Fiserv Inc* 0.38% 01/07/2023 2,523,199 0.67
100,000 Ford Motor Credit Co LLC** 0.00% 01/12/2021 98,211 0.03
1,600,000 Ford Motor Credit Co LLC* 2.39% 17/02/2026 1,625,793 0.43
350,000 GE Capital European Funding Unlimited Co* 0.00% 21/01/2020 350,017 0.09
623,000 GE Capital European Funding Unlimited Co* 0.00% 17/05/2021 621,875 0.16
700,000 General Electric Co* 0.38% 17/05/2022 700,945 0.19
2,200,000 General Motors Financial Co Inc* 0.29% 10/05/2021 2,207,722 0.58
1,400,000 Glencore Finance Europe Ltd** 1.25% 17/03/2021 1,415,419 0.37
1,800,000 Glencore Finance Europe Ltd** 3.38% 30/09/2020 1,846,325 0.49
300,000 HeidelbergCement Finance Luxembourg SA* 3.25% 21/10/2021 317,067 0.08
250,000 Hutchison Whampoa Europe Finance 12 Ltd* 3.63% 06/06/2022 271,087 0.07
3,406,000 Hutchison Whampoa Finance 14 Ltd* 1.38% 31/10/2021 3,486,048 0.92
1,000,000 Imperial Brands Finance Plc* 0.50% 27/07/2021 1,007,032 0.27
500,000 Imperial Brands Finance Plc* 1.13% 14/08/2023 511,683 0.14
500,000 Imperial Brands Finance Plc* 2.25% 26/02/2021 510,579 0.14
900,000 International Game Technology Plc* 4.75% 15/02/2023 987,300 0.26

SCHEDULE OF INVESTMENTS FINANCIAL STATEMENTS
ANNUAL REPORT 2019 849
Neuberger Berman Ultra Short Term Euro Bond Fund (Continued)
Schedule of Investments (Continued)
Financial Assets at Fair Value through Profit or Loss (continued)
Principal Amount Security Description Coupon Maturity
DateFair Value
EUR% of Net
Assets
Corporate Bonds 63.79% (31 December 2018: 89.97%) (continued)
Euro (continued) 665,000 Intesa Sanpaolo SpA** 0.66% 15/06/2020 667,409 0.18
1,000,000 Intesa Sanpaolo SpA** 1.00% 04/07/2024 1,015,431 0.27
1,000,000 Intesa Sanpaolo SpA** 1.13% 04/03/2022 1,020,594 0.27
1,400,000 Islandsbanki HF* 1.13% 12/04/2022 1,428,224 0.38
2,100,000 Jaguar Land Rover Automotive Plc* 6.88% 15/11/2026 2,212,455 0.59
2,500,000 Johnson Controls International Plc* 0.00% 04/12/2020 2,501,703 0.66
2,700,000 JPMorgan Chase & Co* 1.38% 16/09/2021 2,772,081 0.73
2,500,000 JPMorgan Chase & Co* 2.75% 24/08/2022 2,683,522 0.71
1,000,000 JPMorgan Chase & Co* 2.75% 01/02/2023 1,083,455 0.29
1,000,000 LeasePlan Corp NV* 0.13% 13/09/2023 985,477 0.26
4,000,000 LeasePlan Corp NV* 1.00% 08/04/2020 4,012,712 1.06
2,500,000 Lloyds Bank Corporate Markets Plc* 0.25% 04/10/2022 2,510,598 0.66
1,400,000 McKesson Corp* 0.63% 17/08/2021 1,414,690 0.37
4,000,000 Medtronic Global Holdings SCA* 0.00% 02/12/2022 4,004,910 1.06
1,000,000 Mercedes-Benz Finance Co Ltd* 0.00% 21/08/2022 992,931 0.26
2,000,000 Metropolitan Life Global Funding I* 0.88% 20/01/2022 2,038,647 0.54
1,300,000 Morgan Stanley* 0.29% 08/11/2022 1,307,501 0.35
2,435,000 National Australia Bank Ltd* 0.35% 07/09/2022 2,462,054 0.65
400,000 Naturgy Capital Markets SA* 6.00% 27/01/2020 401,666 0.11
500,000 NatWest Markets Plc* 0.32% 18/06/2021 502,110 0.13
1,200,000 NatWest Markets Plc* 5.50% 23/03/2020 1,215,270 0.32
1,200,000 Netflix Inc* 3.88% 15/11/2029 1,273,500 0.34
1,200,000 Nidda Healthcare Holding GmbH* 3.50% 30/09/2024 1,241,280 0.33
3,000,000 Opel Finance International BV* 1.17% 18/05/2020 3,011,649 0.80
600,000 Origin Energy Finance Ltd* 3.50% 04/10/2021 635,705 0.17
743,000 Philip Morris International Inc* 1.88% 03/03/2021 760,409 0.20
1,500,000 Piaggio & C SpA* 3.63% 30/04/2025 1,585,515 0.42
2,300,000 Prologis LP* 1.38% 13/05/2021 2,338,302 0.62
1,000,000 PSA Banque France SA* 0.50% 12/04/2022 1,009,937 0.27
2,400,000 Raiffeisen Bank International AG* 0.25% 05/07/2021 2,413,127 0.64
1,500,000 RCI Banque SA* 0.28% 14/03/2022 1,502,904 0.40
1,000,000 Santander UK Plc* 0.88% 25/11/2020 1,009,419 0.27
1,900,000 Scania CV AB* 0.11% 10/12/2021 1,903,467 0.50
1,000,000 Scania CV AB* 0.20% 27/08/2021 1,003,614 0.27
1,000,000 Schaeffler AG* 1.13% 26/03/2022 1,021,780 0.27
1,200,000 SGL Carbon SE* 4.63% 30/09/2024 1,176,000 0.31
2,540,000 Sky Ltd* 1.50% 15/09/2021 2,610,650 0.69
2,400,000 Societe Generale SA* 0.06% 06/03/2023 2,396,201 0.63

FINANCIAL STATEMENTS SCHEDULE OF INVESTMENTS
850 NEUBERGER BERMAN INVESTMENT FUNDS PLC
Neuberger Berman Ultra Short Term Euro Bond Fund (Continued)
Schedule of Investments (Continued)
Financial Assets at Fair Value through Profit or Loss (continued)
Principal Amount Security Description Coupon Maturity
DateFair Value
EUR% of Net
Assets
Corporate Bonds 63.79% (31 December 2018: 89.97%) (continued)
Euro (continued) 400,000 SSE Plc* 2.00% 17/06/2020 404,052 0.11
1,000,000 SSE Plc* 2.38% 29/12/2049 1,023,622 0.27
4,000,000 Swedbank AB* 1.00% 01/06/2022 4,096,600 1.08
2,700,000 Takeda Pharmaceutical Co Ltd* 0.38% 21/11/2020 2,711,496 0.72
1,300,000 Takeda Pharmaceutical Co Ltd* 1.13% 21/11/2022 1,339,474 0.35
400,000 Tasty Bondco 1 SA* 6.25% 15/05/2026 420,290 0.11
100,000 Telefonica Europe BV* 2.63% 29/12/2049 103,557 0.03
200,000 Telefonica Europe BV* 3.88% 29/12/2049 218,043 0.06
400,000 Teva Pharmaceutical Finance Netherlands II BV* 6.00% 31/01/2025 424,000 0.11
485,000 Total SA* 2.25% 29/12/2049 496,527 0.13
700,000 Toyota Finance Australia Ltd* 0.00% 09/04/2021 701,597 0.19
1,000,000 UBS AG* 0.25% 10/01/2022 1,006,863 0.27
3,000,000 UniCredit SpA* 2.00% 04/03/2023 3,154,327 0.84
600,000 UniCredit SpA* 2.00% 23/09/2029 594,139 0.16
1,400,000 UniCredit SpA* 4.88% 20/02/2029 1,558,718 0.41
4,500,000 Unione di Banche Italiane SpA* 1.00% 22/07/2022 4,499,476 1.19
800,000 Unione di Banche Italiane SpA* 4.38% 12/07/2029 834,735 0.22
400,000 Unione di Banche Italiane SpA* 5.88% 04/03/2029 438,547 0.12
900,000 UPCB Finance VII Ltd* 3.63% 15/06/2029 958,896 0.25
1,700,000 Valeo SA* 0.38% 12/09/2022 1,711,251 0.45
2,000,000 Vivendi SA* 0.75% 26/05/2021 2,022,193 0.54
3,500,000 Volkswagen Bank GmbH* 0.38% 05/07/2022 3,511,694 0.93
500,000 Volkswagen Bank GmbH* 0.63% 08/09/2021 505,409 0.13
2,000,000 Volkswagen Financial Services AG* 0.75% 14/10/2021 2,027,512 0.54
220,000 Volkswagen International Finance NV* 2.00% 14/01/2020 220,149 0.06
100,000 Volkswagen International Finance NV* 2.70% 29/12/2049 103,976 0.03
1,000,000 Volkswagen Leasing GmbH** 2.38% 06/09/2022 1,057,742 0.28
1,000,000 Volvo Treasury AB* 0.10% 09/08/2021 1,003,973 0.27
1,800,000 Volvo Treasury AB* 0.10% 24/05/2022 1,801,996 0.48
3,600,000 Volvo Treasury AB* 4.20% 10/06/2075 3,664,901 0.97
2,000,000 Vonovia Finance BV* 2.13% 09/07/2022 2,105,258 0.56
1,500,000 Wells Fargo & Co* 2.25% 02/05/2023 1,607,279 0.43
5,000,000 Westpac Securities NZ Ltd* 0.50% 29/09/2020 5,030,447 1.33
1,500,000 Whirlpool Corp* 0.63% 12/03/2020 1,502,374 0.40
Total Corporate Bonds 240,805,405 63.79

SCHEDULE OF INVESTMENTS FINANCIAL STATEMENTS
ANNUAL REPORT 2019 851
Neuberger Berman Ultra Short Term Euro Bond Fund (Continued)
Schedule of Investments (Continued)
Financial Assets at Fair Value through Profit or Loss (continued)
Principal Amount Security Description Coupon Maturity
DateFair Value
EUR% of Net
Assets
Government Bonds 12.52% (31 December 2018: 5.45%)
Euro 200,000 Acquirente Unico SpA* 2.80% 20/02/2026 215,582 0.06
2,000,000 Adif-Alta Velocidad* 1.88% 22/09/2022 2,107,814 0.56
1,500,000 Autonomous Community of Madrid Spain* 1.19% 08/05/2022 1,549,497 0.41
400,000 Autonomous Community of Madrid Spain* 3.88% 01/09/2022 442,967 0.12
1,250,000 Cassa Depositi e Prestiti SpA** 2.70% 28/06/2026 1,303,626 0.35
1,800,000 Croatia Government International Bond* 3.88% 30/05/2022 1,965,943 0.52
500,000 Cyprus Government International Bond* 3.88% 06/05/2022 546,927 0.14
2,825,602 Deutsche Bundesrepublik Inflation Linked Bond* 0.10% 15/04/2023 2,944,642 0.78
3,674,720 French Republic Government Bond OAT* 0.10% 01/03/2021 3,733,407 0.99
3,675,665 French Republic Government Bond OAT** 0.10% 25/07/2021 3,756,366 1.00
1,401,625 French Republic Government Bond OAT* 0.10% 01/03/2029 1,547,823 0.41
3,731,700 French Republic Government Bond OAT** 0.25% 25/07/2024 4,016,108 1.06
1,893,407 Italy Buoni Poliennali Del Tesoro** 0.25% 20/11/2023 1,895,761 0.50
1,712,265 Italy Buoni Poliennali Del Tesoro** 0.40% 11/04/2024 1,713,372 0.45
982,025 Italy Buoni Poliennali Del Tesoro** 0.45% 22/05/2023 989,751 0.26
5,500,000 Italy Buoni Poliennali Del Tesoro** 1.35% 15/04/2022 5,660,652 1.50
750,000 Italy Government International Bond* 5.13% 31/07/2024 896,544 0.24
1,800,000 Portugal Obrigacoes do Tesouro OT* 2.00% 30/11/2021 1,856,854 0.49
2,450,000 Portugal Obrigacoes do Tesouro OT* 2.05% 12/08/2021 2,518,718 0.67
1,000,000 Portugal Obrigacoes do Tesouro OT* 2.20% 19/05/2021 1,028,799 0.27
2,905,673 SNCF Reseau* 2.45% 28/02/2023 3,208,432 0.85
3,195,232 Spain Government Inflation Linked Bond* 0.15% 30/11/2023 3,353,314 0.89
Total Government Bonds 47,252,899 12.52
Total Investments 357,377,965 94.67
Forward Currency Contracts 0.09% (31 December 2018: 0.00%)
Amount Receivable
Amount Payable
Maturity Date Counterparty Contracts Unrealised
Gain EUR% of Net
Assets
CHF Hedged Classes CHF 29,516 € 27,021 22/01/2020 Westpac Banking Corp 1 137 0.00
USD Hedged Classes € 54,543,219 US$ 60,914,000 22/01/2020 Westpac Banking Corp 2 342,952 0.09
Total Unrealised Gain on Forward Currency Contracts ∞ 343,089 0.09

FINANCIAL STATEMENTS SCHEDULE OF INVESTMENTS
852 NEUBERGER BERMAN INVESTMENT FUNDS PLC
Neuberger Berman Ultra Short Term Euro Bond Fund (Continued)
Schedule of Investments (Continued)
Financial Assets at Fair Value through Profit or Loss (continued)
Futures Contracts 0.07% (31 December 2018: 0.00%)
Number of Contracts Description Unrealised
Gain EUR% of Net
Assets
(20) Euro-BOBL Future March 2020 14,200 0.00
66 Euro-Bund Future January 2020 7,809 0.00
258 Euro-Bund Future January 2020 188,767 0.05
(2) Euro-Bund Future March 2020 3,860 0.00
(10) Euro-Buxl 30-Year Bond Future March 2020 53,000 0.02
(4) Euro-OAT Future March 2020 6,280 0.00
(90) Euro-Schatz Future March 2020 8,550 0.00
Total Unrealised Gain on Futures Contracts ± 282,466 0.07
Fair Value % of Net
EUR Assets
Total Financial Assets at Fair Value through Profit or Loss 358,003,520 94.83
Financial Liabilities at Fair Value through Profit or Loss Forward Currency Contracts (0.51%) (31 December 2018: (0.00%))
Amount Receivable
Amount Payable
Maturity Date Counterparty Contracts Unrealised
Loss EUR% of Net
Assets
CHF Hedged Classes € 86 CHF 94 22/01/2020 Westpac Banking Corp 1 (0) (0.00)
USD Hedged Classes US$ 40,828,592 € 36,961,817 22/01/2020 Citibank NA 2 (633,213) (0.17)
US$ 41,537,285 € 37,634,847 22/01/2020 Goldman Sachs International 3 (675,659) (0.18)
US$ 39,281,936 € 35,555,521 22/01/2020 Westpac Banking Corp 5 (603,105) (0.16)
Total Unrealised Loss on Forward Currency Contracts ∞ (1,911,977) (0.51)
Futures Contracts (0.00%) (31 December 2018: (0.02%))
Number of Contracts Description Unrealised
Loss EUR% of Net
Assets
70 Euro-BTP Future March 2020 (19,085) (0.00)
Total Unrealised Loss on Futures Contracts ± (19,085) (0.00)

SCHEDULE OF INVESTMENTS FINANCIAL STATEMENTS
ANNUAL REPORT 2019 853
Neuberger Berman Ultra Short Term Euro Bond Fund (Continued)
Schedule of Investments (Continued)
Financial Liabilities at Fair Value through Profit or Loss (continued)
Inflation Swap Contracts (0.00%) (31 December 2018: (0.00%))
Notional Amount Expiration Date Counterparty Receive
/(Pay)# Fixed Rate Variable Rate Fair ValueEUR
% of Net Assets
EUR 1,600,000 15/02/22 LCH Clearnet Ltd1 Receive 0.99% CPTFEMU (3,307) (0.00)
Total Inflation Swap Contracts at Fair Value± (3,307) (0.00)
# Receive - Funds receives variable rate and pays fixed rate.
(Pay) - Fund pays variable rate and receives fixed rate. 1 Centrally cleared swap.
Fair Value % of Net
EUR Assets
Total Financial Liabilities at Fair Value through Profit or Loss (1,934,369) (0.51)
Net Financial Assets at Fair Value through Profit or Loss 356,069,151 94.32
Other Net Assets 21,449,965 5.68
Net Assets Attributable to Holders of Redeemable Participating Shares 377,519,116 100.00
% ofTotal
AssetsPortfolio Analysis EUR
* Transferable securities and/or money market instruments admitted to an official stock exchange listing 257,201,983 67.37
** Transferable securities and/or money market instruments dealt in on a regulated market 100,175,982 26.24
± Financial derivative instruments traded on a regulated market 260,074 0.07
∞ OTC financial derivative instruments (1,568,888) (0.41)
Total Investments 356,069,151 93.27

FINANCIAL STATEMENTS STATEMENT OF SIGNIFICANT PURCHASES AND SALES
854 NEUBERGER BERMAN INVESTMENT FUNDS PLC
Neuberger Berman Ultra Short Term Euro Bond Fund (Continued) Statement of Significant Purchases and Sales (Unaudited) In accordance with the European Communities (Undertakings for Collective Investment in Transferable Securities) Regulations, 2011 as amended, a statement of changes in the composition of the Schedule of Investments during the reporting period is provided to ensure that Shareholders can identify changes in the investments held by the Portfolio. The following statements present the aggregate purchases and sales of transferable securities exceeding one percent of the total value of purchases or sales, respectively, for the period. At a minimum, the largest twenty purchases and twenty sales are presented, if available.
Top twenty purchases:
Units Security Description Cost EUR
8,897,991 European Residential Loan Securitisation 2018-1 DAC Class A, 0.55%, 24/03/2061 8,890,305
7,221,030 Delft 2017 BV Class A, 0.33%, 17/01/2040 7,233,074
7,200,000 European Residential Loan Securitisation 2019-NPL2 DAC, 1.03%, 24/02/2058 7,128,720
7,000,000 Westpac Securities NZ Ltd, 0.50%, 29/09/2020 7,045,950
6,700,000 Italy Buoni Poliennali Del Tesoro, 1.35%, 15/04/2022 6,846,603
6,500,000 Swedbank AB, 1.00%, 01/06/2022 6,686,130
6,000,000 Credit Suisse AG, 1.38%, 31/01/2022 6,215,136
5,540,000 Altria Group Inc, 1.00%, 15/02/2023 5,673,949
5,530,000 European Residential Loan Securitisation 2019-PL1 DAC, 0.39%, 24/03/2063 5,517,834
5,505,977 Jepson 2019 DAC, 0.40%, 24/11/2057 5,503,046
5,500,000 Pepper Residential Securities Trust No 25, 0.66%, 12/03/2061 5,500,000
5,300,000 American Honda Finance, 0.35%, 26/08/2022 5,355,814
5,035,000 National Australia Bank Ltd, 0.35%, 07/09/2022 5,101,462
5,100,000 Italy Buoni Ordinari del Tesoro BOT, 0.00%, 14/04/2020 5,099,524
5,000,000 Unione di Banche Italiane SpA, 1.00%, 22/07/2022 5,068,986
4,560,972 Lanterna Srl, 0.10%, 28/10/2065 4,555,604
4,500,000 LeasePlan Corp NV, 1.00%, 08/04/2020 4,526,280
4,500,000 Unione di Banche Italiane SpA, 1.00%, 22/07/2022 4,510,665
4,500,000 DNB Bank ASA, 0.05%, 14/11/2023 4,490,685
4,206,000 Hutchison Whampoa Finance 14 Ltd, 1.38%, 31/10/2021 4,341,812

STATEMENT OF SIGNIFICANT PURCHASES AND SALES FINANCIAL STATEMENTS
ANNUAL REPORT 2019 855
Neuberger Berman Ultra Short Term Euro Bond Fund (Continued) Statement of Significant Purchases and Sales (Unaudited) (Continued) Top twenty sales:
Units Security Description Proceeds EUR
5,100,000 Italy Buoni Ordinari del Tesoro BOT, 0.00%, 14/04/2020 5,106,899
5,000,000 Unione di Banche Italiane SpA, 1.00%, 22/07/2022 5,072,629
4,000,000 Eni SpA, 4.00%, 29/06/2020 4,132,080
4,000,000 Coca-Cola Co, 0.00%, 08/03/2021 4,015,265
3,500,000 Intesa Sanpaolo SpA, 2.13%, 30/08/2023 3,720,500
3,413,430 French Republic Government Bond OAT, 1.10%, 25/07/2022 3,649,878
3,500,000 DNB Bank ASA, 0.05%, 14/11/2023 3,496,695
3,200,000 Erste Abwicklungsanstalt, 0.00%, 18/11/2022 3,237,827
3,100,000 Sunrise SPV Z70 Srl, 0.40%, 27/05/2044 3,119,685
3,000,000 Italy Buoni Ordinari del Tesoro BOT, 0.00%, 14/07/2020 3,004,941
2,755,000 Intesa Sanpaolo SpA, 2.00%, 18/06/2021 2,856,656
2,500,000 Intesa Sanpaolo SpA, 3.93%, 15/09/2026 2,792,744
2,300,000 Portugal Obrigacoes do Tesouro OT, 2.25%, 18/04/2034 2,768,968
2,600,000 National Australia Bank Ltd, 0.35%, 07/09/2022 2,636,204
2,630,000 CK Hutchison Group Telecom Finance SA, 0.38%, 17/10/2023 2,632,343
2,500,000 Swedbank AB, 1.00%, 01/06/2022 2,564,825
2,500,000 FCA Bank SpA, 1.25%, 21/01/2021 2,541,425
2,400,000 Banco Comercial Portugues SA, 0.75%, 31/05/2022 2,459,614
2,400,000 Fidelity National Information Services Inc, 0.00%, 21/05/2021 2,402,872
2,175,000 Carlsberg Breweries, 2.63%, 15/11/2022 2,348,761

FINANCIAL STATEMENTS INVESTMENT MANAGER’S REPORT
856 NEUBERGER BERMAN INVESTMENT FUNDS PLC
Neuberger Berman Euro Opportunistic Bond Fund Investment Manager’s Report For the 12 months ended 31 December 2019, the total return for the EUR I Accumulating Class was 8.12%. Over the same period, the benchmark index, the Bloomberg Barclays Euro Aggregate Index (EUR Total Return, Hedged) (the “Index”) returned 5.98%. (Performance for all share classes is provided in Appendix II. Performance data quoted represent past performance and do not indicate future results. Total returns shown are net of all fees and expenses and include reinvestment of income dividends and other distributions, if any).
Euro government yields went down during the first eight month of 2019, reaching a new low for most countries. Rising political uncertainties like Brexit and the tariff trade war weighed on growth pace, particularly on German exports, which raised fears of recession in the wake of the fall in corporate confidence. Particularly during the second quarter of the year, the European Central Bank (“ECB”) started to react by extending its forward guidance period, announcing no key rate increase up to mid-2020. Later, when the growth outlook was reviewed to the downside below its potential level, the ECB cut its medium term inflation forecasts: considering its inflation target of 2% not being achievable in the coming years, the ECB concluded that further accommodative monetary policy was needed in the coming months.
During the summer, particularly in Germany, the service sector showed its resilience which reduced the market expectation of a recession which had been feared in the wake of the deeper than expected Chinese slowdown. A large part of Eurozone exports go to Asia, especially in the automobile sector. This led bond market yields to bottom up.
Nevertheless, the ECB decided to focus on all these growing uncertainties to support the activity when the inflation risk, being so low, is not its issue. The ECB decided to act again mid-September by extending its forward guidance period, cutting its key rate by 10 basis points (“bps”) and reopening its Quantitative Easing (“QE”) program. However, it failed to meet the market expectations, which were very strong, leading to a small rebound of rates in September. Investors seem to agree that central policy isn’t the best answer to recession fears but rather a fiscal economic boost from governments north of the Eurozone whose new objective is to switch from an export model to more a more domestic growth model.
Such an ECB policy led again to a new period of government yields convergence. Certain countries in the south of Europe outperformed significantly again, as shown by the Spanish government yield falling close to 0% on the 10 years maturity.
The economic slowdown made investors in their usual search for returns more cautious about the credit market, which slightly underperformed at the end of the 3rd quarter. Numerous trades weighted on private bonds as investors analysed yields they believed were too low to bear the credit risk in the long-run. Some credit defaults on high yield bonds led investors to take their profits.
Euro yields rose over the last quarter of 2019 from their all-time low reached in September. The economic growth slowdown seemed to have bottomed up as shown by the rebound of most Euro leading corporate business indicators at the end of the year. Despite an industrial recession led by the fall in exports, Germany avoided recession thanks to its domestic activity resilience: low rates supported real estate activity and wage increase led to steady consumer spending. Moreover, political uncertainties diminished with the Brexit decision taken by the UK new government and the trade tariff war truce since China and the USA said to be ready to sign a “Phase 1” deal.
In fact, the main economic outcome of the fourth quarter was the rebound in Euro inflation whose core rate increased 1.3% year over year in November. For the first time, inflation started to convergence towards the ECB rate target of 2%. It is a significant change as it is due to a rise in service prices led by protracted domestic demand.
However, for the time being, the ECB considers the inflation rebound as too recent and preferred to maintain its dovish stance, focus on the risks for the activity due to significant external threats. The new ECB president ensured clearly the stability of the monetary policy, leading the market to expect no rate increase for years. Nevertheless, she asked for the ECB policy review considering that now the Euro zone governments should take the lead by increasing the public expense to boost growth.
Such a better economic and political context led to global risk-on sentiment reinforced by the US Federal Reserve’s rate cut policy. Thus, the equity market rallied again, reaching a new all-time high in the US, which helped the credit market to absorb heavy primary flows and to perform up to year-end. Credit spreads tightened over the last quarter whereas German rates increased as witnessed by the tightening of the Itraxx Crossover spread from +232 to +206 bps while the 10-year Bund yield jumped from -57bps to -19bps.
Moreover, the ECB bond buy program re started in November which offered a support to the euro credit as well as peripheral debt markets. Government debts from the south of Europe outperformed significantly again, going on their convergence towards core country rates, as shown by the Spanish government yields tightening to 0.65% on the 10-year maturity relative to the German yields. But in the wake of higher than expected debt level, the Italian BTP underperformed ahead of regional elections, given that the risk surrounding longevity of the government coalition became more prominent.

INVESTMENT MANAGER’S REPORT FINANCIAL STATEMENTS
ANNUAL REPORT 2019 857
Neuberger Berman Euro Opportunistic Bond Fund (Continued) Investment Manager’s Report (Continued) The bond market outperformed strongly until the summer despite most high quality government bonds offering negative returns. In such a context, we decided to underweight duration exposure mainly in order to avoid investing in these negative returns. We reduced significantly our exposures to securities having a maturity below 5 years or a rating of AAA or AA. The very accommodative ECB monetary policy led to a new period of government yields convergence. Part of the Portfolio outperformance versus the Index has been driven by our overweight exposure to Portugal and tactically Spain and Italy, to take into account the short term market volatility. The credit market also performed but with a strong volatility due to the fears of the diffusion of the trade war to all around the world and then to the Eurozone for which growth is very sensitive to exports.
The resilience of domestic activity and the extension of the ECB’s very accommodative monetary policy finally convinced investors searching for returns to buy private sector bonds. In this context, we got additional source of outperformance by overweighing significantly private sector bonds, especially the lowest of the investment grade category. We took advantage of the extra premium offered on the primary market to increase our credit exposure mainly to sectors such as banks, technology, information technology and telecomunications.
In September, we also moved our yield curve positioning to reinforce again the 10-year bucket at the expense of the very long end of the curve: we switched from a flattening to a steeping yield curve strategy.
In June and again in July, we began investing in inflation-linked bonds in order to reach 14% of the Portfolio’s net assets as their pricing is not yet reflective of any inflation recovery, what we believe was a consequence of the global tariff trade war.
Finally, in the fourth quarter of the year, we actively managed the Portfolio duration under exposure between -0.75 and -3.75 years below the benchmark duration. This investment policy was implemented mainly through option strategies, to take advantage of the market volatility. This policy brought an efficient hedge of our peripheral and credit debt overweighted exposures. In addition, the Portfolio underweighted the very long bonds from core countries due to the rising inflation outlook.
In parallel, we started to realize some profits on our peripheral government debt significant over exposure by selling a few long-term bonds of Portugal, Italy and Spain. We still stick to our strong conviction of the yield convergence between the Eurozone countries due to the very accommodative ECB monetary policy reinforced by the re launch of its bond buy program. However, we anticipate a strong primary market at the start of the next year, which could out pass the demand.
Our strategy is to also look for incremental returns. During the period, we took advantage of the numerous primary market auctions to re-increase our private sector over exposure relative to the benchmark. We believe the following sectors could be additive to returns: banks, technology, information technology, telecommunications and also bonds with a below-investment grade rating.
In addition, we continued to increase our exposure to euro inflation rates through inflation-linked bonds and swaps as the market was not anticipating any inflation recovery despite its core rate year on year started to rise since the autumn.
Over the next months, we believe the market could face challenges. Bonds still discount a pessimistic economic scenario despite current resilient domestic activity, corporate outlook improvement and support from the very accommodative ECB policy. We believe the very low rates and steady corporate profits should lead to higher capital expenditure in the wake of the steady consumption, implying growth pace to beat the market consensus. In the euro area, recent slowdown has been caused, in our opinion, mainly by an increasingly protectionist policy of the US administration and related weakness in emerging markets, especially China. Weakness in the automotive sector driven by the change in emission regulations and impact of tariffs on car exports exacerbated this effect as companies cut both production and inventories. We anticipate now a return to normal activity, which means a rebound. In this more optimistic context, we believe the inflation rate could go on rising above 1.5%. Thus, bond yields could rise back toward positive territories and credit spreads could stay at current levels supported by the cash in excess from investors.

FINANCIAL STATEMENTS BALANCE SHEET
The accompanying notes form an integral part of the financial statements.
858 NEUBERGER BERMAN INVESTMENT FUNDS PLC
Neuberger Berman Euro Opportunistic Bond Fund (Continued) Balance Sheet
As at As at
Note 31 December 2019 31 December 2018
EUR EUR
Current Assets
Financial Assets at Fair Value through Profit or Loss 2 10,238,889 4,816,209
Cash and cash equivalents 3 317,053 148,876
Receivable for investments sold 4,300 –
Due from brokers 84,901 15,885
Income receivable and other assets 122,018 74,071
Total Assets 10,767,161 5,055,041
Current Liabilities
Financial Liabilities at Fair Value through Profit or Loss 2 8,193 1,521
Bank overdraft 4 108 17
Accrued expenses 37,330 30,349
Payable for investments purchased 104,397 970
Other payables 5,041 2,293
Liabilities (excluding Net Assets Attributable to Holders of Redeemable Participating Shares) 155,069 35,150
Net Assets Attributable to Holders of Redeemable Participating Shares 10,612,092 5,019,891

PROFIT AND LOSS ACCOUNT FINANCIAL STATEMENTS
The accompanying notes form an integral part of the financial statements.
ANNUAL REPORT 2019 859
Neuberger Berman Euro Opportunistic Bond Fund (Continued) Profit and Loss Account
Year Ended Period Ended
Note 31 December 2019 31 December 2018*
EUR EUR
Income
Interest Income 122,722 11,225
Net Gain/(Loss) on Financial Assets and Liabilities at Fair Value through Profit or Loss 11 481,881 40,346
604,603 51,571
Expenses
Management Fee 6 28,435 2,260
Administration Fee 6 37,966 3,658
Commitment Fee 19 688 –
Custody Fee 6 8,381 1,371
Depositary Fee 6 750 32
Professional Fee 9 34,855 1,872
Directors' Fee 7 3,629 1,753
Transaction Costs 9 10,392 2,036
Organisation Expenses 9 – 30,000
Audit Fee 8 15,824 13,530
VAT Rebate (129) –
Other Expenses 9 12,272 810
Expense Waiver 6 (120,562) (25,642)
Total Expenses 32,501 31,680
Finance Costs
Distribution Paid 1 73,422 –
73,422 –
Withholding Tax 1 757 –
Profit/(Loss) Attributable to Holders of Redeemable Participating Shares from Operations 497,923 19,891
* Portfolio launched on 14 November 2018, as such Profit & Loss figures are not directly comparable. Income and expenses arose solely from continuing operations.

FINANCIAL STATEMENTS STATEMENT OF CHANGES IN NET ASSETS
The accompanying notes form an integral part of the financial statements.
860 NEUBERGER BERMAN INVESTMENT FUNDS PLC
Neuberger Berman Euro Opportunistic Bond Fund (Continued) Statement of Changes in Net Assets Attributable to Holders of Redeemable Participating Shares
Year Ended Period Ended
31 December 2019 31 December 2018*
EUR EUR
Net Assets Attributable to Holders of Redeemable Participating Shares at beginning of year/period 5,019,891 –
Profit/(Loss) Attributable to Holders of Redeemable Participating Shares from Operations 497,923 19,891
Subscriptions 5 5,094,278 5,000,000
Net Assets Attributable to Holders of Redeemable Participating Shares at end of year/period 10,612,092 5,019,891
* Portfolio launched on 14 November 2018, as such Profit & Loss figures are not directly comparable.

SCHEDULE OF INVESTMENTS FINANCIAL STATEMENTS
ANNUAL REPORT 2019 861
Neuberger Berman Euro Opportunistic Bond Fund (Continued)
Schedule of Investments
Financial Assets at Fair Value through Profit or Loss
Principal Amount Security Description Coupon Maturity
DateFair Value
EUR% of Net
Assets
Asset Backed Securities 3.52% (31 December 2018: 0.00%)
Euro 197,081 European Residential Loan Securitisation 2019-NPL2 DAC Class A 1.03% 24/02/2058 195,624 1.84
93,236 Jepson Residential Series 2019-1 DAC Class A 0.38% 24/11/2057 93,236 0.88
85,233 Pembroke Property Finance Series 1 Class A 0.77% 01/06/2037 84,668 0.80
Total Asset Backed Securities ** 373,528 3.52
Corporate Bonds 37.52% (31 December 2018: 66.41%)
Euro 100,000 AbbVie Inc* 0.75% 18/11/2027 101,234 0.95
100,000 Anheuser-Busch InBev SA* 1.65% 28/03/2031 108,940 1.03
100,000 Assicurazioni Generali SpA** 4.13% 04/05/2026 118,011 1.11
100,000 AT&T Inc* 2.45% 15/03/2035 108,793 1.03
100,000 Berry Global Inc* 1.50% 15/01/2027 101,000 0.95
100,000 Capital One Financial Corp* 1.65% 12/06/2029 103,788 0.98
100,000 CK Hutchison Finance 16 II Ltd* 0.88% 03/10/2024 101,647 0.96
100,000 CNP Assurances* 4.00% 29/12/2049 112,887 1.06
100,000 Commerzbank AG* 4.00% 23/03/2026 112,752 1.06
100,000 Credit Agricole SA* 2.85% 27/04/2026 109,674 1.03
100,000 Credit Suisse Group AG* 1.00% 24/06/2027 102,448 0.97
100,000 Daimler International Finance BV* 0.63% 06/05/2027 99,278 0.94
100,000 Danske Bank A/S* 1.38% 12/02/2030 99,725 0.94
100,000 Dexia Credit Local SA* 0.63% 17/01/2026 103,404 0.98
100,000 EDP Finance BV* 1.63% 26/01/2026 106,800 1.01
100,000 eircom Finance DAC* 2.63% 15/02/2027 101,186 0.95
100,000 Europcar Mobility Group* 4.00% 30/04/2026 97,288 0.92
100,000 European Financial Stability Facility* 0.88% 10/04/2035 106,338 1.00
100,000 Faurecia SE* 3.13% 15/06/2026 106,545 1.00
100,000 FCC Servicios Medio Ambiente Holding SA* 1.66% 04/12/2026 100,347 0.95
100,000 Fidelity National Information Services Inc* 1.00% 03/12/2028 100,349 0.95
100,000 Fiserv Inc* 1.13% 01/07/2027 103,556 0.98
100,000 Ford Motor Credit Co LLC* 2.39% 17/02/2026 101,612 0.96
100,000 General Electric Co* 1.25% 26/05/2023 102,694 0.97
100,000 International Game Technology Plc* 4.75% 15/02/2023 109,700 1.03
130,000 Intesa Sanpaolo SpA* 1.00% 19/11/2026 129,693 1.22
100,000 Islandsbanki HF* 1.13% 19/01/2024 100,884 0.95
100,000 Jaguar Land Rover Automotive Plc* 6.88% 15/11/2026 105,355 0.99
100,000 JPMorgan Chase & Co* 1.05% 04/11/2032 101,019 0.95
100,000 Kutxabank SA* 1.25% 22/09/2025 106,874 1.01

FINANCIAL STATEMENTS SCHEDULE OF INVESTMENTS
862 NEUBERGER BERMAN INVESTMENT FUNDS PLC
Neuberger Berman Euro Opportunistic Bond Fund (Continued)
Schedule of Investments (Continued)
Financial Assets at Fair Value through Profit or Loss (continued)
Principal Amount Security Description Coupon Maturity
DateFair Value
EUR% of Net
Assets
Corporate Bonds 37.52% (31 December 2018: 66.41%) (continued)
Euro (continued) 100,000 MMS USA Investments Inc* 0.63% 13/06/2025 98,600 0.93
100,000 Netflix Inc* 3.88% 15/11/2029 106,125 1.00
100,000 SGL Carbon SE* 4.63% 30/09/2024 98,000 0.92
100,000 Stryker Corp* 0.75% 01/03/2029 100,082 0.94
100,000 Thermo Fisher Scientific Inc* 1.88% 01/10/2049 92,503 0.87
100,000 UniCredit SpA* 4.38% 03/01/2027 106,103 1.00
100,000 Unione di Banche Italiane SpA* 5.88% 04/03/2029 109,637 1.03
100,000 UPCB Finance VII Ltd* 3.63% 15/06/2029 106,544 1.00
Total Corporate Bonds 3,981,415 37.52
Government Bonds 45.57% (31 December 2018: 29.48%)
Euro 200,000 Acquirente Unico SpA* 2.80% 20/02/2026 215,582 2.03
100,000 Adif-Alta Velocidad* 0.95% 30/04/2027 103,896 0.98
100,000 Adif-Alta Velocidad* 3.50% 27/05/2024 114,744 1.08
75,000 Cyprus Government International Bond* 4.25% 04/11/2025 92,487 0.87
47,816 French Republic Government Bond OAT* 0.10% 01/03/2028 52,216 0.49
401,547 French Republic Government Bond OAT* 0.10% 01/03/2029 443,430 4.18
23,744 French Republic Government Bond OAT* 0.10% 25/07/2036 27,148 0.26
280,498 French Republic Government Bond OAT** 1.85% 25/07/2027 347,101 3.27
174,721 Italy Buoni Poliennali Del Tesoro** 0.40% 11/04/2024 174,834 1.65
209,366 Italy Buoni Poliennali Del Tesoro** 0.45% 22/05/2023 211,013 1.99
270,000 Italy Buoni Poliennali Del Tesoro* 0.65% 15/10/2023 273,646 2.58
350,000 Italy Buoni Poliennali Del Tesoro* 1.45% 15/11/2024 364,627 3.44
50,000 Italy Buoni Poliennali Del Tesoro* 2.50% 15/11/2025 54,827 0.52
143,794 Italy Buoni Poliennali Del Tesoro** 2.60% 15/09/2023 159,933 1.51
366,000 Italy Buoni Poliennali Del Tesoro* 3.00% 01/08/2029 421,894 3.97
150,000 Italy Buoni Poliennali Del Tesoro** 4.00% 01/02/2037 193,107 1.82
100,000 Italy Government International Bond* 5.13% 31/07/2024 119,539 1.13
95,000 Kingdom of Belgium Government Bond* 1.45% 22/06/2037 108,687 1.02
157,000 Netherlands Government Bond* 4.00% 15/01/2037 256,938 2.42
50,000 Portugal Obrigacoes do Tesouro OT* 1.95% 15/06/2029 56,988 0.54
195,000 Portugal Obrigacoes do Tesouro OT** 4.10% 15/04/2037 290,591 2.74
50,000 Republic of Poland Government International Bond* 2.38% 18/01/2036 61,618 0.58
100,000 Romanian Government International Bond** 2.88% 26/05/2028 112,774 1.06
200,000 Spain Government Bond* 1.85% 30/07/2035 228,698 2.15
150,000 Spain Government Bond* 1.95% 30/07/2030 171,864 1.62
114,024 Spain Government Inflation Linked Bond* 0.65% 30/11/2027 127,460 1.20

SCHEDULE OF INVESTMENTS FINANCIAL STATEMENTS
ANNUAL REPORT 2019 863
Neuberger Berman Euro Opportunistic Bond Fund (Continued)
Schedule of Investments (Continued)
Financial Assets at Fair Value through Profit or Loss (continued)
Principal Amount Security Description Coupon Maturity
DateFair Value
EUR% of Net
Assets
Government Bonds 45.57% (31 December 2018: 29.48%) (continued)
Euro (continued) 50,000 State of North Rhine-Westphalia Germany* 0.80% 30/07/2049 50,182 0.47
Total Government Bonds 4,835,824 45.57
Number of Shares Security Description Fair Value
EUR% of Net
Assets
Investment Funds 9.57% (31 December 2018: 0.00%)
Euro 9,974 Neuberger Berman Ultra Short Term Euro Bond Fund 1,015,652 9.57
Total Investment Funds μ 1,015,652 9.57
Total Investments 10,206,419 96.18
Futures Contracts 0.31% (31 December 2018: 0.03%)
Number of Contracts Description Unrealised
Gain EUR% of Net
Assets
6 Euro-Bund Future January 2020 730 0.01
24 Euro-Bund Future January 2020 17,560 0.17
(4) Euro-Bund Future March 2020 8,880 0.08
(1) Euro-Buxl 30-Year Bond Future March 2020 5,300 0.05
Total Unrealised Gain on Futures Contracts ± 32,470 0.31
Fair Value % of Net
EUR Assets
Total Financial Assets at Fair Value through Profit or Loss 10,238,889 96.49
Financial Liabilities at Fair Value through Profit or Loss
Futures Contracts (0.07%) (31 December 2018: (0.03%))
Number of Contracts Description Unrealised
Loss EUR% of Net
Assets
2 Euro-BOBL Future March 2020 (1,460) (0.01)
4 Euro-OAT Future March 2020 (6,320) (0.06)
Total Unrealised Loss on Futures Contracts ± (7,780) (0.07)

FINANCIAL STATEMENTS SCHEDULE OF INVESTMENTS
864 NEUBERGER BERMAN INVESTMENT FUNDS PLC
Neuberger Berman Euro Opportunistic Bond Fund (Continued)
Schedule of Investments (Continued)
Financial Liabilities at Fair Value through Profit or Loss (continued)
Inflation Swap Contracts (0.01%) (31 December 2018: (0.00%))
Notional Amount Expiration Date Counterparty Receive
/(Pay)# Fixed Rate Variable Rate Fair ValueEUR
% of Net Assets
EUR 200,000 15/02/22 LCH Clearnet Ltd1 Receive 0.99% CPTFEMU (413) (0.01)
Total Inflation Swap Contracts at Fair Value ± (413) (0.01)
# Receive - Funds receives variable rate and pays fixed rate.
(Pay) - Fund pays variable rate and receives fixed rate. 1 Centrally cleared swap.
Fair Value % of Net
EUR Assets
Total Financial Liabilities at Fair Value through Profit or Loss (8,193) (0.08)
Net Financial Assets at Fair Value through Profit or Loss 10,230,696 96.41
Other Net Assets 381,396 3.59
Net Assets Attributable to Holders of Redeemable Participating Shares 10,612,092 100.00
% ofTotal
AssetsPortfolio Analysis EUR
* Transferable securities and/or money market instruments admitted to an official stock exchange listing 7,209,875 66.96
** Transferable securities and/or money market instruments dealt in on a regulated market 1,980,892 18.40
μ Investment funds 1,015,652 9.43
± Financial derivative instruments traded on a regulated market 24,277 0.23
Total Investments 10,230,696 95.02

STATEMENT OF SIGNIFICANT PURCHASES AND SALES FINANCIAL STATEMENTS
ANNUAL REPORT 2019 865
Neuberger Berman Euro Opportunistic Bond Fund (Continued) Statement of Significant Purchases and Sales (Unaudited) In accordance with the European Communities (Undertakings for Collective Investment in Transferable Securities) Regulations, 2011 as amended, a statement of changes in the composition of the Schedule of Investments during the reporting period is provided to ensure that Shareholders can identify changes in the investments held by the Portfolio. The following statements present the aggregate purchases and sales of transferable securities exceeding one percent of the total value of purchases or sales, respectively, for the period. At a minimum, the largest twenty purchases and twenty sales are presented, if available.
Total purchases:
Units Security Description Cost EUR
9,974 Neuberger Berman Ultra Short Term Euro Bond Fund 1,008,463
486,948 French Republic Government Bond OAT, 0.10%, 01/03/2029 534,341
413,000 Italy Buoni Poliennali Del Tesoro, 2.30%, 15/10/2021 429,132
437,770 Italy Buoni Poliennali Del Tesoro, 0.40%, 11/04/2024 417,538
366,000 Italy Buoni Poliennali Del Tesoro, 3.00%, 01/08/2029 396,600
350,000 Italy Buoni Poliennali Del Tesoro, 1.45%, 15/11/2024 361,130
315,000 Spain Government Bond, 1.85%, 30/07/2035 355,481
279,930 French Republic Government Bond OAT, 1.85%, 25/07/2027 354,495
302,000 French Republic Government Bond OAT, 0.75%, 25/05/2028 326,613
272,000 French Republic Government Bond OAT, 1.75%, 25/06/2039 316,263
300,000 Merck KGaA, 2.88%, 25/06/2079 300,000
300,000 Bayer AG, 3.25%, 12/11/2079 300,000
300,000 Italy Buoni Poliennali Del Tesoro, 0.65%, 15/10/2023 294,276
250,000 Ireland Government Bond, 1.35%, 18/03/2031 281,857
200,000 Spain Government Bond, 1.95%, 30/07/2030 219,365
200,000 Intesa Sanpaolo SpA, 3.93%, 15/09/2026 215,600
200,000 UniCredit SpA, 4.38%, 03/01/2027 213,670
213,467 Italy Buoni Poliennali Del Tesoro, 0.45%, 22/05/2023 210,182
170,000 Italy Buoni Poliennali Del Tesoro, 4.00%, 01/02/2037 205,816

FINANCIAL STATEMENTS STATEMENT OF SIGNIFICANT PURCHASES AND SALES
866 NEUBERGER BERMAN INVESTMENT FUNDS PLC
Neuberger Berman Euro Opportunistic Bond Fund (Continued) Statement of Significant Purchases and Sales (Unaudited) (Continued)
Top twenty sales:
Units Security Description Proceeds EUR
413,000 Italy Buoni Poliennali Del Tesoro, 2.30%, 15/10/2021 429,635
305,000 French Republic Government Bond OAT, 1.50%, 25/05/2031 354,340
272,000 French Republic Government Bond OAT, 1.75%, 25/06/2039 340,931
302,000 French Republic Government Bond OAT, 0.75%, 25/05/2028 328,246
325,000 Italy Buoni Poliennali Del Tesoro, 0.70%, 01/05/2020 327,041
300,000 Intesa Sanpaolo SpA, 3.93%, 15/09/2026 324,451
300,000 Merck KGaA, 2.88%, 25/06/2079 309,250
300,000 Bayer AG, 3.25%, 12/11/2079 303,426
250,000 Ireland Government Bond, 1.35%, 18/03/2031 283,021
262,770 Italy Buoni Poliennali Del Tesoro, 0.40%, 11/04/2024 253,252
210,000 Italy Buoni Poliennali Del Tesoro, 4.00%, 01/02/2037 250,276
200,000 Kutxabank SA, 1.25%, 22/09/2025 217,457
200,000 Belfius Bank SA, 2.13%, 30/01/2023 217,355
200,000 Fiserv Inc, 1.63%, 01/07/2030 208,435
200,000 Fidelity National Information Services Inc, 1.50%, 21/05/2027 206,860
200,000 Glencore Finance Europe Ltd, 1.63%, 18/01/2022 205,116
200,000 Intesa Sanpaolo SpA, 1.75%, 04/07/2029 203,418
200,000 Unione di Banche Italiane SpA, 1.00%, 22/07/2022 202,959
200,000 UniCredit SpA, 1.25%, 25/06/2025 202,152
200,000 thyssenkrupp AG, 2.88%, 22/02/2024 202,026

INVESTMENT MANAGER’S REPORT FINANCIAL STATEMENTS
ANNUAL REPORT 2019 867
Neuberger Berman Euro Bond Absolute Return Fund Investment Manager’s Report For the 12 months ended 31 December 2019, the total return for the EUR I Accumulating Class was 3.79%. Over the same period, the benchmark index, the ICE BofA 0-1 year AAA Euro Government Index (EUR Total Return, Hedged) (the “Index”) returned -0.66%. (Performance for all share classes is provided in Appendix II. Performance data quoted represent past performance and do not indicate future results. Total returns shown are net of all fees and expenses and include reinvestment of income dividends and other distributions, if any).
Euro government yields went down during the first eight months of 2019, reaching a new low for most countries. Rising political uncertainties like Brexit and the tariff trade war weighed on growth pace, particularly on German exports, which raised fears of recession in the wake of the drop in corporate confidence. Particularly during the second quarter of the year, the European Central Bank (“ECB”) started to react by extending its forward guidance period, announcing no key rate increase up to mid-2020. Later when the growth outlook was reviewed to the downside below its potential level, the ECB cut its medium term inflation forecasts; considering its inflation target of 2% not being achievable in the coming years, the ECB concluded in June further accommodative monetary policy was needed in the coming months.
During the summer, particularly in Germany, the service sector showed its resilience, which reduced the market expectation of a recession, which had been feared in the wake of the deeper than expected Chinese slowdown. A large part of Eurozone exports go to Asia, especially in the automobile sector. This led bond market yields to bottom up.
Nevertheless, due to all these growing uncertainties, the ECB decided to act again mid-September by extending its forward guidance period, cutting its key rate by 10 basis points (“bps”) and reopening its Quantitative Easing (“QE”) program. However, it failed to meet the market expectations, which were very strong, leading to a small rebound of rates in September. Investors seem to agree that central policy is not the best answer to recession fears but rather a fiscal economic boost from governments north of the Eurozone whose new objective is to switch from an export model to a more domestic growth model.
Such an ECB policy led again to a new period of government yields convergence. Certain countries in the south of Europe outperformed significantly again, as shown by the Spanish government yield falling close to 0% on the 10 years maturity.
The economic slowdown made investors in their usual search for returns more cautious about the credit market which slightly underperformed at the end of the 3rd quarter. Numerous trades weighted on private bonds as investors analysed yields they believed were too low to bear the credit risk in the long run. Some credit defaults on high yield bonds led investors to take their profits.
Euro yields rose over the last quarter of 2019 from their all-time low reached in September. The economic growth slowdown seemed to have bottomed up as shown by the rebound of most Euro leading corporate business indicators at the end of the year. Despite an industrial recession led by the fall in exports, Germany avoided recession thanks to its domestic activity resilience: low rates supported real estate activity and wage increase led to steady consumer spending. Moreover, political uncertainties diminished with the Brexit decision taken by the new UK government and the trade tariff war truce since China and the US said to be ready to sign a “Phase 1” deal.
In fact, the main economic outcome of the fourth quarter was the rebound in Euro inflation whose core rate increased 1.3% year over year in November. For the first time, inflation started to converge towards the ECB rate target of 2%. It is a significant change, as it is due to a rise in service prices led by the protracted domestic demand.
However, for the time being, the ECB consider the inflation rebound as too recent and preferred to maintain its dovish stance, focus on the risks for the activity due to significant external threats. The new ECB president ensured the stability of the monetary policy, leading the market to expect no rate increase for years. Nevertheless, she asked for the ECB policy review considering that now the Euro zone governments should take the lead by increasing the public expense to boost growth.
Such a better economic and political context led to global risk-on sentiment reinforced by the US Federal Reserve’s rate cut policy. Thus, the equity market rallied again, reaching a new all-time high in the US, which helped the credit market to absorb heavy primary flows and to perform up to year-end. Credit spreads tightened over the last quarter whereas German rates increased as witnessed by the tightening of the Itraxx Crossover spread from +232 to +206 bps while the 10 year Bund yield jumped from -57bps to -19bps.
Moreover, the ECB bond buy program restarted in November, which offered a support to the euro credit as well as peripheral debt markets. Government debts from the south of Europe outperformed significantly again, going on their convergence towards core country rates, as shown by the Spanish government yields tightening to 0.65% on the 10 year maturity relative to the German yields. But in the wake of higher than expected debt level, the Italian BTP underperformed ahead of regional elections, given that the risk surrounding longevity of the government coalition became more prominent.
The bond market outperformed strongly until the summer despite most high quality government bonds offering negative returns. In such a context, we decided to be short duration exposure mainly in order to avoid investing in these negative returns. We reduced significantly our exposures to securities having a maturity below 5 years or a rating of AAA or AA. The very accommodative ECB monetary policy led to a new period of government yields convergence.

FINANCIAL STATEMENTS INVESTMENT MANAGER’S REPORT
868 NEUBERGER BERMAN INVESTMENT FUNDS PLC
Neuberger Berman Euro Bond Absolute Return Fund (Continued) Investment Manager’s Report (Continued) Part of the Portfolio’s outperformance versus the Index has been driven by our exposure to Portugal and Spain and tactically Italy and Cyprus, to take into account the short-term market volatility. The credit market also performed but with a strong volatility due to the fears of the diffusion of the trade war to all around the world and then to the Eurozone for which growth is very sensitive to exports.
The resilience of domestic activity and the extension of the ECB’s very accommodative monetary policy finally convinced investors searching for returns to buy private sector bonds. In this context, we got additional source of performance by investing private sector bonds, especially the lowest of the investment grade category. We took advantage of the extra premium offered on the primary market to increase our credit exposure mainly to sectors such as banks, technology, information technology and telecommunications.
In September, we also moved our yield curve positioning to increase the 10-year bucket at the expense of the very long end of the curve on core and semi core countries: we switched from a flattening to a steeping yield curve strategy.
In June and again in July, we started to increase the Portfolio’s inflation exposure by buying inflation-linked bonds in order to reach 18% of the Portfolio’s net assets as their pricing was not yet reflective of any inflation recovery, what we believe was a consequence of the global tariff trade war. Euro inflation expectations for maturities below 5 years were especially attractive like low Italian inflation expectations for maturities between 3 and 4 years.
Finally, in the fourth quarter of the year, we actively managed the Portfolio duration exposure between -0.5 and 2.5 years. We used option strategies, to take advantage of the market volatility. This policy brought an efficient hedge of our peripheral and credit debt exposures.
We increased our exposure in Spanish and Irish government securities during November. For the first, the country is a quasi semicore and needs to be priced as a semicore. For the latter, risk of a “no deal” Brexit has been postponed to end of 2020 and led to a repricing value of Ireland to price close to France and Belgium valuations. By the end of year, we started to take some profits on our peripheral government debt significant exposure by selling a few long-term bonds from Portugal and Italy.
We still stick to our strong conviction of the yield convergence between the Eurozone countries due to the very accommodative ECB monetary policy reinforced by the re launch of its bond buy program. However, we anticipate a strong primary market at the start of the next year, which could out pass the demand.
Our strategy is to also look for incremental returns. During the period, we took advantage of the numerous primary market auctions to re-increase our private sector exposure. We believe the following sectors could be additive to returns: banks, technology, information technology, telecommunication, and also bonds with a below-investment grade rating.
In addition, we continued to increase our exposure to inflation-linked bonds and zero-coupon inflation swaps as the market was not anticipating any inflation recovery, which ishat we anticipate now due to the trade tariff war leading to less globalisation. The fact that the ECB has linked QE2 life to a sustainable recovery of inflation target means higher inflation expectations going forward. Moreover, In December, the performance of inflation was good because of less linkers supply, risk-on mode amplified by declining uncertainties (Trade war and Brexit) and core inflation stable at 1.3%. We realised some profit on 10 year zero coupon inflation swaps with inflation expectations rising gradually.
Over the next months, the market should face challenges coming from the coronavirus risk: euro bonds still discount a pessimistic economic scenario despite current resilient domestic activity. The Chinese flu will likely hurt global growth in the near term. Nevertheless, later this year, we anticipate inflation rate to rise again towards the ECB target and the tariff war fears to fade thanks to a truce between China and the USA. Because of the very low rates and steady corporate profits, we expect capital expenditure to recover later this year thanks to the sustainability of consumption. Thus, bond yields should start to rise back towards positive territories and credit spreads to come back to their average past year level supported by the cash in excess from investors.

BALANCE SHEET FINANCIAL STATEMENTS
The accompanying notes form an integral part of the financial statements.
ANNUAL REPORT 2019 869
Neuberger Berman Euro Bond Absolute Return Fund (Continued) Balance Sheet
As at As at
Note 31 December 2019 31 December 2018
EUR EUR
Current Assets
Financial Assets at Fair Value through Profit or Loss 2 80,833,475 7,738,320
Cash and cash equivalents 3 717,491 2,386,720
Receivable for investments sold 44,751 –
Due from brokers 629,022 45,452
Income receivable and other assets 689,993 89,441
Total Assets 82,914,732 10,259,933
Current Liabilities
Financial Liabilities at Fair Value through Profit or Loss 2 1,347,478 4,630
Bank overdraft 4 2,236 1,668
Accrued expenses 67,007 37,842
Payable for investments purchased 418,748 211,072
Other payables 29,861 923
Liabilities (excluding Net Assets Attributable to Holders of Redeemable Participating Shares) 1,865,330 256,135
Net Assets Attributable to Holders of Redeemable Participating Shares 81,049,402 10,003,798

FINANCIAL STATEMENTS PROFIT AND LOSS ACCOUNT
The accompanying notes form an integral part of the financial statements.
870 NEUBERGER BERMAN INVESTMENT FUNDS PLC
Neuberger Berman Euro Bond Absolute Return Fund (Continued) Profit and Loss Account
Year Ended Period Ended
Note 31 December 2019 31 December 2018*
EUR EUR
Income
Interest Income 410,717 8,639
Net Gain/(Loss) on Financial Assets and Liabilities at Fair Value through Profit or Loss 11 705,186 29,688
1,115,903 38,327
Expenses
Management Fee 6 89,222 3,954
Administration Fee 6 73,707 2,826
Commitment Fee 19 2,497 –
Custody Fee 6 8,826 925
Depositary Fee 6 2,566 44
Professional Fee 9 39,550 1,286
Directors' Fee 7 3,630 1,752
Transaction Costs 9 38,310 1,456
Organisation Expenses 9 – 30,000
Audit Fee 8 16,421 13,530
VAT Rebate (372) –
Other Expenses 9 16,026 554
Expense Waiver 6 (150,520) (21,809)
Total Expenses 139,863 34,518
Finance Costs
Interest Expense 875 –
Distribution Paid 1 74,193 –
75,068 –
Withholding Tax 1 9,511 11
Profit/(Loss) Attributable to Holders of Redeemable Participating Shares from Operations 891,461 3,798
* Portfolio launched on 29 November 2018, as such Profit & Loss figures are not directly comparable. Income and expenses arose solely from continuing operations.

STATEMENT OF CHANGES IN NET ASSETS FINANCIAL STATEMENTS
The accompanying notes form an integral part of the financial statements.
ANNUAL REPORT 2019 871
Neuberger Berman Euro Bond Absolute Return Fund (Continued) Statement of Changes in Net Assets Attributable to Holders of Redeemable Participating Shares
Year Ended Period Ended
31 December 2019 31 December 2018*
EUR EUR
Net Assets Attributable to Holders of Redeemable Participating Shares at beginning of year 10,003,798 –
Profit/(Loss) Attributable to Holders of Redeemable Participating Shares from Operations 891,461 3,798
Subscriptions 5 88,796,280 10,000,000
Redemptions 5 (18,642,137) –
Net Assets Attributable to Holders of Redeemable Participating Shares at end of year 81,049,402 10,003,798
* Portfolio launched on 29 November 2018, as such Profit & Loss figures are not directly comparable.

FINANCIAL STATEMENTS SCHEDULE OF INVESTMENTS
872 NEUBERGER BERMAN INVESTMENT FUNDS PLC
Neuberger Berman Euro Bond Absolute Return Fund (Continued)
Schedule of Investments
Financial Assets at Fair Value through Profit or Loss
Principal Amount Security Description Coupon Maturity
Date Fair Value
EUR% of Net
Assets
Asset Backed Securities 6.37% (31 December 2018: 0.00%)
Euro 170,000 Brignole CQ S.r.l. 2019-1 Class C 1.03% 24/03/2036 170,775 0.21
655,827 European Residential Loan Securitisation 2018-1 DAC Class A 0.55% 24/03/2061 656,418 0.81
985,404 European Residential Loan Securitisation 2019-NPL2 DAC Class A 1.03% 24/02/2058 978,120 1.20
400,000 European Residential Loan Securitisation 2019-PL1 DAC Class C 0.78% 24/03/2063 395,934 0.49
279,709 Jepson Residential Series 2019-1 DAC Class A 0.38% 24/11/2057 279,709 0.34
600,000 Jepson Residential Series 2019-1 DAC Class B 0.78% 24/11/2057 600,507 0.74
300,000 Jepson Residential Series 2019-1 DAC Class C 1.03% 24/11/2057 299,600 0.37
491,314 Lanterna S.r.l. Series 2015-1 Class A 0.10% 28/10/2065 491,799 0.61
268,485 Pembroke Property Finance Series 1 Class A 0.77% 01/06/2037 266,703 0.33
477,942 Pepper Residential Securities Trust No 25 Series 25X Class A1 0.66% 12/03/2061 478,238 0.59
233,606 Siena Mortgages S.r.l. Series 2019-7 Class A3 0.19% 22/11/2070 234,024 0.29
306,629 Tagus - Sociedade de Titularizacao de Creditos SA Series 2009 Class A1 1.50% 12/05/2025 314,987 0.39
Total Asset Backed Securities ** 5,166,814 6.37
Corporate Bonds 33.08% (31 December 2018: 49.01%)
Euro 700,000 AbbVie Inc* 0.75% 18/11/2027 708,640 0.87
100,000 ABN AMRO Bank NV* 2.38% 23/01/2024 110,603 0.14
100,000 ABN AMRO Bank NV* 2.88% 18/01/2028 107,049 0.13
800,000 Ageas* 3.88% 29/12/2049 827,212 1.02
500,000 Anheuser-Busch InBev SA* 1.65% 28/03/2031 544,702 0.67
700,000 Assicurazioni Generali SpA** 4.13% 04/05/2026 826,077 1.02
400,000 AT&T Inc* 2.45% 15/03/2035 435,171 0.54
100,000 AXA Home Loan SFH SA* 0.05% 05/07/2027 100,169 0.12
400,000 Berry Global Inc* 1.50% 15/01/2027 404,000 0.50
100,000 BNP Paribas SA* 2.63% 14/10/2027 106,183 0.13
300,000 Capital One Financial Corp* 1.65% 12/06/2029 311,365 0.38
200,000 CDP Reti SpA* 1.88% 29/05/2022 206,926 0.26
800,000 CK Hutchison Finance 16 II Ltd* 0.88% 03/10/2024 813,174 1.00
500,000 CNP Assurances* 4.00% 29/12/2049 564,433 0.70
700,000 Commerzbank AG* 4.00% 23/03/2026 789,262 0.97
700,000 Credit Suisse Group AG* 1.00% 24/06/2027 717,134 0.88
800,000 Daimler International Finance BV* 0.63% 06/05/2027 794,221 0.98
800,000 Danske Bank A/S* 1.38% 12/02/2030 797,802 0.98
100,000 Dexia Credit Local SA* 0.25% 01/06/2023 101,502 0.13
400,000 Dexia Credit Local SA* 0.63% 17/01/2026 413,615 0.51
300,000 EDP Finance BV* 1.63% 26/01/2026 320,400 0.40

SCHEDULE OF INVESTMENTS FINANCIAL STATEMENTS
ANNUAL REPORT 2019 873
Neuberger Berman Euro Bond Absolute Return Fund (Continued)
Schedule of Investments (Continued)
Financial Assets at Fair Value through Profit or Loss (continued)
Principal Amount Security Description Coupon Maturity
DateFair Value
EUR% of Net
Assets
Corporate Bonds 33.08% (31 December 2018: 49.01%) (continued)
Euro (continued) 200,000 eircom Finance DAC* 1.75% 01/11/2024 200,577 0.25
500,000 eircom Finance DAC* 2.63% 15/02/2027 505,929 0.62
500,000 Europcar Mobility Group* 4.00% 30/04/2026 486,439 0.60
181,000 European Financial Stability Facility* 0.88% 10/04/2035 192,472 0.24
140,000 European Financial Stability Facility** 3.38% 03/04/2037 206,042 0.25
500,000 Faurecia SE* 3.13% 15/06/2026 532,725 0.66
200,000 FCA Bank SpA* 0.63% 24/11/2022 202,184 0.25
800,000 FCC Servicios Medio Ambiente Holding SA* 1.66% 04/12/2026 802,778 0.99
400,000 Federation des Caisses Desjardins du Quebec* 0.35% 30/01/2024 407,269 0.50
200,000 Fidelity National Information Services Inc* 0.75% 21/05/2023 204,621 0.25
500,000 Fidelity National Information Services Inc* 1.00% 03/12/2028 501,746 0.62
800,000 Fiserv Inc* 1.13% 01/07/2027 828,449 1.02
600,000 Ford Motor Credit Co LLC* 2.39% 17/02/2026 609,672 0.75
700,000 General Electric Co* 1.25% 26/05/2023 718,857 0.89
500,000 International Game Technology Plc* 4.75% 15/02/2023 548,500 0.68
520,000 Intesa Sanpaolo SpA* 1.00% 19/11/2026 518,772 0.64
150,000 Islandsbanki HF* 1.13% 19/01/2024 151,326 0.19
800,000 Jaguar Land Rover Automotive Plc* 6.88% 15/11/2026 842,840 1.04
700,000 JPMorgan Chase & Co* 1.05% 04/11/2032 707,132 0.87
800,000 MMS USA Investments Inc* 0.63% 13/06/2025 788,804 0.97
100,000 Nationale-Nederlanden Bank NV* 0.25% 27/02/2024 101,376 0.13
500,000 Netflix Inc* 3.88% 15/11/2029 530,625 0.65
500,000 Nidda Healthcare Holding GmbH* 3.50% 30/09/2024 517,200 0.64
500,000 Piaggio & C SpA* 3.63% 30/04/2025 528,505 0.65
400,000 SGL Carbon SE* 4.63% 30/09/2024 392,000 0.48
100,000 SPIE SA* 2.63% 18/06/2026 105,017 0.13
686,000 Stryker Corp* 0.75% 01/03/2029 686,559 0.85
100,000 Tasty Bondco 1 SA* 6.25% 15/05/2026 105,072 0.13
830,000 Thermo Fisher Scientific Inc* 1.88% 01/10/2049 767,779 0.95
700,000 UniCredit SpA* 4.88% 20/02/2029 779,359 0.96
600,000 Unione di Banche Italiane SpA* 1.00% 22/07/2022 599,930 0.74
500,000 Unione di Banche Italiane SpA* 5.88% 04/03/2029 548,183 0.68
500,000 UPCB Finance VII Ltd* 3.63% 15/06/2029 532,720 0.66
550,000 Westpac Banking Corp* 0.38% 02/04/2026 558,768 0.69
100,000 Westpac Banking Corp* 0.50% 16/01/2025 102,406 0.13
Total Corporate Bonds 26,812,273 33.08

FINANCIAL STATEMENTS SCHEDULE OF INVESTMENTS
874 NEUBERGER BERMAN INVESTMENT FUNDS PLC
Neuberger Berman Euro Bond Absolute Return Fund (Continued)
Schedule of Investments (Continued)
Financial Assets at Fair Value through Profit or Loss (continued)
Principal Amount Security Description Coupon Maturity
DateFair Value
EUR% of Net
Assets
Government Bonds 58.36% (31 December 2018: 23.31%)
Euro 410,000 Acquirente Unico SpA* 2.80% 20/02/2026 441,944 0.54
200,000 Adif-Alta Velocidad* 1.88% 28/01/2025 216,881 0.27
300,000 Adif-Alta Velocidad* 0.95% 30/04/2027 311,687 0.38
300,000 Bank Gospodarstwa Krajowego* 1.63% 30/04/2028 330,677 0.41
400,000 Bank Gospodarstwa Krajowego* 1.75% 06/05/2026 437,373 0.54
350,000 Bank Gospodarstwa Krajowego* 2.00% 01/06/2030 403,530 0.50
327,492 Caisse d'Amortissement de la Dette Sociale* 1.50% 25/07/2021 332,381 0.41
200,000 Cassa Depositi e Prestiti SpA** 2.70% 28/06/2026 208,580 0.26
600,000 Croatia Government International Bond* 1.13% 19/06/2029 619,854 0.76
1,310,000 Croatia Government International Bond* 3.00% 20/03/2027 1,532,184 1.89
1,000,000 Croatia Government International Bond* 3.88% 30/05/2022 1,092,191 1.35
250,000 Cyprus Government International Bond* 2.38% 25/09/2028 288,773 0.36
750,000 Cyprus Government International Bond* 2.75% 26/02/2034 924,968 1.14
200,000 Cyprus Government International Bond* 2.75% 03/05/2049 256,074 0.32
760,739 Deutsche Bundesrepublik Inflation Linked Bond* 0.10% 15/04/2023 792,788 0.98
475,988 Deutsche Bundesrepublik Inflation Linked Bond* 0.10% 15/04/2026 517,974 0.64
810,175 Deutsche Bundesrepublik Inflation Linked Bond** 1.75% 15/04/2020 808,132 1.00
500,000 European Union* 3.38% 04/04/2032 686,868 0.85
2,099,840 French Republic Government Bond OAT* 0.10% 01/03/2021 2,133,375 2.63
3,150,570 French Republic Government Bond OAT** 0.10% 25/07/2021 3,219,743 3.97
1,085,944 French Republic Government Bond OAT* 0.10% 01/03/2029 1,199,214 1.48
738,953 French Republic Government Bond OAT* 0.10% 25/07/2036 844,894 1.04
104,753 French Republic Government Bond OAT* 0.10% 25/07/2047 124,655 0.15
533,100 French Republic Government Bond OAT** 0.25% 25/07/2024 573,730 0.71
105,250 French Republic Government Bond OAT** 0.70% 25/07/2030 124,654 0.15
375,718 French Republic Government Bond OAT** 1.10% 25/07/2022 401,329 0.49
185,250 French Republic Government Bond OAT* 1.50% 25/05/2031 212,124 0.26
768,450 French Republic Government Bond OAT** 2.25% 25/07/2020 785,508 0.97
400,000 Ireland Government Bond* 1.35% 18/03/2031 448,392 0.55
450,000 Ireland Government Bond* 1.70% 15/05/2037 533,355 0.66
800,000 Ireland Government Bond* 2.40% 15/05/2030 981,368 1.21
1,210,784 Italy Buoni Poliennali Del Tesoro** 0.25% 20/11/2023 1,212,289 1.50
1,253,879 Italy Buoni Poliennali Del Tesoro** 0.40% 11/04/2024 1,254,690 1.55
507,895 Italy Buoni Poliennali Del Tesoro* 0.40% 15/05/2030 497,792 0.61
1,202,358 Italy Buoni Poliennali Del Tesoro** 0.45% 22/05/2023 1,211,817 1.49
100,000 Italy Buoni Poliennali Del Tesoro* 0.95% 01/03/2023 102,202 0.13
200,000 Italy Buoni Poliennali Del Tesoro* 1.85% 15/05/2024 211,872 0.26
158,217 Italy Buoni Poliennali Del Tesoro** 2.35% 15/09/2024 177,352 0.22

SCHEDULE OF INVESTMENTS FINANCIAL STATEMENTS
ANNUAL REPORT 2019 875
Neuberger Berman Euro Bond Absolute Return Fund (Continued)
Schedule of Investments (Continued)
Financial Assets at Fair Value through Profit or Loss (continued)
Principal Amount Security Description Coupon Maturity
DateFair Value
EUR% of Net
Assets
Government Bonds 58.36% (31 December 2018: 23.31%) (continued)
Euro (continued)
70,000 Italy Buoni Poliennali Del Tesoro* 2.45% 01/10/2023 75,414 0.09
270,000 Italy Buoni Poliennali Del Tesoro* 2.50% 15/11/2025 296,068 0.36
513,158 Italy Buoni Poliennali Del Tesoro** 2.55% 15/09/2041 656,502 0.81
317,544 Italy Buoni Poliennali Del Tesoro** 2.60% 15/09/2023 353,185 0.44
200,000 Italy Buoni Poliennali Del Tesoro** 3.35% 01/03/2035 238,720 0.29
330,000 Italy Buoni Poliennali Del Tesoro** 3.85% 01/09/2049 427,453 0.53
75,000 Italy Buoni Poliennali Del Tesoro** 4.50% 01/03/2024 87,464 0.11
300,000 Italy Government International Bond* 5.13% 31/07/2024 358,617 0.44
227,601 Kingdom of Belgium Government Bond* 1.00% 22/06/2031 247,559 0.31
360,000 Kingdom of Belgium Government Bond* 1.25% 22/04/2033 403,173 0.50
160,000 Kingdom of Belgium Government Bond* 1.45% 22/06/2037 183,051 0.23
200,000 Kingdom of Belgium Government Bond* 4.25% 28/03/2041 339,748 0.42
1,000,000 Kingdom of Belgium Government Bond* 5.00% 28/03/2035 1,669,945 2.06
187,000 Portugal Obrigacoes do Tesouro OT* 1.95% 15/06/2029 213,136 0.26
400,000 Portugal Obrigacoes do Tesouro OT* 2.13% 17/10/2028 460,271 0.57
100,000 Portugal Obrigacoes do Tesouro OT* 2.88% 15/10/2025 116,103 0.14
460,000 Portugal Obrigacoes do Tesouro OT** 4.10% 15/04/2037 685,498 0.85
100,000 Portugal Obrigacoes do Tesouro OT* 4.10% 15/02/2045 158,540 0.20
1,000,000 Portugal Obrigacoes do Tesouro OT** 4.13% 14/04/2027 1,278,103 1.58
800,000 Republic of Poland Government International Bond* 2.38% 18/01/2036 985,885 1.22
1,000,000 Romanian Government International Bond** 2.88% 26/05/2028 1,127,735 1.39
400,000 Romanian Government International Bond* 2.88% 11/03/2029 452,041 0.56
700,000 Serbia International Bond* 1.50% 26/06/2029 712,779 0.88
348,000 Slovakia Government Bond* 3.88% 08/02/2033 497,880 0.61
472,000 Slovenia Government Bond* 1.19% 14/03/2029 510,887 0.63
167,000 Slovenia Government Bond* 1.50% 25/03/2035 187,353 0.23
200,000 SNCF Reseau* 0.75% 25/05/2036 198,134 0.24
258,282 SNCF Reseau* 2.45% 28/02/2023 285,194 0.35
400,000 Spain Government Bond* 0.60% 31/10/2029 405,147 0.50
600,000 Spain Government Bond* 1.30% 31/10/2026 646,141 0.80
230,000 Spain Government Bond* 1.40% 30/07/2028 250,262 0.31
400,000 Spain Government Bond* 1.50% 30/04/2027 437,141 0.54
1,050,000 Spain Government Bond* 1.85% 30/07/2035 1,200,665 1.48
250,000 Spain Government Bond* 1.95% 30/07/2030 286,439 0.35
1,124,516 Spain Government Inflation Linked Bond* 0.15% 30/11/2023 1,180,150 1.46
742,724 Spain Government Inflation Linked Bond* 0.65% 30/11/2027 830,247 1.02
300,000 State of North Rhine-Westphalia Germany* 0.80% 30/07/2049 301,093 0.37

FINANCIAL STATEMENTS SCHEDULE OF INVESTMENTS
876 NEUBERGER BERMAN INVESTMENT FUNDS PLC
Neuberger Berman Euro Bond Absolute Return Fund (Continued)
Schedule of Investments (Continued)
Financial Assets at Fair Value through Profit or Loss (continued)
Principal Amount Security Description Coupon Maturity
DateFair Value
EUR% of Net
Assets
Government Bonds 58.36% (31 December 2018: 23.31%) (continued)
Euro (continued)
180,000 State of North Rhine-Westphalia Germany* 1.25% 12/05/2036 199,471 0.25
Total Euro 45,396,408 56.01
United States Dollar 1,058,190 United States Treasury Inflation Indexed Bonds* 0.13% 15/04/2022 941,393 1.16
1,065,350 United States Treasury Inflation Indexed Bonds* 0.38% 15/01/2027 963,738 1.19
Total United States Dollar 1,905,131 2.35
Total Government Bonds 47,301,539 58.36
Total Investments 79,280,626 97.81
Forward Currency Contracts 1.23% (31 December 2018: 0.00%)
Amount Receivable
Amount Payable
Maturity Date Counterparty Contracts Unrealised
Gain EUR% of Net
Assets
AUD 5,360,941 US$ 3,680,108 22/01/2020 Citibank NA 7 80,266 0.10
AUD 630,096 US$ 431,965 22/01/2020 Goldman Sachs International 2 9,946 0.01
BRL 10,003,548 US$ 2,400,808 22/01/2020 Goldman Sachs International 7 75,081 0.09
CAD 2,690,915 US$ 2,036,141 22/01/2020 Citibank NA 6 34,896 0.04
CAD 2,095,440 US$ 1,585,757 22/01/2020 Goldman Sachs International 4 27,000 0.03
CHF 630,052 US$ 640,536 22/01/2020 Citibank NA 2 9,793 0.01
CHF 143,364 US$ 145,543 22/01/2020 Goldman Sachs International 3 2,412 0.00
CZK 12,926,763 US$ 552,331 22/01/2020 Citibank NA 1 16,594 0.02
CZK 18,449,706 US$ 805,605 22/01/2020 Goldman Sachs International 4 8,299 0.01
€ 3,138,780 US$ 3,496,761 22/01/2020 Citibank NA 11 27,420 0.04
€ 3,176,655 US$ 3,540,000 22/01/2020 Goldman Sachs International 10 26,822 0.03
€ 454,434 US$ 509,584 22/01/2020 Westpac Banking Corp 3 1,015 0.00
£ 79,809 US$ 103,867 22/01/2020 Citibank NA 1 1,709 0.00
£ 359,983 US$ 456,435 22/01/2020 Goldman Sachs International 3 18,439 0.02
£ 295,830 US$ 382,360 22/01/2020 Westpac Banking Corp 3 8,687 0.01
HUF 27,287,529 US$ 91,205 22/01/2020 Goldman Sachs International 1 1,338 0.00
¥ 56,614,940 US$ 518,328 22/01/2020 Citibank NA 1 2,846 0.01
¥ 175,515,496 US$ 1,615,077 22/01/2020 Goldman Sachs International 4 1,550 0.00
¥ 5,832,742 US$ 53,387 22/01/2020 Westpac Banking Corp 1 305 0.00
KRW 1,064,865,775 US$ 894,244 22/01/2020 Citibank NA 1 25,329 0.03
KRW 262,697,578 US$ 226,737 22/01/2020 Goldman Sachs International 1 793 0.00
MXN 5,562,276 US$ 283,343 22/01/2020 Citibank NA 1 9,204 0.01
MXN 13,063,450 US$ 673,443 22/01/2020 Goldman Sachs International 2 14,508 0.02
NOK 44,587,029 US$ 4,889,724 22/01/2020 Citibank NA 5 164,410 0.20
NOK 50,836,435 US$ 5,553,262 22/01/2020 Goldman Sachs International 9 206,864 0.26

SCHEDULE OF INVESTMENTS FINANCIAL STATEMENTS
ANNUAL REPORT 2019 877
Neuberger Berman Euro Bond Absolute Return Fund (Continued)
Schedule of Investments (Continued)
Financial Assets at Fair Value through Profit or Loss (continued)
Forward Currency Contracts 1.23% (31 December 2018: 0.00%) (continued)
Amount Receivable
Amount Payable
Maturity Date Counterparty Contracts Unrealised
Gain EUR% of Net
Assets
NZD 925,740 US$ 592,018 22/01/2020 Citibank NA 3 29,101 0.04
NZD 1,223,179 US$ 783,629 22/01/2020 Goldman Sachs International 7 37,209 0.05
NZD 220,283 US$ 139,986 22/01/2020 Westpac Banking Corp 1 7,714 0.01
SEK 6,646,709 US$ 698,116 22/01/2020 Citibank NA 4 11,221 0.02
SEK 20,073,180 US$ 2,075,720 22/01/2020 Goldman Sachs International 10 62,895 0.08
US$ 1,658,202 ¥ 179,277,039 22/01/2020 Citibank NA 4 5,991 0.01
US$ 17 CLP 12,405 22/01/2020 Goldman Sachs International 1 1 0.00
US$ 46,940 BRL 187,721 22/01/2020 Goldman Sachs International 1 270 0.00
US$ 459,296 ¥ 49,033,066 22/01/2020 Goldman Sachs International 2 6,772 0.01
US$ 452,267 KRW 521,816,720 22/01/2020 Goldman Sachs International 1 98 0.00
US$ 667,701 TRY 3,923,742 22/01/2020 Westpac Banking Corp 1 10,415 0.01
ZAR 10,109,325 US$ 668,641 22/01/2020 Goldman Sachs International 3 46,664 0.06
EUR Hedged Classes € 81,408 US$ 90,015 22/01/2020 Westpac Banking Corp 1 1,314 0.00
Total Unrealised Gain on Forward Currency Contracts ∞ 995,191 1.23
Futures Contracts 0.66% (31 December 2018: 0.00%)
Number of Contracts Description Unrealised
Gain EUR% of Net
Assets
50 Euro-Bund Future January 2020 6,046 0.01
65 Euro-Bund Future January 2020 18,962 0.02
60 Euro-Bund Future January 2020 43,899 0.06
(105) Euro-Bund Future March 2020 225,730 0.28
(40) Euro-Buxl 30-Year Bond Future March 2020 203,080 0.25
(22) Euro-OAT Future March 2020 35,800 0.04
(9) US Treasury 10-Year Note (CBT) Future March 2020 1,378 0.00
Total Unrealised Gain on Futures Contracts ± 534,895 0.66
Inflation Swap Contracts 0.03% (31 December 2018: 0.00%)
Notional Amount Expiration Date Counterparty Receive
/(Pay)# Fixed Rate Variable Rate Fair Value EUR
% of NetAssets
EUR 1,000,000 15/11/29 LCH Clearnet Ltd1 Receive 1.10% CPTFEMU 10,720 0.02
EUR 1,000,000 15/11/29 LCH Clearnet Ltd1 Receive 1.11% CPTFEMU 9,178 0.01
EUR 1,000,000 15/12/29 LCH Clearnet Ltd1 Receive 1.18% CPTFEMU 2,386 0.00
EUR 150,000 15/05/29 LCH Clearnet Ltd1 Receive 1.18% CPTFEMU 479 0.00
Total Inflation Swap Contracts at Fair Value ± 22,763 0.03

FINANCIAL STATEMENTS SCHEDULE OF INVESTMENTS
878 NEUBERGER BERMAN INVESTMENT FUNDS PLC
Neuberger Berman Euro Bond Absolute Return Fund (Continued)
Schedule of Investments (Continued)
Financial Assets at Fair Value through Profit or Loss (continued) # Receive - Funds receives variable rate and pays fixed rate. (Pay) - Fund pays variable rate and receives fixed rate. 1Centrally cleared swap.
Fair Value % of Net
EUR Assets
Total Financial Assets at Fair Value through Profit or Loss 80,833,475 99.73
Financial Liabilities at Fair Value through Profit or Loss Forward Currency Contracts (1.62%) (31 December 2018: (0.00%))
Amount Receivable
Amount Payable
Maturity Date Counterparty Contracts Unrealised
Loss EUR% of Net
Assets
¥ 604,716,276 US$ 5,625,676 22/01/2020 Citibank NA 12 (49,056) (0.06)
¥ 364,680,077 US$ 3,370,799 22/01/2020 Goldman Sachs International 6 (10,168) (0.01)
¥ 30,903,654 US$ 286,123 22/01/2020 Westpac Banking Corp 3 (1,284) (0.00)
TRY 3,924,232 US$ 664,073 22/01/2020 Goldman Sachs International 5 (7,114) (0.01)
US$ 48,507 BRL 197,813 22/01/2020 Citibank NA 1 (565) (0.00)
US$ 887,633 MXN 17,631,081 22/01/2020 Citibank NA 1 (38,515) (0.05)
US$ 919,420 NOK 8,401,127 22/01/2020 Citibank NA 5 (32,674) (0.04)
US$ 3,111,327 CAD 4,119,577 22/01/2020 Citibank NA 6 (58,621) (0.07)
US$ 1,365,947 € 1,224,241 22/01/2020 Citibank NA 7 (8,844) (0.01)
US$ 1,217,740 CHF 1,201,097 22/01/2020 Citibank NA 5 (21,644) (0.03)
US$ 1,132,917 £ 872,995 22/01/2020 Citibank NA 5 (21,567) (0.03)
US$ 561,232 AUD 813,895 22/01/2020 Citibank NA 3 (9,943) (0.01)
US$ 1,097,212 SEK 10,431,674 22/01/2020 Citibank NA 3 (16,227) (0.02)
US$ 2,570,047 NZD 3,942,034 22/01/2020 Citibank NA 7 (80,245) (0.10)
US$ 916,112 CZK 21,066,760 22/01/2020 Goldman Sachs International 3 (12,827) (0.02)
US$ 1,907,341 CAD 2,523,222 22/01/2020 Goldman Sachs International 8 (34,421) (0.04)
US$ 1,152,928 MXN 22,539,839 22/01/2020 Goldman Sachs International 7 (33,075) (0.04)
US$ 101,538 BRL 416,913 22/01/2020 Goldman Sachs International 1 (1,812) (0.00)
US$ 100,829 ¥ 11,017,360 22/01/2020 Goldman Sachs International 1 (588) (0.00)
US$ 90,528 HUF 27,286,700 22/01/2020 Goldman Sachs International 1 (1,937) (0.00)
US$ 1,254,875 SEK 12,068,937 22/01/2020 Goldman Sachs International 5 (31,716) (0.04)
US$ 23 PLN 92 22/01/2020 Goldman Sachs International 1 (1) (0.00)
US$ 2,161,079 NOK 19,595,781 22/01/2020 Goldman Sachs International 10 (61,518) (0.08)
US$ 4,978,086 € 4,485,959 22/01/2020 Goldman Sachs International 13 (56,540) (0.07)
US$ 592,592 £ 457,401 22/01/2020 Goldman Sachs International 2 (12,185) (0.02)
US$ 9,325,861 CHF 9,179,690 22/01/2020 Goldman Sachs International 18 (148,535) (0.18)
US$ 4,516,244 AUD 6,601,197 22/01/2020 Goldman Sachs International 14 (112,413) (0.14)
US$ 2,497,569 NZD 3,883,480 22/01/2020 Goldman Sachs International 7 (109,576) (0.14)

SCHEDULE OF INVESTMENTS FINANCIAL STATEMENTS
ANNUAL REPORT 2019 879
Neuberger Berman Euro Bond Absolute Return Fund (Continued)
Schedule of Investments (Continued)
Financial Liabilities at Fair Value through Profit or Loss (continued) Forward Currency Contracts (1.62%) (31 December 2018: (0.00%)) (continued)
Amount Receivable
Amount Payable
Maturity Date Counterparty Contracts Unrealised
Loss EUR% of Net
Assets
US$ 680,415 ZAR 10,107,989 22/01/2020 Goldman Sachs International 2 (36,104) (0.04)
US$ 1,128,517 KRW 1,339,902,949 22/01/2020 Goldman Sachs International 7 (28,931) (0.04)
US$ 228,111 € 204,753 22/01/2020 Westpac Banking Corp 7 (1,784) (0.00)
US$ 150,575 AUD 219,935 22/01/2020 Westpac Banking Corp 1 (3,651) (0.00)
US$ 47,067 NOK 429,768 22/01/2020 Westpac Banking Corp 1 (1,642) (0.00)
US$ 26,798 £ 20,827 22/01/2020 Westpac Banking Corp 1 (719) (0.00)
EUR Hedged Classes US$ 239,323 € 214,848 22/01/2020 Goldman Sachs International 2 (1,902) (0.00)
US$ 20,599,236 € 18,595,278 22/01/2020 Westpac Banking Corp 1 (266,420) (0.33)
Total Unrealised Loss on Forward Currency Contracts ∞ (1,314,764) (1.62)
Futures Contracts (0.02%) (31 December 2018: (0.05%))
Number of Contracts Description Unrealised
Loss EUR% of Net
Assets
(5) Short-Term Euro-BTP Future March 2020 (1,750) (0.00)
3 US Treasury 10-Year Ultra Future March 2020 (3,411) (0.01)
(6) US Treasury 2-Year Note (CBT) Future March 2020 (1,503) (0.00)
2 US Treasury Ultra Bond (CBT) Future March 2020 (7,405) (0.01)
Total Unrealised Loss on Futures Contracts ± (14,069) (0.02)
Inflation Swap Contracts (0.01%) (31 December 2018: (0.00%))
Notional Amount Expiration Date Counterparty Receive
/(Pay) # Fixed Rate Variable Rate Fair Value EUR
% of NetAssets
EUR 400,000 15/02/22 LCH Clearnet Ltd1 Receive 0.99% CPTFEMU (827) (0.00)
EUR 500,000 15/03/24 LCH Clearnet Ltd1 Receive 1.02% FRCPXTOB (1,000) (0.00)
EUR 350,000 15/04/29 LCH Clearnet Ltd1 Receive 1.28% CPTFEMU (3,314) (0.00)
EUR 500,000 15/02/29 LCH Clearnet Ltd1 Receive 1.27% CPTFEMU (7,352) (0.01)
Total Inflation Swap Contracts at Fair Value ± (12,493) (0.01)
# Receive - Funds receives variable rate and pays fixed rate.
(Pay) - Fund pays variable rate and receives fixed rate.

FINANCIAL STATEMENTS SCHEDULE OF INVESTMENTS
880 NEUBERGER BERMAN INVESTMENT FUNDS PLC
Neuberger Berman Euro Bond Absolute Return Fund (Continued)
Schedule of Investments (Continued)
Financial Liabilities at Fair Value through Profit or Loss (continued)
Interest Rate Swap Contracts (0.01%) (31 December 2018: (0.00%))
Notional Amount Expiration Date Counterparty Receive
/(Pay) # Fixed Rate Variable Rate Fair Value EUR
% of Net Assets
EUR 100,000 11/01/29 LCH Clearnet Ltd1 Receive 0.82% 6M Euribor (6,152) (0.01)
Total Interest Rate Swap Contracts at Fair Value ± (6,152) (0.01)
# Receive - Funds receives variable rate and pays fixed rate.
(Pay) - Fund pays variable rate and receives fixed rate. 1Centrally cleared swap.
Fair Value % of Net
EUR Assets
Total Financial Liabilities at Fair Value through Profit or Loss (1,347,478) (1.66)
Net Financial Assets at Fair Value through Profit or Loss 79,485,997 98.07
Other Net Assets 1,563,405 1.93
Net Assets Attributable to Holders of Redeemable Participating Shares 81,049,402 100.00
% ofTotal
AssetsPortfolio Analysis EUR
* Transferable securities and/or money market instruments admitted to an official stock exchange listing 58,249,209 70.25
** Transferable securities and/or money market instruments dealt in on a regulated market 21,031,417 25.37
± Financial derivative instruments traded on a regulated market 524,944 0.63
∞ OTC financial derivative instruments (319,573) (0.39)
Total Investments 79,485,997 95.86
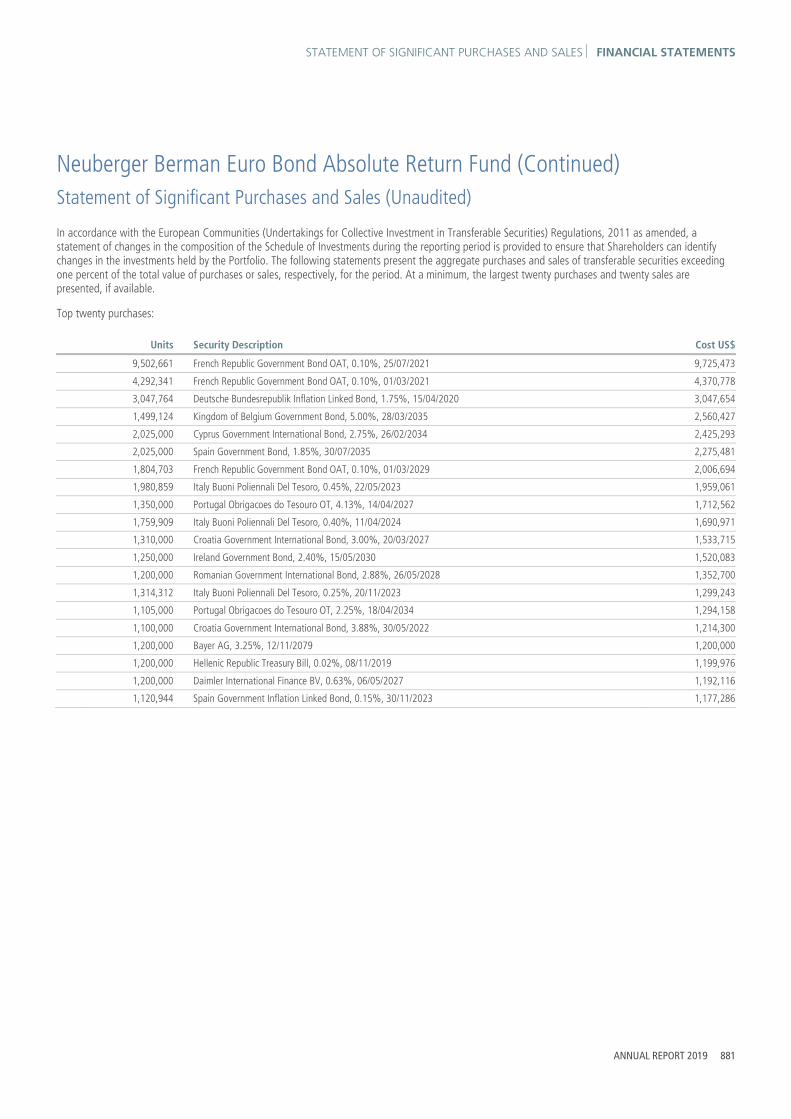
STATEMENT OF SIGNIFICANT PURCHASES AND SALES FINANCIAL STATEMENTS
ANNUAL REPORT 2019 881
Neuberger Berman Euro Bond Absolute Return Fund (Continued) Statement of Significant Purchases and Sales (Unaudited)
In accordance with the European Communities (Undertakings for Collective Investment in Transferable Securities) Regulations, 2011 as amended, a statement of changes in the composition of the Schedule of Investments during the reporting period is provided to ensure that Shareholders can identify changes in the investments held by the Portfolio. The following statements present the aggregate purchases and sales of transferable securities exceeding one percent of the total value of purchases or sales, respectively, for the period. At a minimum, the largest twenty purchases and twenty sales are presented, if available.
Top twenty purchases:
Units Security Description Cost US$
9,502,661 French Republic Government Bond OAT, 0.10%, 25/07/2021 9,725,473
4,292,341 French Republic Government Bond OAT, 0.10%, 01/03/2021 4,370,778
3,047,764 Deutsche Bundesrepublik Inflation Linked Bond, 1.75%, 15/04/2020 3,047,654
1,499,124 Kingdom of Belgium Government Bond, 5.00%, 28/03/2035 2,560,427
2,025,000 Cyprus Government International Bond, 2.75%, 26/02/2034 2,425,293
2,025,000 Spain Government Bond, 1.85%, 30/07/2035 2,275,481
1,804,703 French Republic Government Bond OAT, 0.10%, 01/03/2029 2,006,694
1,980,859 Italy Buoni Poliennali Del Tesoro, 0.45%, 22/05/2023 1,959,061
1,350,000 Portugal Obrigacoes do Tesouro OT, 4.13%, 14/04/2027 1,712,562
1,759,909 Italy Buoni Poliennali Del Tesoro, 0.40%, 11/04/2024 1,690,971
1,310,000 Croatia Government International Bond, 3.00%, 20/03/2027 1,533,715
1,250,000 Ireland Government Bond, 2.40%, 15/05/2030 1,520,083
1,200,000 Romanian Government International Bond, 2.88%, 26/05/2028 1,352,700
1,314,312 Italy Buoni Poliennali Del Tesoro, 0.25%, 20/11/2023 1,299,243
1,105,000 Portugal Obrigacoes do Tesouro OT, 2.25%, 18/04/2034 1,294,158
1,100,000 Croatia Government International Bond, 3.88%, 30/05/2022 1,214,300
1,200,000 Bayer AG, 3.25%, 12/11/2079 1,200,000
1,200,000 Hellenic Republic Treasury Bill, 0.02%, 08/11/2019 1,199,976
1,200,000 Daimler International Finance BV, 0.63%, 06/05/2027 1,192,116
1,120,944 Spain Government Inflation Linked Bond, 0.15%, 30/11/2023 1,177,286

FINANCIAL STATEMENTS STATEMENT OF SIGNIFICANT PURCHASES AND SALES
882 NEUBERGER BERMAN INVESTMENT FUNDS PLC
Neuberger Berman Euro Bond Absolute Return Fund (Continued) Statement of Significant Purchases and Sales (Unaudited) (Continued)
Top twenty sales: Units Security Description Proceeds US$
6,462,008 French Republic Government Bond OAT, 0.10%, 25/07/2021 6,610,201
2,196,974 French Republic Government Bond OAT, 0.10%, 01/03/2021 2,238,694
2,240,046 Deutsche Bundesrepublik Inflation Linked Bond, 1.75%, 15/04/2020 2,238,410
1,275,000 Cyprus Government International Bond, 2.75%, 26/02/2034 1,541,882
1,105,000 Portugal Obrigacoes do Tesouro OT, 2.25%, 18/04/2034 1,323,022
1,200,000 Bayer AG, 3.25%, 12/11/2079 1,213,704
975,000 Spain Government Bond, 1.85%, 30/07/2035 1,099,714
1,000,000 EssilorLuxottica SA, 0.13%, 27/05/2025 996,460
900,000 European Investment Bank, 0.05%, 13/10/2034 872,100
8,450 Neuberger Berman Ultra Short Term Euro Bond Fund 858,605
499,124 Kingdom of Belgium Government Bond, 5.00%, 28/03/2035 853,938
820,000 Mexico Government International Bond, 1.63%, 08/04/2026 835,047
727,043 French Republic Government Bond OAT, 0.10%, 01/03/2029 814,417
800,000 Eli Lilly & Co, 1.70%, 01/11/2049 799,924
800,000 Albemarle New Holding GmbH, 1.63%, 25/11/2028 797,960
800,000 CK Hutchison Holdings Ltd, 1.13%, 17/10/2028 797,176
800,000 ZF Europe Finance BV, 2.00%, 23/02/2026 796,000
800,000 E.ON SE, 0.25%, 24/10/2026 792,360
700,000 Ireland Government Bond, 1.30%, 15/05/2033 788,858
680,215 Spain Government Inflation Linked Bond, 1.80%, 30/11/2024 783,498

INVESTMENT MANAGER’S REPORT FINANCIAL STATEMENTS
ANNUAL REPORT 2019 883
Neuberger Berman Absolute Alpha Fund Investment Manager’s Report From inception of the Portfolio on 20 February 2019 through 31 December 2019, the total return for the Neuberger Berman Absolute Alpha Fund USD I Accumulating Class was -4.40%. Over the same period, the benchmark indices, the S&P 500 Total Return Index (“index A”), returned 18.02% and the HFRX Equity Hedge Index (“index B”) returned 5.40%. (Performance data quoted represent past performance and do not indicate future results. Total returns shown are net of all fees and expenses and include reinvestment of income dividends and other distributions, if any).
In Q4 2018, the market suffered a severe correction. It did so because the Federal Reserve (“Fed”) raised rates just as macro data indicated a slowdown in the global economy. In 2019, severe weakness in the industrial economy did in fact occur. The central question of 2019 was whether this industrial slowdown would expand into the rest of the global economy. Two events supported the markets despite the industrial slump. First, having aggressively raised rates in 2018, the Fed turned dovish in 2019 and lowered rates three times. Second, throughout 2019, negotiations between China and the US were ongoing and late in the year, the two sides reached a Stage 1 deal. Between these two, in our view, the Fed’s actions mattered the most. The Stage 1 deal between China and the US was largely optics. China agreed to buy agricultural products and the US lowered tariffs on certain products. At best, this deal represents a temporary truce. The more important issues of intellectual property theft have been put off, and we expect no resolution on any of these more important issues. We anticipate a trade war may resume but not in an election year.
Despite a dovish Fed and a Stage 1 deal, the industrial slowdown did have a major impact on fundamentals. In 2019, the earnings of the industrial and materials sectors declined by 6% and 25%, respectively. With respect to the overall S&P 500 Index, at the beginning of 2019, analysts estimated that 2019 S&P 500 earnings would increase by 6%-7%. As of this writing, 2019 S&P earnings will be down about 1%. Thus, the entire increase in the market was due to multiple expansion.
There is another aspect of the rally that has not, in our view, received enough attention. In mid-September 2019, the Repo markets suffered a dislocation. Repo markets are where banks and other financial institutions lend to one another overnight. This market is an important part of the financial system and normally is seamless. In early October, however, overnight rates blew out from 1.7% to 8%, a jump that might occur during a severe crisis but never in normal times. In our view, the cause of this Repo market dislocation is due largely to post-crisis regulations that force large banks to horde cash. The simple solution would have been to change those rules. The Fed, however, chose a different approach. Since mid-October, the Fed purchased $300 billion of short-term treasuries, thereby flooding the markets with liquidity. While the Fed did not call it such, this is another quantitative easing. One thing we may have learned this decade is that when the Fed engages in quantitative easing, stock markets go up – hence, the strong year-end rally.
Our underperformance was largely due to positioning. For much of 2019, we maintained a very low net exposure, generally below 30%. Our longs performed well. Our shorts however performed poorly and in combination with a low net, ate up our performance. Why did we maintain a low net exposure? We simply believed that the global industrial recession would infect the rest of the global economy. And here we were simply wrong. The normal mechanism of translation would have been a global industrial slowdown leading to a tightening of credit conditions and a widening of credit spreads and this combination would lead to a slowdown in the rest of the economy. It did not happen. By turning dovish and lowering rates, the Fed insured that credit conditions would remain loose regardless of industrial economic conditions. By engaging in a closet quantitative easing, the Fed ensured a fourth quarter rally by flooding the markets with liquidity.
With respect to credit quality, US data indicates a fairly benign environment. Consumer credit statistics remain strong with delinquencies and losses at multi-year lows. Canada represents the one exception to this benign picture. We have been saying for quite some time that Canada would experience a credit cycle for the first time in over 25 years. It looks like that prediction is finally coming true. While some commentators have been predicting problems in the Canadian mortgage sector, that area still shows no signs of deterioration. The same cannot be said for the corporate sector. Canadian banks reported their fourth quarter numbers in late November. Corporate credit results were the worst we have seen since we have been analysing these banks. For example, CIBC experienced a 26% yr/yr increase in total non-performing loans but a 47% increase in commercial non-performers. For Royal Bank of Canada, the total non-performing and commercial non-performing loan yr/yr increase was 36% and 71%, respectively. We anticipate credit deterioration may continue into 2020 and as a result, the current estimates for Canadian banks are simply too high; we remain short two Canadian banks, Royal Bank of Canada and CIBC.
At the beginning of 2019, the S&P 500 was valued at 14x one year forward earnings. At year-end, the forward multiple was 18x. Given this significantly higher multiple, we do not expect as good a year in 2020. However, with the Fed on hold and with credit conditions as loose as they are, we believe that there is little reason, at this time, to expect a recession. We believe US GDP growth should remain at its slow 2%. While there has been some stabilisation in leading economic indicators, we are still not expecting a bounce-back in the industrial sector. The major risks are largely political. Assuming that the election is between Trump and a moderate Democrat, then the market will largely ignore it. However, an election between Trump and a progressive Democrat will make the markets nervous.
In 2020, net positioning largely determined performance. We feel this year will be different and stock picking will matter much more, both on the longs and the shorts. As a result, our Portfolio has very little in the way of macro themes (other than short two Canadian banks and short HSBC and Standard Charter because of the potential for a recession in Hong Kong). The rest of the Portfolio is exceptionally idiosyncratic both on the long and short sides.

FINANCIAL STATEMENTS INVESTMENT MANAGER’S REPORT
884 NEUBERGER BERMAN INVESTMENT FUNDS PLC
Neuberger Berman Absolute Alpha Fund (Continued) Investment Manager’s Report (Continued) We have made some major changes to the Portfolio. For almost all of 2019, our net exposure was below 30%. At the end of Q3 2019, beta and non-beta adjusted net exposures stood at 15.2% and 25.2%, respectively. However, when the Fed began its closet quantitative easing in October, we began changing the Portfolio. We eliminated most of our macro bets and reduced significantly our European bank shorts. While the Portfolio is certainly net longer, a close examination of the positions indicates that much of the Portfolio is compose of idiosyncratic ideas (both long and short) with very few macro bets. Below, we show a comparison of the Portfolio at the end of Q3 2019 against Q4 2019.
By eliminating most of our European bank shorts and adding positions such as Progressive and Equitable, we are now net long financials. We also added a biotech stock, BioMarin to our healthcare positions and covered two of our shorts in that sector which were not working.
We bought Equitable (“EQH”), which is a life insurance company, largely because of valuation. Life insurance companies do best when long term rates are rising. However, our investment thesis on Equitable is not a rate bet. Based on current estimates, the stock’s 2020 P/E is only 5x. But in actuality it is even lower. EQH owns 65% of Alliance Bernstein (AB). AB sells at 11x 2020 estimates. If we deduct the value of AB, EQH’s pure multiple is 3x. While we are not overly positive on the life insurance sector, 3x earnings seems a bit silly. Also, we think that later this year, EQH will partially sell down its stake in AB and buy back stock.
Progressive is regarded as one of the best companies in all of financial services. It is largely an auto insurer. The stock generally sells at 16x forward earnings. Today it is at 13.5x repressed earnings. Earnings are repressed because in the last few months, loss costs have been elevated. This is a curable problem with price increases. Progressive sells short-term policies so within a year price increases can overcome loss increases. As this comes through earnings, we anticipate that the multiple will rise back up to 16x.
Biomarin focuses on gene therapy and presently has a well-diversified commercial drug Portfolio and has two potential blockbusters that they will be seeking approval in 2020 and 2021. Valrox for the treatment of Hemophilia A and Vosoritide for the treatment of Achondroplasia (dwarfism).

BALANCE SHEET FINANCIAL STATEMENTS
The accompanying notes form an integral part of the financial statements.
ANNUAL REPORT 2019 885
Neuberger Berman Absolute Alpha Fund (Continued) Balance Sheet
As at
Note 31 December 2019
US$
Current Assets
Financial Assets at Fair Value through Profit or Loss 2 37,131,744
Cash and cash equivalents 3 373,116
Receivable for shares issued 29,426
Due from brokers 4,910,000
Income receivable and other assets 198,405
Total Assets 42,642,691
Current Liabilities
Financial Liabilities at Fair Value through Profit or Loss 2 2,457,345
Accrued expenses 89,118
Payable for investments purchased 179,179
Other payables 63,622
Liabilities (excluding Net Assets Attributable to Holders of Redeemable Participating Shares) 2,789,264
Net Assets Attributable to Holders of Redeemable Participating Shares 39,853,427

FINANCIAL STATEMENTS PROFIT AND LOSS ACCOUNT
The accompanying notes form an integral part of the financial statements.
886 NEUBERGER BERMAN INVESTMENT FUNDS PLC
Neuberger Berman Absolute Alpha Fund (Continued) Profit and Loss Account
Period Ended
Note 31 December 2019*
US$
Income
Interest Income 117,133
Dividend Income 389,260
Net Gain/(Loss) on Financial Assets and Liabilities at Fair Value through Profit or Loss 11 (1,223,815)
(717,422)
Expenses
Management Fee 6 652,779
Distribution Fee 6 318
Administration Fee 6 34,478
Commitment Fee 19 3,133
Custody Fee 6 7,682
Depositary Fee 6 1,477
Professional Fee 9 38,345
Directors' Fee 7 3,994
Transaction Costs 9 25,964
Organisation Expenses 9 51,300
Audit Fee 8 9,486
VAT Rebate (489)
Other Expenses 9 280,753
Expense Waiver 6 (55,577)
Total Expenses 1,053,643
Finance Costs
Interest Expense 266
266
Withholding Tax 1 150,533
Profit/(Loss) Attributable to Holders of Redeemable Participating Shares from Operations (1,921,864)
* Portfolio launched on 20 February 2019. Income and expenses arose solely from continuing operations.

STATEMENT OF CHANGES IN NET ASSETS FINANCIAL STATEMENTS
The accompanying notes form an integral part of the financial statements.
ANNUAL REPORT 2019 887
Neuberger Berman Absolute Alpha Fund (Continued) Statement of Changes in Net Assets Attributable to Holders of Redeemable Participating Shares
Period Ended
31 December 2019*
US$
Net Assets Attributable to Holders of Redeemable Participating Shares at beginning of period –
Profit/(Loss) Attributable to Holders of Redeemable Participating Shares from Operations (1,921,864)
Subscriptions 5 43,256,851
Redemptions 5 (1,481,560)
Net Assets Attributable to Holders of Redeemable Participating Shares at end of period 39,853,427
* Portfolio launched on 20 February 2019.

FINANCIAL STATEMENTS SCHEDULE OF INVESTMENTS
888 NEUBERGER BERMAN INVESTMENT FUNDS PLC
Neuberger Berman Absolute Alpha Fund (Continued)
Schedule of Investments
Financial Assets at Fair Value through Profit or Loss
Number of Shares Security Description Fair Value
US$% of Net
Assets
Equities 91.16%
United States Dollar 7,039 Alibaba Group Holding Ltd ADR 1,492,972 3.75
812 Alphabet Inc Class A 1,087,585 2.73
745 Amazon.com Inc 1,376,641 3.45
5,973 Aon Plc 1,244,116 3.12
5,900 Apple Inc 1,732,535 4.35
9,325 Aptiv Plc 885,595 2.22
55,975 AXA Equitable Holdings Inc 1,387,060 3.48
30,935 Bank of America Corp 1,089,531 2.73
12,400 BioMarin Pharmaceutical Inc 1,048,420 2.63
19,739 Bristol-Myers Squibb Co 1,267,046 3.18
7,921 Caterpillar Inc 1,169,773 2.94
14,568 Cheniere Energy Inc 889,668 2.23
21,234 Coca-Cola Co 1,175,302 2.95
13,185 Dominion Energy Inc 1,091,982 2.74
14,620 Evergy Inc 951,616 2.39
6,264 Facebook Inc Class A 1,285,686 3.23
30,592 General Motors Co 1,119,667 2.81
11,071 JPMorgan Chase & Co 1,543,297 3.87
11,184 Leidos Holdings Inc 1,094,802 2.75
12,237 Microsoft Corp 1,929,775 4.83
20,595 Morgan Stanley 1,052,816 2.64
11,071 Procter & Gamble Co 1,382,768 3.47
6,815 Salesforce.com Inc 1,108,392 2.78
4,152 Thermo Fisher Scientific Inc 1,348,860 3.39
11,800 T-Mobile US Inc 925,356 2.32
7,761 Visa Inc Class A 1,458,292 3.66
67,470 Vistra Energy Corp 1,551,135 3.89
10,052 Walt Disney Co 1,453,821 3.65
7,939 Zimmer Biomet Holdings Inc 1,188,310 2.98
Total Equities * 36,332,819 91.16
Total Investments 36,332,819 91.16

SCHEDULE OF INVESTMENTS FINANCIAL STATEMENTS
ANNUAL REPORT 2019 889
Neuberger Berman Absolute Alpha Fund (Continued)
Schedule of Investments (Continued)
Financial Assets at Fair Value through Profit or Loss (continued)
Forward Currency Contracts 0.11%
Amount Receivable
Amount Payable
Maturity Date Counterparty Contracts Unrealised
Gain US$% of Net
Assets
€ 29,000 US$ 32,264 11/03/2020 JPMorgan Chase Bank 1 428 0.00
£ 89,000 US$ 117,535 11/03/2020 JPMorgan Chase Bank 1 589 0.00
SEK 104,000 US$ 10,959 11/03/2020 JPMorgan Chase Bank 1 187 0.00
EUR Hedged Classes € 1,569 US$ 1,733 22/01/2020 Citibank NA 1 30 0.00
€ 1,759 US$ 1,943 22/01/2020 Goldman Sachs International 4 35 0.00
€ 72,781 US$ 81,223 22/01/2020 Westpac Banking Corp 12 575 0.00
GBP Hedged Classes £ 73,004 US$ 95,676 22/01/2020 Westpac Banking Corp 3 1,090 0.00
US$ 555 £ 418 22/01/2020 Westpac Banking Corp 1 1 0.00
SGD Hedged Classes SGD 569,378 US$ 412,762 22/01/2020 Citibank NA 1 10,733 0.03
SGD 653,668 US$ 474,267 22/01/2020 Goldman Sachs International 7 11,922 0.03
SGD 989,497 US$ 717,998 22/01/2020 Westpac Banking Corp 14 17,977 0.05
Total Unrealised Gain on Forward Currency Contracts ∞ 43,567 0.11
Contracts for Differences 1.90%
Units Security Description Counterparty Unrealised Gain US$
% of Net Assets
(37,990) Adtalem Global Education Inc JPMorgan Chase Bank 16,910 0.04
(6,749) Alliance Data Systems Corp JPMorgan Chase Bank 77,613 0.20
(14,285) Canadian Imperial Bank of Commerce JPMorgan Chase Bank 22,880 0.06
(13,895) Canadian Tire Corp JPMorgan Chase Bank 48,540 0.12
(1,607,765) Cisco Systems Inc JPMorgan Chase Bank 55,488 0.14
(1,551,172) Citigroup Inc JPMorgan Chase Bank 188,833 0.47
(2,785) Cummins Inc Morgan Stanley 2,599 0.01
(1,612,970) Fiserv Inc JPMorgan Chase Bank 131,887 0.33
(39,655) Franklin Resources Inc JPMorgan Chase Bank 51,155 0.13
(1,351,980) Phillips 66 JPMorgan Chase Bank 51,786 0.13
(1,261,625) Progressive Corp Morgan Stanley 48,272 0.12
(15,580) Royal Bank Of Canada JPMorgan Chase Bank 46,675 0.12
(8,895) Trex Co Inc JPMorgan Chase Bank 12,720 0.03
Total Unrealised Gain on Contracts for Differences ∞ 755,358 1.90
Fair Value % of Net
US$ Assets
Total Financial Assets at Fair Value through Profit or Loss 37,131,744 93.17

FINANCIAL STATEMENTS SCHEDULE OF INVESTMENTS
890 NEUBERGER BERMAN INVESTMENT FUNDS PLC
Neuberger Berman Absolute Alpha Fund (Continued)
Schedule of Investments (Continued)
Financial Liabilities at Fair Value through Profit or Loss
Forward Currency Contracts (0.06%) Amount Receivable
Amount Payable
Maturity Date Counterparty Contracts Unrealised
Loss US$% of Net
Assets
US$ 13,456 € 12,000 11/03/2020 JPMorgan Chase Bank 1 (72) (0.00)
US$ 89,680 £ 68,000 11/03/2020 JPMorgan Chase Bank 1 (573) (0.00)
US$ 58,397 CAD 77,000 11/03/2020 JPMorgan Chase Bank 2 (997) (0.01)
EUR Hedged Classes US$ 683 € 615 22/01/2020 Goldman Sachs International 6 (7) (0.00)
US$ 484 € 436 22/01/2020 Westpac Banking Corp 5 (5) (0.00)
GBP Hedged Classes £ 132 US$ 176 22/01/2020 Westpac Banking Corp 1 (1) (0.00)
US$ 42 £ 32 22/01/2020 Westpac Banking Corp 1 (0) (0.00)
SGD Hedged Classes US$ 233,313 SGD 317,768 22/01/2020 Goldman Sachs International 7 (3,041) (0.01)
US$ 1,361,444 SGD 1,854,197 22/01/2020 Westpac Banking Corp 20 (17,685) (0.04)
Total Unrealised Loss on Forward Currency Contracts ∞ (22,381) (0.06)
Contracts for Differences (6.11%)
Units Security Description Counterparty UnrealisedLoss US$
% of Net Assets
(6,567) 3M Co JPMorgan Chase Bank (66,442) (0.17)
(7,140) Acuity Brands Inc JPMorgan Chase Bank (94,462) (0.24)
(1,073,173) BNP Paribas SA Morgan Stanley (8,819) (0.02)
(42,199) Career Education Corp Morgan Stanley (106,895) (0.27)
(990) Career Education Corp Morgan Stanley (16,775) (0.04)
(3,584) Clorox Co JPMorgan Chase Bank (19,103) (0.05)
(15,340) Exxon Mobil Corp JPMorgan Chase Bank (9,642) (0.02)
(1,490,698) Health Insurance Innovation JPMorgan Chase Bank (372,746) (0.93)
(158,050) HSBC Holdings Plc JPMorgan Chase Bank (17,330) (0.04)
(6,305) International Flavors & Fragrances JPMorgan Chase Bank (49,194) (0.12)
(1,421,976) Lennar Corp JPMorgan Chase Bank (92,221) (0.23)
(2,337,755) Motorola Solutions Inc JPMorgan Chase Bank (118,052) (0.30)
(2,375) Netflix Inc JPMorgan Chase Bank (69,082) (0.17)
(12,751) Omnicom Group JPMorgan Chase Bank (67,835) (0.17)
(4,034) Simon Property Group Inc JPMorgan Chase Bank (282) (0.00)
(37,250) SoftBank Group Corp Morgan Stanley (83,638) (0.21)
(13,282) Square Inc Morgan Stanley (41,984) (0.11)
(132,770) Standard Chartered Plc JPMorgan Chase Bank (45,797) (0.11)
(4,645) Strategic Education Inc Morgan Stanley (125,671) (0.32)
(50,218) Svenska Handelsbanken AB JPMorgan Chase Bank (42,166) (0.11)
(1,519) Tesla Inc JPMorgan Chase Bank (243,708) (0.61)
(25,682) Trupanion Inc JPMorgan Chase Bank (377,012) (0.95)

SCHEDULE OF INVESTMENTS FINANCIAL STATEMENTS
ANNUAL REPORT 2019 891
Neuberger Berman Absolute Alpha Fund (Continued)
Schedule of Investments (Continued)
Financial Liabilities at Fair Value through Profit or Loss (continued)
Contracts for Differences (6.11%) (continued)
Units Security Description Counterparty UnrealisedLoss US$
% of Net Assets
(16,225) Wells Fargo & Co JPMorgan Chase Bank (59,870) (0.15)
(21,089) Zillow Group Inc JPMorgan Chase Bank (306,238) (0.77)
Total Unrealised Loss on Contracts for Differences ∞ (2,434,964) (6.11)
Fair Value % of Net
US$ Assets
Total Financial Liabilities at Fair Value through Profit or Loss (2,457,345) (6.17)
Net Financial Assets at Fair Value through Profit or Loss 34,674,399 87.00
Other Net Assets 5,179,028 13.00
Net Assets Attributable to Holders of Redeemable Participating Shares 39,853,427 100.00
% ofTotal
AssetsPortfolio Analysis US$
* Transferable securities and/or money market instruments admitted to an official stock exchange listing 36,332,819 85.20
∞ OTC financial derivative instruments (1,658,420) (3.89)
Total Investments 34,674,399 81.31

FINANCIAL STATEMENTS STATEMENT OF SIGNIFICANT PURCHASES AND SALES
892 NEUBERGER BERMAN INVESTMENT FUNDS PLC
Neuberger Berman Absolute Alpha Fund (Continued) Statement of Significant Purchases and Sales (Unaudited) In accordance with the European Communities (Undertakings for Collective Investment in Transferable Securities) Regulations, 2011 as amended, a statement of changes in the composition of the Schedule of Investments during the reporting period is provided to ensure that Shareholders can identify changes in the investments held by the Portfolio. The following statements present the aggregate purchases and sales of transferable securities exceeding one percent of the total value of purchases or sales, respectively, for the period. At a minimum, the largest twenty purchases and twenty sales are presented, if available.
Aggregate purchases greater than one percent of the total value of purchases:
Units Security Description Cost US$
12,540 Alibaba Group Holding Ltd ADR 2,250,855
12,024 Caterpillar Inc 1,687,122
67,470 Vistra Energy Corp 1,648,432
18,886 BioMarin Pharmaceutical Inc 1,586,567
17,903 Aptiv Plc 1,539,643
12,237 Microsoft Corp 1,478,980
36,363 General Motors Co 1,438,254
17,812 Ashland Global Holdings Inc 1,408,916
796 Amazon.com Inc 1,406,166
12,539 JPMorgan Chase & Co 1,359,053
10,592 Walt Disney Co 1,305,941
8,129 Visa Inc Class A 1,294,084
1,117 Alphabet Inc Class A 1,289,390
17,173 T-Mobile US Inc 1,278,668
27,430 Morgan Stanley 1,254,615
39,960 Bank of America Corp 1,253,150
11,071 Procter & Gamble Co 1,252,590
4,637 Thermo Fisher Scientific Inc 1,242,839
55,975 AXA Equitable Holdings Inc 1,238,886
16,097 Ameren Corp 1,233,040
6,571 Apple Inc 1,231,437
6,631 Facebook Inc Class A 1,177,628
15,200 Dominion Energy Inc 1,168,562
18,491 Las Vegas Sands Corp 1,134,920
21,234 Coca-Cola Co 1,121,252
6,274 Aon Plc 1,119,352
13,505 EOG Resources Inc 1,096,745
6,815 Salesforce.com Inc 1,076,182
8,410 Zimmer Biomet Holdings Inc 1,060,226
14,035 Restaurant Brands International Inc 1,057,421
15,394 Cheniere Energy Inc 1,025,066
17,190 Evergy Inc 1,000,757
20,824 Bristol-Myers Squibb Co 999,222

STATEMENT OF SIGNIFICANT PURCHASES AND SALES FINANCIAL STATEMENTS
ANNUAL REPORT 2019 893
Neuberger Berman Absolute Alpha Fund (Continued) Statement of Significant Purchases and Sales (Unaudited) (Continued) Aggregate purchases greater than one percent of the total value of purchases (continued):
Units Security Description Cost US$
11,184 Leidos Holdings Inc 980,172
4,896 Goldman Sachs Group Inc 976,088
13,456 Gilead Sciences Inc 883,194
8,949 Phillips 66 875,214
146,309 Nokia OYJ ADR 874,342
27,321 Elanco Animal Health Inc 845,813
32,147 Nielsen Holdings Plc 841,440
2,257 Netflix Inc 806,219
10,613 CSX Corp 765,411
27,007 Williams Cos Inc 724,850
4,332 Deere & Co 700,298
8,159 Novartis AG ADR 688,467
10,795 Daimler AG 678,544
11,150 CVS Health Corp 660,760

FINANCIAL STATEMENTS STATEMENT OF SIGNIFICANT PURCHASES AND SALES
894 NEUBERGER BERMAN INVESTMENT FUNDS PLC
Neuberger Berman Absolute Alpha Fund (Continued) Statement of Significant Purchases and Sales (Unaudited) (Continued)
Aggregate sales greater than one percent of the total value of sales:
Units Security Description Proceeds US$
17,812 Ashland Global Holdings Inc 1,309,133
16,097 Ameren Corp 1,197,021
18,491 Las Vegas Sands Corp 1,043,426
5,501 Alibaba Group Holding Ltd ADR 1,039,194
13,505 EOG Resources Inc 1,023,809
4,896 Goldman Sachs Group Inc 945,657
14,035 Restaurant Brands International Inc 927,371
13,456 Gilead Sciences Inc 871,930
8,949 Phillips 66 864,455
8,578 Aptiv Plc 778,797
32,147 Nielsen Holdings Plc 760,633
27,321 Elanco Animal Health Inc 732,308
10,613 CSX Corp 729,666
2,257 Netflix Inc 704,222
10,795 Daimler AG 672,774
4,332 Deere & Co 639,204
8,159 Novartis AG ADR 638,833
27,007 Williams Cos Inc 619,768
11,150 CVS Health Corp 597,937
4,103 Caterpillar Inc 585,629
6,486 BioMarin Pharmaceutical Inc 557,723
146,309 Nokia OYJ ADR 554,100
2,597 Raytheon Co 461,954
2,508 Cigna Corp 432,631
5,373 T-Mobile US Inc 386,601
9,226 Activision Blizzard Inc 382,675
14,230 Devon Energy Corp 382,091
6,835 Morgan Stanley 334,579
305 Alphabet Inc Class A 332,572
9,025 Bank of America Corp 295,419
31,005 Federal National Mortgage Association, 8.25%, 29/12/2049 292,762

INVESTMENT MANAGER’S REPORT FINANCIAL STATEMENTS
ANNUAL REPORT 2019 895
Neuberger Berman Multi-Style Premia Fund Investment Manager’s Report From inception of the Portfolio on 1 March through 2019 through period ended 31 December 2019, the total return of the USD I Accumulating Class was 5.40%. Over the same period, the ICE BofA US Dollar 3-month Deposit Offered Rate Constant Maturity Index (the “Index”) returned 2.09%. (Performance for all share classes is provided in Appendix II. Performance data quoted represent past performance and do not indicate future results. Total returns shown are net of all fees and expenses and include reinvestment of income dividends and other distributions, if any).
By investing in a portfolio of diversified risk premia, it seeks attractive absolute returns with managed volatility and low correlation to traditional asset classes, as well as better drawdown characteristics during highly volatile periods. The Portfolio is comprised of well-diversified exposure to four styles of risk premia (value, momentum, carry and liquidity) identified across equities, fixed income, currencies and commodities - for a total of 14 risk premia included in the Portfolio. The Portfolio construction for the risk premia is based upon the team’s proprietary risk-balancing methodology, which seeks balanced risk from each of the four styles of risk premia, and then balances risk across premia within each style, so as to achieve better diversification and drawdown management, and ultimately to achieve its investment objectives.
Performance was positive during the year since March 2019 inception. In long/short equities, our significant efforts to incorporate greater fundamental depth into our quantitative processes continued to drive differentiated outcomes. For example, working closely with Neuberger Berman’s central fundamental equity research team has allowed us to adjust data inputs for select M&A activity to more accurately capture the economics of companies without having to wait for quarterly releases.
During the year from a multi-factor perspective, the Portfolio’s most profitable sectors were technology, materials, financials and energy, while healthcare and staples were the largest detractors. Over the same time period, momentum, income and low risk factors were positive, while value and quality underperformed. Currency momentum and carry were positive along with rates carry. In the volatility book, short volatility options were profitable as equity markets drove higher during the year, while trend following detracted on noisy signals across asset classes. Commodity momentum was the main detractor from Portfolio performance throughout the year due to choppy price action and trend reversals, particularly across grains and soft commodities.
Looking forward into 2020, we anticipate the trade overhang from last year to subside and manufacturing growth to continue to stabilise. Central banks remain highly accommodative and could lend additional fiscal stimulus to provide further support to global growth. Over the last quarter, the Portfolio began to migrate to a more pro-cyclical stance across equity sectors, commodities and the US dollar. Barring acceleration of geopolitical risks in the Middle East, it seems like this secular shift could continue, which would benefit a more risk-on posture as well as exposure to cyclical value. Given the recent developments of the global pandemic, the portfolio continues to be positioned defensively in this uncertain environment, with tactical adjustments to keep key indicators, such as beta and volatility, within desired ranges.

FINANCIAL STATEMENTS BALANCE SHEET
The accompanying notes form an integral part of the financial statements.
896 NEUBERGER BERMAN INVESTMENT FUNDS PLC
Neuberger Berman Multi-Style Premia Fund (Continued) Balance Sheet
As at
Note 31 December 2019
US$
Current Assets
Financial Assets at Fair Value through Profit or Loss 2 8,349,178
Cash and cash equivalents 3 6,003,782
Receivable for investments sold 11,031
Receivable for shares issued 7,081
Due from brokers 3,619,443
Income receivable and other assets 87,769
Total Assets 18,078,284
Current Liabilities
Financial Liabilities at Fair Value through Profit or Loss 2 1,584,072
Accrued expenses 65,281
Payable for investments purchased 26
Other payables 35,051
Liabilities (excluding Net Assets Attributable to Holders of Redeemable Participating Shares) 1,684,430
Net Assets Attributable to Holders of Redeemable Participating Shares 16,393,854

PROFIT AND LOSS ACCOUNT FINANCIAL STATEMENTS
The accompanying notes form an integral part of the financial statements.
ANNUAL REPORT 2019 897
Neuberger Berman Multi-Style Premia Fund (Continued) Profit and Loss Account
Period Ended
Note 31 December 2019*
US$
Income
Interest Income 121,161
Dividend Income 210,270
Net Gain/(Loss) on Financial Assets and Liabilities at Fair Value through Profit or Loss 11 937,581
1,269,012
Expenses
Management Fee 6 83,563
Administration Fee 6 62,304
Commitment Fee 19 1,417
Custody Fee 6 8,286
Depositary Fee 6 654
Professional Fee 9 43,568
Directors' Fee 7 3,994
Transaction Costs 9 59,570
Organisation Expenses 9 51,300
Audit Fee 8 9,298
VAT Rebate (188)
Other Expenses 9 246,590
Expense Waiver 6 (180,398)
Total Expenses 389,958
Finance Costs
Interest Expense 3
3
Withholding Tax 1 91,964
Profit/(Loss) Attributable to Holders of Redeemable Participating Shares from Operations 787,087
* Portfolio launched on 1 March 2019. Income and expenses arose solely from continuing operations.
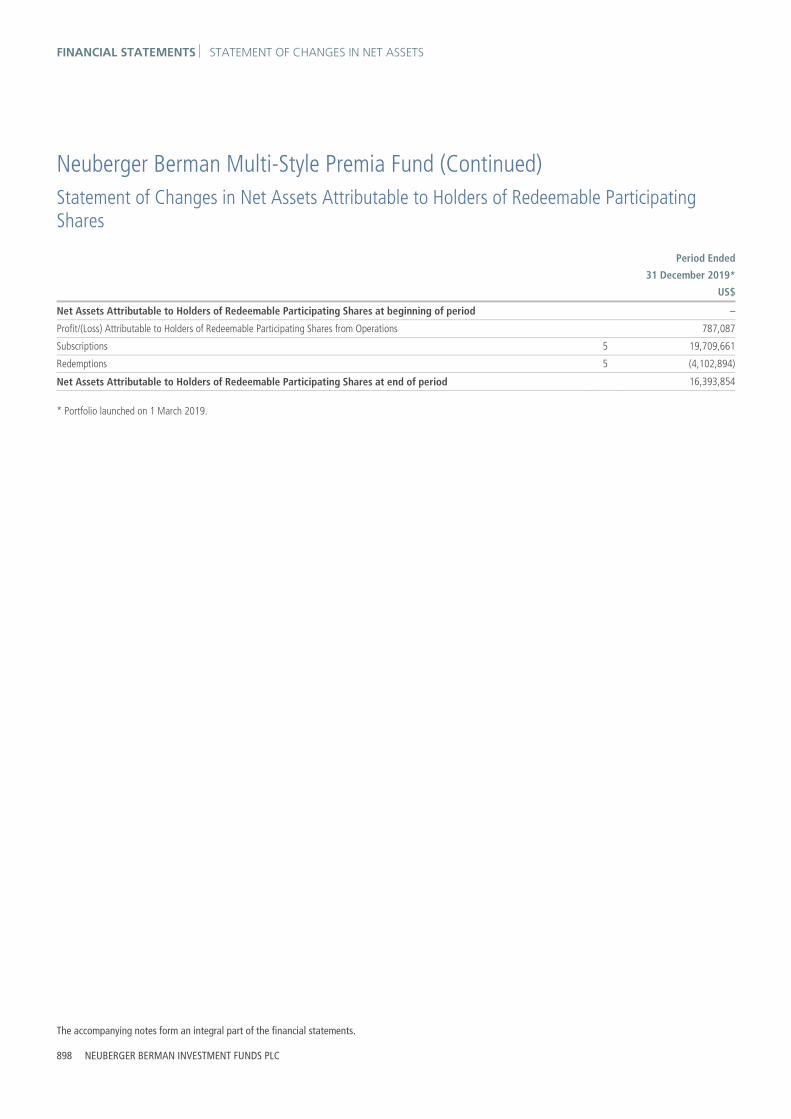
FINANCIAL STATEMENTS STATEMENT OF CHANGES IN NET ASSETS
The accompanying notes form an integral part of the financial statements.
898 NEUBERGER BERMAN INVESTMENT FUNDS PLC
Neuberger Berman Multi-Style Premia Fund (Continued) Statement of Changes in Net Assets Attributable to Holders of Redeemable Participating Shares
Period Ended
31 December 2019*
US$
Net Assets Attributable to Holders of Redeemable Participating Shares at beginning of period –
Profit/(Loss) Attributable to Holders of Redeemable Participating Shares from Operations 787,087
Subscriptions 5 19,709,661
Redemptions 5 (4,102,894)
Net Assets Attributable to Holders of Redeemable Participating Shares at end of period 16,393,854
* Portfolio launched on 1 March 2019.

SCHEDULE OF INVESTMENTS FINANCIAL STATEMENTS
ANNUAL REPORT 2019 899
Neuberger Berman Multi-Style Premia Fund (Continued)
Schedule of Investments
Financial Assets at Fair Value through Profit or Loss
Number of Shares Security Description Fair Value
US$% of Net
Assets
Equities 32.46%
Euro 1,567 ACS Actividades de Construccion y Servicios SA 62,707 0.38
285 adidas AG 92,711 0.56
463 Aena SME SA 88,612 0.54
1,545 Ageas 91,361 0.56
615 Amadeus IT Group SA 50,257 0.31
1,072 Arkema SA 113,954 0.69
1,029 ASM International NV 115,679 0.70
1,012 AXA SA 28,524 0.17
6,533 Banco Bilbao Vizcaya Argentaria SA 36,542 0.22
1,255 BAWAG Group AG 57,195 0.35
851 Capgemini SE 104,026 0.63
1,481 CRH Plc 59,299 0.36
610 Eiffage SA 69,842 0.43
2,965 Endesa SA 79,178 0.48
486 Heineken Holding NV 47,134 0.29
49 Kering SA 32,188 0.20
4,108 Koninklijke Ahold Delhaize NV 102,807 0.63
5,065 Mediobanca Banca di Credito Finanziario SpA 55,808 0.34
8,099 NOS SGPS SA 43,637 0.27
467 OMV AG 26,252 0.16
3,705 Peugeot SA 88,584 0.54
3,411 Proximus SADP 97,712 0.60
1,544 Recordati SpA 65,133 0.40
976 Sanofi 98,184 0.60
556 Schneider Electric SE 57,106 0.35
4,543 Snam SpA 23,903 0.15
758 Sodexo SA 89,893 0.55
1,036 TAG Immobilien AG 25,770 0.16
7,147 Telefonica SA 49,956 0.30
897 Total SA 49,539 0.30
918 UCB SA 73,059 0.45
1,491 Unilever NV 85,741 0.52
1,401 Wolters Kluwer NV 102,252 0.62
Total Euro 2,264,545 13.81
Japanese Yen 3,800 Astellas Pharma Inc 64,854 0.40

FINANCIAL STATEMENTS SCHEDULE OF INVESTMENTS
900 NEUBERGER BERMAN INVESTMENT FUNDS PLC
Neuberger Berman Multi-Style Premia Fund (Continued)
Schedule of Investments (Continued)
Financial Assets at Fair Value through Profit or Loss (continued)
Number of Shares Security Description Fair Value
US$% of Net
Assets
Equities 32.46% (continued)
Japanese Yen (continued)
1,400 Azbil Corp 39,425 0.24
400 Bridgestone Corp 14,857 0.09
1,400 FUJIFILM Holdings Corp 66,846 0.41
3,200 Inpex Corp 33,145 0.20
3,400 ITOCHU Corp 78,786 0.48
1,700 Japan Tobacco Inc 37,897 0.23
2,000 Kamigumi Co Ltd 43,956 0.27
900 Kewpie Corp 20,217 0.12
1,600 Marubeni Corp 11,819 0.07
1,200 Mitsubishi Heavy Industries Ltd 46,524 0.28
800 Mitsui Chemicals Inc 19,484 0.12
1,000 MS&AD Insurance Group Holdings Inc 33,003 0.20
3,600 Nippon Telegraph & Telephone Corp 90,969 0.56
3,100 Nomura Research Institute Ltd 66,285 0.40
900 NS Solutions Corp 29,567 0.18
2,900 NTT DOCOMO Inc 80,768 0.49
1,100 Sankyo Co Ltd 36,527 0.22
1,000 Santen Pharmaceutical Co Ltd 19,040 0.12
1,100 Sawai Pharmaceutical Co Ltd 69,676 0.43
2,800 Sekisui House Ltd 59,783 0.36
1,700 Shimizu Corp 17,314 0.11
1,000 Shionogi & Co Ltd 61,850 0.38
1,100 Softbank Corp 14,748 0.09
300 Sugi Holdings Co Ltd 15,823 0.10
4,600 Sumitomo Corp 68,313 0.42
400 Sumitomo Mitsui Financial Group Inc 14,771 0.09
400 Sumitomo Mitsui Trust Holdings Inc 15,809 0.10
1,000 Taiheiyo Cement Corp 29,348 0.18
3,500 Teijin Ltd 65,376 0.40
400 TIS Inc 23,641 0.14
800 Tokio Marine Holdings Inc 44,783 0.27
100 Tokyo Electron Ltd 21,829 0.13
1,200 Tokyo Gas Co Ltd 29,153 0.18
800 Toyota Motor Corp 56,359 0.34
300 USS Co Ltd 5,670 0.03
Total Japanese Yen 1,448,215 8.83

SCHEDULE OF INVESTMENTS FINANCIAL STATEMENTS
ANNUAL REPORT 2019 901
Neuberger Berman Multi-Style Premia Fund (Continued)
Schedule of Investments (Continued)
Financial Assets at Fair Value through Profit or Loss (continued)
Number of Shares Security Description Fair Value
US$% of Net
Assets
Equities 32.46% (continued)
Pound Sterling 2,334 3i Group Plc 33,950 0.21
620 Admiral Group Plc 18,965 0.12
6,237 Aggreko Plc 68,793 0.42
7,161 Auto Trader Group Plc 56,407 0.34
14,825 Avast Plc 88,927 0.54
7,346 Aviva Plc 40,746 0.25
7,346 Barratt Developments Plc 72,656 0.44
1,026 Berkeley Group Holdings Plc 66,043 0.40
2,996 BHP Group Plc 70,520 0.43
5,329 BP Plc 33,293 0.20
623 Diageo Plc 26,414 0.16
15,477 Direct Line Insurance Group Plc 64,072 0.39
434 Ferguson Plc 39,384 0.24
3,100 GlaxoSmithKline Plc 73,059 0.45
8,164 HSBC Holdings Plc 64,016 0.39
45,618 Lloyds Banking Group Plc 37,770 0.23
11,909 National Express Group Plc 74,086 0.45
733 Next Plc 68,148 0.42
1,735 Redrow Plc 17,123 0.11
2,694 RELX Plc 68,005 0.42
8,455 Rightmove Plc 70,968 0.43
1,339 Rio Tinto Plc 79,876 0.49
2,454 Royal Dutch Shell Plc Class A 72,659 0.44
5,934 Sage Group Plc 58,879 0.36
1,387 Schroders Plc 61,260 0.37
1,505 Smith & Nephew Plc 36,536 0.22
7,836 Tate & Lyle Plc 78,914 0.48
1,178 Unilever Plc 67,892 0.42
Total Pound Sterling 1,609,361 9.82
Total Equities * 5,322,121 32.46
Real Estate Investment Trusts 2.39%
Euro 344 Cofinimmo SA 50,584 0.31
121 Klepierre SA 4,597 0.03
6,942 Merlin Properties Socimi SA 99,665 0.61
Total Euro 154,846 0.95

FINANCIAL STATEMENTS SCHEDULE OF INVESTMENTS
902 NEUBERGER BERMAN INVESTMENT FUNDS PLC
Neuberger Berman Multi-Style Premia Fund (Continued)
Schedule of Investments (Continued)
Financial Assets at Fair Value through Profit or Loss (continued)
Number of Shares Security Description Fair Value
US$% of Net
Assets
Real Estate Investment Trusts 2.39% (continued)
Japanese Yen 115 Invincible Investment Corp 65,503 0.40
56 Japan Hotel REIT Investment Corp 41,842 0.26
31 United Urban Investment Corp 58,209 0.35
Total Japanese Yen 165,554 1.01
Pound Sterling 5,932 Segro Plc 70,506 0.43
Total Pound Sterling 70,506 0.43
Total Real Estate Investment Trusts * 390,906 2.39
Principal Amount Security Description Coupon
Maturity Date
Fair ValueUS$
% of NetAssets
Corporate Bonds 3.74%
United States Dollar 2,784,371 Alphabeta Access Products Ltd 0.00% 01/03/2029 306,281 1.87
2,784,371 Weser Capital Ltd 0.00% 01/03/2029 306,281 1.87
Total Corporate Bonds * 612,562 3.74
Total Investments 6,325,589 38.59
Forward Currency Contracts 1.53%
Amount Receivable
Amount Payable
Maturity Date Counterparty Contracts Unrealised
Gain US$% of Net
Assets
AUD 146,503 US$ 100,000 30/01/2020 Morgan Stanley 1 3,055 0.02
BRL 1,253,410 US$ 306,710 10/01/2020 Morgan Stanley 3 4,797 0.03
CHF 391,106 US$ 400,000 30/01/2020 Morgan Stanley 3 4,685 0.03
CLP 152,878,000 US$ 200,000 10/01/2020 Morgan Stanley 2 3,337 0.02
CNY 3,507,885 US$ 500,000 10/01/2020 Morgan Stanley 5 3,598 0.02
CZK 9,165,496 US$ 400,171 10/01/2020 Morgan Stanley 4 4,665 0.03
HUF 120,375,360 US$ 396,453 30/01/2020 Morgan Stanley 1 12,687 0.08
ILS 1,384,888 US$ 400,000 10/01/2020 Morgan Stanley 2 1,068 0.01
ILS 1,387,722 US$ 400,000 30/01/2020 Morgan Stanley 1 2,314 0.01
INR 100,735,300 US$ 1,400,000 30/01/2020 Morgan Stanley 3 10,902 0.07
KRW 701,136,200 US$ 600,000 10/01/2020 Morgan Stanley 3 7,415 0.05
MXN 33,207,042 US$ 1,700,000 30/01/2020 Morgan Stanley 3 51,004 0.31
RUB 25,379,170 US$ 400,000 10/01/2020 Morgan Stanley 4 8,260 0.05
RUB 96,431,010 US$ 1,500,000 30/01/2020 Morgan Stanley 2 47,501 0.29
SEK 9,582,015 US$ 1,012,184 30/01/2020 Morgan Stanley 3 12,815 0.08
THB 12,074,040 US$ 400,000 10/01/2020 Morgan Stanley 2 3,163 0.02

SCHEDULE OF INVESTMENTS FINANCIAL STATEMENTS
ANNUAL REPORT 2019 903
Neuberger Berman Multi-Style Premia Fund (Continued)
Schedule of Investments (Continued)
Financial Assets at Fair Value through Profit or Loss (continued)
Forward Currency Contracts 1.53% (continued)
Amount Receivable
Amount Payable
Maturity Date Counterparty Contracts Unrealised
Gain US$% of Net
Assets
TWD 12,134,450 US$ 400,000 10/01/2020 Morgan Stanley 2 5,767 0.03
US$ 400,000 RUB 24,904,000 30/01/2020 Morgan Stanley 1 347 0.00
US$ 300,000 INR 21,375,900 30/01/2020 Morgan Stanley 1 609 0.00
US$ 300,000 TRY 1,759,972 30/01/2020 Morgan Stanley 2 6,375 0.04
ZAR 20,433,093 US$ 1,400,000 30/01/2020 Morgan Stanley 3 55,841 0.34
EUR Hedged Classes € 6,179 US$ 6,917 22/01/2020 Goldman Sachs International 2 28 0.00
€ 101,257 US$ 113,057 22/01/2020 Westpac Banking Corp 4 743 0.00
Total Unrealised Gain on Forward Currency Contracts ∞ 250,976 1.53
Futures Contracts 0.88%
Number of Contracts Description Unrealised
Gain US$% of Net
Assets
4 British Pound Currency Future March 2020 3,928 0.02
(27) Canadian 10-Year Bond Future March 2020 53,348 0.33
2 Canadian Dollar Currency Future March 2020 1,050 0.01
1 Euro FX Currency Future March 2020 300 0.00
9 Euro Stoxx 50 Future March 2020 5,455 0.03
2 FTSE 100 Index Future March 2020 9,101 0.06
(2) Japan Government 10-Year Bond (OSE) Future March 2020 16,563 0.10
(2) Japanese Yen Currency Future March 2020 673 0.00
1 Japanese Yen Currency Future March 2020 206 0.00
2 Nasdaq 100 E-mini Future March 2020 14,596 0.09
3 Nikkei 225 (CME) Future March 2020 4,050 0.03
3 S&P 500 E-mini Future March 2020 5,830 0.04
4 Swiss Market Index Future March 2020 6,599 0.04
(4) United Kingdom Long Gilt Future January 2020 770 0.00
(20) US Treasury 10-Year Note (CBT) Future March 2020 21,750 0.13
Total Unrealised Gain on Futures Contracts ± 144,219 0.88
Contracts for Differences 9.93%
Units Security Description Counterparty Unrealised Gain US$
% of Net Assets
(1,462) 2U Inc Morgan Stanley 33,352 0.20
(291) ABIOMED Inc Morgan Stanley 14,689 0.09
(86,373) Accenture Plc Class A Morgan Stanley 24,387 0.15
(1,267) Adient Plc Morgan Stanley 4,067 0.02

FINANCIAL STATEMENTS SCHEDULE OF INVESTMENTS
904 NEUBERGER BERMAN INVESTMENT FUNDS PLC
Neuberger Berman Multi-Style Premia Fund (Continued)
Schedule of Investments (Continued)
Financial Assets at Fair Value through Profit or Loss (continued)
Contracts for Differences 9.93% (continued)
Units Security Description Counterparty Unrealised Gain US$
% of Net Assets
(830) Aerie Pharmaceuticals Inc Morgan Stanley 19,707 0.12
(1,500) Alfresa Holdings Corp Morgan Stanley 2,023 0.01
(681) Allegheny Technologies Inc Morgan Stanley 1,644 0.01
(65,485) Allstate Corp Morgan Stanley 748 0.00
(105,657) Alphabet Inc Morgan Stanley 2,834 0.02
(110,064) Amazon.com Inc Morgan Stanley 2,654 0.02
(36,591) Ameren Corp Morgan Stanley 273 0.00
(1,540) American Airlines Group Inc Morgan Stanley 4,606 0.03
(57,401) American Electric Power Co Inc Morgan Stanley 4,597 0.03
(93,984) Ametek Inc Morgan Stanley 13,834 0.08
(101,396) Amphenol Corp Class A Morgan Stanley 12,570 0.08
(1,891) Antero Resources Corp Morgan Stanley 10,955 0.07
(92,913) Apple Inc Morgan Stanley 63,016 0.38
(97,172) At&T Inc Morgan Stanley 23,547 0.14
(377) Avalara Inc Morgan Stanley 1,357 0.01
(1,457) Avis Budget Group Inc Morgan Stanley 5,044 0.03
(20,083) Banco Bpm SpA Morgan Stanley 427 0.00
(55) Boeing Co Morgan Stanley 803 0.01
(104,216) Booking Holdings Inc Morgan Stanley 8,739 0.05
(107,535) Booz Allen Hamilton Holdings Morgan Stanley 35,365 0.22
(109,236) Bristol-Myers Squibb Co Morgan Stanley 13,046 0.08
(25,393) Brixmor Property Group Inc Morgan Stanley 3,478 0.02
(76,802) Cable One Inc Morgan Stanley 28,879 0.18
(73,176) Carlisle Cos Inc Morgan Stanley 10,334 0.06
(100,432) CDW Corp Morgan Stanley 50,836 0.31
(4,942) Centennial Resource Development Inc Class A Morgan Stanley 26,727 0.16
(636) Chart Industries Inc Morgan Stanley 4,625 0.03
(27,945) Chemed Corp Morgan Stanley 1,924 0.01
(945) Cheniere Energy Inc Morgan Stanley 1,315 0.01
(46,144) Chesapeake Energy Corp Morgan Stanley 64,121 0.39
(51,457) Chubb Ltd Morgan Stanley 3,335 0.02
(96,828) Citigroup Inc Morgan Stanley 16,696 0.10
(6,002) Cloudera Inc Morgan Stanley 4,902 0.03
(100,621) Comcast Corp Class A Morgan Stanley 15,087 0.09
(413) Contomental AG Morgan Stanley 5,588 0.03
(101,037) Cooper Cos Inc Morgan Stanley 9,808 0.06
(681) Cree Inc Morgan Stanley 446 0.00
(105,011) CSX Corp Morgan Stanley 128 0.00

SCHEDULE OF INVESTMENTS FINANCIAL STATEMENTS
ANNUAL REPORT 2019 905
Neuberger Berman Multi-Style Premia Fund (Continued)
Schedule of Investments (Continued)
Financial Assets at Fair Value through Profit or Loss (continued)
Contracts for Differences 9.93% (continued)
Units Security Description Counterparty Unrealised Gain US$
% of Net Assets
(109,172) Cummins Inc Morgan Stanley 17,352 0.11
(1,658) Davide Campari-Milano SpA Morgan Stanley 300 0.00
(102,178) Delta Air Lines Inc Morgan Stanley 9,519 0.06
(200) Dentsu Inc Morgan Stanley 63 0.00
(8,704) Deutsche bank AG Morgan Stanley 7,368 0.05
(122) DiamondBack Energy Inc Morgan Stanley 841 0.01
(69,341) Discover Financial Services Morgan Stanley 5,385 0.03
(106,480) Dollar General Corp Morgan Stanley 32,498 0.20
(55,431) DTE Energy Co Morgan Stanley 3,141 0.02
(117,546) Eaton Corp Plc Morgan Stanley 21,218 0.13
(3,105) EDF Morgan Stanley 1,871 0.01
(1,006) Elastic NV Morgan Stanley 11,479 0.07
(18,266) Emerson Electric Co Morgan Stanley 417 0.00
(95,869) Equity Lifestyle Properties Inc Morgan Stanley 25,343 0.15
(101,368) Evergy Inc Morgan Stanley 11,238 0.07
(106,846) Facebook Inc Class A Morgan Stanley 3,989 0.02
(430) Fedex Corp Morgan Stanley 2,745 0.02
(869) Fevertree Drinks Plc Morgan Stanley 2,693 0.02
(1,192) Fidekitu National Information Services Morgan Stanley 338 0.00
(23,098) First Hawaiian Inc Morgan Stanley 1,742 0.01
(102,380) Gaming & Leisure Propertie Inc Morgan Stanley 16,438 0.10
(97,994) Garmin Ltd Morgan Stanley 14,883 0.09
(31,235) Gentex Corp Morgan Stanley 672 0.00
(5,212) Glanbia Plc Morgan Stanley 12,828 0.08
(754) Glaukos Corp Morgan Stanley 16,012 0.10
(9,929) Globe Life Inc Morgan Stanley 281 0.00
(200) GMO Payment Gateway Inc Morgan Stanley 304 0.00
(101,364) Hanover Insurance Group Inc Morgan Stanley 6,468 0.04
(89,039) Hartford Financial Services Group Inc Morgan Stanley 16,762 0.10
(73,593) Hershey Co Morgan Stanley 17,388 0.11
(125,334) Hill-Rom Holdings Inc Morgan Stanley 7,269 0.04
(107,140) Honeywell International Inc Morgan Stanley 14,636 0.09
(40,539) Humana Inc Morgan Stanley 1,244 0.01
(20,870) Illinois Tool Works Inc Morgan Stanley 3,560 0.02
(15,474) Indivior Plc Morgan Stanley 14,215 0.09
(26,827) Intel Corp Morgan Stanley 1,542 0.01
(114,023) International Paper Co Morgan Stanley 7,503 0.05
(23,439) Interpublic Group of Cos Inc Morgan Stanley 1,994 0.01
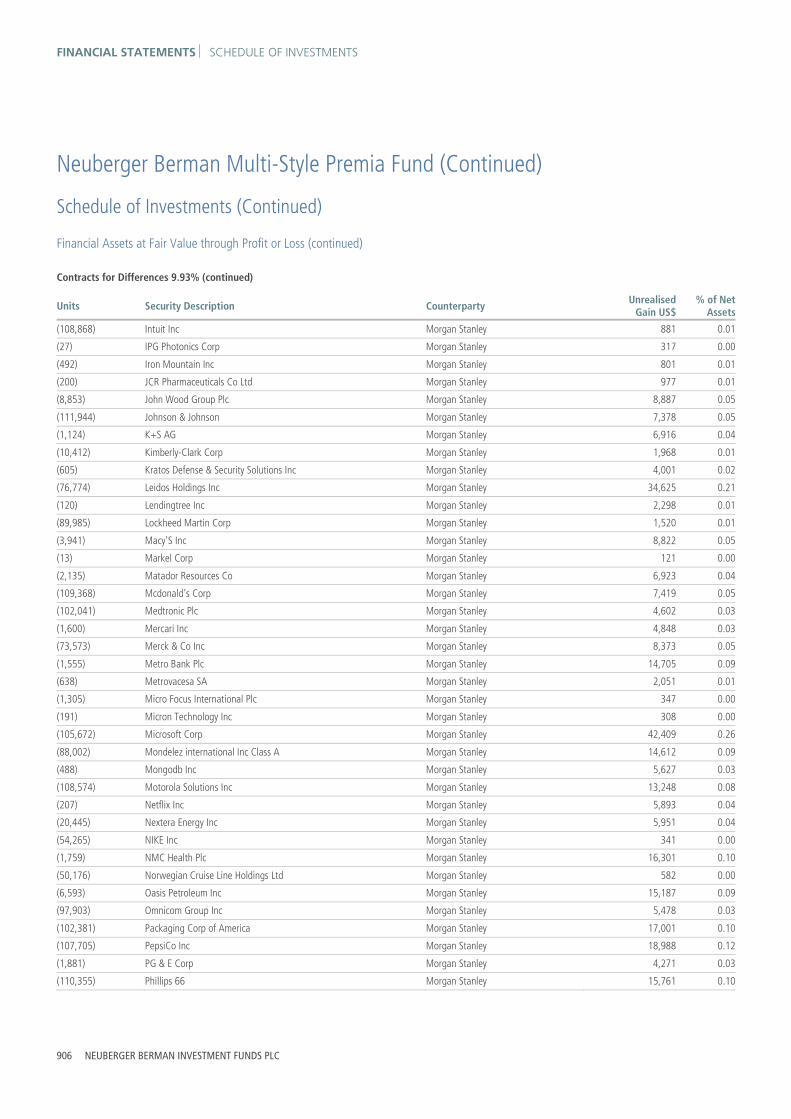
FINANCIAL STATEMENTS SCHEDULE OF INVESTMENTS
906 NEUBERGER BERMAN INVESTMENT FUNDS PLC
Neuberger Berman Multi-Style Premia Fund (Continued)
Schedule of Investments (Continued)
Financial Assets at Fair Value through Profit or Loss (continued)
Contracts for Differences 9.93% (continued)
Units Security Description Counterparty Unrealised Gain US$
% of Net Assets
(108,868) Intuit Inc Morgan Stanley 881 0.01
(27) IPG Photonics Corp Morgan Stanley 317 0.00
(492) Iron Mountain Inc Morgan Stanley 801 0.01
(200) JCR Pharmaceuticals Co Ltd Morgan Stanley 977 0.01
(8,853) John Wood Group Plc Morgan Stanley 8,887 0.05
(111,944) Johnson & Johnson Morgan Stanley 7,378 0.05
(1,124) K+S AG Morgan Stanley 6,916 0.04
(10,412) Kimberly-Clark Corp Morgan Stanley 1,968 0.01
(605) Kratos Defense & Security Solutions Inc Morgan Stanley 4,001 0.02
(76,774) Leidos Holdings Inc Morgan Stanley 34,625 0.21
(120) Lendingtree Inc Morgan Stanley 2,298 0.01
(89,985) Lockheed Martin Corp Morgan Stanley 1,520 0.01
(3,941) Macy'S Inc Morgan Stanley 8,822 0.05
(13) Markel Corp Morgan Stanley 121 0.00
(2,135) Matador Resources Co Morgan Stanley 6,923 0.04
(109,368) Mcdonald's Corp Morgan Stanley 7,419 0.05
(102,041) Medtronic Plc Morgan Stanley 4,602 0.03
(1,600) Mercari Inc Morgan Stanley 4,848 0.03
(73,573) Merck & Co Inc Morgan Stanley 8,373 0.05
(1,555) Metro Bank Plc Morgan Stanley 14,705 0.09
(638) Metrovacesa SA Morgan Stanley 2,051 0.01
(1,305) Micro Focus International Plc Morgan Stanley 347 0.00
(191) Micron Technology Inc Morgan Stanley 308 0.00
(105,672) Microsoft Corp Morgan Stanley 42,409 0.26
(88,002) Mondelez international Inc Class A Morgan Stanley 14,612 0.09
(488) Mongodb Inc Morgan Stanley 5,627 0.03
(108,574) Motorola Solutions Inc Morgan Stanley 13,248 0.08
(207) Netflix Inc Morgan Stanley 5,893 0.04
(20,445) Nextera Energy Inc Morgan Stanley 5,951 0.04
(54,265) NIKE Inc Morgan Stanley 341 0.00
(1,759) NMC Health Plc Morgan Stanley 16,301 0.10
(50,176) Norwegian Cruise Line Holdings Ltd Morgan Stanley 582 0.00
(6,593) Oasis Petroleum Inc Morgan Stanley 15,187 0.09
(97,903) Omnicom Group Inc Morgan Stanley 5,478 0.03
(102,381) Packaging Corp of America Morgan Stanley 17,001 0.10
(107,705) PepsiCo Inc Morgan Stanley 18,988 0.12
(1,881) PG & E Corp Morgan Stanley 4,271 0.03
(110,355) Phillips 66 Morgan Stanley 15,761 0.10

SCHEDULE OF INVESTMENTS FINANCIAL STATEMENTS
ANNUAL REPORT 2019 907
Neuberger Berman Multi-Style Premia Fund (Continued)
Schedule of Investments (Continued)
Financial Assets at Fair Value through Profit or Loss (continued)
Contracts for Differences 9.93% (continued)
Units Security Description Counterparty Unrealised Gain US$
% of Net Assets
(1,377) Pluralsight Inc Morgan Stanley 19,513 0.12
(111,558) PNC Financial Services Group Inc Morgan Stanley 29,076 0.18
(101,021) Popular Inc Morgan Stanley 6,374 0.04
(57,174) Portland General Electric Co Morgan Stanley 457 0.00
(97,343) PPG Industries Inc Morgan Stanley 17,725 0.11
(106,814) Procter & Gamble Co Morgan Stanley 28,702 0.18
(418) Public Service Enterprise Group Inc Morgan Stanley 81 0.00
(3,296) Pure Storage Inc Morgan Stanley 2,871 0.02
(611) PVH Corp Morgan Stanley 6,088 0.04
(24,749) Reliance Steel & Aluminum Co Morgan Stanley 8,425 0.05
(285) Roku Inc Morgan Stanley 1,884 0.01
(4,277) Rolls- Rouce Holdings Plc Morgan Stanley 12,995 0.08
(995) Servicemaster Global Holding Inc Morgan Stanley 9,019 0.06
(105,167) Sirius Xm Holdings Inc Morgan Stanley 3,242 0.02
(700) Softbank Group Corp Morgan Stanley 2,398 0.01
(592) SOITEC Morgan Stanley 3,313 0.02
(405) Spirit Airlines Inc Morgan Stanley 6,599 0.04
(10,691) Sprint Corp Morgan Stanley 12,653 0.08
(178) Stamps.com Inc Morgan Stanley 2,040 0.01
(114,535) Starbucks Corp Morgan Stanley 464 0.00
(97,909) STORE Capital Corp Morgan Stanley 5,506 0.03
(722) Sunrun Inc Morgan Stanley 4,371 0.03
(200) Suzuken Co Ltd Morgan Stanley 180 0.00
(77,116) Synchrony Financial Morgan Stanley 7,759 0.05
(24,611) Sysco Corp Morgan Stanley 3,874 0.02
(516) Tandem Diabetes Care Inc Morgan Stanley 988 0.01
(1,874) Tapestry Inc Morgan Stanley 4,813 0.03
(3,380) Technicolor SA Morgan Stanley 1,802 0.01
(581) Tenable Holdings Inc Morgan Stanley 2,047 0.01
(1,302) Tenaris SA Morgan Stanley 131 0.00
(1,035) Texas Capital Bancshares Inc Morgan Stanley 5,355 0.03
(120,006) Texas Instruments Inc Morgan Stanley 24,192 0.15
(95,336) Thermo Scientific Inc Morgan Stanley 20,968 0.13
(4,963) thyssenkrupp AG Morgan Stanley 2,429 0.02
(700) Tokyo Electric Power Co Morgan Stanley 307 0.00
(118,269) Travelers Cos Inc Morgan Stanley 3,479 0.02
(357) Travis Perkins Plc Morgan Stanley 114 0.00
(199) TreeHouse Foods Inc Morgan Stanley 2,484 0.02

FINANCIAL STATEMENTS SCHEDULE OF INVESTMENTS
908 NEUBERGER BERMAN INVESTMENT FUNDS PLC
Neuberger Berman Multi-Style Premia Fund (Continued)
Schedule of Investments (Continued)
Financial Assets at Fair Value through Profit or Loss (continued)
Contracts for Differences 9.93% (continued)
Units Security Description Counterparty Unrealised Gain US$
% of Net Assets
(747) TUI AG Morgan Stanley 43 0.00
(13,861) Tullow Oil Plc Morgan Stanley 21,434 0.13
(653) Twilio Inc Class A Morgan Stanley 13,945 0.09
(52,339) Union Pacific Corp Morgan Stanley 2,621 0.02
(101,752) Unitedhealth Group Inc Morgan Stanley 18,486 0.11
(1,279) Unti Group Inc Morgan Stanley 2,000 0.01
(37,104) US Bancorp Morgan Stanley 5,111 0.03
(99,988) Valero Energy Corp Morgan Stanley 16,419 0.10
(58,350) Verisk Analytics Inc Morgan Stanley 3,029 0.02
(119,174) Verizon Communications Inc Morgan Stanley 9,275 0.06
(288) Victrex Plc Morgan Stanley 10 0.00
(77,843) Visa Inc Class A Morgan Stanley 1,639 0.01
(121,539) Walmart Inc Morgan Stanley 25,941 0.16
(847) Welbilt Inc Morgan Stanley 1,138 0.01
(61,344) Wells Fargo & Co Morgan Stanley 6,928 0.04
(72,159) Western Union Co Morgan Stanley 11,529 0.07
(25,989) Williams Cos Inc Morgan Stanley 554 0.00
(383) Workday Inc Class A Morgan Stanley 7,861 0.05
(645) Zendesk Inc Morgan Stanley 2,344 0.01
(53,898) Zimmer Biomet Holdings Inc Morgan Stanley 4,029 0.02
(82,063) Zoetis Inc Morgan Stanley 31,361 0.19
(608) Zogenix Inc Morgan Stanley 1,189 0.01
Total Unrealised Gain on Contracts for Differences ∞ 1,628,394 9.93
Fair Value % of Net
US$ Assets
Total Financial Assets at Fair Value through Profit or Loss 8,349,178 50.93
Financial Liabilities at Fair Value through Profit or Loss
Forward Currency Contracts (1.54%) Amount Receivable
Amount Payable
Maturity Date Counterparty Contracts Unrealised
Loss US$% of Net
Assets
CLP 86,206,000 US$ 114,698 10/01/2020 Morgan Stanley 1 (39) (0.00)
TRY 8,124,462 US$ 1,400,000 30/01/2020 Morgan Stanley 2 (44,556) (0.27)
US$ 100,000 RUB 6,398,840 30/01/2020 Morgan Stanley 1 (2,687) (0.02)
US$ 300,000 CLP 239,084,000 10/01/2020 Morgan Stanley 2 (17,996) (0.11)
US$ 200,000 BRL 846,720 10/01/2020 Morgan Stanley 2 (10,433) (0.06)

SCHEDULE OF INVESTMENTS FINANCIAL STATEMENTS
ANNUAL REPORT 2019 909
Neuberger Berman Multi-Style Premia Fund (Continued)
Schedule of Investments (Continued)
Financial Liabilities at Fair Value through Profit or Loss (continued)
Forward Currency Contracts (1.54%) (continued)
Amount Receivable
Amount Payable
Maturity Date Counterparty Contracts Unrealised
Loss US$% of Net
Assets
US$ 296,260 KRW 351,721,800 10/01/2020 Morgan Stanley 3 (8,447) (0.05)
US$ 100,000 TWD 3,003,450 10/01/2020 Morgan Stanley 1 (433) (0.00)
US$ 99,621 RUB 6,430,230 10/01/2020 Morgan Stanley 1 (3,819) (0.02)
US$ 100,000 THB 3,024,050 10/01/2020 Morgan Stanley 1 (976) (0.01)
US$ 100,000 ILS 349,594 10/01/2020 Morgan Stanley 1 (1,244) (0.01)
US$ 1,000,000 SEK 9,582,015 30/01/2020 Morgan Stanley 2 (25,000) (0.15)
US$ 199,921 CNY 1,411,605 10/01/2020 Morgan Stanley 2 (2,731) (0.02)
US$ 400,000 HUF 120,375,360 30/01/2020 Morgan Stanley 1 (9,141) (0.06)
US$ 1,500,000 AUD 2,203,927 30/01/2020 Morgan Stanley 3 (50,322) (0.31)
US$ 1,500,000 ILS 5,191,970 30/01/2020 Morgan Stanley 4 (5,202) (0.03)
US$ 1,500,000 CHF 1,482,340 30/01/2020 Morgan Stanley 2 (33,806) (0.21)
US$ 706,988 INR 50,786,200 30/01/2020 Morgan Stanley 2 (4,325) (0.03)
US$ 300,000 MXN 5,914,693 30/01/2020 Morgan Stanley 1 (11,881) (0.07)
US$ 200,000 TRY 1,201,881 30/01/2020 Morgan Stanley 2 (516) (0.00)
US$ 1,500,000 € 1,348,864 30/01/2020 Morgan Stanley 1 (16,736) (0.10)
US$ 100,000 CZK 2,302,504 10/01/2020 Morgan Stanley 1 (1,700) (0.01)
EUR Hedged Classes US$ 732 € 656 22/01/2020 Goldman Sachs International 1 (5) (0.00)
Total Unrealised Loss on Forward Currency Contracts ∞ (251,995) (1.54)
Futures Contracts (0.88%)
Number of Contracts Description Unrealised
Loss US$% of Net
Assets
(3) Australian Dollar Currency Future March 2020 (5,685) (0.04)
(3) Euro FX Currency Future March 2020 (5,025) (0.03)
18 Euro-BTP Future March 2020 (31,150) (0.19)
(4) Euro-Bund Future January 2020 (140) (0.00)
15 Euro-Bund Future March 2020 (48,548) (0.29)
15 Euro-OAT Future March 2020 (44,114) (0.27)
4 Mexican Peso Currency Future March 2020 (100) (0.00)
3 SPI 200 Index Future March 2020 (2,829) (0.02)
2 United Kingdom Long Gilt Future March 2020 (5,617) (0.03)
1 US Treasury Long Bond (CBT) Future March 2020 (1,094) (0.01)
Total Unrealised Loss on Futures Contracts ± (144,302) (0.88)

FINANCIAL STATEMENTS SCHEDULE OF INVESTMENTS
910 NEUBERGER BERMAN INVESTMENT FUNDS PLC
Neuberger Berman Multi-Style Premia Fund (Continued)
Schedule of Investments (Continued)
Financial Liabilities at Fair Value through Profit or Loss (continued)
Written Options Contracts (0.23%)
Number of Contracts
Expiration Date Type Premium
US$Fair Value
US$% of Net
Assets
Put Options
(10) 03/01/20 CBOE S&P 500 Index, Strike Price $3,090 28,794 (850) (0.01)
(9) 10/01/20 CBOE S&P 500 Index, Strike Price $3,100 8,995 (3,195) (0.02)
(10) 17/01/20 S&P 500 Index, Strike Price $3,145 14,794 (10,000) (0.06)
(5) 21/02/20 US Treasury Bond Futures, Strike Price $155 7,333 (6,797) (0.04)
(5) 24/01/20 US Treasury Bond Futures, Strike Price $159 8,661 (16,719) (0.10)
Total Loss on Written Options Contracts ± (37,561) (0.23)
Contracts for Differences (7.01%)
Units Security Description Counterparty UnrealisedLoss US$
% of Net Assets
(1,692) Advanced Micro Devices Inc Morgan Stanley (35,354) (0.22)
(45) Adyen NV Morgan Stanley (6,052) (0.04)
(112,890) Aflac Inc Morgan Stanley (2,752) (0.02)
(553) American Equity Investment Life Holding Co Morgan Stanley (899) (0.01)
(1,239) American International Group Inc Morgan Stanley (7,984) (0.05)
(1,543) Ameris Bancorp Morgan Stanley (6,592) (0.04)
(1,021) Anaplan Inc Morgan Stanley (6,529) (0.04)
(702) Apache Corp Morgan Stanley (3,753) (0.02)
(106,689) Apple Hospitality REIT Inc Morgan Stanley (268) (0.00)
(956) Aqua America Inc Morgan Stanley (5,108) (0.03)
(3,180) ArcelorMittal Morgan Stanley (977) (0.01)
(1,529) Archer-Daniels-Midland Co Morgan Stanley (11,343) (0.07)
(926) ASOS Plc Morgan Stanley (1,112) (0.01)
(160) Axsome Therapeutics Inc Morgan Stanley (740) (0.00)
(400) Bank of Kyoto Ltd Morgan Stanley (1,400) (0.01)
(452) Bank Of New York Mellon Corp Morgan Stanley (2,916) (0.02)
(8,788) Barclays Plc Morgan Stanley (2,882) (0.02)
(52) Berkshire Hathaway Inc Class B Morgan Stanley (1,216) (0.01)
(7) Blackrock Inc Morgan Stanley (560) (0.00)
(724) Bok Financial Corp Morgan Stanley (6,978) (0.04)
(1,997) Boskalis Westminster Morgan Stanley (3,629) (0.02)
(307) Bunge Ltd Morgan Stanley (724) (0.00)

SCHEDULE OF INVESTMENTS FINANCIAL STATEMENTS
ANNUAL REPORT 2019 911
Neuberger Berman Multi-Style Premia Fund (Continued)
Schedule of Investments (Continued)
Financial Liabilities at Fair Value through Profit or Loss (continued)
Contracts for Differences (7.01%) (continued)
Units Security Description Counterparty UnrealisedLoss US$
% of Net Assets
(153,682) Cabot Oil & Gas Corp Morgan Stanley (37,627) (0.23)
(1,413) CaixaBank SA Morgan Stanley (1,140) (0.01)
(17,919) Capita Group Plc Morgan Stanley (9,497) (0.06)
(850) Capital & Counties Prope Morgan Stanley (87) (0.00)
(1,686) Capri Holdings Ltd Morgan Stanley (3,585) (0.02)
(220) Centerstate Banks Inc Morgan Stanley (424) (0.00)
(1,519) Charles Schwab Corp Morgan Stanley (1,149) (0.01)
(26,687) Check Point Software Tech Ltd Morgan Stanley (2,276) (0.01)
(111,212) Chevron Corp Morgan Stanley (946) (0.01)
(132,089) Cisco Systems Inc Morgan Stanley (8,880) (0.05)
(16,717) Cogent Communications Holdings Inc Morgan Stanley (2) (0.00)
(128,232) Comerica Inc Morgan Stanley (16,661) (0.10)
(2,009) Conagra Brands Inc Morgan Stanley (9,693) (0.06)
(112,880) Conocophillips Morgan Stanley (2,589) (0.02)
(3,611) Convatec Group Plc Morgan Stanley (579) (0.00)
(2,540) Corteva Inc Morgan Stanley (5,849) (0.04)
(6,131) Coty Inc Class A Morgan Stanley (4,748) (0.03)
(518) Coupa Software Inc Morgan Stanley (27,162) (0.17)
(12,841) Cvr Energy Inc Morgan Stanley (429) (0.00)
(900) Cyberagent Inc Morgan Stanley (343) (0.00)
(16,977) CYBG Plc Morgan Stanley (257) (0.00)
(1,052) CyrusOne Inc Morgan Stanley (14,663) (0.09)
(868) Dechra Pharmaceuticals Plc Morgan Stanley (1,592) (0.01)
(1,133) Delivery Hero AG Morgan Stanley (44,815) (0.27)
(347) Dexcom Inc Morgan Stanley (26,114) (0.16)
(535) Digital Realty Trust Inc Morgan Stanley (1,233) (0.01)
(100) Disco Corp Morgan Stanley (8,689) (0.05)
(1,907) DISH Network Corp Class A Morgan Stanley (6,446) (0.04)
(1,082) Docusign Inc Morgan Stanley (23,664) (0.14)
(829) Dominion Energy Inc Morgan Stanley (6,662) (0.04)
(8,270) DS Smith Plc Morgan Stanley (4,362) (0.03)
(54,039) Dunkin' Brands Group Inc Morgan Stanley (27) (0.00)
(389) E*Trade Financial Corp Morgan Stanley (1,909) (0.01)
(1,037) East West Bancorp Inc Morgan Stanley (5,827) (0.04)
(400) Eisai Co Ltd Morgan Stanley (4,078) (0.03)
(975) Elanco Animal Health Inc Morgan Stanley (2,176) (0.01)
(6,511) Element Solutions Inc Morgan Stanley (2,517) (0.02)
(3,318) EQT Corp Morgan Stanley (5,101) (0.03)

FINANCIAL STATEMENTS SCHEDULE OF INVESTMENTS
912 NEUBERGER BERMAN INVESTMENT FUNDS PLC
Neuberger Berman Multi-Style Premia Fund (Continued)
Schedule of Investments (Continued)
Financial Liabilities at Fair Value through Profit or Loss (continued)
Contracts for Differences (7.01%) (continued)
Units Security Description Counterparty UnrealisedLoss US$
% of Net Assets
(95) Eurofins Scientific Morgan Stanley (9,637) (0.06)
(2,825) Evotec AG Morgan Stanley (8,762) (0.05)
(92,093) Exelon Corp Morgan Stanley (5,609) (0.03)
(1,193) First Solar Inc Morgan Stanley (3,626) (0.02)
(6,834) Freeport-McMoRan Inc Morgan Stanley (9,878) (0.06)
(1,685) Gap Inc Morgan Stanley (2,995) (0.02)
(100) Gardner Denver Holdings Inc Morgan Stanley (963) (0.01)
(5,447) General Electric Co Morgan Stanley (5,510) (0.03)
(1,067) Goodyear Tire & Rubber Co Morgan Stanley (1,538) (0.01)
(830) Guardant Health Inc Morgan Stanley (1,364) (0.01)
(2,827) GVC Holdings Plc Morgan Stanley (10,590) (0.06)
(2,651) Hain Celestial Group Inc Morgan Stanley (12,821) (0.08)
(500) Harmonic Drive Systems Inc Morgan Stanley (6,459) (0.04)
(1,600) Hitachi Metals Ltd Morgan Stanley (5,499) (0.03)
(18,379) Home Depot Inc Morgan Stanley (1,345) (0.01)
(392) Howard Hughes Corp Morgan Stanley (6,152) (0.04)
(1,100) Idemitsu Kosan Co Ltd Morgan Stanley (97) (0.00)
(463) Iliad SA Morgan Stanley (12,824) (0.08)
(3,210) Infineon Technologies AG Morgan Stanley (15,241) (0.09)
(26,055) Ingersoll-Rand Plc Morgan Stanley (136) (0.00)
(12,726) Intercontinental Exchange Inc Morgan Stanley (232) (0.00)
(91,525) Intl Business Machines Corp Morgan Stanley (2,925) (0.02)
(2,160) Iridium Communications Inc Morgan Stanley (951) (0.01)
(3,600) Isetan Mitsukoshi Holding Morgan Stanley (3,378) (0.02)
(13,678) J Sainsbury Plc Morgan Stanley (4,269) (0.03)
(2,358) Jefferies Financial Group Inc Morgan Stanley (5,249) (0.03)
(2,700) JGC Corp Morgan Stanley (4,245) (0.03)
(1,051) Johnson Matthey Plc Morgan Stanley (944) (0.01)
(293) Jones Lang Lasalle Inc Morgan Stanley (7,916) (0.05)
(2,935) Just Eat Plc Morgan Stanley (2,138) (0.01)
(5,588) KAZ Minerals Plc Morgan Stanley (1,972) (0.01)
(541) Keurig Dr Pepper Inc Morgan Stanley (4) (0.00)
(187) Kirby Corp Morgan Stanley (2,051) (0.01)
(1,406) Kraft Heinz Co Morgan Stanley (2,200) (0.01)
(1,326) Kroger Co Morgan Stanley (6,508) (0.04)
(81,889) Lam Research Corp Morgan Stanley (17) (0.00)
(288) Liberty Broadband Corp Morgan Stanley (5,323) (0.03)
(900) LINE Corp Morgan Stanley (11,184) (0.07)

SCHEDULE OF INVESTMENTS FINANCIAL STATEMENTS
ANNUAL REPORT 2019 913
Neuberger Berman Multi-Style Premia Fund (Continued)
Schedule of Investments (Continued)
Financial Liabilities at Fair Value through Profit or Loss (continued)
Contracts for Differences (7.01%) (continued)
Units Security Description Counterparty UnrealisedLoss US$
% of Net Assets
(26,486) LyondellBasell Industries NV Class A Morgan Stanley (788) (0.01)
(300) M3 Inc Morgan Stanley (74) (0.00)
(59) Madison Square Garden Co Morgan Stanley (1,624) (0.01)
(2,801) Mattel Inc Morgan Stanley (6,677) (0.04)
(7,292) Mediclinic International Plc Morgan Stanley (7,588) (0.05)
(15,467) Melrose Industries Plc Morgan Stanley (11,862) (0.07)
(93,464) MGIC Investment Corp Morgan Stanley (56) (0.00)
(1,878) MGM Resorts International Morgan Stanley (6,812) (0.04)
(1,300) MISUMI Group Inc Morgan Stanley (617) (0.00)
(100) Mitsui Osk Lines Ltd Morgan Stanley (406) (0.00)
(214) Moody's Corp Morgan Stanley (13,214) (0.08)
(3,373) Mosaic Co Morgan Stanley (949) (0.01)
(1,214) Myokardia Inc Morgan Stanley (27,865) (0.17)
(2,679) National Oilwell Varco Inc Morgan Stanley (7,377) (0.05)
(3,131) Nektar Therapeutics Morgan Stanley (3,080) (0.02)
(248) Nevro Corp Morgan Stanley (8,318) (0.05)
(253) New Relic Inc Morgan Stanley (1,289) (0.01)
(1,123) New Residential Investment Morgan Stanley (908) (0.01)
(114,626) Nucor Corp Morgan Stanley (4,767) (0.03)
(2,370) Nutanix Inc Class A Morgan Stanley (5,311) (0.03)
(2,551) Ocado Group Plc Morgan Stanley (7,892) (0.05)
(521) Okta Inc Morgan Stanley (15,081) (0.09)
(51,467) Oracle Corp Morgan Stanley (712) (0.00)
(1,381) OSRAM Licht AG Morgan Stanley (15,494) (0.09)
(607) Parsley Energy Inc Class A Morgan Stanley (204) (0.00)
(587) Pebblebrook Hotel Trust Morgan Stanley (156) (0.00)
(111,382) Philip Morris International Inc Morgan Stanley (1,275) (0.01)
(2,426) Pilgrim's Pride Corp Morgan Stanley (31,299) (0.19)
(25,998) Pinnacle West Capital Morgan Stanley (1,267) (0.01)
(282) Post Holdings Inc Morgan Stanley (2,001) (0.01)
(191) Prosus NV Morgan Stanley (371) (0.00)
(2,131) Prusmian SpA Morgan Stanley (9,085) (0.06)
(77,180) PS Business Parks Inc Morgan Stanley (3,978) (0.02)
(34) PTC Inc Morgan Stanley (301) (0.00)
(108,338) Pulte Group Inc Morgan Stanley (319) (0.00)
(1,036) Qiagen Nv Morgan Stanley (3,049) (0.02)
(411) Reata Pharmaceuticals Inc Class A Morgan Stanley (44,973) (0.26)
(1,100) Relo Holdings Inc Morgan Stanley (3,566) (0.02)

FINANCIAL STATEMENTS SCHEDULE OF INVESTMENTS
914 NEUBERGER BERMAN INVESTMENT FUNDS PLC
Neuberger Berman Multi-Style Premia Fund (Continued)
Schedule of Investments (Continued)
Financial Liabilities at Fair Value through Profit or Loss (continued)
Contracts for Differences (7.01%) (continued)
Units Security Description Counterparty UnrealisedLoss US$
% of Net Assets
(6,000) Renesas Electronics Corp Morgan Stanley (2,908) (0.02)
(371) Renishaw Plc Morgan Stanley (1,190) (0.01)
(400) Ryohin Keikaku Co Ltd Morgan Stanley (1,010) (0.01)
(13,040) Saipem Spa Morgan Stanley (1,736) (0.01)
(222) Salesforce.Com Inc Morgan Stanley (8,521) (0.05)
(500) Screen Holdings Co Ltd Morgan Stanley (6,244) (0.04)
(147) Sempra Energy Morgan Stanley (4,443) (0.03)
(2,600) Sharp Corp Morgan Stanley (7,995) (0.05)
(4,288) Siemens Gamesa Renewable Energy SA Morgan Stanley (11,304) (0.07)
(631) Siteone Landscape Supply Inc Morgan Stanley (20,983) (0.13)
(553) Southern Co Morgan Stanley (7,591) (0.05)
(36) Spectrum Brands Holdings Inc Morgan Stanley (514) (0.00)
(431) Splunk Inc Morgan Stanley (13,663) (0.08)
(425) Spotify Technology Sa Morgan Stanley (5,200) (0.03)
(600) Square Enix Holdings Co Ltd Morgan Stanley (10,373) (0.06)
(1,372) St James's Place Plc Morgan Stanley (3,498) (0.02)
(2,530) Standard Chartered Plc Morgan Stanley (2,272) (0.01)
(807) State Street Corp Morgan Stanley (6,886) (0.04)
(70,018) Steel Dynamics Inc Morgan Stanley (2,176) (0.01)
(3,858) Suedzucker AG Morgan Stanley (10,881) (0.07)
(260) SVB Financial Group Morgan Stanley (358) (0.00)
(400) Taisho Pharmaceutical Holdings Co Ltd Morgan Stanley (588) (0.00)
(606) Takeaway.com NV Morgan Stanley (8,817) (0.05)
(277) Teladoc Health Inc Morgan Stanley (7,102) (0.04)
(15,661) Telecom Italia SpA Morgan Stanley (124) (0.00)
(12,310) Tesco Plc Morgan Stanley (2,642) (0.02)
(191) Tesla Inc Morgan Stanley (37,907) (0.23)
(166) Tiffany & Co Morgan Stanley (7,806) (0.05)
(500) Tokyo Broadcasting System Holdings Inc Morgan Stanley (444) (0.00)
(4,200) Tokyu Fudosan Holdings Corp Morgan Stanley (4,310) (0.03)
(12,909) Transocean Ltd Morgan Stanley (3,116) (0.02)
(2,109) Twitter Inc Morgan Stanley (2,167) (0.01)
(564) Ubisoft Entertainment SA Morgan Stanley (4,875) (0.03)
(804) Umicore SA Morgan Stanley (11,555) (0.07)
(2,940) Under Armour Inc Morgan Stanley (2,791) (0.02)
(1,459) Univar Inc Morgan Stanley (6,522) (0.04)
(200) Universal Entertainment Corp Morgan Stanley (464) (0.00)
(1,404) Urban Outfitters Inc Morgan Stanley (4,281) (0.03)

SCHEDULE OF INVESTMENTS FINANCIAL STATEMENTS
ANNUAL REPORT 2019 915
Neuberger Berman Multi-Style Premia Fund (Continued)
Schedule of Investments (Continued)
Financial Liabilities at Fair Value through Profit or Loss (continued)
Contracts for Differences (7.01%) (continued)
Units Security Description Counterparty UnrealisedLoss US$
% of Net Assets
(160) Wabtec Corp Morgan Stanley (1,497) (0.01)
(32) Walgreens Boots Alliance Inc Morgan Stanley (220) (0.00)
(1,853) Weir Group Plc Morgan Stanley (3,342) (0.02)
(50,863) Whirlpool Corp Morgan Stanley (2,915) (0.02)
(238) Wintrust Financial Corp Morgan Stanley (1,939) (0.01)
(2,203) Wm Morrison Supermarkets Plc Morgan Stanley (19) (0.00)
(288) Worldline SA Morgan Stanley (1,684) (0.01)
(2,296) Wright Medical Group NV Morgan Stanley (23,936) (0.15)
(112) Wynn Resorts Ltd Morgan Stanley (1) (0.00)
(250) Xcel Energy Inc Morgan Stanley (87) (0.00)
(847) Xpo Logistics Inc Morgan Stanley (21,711) (0.13)
(800) Yaskawa Electric Corp Morgan Stanley (5,704) (0.04)
(282) Zalando SE Morgan Stanley (3,946) (0.02)
(1,711) Zillow Group Inc Class C Morgan Stanley (11,233) (0.07)
Total Unrealised Loss on Contracts for Differences ∞ (1,150,214) (7.01)
Fair Value % of Net
US$ Assets
Total Financial Liabilities at Fair Value through Profit or Loss (1,584,072) (9.66)
Net Financial Assets at Fair Value through Profit or Loss 6,765,106 41.27
Other Net Assets 9,628,748 58.73
Net Assets Attributable to Holders of Redeemable Participating Shares 16,393,854 100.00
% of
Portfolio Analysis US$Total
Assets
* Transferable securities and/or money market instruments admitted to an official stock exchange listing 6,325,589 34.99
± Financial derivative instruments traded on a regulated market (37,644) (0.21)
∞ OTC financial derivative instruments 477,161 2.64
Total Investments 6,765,106 37.42

FINANCIAL STATEMENTS STATEMENT OF SIGNIFICANT PURCHASES AND SALES
916 NEUBERGER BERMAN INVESTMENT FUNDS PLC
Neuberger Berman Multi-Style Premia Fund (Continued) Statement of Significant Purchases and Sales (Unaudited) In accordance with the European Communities (Undertakings for Collective Investment in Transferable Securities) Regulations, 2011 as amended, a statement of changes in the composition of the Schedule of Investments during the reporting period is provided to ensure that Shareholders can identify changes in the investments held by the Portfolio. The following statements present the aggregate purchases and sales of transferable securities exceeding one percent of the total value of purchases or sales, respectively, for the period. At a minimum, the largest twenty purchases and twenty sales are presented, if available.
Top twenty purchases:
Units Security Description Cost US$
2,784,371 Alphabeta Access Products Ltd, 0.00%, 01/03/2029 700,000
2,784,371 Weser Capital Ltd, 0.00%, 01/03/2029 700,000
13,860 Merlin Properties Socimi SA 187,713
7,253 Eni SpA 126,589
1,792 Colruyt SA 117,383
4,108 Koninklijke Ahold Delhaize NV 105,054
851 Capgemini SE 101,891
3,411 Proximus SADP 101,755
1,180 UCB SA 99,531
3,921 Compania de Distribucion Integral Logista Holdings SA 95,750
1,072 Arkema SA 94,507
3,705 Peugeot SA 94,433
863 Koninklijke DSM NV 93,859
1,401 Wolters Kluwer NV 92,563
3,736 Endesa SA 92,120
7,377 Credit Agricole SA 92,040
1,029 ASM International NV 90,616
17,770 Snam SpA 90,428
1,491 Unilever NV 89,827
12,168 British Land Co Plc 88,099

STATEMENT OF SIGNIFICANT PURCHASES AND SALES FINANCIAL STATEMENTS
ANNUAL REPORT 2019 917
Neuberger Berman Multi-Style Premia Fund (Continued) Statement of Significant Purchases and Sales (Unaudited) (Continued) Aggregate sales greater than one percent of the total value of sales: Units Security Description Proceeds US$
7,253 Eni SpA 111,902
863 Koninklijke DSM NV 106,790
7,377 Credit Agricole SA 100,624
1,792 Colruyt SA 99,166
6,918 Merlin Properties Socimi SA 92,001
5,855 Orange SA 88,692
937 Akzo Nobel NV 87,850
3,921 Compania de Distribucion Integral Logista Holdings SA 87,099
12,168 British Land Co Plc 87,052
1,173 Bayerische Motoren Werke AG 85,302
4,500 Mitsui & Co Ltd 74,861
1,735 SCOR SE 74,591
2,897 Anglo American Plc 72,965
1,969 Klepierre SA 69,431
2,782 Hikma Pharmaceuticals Plc 67,393
1,108 Renault SA 67,258
13,227 Snam SpA 66,820
2,300 Idemitsu Kosan Co Ltd 64,202
5,765 National Grid Plc 61,280
21,342 Wm Morrison Supermarkets Plc 60,236
5,832 Pearson Plc 59,898
5,200 Japan Post Holdings Co Ltd 59,536
2,200 Mitsubishi Corp 58,120
6,376 Phoenix Group Holdings Plc 57,881
577 Solvay SA 57,295
3,900 Chubu Electric Power Co Inc 57,161
25,482 Intesa Sanpaolo SpA 55,092
16,335 Legal & General Group Plc 54,877
900 TIS Inc 54,194
1,900 Canon Inc 51,921
36,500 Mizuho Financial Group Inc 51,458
4,169 WPP Plc 50,718
900 Tokio Marine Holdings Inc 48,246
4,755 Informa Plc 48,047

FINANCIAL STATEMENTS INVESTMENT MANAGER’S REPORT
918 NEUBERGER BERMAN INVESTMENT FUNDS PLC
Neuberger Berman Macro Opportunities FX Fund Investment Manager’s Report From the inception on 4 December 2019 through 31 December 2019, the total return for the EUR I Accumulating Class was 0.10%. Over the same period, the benchmark index, the ICE BofA 0-1 Year AAA Euro Government Index (EUR Total Return), returned -0.05%. (Performance for all share classes is provided in Appendix II. Performance data quoted represent past performance and do not indicate future results. Total returns shown are net of all fees and expenses and include reinvestment of income dividends and other distributions, if any).
Over the course of December, the best performing major currencies were the Norwegian krone and New Zealand dollar. The worst performing major currencies were the US dollar and Japanese yen. The Portfolio generated a positive return for the period. Overweights in the Norwegian krone and Brazilian real were the best performing positions whilst underweight the Swiss franc and New Zealand dollar were detractors of performance.
The last month of the year saw renewed risk appetite as the US and China agreed to Phase 1 of a trade deal, political tensions subsided in Chile and Hong Kong and expectations of fiscal stimulus increased. This led to a rally in risk assets and higher yielding currencies. Not participating in the move higher was the Australian dollar where devastating wildfires are certain to have a significant social, environmental and economic cost.
Across the major currencies, yield differentials and forward-looking estimates of volatility remain low compared to history. This environment has led to narrow trading ranges and consequently few opportunities. However, that being said, some valuations remain stretched notably the Norwegian krone, Japanese yen and Swiss franc and should the macroeconomic backdrop change we anticipate some of the valuation imbalances to adjust towards fair value. The increasing consensus building around the need for fiscal policy to take a greater role in stimulating global demand, and therefore for monetary policy’s role to diminish, would be a catalyst for such a change.
Over the course of the month, we remain overweight the Japanese yen, Norwegian krone and Brazilian real; and underweight the Swiss franc and Australian dollar. The Portfolio is largely risk and carry neutral with positions focused on relative value opportunities. We remain confident on the outlook for the Portfolio and continue to monitor the data and risk events closely.

BALANCE SHEET FINANCIAL STATEMENTS
The accompanying notes form an integral part of the financial statements.
ANNUAL REPORT 2019 919
Neuberger Berman Macro Opportunities FX Fund (Continued) Balance Sheet
As at
Note 31 December 2019
EUR
Current Assets
Financial Assets at Fair Value through Profit or Loss 2 20,404,038
Cash and cash equivalents 3 117,430
Income receivable and other assets 61,840
Total Assets 20,583,308
Current Liabilities
Financial Liabilities at Fair Value through Profit or Loss 2 1,061,403
Accrued expenses 37,057
Other payables 262
Liabilities (excluding Net Assets Attributable to Holders of Redeemable Participating Shares) 1,098,722
Net Assets Attributable to Holders of Redeemable Participating Shares 19,484,586

FINANCIAL STATEMENTS PROFIT AND LOSS ACCOUNT
The accompanying notes form an integral part of the financial statements.
920 NEUBERGER BERMAN INVESTMENT FUNDS PLC
Neuberger Berman Macro Opportunities FX Fund (Continued) Profit and Loss Account
Period Ended
Note 31 December 2019*
EUR
Income
Interest Income 11,613
Net Gain/(Loss) on Financial Assets and Liabilities at Fair Value through Profit or Loss 11 (189,474)
(177,861)
Expenses
Management Fee 6 2,340
Administration Fee 6 2,475
Custody Fee 6 401
Depositary Fee 6 69
Professional Fee 9 1,105
Directors' Fee 7 363
Transaction Costs 9 888
Organisation Expenses 9 30,000
Audit Fee 8 13,177
Other Expenses 9 480
Expense Waiver 6 (17,302)
Total Expenses 33,996
Profit/(Loss) Attributable to Holders of Redeemable Participating Shares from Operations (211,857)
* Portfolio launched on 4 December 2019. Income and expenses arose solely from continuing operations.

STATEMENT OF CHANGES IN NET ASSETS FINANCIAL STATEMENTS
The accompanying notes form an integral part of the financial statements.
ANNUAL REPORT 2019 921
Neuberger Berman Macro Opportunities FX Fund (Continued) Statement of Changes in Net Assets Attributable to Holders of Redeemable Participating Shares
Period Ended
31 December 2019*
EUR
Net Assets Attributable to Holders of Redeemable Participating Shares at beginning of period –
Profit/(Loss) Attributable to Holders of Redeemable Participating Shares from Operations (211,857)
Subscriptions 5 19,696,443
Net Assets Attributable to Holders of Redeemable Participating Shares at end of period 19,484,586
* Portfolio launched on 4 December 2019.

FINANCIAL STATEMENTS SCHEDULE OF INVESTMENTS
922 NEUBERGER BERMAN INVESTMENT FUNDS PLC
Neuberger Berman Macro Opportunities FX Fund (Continued)
Schedule of Investments
Financial Assets at Fair Value through Profit or Loss
Principal Amount Security Description Coupon Maturity
DateFair Value
EUR% of Net
Assets
Treasury Bills 20.62%
Euro 1,200,000 European Stability Mechanism Treasury Bill 0.00% 05/03/2020 1,201,167 6.17
1,600,000 France Treasury Bill BTF 0.00% 04/11/2020 1,608,472 8.26
1,200,000 Kingdom of Belgium Treasury Bill 0.00% 12/11/2020 1,207,001 6.19
Total Treasury Bills ** 4,016,640 20.62
Corporate Bonds 75.40%
Euro 900,000 Aegon Bank NV 0.25% 01/12/2020 905,167 4.65
800,000 Bank of Montreal 0.38% 05/08/2020 803,432 4.12
850,000 BPCE SFH SA 0.38% 28/07/2020 853,553 4.38
800,000 Caisse Centrale Desjardins 0.38% 25/11/2020 804,879 4.13
400,000 Caisse Centrale du Credit Immobilier de France SA 0.38% 31/07/2020 401,730 2.06
800,000 Cie de Financement Foncier SA 0.13% 18/02/2020 800,523 4.11
300,000 Credit Mutuel - CIC Home Loan SFH SA 1.38% 22/04/2020 301,585 1.55
780,000 European Financial Stability Facility 1.75% 29/10/2020 794,225 4.08
850,000 ING Bank NV 2.00% 28/08/2020 863,175 4.43
700,000 KA Finanz AG 0.38% 11/08/2020 702,579 3.61
900,000 KBC Bank NV 1.25% 28/05/2020 905,809 4.65
800,000 Landesbank Hessen-Thueringen Girozentrale 0.00% 23/11/2020 802,580 4.12
800,000 Lloyds Bank Plc 4.00% 29/09/2020 825,627 4.24
800,000 Royal Bank of Canada 1.63% 04/08/2020 809,267 4.15
866,000 Santander UK Plc 1.63% 26/11/2020 880,954 4.52
800,000 Skandinaviska Enskilda Banken AB 1.63% 04/11/2020 813,310 4.17
800,000 Stadshypotek AB 1.63% 30/10/2020 813,191 4.17
800,000 Swedbank Hypotek AB 0.38% 29/09/2020 804,370 4.13
800,000 Westpac Securities NZ Ltd 0.50% 29/09/2020 804,872 4.13
Total Corporate Bonds * 14,690,828 75.40
Government Bonds 4.12%
Euro 800,000 Bpifrance Financement SA 0.13% 25/11/2020 803,302 4.12
Total Government Bonds * 803,302 4.12
Total Investments 19,510,770 100.14

SCHEDULE OF INVESTMENTS FINANCIAL STATEMENTS
ANNUAL REPORT 2019 923
Neuberger Berman Macro Opportunities FX Fund (Continued)
Schedule of Investments (Continued)
Financial Assets at Fair Value through Profit or Loss (continued) Forward Currency Contracts 4.58%
Amount Receivable
Amount Payable
Maturity Date Counterparty Contracts Unrealised
Gain EUR% of Net
Assets
AUD 943,372 US$ 646,785 22/01/2020 Goldman Sachs International 1 14,844 0.08
AUD 4,310,053 US$ 2,960,995 22/01/2020 Westpac Banking Corp 2 62,497 0.32
BRL 906,935 US$ 221,842 22/01/2020 Goldman Sachs International 1 3,086 0.02
BRL 14,704,134 US$ 3,499,726 22/01/2020 UBS AG 1 136,344 0.70
CAD 2,058,028 US$ 1,563,023 22/01/2020 Goldman Sachs International 2 21,554 0.11
CHF 657,870 US$ 667,934 22/01/2020 Goldman Sachs International 1 11,010 0.06
CZK 16,078,899 US$ 706,082 22/01/2020 Goldman Sachs International 1 3,675 0.02
CZK 16,083,769 US$ 699,436 22/01/2020 UBS AG 1 9,779 0.05
€ 1,515,976 US$ 1,687,046 22/01/2020 Goldman Sachs International 2 14,871 0.08
€ 357,841 US$ 399,348 22/01/2020 Westpac Banking Corp 1 2,508 0.01
¥ 131,965,413 US$ 1,208,123 22/01/2020 Goldman Sachs International 1 6,691 0.03
¥ 93,477,802 US$ 855,866 22/01/2020 Westpac Banking Corp 1 4,658 0.02
KRW 1,662,221,713 US$ 1,395,535 22/01/2020 Goldman Sachs International 1 39,850 0.20
NOK 11,955,430 US$ 1,332,240 22/01/2020 Goldman Sachs International 2 25,289 0.13
NOK 54,000,000 US$ 5,897,358 22/01/2020 UBS AG 1 221,058 1.13
NOK 72,311,183 US$ 7,899,157 22/01/2020 Westpac Banking Corp 1 294,214 1.51
NZD 248,913 US$ 164,287 22/01/2020 Goldman Sachs International 1 3,283 0.02
SEK 5,926,803 US$ 632,089 22/01/2020 Goldman Sachs International 1 1,476 0.01
SEK 9,329,770 US$ 984,352 22/01/2020 UBS AG 1 11,809 0.06
US$ 665,408 ¥ 72,140,831 22/01/2020 Goldman Sachs International 1 764 0.00
US$ 350,621 TRY 2,070,435 22/01/2020 Westpac Banking Corp 1 3,980 0.02
GBP Hedged Classes £ 2,264 € 2,645 22/01/2020 Goldman Sachs International 1 26 0.00
SEK Hedged Classes € 409 SEK 4,279 22/01/2020 Westpac Banking Corp 1 2 0.00
Total Unrealised Gain on Forward Currency Contracts ∞ 893,268 4.58
Fair Value % of Net
EUR Assets
Total Financial Assets at Fair Value through Profit or Loss 20,404,038 104.72

FINANCIAL STATEMENTS SCHEDULE OF INVESTMENTS
924 NEUBERGER BERMAN INVESTMENT FUNDS PLC
Neuberger Berman Macro Opportunities FX Fund (Continued)
Schedule of Investments (Continued)
Financial Liabilities at Fair Value through Profit or Loss
Forward Currency Contracts (5.45%) Amount Receivable
Amount Payable
Maturity Date Counterparty Contracts Unrealised
Loss EUR% of Net
Assets
¥ 1,537,336,871 US$ 14,177,318 22/01/2020 Westpac Banking Corp 3 (13,908) (0.07)
TRY 2,071,205 US$ 347,023 22/01/2020 Goldman Sachs International 1 (664) (0.00)
US$ 333,000 € 297,350 22/01/2020 Goldman Sachs International 1 (1,052) (0.01)
US$ 700,360 CZK 16,085,863 22/01/2020 Goldman Sachs International 1 (9,040) (0.05)
US$ 922,074 SEK 8,673,067 22/01/2020 Goldman Sachs International 1 (4,742) (0.02)
US$ 499,992 NZD 756,594 22/01/2020 Goldman Sachs International 1 (9,419) (0.05)
US$ 701,135 AUD 1,023,435 22/01/2020 Goldman Sachs International 1 (16,586) (0.08)
US$ 5,283,328 CHF 5,177,211 22/01/2020 Goldman Sachs International 5 (62,702) (0.32)
US$ 713,099 £ 542,139 22/01/2020 Goldman Sachs International 1 (4,900) (0.03)
US$ 697,098 KRW 828,918,801 22/01/2020 Goldman Sachs International 1 (18,831) (0.10)
US$ 2,545,591 NOK 23,073,164 22/01/2020 Goldman Sachs International 2 (71,531) (0.37)
US$ 647,010 MXN 12,596,088 22/01/2020 Goldman Sachs International 1 (16,071) (0.08)
US$ 1,118,062 CAD 1,472,325 22/01/2020 Goldman Sachs International 3 (15,539) (0.08)
US$ 11,924,586 CHF 11,748,818 22/01/2020 UBS AG 1 (200,170) (1.03)
US$ 1,074,434 MXN 21,052,430 22/01/2020 UBS AG 1 (33,039) (0.17)
US$ 1,400,259 KRW 1,666,557,036 22/01/2020 UBS AG 1 (38,989) (0.20)
US$ 4,660,351 AUD 6,795,199 22/01/2020 Westpac Banking Corp 1 (105,590) (0.54)
US$ 593,924 £ 453,290 22/01/2020 Westpac Banking Corp 1 (6,151) (0.03)
US$ 2,816,732 CAD 3,725,841 22/01/2020 Westpac Banking Corp 1 (50,548) (0.26)
US$ 3,343,666 € 3,005,964 22/01/2020 Westpac Banking Corp 1 (30,825) (0.16)
US$ 5,814,558 NZD 8,870,039 22/01/2020 Westpac Banking Corp 4 (152,400) (0.78)
GBP Hedged Classes £ 360,000 € 425,022 22/01/2020 Westpac Banking Corp 2 (435) (0.00)
SEK Hedged Classes SEK 570,216 € 54,483 22/01/2020 Westpac Banking Corp 1 (231) (0.00)
USD Hedged Classes US$ 109,855 € 98,839 22/01/2020 Goldman Sachs International 1 (1,092) (0.01)
US$ 21,295,000 € 19,144,887 22/01/2020 Westpac Banking Corp 2 (196,948) (1.01)
Total Unrealised Loss on Forward Currency Contracts ∞ (1,061,403) (5.45)
Fair Value % of Net
EUR Assets
Total Financial Liabilities at Fair Value through Profit or Loss (1,061,403) (5.45)
Net Financial Assets at Fair Value through Profit or Loss 19,342,635 99.27
Other Net Assets 141,951 0.73
Net Assets Attributable to Holders of Redeemable Participating Shares 19,484,586 100.00

SCHEDULE OF INVESTMENTS FINANCIAL STATEMENTS
ANNUAL REPORT 2019 925
Neuberger Berman Macro Opportunities FX Fund (Continued)
Schedule of Investments (Continued)
% ofTotal
AssetsPortfolio Analysis EUR
* Transferable securities and/or money market instruments admitted to an official stock exchange listing 15,494,130 75.28
** Transferable securities and/or money market instruments dealt in on a regulated market 4,016,640 19.51
∞ OTC financial derivative instruments (168,135) (0.82)
Total Investments 19,342,635 93.97

FINANCIAL STATEMENTS STATEMENT OF SIGNIFICANT PURCHASES AND SALES
926 NEUBERGER BERMAN INVESTMENT FUNDS PLC
Neuberger Berman Macro Opportunities FX Fund (Continued) Statement of Significant Purchases and Sales (Unaudited) In accordance with the European Communities (Undertakings for Collective Investment in Transferable Securities) Regulations, 2011 as amended, a statement of changes in the composition of the Schedule of Investments during the reporting period is provided to ensure that Shareholders can identify changes in the investments held by the Portfolio. The following statements present the aggregate purchases and sales of transferable securities exceeding one percent of the total value of purchases or sales, respectively, for the period. At a minimum, the largest twenty purchases and twenty sales are presented, if available.
Aggregate purchases greater than one percent of the total value of purchases:
Units Security Description Cost EUR
1,600,000 France Treasury Bill BTF, 0.00%, 04/11/2020 1,608,950
1,200,000 Kingdom of Begium Treasury Bill, 0.00%, 12/11/2020 1,206,647
1,200,000 European Stability Mechanism Treasury Bill, 0.00%, 05/03/2020 1,201,507
900,000 KBC Bank NV, 1.25%, 28/05/2020 906,282
900,000 Aegon Bank NV, 0.25%, 01/12/2020 905,256
866,000 Santander UK Plc, 1.63%, 26/11/2020 882,160
850,000 ING Bank NV, 2.00%, 28/08/2020 864,646
850,000 BPCE SFH SA, 0.38%, 28/07/2020 854,004
800,000 Lloyds Bank Plc, 4.00%, 29/09/2020 828,192
800,000 Skandinaviska Enskilda Banken AB, 1.63%, 04/11/2020 814,456
800,000 Stadshypotek AB, 1.63%, 30/10/2020 814,224
800,000 Royal Bank of Canada, 1.63%, 04/08/2020 810,480
800,000 Caisse Centrale Desjardins, 0.38%, 25/11/2020 805,536
800,000 Westpac Securities NZ Ltd, 0.50%, 29/09/2020 805,304
800,000 Swedbank Hypotek AB, 0.38%, 29/09/2020 804,928
800,000 Bpifrance Financement SA, 0.13%, 25/11/2020 804,312
800,000 Bank of Montreal, 0.38%, 05/08/2020 804,304
800,000 Landesbank Hessen-Thueringen Girozentrale, 0.00%, 23/11/2020 802,912
800,000 Cie de Financement Foncier SA, 0.13%, 18/02/2020 800,792
780,000 European Financial Stability Facility, 1.75%, 29/10/2020 795,740
700,000 KA Finanz AG, 0.38%, 11/08/2020 703,878
400,000 Caisse Centrale du Credit Immobilier de France SA, 0.38%, 31/07/2020 401,944
300,000 Credit Mutuel - CIC Home Loan SFH SA, 1.38%, 22/04/2020 301,956
There were no sales during the period.

NOTES TO THE AUDITED FINANCIAL STATEMENTS FINANCIAL STATEMENTS
ANNUAL REPORT 2019 927
NOTES TO THE AUDITED FINANCIAL STATEMENTS
FOR THE YEAR ENDED 31 DECEMBER 2019
1. SIGNIFICANT ACCOUNTING POLICIES
The significant accounting policies adopted by Neuberger Berman Investment Funds plc (the “Company”) are as follows:
Basis of Preparation of Financial Statements
The financial statements have been prepared in accordance with accounting standards generally accepted in Ireland, Irish Statute comprising the Companies Act 2014 (as amended), the European Communities (Undertakings for Collective Investment in Transferable Securities) Regulations, 2011 as amended, the Central Bank (Supervision and Enforcement) Act 2013 (section 48(1)) (Undertakings for Collective Investment in Transferable Securities) Regulations 2019 (the “Central Bank UCITS Regulations”) and the listing rules of Euronext Dublin. The financial statements are prepared in accordance with Financial Reporting Standard (“FRS”) 102: ‘The financial reporting standard applicable in the UK and Republic of Ireland’. Accounting standards generally accepted in Ireland in preparing financial statements giving a true and fair view are those published by the Institute of Chartered Accountants in Ireland and issued by the Financial Reporting Council (“FRC”).
The financial statements are prepared under the historical cost convention as modified by the revaluation of the financial assets and financial liabilities held at fair value through profit and loss. Valuation time is market close on the relevant dealing day. The dealing day is each business day or such other day as the Directors may determine and notify to the administrator and to the shareholders in advance.
The format and certain wordings of the financial statements have been adapted from those contained in the Companies Act 2014 (as amended) and FRS 102 so that, in the opinion of the Directors, they more appropriately reflect the nature of the Company’s business as an investment fund. The Company meets the criteria to avail of the exemption available to certain open-ended investment funds under FRS 102 not to prepare a cash flow statement.
Financial Assets and Financial Liabilities at Fair Value through Profit or Loss
(i) Classification The Company has chosen to apply the recognition and measurement provisions of International Financial Reporting Standard 9: “Financial Instruments” (“IFRS 9”), and the disclosure and presentation requirement of FRS 102 to account for all the financial instruments. IFRS 9, published in July 2014, has replaced previous guidance in IAS 39 and includes revised guidance on the classification and measurement of financial instruments. Effective for reporting periods beginning on or after 1 January 2018 it carries forward the guidance on recognition and derecognition of financial instruments from IAS 39. In accordance with IFRS 9, the Company has designated all of its investments into financial assets or financial liabilities at fair value through profit or loss. All derivatives in a receivable position (positive fair value), as well as options purchased, are included in financial assets at fair value through profit or loss. All derivatives in a payable position (negative fair value), as well as written options, are included in financial liabilities at fair value through profit or loss.
Financial assets that are not at fair value through profit or loss include certain balances due from brokers and accounts receivable, which are classified as loans and receivables.
Financial liabilities that are not at fair value through profit and loss include certain balances due to brokers and accounts payable which are measured at amortised cost.
(ii) Initial Measurement Purchases and sales of financial instruments are accounted for at trade date for financial statement purposes. Realised gains and losses on disposals of financial instruments are calculated using the first in first out method. Financial instruments categorised as financial assets at fair value through profit or loss are measured initially at fair value with transaction costs for such instruments being recognised directly in the Profit and Loss Account.
(iii) Subsequent Measurement After initial measurement, the Company measures financial instruments classified as financial assets at fair value through profit or loss, at their fair values. Fair value is the amount for which an asset could be exchanged, or a liability settled, between knowledgeable, willing parties in an arm’s length transaction. The fair value of financial instruments is based on their official quoted market price on a recognised exchange or sourced from a reputable broker/counterparty in the case of non-exchange traded instruments, at the balance sheet date without any deduction for estimated future selling costs. In accordance with IFRS 9 the Company’s securities and other assets are valued at the last traded price as at 31 December 2019 to determine the Net Assets Attributable to Holders of Redeemable Participating Shares (“Net Assets”).

FINANCIAL STATEMENTS NOTES TO THE AUDITED FINANCIAL STATEMENTS
928 NEUBERGER BERMAN INVESTMENT FUNDS PLC
FOR THE YEAR ENDED 31 DECEMBER 2019
1. SIGNIFICANT ACCOUNTING POLICIES (CONTINUED)
Financial Assets and Financial Liabilities at Fair Value through Profit or Loss (continued)
(iii) Subsequent Measurement (continued) However, the Directors may adjust the value of financial assets if it considers such adjustment is required to better reflect the fair value thereof. If a quoted official market price is not available on a recognised stock exchange or from a broker/counterparty, the probable realisation of value shall be calculated with care and in good faith in accordance with the Company’s valuation policy. Such probable realisation values may be determined by the Administrator using valuation techniques, including use of recent arm’s length market transactions, reference to the current fair value of another instrument that is substantially the same, discounted cash flow techniques, option pricing models or any other valuation technique that provides a reliable estimate of prices obtained in actual market transactions. Subsequent changes in the fair value of financial instruments at fair value through the profit or loss are recognised in the Profit and Loss Account.
The Directors have approved the use of Interactive Data Pricing and Reference Data, Inc. (“Interactive”) to assist in determining the fair value of foreign equity securities when changes in the value of a certain index suggest that the closing prices on the foreign exchanges may no longer represent the amount that a Portfolio could expect to receive for those securities or on days when foreign markets are closed and US markets are open. In each of these events, Interactive will provide adjusted prices for certain foreign equity securities using a statistical analysis of historical correlations of multiple factors (Level 2 inputs, as it is using indirect prices). In the absence of precise information about the market values of these foreign securities as of the close of the New York Stock Exchange, the Directors have determined on the basis of available data that prices adjusted in this way are likely to be closer to the prices a Portfolio could realise on a current sale than are the prices of those securities established at the close of the foreign markets in which the securities primarily trade.
(iv) Derecognition of Financial Assets and Liabilities The Company derecognises a financial asset when the contractual rights to the cash flows from the financial asset expire or when the financial assets
are transferred and the transfer qualifies for derecognition in accordance with IFRS 9. Interest earned or incurred is accrued in interest income on an accrual basis. The Company derecognises a financial liability when the obligation specified in the contract is discharged, cancelled or expires.
Real Estate Investment Trusts
Units or shares in real estate investment trusts will be valued at the latest available Net Asset Value or, if listed or traded on a regulated market, at the last quoted trade price or the mid quotation or, if unavailable or unrepresentative, the latest available Net Asset Value as deemed relevant to the collective investment scheme.
Investment Funds
The fair value of any investment which is a unit of or participation in an investment fund is the latest available unaudited Net Asset Value of such unit or participation. Units or shares in exchange traded funds will be valued at the latest available Net Asset Value, or if listed or traded on a regulated market, at the last quoted trade price.
Participatory Notes
The Portfolios may invest in participatory notes. Participatory notes which are fully paid up and have a zero strike price, exhibit the identical risk and return characteristics as in the case where the Portfolio had acquired the underlying equity directly. Such participatory notes are valued at the last bid price for the underlying equity quoted on the stock exchange or principal market on which it is listed or, if the bid price is unavailable or unrepresentative, the last available mid price on such stock exchange or market.
Asset Backed Securities and Mortgage Backed Securities
Inputs used to value asset backed securities and mortgage backed securities generally include models that consider a number of factors, which may include the following: prepayment speeds, cash flows, spread adjustments and other market information, which may include benchmark yields, reported trades, broker-dealer quotes, issuer spreads, benchmark securities, bids, offers, and reference data, such as market research publications, when available.

NOTES TO THE AUDITED FINANCIAL STATEMENTS FINANCIAL STATEMENTS
ANNUAL REPORT 2019 929
FOR THE YEAR ENDED 31 DECEMBER 2019
1. SIGNIFICANT ACCOUNTING POLICIES (CONTINUED)
To Be Announced Securities
The Portfolios may enter into To Be Announced (“TBA”) purchase commitments to purchase securities for a fixed unit price at a future date beyond customary settlement time. Although the unit price has been established, the principal value has not been finalised. The Portfolio holds and maintains until settlement date, cash or high grade debt obligations in an amount sufficient to meet the purchase price, or the Portfolio may enter into offsetting contracts for the forward sale of other securities that they own. Income on the securities will not be earned until settlement date. Unsettled TBA purchase commitments are valued at the current market price.
The Portfolios may enter into TBA sale commitments to hedge their portfolio positions or to sell mortgage backed securities they own under delayed delivery arrangements. Proceeds of TBA sales commitments are not received until the contractual settlement date. During the time a TBA sale commitment is outstanding, equivalent deliverable securities or an offsetting TBA purchase commitment deliverable on or before the sale commitment date, are held as “cover” for the transaction. Unsettled TBA sale commitments are valued at current market value, generally according to the procedures described previously in the accounting policies.
Forward Currency Contracts
A forward currency contract is an agreement between two parties to buy and sell a currency at a set price on a future date. The market value of a forward currency contract fluctuates with changes in forward currency exchange rates. Forward currency contracts are marked to market daily and the change in value is recorded by the Portfolio as an unrealised gain or loss. Realised gains or losses equal to the difference between the value of the contract at the time it was opened and the value at the time it was closed are recorded upon delivery or receipt of the currency or, if a forward currency contract is offset by entering into another forward currency contract with the same broker, upon settlement of the net gain or loss.
Futures Contracts
Futures contracts may include certain options on exchange-traded futures contracts. Initial margin deposits are made upon entering into futures contracts and are generally made in cash and cash equivalents. The fair value of futures contracts is based upon their quoted daily settlement prices. Changes in the value of open futures contracts are recognised as unrealised gains or losses on futures contracts until the contracts are terminated, at which time realised gains and losses are recognised. Gains or losses on open futures contracts are shown in the Schedule of Investments of each relevant Portfolio and as appropriate, on the Balance Sheet as financial assets/financial liabilities at fair value through profit or loss.
Swap Contracts
A swap contract is a privately negotiated agreement between a Portfolio and a counterparty to exchange or swap the return generated by one instrument for the return generated by another instrument. Some swap contracts are net settled. When entering into an over-the-counter (“OTC”) swap contract and during the term of the transaction, the Portfolio and/or the swap counterparty may post or receive cash or securities as collateral in accordance with the terms of the respective swap agreements to provide assets of value and recourse in the event of default or bankruptcy/insolvency. Certain clearinghouses currently offer clearing for limited types of swaps. In a cleared swap transaction, a Portfolio typically enters into the transaction with a financial institution counterparty that is then cleared through a central clearinghouse. Upon acceptance of a swap by a central clearinghouse, the original swap is extinguished and replaced with a swap with the clearinghouse, thereby reducing or eliminating the Portfolio's exposure to the credit risk of the original counterparty. A Portfolio typically will be required to post specified levels of both initial and variation margin with the clearinghouse or at the instruction of the clearinghouse. The daily change in valuation is recorded as a receivable or payable for variation margin and settled in cash with the centrally clearing party.
Interest Rate Swaps A Portfolio may enter into interest rate swap contracts which are arrangements between two parties to exchange cash flows based on a notional principal amount, to manage a Portfolio’s exposure to interest rates. Interest rate swap contracts are marked-to-market daily based in some cases on quotations from counterparties and in other cases from pricing services and the change in value, if any is recorded as an unrealised gain or loss. Payments made or received are recorded as part of realised gains and losses.
Credit Default Swaps A credit default swap is a bilateral financial contract under which the protection buyer pays a fee, usually expressed in basis points per annum on the notional amount, in return for a payment by the protection seller contingent on the occurrence of a credit event, such as a bankruptcy, default, or restructuring, with respect to a referenced entity. The credit events and applicable settlement mechanism used to determine the contingent payment are negotiated between the counterparties at the time of trading.

FINANCIAL STATEMENTS NOTES TO THE AUDITED FINANCIAL STATEMENTS
930 NEUBERGER BERMAN INVESTMENT FUNDS PLC
FOR THE YEAR ENDED 31 DECEMBER 2019
1. SIGNIFICANT ACCOUNTING POLICIES (CONTINUED)
Swap Contracts (continued)
Credit Default Swaps (continued) Once the credit event has been declared, the protection buyer has the right to settle the contract. Settlement is usually physical, with the protection buyer having the right to deliver bonds of the reference entity up to the notional amount of the contract. In return, the protection buyer receives the par value of those obligations. Selling protection is the synthetic equivalent of buying a bond or alternative form of debt. Buying protection is the equivalent of synthetically shorting or hedging a bond or other credit exposure. Credit default swap agreements on credit indices involve one party making a stream of payments to another party in exchange for the right to receive a specified return in the event of a write-down, principal shortfall, interest shortfall or default of all or part of the reference entities comprising the credit index. A credit index is a list of a basket of credit instruments or exposures designed to be representative of some part of the credit market as a whole. Components of the indices may include, but are not limited to, investment grade securities, high yield securities, asset backed securities, emerging markets, and/or various credit ratings within each sector. Credit indices are traded using credit default swaps with standardised terms including a fixed spread and standard maturity dates. An index credit default swap references all the names in the index, and if there is a default, the credit event is settled based on that name’s weight in the index. The composition of the indices change periodically, usually every six months, and for most indices, each name has an equal weight in the index.
The use of credit default swap contracts is restricted to the extent that the benefits to a Portfolio mirror that which could be obtained by direct investment in the underlying instruments and that the swaps do not expose a Portfolio to risks which it would not otherwise assume (other than the exposure to the credit default swap counterparty). The upfront payment received by a Portfolio, as protection seller, is recorded as a liability on the Portfolio’s books. An upfront payment made by a Portfolio, as protection buyer, is recorded as an asset on the Portfolio’s books. Payments received or paid by a Portfolio are recorded as realised gains or losses. Credit default swaps are valued using a pricing service provider. Where no pricing service provider is available, contracts may be marked-to-market daily based upon quotations received from counterparties or based upon calculations using valuation models and the change, if any, is recorded as an unrealised gain or loss. Payments received or paid as a result of a credit event or termination of the contract are recognised, net of a proportional amount of the upfront payment, as realised gains or losses.
Total Return Swaps A Portfolio may enter into total return and structured swaps in order to trade the return on an index which reflects the general composition of the assets of the Portfolio for a rate of return which will generally be at a fixed rate above or below LIBOR or another index. The rate of return to be paid or received by the Portfolio will be negotiated prior to entering into the swap and will remain fixed throughout the term of the swap.
A Portfolio may enter into total return and structured swaps in order to gain market exposure in circumstances where it is not practical or economical to use direct investments or other forms of derivatives such as futures contracts. Swaps are marked-to-market daily based upon quotations received from counterparties or valued using a pricing service and in other cases based upon calculations using valuation models. The significant assumptions and the formulae behind the calculations used in the valuation models are defined explicitly in the individual term sheets. Generally the total returns are determined by the daily index level or daily price multiplied by a predetermined notional amount and the financing portion is built-in to create an all-in valuation.
Changes in valuations, if any, are recorded as unrealised gains or losses. Payments received or made are recorded as realised gains or losses. The Company discloses outstanding total return swap contracts at the year end in the Portfolio of Investments. For the year ended 31 December 2019, the fair value of total return swaps is disclosed in the Schedule of Investments and Balance Sheet as net unrealised gain or loss. Prior to 31 December 2019, the fair value was presented as showing the current notional value and notional cost separately. This difference in methodology has been deemed immaterial and has no effect on NAV and as such, comparative presentation prior to 31 December 2019 has not been updated.
Cross-Currency Swaps Cross-currency swap agreements involve two parties exchanging two different currencies with an agreement to reverse the exchange at a later date at specified exchange rates. The exchange of currencies at the inception date of the contract takes place at the current spot rate. The re-exchange at maturity may take place at the same exchange rate, a specified rate, or the then current spot rate. Interest payments, if applicable, are made between the parties based on interest rates available in the two currencies at the inception of the contract. The terms of cross currency swap agreements may extend for many years. Cross-currency swaps are usually negotiated with commercial and investment banks. Some cross-currency swaps may not provide for exchanging principal cash flows, but only for exchanging interest cash flows.
Inflation Swaps Inflation swaps involve the exchange of a floating rate linked to an index for a fixed rate interest payment with respect to a notional amount or principal.

NOTES TO THE AUDITED FINANCIAL STATEMENTS FINANCIAL STATEMENTS
ANNUAL REPORT 2019 931
FOR THE YEAR ENDED 31 DECEMBER 2019
1. SIGNIFICANT ACCOUNTING POLICIES (CONTINUED)
Options
Option contracts may include certain options on exchange-traded futures contracts. When a Portfolio writes an option, an amount equal to the premium received by the Portfolio is recorded as a liability and the current fair value of the option written is subsequently adjusted by this amount. The premium on written call options exercised is added to the proceeds from the sale of the underlying security or foreign currency in determining the realised gain or loss. The premium on written put options exercised is subtracted from the cost of the securities or foreign currencies purchased. Premiums received from written options which expire are treated as realised gains. The premium on purchased put options exercised is subtracted from the proceeds of the sale of the underlying security or foreign currency in determining the realised gain or loss. The premium paid on purchased call options exercised is added to the cost of the securities or foreign currency purchased. Premiums paid for the purchase of options which expire unexercised are treated as realised losses. Exchange traded options are valued at the settlement price determined by the relevant exchange.
Swaptions When a Portfolio writes a swaption, an amount equal to the premium received by the Portfolio is recorded as a liability and is subsequently adjusted to the current fair value of the swaption written. Premiums received from the written swaptions which expire unexercised are treated by the Portfolio on the expiration dates as realised gains. If a written call swaption is exercised, the premium is added to the proceeds from the sale of the underlying swap in determining the realised gain or loss. If a written put swaption is exercised, the premium reduces the cost basis of the swap purchased.
When a Portfolio purchases a swaption, an amount equal to the premium paid by the Portfolio is recorded as an asset and is subsequently adjusted to the current fair value of the swaption purchased. Premiums paid for the purchase of swaptions which expire unexercised are treated on the expiration date as realised losses. If a purchased payer swaption is exercised, the premium is subtracted from the proceeds of the underlying swap in determining whether the relevant Portfolio has realised a gain or a loss. If a purchased receiver swaption is exercised, the premium is added to the cost basis of the floating rate investment that has been swapped. Swaptions are priced either via a pricing vendor or a counterparty pricing source.
Contracts for Differences
Contracts for differences are valued based on the closing market price of the underlying security converted into the base currency of the contract for differences, less any financing charges attributable to each contract which are booked separately. The current market value is shown in the Balance Sheet. On entering a contract for differences, a Portfolio may be required to pledge an amount of cash and/or other assets to the broker which is equal to a certain percentage of the contract amount (‘initial margin’). Subsequently, payments known as ‘variation margins’ are made or received by a Portfolio periodically, depending on the fluctuations in the value of the underlying security. During the period that the contract for differences is open, changes in the value of the contract are recognised as unrealised gains or losses and by marking to market at each valuation date in order to reflect the value of the underlying security. Realised gains or losses at the closure of the contract are equal to the difference between the value of the contract for differences at the time it was opened (including any financial charges) and the value at the time it was closed. Dividends (net of withholding taxes) attributable to open contracts for differences are deemed to be dividends receivable or payable at the end of the year. For the year ended 31 December 2019, the fair value of contracts for differences is disclosed in the Schedule of Investments and Balance Sheet as net unrealised gain or loss. Prior to 31 December 2019, the fair value was presented as showing the current notional value and notional cost separately. This difference in methodology has been deemed immaterial and has no effect on NAV and as such, comparative presentation prior to 31 December 2019 has not been updated.
Offsetting Financial Instruments
Financial assets and liabilities are offset and the net amount reported in the Balance Sheet when there is a legally enforceable right to offset the recognised amounts and there is an intention to settle on a net basis, or realise the assets and settle the liability simultaneously.
Cash and Cash Equivalents
Cash comprises current deposits with banks. Cash equivalents are short-term highly liquid investments that are readily convertible to known amounts of cash, are subject to an insignificant risk of changes in value, and are held to meet short-term cash commitments rather than for investment or other purposes.
Cash and cash equivalent assets are valued at their face value with interest accrued, where applicable, to the valuation point on the relevant dealing day, unless in the opinion of the Directors (in consultation with the Investment Manager and the Administrator) an adjustment should be made to reflect the true value thereof.
Company cash accounts A number of Company cash accounts are being operated by the Administrator, on behalf of the Company pursuant to the Central Bank of Ireland Guidance paper entitled Umbrella Funds – Cash Accounts Holding Subscription, Redemption and Dividend Monies. These cash accounts, held with Brown Brothers Harriman Trustee Services (Ireland) Limited (the “Depositary”) for collection of unprocessed subscription monies received from investors, redemption monies payable to investors and/or other amounts due to investors for the Company are deemed assets of the Company. Any balances held on these cash accounts at the financial year end are reflected on the Aggregate Balance Sheets of the Company.

FINANCIAL STATEMENTS NOTES TO THE AUDITED FINANCIAL STATEMENTS
932 NEUBERGER BERMAN INVESTMENT FUNDS PLC
FOR THE YEAR ENDED 31 DECEMBER 2019
1. SIGNIFICANT ACCOUNTING POLICIES (CONTINUED)
Foreign Currency Translation
Functional and Presentation Currency The functional and presentation currency of the Neuberger Berman European High Yield Bond Fund, the Neuberger Berman Corporate Hybrid Bond Fund, the Neuberger Berman Ultra Short Term Euro Bond Fund, the Neuberger Berman Euro Opportunistic Bond Fund, the Neuberger Berman Euro Bond Absolute Return Fund and the Neuberger Berman Macro Opportunies FX Fund is EUR. The functional and presentation currency of the Neuberger Berman China Bond Fund is CNY. The functional and presentation currency of all other Portfolios is US dollars. The base currency of the majority of net assets in the Company is US dollars and thus US dollars is deemed the most appropriate aggregate currency. For more details please refer to Note 15.
Transactions and Balances Assets and liabilities, denominated in currencies other than the functional currency of the Portfolio are translated into the functional currency at the rate of exchange prevailing at the Balance Sheet date. Transactions in currencies other than the functional currency of the Portfolio are translated into the functional currency at the rate of exchange prevailing at the dates of the transactions. Gains and losses on foreign exchange transactions are recognised in the Profit and Loss Account in determining the result for the year.
Proceeds from subscriptions and amounts paid for redemptions of Redeemable Participating Shares in currencies other than the functional currency are translated into the functional currency at the rates prevailing on the dates of the transactions. The Balance Sheet is translated using exchange rates at the year end and the Profit and Loss Account and the Statement of Changes in Net Assets are translated at an average rate over the year. Income and Expense Recognition
Dividend income is recognised in the Profit and Loss Account on the date upon which the relevant security is listed as “ex-dividend” to the extent that information thereof is reasonably available to the Portfolio. Dividend and interest income is shown gross of any non-recoverable withholding taxes, which are disclosed separately in the Profit and Loss Account and net of any tax credits. Bank deposit interest is accounted for on a receipts basis.
Interest income is recognised in the Profit and Loss Account for all debt instruments on an accrual basis.
Realised Gains and Losses on Investments
Realised gains and losses on disposals of financial assets at fair value through profit or loss are calculated on a first in first out basis. The associated foreign exchange movement between the date of purchase and the date of sale on the disposal of financial assets at fair value through profit or loss is included in net gain/(loss) on financial assets at fair value through profit or loss. Investment transactions are accounted for on trade date, the date at which the Portfolio commits to purchase or sell the asset.
Taxation
Under current law and practice, the Company qualifies as an investment undertaking as defined in Section 739B (1) of the Taxes Consolidation Act, 1997 as amended. On that basis, it is not therefore chargeable to Irish tax on its relevant income or relevant gains. However, Irish tax can arise on the happening of a chargeable event in the Company.
A chargeable event includes any distribution payments to shareholders or any encashment, redemption, or transfer of shares and the holding of shares at the end of each eight year period beginning with the acquisition of such shares. No Irish tax will arise on the Company in respect of chargeable events in respect of:
(i) a shareholder who is neither Irish resident nor ordinarily resident in Ireland for tax purposes, at the time of the chargeable event, provided appropriate valid declarations in accordance with the provisions of the Taxes Consolidation Act, 1997 as amended, are held by the Company, and
(ii) certain exempted Irish tax resident shareholders who have provided the Company with the necessary signed statutory declarations.
There were no chargeable events during the year under review.
Capital gains, dividends and interest received (if any, on investments made) by the Company may be subject to withholding taxes imposed by the country from which the investment income/gains are received and such taxes may not be recoverable by the Company or its shareholders.
The Finance Act, 2010 provides that the Revenue Commissioners may grant approval for investment funds marketed outside of Ireland to make payments to non-resident investors without deduction of Irish tax where no relevant declaration is in place, subject to meeting the “equivalent measures”. A Company wishing to receive approval must apply in writing to the Revenue Commissioners confirming compliance with the relevant conditions. As at 31 December 2019 the Company had not applied for approval from the Revenue Commission.
The Company has reviewed the tax positions for the open tax years as of 31 December 2019 and has determined that no provision for income tax and/or uncertain tax positions is required in the Company’s financial statements.

NOTES TO THE AUDITED FINANCIAL STATEMENTS FINANCIAL STATEMENTS
ANNUAL REPORT 2019 933
FOR THE YEAR ENDED 31 DECEMBER 2019
1. SIGNIFICANT ACCOUNTING POLICIES (CONTINUED)
Redeemable Participating Shares
Redeemable Participating Shares are redeemable at the shareholder’s option and are classified as financial liabilities. Any distributions on these shares are recognised in the Profit and Loss Account as Finance Costs. The Redeemable Participating Shares can be put back to the Portfolio on any dealing day for cash equal to a proportionate share of the Portfolio’s Net Asset Value. The Redeemable Participating Shares are carried at the redemption amount that is payable at the balance sheet date if the shareholder exercised the right to put the shares back to the Portfolio.
Distribution Policy
The Directors have determined to accumulate all net investment income and net realised capital gains attributable to the Accumulating Classes and therefore do not intend to declare dividends in respect of shares in such classes.
Source of Distributions Pursuant to the Articles, the Directors may declare dividends, in respect of any shares out of net income (including dividend and interest income) and/or the excess of realised and unrealised capital gains over realised and unrealised losses in respect of investments of the Company (collectively “Net Income”) and also out of capital. Dividends paid out of capital amount to a return or withdrawal of part of a shareholder’s original investment or from any capital gains attributable to that original investment. Such dividends may result in an immediate decrease in the Net Asset Value of the relevant shares.
It is the current intention of the Directors, subject to any de minimis threshold, to declare and pay as a dividend at least 85% of the Net Income attributable to each of the Distributing Classes, other than (i) the (Weekly) Distributing Classes; (ii) the (Monthly) Distributing Classes); (iii) the (CG) Distributing Classes and (iv) such other Distributing Classes in a Portfolio which are specified in the relevant Supplement to pay dividends out of capital and Net Income. However, shareholders should note that the Directors may, in their discretion, decide not to make such declaration and payment in respect of a Distributing Class.
In respect of the (Weekly) Distributing Classes, the (Monthly) Distributing Classes and the (CG) Distributing Classes, the Directors intend to declare and pay a weekly, monthly or semi-annual dividend, respectively, attributable to the shares of each such class out of a combination of Net Income and capital, so that where Net Income during the relevant period is less than the amount declared, the balance will be paid of the capital represented by the relevant shares, which will enable the classes to distribute regular, set dividends. In the event that the Net Income attributable to the (Weekly) Distributing Classes, the (Monthly) Distributing Classes or the (CG) Distributing Classes exceeds the amount declared during the relevant period, the excess of Net Income over this amount will be retained in a distribution account in respect of the relevant shares and will form part of the dividend payable in respect of the succeeding distribution period. While the foregoing represents the Directors’ current intention in respect of the declaration and payment of dividends in respect of the (Weekly) Distributing Classes, the (Monthly) Distributing Classes and the (CG) Distributing Classes, the Directors may in their discretion decide not to make such declaration and payment and there is no guarantee that any such dividends will be paid.
Frequency of Distributions Under normal circumstances, the Directors intend that dividends in respect of:
(a) each of the (Weekly) Distributing Classes in all Portfolios shall be declared and paid on or prior to the last business day of each week; (b) each of the (Monthly) Distributing Classes in all Portfolios shall be declared on or prior to the last business day of each month and paid within three
business days thereafter; (c) each of the (CG) Distributing Classes in all Portfolios shall be declared on a semi-annual basis and paid within thirty business days; (d) each of the other Distributing Classes of the Neuberger Berman US Small Cap Fund, the Neuberger Berman US Real Estate Securities Fund, the
Neuberger Berman US Small Cap Intrinsic Value Fund, the Neuberger Berman China Bond Fund, the Neuberger Berman Global Thematic Equity Fund, the Neuberger Berman Euro Opportunistic Bond Fund, the Neuberger Berman Euro Bond Absolute Return Fund and the Neuberger Berman Ultra Short Term Euro Bond Fund shall be declared on a quarterly basis and paid within thirty business days in relation to the Net Income of such Distributing Classes for the previous quarter;
(e) each of the other Distributing Classes of the Neuberger Berman High Yield Bond Fund, the Neuberger Berman Short Duration High Yield Bond Fund, the Neuberger Berman Global Bond Fund, the Neuberger Berman Emerging Market Debt – Local Currency Fund, the Neuberger Berman Emerging Market Debt – Hard Currency Fund, the Neuberger Berman Emerging Market Corporate Debt Fund, the Neuberger Berman Strategic Income Fund, the Neuberger Berman Global Bond Absolute Return Fund, the Neuberger Berman Short Duration Emerging Market Debt Fund, the Neuberger Berman Emerging Market Debt Blend Fund, the Neuberger Berman European High Yield Bond Fund, the Neuberger Berman Global Real Estate Securities Fund, the Neuberger Berman Corporate Hybrid Bond Fund, the Neuberger Berman Global Opportunistic Bond Fund, the Neuberger Berman Global High Yield Bond Fund, the Neuberger Berman Emerging Market Debt Blend Investment Grade Fund, the Neuberger Berman CLO Income Fund, the Neuberger Berman Multi-Asset Class Income Fund, the Neuberger Berman US Equity Index PutWrite Fund and the Neuberger Berman Global Equity Index PutWrite Fund shall be declared on a quarterly basis and paid within thirty business days;

FINANCIAL STATEMENTS NOTES TO THE AUDITED FINANCIAL STATEMENTS
934 NEUBERGER BERMAN INVESTMENT FUNDS PLC
FOR THE YEAR ENDED 31 DECEMBER 2019
1. SIGNIFICANT ACCOUNTING POLICIES (CONTINUED)
Distribution Policy (continued)
(f) each of the other Distributing Classes of the Neuberger Berman Absolute Return Multi Strategy Fund and the Neuberger Berman US Long Short Equity Fund shall be declared on a semi-annual basis and paid within thirty business days;
(g) each of the other Distributing Classes of the Neuberger Berman US Multi Cap Opportunities Fund, the Neuberger Berman Uncorrelated Strategies Fund and the Neuberger Berman Macro Opportunities FX Fund shall be declared on an annual basis and paid within thirty business days; and
(h) each of the other Distributing Classes of all other Portfolios shall be declared on an annual basis and paid within thirty Business Days in relation to the Net Income of the Distributing Classes for the calendar year ended the previous 31 December.
Subject to income being available for distribution, the Directors may also decide to declare and pay interim dividends in relation to any of the Distributing Classes. All Shares in issue in a Distributing Class on any date on which the Directors determine to declare a dividend in respect of such Distributing Class will be eligible for such dividend.
The Directors reserve the right to change the dividend policy of any class of shares at their discretion on prior notice to shareholders of the relevant class. Any dividend unclaimed after a period of six years from the date of its declaration of such dividend shall be forfeited and shall revert to the relevant Portfolio.

NOTES TO THE AUDITED FINANCIAL STATEMENTS FINANCIAL STATEMENTS
ANNUAL REPORT 2019 935
FOR THE YEAR ENDED 31 DECEMBER 2019
2. FINANCIAL ASSETS AND FINANCIAL LIABILITIES AT FAIR VALUE THROUGH PROFIT OR LOSS
Neuberger Berman High Yield
Bond Fund Neuberger Berman Diversified
Currency Fund As at 31 December 2019 As at 31 December 2018 As at 31 December 2019 As at 31 December 2018 Fair Value Fair Value Fair Value Fair Value Financial Assets at Fair Value through Profit or Loss US$ US$ US$ US$
Held for trading:
Corporate Bonds 3,115,732,226 3,461,236,467 – –
Government Bonds – – 11,499,725 –
Investment Funds 41,877,566 79,589,602 – –
Term Loans 175,946,027 269,335,137 – –
Treasury Bills – – 56,438,081 26,627,172
Unrealised gain on Forward Currency Contracts 79,888,953 31,480,503 2,682,167 1,123,461
Total Financial Assets at Fair Value through Profit or Loss 3,413,444,772 3,841,641,709 70,619,973 27,750,633
Financial Liabilities at Fair Value through Profit or Loss
Unrealised loss on Forward Currency Contracts (19,165,871) (19,871,906) (2,899,862) (1,209,774)
Total Financial Liabilities at Fair Value through Profit or Loss (19,165,871) (19,871,906) (2,899,862) (1,209,774)

FINANCIAL STATEMENTS NOTES TO THE AUDITED FINANCIAL STATEMENTS
936 NEUBERGER BERMAN INVESTMENT FUNDS PLC
FOR THE YEAR ENDED 31 DECEMBER 2019
2. FINANCIAL ASSETS AND FINANCIAL LIABILITIES AT FAIR VALUE THROUGH PROFIT OR LOSS (CONTINUED)
Neuberger Berman US Multi Cap
Opportunities Fund Neuberger Berman US Real Estate
Securities Fund As at 31 December 2019 As at 31 December 2018 As at 31 December 2019 As at 31 December 2018 Fair Value Fair Value Fair Value Fair Value Financial Assets at Fair Value through Profit or Loss US$ US$ US$ US$
Held for trading:
Equities 758,942,228 890,768,700 11,852,632 3,649,236
Real Estate Investment Trusts – – 252,563,760 84,209,496
Unrealised gain on Forward Currency Contracts 1,848,250 863,114 2,695,530 411,458
Total Financial Assets at Fair Value through Profit or Loss 760,790,478 891,631,814 267,111,922 88,270,190
Financial Liabilities at Fair Value through Profit or Loss
Unrealised loss on Forward Currency Contracts (543,012) (1,328,560) (695,653) (321,650)
Total Financial Liabilities at Fair Value through Profit or Loss (543,012) (1,328,560) (695,653) (321,650)

NOTES TO THE AUDITED FINANCIAL STATEMENTS FINANCIAL STATEMENTS
ANNUAL REPORT 2019 937
FOR THE YEAR ENDED 31 DECEMBER 2019
2. FINANCIAL ASSETS AND FINANCIAL LIABILITIES AT FAIR VALUE THROUGH PROFIT OR LOSS (CONTINUED)
Neuberger Berman China
Equity Fund Neuberger Berman Emerging Markets
Equity Fund As at 31 December 2019 As at 31 December 2018 As at 31 December 2019 As at 31 December 2018 Fair Value Fair Value Fair Value Fair Value Financial Assets at Fair Value through Profit or Loss US$ US$ US$ US$
Held for trading:
Equities 829,280,827 787,417,913 424,504,233 432,693,212
Participatory Notes – – – 794,481
Real Estate Investment Trusts – – 3,770,512 –
Unrealised gain on Forward Currency Contracts 813,489 391,713 1,577,634 893,053
Total Financial Assets at Fair Value through Profit or Loss 830,094,316 787,809,626 429,852,379 434,380,746
Financial Liabilities at Fair Value through Profit or Loss
Unrealised loss on Forward Currency Contracts (307,424) (363,639) (649,899) (2,573,630)
Total Financial Liabilities at Fair Value through Profit or Loss (307,424) (363,639) (649,899) (2,573,630)

FINANCIAL STATEMENTS NOTES TO THE AUDITED FINANCIAL STATEMENTS
938 NEUBERGER BERMAN INVESTMENT FUNDS PLC
FOR THE YEAR ENDED 31 DECEMBER 2019
2. FINANCIAL ASSETS AND FINANCIAL LIABILITIES AT FAIR VALUE THROUGH PROFIT OR LOSS (CONTINUED)
Neuberger Berman US
Small Cap Fund Neuberger Berman Short Duration
High Yield Bond Fund As at 31 December 2019 As at 31 December 2018 As at 31 December 2019 As at 31 December 2018 Fair Value Fair Value Fair Value Fair Value Financial Assets at Fair Value through Profit or Loss US$ US$ US$ US$
Held for trading:
Corporate Bonds – – 887,835,954 918,857,130
Equities 410,849,106 327,454,091 – –
Investment Funds – – 3,147,897 5,982,359
Term Loans – – 90,810,636 66,815,648
Unrealised gain on Forward Currency Contracts 340,665 650,246 11,977,984 6,174,948
Total Financial Assets at Fair Value through Profit or Loss 411,189,771 328,104,337 993,772,471 997,830,085
Financial Liabilities at Fair Value through Profit or Loss
Unrealised loss on Forward Currency Contracts (118,358) (210,285) (6,359,779) (5,019,757)
Total Financial Liabilities at Fair Value through Profit or Loss (118,358) (210,285) (6,359,779) (5,019,757)

NOTES TO THE AUDITED FINANCIAL STATEMENTS FINANCIAL STATEMENTS
ANNUAL REPORT 2019 939
FOR THE YEAR ENDED 31 DECEMBER 2019
2. FINANCIAL ASSETS AND FINANCIAL LIABILITIES AT FAIR VALUE THROUGH PROFIT OR LOSS (CONTINUED)
Neuberger Berman Global
Bond Fund Neuberger Berman Emerging Market Debt -
Local Currency Fund As at 31 December 2019 As at 31 December 2018 As at 31 December 2019 As at 31 December 2018 Fair Value Fair Value Fair Value Fair Value Financial Assets at Fair Value through Profit or Loss US$ US$ US$ US$
Held for trading:
Agency Bonds 808,029 742,808 – –
Asset Backed Securities 7,081,113 5,838,893 – –
Corporate Bonds 53,875,832 42,017,408 81,564,811 65,766,072
Government Bonds 109,732,598 76,941,729 2,839,759,622 2,256,689,647
Investment Funds – – 25,786,800 –
Mortgage Backed Securities 28,839,272 24,077,309 – –
Treasury Bills 3,279,380 3,486,598 83,948,277 91,092,259
Unrealised gain on Futures Contracts 659,343 227,357 628,583 –
Unrealised gain on Forward Currency Contracts 1,481,948 1,554,136 61,005,679 36,894,357
Cross Currency Swap Contracts at Fair Value – – 276,641 9,453,350
Interest Rate Swap Contracts at Fair Value 11,372 13,744 47,949,511 38,304,195
Total Financial Assets at Fair Value through Profit or Loss 205,768,887 154,899,982 3,140,919,924 2,498,199,880

FINANCIAL STATEMENTS NOTES TO THE AUDITED FINANCIAL STATEMENTS
940 NEUBERGER BERMAN INVESTMENT FUNDS PLC
FOR THE YEAR ENDED 31 DECEMBER 2019
2. FINANCIAL ASSETS AND FINANCIAL LIABILITIES AT FAIR VALUE THROUGH PROFIT OR LOSS (CONTINUED)
Neuberger Berman Global Bond Fund (continued)
Neuberger Berman Emerging Market Debt - Local Currency Fund (continued)
As at 31 December 2019 As at 31 December 2018 As at 31 December 2019 As at 31 December 2018 Fair Value Fair Value Fair Value Fair Value Financial Liabilities at Fair Value through Profit or Loss US$ US$ US$ US$
Unrealised loss on Futures Contracts (316,205) (683,454) – (609,779)
Unrealised loss on Forward Currency Contracts (2,282,278) (1,064,158) (19,188,088) (40,378,005)
Credit Default Swap Contracts at Fair Value – – (9,456,177) (1,770,312)
Cross Currency Swap Contracts at Fair Value – – (1,600,099) (9,663,954)
Interest Rate Swap Contracts at Fair Value (31,689) (112,074) (9,100,072) (21,224,237)
Total Financial Liabilities at Fair Value through Profit or Loss (2,630,172) (1,859,686) (39,344,436) (73,646,287)

NOTES TO THE AUDITED FINANCIAL STATEMENTS FINANCIAL STATEMENTS
ANNUAL REPORT 2019 941
FOR THE YEAR ENDED 31 DECEMBER 2019
2. FINANCIAL ASSETS AND FINANCIAL LIABILITIES AT FAIR VALUE THROUGH PROFIT OR LOSS (CONTINUED)
Neuberger Berman Emerging Market Debt -
Hard Currency Fund Neuberger Berman Emerging Market
Corporate Debt Fund As at 31 December 2019 As at 31 December 2018 As at 31 December 2019 As at 31 December 2018 Fair Value Fair Value Fair Value Fair Value Financial Assets at Fair Value through Profit or Loss US$ US$ US$ US$
Held for trading:
Corporate Bonds 739,934,633 418,193,056 152,972,400 113,332,258
Government Bonds 1,509,767,060 934,693,370 6,779,074 2,770,970
Investment Funds 15,670,500 – 2,002,873 –
Treasury Bills 21,961,949 – – –
Unrealised gain on Futures Contracts 3,727,306 3,507,813 253,770 –
Unrealised gain on Forward Currency Contracts 15,765,690 2,035,053 2,078,916 131,978
Total Financial Assets at Fair Value through Profit or Loss 2,306,827,138 1,358,429,292 164,087,033 116,235,206
Financial Liabilities at Fair Value through Profit or Loss
Unrealised loss on Futures Contracts (3,964,080) (611,311) – (241,384)
Unrealised loss on Forward Currency Contracts (4,658,111) (1,276,250) (204,131) (94,359)
Total Financial Liabilities at Fair Value through Profit or Loss (8,622,191) (1,887,561) (204,131) (335,743)

FINANCIAL STATEMENTS NOTES TO THE AUDITED FINANCIAL STATEMENTS
942 NEUBERGER BERMAN INVESTMENT FUNDS PLC
FOR THE YEAR ENDED 31 DECEMBER 2019
2. FINANCIAL ASSETS AND FINANCIAL LIABILITIES AT FAIR VALUE THROUGH PROFIT OR LOSS (CONTINUED)
Neuberger Berman Strategic
Income Fund Neuberger Berman Global Bond
Absolute Return Fund As at 31 December 2019 As at 31 December 2018 As at 31 December 2019 As at 31 December 2018 Fair Value Fair Value Fair Value Fair Value Financial Assets at Fair Value through Profit or Loss US$ US$ US$ US$
Held for trading:
Agency Bonds 1,008,490 911,323 – –
Asset Backed Securities 165,819,872 161,568,548 35,159,537 13,773,558
Corporate Bonds 634,341,091 472,938,359 47,384,645 35,683,902
Equities 12,936 13,331 – –
Government Bonds 442,929,285 301,150,999 34,962,371 21,632,609
Investment Funds 36,661,624 14,405,071 6,045,255 4,301,132
Mortgage Backed Securities 218,777,629 283,701,161 3,169,000 1,509,150
Municipal Bonds 20,180,334 14,733,337 – –
Term Loans 129,556,760 15,816,490 – –
Treasury Bills 13,791,360 13,888,166 1,291,877 1,295,022
Unrealised gain on Futures Contracts 4,863,851 3,351,164 1,672,673 1,106,873
Unrealised gain on Forward Currency Contracts 4,167,838 12,787,437 4,708,572 2,699,899
Credit Default Swap Contracts at Fair Value – – 234,717 108,915
Interest Rate Swap Contracts at Fair Value 199,924 155,347 3,833 56,438
Total Financial Assets at Fair Value through Profit or Loss 1,672,310,994 1,295,420,733 134,632,480 82,167,498

NOTES TO THE AUDITED FINANCIAL STATEMENTS FINANCIAL STATEMENTS
ANNUAL REPORT 2019 943
FOR THE YEAR ENDED 31 DECEMBER 2019
2. FINANCIAL ASSETS AND FINANCIAL LIABILITIES AT FAIR VALUE THROUGH PROFIT OR LOSS (CONTINUED) Neuberger Berman Strategic
Income Fund (continued) Neuberger Berman Global Bond
Absolute Return Fund (continued) As at 31 December 2019 As at 31 December 2018 As at 31 December 2019 As at 31 December 2018 Fair Value Fair Value Fair Value Fair Value Financial Liabilities at Fair Value through Profit or Loss US$ US$ US$ US$
Unrealised loss on Futures Contracts (340,128) (10,524,346) (318,924) (2,385,480)
Unrealised loss on Forward Currency Contracts (9,900,200) (1,263,912) (4,434,326) (3,252,732)
Credit Default Swap Contracts at Fair Value – – (4,171,792) (373,321)
Interest Rate Swap Contracts at Fair Value (1,752) – (24,703) (8,705)
Total Financial Liabilities at Fair Value through Profit or Loss (10,242,080) (11,788,258) (8,949,745) (6,020,238)

FINANCIAL STATEMENTS NOTES TO THE AUDITED FINANCIAL STATEMENTS
944 NEUBERGER BERMAN INVESTMENT FUNDS PLC
FOR THE YEAR ENDED 31 DECEMBER 2019
2. FINANCIAL ASSETS AND FINANCIAL LIABILITIES AT FAIR VALUE THROUGH PROFIT OR LOSS (CONTINUED) Neuberger Berman Short Duration
Emerging Market Debt Fund Neuberger Berman Absolute Return
Multi Strategy Fund As at 31 December 2019 As at 31 December 2018 As at 31 December 2019 As at 31 December 2018
Fair Value Fair Value Fair Value Fair Value
Financial Assets at Fair Value through Profit or Loss US$ US$ US$ US$
Held for trading:
Asset Backed Securities – – 10,571,016 10,853,499
Corporate Bonds 4,040,817,203 2,766,053,007 – –
Equities – – 18,555,175 23,749,428
Government Bonds 1,310,673,086 746,660,608 – –
Investment Funds 31,341,000 – – 315,773
Participatory Notes – – 4,659 4,722
Real Estate Investment Trusts – – 274,427 50,278
Treasury Bills 59,896,225 – – –
Unrealised gain on Contracts for Differences – – 638,360 6,731,576
Unrealised gain on Futures Contracts – – 20,848 398,681
Unrealised gain on Forward Currency Contracts 58,954,197 17,682,600 417,466 1,567,922
Total Financial Assets at Fair Value through Profit or Loss 5,501,681,711 3,530,396,215 30,481,951 43,671,879

NOTES TO THE AUDITED FINANCIAL STATEMENTS FINANCIAL STATEMENTS
ANNUAL REPORT 2019 945
FOR THE YEAR ENDED 31 DECEMBER 2019
2. FINANCIAL ASSETS AND FINANCIAL LIABILITIES AT FAIR VALUE THROUGH PROFIT OR LOSS (CONTINUED) Neuberger Berman Short Duration
Emerging Market Debt Fund (continued) Neuberger Berman Absolute Return
Multi Strategy Fund (continued) As at 31 December 2019 As at 31 December 2018 As at 31 December 2019 As at 31 December 2018 Fair Value Fair Value Fair Value Fair Value Financial Liabilities at Fair Value through Profit or Loss US$ US$ US$ US$
Written Options Contracts – – (1,148) (90)
Unrealised loss on Contracts for Differences – – (763,315) (11,642,941)
Unrealised loss on Futures Contracts – – (168,212) (132,547)
Unrealised loss on Forward Currency Contracts (7,478,759) (3,387,555) (1,134,480) (373,617)
Unrealised loss on Total Return Swap Contracts – – – (411,429)
Total Financial Liabilities at Fair Value through Profit or Loss (7,478,759) (3,387,555) (2,067,155) (12,560,624)

FINANCIAL STATEMENTS NOTES TO THE AUDITED FINANCIAL STATEMENTS
946 NEUBERGER BERMAN INVESTMENT FUNDS PLC
FOR THE YEAR ENDED 31 DECEMBER 2019
2. FINANCIAL ASSETS AND FINANCIAL LIABILITIES AT FAIR VALUE THROUGH PROFIT OR LOSS (CONTINUED) Neuberger Berman US Long
Short Equity Fund Neuberger Berman Emerging Market
Debt Blend Fund As at 31 December 2019 As at 31 December 2018 As at 31 December 2019 As at 31 December 2018 Fair Value Fair Value Fair Value Fair Value Financial Assets at Fair Value through Profit or Loss US$ US$ US$ US$
Held for trading:
Corporate Bonds 7,449,144 9,648,901 466,197,432 448,901,829
Equities 120,984,322 142,588,772 – –
Government Bonds – – 1,099,955,272 1,081,843,181
Investment Funds – – 16,672,304 –
Participatory Notes 183,192 – – –
Treasury Bills – – 21,743,601 65,174,661
Purchased Options Contracts 198,691 448,378 – –
Unrealised gain on Futures Contracts 6,458 370,027 1,242,501 2,479,059
Unrealised gain on Forward Currency Contracts 1,159,354 101,067 19,964,061 10,189,209
Unreallised gain on Contracts for Differences 192,020 – – –
Cross Currency Swap Contracts at Fair Value – – 100,597 3,214,555
Interest Rate Swap Contracts at Fair Value – – 17,739,303 14,829,551
Unrealised gain on Total Return Swap Contracts 2,691 – – –
Total Financial Assets at Fair Value through Profit or Loss 130,175,872 153,157,145 1,643,615,071 1,626,632,045

NOTES TO THE AUDITED FINANCIAL STATEMENTS FINANCIAL STATEMENTS
ANNUAL REPORT 2019 947
FOR THE YEAR ENDED 31 DECEMBER 2019
2. FINANCIAL ASSETS AND FINANCIAL LIABILITIES AT FAIR VALUE THROUGH PROFIT OR LOSS (CONTINUED)
Neuberger Berman US Long Short Equity Fund (continued)
Neuberger Berman Emerging Market Debt Blend Fund (continued)
As at 31 December 2019 As at 31 December 2018 As at 31 December 2019 As at 31 December 2018 Fair Value Fair Value Fair Value Fair Value Financial Liabilities at Fair Value through Profit or Loss US$ US$ US$ US$
Written Options Contracts (135,467) (683,829) – –
Unrealised loss on Futures Contracts (244,102) (7,547) (598,729) (1,029,310)
Unrealised loss on Forward Currency Contracts (136,823) (807,332) (5,569,597) (10,561,114)
Unrealised loss on Contracts for Differences (1,942,615) (36,175,836) – –
Credit Default Swap Contracts at Fair Value – – (3,056,605) (572,234)
Cross Currency Swap Contracts at Fair Value – – (381,521) (3,286,169)
Interest Rate Swap Contracts at Fair Value – – (3,084,002) (9,319,052)
Unrealised loss on Total Return Swap Contracts (1,758,261) (10,135,906) – –
Total Financial Liabilities at Fair Value through Profit or Loss (4,217,268) (47,810,450) (12,690,454) (24,767,879)

FINANCIAL STATEMENTS NOTES TO THE AUDITED FINANCIAL STATEMENTS
948 NEUBERGER BERMAN INVESTMENT FUNDS PLC
FOR THE YEAR ENDED 31 DECEMBER 2019
2. FINANCIAL ASSETS AND FINANCIAL LIABILITIES AT FAIR VALUE THROUGH PROFIT OR LOSS (CONTINUED)
Neuberger Berman European High
Yield Bond Fund Neuberger Berman Global
Equity Fund As at 31 December 2019 As at 31 December 2018 As at 31 December 2019 As at 31 December 2018 Fair Value Fair Value Fair Value Fair Value Financial Assets at Fair Value through Profit or Loss EUR EUR US$ US$
Held for trading:
Corporate Bonds 38,633,153 22,491,369 – –
Equities – – 1,372,120 1,218,774
Term Loans 1,045,065 1,444,543 – –
Unrealised gain on Forward Currency Contracts 291,413 412,578 – –
Total Financial Assets at Fair Value through Profit or Loss 39,969,631 24,348,490 1,372,120 1,218,774
Financial Liabilities at Fair Value through Profit or Loss
Unrealised loss on Futures Contracts – (10,041) – –
Unrealised loss on Forward Currency Contracts (1,048,628) (147,150) – –
Total Financial Liabilities at Fair Value through Profit or Loss (1,048,628) (157,191) – –

NOTES TO THE AUDITED FINANCIAL STATEMENTS FINANCIAL STATEMENTS
ANNUAL REPORT 2019 949
FOR THE YEAR ENDED 31 DECEMBER 2019
2. FINANCIAL ASSETS AND FINANCIAL LIABILITIES AT FAIR VALUE THROUGH PROFIT OR LOSS (CONTINUED)
Neuberger Berman Systematic
Global Equity Fund Neuberger Berman Global Real
Estate Securities Fund As at 31 December 2019 As at 31 December 2018 As at 31 December 2019 As at 31 December 2018 Fair Value Fair Value Fair Value Fair Value Financial Assets at Fair Value through Profit or Loss US$ US$ US$ US$
Held for trading:
Equities 30,543,685 19,524,274 14,345,103 851,877
Investment Funds 281,147 209,018 – –
Real Estate Investment Trusts 767,241 881,932 51,865,253 2,383,854
Unrealised gain on Forward Currency Contracts 75,241 20,435 11,835 341
Total Financial Assets at Fair Value through Profit or Loss 31,667,314 20,635,659 66,222,191 3,236,072
Financial Liabilities at Fair Value through Profit or Loss
Unrealised loss on Forward Currency Contracts (26,731) (51,813) (502) (3,187)
Total Financial Liabilities at Fair Value through Profit or Loss (26,731) (51,813) (502) (3,187)

FINANCIAL STATEMENTS NOTES TO THE AUDITED FINANCIAL STATEMENTS
950 NEUBERGER BERMAN INVESTMENT FUNDS PLC
FOR THE YEAR ENDED 31 DECEMBER 2019
2. FINANCIAL ASSETS AND FINANCIAL LIABILITIES AT FAIR VALUE THROUGH PROFIT OR LOSS (CONTINUED)
Neuberger Berman US Small Cap
Intrinsic Value Fund Neuberger Berman Global Credit
Long Short Fund* As at 31 December 2019 As at 31 December 2018 As at 31 December 2019 As at 31 December 2018 Fair Value Fair Value Fair Value Fair Value Financial Assets at Fair Value through Profit or Loss US$ US$ US$ US$
Held for trading:
Equities 99,370,960 76,020,369 – 1,433
Participatory Notes 51,579 – – –
Real Estate Investment Trusts – 606,452 – –
Unrealised gain on Forward Currency Contracts – – – 10,676
Total Financial Assets at Fair Value through Profit or Loss 99,422,539 76,626,821 – 12,109
Financial Liabilities at Fair Value through Profit or Loss
Unrealised loss on Forward Currency Contracts – – – (14,607)
Total Financial Liabilities at Fair Value through Profit or Loss – – – (14,607)
* Portfolio liquidated on 26 November 2018.

NOTES TO THE AUDITED FINANCIAL STATEMENTS FINANCIAL STATEMENTS
ANNUAL REPORT 2019 951
FOR THE YEAR ENDED 31 DECEMBER 2019
2. FINANCIAL ASSETS AND FINANCIAL LIABILITIES AT FAIR VALUE THROUGH PROFIT OR LOSS (CONTINUED)
Neuberger Berman Asian Debt -
Hard Currency Fund Neuberger Berman China
Bond Fund As at 31 December 2019 As at 31 December 2018 As at 31 December 2019 As at 31 December 2018 Fair Value Fair Value Fair Value Fair Value Financial Assets at Fair Value through Profit or Loss US$ US$ CNY CNY
Held for trading:
Corporate Bonds 19,750,092 13,851,050 738,849,931 74,633,341
Government Bonds 1,936,193 1,835,493 39,783,210 2,420,661
Unrealised gain on Futures Contracts 14,148 8,469 – –
Unrealised gain on Forward Currency Contracts 16,099 1,331 2,404,286 66,663
Total Financial Assets at Fair Value through Profit or Loss 21,716,532 15,696,343 781,037,427 77,120,665
Financial Liabilities at Fair Value through Profit or Loss
Unrealised loss on Futures Contracts – (48,750) – –
Unrealised loss on Forward Currency Contracts (1) (3,350) (10,645,318) (6,633)
Total Financial Liabilities at Fair Value through Profit or Loss (1) (52,100) (10,645,318) (6,633)

FINANCIAL STATEMENTS NOTES TO THE AUDITED FINANCIAL STATEMENTS
952 NEUBERGER BERMAN INVESTMENT FUNDS PLC
FOR THE YEAR ENDED 31 DECEMBER 2019
2. FINANCIAL ASSETS AND FINANCIAL LIABILITIES AT FAIR VALUE THROUGH PROFIT OR LOSS (CONTINUED)
Neuberger Berman Global Dynamic
Asset Allocator Fund* Neuberger Berman Asian
Opportunities Fund** As at 31 December 2019 As at 31 December 2018 As at 31 December 2019 As at 31 December 2018 Fair Value Fair Value Fair Value Fair Value Financial Assets at Fair Value through Profit or Loss US$ US$ US$ US$
Held for trading:
Asset Backed Securities – 3,468,364 – –
Corporate Bonds 14,027 10,872,188 – –
Equities – – – 3,017,333
Government Bonds 1,692 6,577,889 – –
Investment Funds – 1,072,480 – –
Mortgage Backed Securities – 443,568 – –
Participatory Notes – – – 250,980
Treasury Bills – 597,702 – –
Unrealised gain on Futures Contracts – 564,774 – –
Unrealised gain on Forward Currency Contracts – 1,596,836 – –
Credit Default Swap Contracts at Fair Value – 27,349 – –
Interest Rate Swap Contracts at Fair Value – 11,099 – –
Total Financial Assets at Fair Value through Profit or Loss 15,719 25,232,249 – 3,268,313

NOTES TO THE AUDITED FINANCIAL STATEMENTS FINANCIAL STATEMENTS
ANNUAL REPORT 2019 953
FOR THE YEAR ENDED 31 DECEMBER 2019
2. FINANCIAL ASSETS AND FINANCIAL LIABILITIES AT FAIR VALUE THROUGH PROFIT OR LOSS (CONTINUED)
Neuberger Berman Global Dynamic Asset Allocator Fund* (continued)
Neuberger Berman Asian Opportunities Fund** (continued)
As at 31 December 2019 As at 31 December 2018 As at 31 December 2019 As at 31 December 2018 Fair Value Fair Value Fair Value Fair Value Financial Liabilities at Fair Value through Profit or Loss US$ US$ US$ US$
Unrealised loss on Futures Contracts – (696,255) – –
Unrealised loss on Forward Currency Contracts – (1,621,993) – –
Credit Default Swap Contracts at Fair Value – (109,077) – –
Interest Rate Swap Contracts at Fair Value – (1,524) – –
Total Financial Liabilities at Fair Value through Profit or Loss – (2,428,849) – – * Portfolio liquidated on 12 April 2019.
** Portfolio liquidated on 24 July 2019.

FINANCIAL STATEMENTS NOTES TO THE AUDITED FINANCIAL STATEMENTS
954 NEUBERGER BERMAN INVESTMENT FUNDS PLC
FOR THE YEAR ENDED 31 DECEMBER 2019
2. FINANCIAL ASSETS AND FINANCIAL LIABILITIES AT FAIR VALUE THROUGH PROFIT OR LOSS (CONTINUED)
Neuberger Berman Corporate
Hybrid Bond Fund Neuberger Berman
US Equity Fund As at 31 December 2019 As at 31 December 2018 As at 31 December 2019 As at 31 December 2018 Fair Value Fair Value Fair Value Fair Value Financial Assets at Fair Value through Profit or Loss EUR EUR US$ US$
Held for trading:
Corporate Bonds 1,048,748,335 794,442,089 – –
Equities – – 5,089,218 3,481,558
Participatory Notes – – 6,283 –
Unrealised gain on Forward Currency Contracts 10,380,822 5,059,235 – –
Total Financial Assets at Fair Value through Profit or Loss 1,059,129,157 799,501,324 5,095,501 3,481,558
Financial Liabilities at Fair Value through Profit or Loss
Unrealised loss on Forward Currency Contracts (13,692,146) (5,295,685) – –
Total Financial Liabilities at Fair Value through Profit or Loss (13,692,146) (5,295,685) – –

NOTES TO THE AUDITED FINANCIAL STATEMENTS FINANCIAL STATEMENTS
ANNUAL REPORT 2019 955
FOR THE YEAR ENDED 31 DECEMBER 2019
2. FINANCIAL ASSETS AND FINANCIAL LIABILITIES AT FAIR VALUE THROUGH PROFIT OR LOSS (CONTINUED) Neuberger Berman Global High
Yield Bond Fund Neuberger Berman Global Opportunistic
Bond Fund As at 31 December 2019 As at 31 December 2018 As at 31 December 2019 As at 31 December 2018 Fair Value Fair Value Fair Value Fair Value Financial Assets at Fair Value through Profit or Loss US$ US$ US$ US$
Held for trading:
Agency Bonds – – 393,177 361,049
Asset Backed Securities – – 12,206,970 9,443,647
Corporate Bonds 69,068,917 54,480,617 77,341,045 38,564,954
Government Bonds – – 56,477,467 36,900,460
Investment Funds – – 13,014,301 9,261,702
Mortgage Backed Securities – – 16,625,002 11,394,706
Term Loans 2,236,935 3,437,606 – –
Treasury Bills – – 3,304,224 323,756
Unrealised gain on Futures Contracts – 10,781 763,363 712,276
Unrealised gain on Forward Currency Contracts 1,101,962 509,187 3,025,978 2,602,782
Credit Default Swap Contracts at Fair Value – – 252,202 –
Interest Rate Swap Contracts at Fair Value – – 19,679 46,334
Total Financial Assets at Fair Value through Profit or Loss 72,407,814 58,438,191 183,423,408 109,611,666

FINANCIAL STATEMENTS NOTES TO THE AUDITED FINANCIAL STATEMENTS
956 NEUBERGER BERMAN INVESTMENT FUNDS PLC
FOR THE YEAR ENDED 31 DECEMBER 2019
2. FINANCIAL ASSETS AND FINANCIAL LIABILITIES AT FAIR VALUE THROUGH PROFIT OR LOSS (CONTINUED) Neuberger Berman Global High
Yield Bond Fund (continued) Neuberger Berman Global Opportunistic
Bond Fund (continued) As at 31 December 2019 As at 31 December 2018 As at 31 December 2019 As at 31 December 2018 Fair Value Fair Value Fair Value Fair Value Financial Liabilities at Fair Value through Profit or Loss US$ US$ US$ US$
Unrealised loss on Futures Contracts (2,797) (9,261) (254,590) (1,307,457)
Unrealised loss on Forward Currency Contracts (861,176) (683,211) (5,702,958) (2,086,779)
Credit Default Swap Contracts at Fair Value – – (3,491,151) (144,412)
Interest Rate Swap Contracts at Fair Value – – (11,229) –
Total Financial Liabilities at Fair Value through Profit or Loss (863,973) (692,472) (9,459,928) (3,538,648)

NOTES TO THE AUDITED FINANCIAL STATEMENTS FINANCIAL STATEMENTS
ANNUAL REPORT 2019 957
FOR THE YEAR ENDED 31 DECEMBER 2019
2. FINANCIAL ASSETS AND FINANCIAL LIABILITIES AT FAIR VALUE THROUGH PROFIT OR LOSS (CONTINUED)
Neuberger Berman Multi-Asset Risk Premia Fund*
Neuberger Berman Multi-Asset Class Income Fund
As at 31 December 2019 As at 31 December 2018 As at 31 December 2019 As at 31 December 2018 Fair Value Fair Value Fair Value Fair Value Financial Assets at Fair Value through Profit or Loss US$ US$ US$ US$
Held for trading:
Agency Bonds – – 112,336 103,157
Asset Backed Securities – – 5,094,658 2,390,183
Corporate Bonds – – 29,104,867 4,986,991
Equities – – 26,011,646 13,643,203
Government Bonds – 13,467,380 22,836,765 6,606,279
Investment Funds – – 4,987,879 3,520,806
Mortgage Backed Securities – – – 5,141,547
Real Estate Investment Trusts – – 5,329,065 2,682,394
Treasury Bills – 33,029,485 – 199,234
Purchased Options Contracts – – 5,125 9,292
Unrealised gain on Futures Contracts – – 164,689 198,681
Unrealised gain on Forward Currency Contracts – 124,929 923,367 439,507
Unrealised gain on Total Return Swap Contracts – 1,555,743 650,330 155,158
Total Financial Assets at Fair Value through Profit or Loss – 48,177,537 95,220,727 40,076,432

FINANCIAL STATEMENTS NOTES TO THE AUDITED FINANCIAL STATEMENTS
958 NEUBERGER BERMAN INVESTMENT FUNDS PLC
FOR THE YEAR ENDED 31 DECEMBER 2019
2. FINANCIAL ASSETS AND FINANCIAL LIABILITIES AT FAIR VALUE THROUGH PROFIT OR LOSS (CONTINUED)
Neuberger Berman Multi-Asset Risk Premia Fund* (continued)
Neuberger Berman Multi-Asset Class Income Fund (continued)
As at 31 December 2019 As at 31 December 2018 As at 31 December 2019 As at 31 December 2018 Fair Value Fair Value Fair Value Fair Value Financial Liabilities at Fair Value through Profit or Loss US$ US$ US$ US$
Written Options Contracts – – (67,350) (183,434)
Unrealised loss on Futures Contracts – – (396,947) (284,850)
Unrealised loss on Forward Currency Contracts – (645,947) (1,096,507) (487,433)
Credit Default Swap Contracts at Fair Value – – – (58,212)
Unrealised loss on Total Return Swap Contracts – (242,227) (490,020) (69,251)
Total Financial Liabilities at Fair Value through Profit or Loss – (888,174) (2,050,824) (1,083,180) * Portfolio liquidated on 26 March 2019.

NOTES TO THE AUDITED FINANCIAL STATEMENTS FINANCIAL STATEMENTS
ANNUAL REPORT 2019 959
FOR THE YEAR ENDED 31 DECEMBER 2019
2. FINANCIAL ASSETS AND FINANCIAL LIABILITIES AT FAIR VALUE THROUGH PROFIT OR LOSS (CONTINUED)
Neuberger Berman US Equity Index
PutWrite Fund Neuberger Berman Global Equity Index
PutWrite Fund As at 31 December 2019 As at 31 December 2018 As at 31 December 2019 As at 31 December 2018 Fair Value Fair Value Fair Value Fair Value Financial Assets at Fair Value through Profit or Loss US$ US$ US$ US$
Held for trading:
Government Bonds 521,939,768 399,009,972 53,992,382 81,562,261
Unrealised gain on Forward Currency Contracts 1,609,667 155,476 957,582 293,200
Total Financial Assets at Fair Value through Profit or Loss 523,549,435 399,165,448 54,949,964 81,855,461
Financial Liabilities at Fair Value through Profit or Loss
Written Options Contracts (3,143,007) (7,227,170) (365,265) (1,475,733)
Unrealised loss on Forward Currency Contracts (63,595) (879,772) (403,043) (598,863)
Total Financial Liabilities at Fair Value through Profit or Loss (3,206,602) (8,106,942) (768,308) (2,074,596)

FINANCIAL STATEMENTS NOTES TO THE AUDITED FINANCIAL STATEMENTS
960 NEUBERGER BERMAN INVESTMENT FUNDS PLC
FOR THE YEAR ENDED 31 DECEMBER 2019
2. FINANCIAL ASSETS AND FINANCIAL LIABILITIES AT FAIR VALUE THROUGH PROFIT OR LOSS (CONTINUED)
Neuberger Berman Uncorrelated Strategies Fund
Neuberger Berman Emerging Market Debt Blend Investment Grade Fund
As at 31 December 2019 As at 31 December 2018 As at 31 December 2019 As at 31 December 2018 Fair Value Fair Value Fair Value Fair Value Financial Assets at Fair Value through Profit or Loss US$ US$ US$ US$
Held for trading:
Corporate Bonds – – 6,092,081 5,185,466
Government Bonds 79,998,088 – 11,965,040 10,800,891
Treasury Bills 756,992,762 439,961,516 374,531 235,451
Unrealised gain on Contracts for Differences 6,445,844 739,132,151 – –
Purchased Options Contracts 13,515,331 4,847,494 – –
Purchased Swaptions 393,143 1,277,803 – –
Unrealised gain on Futures Contracts 6,267,856 14,193,967 29,425 11,516
Unrealised gain on Forward Currency Contracts 56,361,178 3,353,703 133,329 59,252
Interest Rate Swap Contracts at Fair Value – – 12,412 11,482
Total Financial Assets at Fair Value through Profit or Loss 919,974,202 1,202,766,634 18,606,818 16,304,058
Financial Liabilities at Fair Value through Profit or Loss
Unrealised loss on Contracts for Differences (8,118,122) (693,439,028) – –
Written Options Contracts (11,080,819) (6,598,640) – –
Unrealised loss on Futures Contracts (11,854,452) (5,768,104) (27,184) (6,002)
Unrealised loss on Forward Currency Contracts (4,970,498) (18,690,321) (54,864) (83,779)
Interest Rate Swap Contracts at Fair Value – – (12,010) (39,869)
Total Financial Liabilities at Fair Value through Profit or Loss (36,023,891) (724,496,093) (94,058) (129,650)

NOTES TO THE AUDITED FINANCIAL STATEMENTS FINANCIAL STATEMENTS
ANNUAL REPORT 2019 961
FOR THE YEAR ENDED 31 DECEMBER 2019
2. FINANCIAL ASSETS AND FINANCIAL LIABILITIES AT FAIR VALUE THROUGH PROFIT OR LOSS (CONTINUED)
Neuberger Berman Emerging Markets
Sustainable Equity Fund Neuberger Berman China Equity
Opportunities Fund As at 31 December 2019 As at 31 December 2018 As at 31 December 2019 As at 31 December 2018 Fair Value Fair Value Fair Value Fair Value Financial Assets at Fair Value through Profit or Loss US$ US$ US$ US$
Held for trading:
Equities 119,186,266 28,874,910 1,171,089 928,599
Participatory Notes 6,625,155 1,909,423 33,011 –
Real Estate Investment Trusts 1,367,924 – 23,294 –
Total Financial Assets at Fair Value through Profit or Loss 127,179,345 30,784,333 1,227,394 928,599

FINANCIAL STATEMENTS NOTES TO THE AUDITED FINANCIAL STATEMENTS
962 NEUBERGER BERMAN INVESTMENT FUNDS PLC
FOR THE YEAR ENDED 31 DECEMBER 2019
2. FINANCIAL ASSETS AND FINANCIAL LIABILITIES AT FAIR VALUE THROUGH PROFIT OR LOSS (CONTINUED)
Neuberger Berman Multi-Asset
Class Growth Fund Neuberger Berman Global
Thematic Equity Fund1 As at 31 December 2019 As at 31 December 2018 As at 31 December 2019 As at 31 December 2018 Fair Value Fair Value Fair Value Fair Value Financial Assets at Fair Value through Profit or Loss US$ US$ US$ US$
Held for trading:
Asset Backed Securities 1,230,786 1,232,745 – –
Corporate Bonds 3,184,308 4,613,061 – –
Equities 3,958,503 3,095,190 24,333,884 12,146,994
Government Bonds 7,963,346 8,256,663 – –
Investment Funds 1,646,633 1,692,106 – –
Mortgage Backed Securities 199,118 193,744 – –
Real Estate Investment Trusts 112,774 75,245 – –
Purchased Options Contracts 1,024 5,980 – –
Unrealised gain on Futures Contracts 123,837 161,378 – –
Unrealised gain on Forward Currency Contracts 187,691 325,645 – –
Total Credit Default Swap Contracts at Fair Value 16,309 12,715 – –
Interest Rate Swap Contracts at Fair Value 380 – – –
Unrealised gain on Total Return Swap Contracts 127,639 80,239 – –
Total Financial Assets at Fair Value through Profit or Loss 18,752,348 19,744,711 24,333,884 12,146,994

NOTES TO THE AUDITED FINANCIAL STATEMENTS FINANCIAL STATEMENTS
ANNUAL REPORT 2019 963
FOR THE YEAR ENDED 31 DECEMBER 2019
2. FINANCIAL ASSETS AND FINANCIAL LIABILITIES AT FAIR VALUE THROUGH PROFIT OR LOSS (CONTINUED) Neuberger Berman Multi-Asset
Class Growth Fund (continued) Neuberger Berman Global
Thematic Equity Fund1 (continued) As at 31 December 2019 As at 31 December 2018 As at 31 December 2019 As at 31 December 2018 Fair Value Fair Value Fair Value Fair Value Financial Liabilities at Fair Value through Profit or Loss US$ US$ US$ US$
Written Options Contracts (32,548) (181,768) – –
Unrealised loss on Futures Contracts (60,328) (325,872) – –
Unrealised loss on Forward Currency Contracts (273,034) (296,777) – –
Credit Default Swap Contracts at Fair Value (254,667) (47,625) – –
Interest Rate Swap Contracts at Fair Value – (2,578) – –
Unrealised loss on Total Return Swap Contracts (94,357) (49,096) – –
Total Financial Liabilities at Fair Value through Profit or Loss (714,934) (903,716) – –

FINANCIAL STATEMENTS NOTES TO THE AUDITED FINANCIAL STATEMENTS
964 NEUBERGER BERMAN INVESTMENT FUNDS PLC
FOR THE YEAR ENDED 31 DECEMBER 2019
2. FINANCIAL ASSETS AND FINANCIAL LIABILITIES AT FAIR VALUE THROUGH PROFIT OR LOSS (CONTINUED)
Neuberger Berman CLO
Income Fund1 Neuberger Berman China A-Share
Opportunities Fund1* As at 31 December 2019 As at 31 December 2018 As at 31 December 2019 As at 31 December 2018
Fair Value Fair Value Fair Value Fair Value
Financial Assets at Fair Value through Profit or Loss US$ US$ US$ US$
Held for trading:
Asset Backed Securities 135,150,866 100,519,353 – –
Corporate Bonds 3,189,618 5,494,113 – –
Equities – – – 730,092
Unrealised gain on Forward Currency Contracts 6,854,253 527,092 – –
Total Financial Assets at Fair Value through Profit or Loss 145,194,737 106,540,558 – 730,092
Financial Liabilities at Fair Value through Profit or Loss
Unrealised loss on Forward Currency Contracts (290,230) (2,075,894) – –
Total Financial Liabilities at Fair Value through Profit or Loss (290,230) (2,075,894) – –
* Portfolio liquidated on 6 December 2019.

NOTES TO THE AUDITED FINANCIAL STATEMENTS FINANCIAL STATEMENTS
ANNUAL REPORT 2019 965
FOR THE YEAR ENDED 31 DECEMBER 2019
2. FINANCIAL ASSETS AND FINANCIAL LIABILITIES AT FAIR VALUE THROUGH PROFIT OR LOSS (CONTINUED)
Neuberger Berman Next Generation Mobility Fund1
Neuberger Berman Ultra Short Term Euro Bond Fund1
As at 31 December 2019 As at 31 December 2018 As at 31 December 2019 As at 31 December 2018 Fair Value Fair Value Fair Value Fair Value Financial Assets at Fair Value through Profit or Loss US$ US$ EUR EUR
Held for trading:
Asset Backed Securities – – 69,319,661 233,185
Corporate Bonds – – 240,805,405 10,212,921
Equities 40,618,034 2,087,592 – –
Government Bonds – – 47,252,899 618,513
Purchased Options Contracts – – – 1,560
Unrealised gain on Futures Contracts – – 282,466 200
Unrealised gain on Forward Currency Contracts 8,684 9 343,089 –
Total Financial Assets at Fair Value through Profit or Loss 40,626,718 2,087,601 358,003,520 11,066,379
Financial Liabilities at Fair Value through Profit or Loss
Unrealised loss on Futures Contracts – – (19,085) (2,340)
Unrealised loss on Forward Currency Contracts (633) (177) (1,911,977) –
Inflation Swap Contracts at Fair Value – – (3,307) –
Total Financial Liabilities at Fair Value through Profit or Loss (633) (177) (1,934,369) (2,340)

FINANCIAL STATEMENTS NOTES TO THE AUDITED FINANCIAL STATEMENTS
966 NEUBERGER BERMAN INVESTMENT FUNDS PLC
FOR THE YEAR ENDED 31 DECEMBER 2019
2. FINANCIAL ASSETS AND FINANCIAL LIABILITIES AT FAIR VALUE THROUGH PROFIT OR LOSS (CONTINUED)
Neuberger Berman Euro Opportunistic Bond Fund1
Neuberger Berman Euro Bond Absolute Return Fund1
As at 31 December 2019 As at 31 December 2018 As at 31 December 2019 As at 31 December 2018
Fair Value Fair Value Fair Value Fair Value
Financial Assets at Fair Value through Profit or Loss EUR EUR EUR EUR
Held for trading:
Asset Backed Securities 373,528 – 5,166,814 –
Corporate Bonds 3,981,415 3,333,919 26,812,273 4,902,436
Government Bonds 4,835,824 1,479,750 47,301,539 2,332,268
Investment Funds 1,015,652 – – 499,950
Purchased Options Contracts – 780 – 3,120
Unrealised gain on Futures Contracts 32,470 1,760 534,895 546
Unrealised gain on Forward Currency Contracts – – 995,191 –
Inflation Swap Contracts at Fair Value – – 22,763 –
Total Financial Assets at Fair Value through Profit or Loss 10,238,889 4,816,209 80,833,475 7,738,320
Financial Liabilities at Fair Value through Profit or Loss
Unrealised loss on Futures Contracts (7,780) (1,521) (14,069) (4,630)
Unrealised loss on Forward Currency Contracts – – (1,314,764) –
Inflation Swap Contracts at Fair Value (413) – – –
Inflation Swap Contracts at Fair Value – – (12,493) –
Interest Rate Swap Contracts at Fair Value – – (6,152) –
Total Financial Liabilities at Fair Value through Profit or Loss (8,193) (1,521) (1,347,478) (4,630)

NOTES TO THE AUDITED FINANCIAL STATEMENTS FINANCIAL STATEMENTS
ANNUAL REPORT 2019 967
FOR THE YEAR ENDED 31 DECEMBER 2019
2. FINANCIAL ASSETS AND FINANCIAL LIABILITIES AT FAIR VALUE THROUGH PROFIT OR LOSS (CONTINUED)
Neuberger Berman Absolute Alpha Fund2
Neuberger Berman Multi-Style Premia Fund2
Neuberger Berman Macro Opportunities FX Fund2
As at 31 December 2019 As at 31 December 2019 As at 31 December 2019
Fair Value Fair Value Fair Value
Financial Assets at Fair Value through Profit or Loss US$ US$ EUR
Held for trading:
Corporate Bonds – 612,562 14,690,828
Equities 36,332,819 5,322,121 –
Government Bonds – – 803,302
Real Estate Investment Trusts – 390,906 –
Treasury Bills – – 4,016,640
Unrealised gain on Contracts for Differences 755,358 1,628,394 –
Unrealised gain on Futures Contracts – 144,219 –
Unrealised gain on Forward Currency Contracts 43,567 250,976 893,268
Total Financial Assets at Fair Value through Profit or Loss 37,131,744 8,349,178 20,404,038
Financial Liabilities at Fair Value through Profit or Loss
Unrealised loss on Contracts for Differences (2,434,964) (1,150,214) –
Written Options Contracts (37,561) –
Unrealised loss on Futures Contracts – (144,302) –
Unrealised loss on Forward Currency Contracts (22,381) (251,995) (1,061,403)
Total Financial Liabilities at Fair Value through Profit or Loss (2,457,345) (1,584,072) (1,061,403)
1 Portfolio launched during the prior reporting year. 2 Portfolio launched during the current reporting year.

FINANCIAL STATEMENTS NOTES TO THE AUDITED FINANCIAL STATEMENTS
968 NEUBERGER BERMAN INVESTMENT FUNDS PLC
FOR THE YEAR ENDED 31 DECEMBER 2019
3. CASH AND CASH EQUIVALENTS All cash balances are held with Brown Brothers Harriman & Co., or with third party institutions approved by the Company on overnight deposit, or directly with a sub-custodian. The tables which follow reflect the Company’s exposure to the following institutions through its cash holdings at 31 December 2019 and 31 December 2018.
Neuberger Berman High Yield Bond Fund Neuberger Berman Diversified
Currency Fund Neuberger Berman US Multi Cap Opportunities Fund
As at 31 December 2019 As at 31 December 2018 As at 31 December 2019 As at 31 December 2018 As at 31 December 2019 As at 31 December 2018 US$ US$ US$ US$ US$ US$
BBH, Grand Cayman - 9,735 1,141 1,167 10 -
Brown Brothers Harriman & Co 57,343 205,280 4,759 1,855 - 11,878
Citibank, New York 56,167,358 150,000,000 - 758,282 - -
HSBC Bank Plc, London 9,450,946 37,627 - - - -
JPMorgan Chase, New York - 11,001,232 1,220,678 - - 5,471,182
Sumitomo, Tokyo - 2,538,487 - - - -
Total 65,675,647 163,792,361 1,226,578 761,304 10 5,483,060
Neuberger Berman US Real Estate Securities Fund Neuberger Berman China
Equity Fund Neuberger Berman Emerging Markets Equity Fund
As at 31 December 2019 As at 31 December 2018 As at 31 December 2019 As at 31 December 2018 As at 31 December 2019 As at 31 December 2018 US$ US$ US$ US$ US$ US$
BBH, Grand Cayman 11 4 2 2 788 225
Brown Brothers Harriman & Co 1,583 1,703 24,468,582 17,043,206 432,440 341,103
Citibank, New York - 1,515,910 887,162 - 20,997,369 -
HSBC Bank Plc, Hong Kong - - 5,577,022 8,393,660 - -
JPMorgan Chase, New York - - - 7,514,726 - -
Sumitomo, Tokyo - - - - - 13,730,617
Skandinaviska Enskilda Banken, Stockholm 3,950,734 - - - 670,886 -
Total 3,952,328 1,517,617 30,932,768 32,951,594 22,101,483 14,071,945

NOTES TO THE AUDITED FINANCIAL STATEMENTS FINANCIAL STATEMENTS
ANNUAL REPORT 2019 969
FOR THE YEAR ENDED 31 DECEMBER 2019
3. CASH AND CASH EQUIVALENTS (CONTINUED)
Neuberger Berman US Small Cap Fund Neuberger Berman Short Duration
High Yield Bond Fund Neuberger Berman Global Bond Fund
As at 31 December 2019 As at 31 December 2018 As at 31 December 2019 As at 31 December 2018 As at 31 December 2019 As at 31 December 2018 US$ US$ US$ US$ US$ US$
ANZ Bank, London - - - - 44,633 119,065
Bank of Nova Scotia, Toronto - - - - - 60,844
Barclays Bank, London - - - - - 47,288
BBH, Grand Cayman 12,775 16,839 446 406 25,395 394
BNP Paribas, Paris - - - - 28,515 -
Brown Brothers Harriman & Co 4,722 858 19,896 41,128 24,316 28,293
Citibank, London - - - 144,548 - -
Citibank, New York - - 33,026,695 - 813,587 -
HSBC Bank Plc, Hong Kong - - - - - 28,196
JPMorgan Chase, New York 5,677,588 - - - - 802,095
National Australia Bank, London - - - 38,472,712 - -
Skandinaviska Enskilda Banken, Stockholm 24,089 - - - - -
Sumitomo, Tokyo - 5,767,681 3,499,402 - 208,946 170,043
Total 5,719,174 5,785,378 36,546,439 38,658,794 1,145,392 1,256,218

FINANCIAL STATEMENTS NOTES TO THE AUDITED FINANCIAL STATEMENTS
970 NEUBERGER BERMAN INVESTMENT FUNDS PLC
FOR THE YEAR ENDED 31 DECEMBER 2019
3. CASH AND CASH EQUIVALENTS (CONTINUED)
Neuberger Berman Emerging Market Debt – Local Currency Fund Neuberger Berman Emerging Market Debt –
Hard Currency Fund Neuberger Berman Emerging Market Corporate Debt Fund
As at 31 December 2019 As at 31 December 2018 As at 31 December 2019 As at 31 December 2018 As at 31 December 2019 As at 31 December 2018 US$ US$ US$ US$ US$ US$
BBH, Grand Cayman 1,876 1,067 - 2 7 7
Brown Brothers Harriman & Co 4,247,877 5,170,129 137,537 108,115 15,052 2,375
Citibank, New York 75,259,817 31,006,887 161,518,928 87,883,985 - 137,097
HSBC Bank Plc, London - 44,023 - - - -
Sumitomo, Tokyo - - 6,358,045 7,128,224 7,827,042 46,847
Total 79,509,570 36,222,106 168,014,510 95,120,326 7,842,101 186,326
Neuberger Berman Strategic Income Fund Neuberger Berman Global Bond
Absolute Return Fund Neuberger Berman Short Duration Emerging Market Debt Fund
As at 31 December 2019 As at 31 December 2018 As at 31 December 2019 As at 31 December 2018 As at 31 December 2019 As at 31 December 2018 US$ US$ US$ US$ US$ US$
BBH, Grand Cayman 1,841 8,091 301 297 208 200
Brown Brothers Harriman & Co 62,158 378,678 68,924 197,991 254,456 5,857,189
Citibank, London - - - 20,996 16,578,597 -
Citibank, New York 8,885,851 - 5,169,855 2,656,153 - -
HSBC Bank Plc, London - - 146,582 47,761 - -
JPMorgan Chase, New York - 14,883,694 - - 113,871,399 113,194,568
National Australia Bank, London - - - - 148,511,679 -
Skandinaviska Enskilda Banken, Stockholm - - 1,196,615 - - -
Sumitomo, Tokyo 96,346 35,206 - 164,308 6,315,124 -
Total 9,046,196 15,305,669 6,582,277 3,087,506 285,531,463 119,051,957

NOTES TO THE AUDITED FINANCIAL STATEMENTS FINANCIAL STATEMENTS
ANNUAL REPORT 2019 971
FOR THE YEAR ENDED 31 DECEMBER 2019
3. CASH AND CASH EQUIVALENTS (CONTINUED)
Neuberger Berman Absolute Return Multi Strategy Fund Neuberger Berman US Long
Short Equity Fund Neuberger Berman Emerging Market Debt Blend Fund
As at 31 December 2019 As at 31 December 2018 As at 31 December 2019 As at 31 December 2018 As at 31 December 2019 As at 31 December 2018 US$ US$ US$ US$ US$ US$
ANZ Bank, London 349,944 880,497 - - - 83,080,796
Bank of Montreal, London - 513,675 - - - -
Bank of Nova Scotia, Toronto 1,423,631 1,851,128 10,831,611 2,271,336 - -
BBH, Grand Cayman 2,125,214 3,509,215 1 - 4,238 6,295
BNP Paribas, Paris 1,217,407 - - - - -
Brown Brothers Harriman & Co 5,539,074 8,208,973 22,627 43,710 1,170,439 2,947,897
Citibank, New York 5,818,345 1,930,784 - 12,929,799 59,449,605 -
HSBC Bank Plc, London 128,664 - - - 2,294,868 -
JPMorgan Chase, New York 1,185,107 943,873 - 12,929,799 - -
National Australia Bank, London 2,059,334 1,116,194 - - - -
Skandinaviska Enskilda Banken, Stockholm 2,749,109 - 670,800 - - -
Sumitomo, Tokyo 1,003,098 4,882,964 10,831,620 - - 7,303,253
Total 23,598,927 23,837,303 22,356,659 28,174,644 62,919,150 93,338,241

FINANCIAL STATEMENTS NOTES TO THE AUDITED FINANCIAL STATEMENTS
972 NEUBERGER BERMAN INVESTMENT FUNDS PLC
FOR THE YEAR ENDED 31 DECEMBER 2019
3. CASH AND CASH EQUIVALENTS (CONTINUED)
Neuberger BermanEuropean High Yield Bond Fund Neuberger Berman Global
Equity Fund Neuberger Berman Systematic Global Equity Fund
As at 31 December 2019 As at 31 December 2018 As at 31 December 2019 As at 31 December 2018 As at 31 December 2019 As at 31 December 2018 EUR EUR US$ US$ US$ US$
Barclays Bank, London - 294,748 - - - -
BBH, Grand Cayman 10,432 29 - - 2,758 586
Brown Brothers Harriman & Co 130 140 34 50 759 344
Citibank, New York - - 59,327 20,549 - -
Skandinaviska Enskilda Banken, Stockholm 325,305 - - - - -
Sumitomo, Tokyo - 194,105 - - 140,716 168,010
Total 335,867 489,022 59,361 20,599 144,233 168,940
Neuberger Berman Global Real Estate Securities Fund Neuberger Berman
US Small Cap Intrinsic Value Fund Neuberger BermanGlobal Credit Long Short Fund*
As at 31 December 2019 As at 31 December 2018 As at 31 December 2019 As at 31 December 2018 As at 31 December 2019 As at 31 December 2018 US$ US$ US$ US$ US$ US$
ANZ Bank, London - - - - - 312
Bank of Montreal, London - - - - - 312 Bank of Nova Scotia, Toronto - - - - - 312 BBH, Grand Cayman 26 19 - - - 79,758 Brown Brothers Harriman & Co 848 31 6,364 7,587 - 131
Citibank, New York 1,395,495 - - 4,504,750 - 312
JPMorgan Chase, New York - - 6,537,998 - - 312
National Australia Bank, London - - - - - 312
Sumitomo, Tokyo - 62,244 - - - 312
Total 1,396,369 62,294 6,544,362 4,512,337 - 82,073 * Portfolio liquidated on 26 November 2018.

NOTES TO THE AUDITED FINANCIAL STATEMENTS FINANCIAL STATEMENTS
ANNUAL REPORT 2019 973
FOR THE YEAR ENDED 31 DECEMBER 2019
3. CASH AND CASH EQUIVALENTS (CONTINUED)
Neuberger BermanAsian Debt – Hard Currency Fund Neuberger Berman China
Bond Fund Neuberger Berman Global Dynamic Asset Allocator Fund*
As at 31 December 2019 As at 31 December 2018 As at 31 December 2019 As at 31 December 2018 As at 31 December 2019 As at 31 December 2018 US$ US$ CNY CNY US$ US$
Barclays Bank, London - - - - - 153,442
BBH, Grand Cayman - - 4,736 3,807 102 10,513
BNP Paribas, Paris 1,423,184 - - - - -
Brown Brothers Harriman & Co 534 123 28,467,370 357,076 - 53,833
Citibank, New York - 21,356 - - - 340,384
JPMorgan Chase, New York - - - 1,893,119 - -
Sumitomo, Tokyo 1,764,633 - 497,574 - - 48,223
Total 3,188,351 21,479 28,969,680 2,254,002 102 606,395
Neuberger BermanAsian Opportunities Fund** Neuberger Berman Corporate Hybrid
Bond Fund Neuberger Berman US Equity Fund
As at 31 December 2019 As at 31 December 2018 As at 31 December 2019 As at 31 December 2018 As at 31 December 2019 As at 31 December 2018 US$ US$ EUR EUR US$ US$
ANZ Bank, London - - - - - 270,132
Barclays Bank, London - - 336,334 4,381,966 - -
BBH, Grand Cayman 16 8 - - - -
Brown Brothers Harriman & Co - 507 14,887 5,903 349 526
Citibank, London - - 47,174,337 - - -
Citibank, New York - 297,567 - 4,805,218 - 107,686
Skandinaviska Enskilda Banken, Stockholm - - 19,127,644 - 239,049 -
Sumitomo, Tokyo - - - 1,155,982 - -
Total 16 298,082 66,653,202 10,349,069 239,398 378,344
* Portfolio liquidated on 12 April 2019. ** Portfolio liquidated on 24 July 2019.

FINANCIAL STATEMENTS NOTES TO THE AUDITED FINANCIAL STATEMENTS
974 NEUBERGER BERMAN INVESTMENT FUNDS PLC
FOR THE YEAR ENDED 31 DECEMBER 2019
3. CASH AND CASH EQUIVALENTS (CONTINUED)
Neuberger Berman Global High Yield Bond Fund Neuberger Berman Global Opportunistic
Bond Fund Neuberger Berman Multi-Asset Risk Premia Fund*
As at 31 December 2019 As at 31 December 2018 As at 31 December 2019 As at 31 December 2018 As at 31 December 2019 As at 31 December 2018 US$ US$ US$ US$ US$ US$
Bank of Nova Scotia, Toronto - - 1,772,522 - - -
Barclays Bank, London - - - 791,166 - -
BBH, Grand Cayman - 172 13,195 27,394 643 675
BNP Paribas, Paris - - 334,198 - - -
Brown Brothers Harriman & Co 1,399 6,548 115,845 111,024 - 3,581
Citibank, New York - - - - - 1,873,029
HSBC Bank Plc, London 114,826 - - - - -
National Australia Bank, London 2,050,175 - - - - -
Sumitomo, Tokyo 81,229 1,711,706 2,365,567 1,854,291 - -
Total 2,247,629 1,718,426 4,601,327 2,783,875 643 1,877,285
Neuberger Berman Multi-Asset Class Income Fund Neuberger Berman US Equity Index
PutWrite Fund Neuberger Berman Global Equity Index PutWrite Fund
As at 31 December 2019
As at 31 December 2018 As at 31 December 2019 As at 31 December 2018 As at 31 December 2019 As at 31 December 2018
US$ US$ US$ US$ US$ US$
Bank of Nova Scotia, Toronto - 140,039 - - - -
BBH, Grand Cayman 15,259 3,738 2 - 2 -
Brown Brothers Harriman & Co 1,618 3,311 30,079 8,823 2,076 6,266
Citibank, New York 1,416,872 87,938 32,368,172 18,659,699 - -
JPMorgan Chase, New York 333,188 1,393,715 - - - 4,672,567
Skandinaviska Enskilda Banken, Stockholm - - - - 2,800,605 -
Sumitomo, Tokyo 52,129 - - - - -
Total 1,819,066 1,628,741 32,398,253 18,668,522 2,802,683 4,678,833
* Portfolio liquidated on 26 March 2019.

NOTES TO THE AUDITED FINANCIAL STATEMENTS FINANCIAL STATEMENTS
ANNUAL REPORT 2019 975
FOR THE YEAR ENDED 31 DECEMBER 2019
3. CASH AND CASH EQUIVALENTS (CONTINUED)
Neuberger Berman Uncorrelated Strategies Fund Neuberger Berman Emerging Market Debt Blend
Investment Grade Fund Neuberger Berman Emerging Markets Sustainable Equity Fund
As at 31 December 2019
As at 31 December 2018 As at 31 December 2019 As at 31 December 2018 As at 31 December 2019 As at 31 December 2018
US$ US$ US$ US$ US$ US$
ANZ Bank, London 66,507,021 1,676,359 - 392,205 - -
Bank of Montreal, London - 523,466 - - - -
Bank of Nova Scotia, Toronto - 22,994,548 - - - -
BBH, Grand Cayman 5,329 373 11 13 89 43
Brown Brothers Harriman & Co 200,788 545,468 907 49,826 89,691 62,314
Citibank, London 3,019,885 - - - - -
Citibank, New York 8,043,082 60,869,128 - - 2,417,109 -
HSBC Bank Plc, London 4,944,157 - - - 73,457 -
JPMorgan Chase, New York 92,093,582 70,692,686 - - - -
National Australia Bank, London 57,941,483 14,848,414 - - - -
Skandinaviska Enskilda Banken, Stockholm 9,935,100 - 563,937 - - -
Sumitomo, Tokyo 75,415,694 26,297,474 151,180 125,108 - 1,398,206
Total 318,106,121 198,447,916 716,035 567,152 2,580,346 1,460,563

FINANCIAL STATEMENTS NOTES TO THE AUDITED FINANCIAL STATEMENTS
976 NEUBERGER BERMAN INVESTMENT FUNDS PLC
FOR THE YEAR ENDED 31 DECEMBER 2019
3. CASH AND CASH EQUIVALENTS (CONTINUED)
Neuberger Berman China Equity Opportunities Fund Neuberger Berman Multi-Asset Class
Growth Fund Neuberger Berman Global Thematic Equity Fund1
As at 31 December 2019 As at 31 December 2018 As at 31 December 2019 As at 31 December 2018 As at 31 December 2019 As at 31 December 2018 US$ US$ US$ US$ US$ US$
BBH, Grand Cayman 1 12,055 637 9,156 1,850 -
Brown Brothers Harriman & Co 92 - 735 1,884 329 418
Citibank, New York - - 145,389 91,082 - -
HSBC Bank Plc, London - - 96,842 304,636 - -
JPMorgan Chase, New York - - 475,146 - - 188,539
Skandinaviska Enskilda Banken, Stockholm 83,258 - - - - -
Sumitomo, Tokyo - - 153,843 198,387 - -
Total 83,351 12,055 872,592 605,145 2,179 188,957
Neuberger Berman CLO Income Fund1 Neuberger Berman China A-Share
Opportunities Fund1* Neuberger Berman Next Generation Mobility Fund1
As at 31 December 2019 As at 31 December 2018 As at 31 December 2019 As at 31 December 2018 As at 31 December 2019 As at 31 December 2018 US$ US$ US$ US$ US$ US$
ANZ Bank, London - 7,043,447 - - - -
BBH, Grand Cayman - 1,703 18,321 - 9 2
Brown Brothers Harriman & Co 8,412 - 301 - 1,893 227
Citibank, New York - - - - 2,010,160 70,446
Sumitomo, Tokyo 8,432,451 - - 44,755 - -
Total 8,440,863 7,045,150 18,622 44,755 2,012,062 70,675
* Portfolio liquidated on 6 December 2019.

NOTES TO THE AUDITED FINANCIAL STATEMENTS FINANCIAL STATEMENTS
ANNUAL REPORT 2019 977
FOR THE YEAR ENDED 31 DECEMBER 2019
3. CASH AND CASH EQUIVALENTS (CONTINUED)
Neuberger Berman Ultra Short Term Euro Bond Fund1 Neuberger Berman Euro Opportunistic
Bond Fund1 Neuberger Berman Euro Bond Absolute Return Fund1
As at 31 December 2019 As at 31 December 2018 As at 31 December 2019 As at 31 December 2018 As at 31 December 2019 As at 31 December 2018 EUR EUR EUR EUR EUR EUR
BBH, Grand Cayman - - - - 15,996 -
Brown Brothers Harriman & Co - - 22 - 42 -
HSBC Bank Plc, London - - - - 701,453 -
Skandinaviska Enskilda Banken, Stockholm 18,353,226 - - - - -
Sumitomo, Tokyo - 169,638 317,031 148,876 - 2,386,720
Total 18,353,226 169,638 317,053 148,876 717,491 2,386,720
Neuberger Berman Absolute Alpha Fund2
Neuberger Berman Multi-Style Premia Fund2
Neuberger Berman Macro Opportunities FX Fund2
As at 31 December 2019 As at 31 December 2019 As at 31 December 2019
US$ US$ EUR
ANZ Bank, London - 235,834 -
Bank of Nova Scotia, Toronto 324,938 - -
BBH, Grand Cayman 26,541 12,714 -
BNP Paribas, Paris - 1,149,571 -
Brown Brothers Harriman & Co 1,064 7,379 2,494
Citibank, New York - 1,149,571 -
HSBC Bank Plc, London - - 114,936
JPMorgan Chase, New York - 1,149,571 -
National Australia Bank, London - 1,149,571 -
Sumitomo, Tokyo 20,573 1,149,571 -
Total 373,116 6,003,782 117,430
1 Portfolio launched during the prior reporting year. 2 Portfolio launched during the current reporting year.

FINANCIAL STATEMENTS NOTES TO THE AUDITED FINANCIAL STATEMENTS
978 NEUBERGER BERMAN INVESTMENT FUNDS PLC
FOR THE YEAR ENDED 31 DECEMBER 2019
3. CASH AND CASH EQUIVALENTS (CONTINUED) In line with the Central Bank of Ireland (the “CBI”) Guidance paper entitled Umbrella Funds – Cash Accounts Holding Subscription, Redemption and Dividend Monies published in March 2016, one or more Company cash accounts are being operated by the Administrator, on behalf of the Company, in accordance with the requirements of the CBI. Such Company cash accounts are designed to hold unprocessed subscription monies received from investors, redemption monies payable to investors and/or other amounts due to investors. As at 31 December 2019, the amount held in these cash accounts was US$ 12,473,598 (31 December 2018: US$ 3,143,919). Any balances held on these cash accounts at the financial year end are reflected on the Aggregate Balance Sheets of the Company.

NOTES TO THE AUDITED FINANCIAL STATEMENTS FINANCIAL STATEMENTS
ANNUAL REPORT 2019 979
FOR THE YEAR ENDED 31 DECEMBER 2019
4. BANK OVERDRAFT
As at 31 December 2019 and 31 December 2018, all bank overdraft balances as disclosed in the Balance Sheet are held with Brown Brothers Harriman & Co.
5. SHARE CAPITAL
The authorised share capital of the Company is 500,000,040,000 shares of no par value divided into 40,000 Subscriber Shares of no par value and 500,000,000,000 Participating Shares of no par value. The Directors are empowered to issue up to 500,000,000,000 shares of no par value in the Company on such terms as they think fit.
The Company is an investment company with variable capital due to its ability to issue and redeem shares on demand. The share capital of the Company is divided into different series of shares with each series of shares representing a separate investment portfolio of assets. The Portfolios manage capital in accordance with the UCITS Regulations and the investment objectives and policies applicable to such Portfolio as specified in the Company’s prospectus and the Portfolio’s relevant supplement. The Portfolios are not subject to externally imposed capital requirements. While the Portfolios invest in transferable securities and other liquid financial assets, the Investment Manager also employs a risk management framework that features a dedicated risk management team, the Risk Department, which is independent of the Investment Manager’s portfolio managers. On a daily basis, the Risk Department monitors liquidity for the Portfolios and incorporates various stress test scenarios, including stress testing to assess each Portfolio’s ability to meet shareholder redemptions, and other methods of analysis to oversee expected liquidity levels. The Investment Manager’s Investment Risk Committee, the group responsible for risk oversight, also reviews stress test results on at least a quarterly basis. The Investment Manager seeks to ensure that adequate liquidity exists in the Portfolios to provide for shareholder redemptions in normal market conditions and normal levels of redemptions.
There were 2 Subscriber Shares in issue at 31 December 2019 and 31 December 2018. The Subscriber Shares entitle the holders to attend and vote at general meetings of the Company but do not entitle the holders to participate in the profits or assets of the Company except for a return of capital on a winding-up. The Participating Shares entitle the holders to attend and vote at general meetings of the Company and to participate in the profits and assets of the Company.
The Subscriber shareholders are as follows:
Shareholder Name Nominal Shareholding
Matsack Nominees Limited 1 Neuberger Berman Europe Limited 1 The minimum subscriptions and redemption limits in respect of each Portfolio are contained in the Company's Prospectus.

FINANCIAL STATEMENTS NOTES TO THE AUDITED FINANCIAL STATEMENTS
980 NEUBERGER BERMAN INVESTMENT FUNDS PLC
FOR THE YEAR ENDED 31 DECEMBER 2019
5. SHARE CAPITAL (CONTINUED)
Movement in Redeemable Participating Shares during the year:
Neuberger Berman High Yield Bond Fund
AUD A (Monthly)
Distributing Class
AUD A Accumulating
Class
AUD B (Monthly)
Distributing Class
AUD B (Weekly)
Distributing Class
AUD C2 (Monthly)
Distributing Class
AUD C2 (Weekly)
Distributing Class
AUD E(Monthly)
DistributingClass
AUD E Accumulating
Class
AUD I Distributing
Class
AUD I2 (Monthly)
Distributing Class
For the Year Ended 31 December 2019 Redeemable Participating Shares Shares in issue at start of year 6,892,942 665,555 13,657,666 21,593 5,563,509 15,340 4,783,574 123,782 4,115,574 9,275
Redeemable Participating Shares issued 108,787 96,890 2,260,219 3,239 518,316 2,951 690,162 247,530 3,791,129 107,244
Redeemable Participating Shares redeemed (1,756,511) (150,934) (3,456,204) (2,886) (5,086,308) (8,144) (1,562,245) (53,104) (679,327) (69,142)
Shares in issue at end of year 5,245,218 611,511 12,461,681 21,946 995,517 10,147 3,911,491 318,208 7,227,376 47,377
For the Year Ended 31 December 2018 Redeemable Participating Shares Shares in issue at start of year 8,700,673 954,431 16,962,589 125,475 7,072,262 9,781 4,847,647 76,491 4,216,601 9,009
Redeemable Participating Shares issued 1,060,943 74,073 2,999,149 1,846 804,085 9,805 1,522,985 113,040 893,004 266
Redeemable Participating Shares redeemed (2,868,674) (362,949) (6,304,072) (105,728) (2,312,838) (4,246) (1,587,058) (65,749) (994,031) –
Shares in issue at end of year 6,892,942 665,555 13,657,666 21,593 5,563,509 15,340 4,783,574 123,782 4,115,574 9,275

NOTES TO THE AUDITED FINANCIAL STATEMENTS FINANCIAL STATEMENTS
ANNUAL REPORT 2019 981
FOR THE YEAR ENDED 31 DECEMBER 2019
5. SHARE CAPITAL (CONTINUED)
Neuberger Berman High Yield Bond Fund (continued)
AUD I2 Accumulating
Class
AUD T (Monthly)
Distributing Class
AUD T (Weekly)
Distributing Class
AUD T Accumulating
Class
CAD A (Monthly)
Distributing Class
CHF A Accumulating
Class
CHF I Accumulating
Class
CHF IDistributing
Class
For the Year Ended 31 December 2019 Redeemable Participating Shares Shares in issue at start of year 15,287 12,744,396 416,736 157,869 536,018 439,172 60,240 2,889,912
Redeemable Participating Shares issued – 5,952,828 20,661 90,616 622,922 43,374 22,425 –
Redeemable Participating Shares redeemed (9,517) (4,554,638) (151,081) (100,377) (589,605) (117,923) (24,747) (2,867,139)
Shares in issue at end of year 5,770 14,142,586 286,316 148,108 569,335 364,623 57,918 22,773
For the Year Ended 31 December 2018
Redeemable Participating Shares Shares in issue at start of year 10,478 11,626,345 522,492 188,554 1,320,179 772,020 174,494 2,882,312
Redeemable Participating Shares issued 9,517 5,582,837 95,617 29,457 37,738 17,426 1,800 7,600
Redeemable Participating Shares redeemed (4,708) (4,464,786) (201,373) (60,142) (821,899) (350,274) (116,054) –
Shares in issue at end of year 15,287 12,744,396 416,736 157,869 536,018 439,172 60,240 2,889,912

FINANCIAL STATEMENTS NOTES TO THE AUDITED FINANCIAL STATEMENTS
982 NEUBERGER BERMAN INVESTMENT FUNDS PLC
FOR THE YEAR ENDED 31 DECEMBER 2019
5. SHARE CAPITAL (CONTINUED)
Neuberger Berman High Yield Bond Fund (continued)
CHF I2 Accumulating
Class
CHF I2Distributing
Class*
CNY A (Monthly)
Distributing Class
CNY A (Weekly)
Distributing Class
CNY B (Monthly)
Distributing Class
CNY C2 (Monthly)
Distributing Class*
For the Year Ended 31 December 2019 Redeemable Participating Shares Shares in issue at start of year 736,685 1,103 404,006 95,018 987 114,745
Redeemable Participating Shares issued 118,335 – 1,179 – – 926
Redeemable Participating Shares redeemed (532,495) (1,103) (162,704) – – (115,671)
Shares in issue at end of year 322,525 – 242,481 95,018 987 –
For the Year Ended 31 December 2018
Redeemable Participating Shares Shares in issue at start of year 1,068,238 1,103 782,777 104,816 9,091 154,560
Redeemable Participating Shares issued 110,281 – 10,227 – 986 3,005
Redeemable Participating Shares redeemed (441,834) – (388,998) (9,798) (9,090) (42,820)
Shares in issue at end of year 736,685 1,103 404,006 95,018 987 114,745 * Share class launched or closed during the current or prior reporting year.

NOTES TO THE AUDITED FINANCIAL STATEMENTS FINANCIAL STATEMENTS
ANNUAL REPORT 2019 983
FOR THE YEAR ENDED 31 DECEMBER 2019
5. SHARE CAPITAL (CONTINUED)
Neuberger Berman High Yield Bond Fund (continued)
CNY I (Monthly)
Distributing Class
CNY T (Monthly)
Distributing Class
EUR A (Monthly)
Distributing Class
EUR A Accumulating
Class
EUR ADistributing
Class
EUR I Accumulating
Class
EUR IDistributing
Class
For the Year Ended 31 December 2019 Redeemable Participating Shares Shares in issue at start of year 2,682 58,453 2,073,394 2,229,283 847,962 3,780,992 1,464,105
Redeemable Participating Shares issued 2,770,396 108,747 733,528 763,367 88,927 1,350,194 285,255
Redeemable Participating Shares redeemed (2,770,396) (79,191) (1,517,895) (1,342,936) (318,513) (2,615,557) (243,964)
Shares in issue at end of year 2,682 88,009 1,289,027 1,649,714 618,376 2,515,629 1,505,396
For the Year Ended 31 December 2018 Redeemable Participating Shares Shares in issue at start of year 2,682 145,340 3,258,341 4,020,538 1,069,199 17,109,716 2,986,200
Redeemable Participating Shares issued – 6,772 97,235 481,782 179,030 4,089,379 1,357,029
Redeemable Participating Shares redeemed – (93,659) (1,282,182) (2,273,037) (400,267) (17,418,103) (2,879,124)
Shares in issue at end of year 2,682 58,453 2,073,394 2,229,283 847,962 3,780,992 1,464,105

FINANCIAL STATEMENTS NOTES TO THE AUDITED FINANCIAL STATEMENTS
984 NEUBERGER BERMAN INVESTMENT FUNDS PLC
FOR THE YEAR ENDED 31 DECEMBER 2019
5. SHARE CAPITAL (CONTINUED)
Neuberger Berman High Yield Bond Fund (continued)
EUR I2 (Monthly)
Distributing Class
EUR I2 Accumulating
Class
EUR I2 Distributing
Class
EUR I3 Accumulating
Class
EUR I3 Distributing
Class
EUR M Accumulating
Class
EUR M Distributing
Class
EUR Z Accumulating
Class
For the Year Ended 31 December 2019 Redeemable Participating Shares Shares in issue at start of year 45,131 14,504,697 2,389,205 89,475 61,615 27,444 12,830 3,768
Redeemable Participating Shares issued 33,921 1,361,415 987,595 50 – 2,232 1,159 –
Redeemable Participating Shares redeemed (61,192) (2,307,544) (1,354,360) (66,833) (55,715) (23,755) (2,764) (503)
Shares in issue at end of year 17,860 13,558,568 2,022,440 22,692 5,900 5,921 11,225 3,265
For the Year Ended 31 December 2018
Redeemable Participating Shares Shares in issue at start of year 76,231 12,571,815 2,990,019 2,952,721 90,065 27,883 16,982 2,520
Redeemable Participating Shares issued – 8,452,188 1,187,637 137,112 2,035 – 915 1,723
Redeemable Participating Shares redeemed (31,100) (6,519,306) (1,788,451) (3,000,358) (30,485) (439) (5,067) (475)
Shares in issue at end of year 45,131 14,504,697 2,389,205 89,475 61,615 27,444 12,830 3,768

NOTES TO THE AUDITED FINANCIAL STATEMENTS FINANCIAL STATEMENTS
ANNUAL REPORT 2019 985
FOR THE YEAR ENDED 31 DECEMBER 2019
5. SHARE CAPITAL (CONTINUED)
Neuberger Berman High Yield Bond Fund (continued)
GBP A(Monthly)
DistributingClass
GBP A Accumulating
Class
GBP A Distributing
Class
GBP I Accumulating
Class
GBP I Accumulating
Unhedged Class*
GBP I Distributing
Class
GBP I2 Accumulating
Class
GBP I2 Distributing
Class
For the Year Ended 31 December 2019 Redeemable Participating Shares Shares in issue at start of year 873,058 272,880 323,742 757,736 – 3,518,975 751,618 19,523,499
Redeemable Participating Shares issued 338,305 5,777 10,857 15,401 – 525,765 279,691 2,863,657
Redeemable Participating Shares redeemed (73,888) (88,777) (27,933) (373,379) – (1,336,337) (535,240) (11,244,167)
Shares in issue at end of year 1,137,475 189,880 306,666 399,758 – 2,708,403 496,069 11,142,989
For the Year Ended 31 December 2018
Redeemable Participating Shares Shares in issue at start of year 1,016,294 400,678 565,381 762,277 18,614,283 6,447,921 1,061,229 27,274,244
Redeemable Participating Shares issued 61,174 14,300 78,879 178,444 426,934 937,461 213,855 7,196,634
Redeemable Participating Shares redeemed (204,410) (142,098) (320,518) (182,985) (19,041,217) (3,866,407) (523,466) (14,947,379)
Shares in issue at end of year 873,058 272,880 323,742 757,736 – 3,518,975 751,618 19,523,499 * Share class launched or closed during the current or prior reporting year.

FINANCIAL STATEMENTS NOTES TO THE AUDITED FINANCIAL STATEMENTS
986 NEUBERGER BERMAN INVESTMENT FUNDS PLC
FOR THE YEAR ENDED 31 DECEMBER 2019
5. SHARE CAPITAL (CONTINUED)
Neuberger Berman High Yield Bond Fund (continued)
GBP Z Accumulating
Class
HKD A (Monthly)
Distributing Class
HKD A (Weekly)
Distributing Class*
HKD A Accumulating
Class
JPY I Accumulating
Class
JPY I2 Accumulating
Class*
SEK A Accumulating
Class
For the Year Ended 31 December 2019 Redeemable Participating Shares Shares in issue at start of year 6,539 11,777,110 156,000 357,305 1,880 1,160 990,236
Redeemable Participating Shares issued – 184,151 – – – – 113,583
Redeemable Participating Shares redeemed – (3,353,602) (156,000) (141,904) – (1,160) (271,965)
Shares in issue at end of year 6,539 8,607,659 – 215,401 1,880 – 831,854
For the Year Ended 31 December 2018 Redeemable Participating Shares Shares in issue at start of year 6,539 20,590,061 256,454 357,305 44,484 1,160 1,182,969
Redeemable Participating Shares issued – 1,513,524 – – 4,557 – 155,007
Redeemable Participating Shares redeemed – (10,326,475) (100,454) – (47,161) – (347,740)
Shares in issue at end of year 6,539 11,777,110 156,000 357,305 1,880 1,160 990,236 * Share class launched or closed during the current or prior reporting year.

NOTES TO THE AUDITED FINANCIAL STATEMENTS FINANCIAL STATEMENTS
ANNUAL REPORT 2019 987
FOR THE YEAR ENDED 31 DECEMBER 2019
5. SHARE CAPITAL (CONTINUED)
Neuberger Berman High Yield Bond Fund (continued)
SEK I2 Accumulating
Class*
SGD A (Monthly)
Distributing Class
SGD A Accumulating
Class
USD A (Monthly)
Distributing Class
USD A (Weekly)
Distributing Class
USD A Accumulating
Class
USD A Distributing
Class
USD B(Monthly)
DistributingClass
For the Year Ended 31 December 2019 Redeemable Participating Shares Shares in issue at start of year 8,426 2,573,501 374,448 25,006,733 1,768,579 17,310,167 3,983,433 24,312,222
Redeemable Participating Shares issued – 104,438 34,576 3,045,593 59,266 1,845,441 321,325 8,538,232
Redeemable Participating Shares redeemed (8,426) (722,860) (176,979) (7,830,084) (22,220) (6,935,654) (857,672) (9,678,390)
Shares in issue at end of year – 1,955,079 232,045 20,222,242 1,805,625 12,219,954 3,447,086 23,172,064
For the Year Ended 31 December 2018
Redeemable Participating Shares Shares in issue at start of year 8,426 3,554,403 453,001 39,799,139 1,873,082 37,954,348 5,310,369 33,927,070
Redeemable Participating Shares issued – 465,663 14,393 2,188,420 80,646 5,914,357 618,046 9,065,888
Redeemable Participating Shares redeemed – (1,446,565) (92,946) (16,980,826) (185,149) (26,558,538) (1,944,982) (18,680,736)
Shares in issue at end of year 8,426 2,573,501 374,448 25,006,733 1,768,579 17,310,167 3,983,433 24,312,222 * Share class launched or closed during the current or prior reporting year.

FINANCIAL STATEMENTS NOTES TO THE AUDITED FINANCIAL STATEMENTS
988 NEUBERGER BERMAN INVESTMENT FUNDS PLC
FOR THE YEAR ENDED 31 DECEMBER 2019
5. SHARE CAPITAL (CONTINUED)
Neuberger Berman High Yield Bond Fund (continued)
USD B (Weekly)
Distributing Class
USD B Accumulating
Class
USD CAccumulating
Class
USD C Distributing
Class
USD C1 Accumulating
Class
USD C1 Distributing
Class
For the Year Ended 31 December 2019 Redeemable Participating Shares Shares in issue at start of year 32,596 624,083 230,100 54,795 122,742 23,738
Redeemable Participating Shares issued – 533,004 – 101 324,628 71,753
Redeemable Participating Shares redeemed (26,618) (609,351) (88,263) (31,534) (14,792) (14,717)
Shares in issue at end of year 5,978 547,736 141,837 23,362 432,578 80,774
For the Year Ended 31 December 2018
Redeemable Participating Shares Shares in issue at start of year 327,064 1,023,118 352,167 89,193 20,202 30,925
Redeemable Participating Shares issued 35,891 913,575 7,083 229 110,266 12,768
Redeemable Participating Shares redeemed (330,359) (1,312,610) (129,150) (34,627) (7,726) (19,955)
Shares in issue at end of year 32,596 624,083 230,100 54,795 122,742 23,738

NOTES TO THE AUDITED FINANCIAL STATEMENTS FINANCIAL STATEMENTS
ANNUAL REPORT 2019 989
FOR THE YEAR ENDED 31 DECEMBER 2019
5. SHARE CAPITAL (CONTINUED)
Neuberger Berman High Yield Bond Fund (continued)
USD C2 (Monthly)
Distributing Class
USD C2 (Weekly)
Distributing Class
USD C2 Accumulating
Class
USD E (Monthly)
Distributing Class
USD E Accumulating
Class
USD I (Monthly)
Distributing Class
USD I Accumulating
Class
USD I Distributing
Class
USD I2 (Monthly)
Distributing Class
USD I2 (Weekly)
Distributing Class*
For the Year Ended 31 December 2019 Redeemable Participating Shares Shares in issue at start of year 10,246,180 7,203 526,669 8,685,070 495,741 6,628,608 32,296,235 3,148,214 10,464,058 23,904
Redeemable Participating Shares issued 1,202,404 – 284,164 2,296,938 343,210 3,694,715 6,131,503 9,766,701 1,893,755 –
Redeemable Participating Shares redeemed (8,912,555) (3,251) (545,393) (4,181,502) (410,299) (5,028,486) (18,055,750) (3,416,111) (7,095,903) (23,904)
Shares in issue at end of year 2,536,029 3,952 265,440 6,800,506 428,652 5,294,837 20,371,988 9,498,804 5,261,910 –
For the Year Ended 31 December 2018 Redeemable Participating Shares Shares in issue at start of year 12,518,157 17,312 588,675 9,902,613 331,550 9,234,093 78,427,123 20,725,350 1,576,372 16,802
Redeemable Participating Shares issued 2,788,482 3,953 388,986 3,109,006 546,371 4,692,842 9,602,342 970,001 9,763,742 7,102
Redeemable Participating Shares redeemed (5,060,459) (14,062) (450,992) (4,326,549) (382,180) (7,298,327) (55,733,230) (18,547,137) (876,056) –
Shares in issue at end of year 10,246,180 7,203 526,669 8,685,070 495,741 6,628,608 32,296,235 3,148,214 10,464,058 23,904 * Share class launched or closed during the current or prior reporting year.

FINANCIAL STATEMENTS NOTES TO THE AUDITED FINANCIAL STATEMENTS
990 NEUBERGER BERMAN INVESTMENT FUNDS PLC
FOR THE YEAR ENDED 31 DECEMBER 2019
5. SHARE CAPITAL (CONTINUED)
Neuberger Berman High Yield Bond Fund (continued)
USD I2 Accumulating
Class
USD I2 Distributing
Class
USD I4 (Monthly)
Distributing Class
USD MAccumulating
Class
USD M Distributing
Class*
USD P Accumulating
Class*
USD T (Monthly)
Distributing Class
USD T(Weekly)
DistributingClass
USD T Accumulating
Class
USD U (Monthly)
Distributing Class
For the Year Ended 31 December 2019 Redeemable Participating Shares Shares in issue at start of year 24,845,326 17,818,044 13,598,690 56,115 16,419 1,208 23,373,875 603,073 527,117 429,072
Redeemable Participating Shares issued 11,048,563 2,847,340 8,805,067 51,725 68,546 152,037 10,479,403 32,178 610,328 1,812
Redeemable Participating Shares redeemed (12,601,211) (4,104,152) (10,277,029) (16,805) (5,301) (58,045) (10,095,401) (153,239) (659,248) (211,315)
Shares in issue at end of year 23,292,678 16,561,232 12,126,728 91,035 79,664 95,200 23,757,877 482,012 478,197 219,569
For the Year Ended 31 December 2018 Redeemable Participating Shares Shares in issue at start of year 25,784,254 14,989,844 13,598,690 26,220 – – 24,277,692 626,144 665,067 1,955,237
Redeemable Participating Shares issued 28,436,945 13,751,446 – 38,432 16,419 1,208 12,380,839 315,821 337,289 14,613
Redeemable Participating Shares redeemed (29,375,873) (10,923,246) – (8,537) – – (13,284,656) (338,892) (475,239) (1,540,778)
Shares in issue at end of year 24,845,326 17,818,044 13,598,690 56,115 16,419 1,208 23,373,875 603,073 527,117 429,072 * Share class launched or closed during the current or prior reporting year.

NOTES TO THE AUDITED FINANCIAL STATEMENTS FINANCIAL STATEMENTS
ANNUAL REPORT 2019 991
FOR THE YEAR ENDED 31 DECEMBER 2019
5. SHARE CAPITAL (CONTINUED)
Neuberger Berman High Yield Bond Fund (continued)
USD U Accumulating
Class
USD Z Accumulating
Class
ZAR A (Monthly)
Distributing Class
ZAR B (Monthly)
Distributing Class
ZAR C2 (Monthly)
Distributing Class
ZAR E (Monthly)
Distributing Class
ZAR E Accumulating
Class
For the Year Ended 31 December 2019 Redeemable Participating Shares Shares in issue at start of year 1,842,687 5,449,448 113,628 14,920,747 7,420,769 8,014,102 201,100
Redeemable Participating Shares issued – 362,232 6,245 5,505,881 1,000,800 3,475,812 251,023
Redeemable Participating Shares redeemed (791,279) (3,004,785) (15,956) (6,269,024) (6,274,761) (4,226,610) (191,262)
Shares in issue at end of year 1,051,408 2,806,895 103,917 14,157,604 2,146,808 7,263,304 260,861
For the Year Ended 31 December 2018
Redeemable Participating Shares Shares in issue at start of year 5,157,708 4,272,267 118,537 24,840,291 8,159,244 8,388,695 177,773
Redeemable Participating Shares issued 74,513 1,853,490 14,398 4,906,915 2,644,639 3,011,247 155,461
Redeemable Participating Shares redeemed (3,389,534) (676,309) (19,307) (14,826,459) (3,383,114) (3,385,840) (132,134)
Shares in issue at end of year 1,842,687 5,449,448 113,628 14,920,747 7,420,769 8,014,102 201,100

FINANCIAL STATEMENTS NOTES TO THE AUDITED FINANCIAL STATEMENTS
992 NEUBERGER BERMAN INVESTMENT FUNDS PLC
FOR THE YEAR ENDED 31 DECEMBER 2019
5. SHARE CAPITAL (CONTINUED)
Neuberger Berman High Yield Bond Fund (continued)
ZAR T (Monthly)
Distributing Class
ZAR TAccumulating
Class
For the Year Ended 31 December 2019 Redeemable Participating Shares Shares in issue at start of year 37,966,429 34,856
Redeemable Participating Shares issued 9,811,185 206,478
Redeemable Participating Shares redeemed (10,696,167) (174,592)
Shares in issue at end of year 37,081,447 66,742
For the Year Ended 31 December 2018
Redeemable Participating Shares Shares in issue at start of year 39,003,144 108,010
Redeemable Participating Shares issued 13,992,044 29,270
Redeemable Participating Shares redeemed (15,028,759) (102,424)
Shares in issue at end of year 37,966,429 34,856

NOTES TO THE AUDITED FINANCIAL STATEMENTS FINANCIAL STATEMENTS
ANNUAL REPORT 2019 993
FOR THE YEAR ENDED 31 DECEMBER 2019
5. SHARE CAPITAL (CONTINUED)
Neuberger Berman Diversified Currency Fund
EUR AAccumulating
Class
EUR I Accumulating
Class
EUR M Accumulating
Class
GBP I Accumulating
Class
JPY I Accumulating
Class
USD A Accumulating
Class
USD I Accumulating
Class
USD Z Accumulating
Class
For the Year Ended 31 December 2019 Redeemable Participating Shares Shares in issue at start of year 7,895 10,831 72,850 15,874 9,293 16,711 440,000 1,994,973
Redeemable Participating Shares issued – 7,443 – 33,697 – 5,628,518 31,550 330,950
Redeemable Participating Shares redeemed (3,545) (9,040) (47,049) (35,070) – (514,058) (125,323) (1,491,164)
Shares in issue at end of year 4,350 9,234 25,801 14,501 9,293 5,131,171 346,227 834,759
For the Year Ended 31 December 2018
Redeemable Participating Shares Shares in issue at start of year 9,254 8,516 91,226 13,389 5,642 23,753 217,206 1,426,719
Redeemable Participating Shares issued – 2,488 3,246 2,485 3,651 – 765,000 977,263
Redeemable Participating Shares redeemed (1,359) (173) (21,622) – – (7,042) (542,206) (409,009)
Shares in issue at end of year 7,895 10,831 72,850 15,874 9,293 16,711 440,000 1,994,973

FINANCIAL STATEMENTS NOTES TO THE AUDITED FINANCIAL STATEMENTS
994 NEUBERGER BERMAN INVESTMENT FUNDS PLC
FOR THE YEAR ENDED 31 DECEMBER 2019
5. SHARE CAPITAL (CONTINUED)
Neuberger Berman US Multi Cap Opportunities Fund
AUD E Accumulating
Class
AUD T Accumulating
Class
EUR I3 Accumulating
Class
EUR M Accumulating
Class
EUR U Accumulating
Class*
EUR1 A Accumulating
Class
For the Year Ended 31 December 2019
Redeemable Participating Shares
Shares in issue at start of year 96,024 740,224 490,812 124,372 – 193,733
Redeemable Participating Shares issued 32,645 56,160 58,274 14,815 – 84,065
Redeemable Participating Shares redeemed (83,753) (777,404) (416,735) (56,506) – (139,224)
Shares in issue at end of year 44,916 18,980 132,351 82,681 – 138,574
For the Year Ended 31 December 2018
Redeemable Participating Shares
Shares in issue at start of year 33,439 4,160 700,612 155,212 31,038 118,274
Redeemable Participating Shares issued 193,665 1,024,972 817,887 76,927 – 194,074
Redeemable Participating Shares redeemed (131,080) (288,908) (1,027,687) (107,767) (31,038) (118,615)
Shares in issue at end of year 96,024 740,224 490,812 124,372 – 193,733
* Share class launched or closed during the current or prior reporting year.

NOTES TO THE AUDITED FINANCIAL STATEMENTS FINANCIAL STATEMENTS
ANNUAL REPORT 2019 995
FOR THE YEAR ENDED 31 DECEMBER 2019
5. SHARE CAPITAL (CONTINUED)
Neuberger Berman US Multi Cap Opportunities Fund (continued)
EUR1 I Accumulating
Class
GBP I Accumulating
Class
GBP I Distributing
Unhedged Class
GBP I3 Distributing
Class
GBP I3 Distributing
Unhedged Class
SGD A Accumulating
Class
For the Year Ended 31 December 2019
Redeemable Participating Shares
Shares in issue at start of year 2,518,433 589 13,738 20,886 532,733 512,601
Redeemable Participating Shares issued 1,002,307 – – – 25,320 235,470
Redeemable Participating Shares redeemed (2,699,882) – – (886) (556,988) (290,171)
Shares in issue at end of year 820,858 589 13,738 20,000 1,065 457,900
For the Year Ended 31 December 2018
Redeemable Participating Shares
Shares in issue at start of year 442,485 589 30,912 45,096 976,797 313,248
Redeemable Participating Shares issued 2,632,995 – – 886 100,149 492,894
Redeemable Participating Shares redeemed (557,047) – (17,174) (25,096) (544,213) (293,541)
Shares in issue at end of year 2,518,433 589 13,738 20,886 532,733 512,601

FINANCIAL STATEMENTS NOTES TO THE AUDITED FINANCIAL STATEMENTS
996 NEUBERGER BERMAN INVESTMENT FUNDS PLC
FOR THE YEAR ENDED 31 DECEMBER 2019
5. SHARE CAPITAL (CONTINUED)
Neuberger Berman US Multi Cap Opportunities Fund (continued)
USD B Accumulating
Class
USD C Accumulating
Class
USD C1Accumulating
Class
USD C2 Accumulating
Class
USD E Accumulating
Class
USD I2 Accumulating
Class*
USD I2 Distributing
Class
USD I3 Accumulating
Class
For the Year Ended 31 December 2019
Redeemable Participating Shares
Shares in issue at start of year 285,351 99,521 214,475 169,388 232,720 709 15,000 5,757,739
Redeemable Participating Shares issued 1,032,066 – 140,946 108,657 295,662 – – 90,159
Redeemable Participating Shares redeemed (1,163,268) (96,497) (221,104) (237,612) (437,386) (709) – (3,973,774)
Shares in issue at end of year 154,149 3,024 134,317 40,433 90,996 – 15,000 1,874,124
For the Year Ended 31 December 2018
Redeemable Participating Shares
Shares in issue at start of year 132,515 86,142 24,047 82,882 175,710 223,000 15,000 11,459,150
Redeemable Participating Shares issued 1,426,722 20,051 270,637 537,552 607,799 6,691 – 3,984,706
Redeemable Participating Shares redeemed (1,273,886) (6,672) (80,209) (451,046) (550,789) (228,982) – (9,686,117)
Shares in issue at end of year 285,351 99,521 214,475 169,388 232,720 709 15,000 5,757,739
* Share class launched or closed during the current or prior reporting year.

NOTES TO THE AUDITED FINANCIAL STATEMENTS FINANCIAL STATEMENTS
ANNUAL REPORT 2019 997
FOR THE YEAR ENDED 31 DECEMBER 2019
5. SHARE CAPITAL (CONTINUED)
Neuberger Berman US Multi Cap Opportunities Fund (continued)
USD I3 Distributing
Class
USD MAccumulating
Class
USD P Accumulating
Class*
USD T Accumulating
Class
USD U Accumulating
Class
USD Z Accumulating
Class
USD1 A Accumulating
Class
USD1 I Accumulating
Class
USD1 I Distributing
Class
For the Year Ended 31 December 2019
Redeemable Participating Shares
Shares in issue at start of year 965,508 705,901 1,167 2,412,801 4,997,996 4,875 5,936,909 18,851,734 66,102
Redeemable Participating Shares issued 476,913 3,698,891 – 226,743 27,371 – 1,115,044 2,190,693 190,010
Redeemable Participating Shares redeemed (800,506) (477,536) – (2,414,681) (1,064,550) – (2,908,720) (7,253,187) (57,998)
Shares in issue at end of year 641,915 3,927,256 1,167 224,863 3,960,817 4,875 4,143,233 13,789,240 198,114
For the Year Ended 31 December 2018
Redeemable Participating Shares
Shares in issue at start of year 582,798 253,271 – 3,772,306 8,927,431 4,212 6,931,392 14,342,737 690
Redeemable Participating Shares issued 624,495 544,555 1,167 2,705,817 74,866 663 2,843,115 12,547,952 65,833
Redeemable Participating Shares redeemed (241,785) (91,925) – (4,065,322) (4,004,301) – (3,837,598) (8,038,955) (421)
Shares in issue at end of year 965,508 705,901 1,167 2,412,801 4,997,996 4,875 5,936,909 18,851,734 66,102
* Share class launched or closed during the current or prior reporting year.

FINANCIAL STATEMENTS NOTES TO THE AUDITED FINANCIAL STATEMENTS
998 NEUBERGER BERMAN INVESTMENT FUNDS PLC
FOR THE YEAR ENDED 31 DECEMBER 2019
5. SHARE CAPITAL (CONTINUED)
Neuberger Berman US Multi Cap Opportunities Fund (continued)
ZAR B Accumulating
Class
ZAR C2 Accumulating
Class
ZAR E Accumulating
Class
ZAR T Accumulating
Class For the Year Ended 31 December 2019
Redeemable Participating Shares
Shares in issue at start of year 126,390 35,558 62,461 108,806
Redeemable Participating Shares issued 422,317 28,960 186,042 396,785
Redeemable Participating Shares redeemed (513,896) (46,700) (188,179) (435,699)
Shares in issue at end of year 34,811 17,818 60,324 69,892
For the Year Ended 31 December 2018
Redeemable Participating Shares
Shares in issue at start of year 21,937 7,688 9,252 33,502
Redeemable Participating Shares issued 558,240 181,897 215,021 323,712
Redeemable Participating Shares redeemed (453,787) (154,027) (161,812) (248,408)
Shares in issue at end of year 126,390 35,558 62,461 108,806

NOTES TO THE AUDITED FINANCIAL STATEMENTS FINANCIAL STATEMENTS
ANNUAL REPORT 2019 999
FOR THE YEAR ENDED 31 DECEMBER 2019
5. SHARE CAPITAL (CONTINUED)
Neuberger Berman US Real Estate Securities Fund
AUD A (Monthly)
Distributing Class
AUD B (Monthly)
Distributing Class
AUD B Accumulating
Class
AUD C2 (Monthly)
Distributing Class
AUD C2 Accumulating
Class
AUD E (Monthly)
Distributing Class
AUD EAccumulating
Class
AUD T(Monthly)
DistributingClass
For the Year Ended 31 December 2019
Redeemable Participating Shares
Shares in issue at start of year 103,486 105,328 18,573 13,126 5,916 117,647 24,780 111,724
Redeemable Participating Shares issued 125,272 112,639 83,598 129,039 10,421 216,934 69,228 440,712
Redeemable Participating Shares redeemed (128,695) (121,303) (31,726) (80,463) (12,861) (255,576) (60,452) (268,590)
Shares in issue at end of year 100,063 96,664 70,445 61,702 3,476 79,005 33,556 283,846
For the Year Ended 31 December 2018
Redeemable Participating Shares
Shares in issue at start of year 21,011 33,009 18,522 4,673 1,911 3,628 5,683 98,528
Redeemable Participating Shares issued 222,379 117,681 59,763 24,430 84,021 203,112 141,886 297,798
Redeemable Participating Shares redeemed (139,904) (45,362) (59,712) (15,977) (80,016) (89,093) (122,789) (284,602)
Shares in issue at end of year 103,486 105,328 18,573 13,126 5,916 117,647 24,780 111,724

FINANCIAL STATEMENTS NOTES TO THE AUDITED FINANCIAL STATEMENTS
1000 NEUBERGER BERMAN INVESTMENT FUNDS PLC
FOR THE YEAR ENDED 31 DECEMBER 2019
5. SHARE CAPITAL (CONTINUED)
Neuberger Berman US Real Estate Securities Fund (continued)
AUD T Accumulating
Class
CHF A Accumulating
Class
EUR A Accumulating
Class
EUR I Accumulating
Class
EUR M Accumulating
Class
GBP I Distributing
Class
HKD A (Monthly)
Distributing Class
HKD A Accumulating
Class
For the Year Ended 31 December 2019
Redeemable Participating Shares
Shares in issue at start of year 423,591 190,163 266,057 539,929 6,914 817 1,239,878 25,192
Redeemable Participating Shares issued 349,415 23,800 1,053,445 831,739 5,221 131 6,682,879 72,903
Redeemable Participating Shares redeemed (630,803) (55,420) (1,086,445) (725,122) (6,066) (2) (6,299,030) (25,192)
Shares in issue at end of year 142,203 158,543 233,057 646,546 6,069 946 1,623,727 72,903
For the Year Ended 31 December 2018
Redeemable Participating Shares
Shares in issue at start of year 89,065 206,067 319,729 569,166 7,458 1,796 734,795 69,524
Redeemable Participating Shares issued 587,324 – 58,685 21,542 5,395 – 1,117,207 –
Redeemable Participating Shares redeemed (252,798) (15,904) (112,357) (50,779) (5,939) (979) (612,124) (44,332)
Shares in issue at end of year 423,591 190,163 266,057 539,929 6,914 817 1,239,878 25,192

NOTES TO THE AUDITED FINANCIAL STATEMENTS FINANCIAL STATEMENTS
ANNUAL REPORT 2019 1001
FOR THE YEAR ENDED 31 DECEMBER 2019
5. SHARE CAPITAL (CONTINUED)
Neuberger Berman US Real Estate Securities Fund (continued)
SGD A Accumulating
Class
USD A (Monthly)
Distributing Class
USD A Accumulating
Class
USD A Distributing
Class
USD B (Monthly)
Distributing Class
USD B Accumulating
Class
USD C Accumulating
Class
USD C Distributing
Class*
USD C1 Accumulating
Class
USD C2 (Monthly)
Distributing Class
For the Year Ended 31 December 2019 Redeemable Participating Shares Shares in issue at start of year 6,086 279,133 1,712,013 197,019 230,249 131,292 49,213 – 7,013 22,848
Redeemable Participating Shares issued 78,191 1,160,364 2,086,238 473,436 861,945 657,482 – – 928,062 290,846
Redeemable Participating Shares redeemed (41,332) (637,434) (743,009) (408,590) (630,854) (489,899) (45,425) – (12,942) (149,730)
Shares in issue at end of year 42,945 802,063 3,055,242 261,865 461,340 298,875 3,788 – 922,133 163,964
For the Year Ended 31 December 2018 Redeemable Participating Shares Shares in issue at start of year 4,963 430,087 2,981,789 493,006 55,993 210,125 49,213 15,396 9,990 15,724
Redeemable Participating Shares issued 11,072 114,761 198,587 8,799 672,188 482,295 – – 7,013 78,050
Redeemable Participating Shares redeemed (9,949) (265,715) (1,468,363) (304,786) (497,932) (561,128) – (15,396) (9,990) (70,926)
Shares in issue at end of year 6,086 279,133 1,712,013 197,019 230,249 131,292 49,213 – 7,013 22,848 * Share class launched or closed during the current or prior reporting year.

FINANCIAL STATEMENTS NOTES TO THE AUDITED FINANCIAL STATEMENTS
1002 NEUBERGER BERMAN INVESTMENT FUNDS PLC
FOR THE YEAR ENDED 31 DECEMBER 2019
5. SHARE CAPITAL (CONTINUED)
Neuberger Berman US Real Estate Securities Fund (continued)
USD C2 Accumulating
Class
USD E (Monthly)
Distributing Class
USD E Accumulating
Class
USD I (Monthly)
Distributing Class*
USD I Accumulating
Class
USD I Distributing
Class
USD I2 Accumulating
Class
USD M Accumulating
Class
For the Year Ended 31 December 2019
Redeemable Participating Shares
Shares in issue at start of year 34,239 73,740 58,633 – 730,679 1,010 44,611 24,284
Redeemable Participating Shares issued 258,951 449,690 448,481 304,493 1,063,716 47,253 6,670 1,412,038
Redeemable Participating Shares redeemed (222,219) (220,068) (201,226) – (513,241) – (1,500) (83,442)
Shares in issue at end of year 70,971 303,362 305,888 304,493 1,281,154 48,263 49,781 1,352,880
For the Year Ended 31 December 2018
Redeemable Participating Shares
Shares in issue at start of year 55,060 29,767 58,167 – 1,113,786 1,010 64,681 25,861
Redeemable Participating Shares issued 133,348 229,192 165,561 – 162,938 – 15,871 13,575
Redeemable Participating Shares redeemed (154,169) (185,219) (165,095) – (546,045) – (35,941) (15,152)
Shares in issue at end of year 34,239 73,740 58,633 – 730,679 1,010 44,611 24,284
* Share class launched or closed during the current or prior reporting year.

NOTES TO THE AUDITED FINANCIAL STATEMENTS FINANCIAL STATEMENTS
ANNUAL REPORT 2019 1003
FOR THE YEAR ENDED 31 DECEMBER 2019
5. SHARE CAPITAL (CONTINUED)
Neuberger Berman US Real Estate Securities Fund (continued)
USD T (Monthly)
Distributing Class
USD T Accumulating
Class
USD Z Accumulating
Class
ZAR B (Monthly)
Distributing Class
ZAR B Accumulating
Class
ZAR C2 (Monthly)
Distributing Class
ZAR C2 Accumulating
Class*
ZAR E (Monthly)
Distributing Class
ZAR E Accumulating
Class
For the Year Ended 31 December 2019
Redeemable Participating Shares
Shares in issue at start of year 80,944 333,857 6,889 168,648 10,336 52,886 434 251,800 15,401
Redeemable Participating Shares issued 579,017 4,154,534 330,339 588,696 145,262 361,419 30,710 643,698 277,543
Redeemable Participating Shares redeemed (420,604) (1,395,982) – (431,262) (82,818) (303,143) (23,648) (547,765) (187,462)
Shares in issue at end of year 239,357 3,092,409 337,228 326,082 72,780 111,162 7,496 347,733 105,482
For the Year Ended 31 December 2018
Redeemable Participating Shares
Shares in issue at start of year 72,576 2,728,848 5,000 40,351 26,021 2,518 1,352 102,008 27,119
Redeemable Participating Shares issued 344,797 447,118 1,889 235,557 56,485 157,833 1,316 325,923 17,983
Redeemable Participating Shares redeemed (336,429) (2,842,109) – (107,260) (72,170) (107,465) (2,234) (176,131) (29,701)
Shares in issue at end of year 80,944 333,857 6,889 168,648 10,336 52,886 434 251,800 15,401

FINANCIAL STATEMENTS NOTES TO THE AUDITED FINANCIAL STATEMENTS
1004 NEUBERGER BERMAN INVESTMENT FUNDS PLC
FOR THE YEAR ENDED 31 DECEMBER 2019
5. SHARE CAPITAL (CONTINUED)
Neuberger Berman US Real Estate Securities Fund (continued)
ZAR T (Monthly)
DistributingClass
ZAR T Accumulating
Class
For the Year Ended 31 December 2019 Redeemable Participating Shares Shares in issue at start of year 230,480 56,493
Redeemable Participating Shares issued 1,343,760 429,933
Redeemable Participating Shares redeemed (980,268) (385,341)
Shares in issue at end of year 593,972 101,085
For the Year Ended 31 December 2018
Redeemable Participating Shares Shares in issue at start of year 112,529 39,800
Redeemable Participating Shares issued 555,090 56,996
Redeemable Participating Shares redeemed (437,139) (40,303)
Shares in issue at end of year 230,480 56,493

NOTES TO THE AUDITED FINANCIAL STATEMENTS FINANCIAL STATEMENTS
ANNUAL REPORT 2019 1005
FOR THE YEAR ENDED 31 DECEMBER 2019
5. SHARE CAPITAL (CONTINUED)
Neuberger Berman China Equity Fund
CHF I Accumulating
Class
EUR A Accumulating
Class
EUR A Accumulating
Unhedged Class
EUR A Distributing
Class
EUR I Accumulating
Class
EUR I4 Accumulating
Class
EUR M Accumulating
Class
EUR Z Accumulating
Class
GBP A Distributing
Class
For the Year Ended 31 December 2019
Redeemable Participating Shares
Shares in issue at start of year 383,459 166,226 36,020 734 196,654 4,750 37,120 891 50,713
Redeemable Participating Shares issued – – – – – – – – –
Redeemable Participating Shares redeemed – (51,493) (18,843) – (78,474) – (12,207) – (8,202)
Shares in issue at end of year 383,459 114,733 17,177 734 118,180 4,750 24,913 891 42,511
For the Year Ended 31 December 2018
Redeemable Participating Shares
Shares in issue at start of year 383,829 428,743 60,205 3,998 290,076 4,750 88,278 891 50,713
Redeemable Participating Shares issued – – – – 1,839 – – – –
Redeemable Participating Shares redeemed (370) (262,517) (24,185) (3,264) (95,261) – (51,158) – –
Shares in issue at end of year 383,459 166,226 36,020 734 196,654 4,750 37,120 891 50,713

FINANCIAL STATEMENTS NOTES TO THE AUDITED FINANCIAL STATEMENTS
1006 NEUBERGER BERMAN INVESTMENT FUNDS PLC
FOR THE YEAR ENDED 31 DECEMBER 2019
5. SHARE CAPITAL (CONTINUED)
Neuberger Berman China Equity Fund (continued)
GBP I Distributing
Unhedged Class
GBP I2 Distributing
Unhedged Class
GBP I4 Accumulating
Class
GBP I4 Distributing
Class
HKD A Accumulating
Class
SGD A Accumulating
Class
USD A Accumulating
Class
USD A Distributing
Class
USD C Accumulating
Class*
For the Year Ended 31 December 2019
Redeemable Participating Shares
Shares in issue at start of year 630 9,569 24,638 10,576 271,430 389,786 4,853,562 317,374 10,900
Redeemable Participating Shares issued – 60 – – – – – – –
Redeemable Participating Shares redeemed (60) – (7,559) – (23,374) (151,939) (1,398,899) (97,593) (10,900)
Shares in issue at end of year 570 9,629 17,079 10,576 248,056 237,847 3,454,663 219,781 –
For the Year Ended 31 December 2018
Redeemable Participating Shares
Shares in issue at start of year 4,951 13,382 24,638 10,576 978,230 750,599 8,009,304 536,992 20,097
Redeemable Participating Shares issued – – – – – – 22 – –
Redeemable Participating Shares redeemed (4,321) (3,813) – – (706,800) (360,813) (3,155,764) (219,618) (9,197)
Shares in issue at end of year 630 9,569 24,638 10,576 271,430 389,786 4,853,562 317,374 10,900
* Share class launched or closed during the current or prior reporting year.

NOTES TO THE AUDITED FINANCIAL STATEMENTS FINANCIAL STATEMENTS
ANNUAL REPORT 2019 1007
FOR THE YEAR ENDED 31 DECEMBER 2019
5. SHARE CAPITAL (CONTINUED)
Neuberger Berman China Equity Fund (continued)
USD C1Accumulating
Class
USD I Accumulating
Class
USD I2 Accumulating
Class
USD I4 Distributing
Class
USD M Accumulating
Class
USD U Accumulating
Class
USD Z Accumulating
Class
For the Year Ended 31 December 2019
Redeemable Participating Shares
Shares in issue at start of year 3,000 23,677,597 2,685,017 15,244 2,278,502 3,738,035 18,422
Redeemable Participating Shares issued – 17,611 38,880 – – – –
Redeemable Participating Shares redeemed – (4,770,193) (1,255,307) – (416) (308,147) –
Shares in issue at end of year 3,000 18,925,015 1,468,590 15,244 2,278,086 3,429,888 18,422
For the Year Ended 31 December 2018
Redeemable Participating Shares
Shares in issue at start of year 3,000 30,587,825 3,137,632 23,563 2,279,993 5,739,084 22,074
Redeemable Participating Shares issued – 402,120 82,493 – – – –
Redeemable Participating Shares redeemed – (7,312,348) (535,108) (8,319) (1,491) (2,001,049) (3,652)
Shares in issue at end of year 3,000 23,677,597 2,685,017 15,244 2,278,502 3,738,035 18,422

FINANCIAL STATEMENTS NOTES TO THE AUDITED FINANCIAL STATEMENTS
1008 NEUBERGER BERMAN INVESTMENT FUNDS PLC
FOR THE YEAR ENDED 31 DECEMBER 2019
5. SHARE CAPITAL (CONTINUED)
Neuberger Berman Emerging Markets Equity Fund
AUD BAccumulating
Class
AUD C2 Accumulating
Class
AUD E Accumulating
Class
AUD T Accumulating
Class
CAD I Distributing
Unhedged Class*
EUR AAccumulating
Class
EUR I Accumulating
Class
EUR M Accumulating
Class
EUR Z Accumulating
Class*
GBP I Accumulating
Class For the Year Ended 31 December 2019 Redeemable Participating Shares Shares in issue at start of year 125,836 109,768 162,392 314,608 5,010,307 2,324 273,707 173,039 7,946 4,592,919
Redeemable Participating Shares issued 205,448 55,722 184,848 434,413 72,764 – 189,286 18,097 – 38,713
Redeemable Participating Shares redeemed (239,367) (68,429) (168,012) (217,729) – – (284,107) (86,828) – (4,593,893)
Shares in issue at end of year 91,917 97,061 179,228 531,292 5,083,071 2,324 178,886 104,308 7,946 37,739
For the Year Ended 31 December 2018 Redeemable Participating Shares Shares in issue at start of year 75,041 179,549 106,319 223,502 – 1,086 234,075 75,332 – 5,197,097
Redeemable Participating Shares issued 496,842 638,745 629,818 763,370 5,010,307 1,309 764,816 118,732 7,946 19,566
Redeemable Participating Shares redeemed (446,047) (708,526) (573,745) (672,264) – (71) (725,184) (21,025) – (623,744)
Shares in issue at end of year 125,836 109,768 162,392 314,608 5,010,307 2,324 273,707 173,039 7,946 4,592,919 * Share class launched or closed during the current or prior reporting year.

NOTES TO THE AUDITED FINANCIAL STATEMENTS FINANCIAL STATEMENTS
ANNUAL REPORT 2019 1009
FOR THE YEAR ENDED 31 DECEMBER 2019
5. SHARE CAPITAL (CONTINUED)
Neuberger Berman Emerging Markets Equity Fund (continued)
GBP Z Accumulating
Class
JPY IAccumulating
Class
USD A Accumulating
Class
USD B Accumulating
Class
USD C1 Accumulating
Class
USD C2Accumulating
Class
USD E Accumulating
Class
USD I Accumulating
Class
USD M Accumulating
Class
USD T Accumulating
Class For the Year Ended 31 December 2019 Redeemable Participating Shares Shares in issue at start of year 17,841 3,630,505 377,504 443,794 52,436 438,314 442,190 18,305,895 4,695,759 562,299
Redeemable Participating Shares issued – 8,602 398,074 760,906 9 203,480 390,350 6,541,501 4,537,849 330,143
Redeemable Participating Shares redeemed – (12,382) (303,196) (810,466) (8,687) (389,116) (466,790) (6,400,331) (4,584,765) (420,683)
Shares in issue at end of year 17,841 3,626,725 472,382 394,234 43,758 252,678 365,750 18,447,065 4,648,843 471,759
For the Year Ended 31 December 2018 Redeemable Participating Shares Shares in issue at start of year 17,041 5,437,438 175,754 306,224 34,489 307,786 269,958 12,962,858 3,913,252 487,000
Redeemable Participating Shares issued 800 310,509 447,821 1,403,671 91,274 1,597,796 1,286,695 9,970,525 957,341 1,200,597
Redeemable Participating Shares redeemed – (2,117,442) (246,071) (1,266,101) (73,327) (1,467,268) (1,114,463) (4,627,488) (174,834) (1,125,298)
Shares in issue at end of year 17,841 3,630,505 377,504 443,794 52,436 438,314 442,190 18,305,895 4,695,759 562,299

FINANCIAL STATEMENTS NOTES TO THE AUDITED FINANCIAL STATEMENTS
1010 NEUBERGER BERMAN INVESTMENT FUNDS PLC
FOR THE YEAR ENDED 31 DECEMBER 2019
5. SHARE CAPITAL (CONTINUED)
Neuberger Berman Emerging Markets Equity Fund (continued)
USD ZAccumulating
Class
ZAR B Accumulating
Class
ZAR C2 Accumulating
Class
ZAR E Accumulating
Class
ZAR T Accumulating
Class
For the Year Ended 31 December 2019 Redeemable Participating Shares Shares in issue at start of year 771,928 130,306 61,735 127,774 283,843
Redeemable Participating Shares issued 389,825 324,727 98,130 102,176 382,758
Redeemable Participating Shares redeemed – (374,563) (111,663) (141,984) (445,081)
Shares in issue at end of year 1,161,753 80,470 48,202 87,966 221,520
For the Year Ended 31 December 2018
Redeemable Participating Shares Shares in issue at start of year 771,623 66,377 57,138 246,570 300,764
Redeemable Participating Shares issued 84,234 418,095 489,854 249,551 796,293
Redeemable Participating Shares redeemed (83,929) (354,166) (485,257) (368,347) (813,214)
Shares in issue at end of year 771,928 130,306 61,735 127,774 283,843u

NOTES TO THE AUDITED FINANCIAL STATEMENTS FINANCIAL STATEMENTS
ANNUAL REPORT 2019 1011
FOR THE YEAR ENDED 31 DECEMBER 2019
5. SHARE CAPITAL (CONTINUED)
Neuberger Berman US Small Cap Fund
AUD B Accumulating
Class*
AUD C2Accumulating
Class*
AUD E Accumulating
Class
AUD T Accumulating
Class
EUR A Accumulating
Class
EUR IAccumulating
Class
EUR I Accumulating
Unhedged Class
EUR I2 Accumulating
Unhedged Class*
EUR M Accumulating
Class
EUR Z Accumulating
Class For the Year Ended 31 December 2019 Redeemable Participating Shares Shares in issue at start of year – 2,251 102,021 63,244 49,297 38,279 1,351,217 – 14,613 6,374
Redeemable Participating Shares issued 7,493 3,447 13,389 351,046 – 2,080 449,309 1,198,193 2,297 1,724
Redeemable Participating Shares redeemed – (2,251) (77,301) (74,390) (12,660) (29,415) (1,759,116) (105,193) (7,780) –
Shares in issue at end of year 7,493 3,447 38,109 339,900 36,637 10,944 41,410 1,093,000 9,130 8,098
For the Year Ended 31 December 2018 Redeemable Participating Shares Shares in issue at start of year – – 16,117 2,524 69,781 744,515 901,235 – 10,125 1,778
Redeemable Participating Shares issued – 127,563 304,153 172,831 55,521 6,957 652,291 – 15,451 4,596
Redeemable Participating Shares redeemed – (125,312) (218,249) (112,111) (76,005) (713,193) (202,309) – (10,963) –
Shares in issue at end of year – 2,251 102,021 63,244 49,297 38,279 1,351,217 – 14,613 6,374 * Share class launched or closed during the current or prior reporting year.

FINANCIAL STATEMENTS NOTES TO THE AUDITED FINANCIAL STATEMENTS
1012 NEUBERGER BERMAN INVESTMENT FUNDS PLC
FOR THE YEAR ENDED 31 DECEMBER 2019
5. SHARE CAPITAL (CONTINUED)
Neuberger Berman US Small Cap Fund (continued)
GBP I Accumulating
Class*
JPY I Distributing
Class
USD A Accumulating
Class
USD A Distributing
Class
USD B Accumulating
Class
USD C Accumulating
Class
USD C2 Accumulating
Class
USD E Accumulating
Class
USD I Accumulating
Class
USD I Distributing
Class For the Year Ended 31 December 2019 Redeemable Participating Shares Shares in issue at start of year – 1,860,556,734 2,240,036 198,615 363,907 21,653 95,933 260,219 6,013,823 415,526
Redeemable Participating Shares issued 2,376 145,648,297 379,581 39,159 504,092 – 121,625 232,940 1,800,112 154,238
Redeemable Participating Shares redeemed – (619,293,681) (1,074,087) (49,049) (677,334) (8,166) (189,310) (384,409) (2,892,586) (85,271)
Shares in issue at end of year 2,376 1,386,911,350 1,545,530 188,725 190,665 13,487 28,248 108,750 4,921,349 484,493
For the Year Ended 31 December 2018 Redeemable Participating Shares Shares in issue at start of year – 2,331,122,479 3,186,080 40,450 175,016 30,327 29,427 41,430 9,403,368 1,474,686
Redeemable Participating Shares issued – 441,924,438 479,785 212,767 1,766,002 20,129 596,705 1,153,237 5,314,714 385,409
Redeemable Participating Shares redeemed – (912,490,183) (1,425,829) (54,602) (1,577,111) (28,803) (530,199) (934,448) (8,704,259) (1,444,569)
Shares in issue at end of year – 1,860,556,734 2,240,036 198,615 363,907 21,653 95,933 260,219 6,013,823 415,526 * Share class launched or closed during the current or prior reporting year.

NOTES TO THE AUDITED FINANCIAL STATEMENTS FINANCIAL STATEMENTS
ANNUAL REPORT 2019 1013
FOR THE YEAR ENDED 31 DECEMBER 2019
5. SHARE CAPITAL (CONTINUED)
Neuberger Berman US Small Cap Fund (continued)
USD I2 Accumulating
Class
USD I3 Accumulating
Class*
USD M Accumulating
Class
USD T Accumulating
Class
USD Z Accumulating
Class
ZAR E Accumulating
Class
ZAR T Accumulating
Class
For the Year Ended 31 December 2019
Redeemable Participating Shares
Shares in issue at start of year 16,166 8,056 2,514,369 210,326 3,686 189,802 141,067
Redeemable Participating Shares issued 58,000 195 3,534,414 262,736 380 26,804 195,333
Redeemable Participating Shares redeemed (40,000) (52) (208,540) (337,950) – (207,825) (299,207)
Shares in issue at end of year 34,166 8,199 5,840,243 135,112 4,066 8,781 37,193
For the Year Ended 31 December 2018
Redeemable Participating Shares
Shares in issue at start of year 78,055 – 3,434,097 120,414 1,103,343 13,881 22,115
Redeemable Participating Shares issued 70,111 8,096 2,570,871 714,144 3,190 317,870 559,440
Redeemable Participating Shares redeemed (132,000) (40) (3,490,599) (624,232) (1,102,847) (141,949) (440,488)
Shares in issue at end of year 16,166 8,056 2,514,369 210,326 3,686 189,802 141,067
* Share class launched or closed during the current or prior reporting year.

FINANCIAL STATEMENTS NOTES TO THE AUDITED FINANCIAL STATEMENTS
1014 NEUBERGER BERMAN INVESTMENT FUNDS PLC
FOR THE YEAR ENDED 31 DECEMBER 2019
5. SHARE CAPITAL (CONTINUED)
Neuberger Berman Short Duration High Yield Bond Fund
AUD A (Monthly)
Distributing Class
CHF A Accumulating
Class
CHF I Accumulating
Class
CHF I2 Accumulating
Class
CHF I3 Distributing
Class
CNY A (Monthly)
Distributing Class
EUR A Accumulating
Class
EUR A Distributing
Class
EUR I Accumulating
Class
For the Year Ended 31 December 2019
Redeemable Participating Shares
Shares in issue at start of year 128,679 132,417 82,717 5,090 1,593,625 53,528 2,269,708 978,990 1,360,361
Redeemable Participating Shares issued 56,828 – 2,924 – – 644 359,130 72,709 1,173,383
Redeemable Participating Shares redeemed (63,977) (14,492) (1,150) – – (32,783) (937,055) (202,697) (919,742)
Shares in issue at end of year 121,530 117,925 84,491 5,090 1,593,625 21,389 1,691,783 849,002 1,614,002
For the Year Ended 31 December 2018
Redeemable Participating Shares
Shares in issue at start of year 130,446 203,957 99,653 8,840 1,593,625 26,877 5,812,225 1,124,790 7,772,100
Redeemable Participating Shares issued 8,584 – 5,709 – – 32,138 481,658 146,311 1,237,426
Redeemable Participating Shares redeemed (10,351) (71,540) (22,645) (3,750) – (5,487) (4,024,175) (292,111) (7,649,165)
Shares in issue at end of year 128,679 132,417 82,717 5,090 1,593,625 53,528 2,269,708 978,990 1,360,361
* Share class launched or closed during the current or prior reporting year.

NOTES TO THE AUDITED FINANCIAL STATEMENTS FINANCIAL STATEMENTS
ANNUAL REPORT 2019 1015
FOR THE YEAR ENDED 31 DECEMBER 2019
5. SHARE CAPITAL (CONTINUED)
Neuberger Berman Short Duration High Yield Bond Fund (continued)
EUR I Distributing
Class
EUR I2 Accumulating
Class
EUR I2 Distributing
Class
EUR I3 Distributing
Class
EUR M Accumulating
Class
EUR M Distributing
Class
GBP A Distributing
Class*
GBP IAccumulating
Class
GBP I Distributing
Class
GBP I2 Accumulating
Class For the Year Ended 31 December 2019 Redeemable Participating Shares Shares in issue at start of year 92,370 297,161 62,615 25,988,571 348,423 114,126 1,041 1,064,903 1,425,842 125,043
Redeemable Participating Shares issued – 76,593 20,249 2,078,714 29,986 8,736 – 502,074 155,609 31,006
Redeemable Participating Shares redeemed (32,370) (44,910) (6,111) – (83,312) (37,504) (1,041) (456,799) (1,018,008) (28,940)
Shares in issue at end of year 60,000 328,844 76,753 28,067,285 295,097 85,358 – 1,110,178 563,443 127,109
For the Year Ended 31 December 2018 Redeemable Participating Shares Shares in issue at start of year 753,566 530,821 49,412 25,392,611 403,385 134,390 86,011 620,136 4,996,383 192,386
Redeemable Participating Shares issued 23,435 8,500 20,753 2,587,992 32,412 26,122 1,041 473,929 908,758 3,166
Redeemable Participating Shares redeemed (684,631) (242,160) (7,550) (1,992,032) (87,374) (46,386) (86,011) (29,162) (4,479,299) (70,509)
Shares in issue at end of year 92,370 297,161 62,615 25,988,571 348,423 114,126 1,041 1,064,903 1,425,842 125,043 * Share class launched or closed during the current or prior reporting year.

FINANCIAL STATEMENTS NOTES TO THE AUDITED FINANCIAL STATEMENTS
1016 NEUBERGER BERMAN INVESTMENT FUNDS PLC
FOR THE YEAR ENDED 31 DECEMBER 2019
5. SHARE CAPITAL (CONTINUED)
Neuberger Berman Short Duration High Yield Bond Fund (continued)
GBP I2 Distributing
Class
JPY I Accumulating
Class
SGD A (Monthly)
Distributing Class
SGD AAccumulating
Class*
USD A (Monthly)
Distributing Class
USD A Accumulating
Class
USD ADistributing
Class
USD B (Monthly)
Distributing Class*
For the Year Ended 31 December 2019
Redeemable Participating Shares
Shares in issue at start of year 1,582,912 20,732,546 107,124 – 506,602 3,000,309 2,092,500 1,069
Redeemable Participating Shares issued 1,435,888 505,163 38,091 – 69,191 607,636 85,031 –
Redeemable Participating Shares redeemed (460,627) (3,007,439) (125,931) – (267,821) (656,841) (780,834) (1,069)
Shares in issue at end of year 2,558,173 18,230,270 19,284 – 307,972 2,951,104 1,396,697 –
For the Year Ended 31 December 2018
Redeemable Participating Shares
Shares in issue at start of year 2,871,800 27,699,476 150,700 14,536 900,662 5,338,992 1,600,421 1,069
Redeemable Participating Shares issued 294,987 281,924 15,432 – 85,103 453,287 644,254 1,068
Redeemable Participating Shares redeemed (1,583,875) (7,248,854) (59,008) (14,536) (479,163) (2,791,970) (152,175) (1,068)
Shares in issue at end of year 1,582,912 20,732,546 107,124 – 506,602 3,000,309 2,092,500 1,069
* Share class launched or closed during the current or prior reporting year.

NOTES TO THE AUDITED FINANCIAL STATEMENTS FINANCIAL STATEMENTS
ANNUAL REPORT 2019 1017
FOR THE YEAR ENDED 31 DECEMBER 2019
5. SHARE CAPITAL (CONTINUED)
Neuberger Berman Short Duration High Yield Bond Fund (continued)
USD C Accumulating
Class
USD C Distributing
Class
USD C1 Accumulating
Class
USD I Accumulating
Class
USD I Distributing
Class
USD I2Accumulating
Class
For the Year Ended 31 December 2019
Redeemable Participating Shares
Shares in issue at start of year 77,743 45,172 510,273 15,147,713 3,520,342 7,852,728
Redeemable Participating Shares issued – 182 1,057,303 2,642,435 9,846,977 389,703
Redeemable Participating Shares redeemed (38,912) (28,698) (116,951) (3,164,907) (1,558,390) (7,662,644)
Shares in issue at end of year 38,831 16,656 1,450,625 14,625,241 11,808,929 579,787
For the Year Ended 31 December 2018
Redeemable Participating Shares
Shares in issue at start of year 144,963 79,765 16,568 22,776,152 2,901,231 416,829
Redeemable Participating Shares issued – 22,135 496,705 1,225,365 1,292,016 7,601,875
Redeemable Participating Shares redeemed (67,220) (56,728) (3,000) (8,853,804) (672,905) (165,976)
Shares in issue at end of year 77,743 45,172 510,273 15,147,713 3,520,342 7,852,728

FINANCIAL STATEMENTS NOTES TO THE AUDITED FINANCIAL STATEMENTS
1018 NEUBERGER BERMAN INVESTMENT FUNDS PLC
FOR THE YEAR ENDED 31 DECEMBER 2019
5. SHARE CAPITAL (CONTINUED)
Neuberger Berman Short Duration High Yield Bond Fund (continued)
USD I2 Distributing
Class
USD M Accumulating
Class
USD M Distributing
Class
USD T (Monthly)
Distributing Class*
USD Z Accumulating
Class
For the Year Ended 31 December 2019
Redeemable Participating Shares
Shares in issue at start of year 744,765 61,719 2,479 1,051 1,020,006
Redeemable Participating Shares issued 122,322 304,043 93,987 – 203,964
Redeemable Participating Shares redeemed (499,175) (82,617) (7,279) (1,051) –
Shares in issue at end of year 367,912 283,145 89,187 – 1,223,970
For the Year Ended 31 December 2018
Redeemable Participating Shares
Shares in issue at start of year 970,990 31,140 1,478 1,051 203,976
Redeemable Participating Shares issued 507,222 48,417 1,001 – 1,069,084
Redeemable Participating Shares redeemed (733,447) (17,838) – – (253,054)
Shares in issue at end of year 744,765 61,719 2,479 1,051 1,020,006
* Share class launched or closed during the current or prior reporting year.

NOTES TO THE AUDITED FINANCIAL STATEMENTS FINANCIAL STATEMENTS
ANNUAL REPORT 2019 1019
FOR THE YEAR ENDED 31 DECEMBER 2019
5. SHARE CAPITAL (CONTINUED)
Neuberger Berman Global Bond Fund
USD A Accumulating
Class
USD C1 Accumulating
Class*
USD I Accumulating
Class
USD M Accumulating
Class*
USD M Distributing
Class*
USD Z Accumulating
Class
For the Year Ended 31 December 2019
Redeemable Participating Shares
Shares in issue at start of year 3,237 5,000 3,210 22,524 9,900 13,665,345
Redeemable Participating Shares issued 24,658 91,676 836,122 59,110 – 4,802,127
Redeemable Participating Shares redeemed (600) (32,722) (155,292) (21,917) – (1,342,805)
Shares in issue at end of year 27,295 63,954 684,040 59,717 9,900 17,124,667
For the Year Ended 31 December 2018
Redeemable Participating Shares
Shares in issue at start of year 1,068 – 3,210 – – 12,206,018
Redeemable Participating Shares issued 3,721 5,000 – 22,524 9,900 1,989,932
Redeemable Participating Shares redeemed (1,552) – – – – (530,605)
Shares in issue at end of year 3,237 5,000 3,210 22,524 9,900 13,665,345
* Share class launched or closed during the current or prior reporting year.

FINANCIAL STATEMENTS NOTES TO THE AUDITED FINANCIAL STATEMENTS
1020 NEUBERGER BERMAN INVESTMENT FUNDS PLC
FOR THE YEAR ENDED 31 DECEMBER 2019
5. SHARE CAPITAL (CONTINUED)
Neuberger Berman Emerging Market Debt - Local Currency Fund
AUD B (Monthly)
Distributing Class
AUD B Accumulating
Class
AUD C2 (Monthly)
Distributing Class
AUD C2 Accumulating
Class
AUD E (Monthly)
Distributing Class
AUD E Accumulating
Class
AUD T (Monthly)
Distributing Class
AUD T Accumulating
Class
For the Year Ended 31 December 2019
Redeemable Participating Shares
Shares in issue at start of year 7,792,108 161,978 3,528,296 164,503 4,064,826 321,712 4,001,102 136,722
Redeemable Participating Shares issued 2,032,697 179,167 1,515,420 149,629 1,173,474 40,862 5,282,770 181,734
Redeemable Participating Shares redeemed (1,756,458) (121,450) (2,165,482) (127,917) (1,257,313) (121,881) (2,444,279) (153,763)
Shares in issue at end of year 8,068,347 219,695 2,878,234 186,215 3,980,987 240,693 6,839,593 164,693
For the Year Ended 31 December 2018
Redeemable Participating Shares
Shares in issue at start of year 3,655,728 64,084 1,610,075 83,071 1,530,589 134,161 1,127,927 29,814
Redeemable Participating Shares issued 5,971,321 210,531 2,847,185 206,382 3,632,908 239,891 6,025,419 224,605
Redeemable Participating Shares redeemed (1,834,941) (112,637) (928,964) (124,950) (1,098,671) (52,340) (3,152,244) (117,697)
Shares in issue at end of year 7,792,108 161,978 3,528,296 164,503 4,064,826 321,712 4,001,102 136,722

NOTES TO THE AUDITED FINANCIAL STATEMENTS FINANCIAL STATEMENTS
ANNUAL REPORT 2019 1021
FOR THE YEAR ENDED 31 DECEMBER 2019
5. SHARE CAPITAL (CONTINUED)
Neuberger Berman Emerging Market Debt - Local Currency Fund (continued)
EUR A Accumulating
Class
EUR A Accumulating
Unhedged Class*
EUR I Accumulating
Class
EUR I Accumulating
Unhedged Class
EUR I2 Accumulating
Unhedged Class
EUR I3 Distributing
Unhedged Class*
EUR I4 Accumulating
Unhedged Class
EUR I4 Distributing
Unhedged Class
EUR I5 Accumulating
Unhedged Class*
For the Year Ended 31 December 2019 Redeemable Participating Shares Shares in issue at start of year 879,319 898 6,460,457 18,914,898 4,699,441 – 44,129 2,575,012 –
Redeemable Participating Shares issued 10,632,668 – 1,432,304 5,658,132 – 1,355,538 11,170 – 5,381,624
Redeemable Participating Shares redeemed (2,955,838) (898) (4,526,330) (4,108,137) – – (2,315) – (371,402)
Shares in issue at end of year 8,556,149 – 3,366,431 20,464,893 4,699,441 1,355,538 52,984 2,575,012 5,010,222
For the Year Ended 31 December 2018 Redeemable Participating Shares Shares in issue at start of year 203,713 898 5,177,787 3,689,232 4,699,441 – 47,619 2,575,012 –
Redeemable Participating Shares issued 931,013 – 5,431,056 20,480,954 – – 34,685 – –
Redeemable Participating Shares redeemed (255,407) – (4,148,386) (5,255,288) – – (38,175) – –
Shares in issue at end of year 879,319 898 6,460,457 18,914,898 4,699,441 – 44,129 2,575,012 – * Share class launched or closed during the current or prior reporting year.

FINANCIAL STATEMENTS NOTES TO THE AUDITED FINANCIAL STATEMENTS
1022 NEUBERGER BERMAN INVESTMENT FUNDS PLC
FOR THE YEAR ENDED 31 DECEMBER 2019
5. SHARE CAPITAL (CONTINUED)
Neuberger Berman Emerging Market Debt - Local Currency Fund (continued)
EUR M Accumulating
Unhedged Class
EUR M Distributing
Unhedged Class
GBP I Accumulating
Class
GBP I4 Accumulating
Unhedged Class
GBP I4 Distributing
Unhedged Class
GBP I5 Accumulating
Unhedged Class*
For the Year Ended 31 December 2019
Redeemable Participating Shares
Shares in issue at start of year 21,621 46,097 1,011 23,693,821 6,082,402 10,240,591
Redeemable Participating Shares issued 15,712 6,643 7,903 1,677,932 4,324,412 1,093,454
Redeemable Participating Shares redeemed (16,586) (7,747) – (947,222) (2,503,227) (4,177,996)
Shares in issue at end of year 20,747 44,993 8,914 24,424,531 7,903,587 7,156,049
For the Year Ended 31 December 2018
Redeemable Participating Shares
Shares in issue at start of year 10,736 36,310 1,011 15,280,518 12,207,906 –
Redeemable Participating Shares issued 19,541 19,869 – 21,252,128 3,079,318 11,214,063
Redeemable Participating Shares redeemed (8,656) (10,082) – (12,838,825) (9,204,822) (973,472)
Shares in issue at end of year 21,621 46,097 1,011 23,693,821 6,082,402 10,240,591
* Share class launched or closed during the current or prior reporting year.

NOTES TO THE AUDITED FINANCIAL STATEMENTS FINANCIAL STATEMENTS
ANNUAL REPORT 2019 1023
FOR THE YEAR ENDED 31 DECEMBER 2019
5. SHARE CAPITAL (CONTINUED)
Neuberger Berman Emerging Market Debt - Local Currency Fund (continued)
SEK A Accumulating
Class
SGD A (Monthly)
Distributing Class
USD A (Monthly)
Distributing Class
USD A Accumulating
Class
USD B (Monthly)
Distributing Class
USD B Accumulating
Class
USD C1Accumulating
Class
USD C2 (Monthly)
Distributing Class
USD C2 Accumulating
Class
USD E (Monthly)
Distributing Class
For the Year Ended 31 December 2019 Redeemable Participating Shares Shares in issue at start of year 14,380,155 89,030 201,278 5,132,024 14,688,903 638,325 31,188 4,423,055 338,103 4,702,100
Redeemable Participating Shares issued 93,828 636,314 384,173 7,616,649 8,283,823 571,537 24,860 1,524,438 216,478 2,468,893
Redeemable Participating Shares redeemed (3,984,564) (579,022) (65,261) (7,241,046) (5,759,395) (470,439) (24,971) (2,343,119) (215,927) (1,562,573)
Shares in issue at end of year 10,489,419 146,322 520,190 5,507,627 17,213,331 739,423 31,077 3,604,374 338,654 5,608,420
For the Year Ended 31 December 2018
Redeemable Participating Shares Shares in issue at start of year 17,997,642 84,551 49,710 8,149,997 8,343,675 188,358 5,891 1,824,101 132,793 2,285,623
Redeemable Participating Shares issued 7,759,374 418,262 314,369 5,766,437 12,876,501 983,257 642,355 4,588,305 639,323 4,164,759
Redeemable Participating Shares redeemed (11,376,861) (413,783) (162,801) (8,784,410) (6,531,273) (533,290) (617,058) (1,989,351) (434,013) (1,748,282)
Shares in issue at end of year 14,380,155 89,030 201,278 5,132,024 14,688,903 638,325 31,188 4,423,055 338,103 4,702,100

FINANCIAL STATEMENTS NOTES TO THE AUDITED FINANCIAL STATEMENTS
1024 NEUBERGER BERMAN INVESTMENT FUNDS PLC
FOR THE YEAR ENDED 31 DECEMBER 2019
5. SHARE CAPITAL (CONTINUED)
Neuberger Berman Emerging Market Debt - Local Currency Fund (continued)
USD E Accumulating
Class
USD I (Monthly)
Distributing Class*
USD I Accumulating
Class
USD I Distributing
Class
USD I2 Accumulating
Class
USD I4Accumulating
Class*
USD I5 Accumulating
Class*
USD M Accumulating
Class
USD MDistributing
Class*
For the Year Ended 31 December 2019
Redeemable Participating Shares
Shares in issue at start of year 492,186 1,136 49,821,330 4,324,589 13,271,006 – 17,621,504 3,891 –
Redeemable Participating Shares issued 273,395 – 18,604,640 1,117,688 12,689,410 – 11,320,777 9,989 2,000
Redeemable Participating Shares redeemed (291,522) – (5,483,323) (2,465,921) (12,972,842) – (1,672,062) (7,722) –
Shares in issue at end of year 474,059 1,136 62,942,647 2,976,356 12,987,574 – 27,270,219 6,158 2,000
For the Year Ended 31 December 2018
Redeemable Participating Shares
Shares in issue at start of year 199,667 – 40,835,502 2,089,807 29,430,717 10,834,988 – 2,464 –
Redeemable Participating Shares issued 816,911 965,344 30,625,107 2,264,708 6,860,032 4,316,246 17,838,949 36,106 –
Redeemable Participating Shares redeemed (524,392) (964,208) (21,639,279) (29,926) (23,019,743) (15,151,234) (217,445) (34,679) –
Shares in issue at end of year 492,186 1,136 49,821,330 4,324,589 13,271,006 – 17,621,504 3,891 –
* Share class launched or closed during the current or prior reporting year.

NOTES TO THE AUDITED FINANCIAL STATEMENTS FINANCIAL STATEMENTS
ANNUAL REPORT 2019 1025
FOR THE YEAR ENDED 31 DECEMBER 2019
5. SHARE CAPITAL (CONTINUED)
Neuberger Berman Emerging Market Debt - Local Currency Fund (continued)
USD T (Monthly)
Distributing Class
USD T Accumulating
Class
USD XAccumulating
Class
ZAR B(Monthly)
DistributingClass
ZAR B Accumulating
Class
ZAR C2 (Monthly)
Distributing Class
ZAR C2 Accumulating
Class
ZAR E (Monthly)
Distributing Class
ZAR E Accumulating
Class
For the Year Ended 31 December 2019
Redeemable Participating Shares
Shares in issue at start of year 4,799,357 271,973 16,508,962 13,050,269 347,086 5,480,505 122,830 5,609,946 232,446
Redeemable Participating Shares issued 7,485,357 4,949,396 1,223,353 7,765,452 187,124 1,629,201 108,788 3,857,159 217,321
Redeemable Participating Shares redeemed (4,184,164) (4,907,056) (624,052) (4,602,256) (167,666) (2,552,670) (113,540) (2,182,913) (212,814)
Shares in issue at end of year 8,100,550 314,313 17,108,263 16,213,465 366,544 4,557,036 118,078 7,284,192 236,953
For the Year Ended 31 December 2018
Redeemable Participating Shares
Shares in issue at start of year 1,491,328 117,674 13,713,823 5,261,729 125,640 2,282,460 88,803 1,818,872 41,938
Redeemable Participating Shares issued 6,538,928 715,564 3,337,566 12,494,384 414,461 4,586,161 131,524 5,071,645 349,442
Redeemable Participating Shares redeemed (3,230,899) (561,265) (542,427) (4,705,844) (193,015) (1,388,116) (97,497) (1,280,571) (158,934)
Shares in issue at end of year 4,799,357 271,973 16,508,962 13,050,269 347,086 5,480,505 122,830 5,609,946 232,446

FINANCIAL STATEMENTS NOTES TO THE AUDITED FINANCIAL STATEMENTS
1026 NEUBERGER BERMAN INVESTMENT FUNDS PLC
FOR THE YEAR ENDED 31 DECEMBER 2019
5. SHARE CAPITAL (CONTINUED)
Neuberger Berman Emerging Market Debt - Local Currency Fund (continued)
ZAR T (Monthly)
Distributing Class
ZAR T Accumulating
Class
For the Year Ended 31 December 2019 Redeemable Participating Shares Shares in issue at start of year 9,633,050 373,040
Redeemable Participating Shares issued 16,320,057 411,731
Redeemable Participating Shares redeemed (9,140,760) (396,775)
Shares in issue at end of year 16,812,347 387,996
For the Year Ended 31 December 2018
Redeemable Participating Shares Shares in issue at start of year 1,219,807 129,100
Redeemable Participating Shares issued 15,040,446 491,099
Redeemable Participating Shares redeemed (6,627,203) (247,159)
Shares in issue at end of year 9,633,050 373,040

NOTES TO THE AUDITED FINANCIAL STATEMENTS FINANCIAL STATEMENTS
ANNUAL REPORT 2019 1027
FOR THE YEAR ENDED 31 DECEMBER 2019
5. SHARE CAPITAL (CONTINUED)
Neuberger Berman Emerging Market Debt - Hard Currency Fund
AUD A (Monthly)
Distributing Class*
CHF P Accumulating
Class*
EUR A (Monthly)
Distributing Class*
EUR A Accumulating
Class
EUR I Accumulating
Class
EUR I Accumulating
Unhedged Class*
EUR I Distributing
Class
EUR I2 Accumulating
Class*
For the Year Ended 31 December 2019
Redeemable Participating Shares
Shares in issue at start of year – 817,514 38,883 2,486,925 24,678,669 – 15,858,530 –
Redeemable Participating Shares issued 613,759 1,804,829 1,798,689 3,041,933 12,544,457 100,000 12,656,143 7,957,440
Redeemable Participating Shares redeemed (116,573) (102,589) (685,743) (2,515,476) (14,389,045) – (5,012,237) –
Shares in issue at end of year 497,186 2,519,754 1,151,829 3,013,382 22,834,081 100,000 23,502,436 7,957,440
For the Year Ended 31 December 2018
Redeemable Participating Shares
Shares in issue at start of year – – – 2,600,964 15,964,074 – 8,194,094 –
Redeemable Participating Shares issued – 1,008,029 38,883 1,572,071 17,182,499 – 7,946,463 –
Redeemable Participating Shares redeemed – (190,515) – (1,686,110) (8,467,904) – (282,027) –
Shares in issue at end of year – 817,514 38,883 2,486,925 24,678,669 – 15,858,530 –
* Share class launched or closed during the current or prior reporting year.

FINANCIAL STATEMENTS NOTES TO THE AUDITED FINANCIAL STATEMENTS
1028 NEUBERGER BERMAN INVESTMENT FUNDS PLC
FOR THE YEAR ENDED 31 DECEMBER 2019
5. SHARE CAPITAL (CONTINUED)
Neuberger Berman Emerging Market Debt - Hard Currency Fund (continued)
EUR I2 Accumulating
Unhedged Class*
EUR I2 Distributing
Class*
EUR I3 Accumulating
Class
EUR I3 Accumulating
Unhedged Class*
EUR I3 Distributing
Class*
EUR I4 Accumulating
Class
EUR I5 Accumulating
Class*
EUR MAccumulating
Class
EUR M Distributing
Class
EUR P Accumulating
Class* For the Year Ended 31 December 2019 Redeemable Participating Shares Shares in issue at start of year – – 5,506,489 – – 7,338,709 – 76,438 95,404 446,027
Redeemable Participating Shares issued 4,656,617 1,150,000 818,669 7,223,666 694,055 97,850 – 85,934 1,720 1,044,844
Redeemable Participating Shares redeemed (4,656,617) – (2,871,990) (113,716) – (4,413,929) – (27,537) (11,115) (559,185)
Shares in issue at end of year – 1,150,000 3,453,168 7,109,950 694,055 3,022,630 – 134,835 86,009 931,686
For the Year Ended 31 December 2018 Redeemable Participating Shares Shares in issue at start of year – – 5,708,112 – – 7,298,229 134,460 66,771 80,460 –
Redeemable Participating Shares issued – – 1,220,160 – – 595,630 41,117 25,940 41,933 472,992
Redeemable Participating Shares redeemed – – (1,421,783) – – (555,150) (175,577) (16,273) (26,989) (26,965)
Shares in issue at end of year – – 5,506,489 – – 7,338,709 – 76,438 95,404 446,027 * Share class launched or closed during the current or prior reporting year.

NOTES TO THE AUDITED FINANCIAL STATEMENTS FINANCIAL STATEMENTS
ANNUAL REPORT 2019 1029
FOR THE YEAR ENDED 31 DECEMBER 2019
5. SHARE CAPITAL (CONTINUED)
Neuberger Berman Emerging Market Debt - Hard Currency Fund (continued)
EUR Z Accumulating
Class*
GBP I Accumulating
Class
GBP I Distributing
Class*
GBP I2 Accumulating
Class*
GBP I2 Distributing
Class
GBP P Accumulating
Class*
HKD A (Monthly)
Distributing Class*
JPY I Accumulating
Class
SEK A Accumulating
Class
SGD A (Monthly)
Distributing Class
For the Year Ended 31 December 2019 Redeemable Participating Shares Shares in issue at start of year 21,308 58,376 1,116,659 672,152 96,026 978 – 2,000,000 6,025,477 1,117,863
Redeemable Participating Shares issued – 149,882 1,100,895 7,389 111,956 312,966 3,258,099 – 3,032,246 1,404,305
Redeemable Participating Shares redeemed – (4,310) (1,855,744) (134,199) (12,355) (7) (1,719,467) – (6,418,423) (1,138,852)
Shares in issue at end of year 21,308 203,948 361,810 545,342 195,627 313,937 1,538,632 2,000,000 2,639,300 1,383,316
For the Year Ended 31 December 2018 Redeemable Participating Shares Shares in issue at start of year – 3,548 – – 354,815 – – 2,000,000 244,984 936,219
Redeemable Participating Shares issued 21,308 55,738 1,134,062 1,050,255 55,933 978 – – 6,389,889 376,651
Redeemable Participating Shares redeemed – (910) (17,403) (378,103) (314,722) – – – (609,396) (195,007)
Shares in issue at end of year 21,308 58,376 1,116,659 672,152 96,026 978 – 2,000,000 6,025,477 1,117,863 * Share class launched or closed during the current or prior reporting year.

FINANCIAL STATEMENTS NOTES TO THE AUDITED FINANCIAL STATEMENTS
1030 NEUBERGER BERMAN INVESTMENT FUNDS PLC
FOR THE YEAR ENDED 31 DECEMBER 2019
5. SHARE CAPITAL (CONTINUED)
Neuberger Berman Emerging Market Debt - Hard Currency Fund (continued)
USD A (Monthly)
Distributing Class
USD A Accumulating
Class
USD C1Accumulating
Class
USD I Accumulating
Class
USD I Distributing
Class
USD I2 Accumulating
Class
USD I2 Distributing
Class*
USD I3 Distributing
Class*
USD M Accumulating
Class
For the Year Ended 31 December 2019
Redeemable Participating Shares
Shares in issue at start of year 9,361,302 7,983,083 1,718,836 14,805,009 5,786,474 7,354,770 961,903 – 1,677,006
Redeemable Participating Shares issued 9,154,669 8,597,222 2,390,446 49,751,193 5,374,602 1,885,539 941,098 13,514,838 2,840,193
Redeemable Participating Shares redeemed (4,774,457) (4,020,221) (925,651) (16,373,901) (2,314,237) (7,161,549) (655,243) – (1,124,074)
Shares in issue at end of year 13,741,514 12,560,084 3,183,631 48,182,301 8,846,839 2,078,760 1,247,758 13,514,838 3,393,125
For the Year Ended 31 December 2018
Redeemable Participating Shares
Shares in issue at start of year 6,302,791 5,659,316 921,126 9,300,538 3,656,145 2,015,192 – – 1,140,481
Redeemable Participating Shares issued 9,322,871 5,632,107 1,077,589 14,357,970 3,914,284 5,572,279 1,053,629 – 1,045,494
Redeemable Participating Shares redeemed (6,264,360) (3,308,340) (279,879) (8,853,499) (1,783,955) (232,701) (91,726) – (508,969)
Shares in issue at end of year 9,361,302 7,983,083 1,718,836 14,805,009 5,786,474 7,354,770 961,903 – 1,677,006
* Share class launched or closed during the current or prior reporting year.

NOTES TO THE AUDITED FINANCIAL STATEMENTS FINANCIAL STATEMENTS
ANNUAL REPORT 2019 1031
FOR THE YEAR ENDED 31 DECEMBER 2019
5. SHARE CAPITAL (CONTINUED)
Neuberger Berman Emerging Market Debt - Hard Currency Fund (continued)
USD M Distributing
Class
USD P Accumulating
Class*
USD Z Accumulating
Class
For the Year Ended 31 December 2019 Redeemable Participating Shares Shares in issue at start of year 325,884 7,548,845 3,161,670
Redeemable Participating Shares issued 482,243 1,825,375 398,137
Redeemable Participating Shares redeemed (57,103) (4,045,454) (2,175,117)
Shares in issue at end of year 751,024 5,328,766 1,384,690
For the Year Ended 31 December 2018
Redeemable Participating Shares Shares in issue at start of year 160,559 – 1,042,352
Redeemable Participating Shares issued 215,105 9,067,651 2,175,816
Redeemable Participating Shares redeemed (49,780) (1,518,806) (56,498)
Shares in issue at end of year 325,884 7,548,845 3,161,670 * Share class launched or closed during the current or prior reporting year.

FINANCIAL STATEMENTS NOTES TO THE AUDITED FINANCIAL STATEMENTS
1032 NEUBERGER BERMAN INVESTMENT FUNDS PLC
FOR THE YEAR ENDED 31 DECEMBER 2019
5. SHARE CAPITAL (CONTINUED)
Neuberger Berman Emerging Market Corporate Debt Fund
CHF A Accumulating
Class
CHF I Accumulating
Class
CHF I2 Accumulating
Class
CHF I4 Accumulating
Class*
CHF I5 Accumulating
Class
EUR A Accumulating
Class
EUR I Accumulating
Class
EUR I Distributing
Class
EUR I2 Accumulating
Class
EUR I3 Accumulating
Class For the Year Ended 31 December 2019 Redeemable Participating Shares Shares in issue at start of year 58,558 1,803,450 40,000 – 259,243 305,330 16,842 30,840 2,481 169,995
Redeemable Participating Shares issued – 1,017,750 – 1,300,000 4,100 88,198 885,750 27,000 – 33,276
Redeemable Participating Shares redeemed (17,020) (613,500) – – (177,800) (50,461) (453,207) (8,100) – (23,656)
Shares in issue at end of year 41,538 2,207,700 40,000 1,300,000 85,543 343,067 449,385 49,740 2,481 179,615
For the Year Ended 31 December 2018 Redeemable Participating Shares Shares in issue at start of year 95,957 1,584,350 9,940 – 260,843 302,584 22,172 906,531 77,000 100,750
Redeemable Participating Shares issued 15,000 220,000 40,000 – 21,700 9,776 2,157 54,387 2,481 84,091
Redeemable Participating Shares redeemed (52,399) (900) (9,940) – (23,300) (7,030) (7,487) (930,078) (77,000) (14,846)
Shares in issue at end of year 58,558 1,803,450 40,000 – 259,243 305,330 16,842 30,840 2,481 169,995 * Share class launched or closed during the current or prior reporting year.
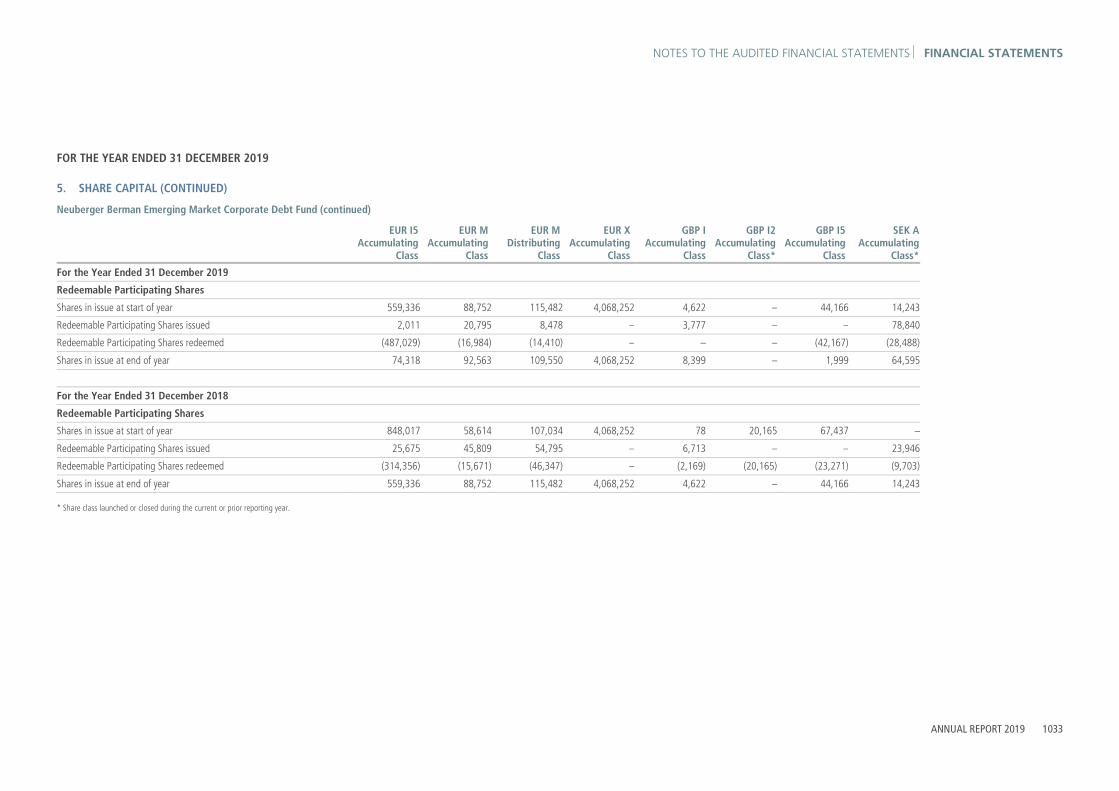
NOTES TO THE AUDITED FINANCIAL STATEMENTS FINANCIAL STATEMENTS
ANNUAL REPORT 2019 1033
FOR THE YEAR ENDED 31 DECEMBER 2019
5. SHARE CAPITAL (CONTINUED)
Neuberger Berman Emerging Market Corporate Debt Fund (continued)
EUR I5 Accumulating
Class
EUR M Accumulating
Class
EUR M Distributing
Class
EUR X Accumulating
Class
GBP I Accumulating
Class
GBP I2 Accumulating
Class*
GBP I5 Accumulating
Class
SEK A Accumulating
Class*
For the Year Ended 31 December 2019
Redeemable Participating Shares
Shares in issue at start of year 559,336 88,752 115,482 4,068,252 4,622 – 44,166 14,243
Redeemable Participating Shares issued 2,011 20,795 8,478 – 3,777 – – 78,840
Redeemable Participating Shares redeemed (487,029) (16,984) (14,410) – – – (42,167) (28,488)
Shares in issue at end of year 74,318 92,563 109,550 4,068,252 8,399 – 1,999 64,595
For the Year Ended 31 December 2018
Redeemable Participating Shares
Shares in issue at start of year 848,017 58,614 107,034 4,068,252 78 20,165 67,437 –
Redeemable Participating Shares issued 25,675 45,809 54,795 – 6,713 – – 23,946
Redeemable Participating Shares redeemed (314,356) (15,671) (46,347) – (2,169) (20,165) (23,271) (9,703)
Shares in issue at end of year 559,336 88,752 115,482 4,068,252 4,622 – 44,166 14,243
* Share class launched or closed during the current or prior reporting year.

FINANCIAL STATEMENTS NOTES TO THE AUDITED FINANCIAL STATEMENTS
1034 NEUBERGER BERMAN INVESTMENT FUNDS PLC
FOR THE YEAR ENDED 31 DECEMBER 2019
5. SHARE CAPITAL (CONTINUED)
Neuberger Berman Emerging Market Corporate Debt Fund (continued)
SGD A (Monthly)
Distributing Class
USD A (Monthly)
Distributing Class
USD AAccumulating
Class
USD C1 Accumulating
Class
USD I Accumulating
Class
USD I Distributing
Class
USD I2 Accumulating
Class
USD I5 Accumulating
Class
USD M Accumulating
Class
USD M Distributing
Class For the Year Ended 31 December 2019 Redeemable Participating Shares Shares in issue at start of year 1,515 345,008 249,041 161,696 1,227,160 289,345 54,698 31,395 1,040 4,876
Redeemable Participating Shares issued 2,186 30,694 565,881 632,050 1,673,402 73,141 72,000 287,700 239,632 53,829
Redeemable Participating Shares redeemed (1,568) (10,754) (133,899) (25,699) (928,086) (65,559) (33,002) (20,694) (34,908) (4,876)
Shares in issue at end of year 2,133 364,948 681,023 768,047 1,972,476 296,927 93,696 298,401 205,764 53,829
For the Year Ended 31 December 2018 Redeemable Participating Shares Shares in issue at start of year 2,044 790,226 328,625 143,666 1,260,503 40,860 72,267 42,880 11,900 20,539
Redeemable Participating Shares issued 3,848 – 54,628 93,518 606,039 255,345 32,547 – 1,040 –
Redeemable Participating Shares redeemed (4,377) (445,218) (134,212) (75,488) (639,382) (6,860) (50,116) (11,485) (11,900) (15,663)
Shares in issue at end of year 1,515 345,008 249,041 161,696 1,227,160 289,345 54,698 31,395 1,040 4,876

NOTES TO THE AUDITED FINANCIAL STATEMENTS FINANCIAL STATEMENTS
ANNUAL REPORT 2019 1035
FOR THE YEAR ENDED 31 DECEMBER 2019
5. SHARE CAPITAL (CONTINUED)
Neuberger Berman Emerging Market Corporate Debt Fund (continued)
USD Z Accumulating
Class*
For the Year Ended 31 December 2019 Redeemable Participating Shares Shares in issue at start of year 103,624
Redeemable Participating Shares issued –
Redeemable Participating Shares redeemed (103,624)
Shares in issue at end of year –
For the Year Ended 31 December 2018
Redeemable Participating Shares Shares in issue at start of year 127,463
Redeemable Participating Shares issued 43,189
Redeemable Participating Shares redeemed (67,028)
Shares in issue at end of year 103,624 * Share class launched or closed during the current or prior reporting year.

FINANCIAL STATEMENTS NOTES TO THE AUDITED FINANCIAL STATEMENTS
1036 NEUBERGER BERMAN INVESTMENT FUNDS PLC
FOR THE YEAR ENDED 31 DECEMBER 2019
5. SHARE CAPITAL (CONTINUED)
Neuberger Berman Strategic Income Fund
AUD A (Monthly)
Distributing Class
AUD Z (Monthly)
Distributing Class*
EUR A (Monthly)
Distributing Class
EUR A Accumulating
Class
EUR I Accumulating
Class
EUR M Accumulating
Class
EUR MDistributing
Class
GBP A (Monthly)
Distributing Class
GBP I Accumulating
Class*
HKD A (Monthly)
Distributing Class
For the Year Ended 31 December 2019 Redeemable Participating Shares Shares in issue at start of year 527,785 – 895,783 201,373 115,865 44,449 31,596 78,776 – 2,185,913
Redeemable Participating Shares issued 434,683 10,168 1,255,899 103,833 61,153 119,988 1,835 132,776 2,376 215,738
Redeemable Participating Shares redeemed (118,205) – (237,061) (185,393) (29,163) (21,014) (2,377) (26,923) – (1,519,554)
Shares in issue at end of year 844,263 10,168 1,914,621 119,813 147,855 143,423 31,054 184,629 2,376 882,097
For the Year Ended 31 December 2018 Redeemable Participating Shares Shares in issue at start of year 383,126 – 202,635 11,852 96,073 18,728 41,089 23,514 – 2,560,213
Redeemable Participating Shares issued 232,116 – 1,104,648 189,521 89,775 30,487 11,432 64,794 – 1,704,908
Redeemable Participating Shares redeemed (87,457) – (411,500) – (69,983) (4,766) (20,925) (9,532) – (2,079,208)
Shares in issue at end of year 527,785 – 895,783 201,373 115,865 44,449 31,596 78,776 – 2,185,913 * Share class launched or closed during the current or prior reporting year.

NOTES TO THE AUDITED FINANCIAL STATEMENTS FINANCIAL STATEMENTS
ANNUAL REPORT 2019 1037
FOR THE YEAR ENDED 31 DECEMBER 2019
5. SHARE CAPITAL (CONTINUED)
Neuberger Berman Strategic Income Fund (continued)
JPY I Accumulating
Class
JPY I Accumulating
Unhedged Class
JPY I CG Distributing
Class
JPY IDistributing
Class
SGD A (Monthly)
Distributing Class
SGD A Accumulating
Class
SGD I (Monthly)
Distributing Class*
USD A (Monthly)
Distributing Class
USD A Accumulating
Class
USD A Distributing
Class For the Year Ended 31 December 2019 Redeemable Participating Shares Shares in issue at start of year 26,137,136 3,116,149 6,692,591 12,131,838 2,300,558 49,397 639,020 4,872,037 7,917,962 15,779
Redeemable Participating Shares issued 1,421,573 – – – 640,750 17,809 340,093 3,506,978 21,557,355 457,938
Redeemable Participating Shares redeemed (2,772,691) (758,260) (507) – (581,939) (3,350) (530,597) (2,118,067) (3,359,782) (2,450)
Shares in issue at end of year 24,786,018 2,357,889 6,692,084 12,131,838 2,359,369 63,856 448,516 6,260,948 26,115,535 471,267
For the Year Ended 31 December 2018 Redeemable Participating Shares Shares in issue at start of year 24,436,403 5,897,810 2,000,000 12,131,838 1,114,804 682 – 5,890,689 6,219,501 5,908
Redeemable Participating Shares issued 5,406,616 – 4,692,591 – 1,935,715 68,918 639,813 5,161,238 9,337,765 9,871
Redeemable Participating Shares redeemed (3,705,883) (2,781,661) – – (749,961) (20,203) (793) (6,179,890) (7,639,304) –
Shares in issue at end of year 26,137,136 3,116,149 6,692,591 12,131,838 2,300,558 49,397 639,020 4,872,037 7,917,962 15,779 * Share class launched or closed during the current or prior reporting year.

FINANCIAL STATEMENTS NOTES TO THE AUDITED FINANCIAL STATEMENTS
1038 NEUBERGER BERMAN INVESTMENT FUNDS PLC
FOR THE YEAR ENDED 31 DECEMBER 2019
5. SHARE CAPITAL (CONTINUED)
Neuberger Berman Strategic Income Fund (continued)
USD C1 Accumulating
Class
USD I Accumulating
Class
USD I Distributing
Class
USD I2 Accumulating
Class*
USD M Accumulating
Class
USD M Distributing
Class
USD T (Monthly)
Distributing Class*
USD Z Accumulating
Class
For the Year Ended 31 December 2019
Redeemable Participating Shares
Shares in issue at start of year 2,368,424 30,305,774 789,597 1,207 1,161,400 207,604 985 2,626,914
Redeemable Participating Shares issued 5,674,421 12,596,592 617,586 – 4,751,507 598,185 – 638,947
Redeemable Participating Shares redeemed (958,266) (13,322,395) (47,243) – (581,803) (58,585) (985) (1,009,841)
Shares in issue at end of year 7,084,579 29,579,971 1,359,940 1,207 5,331,104 747,204 – 2,256,020
For the Year Ended 31 December 2018
Redeemable Participating Shares
Shares in issue at start of year 1,860,610 37,632,160 1,173,384 – 698,174 225,694 985 2,582,563
Redeemable Participating Shares issued 1,381,493 4,424,440 484,106 1,207 857,131 95,170 – 2,049,766
Redeemable Participating Shares redeemed (873,679) (11,750,826) (867,893) – (393,905) (113,260) – (2,005,415)
Shares in issue at end of year 2,368,424 30,305,774 789,597 1,207 1,161,400 207,604 985 2,626,914
* Share class launched or closed during the current or prior reporting year.

NOTES TO THE AUDITED FINANCIAL STATEMENTS FINANCIAL STATEMENTS
ANNUAL REPORT 2019 1039
FOR THE YEAR ENDED 31 DECEMBER 2019
5. SHARE CAPITAL (CONTINUED)
Neuberger Berman Global Bond Absolute Return Fund
CNY C2 Accumulating
Class*
CNY T Accumulating
Class*
EUR I Accumulating
Class
EUR I4 Accumulating
Class*
EUR I4Distributing
Class
EUR I5 Accumulating
Class*
EUR M Accumulating
Class
For the Year Ended 31 December 2019
Redeemable Participating Shares
Shares in issue at start of year 693 681 1,034 1,132 701,149 964 103,320
Redeemable Participating Shares issued – – 2,258,707 – 73,000 – 2,449
Redeemable Participating Shares redeemed (693) (681) (173,679) (1,132) (555,018) (964) (61,149)
Shares in issue at end of year – – 2,086,062 – 219,131 – 44,620
For the Year Ended 31 December 2018
Redeemable Participating Shares
Shares in issue at start of year 693 681 1,034 1,132 401,149 964 17,243
Redeemable Participating Shares issued 693 – 30,000 – 300,000 – 101,153
Redeemable Participating Shares redeemed (693) – (30,000) – – – (15,076)
Shares in issue at end of year 693 681 1,034 1,132 701,149 964 103,320
* Share class launched or closed during the current or prior reporting year.

FINANCIAL STATEMENTS NOTES TO THE AUDITED FINANCIAL STATEMENTS
1040 NEUBERGER BERMAN INVESTMENT FUNDS PLC
FOR THE YEAR ENDED 31 DECEMBER 2019
5. SHARE CAPITAL (CONTINUED)
Neuberger Berman Global Bond Absolute Return Fund (continued)
GBP I Distributing
Class*
GBP I2 Accumulating
Class*
GBP I4Accumulating
Class
GBP I5 Accumulating
Class
GBP I5 Distributing
Class
GBP Z Accumulating
Class
JPY I Accumulating
Class
SGD A (Monthly)
Distributing Class
USD A (Monthly)
Distributing Class
For the Year Ended 31 December 2019 Redeemable Participating Shares Shares in issue at start of year 790 729 822,785 1,155,734 85,927 20,304 323,172 292,603 19,143
Redeemable Participating Shares issued – – 24,376 185,910 – 12,112 3,331 867,541 7,538
Redeemable Participating Shares redeemed (790) (729) (354,283) (245,165) (67,401) – (323,171) (1,113,126) (8,094)
Shares in issue at end of year – – 492,878 1,096,479 18,526 32,416 3,332 47,018 18,587
For the Year Ended 31 December 2018
Redeemable Participating Shares Shares in issue at start of year 790 729 1,644,955 1,105,831 213,884 20,304 284,442 352,529 8,094
Redeemable Participating Shares issued – – 107,081 78,663 – – 63,300 1,237,590 11,049
Redeemable Participating Shares redeemed – – (929,251) (28,760) (127,957) – (24,570) (1,297,516) –
Shares in issue at end of year 790 729 822,785 1,155,734 85,927 20,304 323,172 292,603 19,143 * Share class launched or closed during the current or prior reporting year.

NOTES TO THE AUDITED FINANCIAL STATEMENTS FINANCIAL STATEMENTS
ANNUAL REPORT 2019 1041
FOR THE YEAR ENDED 31 DECEMBER 2019
5. SHARE CAPITAL (CONTINUED)
Neuberger Berman Global Bond Absolute Return Fund (continued)
USD A Accumulating
Class
USD C2Accumulating
Class*
USD I Accumulating
Class
USD I5 Accumulating
Class
USD I5 Distributing
Class*
USD Z Accumulating
Class
For the Year Ended 31 December 2019
Redeemable Participating Shares
Shares in issue at start of year 33,062 1,000 2,245,586 132,643 1,137 1,225,713
Redeemable Participating Shares issued 8,082,571 – – 19,744 – 66,977
Redeemable Participating Shares redeemed (86,221) (1,000) (2,210,574) (151,423) (1,137) (1,052,818)
Shares in issue at end of year 8,029,412 – 35,012 964 – 239,872
For the Year Ended 31 December 2018
Redeemable Participating Shares
Shares in issue at start of year 31,072 1,000 2,052,016 113,700 1,137 1,781,171
Redeemable Participating Shares issued 1,502,746 1,000 263,720 18,943 – 205,412
Redeemable Participating Shares redeemed (1,500,756) (1,000) (70,150) – – (760,870)
Shares in issue at end of year 33,062 1,000 2,245,586 132,643 1,137 1,225,713
* Share class launched or closed during the current or prior reporting year.

FINANCIAL STATEMENTS NOTES TO THE AUDITED FINANCIAL STATEMENTS
1042 NEUBERGER BERMAN INVESTMENT FUNDS PLC
FOR THE YEAR ENDED 31 DECEMBER 2019
5. SHARE CAPITAL (CONTINUED)
Neuberger Berman Short Duration Emerging Market Debt Fund
AUD A (Monthly)
Distributing Class
AUD A Accumulating
Class
CAD A (Monthly)
Distributing Class
CHF A Accumulating
Class
CHF A Distributing
Class
CHF I Accumulating
Class
CHF I Distributing
Class
CHF I2Accumulating
Class
CHF I2 Distributing
Class
CHF I5 Accumulating
Class For the Year Ended 31 December 2019 Redeemable Participating Shares Shares in issue at start of year 142,117 2,647 17,452 369,864 148,663 84,781 150,347 539,854 3,463,967 589,674
Redeemable Participating Shares issued 44,315 1,391 152,026 355,482 119,084 2,145,570 806,450 23,897 – 291,640
Redeemable Participating Shares redeemed – – (150,000) (63,318) (83,275) (708,182) (65,300) (103,131) (218,586) (392,179)
Shares in issue at end of year 186,432 4,038 19,478 662,028 184,472 1,522,169 891,497 460,620 3,245,381 489,135
For the Year Ended 31 December 2018 Redeemable Participating Shares Shares in issue at start of year 131,712 1,542 17,452 372,042 194,222 381,704 139,554 548,815 1,782,351 780,656
Redeemable Participating Shares issued 10,405 1,105 – 213,611 5,741 21,986 13,716 53,959 1,689,616 125,269
Redeemable Participating Shares redeemed – – – (215,789) (51,300) (318,909) (2,923) (62,920) (8,000) (316,251)
Shares in issue at end of year 142,117 2,647 17,452 369,864 148,663 84,781 150,347 539,854 3,463,967 589,674

NOTES TO THE AUDITED FINANCIAL STATEMENTS FINANCIAL STATEMENTS
ANNUAL REPORT 2019 1043
FOR THE YEAR ENDED 31 DECEMBER 2019
5. SHARE CAPITAL (CONTINUED)
Neuberger Berman Short Duration Emerging Market Debt Fund (continued)
CHF I5 Distributing
Class*
CHF P Accumulating
Class
CHF P Distributing
Class
CNY A (Monthly)
Distributing Class
EUR A Accumulating
Class
EUR A Distributing
Class
EUR I Accumulating
Class
EUR IAccumulating
UnhedgedClass*
EUR I Distributing
Class
EUR I2 Accumulating
Class For the Year Ended 31 December 2019 Redeemable Participating Shares Shares in issue at start of year – 2,230,102 1,245 663 18,865,373 2,833,542 54,688,452 – 25,083,775 5,543,285
Redeemable Participating Shares issued – 6,430,599 8,053 – 7,619,793 1,861,258 46,521,356 1,502,568 5,173,175 15,833,380
Redeemable Participating Shares redeemed – (4,169,848) (8,053) – (5,366,267) (2,028,202) (21,498,298) (1,500,000) (12,069,487) (4,201,407)
Shares in issue at end of year – 4,490,853 1,245 663 21,118,899 2,666,598 79,711,510 2,568 18,187,463 17,175,258
For the Year Ended 31 December 2018 Redeemable Participating Shares Shares in issue at start of year 4,500 744,580 1,415 663 10,164,851 3,138,189 62,433,441 – 53,650,827 6,273,188
Redeemable Participating Shares issued – 1,613,808 1,245 – 16,430,935 1,495,281 34,516,959 – 5,640,691 1,077,818
Redeemable Participating Shares redeemed (4,500) (128,286) (1,415) – (7,730,413) (1,799,928) (42,261,948) – (34,207,743) (1,807,721)
Shares in issue at end of year – 2,230,102 1,245 663 18,865,373 2,833,542 54,688,452 – 25,083,775 5,543,285 * Share class launched or closed during the current or prior reporting year.

FINANCIAL STATEMENTS NOTES TO THE AUDITED FINANCIAL STATEMENTS
1044 NEUBERGER BERMAN INVESTMENT FUNDS PLC
FOR THE YEAR ENDED 31 DECEMBER 2019
5. SHARE CAPITAL (CONTINUED)
Neuberger Berman Short Duration Emerging Market Debt Fund (continued)
EUR I2 Distributing
Class
EUR I5 Accumulating
Class
EUR MAccumulating
Class
EUR M Distributing
Class
EUR P Accumulating
Class
EUR U Accumulating
Class*
GBP A Accumulating
Class
GBP IAccumulating
Class
GBP I Distributing
Class*
GBP I2 Accumulating
Class For the Year Ended 31 December 2019 Redeemable Participating Shares Shares in issue at start of year 22,384,994 6,330,500 699,053 193,140 6,737,959 150,834 118,749 1,332,640 4,218,950 168,002
Redeemable Participating Shares issued 1,205,511 2,090,184 93,023 41,764 6,976,202 49,260 93,728 547,237 1,901,516 117,181
Redeemable Participating Shares redeemed (1,182,865) (7,568,420) (145,342) (27,775) (2,080,601) – (39,164) (198,497) (767,750) (8,070)
Shares in issue at end of year 22,407,640 852,264 646,734 207,129 11,633,560 200,094 173,313 1,681,380 5,352,716 277,113
For the Year Ended 31 December 2018 Redeemable Participating Shares Shares in issue at start of year 22,330,743 7,859,447 766,209 185,481 2,406,678 – 137,416 551,043 – 67,572
Redeemable Participating Shares issued 92,204 957,873 135,312 51,438 5,753,705 150,834 79,954 1,895,947 5,021,251 142,181
Redeemable Participating Shares redeemed (37,953) (2,486,820) (202,468) (43,779) (1,422,424) – (98,621) (1,114,350) (802,301) (41,751)
Shares in issue at end of year 22,384,994 6,330,500 699,053 193,140 6,737,959 150,834 118,749 1,332,640 4,218,950 168,002 * Share class launched or closed during the current or prior reporting year.

NOTES TO THE AUDITED FINANCIAL STATEMENTS FINANCIAL STATEMENTS
ANNUAL REPORT 2019 1045
FOR THE YEAR ENDED 31 DECEMBER 2019
5. SHARE CAPITAL (CONTINUED)
Neuberger Berman Short Duration Emerging Market Debt Fund (continued)
GBP I2 Distributing
Class
GBP I5 Distributing
Class
GBP P Accumulating
Class*
JPY IAccumulating
Class
JPY I Distributing
Class
SEK A Accumulating
Class*
SGD A (Monthly)
Distributing Class
USD A (Monthly)
Distributing Class
USD A Accumulating
Class
USD A Distributing
Class For the Year Ended 31 December 2019 Redeemable Participating Shares Shares in issue at start of year 113,058 10,249,935 – 64,190,449 5,419,660 35,735 806,171 683,568 29,990,666 14,782,246
Redeemable Participating Shares issued 54,793,816 1,822,813 17,974 20,588,734 1,656,152 107,622 492,804 634,268 30,148,997 5,659,245
Redeemable Participating Shares redeemed (8,346,490) (1,287,151) (5) (2,190,510) (11,422) (30,600) (479,841) (173,101) (16,349,735) (4,412,234)
Shares in issue at end of year 46,560,384 10,785,597 17,969 82,588,673 7,064,390 112,757 819,134 1,144,735 43,789,928 16,029,257
For the Year Ended 31 December 2018 Redeemable Participating Shares Shares in issue at start of year 18,308 11,908,551 – 42,657,419 1,583,277 – 728,739 1,041,625 25,099,430 11,811,189
Redeemable Participating Shares issued 95,573 2,119,761 – 23,694,648 3,836,383 38,613 983,297 70,461 13,776,869 6,624,987
Redeemable Participating Shares redeemed (823) (3,778,377) – (2,161,618) – (2,878) (905,865) (428,518) (8,885,633) (3,653,930)
Shares in issue at end of year 113,058 10,249,935 – 64,190,449 5,419,660 35,735 806,171 683,568 29,990,666 14,782,246 * Share class launched or closed during the current or prior reporting year.

FINANCIAL STATEMENTS NOTES TO THE AUDITED FINANCIAL STATEMENTS
1046 NEUBERGER BERMAN INVESTMENT FUNDS PLC
FOR THE YEAR ENDED 31 DECEMBER 2019
5. SHARE CAPITAL (CONTINUED)
Neuberger Berman Short Duration Emerging Market Debt Fund (continued)
USD C1 Accumulating
Class
USD C1 Distributing
Class
USD I Accumulating
Class
USD I Distributing
Class
USD I2 Accumulating
Class
USD I2 Distributing
Class
USD I5 Accumulating
Class
USD I5 Distributing
Class
USD MAccumulating
Class
USD M Distributing
Class
For the Year Ended 31 December 2019 Redeemable Participating Shares Shares in issue at start of year 3,146,069 371,530 21,764,949 14,368,668 4,324,532 443,671 2,059,429 552,207 3,106,846 750,345
Redeemable Participating Shares issued 5,995,023 517,918 83,724,660 6,020,489 7,252,358 6,176,381 458,947 169,740 4,716,595 387,710
Redeemable Participating Shares redeemed (1,115,112) (93,240) (44,030,188) (3,958,570) (6,505,090) (2,091,469) (907,589) (80,470) (1,730,851) (336,249)
Shares in issue at end of year 8,025,980 796,208 61,459,421 16,430,587 5,071,800 4,528,583 1,610,787 641,477 6,092,590 801,806
For the Year Ended 31 December 2018 Redeemable Participating Shares Shares in issue at start of year 1,388,859 70,223 26,626,078 1,449,272 4,510,318 299,013 1,560,592 391,207 1,313,193 231,356
Redeemable Participating Shares issued 2,248,838 301,317 12,965,067 14,660,322 3,864,114 326,667 914,849 181,000 2,548,312 1,256,629
Redeemable Participating Shares redeemed (491,628) (10) (17,826,196) (1,740,926) (4,049,900) (182,009) (416,012) (20,000) (754,659) (737,640)
Shares in issue at end of year 3,146,069 371,530 21,764,949 14,368,668 4,324,532 443,671 2,059,429 552,207 3,106,846 750,345

NOTES TO THE AUDITED FINANCIAL STATEMENTS FINANCIAL STATEMENTS
ANNUAL REPORT 2019 1047
FOR THE YEAR ENDED 31 DECEMBER 2019
5. SHARE CAPITAL (CONTINUED)
Neuberger Berman Short Duration Emerging Market Debt Fund (continued)
USD P Accumulating
Class
USD Z Accumulating
Class
For the Year Ended 31 December 2019 Redeemable Participating Shares Shares in issue at start of year 11,159,290 476,183
Redeemable Participating Shares issued 3,253,141 559,133
Redeemable Participating Shares redeemed (4,745,222) (15,000)
Shares in issue at end of year 9,667,209 1,020,316
For the Year Ended 31 December 2018
Redeemable Participating Shares Shares in issue at start of year 11,867,835 268,947
Redeemable Participating Shares issued 6,304,051 3,431,102
Redeemable Participating Shares redeemed (7,012,596) (3,223,866)
Shares in issue at end of year 11,159,290 476,183

FINANCIAL STATEMENTS NOTES TO THE AUDITED FINANCIAL STATEMENTS
1048 NEUBERGER BERMAN INVESTMENT FUNDS PLC
FOR THE YEAR ENDED 31 DECEMBER 2019
5. SHARE CAPITAL (CONTINUED)
Neuberger Berman Absolute Return Multi Strategy Fund
AUD Z Distributing
Class*
CHF I Accumulating
Class
CHF I2 Accumulating
Class*
For the Year Ended 31 December 2019 Redeemable Participating Shares Shares in issue at start of year 885,686 18,116 1,009
Redeemable Participating Shares issued – 153,750 –
Redeemable Participating Shares redeemed (885,686) (10,500) (1,009)
Shares in issue at end of year – 161,366 –
For the Year Ended 31 December 2018
Redeemable Participating Shares Shares in issue at start of year 2,007,601 211,216 1,009
Redeemable Participating Shares issued 65,549 25,600 –
Redeemable Participating Shares redeemed (1,187,464) (218,700) –
Shares in issue at end of year 885,686 18,116 1,009 * Share class launched or closed during the current or prior reporting year.
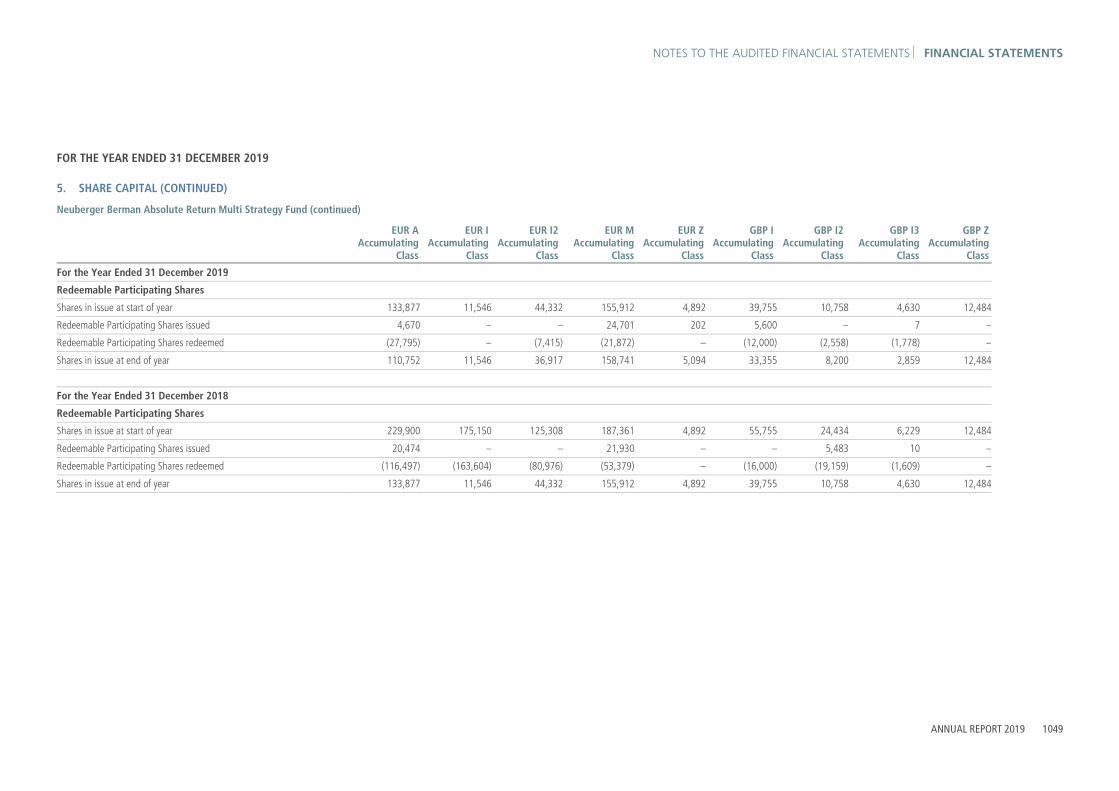
NOTES TO THE AUDITED FINANCIAL STATEMENTS FINANCIAL STATEMENTS
ANNUAL REPORT 2019 1049
FOR THE YEAR ENDED 31 DECEMBER 2019
5. SHARE CAPITAL (CONTINUED)
Neuberger Berman Absolute Return Multi Strategy Fund (continued)
EUR A Accumulating
Class
EUR I Accumulating
Class
EUR I2 Accumulating
Class
EUR M Accumulating
Class
EUR Z Accumulating
Class
GBP I Accumulating
Class
GBP I2 Accumulating
Class
GBP I3 Accumulating
Class
GBP Z Accumulating
Class
For the Year Ended 31 December 2019
Redeemable Participating Shares
Shares in issue at start of year 133,877 11,546 44,332 155,912 4,892 39,755 10,758 4,630 12,484
Redeemable Participating Shares issued 4,670 – – 24,701 202 5,600 – 7 –
Redeemable Participating Shares redeemed (27,795) – (7,415) (21,872) – (12,000) (2,558) (1,778) –
Shares in issue at end of year 110,752 11,546 36,917 158,741 5,094 33,355 8,200 2,859 12,484
For the Year Ended 31 December 2018
Redeemable Participating Shares
Shares in issue at start of year 229,900 175,150 125,308 187,361 4,892 55,755 24,434 6,229 12,484
Redeemable Participating Shares issued 20,474 – – 21,930 – – 5,483 10 –
Redeemable Participating Shares redeemed (116,497) (163,604) (80,976) (53,379) – (16,000) (19,159) (1,609) –
Shares in issue at end of year 133,877 11,546 44,332 155,912 4,892 39,755 10,758 4,630 12,484

FINANCIAL STATEMENTS NOTES TO THE AUDITED FINANCIAL STATEMENTS
1050 NEUBERGER BERMAN INVESTMENT FUNDS PLC
FOR THE YEAR ENDED 31 DECEMBER 2019
5. SHARE CAPITAL (CONTINUED)
Neuberger Berman Absolute Return Multi Strategy Fund (continued)
JPY D Distributing
Class
JPY D Distributing
Unhedged Class*
JPY I Accumulating
Class
USD A Accumulating
Class
USD I Accumulating
Class
For the Year Ended 31 December 2019
Redeemable Participating Shares
Shares in issue at start of year 162,793 172,060 5,501,940 320,414 303,354
Redeemable Participating Shares issued 27,173 6,810 185,695 308,809 86,056
Redeemable Participating Shares redeemed (88,137) (178,870) (852,641) (254,488) (149,880)
Shares in issue at end of year 101,829 – 4,834,994 374,735 239,530
For the Year Ended 31 December 2018
Redeemable Participating Shares
Shares in issue at start of year 283,037 558,263 6,346,741 1,443,399 483,591
Redeemable Participating Shares issued 57,530 52,221 465,881 190,379 171,552
Redeemable Participating Shares redeemed (177,774) (438,424) (1,310,682) (1,313,364) (351,789)
Shares in issue at end of year 162,793 172,060 5,501,940 320,414 303,354
* Share class launched or closed during the current or prior reporting year.

NOTES TO THE AUDITED FINANCIAL STATEMENTS FINANCIAL STATEMENTS
ANNUAL REPORT 2019 1051
FOR THE YEAR ENDED 31 DECEMBER 2019
5. SHARE CAPITAL (CONTINUED)
Neuberger Berman Absolute Return Multi Strategy Fund (continued)
USD I2Accumulating
Class*
USD Z Accumulating
Class
For the Year Ended 31 December 2019 Redeemable Participating Shares Shares in issue at start of year 26,258 10,891
Redeemable Participating Shares issued – –
Redeemable Participating Shares redeemed (26,258) –
Shares in issue at end of year – 10,891
For the Year Ended 31 December 2018
Redeemable Participating Shares Shares in issue at start of year 974,699 84,703
Redeemable Participating Shares issued 93,111 31,068
Redeemable Participating Shares redeemed (1,041,552) (104,880)
Shares in issue at end of year 26,258 10,891 * Share class launched or closed during the current or prior reporting year.

FINANCIAL STATEMENTS NOTES TO THE AUDITED FINANCIAL STATEMENTS
1052 NEUBERGER BERMAN INVESTMENT FUNDS PLC
FOR THE YEAR ENDED 31 DECEMBER 2019
5. SHARE CAPITAL (CONTINUED)
Neuberger Berman US Long Short Equity Fund
CNY C2 Accumulating
Class*
CNY T Accumulating
Class*
EUR AAccumulating
Class
EUR I Accumulating
Class
EUR M Accumulating
Class
GBP A Accumulating
Class*
GBP I Accumulating
Class*
JPY I Accumulating
Class*
JPY I Accumulating
Unhedged Class*
For the Year Ended 31 December 2019
Redeemable Participating Shares
Shares in issue at start of year 673 662 80,947 5,743,529 912,339 30,000 – 45,026 117,665
Redeemable Participating Shares issued – – 1,322 785,761 72,718 – 2,376 500 2,100
Redeemable Participating Shares redeemed (673) (662) (38,269) (2,684,586) (240,971) (30,000) – (45,526) (119,765)
Shares in issue at end of year – – 44,000 3,844,704 744,086 – 2,376 – –
For the Year Ended 31 December 2018
Redeemable Participating Shares
Shares in issue at start of year 673 662 96,159 5,257,012 612,379 30,000 – 52,736 265,435
Redeemable Participating Shares issued 673 – 25,761 2,952,469 482,106 – – 640 –
Redeemable Participating Shares redeemed (673) – (40,973) (2,465,952) (182,146) – – (8,350) (147,770)
Shares in issue at end of year 673 662 80,947 5,743,529 912,339 30,000 – 45,026 117,665
* Share class launched or closed during the current or prior reporting year.

NOTES TO THE AUDITED FINANCIAL STATEMENTS FINANCIAL STATEMENTS
ANNUAL REPORT 2019 1053
FOR THE YEAR ENDED 31 DECEMBER 2019
5. SHARE CAPITAL (CONTINUED)
Neuberger Berman US Long Short Equity Fund (continued)
SGD A Accumulating
Class*
SGD A1 Accumulating
Class
USD A (PF) Accumulating
Class
USD A Accumulating
Class
USD A1 Accumulating
Class
USD C (PF) Accumulating
Class*
USD C1Accumulating
Class
USD C2 Accumulating
Class*
USD D Distributing
Class
For the Year Ended 31 December 2019
Redeemable Participating Shares
Shares in issue at start of year 2,112 24,579 123,137 1,295,288 1,662,601 1,102 48,375 1,000 57,739
Redeemable Participating Shares issued – 3,690 36,305 103,864 79,508 – – – 23,720
Redeemable Participating Shares redeemed (2,112) (4,534) (63,359) (727,810) (588,027) (1,102) (37,963) (1,000) (11,442)
Shares in issue at end of year – 23,735 96,083 671,342 1,154,082 – 10,412 – 70,017
For the Year Ended 31 December 2018
Redeemable Participating Shares
Shares in issue at start of year 2,112 41,618 2,209,619 1,652,389 1,871,517 1,102 46,992 1,000 393,755
Redeemable Participating Shares issued – 11,476 70,589 662,888 342,604 – 6,383 1,000 62,929
Redeemable Participating Shares redeemed – (28,515) (2,157,071) (1,019,989) (551,520) – (5,000) (1,000) (398,945)
Shares in issue at end of year 2,112 24,579 123,137 1,295,288 1,662,601 1,102 48,375 1,000 57,739
* Share class launched or closed during the current or prior reporting year.

FINANCIAL STATEMENTS NOTES TO THE AUDITED FINANCIAL STATEMENTS
1054 NEUBERGER BERMAN INVESTMENT FUNDS PLC
FOR THE YEAR ENDED 31 DECEMBER 2019
5. SHARE CAPITAL (CONTINUED)
Neuberger Berman US Long Short Equity Fund (continued)
USD I (PF) Distributing
Class
USD I Accumulating
Class
USD M Accumulating
Class
USD T Accumulating
Class*
USD U Accumulating
Class
USD Z Accumulating
Class
For the Year Ended 31 December 2019
Redeemable Participating Shares
Shares in issue at start of year 2,821,974 2,363,570 139,000 1,000 758,006 1,051,785
Redeemable Participating Shares issued 1,168,631 1,000,346 36,212 – – 140,902
Redeemable Participating Shares redeemed (1,231,463) (1,252,292) (96,238) (1,000) (198,216) (695,027)
Shares in issue at end of year 2,759,142 2,111,624 78,974 – 559,790 497,660
For the Year Ended 31 December 2018
Redeemable Participating Shares
Shares in issue at start of year 268,189 2,251,401 71,377 1,000 748,948 1,456,493
Redeemable Participating Shares issued 2,868,656 779,093 119,675 – 9,058 630,972
Redeemable Participating Shares redeemed (314,871) (666,924) (52,052) – – (1,035,680)
Shares in issue at end of year 2,821,974 2,363,570 139,000 1,000 758,006 1,051,785
* Share class launched or closed during the current or prior reporting year.

NOTES TO THE AUDITED FINANCIAL STATEMENTS FINANCIAL STATEMENTS
ANNUAL REPORT 2019 1055
FOR THE YEAR ENDED 31 DECEMBER 2019
5. SHARE CAPITAL (CONTINUED)
Neuberger Berman Emerging Market Debt Blend Fund
AUD I3 Distributing
Class*
CHF I2 Distributing
Class
EUR A Accumulating
Class
EUR I Accumulating
Class
EUR I Distributing
Class
EUR I2 Accumulating
Class
EUR I2 Distributing
Class
EUR I3 Distributing
Class*
EUR I4 Accumulating
Class*
For the Year Ended 31 December 2019
Redeemable Participating Shares
Shares in issue at start of year – 920,510 2,046,299 26,967,975 7,591,607 28,186,120 7,145,195 – 2,490,488
Redeemable Participating Shares issued 1,119,714 – 129,993 7,028,150 2,474,559 11,241,469 1,614,406 2,192,766 –
Redeemable Participating Shares redeemed (11,600) (714,671) (742,396) (8,213,313) (2,721,860) (5,176,497) (2,784,321) – (2,490,488)
Shares in issue at end of year 1,108,114 205,839 1,433,896 25,782,812 7,344,306 34,251,092 5,975,280 2,192,766 –
For the Year Ended 31 December 2018
Redeemable Participating Shares
Shares in issue at start of year – 918,548 7,823,021 22,304,439 6,278,084 23,250,089 5,529,232 – 2,873,650
Redeemable Participating Shares issued – 42,962 445,853 9,537,569 3,811,619 8,003,306 2,710,350 – 182,488
Redeemable Participating Shares redeemed – (41,000) (6,222,575) (4,874,033) (2,498,096) (3,067,275) (1,094,387) – (565,650)
Shares in issue at end of year – 920,510 2,046,299 26,967,975 7,591,607 28,186,120 7,145,195 – 2,490,488
* Share class launched or closed during the current or prior reporting year.

FINANCIAL STATEMENTS NOTES TO THE AUDITED FINANCIAL STATEMENTS
1056 NEUBERGER BERMAN INVESTMENT FUNDS PLC
FOR THE YEAR ENDED 31 DECEMBER 2019
5. SHARE CAPITAL (CONTINUED)
Neuberger Berman Emerging Market Debt Blend Fund
EUR I4 Accumulating
Unhedged Class
EUR I5 Accumulating
Class
EUR MAccumulating
Class
EUR M Distributing
Class
EUR Z Accumulating
Class
GBP I Accumulating
Class
GBP I Accumulating
Unhedged Class
GBP I Distributing
Class*
GBP I Distributing
Unhedged Class*
GBP I2 Distributing
Class For the Year Ended 31 December 2019 Redeemable Participating Shares Shares in issue at start of year 44,545 861,823 94,676 153,244 5,732 90,841 14,065,196 100,553 77,741 3,870,908
Redeemable Participating Shares issued 53,970 364,961 42,241 7,182 250 722,898 1,554,063 454,102 37,448 211,093
Redeemable Participating Shares redeemed (28,899) (123,979) (19,777) (33,599) (860) (740,515) (3,028,959) (100,712) (42,927) (1,534,048)
Shares in issue at end of year 69,616 1,102,805 117,140 126,827 5,122 73,224 12,590,300 453,943 72,262 2,547,953
For the Year Ended 31 December 2018 Redeemable Participating Shares Shares in issue at start of year 118,147 926,913 39,092 133,880 3,252 24,915 14,817,314 – – 2,410,619
Redeemable Participating Shares issued 3,500 38,611 83,891 41,130 2,980 66,144 526,643 100,553 92,778 1,720,584
Redeemable Participating Shares redeemed (77,102) (103,701) (28,307) (21,766) (500) (218) (1,278,761) – (15,037) (260,295)
Shares in issue at end of year 44,545 861,823 94,676 153,244 5,732 90,841 14,065,196 100,553 77,741 3,870,908 * Share class launched or closed during the current or prior reporting year.

NOTES TO THE AUDITED FINANCIAL STATEMENTS FINANCIAL STATEMENTS
ANNUAL REPORT 2019 1057
FOR THE YEAR ENDED 31 DECEMBER 2019
5. SHARE CAPITAL (CONTINUED)
Neuberger Berman Emerging Market Debt Blend Fund (continued)
GBP P Accumulating
Class*
GBP P Accumulating
Unhedged Class*
GBP Z Accumulating
Class
NOK U Accumulating
Class
SEK A Accumulating
Class
SGD A (Monthly)
Distributing Class
SGD A Accumulating
Class*
USD A (Monthly)
Distributing Class
USD A Accumulating
Class
USD C1 Accumulating
Class For the Year Ended 31 December 2019 Redeemable Participating Shares Shares in issue at start of year – – 16,887 124,135 386,180 28,913 757 37,568 2,438,242 879,525
Redeemable Participating Shares issued 1,272,787 18,249 – 44,771 509,086 209,281 – 1,751 235,541 53,276
Redeemable Participating Shares redeemed (53,430) (644) – (89,542) (182,355) (128,869) (757) (1,381) (312,888) (448,652)
Shares in issue at end of year 1,219,357 17,605 16,887 79,364 712,911 109,325 – 37,938 2,360,895 484,149
For the Year Ended 31 December 2018 Redeemable Participating Shares Shares in issue at start of year – – 16,887 124,135 442,962 1,008 705 1,025 459,263 429,248
Redeemable Participating Shares issued – – – – 166,585 76,489 52 40,015 4,040,634 780,649
Redeemable Participating Shares redeemed – – – – (223,367) (48,584) – (3,472) (2,061,655) (330,372)
Shares in issue at end of year – – 16,887 124,135 386,180 28,913 757 37,568 2,438,242 879,525 * Share class launched or closed during the current or prior reporting year.
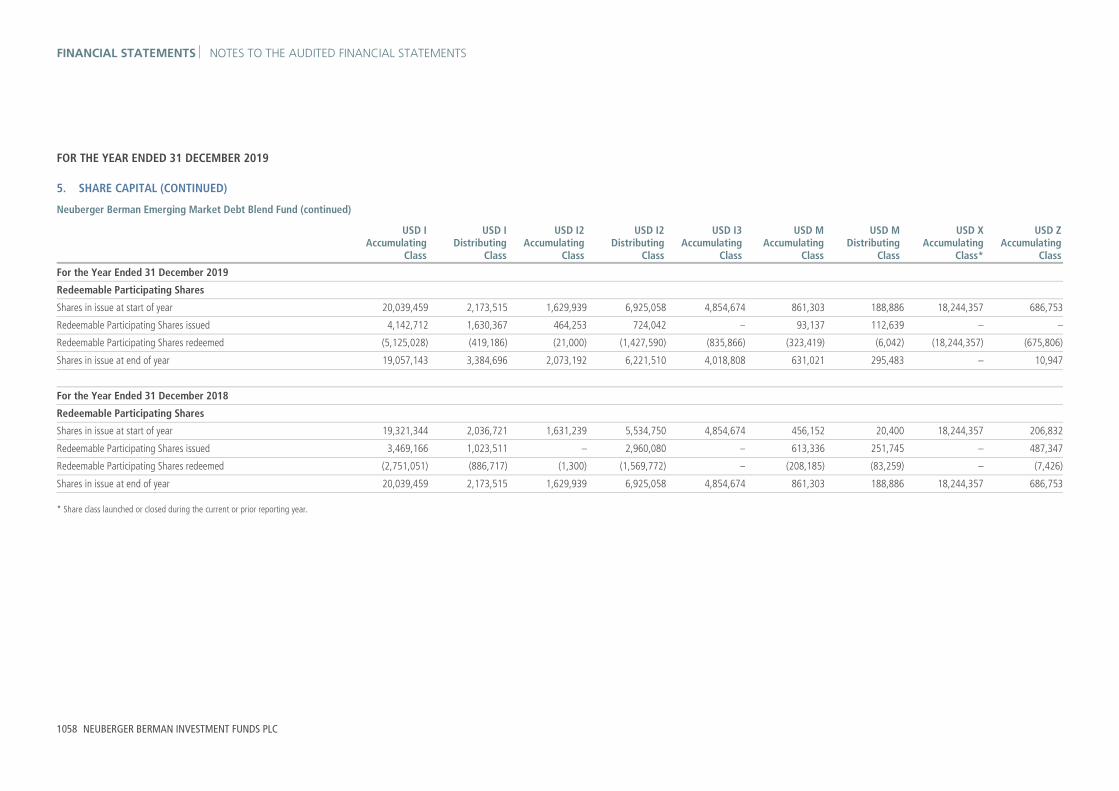
FINANCIAL STATEMENTS NOTES TO THE AUDITED FINANCIAL STATEMENTS
1058 NEUBERGER BERMAN INVESTMENT FUNDS PLC
FOR THE YEAR ENDED 31 DECEMBER 2019
5. SHARE CAPITAL (CONTINUED)
Neuberger Berman Emerging Market Debt Blend Fund (continued)
USD I Accumulating
Class
USD I Distributing
Class
USD I2 Accumulating
Class
USD I2 Distributing
Class
USD I3 Accumulating
Class
USD M Accumulating
Class
USD M Distributing
Class
USD X Accumulating
Class*
USD Z Accumulating
Class For the Year Ended 31 December 2019 Redeemable Participating Shares Shares in issue at start of year 20,039,459 2,173,515 1,629,939 6,925,058 4,854,674 861,303 188,886 18,244,357 686,753
Redeemable Participating Shares issued 4,142,712 1,630,367 464,253 724,042 – 93,137 112,639 – –
Redeemable Participating Shares redeemed (5,125,028) (419,186) (21,000) (1,427,590) (835,866) (323,419) (6,042) (18,244,357) (675,806)
Shares in issue at end of year 19,057,143 3,384,696 2,073,192 6,221,510 4,018,808 631,021 295,483 – 10,947
For the Year Ended 31 December 2018
Redeemable Participating Shares Shares in issue at start of year 19,321,344 2,036,721 1,631,239 5,534,750 4,854,674 456,152 20,400 18,244,357 206,832
Redeemable Participating Shares issued 3,469,166 1,023,511 – 2,960,080 – 613,336 251,745 – 487,347
Redeemable Participating Shares redeemed (2,751,051) (886,717) (1,300) (1,569,772) – (208,185) (83,259) – (7,426)
Shares in issue at end of year 20,039,459 2,173,515 1,629,939 6,925,058 4,854,674 861,303 188,886 18,244,357 686,753 * Share class launched or closed during the current or prior reporting year.

NOTES TO THE AUDITED FINANCIAL STATEMENTS FINANCIAL STATEMENTS
ANNUAL REPORT 2019 1059
FOR THE YEAR ENDED 31 DECEMBER 2019
5. SHARE CAPITAL (CONTINUED)
Neuberger Berman European High Yield Bond Fund
EUR A Accumulating
Class
EUR I Accumulating
Class
EUR I5 Accumulating
Class
EUR M Accumulating
Class
EUR M Distributing
Class
EUR XAccumulating
Class*
GBP I Accumulating
Class*
SGD A (Monthly)
DistributingClass*
SGD A Accumulating
Class*
For the Year Ended 31 December 2019 Redeemable Participating Shares Shares in issue at start of year 39,369 32,784 1,015 18,871 65,132 399,665 – – –
Redeemable Participating Shares issued 8,115 135,114 324,257 21,989 9,578 69,000 4,442 13,760 278,038
Redeemable Participating Shares redeemed (8,350) (10,691) (7,901) (8,722) (12,816) (61,224) (1,403) (4,143) (273,145)
Shares in issue at end of year 39,134 157,207 317,371 32,138 61,894 407,441 3,039 9,617 4,893
For the Year Ended 31 December 2018
Redeemable Participating Shares Shares in issue at start of year 67,584 36,211 1,015 12,988 63,776 – – – –
Redeemable Participating Shares issued 3,850 – – 9,245 7,322 408,701 – – –
Redeemable Participating Shares redeemed (32,065) (3,427) – (3,362) (5,966) (9,036) – – –
Shares in issue at end of year 39,369 32,784 1,015 18,871 65,132 399,665 – – – * Share class launched or closed during the current or prior reporting year.

FINANCIAL STATEMENTS NOTES TO THE AUDITED FINANCIAL STATEMENTS
1060 NEUBERGER BERMAN INVESTMENT FUNDS PLC
FOR THE YEAR ENDED 31 DECEMBER 2019
5. SHARE CAPITAL (CONTINUED)
Neuberger Berman European High Yield Bond Fund (continued)
USD A (Monthly)
Distributing Class
USD A Accumulating
Class*
USD I Accumulating
Class
USD I5 Accumulating
Class*
USD X Accumulating
Class*
USD Z Accumulating
Class*
For the Year Ended 31 December 2019
Redeemable Participating Shares
Shares in issue at start of year 4,249 1,014 1,349,547 – 606,049 –
Redeemable Participating Shares issued 12,249 1,420,646 32,745 24,911 322,867 346,053
Redeemable Participating Shares redeemed (2,128) – (1,352,501) – – –
Shares in issue at end of year 14,370 1,421,660 29,791 24,911 928,916 346,053
For the Year Ended 31 December 2018
Redeemable Participating Shares
Shares in issue at start of year 4,159 – 2,050,361 – – –
Redeemable Participating Shares issued 265 1,501,014 – – 606,049 –
Redeemable Participating Shares redeemed (175) (1,500,000) (700,814) – – –
Shares in issue at end of year 4,249 1,014 1,349,547 – 606,049 –
* Share class launched or closed during the current or prior reporting year.

NOTES TO THE AUDITED FINANCIAL STATEMENTS FINANCIAL STATEMENTS
ANNUAL REPORT 2019 1061
FOR THE YEAR ENDED 31 DECEMBER 2019
5. SHARE CAPITAL (CONTINUED)
Neuberger Berman Global Equity Fund
USD I Accumulating
Class
For the Year Ended 31 December 2019 Redeemable Participating Shares Shares in issue at start of year 109,103
Redeemable Participating Shares issued 810
Redeemable Participating Shares redeemed (9,199)
Shares in issue at end of year 100,714
For the Year Ended 31 December 2018
Redeemable Participating Shares Shares in issue at start of year 109,103
Redeemable Participating Shares issued –
Redeemable Participating Shares redeemed –
Shares in issue at end of year 109,103

FINANCIAL STATEMENTS NOTES TO THE AUDITED FINANCIAL STATEMENTS
1062 NEUBERGER BERMAN INVESTMENT FUNDS PLC
FOR THE YEAR ENDED 31 DECEMBER 2019
5. SHARE CAPITAL (CONTINUED)
Neuberger Berman Systematic Global Equity Fund
EUR M Accumulating
Class
GBP I Accumulating
Class*
GBP Z Accumulating
Class*
SGD A Accumulating
Class
USD A Accumulating
Class
USD I Accumulating
Class
USD T Accumulating
Class
USD Z Accumulating
Class
For the Year Ended 31 December 2019
Redeemable Participating Shares
Shares in issue at start of year 267,108 – 4,297 4,564 2,915 29,630 1,359,927 2,658
Redeemable Participating Shares issued 14,459 2,376 – 1,337 5,117 18,981 – 521,374
Redeemable Participating Shares redeemed (106,595) – (4,297) (3,613) – – – –
Shares in issue at end of year 174,972 2,376 – 2,288 8,032 48,611 1,359,927 524,032
For the Year Ended 31 December 2018
Redeemable Participating Shares
Shares in issue at start of year 227,195 – 4,297 6,984 887 122,852 1,359,927 2,658
Redeemable Participating Shares issued 174,783 – – 11,675 2,028 27,966 – –
Redeemable Participating Shares redeemed (134,870) – – (14,095) – (121,188) – –
Shares in issue at end of year 267,108 – 4,297 4,564 2,915 29,630 1,359,927 2,658
* Share class launched or closed during the current or prior reporting year.

NOTES TO THE AUDITED FINANCIAL STATEMENTS FINANCIAL STATEMENTS
ANNUAL REPORT 2019 1063
FOR THE YEAR ENDED 31 DECEMBER 2019
5. SHARE CAPITAL (CONTINUED)
Neuberger Berman Global Real Estate Securities Fund
EUR M Accumulating
Class
GBP Z Accumulating
Class
USD A Accumulating
Class*
USD I Accumulating
Class
USD I2 Accumulating
Class
USD I5 Accumulating
Class*
USD I5 Distributing
Class*
USD M Accumulating
Class*
USD T Accumulating
Class*
USD Z Accumulating
Class For the Year Ended 31 December 2019 Redeemable Participating Shares Shares in issue at start of year 10,185 4,845 – 118,559 179,000 – – – – 5,190
Redeemable Participating Shares issued 14,223 1,962 159,408 106,760 – – 19,365 25,881 5,470,958 –
Redeemable Participating Shares redeemed (1,882) – (944) (69,981) (26,247) – – – – –
Shares in issue at end of year 22,526 6,807 158,464 155,338 152,753 – 19,365 25,881 5,470,958 5,190
For the Year Ended 31 December 2018 Redeemable Participating Shares Shares in issue at start of year 1,584 4,845 – 207,745 179,000 40,771 – – 2,785,853 5,190
Redeemable Participating Shares issued 8,601 – – 56,105 – 4,246 – – – –
Redeemable Participating Shares redeemed – – – (145,291) – (45,017) – – (2,785,853) –
Shares in issue at end of year 10,185 4,845 – 118,559 179,000 – – – – 5,190 * Share class launched or closed during the current or prior reporting year.

FINANCIAL STATEMENTS NOTES TO THE AUDITED FINANCIAL STATEMENTS
1064 NEUBERGER BERMAN INVESTMENT FUNDS PLC
FOR THE YEAR ENDED 31 DECEMBER 2019
5. SHARE CAPITAL (CONTINUED)
Neuberger Berman US Small Cap Intrinsic Value Fund
USD A
Accumulating Class
USD C1 Accumulating
Class
USD I Accumulating
Class
USD M Accumulating
Class For the Year Ended 31 December 2019 Redeemable Participating Shares Shares in issue at start of year 18,606 1,000 5,769,080 1,546,897
Redeemable Participating Shares issued 5,619 8,252 284,266 2,479,546
Redeemable Participating Shares redeemed (21,168) – (619,209) (1,531,394)
Shares in issue at end of year 3,057 9,252 5,434,137 2,495,049
For the Year Ended 31 December 2018
Redeemable Participating Shares Shares in issue at start of year 5,554 1,000 5,926,415 971,839
Redeemable Participating Shares issued 25,556 – 520,348 1,546,897
Redeemable Participating Shares redeemed (12,504) – (677,683) (971,839)
Shares in issue at end of year 18,606 1,000 5,769,080 1,546,897

NOTES TO THE AUDITED FINANCIAL STATEMENTS FINANCIAL STATEMENTS
ANNUAL REPORT 2019 1065
FOR THE YEAR ENDED 31 DECEMBER 2019
5. SHARE CAPITAL (CONTINUED)
Neuberger Berman Global Credit Long Short Fund**
EUR A (PF) Accumulating
Class*
EUR I (PF) Accumulating
Class*
EUR M (PF) Accumulating
Class*
USD A (PF) (Monthly)
Distributing Class*
USD I (PF) Accumulating
Class*
USD I (PF)Distributing
Class*
USD Z Accumulating
Class*
For the Year Ended 31 December 2019
Redeemable Participating Shares
Shares in issue at start of year – – – – – – –
Redeemable Participating Shares issued – – – – – – –
Redeemable Participating Shares redeemed – – – – – – –
Shares in issue at end of year – – – – – – –
For the Year Ended 31 December 2018
Redeemable Participating Shares
Shares in issue at start of year 893 27,873 15,379 64,519 30,000 1,813,044 716,496
Redeemable Participating Shares issued – 2,821 32,093 – 1,225 – 36,262
Redeemable Participating Shares redeemed (893) (30,694) (47,472) (64,519) (31,225) (1,813,044) (752,758)
Shares in issue at end of year – – – – – – –
* Share class launched or closed during the current or prior reporting year.
**Portfolio liquidated on 26 November 2018.

FINANCIAL STATEMENTS NOTES TO THE AUDITED FINANCIAL STATEMENTS
1066 NEUBERGER BERMAN INVESTMENT FUNDS PLC
FOR THE YEAR ENDED 31 DECEMBER 2019
5. SHARE CAPITAL (CONTINUED)
Neuberger Berman Asian Debt - Hard Currency Fund
SGD A (Monthly)
Distributing Class*
USD A (Monthly)
Distributing Class
USD A Accumulating
Class
USD C1 Accumulating
Class*
USD I Accumulating
Class
USD IDistributing
Class
USD M Accumulating
Class*
For the Year Ended 31 December 2019
Redeemable Participating Shares
Shares in issue at start of year – 1,046 2,678 – 1,000 1,546,846 –
Redeemable Participating Shares issued 539 84,743 318,198 197,102 15,810 – 127,059
Redeemable Participating Shares redeemed – (21,312) (5,072) – – (921) –
Shares in issue at end of year 539 64,477 315,804 197,102 16,810 1,545,925 127,059
For the Year Ended 31 December 2018
Redeemable Participating Shares
Shares in issue at start of year – 1,046 2,315 – 1,000 1,545,346 –
Redeemable Participating Shares issued – – 1,190 – – 1,500 –
Redeemable Participating Shares redeemed – – (827) – – – –
Shares in issue at end of year – 1,046 2,678 – 1,000 1,546,846 –

NOTES TO THE AUDITED FINANCIAL STATEMENTS FINANCIAL STATEMENTS
ANNUAL REPORT 2019 1067
FOR THE YEAR ENDED 31 DECEMBER 2019
5. SHARE CAPITAL (CONTINUED)
Neuberger Berman China Bond Fund
CNY I Accumulating
Class*
CNY I Distributing
Class*
CNY Z Accumulating
Class
EUR M Accumulating
Unhedged Class*
SGD A (Monthly)
Distributing Unhedged
Class*
USD I Accumulating
Unhedged Class
USD M Accumulating
Unhedged Class*
USD Z Accumulating
Class*
USD Z Accumulating
Unhedged Class*
For the Year Ended 31 December 2019
Redeemable Participating Shares
Shares in issue at start of year – 704 1,832 2,617 – 993,066 – – 158,879
Redeemable Participating Shares issued – – 5,927 – 279,386 – 4,500,000 6,166,648 1,100
Redeemable Participating Shares redeemed – – – – (260,377) (585,601) – – –
Shares in issue at end of year – 704 7,759 2,617 19,009 407,465 4,500,000 6,166,648 159,979
For the Year Ended 31 December 2018
Redeemable Participating Shares
Shares in issue at start of year 1,296 – 1,303,966 – – 993,066 – – –
Redeemable Participating Shares issued – 704 1,832 2,617 – 93,284 – – 259,180
Redeemable Participating Shares redeemed (1,296) – (1,303,966) – – (93,284) – – (100,301)
Shares in issue at end of year – 704 1,832 2,617 – 993,066 – – 158,879
* Share class launched or closed during the current or prior reporting year.

FINANCIAL STATEMENTS NOTES TO THE AUDITED FINANCIAL STATEMENTS
1068 NEUBERGER BERMAN INVESTMENT FUNDS PLC
FOR THE YEAR ENDED 31 DECEMBER 2019
5. SHARE CAPITAL (CONTINUED)
Neuberger Berman Global Dynamic Asset Allocator Fund**
CNY C2 (Monthly)
Distributing Class*
CNY T (Monthly)
Distributing Class*
EUR I Accumulating
Class*
EUR M Accumulating
Class*
GBP I Accumulating
Class*
USD C2 (Monthly)
Distributing Class*
USD IAccumulating
Class*
USD I Distributing
Class*
For the Year Ended 31 December 2019
Redeemable Participating Shares
Shares in issue at start of year 669 672 2,775 32,222 771 948 17,316 1,290,411
Redeemable Participating Shares issued – – – 64 – – 235 –
Redeemable Participating Shares redeemed (669) (672) (2,775) (32,286) (771) (948) (17,551) (1,290,411)
Shares in issue at end of year – – – – – – – –
For the Year Ended 31 December 2018
Redeemable Participating Shares
Shares in issue at start of year 669 672 2,775 14,153 771 948 13,532 1,430,249
Redeemable Participating Shares issued 669 – – 22,578 – 948 7,691 –
Redeemable Participating Shares redeemed (669) – – (4,509) – (948) (3,907) (139,838)
Shares in issue at end of year 669 672 2,775 32,222 771 948 17,316 1,290,411
* Share class launched or closed during the current or prior reporting year. ** Portfolio liquidated on 12 April 2019.

NOTES TO THE AUDITED FINANCIAL STATEMENTS FINANCIAL STATEMENTS
ANNUAL REPORT 2019 1069
FOR THE YEAR ENDED 31 DECEMBER 2019
5. SHARE CAPITAL (CONTINUED)
Neuberger Berman Global Dynamic Asset Allocator Fund** (continued)
USD T (Monthly)
Distributing Class*
USD Z Accumulating
Class*
For the Year Ended 31 December 2019 Redeemable Participating Shares Shares in issue at start of year 968 1,054,033
Redeemable Participating Shares issued – 476
Redeemable Participating Shares redeemed (968) (1,054,509)
Shares in issue at end of year – –
For the Year Ended 31 December 2018
Redeemable Participating Shares Shares in issue at start of year 968 1,258,109
Redeemable Participating Shares issued – 3,769
Redeemable Participating Shares redeemed – (207,845)
Shares in issue at end of year 968 1,054,033 * Share class launched or closed during the current or prior reporting year. ** Portfolio liquidated on 12 April 2019.

FINANCIAL STATEMENTS NOTES TO THE AUDITED FINANCIAL STATEMENTS
1070 NEUBERGER BERMAN INVESTMENT FUNDS PLC
FOR THE YEAR ENDED 31 DECEMBER 2019
5. SHARE CAPITAL (CONTINUED)
Neuberger Berman Asian Opportunities Fund**
USD I Accumulating
Class*
USD I Distributing
Class*
USD M Accumulating
Class*
For the Year Ended 31 December 2019 Redeemable Participating Shares Shares in issue at start of year 1,000 301,934 10,406
Redeemable Participating Shares issued – – 1,321,780
Redeemable Participating Shares redeemed (1,000) (301,934) (1,332,186)
Shares in issue at end of year – – –
For the Year Ended 31 December 2018
Redeemable Participating Shares Shares in issue at start of year 164,600 301,934 –
Redeemable Participating Shares issued 53,870 – 2,010,406
Redeemable Participating Shares redeemed (217,470) – (2,000,000)
Shares in issue at end of year 1,000 301,934 10,406 * Share class launched or closed during the current or prior reporting year. ** Portfolio liquidated on 24 July 2019.

NOTES TO THE AUDITED FINANCIAL STATEMENTS FINANCIAL STATEMENTS
ANNUAL REPORT 2019 1071
FOR THE YEAR ENDED 31 DECEMBER 2019
5. SHARE CAPITAL (CONTINUED)
Neuberger Berman Corporate Hybrid Bond Fund
AUD A (Monthly)
Distributing Class
CHF P Accumulating
Class
CHF P Distributing
Class
EUR A (Monthly)
Distributing Class
EUR A Accumulating
Class
EUR I Accumulating
Class
EUR I Distributing
Class
EUR I2 Accumulating
Class
EUR I3 Accumulating
Class
EUR I5 Accumulating
Class For the Year Ended 31 December 2019 Redeemable Participating Shares Shares in issue at start of year 45,691 1,703,878 382,553 1,099,845 4,926,310 18,167,365 1,412,776 26,799,404 216,617 790,126
Redeemable Participating Shares issued 939,531 384,229 73,455 1,671,713 3,380,254 17,182,475 5,723,528 7,599,564 4,002 –
Redeemable Participating Shares redeemed – (510,471) (244,316) (330,097) (2,418,445) (11,989,982) (338,994) (13,416,844) (43,144) (490,127)
Shares in issue at end of year 985,222 1,577,636 211,692 2,441,461 5,888,119 23,359,858 6,797,310 20,982,124 177,475 299,999
For the Year Ended 31 December 2018 Redeemable Participating Shares Shares in issue at start of year 1,390 1,380,607 854,083 1,132,384 7,400,313 17,337,876 1,291,122 12,381,702 358,571 2,400,253
Redeemable Participating Shares issued 44,301 727,722 167,109 592,076 3,310,223 13,969,265 816,730 16,852,033 63,905 –
Redeemable Participating Shares redeemed – (404,451) (638,639) (624,615) (5,784,226) (13,139,776) (695,076) (2,434,331) (205,859) (1,610,127)
Shares in issue at end of year 45,691 1,703,878 382,553 1,099,845 4,926,310 18,167,365 1,412,776 26,799,404 216,617 790,126

FINANCIAL STATEMENTS NOTES TO THE AUDITED FINANCIAL STATEMENTS
1072 NEUBERGER BERMAN INVESTMENT FUNDS PLC
FOR THE YEAR ENDED 31 DECEMBER 2019
5. SHARE CAPITAL (CONTINUED)
Neuberger Berman Corporate Hybrid Bond Fund (continued)
EUR M Accumulating
Class
EUR M Distributing
Class
EUR P Accumulating
Class
EUR P Distributing
Class
GBP I Accumulating
Class
GBP I2 Accumulating
Class
GBP I2 Distributing
Class
GBP P Accumulating
Class*
GBP P Distributing
Class For the Year Ended 31 December 2019 Redeemable Participating Shares Shares in issue at start of year 969,254 363,793 7,993,660 1,443,169 326,851 3,846,402 332,528 – 116,489
Redeemable Participating Shares issued 498,054 183,800 1,594,118 247,999 135,600 1,473,611 142,953 2,479 47,670
Redeemable Participating Shares redeemed (379,490) (133,767) (3,438,078) (565,797) (151,547) (1,263,425) (238,213) (5) (41,910)
Shares in issue at end of year 1,087,818 413,826 6,149,700 1,125,371 310,904 4,056,588 237,268 2,474 122,249
For the Year Ended 31 December 2018
Redeemable Participating Shares Shares in issue at start of year 935,312 308,037 7,472,368 1,701,567 1,112,347 2,896,966 420,790 – 91,241
Redeemable Participating Shares issued 408,841 112,190 2,158,512 447,075 241,797 1,655,913 104,411 – 55,728
Redeemable Participating Shares redeemed (374,899) (56,434) (1,637,220) (705,473) (1,027,293) (706,477) (192,673) – (30,480)
Shares in issue at end of year 969,254 363,793 7,993,660 1,443,169 326,851 3,846,402 332,528 – 116,489 * Share class launched or closed during the current or prior reporting year.

NOTES TO THE AUDITED FINANCIAL STATEMENTS FINANCIAL STATEMENTS
ANNUAL REPORT 2019 1073
FOR THE YEAR ENDED 31 DECEMBER 2019
5. SHARE CAPITAL (CONTINUED)
Neuberger Berman Corporate Hybrid Bond Fund (continued)
HKD A (Monthly)
Distributing Class*
SGD A (Monthly)
Distributing Class*
USD A (Monthly)
Distributing Class
USD A Accumulating
Class
USD C1 Accumulating
Class
USD I Accumulating
Class
USD I2Accumulating
Class
USD I2Distributing
Class
USD M Accumulating
Class
USD M Distributing
Class For the Year Ended 31 December 2019 Redeemable Participating Shares Shares in issue at start of year – – 1,489,569 2,181,645 118,331 1,543,940 141,742 13,698 147,460 67,307
Redeemable Participating Shares issued 550,000 69,712 3,666,279 9,335,786 998,292 2,071,421 117,593 38,067 553,195 95,576
Redeemable Participating Shares redeemed – – (596,698) (671,588) (19,881) (543,938) (7,601) (292) (149,983) (26,084)
Shares in issue at end of year 550,000 69,712 4,559,150 10,845,843 1,096,742 3,071,423 251,734 51,473 550,672 136,799
For the Year Ended 31 December 2018 Redeemable Participating Shares Shares in issue at start of year – – 1,478,285 1,494,985 24,090 1,415,031 95,786 20,979 80,269 90,196
Redeemable Participating Shares issued – – 570,211 2,419,154 129,291 886,831 45,956 12,570 102,773 111,442
Redeemable Participating Shares redeemed – – (558,927) (1,732,494) (35,050) (757,922) – (19,851) (35,582) (134,331)
Shares in issue at end of year – – 1,489,569 2,181,645 118,331 1,543,940 141,742 13,698 147,460 67,307 * Share class launched or closed during the current or prior reporting year.

FINANCIAL STATEMENTS NOTES TO THE AUDITED FINANCIAL STATEMENTS
1074 NEUBERGER BERMAN INVESTMENT FUNDS PLC
FOR THE YEAR ENDED 31 DECEMBER 2019
5. SHARE CAPITAL (CONTINUED)
Neuberger Berman Corporate Hybrid Bond Fund (continued)
USD P Accumulating
Class
USD ZAccumulating
Class
For the Year Ended 31 December 2019 Redeemable Participating Shares Shares in issue at start of year 2,639,067 198,820
Redeemable Participating Shares issued 706,892 230,494
Redeemable Participating Shares redeemed (935,548) (122,388)
Shares in issue at end of year 2,410,411 306,926
For the Year Ended 31 December 2018
Redeemable Participating Shares Shares in issue at start of year 2,310,501 302,214
Redeemable Participating Shares issued 774,162 –
Redeemable Participating Shares redeemed (445,596) (103,394)
Shares in issue at end of year 2,639,067 198,820

NOTES TO THE AUDITED FINANCIAL STATEMENTS FINANCIAL STATEMENTS
ANNUAL REPORT 2019 1075
FOR THE YEAR ENDED 31 DECEMBER 2019
5. SHARE CAPITAL (CONTINUED)
Neuberger Berman US Equity Fund
USD I Accumulating
Class
USD I Distributing
Class
For the Year Ended 31 December 2019 Redeemable Participating Shares Shares in issue at start of year 997 300,000
Redeemable Participating Shares issued 8,925 –
Redeemable Participating Shares redeemed – –
Shares in issue at end of year 9,922 300,000
For the Year Ended 31 December 2018
Redeemable Participating Shares Shares in issue at start of year 997 300,000
Redeemable Participating Shares issued – –
Redeemable Participating Shares redeemed – –
Shares in issue at end of year 997 300,000

FINANCIAL STATEMENTS NOTES TO THE AUDITED FINANCIAL STATEMENTS
1076 NEUBERGER BERMAN INVESTMENT FUNDS PLC
FOR THE YEAR ENDED 31 DECEMBER 2019
5. SHARE CAPITAL (CONTINUED)
Neuberger Berman Global High Yield Bond Fund
EUR MAccumulating
Class
EUR M Distributing
Class
EUR Z (PF) Accumulating
Class
GBP I Accumulating
Class
GBP I2 Accumulating
Class*
GBP Z (PF) Accumulating
Class*
USD A Accumulating
Class
USD C1 Accumulating
Class*
USD I Accumulating
Class
USD M Accumulating
Class* For the Year Ended 31 December 2019 Redeemable Participating Shares Shares in issue at start of year 2,393 2,739 2,891,734 867 928 – 942 – 14,877 –
Redeemable Participating Shares issued 1,545 – 176,761 – – – 947,410 2,600 353,260 3,000
Redeemable Participating Shares redeemed (145) – (651,853) – (928) – – – (152,115) –
Shares in issue at end of year 3,793 2,739 2,416,642 867 – – 948,352 2,600 216,022 3,000
For the Year Ended 31 December 2018 Redeemable Participating Shares Shares in issue at start of year 1,999 4,026 5,393,150 867 928 255,745 1,691,168 – 136,755 –
Redeemable Participating Shares issued 496 190 528,424 – – 43,503 942 – 6,727 –
Redeemable Participating Shares redeemed (102) (1,477) (3,029,840) – – (299,248) (1,691,168) – (128,605) –
Shares in issue at end of year 2,393 2,739 2,891,734 867 928 – 942 – 14,877 – * Share class launched or closed during the current or prior reporting year.

NOTES TO THE AUDITED FINANCIAL STATEMENTS FINANCIAL STATEMENTS
ANNUAL REPORT 2019 1077
FOR THE YEAR ENDED 31 DECEMBER 2019
5. SHARE CAPITAL (CONTINUED)
Neuberger Berman Global High Yield Bond Fund (continued)
USD M Distributing
Class*
USD P Accumulating
Class*
USD Z (PF) Accumulating
Class
USD Z Accumulating
Class
For the Year Ended 31 December 2019 Redeemable Participating Shares Shares in issue at start of year 2,000 1,143 1,060,732 1,326,434
Redeemable Participating Shares issued – – 107,515 –
Redeemable Participating Shares redeemed – – (107,515) (72,623)
Shares in issue at end of year 2,000 1,143 1,060,732 1,253,811
For the Year Ended 31 December 2018
Redeemable Participating Shares Shares in issue at start of year – – 1,769,797 1,900,613
Redeemable Participating Shares issued 2,000 1,143 212,005 –
Redeemable Participating Shares redeemed – – (921,070) (574,179)
Shares in issue at end of year 2,000 1,143 1,060,732 1,326,434 * Share class launched or closed during the current or prior reporting year.

FINANCIAL STATEMENTS NOTES TO THE AUDITED FINANCIAL STATEMENTS
1078 NEUBERGER BERMAN INVESTMENT FUNDS PLC
FOR THE YEAR ENDED 31 DECEMBER 2019
5. SHARE CAPITAL (CONTINUED)
Neuberger Berman Global Opportunistic Bond Fund
EUR I Accumulating
Class
GBP I Accumulating
Class*
JPY I Accumulating
Class
USD A Accumulating
Class
USD C1 Accumulating
Class*
USD I Accumulating
Class
USD I Distributing
Class
USD I2 Accumulating
Class*
USD M Accumulating
Class*
USD Z Accumulating
Class* For the Year Ended 31 December 2019 Redeemable Participating Shares Shares in issue at start of year 96,308 80,084 724,431 3,000 – 3,172,468 588,456 1,680,000 – 3,571,754
Redeemable Participating Shares issued 9,541 – 3,857,243 34,754 20,000 10,202,776 1,050,086 – 79,000 3,260,906
Redeemable Participating Shares redeemed (94,049) (80,084) (2,623,139) (1,825) – (6,000,971) (117,399) – – (3,571,754)
Shares in issue at end of year 11,800 – 1,958,535 35,929 20,000 7,374,273 1,521,143 1,680,000 79,000 3,260,906
For the Year Ended 31 December 2018 Redeemable Participating Shares Shares in issue at start of year 96,308 81,046 226,120 12,901 – 3,684,450 97,101 – – –
Redeemable Participating Shares issued – – 498,385 – – 971,335 498,138 1,680,000 – 3,762,517
Redeemable Participating Shares redeemed – (962) (74) (9,901) – (1,483,317) (6,783) – – (190,763)
Shares in issue at end of year 96,308 80,084 724,431 3,000 – 3,172,468 588,456 1,680,000 – 3,571,754

NOTES TO THE AUDITED FINANCIAL STATEMENTS FINANCIAL STATEMENTS
ANNUAL REPORT 2019 1079
FOR THE YEAR ENDED 31 DECEMBER 2019
5. SHARE CAPITAL (CONTINUED)
Neuberger Berman Multi-Asset Risk Premia Fund**
CHF AAccumulating
Class*
CHF I Accumulating
Class*
CHF I2 Accumulating
Class*
EUR A Accumulating
Class*
EUR I Accumulating
Class*
EUR I2 Accumulating
Class*
EUR I5 Accumulating
Class*
EUR MAccumulating
Class*
EUR Z Accumulating
Class*
GBP I Distributing
Class* For the Year Ended 31 December 2019 Redeemable Participating Shares Shares in issue at start of year 3,026 3,026 3,026 1,707 1,711 2,760 100,000 63,597 40,000 1,499,716
Redeemable Participating Shares issued – – – – – – – – – 112,533
Redeemable Participating Shares redeemed (3,026) (3,026) (3,026) (1,707) (1,711) (2,760) (100,000) (63,597) (40,000) (1,612,249)
Shares in issue at end of year – – – – – – – – – –
For the Year Ended 31 December 2018 Redeemable Participating Shares Shares in issue at start of year 3,026 3,026 3,026 2,760 2,760 2,760 100,000 2,426 – 1,683,173
Redeemable Participating Shares issued – – – – – – – 68,719 40,000 840,152
Redeemable Participating Shares redeemed – – – (1,053) (1,049) – – (7,548) – (1,023,609)
Shares in issue at end of year 3,026 3,026 3,026 1,707 1,711 2,760 100,000 63,597 40,000 1,499,716 * Share class launched or closed during the current or prior reporting year. ** Portfolio liquidated on 26 March 2019.
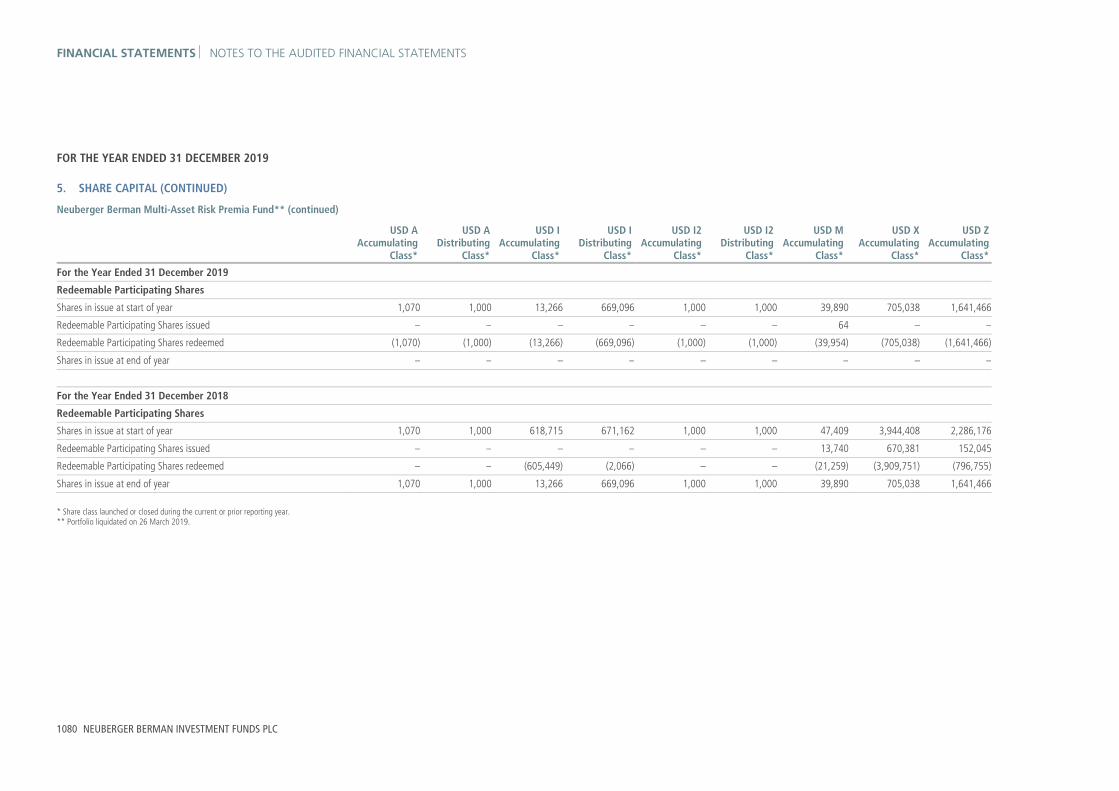
FINANCIAL STATEMENTS NOTES TO THE AUDITED FINANCIAL STATEMENTS
1080 NEUBERGER BERMAN INVESTMENT FUNDS PLC
FOR THE YEAR ENDED 31 DECEMBER 2019
5. SHARE CAPITAL (CONTINUED)
Neuberger Berman Multi-Asset Risk Premia Fund** (continued)
USD A Accumulating
Class*
USD A Distributing
Class*
USD I Accumulating
Class*
USD I Distributing
Class*
USD I2 Accumulating
Class*
USD I2 Distributing
Class*
USD M Accumulating
Class*
USD X Accumulating
Class*
USD Z Accumulating
Class*
For the Year Ended 31 December 2019
Redeemable Participating Shares
Shares in issue at start of year 1,070 1,000 13,266 669,096 1,000 1,000 39,890 705,038 1,641,466
Redeemable Participating Shares issued – – – – – – 64 – –
Redeemable Participating Shares redeemed (1,070) (1,000) (13,266) (669,096) (1,000) (1,000) (39,954) (705,038) (1,641,466)
Shares in issue at end of year – – – – – – – – –
For the Year Ended 31 December 2018
Redeemable Participating Shares
Shares in issue at start of year 1,070 1,000 618,715 671,162 1,000 1,000 47,409 3,944,408 2,286,176
Redeemable Participating Shares issued – – – – – – 13,740 670,381 152,045
Redeemable Participating Shares redeemed – – (605,449) (2,066) – – (21,259) (3,909,751) (796,755)
Shares in issue at end of year 1,070 1,000 13,266 669,096 1,000 1,000 39,890 705,038 1,641,466
* Share class launched or closed during the current or prior reporting year. ** Portfolio liquidated on 26 March 2019.

NOTES TO THE AUDITED FINANCIAL STATEMENTS FINANCIAL STATEMENTS
ANNUAL REPORT 2019 1081
FOR THE YEAR ENDED 31 DECEMBER 2019
5. SHARE CAPITAL (CONTINUED)
Neuberger Berman Multi-Asset Class Income Fund
EUR A Distributing
Class*
EUR I Accumulating
Class*
EUR M Accumulating
Class
EUR M Distributing
Class
GBP I Accumulating
Class*
USD A Accumulating
Class*
USD C1 Accumulating
Class*
USD I Accumulating
Class
USD I Distributing
Class
USD M Accumulating
Class For the Year Ended 31 December 2019 Redeemable Participating Shares Shares in issue at start of year – – 36,452 43,039 – 764,284 424,032 1,007,777 1,193,569 287,613
Redeemable Participating Shares issued 2,675 15,246 8,044 – 2,376 557,385 367,708 170,274 – 6,148,815
Redeemable Participating Shares redeemed – – (7,512) (35,944) – (245,388) (190,395) (155,237) (885,900) (189,086)
Shares in issue at end of year 2,675 15,246 36,984 7,095 2,376 1,076,281 601,345 1,022,814 307,669 6,247,342
For the Year Ended 31 December 2018 Redeemable Participating Shares Shares in issue at start of year – – 3,369 5,517 – – – 667,524 1,900,000 2,097
Redeemable Participating Shares issued – – 36,005 39,091 – 1,756,642 428,821 486,439 9,434 330,831
Redeemable Participating Shares redeemed – – (2,922) (1,569) – (992,358) (4,789) (146,186) (715,865) (45,315)
Shares in issue at end of year – – 36,452 43,039 – 764,284 424,032 1,007,777 1,193,569 287,613 * Share class launched or closed during the current or prior reporting year.

FINANCIAL STATEMENTS NOTES TO THE AUDITED FINANCIAL STATEMENTS
1082 NEUBERGER BERMAN INVESTMENT FUNDS PLC
FOR THE YEAR ENDED 31 DECEMBER 2019
5. SHARE CAPITAL (CONTINUED)
Neuberger Berman US Equity Index PutWrite Fund
EUR I Accumulating
Class
EUR I3Accumulating
Class*
EUR I4 Accumulating
Class
EUR M Accumulating
Class
GBP I Accumulating
Class
GBP I Accumulating
Unhedged Class
GBP I4 Accumulating
Class
GBP I4 Accumulating
Unhedged Class
GBP I4 Distributing
Class
For the Year Ended 31 December 2019
Redeemable Participating Shares
Shares in issue at start of year 154,006 61,800 5,031,973 161,974 41,077 117,987 254,343 4,823,214 79,936
Redeemable Participating Shares issued 11,358 – 2,078,129 5,239 – 51,674 40,164 762,300 18,025
Redeemable Participating Shares redeemed (35,520) (61,800) (1,499,296) (75,930) (9,680) (18,350) (32,143) (440,395) (20,300)
Shares in issue at end of year 129,844 – 5,610,806 91,283 31,397 151,311 262,364 5,145,119 77,661
For the Year Ended 31 December 2018
Redeemable Participating Shares
Shares in issue at start of year 207,037 131,738 822,249 118,475 60,438 96,871 8,246 4,541,476 787
Redeemable Participating Shares issued 113,125 49,300 6,422,174 110,478 15,239 42,059 287,779 911,092 131,165
Redeemable Participating Shares redeemed (166,156) (119,238) (2,212,450) (66,979) (34,600) (20,943) (41,682) (629,354) (52,016)
Shares in issue at end of year 154,006 61,800 5,031,973 161,974 41,077 117,987 254,343 4,823,214 79,936
* Share class launched or closed during the current or prior reporting year.

NOTES TO THE AUDITED FINANCIAL STATEMENTS FINANCIAL STATEMENTS
ANNUAL REPORT 2019 1083
FOR THE YEAR ENDED 31 DECEMBER 2019
5. SHARE CAPITAL (CONTINUED)
Neuberger Berman US Equity Index PutWrite Fund (continued)
JPY I Accumulating
Class*
SGD A (Monthly)
Distributing Class
USD A (Monthly)
Distributing Class*
USD A Accumulating
Class
USD C1 Accumulating
Class
USD I (Monthly)
Distributing Class
USD I Accumulating
Class
USD I Distributing
Class*
USD I3 Accumulating
Class*
USD I4 Accumulating
Class For the Year Ended 31 December 2019 Redeemable Participating Shares Shares in issue at start of year – 15,605 5,000 764,262 250,224 212,235 7,341,941 2,446 22,274,441 5,562,517
Redeemable Participating Shares issued – 639 – 5,917,503 4,344 23,153 234,851 – 256,444 1,243,649
Redeemable Participating Shares redeemed – (705) – (573,032) (177,817) (65,416) (4,050,947) (2,446) (1,800,499) (2,009,655)
Shares in issue at end of year – 15,539 5,000 6,108,733 76,751 169,972 3,525,845 – 20,730,386 4,796,511
For the Year Ended 31 December 2018 Redeemable Participating Shares Shares in issue at start of year 499,999 1,300 – 1,567,760 54,023 261,150 6,661,946 68,774 – 1,285,423
Redeemable Participating Shares issued – 19,900 5,000 1,024,455 371,506 56,944 5,316,137 – 22,583,387 5,582,588
Redeemable Participating Shares redeemed (499,999) (5,595) – (1,827,953) (175,305) (105,859) (4,636,142) (66,328) (308,946) (1,305,494)
Shares in issue at end of year – 15,605 5,000 764,262 250,224 212,235 7,341,941 2,446 22,274,441 5,562,517 * Share class launched or closed during the current or prior reporting year.

FINANCIAL STATEMENTS NOTES TO THE AUDITED FINANCIAL STATEMENTS
1084 NEUBERGER BERMAN INVESTMENT FUNDS PLC
FOR THE YEAR ENDED 31 DECEMBER 2019
5. SHARE CAPITAL (CONTINUED)
Neuberger Berman US Equity Index PutWrite Fund (continued)
USD I4 Distributing
Class*
USD M Accumulating
Class
USD P Accumulating
Class*
USD Z Accumulating
Class
For the Year Ended 31 December 2019 Redeemable Participating Shares Shares in issue at start of year 1,000 525,032 611,812 805,706
Redeemable Participating Shares issued 17,877 216,119 109,192 510,666
Redeemable Participating Shares redeemed (1,590) (560,359) (720,007) (376,993)
Shares in issue at end of year 17,287 180,792 997 939,379
For the Year Ended 31 December 2018
Redeemable Participating Shares Shares in issue at start of year – 138,190 – 55,925
Redeemable Participating Shares issued 1,000 476,806 651,448 908,495
Redeemable Participating Shares redeemed – (89,964) (39,636) (158,714)
Shares in issue at end of year 1,000 525,032 611,812 805,706
* Share class launched or closed during the current or prior reporting year.

NOTES TO THE AUDITED FINANCIAL STATEMENTS FINANCIAL STATEMENTS
ANNUAL REPORT 2019 1085
FOR THE YEAR ENDED 31 DECEMBER 2019
5. SHARE CAPITAL (CONTINUED)
Neuberger Berman Global Equity Index PutWrite Fund
AUD I5 (Monthly)
Distributing Class*
AUD I5 Accumulating
Class*
AUD X (Monthly)
Distributing Class*
AUD X Accumulating
Class
CHF I Distributing
Class
CHF I5 Accumulating
Class
CHF I5 Distributing
Class
CHF XAccumulating
Class
CHF X Distributing
Class
EUR A Accumulating
Class For the Year Ended 31 December 2019 Redeemable Participating Shares Shares in issue at start of year 1,326 1,326 1,326 42,868 66,500 839,392 532,165 54,654 25,000 21,755
Redeemable Participating Shares issued – – – – – 1,560 21,783 – – 3,814
Redeemable Participating Shares redeemed (1,326) (1,326) (1,326) – (53,000) (313,950) (180,125) (39,268) (6,438) (7,925)
Shares in issue at end of year – – – 42,868 13,500 527,002 373,823 15,386 18,562 17,644
For the Year Ended 31 December 2018 Redeemable Participating Shares Shares in issue at start of year 1,326 1,326 1,326 39,788 77,750 660,941 258,550 105,577 7,143 498,122
Redeemable Participating Shares issued – – – 3,080 3,700 460,275 376,988 14,528 21,220 14,496
Redeemable Participating Shares redeemed – – – – (14,950) (281,824) (103,373) (65,451) (3,363) (490,863)
Shares in issue at end of year 1,326 1,326 1,326 42,868 66,500 839,392 532,165 54,654 25,000 21,755 * Share class launched or closed during the current or prior reporting year.

FINANCIAL STATEMENTS NOTES TO THE AUDITED FINANCIAL STATEMENTS
1086 NEUBERGER BERMAN INVESTMENT FUNDS PLC
FOR THE YEAR ENDED 31 DECEMBER 2019
5. SHARE CAPITAL (CONTINUED)
Neuberger Berman Global Equity Index PutWrite Fund (continued)
EUR I Accumulating
Class
EUR I5 (Monthly)
Distributing Class
EUR I5 Accumulating
Class
EUR M Accumulating
Class
EUR X (Monthly)
Distributing Class
EUR X Accumulating
Class
EUR Z Accumulating
Class
GBP IAccumulating
Class
GBP I5 Accumulating
Class
GBP I5 Distributing
Class For the Year Ended 31 December 2019 Redeemable Participating Shares Shares in issue at start of year 579,000 134,538 1,960,549 107,978 2,642 665,867 28,847 52,667 26,297 15,089
Redeemable Participating Shares issued 10,493 113 5,150 2,120 – – – 10,332 – 4,000
Redeemable Participating Shares redeemed (579,002) (52,550) (1,284,021) (41,701) – (477,595) (303) (55,204) (8,000) (4,000)
Shares in issue at end of year 10,491 82,101 681,678 68,397 2,642 188,272 28,544 7,795 18,297 15,089
For the Year Ended 31 December 2018 Redeemable Participating Shares Shares in issue at start of year 235,650 154,807 1,985,666 51,970 8,342 955,009 1,312 197,568 20,087 15,786
Redeemable Participating Shares issued 1,045,500 42,110 909,554 108,177 1,926 180,215 27,535 94,041 6,905 –
Redeemable Participating Shares redeemed (702,150) (62,379) (934,671) (52,169) (7,626) (469,357) – (238,942) (695) (697)
Shares in issue at end of year 579,000 134,538 1,960,549 107,978 2,642 665,867 28,847 52,667 26,297 15,089

NOTES TO THE AUDITED FINANCIAL STATEMENTS FINANCIAL STATEMENTS
ANNUAL REPORT 2019 1087
FOR THE YEAR ENDED 31 DECEMBER 2019
5. SHARE CAPITAL (CONTINUED)
Neuberger Berman Global Equity Index PutWrite Fund (continued)
GBP X Accumulating
Class*
GBP X Distributing
Class*
HKD I5 (Monthly)
Distributing Class*
HKD I5 Accumulating
Class*
HKD X (Monthly)
Distributing Class*
HKD X Accumulating
Class*
SGD A (Monthly)
Distributing Class
SGD I5 (Monthly)
Distributing Class*
SGD I5 Accumulating
Class
SGD X (Monthly)
Distributing Class
For the Year Ended 31 December 2019 Redeemable Participating Shares Shares in issue at start of year 86 786 7,798 7,798 7,798 7,798 4,017 691 5,589 2,469
Redeemable Participating Shares issued – – – – – – 191 – – –
Redeemable Participating Shares redeemed (86) (786) (7,798) (7,798) (7,798) (7,798) (3,269) (691) – –
Shares in issue at end of year – – – – – – 939 – 5,589 2,469
For the Year Ended 31 December 2018 Redeemable Participating Shares Shares in issue at start of year 7,744 786 7,798 7,798 7,798 7,798 950 691 691 2,469
Redeemable Participating Shares issued – – – – – – 6,075 – 4,898 –
Redeemable Participating Shares redeemed (7,658) – – – – – (3,008) – – –
Shares in issue at end of year 86 786 7,798 7,798 7,798 7,798 4,017 691 5,589 2,469 * Share class launched or closed during the current or prior reporting year.

FINANCIAL STATEMENTS NOTES TO THE AUDITED FINANCIAL STATEMENTS
1088 NEUBERGER BERMAN INVESTMENT FUNDS PLC
FOR THE YEAR ENDED 31 DECEMBER 2019
5. SHARE CAPITAL (CONTINUED)
Neuberger Berman Global Equity Index PutWrite Fund (continued)
SGD X Accumulating
Class
USD A Accumulating
Class
USD C1 Accumulating
Class*
USD I Accumulating
Class
USD I Distributing
Class
USD I5 (Monthly)
Distributing Class
USD I5 Accumulating
Class
USD I5 Distributing
Class
USD X (Monthly)
Distributing Class
USD X Accumulating
Class For the Year Ended 31 December 2019 Redeemable Participating Shares Shares in issue at start of year 5,265 21,405 24,688 50,171 2,500 134,996 1,532,448 526,791 220,586 898,655
Redeemable Participating Shares issued 2,013 1,485 – 559,759 – 22,043 204,024 – 1,600 66,799
Redeemable Participating Shares redeemed (5,267) (12,904) (9,946) (24,734) – (51,083) (882,999) (65,399) (56,651) (713,049)
Shares in issue at end of year 2,011 9,986 14,742 585,196 2,500 105,956 853,473 461,392 165,535 252,405
For the Year Ended 31 December 2018 Redeemable Participating Shares Shares in issue at start of year 35,335 23,517 – 695,907 2,500 69,647 1,082,009 525,955 164,331 1,287,569
Redeemable Participating Shares issued 498 1,987,189 32,558 304,567 – 80,573 1,275,286 31,849 129,077 744,073
Redeemable Participating Shares redeemed (30,568) (1,989,301) (7,870) (950,303) – (15,224) (824,847) (31,013) (72,822) (1,132,987)
Shares in issue at end of year 5,265 21,405 24,688 50,171 2,500 134,996 1,532,448 526,791 220,586 898,655 * Share class launched or closed during the current or prior reporting year.

NOTES TO THE AUDITED FINANCIAL STATEMENTS FINANCIAL STATEMENTS
ANNUAL REPORT 2019 1089
FOR THE YEAR ENDED 31 DECEMBER 2019
5. SHARE CAPITAL (CONTINUED)
Neuberger Berman Global Equity Index PutWrite Fund (continued)
USD X Distributing
Class
USD Z Accumulating
Class
For the Year Ended 31 December 2019 Redeemable Participating Shares Shares in issue at start of year 6,000 1,302,650
Redeemable Participating Shares issued – 139,470
Redeemable Participating Shares redeemed – (760,976)
Shares in issue at end of year 6,000 681,144
For the Year Ended 31 December 2018
Redeemable Participating Shares Shares in issue at start of year 6,000 613,396
Redeemable Participating Shares issued 14,259 999,965
Redeemable Participating Shares redeemed (14,259) (310,711)
Shares in issue at end of year 6,000 1,302,650 * Share class launched or closed during the current or prior reporting year.

FINANCIAL STATEMENTS NOTES TO THE AUDITED FINANCIAL STATEMENTS
1090 NEUBERGER BERMAN INVESTMENT FUNDS PLC
FOR THE YEAR ENDED 31 DECEMBER 2019
5. SHARE CAPITAL (CONTINUED)
Neuberger Berman Uncorrelated Strategies Fund
CHF I Accumulating
Class*
CHF I5Accumulating
Class
EUR A Accumulating
Class*
EUR I Accumulating
Class*
EUR I2 Accumulating
Class
EUR I5 Accumulating
Class
EUR M Accumulating
Class
GBP I Accumulating
Class
GBP I2 Accumulating
Class
GBP I5 Accumulating
Class For the Year Ended 31 December 2019 Redeemable Participating Shares Shares in issue at start of year 680,339 58,006 1,407,267 3,251,553 783,202 1,238,709 168,853 3,691,493 23,402,011 12,889,877
Redeemable Participating Shares issued 22,839 – 1,352,342 2,798,431 456,420 41,889 74,403 958,027 16,586,872 2,538,551
Redeemable Participating Shares redeemed (336,055) (2,141) (598,090) (1,344,756) (65,610) (215,349) (139,612) (2,706,086) (4,044,426) (5,747,491)
Shares in issue at end of year 367,123 55,865 2,161,519 4,705,228 1,174,012 1,065,249 103,644 1,943,434 35,944,457 9,680,937
For the Year Ended 31 December 2018 Redeemable Participating Shares Shares in issue at start of year – 58,800 – – 483,136 874,456 1,608 193,885 6,400,857 6,578,063
Redeemable Participating Shares issued 796,137 – 1,455,684 3,540,243 332,449 392,289 179,248 3,725,193 18,031,188 7,551,000
Redeemable Participating Shares redeemed (115,798) (794) (48,417) (288,690) (32,383) (28,036) (12,003) (227,585) (1,030,034) (1,239,186)
Shares in issue at end of year 680,339 58,006 1,407,267 3,251,553 783,202 1,238,709 168,853 3,691,493 23,402,011 12,889,877 * Share class launched or closed during the current or prior reporting year.

NOTES TO THE AUDITED FINANCIAL STATEMENTS FINANCIAL STATEMENTS
ANNUAL REPORT 2019 1091
FOR THE YEAR ENDED 31 DECEMBER 2019
5. SHARE CAPITAL (CONTINUED)
Neuberger Berman Uncorrelated Strategies Fund (continued)
GBP P Accumulating
Class*
GBP Z Accumulating
Class
SGD A Accumulating
Class*
USD A Accumulating
Class*
USD C1 Accumulating
Class*
USD I Accumulating
Class
USD I2 Accumulating
Class
USD I5 Accumulating
Class
USD M Accumulating
Class
USD P Accumulating
Class* For the Year Ended 31 December 2019 Redeemable Participating Shares Shares in issue at start of year 5,036,960 31,506 2,061 3,025,384 2,868,094 5,068,088 3,326,274 3,095,716 1,199,845 306,577
Redeemable Participating Shares issued 9,472,699 – – 3,307,038 747,818 2,478,734 1,755,187 935,197 691,245 4,214,838
Redeemable Participating Shares redeemed (1,075,802) – – (1,826,919) (1,663,299) (2,039,972) (423,538) (594,863) (561,247) (1,068,284)
Shares in issue at end of year 13,433,857 31,506 2,061 4,505,503 1,952,613 5,506,850 4,657,923 3,436,050 1,329,843 3,453,131
For the Year Ended 31 December 2018 Redeemable Participating Shares Shares in issue at start of year – 34,130 – – – 197,810 3,046,906 2,843,559 13,359 –
Redeemable Participating Shares issued 5,105,556 – 2,061 3,206,231 3,012,704 5,201,330 689,984 267,211 1,415,944 306,577
Redeemable Participating Shares redeemed (68,596) (2,624) – (180,847) (144,610) (331,052) (410,616) (15,054) (229,458) –
Shares in issue at end of year 5,036,960 31,506 2,061 3,025,384 2,868,094 5,068,088 3,326,274 3,095,716 1,199,845 306,577 * Share class launched or closed during the current or prior reporting year.

FINANCIAL STATEMENTS NOTES TO THE AUDITED FINANCIAL STATEMENTS
1092 NEUBERGER BERMAN INVESTMENT FUNDS PLC
FOR THE YEAR ENDED 31 DECEMBER 2019
5. SHARE CAPITAL (CONTINUED)
Neuberger Berman Uncorrelated Strategies Fund (continued)
USD Z Accumulating
Class
For the Year Ended 31 December 2019 Redeemable Participating Shares Shares in issue at start of year 1,200,792
Redeemable Participating Shares issued 284,330
Redeemable Participating Shares redeemed (399,390)
Shares in issue at end of year 1,085,732
For the Year Ended 31 December 2018
Redeemable Participating Shares Shares in issue at start of year 1,019,910
Redeemable Participating Shares issued 1,212,241
Redeemable Participating Shares redeemed (1,031,359)
Shares in issue at end of year 1,200,792
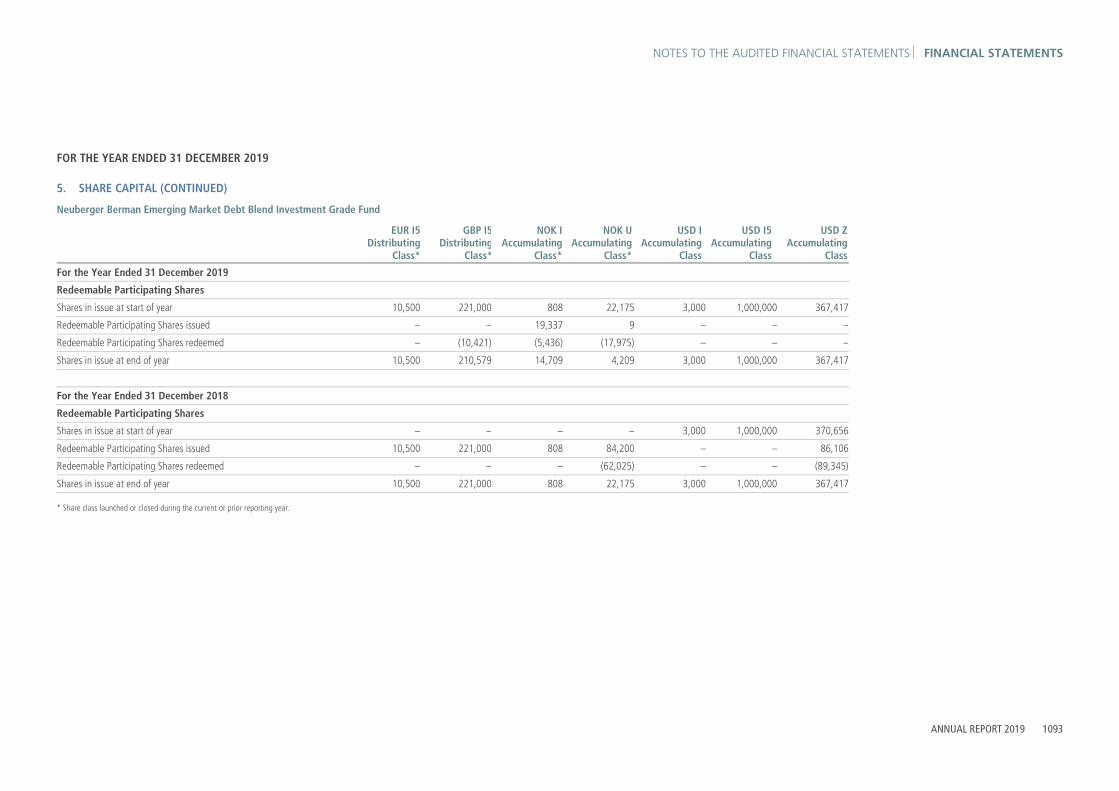
NOTES TO THE AUDITED FINANCIAL STATEMENTS FINANCIAL STATEMENTS
ANNUAL REPORT 2019 1093
FOR THE YEAR ENDED 31 DECEMBER 2019
5. SHARE CAPITAL (CONTINUED)
Neuberger Berman Emerging Market Debt Blend Investment Grade Fund
EUR I5Distributing
Class*
GBP I5Distributing
Class*
NOK I Accumulating
Class*
NOK U Accumulating
Class*
USD I Accumulating
Class
USD I5 Accumulating
Class
USD Z Accumulating
Class
For the Year Ended 31 December 2019
Redeemable Participating Shares
Shares in issue at start of year 10,500 221,000 808 22,175 3,000 1,000,000 367,417
Redeemable Participating Shares issued – – 19,337 9 – – –
Redeemable Participating Shares redeemed – (10,421) (5,436) (17,975) – – –
Shares in issue at end of year 10,500 210,579 14,709 4,209 3,000 1,000,000 367,417
For the Year Ended 31 December 2018
Redeemable Participating Shares
Shares in issue at start of year – – – – 3,000 1,000,000 370,656
Redeemable Participating Shares issued 10,500 221,000 808 84,200 – – 86,106
Redeemable Participating Shares redeemed – – – (62,025) – – (89,345)
Shares in issue at end of year 10,500 221,000 808 22,175 3,000 1,000,000 367,417
* Share class launched or closed during the current or prior reporting year.

FINANCIAL STATEMENTS NOTES TO THE AUDITED FINANCIAL STATEMENTS
1094 NEUBERGER BERMAN INVESTMENT FUNDS PLC
FOR THE YEAR ENDED 31 DECEMBER 2019
5. SHARE CAPITAL (CONTINUED)
Neuberger Berman Emerging Markets Sustainable Equity Fund
EUR M Accumulating
Unhedged Class*
JPY I Accumulating
Unhedged Class*
USD A Accumulating
Class*
USD I Accumulating
Class
USD I Distributing
Class
USD I5 Accumulating
Class
For the Year Ended 31 December 2019
Redeemable Participating Shares
Shares in issue at start of year 2,609 1,299,990 1,000 3,000 488,026 2,014,038
Redeemable Participating Shares issued – – – 9,160,974 2,882 –
Redeemable Participating Shares redeemed – (2,481) – (3,000) (488,026) (20,570)
Shares in issue at end of year 2,609 1,297,509 1,000 9,160,974 2,882 1,993,468
For the Year Ended 31 December 2018
Redeemable Participating Shares
Shares in issue at start of year – – – 3,000 497,000 305,870
Redeemable Participating Shares issued 2,609 1,299,990 1,000 – – 1,883,868
Redeemable Participating Shares redeemed – – – – (8,974) (175,700)
Shares in issue at end of year 2,609 1,299,990 1,000 3,000 488,026 2,014,038
* Share class launched or closed during the current or prior reporting year.
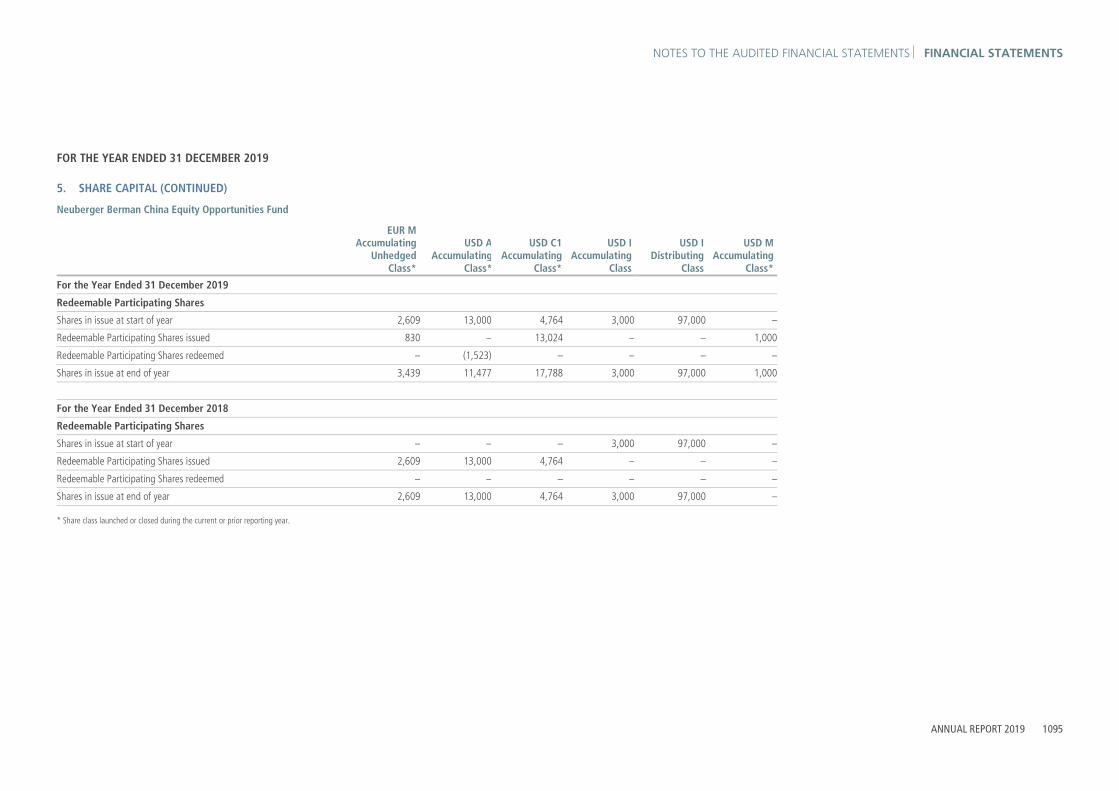
NOTES TO THE AUDITED FINANCIAL STATEMENTS FINANCIAL STATEMENTS
ANNUAL REPORT 2019 1095
FOR THE YEAR ENDED 31 DECEMBER 2019
5. SHARE CAPITAL (CONTINUED)
Neuberger Berman China Equity Opportunities Fund
EUR M Accumulating
Unhedged Class*
USD AAccumulating
Class*
USD C1 Accumulating
Class*
USD I Accumulating
Class
USD I Distributing
Class
USD M Accumulating
Class*
For the Year Ended 31 December 2019
Redeemable Participating Shares
Shares in issue at start of year 2,609 13,000 4,764 3,000 97,000 –
Redeemable Participating Shares issued 830 – 13,024 – – 1,000
Redeemable Participating Shares redeemed – (1,523) – – – –
Shares in issue at end of year 3,439 11,477 17,788 3,000 97,000 1,000
For the Year Ended 31 December 2018
Redeemable Participating Shares
Shares in issue at start of year – – – 3,000 97,000 –
Redeemable Participating Shares issued 2,609 13,000 4,764 – – –
Redeemable Participating Shares redeemed – – – – – –
Shares in issue at end of year 2,609 13,000 4,764 3,000 97,000 –
* Share class launched or closed during the current or prior reporting year.
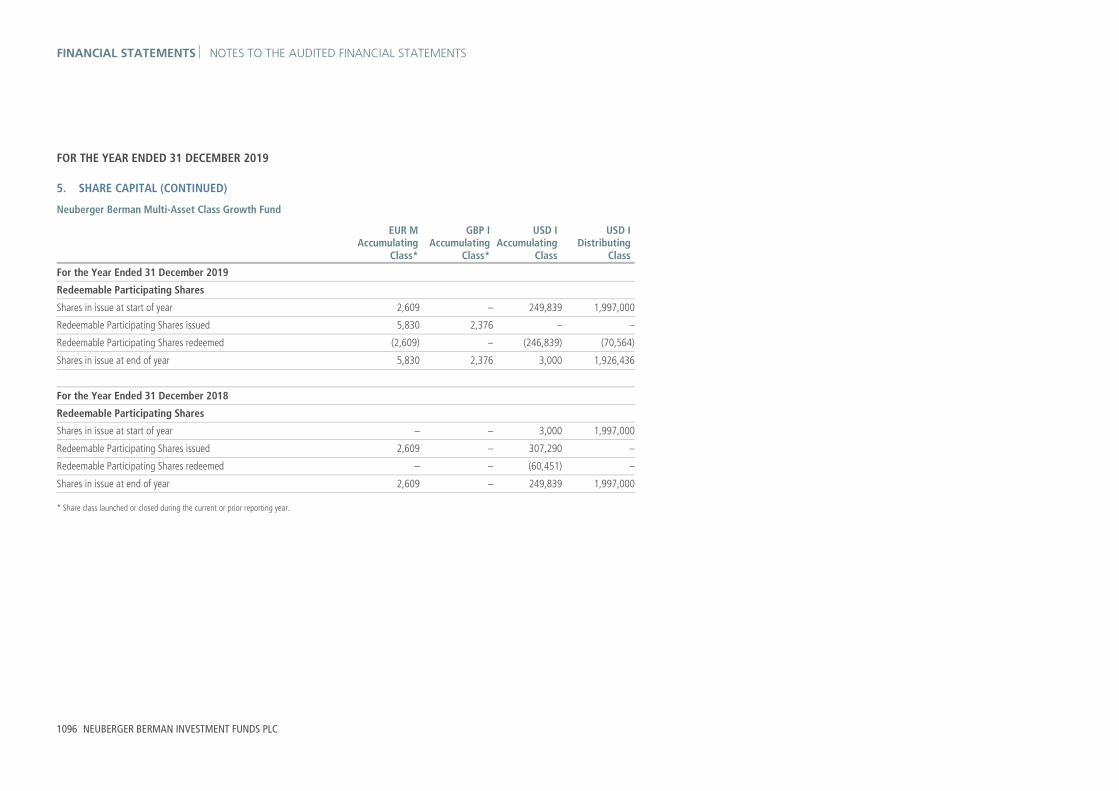
FINANCIAL STATEMENTS NOTES TO THE AUDITED FINANCIAL STATEMENTS
1096 NEUBERGER BERMAN INVESTMENT FUNDS PLC
FOR THE YEAR ENDED 31 DECEMBER 2019
5. SHARE CAPITAL (CONTINUED)
Neuberger Berman Multi-Asset Class Growth Fund
EUR M Accumulating
Class*
GBP I Accumulating
Class*
USD I Accumulating
Class
USD I Distributing
Class For the Year Ended 31 December 2019 Redeemable Participating Shares Shares in issue at start of year 2,609 – 249,839 1,997,000
Redeemable Participating Shares issued 5,830 2,376 – –
Redeemable Participating Shares redeemed (2,609) – (246,839) (70,564)
Shares in issue at end of year 5,830 2,376 3,000 1,926,436
For the Year Ended 31 December 2018
Redeemable Participating Shares Shares in issue at start of year – – 3,000 1,997,000
Redeemable Participating Shares issued 2,609 – 307,290 –
Redeemable Participating Shares redeemed – – (60,451) –
Shares in issue at end of year 2,609 – 249,839 1,997,000 * Share class launched or closed during the current or prior reporting year.

NOTES TO THE AUDITED FINANCIAL STATEMENTS FINANCIAL STATEMENTS
ANNUAL REPORT 2019 1097
FOR THE YEAR ENDED 31 DECEMBER 2019
5. SHARE CAPITAL (CONTINUED)
Neuberger Berman Global Thematic Equity Fund1
EUR M Accumulating
Unhedged Class*
GBP I Accumulating
Class*
USD A Accumulating
Class*
USD C1 Accumulating
Class*
USD I Accumulating
Class*
USD I Distributing
Class*
USD M Accumulating
Class*
For the Year Ended 31 December 2019
Redeemable Participating Shares
Shares in issue at start of year 2,609 – 591,357 106,969 103,040 397,050 227,540
Redeemable Participating Shares issued 13,023 2,376 944,883 285,023 69,130 – 562,230
Redeemable Participating Shares redeemed (6,483) (2,376) (363,099) (21,151) (5,375) (395,987) (279,068)
Shares in issue at end of year 9,149 – 1,173,141 370,841 166,795 1,063 510,702
For the Year Ended 31 December 2018
Redeemable Participating Shares
Shares in issue at start of year – – – – – – –
Redeemable Participating Shares issued 2,609 – 592,136 111,994 103,040 496,000 246,210
Redeemable Participating Shares redeemed – – (779) (5,025) – (98,950) (18,670)
Shares in issue at end of year 2,609 – 591,357 106,969 103,040 397,050 227,540
* Share class launched or closed during the current or prior reporting year.

FINANCIAL STATEMENTS NOTES TO THE AUDITED FINANCIAL STATEMENTS
1098 NEUBERGER BERMAN INVESTMENT FUNDS PLC
FOR THE YEAR ENDED 31 DECEMBER 2019
5. SHARE CAPITAL (CONTINUED)
Neuberger Berman CLO Income Fund1
EUR I Accumulating
Class*
EUR I2 Distributing
Class*
GBP I Accumulating
Class*
GBP I2 Distributing
Class*
GBP I5 Distributing
Class*
GBP Z Accumulating
Class*
SEK I Accumulating
Class*
USD I Accumulating
Class*
USD I2 Distributing
Class*
USD I5 Distributing
Class*
USD Z Accumulating
Class*
For the Year Ended 31 December 2019 Redeemable Participating Shares Shares in issue at start of year 1,350,984 538,800 78,084 1,179,793 4,823,464 – 487,585 954,411 – 941,122 –
Redeemable Participating Shares issued 1,264,159 357,258 – 2,380,952 – 2,285 861,780 532,258 836,873 261,332 342,591
Redeemable Participating Shares redeemed (1,303,200) – (69,294) – (1,082,251) – (577,337) (487,802) (336,873) – –
Shares in issue at end of year 1,311,943 896,058 8,790 3,560,745 3,741,213 2,285 772,028 998,867 500,000 1,202,454 342,591
For the Year Ended 31 December 2018
Redeemable Participating Shares Shares in issue at start of year – – – – – – – – – – –
Redeemable Participating Shares issued 1,681,565 856,423 82,409 1,179,793 4,823,464 – 543,863 1,157,597 – 941,122 –
Redeemable Participating Shares redeemed (330,581) (317,623) (4,325) – – – (56,278) (203,186) – – –
Shares in issue at end of year 1,350,984 538,800 78,084 1,179,793 4,823,464 – 487,585 954,411 – 941,122 – * Share class launched or closed during the current or prior reporting year.

NOTES TO THE AUDITED FINANCIAL STATEMENTS FINANCIAL STATEMENTS
ANNUAL REPORT 2019 1099
FOR THE YEAR ENDED 31 DECEMBER 2019
5. SHARE CAPITAL (CONTINUED)
Neuberger Berman China A-Share Opportunities Fund1**
USD I Accumulating
Class*
USD I Distributing
Class*
For the Year Ended 31 December 2019 Redeemable Participating Shares Shares in issue at start of year 3,000 97,000
Redeemable Participating Shares issued – –
Redeemable Participating Shares redeemed (3,000) (97,000)
Shares in issue at end of year – –
For the Year Ended 31 December 2018
Redeemable Participating Shares Shares in issue at start of year – –
Redeemable Participating Shares issued 3,000 97,000
Redeemable Participating Shares redeemed – –
Shares in issue at end of year 3,000 97,000 * Share class launched or closed during the current or prior reporting year. ** Portfolio liquidated on 6 December 2019.

FINANCIAL STATEMENTS NOTES TO THE AUDITED FINANCIAL STATEMENTS
1100 NEUBERGER BERMAN INVESTMENT FUNDS PLC
FOR THE YEAR ENDED 31 DECEMBER 2019
5. SHARE CAPITAL (CONTINUED)
Neuberger Berman Next Generation Mobility Fund1
AUD X Accumulating
Class*
EUR A Accumulating
Class*
EUR M Accumulating
Unhedged Class*
EUR X Accumulating
Class*
GBP I Accumulating
Class*
GBP X Accumulating
Class*
HKD X Accumulating
Unhedged Class*
SGD X Accumulating
Class*
USD A Accumulating
Class*
USD C1 Accumulating
Class* For the Year Ended 31 December 2019 Redeemable Participating Shares Shares in issue at start of year – 1,000 2,632 – – – – – 25,000 –
Redeemable Participating Shares issued 4,204 1,070 154,137 2,634 2,376 2,295 23,537 2,039 782,012 5,624
Redeemable Participating Shares redeemed – – (2,507) – – – – – (21,020) –
Shares in issue at end of year 4,204 2,070 154,262 2,634 2,376 2,295 23,537 2,039 785,992 5,624
For the Year Ended 31 December 2018 Redeemable Participating Shares Shares in issue at start of year – – – – – – – – – –
Redeemable Participating Shares issued – 1,000 2,632 – – – – – 25,000 –
Redeemable Participating Shares redeemed – – – – – – – – – –
Shares in issue at end of year – 1,000 2,632 – – – – – 25,000 – * Share class launched or closed during the current or prior reporting year.

NOTES TO THE AUDITED FINANCIAL STATEMENTS FINANCIAL STATEMENTS
ANNUAL REPORT 2019 1101
FOR THE YEAR ENDED 31 DECEMBER 2019
5. SHARE CAPITAL (CONTINUED)
Neuberger Berman Next Generation Mobility Fund1 (continued)
USD I Accumulating
Class*
USD I Distributing
Class*
USD M Accumulating
Class*
USD X Accumulating
Class*
For the Year Ended 31 December 2019 Redeemable Participating Shares Shares in issue at start of year 3,000 247,000 – –
Redeemable Participating Shares issued 21,497 2,739,496 3,250 106,492
Redeemable Participating Shares redeemed (39) – – (46,339)
Shares in issue at end of year 24,458 2,986,496 3,250 60,153
For the Year Ended 31 December 2018
Redeemable Participating Shares Shares in issue at start of year – – – –
Redeemable Participating Shares issued 3,000 247,000 – –
Redeemable Participating Shares redeemed – – – –
Shares in issue at end of year 3,000 247,000 – – * Share class launched or closed during the current or prior reporting year.

FINANCIAL STATEMENTS NOTES TO THE AUDITED FINANCIAL STATEMENTS
1102 NEUBERGER BERMAN INVESTMENT FUNDS PLC
FOR THE YEAR ENDED 31 DECEMBER 2019
5. SHARE CAPITAL (CONTINUED)
Neuberger Berman Ultra Short Term Euro Bond Fund1
CHF U Accumulating
Class*
EUR I Accumulating
Class*
EUR I Distributing
Class*
EUR I5 Accumulating
Class*
EUR U Accumulating
Class*
EUR Z Accumulating
Class*
USD M Accumulating
Class*
USD Z Accumulating
Class*
For the Year Ended 31 December 2019
Redeemable Participating Shares
Shares in issue at start of year – 12,000 97,000 – – 5,000 – –
Redeemable Participating Shares issued 294 1,789,222 – 1,809,502 269 13,654 600,297 623,986
Redeemable Participating Shares redeemed – (385,664) (96,881) (50,191) – (8,575) (600,000) (41,581)
Shares in issue at end of year 294 1,415,558 119 1,759,311 269 10,079 297 582,405
For the Year Ended 31 December 2018
Redeemable Participating Shares
Shares in issue at start of year – – – – – – – –
Redeemable Participating Shares issued – 12,000 97,000 – – 5,000 – –
Redeemable Participating Shares redeemed – – – – – – – –
Shares in issue at end of year – 12,000 97,000 – – 5,000 – –
* Share class launched or closed during the current or prior reporting year.

NOTES TO THE AUDITED FINANCIAL STATEMENTS FINANCIAL STATEMENTS
ANNUAL REPORT 2019 1103
FOR THE YEAR ENDED 31 DECEMBER 2019
5. SHARE CAPITAL (CONTINUED)
Neuberger Berman Euro Opportunistic Bond Fund1
EUR I Accumulating
Class*
EUR I Distributing
Class*
For the Year Ended 31 December 2019 Redeemable Participating Shares Shares in issue at start of year 3,000 497,000
Redeemable Participating Shares issued – 481,926
Redeemable Participating Shares redeemed – –
Shares in issue at end of year 3,000 978,926
For the Year Ended 31 December 2018
Redeemable Participating Shares Shares in issue at start of year – –
Redeemable Participating Shares issued 3,000 497,000
Redeemable Participating Shares redeemed – –
Shares in issue at end of year 3,000 497,000 * Share class launched or closed during the current or prior reporting year.
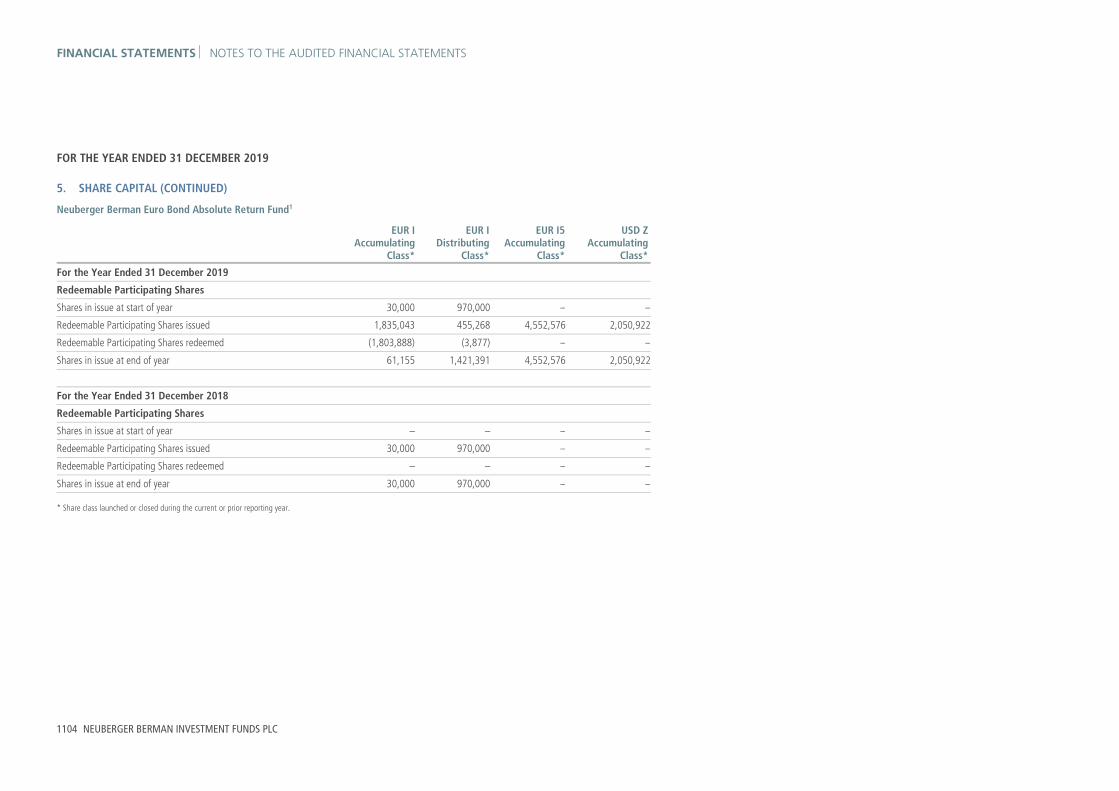
FINANCIAL STATEMENTS NOTES TO THE AUDITED FINANCIAL STATEMENTS
1104 NEUBERGER BERMAN INVESTMENT FUNDS PLC
FOR THE YEAR ENDED 31 DECEMBER 2019
5. SHARE CAPITAL (CONTINUED)
Neuberger Berman Euro Bond Absolute Return Fund1
EUR IAccumulating
Class*
EUR I Distributing
Class*
EUR I5 Accumulating
Class*
USD Z Accumulating
Class* For the Year Ended 31 December 2019 Redeemable Participating Shares Shares in issue at start of year 30,000 970,000 – –
Redeemable Participating Shares issued 1,835,043 455,268 4,552,576 2,050,922
Redeemable Participating Shares redeemed (1,803,888) (3,877) – –
Shares in issue at end of year 61,155 1,421,391 4,552,576 2,050,922
For the Year Ended 31 December 2018
Redeemable Participating Shares Shares in issue at start of year – – – –
Redeemable Participating Shares issued 30,000 970,000 – –
Redeemable Participating Shares redeemed – – – –
Shares in issue at end of year 30,000 970,000 – – * Share class launched or closed during the current or prior reporting year.

NOTES TO THE AUDITED FINANCIAL STATEMENTS FINANCIAL STATEMENTS
ANNUAL REPORT 2019 1105
FOR THE YEAR ENDED 31 DECEMBER 2019
5. SHARE CAPITAL (CONTINUED)
Neuberger Berman Absolute Alpha Fund2
EUR IAccumulating
Class*
EUR M Accumulating
Class*
EUR M Accumulating
Unhedged Class*
GBP Z Accumulating
Class*
SGD A Accumulating
Class*
USD A Accumulating
Class*
USD I Accumulating
Class*
For the Year Ended 31 December 2019 Redeemable Participating Shares Shares in issue at start of year – – – – – – –
Redeemable Participating Shares issued 6,086 1,511 13,616 7,213 105,326 4,165,139 1,000
Redeemable Participating Shares redeemed (26) – (610) – (103,257) – –
Shares in issue at end of year 6,060 1,511 13,006 7,213 2,069 4,165,139 1,000 * Share class launched or closed during the current or prior reporting year.
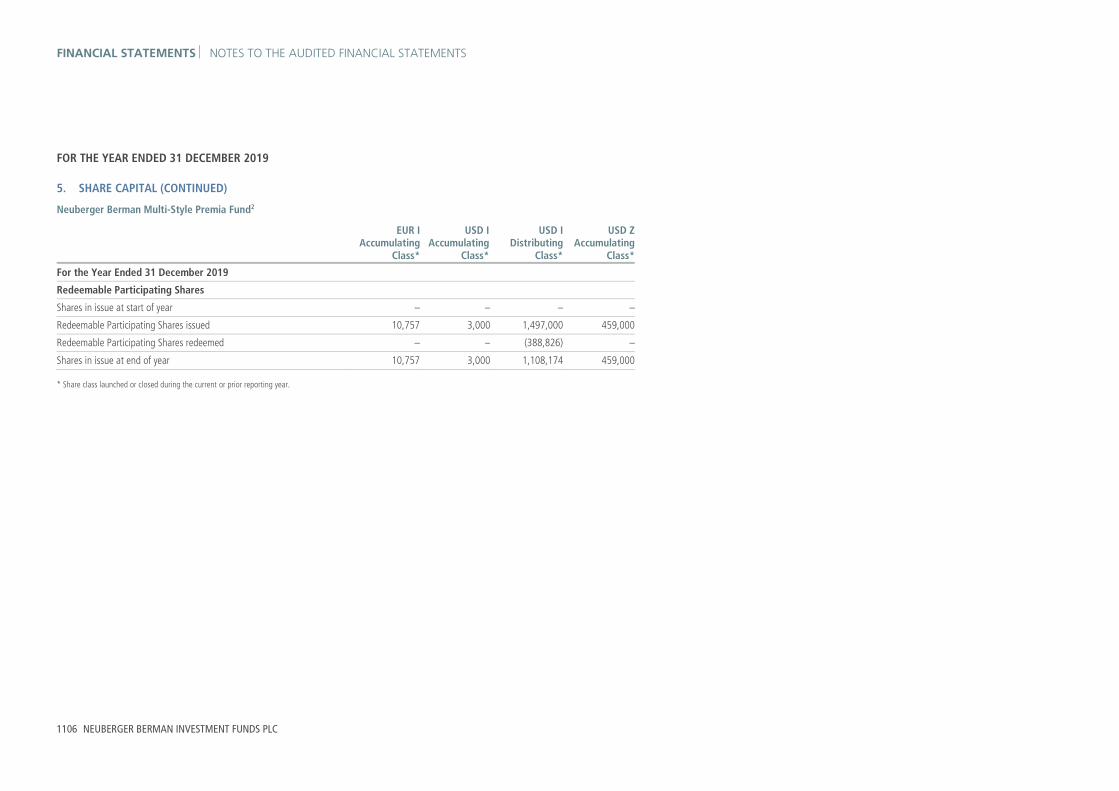
FINANCIAL STATEMENTS NOTES TO THE AUDITED FINANCIAL STATEMENTS
1106 NEUBERGER BERMAN INVESTMENT FUNDS PLC
FOR THE YEAR ENDED 31 DECEMBER 2019
5. SHARE CAPITAL (CONTINUED)
Neuberger Berman Multi-Style Premia Fund2
EUR IAccumulating
Class*
USD I Accumulating
Class*
USD I Distributing
Class*
USD Z Accumulating
Class*
For the Year Ended 31 December 2019 Redeemable Participating Shares Shares in issue at start of year – – – –
Redeemable Participating Shares issued 10,757 3,000 1,497,000 459,000
Redeemable Participating Shares redeemed – – (388,826) –
Shares in issue at end of year 10,757 3,000 1,108,174 459,000 * Share class launched or closed during the current or prior reporting year.

NOTES TO THE AUDITED FINANCIAL STATEMENTS FINANCIAL STATEMENTS
ANNUAL REPORT 2019 1107
FOR THE YEAR ENDED 31 DECEMBER 2019
5. SHARE CAPITAL (CONTINUED)
Neuberger Berman Macro Opportunities FX Fund2
EUR IAccumulating
Class*
GBP Z Accumulating
Class*
SEK I Accumulating
Class*
SEK I Distributing
Class*
USD I Accumulating
Class*
USD X Accumulating
Class*
USD Z Accumulating
Class*
For the Year Ended 31 December 2019 Redeemable Participating Shares Shares in issue at start of year – – – – – – –
Redeemable Participating Shares issued 1,000 35,996 2,830 2,830 3,000 1,727,500 398,275
Redeemable Participating Shares redeemed – – – – – – –
Shares in issue at end of year 1,000 35,996 2,830 2,830 3,000 1,727,500 398,275 * Share class launched or closed during the current or prior reporting year.
1 Portfolio launched during the prior reporting year. 2 Portfolio launched during the current reporting year.

FINANCIAL STATEMENTS NOTES TO THE AUDITED FINANCIAL STATEMENTS
1108 NEUBERGER BERMAN INVESTMENT FUNDS PLC
FOR THE YEAR ENDED 31 DECEMBER 2019
6. INVESTMENT MANAGER, ADMINISTRATOR, DISTRIBUTOR AND DEPOSITARY FEES
In respect to each class of shares, the Investment Manager is entitled to a fee in respect of the investment management services and a fee in respect of the management administration services provided to each Portfolio.
The management administration services fee can charge up to 0.20% per share class, subject to a minimum annual fee of US$ 75,000 per Portfolio. Currently the management administration services fee being charged for the B, C, C1, C2, T and M share classes is 0.10%. All other share classes are currently being charged at 0.075%. The investment management fee rates for each class are set out below.
The management fees, with the exception of any performance fees, accrues daily and is payable monthly in arrears at the end of each calendar month and the Investment Manager will pay the Sub-Investment Manager out of its fee and may pay investment advisers appointed in respect of a Portfolio out of its fee. The current management fees payable in respect of each Portfolio are disclosed in the following tables. The Investment Manager is also entitled to recover from the Company all out-of-pocket expenses suffered or incurred by it or its delegates, the distributor or the administrator in the performance of its duties and pays any such expenses recovered to the appropriate service provider.
Neuberger Berman High Yield Bond Fund
Management Fee
Neuberger Berman High Yield Bond Fund (continued)
Management Fee
AUD A (Monthly) Distributing Class 1.20% EUR I2 (Monthly) Distributing Class 0.50%
AUD A Accumulating Class 1.20% EUR I2 Accumulating Class 0.50%
AUD B (Monthly) Distributing Class 1.80% EUR I2 Distributing Class 0.50%
AUD B (Weekly) Distributing Class 1.80% EUR I3 Accumulating Class 0.42%
AUD C2 (Monthly) Distributing Class 1.80% EUR I3 Distributing Class 0.42%
AUD C2 (Weekly) Distributing Class 1.80% EUR M Accumulating Class 1.20%
AUD E (Monthly) Distributing Class 1.80% EUR M Distributing Class 1.20%
AUD E Accumulating Class 1.80% EUR Z Accumulating Class 0.00%
AUD I Distributing Class 0.60% GBP A (Monthly) Distributing Class 1.20%
AUD I2 (Monthly) Distributing Class 0.50% GBP A Accumulating Class 1.20%
AUD I2 Accumulating Class 0.50% GBP A Distributing Class 1.20%
AUD T (Monthly) Distributing Class 1.80% GBP I Accumulating Class 0.60%
AUD T (Weekly) Distributing Class 1.80% GBP I Distributing Class 0.60%
AUD T Accumulating Class 1.80% GBP I2 Accumulating Class 0.50%
CAD A (Monthly) Distributing Class 1.20% GBP I2 Distributing Class 0.50%
CHF A Accumulating Class 1.20% GBP Z Accumulating Class 0.00%
CHF I Accumulating Class 0.60% HKD A (Monthly) Distributing Class 1.20%
CHF I Distributing Class 0.60% HKD A Accumulating Class 1.20%
CHF I2 Accumulating Class 0.50% JPY I Accumulating Class 0.60%
CNY A (Monthly) Distributing Class 1.20% SEK A Accumulating Class 1.20%
CNY A (Weekly) Distributing Class 1.20% SGD A (Monthly) Distributing Class 1.20%
CNY B (Monthly) Distributing Class 1.80% SGD A Accumulating Class 1.20%
CNY I (Monthly) Distributing Class 0.60% USD A (Monthly) Distributing Class 1.20%
CNY T (Monthly) Distributing Class 1.80% USD A (Weekly) Distributing Class 1.20%
EUR A (Monthly) Distributing Class 1.20% USD A Accumulating Class 1.20%
EUR A Accumulating Class 1.20% USD A Distributing Class 1.20%
EUR A Distributing Class 1.20% USD B (Monthly) Distributing Class 1.80%
EUR I Accumulating Class 0.60% USD B (Weekly) Distributing Class 1.80%
EUR I Distributing Class 0.60% USD B Accumulating Class 1.80%

NOTES TO THE AUDITED FINANCIAL STATEMENTS FINANCIAL STATEMENTS
ANNUAL REPORT 2019 1109
FOR THE YEAR ENDED 31 DECEMBER 2019 6. INVESTMENT MANAGER, ADMINISTRATOR, DISTRIBUTOR AND DEPOSITARY FEES (CONTINUED)
Neuberger Berman High Yield Bond Fund (continued)
Management Fee Neuberger Berman US Multi Cap
Opportunities Fund Management
Fee
USD C Accumulating Class 0.80% AUD E Accumulating Class 1.80%
USD C Distributing Class 0.80% AUD T Accumulating Class 1.80%
USD C1 Accumulating Class 1.20% EUR I3 Accumulating Class 0.50%
USD C1 Distributing Class 1.20% EUR M Accumulating Class 1.70%
USD C2 (Monthly) Distributing Class 1.80% EUR1 A Accumulating Class 1.70%
USD C2 (Weekly) Distributing Class 1.80% EUR1 I Accumulating Class 0.85%
USD C2 Accumulating Class 1.80% GBP I Accumulating Class 0.85%
USD E (Monthly) Distributing Class 1.80% GBP I Distributing Unhedged Class 0.85%
USD E Accumulating Class 1.80% GBP I3 Distributing Class 0.50%
USD I (Monthly) Distributing Class 0.60% GBP I3 Distributing Unhedged Class 0.50%
USD I Accumulating Class 0.60% SGD A Accumulating Class 1.70%
USD I Distributing Class 0.60% USD B Accumulating Class 1.80%
USD I2 (Monthly) Distributing Class 0.50% USD C Accumulating Class 1.10%
USD I2 Accumulating Class 0.50% USD C1 Accumulating Class 1.70%
USD I2 Distributing Class 0.50% USD C2 Accumulating Class 1.80%
USD I4 (Monthly) Distributing Class 0.36% USD E Accumulating Class 1.80%
USD M Accumulating Class 1.20% USD I2 Distributing Class 0.68%
USD M Distributing Class 1.20% USD I3 Accumulating Class 0.50%
USD P Accumulating Class 0.57% USD I3 Distributing Class 0.50%
USD T (Monthly) Distributing Class 1.80% USD M Accumulating Class 1.70%
USD T (Weekly) Distributing Class 1.80% USD P Accumulating Class 0.81%
USD T Accumulating Class 1.80% USD T Accumulating Class 1.80%
USD U (Monthly) Distributing Class 0.90% USD U Accumulating Class 1.25%
USD U Accumulating Class 0.90% USD Z Accumulating Class 0.00%
USD Z Accumulating Class 0.00% USD1 A Accumulating Class 1.70%
ZAR A (Monthly) Distributing Class 1.20% USD1 I Accumulating Class 0.85%
ZAR B (Monthly) Distributing Class 1.80% USD1 I Distributing Class 0.85%
ZAR C2 (Monthly) Distributing Class 1.80% ZAR B Accumulating Class 1.80%
ZAR E (Monthly) Distributing Class 1.80% ZAR C2 Accumulating Class 1.80%
ZAR E Accumulating Class 1.80% ZAR E Accumulating Class 1.80%
ZAR T (Monthly) Distributing Class 1.80% ZAR T Accumulating Class 1.80%
ZAR T Accumulating Class 1.80%
Neuberger Berman US Real Estate Securities Fund
Neuberger Berman Diversified Currency Fund
AUD A (Monthly) Distributing Class 1.50%
EUR A Accumulating Class 1.00% AUD B (Monthly) Distributing Class 1.80%
EUR I Accumulating Class 0.50% AUD B Accumulating Class 1.80%
EUR M Accumulating Class 1.00% AUD C2 (Monthly) Distributing Class 1.80%
GBP I Accumulating Class 0.50% AUD C2 Accumulating Class 1.80%
JPY I Accumulating Class 0.50% AUD E (Monthly) Distributing Class 1.80%
USD A Accumulating Class 1.00% AUD E Accumulating Class 1.80%
USD I Accumulating Class 0.50% AUD T (Monthly) Distributing Class 1.80%
USD Z Accumulating Class 0.00% AUD T Accumulating Class 1.80%

FINANCIAL STATEMENTS NOTES TO THE AUDITED FINANCIAL STATEMENTS
1110 NEUBERGER BERMAN INVESTMENT FUNDS PLC
FOR THE YEAR ENDED 31 DECEMBER 2019 6. INVESTMENT MANAGER, ADMINISTRATOR, DISTRIBUTOR AND DEPOSITARY FEES (CONTINUED)
Neuberger Berman US Real Estate Securities Fund (continued)
Management Fee
Neuberger Berman China Equity Fund (continued)
Management Fee
CHF A Accumulating Class 1.50% EUR I4 Accumulating Class 1.10%
EUR A Accumulating Class 1.50% EUR M Accumulating Class 1.85%
EUR I Accumulating Class 0.75% EUR Z Accumulating Class 0.00%
EUR M Accumulating Class 1.50% GBP A Distributing Class 1.85%
GBP I Distributing Class 0.75% GBP I Distributing Unhedged Class 1.10%
HKD A (Monthly) Distributing Class 1.50% GBP I2 Distributing Unhedged Class 0.88%
HKD A Accumulating Class 1.50% GBP I4 Accumulating Class 1.10%
SGD A Accumulating Class 1.50% GBP I4 Distributing Class 1.10%
USD A (Monthly) Distributing Class 1.50% HKD A Accumulating Class 1.85%
USD A Accumulating Class 1.50% SGD A Accumulating Class 1.85%
USD A Distributing Class 1.50% USD A Accumulating Class 1.85%
USD B (Monthly) Distributing Class 1.80% USD A Distributing Class 1.85%
USD B Accumulating Class 1.80% USD C1 Accumulating Class 1.85%
USD C Accumulating Class 1.00% USD I Accumulating Class 1.10%
USD C1 Accumulating Class 1.50% USD I2 Accumulating Class 0.88%
USD C2 (Monthly) Distributing Class 1.80% USD I4 Distributing Class 1.10%
USD C2 Accumulating Class 1.80% USD M Accumulating Class 1.85%
USD E (Monthly) Distributing Class 1.80% USD U Accumulating Class 1.45%
USD E Accumulating Class 1.80% USD Z Accumulating Class 0.00%
USD I (Monthly) Distributing Class 0.75%
USD I Accumulating Class 0.75% Neuberger Berman Emerging Markets Equity Fund
USD I Distributing Class 0.75%
USD I2 Accumulating Class 0.54% AUD B Accumulating Class 2.00%
USD M Accumulating Class 1.50% AUD C2 Accumulating Class 2.00%
USD T (Monthly) Distributing Class 1.80% AUD E Accumulating Class 2.00%
USD T Accumulating Class 1.80% AUD T Accumulating Class 2.00%
USD Z Accumulating Class 0.00% CAD I Distributing Unhedged Class 1.00%
ZAR B (Monthly) Distributing Class 1.80% EUR A Accumulating Class 2.00%
ZAR B Accumulating Class 1.80% EUR I Accumulating Class 1.00%
ZAR C2 (Monthly) Distributing Class 1.80% EUR M Accumulating Class 2.00%
ZAR C2 Accumulating Class 1.80% EUR Z Accumulating Class 0.00%
ZAR E (Monthly) Distributing Class 1.80% GBP I Accumulating Class 1.00%
ZAR E Accumulating Class 1.80% GBP Z Accumulating Class 0.00%
ZAR T (Monthly) Distributing Class 1.80% JPY I Accumulating Class 1.00%
ZAR T Accumulating Class 1.80% USD A Accumulating Class 2.00%
USD B Accumulating Class 2.00%
Neuberger Berman China Equity Fund USD C1 Accumulating Class 2.00%
CHF I Accumulating Class 1.10% USD C2 Accumulating Class 2.00%
EUR A Accumulating Class 1.85% USD E Accumulating Class 2.00%
EUR A Accumulating Unhedged Class 1.85% USD I Accumulating Class 1.00%
EUR A Distributing Class 1.85% USD M Accumulating Class 2.00%
EUR I Accumulating Class 1.10% USD T Accumulating Class 2.00%

NOTES TO THE AUDITED FINANCIAL STATEMENTS FINANCIAL STATEMENTS
ANNUAL REPORT 2019 1111
FOR THE YEAR ENDED 31 DECEMBER 2019 6. INVESTMENT MANAGER, ADMINISTRATOR, DISTRIBUTOR AND DEPOSITARY FEES (CONTINUED)
Neuberger Berman Emerging Markets Equity Fund (continued)
Management Fee
Neuberger Berman Short Duration High Yield Bond Fund (continued)
Management Fee
USD Z Accumulating Class 0.00% CNY A (Monthly) Distributing Class 1.20%
ZAR B Accumulating Class 2.00% EUR A Accumulating Class 1.20%
ZAR C2 Accumulating Class 2.00% EUR A Distributing Class 1.20%
ZAR E Accumulating Class 2.00% EUR I Accumulating Class 0.60%
ZAR T Accumulating Class 2.00% EUR I Distributing Class 0.60%
EUR I2 Accumulating Class 0.50%
Neuberger Berman US Small Cap Fund EUR I2 Distributing Class 0.50%
AUD B Accumulating Class 1.80% EUR I3 Distributing Class 0.42%
AUD C2 Accumulating Class 1.80% EUR M Accumulating Class 1.20%
AUD E Accumulating Class 1.80% EUR M Distributing Class 1.20%
AUD T Accumulating Class 1.80% GBP I Accumulating Class 0.60%
EUR A Accumulating Class 1.70% GBP I Distributing Class 0.60%
EUR I Accumulating Class 0.85% GBP I2 Accumulating Class 0.50%
EUR I Accumulating Unhedged Class 0.85% GBP I2 Distributing Class 0.50%
EUR I2 Accumulating Unhedged Class 0.68% JPY I Accumulating Class 0.60%
EUR M Accumulating Class 1.70% SGD A (Monthly) Distributing Class 1.20%
EUR Z Accumulating Class 0.00% USD A (Monthly) Distributing Class 1.20%
GBP I Accumulating Class 0.85% USD A Accumulating Class 1.20%
JPY I Distributing Class 0.85% USD A Distributing Class 1.20%
USD A Accumulating Class 1.70% USD C Accumulating Class 0.80%
USD A Distributing Class 1.70% USD C Distributing Class 0.80%
USD B Accumulating Class 1.80% USD C1 Accumulating Class 1.20%
USD C Accumulating Class 1.10% USD I Accumulating Class 0.60%
USD C2 Accumulating Class 1.80% USD I Distributing Class 0.60%
USD E Accumulating Class 1.80% USD I2 Accumulating Class 0.50%
USD I Accumulating Class 0.85% USD I2 Distributing Class 0.50%
USD I Distributing Class 0.85% USD M Accumulating Class 1.20%
USD I2 Accumulating Class 0.68% USD M Distributing Class 1.20%
USD I3 Accumulating Class 0.60% USD Z Accumulating Class 0.00%
USD M Accumulating Class 1.70%
USD T Accumulating Class 1.80% Neuberger Berman Global Bond Fund
USD Z Accumulating Class 0.00% USD A Accumulating Class 0.80%
ZAR E Accumulating Class 1.80% USD C1 Accumulating Class 0.80%
ZAR T Accumulating Class 1.80% USD I Accumulating Class 0.40%
USD M Accumulating Class 0.80%
Neuberger Berman Short Duration High Yield Bond Fund
USD M Distributing Class 0.80%
USD Z Accumulating Class 0.00%
AUD A (Monthly) Distributing Class 1.20%
CHF A Accumulating Class 1.20% Neuberger Berman Emerging Market Debt - Local Currency Fund
CHF I Accumulating Class 0.60%
CHF I2 Accumulating Class 0.50% AUD B (Monthly) Distributing Class 1.80%
CHF I3 Distributing Class 0.42% AUD B Accumulating Class 1.80%

FINANCIAL STATEMENTS NOTES TO THE AUDITED FINANCIAL STATEMENTS
1112 NEUBERGER BERMAN INVESTMENT FUNDS PLC
FOR THE YEAR ENDED 31 DECEMBER 2019 6. INVESTMENT MANAGER, ADMINISTRATOR, DISTRIBUTOR AND DEPOSITARY FEES (CONTINUED)
Neuberger Berman Emerging Market Debt - Local Currency Fund (continued)
Management Fee
Neuberger Berman Emerging Market Debt - Local Currency Fund (continued)
Management Fee
AUD C2 (Monthly) Distributing Class 1.80% ZAR B Accumulating Class 1.80%
AUD C2 Accumulating Class 1.80% ZAR C2 (Monthly) Distributing Class 1.80%
AUD E (Monthly) Distributing Class 1.80% ZAR C2 Accumulating Class 1.80%
AUD E Accumulating Class 1.80% ZAR E (Monthly) Distributing Class 1.80%
AUD T (Monthly) Distributing Class 1.80% ZAR E Accumulating Class 1.80%
AUD T Accumulating Class 1.80% ZAR T (Monthly) Distributing Class 1.80%
EUR A Accumulating Class 1.50% ZAR T Accumulating Class 1.80%
EUR I Accumulating Class 0.75%
EUR I Accumulating Unhedged Class 0.75% Neuberger Berman Emerging Market Debt - Hard Currency Fund
EUR I2 Accumulating Unhedged Class 0.60%
EUR I3 Distributing Unhedged Class 0.53% AUD A (Monthly) Distributing Class 1.40%
EUR I4 Accumulating Unhedged Class 0.45% CHF P Accumulating Class 0.67%
EUR I4 Distributing Unhedged Class 0.45% EUR A (Monthly) Distributing Class 1.40%
EUR I5 Accumulating Unhedged Class 0.38% EUR A Accumulating Class 1.40%
EUR M Accumulating Unhedged Class 1.50% EUR I Accumulating Class 0.70%
EUR M Distributing Unhedged Class 1.50% EUR I Accumulating Unhedged Class 0.70%
GBP I Accumulating Class 0.75% EUR I Distributing Class 0.70%
GBP I4 Accumulating Unhedged Class 0.45% EUR I2 Accumulating Class 0.56%
GBP I4 Distributing Unhedged Class 0.45% EUR I2 Distributing Class 0.56%
GBP I5 Accumulating Unhedged Class 0.38% EUR I3 Accumulating Class 0.49%
SEK A Accumulating Class 1.50% EUR I3 Accumulating Unhedged Class 0.49%
SGD A (Monthly) Distributing Class 1.50% EUR I3 Distributing Class 0.49%
USD A (Monthly) Distributing Class 1.50% EUR I4 Accumulating Class 0.42%
USD A Accumulating Class 1.50% EUR M Accumulating Class 1.40%
USD B (Monthly) Distributing Class 1.80% EUR M Distributing Class 1.40%
USD B Accumulating Class 1.80% EUR P Accumulating Class 0.67%
USD C1 Accumulating Class 1.50% EUR Z Accumulating Class 0.00%
USD C2 (Monthly) Distributing Class 1.80% GBP I Accumulating Class 0.70%
USD C2 Accumulating Class 1.80% GBP I Distributing Class 0.70%
USD E (Monthly) Distributing Class 1.80% GBP I2 Accumulating Class 0.56%
USD E Accumulating Class 1.80% GBP I2 Distributing Class 0.56%
USD I (Monthly) Distributing Class 0.75% GBP P Accumulating Class 0.67%
USD I Accumulating Class 0.75% HKD A (Monthly) Distributing Class 1.40%
USD I Distributing Class 0.75% JPY I Accumulating Class 0.70%
USD I2 Accumulating Class 0.60% SEK A Accumulating Class 1.40%
USD I5 Accumulating Class 0.38% SGD A (Monthly) Distributing Class 1.40%
USD M Accumulating Class 1.50% USD A (Monthly) Distributing Class 1.40%
USD M Distributing Class 1.50% USD A Accumulating Class 1.40%
USD T (Monthly) Distributing Class 1.80% USD C1 Accumulating Class 1.40%
USD T Accumulating Class 1.80% USD I Accumulating Class 0.70%
USD X Accumulating Class 0.38% USD I Distributing Class 0.70%
ZAR B (Monthly) Distributing Class 1.80% USD I2 Accumulating Class 0.56%

NOTES TO THE AUDITED FINANCIAL STATEMENTS FINANCIAL STATEMENTS
ANNUAL REPORT 2019 1113
FOR THE YEAR ENDED 31 DECEMBER 2019 6. INVESTMENT MANAGER, ADMINISTRATOR, DISTRIBUTOR AND DEPOSITARY FEES (CONTINUED)
Neuberger Berman Emerging Market Debt - Hard Currency Fund (continued)
Management Fee
Neuberger Berman Strategic Income Fund (continued)
Management Fee
USD I2 Distributing Class 0.56% EUR A Accumulating Class 1.00%
USD I3 Distributing Class 0.49% EUR I Accumulating Class 0.50%
USD M Accumulating Class 1.40% EUR M Accumulating Class 1.00%
USD M Distributing Class 1.40% EUR M Distributing Class 1.00%
USD P Accumulating Class 0.67% GBP A (Monthly) Distributing Class 1.00%
USD Z Accumulating Class 0.00% GBP I Accumulating Class 0.50%
HKD A (Monthly) Distributing Class 1.00%
Neuberger Berman Emerging Market Corporate Debt Fund
JPY I Accumulating Class 0.50%
JPY I Accumulating Unhedged Class 0.50%
CHF A Accumulating Class 1.60% JPY I CG Distributing Class 0.50%
CHF I Accumulating Class 0.80% JPY I Distributing Class 0.50%
CHF I2 Accumulating Class 0.64% SGD A (Monthly) Distributing Class 1.00%
CHF I4 Accumulating Class 0.48% SGD A Accumulating Class 1.00%
CHF I5 Accumulating Class 0.40% SGD I (Monthly) Distributing Class 0.50%
EUR A Accumulating Class 1.60% USD A (Monthly) Distributing Class 1.00%
EUR I Accumulating Class 0.80% USD A Accumulating Class 1.00%
EUR I Distributing Class 0.80% USD A Distributing Class 1.00%
EUR I2 Accumulating Class 0.64% USD C1 Accumulating Class 1.00%
EUR I3 Accumulating Class 0.48% USD I Accumulating Class 0.50%
EUR I5 Accumulating Class 0.40% USD I Distributing Class 0.50%
EUR M Accumulating Class 1.60% USD I2 Accumulating Class 0.40%
EUR M Distributing Class 1.60% USD M Accumulating Class 1.00%
EUR X Accumulating Class 0.46% USD M Distributing Class 1.00%
GBP I Accumulating Class 0.80% USD Z Accumulating Class 0.00%
GBP I5 Accumulating Class 0.40%
SEK A Accumulating Class 1.60% Neuberger Berman Global Bond Absolute Return Fund
SGD A (Monthly) Distributing Class 1.60%
USD A (Monthly) Distributing Class 1.60% EUR I Accumulating Class 0.50%
USD A Accumulating Class 1.60% EUR I4 Distributing Class 0.30%
USD C1 Accumulating Class 1.60% EUR M Accumulating Class 1.00%
USD I Accumulating Class 0.80% GBP I4 Accumulating Class 0.25%
USD I Distributing Class 0.80% GBP I5 Accumulating Class 0.25%
USD I2 Accumulating Class 0.64% GBP I5 Distributing Class 0.25%
USD I5 Accumulating Class 0.40% GBP Z Accumulating Class 0.00%
USD M Accumulating Class 1.60% JPY I Accumulating Class 0.50%
USD M Distributing Class 1.60% SGD A (Monthly) Distributing Class 1.00%
USD A (Monthly) Distributing Class 1.00%
Neuberger Berman Strategic Income Fund
USD A Accumulating Class 1.00%
USD I Accumulating Class 0.50%
AUD A (Monthly) Distributing Class 1.00% USD I5 Accumulating Class 0.25%
AUD Z (Monthly) Distributing Class 0.00% USD Z Accumulating Class 0.00%
EUR A (Monthly) Distributing Class 1.00%

FINANCIAL STATEMENTS NOTES TO THE AUDITED FINANCIAL STATEMENTS
1114 NEUBERGER BERMAN INVESTMENT FUNDS PLC
FOR THE YEAR ENDED 31 DECEMBER 2019 6. INVESTMENT MANAGER, ADMINISTRATOR, DISTRIBUTOR AND DEPOSITARY FEES (CONTINUED)
Neuberger Berman Short Duration Emerging Market Debt Fund
Management Fee
Neuberger Berman Short Duration Emerging Market Debt Fund (continued)
Management Fee
AUD A (Monthly) Distributing Class 1.00% USD I Distributing Class 0.50%
AUD A Accumulating Class 1.00% USD I2 Accumulating Class 0.40%
CAD A (Monthly) Distributing Class 1.00% USD I2 Distributing Class 0.40%
CHF A Accumulating Class 1.00% USD I5 Accumulating Class 0.25%
CHF A Distributing Class 1.00% USD I5 Distributing Class 0.25%
CHF I Accumulating Class 0.50% USD M Accumulating Class 1.00%
CHF I Distributing Class 0.50% USD M Distributing Class 1.00%
CHF I2 Accumulating Class 0.40% USD P Accumulating Class 0.48%
CHF I2 Distributing Class 0.40% USD Z Accumulating Class 0.00%
CHF I5 Accumulating Class 0.25%
CHF P Accumulating Class 0.48% Neuberger Berman Absolute Return Multi Strategy Fund
CHF P Distributing Class 0.48%
CNY A (Monthly) Distributing Class 1.00% CHF I Accumulating Class 0.75%
EUR A Accumulating Class 1.00% EUR A Accumulating Class 1.50%
EUR A Distributing Class 1.00% EUR I Accumulating Class 0.75%
EUR I Accumulating Class 0.50% EUR I2 Accumulating Class 0.60%
EUR I Accumulating Unhedged Class 0.50% EUR M Accumulating Class 1.50%
EUR I Distributing Class 0.50% EUR Z Accumulating Class 0.00%
EUR I2 Accumulating Class 0.40% GBP I Accumulating Class 0.75%
EUR I2 Distributing Class 0.40% GBP I2 Accumulating Class 0.60%
EUR I5 Accumulating Class 0.25% GBP I3 Accumulating Class 0.50%
EUR M Accumulating Class 1.00% GBP Z Accumulating Class 0.00%
EUR M Distributing Class 1.00% JPY D Distributing Class 0.75%
EUR P Accumulating Class 0.48% JPY I Accumulating Class 0.75%
EUR U Accumulating Class 0.75% USD A Accumulating Class 1.50%
GBP A Accumulating Class 1.00% USD I Accumulating Class 0.75%
GBP I Accumulating Class 0.50% USD Z Accumulating Class 0.00%
GBP I Distributing Class 0.50%
GBP I2 Accumulating Class 0.40% Neuberger Berman US Long Short Equity Fund
GBP I2 Distributing Class 0.40%
GBP I5 Distributing Class 0.25% EUR A Accumulating Class 2.25%
GBP P Accumulating Class 0.48% EUR I Accumulating Class 1.35%
JPY I Accumulating Class 0.50% EUR M Accumulating Class 2.25%
JPY I Distributing Class 0.50% GBP I Accumulating Class 1.35%
SEK A Accumulating Class 1.00% SGD A1 Accumulating Class 2.00%
SGD A (Monthly) Distributing Class 1.00% USD A (PF) Accumulating Class 1.70%
USD A (Monthly) Distributing Class 1.00% USD A Accumulating Class 2.25%
USD A Accumulating Class 1.00% USD A1 Accumulating Class 2.00%
USD A Distributing Class 1.00% USD C1 Accumulating Class 2.25%
USD C1 Accumulating Class 1.00% USD D Distributing Class 1.35%
USD C1 Distributing Class 1.00% USD I (PF) Distributing Class 1.00%
USD I Accumulating Class 0.50% USD I Accumulating Class 1.35%

NOTES TO THE AUDITED FINANCIAL STATEMENTS FINANCIAL STATEMENTS
ANNUAL REPORT 2019 1115
FOR THE YEAR ENDED 31 DECEMBER 2019 6. INVESTMENT MANAGER, ADMINISTRATOR, DISTRIBUTOR AND DEPOSITARY FEES (CONTINUED)
Neuberger Berman US Long Short Equity Fund (continued)
Management Fee
Neuberger Berman European High Yield Bond Fund
Management Fee
USD M Accumulating Class 2.25% EUR A Accumulating Class 1.20%
USD U Accumulating Class 1.80% EUR I Accumulating Class 0.60%
USD Z Accumulating Class 0.00% EUR I5 Accumulating Class 0.30%
EUR M Accumulating Class 1.20%
Neuberger Berman Emerging Market Debt Blend Fund
EUR M Distributing Class 1.20%
EUR X Accumulating Class 0.20%
AUD I3 Distributing Class 0.49% GBP I Accumulating Class 0.60%
CHF I2 Distributing Class 0.56% SGD A (Monthly) Distributing Class 1.20%
EUR A Accumulating Class 1.40% SGD A Accumulating Class 1.20%
EUR I Accumulating Class 0.70% USD A (Monthly) Distributing Class 1.20%
EUR I Distributing Class 0.70% USD A Accumulating Class 1.20%
EUR I2 Accumulating Class 0.56% USD I Accumulating Class 0.60%
EUR I2 Distributing Class 0.56% USD I5 Accumulating Class 0.30%
EUR I3 Distributing Class 0.49% USD X Accumulating Class 0.20%
EUR I4 Accumulating Unhedged Class 0.42% USD Z Accumulating Class 0.00%
EUR I5 Accumulating Class 0.35%
EUR M Accumulating Class 1.40% Neuberger Berman Global Equity Fund
EUR M Distributing Class 1.40% USD I Accumulating Class 0.75%
EUR Z Accumulating Class 0.00%
GBP I Accumulating Class 0.70% Neuberger Berman Systematic Global Equity Fund
GBP I Accumulating Unhedged Class 0.70%
GBP I Distributing Class 0.70% EUR M Accumulating Class 1.30%
GBP I Distributing Unhedged Class 0.70% GBP I Accumulating Class 0.65%
GBP I2 Distributing Class 0.56% SGD A Accumulating Class 1.30%
GBP P Accumulating Class 0.67% USD A Accumulating Class 1.30%
GBP P Accumulating Unhedged Class 0.67% USD I Accumulating Class 0.65%
GBP Z Accumulating Class 0.00% USD T Accumulating Class 1.80%
NOK U Accumulating Class 1.05% USD Z Accumulating Class 0.00%
SEK A Accumulating Class 1.40%
SGD A (Monthly) Distributing Class 1.40% Neuberger Berman Global Real Estate Securities Fund
USD A (Monthly) Distributing Class 1.40%
USD A Accumulating Class 1.40% EUR M Accumulating Class 1.50%
USD C1 Accumulating Class 1.40% GBP Z Accumulating Class 0.00%
USD I Accumulating Class 0.70% USD A Accumulating Class 1.50%
USD I Distributing Class 0.70% USD I Accumulating Class 0.75%
USD I2 Accumulating Class 0.56% USD I2 Accumulating Class 0.60%
USD I2 Distributing Class 0.56% USD I5 Distributing Class 0.38%
USD I3 Accumulating Class 0.49% USD M Accumulating Class 1.50%
USD M Accumulating Class 1.40% USD T Accumulating Class 1.80%
USD M Distributing Class 1.40% USD Z Accumulating Class 0.00%
USD Z Accumulating Class 0.00%

FINANCIAL STATEMENTS NOTES TO THE AUDITED FINANCIAL STATEMENTS
1116 NEUBERGER BERMAN INVESTMENT FUNDS PLC
FOR THE YEAR ENDED 31 DECEMBER 2019 6. INVESTMENT MANAGER, ADMINISTRATOR, DISTRIBUTOR AND DEPOSITARY FEES (CONTINUED)
Neuberger Berman US Small Cap Intrinsic Value Fund
Management Fee
Neuberger Berman Corporate Hybrid Bond Fund (continued)
Management Fee
USD A Accumulating Class 1.70% GBP I2 Accumulating Class 0.48%
USD C1 Accumulating Class 1.70% GBP I2 Distributing Class 0.48%
USD I Accumulating Class 0.85% GBP P Accumulating Class 0.57%
USD M Accumulating Class 1.70% GBP P Distributing Class 0.57%
HKD A (Monthly) Distributing Class 1.20%
Neuberger Berman Asian Debt - Hard Currency Fund
SGD A (Monthly) Distributing Class 1.20%
USD A (Monthly) Distributing Class 1.20%
SGD A (Monthly) Distributing Class 1.20% USD A Accumulating Class 1.20%
USD A (Monthly) Distributing Class 1.20% USD C1 Accumulating Class 1.20%
USD A Accumulating Class 1.20% USD I Accumulating Class 0.60%
USD C1 Accumulating Class 1.20% USD I2 Accumulating Class 0.48%
USD I Accumulating Class 0.60% USD I2 Distributing Class 0.48%
USD I Distributing Class 0.60% USD M Accumulating Class 1.20%
USD M Accumulating Class 1.20% USD M Distributing Class 1.20%
USD P Accumulating Class 0.57%
Neuberger Berman China Bond Fund USD Z Accumulating Class 0.00%
CNY I Distributing Class 0.65%
CNY Z Accumulating Class 0.00% Neuberger Berman US Equity Fund
EUR M Accumulating Unhedged Class 1.30% USD I Accumulating Class 0.75%
SGD A (Monthly) Distributing Unhedged Class 1.30% USD I Distributing Class 0.75%
USD I Accumulating Unhedged Class 0.65% USD M Accumulating Unhedged Class 1.30% Neuberger Berman Global High Yield
Bond Fund
USD Z Accumulating Class 0.00%
USD Z Accumulating Unhedged Class 0.00% EUR M Accumulating Class 1.20%
EUR M Distributing Class 1.20%
Neuberger Berman Corporate Hybrid Bond Fund
EUR Z (PF) Accumulating Class 0.10%
GBP I Accumulating Class 0.60%
AUD A (Monthly) Distributing Class 1.20% USD A Accumulating Class 1.20%
CHF P Accumulating Class 0.57% USD C1 Accumulating Class 1.20%
CHF P Distributing Class 0.57% USD I Accumulating Class 0.60%
EUR A (Monthly) Distributing Class 1.20% USD M Accumulating Class 1.20%
EUR A Accumulating Class 1.20% USD M Distributing Class 1.20%
EUR I Accumulating Class 0.60% USD P Accumulating Class 0.57%
EUR I Distributing Class 0.60% USD Z (PF) Accumulating Class 0.10%
EUR I2 Accumulating Class 0.48% USD Z Accumulating Class 0.00%
EUR I3 Accumulating Class 0.42%
EUR I5 Accumulating Class 0.30% Neuberger Berman Global Opportunistic Bond Fund
EUR M Accumulating Class 1.20%
EUR M Distributing Class 1.20% EUR I Accumulating Class 0.40%
EUR P Accumulating Class 0.57% JPY I Accumulating Class 0.40%
EUR P Distributing Class 0.57% USD A Accumulating Class 0.80%
GBP I Accumulating Class 0.60% USD C1 Accumulating Class 0.80%

NOTES TO THE AUDITED FINANCIAL STATEMENTS FINANCIAL STATEMENTS
ANNUAL REPORT 2019 1117
FOR THE YEAR ENDED 31 DECEMBER 2019 6. INVESTMENT MANAGER, ADMINISTRATOR, DISTRIBUTOR AND DEPOSITARY FEES (CONTINUED)
Neuberger Berman Global Opportunistic Bond Fund (continued)
Management Fee
Neuberger Berman Global Equity Index PutWrite Fund
Management Fee
USD I Accumulating Class 0.40% AUD X Accumulating Class 1.14%
USD I Distributing Class 0.40% CHF I Distributing Class 0.65%
USD I2 Accumulating Class 0.32% CHF I5 Accumulating Class 0.33%
USD M Accumulating Class 0.80% CHF I5 Distributing Class 0.33%
USD Z Accumulating Class 0.00% CHF X Accumulating Class 1.14%
CHF X Distributing Class 1.14%
Neuberger Berman Multi-Asset Class Income Fund
EUR A Accumulating Class 1.30%
EUR I Accumulating Class 0.65%
EUR A Distributing Class 1.30% EUR I5 (Monthly) Distributing Class 0.33%
EUR I Accumulating Class 0.65% EUR I5 Accumulating Class 0.33%
EUR M Accumulating Class 1.30% EUR M Accumulating Class 1.30%
EUR M Distributing Class 1.30% EUR X (Monthly) Distributing Class 1.14%
GBP I Accumulating Class 0.65% EUR X Accumulating Class 1.14%
USD A Accumulating Class 1.30% EUR Z Accumulating Class 0.00%
USD C1 Accumulating Class 1.30% GBP I Accumulating Class 0.65%
USD I Accumulating Class 0.65% GBP I5 Accumulating Class 0.33%
USD I Distributing Class 0.65% GBP I5 Distributing Class 0.33%
USD M Accumulating Class 1.30% SGD A (Monthly) Distributing Class 1.30%
SGD I5 Accumulating Class 0.33%
Neuberger Berman US Equity Index PutWrite Fund
SGD X (Monthly) Distributing Class 1.14%
SGD X Accumulating Class 1.14%
EUR I Accumulating Class 0.60% USD A Accumulating Class 1.30%
EUR I4 Accumulating Class 0.36% USD C1 Accumulating Class 1.30%
EUR M Accumulating Class 1.20% USD I Accumulating Class 0.65%
GBP I Accumulating Class 0.60% USD I Distributing Class 0.65%
GBP I Accumulating Unhedged Class 0.60% USD I5 (Monthly) Distributing Class 0.33%
GBP I4 Accumulating Class 0.36% USD I5 Accumulating Class 0.33%
GBP I4 Accumulating Unhedged Class 0.36% USD I5 Distributing Class 0.33%
GBP I4 Distributing Class 0.36% USD X (Monthly) Distributing Class 1.14%
SGD A (Monthly) Distributing Class 1.20% USD X Accumulating Class 1.14%
USD A (Monthly) Distributing Class 1.20% USD X Distributing Class 1.14%
USD A Accumulating Class 1.20% USD Z Accumulating Class 0.00%
USD C1 Accumulating Class 1.20%
USD I (Monthly) Distributing Class 0.60% Neuberger Berman Uncorrelated Strategies Fund
USD I Accumulating Class 0.60%
USD I3 Accumulating Class 0.42% CHF I Accumulating Class 0.75%
USD I4 Accumulating Class 0.36% CHF I5 Accumulating Class 0.38%
USD I4 Distributing Class 0.36% EUR A Accumulating Class 1.50%
USD M Accumulating Class 1.20% EUR I Accumulating Class 0.75%
USD P Accumulating Class 0.57% EUR I2 Accumulating Class 0.60%
USD Z Accumulating Class 0.00% EUR I5 Accumulating Class 0.38%
EUR M Accumulating Class 1.50%

FINANCIAL STATEMENTS NOTES TO THE AUDITED FINANCIAL STATEMENTS
1118 NEUBERGER BERMAN INVESTMENT FUNDS PLC
FOR THE YEAR ENDED 31 DECEMBER 2019 6. INVESTMENT MANAGER, ADMINISTRATOR, DISTRIBUTOR AND DEPOSITARY FEES (CONTINUED)
Neuberger Berman Uncorrelated Strategies Fund (continued)
Management Fee
Neuberger Berman Multi-Asset Class Growth Fund
Management Fee
GBP I Accumulating Class 0.75% EUR M Accumulating Class 1.30%
GBP I2 Accumulating Class 0.60% GBP I Accumulating Class 0.65%
GBP I5 Accumulating Class 0.38% USD I Accumulating Class 0.65%
GBP P Accumulating Class 0.71% USD I Distributing Class 0.65%
GBP Z Accumulating Class 0.00%
SGD A Accumulating Class 1.50% Neuberger Berman Global Thematic Equity Fund1
USD A Accumulating Class 1.50%
USD C1 Accumulating Class 1.50% EUR M Accumulating Unhedged Class 2.00%
USD I Accumulating Class 0.75% USD A Accumulating Class 2.00%
USD I2 Accumulating Class 0.60% USD C1 Accumulating Class 2.00%
USD I5 Accumulating Class 0.38% USD I Accumulating Class 1.00%
USD M Accumulating Class 1.50% USD I Distributing Class 1.00%
USD P Accumulating Class 0.71% USD M Accumulating Class 2.00%
USD Z Accumulating Class 0.00%
Neuberger Berman CLO Income Fund1
Neuberger Berman Emerging Market Debt Blend Investment Grade Fund
EUR I Accumulating Class 0.75%
EUR I2 Distributing Class 0.60%
EUR I5 Distributing Class 0.30% GBP I Accumulating Class 0.75%
GBP I5 Distributing Class 0.30% GBP I2 Distributing Class 0.60%
NOK I Accumulating Class 0.60% GBP I5 Distributing Class 0.38%
NOK U Accumulating Class 0.90% GBP Z Accumulating Class 0.00%
USD I Accumulating Class 0.60% SEK I Accumulating Class 0.75%
USD I5 Accumulating Class 0.30% USD I Accumulating Class 0.75%
USD Z Accumulating Class 0.00% USD I2 Distributing Class 0.60%
USD I5 Distributing Class 0.38%
Neuberger Berman Emerging Markets Sustainable Equity Fund
USD Z Accumulating Class 0.00%
EUR M Accumulating Unhedged Class 1.70% Neuberger Berman Next Generation Mobility Fund1
JPY I Accumulating Unhedged Class 0.85%
USD A Accumulating Class 1.70% AUD X Accumulating Class 1.55%
USD I Accumulating Class 0.85% EUR A Accumulating Class 1.70%
USD I Distributing Class 0.85% EUR M Accumulating Unhedged Class 1.70%
USD I5 Accumulating Class 0.43% EUR X Accumulating Class 1.55%
GBP I Accumulating Class 0.85%
Neuberger Berman China Equity Opportunities Fund
GBP X Accumulating Class 1.55%
HKD X Accumulating Unhedged Class 1.55%
EUR M Accumulating Unhedged Class 1.80% SGD X Accumulating Class 1.55%
USD A Accumulating Class 1.80% USD A Accumulating Class 1.70%
USD C1 Accumulating Class 1.80% USD C1 Accumulating Class 1.70%
USD I Accumulating Class 0.90% USD I Accumulating Class 0.85%
USD I Distributing Class 0.90% USD I Distributing Class 0.85%
USD M Accumulating Class 1.80% USD M Accumulating Class 1.70%

NOTES TO THE AUDITED FINANCIAL STATEMENTS FINANCIAL STATEMENTS
ANNUAL REPORT 2019 1119
FOR THE YEAR ENDED 31 DECEMBER 2019 6. INVESTMENT MANAGER, ADMINISTRATOR, DISTRIBUTOR AND DEPOSITARY FEES (CONTINUED)
Neuberger Berman Next Generation Mobility Fund1 (continued)
Management Fee
Neuberger Berman Multi-Style Premia Fund2
Management Fee
USD X Accumulating Class 1.55% EUR I Accumulating Class 0.65%
USD I Accumulating Class 0.65%
Neuberger Berman Ultra Short Term Euro Bond Fund1
USD I Distributing Class 0.65%
USD Z Accumulating Class 0.00%
CHF U Accumulating Class 0.29%
EUR I Accumulating Class 0.19% Neuberger Berman Macro Opportunities FX Fund2
EUR I Distributing Class 0.19% EUR I5 Accumulating Class 0.09% EUR I Accumulating Class 0.60%
EUR U Accumulating Class 0.29% GBP Z Accumulating Class 0.00%
EUR Z Accumulating Class 0.00% SEK I Accumulating Class 0.60%
USD M Accumulating Class 0.38% SEK I Distributing Class 0.60%
USD Z Accumulating Class 0.00% USD I Accumulating Class 0.60%
USD X Accumulating Class 0.20%
Neuberger Berman Euro Opportunistic Bond Fund1
USD Z Accumulating Class 0.00%
EUR I Accumulating Class 0.35%
EUR I Distributing Class 0.35%
Neuberger Berman Euro Bond Absolute Return Fund1
EUR I Accumulating Class 0.45%
EUR I Distributing Class 0.45%
EUR I5 Accumulating Class 0.23%
USD Z Accumulating Class 0.00%
Neuberger Berman Absolute Alpha Fund2
EUR I Accumulating Class 1.30%
EUR M Accumulating Class 2.21%
EUR M Accumulating Unhedged Class 2.21%
GBP Z Accumulating Class 0.00%
SGD A Accumulating Class 2.21%
USD A Accumulating Class 2.21%
USD I Accumulating Class 1.30%
Where applicable, a discount may be applied to the above fees.
1 Portfolio launched during the prior reporting year. 2 Portfolio launched during the current reporting year.
The Investment Manager agreed to waive all or part of its fees in order to cap the Portfolios’ Total Expense Ratios (“TERs”). These fee waivers are voluntary and may be discontinued by the Investment Manager at any time without prior notice. Fees voluntarily waived are not subject to recovery by the Investment Manager. A breakdown of the Portfolios’ TERs is provided in Appendix I.

FINANCIAL STATEMENTS NOTES TO THE AUDITED FINANCIAL STATEMENTS
1120 NEUBERGER BERMAN INVESTMENT FUNDS PLC
FOR THE YEAR ENDED 31 DECEMBER 2019
6. INVESTMENT MANAGER, ADMINISTRATOR, DISTRIBUTOR AND DEPOSITARY FEES (CONTINUED)
The Company pays administration fees to the Administrator based on the value of month-end net assets of Neuberger Berman Uncorrelated Strategies Fund at the following rates:
Assets from US$ 0 - US$ 500 million 0.055%
Between US$ 500 - US$ 2,000 million 0.05%
Above US$ 2,000 million 0.04%
Effective 1 March 2019, the Company pays administration fees to the Administrator based on the value of month-end net assets of each of the remaining Portfolios administered by the Administrator at the following rates:
Assets from US$ 0 - US$ 10,000 million 0.010%
Between US$ 10,000 - US$ 25,000 million 0.008%
Between US$ 25,000 - US$ 50,000 million 0.006%
Above US$ 50,000 million 0.005%
Up to 28 February 2019, the Company paid administration fees to the Administrator based on the value of month-end net assets of each of the remaining Portfolios administered by the Administrator at the following rates:
Assets from US$ 0 - US$ 10,000 million 0.012%
Above US$ 10,000 million 0.01%
The above fees are inclusive of four share classes per Portfolio. Any Portfolio which has in excess of four share classes will be charged a monthly fee of US$ 175 per each additional share class.
In addition, the Administrator is entitled to a further fee in respect of transfer agency services provided to the Portfolios.
In respect of the B Shares, C Shares, E Shares, C1 Shares and C2 Shares in each Portfolio the Distributor shall be entitled to a distribution fee at the rate of 1.00% in respect of the distribution services provided to such classes, which shall accrue daily and be payable monthly in arrears at the end of each calendar month. In respect of all other classes, the Investment Manager may pay the Distributor a fee in respect of its distribution services out of the management fee. In respect of the M Shares in each Portfolio, the Distributor shall be entitled to a distribution fee at an annual rate expressed as a percentage of the Net Asset Value of the relevant Classes in respect of the distribution services provided to such Classes, which shall accrue daily and be payable monthly in arrears at the end of each calendar month. The rate of such distribution fee varies between Portfolios and is disclosed in the Supplement to the Prospectus for each Portfolio.
Adviser Fees The fees paid to the advisers appointed by the Investment Manager and/or the Sub-Investment Manager will be paid out of the assets of the Portfolio. The aggregate fees paid to all advisers were between 0.65% and 1.50% of the Net Asset Value of the Portfolio. The aggregate adviser fee for the year ended 31 December 2019 was US$ 413,284 (31 December 2018: US$ 777,254).
Performance Fees
As at the year ended 31 December 2019 a performance fee is being calculated on Neuberger Berman US Long Short Equity Fund, Neuberger Berman Global High Yield Bond Fund and Neuberger Berman Uncorrelated Strategies Fund.
Performance Fee paid to the Investment Manager The Investment Manager may be entitled to receive a performance fee (the “Performance Fee”) payable out of the Portfolio’s assets in respect of each PF Class in the relevant Portfolio. The Depositary shall verify the calculation of the Performance Fee. The Directors may, with the consent of the Investment Manager, reduce the Performance Fee payable by any Class of Shares. Performance fees are payable on realised and unrealised capital gains taking into account realised and unrealised losses at the end of the Calculation Period defined below for each applicable Portfolio. Consequently, performance fees may be paid on unrealised gains which may subsequently never be realised.
Shareholders should note that, as the Performance Fee is calculated at Class level and not at an individual Shareholder level, they may be charged a Performance Fee even where the Net Asset Value of their Shares has remained the same or dropped, for example, where Shareholders purchase or redeem Shares at points other than the start and end of the Calculation Period.

NOTES TO THE AUDITED FINANCIAL STATEMENTS FINANCIAL STATEMENTS
ANNUAL REPORT 2019 1121
FOR THE YEAR ENDED 31 DECEMBER 2019
6. INVESTMENT MANAGER, ADMINISTRATOR, DISTRIBUTOR AND DEPOSITARY FEES (CONTINUED)
Performance Fee paid to the Investment Manager (continued) If the Investment Management Agreement is terminated before the end of a Calculation Period in any year the performance fee in respect of the then current Calculation Period will be calculated and paid as though the date of termination were the end of the relevant Calculation Period.
The performance fee will be accrued in the Net Asset Value on each Dealing Day and will normally be payable to the Investment Manager in arrears within 30 Business Days of the end of each Calculation Period. However, in the case of Shares redeemed during a Calculation Period, the accrued performance fee in respect of those Shares will be payable to the Investment Manager within 30 Business Days of the date of redemption. Crystallised performance fees shall remain in the relevant Class (but shall not participate in subsequent gains and losses of the relevant Class) until paid to the Investment Manager and shall not be used or made available to satisfy redemptions or pay any fees and expenses of the relevant Class.
The methodology used to calculate the Performance Fee for each applicable Portfolio is as follows:
Neuberger Berman US Long Short Equity Fund
The Investment Manager may be entitled to receive a performance fee payable out of the Portfolio’s assets in respect of each PF Class in the Portfolio.
Definitions
Calculation Period
The Calculation Period shall normally run from 1 January to 31 December in each year except that:
in the case of the initial issue of Shares in each PF Class, the first Calculation Period will run from the date of issue to 31 December;
in the case of the termination of a PF Class, the Calculation Period will terminate on the date of the termination; and
in the case of the termination of the Investment Management Agreement in any year, the Calculation Period will terminate on the date of the termination.
The first value used in determining the first Performance Fee for a PF Class shall be the Initial Offer Price.
Crystallisation The point at which any Performance Fee becomes payable to the Investment Manager. Crystallisation will occur either at the end of the Calculation Period or on a Dealing Day on which a Shareholder redeems or exchanges all or part of its Shareholding.
High Water Mark The greater of: (i) the initial offer price per Share; and (ii) the Net Asset Value per Share at the end of any previous Calculation Period in respect of which a Performance Fee was paid.
Methodology
For each Calculation Period, a Performance Fee in respect of each PF Class in issue becomes due in the event that the Net Asset Value per Share at the end of the Calculation Period exceeds the High Water Mark for that particular PF Class.
The Performance Fee will be calculated on each Dealing Day and will be equal to 15% of the amount by which the percentage growth in the Net Asset Value per Share over the Calculation Period exceeds that of the High Water Mark. The Performance Fee will be accrued on each Dealing Day and will form part of the Net Asset Value per Share for each PF Class where applicable. Any Performance Fee accrual on a Dealing Day will be superseded by any accrual made on the following Dealing Day up to the last Dealing Day of the Calculation Period.
In all cases the Net Asset Value per Share used in the calculation of the Performance Fee is unswung, i.e. it does not include any adjustment for swing pricing.
No Performance Fee will be paid until the Net Asset Value per Share exceeds the High Water Mark and such fee is only payable on the outperformance of the Net Asset Value per Share over the Hurdle Rate as described above.

FINANCIAL STATEMENTS NOTES TO THE AUDITED FINANCIAL STATEMENTS
1122 NEUBERGER BERMAN INVESTMENT FUNDS PLC
FOR THE YEAR ENDED 31 DECEMBER 2019
6. INVESTMENT MANAGER, ADMINISTRATOR, DISTRIBUTOR AND DEPOSITARY FEES (CONTINUED)
Performance Fee paid to the Investment Manager (continued)
Neuberger Berman US Long Short Equity Fund (continued)
Methodology (continued)
Shareholders should note that, as the Performance Fee is calculated at Class level and not at an individual Shareholder level, they may be charged a Performance Fee even where the Net Asset Value of their Shares has remained the same or dropped, for example, where Shareholders purchase or redeem Shares at points other than the start and end of the Calculation Period.
The Performance Fee will be accrued in the Net Asset Value on each Dealing Day and will normally be payable to the Investment Manager in arrears within 30 Business Days of the end of each Calculation Period. However, in the case of Shares redeemed during a Calculation Period, the accrued performance fee in respect of those Shares will be payable to the Investment Manager within 30 Business Days of the date of redemption.
Crystallised Performance Fees shall remain in the relevant PF Class (but shall not participate in subsequent gains and losses of the relevant Class) until paid to the Investment Manager and shall not be used or made available to satisfy redemptions or pay any fees and expenses of the relevant PF Class.
The Depositary shall verify the calculation of the Performance Fee.
The Directors may, with the consent of the Investment Manager, reduce the Performance Fee payable by any PF Class. Performance Fees are payable on realised and unrealised capital gains, which for the avoidance of doubt includes investment income, taking into account realised and unrealised losses at the end of the Calculation Period. Consequently, Performance Fees may be paid on unrealised gains which may subsequently never be realised.
The performance fees paid to the Investment Manager by the Portfolio for the year ended 31 December 2019 were US$ 468,838 (31 December 2018: US$ 75,008).
Neuberger Berman Global High Yield Bond Fund
The Investment Manager may be entitled to receive a performance fee payable out of the Portfolio’s assets in respect of each PF Class in the Portfolio.
Definitions
Benchmark ICE BofA Global High Yield Constrained Index in relevant class currency (as detailed below)
Calculation Period
The Calculation Period shall normally run from 1 January to 31 December in each year except that:
in the case of the initial issue of Shares in each PF Class, the first Calculation Period will run from the date of issue to 31 December;
in the case of the termination of a PF Class, the Calculation Period will terminate on the date of the termination; and
in the case of the termination of the Investment Management Agreement in any year, the Calculation Period will terminate on the date of the termination.
The first value used in determining the first Performance Fee for a PF Class shall be the Initial Offer Price.
Crystallisation The point at which any performance fee becomes payable to the Investment Manager. Crystallisation will occur either at the end of the Calculation Period or on a Dealing Day on which a Shareholder redeems or converts all or part of its Shareholding.
Outperformance The excess performance of the Net Asset Value per Share over the performance of the Benchmark during the Calculation Period.

NOTES TO THE AUDITED FINANCIAL STATEMENTS FINANCIAL STATEMENTS
ANNUAL REPORT 2019 1123
FOR THE YEAR ENDED 31 DECEMBER 2019
6. INVESTMENT MANAGER, ADMINISTRATOR, DISTRIBUTOR AND DEPOSITARY FEES (CONTINUED)
Performance Fee paid to the Investment Manager (continued)
Neuberger Berman Global High Yield Bond Fund (continued)
Methodology
For each Calculation Period, a Performance Fee in respect of each PF Class in issue becomes due in respect of any Outperformance, i.e. the excess performance of the Net Asset Value per Share over the performance of the Benchmark applicable to that particular PF Class during the Calculation Period. The Percentage Fee will be calculated on each Dealing Day and will be equal to 20% of the Outperformance applicable to that particular PF Class over the same period.
In all cases the Net Asset Value per Share used in the calculation of the Performance Fee is unswung, i.e. it does not include any adjustment for swing pricing.
In the event that the performance of a PF Class over a Calculation Period is less than that of the Benchmark, no Performance Fee shall be payable in respect of that PF Class until such cumulative underperformance relative to its Benchmark has been recovered.
In the event that the PF Class has achieved Outperformance over a Calculation Period, a Performance Fee shall be payable in respect of that PF Class. Upon payment the Benchmark will be reset, this process ensures the Net Asset Value per Share and the Benchmark start from the same place at the start of the calculation period. Accordingly for the next Calculation Period the commencing Benchmark value will equal the Net Asset Value in respect of the PF Class on which the performance fee was paid i.e. if the Net Asset Value were to equal 110 the commencing Benchmark Value would also equal 110.
Benchmark Indices
Classes Index Code
USD PF Classes ICE BofA Global High Yield Constrained Index HW0C select currency USD
EUR Hedged PF Classes ICE BofA Global High Yield Constrained Index – EUR Hedged HW0C select currency EUR
GBP Hedged PF Classes ICE BofA Global High Yield Constrained Index – GBP Hedged HW0C select currency GBP
Shareholders should note that, as the Performance Fee is payable on the outperformance over the Benchmark, they may be charged a Performance Fee where the Net Asset Value of their Shares has declined but to a lesser extent than the Benchmark.
Shareholders should note that, as the Performance Fee is calculated at Class level and not at an individual Shareholder level, they may be charged a Performance Fee even where the Net Asset Value of their Shares has remained the same or dropped, for example, where Shareholders purchase or redeem Shares at points other than the start and end of a Calculation Period.
The Performance Fee will be accrued in the Net Asset Value on each Dealing Day and will normally be payable to the Investment Manager in arrears within 30 Business Days of the end of each Calculation Period. However, in the case of Shares redeemed during a Calculation Period, the accrued Performance Fee in respect of those Shares will be payable to the Investment Manager within 30 Business Days of the date of redemption.
Crystallised Performance Fees shall remain in the relevant PF Class (but shall not participate in subsequent gains and losses of the relevant Class) until paid to the Investment Manager and shall not be used or made available to satisfy redemptions or pay any fees and expenses of the relevant PF Class.
The Depositary shall verify the calculation of the performance fee.
The Directors may, with the consent of the Investment Manager, reduce the Performance Fee payable by any PF Class. Performance Fees are payable on realised and unrealised capital gains, which for the avoidance of doubt includes investment income, taking into account realised and unrealised losses at the end of the Calculation Period. Consequently, Performance Fees may be paid on unrealised gains which may subsequently never be realised.
There were no performance fees paid to the Investment Manager by the Portfolio for the year ended 31 December 2019 and 31 December 2018.

FINANCIAL STATEMENTS NOTES TO THE AUDITED FINANCIAL STATEMENTS
1124 NEUBERGER BERMAN INVESTMENT FUNDS PLC
FOR THE YEAR ENDED 31 DECEMBER 2019
6. INVESTMENT MANAGER, ADMINISTRATOR, DISTRIBUTOR AND DEPOSITARY FEES (CONTINUED)
Performance Fee paid to the advisers
Neuberger Berman Uncorrelated Strategies Fund
The advisers appointed by the Investment Manager and/or the Sub-Investment Manager (“Non-Affiliated Sub-Advisers”) may be entitled to receive a performance fee (the “Adviser Performance Fee”) payable out of the Portfolio’s assets and as described more fully below. However, for the avoidance of doubt, no performance fees will be paid to the Investment Manager and the Sub-Investment Manager on any portion of the Portfolio’s assets which is managed by the Investment Manager and the Sub-Investment Manager acting in the capacity of an Adviser. All Classes in the Portfolio are PF Classes.
Definitions
Allocated Portion The part of the Portfolio for which a Non-Affiliated Sub-Adviser is responsible.
Calculation Period
The Calculation Period shall normally run from 1 January to 31 December in each year except that:
in the case of the initial appointment of a Non-Affiliated Sub-Adviser, the Calculation Period will run from the date of appointment to 31 December;
in the case of the termination of a Non-Affiliated Sub-Adviser, the Calculation Period will terminate on the date of the termination; and
in the case of the termination of the Investment Management Agreement in any year, the Calculation Period will terminate on the date of the termination.
Crystallisation
The point at which any Adviser Performance Fee becomes payable to the Non-Affiliated Sub-Adviser. Crystallisation in respect of a Non-Affiliated Sub-Adviser will occur either (i) at the end of the Calculation Period; (ii) due to the Investment Manager or the Sub-Investment Manager reducing the capital allocated to the relevant Allocated Portion (iii) termination of the appointment of that Non-Affiliated Sub-Adviser.
High Water Mark
In respect of a Non-Affiliated Sub-Adviser, the greater of: (i) the Net Asset Value of its Allocated Portion at its appointment; and (ii) the value that that Allocated Portion has achieved at the end of any previous Calculation Period in respect of which an Adviser Performance Fee was paid, adjusted for any subscriptions and/or redemptions affecting the Allocated Portion.
Methodology
An Adviser Performance Fee is payable to a Non-Affiliated Sub-Adviser only with respect to the relevant Allocated Portion and only from the time that the Investment Manager or the Sub-Investment Manager appoints that Non-Affiliated Sub-Adviser to manage the Allocated Portion until such time, if ever, that the Non-Affiliated Sub-Adviser ceases to manage the Allocated Portion.
For each Calculation Period in which the net asset value of the Allocated Portion exceeds the High Water Mark, the Adviser Performance Fee payable will be equal to the increase in the Allocated Portion’s net asset value above the High Water Mark, multiplied by the relevant Non-Affiliated Sub-Adviser’s Adviser Performance Fee rate, as agreed with the Investment Manager and the Sub-Investment Manager, which shall not exceed 20%.
The Adviser Performance Fee will be calculated and accrued daily as at each Valuation Point. The Adviser Performance Fee is calculated on the unswung net asset value of the relevant Allocated Portion, i.e. before any adjustment for swing pricing (for more information on “swing pricing” please see the “Determination of Net Asset Value – Adjustments of Valuations and Swing Pricing” section of the Prospectus).
Portfolio expenses (excluding Management Fees) are allocated pro rata to each Allocated Portion and to the portion of the Portfolio’s assets that are not allocated to a Non-Affiliated Sub-Adviser and the Adviser Performance Fee in respect of each Allocated Portion is calculated and paid after the deduction of the portion of such expenses which is attributable to the relevant Allocated Portion.
The Adviser Performance Fee will normally be payable to a Non-Affiliated Sub-Adviser in arrears within 30 Business Days of 31 December each year. However, in the event of the Crystallisation of an Adviser Performance Fee during a Calculation Period, the accrued Adviser Performance Fee in respect of such amounts will be payable within 30 Business Days of the end of the calendar quarter during which the Crystallisation occurred.

NOTES TO THE AUDITED FINANCIAL STATEMENTS FINANCIAL STATEMENTS
ANNUAL REPORT 2019 1125
FOR THE YEAR ENDED 31 DECEMBER 2019
6. INVESTMENT MANAGER, ADMINISTRATOR, DISTRIBUTOR AND DEPOSITARY FEES (CONTINUED)
Performance Fee paid to the advisers (continued)
Neuberger Berman Uncorrelated Strategies Fund (continued)
Methodology (continued)
Crystallised Adviser Performance Fees shall remain in the Portfolio until paid to the Non-Affiliated Sub-Adviser and shall not participate in subsequent gains and losses of the Allocated Portion. Crystallised Adviser Performance Fees shall not be used or made available to satisfy redemptions or pay any fees and expenses of the relevant Allocated Portion, the Portfolio or the Company (other than Adviser Performance Fees payable to the on-Affiliated Sub-Adviser).
The Depositary shall verify the calculation of any Adviser Performance Fee.
Investors should note that, as the Adviser Performance Fee is calculated and may be payable to a Non-Affiliated Sub-Adviser with respect to the performance of its Allocated Portion and not the performance of the Portfolio as a whole, it is possible that the Portfolio could pay an Adviser Performance Fee to a Non-Affiliated Sub-Adviser in circumstances where the overall performance of the Portfolio as a whole is negative. This could occur where, for example, during a Calculation Period one Non-Affiliated Sub-Adviser’s Allocated Portion performs well but the remaining Non-Affiliated Sub-Advisers’ Allocated Portions perform negatively and the aggregate total of the negative performance exceeds that of the positive performance of the Non-Affiliated Sub-Adviser receiving the Adviser Performance Fee.
Adviser Performance Fees are payable on realised and unrealised capital gains, which for the avoidance of doubt includes investment income, taking into account realised and unrealised losses at the end of the Calculation Period. Consequently, Adviser Performance Fees may be paid on unrealised gains which may subsequently never be realised.
Non-Affiliated Sub-Advisers may charge research expenses to the Portfolio through the provision of an annual research budget for the Portfolio, as agreed with the Company.
For the year ended 31 December 2019, Altiq LLP, BH-DG Systematic Trading LLP, P/E Global LLC and Sandbar Asset Management LLP earned performance fees of US$ 4,061,082, US$ 1,409,220, US$ 2,668,945 and US$ 53,667, respectively.
For the year ended 31 December 2018, P/E Global LLC, Academy Investment Management LLC, BH-DG Systemic Trading LLP and True Partner Capital USA Holding Inc earned performance fees of US$ 2,535,486, US$ 30,949, US$ 252,391 and US$ 1,112,351, respectively.
Depositary Fee The Company pays the Depositary a fee in respect of trustee services for each Portfolio which shall not exceed 0.02% per annum of the Net Asset Value of the relevant Portfolio and which accrues monthly and is payable monthly in arrears. The Depositary is also entitled to reimbursement by the Company out of the assets of the Portfolio for safekeeping fees, transaction charges and reasonable out-of pocket expenses (“Custody fees”) incurred for the benefit of the Portfolio including the fees (which will not exceed normal commercial rates) and reasonable out-of-pocket expenses of any sub-custodian appointed by the Depositary.
Amounts incurred by the Company during the year relating to management, distribution, administration, depositary and performance are shown below.
Aggregate Aggregate
31 December 2019 31 December 2018
US$ US$
Management Fee 191,417,062 192,814,615
Distribution Fee 15,868,439 15,417,242
Administration Fee 32,010,320 33,315,948
Custody Fee 5,407,421 5,673,615
Depositary Fee 2,461,123 2,413,456
Performance Fee 8,661,752 4,006,254
The aggregate management fee waiver for the year ended 31 December 2019 was US$ 7,929,988 (31 December 2018: US$ 9,204,124). The aggregate advisory fee waiver for the year ended 31 December 2019 was US$ 540,057 (31 December 2018: US$ 694,629).

FINANCIAL STATEMENTS NOTES TO THE AUDITED FINANCIAL STATEMENTS
1126 NEUBERGER BERMAN INVESTMENT FUNDS PLC
FOR THE YEAR ENDED 31 DECEMBER 2019
7. DIRECTORS’ FEES AND EXPENSES
The Directors are entitled to a fee as remuneration for their services at a rate to be determined from time to time by the Directors provided that the amount of remuneration payable to any Director in any one year in respect of the Company shall not exceed €75,000 (or €85,000, in the case of the chairperson of the Company) or such other amount as the Directors may from time to time determine. The Directors, and any alternate Directors, are also entitled to be paid all travelling, hotel and other expenses properly incurred by them in attending Directors or Shareholders meetings or any other meetings in connection with the business of the Company. All Pay As You Earn (“PAYE”) paid on Directors Fees is included within total expenses. None of the Directors entered into a service contract with the Company nor is any such contract proposed and none of the Directors is an executive of the Company.
The aggregate emoluments of the Directors (including expenses) for the year ended 31 December 2019 were US$ 213,427 in total (31 December 2018: US$ 296,495) of which US$ 46,499 was outstanding at the year end (31 December 2018: US$ 2,932). Tom Finlay, the chairperson of the Company, received an annual fee of €85,000.
As at 31 December 2019, Ms. Michelle Green and Mr. Alex Duncan were employees of the Investment Manager. Up to his resignation on 11 June 2019, Mr. Andy Olding was an employee of the Investment Manager. Ms. Michelle Green, Mr. Alex Duncan and Mr. Andy Olding voluntarily agreed to waive their entitlement to a fee in relation to their duties as Directors for the year ended 31 December 2019 (31 December 2018: same).
Directors’ Fees are reported gross of Income Tax and no Benefit in Kind was earned by the Directors.
8. AUDITORS’ REMUNERATION
Ernst & Young, Chartered Accountants remuneration (inclusive of expenses and value added tax (“VAT”)) for work carried out for the Company in respect of the financial year is as follows:
31 December 2019 31 December 2018
Statutory audit fee: - Ernst & Young (Ireland): €853,251 €835,355
- Ernst & Young (China): - -
Other non-audit fees: - Ernst & Young (Austria): €140,000 €126,198
- Ernst & Young (UK): - £202,820
- Ernst & Young (Germany): - -
- Ernst & Young (Switzerland): €121,600 €119,068
- Ernst & Young (USA): - US$ 110,000
- Ernst & Young (China): - US$ 8,500
9. OTHER FEES AND EXPENSES
Transaction costs are the costs incurred in the acquisition, issue or disposal of financial assets and liabilities. Transaction costs include fees and commissions paid to brokers and dealers, levies by regulatory agencies and securities exchanges, and transfer taxes and duties. Transaction costs do not include debt premiums or discounts, financing costs or internal administrative or holding costs. These costs are accounted for as they are incurred and are recognised as an expense for financial reporting purposes in the Profit and Loss Account.
The Company and the Portfolios also pay certain other costs, charges, fees and expenses incurred in its operation. These may include without limitation; fees and expenses incurred in relation to banking and brokerage in respect of the purchase and sale of Portfolio securities, taxes, insurance, the costs and expenses of maintaining its books of account and of preparing, printing, publishing and distributing (in such languages as may be necessary) prospectuses, supplements, annual and semi-annual reports and other documents or information to current and prospective shareholders (including the costs of developing and enhancing computer software and electronic transmission techniques to distribute such documents or information), the expense of publishing price and yield information, in relevant media, the costs and expenses of obtaining authorisations or registrations of the Company or of any shares with the regulatory authorities in various jurisdictions, including any levy applied by the Central Bank of Ireland, the cost of listing and maintaining a listing of shares on any stock exchange, marketing and promotional expenses, the cost of convening and holding Directors and Shareholders meetings, the costs of exercising voting rights attached to the Company’s investment in the best interest of the Shareholders, professional fees and expenses for legal, auditing and other consulting services, any and all expenses arising in respect of the termination or liquidation of the Company and such other costs and expenses (including non-recurring and extraordinary costs and expenses) as may arise from time to time and which have been approved by the Directors as necessary or appropriate for the continued operation of the Company or of any Portfolio. In connection with the registration of the Company or the shares for sale in certain jurisdictions, the Company pays the fees and expenses of paying agents, information agents and/or correspondent banks, such payments being made at normal commercial rates.

NOTES TO THE AUDITED FINANCIAL STATEMENTS FINANCIAL STATEMENTS
ANNUAL REPORT 2019 1127
FOR THE YEAR ENDED 31 DECEMBER 2019
9. OTHER FEES AND EXPENSES (CONTINUED)
For financial reporting purposes, organisation expenses are expensed to the Profit and Loss Account as they are incurred. For the purpose of calculating the NAV per share for shareholder dealing, organisation expenses are being amortised over the first two financial years of the lifetime of the Portfolio.
10. RELATED PARTY TRANSACTIONS
Under FRS 102 “Related Party Transactions”, parties are related if any one party has the ability to control the other party or exercise significant influence over the other party in making financial or operational decisions.
Ms. Michelle Green and Mr. Alex Duncan are Directors of the Company and also Directors and employees of Neuberger Berman Europe Limited, the Investment Manager, Promoter and Distributor of the Company. Up to his resignation on 11 June 2019, Mr. Andy Olding was a Director of the Company and also a Director and an employee of Neuberger Berman Europe Limited, the Investment Manager, Promoter and Distributor of the Company. Neuberger Berman Europe Limited earned management fees of US$ 191,417,062 (31 December 2018: US$ 192,814,615) during the year ended 31 December 2019 of which US$ 18,013,232 (31 December 2018: US$ 29,244,712) was outstanding at the year end. A performance fee is also payable to the Investment Manager on certain Portfolios as outlined in Note 6. The Investment Manager earned performance fees of US$ 468,838 (31 December 2018: US$ 75,077) during the year ended 31 December 2019 of which US$ 468,838 (31 December 2018: US$ 85,151) was outstanding at the year end. Further information on Management Fees is included in Note 6. Please refer to Note 7 for details of Directors’ Fees paid during the years ended 31 December 2019 and 31 December 2018.
As at 31 December 2019, Neuberger Berman High Yield Bond Fund owned 34,064,306 (31 December 2018: 70,463,357) shares valued at US$ 41,877,566 (31 December 2018: US$ 79,589,602) of the Neuberger Berman Global Floating Rate Income Fund Ltd, which is managed by Neuberger Berman Investment Advisers LLC, an affiliate of Neuberger Berman Europe Limited, the Investment Manager and Distributor of the Company. The management fee for Neuberger Berman Global Floating Rate Income Fund Ltd is 0.75%. The Investment Manager provided a rebate of US$ 501,258 (31 December 2018: US$ 642,266) to Neuberger Berman High Yield Bond Fund relating to its investment such that its effective management fee rate on the investment was 0.00% (31 December 2018: same).
As at 31 December 2019, Neuberger Berman Short Duration High Yield Bond Fund owned 2,560,582 (31 December 2018: 5,296,384) shares valued at US$ 3,147,897 (31 December 2018: US$ 5,982,359) of the Neuberger Berman Global Floating Rate Income Fund Ltd, which is managed by Neuberger Berman Investment Advisers LLC, an affiliate of Neuberger Berman Europe Limited, the Investment Manager and Distributor of the Company. The management fee for Neuberger Berman Global Floating Rate Income Fund Ltd is 0.75%. The Investment Manager provided a rebate of US$ 37,675 (31 December 2018: US$ 50,912) to Neuberger Berman Short Duration High Yield Bond Fund relating to its investment such that its effective management fee rate on the investment was 0.00% (31 December 2018: same).
As at 31 December 2019, Neuberger Berman Emerging Market Debt - Local Currency Fund owned 2,470,000 (31 December 2018: Nil) shares valued at US$ 25,786,800 (31 December 2018: US$ Nil) of the Neuberger Berman China Bond Fund, which is managed by Neuberger Berman Europe Limited, the Investment Manager and Distributor of the Company. The management fee for Neuberger Berman China Bond Fund is 0.00%.
As at 31 December 2019, Neuberger Berman Emerging Market Debt - Hard Currency Fund owned 150,000 (31 December 2018: Nil) shares valued at US$ 15,670,500 (31 December 2018: US$ Nil) of the Neuberger Berman Ultra Short Term Euro Bond Fund, which is managed by Neuberger Berman Europe Limited, the Investment Manager and Distributor of the Company. The management fee for Neuberger Berman Ultra Short Term Euro Bond Fund is 0.00%.
As at 31 December 2019, Neuberger Berman Emerging Market Corporate Debt Fund owned 191,846 (31 December 2018: Nil) shares valued at US$ 2,002,873 (31 December 2018: US$ Nil) of the Neuberger Berman China Bond Fund, which is managed by Neuberger Berman Europe Limited, the Investment Manager and Distributor of the Company. The management fee for Neuberger Berman China Bond Fund is 0.00%.
As at 31 December 2019, Neuberger Berman Strategic Income Fund owned 1,245,691 (31 December 2018: Nil) shares valued at US$ 12,618,854 (31 December 2018: US$ Nil) of the Neuberger Berman Euro Bond Absolute Return Fund, 1,253,811 (31 December 2018: 1,326,434) shares valued at US$ 15,685,170 (31 December 2018: US$ 14,405,071) of the Neuberger Berman Global High Yield Bond Fund and 80,000 (31 December 2018: Nil) shares valued at US$ 8,357,600 (31 December 2018: US$ Nil) of the Neuberger Berman Ultra Short Term Euro Bond Fund. Neuberger Berman Euro Bond Absolute Return Fund, Neuberger Berman Global High Yield Bond Fund and Neuberger Berman Ultra Short Term Euro Bond Fund are managed by Neuberger Berman Europe Limited, the Investment Manager and Distributor of the Company. The management fee for Neuberger Berman Euro Bond Absolute Return Fund, Neuberger Berman Global High Yield Bond Fund and Neuberger Berman Ultra Short Term Euro Bond Fund Fund is 0.00% (31 December 2018: same).
As at 31 December 2019, Neuberger Berman Global Bond Absolute Return Fund owned 199,546 (31 December 2018: Nil) shares valued at US$ 2,026,068 (31 December 2018: US$ Nil) of the Neuberger Berman Euro Bond Absolute Return Fund, which is managed by Neuberger Berman Europe Limited, the Investment Manager and Distributor of the Company. The management fee for Neuberger Berman Euro Bond Absolute Return Fund is 0.00%.

FINANCIAL STATEMENTS NOTES TO THE AUDITED FINANCIAL STATEMENTS
1128 NEUBERGER BERMAN INVESTMENT FUNDS PLC
FOR THE YEAR ENDED 31 DECEMBER 2019
10. RELATED PARTY TRANSACTIONS (CONTINUED)
As at 31 December 2019, Neuberger Berman Short Duration Emerging Market Debt Fund owned 300,000 (31 December 2018: Nil) shares valued at US$ 31,341,000 (31 December 2018: US$ Nil) of the Neuberger Berman Ultra Short Term Euro Bond Fund, which is managed by Neuberger Berman Europe Limited, the Investment Manager and Distributor of the Company. The management fee for Neuberger Berman Ultra Short Term Euro Bond Fund is 0.00%.
As at 31 December 2019, Neuberger Berman Emerging Market Debt Blend Fund owned 1,596,964 (31 December 2018: Nil) shares valued at US$ 16,672,304 (31 December 2018: US$ Nil) of the Neuberger Berman China Bond Fund, which is managed by Neuberger Berman Europe Limited, the Investment Manager and Distributor of the Company. The management fee for Neuberger Berman China Bond Fund is 0.00%.
As at 31 December 2019, Neuberger Berman Global Opportunistic Bond Fund owned 158,879 (31 December 2018: Nil) shares valued at US$ 1,612,619 (31 December 2018: US$ Nil) of the Neuberger Berman China Bond Fund, 239,618 (31 December 2018: Nil) shares valued at US$ 2,427,329 (31 December 2018: US$ Nil) of the Neuberger Berman Euro Bond Absolute Return Fund and 40,740 (31 December 2018: Nil) shares valued at US$ 4,256,111 (31 December 2018: US$ Nil) of the Neuberger Berman Ultra Short Term Euro Bond Fund. Neuberger Berman China Bond Fund, Neuberger Berman Euro Bond Absolute Return Fund and Neuberger Berman Ultra Short Term Euro Bond Fund are managed by Neuberger Berman Europe Limited, the Investment Manager and Distributor of the Company. The management fee for Neuberger Berman China Bond Fund, Neuberger Berman Euro Bond Absolute Return Fund and Neuberger Berman Ultra Short Term Euro Bond Fund is 0.00% (31 December 2018: same).
As at 31 December 2018, Neuberger Berman Global Opportunistic Bond Fund owned 125,000 shares valued at US$ 141,189 of the Neuberger Berman Global Floating Rate Income Fund Ltd, 364,184 shares valued at US$ 3,718,321 of the Neuberger Berman Emerging Market Debt - Hard Currency Fund and 158,879 shares valued at US$ 1,507,759 of the Neuberger Berman China Bond Fund. Neuberger Berman Global Floating Rate Income Fund Ltd is managed by Neuberger Berman Investment Advisers LLC, an affiliate of Neuberger Berman Europe Limited, the Investment Manager and Distributor of the Company. Neuberger Berman Emerging Market Debt - Hard Currency Fund and Neuberger Berman China Bond Fund are managed by Neuberger Berman Europe Limited, the Investment Manager and Distributor of the Company. The management fee for Neuberger Berman Global Floating Rate Income Fund Ltd was 0.75. The management fee for Neuberger Berman Emerging Market Debt – Hard Currency Fund and Neuberger Berman China Bond Fund was 0.00%. The Investment Manager provided a rebate of US$ 1,451 to Neuberger Berman Global Opportunistic Bond Fund relating to its investment such that its effective management fee rate on the investment was 0.00%.
As at 31 December 2018, Neuberger Berman Multi-Asset Class Growth Fund owned 81,677 shares valued at US$ 833,922 of the Neuberger Berman Emerging Market Debt – Hard Currency Fund, which is managed by Neuberger Berman Europe Limited, the Investment Manager and Distributor of the Company. The management fee for Neuberger Berman Emerging Market Debt – Hard Currency Fund is 0.00%.
As at 31 December 2019, Neuberger Berman Euro Opportunistic Bond Fund owned 9,974 (31 December 2018: Nil) shares valued at €1,015,652 (31 December 2018: €Nil) of the Neuberger Berman Ultra Short Term Euro Bond Fund, which is managed by Neuberger Berman Europe Limited, the Investment Manager and Distributor of the Company. The management fee for Neuberger Berman Ultra Short Term Euro Bond Fund is 0.00%.
As at 31 December 2018, Neuberger Berman Euro Bond Absolute Return Fund owned 5,000 shares valued at €499,950 of the Neuberger Berman Ultra Short Term Euro Bond Fund, which is managed by Neuberger Berman Europe Limited, the Investment Manager and Distributor of the Company. The management fee for Neuberger Berman Ultra Short Term Euro Bond Fund is 0.00%.
As at 31 December 2019 and 31 December 2018, the cross investments between Portfolios within the Company were excluded from the Aggregate Financial Statements.

NOTES TO THE AUDITED FINANCIAL STATEMENTS FINANCIAL STATEMENTS
ANNUAL REPORT 2019 1129
FOR THE YEAR ENDED 31 DECEMBER 2019
10. RELATED PARTY TRANSACTIONS (CONTINUED)
The Board of Directors is not aware of any transactions with related parties during the year ended 31 December 2019 (31 December 2018: same), other than those disclosed in these financial statements.
As at 31 December 2019 and 31 December 2018, the following shareholders had made the following investments in the Company which were deemed to be related parties.
31 December 2019 31 December 2018 Portfolio Share Class Shareholder Number of Shares Number of Shares
Neuberger Berman High Yield Bond Fund AUD C2 (Weekly) Distributing Class Neuberger Berman Europe Holdings LLC 1,803 1,803
Neuberger Berman High Yield Bond Fund CHF I2 Distributing Class Neuberger Berman Europe Holdings LLC - 1,103
Neuberger Berman High Yield Bond Fund CNY B (Monthly) Distributing Class Neuberger Berman Europe Holdings LLC 986 986
Neuberger Berman High Yield Bond Fund EUR Z Accumulating Class Neuberger Berman Employee 3,264 3,767
Neuberger Berman High Yield Bond Fund JPY I Accumulating Class Neuberger Berman Europe* 1,880 1,880
Neuberger Berman High Yield Bond Fund JPY I2 Accumulating Class Neuberger Berman Europe Holdings LLC - 1,160
Neuberger Berman High Yield Bond Fund SEK I2 Accumulating Class Neuberger Berman Europe Holdings LLC - 8,427
Neuberger Berman High Yield Bond Fund USD I Accumulating Class Neuberger Berman Bond-Plus Income & Growth Multi-Asset Class Securities Investment Trust Fund
1,654,935 955,851
Neuberger Berman High Yield Bond Fund USD P Accumulating Class Neuberger Berman Europe Holdings LLC 1,208 1,208
Neuberger Berman High Yield Bond Fund USD Z Accumulating Class Neuberger Berman Employee 5,026 5,026
Neuberger Berman High Yield Bond Fund USD Z Accumulating Class Neuberger Berman Strategic Income Fund - 2,850,534
Neuberger Berman High Yield Bond Fund ZAR T Accumulating Class Neuberger Berman Europe Holdings LLC 1,308 1,308
Neuberger Berman Diversified Currency Fund EUR A Accumulating Class Neuberger Berman Europe Holdings LLC 1,383 2,701
Neuberger Berman Diversified Currency Fund EUR I Accumulating Class Neuberger Berman Europe Holdings LLC 1,790 8,515
Neuberger Berman Diversified Currency Fund EUR M Accumulating Class Neuberger Berman Europe Holdings LLC 901 901
Neuberger Berman Diversified Currency Fund USD A Accumulating Class Neuberger Berman Europe Holdings LLC 2,653 16,711
Neuberger Berman Diversified Currency Fund USD Z Accumulating Class Neuberger Berman Employee 3,021 3,021
Neuberger Berman US Multi Cap Opportunities Fund AUD T Accumulating Class Neuberger Berman Europe Holdings LLC 516 516
Neuberger Berman US Multi Cap Opportunities Fund GBP I Accumulating Class Neuberger Berman Europe Holdings LLC 589 589

FINANCIAL STATEMENTS NOTES TO THE AUDITED FINANCIAL STATEMENTS
1130 NEUBERGER BERMAN INVESTMENT FUNDS PLC
FOR THE YEAR ENDED 31 DECEMBER 2019
10. RELATED PARTY TRANSACTIONS (CONTINUED)
31 December 2019 31 December 2018 Portfolio Share Class Shareholder Number of Shares Number of Shares
Neuberger Berman US Multi Cap Opportunities Fund GBP I3 Distributing Unhedged Class Neuberger Berman Europe Holdings LLC 1,065 1,065
Neuberger Berman US Multi Cap Opportunities Fund USD I2 Accumulating Class Neuberger Berman Cayman Holdings Ltd - 709
Neuberger Berman US Multi Cap Opportunities Fund USD P Accumulating Class Neuberger Berman Europe Holdings LLC 1,167 1,167
Neuberger Berman US Multi Cap Opportunities Fund USD Z Accumulating Class Neuberger Berman Employee 4,876 4,876
Neuberger Berman US Multi Cap Opportunities Fund USD1 I Accumulating Class Neuberger Berman US Multi Cap Fundo De Investimento Multimercado - Investimento No Exterior 324,849 813,177
Neuberger Berman US Multi Cap Opportunities Fund USD1 I Accumulating Class Neuberger Berman Europe Holdings LLC 297,762 -
Neuberger Berman US Multi Cap Opportunities Fund USD1 I Distributing Class Neuberger Berman Europe Holdings LLC 268 268
Neuberger Berman US Real Estate Securities Fund AUD B (Monthly) Distributing Class Neuberger Berman Europe Holdings LLC 1,418 1,418
Neuberger Berman US Real Estate Securities Fund AUD C2 (Monthly) Distributing Class Neuberger Berman Europe Holdings LLC 1,613 1,613
Neuberger Berman US Real Estate Securities Fund AUD C2 Accumulating Class Neuberger Berman Europe Holdings LLC 1,342 1,342
Neuberger Berman US Real Estate Securities Fund AUD E (Monthly) Distributing Class Neuberger Berman Europe Holdings LLC 1,586 1,586
Neuberger Berman US Real Estate Securities Fund USD C2 (Monthly) Distributing Class Neuberger Berman Europe Holdings LLC 1,093 1,093
Neuberger Berman US Real Estate Securities Fund USD E (Monthly) Distributing Class Neuberger Berman Europe Holdings LLC 1,351 1,351
Neuberger Berman US Real Estate Securities Fund USD I Distributing Class Neuberger Berman Europe Holdings LLC 1,008 1,008
Neuberger Berman US Real Estate Securities Fund USD Z Accumulating Class Neuberger Berman Employee 6,889 6,889
Neuberger Berman US Real Estate Securities Fund ZAR B (Monthly) Distributing Class Neuberger Berman Europe Holdings LLC 1,809 1,809
Neuberger Berman US Real Estate Securities Fund ZAR C2 (Monthly) Distributing Class Neuberger Berman Europe Holdings LLC 1,837 1,837
Neuberger Berman US Real Estate Securities Fund ZAR C2 Accumulating Class Neuberger Berman Cayman Holdings Ltd 2,921 -
Neuberger Berman US Real Estate Securities Fund ZAR E (Monthly) Distributing Class Neuberger Berman Europe Holdings LLC 1,790 1,790
Neuberger Berman China Equity Fund EUR Z Accumulating Class Neuberger Berman Employee 891 891
Neuberger Berman China Equity Fund USD Z Accumulating Class Neuberger Berman Employee 18,423 18,423
Neuberger Berman Emerging Markets Equity Fund AUD B Accumulating Class Neuberger Berman Europe Holdings LLC 1,356 1,356
Neuberger Berman Emerging Markets Equity Fund AUD C2 Accumulating Class Neuberger Berman Europe Holdings LLC 1,356 1,356
Neuberger Berman Emerging Markets Equity Fund AUD E Accumulating Class Neuberger Berman Europe Holdings LLC 1,356 1,356

NOTES TO THE AUDITED FINANCIAL STATEMENTS FINANCIAL STATEMENTS
ANNUAL REPORT 2019 1131
FOR THE YEAR ENDED 31 DECEMBER 2019
10. RELATED PARTY TRANSACTIONS (CONTINUED)
31 December 2019 31 December 2018 Portfolio Share Class Shareholder Number of Shares Number of Shares
Neuberger Berman Emerging Markets Equity Fund AUD T Accumulating Class Neuberger Berman Europe Holdings LLC 1,356 1,356
Neuberger Berman Emerging Markets Equity Fund CAD I Distributing Unhedged Class Neuberger Berman Cayman Holdings Ltd 4,440 -
Neuberger Berman Emerging Markets Equity Fund EUR A Accumulating Class Neuberger Berman Europe Holdings LLC 1,014 1,014
Neuberger Berman Emerging Markets Equity Fund EUR M Accumulating Class Neuberger Berman Europe Holdings LLC 901 901
Neuberger Berman Emerging Markets Equity Fund EUR Z Accumulating Class Neuberger Berman Employee 7,946 7,946
Neuberger Berman Emerging Markets Equity Fund GBP Z Accumulating Class Neuberger Berman Employee 800 800
Neuberger Berman Emerging Markets Equity Fund USD B Accumulating Class Neuberger Berman Europe Holdings LLC 1,000 1,000
Neuberger Berman Emerging Markets Equity Fund USD C2 Accumulating Class Neuberger Berman Europe Holdings LLC 1,000 1,000
Neuberger Berman Emerging Markets Equity Fund USD E Accumulating Class Neuberger Berman Europe Holdings LLC 1,000 1,000
Neuberger Berman Emerging Markets Equity Fund USD T Accumulating Class Neuberger Berman Europe Holdings LLC 1,000 1,000
Neuberger Berman Emerging Markets Equity Fund USD Z Accumulating Class Neuberger Berman Employee 20,691 20,255
Neuberger Berman Emerging Markets Equity Fund ZAR B Accumulating Class Neuberger Berman Europe Holdings LLC 1,410 1,410
Neuberger Berman Emerging Markets Equity Fund ZAR C2 Accumulating Class Neuberger Berman Europe Holdings LLC 1,410 1,410
Neuberger Berman Emerging Markets Equity Fund ZAR E Accumulating Class Neuberger Berman Europe Holdings LLC 1,410 1,410
Neuberger Berman Emerging Markets Equity Fund ZAR T Accumulating Class Neuberger Berman Europe Holdings LLC 1,410 1,410
Neuberger Berman US Small Cap Fund AUD C2 Accumulating Class Neuberger Berman Europe Holdings LLC 1,010 -
Neuberger Berman US Small Cap Fund AUD E Accumulating Class Neuberger Berman Europe Holdings LLC 756 1,460
Neuberger Berman US Small Cap Fund AUD T Accumulating Class Neuberger Berman Europe Holdings LLC 1,329 1,329
Neuberger Berman US Small Cap Fund EUR Z Accumulating Class Neuberger Berman Employee 8,098 6,374
Neuberger Berman US Small Cap Fund GBP I Accumulating Class Neuberger Berman Cayman Holdings Ltd 2,376 -
Neuberger Berman US Small Cap Fund USD I2 Accumulating Class Neuberger Berman Europe Holdings LLC 1,166 1,166
Neuberger Berman US Small Cap Fund USD Z Accumulating Class Neuberger Berman Employee 4,067 3,687
Neuberger Berman US Small Cap Fund ZAR E Accumulating Class Neuberger Berman Europe Holdings LLC 745 745
Neuberger Berman US Small Cap Fund ZAR T Accumulating Class Neuberger Berman Europe Holdings LLC 1,812 1,812
Neuberger Berman Short Duration High Yield Bond Fund GBP A Distributing Class Neuberger Berman Europe Holdings LLC - 1,041

FINANCIAL STATEMENTS NOTES TO THE AUDITED FINANCIAL STATEMENTS
1132 NEUBERGER BERMAN INVESTMENT FUNDS PLC
FOR THE YEAR ENDED 31 DECEMBER 2019
10. RELATED PARTY TRANSACTIONS (CONTINUED)
31 December 2019 31 December 2018 Portfolio Share Class Shareholder Number of Shares Number of Shares
Neuberger Berman Short Duration High Yield Bond Fund USD B (Monthly) Distributing Class Neuberger Berman Europe Holdings LLC - 1,068
Neuberger Berman Short Duration High Yield Bond Fund USD T (Monthly) Distributing Class Neuberger Berman Europe Holdings LLC - 1,051
Neuberger Berman Short Duration High Yield Bond Fund USD Z Accumulating Class Neuberger Berman Employee 9,906 9,906
Neuberger Berman Global Bond Fund USD A Accumulating Class Neuberger Berman Europe Holdings LLC 1,068 1,068
Neuberger Berman Global Bond Fund USD I Accumulating Class Neuberger Berman Europe Holdings LLC 3,210 3,210
Neuberger Berman Emerging Market Debt - Local Currency Fund AUD B Accumulating Class Neuberger Berman Europe Holdings LLC 1,551 1,551
Neuberger Berman Emerging Market Debt - Local Currency Fund AUD C2 Accumulating Class Neuberger Berman Europe Holdings LLC 1,551 1,551
Neuberger Berman Emerging Market Debt - Local Currency Fund AUD E Accumulating Class Neuberger Berman Europe Holdings LLC 1,494 1,494
Neuberger Berman Emerging Market Debt - Local Currency Fund EUR A Accumulating Unhedged Class Neuberger Berman Europe Holdings LLC - 898
Neuberger Berman Emerging Market Debt - Local Currency Fund GBP I Accumulating Class Neuberger Berman Europe Holdings LLC 1,011 1,011
Neuberger Berman Emerging Market Debt - Local Currency Fund USD B Accumulating Class Neuberger Berman Europe Holdings LLC 1,000 1,000
Neuberger Berman Emerging Market Debt - Local Currency Fund USD C2 Accumulating Class Neuberger Berman Europe Holdings LLC 1,000 1,000
Neuberger Berman Emerging Market Debt - Local Currency Fund USD E Accumulating Class Neuberger Berman Europe Holdings LLC 1,000 1,000
Neuberger Berman Emerging Market Debt - Local Currency Fund USD I (Monthly) Distributing Class Neuberger Berman Europe Holdings LLC 1,136 1,136
Neuberger Berman Emerging Market Debt - Local Currency Fund USD I Accumulating Class Neuberger Berman Bond-Plus Income & Growth Multi-Asset Class Securities Investment Trust Fund
4,067,514 2,466,814
Neuberger Berman Emerging Market Debt - Local Currency Fund ZAR C2 Accumulating Class Neuberger Berman Europe Holdings LLC 1,774 1,780
Neuberger Berman Emerging Market Debt - Local Currency Fund ZAR E Accumulating Class Neuberger Berman Europe Holdings LLC 855 855
Neuberger Berman Emerging Market Debt - Hard Currency Fund CHF P Accumulating Class Neuberger Berman Europe Holdings LLC 1,118 1,118
Neuberger Berman Emerging Market Debt - Hard Currency Fund EUR A (Monthly) Distributing Class Neuberger Berman Europe Holdings LLC 1,008 1,008
Neuberger Berman Emerging Market Debt - Hard Currency Fund EUR P Accumulating Class Neuberger Berman Europe Holdings LLC 946 946
Neuberger Berman Emerging Market Debt - Hard Currency Fund EUR Z Accumulating Class Neuberger Berman Employee 21,308 21,308
Neuberger Berman Emerging Market Debt - Hard Currency Fund GBP P Accumulating Class Neuberger Berman Europe Holdings LLC 978 978
Neuberger Berman Emerging Market Debt - Hard Currency Fund USD I2 Distributing Class Neuberger Berman Europe Holdings LLC 1,000 1,000
Neuberger Berman Emerging Market Debt - Hard Currency Fund USD Z Accumulating Class Neuberger Berman Employee 2,360 939

NOTES TO THE AUDITED FINANCIAL STATEMENTS FINANCIAL STATEMENTS
ANNUAL REPORT 2019 1133
FOR THE YEAR ENDED 31 DECEMBER 2019
10. RELATED PARTY TRANSACTIONS (CONTINUED)
31 December 2019 31 December 2018 Portfolio Share Class Shareholder Number of Shares Number of Shares
Neuberger Berman Emerging Market Debt - Hard Currency Fund USD Z Accumulating Class Neuberger Berman Global Opportunistic Bond Fund - 364,184
Neuberger Berman Emerging Market Debt - Hard Currency Fund USD Z Accumulating Class Neuberger Berman Multi-Asset Class Growth Fund - 81,677
Neuberger Berman Emerging Market Corporate Debt Fund EUR I2 Accumulating Class Neuberger Berman Cayman Holdings Ltd 2,481 2,481
Neuberger Berman Emerging Market Corporate Debt Fund GBP I Accumulating Class Neuberger Berman Europe Holdings LLC 787 787
Neuberger Berman Emerging Market Corporate Debt Fund SEK A Accumulating Class Neuberger Berman Europe Holdings LLC 2,409 2,409
Neuberger Berman Emerging Market Corporate Debt Fund USD M Accumulating Class Neuberger Berman Europe* 1,040 1,040
Neuberger Berman Strategic Income Fund EUR A Accumulating Class Neuberger Berman Europe Holdings LLC 913 913
Neuberger Berman Strategic Income Fund GBP A (Monthly) Distributing Class Neuberger Berman Europe Holdings LLC 834 834
Neuberger Berman Strategic Income Fund GBP I Accumulating Class Neuberger Berman Cayman Holdings Ltd 2,376 -
Neuberger Berman Strategic Income Fund HKD A (Monthly) Distributing Class Neuberger Berman Europe Holdings LLC 11,473 11,473
Neuberger Berman Strategic Income Fund SGD A Accumulating Class Neuberger Berman Europe Holdings LLC 682 682
Neuberger Berman Strategic Income Fund USD A Distributing Class Neuberger Berman Europe Holdings LLC 1,093 1,093
Neuberger Berman Strategic Income Fund USD I2 Accumulating Class Neuberger Berman Europe Holdings LLC 1,207 1,207
Neuberger Berman Strategic Income Fund USD T (Monthly) Distributing Class Neuberger Berman Europe Holdings LLC - 985
Neuberger Berman Strategic Income Fund USD Z Accumulating Class Neuberger Berman Employee 10,062 9,661
Neuberger Berman Global Bond Absolute Return Fund CNY C2 Accumulating Class Neuberger Berman Europe Holdings LLC - 693
Neuberger Berman Global Bond Absolute Return Fund CNY T Accumulating Class Neuberger Berman Europe Holdings LLC - 681
Neuberger Berman Global Bond Absolute Return Fund EUR I Accumulating Class Neuberger Berman Europe Holdings LLC 1,034 1,034
Neuberger Berman Global Bond Absolute Return Fund EUR I4 Accumulating Class Neuberger Berman Europe Holdings LLC - 1,132
Neuberger Berman Global Bond Absolute Return Fund EUR I4 Distributing Class Neuberger Berman Europe Holdings LLC 1,149 1,149
Neuberger Berman Global Bond Absolute Return Fund EUR I5 Accumulating Class Neuberger Berman Europe Holdings LLC - 964
Neuberger Berman Global Bond Absolute Return Fund GBP I Distributing Class Neuberger Berman Europe Holdings LLC - 790
Neuberger Berman Global Bond Absolute Return Fund GBP I2 Accumulating Class Neuberger Berman Europe Holdings LLC - 730
Neuberger Berman Global Bond Absolute Return Fund GBP Z Accumulating Class Neuberger Berman Employee 1,000 1,000
Neuberger Berman Global Bond Absolute Return Fund JPY I Accumulating Class Neuberger Berman Group LLC 3,331 -

FINANCIAL STATEMENTS NOTES TO THE AUDITED FINANCIAL STATEMENTS
1134 NEUBERGER BERMAN INVESTMENT FUNDS PLC
FOR THE YEAR ENDED 31 DECEMBER 2019
10. RELATED PARTY TRANSACTIONS (CONTINUED)
31 December 2019 31 December 2018 Portfolio Share Class Shareholder Number of Shares Number of Shares
Neuberger Berman Global Bond Absolute Return Fund USD C2 Accumulating Class Neuberger Berman Europe Holdings LLC - 1,000
Neuberger Berman Global Bond Absolute Return Fund USD I Accumulating Class Neuberger Berman Group LLC 123 1,896,107
Neuberger Berman Global Bond Absolute Return Fund USD I5 Accumulating Class Neuberger Berman Group LLC 964 -
Neuberger Berman Global Bond Absolute Return Fund USD I5 Distributing Class Neuberger Berman Europe Holdings LLC - 1,137
Neuberger Berman Short Duration Emerging Market Debt Fund AUD A Accumulating Class Neuberger Berman Europe Holdings LLC 1,542 1,542
Neuberger Berman Short Duration Emerging Market Debt Fund CAD A (Monthly) Distributing Class Neuberger Berman Europe Holdings LLC 1,365 1,365
Neuberger Berman Short Duration Emerging Market Debt Fund CHF P Distributing Class Neuberger Berman Europe Holdings LLC 1,245 1,245
Neuberger Berman Short Duration Emerging Market Debt Fund CNY A (Monthly) Distributing Class Neuberger Berman Europe Holdings LLC 664 664
Neuberger Berman Short Duration Emerging Market Debt Fund EUR I Accumulating Unhedged Class Neuberger Berman Cayman Holdings Ltd 2,568 -
Neuberger Berman Short Duration Emerging Market Debt Fund GBP I Distributing Class Neuberger Berman Europe Holdings LLC 814 814
Neuberger Berman Short Duration Emerging Market Debt Fund GBP P Accumulating Class Neuberger Berman Cayman Holdings Ltd 2,487 -
Neuberger Berman Short Duration Emerging Market Debt Fund SEK A Accumulating Class Neuberger Berman Europe Holdings LLC 2,374 2,374
Neuberger Berman Short Duration Emerging Market Debt Fund USD Z Accumulating Class Neuberger Berman Employee 19,380 20,710
Neuberger Berman Absolute Return Multi Strategy Fund CHF I2 Accumulating Class Neuberger Berman Cayman Holdings Ltd - 1,009
Neuberger Berman Absolute Return Multi Strategy Fund EUR Z Accumulating Class Neuberger Berman Employee 5,094 4,892
Neuberger Berman Absolute Return Multi Strategy Fund GBP Z Accumulating Class Neuberger Berman Employee 12,484 12,484
Neuberger Berman Absolute Return Multi Strategy Fund USD Z Accumulating Class Neuberger Berman Employee 10,891 10,891
Neuberger Berman US Long Short Equity Fund CNY C2 Accumulating Class Neuberger Berman Europe Holdings LLC - 673
Neuberger Berman US Long Short Equity Fund CNY T Accumulating Class Neuberger Berman Europe Holdings LLC - 661
Neuberger Berman US Long Short Equity Fund GBP I Accumulating Class Neuberger Berman Cayman Holdings Ltd 2,376 -
Neuberger Berman US Long Short Equity Fund SGD A Accumulating Class Neuberger Berman Europe Holdings LLC - 2,112
Neuberger Berman US Long Short Equity Fund USD C (PF) Accumulating Class Neuberger Berman Europe Holdings LLC - 1,102
Neuberger Berman US Long Short Equity Fund USD C2 Accumulating Class Neuberger Berman Europe Holdings LLC - 1,000
Neuberger Berman US Long Short Equity Fund USD M Accumulating Class Neuberger Berman Europe Holdings LLC 1,115 1,115
Neuberger Berman US Long Short Equity Fund USD T Accumulating Class Neuberger Berman Europe Holdings LLC - 1,000

NOTES TO THE AUDITED FINANCIAL STATEMENTS FINANCIAL STATEMENTS
ANNUAL REPORT 2019 1135
FOR THE YEAR ENDED 31 DECEMBER 2019
10. RELATED PARTY TRANSACTIONS (CONTINUED)
31 December 2019 31 December 2018 Portfolio Share Class Shareholder Number of Shares Number of Shares
Neuberger Berman US Long Short Equity Fund USD Z Accumulating Class Neuberger Berman Employee 15,426 11,240
Neuberger Berman Emerging Market Debt Blend Fund EUR I3 Distributing Class Neuberger Berman Europe Holdings LLC 3,000 -
Neuberger Berman Emerging Market Debt Blend Fund EUR Z Accumulating Class Neuberger Berman Employee 5,122 5,732
Neuberger Berman Emerging Market Debt Blend Fund GBP I Distributing Class Neuberger Berman Europe Holdings LLC 746 746
Neuberger Berman Emerging Market Debt Blend Fund GBP I Distributing Unhedged Class Neuberger Berman Europe Holdings LLC 746 746
Neuberger Berman Emerging Market Debt Blend Fund GBP P Accumulating Class Neuberger Berman Cayman Holdings Ltd 2,314 -
Neuberger Berman Emerging Market Debt Blend Fund GBP P Accumulating Unhedged Class Neuberger Berman Cayman Holdings Ltd 772 -
Neuberger Berman Emerging Market Debt Blend Fund SGD A (Monthly) Distributing Class Neuberger Berman Europe Holdings LLC 699 699
Neuberger Berman Emerging Market Debt Blend Fund SGD A Accumulating Class Neuberger Berman Europe Holdings LLC - 705
Neuberger Berman Emerging Market Debt Blend Fund USD A (Monthly) Distributing Class Neuberger Berman Europe Holdings LLC 1,025 1,025
Neuberger Berman Emerging Market Debt Blend Fund USD I Distributing Class Neuberger Berman Europe Holdings LLC 9 9
Neuberger Berman Emerging Market Debt Blend Fund USD Z Accumulating Class Neuberger Berman Employee 10,947 10,947
Neuberger Berman European High Yield Bond Fund EUR I Accumulating Class Neuberger Berman Europe Holdings LLC 1,947 12,638
Neuberger Berman European High Yield Bond Fund GBP I Accumulating Class Neuberger Berman Cayman Holdings Ltd 2,318 -
Neuberger Berman European High Yield Bond Fund USD A (Monthly) Distributing Class Neuberger Berman Europe Holdings LLC 1,630 1,630
Neuberger Berman European High Yield Bond Fund USD A Accumulating Class Neuberger Berman Europe Holdings LLC 1,014 1,014
Neuberger Berman European High Yield Bond Fund USD I Accumulating Class Neuberger Berman Group LLC - 1,347,000
Neuberger Berman European High Yield Bond Fund USD X Accumulating Class Neuberger Berman Europe Holdings LLC 3,639 3,639
Neuberger Berman European High Yield Bond Fund USD Z Accumulating Class Neuberger Berman Employee 386 -
Neuberger Berman Global Equity Fund USD I Accumulating Class Neuberger Berman Europe Holdings LLC 100,000 100,000
Neuberger Berman Systematic Global Equity Fund GBP I Accumulating Class Neuberger Berman Cayman Holdings Ltd 2,376 -
Neuberger Berman Systematic Global Equity Fund USD A Accumulating Class Neuberger Berman Europe Holdings LLC 886 886
Neuberger Berman Systematic Global Equity Fund USD I Accumulating Class Neuberger Berman Group LLC 1,664 1,664
Neuberger Berman Systematic Global Equity Fund USD Z Accumulating Class Neuberger Berman Employee 2,658 2,658
Neuberger Berman Global Real Estate Securities Fund EUR M Accumulating Class Neuberger Berman Europe Holdings LLC 1,000 1,000

FINANCIAL STATEMENTS NOTES TO THE AUDITED FINANCIAL STATEMENTS
1136 NEUBERGER BERMAN INVESTMENT FUNDS PLC
FOR THE YEAR ENDED 31 DECEMBER 2019
10. RELATED PARTY TRANSACTIONS (CONTINUED)
31 December 2019 31 December 2018 Portfolio Share Class Shareholder Number of Shares Number of Shares
Neuberger Berman Global Real Estate Securities Fund USD Z Accumulating Class Neuberger Berman Employee 5,190 5,190
Neuberger Berman US Small Cap Intrinsic Value Fund USD A Accumulating Class Neuberger Berman Europe Holdings LLC 1,000 1,000
Neuberger Berman Asian Debt - Hard Currency Fund USD A (Monthly) Distributing Class Neuberger Berman Europe Holdings LLC 1,046 1,046
Neuberger Berman Asian Debt - Hard Currency Fund USD A Accumulating Class Neuberger Berman Europe Holdings LLC 1,000 1,000
Neuberger Berman Asian Debt - Hard Currency Fund USD I Accumulating Class Neuberger Berman Europe Holdings LLC 1,000 1,000
Neuberger Berman Asian Debt - Hard Currency Fund USD I Distributing Class Neuberger Berman Group LLC 1,527,776 1,528,697
Neuberger Berman China Bond Fund CNY I Distributing Class Neuberger Berman Europe Holdings LLC 704 704
Neuberger Berman China Bond Fund CNY Z Accumulating Class Neuberger Berman Employee 7,145 1,218
Neuberger Berman China Bond Fund CNY Z Accumulating Class Neuberger Berman Europe Holdings LLC 614 614
Neuberger Berman China Bond Fund EUR M Accumulating Unhedged Class Neuberger Berman Europe Holdings LLC 2,617 2,617
Neuberger Berman China Bond Fund USD I Accumulating Unhedged Class Neuberger Berman Europe Holdings LLC 1,003 1,003
Neuberger Berman China Bond Fund USD I Accumulating Unhedged Class Neuberger Berman Group LLC 406,462 992,063
Neuberger Berman China Bond Fund USD Z Accumulating Class Neuberger Berman Emerging Market Corporate Debt Fund 191,845 -
Neuberger Berman China Bond Fund USD Z Accumulating Class Neuberger Berman Emerging Market Debt - Local Currency Fund 2,470,000 -
Neuberger Berman China Bond Fund USD Z Accumulating Class Neuberger Berman Emerging Market Debt Blend Fund 1,596,963 -
Neuberger Berman China Bond Fund USD Z Accumulating Class Neuberger Berman Employee 40,000 -
Neuberger Berman China Bond Fund USD Z Accumulating Unhedged Class Neuberger Berman Employee 1,100 -
Neuberger Berman China Bond Fund USD Z Accumulating Unhedged Class Neuberger Berman Global Opportunistic Bond Fund 158,879 158,879
Neuberger Berman Global Dynamic Asset Allocator Fund CNY C2 (Monthly) Distributing Class Neuberger Berman Cayman Holdings Ltd - 669
Neuberger Berman Global Dynamic Asset Allocator Fund CNY T (Monthly) Distributing Class Neuberger Berman Cayman Holdings Ltd - 672
Neuberger Berman Global Dynamic Asset Allocator Fund EUR I Accumulating Class Neuberger Berman Cayman Holdings Ltd - 2,775
Neuberger Berman Global Dynamic Asset Allocator Fund GBP I Accumulating Class Neuberger Berman Cayman Holdings Ltd - 771
Neuberger Berman Global Dynamic Asset Allocator Fund USD C2 (Monthly) Distributing Class Neuberger Berman Cayman Holdings Ltd - 948
Neuberger Berman Global Dynamic Asset Allocator Fund USD I Accumulating Class Neuberger Berman Cayman Holdings Ltd - 1,002
Neuberger Berman Global Dynamic Asset Allocator Fund USD I Distributing Class Neuberger Berman Cayman Holdings Ltd - 1,290,411

NOTES TO THE AUDITED FINANCIAL STATEMENTS FINANCIAL STATEMENTS
ANNUAL REPORT 2019 1137
FOR THE YEAR ENDED 31 DECEMBER 2019
10. RELATED PARTY TRANSACTIONS (CONTINUED)
31 December 2019 31 December 2018 Portfolio Share Class Shareholder Number of Shares Number of Shares
Neuberger Berman Global Dynamic Asset Allocator Fund USD T (Monthly) Distributing Class Neuberger Berman Cayman Holdings Ltd - 968
Neuberger Berman Global Dynamic Asset Allocator Fund USD Z Accumulating Class Neuberger Berman Employee - 3,769
Neuberger Berman Asian Opportunities Fund USD I Accumulating Class Neuberger Berman Europe Holdings LLC - 1,000
Neuberger Berman Asian Opportunities Fund USD I Distributing Class Neuberger Berman Group LLC - 301,934
Neuberger Berman Corporate Hybrid Bond Fund AUD A (Monthly) Distributing Class Neuberger Berman Europe Holdings LLC 1,390 1,390
Neuberger Berman Corporate Hybrid Bond Fund GBP P Accumulating Class Neuberger Berman Cayman Holdings Ltd 2,469 -
Neuberger Berman Corporate Hybrid Bond Fund USD I2 Distributing Class Neuberger Berman Europe Holdings LLC 1,128 1,128
Neuberger Berman Corporate Hybrid Bond Fund USD Z Accumulating Class Neuberger Berman Employee 453 -
Neuberger Berman US Equity Fund USD I Accumulating Class Neuberger Berman Europe Holdings LLC 997 997
Neuberger Berman US Equity Fund USD I Distributing Class Neuberger Berman Group LLC 300,000 300,000
Neuberger Berman Global High Yield Bond Fund EUR M Accumulating Class Neuberger Berman Europe Holdings LLC 1,020 1,020
Neuberger Berman Global High Yield Bond Fund GBP I Accumulating Class Neuberger Berman Europe Holdings LLC 867 867
Neuberger Berman Global High Yield Bond Fund GBP I2 Accumulating Class Neuberger Berman Europe Holdings LLC - 928
Neuberger Berman Global High Yield Bond Fund USD A Accumulating Class Neuberger Berman Europe Holdings LLC 942 942
Neuberger Berman Global High Yield Bond Fund USD P Accumulating Class Neuberger Berman Europe Holdings LLC 1,143 1,143
Neuberger Berman Global High Yield Bond Fund USD Z Accumulating Class Neuberger Berman Strategic Income Fund 1,253,811 1,326,434
Neuberger Berman Global Opportunistic Bond Fund EUR I Accumulating Class Neuberger Berman Europe Holdings LLC 2,259 96,308
Neuberger Berman Global Opportunistic Bond Fund GBP I Accumulating Class Neuberger Berman Europe Holdings LLC - 80,085
Neuberger Berman Global Opportunistic Bond Fund JPY I Accumulating Class Neuberger Berman Group LLC 1,837 226,120
Neuberger Berman Global Opportunistic Bond Fund USD A Accumulating Class Neuberger Berman Europe Holdings LLC 1,175 3,000
Neuberger Berman Global Opportunistic Bond Fund USD I Accumulating Class Neuberger Berman Group LLC 669 502,176
Neuberger Berman Global Opportunistic Bond Fund USD I Distributing Class Neuberger Berman Europe Holdings LLC 1,083 90,318
Neuberger Berman Multi-Asset Risk Premia Fund CHF A Accumulating Class Neuberger Berman Cayman Holdings Ltd - 3,026
Neuberger Berman Multi-Asset Risk Premia Fund CHF I Accumulating Class Neuberger Berman Cayman Holdings Ltd - 3,026
Neuberger Berman Multi-Asset Risk Premia Fund CHF I2 Accumulating Class Neuberger Berman Cayman Holdings Ltd - 3,026

FINANCIAL STATEMENTS NOTES TO THE AUDITED FINANCIAL STATEMENTS
1138 NEUBERGER BERMAN INVESTMENT FUNDS PLC
FOR THE YEAR ENDED 31 DECEMBER 2019
10. RELATED PARTY TRANSACTIONS (CONTINUED)
31 December 2019 31 December 2018 Portfolio Share Class Shareholder Number of Shares Number of Shares
Neuberger Berman Multi-Asset Risk Premia Fund EUR A Accumulating Class Neuberger Berman Cayman Holdings Ltd - 1,707
Neuberger Berman Multi-Asset Risk Premia Fund EUR I Accumulating Class Neuberger Berman Cayman Holdings Ltd - 1,710
Neuberger Berman Multi-Asset Risk Premia Fund EUR I2 Accumulating Class Neuberger Berman Cayman Holdings Ltd - 2,760
Neuberger Berman Multi-Asset Risk Premia Fund EUR M Accumulating Class Neuberger Berman Cayman Holdings Ltd - 1,006
Neuberger Berman Multi-Asset Risk Premia Fund EUR Z Accumulating Class Neuberger Berman Employee - 40,000
Neuberger Berman Multi-Asset Risk Premia Fund USD A Accumulating Class Neuberger Berman Cayman Holdings Ltd - 1,070
Neuberger Berman Multi-Asset Risk Premia Fund USD A Distributing Class Neuberger Berman Cayman Holdings Ltd - 1,000
Neuberger Berman Multi-Asset Risk Premia Fund USD I Distributing Class Neuberger Berman Cayman Holdings Ltd - 669,096
Neuberger Berman Multi-Asset Risk Premia Fund USD I2 Accumulating Class Neuberger Berman Cayman Holdings Ltd - 1,000
Neuberger Berman Multi-Asset Risk Premia Fund USD I2 Distributing Class Neuberger Berman Cayman Holdings Ltd - 1,000
Neuberger Berman Multi-Asset Risk Premia Fund USD M Accumulating Class Neuberger Berman Cayman Holdings Ltd - 1,111
Neuberger Berman Multi-Asset Risk Premia Fund USD Z Accumulating Class Neuberger Berman Employee - 9,481
Neuberger Berman Multi-Asset Class Income Fund EUR A Distributing Class Neuberger Berman Cayman Asia Holdings Ltd 2,675 -
Neuberger Berman Multi-Asset Class Income Fund EUR M Accumulating Class Neuberger Berman Europe Holdings LLC - 936
Neuberger Berman Multi-Asset Class Income Fund EUR M Distributing Class Neuberger Berman Europe Holdings LLC - 1,116
Neuberger Berman Multi-Asset Class Income Fund GBP I Accumulating Class Neuberger Berman Cayman Holdings Ltd 2,376 -
Neuberger Berman Multi-Asset Class Income Fund USD I Accumulating Class Neuberger Berman Cayman Asia Holdings Ltd 7,236 7,236
Neuberger Berman Multi-Asset Class Income Fund USD I Distributing Class Neuberger Berman Cayman Asia Holdings Ltd 298,235 1,184,135
Neuberger Berman Multi-Asset Class Income Fund USD M Accumulating Class Neuberger Berman Europe Holdings LLC - 1,525
Neuberger Berman US Equity Index PutWrite Fund EUR I Accumulating Class Neuberger Berman Europe Holdings LLC 2,132 2,132
Neuberger Berman US Equity Index PutWrite Fund EUR I4 Accumulating Class Neuberger Berman Europe Holdings LLC 1,111 1,111
Neuberger Berman US Equity Index PutWrite Fund EUR M Accumulating Class Neuberger Berman Europe Holdings LLC 1,143 1,143
Neuberger Berman US Equity Index PutWrite Fund GBP I Accumulating Unhedged Class Neuberger Berman Europe Holdings LLC 941 941
Neuberger Berman US Equity Index PutWrite Fund GBP I4 Accumulating Class Neuberger Berman Europe Holdings LLC 846 846
Neuberger Berman US Equity Index PutWrite Fund GBP I4 Distributing Class Neuberger Berman Europe Holdings LLC 787 787

NOTES TO THE AUDITED FINANCIAL STATEMENTS FINANCIAL STATEMENTS
ANNUAL REPORT 2019 1139
FOR THE YEAR ENDED 31 DECEMBER 2019
10. RELATED PARTY TRANSACTIONS (CONTINUED)
31 December 2019 31 December 2018 Portfolio Share Class Shareholder Number of Shares Number of Shares
Neuberger Berman US Equity Index PutWrite Fund SGD A (Monthly) Distributing Class Neuberger Berman Europe Holdings LLC 809 809
Neuberger Berman US Equity Index PutWrite Fund USD I Accumulating Class Neuberger Berman Group LLC 2,300 2,300
Neuberger Berman US Equity Index PutWrite Fund USD I Distributing Class Neuberger Berman Group LLC - 2,446
Neuberger Berman US Equity Index PutWrite Fund USD I4 Distributing Class Neuberger Berman Europe* 1,000 1,000
Neuberger Berman US Equity Index PutWrite Fund USD M Accumulating Class Neuberger Berman Europe Holdings LLC 1,134 1,134
Neuberger Berman US Equity Index PutWrite Fund USD P Accumulating Class Neuberger Berman Group LLC 997 -
Neuberger Berman US Equity Index PutWrite Fund USD Z Accumulating Class Neuberger Berman Employee 65,069 87,094
Neuberger Berman Global Equity Index PutWrite Fund AUD I5 (Monthly) Distributing Class Neuberger Berman Europe Holdings LLC - 1,326
Neuberger Berman Global Equity Index PutWrite Fund AUD I5 Accumulating Class Neuberger Berman Europe Holdings LLC - 1,326
Neuberger Berman Global Equity Index PutWrite Fund AUD X (Monthly) Distributing Class Neuberger Berman Europe Holdings LLC - 1,326
Neuberger Berman Global Equity Index PutWrite Fund AUD X Accumulating Class Neuberger Berman Europe Holdings LLC 1,326 1,326
Neuberger Berman Global Equity Index PutWrite Fund CHF I5 Distributing Class Neuberger Berman Europe Holdings LLC 116 116
Neuberger Berman Global Equity Index PutWrite Fund CHF X Accumulating Class Neuberger Berman Europe Holdings LLC 112 112
Neuberger Berman Global Equity Index PutWrite Fund CHF X Distributing Class Neuberger Berman Europe Holdings LLC 128 128
Neuberger Berman Global Equity Index PutWrite Fund EUR A Accumulating Class Neuberger Berman Europe Holdings LLC 1,129 1,129
Neuberger Berman Global Equity Index PutWrite Fund EUR I Accumulating Class Neuberger Berman Group LLC 2,786 -
Neuberger Berman Global Equity Index PutWrite Fund EUR I5 (Monthly) Distributing Class Neuberger Berman Europe Holdings LLC 892 892
Neuberger Berman Global Equity Index PutWrite Fund EUR M Accumulating Class Neuberger Berman Europe Holdings LLC 1,008 1,008
Neuberger Berman Global Equity Index PutWrite Fund EUR X (Monthly) Distributing Class Neuberger Berman Europe Holdings LLC 892 892
Neuberger Berman Global Equity Index PutWrite Fund EUR Z Accumulating Class Neuberger Berman Employee 28,543 28,846
Neuberger Berman Global Equity Index PutWrite Fund GBP I Accumulating Class Neuberger Berman Europe Holdings LLC 781 781
Neuberger Berman Global Equity Index PutWrite Fund GBP I5 Accumulating Class Neuberger Berman Europe Holdings LLC 90 90
Neuberger Berman Global Equity Index PutWrite Fund GBP I5 Distributing Class Neuberger Berman Europe Holdings LLC 88 88
Neuberger Berman Global Equity Index PutWrite Fund GBP X Accumulating Class Neuberger Berman Europe Holdings LLC - 86
Neuberger Berman Global Equity Index PutWrite Fund GBP X Distributing Class Neuberger Berman Europe Holdings LLC - 786

FINANCIAL STATEMENTS NOTES TO THE AUDITED FINANCIAL STATEMENTS
1140 NEUBERGER BERMAN INVESTMENT FUNDS PLC
FOR THE YEAR ENDED 31 DECEMBER 2019
10. RELATED PARTY TRANSACTIONS (CONTINUED)
31 December 2019 31 December 2018 Portfolio Share Class Shareholder Number of Shares Number of Shares
Neuberger Berman Global Equity Index PutWrite Fund HKD I5 (Monthly) Distributing Class Neuberger Berman Europe Holdings LLC - 7,798
Neuberger Berman Global Equity Index PutWrite Fund HKD I5 Accumulating Class Neuberger Berman Europe Holdings LLC - 7,798
Neuberger Berman Global Equity Index PutWrite Fund HKD X (Monthly) Distributing Class Neuberger Berman Europe Holdings LLC - 7,798
Neuberger Berman Global Equity Index PutWrite Fund HKD X Accumulating Class Neuberger Berman Europe Holdings LLC - 7,798
Neuberger Berman Global Equity Index PutWrite Fund SGD I5 (Monthly) Distributing Class Neuberger Berman Europe Holdings LLC - 691
Neuberger Berman Global Equity Index PutWrite Fund SGD I5 Accumulating Class Neuberger Berman Europe Holdings LLC 691 691
Neuberger Berman Global Equity Index PutWrite Fund SGD X Accumulating Class Neuberger Berman Group LLC 2,013 -
Neuberger Berman Global Equity Index PutWrite Fund USD A Accumulating Class Neuberger Berman Europe Holdings LLC 146 146
Neuberger Berman Global Equity Index PutWrite Fund USD I Accumulating Class Neuberger Berman Europe Holdings LLC 142 142
Neuberger Berman Global Equity Index PutWrite Fund USD I Distributing Class Neuberger Berman Europe Holdings LLC 2,500 2,500
Neuberger Berman Global Equity Index PutWrite Fund USD I5 (Monthly) Distributing Class Neuberger Berman Europe Holdings LLC 1,000 1,000
Neuberger Berman Global Equity Index PutWrite Fund USD X Distributing Class Neuberger Berman Europe Holdings LLC 1,000 1,000
Neuberger Berman Global Equity Index PutWrite Fund USD Z Accumulating Class Neuberger Berman Employee 196 196
Neuberger Berman Uncorrelated Strategies Fund EUR A Accumulating Class Neuberger Berman Europe Holdings LLC - 874
Neuberger Berman Uncorrelated Strategies Fund EUR M Accumulating Class Neuberger Berman Europe Holdings LLC - 1,608
Neuberger Berman Uncorrelated Strategies Fund GBP P Accumulating Class Neuberger Berman Europe Holdings LLC - 1,013
Neuberger Berman Uncorrelated Strategies Fund GBP Z Accumulating Class Neuberger Berman Employee 11,785 11,785
Neuberger Berman Uncorrelated Strategies Fund SGD A Accumulating Class Neuberger Berman** 2,061 2,061
Neuberger Berman Uncorrelated Strategies Fund USD A Accumulating Class Neuberger Berman Europe Holdings LLC - 1,012
Neuberger Berman Uncorrelated Strategies Fund USD I Accumulating Class Neuberger Berman Europe Holdings LLC - 1,088
Neuberger Berman Uncorrelated Strategies Fund USD M Accumulating Class Neuberger Berman Europe Holdings LLC - 1,166
Neuberger Berman Uncorrelated Strategies Fund USD Z Accumulating Class Neuberger Berman Employee 9,396 20,250 Neuberger Berman Emerging Market Debt Blend Investment Grade Fund NOK I Accumulating Class Neuberger Berman Europe Holdings LLC 808 808
Neuberger Berman Emerging Market Debt Blend Investment Grade Fund USD I Accumulating Class Neuberger Berman Europe Holdings LLC 3,000 3,000

NOTES TO THE AUDITED FINANCIAL STATEMENTS FINANCIAL STATEMENTS
ANNUAL REPORT 2019 1141
FOR THE YEAR ENDED 31 DECEMBER 2019
10. RELATED PARTY TRANSACTIONS (CONTINUED)
31 December 2019 31 December 2018 Portfolio Share Class Shareholder Number of Shares Number of Shares
Neuberger Berman Emerging Markets Sustainable Equity Fund EUR M Accumulating Unhedged Class Neuberger Berman Europe Holdings LLC 2,609 2,609
Neuberger Berman Emerging Markets Sustainable Equity Fund USD A Accumulating Class Neuberger Berman Europe Holdings LLC 1,000 1,000
Neuberger Berman Emerging Markets Sustainable Equity Fund USD I Accumulating Class Neuberger Berman Europe* 2,860 3,000
Neuberger Berman Emerging Markets Sustainable Equity Fund USD I Distributing Class Neuberger Berman Europe* 2,882 488,026
Neuberger Berman China Equity Opportunities Fund EUR M Accumulating Unhedged Class Neuberger Berman Europe Holdings LLC 2,609 2,609
Neuberger Berman China Equity Opportunities Fund USD I Accumulating Class Neuberger Berman Europe Holdings LLC 3,000 3,000
Neuberger Berman China Equity Opportunities Fund USD I Distributing Class Neuberger Berman Europe Holdings LLC 97,000 97,000
Neuberger Berman Multi-Asset Class Growth Fund EUR M Accumulating Class Neuberger Berman Cayman Holdings Ltd 2,738 -
Neuberger Berman Multi-Asset Class Growth Fund EUR M Accumulating Class Neuberger Berman Europe Holdings LLC - 2,609
Neuberger Berman Multi-Asset Class Growth Fund GBP I Accumulating Class Neuberger Berman Cayman Holdings Ltd 2,376 -
Neuberger Berman Multi-Asset Class Growth Fund USD I Accumulating Class Neuberger Berman Cayman Holdings Ltd 3,000 3,000
Neuberger Berman Multi-Asset Class Growth Fund USD I Distributing Class Neuberger Berman Cayman Holdings Ltd 1,926,436 1,997,000
Neuberger Berman Global Thematic Equity Fund1 EUR M Accumulating Unhedged Class Neuberger Berman Europe Holdings LLC 1,009 2,609
Neuberger Berman Global Thematic Equity Fund1 USD A Accumulating Class Neuberger Berman Europe Holdings LLC 1,000 1,000
Neuberger Berman Global Thematic Equity Fund1 USD C1 Accumulating Class Neuberger Berman Europe Holdings LLC 1,000 1,000
Neuberger Berman Global Thematic Equity Fund1 USD I Accumulating Class Neuberger Berman Europe Holdings LLC 1,000 1,000
Neuberger Berman Global Thematic Equity Fund1 USD I Distributing Class Neuberger Berman Europe Holdings LLC 1,063 397,050
Neuberger Berman Global Thematic Equity Fund1 USD M Accumulating Class Neuberger Berman Europe Holdings LLC 1,000 1,000
Neuberger Berman CLO Income Fund1 GBP Z Accumulating Class Neuberger Berman Cayman Holdings Ltd 2,285 -
Neuberger Berman CLO Income Fund1 USD Z Accumulating Class Neuberger Berman Employee 9,775 -
Neuberger Berman China A-Share Opportunities Fund1 USD I Accumulating Class Neuberger Berman Asia Holdings LLC - 3,000
Neuberger Berman China A-Share Opportunities Fund1 USD I Distributing Class Neuberger Berman Asia Holdings LLC - 97,000
Neuberger Berman Next Generation Mobility Fund1 AUD X Accumulating Class Neuberger Berman Asia Holdings LLC 4,204 -
Neuberger Berman Next Generation Mobility Fund1 EUR A Accumulating Class Neuberger Berman Europe Holdings LLC 1,000 1,000
Neuberger Berman Next Generation Mobility Fund1 EUR M Accumulating Unhedged Class Neuberger Berman Europe Holdings LLC 2,632 2,632

FINANCIAL STATEMENTS NOTES TO THE AUDITED FINANCIAL STATEMENTS
1142 NEUBERGER BERMAN INVESTMENT FUNDS PLC
FOR THE YEAR ENDED 31 DECEMBER 2019
10. RELATED PARTY TRANSACTIONS (CONTINUED)
31 December 2019 31 December 2018 Portfolio Share Class Shareholder Number of Shares Number of Shares
Neuberger Berman Next Generation Mobility Fund1 EUR X Accumulating Class Neuberger Berman Asia Holdings LLC 2,634 -
Neuberger Berman Next Generation Mobility Fund1 GBP I Accumulating Class Neuberger Berman Cayman Holdings Ltd 2,376 -
Neuberger Berman Next Generation Mobility Fund1 GBP X Accumulating Class Neuberger Berman Asia Holdings LLC 2,295 -
Neuberger Berman Next Generation Mobility Fund1 HKD X Accumulating Unhedged Class Neuberger Berman Asia Holdings LLC 23,537 -
Neuberger Berman Next Generation Mobility Fund1 SGD X Accumulating Class Neuberger Berman Asia Holdings LLC 2,039 -
Neuberger Berman Next Generation Mobility Fund1 USD C1 Accumulating Class Neuberger Berman Cayman Holdings Ltd 1,000 -
Neuberger Berman Next Generation Mobility Fund1 USD I Accumulating Class Neuberger Berman Asia Holdings LLC 3,000 3,000
Neuberger Berman Next Generation Mobility Fund1 USD I Distributing Class Neuberger Berman Asia Holdings LLC 2,986,496 247,000
Neuberger Berman Next Generation Mobility Fund1 USD M Accumulating Class Neuberger Berman Cayman Holdings Ltd 1,000 -
Neuberger Berman Next Generation Mobility Fund1 USD X Accumulating Class Neuberger Berman Asia Holdings LLC 3,000 -
Neuberger Berman Ultra Short Term Euro Bond Fund1 CHF U Accumulating Class Neuberger Berman Cayman Holdings Ltd 294 -
Neuberger Berman Ultra Short Term Euro Bond Fund1 EUR I Accumulating Class Neuberger Berman Europe Holdings LLC 122 3,000
Neuberger Berman Ultra Short Term Euro Bond Fund1 EUR I Distributing Class Neuberger Berman Europe Holdings LLC 119 97,000
Neuberger Berman Ultra Short Term Euro Bond Fund1 EUR I5 Accumulating Class Neuberger Berman Cayman Holdings Ltd 88 -
Neuberger Berman Ultra Short Term Euro Bond Fund1 EUR U Accumulating Class Neuberger Berman Cayman Holdings Ltd 269 -
Neuberger Berman Ultra Short Term Euro Bond Fund1 EUR Z Accumulating Class Neuberger Berman Employee 105 -
Neuberger Berman Ultra Short Term Euro Bond Fund1 EUR Z Accumulating Class Neuberger Berman Euro Bond Absolute Return Fund - 5,000
Neuberger Berman Ultra Short Term Euro Bond Fund1 EUR Z Accumulating Class Neuberger Berman Euro Opportunistic Bond Fund 9,974 -
Neuberger Berman Ultra Short Term Euro Bond Fund1 USD M Accumulating Class Neuberger Berman Cayman Holdings Ltd 297 -
Neuberger Berman Ultra Short Term Euro Bond Fund1 USD Z Accumulating Class Neuberger Berman Emerging Market Debt - Hard Currency Fund 150,000 -
Neuberger Berman Ultra Short Term Euro Bond Fund1 USD Z Accumulating Class Neuberger Berman Global Opportunistic Bond Fund 40,740 -
Neuberger Berman Ultra Short Term Euro Bond Fund1 USD Z Accumulating Class Neuberger Berman Short Duration Emerging Market Debt Fund 300,000 -
Neuberger Berman Ultra Short Term Euro Bond Fund1 USD Z Accumulating Class Neuberger Berman Strategic Income Fund 80,000 -
Neuberger Berman Euro Opportunistic Bond Fund1 EUR I Accumulating Class Neuberger Berman Europe Holdings LLC 3,000 3,000
Neuberger Berman Euro Opportunistic Bond Fund1 EUR I Distributing Class Neuberger Berman Europe Holdings LLC 978,926 497,000

NOTES TO THE AUDITED FINANCIAL STATEMENTS FINANCIAL STATEMENTS
ANNUAL REPORT 2019 1143
FOR THE YEAR ENDED 31 DECEMBER 2019
10. RELATED PARTY TRANSACTIONS (CONTINUED)
31 December 2019 31 December 2018 Portfolio Share Class Shareholder Number of Shares Number of Shares
Neuberger Berman Euro Bond Absolute Return Fund1 EUR I Accumulating Class Neuberger Berman Asia Holdings LLC 30,000 30,000
Neuberger Berman Euro Bond Absolute Return Fund1 EUR I Accumulating Class Neuberger Berman Europe Holdings LLC 28,155 -
Neuberger Berman Euro Bond Absolute Return Fund1 EUR I Accumulating Class Neuberger Berman Global Bond Absolute Return Fund 3,000 -
Neuberger Berman Euro Bond Absolute Return Fund1 EUR I Distributing Class Neuberger Berman Asia Holdings LLC 219,027 220,000
Neuberger Berman Euro Bond Absolute Return Fund1 EUR I Distributing Class Neuberger Berman Europe Holdings LLC 1,202,363 750,000
Neuberger Berman Euro Bond Absolute Return Fund1 USD Z Accumulating Class Neuberger Berman Global Bond Absolute Return Fund 196,546 -
Neuberger Berman Euro Bond Absolute Return Fund1 USD Z Accumulating Class Neuberger Berman Global Opportunistic Bond Fund 239,618 -
Neuberger Berman Euro Bond Absolute Return Fund1 USD Z Accumulating Class Neuberger Berman Strategic Income Fund 1,245,691 -
Neuberger Berman Absolute Alpha Fund2 EUR M Accumulating Unhedged Class Neuberger Berman Cayman Holdings Ltd 2,788 -
Neuberger Berman Absolute Alpha Fund2 GBP Z Accumulating Class Neuberger Berman Cayman Holdings Ltd 2,277 -
Neuberger Berman Absolute Alpha Fund2 SGD A Accumulating Class Neuberger Berman Cayman Holdings Ltd 2,069 -
Neuberger Berman Absolute Alpha Fund2 USD I Accumulating Class Neuberger Berman Cayman Holdings Ltd 1,000 -
Neuberger Berman Multi-Style Premia Fund2 USD I Accumulating Class Neuberger Berman Cayman Holdings Ltd 3,000 -
Neuberger Berman Multi-Style Premia Fund2 USD I Distributing Class Neuberger Berman Cayman Asia Holdings Ltd 911,174 -
Neuberger Berman Multi-Style Premia Fund2 USD I Distributing Class Neuberger Berman Cayman Holdings Ltd 197,000 -
Neubeger Berman Macro Opportunities FX Fund2 EUR I Accumulating Class Neuberger Berman Asia Holdings LLC 1,000 -
Neubeger Berman Macro Opportunities FX Fund2 GBP Z Accumulating Class Neuberger Berman Employee 996 -
Neubeger Berman Macro Opportunities FX Fund2 SEK I Accumulating Class Neuberger Berman Cayman Holdings Ltd 2,830 -
Neubeger Berman Macro Opportunities FX Fund2 SEK I Distributing Class Neuberger Berman Cayman Holdings Ltd 2,830 -
Neubeger Berman Macro Opportunities FX Fund2 USD I Accumulating Class Neuberger Berman Asia Holdings LLC 3,000 - * Shares were held by Neuberger Berman Europe Holdings LLC at the year ended 31 December 2019 (31 December 2018: Neuberger Berman Europe Ltd). ** Shares were held by Neuberger Berman Cayman Holdings Ltd at the year ended 31 December 2019 (31 December 2018: Neuberger Berman Europe Ltd).
1 Portfolio launched during the prior reporting year. 2 Portfolio launched during the current reporting year.

FINANCIAL STATEMENTS NOTES TO THE AUDITED FINANCIAL STATEMENTS
1144 NEUBERGER BERMAN INVESTMENT FUNDS PLC
FOR THE YEAR ENDED 31 DECEMBER 2019
11. NET GAIN/(LOSS) ON FINANCIAL ASSETS AND LIABILITIES AT FAIR VALUE THROUGH PROFIT OR LOSS
Fair Value of Investments
Neuberger Berman High Yield Bond Fund
Neuberger Berman Diversified Currency Fund
31 December 2019 31 December 2018 31 December 2019 31 December 2018
US$ US$ US$ US$
Realised and Unrealised Gains/(Losses) on Investments
Net realised Gain/(Loss) on Investments (142,255,920) (128,489,884) 852,791 (82,108)
Net realised Currency Gain/(Loss) (13,258,823) (244,636) (76) 486,446
(155,514,743) (128,734,520) 852,715 404,338
Change in Unrealised Gain/(Loss) on Investments 449,003,261 (410,616,903) (143,667) 169,906
Change in Unrealised Currency Gain/(Loss) 14,400,771 (5,280,218) 10 (199,091)
463,404,032 (415,897,121) (143,657) (29,185)
Net Gain/(Loss) on Financial Assets and Liabilities at Fair Value through Profit or Loss 307,889,289 (544,631,641) 709,058 375,153
The total recognised gains/(losses) arose solely from continuing operations.

NOTES TO THE AUDITED FINANCIAL STATEMENTS FINANCIAL STATEMENTS
ANNUAL REPORT 2019 1145
FOR THE YEAR ENDED 31 DECEMBER 2019
11. NET GAIN/(LOSS) ON FINANCIAL ASSETS AND LIABILITIES AT FAIR VALUE THROUGH PROFIT OR LOSS (CONTINUED)
Fair Value of Investments (continued)
Neuberger Berman US Multi Cap Opportunities Fund
Neuberger Berman US Real Estate Securities Fund
31 December 2019 31 December 2018 31 December 2019 31 December 2018
US$ US$ US$ US$
Realised and Unrealised Gains/(Losses) on Investments
Net realised Gain/(Loss) on Investments 140,663,648 99,709,585 10,101,657 87,248
Net realised Currency Gain/(Loss) (4,948) (13,505) (4,336) (411)
140,658,700 99,696,080 10,097,321 86,837
Change in Unrealised Gain/(Loss) on Investments 57,276,593 (156,245,018) 15,741,713 (12,333,365)
Change in Unrealised Currency Gain/(Loss) (102) 29 216 (15)
57,276,491 (156,244,989) 15,741,929 (12,333,380)
Net Gain/(Loss) on Financial Assets and Liabilities at Fair Value through Profit or Loss 197,935,191 (56,548,909) 25,839,250 (12,246,543)
The total recognised gains/(losses) arose solely from continuing operations.

FINANCIAL STATEMENTS NOTES TO THE AUDITED FINANCIAL STATEMENTS
1146 NEUBERGER BERMAN INVESTMENT FUNDS PLC
FOR THE YEAR ENDED 31 DECEMBER 2019
11. NET GAIN/(LOSS) ON FINANCIAL ASSETS AND LIABILITIES AT FAIR VALUE THROUGH PROFIT OR LOSS (CONTINUED)
Fair Value of Investments (continued)
Neuberger Berman China Equity Fund
Neuberger Berman Emerging Markets Equity Fund
31 December 2019 31 December 2018 31 December 2019 31 December 2018
US$ US$ US$ US$
Realised and Unrealised Gains/(Losses) on Investments
Net realised Gain/(Loss) on Investments 46,050,367 177,388,456 19,818,795 11,925,550
Net realised Currency Gain/(Loss) (3,686,531) (126,335) (10,264,358) (5,041,022)
42,363,836 177,262,121 9,554,437 6,884,528
Change in Unrealised Gain/(Loss) on Investments 186,986,495 (388,784,081) 51,228,251 (104,225,083)
Change in Unrealised Currency Gain/(Loss) 5,291,576 (11,431,885) 9,211,540 (15,924,025)
192,278,071 (400,215,966) 60,439,791 (120,149,108)
Net Gain/(Loss) on Financial Assets and Liabilities at Fair Value through Profit or Loss 234,641,907 (222,953,845) 69,994,228 (113,264,580)
The total recognised gains/(losses) arose solely from continuing operations.
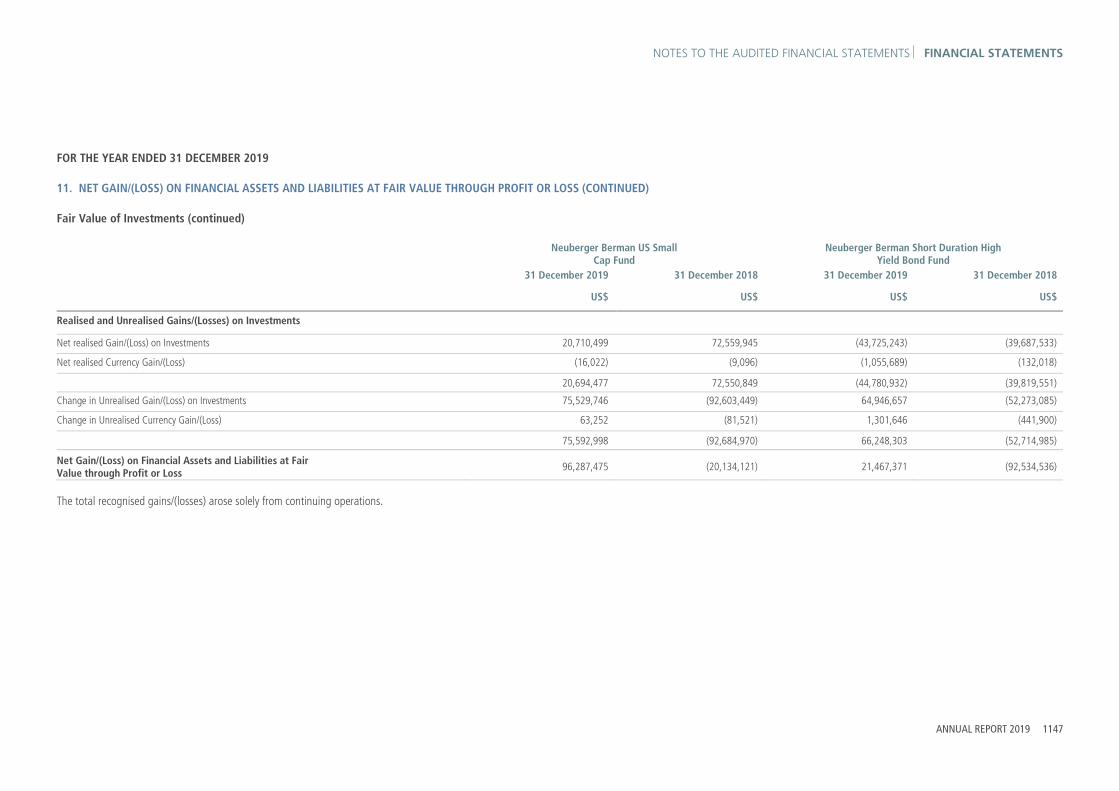
NOTES TO THE AUDITED FINANCIAL STATEMENTS FINANCIAL STATEMENTS
ANNUAL REPORT 2019 1147
FOR THE YEAR ENDED 31 DECEMBER 2019
11. NET GAIN/(LOSS) ON FINANCIAL ASSETS AND LIABILITIES AT FAIR VALUE THROUGH PROFIT OR LOSS (CONTINUED)
Fair Value of Investments (continued)
Neuberger Berman US Small Cap Fund
Neuberger Berman Short Duration High Yield Bond Fund
31 December 2019 31 December 2018 31 December 2019 31 December 2018
US$ US$ US$ US$
Realised and Unrealised Gains/(Losses) on Investments
Net realised Gain/(Loss) on Investments 20,710,499 72,559,945 (43,725,243) (39,687,533)
Net realised Currency Gain/(Loss) (16,022) (9,096) (1,055,689) (132,018)
20,694,477 72,550,849 (44,780,932) (39,819,551)
Change in Unrealised Gain/(Loss) on Investments 75,529,746 (92,603,449) 64,946,657 (52,273,085)
Change in Unrealised Currency Gain/(Loss) 63,252 (81,521) 1,301,646 (441,900)
75,592,998 (92,684,970) 66,248,303 (52,714,985)
Net Gain/(Loss) on Financial Assets and Liabilities at Fair Value through Profit or Loss 96,287,475 (20,134,121) 21,467,371 (92,534,536)
The total recognised gains/(losses) arose solely from continuing operations.

FINANCIAL STATEMENTS NOTES TO THE AUDITED FINANCIAL STATEMENTS
1148 NEUBERGER BERMAN INVESTMENT FUNDS PLC
FOR THE YEAR ENDED 31 DECEMBER 2019
11. NET GAIN/(LOSS) ON FINANCIAL ASSETS AND LIABILITIES AT FAIR VALUE THROUGH PROFIT OR LOSS (CONTINUED)
Fair Value of Investments (continued)
Neuberger Berman Global Bond Fund
Neuberger Berman Emerging Market Debt - Local Currency Fund
31 December 2019 31 December 2018 31 December 2019 31 December 2018
US$ US$ US$ US$
Realised and Unrealised Gains/(Losses) on Investments
Net realised Gain/(Loss) on Investments 2,330,018 (1,954,172) (10,449,967) (98,540,746)
Net realised Currency Gain/(Loss) (768,396) 79,752 (111,158,128) (109,741,279)
1,561,622 (1,874,420) (121,608,095) (208,282,025)
Change in Unrealised Gain/(Loss) on Investments 5,386,814 (1,701,899) 201,979,932 (67,415,784)
Change in Unrealised Currency Gain/(Loss) 1,226,980 (3,245,396) 141,851,155 (208,439,947)
6,613,794 (4,947,295) 343,831,087 (275,855,731)
Net Gain/(Loss) on Financial Assets and Liabilities at Fair Value through Profit or Loss 8,175,416 (6,821,715) 222,222,992 (484,137,756)
The total recognised gains/(losses) arose solely from continuing operations.

NOTES TO THE AUDITED FINANCIAL STATEMENTS FINANCIAL STATEMENTS
ANNUAL REPORT 2019 1149
FOR THE YEAR ENDED 31 DECEMBER 2019
11. NET GAIN/(LOSS) ON FINANCIAL ASSETS AND LIABILITIES AT FAIR VALUE THROUGH PROFIT OR LOSS (CONTINUED)
Fair Value of Investments (continued)
Neuberger Berman Emerging Market Debt -Hard Currency Fund
Neuberger Berman Emerging Market Corporate Debt Fund
31 December 2019 31 December 2018 31 December 2019 31 December 2018
US$ US$ US$ US$
Realised and Unrealised Gains/(Losses) on Investments
Net realised Gain/(Loss) on Investments (28,179,262) (50,484,995) (5,878,695) (8,887,434)
Net realised Currency Gain/(Loss) (4,178,987) 5,838,560 (14,566) 93,071
(32,358,249) (44,646,435) (5,893,261) (8,794,363)
Change in Unrealised Gain/(Loss) on Investments 165,500,812 (129,914,966) 13,630,403 (9,631,502)
Change in Unrealised Currency Gain/(Loss) 334,362 (14,250,379) (23,241) (109,690)
165,835,174 (144,165,345) 13,607,162 (9,741,192)
Net Gain/(Loss) on Financial Assets and Liabilities at Fair Value through Profit or Loss 133,476,925 (188,811,780) 7,713,901 (18,535,555)
The total recognised gains/(losses) arose solely from continuing operations.

FINANCIAL STATEMENTS NOTES TO THE AUDITED FINANCIAL STATEMENTS
1150 NEUBERGER BERMAN INVESTMENT FUNDS PLC
FOR THE YEAR ENDED 31 DECEMBER 2019
11. NET GAIN/(LOSS) ON FINANCIAL ASSETS AND LIABILITIES AT FAIR VALUE THROUGH PROFIT OR LOSS (CONTINUED)
Fair Value of Investments (continued)
Neuberger Berman Strategic Income Fund
Neuberger Berman Global Bond Absolute Return Fund
31 December 2019 31 December 2018 31 December 2019 31 December 2018
US$ US$ US$ US$
Realised and Unrealised Gains/(Losses) on Investments
Net realised Gain/(Loss) on Investments (555,108) (17,999,771) (6,769,233) 868,679
Net realised Currency Gain/(Loss) (7,080,530) (833,510) (1,394,206) 285,115
(7,635,638) (18,833,281) (8,163,439) 1,153,794
Change in Unrealised Gain/(Loss) on Investments 62,719,513 (46,712,263) 7,654,939 (8,551,186)
Change in Unrealised Currency Gain/(Loss) 4,638,293 (4,336,782) 2,415,801 (2,781,435)
67,357,806 (51,049,045) 10,070,740 (11,332,621)
Net Gain/(Loss) on Financial Assets and Liabilities at Fair Value through Profit or Loss 59,722,168 (69,882,326) 1,907,301 (10,178,827)
The total recognised gains/(losses) arose solely from continuing operations.

NOTES TO THE AUDITED FINANCIAL STATEMENTS FINANCIAL STATEMENTS
ANNUAL REPORT 2019 1151
FOR THE YEAR ENDED 31 DECEMBER 2019
11. NET GAIN/(LOSS) ON FINANCIAL ASSETS AND LIABILITIES AT FAIR VALUE THROUGH PROFIT OR LOSS (CONTINUED)
Fair Value of Investments (continued)
Neuberger Berman Short Duration Emerging Market Debt Fund1
Neuberger Berman Absolute Return Multi Strategy Fund1
31 December 2019 31 December 2018 31 December 2019 31 December 2018
US$ US$ US$ US$
Realised and Unrealised Gains/(Losses) on Investments
Net realised Gain/(Loss) on Investments (162,094,846) (196,375,689) 2,807,154 435,183
Net realised Currency Gain/(Loss) (57,316) (46,884) (76,536) 104,545
(162,152,162) (196,422,573) 2,730,618 539,728
Change in Unrealised Gain/(Loss) on Investments 214,695,956 (94,487,514) 1,471,170 (4,132,211)
Change in Unrealised Currency Gain/(Loss) 875,314 (12,336) 203,640 (381,358)
215,571,270 (94,499,850) 1,674,810 (4,513,569)
Net Gain/(Loss) on Financial Assets and Liabilities at Fair Value through Profit or Loss 53,419,108 (290,922,423) 4,405,428 (3,973,841)
The total recognised gains/(losses) arose solely from continuing operations.

FINANCIAL STATEMENTS NOTES TO THE AUDITED FINANCIAL STATEMENTS
1152 NEUBERGER BERMAN INVESTMENT FUNDS PLC
FOR THE YEAR ENDED 31 DECEMBER 2019
11. NET GAIN/(LOSS) ON FINANCIAL ASSETS AND LIABILITIES AT FAIR VALUE THROUGH PROFIT OR LOSS (CONTINUED)
Fair Value of Investments (continued)
Neuberger Berman US Long Short Equity Fund
Neuberger Berman Emerging Market Debt Blend Fund
31 December 2019 31 December 2018 31 December 2019 31 December 2018
US$ US$ US$ US$
Realised and Unrealised Gains/(Losses) on Investments
Net realised Gain/(Loss) on Investments (5,850,762) 9,135,006 (16,970,251) (48,609,701)
Net realised Currency Gain/(Loss) (20,851) (650) (40,196,946) (28,130,233)
(5,871,613) 9,134,356 (57,167,197) (76,739,934)
Change in Unrealised Gain/(Loss) on Investments 29,154,944 (30,694,811) 130,601,362 (99,073,677)
Change in Unrealised Currency Gain/(Loss) 8,182 6,481 47,917,964 (80,037,791)
29,163,126 (30,688,330) 178,519,326 (179,111,468)
Net Gain/(Loss) on Financial Assets and Liabilities at Fair Value through Profit or Loss 23,291,513 (21,553,974) 121,352,129 (255,851,402)
The total recognised gains/(losses) arose solely from continuing operations.

NOTES TO THE AUDITED FINANCIAL STATEMENTS FINANCIAL STATEMENTS
ANNUAL REPORT 2019 1153
FOR THE YEAR ENDED 31 DECEMBER 2019
11. NET GAIN/(LOSS) ON FINANCIAL ASSETS AND LIABILITIES AT FAIR VALUE THROUGH PROFIT OR LOSS (CONTINUED)
Fair Value of Investments (continued)
Neuberger Berman European High Yield Bond Fund
Neuberger Berman Global Equity Fund
31 December 2019 31 December 2018 31 December 2019 31 December 2018
EUR EUR US$ US$
Realised and Unrealised Gains/(Losses) on Investments
Net realised Gain/(Loss) on Investments 1,946,103 859,533 79,184 45,702
Net realised Currency Gain/(Loss) (17,901) (131,595) (6,488) (5,708)
1,928,202 727,938 72,696 39,994
Change in Unrealised Gain/(Loss) on Investments 821,238 (856,988) 227,461 (175,224)
Change in Unrealised Currency Gain/(Loss) 323,653 82,895 12,903 (12,839)
1,144,891 (774,093) 240,364 (188,063)
Net Gain/(Loss) on Financial Assets and Liabilities at Fair Value through Profit or Loss 3,073,093 (46,155) 313,060 (148,069)
The total recognised gains/(losses) arose solely from continuing operations.

FINANCIAL STATEMENTS NOTES TO THE AUDITED FINANCIAL STATEMENTS
1154 NEUBERGER BERMAN INVESTMENT FUNDS PLC
FOR THE YEAR ENDED 31 DECEMBER 2019
11. NET GAIN/(LOSS) ON FINANCIAL ASSETS AND LIABILITIES AT FAIR VALUE THROUGH PROFIT OR LOSS (CONTINUED)
Fair Value of Investments (continued)
Neuberger Berman Systematic Global Equity Fund
Neuberger Berman Global Real Estate Securities Fund
31 December 2019 31 December 2018 31 December 2019 31 December 2018
US$ US$ US$ US$
Realised and Unrealised Gains/(Losses) on Investments
Net realised Gain/(Loss) on Investments 473,766 664,124 357,297 2,317,964
Net realised Currency Gain/(Loss) (210,885) (80,826) (113,415) (16,887)
262,881 583,298 243,882 2,301,077
Change in Unrealised Gain/(Loss) on Investments 3,917,770 (3,231,125) 948,830 (2,400,122)
Change in Unrealised Currency Gain/(Loss) 300,629 (409,259) 687,333 (346,933)
4,218,399 (3,640,384) 1,636,163 (2,747,055)
Net Gain/(Loss) on Financial Assets and Liabilities at Fair Value through Profit or Loss 4,481,280 (3,057,086) 1,880,045 (445,978)
The total recognised gains/(losses) arose solely from continuing operations.

NOTES TO THE AUDITED FINANCIAL STATEMENTS FINANCIAL STATEMENTS
ANNUAL REPORT 2019 1155
FOR THE YEAR ENDED 31 DECEMBER 2019
11. NET GAIN/(LOSS) ON FINANCIAL ASSETS AND LIABILITIES AT FAIR VALUE THROUGH PROFIT OR LOSS (CONTINUED)
Fair Value of Investments (continued)
Neuberger Berman US Small Cap Intrinsic Value Fund
Neuberger Berman Global Credit Long Short Fund*
31 December 2019 31 December 2018 31 December 2019 31 December 2018
US$ US$ US$ US$
Realised and Unrealised Gains/(Losses) on Investments
Net realised Gain/(Loss) on Investments 6,808,291 9,238,780 – (1,137,530)
Net realised Currency Gain/(Loss) 161 4 – (21,699)
6,808,452 9,238,784 – (1,159,229)
Change in Unrealised Gain/(Loss) on Investments 14,223,451 (16,419,759) – (215,027)
Change in Unrealised Currency Gain/(Loss) (6) – – (1,450)
14,223,445 (16,419,759) – (216,477)
Net Gain/(Loss) on Financial Assets and Liabilities at Fair Value through Profit or Loss 21,031,897 (7,180,975) – (1,375,706)
* Portfolio liquidated on 26 November 2018. The total recognised gains/(losses) arose solely from discontinued operations. The total recognised gains/(losses) arose solely from continuing operations.

FINANCIAL STATEMENTS NOTES TO THE AUDITED FINANCIAL STATEMENTS
1156 NEUBERGER BERMAN INVESTMENT FUNDS PLC
FOR THE YEAR ENDED 31 DECEMBER 2019
11. NET GAIN/(LOSS) ON FINANCIAL ASSETS AND LIABILITIES AT FAIR VALUE THROUGH PROFIT OR LOSS (CONTINUED)
Fair Value of Investments (continued)
Neuberger Berman Asian Debt -Hard Currency Fund
Neuberger Berman China Bond Fund
31 December 2019 31 December 2018 31 December 2019 31 December 2018
US$ US$ CNY CNY
Realised and Unrealised Gains/(Losses) on Investments
Net realised Gain/(Loss) on Investments 172,496 (311,943) 15,082,062 (4,032,501)
Net realised Currency Gain/(Loss) (45,817) 15,050 585,002 (337,662)
126,679 (296,893) 15,667,064 (4,370,163)
Change in Unrealised Gain/(Loss) on Investments 1,268,937 (682,277) (6,203,260) 6,637,504
Change in Unrealised Currency Gain/(Loss) 53,579 (63,166) (1,690,104) 468,773
1,322,516 (745,443) (7,893,364) 7,106,277
Net Gain/(Loss) on Financial Assets and Liabilities at Fair Value through Profit or Loss 1,449,195 (1,042,336) 7,773,700 2,736,114
The total recognised gains/(losses) arose solely from continuing operations.

NOTES TO THE AUDITED FINANCIAL STATEMENTS FINANCIAL STATEMENTS
ANNUAL REPORT 2019 1157
FOR THE YEAR ENDED 31 DECEMBER 2019
11. NET GAIN/(LOSS) ON FINANCIAL ASSETS AND LIABILITIES AT FAIR VALUE THROUGH PROFIT OR LOSS (CONTINUED)
Fair Value of Investments (continued)
Neuberger Berman Global Dynamic Asset Allocator Fund*
Neuberger Berman Asian Opportunities Fund**
31 December 2019 31 December 2018 31 December 2019 31 December 2018
US$ US$ US$ US$
Realised and Unrealised Gains/(Losses) on Investments
Net realised Gain/(Loss) on Investments (607,957) (29,300) (361,965) (1,364,526)
Net realised Currency Gain/(Loss) (296,833) 373,243 (148,521) (384,938)
(904,790) 343,943 (510,486) (1,749,464)
Change in Unrealised Gain/(Loss) on Investments 1,027,564 (1,361,886) 545,197 (1,998,854)
Change in Unrealised Currency Gain/(Loss) 324,444 (925,050) 47,818 (136,641)
1,352,008 (2,286,936) 593,015 (2,135,495)
Net Gain/(Loss) on Financial Assets and Liabilities at Fair Value through Profit or Loss 447,218 (1,942,993) 82,529 (3,884,959)
* Portfolio liquidated on 12 April 2019. The total recognised gains/(losses) arose solely from discontinued operations. ** Portfolio liquidated on 24 July 2019. The total recognised gains/(losses) arose solely from discontinued operations.

FINANCIAL STATEMENTS NOTES TO THE AUDITED FINANCIAL STATEMENTS
1158 NEUBERGER BERMAN INVESTMENT FUNDS PLC
FOR THE YEAR ENDED 31 DECEMBER 2019
11. NET GAIN/(LOSS) ON FINANCIAL ASSETS AND LIABILITIES AT FAIR VALUE THROUGH PROFIT OR LOSS (CONTINUED)
Fair Value of Investments (continued)
Neuberger Berman Corporate Hybrid Bond Fund
Neuberger Berman US Equity Fund
31 December 2019 31 December 2018 31 December 2019 31 December 2018
EUR EUR US$ US$
Realised and Unrealised Gains/(Losses) on Investments
Net realised Gain/(Loss) on Investments (15,900,477) (10,343,659) 221,333 288,506
Net realised Currency Gain/(Loss) 3,975,540 (2,659,805) (507) (325)
(11,924,937) (13,003,464) 220,826 288,181
Change in Unrealised Gain/(Loss) on Investments 80,092,855 (70,416,772) 1,094,408 (580,085)
Change in Unrealised Currency Gain/(Loss) 9,818,929 9,266,118 3 –
89,911,784 (61,150,654) 1,094,411 (580,085)
Net Gain/(Loss) on Financial Assets and Liabilities at Fair Value through Profit or Loss 77,986,847 (74,154,118) 1,315,237 (291,904)
The total recognised gains/(losses) arose solely from continuing operations.

NOTES TO THE AUDITED FINANCIAL STATEMENTS FINANCIAL STATEMENTS
ANNUAL REPORT 2019 1159
FOR THE YEAR ENDED 31 DECEMBER 2019
11. NET GAIN/(LOSS) ON FINANCIAL ASSETS AND LIABILITIES AT FAIR VALUE THROUGH PROFIT OR LOSS (CONTINUED)
Fair Value of Investments (continued)
Neuberger Berman Global High Yield Bond Fund
Neuberger Berman Global Opportunistic Bond Fund
31 December 2019 31 December 2018 31 December 2019 31 December 2018
US$ US$ US$ US$
Realised and Unrealised Gains/(Losses) on Investments
Net realised Gain/(Loss) on Investments (2,383,317) (5,815,977) 2,112,504 2,008,588
Net realised Currency Gain/(Loss) (477,859) 624,802 (1,670,011) 129,954
(2,861,176) (5,191,175) 442,493 2,138,542
Change in Unrealised Gain/(Loss) on Investments 6,368,789 (4,578,915) 5,128,925 (2,623,145)
Change in Unrealised Currency Gain/(Loss) 448,803 (1,717,114) 2,161,296 (2,503,118)
6,817,592 (6,296,029) 7,290,221 (5,126,263)
Net Gain/(Loss) on Financial Assets and Liabilities at Fair Value through Profit or Loss 3,956,416 (11,487,204) 7,732,714 (2,987,721)
The total recognised gains/(losses) arose solely from continuing operations.

FINANCIAL STATEMENTS NOTES TO THE AUDITED FINANCIAL STATEMENTS
1160 NEUBERGER BERMAN INVESTMENT FUNDS PLC
FOR THE YEAR ENDED 31 DECEMBER 2019
11. NET GAIN/(LOSS) ON FINANCIAL ASSETS AND LIABILITIES AT FAIR VALUE THROUGH PROFIT OR LOSS (CONTINUED)
Fair Value of Investments (continued)
Neuberger Berman Multi-Asset Risk Premia Fund*
Neuberger Berman Multi-Asset Class Income Fund
31 December 2019 31 December 2018 31 December 2019 31 December 2018
US$ US$ US$ US$
Realised and Unrealised Gains/(Losses) on Investments
Net realised Gain/(Loss) on Investments 1,961,280 (9,324,682) 1,502,447 (1,178,017)
Net realised Currency Gain/(Loss) (18,688) 1,997,036 (306,038) (116,514)
1,942,592 (7,327,646) 1,196,409 (1,294,531)
Change in Unrealised Gain/(Loss) on Investments (1,249,669) 1,234,527 3,960,122 (2,105,952)
Change in Unrealised Currency Gain/(Loss) 15 (682,786) 593,476 (380,736)
(1,249,654) 551,741 4,553,598 (2,486,688)
Net Gain/(Loss) on Financial Assets and Liabilities at Fair Value through Profit or Loss 692,938 (6,775,905) 5,750,007 (3,781,219)
* Portfolio liquidated on 26 March 2019. The total recognised gains/(losses) arose solely from discontinued operations. The total recognised gains/(losses) arose solely from continuing operations.

NOTES TO THE AUDITED FINANCIAL STATEMENTS FINANCIAL STATEMENTS
ANNUAL REPORT 2019 1161
FOR THE YEAR ENDED 31 DECEMBER 2019
11. NET GAIN/(LOSS) ON FINANCIAL ASSETS AND LIABILITIES AT FAIR VALUE THROUGH PROFIT OR LOSS (CONTINUED)
Fair Value of Investments (continued)
Neuberger Berman US Equity Index PutWrite Fund
Neuberger Berman Global Equity Index PutWrite Fund
31 December 2019 31 December 2018 31 December 2019 31 December 2018
US$ US$ US$ US$
Realised and Unrealised Gains/(Losses) on Investments
Net realised Gain/(Loss) on Investments 65,156,730 (51,656,016) 6,730,547 (14,409,802)
Net realised Currency Gain/(Loss) (813) 4,204 (3,261) 357
65,155,917 (51,651,812) 6,727,286 (14,409,445)
Change in Unrealised Gain/(Loss) on Investments 1,570,168 6,725,912 686,356 (304,534)
Change in Unrealised Currency Gain/(Loss) 101 (318) – (178)
1,570,269 6,725,594 686,356 (304,712)
Net Gain/(Loss) on Financial Assets and Liabilities at Fair Value through Profit or Loss 66,726,186 (44,926,218) 7,413,642 (14,714,157)
The total recognised gains/(losses) arose solely from continuing operations.

FINANCIAL STATEMENTS NOTES TO THE AUDITED FINANCIAL STATEMENTS
1162 NEUBERGER BERMAN INVESTMENT FUNDS PLC
FOR THE YEAR ENDED 31 DECEMBER 2019
11. NET GAIN/(LOSS) ON FINANCIAL ASSETS AND LIABILITIES AT FAIR VALUE THROUGH PROFIT OR LOSS (CONTINUED)
Fair Value of Investments (continued)
Neuberger Berman Uncorrelated Strategies Fund
Neuberger Berman Emerging Market Debt Blend Investment Grade Fund
31 December 2019 31 December 2018 31 December 2019 31 December 2018
US$ US$ US$ US$
Realised and Unrealised Gains/(Losses) on Investments
Net realised Gain/(Loss) on Investments 3,634,903 (26,070,594) 470,351 (115,161)
Net realised Currency Gain/(Loss) 404,876 484,801 (142,670) 19,669
4,039,779 (25,585,793) 327,681 (95,492)
Change in Unrealised Gain/(Loss) on Investments 56,450,962 (10,093,977) 1,416,640 (756,209)
Change in Unrealised Currency Gain/(Loss) (357,211) (310,323) 207,116 (266,454)
56,093,751 (10,404,300) 1,623,756 (1,022,663)
Net Gain/(Loss) on Financial Assets and Liabilities at Fair Value through Profit or Loss 60,133,530 (35,990,093) 1,951,437 (1,118,155)
The total recognised gains/(losses) arose solely from continuing operations.

NOTES TO THE AUDITED FINANCIAL STATEMENTS FINANCIAL STATEMENTS
ANNUAL REPORT 2019 1163
FOR THE YEAR ENDED 31 DECEMBER 2019
11. NET GAIN/(LOSS) ON FINANCIAL ASSETS AND LIABILITIES AT FAIR VALUE THROUGH PROFIT OR LOSS (CONTINUED)
Fair Value of Investments (continued)
Neuberger Berman Emerging Markets Sustainable Equity Fund
Neuberger Berman China Equity Opportunities Fund
31 December 2019 31 December 2018 31 December 2019 31 December 2018
US$ US$ US$ US$
Realised and Unrealised Gains/(Losses) on Investments
Net realised Gain/(Loss) on Investments (1,068,624) (893,900) 45,877 (70,539)
Net realised Currency Gain/(Loss) (318,148) (241,887) (12,051) (2,908)
(1,386,772) (1,135,787) 33,826 (73,447)
Change in Unrealised Gain/(Loss) on Investments 11,013,571 (3,999,389) 202,878 (209,182)
Change in Unrealised Currency Gain/(Loss) 1,106,432 (1,092,172) 12,478 (12,625)
12,120,003 (5,091,561) 215,356 (221,807)
Net Gain/(Loss) on Financial Assets and Liabilities at Fair Value through Profit or Loss 10,733,231 (6,227,348) 249,182 (295,254)
The total recognised gains/(losses) arose solely from continuing operations.

FINANCIAL STATEMENTS NOTES TO THE AUDITED FINANCIAL STATEMENTS
1164 NEUBERGER BERMAN INVESTMENT FUNDS PLC
FOR THE YEAR ENDED 31 DECEMBER 2019
11. NET GAIN/(LOSS) ON FINANCIAL ASSETS AND LIABILITIES AT FAIR VALUE THROUGH PROFIT OR LOSS (CONTINUED)
Fair Value of Investments (continued)
Neuberger Berman Multi-Asset Class Growth Fund
Neuberger Berman Global Thematic Equity Fund1
31 December 2019 31 December 2018 31 December 2019 31 December 2018
US$ US$ US$ US$
Realised and Unrealised Gains/(Losses) on Investments
Net realised Gain/(Loss) on Investments (75,092) (614,856) (247,804) (126,481)
Net realised Currency Gain/(Loss) (177,369) (96,473) (17,084) (254)
(252,461) (711,329) (264,888) (126,735)
Change in Unrealised Gain/(Loss) on Investments 1,459,796 (802,400) 4,803,892 (1,794,177)
Change in Unrealised Currency Gain/(Loss) 161,197 (205,571) 41,194 (30,974)
1,620,993 (1,007,971) 4,845,086 (1,825,151)
Net Gain/(Loss) on Financial Assets and Liabilities at Fair Value through Profit or Loss 1,368,532 (1,719,300) 4,580,198 (1,951,886)
The total recognised gains/(losses) arose solely from continuing operations.

NOTES TO THE AUDITED FINANCIAL STATEMENTS FINANCIAL STATEMENTS
ANNUAL REPORT 2019 1165
FOR THE YEAR ENDED 31 DECEMBER 2019
11. NET GAIN/(LOSS) ON FINANCIAL ASSETS AND LIABILITIES AT FAIR VALUE THROUGH PROFIT OR LOSS (CONTINUED)
Fair Value of Investments (continued)
Neuberger Berman CLO Income Fund1
Neuberger Berman China A-Share Opportunities Fund*1
31 December 2019 31 December 2018 31 December 2019 31 December 2018
US$ US$ US$ US$
Realised and Unrealised Gains/(Losses) on Investments
Net realised Gain/(Loss) on Investments (9,738,939) (1,445,054) 78,696 (70,609)
Net realised Currency Gain/(Loss) 3,523 49,009 (22,491) (10,291)
(9,735,416) (1,396,045) 56,205 (80,900)
Change in Unrealised Gain/(Loss) on Investments 13,791,764 (13,170,446) 111,367 (111,367)
Change in Unrealised Currency Gain/(Loss) (157,242) (140,116) 4,178 (4,178)
13,634,522 (13,310,562) 115,545 (115,545)
Net Gain/(Loss) on Financial Assets and Liabilities at Fair Value through Profit or Loss 3,899,106 (14,706,607) 171,750 (196,445)
* Portfolio liquidated on 6 December 2019. The total recognised gains/(losses) arose solely from discontinued operations. The total recognised gains/(losses) arose solely from continuing operations.

FINANCIAL STATEMENTS NOTES TO THE AUDITED FINANCIAL STATEMENTS
1166 NEUBERGER BERMAN INVESTMENT FUNDS PLC
FOR THE YEAR ENDED 31 DECEMBER 2019
11. NET GAIN/(LOSS) ON FINANCIAL ASSETS AND LIABILITIES AT FAIR VALUE THROUGH PROFIT OR LOSS (CONTINUED)
Fair Value of Investments (continued)
Neuberger Berman Next Generation Mobility Fund1
Neuberger Berman Ultra Short Term Euro Bond Fund1
31 December 2019 31 December 2018 31 December 2019 31 December 2018
US$ US$ EUR EUR
Realised and Unrealised Gains/(Losses) on Investments
Net realised Gain/(Loss) on Investments (136,566) (230,774) 4,711,476 6,253
Net realised Currency Gain/(Loss) (70,616) (11,128) 84 –
(207,182) (241,902) 4,711,560 6,253
Change in Unrealised Gain/(Loss) on Investments 7,491,531 (310,490) (1,746,499) (42,461)
Change in Unrealised Currency Gain/(Loss) 9,868 1,528 (283) –
7,501,399 (308,962) (1,746,782) (42,461)
Net Gain/(Loss) on Financial Assets and Liabilities at Fair Value through Profit or Loss 7,294,217 (550,864) 2,964,778 (36,208)
The total recognised gains/(losses) arose solely from continuing operations.

NOTES TO THE AUDITED FINANCIAL STATEMENTS FINANCIAL STATEMENTS
ANNUAL REPORT 2019 1167
FOR THE YEAR ENDED 31 DECEMBER 2019
11. NET GAIN/(LOSS) ON FINANCIAL ASSETS AND LIABILITIES AT FAIR VALUE THROUGH PROFIT OR LOSS (CONTINUED)
Fair Value of Investments (continued)
Neuberger Berman Euro Opportunistic Bond Fund1
Neuberger Berman Euro Bond Absolute Return Fund1
31 December 2019 31 December 2018 31 December 2019 31 December 2018
EUR EUR EUR EUR
Realised and Unrealised Gains/(Losses) on Investments
Net realised Gain/(Loss) on Investments 323,245 5,303 558,127 5,446
Net realised Currency Gain/(Loss) 41 – (1,771) 1
323,286 5,303 556,356 5,447
Change in Unrealised Gain/(Loss) on Investments 158,913 35,043 165,688 24,241
Change in Unrealised Currency Gain/(Loss) (318) – (16,858) –
158,595 35,043 148,830 24,241
Net Gain/(Loss) on Financial Assets and Liabilities at Fair Value through Profit or Loss 481,881 40,346 705,186 29,688
The total recognised gains/(losses) arose solely from continuing operations.

FINANCIAL STATEMENTS NOTES TO THE AUDITED FINANCIAL STATEMENTS
1168 NEUBERGER BERMAN INVESTMENT FUNDS PLC
FOR THE YEAR ENDED 31 DECEMBER 2019
11. NET GAIN/(LOSS) ON FINANCIAL ASSETS AND LIABILITIES AT FAIR VALUE THROUGH PROFIT OR LOSS (CONTINUED)
Fair Value of Investments (continued)
Neuberger Berman Absolute Alpha Fund2
Neuberger Berman Multi-Style Premia Fund2
Neuberger Berman Macro Opportunities FX Fund2
31 December 2019 31 December 2019 31 December 2019
US$ US$ EUR
Realised and Unrealised Gains/(Losses) on Investments
Net realised Gain/(Loss) on Investments (3,703,317) 834,733 –
Net realised Currency Gain/(Loss) (9,729) (20,281) (3,699)
(3,713,046) 814,452 (3,699)
Change in Unrealised Gain/(Loss) on Investments 2,488,993 35,085 (185,775)
Change in Unrealised Currency Gain/(Loss) 238 88,044 –
2,489,231 123,129 (185,775)
Net Gain/(Loss) on Financial Assets and Liabilities at Fair Value through Profit or Loss (1,223,815) 937,581 (189,474)
The total recognised gains/(losses) arose solely from continuing operations.
1 Portfolio launched during the prior reporting year. 2 Portfolio launched during the current reporting year.

NOTES TO THE AUDITED FINANCIAL STATEMENTS FINANCIAL STATEMENTS
ANNUAL REPORT 2019 1169
FOR THE YEAR ENDED 31 DECEMBER 2019
12. FINANCIAL INSTRUMENT DISCLOSURES
In pursuing its investment objectives the Company invests in transferable securities with the aim of spreading risk. Investments in equities and fixed income securities expose the Company to varying risks including market, liquidity and credit/counterparty risks. A description of the specific risks and the policies for managing these risks are included below. In addition, consequences of political, social, economic, diplomatic changes, or public health condition may have disruptive effects on market prices or fair valuations of foreign investments. Fair value is determined in accordance with the methodology outlined in the Statement of Significant Accounting Policies. The Schedules of Investments of the Portfolios at the year-end are representative of the type of investments held during the year.
Market Risk
Market risk embodies the potential for both losses and gains and includes price risk, interest rate risk and foreign currency risk.
All security investments present a risk of loss of capital. The Investment Manager moderates this risk through a careful selection of securities and other financial instruments within specified limits. The Company’s overall market positions are monitored on a daily basis by the Portfolio’s Investment Manager and are reviewed on a quarterly basis by the Board of Directors. The Company’s equity and debt securities and trading derivative financial instruments are susceptible to market price risk arising from uncertainties about future prices of the instruments.
(a) Price Risk
Price risk is the risk that the fair values of securities decrease as a result of changes in the levels of the indices and the values of individual securities. The trading price risk exposure arises from the Company’s investment portfolios.
The majority of the Company’s investments are listed on recognised exchanges or traded on regulated markets as per the Prospectus. As at 31 December 2019 and 31 December 2018, a 10% increase in security prices would have increased the Net Assets and the Changes in Net Assets of each Portfolio as outlined in the table below. An equal change in the opposite direction would have decreased the Net Assets by an equal but opposite amount.
Portfolio Currency 31 December 2019
% of Net Assets
31 December 2018
% of Net Assets
Neuberger Berman High Yield Bond Fund USD 339,427,890 9.69% 382,176,980 9.49%
Neuberger Berman Diversified Currency Fund USD 6,772,011 9.92% 2,654,086 9.73%
Neuberger Berman US Multi Cap Opportunities Fund USD 76,024,747 9.96% 89,030,325 9.95%
Neuberger Berman US Real Estate Securities Fund USD 26,641,627 9.84% 8,794,854 9.91%
Neuberger Berman China Equity Fund USD 82,978,689 9.66% 78,744,599 9.57%
Neuberger Berman Emerging Markets Equity Fund USD 42,920,248 9.52% 43,180,712 9.75%
Neuberger Berman US Small Cap Fund USD 41,107,141 9.90% 32,789,405 9.88%
Neuberger Berman Short Duration High Yield Bond Fund USD 98,741,269 9.55% 99,281,033 9.77%
Neuberger Berman Global Bond Fund USD 20,313,872 10.00% 15,304,030 10.56%
Neuberger Berman Emerging Market Debt – Local Currency Fund USD 310,157,549 9.68% 242,455,359 9.69%
Neuberger Berman Emerging Market Debt – Hard Currency Fund USD 229,820,495 9.18% 135,654,173 9.17%
Neuberger Berman Emerging Market Corporate Debt Fund USD 16,388,290 9.33% 11,589,946 9.78%
Neuberger Berman Strategic Income Fund USD 166,206,891 11.52% 128,363,248 12.29%
Neuberger Berman Global Bond Absolute Return Fund USD 12,568,274 9.34% 7,614,726 9.47%
Neuberger Berman Short Duration Emerging Market Debt Fund USD 549,420,295 9.32% 352,700,866 9.55%
Neuberger Berman Absolute Return Multi Strategy Fund USD 2,841,480 5.17% 3,111,126 4.81%
Neuberger Berman US Long Short Equity Fund USD 12,595,860 8.16% 10,534,670 5.70%
Neuberger Berman Emerging Market Debt Blend Fund USD 163,092,462 9.54% 160,186,417 9.26%
Neuberger Berman European High Yield Bond Fund EUR 3,892,100 9.77% 2,419,130 9.65%
Neuberger Berman Global Equity Fund USD 137,212 9.65% 121,877 10.08%
Neuberger Berman Systematic Global Equity Fund USD 3,164,058 9.99% 2,058,385 9.94%
Neuberger Berman Global Real Estate Securities Fund USD 6,622,169 9.78% 323,289 9.94%
Neuberger Berman US Small Cap Intrinsic Value Fund USD 9,942,254 9.39% 7,662,682 9.46%
Neuberger Berman Global Credit Long Short Fund* USD - - (250) -

FINANCIAL STATEMENTS NOTES TO THE AUDITED FINANCIAL STATEMENTS
1170 NEUBERGER BERMAN INVESTMENT FUNDS PLC
FOR THE YEAR ENDED 31 DECEMBER 2019
12. FINANCIAL INSTRUMENT DISCLOSURES (CONTINUED)
(a) Price Risk (continued)
Portfolio Currency 31 December 2019
% of Net Assets
31 December 2018
% of Net Assets
Neuberger Berman Asian Debt – Hard Currency Fund USD 2,171,653 8.60% 1,564,424 9.87%
Neuberger Berman China Bond Fund CNY 77,039,211 9.43% 7,711,403 9.59%
Neuberger Berman Global Dynamic Asset Allocator Fund** USD 1,572 - 2,280,340 9.39%
Neuberger Berman Asian Opportunities Fund*** USD - - 326,831 9.20%
Neuberger Berman Corporate Hybrid Bond Fund EUR 104,543,701 9.23% 79,420,564 9.77%
Neuberger Berman US Equity Fund USD 509,550 9.55% 348,156 8.96%
Neuberger Berman Global High Yield Bond Fund USD 7,154,384 9.66% 5,774,572 9.60%
Neuberger Berman Global Opportunistic Bond Fund USD 17,396,348 10.02% 10,607,302 10.60%
Neuberger Berman Multi-Asset Risk Premia Fund**** USD - - 4,728,936 9.89%
Neuberger Berman Multi-Asset Class Income Fund USD 9,316,990 9.40% 3,899,325 10.58%
Neuberger Berman US Equity Index PutWrite Fund USD 52,034,283 9.39% 39,105,851 7.95%
Neuberger Berman Global Equity Index PutWrite Fund USD 5,418,166 9.52% 7,978,087 8.09%
Neuberger Berman Uncorrelated Strategies Fund USD 88,395,031 7.40% 47,827,054 5.51%
Neuberger Berman Emerging Market Debt Blend Investment Grade Fund USD 1,851,276 9.50% 1,617,441 9.46%
Neuberger Berman Emerging Markets Sustainable Equity Fund USD 12,717,935 9.79% 3,078,433 9.55%
Neuberger Berman China Equity Opportunities Fund USD 122,739 9.39% 92,860 10.19%
Neuberger Berman Multi-Asset Class Growth Fund USD 1,803,741 9.19% 1,884,100 8.93%
Neuberger Berman Global Thematic Equity Fund1 USD 2,433,388 9.94% 1,214,699 9.97%
Neuberger Berman CLO Income Fund1 USD 14,490,451 9.50% 10,446,466 9.27%
Neuberger Berman China A-Share Opportunities Fund1***** USD - - 208,742 9.52%
Neuberger Berman Next Generation Mobility Fund1 USD 4,062,609 9.52% 73,009 9.68%
Neuberger Berman Ultra Short Term Euro Bond Fund1 EUR 35,606,915 9.43% 1,106,404 9.75%
Neuberger Berman Euro Opportunistic Bond Fund1 EUR 1,023,070 9.64% 481,469 9.59%
Neuberger Berman Euro Bond Absolute Return Fund1 EUR 7,948,600 9.81% 773,369 7.73%
Neuberger Berman Absolute Alpha Fund2 USD 3,467,440 8.70% - -
Neuberger Berman Multi-Style Premia Fund2 USD 676,511 4.13% - -
Neuberger Berman Macro Opportunities FX Fund2 EUR 1,934,264 9.93% - -
* Portfolio liquidated on 26 November 2018. ** Portfolio liquidated on 12 April 2019. *** Portfolio liquidated on 24 July 2019. **** Portfolio liquidated on 26 March 2019. ***** Portfolio liquidated on 6 December 2019. 1 Portfolio launched during the prior reporting year. 2 Portfolio launched during the current reporting year. Other price risk is the risk that the value of the instruments will fluctuate as a result of changes in market prices (other than those arising from interest rate risk or currency risk), whether caused by factors specific to an individual instrument, its issuer or all factors affecting all instruments traded in the market. As the majority of the Company’s financial instruments are carried at fair value with fair value changes recognised in the Profit and Loss Account changes in market conditions will directly affect Net Gain/(Loss) on Financial Assets and Liabilities at Fair Value through Profit or Loss.
Price risk is managed by the Investment Manager by investing in a diversified range of securities in different markets.

NOTES TO THE AUDITED FINANCIAL STATEMENTS FINANCIAL STATEMENTS
ANNUAL REPORT 2019 1171
FOR THE YEAR ENDED 31 DECEMBER 2019
12. FINANCIAL INSTRUMENT DISCLOSURES (CONTINUED)
(a) Price Risk (continued)
The tables below summarise the relevant Portfolio’s overall exposure to price risk.
Neuberger Berman High Yield Bond Fund
As at 31 December 2019 Market ValueUS$
% of Net Assets
Corporate Bonds held for trading:
United States Dollar 3,115,732,226 88.98
Investment Funds held for trading:
Pound Sterling 41,877,566 1.20
Term Loans held for trading:
United States Dollar 175,946,027 5.02
3,333,555,819 95.20
Net Derivative Assets held for trading 60,723,082 1.73
As at 31 December 2018 Market ValueUS$
% of Net Assets
Corporate Bonds held for trading:
United States Dollar 3,461,236,467 85.96
Investment Funds held for trading:
Pound Sterling 79,589,602 1.97
Term Loans held for trading:
United States Dollar 269,335,137 6.69
3,810,161,206 94.62
Net Derivative Assets held for trading 11,608,597 0.29
Neuberger Berman Diversified Currency Fund
As at 31 December 2019 Market ValueUS$
% of Net Assets
Government Bonds held for trading:
United States Dollar 11,499,725 16.84
Treasury Bills held for trading:
United States Dollar 56,438,081 82.65
67,937,806 99.49
Net Derivative Liabilities held for trading (217,695) (0.31)
As at 31 December 2018 Market ValueUS$
% of Net Assets
Treasury Bills held for trading:
United States Dollar 26,627,172 97.66
26,627,172 97.66
Net Derivative Liabilities held for trading (86,313) (0.32)

FINANCIAL STATEMENTS NOTES TO THE AUDITED FINANCIAL STATEMENTS
1172 NEUBERGER BERMAN INVESTMENT FUNDS PLC
FOR THE YEAR ENDED 31 DECEMBER 2019
12. FINANCIAL INSTRUMENT DISCLOSURES (CONTINUED)
(a) Price Risk (continued)
Neuberger Berman US Multi Cap Opportunities Fund
As at 31 December 2019 Market ValueUS$
% of Net Assets
Equities held for trading:
United States Dollar 758,942,228 99.41
758,942,228 99.41
Net Derivative Assets held for trading 1,305,238 0.17
As at 31 December 2018
Market ValueUS$
% of Net Assets
Equities held for trading:
United States Dollar 890,768,700 99.59
890,768,700 99.59
Net Derivative Liabilities held for trading (465,446) (0.05)
Neuberger Berman US Real Estate Securities Fund
As at 31 December 2019 Market ValueUS$
% of Net Assets
Equities held for trading:
United States Dollar 11,852,632 4.38
Real Estate Investment Trusts held for trading:
United States Dollar 252,563,760 93.32
264,416,392 97.70
Net Derivative Assets held for trading 1,999,877 0.74
As at 31 December 2018 Market ValueUS$
% of Net Assets
Equities held for trading:
United States Dollar 3,649,236 4.11
Real Estate Investment Trusts held for trading:
United States Dollar 84,209,496 94.93
87,858,732 99.04
Net Derivative Assets held for trading 89,808 0.10
Neuberger Berman China Equity Fund
As at 31 December 2019 Market ValueUS$
% of Net Assets
Equities held for trading:
Chinese Yuan Renminbi 150,003,081 17.47
Hong Kong Dollar 529,167,109 61.63
United States Dollar 150,110,637 17.48
829,280,827 96.58
829,280,827 96.58
Net Derivative Assets held for trading 506,065 0.05

NOTES TO THE AUDITED FINANCIAL STATEMENTS FINANCIAL STATEMENTS
ANNUAL REPORT 2019 1173
FOR THE YEAR ENDED 31 DECEMBER 2019
12. FINANCIAL INSTRUMENT DISCLOSURES (CONTINUED)
(a) Price Risk (continued)
Neuberger Berman China Equity Fund (continued)
As at 31 December 2018 Market ValueUS$
% of Net Assets
Equities held for trading:
Chinese Yuan Renminbi 180,788,169 21.96
Hong Kong Dollar 472,473,929 57.40
United States Dollar 134,155,815 16.30
787,417,913 95.66
787,417,913 95.66
Net Derivative Assets held for trading 28,074 0.01
Neuberger Berman Emerging Markets Equity Fund
As at 31 December 2019 Market ValueUS$
% of Net Assets
Equities held for trading:
Brazilian Real 28,558,208 6.34
Canadian Dollar 3,539,244 0.79
Chinese Yuan Renminbi 9,819,447 2.18
Czech Koruna 3,396,405 0.75
Euro 3,028,868 0.67
Hong Kong Dollar 100,018,461 22.19
Hungarian Forint 3,335,844 0.74
Indian Rupee 33,918,044 7.53
Indonesian Rupiah 5,593,595 1.24
Malaysian Ringgit 2,485,084 0.55
Mexican Peso 11,408,767 2.53
New Taiwan Dollar 21,701,032 4.82
Philippine Peso 6,827,524 1.51
Polish Zloty 9,894,204 2.20
Pound Sterling 5,770,315 1.28
South African Rand 16,851,279 3.74
South Korean Won 64,127,910 14.23
Thai Baht 6,279,332 1.39
Turkish Lira 3,383,386 0.75
United States Dollar 84,567,284 18.76
424,504,233 94.19
Real Estate Investment Trusts held for trading:
Hong Kong Dollar 3,770,512 0.84
428,274,745 95.03
Net Derivative Assets held for trading 927,735 0.21
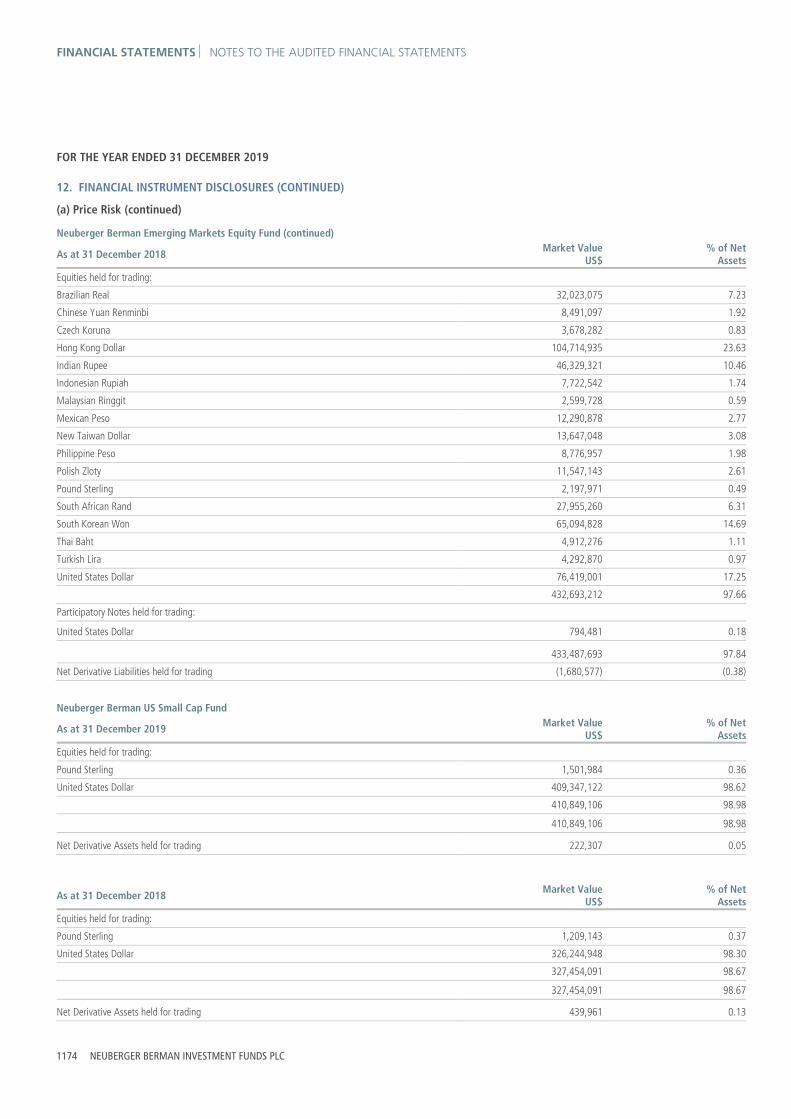
FINANCIAL STATEMENTS NOTES TO THE AUDITED FINANCIAL STATEMENTS
1174 NEUBERGER BERMAN INVESTMENT FUNDS PLC
FOR THE YEAR ENDED 31 DECEMBER 2019
12. FINANCIAL INSTRUMENT DISCLOSURES (CONTINUED)
(a) Price Risk (continued)
Neuberger Berman Emerging Markets Equity Fund (continued)
As at 31 December 2018 Market ValueUS$
% of Net Assets
Equities held for trading:
Brazilian Real 32,023,075 7.23
Chinese Yuan Renminbi 8,491,097 1.92
Czech Koruna 3,678,282 0.83
Hong Kong Dollar 104,714,935 23.63
Indian Rupee 46,329,321 10.46
Indonesian Rupiah 7,722,542 1.74
Malaysian Ringgit 2,599,728 0.59
Mexican Peso 12,290,878 2.77
New Taiwan Dollar 13,647,048 3.08
Philippine Peso 8,776,957 1.98
Polish Zloty 11,547,143 2.61
Pound Sterling 2,197,971 0.49
South African Rand 27,955,260 6.31
South Korean Won 65,094,828 14.69
Thai Baht 4,912,276 1.11
Turkish Lira 4,292,870 0.97
United States Dollar 76,419,001 17.25
432,693,212 97.66
Participatory Notes held for trading:
United States Dollar 794,481 0.18
433,487,693 97.84
Net Derivative Liabilities held for trading (1,680,577) (0.38)
Neuberger Berman US Small Cap Fund
As at 31 December 2019 Market ValueUS$
% of Net Assets
Equities held for trading:
Pound Sterling 1,501,984 0.36
United States Dollar 409,347,122 98.62
410,849,106 98.98
410,849,106 98.98
Net Derivative Assets held for trading 222,307 0.05
As at 31 December 2018 Market ValueUS$
% of Net Assets
Equities held for trading:
Pound Sterling 1,209,143 0.37
United States Dollar 326,244,948 98.30
327,454,091 98.67
327,454,091 98.67
Net Derivative Assets held for trading 439,961 0.13

NOTES TO THE AUDITED FINANCIAL STATEMENTS FINANCIAL STATEMENTS
ANNUAL REPORT 2019 1175
FOR THE YEAR ENDED 31 DECEMBER 2019
12. FINANCIAL INSTRUMENT DISCLOSURES (CONTINUED)
(a) Price Risk (continued)
Neuberger Berman Short Duration High Yield Bond Fund
As at 31 December 2019 Market ValueUS$
% of Net Assets
Corporate Bonds held for trading:
United States Dollar 887,835,954 85.84
Investment Funds held for trading:
Pound Sterling 3,147,897 0.30
Term Loans held for trading:
United States Dollar 90,810,636 8.78
981,794,487 94.92
Net Derivative Assets held for trading 5,618,205 0.55
As at 31 December 2018 Market ValueUS$
% of Net Assets
Corporate Bonds held for trading:
United States Dollar 918,857,130 90.42
Investment Funds held for trading:
Pound Sterling 5,982,359 0.59
Term Loans held for trading:
United States Dollar 66,815,648 6.57
991,655,137 97.58
Net Derivative Assets held for trading 1,155,191 0.12
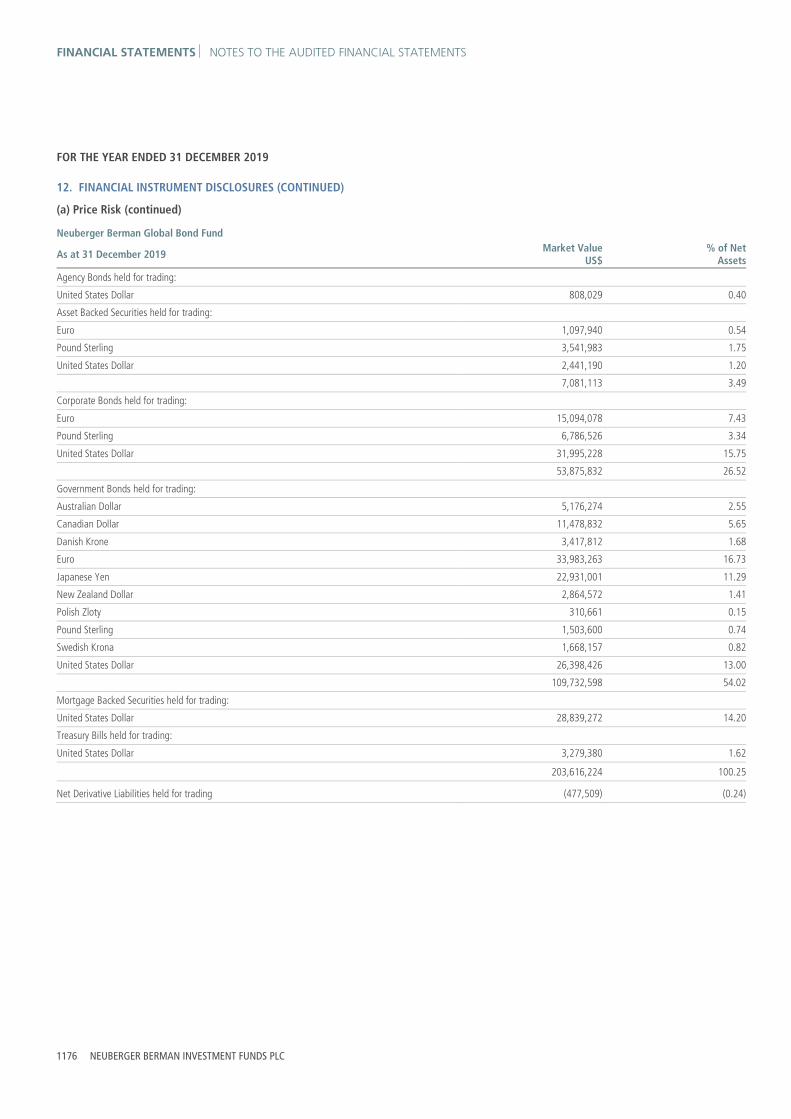
FINANCIAL STATEMENTS NOTES TO THE AUDITED FINANCIAL STATEMENTS
1176 NEUBERGER BERMAN INVESTMENT FUNDS PLC
FOR THE YEAR ENDED 31 DECEMBER 2019
12. FINANCIAL INSTRUMENT DISCLOSURES (CONTINUED)
(a) Price Risk (continued)
Neuberger Berman Global Bond Fund
As at 31 December 2019 Market ValueUS$
% of Net Assets
Agency Bonds held for trading:
United States Dollar 808,029 0.40
Asset Backed Securities held for trading:
Euro 1,097,940 0.54
Pound Sterling 3,541,983 1.75
United States Dollar 2,441,190 1.20
7,081,113 3.49
Corporate Bonds held for trading:
Euro 15,094,078 7.43
Pound Sterling 6,786,526 3.34
United States Dollar 31,995,228 15.75
53,875,832 26.52
Government Bonds held for trading:
Australian Dollar 5,176,274 2.55
Canadian Dollar 11,478,832 5.65
Danish Krone 3,417,812 1.68
Euro 33,983,263 16.73
Japanese Yen 22,931,001 11.29
New Zealand Dollar 2,864,572 1.41
Polish Zloty 310,661 0.15
Pound Sterling 1,503,600 0.74
Swedish Krona 1,668,157 0.82
United States Dollar 26,398,426 13.00
109,732,598 54.02
Mortgage Backed Securities held for trading:
United States Dollar 28,839,272 14.20
Treasury Bills held for trading:
United States Dollar 3,279,380 1.62
203,616,224 100.25
Net Derivative Liabilities held for trading (477,509) (0.24)

NOTES TO THE AUDITED FINANCIAL STATEMENTS FINANCIAL STATEMENTS
ANNUAL REPORT 2019 1177
FOR THE YEAR ENDED 31 DECEMBER 2019
12. FINANCIAL INSTRUMENT DISCLOSURES (CONTINUED)
(a) Price Risk (continued)
Neuberger Berman Global Bond Fund (continued)
As at 31 December 2018 Market ValueUS$
% of Net Assets
Agency Bonds held for trading:
United States Dollar 742,808 0.51
Asset Backed Securities held for trading:
Pound Sterling 3,365,550 2.32
United States Dollar 2,473,343 1.71
5,838,893 4.03
Corporate Bonds held for trading:
Euro 11,846,685 8.17
Pound Sterling 7,173,355 4.95
United States Dollar 22,997,368 15.87
42,017,408 28.99
Government Bonds held for trading:
Australian Dollar 3,136,614 2.17
Canadian Dollar 7,849,395 5.42
Euro 17,194,395 11.86
Japanese Yen 10,247,433 7.07
New Zealand Dollar 2,221,045 1.53
Polish Zloty 306,707 0.21
Pound Sterling 1,002,448 0.69
United States Dollar 34,983,692 24.14
76,941,729 53.09
Mortgage Backed Securities held for trading:
United States Dollar 24,077,309 16.61
Treasury Bills held for trading:
United States Dollar 3,486,598 2.41
153,104,745 105.64
Net Derivative Liabilities held for trading (64,449) (0.04)

FINANCIAL STATEMENTS NOTES TO THE AUDITED FINANCIAL STATEMENTS
1178 NEUBERGER BERMAN INVESTMENT FUNDS PLC
FOR THE YEAR ENDED 31 DECEMBER 2019
12. FINANCIAL INSTRUMENT DISCLOSURES (CONTINUED)
(a) Price Risk (continued)
Neuberger Berman Emerging Market Debt - Local Currency Fund
As at 31 December 2019 Market ValueUS$
% of Net Assets
Corporate Bonds held for trading: Chinese Yuan Renminbi 7,220,705 0.23
Colombian Peso 14,673,933 0.46
Indonesian Rupiah 724,210 0.02
Mexican Peso 58,619,161 1.83
United States Dollar 326,802 0.01
81,564,811 2.55
Government Bonds held for trading: Argentine Peso 6,092,972 0.19
Chilean Peso 69,421,585 2.17
Chinese Yuan Renminbi 21,233,798 0.66
Colombian Peso 132,008,751 4.12
Czech Koruna 94,927,927 2.96
Dominican Republic Peso 21,576,537 0.67
Egyptian Pound 72,581,434 2.27
Euro 17,610,684 0.55
Ghanaian Cedi 79 0.00
Hungarian Forint 88,875,074 2.77
Indonesian Rupiah 341,996,133 10.68
Malaysian Ringgit 227,372,669 7.10
Mexican Peso 378,278,431 11.81
Peruvian Sol 124,762,749 3.89
Philippine Peso 139,931 0.01
Polish Zloty 184,331,043 5.75
Romanian New Leu 95,026,777 2.97
Russian Ruble 208,252,136 6.50
Serbian Dinar 5,079,343 0.16
South African Rand 226,269,945 7.06
Thai Baht 286,963,113 8.96
Turkish Lira 200,612,998 6.26
Ukrainian Hryvnia 21,523,500 0.67
United States Dollar 7,689,470 0.24
Uruguayan Peso 7,132,543 0.22
2,839,759,622 88.64
Investment Funds held for trading: United States Dollar 25,786,800 0.80
Treasury Bills held for trading: Egyptian Pound 11,340,917 0.35
Hungarian Forint 21,255,686 0.66
Nigerian Naira 6,228,016 0.20
United States Dollar 45,123,658 1.41
83,948,277 2.62
3,031,059,510 94.61
Net Derivative Assets held for trading 70,515,978 2.20

NOTES TO THE AUDITED FINANCIAL STATEMENTS FINANCIAL STATEMENTS
ANNUAL REPORT 2019 1179
FOR THE YEAR ENDED 31 DECEMBER 2019
12. FINANCIAL INSTRUMENT DISCLOSURES (CONTINUED)
(a) Price Risk (continued)
Neuberger Berman Emerging Market Debt - Local Currency Fund (continued)
As at 31 December 2018 Market ValueUS$
% of Net Assets
Corporate Bonds held for trading:
China Yuan Renminbi 4,329,627 0.17
Colombian Peso 15,120,514 0.61
Mexican Peso 45,090,445 1.80
United States Dollar 1,225,486 0.05
65,766,072 2.63
Government Bonds held for trading:
Argentine Peso 45,628,218 1.82
Chilean Peso 40,974,791 1.64
China Yuan Renminbi 21,728,527 0.87
Colombian Peso 140,307,467 5.61
Czech Koruna 150,977,031 6.04
Dominican Republic Peso 2,411,989 0.10
Egyptian Pound 17,222,043 0.69
Euro 25,137,725 1.00
Ghanaian Cedi 93 0.00
Hungarian Forint 60,262,286 2.41
Indonesian Rupiah 258,835,825 10.35
Malaysian Ringgit 151,092,740 6.04
Mexican Peso 215,167,114 8.60
Peruvian Sol 89,653,575 3.58
Philippine Peso 131,615 0.00
Polish Zloty 172,837,289 6.91
Romanian New Leu 88,032,815 3.52
Russian Ruble 66,938,425 2.68
Serbia dinar 17,680,207 0.71
South African Rand 226,987,586 9.08
Sri Lanka Rupee 39,543,208 1.58
Thai Baht 191,001,085 7.64
Turkish Lira 177,996,684 7.12
United States Dollar 56,141,309 2.24
2,256,689,647 90.23
Treasury Bills held for trading:
Egyptian Pound 22,717,499 0.91
Malaysian Ringgit 24,649,617 0.98
Thai Baht 41,438,840 1.66
Uruguayan Peso 2,286,303 0.09
91,092,259 3.64
2,413,547,978 96.50
Net Derivative Assets held for trading 11,005,615 0.44

FINANCIAL STATEMENTS NOTES TO THE AUDITED FINANCIAL STATEMENTS
1180 NEUBERGER BERMAN INVESTMENT FUNDS PLC
FOR THE YEAR ENDED 31 DECEMBER 2019
12. FINANCIAL INSTRUMENT DISCLOSURES (CONTINUED)
(a) Price Risk (continued)
Neuberger Berman Emerging Market Debt - Hard Currency Fund
As at 31 December 2019 Market ValueUS$
% of Net Assets
Corporate Bonds held for trading:
Euro 13,663,586 0.55
United States Dollar 726,271,047 29.00
739,934,633 29.55
Government Bonds held for trading:
Euro 289,178,160 11.55
United States Dollar 1,220,588,900 48.74
1,509,767,060 60.29
Investment Funds held for trading:
United States Dollar 15,670,500 0.63
Treasury Bills held for trading:
United States Dollar 21,961,949 0.88
2,287,334,142 91.35
Net Derivative Assets held for trading 10,870,805 0.43
As at 31 December 2018 Market Value
US$% of Net
Assets
Corporate Bonds held for trading:
Euro 12,217,135 0.83
United States Dollar 405,975,921 27.43
418,193,056 28.26
Government Bonds held for trading:
Euro 178,621,258 12.07
United States Dollar 756,072,112 51.09
934,693,370 63.16
1,352,886,426 91.42
Net Derivative Assets held for trading 3,655,305 0.25

NOTES TO THE AUDITED FINANCIAL STATEMENTS FINANCIAL STATEMENTS
ANNUAL REPORT 2019 1181
FOR THE YEAR ENDED 31 DECEMBER 2019
12. FINANCIAL INSTRUMENT DISCLOSURES (CONTINUED)
(a) Price Risk (continued)
Neuberger Berman Emerging Market Corporate Debt Fund
As at 31 December 2019 Market ValueUS$
% of Net Assets
Corporate Bonds held for trading:
Euro 572,944 0.33
United States Dollar 152,399,456 86.78
152,972,400 87.11
Government Bonds held for trading:
Euro 1,792,366 1.02
United States Dollar 4,986,708 2.84
6,779,074 3.86
Investment Funds held for trading:
United States Dollar 2,002,873 1.14
161,754,347 92.11
Net Derivative Assets held for trading 2,128,555 1.21
As at 31 December 2018 Market ValueUS$
% of Net Assets
Corporate Bonds held for trading:
Euro 534,283 0.45
United States Dollar 112,797,975 95.14
113,332,258 95.59
Government Bonds held for trading:
Euro 918,320 0.78
United States Dollar 1,852,650 1.56
2,770,970 2.34
116,103,228 97.93
Net Derivative Liabilities held for trading (203,765) (0.17)

FINANCIAL STATEMENTS NOTES TO THE AUDITED FINANCIAL STATEMENTS
1182 NEUBERGER BERMAN INVESTMENT FUNDS PLC
FOR THE YEAR ENDED 31 DECEMBER 2019
12. FINANCIAL INSTRUMENT DISCLOSURES (CONTINUED)
(a) Price Risk (continued)
Neuberger Berman Strategic Income Fund
As at 31 December 2019 Market ValueUS$
% of Net Assets
Agency Bonds held for trading:
United States Dollar 1,008,490 0.07
Asset Backed Securities held for trading:
United States Dollar 165,819,872 11.49
Corporate Bonds held for trading:
United States Dollar 634,341,091 43.97
Equities held for trading:
United States Dollar 12,936 0.00
Government Bonds held for trading:
Colombian Peso 3,588,529 0.25
Indonesian Rupiah 2,904,484 0.20
Mexican Peso 5,370,495 0.37
Russian Ruble 4,756,025 0.33
South African Rand 2,930,839 0.20
Turkish Lira 1,637,187 0.12
United States Dollar 421,741,726 29.23
442,929,285 30.70
Investment Funds held for trading:
United States Dollar 36,661,624 2.54
Mortgage Backed Securities held for trading:
United States Dollar 218,777,629 15.16
Municipal Bonds held for trading:
United States Dollar 20,180,334 1.40
Term Loans held for trading:
United States Dollar 129,556,760 8.98
Treasury Bills held for trading:
United States Dollar 13,791,360 0.96
1,663,079,381 115.27
Net Derivative Liabilities held for trading (1,010,467) (0.07)

NOTES TO THE AUDITED FINANCIAL STATEMENTS FINANCIAL STATEMENTS
ANNUAL REPORT 2019 1183
FOR THE YEAR ENDED 31 DECEMBER 2019
12. FINANCIAL INSTRUMENT DISCLOSURES (CONTINUED)
(a) Price Risk (continued)
Neuberger Berman Strategic Income Fund (continued)
As at 31 December 2018 Market ValueUS$
% of Net Assets
Agency Bonds held for trading:
United States Dollar 911,323 0.09
Asset Backed Securities held for trading:
United States Dollar 161,568,548 15.47
Corporate Bonds held for trading:
Danish Krone 22,454,169 2.15
Euro 47,298,289 4.53
Pound Sterling 14,715,038 1.41
United States Dollar 388,470,863 37.19
472,938,359 45.28
Equities held for trading:
United States Dollar 13,331 0.00
Government Bonds held for trading:
Colombian Peso 2,940,152 0.28
Indonesian Rupiah 4,373,280 0.42
Mexican Peso 2,560,930 0.25
Russian Ruble 2,574,284 0.25
South African Rand 2,728,091 0.26
Turkish Lira 2,350,944 0.22
United States Dollar 283,623,318 27.16
301,150,999 28.84
Investment Funds held for trading:
United States Dollar 14,405,071 1.38
Mortgage Backed Securities held for trading:
United States Dollar 283,701,161 27.16
Municipal Bonds held for trading:
United States Dollar 14,733,337 1.41
Term Loans held for trading:
United States Dollar 15,816,490 1.51
Treasury Bills held for trading:
United States Dollar 13,888,166 1.33
1,279,126,785 122.47
Net Derivative Assets held for trading 4,505,690 0.44

FINANCIAL STATEMENTS NOTES TO THE AUDITED FINANCIAL STATEMENTS
1184 NEUBERGER BERMAN INVESTMENT FUNDS PLC
FOR THE YEAR ENDED 31 DECEMBER 2019
12. FINANCIAL INSTRUMENT DISCLOSURES (CONTINUED)
(a) Price Risk (continued)
Neuberger Berman Global Bond Absolute Return Fund
As at 31 December 2019 Market ValueUS$
% of Net Assets
Asset Backed Securities held for trading:
Euro 1,317,528 0.98
Pound Sterling 4,299,615 3.20
United States Dollar 29,542,394 21.96
35,159,537 26.14
Corporate Bonds held for trading:
Euro 33,948,504 25.24
Pound Sterling 8,881,663 6.60
United States Dollar 4,554,478 3.38
47,384,645 35.22
Government Bonds held for trading:
Euro 4,756,080 3.53
Japanese Yen 1,314,402 0.98
United States Dollar 28,891,889 21.48
34,962,371 25.99
Investment Funds held for trading:
Euro 35,056 0.02
United States Dollar 6,010,199 4.47
6,045,255 4.49
Mortgage Backed Securities held for trading:
United States Dollar 3,169,000 2.36
Treasury Bills held for trading:
United States Dollar 1,291,877 0.96
128,012,685 95.16
Net Derivative Liabilities held for trading (2,329,950) (1.73)
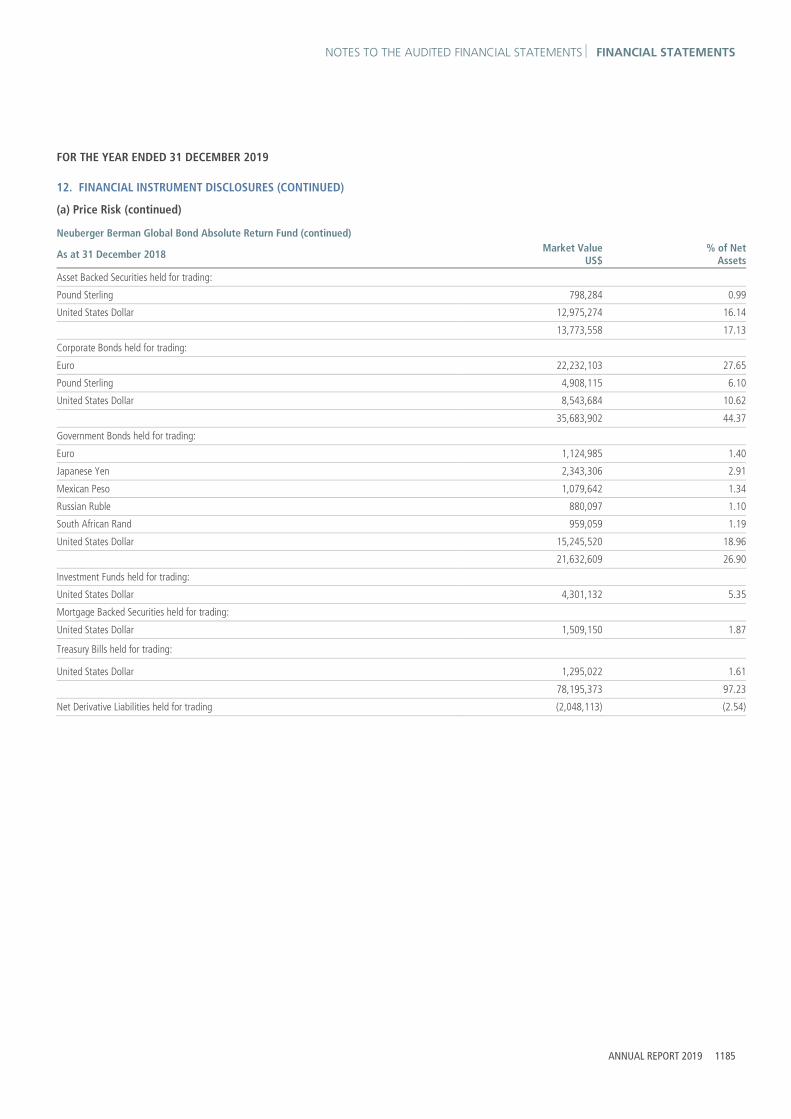
NOTES TO THE AUDITED FINANCIAL STATEMENTS FINANCIAL STATEMENTS
ANNUAL REPORT 2019 1185
FOR THE YEAR ENDED 31 DECEMBER 2019
12. FINANCIAL INSTRUMENT DISCLOSURES (CONTINUED)
(a) Price Risk (continued)
Neuberger Berman Global Bond Absolute Return Fund (continued)
As at 31 December 2018 Market ValueUS$
% of Net Assets
Asset Backed Securities held for trading:
Pound Sterling 798,284 0.99
United States Dollar 12,975,274 16.14
13,773,558 17.13
Corporate Bonds held for trading:
Euro 22,232,103 27.65
Pound Sterling 4,908,115 6.10
United States Dollar 8,543,684 10.62
35,683,902 44.37
Government Bonds held for trading:
Euro 1,124,985 1.40
Japanese Yen 2,343,306 2.91
Mexican Peso 1,079,642 1.34
Russian Ruble 880,097 1.10
South African Rand 959,059 1.19
United States Dollar 15,245,520 18.96
21,632,609 26.90
Investment Funds held for trading:
United States Dollar 4,301,132 5.35
Mortgage Backed Securities held for trading:
United States Dollar 1,509,150 1.87
Treasury Bills held for trading:
United States Dollar 1,295,022 1.61
78,195,373 97.23
Net Derivative Liabilities held for trading (2,048,113) (2.54)

FINANCIAL STATEMENTS NOTES TO THE AUDITED FINANCIAL STATEMENTS
1186 NEUBERGER BERMAN INVESTMENT FUNDS PLC
FOR THE YEAR ENDED 31 DECEMBER 2019
12. FINANCIAL INSTRUMENT DISCLOSURES (CONTINUED)
(a) Price Risk (continued)
Neuberger Berman Short Duration Emerging Market Debt Fund
As at 31 December 2019 Market ValueUS$
% of Net Assets
Corporate Bonds held for trading:
Euro 24,529,185 0.42
United States Dollar 4,016,288,018 68.15
4,040,817,203 68.57
Government Bonds held for trading:
Euro 41,868,583 0.71
United States Dollar 1,268,804,503 21.53
1,310,673,086 22.24
Investment Funds held for trading:
United States Dollar 31,341,000 0.53
Treasury Bills held for trading:
United States Dollar 59,896,225 1.02
5,442,727,514 92.36
Net Derivative Assets held for trading 51,475,438 0.87
As at 31 December 2018 Market ValueUS$
% of Net Assets
Corporate Bonds held for trading:
United States Dollar 2,766,053,007 74.89
Government Bonds held for trading:
United States Dollar 746,660,608 20.21
3,512,713,615 95.10
Net Derivative Assets held for trading 14,295,045 0.39

NOTES TO THE AUDITED FINANCIAL STATEMENTS FINANCIAL STATEMENTS
ANNUAL REPORT 2019 1187
FOR THE YEAR ENDED 31 DECEMBER 2019
12. FINANCIAL INSTRUMENT DISCLOSURES (CONTINUED)
(a) Price Risk (continued)
Neuberger Berman Absolute Return Multi Strategy Fund
As at 31 December 2019 Market ValueUS$
% of Net Assets
Asset Backed Securities held for trading:
United States Dollar 10,571,016 19.22
Equities held for trading:
Canadian Dollar 216,471 0.39
Euro 669,131 1.22
Hong Kong Dollar 229,596 0.42
Mexican Peso 18,270 0.03
Pound Sterling 331,650 0.60
United States Dollar 17,090,057 31.08
18,555,175 33.74
Participatory Notes held for trading:
United States Dollar 4,659 0.01
Real Estate Investment Trusts held for trading:
United States Dollar 274,427 0.50
29,405,277 53.47
Net Derivative Liabilities held for trading (990,481) (1.80)
As at 31 December 2018 Market ValueUS$
% of Net Assets
Asset Backed Securities held for trading:
United States Dollar 10,853,499 16.77
Equities held for trading:
Canadian Dollar 227,126 0.35
Euro 2,104,857 3.25
Hong Kong Dollar 497,961 0.77
Mexican Peso 36,502 0.06
Pound Sterling 906,486 1.40
United States Dollar 19,976,496 30.87
23,749,428 36.70
Investment Funds held for trading:
United States Dollar 315,773 0.49
Participatory Notes held for trading:
United States Dollar 4,722 0.01
Real Estate Investment Trusts held for trading:
United States Dollar 50,278 0.08
34,973,700 54.05
Net Derivative Liabilities held for trading (3,862,445) (5.97)
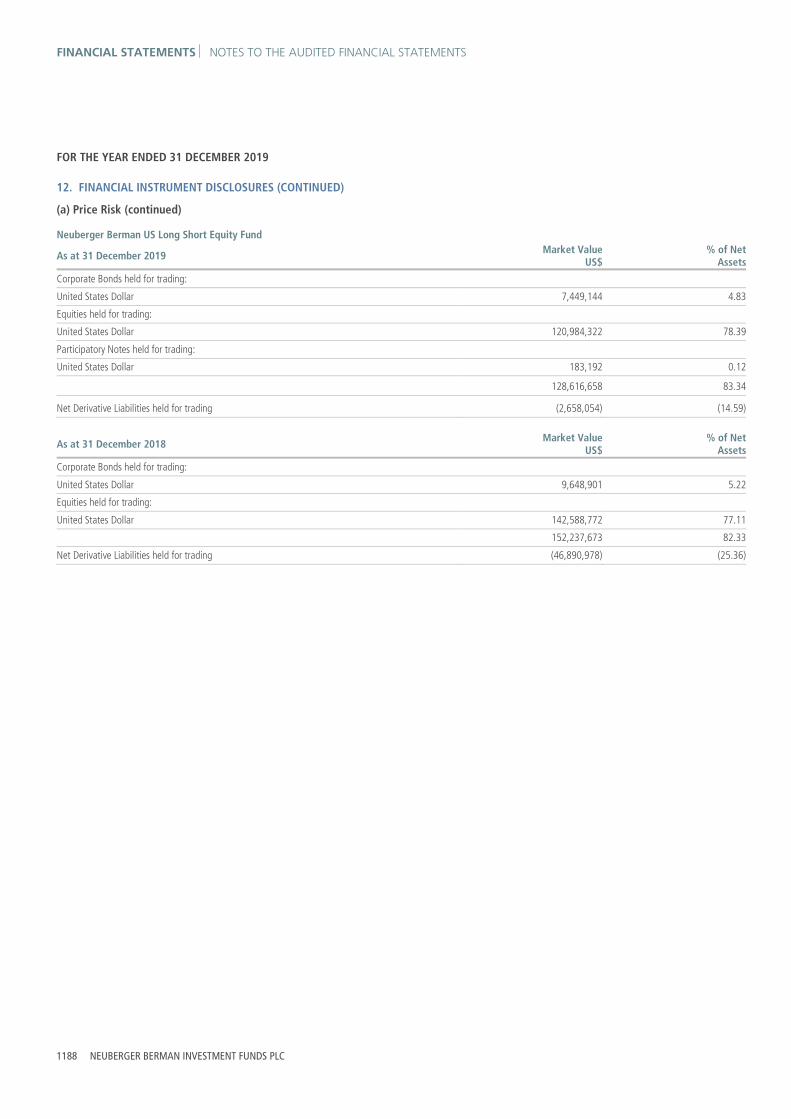
FINANCIAL STATEMENTS NOTES TO THE AUDITED FINANCIAL STATEMENTS
1188 NEUBERGER BERMAN INVESTMENT FUNDS PLC
FOR THE YEAR ENDED 31 DECEMBER 2019
12. FINANCIAL INSTRUMENT DISCLOSURES (CONTINUED)
(a) Price Risk (continued)
Neuberger Berman US Long Short Equity Fund
As at 31 December 2019 Market ValueUS$
% of Net Assets
Corporate Bonds held for trading:
United States Dollar 7,449,144 4.83
Equities held for trading:
United States Dollar 120,984,322 78.39
Participatory Notes held for trading:
United States Dollar 183,192 0.12
128,616,658 83.34
Net Derivative Liabilities held for trading (2,658,054) (14.59)
As at 31 December 2018 Market ValueUS$
% of Net Assets
Corporate Bonds held for trading:
United States Dollar 9,648,901 5.22
Equities held for trading:
United States Dollar 142,588,772 77.11
152,237,673 82.33
Net Derivative Liabilities held for trading (46,890,978) (25.36)

NOTES TO THE AUDITED FINANCIAL STATEMENTS FINANCIAL STATEMENTS
ANNUAL REPORT 2019 1189
FOR THE YEAR ENDED 31 DECEMBER 2019
12. FINANCIAL INSTRUMENT DISCLOSURES (CONTINUED)
(a) Price Risk (continued)
Neuberger Berman Emerging Market Debt Blend Fund
As at 31 December 2019 Market ValueUS$
% of Net Assets
Corporate Bonds held for trading:
Colombian Peso 6,800,809 0.40
Euro 6,515,302 0.38
Mexican Peso 23,195,721 1.36
United States Dollar 429,685,600 25.14
466,197,432 27.28
Government Bonds held for trading:
Argentine Peso 1,828,166 0.11
Chilean Peso 19,015,833 1.11
Colombian Peso 32,225,601 1.88
Czech Koruna 27,201,978 1.59
Dominican Republic Peso 5,794,809 0.34
Egyptian Pound 17,845,142 1.04
Euro 69,039,862 4.04
Ghanaian Cedi 15 0.00
Hungarian Forint 24,464,359 1.43
Indonesian Rupiah 94,270,390 5.51
Malaysian Ringgit 78,325,092 4.58
Mexican Peso 96,847,474 5.67
Peruvian Sol 36,506,789 2.14
Polish Zloty 50,253,942 2.94
Romanian New Leu 25,951,802 1.52
Russian Ruble 50,686,486 2.97
Serbian Dinar 1,394,799 0.08
South African Rand 61,203,464 3.58
Thai Baht 74,465,728 4.36
Turkish Lira 58,392,394 3.42
Ukrainian Hryvnia 5,713,198 0.33
United States Dollar 266,322,046 15.58
Uruguayan Peso 2,205,903 0.13
1,099,955,272 64.35
Investment Funds held for trading:
United States Dollar 16,672,304 0.98
Treasury Bills held for trading:
Egyptian Pound 4,344,758 0.25
Nigerian Naira 1,801,297 0.11
United States Dollar 15,597,546 0.91
21,743,601 1.27
1,604,568,609 93.88
Net Derivative Assets held for trading 26,356,008 1.54

FINANCIAL STATEMENTS NOTES TO THE AUDITED FINANCIAL STATEMENTS
1190 NEUBERGER BERMAN INVESTMENT FUNDS PLC
FOR THE YEAR ENDED 31 DECEMBER 2019
12. FINANCIAL INSTRUMENT DISCLOSURES (CONTINUED)
(a) Price Risk (continued)
Neuberger Berman Emerging Market Debt Blend Fund (continued)
As at 31 December 2018 Market ValueUS$
% of Net Assets
Corporate Bonds held for trading:
Colombian Peso 7,306,127 0.42
Euro 2,786,060 0.16
Mexican Peso 20,576,022 1.19
United States Dollar 418,233,620 24.18
448,901,829 25.95
Government Bonds held for trading:
Argentine Peso 16,995,777 0.98
Chilean Peso 12,043,299 0.70
Colombian Peso 41,046,167 2.37
Czech Koruna 21,294,431 1.23
Dominican Republic Peso 842,445 0.05
Egyptian Pound 3,340,801 0.19
Euro 95,363,971 5.51
Ghanaian Cedi 18 0.00
Hungarian Forint 12,610,156 0.73
Indonesian Rupiah 88,332,966 5.11
Malaysian Ringgit 55,105,837 3.19
Mexican Peso 63,736,692 3.68
Peruvian Sol 32,932,193 1.90
Polish Zloty 67,761,223 3.92
Romanian New Leu 30,154,114 1.74
Russian Ruble 25,796,284 1.49
South African Rand 82,951,758 4.80
Sri Lanka Rupee 13,308,211 0.77
Thai Baht 64,189,766 3.71
Turkish Lira 59,235,486 3.42
United States Dollar 294,801,586 17.04
1,081,843,181 62.53
Treasury Bills held for trading:
Egyptian Pound 11,670,806 0.68
Malaysian Ringgit 16,118,916 0.93
Thai Baht 13,864,475 0.80
United States Dollar 22,482,574 1.30
Uruguayan Peso 1,037,890 0.06
65,174,661 3.77
1,595,919,671 92.25
Net Derivative Assets held for trading 5,944,495 0.35

NOTES TO THE AUDITED FINANCIAL STATEMENTS FINANCIAL STATEMENTS
ANNUAL REPORT 2019 1191
FOR THE YEAR ENDED 31 DECEMBER 2019
12. FINANCIAL INSTRUMENT DISCLOSURES (CONTINUED)
(a) Price Risk (continued)
Neuberger Berman European High Yield Bond Fund
As at 31 December 2019 Market ValueEUR
% of Net Assets
Corporate Bonds held for trading:
Euro 32,164,516 80.74
Pound Sterling 6,468,637 16.24
38,633,153 96.98
Term Loans held for trading:
Euro 739,290 1.85
Pound Sterling 305,775 0.77
1,045,065 2.62
39,678,218 99.60
Net Derivative Liabilities held for trading (757,215) (1.90)
As at 31 December 2018 Market ValueEUR
% of Net Assets
Corporate Bonds held for trading:
Euro 19,375,012 77.26
Pound Sterling 3,116,357 12.43
22,491,369 89.69
Term Loans held for trading:
Euro 1,244,314 4.96
Pound Sterling 200,229 0.80
1,444,543 5.76
23,935,912 95.45
Net Derivative Assets held for trading 255,387 1.02
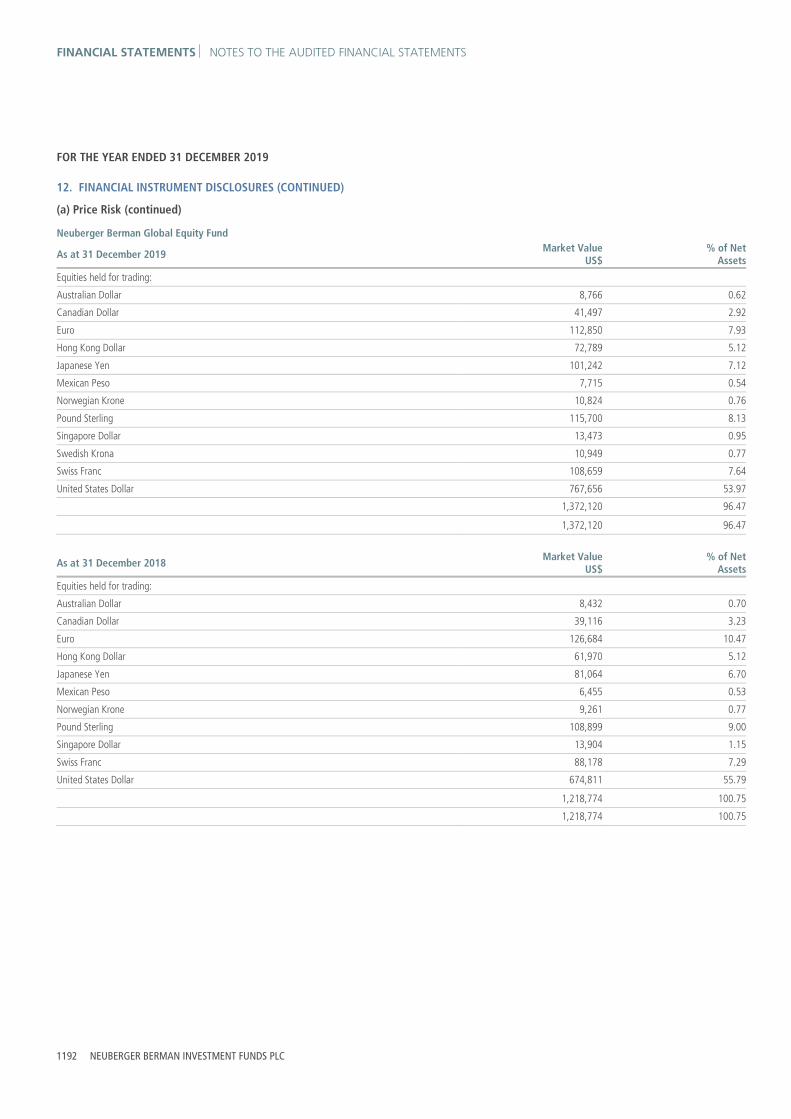
FINANCIAL STATEMENTS NOTES TO THE AUDITED FINANCIAL STATEMENTS
1192 NEUBERGER BERMAN INVESTMENT FUNDS PLC
FOR THE YEAR ENDED 31 DECEMBER 2019
12. FINANCIAL INSTRUMENT DISCLOSURES (CONTINUED)
(a) Price Risk (continued)
Neuberger Berman Global Equity Fund
As at 31 December 2019 Market ValueUS$
% of Net Assets
Equities held for trading:
Australian Dollar 8,766 0.62
Canadian Dollar 41,497 2.92
Euro 112,850 7.93
Hong Kong Dollar 72,789 5.12
Japanese Yen 101,242 7.12
Mexican Peso 7,715 0.54
Norwegian Krone 10,824 0.76
Pound Sterling 115,700 8.13
Singapore Dollar 13,473 0.95
Swedish Krona 10,949 0.77
Swiss Franc 108,659 7.64
United States Dollar 767,656 53.97
1,372,120 96.47
1,372,120 96.47
As at 31 December 2018 Market Value
US$% of Net
Assets
Equities held for trading:
Australian Dollar 8,432 0.70
Canadian Dollar 39,116 3.23
Euro 126,684 10.47
Hong Kong Dollar 61,970 5.12
Japanese Yen 81,064 6.70
Mexican Peso 6,455 0.53
Norwegian Krone 9,261 0.77
Pound Sterling 108,899 9.00
Singapore Dollar 13,904 1.15
Swiss Franc 88,178 7.29
United States Dollar 674,811 55.79
1,218,774 100.75
1,218,774 100.75
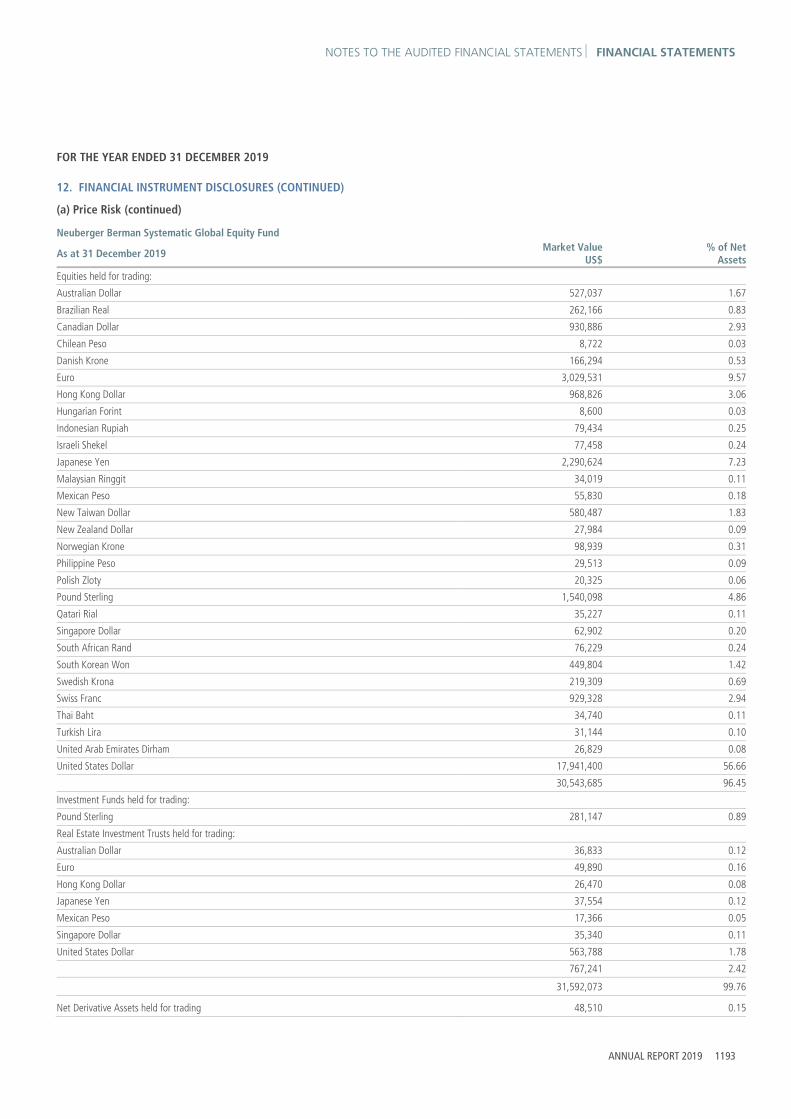
NOTES TO THE AUDITED FINANCIAL STATEMENTS FINANCIAL STATEMENTS
ANNUAL REPORT 2019 1193
FOR THE YEAR ENDED 31 DECEMBER 2019
12. FINANCIAL INSTRUMENT DISCLOSURES (CONTINUED)
(a) Price Risk (continued)
Neuberger Berman Systematic Global Equity Fund
As at 31 December 2019 Market ValueUS$
% of Net Assets
Equities held for trading: Australian Dollar 527,037 1.67
Brazilian Real 262,166 0.83
Canadian Dollar 930,886 2.93
Chilean Peso 8,722 0.03
Danish Krone 166,294 0.53
Euro 3,029,531 9.57
Hong Kong Dollar 968,826 3.06
Hungarian Forint 8,600 0.03
Indonesian Rupiah 79,434 0.25
Israeli Shekel 77,458 0.24
Japanese Yen 2,290,624 7.23
Malaysian Ringgit 34,019 0.11
Mexican Peso 55,830 0.18
New Taiwan Dollar 580,487 1.83
New Zealand Dollar 27,984 0.09
Norwegian Krone 98,939 0.31
Philippine Peso 29,513 0.09
Polish Zloty 20,325 0.06
Pound Sterling 1,540,098 4.86
Qatari Rial 35,227 0.11
Singapore Dollar 62,902 0.20
South African Rand 76,229 0.24
South Korean Won 449,804 1.42
Swedish Krona 219,309 0.69
Swiss Franc 929,328 2.94
Thai Baht 34,740 0.11
Turkish Lira 31,144 0.10
United Arab Emirates Dirham 26,829 0.08
United States Dollar 17,941,400 56.66
30,543,685 96.45
Investment Funds held for trading: Pound Sterling 281,147 0.89
Real Estate Investment Trusts held for trading: Australian Dollar 36,833 0.12
Euro 49,890 0.16
Hong Kong Dollar 26,470 0.08
Japanese Yen 37,554 0.12
Mexican Peso 17,366 0.05
Singapore Dollar 35,340 0.11
United States Dollar 563,788 1.78
767,241 2.42
31,592,073 99.76
Net Derivative Assets held for trading 48,510 0.15

FINANCIAL STATEMENTS NOTES TO THE AUDITED FINANCIAL STATEMENTS
1194 NEUBERGER BERMAN INVESTMENT FUNDS PLC
FOR THE YEAR ENDED 31 DECEMBER 2019
12. FINANCIAL INSTRUMENT DISCLOSURES (CONTINUED)
(a) Price Risk (continued)
Neuberger Berman Systematic Global Equity Fund (continued)
As at 31 December 2018 Market ValueUS$
% of Net Assets
Equities held for trading:
Australian Dollar 483,545 2.34
Brazilian Real 171,845 0.83
Canadian Dollar 570,085 2.75
Chilean Peso 18,878 0.09
Czech Koruna 17,076 0.08
Danish Krone 47,787 0.23
Euro 1,894,133 9.16
Hong Kong Dollar 783,203 3.79
Hungarian Forint 2,980 0.01
Indonesian Rupiah 14,894 0.07
Israeli Shekel 48,779 0.23
Japanese Yen 1,429,973 6.90
Malaysian Ringgit 57,403 0.28
Mexican Peso 24,952 0.12
New Taiwan Dollar 344,957 1.67
Norwegian Krone 140,078 0.68
Philippine Peso 23,099 0.11
Polish Zloty 13,287 0.06
Pound Sterling 1,185,549 5.72
Qatari Rial 30,631 0.15
Singapore Dollar 73,734 0.36
South African Rand 55,216 0.27
South Korean Won 314,397 1.52
Swedish Krona 124,202 0.60
Swiss Franc 658,807 3.19
Thai Baht 59,043 0.28
Turkish Lira 17,512 0.08
United Arab Emirates Dirham 29,196 0.14
United States Dollar 10,889,033 52.60
19,524,274 94.31
Investment Funds held for trading:
Pound Sterling 209,018 1.01
Real Estate Investment Trusts held for trading:
Hong Kong Dollar 116,478 0.56
United States Dollar 765,454 3.70
881,932 4.26
20,615,224 99.58
Net Derivative Liabilities held for trading (31,378) (0.15)

NOTES TO THE AUDITED FINANCIAL STATEMENTS FINANCIAL STATEMENTS
ANNUAL REPORT 2019 1195
FOR THE YEAR ENDED 31 DECEMBER 2019
12. FINANCIAL INSTRUMENT DISCLOSURES (CONTINUED)
(a) Price Risk (continued)
Neuberger Berman Global Real Estate Securities Fund
As at 31 December 2019 Market ValueUS$
% of Net Assets
Equities held for trading:
Canadian Dollar 602,670 0.89
Euro 2,888,265 4.26
Hong Kong Dollar 3,609,747 5.33
Japanese Yen 4,524,716 6.68
Singapore Dollar 1,040,989 1.54
Swedish Krona 1,087,617 1.61
United States Dollar 591,099 0.87
14,345,103 21.18
Real Estate Investment Trusts held for trading:
Australian Dollar 3,306,703 4.88
Canadian Dollar 1,748,048 2.58
Euro 2,193,466 3.24
Japanese Yen 3,451,101 5.10
Pound Sterling 6,817,627 10.07
United States Dollar 34,348,308 50.74
51,865,253 76.61
66,210,356 97.79
Net Derivative Assets held for trading 11,333 0.02
As at 31 December 2018 Market ValueUS$
% of Net Assets
Equities held for trading:
Canadian Dollar 24,095 0.74
Euro 252,672 7.77
Hong Kong Dollar 247,398 7.60
Japanese Yen 215,726 6.63
Singapore Dollar 30,979 0.95
Swedish Krona 52,277 1.61
United States Dollar 28,730 0.88
851,877 26.18
Real Estate Investment Trusts held for trading:
Australian Dollar 224,964 6.92
Canadian Dollar 85,710 2.64
Euro 102,919 3.16
Japanese Yen 176,652 5.43
Pound Sterling 125,113 3.85
Singapore Dollar 33,142 1.02
United States Dollar 1,635,354 50.27
2,383,854 73.29
3,235,731 99.47
Net Derivative Liabilities held for trading (2,846) (0.09)

FINANCIAL STATEMENTS NOTES TO THE AUDITED FINANCIAL STATEMENTS
1196 NEUBERGER BERMAN INVESTMENT FUNDS PLC
FOR THE YEAR ENDED 31 DECEMBER 2019
12. FINANCIAL INSTRUMENT DISCLOSURES (CONTINUED)
(a) Price Risk (continued)
Neuberger Berman US Small Cap Intrinsic Value Fund
As at 31 December 2019 Market ValueUS$
% of Net Assets
Equities held for trading:
United States Dollar 99,370,960 93.90
Participatory Notes held for trading:
United States Dollar 51,579 0.05
99,422,539 93.95
As at 31 December 2018 Market ValueUS$
% of Net Assets
Equities held for trading:
United States Dollar 76,020,369 93.86
Real Estate Investment Trusts held for trading:
United States Dollar 606,452 0.75
76,626,821 94.61
Neuberger Berman Global Credit Long Short Fund*
As at 31 December 2018 Market ValueUS$
% of Net Assets
Equities held for trading:
United States Dollar 1,433 –
1,433 –
Net Derivative Liabilities held for trading (3,931) –
Neuberger Berman Asian Debt - Hard Currency Fund
As at 31 December 2019 Market ValueUS$
% of Net Assets
Corporate Bonds held for trading:
United States Dollar 19,750,092 78.23
Government Bonds held for trading:
United States Dollar 1,936,193 7.67
21,686,285 85.90
Net Derivative Assets held for trading 30,246 0.12
As at 31 December 2018 Market ValueUS$
% of Net Assets
Corporate Bonds held for trading:
United States Dollar 13,851,050 87.37
Government Bonds held for trading:
Sri Lanka Rupee 270,084 1.70
United States Dollar 1,565,409 9.88
1,835,493 11.58
15,686,543 98.95
Net Derivative Liabilities held for trading (42,300) (0.27)
* Portfolio liquidated on 26 November 2018.
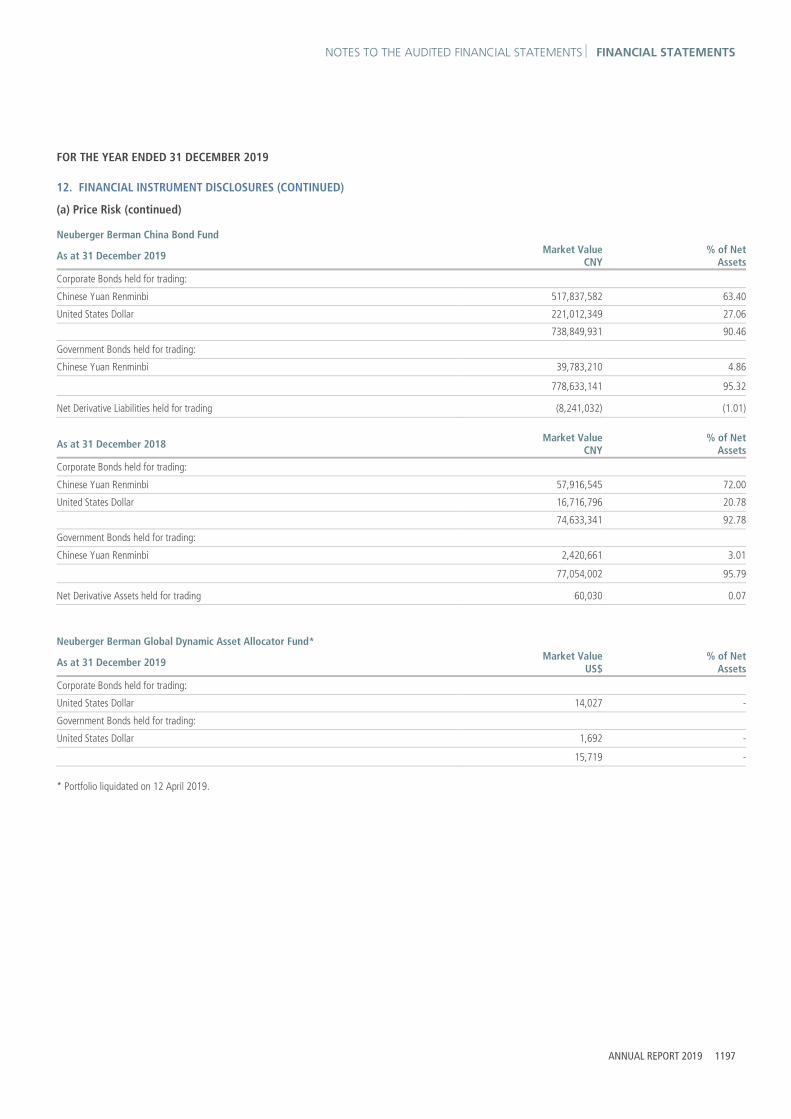
NOTES TO THE AUDITED FINANCIAL STATEMENTS FINANCIAL STATEMENTS
ANNUAL REPORT 2019 1197
FOR THE YEAR ENDED 31 DECEMBER 2019
12. FINANCIAL INSTRUMENT DISCLOSURES (CONTINUED)
(a) Price Risk (continued)
Neuberger Berman China Bond Fund
As at 31 December 2019 Market ValueCNY
% of Net Assets
Corporate Bonds held for trading:
Chinese Yuan Renminbi 517,837,582 63.40
United States Dollar 221,012,349 27.06
738,849,931 90.46
Government Bonds held for trading:
Chinese Yuan Renminbi 39,783,210 4.86
778,633,141 95.32
Net Derivative Liabilities held for trading (8,241,032) (1.01)
As at 31 December 2018 Market ValueCNY
% of Net Assets
Corporate Bonds held for trading:
Chinese Yuan Renminbi 57,916,545 72.00
United States Dollar 16,716,796 20.78
74,633,341 92.78
Government Bonds held for trading:
Chinese Yuan Renminbi 2,420,661 3.01
77,054,002 95.79
Net Derivative Assets held for trading 60,030 0.07
Neuberger Berman Global Dynamic Asset Allocator Fund*
As at 31 December 2019 Market ValueUS$
% of Net Assets
Corporate Bonds held for trading:
United States Dollar 14,027 -
Government Bonds held for trading:
United States Dollar 1,692 -
15,719 -
* Portfolio liquidated on 12 April 2019.

FINANCIAL STATEMENTS NOTES TO THE AUDITED FINANCIAL STATEMENTS
1198 NEUBERGER BERMAN INVESTMENT FUNDS PLC
FOR THE YEAR ENDED 31 DECEMBER 2019
12. FINANCIAL INSTRUMENT DISCLOSURES (CONTINUED)
(a) Price Risk (continued)
Neuberger Berman Global Dynamic Asset Allocator Fund*
As at 31 December 2018 Market ValueUS$
% of Net Assets
Asset Backed Securities held for trading:
Pound Sterling 248,687 1.03
United States Dollar 3,219,677 13.25
3,468,364 14.28
Corporate Bonds held for trading:
Euro 6,178,372 25.43
Pound Sterling 1,393,113 5.73
United States Dollar 3,300,703 13.59
10,872,188 44.75
Government Bonds held for trading:
Euro 325,352 1.34
Japanese Yen 835,523 3.44
Mexican Peso 242,919 1.00
Russian Ruble 194,831 0.80
South African Rand 210,993 0.87
United States Dollar 4,768,271 19.62
6,577,889 27.07
Investment Funds held for trading:
United States Dollar 1,072,480 4.41
Mortgage Backed Securities held for trading:
United States Dollar 443,568 1.83
Treasury Bills held for trading:
United States Dollar 597,702 2.46
23,032,191 94.80
Net Derivative Liabilities held for trading (228,791) (0.94)

NOTES TO THE AUDITED FINANCIAL STATEMENTS FINANCIAL STATEMENTS
ANNUAL REPORT 2019 1199
FOR THE YEAR ENDED 31 DECEMBER 2019
12. FINANCIAL INSTRUMENT DISCLOSURES (CONTINUED)
(a) Price Risk (continued)
Neuberger Berman Asian Opportunities Fund**
As at 31 December 2018 Market ValueUS$
% of Net Assets
Equities held for trading:
Chinese Yuan Renminbi 56,785 1.60
Hong Kong Dollar 1,306,664 36.77
Indonesian Rupiah 59,039 1.66
Malaysian Ringgit 39,973 1.12
New Taiwan Dollar 478,685 13.47
Philippine Peso 43,325 1.22
Singapore Dollar 27,249 0.77
South Korean Won 545,543 15.35
Thai Baht 87,602 2.47
United States Dollar 372,468 10.47
3,017,333 84.90
Participatory Notes held for trading:
United States Dollar 250,980 7.06
3,268,313 91.96
* Portfolio liquidated on 12 April 2019. ** Portfolio liquidated on 24 July 2019.

FINANCIAL STATEMENTS NOTES TO THE AUDITED FINANCIAL STATEMENTS
1200 NEUBERGER BERMAN INVESTMENT FUNDS PLC
FOR THE YEAR ENDED 31 DECEMBER 2019
12. FINANCIAL INSTRUMENT DISCLOSURES (CONTINUED)
(a) Price Risk (continued)
Neuberger Berman Corporate Hybrid Bond Fund
As at 31 December 2019 Market ValueEUR
% of Net Assets
Corporate Bonds held for trading:
Euro 609,354,001 53.82
Pound Sterling 152,705,058 13.49
United States Dollar 286,689,276 25.32
1,048,748,335 92.63
1,048,748,335 92.63
Net Derivative Liabilities held for trading (3,311,324) (0.30)
As at 31 December 2018 Market ValueEUR
% of Net Assets
Corporate Bonds held for trading:
Euro 458,854,337 56.45
Pound Sterling 120,347,598 14.81
United States Dollar 215,240,154 26.48
794,442,089 97.74
794,442,089 97.74
Net Derivative Liabilities held for trading (236,450) (0.03)
Neuberger Berman US Equity Fund
As at 31 December 2019 Market ValueUS$
% of Net Assets
Equities held for trading:
United States Dollar 5,089,218 95.38
Participatory Notes held for trading:
United States Dollar 6,283 0.12
5,095,501 95.50
As at 31 December 2018 Market ValueUS$
% of Net Assets
Equities held for trading:
United States Dollar 3,481,558 89.64
3,481,558 89.64

NOTES TO THE AUDITED FINANCIAL STATEMENTS FINANCIAL STATEMENTS
ANNUAL REPORT 2019 1201
FOR THE YEAR ENDED 31 DECEMBER 2019
12. FINANCIAL INSTRUMENT DISCLOSURES (CONTINUED)
(a) Price Risk (continued)
Neuberger Berman Global High Yield Bond Fund
As at 31 December 2019 Market ValueUS$
% of Net Assets
Corporate Bonds held for trading:
Euro 9,648,041 13.02
Pound Sterling 2,659,767 3.60
United States Dollar 56,761,109 76.65
69,068,917 93.27
Term Loans held for trading:
Euro 214,227 0.28
Pound Sterling 151,339 0.21
United States Dollar 1,871,369 2.53
2,236,935 3.02
71,305,852 96.29
Net Derivative Assets held for trading 237,989 0.32
As at 31 December 2018 Market Value
US$% of Net
Assets
Corporate Bonds held for trading:
Euro 9,466,137 15.74
Pound Sterling 2,043,356 3.40
United States Dollar 42,971,124 71.48
54,480,617 90.62
Term Loans held for trading:
Euro 765,630 1.28
Pound Sterling 142,284 0.24
United States Dollar 2,529,692 4.20
3,437,606 5.72
57,918,223 96.34
Net Derivative Liabilities held for trading (172,504) (0.29)

FINANCIAL STATEMENTS NOTES TO THE AUDITED FINANCIAL STATEMENTS
1202 NEUBERGER BERMAN INVESTMENT FUNDS PLC
FOR THE YEAR ENDED 31 DECEMBER 2019
12. FINANCIAL INSTRUMENT DISCLOSURES (CONTINUED)
(a) Price Risk (continued)
Neuberger Berman Global Opportunistic Bond Fund
As at 31 December 2019 Market ValueUS$
% of Net Assets
Agency Bonds held for trading:
United States Dollar 393,177 0.23
Asset Backed Securities held for trading:
Euro 796,006 0.46
United States Dollar 11,410,964 6.57
12,206,970 7.03
Corporate Bonds held for trading:
Euro 43,264,104 24.91
Pound Sterling 12,110,721 6.97
United States Dollar 21,966,220 12.65
77,341,045 44.53
Government Bonds held for trading:
Canadian Dollar 4,984,576 2.87
Euro 12,506,338 7.20
Japanese Yen 2,025,124 1.17
New Zealand Dollar 774,445 0.44
United States Dollar 36,186,984 20.83
56,477,467 32.51
Investment Funds held for trading:
Pound Sterling 153,671 0.09
United States Dollar 12,860,630 7.40
13,014,301 7.49
Mortgage Backed Securities held for trading:
United States Dollar 16,625,002 9.57
Treasury Bills held for trading:
United States Dollar 3,304,224 1.90
179,362,186 103.26
Net Derivative Liabilities held for trading (5,398,706) (3.10)

NOTES TO THE AUDITED FINANCIAL STATEMENTS FINANCIAL STATEMENTS
ANNUAL REPORT 2019 1203
FOR THE YEAR ENDED 31 DECEMBER 2019
12. FINANCIAL INSTRUMENT DISCLOSURES (CONTINUED)
(a) Price Risk (continued)
Neuberger Berman Global Opportunistic Bond Fund (continued)
As at 31 December 2018 Market ValueUS$
% of Net Assets
Agency Bonds held for trading:
United States Dollar 361,049 0.36
Asset Backed Securities held for trading:
Pound Sterling 124,343 0.12
United States Dollar 9,319,304 9.32
9,443,647 9.44
Corporate Bonds held for trading:
Euro 23,171,830 23.16
Pound Sterling 6,568,935 6.57
United States Dollar 8,824,189 8.82
38,564,954 38.55
Government Bonds held for trading:
Australian Dollar 1,117,677 1.12
Canadian Dollar 2,843,150 2.84
Euro 6,887,477 6.88
Japanese Yen 6,648,338 6.65
Mexican Peso 906,899 0.91
New Zealand Dollar 432,475 0.43
Russian Ruble 835,823 0.84
South African Rand 821,913 0.82
United States Dollar 16,406,708 16.40
36,900,460 36.89
Investment Funds held for trading:
Pound Sterling 141,189 0.14
United States Dollar 9,120,513 9.12
9,261,702 9.26
Mortgage Backed Securities held for trading:
United States Dollar 11,394,706 11.39
Treasury Bills held for trading:
United States Dollar 323,756 0.33
106,250,274 106.22
Net Derivative Liabilities held for trading (177,256) (0.18)

FINANCIAL STATEMENTS NOTES TO THE AUDITED FINANCIAL STATEMENTS
1204 NEUBERGER BERMAN INVESTMENT FUNDS PLC
FOR THE YEAR ENDED 31 DECEMBER 2019
12. FINANCIAL INSTRUMENT DISCLOSURES (CONTINUED)
(a) Price Risk (continued)
Neuberger Berman Multi-Asset Risk Premia Fund*
As at 31 December 2018 Market ValueUS$
% of Net Assets
Government Bonds held for trading:
United States Dollar 13,467,380 28.16
Treasury Bills held for trading:
United States Dollar 33,029,485 69.07
46,496,865 97.23
Net Derivative Assets held for trading 792,498 1.65
* Portfolio liquidated on 26 March 2019.
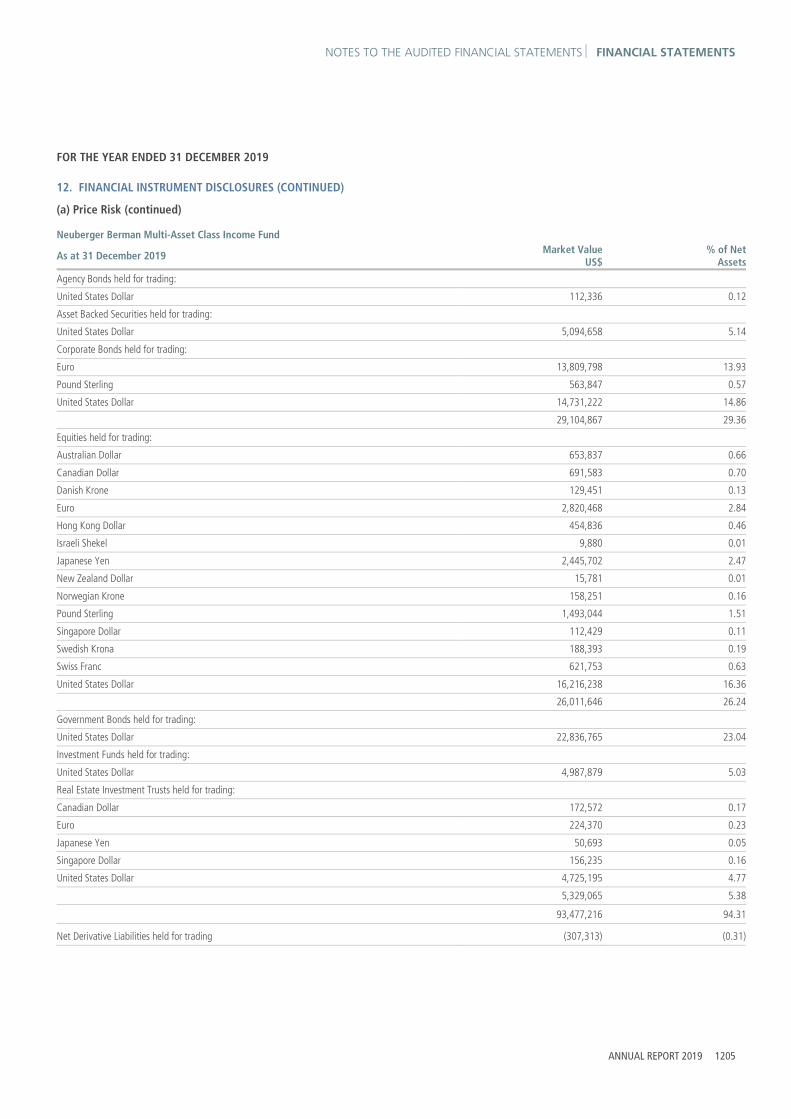
NOTES TO THE AUDITED FINANCIAL STATEMENTS FINANCIAL STATEMENTS
ANNUAL REPORT 2019 1205
FOR THE YEAR ENDED 31 DECEMBER 2019
12. FINANCIAL INSTRUMENT DISCLOSURES (CONTINUED)
(a) Price Risk (continued)
Neuberger Berman Multi-Asset Class Income Fund
As at 31 December 2019 Market ValueUS$
% of Net Assets
Agency Bonds held for trading:
United States Dollar 112,336 0.12
Asset Backed Securities held for trading:
United States Dollar 5,094,658 5.14
Corporate Bonds held for trading:
Euro 13,809,798 13.93
Pound Sterling 563,847 0.57
United States Dollar 14,731,222 14.86
29,104,867 29.36
Equities held for trading:
Australian Dollar 653,837 0.66
Canadian Dollar 691,583 0.70
Danish Krone 129,451 0.13
Euro 2,820,468 2.84
Hong Kong Dollar 454,836 0.46
Israeli Shekel 9,880 0.01
Japanese Yen 2,445,702 2.47
New Zealand Dollar 15,781 0.01
Norwegian Krone 158,251 0.16
Pound Sterling 1,493,044 1.51
Singapore Dollar 112,429 0.11
Swedish Krona 188,393 0.19
Swiss Franc 621,753 0.63
United States Dollar 16,216,238 16.36
26,011,646 26.24
Government Bonds held for trading:
United States Dollar 22,836,765 23.04
Investment Funds held for trading:
United States Dollar 4,987,879 5.03
Real Estate Investment Trusts held for trading:
Canadian Dollar 172,572 0.17
Euro 224,370 0.23
Japanese Yen 50,693 0.05
Singapore Dollar 156,235 0.16
United States Dollar 4,725,195 4.77
5,329,065 5.38
93,477,216 94.31
Net Derivative Liabilities held for trading (307,313) (0.31)

FINANCIAL STATEMENTS NOTES TO THE AUDITED FINANCIAL STATEMENTS
1206 NEUBERGER BERMAN INVESTMENT FUNDS PLC
FOR THE YEAR ENDED 31 DECEMBER 2019
12. FINANCIAL INSTRUMENT DISCLOSURES (CONTINUED)
(a) Price Risk (continued)
Neuberger Berman Multi-Asset Class Income Fund (continued)
As at 31 December 2018 Market ValueUS$
% of Net Assets
Agency Bonds held for trading:
United States Dollar 103,157 0.28
Asset Backed Securities held for trading:
United States Dollar 2,390,183 6.48
Corporate Bonds held for trading:
United States Dollar 4,986,991 13.53
Equities held for trading:
Australian Dollar 478,637 1.30
Canadian Dollar 635,421 1.72
Danish Krone 30,353 0.08
Euro 2,446,995 6.64
Hong Kong Dollar 481,521 1.31
Israeli Shekel 55,419 0.15
Japanese Yen 1,056,454 2.86
New Zealand Dollar 68,589 0.19
Norwegian Krone 92,346 0.25
Pound Sterling 1,310,803 3.55
Singapore Dollar 83,621 0.23
Swedish Krona 123,997 0.34
Swiss Franc 398,790 1.08
United States Dollar 6,380,257 17.30
13,643,203 37.00
Government Bonds held for trading:
United States Dollar 6,606,279 17.92
Investment Funds held for trading:
United States Dollar 3,520,806 9.55
Mortgage Backed Securities held for trading:
United States Dollar 5,141,547 13.95
Real Estate Investment Trusts held for trading:
Australian Dollar 138,288 0.37
Canadian Dollar 129,783 0.35
Euro 136,580 0.37
Hong Kong Dollar 5,064 0.01
Pound Sterling 42,903 0.12
Singapore Dollar 105,865 0.29
United States Dollar 2,123,911 5.77
2,682,394 7.28
Treasury Bills held for trading:
United States Dollar 199,234 0.54
39,273,794 106.53
Net Derivative Liabilities held for trading (280,542) (0.76)

NOTES TO THE AUDITED FINANCIAL STATEMENTS FINANCIAL STATEMENTS
ANNUAL REPORT 2019 1207
FOR THE YEAR ENDED 31 DECEMBER 2019
12. FINANCIAL INSTRUMENT DISCLOSURES (CONTINUED)
(a) Price Risk (continued)
Neuberger Berman US Equity Index PutWrite Fund
As at 31 December 2019 Market ValueUS$
% of Net Assets
Government Bonds held for trading:
United States Dollar 521,939,768 94.14
521,939,768 94.14
Net Derivative Liabilities held for trading (1,596,935) (0.29)
As at 31 December 2018 Market ValueUS$
% of Net Assets
Government Bonds held for trading:
United States Dollar 399,009,972 81.10
399,009,972 81.10
Net Derivative Liabilities held for trading (7,951,466) (1.62)
Neuberger Berman Global Equity Index PutWrite Fund
As at 31 December 2019 Market ValueUS$
% of Net Assets
Government Bonds held for trading:
United States Dollar 53,992,382 94.85
53,992,382 94.85
Net Derivative Assets held for trading 189,274 0.33
As at 31 December 2018 Market Value
US$% of Net
Assets
Government Bonds held for trading:
United States Dollar 81,562,261 82.66
81,562,261 82.66
Net Derivative Liabilities held for trading (1,781,396) (1.80)
Neuberger Berman Uncorrelated Strategies Fund
As at 31 December 2019 Market ValueUS$
% of Net Assets
Government Bonds held for trading:
United States Dollar 79,998,088 6.69
Treasury Bills held for trading:
United States Dollar 756,992,762 63.33
836,990,850 70.02
Net Derivative Assets held for trading 46,959,461 3.93
As at 31 December 2018 Market Value
US$% of Net
Assets
Treasury Bills held for trading:
United States Dollar 439,961,516 50.65
439,961,516 50.65
Net Derivative Assets held for trading 38,309,025 4.40

FINANCIAL STATEMENTS NOTES TO THE AUDITED FINANCIAL STATEMENTS
1208 NEUBERGER BERMAN INVESTMENT FUNDS PLC
FOR THE YEAR ENDED 31 DECEMBER 2019
12. FINANCIAL INSTRUMENT DISCLOSURES (CONTINUED)
(a) Price Risk (continued)
Neuberger Berman Emerging Market Debt Blend Investment Grade Fund
As at 31 December 2019 Market ValueUS$
% of Net Assets
Corporate Bonds held for trading:
United States Dollar 6,092,081 31.26
Government Bonds held for trading:
Chilean Peso 142,669 0.73
Colombian Peso 354,125 1.82
Czech Koruna 235,206 1.21
Euro 1,115,528 5.72
Hungarian Forint 219,713 1.13
Indonesian Rupiah 1,178,740 6.05
Malaysian Ringgit 748,470 3.84
Mexican Peso 1,289,400 6.61
Peruvian Sol 318,271 1.63
Polish Zloty 317,743 1.63
Romanian New Leu 217,553 1.11
Thai Baht 771,415 3.96
United States Dollar 5,043,149 25.87
Uruguayan Peso 13,058 0.07
11,965,040 61.38
Treasury Bills held for trading:
Hungarian Forint 121,451 0.62
United States Dollar 253,080 1.30
374,531 1.92
18,431,652 94.56
Net Derivative Assets held for trading 81,108 0.41

NOTES TO THE AUDITED FINANCIAL STATEMENTS FINANCIAL STATEMENTS
ANNUAL REPORT 2019 1209
FOR THE YEAR ENDED 31 DECEMBER 2019
12. FINANCIAL INSTRUMENT DISCLOSURES (CONTINUED)
(a) Price Risk (continued)
Neuberger Berman Emerging Market Debt Blend Investment Grade Fund (continued)
As at 31 December 2018 Market ValueUS$
% of Net Assets
Corporate Bonds held for trading:
Mexican Peso 15,579 0.09
United States Dollar 5,169,887 30.24
5,185,466 30.33
Government Bonds held for trading:
Chilean Peso 96,321 0.56
Colombian Peso 604,749 3.54
Czech Koruna 335,888 1.97
Euro 1,045,199 6.11
Hungarian Forint 159,032 0.93
Indonesian Rupiah 874,048 5.11
Malaysian Ringgit 540,171 3.16
Mexican Peso 896,709 5.25
Peruvian Sol 280,496 1.64
Polish Zloty 581,553 3.40
Romanian New Leu 239,913 1.40
Russian Ruble 20,430 0.12
Thai Baht 530,720 3.11
United States Dollar 4,595,662 26.89
10,800,891 63.19
Treasury Bills held for trading:
Malaysian Ringgit 86,999 0.51
Thai Baht 18,165 0.11
United States Dollar 130,287 0.76
235,451 1.38
16,221,808 94.90
Net Derivative Liabilities held for trading (47,400) (0.28)

FINANCIAL STATEMENTS NOTES TO THE AUDITED FINANCIAL STATEMENTS
1210 NEUBERGER BERMAN INVESTMENT FUNDS PLC
FOR THE YEAR ENDED 31 DECEMBER 2019
12. FINANCIAL INSTRUMENT DISCLOSURES (CONTINUED)
(a) Price Risk (continued)
Neuberger Berman Emerging Markets Sustainable Equity Fund
As at 31 December 2019 Market ValueUS$
% of Net Assets
Equities held for trading:
Brazilian Real 8,623,120 6.64
Chinese Yuan Renminbi 2,151,921 1.66
Czech Koruna 1,013,356 0.78
Euro 931,781 0.72
Hong Kong Dollar 27,622,769 21.27
Hungarian Forint 989,676 0.76
Indonesian Rupiah 1,781,268 1.37
Mexican Peso 3,971,811 3.06
New Taiwan Dollar 12,763,632 9.83
Philippine Peso 2,306,730 1.78
Polish Zloty 3,320,882 2.56
Pound Sterling 1,628,242 1.25
South African Rand 4,626,522 3.56
South Korean Won 19,782,654 15.23
Thai Baht 2,791,407 2.15
Turkish Lira 764,939 0.59
United States Dollar 24,115,556 18.57
119,186,266 91.78
Participatory Notes held for trading:
United States Dollar 6,625,155 5.10
Real Estate Investment Trusts held for trading:
Hong Kong Dollar 1,367,924 1.05
127,179,345 97.93

NOTES TO THE AUDITED FINANCIAL STATEMENTS FINANCIAL STATEMENTS
ANNUAL REPORT 2019 1211
FOR THE YEAR ENDED 31 DECEMBER 2019
12. FINANCIAL INSTRUMENT DISCLOSURES (CONTINUED)
(a) Price Risk (continued)
Neuberger Berman Emerging Markets Sustainable Equity Fund (continued)
As at 31 December 2018 Market ValueUS$
% of Net Assets
Equities held for trading:
Brazilian Real 2,404,625 7.46
Chinese Yuan Renminbi 573,756 1.78
Czech Koruna 307,010 0.95
Hong Kong Dollar 6,473,548 20.09
Indonesian Rupiah 860,038 2.67
Mexican Peso 1,014,864 3.15
New Taiwan Dollar 1,960,415 6.08
Philippine Peso 712,110 2.21
Polish Zloty 833,084 2.59
Pound Sterling 160,148 0.50
South African Rand 2,193,809 6.81
South Korean Won 4,873,884 15.13
Thai Baht 416,855 1.29
Turkish Lira 272,649 0.85
United States Dollar 5,818,115 18.06
28,874,910 89.62
Participatory Notes held for trading:
United States Dollar 1,909,423 5.93
30,784,333 95.55
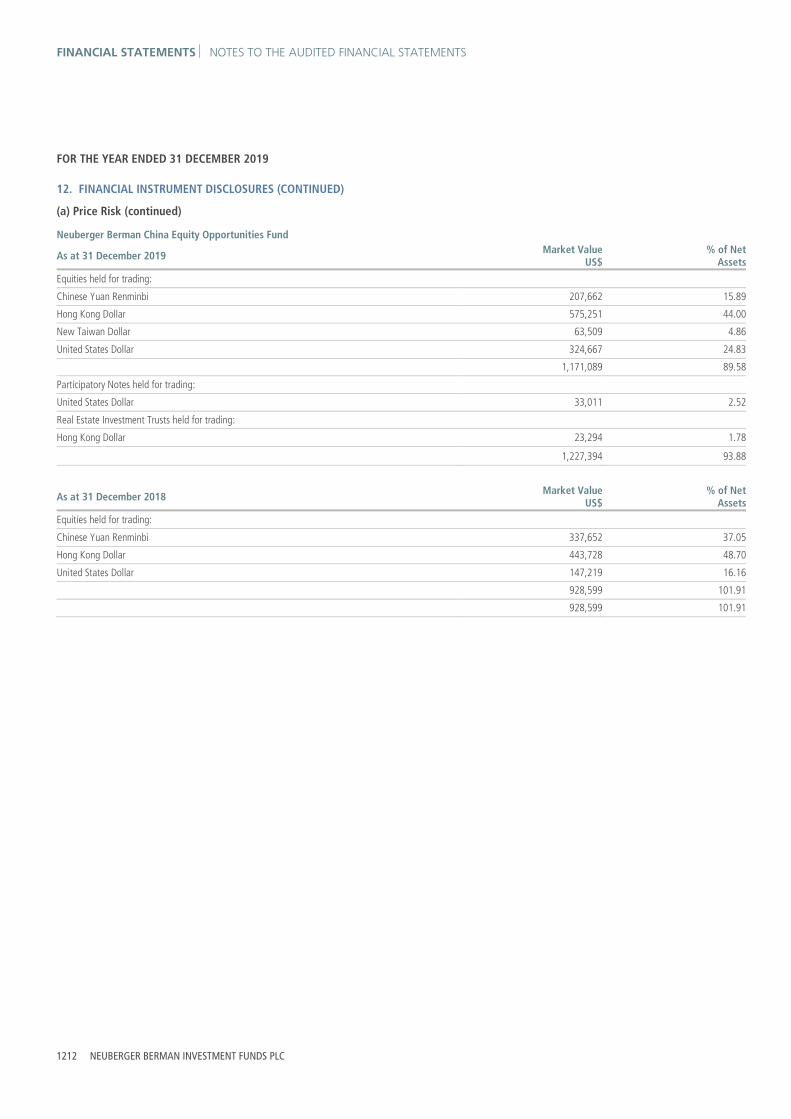
FINANCIAL STATEMENTS NOTES TO THE AUDITED FINANCIAL STATEMENTS
1212 NEUBERGER BERMAN INVESTMENT FUNDS PLC
FOR THE YEAR ENDED 31 DECEMBER 2019
12. FINANCIAL INSTRUMENT DISCLOSURES (CONTINUED)
(a) Price Risk (continued)
Neuberger Berman China Equity Opportunities Fund
As at 31 December 2019 Market ValueUS$
% of Net Assets
Equities held for trading:
Chinese Yuan Renminbi 207,662 15.89
Hong Kong Dollar 575,251 44.00
New Taiwan Dollar 63,509 4.86
United States Dollar 324,667 24.83
1,171,089 89.58
Participatory Notes held for trading:
United States Dollar 33,011 2.52
Real Estate Investment Trusts held for trading:
Hong Kong Dollar 23,294 1.78
1,227,394 93.88
As at 31 December 2018 Market Value
US$% of Net
Assets
Equities held for trading:
Chinese Yuan Renminbi 337,652 37.05
Hong Kong Dollar 443,728 48.70
United States Dollar 147,219 16.16
928,599 101.91
928,599 101.91

NOTES TO THE AUDITED FINANCIAL STATEMENTS FINANCIAL STATEMENTS
ANNUAL REPORT 2019 1213
FOR THE YEAR ENDED 31 DECEMBER 2019
12. FINANCIAL INSTRUMENT DISCLOSURES (CONTINUED)
(a) Price Risk (continued)
Neuberger Berman Multi-Asset Class Growth Fund
As at 31 December 2019 Market ValueUS$
% of Net Assets
Asset Backed Securities held for trading:
United States Dollar 1,230,786 6.27
Corporate Bonds held for trading:
Euro 2,317,373 11.81
Pound Sterling 271,223 1.38
United States Dollar 595,712 3.03
3,184,308 16.22
Equities held for trading:
Australian Dollar 84,644 0.43
Canadian Dollar 135,039 0.69
Danish Krone 25,633 0.13
Euro 428,517 2.18
Hong Kong Dollar 37,306 0.19
Japanese Yen 317,111 1.62
Norwegian Krone 11,999 0.06
Pound Sterling 205,588 1.05
Singapore Dollar 16,543 0.08
Swedish Krona 35,937 0.18
Swiss Franc 144,956 0.74
United States Dollar 2,515,230 12.82
3,958,503 20.17
Government Bonds held for trading:
Japanese Yen 85,722 0.44
United States Dollar 7,877,624 40.13
7,963,346 40.57
Investment Funds held for trading:
United States Dollar 1,646,633 8.39
Mortgage Backed Securities held for trading:
United States Dollar 199,118 1.01
Real Estate Investment Trusts held for trading:
Australian Dollar 3,468 0.02
Euro 6,877 0.04
Japanese Yen 9,968 0.05
Pound Sterling 11,993 0.06
Singapore Dollar 3,313 0.02
United States Dollar 77,155 0.39
112,774 0.58
18,295,468 93.21
Net Derivative Liabilities held for trading (258,054) (1.31)
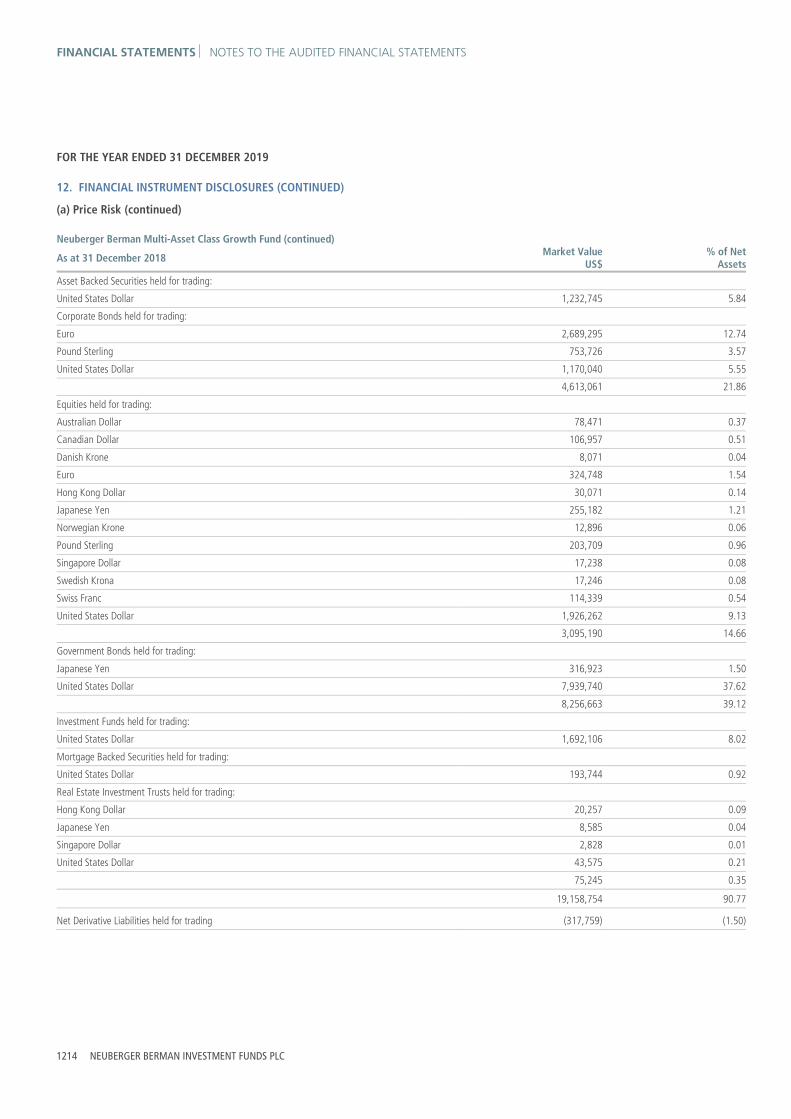
FINANCIAL STATEMENTS NOTES TO THE AUDITED FINANCIAL STATEMENTS
1214 NEUBERGER BERMAN INVESTMENT FUNDS PLC
FOR THE YEAR ENDED 31 DECEMBER 2019
12. FINANCIAL INSTRUMENT DISCLOSURES (CONTINUED)
(a) Price Risk (continued)
Neuberger Berman Multi-Asset Class Growth Fund (continued)
As at 31 December 2018 Market ValueUS$
% of Net Assets
Asset Backed Securities held for trading:
United States Dollar 1,232,745 5.84
Corporate Bonds held for trading:
Euro 2,689,295 12.74
Pound Sterling 753,726 3.57
United States Dollar 1,170,040 5.55
4,613,061 21.86
Equities held for trading:
Australian Dollar 78,471 0.37
Canadian Dollar 106,957 0.51
Danish Krone 8,071 0.04
Euro 324,748 1.54
Hong Kong Dollar 30,071 0.14
Japanese Yen 255,182 1.21
Norwegian Krone 12,896 0.06
Pound Sterling 203,709 0.96
Singapore Dollar 17,238 0.08
Swedish Krona 17,246 0.08
Swiss Franc 114,339 0.54
United States Dollar 1,926,262 9.13
3,095,190 14.66
Government Bonds held for trading:
Japanese Yen 316,923 1.50
United States Dollar 7,939,740 37.62
8,256,663 39.12
Investment Funds held for trading:
United States Dollar 1,692,106 8.02
Mortgage Backed Securities held for trading:
United States Dollar 193,744 0.92
Real Estate Investment Trusts held for trading:
Hong Kong Dollar 20,257 0.09
Japanese Yen 8,585 0.04
Singapore Dollar 2,828 0.01
United States Dollar 43,575 0.21
75,245 0.35
19,158,754 90.77
Net Derivative Liabilities held for trading (317,759) (1.50)

NOTES TO THE AUDITED FINANCIAL STATEMENTS FINANCIAL STATEMENTS
ANNUAL REPORT 2019 1215
FOR THE YEAR ENDED 31 DECEMBER 2019
12. FINANCIAL INSTRUMENT DISCLOSURES (CONTINUED)
(a) Price Risk (continued)
Neuberger Berman Global Thematic Equity Fund1
As at 31 December 2019 Market ValueUS$
% of Net Assets
Equities held for trading:
Pound Sterling 1,569,830 6.41
United States Dollar 22,764,054 92.97
24,333,884 99.38
24,333,884 99.38
As at 31 December 2018 Market ValueUS$
% of Net Assets
Equities held for trading:
Pound Sterling 708,608 5.82
United States Dollar 11,438,386 93.90
12,146,994 99.72
12,146,994 99.72
Neuberger Berman CLO Income Fund1
As at 31 December 2019 Market ValueUS$
% of Net Assets
Asset Backed Securities held for trading:
Euro 8,379,683 5.49
United States Dollar 126,771,183 83.14
135,150,866 88.63
Corporate Bonds held for trading:
United States Dollar 3,189,618 2.09
138,340,484 90.72
Net Derivative Assets held for trading 6,564,023 4.31
As at 31 December 2018 Market ValueUS$
% of Net Assets
Asset Backed Securities held for trading:
Euro 8,324,023 7.39
United States Dollar 92,195,330 81.83
100,519,353 89.22
Corporate Bonds held for trading:
United States Dollar 5,494,113 4.88
106,013,466 94.10
Net Derivative Liabilities held for trading (1,548,802) (1.37)

FINANCIAL STATEMENTS NOTES TO THE AUDITED FINANCIAL STATEMENTS
1216 NEUBERGER BERMAN INVESTMENT FUNDS PLC
FOR THE YEAR ENDED 31 DECEMBER 2019
12. FINANCIAL INSTRUMENT DISCLOSURES (CONTINUED)
(a) Price Risk (continued)
Neuberger Berman China A-Share Opportunities Fund1*
As at 31 December 2018 Market ValueUS$
% of Net Assets
Equities held for trading:
Chinese Yuan Renminbi 730,092 96.76
730,092 96.76
* Portfolio liquidated on 6 December 2019.
Neuberger Berman Next Generation Mobility Fund1
As at 31 December 2019 Market ValueUS$
% of Net Assets
Equities held for trading:
Euro 870,717 2.04
Hong Kong Dollar 924,518 2.17
Japanese Yen 3,044,000 7.13
New Taiwan Dollar 976,448 2.29
United States Dollar 34,802,351 81.59
40,618,034 95.22
40,618,034 95.22
Net Derivative Assets held for trading 8,051 0.02
As at 31 December 2018 Market ValueUS$
% of Net Assets
Equities held for trading:
Australian Dollar 49,883 2.27
Euro 133,623 6.10
Hong Kong Dollar 79,092 3.61
Japanese Yen 225,375 10.28
Pound Sterling 43,922 2.00
South Korean Won 82,343 3.76
Swiss Franc 33,091 1.51
United States Dollar 1,440,263 65.70
2,087,592 95.23
2,087,592 95.23
Net Derivative Liabilities held for trading (168) (0.01)

NOTES TO THE AUDITED FINANCIAL STATEMENTS FINANCIAL STATEMENTS
ANNUAL REPORT 2019 1217
FOR THE YEAR ENDED 31 DECEMBER 2019
12. FINANCIAL INSTRUMENT DISCLOSURES (CONTINUED)
(a) Price Risk (continued)
Neuberger Berman Ultra Short Term Euro Bond Fund1
As at 31 December 2019 Market ValueEUR
% of Net Assets
Asset Backed Securities held for trading:
Euro 69,319,661 18.36
Corporate Bonds held for trading:
Euro 240,805,405 63.79
Government Bonds held for trading:
Euro 47,252,899 12.52
357,377,965 94.67
Net Derivative Liabilities held for trading (1,308,814) (0.35)
As at 31 December 2018 Market ValueEUR
% of Net Assets
Asset Backed Securities held for trading:
Euro 233,185 2.05
Corporate Bonds held for trading:
Euro 10,212,921 89.97
Government Bonds held for trading:
Euro 618,513 5.45
11,064,619 97.47
Net Derivative Liabilities held for trading (580) 0.00
Neuberger Berman Euro Opportunistic Bond Fund1
As at 31 December 2019 Market ValueEUR
% of Net Assets
Asset Backed Securities held for trading:
Euro 373,528 3.52
Corporate Bonds held for trading:
Euro 3,981,415 37.52
Government Bonds held for trading:
Euro 4,835,824 45.57
Investment Funds held for trading:
Euro 1,015,652 9.57
10,206,419 96.18
Net Derivative Assets held for trading 24,277 0.23
As at 31 December 2018 Market ValueEUR
% of Net Assets
Corporate Bonds held for trading:
Euro 3,333,919 66.41
Government Bonds held for trading:
Euro 1,479,750 29.48
4,813,669 95.89
Net Derivative Assets held for trading 1,019 0.02

FINANCIAL STATEMENTS NOTES TO THE AUDITED FINANCIAL STATEMENTS
1218 NEUBERGER BERMAN INVESTMENT FUNDS PLC
FOR THE YEAR ENDED 31 DECEMBER 2019
12. FINANCIAL INSTRUMENT DISCLOSURES (CONTINUED)
(a) Price Risk (continued)
Neuberger Berman Euro Bond Absolute Return Fund1
As at 31 December 2019 Market ValueEUR
% of Net Assets
Asset Backed Securities held for trading:
Euro 5,166,814 6.37
Corporate Bonds held for trading:
Euro 26,812,273 33.08
Government Bonds held for trading:
Euro 45,396,408 56.01
United States Dollar 1,905,131 2.35
47,301,539 58.36
79,280,626 97.81
Net Derivative Assets held for trading 205,371 0.26
As at 31 December 2018 Market ValueEUR
% of Net Assets
Corporate Bonds held for trading:
Euro 4,902,436 49.01
Government Bonds held for trading:
Euro 2,332,268 23.31
Investment Funds held for trading:
Euro 499,950 5.00
7,734,654 77.32
Net Derivative Liabilities held for trading (964) (0.02)
Neuberger Berman Absolute Alpha Fund2
As at 31 December 2019 Market ValueUS$
% of Net Assets
Equities held for trading:
United States Dollar 36,332,819 91.16
36,332,819 91.16
Net Derivative Liabilities held for trading (1,658,420) (4.16)

NOTES TO THE AUDITED FINANCIAL STATEMENTS FINANCIAL STATEMENTS
ANNUAL REPORT 2019 1219
FOR THE YEAR ENDED 31 DECEMBER 2019
12. FINANCIAL INSTRUMENT DISCLOSURES (CONTINUED)
(a) Price Risk (continued)
Neuberger Berman Multi-Style Premia Fund2
As at 31 December 2019 Market ValueUS$
% of Net Assets
Corporate Bonds held for trading:
United States Dollar 612,562 3.74
Equities held for trading:
Euro 2,264,545 13.81
Japanese Yen 1,448,215 8.83
Pound Sterling 1,609,361 9.82
5,322,121 32.46
Real Estate Investment Trusts held for trading:
Euro 154,846 0.95
Japanese Yen 165,554 1.01
Pound Sterling 70,506 0.43
390,906 2.39
6,325,589 38.59
Net Derivative Assets held for trading 439,517 2.68
Neuberger Berman Macro Opportunities FX Fund2
As at 31 December 2019 Market ValueEUR
% of Net Assets
Corporate Bonds held for trading:
Euro 14,690,828 75.40
Government Bonds held for trading:
Euro 803,302 4.12
Treasury Bills held for trading:
Euro 4,016,640 20.62
19,510,770 100.14
Net Derivative Liabilities held for trading (168,135) (0.87)
1 Portfolio launched during the prior reporting year. 2 Portfolio launched during the current reporting year.

FINANCIAL STATEMENTS NOTES TO THE AUDITED FINANCIAL STATEMENTS
1220 NEUBERGER BERMAN INVESTMENT FUNDS PLC
FOR THE YEAR ENDED 31 DECEMBER 2019
12. FINANCIAL INSTRUMENT DISCLOSURES (CONTINUED)
(b) Foreign Currency Risk
The Net Asset Value per share of a Portfolio will be computed in the base currency of the relevant Portfolio, whereas the investments held for the account of that Portfolio may be acquired in other currencies. The base currency value of the investments of a Portfolio designated in another currency may rise and fall due to exchange rate fluctuations in respect of the relevant currencies. Adverse movements in currency exchange rates can result in a decrease in return and a loss of capital. Positions are monitored on a daily basis and hedging strategies are used to ensure positions are maintained within established limits. At 31 December 2019 and 31 December 2018, had the base currency of the relevant Portfolio strengthened by 5% in relation to all currencies, with all other variables held constant, Net Assets and the Change in Net Assets per the Profit and Loss Account would have (decreased)/increased as outlined in the table below. Portfolio Currency 31 December
2019% of Net
Assets 31 December
2018 % of Net
Assets
Neuberger Berman High Yield Bond Fund USD 5,605,801 0.16% 4,686,181 0.12%
Neuberger Berman Diversified Currency Fund USD (10,392) (0.02%) (4,255) (0.02%)
Neuberger Berman US Multi Cap Opportunities Fund USD 51,909 0.01% (102,342) (0.01%)
Neuberger Berman US Real Estate Securities Fund USD 68,920 0.03% 8,166 0.01%
Neuberger Berman China Equity Fund USD 35,409,724 4.12% 34,209,864 4.16%
Neuberger Berman Emerging Markets Equity Fund USD 17,244,580 3.83% 17,720,971 4.00%
Neuberger Berman US Small Cap Fund USD 88,901 0.02% 77,643 0.02%
Neuberger Berman Short Duration High Yield Bond Fund USD 624,720 0.06% 332,233 0.03%
Neuberger Berman Global Bond Fund USD 5,413,142 2.67% 3,250,460 2.24%
Neuberger Berman Emerging Market Debt – Local Currency Fund USD 152,250,523 4.75% 119,404,475 4.77%
Neuberger Berman Emerging Market Debt – Hard Currency Fund USD 15,287,653 0.61% 9,524,556 0.64%
Neuberger Berman Emerging Market Corporate Debt Fund USD 232,282 0.13% 71,433 0.06%
Neuberger Berman Strategic Income Fund USD 918,739 0.06% 5,595,234 0.54%
Neuberger Berman Global Bond Absolute Return Fund USD 2,691,338 2.00% 1,535,918 1.91%
Neuberger Berman Short Duration Emerging Market Debt Fund USD 8,619,747 0.15% 1,073,716 0.03%
Neuberger Berman Absolute Return Multi Strategy Fund USD 52,683 0.10% 219,648 0.34%
Neuberger Berman US Long Short Equity Fund USD 45,829 0.03% (48,485) (0.03%)
Neuberger Berman Emerging Market Debt Blend Fund USD 44,928,155 2.63% 43,574,408 2.52%
Neuberger Berman European High Yield Bond Fund EUR 302,119 0.76% 193,420 0.77%
Neuberger Berman Global Equity Fund USD 30,223 2.12% 27,198 2.25%
Neuberger Berman Systematic Global Equity Fund USD 656,941 2.07% 444,637 2.15%
Neuberger Berman Global Real Estate Securities Fund USD 1,564,115 2.31% 78,441 2.41%
Neuberger Berman US Small Cap Intrinsic Value Fund USD - - - -
Neuberger Berman Global Credit Long Short Fund* USD - - (197) 0.00%
Neuberger Berman Asian Debt – Hard Currency Fund USD 747 0.00% 13,137 0.08%
Neuberger Berman China Bond Fund CNY 17,522,489 2.15% 992,348 1.23%
Neuberger Berman Global Dynamic Asset Allocator Fund** USD (88) 0.00% 435,695 1.79%
Neuberger Berman Asian Opportunities Fund*** USD 1 0.00% 132,244 3.72%
Neuberger Berman Corporate Hybrid Bond Fund EUR 22,786,258 2.01% 17,173,971 2.11%
Neuberger Berman US Equity Fund USD - - - -
Neuberger Berman Global High Yield Bond Fund USD 655,517 0.89% 617,429 1.03%

NOTES TO THE AUDITED FINANCIAL STATEMENTS FINANCIAL STATEMENTS
ANNUAL REPORT 2019 1221
FOR THE YEAR ENDED 31 DECEMBER 2019
12. FINANCIAL INSTRUMENT DISCLOSURES (CONTINUED)
(b) Foreign Currency Risk (continued)
Portfolio Currency 31 December 2019
% of Net Assets
31 December 2018
% of Net Assets
Neuberger Berman Global Opportunistic Bond Fund USD 3,895,185 2.24% 2,590,023 2.59%
Neuberger Berman Multi-Asset Risk Premia Fund**** USD 32 0.00% (25,433) (0.05%)
Neuberger Berman Multi-Asset Class Income Fund USD 1,240,240 1.25% 383,022 1.04%
Neuberger Berman US Equity Index PutWrite Fund USD 79,191 0.01% (30,790) (0.01%)
Neuberger Berman Global Equity Index PutWrite Fund USD 27,176 0.05% (14,479) (0.01%)
Neuberger Berman Uncorrelated Strategies Fund USD 1,421,607 0.12% (617,653) (0.07%)
Neuberger Berman Emerging Market Debt Blend Investment Grade Fund USD 358,352 1.84% 319,214 1.87%
Neuberger Berman Emerging Markets Sustainable Equity Fund USD 4,828,554 3.72% 1,155,848 3.59%
Neuberger Berman China Equity Opportunities Fund USD 44,624 3.41% 39,069 4.29%
Neuberger Berman Multi-Asset Class Growth Fund USD 195,375 1.00% 255,647 1.21%
Neuberger Berman Global Thematic Equity Fund1 USD 80,690 0.33% 35,430 0.29%
Neuberger Berman CLO Income Fund1 USD 716,780 0.47% 329,246 0.29%
Neuberger Berman China A-Share Opportunities Fund1***** USD - - 36,505 4.84%
Neuberger Berman Next Generation Mobility Fund1 USD 308,648 0.72% 35,822 1.63%
Neuberger Berman Ultra Short Term Euro Bond Fund1 EUR (78,989) (0.02%) - -
Neuberger Berman Euro Opportunistic Bond Fund1 EUR (521) 0.00% (64) 0.00%
Neuberger Berman Euro Bond Absolute Return Fund1 EUR 75,401 0.09% (102) 0.00%
Neuberger Berman Absolute Alpha Fund2 USD 5,081 0.01% - -
Neuberger Berman Multi-Style Premia Fund2 USD 304,579 1.86% - -
Neuberger Berman Macro Opportunities FX Fund2 EUR 985,037 5.06% - -
* Portfolio liquidated on 26 November 2018. ** Portfolio liquidated on 12 April 2019. *** Portfolio liquidated on 24 July 2019. **** Portfolio liquidated on 26 March 2019. ***** Portfolio liquidated on 6 December 2019.
1 Portfolio launched during the prior reporting year. 2 Portfolio launched during the current reporting year.
A 5% weakening of the base currency of the relevant Portfolio against the above currencies would have resulted in an equal but opposite effect on the above financial statement amounts to the amounts shown above, on the basis that all other variables remain constant. The foreign currency risk exposure has been calculated on the Net Assets of the Portfolio that are denominated in a currency which is not the base currency of the relevant Portfolio.

FINANCIAL STATEMENTS NOTES TO THE AUDITED FINANCIAL STATEMENTS
1222 NEUBERGER BERMAN INVESTMENT FUNDS PLC
FOR THE YEAR ENDED 31 DECEMBER 2019
12. FINANCIAL INSTRUMENT DISCLOSURES (CONTINUED)
(b) Foreign Currency Risk (continued)
The tables below summarise the relevant Portfolio's overall exposure to currency risk
Neuberger Berman High Yield Bond Fund Neuberger Berman Diversified
Currency Fund Neuberger Berman US Multi Cap
Opportunities Fund As at 31 December 2019 As at 31 December 2018 As at 31 December 2019 As at 31 December 2018 As at 31 December 2019 As at 31 December 2018
US$ US$ US$ US$ US$ US$
Australian Dollar 10,452,538 (555,806) (65,473) (42,473) (48,563) (240,502) Brazilian Real - - 105,292 (7,005) - - Canadian Dollar 96,253 (170,641) (65,956) 26,453 - - Chinese Yuan Renminbi - 1,268 - - - - Chinese Yuan Renminbi - Offshore 454,959 130,907 - - - - Czech Koruna - - 39,977 - - - Euro 5,765,457 (2,794,369) (48,711) 36,194 537,956 (968,797) Hong Kong Dollar 50,487 (83,947) - - - - Hungarian Forint - - (3,041) - - - Japanese Yen (694) 316 (164,849) 50,125 - - Mexican Peso - - (123,328) - - - New Zealand Dollar - - (229,647) (153,429) - - Norwegian Krone - - 458,023 (76,757) - - Polish Zloty - - 3 - - - Pound Sterling 63,971,460 75,419,729 28,944 33,600 36,002 (14,167) Singapore Dollar 762,585 634,569 - - 41,799 120,266 South African Rand 29,731,783 20,814,081 43,296 - 470,988 (943,633) South Korean Won - - 3,193 (1,916) - - Swedish Krona 594,229 309,174 85,830 31,345 - - Swiss Franc 236,961 18,340 (288,330) 2,268 - - Turkish Lira - - 16,930 16,487 - - United States Dollar 3,389,393,120 3,933,004,967 68,491,059 27,349,118 762,423,298 896,490,788
3,501,509,138 4,026,728,588 68,283,212 27,264,010 763,461,480 894,443,955

NOTES TO THE AUDITED FINANCIAL STATEMENTS FINANCIAL STATEMENTS
ANNUAL REPORT 2019 1223
FOR THE YEAR ENDED 31 DECEMBER 2019
12. FINANCIAL INSTRUMENT DISCLOSURES (CONTINUED)
(b) Foreign Currency Risk (continued)
Neuberger Berman US Real Estate Securities Fund Neuberger Berman China
Equity Fund Neuberger Berman Emerging Markets
Equity Fund As at 31 December 2019 As at 31 December 2018 As at 31 December 2019 As at 31 December 2018 As at 31 December 2019 As at 31 December 2018 US$ US$ US$ US$ US$ US$
Australian Dollar 476,476 (62,666) - - 230,591 (162,047) Brazilian Real - - - - 28,558,208 32,023,075 Canadian Dollar - - - - 3,539,285 - Chinese Yuan Renminbi - - 20,233,295 - - - Chinese Yuan Renminbi - Offshore - - 154,220,214 197,819,423 9,604,043 8,491,097 Czech Koruna - - - - 3,396,405 3,678,282 Euro 501,622 (92,374) 110,922 (362,045) 3,098,423 (57,256) Hong Kong Dollar (98,080) (552) 533,255,380 486,639,206 103,825,113 104,696,384 Hungarian Forint - - - - 3,335,844 - Indian Rupee - - - - 33,918,044 46,329,321 Indonesian Rupiah - - - - 5,593,594 7,722,542 Malaysian Ringgit - - - - 2,485,084 2,599,728 Mexican Peso - - - - 11,408,767 12,290,878 New Taiwan Dollar - - - - 21,815,428 13,824,006 Philippine Peso - - - - 6,827,524 8,776,957 Polish Zloty - - - - 9,894,203 11,547,142 Pound Sterling 1,141 (377) 87,222 (37,322) 6,502,197 334,695 Singapore Dollar 15,807 2,967 149,277 133,960 - - South African Rand 421,811 314,435 - - 16,882,837 27,876,928 South Korean Won - - - - 64,313,295 65,242,536 Swiss Franc 59,622 1,884 138,176 4,052 - - Thai Baht - - - - 6,279,332 4,912,276 Turkish Lira - - - - 3,383,386 4,292,870 United States Dollar 269,258,205 88,547,694 150,490,528 138,937,987 105,772,649 88,645,299
270,636,604 88,711,011 858,685,014 823,135,261 450,664,252 443,064,713

FINANCIAL STATEMENTS NOTES TO THE AUDITED FINANCIAL STATEMENTS
1224 NEUBERGER BERMAN INVESTMENT FUNDS PLC
FOR THE YEAR ENDED 31 DECEMBER 2019
12. FINANCIAL INSTRUMENT DISCLOSURES (CONTINUED)
(b) Foreign Currency Risk (continued)
Neuberger Berman US Small Cap Fund Neuberger Berman Short Duration
High Yield Bond Fund Neuberger Berman Global
Bond Fund As at 31 December 2019 As at 31 December 2018 As at 31 December 2019 As at 31 December 2018 As at 31 December 2019 As at 31 December 2018
US$ US$ US$ US$ US$ US$
Australian Dollar 130,527 102,206 33,050 (977) 5,071,385 3,171,976
Brazilian Real - - - - 34,750 (6,263)
Canadian Dollar 12,783 7,262 - - 11,005,139 7,823,521
Chilean Peso - - - - (4,897) -
Chinese Yuan Renminbi - - - - 112,378 -
Chinese Yuan Renminbi - Offshore - - 7,538 11,463 - -
Czech Koruna - - - - 19,377 (992)
Danish Krone - - - - 3,392,235 (3,899)
Euro 55,284 140,972 6,089,471 (3,458,779) 49,143,542 29,005,095
Hong Kong Dollar - - - - 28,538 28,213
Hungarian Forint - - - - 2,414 338
Indonesian Rupiah - - - - 18,838 28,632
Israeli Shekel - - - - 953 (5,925)
Japanese Yen - - (4,318,406) 5,290,074 22,919,649 10,871,913
Malaysian Ringgit - - - - 14,480 3,265
Mexican Peso - - - - (13,785) (10,808)
New Zealand Dollar - - - - 2,737,357 2,165,149
Norwegian Krone - - - - 182,732 (68,396)
Polish Zloty - - - - 322,274 323,828
Pound Sterling 1,530,473 1,233,163 10,247,426 4,770,377 11,833,866 11,675,403
Russian Ruble - - - - 16,406 (4,350)
Singapore Dollar - - 5,907 21,540 8,417 3,747

NOTES TO THE AUDITED FINANCIAL STATEMENTS FINANCIAL STATEMENTS
ANNUAL REPORT 2019 1225
FOR THE YEAR ENDED 31 DECEMBER 2019
12. FINANCIAL INSTRUMENT DISCLOSURES (CONTINUED)
(b) Foreign Currency Risk (continued)
Neuberger Berman US Small Cap Fund (continued) Neuberger Berman Short Duration
High Yield Bond Fund (continued) Neuberger Berman Global
Bond Fund (continued) As at 31 December 2019 As at 31 December 2018 As at 31 December 2019 As at 31 December 2018 As at 31 December 2019 As at 31 December 2018
US$ US$ US$ US$ US$ US$
South African Rand 48,957 69,259 437 403 14,792 2,060
South Korean Won - - - - 82,615 25,391
Swedish Krona - - - - 1,391,418 (38,577)
Swiss Franc - - 428,978 10,564 (89,216) 2,958
Thai Baht - - - - 11,430 4,545
Turkish Lira - - - - 5,756 12,377
United States Dollar 413,329,132 330,321,835 1,021,800,191 1,009,592,694 94,854,845 79,922,391
415,107,156 331,874,697 1,034,294,592 1,016,237,359 203,117,688 144,931,592

FINANCIAL STATEMENTS NOTES TO THE AUDITED FINANCIAL STATEMENTS
1226 NEUBERGER BERMAN INVESTMENT FUNDS PLC
FOR THE YEAR ENDED 31 DECEMBER 2019
12. FINANCIAL INSTRUMENT DISCLOSURES (CONTINUED)
(b) Foreign Currency Risk (continued)
Neuberger Berman Emerging Market Debt -Local Currency Fund Neuberger Berman Emerging Market Debt -
Hard Currency Fund Neuberger Berman Emerging Market Corporate Debt Fund
As at 31 December 2019 As at 31 December 2018 As at 31 December 2019 As at 31 December 2018 As at 31 December 2019 As at 31 December 2018
US$ US$ US$ US$ US$ US$
Argentine Peso 6,491,431 45,463,366 - - - -
Australian Dollar 3,779,831 (1,488,490) 120,834 - - -
Brazilian Real 40,607,849 34,552,908 - - - -
Canadian Dollar 815 767 - - - -
Chilean Peso 71,319,258 40,822,767 - - - -
Chinese Yuan Renminbi 28,731,269 9,793 - - - -
Chinese Yuan Renminbi - Offshore 111,385 26,947,233 - - - -
Colombian Peso 148,120,881 154,648,884 - - - -
Czech Koruna 97,861,642 151,881,949 - - - -
Dominican Republic Peso 21,576,537 2,411,989 - - - -
Egyptian Pound 83,472,561 40,642,070 - - - -
Euro 25,715,065 32,730,514 303,410,203 189,012,723 3,797,861 1,312,306
Ghanaian Cedi 1,204 1,413 - - - -
Hong Kong Dollar - - 14,243 - - -
Hungarian Forint 107,932,278 63,467,009 - - - -
Indian Rupee 327,626 27,607 - - - -
Indonesian Rupiah 341,797,520 258,686,064 - - - -
Israeli Shekel (241,624) 335,048 - - - -
Japanese Yen - 747,672 (57,913) 431,878 - -
Kazahstani Tenge 592,328 (889,784) - - - -
Malaysian Ringgit 227,324,090 175,262,546 - - - -
Mexican Peso 433,606,090 254,168,949 - - 886 849
Nigerian Naira 7,328,045 - - - - -

NOTES TO THE AUDITED FINANCIAL STATEMENTS FINANCIAL STATEMENTS
ANNUAL REPORT 2019 1227
FOR THE YEAR ENDED 31 DECEMBER 2019
12. FINANCIAL INSTRUMENT DISCLOSURES (CONTINUED)
(b) Foreign Currency Risk (continued)
Neuberger Berman Emerging Market Debt -Local Currency Fund (continued) Neuberger Berman Emerging Market Debt -
Hard Currency Fund (continued) Neuberger Berman Emerging Market Corporate Debt Fund (continued)
As at 31 December 2019 As at 31 December 2018 As at 31 December 2019 As at 31 December 2018 As at 31 December 2019 As at 31 December 2018
US$ US$ US$ US$ US$ US$
Peruvian Sol 124,686,244 89,713,745 - - - -
Philippine Peso 212,524 184,317 - - - -
Polish Zloty 185,968,532 167,472,421 - - - -
Pound Sterling 77,372 (167,018) 516,749 (125,686) 4,922 (4,242)
Romanian Leu 92,830,413 85,611,268 - - - -
Russian Ruble 222,913,674 55,149,794 - - - -
Serbian Dinar 5,110,855 17,726,730 - - - -
Singapore Dollar 25,299 6,372 430,487 79,041 (2,093) 124
South African Rand 242,813,698 226,210,783 - - - -
South Korean Won 2,743,214 1,689,172 - - - -
Sri Lankan Rupee - 39,543,208 - - - -
Swedish Krona 3,497,693 2,234,367 851,136 1,052,643 (237) 2,450
Swiss Franc - - 467,328 40,523 844,306 117,178
Thai Baht 287,186,902 232,823,874 - - - -
Turkish Lira 202,366,860 187,189,248 - - - -
Ukrainian Hryvnia 21,735,423 - - - - -
United States Dollar 158,691,334 113,070,975 2,198,259,262 1,289,342,137 170,962,266 117,126,142
Uruguayan Peso 6,381,375 2,265,856 - - - -
Zambian Kwacha 4,307 5,087 - - - -
3,203,701,800 2,501,160,473 2,504,012,329 1,479,833,259 175,607,911 118,554,807

FINANCIAL STATEMENTS NOTES TO THE AUDITED FINANCIAL STATEMENTS
1228 NEUBERGER BERMAN INVESTMENT FUNDS PLC
FOR THE YEAR ENDED 31 DECEMBER 2019
12. FINANCIAL INSTRUMENT DISCLOSURES (CONTINUED)
(b) Foreign Currency Risk (continued)
Neuberger Berman Strategic Income Fund Neuberger Berman Global Bond
Absolute Return Fund Neuberger Berman Short Duration Emerging Market Debt Fund
As at 31 December 2019 As at 31 December 2018 As at 31 December 2019 As at 31 December 2018 As at 31 December 2019 As at 31 December 2018
US$ US$ US$ US$ US$ US$
Argentine Peso - 6,174 - - - -
Australian Dollar 234,267 (3,812) (57,901) (38,673) 43,691 (31,521)
Brazilian Real 597,122 228,654 105,817 22,798 - -
Canadian Dollar (472,466) (448,755) (57,697) 32,331 3,076 (3,609)
Chilean Peso 390,030 - - - - -
Chinese Yuan Renminbi - (1,346) 45 - 35 36
Chinese Yuan Renminbi - Offshore 2,091 (3,998) - 344 84 103
Colombian Peso 2,320,208 2,926,607 - - - -
Czech Koruna 28,876 8,069 32,672 32 - -
Danish Krone 12,292 22,707,964 - - - -
Euro 10,455,927 46,155,265 38,019,608 20,340,898 114,343,769 (3,729,132)
Hong Kong Dollar 7,731 (414) - - - -
Hungarian Forint (4,801) 6,747 (2,459) - - -
Indian Rupee 4,652 - - - - -
Indonesian Rupiah 2,902,717 4,370,638 - - - -
Israeli Shekel (2,998) - - - - -
Japanese Yen (8,738,277) 10,037,572 1,151,765 2,371,609 33,214,064 25,827,222
Malaysian Ringgit - (5,544) - - - -
Mexican Peso 2,211,117 2,547,347 (103,435) 1,188,687 - -
New Zealand Dollar 309,940 308,055 (123,996) (230,039) - -
Norwegian Krone (216) - 428,930 (101,327) - -
Peruvian Sol 3,913 1,443 - - - -
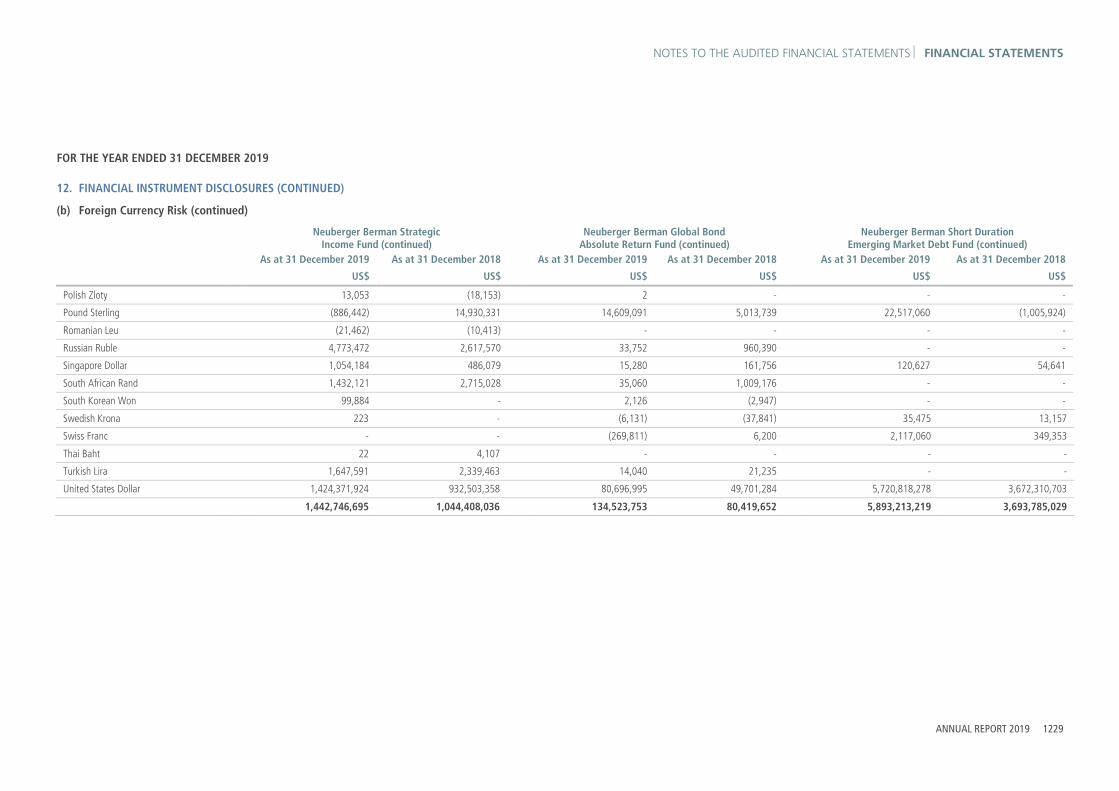
NOTES TO THE AUDITED FINANCIAL STATEMENTS FINANCIAL STATEMENTS
ANNUAL REPORT 2019 1229
FOR THE YEAR ENDED 31 DECEMBER 2019
12. FINANCIAL INSTRUMENT DISCLOSURES (CONTINUED)
(b) Foreign Currency Risk (continued)
Neuberger Berman Strategic Income Fund (continued) Neuberger Berman Global Bond
Absolute Return Fund (continued) Neuberger Berman Short Duration Emerging Market Debt Fund (continued)
As at 31 December 2019 As at 31 December 2018 As at 31 December 2019 As at 31 December 2018 As at 31 December 2019 As at 31 December 2018
US$ US$ US$ US$ US$ US$
Polish Zloty 13,053 (18,153) 2 - - -
Pound Sterling (886,442) 14,930,331 14,609,091 5,013,739 22,517,060 (1,005,924)
Romanian Leu (21,462) (10,413) - - - -
Russian Ruble 4,773,472 2,617,570 33,752 960,390 - -
Singapore Dollar 1,054,184 486,079 15,280 161,756 120,627 54,641
South African Rand 1,432,121 2,715,028 35,060 1,009,176 - -
South Korean Won 99,884 - 2,126 (2,947) - -
Swedish Krona 223 - (6,131) (37,841) 35,475 13,157 Swiss Franc - - (269,811) 6,200 2,117,060 349,353 Thai Baht 22 4,107 - - - - Turkish Lira 1,647,591 2,339,463 14,040 21,235 - -
United States Dollar 1,424,371,924 932,503,358 80,696,995 49,701,284 5,720,818,278 3,672,310,703
1,442,746,695 1,044,408,036 134,523,753 80,419,652 5,893,213,219 3,693,785,029

FINANCIAL STATEMENTS NOTES TO THE AUDITED FINANCIAL STATEMENTS
1230 NEUBERGER BERMAN INVESTMENT FUNDS PLC
FOR THE YEAR ENDED 31 DECEMBER 2019
12. FINANCIAL INSTRUMENT DISCLOSURES (CONTINUED)
(b) Foreign Currency Risk (continued)
Neuberger Berman Absolute Return Multi Strategy Fund Neuberger Berman US Long Short
Equity Fund Neuberger Berman Emerging Market Debt Blend Fund
As at 31 December 2019 As at 31 December 2018 As at 31 December 2019 As at 31 December 2018 As at 31 December 2019 As at 31 December 2018 US$ US$ US$ US$ US$ US$
Argentine Peso - - - - 1,980,638 16,915,566
Australian Dollar 32,023 150,145 - - 77,884 228,593
Brazilian Real 2,477 (2,423) - - 14,424,570 12,849,085
Canadian Dollar 331,146 364,924 - - 271 255
Chilean Peso (3,075) 5,192 - - 19,726,676 11,992,505
Chinese Yuan Renminbi - - - - (10,042) (78,052)
Chinese Yuan Renminbi - Offshore - - - 357 71,165 -
Colombian Peso - - - - 39,592,444 48,052,869
Czech Koruna - - - - 27,999,790 21,990,344
Danish Krone - (6,431) - - - -
Dominican Republic Peso - - - - 5,794,809 842,445
Egyptian Pound - - - - 22,087,365 15,176,029
Euro 685,561 1,568,674 916,422 (970,047) 74,389,052 100,381,850
Ghanaian Cedi - - - - 388 456
Hong Kong Dollar 268,078 487,908 - - - -
Hungarian Forint (2,569) (2,251) - - 24,308,781 14,275,301
Indian Rupee (3,826) 3,133 - - 71,569 -
Indonesian Rupiah - - - - 94,353,604 88,280,604
Israeli Shekel 1,570 (403) - - (62,587) 124,928
Japanese Yen (914,269) 958,249 - 9,818 - 261,413
Kazahstani Tenge - - - - 159,528 (327,286)
Malaysian Ringgit - - - - 77,942,684 70,946,643
Mexican Peso 37,441 29,446 - - 118,950,188 79,034,228

NOTES TO THE AUDITED FINANCIAL STATEMENTS FINANCIAL STATEMENTS
ANNUAL REPORT 2019 1231
FOR THE YEAR ENDED 31 DECEMBER 2019
12. FINANCIAL INSTRUMENT DISCLOSURES (CONTINUED)
(b) Foreign Currency Risk (continued)
Neuberger Berman Absolute Return Multi Strategy Fund (continued) Neuberger Berman US Long Short
Equity Fund (continued) Neuberger Berman Emerging Market Debt Blend Fund (continued)
As at 31 December 2019 As at 31 December 2018 As at 31 December 2019 As at 31 December 2018 As at 31 December 2019 As at 31 December 2018 US$ US$ US$ US$ US$ US$
New Taiwan Dollar - - - - - 401,021
New Zealand Dollar 8,639 (6,848) - - - -
Nigerian Naira - - - - 2,070,607 -
Norwegian Krone (24,794) 15,809 - - 20,585 (12,388)
Peruvian Sol - - - - 36,440,944 32,956,411
Philippine Peso 798 1,721 - - 21,435 16,859
Polish Zloty 19,883 (1,653) - - 50,932,347 66,895,723
Pound Sterling 579,875 875,781 2,220 (11,005) 864,852 (117,764)
Romanian Leu - - - - 25,388,154 29,210,559
Russian Ruble - - - - 55,125,240 22,250,163
Serbian Dinar - - - - 1,394,799 -
Singapore Dollar 14,934 (4,588) (2,065) 1,188 25,635 1,126
South African Rand 20,031 1,981 - - 61,798,810 83,148,924
South Korean Won (6,358) (2,156) - - 1,243,877 745,437
Sri Lankan Rupee - - - - - 13,308,211
Swedish Krona (15,620) 21,143 - - 115,514 150,192
Swiss Franc 38,642 (55,043) - (1) 12,130 (340,338)
Thai Baht 3,836 (141) - - 74,500,326 78,284,363
Turkish Lira (20,759) (9,215) - - 58,991,862 62,608,981
Ukrainian Hryvnia - - - - 5,760,453 -
United States Dollar 53,940,668 60,311,882 153,406,937 185,880,474 810,641,875 858,478,433
Uruguayan Peso - - - - 1,996,155 1,032,210
Zambian Kwacha - - - - 592 699
54,994,332 64,704,836 154,323,514 184,910,784 1,709,204,969 1,729,966,598

FINANCIAL STATEMENTS NOTES TO THE AUDITED FINANCIAL STATEMENTS
1232 NEUBERGER BERMAN INVESTMENT FUNDS PLC
FOR THE YEAR ENDED 31 DECEMBER 2019
12. FINANCIAL INSTRUMENT DISCLOSURES (CONTINUED)
(b) Foreign Currency Risk (continued)
Neuberger Berman European High Yield Bond Fund Neuberger Berman Global
Equity Fund Neuberger Berman Systematic Global Equity Fund
As at 31 December 2019 As at 31 December 2018 As at 31 December 2019 As at 31 December 2018 As at 31 December 2019 As at 31 December 2018 EUR EUR US$ US$ US$ US$
Australian Dollar - - 8,766 8,432 563,870 483,546
Brazilian Real - - - - 262,813 171,859
Canadian Dollar - - 41,497 39,116 932,277 570,447
Chilean Peso - - - - 8,742 18,878
Czech Koruna - - - - - 17,076
Danish Krone - - - - 166,294 47,786
Euro 33,795,116 21,208,011 112,850 126,684 3,124,543 1,827,227
Hong Kong Dollar - - 72,790 61,970 995,308 899,685
Hungarian Forint - - - - 8,600 2,980
Indonesian Rupiah - - - - 79,434 14,894
Israeli Shekel - - - - 77,458 48,779
Japanese Yen - - 101,242 81,064 2,328,186 1,429,963
Malaysian Ringgit - - - - 34,019 57,368
Mexican Peso - - 7,715 6,455 73,196 25,172
New Taiwan Dollar - - - - 580,487 344,081
New Zealand Dollar - - - - 27,985 -
Norwegian Krone - - 10,824 9,261 98,940 140,079
Philippine Peso - - - - 29,516 23,099
Polish Zloty - - - - 20,325 13,287
Pound Sterling 6,493,008 3,703,112 115,700 108,899 1,824,838 1,392,596
Qatari Riyal - - - - 35,227 30,631
Singapore Dollar 6,849 - 13,473 13,905 99,367 74,932
South African Rand - - - - 76,248 55,217

NOTES TO THE AUDITED FINANCIAL STATEMENTS FINANCIAL STATEMENTS
ANNUAL REPORT 2019 1233
FOR THE YEAR ENDED 31 DECEMBER 2019
12. FINANCIAL INSTRUMENT DISCLOSURES (CONTINUED)
(b) Foreign Currency Risk (continued)
Neuberger Berman European High Yield Bond Fund (continued) Neuberger Berman Global
Equity Fund (continued) Neuberger Berman Systematic Global Equity Fund (continued)
As at 31 December 2019 As at 31 December 2018 As at 31 December 2019 As at 31 December 2018 As at 31 December 2019 As at 31 December 2018 EUR EUR US$ US$ US$ US$
South Korean Won - - - - 449,804 314,397
Swedish Krona - - 10,949 - 219,309 124,202
Swiss Franc - - 108,659 88,178 929,328 658,806
Thai Baht - - - - 34,740 59,043
Turkish Lira - - - - 31,144 17,512
United Arab Emirates Dirham - - - - 26,829 29,196
United States Dollar (457,469) 165,292 817,932 665,719 18,528,547 11,809,551
39,837,504 25,076,415 1,422,397 1,209,683 31,667,374 20,702,289

FINANCIAL STATEMENTS NOTES TO THE AUDITED FINANCIAL STATEMENTS
1234 NEUBERGER BERMAN INVESTMENT FUNDS PLC
FOR THE YEAR ENDED 31 DECEMBER 2019
12. FINANCIAL INSTRUMENT DISCLOSURES (CONTINUED)
(b) Foreign Currency Risk (continued)
Neuberger Berman Global Real Estate Securities Fund Neuberger Berman US Small Cap
Intrinsic Value Fund Neuberger Berman Global Credit Long Short Fund*
As at 31 December 2019 As at 31 December 2018 As at 31 December 2019 As at 31 December 2018 As at 31 December 2019 As at 31 December 2018 US$ US$ US$ US$ US$ US$
Australian Dollar 3,306,703 224,965 - - - -
Canadian Dollar 2,350,720 109,805 - - - -
Euro 5,086,567 354,674 - - - (3,935)
Hong Kong Dollar 3,609,756 247,399 - - - -
Japanese Yen 7,975,816 392,378 - - - -
Pound Sterling 6,824,136 123,200 - - - -
Singapore Dollar 1,040,991 64,122 - - - -
Swedish Krona 1,087,617 52,277 - - - -
United States Dollar 36,422,859 1,684,241 105,825,695 80,996,369 - 3,935
67,705,165 3,253,061 105,825,695 80,996,369 - - * Portfolio liquidated on 26 November 2018.

NOTES TO THE AUDITED FINANCIAL STATEMENTS FINANCIAL STATEMENTS
ANNUAL REPORT 2019 1235
FOR THE YEAR ENDED 31 DECEMBER 2019
12. FINANCIAL INSTRUMENT DISCLOSURES (CONTINUED)
(b) Foreign Currency Risk (continued)
Neuberger Berman Asian Debt -Hard Currency Fund Neuberger Berman China
Bond Fund Neuberger Berman Global Dynamic Asset Allocator Fund*
As at 31 December 2019 As at 31 December 2018 As at 31 December 2019 As at 31 December 2018 As at 31 December 2019 As at 31 December 2018 US$ US$ CNY CNY US$ US$
Australian Dollar - - - - - (139,830)
Brazilian Real - - - - - (3,106)
Canadian Dollar - - - - - (12,876)
Chinese Yuan Renminbi - (2,019) 137,248,786 60,597,032 (94) -
Chinese Yuan Renminbi - Offshore 2,069 - 466,412,799 1,173,206 - 276
Czech Koruna - - - - - 13
Euro (5,236) (5,333) 4,730 3,761 (152) 5,983,265
Hong Kong Dollar - - - - - (122,514)
Indian Rupee 2,011 - - - - -
Japanese Yen - - - - - 790,775
Malaysian Ringgit 4,879 - - - - -
Mexican Peso - - - - (633) 267,102
New Zealand Dollar - - - - - (229,859)
Norwegian Krone - - - - - (103,040)
Pound Sterling - - - - 103 1,824,789
Russian Ruble - - - - - 210,676
Singapore Dollar 100 - (73,633) - - -
South African Rand - - - - (684) 223,850
South Korean Won 11,122 - - - - (2,916)
Sri Lankan Rupee - 270,084 - - - -
Swedish Krona - - - - (306) 908
Swiss Franc - - - 45 - 5,100
Turkish Lira - - - - - 21,280

FINANCIAL STATEMENTS NOTES TO THE AUDITED FINANCIAL STATEMENTS
1236 NEUBERGER BERMAN INVESTMENT FUNDS PLC
FOR THE YEAR ENDED 31 DECEMBER 2019
12. FINANCIAL INSTRUMENT DISCLOSURES (CONTINUED)
(b) Foreign Currency Risk (continued)
Neuberger Berman Asian Debt -Hard Currency Fund (continued) Neuberger Berman China
Bond Fund (continued) Neuberger Berman Global Dynamic Asset Allocator Fund* (continued)
As at 31 December 2019 As at 31 December 2018 As at 31 December 2019 As at 31 December 2018 As at 31 December 2019 As at 31 December 2018 US$ US$ CNY CNY US$ US$
United States Dollar 25,231,578 15,591,035 213,269,906 18,669,949 1,766 15,581,325
25,246,523 15,853,767 816,862,588 80,443,993 - 24,295,218 * Portfolio liquidated on 12 April 2019.

NOTES TO THE AUDITED FINANCIAL STATEMENTS FINANCIAL STATEMENTS
ANNUAL REPORT 2019 1237
FOR THE YEAR ENDED 31 DECEMBER 2019
12. FINANCIAL INSTRUMENT DISCLOSURES (CONTINUED)
(b) Foreign Currency Risk (continued)
Neuberger Berman Asian Opportunities Fund* Neuberger Berman Corporate
Hybrid Bond Fund Neuberger Berman US Equity Fund
As at 31 December 2019 As at 31 December 2018 As at 31 December 2019 As at 31 December 2018 As at 31 December 2019 As at 31 December 2018 US$ US$ EUR EUR US$ US$
Australian Dollar - - 140,234 1,631 - -
Chinese Yuan Renminbi - Offshore - 56,784 - - - -
Euro - - 676,497,825 469,314,103 - -
Hong Kong Dollar 15 1,306,673 2,456 - - -
Indonesian Rupiah - 59,039 - - - -
Malaysian Ringgit - 39,973 - - - -
New Taiwan Dollar - 478,685 - - - -
Philippine Peso - 43,325 - - - -
Pound Sterling - - 149,222,494 125,539,048 - -
Singapore Dollar 1 27,249 3,685 - - -
South Korean Won - 545,543 - - - -
Swiss Franc - - 149,995 259,960 - -
Thai Baht - 87,602 - - - -
United States Dollar (16) 909,100 306,206,303 217,678,786 5,335,428 3,883,727
- 3,553,973 1,132,222,992 812,793,528 5,335,428 3,883,727 * Portfolio liquidated on 24 July 2019.
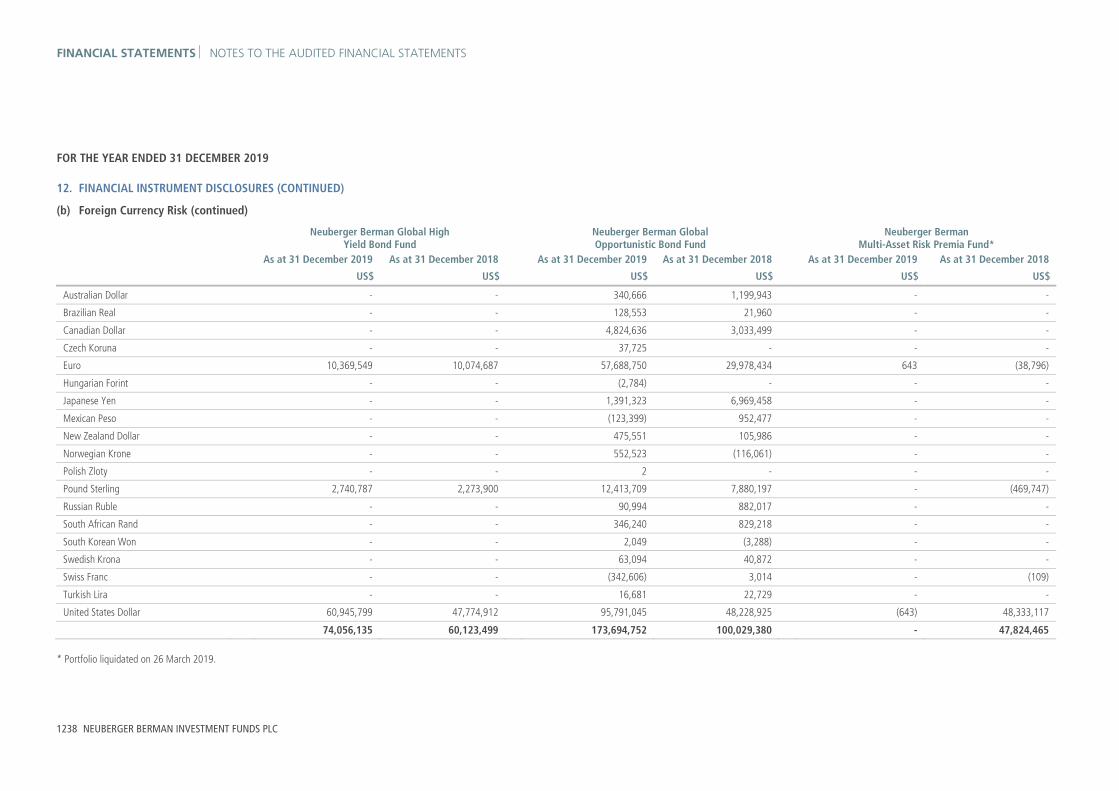
FINANCIAL STATEMENTS NOTES TO THE AUDITED FINANCIAL STATEMENTS
1238 NEUBERGER BERMAN INVESTMENT FUNDS PLC
FOR THE YEAR ENDED 31 DECEMBER 2019
12. FINANCIAL INSTRUMENT DISCLOSURES (CONTINUED)
(b) Foreign Currency Risk (continued)
Neuberger Berman Global High Yield Bond Fund Neuberger Berman Global
Opportunistic Bond Fund Neuberger Berman Multi-Asset Risk Premia Fund*
As at 31 December 2019 As at 31 December 2018 As at 31 December 2019 As at 31 December 2018 As at 31 December 2019 As at 31 December 2018 US$ US$ US$ US$ US$ US$
Australian Dollar - - 340,666 1,199,943 - -
Brazilian Real - - 128,553 21,960 - -
Canadian Dollar - - 4,824,636 3,033,499 - -
Czech Koruna - - 37,725 - - -
Euro 10,369,549 10,074,687 57,688,750 29,978,434 643 (38,796)
Hungarian Forint - - (2,784) - - -
Japanese Yen - - 1,391,323 6,969,458 - -
Mexican Peso - - (123,399) 952,477 - -
New Zealand Dollar - - 475,551 105,986 - -
Norwegian Krone - - 552,523 (116,061) - -
Polish Zloty - - 2 - - -
Pound Sterling 2,740,787 2,273,900 12,413,709 7,880,197 - (469,747)
Russian Ruble - - 90,994 882,017 - -
South African Rand - - 346,240 829,218 - -
South Korean Won - - 2,049 (3,288) - -
Swedish Krona - - 63,094 40,872 - -
Swiss Franc - - (342,606) 3,014 - (109)
Turkish Lira - - 16,681 22,729 - -
United States Dollar 60,945,799 47,774,912 95,791,045 48,228,925 (643) 48,333,117
74,056,135 60,123,499 173,694,752 100,029,380 - 47,824,465 * Portfolio liquidated on 26 March 2019.

NOTES TO THE AUDITED FINANCIAL STATEMENTS FINANCIAL STATEMENTS
ANNUAL REPORT 2019 1239
FOR THE YEAR ENDED 31 DECEMBER 2019
12. FINANCIAL INSTRUMENT DISCLOSURES (CONTINUED)
(b) Foreign Currency Risk (continued)
Neuberger Berman Multi-Asset Class Income Fund Neuberger Berman US Equity
Index PutWrite Fund Neuberger Berman Global Equity Index PutWrite Fund
As at 31 December 2019 As at 31 December 2018 As at 31 December 2019 As at 31 December 2018 As at 31 December 2019 As at 31 December 2018 US$ US$ US$ US$ US$ US$
Australian Dollar 625,870 602,610 - - 13,173 (878)
Brazilian Real 37,189 (3,368) - - - -
Canadian Dollar 860,726 765,187 - - - -
Czech Koruna 12,314 - - - - -
Danish Krone 129,450 30,353 - - - -
Euro 16,885,244 2,507,571 1,186,261 (473,331) 260,225 (269,262)
Hong Kong Dollar 399,604 464,143 - - - (15)
Hungarian Forint (990) - - - - -
Israeli Shekel 9,880 55,419 - - - -
Japanese Yen 2,583,550 1,066,027 - - - -
Mexican Peso (41,110) - - - - -
New Zealand Dollar (67,679) 932 - - - -
Norwegian Krone 328,668 59,647 - - - -
Polish Zloty 1 - - - - -
Pound Sterling 2,021,425 1,381,538 391,967 (145,504) 45,740 (29,078)
Singapore Dollar 268,666 189,486 5,583 3,028 4,240 3,976
South African Rand 14,318 199 - - - -
South Korean Won 759 (921) - - - -
Swedish Krona 216,536 135,238 - - - -
Swiss Franc 514,763 400,189 - - 220,132 5,687
Turkish Lira 5,623 6,185 - - - -
United States Dollar 74,316,018 29,207,248 552,847,312 492,602,416 56,380,566 98,955,910
99,120,825 36,867,683 554,431,123 491,986,609 56,924,076 98,666,340

FINANCIAL STATEMENTS NOTES TO THE AUDITED FINANCIAL STATEMENTS
1240 NEUBERGER BERMAN INVESTMENT FUNDS PLC
FOR THE YEAR ENDED 31 DECEMBER 2019
12. FINANCIAL INSTRUMENT DISCLOSURES (CONTINUED)
(b) Foreign Currency Risk (continued)
Neuberger Berman Uncorrelated Strategies Fund Neuberger Berman Emerging Market Debt Blend
Investment Grade Fund Neuberger Berman Emerging Markets Sustainable Equity Fund
As at 31 December 2019 As at 31 December 2018 As at 31 December 2019 As at 31 December 2018 As at 31 December 2019 As at 31 December 2018 US$ US$ US$ US$ US$ US$
Australian Dollar 20,994,089 (280,442) - 1,440 - -
Brazilian Real 19,340 (28,447) - - 8,623,120 2,404,625
Canadian Dollar (1,605,815) (1,348) 1 1 4 -
Chilean Peso (152,770) 77,323 153,743 93,761 - -
Chinese Yuan Renminbi - - (65) (542) 51,809 -
Chinese Yuan Renminbi - Offshore (32) - 535 - 2,151,921 626,283
Colombian Peso - - 357,138 604,667 - -
Czech Koruna - - 244,497 337,677 1,013,356 307,010
Danish Krone (1,331,579) (128,113) - - - -
Euro 2,161,844 (1,272,436) 1,156,747 1,130,047 931,781 (17)
Hong Kong Dollar (7,267,501) (644,341) - - 28,999,551 6,473,554
Hungarian Forint (56,256) (48,917) 331,056 169,227 989,676 -
Indian Rupee (86,276) 71,857 535 - - -
Indonesian Rupiah - - 1,176,078 874,052 1,781,268 860,038
Israeli Shekel 21,087 (7,798) (476) 2,067 - -
Japanese Yen (56,840,967) (4,085,153) - 1,737 - -
Kazahstani Tenge - - 7,410 (1,858) - -
Malaysian Ringgit - - 744,436 624,534 - -
Mexican Peso 244,582 (97,008) 1,277,931 909,311 3,971,811 1,014,863
New Taiwan Dollar 698,409 - - 3,510 12,741,282 1,960,415
New Zealand Dollar 76,592 (110,525) - - - -
Norwegian Krone 242,141 137,874 8,196 (14,349) - -
Peruvian Sol - - 317,933 280,899 - -

NOTES TO THE AUDITED FINANCIAL STATEMENTS FINANCIAL STATEMENTS
ANNUAL REPORT 2019 1241
FOR THE YEAR ENDED 31 DECEMBER 2019
12. FINANCIAL INSTRUMENT DISCLOSURES (CONTINUED)
(b) Foreign Currency Risk (continued)
Neuberger Berman Uncorrelated Strategies Fund (continued) Neuberger Berman Emerging Market Debt Blend
Investment Grade Fund (continued) Neuberger Berman Emerging Markets Sustainable Equity Fund (continued)
As at 31 December 2019 As at 31 December 2018 As at 31 December 2019 As at 31 December 2018 As at 31 December 2019 As at 31 December 2018 US$ US$ US$ US$ US$ US$
Philippine Peso 13,102 33,131 187 119 2,306,730 712,110
Polish Zloty 171,557 (45,595) 330,500 583,605 3,320,882 833,084
Pound Sterling 67,192,359 (15,359,689) 56,120 (9,216) 1,701,722 160,148
Romanian Leu - - 213,933 234,868 - -
Russian Ruble - - - 6,721 - -
Singapore Dollar 303,191 (159,731) 1 1 - -
South African Rand 442,788 (621,502) - - 4,626,588 2,193,847
South Korean Won 2,256,965 9,285,583 7,688 - 19,803,231 4,881,497
Swedish Krona 789,768 491,194 - - - -
Swiss Franc 530,518 678,704 - - - -
Thai Baht 66,186 (10,213) 771,174 552,172 2,791,407 416,855
Turkish Lira (451,183) (227,469) - - 764,939 272,649
United States Dollar 1,166,876,217 881,009,324 12,325,593 10,709,782 33,293,404 9,102,071
Uruguayan Peso - - 11,743 (178) - -
1,195,308,356 868,656,263 19,492,634 17,094,055 129,864,482 32,219,032

FINANCIAL STATEMENTS NOTES TO THE AUDITED FINANCIAL STATEMENTS
1242 NEUBERGER BERMAN INVESTMENT FUNDS PLC
FOR THE YEAR ENDED 31 DECEMBER 2019
12. FINANCIAL INSTRUMENT DISCLOSURES (CONTINUED)
(b) Foreign Currency Risk (continued)
Neuberger Berman China Equity Opportunities Fund Neuberger Berman Multi-Asset
Class Growth Fund Neuberger Berman Global Thematic Equity Fund1
As at 31 December 2019 As at 31 December 2018 As at 31 December 2019 As at 31 December 2018 As at 31 December 2019 As at 31 December 2018 US$ US$ US$ US$ US$ US$
Australian Dollar - - 83,111 71,059 - - Brazilian Real - - 7,437 (1,924) - - Canadian Dollar - - 116,209 112,891 - - Chinese Yuan Renminbi - Offshore 185,569 337,652 - - - - Czech Koruna - - 2,567 - - - Danish Krone - - 25,633 8,071 - - Euro - - 2,617,825 2,987,903 44,639 - Hong Kong Dollar 707,052 443,728 13,046 37,708 - - Hungarian Forint - - (193) - - - Japanese Yen - - 353,112 550,444 - - Mexican Peso (12,260) - - - New Taiwan Dollar (133) - - - - - New Zealand Dollar - - (16,579) (48,013) - - Norwegian Krone - - 45,737 (5,818) - - Pound Sterling - - 501,765 1,251,429 1,569,166 708,608 Russian Ruble - - (4,397) - - - Singapore Dollar - - 19,856 20,066 - - South African Rand - - (4,878) - - - South Korean Won - - 182 (526) - - Swedish Krona - - 34,535 11,028 - - Swiss Franc - - 123,695 114,991 - - Turkish Lira - - 1,104 3,637 - - United States Dollar 414,886 129,822 15,719,709 15,992,907 22,871,084 11,472,066
1,307,374 911,202 19,627,216 21,105,853 24,484,889 12,180,674

NOTES TO THE AUDITED FINANCIAL STATEMENTS FINANCIAL STATEMENTS
ANNUAL REPORT 2019 1243
FOR THE YEAR ENDED 31 DECEMBER 2019
12. FINANCIAL INSTRUMENT DISCLOSURES (CONTINUED)
(b) Foreign Currency Risk (continued)
Neuberger Berman CLO Income Fund1 Neuberger Berman China A-Share
Opportunities Fund1* Neuberger Berman Next Generation Mobility Fund1
As at 31 December 2019 As at 31 December 2018 As at 31 December 2019 As at 31 December 2018 As at 31 December 2019 As at 31 December 2018 US$ US$ US$ US$ US$ US$
Australian Dollar - - - - 1,442 49,883
Chinese Yuan Renminbi - Offshore - - - 730,092 - -
Euro 8,782,365 8,381,784 - - 1,220,903 133,416
Hong Kong Dollar - - - - 924,521 69,132
Japanese Yen - - - - 3,044,000 227,469
New Taiwan Dollar - - - - 976,449 22,992
Pound Sterling 5,862,807 (1,784,901) - - 4,743 43,924
Singapore Dollar - - - - 892 -
South Korean Won - - - - - 136,537
Swedish Krona (309,572) (11,959) - - - -
Swiss Franc - - - - - 33,091
United States Dollar 138,148,025 106,077,994 - 24,412 36,482,498 1,475,642
152,483,625 112,662,918 - 754,504 42,655,448 2,192,086
* Portfolio liquidated on 6 December 2019.

FINANCIAL STATEMENTS NOTES TO THE AUDITED FINANCIAL STATEMENTS
1244 NEUBERGER BERMAN INVESTMENT FUNDS PLC
FOR THE YEAR ENDED 31 DECEMBER 2019
12. FINANCIAL INSTRUMENT DISCLOSURES (CONTINUED)
(b) Foreign Currency Risk (continued)
Neuberger Berman Ultra Short Term Euro Bond Fund1 Neuberger Berman Euro Opportunistic
Bond Fund1 Neuberger Berman Euro Bond Absolute Return Fund1
As at 31 December 2019 As at 31 December 2018 As at 31 December 2019 As at 31 December 2018 As at 31 December 2019 As at 31 December 2018 EUR EUR EUR EUR EUR EUR
Australian Dollar - - - - (681) -
Brazilian Real - - - - 15,222 -
Canadian Dollar - - - - 8,753 -
Chilean Peso - - - - 1 -
Czech Koruna - - - - 7,171 -
Euro 379,098,904 11,351,503 10,622,516 5,021,174 79,541,377 10,005,831
Hungarian Forint - - - - 140 -
Japanese Yen - - - - (131,116) -
Mexican Peso - - - - (36,728) -
New Zealand Dollar - - - - (62,483) -
Norwegian Krone - - - - 129,604 -
Polish Zloty - - - - (3) -
Pound Sterling (14,602) - (10,419) (1,283) (21,970) 544
South African Rand - - - - (1,598) -
South Korean Won - - - - 8,037 -
Swedish Krona - - - - 29,236 -
Swiss Franc 137 - - - (19,664) -
Turkish Lira - - - - (11,766) -
United States Dollar (1,565,323) - (5) - 1,595,870 (2,577)
377,519,116 11,351,503 10,612,092 5,019,891 81,049,402 10,003,798

NOTES TO THE AUDITED FINANCIAL STATEMENTS FINANCIAL STATEMENTS
ANNUAL REPORT 2019 1245
FOR THE YEAR ENDED 31 DECEMBER 2019
12. FINANCIAL INSTRUMENT DISCLOSURES (CONTINUED)
(b) Foreign Currency Risk (continued)
Neuberger Berman Absolute Alpha Fund2 Neuberger Berman
Multi-Style Premia Fund2 Neuberger Berman
Macro Opportunities FX Fund2
As at 31 December 2019 As at 31 December 2019 As at 31 December 2019 US$ US$ EUR
Australian Dollar - (35,200) (5,585)
Brazilian Real - (5,636) 86,627
Canadian Dollar 129,715 9,889 (10,859)
Chilean Peso - (14,698) -
Chinese Yuan Renminbi - 866 -
Czech Koruna - 2,964 3,532
Euro 42,056 2,703,011 19,625,600
Hong Kong Dollar - (23,420) -
Hungarian Forint - 3,547 -
Indian Rupee - 7,185 -
Israeli Shekel - (3,063) -
Japanese Yen - 1,530,388 (141,224)
Mexican Peso - 39,123 (28,486)
New Taiwan Dollar - 5,334 -
New Zealand Dollar - - (83,740)
Norwegian Krone - - 315,677
Pound Sterling (48,086) 1,810,995 960
Russian Ruble - 49,602 -
Singapore Dollar 19,907 - -
South African Rand - 55,841 -
South Korean Won - (1,032) (6,172)
Swedish Krona (41,979) (12,184) 5,538

FINANCIAL STATEMENTS NOTES TO THE AUDITED FINANCIAL STATEMENTS
1246 NEUBERGER BERMAN INVESTMENT FUNDS PLC
FOR THE YEAR ENDED 31 DECEMBER 2019
12. FINANCIAL INSTRUMENT DISCLOSURES (CONTINUED)
(b) Foreign Currency Risk (continued)
Neuberger Berman Absolute Alpha Fund2 Neuberger Berman
Multi-Style Premia Fund2 Neuberger Berman
Macro Opportunities FX Fund2
As at 31 December 2019 As at 31 December 2019 As at 31 December 2019 US$ US$ EUR
Swiss Franc - 4,585 (61,709)
Thai Baht - 2,188 -
Turkish Lira - (38,697) 588
United States Dollar 39,751,814 10,302,266 (216,161)
39,853,427 16,393,854 19,484,586 1 Portfolio launched during the prior reporting year. 2 Portfolio launched during the current reporting year.

NOTES TO THE AUDITED FINANCIAL STATEMENTS FINANCIAL STATEMENTS
ANNUAL REPORT 2019 1247
FOR THE YEAR ENDED 31 DECEMBER 2019
12. FINANCIAL INSTRUMENT DISCLOSURES (CONTINUED)
(c) Interest Rate Risk
The Portfolios may hold investments in fixed interest bearing securities. Any change to the interest rate for particular securities may result in income either increasing or decreasing. Prices of securities held will be impacted by domestic rates of interest. The Portfolio’s performance therefore will depend in part on its ability to anticipate and respond to such fluctuations in market interest rates. The Investment Managers and Sub-Investment Managers manage this risk by way of duration and yield curve analysis to establish and monitor duration positioning and yield curve structure.
The Company has forty six Portfolios as at the year ended 31 December 2019. Of the Portfolios, seventeen are Portfolios where the majority of the assets and liabilities of the Portfolio is invested in equity securities and are non-interest bearing. As a result, these Portfolios are not subject to significant amounts of risk due to fluctuations in the prevailing level of market interest rates.
At year end, the Portfolios set out in the table below invested primarily in fixed income instruments and are therefore exposed to the effects of fluctuations in the prevailing level of market interest rates on their respective financial position and cash flows.
Based on the Portfolios’ compositions as at 31 December 2019 and 31 December 2018, had interest rates fallen by 0.50% with all other variables held constant, it is estimated that Net Assets and the Change in Net Assets per the Profit and Loss Account would have increased/decreased by approximately the values outlined in the table below. A 0.50% rise in rates would have resulted in an equal but opposite effect.
Portfolio Currency 31 December2019
% of Net Assets
31 December 2018
% of Net Assets
Neuberger Berman High Yield Bond Fund USD 46,906,415 1.34% 68,455,989 1.70%
Neuberger Berman Diversified Currency Fund USD 23,778 0.03% 14,645 0.05%
Neuberger Berman Short Duration High Yield Bond Fund USD 7,193,052 0.70% 12,863,030 1.27%
Neuberger Berman Global Bond Fund USD 7,482,896 3.68% 4,761,558 3.29%
Neuberger Berman Emerging Market Debt – Local Currency Fund USD 86,551,854 2.70% 61,666,151 2.47%
Neuberger Berman Emerging Market Debt – Hard Currency Fund USD 85,528,136 3.42% 44,036,453 2.98%
Neuberger Berman Emerging Market Corporate Debt Fund USD 3,402,706 1.94% 2,565,881 2.16%
Neuberger Berman Strategic Income Fund USD 30,657,731 2.12% 24,535,343 2.35%
Neuberger Berman Global Bond Absolute Return Fund USD (1,542,888) (1.15)% (927,373) (1.15)%
Neuberger Berman Short Duration Emerging Market Debt Fund USD 60,336,960 1.02% 33,897,686 0.92%
Neuberger Berman Absolute Return Multi Strategy Fund USD 3,171 0.01% 164,973 0.25%
Neuberger Berman Emerging Market Debt Blend Fund USD 46,842,941 2.74% 42,770,647 2.47%
Neuberger Berman European High Yield Bond Fund EUR 591,205 1.48% 397,336 1.58%
Neuberger Berman Asian Debt – Hard Currency Fund USD 472,761 1.87% 341,967 2.16%
Neuberger Berman China Bond Fund CNY 5,294,705 0.65% 585,610 0.73%
Neuberger Berman Global Dynamic Asset Allocator Fund* USD - - 166,894 0.69%
Neuberger Berman Corporate Hybrid Bond Fund EUR 17,356,785 1.53% 16,683,284 2.05%
Neuberger Berman Global High Yield Bond Fund USD 1,176,547 1.59% 1,042,528 1.73%
Neuberger Berman Global Opportunistic Bond Fund USD 3,609,749 2.08% 2,434,413 2.43%
Neuberger Berman Multi-Asset Risk Premia Fund** USD - - 999,683 2.09%
Neuberger Berman Multi-Asset Class Income Fund USD 2,388,813 2.41% 378,834 1.03%
Neuberger Berman US Equity Index PutWrite Fund USD 3,392,608 0.61% 2,234,456 0.45%
Neuberger Berman Global Equity Index PutWrite Fund USD 172,776 0.30% 350,718 0.36%

FINANCIAL STATEMENTS NOTES TO THE AUDITED FINANCIAL STATEMENTS
1248 NEUBERGER BERMAN INVESTMENT FUNDS PLC
FOR THE YEAR ENDED 31 DECEMBER 2019
12. FINANCIAL INSTRUMENT DISCLOSURES (CONTINUED)
(c) Interest Rate Risk (continued)
Portfolio Currency 31 December 2019
% of Net Assets
31 December 2018
% of Net Assets
Neuberger Berman Uncorrelated Strategies Fund USD (5,900,785) (0.49)% 2,551,777 0.29%
Neuberger Berman Emerging Market Debt Blend Investment Grade Fund USD 713,305 3.66% 537,753 3.15%
Neuberger Berman Multi-Asset Class Growth Fund USD 67,919 0.35% 290,928 1.38%
Neuberger Berman CLO Income Fund1 USD 3,908,119 2.56% 111,314 0.10%
Neuberger Berman Ultra Short Term Euro Bond Fund1 EUR 1,911,972 0.51% 67,494 0.59%
Neuberger Berman Euro Opportunistic Bond Fund1 EUR 177,382 1.67% 117,454 2.34%
Neuberger Berman Euro Bond Absolute Return Fund1 EUR 265,590 0.33% 33,280 0.33%
Neuberger Berman Macro Opportunities FX Fund2 EUR 67,312 0.35% - -
* Portfolio liquidated on 12 April 2019. ** Portfolio liquidated on 26 March 2019.
1 Portfolio launched during the prior reporting year. 2 Portfolio launched during the current reporting year. The tables below summarise the relevant Portfolios’ exposure to interest rate risk. It includes the Portfolios’ non-derivative interest bearing and non-interest bearing assets and liabilities at fair value, categorised by the maturity dates. Other amounts and liabilities are not subject to changes in interest rates. Neuberger Berman High Yield Bond Fund
31 December 2019
Up to 1 year 1 - 5 years Over 5 yearsNon-interest
bearing Total
Current Assets US$ US$ US$ US$ US$
Financial Assets at Fair Value through Profit or Loss 6,220,513 823,285,266 2,462,172,474 41,877,566 3,333,555,819
Cash and cash equivalents 65,675,647 – – – 65,675,647
Total Assets 71,896,160 823,285,266 2,462,172,474 41,877,566 3,399,231,466
Liabilities (excluding Net Assets Attributable to Holders of Redeemable Participating Shares) – – – – –
Interest rate sensitivity gap for Net Assets attributable to Holders of Redeemable Participating Shares 71,896,160 823,285,266 2,462,172,474 41,877,566 3,399,231,466

NOTES TO THE AUDITED FINANCIAL STATEMENTS FINANCIAL STATEMENTS
ANNUAL REPORT 2019 1249
FOR THE YEAR ENDED 31 DECEMBER 2019
12. FINANCIAL INSTRUMENT DISCLOSURES (CONTINUED)
(c) Interest Rate Risk (continued)
Neuberger Berman High Yield Bond Fund (continued)
31 December 2018
Up to 1 year 1 - 5 years Over 5 yearsNon-interest
bearingTotal
Current Assets US$ US$ US$ US$ US$
Financial Assets at Fair Value through Profit or Loss 84,252,527 1,492,120,792 2,154,198,285 79,589,602 3,810,161,206
Cash and cash equivalents 163,792,361 – – – 163,792,361
Total Assets 248,044,888 1,492,120,792 2,154,198,285 79,589,602 3,973,953,567
Liabilities (excluding Net Assets Attributable to Holders of Redeemable Participating Shares) – – – – –
Interest rate sensitivity gap for Net Assets attributable to Holders of Redeemable Participating Shares 248,044,888 1,492,120,792 2,154,198,285 79,589,602 3,973,953,567
Neuberger Berman Diversified Currency Fund
31 December 2019
Up to 1 year 1 - 5 years Over 5 years Non-interest bearing
Total
Current Assets US$ US$ US$ US$ US$
Financial Assets at Fair Value through Profit or Loss 67,937,806 – – – 67,937,806
Cash and cash equivalents 1,226,578 – – – 1,226,578
Total Assets 69,164,384 – – – 69,164,384
Liabilities (excluding Net Assets Attributable to Holders of Redeemable Participating Shares) – – – – –
Interest rate sensitivity gap for Net Assets attributable to Holders of Redeemable Participating Shares 69,164,384 – – – 69,164,384
31 December 2018 Up to 1 year 1 - 5 years Over 5 years
Non-interestbearing
Total
Current Assets US$ US$ US$ US$ US$
Financial Assets at Fair Value through Profit or Loss 26,627,172 – – – 26,627,172
Cash and cash equivalents 761,304 – – – 761,304
Total Assets 27,388,476 – – – 27,388,476
Liabilities (excluding Net Assets Attributable to Holders of Redeemable Participating Shares) – – – – –
Interest rate sensitivity gap for Net Assets attributable to Holders of Redeemable Participating Shares 27,388,476 – – – 27,388,476
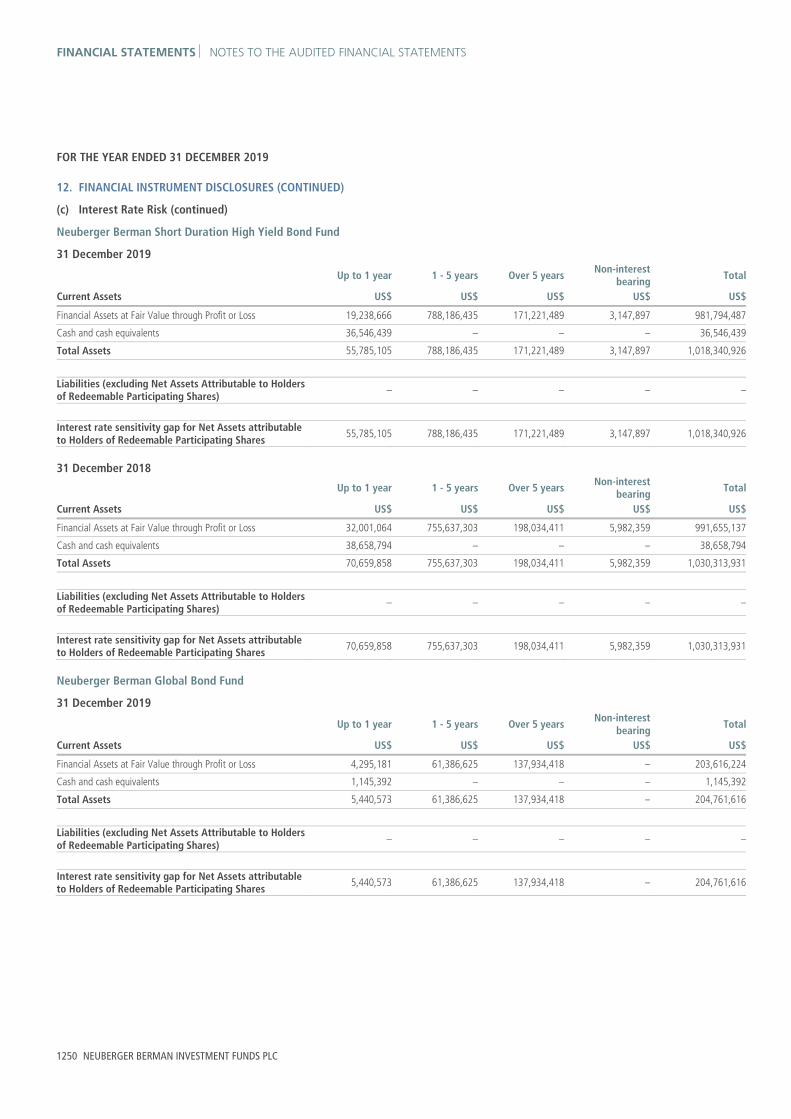
FINANCIAL STATEMENTS NOTES TO THE AUDITED FINANCIAL STATEMENTS
1250 NEUBERGER BERMAN INVESTMENT FUNDS PLC
FOR THE YEAR ENDED 31 DECEMBER 2019
12. FINANCIAL INSTRUMENT DISCLOSURES (CONTINUED)
(c) Interest Rate Risk (continued)
Neuberger Berman Short Duration High Yield Bond Fund
31 December 2019
Up to 1 year 1 - 5 years Over 5 yearsNon-interest
bearing Total
Current Assets US$ US$ US$ US$ US$
Financial Assets at Fair Value through Profit or Loss 19,238,666 788,186,435 171,221,489 3,147,897 981,794,487
Cash and cash equivalents 36,546,439 – – – 36,546,439
Total Assets 55,785,105 788,186,435 171,221,489 3,147,897 1,018,340,926
Liabilities (excluding Net Assets Attributable to Holders of Redeemable Participating Shares) – – – – –
Interest rate sensitivity gap for Net Assets attributable to Holders of Redeemable Participating Shares 55,785,105 788,186,435 171,221,489 3,147,897 1,018,340,926
31 December 2018
Up to 1 year 1 - 5 years Over 5 years Non-interest bearing
Total
Current Assets US$ US$ US$ US$ US$
Financial Assets at Fair Value through Profit or Loss 32,001,064 755,637,303 198,034,411 5,982,359 991,655,137
Cash and cash equivalents 38,658,794 – – – 38,658,794
Total Assets 70,659,858 755,637,303 198,034,411 5,982,359 1,030,313,931
Liabilities (excluding Net Assets Attributable to Holders of Redeemable Participating Shares) – – – – –
Interest rate sensitivity gap for Net Assets attributable to Holders of Redeemable Participating Shares 70,659,858 755,637,303 198,034,411 5,982,359 1,030,313,931
Neuberger Berman Global Bond Fund
31 December 2019
Up to 1 year 1 - 5 years Over 5 yearsNon-interest
bearingTotal
Current Assets US$ US$ US$ US$ US$
Financial Assets at Fair Value through Profit or Loss 4,295,181 61,386,625 137,934,418 – 203,616,224
Cash and cash equivalents 1,145,392 – – – 1,145,392
Total Assets 5,440,573 61,386,625 137,934,418 – 204,761,616
Liabilities (excluding Net Assets Attributable to Holders of Redeemable Participating Shares) – – – – –
Interest rate sensitivity gap for Net Assets attributable to Holders of Redeemable Participating Shares 5,440,573 61,386,625 137,934,418 – 204,761,616
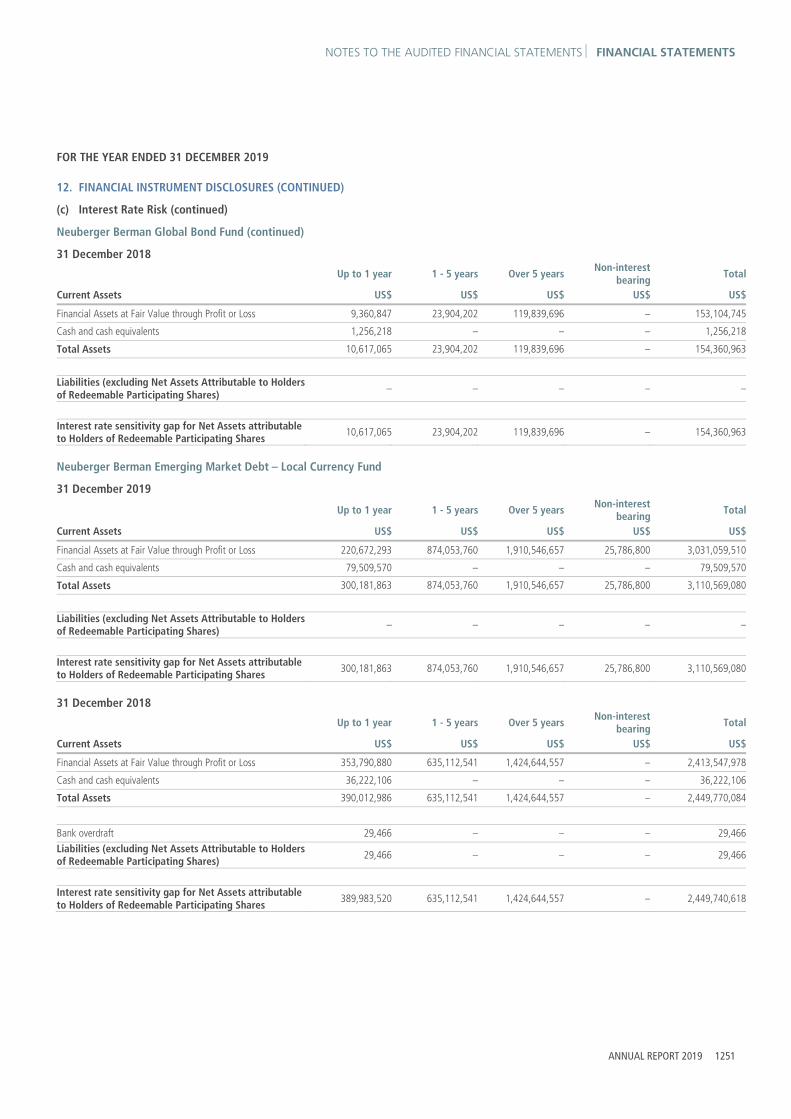
NOTES TO THE AUDITED FINANCIAL STATEMENTS FINANCIAL STATEMENTS
ANNUAL REPORT 2019 1251
FOR THE YEAR ENDED 31 DECEMBER 2019
12. FINANCIAL INSTRUMENT DISCLOSURES (CONTINUED)
(c) Interest Rate Risk (continued)
Neuberger Berman Global Bond Fund (continued)
31 December 2018
Up to 1 year 1 - 5 years Over 5 yearsNon-interest
bearingTotal
Current Assets US$ US$ US$ US$ US$
Financial Assets at Fair Value through Profit or Loss 9,360,847 23,904,202 119,839,696 – 153,104,745
Cash and cash equivalents 1,256,218 – – – 1,256,218
Total Assets 10,617,065 23,904,202 119,839,696 – 154,360,963
Liabilities (excluding Net Assets Attributable to Holders of Redeemable Participating Shares) – – – – –
Interest rate sensitivity gap for Net Assets attributable to Holders of Redeemable Participating Shares 10,617,065 23,904,202 119,839,696 – 154,360,963
Neuberger Berman Emerging Market Debt – Local Currency Fund
31 December 2019
Up to 1 year 1 - 5 years Over 5 years Non-interest bearing
Total
Current Assets US$ US$ US$ US$ US$
Financial Assets at Fair Value through Profit or Loss 220,672,293 874,053,760 1,910,546,657 25,786,800 3,031,059,510
Cash and cash equivalents 79,509,570 – – – 79,509,570
Total Assets 300,181,863 874,053,760 1,910,546,657 25,786,800 3,110,569,080
Liabilities (excluding Net Assets Attributable to Holders of Redeemable Participating Shares) – – – – –
Interest rate sensitivity gap for Net Assets attributable to Holders of Redeemable Participating Shares 300,181,863 874,053,760 1,910,546,657 25,786,800 3,110,569,080
31 December 2018
Up to 1 year 1 - 5 years Over 5 yearsNon-interest
bearingTotal
Current Assets US$ US$ US$ US$ US$
Financial Assets at Fair Value through Profit or Loss 353,790,880 635,112,541 1,424,644,557 – 2,413,547,978
Cash and cash equivalents 36,222,106 – – – 36,222,106
Total Assets 390,012,986 635,112,541 1,424,644,557 – 2,449,770,084
Bank overdraft 29,466 – – – 29,466
Liabilities (excluding Net Assets Attributable to Holders of Redeemable Participating Shares) 29,466 – – – 29,466
Interest rate sensitivity gap for Net Assets attributable to Holders of Redeemable Participating Shares 389,983,520 635,112,541 1,424,644,557 – 2,449,740,618

FINANCIAL STATEMENTS NOTES TO THE AUDITED FINANCIAL STATEMENTS
1252 NEUBERGER BERMAN INVESTMENT FUNDS PLC
FOR THE YEAR ENDED 31 DECEMBER 2019
12. FINANCIAL INSTRUMENT DISCLOSURES (CONTINUED)
(c) Interest Rate Risk (continued)
Neuberger Berman Emerging Market Debt – Hard Currency Fund
31 December 2019
Up to 1 year 1 - 5 years Over 5 yearsNon-interest
bearing Total
Current Assets US$ US$ US$ US$ US$
Financial Assets at Fair Value through Profit or Loss 36,180,997 338,326,407 1,897,156,238 15,670,500 2,287,334,142
Cash and cash equivalents 168,014,510 – – – 168,014,510
Total Assets 204,195,507 338,326,407 1,897,156,238 15,670,500 2,455,348,652
Bank overdraft 3,591 – – – 3,591
Liabilities (excluding Net Assets Attributable to Holders of Redeemable Participating Shares) 3,591 – – – 3,591
Interest rate sensitivity gap for Net Assets attributable to Holders of Redeemable Participating Shares 204,191,916 338,326,407 1,897,156,238 15,670,500 2,455,345,061
31 December 2018
Up to 1 year 1 - 5 years Over 5 yearsNon-interest
bearing Total
Current Assets US$ US$ US$ US$ US$
Financial Assets at Fair Value through Profit or Loss 8,264,458 228,052,286 1,116,569,682 – 1,352,886,426
Cash and cash equivalents 95,120,326 – – – 95,120,326
Total Assets 103,384,784 228,052,286 1,116,569,682 – 1,448,006,752
Bank overdraft 3,480 – – – 3,480
Liabilities (excluding Net Assets Attributable to Holders of Redeemable Participating Shares) 3,480 – – – 3,480
Interest rate sensitivity gap for Net Assets attributable to Holders of Redeemable Participating Shares 103,381,304 228,052,286 1,116,569,682 – 1,448,003,272
Neuberger Berman Emerging Market Corporate Debt Fund
31 December 2019
Up to 1 year 1 - 5 years Over 5 yearsNon-interest
bearing Total
Current Assets US$ US$ US$ US$ US$
Financial Assets at Fair Value through Profit or Loss – 53,692,682 106,058,792 2,002,873 161,754,347
Cash and cash equivalents 7,842,101 – – – 7,842,101
Total Assets 7,842,101 53,692,682 106,058,792 2,002,873 169,596,448
Liabilities (excluding Net Assets Attributable to Holders of Redeemable Participating Shares) – – – – –
Interest rate sensitivity gap for Net Assets attributable to Holders of Redeemable Participating Shares 7,842,101 53,692,682 106,058,792 2,002,873 169,596,448

NOTES TO THE AUDITED FINANCIAL STATEMENTS FINANCIAL STATEMENTS
ANNUAL REPORT 2019 1253
FOR THE YEAR ENDED 31 DECEMBER 2019
12. FINANCIAL INSTRUMENT DISCLOSURES (CONTINUED)
(c) Interest Rate Risk (continued)
Neuberger Berman Emerging Market Corporate Debt Fund (continued)
31 December 2018
Up to 1 year 1 - 5 years Over 5 yearsNon-interest
bearingTotal
Current Assets US$ US$ US$ US$ US$
Financial Assets at Fair Value through Profit or Loss 495,064 44,812,828 70,795,336 – 116,103,228
Cash and cash equivalents 186,326 – – – 186,326
Total Assets 681,390 44,812,828 70,795,336 – 116,289,554
Liabilities (excluding Net Assets Attributable to Holders of Redeemable Participating Shares) – – – – –
Interest rate sensitivity gap for Net Assets attributable to Holders of Redeemable Participating Shares 681,390 44,812,828 70,795,336 – 116,289,554
Neuberger Berman Strategic Income Fund
31 December 2019
Up to 1 year 1 - 5 years Over 5 yearsNon-interest
bearing Total
Current Assets US$ US$ US$ US$ US$
Financial Assets at Fair Value through Profit or Loss 141,693,159 316,027,888 1,168,683,774 36,674,560 1,663,079,381
Cash and cash equivalents 9,046,196 – – – 9,046,196
Total Assets 150,739,355 316,027,888 1,168,683,774 36,674,560 1,672,125,577
Bank overdraft 2,132 – – – 2,132
Liabilities (excluding Net Assets Attributable to Holders of Redeemable Participating Shares) 2,132 – – – 2,132
Interest rate sensitivity gap for Net Assets attributable to Holders of Redeemable Participating Shares 150,737,223 316,027,888 1,168,683,774 36,674,560 1,672,123,445
31 December 2018
Up to 1 year 1 - 5 years Over 5 yearsNon-interest
bearing Total
Current Assets US$ US$ US$ US$ US$
Financial Assets at Fair Value through Profit or Loss 48,777,521 178,278,089 1,037,652,773 14,418,402 1,279,126,785
Cash and cash equivalents 15,305,669 – – – 15,305,669
Total Assets 64,083,190 178,278,089 1,037,652,773 14,418,402 1,294,432,454
Liabilities (excluding Net Assets Attributable to Holders of Redeemable Participating Shares) – – – – –
Interest rate sensitivity gap for Net Assets attributable to Holders of Redeemable Participating Shares 64,083,190 178,278,089 1,037,652,773 14,418,402 1,294,432,454

FINANCIAL STATEMENTS NOTES TO THE AUDITED FINANCIAL STATEMENTS
1254 NEUBERGER BERMAN INVESTMENT FUNDS PLC
FOR THE YEAR ENDED 31 DECEMBER 2019
12. FINANCIAL INSTRUMENT DISCLOSURES (CONTINUED)
(c) Interest Rate Risk (continued)
Neuberger Berman Global Bond Absolute Return Fund
31 December 2019
Up to 1 year 1 - 5 years Over 5 yearsNon-interest
bearing Total
Current Assets US$ US$ US$ US$ US$
Financial Assets at Fair Value through Profit or Loss 4,560,619 22,778,968 94,627,843 6,045,255 128,012,685
Cash and cash equivalents 6,582,277 – – – 6,582,277
Total Assets 11,142,896 22,778,968 94,627,843 6,045,255 134,594,962
Liabilities (excluding Net Assets Attributable to Holders of Redeemable Participating Shares) – – – – –
Interest rate sensitivity gap for Net Assets attributable to Holders of Redeemable Participating Shares 11,142,896 22,778,968 94,627,843 6,045,255 134,594,962
31 December 2018
Up to 1 year 1 - 5 years Over 5 years Non-interest bearing
Total
Current Assets US$ US$ US$ US$ US$
Financial Assets at Fair Value through Profit or Loss 1,693,144 6,109,411 66,091,686 4,301,132 78,195,373
Cash and cash equivalents 3,087,506 – – – 3,087,506
Total Assets 4,780,650 6,109,411 66,091,686 4,301,132 81,282,879
Liabilities (excluding Net Assets Attributable to Holders of Redeemable Participating Shares) – – – – –
Interest rate sensitivity gap for Net Assets attributable to Holders of Redeemable Participating Shares 4,780,650 6,109,411 66,091,686 4,301,132 81,282,879
Neuberger Berman Short Duration Emerging Market Debt Fund
31 December 2019
Up to 1 year 1 - 5 years Over 5 yearsNon-interest
bearing Total
Current Assets US$ US$ US$ US$ US$
Financial Assets at Fair Value through Profit or Loss 920,643,728 3,934,694,789 556,047,997 31,341,000 5,442,727,514
Cash and cash equivalents 285,531,463 – – – 285,531,463
Total Assets 1,206,175,191 3,934,694,789 556,047,997 31,341,000 5,728,258,977
Bank overdraft 8,842 – – – 8,842
Liabilities (excluding Net Assets Attributable to Holders of Redeemable Participating Shares) 8,842 – – – 8,842
Interest rate sensitivity gap for Net Assets attributable to Holders of Redeemable Participating Shares 1,206,166,349 3,934,694,789 556,047,997 31,341,000 5,728,250,135

NOTES TO THE AUDITED FINANCIAL STATEMENTS FINANCIAL STATEMENTS
ANNUAL REPORT 2019 1255
FOR THE YEAR ENDED 31 DECEMBER 2019
12. FINANCIAL INSTRUMENT DISCLOSURES (CONTINUED)
(c) Interest Rate Risk (continued)
Neuberger Berman Short Duration Emerging Market Debt Fund (continued)
31 December 2018
Up to 1 year 1 - 5 years Over 5 yearsNon-interest
bearingTotal
Current Assets US$ US$ US$ US$ US$
Financial Assets at Fair Value through Profit or Loss 647,150,199 2,565,753,079 299,810,337 – 3,512,713,615
Cash and cash equivalents 119,051,957 – – – 119,051,957
Total Assets 766,202,156 2,565,753,079 299,810,337 – 3,631,765,572
Liabilities (excluding Net Assets Attributable to Holders of Redeemable Participating Shares) – – – – –
Interest rate sensitivity gap for Net Assets attributable to Holders of Redeemable Participating Shares 766,202,156 2,565,753,079 299,810,337 – 3,631,765,572
Neuberger Berman Absolute Return Multi Strategy Fund
31 December 2019
Up to 1 year 1 - 5 years Over 5 years Non-interest bearing
Total
Current Assets US$ US$ US$ US$ US$
Financial Assets at Fair Value through Profit or Loss 44,120 663,521 9,863,375 18,834,261 29,405,277
Cash and cash equivalents 23,598,927 – – – 23,598,927
Total Assets 23,643,047 663,521 9,863,375 18,834,261 53,004,204
Liabilities (excluding Net Assets Attributable to Holders of Redeemable Participating Shares) – – – – –
Interest rate sensitivity gap for Net Assets attributable to Holders of Redeemable Participating Shares 23,643,047 663,521 9,863,375 18,834,261 53,004,204
31 December 2018
Up to 1 year 1 - 5 years Over 5 yearsNon-interest
bearingTotal
Current Assets US$ US$ US$ US$ US$
Financial Assets at Fair Value through Profit or Loss 217,985 828,364 9,807,150 24,120,201 34,973,700
Cash and cash equivalents 23,837,303 – – – 23,837,303
Total Assets 24,055,288 828,364 9,807,150 24,120,201 58,811,003
Bank overdraft 2,356 – – – 2,356
Liabilities (excluding Net Assets Attributable to Holders of Redeemable Participating Shares) 2,356 – – – 2,356
Interest rate sensitivity gap for Net Assets attributable to Holders of Redeemable Participating Shares 24,052,932 828,364 9,807,150 24,120,201 58,808,647

FINANCIAL STATEMENTS NOTES TO THE AUDITED FINANCIAL STATEMENTS
1256 NEUBERGER BERMAN INVESTMENT FUNDS PLC
FOR THE YEAR ENDED 31 DECEMBER 2019
12. FINANCIAL INSTRUMENT DISCLOSURES (CONTINUED)
(c) Interest Rate Risk (continued)
Neuberger Berman Emerging Market Debt Blend Fund
31 December 2019
Up to 1 year 1 - 5 years Over 5 yearsNon-interest
bearing Total
Current Assets US$ US$ US$ US$ US$
Financial Assets at Fair Value through Profit or Loss 94,302,333 406,640,593 1,086,953,379 16,672,304 1,604,568,609
Cash and cash equivalents 62,919,150 – – – 62,919,150
Total Assets 157,221,483 406,640,593 1,086,953,379 16,672,304 1,667,487,759
Bank overdraft 2,014 – – – 2,014
Liabilities (excluding Net Assets Attributable to Holders of Redeemable Participating Shares) 2,014 – – – 2,014
Interest rate sensitivity gap for Net Assets attributable to Holders of Redeemable Participating Shares 157,219,469 406,640,593 1,086,953,379 16,672,304 1,667,485,745
31 December 2018
Up to 1 year 1 - 5 years Over 5 yearsNon-interest
bearing Total
Current Assets US$ US$ US$ US$ US$
Financial Assets at Fair Value through Profit or Loss 137,669,901 369,725,482 1,088,524,288 – 1,595,919,671
Cash and cash equivalents 93,338,241 – – – 93,338,241
Total Assets 231,008,142 369,725,482 1,088,524,288 – 1,689,257,912
Bank overdraft 3,517 – – – 3,517
Liabilities (excluding Net Assets Attributable to Holders of Redeemable Participating Shares) 3,517 – – – 3,517
Interest rate sensitivity gap for Net Assets attributable to Holders of Redeemable Participating Shares 231,004,625 369,725,482 1,088,524,288 – 1,689,254,395
Neuberger Berman European High Yield Bond Fund
31 December 2019
Up to 1 year 1 - 5 years Over 5 yearsNon-interest
bearing Total
Current Assets EUR EUR EUR EUR EUR
Financial Assets at Fair Value through Profit or Loss – 9,353,339 30,324,879 – 39,678,218
Cash and cash equivalents 335,867 – – – 335,867
Total Assets 335,867 9,353,339 30,324,879 – 40,014,085
Bank overdraft 289 – – – 289
Liabilities (excluding Net Assets Attributable to Holders of Redeemable Participating Shares) 289 – – – 289
Interest rate sensitivity gap for Net Assets attributable to Holders of Redeemable Participating Shares 335,578 9,353,339 30,324,879 – 40,013,796

NOTES TO THE AUDITED FINANCIAL STATEMENTS FINANCIAL STATEMENTS
ANNUAL REPORT 2019 1257
FOR THE YEAR ENDED 31 DECEMBER 2019
12. FINANCIAL INSTRUMENT DISCLOSURES (CONTINUED)
(c) Interest Rate Risk (continued)
Neuberger Berman European High Yield Bond Fund (continued)
31 December 2018
Up to 1 year 1 - 5 years Over 5 yearsNon-interest
bearingTotal
Current Assets EUR EUR EUR EUR EUR
Financial Assets at Fair Value through Profit or Loss 255,045 6,437,320 17,243,547 – 23,935,912
Cash and cash equivalents 489,022 – – – 489,022
Total Assets 744,067 6,437,320 17,243,547 – 24,424,934
Bank overdraft 149 – – – 149
Liabilities (excluding Net Assets Attributable to Holders of Redeemable Participating Shares) 149 – – – 149
Interest rate sensitivity gap for Net Assets attributable to Holders of Redeemable Participating Shares 743,918 6,437,320 17,243,547 – 24,424,785
Neuberger Berman Global Credit Long Short Fund*
31 December 2018
Up to 1 year 1 - 5 years Over 5 years Non-interest bearing
Total
Current Assets US$ US$ US$ US$ US$
Financial Assets at Fair Value through Profit or Loss – – – 1,433 1,433
Cash and cash equivalents 82,073 – – – 82,073
Total Assets 82,073 – – 1,433 83,506
Liabilities (excluding Net Assets Attributable to Holders of Redeemable Participating Shares) – – – – –
Interest rate sensitivity gap for Net Assets attributable to Holders of Redeemable Participating Shares 82,073 – – 1,433 83,506
* Portfolio liquidated on 26 November 2018.

FINANCIAL STATEMENTS NOTES TO THE AUDITED FINANCIAL STATEMENTS
1258 NEUBERGER BERMAN INVESTMENT FUNDS PLC
FOR THE YEAR ENDED 31 DECEMBER 2019
12. FINANCIAL INSTRUMENT DISCLOSURES (CONTINUED)
(c) Interest Rate Risk (continued)
Neuberger Berman Asian Debt – Hard Currency Fund
31 December 2019
Up to 1 year 1 - 5 years Over 5 yearsNon-interest
bearing Total
Current Assets US$ US$ US$ US$ US$
Financial Assets at Fair Value through Profit or Loss – 9,086,332 12,599,953 – 21,686,285
Cash and cash equivalents 3,188,351 – – – 3,188,351
Total Assets 3,188,351 9,086,332 12,599,953 – 24,874,636
Liabilities (excluding Net Assets Attributable to Holders of Redeemable Participating Shares) – – – – –
Interest rate sensitivity gap for Net Assets attributable to Holders of Redeemable Participating Shares 3,188,351 9,086,332 12,599,953 – 24,874,636
31 December 2018 Up to 1 year 1 - 5 years Over 5 years Non-interest
bearingTotal
Current Assets US$ US$ US$ US$ US$
Financial Assets at Fair Value through Profit or Loss – 6,848,117 8,838,426 – 15,686,543
Cash and cash equivalents 21,479 – – – 21,479
Total Assets 21,479 6,848,117 8,838,426 – 15,708,022
Liabilities (excluding Net Assets Attributable to Holders of Redeemable Participating Shares) – – – – –
Interest rate sensitivity gap for Net Assets attributable to Holders of Redeemable Participating Shares 21,479 6,848,117 8,838,426 – 15,708,022

NOTES TO THE AUDITED FINANCIAL STATEMENTS FINANCIAL STATEMENTS
ANNUAL REPORT 2019 1259
FOR THE YEAR ENDED 31 DECEMBER 2019
12. FINANCIAL INSTRUMENT DISCLOSURES (CONTINUED)
(c) Interest Rate Risk (continued)
Neuberger Berman China Bond Fund
31 December 2019
Up to 1 year 1 - 5 years Over 5 yearsNon-interest
bearing Total
Current Assets CNY CNY CNY CNY CNY
Financial Assets at Fair Value through Profit or Loss 257,478,078 466,942,517 54,212,546 – 778,633,141
Cash and cash equivalents 28,969,680 – – – 28,969,680
Total Assets 286,447,758 466,942,517 54,212,546 – 807,602,821
Liabilities (excluding Net Assets Attributable to Holders of Redeemable Participating Shares) – – – – –
Interest rate sensitivity gap for Net Assets attributable to Holders of Redeemable Participating Shares 286,447,758 466,942,517 54,212,546 – 807,602,821
31 December 2018
Up to 1 year 1 - 5 years Over 5 years Non-interest bearing
Total
Current Assets CNY CNY CNY CNY CNY
Financial Assets at Fair Value through Profit or Loss 7,066,460 64,888,702 5,098,840 – 77,054,002
Cash and cash equivalents 2,254,002 – – – 2,254,002
Total Assets 9,320,462 64,888,702 5,098,840 – 79,308,004
Liabilities (excluding Net Assets Attributable to Holders of Redeemable Participating Shares) – – – – –
Interest rate sensitivity gap for Net Assets attributable to Holders of Redeemable Participating Shares 9,320,462 64,888,702 5,098,840 – 79,308,004
Neuberger Berman Global Dynamic Asset Allocator Fund*
31 December 2019
Up to 1 year 1 - 5 years Over 5 yearsNon-interest
bearingTotal
Current Assets US$ US$ US$ US$ US$
Financial Assets at Fair Value through Profit or Loss – 8,367 7,352 – 15,719
Cash and cash equivalents 102 – – – 102
Total Assets 102 8,367 7,352 – 15,821
Bank overdraft 2,523 – – – 2,523
Liabilities (excluding Net Assets Attributable to Holders of Redeemable Participating Shares) 2,523 – – – 2,523
Interest rate sensitivity gap for Net Assets attributable to Holders of Redeemable Participating Shares (2,421) 8,367 7,352 – 13,298

FINANCIAL STATEMENTS NOTES TO THE AUDITED FINANCIAL STATEMENTS
1260 NEUBERGER BERMAN INVESTMENT FUNDS PLC
FOR THE YEAR ENDED 31 DECEMBER 2019
12. FINANCIAL INSTRUMENT DISCLOSURES (CONTINUED)
(c) Interest Rate Risk (continued)
Neuberger Berman Global Dynamic Asset Allocator Fund* (continued)
31 December 2018
Up to 1 year 1 - 5 years Over 5 yearsNon-interest
bearingTotal
Current Assets US$ US$ US$ US$ US$
Financial Assets at Fair Value through Profit or Loss 597,702 2,425,788 18,936,221 1,072,480 23,032,191
Cash and cash equivalents 606,395 – – – 606,395
Total Assets 1,204,097 2,425,788 18,936,221 1,072,480 23,638,586
Liabilities (excluding Net Assets Attributable to Holders of Redeemable Participating Shares) – – – – –
Interest rate sensitivity gap for Net Assets attributable to Holders of Redeemable Participating Shares 1,204,097 2,425,788 18,936,221 1,072,480 23,638,586
*Portfolio liquidated on 12 April 2019.
Neuberger Berman Corporate Hybrid Bond Fund
31 December 2019
Up to 1 year 1 - 5 years Over 5 yearsNon-interest
bearingTotal
Current Assets EUR EUR EUR EUR EUR
Financial Assets at Fair Value through Profit or Loss – – 1,048,748,335 – 1,048,748,335
Cash and cash equivalents 66,653,202 – – – 66,653,202
Total Assets 66,653,202 – 1,048,748,335 – 1,115,401,537
Bank overdraft 23,721 – – – 23,721
Liabilities (excluding Net Assets Attributable to Holders of Redeemable Participating Shares) 23,721 – – – 23,721
Interest rate sensitivity gap for Net Assets attributable to Holders of Redeemable Participating Shares 66,629,481 – 1,048,748,335 – 1,115,377,816
31 December 2018
Up to 1 year 1 - 5 years Over 5 yearsNon-interest
bearingTotal
Current Assets EUR EUR EUR EUR EUR
Financial Assets at Fair Value through Profit or Loss – – 794,442,089 – 794,442,089
Cash and cash equivalents 10,349,069 – – – 10,349,069
Total Assets 10,349,069 – 794,442,089 – 804,791,158
Bank overdraft 1,751 – – – 1,751
Liabilities (excluding Net Assets Attributable to Holders of Redeemable Participating Shares) 1,751 – – – 1,751
Interest rate sensitivity gap for Net Assets attributable to Holders of Redeemable Participating Shares 10,347,318 – 794,442,089 – 804,789,407

NOTES TO THE AUDITED FINANCIAL STATEMENTS FINANCIAL STATEMENTS
ANNUAL REPORT 2019 1261
FOR THE YEAR ENDED 31 DECEMBER 2019
12. FINANCIAL INSTRUMENT DISCLOSURES (CONTINUED)
(c) Interest Rate Risk (continued)
Neuberger Berman Global High Yield Bond Fund
31 December 2019
Up to 1 year 1 - 5 years Over 5 yearsNon-interest
bearing Total
Current Assets US$ US$ US$ US$ US$
Financial Assets at Fair Value through Profit or Loss – 17,741,543 53,564,309 – 71,305,852
Cash and cash equivalents 2,247,629 – – – 2,247,629
Total Assets 2,247,629 17,741,543 53,564,309 – 73,553,481
Liabilities (excluding Net Assets Attributable to Holders of Redeemable Participating Shares) – – – – –
Interest rate sensitivity gap for Net Assets attributable to Holders of Redeemable Participating Shares 2,247,629 17,741,543 53,564,309 – 73,553,481
31 December 2018
Up to 1 year 1 - 5 years Over 5 years Non-interest bearing
Total
Current Assets US$ US$ US$ US$ US$
Financial Assets at Fair Value through Profit or Loss 940,683 22,945,718 34,031,822 – 57,918,223
Cash and cash equivalents 1,718,426 – – – 1,718,426
Total Assets 2,659,109 22,945,718 34,031,822 – 59,636,649
Liabilities (excluding Net Assets Attributable to Holders of Redeemable Participating Shares) – – – – –
Interest rate sensitivity gap for Net Assets attributable to Holders of Redeemable Participating Shares 2,659,109 22,945,718 34,031,822 – 59,636,649
Neuberger Berman Global Opportunistic Bond Fund
31 December 2019
Up to 1 year 1 - 5 years Over 5 yearsNon-interest
bearingTotal
Current Assets US$ US$ US$ US$ US$
Financial Assets at Fair Value through Profit or Loss 4,883,781 35,593,371 125,870,733 13,014,301 179,362,186
Cash and cash equivalents 4,601,327 – – – 4,601,327
Total Assets 9,485,108 35,593,371 125,870,733 13,014,301 183,963,513
Bank overdraft 1,203 – – – 1,203
Liabilities (excluding Net Assets Attributable to Holders of Redeemable Participating Shares) 1,203 – – – 1,203
Interest rate sensitivity gap for Net Assets attributable to Holders of Redeemable Participating Shares 9,483,905 35,593,371 125,870,733 13,014,301 183,962,310

FINANCIAL STATEMENTS NOTES TO THE AUDITED FINANCIAL STATEMENTS
1262 NEUBERGER BERMAN INVESTMENT FUNDS PLC
FOR THE YEAR ENDED 31 DECEMBER 2019
12. FINANCIAL INSTRUMENT DISCLOSURES (CONTINUED)
(c) Interest Rate Risk (continued)
Neuberger Berman Global Opportunistic Bond Fund (continued)
31 December 2018
Up to 1 year 1 - 5 years Over 5 yearsNon-interest
bearingTotal
Current Assets US$ US$ US$ US$ US$
Financial Assets at Fair Value through Profit or Loss 2,564,102 10,585,917 83,838,553 9,261,702 106,250,274
Cash and cash equivalents 2,783,875 – – – 2,783,875
Total Assets 5,347,977 10,585,917 83,838,553 9,261,702 109,034,149
Liabilities (excluding Net Assets Attributable to Holders of Redeemable Participating Shares) – – – – –
Interest rate sensitivity gap for Net Assets attributable to Holders of Redeemable Participating Shares 5,347,977 10,585,917 83,838,553 9,261,702 109,034,149
Neuberger Berman Multi-Asset Risk Premia Fund*
31 December 2019
Up to 1 year 1 - 5 years Over 5 years Non-interest bearing
Total
Current Assets US$ US$ US$ US$ US$
Financial Assets at Fair Value through Profit or Loss – – – – –
Cash and cash equivalents 643 – – – 643
Total Assets 643 – – – 643
Bank overdraft 3,848 – – – 3,848
Liabilities (excluding Net Assets Attributable to Holders of Redeemable Participating Shares)
3,848 – – – 3,848
Interest rate sensitivity gap for Net Assets attributable to Holders of Redeemable Participating Shares
(3,205)–
– – (3,205)
31 December 2018
Up to 1 year 1 - 5 years Over 5 yearsNon-interest
bearing Total
Current Assets US$ US$ US$ US$ US$
Financial Assets at Fair Value through Profit or Loss 46,496,865 – – – 46,496,865
Cash and cash equivalents 1,877,285 – – – 1,877,285
Total Assets 48,374,150 – – – 48,374,150
Liabilities (excluding Net Assets Attributable to Holders of Redeemable Participating Shares) – – – – –
Interest rate sensitivity gap for Net Assets attributable to Holders of Redeemable Participating Shares 48,374,150 – – – 48,374,150
*Portfolio liquidated on 26 March 2019.

NOTES TO THE AUDITED FINANCIAL STATEMENTS FINANCIAL STATEMENTS
ANNUAL REPORT 2019 1263
FOR THE YEAR ENDED 31 DECEMBER 2019
12. FINANCIAL INSTRUMENT DISCLOSURES (CONTINUED)
(c) Interest Rate Risk (continued)
Neuberger Berman Multi-Asset Class Income Fund
31 December 2019
Up to 1 year 1 - 5 years Over 5 yearsNon-interest
bearing Total
Current Assets US$ US$ US$ US$ US$
Financial Assets at Fair Value through Profit or Loss 576,582 1,482,086 55,089,958 36,328,590 93,477,216
Cash and cash equivalents 1,819,066 – – – 1,819,066
Total Assets 2,395,648 1,482,086 55,089,958 36,328,590 95,296,282
Liabilities (excluding Net Assets Attributable to Holders of Redeemable Participating Shares) – – – – –
Interest rate sensitivity gap for Net Assets attributable to Holders of Redeemable Participating Shares 2,395,648 1,482,086 55,089,958 36,328,590 95,296,282
31 December 2018
Up to 1 year 1 - 5 years Over 5 years Non-interest bearing
Total
Current Assets US$ US$ US$ US$ US$
Financial Assets at Fair Value through Profit or Loss 500,409 1,686,625 17,240,357 19,846,403 39,273,794
Cash and cash equivalents 1,628,741 – – – 1,628,741
Total Assets 2,129,150 1,686,625 17,240,357 19,846,403 40,902,535
Bank overdraft 10,110 – – – 10,110
Liabilities (excluding Net Assets Attributable to Holders of Redeemable Participating Shares) 10,110 – – – 10,110
Interest rate sensitivity gap for Net Assets attributable to Holders of Redeemable Participating Shares 2,119,040 1,686,625 17,240,357 19,846,403 40,892,425
Neuberger Berman US Equity Index PutWrite Fund
31 December 2019
Up to 1 year 1 - 5 years Over 5 years Non-interest bearing
Total
Current Assets US$ US$ US$ US$ US$
Financial Assets at Fair Value through Profit or Loss 211,272,951 310,666,817 – – 521,939,768
Cash and cash equivalents 32,398,253 – – – 32,398,253
Total Assets 243,671,204 310,666,817 – – 554,338,021
Liabilities (excluding Net Assets Attributable to Holders of Redeemable Participating Shares) – – – – –
Interest rate sensitivity gap for Net Assets attributable to Holders of Redeemable Participating Shares 243,671,204 310,666,817 – – 554,338,021

FINANCIAL STATEMENTS NOTES TO THE AUDITED FINANCIAL STATEMENTS
1264 NEUBERGER BERMAN INVESTMENT FUNDS PLC
FOR THE YEAR ENDED 31 DECEMBER 2019
12. FINANCIAL INSTRUMENT DISCLOSURES (CONTINUED)
(c) Interest Rate Risk (continued)
Neuberger Berman US Equity Index PutWrite Fund (continued)
31 December 2018
Up to 1 year 1 - 5 years Over 5 yearsNon-interest
bearingTotal
Current Assets US$ US$ US$ US$ US$
Financial Assets at Fair Value through Profit or Loss 124,253,812 274,756,160 – – 399,009,972
Cash and cash equivalents 18,668,522 – – – 18,668,522
Total Assets 142,922,334 274,756,160 – – 417,678,494
Liabilities (excluding Net Assets Attributable to Holders of Redeemable Participating Shares) – – – – –
Interest rate sensitivity gap for Net Assets attributable to Holders of Redeemable Participating Shares 142,922,334 274,756,160 – – 417,678,494
Neuberger Berman Global Equity Index PutWrite Fund
31 December 2019
Up to 1 year 1 - 5 years Over 5 years Non-interest bearing
Total
Current Assets US$ US$ US$ US$ US$
Financial Assets at Fair Value through Profit or Loss 44,385,356 9,607,026 – – 53,992,382
Cash and cash equivalents 2,802,683 – – – 2,802,683
Total Assets 47,188,039 9,607,026 – – 56,795,065
Liabilities (excluding Net Assets Attributable to Holders of Redeemable Participating Shares) – – – – –
Interest rate sensitivity gap for Net Assets attributable to Holders of Redeemable Participating Shares 47,188,039 9,607,026 – – 56,795,065
31 December 2018
Up to 1 year 1 - 5 years Over 5 yearsNon-interest
bearingTotal
Current Assets US$ US$ US$ US$ US$
Financial Assets at Fair Value through Profit or Loss 42,831,702 38,730,559 – – 81,562,261
Cash and cash equivalents 4,678,833 – – – 4,678,833
Total Assets 47,510,535 38,730,559 – – 86,241,094
Liabilities (excluding Net Assets Attributable to Holders of Redeemable Participating Shares) – – – – –
Interest rate sensitivity gap for Net Assets attributable to Holders of Redeemable Participating Shares 47,510,535 38,730,559 – – 86,241,094

NOTES TO THE AUDITED FINANCIAL STATEMENTS FINANCIAL STATEMENTS
ANNUAL REPORT 2019 1265
FOR THE YEAR ENDED 31 DECEMBER 2019
12. FINANCIAL INSTRUMENT DISCLOSURES (CONTINUED)
(c) Interest Rate Risk (continued)
Neuberger Berman Uncorrelated Strategies Fund
31 December 2019
Up to 1 year 1 - 5 years Over 5 yearsNon-interest
bearing Total
Current Assets US$ US$ US$ US$ US$
Financial Assets at Fair Value through Profit or Loss 836,990,850 – – – 836,990,850
Cash and cash equivalents 318,106,121 – – – 318,106,121
Total Assets 1,155,096,971 – – – 1,155,096,971
Bank overdraft 4,412 – – – 4,412
Liabilities (excluding Net Assets Attributable to Holders of Redeemable Participating Shares) 4,412 – – – 4,412
Interest rate sensitivity gap for Net Assets attributable to Holders of Redeemable Participating Shares 1,155,092,559 – – – 1,155,092,559
31 December 2018
Up to 1 year 1 - 5 years Over 5 yearsNon-interest
bearing Total
Current Assets US$ US$ US$ US$ US$
Financial Assets at Fair Value through Profit or Loss 439,961,516 – – – 439,961,516
Cash and cash equivalents 198,447,916 – – – 198,447,916
Total Assets 638,409,432 – – – 638,409,432
Bank overdraft 2,681 – – – 2,681
Liabilities (excluding Net Assets Attributable to Holders of Redeemable Participating Shares) 2,681 – – – 2,681
Interest rate sensitivity gap for Net Assets attributable to Holders of Redeemable Participating Shares 638,406,751 – – – 638,406,751
Neuberger Berman Emerging Market Debt Blend Investment Grade Fund
31 December 2019
Up to 1 year 1 - 5 years Over 5 yearsNon-interest
bearing Total
Current Assets US$ US$ US$ US$ US$
Financial Assets at Fair Value through Profit or Loss 688,202 3,029,661 14,713,789 – 18,431,652
Cash and cash equivalents 716,035 – – – 716,035
Total Assets 1,404,237 3,029,661 14,713,789 – 19,147,687
Liabilities (excluding Net Assets Attributable to Holders of Redeemable Participating Shares) – – – – –
Interest rate sensitivity gap for Net Assets attributable to Holders of Redeemable Participating Shares 1,404,237 3,029,661 14,713,789 – 19,147,687

FINANCIAL STATEMENTS NOTES TO THE AUDITED FINANCIAL STATEMENTS
1266 NEUBERGER BERMAN INVESTMENT FUNDS PLC
FOR THE YEAR ENDED 31 DECEMBER 2019
12. FINANCIAL INSTRUMENT DISCLOSURES (CONTINUED)
(c) Interest Rate Risk (continued)
Neuberger Berman Emerging Market Debt Blend Investment Grade Fund (continued)
31 December 2018
Up to 1 year 1 - 5 years Over 5 yearsNon-interest
bearingTotal
Current Assets US$ US$ US$ US$ US$
Financial Assets at Fair Value through Profit or Loss 586,515 2,934,331 12,700,962 – 16,221,808
Cash and cash equivalents 567,152 – – – 567,152
Total Assets 1,153,667 2,934,331 12,700,962 – 16,788,960
Liabilities (excluding Net Assets Attributable to Holders of Redeemable Participating Shares) – – – – –
Interest rate sensitivity gap for Net Assets attributable to Holders of Redeemable Participating Shares 1,153,667 2,934,331 12,700,962 – 16,788,960
Neuberger Berman Multi-Asset Class Growth Fund
31 December 2019
Up to 1 year 1 - 5 years Over 5 years Non-interest bearing
Total
Current Assets US$ US$ US$ US$ US$
Financial Assets at Fair Value through Profit or Loss 1,600,019 4,609,156 6,368,383 5,717,910 18,295,468
Cash and cash equivalents 872,592 – – – 872,592
Total Assets 2,472,611 4,609,156 6,368,383 5,717,910 19,168,060
Bank overdraft 313 – – – 313
Liabilities (excluding Net Assets Attributable to Holders of Redeemable Participating Shares) 313 – – – 313
Interest rate sensitivity gap for Net Assets attributable to Holders of Redeemable Participating Shares 2,472,298 4,609,156 6,368,383 5,717,910 19,167,747
31 December 2018
Up to 1 year 1 - 5 years Over 5 yearsNon-interest
bearing Total
Current Assets US$ US$ US$ US$ US$
Financial Assets at Fair Value through Profit or Loss 1,187,445 4,086,308 9,022,460 4,862,541 19,158,754
Cash and cash equivalents 605,145 – – – 605,145
Total Assets 1,792,590 4,086,308 9,022,460 4,862,541 19,763,899
Liabilities (excluding Net Assets Attributable to Holders of Redeemable Participating Shares) – – – – –
Interest rate sensitivity gap for Net Assets attributable to Holders of Redeemable Participating Shares 1,792,590 4,086,308 9,022,460 4,862,541 19,763,899
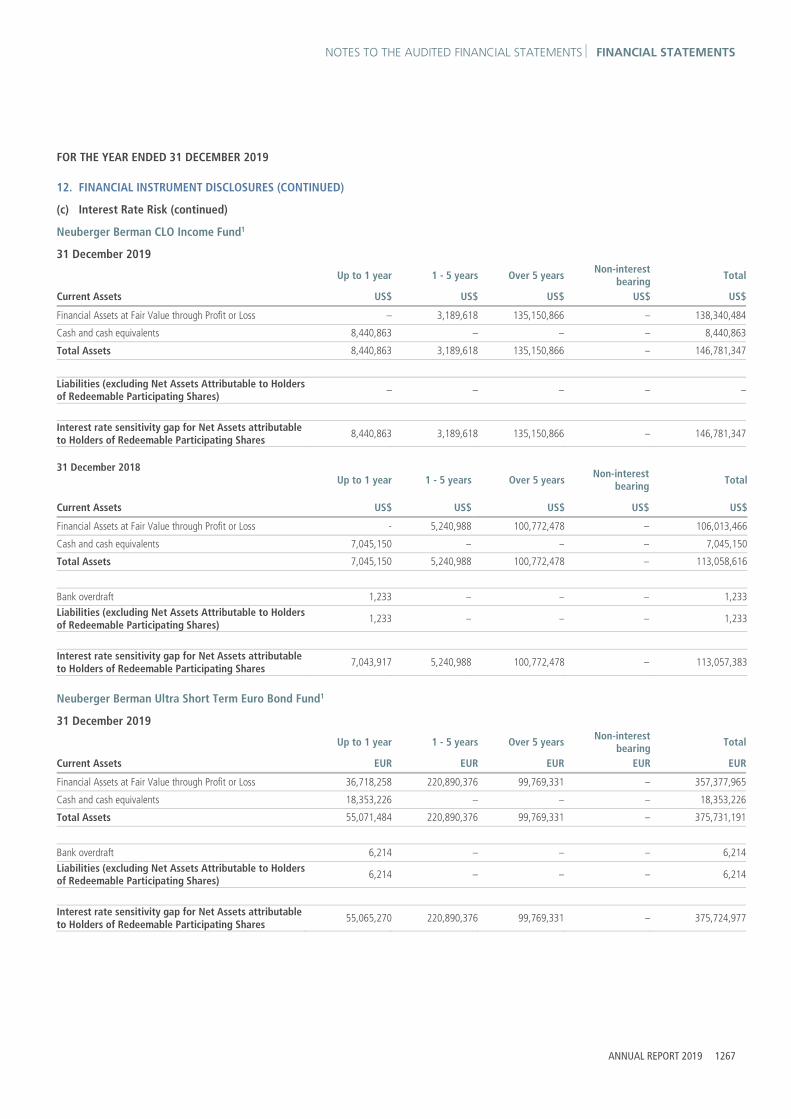
NOTES TO THE AUDITED FINANCIAL STATEMENTS FINANCIAL STATEMENTS
ANNUAL REPORT 2019 1267
FOR THE YEAR ENDED 31 DECEMBER 2019
12. FINANCIAL INSTRUMENT DISCLOSURES (CONTINUED)
(c) Interest Rate Risk (continued)
Neuberger Berman CLO Income Fund1
31 December 2019
Up to 1 year 1 - 5 years Over 5 yearsNon-interest
bearing Total
Current Assets US$ US$ US$ US$ US$
Financial Assets at Fair Value through Profit or Loss – 3,189,618 135,150,866 – 138,340,484
Cash and cash equivalents 8,440,863 – – – 8,440,863
Total Assets 8,440,863 3,189,618 135,150,866 – 146,781,347
Liabilities (excluding Net Assets Attributable to Holders of Redeemable Participating Shares) – – – – –
Interest rate sensitivity gap for Net Assets attributable to Holders of Redeemable Participating Shares 8,440,863 3,189,618 135,150,866 – 146,781,347
31 December 2018
Up to 1 year 1 - 5 years Over 5 yearsNon-interest
bearing Total
Current Assets US$ US$ US$ US$ US$
Financial Assets at Fair Value through Profit or Loss - 5,240,988 100,772,478 – 106,013,466
Cash and cash equivalents 7,045,150 – – – 7,045,150
Total Assets 7,045,150 5,240,988 100,772,478 – 113,058,616
Bank overdraft 1,233 – – – 1,233
Liabilities (excluding Net Assets Attributable to Holders of Redeemable Participating Shares) 1,233 – – – 1,233
Interest rate sensitivity gap for Net Assets attributable to Holders of Redeemable Participating Shares 7,043,917 5,240,988 100,772,478 – 113,057,383
Neuberger Berman Ultra Short Term Euro Bond Fund1
31 December 2019
Up to 1 year 1 - 5 years Over 5 years Non-interest bearing
Total
Current Assets EUR EUR EUR EUR EUR
Financial Assets at Fair Value through Profit or Loss 36,718,258 220,890,376 99,769,331 – 357,377,965
Cash and cash equivalents 18,353,226 – – – 18,353,226
Total Assets 55,071,484 220,890,376 99,769,331 – 375,731,191
Bank overdraft 6,214 – – – 6,214
Liabilities (excluding Net Assets Attributable to Holders of Redeemable Participating Shares) 6,214 – – – 6,214
Interest rate sensitivity gap for Net Assets attributable to Holders of Redeemable Participating Shares 55,065,270 220,890,376 99,769,331 – 375,724,977

FINANCIAL STATEMENTS NOTES TO THE AUDITED FINANCIAL STATEMENTS
1268 NEUBERGER BERMAN INVESTMENT FUNDS PLC
FOR THE YEAR ENDED 31 DECEMBER 2019
12. FINANCIAL INSTRUMENT DISCLOSURES (CONTINUED)
(c) Interest Rate Risk (continued)
Neuberger Berman Ultra Short Term Euro Bond Fund1 (continued)
31 December 2018
Up to 1 year 1 - 5 years Over 5 years Non-interest bearing
Total
Current Assets EUR EUR EUR EUR EUR
Financial Assets at Fair Value through Profit or Loss 200,646 9,877,306 986,667 – 11,064,619
Cash and cash equivalents 169,638 – – – 169,638
Total Assets 370,284 9,877,306 986,667 – 11,234,257
Bank overdraft 168 – – – 168
Liabilities (excluding Net Assets Attributable to Holders of Redeemable Participating Shares) 168 – – – 168
Interest rate sensitivity gap for Net Assets attributable to Holders of Redeemable Participating Shares 370,116 9,877,306 986,667 – 11,234,089
Neuberger Berman Euro Opportunistic Bond Fund1
31 December 2019
Up to 1 year 1 - 5 years Over 5 yearsNon-interest
bearingTotal
Current Assets EUR EUR EUR EUR EUR
Financial Assets at Fair Value through Profit or Loss – 1,931,261 7,259,506 1,015,652 10,206,419
Cash and cash equivalents 317,053 – – – 317,053
Total Assets 317,053 1,931,261 7,259,506 1,015,652 10,523,472
Bank overdraft 108 – – – 108
Liabilities (excluding Net Assets Attributable to Holders of Redeemable Participating Shares) 108 – – – 108
Interest rate sensitivity gap for Net Assets attributable to Holders of Redeemable Participating Shares 316,945 1,931,261 7,259,506 1,015,652 10,523,364
31 December 2018
Up to 1 year 1 - 5 years Over 5 yearsNon-interest
bearingTotal
Current Assets EUR EUR EUR EUR EUR
Financial Assets at Fair Value through Profit or Loss – 1,692,532 3,121,137 – 4,813,669
Cash and cash equivalents 148,876 – – – 148,876
Total Assets 148,876 1,692,532 3,121,137 – 4,962,545
Bank overdraft 17 – – – 17
Liabilities (excluding Net Assets Attributable to Holders of Redeemable Participating Shares) 17 – – – 17
Interest rate sensitivity gap for Net Assets attributable to Holders of Redeemable Participating Shares 148,859 1,692,532 3,121,137 – 4,962,528

NOTES TO THE AUDITED FINANCIAL STATEMENTS FINANCIAL STATEMENTS
ANNUAL REPORT 2019 1269
FOR THE YEAR ENDED 31 DECEMBER 2019
12. FINANCIAL INSTRUMENT DISCLOSURES (CONTINUED)
(c) Interest Rate Risk (continued)
Neuberger Berman Euro Bond Absolute Return Fund1
31 December 2019
Up to 1 year 1 - 5 years Over 5 yearsNon-interest
bearing Total
Current Assets EUR EUR EUR EUR EUR
Financial Assets at Fair Value through Profit or Loss 1,593,640 21,273,221 56,413,765 – 79,280,626
Cash and cash equivalents 717,491 – – – 717,491
Total Assets 2,311,131 21,273,221 56,413,765 – 79,998,117
Bank overdraft 2,236 – – – 2,236
Liabilities (excluding Net Assets Attributable to Holders of Redeemable Participating Shares) 2,236 – – – 2,236
Interest rate sensitivity gap for Net Assets attributable to Holders of Redeemable Participating Shares 2,308,895 21,273,221 56,413,765 – 79,995,881
31 December 2018
Up to 1 year 1 - 5 years Over 5 yearsNon-interest
bearing Total
Current Assets EUR EUR EUR EUR EUR
Financial Assets at Fair Value through Profit or Loss – 3,591,178 3,643,526 499,950 7,734,654
Cash and cash equivalents 2,386,720 – – – 2,386,720
Total Assets 2,386,720 3,591,178 3,643,526 499,950 10,121,374
Bank overdraft 1,668 – – – 1,668
Liabilities (excluding Net Assets Attributable to Holders of Redeemable Participating Shares) 1,668 – – – 1,668
Interest rate sensitivity gap for Net Assets attributable to Holders of Redeemable Participating Shares 2,385,052 3,591,178 3,643,526 499,950 10,119,706
Neuberger Berman Macro Opportunities FX Fund2
31 December 2019
Up to 1 year 1 - 5 years Over 5 yearsNon-interest
bearing Total
Current Assets EUR EUR EUR EUR EUR
Financial Assets at Fair Value through Profit or Loss 19,510,770 – – – 19,510,770
Cash and cash equivalents 117,430 – – – 117,430
Total Assets 19,628,200 – – – 19,628,200
Liabilities (excluding Net Assets Attributable to Holders of Redeemable Participating Shares) – – – – –
Interest rate sensitivity gap for Net Assets attributable to Holders of Redeemable Participating Shares 19,628,200 – – – 19,628,200
1 Portfolio launched during the prior reporting year. 2 Portfolio launched during the current reporting year.

FINANCIAL STATEMENTS NOTES TO THE AUDITED FINANCIAL STATEMENTS
1270 NEUBERGER BERMAN INVESTMENT FUNDS PLC
FOR THE YEAR ENDED 31 DECEMBER 2019
12. FINANCIAL INSTRUMENT DISCLOSURES (CONTINUED)
(d) Credit/Counterparty Risk
Credit risk is the risk that an issuer or counterparty will be unable to meet a commitment that it has entered into with the Company. It is the Company’s policy to enter into financial instruments with a diversity of creditworthy counterparties. Therefore, the Company does not expect to incur material credit losses on its financial instruments. The Investment Manager performs assessments of the credit quality of trading counterparties used by the Company. This assessment includes, at minimum, an initial and annual credit review based on financial and/or third-party ratings data. Counterparties used for forwards and other OTC derivatives are subject to heightened monitoring, which includes in-depth credit reviews considering third-party ratings and/or factors such as capital adequacy, asset quality, management quality, earnings, and liquidity. The Investment Manager also follows news regarding the financial sector to monitor industry trends as well as events that may directly impact specific counterparties.
The Company’s maximum exposure to credit risk (not taking into account the value of any collateral or other security held) in the event that counterparties fail to perform their obligations as at 31 December 2019 in relation to each class of recognised financial assets, other than derivatives, is the carrying amount of those assets as indicated in the Balance Sheet.
Transactions involving derivative financial instruments are usually with counterparties with whom the Portfolio has signed master netting agreements. Master netting agreements provide for the net settlement of contracts with the same counterparty in the event of default. The credit risk associated with derivative financial assets subject to a master netting arrangement is eliminated only to the extent that financial liabilities due to the same counterparty will be settled after the assets are realised. Risk is also managed by collateral being immediately available to the Company without recourse to counterparty in the event of default of counterparty.
Cash held via accounts opened on the books of Brown Brothers Harriman & Co. (“BBH”) are obligations of BBH while cash held in accounts opened directly on the books of a third party cash correspondent bank, sub-custodian or a broker (collectively, “agency accounts”) are obligations of the agent. Cash held via agency cash accounts are liabilities of the agent, creating a debtor/creditor relationship directly between the agent and the Company. Accordingly, while BBH is responsible for exercising reasonable care in the administration of such agency cash accounts where it has appointed the agent (i.e., in the case of cash correspondent banks and sub-custodians), it is not liable for their repayment in the event the agent, by reason of its bankruptcy, insolvency or otherwise, fails to make repayment. As at 31 December 2019, all cash and bank balances held on overnight deposit were with third party institutions, as outlined in Note 3. Cash and Cash Equivalents, that have a long term credit rating which is above investment grade as issued by Standard & Poor’s (31 December 2018: same). BBH has a long term credit rating of A+ (31 December 2018: A+) as issued by Fitch.
The Depositary must ensure that there is legal separation of non-cash assets held in custody, that such assets are held on a fiduciary basis, and that appropriate internal control systems are maintained such that records clearly identify the nature and amount of all assets under custody. As Depositary, Brown Brothers Harriman Trustee Services (Ireland) Limited (“BBHTS”) must ensure the ownership of each asset and the location of documents of title for each asset.
The key risk for the Company remains Credit Risk i.e. that the Investment Manager buys a loan or bond of a particular issuer and it does not perform as expected and either defaults on a payment or experiences a significant drop in the secondary market value.
To mitigate this risk, the Investment Manager carries out independent due diligence on each borrower, and has a focus on stable, performing credits that evidence strong track records through previous economic cycles. Additionally, the size of an issuer is also considered and the Investment Manager continues to favour the larger issuers in the market, defined by having debt issuance greater than $500m. These issuers tend to have broader syndicates, which can aid liquidity in the secondary market. As well as screening out the smaller issuers the Investment Manager also excludes highly cyclical industries and companies with limited earning visibility from its Investment Process.
Once a particular investment has been made, the Investment Manager monitors it. A range of relevant data is reviewed on an ongoing basis for each investment, including, but not limited to, key financial drivers, commodity prices, stock prices, regulatory developments, financial results, press releases and management commentary to identify any indicators of credit deterioration.
To manage this risk further, the Board ensures that the Investment Manager operates in accordance with the investment limits and restrictions policy determined by the Board. The Directors monitor the implementation and results of the investment process with the Investment Manager at each Board meeting and monitor risk factors in respect of each Portfolio.
The securities that BBH holds in custody include equities, fixed income securities, participatory notes, asset backed securities and REITS.

NOTES TO THE AUDITED FINANCIAL STATEMENTS FINANCIAL STATEMENTS
ANNUAL REPORT 2019 1271
FOR THE YEAR ENDED 31 DECEMBER 2019
12. FINANCIAL INSTRUMENT DISCLOSURES (CONTINUED)
(d) Credit/Counterparty Risk (continued)
All securities that BBH holds in custody (as global sub-custodian for and on behalf of BBHTS for further benefit of its underlying clients) are segregated from BBH’s own assets, whether they are held in BBH’s vault, in segregated accounts on the books of their sub-custodians, or in an account maintained at a central securities depository. BBH maintains segregated accounts per client on its own books as well as on the books of the sub-custodian in the local market, where this is possible. As Depositary, BBHTS must also ensure non-cash assets are held on a fiduciary basis through BBH’s network of global sub-custodians.
BBH’s sub-custodians are required by contract with BBH and generally by operation of law to segregate the securities of custody clients from the general banking assets of the sub-custodian.
BBH performs both initial and ongoing due diligence reviews on the sub-custodians within its global custody network through its Network Management Group. Such reviews include an assessment of service level standards, management expertise, market information, custody operations, reporting and technology capabilities at the sub-custodian, as well as reviews in relation to their reputation and standing in the market and their ongoing commitment to providing custody services.
Service level agreements are put in place with each sub-custodian, as well as the usual contractual arrangements, and these are reviewed on a regular basis through service review meetings, including on-site due diligence meetings.
Regular financial analysis of all sub-custodians is carried out by BBH’s Risk and Credit Group and is focused on the sub-custodian bank’s capital adequacy, asset quality, earnings, liquidity and credit ratings as key indicators, amongst others. These reviews form part of BBH’s routine assessment of a sub-custodian’s financial strength and standing.
The Investment Manager monitors the Company’s risk in accordance with UCITS guidelines and reports to the Board of Directors on a periodic basis.
The Company invests in debt instruments that may receive a credit rating from a well-known rating agency. The credit ratings in the tables below are calculated as a percentage of fixed income securities, where there is a significant proportion of that Portfolio held as fixed income. A debt instrument is considered Investment Grade by Standard & Poor's and Fitch if its credit rating is BBB- or higher and by Moody’s if its credit rating is Baa3 or higher. As at 31 December 2019 and 31 December 2018 the exposures by credit rating for each applicable Portfolio were as follows:
Neuberger Berman High Yield Bond Fund
Investments: 31 December 2019US$ 31 December 2018
US$
Corporate Bonds 3,115,732,226 3,461,236,467
Investment Funds 41,877,566 79,589,602
Term Loans 175,946,027 269,335,137
Derivatives 60,723,082 11,608,597
Cash & Cash Equivalents 65,675,647 163,792,361
Credit Ratings of Debt Instruments:
Portfolio By Rating 31 December 2019 %
31 December 2018%
Investment Grade 1.52 9.46
Non-Investment Grade 98.48 90.54
Not Rated 0.00 0.00
Total 100.00 100.00

FINANCIAL STATEMENTS NOTES TO THE AUDITED FINANCIAL STATEMENTS
1272 NEUBERGER BERMAN INVESTMENT FUNDS PLC
FOR THE YEAR ENDED 31 DECEMBER 2019
12. FINANCIAL INSTRUMENT DISCLOSURES (CONTINUED)
(d) Credit/Counterparty Risk (continued)
Neuberger Berman Short Duration High Yield Bond Fund
Investments: 31 December 2019US$ 31 December 2018
US$
Corporate Bonds 887,835,954 918,857,130
Investment Funds 3,147,897 5,982,359
Term Loans 90,810,636 66,815,648
Derivatives 5,618,205 1,155,191
Cash & Cash Equivalents 36,546,439 38,658,794
Credit Ratings of Debt Instruments:
Portfolio By Rating 31 December 2019% 31 December 2018
%
Investment Grade 4.86 6.17
Non-Investment Grade 95.14 93.83
Total 100.00 100.00
Neuberger Berman Global Bond Fund
Investments: 31 December 2019US$ 31 December 2018
US$
Agency Bonds 808,029 742,808
Asset Backed Securities 7,081,113 5,838,893
Corporate Bonds 53,875,832 42,017,408
Government Bonds 109,732,598 76,941,729
Mortgage Backed Securities 28,839,272 24,077,309
Treasury Bills 3,279,380 3,486,598
Derivatives (477,509) (64,449)
Cash & Cash Equivalents 1,145,392 1,256,218
Due from Brokers – 677,347
Due to Brokers (37,051) –
Credit Ratings of Debt Instruments:
Portfolio By Rating 31 December 2019 %
31 December 2018%
Investment Grade 83.95 82.51
Non-Investment Grade 0.35 0.42
Not Rated 15.70 17.07
Total 100.00 100.00

NOTES TO THE AUDITED FINANCIAL STATEMENTS FINANCIAL STATEMENTS
ANNUAL REPORT 2019 1273
FOR THE YEAR ENDED 31 DECEMBER 2019
12. FINANCIAL INSTRUMENT DISCLOSURES (CONTINUED)
(d) Credit/Counterparty Risk (continued)
Neuberger Berman Emerging Market Debt – Local Currency Fund
Investments: 31 December 2019US$ 31 December 2018
US$
Corporate Bonds 81,564,811 65,766,072
Government Bonds 2,839,759,622 2,256,689,647
Investment Funds 25,786,800 –
Treasury Bills 83,948,277 91,092,259
Derivatives 70,515,978 11,005,615
Cash & Cash Equivalents 79,509,570 36,222,106
Bank Overdraft – (29,466)
Due from Brokers 2,027,236 9,142,273
Due to Brokers (29,960,000) (13,090,000)
Credit Ratings of Debt Instruments:
Portfolio By Rating 31 December 2019 %
31 December 2018%
Investment Grade 59.58 59.20
Non-Investment Grade 13.28 20.06
Not Rated 27.14 20.74
Total 100.00 100.00
Neuberger Berman Emerging Market Debt – Hard Currency Fund
Investments: 31 December 2019US$ 31 December 2018
US$
Corporate Bonds 739,934,633 418,193,056
Government Bonds 1,509,767,060 934,693,370
Investment Funds 15,670,500 –
Treasury Bills 21,961,949 –
Derivatives 10,870,805 3,655,305
Cash & Cash Equivalents 168,014,510 95,120,326
Bank Overdraft (3,591) (3,480)
Due from Brokers 7,276,747 1,515,083
Credit Ratings of Debt Instruments:
Portfolio By Rating 31 December 2019 %
31 December 2018%
Investment Grade 40.76 33.43
Non-Investment Grade 56.82 62.56
Not Rated 2.42 4.01
Total 100.00 100.00

FINANCIAL STATEMENTS NOTES TO THE AUDITED FINANCIAL STATEMENTS
1274 NEUBERGER BERMAN INVESTMENT FUNDS PLC
FOR THE YEAR ENDED 31 DECEMBER 2019
12. FINANCIAL INSTRUMENT DISCLOSURES (CONTINUED)
(d) Credit/Counterparty Risk (continued)
Neuberger Berman Emerging Market Corporate Debt Fund
Investments: 31 December 2019US$ 31 December 2018
US$
Corporate Bonds 152,972,400 113,332,258
Government Bonds 6,779,074 2,770,970
Investment Funds 2,002,873 –
Derivatives 2,128,555 (203,765)
Cash & Cash Equivalents 7,842,101 186,326
Due from Brokers 35,816 402,243
Credit Ratings of Debt Instruments:
Portfolio By Rating 31 December 2019% 31 December 2018
%
Investment Grade 46.18 40.62
Non-Investment Grade 49.29 53.72
Not Rated 4.53 5.66
Total 100.00 100.00 Neuberger Berman Strategic Income Fund
Investments: 31 December 2019US$ 31 December 2018
US$
Agency Bonds 1,008,490 911,323
Asset Backed Securities 165,819,872 161,568,548
Corporate Bonds 634,341,091 472,938,359
Equities 12,936 13,331
Government Bonds 442,929,285 301,150,999
Investment Funds 36,661,624 14,405,071
Mortgage Backed Securities 218,777,629 283,701,161
Municipal Bonds 20,180,334 14,733,337
Term Loans 129,556,760 15,816,490
Treasury Bills 13,791,360 13,888,166
Derivatives (1,010,467) 4,505,690
Cash & Cash Equivalents 9,046,196 15,305,669
Bank Overdraft (2,132) –
Due from Brokers 270,000 7,209,807
Due to Brokers (4,110,467) –
Credit Ratings of Debt Instruments:
Portfolio By Rating 31 December 2019% 31 December 2018
%
Investment Grade 54.44 49.66
Non-Investment Grade 31.28 26.97
Not Rated 14.28 23.37
Total 100.00 100.00

NOTES TO THE AUDITED FINANCIAL STATEMENTS FINANCIAL STATEMENTS
ANNUAL REPORT 2019 1275
FOR THE YEAR ENDED 31 DECEMBER 2019
12. FINANCIAL INSTRUMENT DISCLOSURES (CONTINUED)
(d) Credit/Counterparty Risk (continued)
Neuberger Berman Global Bond Absolute Return Fund
Investments: 31 December 2019US$ 31 December 2018
US$
Asset Backed Securities 35,159,537 13,773,558
Corporate Bonds 47,384,645 35,683,902
Government Bonds 34,962,371 21,632,609
Investment Funds 6,045,255 4,301,132
Mortgage Backed Securities 3,169,000 1,509,150
Treasury Bills 1,291,877 1,295,022
Derivatives (2,329,950) (2,048,113)
Cash & Cash Equivalents 6,582,277 3,087,506
Due from Brokers 4,644,339 1,977,609
Credit Ratings of Debt Instruments:
Portfolio By Rating 31 December 2019% 31 December 2018
%
Investment Grade 36.39 46.82
Non-Investment Grade 55.41 49.70
Not Rated 8.20 3.48
Total 100.00 100.00
Neuberger Berman Short Duration Emerging Market Debt Fund
Investments: 31 December 2019US$ 31 December 2018
US$
Corporate Bonds 4,040,817,203 2,766,053,007
Government Bonds 1,310,673,086 746,660,608
Investment Funds 31,341,000 –
Treasury Bills 59,896,225 –
Derivatives 51,475,438 14,295,045
Cash & Cash Equivalents 285,531,463 119,051,957
Bank Overdraft (8,842) –
Credit Ratings of Debt Instruments:
Portfolio By Rating 31 December 2019% 31 December 2018
%
Investment Grade 51.96 47.33
Non-Investment Grade 43.31 47.28
Not Rated 4.73 5.39
Total 100.00 100.00

FINANCIAL STATEMENTS NOTES TO THE AUDITED FINANCIAL STATEMENTS
1276 NEUBERGER BERMAN INVESTMENT FUNDS PLC
FOR THE YEAR ENDED 31 DECEMBER 2019
12. FINANCIAL INSTRUMENT DISCLOSURES (CONTINUED)
(d) Credit/Counterparty Risk (continued)
Neuberger Berman Absolute Return Multi Strategy Fund
Investments: 31 December 2019US$ 31 December 2018
US$
Asset Backed Securities 10,571,016 10,853,499
Equities 18,555,175 23,749,428
Investment Funds – 315,773
Participatory Notes 4,659 4,722
Real Estate Investment Trusts 274,427 50,278
Derivatives (990,481)) (3,862,445)
Cash & Cash Equivalents 23,598,927 23,837,303
Bank Overdraft – (2,356)
Due from Brokers 3,327,037 4,025,688
Credit Ratings of Debt Instruments:
Portfolio By Rating 31 December 2019% 31 December 2018
%
Investment Grade 42.97 34.33
Non-Investment Grade 40.85 62.48
Not Rated 16.18 3.19
Total 100.00 100.00
Neuberger Berman US Long Short Equity Fund
Investments: 31 December 2019US$ 31 December 2018
US$
Corporate Bonds 7,449,144 9,648,901
Equities 120,984,322 142,588,772
Participatory Notes 183,192 –
Derivatives (2,658,054) (46,890,978)
Cash & Cash Equivalents 22,356,659 28,174,644
Bank Overdraft – (494)
Due from Brokers 7,678,305 1,048,654
Due to Brokers – (840,000)
Credit Ratings of Debt Instruments:
Portfolio By Rating 31 December 2019% 31 December 2018
%
Investment Grade – 9.90
Non-Investment Grade 77.41 87.39
Not Rated 22.59 2.71
Total 100.00 100.00

NOTES TO THE AUDITED FINANCIAL STATEMENTS FINANCIAL STATEMENTS
ANNUAL REPORT 2019 1277
FOR THE YEAR ENDED 31 DECEMBER 2019
12. FINANCIAL INSTRUMENT DISCLOSURES (CONTINUED)
(d) Credit/Counterparty Risk (continued)
Neuberger Berman Emerging Market Debt Blend Fund
Investments: 31 December 2019US$ 31 December 2018
US$
Corporate Bonds 466,197,432 448,901,829
Government Bonds 1,099,955,272 1,081,843,181
Investment Funds 16,672,304 –
Treasury Bills 21,743,601 65,174,661
Derivatives 26,356,008 5,944,495
Cash & Cash Equivalents 62,919,150 93,338,241
Bank Overdraft (2,014) (3,517)
Due from Brokers 2,356,015 8,479,777
Due to Brokers (11,620,000) (130,000)
Credit Ratings of Debt Instruments:
Portfolio By Rating 31 December 2019% 31 December 2018
%
Investment Grade 49.01 46.04
Non-Investment Grade 35.93 41.93
Not Rated 15.06 12.03
Total 100.00 100.00
Neuberger Berman European High Yield Bond Fund
Investments: 31 December 2019EUR 31 December 2018
EUR
Corporate Bonds 38,633,153 22,491,369
Term Loans 1,045,065 1,444,543
Derivatives (757,215) 255,387
Cash & Cash Equivalents 335,867 489,022
Bank Overdraft (289) (149)
Due from Brokers – 65,797
Credit Ratings of Debt Instruments:
Portfolio By Rating 31 December 2019% 31 December 2018
%
Investment Grade 3.06 1.29
Non-Investment Grade 96.68 98.71
Not Rated 0.26 –
Total 100.00 100.00

FINANCIAL STATEMENTS NOTES TO THE AUDITED FINANCIAL STATEMENTS
1278 NEUBERGER BERMAN INVESTMENT FUNDS PLC
FOR THE YEAR ENDED 31 DECEMBER 2019
12. FINANCIAL INSTRUMENT DISCLOSURES (CONTINUED)
(d) Credit/Counterparty Risk (continued)
Neuberger Berman Asian Debt - Hard Currency Fund
Investments: 31 December 2019US$ 31 December 2018
US$
Corporate Bonds 19,750,092 13,851,050
Government Bonds 1,936,193 1,835,493
Derivatives 30,246 (42,300)
Cash & Cash Equivalents 3,188,351 21,479
Due from Brokers 25,840 59,970
Credit Ratings of Debt Instruments:
Portfolio By Rating 31 December 2019% 31 December 2018
%
Investment Grade 66.81 62.80
Non-Investment Grade 24.74 19.39
Not Rated 8.45 17.81
Total 100.00 100.00
Neuberger Berman China Bond Fund
Investments: 31 December 2019CNY 31 December 2018
CNY
Corporate Bonds 738,849,931 74,633,341
Government Bonds 39,783,210 2,420,661
Derivatives (8,241,032) 60,030
Cash & Cash Equivalents 28,969,680 2,254,002
Due from Brokers 54,531 54,531
Credit Ratings of Debt Instruments:
Portfolio By Rating 31 December 2019 %
31 December 2018%
Investment Grade 4.46 4.23
Non-Investment Grade 21.60 12.88
Not Rated 73.94 82.89
Total 100.00 100.00

NOTES TO THE AUDITED FINANCIAL STATEMENTS FINANCIAL STATEMENTS
ANNUAL REPORT 2019 1279
FOR THE YEAR ENDED 31 DECEMBER 2019
12. FINANCIAL INSTRUMENT DISCLOSURES (CONTINUED)
(d) Credit/Counterparty Risk (continued)
Neuberger Berman Global Dynamic Asset Allocator Fund*
Investments: 31 December 2019US$ 31 December 2018
US$
Asset Backed Securities – 3,468,364
Corporate Bonds 14,027 10,872,188
Government Bonds 1,692 6,577,889
Investment Funds – 1,072,480
Mortgage Backed Securities – 443,568
Treasury Bills – 597,702
Derivatives – (228,791)
Cash & Cash Equivalents 102 606,395
Bank Overdraft (2,523) –
Due from Brokers – 1,140,558
Credit Ratings of Debt Instruments:
Portfolio By Rating 31 December 2019% 31 December 2018
%
Investment Grade – 52.31
Non-Investment Grade 10.76 43.65
Not Rated 89.24 4.04
Total 100.00 100.00
* Portfolio liquidated on 12 April 2019. Neuberger Berman Corporate Hybrid Bond Fund
Investments: 31 December 2019EUR 31 December 2018
EUR
Corporate Bonds 1,048,748,335 794,442,089
Derivatives (3,311,324) (236,450)
Cash & Cash Equivalents 66,653,202 10,349,069
Bank Overdraft (23,721) (1,751)
Credit Ratings of Debt Instruments:
Portfolio By Rating 31 December 2019 %
31 December 2018%
Investment Grade 71.98 82.60
Non-Investment Grade 28.02 17.40
Total 100.00 100.00

FINANCIAL STATEMENTS NOTES TO THE AUDITED FINANCIAL STATEMENTS
1280 NEUBERGER BERMAN INVESTMENT FUNDS PLC
FOR THE YEAR ENDED 31 DECEMBER 2019
12. FINANCIAL INSTRUMENT DISCLOSURES (CONTINUED)
(d) Credit/Counterparty Risk (continued)
Neuberger Berman Global High Yield Bond Fund
Investments: 31 December 2019US$ 31 December 2018
US$
Corporate Bonds 69,068,917 54,480,617
Term Loans 2,236,935 3,437,606
Derivatives 237,989 (172,504)
Cash & Cash Equivalents 2,247,629 1,718,426
Due from Brokers 8,656 45,540
Due to Brokers – –
Credit Ratings of Debt Instruments:
Portfolio By Rating 31 December 2019% 31 December 2018
%
Investment Grade 0.29 5.33
Non-Investment Grade 99.09 94.67
Not Rated 0.62 –
Total 100.00 100.00
Neuberger Berman Global Opportunistic Bond Fund
Investments: 31 December 2019US$ 31 December 2018
US$
Agency Bonds 393,177 361,049
Asset Backed Securities 12,206,970 9,443,647
Corporate Bonds 77,341,045 38,564,954
Government Bonds 56,477,467 36,900,460
Investment Funds 13,014,301 9,261,702
Mortgage Backed Securities 16,625,002 11,394,706
Treasury Bills 3,304,224 323,756
Derivatives (5,398,706) (177,256)
Cash & Cash Equivalents 4,601,327 2,783,875
Bank Overdraft (1,203) –
Due from Brokers 4,843,283 1,398,765
Credit Ratings of Debt Instruments:
Portfolio By Rating 31 December 2019% 31 December 2018
%
Investment Grade 48.47 54.94
Non-Investment Grade 39.37 33.11
Not Rated 12.16 11.95
Total 100.00 100.00

NOTES TO THE AUDITED FINANCIAL STATEMENTS FINANCIAL STATEMENTS
ANNUAL REPORT 2019 1281
FOR THE YEAR ENDED 31 DECEMBER 2019
12. FINANCIAL INSTRUMENT DISCLOSURES (CONTINUED)
(d) Credit/Counterparty Risk (continued)
Neuberger Berman Multi-Asset Class Income Fund
Investments: 31 December 2019US$ 31 December 2018
US$
Agency Bonds 112,336 103,157
Asset Backed Securities 5,094,658 2,390,183
Corporate Bonds 29,104,867 4,986,991
Equities 26,011,646 13,643,203
Government Bonds 22,836,765 6,606,279
Investment Funds 4,987,879 3,520,806
Mortgage Backed Securities – 5,141,547
Real Estate Investment Trusts 5,329,065 2,682,394
Treasury Bills – 199,234
Derivatives (307,313) (280,542)
Cash & Cash Equivalents 1,819,066 1,628,741
Bank Overdraft – (10,110)
Due from Brokers 3,540,173 1,388,038
Credit Ratings of Debt Instruments:
Portfolio By Rating 31 December 2019% 31 December 2018
%
Investment Grade 65.49 63.83
Non-Investment Grade 29.69 9.60
Not Rated 4.82 26.57
Total 100.00 100.00
Neuberger Berman US Equity Index PutWrite Fund
Investments: 31 December 2019US$ 31 December 2018
US$
Government Bonds 521,939,768 399,009,972
Derivatives (1,596,935) (7,951,466)
Cash & Cash Equivalents 32,398,253 18,668,522
Due from Brokers – 82,052,740
Credit Ratings of Debt Instruments:
Portfolio By Rating 31 December 2019% 31 December 2018
%
Investment Grade 100.00 100.00
Total 100.00 100.00

FINANCIAL STATEMENTS NOTES TO THE AUDITED FINANCIAL STATEMENTS
1282 NEUBERGER BERMAN INVESTMENT FUNDS PLC
FOR THE YEAR ENDED 31 DECEMBER 2019
12. FINANCIAL INSTRUMENT DISCLOSURES (CONTINUED)
(d) Credit/Counterparty Risk (continued)
Neuberger Berman Global Equity Index PutWrite Fund
Investments: 31 December 2019US$ 31 December 2018
US$
Government Bonds 53,992,382 81,562,261
Derivatives 189,274 (1,781,396)
Cash & Cash Equivalents 2,802,683 4,678,833
Due from Brokers – 14,095,202
Credit Ratings of Debt Instruments:
Portfolio By Rating 31 December 2019 %
31 December 2018%
Investment Grade 100.00 100.00
Total 100.00 100.00
Neuberger Berman Emerging Market Debt Blend Investment Grade Fund
Investments: 31 December 2019US$
31 December 2018US$
Corporate Bonds 6,092,081 5,185,466
Government Bonds 11,965,040 10,800,891
Treasury Bills 374,531 235,451
Derivatives 81,108 (47,400)
Cash & Cash Equivalents 716,035 567,152
Due from Brokers 88,441 107,686
Credit Ratings of Debt Instruments:
Portfolio By Rating 31 December 2019% 31 December 2018
%
Investment Grade 91.40 90.27
Non-Investment Grade – 3.56
Not Rated 8.60 6.17
Total 100.00 100.00
Neuberger Berman Multi-Asset Class Growth Fund
Investments: 31 December 2019US$ 31 December 2018
US$
Asset Backed Securities 1,230,786 1,232,745
Corporate Bonds 3,184,308 4,613,061
Equities 3,958,503 3,095,190
Government Bonds 7,963,346 8,256,663
Investment Funds 1,646,633 1,692,106
Mortgage Backed Securities 199,118 193,744
Real Estate Investment Trusts 112,774 75,245
Derivatives (258,054) (317,759)
Cash & Cash Equivalents 872,592 605,145
Bank Overdraft (313) –
Due from Brokers 905,239 1,747,938

NOTES TO THE AUDITED FINANCIAL STATEMENTS FINANCIAL STATEMENTS
ANNUAL REPORT 2019 1283
FOR THE YEAR ENDED 31 DECEMBER 2019
12. FINANCIAL INSTRUMENT DISCLOSURES (CONTINUED)
(d) Credit/Counterparty Risk (continued)
Neuberger Berman Multi-Asset Class Growth Fund (continued) Credit Ratings of Debt Instruments:
Portfolio By Rating 31 December 2019 %
31 December 2018%
Investment Grade 71.67 71.98
Non-Investment Grade 26.07 26.66
Not Rated 2.26 1.36
Total 100.00 100.00
Neuberger Berman CLO Income Fund1
Investments: 31 December 2019US$ 31 December 2018
US$
Asset Backed Securities 135,150,866 100,519,353
Corporate Bonds 3,189,618 5,494,113
Derivatives 6,564,023 (1,548,802)
Cash & Cash Equivalents 8,440,863 7,045,150
Bank Overdraft – (1,233)
Credit Ratings of Debt Instruments:
Portfolio By Rating 31 December 2019 %
31 December 2018%
Investment Grade 0.29 0.12
Non-Investment Grade 2.01 5.06
Not Rated 97.70 94.82
Total 100.00 100.00
Neuberger Berman Ultra Short Term Euro Bond Fund1
Investments: 31 December 2019EUR 31 December 2018
EUR
Asset Backed Securities 69,319,661 233,185
Corporate Bonds 240,805,405 10,212,921
Government Bonds 47,252,899 618,513
Derivatives (1,308,814) (580)
Cash & Cash Equivalents 18,353,226 169,638
Bank Overdraft (6,214) (168)
Due from Brokers 937,536 38,933
Credit Ratings of Debt Instruments:
Portfolio By Rating 31 December 2019 %
31 December 2018%
Investment Grade 77.75 95.94
Non-Investment Grade 5.85 3.14
Not Rated 16.40 0.92
Total 100.00 100.00

FINANCIAL STATEMENTS NOTES TO THE AUDITED FINANCIAL STATEMENTS
1284 NEUBERGER BERMAN INVESTMENT FUNDS PLC
FOR THE YEAR ENDED 31 DECEMBER 2019
12. FINANCIAL INSTRUMENT DISCLOSURES (CONTINUED)
(d) Credit/Counterparty Risk (continued)
Neuberger Berman Euro Opportunistic Bond Fund1
Investments: 31 December 2019EUR 31 December 2018
EUR
Asset Backed Securities 373,528 –
Corporate Bonds 3,981,415 3,333,919
Government Bonds 4,835,824 1,479,750
Investment Funds 1,015,652 –
Derivatives 24,277 1,019
Cash & Cash Equivalents 317,053 148,876
Bank Overdraft (108) (17)
Due from Brokers 84,901 15,885
Credit Ratings of Debt Instruments:
Portfolio By Rating 31 December 2019% 31 December 2018
%
Investment Grade 74.56 95.77
Non-Investment Grade 12.39 4.23
Not Rated 13.05 –
Total 100.00 100.00
Neuberger Berman Euro Bond Absolute Return Fund1
Investments: 31 December 2019EUR 31 December 2018
EUR
Asset Backed Securities 5,166,814 –
Corporate Bonds 26,812,273 4,902,436
Government Bonds 47,301,539 2,332,268
Investment Funds – 499,950
Derivatives 205,371 (964)
Cash & Cash Equivalents 717,491 2,386,720
Bank Overdraft (2,236) (1,668)
Due from Brokers 629,022 45,452
Credit Ratings of Debt Instruments:
Portfolio By Rating 31 December 2019% 31 December 2018
%
Investment Grade 77.15 90.92
Non-Investment Grade 9.92 2.82
Not Rated 12.93 6.26
Total 100.00 100.00

NOTES TO THE AUDITED FINANCIAL STATEMENTS FINANCIAL STATEMENTS
ANNUAL REPORT 2019 1285
FOR THE YEAR ENDED 31 DECEMBER 2019
12. FINANCIAL INSTRUMENT DISCLOSURES (CONTINUED)
(d) Credit/Counterparty Risk (continued)
Neuberger Berman Macro Opportunities FX Fund2
Investments: 31 December 2019EUR
Corporate Bonds 14,690,828
Government Bonds 803,302
Treasury Bills 4,016,640
Derivatives (168,135)
Cash & Cash Equivalents 117,430
Credit Ratings of Debt Instruments:
Portfolio By Rating 31 December 2019%
Investment Grade 87.66
Not Rated 12.34
Total 100.00
1 Portfolio launched during the prior reporting year. 2 Portfolio launched during the current reporting year.
(e) Liquidity Risk
The main liquidity risks of the Company are associated with the need to satisfy Shareholders’ requests for redemptions. The Company is exposed to daily cash redemptions of Redeemable Participating Shares. Redeemable Participating Shares are redeemed on demand at the holder’s option based on the relevant Portfolio’s Net Asset Value per Share at the time of redemption. This risk is mitigated by the Company primarily investing in securities listed or traded on the recognised markets in OECD member states and other countries thus assets comprise principally of realisable securities, which can be readily sold. Additionally, if there are any collateral arrangements in place with a counterparty, this will limit the extent to which liabilities may be extended to the Company.
Financial Assets
The majority of financial assets of the Company can be liquidated within 30 days.
Financial Liabilities
The maturity grouping is based on the remaining period from the end of the reporting period to the contractual maturity date. When the counterparty has a choice of when the amount is paid, the liability is allocated to the earliest on which the Company can be required to pay.
As at 31 December 2019 and 31 December 2018, the vast majority of liabilities (above 95% based on total liabilities including Redeemable Participating Shares) of all Portfolios were payable in one month.

FINANCIAL STATEMENTS NOTES TO THE AUDITED FINANCIAL STATEMENTS
1286 NEUBERGER BERMAN INVESTMENT FUNDS PLC
FOR THE YEAR ENDED 31 DECEMBER 2019
12. FINANCIAL INSTRUMENT DISCLOSURES (CONTINUED)
(e) Liquidity Risk (continued)
Fair Value of Investments
FRS 102 Section 11.27 on “Fair Value: Disclosure” requires disclosure relating to the fair value hierarchy in which fair value measurements are categorised for assets and liabilities. The disclosures are based on a three-level fair value hierarchy for the inputs used in valuation techniques to measure fair value.
The Company has classified fair value measurements using a fair value hierarchy that reflects the significance of the inputs used in making the measurements. The three levels of the fair value hierarchy under FRS 102 are described below:
Level 1 – Unadjusted quoted prices in active markets that are accessible at the measurement date for identical unrestricted assets or liabilities;
Level 2 – Inputs other than quoted prices included in Level 1 that are observable for the asset or liability, either directly (as prices) or indirectly (derived from prices);
Level 3 – Inputs for the asset or liability that are not based on observable market data (unobservable inputs). Pricing inputs are unobservable for the investment and include situations where there is little, if any market activity for the instrument. The inputs into the determination of fair value require significant management, judgement or estimation. As observable prices are not available for these securities, the Portfolios would have used valuation techniques to derive the fair value if applicable.
The level in the fair value hierarchy within which the fair value measurement is categorised in its entirety is determined on the basis of the lowest level input that is significant to the fair value measurement in its entirety. For this purpose, the significance of an input is assessed against the fair value measurement in its entirety. For example, if a fair value measurement uses observable inputs that require significant adjustment based on unobservable inputs, that measure is a Level 3 measurement.
Assessing the significance of a particular input to the fair value measurement in its entirety requires judgement in considering the factors specific to the asset or liability.
The determination of what constitutes “observable” requires judgement by the Directors in consultation with the Investment Manager.

NOTES TO THE AUDITED FINANCIAL STATEMENTS FINANCIAL STATEMENTS
ANNUAL REPORT 2019 1287
FOR THE YEAR ENDED 31 DECEMBER 2019
12. FINANCIAL INSTRUMENT DISCLOSURES (CONTINUED)
Fair Value of Investments (continued)
The following tables show financial investments at the levels of fair value hierarchy:
Neuberger Berman High Yield Bond Fund Financial Instruments at Fair Value through Profit or Loss As at 31 December 2019 Level 1 Level 2 Level 3 Total
US$ US$ US$ US$
Financial Assets held for trading Corporate Bonds – 3,115,732,225 1 3,115,732,226
Investment Funds 41,877,566 – 41,877,566
Term Loans – 168,988,764 6,957,263 175,946,027
Unrealised gain on Forward Currency Contracts – 79,888,953 – 79,888,953
Total – 3,406,487,508 6,957,264 3,413,444,772
Financial Instruments at Fair Value through Profit or Loss As at 31 December 2019 Level 1 Level 2 Level 3 Total
US$ US$ US$ US$
Financial Liabilities held for trading Unrealised loss on Forward Currency Contracts – (19,165,871) – (19,165,871)
Total – (19,165,871) – (19,165,871)
Financial Instruments at Fair Value through Profit or Loss As at 31 December 2018 Level 1 Level 2 Level 3 Total
US$ US$ US$ US$
Financial Assets held for trading Corporate Bonds – 3,461,236,466 1 3,461,236,467
Investment Funds – 79,589,602 – 79,589,602
Term Loans – 247,232,961 22,102,176 269,335,137
Unrealised gain on Forward Currency Contracts – 31,480,503 – 31,480,503
Total – 3,819,539,532 22,102,177 3,841,641,709
Financial Instruments at Fair Value through Profit or Loss As at 31 December 2018 Level 1 Level 2 Level 3 Total
US$ US$ US$ US$
Financial Liabilities held for trading Unrealised loss on Forward Currency Contracts – (19,871,906) – (19,871,906)
Total – (19,871,906) – (19,871,906)

FINANCIAL STATEMENTS NOTES TO THE AUDITED FINANCIAL STATEMENTS
1288 NEUBERGER BERMAN INVESTMENT FUNDS PLC
FOR THE YEAR ENDED 31 DECEMBER 2019
12. FINANCIAL INSTRUMENT DISCLOSURES (CONTINUED)
Fair Value of Investments (continued)
Neuberger Berman Diversified Currency Fund Financial Instruments at Fair Value through Profit or Loss As at 31 December 2019 Level 1 Level 2 Level 3 Total
US$ US$ US$ US$
Financial Assets held for trading Government Bonds – 11,499,725 – 11,499,725
Treasury Bills – 56,438,081 – 56,438,081
Unrealised gain on Forward Currency Contracts – 2,682,167 – 2,682,167
Total – 70,619,973 – 70,619,973
Financial Instruments at Fair Value through Profit or Loss As at 31 December 2019 Level 1 Level 2 Level 3 Total
US$ US$ US$ US$
Financial Liabilities held for trading Unrealised loss on Forward Currency Contracts – (2,899,862) – (2,899,862)
Total – (2,899,862) – (2,899,862)
Financial Instruments at Fair Value through Profit or Loss As at 31 December 2018 Level 1 Level 2 Level 3 Total
US$ US$ US$ US$
Financial Assets held for trading Treasury Bills – 26,627,172 – 26,627,172
Unrealised gain on Forward Currency Contracts – 1,123,461 – 1,123,461
Total – 27,750,633 – 27,750,633
Financial Instruments at Fair Value through Profit or Loss As at 31 December 2018 Level 1 Level 2 Level 3 Total
US$ US$ US$ US$
Financial Liabilities held for trading Unrealised loss on Forward Currency Contracts – (1,209,774) – (1,209,774)
Total – (1,209,774) – (1,209,774)

NOTES TO THE AUDITED FINANCIAL STATEMENTS FINANCIAL STATEMENTS
ANNUAL REPORT 2019 1289
FOR THE YEAR ENDED 31 DECEMBER 2019
12. FINANCIAL INSTRUMENT DISCLOSURES (CONTINUED)
Fair Value of Investments (continued)
Neuberger Berman US Multi Cap Opportunities Fund Financial Instruments at Fair Value through Profit or Loss As at 31 December 2019 Level 1 Level 2 Level 3 Total
US$ US$ US$ US$
Financial Assets held for trading Equities 758,942,228 – – 758,942,228
Unrealised gain on Forward Currency Contracts – 1,848,250 – 1,848,250
Total 758,942,228 1,848,250 – 760,790,478
Financial Instruments at Fair Value through Profit or Loss As at 31 December 2019 Level 1 Level 2 Level 3 Total
US$ US$ US$ US$
Financial Liabilities held for trading Unrealised loss on Forward Currency Contracts – (543,012) – (543,012)
Total – (543,012) – (543,012)
Financial Instruments at Fair Value through Profit or Loss As at 31 December 2018 Level 1 Level 2 Level 3 Total
US$ US$ US$ US$
Financial Assets held for trading Equities 890,768,700 – – 890,768,700
Unrealised gain on Forward Currency Contracts – 863,114 – 863,114
Total 890,768,700 863,114 – 891,631,814
Financial Instruments at Fair Value through Profit or Loss As at 31 December 2018 Level 1 Level 2 Level 3 Total
US$ US$ US$ US$
Financial Liabilities held for trading Unrealised loss on Forward Currency Contracts – (1,328,560) – (1,328,560)
Total – (1,328,560) – (1,328,560)
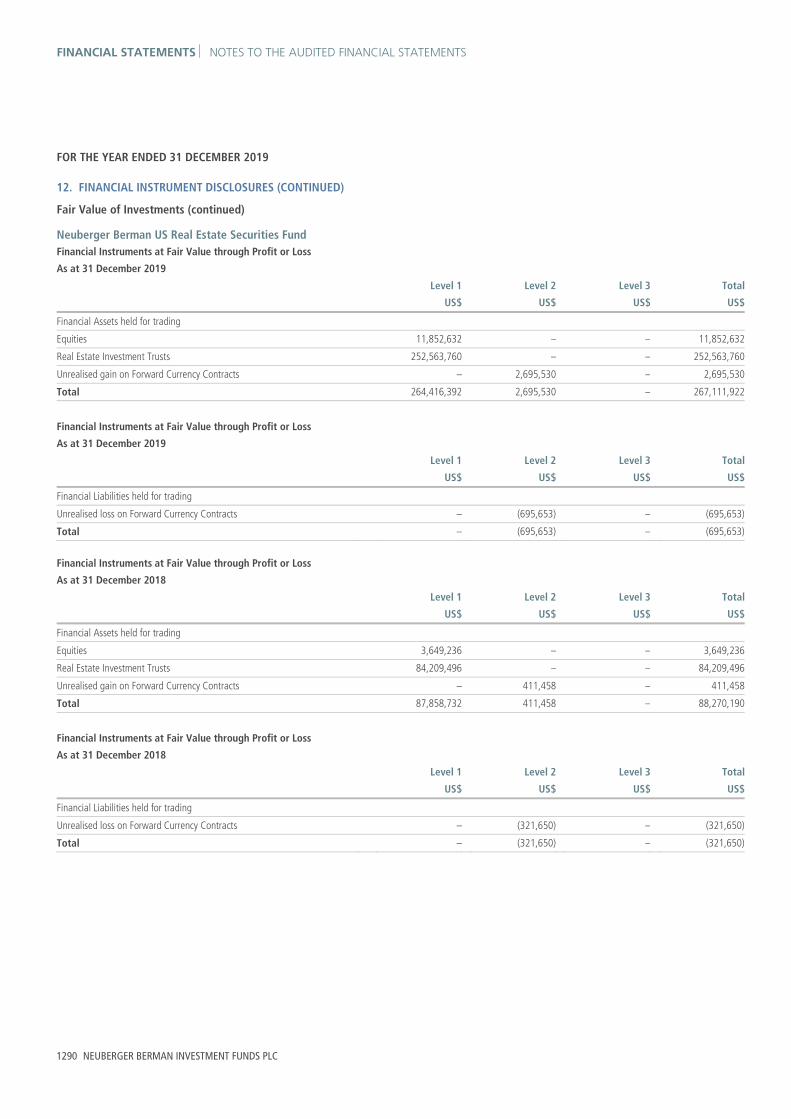
FINANCIAL STATEMENTS NOTES TO THE AUDITED FINANCIAL STATEMENTS
1290 NEUBERGER BERMAN INVESTMENT FUNDS PLC
FOR THE YEAR ENDED 31 DECEMBER 2019
12. FINANCIAL INSTRUMENT DISCLOSURES (CONTINUED)
Fair Value of Investments (continued)
Neuberger Berman US Real Estate Securities Fund Financial Instruments at Fair Value through Profit or Loss As at 31 December 2019 Level 1 Level 2 Level 3 Total
US$ US$ US$ US$
Financial Assets held for trading Equities 11,852,632 – – 11,852,632
Real Estate Investment Trusts 252,563,760 – – 252,563,760
Unrealised gain on Forward Currency Contracts – 2,695,530 – 2,695,530
Total 264,416,392 2,695,530 – 267,111,922
Financial Instruments at Fair Value through Profit or Loss As at 31 December 2019 Level 1 Level 2 Level 3 Total
US$ US$ US$ US$
Financial Liabilities held for trading Unrealised loss on Forward Currency Contracts – (695,653) – (695,653)
Total – (695,653) – (695,653)
Financial Instruments at Fair Value through Profit or Loss As at 31 December 2018 Level 1 Level 2 Level 3 Total
US$ US$ US$ US$
Financial Assets held for trading Equities 3,649,236 – – 3,649,236
Real Estate Investment Trusts 84,209,496 – – 84,209,496
Unrealised gain on Forward Currency Contracts – 411,458 – 411,458
Total 87,858,732 411,458 – 88,270,190
Financial Instruments at Fair Value through Profit or Loss As at 31 December 2018 Level 1 Level 2 Level 3 Total
US$ US$ US$ US$
Financial Liabilities held for trading Unrealised loss on Forward Currency Contracts – (321,650) – (321,650)
Total – (321,650) – (321,650)

NOTES TO THE AUDITED FINANCIAL STATEMENTS FINANCIAL STATEMENTS
ANNUAL REPORT 2019 1291
FOR THE YEAR ENDED 31 DECEMBER 2019
12. FINANCIAL INSTRUMENT DISCLOSURES (CONTINUED)
Fair Value of Investments (continued)
Neuberger Berman China Equity Fund Financial Instruments at Fair Value through Profit or Loss As at 31 December 2019 Level 1 Level 2 Level 3 Total
US$ US$ US$ US$
Financial Assets held for trading Equities 829,280,827 – – 829,280,827
Unrealised gain on Forward Currency Contracts – 813,489 – 813,489
Total 829,280,827 813,489 – 830,094,316
Financial Instruments at Fair Value through Profit or Loss As at 31 December 2019 Level 1 Level 2 Level 3 Total
US$ US$ US$ US$
Financial Liabilities held for trading Unrealised loss on Forward Currency Contracts – (307,424) – (307,424)
Total – (307,424) – (307,424)
Financial Instruments at Fair Value through Profit or Loss As at 31 December 2018 Level 1 Level 2 Level 3 Total
US$ US$ US$ US$
Financial Assets held for trading Equities 606,629,744 180,788,169 – 787,417,913
Unrealised gain on Forward Currency Contracts – 391,713 – 391,713
Total 606,629,744 181,179,882 – 787,809,626
Financial Instruments at Fair Value through Profit or Loss As at 31 December 2018 Level 1 Level 2 Level 3 Total
US$ US$ US$ US$
Financial Liabilities held for trading Unrealised loss on Forward Currency Contracts – (363,639) – (363,639)
Total – (363,639) – (363,639)
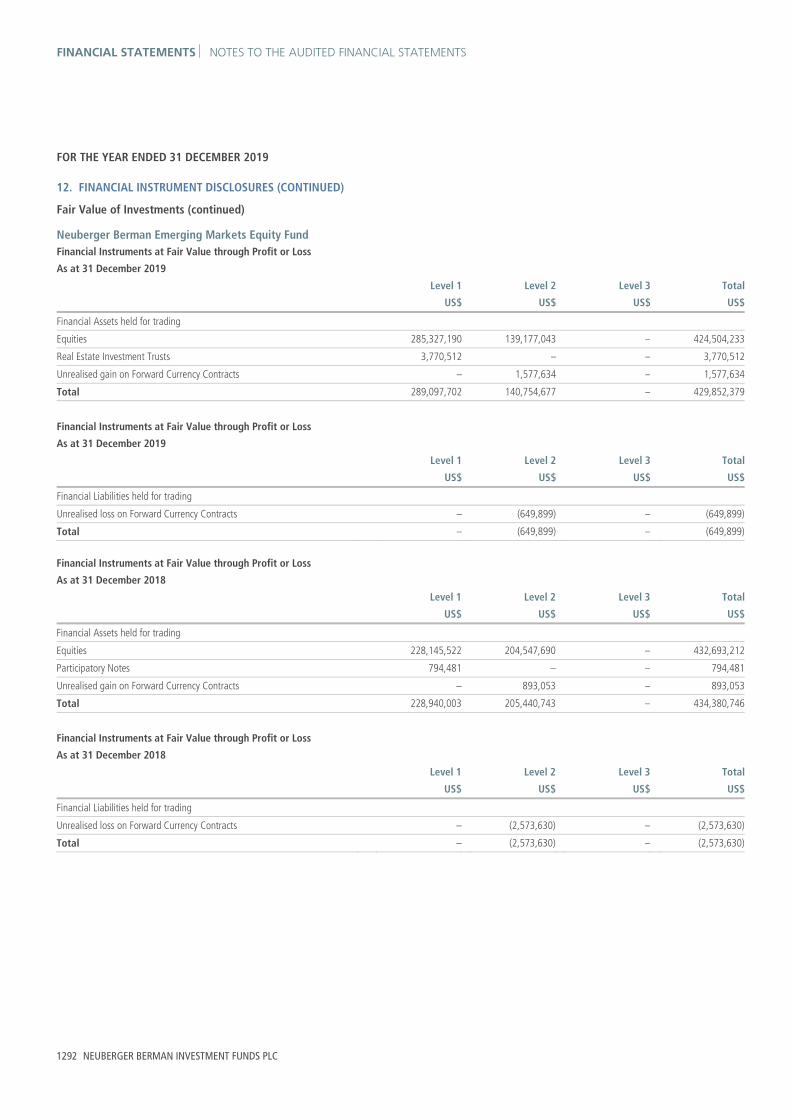
FINANCIAL STATEMENTS NOTES TO THE AUDITED FINANCIAL STATEMENTS
1292 NEUBERGER BERMAN INVESTMENT FUNDS PLC
FOR THE YEAR ENDED 31 DECEMBER 2019
12. FINANCIAL INSTRUMENT DISCLOSURES (CONTINUED)
Fair Value of Investments (continued)
Neuberger Berman Emerging Markets Equity Fund Financial Instruments at Fair Value through Profit or Loss As at 31 December 2019 Level 1 Level 2 Level 3 Total
US$ US$ US$ US$
Financial Assets held for trading Equities 285,327,190 139,177,043 – 424,504,233
Real Estate Investment Trusts 3,770,512 – – 3,770,512
Unrealised gain on Forward Currency Contracts – 1,577,634 – 1,577,634
Total 289,097,702 140,754,677 – 429,852,379
Financial Instruments at Fair Value through Profit or Loss As at 31 December 2019 Level 1 Level 2 Level 3 Total
US$ US$ US$ US$
Financial Liabilities held for trading Unrealised loss on Forward Currency Contracts – (649,899) – (649,899)
Total – (649,899) – (649,899)
Financial Instruments at Fair Value through Profit or Loss As at 31 December 2018 Level 1 Level 2 Level 3 Total
US$ US$ US$ US$
Financial Assets held for trading Equities 228,145,522 204,547,690 – 432,693,212
Participatory Notes 794,481 – – 794,481
Unrealised gain on Forward Currency Contracts – 893,053 – 893,053
Total 228,940,003 205,440,743 – 434,380,746
Financial Instruments at Fair Value through Profit or Loss As at 31 December 2018 Level 1 Level 2 Level 3 Total
US$ US$ US$ US$
Financial Liabilities held for trading Unrealised loss on Forward Currency Contracts – (2,573,630) – (2,573,630)
Total – (2,573,630) – (2,573,630)

NOTES TO THE AUDITED FINANCIAL STATEMENTS FINANCIAL STATEMENTS
ANNUAL REPORT 2019 1293
FOR THE YEAR ENDED 31 DECEMBER 2019
12. FINANCIAL INSTRUMENT DISCLOSURES (CONTINUED)
Fair Value of Investments (continued)
Neuberger Berman US Small Cap Fund Financial Instruments at Fair Value through Profit or Loss As at 31 December 2019 Level 1 Level 2 Level 3 Total
US$ US$ US$ US$
Financial Assets held for trading Equities 406,501,225 4,347,881 – 410,849,106
Unrealised gain on Forward Currency Contracts – 340,665 – 340,665
Total 406,501,225 4,688,546 – 411,189,771
Financial Instruments at Fair Value through Profit or Loss As at 31 December 2019 Level 1 Level 2 Level 3 Total
US$ US$ US$ US$
Financial Liabilities held for trading Unrealised loss on Forward Currency Contracts – (118,358) – (118,358)
Total – (118,358) – (118,358)
Financial Instruments at Fair Value through Profit or Loss As at 31 December 2018 Level 1 Level 2 Level 3 Total
US$ US$ US$ US$
Financial Assets held for trading Equities 323,684,422 3,769,669 – 327,454,091
Unrealised gain on Forward Currency Contracts – 650,246 – 650,246
Total 323,684,422 4,419,915 – 328,104,337
Financial Instruments at Fair Value through Profit or Loss As at 31 December 2018 Level 1 Level 2 Level 3 Total
US$ US$ US$ US$
Financial Liabilities held for trading Unrealised loss on Forward Currency Contracts – (210,285) – (210,285)
Total – (210,285) – (210,285)

FINANCIAL STATEMENTS NOTES TO THE AUDITED FINANCIAL STATEMENTS
1294 NEUBERGER BERMAN INVESTMENT FUNDS PLC
FOR THE YEAR ENDED 31 DECEMBER 2019
12. FINANCIAL INSTRUMENT DISCLOSURES (CONTINUED)
Fair Value of Investments (continued)
Neuberger Berman Short Duration High Yield Bond Fund Financial Instruments at Fair Value through Profit or Loss As at 31 December 2019 Level 1 Level 2 Level 3 Total
US$ US$ US$ US$
Financial Assets held for trading Corporate Bonds – 887,835,954 0 887,835,954
Investment Funds 3,147,897 – – 3,147,897
Term Loans – 88,720,927 2,089,709 90,810,636
Unrealised gain on Forward Currency Contracts – 11,977,984 – 11,977,984
Total 3,147,897 988,534,865 2,089,709 993,772,471
Financial Instruments at Fair Value through Profit or Loss As at 31 December 2019 Level 1 Level 2 Level 3 Total
US$ US$ US$ US$
Financial Liabilities held for trading Unrealised loss on Forward Currency Contracts – (6,359,779) – (6,359,779)
Total – (6,359,779) – (6,359,779)
Level 1 Level 2 Level 3 US$ US$ US$
Transfer levels from 2 to 3 Term Loans – (510,791) 510,791
Transfer levels from 3 to 2 Term Loans – 2,153,244 (2,153,244)
As at the year ended 31 December 2019, a term loan was transferred from Level 2 to Level 3 as a result of a decrease in the quotes available for valuing this term loan. Certain term loans’ transfer from Level 3 to Level 2 was a result of an increase in the quotes available. Financial Instruments at Fair Value through Profit or Loss As at 31 December 2018 Level 1 Level 2 Level 3 Total
US$ US$ US$ US$
Financial Assets held for trading Corporate Bonds – 918,857,130 0 918,857,130
Investment Funds – 5,982,359 – 5,982,359
Term Loans – 62,183,418 4,632,230 66,815,648
Unrealised gain on Forward Currency Contracts – 6,174,948 – 6,174,948
Total – 993,197,855 4,632,230 997,830,085

NOTES TO THE AUDITED FINANCIAL STATEMENTS FINANCIAL STATEMENTS
ANNUAL REPORT 2019 1295
FOR THE YEAR ENDED 31 DECEMBER 2019
12. FINANCIAL INSTRUMENT DISCLOSURES (CONTINUED)
Fair Value of Investments (continued)
Neuberger Berman Short Duration High Yield Bond Fund (continued) Financial Instruments at Fair Value through Profit or Loss As at 31 December 2018 Level 1 Level 2 Level 3 Total
US$ US$ US$ US$
Financial Liabilities held for trading Unrealised loss on Forward Currency Contracts – (5,019,757) – (5,019,757)
Total – (5,019,757) – (5,019,757)
Neuberger Berman Global Bond Fund Financial Instruments at Fair Value through Profit or Loss As at 31 December 2019 Level 1 Level 2 Level 3 Total
US$ US$ US$ US$
Financial Assets held for trading Agency Bonds – 808,029 – 808,029
Asset Backed Securities – 7,081,113 – 7,081,113
Corporate Bonds – 53,875,832 – 53,875,832
Government Bonds – 109,732,598 – 109,732,598
Mortgage Backed Securities – 28,839,272 – 28,839,272
Treasury Bills – 3,279,380 – 3,279,380
Unrealised gain on Forward Currency Contracts – 1,481,948 – 1,481,948
Unrealised gain on Futures Contracts 659,343 – – 659,343
Interest Rate Swap Contracts at Fair Value – 11,372 – 11,372
Total 659,343 205,109,544 – 205,768,887
Financial Instruments at Fair Value through Profit or Loss As at 31 December 2019 Level 1 Level 2 Level 3 Total
US$ US$ US$ US$
Financial Liabilities held for trading Unrealised loss on Forward Currency Contracts – (2,282,278) – (2,282,278)
Unrealised loss on Futures Contracts (316,205) – – (316,205)
Interest Rate Swap Contracts at Fair Value – (31,689) – (31,689)
Total (316,205) (2,313,967) – (2,630,172)

FINANCIAL STATEMENTS NOTES TO THE AUDITED FINANCIAL STATEMENTS
1296 NEUBERGER BERMAN INVESTMENT FUNDS PLC
FOR THE YEAR ENDED 31 DECEMBER 2019
12. FINANCIAL INSTRUMENT DISCLOSURES (CONTINUED)
Fair Value of Investments (continued)
Neuberger Berman Global Bond Fund (continued) Financial Instruments at Fair Value through Profit or Loss As at 31 December 2018 Level 1 Level 2 Level 3 Total
US$ US$ US$ US$
Financial Assets held for trading Agency Bonds – 742,808 – 742,808
Asset Backed Securities – 5,838,893 – 5,838,893
Corporate Bonds – 42,017,408 – 42,017,408
Government Bonds – 76,941,729 – 76,941,729
Mortgage Backed Securities – 24,077,309 – 24,077,309
Treasury Bills – 3,486,598 – 3,486,598
Unrealised gain on Forward Currency Contracts – 1,554,136 – 1,554,136
Unrealised gain on Futures Contracts 227,357 – – 227,357
Interest Rate Swap Contracts at Fair Value – 13,744 – 13,744
Total 227,357 154,672,625 – 154,899,982
Financial Instruments at Fair Value through Profit or Loss As at 31 December 2018 Level 1 Level 2 Level 3 Total
US$ US$ US$ US$
Financial Liabilities held for trading Unrealised loss on Forward Currency Contracts – (1,064,158) – (1,064,158)
Unrealised loss on Futures Contracts (683,454) – – (683,454)
Interest Rate Swap Contracts at Fair Value – (112,074) – (112,074)
Total (683,454) (1,176,232) – (1,859,686)
Level 1 Level 2 Level 3 US$ US$ US$
Transfer levels from 3 to 2 Asset Backed Securities – 1,100,787 (1,100,787)
As at the year ended 31 December 2018, an asset backed security was transferred from Level 3 to Level 2 as a result of the Portfolio’s procedures for valuing securities, as stated in Note 1 of the Notes to the Financial Statements.

NOTES TO THE AUDITED FINANCIAL STATEMENTS FINANCIAL STATEMENTS
ANNUAL REPORT 2019 1297
FOR THE YEAR ENDED 31 DECEMBER 2019
12. FINANCIAL INSTRUMENT DISCLOSURES (CONTINUED)
Fair Value of Investments (continued)
Neuberger Berman Emerging Market Debt - Local Currency Fund Financial Instruments at Fair Value through Profit or Loss As at 31 December 2019 Level 1 Level 2 Level 3 Total
US$ US$ US$ US$
Financial Assets held for trading Corporate Bonds – 80,840,601 724,210 81,564,811
Government Bonds – 2,839,759,622 – 2,839,759,622
Investment Funds – 25,786,800 – 25,786,800
Treasury Bills – 83,948,277 – 83,948,277
Unrealised gain on Forward Currency Contracts – 61,005,679 – 61,005,679
Unrealised gain on Futures Contracts 628,583 – – 628,583
Interest Rate Swap Contracts at Fair Value – 47,949,511 – 47,949,511
Cross Currency Swap Contracts at Fair Value – 276,641 – 276,641
Total 628,583 3,139,567,131 724,210 3,140,919,924
Financial Instruments at Fair Value through Profit or Loss As at 31 December 2019 Level 1 Level 2 Level 3 Total
US$ US$ US$ US$
Financial Liabilities held for trading Unrealised loss on Forward Currency Contracts – (18,432,996) (755,092) (19,188,088)
Credit Default Swap Contracts at Fair Value – (9,456,177) – (9,456,177)
Interest Rate Swap Contracts at Fair Value – (9,100,072) – (9,100,072)
Cross Currency Swap Contracts at Fair Value – (1,600,099) – (1,600,099)
Total – (38,589,344) (755,092) (39,344,436)
Financial Instruments at Fair Value through Profit or Loss As at 31 December 2018 Level 1 Level 2 Level 3 Total
US$ US$ US$ US$
Financial Assets held for trading Corporate Bonds – 65,766,072 – 65,766,072
Government Bonds – 2,256,689,647 – 2,256,689,647
Treasury Bills – 91,092,259 – 91,092,259
Unrealised gain on Forward Currency Contracts – 36,894,357 – 36,894,357
Interest Rate Swap Contracts at Fair Value – 38,304,195 – 38,304,195
Cross Currency Swap at Fair Value – 9,453,350 – 9,453,350
Total – 2,498,199,880 – 2,498,199,880

FINANCIAL STATEMENTS NOTES TO THE AUDITED FINANCIAL STATEMENTS
1298 NEUBERGER BERMAN INVESTMENT FUNDS PLC
FOR THE YEAR ENDED 31 DECEMBER 2019
12. FINANCIAL INSTRUMENT DISCLOSURES (CONTINUED)
Fair Value of Investments (continued)
Neuberger Berman Emerging Market Debt - Local Currency Fund (continued) Financial Instruments at Fair Value through Profit or Loss As at 31 December 2018 Level 1 Level 2 Level 3 Total
US$ US$ US$ US$
Financial Liabilities held for trading Unrealised loss on Forward Currency Contracts – (40,378,005) – (40,378,005)
Unrealised loss on Futures Contracts (609,779) – – (609,779)
Credit Default Swap Contracts at Fair Value – (1,770,312) – (1,770,312)
Interest Rate Swap Contracts at Fair Value – (21,224,237) – (21,224,237)
Cross Currency Swap Contracts at Fair Value – (9,663,954) – (9,663,954)
Total (609,779) (73,036,508) – (73,646,287)
Neuberger Berman Emerging Market Debt - Hard Currency Fund Financial Instruments at Fair Value through Profit or Loss As at 31 December 2019 Level 1 Level 2 Level 3 Total
US$ US$ US$ US$
Financial Assets held for trading Corporate Bonds – 739,934,633 – 739,934,633
Government Bonds – 1,509,767,060 – 1,509,767,060
Investment Funds – 15,670,500 – 15,670,500
Treasury Bills – 21,961,949 – 21,961,949
Unrealised gain on Forward Currency Contracts – 15,765,690 – 15,765,690
Unrealised gain on Futures Contracts 3,727,306 – – 3,727,306
Total 3,727,306 2,303,099,832 – 2,306,827,138
Financial Instruments at Fair Value through Profit or Loss As at 31 December 2019 Level 1 Level 2 Level 3 Total
US$ US$ US$ US$
Financial Liabilities held for trading Unrealised loss on Forward Currency Contracts – (4,658,111) – (4,658,111)
Unrealised loss on Futures Contracts (3,964,080) – – (3,964,080)
Total (3,964,080) (4,658,111) – (8,622,191)

NOTES TO THE AUDITED FINANCIAL STATEMENTS FINANCIAL STATEMENTS
ANNUAL REPORT 2019 1299
FOR THE YEAR ENDED 31 DECEMBER 2019
12. FINANCIAL INSTRUMENT DISCLOSURES (CONTINUED)
Fair Value of Investments (continued)
Neuberger Berman Emerging Market Debt - Hard Currency Fund (continued) Financial Instruments at Fair Value through Profit or Loss As at 31 December 2018 Level 1 Level 2 Level 3 Total
US$ US$ US$ US$
Financial Assets held for trading Corporate Bonds – 418,193,056 – 418,193,056
Government Bonds – 934,693,370 – 934,693,370
Unrealised gain on Forward Currency Contracts – 2,035,053 – 2,035,053
Unrealised gain on Futures Contracts 3,507,813 – – 3,507,813
Total 3,507,813 1,354,921,479 – 1,358,429,292
Financial Instruments at Fair Value through Profit or Loss As at 31 December 2018 Level 1 Level 2 Level 3 Total
US$ US$ US$ US$
Financial Liabilities held for trading Unrealised loss on Forward Currency Contracts – (1,276,250) – (1,276,250)
Unrealised loss on Futures Contracts (611,311) – – (611,311)
Total (611,311) (1,276,250) – (1,887,561)
Neuberger Berman Emerging Market Corporate Debt Fund Financial Instruments at Fair Value through Profit or Loss As at 31 December 2019 Level 1 Level 2 Level 3 Total
US$ US$ US$ US$
Financial Assets held for trading Corporate Bonds – 152,972,400 – 152,972,400
Government Bonds – 6,779,074 – 6,779,074
Investment Funds – 2,002,873 – 2,002,873
Unrealised gain on Forward Currency Contracts – 2,078,916 – 2,078,916
Unrealised gain on Futures Contracts 253,770 – – 253,770
Total 253,770 163,833,263 – 164,087,033
Financial Instruments at Fair Value through Profit or Loss As at 31 December 2019 Level 1 Level 2 Level 3 Total
US$ US$ US$ US$
Financial Liabilities held for trading Unrealised loss on Forward Currency Contracts – (204,131) – (204,131)
Total – (204,131) – (204,131)

FINANCIAL STATEMENTS NOTES TO THE AUDITED FINANCIAL STATEMENTS
1300 NEUBERGER BERMAN INVESTMENT FUNDS PLC
FOR THE YEAR ENDED 31 DECEMBER 2019
12. FINANCIAL INSTRUMENT DISCLOSURES (CONTINUED)
Fair Value of Investments (continued)
Neuberger Berman Emerging Market Corporate Debt Fund (continued) Financial Instruments at Fair Value through Profit or Loss As at 31 December 2018 Level 1 Level 2 Level 3 Total
US$ US$ US$ US$
Financial Assets held for trading Corporate Bonds – 113,332,258 – 113,332,258
Government Bonds – 2,770,970 – 2,770,970
Unrealised gain on Forward Currency Contracts – 131,978 – 131,978
Total – 116,235,206 – 116,235,206
Financial Instruments at Fair Value through Profit or Loss As at 31 December 2018 Level 1 Level 2 Level 3 Total
US$ US$ US$ US$
Financial Liabilities held for trading Unrealised loss on Forward Currency Contracts – (94,359) – (94,359)
Unrealised loss on Futures Contracts (241,384) – – (241,384)
Total (241,384) (94,359) – (335,743)
Neuberger Berman Strategic Income Fund Financial Instruments at Fair Value through Profit or Loss As at 31 December 2019 Level 1 Level 2 Level 3 Total
US$ US$ US$ US$
Financial Assets held for trading Agency Bonds – 1,008,490 – 1,008,490
Asset Backed Securities – 165,819,872 – 165,819,872
Corporate Bonds – 634,341,091 0 634,341,091
Equities – 6,614 6,322 12,936
Government Bonds – 442,929,285 – 442,929,285
Investment Funds – 36,661,624 – 36,661,624
Mortgage Backed Securities – 218,777,629 – 218,777,629
Municipal Bonds – 20,180,334 – 20,180,334
Term Loans – 124,102,688 5,454,072 129,556,760
Treasury Bills – 13,791,360 – 13,791,360
Unrealised gain on Forward Currency Contracts – 4,167,838 – 4,167,838
Unrealised gain on Futures Contracts 4,863,851 – – 4,863,851
Interest Rate Swap Contracts at Fair Value – 199,924 – 199,924
Total 4,863,851 1,661,986,749 5,460,394 1,672,310,994
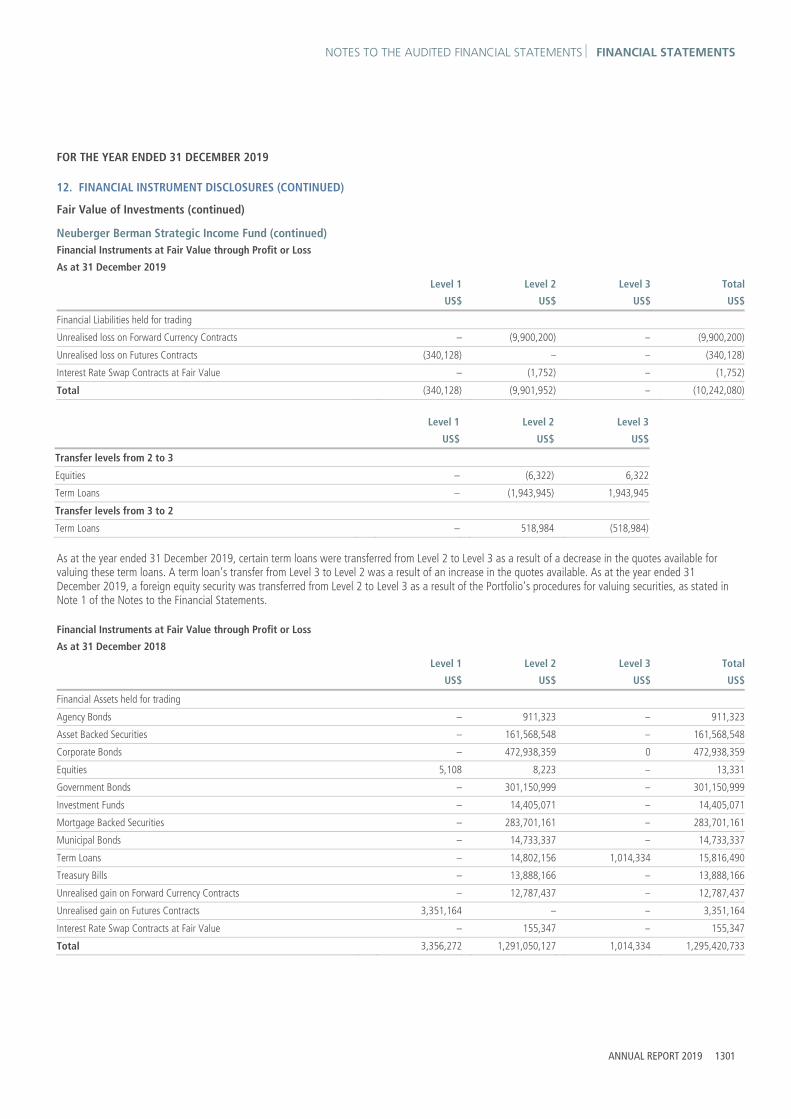
NOTES TO THE AUDITED FINANCIAL STATEMENTS FINANCIAL STATEMENTS
ANNUAL REPORT 2019 1301
FOR THE YEAR ENDED 31 DECEMBER 2019
12. FINANCIAL INSTRUMENT DISCLOSURES (CONTINUED)
Fair Value of Investments (continued)
Neuberger Berman Strategic Income Fund (continued) Financial Instruments at Fair Value through Profit or Loss As at 31 December 2019 Level 1 Level 2 Level 3 Total
US$ US$ US$ US$
Financial Liabilities held for trading Unrealised loss on Forward Currency Contracts – (9,900,200) – (9,900,200)
Unrealised loss on Futures Contracts (340,128) – – (340,128)
Interest Rate Swap Contracts at Fair Value – (1,752) – (1,752)
Total (340,128) (9,901,952) – (10,242,080)
Level 1 Level 2 Level 3 US$ US$ US$
Transfer levels from 2 to 3 Equities – (6,322) 6,322
Term Loans – (1,943,945) 1,943,945
Transfer levels from 3 to 2 Term Loans – 518,984 (518,984)
As at the year ended 31 December 2019, certain term loans were transferred from Level 2 to Level 3 as a result of a decrease in the quotes available for valuing these term loans. A term loan’s transfer from Level 3 to Level 2 was a result of an increase in the quotes available. As at the year ended 31 December 2019, a foreign equity security was transferred from Level 2 to Level 3 as a result of the Portfolio’s procedures for valuing securities, as stated in Note 1 of the Notes to the Financial Statements. Financial Instruments at Fair Value through Profit or Loss As at 31 December 2018 Level 1 Level 2 Level 3 Total
US$ US$ US$ US$
Financial Assets held for trading Agency Bonds – 911,323 – 911,323
Asset Backed Securities – 161,568,548 – 161,568,548
Corporate Bonds – 472,938,359 0 472,938,359
Equities 5,108 8,223 – 13,331
Government Bonds – 301,150,999 – 301,150,999
Investment Funds – 14,405,071 – 14,405,071
Mortgage Backed Securities – 283,701,161 – 283,701,161
Municipal Bonds – 14,733,337 – 14,733,337
Term Loans – 14,802,156 1,014,334 15,816,490
Treasury Bills – 13,888,166 – 13,888,166
Unrealised gain on Forward Currency Contracts – 12,787,437 – 12,787,437
Unrealised gain on Futures Contracts 3,351,164 – – 3,351,164
Interest Rate Swap Contracts at Fair Value – 155,347 – 155,347
Total 3,356,272 1,291,050,127 1,014,334 1,295,420,733

FINANCIAL STATEMENTS NOTES TO THE AUDITED FINANCIAL STATEMENTS
1302 NEUBERGER BERMAN INVESTMENT FUNDS PLC
FOR THE YEAR ENDED 31 DECEMBER 2019
12. FINANCIAL INSTRUMENT DISCLOSURES (CONTINUED)
Fair Value of Investments (continued)
Neuberger Berman Strategic Income Fund (continued) Financial Instruments at Fair Value through Profit or Loss As at 31 December 2018 Level 1 Level 2 Level 3 Total
US$ US$ US$ US$
Financial Liabilities held for trading Unrealised loss on Forward Currency Contracts – (1,263,912) – (1,263,912)
Unrealised loss on Futures Contracts (10,524,346) – – (10,524,346)
Total (10,524,346) (1,263,912) – (11,788,258)
Level 1 Level 2 Level 3
US$ US$ US$
Transfer levels from 2 to 3 Term Loans – (307,609) 307,609
Transfer levels from 3 to 2 Term Loans – 129,702 (129,702)
As at the year ended 31 December 2018, certain term loans were transferred from Level 2 to Level 3 as a result of a decrease in the quotes available for valuing these term loans. A term loan’s transfer from Level 3 to Level 2 was a result of an increase in the quotes available. Neuberger Berman Global Bond Absolute Return Fund Financial Instruments at Fair Value through Profit or Loss As at 31 December 2019 Level 1 Level 2 Level 3 Total
US$ US$ US$ US$
Financial Assets held for trading Asset Backed Securities – 35,159,537 – 35,159,537
Corporate Bonds – 47,384,645 – 47,384,645
Government Bonds – 34,962,371 – 34,962,371
Investment Funds 4,019,187 2,026,068 – 6,045,255
Mortgage Backed Securities – 3,169,000 – 3,169,000
Treasury Bills – 1,291,877 – 1,291,877
Unrealised gain on Forward Currency Contracts – 4,708,572 – 4,708,572
Unrealised gain on Futures Contracts 1,672,673 – – 1,672,673
Interest Rate Swap Contracts at Fair Value – 3,833 – 3,833
Credit Default Swap Contracts at Fair Value – 234,717 – 234,717
Total 5,691,860 128,940,620 – 134,632,480

NOTES TO THE AUDITED FINANCIAL STATEMENTS FINANCIAL STATEMENTS
ANNUAL REPORT 2019 1303
FOR THE YEAR ENDED 31 DECEMBER 2019
12. FINANCIAL INSTRUMENT DISCLOSURES (CONTINUED)
Fair Value of Investments (continued)
Neuberger Berman Global Bond Absolute Return Fund (continued) Financial Instruments at Fair Value through Profit or Loss As at 31 December 2019 Level 1 Level 2 Level 3 Total
US$ US$ US$ US$
Financial Liabilities held for trading Unrealised loss on Forward Currency Contracts – (4,434,326) – (4,434,326)
Unrealised loss on Futures Contracts (318,924) – – (318,924)
Interest Rate Swap Contracts at Fair Value – (24,703) – (24,703)
Credit Default Swap Contracts at Fair Value – (4,171,792) – (4,171,792)
Total (318,924) (8,630,821) – (8,949,745)
Financial Instruments at Fair Value through Profit or Loss As at 31 December 2018 Level 1 Level 2 Level 3 Total
US$ US$ US$ US$
Financial Assets held for trading Asset Backed Securities – 13,773,558 – 13,773,558
Corporate Bonds – 35,683,902 – 35,683,902
Government Bonds – 21,632,609 – 21,632,609
Investment Funds – 4,301,132 – 4,301,132
Mortgage Backed Securities – 1,509,150 – 1,509,150
Treasury Bills – 1,295,022 – 1,295,022
Unrealised gain on Forward Currency Contracts – 2,699,899 – 2,699,899
Unrealised gain on Futures Contracts 1,106,873 – – 1,106,873
Interest Rate Swap Contracts at Fair Value – 56,438 – 56,438
Credit Default Swap Contracts at Fair Value – 108,915 – 108,915
Total 1,106,873 81,060,625 – 82,167,498
Financial Instruments at Fair Value through Profit or Loss As at 31 December 2018 Level 1 Level 2 Level 3 Total
US$ US$ US$ US$
Financial Liabilities held for trading Unrealised loss on Forward Currency Contracts – (3,252,732) – (3,252,732)
Unrealised loss on Futures Contracts (2,385,480) – – (2,385,480)
Interest Rate Swap Contracts at Fair Value – (8,705) – (8,705)
Credit Default Swap Contracts at Fair Value – (373,321) – (373,321)
Total (2,385,480) (3,634,758) – (6,020,238)

FINANCIAL STATEMENTS NOTES TO THE AUDITED FINANCIAL STATEMENTS
1304 NEUBERGER BERMAN INVESTMENT FUNDS PLC
FOR THE YEAR ENDED 31 DECEMBER 2019
12. FINANCIAL INSTRUMENT DISCLOSURES (CONTINUED)
Fair Value of Investments (continued)
Neuberger Berman Global Bond Absolute Return Fund (continued) Level 1 Level 2 Level 3 US$ US$ US$
Transfer levels from 3 to 2 Asset Backed Securities – 640,458 (640,458)
As at the year ended 31 December 2018, an asset backed security was transferred from Level 3 to Level 2 as a result of the Portfolio’s procedures for valuing securities, as stated in Note 1 of the Notes to the Financial Statements.
Neuberger Berman Short Duration Emerging Market Debt Fund Financial Instruments at Fair Value through Profit or Loss As at 31 December 2019 Level 1 Level 2 Level 3 Total
US$ US$ US$ US$
Financial Assets held for trading Corporate Bonds – 4,040,817,203 – 4,040,817,203
Government Bonds – 1,310,673,086 – 1,310,673,086
Investment Funds – 31,341,000 – 31,341,000
Treasury Bills – 59,896,225 – 59,896,225
Unrealised gain on Forward Currency Contracts – 58,954,197 – 58,954,197
Total – 5,501,681,711 – 5,501,681,711
Financial Instruments at Fair Value through Profit or Loss As at 31 December 2019 Level 1 Level 2 Level 3 Total
US$ US$ US$ US$
Financial Liabilities held for trading Unrealised loss on Forward Currency Contracts – (7,478,759) – (7,478,759)
Total – (7,478,759) – (7,478,759)
Level 1 Level 2 Level 3 US$ US$ US$
Transfer levels from 3 to 2 Corporate Bonds – 475,000 (475,000)
As at the year ended 31 December 2019, a corporate bond was transferred from Level 3 to Level 2 as a result of the Portfolio’s procedures for valuing securities, as stated in Note 1 of the Notes to the Financial Statements.

NOTES TO THE AUDITED FINANCIAL STATEMENTS FINANCIAL STATEMENTS
ANNUAL REPORT 2019 1305
FOR THE YEAR ENDED 31 DECEMBER 2019
12. FINANCIAL INSTRUMENT DISCLOSURES (CONTINUED)
Fair Value of Investments (continued)
Neuberger Berman Short Duration Emerging Market Debt Fund (continued) Financial Instruments at Fair Value through Profit or Loss As at 31 December 2018 Level 1 Level 2 Level 3 Total
US$ US$ US$ US$
Financial Assets held for trading Corporate Bonds – 2,759,731,351 6,321,656 2,766,053,007
Government Bonds – 746,660,608 – 746,660,608
Unrealised gain on Forward Currency Contracts – 17,682,600 – 17,682,600
Total – 3,524,074,559 6,321,656 3,530,396,215
Financial Instruments at Fair Value through Profit or Loss As at 31 December 2018 Level 1 Level 2 Level 3 Total
US$ US$ US$ US$
Financial Liabilities held for trading Unrealised loss on Forward Currency Contracts – (3,387,555) – (3,387,555)
Total – (3,387,555) – (3,387,555)
Neuberger Berman Absolute Return Multi Strategy Fund Financial Instruments at Fair Value through Profit or Loss As at 31 December 2019 Level 1 Level 2 Level 3 Total
US$ US$ US$ US$
Financial Assets held for trading Asset Backed Securities – 10,571,016 – 10,571,016
Equities 17,445,553 699,386 410,236 18,555,175
Participatory Notes 3,696 – 963 4,659
Real Estate Investment Trusts 274,427 – – 274,427
Unrealised gain on Forward Currency Contracts – 417,466 – 417,466
Unrealised gain on Futures Contracts 20,848 – – 20,848
Unrealised gain on Contracts for Differences – 638,360 – 638,360
Total 17,744,524 12,326,228 411,199 30,481,951

FINANCIAL STATEMENTS NOTES TO THE AUDITED FINANCIAL STATEMENTS
1306 NEUBERGER BERMAN INVESTMENT FUNDS PLC
FOR THE YEAR ENDED 31 DECEMBER 2019
12. FINANCIAL INSTRUMENT DISCLOSURES (CONTINUED)
Fair Value of Investments (continued)
Neuberger Berman Absolute Return Multi Strategy Fund (continued) Financial Instruments at Fair Value through Profit or Loss As at 31 December 2019 Level 1 Level 2 Level 3 Total
US$ US$ US$ US$
Financial Liabilities held for trading Unrealised loss on Forward Currency Contracts – (1,134,480) – (1,134,480)
Unrealised loss on Futures Contracts (168,212) – – (168,212)
Unrealised loss on Contracts for Differences – (763,315) – (763,315)
Written Options Contracts (1,148) – – (1,148)
Total (169,360) (1,897,795) – (2,067,155)
Financial Instruments at Fair Value through Profit or Loss As at 31 December 2018 Level 1 Level 2 Level 3 Total
US$ US$ US$ US$
Financial Assets held for trading Asset Backed Securities – 10,853,499 – 10,853,499
Equities 20,451,774 3,288,810 8,844 23,749,428
Investment Funds 315,773 – – 315,773
Participatory Notes 4,722 – – 4,722
Real Estate Investment Trusts 50,278 – – 50,278
Unrealised gain on Forward Currency Contracts – 1,567,922 – 1,567,922
Unrealised gain on Futures Contracts 398,681 – – 398,681
Unrealised gain on Contracts for Differences – 6,731,576 – 6,731,576
Total 21,221,228 22,441,807 8,844 43,671,879
Financial Instruments at Fair Value through Profit or Loss As at 31 December 2018 Level 1 Level 2 Level 3 Total
US$ US$ US$ US$
Financial Liabilities held for trading Unrealised loss on Forward Currency Contracts – (373,617) – (373,617)
Unrealised loss on Futures Contracts (132,547) – – (132,547)
Unrealised loss on Contracts for Differences – (11,642,941) – (11,642,941)
Written Options Contracts (50) – (40) (90)
Unrealised loss on Total Return Swap Contracts – (411,429) – (411,429)
Total (132,597) (12,427,987) (40) (12,560,624)

NOTES TO THE AUDITED FINANCIAL STATEMENTS FINANCIAL STATEMENTS
ANNUAL REPORT 2019 1307
FOR THE YEAR ENDED 31 DECEMBER 2019
12. FINANCIAL INSTRUMENT DISCLOSURES (CONTINUED)
Fair Value of Investments (continued)
Neuberger Berman Absolute Return Multi Strategy Fund (continued) Level 1 Level 2 Level 3 US$ US$ US$
Transfer levels from 1 to 3 Equities (1,669) – 1,669
Transfer levels from 3 to 2 Asset Backed Securities – 953,637 (953,637)
As at the year ended 31 December 2018, an equity security was transferred from Level 1 to Level 3 and an asset backed security was transferred from Level 3 to Level 2 as a result of the Portfolio’s procedures for valuing securities, as stated in Note 1 of the Notes to the Financial Statements.
Neuberger Berman US Long Short Equity Fund Financial Instruments at Fair Value through Profit or Loss As at 31 December 2019 Level 1 Level 2 Level 3 Total
US$ US$ US$ US$
Financial Assets held for trading Corporate Bonds – 7,449,144 – 7,449,144
Equities 120,984,322 – – 120,984,322
Participatory Notes 183,192 – – 183,192
Unrealised gain on Forward Currency Contracts – 1,159,354 – 1,159,354
Unrealised gain on Futures Contracts 6,458 – – 6,458
Purchased Options Contracts 198,406 – 285 198,691
Unrealized gain on Contracts for Differences – 192,020 – 192,020
Unrealised gain on Total Return Swap Contracts – 2,691 – 2,691
Total 121,372,378 8,803,209 285 130,175,872
Financial Instruments at Fair Value through Profit or Loss As at 31 December 2019 Level 1 Level 2 Level 3 Total
US$ US$ US$ US$
Financial Liabilities held for trading Unrealised loss on Forward Currency Contracts – (136,823) – (136,823)
Unrealised loss on Futures Contracts (244,102) – – (244,102)
Written Options Contracts (135,467) – – (135,467)
Unreaslised loss on Contracts for Differences – (1,942,615) – (1942,615)
Unrealised loss on Total Return Swap Contracts – (1,758,261) – (1,758,261)
Total (379,569) (3,837,699) – (4,217,268)
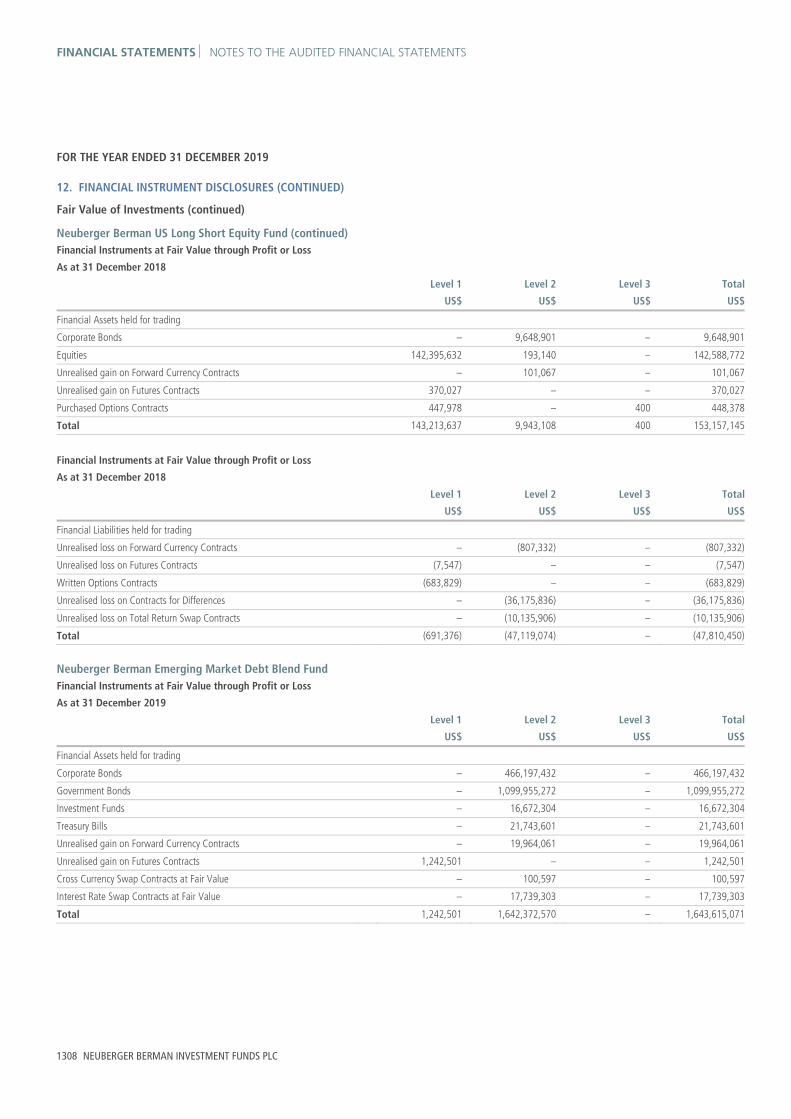
FINANCIAL STATEMENTS NOTES TO THE AUDITED FINANCIAL STATEMENTS
1308 NEUBERGER BERMAN INVESTMENT FUNDS PLC
FOR THE YEAR ENDED 31 DECEMBER 2019
12. FINANCIAL INSTRUMENT DISCLOSURES (CONTINUED)
Fair Value of Investments (continued)
Neuberger Berman US Long Short Equity Fund (continued) Financial Instruments at Fair Value through Profit or Loss As at 31 December 2018 Level 1 Level 2 Level 3 Total
US$ US$ US$ US$
Financial Assets held for trading Corporate Bonds – 9,648,901 – 9,648,901
Equities 142,395,632 193,140 – 142,588,772
Unrealised gain on Forward Currency Contracts – 101,067 – 101,067
Unrealised gain on Futures Contracts 370,027 – – 370,027
Purchased Options Contracts 447,978 – 400 448,378
Total 143,213,637 9,943,108 400 153,157,145
Financial Instruments at Fair Value through Profit or Loss As at 31 December 2018 Level 1 Level 2 Level 3 Total
US$ US$ US$ US$
Financial Liabilities held for trading Unrealised loss on Forward Currency Contracts – (807,332) – (807,332)
Unrealised loss on Futures Contracts (7,547) – – (7,547)
Written Options Contracts (683,829) – – (683,829)
Unrealised loss on Contracts for Differences – (36,175,836) – (36,175,836)
Unrealised loss on Total Return Swap Contracts – (10,135,906) – (10,135,906)
Total (691,376) (47,119,074) – (47,810,450)
Neuberger Berman Emerging Market Debt Blend Fund Financial Instruments at Fair Value through Profit or Loss As at 31 December 2019 Level 1 Level 2 Level 3 Total
US$ US$ US$ US$
Financial Assets held for trading Corporate Bonds – 466,197,432 – 466,197,432
Government Bonds – 1,099,955,272 – 1,099,955,272
Investment Funds – 16,672,304 – 16,672,304
Treasury Bills – 21,743,601 – 21,743,601
Unrealised gain on Forward Currency Contracts – 19,964,061 – 19,964,061
Unrealised gain on Futures Contracts 1,242,501 – – 1,242,501
Cross Currency Swap Contracts at Fair Value – 100,597 – 100,597
Interest Rate Swap Contracts at Fair Value – 17,739,303 – 17,739,303
Total 1,242,501 1,642,372,570 – 1,643,615,071

NOTES TO THE AUDITED FINANCIAL STATEMENTS FINANCIAL STATEMENTS
ANNUAL REPORT 2019 1309
FOR THE YEAR ENDED 31 DECEMBER 2019
12. FINANCIAL INSTRUMENT DISCLOSURES (CONTINUED)
Fair Value of Investments (continued)
Neuberger Berman Emerging Market Debt Blend Fund (continued) Financial Instruments at Fair Value through Profit or Loss As at 31 December 2019 Level 1 Level 2 Level 3 Total
US$ US$ US$ US$
Financial Liabilities held for trading Unrealised loss on Forward Currency Contracts – (5,359,849) (209,748) (5,569,597)
Unrealised loss on Futures Contracts (598,729) – – (598,729)
Credit Default Swap Contracts at Fair Value – (3,056,605) – (3,056,605)
Cross Currency Swap Contracts at Fair Value – (381,521) – (381,521)
Interest Rate Swap Contracts at Fair Value – (3,084,002) – (3,084,002)
Total (598,729) (11,881,977) (209,748) (12,690,454)
Financial Instruments at Fair Value through Profit or Loss As at 31 December 2018 Level 1 Level 2 Level 3 Total
US$ US$ US$ US$
Financial Assets held for trading Corporate Bonds – 448,901,829 – 448,901,829
Government Bonds – 1,081,843,181 – 1,081,843,181
Treasury Bills – 65,174,661 – 65,174,661
Unrealised gain on Forward Currency Contracts – 10,189,209 – 10,189,209
Unrealised gain on Futures Contracts 2,479,059 – – 2,479,059
Interest Rate Swap Contracts at Fair Value – 14,829,551 – 14,829,551
Cross Currency Swap Contracts at Fair Value – 3,214,555 – 3,214,555
Total 2,479,059 1,624,152,986 – 1,626,632,045
Financial Instruments at Fair Value through Profit or Loss As at 31 December 2018 Level 1 Level 2 Level 3 Total
US$ US$ US$ US$
Financial Liabilities held for trading Unrealised loss on Forward Currency Contracts – (10,561,114) – (10,561,114)
Unrealised loss on Futures Contracts (1,029,310) – – (1,029,310)
Credit Default Swap Contracts at Fair Value – (572,234) – (572,234)
Interest Rate Swap Contracts at Fair Value – (9,319,052) – (9,319,052)
Cross Currency Swap Contracts at Fair Value – (3,286,169) – (3,286,169)
Total (1,029,310) (23,738,569) – (24,767,879)
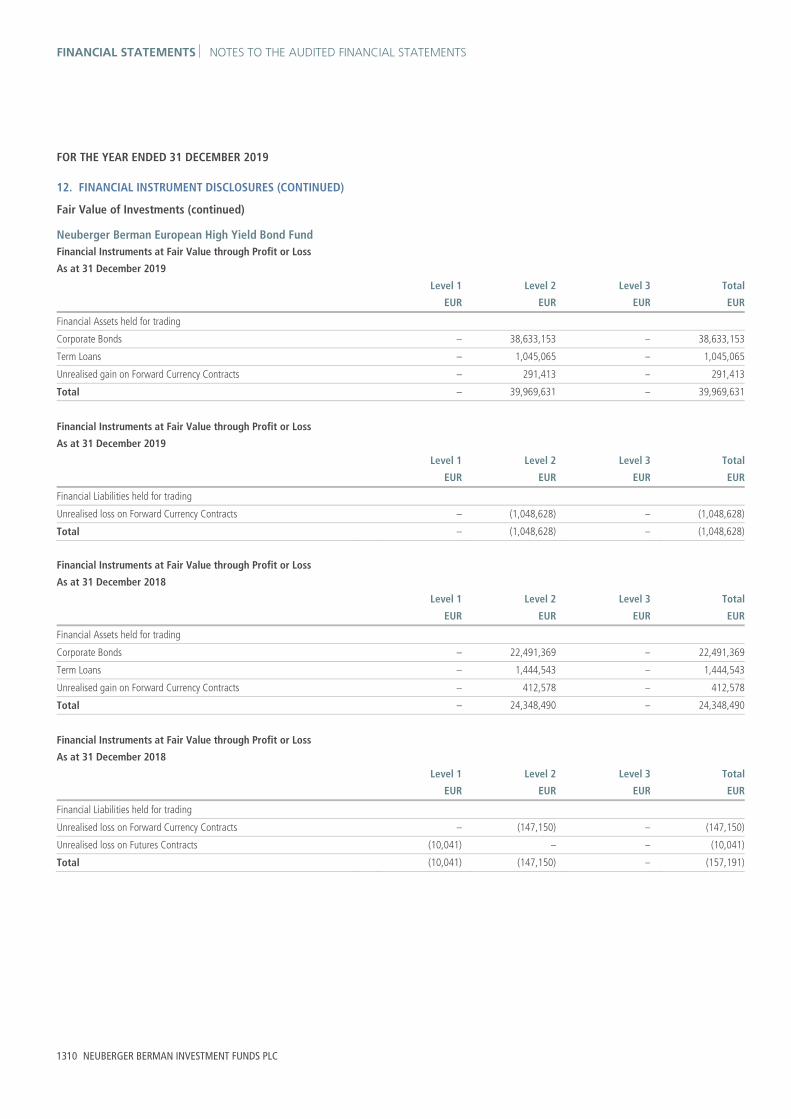
FINANCIAL STATEMENTS NOTES TO THE AUDITED FINANCIAL STATEMENTS
1310 NEUBERGER BERMAN INVESTMENT FUNDS PLC
FOR THE YEAR ENDED 31 DECEMBER 2019
12. FINANCIAL INSTRUMENT DISCLOSURES (CONTINUED)
Fair Value of Investments (continued)
Neuberger Berman European High Yield Bond Fund Financial Instruments at Fair Value through Profit or Loss As at 31 December 2019 Level 1 Level 2 Level 3 Total
EUR EUR EUR EUR
Financial Assets held for trading Corporate Bonds – 38,633,153 – 38,633,153
Term Loans – 1,045,065 – 1,045,065
Unrealised gain on Forward Currency Contracts – 291,413 – 291,413
Total – 39,969,631 – 39,969,631
Financial Instruments at Fair Value through Profit or Loss As at 31 December 2019 Level 1 Level 2 Level 3 Total
EUR EUR EUR EUR
Financial Liabilities held for trading Unrealised loss on Forward Currency Contracts – (1,048,628) – (1,048,628)
Total – (1,048,628) – (1,048,628)
Financial Instruments at Fair Value through Profit or Loss As at 31 December 2018 Level 1 Level 2 Level 3 Total
EUR EUR EUR EUR
Financial Assets held for trading Corporate Bonds – 22,491,369 – 22,491,369
Term Loans – 1,444,543 – 1,444,543
Unrealised gain on Forward Currency Contracts – 412,578 – 412,578
Total – 24,348,490 – 24,348,490
Financial Instruments at Fair Value through Profit or Loss As at 31 December 2018 Level 1 Level 2 Level 3 Total
EUR EUR EUR EUR
Financial Liabilities held for trading Unrealised loss on Forward Currency Contracts – (147,150) – (147,150)
Unrealised loss on Futures Contracts (10,041) – – (10,041)
Total (10,041) (147,150) – (157,191)

NOTES TO THE AUDITED FINANCIAL STATEMENTS FINANCIAL STATEMENTS
ANNUAL REPORT 2019 1311
FOR THE YEAR ENDED 31 DECEMBER 2019
12. FINANCIAL INSTRUMENT DISCLOSURES (CONTINUED)
Fair Value of Investments (continued)
Neuberger Berman Global Equity Fund Financial Instruments at Fair Value through Profit or Loss As at 31 December 2019 Level 1 Level 2 Level 3 Total
US$ US$ US$ US$
Financial Assets held for trading Equities 1,210,010 162,110 – 1,372,120
Total 1,210,010 162,110 – 1,372,120
Financial Instruments at Fair Value through Profit or Loss As at 31 December 2018 Level 1 Level 2 Level 3 Total
US$ US$ US$ US$
Financial Assets held for trading Equities 804,688 414,086 – 1,218,774
Total 804,688 414,086 – 1,218,774
Neuberger Berman Systematic Global Equity Fund Financial Instruments at Fair Value through Profit or Loss As at 31 December 2019 Level 1 Level 2 Level 3 Total
US$ US$ US$ US$
Financial Assets held for trading Equities 24,589,733 5,953,952 0 30,543,685
Investment Funds 281,147 – – 281,147
Real Estate Investment Trusts 729,687 37,554 – 767,241
Unrealised gain on Forward Currency Contracts – 75,241 – 75,241
Total 25,600,567 6,066,747 – 31,667,314
Financial Instruments at Fair Value through Profit or Loss As at 31 December 2019 Level 1 Level 2 Level 3 Total
US$ US$ US$ US$
Financial Liabilities held for trading Unrealised loss on Forward Currency Contracts – (26,731) – (26,731)
Total – (26,731) – (26,731)

FINANCIAL STATEMENTS NOTES TO THE AUDITED FINANCIAL STATEMENTS
1312 NEUBERGER BERMAN INVESTMENT FUNDS PLC
FOR THE YEAR ENDED 31 DECEMBER 2019
12. FINANCIAL INSTRUMENT DISCLOSURES (CONTINUED)
Fair Value of Investments (continued)
Neuberger Berman Systematic Global Equity Fund (continued) Financial Instruments at Fair Value through Profit or Loss As at 31 December 2018 Level 1 Level 2 Level 3 Total
US$ US$ US$ US$
Financial Assets held for trading Equities 12,837,271 6,687,003 0 19,524,274
Investment Funds – 209,018 – 209,018
Real Estate Investment Trusts 881,932 – – 881,932
Unrealised gain on Forward Currency Contracts – 20,435 – 20,435
Total 13,719,203 6,916,456 0 20,635,659
Financial Instruments at Fair Value through Profit or Loss As at 31 December 2018 Level 1 Level 2 Level 3 Total
US$ US$ US$ US$
Financial Liabilities held for trading Unrealised loss on Forward Currency Contracts – (51,813) – (51,813)
Total – (51,813) – (51,813)
Neuberger Berman Global Real Estate Securities Fund Financial Instruments at Fair Value through Profit or Loss As at 31 December 2019 Level 1 Level 2 Level 3 Total
US$ US$ US$ US$
Financial Assets held for trading Equities 7,396,828 6,948,275 – 14,345,103
Real Estate Investment Trusts 41,596,525 10,268,728 – 51,865,253
Unrealised gain on Forward Currency Contracts – 11,835 – 11,835
Total 48,993,353 17,228,838 – 66,222,191
Financial Instruments at Fair Value through Profit or Loss As at 31 December 2019 Level 1 Level 2 Level 3 Total
US$ US$ US$ US$
Financial Liabilities held for trading Unrealised loss on Forward Currency Contracts – (502) – (502)
Total – (502) – (502)

NOTES TO THE AUDITED FINANCIAL STATEMENTS FINANCIAL STATEMENTS
ANNUAL REPORT 2019 1313
FOR THE YEAR ENDED 31 DECEMBER 2019
12. FINANCIAL INSTRUMENT DISCLOSURES (CONTINUED)
Fair Value of Investments (continued)
Neuberger Berman Global Real Estate Securities Fund (continued) Financial Instruments at Fair Value through Profit or Loss As at 31 December 2018 Level 1 Level 2 Level 3 Total
US$ US$ US$ US$
Financial Assets held for trading Equities 400,228 451,649 – 851,877
Real Estate Investment Trusts 2,034,588 349,266 – 2,383,854
Unrealised gain on Forward Currency Contracts – 341 – 341
Total 2,434,816 801,256 – 3,236,072
Financial Instruments at Fair Value through Profit or Loss As at 31 December 2018 Level 1 Level 2 Level 3 Total
US$ US$ US$ US$
Financial Liabilities held for trading Unrealised loss on Forward Currency Contracts – (3,187) – (3,187)
Total – (3,187) – (3,187)
Neuberger Berman US Small Cap Intrinsic Value Fund Financial Instruments at Fair Value through Profit or Loss As at 31 December 2019 Level 1 Level 2 Level 3 Total
US$ US$ US$ US$
Financial Assets held for trading Equities 99,370,960 – – 99,370,960
Participatory Notes 51,579 – – 51,579
Total 99,422,539 – – 99,422,539
Financial Instruments at Fair Value through Profit or Loss As at 31 December 2018 Level 1 Level 2 Level 3 Total
US$ US$ US$ US$
Financial Assets held for trading Equities 76,020,369 – – 76,020,369
Real Estate Investment Trusts 606,452 – – 606,452
Total 76,626,821 – – 76,626,821

FINANCIAL STATEMENTS NOTES TO THE AUDITED FINANCIAL STATEMENTS
1314 NEUBERGER BERMAN INVESTMENT FUNDS PLC
FOR THE YEAR ENDED 31 DECEMBER 2019
12. FINANCIAL INSTRUMENT DISCLOSURES (CONTINUED)
Fair Value of Investments (continued)
Neuberger Berman Global Credit Long Short Fund* Financial Instruments at Fair Value through Profit or Loss As at 31 December 2018 Level 1 Level 2 Level 3 Total
US$ US$ US$ US$
Financial Assets held for trading Equities 1,433 – – 1,433
Unrealised gain on Forward Currency Contracts – 10,676 – 10,676
Total 1,433 10,676 – 12,109
Financial Instruments at Fair Value through Profit or Loss As at 31 December 2018 Level 1 Level 2 Level 3 Total
US$ US$ US$ US$
Financial Liabilities held for trading Unrealised loss on Forward Currency Contracts – (14,607) – (14,607)
Total – (14,607) – (14,607)
* Portfolio liquidated on 26 November 2018.
Neuberger Berman Asian Debt - Hard Currency Fund Financial Instruments at Fair Value through Profit or Loss As at 31 December 2019 Level 1 Level 2 Level 3 Total
US$ US$ US$ US$
Financial Assets held for trading Corporate Bonds – 19,750,092 – 19,750,092
Government Bonds – 1,936,193 – 1,936,193
Unrealised gain on Forward Currency Contracts – 16,099 – 16,099
Unrealised gain on Futures Contracts 14,148 – – 14,148
Total 14,148 21,702,384 – 21,716,532
Financial Instruments at Fair Value through Profit or Loss As at 31 December 2019 Level 1 Level 2 Level 3 Total
US$ US$ US$ US$
Financial Liabilities held for trading Unrealised loss on Forward Currency Contracts – (1) – (1)
Total – (1) – (1)
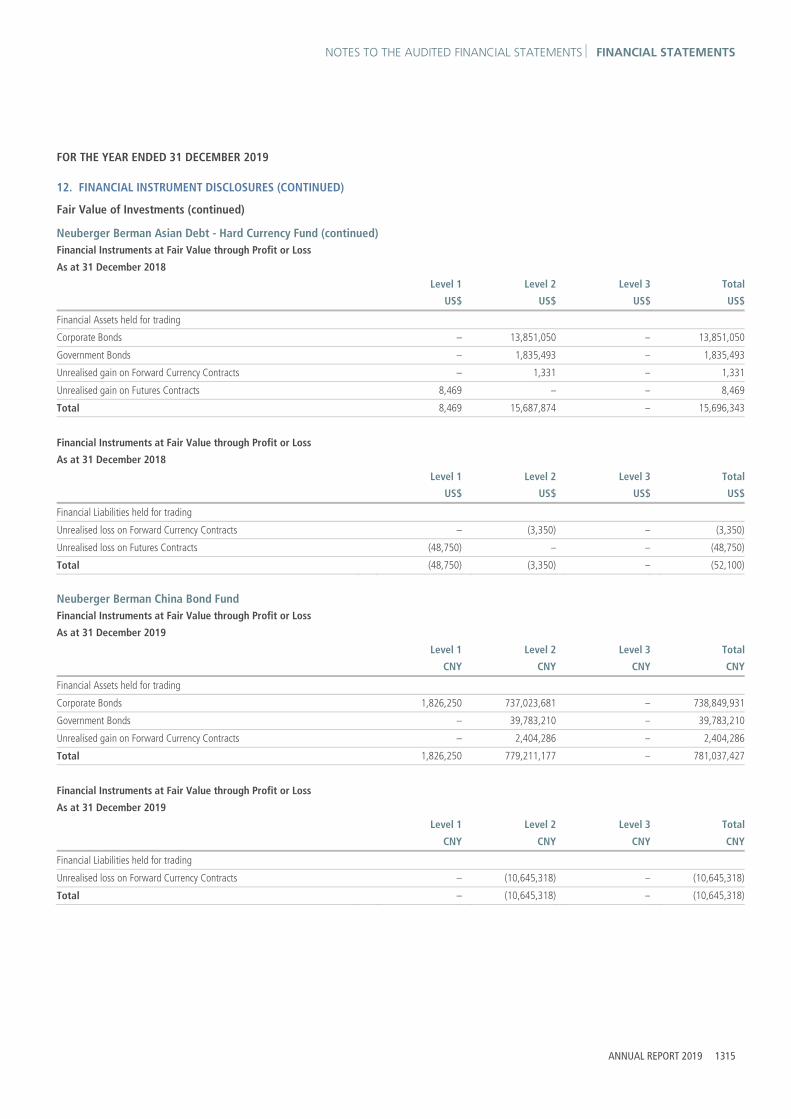
NOTES TO THE AUDITED FINANCIAL STATEMENTS FINANCIAL STATEMENTS
ANNUAL REPORT 2019 1315
FOR THE YEAR ENDED 31 DECEMBER 2019
12. FINANCIAL INSTRUMENT DISCLOSURES (CONTINUED)
Fair Value of Investments (continued)
Neuberger Berman Asian Debt - Hard Currency Fund (continued) Financial Instruments at Fair Value through Profit or Loss As at 31 December 2018 Level 1 Level 2 Level 3 Total
US$ US$ US$ US$
Financial Assets held for trading Corporate Bonds – 13,851,050 – 13,851,050
Government Bonds – 1,835,493 – 1,835,493
Unrealised gain on Forward Currency Contracts – 1,331 – 1,331
Unrealised gain on Futures Contracts 8,469 – – 8,469
Total 8,469 15,687,874 – 15,696,343
Financial Instruments at Fair Value through Profit or Loss As at 31 December 2018 Level 1 Level 2 Level 3 Total
US$ US$ US$ US$
Financial Liabilities held for trading Unrealised loss on Forward Currency Contracts – (3,350) – (3,350)
Unrealised loss on Futures Contracts (48,750) – – (48,750)
Total (48,750) (3,350) – (52,100)
Neuberger Berman China Bond Fund Financial Instruments at Fair Value through Profit or Loss As at 31 December 2019 Level 1 Level 2 Level 3 Total
CNY CNY CNY CNY
Financial Assets held for trading Corporate Bonds 1,826,250 737,023,681 – 738,849,931
Government Bonds – 39,783,210 – 39,783,210
Unrealised gain on Forward Currency Contracts – 2,404,286 – 2,404,286
Total 1,826,250 779,211,177 – 781,037,427
Financial Instruments at Fair Value through Profit or Loss As at 31 December 2019 Level 1 Level 2 Level 3 Total
CNY CNY CNY CNY
Financial Liabilities held for trading Unrealised loss on Forward Currency Contracts – (10,645,318) – (10,645,318)
Total – (10,645,318) – (10,645,318)

FINANCIAL STATEMENTS NOTES TO THE AUDITED FINANCIAL STATEMENTS
1316 NEUBERGER BERMAN INVESTMENT FUNDS PLC
FOR THE YEAR ENDED 31 DECEMBER 2019
12. FINANCIAL INSTRUMENT DISCLOSURES (CONTINUED)
Fair Value of Investments (continued)
Neuberger Berman China Bond Fund (continued) Financial Instruments at Fair Value through Profit or Loss As at 31 December 2018 Level 1 Level 2 Level 3 Total
CNY CNY CNY CNY
Financial Assets held for trading Corporate Bonds – 74,633,341 – 74,633,341
Government Bonds – 2,420,661 – 2,420,661
Unrealised gain on Forward Currency Contracts – 66,663 – 66,663
Total – 77,120,665 – 77,120,665
Financial Instruments at Fair Value through Profit or Loss As at 31 December 2018 Level 1 Level 2 Level 3 Total
CNY CNY CNY CNY
Financial Liabilities held for trading Unrealised loss on Forward Currency Contracts – (6,633) – (6,633)
Total – (6,633) – (6,633)
Neuberger Berman Global Dynamic Asset Allocator Fund* Financial Instruments at Fair Value through Profit or Loss As at 31 December 2019 Level 1 Level 2 Level 3 Total
US$ US$ US$ US$
Financial Assets held for trading Corporate Bonds – 14,027 – 14,027
Government Bonds – 1,692 – 1,692
Total – 15,719 – 15,719

NOTES TO THE AUDITED FINANCIAL STATEMENTS FINANCIAL STATEMENTS
ANNUAL REPORT 2019 1317
FOR THE YEAR ENDED 31 DECEMBER 2019
12. FINANCIAL INSTRUMENT DISCLOSURES (CONTINUED)
Fair Value of Investments (continued)
Neuberger Berman Global Dynamic Asset Allocator Fund* (continued) Financial Instruments at Fair Value through Profit or Loss As at 31 December 2018 Level 1 Level 2 Level 3 Total
US$ US$ US$ US$
Financial Assets held for trading Asset Backed Securities – 3,468,364 – 3,468,364
Corporate Bonds – 10,872,188 – 10,872,188
Government Bonds – 6,577,889 – 6,577,889
Investment Funds – 1,072,480 – 1,072,480
Mortgage Backed Securities – 443,568 – 443,568
Treasury Bills – 597,702 – 597,702
Unrealised gain on Forward Currency Contracts – 1,596,836 – 1,596,836
Unrealised gain on Futures Contracts 564,774 – – 564,774
Credit Default Swap Contracts at Fair Value – 27,349 – 27,349
Interest Rate Swap Contracts at Fair Value – 11,099 – 11,099
Total 564,774 24,667,475 – 25,232,249
Financial Instruments at Fair Value through Profit or Loss As at 31 December 2018 Level 1 Level 2 Level 3 Total
US$ US$ US$ US$
Financial Liabilities held for trading Unrealised loss on Forward Currency Contracts – (1,621,993) – (1,621,993)
Unrealised loss on Futures Contracts (696,255) – – (696,255)
Credit Default Swap Contracts at Fair Value – (109,077) – (109,077)
Interest Rate Swap Contracts at Fair Value – (1,524) – (1,524)
Total (696,255) (1,732,594) – (2,428,849)
Level 1 Level 2 Level 3 US$ US$ US$
Transfer levels from 3 to 2 Asset Backed Securities – 260,186 (260,186)
As at the year ended 31 December 2018, an asset backed security was transferred from Level 3 to Level 2 as a result of the Portfolio’s procedures for valuing securities, as stated in Note 1 of the Notes to the Financial Statements. * Portfolio liquidated on 12 April 2019.

FINANCIAL STATEMENTS NOTES TO THE AUDITED FINANCIAL STATEMENTS
1318 NEUBERGER BERMAN INVESTMENT FUNDS PLC
FOR THE YEAR ENDED 31 DECEMBER 2019
12. FINANCIAL INSTRUMENT DISCLOSURES (CONTINUED)
Fair Value of Investments (continued)
Neuberger Berman Asian Opportunities Fund* Financial Instruments at Fair Value through Profit or Loss As at 31 December 2018 Level 1 Level 2 Level 3 Total
US$ US$ US$ US$
Financial Assets held for trading Equities 1,702,853 1,314,480 – 3,017,333
Participatory Notes 250,980 – – 250,980
Total 1,953,833 1,314,480 – 3,268,313
* Portfolio liquidated on 24 July 2019.
Neuberger Berman Corporate Hybrid Bond Fund Financial Instruments at Fair Value through Profit or Loss As at 31 December 2019 Level 1 Level 2 Level 3 Total
EUR EUR EUR EUR
Financial Assets held for trading Corporate Bonds – 1,048,748,335 – 1,048,748,335
Unrealised gain on Forward Currency Contracts – 10,380,822 – 10,380,822
Total – 1,059,129,157 – 1,059,129,157
Financial Instruments at Fair Value through Profit or Loss As at 31 December 2019 Level 1 Level 2 Level 3 Total
EUR EUR EUR EUR
Financial Liabilities held for trading Unrealised loss on Forward Currency Contracts – (13,692,146) – (13,692,146)
Total – (13,692,146) – (13,692,146)
Financial Instruments at Fair Value through Profit or Loss As at 31 December 2018 Level 1 Level 2 Level 3 Total
EUR EUR EUR EUR
Financial Assets held for trading Corporate Bonds – 794,442,089 – 794,442,089
Unrealised gain on Forward Currency Contracts – 5,059,235 – 5,059,235
Total – 799,501,324 – 799,501,324

NOTES TO THE AUDITED FINANCIAL STATEMENTS FINANCIAL STATEMENTS
ANNUAL REPORT 2019 1319
FOR THE YEAR ENDED 31 DECEMBER 2019
12. FINANCIAL INSTRUMENT DISCLOSURES (CONTINUED)
Fair Value of Investments (continued)
Neuberger Berman Corporate Hybrid Bond Fund (continued) Financial Instruments at Fair Value through Profit or Loss As at 31 December 2018 Level 1 Level 2 Level 3 Total
EUR EUR EUR EUR
Financial Liabilities held for trading Unrealised loss on Forward Currency Contracts – (5,295,685) – (5,295,685)
Total – (5,295,685) – (5,295,685)
Neuberger Berman US Equity Fund Financial Instruments at Fair Value through Profit or Loss As at 31 December 2019 Level 1 Level 2 Level 3 Total
US$ US$ US$ US$
Financial Assets held for trading Equities 5,089,218 – – 5,089,218
Participatory Notes 6,283 – – 6,283
Total 5,095,501 – – 5,095,501
Financial Instruments at Fair Value through Profit or Loss As at 31 December 2018 Level 1 Level 2 Level 3 Total
US$ US$ US$ US$
Financial Assets held for trading Equities 3,461,578 19,980 – 3,481,558
Total 3,461,578 19,980 – 3,481,558

FINANCIAL STATEMENTS NOTES TO THE AUDITED FINANCIAL STATEMENTS
1320 NEUBERGER BERMAN INVESTMENT FUNDS PLC
FOR THE YEAR ENDED 31 DECEMBER 2019
12. FINANCIAL INSTRUMENT DISCLOSURES (CONTINUED)
Fair Value of Investments (continued)
Neuberger Berman Global High Yield Bond Fund Financial Instruments at Fair Value through Profit or Loss As at 31 December 2019 Level 1 Level 2 Level 3 Total
US$ US$ US$ US$
Financial Assets held for trading Corporate Bonds – 69,068,917 0 69,068,917
Term Loans – 2,156,736 80,199 2,236,935
Unrealised gain on Forward Currency Contracts – 1,101,962 – 1,101,962
Total – 72,327,615 80,199 72,407,814
Financial Instruments at Fair Value through Profit or Loss As at 31 December 2019 Level 1 Level 2 Level 3 Total
US$ US$ US$ US$
Financial Liabilities held for trading Unrealised loss on Forward Currency Contracts – (861,176) – (861,176)
Unrealised loss on Futures Contracts (2,797) – – (2,797)
Total (2,797) (861,176) – (863,973)
Financial Instruments at Fair Value through Profit or Loss As at 31 December 2018 Level 1 Level 2 Level 3 Total
US$ US$ US$ US$
Financial Assets held for trading Corporate Bonds – 54,480,617 0 54,480,617
Term Loans – 3,245,787 191,819 3,437,606
Unrealised gain on Forward Currency Contracts – 509,187 – 509,187
Unrealised gain on Futures Contracts 10,781 – – 10,781
Total 10,781 58,235,591 191,819 58,438,191
Financial Instruments at Fair Value through Profit or Loss As at 31 December 2018 Level 1 Level 2 Level 3 Total
US$ US$ US$ US$
Financial Liabilities held for trading Unrealised loss on Forward Currency Contracts – (683,211) – (683,211)
Unrealised loss on Futures Contracts (9,261) – – (9,261)
Total (9,261) (683,211) – (692,472)

NOTES TO THE AUDITED FINANCIAL STATEMENTS FINANCIAL STATEMENTS
ANNUAL REPORT 2019 1321
FOR THE YEAR ENDED 31 DECEMBER 2019
12. FINANCIAL INSTRUMENT DISCLOSURES (CONTINUED)
Fair Value of Investments (continued)
Neuberger Berman Global Opportunistic Bond Fund Financial Instruments at Fair Value through Profit or Loss As at 31 December 2019 Level 1 Level 2 Level 3 Total
US$ US$ US$ US$
Financial Assets held for trading Agency Bonds – 393,177 – 393,177
Asset Backed Securities – 12,206,970 – 12,206,970
Corporate Bonds – 77,341,045 – 77,341,045
Government Bonds – 56,477,467 – 56,477,467
Investment Funds 4,564,571 8,449,730 – 13,014,301
Mortgage Backed Securities – 16,625,002 – 16,625,002
Treasury Bills – 3,304,224 – 3,304,224
Unrealised gain on Forward Currency Contracts – 3,025,978 – 3,025,978
Unrealised gain on Futures Contracts 763,363 – – 763,363
Credit Default Swap Contracts at Fair Value – 252,202 – 252,202
Interest Rate Swap Contracts at Fair Value – 19,679 – 19,679
Total 5,327,934 178,095,474 – 183,423,408
Financial Instruments at Fair Value through Profit or Loss As at 31 December 2019 Level 1 Level 2 Level 3 Total
US$ US$ US$ US$
Financial Liabilities held for trading Unrealised loss on Forward Currency Contracts – (5,702,958) – (5,702,958)
Unrealised loss on Futures Contracts (254,590) – – (254,590)
Credit Default Swap Contracts at Fair Value – (3,491,151) – (3,491,151)
Interest Rate Swap Contracts at Fair Value – (11,229) – (11,229)
Total (254,590) (9,205,338) – (9,459,928)

FINANCIAL STATEMENTS NOTES TO THE AUDITED FINANCIAL STATEMENTS
1322 NEUBERGER BERMAN INVESTMENT FUNDS PLC
FOR THE YEAR ENDED 31 DECEMBER 2019
12. FINANCIAL INSTRUMENT DISCLOSURES (CONTINUED)
Fair Value of Investments (continued)
Neuberger Berman Global Opportunistic Bond Fund (continued) Financial Instruments at Fair Value through Profit or Loss As at 31 December 2018 Level 1 Level 2 Level 3 Total
US$ US$ US$ US$
Financial Assets held for trading Agency Bonds – 361,049 – 361,049
Asset Backed Securities – 9,443,647 – 9,443,647
Corporate Bonds – 38,564,954 – 38,564,954
Government Bonds – 36,900,460 – 36,900,460
Investment Funds – 9,261,702 – 9,261,702
Mortgage Backed Securities – 11,394,706 – 11,394,706
Treasury Bills – 323,756 – 323,756
Unrealised gain on Forward Currency Contracts – 2,602,782 – 2,602,782
Unrealised gain on Futures Contracts 712,276 – – 712,276
Interest Rate Swap Contracts at Fair Value – 46,334 – 46,334
Total 712,276 108,899,390 – 109,611,666
Financial Instruments at Fair Value through Profit or Loss As at 31 December 2018 Level 1 Level 2 Level 3 Total
US$ US$ US$ US$
Financial Liabilities held for trading Unrealised loss on Forward Currency Contracts – (2,086,779) – (2,086,779)
Unrealised loss on Futures Contracts (1,307,457) – – (1,307,457)
Credit Default Swap Contracts at Fair Value – (144,412) – (144,412)
Total (1,307,457) (2,231,191) – (3,538,648)
Level 1 Level 2 Level 3 US$ US$ US$
Transfer levels from 3 to 2 Asset Backed Securities – 200,143 (200,143)
As at the year ended 31 December 2018, an asset backed security was transferred from Level 3 to Level 2 as a result of the Portfolio’s procedures for valuing securities, as stated in Note 1 of the Notes to the Financial Statements.

NOTES TO THE AUDITED FINANCIAL STATEMENTS FINANCIAL STATEMENTS
ANNUAL REPORT 2019 1323
FOR THE YEAR ENDED 31 DECEMBER 2019
12. FINANCIAL INSTRUMENT DISCLOSURES (CONTINUED)
Fair Value of Investments (continued)
Neuberger Berman Multi-Asset Risk Premia Fund* Financial Instruments at Fair Value through Profit or Loss As at 31 December 2018 Level 1 Level 2 Level 3 Total
US$ US$ US$ US$
Financial Assets held for trading Government Bonds – 13,467,380 – 13,467,380
Treasury Bills – 33,029,485 – 33,029,485
Unrealised gain on Forward Currency Contracts – 124,929 – 124,929
Unrealised gain on Total Return Swap Contracts – – 1,555,743 1,555,743
Total – 46,621,794 1,555,743 48,177,537
Financial Instruments at Fair Value through Profit or Loss As at 31 December 2018 Level 1 Level 2 Level 3 Total
US$ US$ US$ US$
Financial Liabilities held for trading Unrealised loss on Forward Currency Contracts – (645,947) – (645,947)
Unrealised loss on Total Return Swap Contracts – – (242,227) (242,227)
Total – (645,947) (242,227) (888,174)
* Portfolio liquidated on 26 March 2019.
Neuberger Berman Multi-Asset Class Income Fund Financial Instruments at Fair Value through Profit or Loss As at 31 December 2019 Level 1 Level 2 Level 3 Total
US$ US$ US$ US$
Financial Assets held for trading Agency Bonds – 112,336 – 112,336
Asset Backed Securities – 5,094,658 – 5,094,658
Corporate Bonds – 29,104,867 – 29,104,867
Equities 22,450,140 3,561,506 – 26,011,646
Government Bonds – 22,836,765 – 22,836,765
Investment Funds 4,987,879 – – 4,987,879
Real Estate Investment Trusts 5,278,372 50,693 – 5,329,065
Unrealised gain on Forward Currency Contracts – 923,367 – 923,367
Unrealised gain on Futures Contracts 164,689 – – 164,689
Purchased Options Contracts 5,065 – 60 5,125
Unrealised gain on Total Return Swap Contracts – 650,330 – 650,330
Total 32,886,145 62,334,522 60 95,220,727

FINANCIAL STATEMENTS NOTES TO THE AUDITED FINANCIAL STATEMENTS
1324 NEUBERGER BERMAN INVESTMENT FUNDS PLC
FOR THE YEAR ENDED 31 DECEMBER 2019
12. FINANCIAL INSTRUMENT DISCLOSURES (CONTINUED)
Fair Value of Investments (continued)
Neuberger Berman Multi-Asset Class Income Fund (continued) Financial Instruments at Fair Value through Profit or Loss As at 31 December 2019 Level 1 Level 2 Level 3 Total
US$ US$ US$ US$
Financial Liabilities held for trading Unrealised loss on Forward Currency Contracts – (1,096,507) – (1,096,507)
Unrealised loss on Futures Contracts (396,947) – – (396,947)
Written Options Contracts (67,350) – – (67,350)
Unrealised loss on Total Return Swap Contracts – (490,020) – (490,020)
Total (464,297) (1,586,527) – (2,050,824)
Financial Instruments at Fair Value through Profit or Loss As at 31 December 2018 Level 1 Level 2 Level 3 Total
US$ US$ US$ US$
Financial Assets held for trading Agency Bonds – 103,157 – 103,157
Asset Backed Securities – 2,390,183 – 2,390,183
Corporate Bonds – 4,986,991 – 4,986,991
Equities 8,130,192 5,513,011 – 13,643,203
Government Bonds – 6,606,279 – 6,606,279
Investment Funds – 3,520,806 – 3,520,806
Mortgage Backed Securities – 5,141,547 – 5,141,547
Real Estate Investment Trusts 2,502,911 179,483 – 2,682,394
Treasury Bills – 199,234 – 199,234
Unrealised gain on Forward Currency Contracts – 439,507 – 439,507
Unrealised gain on Futures Contracts 198,681 – – 198,681
Purchased Options Contracts 9,292 – 0 9,292
Unrealised gain on Total Return Swap Contracts – 54,799 100,359 155,158
Total 10,841,076 29,134,997 100,359 40,076,432

NOTES TO THE AUDITED FINANCIAL STATEMENTS FINANCIAL STATEMENTS
ANNUAL REPORT 2019 1325
FOR THE YEAR ENDED 31 DECEMBER 2019
12. FINANCIAL INSTRUMENT DISCLOSURES (CONTINUED)
Fair Value of Investments (continued)
Neuberger Berman Multi-Asset Class Income Fund (continued) Financial Instruments at Fair Value through Profit or Loss As at 31 December 2018 Level 1 Level 2 Level 3 Total
US$ US$ US$ US$
Financial Liabilities held for trading Unrealised loss on Forward Currency Contracts – (487,433) – (487,433)
Unrealised loss on Futures Contracts (284,850) – – (284,850)
Written Options Contracts (183,434) – (0) (183,434)
Credit Default Swap Contracts at Fair Value – (58,212) – (58,212)
Unrealised loss on Total Return Swap Contracts – (69,251) – (69,251)
Total (468,284) (614,896) (0) (1,083,180)
Level 1 Level 2 Level 3 US$ US$ US$
Transfer levels from 2 to 3 Total Return Swap Contracts – (100,359) 100,359
As at the year ended 31 December 2018, a total return swap contract was transferred from Level 2 to Level 3 as a result of the Portfolio’s procedures for valuing securities, as stated in Note 1 of the Notes to the Financial Statements.

FINANCIAL STATEMENTS NOTES TO THE AUDITED FINANCIAL STATEMENTS
1326 NEUBERGER BERMAN INVESTMENT FUNDS PLC
FOR THE YEAR ENDED 31 DECEMBER 2019
12. FINANCIAL INSTRUMENT DISCLOSURES (CONTINUED)
Fair Value of Investments (continued)
Neuberger Berman US Equity Index PutWrite Fund Financial Instruments at Fair Value through Profit or Loss As at 31 December 2019 Level 1 Level 2 Level 3 Total
US$ US$ US$ US$
Financial Assets held for trading Government Bonds – 521,939,768 – 521,939,768
Unrealised gain on Forward Currency Contracts – 1,609,667 – 1,609,667
Total – 523,549,435 – 523,549,435
Financial Instruments at Fair Value through Profit or Loss As at 31 December 2019 Level 1 Level 2 Level 3 Total
US$ US$ US$ US$
Financial Liabilities held for trading Unrealised loss on Forward Currency Contracts – (63,595) – (63,595)
Written Options Contracts (3,143,007) – – (3,143,007)
Total (3,143,007) (63,595) – (3,206,602)
Financial Instruments at Fair Value through Profit or Loss As at 31 December 2018 Level 1 Level 2 Level 3 Total
US$ US$ US$ US$
Financial Assets held for trading Government Bonds – 399,009,972 – 399,009,972
Unrealised gain on Forward Currency Contracts – 155,476 – 155,476
Total – 399,165,448 – 399,165,448
Financial Instruments at Fair Value through Profit or Loss As at 31 December 2018 Level 1 Level 2 Level 3 Total
US$ US$ US$ US$
Financial Liabilities held for trading Unrealised loss on Forward Currency Contracts – (879,772) – (879,772)
Written Options Contracts (7,227,170) – – (7,227,170)
Total (7,227,170) (879,772) – (8,106,942)

NOTES TO THE AUDITED FINANCIAL STATEMENTS FINANCIAL STATEMENTS
ANNUAL REPORT 2019 1327
FOR THE YEAR ENDED 31 DECEMBER 2019
12. FINANCIAL INSTRUMENT DISCLOSURES (CONTINUED)
Fair Value of Investments (continued)
Neuberger Berman Global Equity Index PutWrite Fund Financial Instruments at Fair Value through Profit or Loss As at 31 December 2019 Level 1 Level 2 Level 3 Total
US$ US$ US$ US$
Financial Assets held for trading Government Bonds – 53,992,382 – 53,992,382
Unrealised gain on Forward Currency Contracts – 957,582 – 957,582
Total – 54,949,964 – 54,949,964
Financial Instruments at Fair Value through Profit or Loss As at 31 December 2019 Level 1 Level 2 Level 3 Total
US$ US$ US$ US$
Financial Liabilities held for trading Unrealised loss on Forward Currency Contracts – (403,043) – (403,043)
Written Options Contracts (365,265) – – (365,265)
Total (365,265) (403,043) – (768,308)
Financial Instruments at Fair Value through Profit or Loss As at 31 December 2018 Level 1 Level 2 Level 3 Total
US$ US$ US$ US$
Financial Assets held for trading Government Bonds – 81,562,261 – 81,562,261
Unrealised gain on Forward Currency Contracts – 293,200 – 293,200
Total – 81,855,461 – 81,855,461
Financial Instruments at Fair Value through Profit or Loss As at 31 December 2018 Level 1 Level 2 Level 3 Total
US$ US$ US$ US$
Financial Liabilities held for trading Unrealised loss on Forward Currency Contracts – (598,863) – (598,863)
Written Options Contracts (1,475,733) – – (1,475,733)
Total (1,475,733) (598,863) – (2,074,596)

FINANCIAL STATEMENTS NOTES TO THE AUDITED FINANCIAL STATEMENTS
1328 NEUBERGER BERMAN INVESTMENT FUNDS PLC
FOR THE YEAR ENDED 31 DECEMBER 2019
12. FINANCIAL INSTRUMENT DISCLOSURES (CONTINUED)
Fair Value of Investments (continued)
Neuberger Berman Uncorrelated Strategies Fund Financial Instruments at Fair Value through Profit or Loss As at 31 December 2019 Level 1 Level 2 Level 3 Total
US$ US$ US$ US$
Financial Assets held for trading
Treasury Bills – 756,992,762 – 756,992,762
Government Bonds – 79,998,088 – 79,998,088
Unrealised gain on Forward Currency Contracts – 56,361,178 – 56,361,178
Unrealised gain on Futures Contracts 6,267,856 – – 6,267,856
Purchased Options Contracts 11,139,976 2,375,355 – 13,515,331
Unrealised gain on Contracts for Differences – 6,445,844 – 6,445,844
Purchased Swaptions – 393,143 – 393,143
Total 17,407,832 902,566,370 – 919,974,202
Financial Instruments at Fair Value through Profit or Loss As at 31 December 2019 Level 1 Level 2 Level 3 Total
US$ US$ US$ US$
Financial Liabilities held for trading Unrealised loss on Forward Currency Contracts – (4,970,498) – (4,970,498)
Unrealised loss on Futures Contracts (11,854,452) – – (11,854,452)
Written Options Contracts (10,504,887) (575,932) – (11,080,819)
Unrealised loss on Contracts for Differences – (8,108,433) (9,689) (8,118,122)
Total (22,359,339) (13,654,863) (9,689) (36,023,891)
Financial Instruments at Fair Value through Profit or Loss As at 31 December 2018 Level 1 Level 2 Level 3 Total
US$ US$ US$ US$
Financial Assets held for trading
Treasury Bills – 439,961,516 – 439,961,516
Unrealised gain on Forward Currency Contracts – 3,353,703 – 3,353,703
Unrealised gain on Futures Contracts 14,172,407 21,560 – 14,193,967
Purchased Options Contracts 4,847,494 – – 4,847,494
Unrealised gain on Contracts for Differences – 739,119,616 12,535 739,132,151
Purchased Swaptions – 1,277,803 – 1,277,803
Total 19,019,901 1,183,734,198 12,535 1,202,766,634

NOTES TO THE AUDITED FINANCIAL STATEMENTS FINANCIAL STATEMENTS
ANNUAL REPORT 2019 1329
FOR THE YEAR ENDED 31 DECEMBER 2019
12. FINANCIAL INSTRUMENT DISCLOSURES (CONTINUED)
Fair Value of Investments (continued)
Neuberger Berman Uncorrelated Strategies Fund (continued) Financial Instruments at Fair Value through Profit or Loss As at 31 December 2018 Level 1 Level 2 Level 3 Total
US$ US$ US$ US$
Financial Liabilities held for trading Unrealised loss on Forward Currency Contracts – (18,690,321) – (18,690,321)
Unrealised loss on Futures Contracts (5,768,104) – – (5,768,104)
Written Options Contracts (6,598,640) – – (6,598,640)
Unrealised loss on Contracts for Differences – (693,436,814) (2,214) (693,439,028)
Total (12,366,744) (712,127,135) (2,214) (724,496,093)
Neuberger Berman Emerging Market Debt Blend Investment Grade Fund Financial Instruments at Fair Value through Profit or Loss As at 31 December 2019 Level 1 Level 2 Level 3 Total
US$ US$ US$ US$
Financial Assets held for trading Corporate Bonds – 6,092,081 – 6,092,081
Government Bonds – 11,965,040 – 11,965,040
Treasury Bills – 374,531 – 374,531
Unrealised gain on Forward Currency Contracts – 133,329 – 133,329
Unrealised gain on Futures Contracts 29,425 – – 29,425
Interest Rate Swap Contracts at Fair Value – 12,412 – 12,412
Total 29,425 18,577,393 – 18,606,818
Financial Instruments at Fair Value through Profit or Loss As at 31 December 2019 Level 1 Level 2 Level 3 Total
US$ US$ US$ US$
Financial Liabilities held for trading Unrealised loss on Forward Currency Contracts – (53,522) (1,342) (54,864)
Unrealised loss on Futures Contracts (27,184) – – (27,184)
Interest Rate Swap Contracts at Fair Value – (12,010) – (12,010)
Total (27,184) (65,532) (1,342) (94,058)

FINANCIAL STATEMENTS NOTES TO THE AUDITED FINANCIAL STATEMENTS
1330 NEUBERGER BERMAN INVESTMENT FUNDS PLC
FOR THE YEAR ENDED 31 DECEMBER 2019
12. FINANCIAL INSTRUMENT DISCLOSURES (CONTINUED)
Fair Value of Investments (continued)
Neuberger Berman Emerging Market Debt Blend Investment Grade Fund (continued) Financial Instruments at Fair Value through Profit or Loss As at 31 December 2018 Level 1 Level 2 Level 3 Total
US$ US$ US$ US$
Financial Assets held for trading Corporate Bonds – 5,185,466 – 5,185,466
Government Bonds – 10,800,891 – 10,800,891
Treasury Bills – 235,451 – 235,451
Unrealised gain on Forward Currency Contracts – 59,252 – 59,252
Unrealised gain on Futures Contracts 11,516 – – 11,516
Interest Rate Swap Contracts at Fair Value – 11,482 – 11,482
Total 11,516 16,292,542 – 16,304,058
Financial Instruments at Fair Value through Profit or Loss As at 31 December 2018 Level 1 Level 2 Level 3 Total
US$ US$ US$ US$
Financial Liabilities held for trading Unrealised loss on Forward Currency Contracts – (83,779) – (83,779)
Unrealised loss on Futures Contracts (6,002) – – (6,002)
Interest Rate Swap Contracts at Fair Value – (39,869) – (39,869)
Total (6,002) (123,648) – (129,650)
Neuberger Berman Emerging Markets Sustainable Equity Fund Financial Instruments at Fair Value through Profit or Loss As at 31 December 2019 Level 1 Level 2 Level 3 Total
US$ US$ US$ US$
Financial Assets held for trading Equities 77,510,993 41,675,273 – 119,186,266
Participatory Notes 6,625,155 – – 6,625,155
Real Estate Investment Trusts 1,367,924 – – 1,367,924
Total 85,504,072 41,675,273 – 127,179,345
Financial Instruments at Fair Value through Profit or Loss As at 31 December 2018 Level 1 Level 2 Level 3 Total
US$ US$ US$ US$
Financial Assets held for trading Equities 12,815,682 16,059,228 – 28,874,910
Participatory Notes 1,909,423 – – 1,909,423
Total 14,725,105 16,059,228 – 30,784,333

NOTES TO THE AUDITED FINANCIAL STATEMENTS FINANCIAL STATEMENTS
ANNUAL REPORT 2019 1331
FOR THE YEAR ENDED 31 DECEMBER 2019
12. FINANCIAL INSTRUMENT DISCLOSURES (CONTINUED)
Fair Value of Investments (continued)
Neuberger Berman China Equity Opportunities Fund Financial Instruments at Fair Value through Profit or Loss As at 31 December 2019 Level 1 Level 2 Level 3 Total
US$ US$ US$ US$
Financial Assets held for trading Equities 1,171,089 – – 1,171,089
Participatory Notes 33,011 – – 33,011
Real Estate Investment Trusts 23,294 – – 23,294
Total 1,227,394 – – 1,227,394
Financial Instruments at Fair Value through Profit or Loss As at 31 December 2018 Level 1 Level 2 Level 3 Total
US$ US$ US$ US$
Financial Assets held for trading Equities 928,599 – – 928,599
Total 928,599 – – 928,599
Neuberger Berman Multi-Asset Class Growth Fund Financial Instruments at Fair Value through Profit or Loss As at 31 December 2019 Level 1 Level 2 Level 3 Total
US$ US$ US$ US$
Financial Assets held for trading Asset Backed Securities – 1,230,786 – 1,230,786
Corporate Bonds – 3,184,308 – 3,184,308
Equities 3,258,141 700,362 – 3,958,503
Government Bonds – 7,963,346 – 7,963,346
Investment Funds 1,646,633 – – 1,646,633
Mortgage Backed Securities – 199,118 – 199,118
Real Estate Investment Trusts 90,813 21,961 – 112,774
Unrealised gain on Forward Currency Contracts – 187,691 – 187,691
Unrealised gain on Futures Contracts 123,837 – – 123,837
Purchased Options Contracts 1,010 – 14 1,024
Interest Rate Swap Contracts at Fair Value – 380 – 380
Credit Default Swap Contracts at Fair Value – 16,309 – 16,309
Unrealised gain on Total Return Swap Contracts – 127,639 – 127,639
Total 5,120,434 13,631,900 14 18,752,348
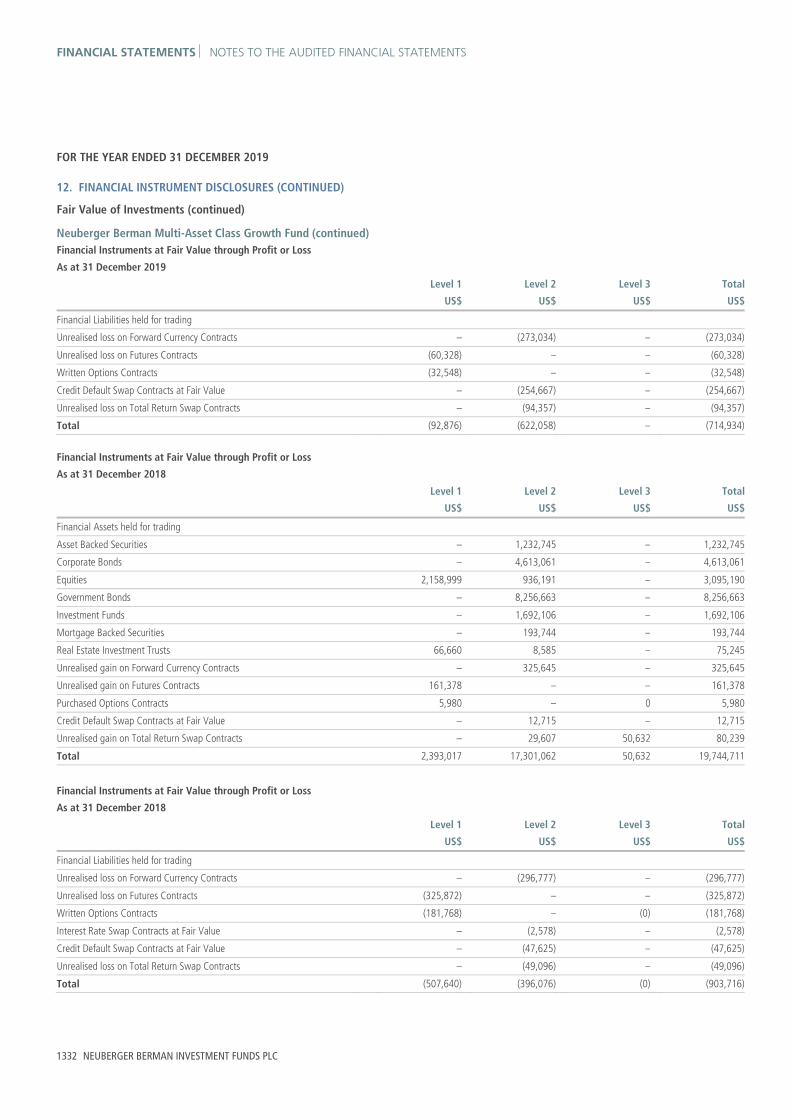
FINANCIAL STATEMENTS NOTES TO THE AUDITED FINANCIAL STATEMENTS
1332 NEUBERGER BERMAN INVESTMENT FUNDS PLC
FOR THE YEAR ENDED 31 DECEMBER 2019
12. FINANCIAL INSTRUMENT DISCLOSURES (CONTINUED)
Fair Value of Investments (continued)
Neuberger Berman Multi-Asset Class Growth Fund (continued) Financial Instruments at Fair Value through Profit or Loss As at 31 December 2019 Level 1 Level 2 Level 3 Total
US$ US$ US$ US$
Financial Liabilities held for trading Unrealised loss on Forward Currency Contracts – (273,034) – (273,034)
Unrealised loss on Futures Contracts (60,328) – – (60,328)
Written Options Contracts (32,548) – – (32,548)
Credit Default Swap Contracts at Fair Value – (254,667) – (254,667)
Unrealised loss on Total Return Swap Contracts – (94,357) – (94,357)
Total (92,876) (622,058) – (714,934)
Financial Instruments at Fair Value through Profit or Loss As at 31 December 2018 Level 1 Level 2 Level 3 Total
US$ US$ US$ US$
Financial Assets held for trading Asset Backed Securities – 1,232,745 – 1,232,745
Corporate Bonds – 4,613,061 – 4,613,061
Equities 2,158,999 936,191 – 3,095,190
Government Bonds – 8,256,663 – 8,256,663
Investment Funds – 1,692,106 – 1,692,106
Mortgage Backed Securities – 193,744 – 193,744
Real Estate Investment Trusts 66,660 8,585 – 75,245
Unrealised gain on Forward Currency Contracts – 325,645 – 325,645
Unrealised gain on Futures Contracts 161,378 – – 161,378
Purchased Options Contracts 5,980 – 0 5,980
Credit Default Swap Contracts at Fair Value – 12,715 – 12,715
Unrealised gain on Total Return Swap Contracts – 29,607 50,632 80,239
Total 2,393,017 17,301,062 50,632 19,744,711
Financial Instruments at Fair Value through Profit or Loss As at 31 December 2018 Level 1 Level 2 Level 3 Total
US$ US$ US$ US$
Financial Liabilities held for trading Unrealised loss on Forward Currency Contracts – (296,777) – (296,777)
Unrealised loss on Futures Contracts (325,872) – – (325,872)
Written Options Contracts (181,768) – (0) (181,768)
Interest Rate Swap Contracts at Fair Value – (2,578) – (2,578)
Credit Default Swap Contracts at Fair Value – (47,625) – (47,625)
Unrealised loss on Total Return Swap Contracts – (49,096) – (49,096)
Total (507,640) (396,076) (0) (903,716)

NOTES TO THE AUDITED FINANCIAL STATEMENTS FINANCIAL STATEMENTS
ANNUAL REPORT 2019 1333
FOR THE YEAR ENDED 31 DECEMBER 2019
12. FINANCIAL INSTRUMENT DISCLOSURES (CONTINUED)
Fair Value of Investments (continued)
Neuberger Berman Global Thematic Equity Fund1 Financial Instruments at Fair Value through Profit or Loss As at 31 December 2019 Level 1 Level 2 Level 3 Total
US$ US$ US$ US$
Financial Assets held for trading Equities 24,333,884 – – 24,333,884
Total 24,333,884 – – 24,333,884
Financial Instruments at Fair Value through Profit or Loss As at 31 December 2018 Level 1 Level 2 Level 3 Total
US$ US$ US$ US$
Financial Assets held for trading Equities 11,438,386 708,608 – 12,146,994
Total 11,438,386 708,608 – 12,146,994
Neuberger Berman CLO Income Fund1 Financial Instruments at Fair Value through Profit or Loss As at 31 December 2019 Level 1 Level 2 Level 3 Total
US$ US$ US$ US$
Financial Assets held for trading Asset Backed Securities – 135,150,866 – 135,150,866
Corporate Bonds – 3,189,618 – 3,189,618
Unrealised gain on Forward Currency Contracts – 6,854,253 – 6,854,253
Total – 145,194,737 – 145,194,737
Financial Instruments at Fair Value through Profit or Loss As at 31 December 2019 Level 1 Level 2 Level 3 Total
US$ US$ US$ US$
Financial Liabilities held for trading Unrealised loss on Forward Currency Contracts – (290,230) – (290,230)
Total – (290,230) – (290,230)

FINANCIAL STATEMENTS NOTES TO THE AUDITED FINANCIAL STATEMENTS
1334 NEUBERGER BERMAN INVESTMENT FUNDS PLC
FOR THE YEAR ENDED 31 DECEMBER 2019
12. FINANCIAL INSTRUMENT DISCLOSURES (CONTINUED)
Fair Value of Investments (continued)
Neuberger Berman CLO Income Fund1 (continued) Financial Instruments at Fair Value through Profit or Loss As at 31 December 2018 Level 1 Level 2 Level 3 Total
US$ US$ US$ US$
Financial Assets held for trading Asset Backed Securities – 100,519,353 – 100,519,353
Corporate Bonds – 5,494,113 – 5,494,113
Unrealised gain on Forward Currency Contracts – 527,092 – 527,092
Total – 106,540,558 – 106,540,558
Financial Instruments at Fair Value through Profit or Loss As at 31 December 2018 Level 1 Level 2 Level 3 Total
US$ US$ US$ US$
Financial Liabilities held for trading Unrealised loss on Forward Currency Contracts – (2,075,894) – (2,075,894)
Total – (2,075,894) – (2,075,894)
Neuberger Berman China A-Share Opportunities Fund1* Financial Instruments at Fair Value through Profit or Loss As at 31 December 2018 Level 1 Level 2 Level 3 Total
US$ US$ US$ US$
Financial Assets held for trading Equities 730,092 – – 730,092
Total 730,092 – – 730,092
* Portfolio liquidated on 6 December 2019.

NOTES TO THE AUDITED FINANCIAL STATEMENTS FINANCIAL STATEMENTS
ANNUAL REPORT 2019 1335
FOR THE YEAR ENDED 31 DECEMBER 2019
12. FINANCIAL INSTRUMENT DISCLOSURES (CONTINUED)
Fair Value of Investments (continued)
Neuberger Berman Next Generation Mobility Fund1 Financial Instruments at Fair Value through Profit or Loss As at 31 December 2019 Level 1 Level 2 Level 3 Total
US$ US$ US$ US$
Financial Assets held for trading Equities 36,703,317 3,914,717 – 40,618,034
Unrealised gain on Forward Currency Contracts – 8,684 – 8,684
Total 36,703,317 3,923,401 – 40,626,718
Financial Instruments at Fair Value through Profit or Loss As at 31 December 2019 Level 1 Level 2 Level 3 Total
US$ US$ US$ US$
Financial Liabilities held for trading Unrealised loss on Forward Currency Contracts – (633) – (633)
Total – (633) – (633)
Financial Instruments at Fair Value through Profit or Loss As at 31 December 2018 Level 1 Level 2 Level 3 Total
US$ US$ US$ US$
Financial Assets held for trading Equities 1,569,237 518,355 – 2,087,592
Unrealised gain on Forward Currency Contracts – 9 – 9
Total 1,569,237 518,364 – 2,087,601
Financial Instruments at Fair Value through Profit or Loss As at 31 December 2018 Level 1 Level 2 Level 3 Total
US$ US$ US$ US$
Financial Liabilities held for trading Unrealised loss on Forward Currency Contracts – (177) – (177)
Total – (177) – (177)

FINANCIAL STATEMENTS NOTES TO THE AUDITED FINANCIAL STATEMENTS
1336 NEUBERGER BERMAN INVESTMENT FUNDS PLC
FOR THE YEAR ENDED 31 DECEMBER 2019
12. FINANCIAL INSTRUMENT DISCLOSURES (CONTINUED)
Fair Value of Investments (continued)
Neuberger Berman Ultra Short Term Euro Bond Fund1 Financial Instruments at Fair Value through Profit or Loss As at 31 December 2019 Level 1 Level 2 Level 3 Total
EUR EUR EUR EUR
Financial Assets held for trading Asset Backed Securities – 69,319,661 – 69,319,661
Corporate Bonds – 240,805,405 – 240,805,405
Government Bonds – 47,252,899 – 47,252,899
Unrealised gain on Forward Currency Contracts – 343,089 – 343,089
Unrealised gain on Futures Contracts 282,466 – – 282,466
Total 282,466 357,721,054 – 358,003,520
Financial Instruments at Fair Value through Profit or Loss As at 31 December 2019 Level 1 Level 2 Level 3 Total
EUR EUR EUR EUR
Financial Liabilities held for trading Unrealised loss on Forward Currency Contracts – (1,911,977) – (1,911,977)
Unrealised loss on Futures Contracts (19,085) – – (19,085)
Inflation Swap Contracts at Fair Value – (3,307) – (3,307)
Total (19,085) (1,915,284) – (1,934,369)
Financial Instruments at Fair Value through Profit or Loss As at 31 December 2018 Level 1 Level 2 Level 3 Total
EUR EUR EUR EUR
Financial Assets held for trading Asset Backed Securities – 233,185 – 233,185
Corporate Bonds – 10,212,921 – 10,212,921
Government Bonds – 618,513 – 618,513
Unrealised gain on Futures Contracts 200 – – 200
Purchased Options Contracts 1,560 – – 1,560
Total 1,760 11,064,619 – 11,066,379
Financial Instruments at Fair Value through Profit or Loss As at 31 December 2018 Level 1 Level 2 Level 3 Total
EUR EUR EUR EUR
Financial Liabilities held for trading Unrealised loss on Futures Contracts (2,340) – – (2,340)
Total (2,340) – – (2,340)

NOTES TO THE AUDITED FINANCIAL STATEMENTS FINANCIAL STATEMENTS
ANNUAL REPORT 2019 1337
FOR THE YEAR ENDED 31 DECEMBER 2019
12. FINANCIAL INSTRUMENT DISCLOSURES (CONTINUED)
Fair Value of Investments (continued)
Neuberger Berman Euro Opportunistic Bond Fund1 Financial Instruments at Fair Value through Profit or Loss As at 31 December 2019 Level 1 Level 2 Level 3 Total
EUR EUR EUR EUR
Financial Assets held for trading Asset Backed Securities – 373,528 – 373,528
Corporate Bonds – 3,981,415 – 3,981,415
Government Bonds – 4,835,824 – 4,835,824
Investment Funds – 1,015,652 – 1,015,652
Unrealised gain on Futures Contracts 32,470 – – 32,470
Total 32,470 10,206,419 – 10,238,889
Financial Instruments at Fair Value through Profit or Loss As at 31 December 2019 Level 1 Level 2 Level 3 Total
EUR EUR EUR EUR
Financial Liabilities held for trading Unrealised loss on Futures Contracts (7,780) – – (7,780)
Inflation Swap Contracts at Fair Value – (413) – (413)
Total (7,780) (413) – (8,193)
Financial Instruments at Fair Value through Profit or Loss As at 31 December 2018 Level 1 Level 2 Level 3 Total
EUR EUR EUR EUR
Financial Assets held for trading Corporate Bonds – 3,333,919 – 3,333,919
Government Bonds – 1,479,750 – 1,479,750
Unrealised gain on Futures Contracts 1,760 – – 1,760
Purchased Options Contracts 780 – – 780
Total 2,540 4,813,669 – 4,816,209
Financial Instruments at Fair Value through Profit or Loss As at 31 December 2018 Level 1 Level 2 Level 3 Total
EUR EUR EUR EUR
Financial Liabilities held for trading Unrealised loss on Futures Contracts (1,521) – – (1,521)
Total (1,521) – – (1,521)

FINANCIAL STATEMENTS NOTES TO THE AUDITED FINANCIAL STATEMENTS
1338 NEUBERGER BERMAN INVESTMENT FUNDS PLC
FOR THE YEAR ENDED 31 DECEMBER 2019
12. FINANCIAL INSTRUMENT DISCLOSURES (CONTINUED)
Fair Value of Investments (continued)
Neuberger Berman Euro Bond Absolute Return Fund1 Financial Instruments at Fair Value through Profit or Loss As at 31 December 2019 Level 1 Level 2 Level 3 Total
EUR EUR EUR EUR
Financial Assets held for trading Asset Backed Securities – 5,166,814 – 5,166,814
Corporate Bonds – 26,812,273 – 26,812,273
Government Bonds – 47,301,539 – 47,301,539
Unrealised gain on Forward Currency Contracts – 995,191 – 995,191
Unrealised gain on Futures Contracts 534,895 – – 534,895
Inflation Swap Contracts at Fair Value – 22,763 – 22,763
Total 534,895 80,298,580 – 80,833,475
Financial Instruments at Fair Value through Profit or Loss As at 31 December 2019 Level 1 Level 2 Level 3 Total
EUR EUR EUR EUR
Financial Liabilities held for trading Unrealised loss on Forward Currency Contracts – (1,314,764) – (1,314,764)
Unrealised loss on Futures Contracts (14,069) – – (14,069)
Inflation Swap Contracts at Fair Value – (12,493) – (12,493)
Interest Rate Swap Contracts at Fair Value – (6,152) – (6,152)
Total (14,069) (1,333,409) – (1,347,478)
Financial Instruments at Fair Value through Profit or Loss As at 31 December 2018 Level 1 Level 2 Level 3 Total
EUR EUR EUR EUR
Financial Assets held for trading Corporate Bonds – 4,902,436 – 4,902,436
Government Bonds – 2,332,268 – 2,332,268
Investment Funds – 499,950 – 499,950
Unrealised gain on Futures Contracts 546 – – 546
Purchased Options Contracts 3,120 – – 3,120
Total 3,666 7,734,654 – 7,738,320
Financial Instruments at Fair Value through Profit or Loss As at 31 December 2018 Level 1 Level 2 Level 3 Total
EUR EUR EUR EUR
Financial Liabilities held for trading Unrealised loss on Futures Contracts (4,630) – – (4,630)
Total (4,630) – – (4,630)Neuberger B erman Euro Bond Absolute Return Fund2

NOTES TO THE AUDITED FINANCIAL STATEMENTS FINANCIAL STATEMENTS
ANNUAL REPORT 2019 1339
FOR THE YEAR ENDED 31 DECEMBER 2019
12. FINANCIAL INSTRUMENT DISCLOSURES (CONTINUED)
Fair Value of Investments (continued)
Neuberger Berman Absolute Alpha Fund2 Financial Instruments at Fair Value through Profit or Loss As at 31 December 2019 Level 1 Level 2 Level 3 Total
US$ US$ US$ US$
Financial Assets held for trading Equities 36,332,819 – – 36,332,819
Unrealised gain on Forward Currency Contracts – 43,567 – 43,567
Unrealised gain on Contracts for Differences – 755,358 – 755,358
Total 36,332,819 798,925 – 37,131,744
Financial Instruments at Fair Value through Profit or Loss As at 31 December 2019 Level 1 Level 2 Level 3 Total
US$ US$ US$ US$
Financial Liabilities held for trading Unrealised loss on Forward Currency Contracts – (22,381) – (22,381)
Unrealised loss on Contracts for Differences – (2,434,964) – (2,434,964)
Total – (2,457,345) – (2,457,345)
Neuberger Berman Multi-Style Premia Fund2 Financial Instruments at Fair Value through Profit or Loss As at 31 December 2019 Level 1 Level 2 Level 3 Total
US$ US$ US$ US$
Financial Assets held for trading Corporate Bonds – 612,562 – 612,562
Equities 1,917,773 3,404,348 – 5,322,121
Real Estate Investment Trusts 154,846 236,060 – 390,906
Unrealised gain on Forward Currency Contracts – 250,976 – 250,976
Unrealised gain on Futures Contracts 144,219 – – 144,219
Unrealised gain on Contracts for Differences – 1,628,394 – 1,628,394
Total 2,216,838 6,132,340 – 8,349,178
Financial Instruments at Fair Value through Profit or Loss As at 31 December 2019 Level 1 Level 2 Level 3 Total
US$ US$ US$ US$
Financial Liabilities held for trading Unrealised loss on Forward Currency Contracts – (251,995) – (251,995)
Unrealised loss on Futures Contracts (144,302) – – (144,302)
Written Options Contracts (37,561) – – (37,561)
Unrealised loss on Contracts for Differences – (1,150,214) – (1,150,214)
Total (181,863) (1,402,209) – (1,584,072)

FINANCIAL STATEMENTS NOTES TO THE AUDITED FINANCIAL STATEMENTS
1340 NEUBERGER BERMAN INVESTMENT FUNDS PLC
FOR THE YEAR ENDED 31 DECEMBER 2019
12. FINANCIAL INSTRUMENT DISCLOSURES (CONTINUED)
Fair Value of Investments (continued)
Neuberger Berman Macro Opportunities FX Fund2 Financial Instruments at Fair Value through Profit or Loss As at 31 December 2019 Level 1 Level 2 Level 3 Total
EUR EUR EUR EUR
Financial Assets held for trading Corporate Bonds – 14,690,828 – 14,690,828
Government Bonds – 803,302 – 803,302
Treasury Bills – 4,016,640 – 4,016,640
Unrealised gain on Forward Currency Contracts – 893,268 – 893,268
Total – 20,404,038 – 20,404,038
Financial Instruments at Fair Value through Profit or Loss As at 31 December 2019 Level 1 Level 2 Level 3 Total
EUR EUR EUR EUR
Financial Liabilities held for trading Unrealised loss on Forward Currency Contracts – (1,061,403) – (1,061,403)
Total – (1,061,403) – (1,061,403)
The following is a reconciliation of investments in which significant unobservable inputs (Level 3) were used in determining value as at 31 December 2019: Neuberger Berman High Yield Bond Fund Total
US$
Balance as at 1 January 2019 22,102,177
Purchases 10,416,751
Sales (26,275,338)
Net realised loss (208,646)
Net change in unrealised gain 922,320
Balance as at 31 December 2019 6,957,264
Neuberger Berman Short Duration High Yield Bond Fund Total
US$
Balance as at 1 January 2019 4,632,230
Purchases 1,559,250
Sales (2,637,779)
Net realised loss (25,432)
Transfer into Level 3 510,791
Transfer out of Level 3 (2,153,244)
Net change in unrealised gain 203,893
Balance as at 31 December 2019 2,089,709

NOTES TO THE AUDITED FINANCIAL STATEMENTS FINANCIAL STATEMENTS
ANNUAL REPORT 2019 1341
FOR THE YEAR ENDED 31 DECEMBER 2019
12. FINANCIAL INSTRUMENT DISCLOSURES (CONTINUED)
Fair Value of Investments (continued)
Neuberger Berman Emerging Market Debt - Local Currency Fund Total
US$
Balance as at 1 January 2019 -
Purchases 718,645
Net change in unrealised loss (749,527)
Balance as at 31 December 2019 (30,882)
Neuberger Berman Strategic Income Fund Total
US$
Balance as at 1 January 2019 1,014,334
Purchases 4,360,630
Sales (1,419,796)
Net realised gain 16,918
Transfer into Level 3 1,950,267
Transfer out of Level 3 (518,984)
Net change in unrealised gain 57,025
Balance as at 31 December 2019 5,460,394
Neuberger Berman Short Duration Emerging Market Debt Fund Total
US$
Balance as at 1 January 2019 6,321,656
Sales (5,700,000)
Net realised loss (308,600)
Transfer out of Level 3 (475,000)
Net change in unrealised gain 161,944
Balance as at 31 December 2019 -
Neuberger Berman Absolute Return Multi Strategy Fund Total
US$
Balance as at 1 January 2019 8,804
Purchases 237,661
Net change in unrealised gain 164,734
Balance as at 31 December 2019 411,199

FINANCIAL STATEMENTS NOTES TO THE AUDITED FINANCIAL STATEMENTS
1342 NEUBERGER BERMAN INVESTMENT FUNDS PLC
FOR THE YEAR ENDED 31 DECEMBER 2019
12. FINANCIAL INSTRUMENT DISCLOSURES (CONTINUED)
Fair Value of Investments (continued)
Neuberger Berman US Long Short Equity Fund Total
US$
Balance as at 1 January 2019 400
Purchases 22,798
Sales (4,449)
Write (59,083)
Net realised gain 686
Net change in unrealised gain 39,933
Balance as at 31 December 2019 285
Neuberger Berman Emerging Market Debt Blend Fund Total
US$
Balance as at 1 January 2019 -
Net change in unrealised loss (209,748)
Balance as at 31 December 2019 (209,748)
Neuberger Berman Systematic Global Equity Fund Total
US$
Balance as at 1 January 2019 0
Balance as at 31 December 2019 0
Neuberger Berman Global High Yield Bond Fund Total
US$
Balance as at 1 January 2019 191,819
Purchases 116,959
Sales (234,390)
Net realised loss (2,793)
Net change in unrealised gain 8,604
Balance as at 31 December 2019 80,199
Neuberger Berman Multi-Asset Risk Premia Fund Total
US$
Balance as at 1 January 2019 1,313,516
Purchases 168,688,978
Sales (170,015,681)
Net realised gain 1,326,703
Net change in unrealised loss (1,313,516)
Balance as at 31 December 2019 -

NOTES TO THE AUDITED FINANCIAL STATEMENTS FINANCIAL STATEMENTS
ANNUAL REPORT 2019 1343
FOR THE YEAR ENDED 31 DECEMBER 2019
12. FINANCIAL INSTRUMENT DISCLOSURES (CONTINUED)
Fair Value of Investments (continued)
Neuberger Berman Multi-Asset Class Income Fund Total
US$
Balance as at 1 January 2019 100,359
Purchases 11,726,300
Sales (11,827,330)
Net realised gain 125,858
Net change in unrealised loss (125,127)
Balance as at 31 December 2019 60
Neuberger Berman Uncorrelated Strategies Fund Total
US$
Balance as at 1 January 2019 10,321
Sales (12,402)
Net realised gain (127)
Net change in unrealised loss (4,677)
Balance as at 31 December 2019 (6,885)
Neuberger Berman Emerging Market Debt Blend Investment Grade Fund Total
US$
Balance as at 1 January 2019 -
Net change in unrealised loss (1,342)
Balance as at 31 December 2019 (1,342)
Neuberger Berman Multi-Asset Class Growth Fund Total
US$
Balance as at 1 January 2019 50,632
Purchases 5,916,022
Sales (5,966,989)
Net realised gain 66,949
Net change in unrealised loss (66,600)
Balance as at 31 December 2019 14

FINANCIAL STATEMENTS NOTES TO THE AUDITED FINANCIAL STATEMENTS
1344 NEUBERGER BERMAN INVESTMENT FUNDS PLC
FOR THE YEAR ENDED 31 DECEMBER 2019
12. FINANCIAL INSTRUMENT DISCLOSURES (CONTINUED)
Fair Value of Investments (continued)
The following is a reconciliation of investments in which significant unobservable inputs (Level 3) were used in determining value as at 31 December 2018: Neuberger Berman High Yield Bond Fund Total
US$
Balance as at 1 January 2018 26,687,185
Purchases 29,441,000
Sales (30,654,855)
Net realised gain 1,886,173
Net change in unrealised loss (5,257,326)
Balance as at 31 December 2018 22,102,177
Neuberger Berman Short Duration High Yield Bond Fund Total
US$
Balance as at 1 January 2018 6,383,941
Purchases 7,243,317
Sales (8,503,315)
Net realised loss (192,065)
Net change in unrealised loss (299,648)
Balance as at 31 December 2018 4,632,230
Neuberger Berman Global Bond Fund Total
US$
Balance as at 1 January 2018 1,106,771
Transfer out of Level 3 (1,100,787)
Net change in unrealised loss (5,984)
Balance as at 31 December 2018 –
Neuberger Berman Emerging Market Debt - Local Currency Fund Total
US$
Balance as at 1 January 2018 5,602,177
Purchases 4,430,968
Sales (10,844,290)
Net realised gain 1,461,001
Net change in unrealised loss (649,856)
Balance as at 31 December 2018 –

NOTES TO THE AUDITED FINANCIAL STATEMENTS FINANCIAL STATEMENTS
ANNUAL REPORT 2019 1345
FOR THE YEAR ENDED 31 DECEMBER 2019
12. FINANCIAL INSTRUMENT DISCLOSURES (CONTINUED)
Fair Value of Investments (continued)
Neuberger Berman Strategic Income Fund Total
US$
Balance as at 1 January 2018 758,861
Purchases 1,263,402
Sales (1,150,787)
Net realised loss (1,038)
Transfer into Level 3 307,609
Transfer out of Level 3 (129,702)
Net change in unrealised loss (34,011)
Balance as at 31 December 2018 1,014,334
Neuberger Berman Global Bond Absolute Return Fund Total
US$
Balance as at 1 January 2018 643,939
Transfer out of Level 3 (640,458)
Net change in unrealised loss (3,481)
Balance as at 31 December 2018 –
Neuberger Berman Short Duration Emerging Market Debt Fund Total
US$
Balance as at 1 January 2018 12,453,906
Sales (5,700,000)
Net realised loss (308,600)
Net change in unrealised loss (123,650)
Balance as at 31 December 2018 6,321,656
Neuberger Berman Absolute Return Multi Strategy Fund Total
US$
Balance as at 1 January 2018 2,889,705
Sales (1,850,709)
Write (304)
Net realised loss (557,783)
Transfer into Level 3 1,669
Transfer out of Level 3 (953,637)
Net change in unrealised gain 479,863
Balance as at 31 December 2018 8,804
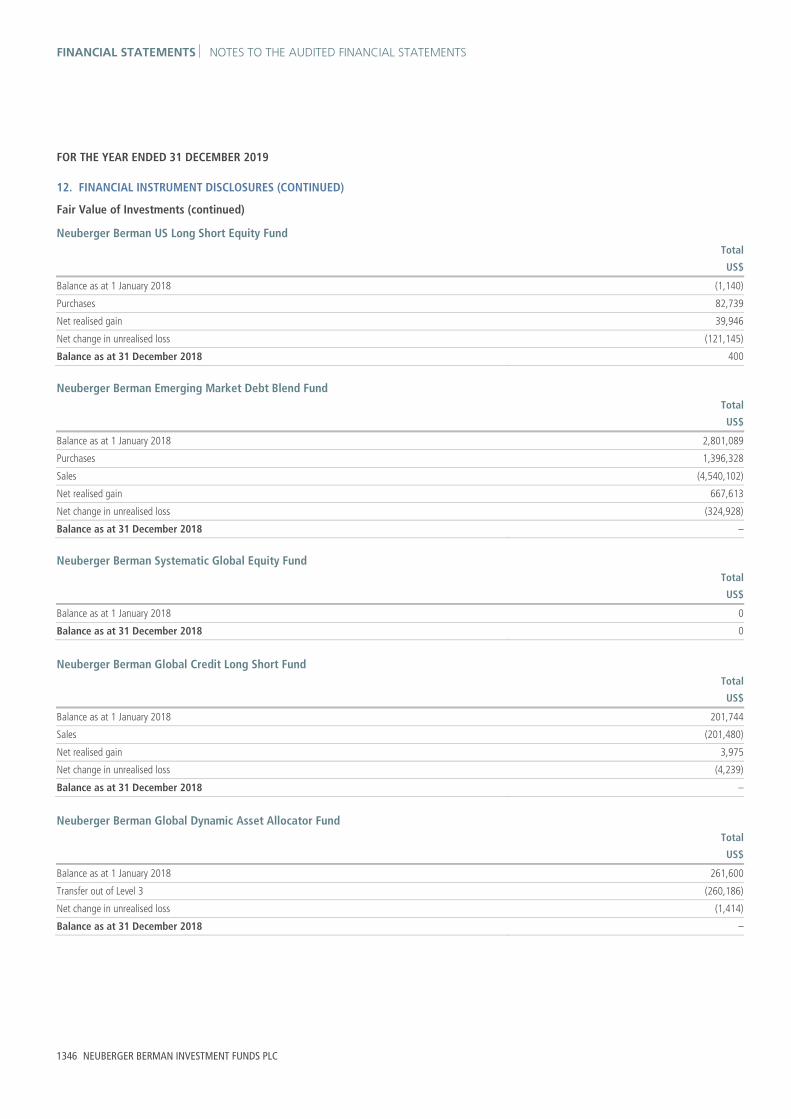
FINANCIAL STATEMENTS NOTES TO THE AUDITED FINANCIAL STATEMENTS
1346 NEUBERGER BERMAN INVESTMENT FUNDS PLC
FOR THE YEAR ENDED 31 DECEMBER 2019
12. FINANCIAL INSTRUMENT DISCLOSURES (CONTINUED)
Fair Value of Investments (continued)
Neuberger Berman US Long Short Equity Fund Total
US$
Balance as at 1 January 2018 (1,140)
Purchases 82,739
Net realised gain 39,946
Net change in unrealised loss (121,145)
Balance as at 31 December 2018 400
Neuberger Berman Emerging Market Debt Blend Fund Total
US$
Balance as at 1 January 2018 2,801,089
Purchases 1,396,328
Sales (4,540,102)
Net realised gain 667,613
Net change in unrealised loss (324,928)
Balance as at 31 December 2018 –
Neuberger Berman Systematic Global Equity Fund Total
US$
Balance as at 1 January 2018 0
Balance as at 31 December 2018 0
Neuberger Berman Global Credit Long Short Fund Total
US$
Balance as at 1 January 2018 201,744
Sales (201,480)
Net realised gain 3,975
Net change in unrealised loss (4,239)
Balance as at 31 December 2018 –
Neuberger Berman Global Dynamic Asset Allocator Fund Total
US$
Balance as at 1 January 2018 261,600
Transfer out of Level 3 (260,186)
Net change in unrealised loss (1,414)
Balance as at 31 December 2018 –

NOTES TO THE AUDITED FINANCIAL STATEMENTS FINANCIAL STATEMENTS
ANNUAL REPORT 2019 1347
FOR THE YEAR ENDED 31 DECEMBER 2019
12. FINANCIAL INSTRUMENT DISCLOSURES (CONTINUED)
Fair Value of Investments (continued)
Neuberger Berman Asian Opportunities Fund Total
US$
Balance as at 1 January 2018 58,568
Sales (47,153)
Net realised loss (6,349)
Net change in unrealised loss (5,066)
Balance as at 31 December 2018 –
Neuberger Berman Global High Yield Bond Fund Total
US$
Balance as at 1 January 2018 232,786
Purchases 326,750
Sales (346,027)
Net realised loss (2,262)
Net change in unrealised loss (19,428)
Balance as at 31 December 2018 191,819
Neuberger Berman Global Opportunistic Bond Fund Total
US$
Balance as at 1 January 2018 201,231
Transfer out of Level 3 (200,143)
Net change in unrealised loss (1,088)
Balance as at 31 December 2018 –
Neuberger Berman Multi-Asset Risk Premia Fund Total
US$
Balance as at 1 January 2018 (272)
Purchases 1,916,790,062
Sales (1,909,429,150)
Net realised loss (7,360,912)
Net change in unrealised gain 1,313,788
Balance as at 31 December 2018 1,313,516
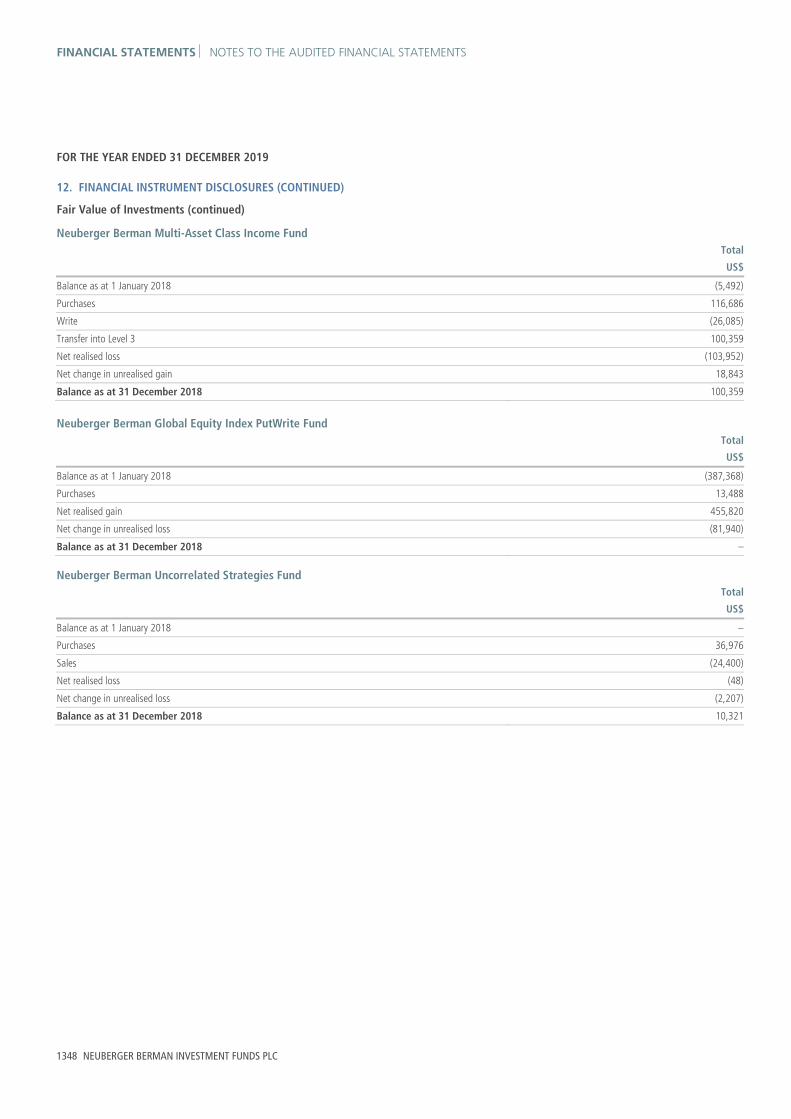
FINANCIAL STATEMENTS NOTES TO THE AUDITED FINANCIAL STATEMENTS
1348 NEUBERGER BERMAN INVESTMENT FUNDS PLC
FOR THE YEAR ENDED 31 DECEMBER 2019
12. FINANCIAL INSTRUMENT DISCLOSURES (CONTINUED)
Fair Value of Investments (continued)
Neuberger Berman Multi-Asset Class Income Fund Total
US$
Balance as at 1 January 2018 (5,492)
Purchases 116,686
Write (26,085)
Transfer into Level 3 100,359
Net realised loss (103,952)
Net change in unrealised gain 18,843
Balance as at 31 December 2018 100,359
Neuberger Berman Global Equity Index PutWrite Fund Total
US$
Balance as at 1 January 2018 (387,368)
Purchases 13,488
Net realised gain 455,820
Net change in unrealised loss (81,940)
Balance as at 31 December 2018 –
Neuberger Berman Uncorrelated Strategies Fund Total
US$
Balance as at 1 January 2018 –
Purchases 36,976
Sales (24,400)
Net realised loss (48)
Net change in unrealised loss (2,207)
Balance as at 31 December 2018 10,321

NOTES TO THE AUDITED FINANCIAL STATEMENTS FINANCIAL STATEMENTS
ANNUAL REPORT 2019 1349
FOR THE YEAR ENDED 31 DECEMBER 2019
12. FINANCIAL INSTRUMENT DISCLOSURES (CONTINUED)
Fair Value of Investments (continued)
Neuberger Berman Multi-Asset Class Growth Fund Total
US$
Balance as at 1 January 2018 –
Purchases 14,483,236
Sales (14,301,830)
Write (16,833)
Net realised loss (178,007)
Net change in unrealised gain 64,066
Balance as at 31 December 2018 50,632
1 Portfolio launched during the prior reporting year. 2 Portfolio launched during the current reporting year. Securities categorised as Level 3 are generally valued based on a single quotation obtained from a dealer, but can also be fair valued securities with unobservable inputs. The Portfolios do not have access to unobservable inputs and therefore cannot disclose such inputs used in formulating such quotation, nor can the impact on valuation of changing one or more inputs to reasonably possible alternative assumption be established.

FINANCIAL STATEMENTS NOTES TO THE AUDITED FINANCIAL STATEMENTS
1350 NEUBERGER BERMAN INVESTMENT FUNDS PLC
FOR THE YEAR ENDED 31 DECEMBER 2019
13. NET ASSET VALUE COMPARATIVE Neuberger Berman High Yield Bond Fund
AUD A (Monthly)
Distributing Class
AUD A (Monthly) Distributing
Class
AUD A Accumulating
Class
AUD A Accumulating
Class
AUD B (Monthly) Distributing
Class
AUD B (Monthly) Distributing
ClassYear Ended NAV NAV per Share NAV NAV per Share NAV NAV per Share
31 December 2019 AUD44,047,480 AUD8.40 AUD9,168,831 AUD14.99 AUD87,121,061 AUD6.99
31 December 2018 AUD54,858,883 AUD7.96 AUD8,905,695 AUD13.38 AUD93,352,979 AUD6.84
31 December 2017 AUD76,657,042 AUD8.81 AUD13,226,438 AUD13.86 AUD132,449,693 AUD7.81
AUD B (Weekly)
Distributing Class
AUD B (Weekly) Distributing
Class
AUD C2 (Monthly) Distributing
Class
AUD C2 (Monthly) Distributing
Class
AUD C2 (Weekly) Distributing
Class
AUD C2 (Weekly) Distributing
ClassYear Ended NAV NAV per Share NAV NAV per Share NAV NAV per Share
31 December 2019 AUD154,907 AUD7.06 AUD6,983,567 AUD7.00 AUD71,609 AUD7.06
31 December 2018 AUD148,965 AUD6.90 AUD38,048,968 AUD6.84 AUD105,825 AUD6.90
31 December 2017 AUD990,671 AUD7.90 AUD55,216,692 AUD7.82 AUD77,214 AUD7.90
AUD E (Monthly)
Distributing Class
AUD E (Monthly) Distributing
Class
AUD E Accumulating
Class
AUD E Accumulating
Class
AUD I Distributing
Class
AUD I Distributing
ClassYear Ended NAV NAV per Share NAV NAV per Share NAV NAV per Share
31 December 2019 AUD27,507,796 AUD7.05 AUD3,570,335 AUD11.22 AUD82,397,036 AUD11.40
31 December 2018 AUD32,983,853 AUD6.90 AUD1,260,008 AUD10.18 AUD43,984,082 AUD10.69
31 December 2017 AUD38,210,094 AUD7.88 AUD819,654 AUD10.72 AUD48,951,862 AUD11.61

NOTES TO THE AUDITED FINANCIAL STATEMENTS FINANCIAL STATEMENTS
ANNUAL REPORT 2019 1351
FOR THE YEAR ENDED 31 DECEMBER 2019
13. NET ASSET VALUE COMPARATIVE (CONTINUED) Neuberger Berman High Yield Bond Fund (continued)
AUD I2 (Monthly)
Distributing Class
AUD I2 (Monthly) Distributing
Class
AUD I2 Accumulating
Class
AUD I2 Accumulating
Class
AUD T (Monthly) Distributing
Class
AUD T (Monthly) Distributing
ClassYear Ended NAV NAV per Share NAV NAV per Share NAV NAV per Share
31 December 2019 AUD453,780 AUD9.58 AUD75,588 AUD13.10 AUD110,672,820 AUD7.82
31 December 2018 AUD83,650 AUD9.02 AUD177,494 AUD11.61 AUD96,520,331 AUD7.57
31 December 2017 AUD89,313 AUD9.91 AUD125,122 AUD11.94 AUD99,593,553 AUD8.57
AUD T (Weekly)
Distributing Class
AUD T (Weekly) Distributing
Class
AUD T Accumulating
Class
AUD T Accumulating
Class
CAD A (Monthly) Distributing
Class
CAD A (Monthly) Distributing
ClassYear Ended NAV NAV per Share NAV NAV per Share NAV NAV per Share
31 December 2019 AUD2,160,768 AUD7.55 AUD1,941,568 AUD13.11 CAD4,828,715 CAD8.48
31 December 2018 AUD3,043,962 AUD7.30 AUD1,858,497 AUD11.77 CAD4,304,093 CAD8.03
31 December 2017 AUD4,324,158 AUD8.28 AUD2,312,931 AUD12.27 CAD11,738,286 CAD8.89
CHF A
Accumulating Class
CHF A Accumulating
Class
CHF I Accumulating
Class
CHF I Accumulating
Class
CHF I Distributing
Class
CHF I Distributing
ClassYear Ended NAV NAV per Share NAV NAV per Share NAV NAV per Share
31 December 2019 CHF4,673,728 CHF12.82 CHF776,727 CHF13.41 CHF182,835 CHF8.03
31 December 2018 CHF5,149,524 CHF11.73 CHF734,601 CHF12.19 CHF22,280,788 CHF7.71
31 December 2017 CHF9,702,844 CHF12.50 CHF2,255,835 CHF12.93 CHF24,844,925 CHF8.62

FINANCIAL STATEMENTS NOTES TO THE AUDITED FINANCIAL STATEMENTS
1352 NEUBERGER BERMAN INVESTMENT FUNDS PLC
FOR THE YEAR ENDED 31 DECEMBER 2019
13. NET ASSET VALUE COMPARATIVE (CONTINUED) Neuberger Berman High Yield Bond Fund (continued)
CHF I2
Accumulating Class
CHF I2 Accumulating
Class
CHF I2 Distributing
Class*
CHF I2 Distributing
Class*
CNY A (Monthly) Distributing
Class
CNY A (Monthly) Distributing
ClassYear Ended NAV NAV per Share NAV NAV per Share NAV NAV per Share
31 December 2019 CHF3,695,165 CHF11.46 – – CNY22,218,096 CNY91.63
31 December 2018 CHF7,666,302 CHF10.41 CHF10,519 CHF9.54 CNY35,162,882 CNY87.04
31 December 2017 CHF11,772,088 CHF11.02 CHF11,708 CHF10.62 CNY74,787,436 CNY95.54
CNY A (Weekly)
Distributing Class
CNY A (Weekly) Distributing
Class
CNY B (Monthly) Distributing
Class
CNY B (Monthly) Distributing
Class
CNY C2 (Monthly) Distributing
Class*
CNY C2 (Monthly) Distributing
Class*Year Ended NAV NAV per Share NAV NAV per Share NAV NAV per Share
31 December 2019 CNY8,404,458 CNY88.45 CNY76,874 CNY77.98 – –
31 December 2018 CNY7,940,678 CNY83.57 CNY74,658 CNY75.73 CNY8,697,103 CNY75.79
31 December 2017 CNY9,625,770 CNY91.84 CNY776,886 CNY85.47 CNY13,218,833 CNY85.53
CNY I (Monthly)
Distributing Class
CNY I (Monthly) Distributing
Class
CNY T (Monthly) Distributing
Class
CNY T (Monthly) Distributing
Class
EUR A (Monthly) Distributing
Class
EUR A (Monthly) Distributing
ClassYear Ended NAV NAV per Share NAV NAV per Share NAV NAV per Share
31 December 2019 CNY255,073 CNY95.07 CNY7,264,465 CNY82.54 €10,361,074 €8.05
31 December 2018 CNY240,832 CNY89.76 CNY4,641,034 CNY79.40 €16,140,527 €7.78
31 December 2017 CNY262,776 CNY97.94 CNY12,891,764 CNY88.70 €28,652,240 €8.79

NOTES TO THE AUDITED FINANCIAL STATEMENTS FINANCIAL STATEMENTS
ANNUAL REPORT 2019 1353
FOR THE YEAR ENDED 31 DECEMBER 2019
13. NET ASSET VALUE COMPARATIVE (CONTINUED) Neuberger Berman High Yield Bond Fund (continued)
EUR A
Accumulating Class
EUR A Accumulating
Class
EUR A Distributing
Class
EUR A Distributing
Class
EUR I Accumulating
Class
EUR I Accumulating
ClassYear Ended NAV NAV per Share NAV NAV per Share NAV NAV per Share
31 December 2019 €33,800,385 €20.49 €5,512,571 €8.91 €44,814,939 €17.81
31 December 2018 €41,559,407 €18.67 €7,232,138 €8.53 €60,990,941 €16.13
31 December 2017 €79,763,520 €19.83 €10,157,603 €9.50 €291,369,545 €17.03
EUR I
Distributing Class
EUR I Distributing
Class
EUR I2 (Monthly) Distributing
Class
EUR I2 (Monthly) Distributing
Class
EUR I2 Accumulating
Class
EUR I2 Accumulating
ClassYear Ended NAV NAV per Share NAV NAV per Share NAV NAV per Share
31 December 2019 €12,919,524 €8.58 €163,049 €9.13 €168,996,871 €12.46
31 December 2018 €12,022,800 €8.21 €395,759 €8.77 €163,560,252 €11.28
31 December 2017 €27,308,951 €9.15 €749,694 €9.83 €149,546,968 €11.90
EUR I2
Distributing Class
EUR I2 Distributing
Class
EUR I3 Accumulating
Class
EUR I3 Accumulating
Class
EUR I3 Distributing
Class
EUR I3 Distributing
ClassYear Ended NAV NAV per Share NAV NAV per Share NAV NAV per Share
31 December 2019 €17,142,921 €8.48 €252,829 €11.14 €54,672 €9.27
31 December 2018 €19,375,354 €8.11 €901,042 €10.07 €546,293 €8.87
31 December 2017 €27,013,143 €9.03 €31,383,926 €10.63 €889,530 €9.88

FINANCIAL STATEMENTS NOTES TO THE AUDITED FINANCIAL STATEMENTS
1354 NEUBERGER BERMAN INVESTMENT FUNDS PLC
FOR THE YEAR ENDED 31 DECEMBER 2019
13. NET ASSET VALUE COMPARATIVE (CONTINUED) Neuberger Berman High Yield Bond Fund (continued)
EUR M
Accumulating Class
EUR M Accumulating
Class
EUR M Distributing
Class
EUR M Distributing
Class
EUR Z Accumulating
Class
EUR Z Accumulating
ClassYear Ended NAV NAV per Share NAV NAV per Share NAV NAV per Share
31 December 2019 €69,465 €11.73 €106,011 €9.44 €38,050 €11.66
31 December 2018 €295,211 €10.76 €118,297 €9.22 €39,536 €10.50
31 December 2017 €320,607 €11.50 €178,035 €10.48 €27,748 €11.02
GBP A (Monthly) Distributing Class
GBP A (Monthly) Distributing Class
GBP A Accumulating
Class
GBP A Accumulating
Class
GBP A Distributing
Class
GBP A Distributing
ClassYear Ended NAV NAV per Share NAV NAV per Share NAV NAV per Share
31 December 2019 £9,190,554 £8.08 £2,660,012 £14.01 £2,890,045 £9.42
31 December 2018 £6,736,639 £7.72 £3,437,527 £12.60 £2,880,826 £8.90
31 December 2017 £8,754,044 £8.62 £5,304,047 £13.24 £5,543,470 £9.80
GBP I
Accumulating Class
GBP I Accumulating
Class
GBP I Accumulating Unhedged
Class*
GBP I Accumulating Unhedged
Class*
GBP I Distributing
Class
GBP I Distributing
ClassYear Ended NAV NAV per Share NAV NAV per Share NAV NAV per Share
31 December 2019 £6,656,377 £16.65 – – £27,833,771 £10.19
31 December 2018 £11,279,356 £14.89 – – £33,861,435 £9.63
31 December 2017 £11,965,206 £15.55 £176,724,100 £9.49 £68,852,909 £10.61

NOTES TO THE AUDITED FINANCIAL STATEMENTS FINANCIAL STATEMENTS
ANNUAL REPORT 2019 1355
FOR THE YEAR ENDED 31 DECEMBER 2019
13. NET ASSET VALUE COMPARATIVE (CONTINUED) Neuberger Berman High Yield Bond Fund (continued)
GBP I2
Accumulating Class
GBP I2 Accumulating
Class
GBP I2 Distributing
Class
GBP I2 Distributing
Class
GBP Z Accumulating
Class
GBP Z Accumulating
ClassYear Ended NAV NAV per Share NAV NAV per Share NAV NAV per Share
31 December 2019 £6,586,383 £13.28 £100,601,883 £9.04 £82,457 £12.61
31 December 2018 £8,911,004 £11.86 £166,751,059 £8.54 £73,264 £11.20
31 December 2017 £13,129,120 £12.37 £257,164,783 £9.41 £76,072 £11.63
HKD A (Monthly)
Distributing Class
HKD A (Monthly) Distributing
Class
HKD A (Weekly) Distributing
Class*
HKD A (Weekly) Distributing
Class*
HKD A Accumulating
Class
HKD A Accumulating
ClassYear Ended NAV NAV per Share NAV NAV per Share NAV NAV per Share
31 December 2019 HKD71,227,544 HKD8.27 – – HKD2,816,038 HKD13.07
31 December 2018 HKD92,108,396 HKD7.82 HKD1,202,189 HKD7.71 HKD4,156,498 HKD11.63
31 December 2017 HKD178,111,663 HKD8.65 HKD2,187,351 HKD8.53 HKD4,323,189 HKD12.10
JPY I
Accumulating Class
JPY I Accumulating
Class
JPY I2 Accumulating
Class*
JPY I2 Accumulating
Class*
SEK A Accumulating
Class
SEK A Accumulating
ClassYear Ended NAV NAV per Share NAV NAV per Share NAV NAV per Share
31 December 2019 ¥3,658,455 ¥1,945.88 – – SEK115,086,164 SEK138.35
31 December 2018 ¥3,305,315 ¥1,758.05 ¥1,278,845 ¥1,102.71 SEK124,540,510 SEK125.76
31 December 2017 ¥82,465,383 ¥1,853.82 ¥1,346,638 ¥1,161.17 SEK158,278,783 SEK133.80

FINANCIAL STATEMENTS NOTES TO THE AUDITED FINANCIAL STATEMENTS
1356 NEUBERGER BERMAN INVESTMENT FUNDS PLC
FOR THE YEAR ENDED 31 DECEMBER 2019
13. NET ASSET VALUE COMPARATIVE (CONTINUED) Neuberger Berman High Yield Bond Fund (continued)
SEK I2
Accumulating Class*
SEK I2 Accumulating
Class*
SGD A (Monthly) Distributing
Class
SGD A (Monthly) Distributing
Class
SGD A Accumulating
Class
SGD A Accumulating
ClassYear Ended NAV NAV per Share NAV NAV per Share NAV NAV per Share
31 December 2019 – – SGD34,153,505 SGD17.47 SGD6,580,154 SGD28.36
31 December 2018 SEK93,861 SEK11.14 SGD42,530,293 SGD16.53 SGD9,460,047 SGD25.26
31 December 2017 SEK99,123 SEK11.76 SGD65,120,926 SGD18.32 SGD11,932,198 SGD26.34
USD A (Monthly)
Distributing Class
USD A (Monthly) Distributing
Class
USD A (Weekly) Distributing
Class
USD A (Weekly) Distributing
Class
USD A Accumulating
Class
USD A Accumulating
ClassYear Ended NAV NAV per Share NAV NAV per Share NAV NAV per Share
31 December 2019 $176,884,590 $8.75 $15,130,543 $8.38 $209,693,859 $17.16
31 December 2018 $205,284,313 $8.21 $13,905,216 $7.86 $262,567,241 $15.16
31 December 2017 $359,308,606 $9.02 $16,192,841 $8.65 $595,458,272 $15.67
USD A
Distributing Class
USD A Distributing
Class
USD B (Monthly) Distributing
Class
USD B (Monthly) Distributing
Class
USD B (Weekly) Distributing
Class
USD B (Weekly) Distributing
ClassYear Ended NAV NAV per Share NAV NAV per Share NAV NAV per Share
31 December 2019 $33,909,601 $9.84 $169,758,520 $7.33 $44,299 $7.41
31 December 2018 $36,348,539 $9.12 $171,735,156 $7.06 $232,675 $7.14
31 December 2017 $52,486,943 $9.88 $270,010,439 $7.96 $2,632,166 $8.05

NOTES TO THE AUDITED FINANCIAL STATEMENTS FINANCIAL STATEMENTS
ANNUAL REPORT 2019 1357
FOR THE YEAR ENDED 31 DECEMBER 2019
13. NET ASSET VALUE COMPARATIVE (CONTINUED) Neuberger Berman High Yield Bond Fund (continued)
USD B
Accumulating Class
USD B Accumulating
Class
USD C Accumulating
Class
USD C Accumulating
Class
USD C Distributing
Class
USD C Distributing
ClassYear Ended NAV NAV per Share NAV NAV per Share NAV NAV per Share
31 December 2019 $6,572,477 $12.00 $1,833,369 $12.93 $225,073 $9.63
31 December 2018 $6,726,457 $10.78 $2,645,004 $11.49 $489,670 $8.94
31 December 2017 $11,596,275 $11.32 $4,208,480 $11.95 $862,975 $9.68
USD C1
Accumulating Class
USD C1 Accumulating
Class
USD C1 Distributing
Class
USD C1 Distributing
Class
USD C2 (Monthly) Distributing
Class
USD C2 (Monthly) Distributing
ClassYear Ended NAV NAV per Share NAV NAV per Share NAV NAV per Share
31 December 2019 $4,617,432 $10.67 $803,128 $9.94 $18,642,575 $7.33
31 December 2018 $1,169,833 $9.53 $218,896 $9.22 $72,406,611 $7.07
31 December 2017 $201,041 $9.95 $308,792 $9.99 $99,592,915 $7.96
USD C2 (Weekly)
Distributing Class
USD C2 (Weekly) Distributing
Class
USD C2 Accumulating
Class
USD C2 Accumulating
Class
USD E (Monthly) Distributing
Class
USD E (Monthly) Distributing
ClassYear Ended NAV NAV per Share NAV NAV per Share NAV NAV per Share
31 December 2019 $29,257 $7.40 $3,187,866 $12.01 $50,701,364 $7.44
31 December 2018 $51,368 $7.13 $5,680,457 $10.79 $62,246,466 $7.17
31 December 2017 $139,281 $8.04 $6,667,061 $11.33 $79,820,244 $8.08

FINANCIAL STATEMENTS NOTES TO THE AUDITED FINANCIAL STATEMENTS
1358 NEUBERGER BERMAN INVESTMENT FUNDS PLC
FOR THE YEAR ENDED 31 DECEMBER 2019
13. NET ASSET VALUE COMPARATIVE (CONTINUED) Neuberger Berman High Yield Bond Fund (continued)
USD E
Accumulating Class
USD E Accumulating
Class
USD I (Monthly) Distributing
Class
USD I (Monthly) Distributing
Class
USD I Accumulating
Class
USD I Accumulating
ClassYear Ended NAV NAV per Share NAV NAV per Share NAV NAV per Share
31 December 2019 $4,639,717 $10.82 $47,263,211 $8.93 $519,940,729 $25.53
31 December 2018 $4,819,604 $9.72 $55,181,183 $8.32 $724,276,598 $22.43
31 December 2017 $3,384,221 $10.21 $83,948,893 $9.09 $1,806,283,483 $23.03
USD I
Distributing Class
USD I Distributing
Class
USD I2 (Monthly) Distributing
Class
USD I2 (Monthly) Distributing
Class
USD I2 (Weekly) Distributing
Class*
USD I2 (Weekly) Distributing
Class*Year Ended NAV NAV per Share NAV NAV per Share NAV NAV per Share
31 December 2019 $108,113,063 $11.38 $52,583,038 $9.99 – –
31 December 2018 $33,266,119 $10.56 $97,415,748 $9.31 $231,310 $9.68
31 December 2017 $236,995,588 $11.43 $16,015,736 $10.16 $177,542 $10.57
USD I2
Accumulating Class
USD I2 Accumulating
Class
USD I2 Distributing
Class
USD I2 Distributing
Class
USD I4 (Monthly) Distributing
Class
USD I4 (Monthly) Distributing
ClassYear Ended NAV NAV per Share NAV NAV per Share NAV NAV per Share
31 December 2019 $331,520,059 $13.92 $157,350,543 $9.50 $126,850,072 $10.46
31 December 2018 $303,561,588 $12.22 $157,029,722 $8.81 $130,498,397 $9.60
31 December 2017 $323,155,819 $12.53 $143,058,972 $9.54 $139,940,874 $10.29

NOTES TO THE AUDITED FINANCIAL STATEMENTS FINANCIAL STATEMENTS
ANNUAL REPORT 2019 1359
FOR THE YEAR ENDED 31 DECEMBER 2019
13. NET ASSET VALUE COMPARATIVE (CONTINUED) Neuberger Berman High Yield Bond Fund (continued)
USD M
Accumulating Class
USD M Accumulating
Class
USD M Distributing
Class*
USD M Distributing
Class*
USD P Accumulating
Class*
USD P Accumulating
Class*Year Ended NAV NAV per Share NAV NAV per Share NAV NAV per Share
31 December 2019 $1,181,181 $12.97 $789,700 $9.91 $1,048,119 $11.01
31 December 2018 $647,529 $11.54 $154,018 $9.38 $11,682 $9.67
31 December 2017 $314,497 $11.99 – – – –
USD T (Monthly)
Distributing Class
USD T (Monthly) Distributing
Class
USD T (Weekly) Distributing
Class
USD T (Weekly) Distributing
Class
USD T Accumulating
Class
USD T Accumulating
ClassYear Ended NAV NAV per Share NAV NAV per Share NAV NAV per Share
31 December 2019 $186,588,759 $7.87 $3,809,314 $7.90 $6,035,747 $12.87
31 December 2018 $175,371,160 $7.50 $4,545,427 $7.54 $6,032,950 $11.45
31 December 2017 $203,522,009 $8.37 $5,270,780 $8.42 $7,812,307 $11.90
USD U (Monthly)
Distributing Class
USD U (Monthly) Distributing
Class
USD U Accumulating
Class
USD U Accumulating
Class
USD Z Accumulating
Class
USD Z Accumulating
ClassYear Ended NAV NAV per Share NAV NAV per Share NAV NAV per Share
31 December 2019 $1,858,924 $8.47 $14,480,604 $13.77 $36,000,649 $12.83
31 December 2018 $3,399,456 $7.92 $22,359,513 $12.13 $61,027,703 $11.20
31 December 2017 $16,964,473 $8.68 $64,463,806 $12.50 $48,840,749 $11.43

FINANCIAL STATEMENTS NOTES TO THE AUDITED FINANCIAL STATEMENTS
1360 NEUBERGER BERMAN INVESTMENT FUNDS PLC
FOR THE YEAR ENDED 31 DECEMBER 2019
13. NET ASSET VALUE COMPARATIVE (CONTINUED) Neuberger Berman High Yield Bond Fund (continued)
ZAR A (Monthly)
Distributing Class
ZAR A (Monthly) Distributing
Class
ZAR B (Monthly) Distributing
Class
ZAR B (Monthly) Distributing
Class
ZAR C2 (Monthly) Distributing
Class
ZAR C2 (Monthly) Distributing
ClassYear Ended NAV NAV per Share NAV NAV per Share NAV NAV per Share
31 December 2019 ZAR8,756,708 ZAR84.27 ZAR1,059,381,093 ZAR74.92 ZAR160,496,459 ZAR74.85
31 December 2018 ZAR9,129,430 ZAR80.35 ZAR1,088,788,551 ZAR72.97 ZAR541,072,756 ZAR72.91
31 December 2017 ZAR10,603,215 ZAR89.45 ZAR2,069,369,371 ZAR83.34 ZAR679,868,617 ZAR83.27
ZAR E (Monthly)
Distributing Class
ZAR E (Monthly) Distributing
Class
ZAR E Accumulating
Class
ZAR E Accumulating
Class
ZAR T (Monthly) Distributing
Class
ZAR T (Monthly) Distributing
ClassYear Ended NAV NAV per Share NAV NAV per Share NAV NAV per Share
31 December 2019 ZAR538,037,347 ZAR74.08 ZAR38,431,371 ZAR147.33 ZAR2,985,651,313 ZAR80.45
31 December 2018 ZAR578,213,134 ZAR72.15 ZAR25,514,924 ZAR126.88 ZAR2,945,172,648 ZAR77.57
31 December 2017 ZAR694,458,227 ZAR82.40 ZAR22,595,277 ZAR127.10 ZAR3,430,333,787 ZAR87.71
ZAR T
Accumulating Class
ZAR T Accumulating
ClassYear Ended NAV NAV per Share
31 December 2019 ZAR9,039,470 ZAR132.00
31 December 2018 ZAR3,922,993 ZAR112.55
31 December 2017 ZAR12,056,180 ZAR111.62

NOTES TO THE AUDITED FINANCIAL STATEMENTS FINANCIAL STATEMENTS
ANNUAL REPORT 2019 1361
FOR THE YEAR ENDED 31 DECEMBER 2019
13. NET ASSET VALUE COMPARATIVE (CONTINUED) Neuberger Berman Diversified Currency Fund
EUR A
Accumulating Class
EUR A Accumulating
Class
EUR I Accumulating
Class
EUR I Accumulating
Class
EUR M Accumulating
Class
EUR M Accumulating
ClassYear Ended NAV NAV per Share NAV NAV per Share NAV NAV per Share
31 December 2019 €42,388 €9.74 €89,919 €10.24 €233,838 €9.06
31 December 2018 €78,916 €10.00 €113,122 €10.45 €680,982 €9.35
31 December 2017 €94,009 €10.16 €89,938 €10.56 €871,902 €9.56
GBP I
Accumulating Class
GBP I Accumulating
Class
JPY I Accumulating
Class
JPY I Accumulating
Class
USD A Accumulating
Class
USD A Accumulating
ClassYear Ended NAV NAV per Share NAV NAV per Share NAV NAV per Share
31 December 2019 £144,847 £9.99 ¥9,123,147 ¥981.70 $54,818,051 $10.68
31 December 2018 £159,566 £10.05 ¥9,297,147 ¥1,000.42 $177,703 $10.63
31 December 2017 £134,537 £10.05 ¥5,690,763 ¥1,008.62 $249,727 $10.51
USD I
Accumulating Class
USD I Accumulating
Class
USD Z Accumulating
Class
USD Z Accumulating
ClassYear Ended NAV NAV per Share NAV NAV per Share
31 December 2019 $3,892,878 $11.24 $8,875,245 $10.63
31 December 2018 $4,898,428 $11.13 $20,899,490 $10.48
31 December 2017 $2,378,945 $10.95 $14,626,759 $10.25

FINANCIAL STATEMENTS NOTES TO THE AUDITED FINANCIAL STATEMENTS
1362 NEUBERGER BERMAN INVESTMENT FUNDS PLC
FOR THE YEAR ENDED 31 DECEMBER 2019
13. NET ASSET VALUE COMPARATIVE (CONTINUED) Neuberger Berman US Multi Cap Opportunities Fund
AUD E
Accumulating Class
AUD E Accumulating
Class
AUD T Accumulating
Class
AUD T Accumulating
Class
EUR I3 Accumulating
Class
EUR I3 Accumulating
ClassYear Ended NAV NAV per Share NAV NAV per Share NAV NAV per Share
31 December 2019 AUD702,736 AUD15.65 AUD270,458 AUD14.25 €2,685,141 €20.29
31 December 2018 AUD1,218,750 AUD12.69 AUD8,475,371 AUD11.45 €8,047,717 €16.40
31 December 2017 AUD459,043 AUD13.73 AUD51,003 AUD12.26 €12,470,575 €17.80
EUR M
Accumulating Class
EUR M Accumulating
Class
EUR U Accumulating
Class*
EUR U Accumulating
Class*
EUR1 A Accumulating
Class
EUR1 A Accumulating
ClassYear Ended NAV NAV per Share NAV NAV per Share NAV NAV per Share
31 December 2019 €1,265,478 €15.31 – – €3,244,065 €23.41
31 December 2018 €1,573,258 €12.65 – – €3,740,552 €19.14
31 December 2017 €2,179,125 €14.04 €525,820 €16.94 €2,485,043 €21.04
EUR1 I
Accumulating Class
EUR1 I Accumulating
Class
GBP I Accumulating
Class
GBP I Accumulating
Class
GBP I Distributing Unhedged
Class
GBP I Distributing Unhedged
ClassYear Ended NAV NAV per Share NAV NAV per Share NAV NAV per Share
31 December 2019 €20,432,584 €24.89 £7,355 £12.50 £335,575 £24.43
31 December 2018 €50,827,765 €20.18 £5,886 £10.00 £274,411 £19.98
31 December 2017 €9,731,306 €21.99 £6,341 £10.78 £614,744 £19.89

NOTES TO THE AUDITED FINANCIAL STATEMENTS FINANCIAL STATEMENTS
ANNUAL REPORT 2019 1363
FOR THE YEAR ENDED 31 DECEMBER 2019
13. NET ASSET VALUE COMPARATIVE (CONTINUED) Neuberger Berman US Multi Cap Opportunities Fund (continued)
GBP I3
Distributing Class
GBP I3 Distributing
Class
GBP I3 Distributing Unhedged
Class
GBP I3 Distributing Unhedged
Class
SGD A Accumulating
Class
SGD A Accumulating
ClassYear Ended NAV NAV per Share NAV NAV per Share NAV NAV per Share
31 December 2019 £412,731 £20.64 £13,370 £12.55 SGD17,313,236 SGD37.79
31 December 2018 £345,141 £16.53 £5,465,748 £10.26 SGD15,485,836 SGD30.23
31 December 2017 £804,759 £17.85 £9,958,984 £10.20 SGD10,368,301 SGD32.60
USD B
Accumulating Class
USD B Accumulating
Class
USD C Accumulating
Class
USD C Accumulating
Class
USD C1 Accumulating
Class
USD C1 Accumulating
ClassYear Ended NAV NAV per Share NAV NAV per Share NAV NAV per Share
31 December 2019 $2,520,461 $16.01 $48,590 $16.06 $1,640,550 $12.21
31 December 2018 $3,661,774 $12.83 $1,272,999 $12.79 $2,098,907 $9.79
31 December 2017 $1,822,631 $13.84 $1,180,211 $13.70 $253,528 $10.54
USD C2
Accumulating Class
USD C2 Accumulating
Class
USD E Accumulating
Class
USD E Accumulating
Class
USD I2 Accumulating
Class*
USD I2 Accumulating
Class*Year Ended NAV NAV per Share NAV NAV per Share NAV NAV per Share
31 December 2019 $647,169 $16.01 $1,378,348 $15.06 – –
31 December 2018 $2,174,198 $12.84 $2,809,858 $12.07 $9,881 $13.94
31 December 2017 $1,140,697 $13.84 $2,188,356 $13.02 $3,282,797 $14.72

FINANCIAL STATEMENTS NOTES TO THE AUDITED FINANCIAL STATEMENTS
1364 NEUBERGER BERMAN INVESTMENT FUNDS PLC
FOR THE YEAR ENDED 31 DECEMBER 2019
13. NET ASSET VALUE COMPARATIVE (CONTINUED) Neuberger Berman US Multi Cap Opportunities Fund (continued)
USD I2
Distributing Class
USD I2 Distributing
Class
USD I3 Accumulating
Class
USD I3 Accumulating
Class
USD I3 Distributing
Class
USD I3 Distributing
ClassYear Ended NAV NAV per Share NAV NAV per Share NAV NAV per Share
31 December 2019 $257,594 $17.17 $41,087,312 $21.92 $12,698,290 $19.78
31 December 2018 $202,496 $13.50 $99,097,115 $17.17 $15,015,941 $15.55
31 December 2017 $214,349 $14.29 $207,344,267 $18.09 $9,607,459 $16.49
USD M
Accumulating Class
USD M Accumulating
Class
USD P Accumulating
Class*
USD P Accumulating
Class*
USD T Accumulating
Class
USD T Accumulating
ClassYear Ended NAV NAV per Share NAV NAV per Share NAV NAV per Share
31 December 2019 $66,660,734 $16.98 $13,489 $11.56 $3,806,673 $17.02
31 December 2018 $9,600,447 $13.60 $10,598 $9.08 $32,570,072 $13.50
31 December 2017 $3,511,443 $14.65 – – $54,381,863 $14.42
USD U
Accumulating Class
USD U Accumulating
Class
USD Z Accumulating
Class
USD Z Accumulating
Class
USD1 A Accumulating
Class
USD1 A Accumulating
ClassYear Ended NAV NAV per Share NAV NAV per Share NAV NAV per Share
31 December 2019 $91,146,894 $23.01 $88,884 $18.23 $105,365,217 $25.42
31 December 2018 $91,707,112 $18.16 $69,286 $14.21 $119,676,786 $20.16
31 December 2017 $172,167,006 $19.29 $62,766 $14.90 $149,117,205 $21.50

NOTES TO THE AUDITED FINANCIAL STATEMENTS FINANCIAL STATEMENTS
ANNUAL REPORT 2019 1365
FOR THE YEAR ENDED 31 DECEMBER 2019
13. NET ASSET VALUE COMPARATIVE (CONTINUED) Neuberger Berman US Multi Cap Opportunities Fund (continued)
USD1 I
Accumulating Class
USD1 I Accumulating
Class
USD1 I Distributing
Class
USD1 I Distributing
Class
ZAR B Accumulating
Class
ZAR B Accumulating
ClassYear Ended NAV NAV per Share NAV NAV per Share NAV NAV per Share
31 December 2019 $382,402,899 $27.73 $5,301,802 $26.76 ZAR7,724,318 ZAR217.01
31 December 2018 $411,036,147 $21.80 $1,390,639 $21.04 ZAR21,136,232 ZAR167.23
31 December 2017 $329,512,255 $23.06 $15,346 $22.26 ZAR3,809,560 ZAR173.66
ZAR C2
Accumulating Class
ZAR C2 Accumulating
Class
ZAR E Accumulating
Class
ZAR E Accumulating
Class
ZAR T Accumulating
Class
ZAR T Accumulating
ClassYear Ended NAV NAV per Share NAV NAV per Share NAV NAV per Share
31 December 2019 ZAR3,844,471 ZAR215.75 ZAR12,055,102 ZAR199.84 ZAR16,163,340 ZAR230.52
31 December 2018 ZAR5,912,020 ZAR166.26 ZAR9,618,626 ZAR153.99 ZAR19,132,204 ZAR175.84
31 December 2017 ZAR1,327,464 ZAR172.65 ZAR1,479,457 ZAR159.91 ZAR6,254,794 ZAR180.77
Neuberger Berman US Real Estate Securities Fund
AUD A (Monthly)
Distributing Class
AUD A (Monthly) Distributing
Class
AUD B (Monthly) Distributing
Class
AUD B (Monthly) Distributing
Class
AUD B Accumulating
Class
AUD B Accumulating
ClassYear Ended NAV NAV per Share NAV NAV per Share NAV NAV per Share
31 December 2019 AUD1,024,716 AUD10.24 AUD954,096 AUD9.87 AUD918,025 AUD13.03
31 December 2018 AUD858,958 AUD8.30 AUD857,998 AUD8.15 AUD190,789 AUD10.27
31 December 2017 AUD197,165 AUD9.38 AUD309,763 AUD9.38 AUD208,147 AUD11.24

FINANCIAL STATEMENTS NOTES TO THE AUDITED FINANCIAL STATEMENTS
1366 NEUBERGER BERMAN INVESTMENT FUNDS PLC
FOR THE YEAR ENDED 31 DECEMBER 2019
13. NET ASSET VALUE COMPARATIVE (CONTINUED) Neuberger Berman US Real Estate Securities Fund (continued)
AUD C2 (Monthly)
Distributing Class
AUD C2 (Monthly) Distributing
Class
AUD C2 Accumulating
Class
AUD C2 Accumulating
Class
AUD E (Monthly) Distributing
Class
AUD E (Monthly) Distributing
ClassYear Ended NAV NAV per Share NAV NAV per Share NAV NAV per Share
31 December 2019 AUD609,015 AUD9.87 AUD48,092 AUD13.83 AUD778,421 AUD9.85
31 December 2018 AUD106,887 AUD8.14 AUD64,573 AUD10.92 AUD957,366 AUD8.14
31 December 2017 AUD43,845 AUD9.38 AUD22,826 AUD11.94 AUD34,036 AUD9.38
AUD E
Accumulating Class
AUD E Accumulating
Class
AUD T (Monthly) Distributing
Class
AUD T (Monthly) Distributing
Class
AUD T Accumulating
Class
AUD T Accumulating
ClassYear Ended NAV NAV per Share NAV NAV per Share NAV NAV per Share
31 December 2019 AUD472,974 AUD14.09 AUD3,152,960 AUD11.11 AUD2,302,206 AUD16.19
31 December 2018 AUD275,475 AUD11.12 AUD1,014,298 AUD9.08 AUD5,358,040 AUD12.65
31 December 2017 AUD69,135 AUD12.16 AUD1,020,686 AUD10.36 AUD1,220,407 AUD13.70
CHF A
Accumulating Class
CHF A Accumulating
Class
EUR A Accumulating
Class
EUR A Accumulating
Class
EUR I Accumulating
Class
EUR I Accumulating
ClassYear Ended NAV NAV per Share NAV NAV per Share NAV NAV per Share
31 December 2019 CHF2,373,651 CHF14.97 €2,073,234 €8.90 €12,433,465 €19.23
31 December 2018 CHF2,272,217 CHF11.95 €1,879,947 €7.07 €8,187,945 €15.16
31 December 2017 CHF2,731,070 CHF13.25 €2,497,351 €7.81 €9,468,581 €16.64
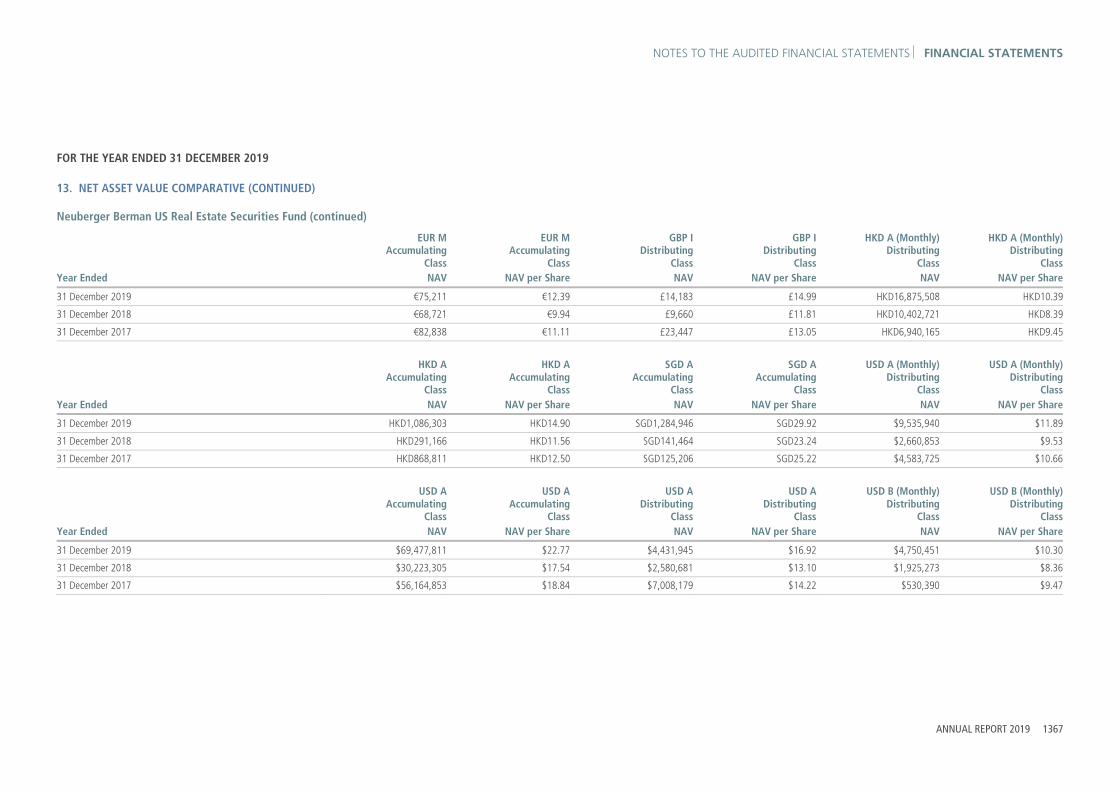
NOTES TO THE AUDITED FINANCIAL STATEMENTS FINANCIAL STATEMENTS
ANNUAL REPORT 2019 1367
FOR THE YEAR ENDED 31 DECEMBER 2019
13. NET ASSET VALUE COMPARATIVE (CONTINUED) Neuberger Berman US Real Estate Securities Fund (continued)
EUR M
Accumulating Class
EUR M Accumulating
Class
GBP I Distributing
Class
GBP I Distributing
Class
HKD A (Monthly) Distributing
Class
HKD A (Monthly) Distributing
ClassYear Ended NAV NAV per Share NAV NAV per Share NAV NAV per Share
31 December 2019 €75,211 €12.39 £14,183 £14.99 HKD16,875,508 HKD10.39
31 December 2018 €68,721 €9.94 £9,660 £11.81 HKD10,402,721 HKD8.39
31 December 2017 €82,838 €11.11 £23,447 £13.05 HKD6,940,165 HKD9.45
HKD A
Accumulating Class
HKD A Accumulating
Class
SGD A Accumulating
Class
SGD A Accumulating
Class
USD A (Monthly) Distributing
Class
USD A (Monthly) Distributing
ClassYear Ended NAV NAV per Share NAV NAV per Share NAV NAV per Share
31 December 2019 HKD1,086,303 HKD14.90 SGD1,284,946 SGD29.92 $9,535,940 $11.89
31 December 2018 HKD291,166 HKD11.56 SGD141,464 SGD23.24 $2,660,853 $9.53
31 December 2017 HKD868,811 HKD12.50 SGD125,206 SGD25.22 $4,583,725 $10.66
USD A
Accumulating Class
USD A Accumulating
Class
USD A Distributing
Class
USD A Distributing
Class
USD B (Monthly) Distributing
Class
USD B (Monthly) Distributing
ClassYear Ended NAV NAV per Share NAV NAV per Share NAV NAV per Share
31 December 2019 $69,477,811 $22.77 $4,431,945 $16.92 $4,750,451 $10.30
31 December 2018 $30,223,305 $17.54 $2,580,681 $13.10 $1,925,273 $8.36
31 December 2017 $56,164,853 $18.84 $7,008,179 $14.22 $530,390 $9.47

FINANCIAL STATEMENTS NOTES TO THE AUDITED FINANCIAL STATEMENTS
1368 NEUBERGER BERMAN INVESTMENT FUNDS PLC
FOR THE YEAR ENDED 31 DECEMBER 2019
13. NET ASSET VALUE COMPARATIVE (CONTINUED) Neuberger Berman US Real Estate Securities Fund (continued)
USD B
Accumulating Class
USD B Accumulating
Class
USD C Accumulating
Class
USD C Accumulating
Class
USD C Distributing
Class*
USD C Distributing
Class*Year Ended NAV NAV per Share NAV NAV per Share NAV NAV per Share
31 December 2019 $4,369,123 $14.56 $59,777 $15.78 – –
31 December 2018 $1,491,220 $11.36 $601,264 $12.22 – –
31 December 2017 $2,638,372 $12.36 $649,101 $13.19 $200,113 $13.00
USD C1
Accumulating Class
USD C1 Accumulating
Class
USD C2 (Monthly) Distributing
Class
USD C2 (Monthly) Distributing
Class
USD C2 Accumulating
Class
USD C2 Accumulating
ClassYear Ended NAV NAV per Share NAV NAV per Share NAV NAV per Share
31 December 2019 $11,103,043 $12.04 $1,618,565 $10.42 $1,032,935 $14.55
31 December 2018 $65,677 $9.37 $193,216 $8.46 $388,799 $11.36
31 December 2017 $101,482 $10.16 $150,725 $9.59 $680,229 $12.35
USD E (Monthly)
Distributing Class
USD E (Monthly) Distributing
Class
USD E Accumulating
Class
USD E Accumulating
Class
USD I (Monthly) Distributing
Class*
USD I (Monthly) Distributing
Class*Year Ended NAV NAV per Share NAV NAV per Share NAV NAV per Share
31 December 2019 $3,067,873 $10.30 $4,246,092 $13.81 $3,028,550 $9.95
31 December 2018 $616,933 $8.37 $631,738 $10.77 – –
31 December 2017 $281,951 $9.47 $661,622 $11.72 – –

NOTES TO THE AUDITED FINANCIAL STATEMENTS FINANCIAL STATEMENTS
ANNUAL REPORT 2019 1369
FOR THE YEAR ENDED 31 DECEMBER 2019
13. NET ASSET VALUE COMPARATIVE (CONTINUED) Neuberger Berman US Real Estate Securities Fund (continued)
USD I
Accumulating Class
USD I Accumulating
Class
USD I Distributing
Class
USD I Distributing
Class
USD I2 Accumulating
Class
USD I2 Accumulating
ClassYear Ended NAV NAV per Share NAV NAV per Share NAV NAV per Share
31 December 2019 $32,192,971 $25.14 $749,823 $15.54 $914,764 $18.38
31 December 2018 $14,017,236 $19.21 $12,128 $12.03 $625,677 $14.02
31 December 2017 $22,779,795 $20.49 $13,161 $13.05 $965,623 $14.93
USD M
Accumulating Class
USD M Accumulating
Class
USD T (Monthly) Distributing
Class
USD T (Monthly) Distributing
Class
USD T Accumulating
Class
USD T Accumulating
ClassYear Ended NAV NAV per Share NAV NAV per Share NAV NAV per Share
31 December 2019 $19,049,640 $14.04 $2,749,568 $11.49 $48,006,154 $15.51
31 December 2018 $265,224 $10.92 $747,828 $9.24 $3,999,160 $11.98
31 December 2017 $306,552 $11.85 $752,250 $10.37 $35,247,835 $12.92
USD Z
Accumulating Class
USD Z Accumulating
Class
ZAR B (Monthly) Distributing
Class
ZAR B (Monthly) Distributing
Class
ZAR B Accumulating
Class
ZAR B Accumulating
ClassYear Ended NAV NAV per Share NAV NAV per Share NAV NAV per Share
31 December 2019 $4,808,557 $14.26 ZAR37,925,348 ZAR101.35 ZAR11,929,223 ZAR163.91
31 December 2018 $74,514 $10.82 ZAR14,025,078 ZAR83.16 ZAR1,266,471 ZAR122.54
31 December 2017 $57,235 $11.45 ZAR3,868,598 ZAR95.87 ZAR3,323,871 ZAR127.74

FINANCIAL STATEMENTS NOTES TO THE AUDITED FINANCIAL STATEMENTS
1370 NEUBERGER BERMAN INVESTMENT FUNDS PLC
FOR THE YEAR ENDED 31 DECEMBER 2019
13. NET ASSET VALUE COMPARATIVE (CONTINUED) Neuberger Berman US Real Estate Securities Fund (continued)
ZAR C2 (Monthly)
Distributing Class
ZAR C2 (Monthly) Distributing
Class
ZAR C2 Accumulating
Class
ZAR C2 Accumulating
Class
ZAR E (Monthly) Distributing
Class
ZAR E (Monthly) Distributing
ClassYear Ended NAV NAV per Share NAV NAV per Share NAV NAV per Share
31 December 2019 ZAR11,138,466 ZAR100.20 ZAR1,213,117 ZAR161.83 ZAR35,315,172 ZAR101.35
31 December 2018 ZAR4,348,066 ZAR82.22 ZAR53,200 ZAR122.59 ZAR20,940,102 ZAR83.16
31 December 2017 ZAR238,633 ZAR94.78 ZAR172,725 ZAR127.77 ZAR9,779,624 ZAR95.87
ZAR E
Accumulating Class
ZAR E Accumulating
Class
ZAR T (Monthly) Distributing
Class
ZAR T (Monthly) Distributing
Class
ZAR T Accumulating
Class
ZAR T Accumulating
ClassYear Ended NAV NAV per Share NAV NAV per Share NAV NAV per Share
31 December 2019 ZAR19,341,386 ZAR183.36 ZAR90,049,616 ZAR151.32 ZAR22,739,732 ZAR218.64
31 December 2018 ZAR2,110,986 ZAR137.07 ZAR28,332,973 ZAR122.93 ZAR9,141,381 ZAR161.81
31 December 2017 ZAR3,874,638 ZAR142.87 ZAR15,782,658 ZAR140.31 ZAR6,699,385 ZAR166.99
Neuberger Berman China Equity Fund
CHF I
Accumulating Class
CHF I Accumulating
Class
EUR A Accumulating
Class
EUR A Accumulating
Class
EUR A Accumulating Unhedged
Class
EUR A Accumulating Unhedged
ClassYear Ended NAV NAV per Share NAV NAV per Share NAV NAV per Share
31 December 2019 CHF5,641,706 CHF14.71 €3,014,720 €26.26 €337,483 €19.65
31 December 2018 CHF4,393,237 CHF11.37 €3,391580 €20.40 €523,408 €14.53
31 December 2017 CHF5,752,558 CHF14.99 €11,600,262 €27.06 €1,069,256 €17.76

NOTES TO THE AUDITED FINANCIAL STATEMENTS FINANCIAL STATEMENTS
ANNUAL REPORT 2019 1371
FOR THE YEAR ENDED 31 DECEMBER 2019
13. NET ASSET VALUE COMPARATIVE (CONTINUED) Neuberger Berman China Equity Fund (continued)
EUR A
Distributing Class
EUR A Distributing C
lass
EUR I Accumulating
Class
EUR I Accumulating
Class
EUR I4 Accumulating
Class
EUR I4 Accumulating
ClassYear Ended NAV NAV per Share NAV NAV per Share NAV NAV per Share
31 December 2019 €10,801 €14.69 €3,292,545 €27.86 €75,891 €15.98
31 December 2018 €8,388 €11.41 €4,236,640 €21.48 €58,524 €12.32
31 December 2017 €60,472 €15.12 €8,203,457 €28.28 €77,033 €16.22
EUR M
Accumulating Class
EUR M Accumulating
Class
EUR Z Accumulating
Class
EUR Z Accumulating
Class
GBP A Distributing
Class
GBP A Distributing
ClassYear Ended NAV NAV per Share NAV NAV per Share NAV NAV per Share
31 December 2019 €419,477 €16.84 €18,551 €20.82 £546,192 £12.85
31 December 2018 €490,679 €13.22 €14,149 €15.88 £501,120 £9.88
31 December 2017 €1,563,241 €17.71 €18,421 €20.67 £658,443 £12.98
GBP I Distributing
Unhedged Class
GBP I Distributing Unhedged
Class
GBP I2 Distributing Unhedged
Class
GBP I2 Distributing Unhedged
Class
GBP I4 Accumulating
Class
GBP I4 Accumulating
ClassYear Ended NAV NAV per Share NAV NAV per Share NAV NAV per Share
31 December 2019 £14,994 £26.30 £253,448 £26.32 £280,197 £16.41
31 December 2018 £13,022 £20.67 £198,018 £20.69 £308,509 £12.52
31 December 2017 £123,317 £24.91 £333,971 £24.96 £402,354 £16.33

FINANCIAL STATEMENTS NOTES TO THE AUDITED FINANCIAL STATEMENTS
1372 NEUBERGER BERMAN INVESTMENT FUNDS PLC
FOR THE YEAR ENDED 31 DECEMBER 2019
13. NET ASSET VALUE COMPARATIVE (CONTINUED) Neuberger Berman China Equity Fund (continued)
GBP I4
Distributing Class
GBP I4 Distributing
Class
HKD A Accumulating
Class
HKD A Accumulating
Class
SGD A Accumulating
Class
SGD A Accumulating
ClassYear Ended NAV NAV per Share NAV NAV per Share NAV NAV per Share
31 December 2019 £161,462 £15.27 HKD3,247,998 HKD13.09 SGD8,441,532 SGD35.48
31 December 2018 £124,046 £11.73 HKD2,698,051 HKD9.94 SGD10,528,061 SGD27.01
31 December 2017 £163,062 £15.42 HKD12,570,344 HKD12.85 SGD26,434,530 SGD35.15
USD A
Accumulating Class
USD A Accumulating
Class
USD A Distributing
Class
USD A Distributing
Class
USD C Accumulating
Class*
USD C Accumulating
Class*Year Ended NAV NAV per Share NAV NAV per Share NAV NAV per Share
31 December 2019 $101,564,744 $29.40 $3,996,639 $18.18 – –
31 December 2018 $107,624,951 $22.15 $4,383,123 $13.70 $163,052 $14.96
31 December 2017 $227,822,690 $28.43 $9,442,810 $17.58 $387,841 $19.30
USD C1
Accumulating Class
USD C1 Accumulating
Class
USD I Accumulating
Class
USD I Accumulating
Class
USD I2 Accumulating
Class
USD I2 Accumulating
ClassYear Ended NAV NAV per Share NAV NAV per Share NAV NAV per Share
31 December 2019 $34,102 $11.37 $592,347,903 $31.30 $28,224,839 $19.22
31 December 2018 $25,958 $8.65 $554,136,457 $23.40 $38,612,373 $14.34
31 December 2017 $33,658 $11.22 $911,991,134 $29.81 $57,185,926 $18.23

NOTES TO THE AUDITED FINANCIAL STATEMENTS FINANCIAL STATEMENTS
ANNUAL REPORT 2019 1373
FOR THE YEAR ENDED 31 DECEMBER 2019
13. NET ASSET VALUE COMPARATIVE (CONTINUED) Neuberger Berman China Equity Fund (continued)
USD I4
Distributing Class
USD I4 Distributing
Class
USD M Accumulating
Class
USD M Accumulating
Class
USD U Accumulating
Class
USD U Accumulating
ClassYear Ended NAV NAV per Share NAV NAV per Share NAV NAV per Share
31 December 2019 $247,980 $16.27 $40,013,734 $17.56 $69,608,681 $20.29
31 December 2018 $186,592 $12.24 $30,464,582 $13.37 $56,923,852 $15.23
31 December 2017 $370,453 $15.72 $39,526,368 $17.34 $111,725,379 $19.47
USD Z
Accumulating Class
USD Z Accumulating
ClassYear Ended NAV NAV per Share
31 December 2019 $375,832 $20.40
31 December 2018 $277,919 $15.09
31 December 2017 $419,652 $19.01
Neuberger Berman Emerging Markets Equity Fund
AUD B
Accumulating Class
AUD B Accumulating
Class
AUD C2 Accumulating
Class
AUD C2 Accumulating
Class
AUD E Accumulating
Class
AUD E Accumulating
ClassYear Ended NAV NAV per Share NAV NAV per Share NAV NAV per Share
31 December 2019 AUD1,150,363 AUD12.52 AUD1,215,251 AUD12.52 AUD2,241,504 AUD12.51
31 December 2018 AUD1,371,379 AUD10.90 AUD1,196,814 AUD10.90 AUD1,768,418 AUD10.89
31 December 2017 AUD1,400,538 AUD13.82 AUD3,444,499 AUD13.83 AUD1,452,296 AUD13.81
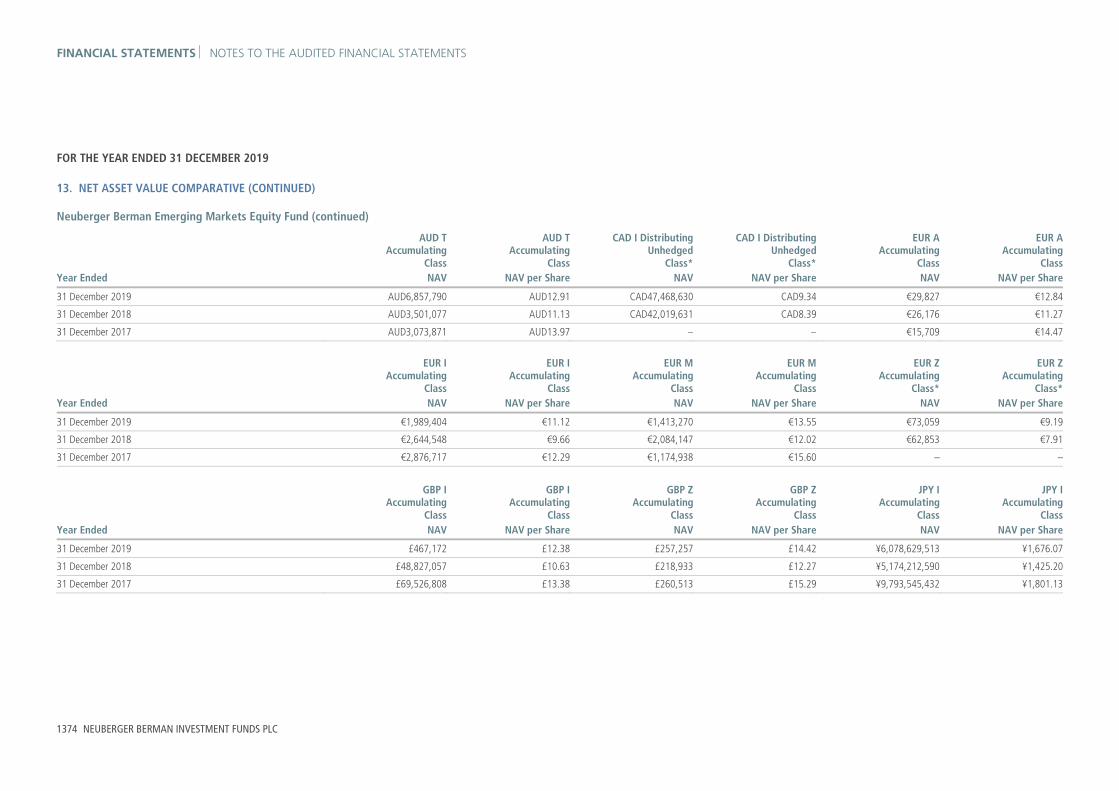
FINANCIAL STATEMENTS NOTES TO THE AUDITED FINANCIAL STATEMENTS
1374 NEUBERGER BERMAN INVESTMENT FUNDS PLC
FOR THE YEAR ENDED 31 DECEMBER 2019
13. NET ASSET VALUE COMPARATIVE (CONTINUED) Neuberger Berman Emerging Markets Equity Fund (continued)
AUD T
Accumulating Class
AUD T Accumulating
Class
CAD I Distributing Unhedged
Class*
CAD I Distributing Unhedged
Class*
EUR A Accumulating
Class
EUR A Accumulating
ClassYear Ended NAV NAV per Share NAV NAV per Share NAV NAV per Share
31 December 2019 AUD6,857,790 AUD12.91 CAD47,468,630 CAD9.34 €29,827 €12.84
31 December 2018 AUD3,501,077 AUD11.13 CAD42,019,631 CAD8.39 €26,176 €11.27
31 December 2017 AUD3,073,871 AUD13.97 – – €15,709 €14.47
EUR I
Accumulating Class
EUR I Accumulating
Class
EUR M Accumulating
Class
EUR M Accumulating
Class
EUR Z Accumulating
Class*
EUR Z Accumulating
Class*Year Ended NAV NAV per Share NAV NAV per Share NAV NAV per Share
31 December 2019 €1,989,404 €11.12 €1,413,270 €13.55 €73,059 €9.19
31 December 2018 €2,644,548 €9.66 €2,084,147 €12.02 €62,853 €7.91
31 December 2017 €2,876,717 €12.29 €1,174,938 €15.60 – –
GBP I
Accumulating Class
GBP I Accumulating
Class
GBP Z Accumulating
Class
GBP Z Accumulating
Class
JPY I Accumulating
Class
JPY I Accumulating
ClassYear Ended NAV NAV per Share NAV NAV per Share NAV NAV per Share
31 December 2019 £467,172 £12.38 £257,257 £14.42 ¥6,078,629,513 ¥1,676.07
31 December 2018 £48,827,057 £10.63 £218,933 £12.27 ¥5,174,212,590 ¥1,425.20
31 December 2017 £69,526,808 £13.38 £260,513 £15.29 ¥9,793,545,432 ¥1,801.13

NOTES TO THE AUDITED FINANCIAL STATEMENTS FINANCIAL STATEMENTS
ANNUAL REPORT 2019 1375
FOR THE YEAR ENDED 31 DECEMBER 2019
13. NET ASSET VALUE COMPARATIVE (CONTINUED) Neuberger Berman Emerging Markets Equity Fund (continued)
USD A
Accumulating Class
USD A Accumulating
Class
USD B Accumulating
Class
USD B Accumulating
Class
USD C1 Accumulating
Class
USD C1 Accumulating
ClassYear Ended NAV NAV per Share NAV NAV per Share NAV NAV per Share
31 December 2019 $5,553,605 $11.75 $5,168,145 $12.76 $426,912 $9.76
31 December 2018 $3,772,183 $9.99 $4,869,286 $10.97 $439,711 $8.39
31 December 2017 $2,082,887 $12.42 $3,959,546 $13.78 $362,964 $10.52
USD C2
Accumulating Class
USD C2 Accumulating
Class
USD E Accumulating
Class
USD E Accumulating
Class
USD I Accumulating
Class
USD I Accumulating
ClassYear Ended NAV NAV per Share NAV NAV per Share NAV NAV per Share
31 December 2019 $3,348,555 $12.77 $4,570,413 $12.76 $237,304,432 $12.86
31 December 2018 $4,810,108 $10.97 $4,850,172 $10.97 $198,320,044 $10.83
31 December 2017 $5,000,559 $13.78 $3,528,770 $13.78 $172,901,681 $13.34
USD M
Accumulating Class
USD M Accumulating
Class
USD T Accumulating
Class
USD T Accumulating
Class
USD Z Accumulating
Class
USD Z Accumulating
ClassYear Ended NAV NAV per Share NAV NAV per Share NAV NAV per Share
31 December 2019 $63,220,028 $13.60 $6,207,291 $13.17 $14,893,717 $12.82
31 December 2018 $54,878,694 $11.69 $6,300,020 $11.20 $8,251,717 $10.69
31 December 2017 $56,923,596 $14.68 $6,690,818 $13.93 $10,051,533 $13.03

FINANCIAL STATEMENTS NOTES TO THE AUDITED FINANCIAL STATEMENTS
1376 NEUBERGER BERMAN INVESTMENT FUNDS PLC
FOR THE YEAR ENDED 31 DECEMBER 2019
13. NET ASSET VALUE COMPARATIVE (CONTINUED) Neuberger Berman Emerging Markets Equity Fund (continued)
ZAR B
Accumulating Class
ZAR B Accumulating
Class
ZAR C2 Accumulating
Class
ZAR C2 Accumulating
Class
ZAR E Accumulating
Class
ZAR E Accumulating
ClassYear Ended NAV NAV per Share NAV NAV per Share NAV NAV per Share
31 December 2019 ZAR11,686,053 ZAR145.22 ZAR6,999,363 ZAR145.21 ZAR12,773,526 ZAR145.21
31 December 2018 ZAR15,730,343 ZAR120.72 ZAR7,452,042 ZAR120.71 ZAR15,423,455 ZAR120.71
31 December 2017 ZAR10,303,502 ZAR147.17 ZAR8,510,425 ZAR147.17 ZAR36,500,582 ZAR147.17
ZAR T
Accumulating Class
ZAR T Accumulating
ClassYear Ended NAV NAV per Share
31 December 2019 ZAR33,342,658 ZAR149.99
31 December 2018 ZAR34,991,411 ZAR123.28
31 December 2017 ZAR45,228,844 ZAR148.79
Neuberger Berman US Small Cap Fund
AUD B
Accumulating Class*
AUD B Accumulating
Class*
AUD C2 Accumulating
Class*
AUD C2 Accumulating
Class*
AUD E Accumulating
Class
AUD E Accumulating
ClassYear Ended NAV NAV per Share NAV NAV per Share NAV NAV per Share
31 December 2019 AUD78,191 AUD10.43 AUD35,108 AUD10.19 AUD556,570 AUD14.60
31 December 2018 – – AUD18,347 AUD8.15 AUD1,192,661 AUD11.69
31 December 2017 – – – – AUD209,077 AUD12.97

NOTES TO THE AUDITED FINANCIAL STATEMENTS FINANCIAL STATEMENTS
ANNUAL REPORT 2019 1377
FOR THE YEAR ENDED 31 DECEMBER 2019
13. NET ASSET VALUE COMPARATIVE (CONTINUED) Neuberger Berman US Small Cap Fund (continued)
AUD T
Accumulating Class
AUD T Accumulating
Class
EUR A Accumulating
Class
EUR A Accumulating
Class
EUR I Accumulating
Class
EUR I Accumulating
ClassYear Ended NAV NAV per Share NAV NAV per Share NAV NAV per Share
31 December 2019 AUD4,453,145 AUD13.10 €520,652 €14.21 €179,229 €16.37
31 December 2018 AUD656,737 AUD10.38 €565,072 €11.46 €501,606 €13.10
31 December 2017 AUD28,768 AUD11.40 €897,378 €12.86 €10,765,513 €14.58
EUR I Accumulating
Unhedged Class
EUR I Accumulating Unhedged
Class
EUR I2 Accumulating Unhedged
Class*
EUR I2 Accumulating Unhedged
Class*
EUR M Accumulating
Class
EUR M Accumulating
ClassYear Ended NAV NAV per Share NAV NAV per Share NAV NAV per Share
31 December 2019 €543,514 €13.13 €13,298,953 €12.18 €135,346 €14.84
31 December 2018 €13,506,593 €9.99 – – €176,553 €12.09
31 December 2017 €9,256,564 €10.27 – – €138,735 €13.70
EUR Z
Accumulating Class
EUR Z Accumulating
Class
GBP I Accumulating
Class*
GBP I Accumulating
Class*
JPY I Distributing
Class
JPY I Distributing
ClassYear Ended NAV NAV per Share NAV NAV per Share NAV NAV per Share
31 December 2019 €122,259 €15.10 £26,746 £11.26 ¥4,644,006,690 ¥3.35
31 December 2018 €76,316 €11.97 – – ¥4,879,536,850 ¥2.62
31 December 2017 €23,477 €13.21 – – ¥6,796,966,277 ¥2.91

FINANCIAL STATEMENTS NOTES TO THE AUDITED FINANCIAL STATEMENTS
1378 NEUBERGER BERMAN INVESTMENT FUNDS PLC
FOR THE YEAR ENDED 31 DECEMBER 2019
13. NET ASSET VALUE COMPARATIVE (CONTINUED) Neuberger Berman US Small Cap Fund (continued)
USD A
Accumulating Class
USD A Accumulating
Class
USD A Distributing
Class
USD A Distributing
Class
USD B Accumulating
Class
USD B Accumulating
ClassYear Ended NAV NAV per Share NAV NAV per Share NAV NAV per Share
31 December 2019 $32,648,117 $21.12 $2,573,488 $13.64 $3,191,151 $16.20
31 December 2018 $36,982,492 $16.53 $2,119,201 $10.67 $4,665,499 $12.82
31 December 2017 $57,338,929 $18.00 $506,001 $11.62 $2,534,134 $14.12
USD C
Accumulating Class
USD C Accumulating
Class
USD C2 Accumulating
Class
USD C2 Accumulating
Class
USD E Accumulating
Class
USD E Accumulating
ClassYear Ended NAV NAV per Share NAV NAV per Share NAV NAV per Share
31 December 2019 $278,433 $20.64 $458,466 $16.23 $1,378,132 $14.29
31 December 2018 $351,224 $16.22 $1,232,516 $12.85 $2,941,939 $11.31
31 December 2017 $537,921 $17.74 $415,575 $14.12 $683,600 $12.45
USD I
Accumulating Class
USD I Accumulating
Class
USD I Distributing
Class
USD I Distributing
Class
USD I2 Accumulating
Class
USD I2 Accumulating
ClassYear Ended NAV NAV per Share NAV NAV per Share NAV NAV per Share
31 December 2019 $112,174,058 $22.80 $8,038,627 $16.59 $509,278 $14.91
31 December 2018 $106,388,734 $17.69 $5,348,633 $12.87 $186,630 $11.54
31 December 2017 $179,588,744 $19.10 $20,484,661 $13.89 $971,248 $12.44

NOTES TO THE AUDITED FINANCIAL STATEMENTS FINANCIAL STATEMENTS
ANNUAL REPORT 2019 1379
FOR THE YEAR ENDED 31 DECEMBER 2019
13. NET ASSET VALUE COMPARATIVE (CONTINUED) Neuberger Berman US Small Cap Fund (continued)
USD I3
Accumulating Class*
USD I3 Accumulating
Class*
USD M Accumulating
Class
USD M Accumulating
Class
USD T Accumulating
Class
USD T Accumulating
ClassYear Ended NAV NAV per Share NAV NAV per Share NAV NAV per Share
31 December 2019 $92,942,690 $11,335.88 $94,867,605 $16.24 $2,360,659 $17.28
31 December 2018 $70,671,365 $8,772.53 $32,291,659 $12.84 $2,847,511 $13.54
31 December 2017 – – $48,512,606 $14.13 $1,787,181 $14.76
USD Z
Accumulating Class
USD Z Accumulating
Class
ZAR E Accumulating
Class
ZAR E Accumulating
Class
ZAR T Accumulating
Class
ZAR T Accumulating
ClassYear Ended NAV NAV per Share NAV NAV per Share NAV NAV per Share
31 December 2019 $61,270 $15.07 ZAR1,652,004 ZAR188.13 ZAR5,683,467 ZAR152.38
31 December 2018 $42,733 $11.59 ZAR27,156,294 ZAR143.08 ZAR16,185,316 ZAR114.74
31 December 2017 $13,689,211 $12.41 ZAR1,891,680 ZAR151.65 ZAR2,850,109 ZAR120.42
Neuberger Berman Short Duration High Yield Bond Fund
AUD A (Monthly)
Distributing Class
AUD A (Monthly) Distributing
Class
CHF A Accumulating
Class
CHF A Accumulating
Class
CHF I Accumulating
Class
CHF I Accumulating
ClassYear Ended NAV NAV per Share NAV NAV per Share NAV NAV per Share
31 December 2019 AUD1,030,797 AUD8.48 CHF1,328,897 CHF11.27 CHF1,012,407 CHF11.98
31 December 2018 AUD1,061,751 AUD8.25 CHF1,421,897 CHF10.74 CHF938,779 CHF11.35
31 December 2017 AUD1,151,602 AUD8.83 CHF2,288,565 CHF11.22 CHF1,174,624 CHF11.79

FINANCIAL STATEMENTS NOTES TO THE AUDITED FINANCIAL STATEMENTS
1380 NEUBERGER BERMAN INVESTMENT FUNDS PLC
FOR THE YEAR ENDED 31 DECEMBER 2019
13. NET ASSET VALUE COMPARATIVE (CONTINUED) Neuberger Berman Short Duration High Yield Bond Fund (continued)
CHF I2
Accumulating Class
CHF I2 Accumulating
Class
CHF I3 Distributing
Class
CHF I3 Distributing
Class
CNY A (Monthly) Distributing
Class
CNY A (Monthly) Distributing
ClassYear Ended NAV NAV per Share NAV NAV per Share NAV NAV per Share
31 December 2019 CHF53,753 CHF10.56 CHF14,397,876 CHF9.03 CNY2,058,692 CNY96.24
31 December 2018 CHF50,859 CHF9.99 CHF14,352,417 CHF9.01 CNY4,992,530 CNY93.27
31 December 2017 CHF91,677 CHF10.37 CHF15,674,846 CHF9.84 CNY2,652,298 CNY98.68
EUR A
Accumulating Class
EUR A Accumulating
Class
EUR A Distributing
Class
EUR A Distributing
Class
EUR I Accumulating
Class
EUR I Accumulating
ClassYear Ended NAV NAV per Share NAV NAV per Share NAV NAV per Share
31 December 2019 €19,869,123 €11.74 €6,807,935 €8.02 €19,771,392 €12.29
31 December 2018 €25,319,973 €11.15 €7,797,686 €7.97 €15,771,055 €11.60
31 December 2017 €67,663,316 €11.60 €9,746,317 €8.67 €93,292,356 €12.00
EUR I
Distributing Class
EUR I Distributing
Class
EUR I2 Accumulating
Class
EUR I2 Accumulating
Class
EUR I2 Distributing
Class
EUR I2 Distributing
ClassYear Ended NAV NAV per Share NAV NAV per Share NAV NAV per Share
31 December 2019 €495,841 €8.26 €3,734,087 €11.36 €610,344 €7.95
31 December 2018 €758,182 €8.21 €3,180,358 €10.70 €494,632 €7.90
31 December 2017 €6,729,164 €8.93 €5,871,519 €11.06 €424,607 €8.59

NOTES TO THE AUDITED FINANCIAL STATEMENTS FINANCIAL STATEMENTS
ANNUAL REPORT 2019 1381
FOR THE YEAR ENDED 31 DECEMBER 2019
13. NET ASSET VALUE COMPARATIVE (CONTINUED) Neuberger Berman Short Duration High Yield Bond Fund (continued)
EUR I3
Distributing Class
EUR I3 Distributing
Class
EUR M Accumulating
Class
EUR M Accumulating
Class
EUR M Distributing
Class
EUR M Distributing
ClassYear Ended NAV NAV per Share NAV NAV per Share NAV NAV per Share
31 December 2019 €255,499,145 €9.10 €3,123,808 €10.60 €734,362 €8.60
31 December 2018 €235,011,990 €9.04 €3,528,435 €10.13 €1,051,306 €8.72
31 December 2017 €249,821,451 €9.84 €4,277,838 €10.60 €1,300,730 €9.68
GBP A
Distributing Class*
GBP A Distributing
Class*
GBP I Accumulating
Class
GBP I Accumulating
Class
GBP I Distributing
Class
GBP I Distributing
ClassYear Ended NAV NAV per Share NAV NAV per Share NAV NAV per Share
31 December 2019 – – £14,583,904 £13.14 £4,918,709 £8.73
31 December 2018 £8,572 £8.24 £13,029,914 £12.24 £12,202,522 £8.56
31 December 2017 £761,856 £8.86 £7,762,809 £12.52 £45,995,360 £9.21
GBP I2
Accumulating Class
GBP I2 Accumulating
Class
GBP I2 Distributing
Class
GBP I2 Distributing
Class
JPY I Accumulating
Class
JPY I Accumulating
ClassYear Ended NAV NAV per Share NAV NAV per Share NAV NAV per Share
31 December 2019 £1,546,024 £12.16 £21,780,086 £8.51 ¥22,313,703,305 ¥1,223.99
31 December 2018 £1,415,100 £11.32 £13,228,696 £8.35 ¥23,896,055,823 ¥1,152.59
31 December 2017 £2,225,498 £11.57 £25,792,738 £8.98 ¥32,917,221,840 ¥1,188.37

FINANCIAL STATEMENTS NOTES TO THE AUDITED FINANCIAL STATEMENTS
1382 NEUBERGER BERMAN INVESTMENT FUNDS PLC
FOR THE YEAR ENDED 31 DECEMBER 2019
13. NET ASSET VALUE COMPARATIVE (CONTINUED) Neuberger Berman Short Duration High Yield Bond Fund (continued)
SGD A (Monthly)
Distributing Class
SGD A (Monthly) Distributing
Class
SGD A Accumulating
Class*
SGD A Accumulating
Class*
USD A (Monthly) Distributing
Class
USD A (Monthly) Distributing
ClassYear Ended NAV NAV per Share NAV NAV per Share NAV NAV per Share
31 December 2019 SGD337,523 SGD17.50 – – $2,712,987 $8.81
31 December 2018 SGD1,820,505 SGD16.99 – – $4,298,381 $8.48
31 December 2017 SGD2,735,647 SGD18.15 SGD311,508 SGD21.43 $8,092,705 $8.99
USD A
Accumulating Class
USD A Accumulating
Class
USD A Distributing
Class
USD A Distributing
Class
USD B (Monthly) Distributing
Class*
USD B (Monthly) Distributing
Class*Year Ended NAV NAV per Share NAV NAV per Share NAV NAV per Share
31 December 2019 $38,217,517 $12.97 $12,444,258 $8.91 – –
31 December 2018 $35,856,349 $11.94 $17,957,387 $8.58 $8,165 $7.64
31 December 2017 $64,530,430 $12.09 $14,528,822 $9.08 $8,849 $8.28
USD C
Accumulating Class
USD C Accumulating
Class
USD C Distributing
Class
USD C Distributing
Class
USD C1 Accumulating
Class
USD C1 Accumulating
ClassYear Ended NAV NAV per Share NAV NAV per Share NAV NAV per Share
31 December 2019 $455,023 $11.72 $149,307 $8.96 $15,176,504 $10.46
31 December 2018 $843,896 $10.86 $389,850 $8.63 $4,966,479 $9.73
31 December 2017 $1,602,365 $11.05 $727,838 $9.12 $164,926 $9.95

NOTES TO THE AUDITED FINANCIAL STATEMENTS FINANCIAL STATEMENTS
ANNUAL REPORT 2019 1383
FOR THE YEAR ENDED 31 DECEMBER 2019
13. NET ASSET VALUE COMPARATIVE (CONTINUED) Neuberger Berman Short Duration High Yield Bond Fund (continued)
USD I
Accumulating Class
USD I Accumulating
Class
USD I Distributing
Class
USD I Distributing
Class
USD I2 Accumulating
Class
USD I2 Accumulating
ClassYear Ended NAV NAV per Share NAV NAV per Share NAV NAV per Share
31 December 2019 $198,782,540 $13.59 $107,920,108 $9.11 $7,363,275 $12.70
31 December 2018 $188,548,433 $12.44 $30,868,632 $8.77 $91,212,732 $11.62
31 December 2017 $285,011,765 $12.52 $26,911,934 $9.28 $4,867,700 $11.68
USD I2
Distributing Class
USD I2 Distributing
Class
USD M Accumulating
Class
USD M Accumulating
Class
USD M Distributing
Class
USD M Distributing
ClassYear Ended NAV NAV per Share NAV NAV per Share NAV NAV per Share
31 December 2019 $3,272,875 $8.90 $3,009,256 $10.63 $853,070 $9.57
31 December 2018 $6,389,919 $8.57 $607,747 $9.85 $23,296 $9.40
31 December 2017 $8,798,433 $9.06 $312,263 $10.03 $14,786 $10.01
USD T (Monthly)
Distributing Class*
USD T (Monthly) Distributing
Class*
USD Z Accumulating
Class
USD Z Accumulating
ClassYear Ended NAV NAV per Share NAV NAV per Share
31 December 2019 – – $14,760,589 $12.06
31 December 2018 $8,418 $8.01 $11,191,724 $10.97
31 December 2017 $9,031 $8.59 $2,236,998 $10.97

FINANCIAL STATEMENTS NOTES TO THE AUDITED FINANCIAL STATEMENTS
1384 NEUBERGER BERMAN INVESTMENT FUNDS PLC
FOR THE YEAR ENDED 31 DECEMBER 2019
13. NET ASSET VALUE COMPARATIVE (CONTINUED) Neuberger Berman Global Bond Fund
USD A
Accumulating Class
USD A Accumulating
Class
USD C1 Accumulating
Class*
USD C1 Accumulating
Class*
USD I Accumulating
Class
USD I Accumulating
ClassYear Ended NAV NAV per Share NAV NAV per Share NAV NAV per Share
31 December 2019 $303,952 $11.14 $647,330 $10.12 $7,468,161 $10.92
31 December 2018 $33,910 $10.48 $48,106 $9.62 $32,858 $10.24
31 December 2017 $11,509 $10.78 – – $33,674 $10.49
USD M
Accumulating Class*
USD M Accumulating
Class*
USD M Distributing
Class*
USD M Distributing
Class*
USD Z Accumulating
Class
USD Z Accumulating
ClassYear Ended NAV NAV per Share NAV NAV per Share NAV NAV per Share
31 December 2019 $627,384 $10.51 $100,284 $10.13 $193,969,834 $11.33
31 December 2018 $223,952 $9.94 $97,590 $9.86 $144,491,014 $10.57
31 December 2017 – – – – $131,746,728 $10.79
Neuberger Berman Emerging Market Debt - Local Currency Fund
AUD B (Monthly)
Distributing Class
AUD B (Monthly) Distributing
Class
AUD B Accumulating
Class
AUD B Accumulating
Class
AUD C2 (Monthly) Distributing
Class
AUD C2 (Monthly) Distributing
ClassYear Ended NAV NAV per Share NAV NAV per Share NAV NAV per Share
31 December 2019 AUD53,171,902 AUD6.59 AUD2,306,512 AUD10.50 AUD18,966,784 AUD6.59
31 December 2018 AUD51,753,908 AUD6.64 AUD1,541,913 AUD9.52 AUD23,442,169 AUD6.64
31 December 2017 AUD29,860,623 AUD8.34 AUD636,599 AUD10.71 AUD13,440,680 AUD8.34

NOTES TO THE AUDITED FINANCIAL STATEMENTS FINANCIAL STATEMENTS
ANNUAL REPORT 2019 1385
FOR THE YEAR ENDED 31 DECEMBER 2019
13. NET ASSET VALUE COMPARATIVE (CONTINUED) Neuberger Berman Emerging Market Debt - Local Currency Fund (continued)
AUD C2
Accumulating Class
AUD C2 Accumulating
Class
AUD E (Monthly) Distributing
Class
AUD E (Monthly) Distributing
Class
AUD E Accumulating
Class
AUD E Accumulating
ClassYear Ended NAV NAV per Share NAV NAV per Share NAV NAV per Share
31 December 2019 AUD1,954,429 AUD10.50 AUD26,274,665 AUD6.60 AUD2,524,724 AUD10.49
31 December 2018 AUD1,565,634 AUD9.52 AUD27,038,914 AUD6.65 AUD3,060,127 AUD9.51
31 December 2017 AUD890,086 AUD10.71 AUD12,796,119 AUD8.35 AUD1,436,626 AUD10.71
AUD T (Monthly)
Distributing Class
AUD T (Monthly) Distributing
Class
AUD T Accumulating
Class
AUD T Accumulating
Class
EUR A Accumulating
Class
EUR A Accumulating
ClassYear Ended NAV NAV per Share NAV NAV per Share NAV NAV per Share
31 December 2019 AUD47,229,706 AUD6.90 AUD1,807,661 AUD10.98 €75,318,298 €8.81
31 December 2018 AUD27,538,553 AUD6.88 AUD1,347,423 AUD9.86 €7,073,200 €8.04
31 December 2017 AUD9,615,423 AUD8.55 AUD327,154 AUD10.98 €1,867,118 €9.17
EUR A Accumulating
Unhedged Class*
EUR A Accumulating Unhedged
Class*
EUR I Accumulating
Class
EUR I Accumulating
Class
EUR I Accumulating Unhedged
Class
EUR I Accumulating Unhedged
ClassYear Ended NAV NAV per Share NAV NAV per Share NAV NAV per Share
31 December 2019 – – €31,109,993 €9.24 €223,053,267 €10.90
31 December 2018 €9,767 €10.88 €54,113,244 €8.38 €177,861,615 €9.40
31 December 2017 €10,255 €11.42 €49,030,242 €9.47 €36,153,551 €9.80

FINANCIAL STATEMENTS NOTES TO THE AUDITED FINANCIAL STATEMENTS
1386 NEUBERGER BERMAN INVESTMENT FUNDS PLC
FOR THE YEAR ENDED 31 DECEMBER 2019
13. NET ASSET VALUE COMPARATIVE (CONTINUED) Neuberger Berman Emerging Market Debt - Local Currency Fund (continued)
EUR I2 Accumulating
Unhedged Class
EUR I2 Accumulating Unhedged
Class
EUR I3 Distributing Unhedged
Class*
EUR I3 Distributing Unhedged
Class*
EUR I4 Accumulating Unhedged
Class
EUR I4 Accumulating Unhedged
ClassYear Ended NAV NAV per Share NAV NAV per Share NAV NAV per Share
31 December 2019 €60,095,182 €12.79 €14,476,021 €10.68 €613,151 €11.57
31 December 2018 €51,767,858 €11.02 – – €439,255 €9.95
31 December 2017 €53,863,305 €11.46 – – €492,560 €10.34
EUR I4 Distributing
Unhedged Class
EUR I4 Distributing Unhedged
Class
EUR I5 Accumulating Unhedged
Class*
EUR I5 Accumulating Unhedged
Class*
EUR M Accumulating Unhedged
Class
EUR M Accumulating Unhedged
ClassYear Ended NAV NAV per Share NAV NAV per Share NAV NAV per Share
31 December 2019 €25,069,490 €9.74 €55,231,639 €11.02 €249,400 €12.02
31 December 2018 €22,720,923 €8.82 – – €227,747 €10.53
31 December 2017 €24,827,190 €9.64 – – €119,683 €11.15
EUR M Distributing
Unhedged Class
EUR M Distributing Unhedged
Class
GBP I Accumulating
Class
GBP I Accumulating
Class
GBP I4 Accumulating Unhedged
Class
GBP I4 Accumulating Unhedged
ClassYear Ended NAV NAV per Share NAV NAV per Share NAV NAV per Share
31 December 2019 €418,175 €9.29 £87,891 £9.86 £264,170,981 £10.82
31 December 2018 €402,996 €8.74 £8,920 £8.82 £233,491,844 £9.85
31 December 2017 €360,109 €9.92 £9,958 £9.85 £154,673,685 £10.12

NOTES TO THE AUDITED FINANCIAL STATEMENTS FINANCIAL STATEMENTS
ANNUAL REPORT 2019 1387
FOR THE YEAR ENDED 31 DECEMBER 2019
13. NET ASSET VALUE COMPARATIVE (CONTINUED) Neuberger Berman Emerging Market Debt - Local Currency Fund (continued)
GBP I4 Distributing
Unhedged Class
GBP I4 Distributing Unhedged
Class
GBP I5 Accumulating Unhedged
Class*
GBP I5 Accumulating Unhedged
Class*
SEK A Accumulating
Class
SEK A Accumulating
ClassYear Ended NAV NAV per Share NAV NAV per Share NAV NAV per Share
31 December 2019 £73,570,500 £9.30 £84,631,482 £11.83 SEK1,146,155,541 SEK109.27
31 December 2018 £54,352,495 £8.93 £110,259,360 £10.77 SEK1,432,514,318 SEK99.62
31 December 2017 £117,560,654 £9.65 – – SEK2,046,275,423 SEK113.70
SGD A (Monthly)
Distributing Class
SGD A (Monthly) Distributing
Class
USD A (Monthly) Distributing
Class
USD A (Monthly) Distributing
Class
USD A Accumulating
Class
USD A Accumulating
ClassYear Ended NAV NAV per Share NAV NAV per Share NAV NAV per Share
31 December 2019 SGD2,450,589 SGD16.77 $3,809,061 $7.32 $54,455,299 $9.89
31 December 2018 SGD1,421,356 SGD15.97 $1,392,437 $6.92 $44,920,863 $8.75
31 December 2017 SGD1,589,547 SGD18.97 $403,720 $8.12 $78,665,650 $9.65
USD B (Monthly)
Distributing Class
USD B (Monthly) Distributing
Class
USD B Accumulating
Class
USD B Accumulating
Class
USD C1 Accumulating
Class
USD C1 Accumulating
ClassYear Ended NAV NAV per Share NAV NAV per Share NAV NAV per Share
31 December 2019 $121,688,327 $7.10 $7,709,700 $10.56 $324,154 $10.43
31 December 2018 $103,348,166 $7.04 $6,046,334 $9.47 $290,926 $9.33
31 December 2017 $71,837,559 $8.66 $1,876,997 $10.58 $61,225 $10.39

FINANCIAL STATEMENTS NOTES TO THE AUDITED FINANCIAL STATEMENTS
1388 NEUBERGER BERMAN INVESTMENT FUNDS PLC
FOR THE YEAR ENDED 31 DECEMBER 2019
13. NET ASSET VALUE COMPARATIVE (CONTINUED) Neuberger Berman Emerging Market Debt - Local Currency Fund (continued)
USD C2 (Monthly)
Distributing Class
USD C2 (Monthly) Distributing
Class
USD C2 Accumulating
Class
USD C2 Accumulating
Class
USD E (Monthly) Distributing
Class
USD E (Monthly) Distributing
ClassYear Ended NAV NAV per Share NAV NAV per Share NAV NAV per Share
31 December 2019 $25,351,267 $7.10 $3,579,153 $10.57 $39,735,367 $7.10
31 December 2018 $31,123,655 $7.04 $3,204,749 $9.48 $33,085,416 $7.04
31 December 2017 $15,809,310 $8.66 $1,561,602 $10.59 $19,416,022 $8.66
USD E
Accumulating Class
USD E Accumulating
Class
USD I (Monthly) Distributing
Class*
USD I (Monthly) Distributing
Class*
USD I Accumulating
Class
USD I Accumulating
ClassYear Ended NAV NAV per Share NAV NAV per Share NAV NAV per Share
31 December 2019 $4,754,527 $10.57 $11,149 $9.81 $654,159,102 $10.39
31 December 2018 $4,663,626 $9.48 $10,455 $9.20 $454,921,914 $9.13
31 December 2017 $2,084,122 $10.59 – – $408,130,875 $9.99
USD I
Distributing Class
USD I Distributing
Class
USD I2 Accumulating
Class
USD I2 Accumulating
Class
USD I4 Accumulating
Class*
USD I4 Accumulating
Class*Year Ended NAV NAV per Share NAV NAV per Share NAV NAV per Share
31 December 2019 $29,372,466 $9.87 $130,433,174 $10.04 – –
31 December 2018 $39,390,173 $9.11 $116,923,966 $8.81 – –
31 December 2017 $21,845,198 $10.45 $283,372,015 $9.63 $134,784,887 $12.44

NOTES TO THE AUDITED FINANCIAL STATEMENTS FINANCIAL STATEMENTS
ANNUAL REPORT 2019 1389
FOR THE YEAR ENDED 31 DECEMBER 2019
13. NET ASSET VALUE COMPARATIVE (CONTINUED) Neuberger Berman Emerging Market Debt - Local Currency Fund (continued)
USD I5
Accumulating Class*
USD I5 Accumulating
Class*
USD M Accumulating
Class
USD M Accumulating
Class
USD M Distributing
Class*
USD M Distributing
Class*Year Ended NAV NAV per Share NAV NAV per Share NAV NAV per Share
31 December 2019 $317,941,719 $11.66 $62,045 $10.07 $20,678 $10.34
31 December 2018 $179,850,620 $10.21 $34,988 $8.99 – –
31 December 2017 – – $24,628 $9.99 – –
USD T (Monthly)
Distributing Class
USD T (Monthly) Distributing
Class
USD T Accumulating
Class
USD T Accumulating
Class
USD X Accumulating
Class
USD X Accumulating
ClassYear Ended NAV NAV per Share NAV NAV per Share NAV NAV per Share
31 December 2019 $60,701,499 $7.55 $3,464,440 $11.05 $173,527,077 $10.14
31 December 2018 $35,562,608 $7.41 $2,667,380 $9.81 $146,429,213 $8.87
31 December 2017 $13,355,611 $9.03 $1,265,956 $10.85 $132,634,354 $9.67
ZAR B (Monthly)
Distributing Class
ZAR B (Monthly) Distributing
Class
ZAR B Accumulating
Class
ZAR B Accumulating
Class
ZAR C2 (Monthly) Distributing
Class
ZAR C2 (Monthly) Distributing
ClassYear Ended NAV NAV per Share NAV NAV per Share NAV NAV per Share
31 December 2019 ZAR1,104,030,427 ZAR68.28 ZAR47,865,481 ZAR130.59 ZAR310,368,705 ZAR68.27
31 December 2018 ZAR895,516,564 ZAR68.62 ZAR39,069,118 ZAR112.56 ZAR376,119,186 ZAR68.63
31 December 2017 ZAR455,793,510 ZAR86.73 ZAR16,305,192 ZAR121.62 ZAR199,013,467 ZAR86.74

FINANCIAL STATEMENTS NOTES TO THE AUDITED FINANCIAL STATEMENTS
1390 NEUBERGER BERMAN INVESTMENT FUNDS PLC
FOR THE YEAR ENDED 31 DECEMBER 2019
13. NET ASSET VALUE COMPARATIVE (CONTINUED) Neuberger Berman Emerging Market Debt - Local Currency Fund (continued)
ZAR C2
Accumulating Class
ZAR C2 Accumulating
Class
ZAR E (Monthly) Distributing
Class
ZAR E (Monthly) Distributing
Class
ZAR E Accumulating
Class
ZAR E Accumulating
ClassYear Ended NAV NAV per Share NAV NAV per Share NAV NAV per Share
31 December 2019 ZAR15,417,316 ZAR130.57 ZAR497,516,359 ZAR68.29 ZAR30,881,561 ZAR130.61
31 December 2018 ZAR13,826,727 ZAR112.57 ZAR384,977,542 ZAR68.62 ZAR26,169,361 ZAR112.58
31 December 2017 ZAR10,800,063 ZAR121.62 ZAR157,947,936 ZAR86.74 ZAR5,101,253 ZAR121.64
ZAR T (Monthly)
Distributing Class
ZAR T (Monthly) Distributing
Class
ZAR T Accumulating
Class
ZAR T Accumulating
ClassYear Ended NAV NAV per Share NAV NAV per Share
31 December 2019 ZAR1,205,700,585 ZAR71.49 ZAR52,810,258 ZAR136.72
31 December 2018 ZAR685,100,456 ZAR71.12 ZAR43,521,925 ZAR116.67
31 December 2017 ZAR108,126,499 ZAR89.00 ZAR17,193,880 ZAR124.79 Neuberger Berman Emerging Market Debt - Hard Currency Fund
AUD A (Monthly)
Distributing Class*
AUD A (Monthly) Distributing
Class*
CHF P Accumulating
Class*
CHF P Accumulating
Class*
EUR A (Monthly) Distributing
Class*
EUR A (Monthly) Distributing
Class*Year Ended NAV NAV per Share NAV NAV per Share NAV NAV per Share
31 December 2019 AUD5,140,208 AUD10.34 CHF25,269,410 CHF10.02 €10,947,421 €9.50
31 December 2018 – – CHF7,349,943 CHF8.99 €349,683 €8.99

NOTES TO THE AUDITED FINANCIAL STATEMENTS FINANCIAL STATEMENTS
ANNUAL REPORT 2019 1391
FOR THE YEAR ENDED 31 DECEMBER 2019
13. NET ASSET VALUE COMPARATIVE (CONTINUED) Neuberger Berman Emerging Market Debt - Hard Currency Fund (continued)
EUR A
Accumulating Class
EUR A Accumulating
Class
EUR I Accumulating
Class
EUR I Accumulating
Class
EUR I Accumulating Unhedged
Class*
EUR I Accumulating Unhedged
Class*Year Ended NAV NAV per Share NAV NAV per Share NAV NAV per Share
31 December 2019 €37,476,419 €12.45 €300,913,681 €13.18 €1,013,938 €10.14
31 December 2018 €27,852,863 €11.20 €290,803,350 €11.78 – –
31 December 2017 €32,116,072 €12.35 €205,859,273 €12.90 – –
EUR I
Distributing Class
EUR I Distributing
Class
EUR I2 Accumulating
Class*
EUR I2 Accumulating
Class*
EUR I2 Distributing
Class*
EUR I2 Distributing
Class*Year Ended NAV NAV per Share NAV NAV per Share NAV NAV per Share
31 December 2019 €223,890,055 €9.53 €79,783,684 €10.03 €11,700,610 €10.17
31 December 2018 €141,574,840 €8.93 – – – –
31 December 2017 €83,788,977 €10.23 – – – –
EUR I3
Accumulating Class
EUR I3 Accumulating
Class
EUR I3 Accumulating Unhedged
Class*
EUR I3 Accumulating Unhedged
Class*
EUR I3 Distributing
Class*
EUR I3 Distributing
Class*Year Ended NAV NAV per Share NAV NAV per Share NAV NAV per Share
31 December 2019 €38,766,134 €11.23 €71,115,212 €10.00 €7,186,356 €10.35
31 December 2018 €55,138,327 €10.01 – – – –
31 December 2017 €62,428,012 €10.94 – – – –

FINANCIAL STATEMENTS NOTES TO THE AUDITED FINANCIAL STATEMENTS
1392 NEUBERGER BERMAN INVESTMENT FUNDS PLC
FOR THE YEAR ENDED 31 DECEMBER 2019
13. NET ASSET VALUE COMPARATIVE (CONTINUED) Neuberger Berman Emerging Market Debt - Hard Currency Fund (continued)
EUR I4
Accumulating Class
EUR I4 Accumulating
Class
EUR I5 Accumulating
Class*
EUR I5 Accumulating
Class*
EUR M Accumulating
Class
EUR M Accumulating
ClassYear Ended NAV NAV per Share NAV NAV per Share NAV NAV per Share
31 December 2019 €38,251,201 €12.65 – – €1,613,459 €11.98
31 December 2018 €82,776,821 €11.28 – – €831,276 €10.88
31 December 2017 €89,850,504 €12.31 €1,631,449 €12.13 €806,996 €12.09
EUR M
Distributing Class
EUR M Distributing
Class
EUR P Accumulating
Class*
EUR P Accumulating
Class*
EUR Z Accumulating
Class*
EUR Z Accumulating
Class*Year Ended NAV NAV per Share NAV NAV per Share NAV NAV per Share
31 December 2019 €835,953 €9.72 €9,502,827 €10.20 €220,843 €10.36
31 December 2018 €889,559 €9.32 €4,127,764 €9.11 €196,042 €9.20
31 December 2017 €880,497 €10.94 – – – –
GBP I
Accumulating Class
GBP I Accumulating
Class
GBP I Distributing
Class*
GBP I Distributing
Class*
GBP I2 Accumulating
Class*
GBP I2 Accumulating
Class*Year Ended NAV NAV per Share NAV NAV per Share NAV NAV per Share
31 December 2019 £2,432,822 £11.93 £3,583,582 £9.90 £5,691,299 £10.44
31 December 2018 £614,701 £10.53 £10,240,570 £9.17 £6,183,382 £9.20
31 December 2017 £40,436 £11.40 – – – –

NOTES TO THE AUDITED FINANCIAL STATEMENTS FINANCIAL STATEMENTS
ANNUAL REPORT 2019 1393
FOR THE YEAR ENDED 31 DECEMBER 2019
13. NET ASSET VALUE COMPARATIVE (CONTINUED) Neuberger Berman Emerging Market Debt - Hard Currency Fund (continued)
GBP I2
Distributing Class
GBP I2 Distributing
Class
GBP P Accumulating
Class*
GBP P Accumulating
Class*
HKD A (Monthly) Distributing
Class*
HKD A (Monthly) Distributing
Class*Year Ended NAV NAV per Share NAV NAV per Share NAV NAV per Share
31 December 2019 £2,015,068 £10.30 £3,351,568 £10.68 HKD16,477,906 HKD10.71
31 December 2018 £915,263 £9.53 £9,214 £9.42 – –
31 December 2017 £3,828,443 £10.79 – – – –
JPY I
Accumulating Class
JPY I Accumulating
Class
SEK A Accumulating
Class
SEK A Accumulating
Class
SGD A (Monthly) Distributing
Class
SGD A (Monthly) Distributing
ClassYear Ended NAV NAV per Share NAV NAV per Share NAV NAV per Share
31 December 2019 ¥2,069,488,397 ¥1,034.74 SEK315,309,604 SEK119.47 SGD28,201,165 SGD20.43
31 December 2018 ¥1,846,679,962 ¥923.34 SEK646,442,590 SEK107.28 SGD21,117,030 SGD18.90
31 December 2017 ¥2,014,311,862 ¥1,007.16 SEK29,005,834 SEK118.40 SGD20,101,361 SGD21.47
USD A (Monthly)
Distributing Class
USD A (Monthly) Distributing
Class
USD A Accumulating
Class
USD A Accumulating
Class
USD C1 Accumulating
Class
USD C1 Accumulating
ClassYear Ended NAV NAV per Share NAV NAV per Share NAV NAV per Share
31 December 2019 $136,979,799 $9.99 $174,440,412 $13.89 $34,220,961 $10.75
31 December 2018 $85,587,787 $9.18 $96,730,883 $12.14 $16,308,843 $9.49
31 December 2017 $64,765,543 $10.33 $73,592,488 $13.00 $9,355,113 $10.26

FINANCIAL STATEMENTS NOTES TO THE AUDITED FINANCIAL STATEMENTS
1394 NEUBERGER BERMAN INVESTMENT FUNDS PLC
FOR THE YEAR ENDED 31 DECEMBER 2019
13. NET ASSET VALUE COMPARATIVE (CONTINUED) Neuberger Berman Emerging Market Debt - Hard Currency Fund (continued)
USD I
Accumulating Class
USD I Accumulating
Class
USD I Distributing
Class
USD I Distributing
Class
USD I2 Accumulating
Class
USD I2 Accumulating
ClassYear Ended NAV NAV per Share NAV NAV per Share NAV NAV per Share
31 December 2019 $697,701,370 $14.55 $94,264,886 $10.66 $26,129,629 $12.57
31 December 2018 $186,228,177 $12.62 $56,062,944 $9.69 $80,107,925 $10.89
31 December 2017 $124,725,884 $13.42 $39,400,536 $10.78 $23,307,426 $11.57
USD I2
Distributing Class*
USD I2 Distributing
Class*
USD I3 Distributing
Class*
USD I3 Distributing
Class*
USD M Accumulating
Class
USD M Accumulating
ClassYear Ended NAV NAV per Share NAV NAV per Share NAV NAV per Share
31 December 2019 $12,860,393 $10.33 $142,227,912 $10.52 $36,566,263 $10.78
31 December 2018 $9,033,129 $9.40 – – $15,922,175 $9.49
31 December 2017 – – – – $9,976,718 $10.25
USD M
Distributing Class
USD M Distributing
Class
USD P Accumulating
Class*
USD P Accumulating
Class*
USD Z Accumulating
Class
USD Z Accumulating
ClassYear Ended NAV NAV per Share NAV NAV per Share NAV NAV per Share
31 December 2019 $7,137,384 $9.50 $57,544,600 $10.80 $16,410,966 $11.85
31 December 2018 $2,884,296 $8.85 $70,709,354 $9.37 $32,294,932 $10.21
31 December 2017 $1,619,647 $10.09 – – $11,241,088 $10.78

NOTES TO THE AUDITED FINANCIAL STATEMENTS FINANCIAL STATEMENTS
ANNUAL REPORT 2019 1395
FOR THE YEAR ENDED 31 DECEMBER 2019
13. NET ASSET VALUE COMPARATIVE (CONTINUED) Neuberger Berman Emerging Market Corporate Debt Fund
CHF A
Accumulating Class
CHF A Accumulating
Class
CHF I Accumulating
Class
CHF I Accumulating
Class
CHF I2 Accumulating
Class
CHF I2 Accumulating
ClassYear Ended NAV NAV per Share NAV NAV per Share NAV NAV per Share
31 December 2019 CHF492,499 CHF11.86 CHF27,769,228 CHF12.58 CHF456,042 CHF11.40
31 December 2018 CHF639,763 CHF10.93 CHF20,735,194 CHF11.50 CHF416,221 CHF10.41
31 December 2017 CHF1,130,140 CHF11.78 CHF19,480,107 CHF12.30 CHF110,394 CHF11.11
CHF I4
Accumulating Class*
CHF I4 Accumulating
Class*
CHF I5 Accumulating
Class
CHF I5 Accumulating
Class
EUR A Accumulating
Class
EUR A Accumulating
ClassYear Ended NAV NAV per Share NAV NAV per Share NAV NAV per Share
31 December 2019 CHF13,130,834 CHF10.10 CHF993,680 CHF11.62 €3,978,256 €11.60
31 December 2018 – – CHF2,742,537 CHF10.58 €3,249,114 €10.64
31 December 2017 – – CHF2,939,163 CHF11.27 €3,456,941 €11.42
EUR I
Accumulating Class
EUR I Accumulating
Class
EUR I Distributing
Class
EUR I Distributing
Class
EUR I2 Accumulating
Class
EUR I2 Accumulating
ClassYear Ended NAV NAV per Share NAV NAV per Share NAV NAV per Share
31 December 2019 €5,843,459 €13.00 €467,219 €9.39 €29,085 €11.72
31 December 2018 €199,247 €11.83 €276,145 €8.95 €26,435 €10.66
31 December 2017 €279,402 €12.60 €9,056,607 €9.99 €872,851 €11.34

FINANCIAL STATEMENTS NOTES TO THE AUDITED FINANCIAL STATEMENTS
1396 NEUBERGER BERMAN INVESTMENT FUNDS PLC
FOR THE YEAR ENDED 31 DECEMBER 2019
13. NET ASSET VALUE COMPARATIVE (CONTINUED) Neuberger Berman Emerging Market Corporate Debt Fund (continued)
EUR I3
Accumulating Class
EUR I3 Accumulating
Class
EUR I5 Accumulating
Class
EUR I5 Accumulating
Class
EUR M Accumulating
Class
EUR M Accumulating
ClassYear Ended NAV NAV per Share NAV NAV per Share NAV NAV per Share
31 December 2019 €1,974,280 €10.99 €894,078 €12.03 €1,050,765 €11.35
31 December 2018 €1,695,545 €9.97 €6,099,663 €10.91 €932,019 €10.50
31 December 2017 €1,066,832 €10.59 €9,810,607 €11.57 €646,220 €11.37
EUR M
Distributing Class
EUR M Distributing
Class
EUR X Accumulating
Class
EUR X Accumulating
Class
GBP I Accumulating
Class
GBP I Accumulating
ClassYear Ended NAV NAV per Share NAV NAV per Share NAV NAV per Share
31 December 2019 €1,015,121 €9.27 €47,359,248 €11.64 £115,017 £13.69
31 December 2018 €1,047,518 €9.07 €42,932,435 €10.55 £56,912 £12.31
31 December 2017 €1,111,867 €10.39 €45,534,284 €11.19 £1,014 £12.95
GBP I2
Accumulating Class*
GBP I2 Accumulating
Class*
GBP I5 Accumulating
Class
GBP I5 Accumulating
Class
SEK A Accumulating
Class*
SEK A Accumulating
Class*Year Ended NAV NAV per Share NAV NAV per Share NAV NAV per Share
31 December 2019 – – £25,082 £12.54 SEK6,540,142 SEK101.25
31 December 2018 – – £496,082 £11.23 SEK1,320,004 SEK92.67
31 December 2017 £235,623 £11.68 £794,269 £11.78 – –

NOTES TO THE AUDITED FINANCIAL STATEMENTS FINANCIAL STATEMENTS
ANNUAL REPORT 2019 1397
FOR THE YEAR ENDED 31 DECEMBER 2019
13. NET ASSET VALUE COMPARATIVE (CONTINUED) Neuberger Berman Emerging Market Corporate Debt Fund (continued)
SGD A (Monthly)
Distributing Class
SGD A (Monthly) Distributing
Class
USD A (Monthly) Distributing
Class
USD A (Monthly) Distributing
Class
USD A Accumulating
Class
USD A Accumulating
ClassYear Ended NAV NAV per Share NAV NAV per Share NAV NAV per Share
31 December 2019 SGD40,354 SGD18.85 $3,444,731 $9.44 $9,257,707 $13.59
31 December 2018 SGD26,907 SGD17.77 $3,050,678 $8.84 $3,016,543 $12.11
31 December 2017 SGD40,183 SGD19.66 $7,665,639 $9.70 $4,153,644 $12.64
USD C1
Accumulating Class
USD C1 Accumulating
Class
USD I Accumulating
Class
USD I Accumulating
Class
USD I Distributing
Class
USD I Distributing
ClassYear Ended NAV NAV per Share NAV NAV per Share NAV NAV per Share
31 December 2019 $8,197,957 $10.67 $28,196,839 $14.31 $3,187,646 $10.74
31 December 2018 $1,552,868 $9.60 $15,518,330 $12.65 $2,874,337 $9.93
31 December 2017 $1,454,161 $10.12 $16,501,178 $13.09 $439,807 $10.76
USD I2
Accumulating Class
USD I2 Accumulating
Class
USD I5 Accumulating
Class
USD I5 Accumulating
Class
USD M Accumulating
Class
USD M Accumulating
ClassYear Ended NAV NAV per Share NAV NAV per Share NAV NAV per Share
31 December 2019 $1,206,546 $12.88 $3,939,704 $13.20 $2,194,974 $10.67
31 December 2018 $621,636 $11.36 $365,031 $11.63 $9,954 $9.58
31 December 2017 $848,927 $11.75 $514,098 $11.99 $119,861 $10.07

FINANCIAL STATEMENTS NOTES TO THE AUDITED FINANCIAL STATEMENTS
1398 NEUBERGER BERMAN INVESTMENT FUNDS PLC
FOR THE YEAR ENDED 31 DECEMBER 2019
13. NET ASSET VALUE COMPARATIVE (CONTINUED) Neuberger Berman Emerging Market Corporate Debt Fund (continued)
USD M
Distributing Class
USD M Distributing
Class
USD Z Accumulating
Class*
USD Z Accumulating
Class*Year Ended NAV NAV per Share NAV NAV per Share
31 December 2019 $512,705 $9.52 – –
31 December 2018 $44,141 $9.05 $1,209,564 $11.67
31 December 2017 $205,712 $10.02 $1,527,994 $11.99
Neuberger Berman Strategic Income Fund
AUD A (Monthly)
Distributing Class
AUD A (Monthly) Distributing
Class
AUD Z (Monthly) Distributing
Class*
AUD Z (Monthly) Distributing
Class*
EUR A (Monthly) Distributing
Class
EUR A (Monthly) Distributing
ClassYear Ended NAV NAV per Share NAV NAV per Share NAV NAV per Share
31 December 2019 AUD8,101,562 AUD9.60 AUD102,244 AUD10.06 €17,540,607 €9.16
31 December 2018 AUD4,859,741 AUD9.21 – – €8,041,409 €8.98
31 December 2017 AUD3,813,542 AUD9.95 – – €2,009,009 €9.91
EUR A
Accumulating Class
EUR A Accumulating
Class
EUR I Accumulating
Class
EUR I Accumulating
Class
EUR M Accumulating
Class
EUR M Accumulating
ClassYear Ended NAV NAV per Share NAV NAV per Share NAV NAV per Share
31 December 2019 €1,321,253 €11.03 €1,664,795 €11.27 €1,541,228 €10.75
31 December 2018 €2,091,828 €10.39 €1,228,682 €10.56 €452,385 €10.18
31 December 2017 €130,619 €11.02 €1,061,364 €11.14 €203,325 €10.86
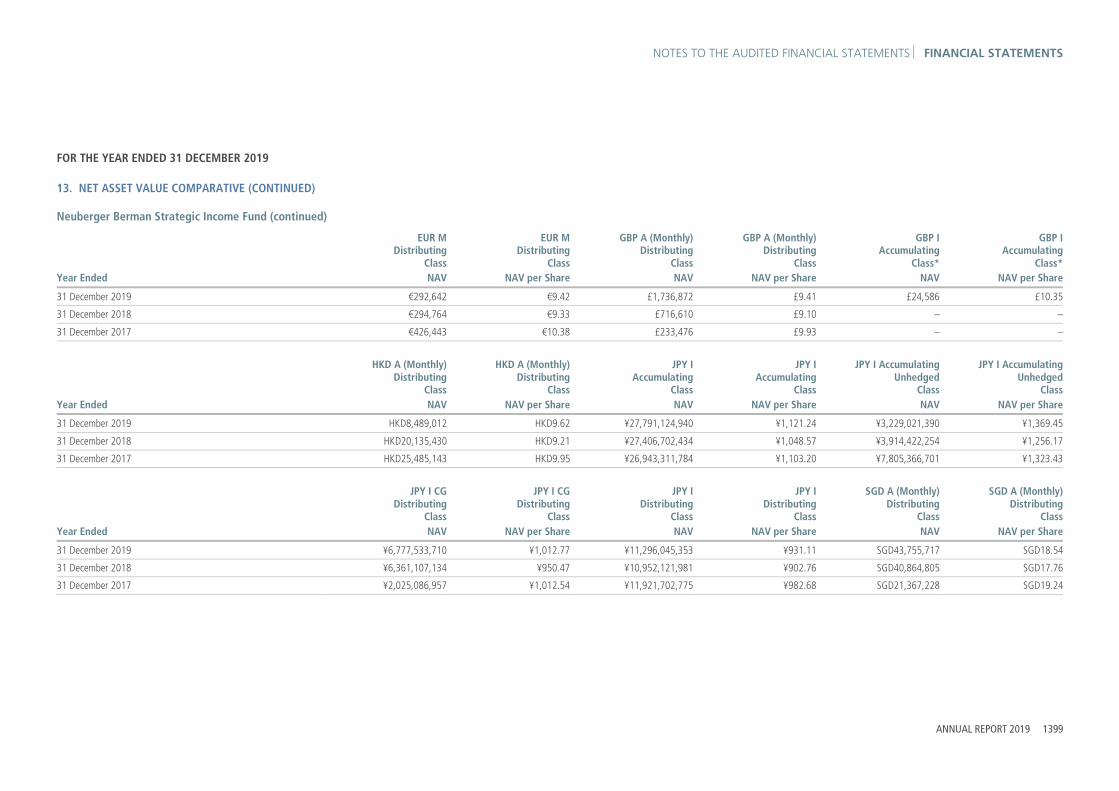
NOTES TO THE AUDITED FINANCIAL STATEMENTS FINANCIAL STATEMENTS
ANNUAL REPORT 2019 1399
FOR THE YEAR ENDED 31 DECEMBER 2019
13. NET ASSET VALUE COMPARATIVE (CONTINUED) Neuberger Berman Strategic Income Fund (continued)
EUR M
Distributing Class
EUR M Distributing
Class
GBP A (Monthly) Distributing
Class
GBP A (Monthly) Distributing
Class
GBP I Accumulating
Class*
GBP I Accumulating
Class*Year Ended NAV NAV per Share NAV NAV per Share NAV NAV per Share
31 December 2019 €292,642 €9.42 £1,736,872 £9.41 £24,586 £10.35
31 December 2018 €294,764 €9.33 £716,610 £9.10 – –
31 December 2017 €426,443 €10.38 £233,476 £9.93 – –
HKD A (Monthly)
Distributing Class
HKD A (Monthly) Distributing
Class
JPY I Accumulating
Class
JPY I Accumulating
Class
JPY I Accumulating Unhedged
Class
JPY I Accumulating Unhedged
ClassYear Ended NAV NAV per Share NAV NAV per Share NAV NAV per Share
31 December 2019 HKD8,489,012 HKD9.62 ¥27,791,124,940 ¥1,121.24 ¥3,229,021,390 ¥1,369.45
31 December 2018 HKD20,135,430 HKD9.21 ¥27,406,702,434 ¥1,048.57 ¥3,914,422,254 ¥1,256.17
31 December 2017 HKD25,485,143 HKD9.95 ¥26,943,311,784 ¥1,103.20 ¥7,805,366,701 ¥1,323.43
JPY I CG
Distributing Class
JPY I CG Distributing
Class
JPY I Distributing
Class
JPY I Distributing
Class
SGD A (Monthly) Distributing
Class
SGD A (Monthly) Distributing
ClassYear Ended NAV NAV per Share NAV NAV per Share NAV NAV per Share
31 December 2019 ¥6,777,533,710 ¥1,012.77 ¥11,296,045,353 ¥931.11 SGD43,755,717 SGD18.54
31 December 2018 ¥6,361,107,134 ¥950.47 ¥10,952,121,981 ¥902.76 SGD40,864,805 SGD17.76
31 December 2017 ¥2,025,086,957 ¥1,012.54 ¥11,921,702,775 ¥982.68 SGD21,367,228 SGD19.24

FINANCIAL STATEMENTS NOTES TO THE AUDITED FINANCIAL STATEMENTS
1400 NEUBERGER BERMAN INVESTMENT FUNDS PLC
FOR THE YEAR ENDED 31 DECEMBER 2019
13. NET ASSET VALUE COMPARATIVE (CONTINUED) Neuberger Berman Strategic Income Fund (continued)
SGD A
Accumulating Class
SGD A Accumulating
Class
SGD I (Monthly) Distributing
Class*
SGD I (Monthly) Distributing
Class*
USD A (Monthly) Distributing
Class
USD A (Monthly) Distributing
ClassYear Ended NAV NAV per Share NAV NAV per Share NAV NAV per Share
31 December 2019 SGD1,340,586 SGD20.99 SGD9,112,952 SGD20.32 $58,114,420 $9.34
31 December 2018 SGD954,381 SGD19.32 SGD12,372,760 SGD19.36 $43,244,460 $8.88
31 December 2017 SGD13,715 SGD20.10 – – $56,158,805 $9.53
USD A
Accumulating Class
USD A Accumulating
Class
USD A Distributing
Class
USD A Distributing
Class
USD C1 Accumulating
Class
USD C1 Accumulating
ClassYear Ended NAV NAV per Share NAV NAV per Share NAV NAV per Share
31 December 2019 $302,431,767 $11.58 $4,881,428 $10.36 $74,322,387 $10.49
31 December 2018 $83,840,661 $10.58 $153,868 $9.75 $22,921,793 $9.68
31 December 2017 $67,207,372 $10.91 $60,929 $10.31 $18,757,306 $10.08
USD I
Accumulating Class
USD I Accumulating
Class
USD I Distributing
Class
USD I Distributing
Class
USD I2 Accumulating
Class*
USD I2 Accumulating
Class*Year Ended NAV NAV per Share NAV NAV per Share NAV NAV per Share
31 December 2019 $365,170,594 $12.32 $14,149,548 $10.40 $13,140 $10.88
31 December 2018 $339,334,017 $11.19 $7,739,411 $9.80 $11,926 $9.88
31 December 2017 $431,930,424 $11.48 $12,204,564 $10.40 – –

NOTES TO THE AUDITED FINANCIAL STATEMENTS FINANCIAL STATEMENTS
ANNUAL REPORT 2019 1401
FOR THE YEAR ENDED 31 DECEMBER 2019
13. NET ASSET VALUE COMPARATIVE (CONTINUED) Neuberger Berman Strategic Income Fund (continued)
USD M
Accumulating Class
USD M Accumulating
Class
USD M Distributing
Class
USD M Distributing
Class
USD T (Monthly) Distributing
Class*
USD T (Monthly) Distributing
Class*Year Ended NAV NAV per Share NAV NAV per Share NAV NAV per Share
31 December 2019 $62,797,276 $11.78 $7,242,203 $9.69 – –
31 December 2018 $12,574,111 $10.83 $1,931,185 $9.30 $9,464 $9.61
31 December 2017 $7,318,709 $11.23 $2,270,466 $10.06 $10,202 $10.36
USD Z
Accumulating Class
USD Z Accumulating
ClassYear Ended NAV NAV per Share
31 December 2019 $27,627,043 $12.25
31 December 2018 $29,083,843 $11.07
31 December 2017 $29,196,193 $11.31
Neuberger Berman Global Bond Absolute Return Fund
CNY C2
Accumulating Class*
CNY C2 Accumulating
Class*
CNY T Accumulating
Class*
CNY T Accumulating
Class*
EUR I Accumulating
Class
EUR I Accumulating
ClassYear Ended NAV NAV per Share NAV NAV per Share NAV NAV per Share
31 December 2019 – – – – €20,593,977 €9.87
31 December 2018 CNY73,404 CNY105.95 CNY75,594 CNY111.04 €10,139 €9.80
31 December 2017 CNY75,820 CNY109.43 CNY77,296 CNY113.54 €10,739 €10.38

FINANCIAL STATEMENTS NOTES TO THE AUDITED FINANCIAL STATEMENTS
1402 NEUBERGER BERMAN INVESTMENT FUNDS PLC
FOR THE YEAR ENDED 31 DECEMBER 2019
13. NET ASSET VALUE COMPARATIVE (CONTINUED) Neuberger Berman Global Bond Absolute Return Fund (continued)
EUR I4
Accumulating Class*
EUR I4 Accumulating
Class*
EUR I4 Distributing
Class
EUR I4 Distributing
Class
EUR I5 Accumulating
Class*
EUR I5 Accumulating
Class*Year Ended NAV NAV per Share NAV NAV per Share NAV NAV per Share
31 December 2019 – – €1,988,629 €9.08 – –
31 December 2018 €10,799 €9.54 €6,504,678 €9.28 €9,534 €9.89
31 December 2017 €11,418 €10.09 €4,045,973 €10.09 €10,075 €10.45
EUR M
Accumulating Class
EUR M Accumulating
Class
GBP I Distributing
Class*
GBP I Distributing
Class*
GBP I2 Accumulating
Class*
GBP I2 Accumulating
Class*Year Ended NAV NAV per Share NAV NAV per Share NAV NAV per Share
31 December 2019 €440,968 €9.88 – – – –
31 December 2018 €1,024,835 €9.92 £7,206 £9.12 £7,553 £10.35
31 December 2017 €183,178 €10.62 £7,692 £9.73 £7,906 £10.84
GBP I4
Accumulating Class
GBP I4 Accumulating
Class
GBP I5 Accumulating
Class
GBP I5 Accumulating
Class
GBP I5 Distributing
Class
GBP I5 Distributing
ClassYear Ended NAV NAV per Share NAV NAV per Share NAV NAV per Share
31 December 2019 £5,097,313 £10.34 £11,234,993 £10.25 £162,877 £8.71
31 December 2018 £8,319,452 £10.11 £11,578,077 £10.02 £755,438 £8.79
31 December 2017 £17,381,890 £10.57 £11,578,198 £10.47 £2,022,460 £9.46

NOTES TO THE AUDITED FINANCIAL STATEMENTS FINANCIAL STATEMENTS
ANNUAL REPORT 2019 1403
FOR THE YEAR ENDED 31 DECEMBER 2019
13. NET ASSET VALUE COMPARATIVE (CONTINUED) Neuberger Berman Global Bond Absolute Return Fund (continued)
GBP Z
Accumulating Class
GBP Z Accumulating
Class
JPY I Accumulating
Class
JPY I Accumulating
Class
SGD A (Monthly) Distributing
Class
SGD A (Monthly) Distributing
ClassYear Ended NAV NAV per Share NAV NAV per Share NAV NAV per Share
31 December 2019 £336,773 £10.39 ¥3,268,234 ¥981.07 SGD806,827 SGD17.05
31 December 2018 £205,734 £10.13 ¥317,589,767 ¥982.73 SGD5,016,896 SGD17.15
31 December 2017 £214,481 £10.56 ¥295,048,024 ¥1,037.29 SGD6,543,527 SGD18.56
USD A (Monthly)
Distributing Class
USD A (Monthly) Distributing
Class
USD A Accumulating
Class
USD A Accumulating
Class
USD C2 Accumulating
Class*
USD C2 Accumulating
Class*Year Ended NAV NAV per Share NAV NAV per Share NAV NAV per Share
31 December 2019 $160,335 $8.63 $82,557,206 $10.28 – –
31 December 2018 $164,631 $8.60 $328,777 $9.94 $9,409 $9.41
31 December 2017 $74,404 $9.19 $319,936 $10.30 $9,876 $9.88
USD I
Accumulating Class
USD I Accumulating
Class
USD I5 Accumulating
Class
USD I5 Accumulating
Class
USD I5 Distributing
Class*
USD I5 Distributing
Class*Year Ended NAV NAV per Share NAV NAV per Share NAV NAV per Share
31 December 2019 $385,197 $11.00 $10,442 $10.83 – –
31 December 2018 $23,778,037 $10.59 $1,378,035 $10.39 $10,659 $9.37
31 December 2017 $22,376,745 $10.90 $1,213,496 $10.67 $11,197 $9.85

FINANCIAL STATEMENTS NOTES TO THE AUDITED FINANCIAL STATEMENTS
1404 NEUBERGER BERMAN INVESTMENT FUNDS PLC
FOR THE YEAR ENDED 31 DECEMBER 2019
13. NET ASSET VALUE COMPARATIVE (CONTINUED) Neuberger Berman Global Bond Absolute Return Fund (continued)
USD Z
Accumulating Class
USD Z Accumulating
ClassYear Ended NAV NAV per Share
31 December 2019 $2,640,072 $11.01
31 December 2018 $12,922,482 $10.54
31 December 2017 $19,244,014 $10.80
Neuberger Berman Short Duration Emerging Market Debt Fund
AUD A (Monthly)
Distributing Class
AUD A (Monthly) Distributing
Class
AUD A Accumulating
Class
AUD A Accumulating
Class
CAD A (Monthly) Distributing
Class
CAD A (Monthly) Distributing
ClassYear Ended NAV NAV per Share NAV NAV per Share NAV NAV per Share
31 December 2019 AUD1,805,619 AUD9.69 AUD44,940 AUD11.13 CAD193,502 CAD9.93
31 December 2018 AUD1,345,718 AUD9.47 AUD27,807 AUD10.51 CAD169,327 CAD9.70
31 December 2017 AUD1,295,421 AUD9.84 AUD16,189 AUD10.50 CAD175,854 CAD10.08
CHF A
Accumulating Class
CHF A Accumulating
Class
CHF A Distributing
Class
CHF A Distributing
Class
CHF I Accumulating
Class
CHF I Accumulating
ClassYear Ended NAV NAV per Share NAV NAV per Share NAV NAV per Share
31 December 2019 CHF6,775,997 CHF10.24 CHF1,536,653 CHF8.33 CHF16,029,645 CHF10.53
31 December 2018 CHF3,666,087 CHF9.91 CHF1,244,206 CHF8.37 CHF860,327 CHF10.15
31 December 2017 CHF3,795,999 CHF10.20 CHF1,739,594 CHF8.96 CHF3,967,492 CHF10.39

NOTES TO THE AUDITED FINANCIAL STATEMENTS FINANCIAL STATEMENTS
ANNUAL REPORT 2019 1405
FOR THE YEAR ENDED 31 DECEMBER 2019
13. NET ASSET VALUE COMPARATIVE (CONTINUED) Neuberger Berman Short Duration Emerging Market Debt Fund (continued)
CHF I
Distributing Class
CHF I Distributing
Class
CHF I2 Accumulating
Class
CHF I2 Accumulating
Class
CHF I2 Distributing
Class
CHF I2 Distributing
ClassYear Ended NAV NAV per Share NAV NAV per Share NAV NAV per Share
31 December 2019 CHF7,454,555 CHF8.36 CHF4,934,885 CHF10.71 CHF29,773,457 CHF9.17
31 December 2018 CHF1,262,484 CHF8.40 CHF5,567,243 CHF10.31 CHF31,924,004 CHF9.22
31 December 2017 CHF1,254,009 CHF8.99 CHF5,791,270 CHF10.55 CHF17,578,660 CHF9.86
CHF I5
Accumulating Class
CHF I5 Accumulating
Class
CHF I5 Distributing
Class*
CHF I5 Distributing
Class*
CHF P Accumulating
Class
CHF P Accumulating
ClassYear Ended NAV NAV per Share NAV NAV per Share NAV NAV per Share
31 December 2019 CHF5,315,474 CHF10.87 – – CHF45,671,278 CHF10.17
31 December 2018 CHF6,157,868 CHF10.44 – – CHF21,852,196 CHF9.80
31 December 2017 CHF8,329,260 CHF10.67 CHF41,005 CHF9.11 CHF7,471,587 CHF10.03
CHF P
Distributing Class
CHF P Distributing
Class
CNY A (Monthly) Distributing
Class
CNY A (Monthly) Distributing
Class
EUR A Accumulating
Class
EUR A Accumulating
ClassYear Ended NAV NAV per Share NAV NAV per Share NAV NAV per Share
31 December 2019 CHF11,600 CHF9.32 CNY68,691 CNY103.50 €221,764,215 €10.51
31 December 2018 CHF11,622 CHF9.34 CNY66,773 CNY100.61 €191,224,359 €10.13
31 December 2017 CHF14,091 CHF9.96 CNY68,747 CNY103.59 €105,537,688 €10.39
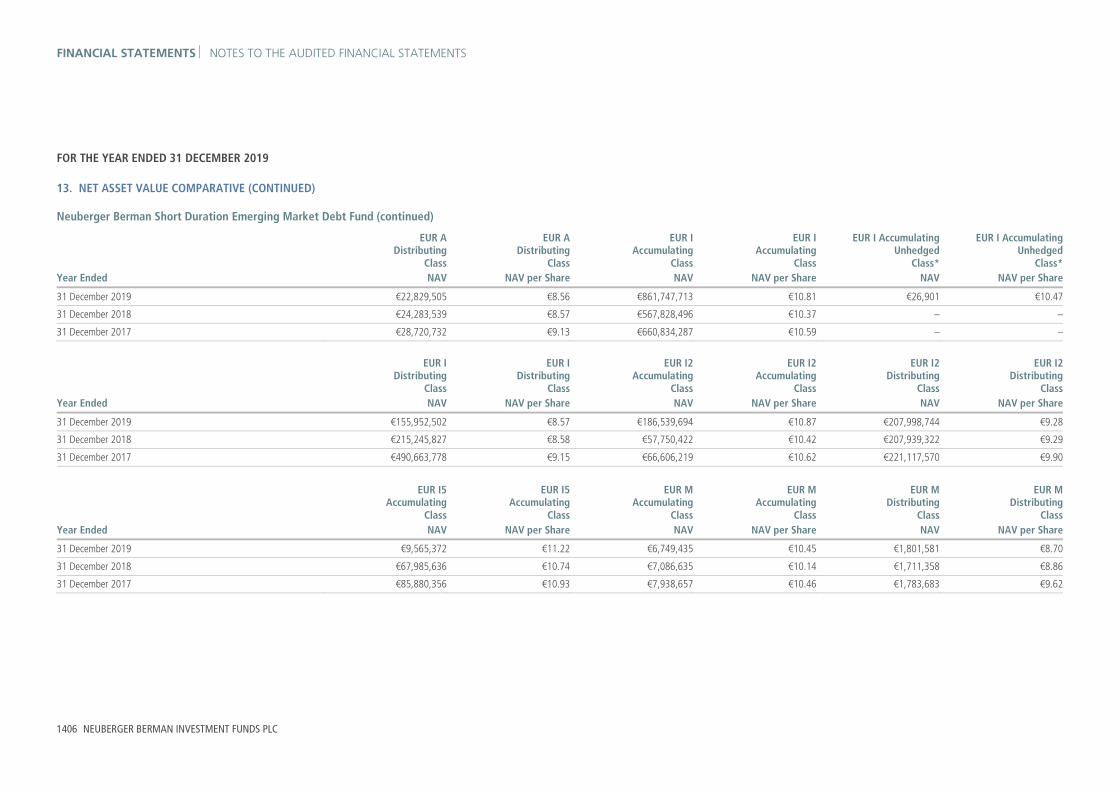
FINANCIAL STATEMENTS NOTES TO THE AUDITED FINANCIAL STATEMENTS
1406 NEUBERGER BERMAN INVESTMENT FUNDS PLC
FOR THE YEAR ENDED 31 DECEMBER 2019
13. NET ASSET VALUE COMPARATIVE (CONTINUED) Neuberger Berman Short Duration Emerging Market Debt Fund (continued)
EUR A
Distributing Class
EUR A Distributing
Class
EUR I Accumulating
Class
EUR I Accumulating
Class
EUR I Accumulating Unhedged
Class*
EUR I Accumulating Unhedged
Class*Year Ended NAV NAV per Share NAV NAV per Share NAV NAV per Share
31 December 2019 €22,829,505 €8.56 €861,747,713 €10.81 €26,901 €10.47
31 December 2018 €24,283,539 €8.57 €567,828,496 €10.37 – –
31 December 2017 €28,720,732 €9.13 €660,834,287 €10.59 – –
EUR I
Distributing Class
EUR I Distributing
Class
EUR I2 Accumulating
Class
EUR I2 Accumulating
Class
EUR I2 Distributing
Class
EUR I2 Distributing
ClassYear Ended NAV NAV per Share NAV NAV per Share NAV NAV per Share
31 December 2019 €155,952,502 €8.57 €186,539,694 €10.87 €207,998,744 €9.28
31 December 2018 €215,245,827 €8.58 €57,750,422 €10.42 €207,939,322 €9.29
31 December 2017 €490,663,778 €9.15 €66,606,219 €10.62 €221,117,570 €9.90
EUR I5
Accumulating Class
EUR I5 Accumulating
Class
EUR M Accumulating
Class
EUR M Accumulating
Class
EUR M Distributing
Class
EUR M Distributing
ClassYear Ended NAV NAV per Share NAV NAV per Share NAV NAV per Share
31 December 2019 €9,565,372 €11.22 €6,749,435 €10.45 €1,801,581 €8.70
31 December 2018 €67,985,636 €10.74 €7,086,635 €10.14 €1,711,358 €8.86
31 December 2017 €85,880,356 €10.93 €7,938,657 €10.46 €1,783,683 €9.62

NOTES TO THE AUDITED FINANCIAL STATEMENTS FINANCIAL STATEMENTS
ANNUAL REPORT 2019 1407
FOR THE YEAR ENDED 31 DECEMBER 2019
13. NET ASSET VALUE COMPARATIVE (CONTINUED) Neuberger Berman Short Duration Emerging Market Debt Fund (continued)
EUR P
Accumulating Class
EUR P Accumulating
Class
EUR U Accumulating
Class*
EUR U Accumulating
Class*
GBP A Accumulating
Class
GBP A Accumulating
ClassYear Ended NAV NAV per Share NAV NAV per Share NAV NAV per Share
31 December 2019 €120,428,523 €10.36 €2,071,738 €10.35 £1,854,190 £10.70
31 December 2018 €67,019,594 €9.93 €1,502,053 €9.96 £1,209,519 £10.19
31 December 2017 €24,273,200 €10.13 – – £1,418,185 £10.32
GBP I
Accumulating Class
GBP I Accumulating
Class
GBP I Distributing
Class*
GBP I Distributing
Class*
GBP I2 Accumulating
Class
GBP I2 Accumulating
ClassYear Ended NAV NAV per Share NAV NAV per Share NAV NAV per Share
31 December 2019 £18,243,738 £10.85 £52,543,654 £9.82 £2,994,878 £10.81
31 December 2018 £13,698,158 £10.28 £40,923,484 £9.70 £1,718,098 £10.23
31 December 2017 £5,712,101 £10.37 – – £711,664 £10.30
GBP I2
Distributing Class
GBP I2 Distributing
Class
GBP I5 Distributing
Class
GBP I5 Distributing
Class
GBP P Accumulating
Class*
GBP P Accumulating
Class*Year Ended NAV NAV per Share NAV NAV per Share NAV NAV per Share
31 December 2019 £449,114,030 £9.65 £97,758,674 £9.07 £182,951 £10.18
31 December 2018 £1,076,846 £9.52 £91,800,543 £8.96 – –
31 December 2017 £183,225 £10.01 £112,372,914 £9.44 – –

FINANCIAL STATEMENTS NOTES TO THE AUDITED FINANCIAL STATEMENTS
1408 NEUBERGER BERMAN INVESTMENT FUNDS PLC
FOR THE YEAR ENDED 31 DECEMBER 2019
13. NET ASSET VALUE COMPARATIVE (CONTINUED) Neuberger Berman Short Duration Emerging Market Debt Fund (continued)
JPY I
Accumulating Class
JPY I Accumulating
Class
JPY I Distributing
Class
JPY I Distributing
Class
SEK A Accumulating
Class*
SEK A Accumulating
Class*Year Ended NAV NAV per Share NAV NAV per Share NAV NAV per Share
31 December 2019 ¥91,102,265,158 ¥1,103.08 ¥6,158,215,097 ¥871.73 SEK11,449,638 SEK101.54
31 December 2018 ¥67,833,536,717 ¥1,056.75 ¥4,718,654,230 ¥870.66 SEK3,490,202 SEK97.67
31 December 2017 ¥45,855,271,148 ¥1,074.97 ¥1,465,153,533 ¥925.39 – –
SGD A (Monthly)
Distributing Class
SGD A (Monthly) Distributing
Class
USD A (Monthly) Distributing
Class
USD A (Monthly) Distributing
Class
USD A Accumulating
Class
USD A Accumulating
ClassYear Ended NAV NAV per Share NAV NAV per Share NAV NAV per Share
31 December 2019 SGD15,974,885 SGD19.46 $11,252,020 $9.83 $519,284,179 $11.86
31 December 2018 SGD15,304,995 SGD18.99 $6,315,185 $9.53 $332,832,989 $11.10
31 December 2017 SGD14,395,338 SGD19.74 $10,234,293 $9.83 $278,616,745 $11.07
USD A
Distributing Class
USD A Distributing
Class
USD C1 Accumulating
Class
USD C1 Accumulating
Class
USD C1 Distributing
Class
USD C1 Distributing Class
Year Ended NAV NAV per Share NAV NAV per Share NAV NAV per Share
31 December 2019 $150,878,972 $9.41 $84,456,299 $10.52 $7,913,180 $9.94
31 December 2018 $135,194,331 $9.14 $31,331,009 $9.95 $3,586,575 $9.65
31 December 2017 $111,861,930 $9.47 $13,921,138 $10.02 $702,095 $10.00

NOTES TO THE AUDITED FINANCIAL STATEMENTS FINANCIAL STATEMENTS
ANNUAL REPORT 2019 1409
FOR THE YEAR ENDED 31 DECEMBER 2019
13. NET ASSET VALUE COMPARATIVE (CONTINUED) Neuberger Berman Short Duration Emerging Market Debt Fund (continued)
USD I
Accumulating Class
USD I Accumulating
Class
USD I Distributing
Class
USD I Distributing
Class
USD I2 Accumulating
Class
USD I2 Accumulating
ClassYear Ended NAV NAV per Share NAV NAV per Share NAV NAV per Share
31 December 2019 $749,492,814 $12.19 $164,445,580 $10.01 $60,467,850 $11.94
31 December 2018 $247,141,104 $11.36 $139,674,358 $9.72 $48,065,170 $11.11
31 December 2017 $300,033,767 $11.26 $14,593,241 $10.07 $49,608,475 $11.01
USD I2
Distributing Class
USD I2 Distributing
Class
USD I5 Accumulating
Class
USD I5 Accumulating
Class
USD I5 Distributing
Class
USD I5 Distributing
ClassYear Ended NAV NAV per Share NAV NAV per Share NAV NAV per Share
31 December 2019 $45,247,086 $9.99 $19,814,052 $12.30 $6,140,093 $9.57
31 December 2018 $4,306,799 $9.71 $23,544,195 $11.43 $5,133,697 $9.30
31 December 2017 $3,006,411 $10.05 $17,649,294 $11.31 $3,767,582 $9.63
USD M
Accumulating Class
USD M Accumulating
Class
USD MDistributing
Class
USD MDistributing
Class
USD P Accumulating
Class
USD P Accumulating
ClassYear Ended NAV NAV per Share NAV NAV per Share NAV NAV per Share
31 December 2019 $64,810,729 $10.63 $7,682,443 $9.58 $114,142,927 $11.81
31 December 2018 $31,117,000 $10.02 $7,108,877 $9.47 $122,710,711 $11.00
31 December 2017 $13,128,332 $10.05 $2,284,915 $9.99 $129,559,625 $10.90

FINANCIAL STATEMENTS NOTES TO THE AUDITED FINANCIAL STATEMENTS
1410 NEUBERGER BERMAN INVESTMENT FUNDS PLC
FOR THE YEAR ENDED 31 DECEMBER 2019
13. NET ASSET VALUE COMPARATIVE (CONTINUED) Neuberger Berman Short Duration Emerging Market Debt Fund (continued)
USD Z
Accumulating Class
USD Z Accumulating
ClassYear Ended NAV NAV per Share
31 December 2019 $12,662,379 $12.41
31 December 2018 $5,478,113 $11.50
31 December 2017 $3,055,058 $11.36
Neuberger Berman Absolute Return Multi Strategy Fund
AUD Z
Distributing Class*
AUD Z Distributing
Class*
CHF I Accumulating
Class
CHF I Accumulating
Class
CHF I2 Accumulating
Class*
CHF I2 Accumulating
Class*Year Ended NAV NAV per Share NAV NAV per Share NAV NAV per Share
31 December 2019 – – CHF1,492,776 CHF9.25 – –
31 December 2018 AUD8,877,271 AUD10.02 CHF159,165 CHF8.79 CHF9,777 CHF9.69
31 December 2017 AUD20,992,378 AUD10.48 CHF2,004,840 CHF9.49 CHF10,539 CHF10.45
EUR A
Accumulating Class
EUR A Accumulating
Class
EUR I Accumulating
Class
EUR I Accumulating
Class
EUR I2 Accumulating
Class
EUR I2 Accumulating
ClassYear Ended NAV NAV per Share NAV NAV per Share NAV NAV per Share
31 December 2019 €997,591 €9.01 €107,745 €9.33 €359,258 €9.73
31 December 2018 €1,153,268 €8.59 €101,927 €8.83 €407,497 €9.19
31 December 2017 €2,136,981 €9.30 €1,661,003 €9.48 €1,236,160 €9.87

NOTES TO THE AUDITED FINANCIAL STATEMENTS FINANCIAL STATEMENTS
ANNUAL REPORT 2019 1411
FOR THE YEAR ENDED 31 DECEMBER 2019
13. NET ASSET VALUE COMPARATIVE (CONTINUED) Neuberger Berman Absolute Return Multi Strategy Fund (continued)
EUR M
Accumulating Class
EUR M Accumulating
Class
EUR Z Accumulating
Class
EUR Z Accumulating
Class
GBP I Accumulating
Class
GBP I Accumulating
ClassYear Ended NAV NAV per Share NAV NAV per Share NAV NAV per Share
31 December 2019 €1,529,102 €9.63 €50,099 €9.83 £326,881 £9.80
31 December 2018 €1,442,983 €9.26 €45,174 €9.23 £363,629 £9.15
31 December 2017 €1,890,530 €10.10 €48,182 €9.85 £541,987 £9.72
GBP I2
Accumulating Class
GBP I2 Accumulating
Class
GBP I3 Accumulating
Class
GBP I3 Accumulating
Class
GBP Z Accumulating
Class
GBP Z Accumulating
ClassYear Ended NAV NAV per Share NAV NAV per Share NAV NAV per Share
31 December 2019 £81,371 £9.92 £29,445 £10.30 £129,252 £10.35
31 December 2018 £99,496 £9.25 £44,395 £9.59 £119,730 £9.59
31 December 2017 £239,822 £9.82 £63,311 £10.16 £126,294 £10.12
JPY D
Distributing Class
JPY D Distributing
Class
JPY D Distributing Unhedged
Class*
JPY D Distributing Unhedged
Class*
JPY I Accumulating
Class
JPY I Accumulating
ClassYear Ended NAV NAV per Share NAV NAV per Share NAV NAV per Share
31 December 2019 ¥95,997,619 ¥942.75 – – ¥4,555,406,289 ¥942.17
31 December 2018 ¥145,089,277 ¥891.26 ¥176,263,764 ¥1,024.42 ¥4,900,677,586 ¥890.72
31 December 2017 ¥270,290,175 ¥954.97 ¥613,742,065 ¥1,099.38 ¥6,057,248,469 ¥954.39

FINANCIAL STATEMENTS NOTES TO THE AUDITED FINANCIAL STATEMENTS
1412 NEUBERGER BERMAN INVESTMENT FUNDS PLC
FOR THE YEAR ENDED 31 DECEMBER 2019
13. NET ASSET VALUE COMPARATIVE (CONTINUED) Neuberger Berman Absolute Return Multi Strategy Fund (continued)
USD A
Accumulating Class
USD A Accumulating
Class
USD I Accumulating
Class
USD I Accumulating
Class
USD I2 Accumulating
Class*
USD I2 Accumulating
Class*Year Ended NAV NAV per Share NAV NAV per Share NAV NAV per Share
31 December 2019 $3,751,491 $10.01 $2,528,096 $10.55 – –
31 December 2018 $2,968,829 $9.27 $2,940,682 $9.69 $256,583 $9.77
31 December 2017 $14,112,059 $9.76 $4,705,413 $10.13 $9,941,151 $10.20
USD Z
Accumulating Class
USD Z Accumulating
ClassYear Ended NAV NAV per Share
31 December 2019 $116,638 $10.71
31 December 2018 $106,326 $9.76
31 December 2017 $857,105 $10.12
Neuberger Berman US Long Short Equity Fund
CNY C2
Accumulating Class*
CNY C2 Accumulating
Class*
CNY T Accumulating
Class*
CNY T Accumulating
Class*
EUR A Accumulating
Class
EUR A Accumulating
ClassYear Ended NAV NAV per Share NAV NAV per Share NAV NAV per Share
31 December 2019 – – – – €463,606 €10.54
31 December 2018 CNY74,683 CNY110.99 CNY76,898 CNY116.28 €778,493 €9.41
31 December 2017 CNY80,738 CNY119.99 CNY82,311 CNY124.47 €1,017,025 €10.53

NOTES TO THE AUDITED FINANCIAL STATEMENTS FINANCIAL STATEMENTS
ANNUAL REPORT 2019 1413
FOR THE YEAR ENDED 31 DECEMBER 2019
13. NET ASSET VALUE COMPARATIVE (CONTINUED) Neuberger Berman US Long Short Equity Fund (continued)
EUR I
Accumulating Class
EUR I Accumulating
Class
EUR M Accumulating
Class
EUR M Accumulating
Class
GBP A Accumulating
Class*
GBP A Accumulating
Class*Year Ended NAV NAV per Share NAV NAV per Share NAV NAV per Share
31 December 2019 €42,513,596 €11.07 €7,883,761 €10.60 – –
31 December 2018 €56,252,843 €9.79 €8,697,833 €9.53 £278,044 £9.27
31 December 2017 €56,699,787 €10.86 €6,536,706 €10.76 £307,703 £10.26
GBP I
Accumulating Class*
GBP I Accumulating
Class*
JPY I Accumulating
Class*
JPY I Accumulating
Class*
JPY I Accumulating Unhedged
Class*
JPY I Accumulating Unhedged
Class*Year Ended NAV NAV per Share NAV NAV per Share NAV NAV per Share
31 December 2019 £25,314 £10.65 – – – –
31 December 2018 – – ¥44,499,496 ¥988.31 ¥110,019,485 ¥935.02
31 December 2017 – – ¥57,520,774 ¥1,090.73 ¥274,515,590 ¥1,034.21
SGD A
Accumulating Class*
SGD A Accumulating
Class*
SGD A1 Accumulating
Class
SGD A1 Accumulating
Class
USD A (PF) Accumulating
Class
USD A (PF) Accumulating
ClassYear Ended NAV NAV per Share NAV NAV per Share NAV NAV per Share
31 December 2019 – – SGD562,590 SGD23.34 $1,093,621 $11.38
31 December 2018 SGD39,655 SGD18.77 SGD499,369 SGD20.32 $1,220,078 $9.91
31 December 2017 SGD43,541 SGD20.61 SGD921,102 SGD22.25 $23,682,218 $10.72

FINANCIAL STATEMENTS NOTES TO THE AUDITED FINANCIAL STATEMENTS
1414 NEUBERGER BERMAN INVESTMENT FUNDS PLC
FOR THE YEAR ENDED 31 DECEMBER 2019
13. NET ASSET VALUE COMPARATIVE (CONTINUED) Neuberger Berman US Long Short Equity Fund (continued)
USD A
Accumulating Class
USD A Accumulating
Class
USD A1 Accumulating
Class
USD A1 Accumulating
Class
USD C (PF) Accumulating
Class*
USD C (PF) Accumulating
Class*Year Ended NAV NAV per Share NAV NAV per Share NAV NAV per Share
31 December 2019 $7,658,079 $11.41 $13,913,863 $12.05 – –
31 December 2018 $12,791,791 $9.88 $17,340,848 $10.41 $10,748 $9.75
31 December 2017 $17,739,408 $10.74 $21,116,481 $11.28 $11,681 $10.60
USD C1
Accumulating Class
USD C1 Accumulating
Class
USD C2 Accumulating
Class*
USD C2 Accumulating
Class*
USD D Distributing
Class
USD D Distributing
ClassYear Ended NAV NAV per Share NAV NAV per Share NAV NAV per Share
31 December 2019 $111,107 $10.67 – – $846,357 $12.09
31 December 2018 $451,482 $9.33 $9,806 $9.81 $599,276 $10.38
31 December 2017 $481,612 $10.25 $10,761 $10.76 $4,404,208 $11.19
USD I (PF)
Distributing Class
USD I (PF) Distributing
Class
USD I Accumulating
Class
USD I Accumulating
Class
USD M Accumulating
Class
USD M Accumulating
ClassYear Ended NAV NAV per Share NAV NAV per Share NAV NAV per Share
31 December 2019 $32,361,066 $11.73 $26,647,412 $12.62 $854,530 $10.82
31 December 2018 $28,718,153 $10.18 $25,703,321 $10.83 $1,313,278 $9.45
31 December 2017 $2,943,327 $10.97 $25,823,999 $11.66 $738,955 $10.35

NOTES TO THE AUDITED FINANCIAL STATEMENTS FINANCIAL STATEMENTS
ANNUAL REPORT 2019 1415
FOR THE YEAR ENDED 31 DECEMBER 2019
13. NET ASSET VALUE COMPARATIVE (CONTINUED) Neuberger Berman US Long Short Equity Fund (continued)
USD T
Accumulating Class*
USD T Accumulating
Class*
USD U Accumulating
Class
USD U Accumulating
Class
USD Z Accumulating
Class
USD Z Accumulating
ClassYear Ended NAV NAV per Share NAV NAV per Share NAV NAV per Share
31 December 2019 – – $6,579,923 $11.75 $6,664,876 $13.39
31 December 2018 $10,274 $10.27 $7,677,971 $10.13 $11,923,549 $11.34
31 December 2017 $11,162 $11.16 $8,209,234 $10.96 $17,549,448 $12.05
Neuberger Berman Emerging Market Debt Blend Fund
AUD I3
Distributing Class*
AUD I3 Distributing
Class*
CHF I2 Distributing
Class
CHF I2 Distributing
Class
EUR A Accumulating
Class
EUR A Accumulating
ClassYear Ended NAV NAV per Share NAV NAV per Share NAV NAV per Share
31 December 2019 AUD11,252,061 AUD10.15 CHF1,886,445 CHF9.16 €16,937,382 €11.81
31 December 2018 – – CHF8,002,251 CHF8.69 €21,558,676 €10.54
31 December 2017 – – CHF9,088,129 CHF9.89 €88,281,300 €11.29
EUR I
Accumulating Class
EUR I Accumulating
Class
EUR I Distributing
Class
EUR I Distributing
Class
EUR I2 Accumulating
Class
EUR I2 Accumulating
ClassYear Ended NAV NAV per Share NAV NAV per Share NAV NAV per Share
31 December 2019 €306,104,167 €11.87 €69,708,586 €9.49 €415,881,588 €12.14
31 December 2018 €283,579,512 €10.52 €66,930,452 €8.82 €302,798,196 €10.74
31 December 2017 €248,499,569 €11.19 €61,745,403 €9.83 €264,963,745 €11.41

FINANCIAL STATEMENTS NOTES TO THE AUDITED FINANCIAL STATEMENTS
1416 NEUBERGER BERMAN INVESTMENT FUNDS PLC
FOR THE YEAR ENDED 31 DECEMBER 2019
13. NET ASSET VALUE COMPARATIVE (CONTINUED) Neuberger Berman Emerging Market Debt Blend Fund (continued)
EUR I2
Distributing Class
EUR I2 Distributing
Class
EUR I3 Distributing
Class*
EUR I3 Distributing
Class*
EUR I4 Accumulating
Class*
EUR I4 Accumulating
Class*Year Ended NAV NAV per Share NAV NAV per Share NAV NAV per Share
31 December 2019 €55,214,669 €9.24 €22,258,519 €10.15 – –
31 December 2018 €61,360,881 €8.59 – – €23,512,137 €9.44
31 December 2017 €52,839,913 €9.58 – – €28,776,568 €10.01
EUR I4 Accumulating
Unhedged Class
EUR I4 Accumulating Unhedged
Class
EUR I5 Accumulating
Class
EUR I5 Accumulating
Class
EUR M Accumulating
Class
EUR M Accumulating
ClassYear Ended NAV NAV per Share NAV NAV per Share NAV NAV per Share
31 December 2019 €770,677 €11.07 €14,055,702 €12.75 €1,368,592 €11.68
31 December 2018 €425,234 €9.55 €9,694,651 €11.25 €994,651 €10.51
31 December 2017 €1,150,275 €9.74 €11,052,036 €11.92 €443,437 €11.34
EUR M
Distributing Class
EUR M Distributing
Class
EUR Z Accumulating
Class
EUR Z Accumulating
Class
GBP I Accumulating
Class
GBP I Accumulating
ClassYear Ended NAV NAV per Share NAV NAV per Share NAV NAV per Share
31 December 2019 €1,169,910 €9.22 €63,969 €12.49 £899,226 £12.28
31 December 2018 €1,356,047 €8.85 €62,964 €10.99 £1,011,063 £11.13
31 December 2017 €1,363,927 €10.19 €37,722 €11.60 £291,562 £11.70

NOTES TO THE AUDITED FINANCIAL STATEMENTS FINANCIAL STATEMENTS
ANNUAL REPORT 2019 1417
FOR THE YEAR ENDED 31 DECEMBER 2019
13. NET ASSET VALUE COMPARATIVE (CONTINUED) Neuberger Berman Emerging Market Debt Blend Fund (continued)
GBP I Accumulating
Unhedged Class
GBP I Accumulating Unhedged
Class
GBP I Distributing
Class*
GBP I Distributing
Class*
GBP I Distributing Unhedged
Class*
GBP I Distributing Unhedged
Class*Year Ended NAV NAV per Share NAV NAV per Share NAV NAV per Share
31 December 2019 £135,790,634 £10.79 £4,633,562 £10.23 £753,242 £10.42
31 December 2018 £138,957,404 £9.88 £977,289 £9.72 £778,497 £10.01
31 December 2017 £148,065,853 £9.99 – – – –
GBP I2
Distributing Class
GBP I2 Distributing
Class
GBP P Accumulating
Class*
GBP P Accumulating
Class*
GBP P Accumulating Unhedged
Class*
GBP P Accumulating Unhedged
Class*Year Ended NAV NAV per Share NAV NAV per Share NAV NAV per Share
31 December 2019 £26,033,285 £10.22 £13,116,981 £10.76 £188,328 £10.70
31 December 2018 £37,564,541 £9.70 – – – –
31 December 2017 £25,780,460 £10.69 – – – –
GBP Z
Accumulating Class
GBP Z Accumulating
Class
NOK U Accumulating
Class
NOK U Accumulating
Class
SEK A Accumulating
Class
SEK A Accumulating
ClassYear Ended NAV NAV per Share NAV NAV per Share NAV NAV per Share
31 December 2019 £220,036 £13.03 NOK9,124,149 NOK114.97 SEK87,334,160 SEK122.50
31 December 2018 £197,840 £11.72 NOK12,596,522 NOK101.47 SEK41,382,820 SEK107.16
31 December 2017 £206,555 £12.23 NOK13,295,604 NOK107.11 SEK49,847,107 SEK113.05

FINANCIAL STATEMENTS NOTES TO THE AUDITED FINANCIAL STATEMENTS
1418 NEUBERGER BERMAN INVESTMENT FUNDS PLC
FOR THE YEAR ENDED 31 DECEMBER 2019
13. NET ASSET VALUE COMPARATIVE (CONTINUED) Neuberger Berman Emerging Market Debt Blend Fund (continued)
SGD A (Monthly)
Distributing Class
SGD A (Monthly) Distributing
Class
SGD A Accumulating
Class*
SGD A Accumulating
Class*
USD A (Monthly) Distributing
Class
USD A (Monthly) Distributing
ClassYear Ended NAV NAV per Share NAV NAV per Share NAV NAV per Share
31 December 2019 SGD1,986,117 SGD18.17 – – $347,822 $9.17
31 December 2018 SGD499,916 SGD17.29 SGD14,018 SGD18.50 $324,359 $8.63
31 December 2017 SGD19,870 SGD19.71 SGD14,050 SGD19.91 $10,142 $9.89
USD A
Accumulating Class
USD A Accumulating
Class
USD C1 Accumulating
Class
USD C1 Accumulating
Class
USD I Accumulating
Class
USD I Accumulating
ClassYear Ended NAV NAV per Share NAV NAV per Share NAV NAV per Share
31 December 2019 $30,221,350 $12.80 $5,018,658 $10.37 $224,801,769 $11.80
31 December 2018 $27,677,145 $11.35 $8,168,014 $9.29 $208,148,488 $10.39
31 December 2017 $5,641,663 $12.28 $4,355,973 $10.15 $215,620,581 $11.16
USD I
Distributing Class
USD I Distributing
Class
USD I2 Accumulating
Class
USD I2 Accumulating
Class
USD I2 Distributing
Class
USD I2 Distributing
ClassYear Ended NAV NAV per Share NAV NAV per Share NAV NAV per Share
31 December 2019 $35,610,573 $10.52 $24,110,190 $11.63 $60,063,462 $9.65
31 December 2018 $20,733,751 $9.72 $16,669,535 $10.23 $61,756,440 $8.92
31 December 2017 $22,286,090 $10.94 $17,897,689 $10.97 $55,541,309 $10.04

NOTES TO THE AUDITED FINANCIAL STATEMENTS FINANCIAL STATEMENTS
ANNUAL REPORT 2019 1419
FOR THE YEAR ENDED 31 DECEMBER 2019
13. NET ASSET VALUE COMPARATIVE (CONTINUED) Neuberger Berman Emerging Market Debt Blend Fund (continued)
USD I3
Accumulating Class
USD I3 Accumulating
Class
USD M Accumulating
Class
USD M Accumulating
Class
USD M Distributing
Class
USD M Distributing
ClassYear Ended NAV NAV per Share NAV NAV per Share NAV NAV per Share
31 December 2019 $42,931,261 $10.68 $6,549,542 $10.38 $2,674,025 $9.05
31 December 2018 $45,567,892 $9.39 $7,992,661 $9.28 $1,629,943 $8.63
31 December 2017 $48,851,959 $10.06 $4,616,568 $10.12 $204,552 $10.03
USD X
Accumulating Class*
USD X Accumulating
Class*
USD Z Accumulating
Class
USD Z Accumulating
ClassYear Ended NAV NAV per Share NAV NAV per Share
31 December 2019 – – $150,132 $13.71
31 December 2018 $196,620,016 $10.78 $8,235,533 $11.99
31 December 2017 $210,306,093 $11.53 $2,646,495 $12.80
Neuberger Berman European High Yield Bond Fund
EUR A
Accumulating Class
EUR A Accumulating
Class
EUR I Accumulating
Class
EUR I Accumulating
Class
EUR I5 Accumulating
Class
EUR I5 Accumulating
ClassYear Ended NAV NAV per Share NAV NAV per Share NAV NAV per Share
31 December 2019 €482,243 €12.32 €1,982,350 €12.61 €3,889,958 €12.26
31 December 2018 €437,046 €11.10 €370,191 €11.29 €11,106 €10.94
31 December 2017 €780,277 €11.55 €422,651 €11.67 €11,445 €11.28

FINANCIAL STATEMENTS NOTES TO THE AUDITED FINANCIAL STATEMENTS
1420 NEUBERGER BERMAN INVESTMENT FUNDS PLC
FOR THE YEAR ENDED 31 DECEMBER 2019
13. NET ASSET VALUE COMPARATIVE (CONTINUED) Neuberger Berman European High Yield Bond Fund (continued)
EUR M
Accumulating Class
EUR M Accumulating
Class
EUR M Distributing
Class
EUR M Distributing
Class
EUR X Accumulating
Class*
EUR X Accumulating
Class*Year Ended NAV NAV per Share NAV NAV per Share NAV NAV per Share
31 December 2019 €384,906 €11.98 €630,828 €10.19 €4,450,489 €10.92
31 December 2018 €204,841 €10.85 €627,634 €9.64 €3,893,671 €9.74
31 December 2017 €147,489 €11.36 €654,540 €10.50 – –
GBP I
Accumulating Class*
GBP I Accumulating
Class*
SGD A (Monthly) Distributing
Class*
SGD A (Monthly) Distributing
Class*
SGD A Accumulating
Class*
SGD A Accumulating
Class*Year Ended NAV NAV per Share NAV NAV per Share NAV NAV per Share
31 December 2019 £32,694 £10.76 SGD198,903 SGD20.68 SGD100,055 SGD21.40
USD A (Monthly)
Distributing Class
USD A (Monthly) Distributing
Class
USD A Accumulating
Class*
USD A Accumulating
Class*
USD I Accumulating
Class
USD I Accumulating
ClassYear Ended NAV NAV per Share NAV NAV per Share NAV NAV per Share
31 December 2019 $143,644 $10.27 $15,971,224 $11.23 $412,729 $13.85
31 December 2018 $40,572 $9.55 $9,966 $9.83 $16,250,882 $12.04
31 December 2017 $42,510 $10.22 – – $24,837,029 $12.11

NOTES TO THE AUDITED FINANCIAL STATEMENTS FINANCIAL STATEMENTS
ANNUAL REPORT 2019 1421
FOR THE YEAR ENDED 31 DECEMBER 2019
13. NET ASSET VALUE COMPARATIVE (CONTINUED) Neuberger Berman European High Yield Bond Fund (continued)
USD I5
Accumulating Class*
USD I5 Accumulating
Class*
USD X Accumulating
Class*
USD X Accumulating
Class*
USD Z Accumulating
Class*
USD Z Accumulating
Class*Year Ended NAV NAV per Share NAV NAV per Share NAV NAV per Share
31 December 2019 $257,752 $10.35 $10,669,791 $11.49 $3,720,825 $10.75
31 December 2018 – – $6,026,513 $9.94 – –
Neuberger Berman Global Equity Fund
USD I
Accumulating Class*
USD I Accumulating
Class*Year Ended NAV NAV per Share
31 December 2019 $1,422,349 $14.12
31 December 2018 $1,209,632 $11.09
31 December 2017 $1,354,065 $12.41
Neuberger Berman Systematic Global Equity Fund
EUR M
Accumulating Class
EUR M Accumulating
Class
GBP I Accumulating
Class*
GBP I Accumulating
Class*
GBP Z Accumulating
Class*
GBP Z Accumulating
Class*Year Ended NAV NAV per Share NAV NAV per Share NAV NAV per Share
31 December 2019 €2,304,149 €13.17 £26,814 £11.28 – –
31 December 2018 €3,019,150 €11.21 – – £50,067 £11.65
31 December 2017 €2,946,996 €12.97 – – £56,111 £13.06

FINANCIAL STATEMENTS NOTES TO THE AUDITED FINANCIAL STATEMENTS
1422 NEUBERGER BERMAN INVESTMENT FUNDS PLC
FOR THE YEAR ENDED 31 DECEMBER 2019
13. NET ASSET VALUE COMPARATIVE (CONTINUED) Neuberger Berman Systematic Global Equity Fund (continued)
SGD A
Accumulating Class
SGD A Accumulating
Class
USD A Accumulating
Class
USD A Accumulating
Class
USD I Accumulating
Class
USD I Accumulating
ClassYear Ended NAV NAV per Share NAV NAV per Share NAV NAV per Share
31 December 2019 SGD62,347 SGD27.23 $108,704 $13.53 $683,309 $14.06
31 December 2018 SGD102,716 SGD22.50 $32,293 $11.08 $338,846 $11.44
31 December 2017 SGD159,425 SGD25.33 $10,938 $12.34 $1,554,127 $12.65
USD T
Accumulating Class
USD T Accumulating
Class
USD Z Accumulating
Class
USD Z Accumulating
ClassYear Ended NAV NAV per Share NAV NAV per Share
31 December 2019 $20,336,438 $14.95 $7,870,710 $15.02
31 December 2018 $16,736,521 $12.31 $32,263 $12.14
31 December 2017 $18,726,323 $13.77 $35,454 $13.34
Neuberger Berman Global Real Estate Securities Fund
EUR M
Accumulating Class
EUR M Accumulating
Class
GBP Z Accumulating
Class
GBP Z Accumulating
Class
USD A Accumulating
Class*
USD A Accumulating
Class*Year Ended NAV NAV per Share NAV NAV per Share NAV NAV per Share
31 December 2019 €275,398 €12.23 £88,048 £12.93 $1,742,703 $11.00
31 December 2018 €103,771 €10.19 £50,327 £10.39 – –
31 December 2017 €17,826 €11.25 £53,566 £11.06 – –

NOTES TO THE AUDITED FINANCIAL STATEMENTS FINANCIAL STATEMENTS
ANNUAL REPORT 2019 1423
FOR THE YEAR ENDED 31 DECEMBER 2019
13. NET ASSET VALUE COMPARATIVE (CONTINUED) Neuberger Berman Global Real Estate Securities Fund (continued)
USD I
Accumulating Class
USD I Accumulating
Class
USD I2 Accumulating
Class
USD I2 Accumulating
Class
USD I5 Accumulating
Class*
USD I5 Accumulating
Class*Year Ended NAV NAV per Share NAV NAV per Share NAV NAV per Share
31 December 2019 $2,110,249 $13.73 $1,854,943 $12.14 – –
31 December 2018 $1,291,884 $10.90 $1,722,383 $9.62 – –
31 December 2017 $2,383,192 $11.47 $1,810,673 $10.12 $496,362 $12.17
USD I5
Distributing Class*
USD I5 Distributing
Class*
USD M Accumulating
Class*
USD M Accumulating
Class*
USD T Accumulating
Class*
USD T Accumulating
Class*Year Ended NAV NAV per Share NAV NAV per Share NAV NAV per Share
31 December 2019 $196,192 $10.13 $268,047 $10.36 $61,012,835 $11.15
31 December 2018 – – – – – –
31 December 2017 – – – – $30,470,955 $10.94
USD Z
Accumulating Class
USD Z Accumulating
ClassYear Ended NAV NAV per Share
31 December 2019 $71,049 $13.69
31 December 2018 $55,962 $10.78
31 December 2017 $58,479 $11.27

FINANCIAL STATEMENTS NOTES TO THE AUDITED FINANCIAL STATEMENTS
1424 NEUBERGER BERMAN INVESTMENT FUNDS PLC
FOR THE YEAR ENDED 31 DECEMBER 2019
13. NET ASSET VALUE COMPARATIVE (CONTINUED) Neuberger Berman US Small Cap Intrinsic Value Fund
USD A
Accumulating Class
USD A Accumulating
Class
USD C1 Accumulating
Class
USD C1 Accumulating
Class
USD I Accumulating
Class
USD I Accumulating
ClassYear Ended NAV NAV per Share NAV NAV per Share NAV NAV per Share
31 December 2019 $47,538 $15.55 $98,894 $10.69 $72,432,470 $13.33
31 December 2018 $240,614 $12.93 $8,982 $8.98 $63,414,887 $10.99
31 December 2017 $79,850 $14.38 $10,087 $10.09 $71,222,290 $12.12
USD M
Accumulating Class
USD M Accumulating
ClassYear Ended NAV NAV per Share
31 December 2019 $33,240,252 $13.32
31 December 2018 $17,323,299 $11.20
31 December 2017 $12,223,742 $12.58
Neuberger Berman Global Credit Long Short Fund**
EUR A (PF)
Accumulating Class*
EUR A (PF) Accumulating
Class*
EUR I (PF) Accumulating
Class*
EUR I (PF) Accumulating
Class*
EUR M (PF) Accumulating
Class*
EUR M (PF) Accumulating
Class*Year Ended NAV NAV per Share NAV NAV per Share NAV NAV per Share
31 December 2019 – – – – – –
31 December 2018 – – – – – –
31 December 2017 €9,254 €10.36 €289,709 €10.39 €145,906 €10.14

NOTES TO THE AUDITED FINANCIAL STATEMENTS FINANCIAL STATEMENTS
ANNUAL REPORT 2019 1425
FOR THE YEAR ENDED 31 DECEMBER 2019
13. NET ASSET VALUE COMPARATIVE (CONTINUED) Neuberger Berman Global Credit Long Short Fund** (continued)
USD A (PF) (Monthly)
Distributing Class*
USD A (PF) (Monthly) Distributing
Class*
USD I (PF) Accumulating
Class*
USD I (PF) Accumulating
Class*
USD I (PF) Distributing
Class*
USD I (PF) Distributing
Class*Year Ended NAV NAV per Share NAV NAV per Share NAV NAV per Share
31 December 2019 – – – – – –
31 December 2018 – – – – – –
31 December 2017 $599,298 $9.29 $306,441 $10.21 $18,110,499 $9.99
USD Z
Accumulating Class*
USD Z Accumulating
Class*Year Ended NAV NAV per Share
31 December 2019 – –
31 December 2018 – –
31 December 2017 $7,658,099 $10.69
**Portfolio liquidated on 26 November 2018. Neuberger Berman Asian Debt - Hard Currency Fund
SGD A (Monthly)
Distributing Class*
SGD A (Monthly) Distributing
Class*
USD A (Monthly) Distributing
Class
USD A (Monthly) Distributing
Class
USD A Accumulating
Class
USD A Accumulating
ClassYear Ended NAV NAV per Share NAV NAV per Share NAV NAV per Share
31 December 2019 SGD10,831 SGD20.10 $655,341 $10.16 $3,923,176 $12.42
31 December 2018 – – $9,866 $9.43 $29,483 $11.01
31 December 2017 – – $10,627 $10.16 $26,245 $11.34

FINANCIAL STATEMENTS NOTES TO THE AUDITED FINANCIAL STATEMENTS
1426 NEUBERGER BERMAN INVESTMENT FUNDS PLC
FOR THE YEAR ENDED 31 DECEMBER 2019
13. NET ASSET VALUE COMPARATIVE (CONTINUED) Neuberger Berman Asian Debt - Hard Currency Fund (continued)
USD C1
Accumulating Class*
USD C1 Accumulating
Class*
USD I Accumulating
Class
USD I Accumulating
Class
USD I Distributing
Class
USD I Distributing
ClassYear Ended NAV NAV per Share NAV NAV per Share NAV NAV per Share
31 December 2019 $1,993,158 $10.11 $214,189 $12.74 $17,154,035 $11.10
31 December 2018 – – $11,237 $11.24 $15,803,058 $10.22
31 December 2017 – – $11,502 $11.50 $16,788,934 $10.86
USD M
Accumulating Class*
USD M Accumulating
Class*Year Ended NAV NAV per Share
31 December 2019 $1,296,435 $10.20
Neuberger Berman China Bond Fund
CNY I
AccumulatingClass*
CNY I Accumulating
Class*
CNY I Distributing
Class*
CNY I Distributing
Class*
CNY Z Accumulating
Class
CNY Z Accumulating
ClassYear Ended NAV NAV per Share NAV NAV per Share NAV NAV per Share
31 December 2019 – – CNY74,503 CNY105.86 CNY930,349 CNY119.91
31 December 2018 – – CNY72,189 CNY102.57 CNY202,941 CNY110.80
31 December 2017 CNY133,406 CNY102.95 – – CNY136,277,833 CNY104.51

NOTES TO THE AUDITED FINANCIAL STATEMENTS FINANCIAL STATEMENTS
ANNUAL REPORT 2019 1427
FOR THE YEAR ENDED 31 DECEMBER 2019
13. NET ASSET VALUE COMPARATIVE (CONTINUED) Neuberger Berman China Bond Fund (continued)
EUR M Accumulating
Unhedged Class*
EUR M Accumulating Unhedged
Class*
SGD A (Monthly) Distributing
Unhedged Class*
SGD A (Monthly) Distributing
Unhedged Class*
USD I Accumulating Unhedged
Class
USD I Accumulating Unhedged
ClassYear Ended NAV NAV per Share NAV NAV per Share NAV NAV per Share
31 December 2019 €28,607 €10.93 SGD361,998 SGD19.04 $4,407,578 $10.82
31 December 2018 €26,817 €10.25 – – $10,103,614 $10.17
31 December 2017 – – – – $10,140,675 $10.21
USD M Accumulating
Unhedged Class*
USD M Accumulating Unhedged
Class*
USD Z Accumulating
Class*
USD Z Accumulating
Class*
USD Z Accumulating Unhedged
Class*
USD Z Accumulating Unhedged
Class*Year Ended NAV NAV per Share NAV NAV per Share NAV NAV per Share
31 December 2019 $46,430,461 $10.32 $64,368,626 $10.44 $1,623,089 $10.15
31 December 2018 – – – – $1,507,022 $9.49
Neuberger Berman Global Dynamic Asset Allocator Fund**
CNY C2 (Monthly)
Distributing Class*
CNY C2 (Monthly) Distributing
Class*
CNY T (Monthly) Distributing
Class*
CNY T (Monthly) Distributing
Class*
EUR I Accumulating
Class*
EUR I Accumulating
Class*Year Ended NAV NAV per Share NAV NAV per Share NAV NAV per Share
31 December 2019 – – – – – –
31 December 2018 CNY59,061 CNY88.24 CNY60,778 CNY90.48 €27,594 €9.94
31 December 2017 CNY66,384 CNY99.18 CNY67,634 CNY100.69 €29,737 €10.72

FINANCIAL STATEMENTS NOTES TO THE AUDITED FINANCIAL STATEMENTS
1428 NEUBERGER BERMAN INVESTMENT FUNDS PLC
FOR THE YEAR ENDED 31 DECEMBER 2019
13. NET ASSET VALUE COMPARATIVE (CONTINUED) Neuberger Berman Global Dynamic Asset Allocator Fund** (continued)
EUR M
Accumulating Class*
EUR M Accumulating
Class*
GBP I Accumulating
Class*
GBP I Accumulating
Class*
USD C2 (Monthly) Distributing
Class*
USD C2 (Monthly) Distributing
Class*Year Ended NAV NAV per Share NAV NAV per Share NAV NAV per Share
31 December 2019 – – – – – –
31 December 2018 €302,589 €9.39 £7,658 £9.93 $8,287 $8.74
31 December 2017 €145,334 €10.27 £8,162 £10.59 $9,316 $9.83
USD I
Accumulating Class*
USD I Accumulating
Class*
USD I Distributing
Class*
USD I Distributing
Class*
USD T (Monthly) Distributing
Class*
USD T (Monthly) Distributing
Class*Year Ended NAV NAV per Share NAV NAV per Share NAV NAV per Share
31 December 2019 – – – – – –
31 December 2018 $178,561 $10.31 $12,598,936 $9.76 $8,676 $8.97
31 December 2017 $146,080 $10.80 $14,941,260 $10.45 $9,655 $9.98
USD Z
Accumulating Class*
USD Z Accumulating
Class*Year Ended NAV NAV per Share
31 December 2019 – –
31 December 2018 $11,095,187 $10.53
31 December 2017 $13,772,556 $10.95
**Portfolio liquidated on 12 April 2019.

NOTES TO THE AUDITED FINANCIAL STATEMENTS FINANCIAL STATEMENTS
ANNUAL REPORT 2019 1429
FOR THE YEAR ENDED 31 DECEMBER 2019
13. NET ASSET VALUE COMPARATIVE (CONTINUED) Neuberger Berman Asian Opportunities Fund**
USD I
Accumulating Class*
USD I Accumulating
Class*
USD I Distributing
Class*
USD I Distributing
Class*
USD M Accumulating
Class*,*
USD M Accumulating
Class*,*Year Ended NAV NAV per Share NAV NAV per Share NAV NAV per Share
31 December 2019 – – – – – –
31 December 2018 $11,819 $11.82 $3,463,438 $11.47 $78,209 $7.52
31 December 2017 $2,505,938 $15.22 $4,514,481 $14.95 – –
**Portfolio liquidated on 24 July 2019. Neuberger Berman Corporate Hybrid Bond Fund
AUD A (Monthly)
Distributing Class
AUD A (Monthly) Distributing
Class
CHF P Accumulating
Class
CHF P Accumulating
Class
CHF P Distributing
Class
CHF P Distributing
ClassYear Ended NAV NAV per Share NAV NAV per Share NAV NAV per Share
31 December 2019 AUD9,987,001 AUD10.14 CHF17,134,267 CHF10.86 CHF2,296,268 CHF10.85
31 December 2018 AUD427,943 AUD9.37 CHF16,557,313 CHF9.72 CHF3,834,245 CHF10.02
31 December 2017 AUD14,358 AUD10.33 CHF14,381,656 CHF10.42 CHF9,427,573 CHF11.04
EUR A (Monthly)
Distributing Class
EUR A (Monthly) Distributing
Class
EUR A Accumulating
Class
EUR A Accumulating
Class
EUR I Accumulating
Class
EUR I Accumulating
ClassYear Ended NAV NAV per Share NAV NAV per Share NAV NAV per Share
31 December 2019 €24,725,445 €10.13 €69,396,048 €11.79 €288,417,790 €12.35
31 December 2018 €10,353,064 €9.36 €52,070,931 €10.57 €200,048,742 €11.01
31 December 2017 €11,765,047 €10.39 €84,027,810 €11.35 €203,545,205 €11.76

FINANCIAL STATEMENTS NOTES TO THE AUDITED FINANCIAL STATEMENTS
1430 NEUBERGER BERMAN INVESTMENT FUNDS PLC
FOR THE YEAR ENDED 31 DECEMBER 2019
13. NET ASSET VALUE COMPARATIVE (CONTINUED) Neuberger Berman Corporate Hybrid Bond Fund (continued)
EUR I
Distributing Class
EUR I Distributing
Class
EUR I2 Accumulating
Class
EUR I2 Accumulating
Class
EUR I3 Accumulating
Class
EUR I3 Accumulating
ClassYear Ended NAV NAV per Share NAV NAV per Share NAV NAV per Share
31 December 2019 €74,695,624 €10.99 €238,231,713 €11.35 €2,031,125 €11.45
31 December 2018 €14,296,717 €10.12 €270,937,539 €10.11 €2,206,215 €10.18
31 December 2017 €14,333,329 €11.10 €133,500,212 €10.78 €3,892,372 €10.86
EUR I5
Accumulating Class
EUR I5 Accumulating
Class
EUR M Accumulating
Class
EUR M Accumulating
Class
EUR M Distributing
Class
EUR M Distributing
ClassYear Ended NAV NAV per Share NAV NAV per Share NAV NAV per Share
31 December 2019 €3,752,108 €12.51 €13,656,769 €12.60 €4,084,793 €9.87
31 December 2018 €8,784,534 €11.12 €10,994,973 €11.37 €3,373,882 €9.27
31 December 2017 €28,405,617 €11.83 €11,402,057 €12.29 €3,145,625 €10.39
EUR P
Accumulating Class
EUR P Accumulating
Class
EUR P Distributing
Class
EUR P Distributing
Class
GBP I Accumulating
Class
GBP I Accumulating
ClassYear Ended NAV NAV per Share NAV NAV per Share NAV NAV per Share
31 December 2019 €67,562,479 €10.99 €12,420,521 €11.04 £3,566,666 £11.47
31 December 2018 €78,305,615 €9.79 €14,662,812 €10.16 £3,300,198 £10.10
31 December 2017 €78,093,980 €10.45 €18,962,025 €11.14 £11,850,690 £10.66

NOTES TO THE AUDITED FINANCIAL STATEMENTS FINANCIAL STATEMENTS
ANNUAL REPORT 2019 1431
FOR THE YEAR ENDED 31 DECEMBER 2019
13. NET ASSET VALUE COMPARATIVE (CONTINUED) Neuberger Berman Corporate Hybrid Bond Fund (continued)
GBP I2
Accumulating Class
GBP I2 Accumulating
Class
GBP I2 Distributing
Class
GBP I2 Distributing
Class
GBP P Accumulating
Class*
GBP P Accumulating
Class*Year Ended NAV NAV per Share NAV NAV per Share NAV NAV per Share
31 December 2019 £45,649,350 £11.25 £2,571,569 £10.84 £25,486 £10.30
31 December 2018 £38,059,077 £9.90 £3,277,405 £9.86 – –
31 December 2017 £30,252,068 £10.44 £4,500,652 £10.69 – –
GBP P
Distributing Class
GBP P Distributing
Class
HKD A (Monthly) Distributing
Class*
HKD A (Monthly) Distributing
Class*
SGD A (Monthly) Distributing
Class*
SGD A (Monthly) Distributing
Class*Year Ended NAV NAV per Share NAV NAV per Share NAV NAV per Share
31 December 2019 £1,279,969 £10.47 HKD5,540,563 HKD10.07 SGD1,421,298 SGD20.39
31 December 2018 £1,109,044 £9.52 – – – –
31 December 2017 £942,409 £10.33 – – – –
USD A (Monthly)
Distributing Class
USD A (Monthly) Distributing
Class
USD A Accumulating
Class
USD A Accumulating
Class
USD C1 Accumulating
Class
USD C1 Accumulating
ClassYear Ended NAV NAV per Share NAV NAV per Share NAV NAV per Share
31 December 2019 $47,709,301 $10.46 $131,356,416 $12.13 $11,855,155 $10.81
31 December 2018 $14,281,569 $9.59 $23,035,047 $10.56 $1,125,032 $9.51
31 December 2017 $15,520,843 $10.52 $16,473,719 $11.04 $241,854 $10.04

FINANCIAL STATEMENTS NOTES TO THE AUDITED FINANCIAL STATEMENTS
1432 NEUBERGER BERMAN INVESTMENT FUNDS PLC
FOR THE YEAR ENDED 31 DECEMBER 2019
13. NET ASSET VALUE COMPARATIVE (CONTINUED) Neuberger Berman Corporate Hybrid Bond Fund (continued)
USD I
Accumulating Class
USD I Accumulating
Class
USD I2 Accumulating
Class
USD I2 Accumulating
Class
USD I2 Distributing
Class
USD I2 Distributing
ClassYear Ended NAV NAV per Share NAV NAV per Share NAV NAV per Share
31 December 2019 $40,443,871 $13.17 $3,080,768 $12.24 $581,215 $11.29
31 December 2018 $17,591,902 $11.39 $1,499,209 $10.58 $138,149 $10.09
31 December 2017 $16,750,113 $11.84 $1,051,081 $10.97 $225,755 $10.76
USD M
Accumulating Class
USD M Accumulating
Class
USD M Distributing
Class
USD M Distributing
Class
USD P Accumulating
Class
USD P Accumulating
ClassYear Ended NAV NAV per Share NAV NAV per Share NAV NAV per Share
31 December 2019 $6,003,909 $10.90 $1,391,972 $10.18 $28,240,576 $11.72
31 December 2018 $1,408,172 $9.55 $624,468 $9.28 $26,746,854 $10.13
31 December 2017 $771,542 $10.04 $905,258 $10.04 $24,319,984 $10.53
USD Z
Accumulating Class
USD Z Accumulating
ClassYear Ended NAV NAV per Share
31 December 2019 $3,806,111 $12.40
31 December 2018 $2,120,800 $10.67
31 December 2017 $3,328,946 $11.02

NOTES TO THE AUDITED FINANCIAL STATEMENTS FINANCIAL STATEMENTS
ANNUAL REPORT 2019 1433
FOR THE YEAR ENDED 31 DECEMBER 2019
13. NET ASSET VALUE COMPARATIVE (CONTINUED) Neuberger Berman US Equity Fund
USD I
Accumulating Class
USD I Accumulating
Class
USD I Distributing
Class
USD I Distributing
ClassYear Ended NAV NAV per Share NAV NAV per Share
31 December 2019 $171,894 $17.32 $5,163,179 $17.21
31 December 2018 $12,910 $12.95 $3,870,293 $12.90
31 December 2017 $13,851 $13.89 $4,160,029 $13.87
Neuberger Berman Global High Yield Bond Fund
EUR M
Accumulating Class
EUR M Accumulating
Class
EUR M Distributing
Class
EUR M Distributing
Class
EUR Z (PF) Accumulating
Class
EUR Z (PF) Accumulating
ClassYear Ended NAV NAV per Share NAV NAV per Share NAV NAV per Share
31 December 2019 €39,619 €10.44 €24,763 €9.04 €27,695,921 €11.46
31 December 2018 €22,791 €9.52 €23,957 €8.75 €29,703,902 €10.27
31 December 2017 €20,264 €10.14 €39,731 €9.87 €57,985,506 €10.75
GBP I
Accumulating Class
GBP I Accumulating
Class
GBP I2 Accumulating
Class*
GBP I2 Accumulating
Class*
GBP Z (PF) Accumulating
Class*
GBP Z (PF) Accumulating
Class*Year Ended NAV NAV per Share NAV NAV per Share NAV NAV per Share
31 December 2019 £9,503 £10.96 – – – –
31 December 2018 £8,442 £9.73 £9,054 £9.75 – –
31 December 2017 £8,782 £10.13 £9,408 £10.13 £2,764,638 £10.81

FINANCIAL STATEMENTS NOTES TO THE AUDITED FINANCIAL STATEMENTS
1434 NEUBERGER BERMAN INVESTMENT FUNDS PLC
FOR THE YEAR ENDED 31 DECEMBER 2019
13. NET ASSET VALUE COMPARATIVE (CONTINUED) Neuberger Berman Global High Yield Bond Fund (continued)
USD A
Accumulating Class
USD A Accumulating
Class
USD C1 Accumulating
Class*
USD C1 Accumulating
Class*
USD I Accumulating
Class
USD I Accumulating
ClassYear Ended NAV NAV per Share NAV NAV per Share NAV NAV per Share
31 December 2019 $11,260,762 $11.87 $26,970 $10.37 $2,647,297 $12.25
31 December 2018 $9,831 $10.44 – – $159,302 $10.71
31 December 2017 $18,168,599 $10.74 – – $1,498,623 $10.96
USD M
Accumulating Class*
USD M Accumulating
Class*
USD M Distributing
Class*
USD M Distributing
Class*
USD P Accumulating
Class*
USD P Accumulating
Class*Year Ended NAV NAV per Share NAV NAV per Share NAV NAV per Share
31 December 2019 $31,334 $10.44 $19,742 $9.87 $12,706 $11.11
31 December 2018 – – $18,474 $9.24 $11,103 $9.71
USD Z (PF)
Accumulating Class
USD Z (PF) Accumulating
Class
USD Z Accumulating
Class
USD Z Accumulating
ClassYear Ended NAV NAV per Share NAV NAV per Share
31 December 2019 $13,202,131 $12.45 $15,680,477 $12.51
31 December 2018 $11,480,006 $10.82 $14,410,715 $10.86
31 December 2017 $19,522,986 $11.03 $20,995,530 $11.05

NOTES TO THE AUDITED FINANCIAL STATEMENTS FINANCIAL STATEMENTS
ANNUAL REPORT 2019 1435
FOR THE YEAR ENDED 31 DECEMBER 2019
13. NET ASSET VALUE COMPARATIVE (CONTINUED) Neuberger Berman Global Opportunistic Bond Fund
EUR I
Accumulating Class
EUR I Accumulating
Class
GBP I Accumulating
Class*
GBP I Accumulating
Class*
JPY I Accumulating
Class
JPY I Accumulating
ClassYear Ended NAV NAV per Share NAV NAV per Share NAV NAV per Share
31 December 2019 €124,414 €10.54 – – ¥2,078,185,321 ¥1,061.09
31 December 2018 €962,215 €9.99 £816,461 £10.19 ¥724,472,611 ¥1,000.06
31 December 2017 €1,000,273 €10.39 £849,233 £10.48 ¥234,436,785 ¥1,036.78
USD A
Accumulating Class
USD A Accumulating
Class
USD C1 Accumulating
Class*
USD C1 Accumulating
Class*
USD I Accumulating
Class
USD I Accumulating
ClassYear Ended NAV NAV per Share NAV NAV per Share NAV NAV per Share
31 December 2019 $390,358 $10.86 $202,809 $10.14 $84,489,590 $11.46
31 December 2018 $29,936 $9.98 – – $33,252,021 $10.49
31 December 2017 $130,535 $10.12 – – $39,060,421 $10.60
USD I
Distributing Class
USD I Distributing
Class
USD I2 Accumulating
Class*
USD I2 Accumulating
Class*
USD M Accumulating
Class*
USD M Accumulating
Class*Year Ended NAV NAV per Share NAV NAV per Share NAV NAV per Share
31 December 2019 $16,365,706 $10.76 $18,168,169 $10.81 $791,002 $10.01
31 December 2018 $5,937,016 $10.09 $16,619,850 $9.89 – –
31 December 2017 $1,013,904 $10.44 – – – –

FINANCIAL STATEMENTS NOTES TO THE AUDITED FINANCIAL STATEMENTS
1436 NEUBERGER BERMAN INVESTMENT FUNDS PLC
FOR THE YEAR ENDED 31 DECEMBER 2019
13. NET ASSET VALUE COMPARATIVE (CONTINUED) Neuberger Berman Global Opportunistic Bond Fund (continued)
USD Z
Accumulating Class*
USD Z Accumulating
Class*Year Ended NAV NAV per Share
31 December 2019 $34,023,408 $10.43
31 December 2018 $35,416,498 $9.92
Neuberger Berman Multi-Asset Risk Premia Fund**
CHF A
Accumulating Class*
CHF A Accumulating
Class*
CHF I Accumulating
Class*
CHF I Accumulating
Class*
CHF I2 Accumulating
Class*
CHF I2 Accumulating
Class*Year Ended NAV NAV per Share NAV NAV per Share NAV NAV per Share
31 December 2019 – – – – – –
31 December 2018 CHF26,608 CHF8.79 CHF26,784 CHF8.85 CHF26,819 CHF8.86
31 December 2017 CHF29,509 CHF9.75 CHF29,585 CHF9.78 CHF29,600 CHF9.78
EUR A
Accumulating Class*
EUR A Accumulating
Class*
EUR I Accumulating
Class*
EUR I Accumulating
Class*
EUR I2 Accumulating
Class*
EUR I2 Accumulating
Class*Year Ended NAV NAV per Share NAV NAV per Share NAV NAV per Share
31 December 2019 – – – – – –
31 December 2018 €15,117 €8.86 €15,246 €8.91 €24,632 €8.93
31 December 2017 €26,990 €9.78 €27,059 €9.81 €27,073 €9.81

NOTES TO THE AUDITED FINANCIAL STATEMENTS FINANCIAL STATEMENTS
ANNUAL REPORT 2019 1437
FOR THE YEAR ENDED 31 DECEMBER 2019
13. NET ASSET VALUE COMPARATIVE (CONTINUED) Neuberger Berman Multi-Asset Risk Premia Fund** (continued)
EUR I5
Accumulating Class*
EUR I5 Accumulating
Class*
EUR M Accumulating
Class*
EUR M Accumulating
Class*
EUR Z Accumulating
Class*
EUR Z Accumulating
Class*Year Ended NAV NAV per Share NAV NAV per Share NAV NAV per Share
31 December 2019 – – – – – –
31 December 2018 €890,485 €8.90 €561,409 €8.83 €370,395 €9.26
31 December 2017 €977,553 €9.78 €23,835 €9.83 – –
GBP I
Distributing Class*
GBP I Distributing
Class*
USD A Accumulating
Class*
USD A Accumulating
Class*
USD A Distributing
Class*
USD A Distributing
Class*Year Ended NAV NAV per Share NAV NAV per Share NAV NAV per Share
31 December 2019 – – – – – –
31 December 2018 £13,511,318 £9.02 $9,764 $9.13 $9,213 $9.21
31 December 2017 £16,508,358 £9.81 $10,497 $9.81 $9,904 $9.90
USD I
Accumulating Class*
USD I Accumulating
Class*
USD I Distributing
Class*
USD I Distributing
Class*
USD I2 Accumulating
Class*
USD I2 Accumulating
Class*Year Ended NAV NAV per Share NAV NAV per Share NAV NAV per Share
31 December 2019 – – – – – –
31 December 2018 $121,522 $9.16 $6,131,215 $9.16 $9,286 $9.29
31 December 2017 $6,068,925 $9.81 $6,585,542 $9.81 $9,935 $9.93
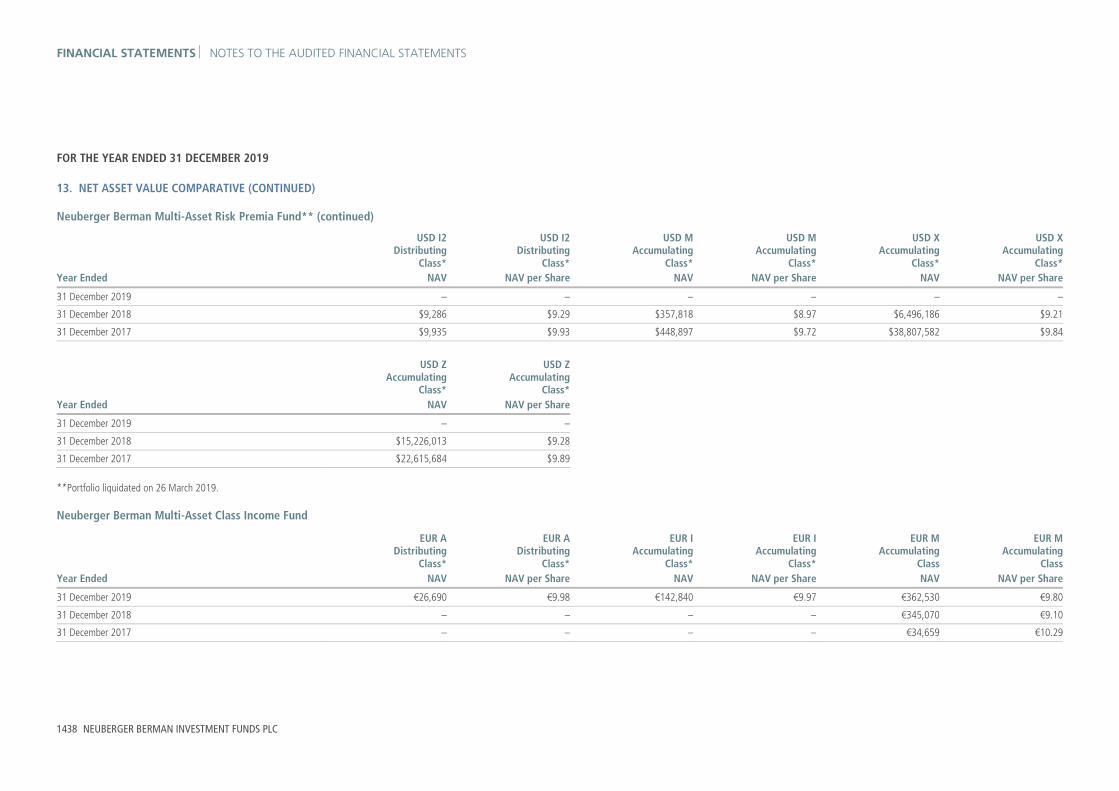
FINANCIAL STATEMENTS NOTES TO THE AUDITED FINANCIAL STATEMENTS
1438 NEUBERGER BERMAN INVESTMENT FUNDS PLC
FOR THE YEAR ENDED 31 DECEMBER 2019
13. NET ASSET VALUE COMPARATIVE (CONTINUED) Neuberger Berman Multi-Asset Risk Premia Fund** (continued)
USD I2
Distributing Class*
USD I2 Distributing
Class*
USD M Accumulating
Class*
USD M Accumulating
Class*
USD X Accumulating
Class*
USD X Accumulating
Class*Year Ended NAV NAV per Share NAV NAV per Share NAV NAV per Share
31 December 2019 – – – – – –
31 December 2018 $9,286 $9.29 $357,818 $8.97 $6,496,186 $9.21
31 December 2017 $9,935 $9.93 $448,897 $9.72 $38,807,582 $9.84
USD Z
Accumulating Class*
USD Z Accumulating
Class*Year Ended NAV NAV per Share
31 December 2019 – –
31 December 2018 $15,226,013 $9.28
31 December 2017 $22,615,684 $9.89
**Portfolio liquidated on 26 March 2019. Neuberger Berman Multi-Asset Class Income Fund
EUR A
Distributing Class*
EUR A Distributing
Class*
EUR I Accumulating
Class*
EUR I Accumulating
Class*
EUR M Accumulating
Class
EUR M Accumulating
ClassYear Ended NAV NAV per Share NAV NAV per Share NAV NAV per Share
31 December 2019 €26,690 €9.98 €142,840 €9.97 €362,530 €9.80
31 December 2018 – – – – €345,070 €9.10
31 December 2017 – – – – €34,659 €10.29

NOTES TO THE AUDITED FINANCIAL STATEMENTS FINANCIAL STATEMENTS
ANNUAL REPORT 2019 1439
FOR THE YEAR ENDED 31 DECEMBER 2019
13. NET ASSET VALUE COMPARATIVE (CONTINUED) Neuberger Berman Multi-Asset Class Income Fund (continued)
EUR M
Distributing Class
EUR M Distributing
Class
GBP I Accumulating
Class*
GBP I Accumulating
Class*
USD A Accumulating
Class*
USD A Accumulating
Class*Year Ended NAV NAV per Share NAV NAV per Share NAV NAV per Share
31 December 2019 €64,216 €9.05 £25,016 £10.53 $11,350,174 $10.55
31 December 2018 €376,122 €8.74 – – $7,198,845 $9.42
31 December 2017 €41,541 €10.23 – – – –
USD C1
Accumulating Class*
USD C1 Accumulating
Class*
USD I Accumulating
Class
USD I Accumulating
Class
USD I Distributing
Class
USD I Distributing
ClassYear Ended NAV NAV per Share NAV NAV per Share NAV NAV per Share
31 December 2019 $6,259,414 $10.41 $11,874,592 $11.61 $3,284,859 $10.68
31 December 2018 $3,981,527 $9.39 $10,381,695 $10.30 $11,773,085 $9.86
31 December 2017 – – $7,339,048 $11.14 $20,768,428 $10.93
USD M
Accumulating Class
USD M Accumulating
ClassYear Ended NAV NAV per Share
31 December 2019 $65,640,444 $10.51
31 December 2018 $2,719,825 $9.46
31 December 2017 $21,752 $10.37
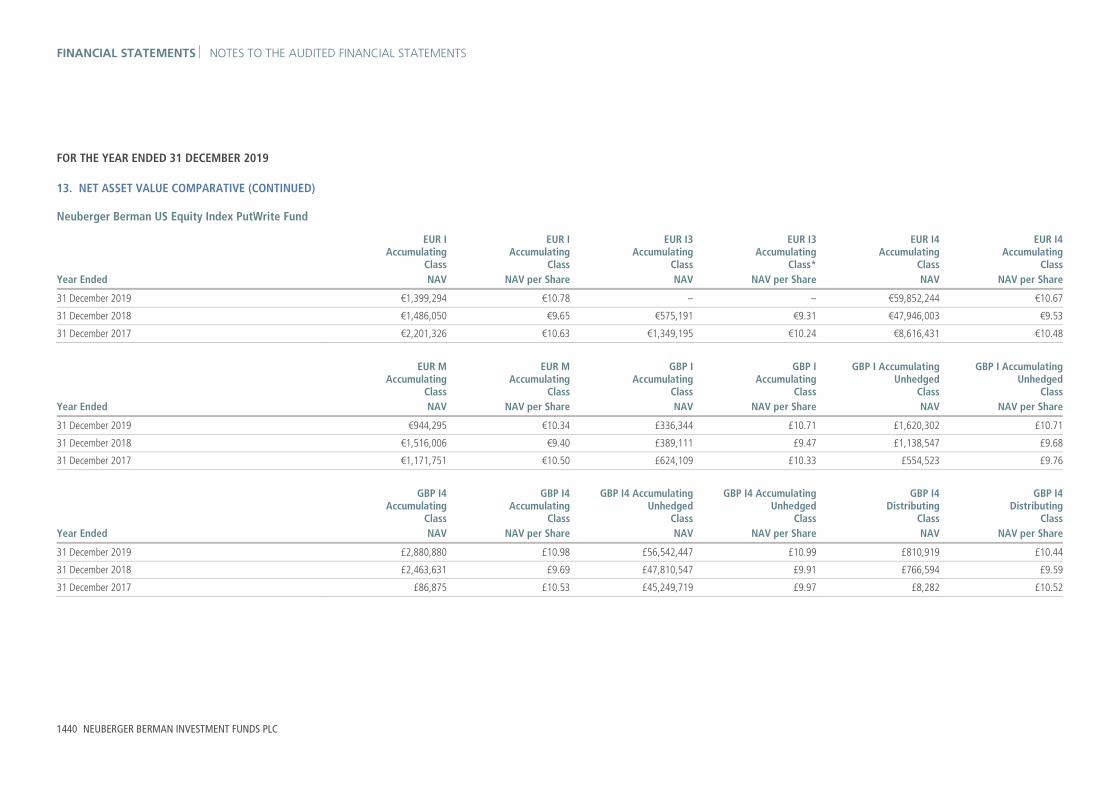
FINANCIAL STATEMENTS NOTES TO THE AUDITED FINANCIAL STATEMENTS
1440 NEUBERGER BERMAN INVESTMENT FUNDS PLC
FOR THE YEAR ENDED 31 DECEMBER 2019
13. NET ASSET VALUE COMPARATIVE (CONTINUED) Neuberger Berman US Equity Index PutWrite Fund
EUR I
Accumulating Class
EUR I Accumulating
Class
EUR I3 Accumulating
Class
EUR I3 Accumulating
Class*
EUR I4 Accumulating
Class
EUR I4 Accumulating
ClassYear Ended NAV NAV per Share NAV NAV per Share NAV NAV per Share
31 December 2019 €1,399,294 €10.78 – – €59,852,244 €10.67
31 December 2018 €1,486,050 €9.65 €575,191 €9.31 €47,946,003 €9.53
31 December 2017 €2,201,326 €10.63 €1,349,195 €10.24 €8,616,431 €10.48
EUR M
Accumulating Class
EUR M Accumulating
Class
GBP I Accumulating
Class
GBP I Accumulating
Class
GBP I Accumulating Unhedged
Class
GBP I Accumulating Unhedged
ClassYear Ended NAV NAV per Share NAV NAV per Share NAV NAV per Share
31 December 2019 €944,295 €10.34 £336,344 £10.71 £1,620,302 £10.71
31 December 2018 €1,516,006 €9.40 £389,111 £9.47 £1,138,547 £9.68
31 December 2017 €1,171,751 €10.50 £624,109 £10.33 £554,523 £9.76
GBP I4
Accumulating Class
GBP I4 Accumulating
Class
GBP I4 Accumulating Unhedged
Class
GBP I4 Accumulating Unhedged
Class
GBP I4 Distributing
Class
GBP I4 Distributing
ClassYear Ended NAV NAV per Share NAV NAV per Share NAV NAV per Share
31 December 2019 £2,880,880 £10.98 £56,542,447 £10.99 £810,919 £10.44
31 December 2018 £2,463,631 £9.69 £47,810,547 £9.91 £766,594 £9.59
31 December 2017 £86,875 £10.53 £45,249,719 £9.97 £8,282 £10.52

NOTES TO THE AUDITED FINANCIAL STATEMENTS FINANCIAL STATEMENTS
ANNUAL REPORT 2019 1441
FOR THE YEAR ENDED 31 DECEMBER 2019
13. NET ASSET VALUE COMPARATIVE (CONTINUED) Neuberger Berman US Equity Index PutWrite Fund (continued)
JPY I
AccumulatingClass*
JPY I Accumulating
Class*
SGD A (Monthly) Distributing
Class
SGD A (Monthly) Distributing
Class
USD A (Monthly) Distributing
Class*
USD A (Monthly) Distributing
Class*Year Ended NAV NAV per Share NAV NAV per Share NAV NAV per Share
31 December 2019 – – SGD301,845 SGD19.42 $49,997 $10.00
31 December 2018 – – SGD278,045 SGD17.82 $45,490 $9.10
31 December 2017 ¥517,253,199 ¥1,034.51 SGD26,241 SGD20.18 – –
USD A
Accumulating Class
USD A Accumulating
Class
USD C1 Accumulating
Class
USD C1 Accumulating
Class
USD I (Monthly) Distributing
Class
USD I (Monthly) Distributing
ClassYear Ended NAV NAV per Share NAV NAV per Share NAV NAV per Share
31 December 2019 $70,568,810 $11.55 $797,245 $10.39 $1,756,635 $10.33
31 December 2018 $7,713,876 $10.09 $2,295,770 $9.17 $1,983,764 $9.35
31 December 2017 $17,042,577 $10.88 $514,391 $9.98 $2,721,162 $10.42
USD I
Accumulating Class
USD I Accumulating
Class
USD I Distributing
Class*
USD I Distributing
Class*
USD I3 Accumulating
Class*
USD I3 Accumulating
Class*Year Ended NAV NAV per Share NAV NAV per Share NAV NAV per Share
31 December 2019 $41,965,812 $11.90 – – $218,512,055 $10.54
31 December 2018 $75,939,435 $10.34 $25,178 $10.29 $203,638,435 $9.14
31 December 2017 $73,831,278 $11.08 $761,759 $11.08 – –

FINANCIAL STATEMENTS NOTES TO THE AUDITED FINANCIAL STATEMENTS
1442 NEUBERGER BERMAN INVESTMENT FUNDS PLC
FOR THE YEAR ENDED 31 DECEMBER 2019
13. NET ASSET VALUE COMPARATIVE (CONTINUED) Neuberger Berman US Equity Index PutWrite Fund (continued)
USD I4
Accumulating Class
USD I4 Accumulating
Class
USD I4 Distributing
Class*
USD I4 Distributing
Class*
USD M Accumulating
Class
USD M Accumulating
ClassYear Ended NAV NAV per Share NAV NAV per Share NAV NAV per Share
31 December 2019 $54,977,042 $11.46 $173,862 $10.06 $2,047,334 $11.15
31 December 2018 $55,261,868 $9.93 $9,075 $9.07 $5,199,249 $9.83
31 December 2017 $13,643,291 $10.61 – – $1,475,056 $10.67
USD P
Accumulating Class*
USD P Accumulating
Class*
USD Z Accumulating
Class
USD Z Accumulating
ClassYear Ended NAV NAV per Share NAV NAV per Share
31 December 2019 $10,490 $10.52 $11,107,652 $11.82
31 December 2018 $5,590,690 $9.14 $8,230,830 $10.22
31 December 2017 – – $608,412 $10.88
Neuberger Berman Global Equity Index PutWrite Fund
AUD I5 (Monthly)
Distributing Class*
AUD I5 (Monthly) Distributing
Class*
AUD I5 Accumulating
Class*
AUD I5 Accumulating
Class*
AUD X (Monthly) Distributing
Class*
AUD X (Monthly) Distributing
Class*Year Ended NAV NAV per Share NAV NAV per Share NAV NAV per Share
31 December 2019 – – – – – –
31 December 2018 AUD11,981 AUD9.03 AUD12,898 AUD9.72 AUD11,831 AUD8.92
31 December 2017 AUD13,522 AUD10.19 AUD13,912 AUD10.49 AUD13,462 AUD10.15
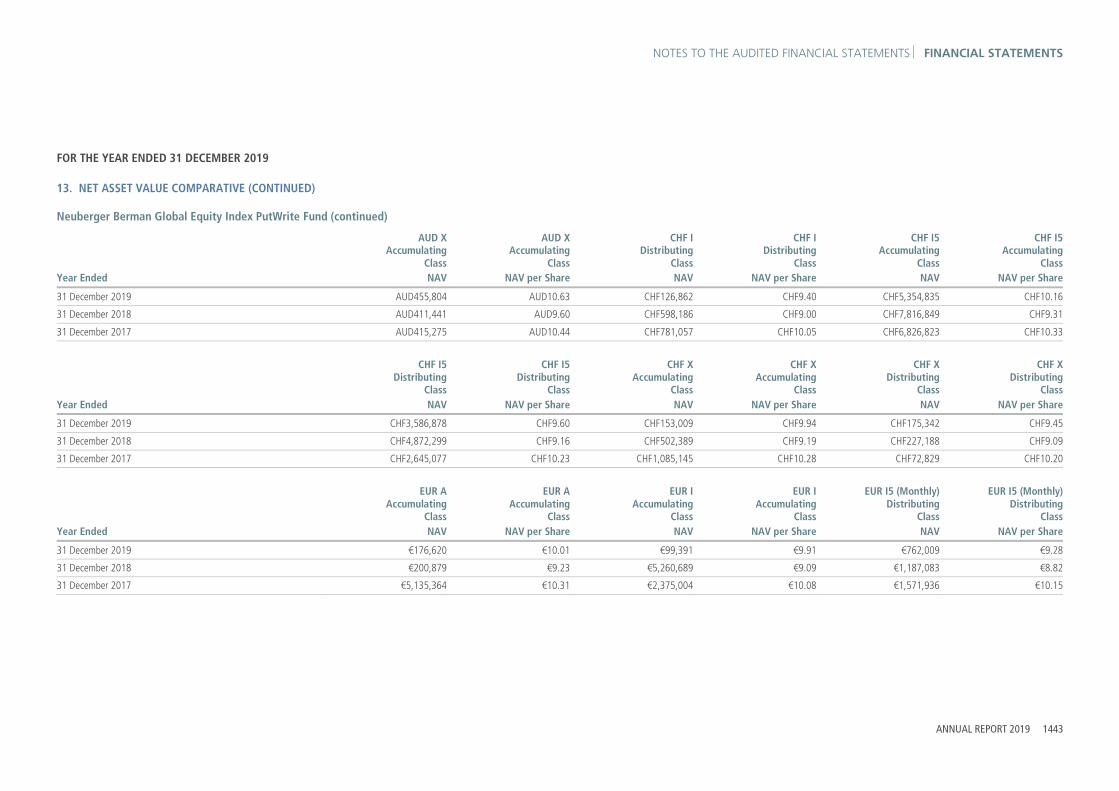
NOTES TO THE AUDITED FINANCIAL STATEMENTS FINANCIAL STATEMENTS
ANNUAL REPORT 2019 1443
FOR THE YEAR ENDED 31 DECEMBER 2019
13. NET ASSET VALUE COMPARATIVE (CONTINUED) Neuberger Berman Global Equity Index PutWrite Fund (continued)
AUD X
Accumulating Class
AUD X Accumulating
Class
CHF I Distributing
Class
CHF I Distributing
Class
CHF I5 Accumulating
Class
CHF I5 Accumulating
ClassYear Ended NAV NAV per Share NAV NAV per Share NAV NAV per Share
31 December 2019 AUD455,804 AUD10.63 CHF126,862 CHF9.40 CHF5,354,835 CHF10.16
31 December 2018 AUD411,441 AUD9.60 CHF598,186 CHF9.00 CHF7,816,849 CHF9.31
31 December 2017 AUD415,275 AUD10.44 CHF781,057 CHF10.05 CHF6,826,823 CHF10.33
CHF I5
Distributing Class
CHF I5 Distributing
Class
CHF X Accumulating
Class
CHF X Accumulating
Class
CHF X Distributing
Class
CHF XDistributing
ClassYear Ended NAV NAV per Share NAV NAV per Share NAV NAV per Share
31 December 2019 CHF3,586,878 CHF9.60 CHF153,009 CHF9.94 CHF175,342 CHF9.45
31 December 2018 CHF4,872,299 CHF9.16 CHF502,389 CHF9.19 CHF227,188 CHF9.09
31 December 2017 CHF2,645,077 CHF10.23 CHF1,085,145 CHF10.28 CHF72,829 CHF10.20
EUR A
Accumulating Class
EUR A Accumulating
Class
EUR I Accumulating
Class
EUR I Accumulating
Class
EUR I5 (Monthly) Distributing
Class
EUR I5 (Monthly) Distributing
ClassYear Ended NAV NAV per Share NAV NAV per Share NAV NAV per Share
31 December 2019 €176,620 €10.01 €99,391 €9.91 €762,009 €9.28
31 December 2018 €200,879 €9.23 €5,260,689 €9.09 €1,187,083 €8.82
31 December 2017 €5,135,364 €10.31 €2,375,004 €10.08 €1,571,936 €10.15

FINANCIAL STATEMENTS NOTES TO THE AUDITED FINANCIAL STATEMENTS
1444 NEUBERGER BERMAN INVESTMENT FUNDS PLC
FOR THE YEAR ENDED 31 DECEMBER 2019
13. NET ASSET VALUE COMPARATIVE (CONTINUED) Neuberger Berman Global Equity Index PutWrite Fund (continued)
EUR I5
Accumulating Class
EUR I5 Accumulating
Class
EUR M Accumulating
Class
EUR M Accumulating
Class
EUR X (Monthly) Distributing
Class
EUR X (Monthly) Distributing
ClassYear Ended NAV NAV per Share NAV NAV per Share NAV NAV per Share
31 December 2019 €7,008,005 €10.28 €670,461 €9.80 €24,000 €9.08
31 December 2018 €18,410,723 €9.39 €974,183 €9.11 €23,006 €8.71
31 December 2017 €20,618,583 €10.38 €23,254 €10.26 €84,350 €10.11
EUR X
Accumulating Class
EUR X Accumulating
Class
EUR Z Accumulating
Class
EUR Z Accumulating
Class
GBP I Accumulating
Class
GBP I Accumulating
ClassYear Ended NAV NAV per Share NAV NAV per Share NAV NAV per Share
31 December 2019 €1,889,209 €10.03 €294,664 €10.32 £81,053 £10.40
31 December 2018 €6,154,850 €9.24 €271,150 €9.40 £495,685 £9.41
31 December 2017 €9,838,325 €10.30 €13,595 €10.36 £2,035,963 £10.32
GBP I5
Accumulating Class
GBP I5 Accumulating
Class
GBP I5 Distributing
Class
GBP I5 Distributing
Class
GBP X Accumulating
Class*
GBP X Accumulating
Class*Year Ended NAV NAV per Share NAV NAV per Share NAV NAV per Share
31 December 2019 £192,597 £10.53 £151,542 £10.04 – –
31 December 2018 £249,653 £9.49 £142,315 £9.43 £810 £9.39
31 December 2017 £208,576 £10.38 £164,148 £10.40 £80,150 £10.35

NOTES TO THE AUDITED FINANCIAL STATEMENTS FINANCIAL STATEMENTS
ANNUAL REPORT 2019 1445
FOR THE YEAR ENDED 31 DECEMBER 2019
13. NET ASSET VALUE COMPARATIVE (CONTINUED) Neuberger Berman Global Equity Index PutWrite Fund (continued)
GBP X
Distributing Class*
GBP X Distributing
Class*
HKD I5 (Monthly) Distributing
Class*
HKD I5 (Monthly) Distributing
Class*
HKD I5 Accumulating
Class*
HKD I5 Accumulating
Class*Year Ended NAV NAV per Share NAV NAV per Share NAV NAV per Share
31 December 2019 – – – – – –
31 December 2018 £7,352 £9.36 HKD70,777 HKD9.08 HKD75,057 HKD9.63
31 December 2017 £8,133 £10.35 HKD79,662 HKD10.22 HKD81,161 HKD10.41
HKD X (Monthly)
Distributing Class*
HKD X (Monthly) Distributing
Class*
HKD X Accumulating
Class*
HKD X Accumulating
Class*
SGD A (Monthly) Distributing
Class
SGD A (Monthly) Distributing
ClassYear Ended NAV NAV per Share NAV NAV per Share NAV NAV per Share
31 December 2019 – – – – SGD17,773 SGD18.95
31 December 2018 HKD69,891 HKD8.96 HKD74,115 HKD9.50 SGD71,506 SGD17.80
31 December 2017 HKD79,306 HKD10.17 HKD80,800 HKD10.36 SGD19,288 SGD20.30
SGD I5 (Monthly)
Distributing Class*
SGD I5 (Monthly) Distributing
Class*
SGD I5 Accumulating
Class
SGD I5 Accumulating
Class
SGD X (Monthly) Distributing
Class
SGD X (Monthly) Distributing
ClassYear Ended NAV NAV per Share NAV NAV per Share NAV NAV per Share
31 December 2019 – – SGD120,320 SGD21.53 SGD47,169 SGD19.10
31 December 2018 SGD12,530 SGD18.14 SGD107,536 SGD19.24 SGD44,238 SGD17.92
31 December 2017 SGD14,148 SGD20.48 SGD14,414 SGD20.87 SGD50,358 SGD20.40

FINANCIAL STATEMENTS NOTES TO THE AUDITED FINANCIAL STATEMENTS
1446 NEUBERGER BERMAN INVESTMENT FUNDS PLC
FOR THE YEAR ENDED 31 DECEMBER 2019
13. NET ASSET VALUE COMPARATIVE (CONTINUED) Neuberger Berman Global Equity Index PutWrite Fund (continued)
SGD X
Accumulating Class
SGD X Accumulating
Class
USD A Accumulating
Class
USD A Accumulating
Class
USD C1 Accumulating
Class*
USD C1 Accumulating
Class*Year Ended NAV NAV per Share NAV NAV per Share NAV NAV per Share
31 December 2019 SGD42,446 SGD21.09 $107,369 $10.75 $154,881 $10.51
31 December 2018 SGD100,085 SGD19.00 $205,927 $9.62 $234,409 $9.50
31 December 2017 SGD734,325 SGD20.78 $245,472 $10.44 – –
USD I
Accumulating Class
USD I Accumulating
Class
USD I Distributing
Class
USD I Distributing
Class
USD I5 (Monthly) Distributing
Class
USD I5 (Monthly) Distributing
ClassYear Ended NAV NAV per Share NAV NAV per Share NAV NAV per Share
31 December 2019 $6,459,880 $11.04 $26,430 $10.57 $1,055,590 $9.96
31 December 2018 $492,441 $9.82 $24,464 $9.79 $1,240,638 $9.19
31 December 2017 $7,358,435 $10.59 $26,475 $10.59 $715,668 $10.28
USD I5
Accumulating Class
USD I5 Accumulating
Class
USD I5 Distributing
Class
USD I5 Distributing
Class
USD X (Monthly) Distributing
Class
USD X (Monthly) Distributing
ClassYear Ended NAV NAV per Share NAV NAV per Share NAV NAV per Share
31 December 2019 $9,381,587 $10.99 $4,834,369 $10.48 $1,615,556 $9.76
31 December 2018 $14,928,482 $9.74 $5,092,283 $9.67 $2,001,751 $9.07
31 December 2017 $11,321,902 $10.46 $5,505,250 $10.47 $1,680,787 $10.23

NOTES TO THE AUDITED FINANCIAL STATEMENTS FINANCIAL STATEMENTS
ANNUAL REPORT 2019 1447
FOR THE YEAR ENDED 31 DECEMBER 2019
13. NET ASSET VALUE COMPARATIVE (CONTINUED) Neuberger Berman Global Equity Index PutWrite Fund (continued)
USD X
Accumulating Class
USD X Accumulating
Class
USD X Distributing
Class
USD X Distributing
Class
USD Z Accumulating
Class
USD Z Accumulating
ClassYear Ended NAV NAV per Share NAV NAV per Share NAV NAV per Share
31 December 2019 $2,716,248 $10.76 $61,926 $10.32 $7,481,851 $10.98
31 December 2018 $8,640,529 $9.61 $57,600 $9.60 $12,638,597 $9.70
31 December 2017 $13,406,338 $10.41 $62,515 $10.42 $6,370,008 $10.38
Neuberger Berman Uncorrelated Strategies Fund
CHF I
Accumulating Class*
CHF I Accumulating
Class*
CHF I5 Accumulating
Class
CHF I5 Accumulating
Class
EUR A Accumulating
Class*
EUR A Accumulating
Class*Year Ended NAV NAV per Share NAV NAV per Share NAV NAV per Share
31 December 2019 CHF3,510,846 CHF9.56 CHF549,166 CHF9.83 €20,458,441 €9.46
31 December 2018 CHF6,577,729 CHF9.67 CHF574,346 CHF9.90 €13,501,572 €9.59
31 December 2017 – – CHF598,405 CHF10.18 – –
EUR I
Accumulating Class*
EUR I Accumulating
Class*
EUR I2Accumulating
Class
EUR I2 Accumulating
Class
EUR I5 Accumulating
Class
EUR I5 Accumulating
ClassYear Ended NAV NAV per Share NAV NAV per Share NAV NAV per Share
31 December 2019 €45,416,243 €9.66 €11,658,626 €9.93 €10,662,818 €10.01
31 December 2018 €31,613,835 €9.72 €7,812,711 €9.98 €12,427,535 €10.03
31 December 2017 – – €4,940,469 €10.23 €8,974,563 €10.26

FINANCIAL STATEMENTS NOTES TO THE AUDITED FINANCIAL STATEMENTS
1448 NEUBERGER BERMAN INVESTMENT FUNDS PLC
FOR THE YEAR ENDED 31 DECEMBER 2019
13. NET ASSET VALUE COMPARATIVE (CONTINUED) Neuberger Berman Uncorrelated Strategies Fund (continued)
EUR M
Accumulating Class
EUR M Accumulating
Class
GBP I Accumulating
Class
GBP I Accumulating
Class
GBP I2 Accumulating
Class
GBP I2 Accumulating
ClassYear Ended NAV NAV per Share NAV NAV per Share NAV NAV per Share
31 December 2019 €981,509 €9.47 £19,882,963 £10.23 £367,281,404 £10.22
31 December 2018 €1,634,469 €9.68 £37,447,921 £10.15 £236,915,732 £10.12
31 December 2017 €16,232 €10.09 £1,991,007 £10.31 £65,370,233 £10.27
GBP I5
Accumulating Class
GBP I5 Accumulating
Class
GBP P Accumulating
Class*
GBP P Accumulating
Class*
GBP Z Accumulating
Class
GBP Z Accumulating
ClassYear Ended NAV NAV per Share NAV NAV per Share NAV NAV per Share
31 December 2019 £99,720,702 £10.31 £132,803,297 £9.90 £328,772 £10.44
31 December 2018 £131,328,697 £10.19 £49,411,086 £9.82 £323,726 £10.28
31 December 2017 £67,829,046 £10.31 – – £353,572 £10.36
SGD A
Accumulating Class*
SGD A Accumulating
Class*
USD A Accumulating
Class*
USD A Accumulating
Class*
USD C1 Accumulating
Class*
USD C1 Accumulating
Class*Year Ended NAV NAV per Share NAV NAV per Share NAV NAV per Share
31 December 2019 SGD41,160 SGD19.97 $44,573,479 $9.98 $19,236,402 $9.85
31 December 2018 SGD40,802 SGD19.79 $29,482,950 $9.83 $28,096,737 $9.80

NOTES TO THE AUDITED FINANCIAL STATEMENTS FINANCIAL STATEMENTS
ANNUAL REPORT 2019 1449
FOR THE YEAR ENDED 31 DECEMBER 2019
13. NET ASSET VALUE COMPARATIVE (CONTINUED) Neuberger Berman Uncorrelated Strategies Fund (continued)
USD I
Accumulating Class
USD I Accumulating
Class
USD I2 Accumulating
Class
USD I2 Accumulating
Class
USD I5 Accumulating
Class
USD I5 Accumulating
ClassYear Ended NAV NAV per Share NAV NAV per Share NAV NAV per Share
31 December 2019 $58,373,597 $10.59 $49,280,438 $10.58 $36,747,654 $10.69
31 December 2018 $52,451,201 $10.35 $34,335,500 $10.32 $32,227,647 $10.41
31 December 2017 $2,049,724 $10.36 $31,440,096 $10.32 $29,523,936 $10.38
USD M
Accumulating Class
USD M Accumulating
Class
USD P Accumulating
Class*
USD P Accumulating
Class*
USD Z Accumulating
Class
USD Z Accumulating
ClassYear Ended NAV NAV per Share NAV NAV per Share NAV NAV per Share
31 December 2019 $13,421,104 $10.09 $35,573,733 $10.30 $11,565,314 $10.65
31 December 2018 $12,016,398 $10.01 $3,085,078 $10.06 $12,407,488 $10.33
31 December 2017 $136,045 $10.18 – – $10,469,286 $10.26
Neuberger Berman Emerging Market Debt Blend Investment Grade Fund
EUR I5
Distributing Class*
EUR I5 Distributing
Class*
GBP I5 Distributing
Class*
GBP I5 Distributing
Class*
NOK I Accumulating
Class*
NOK I Accumulating
Class*Year Ended NAV NAV per Share NAV NAV per Share NAV NAV per Share
31 December 2019 €117,531 €11.19 £2,340,809 £11.12 NOK1,677,329 NOK114.04
31 December 2018 €106,634 €10.16 £2,251,620 £10.19 NOK81,680 NOK101.14

FINANCIAL STATEMENTS NOTES TO THE AUDITED FINANCIAL STATEMENTS
1450 NEUBERGER BERMAN INVESTMENT FUNDS PLC
FOR THE YEAR ENDED 31 DECEMBER 2019
13. NET ASSET VALUE COMPARATIVE (CONTINUED) Neuberger Berman Emerging Market Debt Blend Investment Grade Fund (continued)
NOK U
Accumulating Class*
NOK U Accumulating
Class*
USD I Accumulating
Class
USD I Accumulating
Class
USD I5 Accumulating
Class
USD I5 Accumulating
ClassYear Ended NAV NAV per Share NAV NAV per Share NAV NAV per Share
31 December 2019 NOK459,384 NOK109.14 $35,047 $11.68 $11,769,195 $11.77
31 December 2018 NOK2,152,439 NOK97.07 $30,437 $10.15 $10,190,452 $10.19
31 December 2017 – – $31,423 $10.47 $10,489,305 $10.49
USD Z
Accumulating Class
USD Z Accumulating
ClassYear Ended NAV NAV per Share
31 December 2019 $4,211,853 $11.46
31 December 2018 $3,635,950 $9.90
31 December 2017 $3,764,387 $10.16
Neuberger Berman Emerging Market Sustainable Equity Fund
EUR M Accumulating
Unhedged Class*
EUR M Accumulating Unhedged
Class*
JPY I Accumulating Unhedged
Class*
JPY I Accumulating Unhedged
Class*
USD A Accumulating
Class*
USD A Accumulating
Class*Year Ended NAV NAV per Share NAV NAV per Share NAV NAV per Share
31 December 2019 €31,754 €12.17 ¥1,419,569,870 ¥1,094.07 $12,628 $12.63
31 December 2018 €26,551 €10.18 ¥1,202,677,120 ¥925.14 $10,666 $10.67

NOTES TO THE AUDITED FINANCIAL STATEMENTS FINANCIAL STATEMENTS
ANNUAL REPORT 2019 1451
FOR THE YEAR ENDED 31 DECEMBER 2019
13. NET ASSET VALUE COMPARATIVE (CONTINUED) Neuberger Berman Emerging Market Sustainable Equity Fund (continued)
USD I
Accumulating Class
USD I Accumulating
Class
USD I Distributing
Class
USD I Distributing
Class
USD I5 Accumulating
Class
USD I5 Accumulating
ClassYear Ended NAV NAV per Share NAV NAV per Share NAV NAV per Share
31 December 2019 $96,670,252 $10.55 $30,182 $10.47 $20,052,944 $10.06
31 December 2018 $26,503 $8.83 $4,311,385 $8.83 $16,897,318 $8.39
31 December 2017 $31,624 $10.54 $5,239,010 $10.54 $2,826,113 $9.97
Neuberger Berman China Equity Opportunities Fund
EUR M Accumulating
Unhedged Class*
EUR M Accumulating Unhedged
Class*
USD A Accumulating
Class*
USD A Accumulating
Class*
USD C1 Accumulating
Class*
USD C1 Accumulating
Class*Year Ended NAV NAV per Share NAV NAV per Share NAV NAV per Share
31 December 2019 €42,179 €12.26 $105,614 $9.20 $160,092 $9.00
31 December 2018 €25,344 €9.72 $95,553 $7.35 $34,611 $7.26
USD I
Accumulating Class
USD I Accumulating
Class
USD I Distributing
Class
USD I Distributing
Class
USD M Accumulating
Class*
USD M Accumulating
Class*Year Ended NAV NAV per Share NAV NAV per Share NAV NAV per Share
31 December 2019 $29,471 $9.82 $952,888 $9.82 $10,900 $10.90
31 December 2018 $23,327 $7.78 $754,229 $7.78 – –
31 December 2017 $31,029 $10.34 $1,003,280 $10.34 – –

FINANCIAL STATEMENTS NOTES TO THE AUDITED FINANCIAL STATEMENTS
1452 NEUBERGER BERMAN INVESTMENT FUNDS PLC
FOR THE YEAR ENDED 31 DECEMBER 2019
13. NET ASSET VALUE COMPARATIVE (CONTINUED) Neuberger Berman Multi-Asset Class Growth Fund
EUR M
Accumulating Class*
EUR M Accumulating
Class*
GBP I Accumulating
Class*
GBP I Accumulating
Class*
USD I Accumulating
Class
USD I Accumulating
ClassYear Ended NAV NAV per Share NAV NAV per Share NAV NAV per Share
31 December 2019 €57,282 €9.82 £24,895 £10.48 $30,845 $10.28
31 December 2018 €24,487 €9.39 – – $2,346,503 $9.39
31 December 2017 – – – – $29,999 $10.00
USD I
Distributing Class
USD I Distributing
ClassYear Ended NAV NAV per Share
31 December 2019 $19,496,945 $10.12
31 December 2018 $18,755,353 $9.39
31 December 2017 $19,969,157 $10.00
Neuberger Berman Global Thematic Equity Fund1
EUR M Accumulating
Unhedged Class*
EUR M Accumulating Unhedged
Class*
USD A Accumulating
Class*
USD A Accumulating
Class*
USD C1 Accumulating
Class*
USD C1 Accumulating
Class*Year Ended NAV NAV per Share NAV NAV per Share NAV NAV per Share
31 December 2019 €98,473 €11.85 $12,929,212 $11.02 $4,021,852 $10.85
31 December 2018 €23,730 €9.10 $5,049,192 $8.54 $907,826 $8.49

NOTES TO THE AUDITED FINANCIAL STATEMENTS FINANCIAL STATEMENTS
ANNUAL REPORT 2019 1453
FOR THE YEAR ENDED 31 DECEMBER 2019
13. NET ASSET VALUE COMPARATIVE (CONTINUED) Neuberger Berman Global Thematic Equity Fund1 (continued)
USD I
Accumulating Class*
USD I Accumulating
Class*
USD I Distributing
Class*
USD I Distributing
Class*
USD M Accumulating
Class*
USD M Accumulating
Class*Year Ended NAV NAV per Share NAV NAV per Share NAV NAV per Share
31 December 2019 $1,869,567 $11.21 $11,912 $11.20 $5,539,089 $10.85
31 December 2018 $885,950 $8.60 $3,414,357 $8.60 $1,930,956 $8.49
Neuberger Berman CLO Income Fund1
EUR I
Accumulating Class*
EUR I Accumulating
Class*
EUR I2 Distributing
Class*
EUR I2 Distributing
Class*
GBP I Accumulating
Class*
GBP I Accumulating
Class*Year Ended NAV NAV per Share NAV NAV per Share NAV NAV per Share
31 December 2019 €13,071,874 €9.96 €8,188,088 €9.14 £89,193 £10.15
31 December 2018 €12,409,347 €9.19 €4,866,536 €9.03 £720,788 £9.23
GBP I2
Distributing Class*
GBP I2 Distributing
Class*
GBP I5 Distributing
Class*
GBP I5 Distributing
Class*
GBP Z Accumulating
Class*
GBP Z Accumulating
Class*Year Ended NAV NAV per Share NAV NAV per Share NAV NAV per Share
31 December 2019 £33,038,849 £9.28 £34,760,480 £9.29 £23,223 £10.16
31 December 2018 £10,671,469 £9.05 £43,888,948 £9.10 – –

FINANCIAL STATEMENTS NOTES TO THE AUDITED FINANCIAL STATEMENTS
1454 NEUBERGER BERMAN INVESTMENT FUNDS PLC
FOR THE YEAR ENDED 31 DECEMBER 2019
13. NET ASSET VALUE COMPARATIVE (CONTINUED) Neuberger Berman CLO Income Fund1 (continued)
SEK I
Accumulating Class*
SEK I Accumulating
Class*
USD I Accumulating
Class*
USD I Accumulating
Class*
USD I2 Distributing
Class*
USD I2 Distributing
Class*Year Ended NAV NAV per Share NAV NAV per Share NAV NAV per Share
31 December 2019 SEK77,034,355 SEK99.78 $10,384,935 $10.40 $5,006,552 $10.01
31 December 2018 SEK44,729,924 SEK91.74 $8,874,883 $9.30 – –
USD I5
Distributing Class*
USD I5 Distributing
Class*
USD Z Accumulating
Class*
USD Z Accumulating
Class*Year Ended NAV NAV per Share NAV NAV per Share
31 December 2019 $11,451,546 $9.52 $3,587,083 $10.47
31 December 2018 $8,629,203 $9.17 – –
Neuberger Berman China A-Share Opportunities Fund1**
USD I
Accumulating Class*
USD I Accumulating
Class*
USD I Distributing
Class*
USD I Distributing
Class*Year Ended NAV NAV per Share NAV NAV per Share
31 December 2019 – – – –
31 December 2018 $23,918 $7.97 $773,359 $7.97
**Portfolio liquidated on 6 December 2019.

NOTES TO THE AUDITED FINANCIAL STATEMENTS FINANCIAL STATEMENTS
ANNUAL REPORT 2019 1455
FOR THE YEAR ENDED 31 DECEMBER 2019
13. NET ASSET VALUE COMPARATIVE (CONTINUED) Neuberger Berman Next Generation Mobility Fund1
AUD X
Accumulating Class*
AUD X Accumulating
Class*
EUR A Accumulating
Class*
EUR A Accumulating
Class*
EUR M Accumulating Unhedged
Class*
EUR M Accumulating Unhedged
Class*Year Ended NAV NAV per Share NAV NAV per Share NAV NAV per Share
31 December 2019 AUD51,338 AUD12.21 €20,884 €10.09 €1,902,848 €12.28
31 December 2018 – – €8,074 €8.07 €24,824 €9.43
EUR X
Accumulating Class*
EUR X Accumulating
Class*
GBP I Accumulating
Class*
GBP I Accumulating
Class*
GBP X Accumulating
Class*
GBP X Accumulating
Class*Year Ended NAV NAV per Share NAV NAV per Share NAV NAV per Share
31 December 2019 €31,622 €12.01 £29,143 £12.27 £27,819 £12.12
HKD X Accumulating
Unhedged Class*
HKD X Accumulating Unhedged
Class*
SGD X Accumulating
Class*
SGD X Accumulating
Class*
USD A Accumulating
Class*
USD A Accumulating
Class*Year Ended NAV NAV per Share NAV NAV per Share NAV NAV per Share
31 December 2019 HKD288,831 HKD12.27 SGD49,956 SGD24.50 $8,259,493 $10.51
31 December 2018 – – – – $203,837 $8.15

FINANCIAL STATEMENTS NOTES TO THE AUDITED FINANCIAL STATEMENTS
1456 NEUBERGER BERMAN INVESTMENT FUNDS PLC
FOR THE YEAR ENDED 31 DECEMBER 2019
13. NET ASSET VALUE COMPARATIVE (CONTINUED) Neuberger Berman Next Generation Mobility Fund1 (continued)
USD C1
Accumulating Class*
USD C1 Accumulating
Class*
USD I Accumulating
Class*
USD I Accumulating
Class*
USD I Distributing
Class*
USD I Distributing
Class*Year Ended NAV NAV per Share NAV NAV per Share NAV NAV per Share
31 December 2019 $65,790 $11.70 $253,347 $10.36 $30,939,041 $10.36
31 December 2018 – – $23,911 $7.97 $1,968,634 $7.97
USD M
Accumulating Class*
USD M Accumulating
Class*
USD X Accumulating
Class*
USD X Accumulating
Class*Year Ended NAV NAV per Share NAV NAV per Share
31 December 2019 $38,065 $11.71 $743,363 $12.36
Neuberger Berman Ultra Short Term Euro Bond Fund1
CHF U
Accumulating Class*
CHF U Accumulating
Class*
EUR I Accumulating
Class*
EUR I Accumulating
Class*
EUR I Distributing
Class*
EUR I Distributing
Class*Year Ended NAV NAV per Share NAV NAV per Share NAV NAV per Share
31 December 2019 CHF29,418 CHF99.99 €143,037,881 €101.46 €12,035 €100.85
31 December 2018 – – €1,197,716 €99.81 €9,681,516 €99.81

NOTES TO THE AUDITED FINANCIAL STATEMENTS FINANCIAL STATEMENTS
ANNUAL REPORT 2019 1457
FOR THE YEAR ENDED 31 DECEMBER 2019
13. NET ASSET VALUE COMPARATIVE (CONTINUED) Neuberger Berman Ultra Short Term Euro Bond Fund1 (continued)
EUR I5
Accumulating Class*
EUR I5 Accumulating
Class*
EUR U Accumulating
Class*
EUR U Accumulating
Class*
EUR Z Accumulating
Class*
EUR Z Accumulating
Class*Year Ended NAV NAV per Share NAV NAV per Share NAV NAV per Share
31 December 2019 €178,576,263 €101.51 €26,903 €100.01 €1,026,352 €101.83
31 December 2018 – – – – €499,925 €99.99
USD M
Accumulating Class*
USD M Accumulating
Class*
USD Z Accumulating
Class*
USD Z Accumulating
Class*Year Ended NAV NAV per Share NAV NAV per Share
31 December 2019 $30,057 $101.37 $60,845,458 $104.47
Neuberger Berman Euro Opportunistic Bond Fund1
EUR I
Accumulating Class*
EUR I Accumulating
Class*
EUR IDistributing
Class*
EUR I Distributing
Class*Year Ended NAV NAV per Share NAV NAV per Share
31 December 2019 €32,751 €10.92 €10,592,533 €10.82
31 December 2018 €30,288 €10.10 €5,017,683 €10.10

FINANCIAL STATEMENTS NOTES TO THE AUDITED FINANCIAL STATEMENTS
1458 NEUBERGER BERMAN INVESTMENT FUNDS PLC
FOR THE YEAR ENDED 31 DECEMBER 2019
13. NET ASSET VALUE COMPARATIVE (CONTINUED) Neuberger Berman Euro Bond Absolute Return Fund1
EUR I
Accumulating Class*
EUR I Accumulating
Class*
EUR I Distributing
Class*
EUR I Distributing
Class*
EUR I5 Accumulating
Class*
EUR I5 Accumulating
Class*Year Ended NAV NAV per Share NAV NAV per Share NAV NAV per Share
31 December 2019 €636,585 €10.41 €14,717,319 €10.35 €47,211,695 €10.37
31 December 2018 €301,024 €10.03 €9,733,124 €10.03 – –
USD Z
Accumulating Class*
USD Z Accumulating
Class*Year Ended NAV NAV per Share
31 December 2019 $20,771,275 $10.13 Neuberger Berman Absolute Alpha Fund2
EUR I
Accumulating Class*
EUR I Accumulating
Class*
EUR M Accumulating
Class*
EUR M Accumulating
Class*
EUR M Accumulating Unhedged
Class*
EUR M Accumulating Unhedged
Class*Year Ended NAV NAV per Share NAV NAV per Share NAV NAV per Share
31 December 2019 €56,996 €10.01 €14,406 €9.53 €123,050 €9.46
GBP Z
Accumulating Class*
GBP Z Accumulating
Class*
SGD A Accumulating
Class*
SGD A Accumulating
Class*
USD A Accumulating
Class*
USD A Accumulating
Class*Year Ended NAV NAV per Share NAV NAV per Share NAV NAV per Share
31 December 2019 £72,851 £10.10 SGD40,455 SGD19.55 $39,523,069 $9.49

NOTES TO THE AUDITED FINANCIAL STATEMENTS FINANCIAL STATEMENTS
ANNUAL REPORT 2019 1459
FOR THE YEAR ENDED 31 DECEMBER 2019
13. NET ASSET VALUE COMPARATIVE (CONTINUED) Neuberger Berman Absolute Alpha Fund2 (continued)
USD I
Accumulating Class*
USD I Accumulating
Class*Year Ended NAV NAV per Share
31 December 2019 $9,563 $9.56 Neuberger Berman Multi-Style Premia Fund2
EUR I
Accumulating Class*
EUR I Accumulating
Class*
USD I Accumulating
Class*
USD I Accumulating
Class*
USD I Distributing
Class*
USD I Distributing
Class*Year Ended NAV NAV per Share NAV NAV per Share NAV NAV per Share
31 December 2019 €106,361 €9.89 $31,617 $10.54 $11,677,678 $10.54
USD Z
Accumulating Class*
USD Z Accumulating
Class*Year Ended NAV NAV per Share
31 December 2019 $4,594,860 $10.01
Neuberger Berman Macro Opportunities FX Fund2
EUR I
Accumulating Class*
EUR I Accumulating
Class*
GBP Z Accumulating
Class*
GBP Z Accumulating
Class*
SEK I Accumulating
Class*
SEK I Accumulating
Class*Year Ended NAV NAV per Share NAV NAV per Share NAV NAV per Share
31 December 2019 €10,006 €10.01 £360,690 £10.02 SEK283,007 SEK100.01

FINANCIAL STATEMENTS NOTES TO THE AUDITED FINANCIAL STATEMENTS
1460 NEUBERGER BERMAN INVESTMENT FUNDS PLC
FOR THE YEAR ENDED 31 DECEMBER 2019
13. NET ASSET VALUE COMPARATIVE (CONTINUED) Neuberger Berman Macro Opportunities FX Fund2 (continued)
SEK I
Distributing Class*
SEK I Distributing
Class*
USD I Accumulating
Class*
USD I Accumulating
Class*
USD X Accumulating
Class*
USD X Accumulating
Class*Year Ended NAV NAV per Share NAV NAV per Share NAV NAV per Share
31 December 2019 SEK283,007 SEK100.01 $30,080 $10.03 $17,326,309 $10.03
USD Z
Accumulating Class*
USD Z Accumulating
Class*Year Ended NAV NAV per Share
31 December 2019 $3,995,163 $10.03
* Share class launched or closed during the current or prior reporting year. 1 Portfolio launched during the prior reporting year. 2 Portfolio launched during the current reporting period. All Net Asset Value amounts stated are for shareholder dealing purposes.

NOTES TO THE AUDITED FINANCIAL STATEMENTS FINANCIAL STATEMENTS
ANNUAL REPORT 2019 1461
FOR THE YEAR ENDED 31 DECEMBER 2019
14. EXCHANGE RATES The following exchange rates have been used to translate foreign currency assets and liabilities at year end 31 December 2019:
US$ 1 = AED 3.67315 US$ 1 = CZK 22.64055 US$ 1 = ILS 3.45400 US$ 1 = NOK 8.78730 US$ 1 = SGD 1.34465
US$ 1 = ARS 73.00000 US$ 1 = DKK 6.65700 US$ 1 = INR 71.37815 US$ 1 = NZD 1.48225 US$ 1 = THB 29.95375
US$ 1 = AUD 1.42258 US$ 1 = DOP 53.36000 US$ 1 = JPY 108.67500 US$ 1 = PEN 3.31110 US$ 1 = TRY 5.95100
US$ 1 = BRL 4.02270 US$ 1 = EGP 16.05000 US$ 1 = KES 101.35000 US$ 1 = PHP 50.64500 US$ 1 = TWD 29.97700
US$ 1 = CAD 1.29675 US$ 1 = EUR 0.89087 US$ 1 = KRW 1,156.45000 US$ 1 = PLN 3.78730 US$ 1 = UAH 23.80800
US$ 1 = CHF 0.96835 US$ 1 = GBP 0.75486 US$ 1 = KZT N/A US$ 1 = QAR 3.64100 US$ 1 = UYU 37.42500
US$ 1 = CLP 751.95000 US$ 1 = GHS 5.70000 US$ 1 = LKR N/A US$ 1 = RON 4.26385 US$ 1 = ZAR 13.98350
US$ 1 = CNH 6.96515 US$ 1 = HKD 7.79180 US$ 1 = MXN 18.88400 US$ 1 = RSD 104.74500 US$ 1 = ZMW 14.08500
US$ 1 = CNY 6.96570 US$ 1 = HUF 294.61915 US$ 1 = MYR 4.09050 US$ 1 = RUB 62.11125 US$ 1 = COP 3,281.50000 US$ 1 = IDR 13,882.50000 US$ 1 = NGN 362.92000 US$ 1 = SEK 9.36105
€ 1 = AUD 1.59684 € 1 = GBP 0.84733 € 1 = SGD 1.50937
€ 1 = CHF 1.08697 € 1 = PLN 4.25124 € 1 = USD 1.12250
CNY 1 = CHF N/A CNY 1 = SGD 0.19305
CNY 1 = EUR 0.12790 CNY 1 = USD 0.14357
The following exchange rates have been used to translate foreign currency assets and liabilities at year end 31 December 2018:
US$ 1 = AED 3.67315 US$ 1 = CZK 22.51410 US$ 1 = ILS 3.73675 US$ 1 = NOK 8.65915 US$ 1 = SGD 1.36300
US$ 1 = ARS 37.66000 US$ 1 = DKK 6.52795 US$ 1 = INR 69.81500 US$ 1 = NZD 1.49131 US$ 1 = THB 32.56000
US$ 1 = AUD 1.42045 US$ 1 = DOP 49.98500 US$ 1 = JPY 109.71500 US$ 1 = PEN 3.37850 US$ 1 = TRY 5.31990
US$ 1 = BRL 3.87575 US$ 1 = EGP 17.92000 US$ 1 = KES 101.85000 US$ 1 = PHP 52.58500 US$ 1 = TWD 30.73700
US$ 1 = CAD 1.36580 US$ 1 = EUR 0.87478 US$ 1 = KRW 1,115.80000 US$ 1 = PLN 3.75675 US$ 1 = UAH N/A
US$ 1 = CHF 0.98580 US$ 1 = GBP 0.78518 US$ 1 = KZT 381.03000 US$ 1 = QAR 3.64125 US$ 1 = UYU 32.41500
US$ 1 = CLP 694.00000 US$ 1 = GHS 4.86000 US$ 1 = LKR 182.90000 US$ 1 = RON 4.07210 US$ 1 = ZAR 14.38500
US$ 1 = CNH 6.87035 US$ 1 = HKD 7.82935 US$ 1 = MXN 19.69375 US$ 1 = RSD 103.48500 US$ 1 = ZMW 11.92500
US$ 1 = CNY 6.86570 US$ 1 = HUF 280.62810 US$ 1 = MYR 4.13250 US$ 1 = RUB 69.37250 US$ 1 = COP 3,247.50000 US$ 1 = IDR 14,380.00000 US$ 1 = NGN 363.50000 US$ 1 = SEK 8.86585
€ 1 = AUD 1.62379 € 1 = GBP 0.89757 € 1 = SGD N/A
€ 1 = CHF 1.12692 € 1 = PLN N/A € 1 = USD 1.14315
CNY 1 = CHF 0.14298 CNY 1 = SGD N/A
CNY 1 = EUR 0.12703 CNY 1 = USD 0.14526
AED United Arab Emirates Dirham HUF Hungarian Forint RON Romanian New Leu
ARS Argentine Peso IDR Indonesian Rupiah RSD Serbian Dinar
AUD Australian Dollar ILS Israeli Shekel RUB Russian Ruble
BRL Brazilian Real INR Indian Rupee SEK Swedish Krona
CAD Canadian Dollar JPY Japanese Yen (¥) SGD Singapore Dollar
CHF Swiss Franc KES Kenyan Shilling THB Thai Baht
CLP Chilean Peso KRW South Korean Won TRY Turkish Lira
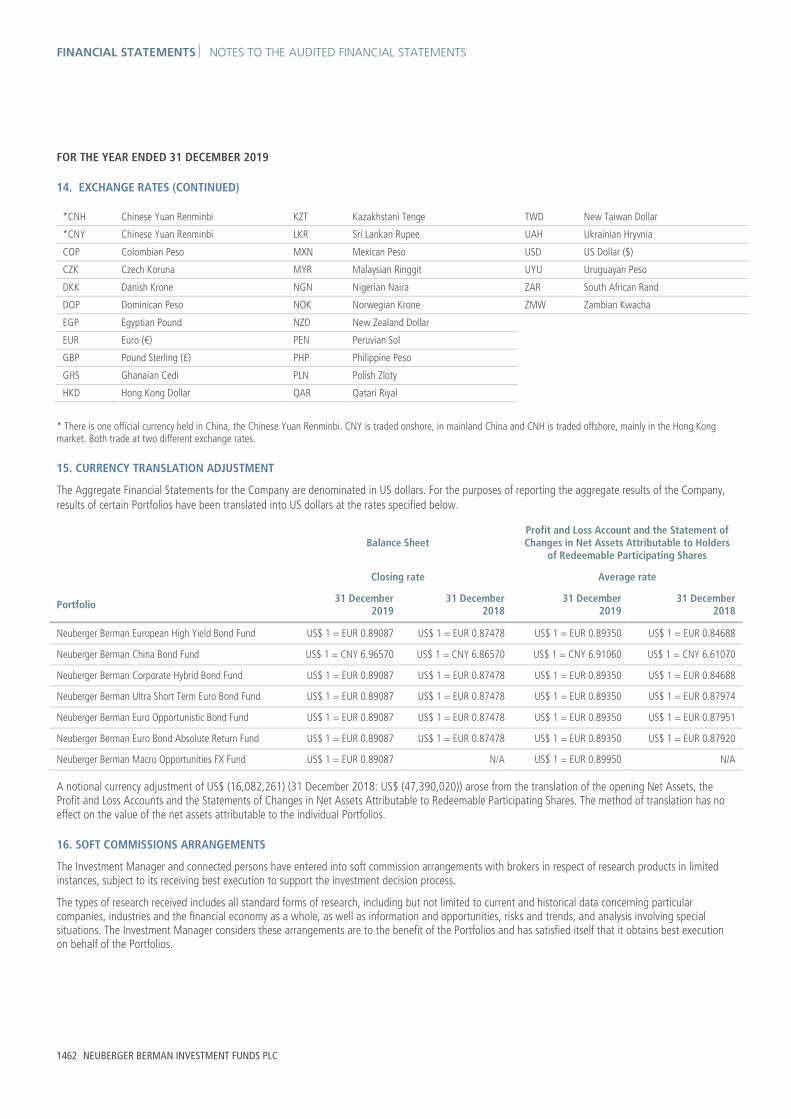
FINANCIAL STATEMENTS NOTES TO THE AUDITED FINANCIAL STATEMENTS
1462 NEUBERGER BERMAN INVESTMENT FUNDS PLC
FOR THE YEAR ENDED 31 DECEMBER 2019
14. EXCHANGE RATES (CONTINUED)
*CNH Chinese Yuan Renminbi KZT Kazakhstani Tenge TWD New Taiwan Dollar
*CNY Chinese Yuan Renminbi LKR Sri Lankan Rupee UAH Ukrainian Hryvnia
COP Colombian Peso MXN Mexican Peso USD US Dollar ($)
CZK Czech Koruna MYR Malaysian Ringgit UYU Uruguayan Peso
DKK Danish Krone NGN Nigerian Naira ZAR South African Rand
DOP Dominican Peso NOK Norwegian Krone ZMW Zambian Kwacha
EGP Egyptian Pound NZD New Zealand Dollar EUR Euro (€) PEN Peruvian Sol GBP Pound Sterling (£) PHP Philippine Peso GHS Ghanaian Cedi PLN Polish Zloty HKD Hong Kong Dollar QAR Qatari Riyal
* There is one official currency held in China, the Chinese Yuan Renminbi. CNY is traded onshore, in mainland China and CNH is traded offshore, mainly in the Hong Kong market. Both trade at two different exchange rates.
15. CURRENCY TRANSLATION ADJUSTMENT
The Aggregate Financial Statements for the Company are denominated in US dollars. For the purposes of reporting the aggregate results of the Company, results of certain Portfolios have been translated into US dollars at the rates specified below.
Balance Sheet Profit and Loss Account and the Statement of Changes in Net Assets Attributable to Holders
of Redeemable Participating Shares
Closing rate Average rate
Portfolio 31 December 2019
31 December 2018
31 December 2019
31 December 2018
Neuberger Berman European High Yield Bond Fund US$ 1 = EUR 0.89087 US$ 1 = EUR 0.87478 US$ 1 = EUR 0.89350 US$ 1 = EUR 0.84688
Neuberger Berman China Bond Fund US$ 1 = CNY 6.96570 US$ 1 = CNY 6.86570 US$ 1 = CNY 6.91060 US$ 1 = CNY 6.61070
Neuberger Berman Corporate Hybrid Bond Fund US$ 1 = EUR 0.89087 US$ 1 = EUR 0.87478 US$ 1 = EUR 0.89350 US$ 1 = EUR 0.84688
Neuberger Berman Ultra Short Term Euro Bond Fund US$ 1 = EUR 0.89087 US$ 1 = EUR 0.87478 US$ 1 = EUR 0.89350 US$ 1 = EUR 0.87974
Neuberger Berman Euro Opportunistic Bond Fund US$ 1 = EUR 0.89087 US$ 1 = EUR 0.87478 US$ 1 = EUR 0.89350 US$ 1 = EUR 0.87951
Neuberger Berman Euro Bond Absolute Return Fund US$ 1 = EUR 0.89087 US$ 1 = EUR 0.87478 US$ 1 = EUR 0.89350 US$ 1 = EUR 0.87920
Neuberger Berman Macro Opportunities FX Fund US$ 1 = EUR 0.89087 N/A US$ 1 = EUR 0.89950 N/A
A notional currency adjustment of US$ (16,082,261) (31 December 2018: US$ (47,390,020)) arose from the translation of the opening Net Assets, the Profit and Loss Accounts and the Statements of Changes in Net Assets Attributable to Redeemable Participating Shares. The method of translation has no effect on the value of the net assets attributable to the individual Portfolios.
16. SOFT COMMISSIONS ARRANGEMENTS
The Investment Manager and connected persons have entered into soft commission arrangements with brokers in respect of research products in limited instances, subject to its receiving best execution to support the investment decision process.
The types of research received includes all standard forms of research, including but not limited to current and historical data concerning particular companies, industries and the financial economy as a whole, as well as information and opportunities, risks and trends, and analysis involving special situations. The Investment Manager considers these arrangements are to the benefit of the Portfolios and has satisfied itself that it obtains best execution on behalf of the Portfolios.

NOTES TO THE AUDITED FINANCIAL STATEMENTS FINANCIAL STATEMENTS
ANNUAL REPORT 2019 1463
FOR THE YEAR ENDED 31 DECEMBER 2019
17. SEGREGATED LIABILITY
The Company has multiple Portfolios and further Portfolios may be created in the future. With the approval of the Company’s Shareholders, by way of a special resolution passed on 3 November 2006, the Company adopted segregated liability between its Portfolios. As at that date, each Portfolio bears its own liabilities and none of the Company, any of the service providers appointed to the Company, the Directors, any receiver, examiner, liquidator nor will any other person have access to the assets of a Portfolio in satisfaction of a liability of any other Portfolio.
18. EFFICIENT PORTFOLIO MANAGEMENT
The Company may employ techniques and instruments relating to transferable securities and/or other financial instruments including financial derivative instruments under the conditions and within the limits laid down by the Central Bank, provided that such instruments are used for efficient portfolio management purposes (i.e. hedging, reducing risks or cost, or increasing capital or income returns) or investment purposes. Techniques and instruments utilised may only be used in accordance with the investment objectives of the relevant Portfolio.
During the year ended 31 December 2019, the Company did not engage in any securities lending or repurchase trading.
During the year ended 31 December 2018, Neuberger Berman Global Credit Long Short Fund engaged in repurchase and reverse repurchase trading. Interest income arising from repurchase agreements for the year ended 31 December 2018 was US$ 4,845. Interest expense arising from reverse repurchase agreements for the year ended 31 December 2018 was US$ 75,162. Direct and indirect costs associated with efficient portfolio management techniques are not readily identifiable. During the year ended 31 December 2018, the Company did not engage in any securities lending.
19. LOAN FACILITY
At the board meeting dated 20 June 2016, arrangements have been made with The Bank of Tokyo Mitsubishi UFJ Ltd, together with a syndicate of other banks (collectively the “Lenders”) to make available a committed liquidity facility, up to a maximum amount of US$ 500,000,000 (the “Facility”), to the Company in respect of the Portfolios from the date of the execution of a credit agreement with the Bank and the proceeds of the Facility could only be used for temporary or emergency liquidity needs of the Portfolios. From 4 October 2018, the maximum amount of the committed liquidity facility has been increased from US$ 500,000,000 to US$ 600,000,000.
There were no loans outstanding under the Facility at 31 December 2019 and 31 December 2018. During the year ended 31 December 2019 and 31 December 2018, none of the Portfolios utilised the loan facility.
The Facility was renewed on 3 October 2019 for the period of 364 days.
20. SIGNIFICANT EVENTS DURING THE YEAR
A new Supplement to the Prospectus was noted by the Central Bank on 22 January 2019 covering the establishment of Neuberger Berman Absolute Alpha Fund which launched on 20 February 2019.
Paul Sullivan resigned as a Director of the Company on 20 February 2019.
Neuberger Berman Multi-Style Premia Fund launched on 1 March 2019.
Neuberger Berman Multi-Asset Risk Premia Fund liquidated on 26 March 2019.
Neuberger Berman Global Dynamic Asset Allocator Fund liquidated on 12 April 2019.
A new Supplement to the Prospectus was noted by the Central Bank on 12 April 2019 covering changes on Neuberger Berman Emerging Markets Equity Fund, Neuberger Berman Global Equity Fund, Neuberger Berman Systematic Global Equity Fund, Neuberger Berman Asian Opportunities Fund, Neuberger Berman Emerging Markets Sustainable Equity Fund, Neuberger Berman Global Thematic Equity Fund and Neuberger Berman Next Generation Mobility Fund.
Andy Olding resigned as a Director of the Company on 11 June 2019.
Naomi Daly was appointed as a Director of the Company on 1 July 2019.
The Performance Fee methodology, where applicable, has been updated with effect from 1 July 2019 following CBI guidance.
Neuberger Berman Asian Opportunities Fund liquidated on 24 July 2019.

FINANCIAL STATEMENTS NOTES TO THE AUDITED FINANCIAL STATEMENTS
1464 NEUBERGER BERMAN INVESTMENT FUNDS PLC
FOR THE YEAR ENDED 31 DECEMBER 2019
20. SIGNIFICANT EVENTS DURING THE YEAR (CONTINUED)
With effect from 31 July 2019, Neuberger Berman Euro Short Term Enhanced Cash Fund changed its name to Neuberger Berman Ultra Short Term Euro Bond Fund.
Alex Duncan was appointed as a Director of the Company on 1 August 2019.
A new version of the Company’s Prospectus and new Supplements to the Prospectus covering changes on all Portfolios were noted by the Central Bank on 2 September 2019.
A new Supplement to the Prospectus was noted by the Central Bank on 26 November 2019 covering the establishment of Neuberger Berman Macro Opportunities FX Fund which launched on 4 December 2019.
Neuberger Berman China A-Share Opportunities Fund liquidated on 6 December 2019.
A new Supplement to the Prospectus was noted by the Central Bank on 30 December 2019 covering the establishment of Neuberger Berman Global High Yield Sustainable Action Fund.
Other than the above, there have been no significant events affecting the Company during the year.
21. SIGNIFICANT EVENTS SINCE THE YEAR END
Neuberger Berman Global High Yield Sustainable Action Fund launched on 21 January 2020.
A new Prospectus and Supplements to the Prospectus were noted by the Central Bank on 28 February 2020.
A new Supplement to the Prospectus was noted by the Central Bank on 2 March 2020 covering name changes for Neuberger Berman Emerging Market Debt Blend Investment Grade Fund, Neuberger Berman Multi-Asset Class Income Fund and Neuberger Berman Multi-Asset Class Growth Fund to Neuberger Berman Emerging Market Debt Sustainable Investment Grade Blend Fund, Neuberger Berman Multi-Asset Income Fund and Neuberger Berman Multi-Asset Growth Fund, respectively.
A new Supplement to the Prospectus was noted by the Central Bank on 9 March 2020 covering the establishment of Neuberger Berman Fixed Maturity Bond I 2024 Fund and Neuberger Berman Global High Income FMB - 2024. The Funds were later renamed as Neuberger Berman Global Flexible Credit Fund and Neuberger Berman Global Diversified Income FMB - 2024, respectively.
The recent outbreak of the COVID-19 in many countries, which is a rapidly evolving situation, has, among other things, disrupted global travel and supply chains, and has adversely impacted global commercial activity, the transportation industry and commodity prices in the energy sector. The impact of this virus has negatively affected and may continue to affect the economies of many nations, individual companies and the global securities and commodities markets, including liquidity and volatility, in ways that cannot necessarily be foreseen at the present time. The rapid development and fluidity of this situation precludes any prediction as to its ultimate impact, which may have a continued adverse effect on economic and market conditions and trigger a period of global economic slowdown. Such conditions (which may be across industries, sectors or geographies) may impact operating performance at the Portfolios' companies in the near term.
The Portfolios entered into a Securities Lending Agreement with Brown Brothers Harriman & Co. on 3 March 2020.
With effect from 4 March 2020, Sound Point Capital Management, L.P. ceased acting as a Non-Affiliated Sub-Adviser of the Company.
A new Supplement to the Prospectus was noted by the Central Bank on 23 March 2020 covering the establishment of Neuberger Berman 5G Connectivity Fund, which launched on 8 April 2020.
On 27 March 2020, the maximum amount of the committed liquidity facility has been increased from US$ 600,000,000 to US$ 975,000,000. The cost of the commitment fee has increased accordingly.
There have been no other significant events affecting the Company since the year end.
22. APPROVAL OF FINANCIAL STATEMENTS
The Board of Directors approved the annual report and audited financial statements on 23 April 2020.

NOTES TO THE AUDITED FINANCIAL STATEMENTS FINANCIAL STATEMENTS
ANNUAL REPORT 2019 1465
FOR THE YEAR ENDED 31 DECEMBER 2019
23. FINANCIAL HIGHLIGHTS
The Investment Manager of the Company is an affiliate of Neuberger Berman Investment Advisers LLC, who is a registered investment adviser with the Securities Exchange Commission (“SEC”) in the United States. The information included here represents US Generally Accepted Accounting Principles (“US GAAP”) equivalent disclosures that are provided in order to enable the Investment Manager to avail of certain exemptions available to it under the SEC Custody Rule.
Neuberger Berman High Yield Bond Fund
AUD A (Monthly)
Distributing Class
AUD A Accumulating
Class
AUD B (Monthly)
Distributing Class
AUD B (Weekly)
Distributing Class
AUD C2 (Monthly)
Distributing Class
AUD C2 (Weekly)
Distributing Class
AUD AUD AUD AUD AUD AUD
31 December 2019 Beginning net asset value 7.96 13.38 6.84 6.90 6.84 6.90
Income from operations: Net investment income/(loss)+ 0.38 0.66 0.21 0.21 0.21 0.21Net realised and unrealised gain/(loss) on trading activities+ 0.56 0.95 0.47 0.48 0.48 0.48
Total from operations 0.94 1.61 0.68 0.69 0.69 0.69
Distributions (0.50) – (0.53) (0.53) (0.53) (0.53)
Ending net asset value 8.40 14.99 6.99 7.06 7.00 7.06
Total return 12.06% 12.03% 10.17% 10.26% 10.32% 10.26%
Ratios to average net assets Expenses++ 1.35% 1.35% 2.95% 2.95% 2.97% 2.96%
Net investment income/(loss) 4.56% 4.55% 2.95% 2.94% 3.02% 2.96%
31 December 2018 Beginning net asset value 8.81 13.86 7.81 7.90 7.82 7.90
Income from operations: Net investment income/(loss)+ 0.43 0.70 0.24 0.33 0.24 0.25Net realised and unrealised gain/(loss) on trading activities+ (0.71) (1.18) (0.60) (0.70) (0.61) (0.62)
Total from operations (0.28) (0.48) (0.36) (0.37) (0.37) (0.37)
Distributions (0.57) – (0.61) (0.63) (0.61) (0.63)
Ending net asset value 7.96 13.38 6.84 6.90 6.84 6.90
Total return (3.43%) (3.46%) (4.88%) (5.03%) (5.00%) (5.03%)
Ratios to average net assets Expenses++ 1.47% 1.47% 3.19% 3.19% 3.19% 3.19%
Net investment income/(loss) 5.06% 5.02% 3.27% 4.27% 3.29% 3.36%

FINANCIAL STATEMENTS NOTES TO THE AUDITED FINANCIAL STATEMENTS
1466 NEUBERGER BERMAN INVESTMENT FUNDS PLC
FOR THE YEAR ENDED 31 DECEMBER 2019
23. FINANCIAL HIGHLIGHTS (CONTINUED)
Neuberger Berman High Yield Bond Fund (continued)
AUD E (Monthly)
Distributing Class
AUD E Accumulating
Class
AUD I Distributing
Class
AUD I2 (Monthly)
Distributing Class
AUD I2 Accumulating
Class
AUD T (Monthly) Distributing
Class AUD AUD AUD AUD AUD AUD
31 December 2019 Beginning net asset value 6.90 10.18 10.69 9.02 11.61 7.57
Income from operations: Net investment income/(loss)+ 0.21 0.31 0.57 0.49 0.67 0.31Net realised and unrealised gain/(loss) on trading activities+ 0.47 0.73 0.75 0.64 0.82 0.53
Total from operations 0.68 1.04 1.32 1.13 1.49 0.84
Distributions (0.53) – (0.61) (0.57) – (0.59)
Ending net asset value 7.05 11.22 11.40 9.58 13.10 7.82
Total return 10.15% 10.22% 12.67% 12.78% 12.83% 11.36%
Ratios to average net assets Expenses++ 2.96% 2.94% 0.74% 0.66% 0.67% 1.96%
Net investment income/(loss) 2.96% 2.90% 5.13% 5.23% 5.29% 3.93%
31 December 2018 Beginning net asset value 7.88 10.72 11.61 9.91 11.94 8.57
Income from operations: Net investment income/(loss)+ 0.24 0.35 0.63 0.54 0.68 0.35Net realised and unrealised gain/(loss) on trading activities+ (0.60) (0.89) (0.94) (0.79) (1.01) (0.67)
Total from operations (0.36) (0.54) (0.31) (0.25) (0.33) (0.32)
Distributions (0.62) – (0.61) (0.64) – (0.68)
Ending net asset value 6.90 10.18 10.69 9.02 11.61 7.57
Total return (4.90%) (5.04%) (2.86%) (2.71%) (2.76%) (4.06%)
Ratios to average net assets Expenses++ 3.19% 3.19% 0.84% 0.73% 0.73% 2.13%
Net investment income/(loss) 3.26% 3.28% 5.64% 5.65% 5.68% 4.35%

NOTES TO THE AUDITED FINANCIAL STATEMENTS FINANCIAL STATEMENTS
ANNUAL REPORT 2019 1467
FOR THE YEAR ENDED 31 DECEMBER 2019
23. FINANCIAL HIGHLIGHTS (CONTINUED)
Neuberger Berman High Yield Bond Fund (continued)
AUD T (Weekly)
Distributing Class
AUD T Accumulating
Class
CAD A (Monthly)
Distributing Class
CHF A Accumulating
Class
CHF I Accumulating
Class
CHF I Distributing
Class AUD AUD CAD CHF CHF CHF
31 December 2019 Beginning net asset value 7.30 11.77 8.03 11.73 12.19 7.71
Income from operations: Net investment income/(loss)+ 0.30 0.50 0.38 0.56 0.66 0.41Net realised and unrealised gain/(loss) on trading activities+ 0.52 0.84 0.57 0.53 0.56 0.34
Total from operations 0.82 1.34 0.95 1.09 1.22 0.75
Distributions (0.57) – (0.50) – – (0.43)
Ending net asset value 7.55 13.11 8.48 12.82 13.41 8.03
Total return 11.45% 11.38% 12.14% 9.29% 10.01% 9.98%
Ratios to average net assets Expenses++ 1.97% 1.96% 1.33% 1.33% 0.74% 0.76%
Net investment income/(loss) 3.95% 3.94% 4.52% 4.49% 5.08% 5.19%
31 December 2018 Beginning net asset value 8.28 12.27 8.89 12.50 12.93 8.62
Income from operations: Net investment income/(loss)+ 0.34 0.53 0.43 0.62 0.68 0.44Net realised and unrealised gain/(loss) on trading activities+ (0.66) (1.03) (0.76) (1.39) (1.42) (0.91)
Total from operations (0.32) (0.50) (0.33) (0.77) (0.74) (0.47)
Distributions (0.66) – (0.53) – – (0.44)
Ending net asset value 7.30 11.77 8.03 11.73 12.19 7.71
Total return (4.14%) (4.07%) (3.96%) (6.16%) (5.72%) (5.67%)
Ratios to average net assets Expenses++ 2.13% 2.13% 1.47% 1.40% 0.80% 0.79%
Net investment income/(loss) 4.32% 4.37% 4.94% 5.00% 5.31% 5.37%

FINANCIAL STATEMENTS NOTES TO THE AUDITED FINANCIAL STATEMENTS
1468 NEUBERGER BERMAN INVESTMENT FUNDS PLC
FOR THE YEAR ENDED 31 DECEMBER 2019
23. FINANCIAL HIGHLIGHTS (CONTINUED)
Neuberger Berman High Yield Bond Fund (continued)
CHF I2 Accumulating
Class
CNY A (Monthly)
Distributing Class
CNY A(Weekly)
Distributing Class
CNY B (Monthly) Distributing
Class
CNY I (Monthly)
Distributing Class
CNY T (Monthly) Distributing
Class CHF CNY CNY CNY CNY CNY
31 December 2019 Beginning net asset value 10.41 87.04 83.57 75.73 89.76 79.40
Income from operations: Net investment income/(loss)+ 0.57 4.21 4.05 2.36 4.92 3.26Net realised and unrealised gain/(loss) on trading activities+ 0.48 6.94 6.71 6.02 7.17 6.33
Total from operations 1.05 11.15 10.76 8.38 12.09 9.59
Distributions – (6.56) (5.88) (6.13) (6.78) (6.45)
Ending net asset value 11.46 91.63 88.45 77.98 95.07 82.54
Total return 10.09% 13.20% 13.20% 11.42% 13.89% 12.49%
Ratios to average net assets Expenses++ 0.65% 1.38% 1.37% 2.98% 0.78% 2.00%
Net investment income/(loss) 5.20% 4.66% 4.64% 3.04% 5.28% 3.99%
31 December 2018 Beginning net asset value 11.02 95.54 91.84 85.47 97.94 88.70
Income from operations: Net investment income/(loss)+ 0.06 4.67 4.36 3.02 5.41 3.68Net realised and unrealised gain/(loss) on trading activities+ (0.67) (6.10) (5.75) (5.59) (6.33) (5.51)
Total from operations (0.61) (1.43) (1.39) (2.57) (0.92) (1.83)
Distributions – (7.07) (6.88) (7.17) (7.26) (7.47)
Ending net asset value 10.41 87.04 83.57 75.73 89.76 79.40
Total return (5.54%) (1.66%) (1.67%) (3.27%) (1.07%) (2.27%)
Ratios to average net assets Expenses++ 0.69% 1.45% 1.44% 3.13% 0.81% 2.09%
Net investment income/(loss) 0.51% 5.01% 4.90% 3.59% 5.71% 4.26%

NOTES TO THE AUDITED FINANCIAL STATEMENTS FINANCIAL STATEMENTS
ANNUAL REPORT 2019 1469
FOR THE YEAR ENDED 31 DECEMBER 2019
23. FINANCIAL HIGHLIGHTS (CONTINUED)
Neuberger Berman High Yield Bond Fund (continued)
EUR A (Monthly) Distributing
Class
EUR A Accumulating
Class
EUR A Distributing
Class
EUR I Accumulating
Class
EUR I Distributing
Class
EUR I2 (Monthly)
Distributing Class
€ € € € € €
31 December 2019 Beginning net asset value 7.78 18.67 8.53 16.13 8.21 8.77
Income from operations: Net investment income/(loss)+ 0.37 0.91 0.41 0.90 0.44 0.49Net realised and unrealised gain/(loss) on trading activities+ 0.38 0.91 0.40 0.78 0.39 0.41
Total from operations 0.75 1.82 0.81 1.68 0.83 0.90
Distributions (0.48) – (0.43) – (0.46) (0.54)
Ending net asset value 8.05 20.49 8.91 17.81 8.58 9.13
Total return 9.88% 9.75% 9.68% 10.42% 10.40% 10.55%
Ratios to average net assets Expenses++ 1.36% 1.36% 1.36% 0.76% 0.76% 0.68%
Net investment income/(loss) 4.60% 4.60% 4.60% 5.21% 5.19% 5.32%
31 December 2018 Beginning net asset value 8.79 19.83 9.50 17.03 9.15 9.83
Income from operations: Net investment income/(loss)+ 0.41 0.96 0.44 0.88 0.48 0.53Net realised and unrealised gain/(loss) on trading activities+ (0.90) (2.12) (0.98) (1.78) (0.95) (1.01)
Total from operations (0.49) (1.16) (0.54) (0.90) (0.47) (0.48)
Distributions (0.52) – (0.43) – (0.47) (0.58)
Ending net asset value 7.78 18.67 8.53 16.13 8.21 8.77
Total return (5.89%) (5.85%) (5.87%) (5.28%) (5.36%) (5.13%)
Ratios to average net assets Expenses++ 1.43% 1.43% 1.43% 0.82% 0.82% 0.71%
Net investment income/(loss) 4.86% 4.92% 4.85% 5.21% 5.47% 5.57%

FINANCIAL STATEMENTS NOTES TO THE AUDITED FINANCIAL STATEMENTS
1470 NEUBERGER BERMAN INVESTMENT FUNDS PLC
FOR THE YEAR ENDED 31 DECEMBER 2019
23. FINANCIAL HIGHLIGHTS (CONTINUED)
Neuberger Berman High Yield Bond Fund (continued)
EUR I2 Accumulating
Class
EUR I2 Distributing
Class
EUR I3 Accumulating
Class
EUR I3 Distributing
Class
EUR M Accumulating
Class
EUR M Distributing
Class € € € € € €
31 December 2019 Beginning net asset value 11.28 8.11 10.07 8.87 10.76 9.22
Income from operations: Net investment income/(loss)+ 0.64 0.44 0.58 0.50 0.45 0.37Net realised and unrealised gain/(loss) on trading activities+ 0.54 0.40 0.49 0.42 0.52 0.44
Total from operations 1.18 0.84 1.07 0.92 0.97 0.81
Distributions – (0.47) – (0.52) – (0.59)
Ending net asset value 12.46 8.48 11.14 9.27 11.73 9.44
Total return 10.46% 10.57% 10.63% 10.61% 9.01% 9.03%
Ratios to average net assets Expenses++ 0.66% 0.66% 0.59% 0.58% 1.99% 1.98%
Net investment income/(loss) 5.29% 5.29% 5.41% 5.52% 4.01% 3.98%
31 December 2018 Beginning net asset value 11.90 9.03 10.63 9.88 11.50 10.48
Income from operations: Net investment income/(loss)+ 0.63 0.49 (0.01) 0.54 0.47 0.42Net realised and unrealised gain/(loss) on trading activities+ (1.25) (0.94) (0.55) (1.02) (1.21) (1.06)
Total from operations (0.62) (0.45) (0.56) (0.48) (0.74) (0.64)
Distributions – (0.47) – (0.53) – (0.62)
Ending net asset value 11.28 8.11 10.07 8.87 10.76 9.22
Total return (5.21%) (5.18%) (5.27%) (5.14%) (6.43%) (6.45%)
Ratios to average net assets Expenses++ 0.71% 0.71% 0.64% 0.63% 2.07% 2.07%
Net investment income/(loss) 5.34% 5.65% (0.06%) 5.64% 4.19% 4.18%

NOTES TO THE AUDITED FINANCIAL STATEMENTS FINANCIAL STATEMENTS
ANNUAL REPORT 2019 1471
FOR THE YEAR ENDED 31 DECEMBER 2019
23. FINANCIAL HIGHLIGHTS (CONTINUED)
Neuberger Berman High Yield Bond Fund (continued)
EUR Z Accumulating
Class
GBP A(Monthly)
Distributing Class
GBP A Accumulating
Class
GBP A Distributing
Class
GBP I Accumulating
Class
GBP I Distributing
Class € £ £ £ £ £
31 December 2019 Beginning net asset value 10.50 7.72 12.60 8.90 14.89 9.63
Income from operations: Net investment income/(loss)+ 0.65 0.35 0.60 0.41 0.81 0.50Net realised and unrealised gain/(loss) on trading activities+ 0.51 0.49 0.81 0.56 0.95 0.60
Total from operations 1.16 0.84 1.41 0.97 1.76 1.10
Distributions – (0.48) – (0.45) – (0.54)
Ending net asset value 11.66 8.08 14.01 9.42 16.65 10.19
Total return 11.05% 11.14% 11.19% 11.12% 11.82% 11.77%
Ratios to average net assets Expenses++ 0.16% 1.31% 1.31% 1.31% 0.74% 0.73%
Net investment income/(loss) 5.79% 4.42% 4.44% 4.44% 5.04% 5.02%
31 December 2018 Beginning net asset value 11.02 8.62 13.24 9.80 15.55 10.61
Income from operations: Net investment income/(loss)+ 0.67 0.41 0.65 0.47 0.60 0.57Net realised and unrealised gain/(loss) on trading activities+ (1.19) (0.80) (1.29) (0.92) (1.26) (1.00)
Total from operations (0.52) (0.39) (0.64) (0.45) (0.66) (0.43)
Distributions – (0.51) – (0.45) – (0.55)
Ending net asset value 10.50 7.72 12.60 8.90 14.89 9.63
Total return (4.72%) (4.77%) (4.83%) (4.80%) (4.24%) (4.28%)
Ratios to average net assets Expenses++ 0.19% 1.45% 1.45% 1.46% 0.82% 0.83%
Net investment income/(loss) 6.13% 4.93% 4.96% 5.00% 3.91% 5.58%

FINANCIAL STATEMENTS NOTES TO THE AUDITED FINANCIAL STATEMENTS
1472 NEUBERGER BERMAN INVESTMENT FUNDS PLC
FOR THE YEAR ENDED 31 DECEMBER 2019
23. FINANCIAL HIGHLIGHTS (CONTINUED)
Neuberger Berman High Yield Bond Fund (continued)
GBP I2 Accumulating
Class
GBP I2 Distributing
Class
GBP Z Accumulating
Class
HKD A (Monthly)
Distributing Class
HKD A Accumulating
Class
JPY I Accumulating
Class £ £ £ HKD HKD ¥
31 December 2019 Beginning net asset value 11.86 8.54 11.20 7.82 11.63 1,758.05
Income from operations: Net investment income/(loss)+ 0.65 0.45 0.68 0.37 0.57 97.62Net realised and unrealised gain/(loss) on trading activities+ 0.77 0.54 0.73 0.57 0.87 90.21
Total from operations 1.42 0.99 1.41 0.94 1.44 187.83
Distributions – (0.49) – (0.49) – –
Ending net asset value 13.28 9.04 12.61 8.27 13.07 1,945.88
Total return 11.97% 11.92% 12.59% 12.30% 12.38% 10.68%
Ratios to average net assets Expenses++ 0.64% 0.64% 0.15% 1.36% 1.36% 0.75%
Net investment income/(loss) 5.12% 5.12% 5.59% 4.59% 4.59% 5.19%
31 December 2018 Beginning net asset value 12.37 9.41 11.63 8.65 12.10 1,853.82
Income from operations: Net investment income/(loss)+ 0.68 0.53 0.72 0.40 0.57 98.40Net realised and unrealised gain/(loss) on trading activities+ (1.19) (0.90) (1.15) (0.72) (1.04) (194.17)
Total from operations (0.51) (0.37) (0.43) (0.32) (0.47) (95.77)
Distributions – (0.50) – (0.51) – –
Ending net asset value 11.86 8.54 11.20 7.82 11.63 1,758.05
Total return (4.12%) (4.19%) (3.70%) (3.87%) (3.88%) (5.17%)
Ratios to average net assets Expenses++ 0.72% 0.72% 0.20% 1.39% 1.38% 0.80%
Net investment income/(loss) 5.51% 5.87% 6.19% 4.75% 4.75% 5.39%

NOTES TO THE AUDITED FINANCIAL STATEMENTS FINANCIAL STATEMENTS
ANNUAL REPORT 2019 1473
FOR THE YEAR ENDED 31 DECEMBER 2019
23. FINANCIAL HIGHLIGHTS (CONTINUED)
Neuberger Berman High Yield Bond Fund (continued)
SEK A Accumulating
Class
SGD A(Monthly)
Distributing Class
SGD A Accumulating
Class
USD A (Monthly)
Distributing Class
USD A (Weekly)
Distributing Class
USD A Accumulating
Class SEK SGD SGD US$ US$ US$
31 December 2019 Beginning net asset value 125.76 16.53 25.26 8.21 7.86 15.16
Income from operations: Net investment income/(loss)+ 6.12 0.78 1.23 0.40 0.38 0.75Net realised and unrealised gain/(loss) on trading activities+ 6.47 1.19 1.87 0.66 0.63 1.25
Total from operations 12.59 1.97 3.10 1.06 1.01 2.00
Distributions – (1.03) – (0.52) (0.49) –
Ending net asset value 138.35 17.47 28.36 8.75 8.38 17.16
Total return 10.01% 12.23% 12.27% 13.18% 13.18% 13.19%
Ratios to average net assets Expenses++ 1.35% 1.34% 1.35% 1.36% 1.36% 1.36%
Net investment income/(loss) 4.57% 4.55% 4.55% 4.61% 4.60% 4.61%
31 December 2018 Beginning net asset value 133.80 18.32 26.34 9.02 8.65 15.67
Income from operations: Net investment income/(loss)+ 6.37 0.85 1.26 0.42 0.40 0.74Net realised and unrealised gain/(loss) on trading activities+ (14.41) (1.56) (2.34) (0.69) (0.67) (1.25)
Total from operations (8.04) (0.71) (1.08) (0.27) (0.27) (0.51)
Distributions – (1.08) – (0.54) (0.52) –
Ending net asset value 125.76 16.53 25.26 8.21 7.86 15.16
Total return (6.01%) (4.06%) (4.10%) (3.22%) (3.30%) (3.25%)
Ratios to average net assets Expenses++ 1.42% 1.40% 1.40% 1.39% 1.39% 1.39%
Net investment income/(loss) 4.83% 4.83% 4.83% 4.79% 4.73% 4.73%

FINANCIAL STATEMENTS NOTES TO THE AUDITED FINANCIAL STATEMENTS
1474 NEUBERGER BERMAN INVESTMENT FUNDS PLC
FOR THE YEAR ENDED 31 DECEMBER 2019
23. FINANCIAL HIGHLIGHTS (CONTINUED)
Neuberger Berman High Yield Bond Fund (continued)
USD A Distributing
Class
USD B(Monthly)
Distributing Class
USD B(Weekly)
Distributing Class
USD B Accumulating
Class
USD C Accumulating
Class
USD C Distributing
Class US$ US$ US$ US$ US$ US$
31 December 2019 Beginning net asset value 9.12 7.06 7.14 10.78 11.49 8.94
Income from operations: Net investment income/(loss)+ 0.44 0.22 0.23 0.34 0.49 0.38Net realised and unrealised gain/(loss) on trading activities+ 0.74 0.56 0.56 0.88 0.95 0.70
Total from operations 1.18 0.78 0.79 1.22 1.44 1.08
Distributions (0.46) (0.51) (0.52) – – (0.39)
Ending net asset value 9.84 7.33 7.41 12.00 12.93 9.63
Total return 13.23% 11.37% 11.28% 11.32% 12.53% 12.35%
Ratios to average net assets Expenses++ 1.36% 2.99% 3.00% 2.99% 1.99% 2.00%
Net investment income/(loss) 4.61% 2.98% 3.05% 2.98% 3.99% 4.01%
31 December 2018 Beginning net asset value 9.88 7.96 8.05 11.32 11.95 9.68
Income from operations: Net investment income/(loss)+ 0.45 0.24 0.26 0.35 0.49 0.40Net realised and unrealised gain/(loss) on trading activities+ (0.76) (0.60) (0.62) (0.89) (0.95) (0.75)
Total from operations (0.31) (0.36) (0.36) (0.54) (0.46) (0.35)
Distributions (0.45) (0.54) (0.55) – – (0.39)
Ending net asset value 9.12 7.06 7.14 10.78 11.49 8.94
Total return (3.27%) (4.82%) (4.72%) (4.77%) (3.85%) (3.81%)
Ratios to average net assets Expenses++ 1.39% 3.01% 3.01% 3.01% 2.01% 2.01%
Net investment income/(loss) 4.73% 3.11% 3.37% 3.08% 4.11% 4.22%

NOTES TO THE AUDITED FINANCIAL STATEMENTS FINANCIAL STATEMENTS
ANNUAL REPORT 2019 1475
FOR THE YEAR ENDED 31 DECEMBER 2019
23. FINANCIAL HIGHLIGHTS (CONTINUED)
Neuberger Berman High Yield Bond Fund (continued)
USD C1 Accumulating
Class
USD C1 Distributing
Class
USD C2 (Monthly)
Distributing Class
USD C2 (Weekly)
Distributing Class
USD C2 Accumulating
Class
USD E(Monthly)
Distributing Class
US$ US$ US$ US$ US$ US$
31 December 2019 Beginning net asset value 9.53 9.22 7.07 7.13 10.79 7.17
Income from operations: Net investment income/(loss)+ 0.37 0.35 0.22 0.22 0.35 0.22Net realised and unrealised gain/(loss) on trading activities+ 0.77 0.74 0.55 0.57 0.87 0.57
Total from operations 1.14 1.09 0.77 0.79 1.22 0.79
Distributions – (0.37) (0.51) (0.52) – (0.52)
Ending net asset value 10.67 9.94 7.33 7.40 12.01 7.44
Total return 11.96% 12.00% 11.21% 11.29% 11.31% 11.30%
Ratios to average net assets Expenses++ 2.37% 2.37% 3.00% 2.99% 2.99% 2.99%
Net investment income/(loss) 3.53% 3.55% 3.03% 2.99% 3.00% 2.99%
31 December 2018 Beginning net asset value 9.95 9.99 7.96 8.04 11.33 8.08
Income from operations: Net investment income/(loss)+ 0.37 0.35 0.24 0.24 0.35 0.24Net realised and unrealised gain/(loss) on trading activities+ (0.79) (0.76) (0.59) (0.60) (0.89) (0.60)
Total from operations (0.42) (0.41) (0.35) (0.36) (0.54) (0.36)
Distributions – (0.36) (0.54) (0.55) – (0.55)
Ending net asset value 9.53 9.22 7.07 7.13 10.79 7.17
Total return (4.22%) (4.26%) (4.68%) (4.73%) (4.77%) (4.77%)
Ratios to average net assets Expenses++ 2.40% 2.41% 3.01% 3.01% 3.00% 3.00%
Net investment income/(loss) 3.71% 3.65% 3.11% 3.09% 3.15% 3.11%

FINANCIAL STATEMENTS NOTES TO THE AUDITED FINANCIAL STATEMENTS
1476 NEUBERGER BERMAN INVESTMENT FUNDS PLC
FOR THE YEAR ENDED 31 DECEMBER 2019
23. FINANCIAL HIGHLIGHTS (CONTINUED)
Neuberger Berman High Yield Bond Fund (continued)
USD E Accumulating
Class
USD I(Monthly)
Distributing Class
USD I Accumulating
Class
USD I Distributing
Class
USD I2 (Monthly)
Distributing Class
USD I2 Accumulating
Class US$ US$ US$ US$ US$ US$
31 December 2019 Beginning net asset value 9.72 8.32 22.43 10.56 9.31 12.22
Income from operations: Net investment income/(loss)+ 0.31 0.46 1.27 0.57 0.52 0.70Net realised and unrealised gain/(loss) on trading activities+ 0.79 0.67 1.83 0.85 0.75 1.00
Total from operations 1.10 1.13 3.10 1.42 1.27 1.70
Distributions – (0.52) – (0.60) (0.59) –
Ending net asset value 10.82 8.93 25.53 11.38 9.99 13.92
Total return 11.32% 13.98% 13.82% 13.78% 13.95% 13.91%
Ratios to average net assets Expenses++ 2.98% 0.76% 0.76% 0.76% 0.67% 0.66%
Net investment income/(loss) 2.98% 5.22% 5.21% 5.19% 5.32% 5.30%
31 December 2018 Beginning net asset value 10.21 9.09 23.03 11.43 10.16 12.53
Income from operations: Net investment income/(loss)+ 0.31 0.47 1.21 0.60 0.56 0.65Net realised and unrealised gain/(loss) on trading activities+ (0.80) (0.70) (1.81) (0.88) (0.80) (0.96)
Total from operations (0.49) (0.23) (0.60) (0.28) (0.24) (0.31)
Distributions – (0.54) – (0.59) (0.61) –
Ending net asset value 9.72 8.32 22.43 10.56 9.31 12.22
Total return (4.80%) (2.68%) (2.61%) (2.60%) (2.57%) (2.47%)
Ratios to average net assets Expenses++ 3.00% 0.79% 0.79% 0.79% 0.65% 0.69%
Net investment income/(loss) 3.10% 5.38% 5.25% 5.45% 5.52% 5.21%
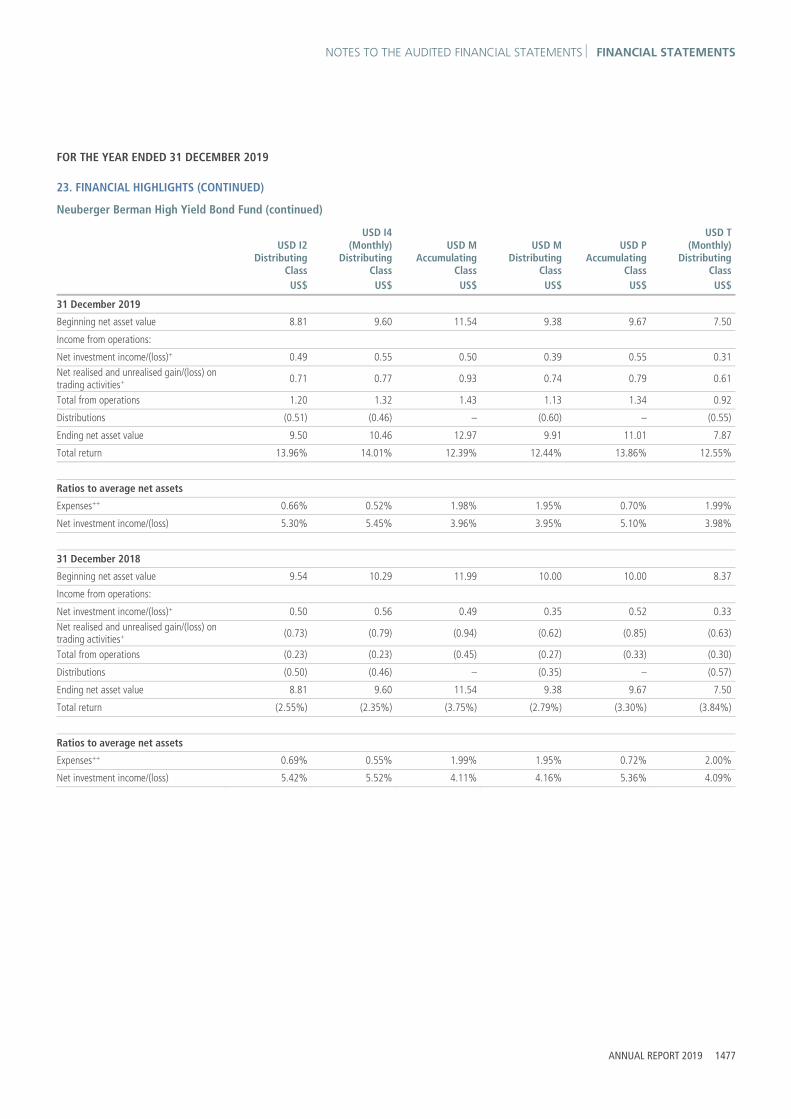
NOTES TO THE AUDITED FINANCIAL STATEMENTS FINANCIAL STATEMENTS
ANNUAL REPORT 2019 1477
FOR THE YEAR ENDED 31 DECEMBER 2019
23. FINANCIAL HIGHLIGHTS (CONTINUED)
Neuberger Berman High Yield Bond Fund (continued)
USD I2 Distributing
Class
USD I4 (Monthly)
Distributing Class
USD M Accumulating
Class
USD M Distributing
Class
USD P Accumulating
Class
USD T(Monthly)
Distributing Class
US$ US$ US$ US$ US$ US$
31 December 2019 Beginning net asset value 8.81 9.60 11.54 9.38 9.67 7.50
Income from operations: Net investment income/(loss)+ 0.49 0.55 0.50 0.39 0.55 0.31Net realised and unrealised gain/(loss) on trading activities+ 0.71 0.77 0.93 0.74 0.79 0.61
Total from operations 1.20 1.32 1.43 1.13 1.34 0.92
Distributions (0.51) (0.46) – (0.60) – (0.55)
Ending net asset value 9.50 10.46 12.97 9.91 11.01 7.87
Total return 13.96% 14.01% 12.39% 12.44% 13.86% 12.55%
Ratios to average net assets Expenses++ 0.66% 0.52% 1.98% 1.95% 0.70% 1.99%
Net investment income/(loss) 5.30% 5.45% 3.96% 3.95% 5.10% 3.98%
31 December 2018 Beginning net asset value 9.54 10.29 11.99 10.00 10.00 8.37
Income from operations: Net investment income/(loss)+ 0.50 0.56 0.49 0.35 0.52 0.33Net realised and unrealised gain/(loss) on trading activities+ (0.73) (0.79) (0.94) (0.62) (0.85) (0.63)
Total from operations (0.23) (0.23) (0.45) (0.27) (0.33) (0.30)
Distributions (0.50) (0.46) – (0.35) – (0.57)
Ending net asset value 8.81 9.60 11.54 9.38 9.67 7.50
Total return (2.55%) (2.35%) (3.75%) (2.79%) (3.30%) (3.84%)
Ratios to average net assets Expenses++ 0.69% 0.55% 1.99% 1.95% 0.72% 2.00%
Net investment income/(loss) 5.42% 5.52% 4.11% 4.16% 5.36% 4.09%

FINANCIAL STATEMENTS NOTES TO THE AUDITED FINANCIAL STATEMENTS
1478 NEUBERGER BERMAN INVESTMENT FUNDS PLC
FOR THE YEAR ENDED 31 DECEMBER 2019
23. FINANCIAL HIGHLIGHTS (CONTINUED)
Neuberger Berman High Yield Bond Fund (continued)
USD T (Weekly)
Distributing Class
USD T Accumulating
Class
USD U(Monthly)
Distributing Class
USD U Accumulating
Class
USD Z Accumulating
Class
ZAR A (Monthly) Distributing
Class US$ US$ US$ US$ US$ ZAR
31 December 2019 Beginning net asset value 7.54 11.45 7.92 12.13 11.20 80.35
Income from operations: Net investment income/(loss)+ 0.31 0.49 0.41 0.64 0.71 3.72Net realised and unrealised gain/(loss) on trading activities+ 0.60 0.93 0.64 1.00 0.92 9.99
Total from operations 0.91 1.42 1.05 1.64 1.63 13.71
Distributions (0.55) – (0.50) – – (9.79)
Ending net asset value 7.90 12.87 8.47 13.77 12.83 84.27
Total return 12.35% 12.40% 13.57% 13.52% 14.55% 18.00%
Ratios to average net assets Expenses++ 1.99% 1.99% 1.07% 1.07% 0.16% 1.32%
Net investment income/(loss) 3.98% 3.98% 4.92% 4.92% 5.80% 4.47%
31 December 2018 Beginning net asset value 8.42 11.90 8.68 12.50 11.43 89.45
Income from operations: Net investment income/(loss)+ 0.33 0.63 0.44 0.63 0.68 4.43Net realised and unrealised gain/(loss) on trading activities+ (0.63) (1.08) (0.68) (1.00) (0.91) (3.06)
Total from operations (0.30) (0.45) (0.24) (0.37) (0.23) 1.37
Distributions (0.58) – (0.52) – – (10.47)
Ending net asset value 7.54 11.45 7.92 12.13 11.20 80.35
Total return (3.80%) (3.78%) (2.98%) (2.96%) (2.01%) 1.46%
Ratios to average net assets Expenses++ 2.00% 2.00% 1.09% 1.09% 0.18% 1.52%
Net investment income/(loss) 4.10% 5.35% 5.25% 5.06% 5.93% 5.17%

NOTES TO THE AUDITED FINANCIAL STATEMENTS FINANCIAL STATEMENTS
ANNUAL REPORT 2019 1479
FOR THE YEAR ENDED 31 DECEMBER 2019
23. FINANCIAL HIGHLIGHTS (CONTINUED)
Neuberger Berman High Yield Bond Fund (continued)
ZAR B (Monthly)
Distributing Class
ZAR C2 (Monthly)
Distributing Class
ZAR E(Monthly)
Distributing Class
ZAR E Accumulating
Class
ZAR T (Monthly)
Distributing Class
ZAR T Accumulating
Class ZAR ZAR ZAR ZAR ZAR ZAR
31 December 2019 Beginning net asset value 72.97 72.91 72.15 126.88 77.57 112.55
Income from operations: Net investment income/(loss)+ 2.16 2.22 2.13 4.01 3.08 4.77Net realised and unrealised gain/(loss) on trading activities+ 8.96 8.88 8.87 16.44 9.59 14.68
Total from operations 11.12 11.10 11.00 20.45 12.67 19.45
Distributions (9.17) (9.16) (9.07) – (9.79) –
Ending net asset value 74.92 74.85 74.08 147.33 80.45 132.00
Total return 16.10% 16.09% 16.10% 16.12% 17.27% 17.28%
Ratios to average net assets Expenses++ 2.89% 2.91% 2.89% 2.89% 1.92% 1.92%
Net investment income/(loss) 2.89% 2.94% 2.89% 2.88% 3.86% 3.85%
31 December 2018 Beginning net asset value 83.34 83.27 82.40 127.10 87.71 111.62
Income from operations: Net investment income/(loss)+ 2.69 2.68 2.63 4.32 3.72 5.00Net realised and unrealised gain/(loss) on trading activities+ (2.69) (2.68) (2.62) (4.54) (2.89) (4.07)
Total from operations 0.00 0.00 0.01 (0.22) 0.83 0.93
Distributions (10.37) (10.36) (10.26) – (10.97) –
Ending net asset value 72.97 72.91 72.15 126.88 77.57 112.55
Total return (0.18%) (0.18%) (0.18%) (0.17%) 0.82% 0.83%
Ratios to average net assets Expenses++ 3.28% 3.28% 3.28% 3.28% 2.19% 2.19%
Net investment income/(loss) 3.36% 3.40% 3.36% 3.35% 4.46% 4.43%

FINANCIAL STATEMENTS NOTES TO THE AUDITED FINANCIAL STATEMENTS
1480 NEUBERGER BERMAN INVESTMENT FUNDS PLC
FOR THE YEAR ENDED 31 DECEMBER 2019
23. FINANCIAL HIGHLIGHTS (CONTINUED)
Neuberger Berman Diversified Currency Fund
EUR A Accumulating
Class
EUR I Accumulating
Class
EUR M Accumulating
Class
GBP I Accumulating
Class
JPY I Accumulating
Class
USD A Accumulating
Class € € € £ ¥ US$
31 December 2019 Beginning net asset value 10.00 10.45 9.35 10.05 1,000.42 10.63
Income from operations: Net investment income/(loss)+ (0.11) (0.06) (0.16) (0.05) (5.53) (0.11)Net realised and unrealised gain/(loss) on trading activities+ (0.15) (0.15) (0.13) (0.01) (13.19) 0.16
Total from operations (0.26) (0.21) (0.29) (0.06) (18.72) 0.05
Ending net asset value 9.74 10.24 9.06 9.99 981.70 10.68
Total return (2.60%) (2.01%) (3.10%) (0.60%) (1.87%) 0.47%
Ratios to average net assets Expenses++ 1.21% 0.71% 1.81% 0.69% 0.71% 1.21%
Net investment income/(loss) (1.06%) (0.55%) (1.67%) (0.54%) (0.56%) (1.02%)
31 December 2018 Beginning net asset value 10.16 10.56 9.56 10.05 1,008.62 10.51
Income from operations: Net investment income/(loss)+ (0.12) (0.11) (0.17) (0.06) (6.38) (0.12)Net realised and unrealised gain/(loss) on trading activities+ (0.04) 0.00 (0.04) 0.06 (1.82) 0.24
Total from operations (0.16) (0.11) (0.21) 0.00 (8.20) 0.12
Ending net asset value 10.00 10.45 9.35 10.05 1,000.42 10.63
Total return (1.57%) (1.04%) (2.20%) 0.00% (0.81%) 1.14%
Ratios to average net assets Expenses++ 1.25% 0.73% 1.87% 0.74% 0.71% 1.21%
Net investment income/(loss) (1.16%) (1.02%) (1.80%) (0.64%) (0.63%) (1.12%)

NOTES TO THE AUDITED FINANCIAL STATEMENTS FINANCIAL STATEMENTS
ANNUAL REPORT 2019 1481
FOR THE YEAR ENDED 31 DECEMBER 2019
23. FINANCIAL HIGHLIGHTS (CONTINUED)
Neuberger Berman Diversified Currency Fund (continued)
USD I Accumulating
Class
USD Z Accumulating
Class US$ US$
31 December 2019 Beginning net asset value 11.13 10.48
Income from operations: Net investment income/(loss)+ (0.06) (0.01)Net realised and unrealised gain/(loss) on trading activities+ 0.17 0.16
Total from operations 0.11 0.15
Ending net asset value 11.24 10.63
Total return 0.99% 1.43%
Ratios to average net assets Expenses++ 0.71% 0.21%
Net investment income/(loss) (0.56%) (0.07%)
31 December 2018 Beginning net asset value 10.95 10.25
Income from operations: Net investment income/(loss)+ (0.07) (0.01)Net realised and unrealised gain/(loss) on trading activities+ 0.25 0.24
Total from operations 0.18 0.23
Ending net asset value 11.13 10.48
Total return 1.64% 2.24%
Ratios to average net assets Expenses++ 0.71% 0.21%
Net investment income/(loss) (0.63%) (0.14%)

FINANCIAL STATEMENTS NOTES TO THE AUDITED FINANCIAL STATEMENTS
1482 NEUBERGER BERMAN INVESTMENT FUNDS PLC
FOR THE YEAR ENDED 31 DECEMBER 2019
23. FINANCIAL HIGHLIGHTS (CONTINUED)
Neuberger Berman US Multi Cap Opportunities Fund
AUD E Accumulating
Class
AUD T Accumulating
Class
EUR I3 Accumulating
Class
EUR M Accumulating
Class
EUR1 A Accumulating
Class
EUR1 I Accumulating
Class AUD AUD € € € €
31 December 2019 Beginning net asset value 12.69 11.45 16.40 12.65 19.14 20.18
Income from operations: Net investment income/(loss)+ (0.28) (0.10) 0.07 (0.27) (0.18) 0.00Net realised and unrealised gain/(loss) on trading activities+ 3.24 2.90 3.82 2.93 4.45 4.71
Total from operations 2.96 2.80 3.89 2.66 4.27 4.71
Ending net asset value 15.65 14.25 20.29 15.31 23.41 24.89
Total return 23.33% 24.45% 23.72% 21.03% 22.31% 23.34%
Ratios to average net assets Expenses++ 2.99% 2.01% 0.70% 2.92% 1.90% 1.05%
Net investment income/(loss) (1.95%) (0.78%) 0.38% (1.87%) (0.85%) 0.00
31 December 2018 Beginning net asset value 13.73 12.26 17.80 14.04 21.04 21.99
Income from operations: Net investment income/(loss)+ (0.29) (0.15) 0.06 (0.28) (0.19) 0.00Net realised and unrealised gain/(loss) on trading activities+ (0.75) (0.66) (1.46) (1.11) (1.71) (1.81)
Total from operations (1.04) (0.81) (1.40) (1.39) (1.90) (1.81)
Ending net asset value 12.69 11.45 16.40 12.65 19.14 20.18
Total return (7.57%) (6.61%) (7.87%) (9.90%) (9.03%) (8.23%)
Ratios to average net assets Expenses++ 3.22% 2.26% 0.72% 3.02% 1.98% 1.10%
Net investment income/(loss) (2.12%) (1.15%) 0.35% (1.98%) (0.90%) (0.02%)

NOTES TO THE AUDITED FINANCIAL STATEMENTS FINANCIAL STATEMENTS
ANNUAL REPORT 2019 1483
FOR THE YEAR ENDED 31 DECEMBER 2019
23. FINANCIAL HIGHLIGHTS (CONTINUED)
Neuberger Berman US Multi Cap Opportunities Fund (continued)
GBP I Accumulating
Class
GBP I Distributing
Unhedged Class
GBP I3 Distributing
Class
GBP I3 Distributing
Unhedged Class
SGD A Accumulating
Class
USD B Accumulating
Class £ £ £ £ SGD US$
31 December 2019 Beginning net asset value 10.00 19.98 16.53 10.26 30.23 12.83
Income from operations: Net investment income/(loss)+ 0.00 0.00 0.06 0.04 (0.29) (0.29)Net realised and unrealised gain/(loss) on trading activities+ 2.50 4.45 4.11 2.29 7.85 3.47
Total from operations 2.50 4.45 4.17 2.33 7.56 3.18
Distributions – – (0.06) (0.04) – –
Ending net asset value 12.50 24.43 20.64 12.55 37.79 16.01
Total return 25.00% 22.27% 25.33% 22.75% 25.01% 24.79%
Ratios to average net assets Expenses++ 0.98% 1.02% 0.68% 0.67% 1.88% 3.03%
Net investment income/(loss) 0.02% (0.01%) 0.32% 0.39% (0.85%) (1.98%)
31 December 2018 Beginning net asset value 10.78 19.89 17.85 10.20 32.60 13.84
Income from operations: Net investment income/(loss)+ 0.00 0.21 0.10 0.04 (0.29) (0.28)Net realised and unrealised gain/(loss) on trading activities+ (0.78) (0.12) (1.32) 0.04 (2.08) (0.73)
Total from operations (0.78) 0.09 (1.22) 0.08 (2.37) (1.01)
Distributions – – (0.10) (0.02) – –
Ending net asset value 10.00 19.98 16.53 10.26 30.23 12.83
Total return (7.24%) 0.45% (6.88%) 0.77% (7.27%) (7.30%)
Ratios to average net assets Expenses++ 1.07% 1.10% 0.73% 0.73% 1.93% 3.04%
Net investment income/(loss) 0.00 1.01% 0.56% 0.33% (0.88%) (2.00%)

FINANCIAL STATEMENTS NOTES TO THE AUDITED FINANCIAL STATEMENTS
1484 NEUBERGER BERMAN INVESTMENT FUNDS PLC
FOR THE YEAR ENDED 31 DECEMBER 2019
23. FINANCIAL HIGHLIGHTS (CONTINUED)
Neuberger Berman US Multi Cap Opportunities Fund (continued)
USD C Accumulating
Class
USD C1 Accumulating
Class
USD C2 Accumulating
Class
USD E Accumulating
Class
USD I2 Distributing
Class
USD I3 Accumulating
Class US$ US$ US$ US$ US$ US$
31 December 2019 Beginning net asset value 12.79 9.79 12.84 12.07 13.50 17.17
Income from operations: Net investment income/(loss)+ (0.18) (0.21) (0.28) (0.27) 0.02 0.07Net realised and unrealised gain/(loss) on trading activities+ 3.45 2.63 3.45 3.26 3.67 4.68
Total from operations 3.27 2.42 3.17 2.99 3.69 4.75
Distributions – – – – (0.02) –
Ending net asset value 16.06 12.21 16.01 15.06 17.17 21.92
Total return 25.57% 24.72% 24.69% 24.77% 27.39% 27.66%
Ratios to average net assets Expenses++ 2.32% 2.93% 3.03% 3.03% 0.89% 0.70%
Net investment income/(loss) (1.27%) (1.85%) (1.95%) (1.96%) 0.16% 0.37%
31 December 2018 Beginning net asset value 13.70 10.54 13.84 13.02 14.29 18.09
Income from operations: Net investment income/(loss)+ (0.18) (0.20) (0.28) (0.27) 0.02 0.05Net realised and unrealised gain/(loss) on trading activities+ (0.73) (0.55) (0.72) (0.68) (0.77) (0.97)
Total from operations (0.91) (0.75) (1.00) (0.95) (0.75) (0.92)
Distributions – – – – (0.04) –
Ending net asset value 12.79 9.79 12.84 12.07 13.50 17.17
Total return (6.64%) (7.12%) (7.23%) (7.30%) (5.28%) (5.09%)
Ratios to average net assets Expenses++ 2.33% 2.95% 3.03% 3.03% 0.89% 0.70%
Net investment income/(loss) (1.32%) (1.90%) (2.00%) (2.00%) 0.14% 0.27%

NOTES TO THE AUDITED FINANCIAL STATEMENTS FINANCIAL STATEMENTS
ANNUAL REPORT 2019 1485
FOR THE YEAR ENDED 31 DECEMBER 2019
23. FINANCIAL HIGHLIGHTS (CONTINUED)
Neuberger Berman US Multi Cap Opportunities Fund (continued)
USD I3 Distributing
Class
USD M Accumulating
Class
USD P Accumulating
Class
USD T Accumulating
Class
USD U Accumulating
Class
USD Z Accumulating
Class US$ US$ US$ US$ US$ US$
31 December 2019 Beginning net asset value 15.55 13.60 9.08 13.50 18.16 14.21
Income from operations: Net investment income/(loss)+ 0.06 (0.32) 0.01 (0.16) (0.09) 0.14Net realised and unrealised gain/(loss) on trading activities+ 4.23 3.70 2.47 3.68 4.94 3.88
Total from operations 4.29 3.38 2.48 3.52 4.85 4.02
Distributions (0.06) – – – – –
Ending net asset value 19.78 16.98 11.56 17.02 23.01 18.23
Total return 27.66% 24.85% 27.31% 26.07% 26.71% 28.29%
Ratios to average net assets Expenses++ 0.71% 2.94% 0.99% 2.02% 1.45% 0.21%
Net investment income/(loss) 0.32% (1.99%) 0.05% (1.03%) (0.41%) 0.84%
31 December 2018 Beginning net asset value 16.49 14.65 10.00 14.42 19.29 14.90
Income from operations: Net investment income/(loss)+ 0.05 (0.28) 0.00 (0.15) (0.08) 0.13Net realised and unrealised gain/(loss) on trading activities+ (0.89) (0.77) (0.92) (0.77) (1.05) (0.82)
Total from operations (0.84) (1.05) (0.92) (0.92) (1.13) (0.69)
Distributions (0.10) – – – – –
Ending net asset value 15.55 13.60 9.08 13.50 18.16 14.21
Total return (5.15%) (7.17%) (9.20%) (6.38%) (5.86%) (4.63%)
Ratios to average net assets Expenses++ 0.72% 2.94% 1.00% 2.03% 1.45% 0.20%
Net investment income/(loss) 0.30% (1.90%) 0.02% (1.01%) (0.41%) 0.83%

FINANCIAL STATEMENTS NOTES TO THE AUDITED FINANCIAL STATEMENTS
1486 NEUBERGER BERMAN INVESTMENT FUNDS PLC
FOR THE YEAR ENDED 31 DECEMBER 2019
23. FINANCIAL HIGHLIGHTS (CONTINUED)
Neuberger Berman US Multi Cap Opportunities Fund (continued)
USD1 A Accumulating
Class
USD1 I Accumulating
Class
USD1 I Distributing
Class
ZAR B Accumulating
Class
ZAR C2 Accumulating
Class
ZAR E Accumulating
Class US$ US$ US$ ZAR ZAR ZAR
31 December 2019 Beginning net asset value 20.16 21.80 21.04 167.23 166.26 153.99
Income from operations: Net investment income/(loss)+ (0.20) 0.00 (0.01) (3.94) (3.72) (3.55)Net realised and unrealised gain/(loss) on trading activities+ 5.46 5.93 5.73 53.72 53.21 49.40
Total from operations 5.26 5.93 5.72 49.78 49.49 45.85
Ending net asset value 25.42 27.73 26.76 217.01 215.75 199.84
Total return 26.09% 27.20% 27.19% 29.77% 29.77% 29.77%
Ratios to average net assets Expenses++ 1.90% 1.05% 1.06% 2.93% 2.93% 2.94%
Net investment income/(loss) (0.86%) (0.01%) (0.02%) (2.05%) (1.93%) (1.96%)
31 December 2018 Beginning net asset value 21.50 23.06 22.26 173.66 172.65 159.91
Income from operations: Net investment income/(loss)+ (0.19) (0.01) 0.00 (3.90) (3.75) (3.60)Net realised and unrealised gain/(loss) on trading activities+ (1.15) (1.25) (1.21) (2.53) (2.64) (2.32)
Total from operations (1.34) (1.26) (1.21) (6.43) (6.39) (5.92)
Distributions – – (0.01) – – –
Ending net asset value 20.16 21.80 21.04 167.23 166.26 153.99
Total return (6.23%) (5.46%) (5.44%) (3.70%) (3.70%) (3.70%)
Ratios to average net assets Expenses++ 1.91% 1.06% 1.09% 3.32% 3.31% 3.31%
Net investment income/(loss) (0.87%) (0.02%) (0.01%) (2.26%) (2.14%) (2.20%)

NOTES TO THE AUDITED FINANCIAL STATEMENTS FINANCIAL STATEMENTS
ANNUAL REPORT 2019 1487
FOR THE YEAR ENDED 31 DECEMBER 2019
23. FINANCIAL HIGHLIGHTS (CONTINUED)
Neuberger Berman US Multi Cap Opportunities Fund (continued)
ZAR T Accumulating
Class ZAR
31 December 2019 Beginning net asset value 175.84
Income from operations: Net investment income/(loss)+ (2.01) Net realised and unrealised gain/(loss) on trading activities+ 56.69
Total from operations 54.68
Ending net asset value 230.52
Total return 31.10%
Ratios to average net assets Expenses++ 1.97%
Net investment income/(loss) (0.98%)
31 December 2018 Beginning net asset value 180.77
Income from operations: Net investment income/(loss)+ (2.00) Net realised and unrealised gain/(loss) on trading activities+ (2.93)
Total from operations (4.93)
Ending net asset value 175.84
Total return (2.73%)
Ratios to average net assets Expenses++ 2.23%
Net investment income/(loss) (1.09%)

FINANCIAL STATEMENTS NOTES TO THE AUDITED FINANCIAL STATEMENTS
1488 NEUBERGER BERMAN INVESTMENT FUNDS PLC
FOR THE YEAR ENDED 31 DECEMBER 2019
23. FINANCIAL HIGHLIGHTS (CONTINUED)
Neuberger Berman US Real Estate Securities Fund
AUD A (Monthly)
Distributing Class
AUD B (Monthly)
Distributing Class
AUD B Accumulating
Class
AUD C2 (Monthly)
Distributing Class
AUD C2 Accumulating
Class
AUD E (Monthly)
Distributing Class
AUD AUD AUD AUD AUD AUD
31 December 2019 Beginning net asset value 8.30 8.15 10.27 8.14 10.92 8.14
Income from operations: Net investment income/(loss)+ 0.04 (0.08) (0.12) (0.09) (0.12) (0.10)Net realised and unrealised gain/(loss) on trading activities+ 2.29 2.22 2.88 2.24 3.03 2.23
Total from operations 2.33 2.14 2.76 2.15 2.91 2.13
Distributions (0.39) (0.42) – (0.42) – (0.42)
Ending net asset value 10.24 9.87 13.03 9.87 13.83 9.85
Total return 28.41% 26.67% 26.87% 26.83% 26.65% 26.57%
Ratios to average net assets Expenses++ 1.85% 3.10% 3.12% 3.12% 3.09% 3.10%
Net investment income/(loss) 0.43% (0.89%) (0.95%) (0.91%) (0.92%) (1.04%)
31 December 2018 Beginning net asset value 9.38 9.38 11.24 9.38 11.94 9.38
Income from operations: Net investment income/(loss)+ 0.06 (0.04) (0.04) (0.02) (0.11) 0.00Net realised and unrealised gain/(loss) on trading activities+ (0.74) (0.73) (0.93) (0.76) (0.91) (0.78)
Total from operations (0.68) (0.77) (0.97) (0.78) (1.02) (0.78)
Distributions (0.40) (0.46) – (0.46) – (0.46)
Ending net asset value 8.30 8.15 10.27 8.14 10.92 8.14
Total return (7.42%) (8.47%) (8.63%) (8.58%) (8.54%) (8.58%)
Ratios to average net assets Expenses++ 2.02% 3.44% 3.39% 3.40% 3.37% 3.44%
Net investment income/(loss) 0.65% (0.46%) (0.34%) (0.23%) (1.01%) (0.01%)

NOTES TO THE AUDITED FINANCIAL STATEMENTS FINANCIAL STATEMENTS
ANNUAL REPORT 2019 1489
FOR THE YEAR ENDED 31 DECEMBER 2019
23. FINANCIAL HIGHLIGHTS (CONTINUED)
Neuberger Berman US Real Estate Securities Fund (continued)
AUD E Accumulating
Class
AUD T (Monthly) Distributing
Class
AUD T Accumulating
Class
CHF A Accumulating
Class
EUR A Accumulating
Class
EUR I Accumulating
Class AUD AUD AUD CHF € €
31 December 2019 Beginning net asset value 11.12 9.08 12.65 11.95 7.07 15.16
Income from operations: Net investment income/(loss)+ (0.14) 0.03 (0.09) 0.06 0.04 0.19Net realised and unrealised gain/(loss) on trading activities+ 3.11 2.47 3.63 2.96 1.79 3.88
Total from operations 2.97 2.50 3.54 3.02 1.83 4.07
Distributions – (0.47) – – – –
Ending net asset value 14.09 11.11 16.19 14.97 8.90 19.23
Total return 26.71% 27.98% 27.98% 25.27% 25.88% 26.85%
Ratios to average net assets Expenses++ 3.12% 2.15% 2.13% 1.79% 1.83% 1.09%
Net investment income/(loss) (1.08%) 0.29% (0.59%) 0.39% 0.43% 1.05%
31 December 2018 Beginning net asset value 12.16 10.36 13.70 13.25 7.81 16.64
Income from operations: Net investment income/(loss)+ (0.05) 0.09 0.12 0.12 0.07 0.29Net realised and unrealised gain/(loss) on trading activities+ (0.99) (0.86) (1.17) (1.42) (0.81) (1.77)
Total from operations (1.04) (0.77) (1.05) (1.30) (0.74) (1.48)
Distributions – (0.51) – – – –
Ending net asset value 11.12 9.08 12.65 11.95 7.07 15.16
Total return (8.55%) (7.67%) (7.66%) (9.81%) (9.48%) (8.89%)
Ratios to average net assets Expenses++ 3.42% 2.31% 2.61% 1.90% 1.95% 1.17%
Net investment income/(loss) (0.43%) 0.92% 0.90% 0.95% 0.95% 1.81%

FINANCIAL STATEMENTS NOTES TO THE AUDITED FINANCIAL STATEMENTS
1490 NEUBERGER BERMAN INVESTMENT FUNDS PLC
FOR THE YEAR ENDED 31 DECEMBER 2019
23. FINANCIAL HIGHLIGHTS (CONTINUED)
Neuberger Berman US Real Estate Securities Fund (continued)
EUR M Accumulating
Class
GBP I Distributing
Class
HKD A (Monthly)
Distributing Class
HKD A Accumulating
Class
SGD A Accumulating
Class
USD A(Monthly)
Distributing Class
€ £ HKD HKD SGD US$
31 December 2019 Beginning net asset value 9.94 11.81 8.39 11.56 23.24 9.53
Income from operations: Net investment income/(loss)+ (0.07) 0.16 0.02 0.03 0.11 0.04Net realised and unrealised gain/(loss) on trading activities+ 2.52 3.19 2.37 3.31 6.57 2.77
Total from operations 2.45 3.35 2.39 3.34 6.68 2.81
Distributions – (0.17) (0.39) – – (0.45)
Ending net asset value 12.39 14.99 10.39 14.90 29.92 11.89
Total return 24.65% 28.48% 28.89% 28.89% 28.74% 29.85%
Ratios to average net assets Expenses++ 2.83% 1.05% 1.83% 1.84% 1.82% 1.86%
Net investment income/(loss) (0.59%) 1.13% 0.24% 0.21% 0.39% 0.36%
31 December 2018 Beginning net asset value 11.11 13.05 9.45 12.50 25.22 10.66
Income from operations: Net investment income/(loss)+ 0.01 (0.43) 0.09 0.08 0.24 0.08Net realised and unrealised gain/(loss) on trading activities+ (1.18) (0.59) (0.79) (1.02) (2.22) (0.80)
Total from operations (1.17) (1.02) (0.70) (0.94) (1.98) (0.72)
Distributions – (0.22) (0.36) – – (0.41)
Ending net asset value 9.94 11.81 8.39 11.56 23.24 9.53
Total return (10.53%) (7.88%) (7.58%) (7.52%) (7.85%) (6.93%)
Ratios to average net assets Expenses++ 3.01% 1.17% 1.91% 1.86% 1.92% 1.88%
Net investment income/(loss) 0.05% (3.41%) 1.03% 0.69% 0.98% 0.76%
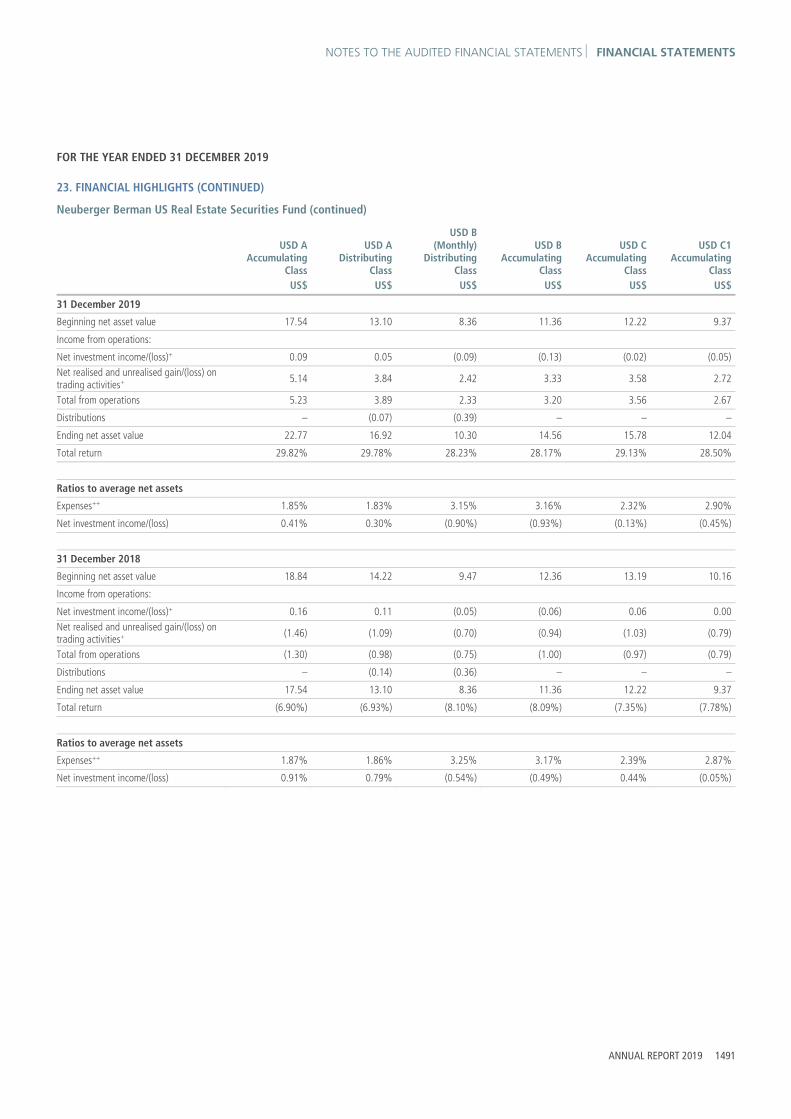
NOTES TO THE AUDITED FINANCIAL STATEMENTS FINANCIAL STATEMENTS
ANNUAL REPORT 2019 1491
FOR THE YEAR ENDED 31 DECEMBER 2019
23. FINANCIAL HIGHLIGHTS (CONTINUED)
Neuberger Berman US Real Estate Securities Fund (continued)
USD A Accumulating
Class
USD A Distributing
Class
USD B(Monthly)
Distributing Class
USD B Accumulating
Class
USD C Accumulating
Class
USD C1 Accumulating
Class US$ US$ US$ US$ US$ US$
31 December 2019 Beginning net asset value 17.54 13.10 8.36 11.36 12.22 9.37
Income from operations: Net investment income/(loss)+ 0.09 0.05 (0.09) (0.13) (0.02) (0.05)Net realised and unrealised gain/(loss) on trading activities+ 5.14 3.84 2.42 3.33 3.58 2.72
Total from operations 5.23 3.89 2.33 3.20 3.56 2.67
Distributions – (0.07) (0.39) – – –
Ending net asset value 22.77 16.92 10.30 14.56 15.78 12.04
Total return 29.82% 29.78% 28.23% 28.17% 29.13% 28.50%
Ratios to average net assets Expenses++ 1.85% 1.83% 3.15% 3.16% 2.32% 2.90%
Net investment income/(loss) 0.41% 0.30% (0.90%) (0.93%) (0.13%) (0.45%)
31 December 2018 Beginning net asset value 18.84 14.22 9.47 12.36 13.19 10.16
Income from operations: Net investment income/(loss)+ 0.16 0.11 (0.05) (0.06) 0.06 0.00Net realised and unrealised gain/(loss) on trading activities+ (1.46) (1.09) (0.70) (0.94) (1.03) (0.79)
Total from operations (1.30) (0.98) (0.75) (1.00) (0.97) (0.79)
Distributions – (0.14) (0.36) – – –
Ending net asset value 17.54 13.10 8.36 11.36 12.22 9.37
Total return (6.90%) (6.93%) (8.10%) (8.09%) (7.35%) (7.78%)
Ratios to average net assets Expenses++ 1.87% 1.86% 3.25% 3.17% 2.39% 2.87%
Net investment income/(loss) 0.91% 0.79% (0.54%) (0.49%) 0.44% (0.05%)

FINANCIAL STATEMENTS NOTES TO THE AUDITED FINANCIAL STATEMENTS
1492 NEUBERGER BERMAN INVESTMENT FUNDS PLC
FOR THE YEAR ENDED 31 DECEMBER 2019
23. FINANCIAL HIGHLIGHTS (CONTINUED)
Neuberger Berman US Real Estate Securities Fund (continued)
USD C2 (Monthly)
Distributing Class
USD C2 Accumulating
Class
USD E(Monthly)
Distributing Class
USD E Accumulating
Class
USD I (Monthly)
Distributing Class*
USD I Accumulating
Class US$ US$ US$ US$ US$ US$
31 December 2019 Beginning net asset value 8.46 11.36 8.37 10.77 10.00 19.21
Income from operations: Net investment income/(loss)+ (0.09) (0.13) (0.08) (0.12) 0.02 0.29Net realised and unrealised gain/(loss) on trading activities+ 2.45 3.32 2.40 3.16 (0.06) 5.64
Total from operations 2.36 3.19 2.32 3.04 (0.04) 5.93
Distributions (0.40) – (0.39) – (0.01) –
Ending net asset value 10.42 14.55 10.30 13.81 9.95 25.14
Total return 28.19% 28.08% 28.08% 28.23% (0.39%) 30.87%
Ratios to average net assets Expenses++ 3.18% 3.15% 3.16% 3.17% 1.31% 1.10%
Net investment income/(loss) (0.90%) (0.96%) (0.83%) (0.88%) 1.91% 1.22%
31 December 2018 Beginning net asset value 9.59 12.35 9.47 11.72 – 20.49
Income from operations: Net investment income/(loss)+ (0.01) (0.04) (0.02) (0.03) – 0.32Net realised and unrealised gain/(loss) on trading activities+ (0.76) (0.95) (0.72) (0.92) – (1.60)
Total from operations (0.77) (0.99) (0.74) (0.95) – (1.28)
Distributions (0.36) – (0.36) – – –
Ending net asset value 8.46 11.36 8.37 10.77 – 19.21
Total return (8.16%) (8.02%) (7.99%) (8.11%) – (6.25%)
Ratios to average net assets Expenses++ 3.18% 3.17% 3.19% 3.19% – 1.13%
Net investment income/(loss) (0.16%) (0.37%) (0.18%) (0.29%) – 1.63%
* Share class launched during the current reporting year.

NOTES TO THE AUDITED FINANCIAL STATEMENTS FINANCIAL STATEMENTS
ANNUAL REPORT 2019 1493
FOR THE YEAR ENDED 31 DECEMBER 2019
23. FINANCIAL HIGHLIGHTS (CONTINUED)
Neuberger Berman US Real Estate Securities Fund (continued)
USD I Distributing
Class
USD I2 Accumulating
Class
USD M Accumulating
Class
USD T (Monthly)
Distributing Class
USD T Accumulating
Class
USD Z Accumulating
Class US$ US$ US$ US$ US$ US$
31 December 2019 Beginning net asset value 12.03 14.02 10.92 9.24 11.98 10.82
Income from operations: Net investment income/(loss)+ 0.30 0.22 (0.08) 0.02 0.04 0.32Net realised and unrealised gain/(loss) on trading activities+ 3.38 4.14 3.20 2.66 3.49 3.12
Total from operations 3.68 4.36 3.12 2.68 3.53 3.44
Distributions (0.17) – – (0.43) – –
Ending net asset value 15.54 18.38 14.04 11.49 15.51 14.26
Total return 30.76% 31.10% 28.57% 29.42% 29.47% 31.79%
Ratios to average net assets Expenses++ 1.27% 0.94% 2.88% 2.16% 2.17% 0.43%
Net investment income/(loss) 1.91% 1.30% (0.55%) 0.21% 0.27% 2.24%
31 December 2018 Beginning net asset value 13.05 14.93 11.85 10.37 12.92 11.45
Income from operations: Net investment income/(loss)+ 0.22 0.27 (0.02) 0.05 0.04 0.28Net realised and unrealised gain/(loss) on trading activities+ (1.02) (1.18) (0.91) (0.78) (0.98) (0.91)
Total from operations (0.80) (0.91) (0.93) (0.73) (0.94) (0.63)
Distributions (0.22) – – (0.40) – –
Ending net asset value 12.03 14.02 10.92 9.24 11.98 10.82
Total return (6.17%) (6.10%) (7.85%) (7.24%) (7.28%) (5.50%)
Ratios to average net assets Expenses++ 1.14% 0.97% 2.90% 2.17% 2.17% 0.40%
Net investment income/(loss) 1.77% 1.85% (0.15%) 0.52% 0.33% 2.49%

FINANCIAL STATEMENTS NOTES TO THE AUDITED FINANCIAL STATEMENTS
1494 NEUBERGER BERMAN INVESTMENT FUNDS PLC
FOR THE YEAR ENDED 31 DECEMBER 2019
23. FINANCIAL HIGHLIGHTS (CONTINUED)
Neuberger Berman US Real Estate Securities Fund (continued)
ZAR B (Monthly)
Distributing Class
ZAR B Accumulating
Class
ZAR C2 (Monthly)
Distributing Class
ZAR C2 Accumulating
Class
ZAR E (Monthly)
Distributing Class
ZAR E Accumulating
Class ZAR ZAR ZAR ZAR ZAR ZAR
31 December 2019 Beginning net asset value 83.16 122.54 82.22 122.59 83.16 137.07
Income from operations: Net investment income/(loss)+ (0.85) (1.32) (0.77) (1.47) (0.87) (1.56)Net realised and unrealised gain/(loss) on trading activities+ 27.94 42.69 27.55 40.71 27.96 47.85
Total from operations 27.09 41.37 26.78 39.24 27.09 46.29
Distributions (8.90) – (8.80) – (8.90) –
Ending net asset value 101.35 163.91 100.20 161.83 101.35 183.36
Total return 33.70% 33.76% 33.69% 12.41% 33.70% 33.77%
Ratios to average net assets Expenses++ 3.05% 3.07% 3.05% 3.13% 3.05% 3.06%
Net investment income/(loss) (0.87%) (0.85%) (0.81%) (1.02%) (0.89%) (0.90%)
31 December 2018 Beginning net asset value 95.87 127.74 94.78 127.77 95.87 142.87
Income from operations: Net investment income/(loss)+ (0.22) (1.06) (0.43) (1.09) (0.40) (1.04)Net realised and unrealised gain/(loss) on trading activities+ (3.45) (4.14) (3.19) (4.09) (3.27) (4.76)
Total from operations (3.67) (5.20) (3.62) (5.18) (3.67) (5.80)
Distributions (9.04) – (8.94) – (9.04) –
Ending net asset value 83.16 122.54 82.22 122.59 83.16 137.07
Total return (4.07%) (4.07%) (4.06%) (4.05%) (4.07%) (4.06%)
Ratios to average net assets Expenses++ 3.55% 3.45% 3.60% 3.44% 3.56% 3.50%
Net investment income/(loss) (0.26%) (0.85%) (0.51%) (0.89%) (0.46%) (0.74%)

NOTES TO THE AUDITED FINANCIAL STATEMENTS FINANCIAL STATEMENTS
ANNUAL REPORT 2019 1495
FOR THE YEAR ENDED 31 DECEMBER 2019
23. FINANCIAL HIGHLIGHTS (CONTINUED)
Neuberger Berman US Real Estate Securities Fund (continued)
ZAR T (Monthly)
Distributing Class
ZAR T Accumulating
Class ZAR ZAR
31 December 2019 Beginning net asset value 122.93 161.81
Income from operations: Net investment income/(loss)+ 0.10 0.30Net realised and unrealised gain/(loss) on trading activities+ 41.50 56.53
Total from operations 41.60 56.83
Distributions (13.21) –
Ending net asset value 151.32 218.64
Total return 35.03% 35.12%
Ratios to average net assets Expenses++ 2.09% 2.08%
Net investment income/(loss) 0.07% 0.15%
31 December 2018 Beginning net asset value 140.31 166.99
Income from operations: Net investment income/(loss)+ 1.51 1.13Net realised and unrealised gain/(loss) on trading activities+ (5.60) (6.31)
Total from operations (4.09) (5.18)
Distributions (13.29) –
Ending net asset value 122.93 161.81
Total return (3.11%) (3.10%)
Ratios to average net assets Expenses++ 2.42% 2.41%
Net investment income/(loss) 1.19% 0.69%

FINANCIAL STATEMENTS NOTES TO THE AUDITED FINANCIAL STATEMENTS
1496 NEUBERGER BERMAN INVESTMENT FUNDS PLC
FOR THE YEAR ENDED 31 DECEMBER 2019
23. FINANCIAL HIGHLIGHTS (CONTINUED)
Neuberger Berman China Equity Fund
CHF I Accumulating
Class
EUR A Accumulating
Class
EUR A Accumulating
Unhedged Class
EUR A Distributing
Class
EUR I Accumulating
Class
EUR I4 Accumulating
Class CHF € € € € €
31 December 2019 Beginning net asset value 11.37 20.40 14.53 11.41 21.48 12.32
Income from operations: Net investment income/(loss)+ 0.15 0.07 0.11 0.06 0.28 0.16Net realised and unrealised gain/(loss) on trading activities+ 3.19 5.79 5.01 3.22 6.10 3.50
Total from operations 3.34 5.86 5.12 3.28 6.38 3.66
Ending net asset value 14.71 26.26 19.65 14.69 27.86 15.98
Total return 29.38% 28.73% 35.24% 28.75% 29.70% 29.71%
Ratios to average net assets Expenses++ 1.38% 2.14% 2.10% 2.10% 1.38% 1.41%
Net investment income/(loss) 1.10% 0.31% 0.63% 0.43% 1.12% 1.12%
31 December 2018 Beginning net asset value 14.99 27.06 17.76 15.12 28.28 16.22
Income from operations: Net investment income/(loss)+ 0.05 (0.17) (0.06) (0.08) 0.10 0.05Net realised and unrealised gain/(loss) on trading activities+ (3.67) (6.49) (3.17) (3.63) (6.90) (3.95)
Total from operations (3.62) (6.66) (3.23) (3.71) (6.80) (3.90)
Ending net asset value 11.37 20.40 14.53 11.41 21.48 12.32
Total return (24.15%) (24.61%) (18.19%) (24.54%) (24.05%) (24.04%)
Ratios to average net assets Expenses++ 1.47% 2.21% 2.22% 2.17% 1.46% 1.50%
Net investment income/(loss) 0.33% (0.62%) (0.35%) (0.55%) 0.35% 0.34%

NOTES TO THE AUDITED FINANCIAL STATEMENTS FINANCIAL STATEMENTS
ANNUAL REPORT 2019 1497
FOR THE YEAR ENDED 31 DECEMBER 2019
23. FINANCIAL HIGHLIGHTS (CONTINUED)
Neuberger Berman China Equity Fund (continued)
EUR M Accumulating
Class
EUR Z Accumulating
Class
GBP A Distributing
Class
GBP I Distributing
Unhedged Class
GBP I2 Distributing
Unhedged Class
GBP I4 Accumulating
Class € € £ £ £ £
31 December 2019 Beginning net asset value 13.22 15.88 9.88 20.67 20.69 12.52
Income from operations: Net investment income/(loss)+ (0.08) 0.42 0.05 0.28 0.31 0.15Net realised and unrealised gain/(loss) on trading activities+ 3.70 4.52 2.92 5.48 5.51 3.74
Total from operations 3.62 4.94 2.97 5.76 5.82 3.89
Distributions – – – (0.13) (0.19) –
Ending net asset value 16.84 20.82 12.85 26.30 26.32 16.41
Total return 27.38% 31.11% 30.06% 28.03% 28.35% 31.07%
Ratios to average net assets Expenses++ 3.15% 0.31% 2.07% 1.35% 1.15% 1.34%
Net investment income/(loss) (0.54%) 2.22% 0.42% 1.14% 1.28% 1.05%
31 December 2018 Beginning net asset value 17.71 20.67 12.98 24.91 24.96 16.33
Income from operations: Net investment income/(loss)+ (0.24) 0.30 (0.05) 0.06 0.18 0.06Net realised and unrealised gain/(loss) on trading activities+ (4.25) (5.09) (3.05) (4.09) (4.15) (3.87)
Total from operations (4.49) (4.79) (3.10) (4.03) (3.97) (3.81)
Distributions – – – (0.21) (0.30) –
Ending net asset value 13.22 15.88 9.88 20.67 20.69 12.52
Total return (25.35%) (23.17%) (23.88%) (16.35%) (16.15%) (23.33%)
Ratios to average net assets Expenses++ 3.26% 0.36% 2.30% 1.40% 1.26% 1.52%
Net investment income/(loss) (1.38%) 1.48% (0.43%) 0.21% 0.71% 0.35%

FINANCIAL STATEMENTS NOTES TO THE AUDITED FINANCIAL STATEMENTS
1498 NEUBERGER BERMAN INVESTMENT FUNDS PLC
FOR THE YEAR ENDED 31 DECEMBER 2019
23. FINANCIAL HIGHLIGHTS (CONTINUED)
Neuberger Berman China Equity Fund (continued)
GBP I4 Distributing
Class
HKD A Accumulating
Class
SGD A Accumulating
Class
USD A Accumulating
Class
USD A Distributing
Class
USD C1 Accumulating
Class £ HKD SGD US$ US$ US$
31 December 2019 Beginning net asset value 11.73 9.94 27.01 22.15 13.70 8.65
Income from operations: Net investment income/(loss)+ 0.14 0.04 0.11 0.09 0.06 (0.07)Net realised and unrealised gain/(loss) on trading activities+ 3.48 3.11 8.36 7.16 4.42 2.79
Total from operations 3.62 3.15 8.47 7.25 4.48 2.72
Distributions (0.08) – – – – –
Ending net asset value 15.27 13.09 35.48 29.40 18.18 11.37
Total return 31.01% 31.69% 31.36% 32.73% 32.70% 31.45%
Ratios to average net assets Expenses++ 1.36% 2.15% 2.11% 2.14% 2.14% 3.18%
Net investment income/(loss) 1.04% 0.32% 0.35% 0.35% 0.35% (0.66%)
31 December 2018 Beginning net asset value 15.42 12.85 35.15 28.43 17.58 11.22
Income from operations: Net investment income/(loss)+ 0.05 0.00 (0.13) (0.11) (0.06) (0.16)Net realised and unrealised gain/(loss) on trading activities+ (3.61) (2.91) (8.01) (6.17) (3.82) (2.41)
Total from operations (3.56) (2.91) (8.14) (6.28) (3.88) (2.57)
Distributions (0.13) – – – – –
Ending net asset value 11.73 9.94 27.01 22.15 13.70 8.65
Total return (23.33%) (22.65%) (23.16%) (22.09%) (22.07%) (22.91%)
Ratios to average net assets Expenses++ 1.52% 2.10% 2.17% 2.17% 2.16% 3.23%
Net investment income/(loss) 0.35% 0.01% (0.37%) (0.38%) (0.33%) (1.43%)

NOTES TO THE AUDITED FINANCIAL STATEMENTS FINANCIAL STATEMENTS
ANNUAL REPORT 2019 1499
FOR THE YEAR ENDED 31 DECEMBER 2019
23. FINANCIAL HIGHLIGHTS (CONTINUED)
Neuberger Berman China Equity Fund (continued)
USD I Accumulating
Class
USD I2 Accumulating
Class
USD I4 Distributing
Class
USD M Accumulating
Class
USD U Accumulating
Class
USD Z Accumulating
Class US$ US$ US$ US$ US$ US$
31 December 2019 Beginning net asset value 23.40 14.34 12.24 13.37 15.23 15.09
Income from operations: Net investment income/(loss)+ 0.32 0.20 0.16 (0.10) 0.14 0.40Net realised and unrealised gain/(loss) on trading activities+ 7.58 4.68 3.95 4.29 4.92 4.91
Total from operations 7.90 4.88 4.11 4.19 5.06 5.31
Distributions – – (0.08) – – –
Ending net asset value 31.30 19.22 16.27 17.56 20.29 20.40
Total return 33.76% 34.03% 33.75% 31.34% 33.22% 35.19%
Ratios to average net assets Expenses++ 1.40% 1.18% 1.41% 3.18% 1.76% 0.31%
Net investment income/(loss) 1.16% 1.17% 1.12% (0.66%) 0.79% 2.22%
31 December 2018 Beginning net asset value 29.81 18.23 15.72 17.34 19.47 19.01
Income from operations: Net investment income/(loss)+ 0.09 0.10 0.05 (0.24) (0.01) 0.26Net realised and unrealised gain/(loss) on trading activities+ (6.50) (3.99) (3.40) (3.73) (4.23) (4.18)
Total from operations (6.41) (3.89) (3.35) (3.97) (4.24) (3.92)
Distributions – – (0.13) – – –
Ending net asset value 23.40 14.34 12.24 13.37 15.23 15.09
Total return (21.50%) (21.34%) (21.50%) (22.90%) (21.78%) (20.62%)
Ratios to average net assets Expenses++ 1.44% 1.23% 1.42% 3.23% 1.78% 0.35%
Net investment income/(loss) 0.31% 0.58% 0.33% (1.43%) (0.06%) 1.37%

FINANCIAL STATEMENTS NOTES TO THE AUDITED FINANCIAL STATEMENTS
1500 NEUBERGER BERMAN INVESTMENT FUNDS PLC
FOR THE YEAR ENDED 31 DECEMBER 2019
23. FINANCIAL HIGHLIGHTS (CONTINUED)
Neuberger Berman Emerging Markets Equity Fund
AUD B Accumulating
Class
AUD C2 Accumulating
Class
AUD E Accumulating
Class
AUD T Accumulating
Class
CAD I Distributing
Unhedged Class
EUR A Accumulating
Class AUD AUD AUD AUD CAD €
31 December 2019 Beginning net asset value 10.90 10.90 10.89 11.13 8.39 11.27
Income from operations: Net investment income/(loss)+ (0.12) (0.11) (0.13) (0.03) 0.09 0.00Net realised and unrealised gain/(loss) on trading activities+ 1.74 1.73 1.75 1.81 0.96 1.57
Total from operations 1.62 1.62 1.62 1.78 1.05 1.57
Distributions – – – – (0.10) –
Ending net asset value 12.52 12.52 12.51 12.91 9.34 12.84
Total return 14.86% 14.86% 14.88% 15.99% 12.68% 13.93%
Ratios to average net assets Expenses++ 3.42% 3.46% 3.46% 2.53% 1.46% 2.48%
Net investment income/(loss) (0.98%) (0.91%) (1.08%) (0.24%) 0.99% 0.03%
31 December 2018 Beginning net asset value 13.82 13.83 13.81 13.97 10.00 14.47
Income from operations: Net investment income/(loss)+ (0.14) (0.13) (0.12) 0.02 0.08 0.06Net realised and unrealised gain/(loss) on trading activities+ (2.78) (2.80) (2.80) (2.86) (1.69) (3.26)
Total from operations (2.92) (2.93) (2.92) (2.84) (1.61) (3.20)
Ending net asset value 10.90 10.90 10.89 11.13 8.39 11.27
Total return (21.13%) (21.19%) (21.14%) (20.33%) (16.10%) (22.11%)
Ratios to average net assets Expenses++ 3.64% 3.62% 3.62% 2.57% 1.63% 2.55%
Net investment income/(loss) (1.09%) (0.98%) (0.93%) 0.14% 0.92% 0.49%

NOTES TO THE AUDITED FINANCIAL STATEMENTS FINANCIAL STATEMENTS
ANNUAL REPORT 2019 1501
FOR THE YEAR ENDED 31 DECEMBER 2019
23. FINANCIAL HIGHLIGHTS (CONTINUED)
Neuberger Berman Emerging Markets Equity Fund (continued)
EUR I Accumulating
Class
EUR M Accumulating
Class
EUR Z Accumulating
Class
GBP I Accumulating
Class
GBP Z Accumulating
Class
JPY I Accumulating
Class € € € £ £ ¥
31 December 2019 Beginning net asset value 9.66 12.02 7.91 10.63 12.27 1,425.20
Income from operations: Net investment income/(loss)+ 0.12 (0.11) 0.17 0.18 0.26 15.65Net realised and unrealised gain/(loss) on trading activities+ 1.34 1.64 1.11 1.57 1.89 235.22
Total from operations 1.46 1.53 1.28 1.75 2.15 250.87
Ending net asset value 11.12 13.55 9.19 12.38 14.42 1,676.07
Total return 15.11% 12.73% 16.18% 16.46% 17.52% 17.60%
Ratios to average net assets Expenses++ 1.43% 3.45% 0.49% 1.25% 0.48% 1.49%
Net investment income/(loss) 1.13% (0.89%) 2.01% 1.60% 1.93% 1.01%
31 December 2018 Beginning net asset value 12.29 15.60 10.00 13.38 15.29 1,801.13
Income from operations: Net investment income/(loss)+ 0.13 (0.15) 0.14 0.09 0.28 14.85Net realised and unrealised gain/(loss) on trading activities+ (2.76) (3.43) (2.23) (2.84) (3.30) (390.78)
Total from operations (2.63) (3.58) (2.09) (2.75) (3.02) (375.93)
Ending net asset value 9.66 12.02 7.91 10.63 12.27 1,425.20
Total return (21.40%) (22.95%) (20.90%) (20.55%) (19.75%) (20.87%)
Ratios to average net assets Expenses++ 1.47% 3.59% 1.01% 1.52% 0.48% 1.43%
Net investment income/(loss) 1.14% (1.08%) 1.79% 0.74% 1.96% 0.89%

FINANCIAL STATEMENTS NOTES TO THE AUDITED FINANCIAL STATEMENTS
1502 NEUBERGER BERMAN INVESTMENT FUNDS PLC
FOR THE YEAR ENDED 31 DECEMBER 2019
23. FINANCIAL HIGHLIGHTS (CONTINUED)
Neuberger Berman Emerging Markets Equity Fund (continued)
USD A Accumulating
Class
USD B Accumulating
Class
USD C1 Accumulating
Class
USD C2 Accumulating
Class
USD E Accumulating
Class
USD I Accumulating
Class US$ US$ US$ US$ US$ US$
31 December 2019 Beginning net asset value 9.99 10.97 8.39 10.97 10.97 10.83
Income from operations: Net investment income/(loss)+ (0.01) (0.11) (0.09) (0.12) (0.11) 0.13Net realised and unrealised gain/(loss) on trading activities+ 1.77 1.90 1.46 1.92 1.90 1.90
Total from operations 1.76 1.79 1.37 1.80 1.79 2.03
Ending net asset value 11.75 12.76 9.76 12.77 12.76 12.86
Total return 17.62% 16.32% 16.33% 16.41% 16.32% 18.74%
Ratios to average net assets Expenses++ 2.52% 3.49% 3.50% 3.49% 3.49% 1.49%
Net investment income/(loss) (0.07%) (0.95%) (0.99%) (1.00%) (0.95%) 1.07%
31 December 2018 Beginning net asset value 12.42 13.78 10.52 13.78 13.78 13.34
Income from operations: Net investment income/(loss)+ 0.00 (0.10) (0.10) (0.10) (0.11) 0.10Net realised and unrealised gain/(loss) on trading activities+ (2.43) (2.71) (2.03) (2.71) (2.70) (2.61)
Total from operations (2.43) (2.81) (2.13) (2.81) (2.81) (2.51)
Ending net asset value 9.99 10.97 8.39 10.97 10.97 10.83
Total return (19.57%) (20.39%) (20.25%) (20.39%) (20.39%) (18.82%)
Ratios to average net assets Expenses++ 2.46% 3.42% 3.42% 3.42% 3.42% 1.49%
Net investment income/(loss) 0.01% (0.80%) (1.00%) (0.78%) (0.91%) 0.83%

NOTES TO THE AUDITED FINANCIAL STATEMENTS FINANCIAL STATEMENTS
ANNUAL REPORT 2019 1503
FOR THE YEAR ENDED 31 DECEMBER 2019
23. FINANCIAL HIGHLIGHTS (CONTINUED)
Neuberger Berman Emerging Markets Equity Fund (continued)
USD M Accumulating
Class
USD T Accumulating
Class
USD Z Accumulating
Class
ZAR B Accumulating
Class
ZAR C2 Accumulating
Class
ZAR E Accumulating
Class US$ US$ US$ ZAR ZAR ZAR
31 December 2019 Beginning net asset value 11.69 11.20 10.69 120.72 120.71 120.71
Income from operations: Net investment income/(loss)+ (0.22) 0.01 0.22 (1.35) (1.43) (1.28)Net realised and unrealised gain/(loss) on trading activities+ 2.13 1.96 1.91 25.85 25.93 25.78
Total from operations 1.91 1.97 2.13 24.50 24.50 24.50
Ending net asset value 13.60 13.17 12.82 145.22 145.21 145.21
Total return 16.34% 17.59% 19.93% 20.29% 20.30% 20.30%
Ratios to average net assets Expenses++ 3.61% 2.49% 0.57% 3.34% 3.39% 3.37%
Net investment income/(loss) (1.73%) 0.06% 1.88% (1.02%) (1.07%) (0.96%)
31 December 2018 Beginning net asset value 14.68 13.93 13.03 147.17 147.17 147.17
Income from operations: Net investment income/(loss)+ (0.16) 0.01 0.22 (1.52) (1.59) (1.72)Net realised and unrealised gain/(loss) on trading activities+ (2.83) (2.74) (2.56) (24.93) (24.87) (24.74)
Total from operations (2.99) (2.73) (2.34) (26.45) (26.46) (26.46)
Ending net asset value 11.69 11.20 10.69 120.72 120.71 120.71
Total return (20.37%) (19.60%) (17.96%) (17.97%) (17.98%) (17.98%)
Ratios to average net assets Expenses++ 3.49% 2.44% 0.47% 3.80% 3.72% 3.75%
Net investment income/(loss) (1.18%) 0.05% 1.83% (1.14%) (1.18%) (1.22%)

FINANCIAL STATEMENTS NOTES TO THE AUDITED FINANCIAL STATEMENTS
1504 NEUBERGER BERMAN INVESTMENT FUNDS PLC
FOR THE YEAR ENDED 31 DECEMBER 2019
23. FINANCIAL HIGHLIGHTS (CONTINUED)
Neuberger Berman Emerging Markets Equity Fund (continued)
ZAR T Accumulating
Class ZAR
31 December 2019 Beginning net asset value 123.28
Income from operations: Net investment income/(loss)+ 0.01 Net realised and unrealised gain/(loss) on trading activities+ 26.70
Total from operations 26.71
Ending net asset value 149.99
Total return 21.67%
Ratios to average net assets Expenses++ 2.41%
Net investment income/(loss) 0.01%
31 December 2018 Beginning net asset value 148.79
Income from operations: Net investment income/(loss)+ (0.06) Net realised and unrealised gain/(loss) on trading activities+ (25.45)
Total from operations (25.51)
Ending net asset value 123.28
Total return (17.14%)
Ratios to average net assets Expenses++ 2.65%
Net investment income/(loss) (0.05%)

NOTES TO THE AUDITED FINANCIAL STATEMENTS FINANCIAL STATEMENTS
ANNUAL REPORT 2019 1505
FOR THE YEAR ENDED 31 DECEMBER 2019
23. FINANCIAL HIGHLIGHTS (CONTINUED)
Neuberger Berman US Small Cap Fund
AUD B Accumulating
Class*
AUD C2 Accumulating
Class
AUD E Accumulating
Class
AUD T Accumulating
Class
EUR A Accumulating
Class
EUR I Accumulating
Class AUD AUD AUD AUD € €
31 December 2019 Beginning net asset value 10.00 8.15 11.69 10.38 11.46 13.10
Income from operations: Net investment income/(loss)+ (0.04) (0.22) (0.30) (0.15) (0.15) (0.04)Net realised and unrealised gain/(loss) on trading activities+ 0.47 2.26 3.21 2.87 2.90 3.31
Total from operations 0.43 2.04 2.91 2.72 2.75 3.27
Ending net asset value 10.43 10.19 14.60 13.10 14.21 16.37
Total return 4.30% 25.03% 24.89% 26.20% 24.00% 24.96%
Ratios to average net assets Expenses++ 3.08% 3.03% 3.03% 2.04% 1.93% 1.09%
Net investment income/(loss) (2.09%) (2.24%) (2.22%) (1.24%) (1.11%) (0.26%)
31 December 2018 Beginning net asset value – 10.00 12.97 11.40 12.86 14.58
Income from operations: Net investment income/(loss)+ – (0.07) (0.32) (0.15) (0.16) (0.05)Net realised and unrealised gain/(loss) on trading activities+ – (1.78) (0.96) (0.87) (1.24) (1.43)
Total from operations – (1.85) (1.28) (1.02) (1.40) (1.48)
Distributions – – – – – –
Ending net asset value – 8.15 11.69 10.38 11.46 13.10
Total return – (18.50%) (9.87%) (8.95%) (10.89%) (10.15%)
Ratios to average net assets Expenses++ – 3.22% 3.29% 2.26% 2.01% 1.10%
Net investment income/(loss) – (2.64%) (2.42%) (1.33%) (1.19%) (0.30%)
* Share class launched during the current reporting year.

FINANCIAL STATEMENTS NOTES TO THE AUDITED FINANCIAL STATEMENTS
1506 NEUBERGER BERMAN INVESTMENT FUNDS PLC
FOR THE YEAR ENDED 31 DECEMBER 2019
23. FINANCIAL HIGHLIGHTS (CONTINUED)
Neuberger Berman US Small Cap Fund (continued)
EUR I Accumulating
Unhedged Class
EUR I2 Accumulating
Unhedged Class*
EUR M Accumulating
Class
EUR Z Accumulating
Class
GBP I Accumulating
Class*
JPY I Distributing
Class € € € € £ ¥
31 December 2019 Beginning net asset value 9.99 10.00 12.09 11.97 10.00 2.62
Income from operations: Net investment income/(loss)+ (0.03) (0.01) (0.30) 0.08 (0.02) (0.01)Net realised and unrealised gain/(loss) on trading activities+ 3.17 2.19 3.05 3.05 1.28 0.74
Total from operations 3.14 2.18 2.75 3.13 1.26 0.73
Ending net asset value 13.13 12.18 14.84 15.10 11.26 3.35
Total return 31.43% 21.80% 22.75% 26.15% 12.60% 27.68%
Ratios to average net assets Expenses++ 1.07% 0.91% 2.95% 0.23% 1.02% 1.08%
Net investment income/(loss) (0.26%) (0.11%) (2.13%) 0.58% (0.28%) (0.26%)
31 December 2018 Beginning net asset value 10.27 – 13.70 13.21 – 2.91
Income from operations: Net investment income/(loss)+ (0.03) – (0.31) 0.08 – (0.01)Net realised and unrealised gain/(loss) on trading activities+ (0.25) – (1.30) (1.32) – (0.28)
Total from operations (0.28) – (1.61) (1.24) – (0.29)
Distributions – – – – – –
Ending net asset value 9.99 – 12.09 11.97 – 2.62
Total return (2.73%) – (11.75%) (9.39%) – (9.78%)
Ratios to average net assets Expenses++ 1.16% – 3.08% 0.28% – 1.11%
Net investment income/(loss) (0.30%) – (2.23%) 0.60% – (0.26%)
* Share class launched during the current reporting year.

NOTES TO THE AUDITED FINANCIAL STATEMENTS FINANCIAL STATEMENTS
ANNUAL REPORT 2019 1507
FOR THE YEAR ENDED 31 DECEMBER 2019
23. FINANCIAL HIGHLIGHTS (CONTINUED)
Neuberger Berman US Small Cap Fund (continued)
USD A Accumulating
Class
USD A Distributing
Class
USD B Accumulating
Class
USD C Accumulating
Class
USD C2 Accumulating
Class
USD E Accumulating
Class US$ US$ US$ US$ US$ US$
31 December 2019 Beginning net asset value 16.53 10.67 12.82 16.22 12.85 11.31
Income from operations: Net investment income/(loss)+ (0.22) (0.14) (0.34) (0.29) (0.34) (0.30)Net realised and unrealised gain/(loss) on trading activities+ 4.81 3.11 3.72 4.71 3.72 3.28
Total from operations 4.59 2.97 3.38 4.42 3.38 2.98
Ending net asset value 21.12 13.64 16.20 20.64 16.23 14.29
Total return 27.77% 27.84% 26.37% 27.25% 26.30% 26.35%
Ratios to average net assets Expenses++ 1.93% 1.93% 3.06% 2.36% 3.06% 3.06%
Net investment income/(loss) (1.11%) (1.11%) (2.24%) (1.53%) (2.23%) (2.25%)
31 December 2018 Beginning net asset value 18.00 11.62 14.12 17.74 14.12 12.45
Income from operations: Net investment income/(loss)+ (0.21) (0.14) (0.32) (0.28) (0.33) (0.29)Net realised and unrealised gain/(loss) on trading activities+ (1.26) (0.81) (0.98) (1.24) (0.94) (0.85)
Total from operations (1.47) (0.95) (1.30) (1.52) (1.27) (1.14)
Ending net asset value 16.53 10.67 12.82 16.22 12.85 11.31
Total return (8.17%) (8.18%) (9.21%) (8.57%) (8.99%) (9.16%)
Ratios to average net assets Expenses++ 1.95% 1.98% 3.09% 2.38% 3.08% 3.11%
Net investment income/(loss) (1.13%) (1.14%) (2.23%) (1.54%) (2.30%) (2.27%)

FINANCIAL STATEMENTS NOTES TO THE AUDITED FINANCIAL STATEMENTS
1508 NEUBERGER BERMAN INVESTMENT FUNDS PLC
FOR THE YEAR ENDED 31 DECEMBER 2019
23. FINANCIAL HIGHLIGHTS (CONTINUED)
Neuberger Berman US Small Cap Fund (continued)
USD I Accumulating
Class
USD I Distributing
Class
USD I2 Accumulating
Class
USD I3 Accumulating
Class
USD M Accumulating
Class
USD T Accumulating
Class US$ US$ US$ US$ US$ US$
31 December 2019 Beginning net asset value 17.69 12.87 11.54 8,772.53 12.84 13.54
Income from operations: Net investment income/(loss)+ (0.05) (0.04) (0.01) (1.36) (0.33) (0.20)Net realised and unrealised gain/(loss) on trading activities+ 5.16 3.76 3.38 2,564.71 3.73 3.94
Total from operations 5.11 3.72 3.37 2,563.35 3.40 3.74
Ending net asset value 22.80 16.59 14.91 11,335.88 16.24 17.28
Total return 28.89% 28.90% 29.20% 29.22% 26.48% 27.62%
Ratios to average net assets Expenses++ 1.08% 1.08% 0.91% 0.83% 2.97% 2.06%
Net investment income/(loss) (0.26%) (0.26%) (0.09%) (0.01%) (2.12%) (1.23%)
31 December 2018 Beginning net asset value 19.10 13.89 12.44 10,000.00 14.13 14.76
Income from operations: Net investment income/(loss)+ (0.06) (0.04) (0.01) (0.69) (0.32) (0.19)Net realised and unrealised gain/(loss) on trading activities+ (1.35) (0.98) (0.89) (1,226.78) (0.97) (1.03)
Total from operations (1.41) (1.02) (0.90) (1,227.47) (1.29) (1.22)
Ending net asset value 17.69 12.87 11.54 8,772.53 12.84 13.54
Total return (7.38%) (7.34%) (7.23%) (12.27%) (9.13%) (8.27%)
Ratios to average net assets Expenses++ 1.10% 1.10% 0.90% 0.93% 2.98% 2.09%
Net investment income/(loss) (0.30%) (0.31%) (0.10%) (0.02%) (2.23%) (1.27%)

NOTES TO THE AUDITED FINANCIAL STATEMENTS FINANCIAL STATEMENTS
ANNUAL REPORT 2019 1509
FOR THE YEAR ENDED 31 DECEMBER 2019
23. FINANCIAL HIGHLIGHTS (CONTINUED)
Neuberger Berman US Small Cap Fund (continued)
USD Z Accumulating
Class
ZAR E Accumulating
Class
ZAR T Accumulating
Class US$ ZAR ZAR
31 December 2019 Beginning net asset value 11.59 143.08 114.74
Income from operations: Net investment income/(loss)+ 0.08 (3.58) (1.62)Net realised and unrealised gain/(loss) on trading activities+ 3.40 48.63 39.26
Total from operations 3.48 45.05 37.64
Ending net asset value 15.07 188.13 152.38
Total return 30.03% 31.49% 32.80%
Ratios to average net assets Expenses++ 0.23% 2.98% 2.00%
Net investment income/(loss) 0.59% (2.16%) (1.19%)
31 December 2018 Beginning net asset value 12.41 151.65 120.42
Income from operations: Net investment income/(loss)+ 0.07 (3.74) (1.63)Net realised and unrealised gain/(loss) on trading activities+ (0.89) (4.83) (4.05)
Total from operations (0.82) (8.57) (5.68)
Ending net asset value 11.59 143.08 114.74
Total return (6.61%) (5.65%) (4.72%)
Ratios to average net assets Expenses++ 0.21% 3.44% 2.30%
Net investment income/(loss) 0.56% (2.51%) (1.37%)

FINANCIAL STATEMENTS NOTES TO THE AUDITED FINANCIAL STATEMENTS
1510 NEUBERGER BERMAN INVESTMENT FUNDS PLC
FOR THE YEAR ENDED 31 DECEMBER 2019
23. FINANCIAL HIGHLIGHTS (CONTINUED)
Neuberger Berman Short Duration High Yield Bond Fund
AUD A (Monthly)
Distributing Class
CHF A Accumulating
Class
CHF I Accumulating
Class
CHF I2 Accumulating
Class
CHF I3 Distributing
Class
CNY A (Monthly)
Distributing Class
AUD CHF CHF CHF CHF CNY
31 December 2019 Beginning net asset value 8.25 10.74 11.35 9.99 9.01 93.27
Income from operations: Net investment income/(loss)+ 0.35 0.46 0.56 0.50 0.44 4.12Net realised and unrealised gain/(loss) on trading activities+ 0.26 0.07 0.07 0.07 0.06 3.87
Total from operations 0.61 0.53 0.63 0.57 0.50 7.99
Distributions (0.38) – – – (0.48) (5.02)
Ending net asset value 8.48 11.27 11.98 10.56 9.03 96.24
Total return 7.52% 4.93% 5.55% 5.71% 5.66% 8.75%
Ratios to average net assets Expenses++ 1.34% 1.32% 0.73% 0.63% 0.56% 1.37%
Net investment income/(loss) 4.19% 4.13% 4.71% 4.81% 4.88% 4.32%
31 December 2018 Beginning net asset value 8.83 11.22 11.79 10.37 9.84 98.68
Income from operations: Net investment income/(loss)+ 0.40 0.49 0.58 0.52 0.49 4.37Net realised and unrealised gain/(loss) on trading activities+ (0.52) (0.97) (1.02) (0.90) (0.82) (3.96)
Total from operations (0.12) (0.48) (0.44) (0.38) (0.33) 0.41
Distributions (0.46) – – – (0.50) (5.82)
Ending net asset value 8.25 10.74 11.35 9.99 9.01 93.27
Total return (1.40%) (4.28%) (3.73%) (3.66%) (3.55%) 0.38%
Ratios to average net assets Expenses++ 1.45% 1.38% 0.78% 0.68% 0.59% 1.43%
Net investment income/(loss) 4.65% 4.37% 5.00% 5.05% 5.15% 4.52%

NOTES TO THE AUDITED FINANCIAL STATEMENTS FINANCIAL STATEMENTS
ANNUAL REPORT 2019 1511
FOR THE YEAR ENDED 31 DECEMBER 2019
23. FINANCIAL HIGHLIGHTS (CONTINUED)
Neuberger Berman Short Duration High Yield Bond Fund (continued)
EUR A Accumulating
Class
EUR A Distributing
Class
EUR I Accumulating
Class
EUR I Distributing
Class
EUR I2 Accumulating
Class
EUR I2 Distributing
Class € € € € € €
31 December 2019 Beginning net asset value 11.15 7.97 11.60 8.21 10.70 7.90
Income from operations: Net investment income/(loss)+ 0.49 0.34 0.58 0.40 0.55 0.39Net realised and unrealised gain/(loss) on trading activities+ 0.10 0.08 0.11 0.08 0.11 0.08
Total from operations 0.59 0.42 0.69 0.48 0.66 0.47
Distributions – (0.37) – (0.43) – (0.42)
Ending net asset value 11.74 8.02 12.29 8.26 11.36 7.95
Total return 5.29% 5.30% 5.95% 5.92% 6.17% 6.05%
Ratios to average net assets Expenses++ 1.35% 1.35% 0.75% 0.75% 0.65% 0.65%
Net investment income/(loss) 4.23% 4.22% 4.80% 4.83% 4.91% 4.91%
31 December 2018 Beginning net asset value 11.60 8.67 12.00 8.93 11.06 8.59
Income from operations: Net investment income/(loss)+ 0.52 0.37 0.62 0.44 0.57 0.43Net realised and unrealised gain/(loss) on trading activities+ (0.97) (0.70) (1.02) (0.72) (0.93) (0.69)
Total from operations (0.45) (0.33) (0.40) (0.28) (0.36) (0.26)
Distributions – (0.37) – (0.44) – (0.43)
Ending net asset value 11.15 7.97 11.60 8.21 10.70 7.90
Total return (3.88%) (3.92%) (3.33%) (3.32%) (3.25%) (3.19%)
Ratios to average net assets Expenses++ 1.42% 1.41% 0.80% 0.80% 0.69% 0.69%
Net investment income/(loss) 4.45% 4.48% 5.12% 5.07% 5.19% 5.23%

FINANCIAL STATEMENTS NOTES TO THE AUDITED FINANCIAL STATEMENTS
1512 NEUBERGER BERMAN INVESTMENT FUNDS PLC
FOR THE YEAR ENDED 31 DECEMBER 2019
23. FINANCIAL HIGHLIGHTS (CONTINUED)
Neuberger Berman Short Duration High Yield Bond Fund (continued)
EUR I3 Distributing
Class
EUR M Accumulating
Class
EUR M Distributing
Class
GBP I Accumulating
Class
GBP I Distributing
Class
GBP I2 Accumulating
Class € € € £ £ £
31 December 2019 Beginning net asset value 9.04 10.13 8.72 12.24 8.56 11.32
Income from operations: Net investment income/(loss)+ 0.46 0.38 0.31 0.60 0.41 0.57Net realised and unrealised gain/(loss) on trading activities+ 0.09 0.09 0.09 0.30 0.21 0.27
Total from operations 0.55 0.47 0.40 0.90 0.62 0.84
Distributions (0.49) – (0.52) – (0.45) –
Ending net asset value 9.10 10.60 8.60 13.14 8.73 12.16
Total return 6.17% 4.64% 4.64% 7.35% 7.35% 7.42%
Ratios to average net assets Expenses++ 0.57% 1.97% 1.97% 0.72% 0.73% 0.63%
Net investment income/(loss) 5.00% 3.60% 3.60% 4.65% 4.68% 4.75%
31 December 2018 Beginning net asset value 9.84 10.60 9.68 12.52 9.21 11.57
Income from operations: Net investment income/(loss)+ 0.49 0.40 0.35 0.65 0.47 0.61Net realised and unrealised gain/(loss) on trading activities+ (0.79) (0.87) (0.77) (0.93) (0.67) (0.86)
Total from operations (0.30) (0.47) (0.42) (0.28) (0.20) (0.25)
Distributions (0.50) – (0.54) – (0.45) –
Ending net asset value 9.04 10.13 8.72 12.24 8.56 11.32
Total return (3.22%) (4.43%) (4.51%) (2.24%) (2.27%) (2.16%)
Ratios to average net assets Expenses++ 0.61% 2.06% 2.06% 0.80% 0.81% 0.70%
Net investment income/(loss) 5.21% 3.83% 3.84% 5.21% 5.16% 5.27%

NOTES TO THE AUDITED FINANCIAL STATEMENTS FINANCIAL STATEMENTS
ANNUAL REPORT 2019 1513
FOR THE YEAR ENDED 31 DECEMBER 2019
23. FINANCIAL HIGHLIGHTS (CONTINUED)
Neuberger Berman Short Duration High Yield Bond Fund (continued)
GBP I2 Distributing
Class
JPY I Accumulating
Class
SGD A(Monthly)
Distributing Class
USD A (Monthly)
Distributing Class
USD A Accumulating
Class
USD A Distributing
Class £ ¥ SGD US$ US$ US$
31 December 2019 Beginning net asset value 8.35 1,152.59 16.99 8.48 11.94 8.58
Income from operations: Net investment income/(loss)+ 0.40 58.03 0.75 0.37 0.53 0.37Net realised and unrealised gain/(loss) on trading activities+ 0.20 13.37 0.55 0.35 0.50 0.35
Total from operations 0.60 71.40 1.30 0.72 1.03 0.72
Distributions (0.44) – (0.79) (0.39) – (0.39)
Ending net asset value 8.51 1,223.99 17.50 8.81 12.97 8.91
Total return 7.39% 6.19% 7.75% 8.68% 8.63% 8.61%
Ratios to average net assets Expenses++ 0.62% 0.75% 1.34% 1.35% 1.35% 1.35%
Net investment income/(loss) 4.73% 4.82% 4.26% 4.24% 4.23% 4.25%
31 December 2018 Beginning net asset value 8.98 1,188.37 18.15 8.99 12.09 9.08
Income from operations: Net investment income/(loss)+ 0.46 58.10 0.78 0.38 0.53 0.39Net realised and unrealised gain/(loss) on trading activities+ (0.64) (93.88) (1.14) (0.49) (0.68) (0.50)
Total from operations (0.18) (35.78) (0.36) (0.11) (0.15) (0.11)
Distributions (0.45) – (0.80) (0.40) – (0.39)
Ending net asset value 8.35 1,152.59 16.99 8.48 11.94 8.58
Total return (2.13%) (3.01%) (2.07%) (1.32%) (1.24%) (1.27%)
Ratios to average net assets Expenses++ 0.70% 0.77% 1.38% 1.37% 1.37% 1.37%
Net investment income/(loss) 5.27% 4.92% 4.39% 4.36% 4.34% 4.36%
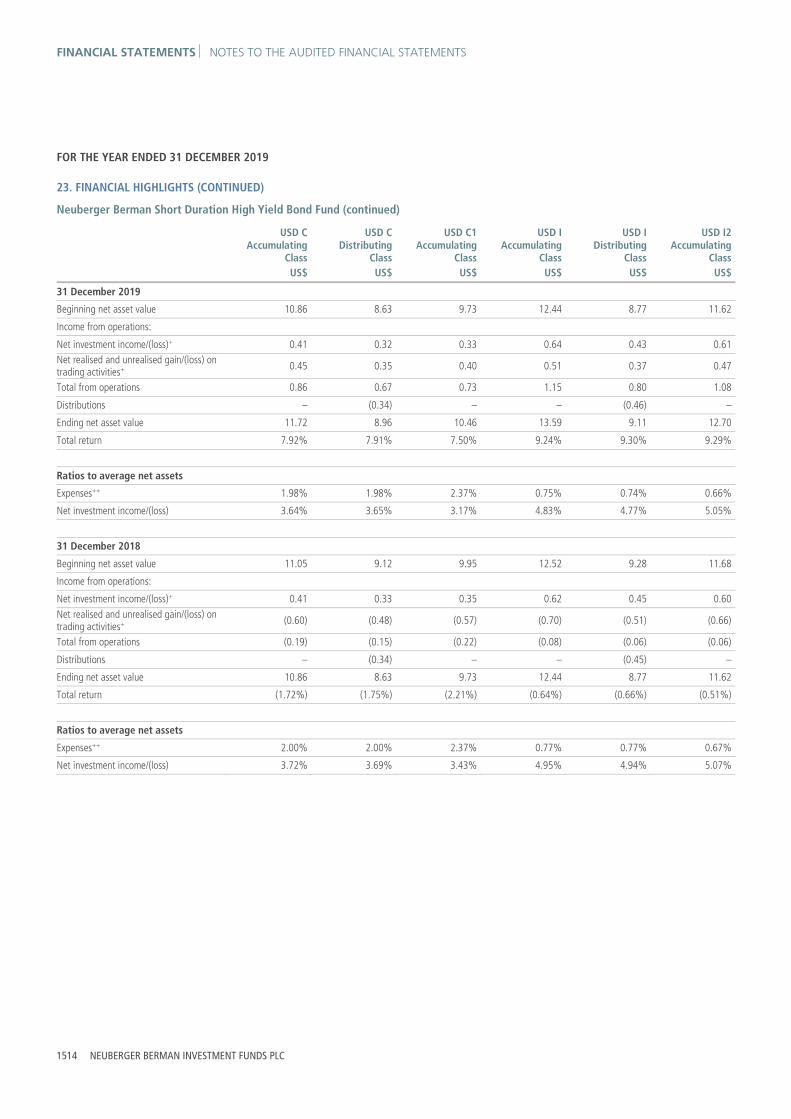
FINANCIAL STATEMENTS NOTES TO THE AUDITED FINANCIAL STATEMENTS
1514 NEUBERGER BERMAN INVESTMENT FUNDS PLC
FOR THE YEAR ENDED 31 DECEMBER 2019
23. FINANCIAL HIGHLIGHTS (CONTINUED)
Neuberger Berman Short Duration High Yield Bond Fund (continued)
USD C Accumulating
Class
USD C Distributing
Class
USD C1 Accumulating
Class
USD I Accumulating
Class
USD I Distributing
Class
USD I2 Accumulating
Class US$ US$ US$ US$ US$ US$
31 December 2019 Beginning net asset value 10.86 8.63 9.73 12.44 8.77 11.62
Income from operations: Net investment income/(loss)+ 0.41 0.32 0.33 0.64 0.43 0.61Net realised and unrealised gain/(loss) on trading activities+ 0.45 0.35 0.40 0.51 0.37 0.47
Total from operations 0.86 0.67 0.73 1.15 0.80 1.08
Distributions – (0.34) – – (0.46) –
Ending net asset value 11.72 8.96 10.46 13.59 9.11 12.70
Total return 7.92% 7.91% 7.50% 9.24% 9.30% 9.29%
Ratios to average net assets Expenses++ 1.98% 1.98% 2.37% 0.75% 0.74% 0.66%
Net investment income/(loss) 3.64% 3.65% 3.17% 4.83% 4.77% 5.05%
31 December 2018 Beginning net asset value 11.05 9.12 9.95 12.52 9.28 11.68
Income from operations: Net investment income/(loss)+ 0.41 0.33 0.35 0.62 0.45 0.60Net realised and unrealised gain/(loss) on trading activities+ (0.60) (0.48) (0.57) (0.70) (0.51) (0.66)
Total from operations (0.19) (0.15) (0.22) (0.08) (0.06) (0.06)
Distributions – (0.34) – – (0.45) –
Ending net asset value 10.86 8.63 9.73 12.44 8.77 11.62
Total return (1.72%) (1.75%) (2.21%) (0.64%) (0.66%) (0.51%)
Ratios to average net assets Expenses++ 2.00% 2.00% 2.37% 0.77% 0.77% 0.67%
Net investment income/(loss) 3.72% 3.69% 3.43% 4.95% 4.94% 5.07%

NOTES TO THE AUDITED FINANCIAL STATEMENTS FINANCIAL STATEMENTS
ANNUAL REPORT 2019 1515
FOR THE YEAR ENDED 31 DECEMBER 2019
23. FINANCIAL HIGHLIGHTS (CONTINUED)
Neuberger Berman Short Duration High Yield Bond Fund (continued)
USD I2 Distributing
Class
USD M Accumulating
Class
USD M Distributing
Class
USD Z Accumulating
Class US$ US$ US$ US$
31 December 2019 Beginning net asset value 8.57 9.85 9.40 10.97
Income from operations: Net investment income/(loss)+ 0.44 0.37 0.34 0.63 Net realised and unrealised gain/(loss) on trading activities+ 0.34 0.41 0.39 0.46
Total from operations 0.78 0.78 0.73 1.09
Distributions (0.45) – (0.56) –
Ending net asset value 8.90 10.63 9.57 12.06
Total return 9.38% 7.92% 7.94% 9.94%
Ratios to average net assets Expenses++ 0.65% 1.96% 1.95% 0.15%
Net investment income/(loss) 4.96% 3.55% 3.54% 5.42%
31 December 2018 Beginning net asset value 9.06 10.03 10.01 10.97
Income from operations: Net investment income/(loss)+ 0.45 0.38 0.37 0.62 Net realised and unrealised gain/(loss) on trading activities+ (0.49) (0.56) (0.54) (0.62)
Total from operations (0.04) (0.18) (0.17) 0.00
Distributions (0.45) – (0.44) –
Ending net asset value 8.57 9.85 9.40 10.97
Total return (0.47%) (1.79%) (1.82%) 0.00%
Ratios to average net assets Expenses++ 0.67% 1.99% 1.97% 0.16%
Net investment income/(loss) 5.02% 3.74% 3.75% 5.53%

FINANCIAL STATEMENTS NOTES TO THE AUDITED FINANCIAL STATEMENTS
1516 NEUBERGER BERMAN INVESTMENT FUNDS PLC
FOR THE YEAR ENDED 31 DECEMBER 2019
23. FINANCIAL HIGHLIGHTS (CONTINUED)
Neuberger Berman Global Bond Fund
USD A Accumulating
Class
USD C1 Accumulating
Class
USD I Accumulating
Class
USD M Accumulating
Class
USD M Distributing
Class
USD Z Accumulating
Class US$ US$ US$ US$ US$ US$
31 December 2019 Beginning net asset value 10.48 9.62 10.24 9.94 9.86 10.57
Income from operations: Net investment income/(loss)+ 0.16 0.06 0.21 0.10 0.10 0.27Net realised and unrealised gain/(loss) on trading activities+ 0.50 0.44 0.47 0.47 0.45 0.49
Total from operations 0.66 0.50 0.68 0.57 0.55 0.76
Distributions – – – – (0.28) –
Ending net asset value 11.14 10.12 10.92 10.51 10.13 11.33
Total return 6.30% 5.20% 6.64% 5.73% 5.60% 7.19%
Ratios to average net assets Expenses++ 1.02% 2.02% 0.62% 1.62% 1.62% 0.22%
Net investment income/(loss) 1.47% 0.60% 1.92% 1.00% 1.04% 2.44%
31 December 2018 Beginning net asset value 10.78 10.00 10.49 10.00 10.00 10.79
Income from operations: Net investment income/(loss)+ 0.19 0.08 0.23 0.06 0.05 0.28Net realised and unrealised gain/(loss) on trading activities+ (0.49) (0.46) (0.48) (0.12) (0.13) (0.50)
Total from operations (0.30) (0.38) (0.25) (0.06) (0.08) (0.22)
Distributions – – – – (0.06) –
Ending net asset value 10.48 9.62 10.24 9.94 9.86 10.57
Total return (2.78%) (3.80%) (2.38%) (0.60%) (0.81%) (2.04%)
Ratios to average net assets Expenses++ 1.01% 2.01% 0.62% 1.62% 1.62% 0.22%
Net investment income/(loss) 1.84% 0.80% 2.19% 1.19% 1.15% 2.59%

NOTES TO THE AUDITED FINANCIAL STATEMENTS FINANCIAL STATEMENTS
ANNUAL REPORT 2019 1517
FOR THE YEAR ENDED 31 DECEMBER 2019
23. FINANCIAL HIGHLIGHTS (CONTINUED)
Neuberger Berman Emerging Market Debt – Local Currency Fund
AUD B (Monthly)
Distributing Class
AUD B Accumulating
Class
AUD C2 (Monthly)
Distributing Class
AUD C2 Accumulating
Class
AUD E (Monthly)
Distributing Class
AUD E Accumulating
Class AUD AUD AUD AUD AUD AUD
31 December 2019 Beginning net asset value 6.64 9.52 6.64 9.52 6.65 9.51
Income from operations: Net investment income/(loss)+ 0.19 0.30 0.20 0.30 0.20 0.29Net realised and unrealised gain/(loss) on trading activities+ 0.45 0.68 0.44 0.68 0.45 0.69
Total from operations 0.64 0.98 0.64 0.98 0.65 0.98
Distributions (0.69) – (0.69) – (0.70) –
Ending net asset value 6.59 10.50 6.59 10.50 6.60 10.49
Total return 10.25% 10.29% 10.25% 10.29% 10.25% 10.30%
Ratios to average net assets Expenses++ 3.00% 3.00% 2.99% 3.00% 3.00% 2.99%
Net investment income/(loss) 2.96% 2.96% 2.97% 2.96% 2.96% 2.95%
31 December 2018 Beginning net asset value 8.34 10.71 8.34 10.71 8.35 10.71
Income from operations: Net investment income/(loss)+ 0.22 0.31 0.22 0.30 0.22 0.31Net realised and unrealised gain/(loss) on trading activities+ (1.10) (1.50) (1.10) (1.49) (1.10) (1.51)
Total from operations (0.88) (1.19) (0.88) (1.19) (0.88) (1.20)
Distributions (0.82) – (0.82) – (0.82) –
Ending net asset value 6.64 9.52 6.64 9.52 6.65 9.51
Total return (11.21%) (11.11%) (11.21%) (11.11%) (11.18%) (11.20%)
Ratios to average net assets Expenses++ 3.16% 3.16% 3.16% 3.16% 3.16% 3.17%
Net investment income/(loss) 3.06% 3.05% 3.05% 3.04% 3.06% 3.07%

FINANCIAL STATEMENTS NOTES TO THE AUDITED FINANCIAL STATEMENTS
1518 NEUBERGER BERMAN INVESTMENT FUNDS PLC
FOR THE YEAR ENDED 31 DECEMBER 2019
23. FINANCIAL HIGHLIGHTS (CONTINUED)
Neuberger Berman Emerging Market Debt – Local Currency Fund (continued)
AUD T (Monthly)
Distributing Class
AUD T Accumulating
Class
EUR A Accumulating
Class
EUR I Accumulating
Class
EUR I Accumulating
Unhedged Class
EUR I2 Accumulating
Unhedged Class
AUD AUD € € € €
31 December 2019 Beginning net asset value 6.88 9.86 8.04 8.38 9.40 11.02
Income from operations: Net investment income/(loss)+ 0.27 0.41 0.36 0.44 0.52 0.62Net realised and unrealised gain/(loss) on trading activities+ 0.47 0.71 0.41 0.42 0.98 1.15
Total from operations 0.74 1.12 0.77 0.86 1.50 1.77
Distributions (0.72) – – – – –
Ending net asset value 6.90 10.98 8.81 9.24 10.90 12.79
Total return 11.40% 11.36% 9.58% 10.26% 15.96% 16.06%
Ratios to average net assets Expenses++ 2.01% 2.01% 1.73% 0.97% 0.98% 0.83%
Net investment income/(loss) 3.94% 3.94% 4.24% 5.03% 5.03% 5.17%
31 December 2018 Beginning net asset value 8.55 10.98 9.17 9.47 9.80 11.46
Income from operations: Net investment income/(loss)+ 0.31 0.42 0.36 0.45 0.48 0.58Net realised and unrealised gain/(loss) on trading activities+ (1.14) (1.54) (1.49) (1.54) (0.88) (1.02)
Total from operations (0.83) (1.12) (1.13) (1.09) (0.40) (0.44)
Distributions (0.84) – – – – –
Ending net asset value 6.88 9.86 8.04 8.38 9.40 11.02
Total return (10.26%) (10.20%) (12.32%) (11.51%) (4.08%) (3.84%)
Ratios to average net assets Expenses++ 2.10% 2.10% 1.74% 0.96% 0.97% 0.81%
Net investment income/(loss) 4.14% 4.14% 4.40% 5.07% 5.11% 5.22%

NOTES TO THE AUDITED FINANCIAL STATEMENTS FINANCIAL STATEMENTS
ANNUAL REPORT 2019 1519
FOR THE YEAR ENDED 31 DECEMBER 2019
23. FINANCIAL HIGHLIGHTS (CONTINUED)
Neuberger Berman Emerging Market Debt – Local Currency Fund (continued)
EUR I3 Distributing
Unhedged Class*
EUR I4 Accumulating
Unhedged Class
EUR I4 Distributing
Unhedged Class
EUR I5 Accumulating
Unhedged Class*
EUR M Accumulating
Unhedged Class
EUR M Distributing
Unhedged Class
€ € € € € €
31 December 2019 Beginning net asset value 10.00 9.95 8.82 10.00 10.53 8.74
Income from operations: Net investment income/(loss)+ 0.43 0.58 0.50 0.42 0.40 0.32Net realised and unrealised gain/(loss) on trading activities+ 0.55 1.04 0.90 0.60 1.09 0.87
Total from operations 0.98 1.62 1.40 1.02 1.49 1.19
Distributions (0.30) – (0.48) – – (0.64)
Ending net asset value 10.68 11.57 9.74 11.02 12.02 9.29
Total return 9.93% 16.28% 16.32% 10.20% 14.15% 14.06%
Ratios to average net assets Expenses++ 0.76% 0.68% 0.68% 0.61% 2.52% 2.52%
Net investment income/(loss) 5.24% 5.32% 5.32% 5.36% 3.48% 3.48%
31 December 2018 Beginning net asset value – 10.34 9.64 – 11.15 9.92
Income from operations: Net investment income/(loss)+ – 0.54 0.49 – 0.37 0.32Net realised and unrealised gain/(loss) on trading activities+ – (0.93) (0.85) – (0.99) (0.85)
Total from operations – (0.39) (0.36) – (0.62) (0.53)
Distributions – – (0.46) – – (0.65)
Ending net asset value – 9.95 8.82 – 10.53 8.74
Total return – (3.77%) (3.79%) – (5.56%) (5.60%)
Ratios to average net assets Expenses++ – 0.65% 0.65% – 2.56% 2.56%
Net investment income/(loss) – 5.38% 5.37% – 3.48% 3.48%
* Share class launched during the current reporting year.

FINANCIAL STATEMENTS NOTES TO THE AUDITED FINANCIAL STATEMENTS
1520 NEUBERGER BERMAN INVESTMENT FUNDS PLC
FOR THE YEAR ENDED 31 DECEMBER 2019
23. FINANCIAL HIGHLIGHTS (CONTINUED)
Neuberger Berman Emerging Market Debt – Local Currency Fund (continued)
GBP I Accumulating
Class
GBP I4 Accumulating
Unhedged Class
GBP I4 Distributing
Unhedged Class
GBP I5 Accumulating
Unhedged Class
SEK A Accumulating
Class
SGD A(Monthly)
Distributing Class
£ £ £ £ SEK SGD
31 December 2019 Beginning net asset value 8.82 9.85 8.93 10.77 99.62 15.97
Income from operations: Net investment income/(loss)+ 0.45 0.54 0.47 0.60 4.43 0.69Net realised and unrealised gain/(loss) on trading activities+ 0.59 0.43 0.38 0.46 5.22 1.17
Total from operations 1.04 0.97 0.85 1.06 9.65 1.86
Distributions – – (0.48) – – (1.06)
Ending net asset value 9.86 10.82 9.30 11.83 109.27 16.77
Total return 11.79% 9.85% 9.69% 9.84% 9.69% 12.06%
Ratios to average net assets Expenses++ 0.95% 0.65% 0.66% 0.58% 1.71% 1.71%
Net investment income/(loss) 4.84% 5.14% 5.14% 5.22% 4.25% 4.25%
31 December 2018 Beginning net asset value 9.85 10.12 9.65 10.00 113.70 18.97
Income from operations: Net investment income/(loss)+ 1.33 0.54 0.50 0.17 4.52 0.75Net realised and unrealised gain/(loss) on trading activities+ (2.36) (0.81) (0.76) 0.60 (18.60) (2.65)
Total from operations (1.03) (0.27) (0.26) 0.77 (14.08) (1.90)
Distributions – – (0.46) – – (1.10)
Ending net asset value 8.82 9.85 8.93 10.77 99.62 15.97
Total return (10.46%) (2.67%) (2.68%) 7.70% (12.38%) (10.35%)
Ratios to average net assets Expenses++ 0.97% 0.67% 0.66% 0.61% 1.71% 1.70%
Net investment income/(loss) 14.18% 5.47% 5.42% 5.70% 4.21% 4.15%

NOTES TO THE AUDITED FINANCIAL STATEMENTS FINANCIAL STATEMENTS
ANNUAL REPORT 2019 1521
FOR THE YEAR ENDED 31 DECEMBER 2019
23. FINANCIAL HIGHLIGHTS (CONTINUED)
Neuberger Berman Emerging Market Debt – Local Currency Fund (continued)
USD A (Monthly)
Distributing Class
USD A Accumulating
Class
USD B(Monthly)
Distributing Class
USD B Accumulating
Class
USD C1 Accumulating
Class
USD C2 (Monthly)
Distributing Class
US$ US$ US$ US$ US$ US$
31 December 2019 Beginning net asset value 6.92 8.75 7.04 9.47 9.33 7.04
Income from operations: Net investment income/(loss)+ 0.30 0.40 0.21 0.30 0.33 0.21Net realised and unrealised gain/(loss) on trading activities+ 0.56 0.74 0.56 0.79 0.77 0.56
Total from operations 0.86 1.14 0.77 1.09 1.10 0.77
Distributions (0.46) – (0.71) – – (0.71)
Ending net asset value 7.32 9.89 7.10 10.56 10.43 7.10
Total return 12.88% 13.03% 11.47% 11.51% 11.79% 11.47%
Ratios to average net assets Expenses++ 1.73% 1.73% 3.03% 3.03% 2.73% 3.03%
Net investment income/(loss) 4.28% 4.31% 2.99% 2.98% 3.30% 3.00%
31 December 2018 Beginning net asset value 8.12 9.65 8.66 10.58 10.39 8.66
Income from operations: Net investment income/(loss)+ 0.30 0.39 0.22 0.29 0.31 0.22Net realised and unrealised gain/(loss) on trading activities+ (1.03) (1.29) (1.08) (1.40) (1.37) (1.08)
Total from operations (0.73) (0.90) (0.86) (1.11) (1.06) (0.86)
Distributions (0.47) – (0.76) – – (0.76)
Ending net asset value 6.92 8.75 7.04 9.47 9.33 7.04
Total return (9.25%) (9.33%) (10.40%) (10.49%) (10.20%) (10.40%)
Ratios to average net assets Expenses++ 1.69% 1.68% 2.98% 2.98% 2.67% 2.98%
Net investment income/(loss) 4.14% 4.13% 2.87% 2.89% 3.03% 2.89%

FINANCIAL STATEMENTS NOTES TO THE AUDITED FINANCIAL STATEMENTS
1522 NEUBERGER BERMAN INVESTMENT FUNDS PLC
FOR THE YEAR ENDED 31 DECEMBER 2019
23. FINANCIAL HIGHLIGHTS (CONTINUED)
Neuberger Berman Emerging Market Debt – Local Currency Fund (continued)
USD C2 Accumulating
Class
USD E(Monthly)
Distributing Class
USD E Accumulating
Class
USD I (Monthly)
Distributing Class
USD I Accumulating
Class
USD I Distributing
Class US$ US$ US$ US$ US$ US$
31 December 2019 Beginning net asset value 9.48 7.04 9.48 9.20 9.13 9.11
Income from operations: Net investment income/(loss)+ 0.30 0.21 0.30 0.48 0.49 0.48Net realised and unrealised gain/(loss) on trading activities+ 0.79 0.56 0.79 0.75 0.77 0.74
Total from operations 1.09 0.77 1.09 1.23 1.26 1.22
Distributions – (0.71) – (0.62) – (0.46)
Ending net asset value 10.57 7.10 10.57 9.81 10.39 9.87
Total return 11.50% 11.47% 11.50% 13.78% 13.80% 13.77%
Ratios to average net assets Expenses++ 3.03% 3.03% 3.03% 0.97% 0.98% 0.98%
Net investment income/(loss) 2.98% 2.98% 2.99% 5.03% 5.04% 5.06%
31 December 2018 Beginning net asset value 10.59 8.66 10.59 10.00 9.99 10.45
Income from operations: Net investment income/(loss)+ 0.29 0.22 0.28 0.28 0.47 0.48Net realised and unrealised gain/(loss) on trading activities+ (1.40) (1.08) (1.39) (0.77) (1.33) (1.35)
Total from operations (1.11) (0.86) (1.11) (0.49) (0.86) (0.87)
Distributions – (0.76) – (0.31) – (0.47)
Ending net asset value 9.48 7.04 9.48 9.20 9.13 9.11
Total return (10.48%) (10.41%) (10.48%) (4.92%) (8.61%) (8.62%)
Ratios to average net assets Expenses++ 2.98% 2.98% 2.98% 0.92% 0.93% 0.94%
Net investment income/(loss) 2.88% 2.88% 2.87% 4.99% 4.87% 4.92%

NOTES TO THE AUDITED FINANCIAL STATEMENTS FINANCIAL STATEMENTS
ANNUAL REPORT 2019 1523
FOR THE YEAR ENDED 31 DECEMBER 2019
23. FINANCIAL HIGHLIGHTS (CONTINUED)
Neuberger Berman Emerging Market Debt – Local Currency Fund (continued)
USD I2 Accumulating
Class
USD I5 Accumulating
Class
USD M Accumulating
Class
USD M Distributing
Class*
USD T (Monthly)
Distributing Class
USD T Accumulating
Class US$ US$ US$ US$ US$ US$
31 December 2019 Beginning net asset value 8.81 10.21 8.99 10.00 7.41 9.81
Income from operations: Net investment income/(loss)+ 0.49 0.59 0.33 0.14 0.30 0.42Net realised and unrealised gain/(loss) on trading activities+ 0.74 0.86 0.75 0.20 0.59 0.82
Total from operations 1.23 1.45 1.08 0.34 0.89 1.24
Distributions – – – – (0.75) –
Ending net asset value 10.04 11.66 10.07 10.34 7.55 11.05
Total return 13.96% 14.20% 12.01% 3.40% 12.61% 12.64%
Ratios to average net assets Expenses++ 0.83% 0.61% 2.52% 2.55% 2.03% 2.02%
Net investment income/(loss) 5.19% 5.39% 3.49% 3.40% 3.98% 4.13%
31 December 2018 Beginning net asset value 9.63 10.00 9.99 – 9.03 10.85
Income from operations: Net investment income/(loss)+ 0.46 0.15 0.33 – 0.31 0.39Net realised and unrealised gain/(loss) on trading activities+ (1.28) 0.06 (1.33) – (1.13) (1.43)
Total from operations (0.82) 0.21 (1.00) – (0.82) (1.04)
Distributions – – – – (0.80) –
Ending net asset value 8.81 10.21 8.99 – 7.41 9.81
Total return (8.52%) 2.10% (10.01%) – (9.56%) (9.59%)
Ratios to average net assets Expenses++ 0.77% 0.59% 2.48% – 1.98% 1.98%
Net investment income/(loss) 5.03% 5.46% 3.35% – 3.89% 3.88% * Share class launched during the current reporting year.

FINANCIAL STATEMENTS NOTES TO THE AUDITED FINANCIAL STATEMENTS
1524 NEUBERGER BERMAN INVESTMENT FUNDS PLC
FOR THE YEAR ENDED 31 DECEMBER 2019
23. FINANCIAL HIGHLIGHTS (CONTINUED)
Neuberger Berman Emerging Market Debt – Local Currency Fund (continued)
USD X Accumulating
Class
ZAR B(Monthly)
Distributing Class
ZAR B Accumulating
Class
ZAR C2 (Monthly)
Distributing Class
ZAR C2 Accumulating
Class
ZAR E(Monthly)
Distributing Class
US$ ZAR ZAR ZAR ZAR ZAR
31 December 2019 Beginning net asset value 8.87 68.62 112.56 68.63 112.57 68.62
Income from operations: Net investment income/(loss)+ 0.52 1.96 3.50 1.98 3.51 1.96Net realised and unrealised gain/(loss) on trading activities+ 0.75 8.11 14.53 8.07 14.49 8.12
Total from operations 1.27 10.07 18.03 10.05 18.00 10.08
Distributions – (10.41) – (10.41) – (10.41)
Ending net asset value 10.14 68.28 130.59 68.27 130.57 68.29
Total return 14.32% 15.94% 16.02% 15.91% 15.99% 15.96%
Ratios to average net assets Expenses++ 0.50% 2.93% 2.93% 2.93% 2.93% 2.93%
Net investment income/(loss) 5.51% 2.89% 2.89% 2.90% 2.90% 2.89%
31 December 2018 Beginning net asset value 9.67 86.73 121.62 86.74 121.62 86.74
Income from operations: Net investment income/(loss)+ 0.50 2.34 3.61 2.33 3.59 2.32Net realised and unrealised gain/(loss) on trading activities+ (1.30) (8.23) (12.67) (8.22) (12.64) (8.22)
Total from operations (0.80) (5.89) (9.06) (5.89) (9.05) (5.90)
Distributions – (12.22) – (12.22) – (12.22)
Ending net asset value 8.87 68.62 112.56 68.63 112.57 68.62
Total return (8.27%) (7.42%) (7.45%) (7.42%) (7.44%) (7.43%)
Ratios to average net assets Expenses++ 0.55% 3.26% 3.26% 3.26% 3.26% 3.26%
Net investment income/(loss) 5.41% 3.15% 3.15% 3.15% 3.17% 3.16%

NOTES TO THE AUDITED FINANCIAL STATEMENTS FINANCIAL STATEMENTS
ANNUAL REPORT 2019 1525
FOR THE YEAR ENDED 31 DECEMBER 2019
23. FINANCIAL HIGHLIGHTS (CONTINUED)
Neuberger Berman Emerging Market Debt – Local Currency Fund (continued)
ZAR E Accumulating
Class
ZAR T(Monthly)
Distributing Class
ZAR T Accumulating
Class ZAR ZAR ZAR
31 December 2019 Beginning net asset value 112.58 71.12 116.67
Income from operations: Net investment income/(loss)+ 3.49 2.72 4.87Net realised and unrealised gain/(loss) on trading activities+ 14.54 8.49 15.18
Total from operations 18.03 11.21 20.05
Distributions – (10.84) –
Ending net asset value 130.61 71.49 136.72
Total return 16.02% 17.12% 17.19%
Ratios to average net assets Expenses++ 2.93% 1.97% 1.97%
Net investment income/(loss) 2.88% 3.86% 3.86%
31 December 2018 Beginning net asset value 121.64 89.00 124.79
Income from operations: Net investment income/(loss)+ 3.54 3.17 4.93Net realised and unrealised gain/(loss) on trading activities+ (12.60) (8.46) (13.05)
Total from operations (9.06) (5.29) (8.12)
Distributions – (12.59) –
Ending net asset value 112.58 71.12 116.67
Total return (7.45%) (6.50%) (6.51%)
Ratios to average net assets Expenses++ 3.26% 2.17% 2.17%
Net investment income/(loss) 3.18% 4.28% 4.27%

FINANCIAL STATEMENTS NOTES TO THE AUDITED FINANCIAL STATEMENTS
1526 NEUBERGER BERMAN INVESTMENT FUNDS PLC
FOR THE YEAR ENDED 31 DECEMBER 2019
23. FINANCIAL HIGHLIGHTS (CONTINUED)
Neuberger Berman Emerging Market Debt – Hard Currency Fund
AUD A (Monthly)
Distributing Class*
CHF P Accumulating
Class
EUR A (Monthly)
Distributing Class
EUR A Accumulating
Class
EUR I Accumulating
Class
EUR I Accumulating
Unhedged Class*
AUD CHF € € € €
31 December 2019 Beginning net asset value 10.00 8.99 8.99 11.20 11.78 10.00
Income from operations: Net investment income/(loss)+ 0.32 0.43 0.35 0.47 0.58 0.13Net realised and unrealised gain/(loss) on trading activities+ 0.41 0.60 0.63 0.78 0.82 0.01
Total from operations 0.73 1.03 0.98 1.25 1.40 0.14
Distributions (0.39) – (0.47) – – –
Ending net asset value 10.34 10.02 9.50 12.45 13.18 10.14
Total return 7.40% 11.46% 11.09% 11.16% 11.88% 1.40%
Ratios to average net assets Expenses++ 1.54% 0.80% 1.55% 1.55% 0.85% 0.85%
Net investment income/(loss) 3.72% 4.44% 3.77% 3.86% 4.56% 4.43%
31 December 2018 Beginning net asset value – 10.00 10.00 12.35 12.90 –
Income from operations: Net investment income/(loss)+ – 0.41 0.27 0.44 0.56 –Net realised and unrealised gain/(loss) on trading activities+ – (1.42) (0.99) (1.59) (1.68) –
Total from operations – (1.01) (0.72) (1.15) (1.12) –
Distributions – – (0.29) – – –
Ending net asset value – 8.99 8.99 11.20 11.78 –
Total return – (10.10%) (7.24%) (9.31%) (8.68%) –
Ratios to average net assets Expenses++ – 0.86% 1.63% 1.63% 0.91% –
Net investment income/(loss) – 4.86% 4.19% 3.79% 4.60% –
* Share class launched during the current reporting year.
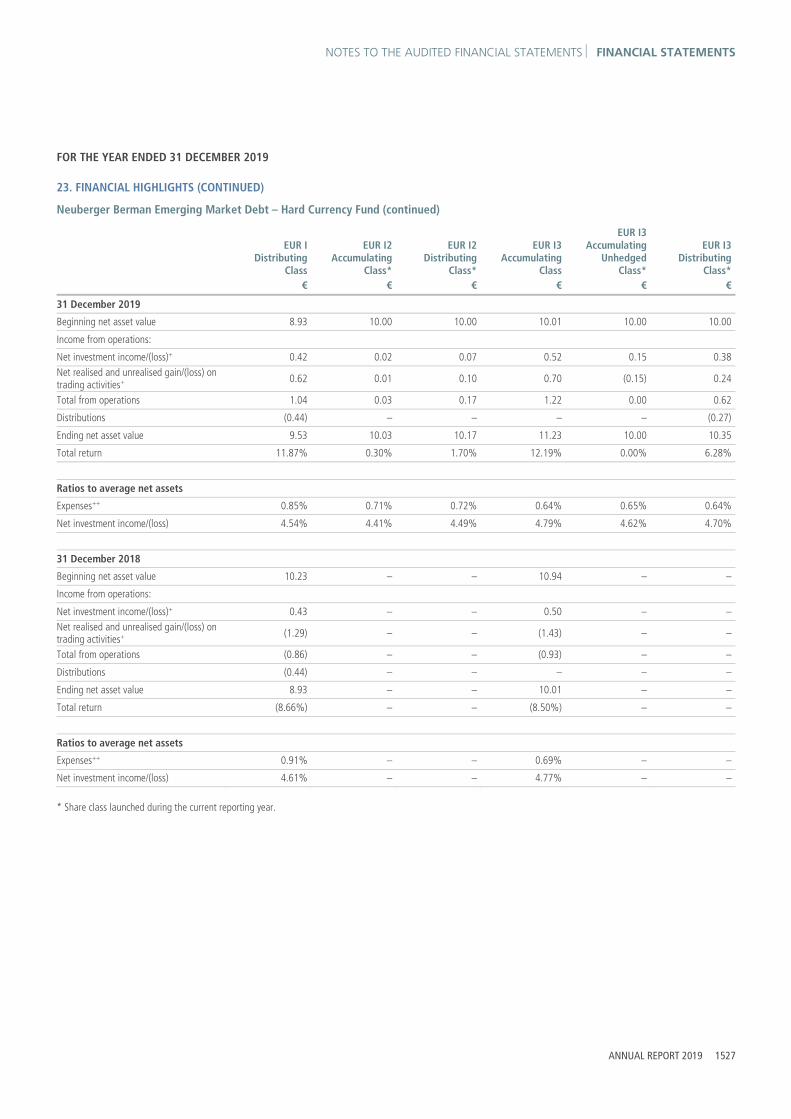
NOTES TO THE AUDITED FINANCIAL STATEMENTS FINANCIAL STATEMENTS
ANNUAL REPORT 2019 1527
FOR THE YEAR ENDED 31 DECEMBER 2019
23. FINANCIAL HIGHLIGHTS (CONTINUED)
Neuberger Berman Emerging Market Debt – Hard Currency Fund (continued)
EUR I Distributing
Class
EUR I2 Accumulating
Class*
EUR I2 Distributing
Class*
EUR I3 Accumulating
Class
EUR I3 Accumulating
Unhedged Class*
EUR I3 Distributing
Class* € € € € € €
31 December 2019 Beginning net asset value 8.93 10.00 10.00 10.01 10.00 10.00
Income from operations: Net investment income/(loss)+ 0.42 0.02 0.07 0.52 0.15 0.38Net realised and unrealised gain/(loss) on trading activities+ 0.62 0.01 0.10 0.70 (0.15) 0.24
Total from operations 1.04 0.03 0.17 1.22 0.00 0.62
Distributions (0.44) – – – – (0.27)
Ending net asset value 9.53 10.03 10.17 11.23 10.00 10.35
Total return 11.87% 0.30% 1.70% 12.19% 0.00% 6.28%
Ratios to average net assets Expenses++ 0.85% 0.71% 0.72% 0.64% 0.65% 0.64%
Net investment income/(loss) 4.54% 4.41% 4.49% 4.79% 4.62% 4.70%
31 December 2018 Beginning net asset value 10.23 – – 10.94 – –
Income from operations: Net investment income/(loss)+ 0.43 – – 0.50 – –Net realised and unrealised gain/(loss) on trading activities+ (1.29) – – (1.43) – –
Total from operations (0.86) – – (0.93) – –
Distributions (0.44) – – – – –
Ending net asset value 8.93 – – 10.01 – –
Total return (8.66%) – – (8.50%) – –
Ratios to average net assets Expenses++ 0.91% – – 0.69% – –
Net investment income/(loss) 4.61% – – 4.77% – –
* Share class launched during the current reporting year.

FINANCIAL STATEMENTS NOTES TO THE AUDITED FINANCIAL STATEMENTS
1528 NEUBERGER BERMAN INVESTMENT FUNDS PLC
FOR THE YEAR ENDED 31 DECEMBER 2019
23. FINANCIAL HIGHLIGHTS (CONTINUED)
Neuberger Berman Emerging Market Debt – Hard Currency Fund (continued)
EUR I4 Accumulating
Class
EUR M Accumulating
Class
EUR M Distributing
Class
EUR P Accumulating
Class
EUR Z Accumulating
Class
GBP I Accumulating
Class € € € € € £
31 December 2019 Beginning net asset value 11.28 10.88 9.32 9.11 9.20 10.53
Income from operations: Net investment income/(loss)+ 0.59 0.35 0.29 0.45 0.52 0.50Net realised and unrealised gain/(loss) on trading activities+ 0.78 0.75 0.64 0.64 0.64 0.90
Total from operations 1.37 1.10 0.93 1.09 1.16 1.40
Distributions – – (0.53) – – –
Ending net asset value 12.65 11.98 9.72 10.20 10.36 11.93
Total return 12.15% 10.11% 10.21% 11.96% 12.61% 13.30%
Ratios to average net assets Expenses++ 0.57% 2.37% 2.37% 0.82% 0.16% 0.82%
Net investment income/(loss) 4.85% 3.01% 3.04% 4.56% 5.25% 4.35%
31 December 2018 Beginning net asset value 12.31 12.09 10.94 10.00 10.00 11.40
Income from operations: Net investment income/(loss)+ 0.57 0.34 0.30 0.43 0.51 0.51Net realised and unrealised gain/(loss) on trading activities+ (1.60) (1.55) (1.36) (1.32) (1.31) (1.38)
Total from operations (1.03) (1.21) (1.06) (0.89) (0.80) (0.87)
Distributions – – (0.56) – – –
Ending net asset value 11.28 10.88 9.32 9.11 9.20 10.53
Total return (8.37%) (10.01%) (10.05%) (8.90%) (8.00%) (7.63%)
Ratios to average net assets Expenses++ 0.62% 2.48% 2.48% 0.89% 0.19% 0.92%
Net investment income/(loss) 4.85% 2.99% 3.00% 4.99% 5.43% 4.79%

NOTES TO THE AUDITED FINANCIAL STATEMENTS FINANCIAL STATEMENTS
ANNUAL REPORT 2019 1529
FOR THE YEAR ENDED 31 DECEMBER 2019
23. FINANCIAL HIGHLIGHTS (CONTINUED)
Neuberger Berman Emerging Market Debt – Hard Currency Fund (continued)
GBP I Distributing
Class
GBP I2 Accumulating
Class
GBP I2 Distributing
Class
GBP P Accumulating
Class
HKD A (Monthly)
Distributing Class*
JPY I Accumulating
Class £ £ £ £ HKD ¥
31 December 2019 Beginning net asset value 9.17 9.20 9.53 9.42 10.00 923.34
Income from operations: Net investment income/(loss)+ 0.42 0.45 0.45 0.54 0.39 45.37Net realised and unrealised gain/(loss) on trading activities+ 0.76 0.79 0.80 0.72 0.79 66.03
Total from operations 1.18 1.24 1.25 1.26 1.18 111.40
Distributions (0.45) – (0.48) – (0.47) –
Ending net asset value 9.90 10.44 10.30 10.68 10.71 1,034.74
Total return 13.15% 13.48% 13.43% 13.38% 11.98% 12.06%
Ratios to average net assets Expenses++ 0.82% 0.69% 0.69% 0.78% 1.55% 0.85%
Net investment income/(loss) 4.38% 4.55% 4.49% 4.16% 3.77% 4.55%
31 December 2018 Beginning net asset value 10.00 10.00 10.79 10.00 – 1,007.16
Income from operations: Net investment income/(loss)+ 0.39 0.43 0.47 0.38 – 42.07Net realised and unrealised gain/(loss) on trading activities+ (0.95) (1.23) (1.25) (0.96) – (125.89)
Total from operations (0.56) (0.80) (0.78) (0.58) – (83.82)
Distributions (0.27) – (0.48) – – –
Ending net asset value 9.17 9.20 9.53 9.42 – 923.34
Total return (5.65%) (8.00%) (7.46%) (5.80%) – (8.32%)
Ratios to average net assets Expenses++ 0.92% 0.77% 0.77% 0.85% – 0.87%
Net investment income/(loss) 4.96% 4.90% 4.54% 4.98% – 4.39%
* Share class launched during the current reporting year.

FINANCIAL STATEMENTS NOTES TO THE AUDITED FINANCIAL STATEMENTS
1530 NEUBERGER BERMAN INVESTMENT FUNDS PLC
FOR THE YEAR ENDED 31 DECEMBER 2019
23. FINANCIAL HIGHLIGHTS (CONTINUED)
Neuberger Berman Emerging Market Debt – Hard Currency Fund (continued)
SEK A Accumulating
Class
SGD A(Monthly)
Distributing Class
USD A(Monthly)
Distributing Class
USD A Accumulating
Class
USD C1 Accumulating
Class
USD I Accumulating
Class SEK SGD US$ US$ US$ US$
31 December 2019 Beginning net asset value 107.28 18.90 9.18 12.14 9.49 12.62
Income from operations: Net investment income/(loss)+ 4.41 0.76 0.38 0.51 0.29 0.63Net realised and unrealised gain/(loss) on trading activities+ 7.78 1.77 0.92 1.24 0.97 1.30
Total from operations 12.19 2.53 1.30 1.75 1.26 1.93
Distributions – (1.00) (0.49) – – –
Ending net asset value 119.47 20.43 9.99 13.89 10.75 14.55
Total return 11.36% 13.64% 14.40% 14.42% 13.28% 15.29%
Ratios to average net assets Expenses++ 1.54% 1.53% 1.56% 1.56% 2.58% 0.86%
Net investment income/(loss) 3.83% 3.80% 3.85% 3.85% 2.82% 4.51%
31 December 2018 Beginning net asset value 118.40 21.47 10.33 13.00 10.26 13.42
Income from operations: Net investment income/(loss)+ 4.36 0.75 0.36 0.47 0.27 0.57Net realised and unrealised gain/(loss) on trading activities+ (15.48) (2.31) (1.02) (1.33) (1.04) (1.37)
Total from operations (11.12) (1.56) (0.66) (0.86) (0.77) (0.80)
Distributions – (1.01) (0.49) – – –
Ending net asset value 107.28 18.90 9.18 12.14 9.49 12.62
Total return (9.39%) (7.44%) (6.56%) (6.62%) (7.50%) (5.96%)
Ratios to average net assets Expenses++ 1.61% 1.59% 1.58% 1.58% 2.60% 0.88%
Net investment income/(loss) 4.12% 3.78% 3.76% 3.78% 2.78% 4.44%

NOTES TO THE AUDITED FINANCIAL STATEMENTS FINANCIAL STATEMENTS
ANNUAL REPORT 2019 1531
FOR THE YEAR ENDED 31 DECEMBER 2019
23. FINANCIAL HIGHLIGHTS (CONTINUED)
Neuberger Berman Emerging Market Debt – Hard Currency Fund (continued)
USD I Distributing
Class
USD I2 Accumulating
Class
USD I2 Distributing
Class
USD I3 Distributing
Class*
USD M Accumulating
Class
USD M Distributing
Class US$ US$ US$ US$ US$ US$
31 December 2019 Beginning net asset value 9.69 10.89 9.40 10.00 9.49 8.85
Income from operations: Net investment income/(loss)+ 0.47 0.56 0.47 0.38 0.31 0.28Net realised and unrealised gain/(loss) on trading activities+ 0.98 1.12 0.94 0.40 0.98 0.88
Total from operations 1.45 1.68 1.41 0.78 1.29 1.16
Distributions (0.48) – (0.48) (0.26) – (0.51)
Ending net asset value 10.66 12.57 10.33 10.52 10.78 9.50
Total return 15.26% 15.43% 15.30% 7.88% 13.59% 13.46%
Ratios to average net assets Expenses++ 0.86% 0.72% 0.72% 0.64% 2.38% 2.38%
Net investment income/(loss) 4.54% 4.71% 4.69% 4.67% 3.01% 3.01%
31 December 2018 Beginning net asset value 10.78 11.57 10.00 – 10.25 10.09
Income from operations: Net investment income/(loss)+ 0.45 0.52 0.33 – 0.29 0.27Net realised and unrealised gain/(loss) on trading activities+ (1.08) (1.20) (0.72) – (1.05) (1.00)
Total from operations (0.63) (0.68) (0.39) – (0.76) (0.73)
Distributions (0.46) – (0.21) – – (0.51)
Ending net asset value 9.69 10.89 9.40 – 9.49 8.85
Total return (5.99%) (5.88%) (3.95%) – (7.41%) (7.43%)
Ratios to average net assets Expenses++ 0.88% 0.74% 0.74% – 2.40% 2.41%
Net investment income/(loss) 4.43% 4.75% 4.88% – 2.94% 2.93%
* Share class launched during the current reporting year.

FINANCIAL STATEMENTS NOTES TO THE AUDITED FINANCIAL STATEMENTS
1532 NEUBERGER BERMAN INVESTMENT FUNDS PLC
FOR THE YEAR ENDED 31 DECEMBER 2019
23. FINANCIAL HIGHLIGHTS (CONTINUED)
Neuberger Berman Emerging Market Debt – Hard Currency Fund (continued)
USD P Accumulating
Class
USD Z Accumulating
Class US$ US$
31 December 2019 Beginning net asset value 9.37 10.21
Income from operations: Net investment income/(loss)+ 0.47 0.59Net realised and unrealised gain/(loss) on trading activities+ 0.96 1.05
Total from operations 1.43 1.64
Ending net asset value 10.80 11.85
Total return 15.26% 16.06%
Ratios to average net assets Expenses++ 0.82% 0.16%
Net investment income/(loss) 4.62% 5.34%
31 December 2018 Beginning net asset value 10.00 10.78
Income from operations: Net investment income/(loss)+ 0.43 0.55Net realised and unrealised gain/(loss) on trading activities+ (1.06) (1.12)
Total from operations (0.63) (0.57)
Ending net asset value 9.37 10.21
Total return (6.30%) (5.29%)
Ratios to average net assets Expenses++ 0.84% 0.18%
Net investment income/(loss) 4.69% 5.28%

NOTES TO THE AUDITED FINANCIAL STATEMENTS FINANCIAL STATEMENTS
ANNUAL REPORT 2019 1533
FOR THE YEAR ENDED 31 DECEMBER 2019
23. FINANCIAL HIGHLIGHTS (CONTINUED)
Neuberger Berman Emerging Market Corporate Debt Fund
CHF A Accumulating
Class
CHF I Accumulating
Class
CHF I2 Accumulating
Class
CHF I4 Accumulating
Class*
CHF I5 Accumulating
Class
EUR A Accumulating
Class CHF CHF CHF CHF CHF €
31 December 2019 Beginning net asset value 10.93 11.50 10.41 10.00 10.58 10.64
Income from operations: Net investment income/(loss)+ 0.40 0.51 0.48 0.07 0.52 0.40Net realised and unrealised gain/(loss) on trading activities+ 0.53 0.57 0.51 0.03 0.52 0.56
Total from operations 0.93 1.08 0.99 0.10 1.04 0.96
Ending net asset value 11.86 12.58 11.40 10.10 11.62 11.60
Total return 8.51% 9.39% 9.51% 1.00% 9.83% 9.02%
Ratios to average net assets Expenses++ 1.76% 0.98% 0.83% 0.64% 0.59% 1.80%
Net investment income/(loss) 3.45% 4.20% 4.37% 4.26% 4.64% 3.51%
31 December 2018 Beginning net asset value 11.78 12.30 11.11 – 11.27 11.42
Income from operations: Net investment income/(loss)+ 0.43 0.55 0.51 – 0.55 0.43Net realised and unrealised gain/(loss) on trading activities+ (1.28) (1.35) (1.21) – (1.24) (1.21)
Total from operations (0.85) (0.80) (0.70) – (0.69) (0.78)
Distributions – – – – – –
Ending net asset value 10.93 11.50 10.41 – 10.58 10.64
Total return (7.22%) (6.50%) (6.30%) – (6.12%) (6.83%)
Ratios to average net assets Expenses++ 1.83% 1.03% 0.87% – 0.62% 1.88%
Net investment income/(loss) 3.82% 4.66% 4.83% – 5.05% 3.93%
* Share class launched during the current reporting year.

FINANCIAL STATEMENTS NOTES TO THE AUDITED FINANCIAL STATEMENTS
1534 NEUBERGER BERMAN INVESTMENT FUNDS PLC
FOR THE YEAR ENDED 31 DECEMBER 2019
23. FINANCIAL HIGHLIGHTS (CONTINUED)
Neuberger Berman Emerging Market Corporate Debt Fund (continued)
EUR I Accumulating
Class
EUR I Distributing
Class
EUR I2 Accumulating
Class
EUR I3 Accumulating
Class
EUR I5 Accumulating
Class
EUR M Accumulating
Class € € € € € €
31 December 2019 Beginning net asset value 11.83 8.95 10.66 9.97 10.91 10.50
Income from operations: Net investment income/(loss)+ 0.54 0.40 0.51 0.49 0.55 0.30Net realised and unrealised gain/(loss) on trading activities+ 0.63 0.46 0.55 0.53 0.57 0.55
Total from operations 1.17 0.86 1.06 1.02 1.12 0.85
Distributions – (0.42) – – – –
Ending net asset value 13.00 9.39 11.72 10.99 12.03 11.35
Total return 9.89% 9.87% 9.94% 10.23% 10.27% 8.10%
Ratios to average net assets Expenses++ 1.00% 1.00% 0.85% 0.69% 0.61% 2.60%
Net investment income/(loss) 4.25% 4.29% 4.47% 4.63% 4.78% 2.71%
31 December 2018 Beginning net asset value 12.60 9.99 11.34 10.59 11.57 11.37
Income from operations: Net investment income/(loss)+ 0.58 0.45 0.53 0.52 0.58 0.34Net realised and unrealised gain/(loss) on trading activities+ (1.35) (1.05) (1.21) (1.14) (1.24) (1.21)
Total from operations (0.77) (0.60) (0.68) (0.62) (0.66) (0.87)
Distributions – (0.44) – – – –
Ending net asset value 11.83 8.95 10.66 9.97 10.91 10.50
Total return (6.11%) (6.19%) (6.00%) (5.85%) (5.70%) (7.65%)
Ratios to average net assets Expenses++ 1.05% 1.05% 0.89% 0.72% 0.64% 2.71%
Net investment income/(loss) 4.76% 4.68% 4.84% 5.11% 5.16% 3.13%

NOTES TO THE AUDITED FINANCIAL STATEMENTS FINANCIAL STATEMENTS
ANNUAL REPORT 2019 1535
FOR THE YEAR ENDED 31 DECEMBER 2019
23. FINANCIAL HIGHLIGHTS (CONTINUED)
Neuberger Berman Emerging Market Corporate Debt Fund (continued)
EUR M Distributing
Class
EUR X Accumulating
Class
GBP I Accumulating
Class
GBP I5 Accumulating
Class
SEK A Accumulating
Class
SGD A(Monthly)
Distributing Class
€ € £ £ SEK SGD
31 December 2019 Beginning net asset value 9.07 10.55 12.31 11.23 92.67 17.77
Income from operations: Net investment income/(loss)+ 0.25 0.53 0.55 0.55 3.36 0.64Net realised and unrealised gain/(loss) on trading activities+ 0.47 0.56 0.83 0.76 5.22 1.36
Total from operations 0.72 1.09 1.38 1.31 8.58 2.00
Distributions (0.52) – – – – (0.92)
Ending net asset value 9.27 11.64 13.69 12.54 101.25 18.85
Total return 8.15% 10.33% 11.21% 11.67% 9.26% 11.52%
Ratios to average net assets Expenses++ 2.60% 0.59% 0.97% 0.59% 1.79% 1.78%
Net investment income/(loss) 2.72% 4.73% 4.13% 4.61% 3.43% 3.44%
31 December 2018 Beginning net asset value 10.39 11.19 12.95 11.78 100.00 19.66
Income from operations: Net investment income/(loss)+ 0.30 0.56 0.60 0.60 3.34 0.72Net realised and unrealised gain/(loss) on trading activities+ (1.07) (1.20) (1.24) (1.15) (10.67) (1.68)
Total from operations (0.77) (0.64) (0.64) (0.55) (7.33) (0.96)
Distributions (0.55) – – – – (0.93)
Ending net asset value 9.07 10.55 12.31 11.23 92.67 17.77
Total return (7.63%) (5.72%) (4.94%) (4.67%) (7.33%) (4.97%)
Ratios to average net assets Expenses++ 2.70% 0.62% 1.07% 0.65% 1.86% 1.84%
Net investment income/(loss) 3.11% 5.19% 4.95% 5.23% 3.97% 3.88%

FINANCIAL STATEMENTS NOTES TO THE AUDITED FINANCIAL STATEMENTS
1536 NEUBERGER BERMAN INVESTMENT FUNDS PLC
FOR THE YEAR ENDED 31 DECEMBER 2019
23. FINANCIAL HIGHLIGHTS (CONTINUED)
Neuberger Berman Emerging Market Corporate Debt Fund (continued)
USD A (Monthly)
Distributing Class
USD A Accumulating
Class
USD C1 Accumulating
Class
USD I Accumulating
Class
USD I Distributing
Class
USD I2 Accumulating
Class US$ US$ US$ US$ US$ US$
31 December 2019 Beginning net asset value 8.84 12.11 9.60 12.65 9.93 11.36
Income from operations: Net investment income/(loss)+ 0.33 0.46 0.25 0.59 0.45 0.55Net realised and unrealised gain/(loss) on trading activities+ 0.73 1.02 0.82 1.07 0.83 0.97
Total from operations 1.06 1.48 1.07 1.66 1.28 1.52
Distributions (0.46) – – – (0.47) –
Ending net asset value 9.44 13.59 10.67 14.31 10.74 12.88
Total return 12.26% 12.22% 11.15% 13.12% 13.21% 13.38%
Ratios to average net assets Expenses++ 1.81% 1.81% 2.81% 1.01% 1.01% 0.85%
Net investment income/(loss) 3.52% 3.47% 2.46% 4.30% 4.32% 4.47%
31 December 2018 Beginning net asset value 9.70 12.64 10.12 13.09 10.76 11.75
Income from operations: Net investment income/(loss)+ 0.35 0.47 0.28 0.58 0.48 0.55Net realised and unrealised gain/(loss) on trading activities+ (0.75) (1.00) (0.80) (1.02) (0.84) (0.94)
Total from operations (0.40) (0.53) (0.52) (0.44) (0.36) (0.39)
Distributions (0.46) – – – (0.47) –
Ending net asset value 8.84 12.11 9.60 12.65 9.93 11.36
Total return (4.18%) (4.19%) (5.14%) (3.36%) (3.41%) (3.32%)
Ratios to average net assets Expenses++ 1.82% 1.82% 2.82% 1.02% 1.02% 0.86%
Net investment income/(loss) 3.78% 3.84% 2.83% 4.57% 4.68% 4.77%
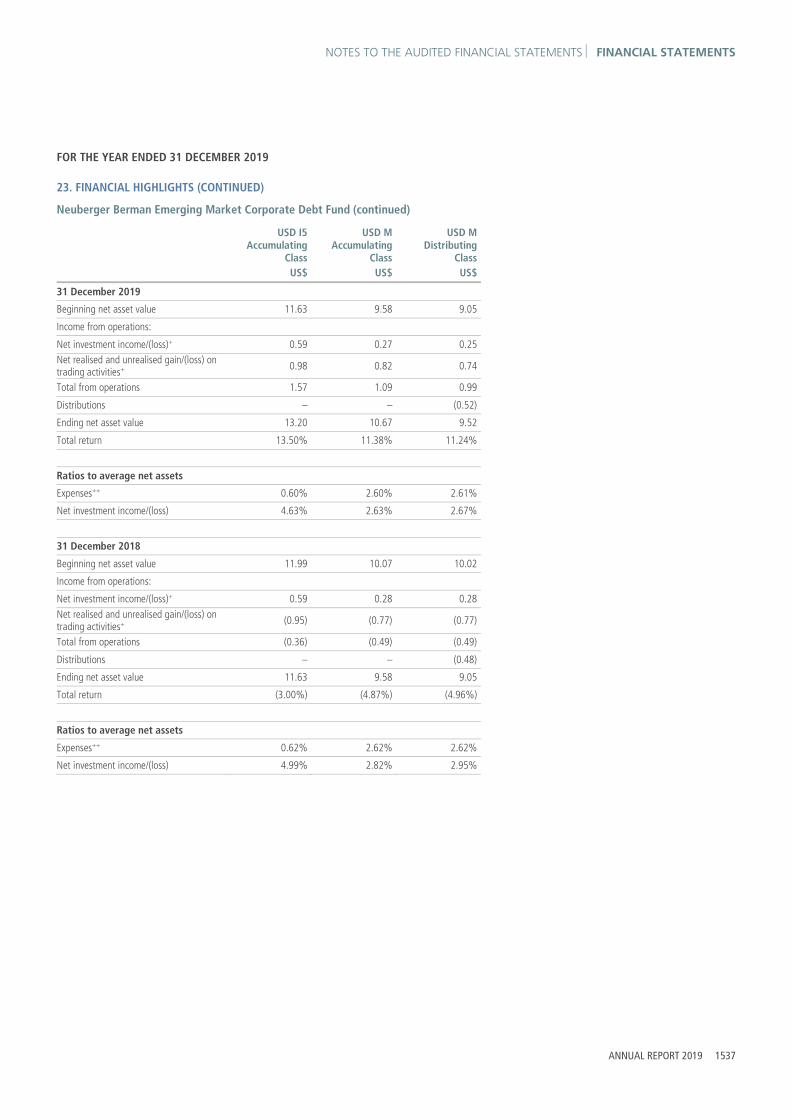
NOTES TO THE AUDITED FINANCIAL STATEMENTS FINANCIAL STATEMENTS
ANNUAL REPORT 2019 1537
FOR THE YEAR ENDED 31 DECEMBER 2019
23. FINANCIAL HIGHLIGHTS (CONTINUED)
Neuberger Berman Emerging Market Corporate Debt Fund (continued)
USD I5 Accumulating
Class
USD M Accumulating
Class
USD M Distributing
Class US$ US$ US$
31 December 2019 Beginning net asset value 11.63 9.58 9.05
Income from operations: Net investment income/(loss)+ 0.59 0.27 0.25Net realised and unrealised gain/(loss) on trading activities+ 0.98 0.82 0.74
Total from operations 1.57 1.09 0.99
Distributions – – (0.52)
Ending net asset value 13.20 10.67 9.52
Total return 13.50% 11.38% 11.24%
Ratios to average net assets Expenses++ 0.60% 2.60% 2.61%
Net investment income/(loss) 4.63% 2.63% 2.67%
31 December 2018 Beginning net asset value 11.99 10.07 10.02
Income from operations: Net investment income/(loss)+ 0.59 0.28 0.28Net realised and unrealised gain/(loss) on trading activities+ (0.95) (0.77) (0.77)
Total from operations (0.36) (0.49) (0.49)
Distributions – – (0.48)
Ending net asset value 11.63 9.58 9.05
Total return (3.00%) (4.87%) (4.96%)
Ratios to average net assets Expenses++ 0.62% 2.62% 2.62%
Net investment income/(loss) 4.99% 2.82% 2.95%

FINANCIAL STATEMENTS NOTES TO THE AUDITED FINANCIAL STATEMENTS
1538 NEUBERGER BERMAN INVESTMENT FUNDS PLC
FOR THE YEAR ENDED 31 DECEMBER 2019
23. FINANCIAL HIGHLIGHTS (CONTINUED)
Neuberger Berman Strategic Income Fund
AUD A (Monthly)
Distributing Class
AUD Z (Monthly)
Distributing Class*
EUR A (Monthly)
Distributing Class
EUR A Accumulating
Class
EUR I Accumulating
Class
EUR M Accumulating
Class AUD AUD € € € €
31 December 2019 Beginning net asset value 9.21 10.00 8.98 10.39 10.56 10.18
Income from operations: Net investment income/(loss)+ 0.28 0.18 0.27 0.32 0.38 0.24Net realised and unrealised gain/(loss) on trading activities+ 0.49 0.05 0.28 0.32 0.33 0.33
Total from operations 0.77 0.23 0.55 0.64 0.71 0.57
Distributions (0.38) (0.17) (0.37) – – –
Ending net asset value 9.60 10.06 9.16 11.03 11.27 10.75
Total return 8.49% 2.29% 6.17% 6.16% 6.72% 5.60%
Ratios to average net assets Expenses++ 1.17% 0.17% 1.18% 1.18% 0.68% 1.80%
Net investment income/(loss) 2.92% 3.73% 2.95% 2.98% 3.46% 2.24%
31 December 2018 Beginning net asset value 9.95 – 9.91 11.02 11.14 10.86
Income from operations: Net investment income/(loss)+ 0.30 – 0.30 0.34 0.39 0.26Net realised and unrealised gain/(loss) on trading activities+ (0.60) – (0.85) (0.97) (0.97) (0.94)
Total from operations (0.30) – (0.55) (0.63) (0.58) (0.68)
Distributions (0.44) – (0.38) – – –
Ending net asset value 9.21 – 8.98 10.39 10.56 10.18
Total return (3.15%) – (5.68%) (5.72%) (5.21%) (6.26%)
Ratios to average net assets Expenses++ 1.29% – 1.26% 1.26% 0.74% 1.88%
Net investment income/(loss) 3.18% – 3.20% 3.29% 3.62% 2.53%
* Share class launched during the current reporting year.

NOTES TO THE AUDITED FINANCIAL STATEMENTS FINANCIAL STATEMENTS
ANNUAL REPORT 2019 1539
FOR THE YEAR ENDED 31 DECEMBER 2019
23. FINANCIAL HIGHLIGHTS (CONTINUED)
Neuberger Berman Strategic Income Fund (continued)
EUR M Distributing
Class
GBP A(Monthly)
Distributing Class
GBP I Accumulating
Class*
HKD A (Monthly)
Distributing Class
JPY I Accumulating
Class
JPY I Accumulating
Unhedged Class
€ £ £ HKD ¥ ¥
31 December 2019 Beginning net asset value 9.33 9.10 10.00 9.21 1,048.57 1,256.17
Income from operations: Net investment income/(loss)+ 0.22 0.27 0.19 0.28 38.11 46.27Net realised and unrealised gain/(loss) on trading activities+ 0.29 0.41 0.16 0.51 34.56 67.01
Total from operations 0.51 0.68 0.35 0.79 72.67 113.28
Distributions (0.42) (0.37) – (0.38) – –
Ending net asset value 9.42 9.41 10.35 9.62 1,121.24 1,369.45
Total return 5.51% 7.63% 3.50% 8.72% 6.93% 9.02%
Ratios to average net assets Expenses++ 1.81% 1.14% 0.64% 1.18% 0.68% 0.69%
Net investment income/(loss) 2.36% 2.85% 3.23% 3.00% 3.47% 3.49%
31 December 2018 Beginning net asset value 10.38 9.93 – 9.95 1,103.20 1,323.43
Income from operations: Net investment income/(loss)+ 0.24 0.30 – 0.28 38.09 45.03Net realised and unrealised gain/(loss) on trading activities+ (0.88) (0.75) – (0.64) (92.72) (112.29)
Total from operations (0.64) (0.45) – (0.36) (54.63) (67.26)
Distributions (0.41) (0.38) – (0.38) – –
Ending net asset value 9.33 9.10 – 9.21 1,048.57 1,256.17
Total return (6.29%) (4.61%) – (3.65%) (4.95%) (5.08%)
Ratios to average net assets Expenses++ 1.88% 1.28% – 1.21% 0.71% 0.71%
Net investment income/(loss) 2.42% 3.23% – 2.96% 3.54% 3.52%
* Share class launched during the current reporting year.

FINANCIAL STATEMENTS NOTES TO THE AUDITED FINANCIAL STATEMENTS
1540 NEUBERGER BERMAN INVESTMENT FUNDS PLC
FOR THE YEAR ENDED 31 DECEMBER 2019
23. FINANCIAL HIGHLIGHTS (CONTINUED)
Neuberger Berman Strategic Income Fund (continued)
JPY I CG Distributing
Class
JPY I Distributing
Class
SGD A(Monthly)
Distributing Class
SGD A Accumulating
Class
SGD I (Monthly)
Distributing Class
USD A(Monthly)
Distributing Class
¥ ¥ SGD SGD SGD US$
31 December 2019 Beginning net asset value 950.47 902.76 17.76 19.32 19.36 8.88
Income from operations: Net investment income/(loss)+ 34.49 32.09 0.54 0.60 0.69 0.27Net realised and unrealised gain/(loss) on trading activities+ 31.34 29.47 0.97 1.07 1.07 0.56
Total from operations 65.83 61.56 1.51 1.67 1.76 0.83
Distributions (3.53) (33.21) (0.73) – (0.80) (0.37)
Ending net asset value 1,012.77 931.11 18.54 20.99 20.32 9.34
Total return 6.93% 6.93% 8.66% 8.64% 9.25% 9.48%
Ratios to average net assets Expenses++ 0.68% 0.68% 1.17% 1.17% 0.68% 1.19%
Net investment income/(loss) 3.47% 3.47% 2.94% 2.93% 3.44% 2.95%
31 December 2018 Beginning net asset value 1,012.54 982.68 19.24 20.10 20.00 9.53
Income from operations: Net investment income/(loss)+ 35.10 31.74 0.57 0.60 0.42 0.27Net realised and unrealised gain/(loss) on trading activities+ (84.63) (79.37) (1.31) (1.38) (0.73) (0.55)
Total from operations (49.53) (47.63) (0.74) (0.78) (0.31) (0.28)
Distributions (12.54) (32.29) (0.74) – (0.33) (0.37)
Ending net asset value 950.47 902.76 17.76 19.32 19.36 8.88
Total return (4.95%) (4.96%) (3.92%) (3.88%) (1.56%) (3.01%)
Ratios to average net assets Expenses++ 0.72% 0.71% 1.23% 1.23% 0.74% 1.21%
Net investment income/(loss) 3.58% 3.37% 3.07% 3.05% 3.75% 2.95%

NOTES TO THE AUDITED FINANCIAL STATEMENTS FINANCIAL STATEMENTS
ANNUAL REPORT 2019 1541
FOR THE YEAR ENDED 31 DECEMBER 2019
23. FINANCIAL HIGHLIGHTS (CONTINUED)
Neuberger Berman Strategic Income Fund (continued)
USD A Accumulating
Class
USD A Distributing
Class
USD C1 Accumulating
Class
USD I Accumulating
Class
USD I Distributing
Class
USD I2 Accumulating
Class US$ US$ US$ US$ US$ US$
31 December 2019 Beginning net asset value 10.58 9.75 9.68 11.19 9.80 9.88
Income from operations: Net investment income/(loss)+ 0.33 0.29 0.19 0.41 0.35 0.38Net realised and unrealised gain/(loss) on trading activities+ 0.67 0.63 0.62 0.72 0.62 0.62
Total from operations 1.00 0.92 0.81 1.13 0.97 1.00
Distributions – (0.31) – – (0.37) –
Ending net asset value 11.58 10.36 10.49 12.32 10.40 10.88
Total return 9.45% 9.59% 8.37% 10.10% 10.03% 10.12%
Ratios to average net assets Expenses++ 1.18% 1.18% 2.21% 0.69% 0.69% 0.55%
Net investment income/(loss) 2.89% 2.79% 1.89% 3.47% 3.46% 3.59%
31 December 2018 Beginning net asset value 10.91 10.31 10.08 11.48 10.40 10.00
Income from operations: Net investment income/(loss)+ 0.32 0.31 0.20 0.39 0.27 0.30Net realised and unrealised gain/(loss) on trading activities+ (0.65) (0.61) (0.60) (0.68) (0.53) (0.42)
Total from operations (0.33) (0.30) (0.40) (0.29) (0.26) (0.12)
Distributions – (0.26) – – (0.34) –
Ending net asset value 10.58 9.75 9.68 11.19 9.80 9.88
Total return (3.02%) (3.00%) (3.97%) (2.53%) (2.54%) (1.20%)
Ratios to average net assets Expenses++ 1.21% 1.22% 2.22% 0.71% 0.72% 0.57%
Net investment income/(loss) 2.98% 3.07% 2.02% 3.44% 2.68% 3.82%

FINANCIAL STATEMENTS NOTES TO THE AUDITED FINANCIAL STATEMENTS
1542 NEUBERGER BERMAN INVESTMENT FUNDS PLC
FOR THE YEAR ENDED 31 DECEMBER 2019
23. FINANCIAL HIGHLIGHTS (CONTINUED)
Neuberger Berman Strategic Income Fund (continued)
USD M Accumulating
Class
USD M Distributing
Class
USD Z Accumulating
Class US$ US$ US$
31 December 2019 Beginning net asset value 10.83 9.30 11.07
Income from operations: Net investment income/(loss)+ 0.26 0.22 0.47Net realised and unrealised gain/(loss) on trading activities+ 0.69 0.59 0.71
Total from operations 0.95 0.81 1.18
Distributions – (0.42) –
Ending net asset value 11.78 9.69 12.25
Total return 8.77% 8.84% 10.66%
Ratios to average net assets Expenses++ 1.80% 1.81% 0.19%
Net investment income/(loss) 2.27% 2.31% 3.99%
31 December 2018 Beginning net asset value 11.23 10.06 11.31
Income from operations: Net investment income/(loss)+ 0.27 0.23 0.45Net realised and unrealised gain/(loss) on trading activities+ (0.67) (0.59) (0.69)
Total from operations (0.40) (0.36) (0.24)
Distributions – (0.40) –
Ending net asset value 10.83 9.30 11.07
Total return (3.56%) (3.65%) (2.12%)
Ratios to average net assets Expenses++ 1.82% 1.82% 0.22%
Net investment income/(loss) 2.42% 2.34% 4.03%

NOTES TO THE AUDITED FINANCIAL STATEMENTS FINANCIAL STATEMENTS
ANNUAL REPORT 2019 1543
FOR THE YEAR ENDED 31 DECEMBER 2019
23. FINANCIAL HIGHLIGHTS (CONTINUED)
Neuberger Berman Global Bond Absolute Return Fund
EUR I Accumulating
Class
EUR I4 Distributing
Class
EUR M Accumulating
Class
GBP I4 Accumulating
Class
GBP I5 Accumulating
Class
GBP I5 Distributing
Class € € € £ £ £
31 December 2019 Beginning net asset value 9.80 9.28 9.92 10.11 10.02 8.79
Income from operations: Net investment income/(loss)+ 0.30 0.39 0.28 0.41 0.40 0.36Net realised and unrealised gain/(loss) on trading activities+ (0.23) (0.30) (0.32) (0.18) (0.17) (0.16)
Total from operations 0.07 0.09 (0.04) 0.23 0.23 0.20
Distributions – (0.29) – – – (0.28)
Ending net asset value 9.87 9.08 9.88 10.34 10.25 8.71
Total return 0.71% 0.98% (0.40%) 2.27% 2.30% 2.29%
Ratios to average net assets Expenses++ 0.72% 0.55% 1.84% 0.48% 0.48% 0.48%
Net investment income/(loss) 3.19% 4.16% 2.82% 3.97% 3.99% 4.09%
31 December 2018 Beginning net asset value 10.38 10.09 10.62 10.57 10.47 9.46
Income from operations: Net investment income/(loss)+ 0.38 0.37 0.26 0.40 0.40 0.21Net realised and unrealised gain/(loss) on trading activities+ (0.96) (0.91) (0.96) (0.86) (0.85) (0.61)
Total from operations (0.58) (0.54) (0.70) (0.46) (0.45) (0.40)
Distributions – (0.27) – – – (0.27)
Ending net asset value 9.80 9.28 9.92 10.11 10.02 8.79
Total return (5.59%) (5.44%) (6.59%) (4.35%) (4.30%) (4.39%)
Ratios to average net assets Expenses++ 0.79% 0.57% 1.91% 0.53% 0.53% 0.53%
Net investment income/(loss) 3.78% 3.80% 2.53% 3.80% 3.82% 2.21%

FINANCIAL STATEMENTS NOTES TO THE AUDITED FINANCIAL STATEMENTS
1544 NEUBERGER BERMAN INVESTMENT FUNDS PLC
FOR THE YEAR ENDED 31 DECEMBER 2019
23. FINANCIAL HIGHLIGHTS (CONTINUED)
Neuberger Berman Global Bond Absolute Return Fund (continued)
GBP Z Accumulating
Class
JPY I Accumulating
Class
SGD A(Monthly)
Distributing Class
USD A (Monthly)
Distributing Class
USD A Accumulating
Class
USD I Accumulating
Class £ ¥ SGD US$ US$ US$
31 December 2019 Beginning net asset value 10.13 982.73 17.15 8.60 9.94 10.59
Income from operations: Net investment income/(loss)+ 0.42 36.94 0.62 0.29 0.26 0.46Net realised and unrealised gain/(loss) on trading activities+ (0.16) (38.60) (0.21) 0.00 0.08 (0.05)
Total from operations 0.26 (1.66) 0.41 0.29 0.34 0.41
Distributions – – (0.51) (0.26) – –
Ending net asset value 10.39 981.07 17.05 8.63 10.28 11.00
Total return 2.57% (0.17%) 2.45% 3.41% 3.42% 3.87%
Ratios to average net assets Expenses++ 0.24% 0.75% 1.25% 1.25% 1.24% 0.75%
Net investment income/(loss) 4.15% 3.72% 3.53% 3.41% 2.61% 4.22%
31 December 2018 Beginning net asset value 10.56 1,037.29 18.56 9.19 10.30 10.90
Income from operations: Net investment income/(loss)+ 0.43 34.68 0.50 0.26 0.28 0.37Net realised and unrealised gain/(loss) on trading activities+ (0.86) (89.24) (1.32) (0.56) (0.64) (0.68)
Total from operations (0.43) (54.56) (0.82) (0.30) (0.36) (0.31)
Distributions – – (0.59) (0.29) – –
Ending net asset value 10.13 982.73 17.15 8.60 9.94 10.59
Total return (4.07%) (5.26%) (4.54%) (3.33%) (3.50%) (2.84%)
Ratios to average net assets Expenses++ 0.26% 0.75% 1.27% 1.25% 1.26% 0.75%
Net investment income/(loss) 4.13% 3.38% 2.73% 2.93% 2.68% 3.43%

NOTES TO THE AUDITED FINANCIAL STATEMENTS FINANCIAL STATEMENTS
ANNUAL REPORT 2019 1545
FOR THE YEAR ENDED 31 DECEMBER 2019
23. FINANCIAL HIGHLIGHTS (CONTINUED)
Neuberger Berman Global Bond Absolute Return Fund (continued)
USD I5 Accumulating
Class
USD Z Accumulating
Class US$ US$
31 December 2019 Beginning net asset value 10.39 10.54
Income from operations: Net investment income/(loss)+ 0.48 0.47Net realised and unrealised gain/(loss) on trading activities+ (0.04) 0.00
Total from operations 0.44 0.47
Ending net asset value 10.83 11.01
Total return 4.23% 4.46%
Ratios to average net assets Expenses++ 0.50% 0.25%
Net investment income/(loss) 4.52% 4.39%
31 December 2018 Beginning net asset value 10.67 10.80
Income from operations: Net investment income/(loss)+ 0.63 0.42Net realised and unrealised gain/(loss) on trading activities+ (0.91) (0.68)
Total from operations (0.28) (0.26)
Ending net asset value 10.39 10.54
Total return (2.62%) (2.41%)
Ratios to average net assets Expenses++ 0.50% 0.25%
Net investment income/(loss) 5.87% 3.93%

FINANCIAL STATEMENTS NOTES TO THE AUDITED FINANCIAL STATEMENTS
1546 NEUBERGER BERMAN INVESTMENT FUNDS PLC
FOR THE YEAR ENDED 31 DECEMBER 2019
23. FINANCIAL HIGHLIGHTS (CONTINUED)
Neuberger Berman Short Duration Emerging Market Debt Fund
AUD A (Monthly)
Distributing Class
AUD A Accumulating
Class
CAD A (Monthly)
Distributing Class
CHF A Accumulating
Class
CHF A Distributing
Class
CHF I Accumulating
Class AUD AUD CAD CHF CHF CHF
31 December 2019 Beginning net asset value 9.47 10.51 9.70 9.91 8.37 10.15
Income from operations: Net investment income/(loss)+ 0.33 0.38 0.34 0.35 0.28 0.41Net realised and unrealised gain/(loss) on trading activities+ 0.23 0.24 0.24 (0.02) (0.01) (0.03)
Total from operations 0.56 0.62 0.58 0.33 0.27 0.38
Distributions (0.34) – (0.35) – (0.31) –
Ending net asset value 9.69 11.13 9.93 10.24 8.33 10.53
Total return 5.97% 5.90% 6.02% 3.33% 3.26% 3.74%
Ratios to average net assets Expenses++ 1.13% 1.12% 1.11% 1.11% 1.11% 0.62%
Net investment income/(loss) 3.46% 3.46% 3.44% 3.40% 3.40% 3.88%
31 December 2018 Beginning net asset value 9.84 10.50 10.08 10.20 8.96 10.39
Income from operations: Net investment income/(loss)+ 0.38 0.41 0.39 0.38 0.32 0.44Net realised and unrealised gain/(loss) on trading activities+ (0.38) (0.40) (0.44) (0.67) (0.57) (0.68)
Total from operations 0.00 0.01 (0.05) (0.29) (0.25) (0.24)
Distributions (0.37) – (0.33) – (0.34) –
Ending net asset value 9.47 10.51 9.70 9.91 8.37 10.15
Total return 0.04% 0.10% (0.46%) (2.84%) (2.90%) (2.31%)
Ratios to average net assets Expenses++ 1.23% 1.23% 1.22% 1.16% 1.16% 0.66%
Net investment income/(loss) 3.95% 3.97% 3.92% 3.75% 3.75% 4.20%

NOTES TO THE AUDITED FINANCIAL STATEMENTS FINANCIAL STATEMENTS
ANNUAL REPORT 2019 1547
FOR THE YEAR ENDED 31 DECEMBER 2019
23. FINANCIAL HIGHLIGHTS (CONTINUED)
Neuberger Berman Short Duration Emerging Market Debt Fund (continued)
CHF I Distributing
Class
CHF I2 Accumulating
Class
CHF I2 Distributing
Class
CHF I5 Accumulating
Class
CHF P Accumulating
Class
CHF P Distributing
Class CHF CHF CHF CHF CHF CHF
31 December 2019 Beginning net asset value 8.40 10.31 9.22 10.44 9.80 9.34
Income from operations: Net investment income/(loss)+ 0.33 0.42 0.37 0.44 0.39 0.37Net realised and unrealised gain/(loss) on trading activities+ (0.02) (0.02) (0.03) (0.01) (0.02) (0.02)
Total from operations 0.31 0.40 0.34 0.43 0.37 0.35
Distributions (0.35) – (0.39) – – (0.37)
Ending net asset value 8.36 10.71 9.17 10.87 10.17 9.32
Total return 3.78% 3.88% 3.81% 4.12% 3.78% 3.81%
Ratios to average net assets Expenses++ 0.62% 0.52% 0.52% 0.38% 0.60% 0.59%
Net investment income/(loss) 3.86% 4.00% 4.00% 4.14% 3.93% 3.95%
31 December 2018 Beginning net asset value 8.99 10.55 9.86 10.67 10.03 9.96
Income from operations: Net investment income/(loss)+ 0.37 0.45 0.41 0.47 0.42 0.41Net realised and unrealised gain/(loss) on trading activities+ (0.58) (0.69) (0.62) (0.70) (0.65) (0.63)
Total from operations (0.21) (0.24) (0.21) (0.23) (0.23) (0.22)
Distributions (0.38) – (0.43) – – (0.40)
Ending net asset value 8.40 10.31 9.22 10.44 9.80 9.34
Total return (2.38%) (2.27%) (2.21%) (2.16%) (2.29%) (2.26%)
Ratios to average net assets Expenses++ 0.66% 0.56% 0.56% 0.41% 0.64% 0.59%
Net investment income/(loss) 4.25% 4.35% 4.36% 4.49% 4.28% 4.32%

FINANCIAL STATEMENTS NOTES TO THE AUDITED FINANCIAL STATEMENTS
1548 NEUBERGER BERMAN INVESTMENT FUNDS PLC
FOR THE YEAR ENDED 31 DECEMBER 2019
23. FINANCIAL HIGHLIGHTS (CONTINUED)
Neuberger Berman Short Duration Emerging Market Debt Fund (continued)
CNY A (Monthly)
Distributing Class
EUR A Accumulating
Class
EUR A Distributing
Class
EUR I Accumulating
Class
EUR I Accumulating
Unhedged Class*
EUR I Distributing
Class CNY € € € € €
31 December 2019 Beginning net asset value 100.61 10.13 8.57 10.37 10.00 8.58
Income from operations: Net investment income/(loss)+ 3.64 0.36 0.30 0.42 0.29 0.34Net realised and unrealised gain/(loss) on trading activities+ 3.59 0.02 0.01 0.02 0.18 0.01
Total from operations 7.23 0.38 0.31 0.44 0.47 0.35
Distributions (4.34) – (0.32) – – (0.36)
Ending net asset value 103.50 10.51 8.56 10.81 10.47 8.57
Total return 7.34% 3.75% 3.66% 4.24% 4.70% 4.18%
Ratios to average net assets Expenses++ 1.12% 1.13% 1.13% 0.64% 0.63% 0.64%
Net investment income/(loss) 3.56% 3.49% 3.50% 3.98% 3.97% 4.00%
31 December 2018 Beginning net asset value 103.59 10.39 9.13 10.59 – 9.15
Income from operations: Net investment income/(loss)+ 3.98 0.39 0.34 0.46 – 0.38Net realised and unrealised gain/(loss) on trading activities+ (2.00) (0.65) (0.56) (0.68) – (0.56)
Total from operations 1.98 (0.26) (0.22) (0.22) – (0.18)
Distributions (4.96) – (0.34) – – (0.39)
Ending net asset value 100.61 10.13 8.57 10.37 – 8.58
Total return 1.98% (2.50%) (2.42%) (2.08%) – (2.02%)
Ratios to average net assets Expenses++ 1.16% 1.19% 1.19% 0.68% – 0.68%
Net investment income/(loss) 3.92% 3.85% 3.84% 4.35% – 4.35%
* Share class launched during the current reporting year.

NOTES TO THE AUDITED FINANCIAL STATEMENTS FINANCIAL STATEMENTS
ANNUAL REPORT 2019 1549
FOR THE YEAR ENDED 31 DECEMBER 2019
23. FINANCIAL HIGHLIGHTS (CONTINUED)
Neuberger Berman Short Duration Emerging Market Debt Fund (continued)
EUR I2 Accumulating
Class
EUR I2 Distributing
Class
EUR I5 Accumulating
Class
EUR M Accumulating
Class
EUR M Distributing
Class
EUR P Accumulating
Class € € € € € €
31 December 2019 Beginning net asset value 10.42 9.29 10.74 10.14 8.86 9.93
Income from operations: Net investment income/(loss)+ 0.44 0.38 0.47 0.30 0.25 0.41Net realised and unrealised gain/(loss) on trading activities+ 0.01 0.01 0.01 0.01 0.02 0.02
Total from operations 0.45 0.39 0.48 0.31 0.27 0.43
Distributions – (0.40) – – (0.43) –
Ending net asset value 10.87 9.28 11.22 10.45 8.70 10.36
Total return 4.32% 4.30% 4.47% 3.06% 3.10% 4.33%
Ratios to average net assets Expenses++ 0.53% 0.54% 0.39% 1.76% 1.76% 0.61%
Net investment income/(loss) 4.08% 4.09% 4.28% 2.87% 2.87% 4.01%
31 December 2018 Beginning net asset value 10.62 9.90 10.93 10.46 9.62 10.13
Income from operations: Net investment income/(loss)+ 0.47 0.42 0.50 0.33 0.29 0.43Net realised and unrealised gain/(loss) on trading activities+ (0.67) (0.60) (0.69) (0.65) (0.58) (0.63)
Total from operations (0.20) (0.18) (0.19) (0.32) (0.29) (0.20)
Distributions – (0.43) – – (0.47) –
Ending net asset value 10.42 9.29 10.74 10.14 8.86 9.93
Total return (1.88%) (1.85%) (1.74%) (3.06%) (3.12%) (1.97%)
Ratios to average net assets Expenses++ 0.57% 0.57% 0.42% 1.84% 1.84% 0.65%
Net investment income/(loss) 4.46% 4.46% 4.60% 3.19% 3.19% 4.39%

FINANCIAL STATEMENTS NOTES TO THE AUDITED FINANCIAL STATEMENTS
1550 NEUBERGER BERMAN INVESTMENT FUNDS PLC
FOR THE YEAR ENDED 31 DECEMBER 2019
23. FINANCIAL HIGHLIGHTS (CONTINUED)
Neuberger Berman Short Duration Emerging Market Debt Fund (continued)
EUR U Accumulating
Class
GBP A Accumulating
Class
GBP I Accumulating
Class
GBP I Distributing
Class
GBP I2 Accumulating
Class
GBP I2 Distributing
Class € £ £ £ £ £
31 December 2019 Beginning net asset value 9.96 10.19 10.28 9.70 10.23 9.52
Income from operations: Net investment income/(loss)+ 0.38 0.35 0.41 0.38 0.42 0.38Net realised and unrealised gain/(loss) on trading activities+ 0.01 0.16 0.16 0.15 0.16 0.16
Total from operations 0.39 0.51 0.57 0.53 0.58 0.54
Distributions – – – (0.41) – (0.41)
Ending net asset value 10.35 10.70 10.85 9.82 10.81 9.65
Total return 3.92% 5.00% 5.54% 5.58% 5.67% 5.82%
Ratios to average net assets Expenses++ 0.88% 1.10% 0.61% 0.61% 0.52% 0.52%
Net investment income/(loss) 3.74% 3.37% 3.85% 3.86% 3.95% 3.94%
31 December 2018 Beginning net asset value 10.00 10.32 10.37 10.00 10.30 10.01
Income from operations: Net investment income/(loss)+ 0.23 0.40 0.45 0.36 0.46 0.43Net realised and unrealised gain/(loss) on trading activities+ (0.27) (0.53) (0.54) (0.40) (0.53) (0.51)
Total from operations (0.04) (0.13) (0.09) (0.04) (0.07) (0.08)
Distributions – – – (0.26) – (0.41)
Ending net asset value 9.96 10.19 10.28 9.70 10.23 9.52
Total return (0.40%) (1.26%) (0.87%) (0.38%) (0.68%) (0.79%)
Ratios to average net assets Expenses++ 0.94% 1.21% 0.69% 0.69% 0.59% 0.58%
Net investment income/(loss) 4.12% 3.90% 4.45% 4.44% 4.53% 4.54%

NOTES TO THE AUDITED FINANCIAL STATEMENTS FINANCIAL STATEMENTS
ANNUAL REPORT 2019 1551
FOR THE YEAR ENDED 31 DECEMBER 2019
23. FINANCIAL HIGHLIGHTS (CONTINUED)
Neuberger Berman Short Duration Emerging Market Debt Fund (continued)
GBP I5 Distributing
Class
GBP P Accumulating
Class*
JPY I Accumulating
Class
JPY I Distributing
Class
SEK A Accumulating
Class
SGD A(Monthly)
Distributing Class
£ £ ¥ ¥ SEK SGD
31 December 2019 Beginning net asset value 8.96 10.00 1,056.75 870.66 97.67 18.99
Income from operations: Net investment income/(loss)+ 0.37 0.16 43.34 34.74 3.45 0.67Net realised and unrealised gain/(loss) on trading activities+ 0.14 0.02 2.99 2.67 0.42 0.48
Total from operations 0.51 0.18 46.33 37.41 3.87 1.15
Distributions (0.40) – – (36.34) – (0.68)
Ending net asset value 9.07 10.18 1,103.08 871.73 101.54 19.46
Total return 5.84% 1.80% 4.38% 4.38% 3.96% 6.13%
Ratios to average net assets Expenses++ 0.37% 0.58% 0.64% 0.64% 1.12% 1.12%
Net investment income/(loss) 4.10% 3.79% 3.99% 3.99% 3.45% 3.45%
31 December 2018 Beginning net asset value 9.44 – 1,074.97 925.39 100.00 19.74
Income from operations: Net investment income/(loss)+ 0.43 – 44.47 37.16 3.36 0.72Net realised and unrealised gain/(loss) on trading activities+ (0.49) – (62.69) (52.58) (5.69) (0.82)
Total from operations (0.06) – (18.22) (15.42) (2.33) (0.10)
Distributions (0.42) – – (39.31) – (0.65)
Ending net asset value 8.96 – 1,056.75 870.66 97.67 18.99
Total return (0.58%) – (1.69%) (1.70%) (2.33%) (0.49%)
Ratios to average net assets Expenses++ 0.42% – 0.65% 0.65% 1.19% 1.17%
Net investment income/(loss) 4.69% – 4.20% 4.22% 3.81% 3.76%
* Share class launched during the current reporting year.

FINANCIAL STATEMENTS NOTES TO THE AUDITED FINANCIAL STATEMENTS
1552 NEUBERGER BERMAN INVESTMENT FUNDS PLC
FOR THE YEAR ENDED 31 DECEMBER 2019
23. FINANCIAL HIGHLIGHTS (CONTINUED)
Neuberger Berman Short Duration Emerging Market Debt Fund (continued)
USD A (Monthly)
Distributing Class
USD A Accumulating
Class
USD A Distributing
Class
USD C1 Accumulating
Class
USD C1 Distributing
Class
USD I Accumulating
Class US$ US$ US$ US$ US$ US$
31 December 2019 Beginning net asset value 9.53 11.10 9.14 9.95 9.65 11.36
Income from operations: Net investment income/(loss)+ 0.34 0.40 0.33 0.25 0.24 0.47Net realised and unrealised gain/(loss) on trading activities+ 0.30 0.36 0.28 0.32 0.31 0.36
Total from operations 0.64 0.76 0.61 0.57 0.55 0.83
Distributions (0.34) – (0.34) – (0.26) –
Ending net asset value 9.83 11.86 9.41 10.52 9.94 12.19
Total return 6.82% 6.85% 6.81% 5.73% 5.78% 7.31%
Ratios to average net assets Expenses++ 1.14% 1.14% 1.14% 2.16% 2.16% 0.64%
Net investment income/(loss) 3.50% 3.49% 3.50% 2.46% 2.47% 3.99%
31 December 2018 Beginning net asset value 9.83 11.07 9.47 10.02 10.00 11.26
Income from operations: Net investment income/(loss)+ 0.36 0.41 0.34 0.27 0.26 0.47Net realised and unrealised gain/(loss) on trading activities+ (0.33) (0.38) (0.31) (0.34) (0.33) (0.37)
Total from operations 0.03 0.03 0.03 (0.07) (0.07) 0.10
Distributions (0.33) – (0.36) – (0.28) –
Ending net asset value 9.53 11.10 9.14 9.95 9.65 11.36
Total return 0.28% 0.27% 0.30% (0.70%) (0.74%) 0.89%
Ratios to average net assets Expenses++ 1.15% 1.16% 1.16% 2.18% 2.18% 0.65%
Net investment income/(loss) 3.71% 3.72% 3.72% 2.70% 2.71% 4.22%

NOTES TO THE AUDITED FINANCIAL STATEMENTS FINANCIAL STATEMENTS
ANNUAL REPORT 2019 1553
FOR THE YEAR ENDED 31 DECEMBER 2019
23. FINANCIAL HIGHLIGHTS (CONTINUED)
Neuberger Berman Short Duration Emerging Market Debt Fund (continued)
USD I Distributing
Class
USD I2 Accumulating
Class
USD I2 Distributing
Class
USD I5 Accumulating
Class
USD I5 Distributing
Class
USD M Accumulating
Class US$ US$ US$ US$ US$ US$
31 December 2019 Beginning net asset value 9.72 11.11 9.71 11.43 9.30 10.02
Income from operations: Net investment income/(loss)+ 0.39 0.48 0.40 0.51 0.40 0.30Net realised and unrealised gain/(loss) on trading activities+ 0.31 0.35 0.30 0.36 0.29 0.31
Total from operations 0.70 0.83 0.70 0.87 0.69 0.61
Distributions (0.41) – (0.42) – (0.42) –
Ending net asset value 10.01 11.94 9.99 12.30 9.57 10.63
Total return 7.37% 7.47% 7.37% 7.61% 7.55% 6.09%
Ratios to average net assets Expenses++ 0.64% 0.54% 0.53% 0.39% 0.39% 1.76%
Net investment income/(loss) 4.00% 4.10% 4.09% 4.25% 4.25% 2.86%
31 December 2018 Beginning net asset value 10.07 11.01 10.05 11.31 9.63 10.05
Income from operations: Net investment income/(loss)+ 0.41 0.48 0.42 0.50 0.42 0.31Net realised and unrealised gain/(loss) on trading activities+ (0.33) (0.38) (0.32) (0.38) (0.32) (0.34)
Total from operations 0.08 0.10 0.10 0.12 0.10 (0.03)
Distributions (0.43) – (0.44) – (0.43) –
Ending net asset value 9.72 11.11 9.71 11.43 9.30 10.02
Total return 0.81% 0.91% 1.01% 1.06% 1.12% (0.30%)
Ratios to average net assets Expenses++ 0.66% 0.56% 0.56% 0.41% 0.41% 1.78%
Net investment income/(loss) 4.25% 4.32% 4.31% 4.45% 4.48% 3.11%
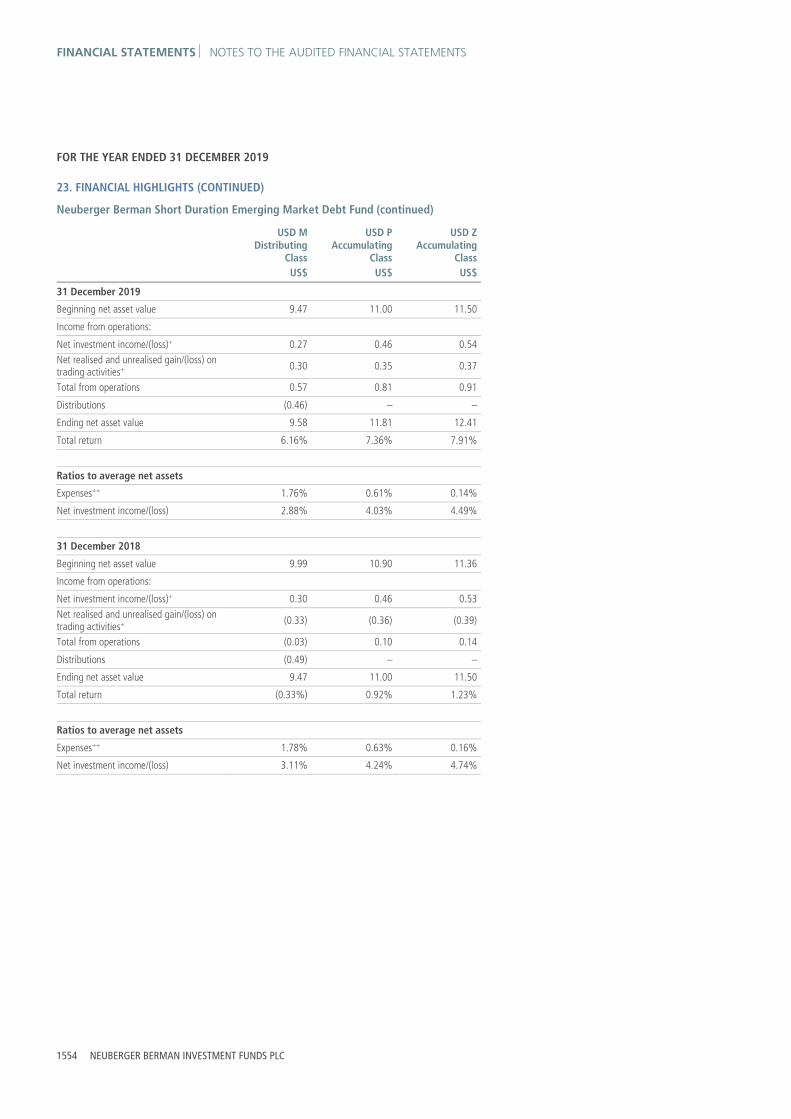
FINANCIAL STATEMENTS NOTES TO THE AUDITED FINANCIAL STATEMENTS
1554 NEUBERGER BERMAN INVESTMENT FUNDS PLC
FOR THE YEAR ENDED 31 DECEMBER 2019
23. FINANCIAL HIGHLIGHTS (CONTINUED)
Neuberger Berman Short Duration Emerging Market Debt Fund (continued)
USD M Distributing
Class
USD P Accumulating
Class
USD Z Accumulating
Class US$ US$ US$
31 December 2019 Beginning net asset value 9.47 11.00 11.50
Income from operations: Net investment income/(loss)+ 0.27 0.46 0.54Net realised and unrealised gain/(loss) on trading activities+ 0.30 0.35 0.37
Total from operations 0.57 0.81 0.91
Distributions (0.46) – –
Ending net asset value 9.58 11.81 12.41
Total return 6.16% 7.36% 7.91%
Ratios to average net assets Expenses++ 1.76% 0.61% 0.14%
Net investment income/(loss) 2.88% 4.03% 4.49%
31 December 2018 Beginning net asset value 9.99 10.90 11.36
Income from operations: Net investment income/(loss)+ 0.30 0.46 0.53Net realised and unrealised gain/(loss) on trading activities+ (0.33) (0.36) (0.39)
Total from operations (0.03) 0.10 0.14
Distributions (0.49) – –
Ending net asset value 9.47 11.00 11.50
Total return (0.33%) 0.92% 1.23%
Ratios to average net assets Expenses++ 1.78% 0.63% 0.16%
Net investment income/(loss) 3.11% 4.24% 4.74%

NOTES TO THE AUDITED FINANCIAL STATEMENTS FINANCIAL STATEMENTS
ANNUAL REPORT 2019 1555
FOR THE YEAR ENDED 31 DECEMBER 2019
23. FINANCIAL HIGHLIGHTS (CONTINUED)
Neuberger Berman Absolute Return Multi Strategy Fund
CHF I Accumulating
Class
EUR A Accumulating
Class
EUR I Accumulating
Class
EUR I2 Accumulating
Class
EUR M Accumulating
Class
EUR Z Accumulating
Class CHF € € € € €
31 December 2019 Beginning net asset value 8.79 8.59 8.83 9.19 9.26 9.23
Income from operations: Net investment income/(loss)+ (0.14) (0.10) (0.04) (0.03) (0.19) 0.03Net realised and unrealised gain/(loss) on trading activities+ 0.60 0.52 0.54 0.57 0.56 0.57
Total from operations 0.46 0.42 0.50 0.54 0.37 0.60
Ending net asset value 9.25 9.01 9.33 9.73 9.63 9.83
Total return 5.23% 4.89% 5.66% 5.88% 4.00% 6.50%
Ratios to average net assets Expenses++ 2.46% 3.07% 2.34% 2.19% 3.89% 1.59%
Net investment income/(loss) (1.45%) (1.16%) (0.41%) (0.26%) (1.96%) 0.34%
31 December 2018 Beginning net asset value 9.49 9.30 9.48 9.87 10.10 9.85
Income from operations: Net investment income/(loss)+ 0.03 0.00 0.01 0.08 (0.17) 0.07Net realised and unrealised gain/(loss) on trading activities+ (0.73) (0.71) (0.66) (0.76) (0.67) (0.69)
Total from operations (0.70) (0.71) (0.65) (0.68) (0.84) (0.62)
Ending net asset value 8.79 8.59 8.83 9.19 9.26 9.23
Total return (7.38%) (7.63%) (6.86%) (6.89%) (8.32%) (6.29%)
Ratios to average net assets Expenses++ 2.33% 3.24% 2.39% 2.28% 4.08% 1.71%
Net investment income/(loss) 0.29% (0.04%) 0.08% 0.82% (1.72%) 0.75%

FINANCIAL STATEMENTS NOTES TO THE AUDITED FINANCIAL STATEMENTS
1556 NEUBERGER BERMAN INVESTMENT FUNDS PLC
FOR THE YEAR ENDED 31 DECEMBER 2019
23. FINANCIAL HIGHLIGHTS (CONTINUED)
Neuberger Berman Absolute Return Multi Strategy Fund (continued)
GBP I Accumulating
Class
GBP I2 Accumulating
Class
GBP I3 Accumulating
Class
GBP Z Accumulating
Class
JPY D Distributing
Class
JPY I Accumulating
Class £ £ £ £ ¥ ¥
31 December 2019 Beginning net asset value 9.15 9.25 9.59 9.59 891.26 890.72
Income from operations: Net investment income/(loss)+ (0.04) (0.02) (0.02) 0.03 (4.09) (3.85)Net realised and unrealised gain/(loss) on trading activities+ 0.69 0.69 0.73 0.73 55.58 55.30
Total from operations 0.65 0.67 0.71 0.76 51.49 51.45
Ending net asset value 9.80 9.92 10.30 10.35 942.75 942.17
Total return 7.10% 7.24% 7.40% 7.92% 5.78% 5.78%
Ratios to average net assets Expenses++ 2.27% 2.11% 1.99% 1.54% 2.33% 2.34%
Net investment income/(loss) (0.40%) (0.25%) (0.16%) 0.33% (0.44%) (0.41%)
31 December 2018 Beginning net asset value 9.72 9.82 10.16 10.12 954.97 954.39
Income from operations: Net investment income/(loss)+ 0.00 0.41 0.05 0.08 10.13 0.31Net realised and unrealised gain/(loss) on trading activities+ (0.57) (0.98) (0.62) (0.61) (73.84) (63.98)
Total from operations (0.57) (0.57) (0.57) (0.53) (63.71) (63.67)
Ending net asset value 9.15 9.25 9.59 9.59 891.26 890.72
Total return (5.86%) (5.80%) (5.61%) (5.24%) (6.67%) (6.67%)
Ratios to average net assets Expenses++ 2.50% 2.34% 2.25% 1.74% 2.38% 2.39%
Net investment income/(loss) (0.02%) 4.16% 0.51% 0.75% 1.07% 0.03%

NOTES TO THE AUDITED FINANCIAL STATEMENTS FINANCIAL STATEMENTS
ANNUAL REPORT 2019 1557
FOR THE YEAR ENDED 31 DECEMBER 2019
23. FINANCIAL HIGHLIGHTS (CONTINUED)
Neuberger Berman Absolute Return Multi Strategy Fund (continued)
USD A Accumulating
Class
USD I Accumulating
Class
USD Z Accumulating
Class US$ US$ US$
31 December 2019 Beginning net asset value 9.27 9.69 9.76
Income from operations: Net investment income/(loss)+ (0.12) (0.04) 0.04Net realised and unrealised gain/(loss) on trading activities+ 0.86 0.90 0.91
Total from operations 0.74 0.86 0.95
Ending net asset value 10.01 10.55 10.71
Total return 7.98% 8.88% 9.73%
Ratios to average net assets Expenses++ 3.13% 2.34% 1.60%
Net investment income/(loss) (1.26%) (0.43%) 0.34%
31 December 2018 Beginning net asset value 9.76 10.13 10.12
Income from operations: Net investment income/(loss)+ (0.05) 0.02 0.08Net realised and unrealised gain/(loss) on trading activities+ (0.44) (0.46) (0.44)
Total from operations (0.49) (0.44) (0.36)
Ending net asset value 9.27 9.69 9.76
Total return (5.02%) (4.34%) (3.56%)
Ratios to average net assets Expenses++ 3.10% 2.39% 1.57%
Net investment income/(loss) (0.47%) 0.24% 0.78%

FINANCIAL STATEMENTS NOTES TO THE AUDITED FINANCIAL STATEMENTS
1558 NEUBERGER BERMAN INVESTMENT FUNDS PLC
FOR THE YEAR ENDED 31 DECEMBER 2019
23. FINANCIAL HIGHLIGHTS (CONTINUED)
Neuberger Berman US Long Short Equity Fund
EUR A Accumulating
Class
EUR I Accumulating
Class
EUR M Accumulating
Class
GBP I Accumulating
Class*
SGD A1 Accumulating
Class
USD A (PF) Accumulating
Class € € € £ SGD US$
31 December 2019 Beginning net asset value 9.41 9.79 9.53 10.00 20.32 9.91
Income from operations: Net investment income/(loss)+ (0.11) (0.03) (0.20) (0.02) (0.20) (0.19)Net realised and unrealised gain/(loss) on trading activities+ 1.24 1.31 1.27 0.67 3.22 1.66
Total from operations 1.13 1.28 1.07 0.65 3.02 1.47
Ending net asset value 10.54 11.07 10.60 10.65 23.34 11.38
Total return 12.01% 13.07% 11.23% 6.50% 14.86% 14.83%
Ratios to average net assets Expenses++ 2.74% 1.86% 3.57% 1.89% 2.50% 3.34%
Net investment income/(loss) (1.13%) (0.24%) (1.96%) (0.40%) (0.90%) (1.73%)
31 December 2018 Beginning net asset value 10.53 10.86 10.76 – 22.25 10.72
Income from operations: Net investment income/(loss)+ (0.13) (0.03) (0.22) – (0.20) (0.13)Net realised and unrealised gain/(loss) on trading activities+ (0.99) (1.04) (1.01) – (1.73) (0.68)
Total from operations (1.12) (1.07) (1.23) – (1.93) (0.81)
Distributions – – – – – –
Ending net asset value 9.41 9.79 9.53 – 20.32 9.91
Total return (10.64%) (9.85%) (11.43%) – (8.67%) (7.56%)
Ratios to average net assets Expenses++ 2.80% 1.88% 3.66% – 2.47% 2.58%
Net investment income/(loss) (1.21%) (0.29%) (2.08%) – (0.92%) (1.18%)
* Share class launched during the current reporting year.

NOTES TO THE AUDITED FINANCIAL STATEMENTS FINANCIAL STATEMENTS
ANNUAL REPORT 2019 1559
FOR THE YEAR ENDED 31 DECEMBER 2019
23. FINANCIAL HIGHLIGHTS (CONTINUED)
Neuberger Berman US Long Short Equity Fund (continued)
USD A Accumulating
Class
USD A1 Accumulating
Class
USD C1 Accumulating
Class
USD D Distributing
Class
USD I (PF) Distributing
Class
USD I Accumulating
Class US$ US$ US$ US$ US$ US$
31 December 2019 Beginning net asset value 9.88 10.41 9.33 10.38 10.18 10.83
Income from operations: Net investment income/(loss)+ (0.12) (0.10) (0.20) (0.03) (0.16) (0.03)Net realised and unrealised gain/(loss) on trading activities+ 1.65 1.74 1.54 1.75 1.71 1.82
Total from operations 1.53 1.64 1.34 1.72 1.55 1.79
Distributions – – – (0.01) – –
Ending net asset value 11.41 12.05 10.67 12.09 11.73 12.62
Total return 15.49% 15.75% 14.36% 16.57% 15.23% 16.53%
Ratios to average net assets Expenses++ 2.76% 2.52% 3.70% 1.89% 3.04% 1.89%
Net investment income/(loss) (1.15%) (0.90%) (2.03%) (0.26%) (1.43%) (0.28%)
31 December 2018 Beginning net asset value 10.74 11.28 10.25 11.19 10.97 11.66
Income from operations: Net investment income/(loss)+ (0.13) (0.09) (0.23) (0.01) 0.00 (0.03)Net realised and unrealised gain/(loss) on trading activities+ (0.73) (0.78) (0.69) (0.80) (0.79) (0.80)
Total from operations (0.86) (0.87) (0.92) (0.81) (0.79) (0.83)
Ending net asset value 9.88 10.41 9.33 10.38 10.18 10.83
Total return (8.01%) (7.71%) (8.98%) (7.24%) (7.20%) (7.12%)
Ratios to average net assets Expenses++ 2.72% 2.47% 3.75% 1.73% 1.53% 1.83%
Net investment income/(loss) (1.17%) (0.83%) (2.23%) (0.10%) 0.04% (0.28%)

FINANCIAL STATEMENTS NOTES TO THE AUDITED FINANCIAL STATEMENTS
1560 NEUBERGER BERMAN INVESTMENT FUNDS PLC
FOR THE YEAR ENDED 31 DECEMBER 2019
23. FINANCIAL HIGHLIGHTS (CONTINUED)
Neuberger Berman US Long Short Equity Fund (continued)
USD M Accumulating
Class
USD U Accumulating
Class
USD Z Accumulating
Class US$ US$ US$
31 December 2019 Beginning net asset value 9.45 10.13 11.34
Income from operations: Net investment income/(loss)+ (0.21) (0.08) 0.14Net realised and unrealised gain/(loss) on trading activities+ 1.58 1.70 1.91
Total from operations 1.37 1.62 2.05
Ending net asset value 10.82 11.75 13.39
Total return 14.50% 15.99% 18.08%
Ratios to average net assets Expenses++ 3.62% 2.33% 0.51%
Net investment income/(loss) (2.01%) (0.73%) 1.13%
31 December 2018 Beginning net asset value 10.35 10.96 12.05
Income from operations: Net investment income/(loss)+ (0.21) (0.08) 0.12Net realised and unrealised gain/(loss) on trading activities+ (0.69) (0.75) (0.83)
Total from operations (0.90) (0.83) (0.71)
Ending net asset value 9.45 10.13 11.34
Total return (8.70%) (7.57%) (5.89%)
Ratios to average net assets Expenses++ 3.56% 2.28% 0.47%
Net investment income/(loss) (2.02%) (0.69%) 1.02%

NOTES TO THE AUDITED FINANCIAL STATEMENTS FINANCIAL STATEMENTS
ANNUAL REPORT 2019 1561
FOR THE YEAR ENDED 31 DECEMBER 2019
23. FINANCIAL HIGHLIGHTS (CONTINUED)
Neuberger Berman Emerging Market Debt Blend Fund
AUD I3 Distributing
Class*
CHF I2 Distributing
Class
EUR A Accumulating
Class
EUR I Accumulating
Class
EUR I Distributing
Class
EUR I2 Accumulating
Class AUD CHF € € € €
31 December 2019 Beginning net asset value 10.00 8.69 10.54 10.52 8.82 10.74
Income from operations: Net investment income/(loss)+ 0.07 0.44 0.47 0.54 0.44 0.57Net realised and unrealised gain/(loss) on trading activities+ 0.08 0.47 0.80 0.81 0.67 0.83
Total from operations 0.15 0.91 1.27 1.35 1.11 1.40
Distributions – (0.44) – – (0.44) –
Ending net asset value 10.15 9.16 11.81 11.87 9.49 12.14
Total return 1.50% 10.71% 12.05% 12.83% 12.87% 13.04%
Ratios to average net assets Expenses++ 0.70% 0.74% 1.60% 0.90% 0.90% 0.77%
Net investment income/(loss) 4.69% 4.88% 4.12% 4.81% 4.82% 4.93%
31 December 2018 Beginning net asset value – 9.89 11.29 11.19 9.83 11.41
Income from operations: Net investment income/(loss)+ – 0.45 0.45 0.52 0.45 0.55Net realised and unrealised gain/(loss) on trading activities+ – (1.20) (1.20) (1.19) (1.02) (1.22)
Total from operations – (0.75) (0.75) (0.67) (0.57) (0.67)
Distributions – (0.45) – – (0.44) –
Ending net asset value – 8.69 10.54 10.52 8.82 10.74
Total return – (7.80%) (6.64%) (5.99%) (5.96%) (5.87%)
Ratios to average net assets Expenses++ – 0.78% 1.66% 0.95% 0.95% 0.80%
Net investment income/(loss) – 4.89% 4.07% 4.87% 4.87% 5.01%
* Share class launched during the current reporting year.

FINANCIAL STATEMENTS NOTES TO THE AUDITED FINANCIAL STATEMENTS
1562 NEUBERGER BERMAN INVESTMENT FUNDS PLC
FOR THE YEAR ENDED 31 DECEMBER 2019
23. FINANCIAL HIGHLIGHTS (CONTINUED)
Neuberger Berman Emerging Market Debt Blend Fund (continued)
EUR I2 Distributing
Class
EUR I3 Distributing
Class*
EUR I4 Accumulating
Unhedged Class
EUR I5 Accumulating
Class
EUR M Accumulating
Class
EUR M Distributing
Class € € € € € €
31 December 2019 Beginning net asset value 8.59 10.00 9.55 11.25 10.51 8.85
Income from operations: Net investment income/(loss)+ 0.44 0.08 0.53 0.62 0.37 0.30Net realised and unrealised gain/(loss) on trading activities+ 0.65 0.07 0.99 0.88 0.80 0.66
Total from operations 1.09 0.15 1.52 1.50 1.17 0.96
Distributions (0.44) – – – – (0.59)
Ending net asset value 9.24 10.15 11.07 12.75 11.68 9.22
Total return 13.00% 1.50% 15.92% 13.33% 11.13% 11.11%
Ratios to average net assets Expenses++ 0.76% 0.71% 0.63% 0.56% 2.42% 2.42%
Net investment income/(loss) 4.95% 4.96% 5.05% 5.13% 3.28% 3.30%
31 December 2018 Beginning net asset value 9.58 – 9.74 11.92 11.34 10.19
Income from operations: Net investment income/(loss)+ 0.45 – 0.49 0.58 0.36 0.31Net realised and unrealised gain/(loss) on trading activities+ (1.00) – (0.68) (1.25) (1.19) (1.04)
Total from operations (0.55) – (0.19) (0.67) (0.83) (0.73)
Distributions (0.44) – – – – (0.61)
Ending net asset value 8.59 – 9.55 11.25 10.51 8.85
Total return (5.89%) – (1.95%) (5.62%) (7.32%) (7.42%)
Ratios to average net assets Expenses++ 0.80% – 0.65% 0.59% 2.50% 2.50%
Net investment income/(loss) 5.02% – 5.12% 5.08% 3.33% 3.32%
* Share class launched during the current reporting year.

NOTES TO THE AUDITED FINANCIAL STATEMENTS FINANCIAL STATEMENTS
ANNUAL REPORT 2019 1563
FOR THE YEAR ENDED 31 DECEMBER 2019
23. FINANCIAL HIGHLIGHTS (CONTINUED)
Neuberger Berman Emerging Market Debt Blend Fund (continued)
EUR Z Accumulating
Class
GBP I Accumulating
Class
GBP I Accumulating
Unhedged Class
GBP I Distributing
Class
GBP I Distributing
Unhedged Class
GBP I2 Distributing
Class € £ £ £ £ £
31 December 2019 Beginning net asset value 10.99 11.13 9.88 9.72 10.01 9.70
Income from operations: Net investment income/(loss)+ 0.65 0.55 0.49 0.46 0.48 0.48Net realised and unrealised gain/(loss) on trading activities+ 0.85 0.60 0.42 0.53 0.43 0.53
Total from operations 1.50 1.15 0.91 0.99 0.91 1.01
Distributions – – – (0.48) (0.50) (0.49)
Ending net asset value 12.49 12.28 10.79 10.23 10.42 10.22
Total return 13.65% 10.33% 9.21% 10.39% 9.16% 10.67%
Ratios to average net assets Expenses++ 0.21% 0.87% 0.87% 0.88% 0.87% 0.74%
Net investment income/(loss) 5.51% 4.66% 4.65% 4.56% 4.65% 4.80%
31 December 2018 Beginning net asset value 11.60 11.70 9.99 10.00 10.00 10.69
Income from operations: Net investment income/(loss)+ 0.62 0.55 0.48 0.29 0.30 0.51Net realised and unrealised gain/(loss) on trading activities+ (1.23) (1.12) (0.59) (0.42) (0.12) (1.01)
Total from operations (0.61) (0.57) (0.11) (0.13) 0.18 (0.50)
Distributions – – – (0.15) (0.17) (0.49)
Ending net asset value 10.99 11.13 9.88 9.72 10.01 9.70
Total return (5.26%) (4.87%) (1.10%) (1.30%) 1.86% (4.77%)
Ratios to average net assets Expenses++ 0.22% 0.97% 0.96% 0.98% 0.98% 0.82%
Net investment income/(loss) 5.59% 4.96% 4.93% 5.01% 5.07% 5.10%

FINANCIAL STATEMENTS NOTES TO THE AUDITED FINANCIAL STATEMENTS
1564 NEUBERGER BERMAN INVESTMENT FUNDS PLC
FOR THE YEAR ENDED 31 DECEMBER 2019
23. FINANCIAL HIGHLIGHTS (CONTINUED)
Neuberger Berman Emerging Market Debt Blend Fund (continued)
GBP P Accumulating
Class*
GBP P Accumulating
Unhedged Class*
GBP Z Accumulating
Class
NOK U Accumulating
Class
SEK A Accumulating
Class
SGD A(Monthly)
Distributing Class
£ £ £ NOK SEK SGD
31 December 2019 Beginning net asset value 10.00 10.00 11.72 101.47 107.16 17.29
Income from operations: Net investment income/(loss)+ 0.32 0.32 0.67 4.89 4.78 0.71Net realised and unrealised gain/(loss) on trading activities+ 0.44 0.38 0.64 8.61 10.56 1.24
Total from operations 0.76 0.70 1.31 13.50 15.34 1.95
Distributions – – – – – (1.07)
Ending net asset value 10.76 10.70 13.03 114.97 122.50 18.17
Total return 7.60% 7.00% 11.18% 13.30% 14.32% 11.58%
Ratios to average net assets Expenses++ 0.86% 0.85% 0.20% 1.26% 1.59% 1.59%
Net investment income/(loss) 4.40% 4.59% 5.32% 4.47% 4.05% 3.98%
31 December 2018 Beginning net asset value – – 12.23 107.11 113.05 19.71
Income from operations: Net investment income/(loss)+ – – 0.67 4.74 4.54 0.74Net realised and unrealised gain/(loss) on trading activities+ – – (1.18) (10.38) (10.43) (2.10)
Total from operations – – (0.51) (5.64) (5.89) (1.36)
Distributions – – – – – (1.06)
Ending net asset value – – 11.72 101.47 107.16 17.29
Total return – – (4.17%) (5.27%) (5.21%) (7.07%)
Ratios to average net assets Expenses++ – – 0.23% 1.35% 1.65% 1.63%
Net investment income/(loss) – – 5.67% 4.64% 4.08% 4.04%
* Share class launched during the current reporting year.

NOTES TO THE AUDITED FINANCIAL STATEMENTS FINANCIAL STATEMENTS
ANNUAL REPORT 2019 1565
FOR THE YEAR ENDED 31 DECEMBER 2019
23. FINANCIAL HIGHLIGHTS (CONTINUED)
Neuberger Berman Emerging Market Debt Blend Fund (continued)
USD A (Monthly)
Distributing Class
USD A Accumulating
Class
USD C1 Accumulating
Class
USD I Accumulating
Class
USD I Distributing
Class
USD I2 Accumulating
Class US$ US$ US$ US$ US$ US$
31 December 2019 Beginning net asset value 8.63 11.35 9.29 10.39 9.72 10.23
Income from operations: Net investment income/(loss)+ 0.37 0.50 0.31 0.54 0.49 0.54Net realised and unrealised gain/(loss) on trading activities+ 0.71 0.95 0.77 0.87 0.79 0.86
Total from operations 1.08 1.45 1.08 1.41 1.28 1.40
Distributions (0.54) – – – (0.48) –
Ending net asset value 9.17 12.80 10.37 11.80 10.52 11.63
Total return 12.83% 12.78% 11.63% 13.57% 13.50% 13.69%
Ratios to average net assets Expenses++ 1.61% 1.61% 2.62% 0.91% 0.91% 0.77%
Net investment income/(loss) 4.12% 4.12% 3.12% 4.82% 4.81% 4.94%
31 December 2018 Beginning net asset value 9.90 12.28 10.15 11.16 10.94 10.97
Income from operations: Net investment income/(loss)+ 0.37 0.48 0.29 0.51 0.48 0.51Net realised and unrealised gain/(loss) on trading activities+ (1.11) (1.41) (1.15) (1.28) (1.21) (1.25)
Total from operations (0.74) (0.93) (0.86) (0.77) (0.73) (0.74)
Distributions (0.53) – – – (0.49) –
Ending net asset value 8.63 11.35 9.29 10.39 9.72 10.23
Total return (7.55%) (7.57%) (8.47%) (6.90%) (6.91%) (6.75%)
Ratios to average net assets Expenses++ 1.62% 1.62% 2.62% 0.92% 0.92% 0.78%
Net investment income/(loss) 4.11% 3.98% 3.04% 4.72% 4.70% 4.85%

FINANCIAL STATEMENTS NOTES TO THE AUDITED FINANCIAL STATEMENTS
1566 NEUBERGER BERMAN INVESTMENT FUNDS PLC
FOR THE YEAR ENDED 31 DECEMBER 2019
23. FINANCIAL HIGHLIGHTS (CONTINUED)
Neuberger Berman Emerging Market Debt Blend Fund (continued)
USD I2 Distributing
Class
USD I3 Accumulating
Class
USD M Accumulating
Class
USD M Distributing
Class
USD Z Accumulating
Class US$ US$ US$ US$ US$
31 December 2019 Beginning net asset value 8.92 9.39 9.28 8.63 11.99
Income from operations: Net investment income/(loss)+ 0.46 0.51 0.33 0.29 0.70 Net realised and unrealised gain/(loss) on trading activities+ 0.72 0.78 0.77 0.70 1.02
Total from operations 1.18 1.29 1.10 0.99 1.72
Distributions (0.45) – – (0.57) –
Ending net asset value 9.65 10.68 10.38 9.05 13.71
Total return 13.61% 13.74% 11.85% 11.80% 14.35%
Ratios to average net assets Expenses++ 0.77% 0.70% 2.42% 2.43% 0.19%
Net investment income/(loss) 4.97% 5.03% 3.32% 3.29% 5.65%
31 December 2018 Beginning net asset value 10.04 10.06 10.12 10.03 12.80
Income from operations: Net investment income/(loss)+ 0.45 0.48 0.31 0.29 0.67 Net realised and unrealised gain/(loss) on trading activities+ (1.11) (1.15) (1.15) (1.09) (1.48)
Total from operations (0.66) (0.67) (0.84) (0.80) (0.81)
Distributions (0.46) – – (0.60) –
Ending net asset value 8.92 9.39 9.28 8.63 11.99
Total return (6.78%) (6.66%) (8.30%) (8.32%) (6.33%)
Ratios to average net assets Expenses++ 0.78% 0.71% 2.42% 2.42% 0.22%
Net investment income/(loss) 4.87% 4.92% 3.23% 3.23% 5.42%
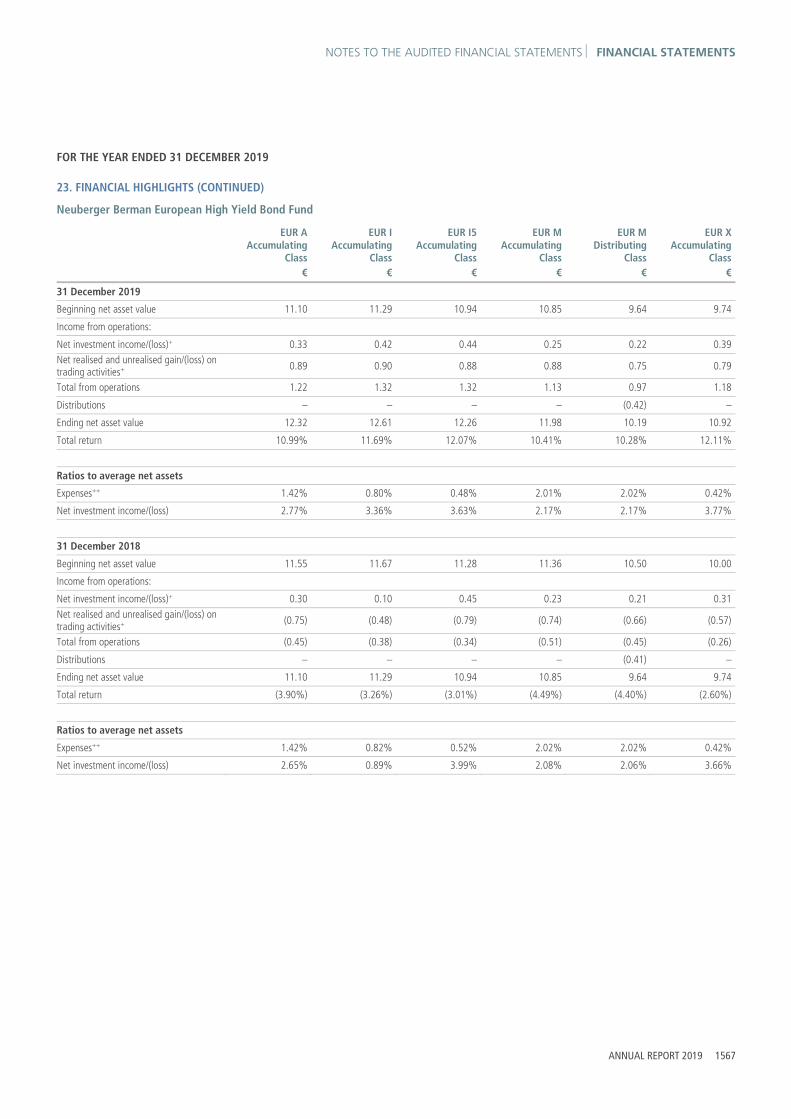
NOTES TO THE AUDITED FINANCIAL STATEMENTS FINANCIAL STATEMENTS
ANNUAL REPORT 2019 1567
FOR THE YEAR ENDED 31 DECEMBER 2019
23. FINANCIAL HIGHLIGHTS (CONTINUED)
Neuberger Berman European High Yield Bond Fund
EUR A Accumulating
Class
EUR I Accumulating
Class
EUR I5 Accumulating
Class
EUR M Accumulating
Class
EUR M Distributing
Class
EUR X Accumulating
Class € € € € € €
31 December 2019 Beginning net asset value 11.10 11.29 10.94 10.85 9.64 9.74
Income from operations: Net investment income/(loss)+ 0.33 0.42 0.44 0.25 0.22 0.39Net realised and unrealised gain/(loss) on trading activities+ 0.89 0.90 0.88 0.88 0.75 0.79
Total from operations 1.22 1.32 1.32 1.13 0.97 1.18
Distributions – – – – (0.42) –
Ending net asset value 12.32 12.61 12.26 11.98 10.19 10.92
Total return 10.99% 11.69% 12.07% 10.41% 10.28% 12.11%
Ratios to average net assets Expenses++ 1.42% 0.80% 0.48% 2.01% 2.02% 0.42%
Net investment income/(loss) 2.77% 3.36% 3.63% 2.17% 2.17% 3.77%
31 December 2018 Beginning net asset value 11.55 11.67 11.28 11.36 10.50 10.00
Income from operations: Net investment income/(loss)+ 0.30 0.10 0.45 0.23 0.21 0.31Net realised and unrealised gain/(loss) on trading activities+ (0.75) (0.48) (0.79) (0.74) (0.66) (0.57)
Total from operations (0.45) (0.38) (0.34) (0.51) (0.45) (0.26)
Distributions – – – – (0.41) –
Ending net asset value 11.10 11.29 10.94 10.85 9.64 9.74
Total return (3.90%) (3.26%) (3.01%) (4.49%) (4.40%) (2.60%)
Ratios to average net assets Expenses++ 1.42% 0.82% 0.52% 2.02% 2.02% 0.42%
Net investment income/(loss) 2.65% 0.89% 3.99% 2.08% 2.06% 3.66%

FINANCIAL STATEMENTS NOTES TO THE AUDITED FINANCIAL STATEMENTS
1568 NEUBERGER BERMAN INVESTMENT FUNDS PLC
FOR THE YEAR ENDED 31 DECEMBER 2019
23. FINANCIAL HIGHLIGHTS (CONTINUED)
Neuberger Berman European High Yield Bond Fund (continued)
GBP I Accumulating
Class*
SGD A(Monthly)
Distributing Class*
SGD A Accumulating
Class*
USD A (Monthly)
Distributing Class
USD A Accumulating
Class
USD I Accumulating
Class £ SGD SGD US$ US$ US$
31 December 2019 Beginning net asset value 10.00 20.00 20.00 9.55 9.83 12.04
Income from operations: Net investment income/(loss)+ 0.25 0.36 0.41 0.28 0.30 0.43Net realised and unrealised gain/(loss) on trading activities+ 0.51 0.98 0.99 1.05 1.10 1.38
Total from operations 0.76 1.34 1.40 1.33 1.40 1.81
Distributions – (0.66) – (0.61) – –
Ending net asset value 10.76 20.68 21.40 10.27 11.23 13.85
Total return 7.60% 6.83% 7.00% 14.31% 14.24% 15.03%
Ratios to average net assets Expenses++ 0.79% 1.40% 1.42% 1.42% 1.41% 0.83%
Net investment income/(loss) 3.24% 2.73% 2.72% 2.77% 2.76% 3.41%
31 December 2018 Beginning net asset value – – – 10.22 10.00 12.11
Income from operations: Net investment income/(loss)+ – – – 0.26 0.23 0.39Net realised and unrealised gain/(loss) on trading activities+ – – – (0.37) (0.40) (0.46)
Total from operations – – – (0.11) (0.17) (0.07)
Distributions – – – (0.56) – –
Ending net asset value – – – 9.55 9.83 12.04
Total return – – – (1.16%) (1.70%) (0.58%)
Ratios to average net assets Expenses++ – – – 1.38% 1.37% 0.80%
Net investment income/(loss) – – – 2.62% 2.44% 3.20%
* Share class launched during the current reporting year.

NOTES TO THE AUDITED FINANCIAL STATEMENTS FINANCIAL STATEMENTS
ANNUAL REPORT 2019 1569
FOR THE YEAR ENDED 31 DECEMBER 2019
23. FINANCIAL HIGHLIGHTS (CONTINUED)
Neuberger Berman European High Yield Bond Fund (continued)
USD I5 Accumulating
Class*
USD X Accumulating
Class*
USD Z Accumulating
Class* US$ US$ US$
31 December 2019 Beginning net asset value 10.00 9.94 10.00
Income from operations: Net investment income/(loss)+ 0.09 0.41 0.29Net realised and unrealised gain/(loss) on trading activities+ 0.26 1.14 0.46
Total from operations 0.35 1.55 0.75
Ending net asset value 10.35 11.49 10.75
Total return 3.50% 15.59% 7.50%
Ratios to average net assets Expenses++ 0.48% 0.41% 0.20%
Net investment income/(loss) 3.65% 3.78% 3.94%
31 December 2018 Beginning net asset value – – –
Income from operations: Net investment income/(loss)+ – – –Net realised and unrealised gain/(loss) on trading activities+ – – –
Total from operations – – –
Distributions – – –
Ending net asset value – – –
Total return – – –
Ratios to average net assets Expenses++ – – –
Net investment income/(loss) – – –
* Share class launched during the current reporting year.

FINANCIAL STATEMENTS NOTES TO THE AUDITED FINANCIAL STATEMENTS
1570 NEUBERGER BERMAN INVESTMENT FUNDS PLC
FOR THE YEAR ENDED 31 DECEMBER 2019
23. FINANCIAL HIGHLIGHTS (CONTINUED)
Neuberger Berman Global Equity Fund
USD I Accumulating
Class US$
31 December 2019 Beginning net asset value 11.09
Income from operations: Net investment income/(loss)+ 0.03 Net realised and unrealised gain/(loss) on trading activities+ 3.00
Total from operations 3.03
Ending net asset value 14.12
Total return 27.32%
Ratios to average net assets Expenses++ 2.12%
Net investment income/(loss) 0.23%
31 December 2018 Beginning net asset value 12.41
Income from operations: Net investment income/(loss)+ 0.03 Net realised and unrealised gain/(loss) on trading activities+ (1.35)
Total from operations (1.32)
Ending net asset value 11.09
Total return (10.64%)
Ratios to average net assets Expenses++ 1.12%
Net investment income/(loss) 0.27%

NOTES TO THE AUDITED FINANCIAL STATEMENTS FINANCIAL STATEMENTS
ANNUAL REPORT 2019 1571
FOR THE YEAR ENDED 31 DECEMBER 2019
23. FINANCIAL HIGHLIGHTS (CONTINUED)
Neuberger Berman Systematic Global Equity Fund
EUR M Accumulating
Class
GBP I Accumulating
Class*
SGD A Accumulating
Class
USD A Accumulating
Class
USD I Accumulating
Class
USD T Accumulating
Class € £ SGD US$ US$ US$
31 December 2019 Beginning net asset value 11.21 10.00 22.50 11.08 11.44 12.31
Income from operations: Net investment income/(loss)+ 0.01 0.06 0.25 0.10 0.18 0.05Net realised and unrealised gain/(loss) on trading activities+ 1.95 1.22 4.48 2.35 2.44 2.59
Total from operations 1.96 1.28 4.73 2.45 2.62 2.64
Ending net asset value 13.17 11.28 27.23 13.53 14.06 14.95
Total return 17.48% 12.80% 21.02% 22.11% 22.90% 21.45%
Ratios to average net assets Expenses++ 2.52% 1.16% 1.69% 1.76% 1.17% 2.25%
Net investment income/(loss) 0.12% 0.95% 1.02% 0.82% 1.37% 0.34%
31 December 2018 Beginning net asset value 12.97 – 25.33 12.34 12.65 13.77
Income from operations: Net investment income/(loss)+ 0.02 – 0.14 0.07 0.21 0.04Net realised and unrealised gain/(loss) on trading activities+ (1.78) – (2.97) (1.33) (1.42) (1.50)
Total from operations (1.76) – (2.83) (1.26) (1.21) (1.46)
Distributions – – – – – –
Ending net asset value 11.21 – 22.50 11.08 11.44 12.31
Total return (13.57%) – (11.17%) (10.21%) (9.57%) (10.60%)
Ratios to average net assets Expenses++ 2.66% – 1.78% 2.01% 1.02% 2.31%
Net investment income/(loss) 0.16% – 0.56% 0.55% 1.67% 0.32%
* Share class launched during the current reporting year.

FINANCIAL STATEMENTS NOTES TO THE AUDITED FINANCIAL STATEMENTS
1572 NEUBERGER BERMAN INVESTMENT FUNDS PLC
FOR THE YEAR ENDED 31 DECEMBER 2019
23. FINANCIAL HIGHLIGHTS (CONTINUED)
Neuberger Berman Systematic Global Equity Fund (continued)
USD Z Accumulating
Class US$
31 December 2019 Beginning net asset value 12.14
Income from operations: Net investment income/(loss)+ 0.09 Net realised and unrealised gain/(loss) on trading activities+ 2.79
Total from operations 2.88
Ending net asset value 15.02
Total return 23.72%
Ratios to average net assets Expenses++ 1.01%
Net investment income/(loss) 0.60%
31 December 2018 Beginning net asset value 13.34
Income from operations: Net investment income/(loss)+ 0.28 Net realised and unrealised gain/(loss) on trading activities+ (1.48)
Total from operations (1.20)
Ending net asset value 12.14
Total return (9.00%)
Ratios to average net assets Expenses++ 0.52%
Net investment income/(loss) 2.12%

NOTES TO THE AUDITED FINANCIAL STATEMENTS FINANCIAL STATEMENTS
ANNUAL REPORT 2019 1573
FOR THE YEAR ENDED 31 DECEMBER 2019
23. FINANCIAL HIGHLIGHTS (CONTINUED)
Neuberger Berman Global Real Estate Securities Fund
EUR M Accumulating
Class
GBP Z Accumulating
Class
USD A Accumulating
Class*
USD I Accumulating
Class
USD I2 Accumulating
Class
USD I5 Distributing
Class* € £ US$ US$ US$ US$
31 December 2019 Beginning net asset value 10.19 10.39 10.00 10.90 9.62 10.00
Income from operations: Net investment income/(loss)+ (0.07) 0.23 0.01 0.16 0.16 0.00Net realised and unrealised gain/(loss) on trading activities+ 2.11 2.31 0.99 2.67 2.36 0.13
Total from operations 2.04 2.54 1.00 2.83 2.52 0.13
Ending net asset value 12.23 12.93 11.00 13.73 12.14 10.13
Total return 20.02% 24.45% 10.00% 25.96% 26.20% 1.30%
Ratios to average net assets Expenses++ 2.96% 0.44% 2.23% 1.20% 1.01% 3.90%
Net investment income/(loss) (0.57%) 1.92% 0.12% 1.22% 1.46% 1.26%
31 December 2018 Beginning net asset value 11.25 11.06 – 11.47 10.12 –
Income from operations: Net investment income/(loss)+ (0.03) 0.24 – 0.16 0.15 –Net realised and unrealised gain/(loss) on trading activities+ (1.03) (0.91) – (0.73) (0.65) –
Total from operations (1.06) (0.67) – (0.57) (0.50) –
Distributions – – – – – –
Ending net asset value 10.19 10.39 – 10.90 9.62 –
Total return (9.42%) (6.06%) – (4.97%) (4.94%) –
Ratios to average net assets Expenses++ 3.96% 1.29% – 1.73% 1.89% –
Net investment income/(loss) (0.32%) 2.24% – 1.41% 1.54% –
* Share class launched during the current reporting year.

FINANCIAL STATEMENTS NOTES TO THE AUDITED FINANCIAL STATEMENTS
1574 NEUBERGER BERMAN INVESTMENT FUNDS PLC
FOR THE YEAR ENDED 31 DECEMBER 2019
23. FINANCIAL HIGHLIGHTS (CONTINUED)
Neuberger Berman Global Real Estate Securities Fund (continued)
USD M Accumulating
Class*
USD T Accumulating
Class*
USD Z Accumulating
Class US$ US$ US$
31 December 2019 Beginning net asset value 10.00 10.97** 10.78
Income from operations: Net investment income/(loss)+ (0.04) 0.00 0.26Net realised and unrealised gain/(loss) on trading activities+ 0.40 0.18 2.65
Total from operations 0.36 0.18 2.91
Ending net asset value 10.36 11.15 13.69
Total return 3.60% 1.67% 26.99%
Ratios to average net assets Expenses++ 4.00% 7.48% 0.42%
Net investment income/(loss) (1.30%) (0.26%) 2.02%
31 December 2018 Beginning net asset value – – 11.27
Income from operations: Net investment income/(loss)+ – – 0.24Net realised and unrealised gain/(loss) on trading activities+ – – (0.73)
Total from operations – – (0.49)
Distributions – – –
Ending net asset value – – 10.78
Total return – – (4.35%)
Ratios to average net assets Expenses++ – – 1.29%
Net investment income/(loss) – – 2.13%
* Share class launched during the current reporting year. ** Beginning net asset value includes swing pricing adjustment.

NOTES TO THE AUDITED FINANCIAL STATEMENTS FINANCIAL STATEMENTS
ANNUAL REPORT 2019 1575
FOR THE YEAR ENDED 31 DECEMBER 2019
23. FINANCIAL HIGHLIGHTS (CONTINUED)
Neuberger Berman US Small Cap Intrinsic Value Fund
USD A Accumulating
Class
USD C1 Accumulating
Class
USD I Accumulating
Class
USD M Accumulating
Class US$ US$ US$ US$
31 December 2019 Beginning net asset value 12.93 8.98 10.99 11.20
Income from operations: Net investment income/(loss)+ (0.21) (0.27) (0.08) (0.33) Net realised and unrealised gain/(loss) on trading activities+ 2.83 1.98 2.42 2.45
Total from operations 2.62 1.71 2.34 2.12
Ending net asset value 15.55 10.69 13.33 13.32
Total return 20.26% 19.04% 21.29% 18.93%
Ratios to average net assets Expenses++ 1.98% 3.21% 1.18% 3.11%
Net investment income/(loss) (1.45%) (2.64%) (0.60%) (2.53%)
31 December 2018 Beginning net asset value 14.38 10.09 12.12 12.58
Income from operations: Net investment income/(loss)+ (0.21) (0.26) (0.08) (0.33) Net realised and unrealised gain/(loss) on trading activities+ (1.24) (0.85) (1.05) (1.05)
Total from operations (1.45) (1.11) (1.13) (1.38)
Ending net asset value 12.93 8.98 10.99 11.20
Total return (10.08%) (11.00%) (9.32%) (10.97%)
Ratios to average net assets Expenses++ 1.98% 3.00% 1.14% 3.06%
Net investment income/(loss) (1.42%) (2.45%) (0.60%) (2.48%)

FINANCIAL STATEMENTS NOTES TO THE AUDITED FINANCIAL STATEMENTS
1576 NEUBERGER BERMAN INVESTMENT FUNDS PLC
FOR THE YEAR ENDED 31 DECEMBER 2019
23. FINANCIAL HIGHLIGHTS (CONTINUED)
Neuberger Berman Asian Debt – Hard Currency Fund
SGD A (Monthly)
Distributing Class*
USD A(Monthly)
Distributing Class
USD A Accumulating
Class
USD C1 Accumulating
Class*
USD I Accumulating
Class
USD I Distributing
Class SGD US$ US$ US$ US$ US$
31 December 2019 Beginning net asset value 20.00 9.43 11.01 10.00 11.24 10.22
Income from operations: Net investment income/(loss)+ 0.11 0.33 0.38 0.04 0.47 0.43Net realised and unrealised gain/(loss) on trading activities+ 0.08 0.85 1.03 0.07 1.03 0.88
Total from operations 0.19 1.18 1.41 0.11 1.50 1.31
Distributions (0.09) (0.45) – – – (0.43)
Ending net asset value 20.10 10.16 12.42 10.11 12.74 11.10
Total return 0.95% 12.70% 12.81% 1.10% 13.35% 13.38%
Ratios to average net assets Expenses++ 1.39% 1.42% 1.42% 2.41% 0.85% 0.91%
Net investment income/(loss) 2.94% 3.26% 3.14% 1.88% 3.72% 4.02%
31 December 2018 Beginning net asset value – 10.16 11.34 – 11.50 10.86
Income from operations: Net investment income/(loss)+ – 0.35 0.41 – 0.48 0.44Net realised and unrealised gain/(loss) on trading activities+ – (0.64) (0.74) – (0.74) (0.67)
Total from operations – (0.29) (0.33) – (0.26) (0.23)
Distributions – (0.44) – – – (0.41)
Ending net asset value – 9.43 11.01 – 11.24 10.22
Total return – (2.90%) (2.91%) – (2.26%) (2.23%)
Ratios to average net assets Expenses++ – 1.36% 1.36% – 0.76% 0.77%
Net investment income/(loss) – 3.68% 3.67% – 4.28% 4.27%
* Share class launched during the current reporting year.

NOTES TO THE AUDITED FINANCIAL STATEMENTS FINANCIAL STATEMENTS
ANNUAL REPORT 2019 1577
FOR THE YEAR ENDED 31 DECEMBER 2019
23. FINANCIAL HIGHLIGHTS (CONTINUED)
Neuberger Berman Asian Debt – Hard Currency Fund (continued)
USD M Accumulating
Class* US$
31 December 2019 Beginning net asset value 10.00
Income from operations: Net investment income/(loss)+ 0.10 Net realised and unrealised gain/(loss) on trading activities+ 0.10
Total from operations 0.20
Ending net asset value 10.20
Total return 2.00%
Ratios to average net assets Expenses++ 2.01%
Net investment income/(loss) 2.40% * Share class launched during the current reporting year.

FINANCIAL STATEMENTS NOTES TO THE AUDITED FINANCIAL STATEMENTS
1578 NEUBERGER BERMAN INVESTMENT FUNDS PLC
FOR THE YEAR ENDED 31 DECEMBER 2019
23. FINANCIAL HIGHLIGHTS (CONTINUED)
Neuberger Berman China Bond Fund
CNY I Distributing
Class
CNY Z Accumulating
Class
EUR M Accumulating
Unhedged Class
SGD A (Monthly)
Distributing Unhedged
Class*
USD I Accumulating
Unhedged Class
USD M Accumulating
Unhedged Class*
CNY CNY € SGD US$ US$
31 December 2019 Beginning net asset value 102.57 110.80 10.25 20.00 10.17 10.00
Income from operations: Net investment income/(loss)+ 4.42 5.69 0.30 0.57 0.44 0.11Net realised and unrealised gain/(loss) on trading activities+ 3.12 3.42 0.38 (0.70) 0.21 0.21
Total from operations 7.54 9.11 0.68 (0.13) 0.65 0.32
Distributions (4.25) – – (0.83) – –
Ending net asset value 105.86 119.91 10.93 19.04 10.82 10.32
Total return 7.51% 8.22% 6.63% (0.61%) 6.39% 3.20%
Ratios to average net assets Expenses++ 0.97% 0.33% 2.39% 1.60% 0.97% 2.36%
Net investment income/(loss) 4.24% 4.84% 2.76% 3.64% 4.22% 2.70%
31 December 2018 Beginning net asset value 100.00 104.51 10.00 – 10.21 –
Income from operations: Net investment income/(loss)+ 1.90 3.10 0.04 – 0.27 –Net realised and unrealised gain/(loss) on trading activities+ 1.57 3.19 0.21 – (0.31) –
Total from operations 3.47 6.29 0.25 – (0.04) –
Distributions (0.90) – – – – –
Ending net asset value 102.57 110.80 10.25 – 10.17 –
Total return 3.49% 6.02% 2.50% – (0.39%) –
Ratios to average net assets Expenses++ 0.92% 0.13% 2.63% – 0.80% –
Net investment income/(loss) 3.33% 3.09% 2.24% – 2.65% –
* Share class launched during the current reporting year.

NOTES TO THE AUDITED FINANCIAL STATEMENTS FINANCIAL STATEMENTS
ANNUAL REPORT 2019 1579
FOR THE YEAR ENDED 31 DECEMBER 2019
23. FINANCIAL HIGHLIGHTS (CONTINUED)
Neuberger Berman China Bond Fund (continued)
USD Z Accumulating
Class*
USD Z Accumulating
Unhedged Class*
US$ US$
31 December 2019 Beginning net asset value 10.00 9.49
Income from operations: Net investment income/(loss)+ 0.37 0.48Net realised and unrealised gain/(loss) on trading activities+ 0.07 0.18
Total from operations 0.44 0.66
Ending net asset value 10.44 10.15
Total return 4.40% 6.95%
Ratios to average net assets Expenses++ 0.29% 0.32%
Net investment income/(loss) 4.82% 4.85%
31 December 2018 Beginning net asset value – –
Income from operations: Net investment income/(loss)+ – –Net realised and unrealised gain/(loss) on trading activities+ – –
Total from operations – –
Distributions – –
Ending net asset value – –
Total return – –
Ratios to average net assets Expenses++ – –
Net investment income/(loss) – –
* Share class launched during the current reporting year.

FINANCIAL STATEMENTS NOTES TO THE AUDITED FINANCIAL STATEMENTS
1580 NEUBERGER BERMAN INVESTMENT FUNDS PLC
FOR THE YEAR ENDED 31 DECEMBER 2019
23. FINANCIAL HIGHLIGHTS (CONTINUED)
Neuberger Berman Corporate Hybrid Bond Fund
AUD A (Monthly)
Distributing Class
CHF P Accumulating
Class
CHF P Distributing
Class
EUR A (Monthly) Distributing
Class
EUR A Accumulating
Class
EUR I Accumulating
Class AUD CHF CHF € € €
31 December 2019 Beginning net asset value 9.37 9.72 10.02 9.36 10.57 11.01
Income from operations: Net investment income/(loss)+ 0.24 0.32 0.33 0.25 0.29 0.37Net realised and unrealised gain/(loss) on trading activities+ 1.02 0.82 0.84 0.82 0.93 0.97
Total from operations 1.26 1.14 1.17 1.07 1.22 1.34
Distributions (0.49) – (0.34) (0.30) – –
Ending net asset value 10.14 10.86 10.85 10.13 11.79 12.35
Total return 13.77% 11.73% 11.83% 11.52% 11.54% 12.17%
Ratios to average net assets Expenses++ 1.34% 0.71% 0.72% 1.36% 1.36% 0.76%
Net investment income/(loss) 2.39% 3.11% 3.14% 2.50% 2.54% 3.13%
31 December 2018 Beginning net asset value 10.33 10.42 11.04 10.39 11.35 11.76
Income from operations: Net investment income/(loss)+ 0.23 0.28 0.30 0.22 0.24 0.33Net realised and unrealised gain/(loss) on trading activities+ (0.67) (0.98) (1.03) (0.92) (1.02) (1.08)
Total from operations (0.44) (0.70) (0.73) (0.70) (0.78) (0.75)
Distributions (0.52) – (0.29) (0.33) – –
Ending net asset value 9.37 9.72 10.02 9.36 10.57 11.01
Total return (4.39%) (6.72%) (6.74%) (6.93%) (6.87%) (6.38%)
Ratios to average net assets Expenses++ 1.42% 0.74% 0.74% 1.39% 1.39% 0.79%
Net investment income/(loss) 2.36% 2.75% 2.81% 2.25% 2.19% 2.85%

NOTES TO THE AUDITED FINANCIAL STATEMENTS FINANCIAL STATEMENTS
ANNUAL REPORT 2019 1581
FOR THE YEAR ENDED 31 DECEMBER 2019
23. FINANCIAL HIGHLIGHTS (CONTINUED)
Neuberger Berman Corporate Hybrid Bond Fund (continued)
EUR I Distributing
Class
EUR I2 Accumulating
Class
EUR I3 Accumulating
Class
EUR I5 Accumulating
Class
EUR M Accumulating
Class
EUR M Distributing
Class € € € € € €
31 December 2019 Beginning net asset value 10.12 10.11 10.18 11.12 11.37 9.27
Income from operations: Net investment income/(loss)+ 0.33 0.36 0.37 0.42 0.23 0.19Net realised and unrealised gain/(loss) on trading activities+ 0.88 0.88 0.90 0.97 1.00 0.80
Total from operations 1.21 1.24 1.27 1.39 1.23 0.99
Distributions (0.34) – – – – (0.39)
Ending net asset value 10.99 11.35 11.45 12.51 12.60 9.87
Total return 12.15% 12.27% 12.48% 12.50% 10.82% 10.86%
Ratios to average net assets Expenses++ 0.75% 0.64% 0.58% 0.47% 1.99% 1.99%
Net investment income/(loss) 3.05% 3.29% 3.34% 3.50% 1.92% 1.93%
31 December 2018 Beginning net asset value 11.10 10.78 10.86 11.83 12.29 10.39
Income from operations: Net investment income/(loss)+ 0.31 0.32 0.33 0.43 0.20 0.16Net realised and unrealised gain/(loss) on trading activities+ (1.00) (0.99) (1.01) (1.14) (1.12) (0.92)
Total from operations (0.69) (0.67) (0.68) (0.71) (0.92) (0.76)
Distributions (0.29) – – – – (0.36)
Ending net asset value 10.12 10.11 10.18 11.12 11.37 9.27
Total return (6.34%) (6.22%) (6.26%) (6.00%) (7.49%) (7.53%)
Ratios to average net assets Expenses++ 0.79% 0.67% 0.61% 0.49% 2.01% 2.01%
Net investment income/(loss) 2.86% 2.99% 3.08% 3.71% 1.65% 1.61%

FINANCIAL STATEMENTS NOTES TO THE AUDITED FINANCIAL STATEMENTS
1582 NEUBERGER BERMAN INVESTMENT FUNDS PLC
FOR THE YEAR ENDED 31 DECEMBER 2019
23. FINANCIAL HIGHLIGHTS (CONTINUED)
Neuberger Berman Corporate Hybrid Bond Fund (continued)
EUR P Accumulating
Class
EUR P Distributing
Class
GBP I Accumulating
Class
GBP I2 Accumulating
Class
GBP I2 Distributing
Class
GBP P Accumulating
Class* € € £ £ £ £
31 December 2019 Beginning net asset value 9.79 10.16 10.10 9.90 9.86 10.00
Income from operations: Net investment income/(loss)+ 0.34 0.34 0.33 0.34 0.33 0.11Net realised and unrealised gain/(loss) on trading activities+ 0.86 0.88 1.04 1.01 0.99 0.19
Total from operations 1.20 1.22 1.37 1.35 1.32 0.30
Distributions – (0.34) – – (0.34) –
Ending net asset value 10.99 11.04 11.47 11.25 10.84 10.30
Total return 12.26% 12.25% 13.56% 13.64% 13.66% 3.00%
Ratios to average net assets Expenses++ 0.73% 0.73% 0.74% 0.62% 0.62% 0.69%
Net investment income/(loss) 3.19% 3.20% 3.05% 3.16% 3.19% 2.90%
31 December 2018 Beginning net asset value 10.45 11.14 10.66 10.44 10.69 –
Income from operations: Net investment income/(loss)+ 0.29 0.31 0.29 0.31 0.31 –Net realised and unrealised gain/(loss) on trading activities+ (0.95) (1.00) (0.85) (0.85) (0.85) –
Total from operations (0.66) (0.69) (0.56) (0.54) (0.54) –
Distributions – (0.29) – – (0.29) –
Ending net asset value 9.79 10.16 10.10 9.90 9.86 –
Total return (6.32%) (6.28%) (5.25%) (5.17%) (5.14%) –
Ratios to average net assets Expenses++ 0.76% 0.76% 0.80% 0.68% 0.68% –
Net investment income/(loss) 2.79% 2.92% 2.69% 3.00% 3.02% –
* Share class launched during the current reporting year.

NOTES TO THE AUDITED FINANCIAL STATEMENTS FINANCIAL STATEMENTS
ANNUAL REPORT 2019 1583
FOR THE YEAR ENDED 31 DECEMBER 2019
23. FINANCIAL HIGHLIGHTS (CONTINUED)
Neuberger Berman Corporate Hybrid Bond Fund (continued)
GBP P Distributing
Class
HKD A (Monthly)
Distributing Class*
SGD A(Monthly)
Distributing Class*
USD A (Monthly)
Distributing Class
USD A Accumulating
Class
USD C1 Accumulating
Class £ HKD SGD US$ US$ US$
31 December 2019 Beginning net asset value 9.52 10.00 20.00 9.59 10.56 9.51
Income from operations: Net investment income/(loss)+ 0.31 0.04 0.20 0.26 0.29 0.15Net realised and unrealised gain/(loss) on trading activities+ 0.96 0.07 0.51 1.13 1.28 1.15
Total from operations 1.27 0.11 0.71 1.39 1.57 1.30
Distributions (0.32) (0.04) (0.32) (0.52) – –
Ending net asset value 10.47 10.07 20.39 10.46 12.13 10.81
Total return 13.60% 1.15% 3.57% 14.79% 14.87% 13.67%
Ratios to average net assets Expenses++ 0.71% 1.33% 1.33% 1.36% 1.36% 2.38%
Net investment income/(loss) 3.06% 2.32% 2.33% 2.49% 2.45% 1.42%
31 December 2018 Beginning net asset value 10.33 – – 10.52 11.04 10.04
Income from operations: Net investment income/(loss)+ 0.28 – – 0.22 0.24 0.12Net realised and unrealised gain/(loss) on trading activities+ (0.82) – – (0.66) (0.72) (0.65)
Total from operations (0.54) – – (0.44) (0.48) (0.53)
Distributions (0.27) – – (0.49) – –
Ending net asset value 9.52 – – 9.59 10.56 9.51
Total return (5.30%) – – (4.30%) (4.35%) (5.28%)
Ratios to average net assets Expenses++ 0.77% – – 1.34% 1.34% 2.34%
Net investment income/(loss) 2.84% – – 2.22% 2.18% 1.22%
* Share class launched during the current reporting year.

FINANCIAL STATEMENTS NOTES TO THE AUDITED FINANCIAL STATEMENTS
1584 NEUBERGER BERMAN INVESTMENT FUNDS PLC
FOR THE YEAR ENDED 31 DECEMBER 2019
23. FINANCIAL HIGHLIGHTS (CONTINUED)
Neuberger Berman Corporate Hybrid Bond Fund (continued)
USD I Accumulating
Class
USD I2 Accumulating
Class
USD I2 Distributing
Class
USD M Accumulating
Class
USD M Distributing
Class
USD P Accumulating
Class US$ US$ US$ US$ US$ US$
31 December 2019 Beginning net asset value 11.39 10.58 10.09 9.55 9.28 10.13
Income from operations: Net investment income/(loss)+ 0.39 0.38 0.35 0.20 0.19 0.35Net realised and unrealised gain/(loss) on trading activities+ 1.39 1.28 1.20 1.15 1.10 1.24
Total from operations 1.78 1.66 1.55 1.35 1.29 1.59
Distributions – – (0.35) – (0.39) –
Ending net asset value 13.17 12.24 11.29 10.90 10.18 11.72
Total return 15.63% 15.69% 15.66% 14.14% 14.17% 15.70%
Ratios to average net assets Expenses++ 0.76% 0.64% 0.64% 1.99% 1.99% 0.73%
Net investment income/(loss) 3.12% 3.26% 3.22% 1.87% 1.89% 3.19%
31 December 2018 Beginning net asset value 11.84 10.97 10.76 10.04 10.04 10.53
Income from operations: Net investment income/(loss)+ 0.33 0.32 0.29 0.16 0.14 0.28Net realised and unrealised gain/(loss) on trading activities+ (0.78) (0.71) (0.67) (0.65) (0.63) (0.68)
Total from operations (0.45) (0.39) (0.38) (0.49) (0.49) (0.40)
Distributions – – (0.29) – (0.27) –
Ending net asset value 11.39 10.58 10.09 9.55 9.28 10.13
Total return (3.80%) (3.56%) (3.58%) (4.88%) (4.94%) (3.80%)
Ratios to average net assets Expenses++ 0.76% 0.64% 0.65% 1.95% 1.95% 0.73%
Net investment income/(loss) 2.84% 2.96% 2.82% 1.59% 1.49% 2.70%

NOTES TO THE AUDITED FINANCIAL STATEMENTS FINANCIAL STATEMENTS
ANNUAL REPORT 2019 1585
FOR THE YEAR ENDED 31 DECEMBER 2019
23. FINANCIAL HIGHLIGHTS (CONTINUED)
Neuberger Berman Corporate Hybrid Bond Fund (continued)
USD Z Accumulating
Class US$
31 December 2019 Beginning net asset value 10.67
Income from operations: Net investment income/(loss)+ 0.44 Net realised and unrealised gain/(loss) on trading activities+ 1.29
Total from operations 1.73
Ending net asset value 12.40
Total return 16.21%
Ratios to average net assets Expenses++ 0.16%
Net investment income/(loss) 3.74%
31 December 2018 Beginning net asset value 11.02
Income from operations: Net investment income/(loss)+ 0.37 Net realised and unrealised gain/(loss) on trading activities+ (0.72)
Total from operations (0.35)
Ending net asset value 10.67
Total return (3.18%)
Ratios to average net assets Expenses++ 0.18%
Net investment income/(loss) 3.39%

FINANCIAL STATEMENTS NOTES TO THE AUDITED FINANCIAL STATEMENTS
1586 NEUBERGER BERMAN INVESTMENT FUNDS PLC
FOR THE YEAR ENDED 31 DECEMBER 2019
23. FINANCIAL HIGHLIGHTS (CONTINUED)
Neuberger Berman US Equity Fund
USD I Accumulating
Class
USD I Distributing
Class US$ US$
31 December 2019 Beginning net asset value 12.95 12.90
Income from operations: Net investment income/(loss)+ (0.01) 0.01Net realised and unrealised gain/(loss) on trading activities+ 4.38 4.33
Total from operations 4.37 4.34
Distributions – (0.03)
Ending net asset value 17.32 17.21
Total return 33.75% 33.75%
Ratios to average net assets Expenses++ 1.22% 1.52%
Net investment income/(loss) (0.03%) 0.10%
31 December 2018 Beginning net asset value 13.89 13.87
Income from operations: Net investment income/(loss)+ 0.03 0.03Net realised and unrealised gain/(loss) on trading activities+ (0.97) (0.97)
Total from operations (0.94) (0.94)
Distributions – (0.03)
Ending net asset value 12.95 12.90
Total return (6.77%) (6.82%)
Ratios to average net assets Expenses++ 0.98% 0.99%
Net investment income/(loss) 0.22% 0.22%

NOTES TO THE AUDITED FINANCIAL STATEMENTS FINANCIAL STATEMENTS
ANNUAL REPORT 2019 1587
FOR THE YEAR ENDED 31 DECEMBER 2019
23. FINANCIAL HIGHLIGHTS (CONTINUED)
Neuberger Berman Global High Yield Bond Fund
EUR M Accumulating
Class
EUR M Distributing
Class
EUR Z (PF) Accumulating
Class
GBP I Accumulating
Class
USD A Accumulating
Class
USD C1 Accumulating
Class* € € € £ US$ US$
31 December 2019 Beginning net asset value 9.52 8.75 10.27 9.73 10.44 10.00
Income from operations: Net investment income/(loss)+ 0.39 0.34 0.61 0.51 0.51 0.12Net realised and unrealised gain/(loss) on trading activities+ 0.53 0.48 0.58 0.72 0.92 0.25
Total from operations 0.92 0.82 1.19 1.23 1.43 0.37
Distributions – (0.53) – – – –
Ending net asset value 10.44 9.04 11.46 10.96 11.87 10.37
Total return 9.66% 9.63% 11.59% 12.64% 13.70% 3.70%
Ratios to average net assets Expenses++ 2.01% 2.01% 0.32% 0.79% 1.42% 2.39%
Net investment income/(loss) 3.85% 3.84% 5.54% 4.86% 4.46% 3.53%
31 December 2018 Beginning net asset value 10.14 9.87 10.75 10.13 10.74 –
Income from operations: Net investment income/(loss)+ 0.38 0.36 0.59 0.52 0.44 –Net realised and unrealised gain/(loss) on trading activities+ (1.00) (0.93) (1.07) (0.92) (0.74) –
Total from operations (0.62) (0.57) (0.48) (0.40) (0.30) –
Distributions – (0.55) – – – –
Ending net asset value 9.52 8.75 10.27 9.73 10.44 –
Total return (6.11%) (6.04%) (4.47%) (3.95%) (2.79%) –
Ratios to average net assets Expenses++ 2.07% 2.07% 0.31% 0.84% 1.40% –
Net investment income/(loss) 3.86% 3.84% 5.57% 5.17% 4.13% –
* Share class launched during the current reporting year.

FINANCIAL STATEMENTS NOTES TO THE AUDITED FINANCIAL STATEMENTS
1588 NEUBERGER BERMAN INVESTMENT FUNDS PLC
FOR THE YEAR ENDED 31 DECEMBER 2019
23. FINANCIAL HIGHLIGHTS (CONTINUED)
Neuberger Berman Global High Yield Bond Fund (continued)
USD I Accumulating
Class
USD M Accumulating
Class*
USD M Distributing
Class
USD P Accumulating
Class
USD Z (PF) Accumulating
Class
USD Z Accumulating
Class US$ US$ US$ US$ US$ US$
31 December 2019 Beginning net asset value 10.71 10.00 9.24 9.71 10.82 10.86
Income from operations: Net investment income/(loss)+ 0.60 0.16 0.37 0.53 0.65 0.67Net realised and unrealised gain/(loss) on trading activities+ 0.94 0.28 0.80 0.87 0.98 0.98
Total from operations 1.54 0.44 1.17 1.40 1.63 1.65
Distributions – – (0.54) – – –
Ending net asset value 12.25 10.44 9.87 11.11 12.45 12.51
Total return 14.38% 4.40% 13.00% 14.42% 15.06% 15.19%
Ratios to average net assets Expenses++ 0.80% 2.00% 2.02% 0.79% 0.32% 0.22%
Net investment income/(loss) 5.07% 3.91% 3.85% 5.07% 5.55% 5.65%
31 December 2018 Beginning net asset value 10.96 – 10.00 10.00 11.03 11.05
Income from operations: Net investment income/(loss)+ 0.52 – 0.33 0.48 0.59 0.61Net realised and unrealised gain/(loss) on trading activities+ (0.77) – (0.72) (0.77) (0.80) (0.80)
Total from operations (0.25) – (0.39) (0.29) (0.21) (0.19)
Distributions – – (0.37) – – –
Ending net asset value 10.71 – 9.24 9.71 10.82 10.86
Total return (2.28%) – (4.02%) (2.90%) (1.90%) (1.72%)
Ratios to average net assets Expenses++ 0.80% – 2.01% 0.77% 0.31% 0.20%
Net investment income/(loss) 4.83% – 3.74% 4.97% 5.38% 5.51%
* Share class launched during the current reporting year.

NOTES TO THE AUDITED FINANCIAL STATEMENTS FINANCIAL STATEMENTS
ANNUAL REPORT 2019 1589
FOR THE YEAR ENDED 31 DECEMBER 2019
23. FINANCIAL HIGHLIGHTS (CONTINUED)
Neuberger Berman Global Opportunistic Bond Fund
EUR I Accumulating
Class
JPY I Accumulating
Class
USD A Accumulating
Class
USD C1 Accumulating
Class*
USD I Accumulating
Class
USD I Distributing
Class € ¥ US$ US$ US$ US$
31 December 2019 Beginning net asset value 9.99 1,000.06 9.98 10.00 10.49 10.09
Income from operations: Net investment income/(loss)+ 0.25 30.94 0.27 0.07 0.33 0.30Net realised and unrealised gain/(loss) on trading activities+ 0.30 30.09 0.61 0.07 0.64 0.62
Total from operations 0.55 61.03 0.88 0.14 0.97 0.92
Distributions – – – – – (0.25)
Ending net asset value 10.54 1,061.09 10.86 10.14 11.46 10.76
Total return 5.51% 6.10% 8.82% 1.40% 9.25% 9.22%
Ratios to average net assets Expenses++ 0.62% 0.63% 1.02% 2.03% 0.63% 0.63%
Net investment income/(loss) 2.43% 2.95% 2.35% 1.36% 2.94% 2.84%
31 December 2018 Beginning net asset value 10.39 1,036.78 10.12 – 10.60 10.44
Income from operations: Net investment income/(loss)+ 0.28 27.28 0.22 – 0.27 0.26Net realised and unrealised gain/(loss) on trading activities+ (0.68) (64.00) (0.36) – (0.38) (0.36)
Total from operations (0.40) (36.72) (0.14) – (0.11) (0.10)
Distributions – – – – – (0.25)
Ending net asset value 9.99 1,000.06 9.98 – 10.49 10.09
Total return (3.85%) (3.54%) (1.38%) – (1.04%) (1.00%)
Ratios to average net assets Expenses++ 0.62% 0.60% 1.00% – 0.60% 0.60%
Net investment income/(loss) 2.76% 2.66% 2.16% – 2.61% 2.51%
* Share class launched during the current reporting year.

FINANCIAL STATEMENTS NOTES TO THE AUDITED FINANCIAL STATEMENTS
1590 NEUBERGER BERMAN INVESTMENT FUNDS PLC
FOR THE YEAR ENDED 31 DECEMBER 2019
23. FINANCIAL HIGHLIGHTS (CONTINUED)
Neuberger Berman Global Opportunistic Bond Fund (continued)
USD I2 Accumulating
Class
USD M Accumulating
Class*
USD Z Accumulating
Class** US$ US$ US$
31 December 2019 Beginning net asset value 9.89 10.00 9.92
Income from operations: Net investment income/(loss)+ 0.31 0.01 0.24Net realised and unrealised gain/(loss) on trading activities+ 0.61 0.00 0.27
Total from operations 0.92 0.01 0.51
Ending net asset value 10.81 10.01 10.43
Total return 9.30% 0.10% 4.30%
Ratios to average net assets Expenses++ 0.55% 1.61% 0.30%
Net investment income/(loss) 3.00% 1.70% 3.93%
31 December 2018 Beginning net asset value 10.00 – 10.00
Income from operations: Net investment income/(loss)+ 0.19 – 0.12Net realised and unrealised gain/(loss) on trading activities+ (0.30) – (0.20)
Total from operations (0.11) – (0.08)
Distributions – – –
Ending net asset value 9.89 – 9.92
Total return (1.10%) – (0.80%)
Ratios to average net assets Expenses++ 0.53% – 0.20%
Net investment income/(loss) 2.74% – 2.84%
* Share class launched during the current reporting year. ** Share class closed and relaunched during the current reporting year.

NOTES TO THE AUDITED FINANCIAL STATEMENTS FINANCIAL STATEMENTS
ANNUAL REPORT 2019 1591
FOR THE YEAR ENDED 31 DECEMBER 2019
23. FINANCIAL HIGHLIGHTS (CONTINUED)
Neuberger Berman Multi-Asset Class Income Fund
EUR A Distributing
Class*
EUR I Accumulating
Class*
EUR M Accumulating
Class
EUR M Distributing
Class
GBP I Accumulating
Class*
USD A Accumulating
Class € € € € £ US$
31 December 2019 Beginning net asset value 10.00 10.00 9.10 8.74 10.00 9.42
Income from operations: Net investment income/(loss)+ 0.00 0.01 0.11 0.11 0.13 0.21Net realised and unrealised gain/(loss) on trading activities+ (0.02) (0.04) 0.59 0.56 0.40 0.92
Total from operations (0.02) (0.03) 0.70 0.67 0.53 1.13
Distributions – – – (0.36) – –
Ending net asset value 9.98 9.97 9.80 9.05 10.53 10.55
Total return (0.20%) (0.30%) 7.69% 7.78% 5.30% 12.00%
Ratios to average net assets Expenses++ 775.12% 2.05% 2.42% 2.39% 0.96% 1.64%
Net investment income/(loss) (640.47%) 2.44% 1.15% 1.26% 2.22% 2.06%
31 December 2018 Beginning net asset value – – 10.29 10.23 – 10.00
Income from operations: Net investment income/(loss)+ – – 0.13 0.13 – 0.19Net realised and unrealised gain/(loss) on trading activities+ – – (1.32) (1.28) – (0.77)
Total from operations – – (1.19) (1.15) – (0.58)
Distributions – – – (0.34) – –
Ending net asset value – – 9.10 8.74 – 9.42
Total return – – (11.56%) (11.54%) – (5.80%)
Ratios to average net assets Expenses++ – – 2.43% 2.44% – 1.55%
Net investment income/(loss) – – 1.32% 1.39% – 2.23%
* Share class launched during the current reporting year.

FINANCIAL STATEMENTS NOTES TO THE AUDITED FINANCIAL STATEMENTS
1592 NEUBERGER BERMAN INVESTMENT FUNDS PLC
FOR THE YEAR ENDED 31 DECEMBER 2019
23. FINANCIAL HIGHLIGHTS (CONTINUED)
Neuberger Berman Multi-Asset Class Income Fund (continued)
USD C1 Accumulating
Class
USD I Accumulating
Class
USD I Distributing
Class
USD M Accumulating
Class US$ US$ US$ US$
31 December 2019 Beginning net asset value 9.39 10.30 9.86 9.46
Income from operations: Net investment income/(loss)+ 0.11 0.29 0.28 0.09 Net realised and unrealised gain/(loss) on trading activities+ 0.91 1.02 0.96 0.96
Total from operations 1.02 1.31 1.24 1.05
Distributions – – (0.42) –
Ending net asset value 10.41 11.61 10.68 10.51
Total return 10.86% 12.72% 12.75% 11.10%
Ratios to average net assets Expenses++ 2.64% 0.98% 0.94% 2.48%
Net investment income/(loss) 1.06% 2.63% 2.68% 0.85%
31 December 2018 Beginning net asset value 10.00 11.14 10.93 10.37
Income from operations: Net investment income/(loss)+ 0.09 0.28 0.26 0.13 Net realised and unrealised gain/(loss) on trading activities+ (0.70) (1.12) (1.07) (1.04)
Total from operations (0.61) (0.84) (0.81) (0.91)
Distributions – – (0.26) –
Ending net asset value 9.39 10.30 9.86 9.46
Total return (6.10%) (7.54%) (7.60%) (8.78%)
Ratios to average net assets Expenses++ 2.60% 0.89% 0.87% 2.40%
Net investment income/(loss) 1.10% 2.60% 2.51% 1.27%

NOTES TO THE AUDITED FINANCIAL STATEMENTS FINANCIAL STATEMENTS
ANNUAL REPORT 2019 1593
FOR THE YEAR ENDED 31 DECEMBER 2019
23. FINANCIAL HIGHLIGHTS (CONTINUED)
Neuberger Berman US Equity Index PutWrite Fund
EUR I Accumulating
Class
EUR I4 Accumulating
Class
EUR M Accumulating
Class
GBP I Accumulating
Class
GBP I Accumulating
Unhedged Class
GBP I4 Accumulating
Class € € € £ £ £
31 December 2019 Beginning net asset value 9.65 9.53 9.40 9.47 9.68 9.69
Income from operations: Net investment income/(loss)+ 0.08 0.11 (0.06) 0.08 0.08 0.11Net realised and unrealised gain/(loss) on trading activities+ 1.05 1.03 1.00 1.16 0.95 1.18
Total from operations 1.13 1.14 0.94 1.24 1.03 1.29
Ending net asset value 10.78 10.67 10.34 10.71 10.71 10.98
Total return 11.71% 11.96% 10.00% 13.09% 10.64% 13.31%
Ratios to average net assets Expenses++ 0.78% 0.54% 2.20% 0.75% 0.75% 0.52%
Net investment income/(loss) 0.80% 1.05% (0.65%) 0.77% 0.80% 1.02%
31 December 2018 Beginning net asset value 10.63 10.48 10.50 10.33 9.76 10.53
Income from operations: Net investment income/(loss)+ 0.03 0.06 (0.12) 0.03 0.03 0.06Net realised and unrealised gain/(loss) on trading activities+ (1.01) (1.01) (0.98) (0.89) (0.11) (0.90)
Total from operations (0.98) (0.95) (1.10) (0.86) (0.08) (0.84)
Ending net asset value 9.65 9.53 9.40 9.47 9.68 9.69
Total return (9.22%) (9.06%) (10.48%) (8.33%) (0.82%) (7.98%)
Ratios to average net assets Expenses++ 0.83% 0.59% 2.28% 0.84% 0.84% 0.60%
Net investment income/(loss) 0.31% 0.57% (1.15%) 0.29% 0.31% 0.61%

FINANCIAL STATEMENTS NOTES TO THE AUDITED FINANCIAL STATEMENTS
1594 NEUBERGER BERMAN INVESTMENT FUNDS PLC
FOR THE YEAR ENDED 31 DECEMBER 2019
23. FINANCIAL HIGHLIGHTS (CONTINUED)
Neuberger Berman US Equity Index PutWrite Fund (continued)
GBP I4 Accumulating
Unhedged Class
GBP I4 Distributing
Class
SGD A(Monthly)
Distributing Class
USD A (Monthly)
Distributing Class
USD A Accumulating
Class
USD C1 Accumulating
Class £ £ SGD US$ US$ US$
31 December 2019 Beginning net asset value 9.91 9.59 17.82 9.10 10.09 9.17
Income from operations: Net investment income/(loss)+ 0.11 0.10 0.04 0.02 0.04 (0.09)Net realised and unrealised gain/(loss) on trading activities+ 0.97 1.15 2.31 1.26 1.42 1.31
Total from operations 1.08 1.25 2.35 1.28 1.46 1.22
Distributions – (0.40) (0.75) (0.38) – –
Ending net asset value 10.99 10.44 19.42 10.00 11.55 10.39
Total return 10.90% 13.34% 13.44% 14.38% 14.47% 13.30%
Ratios to average net assets Expenses++ 0.52% 0.52% 1.36% 1.38% 1.37% 2.40%
Net investment income/(loss) 1.02% 1.01% 0.21% 0.21% 0.40% (0.88%)
31 December 2018 Beginning net asset value 9.97 10.52 20.18 10.00 10.88 9.98
Income from operations: Net investment income/(loss)+ 0.06 0.06 (0.06) (0.01) (0.04) (0.13)Net realised and unrealised gain/(loss) on trading activities+ (0.12) (0.90) (1.52) (0.77) (0.75) (0.68)
Total from operations (0.06) (0.84) (1.58) (0.78) (0.79) (0.81)
Distributions – (0.09) (0.78) (0.12) – –
Ending net asset value 9.91 9.59 17.82 9.10 10.09 9.17
Total return (0.60%) (8.10%) (8.08%) (7.90%) (7.26%) (8.12%)
Ratios to average net assets Expenses++ 0.59% 0.59% 1.42% 1.40% 1.40% 2.41%
Net investment income/(loss) 0.56% 0.58% (0.30%) (0.18%) (0.34%) (1.30%)

NOTES TO THE AUDITED FINANCIAL STATEMENTS FINANCIAL STATEMENTS
ANNUAL REPORT 2019 1595
FOR THE YEAR ENDED 31 DECEMBER 2019
23. FINANCIAL HIGHLIGHTS (CONTINUED)
Neuberger Berman US Equity Index PutWrite Fund (continued)
USD I (Monthly)
Distributing Class
USD I Accumulating
Class
USD I3 Accumulating
Class
USD I4 Accumulating
Class
USD I4 Distributing
Class
USD M Accumulating
Class US$ US$ US$ US$ US$ US$
31 December 2019 Beginning net asset value 9.35 10.34 9.14 9.93 9.07 9.83
Income from operations: Net investment income/(loss)+ 0.08 0.08 0.10 0.11 0.13 (0.07)Net realised and unrealised gain/(loss) on trading activities+ 1.29 1.48 1.30 1.42 1.24 1.39
Total from operations 1.37 1.56 1.40 1.53 1.37 1.32
Distributions (0.39) – – – (0.38) –
Ending net asset value 10.33 11.90 10.54 11.46 10.06 11.15
Total return 15.00% 15.09% 15.32% 15.41% 15.47% 13.43%
Ratios to average net assets Expenses++ 0.78% 0.78% 0.60% 0.54% 0.53% 2.21%
Net investment income/(loss) 0.79% 0.76% 0.99% 1.05% 1.31% (0.70%)
31 December 2018 Beginning net asset value 10.42 11.08 10.00 10.61 10.00 10.67
Income from operations: Net investment income/(loss)+ 0.03 0.03 0.02 0.06 0.02 (0.11)Net realised and unrealised gain/(loss) on trading activities+ (0.69) (0.77) (0.88) (0.74) (0.95) (0.73)
Total from operations (0.66) (0.74) (0.86) (0.68) (0.93) (0.84)
Distributions (0.41) – – – 0.00 –
Ending net asset value 9.35 10.34 9.14 9.93 9.07 9.83
Total return (6.60%) (6.68%) (8.60%) (6.41%) (9.27%) (7.87%)
Ratios to average net assets Expenses++ 0.80% 0.80% 0.62% 0.57% 0.55% 2.21%
Net investment income/(loss) 0.28% 0.29% 0.62% 0.55% 0.75% (1.08%)

FINANCIAL STATEMENTS NOTES TO THE AUDITED FINANCIAL STATEMENTS
1596 NEUBERGER BERMAN INVESTMENT FUNDS PLC
FOR THE YEAR ENDED 31 DECEMBER 2019
23. FINANCIAL HIGHLIGHTS (CONTINUED)
Neuberger Berman US Equity Index PutWrite Fund (continued)
USD P Accumulating
Class
USD Z Accumulating
Class US$ US$
31 December 2019 Beginning net asset value 9.14 10.22
Income from operations: Net investment income/(loss)+ 0.06 0.16Net realised and unrealised gain/(loss) on trading activities+ 1.32 1.44
Total from operations 1.38 1.60
Ending net asset value 10.52 11.82
Total return 15.10% 15.66%
Ratios to average net assets Expenses++ 0.75% 0.18%
Net investment income/(loss) 0.66% 1.44%
31 December 2018 Beginning net asset value 10.00 10.88
Income from operations: Net investment income/(loss)+ 0.01 0.10Net realised and unrealised gain/(loss) on trading activities+ (0.87) (0.76)
Total from operations (0.86) (0.66)
Ending net asset value 9.14 10.22
Total return (8.60%) (6.07%)
Ratios to average net assets Expenses++ 0.81% 0.21%
Net investment income/(loss) 0.49% 0.90%

NOTES TO THE AUDITED FINANCIAL STATEMENTS FINANCIAL STATEMENTS
ANNUAL REPORT 2019 1597
FOR THE YEAR ENDED 31 DECEMBER 2019
23. FINANCIAL HIGHLIGHTS (CONTINUED)
Neuberger Berman Global Equity Index PutWrite Fund
AUD X Accumulating
Class
CHF I Distributing
Class
CHF I5 Accumulating
Class
CHF I5 Distributing
Class
CHF X Accumulating
Class
CHF X Distributing
Class AUD CHF CHF CHF CHF CHF
31 December 2019 Beginning net asset value 9.60 9.00 9.31 9.16 9.19 9.09
Income from operations: Net investment income/(loss)+ 0.00 0.04 0.07 0.07 (0.01) 0.00Net realised and unrealised gain/(loss) on trading activities+ 1.03 0.73 0.78 0.75 0.76 0.73
Total from operations 1.03 0.77 0.85 0.82 0.75 0.73
Distributions – (0.37) – (0.38) – (0.37)
Ending net asset value 10.63 9.40 10.16 9.60 9.94 9.45
Total return 10.73% 8.73% 9.13% 9.11% 8.16% 8.23%
Ratios to average net assets Expenses++ 1.36% 0.84% 0.54% 0.54% 1.32% 1.34%
Net investment income/(loss) (0.03%) 0.39% 0.75% 0.75% (0.07%) (0.04%)
31 December 2018 Beginning net asset value 10.44 10.05 10.33 10.23 10.28 10.20
Income from operations: Net investment income/(loss)+ (0.03) 0.02 0.05 0.05 (0.03) (0.03)Net realised and unrealised gain/(loss) on trading activities+ (0.81) (1.03) (1.07) (1.05) (1.06) (1.05)
Total from operations (0.84) (1.01) (1.02) (1.00) (1.09) (1.08)
Distributions – (0.04) – (0.07) – (0.03)
Ending net asset value 9.60 9.00 9.31 9.16 9.19 9.09
Total return (8.05%) (10.12%) (9.87%) (9.80%) (10.60%) (10.59%)
Ratios to average net assets Expenses++ 1.43% 0.86% 0.53% 0.54% 1.35% 1.36%
Net investment income/(loss) (0.29%) 0.21% 0.54% 0.55% (0.28%) (0.27%)

FINANCIAL STATEMENTS NOTES TO THE AUDITED FINANCIAL STATEMENTS
1598 NEUBERGER BERMAN INVESTMENT FUNDS PLC
FOR THE YEAR ENDED 31 DECEMBER 2019
23. FINANCIAL HIGHLIGHTS (CONTINUED)
Neuberger Berman Global Equity Index PutWrite Fund (continued)
EUR A Accumulating
Class
EUR I Accumulating
Class
EUR I5 (Monthly)
Distributing Class
EUR I5 Accumulating
Class
EUR M Accumulating
Class
EUR X (Monthly) Distributing
Class € € € € € €
31 December 2019 Beginning net asset value 9.23 9.09 8.82 9.39 9.11 8.71
Income from operations: Net investment income/(loss)+ (0.02) 0.04 0.07 0.07 (0.09) 0.00Net realised and unrealised gain/(loss) on trading activities+ 0.80 0.78 0.75 0.82 0.78 0.73
Total from operations 0.78 0.82 0.82 0.89 0.69 0.73
Distributions – – (0.36) – – (0.36)
Ending net asset value 10.01 9.91 9.28 10.28 9.80 9.08
Total return 8.45% 9.02% 9.52% 9.48% 7.57% 8.51%
Ratios to average net assets Expenses++ 1.53% 0.85% 0.55% 0.54% 2.32% 1.37%
Net investment income/(loss) (0.20%) 0.37% 0.76% 0.75% (1.00%) (0.03%)
31 December 2018 Beginning net asset value 10.31 10.08 10.15 10.38 10.26 10.11
Income from operations: Net investment income/(loss)+ (0.05) 0.02 0.05 0.06 (0.12) (0.03)Net realised and unrealised gain/(loss) on trading activities+ (1.03) (1.01) (0.99) (1.05) (1.03) (0.99)
Total from operations (1.08) (0.99) (0.94) (0.99) (1.15) (1.02)
Distributions – – (0.39) – – (0.38)
Ending net asset value 9.23 9.09 8.82 9.39 9.11 8.71
Total return (10.48%) (9.82%) (9.54%) (9.54%) (11.21%) (10.31%)
Ratios to average net assets Expenses++ 1.54% 0.89% 0.54% 0.55% 2.38% 1.38%
Net investment income/(loss) (0.48%) 0.22% 0.56% 0.55% (1.27%) (0.29%)

NOTES TO THE AUDITED FINANCIAL STATEMENTS FINANCIAL STATEMENTS
ANNUAL REPORT 2019 1599
FOR THE YEAR ENDED 31 DECEMBER 2019
23. FINANCIAL HIGHLIGHTS (CONTINUED)
Neuberger Berman Global Equity Index PutWrite Fund (continued)
EUR X Accumulating
Class
EUR Z Accumulating
Class
GBP I Accumulating
Class
GBP I5 Accumulating
Class
GBP I5 Distributing
Class
SGD A(Monthly)
Distributing Class
€ € £ £ £ SGD
31 December 2019 Beginning net asset value 9.24 9.40 9.41 9.49 9.43 17.80
Income from operations: Net investment income/(loss)+ (0.01) 0.11 0.04 0.07 0.07 (0.04)Net realised and unrealised gain/(loss) on trading activities+ 0.80 0.81 0.95 0.97 0.93 1.93
Total from operations 0.79 0.92 0.99 1.04 1.00 1.89
Distributions – – – – (0.39) (0.74)
Ending net asset value 10.03 10.32 10.40 10.53 10.04 18.95
Total return 8.55% 9.79% 10.52% 10.96% 10.84% 10.82%
Ratios to average net assets Expenses++ 1.35% 0.24% 0.83% 0.54% 0.54% 1.50%
Net investment income/(loss) (0.07%) 1.10% 0.39% 0.75% 0.76% (0.24%)
31 December 2018 Beginning net asset value 10.30 10.36 10.32 10.38 10.40 20.30
Income from operations: Net investment income/(loss)+ (0.03) 0.09 0.02 0.06 0.06 (0.08)Net realised and unrealised gain/(loss) on trading activities+ (1.03) (1.05) (0.93) (0.95) (0.95) (1.64)
Total from operations (1.06) (0.96) (0.91) (0.89) (0.89) (1.72)
Distributions – – – – (0.08) (0.78)
Ending net asset value 9.24 9.40 9.41 9.49 9.43 17.80
Total return (10.29%) (9.27%) (8.82%) (8.57%) (8.60%) (8.72%)
Ratios to average net assets Expenses++ 1.38% 0.22% 0.88% 0.56% 0.56% 1.52%
Net investment income/(loss) (0.28%) 0.90% 0.23% 0.57% 0.56% (0.44%)

FINANCIAL STATEMENTS NOTES TO THE AUDITED FINANCIAL STATEMENTS
1600 NEUBERGER BERMAN INVESTMENT FUNDS PLC
FOR THE YEAR ENDED 31 DECEMBER 2019
23. FINANCIAL HIGHLIGHTS (CONTINUED)
Neuberger Berman Global Equity Index PutWrite Fund (continued)
SGD I5 Accumulating
Class
SGD X(Monthly)
Distributing Class
SGD X Accumulating
Class
USD A Accumulating
Class
USD C1 Accumulating
Class
USD I Accumulating
Class SGD SGD SGD US$ US$ US$
31 December 2019 Beginning net asset value 19.24 17.92 19.00 9.62 9.50 9.82
Income from operations: Net investment income/(loss)+ 0.16 (0.01) (0.01) (0.02) (0.12) 0.05Net realised and unrealised gain/(loss) on trading activities+ 2.13 1.93 2.10 1.15 1.13 1.17
Total from operations 2.29 1.92 2.09 1.13 1.01 1.22
Distributions – (0.74) – – – –
Ending net asset value 21.53 19.10 21.09 10.75 10.51 11.04
Total return 11.90% 10.94% 11.00% 11.75% 10.63% 12.42%
Ratios to average net assets Expenses++ 0.56% 1.36% 1.34% 1.53% 2.53% 0.90%
Net investment income/(loss) 0.77% (0.03%) (0.07%) (0.22%) (1.21%) 0.49%
31 December 2018 Beginning net asset value 20.87 20.40 20.78 10.44 10.00 10.59
Income from operations: Net investment income/(loss)+ 0.11 (0.05) (0.06) (0.05) (0.11) 0.02Net realised and unrealised gain/(loss) on trading activities+ (1.74) (1.65) (1.72) (0.77) (0.39) (0.79)
Total from operations (1.63) (1.70) (1.78) (0.82) (0.50) (0.77)
Distributions – (0.78) – – – –
Ending net asset value 19.24 17.92 19.00 9.62 9.50 9.82
Total return (7.81%) (8.55%) (8.57%) (7.85%) (5.00%) (7.27%)
Ratios to average net assets Expenses++ 0.60% 1.36% 1.34% 1.49% 2.51% 0.84%
Net investment income/(loss) 0.52% (0.28%) (0.28%) (0.45%) (1.42%) 0.21%

NOTES TO THE AUDITED FINANCIAL STATEMENTS FINANCIAL STATEMENTS
ANNUAL REPORT 2019 1601
FOR THE YEAR ENDED 31 DECEMBER 2019
23. FINANCIAL HIGHLIGHTS (CONTINUED)
Neuberger Berman Global Equity Index PutWrite Fund (continued)
USD I Distributing
Class
USD I5 (Monthly)
Distributing Class
USD I5 Accumulating
Class
USD I5 Distributing
Class
USD X (Monthly)
Distributing Class
USD X Accumulating
Class US$ US$ US$ US$ US$ US$
31 December 2019 Beginning net asset value 9.79 9.19 9.74 9.67 9.07 9.61
Income from operations: Net investment income/(loss)+ 0.05 0.07 0.08 0.08 0.00 (0.01)Net realised and unrealised gain/(loss) on trading activities+ 1.14 1.08 1.17 1.13 1.07 1.16
Total from operations 1.19 1.15 1.25 1.21 1.07 1.15
Distributions (0.41) (0.38) – (0.40) (0.38) –
Ending net asset value 10.57 9.96 10.99 10.48 9.76 10.76
Total return 12.40% 12.81% 12.83% 12.83% 12.01% 11.97%
Ratios to average net assets Expenses++ 0.89% 0.56% 0.55% 0.56% 1.37% 1.35%
Net investment income/(loss) 0.46% 0.77% 0.76% 0.78% (0.05%) (0.08%)
31 December 2018 Beginning net asset value 10.59 10.28 10.46 10.47 10.23 10.41
Income from operations: Net investment income/(loss)+ 0.02 0.05 0.06 0.05 (0.03) (0.03)Net realised and unrealised gain/(loss) on trading activities+ (0.77) (0.74) (0.78) (0.77) (0.74) (0.77)
Total from operations (0.75) (0.69) (0.72) (0.72) (0.77) (0.80)
Distributions (0.05) (0.40) – (0.08) (0.39) –
Ending net asset value 9.79 9.19 9.74 9.67 9.07 9.61
Total return (7.15%) (6.94%) (6.88%) (6.89%) (7.70%) (7.68%)
Ratios to average net assets Expenses++ 0.86% 0.53% 0.53% 0.53% 1.34% 1.34%
Net investment income/(loss) 0.21% 0.54% 0.54% 0.54% (0.28%) (0.28%)

FINANCIAL STATEMENTS NOTES TO THE AUDITED FINANCIAL STATEMENTS
1602 NEUBERGER BERMAN INVESTMENT FUNDS PLC
FOR THE YEAR ENDED 31 DECEMBER 2019
23. FINANCIAL HIGHLIGHTS (CONTINUED)
Neuberger Berman Global Equity Index PutWrite Fund (continued)
USD X
Distributing Class
USD Z Accumulating
Class US$ US$
31 December 2019 Beginning net asset value 9.60 9.70
Income from operations: Net investment income/(loss)+ 0.00 0.11Net realised and unrealised gain/(loss) on trading activities+ 1.12 1.17
Total from operations 1.12 1.28
Distributions (0.40) –
Ending net asset value 10.32 10.98
Total return 11.91% 13.20%
Ratios to average net assets Expenses++ 1.38% 0.23%
Net investment income/(loss) (0.03%) 1.09%
31 December 2018 Beginning net asset value 10.42 10.38
Income from operations: Net investment income/(loss)+ (0.03) 0.09Net realised and unrealised gain/(loss) on trading activities+ (0.76) (0.77)
Total from operations (0.79) (0.68)
Distributions (0.03) –
Ending net asset value 9.60 9.70
Total return (7.57%) (6.55%)
Ratios to average net assets Expenses++ 1.33% 0.21%
Net investment income/(loss) (0.27%) 0.87%

NOTES TO THE AUDITED FINANCIAL STATEMENTS FINANCIAL STATEMENTS
ANNUAL REPORT 2019 1603
FOR THE YEAR ENDED 31 DECEMBER 2019
23. FINANCIAL HIGHLIGHTS (CONTINUED)
Neuberger Berman Uncorrelated Strategies Fund
CHF I Accumulating
Class
CHF I5 Accumulating
Class
EUR A Accumulating
Class
EUR I Accumulating
Class
EUR I2 Accumulating
Class
EUR I5 Accumulating
Class CHF CHF € € € €
31 December 2019 Beginning net asset value 9.67 9.90 9.59 9.72 9.98 10.03
Income from operations: Net investment income/(loss)+ (0.23) (0.20) (0.31) (0.24) (0.23) (0.21)Net realised and unrealised gain/(loss) on trading activities+ 0.12 0.13 0.18 0.18 0.18 0.19
Total from operations (0.11) (0.07) (0.13) (0.06) (0.05) (0.02)
Ending net asset value 9.56 9.83 9.46 9.66 9.93 10.01
Total return (1.14%) (0.71%) (1.36%) (0.62%) (0.50%) (0.20%)
Ratios to average net assets Expenses++ 2.36% 2.05% 3.26% 2.53% 2.37% 2.09%
Net investment income/(loss) (2.34%) (2.02%) (3.22%) (2.48%) (2.33%) (2.07%)
31 December 2018 Beginning net asset value 10.00 10.18 10.00 10.00 10.23 10.26
Income from operations: Net investment income/(loss)+ (0.17) (0.19) (0.09) (0.13) (0.21) (0.19)Net realised and unrealised gain/(loss) on trading activities+ (0.16) (0.09) (0.32) (0.15) (0.04) (0.04)
Total from operations (0.33) (0.28) (0.41) (0.28) (0.25) (0.23)
Ending net asset value 9.67 9.90 9.59 9.72 9.98 10.03
Total return (3.30%) (2.75%) (4.10%) (2.80%) (2.44%) (2.24%)
Ratios to average net assets Expenses++ 2.38% 1.87% 3.04% 1.91% 2.11% 1.89%
Net investment income/(loss) (2.17%) (1.90%) (2.74%) (1.68%) (2.11%) (1.88%)

FINANCIAL STATEMENTS NOTES TO THE AUDITED FINANCIAL STATEMENTS
1604 NEUBERGER BERMAN INVESTMENT FUNDS PLC
FOR THE YEAR ENDED 31 DECEMBER 2019
23. FINANCIAL HIGHLIGHTS (CONTINUED)
Neuberger Berman Uncorrelated Strategies Fund (continued)
EUR M Accumulating
Class
GBP I Accumulating
Class
GBP I2 Accumulating
Class
GBP I5 Accumulating
Class
GBP P Accumulating
Class
GBP Z Accumulating
Class € £ £ £ £ £
31 December 2019 Beginning net asset value 9.68 10.15 10.12 10.19 9.82 10.28
Income from operations: Net investment income/(loss)+ (0.39) (0.24) (0.23) (0.21) (0.25) (0.17)Net realised and unrealised gain/(loss) on trading activities+ 0.18 0.32 0.33 0.33 0.33 0.33
Total from operations (0.21) 0.08 0.10 0.12 0.08 0.16
Ending net asset value 9.47 10.23 10.22 10.31 9.90 10.44
Total return (2.17%) 0.79% 0.99% 1.18% 0.81% 1.56%
Ratios to average net assets Expenses++ 3.99% 2.30% 2.31% 2.01% 2.56% 1.67%
Net investment income/(loss) (3.98%) (2.28%) (2.27%) (2.00%) (2.48%) (1.65%)
31 December 2018 Beginning net asset value 10.09 10.31 10.27 10.31 10.00 10.36
Income from operations: Net investment income/(loss)+ (0.35) (0.20) (0.20) (0.19) (0.05) (0.17)Net realised and unrealised gain/(loss) on trading activities+ (0.06) 0.04 0.05 0.07 (0.13) 0.09
Total from operations (0.41) (0.16) (0.15) (0.12) (0.18) (0.08)
Ending net asset value 9.68 10.15 10.12 10.19 9.82 10.28
Total return (4.06%) (1.55%) (1.46%) (1.16%) (1.80%) (0.77%)
Ratios to average net assets Expenses++ 3.64% 2.07% 2.01% 1.88% 2.33% 1.59%
Net investment income/(loss) (3.56%) (1.94%) (1.95%) (1.88%) (1.99%) (1.63%)

NOTES TO THE AUDITED FINANCIAL STATEMENTS FINANCIAL STATEMENTS
ANNUAL REPORT 2019 1605
FOR THE YEAR ENDED 31 DECEMBER 2019
23. FINANCIAL HIGHLIGHTS (CONTINUED)
Neuberger Berman Uncorrelated Strategies Fund (continued)
SGD A Accumulating
Class
USD A Accumulating
Class
USD C1 Accumulating
Class
USD I Accumulating
Class
USD I2 Accumulating
Class
USD I5 Accumulating
Class SGD US$ US$ US$ US$ US$
31 December 2019 Beginning net asset value 19.79 9.83 9.80 10.35 10.32 10.41
Income from operations: Net investment income/(loss)+ (0.63) (0.32) (0.41) (0.26) (0.24) (0.23)Net realised and unrealised gain/(loss) on trading activities+ 0.81 0.47 0.46 0.50 0.50 0.51
Total from operations 0.18 0.15 0.05 0.24 0.26 0.28
Ending net asset value 19.97 9.98 9.85 10.59 10.58 10.69
Total return 0.91% 1.53% 0.51% 2.32% 2.52% 2.69%
Ratios to average net assets Expenses++ 3.17% 3.22% 4.17% 2.45% 2.37% 2.14%
Net investment income/(loss) (3.14%) (3.19%) (4.17%) (2.42%) (2.31%) (2.11%)
31 December 2018 Beginning net asset value 20.00 10.00 10.00 10.36 10.32 10.38
Income from operations: Net investment income/(loss)+ (0.08) (0.23) (0.29) (0.20) (0.22) (0.20)Net realised and unrealised gain/(loss) on trading activities+ (0.13) 0.06 0.09 0.19 0.22 0.23
Total from operations (0.21) (0.17) (0.20) (0.01) 0.00 0.03
Ending net asset value 19.79 9.83 9.80 10.35 10.32 10.41
Total return (1.05%) (1.70%) (2.00%) (0.10%) 0.00% 0.29%
Ratios to average net assets Expenses++ 3.19% 2.65% 3.71% 2.09% 2.05% 1.85%
Net investment income/(loss) (2.88%) (2.43%) (3.51%) (1.89%) (2.07%) (1.86%)

FINANCIAL STATEMENTS NOTES TO THE AUDITED FINANCIAL STATEMENTS
1606 NEUBERGER BERMAN INVESTMENT FUNDS PLC
FOR THE YEAR ENDED 31 DECEMBER 2019
23. FINANCIAL HIGHLIGHTS (CONTINUED)
Neuberger Berman Uncorrelated Strategies Fund (continued)
USD M Accumulating
Class
USD P Accumulating
Class
USD Z Accumulating
Class US$ US$ US$
31 December 2019 Beginning net asset value 10.01 10.06 10.33
Income from operations: Net investment income/(loss)+ (0.41) (0.34) (0.18)Net realised and unrealised gain/(loss) on trading activities+ 0.49 0.58 0.50
Total from operations 0.08 0.24 0.32
Ending net asset value 10.09 10.30 10.65
Total return 0.80% 2.39% 3.10%
Ratios to average net assets Expenses++ 4.01% 3.36% 1.72%
Net investment income/(loss) (3.99%) (3.25%) (1.66%)
31 December 2018 Beginning net asset value 10.18 10.00 10.26
Income from operations: Net investment income/(loss)+ (0.34) (0.01) (0.18)Net realised and unrealised gain/(loss) on trading activities+ 0.17 0.07 0.25
Total from operations (0.17) 0.06 0.07
Ending net asset value 10.01 10.06 10.33
Total return (1.67%) 0.60% 0.68%
Ratios to average net assets Expenses++ 3.46% 3.02% 1.84%
Net investment income/(loss) (3.30%) (2.82%) (1.71%)

NOTES TO THE AUDITED FINANCIAL STATEMENTS FINANCIAL STATEMENTS
ANNUAL REPORT 2019 1607
FOR THE YEAR ENDED 31 DECEMBER 2019
23. FINANCIAL HIGHLIGHTS (CONTINUED)
Neuberger Berman Emerging Market Debt Blend Investment Grade Fund
EUR I5 Distributing
Class
GBP I5Distributing
Class
NOK I Accumulating
Class
NOK U Accumulating
Class
USD I Accumulating
Class
USD I5 Accumulating
Class € £ NOK NOK US$ US$
31 December 2019 Beginning net asset value 10.16 10.19 101.14 97.07 10.15 10.19
Income from operations: Net investment income/(loss)+ 0.43 0.41 3.70 3.59 0.40 0.44Net realised and unrealised gain/(loss) on trading activities+ 0.96 0.88 9.20 8.48 1.13 1.14
Total from operations 1.39 1.29 12.90 12.07 1.53 1.58
Distributions (0.36) (0.36) – – – –
Ending net asset value 11.19 11.12 114.04 109.14 11.68 11.77
Total return 13.84% 12.78% 12.75% 12.43% 15.07% 15.51%
Ratios to average net assets Expenses++ 0.44% 0.43% 0.81% 1.00% 0.74% 0.44%
Net investment income/(loss) 3.95% 3.82% 3.35% 3.51% 3.65% 3.95%
31 December 2018 Beginning net asset value 10.00 10.00 100.00 100.00 10.47 10.49
Income from operations: Net investment income/(loss)+ 0.04 0.04 2.65 3.45 0.40 0.43Net realised and unrealised gain/(loss) on trading activities+ 0.12 0.15 (1.51) (6.38) (0.72) (0.73)
Total from operations 0.16 0.19 1.14 (2.93) (0.32) (0.30)
Ending net asset value 10.16 10.19 101.14 97.07 10.15 10.19
Total return 1.60% 1.90% 1.14% (2.93%) (3.06%) (2.86%)
Ratios to average net assets Expenses++ 0.42% 0.43% 0.69% 1.01% 0.65% 0.35%
Net investment income/(loss) 4.20% 4.26% 4.17% 3.81% 3.87% 4.17%
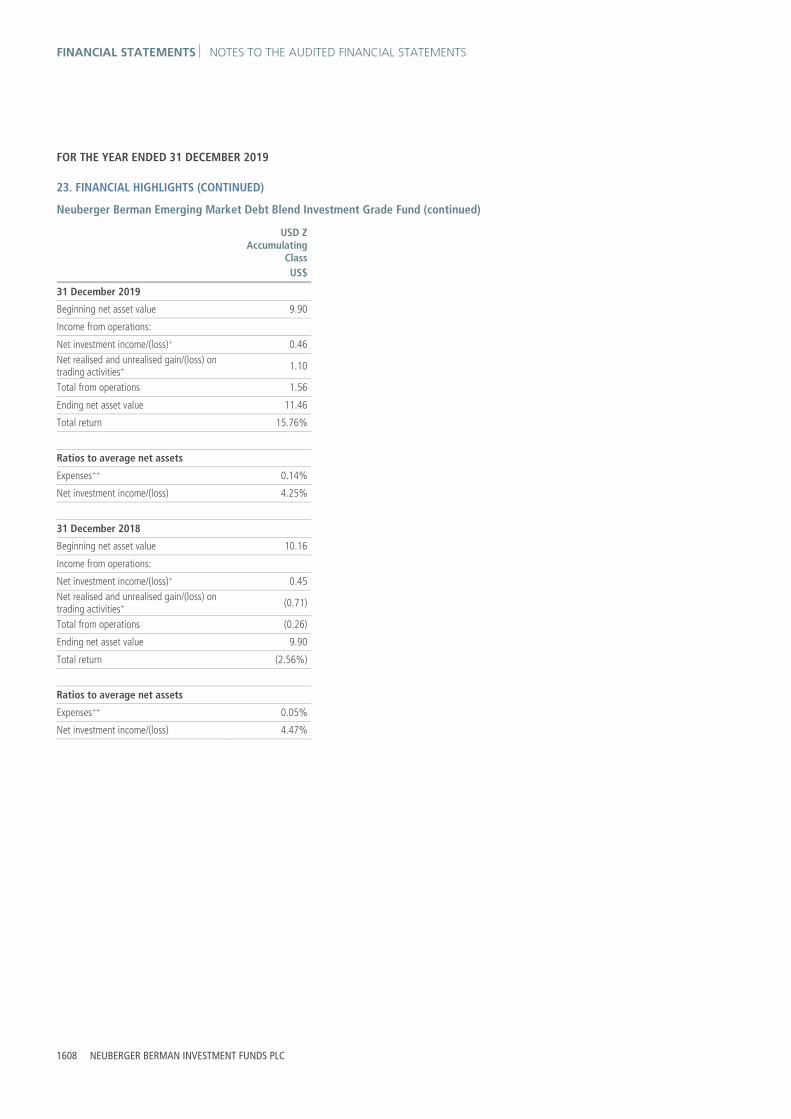
FINANCIAL STATEMENTS NOTES TO THE AUDITED FINANCIAL STATEMENTS
1608 NEUBERGER BERMAN INVESTMENT FUNDS PLC
FOR THE YEAR ENDED 31 DECEMBER 2019
23. FINANCIAL HIGHLIGHTS (CONTINUED)
Neuberger Berman Emerging Market Debt Blend Investment Grade Fund (continued)
USD Z Accumulating
Class US$
31 December 2019 Beginning net asset value 9.90
Income from operations: Net investment income/(loss)+ 0.46 Net realised and unrealised gain/(loss) on trading activities+ 1.10
Total from operations 1.56
Ending net asset value 11.46
Total return 15.76%
Ratios to average net assets Expenses++ 0.14%
Net investment income/(loss) 4.25%
31 December 2018 Beginning net asset value 10.16
Income from operations: Net investment income/(loss)+ 0.45 Net realised and unrealised gain/(loss) on trading activities+ (0.71)
Total from operations (0.26)
Ending net asset value 9.90
Total return (2.56%)
Ratios to average net assets Expenses++ 0.05%
Net investment income/(loss) 4.47%

NOTES TO THE AUDITED FINANCIAL STATEMENTS FINANCIAL STATEMENTS
ANNUAL REPORT 2019 1609
FOR THE YEAR ENDED 31 DECEMBER 2019
23. FINANCIAL HIGHLIGHTS (CONTINUED)
Neuberger Berman Emerging Markets Sustainable Equity Fund
EUR M Accumulating
Unhedged Class
JPY I Accumulating
Unhedged Class
USD A Accumulating
Class
USD I Accumulating
Class
USD I Distributing
Class
USD I5 Accumulating
Class € ¥ US$ US$ US$ US$
31 December 2019 Beginning net asset value 10.18 925.14 10.67 8.83 8.83 8.39
Income from operations: Net investment income/(loss)+ (0.06) 11.16 0.03 0.02 0.10 0.14Net realised and unrealised gain/(loss) on trading activities+ 2.05 157.77 1.93 1.70 1.60 1.53
Total from operations 1.99 168.93 1.96 1.72 1.70 1.67
Distributions – – – – (0.06) –
Ending net asset value 12.17 1,094.07 12.63 10.55 10.47 10.06
Total return 19.55% 18.26% 18.37% 19.48% 19.39% 19.90%
Ratios to average net assets Expenses++ 2.87% 1.22% 2.08% 1.84% 1.10% 0.80%
Net investment income/(loss) (0.54%) 1.10% 0.26% 0.17% 1.05% 1.53%
31 December 2018 Beginning net asset value 10.00 1,000.00 10.00 10.54 10.54 9.97
Income from operations: Net investment income/(loss)+ (0.05) (0.97) (0.03) 0.09 0.09 0.12Net realised and unrealised gain/(loss) on trading activities+ 0.23 (73.89) 0.70 (1.80) (1.80) (1.70)
Total from operations 0.18 (74.86) 0.67 (1.71) (1.71) (1.58)
Ending net asset value 10.18 925.14 10.67 8.83 8.83 8.39
Total return 1.80% (7.49%) 6.70% (16.22%) (16.22%) (15.85%)
Ratios to average net assets Expenses++ 3.87% 3.60% 3.10% 1.21% 1.21% 0.81%
Net investment income/(loss) (2.62%) (1.41%) (1.80%) 0.93% 0.94% 1.24%
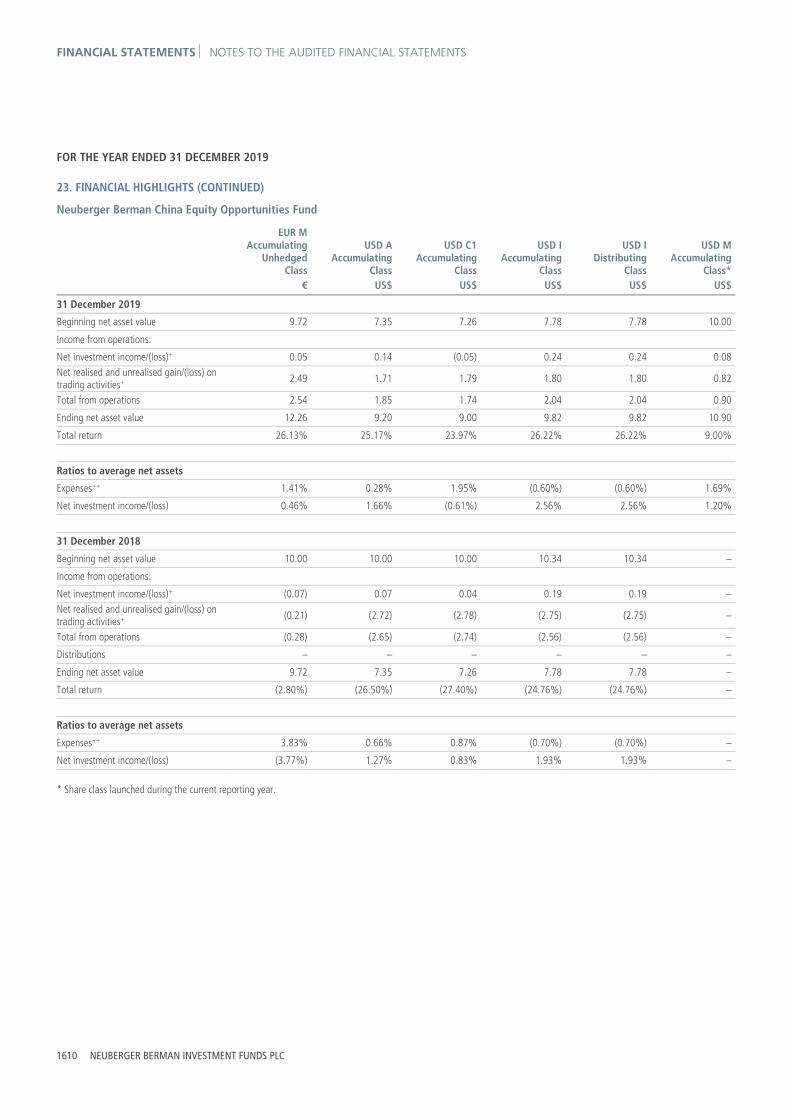
FINANCIAL STATEMENTS NOTES TO THE AUDITED FINANCIAL STATEMENTS
1610 NEUBERGER BERMAN INVESTMENT FUNDS PLC
FOR THE YEAR ENDED 31 DECEMBER 2019
23. FINANCIAL HIGHLIGHTS (CONTINUED)
Neuberger Berman China Equity Opportunities Fund
EUR M Accumulating
Unhedged Class
USD A Accumulating
Class
USD C1 Accumulating
Class
USD I Accumulating
Class
USD I Distributing
Class
USD M Accumulating
Class* € US$ US$ US$ US$ US$
31 December 2019 Beginning net asset value 9.72 7.35 7.26 7.78 7.78 10.00
Income from operations: Net investment income/(loss)+ 0.05 0.14 (0.05) 0.24 0.24 0.08Net realised and unrealised gain/(loss) on trading activities+ 2.49 1.71 1.79 1.80 1.80 0.82
Total from operations 2.54 1.85 1.74 2.04 2.04 0.90
Ending net asset value 12.26 9.20 9.00 9.82 9.82 10.90
Total return 26.13% 25.17% 23.97% 26.22% 26.22% 9.00%
Ratios to average net assets Expenses++ 1.41% 0.28% 1.95% (0.60%) (0.60%) 1.69%
Net investment income/(loss) 0.46% 1.66% (0.61%) 2.56% 2.56% 1.20%
31 December 2018 Beginning net asset value 10.00 10.00 10.00 10.34 10.34 –
Income from operations: Net investment income/(loss)+ (0.07) 0.07 0.04 0.19 0.19 –Net realised and unrealised gain/(loss) on trading activities+ (0.21) (2.72) (2.78) (2.75) (2.75) –
Total from operations (0.28) (2.65) (2.74) (2.56) (2.56) –
Distributions – – – – – –
Ending net asset value 9.72 7.35 7.26 7.78 7.78 –
Total return (2.80%) (26.50%) (27.40%) (24.76%) (24.76%) –
Ratios to average net assets Expenses++ 3.83% 0.66% 0.87% (0.70%) (0.70%) –
Net investment income/(loss) (3.77%) 1.27% 0.83% 1.93% 1.93% –
* Share class launched during the current reporting year.

NOTES TO THE AUDITED FINANCIAL STATEMENTS FINANCIAL STATEMENTS
ANNUAL REPORT 2019 1611
FOR THE YEAR ENDED 31 DECEMBER 2019
23. FINANCIAL HIGHLIGHTS (CONTINUED)
Neuberger Berman Multi-Asset Class Growth Fund
EUR M Accumulating
Class
GBP I Accumulating
Class*
USD I Accumulating
Class
USD I Distributing
Class € £ US$ US$
31 December 2019 Beginning net asset value 9.39 10.00 9.39 9.39
Income from operations: Net investment income/(loss)+ 0.07 0.13 0.19 0.23 Net realised and unrealised gain/(loss) on trading activities+ 0.36 0.35 0.70 0.65
Total from operations 0.43 0.48 0.89 0.88
Distributions – – – (0.15)
Ending net asset value 9.82 10.48 10.28 10.12
Total return 4.58% 4.80% 9.48% 9.48%
Ratios to average net assets Expenses++ 2.32% 0.85% 0.77% 0.83%
Net investment income/(loss) 0.74% 2.16% 1.98% 2.35%
31 December 2018 Beginning net asset value 10.00 – 10.00 10.00
Income from operations: Net investment income/(loss)+ 0.01 – 0.20 0.19 Net realised and unrealised gain/(loss) on trading activities+ (0.62) – (0.81) (0.80)
Total from operations (0.61) – (0.61) (0.61)
Distributions – – – –
Ending net asset value 9.39 9.39 9.39
Total return (6.10%) – (6.10%) (6.10%)
Ratios to average net assets Expenses++ 2.55% – 0.84% 0.81%
Net investment income/(loss) 0.35% – 2.04% 1.90% * Share class launched during the current reporting year.

FINANCIAL STATEMENTS NOTES TO THE AUDITED FINANCIAL STATEMENTS
1612 NEUBERGER BERMAN INVESTMENT FUNDS PLC
FOR THE YEAR ENDED 31 DECEMBER 2019
23. FINANCIAL HIGHLIGHTS (CONTINUED)
Neuberger Berman Global Thematic Equity Fund1
EUR M Accumulating
Unhedged Class
USD A Accumulating
Class
USD C1 Accumulating
Class
USD I Accumulating
Class
USD I Distributing
Class
USD M Accumulating
Class € US$ US$ US$ US$ US$
31 December 2019 Beginning net asset value 9.10 8.54 8.49 8.60 8.60 8.49
Income from operations: Net investment income/(loss)+ (0.26) (0.11) (0.21) (0.02) (0.04) (0.21)Net realised and unrealised gain/(loss) on trading activities+ 3.01 2.59 2.57 2.63 2.65 2.57
Total from operations 2.75 2.48 2.36 2.61 2.61 2.36
Distributions – – – – (0.01) –
Ending net asset value 11.85 11.02 10.85 11.21 11.20 10.85
Total return 30.22% 29.04% 27.80% 30.35% 30.32% 27.80%
Ratios to average net assets Expenses++ 3.27% 2.22% 3.23% 1.22% 1.12% 3.22%
Net investment income/(loss) (2.39%) (1.13%) (2.10%) (0.15%) (0.45%) (2.12%)
31 December 2018 Beginning net asset value 10.00 10.00 10.00 10.00 10.00 10.00
Income from operations: Net investment income/(loss)+ (0.05) (0.11) (0.17) (0.04) (0.04) (0.18)Net realised and unrealised gain/(loss) on trading activities+ (0.85) (1.35) (1.34) (1.36) (1.36) (1.33)
Total from operations (0.90) (1.46) (1.51) (1.40) (1.40) (1.51)
Distributions – – – – – –
Ending net asset value 9.10 8.54 8.49 8.60 8.60 8.49
Total return (9.00%) (14.60%) (15.10%) (14.00%) (14.00%) (15.10%)
Ratios to average net assets Expenses++ 4.16% 2.96% 3.96% 2.01% 2.05% 4.02%
Net investment income/(loss) (2.49%) (1.71%) (2.68%) (0.64%) (0.66%) (2.74%)
1 Portfolio launched during the prior reporting year.

NOTES TO THE AUDITED FINANCIAL STATEMENTS FINANCIAL STATEMENTS
ANNUAL REPORT 2019 1613
FOR THE YEAR ENDED 31 DECEMBER 2019
23. FINANCIAL HIGHLIGHTS (CONTINUED)
Neuberger Berman CLO Income Fund1
EUR I Accumulating
Class
EUR I2 Distributing
Class
GBP I Accumulating
Class
GBP I2 Distributing
Class
GBP I5 Distributing
Class
GBP Z Accumulating
Class* € € £ £ £ £
31 December 2019 Beginning net asset value 9.19 9.03 9.23 9.05 9.10 10.00
Income from operations: Net investment income/(loss)+ 0.71 0.68 0.71 0.66 0.69 0.04Net realised and unrealised gain/(loss) on trading activities+ 0.06 0.09 0.21 0.23 0.22 0.12
Total from operations 0.77 0.77 0.92 0.89 0.91 0.16
Distributions – (0.66) – (0.66) (0.72) –
Ending net asset value 9.96 9.14 10.15 9.28 9.29 10.16
Total return 8.38% 8.74% 9.97% 10.11% 10.36% 1.60%
Ratios to average net assets Expenses++ 0.97% 0.84% 0.92% 0.81% 0.58% 0.28%
Net investment income/(loss) 7.29% 7.38% 7.22% 7.07% 7.42% 6.49%
31 December 2018 Beginning net asset value 10.00 10.00 10.00 10.00 10.00 –
Income from operations: Net investment income/(loss)+ 0.28 0.08 0.28 0.08 0.29 –Net realised and unrealised gain/(loss) on trading activities+ (1.09) (1.05) (1.05) (1.03) (1.03) –
Total from operations (0.81) (0.97) (0.77) (0.95) (0.74) –
Distributions – – – – (0.16) –
Ending net asset value 9.19 9.03 9.23 9.05 9.10 –
Total return (8.10%) (9.70%) (7.70%) (9.50%) (7.50%) –
Ratios to average net assets Expenses++ 1.20% 1.12% 1.21% 1.21% 0.83% –
Net investment income/(loss) 6.04% 6.59% 5.98% 6.72% 6.31% –
* Share class launched during the current reporting year. 1 Portfolio launched during the prior reporting year.

FINANCIAL STATEMENTS NOTES TO THE AUDITED FINANCIAL STATEMENTS
1614 NEUBERGER BERMAN INVESTMENT FUNDS PLC
FOR THE YEAR ENDED 31 DECEMBER 2019
23. FINANCIAL HIGHLIGHTS (CONTINUED)
Neuberger Berman CLO Income Fund1 (continued)
SEK I Accumulating
Class
USD I Accumulating
Class
USD I2 Distributing
Class*
USD I5 Distributing
Class
USD Z Accumulating
Class* SEK US$ US$ US$ US$
31 December 2019 Beginning net asset value 91.74 9.30 10.00 9.17 10.00
Income from operations: Net investment income/(loss)+ 7.02 0.73 0.59 0.72 0.55 Net realised and unrealised gain/(loss) on trading activities+ 1.02 0.37 (0.13) 0.37 (0.08)
Total from operations 8.04 1.10 0.46 1.09 0.47
Distributions – – (0.45) (0.74) –
Ending net asset value 99.78 10.40 10.01 9.52 10.47
Total return 8.76% 11.83% 4.76% 12.23% 4.70%
Ratios to average net assets Expenses++ 0.96% 0.99% 0.80% 0.61% 0.28%
Net investment income/(loss) 7.20% 7.27% 7.43% 7.64% 7.64%
31 December 2018 Beginning net asset value 100.00 10.00 – 10.00 –
Income from operations: Net investment income/(loss)+ 2.71 0.29 – 0.29 – Net realised and unrealised gain/(loss) on trading activities+ (10.97) (0.99) – (0.96) –
Total from operations (8.26) (0.70) – (0.67) –
Distributions – – – (0.16) –
Ending net asset value 91.74 9.30 – 9.17 –
Total return (8.26%) (7.00%) – (6.79%) –
Ratios to average net assets Expenses++ 1.17% 1.23% – 0.81% –
Net investment income/(loss) 5.80% 6.10% – 6.20% – * Share class launched during the current reporting year. 1 Portfolio launched during the prior reporting year.

NOTES TO THE AUDITED FINANCIAL STATEMENTS FINANCIAL STATEMENTS
ANNUAL REPORT 2019 1615
FOR THE YEAR ENDED 31 DECEMBER 2019
23. FINANCIAL HIGHLIGHTS (CONTINUED)
Neuberger Berman Next Generation Mobility Fund1
AUD X Accumulating
Class*
EUR A Accumulating
Class
EUR M Accumulating
Unhedged Class
EUR X Accumulating
Class*
GBP I Accumulating
Class*
GBP X Accumulating
Class* AUD € € € £ £
31 December 2019 Beginning net asset value 10.00 8.07 9.43 10.00 10.00 10.00
Income from operations: Net investment income/(loss)+ (0.07) (0.07) (0.47) (0.07) (0.04) (0.07)Net realised and unrealised gain/(loss) on trading activities+ 2.28 2.09 3.32 2.08 2.31 2.19
Total from operations 2.21 2.02 2.85 2.01 2.27 2.12
Ending net asset value 12.21 10.09 12.28 12.01 12.27 12.12
Total return 22.10% 25.03% 30.22% 20.10% 22.70% 21.20%
Ratios to average net assets Expenses++ 1.91% 2.05% 4.49% 1.92% 1.28% 1.86%
Net investment income/(loss) (0.69%) (0.81%) (3.69%) (0.70%) (0.65%) (0.67%)
31 December 2018 Beginning net asset value – 10.00 10.00 – – –
Income from operations: Net investment income/(loss)+ – (0.18) (0.14) – – –Net realised and unrealised gain/(loss) on trading activities+ – (1.75) (0.43) – – –
Total from operations – (1.93) (0.57) – – –
Ending net asset value – 8.07 9.43 – – –
Total return – (19.30%) (5.70%) – – –
Ratios to average net assets Expenses++ – 7.29% 8.77% – – –
Net investment income/(loss) – (6.39%) (7.91%) – – –
* Share class launched during the current reporting year. 1 Portfolio launched during the prior reporting year.

FINANCIAL STATEMENTS NOTES TO THE AUDITED FINANCIAL STATEMENTS
1616 NEUBERGER BERMAN INVESTMENT FUNDS PLC
FOR THE YEAR ENDED 31 DECEMBER 2019
23. FINANCIAL HIGHLIGHTS (CONTINUED)
Neuberger Berman Next Generation Mobility Fund1 (continued)
HKD X Accumulating
Unhedged Class*
SGD X Accumulating
Class*
USD A Accumulating
Class
USD C1 Accumulating
Class*
USD I Accumulating
Class
USD I Distributing
Class HKD SGD US$ US$ US$ US$
31 December 2019 Beginning net asset value 10.00 20.00 8.15 10.00 7.97 7.97
Income from operations: Net investment income/(loss)+ (0.07) (0.14) (0.11) (0.17) (0.08) 0.00Net realised and unrealised gain/(loss) on trading activities+ 2.34 4.64 2.47 1.87 2.47 2.39
Total from operations 2.27 4.50 2.36 1.70 2.39 2.39
Ending net asset value 12.27 24.50 10.51 11.70 10.36 10.36
Total return 22.70% 22.50% 28.96% 17.00% 29.99% 29.99%
Ratios to average net assets Expenses++ 1.92% 1.90% 2.16% 3.23% 1.87% 1.22%
Net investment income/(loss) (0.70%) (0.70%) (1.19%) (2.51%) (0.78%) 0.00
31 December 2018 Beginning net asset value – – 10.00 – 10.00 10.00
Income from operations: Net investment income/(loss)+ – – (0.18) – (0.17) (0.17)Net realised and unrealised gain/(loss) on trading activities+ – – (1.67) – (1.86) (1.86)
Total from operations – – (1.85) – (2.03) (2.03)
Distributions – – – – – –
Ending net asset value – – 8.15 – 7.97 7.97
Total return – – (18.50%) – (20.30%) (20.30%)
Ratios to average net assets Expenses++ – – 7.29% – 6.33% 6.33%
Net investment income/(loss) – – (6.37%) – (5.34%) (5.34%)
* Share class launched during the current reporting year. 1 Portfolio launched during the prior reporting year.

NOTES TO THE AUDITED FINANCIAL STATEMENTS FINANCIAL STATEMENTS
ANNUAL REPORT 2019 1617
FOR THE YEAR ENDED 31 DECEMBER 2019
23. FINANCIAL HIGHLIGHTS (CONTINUED)
Neuberger Berman Next Generation Mobility Fund1 (continued)
USD M Accumulating
Class*
USD X Accumulating
Class* US$ US$
31 December 2019 Beginning net asset value 10.00 10.00
Income from operations: Net investment income/(loss)+ (0.17) (0.06)Net realised and unrealised gain/(loss) on trading activities+ 1.88 2.42
Total from operations 1.71 2.36
Ending net asset value 11.71 12.36
Total return 17.10% 23.60%
Ratios to average net assets Expenses++ 3.28% 1.91%
Net investment income/(loss) (2.51%) (0.62%)
* Share class launched during the current reporting year. 1 Portfolio launched during the prior reporting year.

FINANCIAL STATEMENTS NOTES TO THE AUDITED FINANCIAL STATEMENTS
1618 NEUBERGER BERMAN INVESTMENT FUNDS PLC
FOR THE YEAR ENDED 31 DECEMBER 2019
23. FINANCIAL HIGHLIGHTS (CONTINUED)
Neuberger Berman Ultra Short Term Euro Bond Fund1
CHF U Accumulating
Class*
EUR I Accumulating
Class
EUR I Distributing
Class
EUR I5 Accumulating
Class*
EUR U Accumulating
Class*
EUR Z Accumulating
Class CHF € € € € €
31 December 2019 Beginning net asset value 100.00 99.81 99.81 100.00 100.00 99.99
Income from operations: Net investment income/(loss)+ 0.03 0.77 0.74 0.77 0.03 0.94Net realised and unrealised gain/(loss) on trading activities+ (0.04) 0.88 0.93 0.74 (0.02) 0.90
Total from operations (0.01) 1.65 1.67 1.51 0.01 1.84
Distributions – – (0.63) – – –
Ending net asset value 99.99 101.46 100.85 101.51 100.01 101.83
Total return (0.01%) 1.65% 1.68% 1.51% 0.01% 1.84%
Ratios to average net assets Expenses++ 0.44% 0.33% 0.27% 0.21% 0.45% 0.11%
Net investment income/(loss) 0.71% 0.74% 0.73% 0.84% 0.73% 0.93%
31 December 2018 Beginning net asset value – 100.00 100.00 – – 100.00
Income from operations: Net investment income/(loss)+ – (0.07) (0.08) – – (0.01)Net realised and unrealised gain/(loss) on trading activities+ – (0.12) (0.11) – – 0.00
Total from operations – (0.19) (0.19) – – (0.01)
Distributions – – – – – –
Ending net asset value – 99.81 99.81 – – 99.99
Total return – (0.19%) (0.19%) – – (0.01%)
Ratios to average net assets Expenses++ – 1.85% 1.88% – – 1.65%
Net investment income/(loss) – (0.44%) (0.51%) – – (0.17%)
* Share class launched during the current reporting year. 1 Portfolio launched during the prior reporting year.

NOTES TO THE AUDITED FINANCIAL STATEMENTS FINANCIAL STATEMENTS
ANNUAL REPORT 2019 1619
FOR THE YEAR ENDED 31 DECEMBER 2019
23. FINANCIAL HIGHLIGHTS (CONTINUED)
Neuberger Berman Ultra Short Term Euro Bond Fund1 (continued)
USD M Accumulating
Class*
USD Z Accumulating
Class* US$ US$
31 December 2019 Beginning net asset value 100.00 100.00
Income from operations: Net investment income/(loss)+ (0.03) 0.88Net realised and unrealised gain/(loss) on trading activities+ 1.40 3.59
Total from operations 1.37 4.47
Ending net asset value 101.37 104.47
Total return 1.37% 4.47%
Ratios to average net assets Expenses++ 1.11% 0.12%
Net investment income/(loss) (0.07%) 0.92%
* Share class launched during the current reporting year. 1 Portfolio launched during the prior reporting year.

FINANCIAL STATEMENTS NOTES TO THE AUDITED FINANCIAL STATEMENTS
1620 NEUBERGER BERMAN INVESTMENT FUNDS PLC
FOR THE YEAR ENDED 31 DECEMBER 2019
23. FINANCIAL HIGHLIGHTS (CONTINUED)
Neuberger Berman Euro Opportunistic Bond Fund1
EUR I Accumulating
Class
EUR IDistributing
Class € €
31 December 2019 Beginning net asset value 10.10 10.10
Income from operations: Net investment income/(loss)+ 0.12 0.12Net realised and unrealised gain/(loss) on trading activities+ 0.70 0.69
Total from operations 0.82 0.81
Distributions – (0.09)
Ending net asset value 10.92 10.82
Total return 8.12% 8.07%
Ratios to average net assets Expenses++ 0.37% 0.40%
Net investment income/(loss) 1.18% 1.10%
31 December 2018 Beginning net asset value 10.00 10.00
Income from operations: Net investment income/(loss)+ (0.04) (0.04)Net realised and unrealised gain/(loss) on trading activities+ 0.14 0.14
Total from operations 0.10 0.10
Ending net asset value 10.10 10.10
Total return 1.00% 1.00%
Ratios to average net assets Expenses++ 4.92% 4.91%
Net investment income/(loss) (3.19%) (3.17%)
1 Portfolio launched during the prior reporting year.

NOTES TO THE AUDITED FINANCIAL STATEMENTS FINANCIAL STATEMENTS
ANNUAL REPORT 2019 1621
FOR THE YEAR ENDED 31 DECEMBER 2019
23. FINANCIAL HIGHLIGHTS (CONTINUED)
Neuberger Berman Euro Bond Absolute Return Fund1
EUR I Accumulating
Class
EUR I Distributing
Class
EUR I5 Accumulating
Class*
USD Z Accumulating
Class* € € € US$
31 December 2019 Beginning net asset value 10.03 10.03 10.00 10.00
Income from operations: Net investment income/(loss)+ 0.10 0.09 0.08 0.01 Net realised and unrealised gain/(loss) on trading activities+ 0.28 0.29 0.29 0.12
Total from operations 0.38 0.38 0.37 0.13
Distributions – (0.06) – –
Ending net asset value 10.41 10.35 10.37 10.13
Total return 3.79% 3.78% 3.70% 1.30%
Ratios to average net assets Expenses++ 0.63% 0.61% 0.44% 0.29%
Net investment income/(loss) 0.95% 0.85% 1.08% 1.14%
31 December 2018 Beginning net asset value 10.00 10.00 – –
Income from operations: Net investment income/(loss)+ (0.03) (0.03) – – Net realised and unrealised gain/(loss) on trading activities+ 0.06 0.06 – –
Total from operations 0.03 0.03 – –
Distributions – – – –
Ending net asset value 10.03 10.03 Total return 0.30% 0.30% – –
Ratios to average net assets Expenses++ 3.93% 3.93% – –
Net investment income/(loss) (2.95%) (2.95%) – –
* Share class launched during the current reporting year. 1 Portfolio launched during the prior reporting year.

FINANCIAL STATEMENTS NOTES TO THE AUDITED FINANCIAL STATEMENTS
1622 NEUBERGER BERMAN INVESTMENT FUNDS PLC
FOR THE YEAR ENDED 31 DECEMBER 2019
23. FINANCIAL HIGHLIGHTS (CONTINUED)
Neuberger Berman Absolute Alpha Fund2
EUR I Accumulating
Class*
EUR M Accumulating
Class*
EUR M Accumulating
Unhedged Class*
GBP Z Accumulating
Class*
SGD A Accumulating
Class*
USD A Accumulating
Class* € € € £ SGD US$
31 December 2019 Beginning net asset value 10.00 10.00 10.00 10.00 20.00 10.00
Income from operations: Net investment income/(loss)+ (0.01) (0.14) (0.25) 0.00 (0.14) (0.20)Net realised and unrealised gain/(loss) on trading activities+ 0.02 (0.33) (0.29) 0.10 (0.31) (0.31)
Total from operations 0.01 (0.47) (0.54) 0.10 (0.45) (0.51)
Ending net asset value 10.01 9.53 9.46 10.10 19.55 9.49
Total return 0.10% (4.70%) (5.40%) 1.00% (2.25%) (5.10%)
Ratios to average net assets Expenses++ 2.26% 4.40% 4.43% 0.94% 3.59% 3.57%
Net investment income/(loss) (2.15%) (3.33%) (3.30%) (0.57%) (2.52%) (2.36%)
USD I Accumulating
Class* US$
31 December 2019 Beginning net asset value 10.00
Income from operations: Net investment income/(loss)+ (0.12) Net realised and unrealised gain/(loss) on trading activities+ (0.32)
Total from operations (0.44)
Ending net asset value 9.56
Total return (4.40%)
Ratios to average net assets Expenses++ 2.65%
Net investment income/(loss) (1.43%)
* Share class launched during the current reporting year. 2 Portfolio launched during the prior reporting year.

NOTES TO THE AUDITED FINANCIAL STATEMENTS FINANCIAL STATEMENTS
ANNUAL REPORT 2019 1623
FOR THE YEAR ENDED 31 DECEMBER 2019
23. FINANCIAL HIGHLIGHTS (CONTINUED)
Neuberger Berman Multi-Style Premia Fund2
EUR I Accumulating
Class*
USD I Accumulating
Class*
USD I Distributing
Class*
USD Z Accumulating
Class* € US$ US$ US$
31 December 2019 Beginning net asset value 10.00 10.00 10.00 10.00
Income from operations: Net investment income/(loss)+ (0.03) (0.10) (0.09) (0.04) Net realised and unrealised gain/(loss) on trading activities+ (0.08) 0.64 0.63 0.05
Total from operations (0.11) 0.54 0.54 0.01
Ending net asset value 9.89 10.54 10.54 10.01
Total return (1.10%) 5.40% 5.40% 0.10%
Ratios to average net assets Expenses++ 8.16% 3.01% 2.93% 3.68%
Net investment income/(loss) (6.50%) (1.17%) (1.07%) (2.39%)
* Share class launched during the current reporting year. 2 Portfolio launched during the prior reporting year.

FINANCIAL STATEMENTS NOTES TO THE AUDITED FINANCIAL STATEMENTS
1624 NEUBERGER BERMAN INVESTMENT FUNDS PLC
FOR THE YEAR ENDED 31 DECEMBER 2019
23. FINANCIAL HIGHLIGHTS (CONTINUED)
Neuberger Berman Macro Opportunities FX Fund2
EUR I Accumulating
Class*
GBP Z Accumulating
Class*
SEK I Accumulating
Class*
SEK I Distributing
Class*
USD I Accumulating
Class*
USD X Accumulating
Class* € £ SEK SEK US$ US$
31 December 2019 Beginning net asset value 10.00 10.00 100.00 100.00 10.00 10.00
Income from operations: Net investment income/(loss)+ (0.01) (0.01) (0.10) (0.10) (0.02) (0.01)Net realised and unrealised gain/(loss) on trading activities+ 0.02 0.03 0.11 0.11 0.05 0.04
Total from operations 0.01 0.02 0.01 0.01 0.03 0.03
Ending net asset value 10.01 10.02 100.01 100.01 10.03 10.03
Total return 0.10% 0.20% 0.01% 0.01% 0.30% 0.30%
Ratios to average net assets Expenses++ 2.76% 2.29% 2.87% 2.87% 2.92% 2.52%
Net investment income/(loss) (1.93%) (1.46%) (1.87%) (1.87%) (2.08%) (1.68%)
USD Z Accumulating
Class* US$
31 December 2019 Beginning net asset value 10.00
Income from operations: Net investment income/(loss)+ (0.01) Net realised and unrealised gain/(loss) on trading activities+ 0.04
Total from operations 0.03
Ending net asset value 10.03
Total return 0.30%
Ratios to average net assets Expenses++ 2.29%
Net investment income/(loss) (1.36%)
+ Calculated based on the average number of shares outstanding during the period. ++ Ratios are net of expense waiver, where applicable. The net expense ratio includes both operational and non-operational expenses and any adjustments required to comply with appropriate accounting standards. Where applicable, ratios have been annualised. * Share class launched during the current reporting year. 2 Portfolio launched during the current reporting year.

NOTES TO THE AUDITED FINANCIAL STATEMENTS FINANCIAL STATEMENTS
ANNUAL REPORT 2019 1625
FOR THE YEAR ENDED 31 DECEMBER 2019
24. DERIVATIVE CONTRACTS
The Investment Manager of the Company is an affiliate of Neuberger Berman Group LLC, who is a registered investment adviser with the SEC in the United States. The information included here represents US GAAP equivalent disclosures that are provided in order to enable the Investment Manager to avail of certain exemptions available to it under the SEC Custody Rule.
The Portfolios may transact in a variety of derivative instruments including swaptions, forward currency contracts, futures contracts, contracts for differences, options contracts, interest rate, credit default, cross currency, inflation and total return swap contracts.
Typically derivatives serve as components of the Portfolios’ investment strategy and are utilised primarily to structure and hedge investments, to enhance performance and reduce risk to the Portfolios (the Company does not designate any derivative as a hedging instrument for hedge accounting purposes).
The Company uses financial derivative instruments to economically hedge its risks associated primarily with interest rate and foreign currency fluctuations. Derivatives may also be used for trading purposes where the Investment Manager believes this would be more effective than investing directly in the underlying financial instruments.
Derivatives often reflect, at their inception only a mutual exchange of promises with little or no transfer of tangible consideration. However, these instruments frequently involve a high degree of leverage and are very volatile. A relatively small movement in the underlying of a derivative contract may have a significant impact on the profit or loss of the Company.
The Investment Manager closely monitors the Portfolios’ exposure under derivatives as part of the overall management of the Portfolios.
The Fair Value of these derivative instruments is included in the Balance Sheet with changes in Fair Value included in Net gain/(loss) on Financial Assets and Liabilities at Fair Value through Profit and Loss Account.
The Portfolios hold forward currency contracts some of which are specific to hedged share classes. Currency rate fluctuations that impact these forwards will only affect the net assets in the respective class and not the Portfolio as a whole. Refer to the Schedules of Investments for further information on class level forward currency contracts.
The notionals summarised in the table below are as at 31 December 2019 and are indicative of the volume of derivative activity for the year/period. The notionals are not indicative of market risk or credit risk.
31 December 2019 31 December 2018
Forward Currency Contracts Currency Notional Notional
Neuberger Berman High Yield Bond Fund USD 2,147,911,352 2,496,098,191
Neuberger Berman Diversified Currency Fund USD 230,813,764 124,125,317
Neuberger Berman US Multi Cap Opportunities Fund USD 83,946,437 205,665,324
Neuberger Berman US Real Estate Securities Fund USD 101,275,864 50,337,146
Neuberger Berman China Equity Fund USD 53,771,098 81,171,625
Neuberger Berman Emerging Markets Equity Fund USD 51,288,030 168,478,329
Neuberger Berman US Small Cap Fund USD 10,192,316 50,344,670
Neuberger Berman Short Duration High Yield Bond Fund USD 792,662,106 815,978,668
Neuberger Berman Global Bond Fund USD 144,338,941 129,291,126
Neuberger Berman Emerging Market Debt - Local Currency Fund USD 3,366,364,377 4,575,617,255
Neuberger Berman Emerging Market Debt - Hard Currency Fund USD 1,466,186,934 1,084,588,085
Neuberger Berman Emerging Market Corporate Debt Fund USD 138,836,602 114,809,004
Neuberger Berman Strategic Income Fund USD 724,469,707 667,596,843
Neuberger Berman Global Bond Absolute Return Fund USD 322,220,791 321,017,271
Neuberger Berman Short Duration Emerging Market Debt Fund USD 4,484,172,856 3,204,741,114
Neuberger Berman Absolute Return Multi Strategy Fund USD 85,612,170 120,110,055
Neuberger Berman US Long Short Equity Fund USD 75,981,851 122,071,919

FINANCIAL STATEMENTS NOTES TO THE AUDITED FINANCIAL STATEMENTS
1626 NEUBERGER BERMAN INVESTMENT FUNDS PLC
FOR THE YEAR ENDED 31 DECEMBER 2019
24. DERIVATIVE CONTRACTS (CONTINUED) 31 December 2019 31 December 2018
Forward Currency Contracts (continued) Currency Notional Notional
Neuberger Berman Emerging Market Debt Blend Fund USD 1,444,838,005 1,907,736,883
Neuberger Berman European High Yield Bond Fund EUR 65,076,978 61,483,911
Neuberger Berman Systematic Global Equity Fund USD 5,904,077 9,255,218
Neuberger Berman Global Real Estate Securities Fund USD 501,303 261,227
Neuberger Berman Global Credit Long Short Fund* USD - 2,865,025
Neuberger Berman Asian Debt - Hard Currency Fund USD 1,499,607 327,178
Neuberger Berman China Bond Fund CNY 673,360,521 17,124,481
Neuberger Berman Global Dynamic Asset Allocator Fund** USD - 172,513,403
Neuberger Berman Corporate Hybrid Bond Fund EUR 906,594,362 766,546,049
Neuberger Berman Global High Yield Bond Fund USD 105,903,836 123,126,816
Neuberger Berman Global Opportunistic Bond Fund USD 390,868,513 248,319,755
Neuberger Berman Multi-Asset Risk Premia Fund*** USD - 31,596,598
Neuberger Berman Multi-Asset Class Income Fund USD 95,260,624 49,777,938
Neuberger Berman US Equity Index PutWrite Fund USD 83,397,682 123,903,895
Neuberger Berman Global Equity Index PutWrite Fund USD 58,279,459 111,645,912
Neuberger Berman Uncorrelated Strategies Fund USD 1,613,730,663 1,230,453,015
Neuberger Berman Emerging Market Debt Blend Investment Grade Fund USD 10,388,877 13,519,594
Neuberger Berman Multi-Asset Class Growth Fund USD 19,175,396 33,608,562
Neuberger Berman CLO Income Fund¹ USD 144,571,043 139,801,306
Neuberger Berman Next Generation Mobility Fund¹ USD 254,539 20,483
Neuberger Berman Ultra Short Term Euro Bond Fund¹ EUR 162,942,676 -
Neuberger Berman Euro Bond Absolute Return Fund¹ EUR 107,301,865 -
Neuberger Berman Absolute Alpha Fund² USD 3,747,379 -
Neuberger Berman Multi-Style Premia Fund² USD 24,975,403 -
Neuberger Berman Macro Opportunities FX Fund² EUR 104,814,284 - 31 December 2019 31 December 2018
Contracts For Differences**** Currency Notional Notional
Neuberger Berman Absolute Return Multi Strategy Fund USD (2,310,711) 607,787
Neuberger Berman US Long Short Equity Fund USD (21,608,344) 836,012
Neuberger Berman Uncorrelated Strategies Fund USD 63,074,006 12,488,073
Neuberger Berman Absolute Alpha Fund² USD (11,649,894) -
Neuberger Berman Multi-Style Premia Fund² USD 1,158,638 -

NOTES TO THE AUDITED FINANCIAL STATEMENTS FINANCIAL STATEMENTS
ANNUAL REPORT 2019 1627
FOR THE YEAR ENDED 31 DECEMBER 2019
24. DERIVATIVE CONTRACTS (CONTINUED) 31 December 2019 31 December 2018
Options Contracts Currency Notional Notional
Neuberger Berman Absolute Return Multi Strategy Fund USD (150,000) (23,700)
Neuberger Berman US Long Short Equity Fund USD (4,170,450) 315,800
Neuberger Berman Multi-Asset Class Income Fund USD (17,000) -
Neuberger Berman US Equity Index PutWrite Fund USD (555,243,000) (500,172,500)
Neuberger Berman Global Equity Index PutWrite Fund USD (56,565,500) (100,206,500)
Neuberger Berman Uncorrelated Strategies Fund USD 238,352,238 97,172,792
Neuberger Berman Multi-Asset Class Growth Fund USD (3,838,600) (4,660,300)
Neuberger Berman Ultra Short Term Euro Bond Fund¹ EUR - 972,000
Neuberger Berman Euro Opportunistic Bond Fund¹ EUR - 486,000
Neuberger Berman Euro Bond Absolute Return Fund¹ EUR - 1,944,000
Neuberger Berman Multi-Style Premia Fund² USD (10,595,000) -
31 December 2019 31 December 2018
Futures Contracts Currency Notional Notional
Neuberger Berman Global Bond Fund USD 25,447,691 (638,103)
Neuberger Berman Emerging Market Debt – Local Currency Fund USD 85,247,125 (55,101,544)
Neuberger Berman Emerging Market Debt – Hard Currency Fund USD 27,366,774 17,904,249
Neuberger Berman Emerging Market Corporate Debt Fund USD (16,263,005) (7,807,355)
Neuberger Berman Strategic Income Fund USD (2,911,090) (7,198,938)
Neuberger Berman Global Bond Absolute Return Fund USD (13,362,222) (5,900,090)
Neuberger Berman Absolute Return Multi Strategy Fund USD (27,022,475) 42,787,770
Neuberger Berman US Long Short Equity Fund USD (20,253,886) (27,325,902)
Neuberger Berman Emerging Market Debt Blend Fund USD (8,935,651) (8,325,270)
Neuberger Berman European High Yield Bond Fund EUR - (1,572,730)
Neuberger Berman Asian Debt - Hard Currency Fund USD (1,565,023) (1,895,313)
Neuberger Berman Global Dynamic Asset Allocator Fund** USD - 12,960,384
Neuberger Berman Global High Yield Bond Fund USD 714,453 (1,910,245)
Neuberger Berman Global Opportunistic Bond Fund USD 33,157,729 58,249,123
Neuberger Berman Multi-Asset Class Income Fund USD 25,489,776 7,084,195
Neuberger Berman Uncorrelated Strategies Fund USD 18,028,880 1,459,497,766
Neuberger Berman Emerging Market Debt Blend Investment Grade Fund USD (1,336,242) (677,121)
Neuberger Berman Multi-Asset Class Growth Fund USD 1,709,510 1,482,245
Neuberger Berman Ultra Short Term Euro Bond Fund¹ EUR 49,490,485 (802,380)
Neuberger Berman Euro Opportunistic Bond Fund¹ EUR 5,152,600 (406,644)
Neuberger Berman Euro Bond Absolute Return Fund¹ EUR (2,128,508) (2,195,487)
Neuberger Berman Multi-Style Premia Fund² USD 1,837,837 -

FINANCIAL STATEMENTS NOTES TO THE AUDITED FINANCIAL STATEMENTS
1628 NEUBERGER BERMAN INVESTMENT FUNDS PLC
FOR THE YEAR ENDED 31 DECEMBER 2019
24. DERIVATIVE CONTRACTS (CONTINUED) 31 December 2019 31 December 2018
Interest Rate Swap Contracts**** Currency Notional Notional
Neuberger Berman Global Bond Fund USD 4,355,648 8,230,510
Neuberger Berman Emerging Market Debt – Local Currency Fund USD 2,341,456,467 1,772,042,300
Neuberger Berman Strategic Income Fund USD 4,581,774 2,884,499
Neuberger Berman Global Bond Absolute Return Fund USD 6,595,262 21,048,889
Neuberger Berman Emerging Market Debt Blend Fund USD 733,071,038 648,541,901
Neuberger Berman Global Dynamic Asset Allocator Fund** USD - 5,646,246
Neuberger Berman Global Opportunistic Bond Fund USD 14,552,883 13,098,785
Neuberger Berman Emerging Market Debt Blend Investment Grade Fund USD 2,859,068 2,377,685
Neuberger Berman Multi-Asset Class Growth Fund USD 1,272,293 1,343,357
Neuberger Berman Euro Bond Absolute Return Fund¹ EUR 100,000 -
31 December 2019 31 December 2018
Credit Default Swap Contracts**** Currency Notional Notional
Neuberger Berman Emerging Market Debt - Local Currency Fund USD 17,296,113 17,296,113
Neuberger Berman Global Bond Absolute Return Fund USD 37,596,187 16,553,800
Neuberger Berman Emerging Market Debt Blend Fund USD 5,590,777 5,590,777
Neuberger Berman Global Dynamic Asset Allocator Fund** USD - 4,655,800
Neuberger Berman Global Opportunistic Bond Fund USD 33,121,062 4,700,000
Neuberger Berman Multi-Asset Class Income Fund USD - 2,303,500
Neuberger Berman Multi-Asset Class Growth Fund USD 2,353,962 2,064,100
31 December 2019 31 December 2018
Cross Currency Swap Contracts**** Currency Notional Notional
Neuberger Berman Emerging Market Debt – Local Currency Fund USD 55,944,894 137,342,748
Neuberger Berman Emerging Market Debt Blend Fund USD 15,737,537 46,702,574
31 December 2019 31 December 2018
Total Return Swap Contracts**** Currency Notional Notional
Neuberger Berman Absolute Return Multi Strategy Fund USD - 448,220
Neuberger Berman US Long Short Equity Fund USD 18,369,222 10,488,611
Neuberger Berman Multi-Asset Risk Premia Fund*** USD - 72,153,912
Neuberger Berman Multi-Asset Class Income Fund USD 11,180,673 6,065,363
Neuberger Berman Multi-Asset Class Growth Fund USD 2,203,234 3,128,137

NOTES TO THE AUDITED FINANCIAL STATEMENTS FINANCIAL STATEMENTS
ANNUAL REPORT 2019 1629
FOR THE YEAR ENDED 31 DECEMBER 2019
24. DERIVATIVE CONTRACTS (CONTINUED) 31 December 2019 31 December 2018
Swaptions Currency Notional Notional
Neuberger Berman Uncorrelated Strategies Fund USD 5,500,000 5,500,000
31 December 2019 31 December 2018
Inflation Swap Contracts**** Currency Notional Notional
Neuberger Berman Ultra Short Term Euro Bond Fund¹ EUR 1,600,000 -
Neuberger Berman Euro Opportunistic Bond Fund¹ EUR 200,000 -
Neuberger Berman Euro Bond Absolute Return Fund¹ EUR 4,900,000 -
* Portfolio liquidated on 26 November 2018. ** Portfolio liquidated on 12 April 2019. *** Portfolio liquidated on 26 March 2019. **** Amounts shown are absolute notionals.
1 Portfolio launched during the prior reporting year. 2 Portfolio launched during the current reporting year. The realised net gain/(loss) and the change in net unrealised gain/(loss) for the year and the amounts included in Net Gain/(Loss) on Financial Assets and Liabilities at Fair Value through Profit and Loss within the Profit and Loss Account are as follows:
31 December 2019 31 December 2018
Net Realised
Gain/(Loss)
Change in Net Unrealised Gain/(Loss)
Net RealisedGain/(Loss)
Change in Net Unrealised Gain/(Loss)
Neuberger Berman High Yield Bond Fund
Forward Currency Contracts (43,527,459) 49,114,485 (97,942,048) (46,575,605)
Neuberger Berman Diversified Currency Fund
Forward Currency Contracts 1,153 (131,382) (362,817) 99,105
Neuberger Berman US Multi Cap Opportunities Fund
Forward Currency Contracts (4,337,086) 1,770,684 (7,021,853) (1,065,424)
Neuberger Berman US Real Estate Securities Fund
Forward Currency Contracts (1,411,903) 1,910,069 (1,460,851) (359,686)
Neuberger Berman China Equity Fund
Forward Currency Contracts (1,020,607) 477,991 (1,727,936) (528,601)
Neuberger Berman Emerging Markets Equity Fund
Forward Currency Contracts (5,972,085) 2,608,312 (4,420,264) (4,211,420)
Neuberger Berman US Small Cap Fund
Forward Currency Contracts 352,312 (217,654) (1,178,723) 237,045
Neuberger Berman Short Duration High Yield Bond Fund
Forward Currency Contracts (24,724,657) 4,463,014 (25,055,001) (3,709,670)
Neuberger Berman Global Bond Fund
Forward Currency Contracts 482,061 (1,290,308) (410,675) 574,465
Futures Contracts (2,939,031) 799,235 532,958 (481,819)
Swap Contracts (188,269) 78,040 76,314 (96,609)

FINANCIAL STATEMENTS NOTES TO THE AUDITED FINANCIAL STATEMENTS
1630 NEUBERGER BERMAN INVESTMENT FUNDS PLC
FOR THE YEAR ENDED 31 DECEMBER 2019
24. DERIVATIVE CONTRACTS (CONTINUED) 31 December 2019 31 December 2018
Net Realised
Gain/(Loss)
Change in NetUnrealisedGain/(Loss)
Net Realised Gain/(Loss)
Change in Net Unrealised Gain/(Loss)
Neuberger Berman Emerging Market Debt - Local Currency Fund
Forward Currency Contracts (46,591,348) 45,301,239 (88,229,602) (21,699,783)
Futures Contracts (892,244) 1,238,362 1,762,741 (1,024,944)
Swap Contracts 11,532,745 1,053,341 15,017,288 19,464,474
Neuberger Berman Emerging Market Debt - Hard Currency Fund
Forward Currency Contracts (37,960,494) 10,348,776 (39,250,494) 675,314
Futures Contracts 5,170,742 (3,133,276) (8,186,429) 1,945,429
Neuberger Berman Emerging Market Corporate Debt Fund
Forward Currency Contracts (5,239,812) 1,837,166 (6,594,345) (517,166)
Futures Contracts (1,060,628) 495,154 501,300 (271,675)
Swap Contracts (16,415) – – –
Neuberger Berman Strategic Income Fund
Forward Currency Contracts 12,431,696 (17,255,887) (12,567,040) 14,482,325
Futures Contracts (38,493,821) 11,696,905 6,057,128 (6,025,041)
Swap Contracts 195,913 42,825 1,375,184 (723,975)
Neuberger Berman Global Bond Absolute Return Fund
Forward Currency Contracts (1,248,322) 827,079 512,494 (877,239)
Futures Contracts (4,649,949) 2,632,356 1,353,043 (1,765,873)
Options Contracts (2,549) – – –
Swap Contracts (793,129) (855,015) (845,910) 1,018,069
Neuberger Berman Short Duration Emerging Market Debt Fund Forward Currency Contracts (121,849,756) 37,180,393 (177,516,950) 12,170,952
Neuberger Berman Absolute Return Multi Strategy Fund Forward Currency Contracts 746,759 (1,911,319) (2,480,847) 1,616,238
Futures Contracts 1,902,193 (413,498) 804,803 409,697
Options Contracts (2,610) 1,209 128,159 30,019
Swap Contracts 14,175 (36,791) (755,455) (97,156)
Contracts for Difference (797,203) (359,305) 587,911 205,047
Neuberger Berman US Long Short Equity Fund
Forward Currency Contracts (5,112,087) 1,728,796 (5,699,413) (1,730,562)
Futures Contracts (6,038,152) (600,124) 1,569,920 706,696
Options Contracts 586,531 555,977 1,671,828 (991,326)
Swap Contracts (2,526,317) (2,108,275) (644,418) 936,343
Contracts for Difference (547,852) (5,316,430) (2,558,286) 5,093,476
Neuberger Berman Emerging Market Debt Blend Fund
Forward Currency Contracts (28,364,236) 14,766,369 (34,656,094) (3,581,176)
Futures Contracts (1,477,254) (805,977) (2,218,973) 449,884
Swap Contracts 2,062,319 2,257,176 4,717,757 5,891,408

NOTES TO THE AUDITED FINANCIAL STATEMENTS FINANCIAL STATEMENTS
ANNUAL REPORT 2019 1631
FOR THE YEAR ENDED 31 DECEMBER 2019
24. DERIVATIVE CONTRACTS (CONTINUED) 31 December 2019 31 December 2018
Net Realised
Gain/(Loss)
Change in Net Unrealised Gain/(Loss)
Net Realised Gain/(Loss)
Change in Net Unrealised Gain/(Loss)
Neuberger Berman European High Yield Bond Fund Forward Currency Contracts 1,607,671 (1,022,643) 1,489,815 575,771
Futures Contracts (84,883) 10,041 (42,922) (16,453)
Neuberger Berman Systematic Global Equity Fund Forward Currency Contracts (233,207) 79,888 (368,358) (85,646)
Neuberger Berman Global Real Estate Securities Fund Forward Currency Contracts (17,964) 14,179 (10,549) (4,263)
Neuberger Berman Global Credit Long Short Fund* Forward Currency Contracts – 3,931 (27,319) (8,737)
Futures Contracts – – (40,777) (22,869)
Options Contracts – – 19,833 23,544
Swap Contracts – – (81,427) (170,324)
Contracts for Difference – – 12,140 –
Neuberger Berman Asian Debt - Hard Currency Fund Forward Currency Contracts 395 18,117 (6,386) 4,556
Futures Contracts (94,934) 54,429 80,042 (46,880)
Swap Contracts (9,559) – – –
Neuberger Berman China Bond Fund Forward Currency Contracts 10,354,091 (8,301,062) 208,478 (213,111)
Futures Contracts 213,240 – 304,791 (22,131)
Swap Contracts – – (25,309) 7,039
Neuberger Berman Global Dynamic Asset Allocator Fund** Forward Currency Contracts 8,390 25,157 711,077 177,935
Futures Contracts (334,944) 131,481 (371,500) (244,812)
Swap Contracts (54,869) (122,574) (230,411) 280,190
Contracts for Difference 5 – – –
Neuberger Berman Corporate Hybrid Bond Fund Forward Currency Contracts (10,559,575) (3,074,874) (5,560,100) 863,058
Neuberger Berman Global High Yield Bond Fund Forward Currency Contracts (1,655,592) 414,810 (2,316,870) (860,456)
Futures Contracts (74,837) (4,317) 117,746 (24,569)
Neuberger Berman Global Opportunistic Bond Fund Forward Currency Contracts 4,079,383 (3,192,983) 2,402,724 731,973
Futures Contracts (4,164,699) 1,103,954 529,118 (655,789)
Options Contracts (2,879) – – –
Swap Contracts (545,863) (543,320) 120,821 230,875
Neuberger Berman Multi-Asset Risk Premia Fund*** Forward Currency Contracts (12,008) 521,018 (2,247,912) (476,944)
Swap Contracts 1,471,809 (1,313,516) (7,770,572) 1,313,789

FINANCIAL STATEMENTS NOTES TO THE AUDITED FINANCIAL STATEMENTS
1632 NEUBERGER BERMAN INVESTMENT FUNDS PLC
FOR THE YEAR ENDED 31 DECEMBER 2019
24. DERIVATIVE CONTRACTS (CONTINUED) 31 December 2019 31 December 2018
Net Realised
Gain/(Loss)
Change in Net Unrealised Gain/(Loss)
Net RealisedGain/(Loss)
Change in Net Unrealised Gain/(Loss)
Neuberger Berman Multi-Asset Class Income Fund
Forward Currency Contracts (61,712) (125,214) 25,191 (43,640)
Futures Contracts (329,868) (146,089) (172,964) (84,279)
Options Contracts 190,814 21,496 (238,698) (18,708)
Swap Contracts 178,783 49,217 (405,937) 45,357
Contracts for Difference – – 4,499 –
Neuberger Berman US Equity Index PutWrite Fund
Forward Currency Contracts (5,111,243) 2,270,368 (5,049,001) (914,239)
Options Contracts 68,327,820 (3,322,626) (46,374,310) 5,346,766
Neuberger Berman Global Equity Index PutWrite Fund
Forward Currency Contracts (2,710,569) 860,202 (4,244,046) (1,083,976)
Options Contracts 9,021,968 (693,978) (10,294,894) 638,008
Neuberger Berman Uncorrelated Strategies Fund
Forward Currency Contracts (58,116,702) 66,727,298 (19,110,066) (19,474,299)
Futures Contracts 49,708,249 (14,012,459) (13,725,835) 10,396,442
Options Contracts 2,617,137 3,351,949 20,915,070 (1,548,972)
Swap Contracts (10,346,311) 610,695 (4,749,703) (130,303)
Contracts for Difference 4,297,192 1,613,931 (14,026,845) (765,251)
Neuberger Berman Emerging Market Debt Blend Investment Grade Fund Forward Currency Contracts (6,610) 102,992 (36,536) (28,213)
Futures Contracts (10,495) (3,273) (24,115) (8,290)
Swap Contracts (9,250) 28,792 981 (16,588)
Neuberger Berman Multi-Asset Class Growth Fund
Forward Currency Contracts 186,380 (114,211) 364,553 47,883
Futures Contracts (881,372) 228,003 60,733 (137,317)
Options Contracts 537,279 (36,790) (525,184) 53,151
Swap Contracts (12,788) (83,597) (294,889) 102,587
Contracts for Difference – – 3,186 –
Neuberger Berman CLO Income Fund1 Forward Currency Contracts (8,406,091) 8,112,825 (1,416,278) (1,548,802)
Neuberger Berman Next Generation Mobility Fund1
Forward Currency Contracts (9,748) 8,219 (96) (168)
Neuberger Berman Ultra Short Term Euro Bond Fund1 Forward Currency Contracts 3,608,599 (1,568,888) – –
Futures Contracts 489,424 265,521 16,370 (2,140)
Options Contracts 1,681 386 (689) (386)
Swap Contracts 65,168 3,307 – –
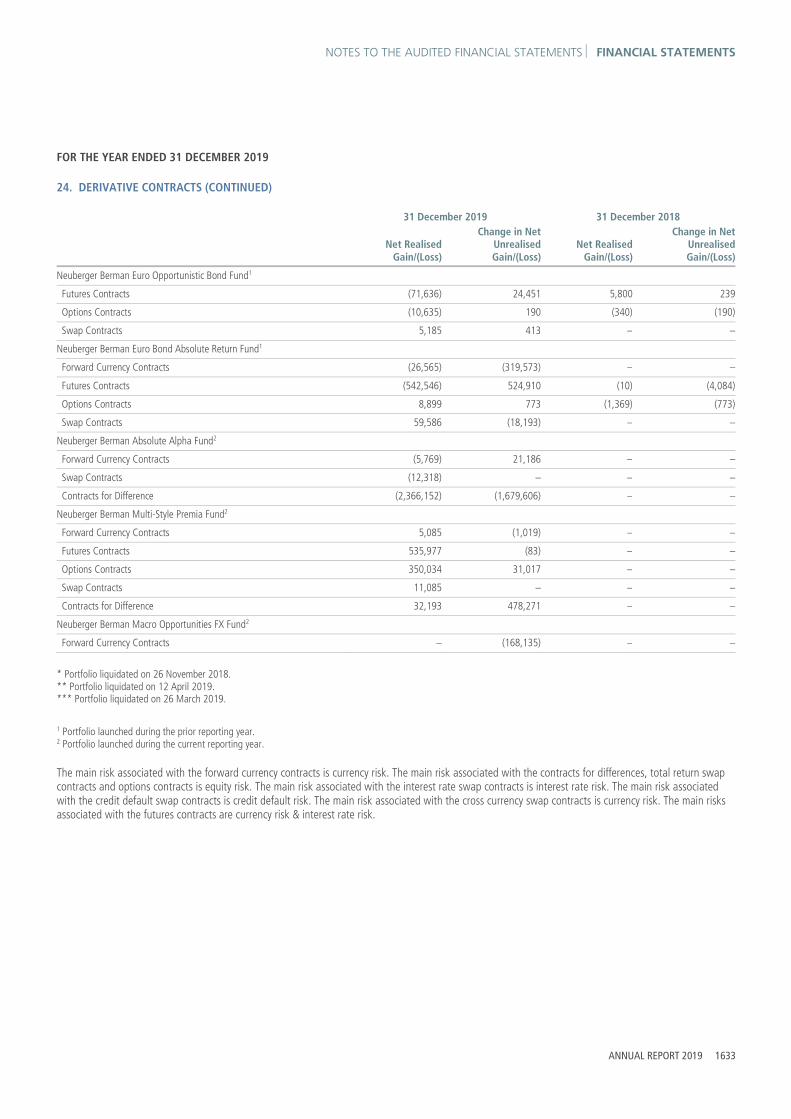
NOTES TO THE AUDITED FINANCIAL STATEMENTS FINANCIAL STATEMENTS
ANNUAL REPORT 2019 1633
FOR THE YEAR ENDED 31 DECEMBER 2019
24. DERIVATIVE CONTRACTS (CONTINUED) 31 December 2019 31 December 2018
Net Realised
Gain/(Loss)
Change in Net Unrealised Gain/(Loss)
Net RealisedGain/(Loss)
Change in Net Unrealised Gain/(Loss)
Neuberger Berman Euro Opportunistic Bond Fund1
Futures Contracts (71,636) 24,451 5,800 239
Options Contracts (10,635) 190 (340) (190)
Swap Contracts 5,185 413 – –
Neuberger Berman Euro Bond Absolute Return Fund1 Forward Currency Contracts (26,565) (319,573) – –
Futures Contracts (542,546) 524,910 (10) (4,084)
Options Contracts 8,899 773 (1,369) (773)
Swap Contracts 59,586 (18,193) – –
Neuberger Berman Absolute Alpha Fund2 Forward Currency Contracts (5,769) 21,186 – –
Swap Contracts (12,318) – – –
Contracts for Difference (2,366,152) (1,679,606) – –
Neuberger Berman Multi-Style Premia Fund2 Forward Currency Contracts 5,085 (1,019) – –
Futures Contracts 535,977 (83) – –
Options Contracts 350,034 31,017 – –
Swap Contracts 11,085 – – –
Contracts for Difference 32,193 478,271 – –
Neuberger Berman Macro Opportunities FX Fund2 Forward Currency Contracts – (168,135) – –
* Portfolio liquidated on 26 November 2018. ** Portfolio liquidated on 12 April 2019. *** Portfolio liquidated on 26 March 2019.
1 Portfolio launched during the prior reporting year. 2 Portfolio launched during the current reporting year. The main risk associated with the forward currency contracts is currency risk. The main risk associated with the contracts for differences, total return swap contracts and options contracts is equity risk. The main risk associated with the interest rate swap contracts is interest rate risk. The main risk associated with the credit default swap contracts is credit default risk. The main risk associated with the cross currency swap contracts is currency risk. The main risks associated with the futures contracts are currency risk & interest rate risk.

FINANCIAL STATEMENTS NOTES TO THE AUDITED FINANCIAL STATEMENTS
1634 NEUBERGER BERMAN INVESTMENT FUNDS PLC
FOR THE YEAR ENDED 31 DECEMBER 2019
24. DERIVATIVE CONTRACTS (CONTINUED)
Commitments
In the normal course of business the Company enters into contracts that contain a variety of representations and warranties which provide general indemnifications. Certain contracts are required to be accounted for pursuant to “Guarantor’s Accounting and Disclosure Requirements for Guarantees, Including Indirect Guarantees of Indebtedness of Others”, which addresses the disclosures to be made by a guarantor and whether a liability should be recognised by a guarantor at the inception of a guarantee. If required by that statement, the liability for a guarantee would be recorded at fair value at the inception of the guarantee. The Company’s maximum exposure under other arrangements is unknown, as this would involve future claims that may be made against the Company that have not yet occurred. However, based on experience, the Company expects the risk of loss to be low.
Credit-Risk-Related Contingent Features
The Portfolios’ derivative contracts are subject to International Swaps and Derivatives Association (“ISDA”) Master Agreements which contain certain covenants and other provisions that may require the Company to post additional collateral on derivatives or terminate these agreements if the Company fails to maintain sufficient asset coverage for its contracts or its Net Assets decline by stated percentages or amounts. The Portfolios entered into credit default swaps as part of its investment strategies, to hedge against unfavourable changes in the value of investments and to protect against adverse movements in interest rates or credit performance with counterparties. The maximum potential amount the Portfolios could be required to pay as a seller of credit protection if a credit event occurs as at 31 December 2019 was US$ 22,886,890 (31 December 2018: US$ 25,190,390). The aggregate fair value of all credit default swaps as at 31 December 2019 was US$ (19,927,164) (31 December 2018: US$ (2,926,214)). There were no other derivative instruments with credit-risk-related contingent features held by the Company at 31 December 2019 and 31 December 2018.
25. OFFSETTING FINANCIAL INSTRUMENTS
The Investment Manager of the Company is an affiliate of Neuberger Berman Group LLC, who is a registered investment adviser with the SEC in the United States. The information included here represents US GAAP equivalent disclosures that are provided in order to enable the Investment Manager to avail of certain exemptions available to it under the SEC Custody Rule.
Financial assets and liabilities are offset and the net amount reported in the Balance Sheet when there is a legally enforceable right to offset the recognised amounts and there is an intention to settle on a net basis, or realise the asset and settle the liability simultaneously.
For financial reporting purpose, the Company does not offset derivative assets and derivative liabilities in the Balance Sheet. The following tables present the Company’s derivative assets and liabilities by counterparty, net of amounts available for offset under a master netting agreement and net of the related collateral received by the Company for assets and pledged by the Company for liabilities as at 31 December 2019 and 31 December 2018.

NOTES TO THE AUDITED FINANCIAL STATEMENTS FINANCIAL STATEMENTS
ANNUAL REPORT 2019 1635
FOR THE YEAR ENDED 31 DECEMBER 2019
25. OFFSETTING FINANCIAL INSTRUMENTS (CONTINUED)
Neuberger Berman High Yield Bond Fund 31 December 2019
Gross Amounts ofRecognised
AssetsGross Amounts Offset
in the Balance Sheet
Net Amounts of Assets presented
in the Balance SheetDerivative Assets US$ US$ US$
Forward Currency Contracts 79,888,953 - 79,888,953
Total 79,888,953 - 79,888,953
Gross Amounts Not Offset in the Balance Sheet
Counterparty
Net Amounts ofAssets presented
in the Balance SheetLiabilities Available
for OffsetCash Collateral
Received(a) Net Amount(b)
US$ US$ US$ US$
Goldman Sachs International 28,238,950 (5,258,240) - 22,980,710
UBS AG 27,332,549 (7,899,125) - 19,433,424
Westpac Banking Corp 24,317,454 (6,008,506) - 18,308,948
Total 79,888,953 (19,165,871) - 60,723,082
Derivative Liabilities
Gross Amounts ofRecognised
LiabilitiesGross Amounts Offset
in the Balance Sheet
Net Amounts of Liabilities presented in the Balance Sheet
US$ US$ US$
Forward Currency Contracts (19,165,871) - (19,165,871)
Total (19,165,871) - (19,165,871)
Gross Amounts Not Offset in the Balance Sheet
Counterparty
Net Amounts ofLiabilities presented
in the Balance SheetAssets Available
for OffsetCash Collateral
Pledged(a) Net Amount(c)
US$ US$ US$ US$
Goldman Sachs International (5,258,240) 5,258,240 - -
UBS AG (7,899,125) 7,899,125 - -
Westpac Banking Corp (6,008,506) 6,008,506 - -
Total (19,165,871) 19,165,871 - -

FINANCIAL STATEMENTS NOTES TO THE AUDITED FINANCIAL STATEMENTS
1636 NEUBERGER BERMAN INVESTMENT FUNDS PLC
FOR THE YEAR ENDED 31 DECEMBER 2019
25. OFFSETTING FINANCIAL INSTRUMENTS (CONTINUED)
Neuberger Berman High Yield Bond Fund (continued) 31 December 2018
Derivative Assets
Gross Amounts ofRecognised
Assets
Gross Amounts Offset in the Balance Sheet
Net Amounts of Assets presented
in the Balance SheetUS$ US$ US$
Forward Currency Contracts 31,480,503 - 31,480,503
Total 31,480,503 - 31,480,503
Gross Amounts Not Offset in the Balance Sheet
Counterparty
Net Amounts ofAssets presented
in the Balance SheetLiabilities Available
for OffsetCash Collateral
Received(a) Net Amount(b)
US$ US$ US$ US$
Goldman Sachs International 11,656,518 (6,660,070) - 4,996,448
UBS AG 8,695,675 (6,260,128) - 2,435,547
Westpac Banking Corp 11,128,310 (6,951,708) - 4,176,602
Total 31,480,503 (19,871,906) - 11,608,597
Derivative Liabilities
Gross Amounts ofRecognised
Liabilities
Gross Amounts Offset in the Balance Sheet
Net Amounts of Liabilities presented in the Balance
SheetUS$ US$ US$
Forward Currency Contracts (19,871,906) - (19,871,906)
Total (19,871,906) - (19,871,906)
Gross Amounts Not Offset in the Balance Sheet
Counterparty
Net Amounts of Liabilities presented in the Balance
SheetAssets Available
for OffsetCash Collateral
Pledged(a) Net Amount(c)
US$ US$ US$ US$
Goldman Sachs International (6,660,070) 6,660,070 - -
UBS AG (6,260,128) 6,260,128 - -
Westpac Banking Corp (6,951,708) 6,951,708 - -
Total (19,871,906) 19,871,906 - -

NOTES TO THE AUDITED FINANCIAL STATEMENTS FINANCIAL STATEMENTS
ANNUAL REPORT 2019 1637
FOR THE YEAR ENDED 31 DECEMBER 2019
25. OFFSETTING FINANCIAL INSTRUMENTS (CONTINUED)
Neuberger Berman Diversified Currency Fund 31 December 2019
Derivative Assets
Gross Amounts ofRecognised
Assets
Gross Amounts Offset in the Balance Sheet
Net Amounts of Assets presented
in the Balance SheetUS$ US$ US$
Forward Currency Contracts 2,682,167 - 2,682,167
Total 2,682,167 - 2,682,167
Gross Amounts Not Offset in the Balance Sheet
Counterparty
Net Amounts ofAssets presented
in the Balance SheetLiabilities Available
for OffsetCash Collateral
Received(a) Net Amount(b)
US$ US$ US$ US$
Citibank NA 709,137 (709,137) - -
Goldman Sachs International 1,550,026 (779,582) (620,000) 150,444
Royal Bank of Canada 10,480 - - 10,480
Société Générale 5,236 - - 5,236
State Street Bank and Trust and Co 325,025 (325,025) - -
UBS AG 33,404 (11,611) - 21,793
Westpac Banking Corp 48,859 (24,143) - 24,716
Total 2,682,167 (1,849,498) (620,000) 212,669
Derivative Liabilities
Gross Amounts ofRecognised
LiabilitiesGross Amounts Offset
in the Balance Sheet
Net Amounts of Liabilities presented in the Balance
SheetUS$ US$ US$
Forward Currency Contracts (2,899,862) - (2,899,862)
Total (2,899,862) - (2,899,862)
Gross Amounts Not Offset in the Balance Sheet
Counterparty
Net Amounts of Liabilities presented in the Balance
SheetAssets Available
for OffsetCash Collateral
Pledged(a) Net Amount(c)
US$ US$ US$ US$
Citibank NA (1,012,870) 709,137 - (303,733)
Goldman Sachs International (779,582) 779,582 - -
State Street Bank and Trust and Co (1,071,656) 325,025 - (746,631)
UBS AG (11,611) 11,611 - -
Westpac Banking Corp (24,143) 24,143 - -
Total (2,899,862) 1,849,498 - (1,050,364)

FINANCIAL STATEMENTS NOTES TO THE AUDITED FINANCIAL STATEMENTS
1638 NEUBERGER BERMAN INVESTMENT FUNDS PLC
FOR THE YEAR ENDED 31 DECEMBER 2019
25. OFFSETTING FINANCIAL INSTRUMENTS (CONTINUED)
Neuberger Berman Diversified Currency Fund (continued) 31 December 2018
Derivative Assets
Gross Amounts ofRecognised
AssetsGross Amounts Offset
in the Balance Sheet
Net Amounts of Assets presented
in the Balance SheetUS$ US$ US$
Forward Currency Contracts 1,123,461 - 1,123,461
Total 1,123,461 - 1,123,461
Gross Amounts Not Offset in the Balance Sheet
Counterparty
Net Amounts ofAssets presented
in the Balance SheetLiabilities Available
for OffsetCash Collateral
Received(a) Net Amount(b)
US$ US$ US$ US$
Citibank NA 480,679 (480,679) - -
Goldman Sachs International 488,467 (488,467) - -
Royal Bank of Canada 2,163 (935) - 1,228
State Street Bank and Trust and Co 118,058 (118,058) - -
UBS AG 710 (710) - -
Westpac Banking Corp 33,384 (33,384) - -
Total 1,123,461 (1,122,233) - 1,228
Derivative Liabilities
Gross Amounts ofRecognised
LiabilitiesGross Amounts Offset
in the Balance Sheet
Net Amounts of Liabilities presented in the Balance
SheetUS$ US$ US$
Forward Currency Contracts (1,209,774) - (1,209,774)
Total (1,209,774) - (1,209,774)
Gross Amounts Not Offset in the Balance Sheet
Counterparty
Net Amounts of Liabilities presented in the Balance
SheetAssets Available
for OffsetCash Collateral
Pledged(a) Net Amount(c)
US$ US$ US$ US$
Citibank NA (488,762) 480,679 - (8,083)
Goldman Sachs International (504,928) 488,467 - (16,461)
Royal Bank of Canada (935) 935 - -
State Street Bank and Trust and Co (156,038) 118,058 - (37,980)
UBS AG (7,944) 710 - (7,234)
Westpac Banking Corp (51,167) 33,384 - (17,783)
Total (1,209,774) 1,122,233 - (87,541)

NOTES TO THE AUDITED FINANCIAL STATEMENTS FINANCIAL STATEMENTS
ANNUAL REPORT 2019 1639
FOR THE YEAR ENDED 31 DECEMBER 2019
25. OFFSETTING FINANCIAL INSTRUMENTS (CONTINUED)
Neuberger Berman US Multi Cap Opportunities Fund 31 December 2019
Derivative Assets
Gross Amounts ofRecognised
AssetsGross Amounts Offset
in the Balance Sheet
Net Amounts of Assets presented
in the Balance SheetUS$ US$ US$
Forward Currency Contracts 1,848,250 - 1,848,250
Total 1,848,250 - 1,848,250
Gross Amounts Not Offset in the Balance Sheet
Counterparty
Net Amounts ofAssets presented
in the Balance SheetLiabilities Available
for OffsetCash Collateral
Received(a) Net Amount(b)
US$ US$ US$ US$
Goldman Sachs International 522,043 (99,818) - 422,225
UBS AG 452,029 (41,579) - 410,450
Westpac Banking Corp 874,178 (401,615) - 472,563
Total 1,848,250 (543,012) - 1,305,238
Derivative Liabilities
Gross Amounts ofRecognised
LiabilitiesGross Amounts Offset
in the Balance Sheet
Net Amounts of Liabilities presented in the Balance
SheetUS$ US$ US$
Forward Currency Contracts (543,012) - (543,012)
Total (543,012) - (543,012)
Gross Amounts Not Offset in the Balance Sheet
Counterparty
Net Amounts of Liabilitiespresented in the Balance
SheetAssets Available
for OffsetCash Collateral
Pledged(a) Net Amount(c)
US$ US$ US$ US$
Goldman Sachs International (99,818) 99,818 - -
UBS AG (41,579) 41,579 - -
Westpac Banking Corp (401,615) 401,615 - -
Total (543,012) 543,012 - -

FINANCIAL STATEMENTS NOTES TO THE AUDITED FINANCIAL STATEMENTS
1640 NEUBERGER BERMAN INVESTMENT FUNDS PLC
FOR THE YEAR ENDED 31 DECEMBER 2019
25. OFFSETTING FINANCIAL INSTRUMENTS (CONTINUED)
Neuberger Berman US Multi Cap Opportunities Fund (continued) 31 December 2018
Derivative Assets
Gross Amounts ofRecognised
AssetsGross Amounts Offset
in the Balance Sheet
Net Amounts of Assets presented
in the Balance SheetUS$ US$ US$
Forward Currency Contracts 863,114 - 863,114
Total 863,114 - 863,114
Gross Amounts Not Offset in the Balance Sheet
Counterparty
Net Amounts ofAssets presented
in the Balance SheetLiabilities Available
for OffsetCash Collateral
Received(a) Net Amount(b)
US$ US$ US$ US$
Goldman Sachs International 271,347 (271,347) - -
UBS AG 152,873 (152,873) - -
Westpac Banking Corp 438,894 (438,894) - -
Total 863,114 (863,114) - -
Derivative Liabilities
Gross Amounts ofRecognised
LiabilitiesGross Amounts Offset
in the Balance Sheet
Net Amounts of Liabilities presented in the Balance
SheetUS$ US$ US$
Forward Currency Contracts (1,328,560) - (1,328,560)
Total (1,328,560) - (1,328,560)
Gross Amounts Not Offset in the Balance Sheet
Counterparty
Net Amounts of Liabilitiespresented in the Balance
SheetAssets Available
for OffsetCash Collateral
Pledged(a) Net Amount(c)
US$ US$ US$ US$
Goldman Sachs International (366,396) 271,347 - (95,049)
UBS AG (207,699) 152,873 - (54,826)
Westpac Banking Corp (754,465) 438,894 - (315,571)
Total (1,328,560) 863,114 - (465,446)

NOTES TO THE AUDITED FINANCIAL STATEMENTS FINANCIAL STATEMENTS
ANNUAL REPORT 2019 1641
FOR THE YEAR ENDED 31 DECEMBER 2019
25. OFFSETTING FINANCIAL INSTRUMENTS (CONTINUED)
Neuberger Berman US Real Estate Securities Fund 31 December 2019
Derivative Assets
Gross Amounts of Recognised
AssetsGross Amounts Offset
in the Balance Sheet
Net Amounts of Assets presented
in the Balance SheetUS$ US$ US$
Forward Currency Contracts 2,695,530 - 2,695,530
Total 2,695,530 - 2,695,530
Gross Amounts Not Offset in the Balance Sheet
Counterparty
Net Amounts of Assets presented
in the Balance SheetLiabilities Available
for OffsetCash Collateral
Received(a) Net Amount(b)
US$ US$ US$ US$
Goldman Sachs International 866,965 (156,215) - 710,750
UBS AG 678,524 (31,460) - 647,064
Westpac Banking Corp 1,150,041 (507,978) - 642,063
Total 2,695,530 (695,653) - 1,999,877
Derivative Liabilities
Gross Amounts of Recognised
LiabilitiesGross Amounts Offset
in the Balance Sheet
Net Amounts of Liabilities presented in the Balance
SheetUS$ US$ US$
Forward Currency Contracts (695,653) - (695,653)
Total (695,653) - (695,653)
Gross Amounts Not Offset in the Balance Sheet
Counterparty
Net Amounts of Liabilities presented in the Balance
SheetAssets Available
for OffsetCash Collateral
Pledged(a) Net Amount(c)
US$ US$ US$ US$
Goldman Sachs International (156,215) 156,215 - -
UBS AG (31,460) 31,460 - -
Westpac Banking Corp (507,978) 507,978 - -
Total (695,653) 695,653 - -

FINANCIAL STATEMENTS NOTES TO THE AUDITED FINANCIAL STATEMENTS
1642 NEUBERGER BERMAN INVESTMENT FUNDS PLC
FOR THE YEAR ENDED 31 DECEMBER 2019
25. OFFSETTING FINANCIAL INSTRUMENTS (CONTINUED)
Neuberger Berman US Real Estate Securities Fund (continued) 31 December 2018
Derivative Assets
Gross Amounts of Recognised
AssetsGross Amounts Offset
in the Balance Sheet
Net Amounts of Assets presented
in the Balance SheetUS$ US$ US$
Forward Currency Contracts 411,458 - 411,458
Total 411,458 - 411,458
Gross Amounts Not Offset in the Balance Sheet
Counterparty
Net Amounts of Assets presented
in the Balance SheetLiabilities Available
for OffsetCash Collateral
Received(a) Net Amount(b)
US$ US$ US$ US$
Goldman Sachs International 140,517 (82,539) - 57,978
UBS AG 104,119 (37,425) - 66,694
Westpac Banking Corp 166,822 (166,822) - -
Total 411,458 (286,786) - 124,672
Derivative Liabilities
Gross Amounts of Recognised
LiabilitiesGross Amounts Offset
in the Balance Sheet
Net Amounts of Liabilities presented in the Balance
SheetUS$ US$ US$
Forward Currency Contracts (321,650) - (321,650)
Total (321,650) - (321,650)
Gross Amounts Not Offset in the Balance Sheet
Counterparty
Net Amounts of Liabilities presented in the Balance
SheetAssets Available
for OffsetCash Collateral
Pledged(a) Net Amount(c)
US$ US$ US$ US$
Goldman Sachs International (82,539) 82,539 - -
UBS AG (37,425) 37,425 - -
Westpac Banking Corp (201,686) 166,822 - (34,864)
Total (321,650) 286,786 - (34,864)

NOTES TO THE AUDITED FINANCIAL STATEMENTS FINANCIAL STATEMENTS
ANNUAL REPORT 2019 1643
FOR THE YEAR ENDED 31 DECEMBER 2019
25. OFFSETTING FINANCIAL INSTRUMENTS (CONTINUED)
Neuberger Berman China Equity Fund 31 December 2019
Derivative Assets
Gross Amounts of Recognised
AssetsGross Amounts Offset
in the Balance Sheet
Net Amounts of Assets presented
in the Balance SheetUS$ US$ US$
Forward Currency Contracts 813,489 - 813,489
Total 813,489 - 813,489
Gross Amounts Not Offset in the Balance Sheet
Counterparty
Net Amounts of Assets presented
in the Balance SheetLiabilities Available
for OffsetCash Collateral
Received(a) Net Amount(b)
US$ US$ US$ US$
Goldman Sachs International 309,099 (127,503) - 181,596
UBS AG 263,313 (85,635) - 177,678
Westpac Banking Corp 241,077 (94,286) - 146,791
Total 813,489 (307,424) - 506,065
Derivative Liabilities
Gross Amounts of Recognised
LiabilitiesGross Amounts Offset
in the Balance Sheet
Net Amounts of Liabilities presented in the Balance
SheetUS$ US$ US$
Forward Currency Contracts (307,424) - (307,424)
Total (307,424) - (307,424)
Gross Amounts Not Offset in the Balance Sheet
Counterparty
Net Amounts of Liabilities presented in the Balance
SheetAssets Available
for OffsetCash Collateral
Pledged(a) Net Amount(c)
US$ US$ US$ US$
Goldman Sachs International (127,503) 127,503 - -
UBS AG (85,635) 85,635 - -
Westpac Banking Corp (94,286) 94,286 - -
Total (307,424) 307,424 - -

FINANCIAL STATEMENTS NOTES TO THE AUDITED FINANCIAL STATEMENTS
1644 NEUBERGER BERMAN INVESTMENT FUNDS PLC
FOR THE YEAR ENDED 31 DECEMBER 2019
25. OFFSETTING FINANCIAL INSTRUMENTS (CONTINUED)
Neuberger Berman China Equity Fund (continued) 31 December 2018
Derivative Assets
Gross Amounts of Recognised
AssetsGross Amounts Offset
in the Balance Sheet
Net Amounts of Assets presented
in the Balance SheetUS$ US$ US$
Forward Currency Contracts 391,713 - 391,713
Total 391,713 - 391,713
Gross Amounts Not Offset in the Balance Sheet
Counterparty
Net Amounts of Assets presented
in the Balance SheetLiabilities Available
for OffsetCash Collateral
Received(a) Net Amount(b)
US$ US$ US$ US$
Goldman Sachs International 145,038 (138,094) - 6,944
UBS AG 92,536 (79,006) - 13,530
Westpac Banking Corp 154,139 (146,539) - 7,600
Total 391,713 (363,639) - 28,074
Derivative Liabilities
Gross Amounts of Recognised
LiabilitiesGross Amounts Offset
in the Balance Sheet
Net Amounts of Liabilities presented in the Balance
SheetUS$ US$ US$
Forward Currency Contracts (363,639) - (363,639)
Total (363,639) - (363,639)
Gross Amounts Not Offset in the Balance Sheet
Counterparty
Net Amounts of Liabilities presented in the Balance
SheetAssets Available
for OffsetCash Collateral
Pledged(a) Net Amount(c)
US$ US$ US$ US$
Goldman Sachs International (138,094) 138,094 - -
UBS AG (79,006) 79,006 - -
Westpac Banking Corp (146,539) 146,539 - -
Total (363,639) 363,639 - -
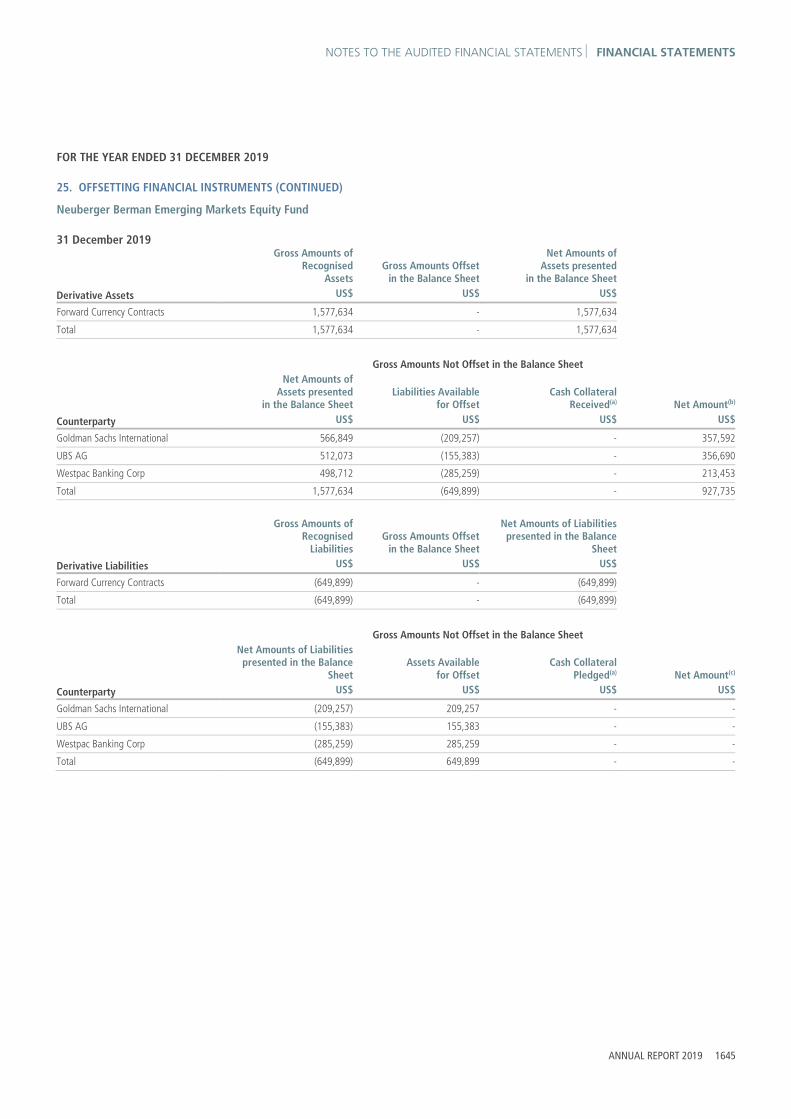
NOTES TO THE AUDITED FINANCIAL STATEMENTS FINANCIAL STATEMENTS
ANNUAL REPORT 2019 1645
FOR THE YEAR ENDED 31 DECEMBER 2019
25. OFFSETTING FINANCIAL INSTRUMENTS (CONTINUED)
Neuberger Berman Emerging Markets Equity Fund 31 December 2019
Derivative Assets
Gross Amounts of Recognised
AssetsGross Amounts Offset
in the Balance Sheet
Net Amounts of Assets presented
in the Balance Sheet US$ US$ US$
Forward Currency Contracts 1,577,634 - 1,577,634
Total 1,577,634 - 1,577,634
Gross Amounts Not Offset in the Balance Sheet
Counterparty
Net Amounts of Assets presented
in the Balance SheetLiabilities Available
for OffsetCash Collateral
Received(a) Net Amount(b)
US$ US$ US$ US$
Goldman Sachs International 566,849 (209,257) - 357,592
UBS AG 512,073 (155,383) - 356,690
Westpac Banking Corp 498,712 (285,259) - 213,453
Total 1,577,634 (649,899) - 927,735
Derivative Liabilities
Gross Amounts of Recognised
LiabilitiesGross Amounts Offset
in the Balance Sheet
Net Amounts of Liabilities presented in the Balance
SheetUS$ US$ US$
Forward Currency Contracts (649,899) - (649,899)
Total (649,899) - (649,899)
Gross Amounts Not Offset in the Balance Sheet
Counterparty
Net Amounts of Liabilities presented in the Balance
SheetAssets Available
for OffsetCash Collateral
Pledged(a) Net Amount(c)
US$ US$ US$ US$
Goldman Sachs International (209,257) 209,257 - -
UBS AG (155,383) 155,383 - -
Westpac Banking Corp (285,259) 285,259 - -
Total (649,899) 649,899 - -

FINANCIAL STATEMENTS NOTES TO THE AUDITED FINANCIAL STATEMENTS
1646 NEUBERGER BERMAN INVESTMENT FUNDS PLC
FOR THE YEAR ENDED 31 DECEMBER 2019
25. OFFSETTING FINANCIAL INSTRUMENTS (CONTINUED)
Neuberger Berman Emerging Markets Equity Fund (continued) 31 December 2018
Derivative Assets
Gross Amounts of Recognised
AssetsGross Amounts Offset
in the Balance Sheet
Net Amounts of Assets presented
in the Balance Sheet US$ US$ US$
Forward Currency Contracts 893,053 - 893,053
Total 893,053 - 893,053
Gross Amounts Not Offset in the Balance Sheet
Counterparty
Net Amounts of Assets presented
in the Balance SheetLiabilities Available
for OffsetCash Collateral
Received(a) Net Amount(b)
US$ US$ US$ US$
Goldman Sachs International 318,194 (318,194) - -
UBS AG 132,070 (132,070) - -
Westpac Banking Corp 442,789 (442,789) - -
Total 893,053 (893,053) - -
Derivative Liabilities
Gross Amounts of Recognised
LiabilitiesGross Amounts Offset
in the Balance Sheet
Net Amounts of Liabilities presented in the Balance
SheetUS$ US$ US$
Forward Currency Contracts (2,573,630) - (2,573,630)
Total (2,573,630) - (2,573,630)
Gross Amounts Not Offset in the Balance Sheet
Counterparty
Net Amounts of Liabilities presented in the Balance
SheetAssets Available
for OffsetCash Collateral
Pledged(a) Net Amount(c)
US$ US$ US$ US$
Goldman Sachs International (942,955) 318,194 - (624,761)
UBS AG (694,447) 132,070 - (562,377)
Westpac Banking Corp (936,228) 442,789 - (493,439)
Total (2,573,630) 893,053 - (1,680,577)

NOTES TO THE AUDITED FINANCIAL STATEMENTS FINANCIAL STATEMENTS
ANNUAL REPORT 2019 1647
FOR THE YEAR ENDED 31 DECEMBER 2019
25. OFFSETTING FINANCIAL INSTRUMENTS (CONTINUED)
Neuberger Berman US Small Cap Fund 31 December 2019
Derivative Assets
Gross Amounts ofRecognised
AssetsGross Amounts Offset
in the Balance Sheet
Net Amounts of Assets presented
in the Balance Sheet US$ US$ US$
Forward Currency Contracts 340,665 - 340,665
Total 340,665 - 340,665
Gross Amounts Not Offset in the Balance Sheet
Counterparty
Net Amounts ofAssets presented
in the Balance SheetLiabilities Available
for OffsetCash Collateral
Received(a) Net Amount(b)
US$ US$ US$ US$
Goldman Sachs International 114,947 (33,929) - 81,018
UBS AG 100,673 (18,862) - 81,811
Westpac Banking Corp 125,045 (65,567) - 59,478
Total 340,665 (118,358) - 222,307
Derivative Liabilities
Gross Amounts ofRecognised
LiabilitiesGross Amounts Offset
in the Balance Sheet
Net Amounts of Liabilities presented in the Balance
SheetUS$ US$ US$
Forward Currency Contracts (118,358) - (118,358)
Total (118,358) - (118,358)
Gross Amounts Not Offset in the Balance Sheet
Counterparty
Net Amounts of Liabilitiespresented in the Balance
SheetAssets Available
for OffsetCash Collateral
Pledged(a) Net Amount(c)
US$ US$ US$ US$
Goldman Sachs International (33,929) 33,929 - -
UBS AG (18,862) 18,862 - -
Westpac Banking Corp (65,567) 65,567 - -
Total (118,358) 118,358 - -

FINANCIAL STATEMENTS NOTES TO THE AUDITED FINANCIAL STATEMENTS
1648 NEUBERGER BERMAN INVESTMENT FUNDS PLC
FOR THE YEAR ENDED 31 DECEMBER 2019
25. OFFSETTING FINANCIAL INSTRUMENTS (CONTINUED)
Neuberger Berman US Small Cap Fund (continued) 31 December 2018
Derivative Assets
Gross Amounts ofRecognised
AssetsGross Amounts Offset
in the Balance Sheet
Net Amounts of Assets presented
in the Balance Sheet US$ US$ US$
Forward Currency Contracts 650,246 - 650,246
Total 650,246 - 650,246
Gross Amounts Not Offset in the Balance Sheet
Counterparty
Net Amounts ofAssets presented
in the Balance SheetLiabilities Available
for OffsetCash Collateral
Received(a) Net Amount(b)
US$ US$ US$ US$
Goldman Sachs International 114,342 (73,051) - 41,291
UBS AG 87,343 (43,027) - 44,316
Westpac Banking Corp 448,561 (94,207) - 354,354
Total 650,246 (210,285) - 439,961
Derivative Liabilities
Gross Amounts ofRecognised
LiabilitiesGross Amounts Offset
in the Balance Sheet
Net Amounts of Liabilities presented in the Balance
SheetUS$ US$ US$
Forward Currency Contracts (210,285) - (210,285)
Total (210,285) - (210,285)
Gross Amounts Not Offset in the Balance Sheet
Counterparty
Net Amounts of Liabilities presented in the Balance
SheetAssets Available
for OffsetCash Collateral
Pledged(a) Net Amount(c)
US$ US$ US$ US$
Goldman Sachs International (73,051) 73,051 - -
UBS AG (43,027) 43,027 - -
Westpac Banking Corp (94,207) 94,207 - -
Total (210,285) 210,285 - -
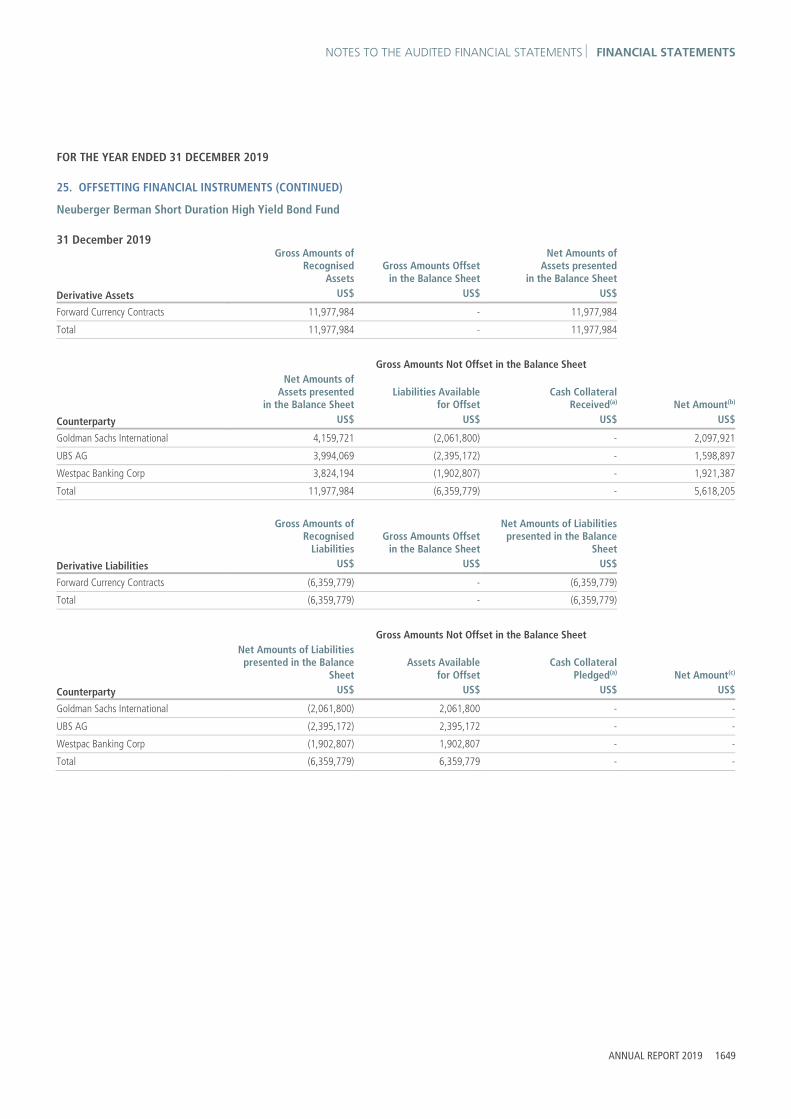
NOTES TO THE AUDITED FINANCIAL STATEMENTS FINANCIAL STATEMENTS
ANNUAL REPORT 2019 1649
FOR THE YEAR ENDED 31 DECEMBER 2019
25. OFFSETTING FINANCIAL INSTRUMENTS (CONTINUED)
Neuberger Berman Short Duration High Yield Bond Fund 31 December 2019
Derivative Assets
Gross Amounts ofRecognised
AssetsGross Amounts Offset
in the Balance Sheet
Net Amounts of Assets presented
in the Balance Sheet US$ US$ US$
Forward Currency Contracts 11,977,984 - 11,977,984
Total 11,977,984 - 11,977,984
Gross Amounts Not Offset in the Balance Sheet
Counterparty
Net Amounts ofAssets presented
in the Balance SheetLiabilities Available
for OffsetCash Collateral
Received(a) Net Amount(b)
US$ US$ US$ US$
Goldman Sachs International 4,159,721 (2,061,800) - 2,097,921
UBS AG 3,994,069 (2,395,172) - 1,598,897
Westpac Banking Corp 3,824,194 (1,902,807) - 1,921,387
Total 11,977,984 (6,359,779) - 5,618,205
Derivative Liabilities
Gross Amounts ofRecognised
LiabilitiesGross Amounts Offset
in the Balance Sheet
Net Amounts of Liabilities presented in the Balance
SheetUS$ US$ US$
Forward Currency Contracts (6,359,779) - (6,359,779)
Total (6,359,779) - (6,359,779)
Gross Amounts Not Offset in the Balance Sheet
Counterparty
Net Amounts of Liabilitiespresented in the Balance
SheetAssets Available
for OffsetCash Collateral
Pledged(a) Net Amount(c)
US$ US$ US$ US$
Goldman Sachs International (2,061,800) 2,061,800 - -
UBS AG (2,395,172) 2,395,172 - -
Westpac Banking Corp (1,902,807) 1,902,807 - -
Total (6,359,779) 6,359,779 - -

FINANCIAL STATEMENTS NOTES TO THE AUDITED FINANCIAL STATEMENTS
1650 NEUBERGER BERMAN INVESTMENT FUNDS PLC
FOR THE YEAR ENDED 31 DECEMBER 2019
25. OFFSETTING FINANCIAL INSTRUMENTS (CONTINUED)
Neuberger Berman Short Duration High Yield Bond Fund (continued) 31 December 2018
Derivative Assets
Gross Amounts ofRecognised
AssetsGross Amounts Offset
in the Balance Sheet
Net Amounts of Assets presented
in the Balance Sheet US$ US$ US$
Forward Currency Contracts 6,174,948 - 6,174,948
Total 6,174,948 - 6,174,948
Gross Amounts Not Offset in the Balance Sheet
Counterparty
Net Amounts ofAssets presented
in the Balance SheetLiabilities Available
for OffsetCash Collateral
Received(a) Net Amount(b)
US$ US$ US$ US$
Goldman Sachs International 2,079,115 (1,628,002) - 451,113
UBS AG 1,899,154 (1,531,423) - 367,731
Westpac Banking Corp 2,196,679 (1,860,332) - 336,347
Total 6,174,948 (5,019,757) - 1,155,191
Derivative Liabilities
Gross Amounts ofRecognised
Liabilities
Gross Amounts Offset in the Balance Sheet
Net Amounts of Liabilities presented in the Balance
SheetUS$ US$ US$
Forward Currency Contracts (5,019,757) - (5,019,757)
Total (5,019,757) - (5,019,757)
Gross Amounts Not Offset in the Balance Sheet
Counterparty
Net Amounts of Liabilitiespresented in the Balance
SheetAssets Available
for OffsetCash Collateral
Pledged(a) Net Amount(c)
US$ US$ US$ US$
Goldman Sachs International (1,628,002) 1,628,002 - -
UBS AG (1,531,423) 1,531,423 - -
Westpac Banking Corp (1,860,332) 1,860,332 - -
Total (5,019,757) 5,019,757 - -

NOTES TO THE AUDITED FINANCIAL STATEMENTS FINANCIAL STATEMENTS
ANNUAL REPORT 2019 1651
FOR THE YEAR ENDED 31 DECEMBER 2019
25. OFFSETTING FINANCIAL INSTRUMENTS (CONTINUED)
Neuberger Berman Global Bond Fund 31 December 2019
Derivative Assets
Gross Amounts of Recognised
AssetsGross Amounts Offset
in the Balance Sheet
Net Amounts ofAssets presented
in the Balance SheetUS$ US$ US$
Forward Currency Contracts 1,481,948 - 1,481,948
Total 1,481,948 - 1,481,948
Gross Amounts Not Offset in the Balance Sheet
Counterparty
Net Amounts of Assets presented
in the Balance SheetLiabilities Available
for OffsetCash Collateral
Received(a) Net Amount(b)
US$ US$ US$ US$
Citibank NA 267,774 (267,774) - -
Goldman Sachs International 831,894 (549,873) - 282,021
Royal Bank of Canada 1,675 - - 1,675
State Street Bank and Trust and Co 112,640 (112,640) - -
UBS AG 187,034 (1,540) - 185,494
Westpac Banking Corp 80,931 (80,931) - -
Total 1,481,948 (1,012,758) - 469,190
Derivative Liabilities
Gross Amounts of Recognised
LiabilitiesGross Amounts Offset
in the Balance Sheet
Net Amounts of Liabilitiespresented in the Balance
SheetUS$ US$ US$
Forward Currency Contracts (2,282,278) - (2,282,278)
Total (2,282,278) - (2,282,278)
Gross Amounts Not Offset in the Balance Sheet
Counterparty
Net Amounts of Liabilities presented in the Balance
SheetAssets Available
for OffsetCash Collateral
Pledged(a) Net Amount(c)
US$ US$ US$ US$
Citibank NA (335,056) 267,774 - (67,282)
Goldman Sachs International (549,873) 549,873 - -
Société Générale (41,636) - - (41,636)
State Street Bank and Trust and Co (364,505) 112,640 - (251,865)
UBS AG (1,540) 1,540 - -
Westpac Banking Corp (989,668) 80,931 - (908,737)
Total (2,282,278) 1,012,758 - (1,269,520)

FINANCIAL STATEMENTS NOTES TO THE AUDITED FINANCIAL STATEMENTS
1652 NEUBERGER BERMAN INVESTMENT FUNDS PLC
FOR THE YEAR ENDED 31 DECEMBER 2019
25. OFFSETTING FINANCIAL INSTRUMENTS (CONTINUED)
Neuberger Berman Global Bond Fund (continued) 31 December 2018
Derivative Assets
Gross Amounts of Recognised
AssetsGross Amounts Offset
in the Balance Sheet
Net Amounts ofAssets presented
in the Balance SheetUS$ US$ US$
Forward Currency Contracts 1,554,136 - 1,554,136
Total 1,554,136 - 1,554,136
Gross Amounts Not Offset in the Balance Sheet
Counterparty
Net Amounts of Assets presented
in the Balance SheetLiabilities Available
for OffsetCash Collateral
Received(a) Net Amount(b)
US$ US$ US$ US$
Citibank NA 371,941 (371,941) - -
Goldman Sachs International 1,089,252 (523,517) - 565,735
State Street Bank and Trust and Co 87,499 (87,499) - -
UBS AG 3,265 - - 3,265
Westpac Banking Corp 2,179 (1,106) - 1,073
Total 1,554,136 (984,063) - 570,073
Derivative Liabilities
Gross Amounts of Recognised
LiabilitiesGross Amounts Offset
in the Balance Sheet
Net Amounts of Liabilitiespresented in the Balance
SheetUS$ US$ US$
Forward Currency Contracts (1,064,158) - (1,064,158)
Total (1,064,158) - (1,064,158)
Gross Amounts Not Offset in the Balance Sheet
Counterparty
Net Amounts of Liabilities presented in the Balance
SheetAssets Available
for OffsetCash Collateral
Pledged(a) Net Amount(c)
US$ US$ US$ US$
Citibank NA (421,595) 371,941 - (49,654)
Goldman Sachs International (523,517) 523,517 - -
State Street Bank and Trust and Co (117,940) 87,499 - (30,441)
Westpac Banking Corp (1,106) 1,106 - -
Total (1,064,158) 984,063 - (80,095)

NOTES TO THE AUDITED FINANCIAL STATEMENTS FINANCIAL STATEMENTS
ANNUAL REPORT 2019 1653
FOR THE YEAR ENDED 31 DECEMBER 2019
25. OFFSETTING FINANCIAL INSTRUMENTS (CONTINUED)
Neuberger Berman Emerging Market Debt – Local Currency Fund 31 December 2019
Derivative Assets
Gross Amounts ofRecognised
AssetsGross Amounts Offset
in the Balance Sheet
Net Amounts of Assets presented
in the Balance SheetUS$ US$ US$
Forward Currency Contracts 61,005,679 - 61,005,679
OTC Swap Contracts 31,598,237 - 31,598,237
Total 92,603,916 - 92,603,916
Gross Amounts Not Offset in the Balance Sheet
Counterparty
Net Amounts ofAssets presented
in the Balance SheetLiabilities Available
for OffsetCash Collateral
Received(a) Net Amount(b)
US$ US$ US$ US$
Brown Brothers Harriman 316,960 (316,960) - -
Citibank NA 13,946,973 (3,458,018) (9,390,000) 1,098,955
Credit Suisse International 2,004,609 - (2,004,609) -
Deutsche Bank AG 1,782,052 (154,845) (1,520,000) 107,207
Goldman Sachs International 42,308,997 (7,196,165) (15,920,000) 19,192,832
HSBC Bank Plc 1,893,337 (768,856) (1,000,000) 124,481
JPMorgan Chase Bank 14,690,387 (12,800,591) (110,000) 1,779,796
Merrill Lynch International 65,321 (65,321) - -
Morgan Stanley 979,852 (979,852) - -
Société Générale 23,248 - - 23,248
Standard Chartered Bank 7,508,225 (2,997,780) - 4,510,445
State Street Bank and Trust and Co 2,775,930 (1,180,575) - 1,595,355
Ubs Ag 125,420 (125,420) - -
Westpac Banking Corp 4,182,605 (427,289) - 3,755,316
Total 92,603,916 (30,471,672) (29,944,609) 32,187,635
Derivative Liabilities
Gross Amounts ofRecognised
LiabilitiesGross Amounts Offset
in the Balance Sheet
Net Amounts of Liabilities presented in the Balance
SheetUS$ US$ US$
Forward Currency Contracts (19,188,088) - (19,188,088)
OTC Swap Contracts (12,299,323) - (12,299,323)
Total (31,487,411) - (31,487,411)

FINANCIAL STATEMENTS NOTES TO THE AUDITED FINANCIAL STATEMENTS
1654 NEUBERGER BERMAN INVESTMENT FUNDS PLC
FOR THE YEAR ENDED 31 DECEMBER 2019
25. OFFSETTING FINANCIAL INSTRUMENTS (CONTINUED)
Neuberger Berman Emerging Market Debt – Local Currency Fund (continued) 31 December 2019 (continued)
Gross Amounts Not Offset in the Balance Sheet
Counterparty
Net Amounts of Liabilities presented in the Balance
SheetAssets Available
for OffsetCash Collateral
Pledged(a) Net Amount(c)
US$ US$ US$ US$
Brown Brothers Harriman (366,583) 316,960 - (49,623)
Citibank NA (3,458,018) 3,458,018 - -
Deutsche Bank AG (154,845) 154,845 - -
Goldman Sachs International (7,196,165) 7,196,165 - -
HSBC Bank Plc (768,856) 768,856 - -
JPMorgan Chase Bank (12,800,591) 12,800,591 - -
Merrill Lynch International (233,990) 65,321 168,669 -
Morgan Stanley (1,712,597) 979,852 590,000 (142,745)
Standard Chartered Bank (2,997,780) 2,997,780 - -
State Street Bank and Trust and Co (1,180,575) 1,180,575 - -
UBS AG (190,122) 125,420 64,702 -
Westpac Banking Corp (427,289) 427,289 - -
Total (31,487,411) 30,471,672 823,371 (192,368)
31 December 2018
Derivative Assets
Gross Amounts ofRecognised
AssetsGross Amounts Offset
in the Balance Sheet
Net Amounts of Assets presented
in the Balance SheetUS$ US$ US$
Forward Currency Contracts 36,894,357 - 36,894,357
OTC Swap Contracts 31,637,747 - 31,637,747
Total 68,532,104 - 68,532,104
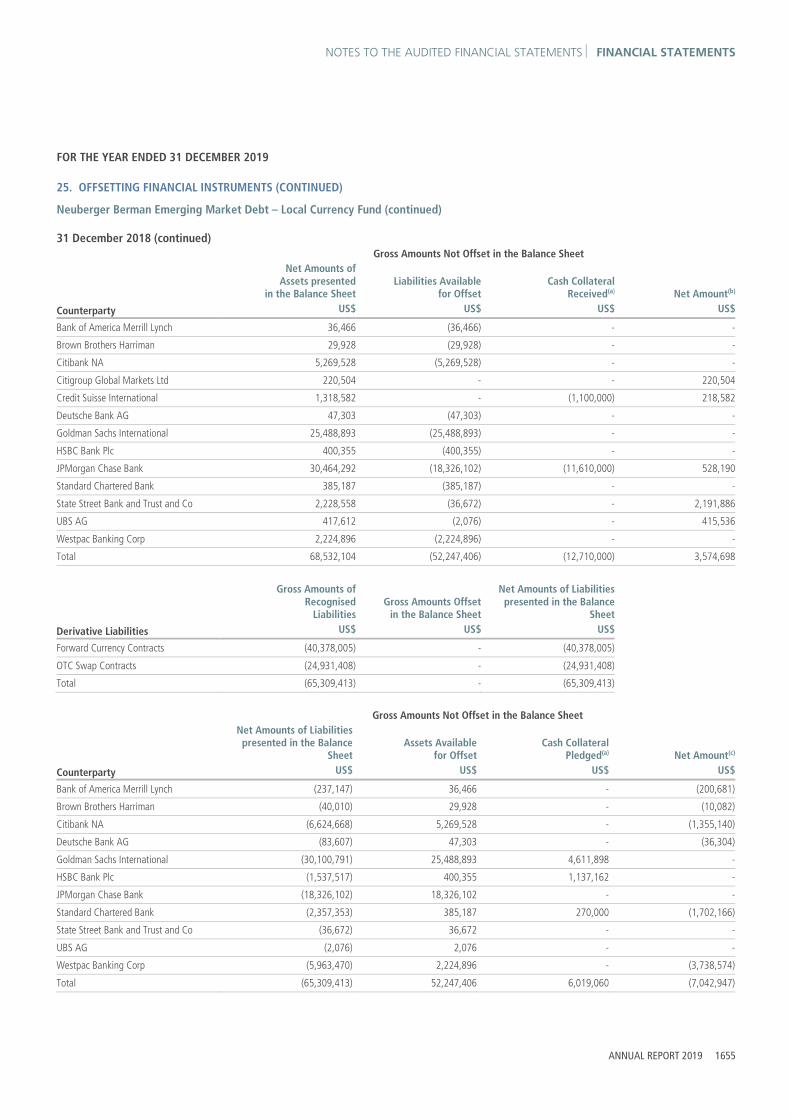
NOTES TO THE AUDITED FINANCIAL STATEMENTS FINANCIAL STATEMENTS
ANNUAL REPORT 2019 1655
FOR THE YEAR ENDED 31 DECEMBER 2019
25. OFFSETTING FINANCIAL INSTRUMENTS (CONTINUED)
Neuberger Berman Emerging Market Debt – Local Currency Fund (continued) 31 December 2018 (continued) Gross Amounts Not Offset in the Balance Sheet
Counterparty
Net Amounts ofAssets presented
in the Balance SheetLiabilities Available
for OffsetCash Collateral
Received(a) Net Amount(b)
US$ US$ US$ US$
Bank of America Merrill Lynch 36,466 (36,466) - -
Brown Brothers Harriman 29,928 (29,928) - -
Citibank NA 5,269,528 (5,269,528) - -
Citigroup Global Markets Ltd 220,504 - - 220,504
Credit Suisse International 1,318,582 - (1,100,000) 218,582
Deutsche Bank AG 47,303 (47,303) - -
Goldman Sachs International 25,488,893 (25,488,893) - -
HSBC Bank Plc 400,355 (400,355) - -
JPMorgan Chase Bank 30,464,292 (18,326,102) (11,610,000) 528,190
Standard Chartered Bank 385,187 (385,187) - -
State Street Bank and Trust and Co 2,228,558 (36,672) - 2,191,886
UBS AG 417,612 (2,076) - 415,536
Westpac Banking Corp 2,224,896 (2,224,896) - -
Total 68,532,104 (52,247,406) (12,710,000) 3,574,698
Derivative Liabilities
Gross Amounts ofRecognised
LiabilitiesGross Amounts Offset
in the Balance Sheet
Net Amounts of Liabilities presented in the Balance
SheetUS$ US$ US$
Forward Currency Contracts (40,378,005) - (40,378,005)
OTC Swap Contracts (24,931,408) - (24,931,408)
Total (65,309,413) - (65,309,413)
Gross Amounts Not Offset in the Balance Sheet
Counterparty
Net Amounts of Liabilities presented in the Balance
SheetAssets Available
for OffsetCash Collateral
Pledged(a) Net Amount(c)
US$ US$ US$ US$
Bank of America Merrill Lynch (237,147) 36,466 - (200,681)
Brown Brothers Harriman (40,010) 29,928 - (10,082)
Citibank NA (6,624,668) 5,269,528 - (1,355,140)
Deutsche Bank AG (83,607) 47,303 - (36,304)
Goldman Sachs International (30,100,791) 25,488,893 4,611,898 -
HSBC Bank Plc (1,537,517) 400,355 1,137,162 -
JPMorgan Chase Bank (18,326,102) 18,326,102 - -
Standard Chartered Bank (2,357,353) 385,187 270,000 (1,702,166)
State Street Bank and Trust and Co (36,672) 36,672 - -
UBS AG (2,076) 2,076 - -
Westpac Banking Corp (5,963,470) 2,224,896 - (3,738,574)
Total (65,309,413) 52,247,406 6,019,060 (7,042,947)

FINANCIAL STATEMENTS NOTES TO THE AUDITED FINANCIAL STATEMENTS
1656 NEUBERGER BERMAN INVESTMENT FUNDS PLC
FOR THE YEAR ENDED 31 DECEMBER 2019
25. OFFSETTING FINANCIAL INSTRUMENTS (CONTINUED)
Neuberger Berman Emerging Market Debt – Hard Currency Fund 31 December 2019
Derivative Assets
Gross Amounts ofRecognised
AssetsGross Amounts Offset
in the Balance Sheet
Net Amounts ofAssets presented
in the Balance SheetUS$ US$ US$
Forward Currency Contracts 15,765,690 - 15,765,690
Total 15,765,690 - 15,765,690
Gross Amounts Not Offset in the Balance Sheet
Counterparty
Net Amounts ofAssets presented
in the Balance SheetLiabilities Available
for OffsetCash Collateral
Received(a) Net Amount(b)
US$ US$ US$ US$
Citibank NA 11,903,834 (441,629) - 11,462,205
Goldman Sachs International 973,318 (51,771) - 921,547
UBS AG 1,429,270 (123,942) - 1,305,328
Westpac Banking Corp 1,459,268 (1,459,268) - -
Total 15,765,690 (2,076,610) - 13,689,080
Derivative Liabilities
Gross Amounts ofRecognised
LiabilitiesGross Amounts Offset
in the Balance Sheet
Net Amounts of Liabilitiespresented in the Balance
SheetUS$ US$ US$
Forward Currency Contracts (4,658,111) - (4,658,111)
Total (4,658,111) - (4,658,111)
Gross Amounts Not Offset in the Balance Sheet
Counterparty
Net Amounts of Liabilitiespresented in the Balance
SheetAssets Available
for OffsetCash Collateral
Pledged(a) Net Amount(c)
US$ US$ US$ US$
Citibank NA (441,629) 441,629 - -
Deutsche Bank AG (209,908) - - (209,908)
Goldman Sachs International (51,771) 51,771 - -
JPMorgan Chase Bank (2,131,230) - - (2,131,230)
UBS AG (123,942) 123,942 - -
Westpac Banking Corp (1,699,631) 1,459,268 - (240,363)
Total (4,658,111) 2,076,610 - (2,581,501)

NOTES TO THE AUDITED FINANCIAL STATEMENTS FINANCIAL STATEMENTS
ANNUAL REPORT 2019 1657
FOR THE YEAR ENDED 31 DECEMBER 2019
25. OFFSETTING FINANCIAL INSTRUMENTS (CONTINUED)
Neuberger Berman Emerging Market Debt – Hard Currency Fund (continued) 31 December 2018
Derivative Assets
Gross Amounts ofRecognised
AssetsGross Amounts Offset
in the Balance Sheet
Net Amounts ofAssets presented
in the Balance SheetUS$ US$ US$
Forward Currency Contracts 2,035,053 - 2,035,053
Total 2,035,053 - 2,035,053
Gross Amounts Not Offset in the Balance Sheet
Counterparty
Net Amounts ofAssets presented
in the Balance SheetLiabilities Available
for OffsetCash Collateral
Received(a) Net Amount(b)
US$ US$ US$ US$
Goldman Sachs International 899,412 (622,107) - 277,305
JPMorgan Chase Bank 73,084 (73,084) - -
UBS AG 15,781 - - 15,781
Westpac Banking Corp 1,046,776 (306,541) - 740,235
Total 2,035,053 (1,001,732) - 1,033,321
Derivative Liabilities
Gross Amounts ofRecognised
LiabilitiesGross Amounts Offset
in the Balance Sheet
Net Amounts of Liabilitiespresented in the Balance
SheetUS$ US$ US$
Forward Currency Contracts (1,276,250) - (1,276,250)
Total (1,276,250) - (1,276,250)
Gross Amounts Not Offset in the Balance Sheet
Counterparty
Net Amounts of Liabilities presented in the Balance
SheetAssets Available
for OffsetCash Collateral
Pledged(a) Net Amount(c)
US$ US$ US$ US$
Goldman Sachs International (622,107) 622,107 - -
JPMorgan Chase Bank (347,602) 73,084 274,518 -
Westpac Banking Corp (306,541) 306,541 - -
Total (1,276,250) 1,001,732 274,518 -

FINANCIAL STATEMENTS NOTES TO THE AUDITED FINANCIAL STATEMENTS
1658 NEUBERGER BERMAN INVESTMENT FUNDS PLC
FOR THE YEAR ENDED 31 DECEMBER 2019
25. OFFSETTING FINANCIAL INSTRUMENTS (CONTINUED)
Neuberger Berman Emerging Market Corporate Debt Fund 31 December 2019
Derivative Assets
Gross Amounts ofRecognised
AssetsGross Amounts Offset
in the Balance Sheet
Net Amounts of Assets presented
in the Balance Sheet US$ US$ US$
Forward Currency Contracts 2,078,916 - 2,078,916
Total 2,078,916 - 2,078,916
Gross Amounts Not Offset in the Balance Sheet
Counterparty
Net Amounts ofAssets presented
in the Balance SheetLiabilities Available
for OffsetCash Collateral
Received(a) Net Amount(b)
US$ US$ US$ US$
Citibank NA 1,185,489 (143,587) - 1,041,902
Goldman Sachs International 29,279 (40) - 29,239
UBS AG 797,008 (7,580) - 789,428
Westpac Banking Corp 67,140 (9,643) - 57,497
Total 2,078,916 (160,850) - 1,918,066
Derivative Liabilities
Gross Amounts ofRecognised
LiabilitiesGross Amounts Offset
in the Balance SheetNet Amounts of Liabilities
presented in the Balance Sheet US$ US$ US$
Forward Currency Contracts (204,131) - (204,131) Total (204,131) - (204,131)
Gross Amounts Not Offset in the Balance Sheet
Counterparty
Net Amounts of Liabilities presented in the Balance
SheetAssets Available
for OffsetCash Collateral
Pledged(a) Net Amount(c)
US$ US$ US$ US$
Citibank NA (143,587) 143,587 - -
Goldman Sachs International (40) 40 - -
JPMorgan Chase Bank (43,281) - - (43,281)
UBS AG (7,580) 7,580 - -
Westpac Banking Corp (9,643) 9,643 - -
Total (204,131) 160,850 - (43,281)

NOTES TO THE AUDITED FINANCIAL STATEMENTS FINANCIAL STATEMENTS
ANNUAL REPORT 2019 1659
FOR THE YEAR ENDED 31 DECEMBER 2019
25. OFFSETTING FINANCIAL INSTRUMENTS (CONTINUED)
Neuberger Berman Emerging Market Corporate Debt Fund (continued) 31 December 2018
Derivative Assets
Gross Amounts ofRecognised
AssetsGross Amounts Offset
in the Balance Sheet
Net Amounts of Assets presented
in the Balance Sheet US$ US$ US$
Forward Currency Contracts 131,978 - 131,978
Total 131,978 - 131,978
Gross Amounts Not Offset in the Balance Sheet
Counterparty
Net Amounts ofAssets presented
in the Balance SheetLiabilities Available
for OffsetCash Collateral
Received(a) Net Amount(b)
US$ US$ US$ US$
Goldman Sachs International 63,106 (63,106) - -
UBS AG 915 - - 915
Westpac Banking Corp 67,957 (18,786) - 49,171
Total 131,978 (81,892) - 50,086
Derivative Liabilities
Gross Amounts ofRecognised
LiabilitiesGross Amounts Offset
in the Balance SheetNet Amounts of Liabilities
presented in the Balance Sheet US$ US$ US$
Forward Currency Contracts (94,359) - (94,359) Total (94,359) - (94,359)
Gross Amounts Not Offset in the Balance Sheet
Counterparty
Net Amounts of Liabilities presented in the Balance
SheetAssets Available
for OffsetCash Collateral
Pledged(a) Net Amount(c)
US$ US$ US$ US$
Goldman Sachs International (70,185) 63,106 - (7,079)
JPMorgan Chase Bank (5,388) - - (5,388)
Westpac Banking Corp (18,786) 18,786 - -
Total (94,359) 81,892 - (12,467)

FINANCIAL STATEMENTS NOTES TO THE AUDITED FINANCIAL STATEMENTS
1660 NEUBERGER BERMAN INVESTMENT FUNDS PLC
FOR THE YEAR ENDED 31 DECEMBER 2019
25. OFFSETTING FINANCIAL INSTRUMENTS (CONTINUED)
Neuberger Berman Strategic Income Fund 31 December 2019
Derivative Assets
Gross Amounts ofRecognised
AssetsGross Amounts Offset
in the Balance Sheet
Net Amounts of Assets presented
in the Balance Sheet US$ US$ US$
Forward Currency Contracts 4,167,838 - 4,167,838
OTC Swap Contracts 5,978 - 5,978
Total 4,173,816 - 4,173,816
Gross Amounts Not Offset in the Balance Sheet
Counterparty
Net Amounts ofAssets presented
in the Balance SheetLiabilities Available
for OffsetCash Collateral
Received(a) Net Amount(b)
US$ US$ US$ US$
Brown Brothers Harriman 1,371 - - 1,371
Citibank NA 373,728 (135,574) - 238,154
Goldman Sachs International 876,472 (876,472) - -
HSBC Bank Plc 4,657 (4,312) - 345
Morgan Stanley 51,008 (28,479) - 22,529
Royal Bank of Canada 1,329,670 (11,178) (930,000) 388,492
Standard Chartered Bank 78,080 (63,093) - 14,987
UBS AG 726,384 (726,384) - -
Westpac Banking Corp 732,446 (732,446) - -
Total 4,173,816 (2,577,938) (930,000) 665,878
Derivative Liabilities
Gross Amounts ofRecognised
LiabilitiesGross Amounts Offset
in the Balance Sheet
Net Amounts of Liabilities presented in the Balance
Sheet US$ US$ US$
Forward Currency Contracts (9,900,200) - (9,900,200) Total (9,900,200) - (9,900,200) Gross Amounts Not Offset in the Balance Sheet
Counterparty
Net Amounts of Liabilities presented in the Balance
SheetAssets Available
for OffsetCash Collateral
Pledged(a) Net Amount(c)
US$ US$ US$ US$
Citibank NA (135,574) 135,574 - -
Goldman Sachs International (3,622,869) 876,472 270,000 (2,476,397)
HSBC Bank Plc (4,312) 4,312 - -
Morgan Stanley (28,479) 28,479 - -
Royal Bank of Canada (11,178) 11,178 - -
Standard Chartered Bank (63,093) 63,093 - -
UBS AG (3,165,693) 726,384 - (2,439,309)
Westpac Banking Corp (2,869,002) 732,446 - (2,136,556)
Total (9,900,200) 2,577,938 270,000 (7,052,262)

NOTES TO THE AUDITED FINANCIAL STATEMENTS FINANCIAL STATEMENTS
ANNUAL REPORT 2019 1661
FOR THE YEAR ENDED 31 DECEMBER 2019
25. OFFSETTING FINANCIAL INSTRUMENTS (CONTINUED)
Neuberger Berman Strategic Income Fund (continued) 31 December 2018
Derivative Assets
Gross Amounts ofRecognised
AssetsGross Amounts Offset
in the Balance Sheet
Net Amounts of Assets presented
in the Balance Sheet US$ US$ US$
Forward Currency Contracts 12,787,437 - 12,787,437
Total 12,787,437 - 12,787,437
Gross Amounts Not Offset in the Balance Sheet
Counterparty
Net Amounts ofAssets presented
in the Balance SheetLiabilities Available
for OffsetCash Collateral
Received(a) Net Amount(b)
US$ US$ US$ US$
Citibank NA 1,010,753 (130,110) - 880,643
Goldman Sachs International 4,001,861 (297,687) - 3,704,174
Royal Bank of Canada 2,943 (2,249) - 694
UBS AG 3,519,499 (108,001) - 3,411,498
Westpac Banking Corp 4,252,381 (725,865) - 3,526,516
Total 12,787,437 (1,263,912) - 11,523,525
Derivative Liabilities
Gross Amounts ofRecognised
LiabilitiesGross Amounts Offset
in the Balance Sheet
Net Amounts of Liabilities presented in the Balance
Sheet US$ US$ US$
Forward Currency Contracts (1,263,912) - (1,263,912) Total (1,263,912) - (1,263,912)
Gross Amounts Not Offset in the Balance Sheet
Counterparty
Net Amounts of Liabilities presented in the Balance
SheetAssets Available
for OffsetCash Collateral
Pledged(a) Net Amount(c)
US$ US$ US$ US$
Citibank NA (130,110) 130,110 - -
Goldman Sachs International (297,687) 297,687 - -
Royal Bank of Canada (2,249) 2,249 - -
UBS AG (108,001) 108,001 - -
Westpac Banking Corp (725,865) 725,865 - -
Total (1,263,912) 1,263,912 - -

FINANCIAL STATEMENTS NOTES TO THE AUDITED FINANCIAL STATEMENTS
1662 NEUBERGER BERMAN INVESTMENT FUNDS PLC
FOR THE YEAR ENDED 31 DECEMBER 2019
25. OFFSETTING FINANCIAL INSTRUMENTS (CONTINUED)
Neuberger Berman Global Bond Absolute Return Fund 31 December 2019
Derivative Assets
Gross Amounts of Recognised
AssetsGross Amounts Offset
in the Balance Sheet
Net Amounts of Assets presented
in the Balance SheetUS$ US$ US$
Forward Currency Contracts 4,708,572 - 4,708,572
Total 4,708,572 - 4,708,572
Gross Amounts Not Offset in the Balance Sheet
Counterparty
Net Amounts of Assets presented
in the Balance SheetLiabilities Available
for OffsetCash Collateral
Received(a) Net Amount(b)
US$ US$ US$ US$
Citibank NA 1,390,182 (970,599) - 419,583
Goldman Sachs International 2,150,387 (1,281,990) - 868,397
Royal Bank of Canada 590 - - 590
Société Générale 162 (132) - 30
State Street Bank and Trust and Co 295,044 (295,044) - -
UBS AG 32 (32) - -
Westpac Banking Corp 872,175 (872,175) - -
Total 4,708,572 (3,419,972) - 1,288,600
Derivative Liabilities
Gross Amounts of Recognised
LiabilitiesGross Amounts Offset
in the Balance Sheet
Net Amounts of Liabilities presented in the Balance
Sheet US$ US$ US$
Forward Currency Contracts (4,434,326) - (4,434,326)
Total (4,434,326) - (4,434,326)
Gross Amounts Not Offset in the Balance Sheet
Counterparty
Net Amounts of Liabilities presented in the Balance
SheetAssets Available
for OffsetCash Collateral
Pledged(a) Net Amount(c)
US$ US$ US$ US$
Citibank NA (970,599) 970,599 - -
Goldman Sachs International (1,281,990) 1,281,990 - -
Société Générale (132) 132 - -
State Street Bank and Trust and Co (881,837) 295,044 - (586,793)
UBS AG (2,648) 32 - (2,616)
Westpac Banking Corp (1,297,120) 872,175 - (424,945)
Total (4,434,326) 3,419,972 - (1,014,354)
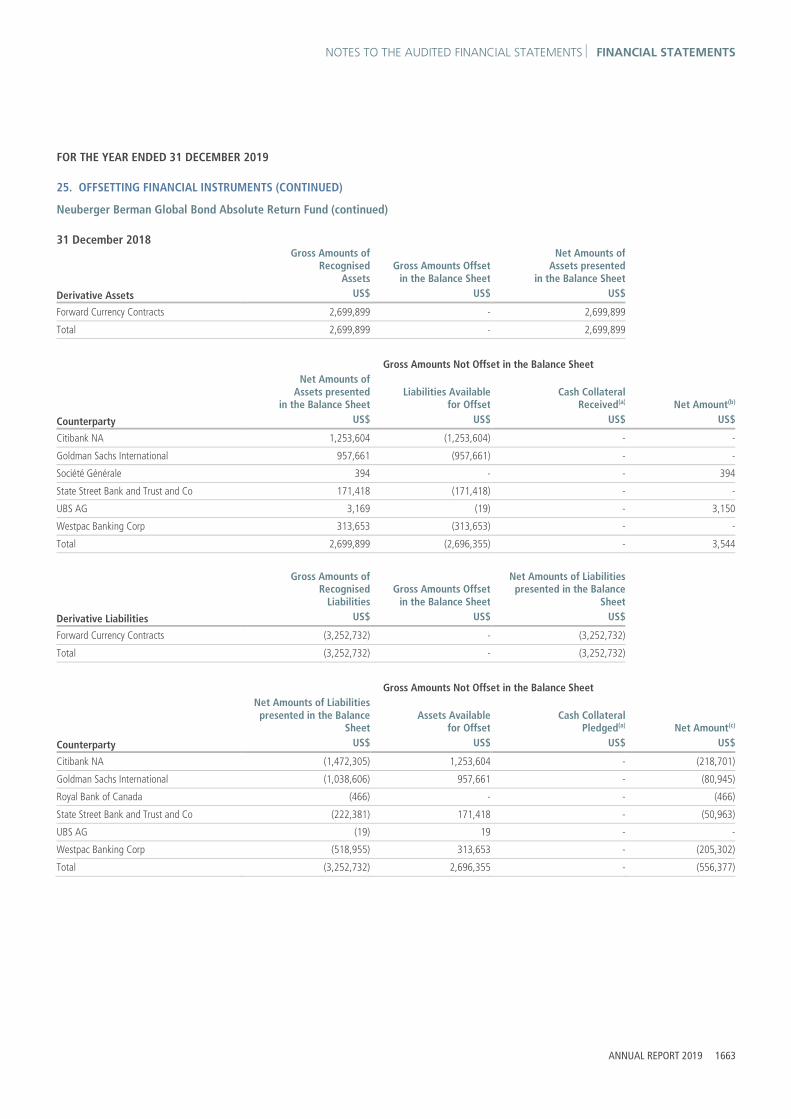
NOTES TO THE AUDITED FINANCIAL STATEMENTS FINANCIAL STATEMENTS
ANNUAL REPORT 2019 1663
FOR THE YEAR ENDED 31 DECEMBER 2019
25. OFFSETTING FINANCIAL INSTRUMENTS (CONTINUED)
Neuberger Berman Global Bond Absolute Return Fund (continued) 31 December 2018
Derivative Assets
Gross Amounts of Recognised
AssetsGross Amounts Offset
in the Balance Sheet
Net Amounts of Assets presented
in the Balance SheetUS$ US$ US$
Forward Currency Contracts 2,699,899 - 2,699,899
Total 2,699,899 - 2,699,899
Gross Amounts Not Offset in the Balance Sheet
Counterparty
Net Amounts of Assets presented
in the Balance SheetLiabilities Available
for OffsetCash Collateral
Received(a) Net Amount(b)
US$ US$ US$ US$
Citibank NA 1,253,604 (1,253,604) - -
Goldman Sachs International 957,661 (957,661) - -
Société Générale 394 - - 394
State Street Bank and Trust and Co 171,418 (171,418) - -
UBS AG 3,169 (19) - 3,150
Westpac Banking Corp 313,653 (313,653) - -
Total 2,699,899 (2,696,355) - 3,544
Derivative Liabilities
Gross Amounts of Recognised
LiabilitiesGross Amounts Offset
in the Balance Sheet
Net Amounts of Liabilities presented in the Balance
SheetUS$ US$ US$
Forward Currency Contracts (3,252,732) - (3,252,732)
Total (3,252,732) - (3,252,732)
Gross Amounts Not Offset in the Balance Sheet
Counterparty
Net Amounts of Liabilities presented in the Balance
SheetAssets Available
for OffsetCash Collateral
Pledged(a) Net Amount(c)
US$ US$ US$ US$
Citibank NA (1,472,305) 1,253,604 - (218,701)
Goldman Sachs International (1,038,606) 957,661 - (80,945)
Royal Bank of Canada (466) - - (466)
State Street Bank and Trust and Co (222,381) 171,418 - (50,963)
UBS AG (19) 19 - -
Westpac Banking Corp (518,955) 313,653 - (205,302)
Total (3,252,732) 2,696,355 - (556,377)

FINANCIAL STATEMENTS NOTES TO THE AUDITED FINANCIAL STATEMENTS
1664 NEUBERGER BERMAN INVESTMENT FUNDS PLC
FOR THE YEAR ENDED 31 DECEMBER 2019
25. OFFSETTING FINANCIAL INSTRUMENTS (CONTINUED)
Neuberger Berman Short Duration Emerging Market Debt Fund 31 December 2019
Derivative Assets
Gross Amounts of Recognised
AssetsGross Amounts Offset
in the Balance Sheet
Net Amounts ofAssets presented
in the Balance Sheet US$ US$ US$
Forward Currency Contracts 58,954,197 - 58,954,197
Total 58,954,197 - 58,954,197
Gross Amounts Not Offset in the Balance Sheet
Counterparty
Net Amounts of Assets presented
in the Balance SheetLiabilities Available
for OffsetCash Collateral
Received(a) Net Amount(b)
US$ US$ US$ US$
Citibank NA 32,580,485 (4,360,356) - 28,220,129
Deutsche Bank AG 9,691 (9,691) - -
Goldman Sachs International 297,351 (14,854) - 282,497
Royal Bank of Canada 81,870 - - 81,870
UBS AG 24,304,557 (679) - 24,303,878
Westpac Banking Corp 1,680,243 (1,680,243) - -
Total 58,954,197 (6,065,823) - 52,888,374
Derivative Liabilities
Gross Amounts of Recognised
LiabilitiesGross Amounts Offset
in the Balance Sheet
Net Amounts of Liabilitiespresented in the Balance
SheetUS$ US$ US$
Forward Currency Contracts (7,478,759) - (7,478,759)
Total (7,478,759) - (7,478,759)
Gross Amounts Not Offset in the Balance Sheet
Counterparty
Net Amounts of Liabilities presented in the Balance
SheetAssets Available
for OffsetCash Collateral
Pledged(a) Net Amount(c)
US$ US$ US$ US$
Citibank NA (4,360,356) 4,360,356 - -
Deutsche Bank AG (68,818) 9,691 - (59,127)
Goldman Sachs International (14,854) 14,854 - -
UBS AG (679) 679 - -
Westpac Banking Corp (3,034,052) 1,680,243 - (1,353,809)
Total (7,478,759) 6,065,823 - (1,412,936)

NOTES TO THE AUDITED FINANCIAL STATEMENTS FINANCIAL STATEMENTS
ANNUAL REPORT 2019 1665
FOR THE YEAR ENDED 31 DECEMBER 2019
25. OFFSETTING FINANCIAL INSTRUMENTS (CONTINUED)
Neuberger Berman Short Duration Emerging Market Debt Fund (continued) 31 December 2018
Derivative Assets
Gross Amounts of Recognised
AssetsGross Amounts Offset
in the Balance Sheet
Net Amounts ofAssets presented
in the Balance SheetUS$ US$ US$
Forward Currency Contracts 17,682,600 - 17,682,600
Total 17,682,600 - 17,682,600
Gross Amounts Not Offset in the Balance Sheet
Counterparty
Net Amounts of Assets presented
in the Balance SheetLiabilities Available
for OffsetCash Collateral
Received(a) Net Amount(b)
US$ US$ US$ US$
Goldman Sachs International 8,613,956 (2,173,870) - 6,440,086
UBS AG 21,419 (1,673) - 19,746
Westpac Banking Corp 9,047,225 (1,212,012) - 7,835,213
Total 17,682,600 (3,387,555) - 14,295,045
Derivative Liabilities
Gross Amounts of Recognised
LiabilitiesGross Amounts Offset
in the Balance Sheet
Net Amounts of Liabilitiespresented in the Balance
SheetUS$ US$ US$
Forward Currency Contracts (3,387,555) - (3,387,555)
Total (3,387,555) - (3,387,555)
Gross Amounts Not Offset in the Balance Sheet
Counterparty
Net Amounts of Liabilities presented in the Balance
SheetAssets Available
for OffsetCash Collateral
Pledged(a) Net Amount(c)
US$ US$ US$ US$
Goldman Sachs International (2,173,870) 2,173,870 - -
UBS AG (1,673) 1,673 - -
Westpac Banking Corp (1,212,012) 1,212,012 - -
Total (3,387,555) 3,387,555 - -

FINANCIAL STATEMENTS NOTES TO THE AUDITED FINANCIAL STATEMENTS
1666 NEUBERGER BERMAN INVESTMENT FUNDS PLC
FOR THE YEAR ENDED 31 DECEMBER 2019
25. OFFSETTING FINANCIAL INSTRUMENTS (CONTINUED)
Neuberger Berman Absolute Return Multi Strategy Fund 31 December 2019
Derivative Assets
Gross Amounts ofRecognised
AssetsGross Amounts Offset
in the Balance Sheet
Net Amounts ofAssets presented
in the Balance SheetUS$ US$ US$
Forward Currency Contracts 417,466 - 417,466
OTC Swap Contracts 6,152,976 - 6,152,976
Total 6,570,442 - 6,570,442
Gross Amounts Not Offset in the Balance Sheet
Counterparty
Net Amounts ofAssets presented
in the Balance SheetLiabilities Available
for OffsetCash Collateral
Received(a) Net Amount(b)
US$ US$ US$ US$
BNP Paribas 30,216 (3,286) - 26,930
Citibank NA 63,395 (63,395) - -
Goldman Sachs International 69,428 (69,428) - -
JPMorgan Chase Bank 4,395,001 (4,395,001) - -
Morgan Stanley 1,758,021 (1,674,922) - 83,099
Société Générale 126,918 (107,809) - 19,109
UBS AG 60,697 (44,487) - 16,210
Westpac Banking Corp 66,766 (66,766) - -
Total 6,570,442 (6,425,094) - 145,348
Derivative Liabilities
Gross Amounts ofRecognised
LiabilitiesGross Amounts Offset
in the Balance Sheet
Net Amounts of Liabilitiespresented in the Balance
SheetUS$ US$ US$
Forward Currency Contracts (1,134,480) - (1,134,480)
OTC Swap Contracts (8,463,687) - (8,463,687)
Total (9,598,167) - (9,598,167)
Gross Amounts Not Offset in the Balance Sheet
Counterparty
Net Amounts of Liabilities presented in the Balance
SheetAssets Available
for OffsetCash Collateral
Pledged(a) Net Amount(c)
US$ US$ US$ US$
BNP Paribas (3,286) 3,286 - -
Brown Brothers Harriman (10,056) - - (10,056)
Citibank NA (338,769) 63,395 - (275,374)
Goldman Sachs International (335,093) 69,428 265,665 -
JPMorgan Chase Bank (6,789,217) 4,395,001 1,280,000 (1,114,216)
Morgan Stanley (1,674,922) 1,674,922 - -
Société Générale (107,809) 107,809 - -
UBS AG (44,487) 44,487 - -
Westpac Banking Corp (294,528) 66,766 - (227,762)
Total (9,598,167) 6,425,094 1,545,665 (1,627,408)

NOTES TO THE AUDITED FINANCIAL STATEMENTS FINANCIAL STATEMENTS
ANNUAL REPORT 2019 1667
FOR THE YEAR ENDED 31 DECEMBER 2019
25. OFFSETTING FINANCIAL INSTRUMENTS (CONTINUED)
Neuberger Berman Absolute Return Multi Strategy Fund (continued) 31 December 2018
Derivative Assets
Gross Amounts ofRecognised
AssetsGross Amounts Offset
in the Balance Sheet
Net Amounts ofAssets presented
in the Balance SheetUS$ US$ US$
Forward Currency Contracts 1,567,922 - 1,567,922
OTC Swap Contracts 6,731,576 - 6,731,576
Total 8,299,498 - 8,299,498
Gross Amounts Not Offset in the Balance Sheet
Counterparty
Net Amounts ofAssets presented
in the Balance SheetLiabilities Available
for OffsetCash Collateral
Received(a) Net Amount(b)
US$ US$ US$ US$
Brown Brothers Harriman 2,921 (2,921) - -
Citibank NA 389,299 (36,182) - 353,117
Goldman Sachs International 438,507 (438,507) - -
JPMorgan Chase Bank 5,081,272 (5,081,272) - -
Morgan Stanley 1,635,932 (1,635,932) - -
Société Générale 151,238 (133,667) - 17,571
UBS AG 177 (14) - 163
Westpac Banking Corp 600,152 (84,351) - 515,801
Total 8,299,498 (7,412,846) - 886,652
Derivative Liabilities
Gross Amounts ofRecognised
LiabilitiesGross Amounts Offset
in the Balance Sheet
Net Amounts of Liabilitiespresented in the Balance
SheetUS$ US$ US$
Forward Currency Contracts (373,617) - (373,617)
OTC Swap Contracts (12,054,370) - (12,054,370)
Total (12,427,987) - (12,427,987)
Gross Amounts Not Offset in the Balance Sheet
Counterparty
Net Amounts of Liabilities presented in the Balance
SheetAssets Available
for OffsetCash Collateral
Pledged(a) Net Amount(c)
US$ US$ US$ US$
Brown Brothers Harriman (12,805) 2,921 - (9,884)
Citibank NA (36,182) 36,182 - -
Goldman Sachs International (694,868) 438,507 - (256,361)
JPMorgan Chase Bank (9,113,372) 5,081,272 1,960,000 (2,072,100)
Morgan Stanley (2,352,728) 1,635,932 716,796 -
Société Générale (133,667) 133,667 - -
UBS AG (14) 14 - -
Westpac Banking Corp (84,351) 84,351 - -
Total (12,427,987) 7,412,846 2,676,796 (2,338,345)

FINANCIAL STATEMENTS NOTES TO THE AUDITED FINANCIAL STATEMENTS
1668 NEUBERGER BERMAN INVESTMENT FUNDS PLC
FOR THE YEAR ENDED 31 DECEMBER 2019
25. OFFSETTING FINANCIAL INSTRUMENTS (CONTINUED)
Neuberger Berman US Long Short Equity Fund
31 December 2019
Derivative Assets
Gross Amounts ofRecognised
AssetsGross Amounts Offset
in the Balance Sheet
Net Amounts of Assets presented
in the Balance SheetUS$ US$ US$
Forward Currency Contracts 1,159,354 - 1,159,354
OTC Swap Contracts 2,691 - 2,691
Total 1,162,045 - 1,162,045
Gross Amounts Not Offset in the Balance Sheet
Counterparty
Net Amounts ofAssets presented
in the Balance SheetLiabilities Available
for OffsetCash Collateral
Received(a) Net Amount(b)
US$ US$ US$ US$
Citibank NA 387,372 (262,645) - 124,727
Goldman Sachs International 415,868 (415,868) - -
JPMorgan Chase Bank 2,691 (2,691) - -
UBS AG 2 - - 2
Westpac Banking Corp 356,112 (63,228) - 292,884
Total 1,162,045 (744,432) - 417,613
Derivative Liabilities
Gross Amounts ofRecognised
LiabilitiesGross Amounts Offset
in the Balance Sheet
Net Amounts of Liabilities presented in the Balance
SheetUS$ US$ US$
Forward Currency Contracts (136,823) - (136,823)
OTC Swap Contracts (23,366,605) - (23,366,605)
Total (23,503,428) - (23,503,428)
Gross Amounts Not Offset in the Balance Sheet
Counterparty
Net Amounts of Liabilities presented in the Balance
SheetAssets Available
for OffsetCash Collateral
Pledged(a) Net Amount(c)
US$ US$ US$ US$
Citibank NA (262,645) 262,645 - -
Goldman Sachs International (686,838) 415,868 270,970 -
JPMorgan Chase Bank (22,490,717) 2,691 6,150,000 (16,338,026)
Westpac Banking Corp (63,228) 63,228 - -
Total (23,503,428) 744,432 6,420,970 (16,338,026)

NOTES TO THE AUDITED FINANCIAL STATEMENTS FINANCIAL STATEMENTS
ANNUAL REPORT 2019 1669
FOR THE YEAR ENDED 31 DECEMBER 2019
25. OFFSETTING FINANCIAL INSTRUMENTS (CONTINUED)
Neuberger Berman US Long Short Equity Fund (continued) 31 December 2018
Derivative Assets
Gross Amounts ofRecognised
AssetsGross Amounts Offset
in the Balance Sheet
Net Amounts ofAssets presented
in the Balance SheetUS$ US$ US$
Forward Currency Contracts 101,067 - 101,067
Total 101,067 - 101,067
Gross Amounts Not Offset in the Balance Sheet
Counterparty
Net Amounts ofAssets presented
in the Balance SheetLiabilities Available
for OffsetCash Collateral
Received(a) Net Amount(b)
US$ US$ US$ US$
Citibank NA 17,757 (17,757) - -
Goldman Sachs International 31,432 (31,432) - -
UBS AG 106 (106) - -
Westpac Banking Corp 51,772 (51,772) - -
Total 101,067 (101,067) - -
Derivative Liabilities
Gross Amounts ofRecognised
LiabilitiesGross Amounts Offset
in the Balance Sheet
Net Amounts of Liabilitiespresented in the Balance
SheetUS$ US$ US$
Forward Currency Contracts (807,332) - (807,332)
OTC Swap Contracts (46,311,742) - (46,311,742)
Total (47,119,074) - (47,119,074)
Gross Amounts Not Offset in the Balance Sheet
Counterparty
Net Amounts of Liabilities presented in the Balance
SheetAssets Available
for OffsetCash Collateral
Pledged(a) Net Amount(c)
US$ US$ US$ US$
Citibank NA (10,960,385) 17,757 - (10,942,628)
Goldman Sachs International (5,296,339) 31,432 - (5,264,907)
JPMorgan Chase Bank (27,399,026) - 80,000 (27,319,026)
Morgan Stanley (3,161,023) - - (3,161,023)
UBS AG (3,672) 106 - (3,566)
Westpac Banking Corp (298,629) 51,772 - (246,857)
Total (47,119,074) 101,067 80,000 (46,938,007)

FINANCIAL STATEMENTS NOTES TO THE AUDITED FINANCIAL STATEMENTS
1670 NEUBERGER BERMAN INVESTMENT FUNDS PLC
FOR THE YEAR ENDED 31 DECEMBER 2019
25. OFFSETTING FINANCIAL INSTRUMENTS (CONTINUED)
Neuberger Berman Emerging Market Debt Blend Fund 31 December 2019
Derivative Assets
Gross Amounts of Recognised
AssetsGross Amounts Offset
in the Balance Sheet
Net Amounts of Assets presented
in the Balance SheetUS$ US$ US$
Forward Currency Contracts 19,964,061 - 19,964,061
OTC Swap Contracts 12,584,010 - 12,584,010
Total 32,548,071 - 32,548,071
Gross Amounts Not Offset in the Balance Sheet
Counterparty
Net Amounts of Assets presented
in the Balance SheetLiabilities Available
for OffsetCash Collateral
Received(a) Net Amount(b)
US$ US$ US$ US$
Brown Brothers Harriman 249,389 (80,482) - 168,907
Citibank NA 10,514,954 (987,459) (1,800,000) 7,727,495
Deutsche Bank AG 477,361 - (390,000) 87,361
Goldman Sachs International 9,841,101 (1,273,433) (7,580,000) 987,668
HSBC Bank Plc 671,026 (47,616) (600,000) 23,410
JPMorgan Chase Bank 5,817,564 (4,335,929) (990,000) 491,635
Morgan Stanley 141,315 (141,315) - -
Société Générale 2,987 (2,987) - -
Standard Chartered Bank 2,617,443 (505,491) (260,000) 1,851,952
State Street Bank and Trust and Co 897,999 (594,620) - 303,379
UBS AG 716,344 (72,581) - 643,763
Westpac Banking Corp 600,588 (371,445) - 229,143
Total 32,548,071 (8,413,358) (11,620,000) 12,514,713
Derivative Liabilities
Gross Amounts of Recognised
LiabilitiesGross Amounts Offset
in the Balance Sheet
Net Amounts of Liabilities presented in the Balance
SheetUS$ US$ US$
Forward Currency Contracts (5,569,597) - (5,569,597)
OTC Swap Contracts (4,067,134) - (4,067,134)
Total (9,636,731) - (9,636,731)
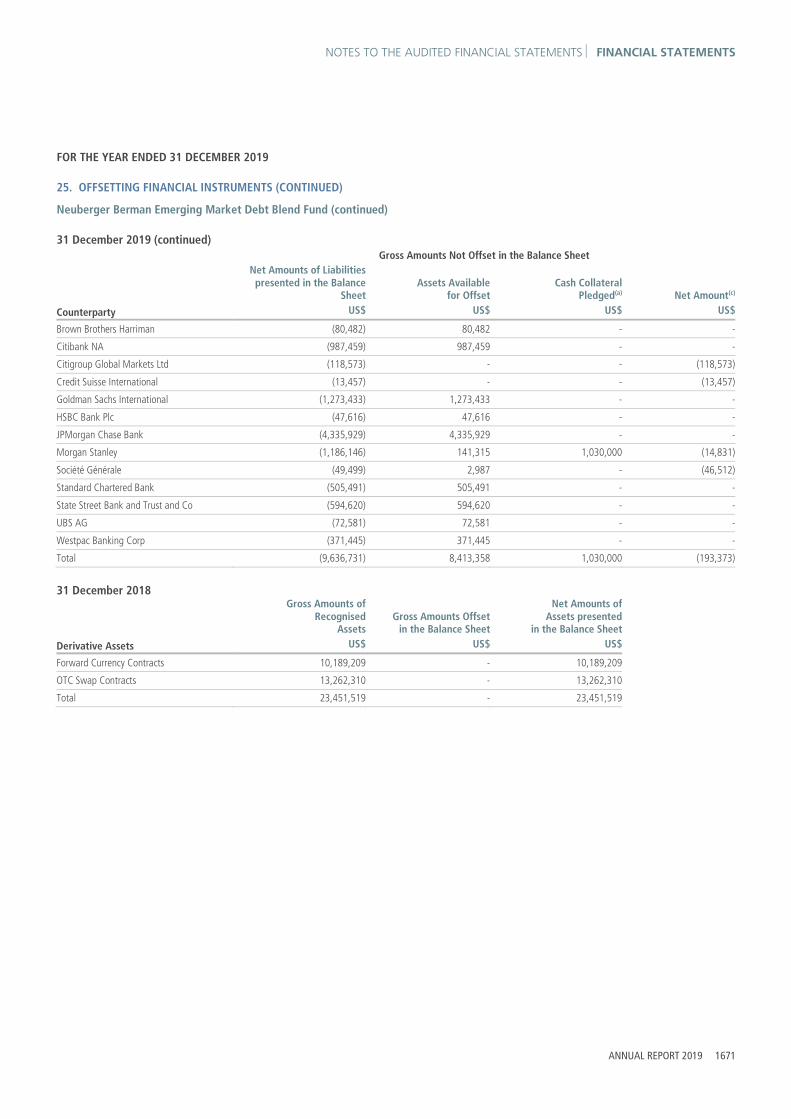
NOTES TO THE AUDITED FINANCIAL STATEMENTS FINANCIAL STATEMENTS
ANNUAL REPORT 2019 1671
FOR THE YEAR ENDED 31 DECEMBER 2019
25. OFFSETTING FINANCIAL INSTRUMENTS (CONTINUED)
Neuberger Berman Emerging Market Debt Blend Fund (continued) 31 December 2019 (continued) Gross Amounts Not Offset in the Balance Sheet
Counterparty
Net Amounts of Liabilities presented in the Balance
SheetAssets Available
for OffsetCash Collateral
Pledged(a) Net Amount(c)
US$ US$ US$ US$
Brown Brothers Harriman (80,482) 80,482 - -
Citibank NA (987,459) 987,459 - -
Citigroup Global Markets Ltd (118,573) - - (118,573)
Credit Suisse International (13,457) - - (13,457)
Goldman Sachs International (1,273,433) 1,273,433 - -
HSBC Bank Plc (47,616) 47,616 - -
JPMorgan Chase Bank (4,335,929) 4,335,929 - -
Morgan Stanley (1,186,146) 141,315 1,030,000 (14,831)
Société Générale (49,499) 2,987 - (46,512)
Standard Chartered Bank (505,491) 505,491 - -
State Street Bank and Trust and Co (594,620) 594,620 - -
UBS AG (72,581) 72,581 - -
Westpac Banking Corp (371,445) 371,445 - -
Total (9,636,731) 8,413,358 1,030,000 (193,373)
31 December 2018
Derivative Assets
Gross Amounts of Recognised
AssetsGross Amounts Offset
in the Balance Sheet
Net Amounts of Assets presented
in the Balance SheetUS$ US$ US$
Forward Currency Contracts 10,189,209 - 10,189,209
OTC Swap Contracts 13,262,310 - 13,262,310
Total 23,451,519 - 23,451,519

FINANCIAL STATEMENTS NOTES TO THE AUDITED FINANCIAL STATEMENTS
1672 NEUBERGER BERMAN INVESTMENT FUNDS PLC
FOR THE YEAR ENDED 31 DECEMBER 2019
25. OFFSETTING FINANCIAL INSTRUMENTS (CONTINUED)
Neuberger Berman Emerging Market Debt Blend Fund (continued) 31 December 2018 (continued) Gross Amounts Not Offset in the Balance Sheet
Counterparty
Net Amounts of Assets presented
in the Balance SheetLiabilities Available
for OffsetCash Collateral
Received(a) Net Amount(b)
US$ US$ US$ US$
Citibank NA 2,383,364 (2,142,093) - 241,271
Citigroup Global Markets Ltd 81,012 (81,012) - -
Credit Suisse International 55,906 - - 55,906
Goldman Sachs International 9,854,895 (9,232,529) (130,000) 492,366
HSBC Bank Plc 17,489 (16,073) - 1,416
JPMorgan Chase Bank 10,062,049 (5,472,983) - 4,589,066
Standard Chartered Bank 95,903 (95,903) - -
State Street Bank and Trust and Co 657,792 (4,722) - 653,070
UBS AG 176,729 - - 176,729
Westpac Banking Corp 66,380 (66,380) - -
Total 23,451,519 (17,111,695) (130,000) 6,209,824
Derivative Liabilities
Gross Amounts of Recognised
LiabilitiesGross Amounts Offset
in the Balance Sheet
Net Amounts of Liabilities presented in the Balance
SheetUS$ US$ US$
Forward Currency Contracts (10,561,114) - (10,561,114)
OTC Swap Contracts (9,211,000) - (9,211,000)
Total (19,772,114) - (19,772,114)
Gross Amounts Not Offset in the Balance Sheet
Counterparty
Net Amounts of Liabilities presented in the Balance
SheetAssets Available
for OffsetCash Collateral
Pledged(a) Net Amount(c)
US$ US$ US$ US$
Brown Brothers Harriman (178,671) - - (178,671)
Citibank NA (2,142,093) 2,142,093 - -
Citigroup Global Markets Ltd (587,971) 81,012 - (506,959)
Deutsche Bank AG (561,632) - 300,000 (261,632)
Goldman Sachs International (9,232,529) 9,232,529 - -
HSBC Bank Plc (16,073) 16,073 - -
JPMorgan Chase Bank (5,472,983) 5,472,983 - -
Standard Chartered Bank (1,425,571) 95,903 1,040,000 (289,668)
State Street Bank and Trust and Co (4,722) 4,722 - -
Westpac Banking Corp (149,869) 66,380 - (83,489)
Total (19,772,114) 17,111,695 1,340,000 (1,320,419)

NOTES TO THE AUDITED FINANCIAL STATEMENTS FINANCIAL STATEMENTS
ANNUAL REPORT 2019 1673
FOR THE YEAR ENDED 31 DECEMBER 2019
25. OFFSETTING FINANCIAL INSTRUMENTS (CONTINUED)
Neuberger Berman European High Yield Bond Fund 31 December 2019
Derivative Assets
Gross Amounts of Recognised
AssetsGross Amounts Offset
in the Balance Sheet
Net Amounts ofAssets presented
in the Balance SheetEUR EUR EUR
Forward Currency Contracts 291,413 - 291,413
Total 291,413 - 291,413
Gross Amounts Not Offset in the Balance Sheet
Counterparty
Net Amounts of Assets presented
in the Balance SheetLiabilities Available
for OffsetCash Collateral
Received(a) Net Amount(b)
EUR EUR EUR EUR
Goldman Sachs International 94,424 (94,424) - -
UBS AG 90,747 (90,747) - -
Westpac Banking Corp 106,242 (106,242) - -
Total 291,413 (291,413) - -
Derivative Liabilities
Gross Amounts of Recognised
LiabilitiesGross Amounts Offset
in the Balance Sheet
Net Amounts of Liabilitiespresented in the Balance
Sheet
Forward Currency Contracts (1,048,628) - (1,048,628)
Total (1,048,628) - (1,048,628)
Gross Amounts Not Offset in the Balance Sheet
Counterparty
Net Amounts of Liabilities presented in the Balance
SheetAssets Available
for OffsetCash Collateral
Pledged(a) Net Amount(c)
EUR EUR EUR EUR
Goldman Sachs International (257,301) 94,424 - (162,877)
UBS AG (563,619) 90,747 - (472,872)
Westpac Banking Corp (227,708) 106,242 - (121,466)
Total (1,048,628) 291,413 - (757,215)

FINANCIAL STATEMENTS NOTES TO THE AUDITED FINANCIAL STATEMENTS
1674 NEUBERGER BERMAN INVESTMENT FUNDS PLC
FOR THE YEAR ENDED 31 DECEMBER 2019
25. OFFSETTING FINANCIAL INSTRUMENTS (CONTINUED)
Neuberger Berman European High Yield Bond Fund (continued) 31 December 2018
Derivative Assets
Gross Amounts of Recognised
AssetsGross Amounts Offset
in the Balance Sheet
Net Amounts ofAssets presented
in the Balance SheetEUR EUR EUR
Forward Currency Contracts 412,578 - 412,578
Total 412,578 - 412,578
Gross Amounts Not Offset in the Balance Sheet
Counterparty
Net Amounts of Assets presented
in the Balance SheetLiabilities Available
for OffsetCash Collateral
Received(a) Net Amount(b)
EUR EUR EUR EUR
Goldman Sachs International 89,076 (33,619) - 55,457
UBS AG 220,942 (67,376) - 153,566
Westpac Banking Corp 102,560 (46,155) - 56,405
Total 412,578 (147,150) - 265,428
Derivative Liabilities
Gross Amounts of Recognised
LiabilitiesGross Amounts Offset
in the Balance Sheet
Net Amounts of Liabilitiespresented in the Balance
SheetEUR EUR EUR
Forward Currency Contracts (147,150) - (147,150)
Total (147,150) - (147,150)
Gross Amounts Not Offset in the Balance Sheet
Counterparty
Net Amounts of Liabilities presented in the Balance
SheetAssets Available
for OffsetCash Collateral
Pledged(a) Net Amount(c)
EUR EUR EUR EUR
Goldman Sachs International (33,619) 33,619 - -
UBS AG (67,376) 67,376 - -
Westpac Banking Corp (46,155) 46,155 - -
Total (147,150) 147,150 - -

NOTES TO THE AUDITED FINANCIAL STATEMENTS FINANCIAL STATEMENTS
ANNUAL REPORT 2019 1675
FOR THE YEAR ENDED 31 DECEMBER 2019
25. OFFSETTING FINANCIAL INSTRUMENTS (CONTINUED)
Neuberger Berman Systematic Global Equity Fund 31 December 2019
Derivative Assets
Gross Amounts of Recognised
AssetsGross Amounts Offset
in the Balance Sheet
Net Amounts ofAssets presented
in the Balance SheetUS$ US$ US$
Forward Currency Contracts 75,241 - 75,241
Total 75,241 - 75,241
Gross Amounts Not Offset in the Balance Sheet
Counterparty
Net Amounts of Assets presented
in the Balance SheetLiabilities Available
for OffsetCash Collateral
Received(a) Net Amount(b)
US$ US$ US$ US$
Goldman Sachs International 26,700 (10,009) - 16,691
UBS AG 23,994 (7,588) - 16,406
Westpac Banking Corp 24,547 (9,134) - 15,413
Total 75,241 (26,731) - 48,510
Derivative Liabilities
Gross Amounts of Recognised
LiabilitiesGross Amounts Offset
in the Balance Sheet
Net Amounts of Liabilitiespresented in the Balance
SheetUS$ US$ US$
Forward Currency Contracts (26,731) - (26,731)
Total (26,731) - (26,731)
Gross Amounts Not Offset in the Balance Sheet
Counterparty
Net Amounts of Liabilities presented in the Balance
SheetAssets Available
for OffsetCash Collateral
Pledged(a) Net Amount(c)
US$ US$ US$ US$
Goldman Sachs International (10,009) 10,009 - -
UBS AG (7,588) 7,588 - -
Westpac Banking Corp (9,134) 9,134 - -
Total (26,731) 26,731 - -

FINANCIAL STATEMENTS NOTES TO THE AUDITED FINANCIAL STATEMENTS
1676 NEUBERGER BERMAN INVESTMENT FUNDS PLC
FOR THE YEAR ENDED 31 DECEMBER 2019
25. OFFSETTING FINANCIAL INSTRUMENTS (CONTINUED)
Neuberger Berman Systematic Global Equity Fund (continued) 31 December 2018
Derivative Assets
Gross Amounts of Recognised
AssetsGross Amounts Offset
in the Balance Sheet
Net Amounts ofAssets presented
in the Balance SheetUS$ US$ US$
Forward Currency Contracts 20,435 - 20,435
Total 20,435 - 20,435
Gross Amounts Not Offset in the Balance Sheet
Counterparty
Net Amounts of Assets presented
in the Balance SheetLiabilities Available
for OffsetCash Collateral
Received(a) Net Amount(b)
US$ US$ US$ US$
Goldman Sachs International 5,968 (5,968) - -
UBS AG 2,835 (2,835) - -
Westpac Banking Corp 11,632 (11,632) - -
Total 20,435 (20,435) - -
Derivative Liabilities
Gross Amounts of Recognised
LiabilitiesGross Amounts Offset
in the Balance Sheet
Net Amounts of Liabilitiespresented in the Balance
SheetUS$ US$ US$
Forward Currency Contracts (51,813) - (51,813)
Total (51,813) - (51,813)
Gross Amounts Not Offset in the Balance Sheet
Counterparty
Net Amounts of Liabilities presented in the Balance
SheetAssets Available
for OffsetCash Collateral
Pledged(a) Net Amount(c)US$ US$ US$ US$
Goldman Sachs International (18,156) 5,968 - (12,188)
UBS AG (14,517) 2,835 - (11,682)
Westpac Banking Corp (19,140) 11,632 - (7,508)
Total (51,813) 20,435 - (31,378)

NOTES TO THE AUDITED FINANCIAL STATEMENTS FINANCIAL STATEMENTS
ANNUAL REPORT 2019 1677
FOR THE YEAR ENDED 31 DECEMBER 2019
25. OFFSETTING FINANCIAL INSTRUMENTS (CONTINUED)
Neuberger Berman Global Real Estate Securities Fund 31 December 2019
Derivative Assets
Gross Amounts of Recognised
AssetsGross Amounts Offset
in the Balance Sheet
Net Amounts ofAssets presented
in the Balance SheetUS$ US$ US$
Forward Currency Contracts 11,835 - 11,835
Total 11,835 - 11,835
Gross Amounts Not Offset in the Balance Sheet
Counterparty
Net Amounts of Assets presented
in the Balance SheetLiabilities Available
for OffsetCash Collateral
Received(a) Net Amount(b)
US$ US$ US$ US$
Goldman Sachs International 3,999 (215) - 3,784
UBS AG 3,499 (13) - 3,486
Westpac Banking Corp 4,337 (274) - 4,063
Total 11,835 (502) - 11,333
Derivative Liabilities
Gross Amounts of Recognised
LiabilitiesGross Amounts Offset
in the Balance Sheet
Net Amounts of Liabilitiespresented in the Balance
SheetUS$ US$ US$
Forward Currency Contracts (502) - (502)
Total (502) - (502)
Gross Amounts Not Offset in the Balance Sheet
Counterparty
Net Amounts of Liabilities presented in the Balance
SheetAssets Available
for OffsetCash Collateral
Pledged(a) Net Amount(c)
US$ US$ US$ US$
Goldman Sachs International (215) 215 - -
UBS AG (13) 13 - -
Westpac Banking Corp (274) 274 - -
Total (502) 502 - -

FINANCIAL STATEMENTS NOTES TO THE AUDITED FINANCIAL STATEMENTS
1678 NEUBERGER BERMAN INVESTMENT FUNDS PLC
FOR THE YEAR ENDED 31 DECEMBER 2019
25. OFFSETTING FINANCIAL INSTRUMENTS (CONTINUED)
Neuberger Berman Global Real Estate Securities Fund (continued) 31 December 2018
Derivative Assets
Gross Amounts of Recognised
AssetsGross Amounts Offset
in the Balance Sheet
Net Amounts ofAssets presented
in the Balance SheetUS$ US$ US$
Forward Currency Contracts 341 - 341
Total 341 - 341
Gross Amounts Not Offset in the Balance Sheet
Counterparty
Net Amounts of Assets presented
in the Balance SheetLiabilities Available
for OffsetCash Collateral
Received(a) Net Amount(b)
US$ US$ US$ US$
Goldman Sachs International 161 (161) - -
Westpac Banking Corp 180 (180) - -
Total 341 (341) - -
Derivative Liabilities
Gross Amounts of Recognised
LiabilitiesGross Amounts Offset
in the Balance Sheet
Net Amounts of Liabilitiespresented in the Balance
SheetUS$ US$ US$
Forward Currency Contracts (3,187) - (3,187)
Total (3,187) - (3,187)
Gross Amounts Not Offset in the Balance Sheet
Counterparty
Net Amounts of Liabilities presented in the Balance
SheetAssets Available
for OffsetCash Collateral
Pledged(a) Net Amount(c)
US$ US$ US$ US$
Goldman Sachs International (1,187) 161 - (1,026)
UBS AG (951) - - (951)
Westpac Banking Corp (1,049) 180 - (869)
Total (3,187) 341 - (2,846)
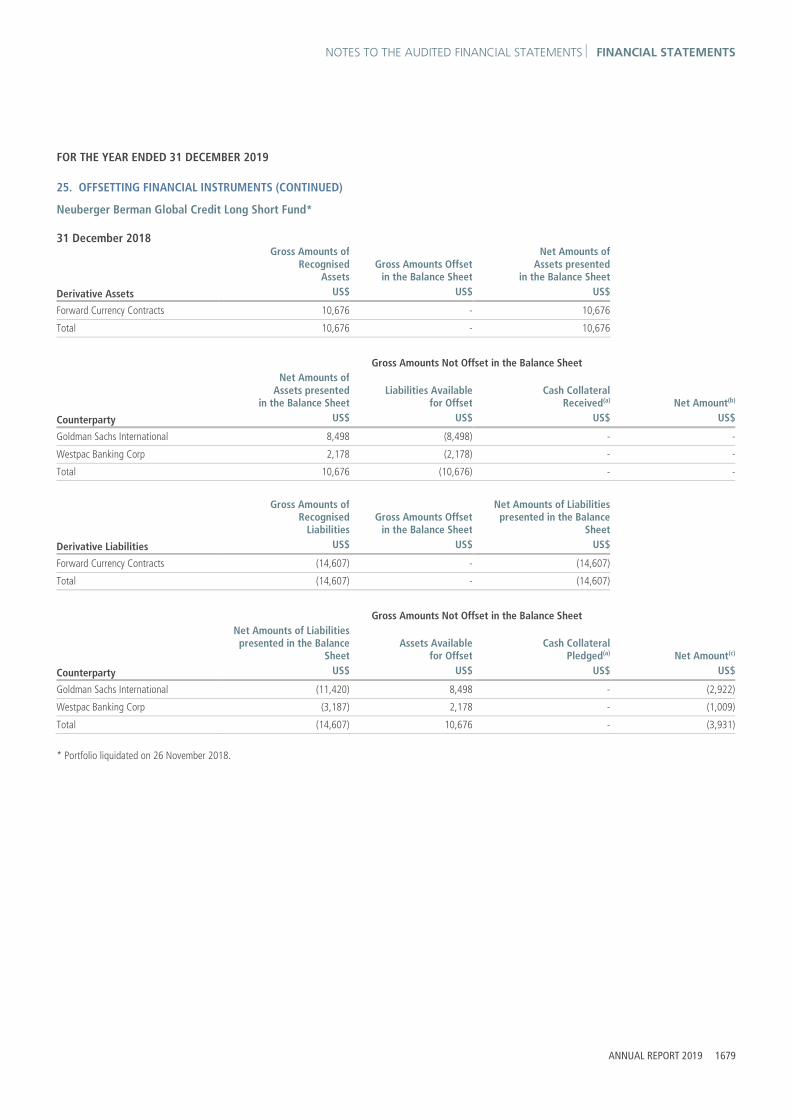
NOTES TO THE AUDITED FINANCIAL STATEMENTS FINANCIAL STATEMENTS
ANNUAL REPORT 2019 1679
FOR THE YEAR ENDED 31 DECEMBER 2019
25. OFFSETTING FINANCIAL INSTRUMENTS (CONTINUED)
Neuberger Berman Global Credit Long Short Fund* 31 December 2018
Derivative Assets
Gross Amounts ofRecognised
AssetsGross Amounts Offset
in the Balance Sheet
Net Amounts of Assets presented
in the Balance Sheet US$ US$ US$
Forward Currency Contracts 10,676 - 10,676
Total 10,676 - 10,676
Gross Amounts Not Offset in the Balance Sheet
Counterparty
Net Amounts ofAssets presented
in the Balance SheetLiabilities Available
for OffsetCash Collateral
Received(a) Net Amount(b)
US$ US$ US$ US$
Goldman Sachs International 8,498 (8,498) - -
Westpac Banking Corp 2,178 (2,178) - -
Total 10,676 (10,676) - -
Derivative Liabilities
Gross Amounts ofRecognised
LiabilitiesGross Amounts Offset
in the Balance Sheet
Net Amounts of Liabilities presented in the Balance
Sheet US$ US$ US$
Forward Currency Contracts (14,607) - (14,607) Total (14,607) - (14,607)
Gross Amounts Not Offset in the Balance Sheet
Counterparty
Net Amounts of Liabilities presented in the Balance
SheetAssets Available
for OffsetCash Collateral
Pledged(a) Net Amount(c)
US$ US$ US$ US$
Goldman Sachs International (11,420) 8,498 - (2,922)
Westpac Banking Corp (3,187) 2,178 - (1,009)
Total (14,607) 10,676 - (3,931)
* Portfolio liquidated on 26 November 2018.

FINANCIAL STATEMENTS NOTES TO THE AUDITED FINANCIAL STATEMENTS
1680 NEUBERGER BERMAN INVESTMENT FUNDS PLC
FOR THE YEAR ENDED 31 DECEMBER 2019
25. OFFSETTING FINANCIAL INSTRUMENTS (CONTINUED)
Neuberger Berman Asian Debt - Hard Currency Fund 31 December 2019
Derivative Assets
Gross Amounts ofRecognised
AssetsGross Amounts Offset
in the Balance Sheet
Net Amounts of Assets presented
in the Balance Sheet US$ US$ US$
Forward Currency Contracts 16,099 - 16,099
Total 16,099 - 16,099
Gross Amounts Not Offset in the Balance Sheet
Counterparty
Net Amounts ofAssets presented
in the Balance SheetLiabilities Available
for OffsetCash Collateral
Received(a) Net Amount(b)
US$ US$ US$ US$
Citibank NA 1,303 - - 1,303
Goldman Sachs International 2,520 (1) - 2,519
HSBC Bank Plc 2,001 - - 2,001
Standard Chartered Bank 10,175 - - 10,175
Westpac Banking Corp 100 - - 100
Total 16,099 (1) - 16,098
Derivative Liabilities
Gross Amounts ofRecognised
LiabilitiesGross Amounts Offset
in the Balance Sheet
Net Amounts of Liabilities presented in the Balance
Sheet US$ US$ US$
Forward Currency Contracts (1) - (1)
Total (1) - (1)
Gross Amounts Not Offset in the Balance Sheet
Counterparty
Net Amounts of Liabilities presented in the Balance
SheetAssets Available
for OffsetCash Collateral
Pledged(a) Net Amount(c)
US$ US$ US$ US$
Goldman Sachs International (1) 1 - -
Total (1) 1 - -

NOTES TO THE AUDITED FINANCIAL STATEMENTS FINANCIAL STATEMENTS
ANNUAL REPORT 2019 1681
FOR THE YEAR ENDED 31 DECEMBER 2019
25. OFFSETTING FINANCIAL INSTRUMENTS (CONTINUED)
Neuberger Berman Asian Debt - Hard Currency Fund 31 December 2018
Gross Amounts ofRecognised
AssetsGross Amounts Offset
in the Balance Sheet
Net Amounts of Assets presented
in the Balance Sheet Derivative Assets US$ US$ US$ Forward Currency Contracts 1,331 - 1,331
Total 1,331 - 1,331
Gross Amounts Not Offset in the Balance Sheet
Counterparty
Net Amounts ofAssets presented
in the Balance SheetLiabilities Available
for OffsetCash Collateral
Received(a) Net Amount(b)
US$ US$ US$ US$
Citibank NA 1,331 (1,331) - -
Total 1,331 (1,331) - -
Derivative Liabilities
Gross Amounts ofRecognised
LiabilitiesGross Amounts Offset
in the Balance Sheet
Net Amounts of Liabilities presented in the Balance
Sheet US$ US$ US$
Forward Currency Contracts (3,350) - (3,350)
Total (3,350) - (3,350)
Gross Amounts Not Offset in the Balance Sheet
Counterparty
Net Amounts of Liabilities presented in the Balance
SheetAssets Available
for OffsetCash Collateral
Pledged(a) Net Amount(c)
US$ US$ US$ US$
Citibank NA (3,350) 1,331 - (2,019)
Total (3,350) 1,331 - (2,019)

FINANCIAL STATEMENTS NOTES TO THE AUDITED FINANCIAL STATEMENTS
1682 NEUBERGER BERMAN INVESTMENT FUNDS PLC
FOR THE YEAR ENDED 31 DECEMBER 2019
25. OFFSETTING FINANCIAL INSTRUMENTS (CONTINUED)
Neuberger Berman China Bond Fund 31 December 2019
Derivative Assets
Gross Amounts ofRecognised
AssetsGross Amounts Offset
in the Balance Sheet
Net Amounts of Assets presented
in the Balance Sheet CNY CNY CNY
Forward Currency Contracts 2,404,286 - 2,404,286
Total 2,404,286 - 2,404,286
Gross Amounts Not Offset in the Balance Sheet
Counterparty
Net Amounts ofAssets presented
in the Balance SheetLiabilities Available
for OffsetCash Collateral
Received(a) Net Amount(b)
CNY CNY CNY CNY
Brown Brothers Harriman 62 - - 62
Citibank NA 1,327,915 (257,207) - 1,070,708
Goldman Sachs International 1,076,309 (183,685) - 892,624
Total 2,404,286 (440,892) - 1,963,394
Derivative Liabilities
Gross Amounts ofRecognised
LiabilitiesGross Amounts Offset
in the Balance Sheet
Net Amounts of Liabilities presented in the Balance
Sheet CNY CNY CNY
Forward Currency Contracts (10,645,318) - (10,645,318)
Total (10,645,318) - (10,645,318)
Gross Amounts Not Offset in the Balance Sheet
Counterparty
Net Amounts of Liabilities presented in the Balance
SheetAssets Available
for OffsetCash Collateral
Pledged(a) Net Amount(c)
CNY CNY CNY CNY
Citibank NA (257,207) 257,207 - -
Goldman Sachs International (183,685) 183,685 - -
UBS AG (64,174) - - (64,174)
Westpac Banking Corp (10,140,252) - - (10,140,252)
Total (10,645,318) 440,892 - (10,204,426)

NOTES TO THE AUDITED FINANCIAL STATEMENTS FINANCIAL STATEMENTS
ANNUAL REPORT 2019 1683
FOR THE YEAR ENDED 31 DECEMBER 2019
25. OFFSETTING FINANCIAL INSTRUMENTS (CONTINUED)
Neuberger Berman China Bond Fund (continued) 31 December 2018
Derivative Assets
Gross Amounts ofRecognised
AssetsGross Amounts Offset
in the Balance Sheet
Net Amounts of Assets presented
in the Balance Sheet CNY CNY CNY
Forward Currency Contracts 66,663 - 66,663
Total 66,663 - 66,663
Gross Amounts Not Offset in the Balance Sheet
Counterparty
Net Amounts ofAssets presented
in the Balance SheetLiabilities Available
for OffsetCash Collateral
Received(a) Net Amount(b)
CNY CNY CNY CNY
Citibank NA 42,054 - - 42,054
Goldman Sachs International 24,609 (6,633) - 17,976
Total 66,663 (6,633) - 60,030
Derivative Liabilities
Gross Amounts ofRecognised
LiabilitiesGross Amounts Offset
in the Balance Sheet
Net Amounts of Liabilities presented in the Balance
Sheet CNY CNY CNY
Forward Currency Contracts (6,633) - (6,633)
Total (6,633) - (6,633)
Gross Amounts Not Offset in the Balance Sheet
Counterparty
Net Amounts of Liabilities presented in the Balance
SheetAssets Available
for OffsetCash Collateral
Pledged(a) Net Amount(c)
CNY CNY CNY CNY
Goldman Sachs International (6,633) 6,633 - -
Total (6,633) 6,633 - -

FINANCIAL STATEMENTS NOTES TO THE AUDITED FINANCIAL STATEMENTS
1684 NEUBERGER BERMAN INVESTMENT FUNDS PLC
FOR THE YEAR ENDED 31 DECEMBER 2019
25. OFFSETTING FINANCIAL INSTRUMENTS (CONTINUED)
Neuberger Berman Global Dynamic Asset Allocator Fund* 31 December 2018
Derivative Assets
Gross Amounts ofRecognised
AssetsGross Amounts Offset
in the Balance Sheet
Net Amounts of Assets presented
in the Balance Sheet US$ US$ US$
Forward Currency Contracts 1,596,836 - 1,596,836
Total 1,596,836 - 1,596,836
Gross Amounts Not Offset in the Balance Sheet
Counterparty
Net Amounts ofAssets presented
in the Balance SheetLiabilities Available
for OffsetCash Collateral
Received(a) Net Amount(b)
US$ US$ US$ US$
Citibank NA 627,117 (627,117) - -
Goldman Sachs International 806,824 (645,632) - 161,192
Royal Bank of Canada 403 - - 403
State Street Bank and Trust and Co 156,353 (156,353) - -
UBS AG 3,750 (207) - 3,543
Westpac Banking Corp 2,389 (2,389) - -
Total 1,596,836 (1,431,698) - 165,138
Derivative Liabilities
Gross Amounts ofRecognised
LiabilitiesGross Amounts Offset
in the Balance Sheet
Net Amounts of Liabilities presented in the Balance
Sheet US$ US$ US$
Forward Currency Contracts (1,621,993) - (1,621,993) Total (1,621,993) - (1,621,993)
Gross Amounts Not Offset in the Balance Sheet
Counterparty
Net Amounts of Liabilities presented in the Balance
SheetAssets Available
for OffsetCash Collateral
Pledged(a) Net Amount(c)
US$ US$ US$ US$
Citibank NA (730,392) 627,117 - (103,275)
Goldman Sachs International (645,632) 645,632 - -
State Street Bank and Trust and Co (215,364) 156,353 - (59,011)
UBS AG (207) 207 - -
Westpac Banking Corp (30,398) 2,389 - (28,009)
Total (1,621,993) 1,431,698 - (190,295)
* Portfolio liquidated on 12 April 2019.

NOTES TO THE AUDITED FINANCIAL STATEMENTS FINANCIAL STATEMENTS
ANNUAL REPORT 2019 1685
FOR THE YEAR ENDED 31 DECEMBER 2019
25. OFFSETTING FINANCIAL INSTRUMENTS (CONTINUED)
Neuberger Berman Corporate Hybrid Bond Fund 31 December 2019
Derivative Assets
Gross Amounts ofRecognised
AssetsGross Amounts Offset
in the Balance Sheet
Net Amounts of Assets presented
in the Balance Sheet EUR EUR EUR
Forward Currency Contracts 10,380,822 - 10,380,822
Total 10,380,822 - 10,380,822
Gross Amounts Not Offset in the Balance Sheet
Counterparty
Net Amounts ofAssets presented
in the Balance SheetLiabilities Available
for OffsetCash Collateral
Received(a) Net Amount(b)
EUR EUR EUR EUR
Goldman Sachs International 6,269,438 (6,269,438) - -
UBS AG 1,371,968 (1,371,968) - -
Westpac Banking Corp 2,739,416 (1,916,401) - 823,015
Total 10,380,822 (9,557,807) - 823,015
Derivative Liabilities
Gross Amounts ofRecognised
LiabilitiesGross Amounts Offset
in the Balance Sheet
Net Amounts of Liabilities presented in the Balance
Sheet EUR EUR EUR
Forward Currency Contracts (13,692,146) - (13,692,146) Total (13,692,146) - (13,692,146)
Gross Amounts Not Offset in the Balance Sheet
Counterparty
Net Amounts of Liabilities presented in the Balance
SheetAssets Available
for OffsetCash Collateral
Pledged(a) Net Amount(c)
EUR EUR EUR EUR
Goldman Sachs International (10,288,297) 6,269,438 - (4,018,859)
UBS AG (1,487,448) 1,371,968 - (115,480)
Westpac Banking Corp (1,916,401) 1,916,401 - -
Total (13,692,146) 9,557,807 - (4,134,339)

FINANCIAL STATEMENTS NOTES TO THE AUDITED FINANCIAL STATEMENTS
1686 NEUBERGER BERMAN INVESTMENT FUNDS PLC
FOR THE YEAR ENDED 31 DECEMBER 2019
25. OFFSETTING FINANCIAL INSTRUMENTS (CONTINUED)
Neuberger Berman Corporate Hybrid Bond Fund (continued) 31 December 2018
Derivative Assets
Gross Amounts ofRecognised
AssetsGross Amounts Offset
in the Balance Sheet
Net Amounts of Assets presented
in the Balance Sheet EUR EUR EUR
Forward Currency Contracts 5,059,235 - 5,059,235
Total 5,059,235 - 5,059,235
Gross Amounts Not Offset in the Balance Sheet
Counterparty
Net Amounts ofAssets presented
in the Balance SheetLiabilities Available
for OffsetCash Collateral
Received(a) Net Amount(b)
EUR EUR EUR EUR
Goldman Sachs International 821,795 (821,795) - -
UBS AG 3,559,993 (2,822,196) - 737,797
Westpac Banking Corp 677,447 (677,447) - -
Total 5,059,235 (4,321,438) - 737,797
Derivative Liabilities
Gross Amounts ofRecognised
LiabilitiesGross Amounts Offset
in the Balance Sheet
Net Amounts of Liabilities presented in the Balance
Sheet EUR EUR EUR
Forward Currency Contracts (5,295,685) - (5,295,685) Total (5,295,685) - (5,295,685)
Gross Amounts Not Offset in the Balance Sheet
Counterparty
Net Amounts of Liabilities presented in the Balance
SheetAssets Available
for OffsetCash Collateral
Pledged(a) Net Amount(c)
EUR EUR EUR EUR
Goldman Sachs International (1,447,894) 821,795 - (626,099)
UBS AG (2,822,196) 2,822,196 - -
Westpac Banking Corp (1,025,595) 677,447 - (348,148)
Total (5,295,685) 4,321,438 - (974,247)

NOTES TO THE AUDITED FINANCIAL STATEMENTS FINANCIAL STATEMENTS
ANNUAL REPORT 2019 1687
FOR THE YEAR ENDED 31 DECEMBER 2019
25. OFFSETTING FINANCIAL INSTRUMENTS (CONTINUED)
Neuberger Berman Global High Yield Bond Fund 31 December 2019
Derivative Assets
Gross Amounts ofRecognised
AssetsGross Amounts Offset
in the Balance Sheet
Net Amounts of Assets presented
in the Balance Sheet US$ US$ US$
Forward Currency Contracts 1,101,962 - 1,101,962
Total 1,101,962 - 1,101,962
Gross Amounts Not Offset in the Balance Sheet
Counterparty
Net Amounts ofAssets presented
in the Balance SheetLiabilities Available
for OffsetCash Collateral
Received(a) Net Amount(b)
US$ US$ US$ US$
Goldman Sachs International 384,417 (47,456) - 336,961
UBS AG 396,466 (396,466) - -
Westpac Banking Corp 321,079 (160,612) - 160,467
Total 1,101,962 (604,534) - 497,428
Derivative Liabilities
Gross Amounts ofRecognised
LiabilitiesGross Amounts Offset
in the Balance Sheet
Net Amounts of Liabilities presented in the Balance
Sheet US$ US$ US$
Forward Currency Contracts (861,176) - (861,176) Total (861,176) - (861,176)
Gross Amounts Not Offset in the Balance Sheet
Counterparty
Net Amounts of Liabilities presented in the Balance
SheetAssets Available
for OffsetCash Collateral
Pledged(a) Net Amount(c)
US$ US$ US$ US$
Goldman Sachs International (47,456) 47,456 - -
UBS AG (653,108) 396,466 - (256,642)
Westpac Banking Corp (160,612) 160,612 - -
Total (861,176) 604,534 - (256,642)

FINANCIAL STATEMENTS NOTES TO THE AUDITED FINANCIAL STATEMENTS
1688 NEUBERGER BERMAN INVESTMENT FUNDS PLC
FOR THE YEAR ENDED 31 DECEMBER 2019
25. OFFSETTING FINANCIAL INSTRUMENTS (CONTINUED)
Neuberger Berman Global High Yield Bond Fund (continued) 31 December 2018
Derivative Assets
Gross Amounts ofRecognised
AssetsGross Amounts Offset
in the Balance Sheet
Net Amounts of Assets presented
in the Balance Sheet US$ US$ US$
Forward Currency Contracts 509,187 - 509,187
Total 509,187 - 509,187
Gross Amounts Not Offset in the Balance Sheet
Counterparty
Net Amounts ofAssets presented
in the Balance SheetLiabilities Available
for OffsetCash Collateral
Received(a) Net Amount(b)
US$ US$ US$ US$
Goldman Sachs International 282,549 (201,462) - 81,087
UBS AG 14,277 (14,277) - -
Westpac Banking Corp 212,361 (212,361) - -
Total 509,187 (428,100) - 81,087
Derivative Liabilities
Gross Amounts ofRecognised
LiabilitiesGross Amounts Offset
in the Balance Sheet
Net Amounts of Liabilities presented in the Balance
Sheet US$ US$ US$
Forward Currency Contracts (683,211) - (683,211) Total (683,211) - (683,211)
Gross Amounts Not Offset in the Balance Sheet
Counterparty
Net Amounts of Liabilities presented in the Balance
SheetAssets Available
for OffsetCash Collateral
Pledged(a) Net Amount(c)
US$ US$ US$ US$
Goldman Sachs International (201,462) 201,462 - -
UBS AG (212,706) 14,277 - (198,429)
Westpac Banking Corp (269,043) 212,361 - (56,682)
Total (683,211) 428,100 - (255,111)

NOTES TO THE AUDITED FINANCIAL STATEMENTS FINANCIAL STATEMENTS
ANNUAL REPORT 2019 1689
FOR THE YEAR ENDED 31 DECEMBER 2019
25. OFFSETTING FINANCIAL INSTRUMENTS (CONTINUED)
Neuberger Berman Global Opportunistic Bond Fund 31 December 2019
Derivative Assets
Gross Amounts ofRecognised
AssetsGross Amounts Offset
in the Balance Sheet
Net Amounts of Assets presented
in the Balance Sheet US$ US$ US$
Forward Currency Contracts 3,025,978 - 3,025,978
Total 3,025,978 - 3,025,978
Gross Amounts Not Offset in the Balance Sheet
Counterparty
Net Amounts ofAssets presented
in the Balance SheetLiabilities Available
for OffsetCash Collateral
Received(a) Net Amount(b)
US$ US$ US$ US$
Citibank NA 784,614 (784,614) - -
Goldman Sachs International 1,575,689 (1,575,689) - -
State Street Bank and Trust and Co 320,184 (320,184) - -
UBS AG 3,086 (3,086) - -
Westpac Banking Corp 342,405 (342,405) - -
Total 3,025,978 (3,025,978) - -
Derivative Liabilities
Gross Amounts ofRecognised
LiabilitiesGross Amounts Offset
in the Balance Sheet
Net Amounts of Liabilities presented in the Balance
Sheet US$ US$ US$
Forward Currency Contracts (5,702,958) - (5,702,958) Total (5,702,958) - (5,702,958)
Gross Amounts Not Offset in the Balance Sheet
Counterparty
Net Amounts of Liabilities presented in the Balance
SheetAssets Available
for OffsetCash Collateral
Pledged(a) Net Amount(c)
US$ US$ US$ US$
Citibank NA (1,331,537) 784,614 - (546,923)
Goldman Sachs International (1,937,112) 1,575,689 - (361,423)
Royal Bank of Canada (14,459) - - (14,459)
State Street Bank and Trust and Co (982,209) 320,184 - (662,025)
UBS AG (6,552) 3,086 - (3,466)
Westpac Banking Corp (1,431,089) 342,405 - (1,088,684)
Total (5,702,958) 3,025,978 - (2,676,980)

FINANCIAL STATEMENTS NOTES TO THE AUDITED FINANCIAL STATEMENTS
1690 NEUBERGER BERMAN INVESTMENT FUNDS PLC
FOR THE YEAR ENDED 31 DECEMBER 2019
25. OFFSETTING FINANCIAL INSTRUMENTS (CONTINUED)
Neuberger Berman Global Opportunistic Bond Fund (continued) 31 December 2018
Derivative Assets
Gross Amounts ofRecognised
AssetsGross Amounts Offset
in the Balance Sheet
Net Amounts of Assets presented
in the Balance Sheet US$ US$ US$
Forward Currency Contracts 2,602,782 - 2,602,782
Total 2,602,782 - 2,602,782
Gross Amounts Not Offset in the Balance Sheet
Counterparty
Net Amounts ofAssets presented
in the Balance SheetLiabilities Available
for OffsetCash Collateral
Received(a) Net Amount(b)
US$ US$ US$ US$
Citibank NA 689,666 (689,666) - -
Goldman Sachs International 1,518,817 (977,531) - 541,286
State Street Bank and Trust and Co 225,025 (225,025) - -
Westpac Banking Corp 169,274 (24,293) - 144,981
Total 2,602,782 (1,916,515) - 686,267
Derivative Liabilities
Gross Amounts ofRecognised
LiabilitiesGross Amounts Offset
in the Balance Sheet
Net Amounts of Liabilities presented in the Balance
Sheet US$ US$ US$
Forward Currency Contracts (2,086,779) - (2,086,779) Total (2,086,779) - (2,086,779)
Gross Amounts Not Offset in the Balance Sheet
Counterparty
Net Amounts of Liabilities presented in the Balance
SheetAssets Available
for OffsetCash Collateral
Pledged(a) Net Amount(c)
US$ US$ US$ US$
Citibank NA (854,938) 689,666 - (165,272)
Goldman Sachs International (977,531) 977,531 - -
State Street Bank and Trust and Co (230,017) 225,025 - (4,992)
Westpac Banking Corp (24,293) 24,293 - -
Total (2,086,779) 1,916,515 - (170,264)
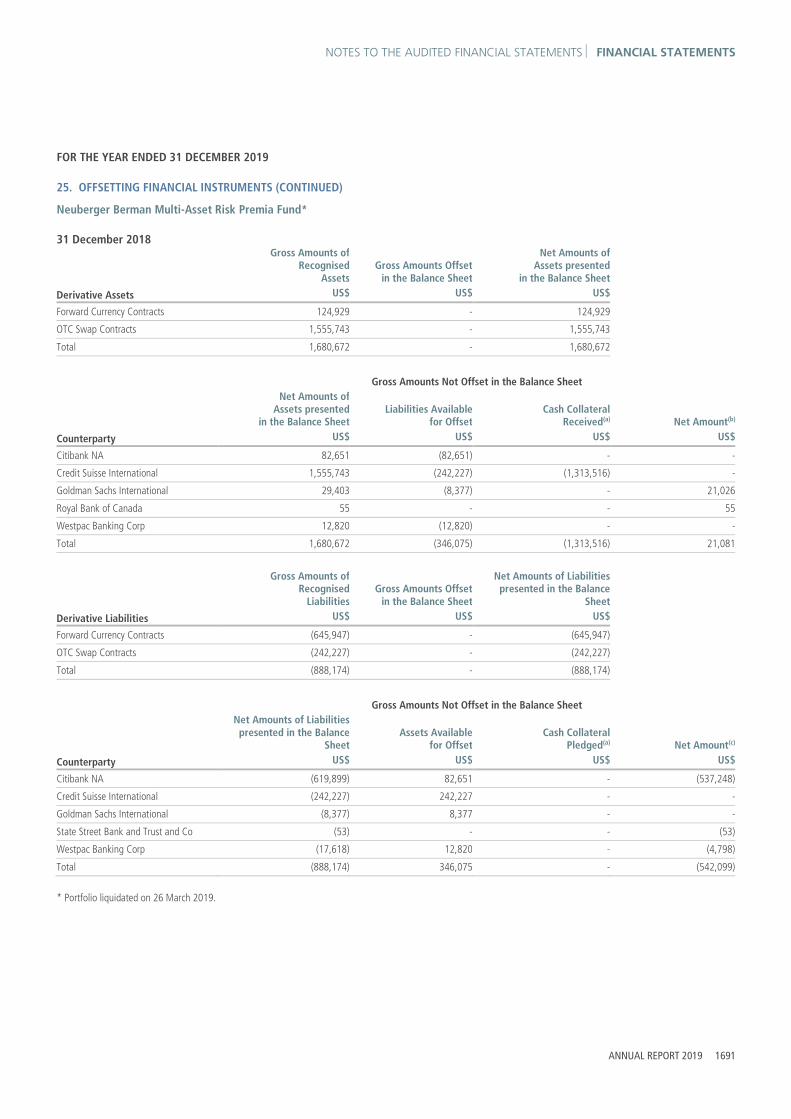
NOTES TO THE AUDITED FINANCIAL STATEMENTS FINANCIAL STATEMENTS
ANNUAL REPORT 2019 1691
FOR THE YEAR ENDED 31 DECEMBER 2019
25. OFFSETTING FINANCIAL INSTRUMENTS (CONTINUED)
Neuberger Berman Multi-Asset Risk Premia Fund* 31 December 2018
Derivative Assets
Gross Amounts ofRecognised
AssetsGross Amounts Offset
in the Balance Sheet
Net Amounts of Assets presented
in the Balance Sheet US$ US$ US$
Forward Currency Contracts 124,929 - 124,929
OTC Swap Contracts 1,555,743 - 1,555,743
Total 1,680,672 - 1,680,672
Gross Amounts Not Offset in the Balance Sheet
Counterparty
Net Amounts ofAssets presented
in the Balance SheetLiabilities Available
for OffsetCash Collateral
Received(a) Net Amount(b)
US$ US$ US$ US$
Citibank NA 82,651 (82,651) - -
Credit Suisse International 1,555,743 (242,227) (1,313,516) -
Goldman Sachs International 29,403 (8,377) - 21,026
Royal Bank of Canada 55 - - 55
Westpac Banking Corp 12,820 (12,820) - -
Total 1,680,672 (346,075) (1,313,516) 21,081
Derivative Liabilities
Gross Amounts ofRecognised
LiabilitiesGross Amounts Offset
in the Balance Sheet
Net Amounts of Liabilities presented in the Balance
Sheet US$ US$ US$
Forward Currency Contracts (645,947) - (645,947) OTC Swap Contracts (242,227) - (242,227) Total (888,174) - (888,174)
Gross Amounts Not Offset in the Balance Sheet
Counterparty
Net Amounts of Liabilities presented in the Balance
SheetAssets Available
for OffsetCash Collateral
Pledged(a) Net Amount(c)
US$ US$ US$ US$
Citibank NA (619,899) 82,651 - (537,248)
Credit Suisse International (242,227) 242,227 - -
Goldman Sachs International (8,377) 8,377 - -
State Street Bank and Trust and Co (53) - - (53)
Westpac Banking Corp (17,618) 12,820 - (4,798)
Total (888,174) 346,075 - (542,099)
* Portfolio liquidated on 26 March 2019.

FINANCIAL STATEMENTS NOTES TO THE AUDITED FINANCIAL STATEMENTS
1692 NEUBERGER BERMAN INVESTMENT FUNDS PLC
FOR THE YEAR ENDED 31 DECEMBER 2019
25. OFFSETTING FINANCIAL INSTRUMENTS (CONTINUED)
Neuberger Berman Multi-Asset Class Income Fund 31 December 2019
Derivative Assets
Gross Amounts ofRecognised
AssetsGross Amounts Offset
in the Balance Sheet
Net Amounts of Assets presented
in the Balance Sheet US$ US$ US$
Forward Currency Contracts 923,367 - 923,367
OTC Swap Contracts 650,330 - 650,330
Total 1,573,697 - 1,573,697
Gross Amounts Not Offset in the Balance Sheet
Counterparty
Net Amounts ofAssets presented
in the Balance SheetLiabilities Available
for OffsetCash Collateral
Received(a) Net Amount(b)
US$ US$ US$ US$
Citibank NA 765,870 (765,870) - -
Goldman Sachs International 694,656 (303,339) - 391,317
State Street Bank and Trust and Co 106,486 (106,486) - -
UBS AG 6 - - 6
Westpac Banking Corp 6,679 (1,291) - 5,388
Total 1,573,697 (1,176,986) - 396,711
Derivative Liabilities
Gross Amounts ofRecognised
LiabilitiesGross Amounts Offset
in the Balance Sheet
Net Amounts of Liabilities presented in the Balance
Sheet US$ US$ US$
Forward Currency Contracts (1,096,507) - (1,096,507) OTC Swap Contracts (490,020) - (490,020) Total (1,586,527) - (1,586,527)
Gross Amounts Not Offset in the Balance Sheet
Counterparty
Net Amounts of Liabilities presented in the Balance
SheetAssets Available
for OffsetCash Collateral
Pledged(a) Net Amount(c)
US$ US$ US$ US$
Citibank NA (767,995) 765,870 - (2,125)
Goldman Sachs International (303,339) 303,339 - -
JPMorgan Chase Bank (67,005) - - (67,005)
State Street Bank and Trust and Co (446,897) 106,486 - (340,411)
Westpac Banking Corp (1,291) 1,291 - -
Total (1,586,527) 1,176,986 - (409,541)
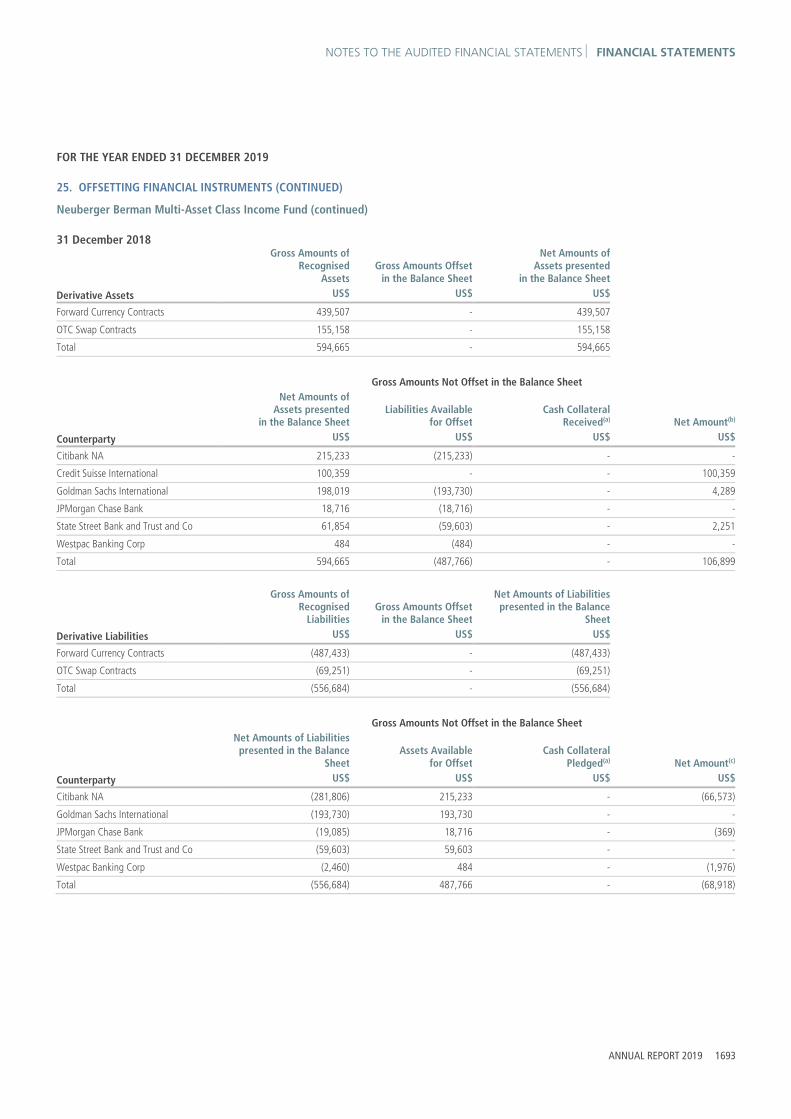
NOTES TO THE AUDITED FINANCIAL STATEMENTS FINANCIAL STATEMENTS
ANNUAL REPORT 2019 1693
FOR THE YEAR ENDED 31 DECEMBER 2019
25. OFFSETTING FINANCIAL INSTRUMENTS (CONTINUED)
Neuberger Berman Multi-Asset Class Income Fund (continued) 31 December 2018
Derivative Assets
Gross Amounts ofRecognised
AssetsGross Amounts Offset
in the Balance Sheet
Net Amounts of Assets presented
in the Balance Sheet US$ US$ US$
Forward Currency Contracts 439,507 - 439,507
OTC Swap Contracts 155,158 - 155,158
Total 594,665 - 594,665
Gross Amounts Not Offset in the Balance Sheet
Counterparty
Net Amounts ofAssets presented
in the Balance SheetLiabilities Available
for OffsetCash Collateral
Received(a) Net Amount(b)
US$ US$ US$ US$
Citibank NA 215,233 (215,233) - -
Credit Suisse International 100,359 - - 100,359
Goldman Sachs International 198,019 (193,730) - 4,289
JPMorgan Chase Bank 18,716 (18,716) - -
State Street Bank and Trust and Co 61,854 (59,603) - 2,251
Westpac Banking Corp 484 (484) - -
Total 594,665 (487,766) - 106,899
Derivative Liabilities
Gross Amounts ofRecognised
LiabilitiesGross Amounts Offset
in the Balance Sheet
Net Amounts of Liabilities presented in the Balance
Sheet US$ US$ US$
Forward Currency Contracts (487,433) - (487,433) OTC Swap Contracts (69,251) - (69,251) Total (556,684) - (556,684)
Gross Amounts Not Offset in the Balance Sheet
Counterparty
Net Amounts of Liabilities presented in the Balance
SheetAssets Available
for OffsetCash Collateral
Pledged(a) Net Amount(c)
US$ US$ US$ US$
Citibank NA (281,806) 215,233 - (66,573)
Goldman Sachs International (193,730) 193,730 - -
JPMorgan Chase Bank (19,085) 18,716 - (369)
State Street Bank and Trust and Co (59,603) 59,603 - -
Westpac Banking Corp (2,460) 484 - (1,976)
Total (556,684) 487,766 - (68,918)

FINANCIAL STATEMENTS NOTES TO THE AUDITED FINANCIAL STATEMENTS
1694 NEUBERGER BERMAN INVESTMENT FUNDS PLC
FOR THE YEAR ENDED 31 DECEMBER 2019
25. OFFSETTING FINANCIAL INSTRUMENTS (CONTINUED)
Neuberger Berman US Equity Index PutWrite Fund 31 December 2019
Derivative Assets
Gross Amounts ofRecognised
AssetsGross Amounts Offset
in the Balance Sheet
Net Amounts of Assets presented
in the Balance Sheet US$ US$ US$
Forward Currency Contracts 1,609,667 - 1,609,667
Total 1,609,667 - 1,609,667
Gross Amounts Not Offset in the Balance Sheet
Counterparty
Net Amounts ofAssets presented
in the Balance SheetLiabilities Available
for OffsetCash Collateral
Received(a) Net Amount(b)
US$ US$ US$ US$
Citibank NA 524,147 - - 524,147
Goldman Sachs International 578,074 (44,746) - 533,328
Westpac Banking Corp 507,446 (18,849) - 488,597
Total 1,609,667 (63,595) - 1,546,072
Derivative Liabilities
Gross Amounts ofRecognised
LiabilitiesGross Amounts Offset
in the Balance Sheet
Net Amounts of Liabilities presented in the Balance
Sheet US$ US$ US$
Forward Currency Contracts (63,595) - (63,595) Total (63,595) - (63,595)
Gross Amounts Not Offset in the Balance Sheet
Counterparty
Net Amounts of Liabilities presented in the Balance
SheetAssets Available
for OffsetCash Collateral
Pledged(a) Net Amount(c)
US$ US$ US$ US$
Goldman Sachs International (44,746) 44,746 - -
Westpac Banking Corp (18,849) 18,849 - -
Total (63,595) 63,595 - -

NOTES TO THE AUDITED FINANCIAL STATEMENTS FINANCIAL STATEMENTS
ANNUAL REPORT 2019 1695
FOR THE YEAR ENDED 31 DECEMBER 2019
25. OFFSETTING FINANCIAL INSTRUMENTS (CONTINUED)
Neuberger Berman US Equity Index PutWrite Fund (continued) 31 December 2018
Derivative Assets
Gross Amounts ofRecognised
AssetsGross Amounts Offset
in the Balance Sheet
Net Amounts of Assets presented
in the Balance Sheet US$ US$ US$
Forward Currency Contracts 155,476 - 155,476
Total 155,476 - 155,476
Gross Amounts Not Offset in the Balance Sheet
Counterparty
Net Amounts ofAssets presented
in the Balance SheetLiabilities Available
for OffsetCash Collateral
Received(a) Net Amount(b)
US$ US$ US$ US$
Citibank NA 7,958 (7,958) - -
Goldman Sachs International 30,907 (30,907) - -
Westpac Banking Corp 116,611 (116,611) - -
Total 155,476 (155,476) - -
Derivative Liabilities
Gross Amounts ofRecognised
LiabilitiesGross Amounts Offset
in the Balance Sheet
Net Amounts of Liabilities presented in the Balance
Sheet US$ US$ US$
Forward Currency Contracts (879,772) - (879,772) Total (879,772) - (879,772)
Gross Amounts Not Offset in the Balance Sheet
Counterparty
Net Amounts of Liabilities presented in the Balance
SheetAssets Available
for OffsetCash Collateral
Pledged(a) Net Amount(c)
US$ US$ US$ US$
Citibank NA (235,181) 7,958 - (227,223)
Goldman Sachs International (282,094) 30,907 - (251,187)
Westpac Banking Corp (362,497) 116,611 - (245,886)
Total (879,772) 155,476 - (724,296)

FINANCIAL STATEMENTS NOTES TO THE AUDITED FINANCIAL STATEMENTS
1696 NEUBERGER BERMAN INVESTMENT FUNDS PLC
FOR THE YEAR ENDED 31 DECEMBER 2019
25. OFFSETTING FINANCIAL INSTRUMENTS (CONTINUED)
Neuberger Berman Global Equity Index PutWrite Fund 31 December 2019
Derivative Assets
Gross Amounts ofRecognised
AssetsGross Amounts Offset
in the Balance Sheet
Net Amounts of Assets presented
in the Balance Sheet US$ US$ US$
Forward Currency Contracts 957,582 - 957,582
Total 957,582 - 957,582
Gross Amounts Not Offset in the Balance Sheet
Counterparty
Net Amounts ofAssets presented
in the Balance SheetLiabilities Available
for OffsetCash Collateral
Received(a) Net Amount(b)
US$ US$ US$ US$
Citibank NA 319,537 (102,968) - 216,569
Goldman Sachs International 351,082 (125,815) - 225,267
UBS AG 978 - - 978
Westpac Banking Corp 285,985 (174,260) - 111,725
Total 957,582 (403,043) - 554,539
Derivative Liabilities
Gross Amounts ofRecognised
LiabilitiesGross Amounts Offset
in the Balance Sheet
Net Amounts of Liabilities presented in the Balance
Sheet US$ US$ US$
Forward Currency Contracts (403,043) - (403,043) Total (403,043) - (403,043)
Gross Amounts Not Offset in the Balance Sheet
Counterparty
Net Amounts of Liabilities presented in the Balance
SheetAssets Available
for OffsetCash Collateral
Pledged(a) Net Amount(c)
US$ US$ US$ US$
Citibank NA (102,968) 102,968 - -
Goldman Sachs International (125,815) 125,815 - -
Westpac Banking Corp (174,260) 174,260 - -
Total (403,043) 403,043 - -

NOTES TO THE AUDITED FINANCIAL STATEMENTS FINANCIAL STATEMENTS
ANNUAL REPORT 2019 1697
FOR THE YEAR ENDED 31 DECEMBER 2019
25. OFFSETTING FINANCIAL INSTRUMENTS (CONTINUED)
Neuberger Berman Global Equity Index PutWrite Fund (continued) 31 December 2018
Derivative Assets
Gross Amounts ofRecognised
AssetsGross Amounts Offset
in the Balance Sheet
Net Amounts of Assets presented
in the Balance Sheet US$ US$ US$
Forward Currency Contracts 293,200 - 293,200
Total 293,200 - 293,200
Gross Amounts Not Offset in the Balance Sheet
Counterparty
Net Amounts ofAssets presented
in the Balance SheetLiabilities Available
for OffsetCash Collateral
Received(a) Net Amount(b)
US$ US$ US$ US$
Citibank NA 16,477 (16,477) - -
Goldman Sachs International 34,067 (34,067) - -
UBS AG 442 (442) - -
Westpac Banking Corp 242,214 (214,916) - 27,298
Total 293,200 (265,902) - 27,298
Derivative Liabilities
Gross Amounts ofRecognised
LiabilitiesGross Amounts Offset
in the Balance Sheet
Net Amounts of Liabilities presented in the Balance
Sheet US$ US$ US$
Forward Currency Contracts (598,863) - (598,863) Total (598,863) - (598,863)
Gross Amounts Not Offset in the Balance Sheet
Counterparty
Net Amounts of Liabilities presented in the Balance
SheetAssets Available
for OffsetCash Collateral
Pledged(a) Net Amount(c)
US$ US$ US$ US$
Citibank NA (175,663) 16,477 - (159,186)
Goldman Sachs International (206,751) 34,067 - (172,684)
UBS AG (1,533) 442 - (1,091)
Westpac Banking Corp (214,916) 214,916 - -
Total (598,863) 265,902 - (332,961)

FINANCIAL STATEMENTS NOTES TO THE AUDITED FINANCIAL STATEMENTS
1698 NEUBERGER BERMAN INVESTMENT FUNDS PLC
FOR THE YEAR ENDED 31 DECEMBER 2019
25. OFFSETTING FINANCIAL INSTRUMENTS (CONTINUED)
Neuberger Berman Uncorrelated Strategies Fund 31 December 2019
Derivative Assets
Gross Amounts ofRecognised
AssetsGross Amounts Offset
in the Balance Sheet
Net Amounts of Assets presented
in the Balance Sheet US$ US$ US$
Forward Currency Contracts 56,361,178 - 56,361,178
OTC Swap Contracts 6,445,844 - 6,445,844
OTC Options 2,375,355 - 2,375,355
OTC Swaptions 393,143 - 393,143
Total 65,575,520 - 65,575,520
Gross Amounts Not Offset in the Balance Sheet
Counterparty
Net Amounts ofAssets presented
in the Balance SheetLiabilities Available
for OffsetCash Collateral
Received(a) Net Amount(b)
US$ US$ US$ US$
BNP Paribas 223,184 (147,489) - 75,695
Goldman Sachs International 17,433,235 (610,441) (13,510,000) 3,312,794
Morgan Stanley 6,337,816 (6,337,816) - -
Société Générale 4,785,048 (3,779,868) - 1,005,180
UBS AG 17,797,000 (1,574,122) - 16,222,878
Westpac Banking Corp 18,999,237 (1,019,564) - 17,979,673
Total 65,575,520 (13,469,300) (13,510,000) 38,596,220
Derivative Liabilities
Gross Amounts ofRecognised
LiabilitiesGross Amounts Offset
in the Balance Sheet
Net Amounts of Liabilities presented in the Balance
Sheet US$ US$ US$
Forward Currency Contracts (4,970,498) - (4,970,498) OTC Swap Contracts (8,118,122) - (8,118,122) OTC Options (1,856,882) - (1,856,882) Total (14,945,502) - (14,945,502)
Gross Amounts Not Offset in the Balance Sheet
Counterparty
Net Amounts of Liabilities presented in the Balance
SheetAssets Available
for OffsetCash Collateral
Pledged(a) Net Amount(c)
US$ US$ US$ US$
BNP Paribas (147,489) 147,489 - -
Goldman Sachs International (610,441) 610,441 - -
Morgan Stanley (7,814,018) 6,337,816 - (1,476,202)
Société Générale (3,779,868) 3,779,868 - -
UBS AG (1,574,122) 1,574,122 - -
Westpac Banking Corp (1,019,564) 1,019,564 - -
Total (14,945,502) 13,469,300 - (1,476,202)

NOTES TO THE AUDITED FINANCIAL STATEMENTS FINANCIAL STATEMENTS
ANNUAL REPORT 2019 1699
FOR THE YEAR ENDED 31 DECEMBER 2019
25. OFFSETTING FINANCIAL INSTRUMENTS (CONTINUED)
Neuberger Berman Uncorrelated Strategies Fund (continued) 31 December 2018
Derivative Assets
Gross Amounts ofRecognised
AssetsGross Amounts Offset
in the Balance Sheet
Net Amounts of Assets presented
in the Balance Sheet US$ US$ US$
Forward Currency Contracts 3,353,703 - 3,353,703
OTC Swap Contracts 739,132,151 - 739,132,151
OTC Swaptions 1,277,803 - 1,277,803
Total 743,763,657 - 743,763,657
Gross Amounts Not Offset in the Balance Sheet
Counterparty
Net Amounts ofAssets presented
in the Balance SheetLiabilities Available
for OffsetCash Collateral
Received(a) Net Amount(b)
US$ US$ US$ US$
Goldman Sachs International 221,285,492 (194,705,894) - 26,579,598
Morgan Stanley 519,296,118 (503,142,944) - 16,153,174
Société Générale 2,818,621 (2,546,150) - 272,471
UBS AG 51,038 (51,038) - -
Westpac Banking Corp 312,388 (312,388) - -
Total 743,763,657 (700,758,414) - 43,005,243
Derivative Liabilities
Gross Amounts ofRecognised
LiabilitiesGross Amounts Offset
in the Balance Sheet
Net Amounts of Liabilities presented in the Balance
Sheet US$ US$ US$
Forward Currency Contracts (18,690,321) - (18,690,321) OTC Swap Contracts (693,439,028) - (693,439,028) Total (712,129,349) - (712,129,349)
Gross Amounts Not Offset in the Balance Sheet
Counterparty
Net Amounts of Liabilities presented in the Balance
SheetAssets Available
for OffsetCash Collateral
Pledged(a) Net Amount(c)
US$ US$ US$ US$
Goldman Sachs International (194,705,894) 194,705,894 - -
Morgan Stanley (503,142,944) 503,142,944 - -
Société Générale (2,546,150) 2,546,150 - -
UBS AG (4,289,785) 51,038 - (4,238,747)
Westpac Banking Corp (7,444,576) 312,388 - (7,132,188)
Total (712,129,349) 700,758,414 - (11,370,935)

FINANCIAL STATEMENTS NOTES TO THE AUDITED FINANCIAL STATEMENTS
1700 NEUBERGER BERMAN INVESTMENT FUNDS PLC
FOR THE YEAR ENDED 31 DECEMBER 2019
25. OFFSETTING FINANCIAL INSTRUMENTS (CONTINUED)
Neuberger Berman Emerging Market Debt Blend Investment Grade Fund 31 December 2019
Derivative Assets
Gross Amounts ofRecognised
AssetsGross Amounts Offset
in the Balance Sheet
Net Amounts of Assets presented
in the Balance Sheet US$ US$ US$
Forward Currency Contracts 133,329 - 133,329
OTC Swap Contracts 4,351 - 4,351
Total 137,680 - 137,680
Gross Amounts Not Offset in the Balance Sheet
Counterparty
Net Amounts ofAssets presented
in the Balance SheetLiabilities Available
for OffsetCash Collateral
Received(a) Net Amount(b)
US$ US$ US$ US$
Citibank NA 43,302 (21,179) - 22,123
Deutsche Bank AG 3,981 (450) - 3,531
Goldman Sachs International 4,977 (3,998) - 979
JPMorgan Chase Bank 17,881 (12,073) - 5,808
Morgan Stanley 129 (129) - -
Standard Chartered Bank 4,800 (4,800) - -
State Street Bank and Trust and Co 62,610 (9,291) - 53,319
Total 137,680 (51,920) - 85,760
Derivative Liabilities
Gross Amounts ofRecognised
LiabilitiesGross Amounts Offset
in the Balance Sheet
Net Amounts of Liabilities presented in the Balance
Sheet US$ US$ US$
Forward Currency Contracts (54,864) - (54,864) Total (54,864) - (54,864)
Gross Amounts Not Offset in the Balance Sheet
Counterparty
Net Amounts of Liabilities presented in the Balance
SheetAssets Available
for OffsetCash Collateral
Pledged(a) Net Amount(c)
US$ US$ US$ US$
Citibank NA (21,179) 21,179 - -
Deutsche Bank AG (450) 450 - -
Goldman Sachs International (3,998) 3,998 - -
JPMorgan Chase Bank (12,073) 12,073 - -
Morgan Stanley (1,743) 129 - (1,614)
Standard Chartered Bank (6,130) 4,800 - (1,330)
State Street Bank and Trust and Co (9,291) 9,291 - -
Total (54,864) 51,920 - (2,944)

NOTES TO THE AUDITED FINANCIAL STATEMENTS FINANCIAL STATEMENTS
ANNUAL REPORT 2019 1701
FOR THE YEAR ENDED 31 DECEMBER 2019
25. OFFSETTING FINANCIAL INSTRUMENTS (CONTINUED)
Neuberger Berman Emerging Market Debt Blend Investment Grade Fund (continued) 31 December 2018
Derivative Assets
Gross Amounts ofRecognised
AssetsGross Amounts Offset
in the Balance Sheet
Net Amounts of Assets presented
in the Balance Sheet US$ US$ US$
Forward Currency Contracts 59,252 - 59,252
OTC Swap Contracts 2,158 - 2,158
Total 61,410 - 61,410
Gross Amounts Not Offset in the Balance Sheet
Counterparty
Net Amounts ofAssets presented
in the Balance SheetLiabilities Available
for OffsetCash Collateral
Received(a) Net Amount(b)
US$ US$ US$ US$
Citibank NA 19,962 (19,962) - -
Citigroup Global Markets Ltd 528 - - 528
Goldman Sachs International 27,521 (27,521) - -
JPMorgan Chase Bank 8,109 (8,109) - -
Standard Chartered Bank 2,962 (2,962) - -
State Street Bank and Trust and Co 2,328 (2,328) - -
Total 61,410 (60,882) - 528
Derivative Liabilities
Gross Amounts ofRecognised
LiabilitiesGross Amounts Offset
in the Balance Sheet
Net Amounts of Liabilities presented in the Balance
Sheet US$ US$ US$
Forward Currency Contracts (83,779) - (83,779) OTC Swap Contracts (16,621) - (16,621) Total (100,400) - (100,400)
Gross Amounts Not Offset in the Balance Sheet
Counterparty
Net Amounts of Liabilities presented in the Balance
SheetAssets Available
for OffsetCash Collateral
Pledged(a) Net Amount(c)
US$ US$ US$ US$
Citibank NA (27,804) 19,962 - (7,842)
Goldman Sachs International (53,115) 27,521 - (25,594)
JPMorgan Chase Bank (10,251) 8,109 - (2,142)
Standard Chartered Bank (6,495) 2,962 - (3,533)
State Street Bank and Trust and Co (2,735) 2,328 - (407)
Total (100,400) 60,882 - (39,518)

FINANCIAL STATEMENTS NOTES TO THE AUDITED FINANCIAL STATEMENTS
1702 NEUBERGER BERMAN INVESTMENT FUNDS PLC
FOR THE YEAR ENDED 31 DECEMBER 2019
25. OFFSETTING FINANCIAL INSTRUMENTS (CONTINUED)
Neuberger Berman Multi-Asset Class Growth Fund 31 December 2019
Derivative Assets
Gross Amounts ofRecognised
AssetsGross Amounts Offset
in the Balance Sheet
Net Amounts of Assets presented
in the Balance Sheet US$ US$ US$
Forward Currency Contracts 187,691 - 187,691
OTC Swap Contracts 127,639 - 127,639
Total 315,330 - 315,330
Gross Amounts Not Offset in the Balance Sheet
Counterparty
Net Amounts ofAssets presented
in the Balance SheetLiabilities Available
for OffsetCash Collateral
Received(a) Net Amount(b)
US$ US$ US$ US$
Citibank NA 151,579 (150,146) - 1,433
Goldman Sachs International 131,603 (95,295) - 36,308
Royal Bank of Canada 89 - - 89
State Street Bank and Trust and Co 23,153 (23,153) - -
Westpac Banking Corp 8,906 (8,906) - -
Total 315,330 (277,500) - 37,830
Derivative Liabilities
Gross Amounts ofRecognised
LiabilitiesGross Amounts Offset
in the Balance Sheet
Net Amounts of Liabilities presented in the Balance
Sheet US$ US$ US$
Forward Currency Contracts (273,034) - (273,034) OTC Swap Contracts (94,357) - (94,357) Total (367,391) - (367,391)
Gross Amounts Not Offset in the Balance Sheet
Counterparty
Net Amounts of Liabilities presented in the Balance
SheetAssets Available
for OffsetCash Collateral
Pledged(a) Net Amount(c)
US$ US$ US$ US$
Citibank NA (150,146) 150,146 - -
Goldman Sachs International (95,295) 95,295 - -
JPMorgan Chase Bank (11,808) - - (11,808)
State Street Bank and Trust and Co (69,144) 23,153 - (45,991)
Westpac Banking Corp (40,998) 8,906 - (32,092)
Total (367,391) 277,500 - (89,891)

NOTES TO THE AUDITED FINANCIAL STATEMENTS FINANCIAL STATEMENTS
ANNUAL REPORT 2019 1703
FOR THE YEAR ENDED 31 DECEMBER 2019
25. OFFSETTING FINANCIAL INSTRUMENTS (CONTINUED)
Neuberger Berman Multi-Asset Class Growth Fund (continued) 31 December 2018
Derivative Assets
Gross Amounts ofRecognised
AssetsGross Amounts Offset
in the Balance Sheet
Net Amounts of Assets presented
in the Balance Sheet US$ US$ US$
Forward Currency Contracts 325,645 - 325,645
OTC Swap Contracts 80,239 - 80,239
Total 405,884 - 405,884
Gross Amounts Not Offset in the Balance Sheet
Counterparty
Net Amounts ofAssets presented
in the Balance SheetLiabilities Available
for OffsetCash Collateral
Received(a) Net Amount(b)
US$ US$ US$ US$
Citibank NA 121,707 (121,707) - -
Credit Suisse International 50,632 - - 50,632
Goldman Sachs International 185,602 (129,927) - 55,675
JPMorgan Chase Bank 10,761 (10,761) - -
State Street Bank and Trust and Co 35,433 (35,433) - -
Westpac Banking Corp 1,749 (1,624) - 125
Total 405,884 (299,452) - 106,432
Derivative Liabilities
Gross Amounts ofRecognised
LiabilitiesGross Amounts Offset
in the Balance Sheet
Net Amounts of Liabilities presented in the Balance
Sheet US$ US$ US$
Forward Currency Contracts (296,777) - (296,777) OTC Swap Contracts (49,096) - (49,096) Total (345,873) - (345,873)
Gross Amounts Not Offset in the Balance Sheet
Counterparty
Net Amounts of Liabilities presented in the Balance
SheetAssets Available
for OffsetCash Collateral
Pledged(a) Net Amount(c)
US$ US$ US$ US$
Citibank NA (167,455) 121,707 - (45,748)
Goldman Sachs International (129,927) 129,927 - -
JPMorgan Chase Bank (10,859) 10,761 - (98)
State Street Bank and Trust and Co (36,008) 35,433 - (575)
Westpac Banking Corp (1,624) 1,624 - -
Total (345,873) 299,452 - (46,421)
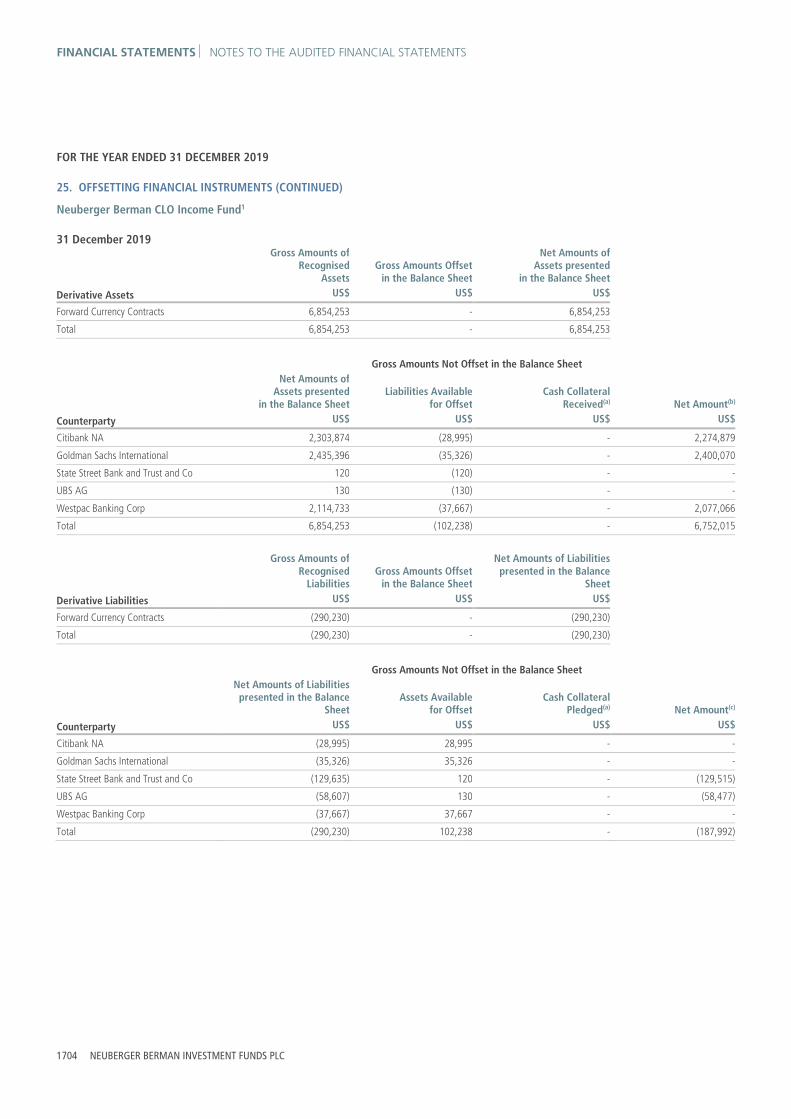
FINANCIAL STATEMENTS NOTES TO THE AUDITED FINANCIAL STATEMENTS
1704 NEUBERGER BERMAN INVESTMENT FUNDS PLC
FOR THE YEAR ENDED 31 DECEMBER 2019
25. OFFSETTING FINANCIAL INSTRUMENTS (CONTINUED)
Neuberger Berman CLO Income Fund1 31 December 2019
Derivative Assets
Gross Amounts ofRecognised
AssetsGross Amounts Offset
in the Balance Sheet
Net Amounts of Assets presented
in the Balance Sheet US$ US$ US$
Forward Currency Contracts 6,854,253 - 6,854,253
Total 6,854,253 - 6,854,253
Gross Amounts Not Offset in the Balance Sheet
Counterparty
Net Amounts ofAssets presented
in the Balance SheetLiabilities Available
for OffsetCash Collateral
Received(a) Net Amount(b)
US$ US$ US$ US$
Citibank NA 2,303,874 (28,995) - 2,274,879
Goldman Sachs International 2,435,396 (35,326) - 2,400,070
State Street Bank and Trust and Co 120 (120) - -
UBS AG 130 (130) - -
Westpac Banking Corp 2,114,733 (37,667) - 2,077,066
Total 6,854,253 (102,238) - 6,752,015
Derivative Liabilities
Gross Amounts ofRecognised
LiabilitiesGross Amounts Offset
in the Balance Sheet
Net Amounts of Liabilities presented in the Balance
Sheet US$ US$ US$
Forward Currency Contracts (290,230) - (290,230) Total (290,230) - (290,230)
Gross Amounts Not Offset in the Balance Sheet
Counterparty
Net Amounts of Liabilities presented in the Balance
SheetAssets Available
for OffsetCash Collateral
Pledged(a) Net Amount(c)
US$ US$ US$ US$
Citibank NA (28,995) 28,995 - -
Goldman Sachs International (35,326) 35,326 - -
State Street Bank and Trust and Co (129,635) 120 - (129,515)
UBS AG (58,607) 130 - (58,477)
Westpac Banking Corp (37,667) 37,667 - -
Total (290,230) 102,238 - (187,992)

NOTES TO THE AUDITED FINANCIAL STATEMENTS FINANCIAL STATEMENTS
ANNUAL REPORT 2019 1705
FOR THE YEAR ENDED 31 DECEMBER 2019
25. OFFSETTING FINANCIAL INSTRUMENTS (CONTINUED)
Neuberger Berman CLO Income Fund1 (continued) 31 December 2018
Derivative Assets
Gross Amounts ofRecognised
AssetsGross Amounts Offset
in the Balance Sheet
Net Amounts of Assets presented
in the Balance Sheet US$ US$ US$
Forward Currency Contracts 527,092 - 527,092
Total 527,092 - 527,092
Gross Amounts Not Offset in the Balance Sheet
Counterparty
Net Amounts ofAssets presented
in the Balance SheetLiabilities Available
for OffsetCash Collateral
Received(a) Net Amount(b)
US$ US$ US$ US$
Citibank NA 39,971 (39,971) - -
Goldman Sachs International 65,742 (65,742) - -
Westpac Banking Corp 421,379 (421,379) - -
Total 527,092 (527,092) - -
Derivative Liabilities
Gross Amounts ofRecognised
LiabilitiesGross Amounts Offset
in the Balance Sheet
Net Amounts of Liabilities presented in the Balance
Sheet US$ US$ US$
Forward Currency Contracts (2,075,894) - (2,075,894) Total (2,075,894) - (2,075,894)
Gross Amounts Not Offset in the Balance Sheet
Counterparty
Net Amounts of Liabilities presented in the Balance
SheetAssets Available
for OffsetCash Collateral
Pledged(a) Net Amount(c)
US$ US$ US$ US$
Citibank NA (621,403) 39,971 - (581,432)
Goldman Sachs International (644,377) 65,742 - (578,635)
State Street Bank and Trust and Co (607) - - (607)
Westpac Banking Corp (809,507) 421,379 - (388,128)
Total (2,075,894) 527,092 - (1,548,802)

FINANCIAL STATEMENTS NOTES TO THE AUDITED FINANCIAL STATEMENTS
1706 NEUBERGER BERMAN INVESTMENT FUNDS PLC
FOR THE YEAR ENDED 31 DECEMBER 2019
25. OFFSETTING FINANCIAL INSTRUMENTS (CONTINUED)
Neuberger Berman Next Generation Mobility Fund1 31 December 2019
Derivative Assets
Gross Amounts ofRecognised
AssetsGross Amounts Offset
in the Balance Sheet
Net Amounts of Assets presented
in the Balance Sheet US$ US$ US$
Forward Currency Contracts 8,684 - 8,684
Total 8,684 - 8,684
Gross Amounts Not Offset in the Balance Sheet
Counterparty
Net Amounts ofAssets presented
in the Balance SheetLiabilities Available
for OffsetCash Collateral
Received(a) Net Amount(b)
US$ US$ US$ US$
Citibank NA 2,762 - - 2,762
Goldman Sachs International 3,269 (582) - 2,687
UBS AG 25 - - 25
Westpac Banking Corp 2,628 (51) - 2,577
Total 8,684 (633) - 8,051
Derivative Liabilities
Gross Amounts ofRecognised
LiabilitiesGross Amounts Offset
in the Balance Sheet
Net Amounts of Liabilities presented in the Balance
Sheet US$ US$ US$
Forward Currency Contracts (633) - (633) Total (633) - (633)
Gross Amounts Not Offset in the Balance Sheet
Counterparty
Net Amounts of Liabilities presented in the Balance
SheetAssets Available
for OffsetCash Collateral
Pledged(a) Net Amount(c)
US$ US$ US$ US$
Goldman Sachs International (582) 582 - -
Westpac Banking Corp (51) 51 - -
Total (633) 633 - -

NOTES TO THE AUDITED FINANCIAL STATEMENTS FINANCIAL STATEMENTS
ANNUAL REPORT 2019 1707
FOR THE YEAR ENDED 31 DECEMBER 2019
25. OFFSETTING FINANCIAL INSTRUMENTS (CONTINUED)
Neuberger Berman Next Generation Mobility Fund1 (continued) 31 December 2018
Derivative Assets
Gross Amounts ofRecognised
AssetsGross Amounts Offset
in the Balance Sheet
Net Amounts of Assets presented
in the Balance Sheet US$ US$ US$
Forward Currency Contracts 9 - 9
Total 9 - 9
Gross Amounts Not Offset in the Balance Sheet
Counterparty
Net Amounts ofAssets presented
in the Balance SheetLiabilities Available
for OffsetCash Collateral
Received(a) Net Amount(b)
US$ US$ US$ US$
Goldman Sachs International 7 (7) - -
Westpac Banking Corp 2 (2) - -
Total 9 (9) - -
Derivative Liabilities
Gross Amounts ofRecognised
LiabilitiesGross Amounts Offset
in the Balance Sheet
Net Amounts of Liabilities presented in the Balance
Sheet US$ US$ US$
Forward Currency Contracts (177) - (177) Total (177) - (177)
Gross Amounts Not Offset in the Balance Sheet
Counterparty
Net Amounts of Liabilities presented in the Balance
SheetAssets Available
for OffsetCash Collateral
Pledged(a) Net Amount(c)
US$ US$ US$ US$
Brown Brothers Harriman (21) - - (21)
Citibank NA (142) - - (142)
Goldman Sachs International (11) 7 - (4)
Westpac Banking Corp (3) 2 - (1)
Total (177) 9 - (168)

FINANCIAL STATEMENTS NOTES TO THE AUDITED FINANCIAL STATEMENTS
1708 NEUBERGER BERMAN INVESTMENT FUNDS PLC
FOR THE YEAR ENDED 31 DECEMBER 2019
25. OFFSETTING FINANCIAL INSTRUMENTS (CONTINUED)
Neuberger Berman Ultra Short Term Euro Bond Fund1 31 December 2019
Derivative Assets
Gross Amounts ofRecognised
AssetsGross Amounts Offset
in the Balance Sheet
Net Amounts of Assets presented
in the Balance Sheet EUR EUR EUR
Forward Currency Contracts 343,089 - 343,089
Total 343,089 - 343,089
Gross Amounts Not Offset in the Balance Sheet
Counterparty
Net Amounts ofAssets presented
in the Balance SheetLiabilities Available
for OffsetCash Collateral
Received(a) Net Amount(b)
EUR EUR EUR EUR
Westpac Banking Corp 343,089 (343,089) - -
Total 343,089 (343,089) - -
Derivative Liabilities
Gross Amounts ofRecognised
LiabilitiesGross Amounts Offset
in the Balance Sheet
Net Amounts of Liabilities presented in the Balance
Sheet EUR EUR EUR
Forward Currency Contracts (1,911,977) - (1,911,977) Total (1,911,977) - (1,911,977)
Gross Amounts Not Offset in the Balance Sheet
Counterparty
Net Amounts of Liabilities presented in the Balance
SheetAssets Available
for OffsetCash Collateral
Pledged(a) Net Amount(c)
EUR EUR EUR EUR
Citibank NA (633,213) - - (633,213)
Goldman Sachs International (675,659) - - (675,659)
Westpac Banking Corp (603,105) 343,089 - (260,016)
Total (1,911,977) 343,089 - (1,568,888)

NOTES TO THE AUDITED FINANCIAL STATEMENTS FINANCIAL STATEMENTS
ANNUAL REPORT 2019 1709
FOR THE YEAR ENDED 31 DECEMBER 2019
25. OFFSETTING FINANCIAL INSTRUMENTS (CONTINUED)
Neuberger Berman Euro Bond Absolute Return Fund1 31 December 2019
Derivative Assets
Gross Amounts ofRecognised
AssetsGross Amounts Offset
in the Balance Sheet
Net Amounts of Assets presented
in the Balance Sheet EUR EUR EUR
Forward Currency Contracts 995,191 - 995,191
Total 995,191 - 995,191
Gross Amounts Not Offset in the Balance Sheet
Counterparty
Net Amounts ofAssets presented
in the Balance SheetLiabilities Available
for OffsetCash Collateral
Received(a) Net Amount(b)
EUR EUR EUR EUR
Citibank NA 418,780 (337,901) - 80,879
Goldman Sachs International 546,961 (546,961) - -
Westpac Banking Corp 29,450 (29,450) - -
Total 995,191 (914,312) - 80,879
Derivative Liabilities
Gross Amounts ofRecognised
LiabilitiesGross Amounts Offset
in the Balance Sheet
Net Amounts of Liabilities presented in the Balance
Sheet EUR EUR EUR
Forward Currency Contracts (1,314,764) - (1,314,764) Total (1,314,764) - (1,314,764)
Gross Amounts Not Offset in the Balance Sheet
Counterparty
Net Amounts of Liabilities presented in the Balance
SheetAssets Available
for OffsetCash Collateral
Pledged(a) Net Amount(c)
EUR EUR EUR EUR
Citibank NA (337,901) 337,901 - -
Goldman Sachs International (701,363) 546,961 - (154,402)
Westpac Banking Corp (275,500) 29,450 - (246,050)
Total (1,314,764) 914,312 - (400,452)

FINANCIAL STATEMENTS NOTES TO THE AUDITED FINANCIAL STATEMENTS
1710 NEUBERGER BERMAN INVESTMENT FUNDS PLC
FOR THE YEAR ENDED 31 DECEMBER 2019
25. OFFSETTING FINANCIAL INSTRUMENTS (CONTINUED)
Neuberger Berman Absolute Alpha Fund2 31 December 2019
Derivative Assets
Gross Amounts ofRecognised
AssetsGross Amounts Offset
in the Balance Sheet
Net Amounts of Assets presented
in the Balance Sheet US$ US$ US$
Forward Currency Contracts 43,567 - 43,567
OTC Swap Contracts 755,358 - 755,358
Total 798,925 - 798,925
Gross Amounts Not Offset in the Balance Sheet
Counterparty
Net Amounts ofAssets presented
in the Balance SheetLiabilities Available
for OffsetCash Collateral
Received(a) Net Amount(b)
US$ US$ US$ US$
Citibank NA 10,763 - - 10,763
Goldman Sachs International 11,957 (3,048) - 8,909
JPMorgan Chase Bank 705,691 (705,691) - -
Morgan Stanley 50,871 (50,871) - -
Westpac Banking Corp 19,643 (17,691) - 1,952
Total 798,925 (777,301) - 21,624
Derivative Liabilities
Gross Amounts ofRecognised
LiabilitiesGross Amounts Offset
in the Balance Sheet
Net Amounts of Liabilities presented in the Balance
Sheet US$ US$ US$
Forward Currency Contracts (22,381) - (22,381) OTC Swap Contracts (2,434,964) - (2,434,964) Total (2,457,345) - (2,457,345)
Gross Amounts Not Offset in the Balance Sheet
Counterparty
Net Amounts of Liabilities presented in the Balance
SheetAssets Available
for OffsetCash Collateral
Pledged(a) Net Amount(c)
US$ US$ US$ US$
Goldman Sachs International (3,048) 3,048 - -
JPMorgan Chase Bank (2,052,824) 705,691 1,347,133 -
Morgan Stanley (383,782) 50,871 332,911 -
Westpac Banking Corp (17,691) 17,691 - -
Total (2,457,345) 777,301 1,680,044 -

NOTES TO THE AUDITED FINANCIAL STATEMENTS FINANCIAL STATEMENTS
ANNUAL REPORT 2019 1711
FOR THE YEAR ENDED 31 DECEMBER 2019
25. OFFSETTING FINANCIAL INSTRUMENTS (CONTINUED)
Neuberger Berman Multi-Style Premia Fund2 31 December 2019
Derivative Assets
Gross Amounts ofRecognised
AssetsGross Amounts Offset
in the Balance Sheet
Net Amounts of Assets presented
in the Balance Sheet US$ US$ US$
Forward Currency Contracts 250,976 - 250,976
OTC Swap Contracts 1,628,394 - 1,628,394
Total 1,879,370 - 1,879,370
Gross Amounts Not Offset in the Balance Sheet
Counterparty
Net Amounts ofAssets presented
in the Balance SheetLiabilities Available
for OffsetCash Collateral
Received(a) Net Amount(b)
US$ US$ US$ US$
Goldman Sachs International 28 (5) - 23
Morgan Stanley 1,878,599 (1,402,204) - 476,395
Westpac Banking Corp 743 - - 743
Total 1,879,370 (1,402,209) - 477,161
Derivative Liabilities
Gross Amounts ofRecognised
LiabilitiesGross Amounts Offset
in the Balance Sheet
Net Amounts of Liabilities presented in the Balance
Sheet US$ US$ US$
Forward Currency Contracts (251,995) - (251,995) OTC Swap Contracts (1,150,214) - (1,150,214) Total (1,402,209) - (1,402,209)
Gross Amounts Not Offset in the Balance Sheet
Counterparty
Net Amounts of Liabilities presented in the Balance
SheetAssets Available
for OffsetCash Collateral
Pledged(a) Net Amount(c)
US$ US$ US$ US$
Goldman Sachs International (5) 5 - -
Morgan Stanley (1,402,204) 1,402,204 - -
Total (1,402,209) 1,402,209 - -

FINANCIAL STATEMENTS NOTES TO THE AUDITED FINANCIAL STATEMENTS
1712 NEUBERGER BERMAN INVESTMENT FUNDS PLC
FOR THE YEAR ENDED 31 DECEMBER 2019
25. OFFSETTING FINANCIAL INSTRUMENTS (CONTINUED)
Neuberger Berman Macro Opportunities FX Fund2 31 December 2019
Derivative Assets
Gross Amounts ofRecognised
AssetsGross Amounts Offset
in the Balance Sheet
Net Amounts of Assets presented
in the Balance Sheet EUR EUR EUR
Forward Currency Contracts 893,268 - 893,268
Total 893,268 - 893,268
Gross Amounts Not Offset in the Balance Sheet
Counterparty
Net Amounts ofAssets presented
in the Balance SheetLiabilities Available
for OffsetCash Collateral
Received(a) Net Amount(b)
EUR EUR EUR EUR
Goldman Sachs International 146,419 (146,419) - -
UBS AG 378,990 (272,198) - 106,792
Westpac Banking Corp 367,859 (367,859) - -
Total 893,268 (786,476) - 106,792
Derivative Liabilities
Gross Amounts ofRecognised
LiabilitiesGross Amounts Offset
in the Balance Sheet
Net Amounts of Liabilities presented in the Balance
Sheet EUR EUR EUR
Forward Currency Contracts (1,061,403) - (1,061,403) Total (1,061,403) - (1,061,403)
Gross Amounts Not Offset in the Balance Sheet
Counterparty
Net Amounts of Liabilities presented in the Balance
SheetAssets Available
for OffsetCash Collateral
Pledged(a) Net Amount(c)
EUR EUR EUR EUR
Goldman Sachs International (232,169) 146,419 - (85,750)
UBS AG (272,198) 272,198 - -
Westpac Banking Corp (557,036) 367,859 - (189,177)
Total (1,061,403) 786,476 - (274,927)
(a) Collateral received (or pledged) is limited to an amount not to exceed 100% of the net amount of assets (or liabilities) in the tables presented above, for each respective counterparty. (b) Net Amount represents amounts subject to loss as at 31 December 2019, in the event of a counterparty failure. (c) Net Amount represents amounts under-collateralised by the Portfolio to each counterparty as at 31 December 2019. 1 Portfolio launched during the prior reporting year. 2 Portfolio launched during the current reporting year.

NOTES TO THE AUDITED FINANCIAL STATEMENTS FINANCIAL STATEMENTS
ANNUAL REPORT 2019 1713
FOR THE YEAR ENDED 31 DECEMBER 2019
26. CLOSED FUNDS
In addition to the funds detailed in this report, there are a number of terminated sub-funds that have not yet been de-authorised. A complete list of these funds is provided below. At the year ended 31 December 2019, one of these sub-funds, Lehman Brothers Commodity Plus Fund, held US$1.81m (31 December 2018: US$1.78m) in an account with the Depositary pending resolution of a disputed derivative transaction.
- Lehman Brothers Global Value Fund - Lehman Brothers USA Value Fund - Lehman Brothers European Value Fund - Lehman Brothers Global Bond Fund - Lehman Brothers US Bond Fund - Lehman Brothers Emerging Markets Local Currency Bond Fund - Lehman Brothers US Large Cap Value Fund - Lehman Brothers Socially Responsible Investment Fund - Lehman Brothers Commodity Plus Fund - Lehman Brothers Alpha Select 2 Fund - Lehman Brothers Alpha Select 4 Fund - Lehman Brothers Global Real Estate Securities

FINANCIAL STATEMENTS TOTAL EXPENSE RATIOS (UNAUDITED)
1714 NEUBERGER BERMAN INVESTMENT FUNDS PLC
Appendix I TOTAL EXPENSE RATIOS (UNAUDITED) For the year ended 31 December 2019, Total Expenses Ratios (“TERs”) are based on the trailing 12 months preceding the year end. 31 December 2019 Neuberger Berman High Yield Bond Fund
Annualised TER % Annualised TER % Share Class (Without fee waiver) (With fee waiver)
AUD A (Monthly) Distributing Class 1.37% 1.37% AUD A Accumulating Class 1.37% 1.37% AUD B (Monthly) Distributing Class 2.99% 2.99% AUD B (Weekly) Distributing Class 2.99% 2.99% AUD C2 (Monthly) Distributing Class 3.01% 3.00% AUD C2 (Weekly) Distributing Class 2.99% 2.99% AUD E (Monthly) Distributing Class 2.99% 2.99% AUD E Accumulating Class 2.98% 2.98% AUD I Distributing Class 0.76% 0.76% AUD I2 (Monthly) Distributing Class 0.67% 0.67% AUD I2 Accumulating Class 0.68% 0.68% AUD T (Monthly) Distributing Class 1.99% 1.99% AUD T (Weekly) Distributing Class 1.99% 1.99% AUD T Accumulating Class 1.99% 1.99% CAD A (Monthly) Distributing Class 1.37% 1.37% CHF A Accumulating Class 1.37% 1.37% CHF I Accumulating Class 0.76% 0.76% CHF I Distributing Class 0.78% 0.78% CHF I2 Accumulating Class 0.67% 0.67% CNY A (Monthly) Distributing Class 1.37% 1.37% CNY A (Weekly) Distributing Class 1.37% 1.37% CNY B (Monthly) Distributing Class 2.97% 2.97% CNY I (Monthly) Distributing Class 0.78% 0.78% CNY T (Monthly) Distributing Class 1.99% 1.99% EUR A (Monthly) Distributing Class 1.37% 1.37% EUR A Accumulating Class 1.37% 1.37% EUR A Distributing Class 1.37% 1.37% EUR I Accumulating Class 0.77% 0.77% EUR I Distributing Class 0.76% 0.76% EUR I2 (Monthly) Distributing Class 0.68% 0.68% EUR I2 Accumulating Class 0.66% 0.66% EUR I2 Distributing Class 0.67% 0.67% EUR I3 Accumulating Class 0.59% 0.59% EUR I3 Distributing Class 0.57% 0.57% EUR M Accumulating Class 2.00% 2.00% EUR M Distributing Class 1.99% 1.99% EUR Z Accumulating Class 0.16% 0.16% GBP A (Monthly) Distributing Class 1.36% 1.36% GBP A Accumulating Class 1.37% 1.37% GBP A Distributing Class 1.36% 1.36% GBP I Accumulating Class 0.77% 0.77%

TOTAL EXPENSE RATIOS (UNAUDITED) FINANCIAL STATEMENTS
ANNUAL REPORT 2019 1715
Appendix I (Continued)
TOTAL EXPENSE RATIOS (UNAUDITED) (CONTINUED)
31 December 2019 (continued) Neuberger Berman High Yield Bond Fund (continued)
Annualised TER % Annualised TER % Share Class (Without fee waiver) (With fee waiver)
GBP I Distributing Class 0.77% 0.77% GBP I2 Accumulating Class 0.67% 0.67% GBP I2 Distributing Class 0.67% 0.67% GBP Z Accumulating Class 0.16% 0.16% HKD A (Monthly) Distributing Class 1.37% 1.37% HKD A Accumulating Class 1.37% 1.37% JPY I Accumulating Class 0.76% 0.76% SEK A Accumulating Class 1.37% 1.37% SGD A (Monthly) Distributing Class 1.37% 1.37% SGD A Accumulating Class 1.37% 1.37% USD A (Monthly) Distributing Class 1.37% 1.37% USD A (Weekly) Distributing Class 1.36% 1.36% USD A Accumulating Class 1.37% 1.37% USD A Distributing Class 1.37% 1.37% USD B (Monthly) Distributing Class 2.99% 2.99% USD B (Weekly) Distributing Class 3.01% 3.00% USD B Accumulating Class 2.99% 2.99% USD C Accumulating Class 1.99% 1.99% USD C Distributing Class 2.00% 2.00% USD C1 Accumulating Class 2.37% 2.37% USD C1 Distributing Class 2.38% 2.38% USD C2 (Monthly) Distributing Class 3.00% 3.00% USD C2 (Weekly) Distributing Class 2.99% 2.99% USD C2 Accumulating Class 3.00% 3.00% USD E (Monthly) Distributing Class 2.99% 2.99% USD E Accumulating Class 2.99% 2.99% USD I (Monthly) Distributing Class 0.77% 0.77% USD I Accumulating Class 0.77% 0.77% USD I Distributing Class 0.76% 0.76% USD I2 (Monthly) Distributing Class 0.67% 0.67% USD I2 Accumulating Class 0.66% 0.66% USD I2 Distributing Class 0.67% 0.67% USD I4 (Monthly) Distributing Class 0.52% 0.52% USD M Accumulating Class 1.99% 1.99% USD M Distributing Class 1.95% 1.95% USD P Accumulating Class 0.71% 0.71% USD T (Monthly) Distributing Class 1.99% 1.99% USD T (Weekly) Distributing Class 1.99% 1.99% USD T Accumulating Class 1.99% 1.99% USD U (Monthly) Distributing Class 1.07% 1.07% USD U Accumulating Class 1.07% 1.07% USD Z Accumulating Class 0.16% 0.16% ZAR A (Monthly) Distributing Class 1.37% 1.37%

FINANCIAL STATEMENTS TOTAL EXPENSE RATIOS (UNAUDITED)
1716 NEUBERGER BERMAN INVESTMENT FUNDS PLC
Appendix I (Continued)
TOTAL EXPENSE RATIOS (UNAUDITED) (CONTINUED)
31 December 2019 (continued) Neuberger Berman High Yield Bond Fund (continued)
Annualised TER % Annualised TER % Share Class (Without fee waiver) (With fee waiver)
ZAR B (Monthly) Distributing Class 2.99% 2.99% ZAR C2 (Monthly) Distributing Class 3.00% 3.00% ZAR E (Monthly) Distributing Class 2.99% 2.99% ZAR E Accumulating Class 2.99% 2.99% ZAR T (Monthly) Distributing Class 1.99% 1.99% ZAR T Accumulating Class 1.99% 1.99% Neuberger Berman Diversified Currency Fund
EUR A Accumulating Class 1.58% 1.20% EUR I Accumulating Class 1.09% 0.70% EUR M Accumulating Class 2.22% 1.80% GBP I Accumulating Class 1.04% 0.70% JPY I Accumulating Class 1.06% 0.70% USD A Accumulating Class 1.33% 1.20% USD I Accumulating Class 1.07% 0.70% USD Z Accumulating Class 0.57% 0.20% Neuberger Berman US Multi Cap Opportunities Fund
AUD E Accumulating Class 3.00% 3.00% AUD T Accumulating Class 2.01% 2.01% EUR I3 Accumulating Class 0.68% 0.68% EUR M Accumulating Class 2.90% 2.90% EUR1 A Accumulating Class 1.87% 1.87% EUR1 I Accumulating Class 1.03% 1.03% GBP I Accumulating Class 0.99% 0.99% GBP I Distributing Unhedged Class 1.02% 1.02% GBP I3 Distributing Class 0.67% 0.67% GBP I3 Distributing Unhedged Class 0.68% 0.68% SGD A Accumulating Class 1.87% 1.87% USD B Accumulating Class 3.00% 3.00% USD C Accumulating Class 2.31% 2.30% USD C1 Accumulating Class 2.90% 2.90% USD C2 Accumulating Class 3.00% 3.00% USD E Accumulating Class 3.00% 3.00% USD I2 Distributing Class 0.85% 0.85% USD I3 Accumulating Class 0.68% 0.68% USD I3 Distributing Class 0.67% 0.67% USD M Accumulating Class 2.88% 2.88% USD P Accumulating Class 0.96% 0.96% USD T Accumulating Class 2.01% 2.01% USD U Accumulating Class 1.42% 1.42% USD Z Accumulating Class 0.17% 0.17% USD1 A Accumulating Class 1.87% 1.87%

TOTAL EXPENSE RATIOS (UNAUDITED) FINANCIAL STATEMENTS
ANNUAL REPORT 2019 1717
Appendix I (Continued)
TOTAL EXPENSE RATIOS (UNAUDITED) (CONTINUED)
31 December 2019 (continued) Neuberger Berman US Multi Cap Opportunities Fund (continued)
Annualised TER % Annualised TER % Share Class (Without fee waiver) (With fee waiver)
USD1 I Accumulating Class 1.02% 1.02% USD1 I Distributing Class 1.02% 1.02% ZAR B Accumulating Class 3.00% 3.00% ZAR C2 Accumulating Class 3.00% 3.00% ZAR E Accumulating Class 2.99% 2.99% ZAR T Accumulating Class 2.00% 2.00% Neuberger Berman US Real Estate Securities Fund
AUD A (Monthly) Distributing Class 2.06% 1.80% AUD B (Monthly) Distributing Class 3.42% 3.10% AUD B Accumulating Class 3.34% 3.10% AUD C2 (Monthly) Distributing Class 3.36% 3.10% AUD C2 Accumulating Class 3.36% 3.10% AUD E (Monthly) Distributing Class 3.42% 3.10% AUD E Accumulating Class 3.40% 3.10% AUD T (Monthly) Distributing Class 2.41% 2.10% AUD T Accumulating Class 2.37% 2.10% CHF A Accumulating Class 2.09% 1.80% EUR A Accumulating Class 2.11% 1.80% EUR I Accumulating Class 1.31% 1.05% EUR M Accumulating Class 3.11% 2.80% GBP I Distributing Class 1.32% 1.05% HKD A (Monthly) Distributing Class 2.01% 1.80% HKD A Accumulating Class 2.03% 1.80% SGD A Accumulating Class 2.03% 1.80% USD A (Monthly) Distributing Class 2.04% 1.80% USD A Accumulating Class 2.06% 1.80% USD A Distributing Class 2.08% 1.80% USD B (Monthly) Distributing Class 3.36% 3.10% USD B Accumulating Class 3.36% 3.10% USD C Accumulating Class 2.72% 2.30%
USD C1 Accumulating Class 3.04% 2.80%
USD C2 (Monthly) Distributing Class 3.35% 3.10%
USD C2 Accumulating Class 3.36% 3.10% USD E (Monthly) Distributing Class 3.37% 3.10% USD E Accumulating Class 3.35% 3.10% USD I (Monthly) Distributing Class 1.40% 1.05% USD I Accumulating Class 1.32% 1.05% USD I Distributing Class 1.42% 1.05% USD I2 Accumulating Class 1.12% 0.90% USD M Accumulating Class 3.02% 2.80% USD T (Monthly) Distributing Class 2.37% 2.10%

FINANCIAL STATEMENTS TOTAL EXPENSE RATIOS (UNAUDITED)
1718 NEUBERGER BERMAN INVESTMENT FUNDS PLC
Appendix I (Continued)
TOTAL EXPENSE RATIOS (UNAUDITED) (CONTINUED)
31 December 2019 (continued) Neuberger Berman US Real Estate Securities Fund (continued)
Annualised TER % Annualised TER % Share Class (Without fee waiver) (With fee waiver)
USD T Accumulating Class 2.31% 2.10% USD Z Accumulating Class 0.51% 0.30% ZAR B (Monthly) Distributing Class 3.38% 3.10% ZAR B Accumulating Class 3.32% 3.10% ZAR C2 (Monthly) Distributing Class 3.41% 3.10% ZAR C2 Accumulating Class 3.32% 3.10% ZAR E (Monthly) Distributing Class 3.40% 3.10% ZAR E Accumulating Class 3.35% 3.10% ZAR T (Monthly) Distributing Class 2.37% 2.10% ZAR T Accumulating Class 2.39% 2.10% Neuberger Berman China Equity Fund
CHF I Accumulating Class 1.26% 1.26% EUR A Accumulating Class 2.01% 2.01% EUR A Accumulating Unhedged Class 2.02% 2.02% EUR A Distributing Class 1.97% 1.97% EUR I Accumulating Class 1.26% 1.26% EUR I4 Accumulating Class 1.19% 1.19% EUR M Accumulating Class 3.04% 3.04% EUR Z Accumulating Class 0.16% 0.16% GBP A Distributing Class 2.01% 2.01% GBP I Distributing Unhedged Class 1.26% 1.26% GBP I2 Distributing Unhedged Class 1.04% 1.04% GBP I4 Accumulating Class 1.19% 1.19% GBP I4 Distributing Class 1.19% 1.19% HKD A Accumulating Class 2.01% 2.01% SGD A Accumulating Class 2.01% 2.01% USD A Accumulating Class 2.01% 2.01% USD A Distributing Class 2.01% 2.01% USD C1 Accumulating Class 3.03% 3.03% USD I Accumulating Class 1.26% 1.26% USD I2 Accumulating Class 1.04% 1.04% USD I4 Distributing Class 1.19% 1.19% USD M Accumulating Class 3.04% 3.04%
USD U Accumulating Class 1.61% 1.61%
USD Z Accumulating Class 0.16% 0.16% Neuberger Berman Emerging Markets Equity Fund AUD B Accumulating Class 3.29% 3.29% AUD C2 Accumulating Class 3.29% 3.29% AUD E Accumulating Class 3.29% 3.29% AUD T Accumulating Class 2.29% 2.29%

TOTAL EXPENSE RATIOS (UNAUDITED) FINANCIAL STATEMENTS
ANNUAL REPORT 2019 1719
Appendix I (Continued)
TOTAL EXPENSE RATIOS (UNAUDITED) (CONTINUED)
31 December 2019 (continued) Neuberger Berman Emerging Markets Equity Fund (continued)
Annualised TER % Annualised TER % Share Class (Without fee waiver) (With fee waiver)
CAD I Distributing Unhedged Class 1.26% 1.26% EUR A Accumulating Class 2.25% 2.25% EUR I Accumulating Class 1.27% 1.27% EUR M Accumulating Class 3.29% 3.29% EUR Z Accumulating Class 0.26% 0.26% GBP I Accumulating Class 1.27% 1.27% GBP Z Accumulating Class 0.26% 0.26% JPY I Accumulating Class 1.26% 1.26% USD A Accumulating Class 2.26% 2.26% USD B Accumulating Class 3.29% 3.29%
USD C1 Accumulating Class 3.29% 3.29%
USD C2 Accumulating Class 3.29% 3.29%
USD E Accumulating Class 3.29% 3.29%
USD I Accumulating Class 1.26% 1.26%
USD M Accumulating Class 3.28% 3.28% USD T Accumulating Class 2.29% 2.29% USD Z Accumulating Class 0.26% 0.26% ZAR B Accumulating Class 3.29% 3.29% ZAR C2 Accumulating Class 3.29% 3.29% ZAR E Accumulating Class 3.29% 3.29% ZAR T Accumulating Class 2.29% 2.29% Neuberger Berman US Small Cap Fund AUD B Accumulating Class 2.98% 2.98% AUD C2 Accumulating Class 3.00% 3.00% AUD E Accumulating Class 3.03% 3.03% AUD T Accumulating Class 1.99% 1.99% EUR A Accumulating Class 1.90% 1.90% EUR I Accumulating Class 1.07% 1.07% EUR I Accumulating Unhedged Class 1.05% 1.05% EUR I2 Accumulating Unhedged Class 0.87% 0.87% EUR M Accumulating Class 2.93% 2.93% EUR Z Accumulating Class 0.20% 0.20% GBP I Accumulating Class 1.01% 1.01% JPY I Distributing Class 1.05% 1.05% USD A Accumulating Class 1.90% 1.90% USD A Distributing Class 1.90% 1.90% USD B Accumulating Class 3.03% 3.03% USD C Accumulating Class 2.33% 2.33% USD C2 Accumulating Class 3.03% 3.03% USD E Accumulating Class 3.03% 3.03% USD I Accumulating Class 1.05% 1.05% USD I Distributing Class 1.05% 1.05%

FINANCIAL STATEMENTS TOTAL EXPENSE RATIOS (UNAUDITED)
1720 NEUBERGER BERMAN INVESTMENT FUNDS PLC
Appendix I (Continued)
TOTAL EXPENSE RATIOS (UNAUDITED) (CONTINUED)
31 December 2019 (continued) Neuberger Berman US Small Cap Fund (continued)
Annualised TER % Annualised TER % Share Class (Without fee waiver) (With fee waiver)
USD I2 Accumulating Class 0.88% 0.88% USD I3 Accumulating Class 0.80% 0.80% USD M Accumulating Class 2.91% 2.91% USD T Accumulating Class 2.03% 2.03% USD Z Accumulating Class 0.20% 0.20% ZAR E Accumulating Class 3.06% 3.06% ZAR T Accumulating Class 2.03% 2.03% Neuberger Berman Short Duration High Yield Bond Fund AUD A (Monthly) Distributing Class 1.34% 1.34% CHF A Accumulating Class 1.34% 1.34% CHF I Accumulating Class 0.74% 0.74% CHF I2 Accumulating Class 0.64% 0.64% CHF I3 Distributing Class 0.56% 0.56% CNY A (Monthly) Distributing Class 1.35% 1.35% EUR A Accumulating Class 1.34% 1.34% EUR A Distributing Class 1.34% 1.34% EUR I Accumulating Class 0.74% 0.74% EUR I Distributing Class 0.74% 0.74% EUR I2 Accumulating Class 0.64% 0.64% EUR I2 Distributing Class 0.64% 0.64% EUR I3 Distributing Class 0.56% 0.56% EUR M Accumulating Class 1.97% 1.97% EUR M Distributing Class 1.97% 1.97% GBP I Accumulating Class 0.74% 0.74% GBP I Distributing Class 0.75% 0.75% GBP I2 Accumulating Class 0.64% 0.64% GBP I2 Distributing Class 0.64% 0.64% JPY I Accumulating Class 0.74% 0.74% SGD A (Monthly) Distributing Class 1.35% 1.35% USD A (Monthly) Distributing Class 1.35% 1.35% USD A Accumulating Class 1.34% 1.34% USD A Distributing Class 1.35% 1.35% USD C Accumulating Class 1.97% 1.97% USD C Distributing Class 1.97% 1.97% USD C1 Accumulating Class 2.36% 2.36% USD I Accumulating Class 0.74% 0.74% USD I Distributing Class 0.73% 0.73% USD I2 Accumulating Class 0.65% 0.65% USD I2 Distributing Class 0.65% 0.65% USD M Accumulating Class 1.96% 1.96% USD M Distributing Class 1.95% 1.95% USD Z Accumulating Class 0.14% 0.14%
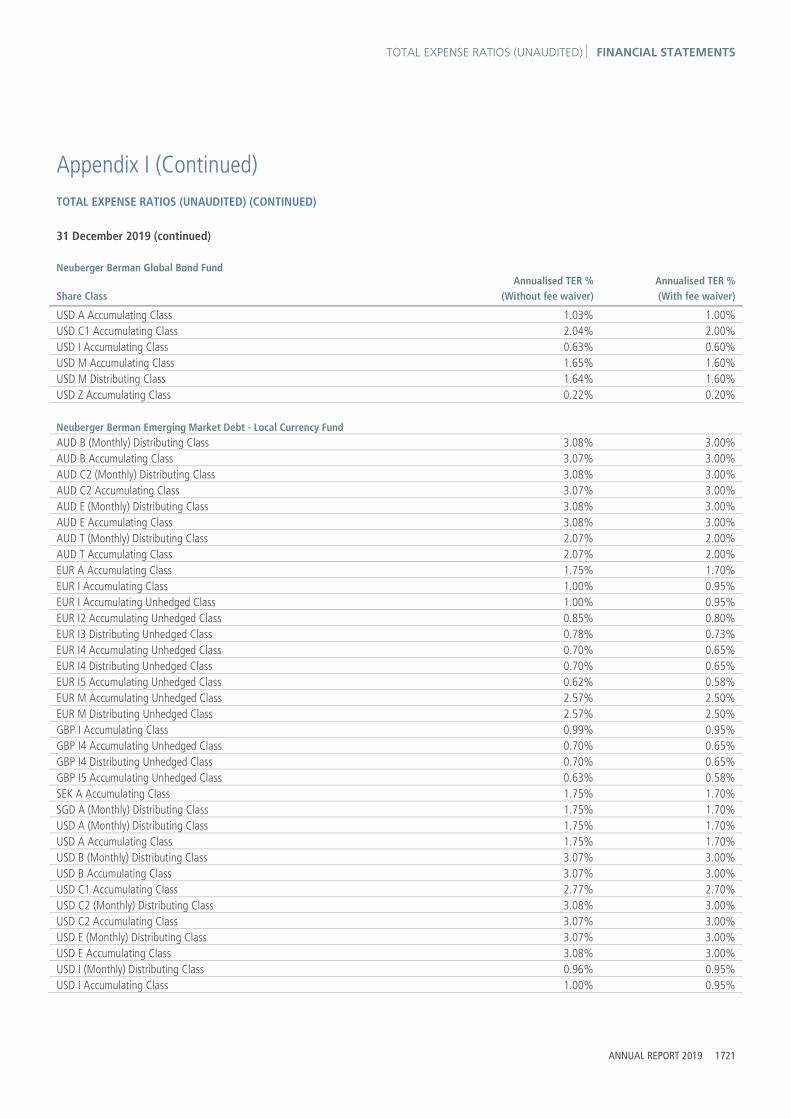
TOTAL EXPENSE RATIOS (UNAUDITED) FINANCIAL STATEMENTS
ANNUAL REPORT 2019 1721
Appendix I (Continued)
TOTAL EXPENSE RATIOS (UNAUDITED) (CONTINUED)
31 December 2019 (continued) Neuberger Berman Global Bond Fund
Annualised TER % Annualised TER % Share Class (Without fee waiver) (With fee waiver)
USD A Accumulating Class 1.03% 1.00% USD C1 Accumulating Class 2.04% 2.00% USD I Accumulating Class 0.63% 0.60% USD M Accumulating Class 1.65% 1.60% USD M Distributing Class 1.64% 1.60% USD Z Accumulating Class 0.22% 0.20% Neuberger Berman Emerging Market Debt - Local Currency Fund AUD B (Monthly) Distributing Class 3.08% 3.00% AUD B Accumulating Class 3.07% 3.00% AUD C2 (Monthly) Distributing Class 3.08% 3.00% AUD C2 Accumulating Class 3.07% 3.00% AUD E (Monthly) Distributing Class 3.08% 3.00% AUD E Accumulating Class 3.08% 3.00% AUD T (Monthly) Distributing Class 2.07% 2.00% AUD T Accumulating Class 2.07% 2.00% EUR A Accumulating Class 1.75% 1.70% EUR I Accumulating Class 1.00% 0.95% EUR I Accumulating Unhedged Class 1.00% 0.95% EUR I2 Accumulating Unhedged Class 0.85% 0.80% EUR I3 Distributing Unhedged Class 0.78% 0.73% EUR I4 Accumulating Unhedged Class 0.70% 0.65% EUR I4 Distributing Unhedged Class 0.70% 0.65% EUR I5 Accumulating Unhedged Class 0.62% 0.58% EUR M Accumulating Unhedged Class 2.57% 2.50% EUR M Distributing Unhedged Class 2.57% 2.50% GBP I Accumulating Class 0.99% 0.95% GBP I4 Accumulating Unhedged Class 0.70% 0.65% GBP I4 Distributing Unhedged Class 0.70% 0.65% GBP I5 Accumulating Unhedged Class 0.63% 0.58% SEK A Accumulating Class 1.75% 1.70% SGD A (Monthly) Distributing Class 1.75% 1.70% USD A (Monthly) Distributing Class 1.75% 1.70% USD A Accumulating Class 1.75% 1.70% USD B (Monthly) Distributing Class 3.07% 3.00% USD B Accumulating Class 3.07% 3.00% USD C1 Accumulating Class 2.77% 2.70% USD C2 (Monthly) Distributing Class 3.08% 3.00% USD C2 Accumulating Class 3.07% 3.00% USD E (Monthly) Distributing Class 3.07% 3.00% USD E Accumulating Class 3.08% 3.00% USD I (Monthly) Distributing Class 0.96% 0.95% USD I Accumulating Class 1.00% 0.95%

FINANCIAL STATEMENTS TOTAL EXPENSE RATIOS (UNAUDITED)
1722 NEUBERGER BERMAN INVESTMENT FUNDS PLC
Appendix I (Continued)
TOTAL EXPENSE RATIOS (UNAUDITED) (CONTINUED)
31 December 2019 (continued) Neuberger Berman Emerging Market Debt - Local Currency Fund (continued)
Annualised TER % Annualised TER % Share Class (Without fee waiver) (With fee waiver)
USD I Distributing Class 1.00% 0.95% USD I2 Accumulating Class 0.85% 0.80% USD I5 Accumulating Class 0.62% 0.58% USD M Accumulating Class 2.58% 2.50% USD M Distributing Class 2.56% 2.50% USD T (Monthly) Distributing Class 2.07% 2.00% USD T Accumulating Class 2.08% 2.00% USD X Accumulating Class 0.62% 0.47% ZAR B (Monthly) Distributing Class 3.07% 3.00% ZAR B Accumulating Class 3.07% 3.00% ZAR C2 (Monthly) Distributing Class 3.08% 3.00% ZAR C2 Accumulating Class 3.07% 3.00% ZAR E (Monthly) Distributing Class 3.07% 3.00% ZAR E Accumulating Class 3.08% 3.00% ZAR T (Monthly) Distributing Class 2.07% 2.00% ZAR T Accumulating Class 2.07% 2.00% Neuberger Berman Emerging Market Debt - Hard Currency Fund AUD A (Monthly) Distributing Class 1.54% 1.54% CHF P Accumulating Class 0.80% 0.80% EUR A (Monthly) Distributing Class 1.54% 1.54% EUR A Accumulating Class 1.54% 1.54% EUR I Accumulating Class 0.84% 0.84% EUR I Accumulating Unhedged Class 0.83% 0.83% EUR I Distributing Class 0.84% 0.84% EUR I2 Accumulating Class 0.70% 0.70% EUR I2 Distributing Class 0.69% 0.69% EUR I3 Accumulating Class 0.63% 0.63% EUR I3 Accumulating Unhedged Class 0.63% 0.63% EUR I3 Distributing Class 0.63% 0.63% EUR I4 Accumulating Class 0.56% 0.56% EUR M Accumulating Class 2.36% 2.36% EUR M Distributing Class 2.37% 2.37% EUR P Accumulating Class 0.80% 0.80% EUR Z Accumulating Class 0.14% 0.14% GBP I Accumulating Class 0.84% 0.84% GBP I Distributing Class 0.84% 0.84% GBP I2 Accumulating Class 0.70% 0.70% GBP I2 Distributing Class 0.70% 0.70% GBP P Accumulating Class 0.80% 0.80% HKD A (Monthly) Distributing Class 1.54% 1.54% JPY I Accumulating Class 0.84% 0.84% SEK A Accumulating Class 1.54% 1.54%

TOTAL EXPENSE RATIOS (UNAUDITED) FINANCIAL STATEMENTS
ANNUAL REPORT 2019 1723
Appendix I (Continued)
TOTAL EXPENSE RATIOS (UNAUDITED) (CONTINUED)
31 December 2019 (continued) Neuberger Berman Emerging Market Debt - Hard Currency Fund (continued)
Annualised TER % Annualised TER % Share Class (Without fee waiver) (With fee waiver)
SGD A (Monthly) Distributing Class 1.54% 1.54% USD A (Monthly) Distributing Class 1.54% 1.54% USD A Accumulating Class 1.54% 1.54% USD C1 Accumulating Class 2.56% 2.56% USD I Accumulating Class 0.84% 0.84% USD I Distributing Class 0.84% 0.84% USD I2 Accumulating Class 0.70% 0.70% USD I2 Distributing Class 0.70% 0.70% USD I3 Distributing Class 0.63% 0.63% USD M Accumulating Class 2.36% 2.36% USD M Distributing Class 2.36% 2.36% USD P Accumulating Class 0.81% 0.81% USD Z Accumulating Class 0.14% 0.14% Neuberger Berman Emerging Market Corporate Debt Fund CHF A Accumulating Class 1.92% 1.80% CHF I Accumulating Class 1.11% 1.00% CHF I2 Accumulating Class 0.95% 0.84% CHF I4 Accumulating Class 0.67% 0.67% CHF I5 Accumulating Class 0.74% 0.60% EUR A Accumulating Class 1.91% 1.80% EUR I Accumulating Class 1.10% 1.00% EUR I Distributing Class 1.11% 1.00% EUR I2 Accumulating Class 0.95% 0.84% EUR I3 Accumulating Class 0.79% 0.68% EUR I5 Accumulating Class 0.75% 0.60% EUR M Accumulating Class 2.74% 2.60% EUR M Distributing Class 2.74% 2.60% EUR X Accumulating Class 0.77% 0.58% GBP I Accumulating Class 1.10% 1.00% GBP I5 Accumulating Class 0.74% 0.60% SEK A Accumulating Class 1.89% 1.80% SGD A (Monthly) Distributing Class 1.90% 1.80% USD A (Monthly) Distributing Class 1.91% 1.80% USD A Accumulating Class 1.89% 1.80% USD C1 Accumulating Class 2.91% 2.80% USD I Accumulating Class 1.10% 1.00% USD I Distributing Class 1.11% 1.00% USD I2 Accumulating Class 0.95% 0.84% USD I5 Accumulating Class 0.68% 0.60% USD M Accumulating Class 2.70% 2.60% USD M Distributing Class 2.72% 2.60%

FINANCIAL STATEMENTS TOTAL EXPENSE RATIOS (UNAUDITED)
1724 NEUBERGER BERMAN INVESTMENT FUNDS PLC
Appendix I (Continued)
TOTAL EXPENSE RATIOS (UNAUDITED) (CONTINUED)
31 December 2019 (continued) Neuberger Berman Strategic Income Fund
Annualised TER % Annualised TER % Share Class (Without fee waiver) (With fee waiver)
AUD A (Monthly) Distributing Class 1.17% 1.17% AUD Z (Monthly) Distributing Class 0.15% 0.15% EUR A (Monthly) Distributing Class 1.16% 1.16% EUR A Accumulating Class 1.16% 1.16% EUR I Accumulating Class 0.67% 0.67% EUR M Accumulating Class 1.78% 1.78% EUR M Distributing Class 1.79% 1.79% GBP A (Monthly) Distributing Class 1.17% 1.17% GBP I Accumulating Class 0.65% 0.65% HKD A (Monthly) Distributing Class 1.17% 1.17% JPY I Accumulating Class 0.67% 0.67% JPY I Accumulating Unhedged Class 0.67% 0.67% JPY I CG Distributing Class 0.67% 0.67% JPY I Distributing Class 0.67% 0.67% SGD A (Monthly) Distributing Class 1.17% 1.17% SGD A Accumulating Class 1.17% 1.17% SGD I (Monthly) Distributing Class 0.67% 0.67% USD A (Monthly) Distributing Class 1.17% 1.17% USD A Accumulating Class 1.16% 1.16% USD A Distributing Class 1.16% 1.16% USD C1 Accumulating Class 2.19% 2.19% USD I Accumulating Class 0.67% 0.67% USD I Distributing Class 0.67% 0.67% USD I2 Accumulating Class 0.54% 0.54% USD M Accumulating Class 1.78% 1.78% USD M Distributing Class 1.79% 1.79% USD Z Accumulating Class 0.17% 0.17% Neuberger Berman Global Bond Absolute Return Fund EUR I Accumulating Class 0.85% 0.70% EUR I4 Distributing Class 0.86% 0.50% EUR M Accumulating Class 2.17% 1.80% GBP I4 Accumulating Class 0.79% 0.45% GBP I5 Accumulating Class 0.79% 0.45% GBP I5 Distributing Class 0.81% 0.45% GBP Z Accumulating Class 0.51% 0.20% JPY I Accumulating Class 1.05% 0.70% SGD A (Monthly) Distributing Class 1.59% 1.20% USD A (Monthly) Distributing Class 1.54% 1.20% USD A Accumulating Class 1.36% 1.20% USD I Accumulating Class 1.10% 0.70% USD I5 Accumulating Class 0.88% 0.45% USD Z Accumulating Class 0.55% 0.20%

TOTAL EXPENSE RATIOS (UNAUDITED) FINANCIAL STATEMENTS
ANNUAL REPORT 2019 1725
Appendix I (Continued)
TOTAL EXPENSE RATIOS (UNAUDITED) (CONTINUED)
31 December 2019 (continued) Neuberger Berman Short Duration Emerging Market Debt Fund
Annualised TER % Annualised TER % Share Class (Without fee waiver) (With fee waiver)
AUD A (Monthly) Distributing Class 1.13% 1.13% AUD A Accumulating Class 1.12% 1.12% CAD A (Monthly) Distributing Class 1.13% 1.13% CHF A Accumulating Class 1.12% 1.12% CHF A Distributing Class 1.12% 1.12% CHF I Accumulating Class 0.62% 0.62% CHF I Distributing Class 0.62% 0.62% CHF I2 Accumulating Class 0.53% 0.53% CHF I2 Distributing Class 0.53% 0.53% CHF I5 Accumulating Class 0.38% 0.38% CHF P Accumulating Class 0.60% 0.60% CHF P Distributing Class 0.59% 0.59% CNY A (Monthly) Distributing Class 1.10% 1.10% EUR A Accumulating Class 1.13% 1.13% EUR A Distributing Class 1.13% 1.13% EUR I Accumulating Class 0.63% 0.63% EUR I Accumulating Unhedged Class 0.62% 0.62% EUR I Distributing Class 0.63% 0.63% EUR I2 Accumulating Class 0.52% 0.52% EUR I2 Distributing Class 0.53% 0.53% EUR I5 Accumulating Class 0.38% 0.38% EUR M Accumulating Class 1.75% 1.75% EUR M Distributing Class 1.75% 1.75% EUR P Accumulating Class 0.60% 0.60% EUR U Accumulating Class 0.88% 0.88% GBP A Accumulating Class 1.12% 1.12% GBP I Accumulating Class 0.63% 0.63% GBP I Distributing Class 0.63% 0.63% GBP I2 Accumulating Class 0.52% 0.52% GBP I2 Distributing Class 0.52% 0.52% GBP I5 Distributing Class 0.38% 0.38% GBP P Accumulating Class 0.59% 0.59% JPY I Accumulating Class 0.63% 0.63% JPY I Distributing Class 0.63% 0.63% SEK A Accumulating Class 1.12% 1.12% SGD A (Monthly) Distributing Class 1.13% 1.13% USD A (Monthly) Distributing Class 1.12% 1.12% USD A Accumulating Class 1.12% 1.12% USD A Distributing Class 1.13% 1.13% USD C1 Accumulating Class 2.15% 2.15% USD C1 Distributing Class 2.15% 2.15% USD I Accumulating Class 0.62% 0.62% USD I Distributing Class 0.63% 0.63%

FINANCIAL STATEMENTS TOTAL EXPENSE RATIOS (UNAUDITED)
1726 NEUBERGER BERMAN INVESTMENT FUNDS PLC
Appendix I (Continued)
TOTAL EXPENSE RATIOS (UNAUDITED) (CONTINUED)
31 December 2019 (continued) Neuberger Berman Short Duration Emerging Market Debt Fund (continued)
Annualised TER % Annualised TER % Share Class (Without fee waiver) (With fee waiver)
USD I2 Accumulating Class 0.53% 0.53% USD I2 Distributing Class 0.52% 0.52% USD I5 Accumulating Class 0.38% 0.38% USD I5 Distributing Class 0.38% 0.38% USD M Accumulating Class 1.75% 1.75% USD M Distributing Class 1.75% 1.75% USD P Accumulating Class 0.60% 0.60% USD Z Accumulating Class 0.12% 0.12% Neuberger Berman Absolute Return Multi Strategy Fund CHF I Accumulating Class 2.31% 1.95% EUR A Accumulating Class 3.22% 2.70% EUR I Accumulating Class 2.45% 1.95% EUR I2 Accumulating Class 2.31% 1.80% EUR M Accumulating Class 4.03% 3.50% EUR Z Accumulating Class 1.70% 1.20% GBP I Accumulating Class 2.45% 1.95% GBP I2 Accumulating Class 2.32% 1.80% GBP I3 Accumulating Class 2.22% 1.70% GBP Z Accumulating Class 1.70% 1.20% JPY D Distributing Class 2.47% 1.95% JPY I Accumulating Class 2.46% 1.95% USD A Accumulating Class 3.20% 2.70% USD I Accumulating Class 2.46% 1.95% USD Z Accumulating Class 1.70% 1.20% Neuberger Berman US Long Short Equity Fund EUR A Accumulating Class 2.55% 2.55% EUR I Accumulating Class 1.64% 1.64% EUR M Accumulating Class 3.36% 3.35% GBP I Accumulating Class 1.61% 1.61% SGD A1 Accumulating Class 2.28% 2.28% USD A (PF) Accumulating Class 1.99% 1.99% USD A Accumulating Class 2.54% 2.54% USD A1 Accumulating Class 2.29% 2.29% USD C1 Accumulating Class 3.58% 3.55% USD D Distributing Class 1.63% 1.63% USD I (PF) Distributing Class 1.28% 1.28% USD I Accumulating Class 1.63% 1.63% USD M Accumulating Class 3.36% 3.35% USD U Accumulating Class 2.09% 2.09% USD Z Accumulating Class 0.29% 0.29% EUR A Accumulating Class 2.55% 2.55%

TOTAL EXPENSE RATIOS (UNAUDITED) FINANCIAL STATEMENTS
ANNUAL REPORT 2019 1727
Appendix I (Continued)
TOTAL EXPENSE RATIOS (UNAUDITED) (CONTINUED)
31 December 2019 (continued) Neuberger Berman US Long Short Equity Fund (continued)
Annualised TER % Annualised TER % Share Class (Without fee waiver) (With fee waiver)
EUR I Accumulating Class 1.64% 1.64% EUR M Accumulating Class 3.36% 3.35% GBP I Accumulating Class 1.61% 1.61% SGD A1 Accumulating Class 2.28% 2.28% USD A (PF) Accumulating Class 1.99% 1.99% USD A Accumulating Class 2.54% 2.54% USD A1 Accumulating Class 2.29% 2.29% USD C1 Accumulating Class 3.58% 3.55% USD D Distributing Class 1.63% 1.63% USD I (PF) Distributing Class 1.28% 1.28% USD I Accumulating Class 1.63% 1.63% USD M Accumulating Class 3.36% 3.35% USD U Accumulating Class 2.09% 2.09% USD Z Accumulating Class 0.29% 0.29% Neuberger Berman Emerging Market Debt Blend Fund AUD I3 Distributing Class 0.62% 0.62% CHF I2 Distributing Class 0.75% 0.75% EUR A Accumulating Class 1.58% 1.58% EUR I Accumulating Class 0.88% 0.88% EUR I Distributing Class 0.88% 0.88% EUR I2 Accumulating Class 0.74% 0.74% EUR I2 Distributing Class 0.74% 0.74% EUR I3 Distributing Class 0.55% 0.55% EUR I4 Accumulating Unhedged Class 0.60% 0.60% EUR I5 Accumulating Class 0.53% 0.53% EUR M Accumulating Class 2.41% 2.40% EUR M Distributing Class 2.41% 2.40% EUR Z Accumulating Class 0.18% 0.18% GBP I Accumulating Class 0.89% 0.89% GBP I Accumulating Unhedged Class 0.88% 0.88% GBP I Distributing Class 0.88% 0.88% GBP I Distributing Unhedged Class 0.88% 0.88% GBP I2 Distributing Class 0.74% 0.74% GBP P Accumulating Class 0.80% 0.80% GBP P Accumulating Unhedged Class 0.79% 0.79% GBP Z Accumulating Class 0.18% 0.18% NOK U Accumulating Class 1.23% 1.23% SEK A Accumulating Class 1.58% 1.58% SGD A (Monthly) Distributing Class 1.57% 1.57% USD A (Monthly) Distributing Class 1.58% 1.58% USD A Accumulating Class 1.58% 1.58% USD C1 Accumulating Class 2.61% 2.60%

FINANCIAL STATEMENTS TOTAL EXPENSE RATIOS (UNAUDITED)
1728 NEUBERGER BERMAN INVESTMENT FUNDS PLC
Appendix I (Continued)
TOTAL EXPENSE RATIOS (UNAUDITED) (CONTINUED)
31 December 2019 (continued) Neuberger Berman Emerging Market Debt Blend Fund (continued)
Annualised TER % Annualised TER % Share Class (Without fee waiver) (With fee waiver)
USD I Accumulating Class 0.88% 0.88% USD I Distributing Class 0.88% 0.88% USD I2 Accumulating Class 0.74% 0.74% USD I2 Distributing Class 0.74% 0.74% USD I3 Accumulating Class 0.67% 0.67% USD M Accumulating Class 2.41% 2.40% USD M Distributing Class 2.40% 2.40% USD Z Accumulating Class 0.18% 0.18% Neuberger Berman European High Yield Bond Fund EUR A Accumulating Class 2.01% 1.40% EUR I Accumulating Class 1.63% 0.80% EUR I5 Accumulating Class 1.48% 0.50% EUR M Accumulating Class 2.67% 2.00% EUR M Distributing Class 2.62% 2.00% EUR X Accumulating Class 1.00% 0.40% GBP I Accumulating Class 1.48% 0.80% SGD A (Monthly) Distributing Class 2.10% 1.40% SGD A Accumulating Class 1.88% 1.40% USD A (Monthly) Distributing Class 2.06% 1.40% USD A Accumulating Class 2.10% 1.40% USD I Accumulating Class 1.28% 0.80% USD I5 Accumulating Class 1.42% 0.50% USD X Accumulating Class 1.04% 0.40% USD Z Accumulating Class 1.00% 0.20% Neuberger Berman Global Equity Fund USD I Accumulating Class 9.55% 1.05% Neuberger Berman Systematic Global Equity Fund EUR M Accumulating Class 3.62% 2.40% GBP I Accumulating Class 2.02% 0.95% SGD A Accumulating Class 2.79% 1.60% USD A Accumulating Class 2.74% 1.60% USD I Accumulating Class 1.98% 0.95% USD T Accumulating Class 3.28% 2.10% USD Z Accumulating Class 0.27% 0.27% Neuberger Berman Global Real Estate Securities Fund EUR M Accumulating Class 4.39% 2.80% GBP Z Accumulating Class 2.04% 0.30% USD A Accumulating Class 2.75% 1.80% USD I Accumulating Class 2.85% 1.05%

TOTAL EXPENSE RATIOS (UNAUDITED) FINANCIAL STATEMENTS
ANNUAL REPORT 2019 1729
Appendix I (Continued)
TOTAL EXPENSE RATIOS (UNAUDITED) (CONTINUED)
31 December 2019 (continued) Neuberger Berman Global Real Estate Securities Fund (continued)
Annualised TER % Annualised TER % Share Class (Without fee waiver) (With fee waiver)
USD I2 Accumulating Class 2.82% 0.90% USD I5 Distributing Class 1.74% 0.67% USD M Accumulating Class 3.26% 2.80% USD T Accumulating Class 2.30% 2.10% USD Z Accumulating Class 2.15% 0.30% Neuberger Berman US Small Cap Intrinsic Value Fund USD A Accumulating Class 1.92% 1.92% USD C1 Accumulating Class 3.00% 3.00% USD I Accumulating Class 1.08% 1.08% USD M Accumulating Class 2.97% 2.97% Neuberger Berman Asian Debt - Hard Currency Fund SGD A (Monthly) Distributing Class 2.31% 1.40% USD A (Monthly) Distributing Class 2.21% 1.40% USD A Accumulating Class 2.21% 1.40% USD C1 Accumulating Class 3.62% 2.40% USD I Accumulating Class 1.74% 0.80% USD I Distributing Class 1.38% 0.80% USD M Accumulating Class 3.07% 2.00% Neuberger Berman China Bond Fund CNY I Distributing Class 1.47% 0.85% CNY Z Accumulating Class 0.65% 0.20% EUR M Accumulating Unhedged Class 2.94% 2.30% SGD A (Monthly) Distributing Unhedged Class 1.95% 1.50% USD I Accumulating Unhedged Class 1.57% 0.85% USD M Accumulating Unhedged Class 2.65% 2.30% USD Z Accumulating Class 0.55% 0.20% USD Z Accumulating Unhedged Class 0.81% 0.20% Neuberger Berman Corporate Hybrid Bond Fund AUD A (Monthly) Distributing Class 1.34% 1.34% CHF P Accumulating Class 0.72% 0.72% CHF P Distributing Class 0.72% 0.72% EUR A (Monthly) Distributing Class 1.34% 1.34% EUR A Accumulating Class 1.35% 1.35% EUR I Accumulating Class 0.75% 0.75% EUR I Distributing Class 0.74% 0.74% EUR I2 Accumulating Class 0.63% 0.63% EUR I3 Accumulating Class 0.57% 0.57% EUR I5 Accumulating Class 0.45% 0.45% EUR M Accumulating Class 1.97% 1.97%

FINANCIAL STATEMENTS TOTAL EXPENSE RATIOS (UNAUDITED)
1730 NEUBERGER BERMAN INVESTMENT FUNDS PLC
Appendix I (Continued)
TOTAL EXPENSE RATIOS (UNAUDITED) (CONTINUED)
31 December 2019 (continued) Neuberger Berman Corporate Hybrid Bond Fund (continued)
Annualised TER % Annualised TER % Share Class (Without fee waiver) (With fee waiver)
EUR M Distributing Class 1.97% 1.97% EUR P Accumulating Class 0.72% 0.72% EUR P Distributing Class 0.72% 0.72% GBP I Accumulating Class 0.75% 0.75% GBP I2 Accumulating Class 0.63% 0.63% GBP I2 Distributing Class 0.63% 0.63% GBP P Accumulating Class 0.71% 0.71% GBP P Distributing Class 0.72% 0.72% HKD A (Monthly) Distributing Class 1.33% 1.33% SGD A (Monthly) Distributing Class 1.33% 1.33% USD A (Monthly) Distributing Class 1.34% 1.34% USD A Accumulating Class 1.34% 1.34% USD C1 Accumulating Class 2.36% 2.36% USD I Accumulating Class 0.74% 0.74% USD I2 Accumulating Class 0.63% 0.63% USD I2 Distributing Class 0.62% 0.62% USD M Accumulating Class 1.97% 1.97% USD M Distributing Class 1.97% 1.97% USD P Accumulating Class 0.72% 0.72% USD Z Accumulating Class 0.15% 0.15% Neuberger Berman US Equity Fund USD I Accumulating Class 5.09% 0.95% USD I Distributing Class 3.39% 0.95% Neuberger Berman Global High Yield Bond Fund EUR M Accumulating Class 2.28% 2.00% EUR M Distributing Class 2.29% 2.00% EUR Z (PF) Accumulating Class 0.57% 0.30% GBP I Accumulating Class 1.05% 0.80% USD A Accumulating Class 1.65% 1.40% USD C1 Accumulating Class 2.70% 2.40% USD I Accumulating Class 1.08% 0.80% USD M Accumulating Class 2.30% 2.00% USD M Distributing Class 2.29% 2.00% USD P Accumulating Class 1.03% 0.77% USD Z (PF) Accumulating Class 0.57% 0.30% USD Z Accumulating Class 0.47% 0.20% Neuberger Berman Global Opportunistic Bond Fund EUR I Accumulating Class 0.67% 0.60% JPY I Accumulating Class 0.67% 0.60% USD A Accumulating Class 1.08% 1.00%

TOTAL EXPENSE RATIOS (UNAUDITED) FINANCIAL STATEMENTS
ANNUAL REPORT 2019 1731
Appendix I (Continued)
TOTAL EXPENSE RATIOS (UNAUDITED) (CONTINUED)
31 December 2019 (continued) Neuberger Berman Global Opportunistic Bond Fund (continued)
Annualised TER % Annualised TER % Share Class (Without fee waiver) (With fee waiver)
USD C1 Accumulating Class 2.09% 2.00% USD I Accumulating Class 0.67% 0.60% USD I Distributing Class 0.67% 0.60% USD I2 Accumulating Class 0.59% 0.52% USD M Accumulating Class 1.73% 1.60% USD Z Accumulating Class 0.27% 0.20% Neuberger Berman Multi-Asset Class Income Fund EUR A Distributing Class 1.75% 1.75% EUR I Accumulating Class 1.17% 0.85% EUR M Accumulating Class 2.66% 2.30% EUR M Distributing Class 2.68% 2.30% GBP I Accumulating Class 1.17% 0.85% USD A Accumulating Class 1.82% 1.50% USD C1 Accumulating Class 2.85% 2.50% USD I Accumulating Class 1.18% 0.85% USD I Distributing Class 1.22% 0.85% USD M Accumulating Class 2.58% 2.30% Neuberger Berman US Equity Index PutWrite Fund
EUR I Accumulating Class 0.76% 0.76% EUR I4 Accumulating Class 0.52% 0.52% EUR M Accumulating Class 2.18% 2.18% GBP I Accumulating Class 0.76% 0.76% GBP I Accumulating Unhedged Class 0.76% 0.76% GBP I4 Accumulating Class 0.52% 0.52% GBP I4 Accumulating Unhedged Class 0.52% 0.52% GBP I4 Distributing Class 0.52% 0.52% SGD A (Monthly) Distributing Class 1.36% 1.36% USD A (Monthly) Distributing Class 1.35% 1.35% USD A Accumulating Class 1.34% 1.34% USD C1 Accumulating Class 2.39% 2.39% USD I (Monthly) Distributing Class 0.76% 0.76% USD I Accumulating Class 0.76% 0.76% USD I3 Accumulating Class 0.58% 0.58% USD I4 Accumulating Class 0.52% 0.52% USD I4 Distributing Class 0.49% 0.49% USD M Accumulating Class 2.19% 2.19% USD P Accumulating Class 0.74% 0.74% USD Z Accumulating Class 0.15% 0.15%

FINANCIAL STATEMENTS TOTAL EXPENSE RATIOS (UNAUDITED)
1732 NEUBERGER BERMAN INVESTMENT FUNDS PLC
Appendix I (Continued)
TOTAL EXPENSE RATIOS (UNAUDITED) (CONTINUED)
31 December 2019 (continued) Neuberger Berman Global Equity Index PutWrite Fund
Annualised TER % Annualised TER % Share Class (Without fee waiver) (With fee waiver)
AUD X Accumulating Class 1.80% 1.34% CHF I Distributing Class 1.26% 0.85% CHF I5 Accumulating Class 0.98% 0.52% CHF I5 Distributing Class 0.98% 0.53% CHF X Accumulating Class 1.79% 1.34% CHF X Distributing Class 1.79% 1.34% EUR A Accumulating Class 1.96% 1.50% EUR I Accumulating Class 1.26% 0.85% EUR I5 (Monthly) Distributing Class 0.98% 0.52% EUR I5 Accumulating Class 0.98% 0.52% EUR M Accumulating Class 2.79% 2.30% EUR X (Monthly) Distributing Class 1.80% 1.34% EUR X Accumulating Class 1.77% 1.34% EUR Z Accumulating Class 0.66% 0.20% GBP I Accumulating Class 1.30% 0.85% GBP I5 Accumulating Class 0.99% 0.52% GBP I5 Distributing Class 1.00% 0.53% SGD A (Monthly) Distributing Class 1.92% 1.50% SGD I5 Accumulating Class 0.99% 0.53% SGD X (Monthly) Distributing Class 1.80% 1.34% SGD X Accumulating Class 1.78% 1.34% USD A Accumulating Class 1.95% 1.50% USD C1 Accumulating Class 2.98% 2.50% USD I Accumulating Class 1.35% 0.85% USD I Distributing Class 1.31% 0.85% USD I5 (Monthly) Distributing Class 0.99% 0.53% USD I5 Accumulating Class 0.97% 0.53% USD I5 Distributing Class 0.99% 0.53% USD X (Monthly) Distributing Class 1.79% 1.34% USD X Accumulating Class 1.76% 1.34% USD X Distributing Class 1.80% 1.34% USD Z Accumulating Class 0.65% 0.20% Neuberger Berman Uncorrelated Strategies Fund CHF I Accumulating Class 1.01% 0.95% CHF I5 Accumulating Class 0.64% 0.58% EUR A Accumulating Class 1.76% 1.70% EUR I Accumulating Class 1.02% 0.95% EUR I2 Accumulating Class 0.86% 0.80% EUR I5 Accumulating Class 0.63% 0.57% EUR M Accumulating Class 2.58% 2.50% GBP I Accumulating Class 1.01% 0.95% GBP I2 Accumulating Class 0.86% 0.80%

TOTAL EXPENSE RATIOS (UNAUDITED) FINANCIAL STATEMENTS
ANNUAL REPORT 2019 1733
Appendix I (Continued)
TOTAL EXPENSE RATIOS (UNAUDITED) (CONTINUED)
31 December 2019 (continued) Neuberger Berman Uncorrelated Strategies Fund (continued)
Annualised TER % Annualised TER % Share Class (Without fee waiver) (With fee waiver)
GBP I5 Accumulating Class 0.63% 0.58% GBP P Accumulating Class 0.98% 0.91% GBP Z Accumulating Class 0.26% 0.20% SGD A Accumulating Class 1.75% 1.70% USD A Accumulating Class 1.77% 1.70% USD C1 Accumulating Class 2.78% 2.70% USD I Accumulating Class 1.01% 0.95% USD I2 Accumulating Class 0.86% 0.80% USD I5 Accumulating Class 0.63% 0.57% USD M Accumulating Class 2.59% 2.50% USD P Accumulating Class 0.98% 0.91% USD Z Accumulating Class 0.26% 0.20% Neuberger Berman Emerging Market Debt Blend Investment Grade Fund EUR I5 Distributing Class 1.68% 0.50% GBP I5 Distributing Class 1.67% 0.50% NOK I Accumulating Class 2.39% 0.80% NOK U Accumulating Class 2.11% 1.10% USD I Accumulating Class 1.99% 0.80% USD I5 Accumulating Class 1.68% 0.50% USD Z Accumulating Class 1.38% 0.20% Neuberger Berman Emerging Markets Sustainable Equity Fund EUR M Accumulating Unhedged Class 3.06% 2.80% JPY I Accumulating Unhedged Class 1.39% 1.15% USD A Accumulating Class 2.21% 2.00% USD I Accumulating Class 1.14% 1.14% USD I Distributing Class 1.40% 1.15% USD I5 Accumulating Class 0.97% 0.73% Neuberger Berman China Equity Opportunities Fund EUR M Accumulating Unhedged Class 15.80% 3.10% USD A Accumulating Class 14.44% 2.10% USD C1 Accumulating Class 17.41% 3.10% USD I Accumulating Class 13.54% 1.20% USD I Distributing Class 13.54% 1.20% USD M Accumulating Class 16.93% 3.10% Neuberger Berman Multi-Asset Class Growth Fund EUR M Accumulating Class 3.76% 2.30% GBP I Accumulating Class 2.55% 0.85% USD I Accumulating Class 1.78% 0.85% USD I Distributing Class 2.22% 0.85%

FINANCIAL STATEMENTS TOTAL EXPENSE RATIOS (UNAUDITED)
1734 NEUBERGER BERMAN INVESTMENT FUNDS PLC
Appendix I (Continued)
TOTAL EXPENSE RATIOS (UNAUDITED) (CONTINUED)
31 December 2019 (continued) Neuberger Berman Global Thematic Equity Fund
Annualised TER % Annualised TER % Share Class (Without fee waiver) (With fee waiver)
EUR M Accumulating Unhedged Class 4.12% 3.30% USD A Accumulating Class 3.02% 2.30% USD C1 Accumulating Class 4.03% 3.30% USD I Accumulating Class 2.02% 1.30% USD I Distributing Class 2.04% 1.30% USD M Accumulating Class 4.02% 3.30% Neuberger Berman CLO Income Fund1 EUR I Accumulating Class 0.98% 0.98% EUR I2 Distributing Class 0.84% 0.84% GBP I Accumulating Class 0.96% 0.96% GBP I2 Distributing Class 0.84% 0.84% GBP I5 Distributing Class 0.61% 0.61% GBP Z Accumulating Class 0.46% 0.30% SEK I Accumulating Class 0.98% 0.98% USD I Accumulating Class 0.99% 0.99% USD I2 Distributing Class 0.81% 0.81% USD I5 Distributing Class 0.62% 0.62% USD Z Accumulating Class 0.28% 0.28% Neuberger Berman Next Generation Mobility Fund1 AUD X Accumulating Class 2.33% 1.85% EUR A Accumulating Class 2.66% 2.00% EUR M Accumulating Unhedged Class 3.63% 2.80% EUR X Accumulating Class 2.33% 1.85% GBP I Accumulating Class 1.81% 1.15% GBP X Accumulating Class 2.33% 1.85% HKD X Accumulating Unhedged Class 2.33% 1.85% SGD X Accumulating Class 2.33% 1.85% USD A Accumulating Class 2.59% 2.00% USD C1 Accumulating Class 3.67% 3.00% USD I Accumulating Class 1.93% 1.15% USD I Distributing Class 1.65% 1.15% USD M Accumulating Class 3.47% 2.80% USD X Accumulating Class 2.35% 1.85% Neuberger Berman Ultra Short Term Euro Bond Fund1 CHF U Accumulating Class 0.84% 0.39% EUR I Accumulating Class 0.43% 0.29% EUR I Distributing Class 0.57% 0.29% EUR I5 Accumulating Class 0.32% 0.19% EUR U Accumulating Class 0.84% 0.39% EUR Z Accumulating Class 0.27% 0.10%

TOTAL EXPENSE RATIOS (UNAUDITED) FINANCIAL STATEMENTS
ANNUAL REPORT 2019 1735
Appendix I (Continued)
TOTAL EXPENSE RATIOS (UNAUDITED) (CONTINUED)
31 December 2019 (continued) Neuberger Berman Ultra Short Term Euro Bond Fund1 (continued)
Annualised TER % Annualised TER % Share Class (Without fee waiver) (With fee waiver)
USD M Accumulating Class 1.18% 1.08% USD Z Accumulating Class 0.24% 0.10% Neuberger Berman Euro Opportunistic Bond Fund1 EUR I Accumulating Class 2.04% 0.55% EUR I Distributing Class 2.03% 0.55% Neuberger Berman Euro Bond Absolute Return Fund1 EUR I Accumulating Class 0.97% 0.65% EUR I Distributing Class 1.24% 0.65% EUR I5 Accumulating Class 0.98% 0.43% USD Z Accumulating Class 0.83% 0.20% Neuberger Berman Absolute Alpha Fund2 EUR I Accumulating Class 1.06% 1.06% EUR M Accumulating Class 3.28% 3.28% EUR M Accumulating Unhedged Class 3.43% 3.31% GBP Z Accumulating Class 0.00% 0.00% SGD A Accumulating Class 2.65% 2.51% USD A Accumulating Class 2.70% 2.51% USD I Accumulating Class 1.82% 1.60% Neuberger Berman Multi-Style Premia Fund2 EUR I Accumulating Class 8.60% 0.85% USD I Accumulating Class 2.21% 0.85% USD I Distributing Class 2.15% 0.85% USD Z Accumulating Class 2.71% 0.20% Neuberger Berman Macro Opportunities FX Fund2 EUR I Accumulating Class 2.02% 0.80% GBP Z Accumulating Class 1.45% 0.20% SEK I Accumulating Class 2.04% 0.80% SEK I Distributing Class 2.04% 0.80% USD I Accumulating Class 2.05% 0.80% USD X Accumulating Class 1.65% 0.40% USD Z Accumulating Class 1.43% 0.20%
1 Portfolio launched during the prior reporting year. 2 Portfolio launched during the current reporting year.

FINANCIAL STATEMENTS PERFORMANCE DATA (UNAUDITED)
1736 NEUBERGER BERMAN INVESTMENT FUNDS PLC
Appendix II
PERFORMANCE DATA (UNAUDITED)
Neuberger Berman High Yield Bond Fund Year Ended 31 December
2017 2018 2019
Share Class Inception Date ISIN % % %
AUD A (Monthly) Distributing Class 05/09/2012 IE00B7VR8263 5.41 (3.43) 12.06
AUD A Accumulating Class 28/08/2012 IE00B5NTQ667 5.40 (3.46) 12.03
AUD B (Monthly) Distributing Class 22/07/2013 IE00B9276P83 3.60 (4.88) 10.17
AUD B (Weekly) Distributing Class 11/06/2013 IE00B7TQ7849 3.74 (5.03) 10.26
AUD C2 (Monthly) Distributing Class 19/07/2013 IE00B9276Q90 3.73 (5.00) 10.32
AUD C2 (Weekly) Distributing Class 11/06/2013 IE00B7L3WM21 3.74 (5.03) 10.26
AUD E (Monthly) Distributing Class 02/07/2014 IE00BNJZT320 3.65 (4.90) 10.15
AUD E Accumulating Class 02/07/2014 IE00BNJZT213 3.68 (5.04) 10.22
AUD I Distributing Class 29/12/2011 IE00B52MT459 6.04 (2.86) 12.67
AUD I2 (Monthly) Distributing Class 24/09/2015 IE00BYZS6P35 6.11 (2.71) 12.78
AUD I2 Accumulating Class 24/09/2015 IE00BYZS6N11 6.13 (2.76) 12.83
AUD T (Monthly) Distributing Class 27/06/2013 IE00B9276R08 4.70 (4.06) 11.36
AUD T (Weekly) Distributing Class 11/06/2013 IE00B95QHL52 4.72 (4.14) 11.45
AUD T Accumulating Class 02/08/2013 IE00B8HXFR97 4.78 (4.07) 11.38
CAD A (Monthly) Distributing Class 23/07/2013 IE00B8HXG658 4.26 (3.96) 12.14
CHF A Accumulating Class 05/07/2011 IE00B5YDJD53 2.29 (6.16) 9.29
CHF I Accumulating Class 27/05/2011 IE00B53JGK04 2.95 (5.72) 10.01
CHF I Distributing Class 07/05/2013 IE00B4QWB156 2.94 (5.67) 9.98
CHF I2 Accumulating Class 22/10/2013 IE00BCDYX925 3.09 (5.54) 10.09
CHF I2 Distributing Class 03/03/2016 IE00BCDYXC58 3.07 (5.54) -
CNY A (Monthly) Distributing Class 01/08/2012 IE00B7YPR088 8.77 (1.66) 13.20
CNY A (Weekly) Distributing Class 10/01/2013 IE00B7X4QQ52 8.78 (1.67) 13.20
CNY B (Monthly) Distributing Class 14/04/2014 IE00BK4YY940 7.03 (3.27) 11.42
CNY C2 (Monthly) Distributing Class 14/04/2014 IE00BK4YYB68 7.04 (3.26) -
CNY I (Monthly) Distributing Class 09/11/2012 IE00B841H259 9.39 (1.07) 13.89
CNY T (Monthly) Distributing Class 14/04/2014 IE00BK4YYC75 8.10 (2.27) 12.49
EUR A (Monthly) Distributing Class 19/06/2012 IE00B4024J04 2.75 (5.89) 9.88
EUR A Accumulating Class 03/05/2006 IE00B12VWB25 2.80 (5.85) 9.75
EUR A Distributing Class 24/02/2012 IE00B718SL89 2.84 (5.87) 9.68
EUR I Accumulating Class 09/11/2009 IE00B12VW904 3.40 (5.28) 10.42
EUR I Distributing Class 18/10/2012 IE00B8FFFY43 3.49 (5.36) 10.40
EUR I2 (Monthly) Distributing Class 24/09/2015 IE00BH2RDN17 3.57 (5.13) 10.55
EUR I2 Accumulating Class 05/12/2012 IE00B86LQM64 3.57 (5.21) 10.46
EUR I2 Distributing Class 05/12/2012 IE00B6TSGL97 3.46 (5.18) 10.57
EUR I3 Accumulating Class 22/07/2016 IE00B8FHP284 3.71 (5.27) 10.63
EUR I3 Distributing Class 30/08/2016 IE00B80YQC18 3.70 (5.14) 10.61
EUR M Accumulating Class 29/01/2016 IE00BSS7G446 2.13 (6.43) 9.01
EUR M Distributing Class 29/01/2016 IE00BSS7G552 2.14 (6.45) 9.03
EUR Z Accumulating Class 05/11/2014 IE00BKJ95L31 4.06 (4.72) 11.05

PERFORMANCE DATA (UNAUDITED) FINANCIAL STATEMENTS
ANNUAL REPORT 2019 1737
Appendix II (Continued)
PERFORMANCE DATA (UNAUDITED) (CONTINUED)
Neuberger Berman High Yield Bond Fund (continued) Year Ended 31 December
2017 2018 2019
Share Class Inception Date ISIN % % %
GBP A (Monthly) Distributing Class 07/07/2014 IE00BCDYX818 3.60 (4.77) 11.14
GBP A Accumulating Class 27/04/2011 IE00B1G9WD45 3.68 (4.83) 11.19
GBP A Distributing Class 24/02/2012 IE00B1G9WG75 3.59 (4.80) 11.12
GBP I Accumulating Class 27/07/2010 IE00B1G9WC38 4.29 (4.24) 11.82
GBP I Accumulating Unhedged Class 12/04/2017 IE00BD3WD717 (5.10) - -
GBP I Distributing Class 08/11/2006 IE00B1G9WJ07 4.28 (4.28) 11.77
GBP I2 Accumulating Class 05/12/2012 IE00B76HSR65 4.39 (4.12) 11.97
GBP I2 Distributing Class 05/12/2012 IE00B8KDTL88 4.27 (4.19) 11.92
GBP Z Accumulating Class 17/03/2016 IE00BKJ95N54 4.87 (3.70) 12.59
HKD A (Monthly) Distributing Class 14/09/2012 IE00B87ZP976 3.96 (3.87) 12.30
HKD A (Weekly) Distributing Class 10/01/2013 IE00B8BK5Y38 4.02 (3.81) -
HKD A Accumulating Class 19/09/2012 IE00B8G0M149 3.95 (3.88) 12.38
JPY I Accumulating Class 26/08/2009 IE00B42N7W58 3.62 (5.17) 10.68
JPY I2 Accumulating Class 03/03/2016 IE00BZ0RDL70 3.79 (5.03) -
SEK A Accumulating Class 16/06/2011 IE00B5N0GF80 2.60 (6.01) 10.01
SEK I2 Accumulating Class 13/01/2016 IE00BYZS6T72 3.34 (5.27) -
SGD A (Monthly) Distributing Class 30/03/2012 IE00B513D147 4.33 (4.06) 12.23
SGD A Accumulating Class 09/03/2012 IE00B3VJ3Q31 4.36 (4.10) 12.27
USD A (Monthly) Distributing Class 02/05/2012 IE00B4KRFX62 4.75 (3.22) 13.18
USD A (Weekly) Distributing Class 22/01/2013 IE00B88XV589 4.76 (3.30) 13.18
USD A Accumulating Class 11/01/2010 IE00B12VW672 4.75 (3.25) 13.19
USD A Distributing Class 24/02/2012 IE00B1G9WM36 4.78 (3.27) 13.23
USD B (Monthly) Distributing Class 31/10/2012 IE00B9276S15 3.01 (4.82) 11.37
USD B (Weekly) Distributing Class 11/06/2013 IE00B8HWN052 3.14 (4.72) 11.28
USD B Accumulating Class 31/10/2012 IE00B9276M52 3.10 (4.77) 11.32
USD C Accumulating Class 21/11/2012 IE00B8JXNK68 4.09 (3.85) 12.53
USD C Distributing Class 21/11/2012 IE00B76CC794 4.15 (3.81) 12.35
USD C1 Accumulating Class 25/10/2017 IE00B8521692 (0.50) (4.22) 11.96
USD C1 Distributing Class 07/09/2017 IE00BF2DC164 0.11 (4.26) 12.00
USD C2 (Monthly) Distributing Class 31/10/2012 IE00B9276T22 3.01 (4.68) 11.21
USD C2 (Weekly) Distributing Class 11/06/2013 IE00B7VT9G37 3.02 (4.73) 11.29
USD C2 Accumulating Class 31/10/2012 IE00B9276N69 3.09 (4.77) 11.31
USD E (Monthly) Distributing Class 02/07/2014 IE00BLDYHX78 3.07 (4.77) 11.30
USD E Accumulating Class 02/07/2014 IE00BNJZWJ94 3.03 (4.80) 11.32
USD I (Monthly) Distributing Class 13/09/2012 IE00B6VF0729 5.34 (2.68) 13.98
USD I Accumulating Class 03/05/2006 IE00B12VW565 5.40 (2.61) 13.82
USD I Distributing Class 16/11/2006 IE00B1G9WK12 5.29 (2.60) 13.78
USD I2 (Monthly) Distributing Class 24/09/2015 IE00BH2RDM00 5.48 (2.57) 13.95
USD I2 (Weekly) Distributing Class 08/12/2015 IE00BZ0RDM87 5.50 (2.54) -

FINANCIAL STATEMENTS PERFORMANCE DATA (UNAUDITED)
1738 NEUBERGER BERMAN INVESTMENT FUNDS PLC
Appendix II (Continued)
PERFORMANCE DATA (UNAUDITED) (CONTINUED)
Neuberger Berman High Yield Bond Fund (continued) Year Ended 31 December
2017 2018 2019
Share Class Inception Date ISIN % % %
USD I2 Accumulating Class 05/12/2012 IE00B8QBJF01 5.47 (2.47) 13.91
USD I2 Distributing Class 05/12/2012 IE00B8BBXZ30 5.41 (2.55) 13.96
USD I4 (Monthly) Distributing Class 01/06/2016 IE00BYX24752 5.63 (2.35) 14.01
USD M Accumulating Class 18/02/2016 IE00BD9WHR30 4.08 (3.75) 12.39
USD M Distributing Class 01/03/2018 IE00BDFBKN13 - (2.79) 12.44
USD P Accumulating Class 09/01/2018 IE00BTKH9V70 - (3.30) 13.86
USD T (Monthly) Distributing Class 31/10/2012 IE00B9276V44 4.05 (3.84) 12.55
USD T (Weekly) Distributing Class 11/06/2013 IE00B8B5Y742 4.16 (3.80) 12.35
USD T Accumulating Class 31/10/2012 IE00B9276L46 4.11 (3.78) 12.40
USD U (Monthly) Distributing Class 02/05/2013 IE00B7Y5Q239 5.15 (2.98) 13.57
USD U Accumulating Class 09/10/2012 IE00B84LT637 5.04 (2.96) 13.52
USD Z Accumulating Class 02/05/2014 IE00BKJ9LT35 6.03 (2.01) 14.55
ZAR A (Monthly) Distributing Class 05/11/2013 IE00BCZTFM26 11.37 1.46 18.00
ZAR B (Monthly) Distributing Class 11/06/2013 IE00BBGB0S16 9.57 (0.18) 16.10
ZAR C2 (Monthly) Distributing Class 11/06/2013 IE00BBGB0T23 9.57 (0.18) 16.09
ZAR E (Monthly) Distributing Class 02/07/2014 IE00BLDYHZ92 9.57 (0.18) 16.10
ZAR E Accumulating Class 02/07/2014 IE00BNJZT544 9.59 (0.17) 16.12
ZAR T (Monthly) Distributing Class 11/06/2013 IE00BBGB0V45 10.68 0.82 17.27
ZAR T Accumulating Class 19/12/2016 IE00BCDYXM56 10.69 0.83 17.28
Neuberger Berman Diversified Currency Fund
EUR A Accumulating Class 08/12/2009 IE00B3L3LY94 (0.20) (1.57) (2.60)
EUR I Accumulating Class 25/02/2009 IE00B3L3LX87 0.19 (1.04) (2.01)
EUR M Accumulating Class 18/02/2016 IE00BD9WHT53 (0.83) (2.20) (3.10)
GBP I Accumulating Class 04/02/2011 IE00B3L3M133 1.01 0.00 (0.60)
JPY I Accumulating Class 22/02/2017 IE00B4WLDM10 0.86 (0.81) (1.87)
USD A Accumulating Class 08/12/2009 IE00B3L3LT42 1.55 1.14 0.47
USD I Accumulating Class 25/02/2009 IE00B3L3LS35 2.05 1.64 0.99
USD Z Accumulating Class 20/01/2017 IE00BKJ9M126 2.50 2.24 1.43
Neuberger Berman US Multi Cap Opportunities Fund
AUD E Accumulating Class 02/07/2014 IE00BNK02N76 22.26 (7.57) 23.33
AUD T Accumulating Class 19/12/2016 IE00BCDZ0167 23.59 (6.61) 24.45
EUR I3 Accumulating Class 21/03/2013 IE00B80TLB03 22.17 (7.87) 23.72
EUR M Accumulating Class 29/01/2016 IE00BWB95S20 19.49 (9.90) 21.03
EUR U Accumulating Class 16/04/2013 IE00B8GFK154 21.26 - -
EUR1 A Accumulating Class 28/06/2012 IE00B7F25G09 20.71 (9.03) 22.31
EUR1 I Accumulating Class 28/06/2012 IE00B84HCB79 21.69 (8.23) 23.34
GBP I Accumulating Class 22/09/2017 IE00BDZRNS54 7.80 (7.24) 25.00
GBP I Distributing Unhedged Class 11/03/2013 IE00B8305Z21 13.17 0.45 22.27

PERFORMANCE DATA (UNAUDITED) FINANCIAL STATEMENTS
ANNUAL REPORT 2019 1739
Appendix II (Continued)
PERFORMANCE DATA (UNAUDITED) (CONTINUED)
Neuberger Berman US Multi Cap Opportunities Fund (continued) Year Ended 31 December
2017 2018 2019
Share Class Inception Date ISIN % % %
GBP I3 Distributing Class 21/03/2013 IE00B83R3Y89 23.21 (6.88) 25.33
GBP I3 Distributing Unhedged Class 06/11/2017 IE00B7WF5P11 2.00 0.77 22.75
SGD A Accumulating Class 16/07/2013 IE00B3S45H60 22.42 (7.27) 25.01
USD B Accumulating Class 22/11/2013 IE00BCDZ0381 21.40 (7.30) 24.79
USD C Accumulating Class 27/01/2015 IE00BQR9Q030 22.32 (6.64) 25.57
USD C1 Accumulating Class 13/10/2017 IE00BDFBKF39 5.40 (7.12) 24.72
USD C2 Accumulating Class 22/11/2013 IE00BCDZ0506 21.40 (7.23) 24.69
USD E Accumulating Class 02/07/2014 IE00BNK02L52 21.34 (7.30) 24.77
USD I2 Accumulating Class 26/03/2014 IE00B6VHJR14 24.01 (5.30) -
USD I2 Distributing Class 12/05/2014 IE00B7WKBJ23 24.08 (5.28) 27.39
USD I3 Accumulating Class 29/04/2013 IE00B87F0588 24.24 (5.09) 27.66
USD I3 Distributing Class 30/07/2013 IE00B6W3XJ81 24.35 (5.15) 27.66
USD M Accumulating Class 18/02/2016 IE00BD9WHM84 21.58 (7.17) 24.85
USD P Accumulating Class 13/07/2018 IE00BTKHB552 - (9.20) 27.31
USD T Accumulating Class 22/11/2013 IE00BCDZ0720 22.72 (6.38) 26.07
USD U Accumulating Class 22/01/2013 IE00B819XJ19 23.42 (5.86) 26.71
USD Z Accumulating Class 02/05/2014 IE00BKJ9MD40 24.90 (4.63) 28.29
USD1 A Accumulating Class 29/06/2012 IE00B775SV38 22.79 (6.23) 26.09
USD1 I Accumulating Class 28/06/2012 IE00B7XCGB41 23.85 (5.46) 27.20
USD1 I Distributing Class 29/06/2012 IE00B3RSF130 23.84 (5.44) 27.19
ZAR B Accumulating Class 13/01/2014 IE00BH2RDW08 28.96 (3.70) 29.77
ZAR C2 Accumulating Class 13/01/2014 IE00BH2RDX15 28.92 (3.70) 29.77
ZAR E Accumulating Class 02/07/2014 IE00BNK02M69 28.97 (3.70) 29.77
ZAR T Accumulating Class 13/01/2014 IE00BH2RDY22 30.26 (2.73) 31.10
Neuberger Berman US Real Estate Securities Fund
AUD A (Monthly) Distributing Class 08/08/2016 IE00BD0PCG51 10.32 (7.42) 28.41
AUD B (Monthly) Distributing Class 16/08/2016 IE00B95Z2Z11 8.99 (8.47) 26.67
AUD B Accumulating Class 19/08/2015 IE00B8HXG989 9.02 (8.63) 26.87
AUD C2 (Monthly) Distributing Class 16/08/2016 IE00B95S5V74 8.87 (8.58) 26.83
AUD C2 Accumulating Class 25/09/2015 IE00B8HXGC10 8.84 (8.54) 26.65
AUD E (Monthly) Distributing Class 16/08/2016 IE00BYN4NT64 8.87 (8.58) 26.57
AUD E Accumulating Class 02/07/2014 IE00BNK02P90 8.96 (8.55) 26.71
AUD T (Monthly) Distributing Class 13/10/2015 IE00B961PR15 10.02 (7.67) 27.98
AUD T Accumulating Class 16/07/2013 IE00B8HXGG57 9.95 (7.66) 27.98
CHF A Accumulating Class 11/10/2012 IE00B68CYF25 7.29 (9.81) 25.27
EUR A Accumulating Class 01/02/2006 IE00B0T0GT17 7.87 (9.48) 25.88
EUR I Accumulating Class 01/02/2006 IE00B0T0GS00 8.69 (8.89) 26.85
EUR M Accumulating Class 29/01/2016 IE00BWB97865 6.83 (10.53) 24.65

FINANCIAL STATEMENTS PERFORMANCE DATA (UNAUDITED)
1740 NEUBERGER BERMAN INVESTMENT FUNDS PLC
Appendix II (Continued)
PERFORMANCE DATA (UNAUDITED) (CONTINUED)
Neuberger Berman US Real Estate Securities Fund (continued) Year Ended 31 December
2017 2018 2019
Share Class Inception Date ISIN % % %
GBP I Distributing Class 08/11/2006 IE00B1G9WV27 9.41 (7.88) 28.48
HKD A (Monthly) Distributing Class 28/07/2016 IE00BD0PCF45 9.17 (7.58) 28.89
HKD A Accumulating Class 11/02/2016 IE00B54N7087 9.08 (7.52) 28.89
SGD A Accumulating Class 28/05/2013 IE00B45NX917 9.37 (7.85) 28.74
USD A (Monthly) Distributing Class 18/11/2015 IE00B95QR487 9.86 (6.93) 29.85
USD A Accumulating Class 01/02/2006 IE00B0T0GQ85 9.92 (6.90) 29.82
USD A Distributing Class 21/03/2012 IE00B1G9WX41 9.88 (6.93) 29.78
USD B (Monthly) Distributing Class 15/08/2016 IE00B95SNQ81 8.44 (8.10) 28.23
USD B Accumulating Class 16/07/2013 IE00B8HXHJ53 8.42 (8.09) 28.17
USD C Accumulating Class 07/02/2013 IE00B9HLS607 9.37 (7.35) 29.13
USD C Distributing Class 14/02/2013 IE00B9HLDB09 9.33 - -
USD C1 Accumulating Class 31/08/2017 IE00BDFBLK56 1.60 (7.78) 28.50
USD C2 (Monthly) Distributing Class 16/08/2016 IE00B95TPW15 8.50 (8.16) 28.19
USD C2 Accumulating Class 16/07/2013 IE00B8HXHK68 8.33 (8.02) 28.08
USD E (Monthly) Distributing Class 15/08/2016 IE00BYN4NV86 8.44 (7.99) 28.08
USD E Accumulating Class 02/07/2014 IE00BNK02Q08 8.52 (8.11) 28.23
USD I (Monthly) Distributing Class 19/11/2019 IE00B95SJP96 - - (0.39)
USD I Accumulating Class 01/02/2006 IE00B0T0GP78 10.76 (6.25) 30.87
USD I Distributing Class 14/02/2013 IE00B90CY062 10.60 (6.17) 30.76
USD I2 Accumulating Class 05/12/2012 IE00B8B20D34 10.92 (6.10) 31.10
USD M Accumulating Class 18/02/2016 IE00BD9WHN91 8.72 (7.85) 28.57
USD T (Monthly) Distributing Class 01/01/2016 IE00BDD1NC38 9.58 (7.24) 29.42
USD T Accumulating Class 16/07/2013 IE00B8HXHL75 9.58 (7.28) 29.47
USD Z Accumulating Class 10/02/2015 IE00BKJ9MS92 11.60 (5.50) 31.79
ZAR B (Monthly) Distributing Class 16/08/2016 IE00BD89KB03 14.83 (4.07) 33.70
ZAR B Accumulating Class 13/03/2015 IE00BCDYZB81 14.82 (4.07) 33.76
ZAR C2 (Monthly) Distributing Class 15/08/2016 IE00BD89K988 14.84 (4.06) 33.69
ZAR C2 Accumulating Class 13/03/2015 IE00BCDYZD06 14.83 (4.05) 12.41
ZAR E (Monthly) Distributing Class 16/08/2016 IE00BYN4NX01 14.83 (4.07) 33.70
ZAR E Accumulating Class 02/07/2014 IE00BNK02R15 14.83 (4.06) 33.77
ZAR T (Monthly) Distributing Class 11/06/2013 IE00BBGB0Y75 15.98 (3.11) 35.03
ZAR T Accumulating Class 26/07/2013 IE00BCDYZG37 15.97 (3.10) 35.12
Neuberger Berman China Equity Fund
CHF I Accumulating Class 31/07/2015 IE00B63FQV68 62.41 (24.15) 29.38
EUR A Accumulating Class 14/07/2009 IE00B54BK812 61.84 (24.61) 28.73
EUR A Accumulating Unhedged Class 04/02/2016 IE00BYMMV192 44.98 (18.19) 35.24
EUR A Distributing Class 25/03/2015 IE00BPRC5G44 61.73 (24.54) 28.75
EUR I Accumulating Class 14/07/2009 IE00B54BLX33 63.09 (24.05) 29.70

PERFORMANCE DATA (UNAUDITED) FINANCIAL STATEMENTS
ANNUAL REPORT 2019 1741
Appendix II (Continued)
PERFORMANCE DATA (UNAUDITED) (CONTINUED)
Neuberger Berman China Equity Fund (continued) Year Ended 31 December
2017 2018 2019
Share Class Inception Date ISIN % % %
EUR I4 Accumulating Class 13/03/2015 IE00BWB99W46 63.02 (24.04) 29.71
EUR M Accumulating Class 29/01/2016 IE00BYNBZG85 60.27 (25.35) 27.38
EUR Z Accumulating Class 03/06/2014 IE00BKJ9MV22 64.96 (23.17) 31.11
GBP A Distributing Class 21/05/2015 IE00BWB9BT54 63.27 (23.88) 30.06
GBP I Distributing Unhedged Class 23/06/2014 IE00BMN94B69 51.85 (16.35) 28.03
GBP I2 Distributing Unhedged Class 23/06/2014 IE00BMN94C76 52.20 (16.15) 28.35
GBP I4 Accumulating Class 13/03/2015 IE00BWB9BR31 64.62 (23.33) 31.07
GBP I4 Distributing Class 25/03/2015 IE00BWB9BS48 64.63 (23.33) 31.01
HKD A Accumulating Class 23/04/2015 IE00B5KQW063 63.69 (22.65) 31.69
SGD A Accumulating Class 01/12/2014 IE00B5MMRT66 64.18 (23.16) 31.36
USD A Accumulating Class 14/07/2009 IE00B543WZ88 65.10 (22.09) 32.73
USD A Distributing Class 27/08/2014 IE00BPRC5H50 65.07 (22.07) 32.70
USD C Accumulating Class 19/02/2013 IE00B84FWZ53 64.26 (22.49) -
USD C1 Accumulating Class 29/08/2017 IE00BDFBJ560 12.20 (22.91) 31.45
USD I Accumulating Class 14/07/2009 IE00B547N797 66.26 (21.50) 33.76
USD I2 Accumulating Class 11/08/2014 IE00B8BY0V78 66.64 (21.34) 34.03
USD I4 Distributing Class 25/03/2015 IE00BWB9BW83 66.20 (21.50) 33.75
USD M Accumulating Class 27/05/2016 IE00BYVF7440 63.43 (22.90) 31.34
USD U Accumulating Class 27/06/2014 IE00BLSP6051 65.70 (21.78) 33.22
USD Z Accumulating Class 01/08/2014 IE00BKJ9MZ69 68.08 (20.62) 35.19
Neuberger Berman Emerging Markets Equity Fund
AUD B Accumulating Class 30/11/2016 IE00BYN4NY18 39.03 (21.13) 14.86
AUD C2 Accumulating Class 30/11/2016 IE00BYN4NZ25 39.13 (21.19) 14.86
AUD E Accumulating Class 30/11/2016 IE00BYN4P011 38.93 (21.14) 14.88
AUD T Accumulating Class 30/11/2016 IE00BYN4P128 40.40 (20.33) 15.99
CAD I Distributing Unhedged Class 24/01/2018 IE00BF8P8L84 - (16.10) 12.68
EUR A Accumulating Class 16/06/2016 IE00BD6S7K78 37.16 (22.11) 13.93
EUR I Accumulating Class 04/10/2010 IE00B3SRML86 38.56 (21.40) 15.11
EUR M Accumulating Class 18/02/2016 IE00BWB99R92 35.89 (22.95) 12.73
EUR Z Accumulating Class 05/02/2018 IE00BKJ9SM50 - (20.90) 16.18
GBP I Accumulating Class 15/01/2014 IE00B3SC5588 39.67 (20.55) 16.46
GBP Z Accumulating Class 17/03/2016 IE00BKJ9SX65 41.18 (19.75) 17.52
JPY I Accumulating Class 04/10/2010 IE00B6780209 36.49 (20.87) 17.60
USD A Accumulating Class 04/10/2010 IE00B3M56506 39.86 (19.57) 17.62
USD B Accumulating Class 30/11/2016 IE00BYN4P235 38.63 (20.39) 16.32
USD C1 Accumulating Class 15/09/2017 IE00BDFBKJ76 5.20 (20.25) 16.33
USD C2 Accumulating Class 30/11/2016 IE00BYN4P342 38.63 (20.39) 16.41
USD E Accumulating Class 30/11/2016 IE00BYN4P458 38.63 (20.39) 16.32

FINANCIAL STATEMENTS PERFORMANCE DATA (UNAUDITED)
1742 NEUBERGER BERMAN INVESTMENT FUNDS PLC
Appendix II (Continued)
PERFORMANCE DATA (UNAUDITED) (CONTINUED)
Neuberger Berman Emerging Markets Equity Fund (continued) Year Ended 31 December
2017 2017 2017
Share Class Inception Date ISIN % % %
USD I Accumulating Class 04/10/2010 IE00B3NBSZ12 41.31 (18.82) 18.74
USD M Accumulating Class 27/05/2016 IE00BYQQ4J61 38.62 (20.37) 16.34
USD T Accumulating Class 30/11/2016 IE00BYN4P565 40.00 (19.60) 17.59
USD Z Accumulating Class 30/06/2014 IE00BKJ9TD35 42.72 (17.96) 19.93
ZAR B Accumulating Class 30/11/2016 IE00BYN4P672 46.13 (17.97) 20.29
ZAR C2 Accumulating Class 30/11/2016 IE00BYN4P789 46.13 (17.98) 20.30
ZAR E Accumulating Class 30/11/2016 IE00BYN4P896 46.13 (17.98) 20.30
ZAR T Accumulating Class 30/11/2016 IE00BYN4P904 47.62 (17.14) 21.67
Neuberger Berman US Small Cap Fund
AUD B Accumulating Class 25/10/2019 IE00B8HXHQ21 - - 4.30
AUD C2 Accumulating Class 04/09/2018 IE00B8HXHT51 - (18.50) 25.03
AUD E Accumulating Class 02/07/2014 IE00BNK02S22 13.77 (9.87) 24.89
AUD T Accumulating Class 19/12/2016 IE00B8HXJ447 14.92 (8.95) 26.20
EUR A Accumulating Class 28/06/2016 IE00B44F1J46 12.22 (10.89) 24.00
EUR I Accumulating Class 06/08/2013 IE00B3PY8J28 13.29 (10.15) 24.96
EUR I Accumulating Unhedged Class 16/10/2017 IE00B4NQT611 2.70 (2.73) 31.43
EUR I2 Accumulating Unhedged Class 24/01/2019 IE00BGSF1T43 - - 21.80
EUR M Accumulating Class 04/02/2016 IE00BWB97H54 11.11 (11.75) 22.75
EUR Z Accumulating Class 31/03/2016 IE00BKJB1D33 14.27 (9.39) 26.15
GBP I Accumulating Class 31/05/2019 IE00B5ST8H60 - - 12.60
JPY I Distributing Class 29/07/2011 IE00B4TSG157 11.29 (9.78) 27.68
USD A Accumulating Class 05/07/2011 IE00B64QTZ34 14.29 (8.17) 27.77
USD A Distributing Class 28/11/2016 IE00BLDYK493 14.26 (8.18) 27.84
USD B Accumulating Class 16/07/2013 IE00B8HXJT91 12.96 (9.21) 26.37
USD C Accumulating Class 21/11/2012 IE00B83SW661 13.79 (8.57) 27.25
USD C2 Accumulating Class 16/07/2013 IE00B8HXK635 12.87 (8.99) 26.30
USD E Accumulating Class 02/07/2014 IE00BNK02T39 12.98 (9.16) 26.35
USD I Accumulating Class 01/07/2011 IE00B66ZT477 15.20 (7.38) 28.89
USD I Distributing Class 10/12/2013 IE00BH2RF025 15.17 (7.34) 28.90
USD I2 Accumulating Class 23/09/2016 IE00B8FWVN60 15.40 (7.23) 29.20
USD I3 Accumulating Class 30/07/2018 IE00B8GCB135 - (12.27) 29.22
USD M Accumulating Class 18/02/2016 IE00BD9WHP16 13.13 (9.13) 26.48
USD T Accumulating Class 16/07/2013 IE00B8HXK965 14.06 (8.27) 27.62
USD Z Accumulating Class 30/08/2016 IE00BKJ9TJ96 16.20 (6.61) 30.03
ZAR E Accumulating Class 08/08/2017 IE00BNK02V50 12.64 (5.65) 31.49
ZAR T Accumulating Class 19/12/2016 IE00BH2RF918 21.06 (4.72) 32.80

PERFORMANCE DATA (UNAUDITED) FINANCIAL STATEMENTS
ANNUAL REPORT 2019 1743
Appendix II (Continued)
PERFORMANCE DATA (UNAUDITED) (CONTINUED)
Neuberger Berman Short Duration High Yield Bond Fund Year Ended 31 December
2017 2017 2017
Share Class Inception Date ISIN % % %
AUD A (Monthly) Distributing Class 11/06/2013 IE00B8DK4D30 3.67 (1.40) 7.52
CHF A Accumulating Class 09/03/2012 IE00B7FN4Q69 0.54 (4.28) 4.93
CHF I Accumulating Class 20/12/2011 IE00B7FN4P52 1.20 (3.73) 5.55
CHF I2 Accumulating Class 07/02/2014 IE00BH2RFF72 1.27 (3.66) 5.71
CHF I3 Distributing Class 05/05/2017 IE00BD3DV818 0.31 (3.55) 5.66
CNY A (Monthly) Distributing Class 01/08/2012 IE00B8474M21 6.97 0.38 8.75
EUR A Accumulating Class 20/12/2011 IE00B7FN4G61 1.05 (3.88) 5.29
EUR A Distributing Class 14/02/2014 IE00B51MHK83 1.12 (3.92) 5.30
EUR I Accumulating Class 20/12/2011 IE00B7FN4F54 1.69 (3.33) 5.95
EUR I Distributing Class 23/01/2012 IE00B53T1H24 1.69 (3.32) 5.92
EUR I2 Accumulating Class 05/12/2012 IE00B83NML60 1.75 (3.25) 6.17
EUR I2 Distributing Class 05/12/2012 IE00B87KSN79 1.67 (3.19) 6.05
EUR I3 Distributing Class 30/03/2017 IE00B76LTP37 0.78 (3.22) 6.17
EUR M Accumulating Class 29/01/2016 IE00BWB93P58 0.38 (4.43) 4.64
EUR M Distributing Class 29/01/2016 IE00BWB93Q65 0.42 (4.51) 4.64
GBP A Distributing Class 26/02/2014 IE00B7FN4N39 1.94 (2.82) -
GBP I Accumulating Class 17/01/2012 IE00B7FN4H78 2.54 (2.24) 7.35
GBP I Distributing Class 20/12/2011 IE00B7FN4M22 2.52 (2.27) 7.35
GBP I2 Accumulating Class 05/12/2012 IE00B87CZ321 2.66 (2.16) 7.42
GBP I2 Distributing Class 05/12/2012 IE00B7NK7601 2.57 (2.13) 7.39
JPY I Accumulating Class 28/03/2012 IE00B7FN4K08 1.85 (3.01) 6.19
SGD A (Monthly) Distributing Class 17/01/2014 IE00B6RMDS91 2.57 (2.07) 7.75
SGD A Accumulating Class 28/01/2014 IE00B7FN4T90 2.63 - -
USD A (Monthly) Distributing Class 22/01/2014 IE00B7FN5305 3.00 (1.32) 8.68
USD A Accumulating Class 20/12/2011 IE00B7FN4D31 2.98 (1.24) 8.63
USD A Distributing Class 30/11/2012 IE00B7FN5073 3.01 (1.27) 8.61
USD B (Monthly) Distributing Class 14/04/2014 IE00B9277773 1.36 (2.74) -
USD C Accumulating Class 21/11/2012 IE00B8DP2F62 2.31 (1.72) 7.92
USD C Distributing Class 21/11/2012 IE00B7KQ7V62 2.27 (1.75) 7.91
USD C1 Accumulating Class 02/10/2017 IE00BDFBKS67 (0.50) (2.21) 7.50
USD I Accumulating Class 20/12/2011 IE00B7FN4C24 3.64 (0.64) 9.24
USD I Distributing Class 09/01/2012 IE00B7FN4Z50 3.65 (0.66) 9.30
USD I2 Accumulating Class 05/12/2012 IE00B8110967 3.73 (0.51) 9.29
USD I2 Distributing Class 05/12/2012 IE00B8K3ZX25 3.73 (0.47) 9.38
USD M Accumulating Class 25/08/2017 IE00BDFBKT74 0.30 (1.79) 7.92
USD M Distributing Class 20/12/2017 IE00BDFBKV96 0.10 (1.82) 7.94
USD T (Monthly) Distributing Class 14/04/2014 IE00B9277997 2.30 (1.71) -
USD Z Accumulating Class 01/04/2014 IE00BKJ9TG65 4.18 0.00 9.94

FINANCIAL STATEMENTS PERFORMANCE DATA (UNAUDITED)
1744 NEUBERGER BERMAN INVESTMENT FUNDS PLC
Appendix II (Continued)
PERFORMANCE DATA (UNAUDITED) (CONTINUED)
Neuberger Berman Global Bond Fund Year Ended 31 December
2017 2017 2017
Share Class Inception Date ISIN % % %
USD A Accumulating Class 04/02/2016 IE00B87J3J52 7.91 (2.78) 6.30
USD C1 Accumulating Class 03/01/2018 IE00B8H49690 - (3.80) 5.20
USD I Accumulating Class 16/07/2012 IE00B8GFHY73 7.81 (2.38) 6.64
USD M Accumulating Class 02/07/2018 IE00BDFBKC08 - (0.60) 5.73
USD M Distributing Class 13/07/2018 IE00BDFBKD15 - (0.81) 5.60
USD Z Accumulating Class 20/01/2017 IE00BKJ9T774 7.90 (2.04) 7.19
Neuberger Berman Emerging Market Debt - Local Currency Fund
AUD B (Monthly) Distributing Class 04/06/2015 IE00BTLWS819 14.24 (11.21) 10.25
AUD B Accumulating Class 04/06/2015 IE00BTLWS702 14.18 (11.11) 10.29
AUD C2 (Monthly) Distributing Class 04/06/2015 IE00BTLWSB42 14.24 (11.21) 10.25
AUD C2 Accumulating Class 04/06/2015 IE00BTLWS926 14.18 (11.11) 10.29
AUD E (Monthly) Distributing Class 04/06/2015 IE00BTLWSD65 14.23 (11.18) 10.25
AUD E Accumulating Class 04/06/2015 IE00BTLWSC58 14.18 (11.20) 10.30
AUD T (Monthly) Distributing Class 04/06/2015 IE00BTLWSG96 15.26 (10.26) 11.40
AUD T Accumulating Class 04/06/2015 IE00BTLWSF89 15.34 (10.20) 11.36
EUR A Accumulating Class 28/06/2013 IE00B975F382 12.93 (12.32) 9.58
EUR A Accumulating Unhedged Class 04/02/2016 IE00BQR9P065 1.33 (4.73) -
EUR I Accumulating Class 28/06/2013 IE00B975F507 13.69 (11.51) 10.26
EUR I Accumulating Unhedged Class 27/06/2017 IE00BD5BKF38 (2.00) (4.08) 15.96
EUR I2 Accumulating Unhedged Class 29/12/2015 IE00BZ1J8T56 2.23 (3.84) 16.06
EUR I3 Distributing Unhedged Class 12/03/2019 IE00BJ2JSW56 - - 9.93
EUR I4 Accumulating Unhedged Class 12/12/2016 IE00BZ0BMD44 2.38 (3.77) 16.28
EUR I4 Distributing Unhedged Class 14/03/2017 IE00BYX7M324 (0.71) (3.79) 16.32
EUR I5 Accumulating Unhedged Class 29/03/2019 IE00BHR06699 - - 10.20
EUR M Accumulating Unhedged Class 18/02/2016 IE00BD9WJ778 0.54 (5.56) 14.15
EUR M Distributing Unhedged Class 18/02/2016 IE00BD9WJ885 0.65 (5.60) 14.06
GBP I Accumulating Class 22/09/2017 IE00BDZRNT61 (1.50) (10.46) 11.79
GBP I4 Accumulating Unhedged Class 02/11/2016 IE00BYX4Q207 6.53 (2.67) 9.85
GBP I4 Distributing Unhedged Class 02/11/2016 IE00BYSW3D96 6.46 (2.68) 9.69
GBP I5 Accumulating Unhedged Class 17/09/2018 IE00BFNPGD13 - 7.70 9.84
SEK A Accumulating Class 05/11/2015 IE00BYSW3401 12.59 (12.38) 9.69
SGD A (Monthly) Distributing Class 04/03/2015 IE00B99K6K59 14.53 (10.35) 12.06
USD A (Monthly) Distributing Class 31/10/2014 IE00B99K7G88 15.47 (9.25) 12.88
USD A Accumulating Class 28/06/2013 IE00B99K7H95 15.29 (9.33) 13.03
USD B (Monthly) Distributing Class 04/06/2015 IE00BTLWSH04 13.86 (10.40) 11.47
USD B Accumulating Class 04/06/2015 IE00B99K7M49 13.89 (10.49) 11.51
USD C1 Accumulating Class 03/11/2017 IE00BDFBJG72 3.90 (10.20) 11.79
USD C2 (Monthly) Distributing Class 04/06/2015 IE00BTLWSJ28 13.86 (10.40) 11.47

PERFORMANCE DATA (UNAUDITED) FINANCIAL STATEMENTS
ANNUAL REPORT 2019 1745
Appendix II (Continued)
PERFORMANCE DATA (UNAUDITED) (CONTINUED)
Neuberger Berman Emerging Market Debt - Local Currency Fund (continued) Year Ended 31 December
2017 2017 2017
Share Class Inception Date ISIN % % %
USD C2 Accumulating Class 04/06/2015 IE00B99K7Z77 13.99 (10.48) 11.50
USD E (Monthly) Distributing Class 04/06/2015 IE00BTLWSL40 13.86 (10.41) 11.47
USD E Accumulating Class 04/06/2015 IE00BTLWSK33 13.99 (10.48) 11.50
USD I (Monthly) Distributing Class 30/05/2018 IE00B9Z1CK41 - (4.92) 13.78
USD I Accumulating Class 28/06/2013 IE00B9Z1CL57 16.16 (8.61) 13.80
USD I Distributing Class 14/10/2016 IE00BYT43784 16.28 (8.62) 13.77
USD I2 Accumulating Class 13/08/2014 IE00B9Z1CN71 16.44 (8.52) 13.96
USD I4 Accumulating Class 16/11/2015 IE00BCFFTQ26 16.59 - -
USD I5 Accumulating Class 26/09/2018 IE00BYNVFZ74 - 2.10 14.20
USD M Accumulating Class 29/08/2017 IE00BDFBJH89 (0.10) (10.01) 12.01
USD M Distributing Class 01/08/2019 IE00BDFBJJ04 - - 3.40
USD T (Monthly) Distributing Class 31/03/2016 IE00BTLWSM56 15.10 (9.56) 12.61
USD T Accumulating Class 04/06/2015 IE00B9Z1CQ03 14.94 (9.59) 12.64
USD X Accumulating Class 23/10/2013 IE00B9Z1CS27 16.79 (8.27) 14.32
ZAR B (Monthly) Distributing Class 05/06/2015 IE00BTLWSP87 20.17 (7.42) 15.94
ZAR B Accumulating Class 05/06/2015 IE00BTLWSN63 20.20 (7.45) 16.02
ZAR C2 (Monthly) Distributing Class 05/06/2015 IE00BTLWSR02 20.17 (7.42) 15.91
ZAR C2 Accumulating Class 05/06/2015 IE00BTLWSQ94 20.20 (7.44) 15.99
ZAR E (Monthly) Distributing Class 05/06/2015 IE00BTLWSS19 20.18 (7.43) 15.96
ZAR E Accumulating Class 05/06/2015 IE00BTLWST26 20.21 (7.45) 16.02
ZAR T (Monthly) Distributing Class 05/06/2015 IE00BTLWSW54 21.37 (6.50) 17.12
ZAR T Accumulating Class 05/06/2015 IE00BTLWSV48 21.40 (6.51) 17.19
Neuberger Berman Emerging Market Debt - Hard Currency Fund
AUD A (Monthly) Distributing Class 26/02/2019 IE00BF0K7B44 - - 7.40
CHF P Accumulating Class 24/01/2018 IE00BFNPGF37 - (10.10) 11.46
EUR A (Monthly) Distributing Class 16/04/2018 IE00B986FR42 - (7.24) 11.09
EUR A Accumulating Class 31/05/2013 IE00B986FT65 10.96 (9.31) 11.16
EUR I Accumulating Class 31/05/2013 IE00B986G486 11.79 (8.68) 11.88
EUR I Accumulating Unhedged Class 17/09/2019 IE00BK5V1269 - - 1.40
EUR I Distributing Class 07/10/2016 IE00B986GB56 11.73 (8.66) 11.87
EUR I2 Accumulating Class 16/06/2015 IE00B986GC63 - - 0.30
EUR I2 Distributing Class 06/11/2019 IE00BK6H5655 - - 1.70
EUR I3 Accumulating Class 29/07/2016 IE00BD0PCJ82 11.98 (8.50) 12.19
EUR I3 Accumulating Unhedged Class 06/09/2019 IE00BJ7VWB39 - - 0.00
EUR I3 Distributing Class 12/03/2019 IE00BJ2JSZ87 - - 6.28
EUR I4 Accumulating Class 10/12/2015 IE00BXQ9CQ11 12.01 (8.37) 12.15
EUR I5 Accumulating Class 23/06/2014 IE00BCFFTJ58 12.11 - -
EUR M Accumulating Class 18/02/2016 IE00BSNLZN33 10.11 (10.01) 10.11

FINANCIAL STATEMENTS PERFORMANCE DATA (UNAUDITED)
1746 NEUBERGER BERMAN INVESTMENT FUNDS PLC
Appendix II (Continued)
PERFORMANCE DATA (UNAUDITED) (CONTINUED)
Neuberger Berman Emerging Market Debt - Hard Currency Fund (continued) Year Ended 31 December
2017 2017 2017
Share Class Inception Date ISIN % % %
EUR M Distributing Class 18/02/2016 IE00BSNLZP56 10.02 (10.05) 10.21
EUR P Accumulating Class 23/01/2018 IE00BFNPGG44 - (8.90) 11.96
EUR Z Accumulating Class 29/12/2017 IE00BKJB1B19 - (8.00) 12.61
GBP I Accumulating Class 16/12/2016 IE00BDDNB708 12.76 (7.63) 13.30
GBP I Distributing Class 21/02/2018 IE00BZ1D2402 - (5.65) 13.15
GBP I2 Accumulating Class 26/01/2018 IE00B986H344 - (8.00) 13.48
GBP I2 Distributing Class 06/07/2015 IE00B986H450 12.77 (7.46) 13.43
GBP P Accumulating Class 14/03/2018 IE00BF0V1041 - (5.80) 13.38
HKD A (Monthly) Distributing Class 09/01/2019 IE00BF0K7C50 - - 11.98
JPY I Accumulating Class 11/12/2017 IE00BD4H0D07 0.72 (8.32) 12.06
SEK A Accumulating Class 05/11/2015 IE00BYSW3F11 10.75 (9.39) 11.36
SGD A (Monthly) Distributing Class 17/02/2015 IE00B99K3R14 12.68 (7.44) 13.64
USD A (Monthly) Distributing Class 31/10/2014 IE00B986J720 13.11 (6.56) 14.40
USD A Accumulating Class 31/05/2013 IE00B986J944 13.24 (6.62) 14.42
USD C1 Accumulating Class 24/08/2017 IE00BDFBJ891 2.60 (7.50) 13.28
USD I Accumulating Class 31/05/2013 IE00B99K4563 14.02 (5.96) 15.29
USD I Distributing Class 31/05/2013 IE00B99K4670 14.02 (5.99) 15.26
USD I2 Accumulating Clas) 15/11/2016 IE00B99K6R29 14.22 (5.88) 15.43
USD I2 Distributing Class 20/04/2018 IE00B99K6W71 - (3.95) 15.30
USD I3 Distributing Class 20/03/2019 IE00BCFFTG28 - - 7.88
USD M Accumulating Class 25/08/2017 IE00BDFBJ909 2.50 (7.41) 13.59
USD M Distributing Class 15/09/2017 IE00BDFBJB28 1.11 (7.43) 13.46
USD P Accumulating Class 11/01/2018 IE00BTKH9G20 - (6.30) 15.26
USD Z Accumulating Class 26/04/2017 IE00BD4H0C99 7.80 (5.29) 16.06
Neuberger Berman Emerging Market Corporate Debt Fund
CHF A Accumulating Class 28/06/2013 IE00B97C6B44 5.18 (7.22) 8.51
CHF I Accumulating Class 28/06/2013 IE00B97C6C50 6.03 (6.50) 9.39
CHF I2 Accumulating Class 25/03/2015 IE00BLDYJP35 6.11 (6.30) 9.51
CHF I4 Accumulating Class 05/11/2019 IE00BK70Z858 - - 1.00
CHF I5 Accumulating Class 12/06/2014 IE00BLDYJR58 6.42 (6.12) 9.83
EUR A Accumulating Class 17/12/2015 IE00B984JD20 5.55 (6.83) 9.02
EUR I Accumulating Class 28/06/2013 IE00B984JG50 6.51 (6.11) 9.89
EUR I Distributing Class 05/12/2014 IE00B984JQ58 6.48 (6.19) 9.87
EUR I2 Accumulating Class 25/03/2015 IE00B984JS72 6.68 (6.00) 9.94
EUR I3 Accumulating Class 29/07/2016 IE00BD3H7L85 6.86 (5.85) 10.23
EUR I5 Accumulating Class 11/06/2014 IE00BCFFV337 6.93 (5.70) 10.27
EUR M Accumulating Class 18/02/2016 IE00BWB97F31 4.79 (7.65) 8.10
EUR M Distributing Class 18/02/2016 IE00BWB97G48 4.82 (7.63) 8.15

PERFORMANCE DATA (UNAUDITED) FINANCIAL STATEMENTS
ANNUAL REPORT 2019 1747
Appendix II (Continued)
PERFORMANCE DATA (UNAUDITED) (CONTINUED)
Neuberger Berman Emerging Market Corporate Debt Fund (continued) Year Ended 31 December
2017 2017 2017
Share Class Inception Date ISIN % % %
EUR X Accumulating Class 20/07/2015 IE00BXDZNR08 6.88 (5.72) 10.33
GBP I Accumulating Class 28/06/2013 IE00B984KJ54 7.29 (4.94) 11.21
GBP I2 Accumulating Class 19/03/2015 IE00B984L812 7.55 - -
GBP I5 Accumulating Class 16/06/2014 IE00BCFFV667 7.78 (4.67) 11.67
SEK A Accumulating Class 01/02/2018 IE00BYMJ8H55 - (7.33) 9.26
SGD A (Monthly) Distributing Class 01/12/2014 IE00B984LY70 7.25 (4.97) 11.52
USD A (Monthly) Distributing Class 31/10/2014 IE00B984MC26 7.68 (4.18) 12.26
USD A Accumulating Class 28/06/2013 IE00B984MH70 7.76 (4.19) 12.22
USD C1 Accumulating Class 29/08/2017 IE00BDFBJC35 1.20 (5.14) 11.15
USD I Accumulating Class 28/06/2013 IE00B984QG44 8.54 (3.36) 13.12
USD I Distributing Class 28/06/2013 IE00B984QK89 8.50 (3.41) 13.21
USD I2 Accumulating Class 25/03/2015 IE00B984N180 8.80 (3.32) 13.38
USD I5 Accumulating Class 11/06/2014 IE00BCFFV006 9.10 (3.00) 13.50
USD M Accumulating Class 03/10/2017 IE00BDFBJD42 0.70 (4.87) 11.38
USD M Distributing Class 03/11/2017 IE00BDFBJF65 0.20 (4.96) 11.24
USD Z Accumulating Class 21/10/2014 IE00B9XQXT75 9.50 (2.67) -
Neuberger Berman Strategic Income Fund
AUD A (Monthly) Distributing Class 15/09/2017 IE00BRJFZ213 0.75 (3.15) 8.49
AUD Z (Monthly) Distributing Class 01/07/2019 IE00BH3W6Z85 - - 2.29
EUR A (Monthly) Distributing Class 07/08/2017 IE00BQR9PJ58 0.36 (5.68) 6.17
EUR A Accumulating Class 04/02/2016 IE00BQR9PH35 4.16 (5.72) 6.16
EUR I Accumulating Class 22/01/2016 IE00B9154717 4.70 (5.21) 6.72
EUR M Accumulating Class 29/01/2016 IE00BWB97642 3.53 (6.26) 5.60
EUR M Distributing Class 18/02/2016 IE00BWB97758 3.64 (6.29) 5.51
GBP A (Monthly) Distributing Class 15/09/2017 IE00BRJFZD22 0.12 (4.61) 7.63
GBP I Accumulating Class 31/05/2019 IE00BDDRM243 - - 3.50
HKD A (Monthly) Distributing Class 15/09/2017 IE00BRJFZH69 0.32 (3.65) 8.72
JPY I Accumulating Class 26/04/2013 IE00B9F63958 4.78 (4.95) 6.93
JPY I Accumulating Unhedged Class 26/04/2013 IE00B9C7XK23 3.06 (5.08) 9.02
JPY I CG Distributing Class 10/08/2015 IE00BYZFYQ11 4.65 (4.95) 6.93
JPY I Distributing Class 25/06/2014 IE00BNCBRC28 4.77 (4.96) 6.93
SGD A (Monthly) Distributing Class 31/10/2014 IE00BRJFZM13 5.70 (3.92) 8.66
SGD A Accumulating Class 15/09/2017 IE00BQSBQV90 0.50 (3.88) 8.64
SGD I (Monthly) Distributing Class 04/06/2018 IE00BDFDPD26 - (1.56) 9.25
USD A (Monthly) Distributing Class 31/10/2014 IE00B7BTH691 6.17 (3.01) 9.48
USD A Accumulating Class 11/02/2015 IE00B87L2R26 6.23 (3.02) 9.45
USD A Distributing Class 10/08/2016 IE00BD0PCD21 6.12 (3.00) 9.59
USD C1 Accumulating Class 25/08/2017 IE00BDFBLQ19 0.80 (3.97) 8.37
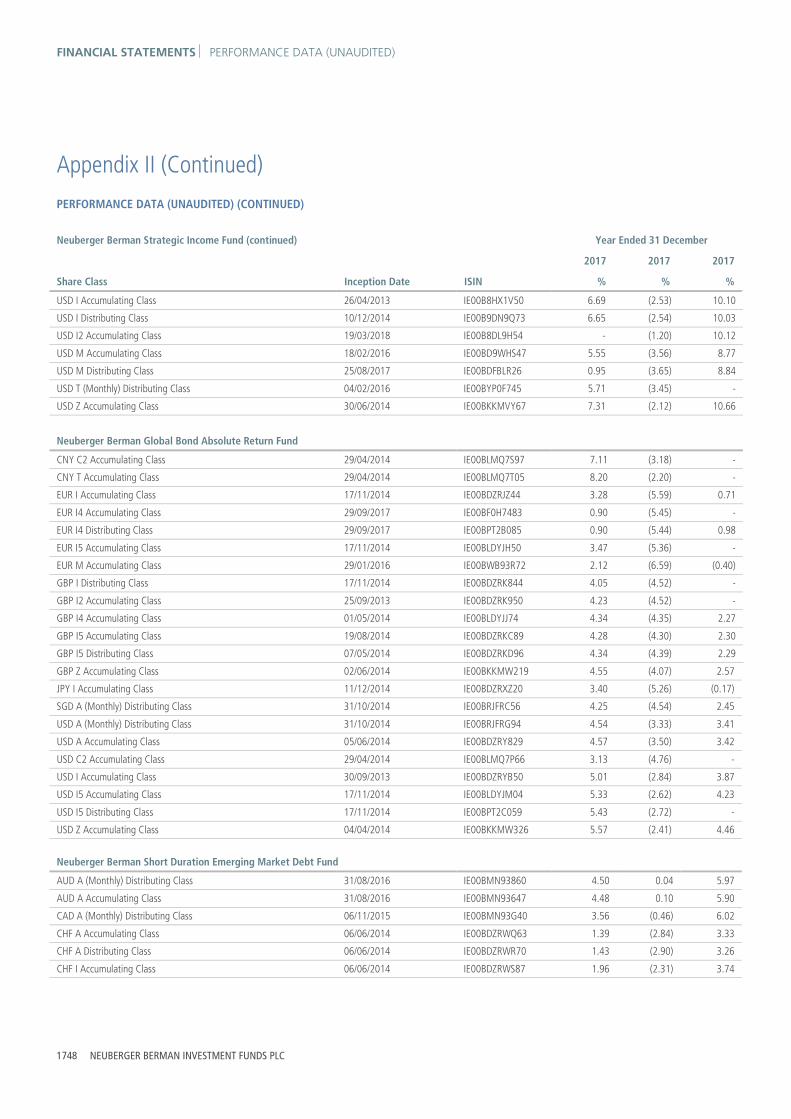
FINANCIAL STATEMENTS PERFORMANCE DATA (UNAUDITED)
1748 NEUBERGER BERMAN INVESTMENT FUNDS PLC
Appendix II (Continued)
PERFORMANCE DATA (UNAUDITED) (CONTINUED)
Neuberger Berman Strategic Income Fund (continued) Year Ended 31 December
2017 2017 2017
Share Class Inception Date ISIN % % %
USD I Accumulating Class 26/04/2013 IE00B8HX1V50 6.69 (2.53) 10.10
USD I Distributing Class 10/12/2014 IE00B9DN9Q73 6.65 (2.54) 10.03
USD I2 Accumulating Class 19/03/2018 IE00B8DL9H54 - (1.20) 10.12
USD M Accumulating Class 18/02/2016 IE00BD9WHS47 5.55 (3.56) 8.77
USD M Distributing Class 25/08/2017 IE00BDFBLR26 0.95 (3.65) 8.84
USD T (Monthly) Distributing Class 04/02/2016 IE00BYP0F745 5.71 (3.45) -
USD Z Accumulating Class 30/06/2014 IE00BKKMVY67 7.31 (2.12) 10.66
Neuberger Berman Global Bond Absolute Return Fund
CNY C2 Accumulating Class 29/04/2014 IE00BLMQ7S97 7.11 (3.18) -
CNY T Accumulating Class 29/04/2014 IE00BLMQ7T05 8.20 (2.20) -
EUR I Accumulating Class 17/11/2014 IE00BDZRJZ44 3.28 (5.59) 0.71
EUR I4 Accumulating Class 29/09/2017 IE00BF0H7483 0.90 (5.45) -
EUR I4 Distributing Class 29/09/2017 IE00BPT2B085 0.90 (5.44) 0.98
EUR I5 Accumulating Class 17/11/2014 IE00BLDYJH50 3.47 (5.36) -
EUR M Accumulating Class 29/01/2016 IE00BWB93R72 2.12 (6.59) (0.40)
GBP I Distributing Class 17/11/2014 IE00BDZRK844 4.05 (4.52) -
GBP I2 Accumulating Class 25/09/2013 IE00BDZRK950 4.23 (4.52) -
GBP I4 Accumulating Class 01/05/2014 IE00BLDYJJ74 4.34 (4.35) 2.27
GBP I5 Accumulating Class 19/08/2014 IE00BDZRKC89 4.28 (4.30) 2.30
GBP I5 Distributing Class 07/05/2014 IE00BDZRKD96 4.34 (4.39) 2.29
GBP Z Accumulating Class 02/06/2014 IE00BKKMW219 4.55 (4.07) 2.57
JPY I Accumulating Class 11/12/2014 IE00BDZRXZ20 3.40 (5.26) (0.17)
SGD A (Monthly) Distributing Class 31/10/2014 IE00BRJFRC56 4.25 (4.54) 2.45
USD A (Monthly) Distributing Class 31/10/2014 IE00BRJFRG94 4.54 (3.33) 3.41
USD A Accumulating Class 05/06/2014 IE00BDZRY829 4.57 (3.50) 3.42
USD C2 Accumulating Class 29/04/2014 IE00BLMQ7P66 3.13 (4.76) -
USD I Accumulating Class 30/09/2013 IE00BDZRYB50 5.01 (2.84) 3.87
USD I5 Accumulating Class 17/11/2014 IE00BLDYJM04 5.33 (2.62) 4.23
USD I5 Distributing Class 17/11/2014 IE00BPT2C059 5.43 (2.72) -
USD Z Accumulating Class 04/04/2014 IE00BKKMW326 5.57 (2.41) 4.46
Neuberger Berman Short Duration Emerging Market Debt Fund
AUD A (Monthly) Distributing Class 31/08/2016 IE00BMN93860 4.50 0.04 5.97
AUD A Accumulating Class 31/08/2016 IE00BMN93647 4.48 0.10 5.90
CAD A (Monthly) Distributing Class 06/11/2015 IE00BMN93G40 3.56 (0.46) 6.02
CHF A Accumulating Class 06/06/2014 IE00BDZRWQ63 1.39 (2.84) 3.33
CHF A Distributing Class 06/06/2014 IE00BDZRWR70 1.43 (2.90) 3.26
CHF I Accumulating Class 06/06/2014 IE00BDZRWS87 1.96 (2.31) 3.74

PERFORMANCE DATA (UNAUDITED) FINANCIAL STATEMENTS
ANNUAL REPORT 2019 1749
Appendix II (Continued)
PERFORMANCE DATA (UNAUDITED) (CONTINUED)
Neuberger Berman Short Duration Emerging Market Debt Fund (continued) Year Ended 31 December
2017 2017 2017
Share Class Inception Date ISIN % % %
CHF I Distributing Class 13/06/2014 IE00BDZRWT94 2.02 (2.38) 3.78
CHF I2 Accumulating Class 20/02/2015 IE00BDZRWV17 2.03 (2.27) 3.88
CHF I2 Distributing Class 18/04/2017 IE00BNJZW449 0.54 (2.21) 3.81
CHF I5 Accumulating Class 31/03/2014 IE00BDZRWX31 2.20 (2.16) 4.12
CHF I5 Distributing Class 09/10/2014 IE00BDZRWY48 2.13 - -
CHF P Accumulating Class 25/04/2017 IE00BVJF0P79 0.30 (2.29) 3.78
CHF P Distributing Class 14/07/2017 IE00BYVLFJ35 0.49 (2.26) 3.81
CNY A (Monthly) Distributing Class 10/06/2015 IE00BMN93V90 7.73 1.98 7.34
EUR A Accumulating Class 13/06/2014 IE00BDZRWZ54 1.96 (2.50) 3.75
EUR A Distributing Class 06/06/2014 IE00BDZRX078 1.89 (2.42) 3.66
EUR I Accumulating Class 06/06/2014 IE00BDZRX185 2.52 (2.08) 4.24
EUR I Accumulating Unhedged Class 11/04/2019 IE00BJ7JJS33 - - 4.70
EUR I Distributing Class 06/06/2014 IE00BDZRX292 2.51 (2.02) 4.18
EUR I2 Accumulating Class 23/06/2014 IE00BDZRX300 2.61 (1.88) 4.32
EUR I2 Distributing Class 30/03/2017 IE00BDZRX417 1.14 (1.85) 4.30
EUR I5 Accumulating Class 14/03/2014 IE00BDZRX524 2.73 (1.74) 4.47
EUR M Accumulating Class 29/01/2016 IE00BWB95M67 1.36 (3.06) 3.06
EUR M Distributing Class 29/01/2016 IE00BWB93N35 1.37 (3.12) 3.10
EUR P Accumulating Class 23/02/2017 IE00BYXJQV46 1.30 (1.97) 4.33
EUR U Accumulating Class 06/06/2018 IE00BNJZW555 - (0.40) 3.92
GBP A Accumulating Class 22/11/2016 IE00BDZRX748 2.69 (1.26) 5.00
GBP I Accumulating Class 16/12/2016 IE00BDZRX961 3.29 (0.87) 5.54
GBP I Distributing Class 20/02/2018 IE00BDZRXB85 - (0.38) 5.58
GBP I2 Accumulating Class 30/09/2016 IE00BDZRXC92 3.31 (0.68) 5.67
GBP I2 Distributing Class 19/10/2017 IE00BDZRXD00 0.10 (0.79) 5.82
GBP I5 Distributing Class 11/04/2014 IE00BDZRXG31 3.56 (0.58) 5.84
GBP P Accumulating Class 13/08/2019 IE00BGV7J266 - - 1.80
JPY I Accumulating Class 23/02/2015 IE00BDZRXK76 2.63 (1.69) 4.38
JPY I Distributing Class 22/09/2014 IE00BDZRXL83 2.63 (1.70) 4.38
SEK A Accumulating Class 02/02/2018 IE00BF18PM41 - (2.33) 3.96
SGD A (Monthly) Distributing Class 31/10/2014 IE00BMN94165 3.52 (0.49) 6.13
USD A (Monthly) Distributing Class 31/10/2014 IE00BMN94611 4.00 0.28 6.82
USD A Accumulating Class 06/12/2013 IE00BDZRXR46 3.94 0.27 6.85
USD A Distributing Class 06/06/2014 IE00BDZRXS52 3.90 0.30 6.81
USD C1 Accumulating Class 29/08/2017 IE00BFH58D19 0.20 (0.70) 5.73
USD C1 Distributing Class 29/08/2017 IE00BF2DC271 0.25 (0.74) 5.78
USD I Accumulating Class 31/10/2013 IE00BDZRXT69 4.36 0.89 7.31
USD I Distributing Class 02/06/2016 IE00BDZRXW98 4.42 0.81 7.37
USD I2 Accumulating Class 12/09/2014 IE00BDZRXY13 4.56 0.91 7.47

FINANCIAL STATEMENTS PERFORMANCE DATA (UNAUDITED)
1750 NEUBERGER BERMAN INVESTMENT FUNDS PLC
Appendix II (Continued)
PERFORMANCE DATA (UNAUDITED) (CONTINUED)
Neuberger Berman Short Duration Emerging Market Debt Fund (continued) Year Ended 31 December
2017 2017 2017
Share Class Inception Date ISIN % % %
USD I2 Distributing Class 30/10/2015 IE00BDZRY043 4.52 1.01 7.37
USD I5 Accumulating Class 19/03/2014 IE00BDZRY266 4.72 1.06 7.61
USD I5 Distributing Class 09/10/2014 IE00BDZRY597 4.68 1.12 7.55
USD M Accumulating Class 24/08/2017 IE00BDFBKQ44 0.50 (0.30) 6.09
USD M Distributing Class 29/08/2017 IE00BDFBKR50 0.34 (0.33) 6.16
USD P Accumulating Class 10/08/2015 IE00BTKH9Z19 4.51 0.92 7.36
USD Z Accumulating Class 01/04/2014 IE00BKKMWB06 4.99 1.23 7.91
Neuberger Berman Absolute Return Multi Strategy Fund
AUD Z Distributing Class 18/08/2014 IE00BFH58N17 4.72 (3.81) -
CHF I Accumulating Class 06/02/2014 IE00BDZTLL02 0.96 (7.38) 5.23
CHF I2 Accumulating Class 03/03/2016 IE00BDZTLN26 1.16 (7.27) -
EUR A Accumulating Class 22/04/2014 IE00BDZTLS70 0.65 (7.63) 4.89
EUR I Accumulating Class 12/02/2014 IE00BDZTLV00 1.39 (6.86) 5.66
EUR I2 Accumulating Class 24/09/2015 IE00BDZTLX24 1.65 (6.89) 5.88
EUR M Accumulating Class 29/01/2016 IE00BWB95T37 (0.20) (8.32) 4.00
EUR Z Accumulating Class 01/05/2014 IE00BKKN0W00 2.18 (6.29) 6.50
GBP I Accumulating Class 24/06/2014 IE00BF109M85 2.21 (5.86) 7.10
GBP I2 Accumulating Class 25/09/2014 IE00BF109P17 2.29 (5.80) 7.24
GBP I3 Accumulating Class 08/11/2013 IE00BF109S48 2.52 (5.61) 7.40
GBP Z Accumulating Class 25/04/2014 IE00BKKMWF44 3.05 (5.24) 7.92
JPY D Distributing Class 29/08/2014 IE00BNHL3T63 1.65 (6.67) 5.78
JPY D Distributing Unhedged Class 08/08/2014 IE00BNHL3R40 (0.22) (6.82) -
JPY I Accumulating Class 04/06/2014 IE00BF109W83 1.65 (6.67) 5.78
USD A Accumulating Class 04/12/2013 IE00BF10B228 2.52 (5.02) 7.98
USD I Accumulating Class 31/10/2013 IE00BF10B442 3.37 (4.34) 8.88
USD I2 Accumulating Class 24/09/2015 IE00BF10B665 3.45 (4.22) -
USD Z Accumulating Class 04/04/2014 IE00BFH59G15 4.12 (3.56) 9.73
Neuberger Berman US Long Short Equity Fund
CNY C2 Accumulating Class 29/04/2014 IE00BLMQ7L29 14.72 (7.50) -
CNY T Accumulating Class 29/04/2014 IE00BLMQ7M36 15.88 (6.58) -
EUR A Accumulating Class 06/07/2015 IE00BPRC5K89 9.57 (10.64) 12.01
EUR I Accumulating Class 01/12/2014 IE00BJTD3X67 10.48 (9.85) 13.07
EUR M Accumulating Class 04/12/2015 IE00BWB95R13 8.58 (11.43) 11.23
GBP A Accumulating Class 09/10/2017 IE00BJTD4442 2.60 (9.65) -
GBP I Accumulating Class 31/05/2019 IE00BJTD4665 - - 6.50
JPY I Accumulating Class 10/09/2014 IE00BQN1FZ16 10.52 (9.39) -
JPY I Accumulating Unhedged Class 30/04/2015 IE00BVYPC121 8.69 (9.59) -

PERFORMANCE DATA (UNAUDITED) FINANCIAL STATEMENTS
ANNUAL REPORT 2019 1751
Appendix II (Continued)
PERFORMANCE DATA (UNAUDITED) (CONTINUED)
Neuberger Berman US Long Short Equity Fund (continued) Year Ended 31 December
2017 2017 2017
Share Class Inception Date ISIN % % %
SGD A Accumulating Class 01/08/2017 IE00BVYJ5820 3.05 (8.93) -
SGD A1 Accumulating Class 31/10/2014 IE00BJTD4N35 11.42 (8.67) 14.86
USD A (PF) Accumulating Class 10/06/2015 IE00BWB95Q06 10.74 (7.56) 14.83
USD A Accumulating Class 24/02/2015 IE00BVYJ5W68 11.53 (8.01) 15.49
USD A1 Accumulating Class 03/04/2014 IE00BJTD4V19 11.79 (7.71) 15.75
USD C (PF) Accumulating Class 10/06/2015 IE00BVYPC238 10.42 (8.02) -
USD C1 Accumulating Class 11/09/2017 IE00BDFBKX11 2.50 (8.98) 14.36
USD C2 Accumulating Class 29/04/2014 IE00BLMQ7H82 10.47 (8.83) -
USD D Distributing Class 19/12/2014 IE00BSNLZV17 12.58 (7.24) 16.57
USD I (PF) Distributing Class 13/03/2015 IE00BV9FSD10 10.47 (7.20) 15.23
USD I Accumulating Class 28/02/2014 IE00BJTCX997 12.55 (7.12) 16.53
USD M Accumulating Class 09/08/2017 IE00BZ3CG435 3.50 (8.70) 14.50
USD T Accumulating Class 29/04/2014 IE00BLMQ7J07 11.60 (7.97) -
USD U Accumulating Class 06/03/2015 IE00BNJZX306 12.07 (7.57) 15.99
USD Z Accumulating Class 15/05/2014 IE00BKKN1160 14.11 (5.89) 18.08
Neuberger Berman Emerging Market Debt Blend Fund AUD I3 Distributing Class 06/11/2019 IE00BKPHTZ39 - - 1.50
CHF I2 Distributing Class 27/02/2015 IE00BMMV1M30 10.67 (7.80) 10.71
EUR A Accumulating Class 04/12/2015 IE00BK4YZ020 5.32 (6.64) 12.05
EUR I Accumulating Class 08/07/2014 IE00BK4YYZ03 6.07 (5.99) 12.83
EUR I Distributing Class 19/06/2015 IE00BY7S2G49 6.00 (5.96) 12.87
EUR I2 Accumulating Class 27/05/2014 IE00BMMV6Y07 6.14 (5.87) 13.04
EUR I2 Distributing Class 24/02/2015 IE00BMMV6Z14 6.18 (5.89) 13.00
EUR I3 Distributing Class 05/11/2019 IE00BLDYHM63 - - 1.50
EUR I4 Accumulating Class 01/09/2017 IE00BXQ9CV63 0.10 (5.69) -
EUR I4 Accumulating Unhedged Class 23/03/2017 IE00BD3WDH16 (2.60) (1.95) 15.92
EUR I5 Accumulating Class 23/04/2014 IE00BLDYHL56 6.33 (5.62) 13.33
EUR M Accumulating Class 29/01/2016 IE00BSNLZD35 4.42 (7.32) 11.13
EUR M Distributing Class 29/01/2016 IE00BSNLZF58 4.50 (7.42) 11.11
EUR Z Accumulating Class 02/06/2014 IE00BKKN1384 6.72 (5.26) 13.65
GBP I Accumulating Class 31/03/2016 IE00BK4YYR29 6.85 (4.87) 10.33
GBP I Accumulating Unhedged Class 12/04/2017 IE00BD3WDG09 (0.10) (1.10) 9.21
GBP I Distributing Class 22/05/2018 IE00BK4YYW71 - (1.30) 10.39
GBP I Distributing Unhedged Class 22/05/2018 IE00BF0V1488 - 1.86 9.16
GBP I2 Distributing Class 25/02/2015 IE00BMMV7254 8.73 (4.77) 10.67
GBP P Accumulating Class 13/05/2019 IE00BGPZW838 - - 7.60
GBP P Accumulating Unhedged Class 13/05/2019 IE00BGPZW721 - - 7.00
GBP Z Accumulating Class 17/03/2016 IE00BKKN1509 9.39 (4.17) 11.18

FINANCIAL STATEMENTS PERFORMANCE DATA (UNAUDITED)
1752 NEUBERGER BERMAN INVESTMENT FUNDS PLC
Appendix II (Continued)
PERFORMANCE DATA (UNAUDITED) (CONTINUED)
Neuberger Berman Emerging Market Debt Blend Fund (continued) Year Ended 31 December
2017 2017 2017
Share Class Inception Date ISIN % % %
NOK U Accumulating Class 13/03/2017 IE00BZCPRQ22 7.11 (5.27) 13.30
SEK A Accumulating Class 05/11/2015 IE00BMN92P65 6.55 (5.21) 14.32
SGD A (Monthly) Distributing Class 15/09/2017 IE00BMN93084 (0.43) (7.07) 11.58
SGD A Accumulating Class 15/09/2017 IE00BMN92Y56 (0.45) (7.08) -
USD A (Monthly) Distributing Class 15/09/2017 IE00BRJTF125 (0.08) (7.55) 12.83
USD A Accumulating Class 04/02/2016 IE00BK4YYX88 13.49 (7.57) 12.78
USD C1 Accumulating Class 24/08/2017 IE00BDFBKG46 1.50 (8.47) 11.63
USD I Accumulating Class 23/04/2014 IE00BK4YYS36 14.23 (6.90) 13.57
USD I Distributing Class 01/06/2016 IE00BK4YYT43 14.17 (6.91) 13.50
USD I2 Accumulating Class 24/09/2014 IE00BMN93423 14.39 (6.75) 13.69
USD I2 Distributing Class 24/02/2015 IE00BMN93530 14.41 (6.78) 13.61
USD I3 Accumulating Class 20/12/2017 IE00BD21NN56 0.60 (6.66) 13.74
USD M Accumulating Class 25/08/2017 IE00BF46ZC54 1.20 (8.30) 11.85
USD M Distributing Class 26/09/2017 IE00BDFBKH52 0.30 (8.32) 11.80
USD X Accumulating Class 27/02/2015 IE00BLDYHQ02 14.84 (6.50) -
USD Z Accumulating Class 28/09/2015 IE00BKKN1616 15.11 (6.33) 14.35
Neuberger Berman European High Yield Bond Fund
EUR A Accumulating Class 04/02/2016 IE00BNH72N19 5.67 (3.90) 10.99
EUR I Accumulating Class 27/06/2014 IE00BNH72V92 6.09 (3.26) 11.69
EUR I5 Accumulating Class 10/04/2015 IE00BNH73052 6.52 (3.01) 12.07
EUR M Accumulating Class 29/01/2016 IE00BSNLZ880 4.99 (4.49) 10.41
EUR M Distributing Class 29/01/2016 IE00BSNLZ997 4.91 (4.40) 10.28
EUR X Accumulating Class 20/02/2018 IE00BD2B9W69 - (2.60) 12.11
GBP I Accumulating Class 29/03/2019 IE00BNH73C78 - - 7.60
SGD A (Monthly) Distributing Class 09/05/2019 IE00BNH73D85 - - 6.83
SGD A Accumulating Class 09/04/2019 IE00BNH73B61 - - 7.00
USD A (Monthly) Distributing Class 31/10/2014 IE00BNH73J48 7.55 (1.16) 14.31
USD A Accumulating Class 10/01/2018 IE00BNH73H24 - (1.70) 14.24
USD I Accumulating Class 27/06/2014 IE00BNH73L69 8.22 (0.58) 15.03
USD I5 Accumulating Class 07/10/2019 IE00BYY9SH32 - - 3.50
USD X Accumulating Class 12/01/2018 IE00BD2B9Y83 - (0.60) 15.59
USD Z Accumulating Class 26/04/2019 IE00BPT29L50 - - 7.50
Neuberger Berman Global Equity Fund
USD I Accumulating Class 09/12/2014 IE00BSPLDJ33 24.72 (10.64) 27.32
Neuberger Berman Systematic Global Equity Fund
EUR M Accumulating Class 29/01/2016 IE00BYNBZH92 17.70 (13.57) 17.48
GBP I Accumulating Class 31/05/2019 IE00BSNM7308 - - 12.80

PERFORMANCE DATA (UNAUDITED) FINANCIAL STATEMENTS
ANNUAL REPORT 2019 1753
Appendix II (Continued)
PERFORMANCE DATA (UNAUDITED) (CONTINUED)
Neuberger Berman Systematic Global Equity Fund (continued) Year Ended 31 December
2017 2017 2017
Share Class Inception Date ISIN % % %
GBP Z Accumulating Class 17/03/2016 IE00BSNM7969 21.15 (10.80) -
SGD A Accumulating Class 21/04/2016 IE00BYSW3T56 20.50 (11.17) 21.02
USD A Accumulating Class* 14/08/2017 IE00BSNM7G36 23.40 (10.21) 22.11
USD I Accumulating Class 18/12/2014 IE00BSNM7J66 21.75 (9.57) 22.90
USD T Accumulating Class 04/02/2016 IE00BYP0F851 20.37 (10.60) 21.45
USD Z Accumulating Class 24/05/2016 IE00BSNM7Q34 22.61 (9.00) 23.72 * Share class closed and launched during the year ended 31 December 2017. Neuberger Berman Global Real Estate Securities Fund
EUR M Accumulating Class 29/01/2016 IE00BYNBZJ17 9.22 (9.42) 20.02
GBP Z Accumulating Class 17/03/2016 IE00BSPPW214 12.97 (6.06) 24.45
USD A Accumulating Class 09/05/2019 IE00BSPPW651 - - 10.00
USD I Accumulating Class 30/12/2014 IE00BSPPW875 13.34 (4.97) 25.96
USD I2 Accumulating Class 29/11/2017 IE00BSPPWB00 1.20 (4.94) 26.20
USD I5 Accumulating Class 03/02/2016 IE00BDD1ND45 13.74 - -
USD I5 Distributing Class 20/12/2019 IE00BL4KJW74 - - 1.30
USD M Accumulating Class 02/10/2019 IE00BF47NQ85 - - 3.60
USD T Accumulating Class 27/05/2016 IE00BYQQ4K76 12.21 - 1.67
USD Z Accumulating Class 13/02/2015 IE00BSPPWG54 14.18 (4.35) 26.99
Neuberger Berman US Small Cap Intrinsic Value Fund
USD A Accumulating Class 04/02/2016 IE00BY7S3S36 16.25 (10.08) 20.26
USD C1 Accumulating Class 13/10/2017 IE00BDFBLH28 0.90 (11.00) 19.04
USD I Accumulating Class 30/04/2015 IE00BX1D4S49 17.21 (9.32) 21.29
USD M Accumulating Class 27/05/2016 IE00BYQQ4L83 15.10 (10.97) 18.93
Neuberger Berman Global Credit Long Short Fund**
EUR A (PF) Accumulating Class 04/02/2016 IE00BZ08ZW52 1.27 - -
EUR I (PF) Accumulating Class 22/01/2016 IE00BZ08ZX69 1.76 - -
EUR M (PF) Accumulating Class 29/01/2016 IE00BYNVG093 0.30 - -
USD A (PF) (Monthly) Distributing Class 01/12/2015 IE00BYNK3V66 3.19 - -
USD I (PF) Accumulating Class 24/06/2015 IE00BYZFYM72 3.87 - -
USD I (PF) Distributing Class 24/06/2015 IE00BYZFYN89 3.97 - -
USD Z Accumulating Class 28/09/2015 IE00BZ0RDH35 5.32 - - ** Portfolio liquidated on 26 November 2018.
Neuberger Berman Asian Debt – Hard Currency Fund
SGD A (Monthly) Distributing Class 25/10/2019 IE00BYV1RM06 - - 0.95
USD A (Monthly) Distributing Class 30/06/2015 IE00BYZS6L96 6.92 (2.90) 12.70

FINANCIAL STATEMENTS PERFORMANCE DATA (UNAUDITED)
1754 NEUBERGER BERMAN INVESTMENT FUNDS PLC
Appendix II (Continued)
PERFORMANCE DATA (UNAUDITED) (CONTINUED)
Neuberger Berman Asian Debt – Hard Currency Fund (continued) Year Ended 31 December
2017 2018 2019
Share Class Inception Date ISIN % % %
USD A Accumulating Class 30/06/2015 IE00BYZS6K89 6.98 (2.91) 12.81
USD C1 Accumulating Class 15/10/2019 IE00BJ023P46 - - 1.10
USD I Accumulating Class 30/06/2015 IE00BYZS6J74 7.58 (2.26) 13.35
USD I Distributing Class 30/06/2015 IE00BYZS6M04 7.55 (2.23) 13.38
USD M Accumulating Class 14/08/2019 IE00BF47N027 - - 2.00
Neuberger Berman China Bond Fund
CNY I Accumulating Class 08/09/2015 IE00BYRGQL15 (0.92) - -
CNY I Distributing Class 08/06/2018 IE00BYRGQM22 - 3.49 7.51
CNY Z Accumulating Class 08/09/2015 IE00BYRGQQ69 (0.28) 6.02 8.22
EUR M Accumulating Unhedged Class 22/10/2018 IE00BFZ89X99 - 2.50 6.63
SGD A (Monthly) Distributing Unhedged Class 12/03/2019 IE00BHXGRN56 - - (0.61)
USD I Accumulating Unhedged Class 08/09/2015 IE00BYQX7S71 6.02 (0.39) 6.39
USD M Accumulating Unhedged Class 06/08/2019 IE00BJ7WS850 - - 3.20
USD Z Accumulating Class 29/03/2019 IE00BYRGQJ92 - - 4.40
USD Z Accumulating Unhedged Class 10/04/2018 IE00BYRGQN39 - (5.10) 6.95
Neuberger Berman Global Dynamic Asset Allocator Fund***
CNY C2 (Monthly) Distributing Class 28/06/2016 IE00BD37NR62 10.66 (5.03) -
CNY T (Monthly) Distributing Class 28/06/2016 IE00BD37NS79 11.78 (4.08) -
EUR I Accumulating Class 22/01/2016 IE00BYW8SS34 6.88 (7.28) -
EUR M Accumulating Class**** 11/05/2017 IE00BD9WHV75 2.70 (8.57) -
GBP I Accumulating Class 14/07/2016 IE00BDHBH941 7.84 (6.23) -
USD C2 (Monthly) Distributing Class 28/06/2016 IE00BD37NP49 6.53 (6.52) -
USD I Accumulating Class 30/09/2015 IE00BYVYH189 8.87 (4.54) -
USD I Distributing Class 30/09/2015 IE00BYVYH072 8.91 (4.53) -
USD T (Monthly) Distributing Class 28/06/2016 IE00BD37NQ55 7.60 (5.50) -
USD Z Accumulating Class 30/09/2015 IE00BYVYGZ54 9.61 (3.84) -
*** Portfolio liquidated on 12 April 2019. **** Share class closed and launched during the year ended 31 December 2017.
Neuberger Berman Asian Opportunities Fund*****
USD I Accumulating Class 02/11/2015 IE00BYQ5T546 43.58 (22.34) -
USD I Distributing Class 02/11/2015 IE00BYQ5T652 43.53 (22.32) -
USD M Accumulating Class 10/01/2018 IE00BF4W5M32 - (24.80) - ***** Portfolio liquidated on 24 July 2019.
Neuberger Berman Corporate Hybrid Bond Fund
AUD A (Monthly) Distributing Class 23/09/2016 IE00BD5YX427 10.68 (4.39) 13.77

PERFORMANCE DATA (UNAUDITED) FINANCIAL STATEMENTS
ANNUAL REPORT 2019 1755
Appendix II (Continued)
PERFORMANCE DATA (UNAUDITED) (CONTINUED)
Neuberger Berman Corporate Hybrid Bond Fund (continued) Year Ended 31 December
2017 2018 2019
Share Class Inception Date ISIN % % %
CHF P Accumulating Class 27/04/2017 IE00BD4H0K73 4.20 (6.72) 11.73
CHF P Distributing Class 17/06/2016 IE00BDHBH834 8.18 (6.74) 11.83
EUR A (Monthly) Distributing Class 18/07/2016 IE00BDHBH727 7.92 (6.93) 11.52
EUR A Accumulating Class 03/06/2016 IE00BYV1RN13 7.89 (6.87) 11.54
EUR I Accumulating Class 19/11/2015 IE00BZ090894 8.59 (6.38) 12.17
EUR I Distributing Class 19/11/2015 IE00BZ090902 8.52 (6.34) 12.15
EUR I2 Accumulating Class 03/02/2017 IE00BYVF7770 7.80 (6.22) 12.27
EUR I3 Accumulating Class 13/09/2016 IE00BD3H7K78 8.82 (6.26) 12.48
EUR I5 Accumulating Class 19/11/2015 IE00BZ090787 8.83 (6.00) 12.50
EUR M Accumulating Class 18/02/2016 IE00BD9WHQ23 7.24 (7.49) 10.82
EUR M Distributing Class 13/02/2017 IE00BZ0BMF67 6.31 (7.53) 10.86
EUR P Accumulating Class 27/04/2017 IE00BYVF7663 4.50 (6.32) 12.26
EUR P Distributing Class 24/06/2016 IE00BD37ND27 8.53 (6.28) 12.25
GBP I Accumulating Class 09/03/2017 IE00BYMJ8V99 6.60 (5.25) 13.56
GBP I2 Accumulating Class 15/05/2017 IE00BDRKGS35 4.40 (5.17) 13.64
GBP I2 Distributing Class 24/08/2016 IE00BZCPRS46 9.61 (5.14) 13.66
GBP P Accumulating Class 16/08/2019 IE00BH3W6W54 - - 3.00
GBP P Distributing Class 19/05/2017 IE00BD4H0M97 4.34 (5.30) 13.60
HKD A (Monthly) Distributing Class 31/10/2019 IE00BJR5T254 - - 1.15
SGD A (Monthly) Distributing Class 02/08/2019 IE00BJR5T361 - - 3.57
USD A (Monthly) Distributing Class 18/07/2016 IE00BDHBH610 10.04 (4.30) 14.79
USD A Accumulating Class 10/08/2016 IE00BD0PCH68 9.96 (4.35) 14.87
USD C1 Accumulating Class 13/12/2017 IE00BDFBJ677 0.40 (5.28) 13.67
USD I Accumulating Class 14/06/2016 IE00BDHBH503 10.65 (3.80) 15.63
USD I2 Accumulating Class 03/02/2017 IE00BDRKGR28 9.70 (3.56) 15.69
USD I2 Distributing Class 03/02/2017 IE00BD37NK93 9.72 (3.58) 15.66
USD M Accumulating Class 15/12/2017 IE00BDFBLB65 0.40 (4.88) 14.14
USD M Distributing Class 15/12/2017 IE00BDFBJ784 0.40 (4.94) 14.17
USD P Accumulating Class 05/05/2017 IE00BD4H0L80 5.30 (3.80) 15.70
USD Z Accumulating Class 20/01/2017 IE00BZ56PT19 10.20 (3.18) 16.21
Neuberger Berman US Equity Fund
USD I Accumulating Class 18/12/2015 IE00BD34ZN73 23.25 (6.77) 33.75
USD I Distributing Class 18/12/2015 IE00BD350682 23.29 (6.82) 33.75
Neuberger Berman Global High Yield Bond Fund
EUR M Accumulating Class 13/02/2017 IE00BZ0BMB20 1.40 (6.11) 9.66
EUR M Distributing Class 13/02/2017 IE00BZ0BMC37 1.39 (6.04) 9.63
EUR Z (PF) Accumulating Class 04/08/2016 IE00BD0PCC14 5.19 (4.47) 11.59

FINANCIAL STATEMENTS PERFORMANCE DATA (UNAUDITED)
1756 NEUBERGER BERMAN INVESTMENT FUNDS PLC
Appendix II (Continued)
PERFORMANCE DATA (UNAUDITED) (CONTINUED)
Neuberger Berman Global High Yield Bond Fund (continued) Year Ended 31 December
2017 2018 2019
Share Class Inception Date ISIN % % %
GBP I Accumulating Class 02/06/2017 IE00BYMJ8S60 1.30 (3.95) 12.64
GBP I2 Accumulating Class 02/06/2017 IE00BYY9SL77 1.30 (3.75) -
GBP Z (PF) Accumulating Class 20/09/2016 IE00BD0PC875 6.08 - -
USD A Accumulating Class 16/08/2016 IE00BZ090126 6.02 (2.79) 13.70
USD C1 Accumulating Class 27/08/2019 IE00BDFBKK81 - - 3.70
USD I Accumulating Class 04/08/2016 IE00BYMW5M88 6.72 (2.28) 14.38
USD M Accumulating Class 07/08/2019 IE00BDFBKL98 - - 4.40
USD M Distributing Class 29/01/2018 IE00BDFBKM06 - (4.02) 13.00
USD P Accumulating Class 09/01/2018 IE00BFNPGC06 - (2.90) 14.42
USD Z (PF) Accumulating Class 04/08/2016 IE00BD0PC982 7.19 (1.90) 15.06
USD Z Accumulating Class 04/08/2016 IE00BD0PC768 7.28 (1.72) 15.19
Neuberger Berman Global Opportunistic Bond Fund
EUR I Accumulating Class 20/12/2016 IE00BDDWGK50 3.38 (3.85) 5.51
GBP I Accumulating Class 20/12/2016 IE00BDDWGM74 4.28 (2.77) -
JPY I Accumulating Class 16/03/2017 IE00BF076293 3.68 (3.54) 6.10
USD A Accumulating Class 22/09/2017 IE00BD3WF316 1.20 (1.38) 8.82
USD C1 Accumulating Class 01/07/2019 IE00BF47NL31 - - 1.40
USD I Accumulating Class 20/12/2016 IE00BD3WD824 5.37 (1.04) 9.25
USD I Distributing Class 20/12/2016 IE00BD3WD931 5.35 (1.00) 9.22
USD I2 Accumulating Class 23/04/2018 IE00BF0V1595 - (1.10) 9.30
USD M Accumulating Class 18/12/2019 IE00BF47NM48 - - 0.10
USD Z Accumulating Class 31/07/2018 IE00BD3WDB53 - (0.80) 4.30
Neuberger Berman Multi-Asset Risk Premia Fund*
CHF A Accumulating Class 10/05/2017 IE00BYPFKB81 (2.50) (9.85) -
CHF I Accumulating Class 10/05/2017 IE00BYPFK960 (2.20) (9.51) -
CHF I2 Accumulating Class 10/05/2017 IE00BYPFKC98 (2.20) (9.41) -
EUR A Accumulating Class 10/05/2017 IE00BYPFKD06 (2.20) (9.41) -
EUR I Accumulating Class 10/05/2017 IE00BYPFKF20 (1.90) (9.17) -
EUR I2 Accumulating Class 10/05/2017 IE00BYPFKG37 (1.90) (8.97) -
EUR I5 Accumulating Class 27/04/2017 IE00BYX4PY56 (2.20) (9.00) -
EUR M Accumulating Class 01/06/2017 IE00BYMJ8L91 (1.70) (10.17) -
EUR Z Accumulating Class 23/03/2018 IE00BF0SXY31 - (7.40) -
GBP I Distributing Class 26/04/2017 IE00BD4H0J68 (1.90) (8.05) -
USD A Accumulating Class 25/01/2017 IE00BD3WDK45 (1.90) (6.93) -
USD A Distributing Class 10/05/2017 IE00BD3WDL51 (1.00) (6.97) -
USD I Accumulating Class 22/12/2016 IE00BYX4PW33 (1.90) (6.63) -
USD I Distributing Class 22/12/2016 IE00BYX4Q199 (1.90) (6.63) -

PERFORMANCE DATA (UNAUDITED) FINANCIAL STATEMENTS
ANNUAL REPORT 2019 1757
Appendix II (Continued)
PERFORMANCE DATA (UNAUDITED) (CONTINUED)
Neuberger Berman Multi-Asset Risk Premia Fund* (continued) Year Ended 31 December
2017 2018 2019
Share Class Inception Date ISIN % % %
USD I2 Accumulating Class 10/05/2017 IE00BYPFKH44 (0.70) (6.45) -
USD I2 Distributing Class 10/05/2017 IE00BYPFKJ67 (0.70) (6.45) -
USD M Accumulating Class 14/02/2017 IE00BYMJ8M09 (2.80) (7.72) -
USD X Accumulating Class 22/12/2016 IE00BYMB5811 (1.60) (6.40) -
USD Z Accumulating Class 24/01/2017 IE00BYX4Q082 (1.10) (6.17) -
* Portfolio liquidated on 26 March 2019.
Neuberger Berman Multi-Asset Class Income Fund
EUR A Distributing Class 30/12/2019 IE00BL4KJV67 - - (0.20)
EUR I Accumulating Class 13/12/2019 IE00BKTC3418 - - (0.30)
EUR M Accumulating Class 09/08/2017 IE00BYMJ8N16 2.90 (11.56) 7.69
EUR M Distributing Class 09/08/2017 IE00BYX7M100 2.87 (11.54) 7.78
GBP I Accumulating Class 31/05/2019 IE00BHR06C50 - - 5.30
USD A Accumulating Class 28/02/2018 IE00BYW7V037 - (5.80) 12.00
USD C1 Accumulating Class 01/03/2018 IE00BF47NK24 - (6.10) 10.86
USD I Accumulating Class 28/12/2016 IE00BYX4Q314 11.18 (7.54) 12.72
USD I Distributing Class 28/12/2016 IE00BYX4Q421 11.22 (7.60) 12.75
USD M Accumulating Class 09/08/2017 IE00BYMJ8K84 3.70 (8.78) 11.10
Neuberger Berman US Equity Index PutWrite Fund
EUR I Accumulating Class 13/02/2017 IE00BYX7LW42 6.30 (9.22) 11.71
EUR I3 Accumulating Class 04/08/2017 IE00BDDWGG15 2.40 (9.08) -
EUR I4 Accumulating Class 28/04/2017 IE00BD4H0968 4.80 (9.06) 11.96
EUR M Accumulating Class 13/02/2017 IE00BYX7LX58 5.00 (10.48) 10.00
GBP I Accumulating Class 12/07/2017 IE00BF0K7926 3.30 (8.33) 13.09
GBP I Accumulating Unhedged Class 02/03/2017 IE00BYWPKN37 (2.40) (0.82) 10.64
GBP I4 Accumulating Class 28/04/2017 IE00BD4H0851 5.30 (7.98) 13.31
GBP I4 Accumulating Unhedged Class 25/10/2017 IE00BYXH8345 (0.30) (0.60) 10.90
GBP I4 Distributing Class 05/05/2017 IE00BD3DV701 5.20 (8.10) 13.34
JPY I Accumulating Class 05/07/2017 IE00BD5BKD14 3.45 - -
SGD A (Monthly) Distributing Class 15/08/2017 IE00BDRKGH20 2.09 (8.08) 13.44
USD A (Monthly) Distributing Class 13/08/2018 IE00BDRKGF06 - (7.90) 14.38
USD A Accumulating Class 23/01/2017 IE00BDDWGC76 8.80 (7.26) 14.47
USD C1 Accumulating Class 18/12/2017 IE00BDFBKW04 (0.20) (8.12) 13.30
USD I (Monthly) Distributing Class 18/05/2017 IE00BD461232 6.47 (6.60) 15.00
USD I Accumulating Class 30/12/2016 IE00BDDWG831 10.80 (6.68) 15.09
USD I Distributing Class 30/12/2016 IE00BDDWGB69 10.80 (6.68) -
USD I3 Accumulating Class 24/08/2018 IE00BYXH8121 - (8.60) 15.32
USD I4 Accumulating Class 28/04/2017 IE00BD4H0B82 6.10 (6.41) 15.41

FINANCIAL STATEMENTS PERFORMANCE DATA (UNAUDITED)
1758 NEUBERGER BERMAN INVESTMENT FUNDS PLC
Appendix II (Continued)
PERFORMANCE DATA (UNAUDITED) (CONTINUED)
Neuberger Berman US Equity Index PutWrite Fund (continued) Year Ended 31 December
2017 2018 2019
Share Class Inception Date ISIN % % %
USD I4 Distributing Class 25/09/2018 IE00BYVNDF13 - (9.27) 15.47
USD M Accumulating Class 13/02/2017 IE00BYX7LY65 6.70 (7.87) 13.43
USD P Accumulating Class 08/10/2018 IE00BF0V0H42 - (8.60) 15.10
USD Z Accumulating Class 10/02/2017 IE00BDDWGF08 8.80 (6.07) 15.66
Neuberger Berman Global Equity Index PutWrite Fund
AUD I5 (Monthly) Distributing Class 13/06/2017 IE00BF0P1H35 4.84 (7.26) -
AUD I5 Accumulating Class 13/06/2017 IE00BF0P1F11 4.90 (7.34) -
AUD X (Monthly) Distributing Class 13/06/2017 IE00BF0P1G28 4.43 (8.03) -
AUD X Accumulating Class 13/06/2017 IE00BF0P1D96 4.40 (8.05) 10.73
CHF I Distributing Class 03/11/2017 IE00BD93YN15 0.50 (10.12) 8.73
CHF I5 Accumulating Class 13/06/2017 IE00BYPFK747 3.30 (9.87) 9.13
CHF I5 Distributing Class 24/07/2017 IE00BF2D6P81 2.30 (9.80) 9.11
CHF X Accumulating Class 13/06/2017 IE00BF0P1064 2.80 (10.60) 8.16
CHF X Distributing Class 24/07/2017 IE00BF2D6Q98 2.00 (10.59) 8.23
EUR A Accumulating Class 30/05/2017 IE00BD4H0H45 3.10 (10.48) 8.45
EUR I Accumulating Class 13/11/2017 IE00BD4H0F21 0.80 (9.82) 9.02
EUR I5 (Monthly) Distributing Class 13/06/2017 IE00BF0P1395 3.41 (9.54) 9.52
EUR I5 Accumulating Class 25/05/2017 IE00BYWPKL13 3.80 (9.54) 9.48
EUR M Accumulating Class 30/05/2017 IE00BD4H0G38 2.60 (11.21) 7.57
EUR X (Monthly) Distributing Class 13/06/2017 IE00BF0P1288 3.00 (10.31) 8.51
EUR X Accumulating Class 13/06/2017 IE00BF0P1171 3.00 (10.29) 8.55
EUR Z Accumulating Class 16/06/2017 IE00BF5M5113 3.60 (9.27) 9.79
GBP I Accumulating Class 12/07/2017 IE00BF0K7819 3.20 (8.82) 10.52
GBP I5 Accumulating Class 13/06/2017 IE00BYWPKM20 3.80 (8.57) 10.96
GBP I5 Distributing Class 13/06/2017 IE00BF0P1627 4.00 (8.60) 10.84
GBP X Accumulating Class 13/06/2017 IE00BF0P1403 3.50 (9.28) -
GBP X Distributing Class 13/06/2017 IE00BF0P1510 3.50 (9.27) -
HKD I5 (Monthly) Distributing Class 13/06/2017 IE00BF0P1M87 4.12 (7.51) -
HKD I5 Accumulating Class 13/06/2017 IE00BF0P1K63 4.10 (7.49) -
HKD X (Monthly) Distributing Class 13/06/2017 IE00BF0P1L70 3.61 (8.29) -
HKD X Accumulating Class 13/06/2017 IE00BF0P1J58 3.60 (8.30) -
SGD A (Monthly) Distributing Class 15/08/2017 IE00BD3DVD60 2.70 (8.72) 10.82
SGD I5 (Monthly) Distributing Class 13/06/2017 IE00BF0P1S40 4.33 (7.79) -
SGD I5 Accumulating Class 13/06/2017 IE00BF0P1Q26 4.35 (7.81) 11.90
SGD X (Monthly) Distributing Class 13/06/2017 IE00BF0P1R33 3.92 (8.55) 10.94
SGD X Accumulating Class 13/06/2017 IE00BF0P1P19 3.90 (8.57) 11.00
USD A Accumulating Class 30/05/2017 IE00BYWPKH76 4.40 (7.85) 11.75
USD C1 Accumulating Class 26/03/2018 IE00BF47NG87 - (5.00) 10.63

PERFORMANCE DATA (UNAUDITED) FINANCIAL STATEMENTS
ANNUAL REPORT 2019 1759
Appendix II (Continued)
PERFORMANCE DATA (UNAUDITED) (CONTINUED)
Neuberger Berman Global Equity Index PutWrite Fund (continued) Year Ended 31 December
2017 2018 2019
Share Class Inception Date ISIN % % %
USD I Accumulating Class 03/05/2017 IE00BYWPKF52 5.90 (7.27) 12.42
USD I Distributing Class 03/05/2017 IE00BYWPKG69 5.90 (7.15) 12.40
USD I5 (Monthly) Distributing Class 13/06/2017 IE00BF0P1C89 4.73 (6.94) 12.81
USD I5 Accumulating Class 13/06/2017 IE00BYWPKK06 4.60 (6.88) 12.83
USD I5 Distributing Class 13/06/2017 IE00BYPFK853 4.70 (6.89) 12.83
USD X (Monthly) Distributing Class 13/06/2017 IE00BF0P1B72 4.23 (7.70) 12.01
USD X Accumulating Class 13/06/2017 IE00BF0P1734 4.10 (7.68) 11.97
USD X Distributing Class 13/06/2017 IE00BF0P1841 4.20 (7.57) 11.91
USD Z Accumulating Class 18/08/2017 IE00BYWPKJ90 3.80 (6.55) 13.20
Neuberger Berman Uncorrelated Strategies Fund
CHF I Accumulating Class 13/03/2018 IE00BF2F4M73 - (3.30) (1.14)
CHF I5 Accumulating Class 08/09/2017 IE00BZ3CG211 1.80 (2.75) (0.71)
EUR A Accumulating Class 20/08/2018 IE00BDC3ND11 - (4.10) (1.36)
EUR I Accumulating Class 06/03/2018 IE00BF2F4L66 - (2.80) (0.62)
EUR I2 Accumulating Class 06/07/2017 IE00BD5BKL97 2.30 (2.44) (0.50)
EUR I5 Accumulating Class 31/05/2017 IE00BF076079 2.60 (2.24) (0.20)
EUR M Accumulating Class 15/09/2017 IE00BDC3NF35 0.90 (4.06) (2.17)
GBP I Accumulating Class 30/06/2017 IE00BF47M490 3.10 (1.55) 0.79
GBP I2 Accumulating Class 06/07/2017 IE00BD5BKG45 2.70 (1.46) 0.99
GBP I5 Accumulating Class 31/05/2017 IE00BF076186 3.10 (1.16) 1.18
GBP P Accumulating Class 02/10/2018 IE00BFXBF434 - (1.80) 0.81
GBP Z Accumulating Class 29/06/2017 IE00BYQDD455 3.60 (0.77) 1.56
SGD A Accumulating Class 06/11/2018 IE00BGR6TZ09 - (1.05) 0.91
USD A Accumulating Class 26/01/2018 IE00BF076L85 - (1.70) 1.53
USD C1 Accumulating Class 06/03/2018 IE00BYW7V144 - (2.00) 0.51
USD I Accumulating Class 31/05/2017 IE00BF075X33 3.60 (0.10) 2.32
USD I2 Accumulating Class 06/07/2017 IE00BD5BKM05 3.20 0.00 2.52
USD I5 Accumulating Class 31/05/2017 IE00BF07FG69 3.80 0.29 2.69
USD M Accumulating Class 09/08/2017 IE00BZ3CG328 1.80 (1.67) 0.80
USD P Accumulating Class 12/12/2018 IE00BFZPTC98 - 0.60 2.39
USD Z Accumulating Class 08/09/2017 IE00BF23SS52 2.60 0.68 3.10
Neuberger Berman Emerging Market Debt Blend Investment Grade Fund
EUR I5 Distributing Class 29/11/2018 IE00BYT26Y08 - 1.60 13.84
GBP I5 Distributing Class 29/11/2018 IE00BFWY3R22 - 1.90 12.78
NOK I Accumulating Class 09/05/2018 IE00BYT26W83 - 1.14 12.75
NOK U Accumulating Class 22/01/2018 IE00BD9FZX49 - (2.93) 12.43
USD I Accumulating Class 10/07/2017 IE00BD3DV032 4.70 (3.06) 15.07

FINANCIAL STATEMENTS PERFORMANCE DATA (UNAUDITED)
1760 NEUBERGER BERMAN INVESTMENT FUNDS PLC
Appendix II (Continued)
PERFORMANCE DATA (UNAUDITED) (CONTINUED)
Neuberger Berman Emerging Market Debt Blend Investment Grade Fund (continued) Year Ended 31 December
2017 2018 2019
Share Class Inception Date ISIN % % %
USD I5 Accumulating Class 10/07/2017 IE00BD3DV693 4.90 (2.86) 15.51
USD Z Accumulating Class 02/11/2017 IE00BD3DV362 1.60 (2.56) 15.76
Neuberger Berman Emerging Markets Sustainable Equity Fund
EUR M Accumulating Unhedged Class 19/10/2018 IE00BFZ89Y07 - 1.80 19.55
JPY I Accumulating Unhedged Class 03/12/2018 IE00BG365X48 - (7.49) 18.26
USD A Accumulating Class 29/10/2018 IE00BZ3CFX52 - 6.70 18.37
USD I Accumulating Class 24/10/2017 IE00BZ3CFW46 5.40 (16.22) 19.48
USD I Distributing Class 24/10/2017 IE00BZ3CFV39 5.40 (16.22) 19.39
USD I5 Accumulating Class 22/11/2017 IE00BZ3CFZ76 (0.30) (15.85) 19.90
Neuberger Berman China Equity Opportunities Fund
EUR M Accumulating Unhedged Class 19/10/2018 IE00BFZ89W82 - (2.80) 26.13
USD A Accumulating Class 11/05/2018 IE00BFNKN794 - (26.50) 25.17
USD C1 Accumulating Class 14/05/2018 IE00BFNKN802 - (27.40) 23.97
USD I Accumulating Class 15/12/2017 IE00BYWSP828 3.40 (24.76) 26.22
USD I Distributing Class 15/12/2017 IE00BYWSP711 3.40 (24.76) 26.22
USD M Accumulating Class 20/05/2019 IE00BFNKN919 - - 9.00
Neuberger Berman Multi-Asset Class Growth Fund
EUR M Accumulating Class 19/10/2018 IE00BFZ8B003 - (6.10) 4.58
GBP I Accumulating Class 31/05/2019 IE00BHR06707 - - 4.80
USD I Accumulating Class 22/12/2017 IE00BYWRVS11 0.00 (6.10) 9.48
USD I Distributing Class 22/12/2017 IE00BYWSNW22 0.00 (6.10) 9.48
Neuberger Berman Global Thematic Equity Fund1
EUR M Accumulating Unhedged Class 19/10/2018 IE00BFZ89Z14 - (9.00) 30.22
USD A Accumulating Class 27/04/2018 IE00BFMHRM44 - (14.60) 29.04
USD C1 Accumulating Class 27/04/2018 IE00BFMHRS06 - (15.10) 27.80
USD I Accumulating Class 27/04/2018 IE00BFMHRK20 - (14.00) 30.35
USD I Distributing Class 27/04/2018 IE00BFMHRL37 - (14.00) 30.32
USD M Accumulating Class 27/04/2018 IE00BFMHRT13 - (15.10) 27.80
Neuberger Berman CLO Income Fund1
EUR I Accumulating Class 12/07/2018 IE00BG7PQ018 - (8.10) 8.38
EUR I2 Distributing Class 15/11/2018 IE00BD102V45 - (9.70) 8.74
GBP I Accumulating Class 12/07/2018 IE00BG7PQ125 - (7.70) 9.97
GBP I2 Distributing Class 15/11/2018 IE00BD102W51 - (9.50) 10.11
GBP I5 Distributing Class 12/07/2018 IE00BD5KHL59 - (7.50) 10.36

PERFORMANCE DATA (UNAUDITED) FINANCIAL STATEMENTS
ANNUAL REPORT 2019 1761
Appendix II (Continued)
PERFORMANCE DATA (UNAUDITED) (CONTINUED)
Neuberger Berman CLO Income Fund1 (continued) Year Ended 31 December
2017 2018 2019
Share Class Inception Date ISIN % % %
GBP Z Accumulating Class 12/12/2019 IE00BHR46W74 - - 1.60
SEK I Accumulating Class 12/07/2018 IE00BG7P3L15 - (8.26) 8.76
USD I Accumulating Class 12/07/2018 IE00BF4NG566 - (7.00) 11.83
USD I2 Distributing Class 21/03/2019 IE00BHXGRM40 - - 4.76
USD I5 Distributing Class 12/07/2018 IE00BG7P3H78 - (6.79) 12.23
USD Z Accumulating Class 18/04/2019 IE00BG7PPZ91 - - 4.70
Neuberger Berman China A-Share Opportunities Fund1*
USD I Accumulating Class 26/07/2018 IE00BFYFHQ08 - (20.30) -
USD I Distributing Class 26/07/2018 IE00BFYFHR15 - (20.30) -
* Portfolio liquidated on 6 December 2019.
Neuberger Berman Next Generation Mobility Fund1
AUD X Accumulating Class 23/01/2019 IE00BGV7KH84 - - 22.10
EUR A Accumulating Class 07/09/2018 IE00BD6J9V56 - (19.30) 25.03
EUR M Accumulating Unhedged Class 26/10/2018 IE00BD6JB422 - (5.70) 30.22
EUR X Accumulating Class 23/01/2019 IE00BGQVT674 - - 20.10
GBP I Accumulating Class 31/05/2019 IE00BHR06582 - - 22.70
GBP X Accumulating Class 23/01/2019 IE00BGQVXZ48 - - 21.20
HKD X Accumulating Unhedged Class 23/01/2019 IE00BGV7KG77 - - 22.70
SGD X Accumulating Class 23/01/2019 IE00BGV7KJ09 - - 22.50
USD A Accumulating Class 11/09/2018 IE00BD6J9T35 - (18.50) 28.96
USD C1 Accumulating Class 21/05/2019 IE00BHR06368 - - 17.00
USD I Accumulating Class 21/08/2018 IE00BFY81J05 - (20.30) 29.99
USD I Distributing Class 21/08/2018 IE00BFLTYG40 - (20.30) 29.99
USD M Accumulating Class 21/05/2019 IE00BHR06475 - - 17.10
USD X Accumulating Class 23/01/2019 IE00BGQVSN72 - - 23.60
Neuberger Berman Ultra Short Term Euro Bond Fund1
CHF U Accumulating Class 17/12/2019 IE00BL1GVV11 - - (0.01)
EUR I Accumulating Class 31/10/2018 IE00BFZMJT78 - (0.19) 1.65
EUR I Distributing Class 31/10/2018 IE00BFZMJS61 - (0.19) 1.68
EUR I5 Accumulating Class 06/02/2019 IE00BHR3GK28 - - 1.51
EUR U Accumulating Class 17/12/2019 IE00BL1GVT98 - - 0.01
EUR Z Accumulating Class 20/12/2018 IE00BH453S87 - (0.01) 1.84
USD M Accumulating Class 05/08/2019 IE00BJ7WS967 - - 1.37
USD Z Accumulating Class 24/01/2019 IE00BH453T94 - - 4.47

FINANCIAL STATEMENTS PERFORMANCE DATA (UNAUDITED)
1762 NEUBERGER BERMAN INVESTMENT FUNDS PLC
Appendix II (Continued)
PERFORMANCE DATA (UNAUDITED) (CONTINUED)
Neuberger Berman Euro Opportunistic Bond Fund1 Year Ended 31 December
2017 2018 2019
Share Class Inception Date ISIN % % %
EUR I Accumulating Class 14/11/2018 IE00BD9GYJ62 - 1.00 8.12
EUR I Distributing Class 14/11/2018 IE00BFZMGH42 - 1.00 8.07
Neuberger Berman Euro Bond Absolute Return Fund1
EUR I Accumulating Class 29/11/2018 IE00BFZMG962 - 0.30 3.79
EUR I Distributing Class 29/11/2018 IE00BFZMGB89 - 0.30 3.78
EUR I5 Accumulating Class 28/03/2019 IE00BGL9FP72 - - 3.70
USD Z Accumulating Class 22/11/2019 IE00BHXMF734 - - 1.30
Neuberger Berman Absolute Alpha Fund2
EUR I Accumulating Class 13/12/2019 IE00BKTC3525 - - 0.10
EUR M Accumulating Class 30/07/2019 IE00BJH7GQ41 - - (4.70)
EUR M Accumulating Unhedged Class 27/03/2019 IE00BJH7GP34 - - (5.40)
GBP Z Accumulating Class 10/12/2019 IE00BHR46X81 - - 1.00
SGD A Accumulating Class 17/09/2019 IE00BJ023Q52 - - (2.25)
USD A Accumulating Class 20/02/2019 IE00BJCYZD00 - - (5.10)
USD I Accumulating Class 20/02/2019 IE00BHSR8M95 - - (4.40)
Neuberger Berman Multi-Style Premia Fund2
EUR I Accumulating Class 16/12/2019 IE00BKTC3632 - - (1.10)
USD I Accumulating Class 01/03/2019 IE00BF0V0639 - - 5.40
USD I Distributing Class 01/03/2019 IE00BF0V0746 - - 5.40
USD Z Accumulating Class 30/10/2019 IE00BF0V0969 - - 0.10
Neuberger Berman Macro Opportunities FX Fund2
EUR I Accumulating Class 04/12/2019 IE00BK70Z635 - - 0.10
GBP Z Accumulating Class 04/12/2019 IE00BG0WMX45 - - 0.20
SEK I Accumulating Class 11/12/2019 IE00BK70Z742 - - 0.01
SEK I Distributing Class 11/12/2019 IE00BL1GVW28 - - 0.01
USD I Accumulating Class 04/12/2019 IE00BK70Z528 - - 0.30
USD X Accumulating Class 04/12/2019 IE00BK96H638 - - 0.30
USD Z Accumulating Class 04/12/2019 IE00BK70Z411 - - 0.30
1 Portfolio launched during the prior reporting year. 2 Portfolio launched during the current reporting year.

INFORMATION ON GLOBAL EXPOSURE (UNAUDITED) FINANCIAL STATEMENTS
ANNUAL REPORT 2019 1763
Appendix III INFORMATION ON GLOBAL EXPOSURE (UNAUDITED)
Measurement of Market Risk and Leverage using the Commitment Approach and VaR
The Portfolios will seek to limit the market risk and leverage created through the use of derivatives by using either the commitment approach or by using a sophisticated risk measurement technique known as value-at-risk (“VaR”). The Neuberger Berman High Yield Bond Fund, Neuberger Berman US Multi Cap Opportunities Fund, Neuberger Berman US Real Estate Securities Fund, Neuberger Berman China Equity Fund, Neuberger Berman Emerging Markets Equity Fund, Neuberger Berman US Small Cap Fund, Neuberger Berman Short Duration High Yield Bond Fund, Neuberger Berman Short Duration Emerging Market Debt Fund, Neuberger Berman European High Yield Bond Fund, Neuberger Berman Global Equity Fund, Neuberger Berman Systematic Global Equity Fund, Neuberger Berman Global Real Estate Securities Fund, Neuberger Berman US Small Cap Intrinsic Value Fund, Neuberger Berman Corporate Hybrid Bond Fund, Neuberger Berman US Equity Fund, Neuberger Berman Global High Yield Bond Fund, Neuberger Berman Emerging Markets Sustainable Equity Fund, Neuberger Berman China Equity Opportunities Fund, Neuberger Berman Global Thematic Equity Fund, Neuberger Berman CLO Income Fund and Neuberger Berman Next Generation Mobility Fund use the commitment approach. The commitment approach calculates leverage by measuring the market value of the underlying exposures of derivatives relative to the relevant Portfolio’s NAV but such leverage will not exceed the Portfolio’s Net Asset Value at any time.
A Portfolio may use an “absolute” VaR model where the measurement of VaR is relative to the NAV of the Portfolio or the Portfolio may use a relative VaR model where the measurement of VaR is relative to a derivatives free comparable benchmark or equivalent portfolio. The model used by certain Portfolios is noted in the subsequent chart labeled VaR analysis. The VaR methodology used is subject to several limitations. First, VaR is based on a model of stock price returns which uses risk factors. To the extent that there are missing risk factors, mis-specified risk factors, or risk factors which are not predictive, the VaR may not be indicative of future risk. Also, the returns to various risk factors are not directly observable in the market and must be estimated using statistical techniques. To the extent that these estimates may be imprecise, the VaR may not be indicative of future risk. In addition, the co-variance between the risk factors is estimated over a particular historical time period. To the extent that the future time period may be different from the historical time period, the VaR may not be indicative of future risk. For these reasons, VaR may be more useful as a relative measure of risk among Portfolios, rather than as an absolute measure of risk
A number of calculation standards are employed for the Portfolios using the VaR model. However, these calculation standards are dealt with in more detail in the risk management process of the Portfolio and may change from time to time at the discretion of the Investment Manager and in accordance with the requirements of the Central Bank.
The tables below detail the maximum, minimum and average usage of regulatory limit calculated during the year ended 31 December 2019 for each Portfolio using VaR:
Portfolio Market Risk Observed VaR at
31 December 2019
Maximum usage of Regulatory
Limit
Minimum usage of Regulatory
Limit Average usage of Regulatory Limit
Neuberger Berman Diversified Currency Fund Absolute VaR 1.27% 10.1% 4.6% 6.6%
Neuberger Berman Global Bond Fund Relative VaR 103.2 55.8% 49.5% 51.5%
Neuberger Berman Emerging Market Debt - Local Currency Fund Relative VaR 143.5 75.0% 53.2% 70.7%
Neuberger Berman Emerging Market Debt - Hard Currency Fund Relative VaR 118.7 81.8% 56.5% 63.0%
Neuberger Berman Emerging Market Corporate Debt Fund Relative VaR 100.3 87.4% 48.0% 63.9%
Neuberger Berman Strategic Income Fund Relative VaR 83.6 78.1% 41.2% 53.6%
Neuberger Berman Global Bond Absolute Return Fund Absolute VaR 3.54% 22.9% 10.6% 17.7%
Neuberger Berman Absolute Return Multi Strategy Fund Absolute VaR 2.72% 29.5% 6.7% 12.3%
Neuberger Berman US Long Short Equity Fund Absolute VaR 5.21% 34.3% 24.5% 26.8%
Neuberger Berman Emerging Market Debt Blend Fund Relative VaR 146.0 83.9% 59.6% 76.4%
Neuberger Berman Asian Debt - Hard Currency Fund Relative VaR 112.4 89.5% 54.6% 60.2%
Neuberger Berman China Bond Fund Relative VaR 71.2 51.7% 27.9% 38.2%
Neuberger Berman Global Opportunistic Bond Fund Relative VaR 76.6 84.9% 36.1% 56.5%
Neuberger Berman Multi-Asset Class Income Fund Absolute VaR 6.85% 37.1% 12.2% 28.7%
Neuberger Berman US Equity Index PutWrite Fund Absolute VaR 6.29% 62.2% 24.1% 41.2%

FINANCIAL STATEMENTS INFORMATION ON GLOBAL EXPOSURE (UNAUDITED)
1764 NEUBERGER BERMAN INVESTMENT FUNDS PLC
Appendix III (Continued) INFORMATION ON GLOBAL EXPOSURE (UNAUDITED) (CONTINUED)
Portfolio Market Risk Observed VaR at
31 December 2019
Maximum usage of Regulatory
Limit
Minimum usage of Regulatory
Limit Average usage of Regulatory Limit
Neuberger Berman Global Equity Index PutWrite Fund Absolute VaR 4.31% 72.6% 17.3% 26.7%
Neuberger Berman Uncorrelated Strategies Fund Absolute VaR 1.11% 35.8% 5.4% 12.6% Neuberger Berman Emerging Market Debt Blend Investment Grade Fund
Relative VaR 107.6 55.6% 50.3% 52.9%
Neuberger Berman Multi-Asset Class Growth Fund Absolute VaR 5.67% 34.3% 9.4% 26.9%
Neuberger Berman Ultra Short Term Euro Bond Fund Absolute VaR 1.77% 37.7% 3.5% 13.9%
Neuberger Berman Euro Opportunistic Bond Fund Relative VaR 177.3 99.2% 36.5% 79.4%
Neuberger Berman Euro Bond Absolute Return Fund Absolute VaR 4.44% 50.9% 17.0% 28.2%
Neuberger Berman Absolute Alpha Fund Absolute VaR 9.03% 55.0% 4.2% 32.9%
Neuberger Berman Macro Opportunities FX Fund Absolute VaR 4.49% 22.7% 21.1% 22.4%
Depending on market conditions, the Portfolios may employ leverage from time to time. In this context, “leverage” is calculated, in accordance with the requirements of the Central Bank, as the sum of the notionals of the derivatives used. Applying this calculation method, it is possible for the leverage of the Portfolios to be as high as 2 times (200 percent) of the Net Asset Value of the Portfolios. The disclosed level of leverage is not intended to be an additional risk exposure limit for the Portfolios. Furthermore, it is not intended that the leverage level by itself be indicative of the risk profile of the Portfolios. The table below details the level of leverage employed during the year ended 31 December 2019 and is calculated as the sum of the absolute value of the notionals of the derivatives used and expressed as a percentage of the Net Asset Value:
Portfolio 31 December 2019
Neuberger Berman Diversified Currency Fund 438%
Neuberger Berman Global Bond Fund 221%
Neuberger Berman Emerging Market Debt - Local Currency Fund 286%
Neuberger Berman Emerging Market Debt - Hard Currency Fund 133%
Neuberger Berman Emerging Market Corporate Debt Fund 111%
Neuberger Berman Strategic Income Fund 159%
Neuberger Berman Global Bond Absolute Return Fund 526%
Neuberger Berman Absolute Return Multi Strategy Fund 176%
Neuberger Berman US Long Short Equity Fund 125%
Neuberger Berman Emerging Market Debt Blend Fund 217%
Neuberger Berman Asian Debt - Hard Currency Fund 113%
Neuberger Berman China Bond Fund 134%
Neuberger Berman Global Opportunistic Bond Fund 413%
Neuberger Berman Multi-Asset Class Income Fund 349%
Neuberger Berman US Equity Index PutWrite Fund 134%
Neuberger Berman Global Equity Index PutWrite Fund 134%
Neuberger Berman Uncorrelated Strategies Fund 809%
Neuberger Berman Emerging Market Debt Blend Investment Grade Fund 179%
Neuberger Berman Multi-Asset Class Growth Fund 442%
Neuberger Berman Ultra Short Term Euro Bond Fund 122%
Neuberger Berman Euro Opportunistic Bond Fund 167%
Neuberger Berman Euro Bond Absolute Return Fund 386%
Neuberger Berman Absolute Alpha Fund 190%
Neuberger Berman Multi-Style Premia Fund 327%

SECURITIES FINANCING TRANSACTION REGULATION (UNAUDITED) FINANCIAL STATEMENTS
ANNUAL REPORT 2019 1765
Appendix IV SECURITIES FINANCING TRANSACTION REGULATION (UNAUDITED) Securities Financing Transaction Regulation (“SFTR”) introduces reporting requirements for securities financing transactions (“SFTs”) and total return swaps. A Securities Financing Transaction (SFT) is defined as per Article 3(11) of the SFTR as:
a repurchase/reverse repurchase agreement securities or commodities lending and securities or commodities borrowing a buy-sell back transaction or sell-buy back transaction, or a margin lending transaction
As at 31 December 2019 the following Portfolios held total return swaps as types of instruments under the scope of the SFTR: Neuberger Berman US Long Short Equity Fund Neuberger Berman Multi-Asset Class Income Fund Neuberger Berman Multi-Asset Class Growth Fund Neuberger Berman US Long Short Equity Fund Global Data: The amount of assets across total return swaps as at 31 December 2019 was as follows:
Type of Asset Amount US$ Proportion of NAV (%)Total Return Swaps – Assets 2,691 0.00%Total Return Swaps - Liabilities 1,758,261 1.14%
Data on Reuse of Collateral: Cash collateral is received into the custody account for the Portfolio and therefore is not tracked specifically to determine if it is re-used. Therefore any cash collateral re-used cannot be reasonably verified.

FINANCIAL STATEMENTS SECURITIES FINANCING TRANSACTION REGULATION (UNAUDITED)
1766 NEUBERGER BERMAN INVESTMENT FUNDS PLC
Appendix IV (Continued) SECURITIES FINANCING TRANSACTION REGULATION (UNAUDITED) (CONTINUED) Neuberger Berman US Long Short Equity Fund (continued) Concentration Data: The Portfolio did not receive any securities as collateral for the total return swaps as at 31 December 2019.
The counterparties across all total return swaps as at 31 December 2019 were as follows:
Counterparty Amount US$
Citibank NA 234,511
Goldman Sachs International 641,377
JPMorgan Chase Bank 885,064
Safekeeping of Collateral Received: As at 31 December 2019 there was no collateral received or held with the Depositary.

SECURITIES FINANCING TRANSACTION REGULATION (UNAUDITED) FINANCIAL STATEMENTS
ANNUAL REPORT 2019 1767
Appendix IV (Continued) SECURITIES FINANCING TRANSACTION REGULATION (UNAUDITED) (CONTINUED) Neuberger Berman US Long Short Equity Fund (continued) Aggregate Transaction Data: The aggregate transaction data for collateral positions (including cash) pledged/(received) across all total return swaps as at 31 December 2019 was as follows:
Type of collateral Amount US$* Quality** Maturity tenor (collateral)***
Currency of collateral
Country of counterparty
establishment**** Settlement and
clearing Total Return Swap Citibank NA Cash Collateral 250,000 N/A N/A USD United States OTC Goldman Sachs International Cash Collateral 300,000 N/A N/A USD United Kingdom OTC JPMorgan Chase Bank Cash Collateral 6,150,000 N/A N/A USD United States OTC * Cash collaterals may cover a combination of swaps instruments, as such a portion of the collaterals relates to swap agreements not in scope of the SFTR. ** There is no credit rating for cash assets. Cash denominated in USD is deemed to be at highest quality due to its high liquid nature. *** Split to be provided by 7 maturity buckets (< 1 day, 1 day to 1 week, 1 week to 1 month, 1 month to 3 months, 3 months to 1 year, > 1 year, open maturity). Cash collateral has no maturity tenor. **** Country corresponds with the address of our actual counterparty. The maturity tenor of total return swaps positions as at 31 December 2019 was as follows: Amount US$
Maturity * < 1 day 1 day to 1 week 1 week to 1 month 1 month to 3 months 3 months to 1 year > 1 year open maturity
Total Return Swaps - Assets - - - 2,691 - - - Total Return Swaps - Liabilities - - - 12,469 1,491,728 254,064 -

FINANCIAL STATEMENTS SECURITIES FINANCING TRANSACTION REGULATION (UNAUDITED)
1768 NEUBERGER BERMAN INVESTMENT FUNDS PLC
Appendix IV (Continued) SECURITIES FINANCING TRANSACTION REGULATION (UNAUDITED) (CONTINUED) Neuberger Berman US Long Short Equity Fund (continued) Safekeeping of Collateral Granted: The proportion of collateral held in segregated, pooled or other accounts as at 31 December 2019 was as follows:
%
Segregated Accounts 0% Pooled Accounts 0% Other 100% 100%
Return/Costs: For total return swaps transactions costs, if applicable, are not separately identifiable. For these investments, transaction costs are included in the purchase and sales price and are part of the gross investment performance of each Portfolio. Returns are identified as the realised gains/losses and change in unrealised gains/losses on the swap contracts during the reporting period. Neuberger Berman Multi-Asset Class Income Fund Global Data: The amount of assets across total return swaps as at 31 December 2019 was as follows:
Type of Asset Amount US$ Proportion of NAV (%)
Total Return Swaps – Assets 650,330 0.66% Total Return Swaps – Liabilities 490,020 0.50%

SECURITIES FINANCING TRANSACTION REGULATION (UNAUDITED) FINANCIAL STATEMENTS
ANNUAL REPORT 2019 1769
Appendix IV (Continued) SECURITIES FINANCING TRANSACTION REGULATION (UNAUDITED) (CONTINUED) Neuberger Berman Multi-Asset Class Income Fund (continued) Data on Reuse of Collateral: Cash collateral is received into the custody account for the Portfolio and therefore is not tracked specifically to determine if it is re-used. Therefore any cash collateral re-used cannot be reasonably verified. Concentration Data: The Portfolio did not receive any securities as collateral for the total return swaps as at 31 December 2019. The counterparties across all total return swaps as at 31 December 2019 were as follows:
Counterparty Amount US$
Citibank NA 926,532 Goldman Sachs International 146,813 JPMorgan Chase Bank 67,005
Safekeeping of Collateral Received: As at 31 December 2019 there was no collateral received or held with the Depositary. Aggregate Transaction Data: As at 31 December 2019 there was no collateral positions (including cash) pledged/(received) across all total return swaps. The maturity tenor of total return swaps positions as at 31 December 2019 was 3 months to 1 year.

FINANCIAL STATEMENTS SECURITIES FINANCING TRANSACTION REGULATION (UNAUDITED)
1770 NEUBERGER BERMAN INVESTMENT FUNDS PLC
Appendix IV (Continued) SECURITIES FINANCING TRANSACTION REGULATION (UNAUDITED) (CONTINUED) Neuberger Berman Multi-Asset Class Income Fund (continued) Safekeeping of Collateral Granted: There was no collateral held in segregated, pooled or other accounts as at 31 December 2019. Return/Costs: For total return swaps transactions costs, if applicable, are not separately identifiable. For these investments, transaction costs are included in the purchase and sales price and are part of the gross investment performance of each Portfolio. Returns are identified as the realised gains/losses and change in unrealised gains/losses on the swap contracts during the reporting period. Neuberger Berman Multi-Asset Class Growth Fund Global Data: The amount of assets across total return swaps as at 31 December 2019 was as follows:
Type of Asset Amount US$ Proportion of NAV (%)
Total Return Swaps – Assets 127,639 0.65% Total Return Swaps – Liabilities 94,357 0.48%
Data on Reuse of Collateral: Cash collateral is received into the custody account for the Portfolio and therefore is not tracked specifically to determine if it is re-used. Therefore any cash collateral re-used cannot be reasonably verified.

SECURITIES FINANCING TRANSACTION REGULATION (UNAUDITED) FINANCIAL STATEMENTS
ANNUAL REPORT 2019 1771
Appendix IV (Continued) SECURITIES FINANCING TRANSACTION REGULATION (UNAUDITED) (CONTINUED) Neuberger Berman Multi-Asset Class Growth Fund (continued) Concentration Data: The Portfolio did not receive any securities as collateral for the total return swaps as at 31 December 2019. The counterparties across all total return swaps as at 31 December 2019 were as follows:
Counterparty Amount US$
Citibank NA 182,283 Goldman Sachs International 27,905 JPMorgan Chase Bank 11,808
Safekeeping of Collateral Received: As at 31 December 2019 there was no collateral received or held with the Depositary. Aggregate Transaction Data: As at 31 December 2019 there was no collateral positions (including cash) pledged/(received) across all total return swaps. The maturity tenor of total return swaps positions as at 31 December 2019 was 3 months to 1 year. Safekeeping of Collateral Granted: There was no collateral held in segregated, pooled or other accounts as at 31 December 2019. Return/Costs: For total return swaps transactions costs, if applicable, are not separately identifiable. For these investments, transaction costs are included in the purchase and sales price and are part of the gross investment performance of each Portfolio. Returns are identified as the realised gains/losses and change in unrealised gains/losses on the swap contracts during the reporting period.

FINANCIAL STATEMENTS REMUNERATION DISCLOSURE (UNAUDITED)
1772 NEUBERGER BERMAN INVESTMENT FUNDS PLC
Appendix V REMUNERATION DISCLOSURE (UNAUDITED)
The European Union Directive 2014/91/EU (known as the “UCITS V Directive”) came into effect on 18 March 2016. The Company has adopted a remuneration policy in order to meet the requirements of the UCITS V Directive and ESMA’s Guidelines on Sound Remuneration Policies under the UCITS V Directive in a way and to the extent that is appropriate to the Company’s size, internal organisation and the nature, scope and complexity of its activities.
The Company’s remuneration policy applies to staff whose professional activities have a material impact on the risk profile of the Company.
As at 31 December 2019, the Company did not have any employees and the Company’s remuneration policy applied only to the Company’s board of directors who manage and control the Company. Please refer to Note 7 for details of Directors’ remuneration.

GLOSSARY OF INDICES (UNAUDITED) FINANCIAL STATEMENTS
ANNUAL REPORT 2019 1773
Appendix VI GLOSSARY OF INDICES (UNAUDITED) Bloomberg Barclays Euro Aggregate Bond Index (EUR)
The index is a benchmark that measures the investment grade, euro-denominated, fixed- rate bond market, including treasuries, government-related, corporate and securitised issues. Inclusion is based on currency denomination of a bond and not country of risk of the issuer.
Bloomberg Barclays Global Aggregate Index The index measures global investment grade debt from twenty-four different local currency markets and includes fixed-rate treasury, government-related, corporate and securitised bonds from both developed and emerging markets issuers. The index is largely comprised of three major regional aggregate components: the Bloomberg Barclays US Aggregate Bond Index, the Bloomberg Barclays Pan-European Aggregate Bond Index, and the Bloomberg Barclays Asian-Pacific Aggregate Index. In addition to securities from these three indices, the Bloomberg Barclays Global Aggregate Index also includes investment grade Eurodollar, Euro-Yen, Canadian, and 144A Index-eligible securities not already in these three indices.
Bloomberg Barclays Global Aggregate Index hedged in USD
The index measures global investment grade debt from twenty-four different local currency markets and includes fixed-rate treasury, government-related, corporate and securitised bonds from both developed and emerging markets issuers. The index is largely comprised of three major regional aggregate components: the Bloomberg Barclays US Aggregate Bond Index, the Bloomberg Barclays Pan-European Aggregate Bond Index, and the Bloomberg Barclays Asian-Pacific Aggregate Index. In addition to securities from these three indices, the Bloomberg Barclays Global Aggregate Index also includes investment grade Eurodollar, Euro-Yen, Canadian, and 144A Index-eligible securities not already in these three indices. The index is fully hedged back to USD.
Bloomberg Barclays US Aggregate Bond Index
The index measures the investment grade, US dollar-denominated, fixed-rate, taxable bond market and includes Treasuries, government-related and corporate securities, mortgage-backed securities (“MBS”) (agency fixed-rate and hybrid adjustable rate mortgage (“ARM”) pass-throughs), asset-backed securities (“ABS”), and commercial mortgage-backed securities (“CMBS”) (agency and nonagency).
CBOE MSCI EAFE PutWrite Index The index is designed to track the performance of a hypothetical passive investment strategy that collects option premiums from writing an At-the-Money (ATM) MXEA Put option on a monthly basis and holds a rolling money market account invested in one-month T-bills to cover the liability from the short MXEA Put option position. The index is a total return index that is rebalanced monthly.
CBOE MSCI Emerging Markets PutWrite Index The index is designed to track the performance of a hypothetical passive investment strategy that collects option premiums from writing an At-the-Money (ATM) MXEF Put option on a monthly basis and holds a rolling money market account invested in one-month T-bills to cover the liability from the short MXEF Put option position. The index is a total return index that is rebalanced monthly.
CBOE Russell 2000® PutWrite Index The index tracks the value of a passive investment strategy, which consists of overlaying Russell 2000 (“RUT”) short put options over a money market account invested in one-month Treasury bills. The RUT puts are struck at-the-money and are sold on a monthly basis.
CBOE S&P 500® PutWrite Index The index tracks the value of a passive investment strategy which consists of overlaying S&P 500 (“SPX”) short put options over a money market account invested in one- and three-months Treasury bills. The SPX puts are struck at-the-money and are sold on a monthly basis.

FINANCIAL STATEMENTS GLOSSARY OF INDICES (UNAUDITED)
1774 NEUBERGER BERMAN INVESTMENT FUNDS PLC
Appendix VI (Continued) GLOSSARY OF INDICES (UNAUDITED) (CONTINUED) FTSE Chinese Government and Policy Bank Bond 0-1 Year Select Index
The index includes fixed-rate book entry China government bonds with original maturity greater than 1 year and less than or equal to 7 years, fixed-rate China bonds issued by the policy banks with original maturity greater than 1 year and less than or equal to 7 years and fixed-rate and zero coupon China bonds with original maturity less than or equal to 1 year. The following instruments are excluded: savings bonds, special government bonds, central bank bills, private placements and callable and putable bonds.
FTSE EPRA/NAREIT Developed Real Estate Index (NET)
The index is designed to represent general trends in eligible real estate equities worldwide. Relevant activities are defined as the ownership, disposal and development of income-producing real estate. The index series now covers Global, Developed and Emerging indices, as well the UK's AIM market. The FTSE EPRA Nareit Global Index is designed to track the performance of listed real estate companies and REITS in both developed and emerging markets.
FTSE NAREIT All Equity REITs Index (NET) The index is a free-float adjusted, market capitalisation-weighted index that tracks the performance of US equity real estate investment trusts (REITs) that are listed on the New York Stock Exchange or NASDAQ. Equity REITs include all tax-qualified REITs with more than 50% of total assets in qualifying real estate assets other than mortgages secured by real property.
HFRX Equity Hedge Index The index comprises equity hedge strategies. Equity hedge strategies maintain positions both long and short in primarily equity and equity derivative securities. A wide variety of investment processes can be employed to arrive at an investment decision, including both quantitative and fundamental techniques; strategies can be broadly diversified or narrowly focused on specific sectors and can range broadly in terms of levels of net exposure, leverage employed, holding period, concentrations of market capitalizations and valuation ranges of typical portfolios. Equity hedge managers would typically maintain at least 50%,Únd may in some cases be substantially entirely invested, in equities, both long and short.
Constituent funds are selected from an eligible pool of the more than 7,500 funds worldwide that report to the Hedge Fund Research (HFR) Database. Constituent funds must meet all of the following criteria: report monthly; report performance net of all fees; be U.S. dollar-denominated; be active and accepting new investments; have a minimum 24 months track record; and the fund’s manager must have at least $50 million in assets under management. The index is rebalanced quarterly.
HFRX Global Hedge Fund Index
The index is designed to be representative of the overall composition of the hedge fund universe. It is comprised of all eligible hedge fund strategies; including but not limited to convertible arbitrage, distressed securities, equity hedge, equity market neutral, event driven, macro, merger arbitrage, and relative value arbitrage. The strategies are asset weighted based on the distribution of assets in the hedge fund industry. Constituent funds are selected from an eligible pool of the more than 7,500 funds worldwide that report to the Hedge Fund Research (“HFR”) Database. Constituent funds must meet all of the following criteria: report monthly; report performance net of all fees; be US dollar denominated; be active and accepting new investments; have a minimum 24 months track record; and the fund’s manager must have at least $50 million in assets under management. The index is rebalanced quarterly.

GLOSSARY OF INDICES (UNAUDITED) FINANCIAL STATEMENTS
ANNUAL REPORT 2019 1775
Appendix VI (Continued) GLOSSARY OF INDICES (UNAUDITED) (CONTINUED) ICE BofA European Currency Non-Financial High Yield 3% Constrained Index hedged in EUR
The index contains all non-Financial securities in the ICE BofA European Currency High Yield Index but caps issuer exposure at 3%. Index constituents are capitalisation-weighted, based on their current amount outstanding, provided the total allocation to an individual issuer does not exceed 3%. Issuers that exceed the limit are reduced to 3% and the face value of each of their bonds is adjusted on a pro-rata basis. Similarly, the face values of bonds of all other issuers that fall below the 3% cap are increased on a pro-rata basis. In the event there are fewer than 34 issuers in the index, each is equally weighted and the face values of their respective bonds are increased or decreased on a pro-rata basis.
ICE BofA Global High Yield Constrained Index (USD Hedged Total Return, gross of fees)
The index contains all securities in the ICE BofA Global High Yield Index but caps issuer exposure at 2%. Index constituents are capitalisation-weighted, based on their current amount outstanding, provided the total allocation to an individual issuer does not exceed 2%. Issuers that exceed the limit are reduced to 2% and the face value of each of their bonds is adjusted on a pro-rata basis. Similarly, the face values of bonds of all other issuers that fall below the 2% cap are increased on a pro-rata basis. In the event there are fewer than 50 issuers in the index, each is equally weighted and the face values of their respective bonds are increased or decreased on a pro-rata basis.
ICE BofA Global Hybrid Non-Financial 5% Constrained Custom Index (EUR Hedged)
The index tracks the performance of investment grade non-financial hybrid corporate debt publicly issued in major domestic and Eurobond markets. The benchmark is calculated on a total return basis. Additional disclosures for complete benchmark descriptions are available upon request.
ICE BofA US Dollar 3-Month Deposit Offered Rate Constant Maturity Index
The index tracks the performance of a synthetic asset paying Libor to a stated maturity. The index is based on the assumed purchase at par of a synthetic instrument having exactly its stated maturity and with a coupon equal to that day’s fixing rate.
That issue is assumed to be sold the following business day (priced at a yield equal to the current day fixing rate) and rolled into a new instrument.
ICE BofA US High Yield Constrained Index The index tracks the performance of US dollar-denominated below investment grade corporate debt publicly issued in the US domestic market. In addition to meeting other criteria, qualifying securities must have a below investment grade rating (based on an average of Moody’s, S&P and Fitch ratings), and have risk exposure to countries that are members of the FX-G10, Western Europe or territories of the US and Western Europe. Securities in legal default are excluded from the index. Index constituents are capitalisation-weighted, provided the total allocation to an individual issuer does not exceed 2%.
ICE BofA 0-1 Year AAA Euro Government Index (EUR)
The index is a subset of ICE BofA All Maturity Euro Government Index including all securities with a remaining term to final maturity less than 1 years and rated AAA.
The index tracks the performance of EUR denominated sovereign debt publicly issued by Euro member countries in either the eurobond market or the issuer’s own domestic market. Qualifying countries must be Euro members, have an investment grade foreign currency long-term sovereign debt rating (based on an average of Moody’s, S&P and Fitch), and must have at least one readily available, transparent price source for their securities. To be considered for inclusion a country must be a Euro member as of the first of the month.

FINANCIAL STATEMENTS GLOSSARY OF INDICES (UNAUDITED)
1776 NEUBERGER BERMAN INVESTMENT FUNDS PLC
Appendix VI (Continued) GLOSSARY OF INDICES (UNAUDITED) (CONTINUED) ICE BofA 0-3 Month US Treasury Bill Index
ICE BofA 0-3 Month US Treasury Bill Index is a subset of ICE BofA US Treasury Bill Index including all securities with a remaining term to final maturity less than 3 months.
ICE BofA US Treasury Bill Index tracks the performance of US dollar denominated US Treasury Bills publicly issued in the US domestic market. Qualifying securities must have at least one month remaining term to final maturity and a minimum amount outstanding of $1 billion. Securities issued or marketed primarily to retail investors are excluded. Index constituents are market capitalisation weighted. Accrued interest is calculated assuming next-day settlement. Cash flows from bond payments that are received during the month are retained in the index until the end of the month and then are removed as part of the rebalancing. Cash does not earn any reinvestment income while it is held in the index. Information concerning constituent bond prices, timing and conventions is provided in the ICE BofA Bond Index Guide, which can be accessed on our public website (https://indices.theice.com), or by sending a request to [email protected]. The index is rebalanced on the last calendar day of the month, based on information available up to and including the third business day before the last business day of the month. New issues must settle on or before the calendar month end rebalancing date in order to qualify for the coming month. No changes are made to constituent holdings other than on month end rebalancing dates.
ICE BofA 3-Month US Treasury Bill Index The index is comprised of a single issue purchased at the beginning of the month and held for a full month. At the end of the month that issue is sold and rolled into a newly selected issue. The issue selected at each month-end rebalancing is the outstanding Treasury Bill that matures closest to, but not beyond, three months from the rebalancing date.
JP Morgan Asia Credit Index (JACI)
The index tracks the total return performance for actively traded USD denominated debt instruments in the Asia region (excluding Japan). The JP Morgan Asia Credit Index (“JACI”) tracks total return performance of the Asia fixed-rate dollar bond market. JACI is a market cap-weighted index comprising sovereign, quasi-sovereign and corporate bonds and it is partitioned by country, sector and credit rating. The benchmark is calculated on a total return basis. Additional disclosures for complete benchmark descriptions are available upon request.
JP Morgan Corporate Emerging Markets Bond Index (CEMBI)-Diversified Index
The index tracks the performance of US dollar-denominated corporate emerging market bonds, including emerging market countries from Asia, Europe, Latin America and the Middle East/Africa. The Diversified version of the index is market capitalisation-weighted and limits the weights of those index countries with larger corporate debt stocks by including only specified portions of those countries’ eligible current face amounts of debt outstanding.
JP Morgan Emerging Markets Bond Index (EMBI) Global Diversified
The index tracks the performance of US dollar-denominated debt instruments issued by emerging market sovereign and quasi-sovereign entities (Brady bonds, loans and Eurobonds), including emerging market countries from Asia, Europe, Latin America and the Middle East/Africa. The Global version of the index captures a broad, comprehensive universe of emerging market issues. The Diversified version of the index is market capitalisation-weighted and limits the weights of those index countries with larger debt stocks by including only specified portions of those countries’ eligible current face amounts of debt outstanding.

GLOSSARY OF INDICES (UNAUDITED) FINANCIAL STATEMENTS
ANNUAL REPORT 2019 1777
Appendix VI (Continued) GLOSSARY OF INDICES (UNAUDITED) (CONTINUED) JP Morgan Government Bond Index (GBI)-Emerging Markets Global Diversified
The index tracks the performance of local currency denominated bonds issued by emerging market governments, including emerging market countries from Asia, Europe, Latin America and the Middle East/Africa. The Global version of the index includes only countries that are accessible by most of the international investor base, while countries with explicit capital controls are excluded. The Diversified version of the index is market capitalisation-weighted, with a maximum weight to a country capped at 10%.
MSCI All Country Asia ex-Japan Index The index captures large and mid cap representation across 2 of 3 Developed Markets (“DM”) countries* (excluding Japan) and 9 Emerging Markets (“EM”) countries* in Asia. With 944 constituents, the index covers approximately 85% of the free float adjusted market capitalisation in each country.
* DM countries in the index include: Hong Kong and Singapore. EM countries include: China, India, Indonesia, Korea, Malaysia, Pakistan, the Philippines, Taiwan and Thailand.
MSCI All Country World Index ex-US (Net)
The MSCI ACWI ex USA Index captures large and mid cap representation across 22 of 23 Developed Markets (“DM”) countries (excluding the US) and 24 Emerging Markets (“EM”) countries*. With 2,137 constituents, the index covers approximately 85% of the global equity opportunity set outside the US.
The index is based on the MSCI Global Investable Market Indexes (“GIMI”) Methodology - a comprehensive and consistent approach to index construction that allows for meaningful global views and cross regional comparisons across all market capitalisation size, sector and style segments and combinations. This methodology aims to provide exhaustive coverage of the relevant investment opportunity set with a strong emphasis on index liquidity, investability and replicability. The index is reviewed quarterly - in February, May, August and November -with the objective of reflecting change in the underlying equity markets in a timely manner, while limiting undue index turnover. During the May and November semi-annual index reviews, the index is rebalanced and the large and mid-capitalisation cutoff points are recalculated.
MSCI All Country World Index (Net)
The index is a free float-adjusted market capitalisation-weighted index that is designed to measure the equity market performance of developed and emerging markets. The index consists of 49 country indexes comprising 23 developed and 26 emerging market country indexes. The developed market country indexes included are: Australia, Austria, Belgium, Canada, Denmark, Finland, France, Germany, Hong Kong, Ireland, Israel, Italy, Japan, the Netherlands, New Zealand, Norway, Portugal, Singapore, Spain, Sweden, Switzerland, the United Kingdom and the United States. The emerging market country indexes included are: Argentina, Brazil, Chile, China, Colombia, Czech Republic, Egypt, Greece, Hungary, India, Indonesia, Korea, Malaysia, Mexico, Pakistan, Peru, the Philippines, Poland, Qatar, Russia, Saudi Arabia, South Africa, Taiwan, Thailand, Turkey, and the UAE. China A shares are included starting from 1 June, 2018 and are partially represented at 15% of their free float-adjusted market capitalization as of Agugust 2019. Net total return indexes reinvest dividends after the deduction of withholding taxes, using (for international indexes) a tax rate applicable to non-resident institutional investors who do not benefit from double taxation treaties.

FINANCIAL STATEMENTS GLOSSARY OF INDICES (UNAUDITED)
1778 NEUBERGER BERMAN INVESTMENT FUNDS PLC
Appendix VI (Continued) GLOSSARY OF INDICES (UNAUDITED) (CONTINUED) MSCI China A Onshore Index (Net)
The index captures large and mid-cap representation across China securities listed on the Shanghai and Shenzhen exchanges. The index is based on the MSCI Global Investable Indexes (“GIMI”) Methodology- a comprehensive and consistent approach to index construction that lends a global perspective cross regions, and variations in market capitalisation size, sector and style. This methodology aims to provide thorough coverage of the relevant investment opportunity set with a strong emphasis on index liquidity, investability and replicability. The index is reviewed quarterly - in February, May, August and November - with the objective of reflecting changes in the underlying equity markets in a timely manner, while limiting undue index turnover.
MSCI China Index (Net)
The index is a free float-adjusted market capitalisation-weighted index that is designed to measure the equity market performance of Chinese securities readily accessible to nondomestic investors. The index includes equity securities issued by companies incorporated in the People’s Republic of China (“PRC”), and listed in the form of China B shares on the Shanghai Stock Exchange (in US$) or Shenzhen Stock Exchange (in HK$), or China H shares on the Hong Kong Stock Exchange (in HK$) and other foreign exchanges. It also includes Red-Chips and P-Chips, which are not incorporated in the PRC and are listed on the Hong Kong Stock Exchange. Red-Chips include companies that are directly or indirectly controlled by organisations or enterprises that are owned by the state, provinces, or municipalities of the PRC. P-Chips include non-state-owned Chinese companies incorporated outside the mainland and traded in Hong Kong. US-listed China stocks in the index.
China A shares are included starting from 1 June 2018 and are partially represented at 15% of their free float-adjusted market capitalisation. As of August 2019. Net total return indexes reinvest dividends after the deduction of withholding taxes, using (for international indexes) a tax rate applicable to non-resident institutional investors who do not benefit from double taxation treaties.
MSCI Emerging Markets Index (Net)
The index is a free float-adjusted market capitalisation-weighted index that is designed to measure the equity market performance of emerging markets. The index consists of the following 26 emerging market country indexes: Argentina, Brazil, Chile, China, Colombia, Czech Republic, Egypt, Greece, Hungary, India, Indonesia, Korea, Malaysia, Mexico, Pakistan, Peru, the Philippines, Poland, Qatar, Russia, Saudi Arabia, South Africa, Taiwan, Thailand, Turkey, and the UAE. China A shares are included starting from 1 June 2018 and are partially represented at 15% of their free float-adjusted market capitalization as of August 2019. Net total return indexes reinvest dividends after the deduction of withholding taxes, using (for international indexes) a tax rate applicable to non-resident institutional investors who do not benefit from double taxation treaties.
Russell 2000® Index
The index is a float-adjusted market capitalisation-weighted index that measures the performance of the small-cap segment of the US equity market. It includes approximately 2,000 of the smallest securities in the Russell 3000 Index (which measures the performance of the 3,000 largest US public companies based on total market capitalisation). The index is rebalanced annually in June.
Russell 2000® Value Index The index is a float-adjusted market capitalisation-weighted index that measures the performance of the small-cap value segment of the US equity market. It includes those Russell 2000 Index companies with lower price-to-book ratios and lower forecasted growth rates. The index is rebalanced annually in June.

GLOSSARY OF INDICES (UNAUDITED) FINANCIAL STATEMENTS
ANNUAL REPORT 2019 1779
Appendix VI (Continued) GLOSSARY OF INDICES (UNAUDITED) (CONTINUED) S&P 500® Index The S&P 500 Index is a capitalization weighted index comprised of 500 stocks chosen
for market size, liquidity, and industry group representation. The S&P 500 Index is constructed to represent a broad range of industry segments in the U.S. economy. The S&P 500 Index focuses on the large-cap segment of the market with over 80% coverage of US equities. Criteria for inclusion include financial stability (minimize turnover in the index), screening of common shares to eliminate closely held companies, and trading activity indicative of ample liquidity and efficient share pricing. Companies in merger, acquisition, leveraged-buy-outs, bankruptcy (Chapter 11 filing or any shareholder approval of recapitalization which changes a company's debt-to-equity ratio), restructuring, or lack of representation in their representative industry groups are eliminated from the index.
Weighted average of 2/3 JP Morgan Emerging Markets Bond Index Global Diversified Investment Grade Index (USD total return) and 1/3 of JP Morgan GBI EM Global Diversified Index Investment Grade 15% Cap Index (USD unhedged total return)
The blended index is composed of the weighted average of 2/3 JP Morgan EMBI Global Diversified Investment Grade Index (USD total return) (described previously) and 1/3 of JP Morgan GBI-EM Global Diversified Index Investment Grade 15% Cap Index (USD unhedged total return) (described previously), and is rebalanced monthly.
25% JP Morgan Emerging Markets Bond Index Global Diversified, 25% of JP Morgan Emerging Markets Corporate Bond Index Diversified and 50% of JP Morgan GBI EM Global Diversified Index
The blended index is composed of 25% JP Morgan Emerging Markets Bond Index Global Diversified (described previously), 25% of JP Morgan Emerging Markets Corporate Bond Index Diversified (described previously) and 50% of JP Morgan GBI EM Global Diversified Index (described previously), and is rebalanced monthly.
50% CBOE S&P 500® PutWrite Index, 25% MSCI All Country World Index ex-US (Net) and 25% ICE BofA 0-3 Month US Treasury Bill Index
The blended index is composed of 50% in the CBOE S&P 500 PutWrite Index (described previously), 25% in the MSCI All Country World Index ex-US (net) (described previously) and 25% in the ICE BofA 0-3 Month US Treasury Bill Index (described previously), and is rebalanced monthly.
50% CBOE S&P 500® PutWrite Index, 35% MSCI EAFE PutWrite Index, and 15% CBOE MSCI Emerging Markets PutWrite Index
The blended index is composed of 50% in the CBOE S&P 500 PutWrite Index (described previously), 35% in the MSCI EAFE PutWrite Index (described previously) and 15% in the CBOE MSCI Emerging Markets PutWrite Index, and is rebalanced monthly.
85% to the CBOE S&P500® PutWrite Index and 15% to the CBOE Russell 2000® PutWrite Index
The blended index is composed of 85% in the CBOE S&P 500 PutWrite Index (described previously) and 15% to the CBOE Russell 2000 PutWrite Index (described previously), and is rebalanced monthly.

FINANCIAL STATEMENTS INVESTMENT MANAGERS, SUB-INVESTMENT MANAGERS AND SUB-ADVISERS (UNAUDITED)
1780 NEUBERGER BERMAN INVESTMENT FUNDS PLC
Appendix VII INVESTMENT MANAGERS, SUB-INVESTMENT MANAGERS AND SUB-ADVISERS (UNAUDITED) Details of Investment Managers, Sub-Investment Managers and Sub-Advisers for each Portfolio are listed in the table below:
Fund Name Investment Manager Sub-Investment Managers Sub-Advisers (Affiliated) Sub-Advisers (Non-Affiliated)
Neuberger Berman US Real Estate Securities Fund
Neuberger Berman Europe Limited (“NBEL”)
Neuberger Berman Investment Advisers LLC (“NBIA”)
Neuberger Berman High Yield Bond Fund NBEL NBIA Neuberger Berman US Multi Cap Opportunities Fund
NBEL NBIA
Neuberger Berman Diversified Currency Fund NBEL NBIA
Neuberger Berman China Equity Fund NBEL Green Court Capital Management Limited (“Green Court”)
Neuberger Berman Emerging Markets Equity Fund
NBEL NBIA
Neuberger Berman US Small Cap Fund NBEL NBIA Neuberger Berman Short Duration High Yield Bond Fund
NBEL NBIA
Neuberger Berman Global Bond Fund NBEL NBIA
Neuberger Berman Singapore Pte. Limited (“NBS”)
Neuberger Berman Asset Management Ireland Limited (“NBAMIL”)
Neuberger Berman Strategic Income Fund NBEL
NBIA
NBS
NBAMIL
Neuberger Berman Emerging Market Debt – Hard Currency Fund
NBEL
NBIA
NBS
NBAMIL
Neuberger Berman Emerging Market Corporate Debt Fund
NBEL
NBIA
NBS
NBAMIL
Neuberger Berman Emerging Market Debt – Local Currency Fund
NBEL
NBIA Neuberger Berman Investment Management (Shanghai) Limited (“NB Shanghai”)
NBS
NBAMIL
Neuberger Berman Global Bond Absolute Return Fund NBEL
NBIA
NBS
NBAMIL

INVESTMENT MANAGERS, SUB-INVESTMENT MANAGERS AND SUB-ADVISERS (UNAUDITED) FINANCIAL STATEMENTS
ANNUAL REPORT 2019 1781
Appendix VII (Continued) INVESTMENT MANAGERS, SUB-INVESTMENT MANAGERS AND SUB-ADVISERS (UNAUDITED) (CONTINUED)
Fund Name Investment Manager Sub-Investment Managers Sub-Advisers (Affiliated) Sub-Advisers (Non-Affiliated)
Neuberger Berman Absolute Return Multi Strategy Fund
NBEL NBIA
Cramer Rosenthal McGlynn, LLC (“Cramer Rosenthal McGlynn”) Good Hill Partners LP (“Good Hill”) GAMCO Asset Management Inc. (“Gabelli”) Portland Hill Asset Management Limited (“Portland Hill”) P/E Global LLC (“P/E Global”) BH-DG Systematic Trading LLP (“BH-DG”) Sound Point Capital Management, L.P. (“Sound Point Capital”) (until 4 March 2020)
Neuberger Berman Short Duration Emerging Market Debt Fund
NBEL
NBIA
NBS
NBAMIL
Neuberger Berman US Long Short Equity Fund NBEL NBIA
Neuberger Berman Emerging Market Debt Blend Fund NBEL
NBIA
NB Shanghai NBS
NBAMIL Neuberger Berman European High Yield Bond Fund
NBEL NBIA
Neuberger Berman Global Equity Fund NBEL NBIA
Neuberger Berman Systematic Global Equity Fund NBEL
NBIA Neuberger Berman Breton Hill
ULC (“Breton Hill”)
Neuberger Berman Global Real Estate Securities Fund
NBEL NBIA
Neuberger Berman Asia Limited (“NBAL”)
Neuberger Berman US Small Cap Intrinsic Value Fund NBEL NBIA
Neuberger Berman Asian Debt – Hard Currency Fund
NBEL
NBIA
NBS
NBAMIL

FINANCIAL STATEMENTS INVESTMENT MANAGERS, SUB-INVESTMENT MANAGERS AND SUB-ADVISERS (UNAUDITED)
1782 NEUBERGER BERMAN INVESTMENT FUNDS PLC
Appendix VII (Continued) INVESTMENT MANAGERS, SUB-INVESTMENT MANAGERS AND SUB-ADVISERS (UNAUDITED) (CONTINUED)
Fund Name Investment Manager Sub-Investment Managers Sub-Advisers (Affiliated) Sub-Advisers (Non-Affiliated)
Neuberger Berman China Bond Fund NBEL
NBIA
NBS
NBAL
Neuberger Berman Corporate Hybrid Bond Fund NBEL NBIA
NBS
Neuberger Berman US Equity Fund NBEL NBIA
Neuberger Berman Global High Yield Bond Fund
NBEL
NBIA
NBS
NBAMIL
Neuberger Berman Global Opportunistic Bond Fund NBEL
NBIA
NBS
NBAMIL
Neuberger Berman Multi-Asset Class Income Fund
NBEL
NBIA
Breton Hill
NBAMIL Neuberger Berman US Equity Index PutWrite Fund
NBEL NBIA
Neuberger Berman Global Equity Index PutWrite Fund
NBEL NBIA
Neuberger Berman Uncorrelated Strategies Fund NBEL NBIA
Altiq LLP (“Altiq”) BH-DG Systematic Trading LLP (“BH-DG”) P/E Global LLC (“P/E Global”) Sabre Fund Management Limited (“Sabre”) True Partner Capital USA Holding Inc (“True Partner”) Alcova Asset Management LLP (“Alcova”) Sandbar Asset Management LLP (“Sandbar”) LCJ Investments SA (“LCJ”)
Neuberger Berman Emerging Market Debt Blend Investment Grade Fund
NBEL
NBIA
NBS
NBAMIL

INVESTMENT MANAGERS, SUB-INVESTMENT MANAGERS AND SUB-ADVISERS (UNAUDITED) FINANCIAL STATEMENTS
ANNUAL REPORT 2019 1783
Appendix VII (Continued) INVESTMENT MANAGERS, SUB-INVESTMENT MANAGERS AND SUB-ADVISERS (UNAUDITED) (CONTINUED)
Fund Name Investment Manager Sub-Investment Managers Sub-Advisers (Affiliated) Sub-Advisers (Non-Affiliated)
Neuberger Berman Emerging Markets Sustainable Equity Fund NBEL NBIA
Neuberger Berman China Equity Opportunities Fund NBEL
NBAL
NBIA
Neuberger Berman Multi-Asset Class Growth Fund NBEL
NBIA
Breton Hill
NBAL
NBS
NBAMIL
Neuberger Berman Global Thematic Equity Fund NBEL NBIA Neuberger Berman CLO Income Fund NBEL NBIA
Neuberger Berman Next Generation Mobility Fund NBEL
NBIA
NBALNeuberger Berman Ultra Short Term Euro Bond Fund NBEL NBAMIL Neuberger Berman Euro Opportunistic Bond Fund NBEL NBAMIL Neuberger Berman Euro Bond Absolute Return Fund NBEL NBAMIL
Neuberger Berman Absolute Alpha Fund NBEL NBIA Neuberger Berman Multi-Style Premia Fund NBEL Breton Hill
Neuberger Berman Macro Opportunities FX Fund NBEL
NBAMIL
NBIA

FINANCIAL STATEMENTS NEUBERGER BERMAN INVESTMENT FUNDS PLC
1784 NEUBERGER BERMAN INVESTMENT FUNDS PLC
This document is issued by Neuberger Berman Europe Limited (“NBEL”) which is authorised and regulated by the UK Financial Conduct Authority (“FCA”) and is registered in England and Wales, at Lansdowne House, 57 Berkeley Square, London, W1J 6ER and is also a Registered Investment Adviser with the Securities and Exchange Commission in the US and regulated by the Dubai Financial Services Authority. In Switzerland the representative and paying agent is BNP Paribas Securities Services, succursale de Zurich, Selnaustrasse 16, 8002 Zurich, Switzerland. Both the place of performance and the place of jurisdiction for Shares in the Company's sub-funds offered or distributed in or from Switzerland shall be the seat of the Swiss representative. The prospectus, key investor information document, the company's articles of association, the latest audited annual accounts and any subsequent half-yearly accounts of the Company may be obtained free of charge from the representative in Switzerland.
Neuberger Berman Investment Funds plc (the “Company”) is authorised by the Central Bank of Ireland (the “Central Bank”) as an Undertaking for Collective Investment in Transferable Securities under the European Communities (“UCITS”) Regulations 2011 (S.I. 352 of 2011) of Ireland, as amended.
This document has been provided for information purposes only to and/or directed only at persons who are professional clients or eligible counterparties. All information is subject to change without notice. No part of this document may be reproduced in any manner without the written permission of NBEL. Firm data, where relevant, including employee and assets under management figures, reflect collective data for the various affiliated investment advisers that are subsidiaries of Neuberger Berman Group LLC (the “firm”). Firm history/timeline information dates back to the 1939 founding of Neuberger & Berman (the predecessor to Neuberger Berman Group LLC), and highlights key business expansions, including those that resulted from acquisitions of the various affiliated investment advisers that now comprise the firm. Investment professionals referenced include portfolio managers, research analysts/associates, traders, and product specialists and team dedicated economists/strategists.
While Neuberger Berman believe that the information is correct at the date of production, no warranty or representation is given to this effect and no responsibility can be accepted by Neuberger Berman to the recipient of this document or end users for any action taken on the basis of the information contained herein. No reliance may be placed for any purpose on the information and opinions contained in this document or their accuracy or completeness. Opinions expressed herein reflect the opinion of Neuberger Berman and are subject to change without notice. The Company may not be eligible for sale in some countries and it may not be suitable for all types of investor for further information see the current prospectus. Please go to www.nb.com/europe/literature.html for more information.
Fixed income securities are subject to the risk of an issuer’s ability to meet principal and interest payments on the obligation (credit risk) and may also be subject to price volatility due to such factors as interest rate sensitivity, market perception of the creditworthiness of the issuer and general market liquidity (market risk). Fixed income securities are also exposed to the risk that their or their issuers’ credit ratings may be downgraded, which can cause a significant drop in the value of such securities.
Lower rated or unrated (i.e. non-investment grade or high yield) securities are more likely to react to developments affecting market and credit risk than are more highly rated securities, which primarily react to movements in the general level of interest rates. Investors should carefully consider the relative risks of investing in high yield securities and understand that such securities generally are not meant for short-term investing. Investors who subscribe in a currency other than the base currency of the Company are exposed to currency risk. Fluctuations in these exchange rates may affect the return on investment.
Past performance is not indicative of future results. For details of the investment risks, which may include but are not limited to liquidity, interest rate, credit and currency risk, see the current prospectus. Please note that any dividends/interest which the Company may receive may be subject to withholding tax. The benchmark does not take into account the effects of tax and the deduction is therefore not reflected in the benchmark return illustrated herein. The investment objective and performance benchmark is a target only and not a guarantee of the Company performance. The index is unmanaged and cannot be invested in directly. Index returns assume reinvestment of dividends and capital gains and unlike fund returns do not reflect fees or expenses. Adverse movements in currency exchange rates can result in a decrease in return and a loss of capital. The investments of each Portfolio may be fully hedged into the Portfolio's base currency: this may reduce currency risks but may also expose the Portfolio to other risks such as the default of a counterparty. As noted above for further information relating to risks specific to this strategy please see the current prospectus.
Neuberger Berman is a registered trademark.
© 2020 Neuberger Berman
Contact details for NB Europe German branch: Tel +4969 50956 5647/5648 E-mail: [email protected]